Continuing to strengthen FDA's science approach to emerging technologies
Upload
khangminh22Category
view
1download
0
Organizations and NeighborhoodNetworks that Strengthen Families in
the District of ColumbiaFinal Report to the Annie E. Casey Foundation
by
Carol J. De VitaCarlos ManjarrezEric C. Twombly
THE URBAN INSTITUTE
Center on Nonprofits and PhilanthropyThe Urban Institute2100 M Street, NW
Washington, DC 20037(202) 261-5790

THE URBAN INSTITUTE Center on Nonprofits and Philanthropy
ACKNOWLEDGMENTS
This study was made possible with the support and guidance of many people. At theUrban Institute, Elizabeth T. Boris served as project director; Carol J. De Vita was theprincipal investigator; and Tobi Printz Platnick managed the project from January 1997 toDecember 1998, after which time Carlos Manjarrez became project manager. Eric C.Twombly was responsible for database management and the spatial analysis. Researchassistance was provided by Malikah Ash, Roseanna Bess, Robyn Mercurio, AnnaStattmiller, Stephanie Scott-Melnyk, Patrick Sweetman, Karin Willner and RobertGrimm.
The authors also would like to thank Irene Lee, project officer, at the Annie E. CaseyFoundation, and members of the national and local advisory committees whose expertisehelped guide the study design.
The study was funded by the Annie E. Casey Foundation. Additional support fordissemination was provided by The Morris and Gwendolyn Cafritz Foundation.
For additional information, please contact the Center on Nonprofits and Philanthropy,The Urban Institute, 2100 M Street, NW, Washington, DC 20037, (202) 261-5790.

EXECUTIVE SUMMARY
Final ReportAnnie E. Casey Foundation
Grant No. 98/1578
Submitted byCenter on Nonprofits and Philanthropy
The Urban Institute2100 M Street NW
Washington, D.C. 20037
The problems affecting children in the nation’s capital are well known. Year after year,the KIDS COUNT Data Book documents the severity of problems facing children and youthin the District of Columbia. Poverty runs high. The majority of school children scorebelow basic reading levels. Birth rates to teenagers and juvenile violent crime arrest ratesfar exceed the national average. Such data raise serious concerns about the quality of lifeand opportunities for children in the District, particularly for those living in the poorest,inner-city neighborhoods.
Purpose and ObjectivesBecause research shows that neighborhood characteristics and local institutions affect theoverall well-being of children and youth, the Center on Nonprofits and Philanthropy atthe Urban Institute undertook a study of the institutional factors that make a positivedifference in the lives of children and families in local communities. More specifically,the purpose of the study was to construct a methodology to identify and describecommunity organizations and networks that strengthen families and children in threelow-income neighborhoods in Washington, D.C. It included the following tasks:
• Develop tools to analyze the size, scope, and structure of community organizationsthat foster local leadership and leverage resources on behalf of families and children;
• Conduct a spatial analysis to understand the relationship between the nonprofitinfrastructure and socioeconomic characteristics of three low-income neighborhoodsin the District of Columbia; and
• Describe the community-based groups and networks that enhance the well-being offamilies and children.
Selection of NeighborhoodsThe selection of neighborhoods began with three criteria that affect communityinfrastructures at the local level. The communities had to be: 1) similar in populationsize; 2) dispersed geographically throughout the city; and 3) similar in income levels, asmeasured by percentage of households in poverty. After identifying severalneighborhoods that fit the three selection criteria and consulting with Annie E. Casey

Executive Summary
Center on Nonprofits and Philanthropy • The Urban Institute
ii
Foundation staff, the final selection of sites also captured several differences among thecommunities. The three sites selected for study were:
• Columbia Heights, a racially/ethnically diverse neighborhood in Northwest D.C.;
• Marshall Heights, a predominantly African-American community in Northeast D.C.that has relatively high homeownership rates; and
• Washington Highlands, a troubled and neglected African-American neighborhoodin Southeast D.C. that is in the midst of new housing construction.
Research MethodsA three-step strategy, using both quantitative and qualitative methods, was used tomeasure and understand the dynamics of the study neighborhoods. First, data wereobtained from the U.S. Bureau of the Census, National Neighborhood Indicators Project,D.C. Office of Planning and Evaluation, D.C. Department of Children and FamilyServices, and other governmental agencies to construct a socioeconomic anddemographic profile of each community. These data provided measures of the number ofchildren in each neighborhood, school performance, crime rates, and a host of othercommunity indicators.
Second, an electronic database was created using data from the Internal RevenueService (IRS) on nonprofit organizations that have filed for tax-exempt, 501(c)(3) status.These data were supplemented with information from local directories and keyinformants who identified small neighborhood groups not required by the IRS to seektax-exempt status. The database was further expanded to include religious congregationslocated in the city. The database provides a comprehensive list of the local organizationalinfrastructure that is addressing the needs of children and families in the study sites.These data were geographically mapped to assess their spatial distribution in relation tolocal socioeconomic needs.
The final step was to conduct ethnographic field work in the neighborhoods. Aseries of activities was undertaken to gather both qualitative and quantitative data aboutthe neighborhoods and local efforts to help children and families. First, interviews wereconducted with 62 individuals (key informants) to learn about the strengths of eachcommunity, local needs, local organizations, and community networks focused onhelping children and families. Key informants included leaders of nonprofitorganizations, religious clergy, school principals, police officers, and local politicalleaders. Later, a survey of 51 nonprofit organizations that work with children andfamilies was conducted to measure the size, scope, capacity, funding sources, andresidents’ participation in these organizations. Finally, field staff provided ethnographicobservations about the neighborhoods, community groups, and local networks that areactively addressing the needs of children and families in the study sites.

Executive Summary
Center on Nonprofits and Philanthropy • The Urban Institute
iii
Key FindingsOur research revealed a unique story in each neighborhood, and details of these analysesare provided in the full report. Seven key findings, however, provide a general summaryof the common themes and comparative differences that emerged from the research. Thefindings are viewed as essential elements in developing strategies to address the needs ofchildren and families in local neighborhoods.
1. Local, neighborhood conditions matter. Although the three study sites were selectedbecause of similarities along a number of socioeconomic dimensions, it soon becameapparent that each neighborhood had its own unique organizational and environmentalcontext. These conditions were instrumental in shaping local institutions and theirlinkages to broader community-based and citywide networks.
—Columbia Heights, for example, with its ethnic diversity has seven times morenonprofit organizations and a more complex web of networks than either MarshallHeights or Washington Highlands. Communication across ethnic groups is not welldeveloped, however.
—In Marshall Heights, the Marshall Heights Community DevelopmentOrganization anchors and dominates the civic infrastructure. It is regarded by our keyinformants as “the place to go” if you have a problem. A handful of smaller groups alsooffer programs for children and families, but the out-migration of residents fromMarshall Heights, in part, undercuts the development of local leadership as familiesmove out of the area in search of better opportunities.
—Washington Highlands is undergoing dramatic environmental change. Publichousing is being torn down and replaced by mixed income housing. Crime is regarded asthe number one problem in this community. A civic infrastructure is beginning to appearas community groups and local churches work together to create programs that addressthe needs of children and families in the area.
2. Civic infrastructure in poor neighborhoods tends to be fragile and transient. Ourfield work revealed considerable turnover in the number of community-based groupsworking in the three study sites with some groups moving in or out of the neighborhoodand others being newly formed or recently disband. About half of the groups identifiedthrough IRS data were confirmed by our field work to be in the area; another one-quarterwere no longer in the study sites. This finding suggests the need for local-level field workto develop a current and complete picture of the civic infrastructure in a specificneighborhood, and the need for periodic monitoring to keep on top of changes. It alsosuggests the need for intervention strategies that will invest in capacity building for thesecommunity-based organizations.
3. Nonprofit organizations matter. Over 80 percent of respondents cited the work ofnonprofits as making a difference in promoting the well-being of children and families inlocal neighborhoods. This response was consistent across study sites and regardless of therespondent’s affiliation. Yet there are relatively few services for kids. On average, thereis one nonprofit for every 46 children in Columbia Heights; one for every 490 children inMarshall Heights; and one for every 703 children in Washington Highlands.

Executive Summary
Center on Nonprofits and Philanthropy • The Urban Institute
iv
4. Money matters. Our survey data show that many of the neighborhood groups in thethree study sites are tackling important community issues with very limited resources.The average budget ranges from $674,000 in Columbia Heights to $275,000 inWashington Highlands. But dollars, alone, do not tell the whole story. In ColumbiaHeights, nonprofit groups have a broad funding base, drawing on more than five differentfunding sources to support their activities, whereas in Marshall Heights and WashingtonHighlands, the base of financial support is much more limited. Two-thirds of the groupsin Washington Highlands reported that more than 80 percent of their funds came from asingle source. Resource dependence can be an indirect measure of organizational strengthand capacity, and our data show that nonprofit organizations in these low-income areas,and especially those in Washington Highlands, will need a larger and more diversefinancial base to build their organizational capacity to make change possible.
5. Leadership matters. Strong leaders make things happen, and the three study sites allhave strong leaders who are working hard to improve the lives of children and families intheir neighborhoods. In Columbia Heights, heads of community organizations were seenas the principal leaders of the neighborhood, along with the local communitydevelopment corporation. In Marshall Heights, respondents noted two primary sources ofleadership: the Marshall Heights Community Development Organization, and theAdvisory Neighborhood Commission. In Washington Highlands, the resident councilswere cited more than any other group as providing effective leadership. The local CityCouncil member also received high marks, although government, itself, was not generallyregarded as an effective force in the community.
6. Religious congregations could be potential resources. Perhaps one of the untappedresources of these communities is religious congregations. In Columbia Heights andWashington Highlands, for example, several congregations provide physical space andvolunteers for nonprofit organizations to run their programs. This type of arrangementwas much less evident in Marshall Heights, although houses of worship outnumbernonprofit groups by a factor of more than three to one in Marshall Heights. The majorityof our key informants in Marshall Heights identified churches as important influences inthe community, but gave mixed reviews on their effectiveness in addressing local needs.Part of this reluctance was based on the perception that local congregations provideservices only to their members and that most of the members no longer live in theneighborhood, but have moved to Maryland or other parts of the District. Because theneighborhood environment can serve as an incubator for local leadership, it is importantto explore the many avenues that can nurture local leaders.
7. Programs should be “family focused.” There was a strong consensus across all threecommunities that programs should be holistic in their approach to problem solving orservice delivery. This approach was generally characterized as “family focused” asopposed to “individually focused,” and implied that a constellation of family needs andcharacteristics must be addressed to make change possible. Many of the respondentsbelieved that programs should focus on the needs of the children, particularly onimproving the local schools and supporting school-based programs for older youth.

Executive Summary
Center on Nonprofits and Philanthropy • The Urban Institute
v
ConclusionThe methodology developed and tested in this study provides an important framework forunderstanding the needs and institutional infrastructures of local neighborhoods. Itprovides a set of both quantitative and qualitative research tools that can be used toinvestigate factors affecting community life and the well-being of children and families inother D.C. neighborhoods, as well as in other communities across the country.
The study’s findings emphasize the importance of looking carefully at thestrengths and assets of local neighborhoods before developing initiatives to address localneeds. Both organizational and environmental factors can vary widely from place to placeand must to be taken into account when designing initiatives to produce positive changefor children and families. Based on our research findings, CNP offers fourrecommendations for investing in low-income communities.
1. An initial step in designing programs for low-income communities must beginwith a careful assessment of the neighborhood’s organizational and environmentalcontext. Although the three D.C. study sites were selected because they shared severalcommon features, the research found substantial differences in the resources andnetworks of the three communities. Intervention strategies will need to take account ofthese community conditions to be effective.
2. Programmatic interventions must be tailored to fit local conditions. While aspecific strategy may be effective in one neighborhood, it may fail to produce the desiredresults in another community because organizational and environmental factors varygreatly from place to place. Indeed, the efficacy of strategies are constrained byorganizational and sociopolitical environments, which provide their own challenges.Instead, programmatic approaches should be tailored to support and strengthen existingorganizational assets and community resources or to fill gaps in the local infrastructure.
3. For an initiative to succeed in low-income areas, it must be long-term and flexible.The problems facing many low-income neighborhoods are likely to be deeply rooted anddifficult to change in a short funding cycle. A long-term commitment is required to effectreal change. But environments and needs also change over time, and effective place-based strategies must be flexible to respond to change. The implementation of long-termand flexible programs has a two-fold advantage. First, it will help meet existing needs,while also contributing to the future viability of the community. Second, thedemonstration of a foundation’s continued commitment to a low-income neighborhoodmay encourage additional public and private investment to the area.
4. Making a difference in the lives of children and families in poor neighborhoodsrequires periodic monitoring of organizational and environmental conditions. Whileeffective place-based strategies must begin with a solid understanding of theorganizational and environmental characteristics of the neighborhood, they also requireon-going monitoring of organizational and environmental change. This process providesan invaluable and essential feedback loop to make programmatic adjustments that fitcurrent needs and conditions.

Final ReportAnnie E. Casey Foundation
Grant No. 98.1578
Submitted byCenter on Nonprofits and Philanthropy
The Urban Institute2100 M Street NW
Washington, DC 20037
The problems affecting children in the nation’s capital are well known. Census data place
the District of Columbia behind most states on various social and economic indicators
(KIDS COUNT Data Books, 1999 and 1998). Poverty runs high. About one in five children
in the District, compared with one in ten nationwide, lives in extreme poverty (that is, in
families with income below 50 percent of poverty). Nearly three-quarters (72 percent) of
D.C.’s fourth graders and more than half (56 percent) of the eighth graders scored below
basic reading levels in 1998—almost double the national average. Birth rates to teenagers
are more than twice the national average, and juvenile violent crime arrest rates are three
times the national average.
Such data raise serious concerns about the quality of life and opportunities for
children in the District of Columbia, particularly for those living in the poorest
neighborhoods. Empirical studies show that family characteristics, alone, do not account
for many of these negative outcomes. Neighborhood characteristics also affect the overall
well-being of children and youth (Turner and Ellen, 1997). Such findings provide both
theoretical and pragmatic reasons for investigating the community-based assets that
contribute to strong communities. These factors can serve as a starting point for creating
and leveraging social and economic capital in local neighborhoods.

Center on Nonprofits and Philanthropy • The Urban Institute
2
The Center on Nonprofits and Philanthropy (CNP) at the Urban Institute, with a
grant from the Annie E. Casey Foundation, undertook a study to measure and understand
the institutional factors that make a positive difference in the lives of children and
families in local communities. Using Washington, D.C. as a case study, the work
analyzes how nonprofit organizations and informal community groups help build social
capital in the nation’s capital. The study had two major components: 1) a spatial analysis
of nonprofit organizations located within the city’s boundaries; and 2) field work in three
low-income neighborhoods to identify the community organizations and neighborhood
networks that support children and families in these local communities.
Study Objectives and Tasks
The purpose of the study was to develop tools and methodologies to identify and describe
community organizations and neighborhood networks that strengthen families in low-
income neighborhoods in the District of Columbia. It included the following tasks:
1. Develop tools and methodologies to analyze the scope and structure of communityorganizations that develop resident leadership and leverage resources on behalf ofchildren and families;
2. Develop maps that reflect the nonprofit infrastructure and sociodemographiccharacteristics of three low-income neighborhoods in the District of Columbia; and
3. Describe the community institutions and infrastructures that enhance the well-beingof families and community life.
Advisory Committees
An important component of the study was the creation of two advisory committees. A
national advisory committee was formed to help guide the overall research design, and a

Center on Nonprofits and Philanthropy • The Urban Institute
3
local advisory committee provided a contextual framework for the neighborhood field
work. Members of the advisory committees are listed in Appendix A.
National Committee. The national committee was designed to provide expertise
in community-based research and neighborhood issues. It served as a critical sounding
board to help CNP staff grapple with conceptual and measurement issues from both
theoretical and practical perspectives. The committee included government officials,
nonprofit practitioners, policy researchers, and academic scholars. The committee met on
June 3, 1998, for an all-day meeting at the Urban Institute. The agenda focused on
definitional concepts and constructs, as well as specific survey tools and methodologies
that have been effective in local area studies.
The committee was very supportive of the study, particularly its focus on
identifying and strengthening institutional capacities in local neighborhoods. They
cautioned, however, that the study design was very ambitious and believed that it could
serve as a valuable exploratory model for understanding the institutional structures that
support children and families in local settings. More specifically, the committee made the
following recommendations:
1. The study should emphasize an asset-based approach. It should highlight positivestrengths of each neighborhood, rather than simply listing the problems or deficits ofthe neighborhoods.
2. Because defining community boundaries can sometimes be a contentious issue, thestudy should take time to obtain the perspective of local leaders and residents on whatdefines their neighborhoods. The use of maps was seen as an effective tool indetermining boundaries and building a consensus on this issue.
3. Interviews with community leaders should be more qualitative than quantitative inorder to get the textured nuances of the local area. The questions should solicit thelocal leaders’ opinions about the strengths and current needs of their neighborhoods,and obtain information about the local leaders’ involvement in the community beyondtheir official capacities.

Center on Nonprofits and Philanthropy • The Urban Institute
4
4. The organizational survey should be fairly quantitative in design to determineprogram activities and service capacity (such as size of budgets and sources offunding). It also should explore the organization’s outreach to the community, such asthe networks that have been established with other local or citywide groups, and howthe organization involves community residents.
5. Interviews with local residents should obtain their views on neighborhood needs andcurrent use of local services. The questions could be asked in a problem-solvingframework (such as, where do you go to get child care; why?) in order to make thequeries more relevant to the respondent.
Local Committee. On August 28, 1998, the local advisory committee met at the
Urban Institute for a half-day session. The committee consisted of community leaders
and local advocates from the three study sites. The purpose of the meeting was to brief
committee members on the objectives of the study and obtain their support and guidance
for the local neighborhood work. Three key outcomes resulted from the meeting:
1. Committee members helped define the geographic boundaries of their neighborhoods.Using street maps of each neighborhood, committee members were asked if theyagreed with the neighborhood boundaries as defined by CNP staff. Based on thediscussion, adjustments were made to correspond more closely with programmaticdefinitions and residents’ perceptions.
2. Committee members briefed CNP staff on issues that were of particular concern inthe three study neighborhoods. This discussion provided an important contextualframework for understanding the past history and current dynamics of these localcommunities. The information also was incorporated into the training sessions heldfor interviewers, and into the final data analyses.
3. Committee members agreed to serve as resources for identifying small and easilymissed groups that operate within their neighborhoods and to help secureneighborhood participation in the study.

Center on Nonprofits and Philanthropy • The Urban Institute
5
Research Questions
Based on discussions with the national and local advisory committees, as well as with
staff of the Annie E. Casey Foundation, four broad research questions were developed to
guide the study.
1. What types of organizations, groups, and coalitions promote neighborhood social andeconomic well-being and participation within the community?
2. How many and which organizations or groups actively strengthen families, connectthem to resources, and involve them in community building?
3. Which programs and activities are seen as “making a difference” for children andfamilies within their neighborhoods, and why?
4. What are the characteristics of these positively viewed efforts and the organizationsthat provide them?
Tools and Methodologies
An initial starting point for the project was the collection of secondary data to provide
both quantitative and qualitative context to the study neighborhoods. Materials included:
1. administrative data obtained from the D.C. government, such as the number oflicensed child care providers in the District and neighborhood crime statistics;
2. sociodemographic and economic data obtained from the U.S. Bureau of the Census,the D.C. Office of Planning and Evaluation, and the National NeighborhoodIndicators Project; and
3. various reports and newspaper articles obtained from D.C. Agenda; Healthy Families/Thriving Communities Collaboratives; and a computer search of newspaper files.
A complete listing and descriptions of these materials are provided in Appendix B.
The materials were used to help select study neighborhoods and to provide
citywide comparisons to the three neighborhood sites. They also were used to provide a
richer context for understanding the dynamics of community life.

Center on Nonprofits and Philanthropy • The Urban Institute
6
In conducting these data collection efforts, the Urban Institute staff discovered
that our project work overlapped with a neighborhood study being conducted by D.C.
Agenda. In their study, D.C. Agenda conducted focus groups with the District’s eight
Healthy Families/Thriving Communities Collaboratives to obtain residents’ views on out-
of-school activities for youth. Because of the overlap between the two projects in terms
of study sites and substantive interests, there was an opportunity to share and exchange
information and findings, rather than duplicate efforts. The D.C. Agenda report, Out of
School Needs of the District ’s Children and Youth, February 1999, was used by CNP
staff as a primary source of information on resident’s views of neighborhood programs
for school-age youth.
The decision to draw upon the information gathered from the D.C. Agenda focus
groups was based on time and cost considerations, as well as a need to reduce respondent
burden. Several local leaders expressed the opinion that the community was becoming
“survey-weary” and skeptical of the practical benefits of research studies.
Selection of Neighborhoods. The selection of neighborhoods for the study began
with three basic criteria: 1) the communities should be similar in population size; 2) they
should be dispersed geographically throughout the city; and 3) they should have similar
income levels (as measured by percentage of households in poverty). These selection
criteria were designed to control for some of the factors that might affect community
infrastructures at the local level. Census data were used to determine these neighborhood
characteristics.1 After identifying several neighborhoods that fit the three selection
1 The decennial Census is the most complete and comparable source of data for small, geographic areas.Although some change has occurred in each of the three study communities since the 1990 Census wastaken, the areas are sufficiently similar in their baseline characteristics and distinguishing features towarrant inclusion in this study.

Center on Nonprofits and Philanthropy • The Urban Institute
7
criteria and consulting with Annie E. Casey Foundation staff, the final selection of sites
was designed to maximize contrasts among the communities.
As table 1 shows, the three communities in the study—Columbia Heights,
Marshall Heights, and Washington Highlands—fit the selection criteria well. All three
communities have populations of approximately 14,000 to 15,000 residents. They are
dispersed in three different quadrants of the city (Northwest, Northeast, and Southeast,
respectively), and are in three different political wards (Wards 1, 7, and 8). Poverty rates
in 1990 for the three areas fall within a narrow range, from 34.6 percent to 36.2 percent.
In addition, the three communities provide some distinct contrasts. Marshall
Heights appears to be the most stable of the neighborhoods (see table 1). Compared with
the other study sites, it has the greatest percentage of homeowners (29 percent) and the
highest average income ($28,200). It is a homogeneous community with 98 percent of the
residents identified as African-American. In contrast, Columbia Heights is a multicultural
community. More than one in five residents is Hispanic, according to the 1990 Census,
and the influx of new immigrants to the area since that time has unquestionably increased
this share. Columbia Heights is a working but poor neighborhood. It has the lowest
unemployment rate (9.0 percent) of the three study sites, but the highest poverty rate
(36.2 percent). Washington Highlands seems to be the most troubled, or neglected,
neighborhood in the study. Residents have the lowest average family income ($23,200),
the highest unemployment rate (15.1 percent), and the highest share of vacant housing
units (16.4 percent). Like Marshall Heights, the vast majority of residents in Washington
Highlands (99 percent) are African-American.

Center on Nonprofits and Philanthropy • The Urban Institute
8
Table 1.Socioeconomic, Demographic, and Political Characteristics of Study Sites
CharacteristicColumbia
HeightsMarshallHeights
WashingtonHighlands
Demographics Population, 1990 13,751 14,821 15,198
Percent Black
Percent Hispanic Number of children under age 18
Percent children under age 18 Percent female-headed families
Income Average family income
72.9
22.23,478
25.357.5
$26,500
98.2
0.44,418
29.872.5
$28,200
99.2
0.15,628
37.075.6
$23,200
Poverty rate 36.2 34.6 34.8 Unemployment rate 9.0 10.8 15.1
Percent households on public assistance 20.2 19.7 23.1
Housing Owner occupancy rate 14.7 29.4 15.0 Percent vacant units 10.9 7.9 16.4
Geographic and Political Boundaries Quadrant of city Northwest Northeast Southeast
Political ward 1 7 8
Source: Tabulations from the 1990 Census.
Building of Databases. The first task in mapping community-based assets was to
create a database of the nonprofit organizations and grassroots groups that are located in
the District of Columbia. These data were used to compare and contrast the study sites
with the remainder of the District’s resources. Because there is no citywide information
and referral system and no comprehensive listing of service providers and resident
associations, the Urban Institute needed to construct one.

Center on Nonprofits and Philanthropy • The Urban Institute
9
Database on Nonprofit Organizations. The starting point for creating a D.C.
database on nonprofit organizations was the 1997 Business Master File (BMF) and the
Form 990 Return Transaction Files (RTF) of the U.S. Internal Revenue Service (IRS).
These are the primary sources of data on nonprofit organizations in the United States.
The BMF contains information on all nonprofits that have received tax-exempt status
from the IRS, and the RTF provides annual data on organizations that file information
returns (Forms 990) with the IRS. These sources, however, do not provide a complete
listing of nonprofits. Some nonprofit groups, such as religious congregations, are exempt
from obtaining IRS recognition of their tax-exempt status, and small organizations with
annual revenues of less than $25,000 are not required to file Forms 990.
To supplement the IRS data, the Urban Institute compiled and verified lists of
D.C. nonprofit organizations obtained from a variety of community groups and local
governmental agencies. About 30 lists were collected, including lists of resident
associations, Hispanic and Asian organizations, grantees of local foundations and the
United Way, Head Start grantees, and organizations exempt from D.C. property tax (see
Appendix C). After the local lists and IRS data were merged and checked for duplication
and consistency, the resulting data base contained 6,992 nonprofit organizations. Nearly
eight percent of the data set, or 536 groups, were added from the lists acquired by the
Urban Institute staff.
Using the National Taxonomy of Exempt Entities (NTEE), all nonprofits were
classified by the organization’s primary activity.2 As table 2 shows, the three most
prevalent types of nonprofit organizations in Washington, D.C. focus on public and
2 For a complete description of the NTEE, see Stevenson, Pollak, and Lampkin, 1997. State NonprofitAlmanac. Washington, DC: The Urban Institute Press.

Center on Nonprofits and Philanthropy • The Urban Institute
10
societal benefits, such as advocacy groups, civil rights, and policy-oriented think tanks
(24 percent); human services, including groups addressing issues of crime, employment,
food, housing, youth development, and similar issues (nearly 20 percent); and education
(roughly 14 percent). Because Washington, D.C. is the nation’s capital, the multitude of
public and societal benefit groups that relate to political issues and policy concerns is not
surprising. Compared with other parts of the country, D.C. has roughly three times the
share of public-societal benefit groups, and proportionately one-third fewer human
service nonprofits (Stevenson, Pollak, and Lampkin, 1997). Human service organizations
typically are the dominant type of nonprofit nationally, but their relative share in the
District is reduced by the abundance of issue- and policy-oriented groups in the city.
Table 2.Primary Service Activity of Nonprofit Organizations inWashington, D.C.Organizational Activity Number Percentage
Public, Societal Benefit 1,681 24.0
Human Services 1,374 19.7
Education 996 14.2
Arts, Culture and Humanities 818 11.7
Religion-related 614 8.8
Health 565 8.1
International, Foreign Affairs 415 5.9
Environment and Animals 244 3.5
Mutual/Membership Benefit 25 0.4
Primary Activity Unknown 260 3.7
Total 6,992 100.0
Source: IRS data, supplemented with community directories andgovernment lists of nonprofit organizations.

Center on Nonprofits and Philanthropy • The Urban Institute
11
Database on Religious Organizations. Missing from this profile of D.C.
nonprofits, however, is the role that religious congregations play in community life. They
generally provide care, counseling, spirituality, and social networks not only to their
members but also to people in the community. Indeed, religious congregations often are
regarded as institutional anchors to a neighborhood and integral components of the social
fabric of local communities.
Because religious congregations are not required to seek tax-exempt status from
the IRS, the BMF underrepresents these faith-based groups. Using membership lists from
the InterFaith Conference of Metropolitan Washington, and information from the
American Church List and the Bell Atlantic Telephone Directory, 1,302 congregations
were identified in the District of Columbia. Nearly 75 percent of these congregations
were not found in the IRS files.
After adding religious congregations to the database, the total number of nonprofit
groups in the District increased by roughly 18 percent to 7,949 organizations. The
combined database is the most comprehensive data set on D.C. nonprofit organizations
ever compiled, although as our neighborhood work (discussed below) revealed, there was
still more to learn about nonprofit groups in local communities.
Mapping Nonprofits. In order to study where nonprofit and community-based
groups are located in the city, the database, representing both secular and faith-based
organizations, was prepared for geographic mapping. Working from a group’s street
address, each organization was “geocoded” (that is, it was assigned a longitude and
latitude code) through a computer software mapping program. The resulting maps

Center on Nonprofits and Philanthropy • The Urban Institute
12
indicate the geographic location and concentration of nonprofit and community-based
organizations within the city, and were used in the spatial analysis, described below.
Interview Protocols. As suggested by the national advisory committee,
interviews with local community leaders (called key informants) were designed to learn
about the strengths of the neighborhoods and the organizational structures helping
children and families. Because we wanted to hear the opinions of these leaders in their
own words, face-to-face, open-ended interviews were used, rather than a close-ended,
check-off survey form.
Development of the interview protocols was modeled after the work of Professors
John McKnight and John Kretzmann, Northwestern University, who are nationally
recognized in community assets and capacity-building research. The interview protocols
used in the study sites were structured into five sections, covering:
1. The neighborhood boundaries and an assessment of the community’s cohesion;
2. Stability and change in the neighborhood over time;
3. Formal and informal organizations that are located in the community, especially thosethat “make a difference” for children and families;
4. Leadership capacity of the neighborhood; and
5. Neighborhood strengths.
A copy of the interview protocol is provided in Appendix D.
Urban Institute interns conducted the interviews. They received training from
CNP staff in interview techniques and participated in role-playing exercises to practice
these skills. Because we wanted to obtain as much information as possible from each
interviewee, interviewers were instructed to use additional prompts (such as, can you
elaborate on that? is there anything else that comes to mind?) to probe for additional

Center on Nonprofits and Philanthropy • The Urban Institute
13
information or insights. To encourage candor in the interviews, respondents were told
that no one would be quoted by name.
A list of neighborhood key informants was compiled with the assistance of local
advisory committee members. Most of interviewees were associated with neighborhood
nonprofit groups, but they also included religious clergy, school principals, police
officers, and local political leaders.
Interviews were conducted from November 1998 through January 1999. A total of
62 individuals from the three communities participated in this portion of the study.
Appendix E provides a list of key informants who participated in the study.
Survey Forms. The organizational survey was designed to provide systematic
and quantifiable information on community-based programs and services (see Appendix
F). It included questions on:
1. The organization’s origins and purpose;
2. Leadership, including the executive director and board of directors;
3. Budget information, including amounts, sources, and changes over time;
4. Staffing patterns, covering both paid staff and use of volunteers;
5. Services and clients, including types of services offered and number of clients served;
6. Community outreach and communication strategies;
7. Networks and collaborations with other nonprofit groups or with government.
Measuring the size, scope, capacity, and extent of community involvement of
nonprofit organizations in local neighborhoods proved to be a challenging assignment.
The survey instrument was field tested and revised four times before the final format
yielded satisfactory results. Earlier versions were too long and complex, and the wording

Center on Nonprofits and Philanthropy • The Urban Institute
14
of questions had to be simplified and stated more clearly. The final version incorporated
more information on the ways in which neighborhood organizations reach out to local
residents and work with one another to strengthen community resources.
Initially, the organizational surveys were to be conducted in person by the interns
assigned to each neighborhood. However, because of the difficulties encountered in
scheduling interviews with organization leaders and intern attrition over the course of the
study, an alternate strategy was followed.
Using information from the key informant interviews and our own community
field work, 51 nonprofit human service providers were identified as working directly with
children and families in the study neighborhoods. CNP staff and interns visited these
organizations and left a copy of the survey form for the executive director or
knowledgeable staff member to complete and return. Respondents were instructed to
return the completed form by mail, fax, or by calling the Urban Institute to request that a
staff member retrieve the completed questionnaire. Follow-up phone calls were made to
the organizations to encourage their participation and to answer any questions.
This strategy worked well because it provided an opportunity for CNP staff to
visit the providers’ service sites and observe their operations directly. It also reduced the
amount of time spent scheduling (and rescheduling) interviews, freeing up staff time for
other tasks. Although some level of detail was lost by not having face-to-face interviews,
the administrative advantages of this strategy proved to be an acceptable alternative.

Center on Nonprofits and Philanthropy • The Urban Institute
15
Spatial Analysis of Nonprofit Organizations in the District of Columbia
Looking at neighborhoods in isolation can give a distorted picture of the needs and
resources of an area. The spatial analysis began with a profile of nonprofit organizations
and religious congregations in the District of Columbia. It then focused on groups in low-
income areas, and finally on the three study sites. This procedure provides a broad
socioeconomic context in which to view the community-based assets of the study sites.
More specifically, the analysis provides a starting point for exploring the
community institutions and infrastructures that enhance the well-being of children and
families in local neighborhoods. For example, what is the density of nonprofit and
religious organizations in the District of Columbia and in low-income neighborhoods of
the District? Is there a spatial mismatch between the location of service organizations and
the needs of residents? Are there significant differences between the groups that are sited
in low-income areas and those in more economically advantaged neighborhoods? And of
particular importance to this study, are preschool and youth providers located in
neighborhoods where the most vulnerable children and youth reside?
To explore these questions and assess neighborhood variation in community-
based resources, the analysis used two databases: 1) the Urban Institute database on D.C.
nonprofit organizations and religious congregations, and 2) the 1990 U.S. Decennial
Census reported by census tracts. These data sets are described above.
Density of Nonprofit Organizations. An initial look at nonprofit organizations
in the District of Columbia suggests a large and vibrant nonprofit sector. Not only are
there a large number of nonprofit organizations, they also offer a wide range of services
and activities. In fact, when compared to other states, D.C. has the highest density of

Center on Nonprofits and Philanthropy • The Urban Institute
16
nonprofit organizations in the United States—more than six times higher than the
national average (see Stevenson, Pollak, and Lampkin, 1997). In 1998, the density of
nonprofit organizations in the nation’s capital was roughly one nonprofit for every 77
residents.3 This is not surprising, given that many trade associations and lobbying firms
are sited in the District of Columbia to maximize access to national policymakers.
The number and density of organizations suggests that the nonprofit sector may
have the capacity to meet the needs of District residents, but the spatial distribution of the
organizations raises questions of whether groups are sited in locations that effectively and
equitably reach the city’s disadvantaged population. As map 1 illustrates, nonprofit
organizations cluster prominently in three locations: the downtown business area, Capitol
Hill, and the Northwest quadrant of the city, which contains many middle- and upper-
income neighborhoods. Nonprofit organizations are far less likely to be in the lower-
income neighborhoods of Washington, D.C. Only 16 percent of the nonprofit
organizations are physically located in areas of high-poverty (that is, where the poverty
rate is 30 percent or greater).4 The origins of these spatial patterns are unclear, but may
reflect a combination of zoning regulations, access to available and affordable office
space, issues of safety, and perhaps the desire of organizations to be close to their
potential clients, funding sources, or seats of power and influence. The uneven
distribution of nonprofit organizations in low-income neighborhoods is not unique to the
District of Columbia, however. A spatial analysis of the 85 largest metropolitan areas in
3 If one includes religious congregations in the District of Columbia, the density is one organization forevery 66 residents.
4 Of the 192 census tracts in the District, 37 (or roughly 19 percent) meet the criterion of a high—povertyarea, that is, where the poverty rate is 30 percent or greater. Some tracts, however, such as those thatcomprise the National Mall, have very few residents.

Center on Nonprofits and Philanthropy • The Urban Institute
17
the United States found a much higher density of nonprofit organizations in more affluent
neighborhoods than in lower income areas (Wolpert, 1996).
Religious Congregations. Like nonprofit organizations, religious congregations
also are not evenly spread across the District. In contrast to nonprofits, they tend to
cluster in the predominantly African-American neighborhoods (see map 2). Roughly 60
percent of D.C. congregations (that is, 793 congregations) are located in areas where at
least 80 percent of the population is African-American. Of these, 156 congregations are
located in high-poverty, predominantly black areas.5 The strong historical linkages
between the church and the African-American population are well documented (Lincoln
and Mamiya, 1990), and the current prominence of congregations in predominantly black
neighborhoods suggests a continuation of this pattern. When one examines
predominantly black areas, the ratio of religious congregations to secular nonprofit
organizations is quite high—namely, seven congregations for every ten nonprofits. This
ratio holds fairly constant in poor black areas, as well as in other black areas. In contrast,
the ratio of congregations to nonprofits in the remainder of the city is one to ten.
Although many religious congregations provide programs and activities to local
residents, the presence of churches in high-poverty areas does not significantly change
the density of potential service providers in local communities. On average, the density of
secular nonprofit organizations in high-poverty areas is about 10 groups for every 1,000
residents, compared with 11 groups per 1,000 residents in other sections of the city (see
table 3). If religious congregations are added to the ratio, the density becomes 11.5
groups per 1,000 residents in high-poverty areas compared with 13 per 1,000 in other
5 A census tract is defined as “predominantly black” if 80 percent or more of the population is AfricanAmerican—a definition used by other research scholars (see Ellen, 1996).

Center on Nonprofits and Philanthropy • The Urban Institute
18
parts of the city. Counting both religious congregations and nonprofit groups increases
the density of community-based resources but does not close the gap between high-
poverty areas and the remainder of the District. What is more difficult to measure,
however, is the trust that community residents have in these different types of institutions
and how that trust affects the building of social capital and neighborhood ties.
Table 3.Number and Density of Community-based Organizations
CharacteristicAreas with
High-Poverty Remainder
of D.C.Population 109,107 497,793
Number of Nonprofit Organizations 1,055 5,489 Congregations 205 987
Density Per 1,000 Residents Nonprofit Organizations 9.7 11.0 Congregations 1.9 2.0 All Groups 11.5 13.0Source: Authors’ tabulations of IRS and other data sources.Note: Areas with high-poverty are defined as census tracts in whichthe poverty rate is 30 percent or greater.
Nonprofits in High-Poverty Areas. The types of nonprofit organizations found
in high-poverty areas differ from other parts of the District, as shown in table 4. For
example, they have a greater share of human service providers (24 percent) than other
neighborhoods (19 percent). They also have a higher proportion of education groups (18
percent versus 13 percent, respectively). Conversely, high-poverty areas have a smaller
share (21 percent) of nonprofit public and societal benefit organizations (such as political
parties, veterans’ organizations, or consumer protection groups) than are found elsewhere
in the District (25 percent). While the distribution of nonprofit service providers differs

Center on Nonprofits and Philanthropy • The Urban Institute
19
Table 4.Characteristics of Nonprofit Organizations
CharacteristicAreas with
High-PovertyRemainder
of D.C.Type Percent (%) Percent (%)Arts, Culture and Humanities 10.9 12.0Education 18.0 13.4Environment and Animals 2.5 3.7Health 8.0 8.2Human Services 24.1 19.0International, Foreign Affairs 3.2 6.5Public, Societal Benefit 20.9 24.8Religion-related 9.5 8.7Mutual/Membership Benefit 0.3 0.4Primary Activity Unknown 2.6 3.3 Total 100.0 100.0 Number of Organizations 1052 5761
Age of Organizations Percent (%) Percent (%) 1 to 4 years 16.3 17.5 5 to 9 years 19.5 20.5 10 to 19 years 23.3 23.1 20 or more years 40.9 38.9 Total 100.0 100.0 Number of Organizations 911 5226
1996 Financial Measures Dollars ($) Dollars ($) Average (Mean) Value Revenues 6,546,000 4,186,000 Expenditures 6,163,000 3,815,000 Assets 7,263,000 6,642,000
Median Value Revenues 511,000 408,000 Expenditures 405,000 371,000 Assets 377,000 247,000Source: Authors’ tabulations of IRS and other data sources.Note: Areas with high-poverty are defined as census tracts in which thepoverty rate is 30 percent or greater.
along some dimensions, the low absolute number of providers in high-poverty areas
suggests that there are relatively few groups to address the needs of a harder-to-serve and

Center on Nonprofits and Philanthropy • The Urban Institute
20
more vulnerable clientele. Looking at human service organizations, for example, there is
one nonprofit human service provider for every 104 people in high-poverty areas of the
District, compared with one for every 86 people in the remainder of the city.
As table 4 also shows, most nonprofit organizations are well established in the
community. About 40 percent of these groups have been in operation for 20 years or
more. Fewer than 20 percent have been in existence for less than five years. This pattern
is found in both high-poverty and more affluent areas, indicating no significant difference
by the organizational age of service providers.
Nonprofits in high-poverty areas tend to be somewhat larger, however, than those
in other sections of the city. Revenues and expenditures for nonprofit organizations in
high-poverty areas, for example, averaged around $6 million, while their counterparts
elsewhere in the city reported budgets of roughly $4 million (see table 4). The differences
were less for assets, however. The asset holdings for groups in high-poverty areas
averaged approximately $7.3 million, while those of groups in other parts of the city were
$6.6 million. These findings suggest a large and well-endowed group of organizations,
but the data are skewed by several large hospitals, universities, and professional
associations that are located in high-poverty census tracts. The typical organization
throughout the District of Columbia operates on a much smaller budget. The median level
of revenues and expenditures for nonprofit organizations in the District of Columbia
ranged from $370,000 to $510,000. Median assets were approximately $300,000.
In short, these findings suggest that while high-poverty neighborhoods have a
lower density of nonprofit organizations than the remainder of D.C., the groups that
locate in disadvantaged communities are not fundamentally different by age or financial

Center on Nonprofits and Philanthropy • The Urban Institute
21
resources. Our field work in three communities found, however, that these averages hide
tremendous variation in the resources that can be identified in specific neighborhoods.
Children and Youth. Turning to programs for children and youth in the District,
the pool of community-based resources quickly begins to dwindle. About 14 percent of
the nonprofit human service providers in D.C. focus primarily on children. Our study
found 112 nonprofit organizations that offer programs for preschool children, such as
child care and early childhood development programs, and another 72 providers that
target their services to school-age (ages 6-17) children. These groups include Boys and
Girls Clubs; adult/child matching programs, such as mentoring and tutoring programs;
and family services providers with programs targeted specifically toward teenagers. In
addition to secular nonprofits, some religious congregations also provide programs for
children and youth. Systematic data on faith-based programs is very limited, however.6
What is most striking is the apparent mismatch between the location of nonprofit
providers for children and youth and the areas in the District where the most vulnerable
children live (see map 3). Ward 8, for example, is home to more than one of every five
children in the District and has the highest percentage of children in poverty (almost 40
percent). Yet Ward 8 has only 13 organizations (7 percent of the providers) that focus on
children and youth. Ward 7 presents a similar picture. Despite a child poverty rate in
excess of 30 percent, and 16 percent of the District’s children, Ward 7 has only six
nonprofit providers (4 percent) of preschool and youth-focused programs.
6 Data on the program activities of religious congregations are difficult to obtain. In 1997-1998, the UrbanInstitute conducted a survey of about 1,100 religious congregations in the Washington, D.C. metropolitanarea. Of the 266 congregations that responded (a 25 percent response rate), approximately one in four D.C.congregations offered child care, 28 percent provided tutoring, and 21 percent had mentoring programs.

Center on Nonprofits and Philanthropy • The Urban Institute
22
Based on our field work, there is also a significant disparity in the spatial
distribution of nonprofit youth and preschool providers among the specific
neighborhoods (see Appendix G for a comparison of IRS data and field observations).
Roughly 80 percent of the nonprofit organizations identified through our ethnographic
analysis are located in Columbia Heights (see map 4). Yet Columbia Heights has about
6,500 fewer children than the other two study sites, combined. The spatial concentration
of service providers highlights the difficulties in reaching needy children in the most
vulnerable neighborhoods. In Columbia Heights, for example, there is approximately one
nonprofit provider for every 46 children. In sharp contrast, Marshall Heights has one
nonprofit organization for every 490 children, while Washington Highlands has one
nonprofit for every 703 children.
The imbalance raised by such statistics might be lessened if local religious
congregations are also providing services targeted to children. Our data suggest, however,
that churches fill only a small portion of the service gap. The ratio of religious
congregations to secular nonprofit organizations is relatively high in both Washington
Highlands and Marshall Heights. There are more than six congregations for every ten
nonprofit organizations in Washington Highlands, and the ratio is three to one in
Marshall Heights. Unpublished data from an earlier study of religious congregations
conducted by the Urban Institute found that of the eight survey respondents that operated
in the three study sites, only two engaged in activities relating to youth. The other six
congregations provided different types of services, some of them clearly assisting poor
families, but not specifically focusing on children.

Center on Nonprofits and Philanthropy • The Urban Institute
23
In summary, our spatial analysis suggests that at-risk children in the District are
underserved by the nonprofit community. Areas with the highest number and share of
children in poverty have relatively few resources in their local neighborhoods. This
spatial mismatch not only is evident between areas with high-poverty rates and the
remainder of the District, but the uneven allocation of resources is also found among the
three study sites. Our neighborhood field work provides a more detailed analysis of the
different resources and asset bases that exist at the local community level.
Neighborhood Findings
The study’s field work illustrates both the common threads and unique assets of each
neighborhood. Together, these factors shape the needs, resources, and opportunities for
helping children and families in low-income communities and underpin the conceptual
models developed later in the study to understand the strengths of each neighborhood.
Changing Demographics. Demographic factors provide an important backdrop
for understanding the socioeconomic dynamics of the District of Columbia and,
specifically, of the three study neighborhoods.7 They not only show the number and types
of people living in each community, but also suggest that services and activities in a local
area must be tailored to address a variety of needs.
A striking feature of demographic change in the District between 1990 and1998 is
the overall decline in population. Data from the D.C. Office of Planning and Evaluation
show that the population of the District of Columbia dropped by nearly 14 percent during
7Although the 1990 Census provides the most detailed and comparable information on smallneighborhoods, a few measures (namely, age and race/ethnicity of residents) could be updated using datafrom the D.C. Office of Planning and Evaluation.

Center on Nonprofits and Philanthropy • The Urban Institute
24
this period (see table 5). The largest drop (18 percent) occurred among adults (ages 18 to
64), with a small increase (5 percent) in the number of school-age children (ages 5-17).
Population losses were also recorded in each of the three study neighborhoods.
Columbia Heights had the smallest drop (10 percent), while Marshall Heights and
Washington Highlands declined by 14 and 19 percent, respectively. The patterns of
change, however, reflect some of the distinct features of each community. In Columbia
Heights, for example, the decline affected all age groups, but the in-migration of young
professionals and young immigrant families to the neighborhood slowed the decline in
the working-age and child populations. In Marshall Heights and Washington Highlands,
young adults and children have primarily left the neighborhood, leaving behind an older
group of residents. While the share of older residents in these neighborhoods increased
between 1990 and 1998, children (under age 18) continued to account for a large
proportion of the neighborhood population—about 25 percent in Marshall Heights and
almost 40 percent in Washington Highlands. The high rate of population loss in
Washington Highlands is attributable, in part, to the demolition of approximately 400
public housing units and the displacement of its residents.
Estimates of the changing racial/ethnic composition of the neighborhoods are
somewhat problematic, however, because the D.C. government uses slightly different
definitions of racial/ethnic categories than the U.S. Bureau of the Census. Nevertheless,
table 5 suggests the broad trends that are occurring in each of the three communities.
Marshall Heights and Washington Highlands continue to be predominantly black
neighborhoods with nearly 99 percent of the residents in 1998 estimated to be African-
American. Columbia Heights, on the other hand, grew even more racially and

Center on Nonprofits and Philantropy - The Urban Institute
Table 5.Population Change in the District of Columbia, 1990-1998
Columbia Heights Marshall Heights Washington Highlands District of Columbia
Characteristic 1990 1998%
Change 1990 1998%
Change 1990 1998%
Change 1990 1998%
Change
Total Population 13,751 12,349 -10.2 14,821 12,817 -13.5 15,198 12,250 -19.4 606,900 523,124 -13.8
Age Distribution Under 5 1,086 1,073 -1.2 1,435 1,202 -16.2 1,907 1,541 -19.2 37,351 32,865 -12.0 5 - 17 2,392 2,283 -4.6 3,218 1,967 -38.9 3,616 3,145 -13.0 69,741 73,155 4.9 18 - 64 8,573 7,597 -11.4 8,296 7,844 -5.4 9,136 6,878 -24.7 421,961 344,539 -18.3 65 or older 1,700 1,396 -17.9 1,872 1,804 -3.6 539 686 27.3 77,847 72,565 -6.8
Racial/Ethnicity Asian 264 423 60.2 0 24 * 17 12 -29.4 11,214 1,630 -85.5 Black 10,059 8,788 -12.6 14,661 12,672 -13.6 15,078 12,122 -19.6 399,604 329,222 -17.6 White 1,439 3,097 115.2 119 87 -26.9 54 80 48.1 179,667 176,862 -1.6 Other 1,989 41 -97.9 41 34 -17.1 49 36 -26.5 16,415 15,410 -6.1 Hispanic 3,042 3,549 16.7 62 41 -33.9 11 118 972.7 32,710 38,710 18.3
Source: 1990 data are from the U.S. Bureau of the Census; 1998 data are from D.C. Office of Planning and Evaluation.Note: Racial/ethnic categories are defined somewhat differently in 1990 and 1998.
25

Center on Nonprofits and Philanthropy • The Urban Institute
26
ethnically diverse. The share of the Hispanic population grew from roughly 22 percent to
29 percent between 1990 and 1998, and the Asian population increased from 2 percent to
3 percent. The number of white residents also increased, but the magnitude of change is
difficult to disentangle because of the overlapping and inconsistent racial and ethnic
definitions used during the two points in time. The 2000 Census will provide a better
measure of racial and ethnic change, but current data provide a strong indication of a
growing mix of population groups in Columbia Heights.
Neighborhood Profiles. While the changing demographics of the neighborhoods
provide a statistical framework for understanding the differences of each community, the
field work sheds new light on their distinct features. Although the sites were selected
because they shared a common poverty level, the distinct organizational infrastructure
observed during the field work soon overshadowed this common denominator.
Columbia Heights. One word can be used to capture the essence of Columbia
Heights: diverse. Located in the Northwest quadrant of the District and bounded by a
main transportation artery (Sixteenth Street), Columbia Heights is one of the most
racially, ethnically, and linguistically diverse parts of the District of Columbia. It
combines residential and commercial areas, and currently is in the midst of a large scale
public transportation and economic development project. A new Metro station is
scheduled to open in the middle of the neighborhood in the Fall of 1999. The
development process has sparked intense debate among residents and planners as it
threatens to change the social and economic contours of this vibrant community.
Columbia Heights’ cultural diversity is attributable, in large part, to the influx of
immigrants to the area. Among the largest groups are Latinos (primarily from El

Center on Nonprofits and Philanthropy • The Urban Institute
27
Salvador), East Africans, and Asians (especially Vietnamese). According to our key
informants, the neighborhood is also diverse in terms of family and economic
circumstances. The principal groups identified include older African-American
homeowners who have lived in the area for many years, a growing contingent of
moderate- to high-income white homeowners who more recently moved to the area, and
large clusters of immigrant families with children, many of whom are living in poverty.
Marshall Heights. The Marshall Heights neighborhood is located on the far
eastern tip of the District, straddling the Northeast and Southeast quadrants and bordering
Prince George’s County, Maryland. Like Ward 7 generally, Marshall Heights has
experienced a rapid population drop over the last two decades. Evidence of these declines
can be seen in school closures. Two of the seven elementary schools in the community
have closed their doors, and one of the two junior high schools has closed. None of the
schools in the area operates at capacity.
The population decline served to accentuate some of the key differences among
residents in this predominantly black community. Several respondents mentioned that
very few families with children move into the neighborhood and that there is a growing
friction between older homeowners and the more fluid population of younger low-income
families, many of whom rent or live in public housing.
Key informants also described Marshall Heights as having a small town
atmosphere and as the type of place people come home to. In probing this idea, the issue
of out-migration was salient. When asked about residents coming home, it became clear
that several of our respondents used the term quite literally to define people who had
moved out of the community, but return to be with family. In the words of one resident:

Center on Nonprofits and Philanthropy • The Urban Institute
28
“They still consider Marshall Heights their home and they come back for [church]
services. . . . On Sunday, 90 percent of the license plates you see are from Maryland.”
Prince George’s County was the number one destination of people moving out of
Marshall Heights. Several of the respondents characterized P.G. County as a place where
services are more comprehensive, the schools are better, and the crime rate is lower.
Washington Highlands. Finally, Washington Highlands is a community
undergoing dramatic environmental change. Located on the southernmost tip of Ward 8,
Washington Highlands is physically separated from much of the District by the Anacostia
River and from much of Ward 8 by a grassy, drainage knoll. Unlike the other study sites,
Washington Highlands is not served by the Metro system, and there is no main road or
transportation artery running through the community to connect it with other parts of the
city. Despite the rolling hills and open space, the natural beauty of Washington Highlands
is overshadowed by the noise and commotion of construction work on the one hand and
the silence of empty buildings on the other. A new large-scale housing development is
being built, and abandoned public housing complexes pepper the landscape.
Although Washington Highlands is a homogeneous community in terms of race
and class, being overwhelmingly African-American and poor, key informants in the study
were reluctant to call it a close-knit community. The respondents identified a tension
between public housing residents and homeowners. The crime rate and drug problems in
the neighborhood are viewed as principal reasons behind the lack of communication.
Homeowners tend to blame public housing residents for much of the illegal activity in the
community. This is seen most clearly in the repeated sentiment that the new housing
developments will bring about a dramatic change in the community. As one respondent

Center on Nonprofits and Philanthropy • The Urban Institute
29
put it: “It was one of the busiest PSA’s [police service areas] in the District. As more
housing is closed down we are losing the [crime] problem.”
Community Concerns. In order to understand the current concerns of local
residents, key informants were asked “What are the biggest issues facing families with
children within the community?” Responses to this broad, open-ended question were
coded by Urban Institute staff and are presented in table 6.8
Table 6.The Biggest Issues Facing Children and Families in the Three Study Sites
Major IssueColumbiaHeights
MarshallHeights
WashingtonHighlands
Crime and safety 1 1 7
Education 7 3 2
Lack of family services 11 1 4
Lack of community services 1 0 0
Unemployment 3 3 1
General poverty 3 3 2
Single parenting 1 3 0
Number of respondents 27 14 16
Source: The Urban Institute, CNP Key Informant Interviews 1998-1999.Note: Five respondents did not answer this question—three from Marshall Heights andtwo from Washington Highlands.
The principal concern expressed by Washington Highland residents was clearly
crime and safety. Nearly half of the respondents from this neighborhood cited crime as
the biggest issue facing residents. Crime statistics for the District show that Washington
Highlands is one of the more troubled spots in the city. Violent crime, in particular,
8 Almost half (45 percent) of the respondents named only one issue area, but in cases where the respondentprovided more than one answer, only the first response is presented in table 6.

Center on Nonprofits and Philanthropy • The Urban Institute
30
seems to have plagued the community. Data from the District government show that the
Seventh Police District, which includes Washington Highlands, ranked first in homicides
for four of the last six years, first in sexual assaults for five of the last six years, and first
in aggravated sexual assaults for each of the last six years. Indeed, signs of the
community’s violent legacy are physically evident. The police precinct, for example,
operates behind a bullet-proof reception window. Seven impromptu shrines to
memorialize community members slain in public were seen by field staff. It is not
surprising, therefore, that crime ranks well above any other concern for Washington
Highlands’ residents.
In the two other neighborhoods, responses to the question “what is the biggest
issue facing children and families” drew more varied replies. In Columbia Heights, for
example, the dominant response was the lack of family services. About 40 percent of key
informants in this neighborhood cited the need for additional services. Inadequate
educational opportunities for the community’s children was the second most frequently
mentioned concern. In Marshall Heights, respondents’ replies were distributed broadly,
with no one area dominating the list. Equal weight was given to issues of education,
unemployment, general poverty, and single parenting.
The responses given by our key informants, in large part, were echoed by the
focus groups conducted by D.C. Agenda (1999). Participants in the focus groups
repeatedly cited safety issues among their concerns for out-of-school programs for youth.
Parents wanted their children to be in a physically safe environment and expressed
concern that children often had to walk to and from programs alone. Both parents and

Center on Nonprofits and Philanthropy • The Urban Institute
31
students wanted the activities to be educational and enriching, and all expressed a desire
to get parents more actively involved in out-of-school programs.
Nonprofit Community Resources. Street-level field observations provided an
opportunity to identify a broad range of organizations serving community needs. Walking
through the neighborhoods and speaking with key informants increased the odds that
smaller organizations, not otherwise found in formal data bases, would be identified. (See
Appendix H for a list of nonprofit organizations in the three study sites.)
Number and Types of Nonprofit Organizations. The three study neighborhoods
vary both by quantity and type of nonprofit resources, as shown in table 7. Columbia
Heights is distinct from the other two study sites in that it has the greatest number of
nonprofit organizations and covers the broadest range of activities. Our study found 75
nonprofit organizations in Columbia Heights—more than seven times the number found
in the other two communities. This numerical strength, in large part, reflects Columbia
Heights’ diversity. There are nonprofit organizations for at least five different ethnic
groups. Sixteen of the 41 human service agencies in the area offer their services in a
language other than English. Although some of the providers in Columbia Heights focus
their services on specific groups in the neighborhood, others take a citywide approach,
serving anyone regardless of where the individual lives in the city.
In all of the study neighborhoods nonprofit human service providers dominate the
landscape. They represent approximately half of all nonprofit groups in each site.
Generally, the second most prevalent group was public and societal benefit organizations
(such as advocacy, civil rights, and community development organizations). Community
development organizations, in particular, play an important role in promoting economic

Center on Nonprofits and Philanthropy • The Urban Institute
32
development and neighborhood change in these communities. Indeed, the Marshall
Heights Community Development Organization is the largest and dominant group in its
neighborhood, eclipsing all the other organizations in both its size and scope of activities.
Table 7.Number and Types of Community Organizations in the Three Study Sites
Nonprofit Groups by NTEEColumbiaHeights
MarshallHeights
WashingtonHighlands
All ThreeCommunities
Arts, Culture, and Humanities 2 - - 2
Education 6 3 1 10Environment & Animals 1 - - 1
Health 6 - 1 7
Human Services 41 5 5 51
Public, Societal Benefit 11 2 3 16Religion-related 7 1 1 9
Mutual/Membership Benefit 1 - - 1Total 75 11 11 97
Churches 11 29 5 45All Nonprofits & Churches 86 40 16 142
Source: The Urban Institute, CNP Field Work 1998-1999.
The distribution of nonprofit providers in table 7 shows a dearth of organizations
specializing in arts, the environment, and even health. Indeed, each of the three
communities is a federally designated Health Professionals Shortage Area (HPSA). The
data seem to suggest that Columbia Heights’ residents may have comparatively better
access to health services than residents of either Marshall Heights or Washington
Highlands, but a closer look at the nonprofit health providers in the neighborhood shows
that this may not necessarily be true. Five of the six health facilities in Columbia Heights
serve special populations, such as the homeless, Spanish-speakers, and individuals with

Center on Nonprofits and Philanthropy • The Urban Institute
33
mental disabilities. The sixth facility is a federally-run neighborhood health center. Easy
access to general health care in the local area appears to be fairly limited.
If religious congregations are added to the list of community-based resources, the
comparative profile of the three sites changes slightly but not dramatically (see table 7).
Columbia Heights continues to have the largest number of community-based assets,
followed by Marshall Heights and Washington Highlands. A total of 45 churches were
identified in the three neighborhoods, with the vast majority of these houses of worship
(29) in Marshall Heights. Indeed, congregations outnumber nonprofit organizations in
Marshall Heights by a factor of three to one. Marshall Heights is also the home of the
Progressive National Baptist Convention. As discussed below, religious congregations
play an important, but varied, role in each of these communities.
Capacity Measures. Putting roots into the community and building organizational
capacity often takes time. Our field work surveyed 51 nonprofit groups identified as
providing services to children and families in the three neighborhoods.9 The results of
this study found considerable variation in the age, tenure, size, and funding patterns of
the community-based nonprofit groups that work in the three study sites (see table 8).
Nonprofit organizations in Washington Highlands are quite young. Half of the
organizations that responded to our survey indicated that they had been formed within the
past five years, and the average age of an organization in Washington Highlands was 2.5
years. In contrast, community-based nonprofit groups in Columbia Heights and Marshall
9 Obtaining information on neighborhood-based groups proved challenging. Of the 51 nonprofit groupssurveyed, 28 completed and returned the survey forms (a 55 percent response rate). Groups that refused toparticipate cited lack of time and resource constraints as inhibiting factors. A few organizations indicatedthat they were dubious that a research study would have much direct impact on their organization or thepeople that they serve.

Center on Nonprofits and Philanthropy • The Urban Institute
34
Table 8.Age, Tenure, Staffing, and Funding of Nonprofit Groups in the Three Study Sites
CharacteristicColumbiaHeights
MarshallHeights
WashingtonHighlands
Age of OrganizationAverage number of years as a 501(c)3 19.0 14.8 2.5Number of organizations less than 5 years old 2 of 16 0 of 6 3 of 6
TenureAverage number of years at current site 10.8 7.4 10.5*
Number that own their facility 8 of 16 3 of 6 1 of 6
StaffingNumber with more than 5 full-time staff 14 of 16 4 of 6 1 of 6
Number with more than 5 part-time staff 8 of 16 1 of 6 1 of 6Average number volunteers per week, per organization 16 11 8
Average tenure of Chief Executive Officer 9.2 4.5 1.5
Funding1998 revenues (average) $674,000 $284,000** $276,000Average number of funding sources 5.4 3.8 2.0
Number with 80 percent or more of funding from asingle source 3 of 16 0 of 6 4 of 6
Source: The Urban Institute, CNP Community Organization Survey 1998-1999.*Includes the Johenning Baptist Community Center, which has been at its current site fornearly 50 years.**This average excludes the budget of the Marshall Heights Community DevelopmentOrganization. If MHCDO’s budget is included, the average is $1.2 million.
Heights are much older. The average age of a nonprofit in Columbia Heights is 19 years,
while in Marshall Heights, it is nearly 15 years.
Similarly, measures of property holdings and tenure reflect the longevity of
organizations in Columbia Heights and Marshall Heights. Half of the survey respondents
in both communities reported that they owned their facilities. The average tenure of

Center on Nonprofits and Philanthropy • The Urban Institute
35
groups at their current location was approximately 11 years in Columbia Heights and 7
years in Marshall Heights.
Staffing patterns capture another measure of capacity. Of the organizations in our
sample, Columbia Heights groups had the greatest number of paid, full- and part-time
staff. All but two respondents indicated that they had more than five full-time employees,
and half reported more than five part-time staff. In Marshall Heights, respondents were
more likely to report more than five paid, full-time employees, but not paid, part-time
employees. On the other hand, Washington Highland groups generally had very few paid
staff. The only organization in Washington Highlands with more than five full-time staff
was Far Southeast Family Strengthening Collaborative.
Volunteers often supplement full- and part-time staff. The pattern, again, shows
that Columbia Heights has a far greater resource base than the other two study sites. On
average, the typical organization in Columbia Heights has 16 volunteers per week,
compared with 11 volunteers in Marshall Heights and eight in Washington Highlands.
Like staffing and tenure measures, data on funding sources point to some real
differences in organizational capacity across the three communities. On average, the
revenues of organizations in Columbia Heights were more than twice as large as those of
groups in either Marshall Heights or Washington Highlands. The average budget in
Columbia Heights was approximately $674,000, compared with less than $300,000 in the
other two study sites.
Resource dependence is often used as an indirect measure of organizational
strength and capacity. Researchers often argue that a broad funding base can help an
organization develop its program areas without compromising its mission (Gronbjerg,

Center on Nonprofits and Philanthropy • The Urban Institute
36
1993). Although new and fledgling organizations sometimes have a high degree of
dependence on a single funder, this arrangement has implications for the organization’s
future growth and development.
Of the three study sites, Columbia Heights’ nonprofits reported the broadest
funding base. On average, they reported receiving support from 5.4 different sources.
Organizations in Marshall Heights and Washington Highlands, on the other hand,
reported support from only 3.8 and 2.0 sources, respectively.
Washington Highlands nonprofit organizations are highly dependent on a limited
number of funders. Four of the six responding organizations said that more than 80
percent of their funding came from just one source. In contrast, none of the Marshall
Heights organizations and only three of the 16 organizations in Columbia Heights
reported this level of dependency. The high degree of resource dependence in
Washington Highlands is another indicator of the fragile and start-up nature of
community-based groups in this community.
Community Involvement. Building a strong community base requires the support
and involvement of local residents and ties to other organizations in the neighborhood. In
our survey work, we asked several questions to measure the extent to which local
residents participate in local nonprofit groups. These data are shown in table 9. What we
learned was that many groups, particularly those in Columbia Heights, defined their
service areas beyond their immediate neighborhood boundaries, so that community
involvement can encompass either a geographically narrow or very broad definition of
community inputs.

Center on Nonprofits and Philanthropy • The Urban Institute
37
Table 9.Residents’ Participation in Community-based Nonprofit Organizations
Type of participation by residentsColumbiaHeights
MarshallHeights
WashingtonHighlands
Percent Percent Percent
Sit on board of directors 88 66 66Employed on staff 81 83 50
Serve as volunteers 94 83 50 Number of responding organizations 16 6 6
Source: The Urban Institute, CNP Community Organization Survey 1999.
Almost all survey respondents in Columbia Heights reported that they have local
residents on their boards of directors (88 percent of responding organizations), on their
staffs (81 percent), and among their volunteers (94 percent). But less than half of the
organizations in the community defined their service areas as being contained within the
geographic boundaries of Columbia Heights. Clients and participants may come from
anywhere in the city. Only six of 16 survey respondents in Columbia Heights indicated
that neighborhood residents account for 75 percent or more of their client base.
Several respondents noted, however, that communication across the various
ethnic groups and their respective leaders in Columbia Heights is sometimes poor or non-
existent. This may reflect language barriers, but it also may reflect different sets of
interests and needs. Communication is high, however, among organizations that serve the
same ethnic group. The Council of Latino Agencies, for example, is an umbrella group of
35 Hispanic-serving agencies. Formed in response to riots in an adjacent Hispanic
neighborhood in the summer of 1991, the Council serves as the single convening body
for the heads of the various Latino agencies. It also works to promote resident
participation on a range of civic issues, such as traditional voter registration and political

Center on Nonprofits and Philanthropy • The Urban Institute
38
participation drives. One of its current projects is a campaign to encourage Hispanic
residents to participate in the 2000 Census.
Organizations in Marshall Heights, like those in the other two communities, rely
on residents as resources for their day-to-day program work. Indeed, survey respondents
reported high levels of local resident involvement on their boards of directors, staff, and
among their volunteers. Neighborhood residents form a particularly important resource
base for the smaller organizations. In smaller agencies, neighborhood volunteers
outnumbered paid full-time staff. For example, Teen Life Choices, an organization with
two full-time staff, reported six volunteers on a weekly basis. The Boys and Girls Club,
an organization with six full-time staff, reported using 30 volunteers each week, and the
Children’s Neighborhood Trust Initiative, with a staff of eight employees, reported using
up to 10 volunteers per week.
Despite the large number of volunteers reported by community-based groups,
many of our respondents spoke of the difficulty of keeping and maintaining a core group
of neighborhood residents engaged in organizational activities. PTAs were mentioned by
respondents as being particularly weak in the Marshall Heights schools. In the words of
one respondent: “The people you want to have come most often have the least amount of
time available. Many work two jobs to make ends meet.”
Resident involvement in Washington Highlands nonprofit and grassroots groups
is also strong, but limited to a handful of individuals. Many of the organizations suffer
from a lack of organizational capacity. Five of the six organizations had fewer than five
full-time staff members. In some cases, groups share the same physical space for program
operations in order to stretch program funds.

Center on Nonprofits and Philanthropy • The Urban Institute
39
The richness of the community ties can be seen in an organization’s staffing
patterns and administrative structures. About half of the groups in Washington Highlands
had staff members who lived in the community, and half of the organizations drew their
volunteers from the community. Even at the board of director level, community
involvement is high. Four of the six organizations reported having formal boards, and all
reported that community residents were represented on these boards.
In short, an organizational infrastructure is developing in Washington Highlands,
but will need time to coalesce into a potent community force. Its roots are clearly based
in the community, but currently are in their infancy. The leadership of these organizations
expressed a strong desire to expand their operations in order to serve the neighborhood.
Collaborations and Working Relationships. The desire to generate community
involvement also extends to building strong ties with other organizations within the
community and around the District. Partnerships among nonprofit organizations and with
the D.C. government were reported in all three communities (see Appendix I).
Because Columbia Heights has an extensive array of nonprofit organizations, the
number of working relationships and formal collaborations was great (see table 10).
Thirteen of the 16 survey respondents in Columbia Heights indicated a working
arrangement with another community group. In addition, ten of the 16 organizations
identified working relationships with government agencies, suggesting a complex web of
public and private arrangements.
Although there are numerous partnerships or working relationships in Columbia
Heights, the community has a complex and sometimes uneasy relationship with
government. Community groups, particularly those representing the fast-growing

Center on Nonprofits and Philanthropy • The Urban Institute
40
Hispanic population, feel their voices are not heard sufficiently in citywide politics. For
example, funds for Latino services have stagnated for several years while the size of the
Hispanic population has grown. To address this perceived imbalance, several Hispanic-
serving nonprofit groups invited members of the City Council to a one-day meeting in
May, 1999, with community residents to educate Council members about the Latino
community’s concerns.
Table 10.Working Relationships with Government and Other Community-based Groups
Type of RelationshipColumbiaHeights
MarshallHeights
WashingtonHighlands
Working with other groups
With other nonprofit organizations 13 of 16 3 of 6 6 of 6
With government 10 of 16 5 of 6 5 of 6
Collaborations
Average number with other nonprofit organizations 2.2 1.5 3.2
Average number with government 1.2 1.5 2.1
Source: The Urban Institute, CNP Community Organization Survey 1999.
Community residents also have been active in expressing their opinions on
development and land use issues related to construction of the new Metro station in the
neighborhood. During 1998-1999, there were three formal events to discuss these
concerns. The first event was held to gather resident opinions on the how developers
should treat various parcels of land. This information was submitted to the D.C.
government and incorporated into the request for proposals sent to developers. Follow-up
meetings were then held at a local strategic planning conference, where residents
discussed the results of the proposed development plan and raised additional concerns

Center on Nonprofits and Philanthropy • The Urban Institute
41
about the development process. The list of concerns was extensive and included parking,
crime, affordable housing, vacant buildings, the restoration of historic landmarks, the
need for a supermarket, the lack of a post office, over-development, economic
opportunities for local residents, bus routes, and the appropriate mix of commercial and
residential activities.
In contrast to Columbia Heights, nonprofit organizations in Marshall Heights that
responded to our survey indicated that they were more likely to have ties to government
than to other nonprofit groups. Nearly all of the respondents reported a working
relationship with government, but only half identified links to other community-based
organizations. Community ties appear to be fostered by the Marshall Heights Community
Development Organization, which acts both as a partner and facilitator to many of the
other local and citywide groups in the area.
Although smaller organizations in Marshall Heights identified a number of formal
and informal collaborations with other community groups, most partnerships were with
organizations far outside of the neighborhood. The local senior high school, for example,
partners with the Fannie Mae Foundation and the Coast Guard to offer educational and
enrichment programs to its students.
The work of nonprofit organizations in Washington Highlands is primarily based
on collaborative efforts. According to survey respondents in this community, the small
number of organizations clearly facilitates working relationships and collaborations. At
least six distinct partnerships among nonprofit groups within the neighborhood could be
identified from our field work. Others were with groups that are headquartered in other

Center on Nonprofits and Philanthropy • The Urban Institute
42
parts of the city. Much of the nonprofit activity in Washington Highlands is done in
concert with various D.C. government agencies.
Other Resources. In addition to nonprofit organizations, two other community-
based assets emerged from our neighborhood field work: religious congregations and
schools. Each of these community institutions contributes to the resource base of the local
area, but like other factors, the roles they play differ.
Religious Congregations. One of the most important roles that local area churches
play in these study sites is that of an incubator for nonprofit human service providers.
Particularly in Columbia Heights and Washington Highlands, local congregations provide
physical space for nonprofit organizations to run their programs. Sometimes these
relationships are temporary while groups get established; in other cases, there has been a
longer-term relationship.
In Columbia Heights, for example, ten human service organizations presently
work from church property. Several other nonprofit groups began operations at church
facilities, but have since moved into their own facilities. One of the most successful
examples of this relationship is the Calvary Bilingual Multicultural Learning Center.
Calvary began by serving 15 children in a church basement in 1986. It has now grown to
a nationally recognized 70,000 square foot Center serving over 220 children. Programs
range from prenatal services for expectant mothers to activities for children up to age 15.
Other organizations with ties to local religious congregations include Barney Center,
D.C. Refugee Center, Community of Hope, Charles Brooks Youth Organization,
McKenna House, and Growing Together.

Center on Nonprofits and Philanthropy • The Urban Institute
43
Field work in Washington Highlands identified five churches in the community,
and, similar to Columbia Heights, these congregations are serving as fertile ground for
newly developed nonprofit organizations. In particular, the Johenning Baptist Church has
been an active promoter of community-based groups. In addition to its own activities,
including child care for preschoolers, after-school programs for older children, and GED
programs and employment training for teens and young adults, the Johenning Baptist
Community Center also provides space for newly formed community organizations such
as the Washington Highlands Community Organization.
Houses of worship in Marshall Heights are plentiful and outnumber nonprofit
organizations in the area by a factor of three to one. These institutions vary considerably
in size, ranging from a cluster of smaller storefront churches to congregations exceeding
500 members. While the majority of our key informants identified churches as important
influences in the community, respondents gave mixed reviews of their effectiveness in
addressing the needs of local residents. Key informants were more likely to identify
nonprofit organizations than congregations as the institutions that would unite residents
to work together on local problems. There was a sense, particularly among key
informants who live in the neighborhood, that the faith community served local residents
who were affiliated as members. In the words of one respondent, “They mostly serve
their own and don’t go beyond their members in their outreach . . . and most of them are
from Maryland.”
Our field work and organizational survey echo some of these concerns regarding
the integration of the faith community in Marshall Heights into local affairs. For
example, there is no local interfaith group in Marshall Heights, which might be expected

Center on Nonprofits and Philanthropy • The Urban Institute
44
given the multitude of congregations in the neighborhood and in Ward 7 generally. Only
two of the 29 congregations in Marshall Heights have human service outreach programs
that are structured as nonprofit organizations to serve local residents. These are Teen Life
Choices of the St. Luke Catholic Church, and a United Planning Organization Early
Childhood Development Center operating out of Hughes Memorial United Methodist
Church. The abundance of churches in Marshall Heights may be an untapped resource
that can be better utilized for addressing the needs of children and families in the area.
Schools. Another important community resource is the local school system. In all
three study sites, respondents named education as one of the biggest issues facing
children and families in the neighborhoods. This corresponds with the information
provided by the D.C. Agenda focus groups. Many of our respondents noted that the
schools specifically need greater financial support to improve their educational programs
and reach out to community residents. (See Appendix J for a statistical profile of the
school systems.)
Elementary schools are fairly prominent in all three study sites, but only
Columbia Heights has senior high schools within its neighborhood borders (see table 11).
High school students in Marshall Heights and Washington Highlands go to neighboring
communities for grades 8-12. In Washington Highlands, one of the elementary schools
(the Patricia Robert Harris Educational Center) defies a strict comparison to other
elementary schools identified in the three communities. It serves 1,000 children and is
comprised of students from Pre-K to the 8th grade.
The public charter school system is a recent experiment in the District of
Columbia, most having been in operation only one academic year. Charter schools are

Center on Nonprofits and Philanthropy • The Urban Institute
45
independently managed, nonprofit, nonreligious public schools that receive public
funding and are free-of-charge and open to all D.C. residents. Charter schools originate in
a number of different ways—some by individuals with a vision, others by nonprofit
organizations wanting to establish a charter school to supplement their other services.
The latter is the case for two of the schools in the Columbia Heights community. The
formation of public charter schools in the District provides another glimpse into the
organizational capacity of each community. The establishment of five new charter
schools in Columbia Heights, for example, points to the very active participation of local
residents in educational affairs.
Table 11.Number and Types of Schools in the Three Study Sites
Type of SchoolColumbiaHeights
MarshallHeights
WashingtonHighlands
Elementary schools 3 3 6Middle schools 1 1 1
Senior high schools 2 0 0
Charter schools 5 1 0Private/ Special schools 1 1 1
Total 12 6 8
Source: D.C. Board of Education, 1999.
Key informants often mentioned specific schools (or principals) that were active
in the community and making a difference for children. In Columbia Heights, for
example, the principal of the Harriet Tubman School was cited for her outreach into the
community and for the programs housed in the school facilities. In Marshall Heights, the
J.C. Nalle Community School was frequently mentioned as a community resource. It
provides space to the Marshall Heights Community Development Organization to operate

Center on Nonprofits and Philanthropy • The Urban Institute
46
an arts program and GED program at the school. There was some speculation that in the
future a health program might also be run from the J.C. Nalle School.
In Washington Highlands, two schools provide a home for community-based
services. The Ferebee Hope Elementary School provides space to the Ferebee Hope
Community Services Center that serves as an information and referral service for local
residents. This program is sponsored by the Far Southeast Family Strengthening
Collaborative and is focused on building strong, healthy families in the neighborhood.
The other school in Washington Highlands that houses some community-based services
is the Patricia Robert Harris School. Several key informants, as well as staff of the Harris
School, mentioned that the school currently offers fewer community services than in
prior years, but that it is still an important resource for community residents. We were
unable to determine the reasons for these cutbacks, but the past financial difficulties of
the District government and a general back-to-basics education movement appear to be
contributing factors for the reductions.
The physical space that schools occupy in a community is clearly an underused
resource. Our field work noted a number of public schools, particularly in Marshall
Heights, that have been closed and stand vacant. These properties could be converted into
homes for nonprofit service providers that are specifically addressing the needs of
children and families in the neighborhood. Participants in the D.C. Agenda focus groups
also cited better access to the school buildings as possible venues for organizing out-of-
school activities for children. Because physical space for nonprofit organizations is often
at a premium in these neighborhoods, this is an opportunity that could have lasting value
for community residents.

Center on Nonprofits and Philanthropy • The Urban Institute
47
Making a Difference
The qualities and characteristics of “what makes a difference” for improving the lives of
children and families in low-income neighborhoods are fairly amorphous and difficult to
define. Three components, however, appear to be essential: clearly defined programs,
leadership, and trust. Our interviews with key informants and field observations suggest
that these elements are present in all three study sites, but are manifest in numerous ways.
Community Assets. When key informants were asked to identify the community
assets that tend to unite residents in the neighborhood, most were reluctant to identify a
single individual or organization. Instead, the answers tended to be fairly categorical and
reflected the differences in the three study sites.
In Columbia Heights, for example, the community asset most frequently
mentioned was the diversity of the community. Respondents listed the social and
economic mix, the various languages heard on the street, and the different ethnic-serving
organizations as symbols of this dynamic community. One resident expressed it in the
following terms: “We have a lot of people. Tolerance, this has always been a very
tolerant community and very accepting. If you go to community meetings you’ll hear a
lot of celebrating of differences.”
In Washington Highlands, respondents were quick to identify the children of the
community as their principal asset and the one issue most likely to unite residents to work
together on local problems. Four of the respondents identified the relatively small size of
the human service sector in the community as an important factor that allows easy access
to individuals and information. It is somewhat paradoxical that the small size of the

Center on Nonprofits and Philanthropy • The Urban Institute
48
human service sector in Washington Highlands is viewed as both a strength and a
weakness by community leaders. On the one hand, it enables individuals and groups to
have a fairly thorough understanding of the services and activities that are available in the
community; on the other hand, the lack of services is cited as a major concern.
Marshall Heights respondents had a broader range of answers than did key
informants in the other two communities. Attributes such as the willingness of people to
care for one another, the spirit of the community, love for each other, and the youth of the
neighborhood, were highlighted. One respondent summarized this general sense of
community spirit by saying, “There are some really good people who care about the
community and youth and the future. They really are eager to support the youth. This
kind of attitude is what we need more of.”
Organizations. There was a general consensus among the study’s key informants
that nonprofit organizations were the most likely entity to make a difference in promoting
the well-being of children and families in local neighborhoods (see table 12). Over 80
percent of the respondents named nonprofit organizations as the type of organization
promoting community change and well-being for local residents. This pattern was
consistent across study sites and regardless of the respondent’s affiliation.
Table 12.Organizations That Make a Difference
Type of OrganizationColumbiaHeights
MarshallHeights
WashingtonHighlands
Nonprofit 22 11 15
Religious Congregation 1 1 3
School 1 1 0
Public Services 2 2 0
Source: The Urban Institute, CNP Key Informant Interviews 1998-1999.

Center on Nonprofits and Philanthropy • The Urban Institute
49
Further probes to determine the type of program regarded as most effective
yielded a somewhat different pattern, however. After coding the responses to the open-
ended interviews into a broad array of categories, the results showed a wide range of
opinion regarding the most effective means of providing support to families with
children. Although there was strong consensus across all communities that the programs
should be family-focused (that is, holistic in their approach to problem solving or service
delivery), there were considerable differences regarding the other characteristics that
mattered (see table 13).
Table 13.Types of Programs That Make a Difference
Type of programColumbiaHeights
MarshallHeights
WashingtonHighlands
Individually focused 7 1 8
Family focused (i.e., holistic) 14 9 12
School-based 7 4 6
Faith-based 3 6 5
Community development 7 3 5
Culturally sensitive 10 1 0
Source: The Urban Institute, CNP Key Informant Interviews 1998-1999.
In Columbia Heights, for example, key informants most commonly named
programs offering broad family-centered services as the most effective programs, but
many respondents quickly added that the programs needed to account for the cultural
background of the community and clients. In Washington Highlands, respondents
regarded family-centered programs as the most effective, but a strong second choice was
for programs addressing individual needs. Among the eight respondents who spoke of

Center on Nonprofits and Philanthropy • The Urban Institute
50
“individual needs,” five of the eight indicated that these programs should focus on the
needs of children in the community. In Marshall Heights, respondents thought that the
programs making the most difference in their community were offering comprehensive
family assistance and were faith based.
Leadership. The research literature on civil society and social capital suggests
that the starting point for effective neighborhood change begins with individuals (see, for
example, Lappe and DuBoise, 1997; Verba, Schlozman, and Brady, 1995). Nonprofit
organizations and community-based groups often provide a venue for teaching and
cultivating civic skills and effective leadership.
In probing the idea of how nonprofit organizations might build local leadership
potential, we asked key informants, “what prompts an individual to assume a leadership
role within the community?” The question produced a range of responses. The most
common reason cited was the presence of a crisis or tragedy. Respondents were quick to
identify moments when a shooting or other tragic event served as a catalyst, bringing
members of the community together. In the words of one respondent: “When they’re tired
of seeing all the wrongs, the violence and abuses … they do what they have to do to help
the community.” The second most common response was love for the community or for
its members. One respondent spoke to this issue by saying that “Effective leaders are
those who really care about people and the cause. You need to believe in what you are
doing, need to be dedicated to what residents are doing.” In short, for many respondents,
the reason for leadership is a desire to serve, or simply, “trying to do good.”
After discussing how leadership emerges in a local community, respondents were
asked to identify the individuals or organizations that they regarded as outstanding

Center on Nonprofits and Philanthropy • The Urban Institute
51
leaders. Not surprisingly, the answers reflect the historical and emerging circumstances
of each community. In Columbia Heights, for example, heads of community
organizations were seen as the principal leaders of the neighborhood. The local
community development corporation leader received the greatest number of mentions,
followed closely by the leaders of two predominantly Hispanic-serving organizations.
In Washington Highlands, area residents and resident councils were cited more
than any other group as providing effective leadership in the community, particularly as
public housing units were closed and housing renewal programs developed. Respondents
cited the work of individual resident council members and directors of housing as being
the voice, advocates, and leadership for the community. The local City Council member
also received high marks. Washington Highlands respondents were more likely than
those in other study sites to name their Council member as an important influence in the
community, however government, itself, was not generally regarded as an effective force
in the community.
In Marshall Heights, respondents noted two primary sources of community
leadership. The source most frequently mentioned was the Marshall Heights Community
Development Organization (MHCDO), and the second was the elected members of the
Advisory Neighborhood Commission. Pastors of local congregations received a blanket
acknowledgment of their leadership role without having any one individual singled out.
MHCDO was mentioned by all key informants as the principal nonprofit in the
area. In the words of one respondent, “People are much more likely to go to MHCDO
when they have a problem than they are to District government.” MHCDO has gained
praise nationally and internationally for its work in Ward 7. In fact, among our

Center on Nonprofits and Philanthropy • The Urban Institute
52
respondents, the individual named most often as a leader in the community was the
founder of MHCDO, Lloyd Smith, and several mentioned his nick-name, “The Mayor of
Ward 7.”
MHCDO started out in the Marshall Heights neighborhood 19 years ago, but has
moved several times and currently resides in Benning Heights, a neighborhood closer to
the center of Ward 7. MHCDO has grown to a staff of 65 persons, a service area covering
all of Ward 7, and an asset base of $8.7 million. The organization works in collaboration
with many local and citywide groups in developing its human service and development
programs. Its budget is split between human services (43 percent), housing and economic
development (42 percent), and a six-year initiative called Rebuilding Community (14
percent). MHCDO is dedicated to economic development in the community and counts a
seven-store, mini-mall development as one of its recent achievements. The mall also
includes one of the only large chain grocery stores in the area.
The size and vitality of MHCDO stand in stark contrast to the other organizations
that serve the local Marshall Heights community. MHCDO’s annual program expenditure
for FY98 ($4,500,000) is eight times more than the second largest nonprofit budget in the
area. Most Marshall Heights organizations that responded to the survey focus their work
and service delivery much less broadly than does MHCDO, and concentrate their
activities largely on the residents of the Marshall Heights neighborhood. These
organizations provide youth and family support services. For example, the Children’s
Trust Neighborhood Initiative, established in 1992, focuses on youth development and
provides family support through counseling, referral, and parenting and health education.
Teen Life Choices focuses on neighborhood teens by providing preventive counseling on

Center on Nonprofits and Philanthropy • The Urban Institute
53
pregnancy, violence, and drugs. The local Police Boys and Girls Club #14 supplies a
broad range of recreational and youth counseling and tutoring services throughout the
year. The local Weed and Seed program, active in technology issues in the local library
and schools, provides GED training, summer arts and crafts, and family support. It also is
a vehicle for Grandparents on the Move, a program for grandparents who are raising their
children’s children.
Conclusions
This exploratory study of three low-income neighborhoods in the District of Columbia
provides an important framework for understanding the needs and institutional
infrastructures that serve children and families in local communities. It provides a set of
both quantitative and qualitative research tools that can be used to investigate factors
affecting community life and the well-being of children and families in future studies of
other D.C. neighborhoods or other communities across the country.
The study’s findings emphasize the importance of looking carefully at the
strengths and assets of local neighborhoods before developing initiatives to address local
needs. Both organizational and environmental factors can vary widely from place to
place, as was evident in the three study sites. These factors need to be taken into account
when designing initiatives that can bring positive change to the lives of children and
families residing in distressed communities.
The work also highlights three factors that help characterize community
infrastructures and should be part of a full typology of neighborhood conditions. These
factors are:

Center on Nonprofits and Philanthropy • The Urban Institute
54
1. the number and types of community-based organizations;
2. the extent to which activities are centralized or dispersed; and
3. the extent of communication among neighborhood groups.
Although the study sites were selected because they were similar in population
size and rates of poverty, they are remarkably different along these three important
dimensions. These differences suggest somewhat different intervention strategies to
address particular needs and build organizational capacity. For example:
Columbia Heights has a large number of nonprofit organizations, and activities
are largely decentralized. Communication is high among nonprofit organizations that
serve the same ethnic group, but low between groups serving different ethnic populations.
Not only are the numbers of nonprofit groups in Columbia Heights significantly higher
than in the other two study sites, but they also exhibit a strong capacity for innovation,
creative service delivery, and advocacy.10 Several groups have undertaken extensive
capital campaigns to purchase and renovate their facilities. New multiorganizational
complexes are forming to provide a broad range of programs under a single roof. Newly
established charter schools are offering alternative educational opportunities for the
area’s children. Yet, in part, because of cultural and language barriers, many nonprofit
groups in Columbia Heights do not communicate, collaborate, or network extensively
with one another. Moreover, many of the groups that offer programs for children are
small-scale initiatives with limited budgets. Thus, one potential intervention in Columbia
10 One of the more innovative groups located in Columbia Heights is Washington Parks and People—agroup dedicated to “reclaiming Washington, D.C.’s public spaces.” It recently purchased and is nowrenovating a large Victorian mansion that will serve as a local community center. The building will housenine separate nonprofit agencies.

Center on Nonprofits and Philanthropy • The Urban Institute
55
Heights is direct program support to help small nonprofits expand their programs and
reach more children and families in the neighborhood.
In Marshall Heights, the composition and dynamics of nonprofit organizations are
very different from what was found in Columbia Heights. For example, instead of a wide
array of nonprofit organizations that operate in a decentralized structure, Marshall
Heights has a more limited number of community-based organizations and a more
centralized structure. Specifically, the Marshall Heights Community Development
Organization (MHCDO) anchors and dominates the civic infrastructure throughout Ward
7. This dynamic, multiservice, central agency not only serves Marshall Heights, but all of
Ward 7. Within Marshall Heights, however, is a cluster of small, programmatically
focused nonprofit organizations that generally target their efforts specifically to Marshall
Heights residents. While the communication network is dense between area providers and
MHCDO, it is low among the remainder of the nonprofit organizations. The civic
infrastructure in Marshall Heights could be strengthened in several ways: by promoting
better interorganizational communication directly, by fostering stronger collaborations
among small nonprofit groups in the area, or by identifying service gaps that could be
filled through the formation of new organizations in the neighborhood.
One untapped resource in Marshall Heights is the religious community. Because
of the extensive number of congregations in this neighborhood vis-à-vis the other study
sites, supporting interfaith collaborations may produce new opportunities and resources
for local organizations and community residents.
Finally, Washington Highlands represents an area with a small number of
community-based organizations, a somewhat diffuse and evolving structure, but high

Center on Nonprofits and Philanthropy • The Urban Institute
56
inter-organizational communication among the few nonprofit groups in the
neighborhood. Addressing the needs of the large number of poor children who live in
Washington Highlands is a formidable task for the handful of organizations that operate
in this community. One of the more ambitious undertakings in Washington Highlands is
The Arc Project. Although still in the planning stage, this new program will bring the first
multiservice youth center to the residents of the area.
Because the civic infrastructure in Washington Highlands is small and fledgling,
the most immediate need is for capital and administrative support to build the
organizational capacity of these emerging community-based groups. Several of them
operate from church buildings, such as the Johenning Baptist Church, which generously
provides space and resources to new community groups. Providing financial support
either directly to the new groups or indirectly through established organizations that
provide space or other resources to these emerging entities will significantly assist the
development of a viable community infrastructure in Washington Highlands.
Recommendations. The findings of this exploratory work demonstrate the
complexities and subtleties of local areas. Although communities may initially look quite
similar, the dynamics and interactions of local infrastructures and community networks
may function quite differently. Because of these differences, a one-size-fits-all strategy
for investing in local neighborhoods is not likely to succeed. CNP, therefore, offers four
recommendations for investing in low-income communities.
• An initial step in designing programs for low-income communities must begin
with a careful assessment of the neighborhood’s organizational and
environmental context. The research suggests that effective place-based strategies
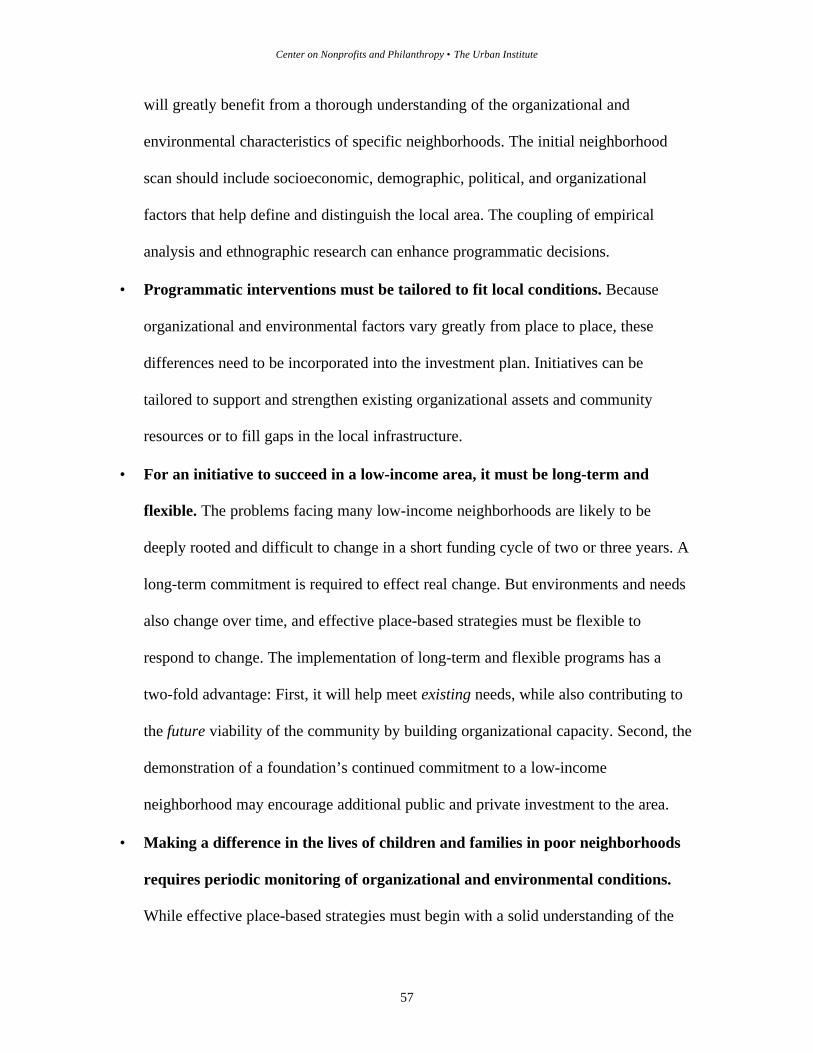
Center on Nonprofits and Philanthropy • The Urban Institute
57
will greatly benefit from a thorough understanding of the organizational and
environmental characteristics of specific neighborhoods. The initial neighborhood
scan should include socioeconomic, demographic, political, and organizational
factors that help define and distinguish the local area. The coupling of empirical
analysis and ethnographic research can enhance programmatic decisions.
• Programmatic interventions must be tailored to fit local conditions. Because
organizational and environmental factors vary greatly from place to place, these
differences need to be incorporated into the investment plan. Initiatives can be
tailored to support and strengthen existing organizational assets and community
resources or to fill gaps in the local infrastructure.
• For an initiative to succeed in a low-income area, it must be long-term and
flexible. The problems facing many low-income neighborhoods are likely to be
deeply rooted and difficult to change in a short funding cycle of two or three years. A
long-term commitment is required to effect real change. But environments and needs
also change over time, and effective place-based strategies must be flexible to
respond to change. The implementation of long-term and flexible programs has a
two-fold advantage: First, it will help meet existing needs, while also contributing to
the future viability of the community by building organizational capacity. Second, the
demonstration of a foundation’s continued commitment to a low-income
neighborhood may encourage additional public and private investment to the area.
• Making a difference in the lives of children and families in poor neighborhoods
requires periodic monitoring of organizational and environmental conditions.
While effective place-based strategies must begin with a solid understanding of the

Center on Nonprofits and Philanthropy • The Urban Institute
58
organizational and environmental characteristics of the neighborhood, it also requires
on-going monitoring of organizational and environmental change. This process
provides an invaluable and essential feedback loop to make programmatic
adjustments that fit current needs and conditions.
The findings of this research highlight diverse community needs and identify the
organizations that are actively working toward improving the lives of children and
families in three low-income neighborhoods of the District of Columbia. Much work
remains, however. As indicated above, an ongoing monitoring of environmental change
will supply an essential feedback loop to make programmatic decisions and adjustments.
Results of the 2000 Census will also provide an opportunity to update many of the
socioeconomic and demographic variables and examine change over time. In addition,
replication of the study in additional neighborhoods will provide a wider baseline for
developing models and typologies of community infrastructures and local needs.
A plethora of research questions that also deserve attention fell outside the scope
of the current study. In particular, much more could be learned about the role of
coalitions and advocacy organizations in connecting residents to the policy process. Are
community-based organizations in low-income neighborhoods exercising their political
“voice”? How can the promotion of political participation among neighborhood
organizations produce positive social and economic change for families and children?
How can foundations stimulate community activism? Answers to these questions will
provide further measures of effective ways to support and strengthen local community
groups and the children and families that they serve.

Center on Nonprofits and Philanthropy • The Urban Institute
59
References
Boris, Elizabeth T. 1999. “The Nonprofit Sector in the 1990’s,” in The Future ofPhilanthropy in a Changing America. Charles Clotfelter and Thomas Ehrlich, eds.Indianapolis, IN: Indiana University Press.
D.C. Agenda. 1999. Out of School Needs in the District. Issued February 1999.
Ellen, Ingrid G. 1996. Sharing America ’s Neighborhoods: The Changing Prospects forStable, Racial Integration. Unpublished Dissertation. Cambridge, MA: HarvardUniversity.
Gronbjerg, Kirsten A. 1993. Understanding Nonprofit Funding: Managing Revenues inSocial Services and Community Development Organizations. San Francisco: Jossey-Bass.
KIDS COUNT Data Book. 1999. Baltimore: The Annie E. Casey Foundation.
KIDS COUNT Data Book. 1998. Baltimore: The Annie E. Casey Foundation.
Lappe, Francis Moore and Paul Martin DuBois. 1997. “Building Social Capital withoutLooking Backwards.” National Civic Review 86 (2, Summer): 119-128.
Lincoln, C. Eric and Lawrence H. Mamiya. 1990. The Black Church and the AfricanAmerican Experience. Durham, NC: Duke University Press.
Printz, Tobi Jennifer. 1998. Faith-Based Service Providers in the Nation ’s Capital: CanThey Do More? Center on Nonprofits and Philanthropy Policy Brief. Washington, DC:The Urban Institute, April.
Stevenson, David R., Thomas H. Pollak, and Linda M. Lampkin. 1997. State NonprofitAlmanac 1997: Profiles of Charitable Organizations. Washington, D.C.: The UrbanInstitute Press.
Turner, Margery A. and Ingrid G. Ellen. 1997. “Location, Location, Location: How DoesNeighborhood Environment Affect the Well-Being of Families and Children?” WorkingPaper (July). Washington, D.C.: The Urban Institute Press.
Twombly, Eric C. and Carol J. De Vita. 1998. D.C.-Area Ties to ReligiousCongregations. Center on Nonprofits and Philanthropy Policy Brief. Washington, DC:The Urban Institute, May.
Verba, Sidney, Kay Lehman Schlozman, and Henry Brady. 1995. Voice and Equality:Civic Voluntarism in American Politics. Cambridge, MA: Harvard University Press.
Wolpert, Julian. 1996. What Charity Can and Cannot Do. New York: Twentieth CenturyFund Press.

Center on Nonprofits and Philanthropy • The Urban Institute
60
Appendix AAdvisory Committees
National Advisory Committee
Xavier de Souza Briggs, Deputy Assistant Secretary for Research, U.S. Department ofHousing and Urban Development
Stephen Fuller, Professor of Public Policy, Institute for Public Policy, George MasonUniversity
Cheryl Hayes, Executive Director, The Finance Project
Jeffrey Henig, Director, Center for Washington Area Studies, George WashingtonUniversity
Damon Lynch, Director, Asset-Based Community Development Institute of Ohio
Margaret Simms, Vice President for Research, Joint Center for Political and EconomicStudies
Annie E. Casey FoundationPaula DresselIrene Lee
The Urban Institute, Center on Nonprofits and PhilanthropyElizabeth T. BorisCarol J. De VitaCarlos Manjarrez (joined staff, December 1998)Tobi Printz (left staff, December 1998)Eric C. Twombly

Center on Nonprofits and Philanthropy • The Urban Institute
61
Local Advisory Committee
Jacquelyn Henry, East River Family Strengthening CollaborativeMeredith Johnson, United Way of the National Capital AreaPhyllis Jones, Local Initiative Support CoalitionBarbara Kamara, DC Office of Early Childhood DevelopmentLori Kaplan, Latin American Youth Center
Beverly Langford-Thomas, DC Public Schools’ Head Start ProgramGladys Mack, United Planning OrganizationJacqueline Massey, Valley Green Resident CouncilRobert Moore, Development Corporation of Columbia HeightsGail Oliver, Columbia Heights Youth Club
Beatriz Otero, Calvary Bilingual Multicultural Learning CenterFather Mark Poletunow, Spanish Catholic CenterPatricia Press, Marshall Heights Community Development OrganizationBrenda Richardson, Metropolitan DialogueCarmen Robles-Gordon, DC Agenda
Joy Smith, Far Southeast Family Strengthening CollaborativeBessie Swann, Willow Creek Community Development CorporationReverend Wallace Charles Smith, Shiloh Baptist ChurchTony Whitehead, University of MarylandMarion Urquilla, Columbia Heights/Shaw Collaborative
Annie E. Casey FoundationPaula DresselIrene Lee
The Urban Institute, Center on Nonprofits and PhilanthropyElizabeth T. BorisCarol J. De VitaCarlos Manjarrez (joined staff, December 1998)Tobi Printz (left staff, December 1998)Eric C. Twombly

Center on Nonprofits and Philanthropy • The Urban Institute
62
Appendix BSecondary Data Sources
Administrative DataD.C. Department of Children and Family ServicesA list of all licensed child care providers was obtained from this office. In order toidentify the providers that were located in the three study sites, the data were sorted byzip code, then geo-coded, and mapped. The District provides information on licensedcapacity (that is, the number of licensed child care slots) for child care centers, but not forindividual providers. The licensed capacity within each neighborhood can only becalculated for center-based care.
Socioeconomic DataU.S. Bureau of the Census, 1990 Census dataThe decennial census is the most complete source of data for examining thesociodemographic and economic features of small geographic areas. These data wereused to construct neighborhood maps that reflect a variety of social indicators at theneighborhood level.
D.C. Office of Planning and EvaluationThis office provided 1998 population estimates by census tract for four variables: age,race/ethnicity, median household income, and per capita income. The data were used toconstruct neighborhood maps and to provide estimates of population change between1990 and 1998.
Various Reports and Newspaper ArticlesD.C. AgendaA report on “Out of School Needs in the District” was obtained from D.C. Agenda inFebruary 1999. The report summarizes the results of focus groups conducted by D.C.Agenda with the eight Healthy Families/Thriving Communities Collaboratives. Fourfocus groups, covering different perspectives, were held in each neighborhood. Theperspectives included: young students (4th, 5th, and 6th graders); older students (7th-12th
graders); parents and caregivers; and area service providers.
Newspaper articlesUsing the Nexus/Lexus computer search engine, project interns found 29 newspaperarticles that focused on general community concerns in the three study sites. Thecomputer search was conducted by community name, and only articles that focused onindividual neighborhood issues were selected.

Center on Nonprofits and Philanthropy • The Urban Institute
63
Appendix CSupplemental Databases, Directories, and Lists
• Asian/Pacific Islander organizations from the Executive Office of the Mayor• Hispanic organizations from the Council of Latino Agencies• People’s House database from the “Little White House”• Civic associations from the D.C. Board of Elections and Ethics• Head Start grantees• Morris and Gwendolyn Cafritz Foundation grantees• Religious congregations and emergency service providers from the InterFaith Conference of
Metropolitan Washington• Registered charitable organizations from the D.C. Department of Consumer and Regulatory
Affairs• Contacts of the D.C. Family Policy Seminar from the National Center for Education on
Maternal and Child Health of Georgetown University• Organizations exempt from D.C. property tax from the D.C. Department of Finance and
Revenue
• Contact list from the Development Corporation of Columbia Heights• D.C. nonprofit organizations from Philanthropic Research, Inc.• Membership data base from the Cultural Alliance of Greater Washington• Descriptions of D.C. Community Development Corporations from the Local Initiative
Support Coalition• Electronic list of United Way grantees• Coalitions compiled by the Washington Regional Association of Grantmakers• Organizations identified by Greater DC Cares in the “Community Service Source”• Grantees of the Meyer Foundation for the past five years• Contacts for all Parent Teacher Associations of elementary, junior, and high schools in D.C.• Contact list from the United Planning Organization
• Local employment resources from Wurzbacher and Associates, human service consultants• Data base of religious congregations in the Washington, DC metropolitan area from the
American Church Lists, Inc.• Membership list from the Washington Council of Agencies• Service Directory of the D.C. Office on Aging• 1996 Referral Directory from the D.C. Hotline• 1997 Directory of Resources from the Criminal Practice Institute of the Bar Association of
the District of Columbia and the Public Defender Service for the District of Columbia• Organizational members of the Combined Federal Campaign• Contact list from the D.C. Office of Grants Management and Development• Data from the Internal Revenue Service that has been classified by the National Center for
Charitable Statistics (NCCS)

Center on Nonprofits and Philanthropy • The Urban Institute
64
Appendix DInterview Protocol
A Study of Community Organizations and Neighborhood Networksthat Strengthen Families in the District of Columbia
[Note: This interview protocol was used for Advisory Neighborhood Commissioners,elementary and high school principals, pastors, police officers, nonprofit serviceproviders, and D.C. Council members.]
Thank you for meeting with me today. Let’s start our discussion by looking at thegeographic boundaries of (insert community name).
I. How do you define this community?1. When you think of (insert community name), are these the street boundaries that you
feel best define the neighborhood?
a. Show a map of the community as we have defined it, and ask if it is correct.Discuss the map and the street boundaries to determine the respondent’sperceptions.
2. How would you describe this community to a new resident and neighbor?
a. Is it a close-knit neighborhood? What is the racial, economic, and employmentstatus of most residents?
II. We are interested in learning about change or stability in the neighborhood.3. Do families stay in the neighborhood for more than one generation?
4. If a family’s economic situation improves, do they stay in the community or moveout? If they move, do you know where they typically go?
5. Do new businesses open in the community, or have companies and stores relocatedelsewhere?
6. What do residents like about this neighborhood?
7. What are the biggest issues facing residents within the community?
8. What are the biggest issues facing families with children within the community?

Center on Nonprofits and Philanthropy • The Urban Institute
65
III. We are also interested in the formal and informal groups or organizations thatcan be found in the neighborhood. These can include organizations physically locatedhere, or projects in or for the community offered by groups located elsewhere.
9. What types of organizations, groups or coalitions promote neighborhood well-beingin (insert community name)?
10. Which programs and activities “make a difference” in actively strengthening families,connecting them to resources and involving them in community building?
11. Why, or how, do these positively viewed efforts and organizations effect change?
12. Do any of these groups promote resident involvement? Which ones?
a. If yes, how? Do they solicit volunteers from the community? Advertiseemployment opportunities? Hold community forums?
13. What groups in the community are residents likely to trust?
IV. Can you tell me something about the leadership capacity of neighborhoodresidents?
14. Who, do you think, are the effective leaders within the community?
15. What prompts an individual to assume a leadership role within a group or thecommunity?
V. Finally, I want to ask you about the strengths of the neighborhood.16. What are the greatest community assets that can unite residents to work together on a
local problem?
VI. Is there anything else you want to tell us about (insert community name)?
Thank you for your taking the time to answer our questions.We will send you a copy of our final report upon its completion early next year.

Center on Nonprofits and Philanthropy • The Urban Institute
66
Appendix EKey Informants
Columbia Heights
Commander Acosta3rd District Police Department
Perry King, Social WorkerUpper Cardozo Health Clinic
Marion Brown, Executive DirectorSojourners
David McIntire, HistorianColumbia Heights Webmaster
Sandy Dang, Executive DirectorAsian American LEAD
Elizabeth McIntireWard 1-A03 Advisory Neighborhood Commissioner
Helene Fisher, Formerly Lead OrganizerColumbia Heights/Shaw Collaborative
Father MoisesSacred Heart Catholic Church
Maria Gomez, Executive DirectorMary=s Center
Bob Moore, Executive DirectorDevelopment Corporation of Columbia Heights
Edwin Gonzalez, Executive DirectorCasa del Pueblo
Gail Oliver, Community CoordinatorCircle of Hope/Columbia Heights Youth Club
Honorable Jim GrahamWard 1 Council Member (Current)
Beatriz Otero, Executive DirectorCalvary Bilingual Multicultural Center
Phyllis Jones, Program OfficerLocal Initiative Support Corporation
Veronica Park, PresidentMartha=s Table
Carletha Jones, DirectorArizona House Boys and Girls Club Group Home
Gracey Rolling, Executive DirectorChange Inc.
Lori Kaplan, Executive DirectorLatin American Youth Center
Commander Scott4th District Police Precinct
Frank SmithWard 1 Council Member (Former)
Peggy Wines, PrincipalHarriet Tubman Elementary School
Pastor Wallace Charles SmithShiloh Baptist Church
Bob Wittig, Executive DirectorAcademy of Hope
Ms. Towns, Building President1451 Park Rd Cooperative
James Woody, Executive DirectorCommunity of Hope

Center on Nonprofits and Philanthropy • The Urban Institute
67
Marshall Heights
Greg Bargeman, LibrarianCapitol View Public View Library
Ms. Connie NugentWeed and Seed Program
Lillian Barnes, Neighborhood AdvocateChildren’s Trust Neighborhood Initiative
Shirley Profit, Resource Development DirectorMarshall Heights C71ommunity DevelopmentOrganization
Ali Bird, PresidentChildren=s Family Trust Neighborhood
Loretta Tate, Vice President MHCDO andPresidentMarshall Heights Civic Association
Michael Cresenzo, Vice President of Housing andEconomic Development
Ms. Helena Valentine, DirectorTeen Life ChoicesSt. Luke=s Catholic Church
Jackie Henry, Vice-President (former)Marshall Heights Community DevelopmentOrganization
Captain VelarealPolice Precinct, 6D
Honorable Mary JacksonANC Commissioner 7E04
Michael Watts, Service DirectorJC Nalle Community School
Anna Jefferson, Assistant PrincipalWoodson High School
Honorable Cathy WoodsANC Commissioner
Father James McLindenSt. Luke=s Catholic Church
Neil Owens, Director of ServicesPolice Boys and Girls Club

Center on Nonprofits and Philanthropy • The Urban Institute
68
Washington Highlands
Honorable Sandy AllenWard 8 Council Member
Alan Parish, Youth LeaderAnacostia-Congress Heights Partnership
Nigel Collie, Business Development DirectorEast of the River Community Development Corporation
Brenda RichardsonMetropolitan Dialogue
Habibah Haqq, Family AdvocateFar Southeast Family Strengthening Collaborative
Patrice Sheppard, Executive DirectorLydia=s House
Michelle LeShane, Director of Community RelationsGreater Southeast Community Hospital
Joy Smith, Executive DirectorFar Southeast Family Strengthening Collaborative
David Mason, PrincipleGreen Elementary
Bessie SwanWheeler Creek Estates Community Development Inc.
Linda Moody, Founder & PresidentWard 8 Forum on Education
Toni Thomas, MemberWashington Highlands Community Organization
Evans Moore, Project DirectorWard 8 Mentoring Project
Gloria Thurman, Managing DirectorHighland Addition Community Center
R. Bruce O=Neill, Executive DirectorAnacostia-Congress Heights Partnership
Vivian Townsell, Business ManagerParamount Baptist ChurchParamount Child Development Center

Center on Nonprofits and Philanthropy • The Urban Institute
69
Appendix FOrganizational Survey
INFORMATION SHEET
Date: __________________________________________________
Interviewer: __________________________________________________
Type of Interview: _____ In-person _____ Telephone
Neighborhood: CH MH WH
Note: If this is an in-person interview, please observe the following items:
A. Which of the following items are posted or otherwise available to potential clients:
____ Organizational advertising (signs or banners outside building or at entrance)
____ Informational leaflets detailing programs or services provided
____ Message board/kiosk with neighborhood events
____ Materials from other community organizations
____ Web site Address: ___________________
B. Is the information posted in more than one language?_____ Yes _____ No (Go to D)
C. In which language is the information posted?Materials Language____________________ ______________________________________ ______________________________________ __________________
D. Is the main entrance to the site locked when the organization is open forbusiness?____ Yes ____ No
E. Is the building generally in good physical condition? _____ Yes _____ No
F. Are there any signs of disrepair? _____Yes _____No
G. Is the site handicapped accessible? _____Yes ____No
H. Is the site close (within 3 blocks) to a public transportation stop? ____Yes ____No

Center on Nonprofits and Philanthropy • The Urban Institute
70
Urban InstituteCenter on Nonprofits & Philanthropy
COMMUNITY ORGANIZATION SURVEY
Organization Information
Please confirm the following information:
1. Organization name ___________________________________________________
2. Street address _______________________________________________________
3. Zip code _________________________________
4. Phone number _________________________________
5. Respondent’s Name ________________________________
6. Respondent’s Title _________________________________
Begin the Interview:
Origin and Purpose
7. What year was your organization started? _______________
8. Is your organization a: ____ single site operation? (Go to 10)____ part of larger organization?
9. Is your organization: ___ a headquarters? ___ a satellite?
10. Are your services from this site directed primarily at the residents of ____________?_______Yes _______No (neighborhood)
11. In a few words, please describe the primary purpose of your organization.

Center on Nonprofits and Philanthropy • The Urban Institute
71
Leadership
This next series of questions deal with the characteristics of the leaders and leadershipstructures in this community.
12. Who is the leader of your organization?____________________________
13. What is the leader’s approximate age?___ 20s ___50s___ 30s ___60+___ 40s
14. What is the leader’s racial/ethnic background?
___African-Amer. ___Asian ____Hispanic ___White Specify Other________
15. What is the leader’s gender? ___ Male ___ Female
16. Does the leader live in ? ___ Yes ___ No
(neighborhood)
17. How many years has the leader headed the organization? _____ years
If less than one year, how many months? _____ months
18. Is there a formal board of directors or set of advisors for your organization?___ Yes ___ No (Go to 23)
19. To what degree is your board or advisors involved in making budget decisions?___ Not involved ___ Somewhat involved ___ Very involved
20. To what degree is your board or advisors involved in making operating decisions?___ Not involved ___ Somewhat involved ___ Very involved
21. What are the sources of your board members? (choose all that apply)___ Neighborhood residents___ Business community___ Other nonprofit leaders___ Government officials___ Clients and others who benefits from your services
22. Could we have the list of your current board members?

Center on Nonprofits and Philanthropy • The Urban Institute
72
Budget
I ’d like to ask you about your budget and sources of funding.
23. Please indicate your total operating budget for the past two fiscal years.$_______________ Fiscal Year 1997 $_______________ Fiscal Year 1998
[Ask the respondent to explain a major change from FY97 to FY98. (< or > 50%)]
24. Approximately what percentage of your organization’s total revenues came from thefollowing sources during the 1998 fiscal year? (Should total 100 percent)
______% District government______% Federal government______% Other government (MD or VA)______% United Way or Combined Federal Campaign designations & grants______% Direct donations from individuals______% Corporate or foundation grants______% Fees for services______% Endowment and interest income______% Fundraisers and special events______% Other sources _________________ (Specify)
25. Please indicate how your funding has changed over the past two fiscal years for eachof the following sources.
(Please circle the number in the appropriate column, mark N/A for no funding from source)
Largedecrease(over 20%)
Moderatedecrease(-5 to -20%)
Small/Nochange(-5 to +5%)
Moderateincrease(+5 to +20%)
Largeincrease(over 20%)
N/A
District government 1 2 3 4 5 0
Federal government 1 2 3 4 5 0
Other government (MD, VA) 1 2 3 4 5 0
United Way or CFC 1 2 3 4 5 0
Corporations or Foundations 1 2 3 4 5 0
Earned income 1 2 3 4 5 0
Other individual giving 1 2 3 4 5 0
Total Funding 1 2 3 4 5 0

Center on Nonprofits and Philanthropy • The Urban Institute
73
26. How much do you expect your total operating budget to change from fiscal years1998 to 1999. (please choose one category)
___ Large increase (over 20%)___ Moderate increase (5 to 20%)___ Small/No change (-5 to +5%)___ Moderate decrease (-5 to -20%)___ Large decrease (over 20%)
StaffNow I ’d like to turn to some questions about your staff.
27. What is the number of full-time paid employees (more than 35 hours per week)? ____ (Include workers from Americorp and other externally funded employees.)
28. What is the number of part-time paid employees (less than 35 hours per week) ?_____
29. How many of your employees live in ? _________/Don’t know
(neighborhood) (number)
30. Does your organization use volunteers? Yes No (Go to 35)
31. What is the total number of volunteers used by your organization during an averageweek? _____
32. What is the average number of hours a volunteer works during a typical week? ___
33. What are the sources of your volunteers? (check all that apply)___ Residents of ____________
(neighborhood)___ Business community___ Other nonprofit organizations___ Government agencies___ Clients and others who benefits from your services___ Compulsory community service___ Other (please list__________________________)
34. How many of your volunteers are under the age of 18? ____

Center on Nonprofits and Philanthropy • The Urban Institute
74
Clients and Services
I am going to ask you a couple of questions about your clients and the services yourorganization provides.
35. Please estimate the percentage of your clients who live in the District. _____%
36. Please estimate the percentage of your clients who live in ______________._____% / Don’t know (neighborhood)
37. Approximately how many adults receive your services? _____
38. Approximately how many children or youth (under 18) receive your services? _____
39. Do you provide grants or loans to other organizations? ____ Yes ____No (Go to 41)
40. What organizations have you provided monies for in the last year?(Write all that are mentioned by respondent.)
41. What geographic area do you serve?(Note: This question should be delivered open ended. Categories listed below were inserted for codingpurposes. If the respondent mentioned specific neighborhoods, please list.)
___ NW ___NE __SE __SW __ Other__________

Center on Nonprofits and Philanthropy • The Urban Institute
75
42. I ’m going to read a list of services that nonprofit organizations sometimes provide.Please tell me which of these services your organization offers directly. For those thatare offered, we would like to know if you charge a fee, and what times of the week oryear the service is provided.
(Note: Mark either “y” for yes or “n” for no for each service. If the service is provided, thenmark all “x” in any boxes that apply.)
Type of Service Serviceprovided
Feecharged
to client?Weekdays(Mon. - Fri.)
Weekends(Sat. -Sun.)
Sept. - May(school yr.)
June- Aug.(summer )
Child day care Y N Y N
After school care/ Tutoring Y N Y N
Youth development;recreation
Y N Y N
Food services; nutrition Y N Y N
Mentoring Y N Y N
Pregnancy prevention Y N Y N
Drop-out prevention Y N Y N
Adoption assistance; fostercare
Y N Y N
Basic life skills Y N Y N
Job training Y N Y N
Job placement/referral Y N Y N
Indiv. or family counseling Y N Y N
Substance abuse treatment Y N Y N
Parenting education Y N Y N
Health education Y N Y N
Medical services Y N Y N
Information and referral Y N Y N
Housing Y N Y N
Emergency shelter Y N Y N
Violence prevention Y N Y N
Rights Protection/Advocacy
Y N Y N
Other Y N Y N

Center on Nonprofits and Philanthropy • The Urban Institute
76
43. If you offer more than one service, which services receive the greatest share of yourbudget expenditures? Select only three services and rank order them.
(Note: Place a “1” after the service that receives the greatest percentage of the organization’sbudget; a “2” after the service that receives the second greatest percentage of theorganization’s budget; and “3” after the third service.)
Child day care ______After school care/ tutoring ______Youth development; recreation ______Food services; nutrition ______Mentoring ______Pregnancy prevention ______Drop-out prevention ______Adoption assistance; foster care ______Basic life skills ______Job training ______Job placement/ referral ______Individual or family counseling ______Substance abuse treatment ______Parenting education ______Health education ______Medical services ______Information and referral ______Housing ______Emergency Shelter ______Violence Prevention ______Rights Protection/Advocacy ______Other (from above) ______

Center on Nonprofits and Philanthropy • The Urban Institute
77
Community Involvement, Networks, and Government
Considering the ways in which your organization works with other groups and people toaddress issues that relate to children and families, please answer the following fewquestions.
44. Does your organization work with government officials or government agencies toaddress community issues relating to children and families in ______________?
___ Yes ___ No (Go to 47) (neighborhood)
45. Who are the government officials or what government agencies does yourorganization work with on issues relating to children and families in _____________?
(neighborhood)
Name of agency Name of official
1)____________________________ _________________________________
2)____________________________ _________________________________
3)____________________________ _________________________________
4)___________________________ _________________________________
46. For each agency/official listed above, please list the issues involved, the goals andobjective of the collaboration, and your assessment of the project’s success. (Note: Thenumbers in each row correspond to agency list from Question 45.)
Issues Goals & ObjectivesSuccess Rating
(1 low to 10 high)Too
early totell
1) 1 2 3 4 5 6 7 8 9 10
2) 1 2 3 4 5 6 7 8 9 10
3) 1 2 3 4 5 6 7 8 9 10
4) 1 2 3 4 5 6 7 8 9 10

Center on Nonprofits and Philanthropy • The Urban Institute
78
47. Does your organization work with nongovernmental groups or people to addressissues relating to children and families in _____________? ___ Yes ___ No (Go to 50)
(neighborhood)
48. If so, what groups/individuals does your organization work with and are theynonprofit groups, local businesses, or something else?
Name of group/individual Type (nonprofit, business, other)1)__________________________________ _____________________________
2)__________________________________ _____________________________
3)__________________________________ _____________________________
4)__________________________________ _____________________________
49. For each group listed above, please list the issues involved, the goals and objective ofthe collaboration, and your assessment of the project’s success. (Note: The numbers ineach row correspond to agency list from Question 48.)
Issues Goals & ObjectivesSuccess Rating
(1 low to 10 high)Too
early totell
1) 1 2 3 4 5 6 7 8 9 10
2) 1 2 3 4 5 6 7 8 9 10
3) 1 2 3 4 5 6 7 8 9 10
4) 1 2 3 4 5 6 7 8 9 10

Center on Nonprofits and Philanthropy • The Urban Institute
79
Communication & Community Opinions and Perspectives
50. How does your organization get the word out to the community about the variousprograms and services you provide?
Newspaper ___Newsletter Flyers/posters ___Mailings Church announcements ___E-mail distribution/Website Radio Spots Word of mouth Other (Specify)
51. What do you feel are the two most effective means of getting the word out about yourprograms and services?
1)_____________ 2)_____________
52. How does your organization gather information about community needs/concerns? Townhall/community forum Resident/block/group associations Survey Key resident contacts Web site ___Other __________________ (Specify)
53. What do you feel are the two most effective means of gathering information aboutcommunity needs/concerns?
1)_________________ 2)_________________
54. What issues do you believe are the most important ones to your organization?
55. Which groups or organizations do you feel are important to the children and familiesof ?
(neighborhood)
56. What problems and issues are most important to the children and families who live in ?
(neighborhood)

Center on Nonprofits and Philanthropy • The Urban Institute
80
Office and Facility Information
Now, please consider the following questions about your office or facility.
57. How many years has your organization been at this site? _____
58. Does your organization own or rent the property at this site? ___ Own ___ Rent
59. Does your organization have a large room that can be used for meetings at this site?___ Yes ___ No
60. Is there a kitchen at this site? ___ Yes ___ No
61. Does your organization allow other groups to use space at this site for meetings orother activities?
___ Yes ___ No (Go to Q. 63)
62. Does your organization charge fees to other groups for the use of this site?___ Yes ___ No
63. Does your organization use computers in its operations for tasks such as budgetingand client information? ___ Yes ___ No
64. Does your staff have access to E-mail or the Internet through the organization’scomputer(s)?
___ Yes ___ No
THANK YOU FOR YOUR COOPERATION AND TIME!

Center on Nonprofits and Philanthropy • The Urban Institute
81
Appendix GComparison of the IRS Database and Field Observations
Using IRS data for small neighborhood analyses presented some analytic challenges and
shows the need for ethnographic field work to capture the changing dynamics of a local
area. The IRS data provide a good starting point to give a general overview of the size,
scope, and density of nonprofit organizations in a community, but they begin to lose
some of their analytic power in very small and well-defined neighborhoods. These
limitations became readily apparent during our field work. We, therefore, used the
study’s field observations, supplemented with IRS data, to perform the neighborhood
analyzes. Some of the difficulties encountered between the IRS data and the field
observations are discussed below.
Because the IRS data are collected primarily for administrative purposes, they
suffer from a time lag. Some organizations in the database have moved from the area or
ceased operations; newly formed organizations or those too small to report to the IRS
may be missing. A total of 119 nonprofit organizations and 90 congregations were
Table A.Distribution of Organizations in the Three Study Neighborhoods by Data
Data SourceColumbiaHeights
MarshallHeights
WashingtonHighlands Total
IRS/Community Data Files Secular Nonprofits 84 13 22 119 Congregations 35 38 17 90 All groups 119 51 39 209
Field work Secular Nonprofits 75 11 11 97 Congregations 11 29 5 45 All groups 86 40 16 142Source: Authors’ tabulations of IRS and other data sources.

Center on Nonprofits and Philanthropy • The Urban Institute
82
identified in the three study neighborhoods through IRS data files and other sources
compiled by the Urban Institute. The field work, on the other hand, found 97 nonprofit
organizations and 45 congregations (see table A).
The differences between the two sources suggests that the IRS data and other
formal lists have important limitations, such as lags in updating administrative records,
but these differences may also reflect the considerable movement into and out of the local
area (see table B). A total of 52 organizations appeared in both data sources, while 45
groups were identified through our field work as being new to the neighborhood. Another
25 groups were confirmed as out of business or moved from the neighborhood, but the
status of 42 groups remains unexplained. These organizations could not be located within
the neighborhoods, nor could we confirm that they had moved away or were ever active
in the neighborhood.
Table B.Reasons for Differences Between the IRS and Field Data Sources
CategoryColumbiaHeights
MarshallHeights
WashingtonHighlands Total
Organizations in IRS files verified duringfieldwork 49 1 2 52
New groups discovered in fieldwork 26 10 9 45
Organizations no longer in neighborhood 15 5 5 25
Unconfirmed groups from IRS files 20 7 15 42Source: Authors’ tabulations of IRS and other data sources.Note: Only secular nonprofit organizations are included in this analysis.
As table B also shows, the differences also reflect the considerable movement into
and out of the local area. The Columbia Heights neighborhood displays the most
movement. The field work, for example, revealed more than twice as many previously

Center on Nonprofits and Philanthropy • The Urban Institute
83
unidentified groups in Columbia Heights than in Marshall Heights, and almost three
times as many in Washington Highlands. While these differences are partly because of
the greater organizational density in Columbia Heights vis-à-vis the other two
neighborhoods, it also suggests that the organizational environment in Columbia Heights
is particularly dynamic.

Center on Nonprofits and Philanthropy • The Urban Institute
84
Appendix HOrganizations Identified in the Community
Columbia HeightsOrganization Name Street Address City Zip Phone
Academy of Hope 1501 Columbia Rd NW DC 20009-4213 328-2029Alpha Omega Social Action and Scholarship Foundation 1231 Harvard St NW DC 20009-5311 462-9345Asian American LEAD* 3045 15th St NW DC 20009Barbara Chambers Children’s Center* 1470 Irving St NW DC 20010-2804 382-2029Barney Senior Center – Columbia Heights 2900 14th St NW DC 20009-6863 234-6900Barney Senior Center – Saint Stephen's Church 1525 Newton St NW DC 20010-3103 232-0900Bedford Plaza Community Room* 1401 A Columbia Rd NW DC 20009-4711Beginning Tomorrows Challenges Today* 2437 15th St NW DC 20009Belmont Independent Living Inc 1301 Belmont St NW DC 20009-4899 265-0405Bethany Inc. 2523 14th St NW DC 20009-6952Boys and Girls Club – Family Life Center Home* 1201 Harvard St NW DC 20009 234-1531Boys and Girls Club – Jelleff Home (Girls)* 1315 Irving St NW DC 20010Calvary Bilingual Multicultural Learning Center* 1420 Columbia Rd NW DC 20009 332-4200Cardoza Heights Association for Neighborhood Growthand Enrichment* 1331 Park Rd NW DC 20010Carecen 1467 Columbia Rd NW DC 20009 328-9799Casa del Pueblo* 1467 Columbia Rd NW DC 20009 332-1094Catholic Charities – McKenna House 1501 Park Rd NW DC 20010 322-7333Centre Haitien Dinformation de Documentation et DactionSociale 2728 13th St NW DC 20009Centro del Arte 1470 Irving St NW DC 20010 588-5143Change Inc.* 1413 Park Rd NW DC 20009 387-3725Charles E. Brown Jr. Memorial Fund 3145 Hiatt Pl. NW DC 20010-3351Charles W. Brooks Youth Organization* 1501 Columbia Rd NW DC 20009-4213Coalition for the Homeless 1433 Spring St NW DC 20010 726-2203Columbia Heights Youth Club* 2835 16th St NW DC 20009-4204 234-1531Community of Hope* 1417 Belmont St NW DC 20009-4006 232-9022Community of Hope Health Clinic* 1417 Belmont St NW DC 20009-4006 265-5841Conquer Community Action Foundation 1302 Monroe St NW DC 20010Council of Latino Agencies 2437 15th St NW DC 20009 328-9451Cyberyouth* 2437 15th St NW DC 20009DC Refugee Service Center 1501 Columbia Rd NW DC 20009 667-9000Development Corporation of Columbia Heights Inc.* 3419 14th St NW DC 20010 483-4986District of Columbia Baptist Convention 1501 Columbia Rd NW DC 20009 265-1410Easter Seal Society – Children’s Center* 2800 13th St NW DC 20009-5318 387-4434Ecumenical Program on Central America & the Caribbean 1470 Irving St NW DC 20010-2804 332-0292Ethiopian Community Development Council (ECDC) 2437 15th St NW DC 20009 483-0780Fairmont Apartments Tenant Association 1400 Fairmont St NW DC 20009-6966 232-6440Family Friends* 2800 13th St NW DC 20009-5318Family Place* 3309 16th St NW DC 20010 265-0149Greater Washington Urban League* 3501 14th St NW DC 20009 265-8200Growing Together* 1525 Newton St NW DC 20010 232-8016Health Care for the Homeless Project* 3020 14th St NW DC 20009 328-1084Hope Housing 1417 Belmont St NW DC 20009-4006 387-9013Independent Living for the Handicapped Inc 1301 Belmont St NW DC 20009 797-9805Islamic Theological Institute 4312 Park Rd NW DC 20009 955-7174

Center on Nonprofits and Philanthropy • The Urban Institute
85
La Casa Men's Shelter 1436 Irving St NW DC 20009 673-3592La Clinica del Pueblo Inc.* 1470 Irving St NW DC 20009 462-4788Latin American Youth Center Inc.* 1419 Columbia Rd NW DC 20009 319-2225Lazarus House 2523 14th St NW DC 20009 677-0405Life Pathways 2437 15th St NW DC 20009-4101 332-0494Mexican Cultural Institute 2829 16th St NW DC 20009-4204 728-1628National Assn. of Former Foster Care Children of America 1201 Clifton St NW DC 20009National Center on Black Aged Housing DevelopmentCorporation of D.C. 2801 14th St NW DC 20009-4968 387-4022National Dental Association 3517 16th St NW DC 20010 588-1697National Newspaper Publishers Association Fund 3200 13th St NW DC 20010-2410 588-8764North Community Mental Health Center 1125 Spring Rd NW DC 20010-1421 576-7253Park Road Transitional Shelter 1473 Park Rd NW DC 20010Police Boys and Girls Club, #10* 2500 14th St NW DC 20009 673-6941Project Northstar* 2437 15th St NW DC 20009 483-0780Saints Missionary Foundation 1305 Irving St NW DC 20010-2313 462-9012Salomon Zelaya Rehabilitation Center 1345 Newton St NW DC 20010 745-7719Samaritan Inns Inc 2523 14th St NW DC 20009 677-0405Samuel Kelsey Community Outreach Center* 1430 Park Rd NW DC 20010 667-0126?Second Genesis* 1320 Harvard St DC 20009-4904 234-6800Shalom Children's Academy (Academia Infantil)* 1467 Columbia Rd NW DC 20009Sojourners 2401 15th St NW DC 20009-4101 382-8842Sojourners Neighborhood Center* 1323 Girard St NW DC 20009-4915 387-7000Southern Columbia Heights Tenants Union 1323 Girard St NW DC 20009-4915St. Stephens Community Center Inc.* 1525 Newton St NW DC 20010 232-0900Temporary Living Community Corporation 1473 Park Rd NW DC 20009 332-1505Upper Cardozo Neighborhood Health Center 3020 14th St NW DC 20009 745-4300Victory Outreach 3552 14th St NW DC 20010-1357 832-2429Waltajjii Oromo Center Inc 3511 14th St NW DC 20010 387-0736Washington Free Clinic 1525 Newton St NW DC 20010 667-1106Washington Parks and People* 2437 15th St NW DC 20009 462-7275Youth Build* 1474 B Columbia Rd NW DC 20009 518-0601*Indicates an organization with at least one direct service program targeted at children and/or families.
Continued on next page

Center on Nonprofits and Philanthropy • The Urban Institute
86
Marshall HeightsOrganization Name Street Address City Zip Phone
Boys and Girls Club – Shadd Branch* 5601 E Capital St DC 20019 581-3801Children's Trust Neighborhood Initiative* 603 50th St NE DC 20019 396-4102East Capital Resident Council / Center for Change* 5800 Blaine St NE DC 20019 399-6224UPO Early Childhood Development Center #6* 53rd and Ames Street NE DC 20019 398-1344UPO Early Childhood Development Center #7* 400 50th St NE DC 20019 397-2840Marshall Heights Community Development Org.* 3917 Minnesota Ave NE DC 20019 396-1200Progressive National Baptist Convention 601 50th St NE DC 20019 396-0558So Others Might Eat - Southeast* 4609 Benning Rd SE DC 20019 581-8000CARA House* 603 50th St NE DC 20019 396-4102Teen Life Choices* 4901 Ayers Pl. SE DC 20019 581-9040Nannie Helen Buroughs School, Inc. 601 50th St SE DC 20019 398-5266*Indicates an organization with at least one direct service program targeted at children and/or families.
Washington HighlandsOrganization Name Street Address City Zip Phone
Anna Johenning Baptist Community Center* 4025 9th St SE DC 20032 561-5200Anacostia-Congress Heights Partnership* 2041 MLK Jr. Ave Suite 302 DC 20032 889-2102ARC Project Building Bridges Across the River 2000 Mississippi Ave SE DC 20032 889-8952Bread for the City* 4269 4th SE DC 20032 561-8587Covenant House* 1920 MLK Jr. Ave SE DC 20032 610-9612Far Southeast Family Strengthening Collaborative* 2041 MLK Jr. Ave Suite 304 DC 20032 889-1425Greater Southeast Community Hospital Corp.* 1310 Southern Ave SE DC 20032 574-6000Highland Addition Community Center* 3849 9th St SE DC 20032 645-0872Washington Highlands Community Organization* 4025 9th St SE DC 20032 561-5200Wheeler Creek Estates Community Development Corp.* 1010 Wanler Pl. SE DC 20032 574-1508St Thomas Moore Catholic Elementary School 4269 4th SE DC 20032 561-1189*Indicates an organization with at least one direct service program targeted at children and/or families.

Center on Nonprofits and Philanthropy • The Urban Institute
87
Appendix IWorking Relationships with Government and Other Nonprofit
Organizations
Columbia HeightsOrganization With Government With Nonprofit GroupsBoys and Girls Club – Jelleff Home (Girls) None mentioned Boys & Girls Club – Family Life Center
Change Inc. DC Child and Family ServicesMaternal & Child Health
Council of Latino AgenciesLatin American Youth CenterDevelopment Corp. of Columbia Heights
Community of Hope None mentioned Coalition for the HomelessChange, Inc.Academy of HopeHope Housing
Development Corporation of Columbia Heights DC Public SchoolsDC Department of HousingDC Recreation and Parks
Latin American Youth CenterCalvary Multicultural Learning CenterCoalition of Latino Agencies
Easter Seal Society – Children’s Center None mentioned None mentioned
Family Place DC Child and Family Service Coalition of Latino AgenciesSpanish Catholic CenterMary’s Center
Greater Washington Urban League DC Department of Housing andCommunity DevelopmentDC Public SchoolsDC Recreation and ParksDC Employment Services
Calvary Multicultural Learning CenterShaw/ Columbia Heights Collaborative
Growing Together None mentioned None mentioned
Health Care for the Homeless Project DC Department of HealthUpper Cardozo Health Clinic
Change Inc.Spanish Catholic Center
Latin American Youth Center Inc DC Child and Family ServiceDC Public Schools
Council of Latino AgenciesCalvary Bilingual Multicultural CenterLa Casa Men’s ShelterDevelopment Corp. of Columbia HeightsLa Clinica del Pueblo
Police Boys and Girls Club, #10 Police Department Latin American YouthDevelopment Corp. of Columbia Heights
Project Northstar DC Public Schools Washington Parks and PeopleDC Homeless Coalition

Center on Nonprofits and Philanthropy • The Urban Institute
88
Second Genesis None mentioned None mentioned
Sojourners Neighborhood Center None mentioned Sojourners
Washington Parks and People National Park ServiceDC Recreation & Parks
Council of Latino AgenciesEthiopian Community DevelopmentProject NorthstarFriends of Meridian HillLife PathwaysCyberyouthUrban RangersDC Single Volunteers
Youth Build DC Child and Family Services Latin American Youth Center
continued on next page

Center on Nonprofits and Philanthropy • The Urban Institute
89
Marshall HeightsOrganization With Government With Nonprofit GroupsBoys and Girls Club – Shadd Branch Police Department None mentioned
Children's Trust Neighborhood Initiative DC Healthy Start Living Stage TheaterFishing SchoolMHCDO
Marshall Heights Community DevelopmentOrganization (MHCDO)
DC Child and Family ServicesDepartment of Housing and CommunityDevelopment
Children’s Trust Neighborhood InitiativeCARA HouseTeen Life ChoicesResident Councils (Housing Projects)Providence HospitalEast of the River Collaborative
Peaches & Cream Child Development Center DC Child and Family Services None mentioned
CARA House None mentioned MHCDOProgressive Baptist Convention
Teen Life Choices Maternal and Child HealthDC Healthy StartEmpowerment Zone Community Grant
None mentioned
Washington HighlandsOrganization With Government With Nonprofit GroupsAnna Johenning Baptist Community Center DC Police Department
DC SchoolsWashington Highland Community Org.Ferebee – Hope Elementary SchoolMetropolitan Outreach Ministries
Anacostia-Congress Heights Partnership None mentioned Far SE Strengthening CollaborativeWashington Highlands Community Org.Johenning Community Church
Far South East Family StrengtheningCollaborative
DC Child and Family ServicesANCDC Employment ServicesChild Protective Services
Anacostia-Congress Heights PartnershipWashington Highlands Community Org.Covenant HouseFerebee-Hope Elementary SchoolSarah’s House
Highland Addition Community Center DC Housing AuthorityDC Employment ServicesDC School Board
Anacostia-Congress Heights PartnershipCovenant HouseDC Central KitchenKid’s ConnectionSarah’s HouseFourth World Movement
Washington Highlands CommunityOrganization
Child Protective Services Far SE Strengthening Collaborative
Wheeler Creek Estates CommunityDevelopment Corp.
DC Housing AuthorityANCDC Employment Services
Enterprise FoundationWH Advisory CommitteeWashington Highlands Community Org.
Source: The Urban Institute, CNP Community Organization Survey, 1999.

Center on Nonprofits and Philanthropy • The Urban Institute
90
Appendix JProfile of Public Schools in the Three Study Sites
School profiles for the community public schools were obtained from the District
of Columbia Board of Education. Each profile contains baseline student population data
and summaries of Stanford Achievement Test Scores. These data are presented in the
table below.
Profile of Public Schools in the District of Columbia
CharacteristicsColumbiaHeights
MarshallHeights
WashingtonHighlands
Size of schoolsAverage number of students in elementary school 605 428 431*
Average number of elementary teachers 44 30 35Average number of teacher aides 8 7 8
Student-teacher ratio 13.8 14.3 12.3
Poverty measureNumber of schools reporting over 90% of studentsgetting free school lunch, 1997-1998 4 of 6 4 of 4 4 of 6
Student performanceSchools reporting majority of students below basicperformance on Stanford for either reading or mathfor all grades
3 of 6 1 of 4 2 of 6
Source: Individual School Profiles, D.C. Board of Education.
* Elementary school averages do not include the student population from Patricia. R.Harris School (PreK-8) with 1,000 children.
Both Washington Highlands and Marshall Heights schools have substantially
lower concentrations of elementary school students per school than does Columbia

Center on Nonprofits and Philanthropy • The Urban Institute
91
Heights. However, the collective student to teacher ratios are quite close, falling between
12 and 14 students per teacher in each community.
Using free lunches as a proxy for poverty, all three communities serve a fairly
poor student body. All schools in Marshall Heights, for example, reported that over 90
percent of their student population received federally funded school lunches in 1997-
1998, compared with two-thirds of the schools in Columbia Heights and Washington
Highlands. All of the elementary schools in Columbia Heights, however, reported more
than 90 percent of their student body receiving free school lunches.
Scores on the Stanford Achievement Tests indicate the need for educational
improvements. In Columbia Heights, half of the schools reported that the majority of
their students fell below basic performance measures in either reading or math for all
grades. Likewise, one-third of the schools in Washington Highlands and one-quarter of
the schools in Marshall Heights had similarly low ratings.

Center on Nonprofits and Philanthropy • The Urban Institute
92
Appendix KMaps

Map 1. Geographic Distribution of Nonprofits in the District of Columbia
Source: Center on Nonprofits and Philanthropy, The Urban Institute
NW
NE
SESW
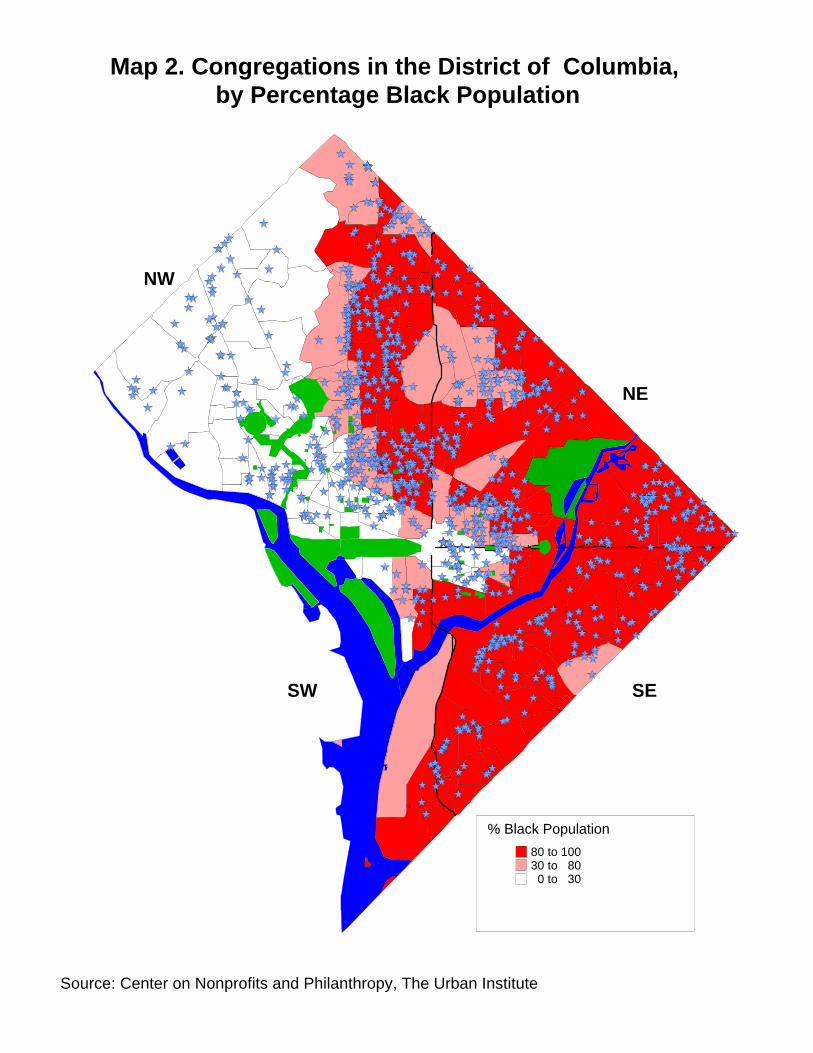
% Black Population
80 to 10030 to 80
0 to 30
Map 2. Congregations in the District of Columbia, by Percentage Black Population
Source: Center on Nonprofits and Philanthropy, The Urban Institute
NW
NE
SESW

Ward 7
Ward 8
Ward 6
Ward 2
Ward 1
Ward 3
Ward 4
Ward 5
Percentage of Children in Poverty
30 to 4020 to 300 to 20
Map 3. Youth and Preschool Nonprofit Providers,by Percentage of Children in Poverty by Wards
Source: Center on Nonprofits and Philanthropy, The Urban Institute
NW
NE
SESW

Map 4. Nonprofit Organizations in the Three Study Neighborhoods
Source: Center on Nonprofits and Philanthropy, The Urban Institute
NW
NE
SESW
ColumbiaHeights
Marshall Heights
WashingtonHighlands
Copyright © 2022 FDOKUMEN