Final Report - West Boulevard Neighborhood Coalition
149
WTL+ a WTL +a Real Estate & Economic Advisors Washington, DC—Provincetown, MA 202.885.9121 301.502.4171 774.538.6070 1 Final Report West Boulevard Market Assessment & Strategic Revitalization Study Charlotte, NC Prepared for: City of Charlotte Department of Economic Development Charlotte, NC May 2019 FINAL
-
Upload
khangminh22 -
Category
Documents
-
view
3 -
download
0
Transcript of Final Report - West Boulevard Neighborhood Coalition
WTL+a
WTL +a
R e a l E s t a t e & E c o n o m i c A d v i s o r s
W a s h i n g t o n , D C—P r o v i n c e t o w n , M A
2 0 2 . 8 8 5 . 9 1 2 1 3 0 1 . 5 0 2 . 4 1 7 1 7 7 4 . 5 3 8 . 6 0 7 0 1
Final Report West Boulevard Market Assessment &
Strategic Revitalization Study
Charlotte, NC
Prepared for:
City of Charlotte Department of Economic Development Charlotte, NC
May 2019 FINAL
WTL+a
WTL +a
R e a l E s t a t e & E c o n o m i c A d v i s o r s
W a s h i n g t o n , D C—P r o v i n c e t o w n , M A
2 0 2 . 8 8 5 . 9 1 2 1 3 0 1 . 5 0 2 . 4 1 7 1 7 7 4 . 5 3 8 . 6 0 7 0 2
General & Limiting Conditions
Every reasonable effort has been made to ensure that the data contained in this study reflect
the most accurate and timely information possible. These data are believed to be reliable at the
time the study was conducted. This study is based on estimates, assumptions, and other
information developed by WTL +Associates (referred hereinafter as “WTL+a”) from its
independent research effort, general knowledge of the market and the industry, and
consultations with the client and its representatives. No responsibility is assumed for
inaccuracies in reporting by the client, its agent and/or representatives, or any other data source
used in preparing or presenting this study.
No warranty or representation is made by WTL+a that any of the projected values or results
contained in this study will be achieved. Possession of this study does not carry with it the right
of publication thereof or to use the name of "WTL+a" in any manner without first obtaining the
prior written consent of WTL+a. No abstracting, excerpting or summarizing of this study may be
made without first obtaining the prior written consent of WTL+a. This report is not to be used in
conjunction with any public or private offering of securities or other similar purpose where it may
be relied upon to any degree by any person, other than the client, without first obtaining the prior
written consent of WTL+a. This study may not be used for purposes other than that for which it
is prepared or for which prior written consent has first been obtained from WTL+a.
This study is qualified in its entirety by, and should be considered in light of, these limitations,
conditions and considerations.
WTL+a
WTL +a
R e a l E s t a t e & E c o n o m i c A d v i s o r s
W a s h i n g t o n , D C—P r o v i n c e t o w n , M A
2 0 2 . 8 8 5 . 9 1 2 1 3 0 1 . 5 0 2 . 4 1 7 1 7 7 4 . 5 3 8 . 6 0 7 0 3
Table of Contents
General & Limiting Conditions ........................................................................................ 2
Table of Contents ................................................................................................................ 3
Tables & Figures .................................................................................................................. 4
1 Executive Summary ..................................................................................................... 6
Introduction ................................................................................................................................ 6
Key Findings: Demographics ....................................................................................................10
Key Findings: Economic Profile .................................................................................................11
Key Findings: Real Estate Market Conditions ...........................................................................12
Key Findings: Market Potentials ................................................................................................18
Implementation Priorities of Participating Public Partners .........................................................22
2 Demographic & Economic Profile ...........................................................................24
Demographic Trends & Forecasts .............................................................................................24
Household Incomes & Retail Spending .....................................................................................33
Retail “Recapture” Opportunities ...............................................................................................37
Economic Characteristics ..........................................................................................................42
3 Real Estate Market Conditions ................................................................................52
Housing.....................................................................................................................................52
Hotel/Lodging ............................................................................................................................67
Workplace: Office ......................................................................................................................73
General Retail ...........................................................................................................................80
4 Market Potentials ........................................................................................................88
Potential Land Use Concepts ....................................................................................................88
Market-rate Housing..................................................................................................................92
Workplace/Office .......................................................................................................................94
Hotel/Lodging .......................................................................................................................... 100
General Retail ......................................................................................................................... 101
5 Recommended Implementation Strategies ....................................................... 104
WTL+a
WTL +a
R e a l E s t a t e & E c o n o m i c A d v i s o r s
W a s h i n g t o n , D C—P r o v i n c e t o w n , M A
2 0 2 . 8 8 5 . 9 1 2 1 3 0 1 . 5 0 2 . 4 1 7 1 7 7 4 . 5 3 8 . 6 0 7 0 4
Introduction ............................................................................................................................. 104
Potential Economic ‘Drivers’.................................................................................................... 108
Implementation Overview ........................................................................................................ 111
Near-Term Implementation Recommendations (Next 3 Years) ............................................... 113
Opportunity Zones & Other Incentives .................................................................................... 133
Long-term Implementation Recommendations (Year 4 & Beyond) .......................................... 142
Other Tools & Incentives for West Boulevard .......................................................................... 144
Tables & Figures
Table 1: Regional Population Trends & Forecasts, 2000—2030 ...............................................25
Table 2: Demographic Trends & Forecasts—City of Charlotte, 2000—2023 .............................27
Table 3: Demographic Trends & Forecasts—North Trade Area, 2010—2023 ...........................30
Table 4: Demographic Trends & Forecasts—North Trade Area, 2010—2023 ...........................32
Table 5: Annual Household Consumer Spending, 2018 ............................................................34
Table 6: Retail “Recapture” Opportunities—West Boulevard Study Area, 2018.........................39
Table 7: Study Area & West Boulevard Retail Sales, 2018 .......................................................42
Table 8: Charlotte-Concord-Gastonia MSA Employment Trends, 2008—2017 .........................43
Table 9: Business Mix—City of Charlotte, 2018 ........................................................................44
Table 10: State Employment Forecasts—Southwest Prosperity Zone, 2014—2024 .................46
Table 11: Business Mix—West Boulevard Study Area, 2018 ....................................................47
Table 12: 10-Year Employment Trends—West Boulevard Study Area, 2006—2015 .................49
Table 13: Housing Profile—West Boulevard Study Area, 2010—2023 ......................................53
Table 14: 10-Year Housing Starts—Selected Geographies, 2008—2017..................................56
Table 15: Key Statistics—West/Charlotte Airport Apartment Market, 2009-2018 .......................58
Table 16: Market Profile of Selected Competitive Apartment Properties ...................................60
Table 17: For-Sale Market Trends—West Boulevard Study Area, 2013—2018.........................65
Table 18: Charlotte Area Hotel Inventory, 2018.........................................................................69
Table 19: Market Performance of Selected Competitive Hotel Properties, 2012—2017 ............71
Table 20: Office Market Profile—Airport Submarket, 2009—3Q/2018 .......................................75
Table 21: Office Market Profile—West Boulevard Study Area, 2009—3Q/2018 ........................78
Table 22: Retail Market Profile—Southwest Charlotte, 2009—3Q/2018 ....................................81
Table 23: Retail Market Profile—West Boulevard Study Area, 2009—3Q/2018 ........................83
Table 24: Retail Inventory—West Boulevard Corridor, 2018 ....................................................84
Table 25: Housing Potentials—North & South Trade Areas, 2019—2028 .................................93
Table 26: Office Potentials—Southwest Prosperity Zone & City of Charlotte, 2014—2024 .......97
Table 27: Office Potentials—West Boulevard Study Area & Corridor, 2014—2024 ...................99
Table 28: Durham Co-op Market Annual Income Statement, 2018.......................................... 127
WTL+a
WTL +a
R e a l E s t a t e & E c o n o m i c A d v i s o r s
W a s h i n g t o n , D C—P r o v i n c e t o w n , M A
2 0 2 . 8 8 5 . 9 1 2 1 3 0 1 . 5 0 2 . 4 1 7 1 7 7 4 . 5 3 8 . 6 0 7 0 5
Figure 1: West Boulevard Corridor Study Boundaries ................................................................ 7
Figure 2: West Boulevard “Area of Influence” ............................................................................. 8
Figure 3: Study Area Map—North .............................................................................................29
Figure 4: Study Area Map—South.............................................................................................31
Figure 5: Retail Leakage & Surplus—West Boulevard Study Area, 2018 ..................................38
Figure 6: Employment Densities—West Boulevard Study Area, 2015 .......................................50
Figure 7: Employment Inflow/Outflow—West Boulevard Study Area, 2015 ...............................51
Figure 8: Area Multi-Family Properties Map ..............................................................................59
Figure 9: CLT Airport Office Submarket Boundaries .................................................................74
Figure 10: Southwest Charlotte Retail Submarket Boundaries ..................................................80
Figure 11: Illustrative Land Use Concept—Remount Road .......................................................89
Figure 12: Illustrative Land Use Concept—Clanton Road .........................................................90
Figure 13: Illustrative Site Plan—West Boulevard Corridor .......................................................91
Figure 14: Charlotte Opportunity Zone Boundaries ................................................................. 110
Figure 15: Opportunity Zones—West Side .............................................................................. 133
WTL+a
WTL +a
R e a l E s t a t e & E c o n o m i c A d v i s o r s
W a s h i n g t o n , D C—P r o v i n c e t o w n , M A
2 0 2 . 8 8 5 . 9 1 2 1 3 0 1 . 5 0 2 . 4 1 7 1 7 7 4 . 5 3 8 . 6 0 7 0 6
1 Executive Summary
Introduction
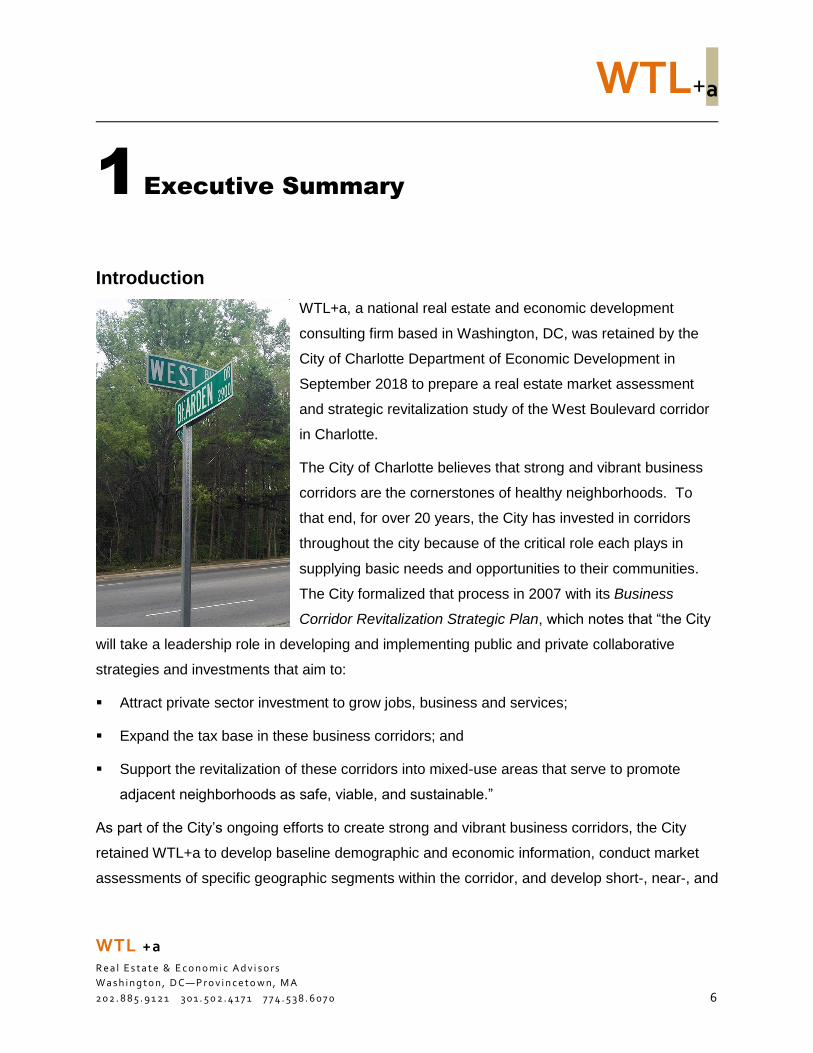
WTL+a, a national real estate and economic development
consulting firm based in Washington, DC, was retained by the
City of Charlotte Department of Economic Development in
September 2018 to prepare a real estate market assessment
and strategic revitalization study of the West Boulevard corridor
in Charlotte.
The City of Charlotte believes that strong and vibrant business
corridors are the cornerstones of healthy neighborhoods. To
that end, for over 20 years, the City has invested in corridors
throughout the city because of the critical role each plays in
supplying basic needs and opportunities to their communities.
The City formalized that process in 2007 with its Business
Corridor Revitalization Strategic Plan, which notes that “the City
will take a leadership role in developing and implementing public and private collaborative
strategies and investments that aim to:
Attract private sector investment to grow jobs, business and services;
Expand the tax base in these business corridors; and
Support the revitalization of these corridors into mixed-use areas that serve to promote
adjacent neighborhoods as safe, viable, and sustainable.”
As part of the City’s ongoing efforts to create strong and vibrant business corridors, the City
retained WTL+a to develop baseline demographic and economic information, conduct market
assessments of specific geographic segments within the corridor, and develop short-, near-, and
WTL+a
WTL +a
R e a l E s t a t e & E c o n o m i c A d v i s o r s
W a s h i n g t o n , D C—P r o v i n c e t o w n , M A
2 0 2 . 8 8 5 . 9 1 2 1 3 0 1 . 5 0 2 . 4 1 7 1 7 7 4 . 5 3 8 . 6 0 7 0 7
long-term tools and strategies as part of an “action plan” focused on improving these targeted
geographies in the West Boulevard corridor.
Moreover, key objectives of the market assessment as identified by the City include:
Consider advantages unique to (or characteristic of) the West Boulevard corridor study area,
including for example, institutional resources, accessibility to anchor institutions, character of
the local workforce, infrastructure capacity and investment, historic development trends, and
the comprehensive marketing resources of allied neighborhood groups, such as the West
Boulevard Neighborhood Coalition (WBNC) and City government;
Prepare a “SWOT” (strengths/weaknesses/opportunities/threats) analysis intended to
provide a framework for possible implementation strategies. For example, how can West
Boulevard capitalize on its strategic location between key economic generators such as
Uptown/South End and Charlotte Douglas International Airport;
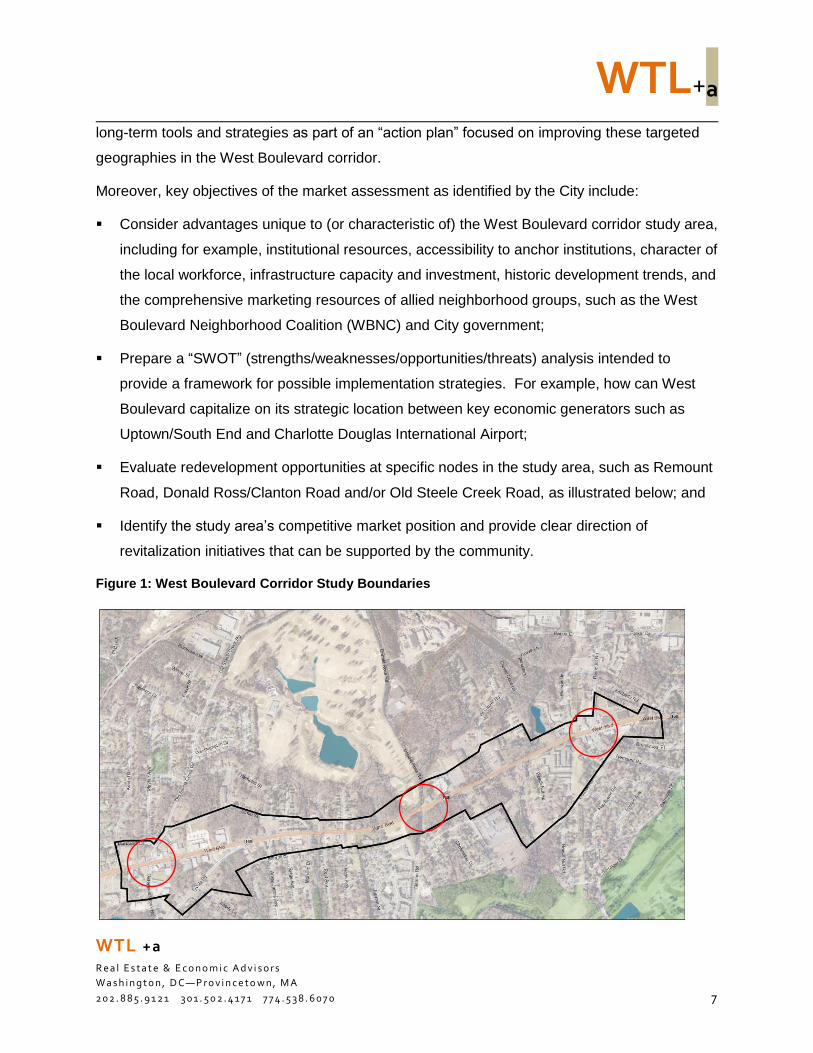
Evaluate redevelopment opportunities at specific nodes in the study area, such as Remount
Road, Donald Ross/Clanton Road and/or Old Steele Creek Road, as illustrated below; and
Identify the study area’s competitive market position and provide clear direction of
revitalization initiatives that can be supported by the community.
Figure 1: West Boulevard Corridor Study Boundaries
WTL+a
WTL +a
R e a l E s t a t e & E c o n o m i c A d v i s o r s
W a s h i n g t o n , D C—P r o v i n c e t o w n , M A
2 0 2 . 8 8 5 . 9 1 2 1 3 0 1 . 5 0 2 . 4 1 7 1 7 7 4 . 5 3 8 . 6 0 7 0 8
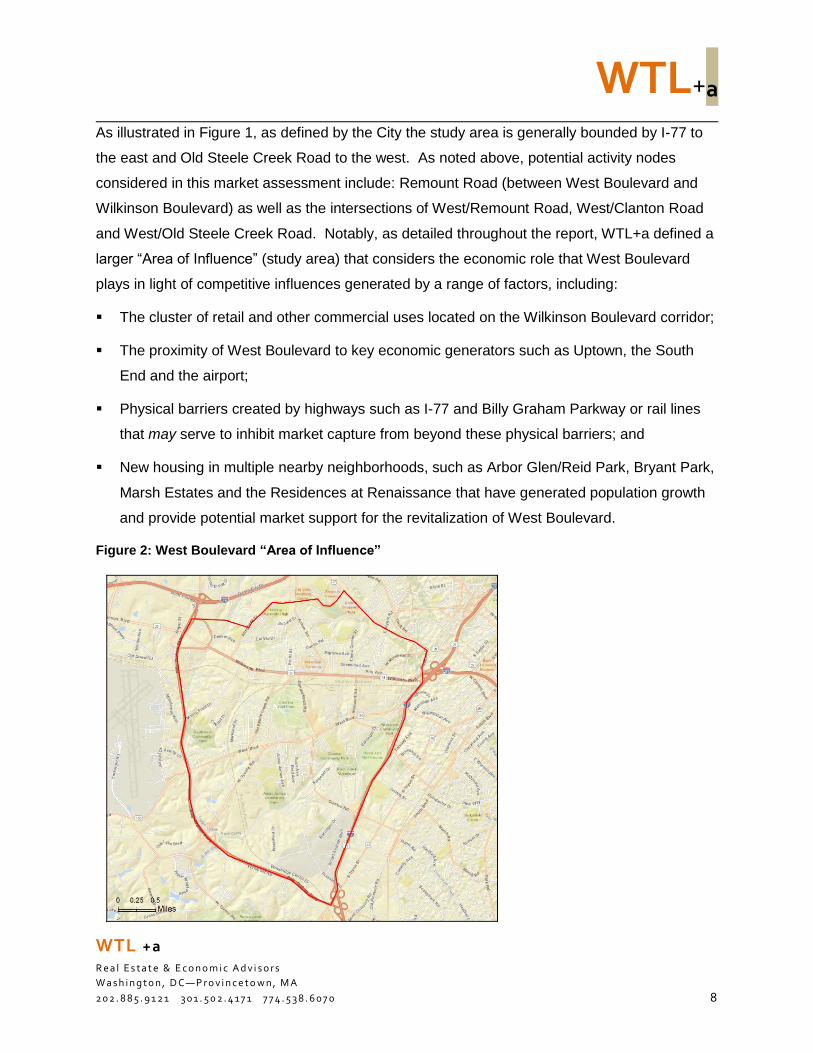
As illustrated in Figure 1, as defined by the City the study area is generally bounded by I-77 to
the east and Old Steele Creek Road to the west. As noted above, potential activity nodes
considered in this market assessment include: Remount Road (between West Boulevard and
Wilkinson Boulevard) as well as the intersections of West/Remount Road, West/Clanton Road
and West/Old Steele Creek Road. Notably, as detailed throughout the report, WTL+a defined a
larger “Area of Influence” (study area) that considers the economic role that West Boulevard
plays in light of competitive influences generated by a range of factors, including:
The cluster of retail and other commercial uses located on the Wilkinson Boulevard corridor;
The proximity of West Boulevard to key economic generators such as Uptown, the South
End and the airport;
Physical barriers created by highways such as I-77 and Billy Graham Parkway or rail lines
that may serve to inhibit market capture from beyond these physical barriers; and
New housing in multiple nearby neighborhoods, such as Arbor Glen/Reid Park, Bryant Park,
Marsh Estates and the Residences at Renaissance that have generated population growth
and provide potential market support for the revitalization of West Boulevard.
Figure 2: West Boulevard “Area of Influence”
WTL+a
WTL +a
R e a l E s t a t e & E c o n o m i c A d v i s o r s
W a s h i n g t o n , D C—P r o v i n c e t o w n , M A
2 0 2 . 8 8 5 . 9 1 2 1 3 0 1 . 5 0 2 . 4 1 7 1 7 7 4 . 5 3 8 . 6 0 7 0 9
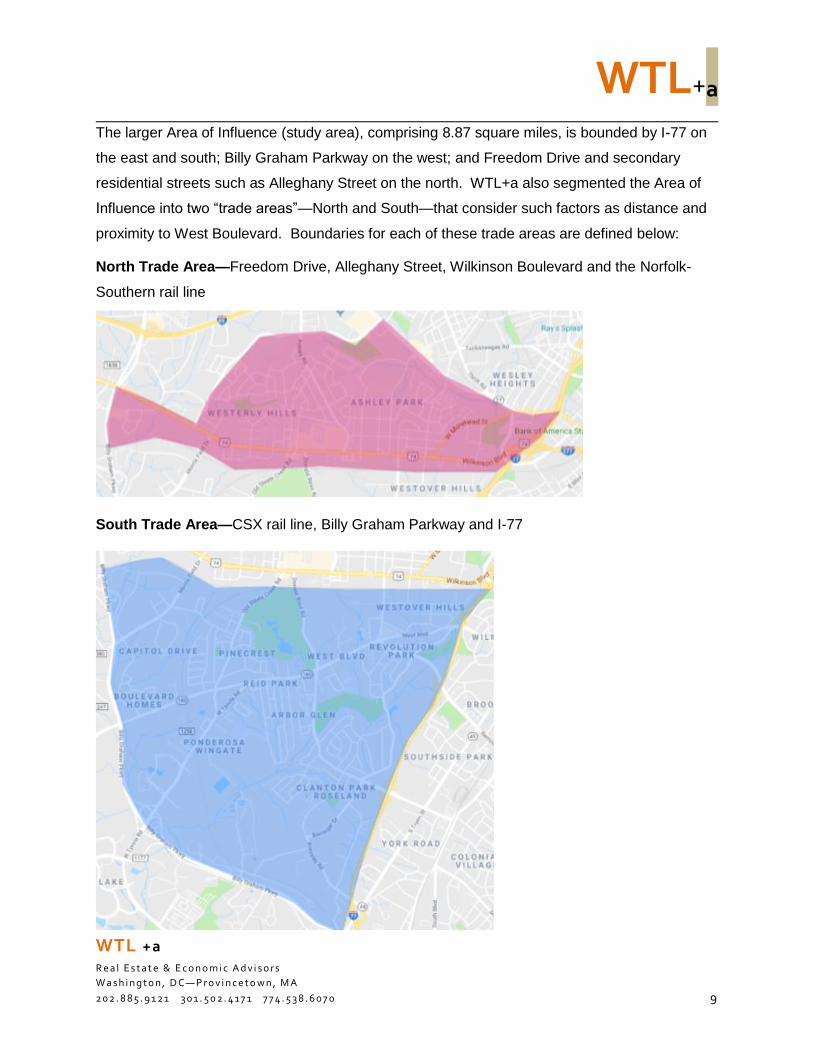
The larger Area of Influence (study area), comprising 8.87 square miles, is bounded by I-77 on
the east and south; Billy Graham Parkway on the west; and Freedom Drive and secondary
residential streets such as Alleghany Street on the north. WTL+a also segmented the Area of
Influence into two “trade areas”—North and South—that consider such factors as distance and
proximity to West Boulevard. Boundaries for each of these trade areas are defined below:
North Trade Area—Freedom Drive, Alleghany Street, Wilkinson Boulevard and the Norfolk-
Southern rail line
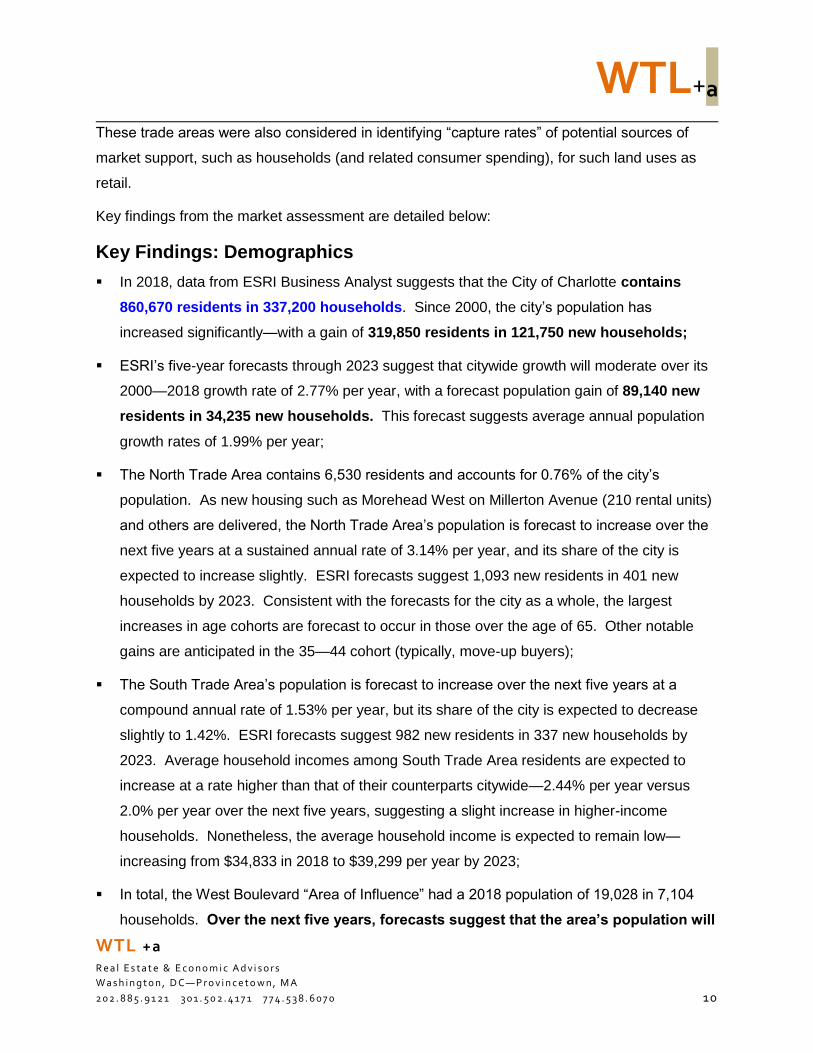
South Trade Area—CSX rail line, Billy Graham Parkway and I-77
WTL+a
WTL +a
R e a l E s t a t e & E c o n o m i c A d v i s o r s
W a s h i n g t o n , D C—P r o v i n c e t o w n , M A
2 0 2 . 8 8 5 . 9 1 2 1 3 0 1 . 5 0 2 . 4 1 7 1 7 7 4 . 5 3 8 . 6 0 7 0 10
These trade areas were also considered in identifying “capture rates” of potential sources of
market support, such as households (and related consumer spending), for such land uses as
retail.
Key findings from the market assessment are detailed below:
Key Findings: Demographics
In 2018, data from ESRI Business Analyst suggests that the City of Charlotte contains
860,670 residents in 337,200 households. Since 2000, the city’s population has
increased significantly—with a gain of 319,850 residents in 121,750 new households;
ESRI’s five-year forecasts through 2023 suggest that citywide growth will moderate over its
2000—2018 growth rate of 2.77% per year, with a forecast population gain of 89,140 new
residents in 34,235 new households. This forecast suggests average annual population
growth rates of 1.99% per year;
The North Trade Area contains 6,530 residents and accounts for 0.76% of the city’s
population. As new housing such as Morehead West on Millerton Avenue (210 rental units)
and others are delivered, the North Trade Area’s population is forecast to increase over the
next five years at a sustained annual rate of 3.14% per year, and its share of the city is
expected to increase slightly. ESRI forecasts suggest 1,093 new residents in 401 new
households by 2023. Consistent with the forecasts for the city as a whole, the largest
increases in age cohorts are forecast to occur in those over the age of 65. Other notable
gains are anticipated in the 35—44 cohort (typically, move-up buyers);
The South Trade Area’s population is forecast to increase over the next five years at a
compound annual rate of 1.53% per year, but its share of the city is expected to decrease
slightly to 1.42%. ESRI forecasts suggest 982 new residents in 337 new households by
2023. Average household incomes among South Trade Area residents are expected to
increase at a rate higher than that of their counterparts citywide—2.44% per year versus
2.0% per year over the next five years, suggesting a slight increase in higher-income
households. Nonetheless, the average household income is expected to remain low—
increasing from $34,833 in 2018 to $39,299 per year by 2023;
In total, the West Boulevard “Area of Influence” had a 2018 population of 19,028 in 7,104
households. Over the next five years, forecasts suggest that the area’s population will
WTL+a
WTL +a
R e a l E s t a t e & E c o n o m i c A d v i s o r s
W a s h i n g t o n , D C—P r o v i n c e t o w n , M A
2 0 2 . 8 8 5 . 9 1 2 1 3 0 1 . 5 0 2 . 4 1 7 1 7 7 4 . 5 3 8 . 6 0 7 0 11
increases to 21,103 in 7,842 households, reflecting 2,075 new residents and 738 new
households.
The City’s households spend almost $20,250 per year on consumer retail goods, including
clothing, entertainment/recreation, electronics, groceries, food & beverage, household
furnishings and health care; and
By comparison, lower incomes of trade area households are indicative of much more
limited retail spending. In fact, U.S. Census data indicate that households in the North
Trade Area spend only $9,057 per year and South Trade Area households spend only
$8,482 per household.
Key Findings: Economic Profile
While the MSA lost 59,200 jobs during the 2007—2010 recession, in only seven years
between 2011 and 2017, the economy of the Charlotte MSA added 258,800 new jobs for
a net gain of 199,600 new jobs in the 10-year period between 2008 and 2017. This
growth, which translates into over 19,900 new jobs annually, was focused largely in specific
sectors, including: Professional/Business Services (57,400), Trade/Transportation/Utilities
(38,100), Leisure/Hospitality (32,200) and Education/Health Services (23,500);
In 2018, Dun & Bradstreet, Inc. estimates that the City of Charlotte contained more than
493,230 full-time jobs in 32,450 registered businesses in 2018. The State of North
Carolina prepares employment forecasts for clusters of counties throughout the state
(Mecklenburg County is located in the “Southwest Prosperity Zone”). If the City of Charlotte
maintains its 49.2% share of employment (as of the 2014 base year), it would capture
91,800 new jobs between 2014 and 2024;
In 2018, Dun & Bradstreet, Inc. estimates that there are 14,074 jobs in 1,079 registered
businesses in West Boulevard’s Area of Influence. The study area accounts for
approximately 2.85% of the 493,230 full-time jobs in the city. If the study area maintains its
2.85% share of future employment growth, this would translate into 2,620 new jobs by 2024
based on job forecasts prepared by the North Carolina Department of Commerce;
According to the U.S. Census Bureau, the study area had a net gain of 3,238 new jobs
between 2005 and 2015 (latest data available). The highest employment densities were
concentrated in clusters along Billy Graham Parkway, the office park on Perimeter Pointe
WTL+a
WTL +a
R e a l E s t a t e & E c o n o m i c A d v i s o r s
W a s h i n g t o n , D C—P r o v i n c e t o w n , M A
2 0 2 . 8 8 5 . 9 1 2 1 3 0 1 . 5 0 2 . 4 1 7 1 7 7 4 . 5 3 8 . 6 0 7 0 1 2
Parkway, the industrial/business park on Pressley Road/Stuart Andrew Boulevard and
Barringer Drive, and in the retail businesses along Wilkinson Boulevard. It is notable that
the study area’s jobs are concentrated on its periphery—along Billy Graham Parkway,
Wilkinson Boulevard and I-77. This reinforces the importance of strategies that serve to
attract businesses and jobs to West Boulevard that benefit study area residents.
Key Findings: Real Estate Market Conditions
Housing
Residents from the West Boulevard Neighborhood Coalition (WBNC) have expressed
concern about the potential, longer-term impacts of gentrification and economic
displacement in the West Boulevard study area. To understand possible impacts and to
guide appropriate implementation strategies, WTL+a examined trends in the study area’s
housing market from various data sources. Key findings are summarized below:
The West Boulevard study area contains 8,085 housing units. Since the 2010 Census,
ESRI data suggest that the study area’s housing inventory has increased by fully 1,231
units;
Like many diverse neighborhoods in communities across the U.S. after the 2007—2010
recession, the number of owner-occupied units has decreased—from 32% in 2010 to
28% in 2018. Conversely, the number of renter-occupied units increased during this time—
from almost 55.8% in 2010 to 59.8% by 2018;
The average unit value of all housing units in the study area in 2018 is slightly more than
$124,000. Over the next five years, forecasts suggest that average values will increase to
$144,300;
Unoccupied units include seasonally-owned (i.e., occupied for only a portion of the year) as
well as unoccupied units that have been sold but are not yet occupied. When such units are
removed from this category, the study area’s true vacancy in 2010 was lower—10.8% (738
units). The 2016 American Community Survey (ACS) suggests that the number of truly
vacant units has increased—to 874 units in 2016, revealing a true vacancy rate of 12.6%;
Based on data from the City and ESRI (May 2019), there were 61,371 units built in the City
of Charlotte in the 11 years between 2008 and 2018, resulting in a sustained annual pace of
WTL+a
WTL +a
R e a l E s t a t e & E c o n o m i c A d v i s o r s
W a s h i n g t o n , D C—P r o v i n c e t o w n , M A
2 0 2 . 8 8 5 . 9 1 2 1 3 0 1 . 5 0 2 . 4 1 7 1 7 7 4 . 5 3 8 . 6 0 7 0 13
5,579 units per year. This equates to a sustained average annual increase in citywide
housing stock of 1.6% per year (17.5% total);
Using both City and new ESRI data (May 2019), between 2008 and 2018 there were 1,265
housing starts in 10 neighborhoods roughly coinciding with the West Boulevard
study area, equating to a sustained annual pace of 115 units per year. This equates to
a sustained average annual increase in study area housing stock of 1.7% per year (18.5%
total), reflecting a rate of growth slightly higher than the city as a whole. This includes:
o Several new “infill” units in scattered locations in Clanton Park and Revolution Park
o Scattered units built in various neighborhoods such as Westerly Hills and Arbor
Glen/Reid Park, and
o Larger new residential developments in Bryant Park and Marsh Estates (north of
Wilkinson Boulevard) and the Residences at Renaissance
As the basis for understanding trends in for-sale housing, data provided by the Carolina
Multiple Listing Service, Inc. (through the Charlotte Regional Realtor Association) indicates
the following:
o The North Trade Area contains the highest price housing in the study area—with
average sales prices increasing from $142,512 in 2013 to $192,666 in 2018—an
increase of 35%
o Median prices in the North Trade Area (the price where 50% are above and 50% are
below) jumped by fully 240%—from $42,000 in 2013 to $143,000 in 2018
o The South Trade Area also exhibited significant changes in price and sales activity
between 2013 and 2018. While overall pricing is lower than the North Trade Area,
average sales prices jumped 160%—from $52,057 in 2013 to $132,690 in 2018
o Similarly, median prices increased by 165%—from $48,500 in 2013 to $128,500 in
2018
WTL+a
WTL +a
R e a l E s t a t e & E c o n o m i c A d v i s o r s
W a s h i n g t o n , D C—P r o v i n c e t o w n , M A
2 0 2 . 8 8 5 . 9 1 2 1 3 0 1 . 5 0 2 . 4 1 7 1 7 7 4 . 5 3 8 . 6 0 7 0 14
In conclusion, the West Boulevard housing market reflects apparent uneven market
conditions based on a review of key metrics. While the majority of residents are renters
(72%), the study area’s true vacancy rate has increased (12.6%), vacancies in competitive
properties also increased over the past year (from 10.1% to 13.5%) and absorption has been
limited over the past five years (averaging only nine units per year).
Conversely, the for-sale market has become more competitive over the past six years—with
significant increases in both average and median prices and declines in other sale metrics as
noted above. This reinforces the importance of strategies that serve to protect existing
residents, provide opportunities for homeownership, and provide public realm
improvements that leverage new development to strengthen existing retailers and
support new businesses.
Office
Residents in the West Boulevard study area expressed the need for additional professional
services/office businesses, including medical, dental, insurance and legal;
West Boulevard and its larger study area are located in the Airport submarket, as defined by
CoStar, Inc., a national real estate data provider. As the analysis below indicates, West
Boulevard is the “hole in the doughnut”, as almost all of the submarket’s office space is
located around West Boulevard—along Wilkinson, on (or adjacent to) Billy Graham
Parkway, Perimeter Pointe, the Westinghouse Boulevard area, Carowinds Boulevard and
multiple other locations in this large submarket;
The Airport submarket contains 13.5 million sq. ft. of office space and 1.81 million sq. ft.
of vacant office space, which reflects a third-quarter 2018 vacancy rate of 13.4%. Office
vacancies have decreased from a peak of 20.3% recorded at the end of the recession in
2011 as economic recovery gained momentum. Over the past 10 years, the Airport
submarket’s annual net absorption averaged 197,400 sq. ft. per year;
WTL+a conducted a more detailed analysis of office market trends in and near West
Boulevard. The study area contains 1,889,632 sq. ft. of office space in 57 buildings, with
210,600 sq. ft. of vacant office space, which reflects a third-quarter 2018 vacancy rate of
WTL+a
WTL +a
R e a l E s t a t e & E c o n o m i c A d v i s o r s
W a s h i n g t o n , D C—P r o v i n c e t o w n , M A
2 0 2 . 8 8 5 . 9 1 2 1 3 0 1 . 5 0 2 . 4 1 7 1 7 7 4 . 5 3 8 . 6 0 7 0 15
11.1%. Over the past 10 years, the study area’s annual net absorption averaged 46,111 sq.
ft. per year;
While the study area accounted for 23% of the Airport submarket’s annual absorption over
10 years, stronger economic performance over the last five years generated higher
absorption of 112,410 sq. ft. per year—or 54% of the larger Airport submarket’s 210,000 sq.
ft. of annual net absorption since 2014;
There is very little office space on West Boulevard itself. In fact, according to CoStar,
Inc. data, there are only 12,500 sq. ft. of office space, including conversions of residential
units into office space for professional/business services. Limited market data on key
performance metrics—such as vacancy rates and net absorption—preclude a detailed
analysis of the corridor’s office market performance; and
By comparison, the Wilkinson Boulevard corridor contains 283,700 sq. ft. of office space in
multiple, small “garden” office buildings, which are defined by the real estate industry as
5,000 to 15,000 sq. ft. in size and typically occupied by owner-users. According to CoStar,
current vacancy rates are in the range of 6%, which would be considered near stabilized
levels.
In conclusion, the office market in the larger West Boulevard study area is generally
improving—with rising rents, solid (and increasing) net absorption and investment-grade new
construction driven by positive locational characteristics. Notably, office inventory is located
along the periphery of the study area in office and business parks along Billy Graham Parkway
and I-77, with very little office space on or immediately near West Boulevard. As specific
programming initiatives associated with the proposed County Resource Center (CRC) are not
known, it is uncertain what impacts the CRC may have on market opportunities for new office
space on West Boulevard.
Hotel/Lodging
Given West Boulevard’s proximity to Charlotte-Douglas International Airport (CLT), which
serves as a major economic development engine, WTL+a reviewed data on market
conditions for hotel and lodging uses in this area based on performance data provided by
STR Global, the industry leader in hotel market data. The competitive set is comprised of 24
properties in a mix of product classes and located on the periphery of the West Boulevard
WTL+a
WTL +a
R e a l E s t a t e & E c o n o m i c A d v i s o r s
W a s h i n g t o n , D C—P r o v i n c e t o w n , M A
2 0 2 . 8 8 5 . 9 1 2 1 3 0 1 . 5 0 2 . 4 1 7 1 7 7 4 . 5 3 8 . 6 0 7 0 16
study area, including various interchanges of I-77, along Billy Graham Parkway and a
cluster of hotels located to the north of the airport at Little Rock Road/I-85 and Billy Graham
Parkway/I-85;
The 24 properties selected for this analysis include 2,883 rooms, fully 10% of the
metropolitan area’s room inventory in a mix of product classes; and
Occupancy levels are strong; over the past six years, average annual occupancies ranged
from 63.4% in 2012 to a peak of 73.7% in 2016, with a six-year average of 69.9%.
In conclusion, for the past three years, sustained annual occupancies among these competitive
hotel properties surrounding West Boulevard averaged 72.7%. In 2018, occupancies through
September averaged 71.6%. Notably, the industry benchmark identified for construction
feasibility/potential expansion is a sustained annual occupancy level between 65% and 72%.
If a market/location sustains an average annual occupancy within these levels (or higher),
additional room capacity can be supported and development of new hotel rooms warranted.
Retail
The larger “Area of Influence”/study area contains 1,190,600 gross sq. ft. of retail space in
132 buildings or centers. This includes the cluster of retail uses located on Wilkinson
Boulevard, such as the Walmart Supercenter, and both strip centers and freestanding pad
retail sites along Freedom Drive, West Boulevard and Remount Road. This area comprises
31% of the Southwest Charlotte submarket’s 3.8 million sq. ft. of retail space. Since 2009,
only 60,400 sq. ft. of new retail space was built;
There are only 23,300 sq. ft. of vacant retail space (including direct vacancies and sublet
space), which reflects a third-quarter 2018 vacancy rate of 2.0%. Retail vacancies
decreased from a peak of only 6.3% recorded during the national recession in 2009;
While key metrics suggest that the larger study area’s retail market is stabilized—with very
low vacancies—its pace of absorption (net leasing activity) has been limited over the past
(almost) 10 years. For example, net absorption totaled only 81,900 sq. ft. between 2009
and 2018, or 8,400 sq. ft. per year. The study area accounted for only 8.6% of the entire
submarket’s annual absorption over this period;
WTL+a
WTL +a
R e a l E s t a t e & E c o n o m i c A d v i s o r s
W a s h i n g t o n , D C—P r o v i n c e t o w n , M A
2 0 2 . 8 8 5 . 9 1 2 1 3 0 1 . 5 0 2 . 4 1 7 1 7 7 4 . 5 3 8 . 6 0 7 0 17
West Boulevard’s retail inventory is generally characterized by auto-oriented, low-
scale freestanding pad buildings and small retail strip centers. There are an estimated
128,000 sq. ft. of retail space on the corridor and in several other locations, including
Tyvola Road, Remount Road and Clanton Road. This inventory comprises approximately
10.8% of the 1,190,600 sq. ft. of retail space located in the larger “Area of Influence”;
Other than the internalized, self-contained layout of City West Commons, a 37,150 sq. ft.
unanchored neighborhood retail center built in a cluster of three buildings in 2003, the
corridor is not pedestrian-scale or walkable. According to Walkscore.com, which ranks
locations nationwide according to their “walkability”, the West Boulevard corridor has low-
to moderate-walk scores ranging from 29 to 41. These scores are defined as “Car
Dependent”, meaning that most errands require a car;
The corridor also contains 15,954 sq. ft. of Automotive uses, which includes gas stations;
auto parts sales; automotive repair services; used car sales; transmission and brake
services, etc. This includes the Amoco at 1601 Remount Road, the Citgo at 2650 West
Boulevard and Glen’s Automotive at 2715 West Boulevard;
Most notably, Automotive retail sales comprise a disproportionate share of all retail
sales. Automotive sales accounted for $6.1 million (53%) of the $11.5 million in total retail
sales in the corridor in 2018;
The largest retail business in the corridor includes Family Dollar, which has two locations at
4611 W. Tyvola Road (13,801 sq. ft.) and 1560 West Boulevard in City West Commons
(13,420 sq. ft.); and
One of the metrics used to understand retail market potentials is to determine the supply of
retail space on a per capita basis. Key findings indicate that:
o The West Boulevard corridor (and adjacent streets such as Remount Road) contains
128,000 sq. ft. of retail space. As this inventory is located entirely in the
“South Trade Area”, which has a 2018 population of 12,490, this equates to
approximately 10.2 sq. ft. of retail space per resident
o The entire “Area of Influence” (both North and South trade areas), with a 2018
population of 19,028 and 1,190,600 sq. ft. of retail space equates to 62.5 sq. ft. of
retail space per resident. This illustrates the significant levels of inflow spending
WTL+a
WTL +a
R e a l E s t a t e & E c o n o m i c A d v i s o r s
W a s h i n g t o n , D C—P r o v i n c e t o w n , M A
2 0 2 . 8 8 5 . 9 1 2 1 3 0 1 . 5 0 2 . 4 1 7 1 7 7 4 . 5 3 8 . 6 0 7 0 18
generated by pass-through traffic, daytime employment and/or residents who live
outside of the trade areas, particularly to the retail cluster located along Wilkinson
Boulevard
o To put the study area’s retail supply into perspective, the 2018 U.S. estimate of total
retail space is approximately 26 sq. ft. per capita
In conclusion, CoStar data indicate that there are 17,770 sq. ft. of vacant retail space in the
West Boulevard corridor, equating to a vacancy rate of 14%. West Boulevard has a low walk
score, a preponderance of Automotive-oriented retail businesses and an overage of retail
space on a per capita basis (corresponding with the larger “Area of Influence”/study area).
Key Findings: Market Potentials
This analysis of market potentials is intended to inform land use planning concepts prepared by
the planning and design team with the City of Charlotte, and to guide specific implementation
strategies and public policies to ensure that revitalization of West Boulevard is successful. The
market analysis focused on four core uses: housing, workplace/office, retail and hotel/lodging:
Housing
A key recommendation to ensure the successful revitalization of the West Boulevard corridor is
to encourage mixed-use redevelopment with infill housing and other/supporting uses as
illustrated above. Expanding the neighborhood’s population—particularly in key redevelopment
“nodes”—provides multiple benefits, including new jobs and additional consumers for the
corridor’s existing retail businesses as well as opportunities to support new businesses, and
generate new tax revenues for the City of Charlotte.
In the North trade area, ESRI Business Analyst is forecasting a compound annual growth
rate in population of 3.14% over the next five years. WTL+a believes this strong growth rate
is in anticipation of future CATS transit service along the Wilkinson Boulevard corridor.
Extrapolating this five-year forecast for 10 years would yield 2,369 new residents in 911
new households (i.e., housing units) assuming the North trade area’s average household
size of 2.60 remains unchanged. This would translate into annual demand of roughly 90
units per year; and
WTL+a
WTL +a
R e a l E s t a t e & E c o n o m i c A d v i s o r s
W a s h i n g t o n , D C—P r o v i n c e t o w n , M A
2 0 2 . 8 8 5 . 9 1 2 1 3 0 1 . 5 0 2 . 4 1 7 1 7 7 4 . 5 3 8 . 6 0 7 0 19
In the South trade area, ESRI Business Analyst is forecasting a compound annual growth
rate in population of 1.53% over the next five years. This rate, while lower than the forecast
for the North trade area, may be higher depending on the extent of development pressures
on the housing market, spillover demand generated by growth in the North trade area, and
overall macro-economic factors (e.g., availability of financing, low interest rates, regional job
growth, etc.). In addition, in the case of fast-growing MSAs such as Charlotte’s, the general
approach of considering a straight-line compound annual growth rate for the South trade
area may not fully reflect future projections, particularly in areas of the city that are not fully
built-out. In these areas, a higher annual rate of growth may occur;
Extrapolating this five-year forecast for 10 years would yield 2,041 new residents in 764
new households (i.e., housing units) assuming the South trade area’s average household
size of 2.67 remains unchanged. This would translate into annual demand of roughly 75
units per year.
In summary, these forecast growth rates would yield over 4,400 new residents in more than
1,670 new households (housing units) over the next 10 years. This forecast is a solid,
positive factor that will generate other supporting benefits as part of the revitalization of the
West Boulevard corridor.
10-Year Planning Target for New Housing:
Up to 1,670 Units across Entire Study Area
Office
The first step in measuring support for new multi-tenant/speculative office space as part of a
revitalization strategy for West Boulevard examines market potentials for office use in the
“Southwest Prosperity Zone” (a multi-county region identified by the state’s Department of
Commerce for employment forecasts), and allocates demand to the City of Charlotte, the larger
study area generally and West Boulevard in particular. The analysis translates employment
forecasts (for 2014—2024) among specific industry sectors in Charlotte (as prepared by the
North Carolina Department of Commerce), into demand for office space by applying an
occupancy factor (of occupied space per employee) and estimates the proportion of employees
WTL+a
WTL +a
R e a l E s t a t e & E c o n o m i c A d v i s o r s
W a s h i n g t o n , D C—P r o v i n c e t o w n , M A
2 0 2 . 8 8 5 . 9 1 2 1 3 0 1 . 5 0 2 . 4 1 7 1 7 7 4 . 5 3 8 . 6 0 7 0 20
in each sector who are office workers. The SPZ and Charlotte analyses are documented in
Section 4.
With an estimated 14,074 employees working in West Boulevard’s “Area of Influence”
(larger study area), its share of the city’s total jobs is 2.85%;
Under this “fair share” analysis, the study area would continue to capture 2.85% of future
citywide job growth, or approximately 2,619 new employees, by 2024. Assuming similar
proportions of office-using jobs and occupancy factors translates into gross demand for
143,500 sq. ft. of office space by 2024;
For purposes of this analysis, WTL+a conservatively assumes that 25% of the study area’s
vacant office inventory (approximately 210,650 sq. ft.) is leased before financing is provided
for new office construction. This serves to reduce the study area’s office vacancy rate to
roughly 8.4% from current levels, and lowers demand generated by job growth in office-
using sectors to approximately 90,700 sq. ft. of net new space across the study area
by 2024;
The West Boulevard corridor contains an estimated 12,550 sq. ft. of office space. Using an
office occupancy factor of 176 sq. ft. per employee suggests that there are only 71 office
employees working in the corridor (or on nearby/surrounding streets such as Remount
Road); and
These 71 office employees represent a 0.5% share of the 14,074 total jobs located in the
West Boulevard “Area of Influence”. If this share is maintained in the future, it would
translate into very few (4) office-using jobs and into demand for less than 750 sq. ft. of
speculative/general office space in the corridor.
In conclusion, the West Boulevard corridor contains a very limited amount of office space today.
Limited data preclude an accurate understanding of key metrics such as existing vacant
space and annual net absorption. Feedback from community residents and members of the
West Boulevard Neighborhood Coalition identified the need and community support for
additional professional services such as accounting, legal and medical businesses.
The fair share analysis suggests very limited market support for office uses based on forecast
job growth in office-using sectors. If speculative professional office space is a desired addition
to the West Boulevard corridor, it would require public subsidy in some fashion. Market forces
WTL+a
WTL +a
R e a l E s t a t e & E c o n o m i c A d v i s o r s
W a s h i n g t o n , D C—P r o v i n c e t o w n , M A
2 0 2 . 8 8 5 . 9 1 2 1 3 0 1 . 5 0 2 . 4 1 7 1 7 7 4 . 5 3 8 . 6 0 7 0 2 1
alone will not justify conventional financing. Concurrently, supporting new residential
development, that serves to generate population/household growth throughout the study area,
may also enhance potential market support for office/professional and business service tenants
over the long-term.
Office Market Potentials on West Boulevard are Very Limited
& Tied to Public Policies/Incentives & Future Population Growth
Hotel/Lodging
Our analysis suggests that there may be sufficient demand/investment-level
performance necessary to justify the addition of new hotel rooms in the competitive
market area. The ability of the West Boulevard corridor to capture this growth is
likely limited to its most marketable location—the intersection with Billy Graham
Parkway. However, WTL+a notes that the Airport Commercial Development Strategy,
prepared in March 2017 to guide preparation of the CLT Airport Strategic Development Plan
on behalf of the City of Charlotte Aviation Department, identifies multiple locations of airport-
controlled sites for future hotel development under various economic scenarios:
o Low Economic Growth—Up to 769 keys (rooms) on 15 acres
o Moderate Economic Growth—Up to 1,106 rooms on 21 acres
o High Economic Growth—Up to 1,442 rooms plus a convention hotel on 29 acres
In conclusion, these competitive market forces are likely to prove difficult for a speculative hotel
to be developed on West Boulevard—even at its most marketable location with Billy Graham
Parkway. This will also be affected by the time required to implement the airport’s strategic
development plan.
General Retail
As detailed in the demographic profile in Section 2, the West Boulevard study area and environs
do not have sufficient population density or household retail spending levels to support
substantial retail growth. This market challenge exists despite the fact that the West
Boulevard corridor and its adjacent neighborhoods are undersupplied in groceries, pharmacy,
WTL+a
WTL +a
R e a l E s t a t e & E c o n o m i c A d v i s o r s
W a s h i n g t o n , D C—P r o v i n c e t o w n , M A
2 0 2 . 8 8 5 . 9 1 2 1 3 0 1 . 5 0 2 . 4 1 7 1 7 7 4 . 5 3 8 . 6 0 7 0 2 2
professional services and options to expand dining/food and beverage offerings. The
competitive supply along Wilkinson Boulevard already has a significant critical mass of retail
(especially at the Walmart Super-Center and its in-line stores). Poor north-south connections
from West Boulevard to Wilkinson exacerbate the challenges of access and convenience
to the retail supply along Wilkinson than if there were more retail stores along West
Boulevard.
As noted in the housing analysis above, forecast population growth and market potentials for
new housing within the study area (i.e., both north and south of the Norfolk Southern rail line)
could add up to 4,400 new residents (and up to 1,700 new housing units) to the study area over
the next 10 years. However, that increment of growth could be expected to support only
about 13,200 to 22,000 sq. ft. of retail throughout the study area to capture household
spending during the forecast period. The increment of new space would include relocation
of viable existing businesses that could afford higher rents required in new construction. This
does not include re-use of obsolete existing retail buildings. The recommended food co-
operative on West Boulevard could provide up to 10,000 sq. ft. of new retail space, but demand
beyond this anchor use and any additional supportable retail space for food and beverage,
banking and professional/consumer services will be limited.
Implementation Priorities of Participating Public Partners
Key implementation priorities and actions of relevant participating public agencies and partners
are summarized below. The entirety of these strategies and actions is presented in Section 5 of
this report.
1. Plan, adopt and implement road and streetscape enhancements along West
Boulevard. This includes completion of the new Ashley Road extension, streetscape
improvements at key intersections along the corridor to improve pedestrian and bicyclist
safety, traffic calming measures that visibly reduce/eliminate vehicular speeding along
the corridor, and other improvements designed to create a more walkable environment.
We understand that the Ashley Road extension is currently unfunded and unscheduled,
but the West Boulevard Corridor Playbook will make it a priority recommendation
WTL+a
WTL +a
R e a l E s t a t e & E c o n o m i c A d v i s o r s
W a s h i n g t o n , D C—P r o v i n c e t o w n , M A
2 0 2 . 8 8 5 . 9 1 2 1 3 0 1 . 5 0 2 . 4 1 7 1 7 7 4 . 5 3 8 . 6 0 7 0 23
2. Support the WSCLT by (a) participating in its organizational governance as a public
partner, and (b) as available, provide supportive zoning policies and potential acquisition
and operating funding, as possible, to accelerate financial stability for the program
3. Foster construction of a Food Cooperative/Three Sisters Coop Market in the study
area, preferably in a central location to allow ready access to all neighborhoods on the
corridor and enhance synergy with other community services
4. Focus any available policy, planning and financial incentives (community-benefiting
Qualified Opportunity Fund investments, business development and other programs) in
the study area, including cooperation with Mecklenburg County on the proposed CRC
facility and site location and adjoining uses, and with CATS on long-term planning and
development of the potential LYNX Silver Line extension between Uptown and
Charlotte-Douglas International Airport
5. Work toward planning and cooperative partnerships with the WSCLT, the Charlotte-
Mecklenburg Housing Partnership, the Charlotte Housing Authority and private
developers to build neighborhood-scaled, infill housing in the study area such as the
conceptual plans included in this document.

WTL+a
WTL +a
R e a l E s t a t e & E c o n o m i c A d v i s o r s
W a s h i n g t o n , D C—P r o v i n c e t o w n , M A
2 0 2 . 8 8 5 . 9 1 2 1 3 0 1 . 5 0 2 . 4 1 7 1 7 7 4 . 5 3 8 . 6 0 7 0 24
2 Demographic & Economic Profile
The following evaluates those indices that drive fundamental market demand for various land
uses to inform revitalization potentials along the West Boulevard corridor. This section of the
report focuses on population and household growth, employment trends and forecasts,
household incomes and annual retail spending power, the current business mix on the corridor
as well as the larger “trade area”, and other economic indicators based on available data that
form the basis of potential market support.
This profile and analysis are based on data from various secondary public and private sources,
including U.S. Census Bureau; North Carolina Department of Commerce, Labor and Economic
Analysis Division; North Carolina Office of State Budget and Management (OSBM); City of
Charlotte and Mecklenburg County; ESRI Business Analyst; Dun & Bradstreet, Inc.; and other
sources.
Demographic Trends & Forecasts
WTL+a evaluated historic population
patterns and growth forecasts in
various geographies—including two
specific trade areas (as detailed
below), the City of Charlotte and
Mecklenburg County using the sources
above. Key findings are summarized
below, with data illustrated in the
accompanying tables.
WTL+a
WTL +a
R e a l E s t a t e & E c o n o m i c A d v i s o r s
W a s h i n g t o n , D C—P r o v i n c e t o w n , M A
2 0 2 . 8 8 5 . 9 1 2 1 3 0 1 . 5 0 2 . 4 1 7 1 7 7 4 . 5 3 8 . 6 0 7 0 25
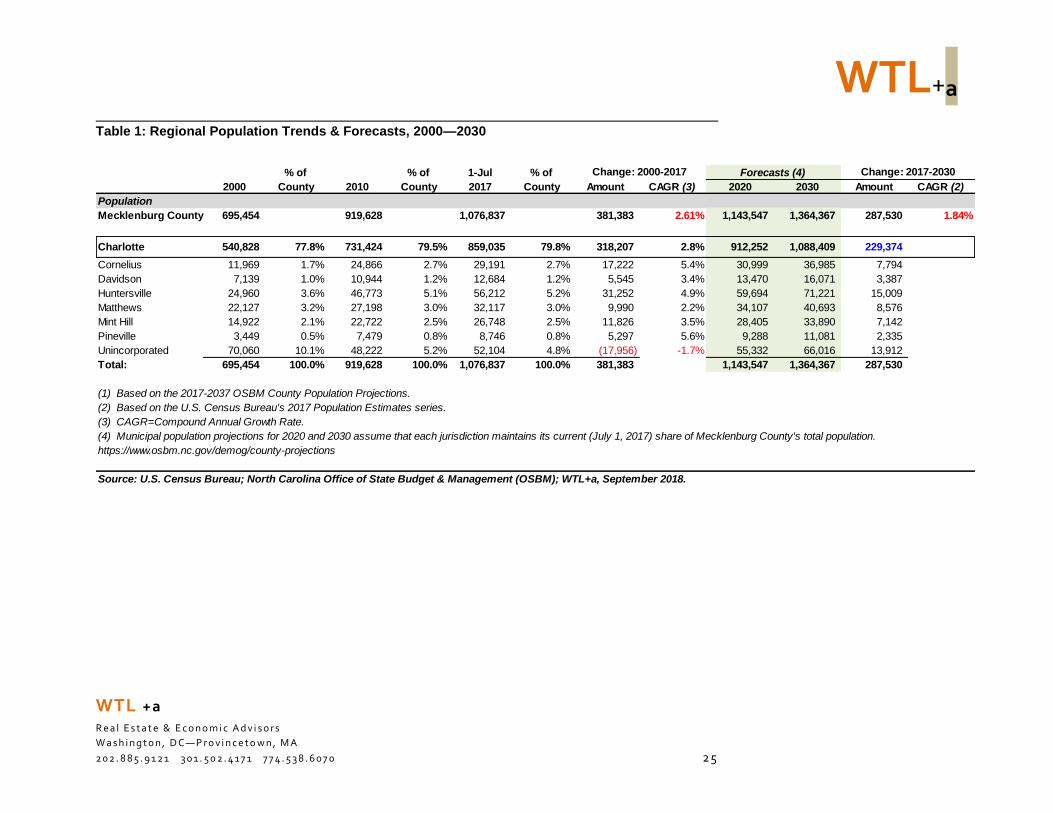
Table 1: Regional Population Trends & Forecasts, 2000—2030
% of % of 1-Jul % of
2000 County 2010 County 2017 County Amount CAGR (3) 2020 2030 Amount CAGR (2)
Population
Mecklenburg County 695,454 919,628 1,076,837 381,383 2.61% 1,143,547 1,364,367 287,530 1.84%
Charlotte 540,828 77.8% 731,424 79.5% 859,035 79.8% 318,207 2.8% 912,252 1,088,409 229,374
Cornelius 11,969 1.7% 24,866 2.7% 29,191 2.7% 17,222 5.4% 30,999 36,985 7,794
Davidson 7,139 1.0% 10,944 1.2% 12,684 1.2% 5,545 3.4% 13,470 16,071 3,387
Huntersville 24,960 3.6% 46,773 5.1% 56,212 5.2% 31,252 4.9% 59,694 71,221 15,009
Matthews 22,127 3.2% 27,198 3.0% 32,117 3.0% 9,990 2.2% 34,107 40,693 8,576
Mint Hill 14,922 2.1% 22,722 2.5% 26,748 2.5% 11,826 3.5% 28,405 33,890 7,142
Pineville 3,449 0.5% 7,479 0.8% 8,746 0.8% 5,297 5.6% 9,288 11,081 2,335
Unincorporated 70,060 10.1% 48,222 5.2% 52,104 4.8% (17,956) -1.7% 55,332 66,016 13,912
Total: 695,454 100.0% 919,628 100.0% 1,076,837 100.0% 381,383 1,143,547 1,364,367 287,530
(1) Based on the 2017-2037 OSBM County Population Projections.
(2) Based on the U.S. Census Bureau's 2017 Population Estimates series.
(3) CAGR=Compound Annual Growth Rate.
(4) Municipal population projections for 2020 and 2030 assume that each jurisdiction maintains its current (July 1, 2017) share of Mecklenburg County's total population.
https://www.osbm.nc.gov/demog/county-projections
Source: U.S. Census Bureau; North Carolina Office of State Budget & Management (OSBM); WTL+a, September 2018.
Change: 2000-2017 Change: 2017-2030Forecasts (4)
WTL+a
WTL +a
R e a l E s t a t e & E c o n o m i c A d v i s o r s
W a s h i n g t o n , D C—P r o v i n c e t o w n , M A
2 0 2 . 8 8 5 . 9 1 2 1 3 0 1 . 5 0 2 . 4 1 7 1 7 7 4 . 5 3 8 . 6 0 7 0 26
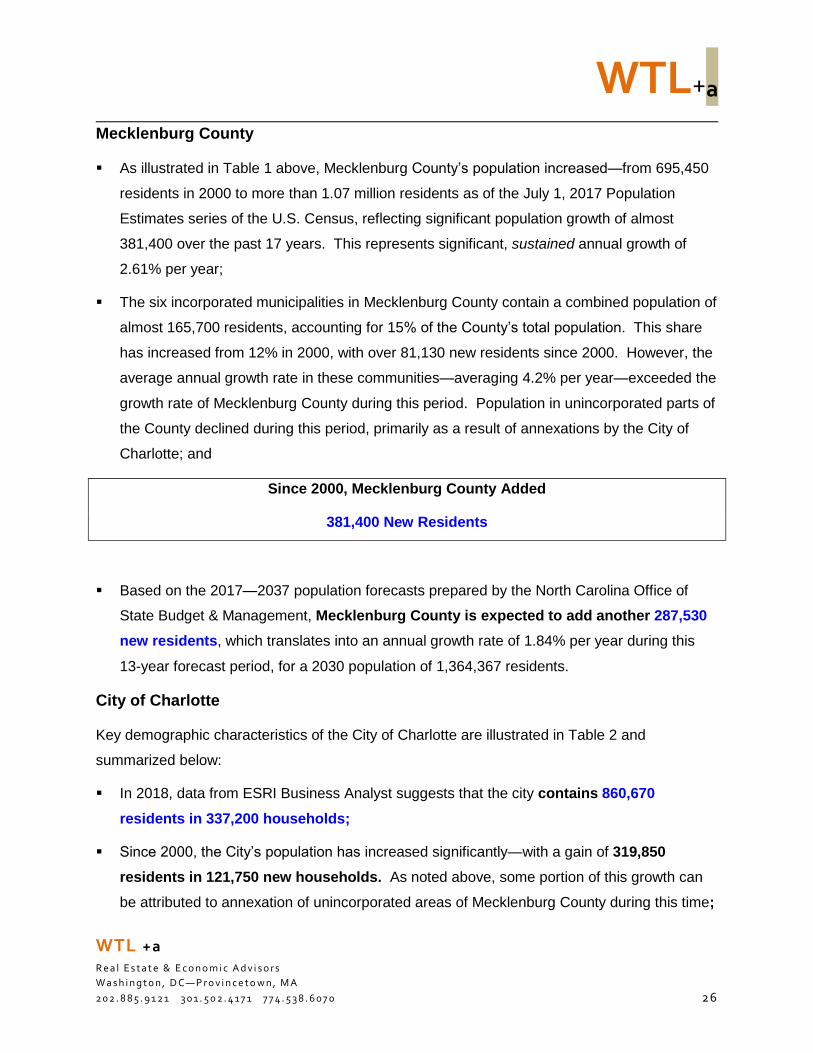
Mecklenburg County
As illustrated in Table 1 above, Mecklenburg County’s population increased—from 695,450
residents in 2000 to more than 1.07 million residents as of the July 1, 2017 Population
Estimates series of the U.S. Census, reflecting significant population growth of almost
381,400 over the past 17 years. This represents significant, sustained annual growth of
2.61% per year;
The six incorporated municipalities in Mecklenburg County contain a combined population of
almost 165,700 residents, accounting for 15% of the County’s total population. This share
has increased from 12% in 2000, with over 81,130 new residents since 2000. However, the
average annual growth rate in these communities—averaging 4.2% per year—exceeded the
growth rate of Mecklenburg County during this period. Population in unincorporated parts of
the County declined during this period, primarily as a result of annexations by the City of
Charlotte; and
Since 2000, Mecklenburg County Added
381,400 New Residents
Based on the 2017—2037 population forecasts prepared by the North Carolina Office of
State Budget & Management, Mecklenburg County is expected to add another 287,530
new residents, which translates into an annual growth rate of 1.84% per year during this
13-year forecast period, for a 2030 population of 1,364,367 residents.
City of Charlotte
Key demographic characteristics of the City of Charlotte are illustrated in Table 2 and
summarized below:
In 2018, data from ESRI Business Analyst suggests that the city contains 860,670
residents in 337,200 households;
Since 2000, the City’s population has increased significantly—with a gain of 319,850
residents in 121,750 new households. As noted above, some portion of this growth can
be attributed to annexation of unincorporated areas of Mecklenburg County during this time;
WTL+a
WTL +a
R e a l E s t a t e & E c o n o m i c A d v i s o r s
W a s h i n g t o n , D C—P r o v i n c e t o w n , M A
2 0 2 . 8 8 5 . 9 1 2 1 3 0 1 . 5 0 2 . 4 1 7 1 7 7 4 . 5 3 8 . 6 0 7 0 27
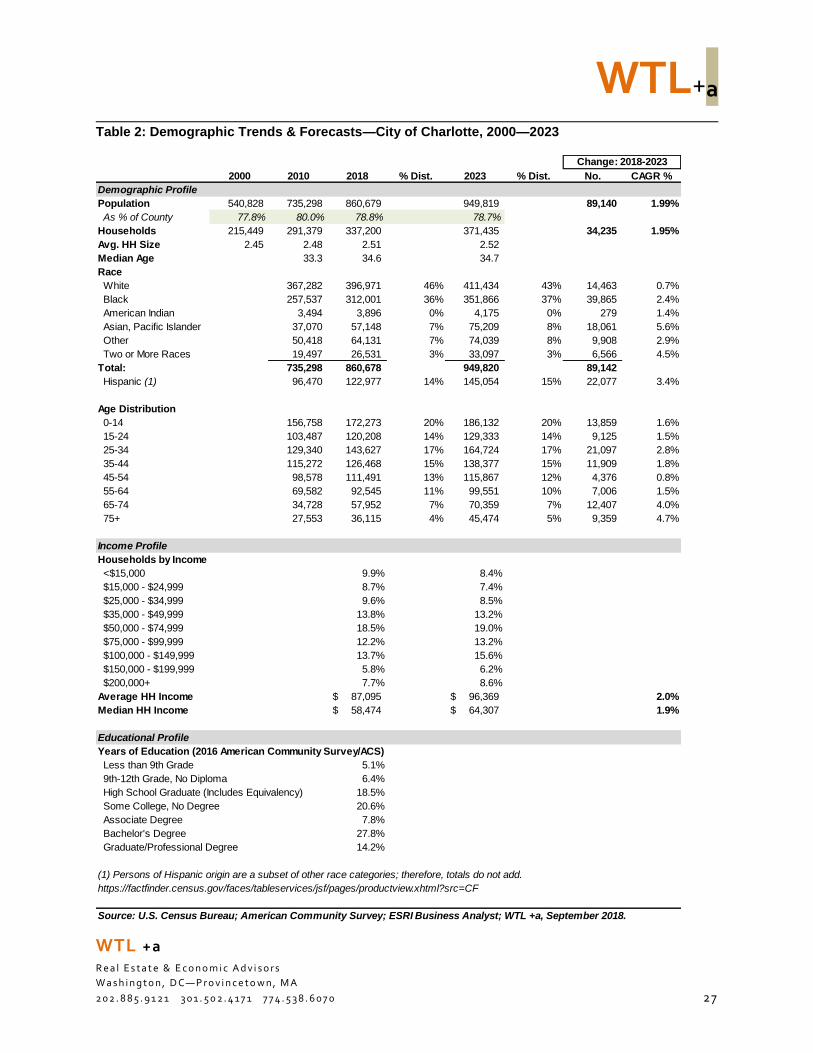
Table 2: Demographic Trends & Forecasts—City of Charlotte, 2000—2023
2000 2010 2018 % Dist. 2023 % Dist. No. CAGR %
Demographic Profile
Population 540,828 735,298 860,679 949,819 89,140 1.99%
As % of County 77.8% 80.0% 78.8% 78.7%
Households 215,449 291,379 337,200 371,435 34,235 1.95%
Avg. HH Size 2.45 2.48 2.51 2.52
Median Age 33.3 34.6 34.7
Race
White 367,282 396,971 46% 411,434 43% 14,463 0.7%
Black 257,537 312,001 36% 351,866 37% 39,865 2.4%
American Indian 3,494 3,896 0% 4,175 0% 279 1.4%
Asian, Pacific Islander 37,070 57,148 7% 75,209 8% 18,061 5.6%
Other 50,418 64,131 7% 74,039 8% 9,908 2.9%
Two or More Races 19,497 26,531 3% 33,097 3% 6,566 4.5%
Total: 735,298 860,678 949,820 89,142
Hispanic (1) 96,470 122,977 14% 145,054 15% 22,077 3.4%
Age Distribution
0-14 156,758 172,273 20% 186,132 20% 13,859 1.6%
15-24 103,487 120,208 14% 129,333 14% 9,125 1.5%
25-34 129,340 143,627 17% 164,724 17% 21,097 2.8%
35-44 115,272 126,468 15% 138,377 15% 11,909 1.8%
45-54 98,578 111,491 13% 115,867 12% 4,376 0.8%
55-64 69,582 92,545 11% 99,551 10% 7,006 1.5%
65-74 34,728 57,952 7% 70,359 7% 12,407 4.0%
75+ 27,553 36,115 4% 45,474 5% 9,359 4.7%
Income Profile
Households by Income
<$15,000 9.9% 8.4%
$15,000 - $24,999 8.7% 7.4%
$25,000 - $34,999 9.6% 8.5%
$35,000 - $49,999 13.8% 13.2%
$50,000 - $74,999 18.5% 19.0%
$75,000 - $99,999 12.2% 13.2%
$100,000 - $149,999 13.7% 15.6%
$150,000 - $199,999 5.8% 6.2%
$200,000+ 7.7% 8.6%
Average HH Income 87,095$ 96,369$ 2.0%
Median HH Income 58,474$ 64,307$ 1.9%
Educational Profile
Years of Education (2016 American Community Survey/ACS)
Less than 9th Grade 5.1%
9th-12th Grade, No Diploma 6.4%
High School Graduate (Includes Equivalency) 18.5%
Some College, No Degree 20.6%
Associate Degree 7.8%
Bachelor's Degree 27.8%
Graduate/Professional Degree 14.2%
(1) Persons of Hispanic origin are a subset of other race categories; therefore, totals do not add.
https://factfinder.census.gov/faces/tableservices/jsf/pages/productview.xhtml?src=CF
Source: U.S. Census Bureau; American Community Survey; ESRI Business Analyst; WTL +a, September 2018.
Change: 2018-2023
WTL+a
WTL +a
R e a l E s t a t e & E c o n o m i c A d v i s o r s
W a s h i n g t o n , D C—P r o v i n c e t o w n , M A
2 0 2 . 8 8 5 . 9 1 2 1 3 0 1 . 5 0 2 . 4 1 7 1 7 7 4 . 5 3 8 . 6 0 7 0 28
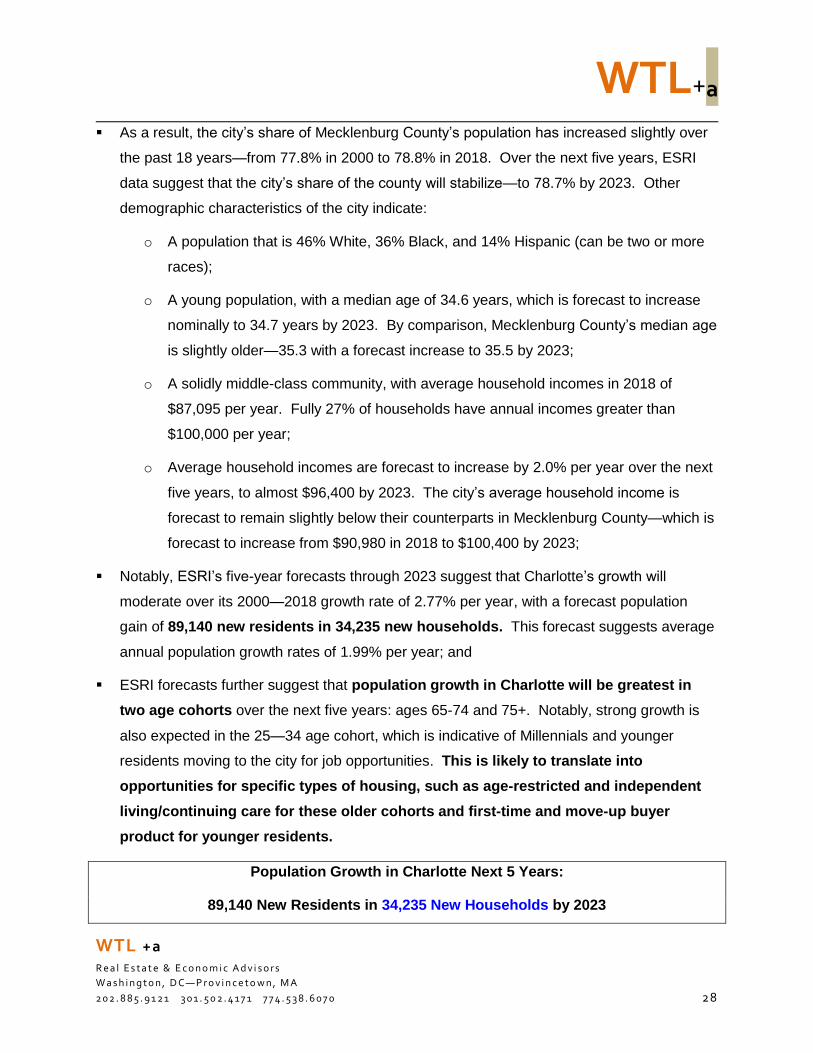
As a result, the city’s share of Mecklenburg County’s population has increased slightly over
the past 18 years—from 77.8% in 2000 to 78.8% in 2018. Over the next five years, ESRI
data suggest that the city’s share of the county will stabilize—to 78.7% by 2023. Other
demographic characteristics of the city indicate:
o A population that is 46% White, 36% Black, and 14% Hispanic (can be two or more
races);
o A young population, with a median age of 34.6 years, which is forecast to increase
nominally to 34.7 years by 2023. By comparison, Mecklenburg County’s median age
is slightly older—35.3 with a forecast increase to 35.5 by 2023;
o A solidly middle-class community, with average household incomes in 2018 of
$87,095 per year. Fully 27% of households have annual incomes greater than
$100,000 per year;
o Average household incomes are forecast to increase by 2.0% per year over the next
five years, to almost $96,400 by 2023. The city’s average household income is
forecast to remain slightly below their counterparts in Mecklenburg County—which is
forecast to increase from $90,980 in 2018 to $100,400 by 2023;
Notably, ESRI’s five-year forecasts through 2023 suggest that Charlotte’s growth will
moderate over its 2000—2018 growth rate of 2.77% per year, with a forecast population
gain of 89,140 new residents in 34,235 new households. This forecast suggests average
annual population growth rates of 1.99% per year; and
ESRI forecasts further suggest that population growth in Charlotte will be greatest in
two age cohorts over the next five years: ages 65-74 and 75+. Notably, strong growth is
also expected in the 25—34 age cohort, which is indicative of Millennials and younger
residents moving to the city for job opportunities. This is likely to translate into
opportunities for specific types of housing, such as age-restricted and independent
living/continuing care for these older cohorts and first-time and move-up buyer
product for younger residents.
Population Growth in Charlotte Next 5 Years:
89,140 New Residents in 34,235 New Households by 2023
WTL+a
WTL +a
R e a l E s t a t e & E c o n o m i c A d v i s o r s
W a s h i n g t o n , D C—P r o v i n c e t o w n , M A
2 0 2 . 8 8 5 . 9 1 2 1 3 0 1 . 5 0 2 . 4 1 7 1 7 7 4 . 5 3 8 . 6 0 7 0 29
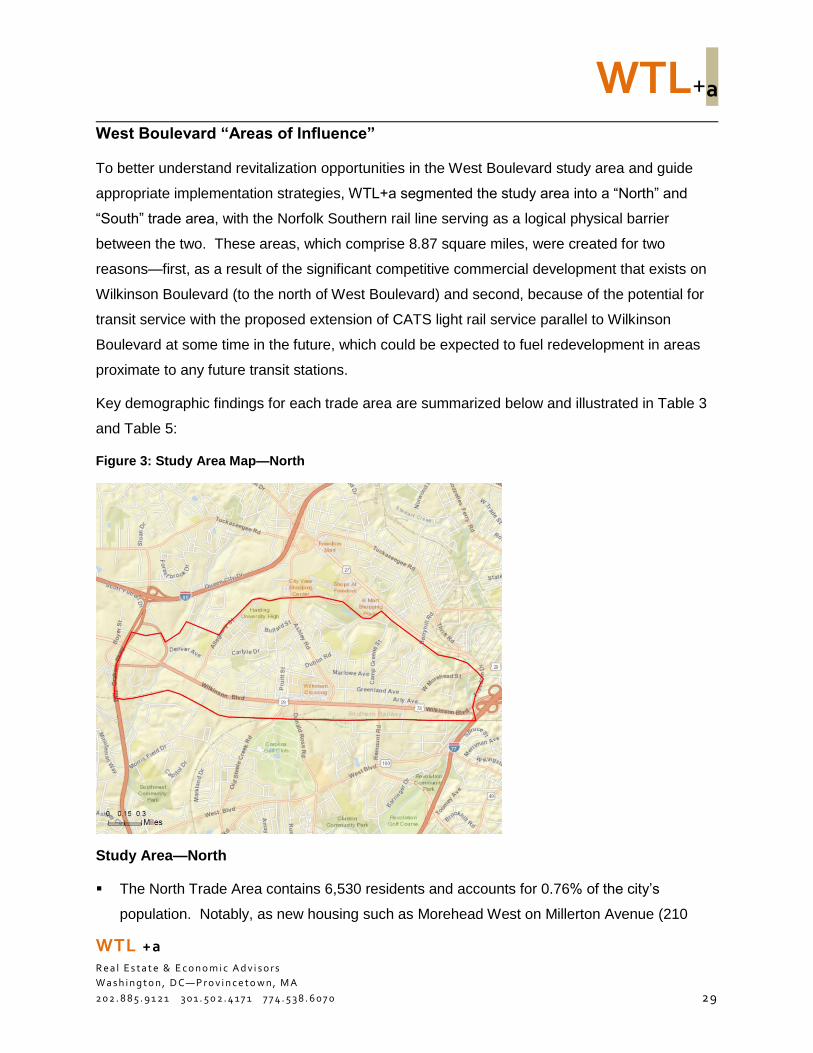
West Boulevard “Areas of Influence”
To better understand revitalization opportunities in the West Boulevard study area and guide
appropriate implementation strategies, WTL+a segmented the study area into a “North” and
“South” trade area, with the Norfolk Southern rail line serving as a logical physical barrier
between the two. These areas, which comprise 8.87 square miles, were created for two
reasons—first, as a result of the significant competitive commercial development that exists on
Wilkinson Boulevard (to the north of West Boulevard) and second, because of the potential for
transit service with the proposed extension of CATS light rail service parallel to Wilkinson
Boulevard at some time in the future, which could be expected to fuel redevelopment in areas
proximate to any future transit stations.
Key demographic findings for each trade area are summarized below and illustrated in Table 3
and Table 5:
Figure 3: Study Area Map—North
Study Area—North
The North Trade Area contains 6,530 residents and accounts for 0.76% of the city’s
population. Notably, as new housing such as Morehead West on Millerton Avenue (210
WTL+a
WTL +a
R e a l E s t a t e & E c o n o m i c A d v i s o r s
W a s h i n g t o n , D C—P r o v i n c e t o w n , M A
2 0 2 . 8 8 5 . 9 1 2 1 3 0 1 . 5 0 2 . 4 1 7 1 7 7 4 . 5 3 8 . 6 0 7 0 3 0
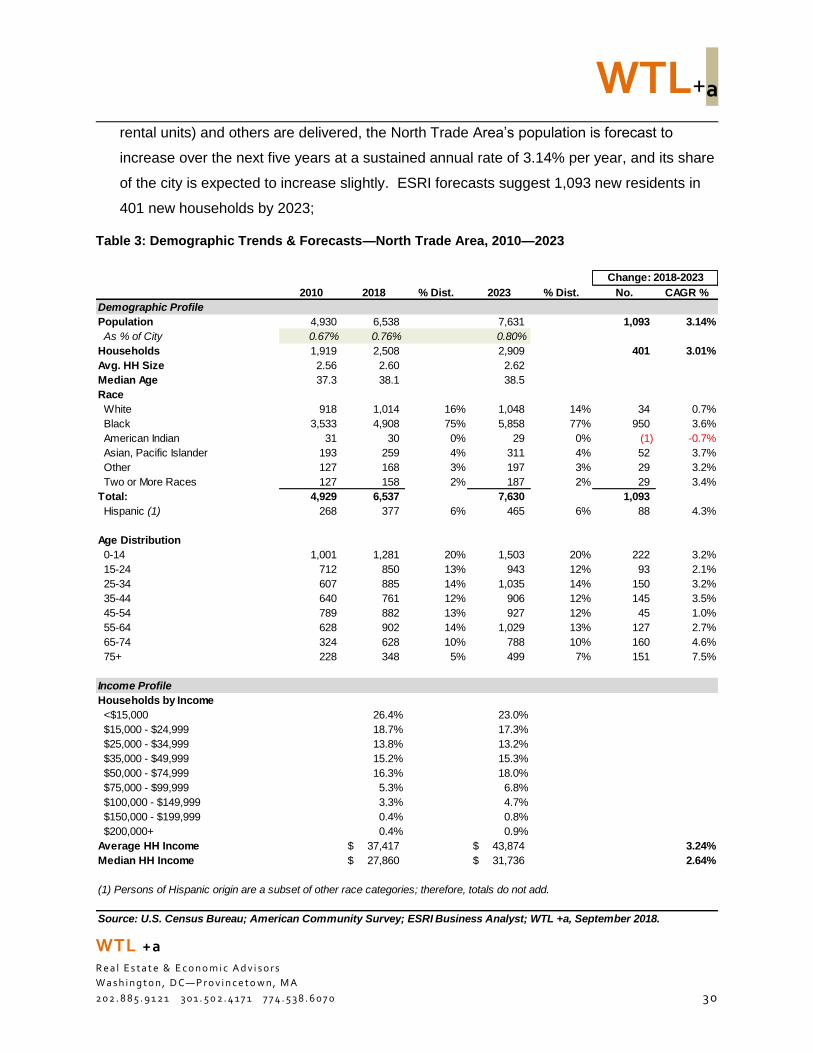
rental units) and others are delivered, the North Trade Area’s population is forecast to
increase over the next five years at a sustained annual rate of 3.14% per year, and its share
of the city is expected to increase slightly. ESRI forecasts suggest 1,093 new residents in
401 new households by 2023;
Table 3: Demographic Trends & Forecasts—North Trade Area, 2010—2023
2010 2018 % Dist. 2023 % Dist. No. CAGR %
Demographic Profile
Population 4,930 6,538 7,631 1,093 3.14%
As % of City 0.67% 0.76% 0.80%
Households 1,919 2,508 2,909 401 3.01%
Avg. HH Size 2.56 2.60 2.62
Median Age 37.3 38.1 38.5
Race
White 918 1,014 16% 1,048 14% 34 0.7%
Black 3,533 4,908 75% 5,858 77% 950 3.6%
American Indian 31 30 0% 29 0% (1) -0.7%
Asian, Pacific Islander 193 259 4% 311 4% 52 3.7%
Other 127 168 3% 197 3% 29 3.2%
Two or More Races 127 158 2% 187 2% 29 3.4%
Total: 4,929 6,537 7,630 1,093
Hispanic (1) 268 377 6% 465 6% 88 4.3%
Age Distribution
0-14 1,001 1,281 20% 1,503 20% 222 3.2%
15-24 712 850 13% 943 12% 93 2.1%
25-34 607 885 14% 1,035 14% 150 3.2%
35-44 640 761 12% 906 12% 145 3.5%
45-54 789 882 13% 927 12% 45 1.0%
55-64 628 902 14% 1,029 13% 127 2.7%
65-74 324 628 10% 788 10% 160 4.6%
75+ 228 348 5% 499 7% 151 7.5%
Income Profile
Households by Income
<$15,000 26.4% 23.0%
$15,000 - $24,999 18.7% 17.3%
$25,000 - $34,999 13.8% 13.2%
$35,000 - $49,999 15.2% 15.3%
$50,000 - $74,999 16.3% 18.0%
$75,000 - $99,999 5.3% 6.8%
$100,000 - $149,999 3.3% 4.7%
$150,000 - $199,999 0.4% 0.8%
$200,000+ 0.4% 0.9%
Average HH Income 37,417$ 43,874$ 3.24%
Median HH Income 27,860$ 31,736$ 2.64%
(1) Persons of Hispanic origin are a subset of other race categories; therefore, totals do not add.
Source: U.S. Census Bureau; American Community Survey; ESRI Business Analyst; WTL +a, September 2018.
Change: 2018-2023
WTL+a
WTL +a
R e a l E s t a t e & E c o n o m i c A d v i s o r s
W a s h i n g t o n , D C—P r o v i n c e t o w n , M A
2 0 2 . 8 8 5 . 9 1 2 1 3 0 1 . 5 0 2 . 4 1 7 1 7 7 4 . 5 3 8 . 6 0 7 0 3 1
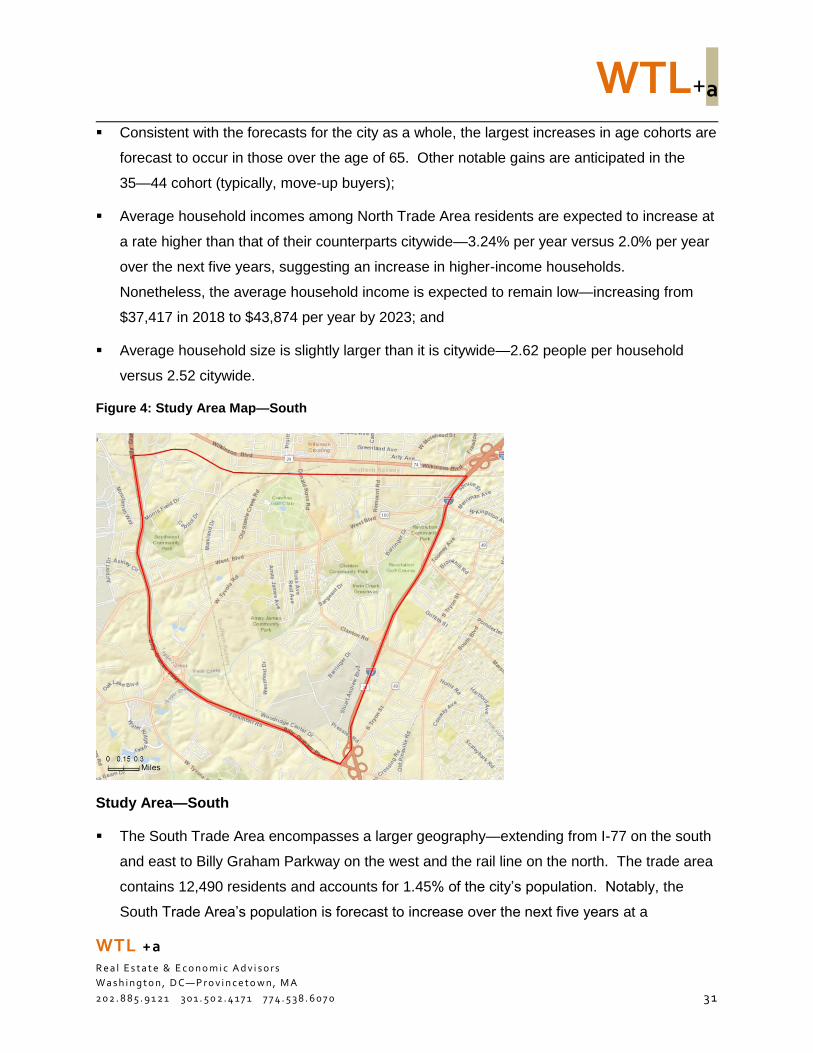
Consistent with the forecasts for the city as a whole, the largest increases in age cohorts are
forecast to occur in those over the age of 65. Other notable gains are anticipated in the
35—44 cohort (typically, move-up buyers);
Average household incomes among North Trade Area residents are expected to increase at
a rate higher than that of their counterparts citywide—3.24% per year versus 2.0% per year
over the next five years, suggesting an increase in higher-income households.
Nonetheless, the average household income is expected to remain low—increasing from
$37,417 in 2018 to $43,874 per year by 2023; and
Average household size is slightly larger than it is citywide—2.62 people per household
versus 2.52 citywide.
Figure 4: Study Area Map—South
Study Area—South
The South Trade Area encompasses a larger geography—extending from I-77 on the south
and east to Billy Graham Parkway on the west and the rail line on the north. The trade area
contains 12,490 residents and accounts for 1.45% of the city’s population. Notably, the
South Trade Area’s population is forecast to increase over the next five years at a
WTL+a
WTL +a
R e a l E s t a t e & E c o n o m i c A d v i s o r s
W a s h i n g t o n , D C—P r o v i n c e t o w n , M A
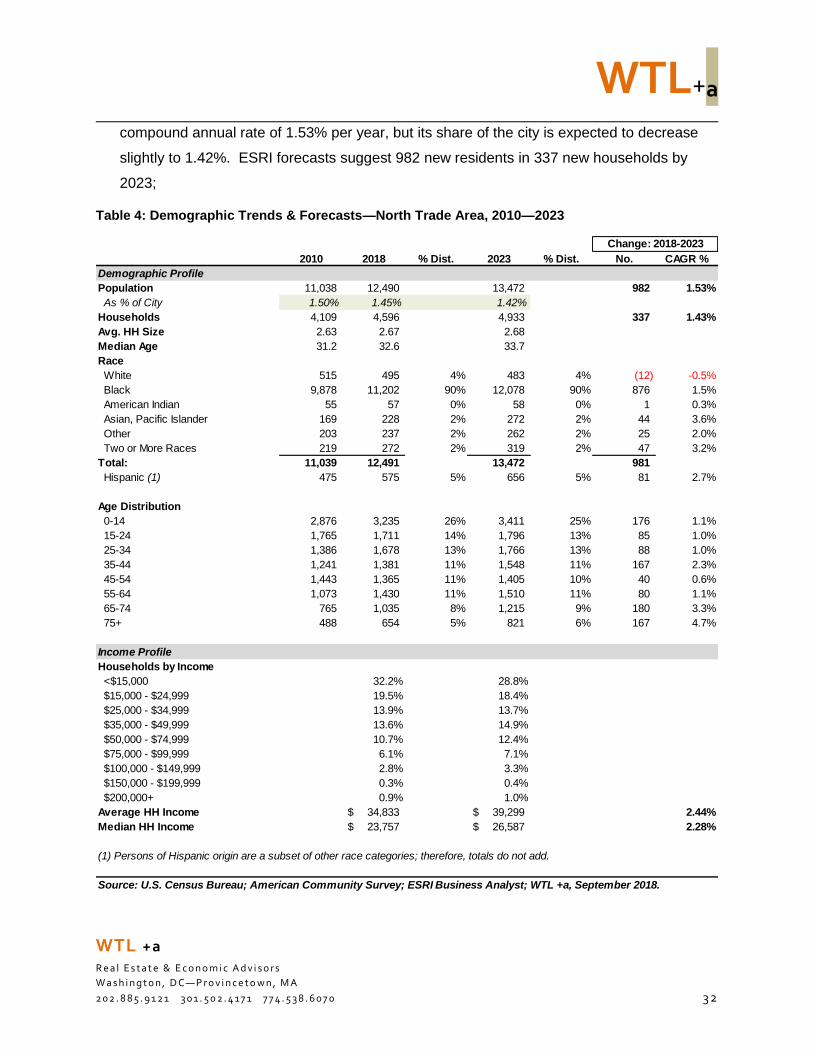
2 0 2 . 8 8 5 . 9 1 2 1 3 0 1 . 5 0 2 . 4 1 7 1 7 7 4 . 5 3 8 . 6 0 7 0 3 2
compound annual rate of 1.53% per year, but its share of the city is expected to decrease
slightly to 1.42%. ESRI forecasts suggest 982 new residents in 337 new households by
2023;
Table 4: Demographic Trends & Forecasts—North Trade Area, 2010—2023
2010 2018 % Dist. 2023 % Dist. No. CAGR %
Demographic Profile
Population 11,038 12,490 13,472 982 1.53%
As % of City 1.50% 1.45% 1.42%
Households 4,109 4,596 4,933 337 1.43%
Avg. HH Size 2.63 2.67 2.68
Median Age 31.2 32.6 33.7
Race
White 515 495 4% 483 4% (12) -0.5%
Black 9,878 11,202 90% 12,078 90% 876 1.5%
American Indian 55 57 0% 58 0% 1 0.3%
Asian, Pacific Islander 169 228 2% 272 2% 44 3.6%
Other 203 237 2% 262 2% 25 2.0%
Two or More Races 219 272 2% 319 2% 47 3.2%
Total: 11,039 12,491 13,472 981
Hispanic (1) 475 575 5% 656 5% 81 2.7%
Age Distribution
0-14 2,876 3,235 26% 3,411 25% 176 1.1%
15-24 1,765 1,711 14% 1,796 13% 85 1.0%
25-34 1,386 1,678 13% 1,766 13% 88 1.0%
35-44 1,241 1,381 11% 1,548 11% 167 2.3%
45-54 1,443 1,365 11% 1,405 10% 40 0.6%
55-64 1,073 1,430 11% 1,510 11% 80 1.1%
65-74 765 1,035 8% 1,215 9% 180 3.3%
75+ 488 654 5% 821 6% 167 4.7%
Income Profile
Households by Income
<$15,000 32.2% 28.8%
$15,000 - $24,999 19.5% 18.4%
$25,000 - $34,999 13.9% 13.7%
$35,000 - $49,999 13.6% 14.9%
$50,000 - $74,999 10.7% 12.4%
$75,000 - $99,999 6.1% 7.1%
$100,000 - $149,999 2.8% 3.3%
$150,000 - $199,999 0.3% 0.4%
$200,000+ 0.9% 1.0%
Average HH Income 34,833$ 39,299$ 2.44%
Median HH Income 23,757$ 26,587$ 2.28%
(1) Persons of Hispanic origin are a subset of other race categories; therefore, totals do not add.
Source: U.S. Census Bureau; American Community Survey; ESRI Business Analyst; WTL +a, September 2018.
Change: 2018-2023
WTL+a
WTL +a
R e a l E s t a t e & E c o n o m i c A d v i s o r s
W a s h i n g t o n , D C—P r o v i n c e t o w n , M A
2 0 2 . 8 8 5 . 9 1 2 1 3 0 1 . 5 0 2 . 4 1 7 1 7 7 4 . 5 3 8 . 6 0 7 0 3 3
Consistent with the forecasts for the city as a whole, the largest increases in age cohorts are
forecast to occur in those over the age of 65. Other notable gains are anticipated in the
35—44 cohort (typically, move-up buyers);
Average household incomes among South Trade Area residents are expected to increase at
a rate higher than that of their counterparts citywide—2.44% per year versus 2.0% per year
over the next five years, suggesting a slight increase in higher-income households.
Nonetheless, the average household income is expected to remain low—increasing from
$34,833 in 2018 to $39,299 per year by 2023; and
Average household size is slightly larger than it is citywide—2.67 people per household
versus 2.52 citywide.
In total, the West Boulevard “Area of Influence” had a
2018 population of 19,028 in 7,104 households. Over
the next five years, forecasts suggest that the area’s
population will increases to 21,103 in 7,842
households, reflecting 2,075 new residents and 738
new households.
An analysis of demographic trends and forecasts for
each trade area suggest that future transit service is
anticipated and will fuel additional residential
development—particularly in the North Trade Area.
While specific routing and station locations have not been identified, a key objective of
revitalization strategies for West Boulevard should ensure that implementation of transit (rail)
service benefit the corridor, particularly in specific areas/nodes located proximate to future
station(s), such as Remount Road.
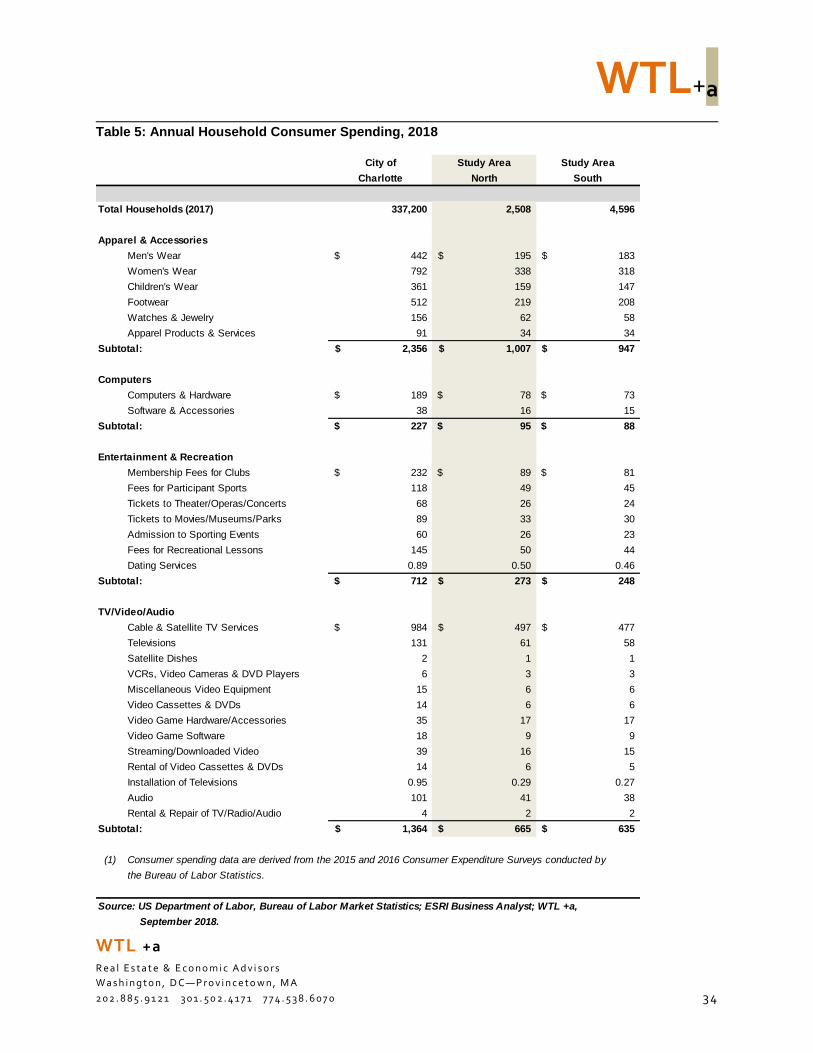
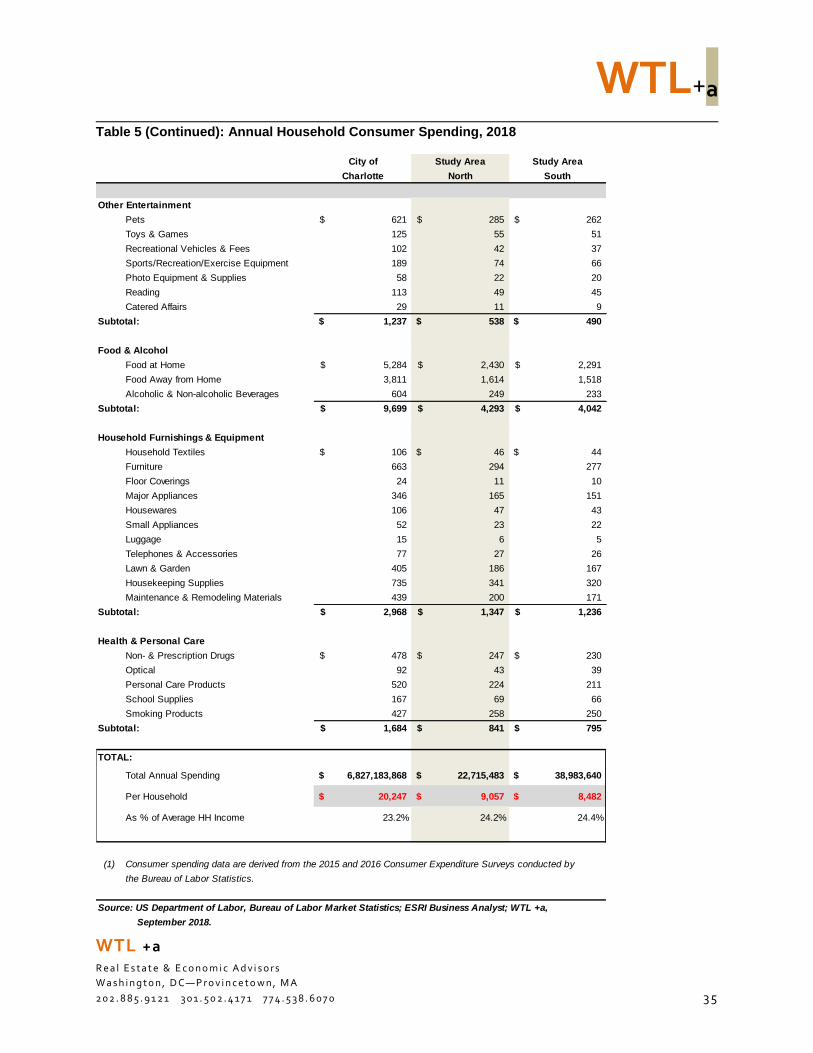
Household Incomes & Retail Spending
Household retail spending is the primary driver of demand for retail space such as shopping
centers, “Big Box” stores such as Wal-Mart or Target, food & beverage, and specialty or
destination retail projects. Household retail spending patterns among households in the City of
Charlotte and the two trade areas are illustrated in Table 5.
WTL+a
WTL +a
R e a l E s t a t e & E c o n o m i c A d v i s o r s
W a s h i n g t o n , D C—P r o v i n c e t o w n , M A
2 0 2 . 8 8 5 . 9 1 2 1 3 0 1 . 5 0 2 . 4 1 7 1 7 7 4 . 5 3 8 . 6 0 7 0 3 4
Table 5: Annual Household Consumer Spending, 2018
City of Study Area Study Area
Charlotte North South
Total Households (2017) 337,200 2,508 4,596
Apparel & Accessories
Men's Wear 442$ 195$ 183$
Women's Wear 792 338 318
Children's Wear 361 159 147
Footwear 512 219 208
Watches & Jewelry 156 62 58
Apparel Products & Services 91 34 34
Subtotal: 2,356$ 1,007$ 947$
Computers
Computers & Hardware 189$ 78$ 73$
Software & Accessories 38 16 15
Subtotal: 227$ 95$ 88$
Entertainment & Recreation
Membership Fees for Clubs 232$ 89$ 81$
Fees for Participant Sports 118 49 45
Tickets to Theater/Operas/Concerts 68 26 24
Tickets to Movies/Museums/Parks 89 33 30
Admission to Sporting Events 60 26 23
Fees for Recreational Lessons 145 50 44
Dating Services 0.89 0.50 0.46
Subtotal: 712$ 273$ 248$
TV/Video/Audio
Cable & Satellite TV Services 984$ 497$ 477$
Televisions 131 61 58
Satellite Dishes 2 1 1
VCRs, Video Cameras & DVD Players 6 3 3
Miscellaneous Video Equipment 15 6 6
Video Cassettes & DVDs 14 6 6
Video Game Hardware/Accessories 35 17 17
Video Game Software 18 9 9
Streaming/Downloaded Video 39 16 15
Rental of Video Cassettes & DVDs 14 6 5
Installation of Televisions 0.95 0.29 0.27
Audio 101 41 38
Rental & Repair of TV/Radio/Audio 4 2 2
Subtotal: 1,364$ 665$ 635$
(1) Consumer spending data are derived from the 2015 and 2016 Consumer Expenditure Surveys conducted by
the Bureau of Labor Statistics.
Source: US Department of Labor, Bureau of Labor Market Statistics; ESRI Business Analyst; WTL +a,
September 2018.
WTL+a
WTL +a
R e a l E s t a t e & E c o n o m i c A d v i s o r s
W a s h i n g t o n , D C—P r o v i n c e t o w n , M A
2 0 2 . 8 8 5 . 9 1 2 1 3 0 1 . 5 0 2 . 4 1 7 1 7 7 4 . 5 3 8 . 6 0 7 0 3 5
Table 5 (Continued): Annual Household Consumer Spending, 2018
City of Study Area Study Area
Charlotte North South
Other Entertainment
Pets 621$ 285$ 262$
Toys & Games 125 55 51
Recreational Vehicles & Fees 102 42 37
Sports/Recreation/Exercise Equipment 189 74 66
Photo Equipment & Supplies 58 22 20
Reading 113 49 45
Catered Affairs 29 11 9
Subtotal: 1,237$ 538$ 490$
Food & Alcohol
Food at Home 5,284$ 2,430$ 2,291$
Food Away from Home 3,811 1,614 1,518
Alcoholic & Non-alcoholic Beverages 604 249 233
Subtotal: 9,699$ 4,293$ 4,042$
Household Furnishings & Equipment
Household Textiles 106$ 46$ 44$
Furniture 663 294 277
Floor Coverings 24 11 10
Major Appliances 346 165 151
Housewares 106 47 43
Small Appliances 52 23 22
Luggage 15 6 5
Telephones & Accessories 77 27 26
Lawn & Garden 405 186 167
Housekeeping Supplies 735 341 320
Maintenance & Remodeling Materials 439 200 171
Subtotal: 2,968$ 1,347$ 1,236$
Health & Personal Care
Non- & Prescription Drugs 478$ 247$ 230$
Optical 92 43 39
Personal Care Products 520 224 211
School Supplies 167 69 66
Smoking Products 427 258 250
Subtotal: 1,684$ 841$ 795$
TOTAL:
Total Annual Spending 6,827,183,868$ 22,715,483$ 38,983,640$
Per Household 20,247$ 9,057$ 8,482$
As % of Average HH Income 23.2% 24.2% 24.4%
(1) Consumer spending data are derived from the 2015 and 2016 Consumer Expenditure Surveys conducted by
the Bureau of Labor Statistics.
Source: US Department of Labor, Bureau of Labor Market Statistics; ESRI Business Analyst; WTL +a,
September 2018.
WTL+a
WTL +a
R e a l E s t a t e & E c o n o m i c A d v i s o r s
W a s h i n g t o n , D C—P r o v i n c e t o w n , M A
2 0 2 . 8 8 5 . 9 1 2 1 3 0 1 . 5 0 2 . 4 1 7 1 7 7 4 . 5 3 8 . 6 0 7 0 3 6
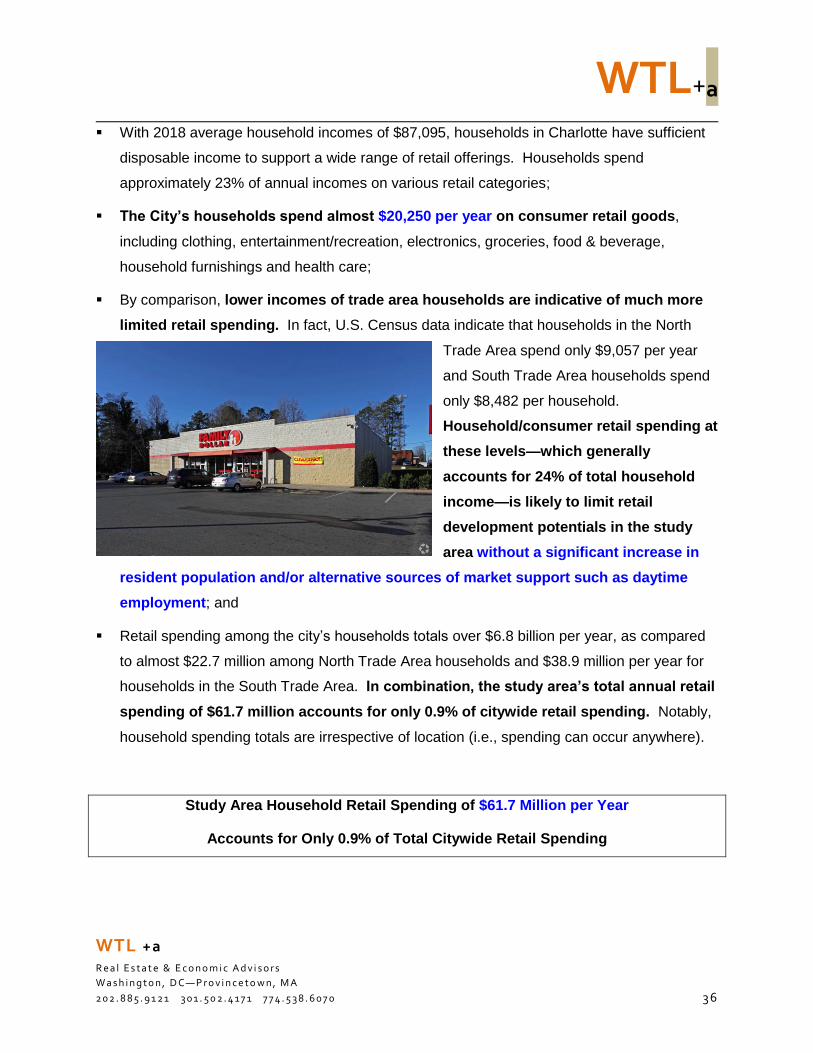
With 2018 average household incomes of $87,095, households in Charlotte have sufficient
disposable income to support a wide range of retail offerings. Households spend
approximately 23% of annual incomes on various retail categories;
The City’s households spend almost $20,250 per year on consumer retail goods,
including clothing, entertainment/recreation, electronics, groceries, food & beverage,
household furnishings and health care;
By comparison, lower incomes of trade area households are indicative of much more
limited retail spending. In fact, U.S. Census data indicate that households in the North
Trade Area spend only $9,057 per year
and South Trade Area households spend
only $8,482 per household.
Household/consumer retail spending at
these levels—which generally
accounts for 24% of total household
income—is likely to limit retail
development potentials in the study
area without a significant increase in
resident population and/or alternative sources of market support such as daytime
employment; and
Retail spending among the city’s households totals over $6.8 billion per year, as compared
to almost $22.7 million among North Trade Area households and $38.9 million per year for
households in the South Trade Area. In combination, the study area’s total annual retail
spending of $61.7 million accounts for only 0.9% of citywide retail spending. Notably,
household spending totals are irrespective of location (i.e., spending can occur anywhere).
Study Area Household Retail Spending of $61.7 Million per Year
Accounts for Only 0.9% of Total Citywide Retail Spending
WTL+a
WTL +a
R e a l E s t a t e & E c o n o m i c A d v i s o r s
W a s h i n g t o n , D C—P r o v i n c e t o w n , M A
2 0 2 . 8 8 5 . 9 1 2 1 3 0 1 . 5 0 2 . 4 1 7 1 7 7 4 . 5 3 8 . 6 0 7 0 3 7
Retail “Recapture” Opportunities
Another key indicator of retail market potentials involves what is known as “retail opportunity
gap”. This compares annual household spending (i.e., “demand”) in specific merchandise
categories against estimated annual retail sales by businesses in those same categories (i.e.,
“supply”). The difference between demand and supply represents the “recapture” opportunity,
or surplus, available in each retail category in the reporting geography.
When demand is greater than supply, there is an apparent opportunity for additional
retail space in that category. By comparison, when demand is less than supply, there is a
surplus of sales in that retail category. That is, a positive value in green (in the table) = a
potential recapture opportunity, while a negative value in red (in the table) = a surplus of sales
among businesses, or an “inflow” of sales from outside of the reporting geography. In Figure 5
below, recapture opportunities (Leakage) among specific merchandise categories are on the
right side of the graph, while inflow sales (Surplus) are illustrated on the left side of the graph.
Numerical findings for the study area are illustrated in Table 6.
Current population densities and household spending power in the study area do not meet
minimum location requirements for commercial grocery stores. Alternatively, the food
cooperative is structured as a community-based non-profit organization and can be created and
operated with additional subsidy in response to these market challenges. In our view, a food
cooperative offers a better approach to address legitimate community food needs without the
burden of commercial grocery store operating economics.
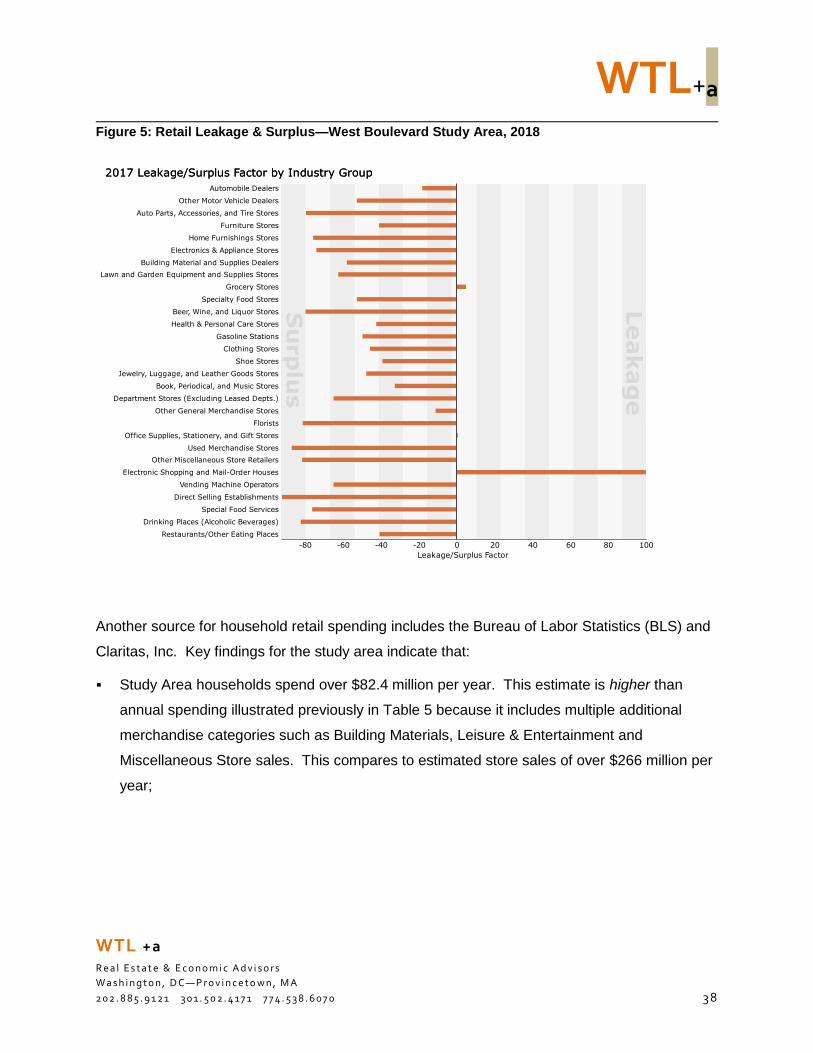
WTL+a
WTL +a
R e a l E s t a t e & E c o n o m i c A d v i s o r s
W a s h i n g t o n , D C—P r o v i n c e t o w n , M A
2 0 2 . 8 8 5 . 9 1 2 1 3 0 1 . 5 0 2 . 4 1 7 1 7 7 4 . 5 3 8 . 6 0 7 0 3 8
Figure 5: Retail Leakage & Surplus—West Boulevard Study Area, 2018
Another source for household retail spending includes the Bureau of Labor Statistics (BLS) and
Claritas, Inc. Key findings for the study area indicate that:
Study Area households spend over $82.4 million per year. This estimate is higher than
annual spending illustrated previously in Table 5 because it includes multiple additional
merchandise categories such as Building Materials, Leisure & Entertainment and
Miscellaneous Store sales. This compares to estimated store sales of over $266 million per
year;
2017 Leakage/Surplus Factor by Industry Group2017 Leakage/Surplus Factor by Industry Group
Restaurants/Other Eating Places
Drinking Places (Alcoholic Beverages)
Special Food Services
Direct Selling Establishments
Vending Machine Operators
Electronic Shopping and Mail-Order Houses
Other Miscellaneous Store Retailers
Used Merchandise Stores
Office Supplies, Stationery, and Gift Stores
Florists
Other General Merchandise Stores
Department Stores (Excluding Leased Depts.)
Book, Periodical, and Music Stores
Jewelry, Luggage, and Leather Goods Stores
Shoe Stores
Clothing Stores
Gasoline Stations
Health & Personal Care Stores
Beer, Wine, and Liquor Stores
Specialty Food Stores
Grocery Stores
Lawn and Garden Equipment and Supplies Stores
Building Material and Supplies Dealers
Electronics & Appliance Stores
Home Furnishings Stores
Furniture Stores
Auto Parts, Accessories, and Tire Stores
Other Motor Vehicle Dealers
Automobile Dealers
Leakage/Surplus Factor
100806040200-20-40-60-80
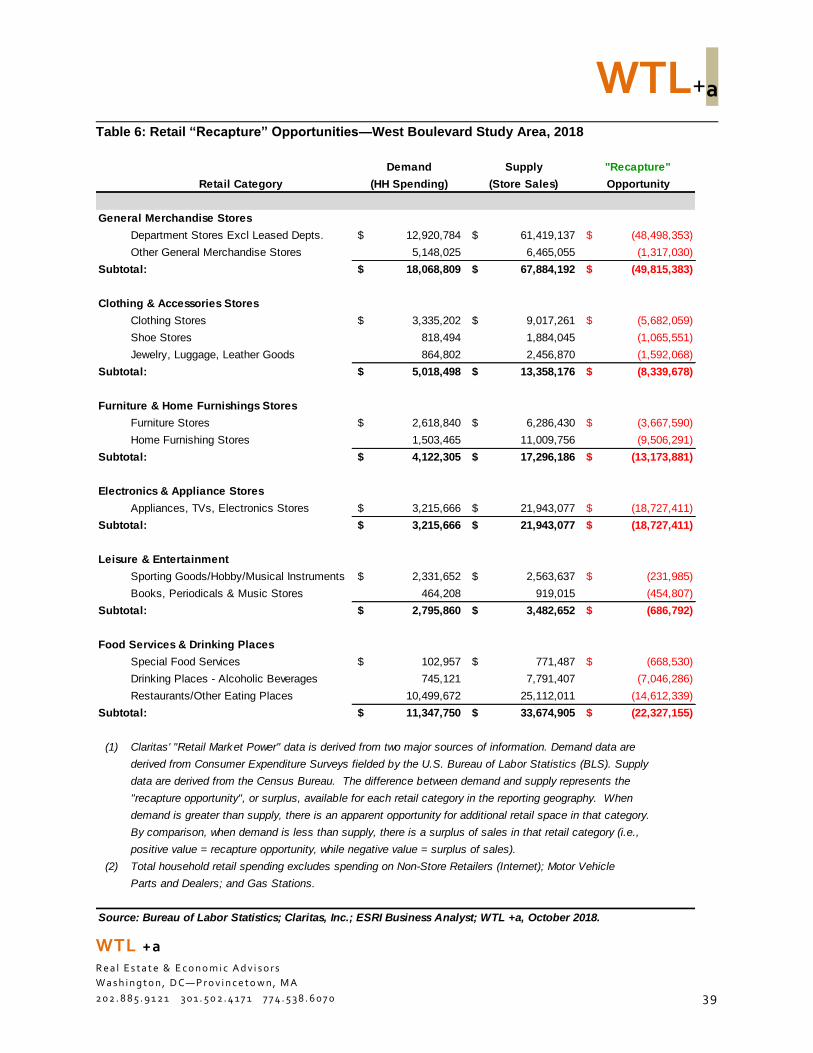
WTL+a
WTL +a
R e a l E s t a t e & E c o n o m i c A d v i s o r s
W a s h i n g t o n , D C—P r o v i n c e t o w n , M A
2 0 2 . 8 8 5 . 9 1 2 1 3 0 1 . 5 0 2 . 4 1 7 1 7 7 4 . 5 3 8 . 6 0 7 0 3 9
Table 6: Retail “Recapture” Opportunities—West Boulevard Study Area, 2018
Demand Supply "Recapture"
Retail Category (HH Spending) (Store Sales) Opportunity
General Merchandise Stores
Department Stores Excl Leased Depts. 12,920,784$ 61,419,137$ (48,498,353)$
Other General Merchandise Stores 5,148,025 6,465,055 (1,317,030)
Subtotal: 18,068,809$ 67,884,192$ (49,815,383)$
Clothing & Accessories Stores
Clothing Stores 3,335,202$ 9,017,261$ (5,682,059)$
Shoe Stores 818,494 1,884,045 (1,065,551)
Jewelry, Luggage, Leather Goods 864,802 2,456,870 (1,592,068)
Subtotal: 5,018,498$ 13,358,176$ (8,339,678)$
Furniture & Home Furnishings Stores
Furniture Stores 2,618,840$ 6,286,430$ (3,667,590)$
Home Furnishing Stores 1,503,465 11,009,756 (9,506,291)
Subtotal: 4,122,305$ 17,296,186$ (13,173,881)$
Electronics & Appliance Stores
Appliances, TVs, Electronics Stores 3,215,666$ 21,943,077$ (18,727,411)$
Subtotal: 3,215,666$ 21,943,077$ (18,727,411)$
Leisure & Entertainment
Sporting Goods/Hobby/Musical Instruments 2,331,652$ 2,563,637$ (231,985)$
Books, Periodicals & Music Stores 464,208 919,015 (454,807)
Subtotal: 2,795,860$ 3,482,652$ (686,792)$
Food Services & Drinking Places
Special Food Services 102,957$ 771,487$ (668,530)$
Drinking Places - Alcoholic Beverages 745,121 7,791,407 (7,046,286)
Restaurants/Other Eating Places 10,499,672 25,112,011 (14,612,339)
Subtotal: 11,347,750$ 33,674,905$ (22,327,155)$
(1) Claritas' "Retail Market Power" data is derived from two major sources of information. Demand data are
derived from Consumer Expenditure Surveys fielded by the U.S. Bureau of Labor Statistics (BLS). Supply
data are derived from the Census Bureau. The difference between demand and supply represents the
"recapture opportunity", or surplus, available for each retail category in the reporting geography. When
demand is greater than supply, there is an apparent opportunity for additional retail space in that category.
By comparison, when demand is less than supply, there is a surplus of sales in that retail category (i.e.,
positive value = recapture opportunity, while negative value = surplus of sales).
(2) Total household retail spending excludes spending on Non-Store Retailers (Internet); Motor Vehicle
Parts and Dealers; and Gas Stations.
Source: Bureau of Labor Statistics; Claritas, Inc.; ESRI Business Analyst; WTL +a, October 2018.
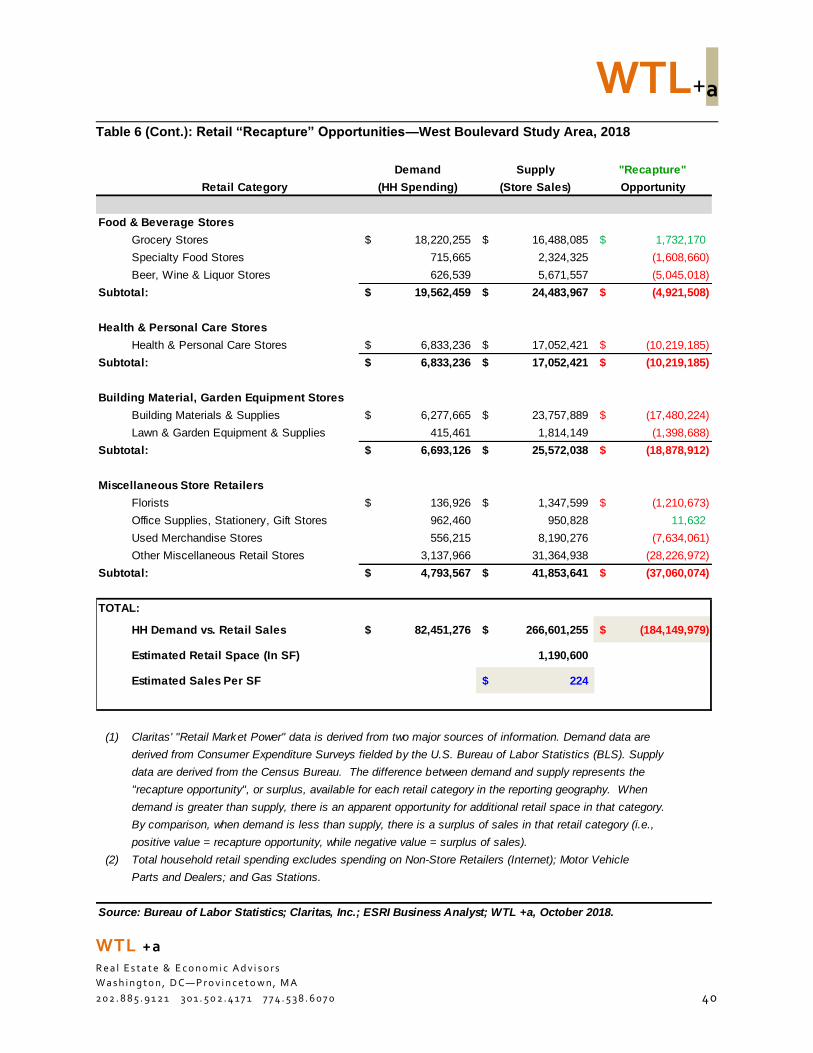
WTL+a
WTL +a
R e a l E s t a t e & E c o n o m i c A d v i s o r s
W a s h i n g t o n , D C—P r o v i n c e t o w n , M A
2 0 2 . 8 8 5 . 9 1 2 1 3 0 1 . 5 0 2 . 4 1 7 1 7 7 4 . 5 3 8 . 6 0 7 0 40
Table 6 (Cont.): Retail “Recapture” Opportunities—West Boulevard Study Area, 2018
Demand Supply "Recapture"
Retail Category (HH Spending) (Store Sales) Opportunity
Food & Beverage Stores
Grocery Stores 18,220,255$ 16,488,085$ 1,732,170$
Specialty Food Stores 715,665 2,324,325 (1,608,660)
Beer, Wine & Liquor Stores 626,539 5,671,557 (5,045,018)
Subtotal: 19,562,459$ 24,483,967$ (4,921,508)$
Health & Personal Care Stores
Health & Personal Care Stores 6,833,236$ 17,052,421$ (10,219,185)$
Subtotal: 6,833,236$ 17,052,421$ (10,219,185)$
Building Material, Garden Equipment Stores
Building Materials & Supplies 6,277,665$ 23,757,889$ (17,480,224)$
Lawn & Garden Equipment & Supplies 415,461 1,814,149 (1,398,688)
Subtotal: 6,693,126$ 25,572,038$ (18,878,912)$
Miscellaneous Store Retailers
Florists 136,926$ 1,347,599$ (1,210,673)$
Office Supplies, Stationery, Gift Stores 962,460 950,828 11,632
Used Merchandise Stores 556,215 8,190,276 (7,634,061)
Other Miscellaneous Retail Stores 3,137,966 31,364,938 (28,226,972)
Subtotal: 4,793,567$ 41,853,641$ (37,060,074)$
TOTAL:
HH Demand vs. Retail Sales 82,451,276$ 266,601,255$ (184,149,979)$
Estimated Retail Space (In SF) 1,190,600
Estimated Sales Per SF 224$
(1) Claritas' "Retail Market Power" data is derived from two major sources of information. Demand data are
derived from Consumer Expenditure Surveys fielded by the U.S. Bureau of Labor Statistics (BLS). Supply
data are derived from the Census Bureau. The difference between demand and supply represents the
"recapture opportunity", or surplus, available for each retail category in the reporting geography. When
demand is greater than supply, there is an apparent opportunity for additional retail space in that category.
By comparison, when demand is less than supply, there is a surplus of sales in that retail category (i.e.,
positive value = recapture opportunity, while negative value = surplus of sales).
(2) Total household retail spending excludes spending on Non-Store Retailers (Internet); Motor Vehicle
Parts and Dealers; and Gas Stations.
Source: Bureau of Labor Statistics; Claritas, Inc.; ESRI Business Analyst; WTL +a, October 2018.
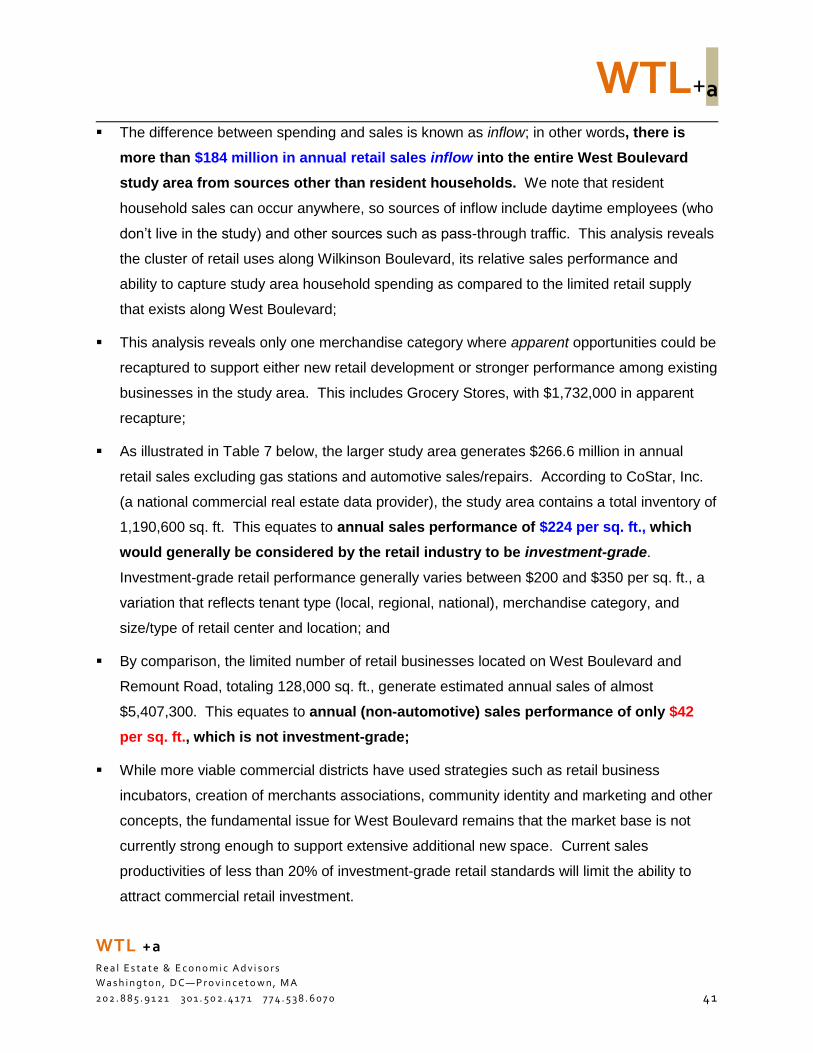
WTL+a
WTL +a
R e a l E s t a t e & E c o n o m i c A d v i s o r s
W a s h i n g t o n , D C—P r o v i n c e t o w n , M A
2 0 2 . 8 8 5 . 9 1 2 1 3 0 1 . 5 0 2 . 4 1 7 1 7 7 4 . 5 3 8 . 6 0 7 0 41
The difference between spending and sales is known as inflow; in other words, there is
more than $184 million in annual retail sales inflow into the entire West Boulevard
study area from sources other than resident households. We note that resident
household sales can occur anywhere, so sources of inflow include daytime employees (who
don’t live in the study) and other sources such as pass-through traffic. This analysis reveals
the cluster of retail uses along Wilkinson Boulevard, its relative sales performance and
ability to capture study area household spending as compared to the limited retail supply
that exists along West Boulevard;
This analysis reveals only one merchandise category where apparent opportunities could be
recaptured to support either new retail development or stronger performance among existing
businesses in the study area. This includes Grocery Stores, with $1,732,000 in apparent
recapture;
As illustrated in Table 7 below, the larger study area generates $266.6 million in annual
retail sales excluding gas stations and automotive sales/repairs. According to CoStar, Inc.
(a national commercial real estate data provider), the study area contains a total inventory of
1,190,600 sq. ft. This equates to annual sales performance of $224 per sq. ft., which
would generally be considered by the retail industry to be investment-grade.
Investment-grade retail performance generally varies between $200 and $350 per sq. ft., a
variation that reflects tenant type (local, regional, national), merchandise category, and
size/type of retail center and location; and
By comparison, the limited number of retail businesses located on West Boulevard and
Remount Road, totaling 128,000 sq. ft., generate estimated annual sales of almost
$5,407,300. This equates to annual (non-automotive) sales performance of only $42
per sq. ft., which is not investment-grade;
While more viable commercial districts have used strategies such as retail business
incubators, creation of merchants associations, community identity and marketing and other
concepts, the fundamental issue for West Boulevard remains that the market base is not
currently strong enough to support extensive additional new space. Current sales
productivities of less than 20% of investment-grade retail standards will limit the ability to
attract commercial retail investment.
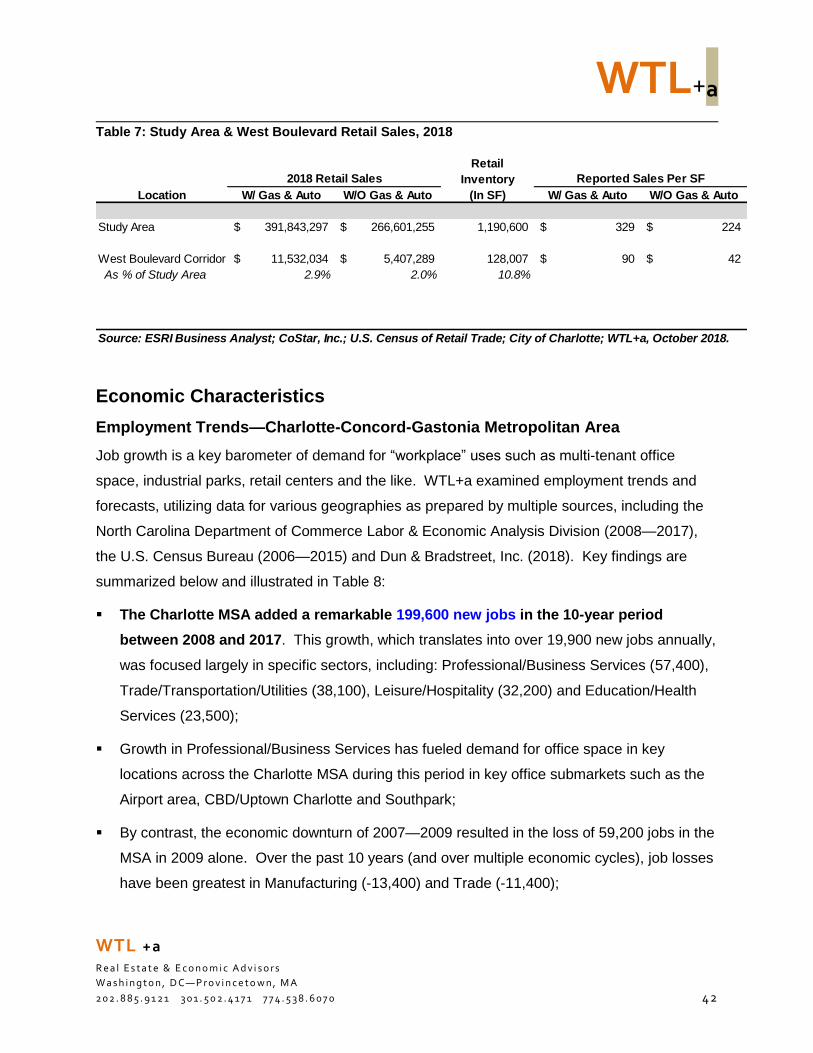
WTL+a
WTL +a
R e a l E s t a t e & E c o n o m i c A d v i s o r s
W a s h i n g t o n , D C—P r o v i n c e t o w n , M A
2 0 2 . 8 8 5 . 9 1 2 1 3 0 1 . 5 0 2 . 4 1 7 1 7 7 4 . 5 3 8 . 6 0 7 0 42
Table 7: Study Area & West Boulevard Retail Sales, 2018
Economic Characteristics
Employment Trends—Charlotte-Concord-Gastonia Metropolitan Area
Job growth is a key barometer of demand for “workplace” uses such as multi-tenant office
space, industrial parks, retail centers and the like. WTL+a examined employment trends and
forecasts, utilizing data for various geographies as prepared by multiple sources, including the
North Carolina Department of Commerce Labor & Economic Analysis Division (2008—2017),
the U.S. Census Bureau (2006—2015) and Dun & Bradstreet, Inc. (2018). Key findings are
summarized below and illustrated in Table 8:
The Charlotte MSA added a remarkable 199,600 new jobs in the 10-year period
between 2008 and 2017. This growth, which translates into over 19,900 new jobs annually,
was focused largely in specific sectors, including: Professional/Business Services (57,400),
Trade/Transportation/Utilities (38,100), Leisure/Hospitality (32,200) and Education/Health
Services (23,500);
Growth in Professional/Business Services has fueled demand for office space in key
locations across the Charlotte MSA during this period in key office submarkets such as the
Airport area, CBD/Uptown Charlotte and Southpark;
By contrast, the economic downturn of 2007—2009 resulted in the loss of 59,200 jobs in the
MSA in 2009 alone. Over the past 10 years (and over multiple economic cycles), job losses
have been greatest in Manufacturing (-13,400) and Trade (-11,400);
Retail
Inventory
Location W/ Gas & Auto W/O Gas & Auto (In SF) W/ Gas & Auto W/O Gas & Auto
Study Area 391,843,297$ 266,601,255$ 1,190,600 329$ 224$
West Boulevard Corridor 11,532,034$ 5,407,289$ 128,007 90$ 42$
As % of Study Area 2.9% 2.0% 10.8%
Source: ESRI Business Analyst; CoStar, Inc.; U.S. Census of Retail Trade; City of Charlotte; WTL+a, October 2018.
2018 Retail Sales Reported Sales Per SF
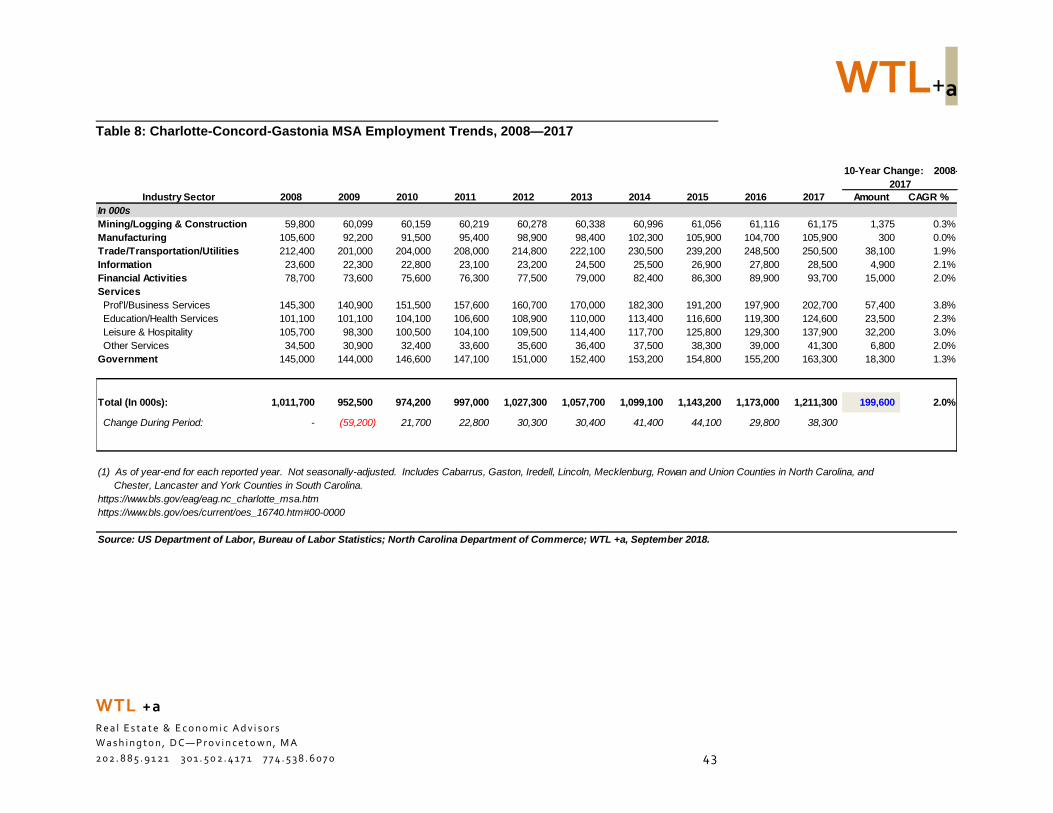
WTL+a
WTL +a
R e a l E s t a t e & E c o n o m i c A d v i s o r s
W a s h i n g t o n , D C—P r o v i n c e t o w n , M A
2 0 2 . 8 8 5 . 9 1 2 1 3 0 1 . 5 0 2 . 4 1 7 1 7 7 4 . 5 3 8 . 6 0 7 0 43
Table 8: Charlotte-Concord-Gastonia MSA Employment Trends, 2008—2017
Industry Sector 2008 2009 2010 2011 2012 2013 2014 2015 2016 2017 Amount CAGR %
In 000s
Mining/Logging & Construction 59,800 60,099 60,159 60,219 60,278 60,338 60,996 61,056 61,116 61,175 1,375 0.3%
Manufacturing 105,600 92,200 91,500 95,400 98,900 98,400 102,300 105,900 104,700 105,900 300 0.0%
Trade/Transportation/Utilities 212,400 201,000 204,000 208,000 214,800 222,100 230,500 239,200 248,500 250,500 38,100 1.9%
Information 23,600 22,300 22,800 23,100 23,200 24,500 25,500 26,900 27,800 28,500 4,900 2.1%
Financial Activities 78,700 73,600 75,600 76,300 77,500 79,000 82,400 86,300 89,900 93,700 15,000 2.0%
Services
Prof'l/Business Services 145,300 140,900 151,500 157,600 160,700 170,000 182,300 191,200 197,900 202,700 57,400 3.8%
Education/Health Services 101,100 101,100 104,100 106,600 108,900 110,000 113,400 116,600 119,300 124,600 23,500 2.3%
Leisure & Hospitality 105,700 98,300 100,500 104,100 109,500 114,400 117,700 125,800 129,300 137,900 32,200 3.0%
Other Services 34,500 30,900 32,400 33,600 35,600 36,400 37,500 38,300 39,000 41,300 6,800 2.0%
Government 145,000 144,000 146,600 147,100 151,000 152,400 153,200 154,800 155,200 163,300 18,300 1.3%
Total (In 000s): 1,011,700 952,500 974,200 997,000 1,027,300 1,057,700 1,099,100 1,143,200 1,173,000 1,211,300 199,600 2.0%
Change During Period: - (59,200) 21,700 22,800 30,300 30,400 41,400 44,100 29,800 38,300
(1) As of year-end for each reported year. Not seasonally-adjusted. Includes Cabarrus, Gaston, Iredell, Lincoln, Mecklenburg, Rowan and Union Counties in North Carolina, and
Chester, Lancaster and York Counties in South Carolina.
https://www.bls.gov/eag/eag.nc_charlotte_msa.htm
https://www.bls.gov/oes/current/oes_16740.htm#00-0000
Source: US Department of Labor, Bureau of Labor Statistics; North Carolina Department of Commerce; WTL +a, September 2018.
10-Year Change: 2008-
2017
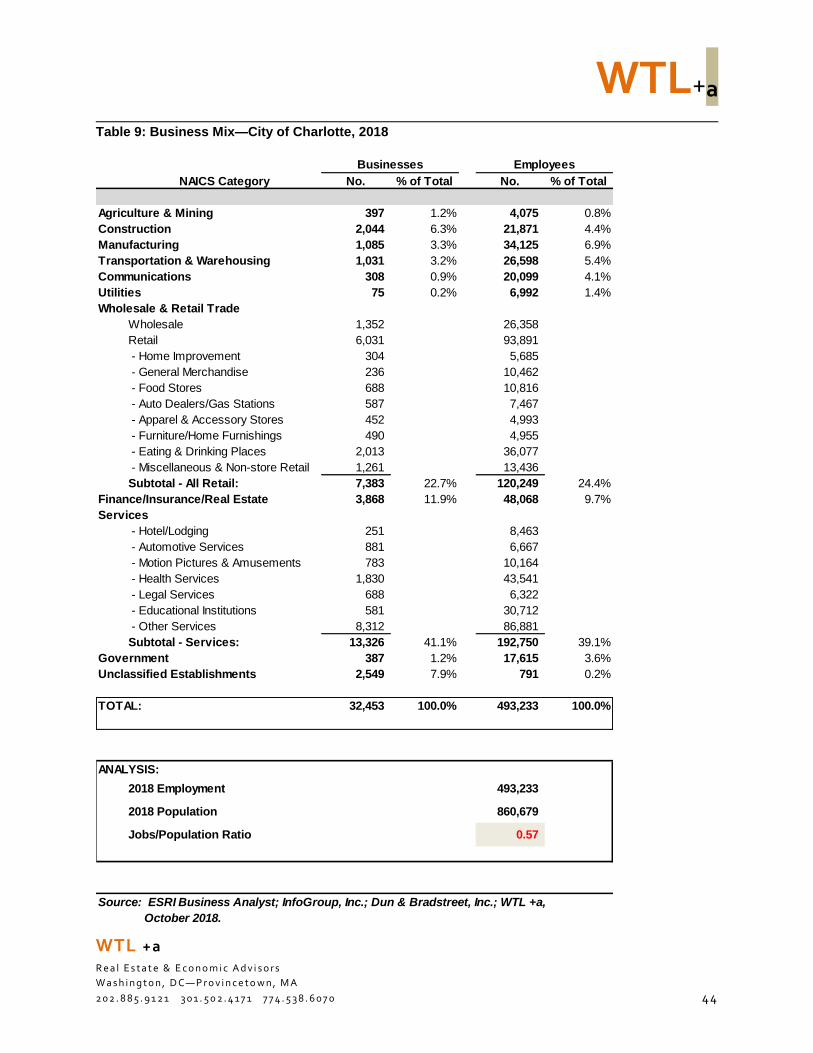
WTL+a
WTL +a
R e a l E s t a t e & E c o n o m i c A d v i s o r s
W a s h i n g t o n , D C—P r o v i n c e t o w n , M A
2 0 2 . 8 8 5 . 9 1 2 1 3 0 1 . 5 0 2 . 4 1 7 1 7 7 4 . 5 3 8 . 6 0 7 0 44
Table 9: Business Mix—City of Charlotte, 2018
NAICS Category No. % of Total No. % of Total
Agriculture & Mining 397 1.2% 4,075 0.8%
Construction 2,044 6.3% 21,871 4.4%
Manufacturing 1,085 3.3% 34,125 6.9%
Transportation & Warehousing 1,031 3.2% 26,598 5.4%
Communications 308 0.9% 20,099 4.1%
Utilities 75 0.2% 6,992 1.4%
Wholesale & Retail Trade
Wholesale 1,352 26,358
Retail 6,031 93,891
- Home Improvement 304 5,685
- General Merchandise 236 10,462
- Food Stores 688 10,816
- Auto Dealers/Gas Stations 587 7,467
- Apparel & Accessory Stores 452 4,993
- Furniture/Home Furnishings 490 4,955
- Eating & Drinking Places 2,013 36,077
- Miscellaneous & Non-store Retail 1,261 13,436
Subtotal - All Retail: 7,383 22.7% 120,249 24.4%
Finance/Insurance/Real Estate 3,868 11.9% 48,068 9.7%
Services
- Hotel/Lodging 251 8,463
- Automotive Services 881 6,667
- Motion Pictures & Amusements 783 10,164
- Health Services 1,830 43,541
- Legal Services 688 6,322
- Educational Institutions 581 30,712
- Other Services 8,312 86,881
Subtotal - Services: 13,326 41.1% 192,750 39.1%
Government 387 1.2% 17,615 3.6%
Unclassified Establishments 2,549 7.9% 791 0.2%
TOTAL: 32,453 100.0% 493,233 100.0%
ANALYSIS:
2018 Employment 493,233
2018 Population 860,679
Jobs/Population Ratio 0.57
Source: ESRI Business Analyst; InfoGroup, Inc.; Dun & Bradstreet, Inc.; WTL +a,
October 2018.
Businesses Employees
WTL+a
WTL +a
R e a l E s t a t e & E c o n o m i c A d v i s o r s
W a s h i n g t o n , D C—P r o v i n c e t o w n , M A
2 0 2 . 8 8 5 . 9 1 2 1 3 0 1 . 5 0 2 . 4 1 7 1 7 7 4 . 5 3 8 . 6 0 7 0 45
In only seven years between 2011 and 2017, however, the economy of the Charlotte MSA
has significantly recovered from the 2007—2009 recession, with the creation of
258,800 new jobs;
(59,200) Recession-based Job Losses
Replaced with 258,800 New Jobs Since 2010
Notably, the Services sector—which comprises multiple categories such as Business and
Professional Services, Health, Education and Leisure/Hospitality, has gained the largest
share of new jobs, exhibiting a net gain of 119,900 new jobs between 2008 and 2017;
As illustrated in Table 9, Dun & Bradstreet, Inc. estimates that the City of Charlotte
contained more than 493,230 full-time jobs in 32,450 registered businesses in 2018,
which reflects a jobs-to-population ratio of 0.57. That is, there is more than one-half a job
for every one of the 860,679 city residents, and reflects the concentration of larger
employment centers such as the CBD/Uptown and the Airport area; and
Employment is concentrated in particular sectors, including Services (39%),
Wholesale/Retail Trade (24%), and Financial Activities (10%).
Employment Trends & Forecasts—"Southwest Prosperity Zone”
Employment forecasts for specific jurisdictions in North Carolina are also prepared by the state’s
Department of Commerce, Labor & Economic Analysis Division in 10-year forecast periods for
specific regions across the state; each region includes a cluster of counties. Mecklenburg
County is in the “Southwest Prosperity Zone”, which includes the following 10 counties: Anson,
Cabarrus, Cleveland, Gaston, Iredell, Lincoln, Mecklenburg, Rowan, Stanly and Union.
As illustrated in Table 10 below, these forecasts suggest that:
The entire Southwest Prosperity Zone is expected to add 186,565 new jobs between
2014 and 2024, reflecting a forecast of almost 18,700 new jobs annually over this 10-year
period; and
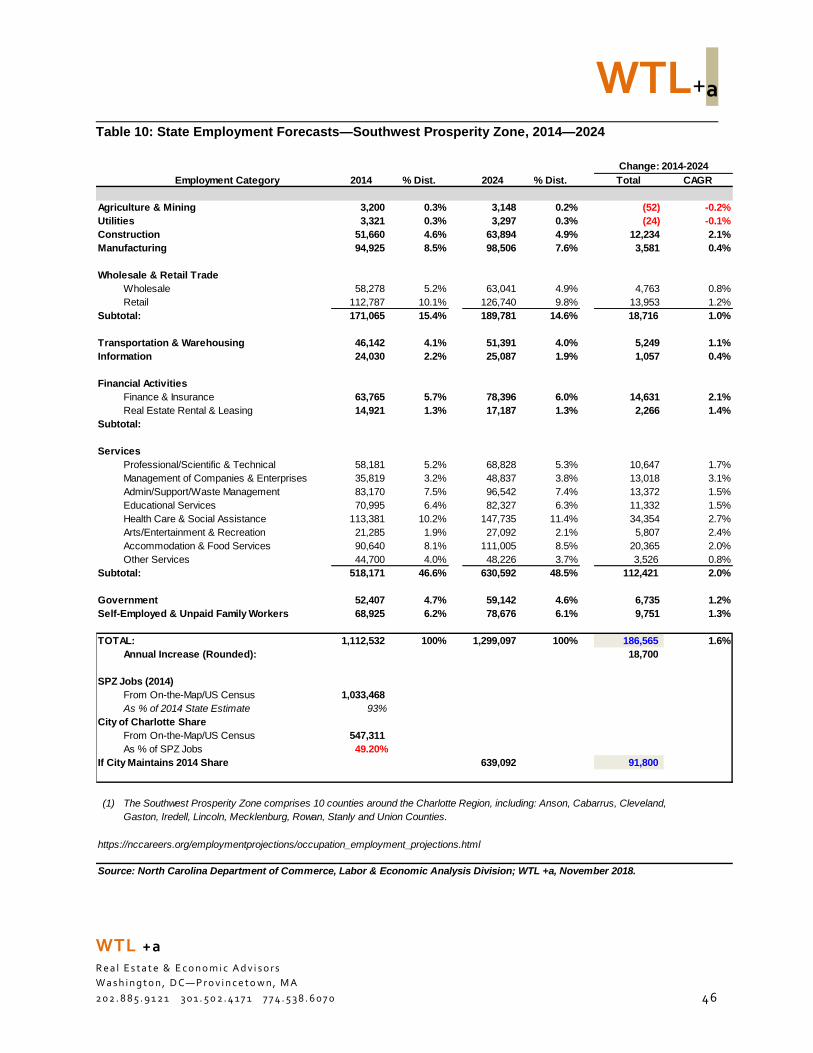
WTL+a
WTL +a
R e a l E s t a t e & E c o n o m i c A d v i s o r s
W a s h i n g t o n , D C—P r o v i n c e t o w n , M A
2 0 2 . 8 8 5 . 9 1 2 1 3 0 1 . 5 0 2 . 4 1 7 1 7 7 4 . 5 3 8 . 6 0 7 0 46
Table 10: State Employment Forecasts—Southwest Prosperity Zone, 2014—2024
Employment Category 2014 % Dist. 2024 % Dist. Total CAGR
Agriculture & Mining 3,200 0.3% 3,148 0.2% (52) -0.2%
Utilities 3,321 0.3% 3,297 0.3% (24) -0.1%
Construction 51,660 4.6% 63,894 4.9% 12,234 2.1%
Manufacturing 94,925 8.5% 98,506 7.6% 3,581 0.4%
Wholesale & Retail Trade
Wholesale 58,278 5.2% 63,041 4.9% 4,763 0.8%
Retail 112,787 10.1% 126,740 9.8% 13,953 1.2%
Subtotal: 171,065 15.4% 189,781 14.6% 18,716 1.0%
Transportation & Warehousing 46,142 4.1% 51,391 4.0% 5,249 1.1%
Information 24,030 2.2% 25,087 1.9% 1,057 0.4%
Financial Activities
Finance & Insurance 63,765 5.7% 78,396 6.0% 14,631 2.1%
Real Estate Rental & Leasing 14,921 1.3% 17,187 1.3% 2,266 1.4%
Subtotal:
Services
Professional/Scientific & Technical 58,181 5.2% 68,828 5.3% 10,647 1.7%
Management of Companies & Enterprises 35,819 3.2% 48,837 3.8% 13,018 3.1%
Admin/Support/Waste Management 83,170 7.5% 96,542 7.4% 13,372 1.5%
Educational Services 70,995 6.4% 82,327 6.3% 11,332 1.5%
Health Care & Social Assistance 113,381 10.2% 147,735 11.4% 34,354 2.7%
Arts/Entertainment & Recreation 21,285 1.9% 27,092 2.1% 5,807 2.4%
Accommodation & Food Services 90,640 8.1% 111,005 8.5% 20,365 2.0%
Other Services 44,700 4.0% 48,226 3.7% 3,526 0.8%
Subtotal: 518,171 46.6% 630,592 48.5% 112,421 2.0%
Government 52,407 4.7% 59,142 4.6% 6,735 1.2%
Self-Employed & Unpaid Family Workers 68,925 6.2% 78,676 6.1% 9,751 1.3%
TOTAL: 1,112,532 100% 1,299,097 100% 186,565 1.6%
Annual Increase (Rounded): 18,700
SPZ Jobs (2014)
From On-the-Map/US Census 1,033,468
As % of 2014 State Estimate 93%
City of Charlotte Share
From On-the-Map/US Census 547,311
As % of SPZ Jobs 49.20%
If City Maintains 2014 Share 639,092 91,800
(1) The Southwest Prosperity Zone comprises 10 counties around the Charlotte Region, including: Anson, Cabarrus, Cleveland,
Gaston, Iredell, Lincoln, Mecklenburg, Rowan, Stanly and Union Counties.
https://nccareers.org/employmentprojections/occupation_employment_projections.html
Source: North Carolina Department of Commerce, Labor & Economic Analysis Division; WTL +a, November 2018.
Change: 2014-2024
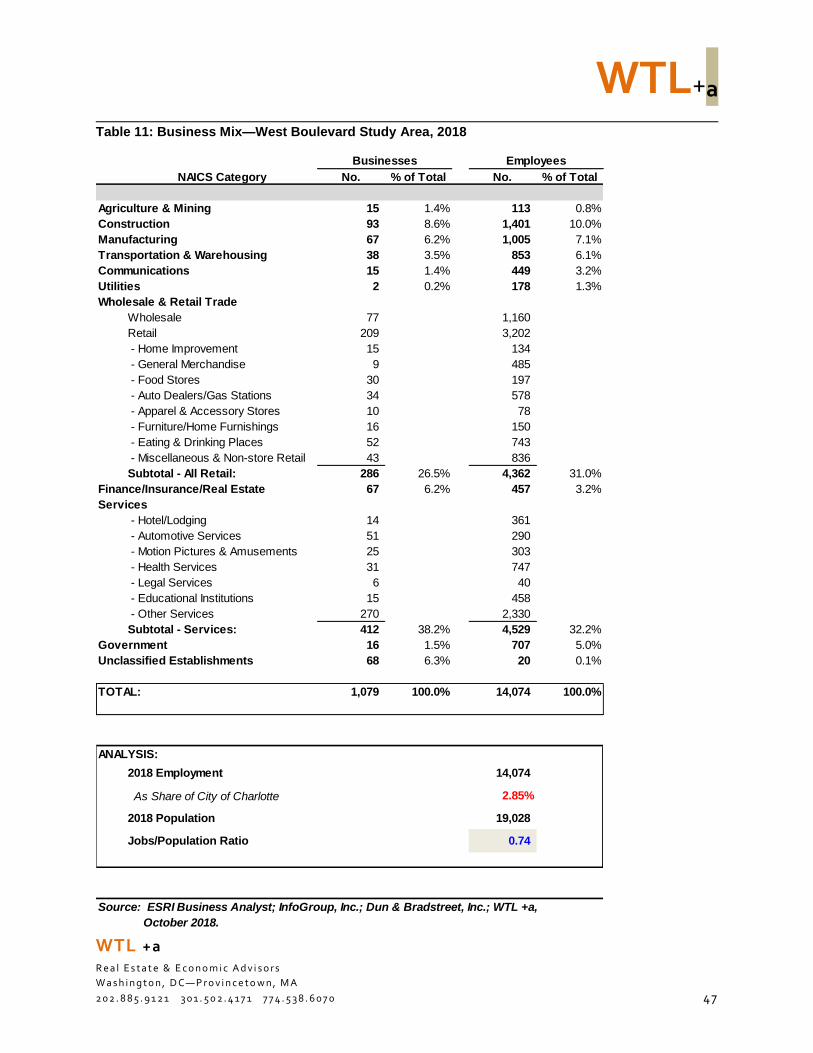
WTL+a
WTL +a
R e a l E s t a t e & E c o n o m i c A d v i s o r s
W a s h i n g t o n , D C—P r o v i n c e t o w n , M A
2 0 2 . 8 8 5 . 9 1 2 1 3 0 1 . 5 0 2 . 4 1 7 1 7 7 4 . 5 3 8 . 6 0 7 0 47
Table 11: Business Mix—West Boulevard Study Area, 2018
NAICS Category No. % of Total No. % of Total
Agriculture & Mining 15 1.4% 113 0.8%
Construction 93 8.6% 1,401 10.0%
Manufacturing 67 6.2% 1,005 7.1%
Transportation & Warehousing 38 3.5% 853 6.1%
Communications 15 1.4% 449 3.2%
Utilities 2 0.2% 178 1.3%
Wholesale & Retail Trade
Wholesale 77 1,160
Retail 209 3,202
- Home Improvement 15 134
- General Merchandise 9 485
- Food Stores 30 197
- Auto Dealers/Gas Stations 34 578
- Apparel & Accessory Stores 10 78
- Furniture/Home Furnishings 16 150
- Eating & Drinking Places 52 743
- Miscellaneous & Non-store Retail 43 836
Subtotal - All Retail: 286 26.5% 4,362 31.0%
Finance/Insurance/Real Estate 67 6.2% 457 3.2%
Services
- Hotel/Lodging 14 361
- Automotive Services 51 290
- Motion Pictures & Amusements 25 303
- Health Services 31 747
- Legal Services 6 40
- Educational Institutions 15 458
- Other Services 270 2,330
Subtotal - Services: 412 38.2% 4,529 32.2%
Government 16 1.5% 707 5.0%
Unclassified Establishments 68 6.3% 20 0.1%
TOTAL: 1,079 100.0% 14,074 100.0%
ANALYSIS:
2018 Employment 14,074
As Share of City of Charlotte 2.85%
2018 Population 19,028
Jobs/Population Ratio 0.74
Source: ESRI Business Analyst; InfoGroup, Inc.; Dun & Bradstreet, Inc.; WTL +a,
October 2018.
Businesses Employees
WTL+a
WTL +a
R e a l E s t a t e & E c o n o m i c A d v i s o r s
W a s h i n g t o n , D C—P r o v i n c e t o w n , M A
2 0 2 . 8 8 5 . 9 1 2 1 3 0 1 . 5 0 2 . 4 1 7 1 7 7 4 . 5 3 8 . 6 0 7 0 48
In order to determine the share of future jobs for the City of Charlotte, WTL+a utilized the
city’s 2014 share of the Southwest Prosperity Zone’s total jobs based on employment data
from On-the-Map, prepared by the U.S. Census Bureau. Based on this data, the city
contained 547,311 jobs in 2014, or 49.2% of the SPZ’s total jobs. If the City of Charlotte
maintains its 49.2% share in 2024 would translate into 91,800 new jobs over the
forecast period.
Employment Trends—West Boulevard Study Area
As illustrated in Table 11 above, Dun & Bradstreet, Inc. estimates that there are 14,074 jobs
in 1,079 registered businesses in the study area. The study area accounts for
approximately 2.85% of the 493,230 full-time jobs in the City of Charlotte;
The two largest sectors generating demand for “workplace” real estate in the study area
include: Wholesale/Retail Trade (4,362 jobs, or 31%) and Services (4,529 jobs, or 32%).
Within Services, “Other Services” accounts for fully 51% of the total (2,330 jobs). Together,
these sectors account for 63% of the 14,074 jobs in the study area. “Other Services”
includes such industries as automotive repair and maintenance, which are prominent along
the West Boulevard corridor;
As noted, the study area contains 2.85% of all at-place jobs in the City of Charlotte.
This is known as fair share, and has been considered in our analysis of workplace market
potentials in Section 4 of this report;
Fair Share:
West Boulevard Study Area Accounts for
2.85% of the City’s Total Jobs
The data also suggest that the study area’s current jobs-to-population ratio is 0.74 (i.e.,
there is three-quarters of a job for the 19,028 residents living in the study area). This is
higher than the City’s ratio (0.57) and reflects a diverse business mix and concentration of
businesses along commercial corridors such as Wilkinson Boulevard, and in office/business
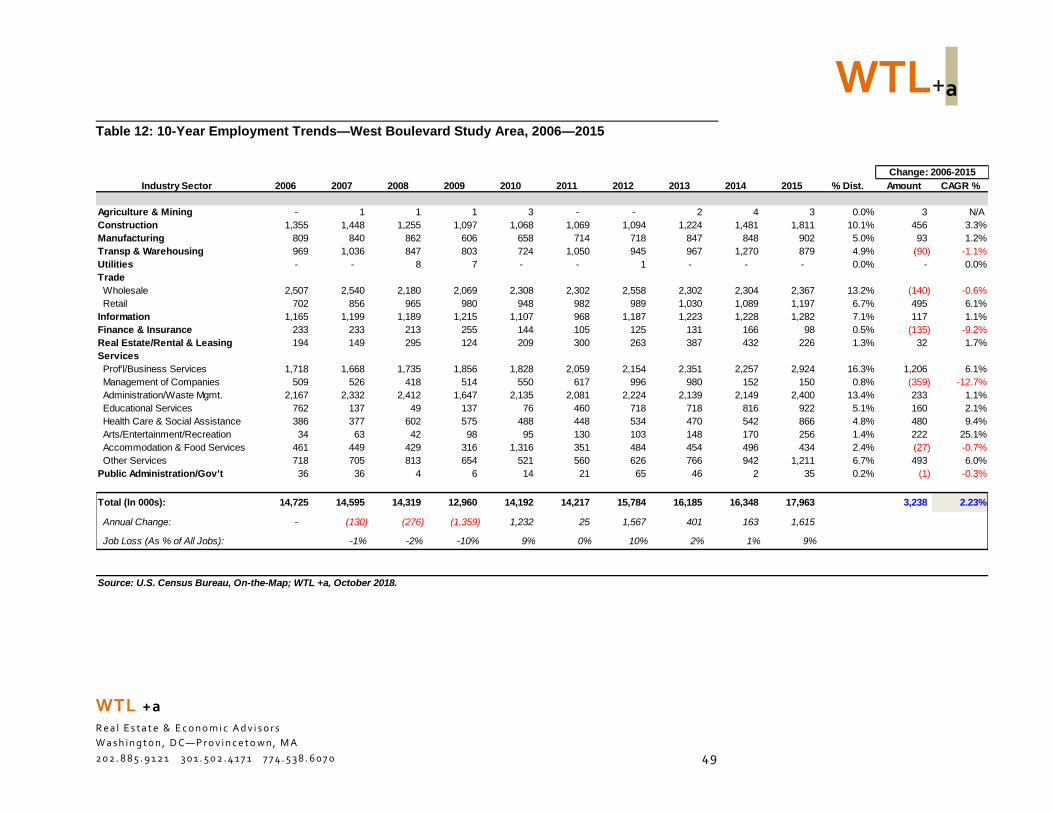
WTL+a
WTL +a
R e a l E s t a t e & E c o n o m i c A d v i s o r s
W a s h i n g t o n , D C—P r o v i n c e t o w n , M A
2 0 2 . 8 8 5 . 9 1 2 1 3 0 1 . 5 0 2 . 4 1 7 1 7 7 4 . 5 3 8 . 6 0 7 0 49
Table 12: 10-Year Employment Trends—West Boulevard Study Area, 2006—2015
Industry Sector 2006 2007 2008 2009 2010 2011 2012 2013 2014 2015 % Dist. Amount CAGR %
Agriculture & Mining - 1 1 1 3 - - 2 4 3 0.0% 3 N/A
Construction 1,355 1,448 1,255 1,097 1,068 1,069 1,094 1,224 1,481 1,811 10.1% 456 3.3%
Manufacturing 809 840 862 606 658 714 718 847 848 902 5.0% 93 1.2%
Transp & Warehousing 969 1,036 847 803 724 1,050 945 967 1,270 879 4.9% (90) -1.1%
Utilities - - 8 7 - - 1 - - - 0.0% - 0.0%
Trade
Wholesale 2,507 2,540 2,180 2,069 2,308 2,302 2,558 2,302 2,304 2,367 13.2% (140) -0.6%
Retail 702 856 965 980 948 982 989 1,030 1,089 1,197 6.7% 495 6.1%
Information 1,165 1,199 1,189 1,215 1,107 968 1,187 1,223 1,228 1,282 7.1% 117 1.1%
Finance & Insurance 233 233 213 255 144 105 125 131 166 98 0.5% (135) -9.2%
Real Estate/Rental & Leasing 194 149 295 124 209 300 263 387 432 226 1.3% 32 1.7%
Services
Prof'l/Business Services 1,718 1,668 1,735 1,856 1,828 2,059 2,154 2,351 2,257 2,924 16.3% 1,206 6.1%
Management of Companies 509 526 418 514 550 617 996 980 152 150 0.8% (359) -12.7%
Administration/Waste Mgmt. 2,167 2,332 2,412 1,647 2,135 2,081 2,224 2,139 2,149 2,400 13.4% 233 1.1%
Educational Services 762 137 49 137 76 460 718 718 816 922 5.1% 160 2.1%
Health Care & Social Assistance 386 377 602 575 488 448 534 470 542 866 4.8% 480 9.4%
Arts/Entertainment/Recreation 34 63 42 98 95 130 103 148 170 256 1.4% 222 25.1%
Accommodation & Food Services 461 449 429 316 1,316 351 484 454 496 434 2.4% (27) -0.7%
Other Services 718 705 813 654 521 560 626 766 942 1,211 6.7% 493 6.0%
Public Administration/Gov't 36 36 4 6 14 21 65 46 2 35 0.2% (1) -0.3%
Total (In 000s): 14,725 14,595 14,319 12,960 14,192 14,217 15,784 16,185 16,348 17,963 3,238 2.23%
Annual Change: - (130) (276) (1,359) 1,232 25 1,567 401 163 1,615
Job Loss (As % of All Jobs): -1% -2% -10% 9% 0% 10% 2% 1% 9%
Source: U.S. Census Bureau, On-the-Map; WTL +a, October 2018.
Change: 2006-2015
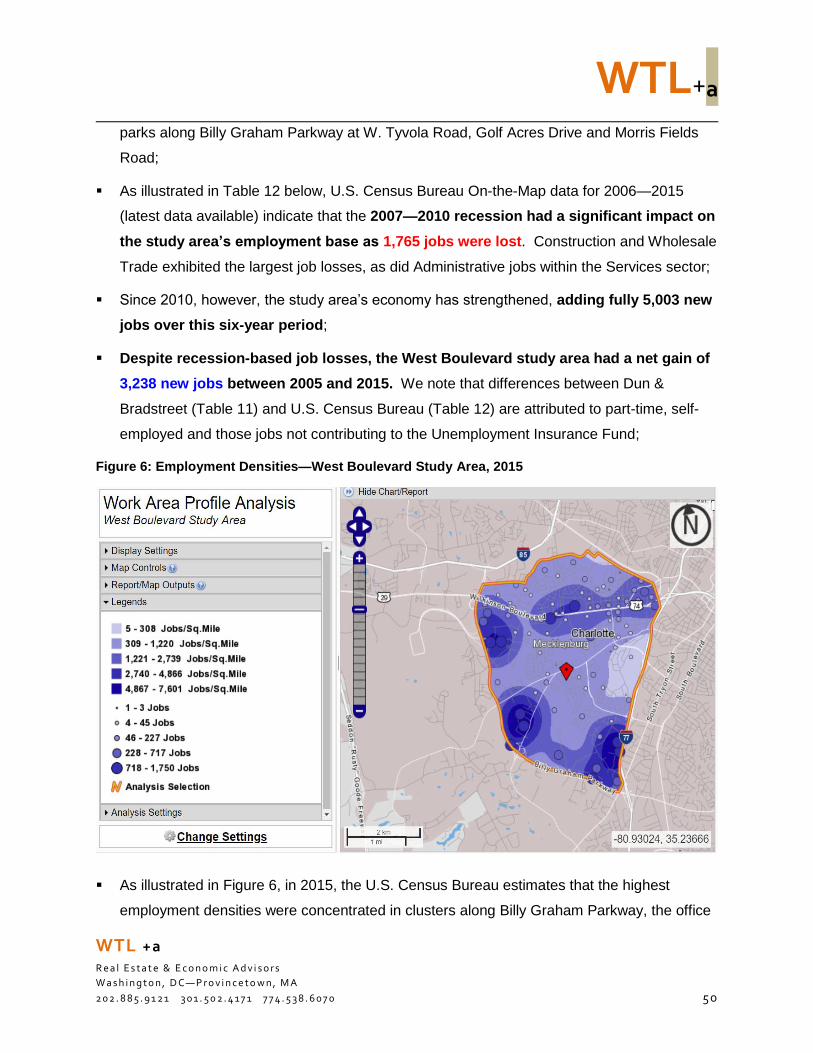
WTL+a
WTL +a
R e a l E s t a t e & E c o n o m i c A d v i s o r s
W a s h i n g t o n , D C—P r o v i n c e t o w n , M A
2 0 2 . 8 8 5 . 9 1 2 1 3 0 1 . 5 0 2 . 4 1 7 1 7 7 4 . 5 3 8 . 6 0 7 0 50
parks along Billy Graham Parkway at W. Tyvola Road, Golf Acres Drive and Morris Fields
Road;
As illustrated in Table 12 below, U.S. Census Bureau On-the-Map data for 2006—2015
(latest data available) indicate that the 2007—2010 recession had a significant impact on
the study area’s employment base as 1,765 jobs were lost. Construction and Wholesale
Trade exhibited the largest job losses, as did Administrative jobs within the Services sector;
Since 2010, however, the study area’s economy has strengthened, adding fully 5,003 new
jobs over this six-year period;
Despite recession-based job losses, the West Boulevard study area had a net gain of
3,238 new jobs between 2005 and 2015. We note that differences between Dun &
Bradstreet (Table 11) and U.S. Census Bureau (Table 12) are attributed to part-time, self-
employed and those jobs not contributing to the Unemployment Insurance Fund;
Figure 6: Employment Densities—West Boulevard Study Area, 2015
As illustrated in Figure 6, in 2015, the U.S. Census Bureau estimates that the highest
employment densities were concentrated in clusters along Billy Graham Parkway, the office
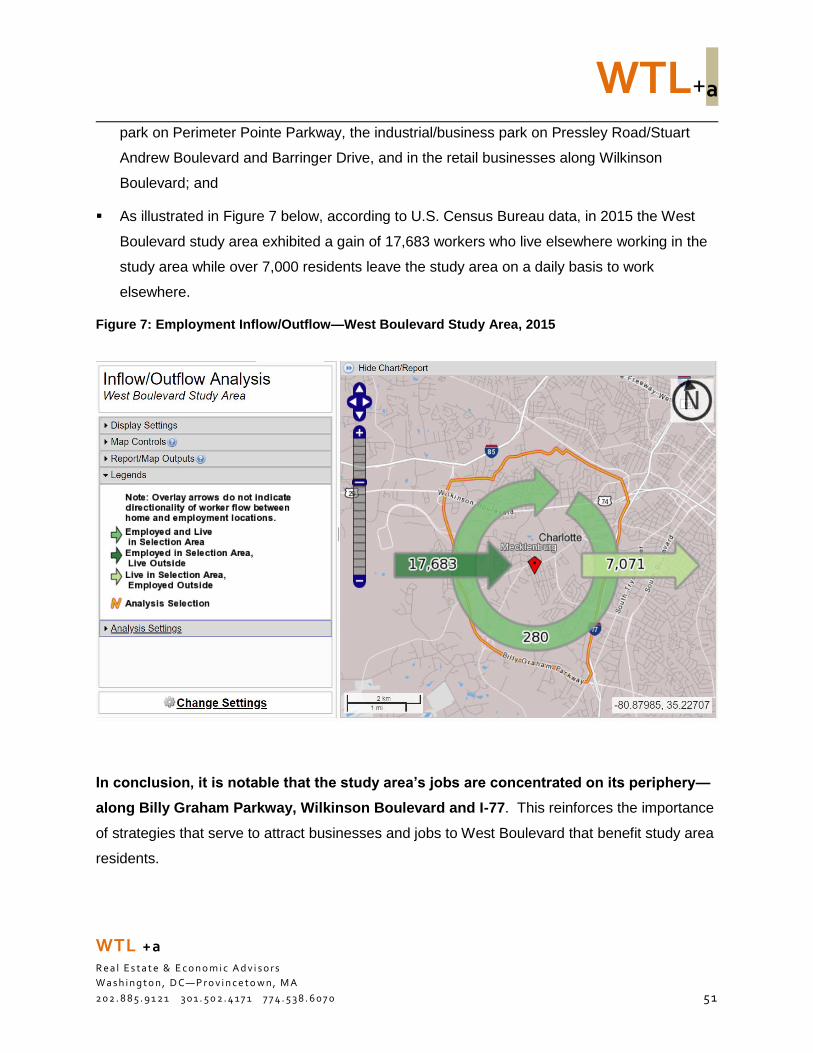
WTL+a
WTL +a
R e a l E s t a t e & E c o n o m i c A d v i s o r s
W a s h i n g t o n , D C—P r o v i n c e t o w n , M A
2 0 2 . 8 8 5 . 9 1 2 1 3 0 1 . 5 0 2 . 4 1 7 1 7 7 4 . 5 3 8 . 6 0 7 0 51
park on Perimeter Pointe Parkway, the industrial/business park on Pressley Road/Stuart
Andrew Boulevard and Barringer Drive, and in the retail businesses along Wilkinson
Boulevard; and
As illustrated in Figure 7 below, according to U.S. Census Bureau data, in 2015 the West
Boulevard study area exhibited a gain of 17,683 workers who live elsewhere working in the
study area while over 7,000 residents leave the study area on a daily basis to work
elsewhere.
Figure 7: Employment Inflow/Outflow—West Boulevard Study Area, 2015
In conclusion, it is notable that the study area’s jobs are concentrated on its periphery—
along Billy Graham Parkway, Wilkinson Boulevard and I-77. This reinforces the importance
of strategies that serve to attract businesses and jobs to West Boulevard that benefit study area
residents.
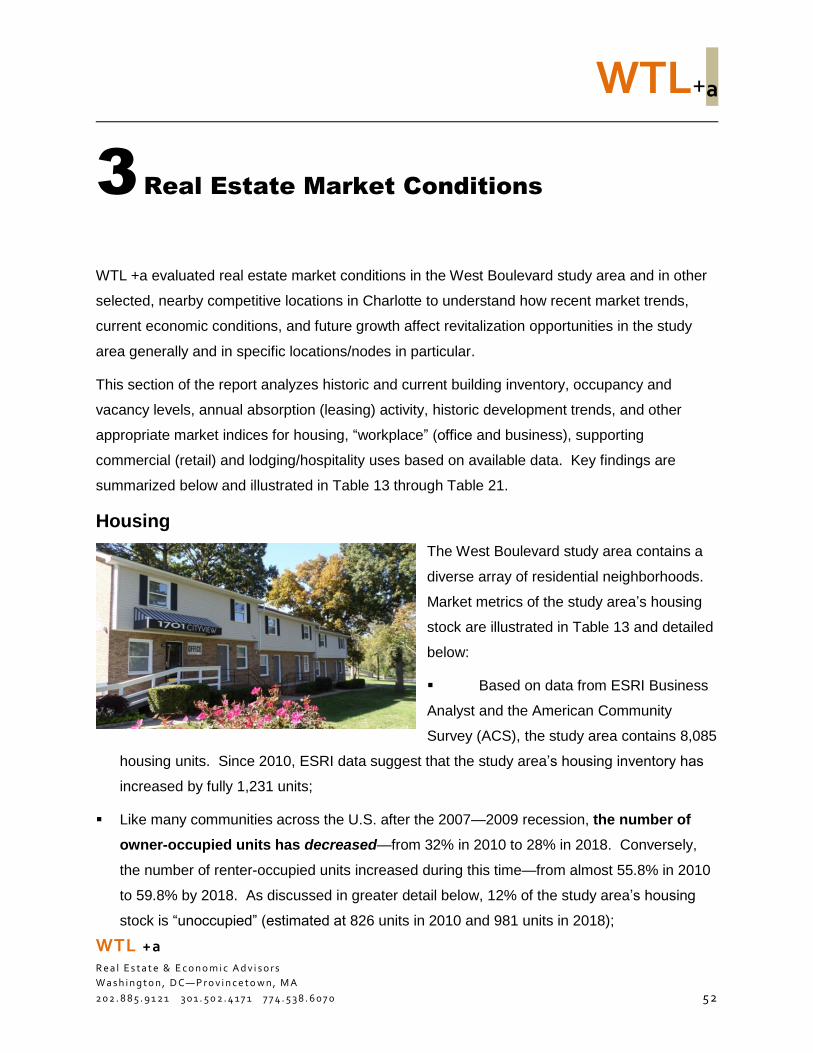
WTL+a
WTL +a
R e a l E s t a t e & E c o n o m i c A d v i s o r s
W a s h i n g t o n , D C—P r o v i n c e t o w n , M A
2 0 2 . 8 8 5 . 9 1 2 1 3 0 1 . 5 0 2 . 4 1 7 1 7 7 4 . 5 3 8 . 6 0 7 0 52
3 Real Estate Market Conditions
WTL +a evaluated real estate market conditions in the West Boulevard study area and in other
selected, nearby competitive locations in Charlotte to understand how recent market trends,
current economic conditions, and future growth affect revitalization opportunities in the study
area generally and in specific locations/nodes in particular.
This section of the report analyzes historic and current building inventory, occupancy and
vacancy levels, annual absorption (leasing) activity, historic development trends, and other
appropriate market indices for housing, “workplace” (office and business), supporting
commercial (retail) and lodging/hospitality uses based on available data. Key findings are
summarized below and illustrated in Table 13 through Table 21.
Housing
The West Boulevard study area contains a
diverse array of residential neighborhoods.
Market metrics of the study area’s housing
stock are illustrated in Table 13 and detailed
below:
Based on data from ESRI Business
Analyst and the American Community
Survey (ACS), the study area contains 8,085
housing units. Since 2010, ESRI data suggest that the study area’s housing inventory has
increased by fully 1,231 units;
Like many communities across the U.S. after the 2007—2009 recession, the number of
owner-occupied units has decreased—from 32% in 2010 to 28% in 2018. Conversely,
the number of renter-occupied units increased during this time—from almost 55.8% in 2010
to 59.8% by 2018. As discussed in greater detail below, 12% of the study area’s housing
stock is “unoccupied” (estimated at 826 units in 2010 and 981 units in 2018);
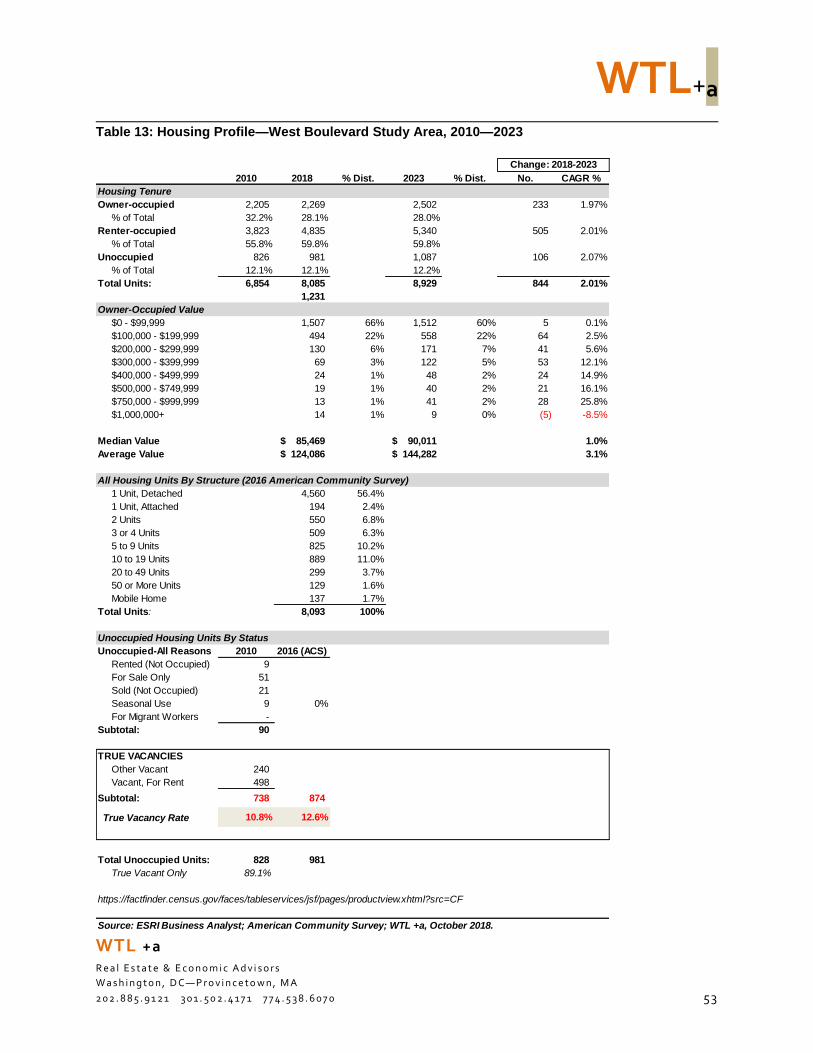
WTL+a
WTL +a
R e a l E s t a t e & E c o n o m i c A d v i s o r s
W a s h i n g t o n , D C—P r o v i n c e t o w n , M A
2 0 2 . 8 8 5 . 9 1 2 1 3 0 1 . 5 0 2 . 4 1 7 1 7 7 4 . 5 3 8 . 6 0 7 0 53
Table 13: Housing Profile—West Boulevard Study Area, 2010—2023
2010 2018 % Dist. 2023 % Dist. No. CAGR %
Housing Tenure
Owner-occupied 2,205 2,269 2,502 233 1.97%
% of Total 32.2% 28.1% 28.0%
Renter-occupied 3,823 4,835 5,340 505 2.01%
% of Total 55.8% 59.8% 59.8%
Unoccupied 826 981 1,087 106 2.07%
% of Total 12.1% 12.1% 12.2%
Total Units: 6,854 8,085 8,929 844 2.01%
1,231
Owner-Occupied Value
$0 - $99,999 1,507 66% 1,512 60% 5 0.1%
$100,000 - $199,999 494 22% 558 22% 64 2.5%
$200,000 - $299,999 130 6% 171 7% 41 5.6%
$300,000 - $399,999 69 3% 122 5% 53 12.1%
$400,000 - $499,999 24 1% 48 2% 24 14.9%
$500,000 - $749,999 19 1% 40 2% 21 16.1%
$750,000 - $999,999 13 1% 41 2% 28 25.8%
$1,000,000+ 14 1% 9 0% (5) -8.5%
Median Value 85,469$ 90,011$ 1.0%
Average Value 124,086$ 144,282$ 3.1%
All Housing Units By Structure (2016 American Community Survey)
1 Unit, Detached 4,560 56.4%
1 Unit, Attached 194 2.4%
2 Units 550 6.8%
3 or 4 Units 509 6.3%
5 to 9 Units 825 10.2%
10 to 19 Units 889 11.0%
20 to 49 Units 299 3.7%
50 or More Units 129 1.6%
Mobile Home 137 1.7%
Total Units: 8,093 100%
Unoccupied Housing Units By Status
Unoccupied-All Reasons 2010 2016 (ACS)
Rented (Not Occupied) 9
For Sale Only 51
Sold (Not Occupied) 21
Seasonal Use 9 0%
For Migrant Workers -
Subtotal: 90
TRUE VACANCIES
Other Vacant 240
Vacant, For Rent 498
Subtotal: 738 874
True Vacancy Rate 10.8% 12.6%
Total Unoccupied Units: 828 981
True Vacant Only 89.1%
https://factfinder.census.gov/faces/tableservices/jsf/pages/productview.xhtml?src=CF
Source: ESRI Business Analyst; American Community Survey; WTL +a, October 2018.
Change: 2018-2023
WTL+a
WTL +a
R e a l E s t a t e & E c o n o m i c A d v i s o r s
W a s h i n g t o n , D C—P r o v i n c e t o w n , M A
2 0 2 . 8 8 5 . 9 1 2 1 3 0 1 . 5 0 2 . 4 1 7 1 7 7 4 . 5 3 8 . 6 0 7 0 54
The average unit value of all housing units in the study area in 2018 is slightly more than
$124,000. Over the next five years, ESRI forecasts suggest that average housing values in
the study area will increase at a nominal compound annual rate of 3.1% per year—to almost
$144,300;
More specific analysis of the study area’s unoccupied housing stock indicates that units are
unoccupied for various reasons. As a result, this does not accurately reflect actual vacant
units. Based on U.S. Census data, 826 units were unoccupied in 2010. While recovery
from the 2007—2009 recession gained momentum in many housing markets, in the West
Boulevard study area the number of unoccupied units actually increased between 2010
and 2018—from 826 units in 2010 to 981 units in 2018;
The number of unoccupied units includes nine “seasonally-owned” (i.e., as defined by the
Census Bureau, occupied for only a portion of the year) as well as 81 unoccupied units that
have been sold, rented or for-sale and are not yet occupied. When such units are removed
from the unoccupied category, the study area’s true vacancy in 2010 was lower—10.8%
(738 units). The 2016 American Community Survey (ACS) suggests that the number of
truly vacant units has increased—to 874 units in 2016, revealing a true vacancy rate of
12.6%. These findings reinforce appropriate strategies designed to reduce the study area’s
vacant housing stock and increase homeownership opportunities; and
ACS data reveal that the study area’s housing stock consists of a diverse array of housing
types. This includes single-family attached and detached (58.4%) and multi-family units
(39.6%). In addition, another 1.7% of the study area’s housing stock, or 137 units, consists
of mobile homes.
WTL+a
WTL +a
R e a l E s t a t e & E c o n o m i c A d v i s o r s
W a s h i n g t o n , D C—P r o v i n c e t o w n , M A
2 0 2 . 8 8 5 . 9 1 2 1 3 0 1 . 5 0 2 . 4 1 7 1 7 7 4 . 5 3 8 . 6 0 7 0 55
Housing Starts
To document how population and household growth affects market potentials for new housing in
the West Boulevard study area, WTL+a reviewed information on annual housing
starts/residential building permits. This analysis also compares housing starts to household
growth to understand whether the pace of one metric is consistent with (or exceeds) the other.
Housing starts for the 10-year period between 2008 and 2017 are illustrated in Table 14 below.
Key findings indicate that:
Since the 2007-2009 recession and subsequent recovery and economic momentum,
housing starts across Mecklenburg County resulted in delivery of 71,601 new housing units,
producing a sustained annual pace of 7,160 units per year. According to data from the
U.S. Department of Housing & Urban Development (HUD), this includes 32,588 single-
family units (46% of the total) and 39,013 multi-family units (54% of the total);
Based on data from the City and ESRI (May 2019), there were 61,371 units built in the City
of Charlotte in the 11 years between 2008 and 2018, resulting in a sustained annual pace of
5,579 units per year. This equates to a sustained average annual increase in citywide
housing stock of 1.6% per year (17.5% total);
Using both City and new ESRI data (May 2019), between 2008 and 2018 there were 1,265
housing starts in 10 neighborhoods roughly coinciding with the West Boulevard
study area, equating to a sustained annual pace of 115 units per year. This equates to
a sustained average annual increase in study area housing stock of 1.7% per year (18.5%
total), reflecting a rate of growth slightly higher than the city as a whole. This includes:
o Few new “infill” units in Clanton Park and Revolution Park
o Scattered units built in various neighborhoods such as Westerly Hills and Arbor
Glen/Reid Park, and
o Larger new residential developments in Bryant Park and Marsh Estates (north of
Wilkinson Boulevard) and the Residences at Renaissance, a Hope VI development,
with 477 new units delivered between 2014 and 2016, located at the intersection of
West Boulevard and Billy Graham Parkway
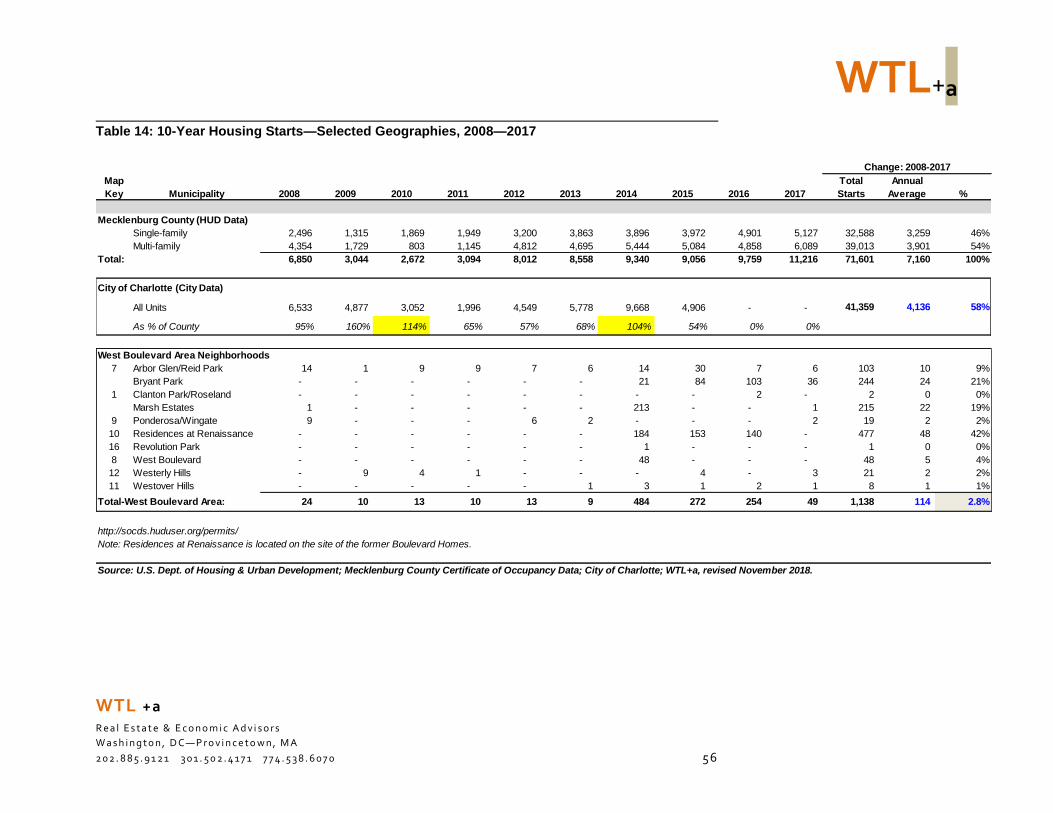
WTL+a
WTL +a
R e a l E s t a t e & E c o n o m i c A d v i s o r s
W a s h i n g t o n , D C—P r o v i n c e t o w n , M A
2 0 2 . 8 8 5 . 9 1 2 1 3 0 1 . 5 0 2 . 4 1 7 1 7 7 4 . 5 3 8 . 6 0 7 0 56
Table 14: 10-Year Housing Starts—Selected Geographies, 2008—2017
Map Total Annual
Key Municipality 2008 2009 2010 2011 2012 2013 2014 2015 2016 2017 Starts Average %
Mecklenburg County (HUD Data)
Single-family 2,496 1,315 1,869 1,949 3,200 3,863 3,896 3,972 4,901 5,127 32,588 3,259 46%
Multi-family 4,354 1,729 803 1,145 4,812 4,695 5,444 5,084 4,858 6,089 39,013 3,901 54%
Total: 6,850 3,044 2,672 3,094 8,012 8,558 9,340 9,056 9,759 11,216 71,601 7,160 100%
City of Charlotte (City Data)
All Units 6,533 4,877 3,052 1,996 4,549 5,778 9,668 4,906 - - 41,359 4,136 58%
As % of County 95% 160% 114% 65% 57% 68% 104% 54% 0% 0%
West Boulevard Area Neighborhoods
7 Arbor Glen/Reid Park 14 1 9 9 7 6 14 30 7 6 103 10 9%
Bryant Park - - - - - - 21 84 103 36 244 24 21%
1 Clanton Park/Roseland - - - - - - - - 2 - 2 0 0%
Marsh Estates 1 - - - - - 213 - - 1 215 22 19%
9 Ponderosa/Wingate 9 - - - 6 2 - - - 2 19 2 2%
10 Residences at Renaissance - - - - - - 184 153 140 - 477 48 42%
16 Revolution Park - - - - - - 1 - - - 1 0 0%
8 West Boulevard - - - - - - 48 - - - 48 5 4%
12 Westerly Hills - 9 4 1 - - - 4 - 3 21 2 2%
11 Westover Hills - - - - - 1 3 1 2 1 8 1 1%
Total-West Boulevard Area: 24 10 13 10 13 9 484 272 254 49 1,138 114 2.8%
http://socds.huduser.org/permits/
Note: Residences at Renaissance is located on the site of the former Boulevard Homes.
Source: U.S. Dept. of Housing & Urban Development; Mecklenburg County Certificate of Occupancy Data; City of Charlotte; WTL+a, revised November 2018.
Change: 2008-2017
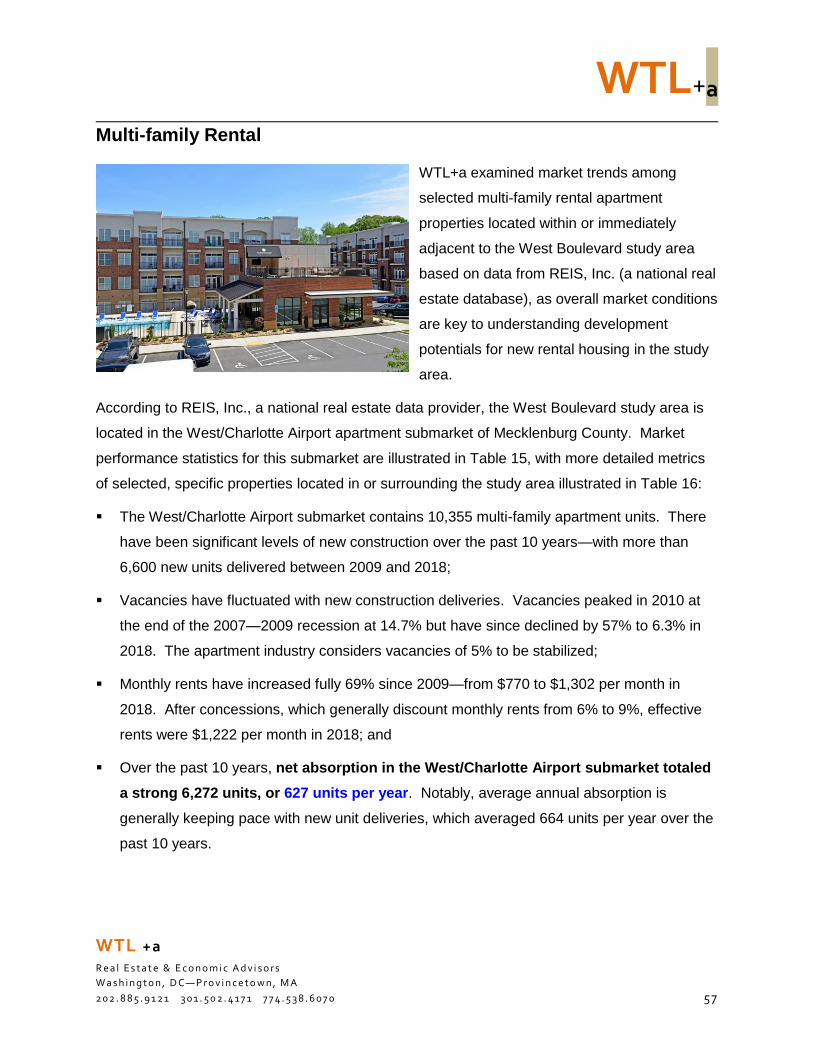
WTL+a
WTL +a
R e a l E s t a t e & E c o n o m i c A d v i s o r s
W a s h i n g t o n , D C—P r o v i n c e t o w n , M A
2 0 2 . 8 8 5 . 9 1 2 1 3 0 1 . 5 0 2 . 4 1 7 1 7 7 4 . 5 3 8 . 6 0 7 0 57
Multi-family Rental
WTL+a examined market trends among
selected multi-family rental apartment
properties located within or immediately
adjacent to the West Boulevard study area
based on data from REIS, Inc. (a national real
estate database), as overall market conditions
are key to understanding development
potentials for new rental housing in the study
area.
According to REIS, Inc., a national real estate data provider, the West Boulevard study area is
located in the West/Charlotte Airport apartment submarket of Mecklenburg County. Market
performance statistics for this submarket are illustrated in Table 15, with more detailed metrics
of selected, specific properties located in or surrounding the study area illustrated in Table 16:
The West/Charlotte Airport submarket contains 10,355 multi-family apartment units. There
have been significant levels of new construction over the past 10 years—with more than
6,600 new units delivered between 2009 and 2018;
Vacancies have fluctuated with new construction deliveries. Vacancies peaked in 2010 at
the end of the 2007—2009 recession at 14.7% but have since declined by 57% to 6.3% in
2018. The apartment industry considers vacancies of 5% to be stabilized;
Monthly rents have increased fully 69% since 2009—from $770 to $1,302 per month in
2018. After concessions, which generally discount monthly rents from 6% to 9%, effective
rents were $1,222 per month in 2018; and
Over the past 10 years, net absorption in the West/Charlotte Airport submarket totaled
a strong 6,272 units, or 627 units per year. Notably, average annual absorption is
generally keeping pace with new unit deliveries, which averaged 664 units per year over the
past 10 years.
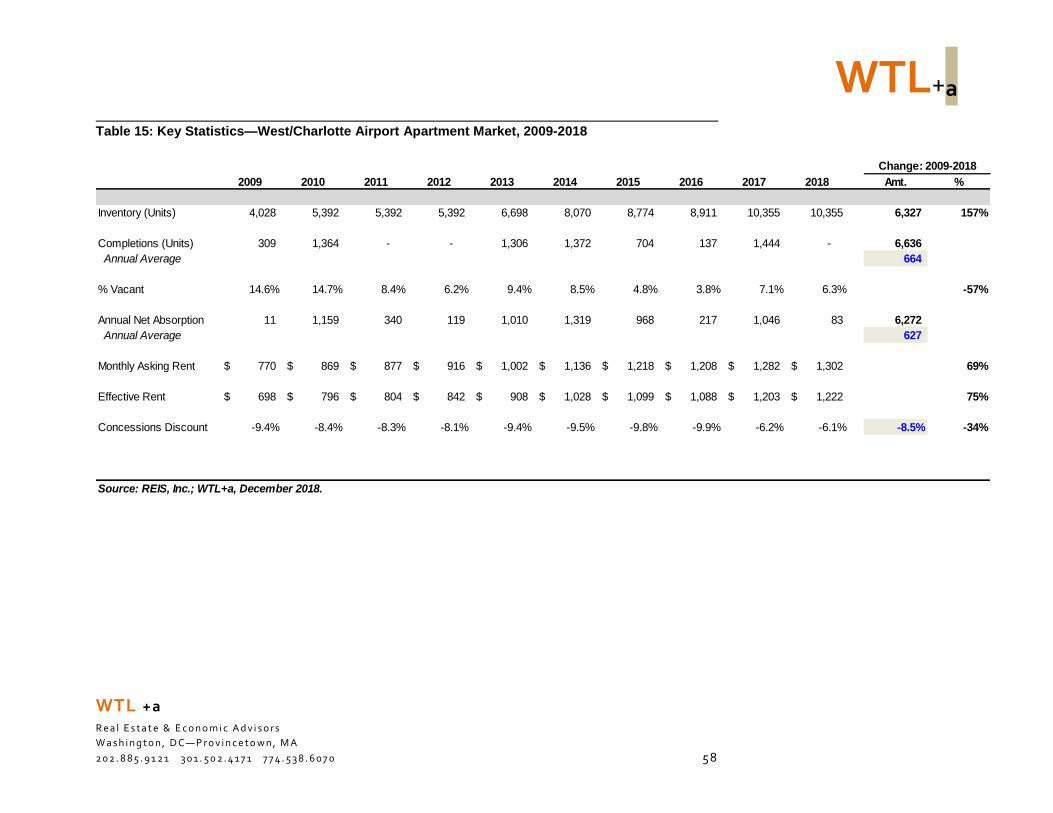
WTL+a
WTL +a
R e a l E s t a t e & E c o n o m i c A d v i s o r s
W a s h i n g t o n , D C—P r o v i n c e t o w n , M A
2 0 2 . 8 8 5 . 9 1 2 1 3 0 1 . 5 0 2 . 4 1 7 1 7 7 4 . 5 3 8 . 6 0 7 0 58
Table 15: Key Statistics—West/Charlotte Airport Apartment Market, 2009-2018
2009 2010 2011 2012 2013 2014 2015 2016 2017 2018 Amt. %
Inventory (Units) 4,028 5,392 5,392 5,392 6,698 8,070 8,774 8,911 10,355 10,355 6,327 157%
Completions (Units) 309 1,364 - - 1,306 1,372 704 137 1,444 - 6,636
Annual Average 664
% Vacant 14.6% 14.7% 8.4% 6.2% 9.4% 8.5% 4.8% 3.8% 7.1% 6.3% -57%
Annual Net Absorption 11 1,159 340 119 1,010 1,319 968 217 1,046 83 6,272
Annual Average 627
Monthly Asking Rent 770$ 869$ 877$ 916$ 1,002$ 1,136$ 1,218$ 1,208$ 1,282$ 1,302$ 69%
Effective Rent 698$ 796$ 804$ 842$ 908$ 1,028$ 1,099$ 1,088$ 1,203$ 1,222$ 75%
Concessions Discount -9.4% -8.4% -8.3% -8.1% -9.4% -9.5% -9.8% -9.9% -6.2% -6.1% -8.5% -34%
Source: REIS, Inc.; WTL+a, December 2018.
Change: 2009-2018
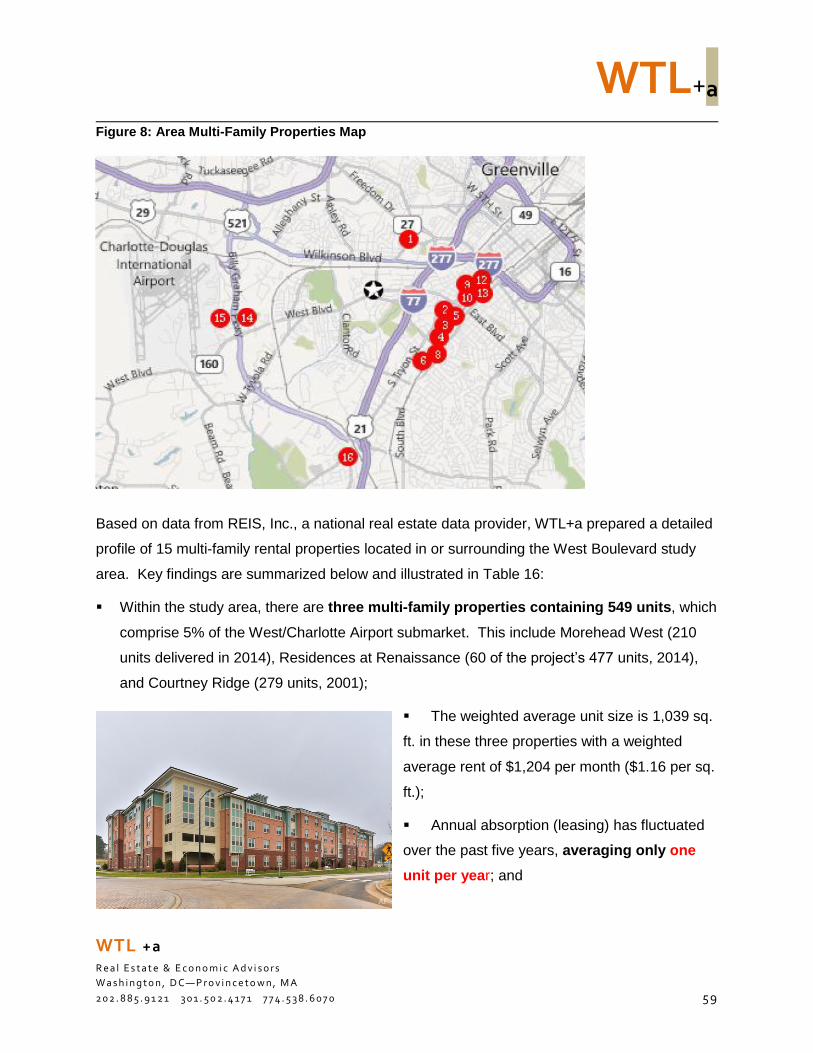
WTL+a
WTL +a
R e a l E s t a t e & E c o n o m i c A d v i s o r s
W a s h i n g t o n , D C—P r o v i n c e t o w n , M A
2 0 2 . 8 8 5 . 9 1 2 1 3 0 1 . 5 0 2 . 4 1 7 1 7 7 4 . 5 3 8 . 6 0 7 0 59
Figure 8: Area Multi-Family Properties Map
Based on data from REIS, Inc., a national real estate data provider, WTL+a prepared a detailed
profile of 15 multi-family rental properties located in or surrounding the West Boulevard study
area. Key findings are summarized below and illustrated in Table 16:
Within the study area, there are three multi-family properties containing 549 units, which
comprise 5% of the West/Charlotte Airport submarket. This include Morehead West (210
units delivered in 2014), Residences at Renaissance (60 of the project’s 477 units, 2014),
and Courtney Ridge (279 units, 2001);
The weighted average unit size is 1,039 sq.
ft. in these three properties with a weighted
average rent of $1,204 per month ($1.16 per sq.
ft.);
Annual absorption (leasing) has fluctuated
over the past five years, averaging only one
unit per year; and
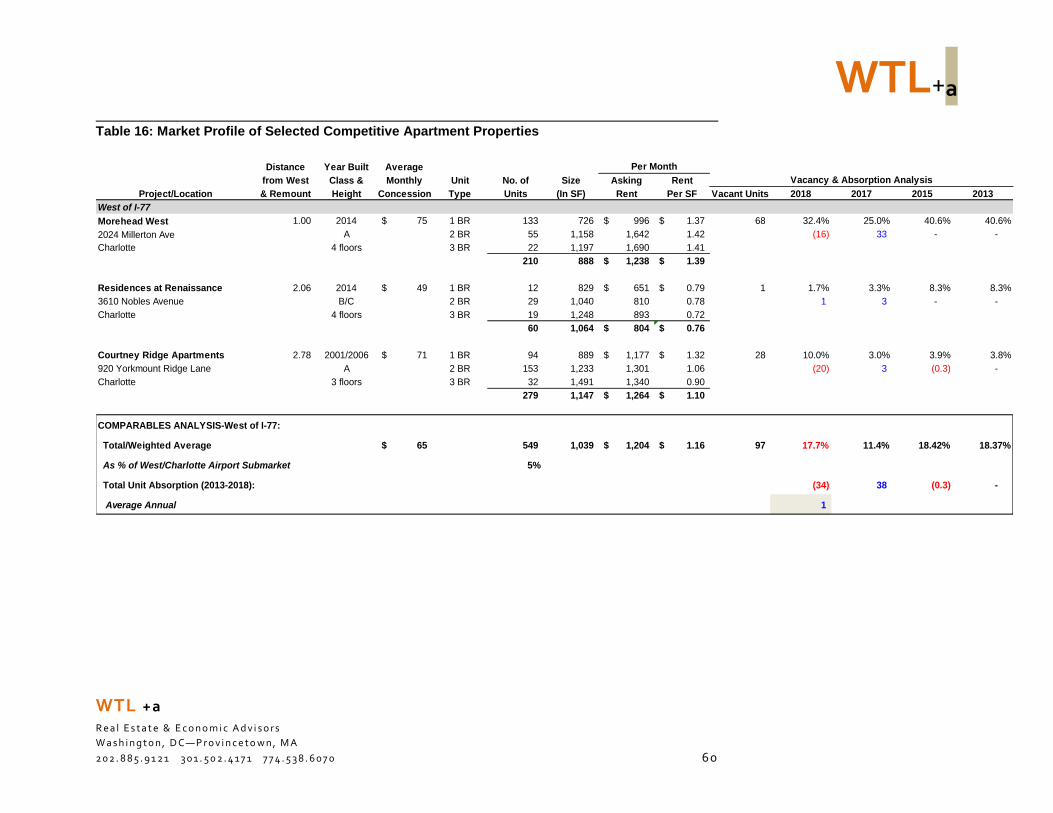
WTL+a
WTL +a
R e a l E s t a t e & E c o n o m i c A d v i s o r s
W a s h i n g t o n , D C—P r o v i n c e t o w n , M A
2 0 2 . 8 8 5 . 9 1 2 1 3 0 1 . 5 0 2 . 4 1 7 1 7 7 4 . 5 3 8 . 6 0 7 0 6 0
Table 16: Market Profile of Selected Competitive Apartment Properties
Distance Year Built Average
from West Class & Monthly Unit No. of Size Asking Rent
Project/Location & Remount Height Concession Type Units (In SF) Rent Per SF Vacant Units 2018 2017 2015 2013
West of I-77
Morehead West 1.00 2014 75$ 1 BR 133 726 996$ 1.37$ 68 32.4% 25.0% 40.6% 40.6%
2024 Millerton Ave A 2 BR 55 1,158 1,642 1.42 (16) 33 - -
Charlotte 4 floors 3 BR 22 1,197 1,690 1.41
210 888 1,238$ 1.39$
Residences at Renaissance 2.06 2014 49$ 1 BR 12 829 651$ 0.79$ 1 1.7% 3.3% 8.3% 8.3%
3610 Nobles Avenue B/C 2 BR 29 1,040 810 0.78 1 3 - -
Charlotte 4 floors 3 BR 19 1,248 893 0.72
60 1,064 804$ 0.76$
Courtney Ridge Apartments 2.78 2001/2006 71$ 1 BR 94 889 1,177$ 1.32$ 28 10.0% 3.0% 3.9% 3.8%
920 Yorkmount Ridge Lane A 2 BR 153 1,233 1,301 1.06 (20) 3 (0.3) -
Charlotte 3 floors 3 BR 32 1,491 1,340 0.90
279 1,147 1,264$ 1.10$
COMPARABLES ANALYSIS-West of I-77:
Total/Weighted Average 65$ 549 1,039 1,204$ 1.16$ 97 17.7% 11.4% 18.42% 18.37%
As % of West/Charlotte Airport Submarket 5%
Total Unit Absorption (2013-2018): (34) 38 (0.3) -
Average Annual 1
Per Month
Vacancy & Absorption Analysis

WTL+a
WTL +a
R e a l E s t a t e & E c o n o m i c A d v i s o r s
W a s h i n g t o n , D C—P r o v i n c e t o w n , M A
2 0 2 . 8 8 5 . 9 1 2 1 3 0 1 . 5 0 2 . 4 1 7 1 7 7 4 . 5 3 8 . 6 0 7 0 6 1
Table 16 (Continued): Market Profile of Selected Competitive Apartment Properties
Distance Year Built Average
from West Class & Monthly Unit No. of Size Asking Rent
Project/Location & Remount Height Concession Type Units (In SF) Rent Per SF Vacant Units 2018 2017 2015 2013
East of I-77/South End
Three 30 Five 1.17 2013 82$ Studio 26 543 1,010$ 1.86$ 8 4.9% 5.8% 4.8% 22.9%
335 Doggett Street A 1 BR 54 776 1,123 1.45 1 (2) 30 -
Charlotte 5 floors 2 BR 67 1,050 1,446 1.38
3 BR 16 1,186 2,306 1.94
163 892 1,354$ 1.52$
Spectrum South End 1.26 2010 95$ Studio 22 663 1,379$ 2.08$ 26 7.9% 7.9% 5.4% 5.2%
2225 Hawkins Street A 1 BR 205 828 1,475 1.78 - (8) (1) -
Charlotte 4 floors 2 BR 103 1,267 1,784 1.41
330 954 1,565$ 1.64$
Junction 1504 1.31 2013 101$ 1 BR 177 805 1,533$ 1.90$ 7 2.5% 4.4% 3.6% 5.6%
1504 Mainline Boulevard A 2 BR 104 1,084 1,920 1.77 5 (2) 6 -
Charlotte 3 floors 3 BR - - - -
281 908 1,676$ 1.85$
Ashton South End 1.37 2009 142$ 1 BR 151 1,052 1,850$ 1.76$ 7 2.3% 2.6% 2.5% 4.2%
125 W. Tremont A 1 BR 15 1,190 2,000$ 1.68
Charlotte 11 floors 2 BR 122 1,393 2,200 1.58 1 (0.3) 5 -
2 BR 21 2,084 3,500 1.68
309 1,263 2,352$ 1.86$
Fountains South End 1.40 2013 100$ Studio 18 546 1,164$ 2.13$ 8 3.9% 4.9% 4.0% 3.6%
126 New Bern Street A 1 BR 110 770 1,612 2.09 2 (2) (1) -
Charlotte 5 floors 2 BR 2 863 1,095 1.27
2 BR 72 1,171 2,243 1.92
3 BR 4 1,296 2,122 1.64
206 902 1,656$ 1.84$
Per Month
Vacancy & Absorption Analysis
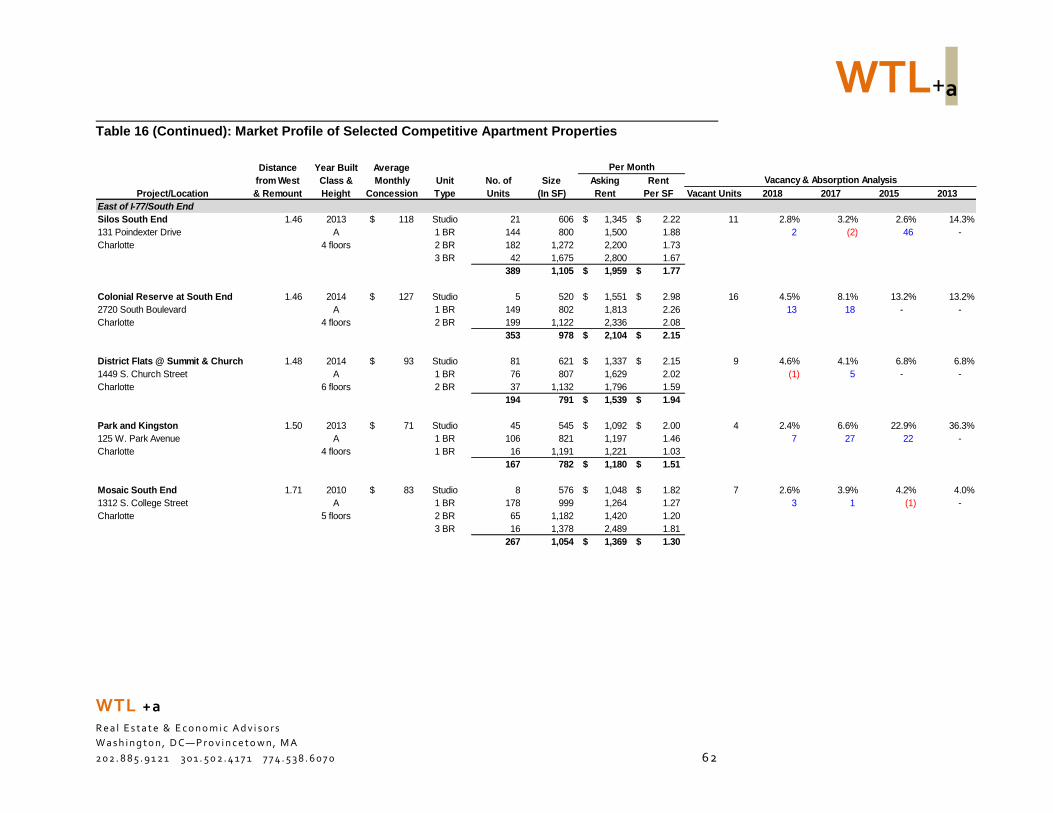
WTL+a
WTL +a
R e a l E s t a t e & E c o n o m i c A d v i s o r s
W a s h i n g t o n , D C—P r o v i n c e t o w n , M A
2 0 2 . 8 8 5 . 9 1 2 1 3 0 1 . 5 0 2 . 4 1 7 1 7 7 4 . 5 3 8 . 6 0 7 0 6 2
Table 16 (Continued): Market Profile of Selected Competitive Apartment Properties
Distance Year Built Average
from West Class & Monthly Unit No. of Size Asking Rent
Project/Location & Remount Height Concession Type Units (In SF) Rent Per SF Vacant Units 2018 2017 2015 2013
East of I-77/South End
Silos South End 1.46 2013 118$ Studio 21 606 1,345$ 2.22$ 11 2.8% 3.2% 2.6% 14.3%
131 Poindexter Drive A 1 BR 144 800 1,500 1.88 2 (2) 46 -
Charlotte 4 floors 2 BR 182 1,272 2,200 1.73
3 BR 42 1,675 2,800 1.67
389 1,105 1,959$ 1.77$
Colonial Reserve at South End 1.46 2014 127$ Studio 5 520 1,551$ 2.98$ 16 4.5% 8.1% 13.2% 13.2%
2720 South Boulevard A 1 BR 149 802 1,813 2.26 13 18 - -
Charlotte 4 floors 2 BR 199 1,122 2,336 2.08
353 978 2,104$ 2.15$
District Flats @ Summit & Church 1.48 2014 93$ Studio 81 621 1,337$ 2.15$ 9 4.6% 4.1% 6.8% 6.8%
1449 S. Church Street A 1 BR 76 807 1,629 2.02 (1) 5 - -
Charlotte 6 floors 2 BR 37 1,132 1,796 1.59
194 791 1,539$ 1.94$
Park and Kingston 1.50 2013 71$ Studio 45 545 1,092$ 2.00$ 4 2.4% 6.6% 22.9% 36.3%
125 W. Park Avenue A 1 BR 106 821 1,197 1.46 7 27 22 -
Charlotte 4 floors 1 BR 16 1,191 1,221 1.03
167 782 1,180$ 1.51$
Mosaic South End 1.71 2010 83$ Studio 8 576 1,048$ 1.82$ 7 2.6% 3.9% 4.2% 4.0%
1312 S. College Street A 1 BR 178 999 1,264 1.27 3 1 (1) -
Charlotte 5 floors 2 BR 65 1,182 1,420 1.20
3 BR 16 1,378 2,489 1.81
267 1,054 1,369$ 1.30$
Per Month
Vacancy & Absorption Analysis
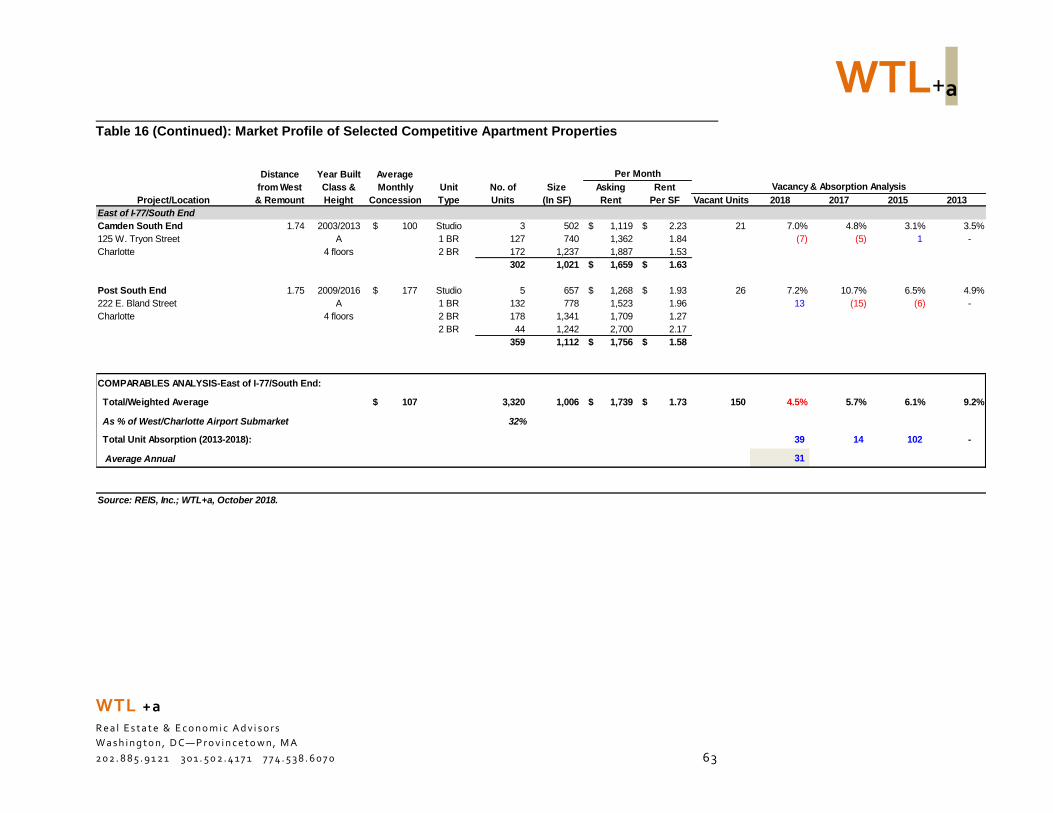
WTL+a
WTL +a
R e a l E s t a t e & E c o n o m i c A d v i s o r s
W a s h i n g t o n , D C—P r o v i n c e t o w n , M A
2 0 2 . 8 8 5 . 9 1 2 1 3 0 1 . 5 0 2 . 4 1 7 1 7 7 4 . 5 3 8 . 6 0 7 0 6 3
Table 16 (Continued): Market Profile of Selected Competitive Apartment Properties
Distance Year Built Average
from West Class & Monthly Unit No. of Size Asking Rent
Project/Location & Remount Height Concession Type Units (In SF) Rent Per SF Vacant Units 2018 2017 2015 2013
East of I-77/South End
Camden South End 1.74 2003/2013 100$ Studio 3 502 1,119$ 2.23$ 21 7.0% 4.8% 3.1% 3.5%
125 W. Tryon Street A 1 BR 127 740 1,362 1.84 (7) (5) 1 -
Charlotte 4 floors 2 BR 172 1,237 1,887 1.53
302 1,021 1,659$ 1.63$
Post South End 1.75 2009/2016 177$ Studio 5 657 1,268$ 1.93$ 26 7.2% 10.7% 6.5% 4.9%
222 E. Bland Street A 1 BR 132 778 1,523 1.96 13 (15) (6) -
Charlotte 4 floors 2 BR 178 1,341 1,709 1.27
2 BR 44 1,242 2,700 2.17
359 1,112 1,756$ 1.58$
COMPARABLES ANALYSIS-East of I-77/South End:
Total/Weighted Average 107$ 3,320 1,006 1,739$ 1.73$ 150 4.5% 5.7% 6.1% 9.2%
As % of West/Charlotte Airport Submarket 32%
Total Unit Absorption (2013-2018): 39 14 102 -
Average Annual 31
Source: REIS, Inc.; WTL+a, October 2018.
Per Month
Vacancy & Absorption Analysis
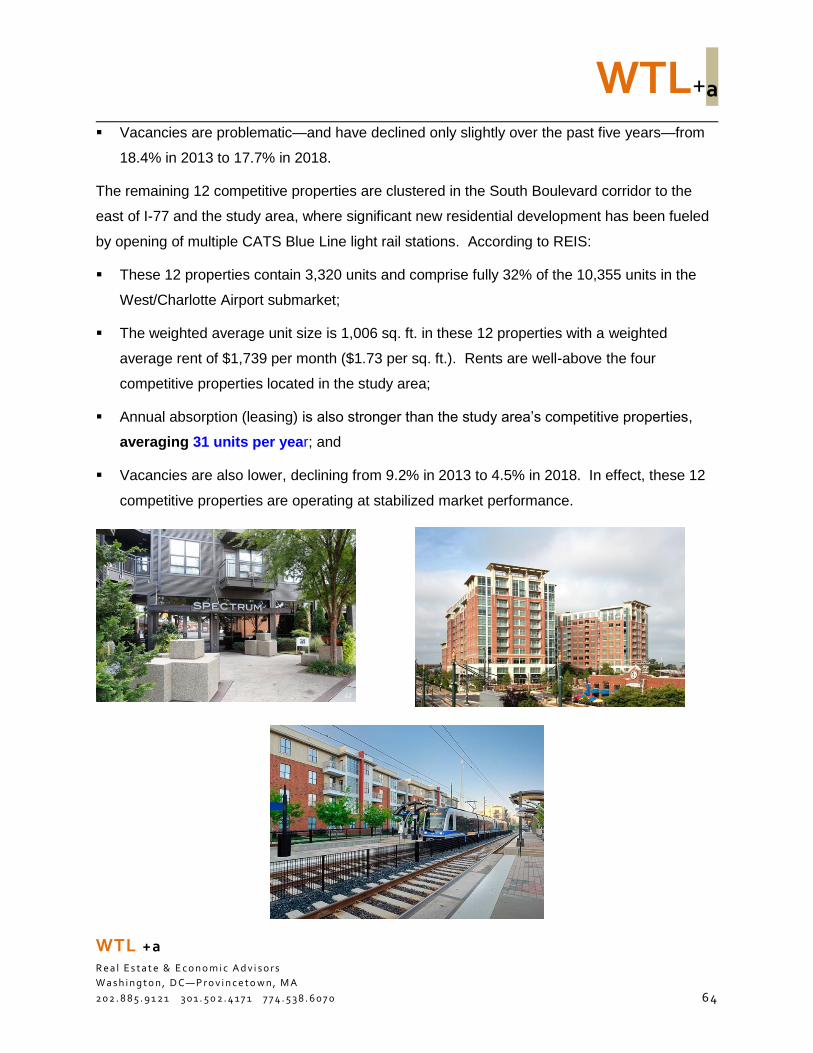
WTL+a
WTL +a
R e a l E s t a t e & E c o n o m i c A d v i s o r s
W a s h i n g t o n , D C—P r o v i n c e t o w n , M A
2 0 2 . 8 8 5 . 9 1 2 1 3 0 1 . 5 0 2 . 4 1 7 1 7 7 4 . 5 3 8 . 6 0 7 0 6 4
Vacancies are problematic—and have declined only slightly over the past five years—from
18.4% in 2013 to 17.7% in 2018.
The remaining 12 competitive properties are clustered in the South Boulevard corridor to the
east of I-77 and the study area, where significant new residential development has been fueled
by opening of multiple CATS Blue Line light rail stations. According to REIS:
These 12 properties contain 3,320 units and comprise fully 32% of the 10,355 units in the
West/Charlotte Airport submarket;
The weighted average unit size is 1,006 sq. ft. in these 12 properties with a weighted
average rent of $1,739 per month ($1.73 per sq. ft.). Rents are well-above the four
competitive properties located in the study area;
Annual absorption (leasing) is also stronger than the study area’s competitive properties,
averaging 31 units per year; and
Vacancies are also lower, declining from 9.2% in 2013 to 4.5% in 2018. In effect, these 12
competitive properties are operating at stabilized market performance.
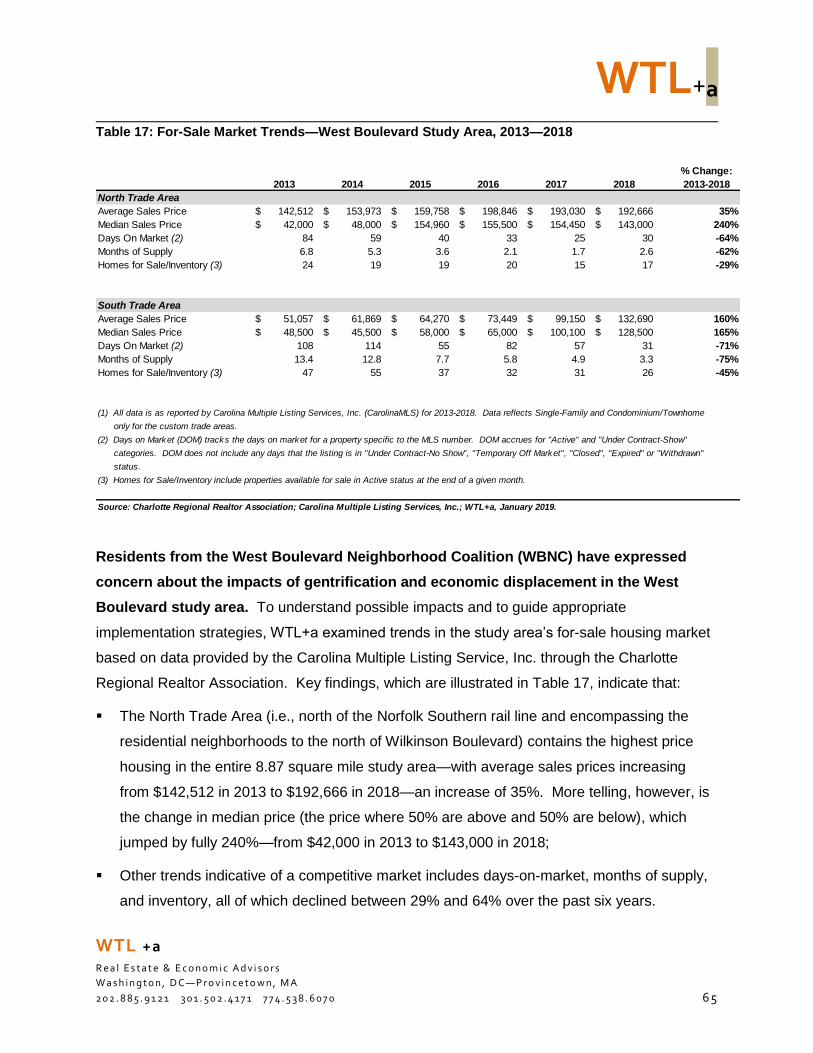
WTL+a
WTL +a
R e a l E s t a t e & E c o n o m i c A d v i s o r s
W a s h i n g t o n , D C—P r o v i n c e t o w n , M A
2 0 2 . 8 8 5 . 9 1 2 1 3 0 1 . 5 0 2 . 4 1 7 1 7 7 4 . 5 3 8 . 6 0 7 0 6 5
Table 17: For-Sale Market Trends—West Boulevard Study Area, 2013—2018
Residents from the West Boulevard Neighborhood Coalition (WBNC) have expressed
concern about the impacts of gentrification and economic displacement in the West
Boulevard study area. To understand possible impacts and to guide appropriate
implementation strategies, WTL+a examined trends in the study area’s for-sale housing market
based on data provided by the Carolina Multiple Listing Service, Inc. through the Charlotte
Regional Realtor Association. Key findings, which are illustrated in Table 17, indicate that:
The North Trade Area (i.e., north of the Norfolk Southern rail line and encompassing the
residential neighborhoods to the north of Wilkinson Boulevard) contains the highest price
housing in the entire 8.87 square mile study area—with average sales prices increasing
from $142,512 in 2013 to $192,666 in 2018—an increase of 35%. More telling, however, is
the change in median price (the price where 50% are above and 50% are below), which
jumped by fully 240%—from $42,000 in 2013 to $143,000 in 2018;
Other trends indicative of a competitive market includes days-on-market, months of supply,
and inventory, all of which declined between 29% and 64% over the past six years.
% Change:
2013 2014 2015 2016 2017 2018 2013-2018
North Trade Area
Average Sales Price 142,512$ 153,973$ 159,758$ 198,846$ 193,030$ 192,666$ 35%
Median Sales Price 42,000$ 48,000$ 154,960$ 155,500$ 154,450$ 143,000$ 240%
Days On Market (2) 84 59 40 33 25 30 -64%
Months of Supply 6.8 5.3 3.6 2.1 1.7 2.6 -62%
Homes for Sale/Inventory (3) 24 19 19 20 15 17 -29%
South Trade Area
Average Sales Price 51,057$ 61,869$ 64,270$ 73,449$ 99,150$ 132,690$ 160%
Median Sales Price 48,500$ 45,500$ 58,000$ 65,000$ 100,100$ 128,500$ 165%
Days On Market (2) 108 114 55 82 57 31 -71%
Months of Supply 13.4 12.8 7.7 5.8 4.9 3.3 -75%
Homes for Sale/Inventory (3) 47 55 37 32 31 26 -45%
(1) All data is as reported by Carolina Multiple Listing Services, Inc. (CarolinaMLS) for 2013-2018. Data reflects Single-Family and Condominium/Townhome
only for the custom trade areas.
(2) Days on Market (DOM) tracks the days on market for a property specific to the MLS number. DOM accrues for "Active" and "Under Contract-Show"
categories. DOM does not include any days that the listing is in "Under Contract-No Show", "Temporary Off Market", "Closed", "Expired" or "Withdrawn"
status.
(3) Homes for Sale/Inventory include properties available for sale in Active status at the end of a given month.
Source: Charlotte Regional Realtor Association; Carolina Multiple Listing Services, Inc.; WTL+a, January 2019.
WTL+a
WTL +a
R e a l E s t a t e & E c o n o m i c A d v i s o r s
W a s h i n g t o n , D C—P r o v i n c e t o w n , M A
2 0 2 . 8 8 5 . 9 1 2 1 3 0 1 . 5 0 2 . 4 1 7 1 7 7 4 . 5 3 8 . 6 0 7 0 6 6
According to the housing industry, a six-month supply is standard, but the North Trade
Area’s supply of houses for sale in 2018 was only 2.6;
The South Trade Area (encompassing the remaining study area below the Norfolk Southern
rail line and inside Billy Graham Parkway and I-77) also exhibited significant changes in
price and sales activity between 2013 and 2018. While overall pricing is lower than the
North Trade Area, average sales prices jumped 160%—from $52,057 in 2013 to $132,690
in 2018. Similarly, median prices increased by 165%—from $48,500 in 2013 to $128,500 in
2018; and
Housing in the South Trade Area, while lower in price than North, is becoming much more
competitive when trends in other metrics are considered. For example, days-on-market
declined by 71%, months of supply by 75% and available inventory by 45%. In 2018, there
were only 3.3 months of supply in the South Trade Area, down from 13.4 months in 2013.
In conclusion, the West Boulevard housing market reflects apparent uneven market
conditions based on a review of key metrics. While the majority of residents are renters
(72%), the study area’s true vacancy rate has increased (12.6%), vacancies in three competitive
properties located closest to West Boulevard have remained high in the range of 17% to 18%,
and absorption has been limited over the past five years (averaging only one unit per year).
Conversely, the for-sale market has become more competitive over the past six years—with
significant increases in both average and median prices and declines in other sale metrics as
noted above. This reinforces the importance of strategies that serve to protect existing
residents, provide opportunities for homeownership, and provide public realm improvements
that leverage new development to strengthen existing retailers and support new businesses.
WTL+a reviewed “The State of Housing in Charlotte”, prepared by the Childress Klein Center for
Real Estate at the University of North Carolina. This report (released in February 2019) was
provided in April 2019 after a draft of this study was completed. The report documents the
impacts of population growth, the reduction in available housing units since 2005 (both for-sale
and rental properties), and the greater impacts resulting from limited supply/increasing demand
on price increases, particularly on the lowest 10% of housing values in the Charlotte region.
The implications of these growth and property-value pressures are clear, and the West
Boulevard study area includes properties that fall within the lower-end of the area average
property value spectrum. Because the report was solely focused on general housing
WTL+a
WTL +a
R e a l E s t a t e & E c o n o m i c A d v i s o r s
W a s h i n g t o n , D C—P r o v i n c e t o w n , M A
2 0 2 . 8 8 5 . 9 1 2 1 3 0 1 . 5 0 2 . 4 1 7 1 7 7 4 . 5 3 8 . 6 0 7 0 6 7
characteristics and patterns of change, it did not include other factors which can increase
pressures on ownership, such as employment growth or site-specific impacts of related
initiatives such as the Lynx Line extension to Charlotte-Douglas International Airport.
In our view, these two factors are specific to West Boulevard above and beyond the general
economic pressures on housing supply and property values throughout the area. These two
factors pose an even greater concern about displacement of long-term residents, limiting
prospects to remain in the area if property owners decide to sell, and the ability to retain
ownership in the neighborhood in the face of pending development pressures. While TOD has
contributed to Charlotte’s economic and property tax base along South Boulevard and the Blue
Line extension, these changes are likely to result in a significant alteration of ownership,
community connections and family legacies along the West Boulevard corridor. The West Side
Community Land Trust is an immediate opportunity to provide an alternative to neighborhood
dislocation.
Hotel/Lodging
Given West Boulevard’s proximity to Charlotte-Douglas International Airport (CLT), which
serves as a major economic development engine, WTL+a reviewed data on market conditions
for hotel and lodging uses in this area based on performance data provided by STR Global, the
industry leader in hotel market data. Performance metrics from this analysis were used to
determine hotel/lodging market potentials, particularly in locations most proximate to the airport
such as parcels along Billy Graham Parkway.
In larger population centers and communities with established commercial office concentrations,
hotels can serve as an important supporting amenity to corporate and business activity
generators, for tourism destinations and for nearby residential clusters. Hotel quality levels are
generally determined by the depth and sustainability of support from available market segments.
In areas with lower spending potentials or more price-sensitive consumers (such as logistics-
related markets serving truck drivers and others), market potentials may be best met by a
limited-service property (which is defined by the hotel industry to include no on-site restaurant,
and limited other amenities such as gyms, meeting/conference/event spaces, swimming pools,
spas, etc.) as opposed to higher-priced hotel categories (such as full-service business-oriented
hotels, which include all of the above amenities) or destination resort properties oriented toward
beaches/waterfronts, golf courses, etc.
WTL+a
WTL +a
R e a l E s t a t e & E c o n o m i c A d v i s o r s
W a s h i n g t o n , D C—P r o v i n c e t o w n , M A
2 0 2 . 8 8 5 . 9 1 2 1 3 0 1 . 5 0 2 . 4 1 7 1 7 7 4 . 5 3 8 . 6 0 7 0 6 8
As illustrated in Table 18, the Charlotte metropolitan area contains 27,615 hotel rooms in
multiple submarkets. Uptown/Airport is the largest submarket, with 9,197 rooms, or 33% of the
area’s total. In addition, there are 400 rooms under construction. STR Global, the industry
leader in tracking hotel market performance, categorizes hotel properties into the following class
levels:
Economy—properties in this class include EconoLodge, Day’s Inn, Extended Stay America,
Red Roof Inn and a number of smaller, non-chain affiliated properties across Mecklenburg
County. This category comprises 22% of the metropolitan area hotel market
Midscale—hotels in this category include Best Western, Quality Inn, Sleep Inn and Wingate
by Wyndham. This category comprises 9% of the metropolitan area’s hotel market
Upper Midscale—properties in this category include the Comfort Inn, Fairfield Inn, Hampton
Inn and Holiday Inn Express & Suites. This category comprises 22% of the metropolitan
area’s hotel market
Upscale—properties in this class include Marriott Courtyard, Hilton Garden Inn, Hyatt Place
and Residence Inn. This category comprises 27% of the area’s hotel market
Upper Upscale—properties in this class include Hyatt Regency, Marriott, Sheraton and
Wyndham. This category comprises 18% of the area’s hotel market, and
Luxury—properties in this class include Ritz Carlton, The Ivey’s Hotel and Dunhill Hotel.
This category comprises only 2% of the area’s hotel market.
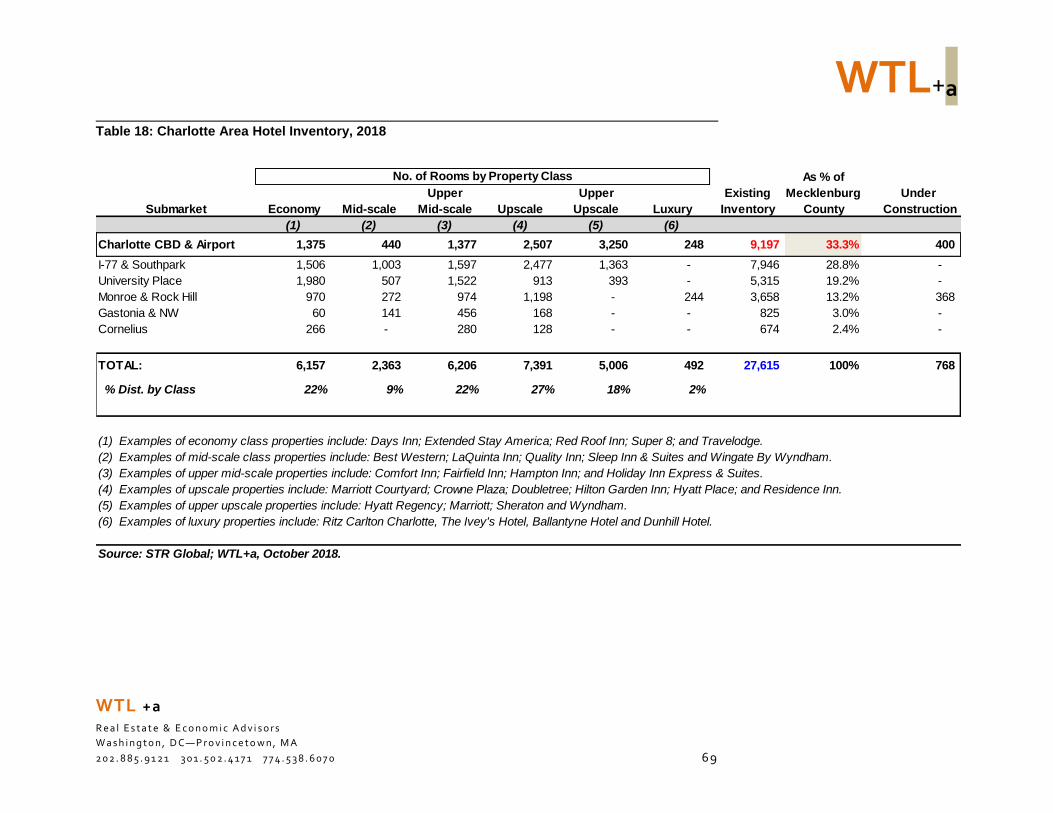
WTL+a
WTL +a
R e a l E s t a t e & E c o n o m i c A d v i s o r s
W a s h i n g t o n , D C—P r o v i n c e t o w n , M A
2 0 2 . 8 8 5 . 9 1 2 1 3 0 1 . 5 0 2 . 4 1 7 1 7 7 4 . 5 3 8 . 6 0 7 0 6 9
Table 18: Charlotte Area Hotel Inventory, 2018
As % of
Upper Upper Existing Mecklenburg Under
Submarket Economy Mid-scale Mid-scale Upscale Upscale Luxury Inventory County Construction
(1) (2) (3) (4) (5) (6)
Charlotte CBD & Airport 1,375 440 1,377 2,507 3,250 248 9,197 33.3% 400
I-77 & Southpark 1,506 1,003 1,597 2,477 1,363 - 7,946 28.8% -
University Place 1,980 507 1,522 913 393 - 5,315 19.2% -
Monroe & Rock Hill 970 272 974 1,198 - 244 3,658 13.2% 368
Gastonia & NW 60 141 456 168 - - 825 3.0% -
Cornelius 266 - 280 128 - - 674 2.4% -
TOTAL: 6,157 2,363 6,206 7,391 5,006 492 27,615 100% 768
% Dist. by Class 22% 9% 22% 27% 18% 2%
(1) Examples of economy class properties include: Days Inn; Extended Stay America; Red Roof Inn; Super 8; and Travelodge.
(2) Examples of mid-scale class properties include: Best Western; LaQuinta Inn; Quality Inn; Sleep Inn & Suites and Wingate By Wyndham.
(3) Examples of upper mid-scale properties include: Comfort Inn; Fairfield Inn; Hampton Inn; and Holiday Inn Express & Suites.
(4) Examples of upscale properties include: Marriott Courtyard; Crowne Plaza; Doubletree; Hilton Garden Inn; Hyatt Place; and Residence Inn.
(5) Examples of upper upscale properties include: Hyatt Regency; Marriott; Sheraton and Wyndham.
(6) Examples of luxury properties include: Ritz Carlton Charlotte, The Ivey's Hotel, Ballantyne Hotel and Dunhill Hotel.
Source: STR Global; WTL+a, October 2018.
No. of Rooms by Property Class
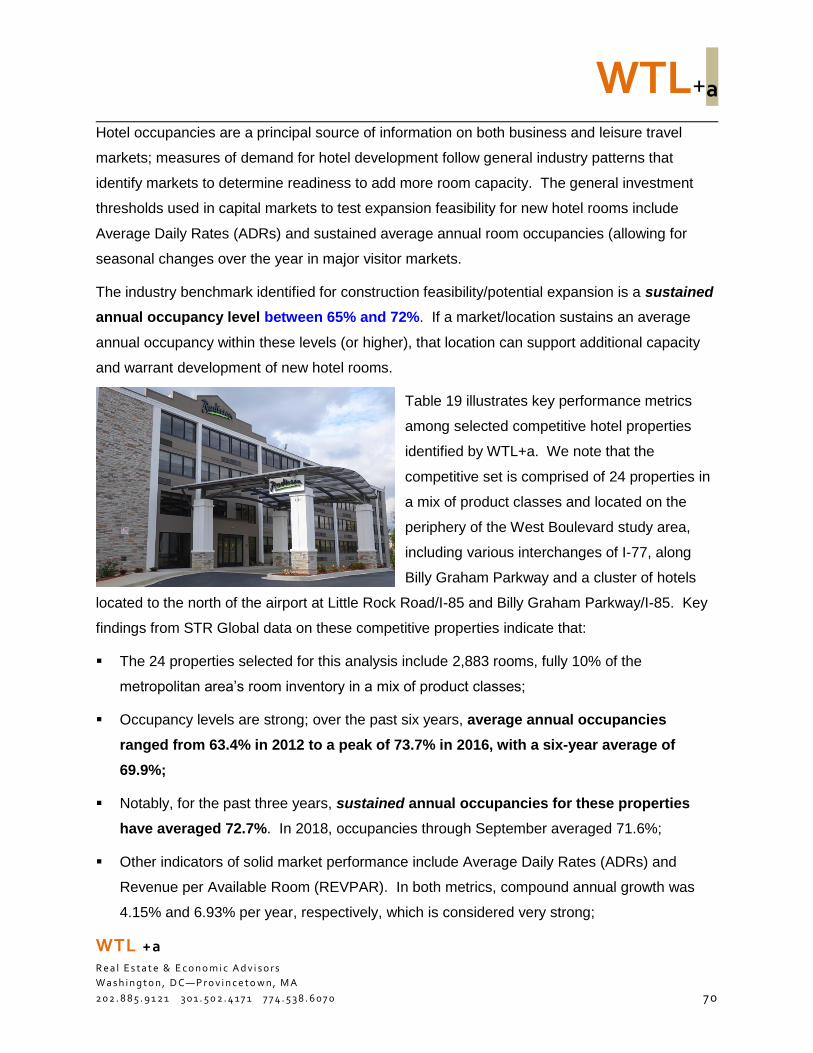
WTL+a
WTL +a
R e a l E s t a t e & E c o n o m i c A d v i s o r s
W a s h i n g t o n , D C—P r o v i n c e t o w n , M A
2 0 2 . 8 8 5 . 9 1 2 1 3 0 1 . 5 0 2 . 4 1 7 1 7 7 4 . 5 3 8 . 6 0 7 0 7 0
Hotel occupancies are a principal source of information on both business and leisure travel
markets; measures of demand for hotel development follow general industry patterns that
identify markets to determine readiness to add more room capacity. The general investment
thresholds used in capital markets to test expansion feasibility for new hotel rooms include
Average Daily Rates (ADRs) and sustained average annual room occupancies (allowing for
seasonal changes over the year in major visitor markets.
The industry benchmark identified for construction feasibility/potential expansion is a sustained
annual occupancy level between 65% and 72%. If a market/location sustains an average
annual occupancy within these levels (or higher), that location can support additional capacity
and warrant development of new hotel rooms.
Table 19 illustrates key performance metrics
among selected competitive hotel properties
identified by WTL+a. We note that the
competitive set is comprised of 24 properties in
a mix of product classes and located on the
periphery of the West Boulevard study area,
including various interchanges of I-77, along
Billy Graham Parkway and a cluster of hotels
located to the north of the airport at Little Rock Road/I-85 and Billy Graham Parkway/I-85. Key
findings from STR Global data on these competitive properties indicate that:
The 24 properties selected for this analysis include 2,883 rooms, fully 10% of the
metropolitan area’s room inventory in a mix of product classes;
Occupancy levels are strong; over the past six years, average annual occupancies
ranged from 63.4% in 2012 to a peak of 73.7% in 2016, with a six-year average of
69.9%;
Notably, for the past three years, sustained annual occupancies for these properties
have averaged 72.7%. In 2018, occupancies through September averaged 71.6%;
Other indicators of solid market performance include Average Daily Rates (ADRs) and
Revenue per Available Room (REVPAR). In both metrics, compound annual growth was
4.15% and 6.93% per year, respectively, which is considered very strong;
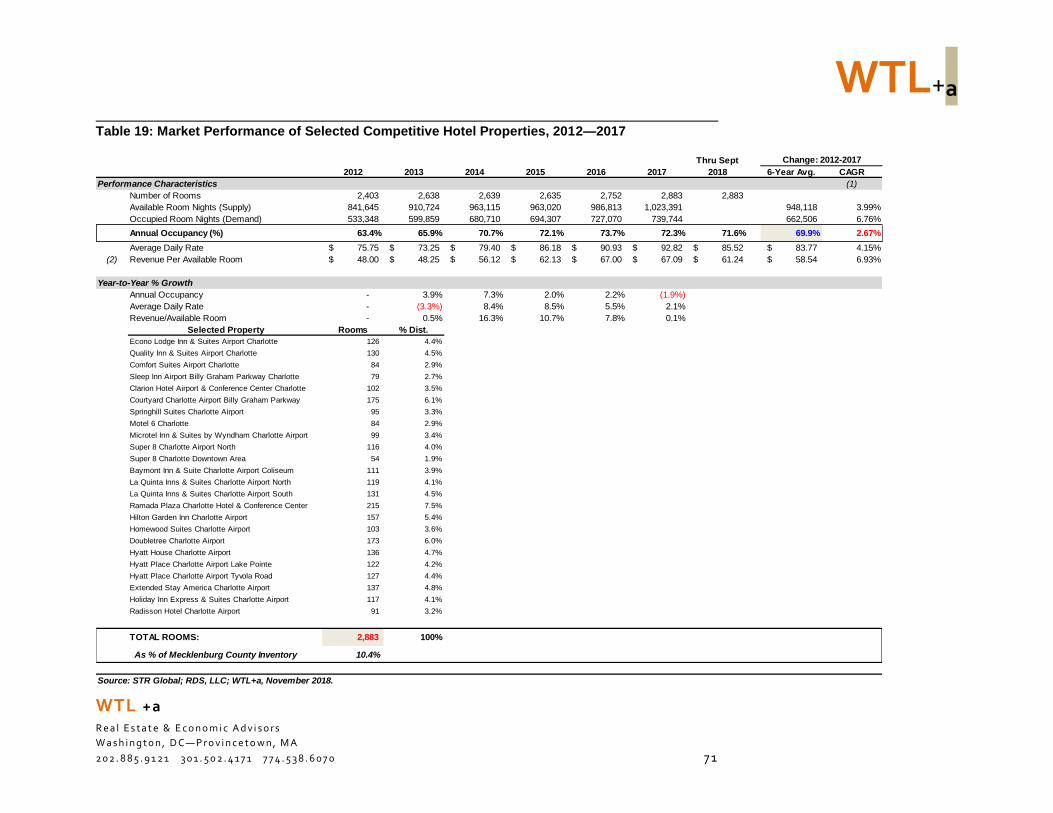
WTL+a
WTL +a
R e a l E s t a t e & E c o n o m i c A d v i s o r s
W a s h i n g t o n , D C—P r o v i n c e t o w n , M A
2 0 2 . 8 8 5 . 9 1 2 1 3 0 1 . 5 0 2 . 4 1 7 1 7 7 4 . 5 3 8 . 6 0 7 0 7 1
Table 19: Market Performance of Selected Competitive Hotel Properties, 2012—2017
Thru Sept
2012 2013 2014 2015 2016 2017 2018 6-Year Avg. CAGR
Performance Characteristics (1)
Number of Rooms 2,403 2,638 2,639 2,635 2,752 2,883 2,883
Available Room Nights (Supply) 841,645 910,724 963,115 963,020 986,813 1,023,391 948,118 3.99%
Occupied Room Nights (Demand) 533,348 599,859 680,710 694,307 727,070 739,744 662,506 6.76%
Annual Occupancy (%) 63.4% 65.9% 70.7% 72.1% 73.7% 72.3% 71.6% 69.9% 2.67%
Average Daily Rate 75.75$ 73.25$ 79.40$ 86.18$ 90.93$ 92.82$ 85.52$ 83.77$ 4.15%
(2) Revenue Per Available Room 48.00$ 48.25$ 56.12$ 62.13$ 67.00$ 67.09$ 61.24$ 58.54$ 6.93%
Year-to-Year % Growth
Annual Occupancy - 3.9% 7.3% 2.0% 2.2% (1.9%)
Average Daily Rate - (3.3%) 8.4% 8.5% 5.5% 2.1%
Revenue/Available Room - 0.5% 16.3% 10.7% 7.8% 0.1%
Selected Property Rooms % Dist.
Econo Lodge Inn & Suites Airport Charlotte 126 4.4%
Quality Inn & Suites Airport Charlotte 130 4.5%
Comfort Suites Airport Charlotte 84 2.9%
Sleep Inn Airport Billy Graham Parkway Charlotte 79 2.7%
Clarion Hotel Airport & Conference Center Charlotte 102 3.5%
Courtyard Charlotte Airport Billy Graham Parkway 175 6.1%
Springhill Suites Charlotte Airport 95 3.3%
Motel 6 Charlotte 84 2.9%
Microtel Inn & Suites by Wyndham Charlotte Airport 99 3.4%
Super 8 Charlotte Airport North 116 4.0%
Super 8 Charlotte Downtown Area 54 1.9%
Baymont Inn & Suite Charlotte Airport Coliseum 111 3.9%
La Quinta Inns & Suites Charlotte Airport North 119 4.1%
La Quinta Inns & Suites Charlotte Airport South 131 4.5%
Ramada Plaza Charlotte Hotel & Conference Center 215 7.5%
Hilton Garden Inn Charlotte Airport 157 5.4%
Homewood Suites Charlotte Airport 103 3.6%
Doubletree Charlotte Airport 173 6.0%
Hyatt House Charlotte Airport 136 4.7%
Hyatt Place Charlotte Airport Lake Pointe 122 4.2%
Hyatt Place Charlotte Airport Tyvola Road 127 4.4%
Extended Stay America Charlotte Airport 137 4.8%
Holiday Inn Express & Suites Charlotte Airport 117 4.1%
Radisson Hotel Charlotte Airport 91 3.2%
TOTAL ROOMS: 2,883 100%
As % of Mecklenburg County Inventory 10.4%
Source: STR Global; RDS, LLC; WTL+a, November 2018.
Change: 2012-2017
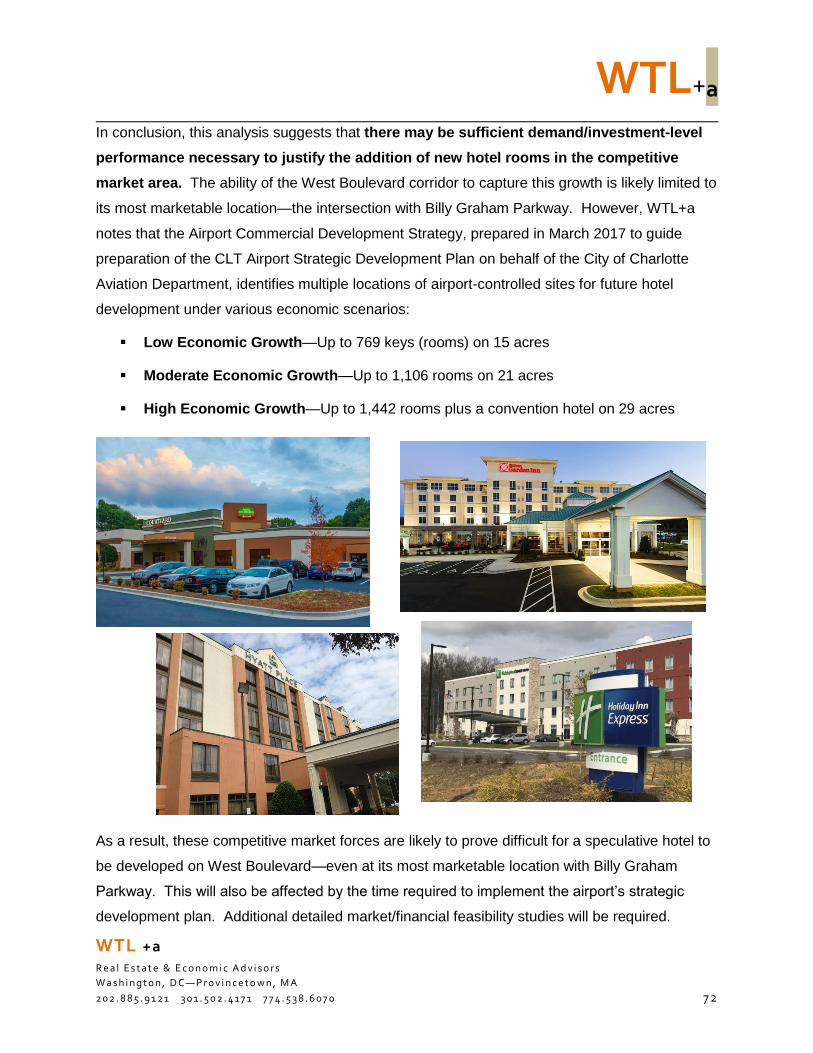
WTL+a
WTL +a
R e a l E s t a t e & E c o n o m i c A d v i s o r s
W a s h i n g t o n , D C—P r o v i n c e t o w n , M A
2 0 2 . 8 8 5 . 9 1 2 1 3 0 1 . 5 0 2 . 4 1 7 1 7 7 4 . 5 3 8 . 6 0 7 0 7 2
In conclusion, this analysis suggests that there may be sufficient demand/investment-level
performance necessary to justify the addition of new hotel rooms in the competitive
market area. The ability of the West Boulevard corridor to capture this growth is likely limited to
its most marketable location—the intersection with Billy Graham Parkway. However, WTL+a
notes that the Airport Commercial Development Strategy, prepared in March 2017 to guide
preparation of the CLT Airport Strategic Development Plan on behalf of the City of Charlotte
Aviation Department, identifies multiple locations of airport-controlled sites for future hotel
development under various economic scenarios:
Low Economic Growth—Up to 769 keys (rooms) on 15 acres
Moderate Economic Growth—Up to 1,106 rooms on 21 acres
High Economic Growth—Up to 1,442 rooms plus a convention hotel on 29 acres
As a result, these competitive market forces are likely to prove difficult for a speculative hotel to
be developed on West Boulevard—even at its most marketable location with Billy Graham
Parkway. This will also be affected by the time required to implement the airport’s strategic
development plan. Additional detailed market/financial feasibility studies will be required.
WTL+a
WTL +a
R e a l E s t a t e & E c o n o m i c A d v i s o r s
W a s h i n g t o n , D C—P r o v i n c e t o w n , M A
2 0 2 . 8 8 5 . 9 1 2 1 3 0 1 . 5 0 2 . 4 1 7 1 7 7 4 . 5 3 8 . 6 0 7 0 7 3
Workplace: Office
Residents in the West Boulevard study area expressed the need for additional
professional services/office businesses, including medical, dental, insurance and legal.
As such, the market analysis evaluated market conditions in “workplace” uses, including multi-
tenant/speculative office and business services sectors in the Airport office submarket to:
Understand the submarket’s overall competitive position for such uses based on data from
various commercial real estate sources, in the following key market indices: total inventory,
construction deliveries, net absorption (i.e., leasing) activity, vacant stock, vacancy rates,
and rental rates;
Inform our evaluation of market opportunities for workplace uses and the ability of the West
Boulevard corridor to capture these opportunities based on the findings of key metrics in this
profile; and
Guide the planning/design team’s testing of revitalization scenarios to ensure that uses such
as office space will physically fit and be sufficiently marketable.
Charlotte Airport Office Submarket
Key findings for the Airport office market are summarized below and based on data from
CoStar, Inc., a national commercial real estate data provider that tracks office (and retail)
market performance in locations nationwide. The Airport submarket’s boundaries are illustrated
in Figure 9. Key metrics are illustrated in Table 20 and summarized below:
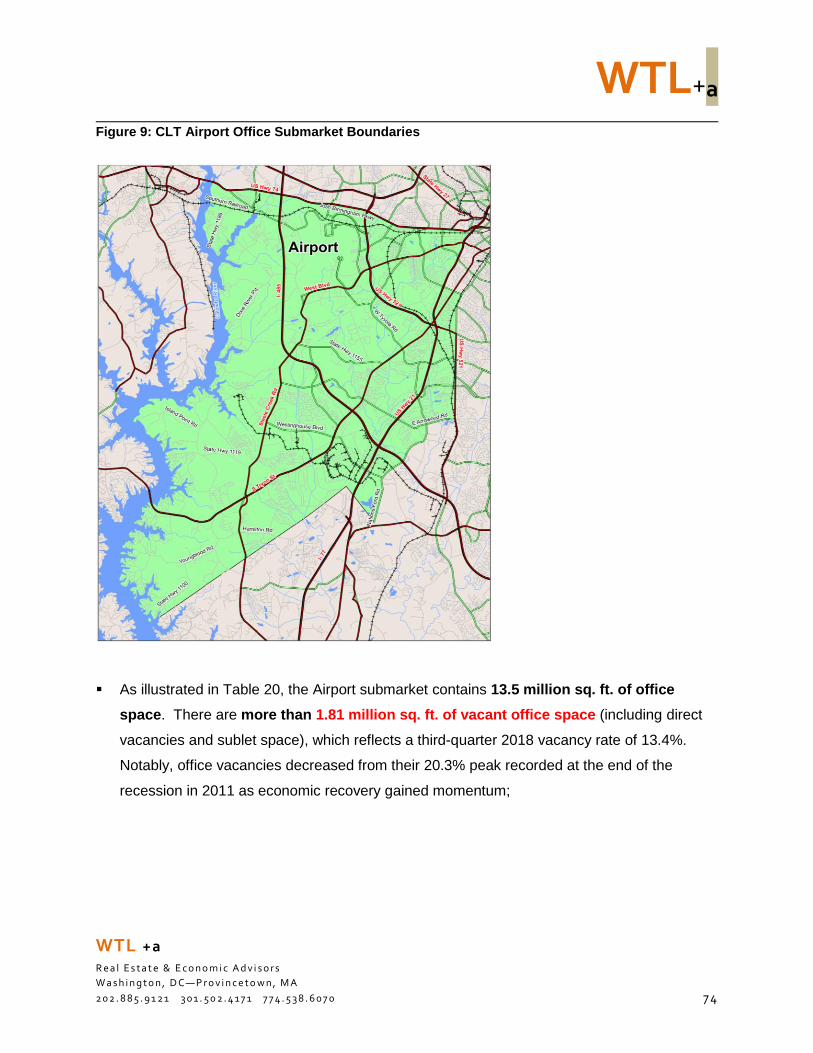
WTL+a
WTL +a
R e a l E s t a t e & E c o n o m i c A d v i s o r s
W a s h i n g t o n , D C—P r o v i n c e t o w n , M A
2 0 2 . 8 8 5 . 9 1 2 1 3 0 1 . 5 0 2 . 4 1 7 1 7 7 4 . 5 3 8 . 6 0 7 0 7 4
Figure 9: CLT Airport Office Submarket Boundaries
As illustrated in Table 20, the Airport submarket contains 13.5 million sq. ft. of office
space. There are more than 1.81 million sq. ft. of vacant office space (including direct
vacancies and sublet space), which reflects a third-quarter 2018 vacancy rate of 13.4%.
Notably, office vacancies decreased from their 20.3% peak recorded at the end of the
recession in 2011 as economic recovery gained momentum;
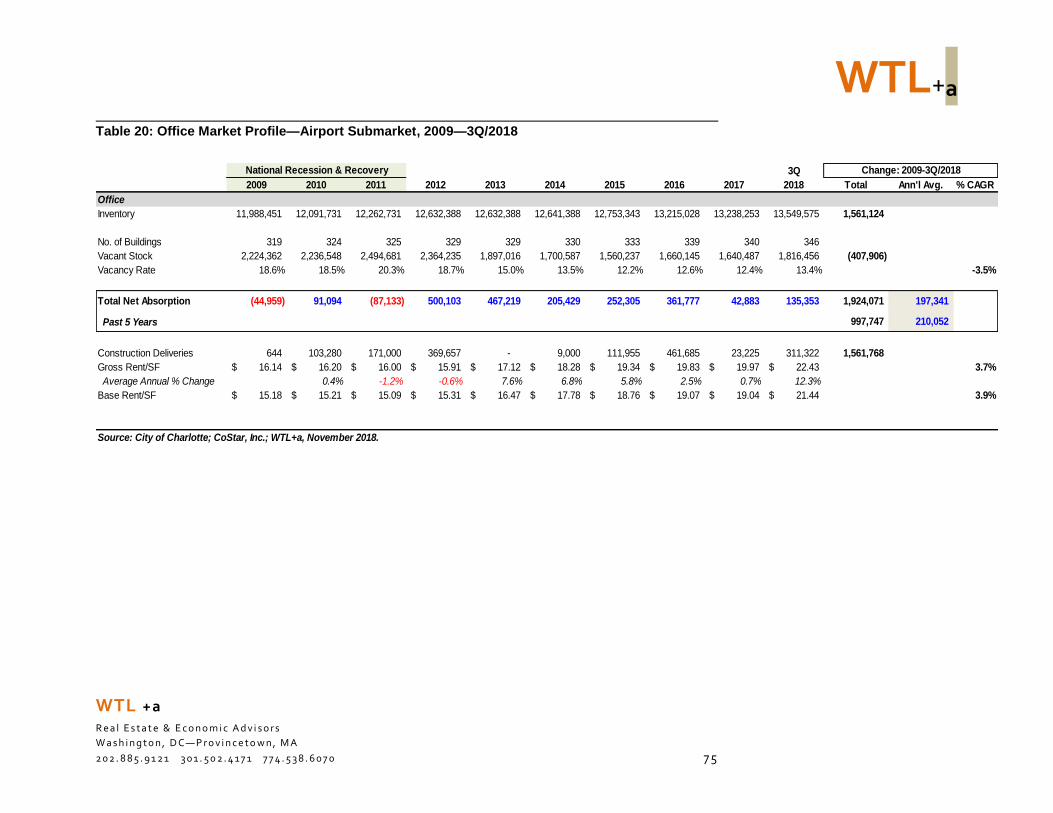
WTL+a
WTL +a
R e a l E s t a t e & E c o n o m i c A d v i s o r s
W a s h i n g t o n , D C—P r o v i n c e t o w n , M A
2 0 2 . 8 8 5 . 9 1 2 1 3 0 1 . 5 0 2 . 4 1 7 1 7 7 4 . 5 3 8 . 6 0 7 0 7 5
Table 20: Office Market Profile—Airport Submarket, 2009—3Q/2018
3Q
2009 2010 2011 2012 2013 2014 2015 2016 2017 2018 Total Ann'l Avg. % CAGR
Office
Inventory 11,988,451 12,091,731 12,262,731 12,632,388 12,632,388 12,641,388 12,753,343 13,215,028 13,238,253 13,549,575 1,561,124
No. of Buildings 319 324 325 329 329 330 333 339 340 346
Vacant Stock 2,224,362 2,236,548 2,494,681 2,364,235 1,897,016 1,700,587 1,560,237 1,660,145 1,640,487 1,816,456 (407,906)
Vacancy Rate 18.6% 18.5% 20.3% 18.7% 15.0% 13.5% 12.2% 12.6% 12.4% 13.4% -3.5%
Total Net Absorption (44,959) 91,094 (87,133) 500,103 467,219 205,429 252,305 361,777 42,883 135,353 1,924,071 197,341
Past 5 Years 997,747 210,052
Construction Deliveries 644 103,280 171,000 369,657 - 9,000 111,955 461,685 23,225 311,322 1,561,768
Gross Rent/SF 16.14$ 16.20$ 16.00$ 15.91$ 17.12$ 18.28$ 19.34$ 19.83$ 19.97$ 22.43$ 3.7%
Average Annual % Change 0.4% -1.2% -0.6% 7.6% 6.8% 5.8% 2.5% 0.7% 12.3%
Base Rent/SF 15.18$ 15.21$ 15.09$ 15.31$ 16.47$ 17.78$ 18.76$ 19.07$ 19.04$ 21.44$ 3.9%
Source: City of Charlotte; CoStar, Inc.; WTL+a, November 2018.
National Recession & Recovery Change: 2009-3Q/2018
WTL+a
WTL +a
R e a l E s t a t e & E c o n o m i c A d v i s o r s
W a s h i n g t o n , D C—P r o v i n c e t o w n , M A
2 0 2 . 8 8 5 . 9 1 2 1 3 0 1 . 5 0 2 . 4 1 7 1 7 7 4 . 5 3 8 . 6 0 7 0 7 6
Multiple factors have combined to strengthen overall leasing activity, including recovery from
the 2007—2009 recession, net new job growth in office-using sectors and new or expanded
businesses throughout the Charlotte metropolitan area;
In the Airport submarket, net absorption totaled 1,924,071 sq. ft. over the past 9.75 years.
If this annual pace of 197,341 sq. ft. can be sustained, it would require approximately 8.5
years to reduce the 1.8 million sq. ft. of vacant office space to stabilized levels in the range
of 7% vacancy (i.e., the real estate industry considers stabilized occupancies for office
buildings to be in the range of 93% to 95%). Based on absorption trends, the Airport
submarket’s office market has strengthened over the past five years—with 210,000
sq. ft. of annual net absorption since 2014; and
Indicative of this strengthening market, office rents continue to increase. In fact, average
asking (gross) rents increased by a compound annual rate of 3.7% per year between 2009
and 2018—from $16.14 per sq. ft. in 2009 to $22.43 per sq. ft. as of the third-quarter of
2018.
West Boulevard Study Area
WTL+a conducted a more detailed analysis of office market trends in and near West Boulevard
based on data from CoStar, Inc., a national real estate data provider. Data are illustrated in
Table 21 and summarized below:
The larger study area contains 1,889,632 gross sq. ft. of office space in 57 buildings. This
includes office buildings located in the Perimeter Pointe office park off of W. Tyvola Road,
Atrium Corporate Center located on Pressley Road, and others;
The study area comprises 14% of the Airport submarket’s 13.5 million sq. ft. of office space.
Since 2009, over 550,800 sq. ft. of new office space was built;
There are more than 210,600 sq. ft. of vacant office space (including direct vacancies
and sublet space), which reflects a third-quarter 2018 vacancy rate of 11.1%. Office
vacancies decreased from a peak of 27.4% recorded at the end of the recession in 2011;
Notably, key metrics suggest that the study area’s office market is strengthening. For
example, net absorption totaled 449,579 sq. ft. between 2009 and 2018, or 46,111 sq. ft.
per year. While the study area accounted for 23% of the entire submarket’s annual
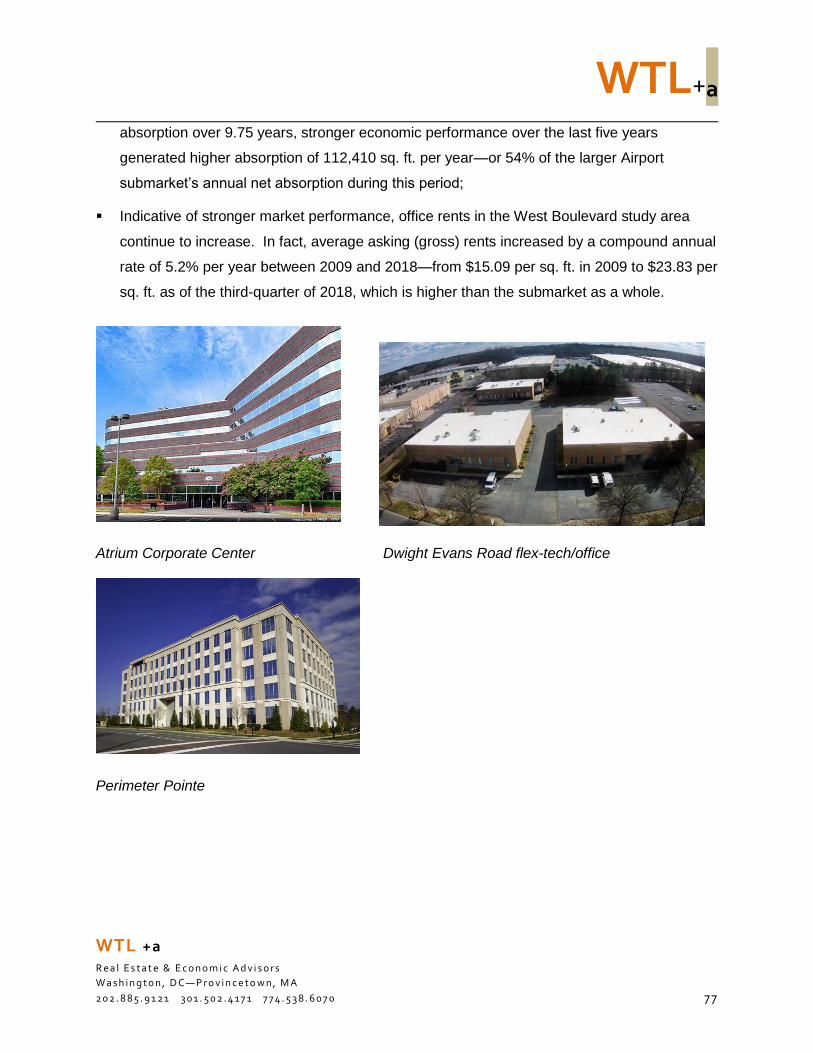
WTL+a
WTL +a
R e a l E s t a t e & E c o n o m i c A d v i s o r s
W a s h i n g t o n , D C—P r o v i n c e t o w n , M A
2 0 2 . 8 8 5 . 9 1 2 1 3 0 1 . 5 0 2 . 4 1 7 1 7 7 4 . 5 3 8 . 6 0 7 0 7 7
absorption over 9.75 years, stronger economic performance over the last five years
generated higher absorption of 112,410 sq. ft. per year—or 54% of the larger Airport
submarket’s annual net absorption during this period;
Indicative of stronger market performance, office rents in the West Boulevard study area
continue to increase. In fact, average asking (gross) rents increased by a compound annual
rate of 5.2% per year between 2009 and 2018—from $15.09 per sq. ft. in 2009 to $23.83 per
sq. ft. as of the third-quarter of 2018, which is higher than the submarket as a whole.
Atrium Corporate Center Dwight Evans Road flex-tech/office
Perimeter Pointe
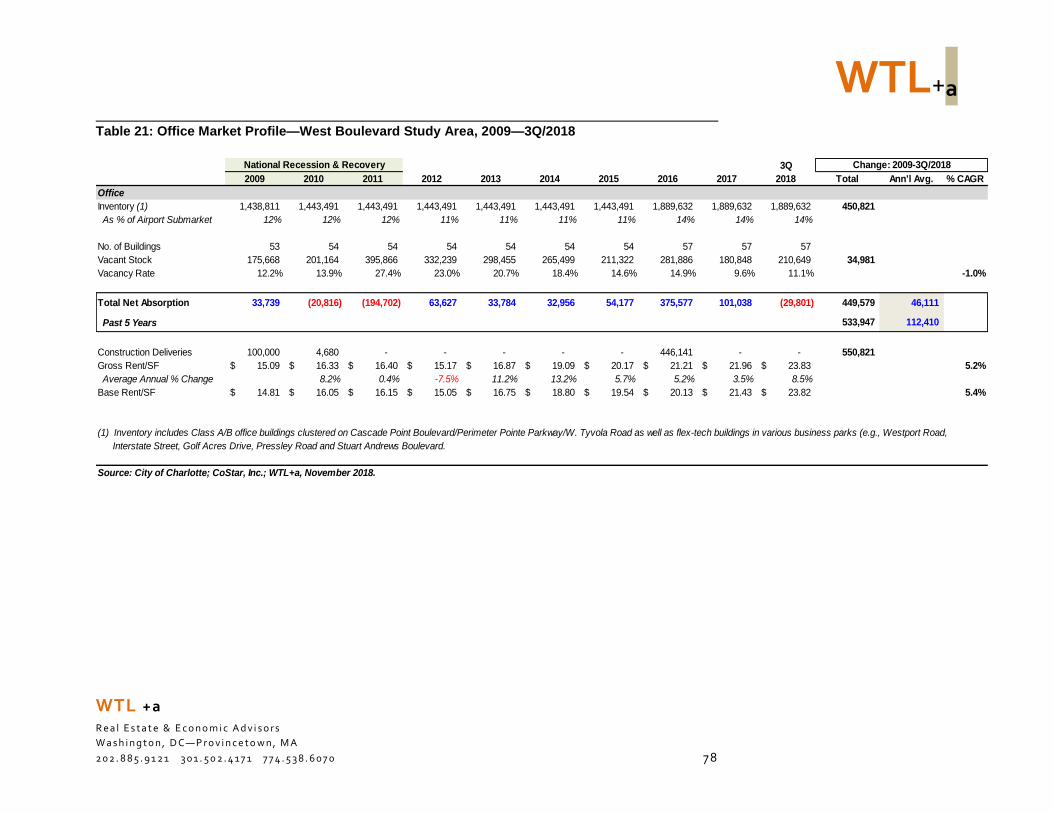
WTL+a
WTL +a
R e a l E s t a t e & E c o n o m i c A d v i s o r s
W a s h i n g t o n , D C—P r o v i n c e t o w n , M A
2 0 2 . 8 8 5 . 9 1 2 1 3 0 1 . 5 0 2 . 4 1 7 1 7 7 4 . 5 3 8 . 6 0 7 0 7 8
Table 21: Office Market Profile—West Boulevard Study Area, 2009—3Q/2018
3Q
2009 2010 2011 2012 2013 2014 2015 2016 2017 2018 Total Ann'l Avg. % CAGR
Office
Inventory (1) 1,438,811 1,443,491 1,443,491 1,443,491 1,443,491 1,443,491 1,443,491 1,889,632 1,889,632 1,889,632 450,821
As % of Airport Submarket 12% 12% 12% 11% 11% 11% 11% 14% 14% 14%
No. of Buildings 53 54 54 54 54 54 54 57 57 57
Vacant Stock 175,668 201,164 395,866 332,239 298,455 265,499 211,322 281,886 180,848 210,649 34,981
Vacancy Rate 12.2% 13.9% 27.4% 23.0% 20.7% 18.4% 14.6% 14.9% 9.6% 11.1% -1.0%
Total Net Absorption 33,739 (20,816) (194,702) 63,627 33,784 32,956 54,177 375,577 101,038 (29,801) 449,579 46,111
Past 5 Years 533,947 112,410
Construction Deliveries 100,000 4,680 - - - - - 446,141 - - 550,821
Gross Rent/SF 15.09$ 16.33$ 16.40$ 15.17$ 16.87$ 19.09$ 20.17$ 21.21$ 21.96$ 23.83$ 5.2%
Average Annual % Change 8.2% 0.4% -7.5% 11.2% 13.2% 5.7% 5.2% 3.5% 8.5%
Base Rent/SF 14.81$ 16.05$ 16.15$ 15.05$ 16.75$ 18.80$ 19.54$ 20.13$ 21.43$ 23.82$ 5.4%
(1) Inventory includes Class A/B office buildings clustered on Cascade Point Boulevard/Perimeter Pointe Parkway/W. Tyvola Road as well as flex-tech buildings in various business parks (e.g., Westport Road,
Interstate Street, Golf Acres Drive, Pressley Road and Stuart Andrews Boulevard.
Source: City of Charlotte; CoStar, Inc.; WTL+a, November 2018.
National Recession & Recovery Change: 2009-3Q/2018
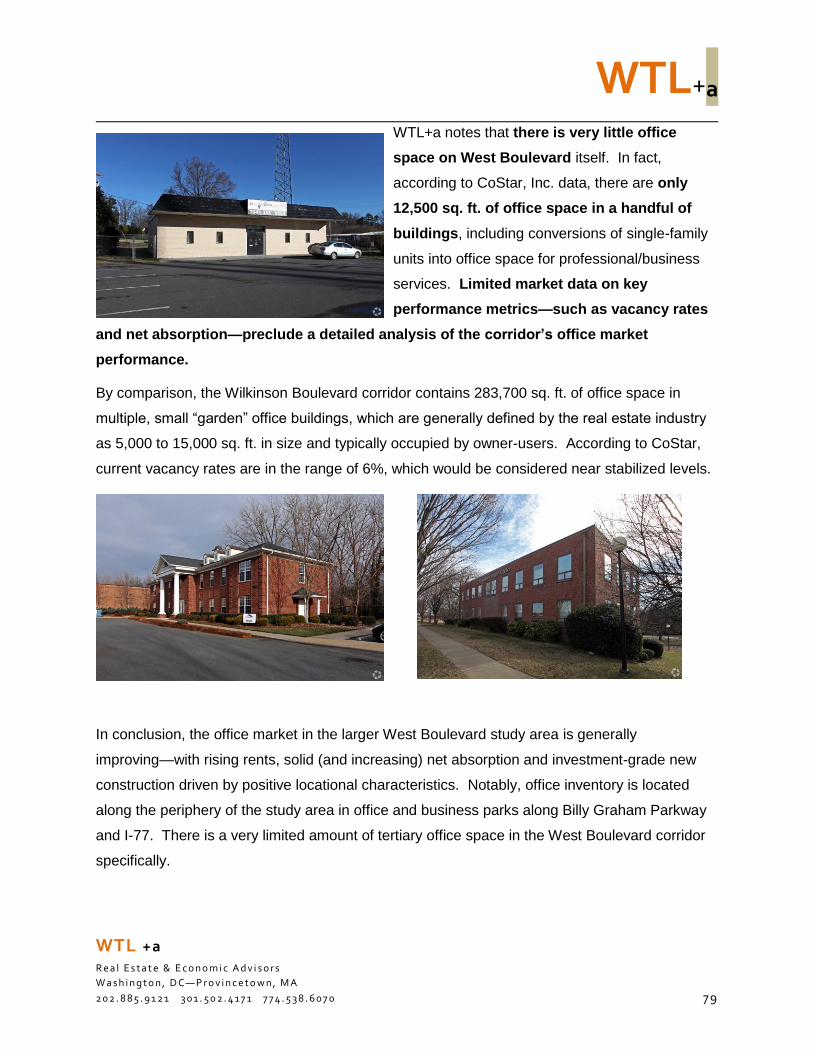
WTL+a
WTL +a
R e a l E s t a t e & E c o n o m i c A d v i s o r s
W a s h i n g t o n , D C—P r o v i n c e t o w n , M A
2 0 2 . 8 8 5 . 9 1 2 1 3 0 1 . 5 0 2 . 4 1 7 1 7 7 4 . 5 3 8 . 6 0 7 0 7 9
WTL+a notes that there is very little office
space on West Boulevard itself. In fact,
according to CoStar, Inc. data, there are only
12,500 sq. ft. of office space in a handful of
buildings, including conversions of single-family
units into office space for professional/business
services. Limited market data on key
performance metrics—such as vacancy rates
and net absorption—preclude a detailed analysis of the corridor’s office market
performance.
By comparison, the Wilkinson Boulevard corridor contains 283,700 sq. ft. of office space in
multiple, small “garden” office buildings, which are generally defined by the real estate industry
as 5,000 to 15,000 sq. ft. in size and typically occupied by owner-users. According to CoStar,
current vacancy rates are in the range of 6%, which would be considered near stabilized levels.
In conclusion, the office market in the larger West Boulevard study area is generally
improving—with rising rents, solid (and increasing) net absorption and investment-grade new
construction driven by positive locational characteristics. Notably, office inventory is located
along the periphery of the study area in office and business parks along Billy Graham Parkway
and I-77. There is a very limited amount of tertiary office space in the West Boulevard corridor
specifically.
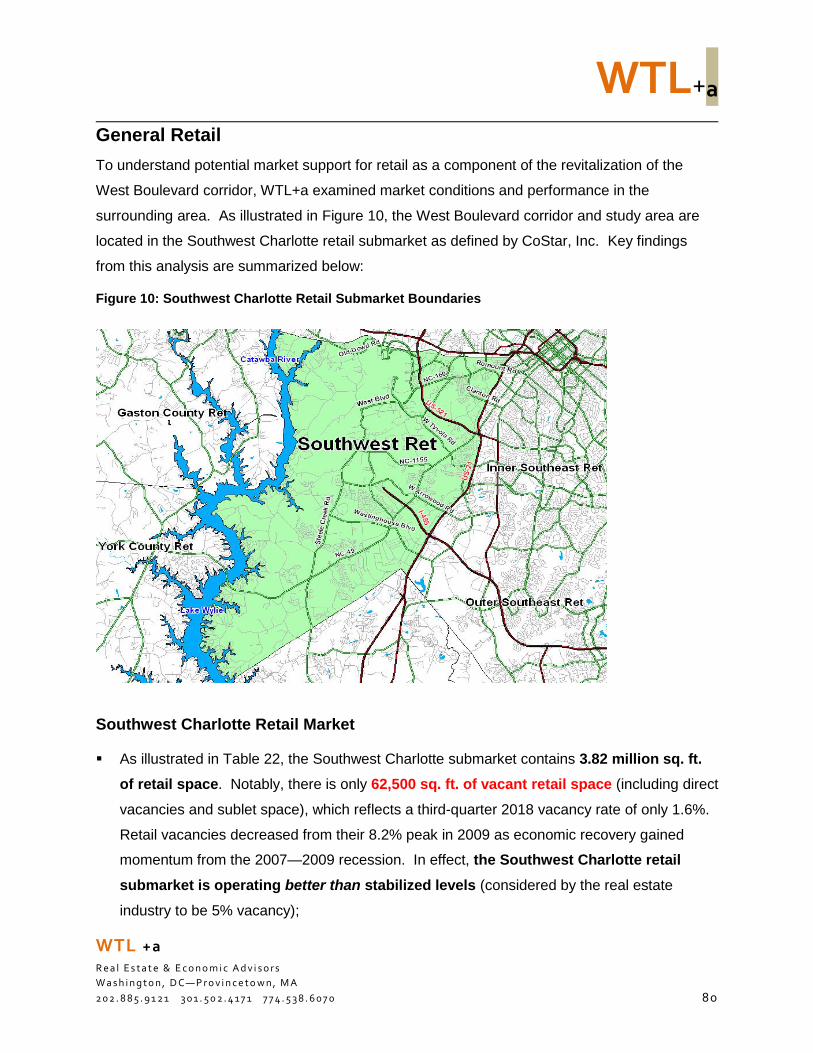
WTL+a
WTL +a
R e a l E s t a t e & E c o n o m i c A d v i s o r s
W a s h i n g t o n , D C—P r o v i n c e t o w n , M A
2 0 2 . 8 8 5 . 9 1 2 1 3 0 1 . 5 0 2 . 4 1 7 1 7 7 4 . 5 3 8 . 6 0 7 0 80
General Retail
To understand potential market support for retail as a component of the revitalization of the
West Boulevard corridor, WTL+a examined market conditions and performance in the
surrounding area. As illustrated in Figure 10, the West Boulevard corridor and study area are
located in the Southwest Charlotte retail submarket as defined by CoStar, Inc. Key findings
from this analysis are summarized below:
Figure 10: Southwest Charlotte Retail Submarket Boundaries
Southwest Charlotte Retail Market
As illustrated in Table 22, the Southwest Charlotte submarket contains 3.82 million sq. ft.
of retail space. Notably, there is only 62,500 sq. ft. of vacant retail space (including direct
vacancies and sublet space), which reflects a third-quarter 2018 vacancy rate of only 1.6%.
Retail vacancies decreased from their 8.2% peak in 2009 as economic recovery gained
momentum from the 2007—2009 recession. In effect, the Southwest Charlotte retail
submarket is operating better than stabilized levels (considered by the real estate
industry to be 5% vacancy);
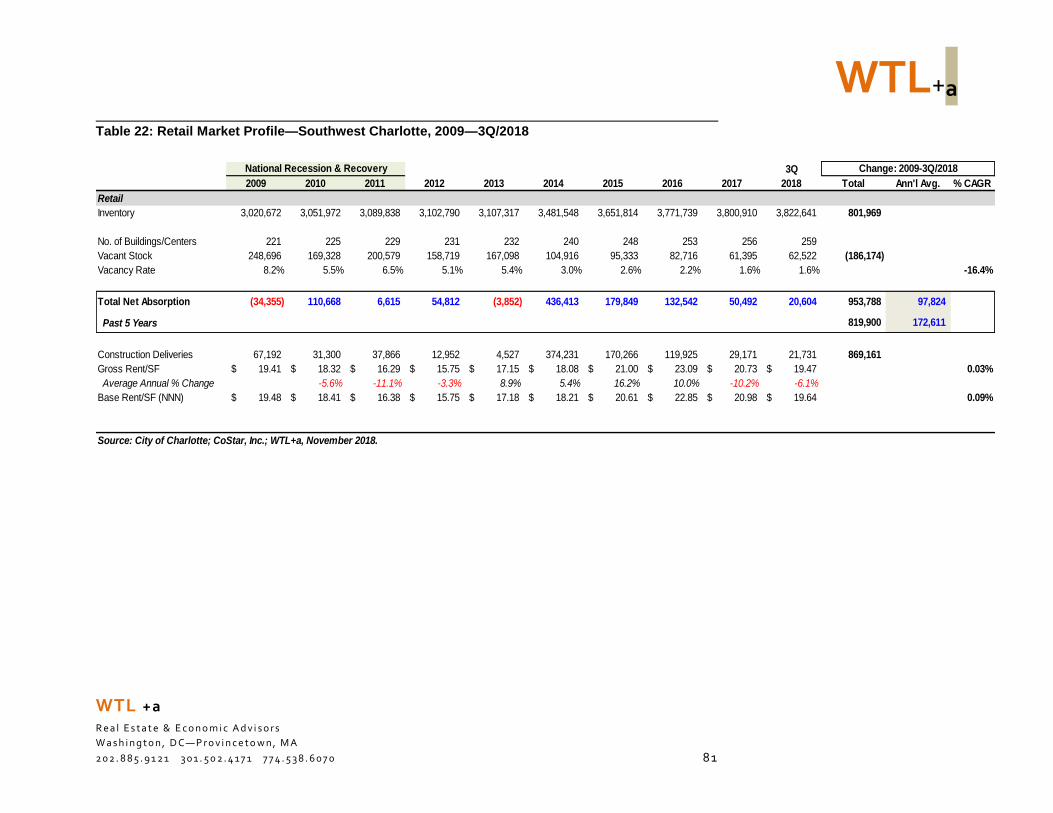
WTL+a
WTL +a
R e a l E s t a t e & E c o n o m i c A d v i s o r s
W a s h i n g t o n , D C—P r o v i n c e t o w n , M A
2 0 2 . 8 8 5 . 9 1 2 1 3 0 1 . 5 0 2 . 4 1 7 1 7 7 4 . 5 3 8 . 6 0 7 0 81
Table 22: Retail Market Profile—Southwest Charlotte, 2009—3Q/2018
3Q
2009 2010 2011 2012 2013 2014 2015 2016 2017 2018 Total Ann'l Avg. % CAGR
Retail
Inventory 3,020,672 3,051,972 3,089,838 3,102,790 3,107,317 3,481,548 3,651,814 3,771,739 3,800,910 3,822,641 801,969
No. of Buildings/Centers 221 225 229 231 232 240 248 253 256 259
Vacant Stock 248,696 169,328 200,579 158,719 167,098 104,916 95,333 82,716 61,395 62,522 (186,174)
Vacancy Rate 8.2% 5.5% 6.5% 5.1% 5.4% 3.0% 2.6% 2.2% 1.6% 1.6% -16.4%
Total Net Absorption (34,355) 110,668 6,615 54,812 (3,852) 436,413 179,849 132,542 50,492 20,604 953,788 97,824
Past 5 Years 819,900 172,611
Construction Deliveries 67,192 31,300 37,866 12,952 4,527 374,231 170,266 119,925 29,171 21,731 869,161
Gross Rent/SF 19.41$ 18.32$ 16.29$ 15.75$ 17.15$ 18.08$ 21.00$ 23.09$ 20.73$ 19.47$ 0.03%
Average Annual % Change -5.6% -11.1% -3.3% 8.9% 5.4% 16.2% 10.0% -10.2% -6.1%
Base Rent/SF (NNN) 19.48$ 18.41$ 16.38$ 15.75$ 17.18$ 18.21$ 20.61$ 22.85$ 20.98$ 19.64$ 0.09%
Source: City of Charlotte; CoStar, Inc.; WTL+a, November 2018.
National Recession & Recovery Change: 2009-3Q/2018
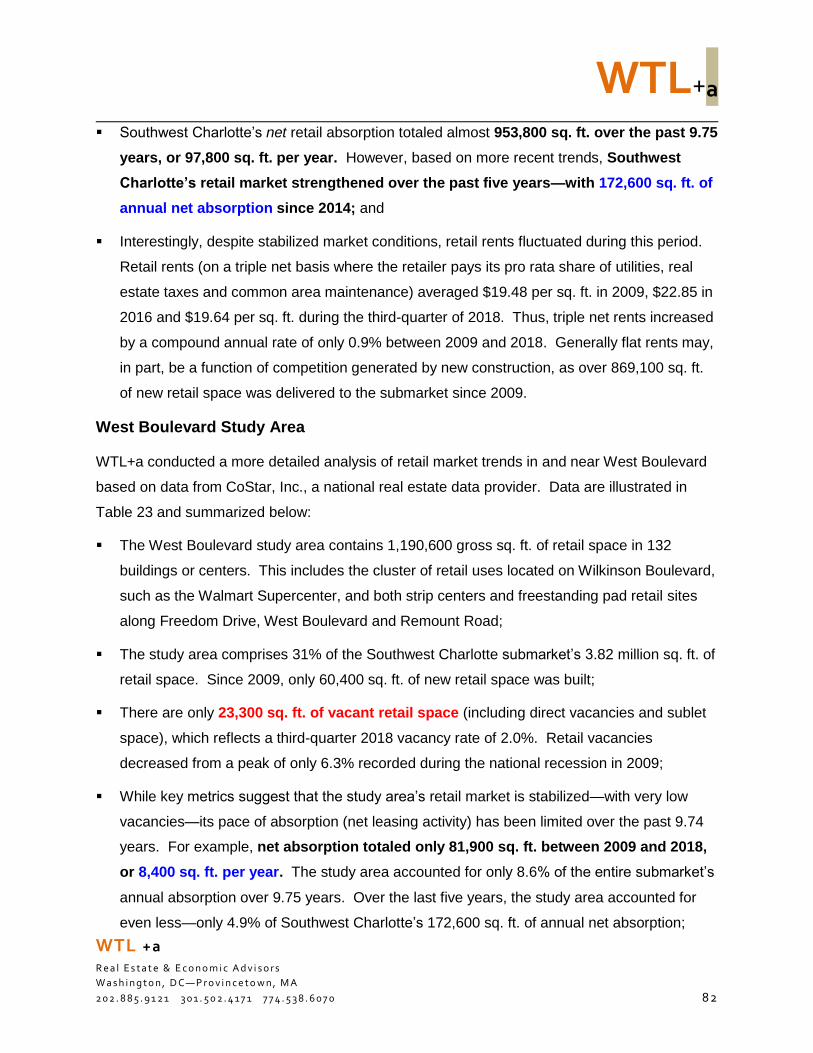
WTL+a
WTL +a
R e a l E s t a t e & E c o n o m i c A d v i s o r s
W a s h i n g t o n , D C—P r o v i n c e t o w n , M A
2 0 2 . 8 8 5 . 9 1 2 1 3 0 1 . 5 0 2 . 4 1 7 1 7 7 4 . 5 3 8 . 6 0 7 0 82
Southwest Charlotte’s net retail absorption totaled almost 953,800 sq. ft. over the past 9.75
years, or 97,800 sq. ft. per year. However, based on more recent trends, Southwest
Charlotte’s retail market strengthened over the past five years—with 172,600 sq. ft. of
annual net absorption since 2014; and
Interestingly, despite stabilized market conditions, retail rents fluctuated during this period.
Retail rents (on a triple net basis where the retailer pays its pro rata share of utilities, real
estate taxes and common area maintenance) averaged $19.48 per sq. ft. in 2009, $22.85 in
2016 and $19.64 per sq. ft. during the third-quarter of 2018. Thus, triple net rents increased
by a compound annual rate of only 0.9% between 2009 and 2018. Generally flat rents may,
in part, be a function of competition generated by new construction, as over 869,100 sq. ft.
of new retail space was delivered to the submarket since 2009.
West Boulevard Study Area
WTL+a conducted a more detailed analysis of retail market trends in and near West Boulevard
based on data from CoStar, Inc., a national real estate data provider. Data are illustrated in
Table 23 and summarized below:
The West Boulevard study area contains 1,190,600 gross sq. ft. of retail space in 132
buildings or centers. This includes the cluster of retail uses located on Wilkinson Boulevard,
such as the Walmart Supercenter, and both strip centers and freestanding pad retail sites
along Freedom Drive, West Boulevard and Remount Road;
The study area comprises 31% of the Southwest Charlotte submarket’s 3.82 million sq. ft. of
retail space. Since 2009, only 60,400 sq. ft. of new retail space was built;
There are only 23,300 sq. ft. of vacant retail space (including direct vacancies and sublet
space), which reflects a third-quarter 2018 vacancy rate of 2.0%. Retail vacancies
decreased from a peak of only 6.3% recorded during the national recession in 2009;
While key metrics suggest that the study area’s retail market is stabilized—with very low
vacancies—its pace of absorption (net leasing activity) has been limited over the past 9.74
years. For example, net absorption totaled only 81,900 sq. ft. between 2009 and 2018,
or 8,400 sq. ft. per year. The study area accounted for only 8.6% of the entire submarket’s
annual absorption over 9.75 years. Over the last five years, the study area accounted for
even less—only 4.9% of Southwest Charlotte’s 172,600 sq. ft. of annual net absorption;
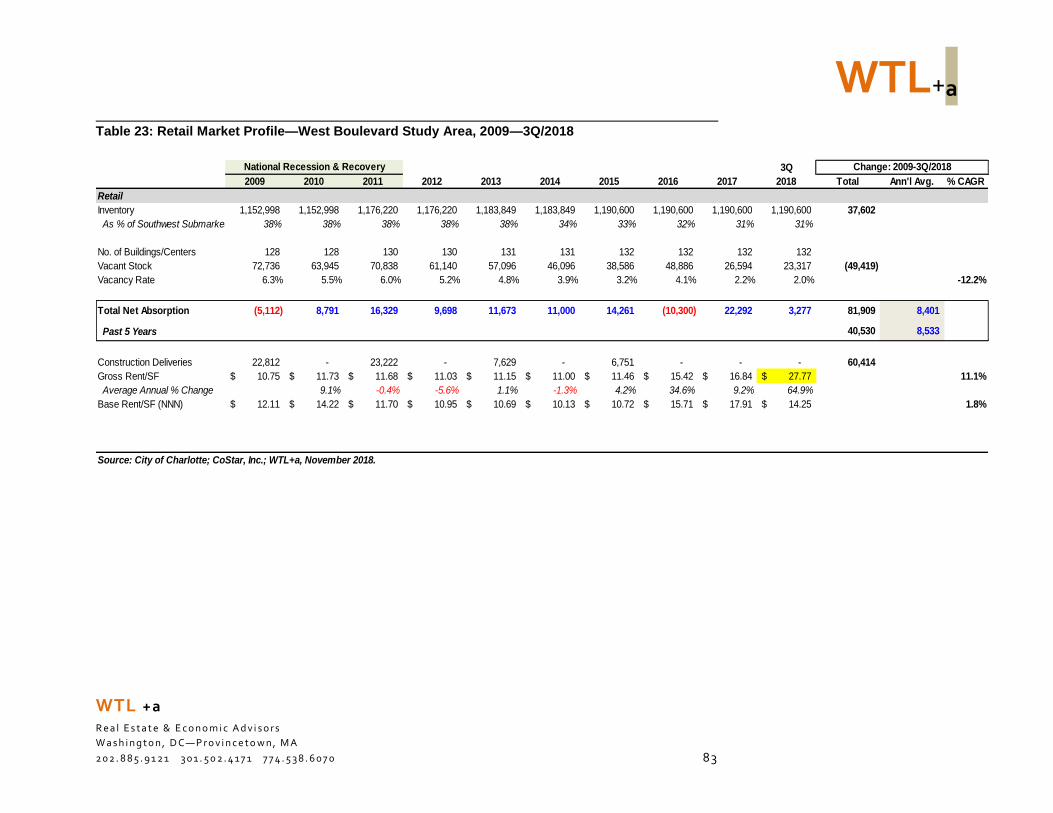
WTL+a
WTL +a
R e a l E s t a t e & E c o n o m i c A d v i s o r s
W a s h i n g t o n , D C—P r o v i n c e t o w n , M A
2 0 2 . 8 8 5 . 9 1 2 1 3 0 1 . 5 0 2 . 4 1 7 1 7 7 4 . 5 3 8 . 6 0 7 0 83
Table 23: Retail Market Profile—West Boulevard Study Area, 2009—3Q/2018
3Q
2009 2010 2011 2012 2013 2014 2015 2016 2017 2018 Total Ann'l Avg. % CAGR
Retail
Inventory 1,152,998 1,152,998 1,176,220 1,176,220 1,183,849 1,183,849 1,190,600 1,190,600 1,190,600 1,190,600 37,602
As % of Southwest Submarket 38% 38% 38% 38% 38% 34% 33% 32% 31% 31%
No. of Buildings/Centers 128 128 130 130 131 131 132 132 132 132
Vacant Stock 72,736 63,945 70,838 61,140 57,096 46,096 38,586 48,886 26,594 23,317 (49,419)
Vacancy Rate 6.3% 5.5% 6.0% 5.2% 4.8% 3.9% 3.2% 4.1% 2.2% 2.0% -12.2%
Total Net Absorption (5,112) 8,791 16,329 9,698 11,673 11,000 14,261 (10,300) 22,292 3,277 81,909 8,401
Past 5 Years 40,530 8,533
Construction Deliveries 22,812 - 23,222 - 7,629 - 6,751 - - - 60,414
Gross Rent/SF 10.75$ 11.73$ 11.68$ 11.03$ 11.15$ 11.00$ 11.46$ 15.42$ 16.84$ 27.77$ 11.1%
Average Annual % Change 9.1% -0.4% -5.6% 1.1% -1.3% 4.2% 34.6% 9.2% 64.9%
Base Rent/SF (NNN) 12.11$ 14.22$ 11.70$ 10.95$ 10.69$ 10.13$ 10.72$ 15.71$ 17.91$ 14.25$ 1.8%
Source: City of Charlotte; CoStar, Inc.; WTL+a, November 2018.
National Recession & Recovery Change: 2009-3Q/2018
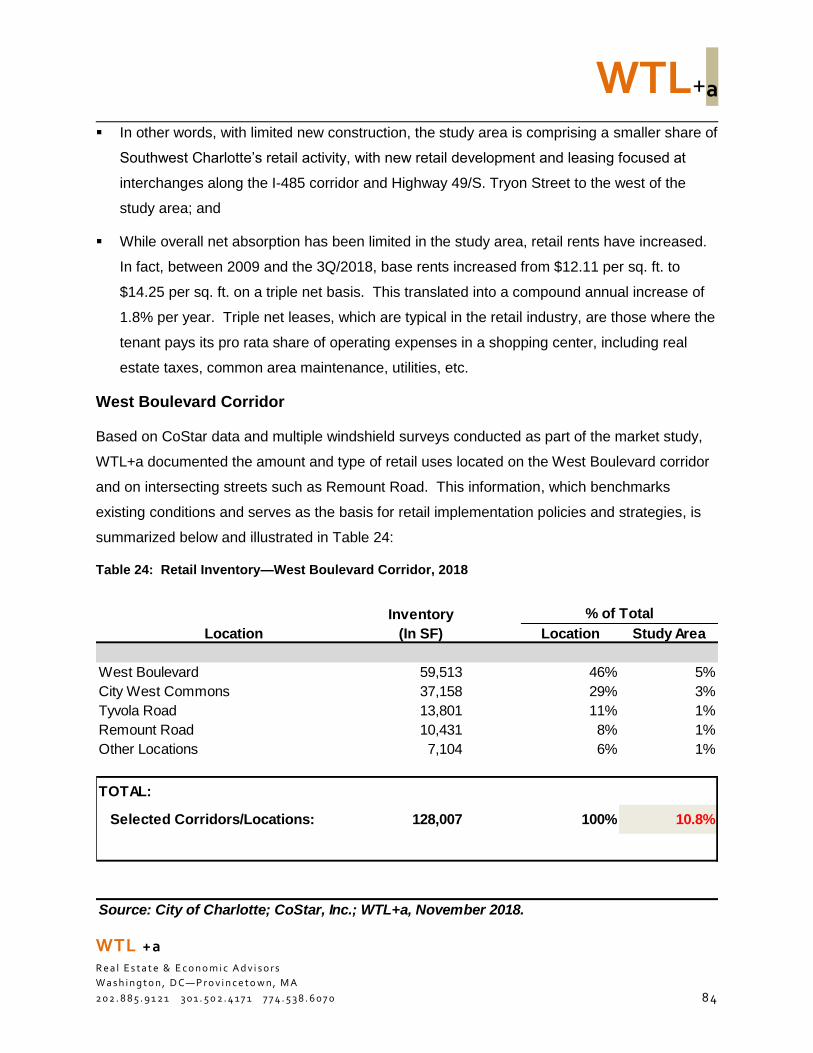
WTL+a
WTL +a
R e a l E s t a t e & E c o n o m i c A d v i s o r s
W a s h i n g t o n , D C—P r o v i n c e t o w n , M A
2 0 2 . 8 8 5 . 9 1 2 1 3 0 1 . 5 0 2 . 4 1 7 1 7 7 4 . 5 3 8 . 6 0 7 0 84
In other words, with limited new construction, the study area is comprising a smaller share of
Southwest Charlotte’s retail activity, with new retail development and leasing focused at
interchanges along the I-485 corridor and Highway 49/S. Tryon Street to the west of the
study area; and
While overall net absorption has been limited in the study area, retail rents have increased.
In fact, between 2009 and the 3Q/2018, base rents increased from $12.11 per sq. ft. to
$14.25 per sq. ft. on a triple net basis. This translated into a compound annual increase of
1.8% per year. Triple net leases, which are typical in the retail industry, are those where the
tenant pays its pro rata share of operating expenses in a shopping center, including real
estate taxes, common area maintenance, utilities, etc.
West Boulevard Corridor
Based on CoStar data and multiple windshield surveys conducted as part of the market study,
WTL+a documented the amount and type of retail uses located on the West Boulevard corridor
and on intersecting streets such as Remount Road. This information, which benchmarks
existing conditions and serves as the basis for retail implementation policies and strategies, is
summarized below and illustrated in Table 24:
Table 24: Retail Inventory—West Boulevard Corridor, 2018
Inventory
Location (In SF) Location Study Area
West Boulevard 59,513 46% 5%
City West Commons 37,158 29% 3%
Tyvola Road 13,801 11% 1%
Remount Road 10,431 8% 1%
Other Locations 7,104 6% 1%
TOTAL:
Selected Corridors/Locations: 128,007 100% 10.8%
Source: City of Charlotte; CoStar, Inc.; WTL+a, November 2018.
% of Total
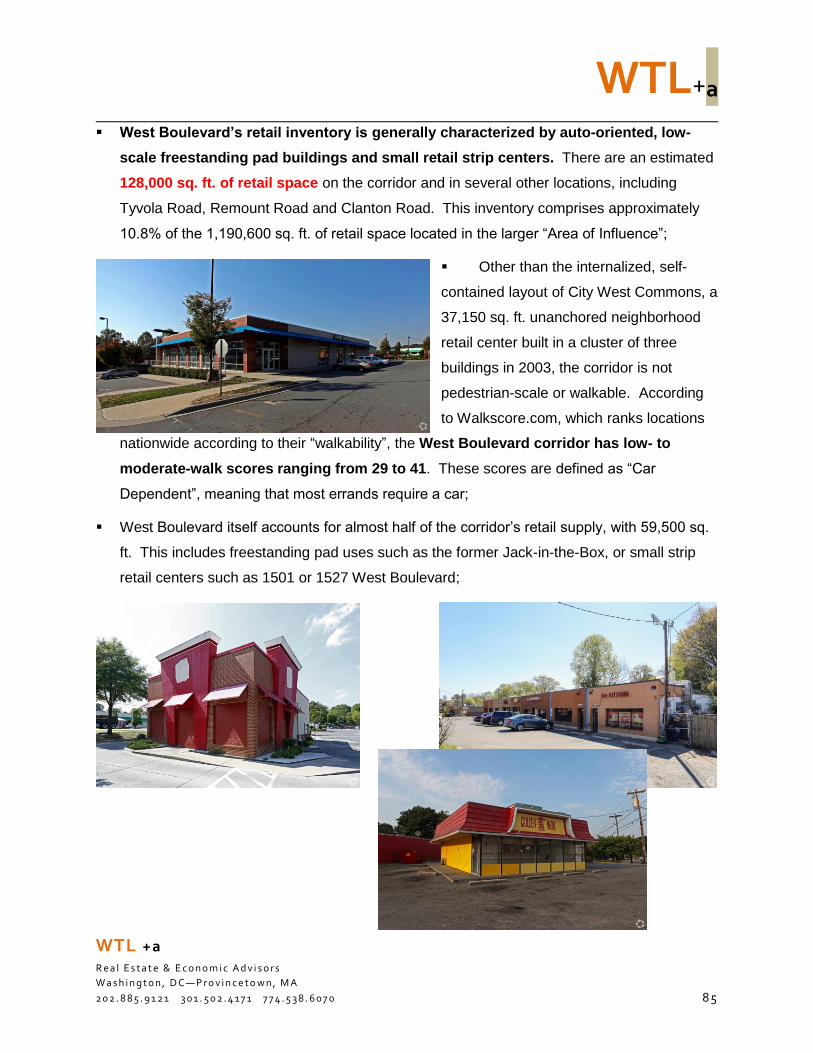
WTL+a
WTL +a
R e a l E s t a t e & E c o n o m i c A d v i s o r s
W a s h i n g t o n , D C—P r o v i n c e t o w n , M A
2 0 2 . 8 8 5 . 9 1 2 1 3 0 1 . 5 0 2 . 4 1 7 1 7 7 4 . 5 3 8 . 6 0 7 0 85
West Boulevard’s retail inventory is generally characterized by auto-oriented, low-
scale freestanding pad buildings and small retail strip centers. There are an estimated
128,000 sq. ft. of retail space on the corridor and in several other locations, including
Tyvola Road, Remount Road and Clanton Road. This inventory comprises approximately
10.8% of the 1,190,600 sq. ft. of retail space located in the larger “Area of Influence”;
Other than the internalized, self-
contained layout of City West Commons, a
37,150 sq. ft. unanchored neighborhood
retail center built in a cluster of three
buildings in 2003, the corridor is not
pedestrian-scale or walkable. According
to Walkscore.com, which ranks locations
nationwide according to their “walkability”, the West Boulevard corridor has low- to
moderate-walk scores ranging from 29 to 41. These scores are defined as “Car
Dependent”, meaning that most errands require a car;
West Boulevard itself accounts for almost half of the corridor’s retail supply, with 59,500 sq.
ft. This includes freestanding pad uses such as the former Jack-in-the-Box, or small strip
retail centers such as 1501 or 1527 West Boulevard;
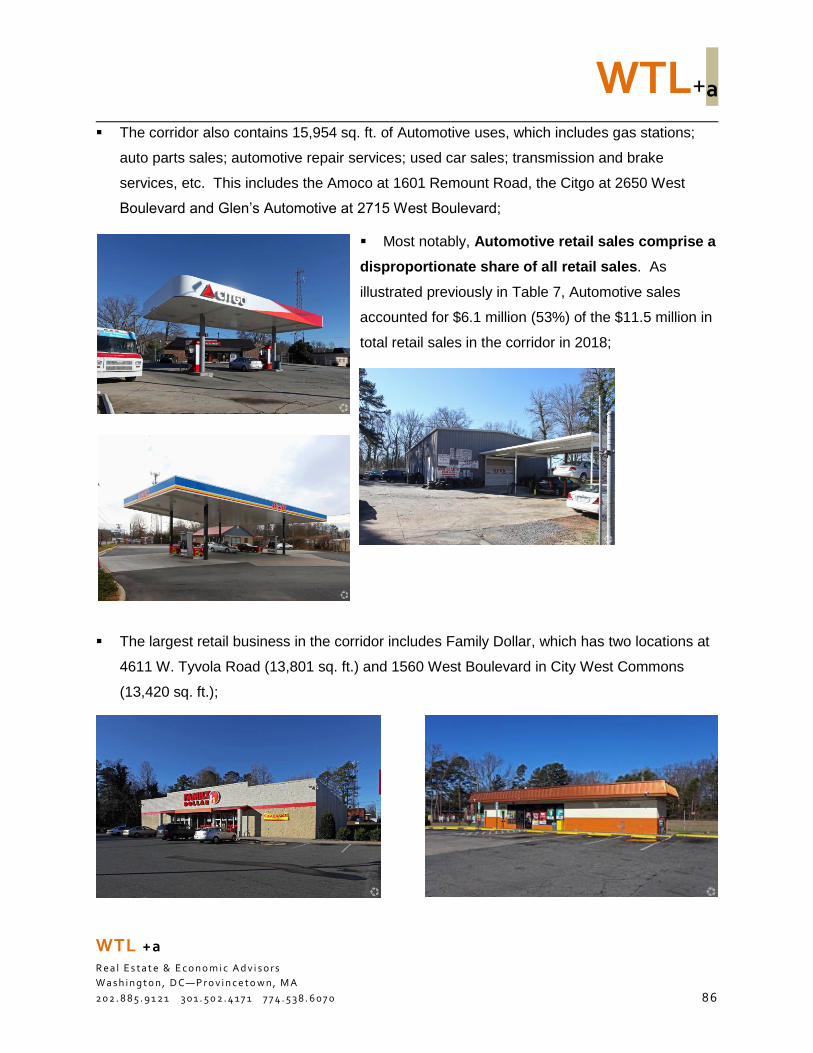
WTL+a
WTL +a
R e a l E s t a t e & E c o n o m i c A d v i s o r s
W a s h i n g t o n , D C—P r o v i n c e t o w n , M A
2 0 2 . 8 8 5 . 9 1 2 1 3 0 1 . 5 0 2 . 4 1 7 1 7 7 4 . 5 3 8 . 6 0 7 0 86
The corridor also contains 15,954 sq. ft. of Automotive uses, which includes gas stations;
auto parts sales; automotive repair services; used car sales; transmission and brake
services, etc. This includes the Amoco at 1601 Remount Road, the Citgo at 2650 West
Boulevard and Glen’s Automotive at 2715 West Boulevard;
Most notably, Automotive retail sales comprise a
disproportionate share of all retail sales. As
illustrated previously in Table 7, Automotive sales
accounted for $6.1 million (53%) of the $11.5 million in
total retail sales in the corridor in 2018;
The largest retail business in the corridor includes Family Dollar, which has two locations at
4611 W. Tyvola Road (13,801 sq. ft.) and 1560 West Boulevard in City West Commons
(13,420 sq. ft.);
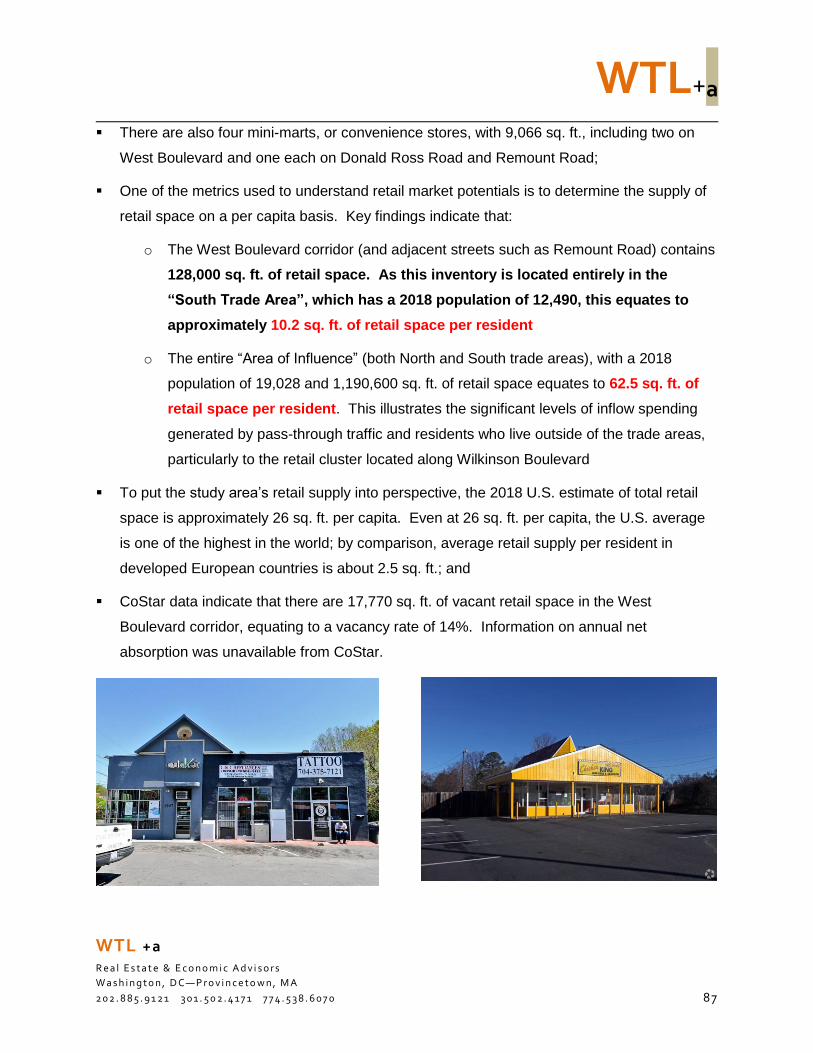
WTL+a
WTL +a
R e a l E s t a t e & E c o n o m i c A d v i s o r s
W a s h i n g t o n , D C—P r o v i n c e t o w n , M A
2 0 2 . 8 8 5 . 9 1 2 1 3 0 1 . 5 0 2 . 4 1 7 1 7 7 4 . 5 3 8 . 6 0 7 0 87
There are also four mini-marts, or convenience stores, with 9,066 sq. ft., including two on
West Boulevard and one each on Donald Ross Road and Remount Road;
One of the metrics used to understand retail market potentials is to determine the supply of
retail space on a per capita basis. Key findings indicate that:
o The West Boulevard corridor (and adjacent streets such as Remount Road) contains
128,000 sq. ft. of retail space. As this inventory is located entirely in the
“South Trade Area”, which has a 2018 population of 12,490, this equates to
approximately 10.2 sq. ft. of retail space per resident
o The entire “Area of Influence” (both North and South trade areas), with a 2018
population of 19,028 and 1,190,600 sq. ft. of retail space equates to 62.5 sq. ft. of
retail space per resident. This illustrates the significant levels of inflow spending
generated by pass-through traffic and residents who live outside of the trade areas,
particularly to the retail cluster located along Wilkinson Boulevard
To put the study area’s retail supply into perspective, the 2018 U.S. estimate of total retail
space is approximately 26 sq. ft. per capita. Even at 26 sq. ft. per capita, the U.S. average
is one of the highest in the world; by comparison, average retail supply per resident in
developed European countries is about 2.5 sq. ft.; and
CoStar data indicate that there are 17,770 sq. ft. of vacant retail space in the West
Boulevard corridor, equating to a vacancy rate of 14%. Information on annual net
absorption was unavailable from CoStar.
WTL+a
WTL +a
R e a l E s t a t e & E c o n o m i c A d v i s o r s
W a s h i n g t o n , D C—P r o v i n c e t o w n , M A
2 0 2 . 8 8 5 . 9 1 2 1 3 0 1 . 5 0 2 . 4 1 7 1 7 7 4 . 5 3 8 . 6 0 7 0 88
4 Market Potentials
This section of the report details our analysis of real estate market potentials for four key land
uses in the West Boulevard corridor based on the demographic profile in Section 2 and
evaluation of real estate market conditions in Section 3. This analysis is intended to inform land
use planning concepts prepared by the planning and design team with the City of Charlotte, and
to guide specific implementation strategies and public policies to ensure that revitalization of
West Boulevard is successful. As presented in detail below, the market analysis focused on
four core uses: housing, workplace/office, retail and hotel/lodging.
Potential Land Use Concepts
Based on the market analysis, the following land use concepts were created by the City’s
planning and design team. Mixed-use development concepts are illustrated for two notes—the
Remount Road intersection in Figure 11 and the Clanton Road intersection in Figure 12.
Remount Road
Residential—Includes 327 multi-family units and 326,480 sq. ft. of gross building area
(assuming 1,000 sq. ft. per unit)
Townhouses—46 units
Commercial—12,000 sq. ft. for either street-level retail and/or office
Clanton:
Residential—Includes 258 multi-family units and 257,280 sq. ft. of gross building area
(assuming 1,000 sq. ft. per unit)
Townhouses—33 units
Commercial—16,800 sq. ft. for either street-level retail and/or office
Office (Mecklenburg County Community Resource Center)—117,000 sq. ft.
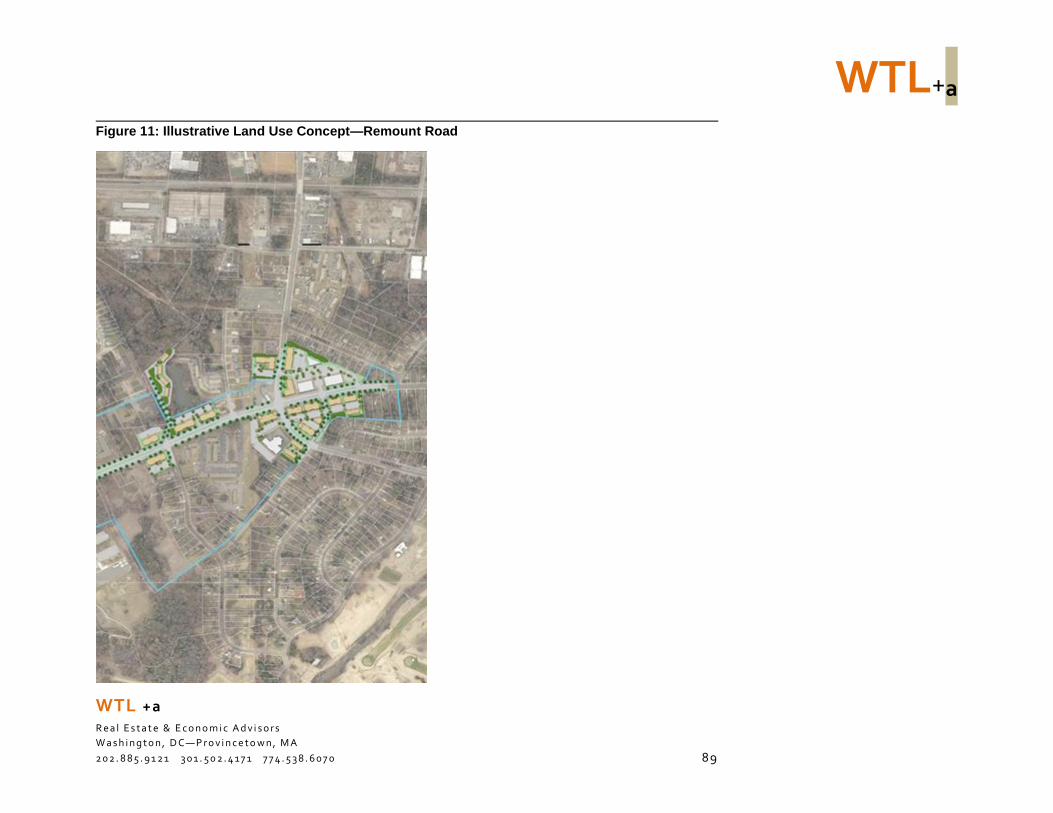
WTL+a
WTL +a
R e a l E s t a t e & E c o n o m i c A d v i s o r s
W a s h i n g t o n , D C—P r o v i n c e t o w n , M A
2 0 2 . 8 8 5 . 9 1 2 1 3 0 1 . 5 0 2 . 4 1 7 1 7 7 4 . 5 3 8 . 6 0 7 0 89
Figure 11: Illustrative Land Use Concept—Remount Road
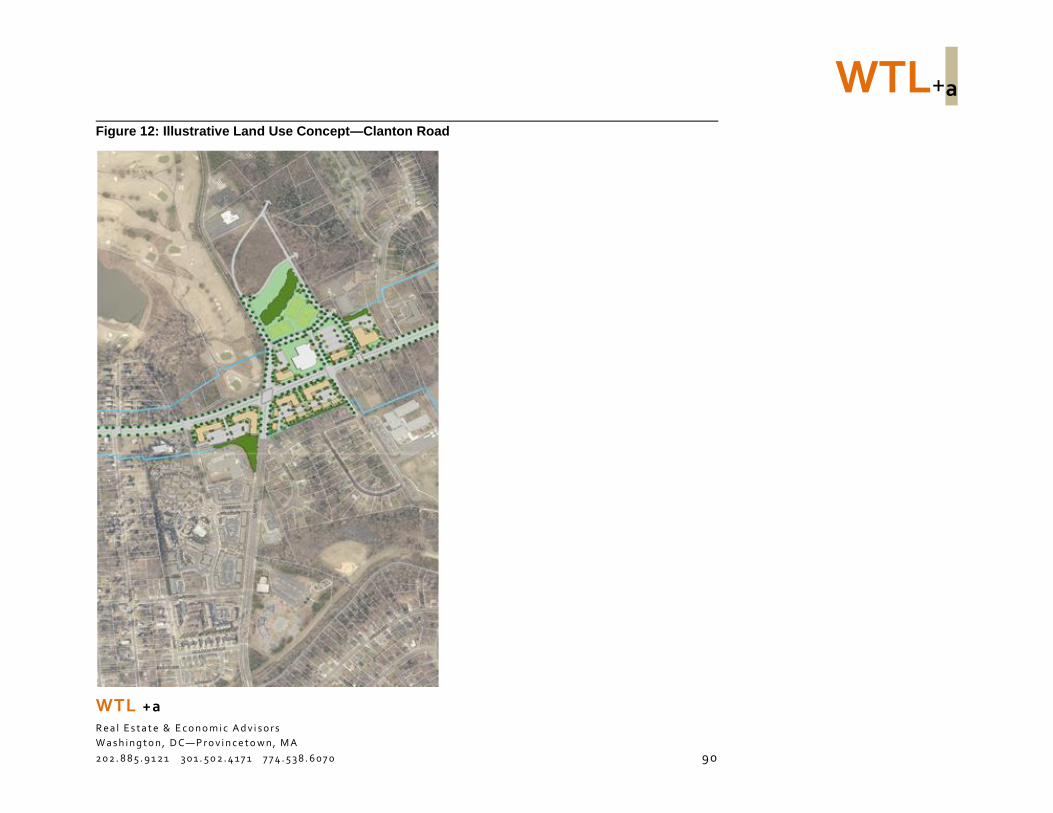
WTL+a
WTL +a
R e a l E s t a t e & E c o n o m i c A d v i s o r s
W a s h i n g t o n , D C—P r o v i n c e t o w n , M A
2 0 2 . 8 8 5 . 9 1 2 1 3 0 1 . 5 0 2 . 4 1 7 1 7 7 4 . 5 3 8 . 6 0 7 0 9 0
Figure 12: Illustrative Land Use Concept—Clanton Road
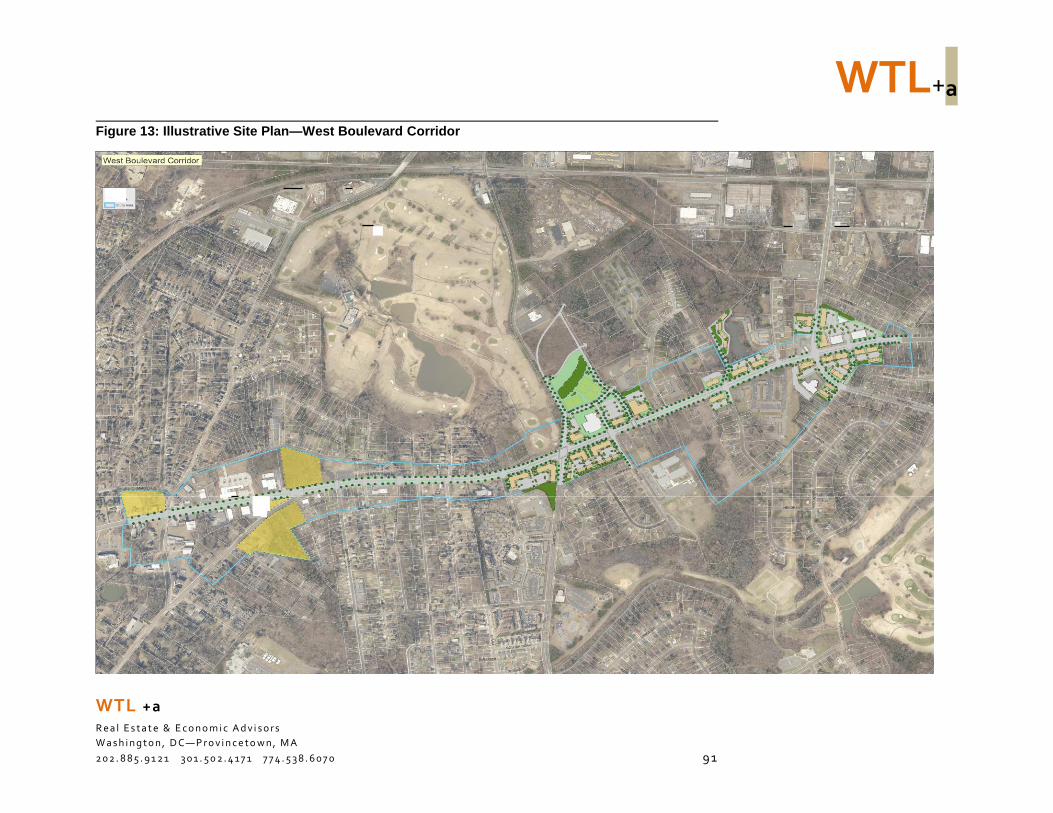
WTL+a
WTL +a
R e a l E s t a t e & E c o n o m i c A d v i s o r s
W a s h i n g t o n , D C—P r o v i n c e t o w n , M A
2 0 2 . 8 8 5 . 9 1 2 1 3 0 1 . 5 0 2 . 4 1 7 1 7 7 4 . 5 3 8 . 6 0 7 0 9 1
Figure 13: Illustrative Site Plan—West Boulevard Corridor
WTL+a
WTL +a
R e a l E s t a t e & E c o n o m i c A d v i s o r s
W a s h i n g t o n , D C—P r o v i n c e t o w n , M A
2 0 2 . 8 8 5 . 9 1 2 1 3 0 1 . 5 0 2 . 4 1 7 1 7 7 4 . 5 3 8 . 6 0 7 0 9 2
Market-rate Housing
A key recommendation to ensure the successful revitalization of the West Boulevard corridor is
to encourage mixed-use redevelopment with infill housing and other/supporting uses as
illustrated above. Expanding the neighborhood’s population—particularly in key redevelopment
“nodes”—provides multiple benefits, including new jobs and additional consumers for the
corridor’s existing retail businesses as well as opportunities to support new businesses, and
generate new tax revenues for the City of Charlotte.
WTL+a prepared a demand analysis that measures market potentials for new housing for a 10-
year period between 2019 and 2028. For both the North and South “trade areas” within the
larger “Area of Influence”, the analysis utilizes an annual (“straight-line”) growth rate of 3.14%
per year (North) and 1.67% per year (South), based on forecasts prepared by ESRI Business
Analyst, a demographic data provider. For purposes of this analysis, we extrapolated ESRI’s
five-year forecast through 2028.
At the time of the analysis, there were no known approved/entitled residential projects in either
the North or South trade areas. If there are any currently approved projects, the analysis
allocates market share to these known residential projects to determine the number of
“unallocated” units elsewhere in the trade areas that could be available to accommodate future
population/household growth as part of a revitalization strategy for West Boulevard.
North Trade Area
As noted in the demographic profile in Section 2, the population of the North trade area
increased at a compound annual rate of 3.59% per year between 2010 and 2018—
producing a net gain of 1,608 new residents and 589 new households. This can be
attributed to new development, such as construction of Morehead West, a new 210-unit
multi-family complex located on Millerton Avenue, and new infill single-family detached units
in selected neighborhoods in the North trade area;
In 2018, the North trade area had a population of 6,538 residents in 2,508 households;
and
As illustrated in Table 25, ESRI Business Analyst is forecasting a compound annual growth
rate of 3.14% over the next five years. WTL+a believes this strong growth rate is in
anticipation of future CATS transit service along the Wilkinson Boulevard corridor.
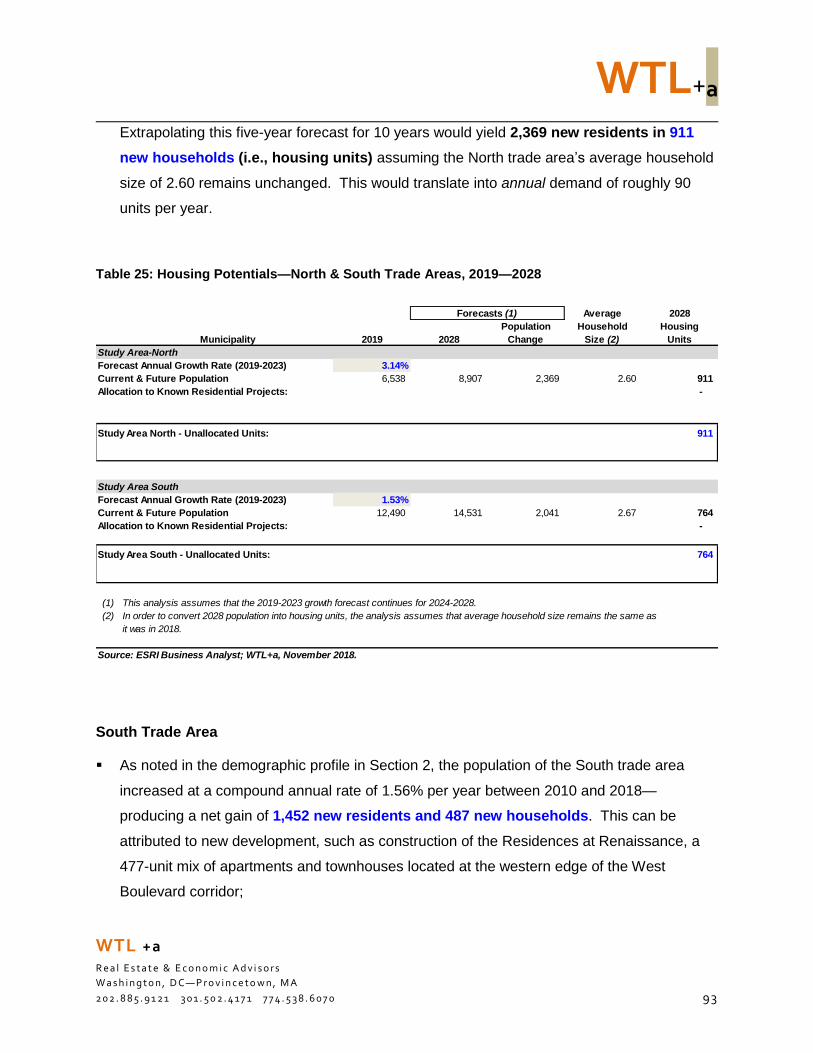
WTL+a
WTL +a
R e a l E s t a t e & E c o n o m i c A d v i s o r s
W a s h i n g t o n , D C—P r o v i n c e t o w n , M A
2 0 2 . 8 8 5 . 9 1 2 1 3 0 1 . 5 0 2 . 4 1 7 1 7 7 4 . 5 3 8 . 6 0 7 0 9 3
Extrapolating this five-year forecast for 10 years would yield 2,369 new residents in 911
new households (i.e., housing units) assuming the North trade area’s average household
size of 2.60 remains unchanged. This would translate into annual demand of roughly 90
units per year.
Table 25: Housing Potentials—North & South Trade Areas, 2019—2028
South Trade Area
As noted in the demographic profile in Section 2, the population of the South trade area
increased at a compound annual rate of 1.56% per year between 2010 and 2018—
producing a net gain of 1,452 new residents and 487 new households. This can be
attributed to new development, such as construction of the Residences at Renaissance, a
477-unit mix of apartments and townhouses located at the western edge of the West
Boulevard corridor;
Average 2028
Population Household Housing
Municipality 2019 2028 Change Size (2) Units
Study Area-North
Forecast Annual Growth Rate (2019-2023) 3.14%
Current & Future Population 6,538 8,907 2,369 2.60 911
Allocation to Known Residential Projects: -
Study Area North - Unallocated Units: 911
Study Area South
Forecast Annual Growth Rate (2019-2023) 1.53%
Current & Future Population 12,490 14,531 2,041 2.67 764
Allocation to Known Residential Projects: -
Study Area South - Unallocated Units: 764
(1) This analysis assumes that the 2019-2023 growth forecast continues for 2024-2028.
(2) In order to convert 2028 population into housing units, the analysis assumes that average household size remains the same as
it was in 2018.
Source: ESRI Business Analyst; WTL+a, November 2018.
Forecasts (1)
WTL+a
WTL +a
R e a l E s t a t e & E c o n o m i c A d v i s o r s
W a s h i n g t o n , D C—P r o v i n c e t o w n , M A
2 0 2 . 8 8 5 . 9 1 2 1 3 0 1 . 5 0 2 . 4 1 7 1 7 7 4 . 5 3 8 . 6 0 7 0 9 4
In 2018, the South trade area had a population of 12,490 residents in 4,596 households;
and
As illustrated in Table 25 above, ESRI Business Analyst is forecasting a compound annual
growth rate of 1.53% over the next five years. This forecast is roughly half of the anticipated
growth of the North trade area. Extrapolating this five-year forecast for 10 years would yield
2,041 new residents in 764 new households (i.e., housing units) assuming the South
trade area’s average household size of 2.67 remains unchanged. This would translate into
annual demand of roughly 75 units per year.
In addition, as noted previously in Section 3 (Table 13), the larger “Area of Influence” has a
number of “true vacant” housing units. True vacancy is defined as unoccupied units available
for rent but excludes units that are unoccupied because they are for sale or are seasonally-
occupied units. According to the 2016 American Community Survey (ACS), the study area has
an estimated 874 “truly vacant” units, which reflects a vacancy rate of 12.6%. While the
physical and/or functional obsolescence of these units is unknown, some portion of these
vacant units are assumed to be habitable and may serve to reduce demand for new
residential construction that are also affected by such variables as the availability of financing,
developable sites and other macro-economic factors.
In summary, these forecast growth rates would yield over 4,400 new residents in more than
1,670 new households (housing units) over the next 10 years. This forecast is a solid,
positive factor that will generate other supporting benefits as part of the revitalization of the
West Boulevard corridor.
Workplace/Office
Knowledge-based industries like finance, software, business and management consulting
services, market and communications, professional/business services such as accountants,
legal and medical and other similar businesses house most of their employees in commercial
office buildings.
The first step in measuring support for new multi-tenant/speculative office space as part of a
revitalization strategy for West Boulevard examines market potentials for office use in the
“Southwest Prosperity Zone” (a multi-county region identified by the state’s Department of
Commerce for employment forecasts), and allocates demand to the City of Charlotte, the larger
WTL+a
WTL +a
R e a l E s t a t e & E c o n o m i c A d v i s o r s
W a s h i n g t o n , D C—P r o v i n c e t o w n , M A
2 0 2 . 8 8 5 . 9 1 2 1 3 0 1 . 5 0 2 . 4 1 7 1 7 7 4 . 5 3 8 . 6 0 7 0 9 5
study area generally and West Boulevard in particular. The analysis translates employment
forecasts (for 2014—2024) among specific industry sectors in Charlotte (as prepared by the
North Carolina Department of Commerce), into demand for office space by applying an
occupancy factor (of occupied space per employee) and estimates the proportion of employees
in each sector who are office workers. We note that the state’s employment forecasts are
issued only in 10-year periods (with 2014 being the most recent base year).
The analysis also considers demand generated by other market factors, such as vacancy
adjustments, part-time/self-employed individuals (who may or may not occupy multi-tenant
office space), and cumulative replacement; these estimates either increase or reduce future
demand for office space. Cumulative replacement, for example, considers tenants that move
when a building is removed from the inventory due to physical and/or functional obsolescence.
We note that assumptions pertaining to occupancy factors may be overstated. Since the
2007—2009 recession, office-using businesses have been reducing office occupancies, in
some cases by significant amounts. Historically, the commercial real estate industry has used
an average occupancy factor of 250 sq. ft. per office employee. However, according to a 2017
study by REIS, Inc. (a national commercial real estate data provider) the amount of office space
per employee has been steadily declining in each successive business cycle after a recession.
REIS data indicate that, in the national economic expansion of the late 1990s, a new office
employee was typically associated with approximately 175 sq. ft. of additional office space.
During the early- and mid-2000s (until the 2007—2009 recession), the typical employee was
associated with approximately 125 sq. ft. of additional office space. Since 2010, however, each
added/new employee has been associated with only about 50 sq. ft. of additional office space.
This is particularly notable in space-efficient industries like software and professional/business
services, which have been the strongest growing sectors in this business cycle. Moreover,
hoteling and remote work-arrangements, where employees share space rather than having
dedicated offices or cubicles, enables companies to accommodate even more workers in a
given amount of occupied space.
The office analysis is illustrated in Table 26 and Table 27, and summarized below:
WTL+a
WTL +a
R e a l E s t a t e & E c o n o m i c A d v i s o r s
W a s h i n g t o n , D C—P r o v i n c e t o w n , M A
2 0 2 . 8 8 5 . 9 1 2 1 3 0 1 . 5 0 2 . 4 1 7 1 7 7 4 . 5 3 8 . 6 0 7 0 9 6
Southwest Prosperity Zone
Employment forecasts for specific jurisdictions in North Carolina are prepared by the state’s
Department of Commerce, Labor & Economic Analysis Division in 10-year forecast periods
for specific regions across the state; each region includes a cluster of counties.
Mecklenburg County is in the “Southwest Prosperity Zone” (SPZ), which includes the
following 10 counties: Anson, Cabarrus, Cleveland, Gaston, Iredell, Lincoln, Mecklenburg,
Rowan, Stanly and Union;
The entire Southwest Prosperity Zone is expected to add 186,565 new jobs between
2014 and 2024, reflecting a forecast of almost 18,700 new jobs annually over this 10-year
period; and
The analysis indicates gross demand for 11.8 million sq. ft. of office space across the
Southwest Prosperity Zone between 2014 and 2024, assuming an average occupancy
factor of 176 sq. ft. per office employee, generated by growth in office-using jobs. This is
inclusive of adjustments related to vacancy, cumulative (building) replacements, tenant
churn, etc. We note that this occupancy factor of 176 sq. ft. per employee reflects the
declining occupancies among office-using employees as detailed above;
City of Charlotte
In order to determine the share of future jobs located in the City of Charlotte, WTL+a utilized
the city’s 2014 share of the Southwest Prosperity Zone’s total jobs based on employment
data from On-the-Map, prepared by the U.S. Census Bureau. Based on this data, the city
contained 547,311 jobs in 2014, or 49.2% of the SPZ’s total jobs;
If the City of Charlotte maintains its 49.2% share in 2024 would translate into 91,800
new jobs over the forecast period;
If these jobs are created, office-using jobs would translate into gross demand for 5.4
million sq. ft. of office space in the City of Charlotte between 2014 and 2024, assuming
the same average occupancy factor of 176 sq. ft. per office employee. This is inclusive of
adjustments related to vacancy, cumulative (building) replacements, tenant churn, etc.;
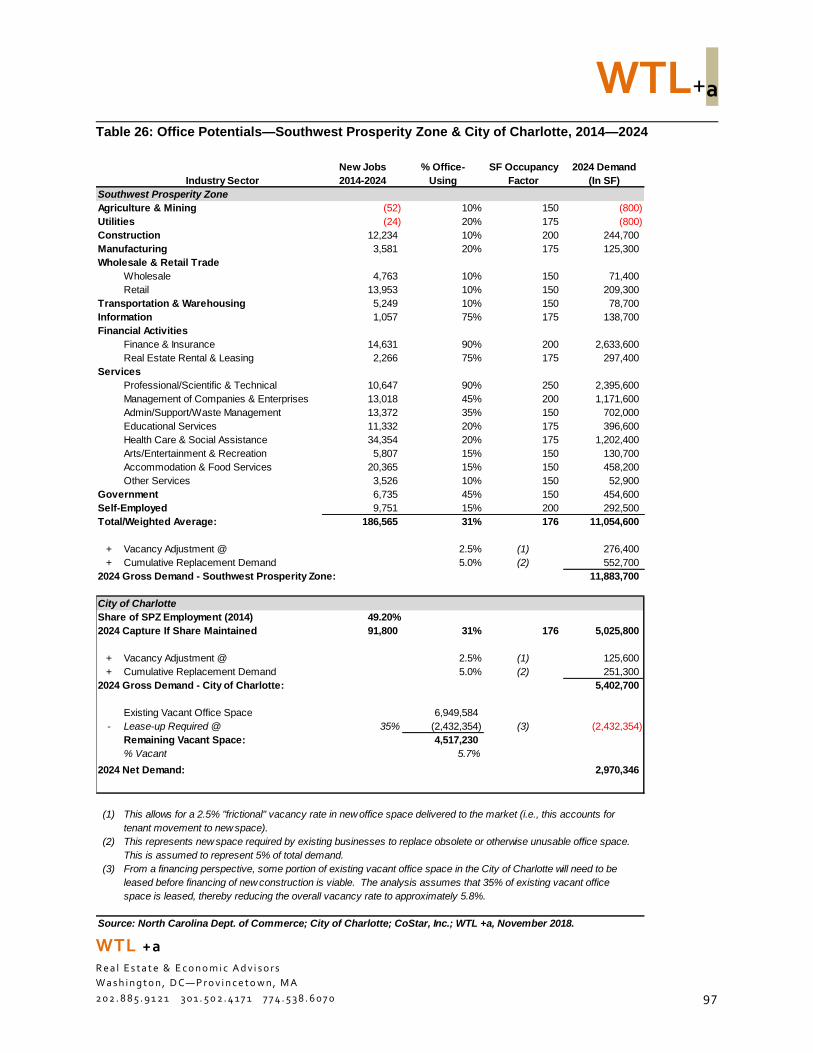
WTL+a
WTL +a
R e a l E s t a t e & E c o n o m i c A d v i s o r s
W a s h i n g t o n , D C—P r o v i n c e t o w n , M A
2 0 2 . 8 8 5 . 9 1 2 1 3 0 1 . 5 0 2 . 4 1 7 1 7 7 4 . 5 3 8 . 6 0 7 0 9 7
Table 26: Office Potentials—Southwest Prosperity Zone & City of Charlotte, 2014—2024
New Jobs % Office- SF Occupancy 2024 Demand
Industry Sector 2014-2024 Using Factor (In SF)
Southwest Prosperity Zone
Agriculture & Mining (52) 10% 150 (800)
Utilities (24) 20% 175 (800)
Construction 12,234 10% 200 244,700
Manufacturing 3,581 20% 175 125,300
Wholesale & Retail Trade
Wholesale 4,763 10% 150 71,400
Retail 13,953 10% 150 209,300
Transportation & Warehousing 5,249 10% 150 78,700
Information 1,057 75% 175 138,700
Financial Activities
Finance & Insurance 14,631 90% 200 2,633,600
Real Estate Rental & Leasing 2,266 75% 175 297,400
Services
Professional/Scientific & Technical 10,647 90% 250 2,395,600
Management of Companies & Enterprises 13,018 45% 200 1,171,600
Admin/Support/Waste Management 13,372 35% 150 702,000
Educational Services 11,332 20% 175 396,600
Health Care & Social Assistance 34,354 20% 175 1,202,400
Arts/Entertainment & Recreation 5,807 15% 150 130,700
Accommodation & Food Services 20,365 15% 150 458,200
Other Services 3,526 10% 150 52,900
Government 6,735 45% 150 454,600
Self-Employed 9,751 15% 200 292,500
Total/Weighted Average: 186,565 31% 176 11,054,600
+ Vacancy Adjustment @ 2.5% (1) 276,400
+ Cumulative Replacement Demand 5.0% (2) 552,700
2024 Gross Demand - Southwest Prosperity Zone: 11,883,700
City of Charlotte
Share of SPZ Employment (2014) 49.20%
2024 Capture If Share Maintained 91,800 31% 176 5,025,800
+ Vacancy Adjustment @ 2.5% (1) 125,600
+ Cumulative Replacement Demand 5.0% (2) 251,300
2024 Gross Demand - City of Charlotte: 5,402,700
Existing Vacant Office Space 6,949,584
- Lease-up Required @ 35% (2,432,354) (3) (2,432,354)
Remaining Vacant Space: 4,517,230
% Vacant 5.7%
2024 Net Demand: 2,970,346
(1)
(2)
(3)
space is leased, thereby reducing the overall vacancy rate to approximately 5.8%.
From a financing perspective, some portion of existing vacant office space in the City of Charlotte will need to be
leased before financing of new construction is viable. The analysis assumes that 35% of existing vacant office
This allows for a 2.5% "frictional" vacancy rate in new office space delivered to the market (i.e., this accounts for
tenant movement to new space).
This represents new space required by existing businesses to replace obsolete or otherwise unusable office space.
This is assumed to represent 5% of total demand.
Source: North Carolina Dept. of Commerce; City of Charlotte; CoStar, Inc.; WTL +a, November 2018.
WTL+a
WTL +a
R e a l E s t a t e & E c o n o m i c A d v i s o r s
W a s h i n g t o n , D C—P r o v i n c e t o w n , M A
2 0 2 . 8 8 5 . 9 1 2 1 3 0 1 . 5 0 2 . 4 1 7 1 7 7 4 . 5 3 8 . 6 0 7 0 9 8
From a financing perspective, however, some portion of the city’s existing 6.94 million sq. ft.
of vacant office space would need to be leased before new office space could be financed.
It is also not known how much of the remaining existing vacant inventory suffers from
physical and/or functional obsolescence, will be converted to other uses such as residential,
or could be demolished; and
For purposes of this analysis, WTL+a conservatively assumes that 35% of the city’s vacant
office inventory (approximately 2.4 million sq. ft.) is leased before financing is provided for
new office construction. This serves to reduce the city’s office vacancy rate to roughly 5.7%
from current levels (in other words, near stabilized levels). This serves to lower demand
generated by job growth in office-using sectors to approximately 2.97 million sq. ft. of
net new space citywide by 2024.
West Boulevard “Area of Influence”
The next step in the analysis for the West Boulevard study area is illustrated in Table 27 and
detailed below:
With an estimated 14,074 employees working in the study area, its share of the city’s total
jobs is 2.85%;
Under this “fair share” analysis, the study area would continue to capture 2.85% of future
citywide job growth, or approximately 2,619 new employees, by 2024. Assuming similar
proportions of office-using jobs and occupancy factors translates into gross demand for
143,500 sq. ft. of office space by 2024; and
For purposes of this analysis, WTL+a conservatively assumes that 25% of the study area’s
vacant office inventory (approximately 210,650 sq. ft.) is leased before financing is provided
for new office construction. This serves to reduce the study area’s office vacancy rate to
roughly 8.4% from current levels, and lowers demand generated by job growth in office-
using sectors to approximately 90,700 sq. ft. of net new space across the study area
by 2024.
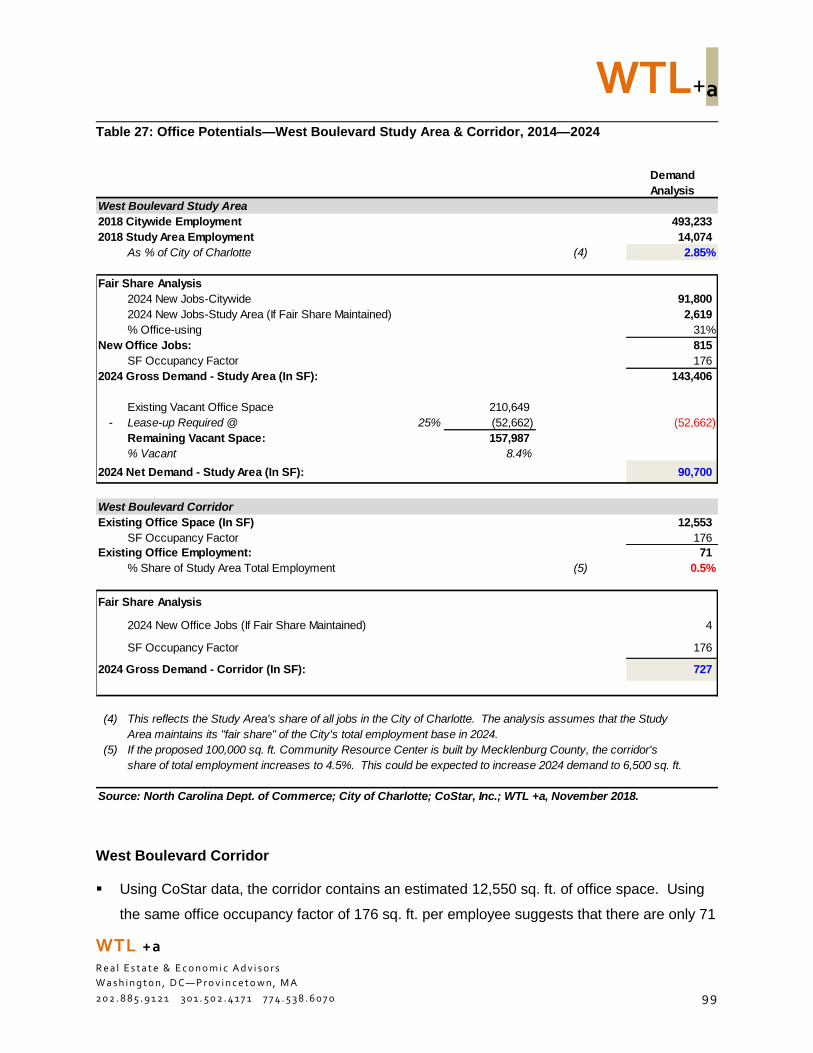
WTL+a
WTL +a
R e a l E s t a t e & E c o n o m i c A d v i s o r s
W a s h i n g t o n , D C—P r o v i n c e t o w n , M A
2 0 2 . 8 8 5 . 9 1 2 1 3 0 1 . 5 0 2 . 4 1 7 1 7 7 4 . 5 3 8 . 6 0 7 0 9 9
Table 27: Office Potentials—West Boulevard Study Area & Corridor, 2014—2024
West Boulevard Corridor
Using CoStar data, the corridor contains an estimated 12,550 sq. ft. of office space. Using
the same office occupancy factor of 176 sq. ft. per employee suggests that there are only 71
Demand
Analysis
West Boulevard Study Area
2018 Citywide Employment 493,233
2018 Study Area Employment 14,074
As % of City of Charlotte (4) 2.85%
Fair Share Analysis
2024 New Jobs-Citywide 91,800
2024 New Jobs-Study Area (If Fair Share Maintained) 2,619
% Office-using 31%
New Office Jobs: 815
SF Occupancy Factor 176
2024 Gross Demand - Study Area (In SF): 143,406
Existing Vacant Office Space 210,649
- Lease-up Required @ 25% (52,662) (52,662)
Remaining Vacant Space: 157,987
% Vacant 8.4%
2024 Net Demand - Study Area (In SF): 90,700
West Boulevard Corridor
Existing Office Space (In SF) 12,553
SF Occupancy Factor 176
Existing Office Employment: 71
% Share of Study Area Total Employment (5) 0.5%
Fair Share Analysis
2024 New Office Jobs (If Fair Share Maintained) 4
SF Occupancy Factor 176
2024 Gross Demand - Corridor (In SF): 727
(4) This reflects the Study Area's share of all jobs in the City of Charlotte. The analysis assumes that the Study
Area maintains its "fair share" of the City's total employment base in 2024.
(5) If the proposed 100,000 sq. ft. Community Resource Center is built by Mecklenburg County, the corridor's
share of total employment increases to 4.5%. This could be expected to increase 2024 demand to 6,500 sq. ft.
Source: North Carolina Dept. of Commerce; City of Charlotte; CoStar, Inc.; WTL +a, November 2018.
WTL+a
WTL +a
R e a l E s t a t e & E c o n o m i c A d v i s o r s
W a s h i n g t o n , D C—P r o v i n c e t o w n , M A
2 0 2 . 8 8 5 . 9 1 2 1 3 0 1 . 5 0 2 . 4 1 7 1 7 7 4 . 5 3 8 . 6 0 7 0 100
office employees working in the corridor (or on nearby/surrounding streets such as Remount
Road); and
These 71 office employees represent a 0.5% share of the 14,074 total jobs located in the
West Boulevard “Area of Influence”. If this share is maintained in the future, it would
translate into very few (4) office-using jobs and into demand for less than 750 sq. ft. of
speculative/general office space in the corridor.
In conclusion, the West Boulevard corridor contains a very limited amount of office space today.
Moreover, limited data preclude an accurate understanding of key metrics such as
existing vacant space and annual net absorption. Feedback from community residents and
members of the West Boulevard Neighborhood Coalition identified the need and community
support for additional professional services such as accounting, legal and medical businesses.
However, the fair share analysis suggests very limited market support for office uses based on
forecast job growth in office-using sectors. Thus, consideration of public policies tailored to
business retention and recruitment in office-using sectors as well as regulatory and/or financial
incentives for office/professional and business service tenants will be critical to enhance the
marketability of the West Boulevard corridor. Concurrently, supporting new residential
development, that serves to generate population/household growth throughout the study area,
will also expand potential market support for office/professional and business service tenants.
Office Market Potentials on West Boulevard are Very Limited
& Tied to Public Policies/Incentives & Future Population Growth
Hotel/Lodging
As noted previously in Section 3, the industry benchmark identified for construction
feasibility/potential expansion is a sustained annual occupancy level between 65% and 72%.
If a market/location sustains an average annual occupancy within these levels (or higher), that
location can support additional capacity and warrant development of new hotel rooms. The 24
properties selected for our analysis include 2,883 rooms and occupancy levels are strong. In
fact, over the past six years, average annual occupancies ranged from 63.4% in 2012 to a peak
WTL+a
WTL +a
R e a l E s t a t e & E c o n o m i c A d v i s o r s
W a s h i n g t o n , D C—P r o v i n c e t o w n , M A
2 0 2 . 8 8 5 . 9 1 2 1 3 0 1 . 5 0 2 . 4 1 7 1 7 7 4 . 5 3 8 . 6 0 7 0 10 1
of 73.7% in 2016, with a six-year average of 69.9%. Notably, for the past three years,
sustained annual occupancies for these properties have averaged 72.7%.
These findings suggest that there may be
sufficient demand/investment-level
performance necessary to justify the addition
of new hotel rooms in the competitive market
area. The ability of the West Boulevard corridor
to capture this growth is likely limited to its most
marketable location—the intersection with Billy
Graham Parkway. However, WTL+a notes that
the Airport Commercial Development Strategy,
prepared in March 2017 to guide preparation of
the CLT Airport Strategic Development Plan on
behalf of the City of Charlotte Aviation
Department, identifies multiple locations of airport-controlled sites for future hotel development
under various economic scenarios:
Low Economic Growth—Up to 769 keys (rooms) on 15 acres
Moderate Economic Growth—Up to 1,106 rooms on 21 acres
High Economic Growth—Up to 1,442 rooms plus a convention hotel on 29 acres
As a result, these competitive market forces are likely to prove difficult for a speculative hotel to
be developed on West Boulevard—even at its most marketable location with Billy Graham
Parkway. This will also be affected by the time required to implement the airport’s strategic
development plan. Additional detailed market/financial feasibility studies will be required.
General Retail
Demonstrated retail demand and the desire for additional retail by study area residents are two
very different conditions. As detailed in this report, the West Boulevard corridor is
undersupplied in many basic neighborhood needs, including a grocery store and a pharmacy;
lacking in professional and consumer services such as medical and legal offices and banking;
and, there are few options for dining out at food and beverage locations. In part, this is due to
the length of the West Boulevard corridor, which is approximately 2.5 miles in length from Billy
WTL+a
WTL +a
R e a l E s t a t e & E c o n o m i c A d v i s o r s
W a s h i n g t o n , D C—P r o v i n c e t o w n , M A
2 0 2 . 8 8 5 . 9 1 2 1 3 0 1 . 5 0 2 . 4 1 7 1 7 7 4 . 5 3 8 . 6 0 7 0 10 2
Graham Parkway to its eastern edge near Remount Road. There is only 128,000 sq. ft. of retail
and commercial space along the corridor (and adjacent streets), as opposed to 665,800 sq. ft.
of retail uses located along Wilkerson Boulevard to the north of West Boulevard. The limited
supply of retail space is also hampered by the closing and extended vacancy of the Jack-in-the
Box restaurant—a national, creditworthy tenant—as well as scattered vacancies and limited
other creditworthy businesses, which has combined to symbolize a lack of activity and
perceived demand for quality retail space.
From the standpoint of overall retail demand, general development patterns along West
Boulevard are lower densities and the study area’s total population is not large enough to meet
threshold criteria for a conventional commercial grocery store. The proximity of the study area
to Charlotte-Douglas International Airport is potentially of value, but most vehicular traffic to the
airport is concentrated on Wilkinson Boulevard. Higher traffic counts ensure that Wilkinson is a
more vibrant commercial corridor today, as it meets (and exceeds) vehicular traffic counts
critical to attracting national/creditworthy retail businesses.
Additional retail space will be based in large measure on new housing, as “retail follows
rooftops” in industry location theory. As demonstrated in the housing demand analysis, new
housing generated by population/household growth over the next 10 years is expected to
add approximately 900 new housing units in the North trade area (above the Norfolk
Southern rail line), and another 750 to 800 units in the South trade area (below the Norfolk
Southern rail line). These new residents will create net new spending potentials to the existing
market base.
For new retail to be feasible based on market conditions, it is useful to consider the relationship
between sales and achieved rents. From the standpoint of real estate investment, most
property owners require average rents of between $20 and $35 per sq. ft. to provide a
reasonable return on their initial capital investment in buildings, maintenance, operating systems
and reinvestment over time. A retailer’s ability to pay those threshold rents is a function of
sales. Most retailers can afford to spend between 8% and 12% of their gross annual sales on
rent costs. Using an average of 10% of gross sales, required “investment-grade” rents would
necessitate annual sales of $200 to $350 per sq. ft. per year to meet these investment
standards. We note that both current rents for retail space in the West Boulevard corridor
WTL+a
WTL +a
R e a l E s t a t e & E c o n o m i c A d v i s o r s
W a s h i n g t o n , D C—P r o v i n c e t o w n , M A
2 0 2 . 8 8 5 . 9 1 2 1 3 0 1 . 5 0 2 . 4 1 7 1 7 7 4 . 5 3 8 . 6 0 7 0 103
and non-automotive annual retail sales of only $42 per sq. ft. (as illustrated previously in
Table 7) are far below these threshold levels.
The following illustrates retail demand potentials for the West Boulevard study area over the
next 10 years:
First, to project new supportable space, and using the investment-grade retail sales-to-rent
ratio, each new resident in a lower-income residential area supports between three
and five square feet of retail space
Applying this factor to forecast growth in population over the next 10 years, 4,400 new
residents within the “Area of Influence” for future retail will support between 7,100 and
11,800 sq. ft. of retail space in the North trade area and an additional 6,100 to 10,200
sq. ft. in the South trade area.
It should be noted that these totals must also include filling of currently vacant retail space as
well as possible new construction. The demographic profile of the resident market does not
support a commercial grocer, but the recommended food co-operative offers a non-profit
approach that is a better match for the study area’s consumer characteristics. The suggested
prototype co-op would be about 10,000 sq. ft. in size, completely absorbing potential 10-year
demand in the South trade area. This analysis illustrates the limited additional retail potentials
that can be supported by current and future resident-based demand.
Additional market support for retail from office workers and hotel guests is also limited, as the
study area is not an office destination, and new hotels near the airport will be more likely to
cluster in the airport’s designated new growth area located to the north of the main terminal.
Small, price-sensitive retail and food service businesses may be possible in the ground floors of
new residential mixed-use projects, such as those illustrated in the concept plans for both the
Remount Road and Clanton Road intersections. However, limited demand will restrict both the
total square footage and long-term market potentials for new retail space in the West Boulevard
corridor.
WTL+a
WTL +a
R e a l E s t a t e & E c o n o m i c A d v i s o r s
W a s h i n g t o n , D C—P r o v i n c e t o w n , M A
2 0 2 . 8 8 5 . 9 1 2 1 3 0 1 . 5 0 2 . 4 1 7 1 7 7 4 . 5 3 8 . 6 0 7 0 104
5 Recommended Implementation Strategies
Introduction
This section presents a series of recommended actions for consideration by the City of
Charlotte, Mecklenburg County in partnership with the West Side Community Land Trust
(WSCLT), the West Boulevard Neighborhood Coalition (WBNC) and other area businesses,
charitable foundations and community development entities. As documented in the market
analyses, West Boulevard is challenged in several sectors:
General Retail—Residents of the study area expressed the desire to attract more retail to
the corridor to serve neighborhood needs. However, retail is governed by the depth and
type of available market support. The study area is characterized by lower development
densities and population, lower household incomes (as compared to other neighborhoods of
Charlotte), and limited household retail spending ($9,057 per year per household in the
North trade area and $8,482 per year per household in the South trade area as compared to
$20,247 per year per household in the City of Charlotte).
Areas with low household incomes are viewed by many retailers as conditions that limit their
interest in considering store locations. There are also perceptions of crime, although actual
crime data suggests that this is not a real issue. As a result, West Boulevard’s key
problem is its consumer population is not currently as ‘competitive’ in attracting
retailers when compared to other areas of Charlotte. In fact, the city has stronger
residential markets elsewhere that generate higher demand than the West Boulevard study
area.
In addition, average daily traffic counts (as determined in transportation studies) are another
metric used by retailers in store location decisions. The study area is generally below
required thresholds of at least 25,000 vehicles per day. In fact, West Boulevard and
Remount Road is the only intersection in the entire study area that approaches
sufficient traffic count requirements used by retailers.
WTL+a
WTL +a
R e a l E s t a t e & E c o n o m i c A d v i s o r s
W a s h i n g t o n , D C—P r o v i n c e t o w n , M A
2 0 2 . 8 8 5 . 9 1 2 1 3 0 1 . 5 0 2 . 4 1 7 1 7 7 4 . 5 3 8 . 6 0 7 0 105
There is also a substantial supply of competitive retail along Wilkinson Boulevard to the
north, although the north/south links between West and Wilkinson Boulevards range from
marginal to non-existent and are considered unsafe. Pedestrian and bicycle routes along
West Boulevard are also inadequate and inconsistently illuminated to provide a safe walking
and biking environment.
The City of Charlotte is fully aware of these inadequacies and has identified improvements
in various plans, such as the city’s Capital Improvement Plan (CIP) for improvements as part
of this analysis, but should consider prioritizing these projects higher on the potential for
funding. Planning for the Ashley Road extension/reconfiguration should incorporate
significant pedestrian and bicycle circulation improvements. Because of the potential infill
development being planned for the YMCA site (the Community Resource Center and new
library, and the potential location for the food cooperative), better linkages for pedestrians
and bicycles can improve circulation to this central destination.
As a result of these market limitations as well as the linear nature of the corridor and its poor
links to Wilkinson Boulevard, West Boulevard residents are undersupplied with
reasonably priced groceries and fresh foods. There are also few places available for
dining out, despite the presence of several small, locally-owned fast food and casual
dining/carry out restaurants, located primarily at the Remount Road intersection. A key
recommendation of this study is that a new food coop be located somewhere within
or near the YMCA site, perhaps associated with the new public library to be constructed,
and near the YMCA facility. As described previously, the charitable and subsidized
economics of operating a food coop are a better fit for the study area than the significantly
greater subsidy which would be required for a commercial grocery store.
While initial plans for a food coop (to be called the Three Sisters Market) have been under
consideration by the West Boulevard Neighborhood Coalition, plans are still evolving. A
detailed description of two successful food coops, in Durham, NC and in Washington, DC,
are included to provide background on how they were established, what annual revenues
and operating costs should be sought, and how programming and educational opportunities
can be created through the provision of fresh, locally-grown foods and products and
community services.
WTL+a
WTL +a
R e a l E s t a t e & E c o n o m i c A d v i s o r s
W a s h i n g t o n , D C—P r o v i n c e t o w n , M A
2 0 2 . 8 8 5 . 9 1 2 1 3 0 1 . 5 0 2 . 4 1 7 1 7 7 4 . 5 3 8 . 6 0 7 0 106
Housing—as detailed in the market study, there is both sufficient demand and market
opportunities for additional residential units in the study area, including both market-rate and
mixed-income/affordable housing. Like most growing U.S. cities, Charlotte needs to provide
more affordable and workforce housing as continued economic development and job growth
have attracted new residents and generated additional, concurrent development pressures
in many older, less dense neighborhoods.
The planning elements of this market study provide a series of ‘test fit’ locations in which
new, mixed-income, infill housing can be incorporated without overly increasing densities
and pricing pressures. In all cases, the scale of proposed infill housing is compatible
with the existing character of the residential neighborhoods surrounding West
Boulevard. The planned locations of new infill housing suggested by the City reinforce the
benefits of emerging nodes along the West Boulevard corridor. There are multiple vacant or
underutilized parcels where several hundred new housing units can be built over time,
whether in multi-family, mixed use projects or in townhouse blocks at a scale that is
compatible with adjacent single-family detached housing. While the addition of new housing
along West Boulevard will introduce new residents to the neighborhood, it should be noted
that, at investment-grade retail sales requirements, each new resident will support only two
to five square feet of retail space.
With regard to multiple vacant or underutilized parcels, this study did not include a detailed
mapping component of land uses, nor did the scope incorporate a building-by-building
analysis of conditions and/or uses. As future developments, such as the Ashley Road
connector between Wilkinson and West Boulevards, relocation of the library and
construction of the County’s CRC are completed along the corridor, they will affect multiple
elements of the built environment and currently undeveloped/open spaces. Therefore,
WTL+a recommends that the City of Charlotte:
o Consider a detailed planning analysis of buildings and sites
o Create urban design standards (incorporating the new streetscape enhancements
planned for West Boulevard)
o Integrate the planning concepts for new infill housing and mixed-use development as
illustrated in Section 4 of this report, and
WTL+a
WTL +a
R e a l E s t a t e & E c o n o m i c A d v i s o r s
W a s h i n g t o n , D C—P r o v i n c e t o w n , M A
2 0 2 . 8 8 5 . 9 1 2 1 3 0 1 . 5 0 2 . 4 1 7 1 7 7 4 . 5 3 8 . 6 0 7 0 107
o Identify potential station locations for the Lynx rail extension just south of Wilkinson
Boulevard.
This more detailed land and planning analysis should involve extensive community review
and consideration to ensure protection of elements of the existing character, careful
introduction of new development and uses which will benefit residents, and improve the
safety and mobility of pedestrians, bicycles and other non-auto transportation modes.
Office & Commercial—As detailed in this study, there is limited market demand for new
office and commercial space in the study area, although it was noted that many essential
professional services, such as accountants, attorneys, doctors, dentists and others, are not
available to current residents. The County’s proposed Community Resource Center (CRC)
could be planned to incorporate a limited amount of office space for professional and/or
business services tenants or located in adjacent structures to complement planned social
services operations within the County facility. As the CRC’s intended location will be
somewhere on the expansive YMCA site along a reconfigured Ashley Road, the addition of
other professional services would reinforce the destinational role of this central location in
the study area. Alternatively, professional/business services could be located in the mixed-
use blocks of multi-family residential, as illustrated in the concept plans in Figure 11 and
Figure 12.
General Industrial—there are light industrial, and flex-tech uses located in the study area,
such as Dwight Evans Square (an office/warehouse park on Dwight Evans Road) and
Greenbrier Business Park (on Taggart Creek Road). WTL+a considers these uses to be
important as employment generators for local residents and as a diversifying land use for
less developed areas. While the City did not request an analysis of industrial demand
potentials, we note that growth in airport-related shipping and distribution may also affect
industrial potentials in portions of the study area. We also note that industrial uses generally
require lower-priced land and buildings than office, residential or retail. As land and building
values rise, these uses should be weighed as to their employment benefits to study area
residents. While some cities have created maker spaces as potential industrial catalysts,
the West Boulevard study did not include assessments of specific buildings; the volume and
location of other maker spaces elsewhere in Charlotte is also unknown. As a result, the
competitive position of specific buildings along West Boulevard will require further study.
WTL+a
WTL +a
R e a l E s t a t e & E c o n o m i c A d v i s o r s
W a s h i n g t o n , D C—P r o v i n c e t o w n , M A
2 0 2 . 8 8 5 . 9 1 2 1 3 0 1 . 5 0 2 . 4 1 7 1 7 7 4 . 5 3 8 . 6 0 7 0 108
Potential Economic ‘Drivers’
The timing of the market assessment and strategic revitalization study for West Boulevard is
occurring at a point in which there are several emerging possibilities that could have a
significant effect on longer-term strategies. None of these economic drivers is fully determined
or planned, but each has the potential to address development pressures, community needs,
and longer-term implementation strategies as specific details are finalized. In order of
precedence, these economic catalysts include:
Fully Operational West Side Community Land Trust (WSCLT)—The WSCLT was
created as a legal entity in 2017 as an outgrowth of concerns of grassroots community
organizations—the West Boulevard Neighborhood Coalition and QC Family Tree—about
increasing displacement of African-American, low-income residents from Charlotte’s west
side due to rapidly rising rents and real estate speculation. The WSCLT’s mission is to
provide permanently affordable housing with community-centered development in West
Charlotte. It is operating with a Board of Directors (which meets regularly), working
committees, and a half-time Executive Director who began work in May 2018. As this study
was being completed, the WSCLT presented its five-year (2019—2023) business plan as a
basis for seeking funding for its operational and capital budget needs. This section of the
report outlines practices and principles of Community Land Trusts (CLTs) which illustrate the
usefulness of this model for stabilizing neighborhoods in the West Boulevard corridor and
the broader West Charlotte community as residents face the market conditions analyzed in
this report.
Growth of Charlotte-Douglas International Airport—the airport is located adjacent to the
western edge of the West Boulevard study area. Its recent CLT Airport Strategic
Development Plan, prepared on behalf of the City of Charlotte Aviation Department in March
2017, is intended to guide airport investments, development of new supporting services
such as warehousing and distribution, and add new non-aviation revenues to the airport’s
sources of income. This growth (primarily in the area north of the airport entrance) will also
potentially provide new jobs, some of which could go to West Boulevard neighborhood
residents.
The airport plan has designated two sub-areas for future development that could affect the
West Boulevard study area. The first, designated as “Billy Graham Corridor”, includes land
WTL+a
WTL +a
R e a l E s t a t e & E c o n o m i c A d v i s o r s
W a s h i n g t o n , D C—P r o v i n c e t o w n , M A
2 0 2 . 8 8 5 . 9 1 2 1 3 0 1 . 5 0 2 . 4 1 7 1 7 7 4 . 5 3 8 . 6 0 7 0 109
east of the existing CLT Airside/runway areas and north of the western edge of the West
Boulevard study area. The preferred “Economic Positioning” use for this sub-area is for
“Knowledge-based Education and Skills Training” facilities. The second area, designated as
“CLT South”, combines Logistics and Distribution, National Defense/NC Air National Guard
and Aerospace and Truck Services, among other uses.
In order to provide for these uses over the long-term, one possible outcome would restrict
public access to the airport property along West Boulevard to the west of Billy Graham
Parkway, possibly through a controlled access gate or by removing part of the existing
roadway. However this planning concept is resolved, it is likely that the traffic pattern
and road configuration at West Boulevard and Billy Graham Parkway could change.
The market study has identified this intersection as a possible hotel site for an 80-120 room
limited-service hotel over the long-term. This would most likely occur after all hotels on
airport-controlled land (identified in Section 3) are built out.
Extension of the Lynx System from Uptown to CLT Airport—CATS is considering
extension of the Lynx Light Rail system from its Uptown Charlotte hub west to the airport,
and eventually to Gastonia/Gaston County. The existing Norfolk Southern rail corridor is
parallel to Wilkinson Boulevard and continues westward between the airport terminal and
Wilkinson. Based on our stakeholder discussions with CATS staff, light rail may be located
within the Wilkinson Boulevard right-of-way/corridor. While there are no station designations
identified for this proposed rail transit extension, possible construction of the line would
increase development pressures in the West Boulevard study area, similar to that which has
occurred along South Boulevard and the UNC Charlotte corridor over the last five to 10
years. The impact of transit-oriented development (TOD) is certain to attract greater
developer interest and the potential to increase development pressures in the study area.
Location of Charlotte’s Opportunity Zone (OZ) Designated Areas—The Federal
government’s recently announced investment incentive program, called “Opportunity Zones”
(OZs), is a new initiative to induce reinvestment in designated lower-income areas across
the country. In response to this initiative, states identified over 8,700 Opportunity Zones as
investment target areas. Charlotte’s Opportunity Zone includes two areas (sub-sections
3902 and 3903) within the West Boulevard study area, extending from the existing Norfolk
Southern rail alignment south to one-half mile below West Boulevard. Other parts of the
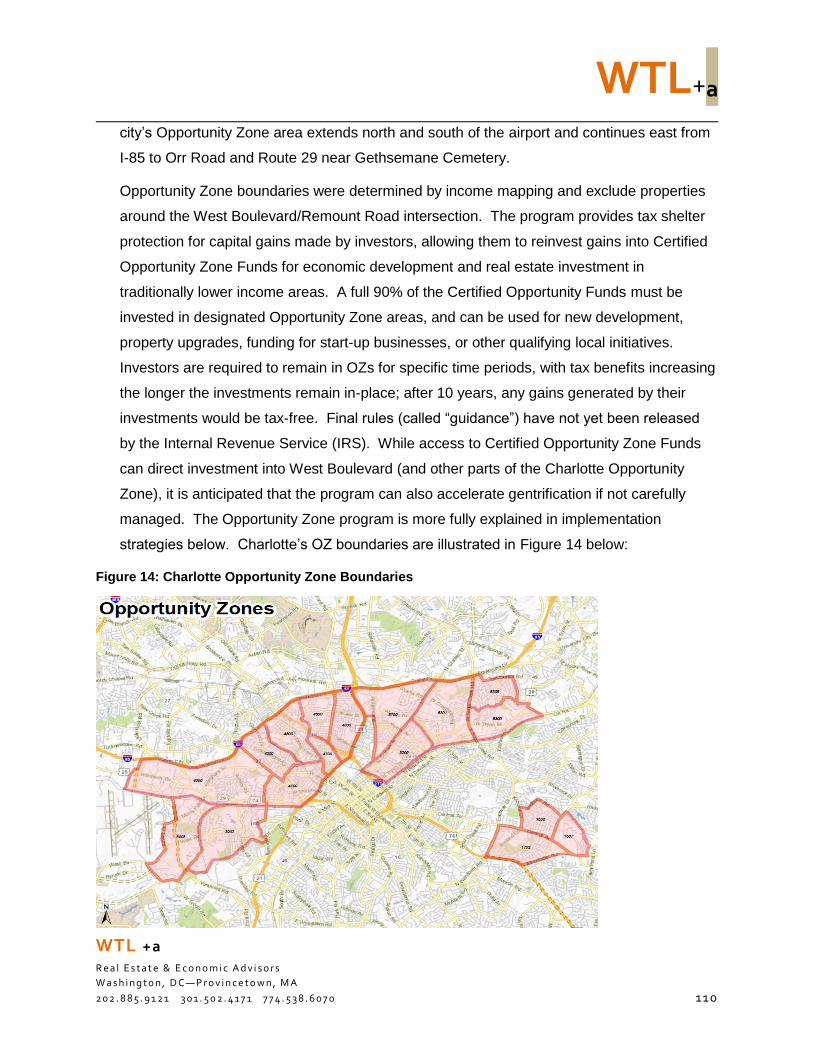
WTL+a
WTL +a
R e a l E s t a t e & E c o n o m i c A d v i s o r s
W a s h i n g t o n , D C—P r o v i n c e t o w n , M A
2 0 2 . 8 8 5 . 9 1 2 1 3 0 1 . 5 0 2 . 4 1 7 1 7 7 4 . 5 3 8 . 6 0 7 0 11 0
city’s Opportunity Zone area extends north and south of the airport and continues east from
I-85 to Orr Road and Route 29 near Gethsemane Cemetery.
Opportunity Zone boundaries were determined by income mapping and exclude properties
around the West Boulevard/Remount Road intersection. The program provides tax shelter
protection for capital gains made by investors, allowing them to reinvest gains into Certified
Opportunity Zone Funds for economic development and real estate investment in
traditionally lower income areas. A full 90% of the Certified Opportunity Funds must be
invested in designated Opportunity Zone areas, and can be used for new development,
property upgrades, funding for start-up businesses, or other qualifying local initiatives.
Investors are required to remain in OZs for specific time periods, with tax benefits increasing
the longer the investments remain in-place; after 10 years, any gains generated by their
investments would be tax-free. Final rules (called “guidance”) have not yet been released
by the Internal Revenue Service (IRS). While access to Certified Opportunity Zone Funds
can direct investment into West Boulevard (and other parts of the Charlotte Opportunity
Zone), it is anticipated that the program can also accelerate gentrification if not carefully
managed. The Opportunity Zone program is more fully explained in implementation
strategies below. Charlotte’s OZ boundaries are illustrated in Figure 14 below:
Figure 14: Charlotte Opportunity Zone Boundaries
WTL+a
WTL +a
R e a l E s t a t e & E c o n o m i c A d v i s o r s
W a s h i n g t o n , D C—P r o v i n c e t o w n , M A
2 0 2 . 8 8 5 . 9 1 2 1 3 0 1 . 5 0 2 . 4 1 7 1 7 7 4 . 5 3 8 . 6 0 7 0 11 1
Implementation Overview
Recommended strategies and actions in this section were determined based on two intersecting
priorities:
Opportunities & Current Constraints—as determined by general market conditions for
residential, office/commercial and retail land uses along the West Boulevard study
area/corridor, and
Specific Approaches—which can assist residents, community organizations and local
government in addressing larger real estate forces/conditions as they affect ownership
patterns, property values, displacement and future redevelopment
Strategic recommendations are organized into three major categories:
Coordination—these actions involve opportunities for local residents, churches, community
organizations like the WBNC, WSCLT and governmental/economic development/charitable
organizations to coordinate collective efforts to assure beneficial outcomes for West
Boulevard neighborhood residents as the area evolves
Specific Projects & Initiatives—the City of Charlotte and Mecklenburg County are
currently planning a series of infrastructure and facility improvements along the West
Boulevard corridor to address a range of needs. These include: pedestrian safety; vehicular
traffic calming and mitigation; improved accessibility through bike lanes, wider sidewalks and
better lighting; expansion/relocation of the West Boulevard Public Library; introduction of a
new County-funded CRC being planned for a location near the YMCA; relocation of the
Ashley Road north-south connector between West Boulevard and Wilkinson Boulevard; and
(at some point in the future) potential
extension of CATS’ Silver Line light rail on
the existing Norfolk Southern freight rail
corridor, which will link Uptown Charlotte
and the Charlotte-Douglas International
Airport, and eventually extending to
Gastonia.
As part of the recently initiated
Comprehensive Plan 2040 process, a range of public policies controlling or affecting zoning,
WTL+a
WTL +a
R e a l E s t a t e & E c o n o m i c A d v i s o r s
W a s h i n g t o n , D C—P r o v i n c e t o w n , M A
2 0 2 . 8 8 5 . 9 1 2 1 3 0 1 . 5 0 2 . 4 1 7 1 7 7 4 . 5 3 8 . 6 0 7 0 11 2
land use and future development potentials along the West Boulevard corridor are also
being considered. Because of increasing real estate speculation and rising rents, the
resulting displacement of current neighborhood residents due to increasing property value,
and market-based pressures resulting from historic property under-valuations (as compared
to the regional marketplace) is a significant concern.
The potential to alter the character and patterns of land and property ownership of West
Boulevard and its residential neighborhoods is clear when the influence of TOD along South
Boulevard is considered. Market opportunities presented by lower-priced land along
the West Boulevard corridor can serve to create imbalances in current ownership
patterns and densities to the detriment of study area neighborhoods and populations.
Unless strategies to balance these market, forces are implemented to allow measured
change over time and retention of residents who want to remain in their homes,
traditional real estate development momentum will likely occur. As documented in the
South Boulevard corridor, the momentum for change will also increase if the proposed
CATS transit line extension is built. Just as the densities and character of South Boulevard
has dramatically changed over the past 10 years, the next 10 to 20 years along Wilkinson
and West Boulevard could result in the same degree of change unless properly planned and
adopted. A priority of this market analysis and strategic revitalization study is to find the
best ways to understand, manage and address these conditions, and to maintain
neighborhood and resident stability during the process.
Incentives to Build Neighborhood Capacity—a critical objective in this study is to
recommend potential types of financial, public policy and outside partnership-based
incentives to foster greater stability for West Boulevard corridor neighborhoods—through
direct funding, proper application of public policy to balance redevelopment and
opportunities for new partners from the foundation and redevelopment communities in
Charlotte—to increase the neighborhood’s capacity to maintain and strengthen its own
future in the face of property-value driven redevelopment forces.
The Charlotte area has particular advantages because of the city’s economic position as a
banking capital. Having the headquarters of Bank of America and the recently announced
merger of SunTrust Bank and Winston-Salem-based BB&T with its new headquarters in
WTL+a
WTL +a
R e a l E s t a t e & E c o n o m i c A d v i s o r s
W a s h i n g t o n , D C—P r o v i n c e t o w n , M A
2 0 2 . 8 8 5 . 9 1 2 1 3 0 1 . 5 0 2 . 4 1 7 1 7 7 4 . 5 3 8 . 6 0 7 0 113
Charlotte could provide particular opportunities for partnerships and projects fostered by large
commercial banks. These strategies could include a number of initiatives:
Demonstration project funding partnerships with large-scale banks to demonstrate new
commitments to more affordable housing, including $50 million in funding already committed
Property retention by long-time owners and the ability to age-in-place rather than selling and
moving out of the neighborhood
Innovative financing mechanisms to incorporate a range of housing types and prices into
redeveloped neighborhoods
Suitable adaptation and incorporation of Opportunity Zone (OZ) investments by registered
and certified OZ funds in the near-term, and
Explore use of existing City of Charlotte programs for Business Security Improvement
Grants and Façade Improvement Matching Grants
Charlotte also has a number of other corporations headquartered in either the city or county. In
fact, the area is the headquarters of six Fortune 500 companies (Bank of America, Lowes,
Nucor, Sealed Air, Sonic Automotive and Duke Energy); by contrast, Raleigh has only one
headquarters. According to Fortune magazine, at least half of all Fortune 500 Companies have
a presence in the Charlotte area. The racing industry is also in Charlotte and the rapidly
growing CLT airport is ranked seventh in passenger volume in the United States, with over 45
million passengers in 2018. Due to the concentration of large financial institutions, the
Charlotte area offers advantages in seeking corporate and company foundation support
for innovative approaches to community redevelopment, such as the recommendations
proposed for West Boulevard.
Near-Term Implementation Recommendations (Next 3 Years)
Three near-term implementation recommendations are suggested as primary action steps for
the West Boulevard community and both City of Charlotte and Mecklenburg County
governments:
1. Support the West Side Community Land Trust (WSCLT)
2. Establish a food cooperative (co-op) grocery store
WTL+a
WTL +a
R e a l E s t a t e & E c o n o m i c A d v i s o r s
W a s h i n g t o n , D C—P r o v i n c e t o w n , M A
2 0 2 . 8 8 5 . 9 1 2 1 3 0 1 . 5 0 2 . 4 1 7 1 7 7 4 . 5 3 8 . 6 0 7 0 11 4
3. Utilize appropriate financial and regulatory incentives
Recommendation #1:
Support the West Side Community Land Trust (WSCLT)
The first implementation strategy is to address increasing property values and displacement of
long-time residents through supporting work that has already begun in the West Boulevard
study area by the West Side Community Land Trust (WSCLT). The WSCLT is a non-profit
created by grassroots organizations rooted in the neighborhoods it intends to serve in West
Charlotte to address the increasing displacement of residents and disruption of neighborhood
stability due to housing market pressures. Its mission is to provide permanently affordable
housing with community-centered development in West Charlotte.
The WSCLT has been operating for two
years with an active Board of Directors and,
in the last year, with a part-time Executive
Director. It recently completed a five-year
business plan (2019—2023). The WSCLT’s
goal is to acquire, develop, and sell 50
affordable homes by 2023. This would
establish its proof of concept and serve as
an example of permanent affordability and community ownership. WSCLT’s focus on
educational efforts and demonstration of concrete results on the ground will facilitate its ability to
interact with and gain credibility in the eyes of the residents of these long-neglected
neighborhoods as well as public and private sector advocates for affordable housing.
Community Land Trust Model
Community land trusts (CLTs) are place-based organizations with a core commitment to the
community both in governance and in service. They work to create stable, thriving
neighborhoods by making housing permanently affordable. CLTs do this by acquiring land
through purchase and donation, and holding it in trust. Housing is sold (or in some cases
WTL+a
WTL +a
R e a l E s t a t e & E c o n o m i c A d v i s o r s
W a s h i n g t o n , D C—P r o v i n c e t o w n , M A
2 0 2 . 8 8 5 . 9 1 2 1 3 0 1 . 5 0 2 . 4 1 7 1 7 7 4 . 5 3 8 . 6 0 7 0 11 5
rented) to neighbors who own the structure and improvements on the land and hold an
inheritable and renewable 99-year lease on the land itself.
By removing the cost of land from the cost of housing, CLTs can create permanent affordability,
stabilizing neighborhoods and neighbors facing displacement because of the rising cost of land.
A key feature which distinguishes CLTs from most other types of investments in affordable
housing is that the subsidy invested in a home/building stays with it in perpetuity through
shared-equity ownership. The most common investments in affordable housing entail time-
limited deed restrictions applied to most tax-credit funded properties or the capture of the full
appreciation of the property’s market value by the first owner when a subsidized affordable
property is sold.
The CLT model has existed for more than 40 years and CLTs have been operating in many
communities for 35 years of more. Early land trusts were created to prevent development of
open space and natural landscapes. The evolution of the land trust model for application in
urban districts is a more recent approach to maintaining a balance between uncontrolled,
market-driven growth and the ability for long-standing neighborhoods to exercise some control
over rapidly increasing land values. In rapidly growing cities like Charlotte, it is frequently the
case that, particularly in older neighborhoods, the majority of market value in real estate is the
land itself, not structures (whether homes, retail and office commercial buildings, or industrial
facilities). Partnership with a CLT can provide property owners with a mechanism to
retain their properties over time, while transferring the value of the underlying land to a
community based non-profit organization. Because it is non-profit with a formalized model
of service for valuation and resale, the motivation to sell for higher prices is removed. The CLT
also creates new opportunities for low-income residents to become homeowners and to access
affordable rental properties.
By providing an alternative to speculative increases in land values, the CLT model can balance
the pricing differences that often encourage owners to ‘cash-out’ to development interests, but
who may not be able to find other properties in their price range. As a custodial owner without a
profit motive, the CLT can relieve this pressure and allow residents to remain in their homes
and determine what will happen to their properties later on. By removing the speculative
component of increasing land values, the CLT can manage and maintain the objective of
broader community stability. Of course, the CLT does not prevent property owners who are
WTL+a
WTL +a
R e a l E s t a t e & E c o n o m i c A d v i s o r s
W a s h i n g t o n , D C—P r o v i n c e t o w n , M A
2 0 2 . 8 8 5 . 9 1 2 1 3 0 1 . 5 0 2 . 4 1 7 1 7 7 4 . 5 3 8 . 6 0 7 0 116
not lessees of the trust from selling their properties to developers and investors, nor do CLTs
reduced-priced homes affect the value of other homes in the community when selling.
Land Trust Duties & Responsibilities
CLTs have clear responsibilities and duties in addressing their objectives:
As non-profit entities, CLTs are organized to prevent displacement through speculative
valuation, and maintain stability in changing neighborhoods;
CLTs have the ability to assemble and manage land, and their ownership is established in
perpetuity;
By removing real estate valuation pressures to sell and relocate, owner-occupied homes
can remain affordable, and provide flexibility to owners for future decisions;
CLTs are able to market homes (and CLT ground leases for the land under the buildings) to
income-qualified buyers in a fair and transparent process;
CLTs educate participating property owners on the rights and responsibilities resulting from
participation in the Land Trust structure;
As part of the future sale process, CLTs are responsible for selecting and verifying that
prospective buyers meet requirements for income-qualification; and
CLTs provide ongoing stewardship to CLT homes and homeowners.
After transfer of a land title, property owners pay a nominal monthly ground lease fee to the CLT
in exchange for the protection of values that the Trust provides. Property owners are required
to hold property insurance, to pay property taxes on the buildings (but not the land), and to
provide ‘responsible maintenance’ levels so that buildings do not deteriorate. The partnership
with the CLT reduces property taxes (since the land is held by a non-profit and the equity of the
property is shared at time of sale as stipulated in the ground lease). Restrictions on re-sale
make it possible to maintain affordability for future buyers by relieving speculative pricing
pressure on current owners. By preserving more affordable property values for re-sale to
income-qualified buyers, the probability of maintaining a mix of incomes in the neighborhood
increases. Property owners can also leave their properties to their heirs and transfer ownership,
subject to the terms of the Land Trust title transfer.
WTL+a
WTL +a
R e a l E s t a t e & E c o n o m i c A d v i s o r s
W a s h i n g t o n , D C—P r o v i n c e t o w n , M A
2 0 2 . 8 8 5 . 9 1 2 1 3 0 1 . 5 0 2 . 4 1 7 1 7 7 4 . 5 3 8 . 6 0 7 0 117
Because the participation and ground lease for land underneath the owners’ structures require
“appropriate maintenance levels,” CLT stewardship includes monitoring and enforcing
homeowner compliance with controls over occupancy, subletting, financing, repairs and
necessary building improvements. The CLT also verifies that property taxes are paid, that
property and other insurance is maintained and that owners are in a position to keep the
buildings in acceptable conditions. Because participating properties are dually-owned, both the
CLT and the property owners have an interest in keeping the buildings in good condition, and in
preventing blighted conditions or demolition by neglect. The goal is to keep the scale and
positive characteristics of the neighborhood intact over time, while supporting changes
embodying the community’s needs and aspirations.
Another benefit of the dual-ownership structure is that CLTs can intervene if a property owner
has financial challenges and cannot keep up mortgage payments; without the CLT ownership
role, a property owner could lose the property through mortgage default. The CLT can be the
intermediary with the mortgage company. In addition, mortgage companies have more difficulty
displacing a property owner if the site
is co-owned, and the land is owned by
a CLT. Notably, mortgage lenders to
individual property owners can require
full payments on the outstanding debt
if property transfers happen. If a CLT
holds title to the underlying land,
lenders have more difficulty in
requiring accelerated full payment, as there are two property holders.
Governance of CLTs
There are a number of ‘checks and balances’ in CLTs which protect private property owners
who participate in a CLT. First, participation is completely voluntary. No property owner is
forced to join in the CLT partnership. This is why it is a central responsibility of CLTs to educate
the general public about what participation means and what rights and responsibilities are
assigned to participating property owners as well as to the Land Trust upon transferring title to
the land. This is also why the management structure for Land Trusts requires a diversified
Board of Directors. In the most typical CLT Board of Directors (which is the organizational
WTL+a
WTL +a
R e a l E s t a t e & E c o n o m i c A d v i s o r s
W a s h i n g t o n , D C—P r o v i n c e t o w n , M A
2 0 2 . 8 8 5 . 9 1 2 1 3 0 1 . 5 0 2 . 4 1 7 1 7 7 4 . 5 3 8 . 6 0 7 0 11 8
structure in place for the WSCLT), two-thirds of the Board is comprised and controlled by
community members:
Property owners who have land leases appoint one-third of the Board members,
Members of the CLT who are community residents but not lessees appoint another one-
third, and
The last one-third of the Board is comprised of non-resident members of the CLT who
represent other forms of oversight and advice, including public officials, local funders,
persons with skills relevant to the CLT’s business (e.g. accountants, lawyers, real estate
brokers, bankers) and non-profit providers of affordable housing and/or social services.
By requiring broad participation, CLT Boards of Directors are able to represent community
residents’ interests in a comprehensive way and draw on a broad range of opinions and
knowledge for defining policies and making decisions.
WSCLT: A Critical Tool to Address Pressing Market Conditions
The approach embodied by the WSCLT is critical to the future of the West Boulevard
corridor. As one of the fastest growing metropolitan areas in the country, the Charlotte-
Mecklenburg housing market is under strong market pressures as documented in “The State of
Housing in Charlotte” report issued in February 2018 by UNC Charlotte’s Childress Klein Center
for Real Estate. That study found that the largest increases in housing prices and rental costs
are in the lowest 10% in value of the regional market; this price level largely characterizes the
area covered by the WSCLT including the West Boulevard study area.
The West Boulevard study area is positioned on all sides by other, more developed areas with
significantly higher property values. Moreover, these areas have already been affected by
economic “drivers” generating rapid change—including significant new residential and
commercial development resulting from development of the LYNX rail line along South
Boulevard. These same economic dynamics are expected to occur when rail is extended
between Uptown and Charlotte-Douglas International Airport with potential for Transit-Oriented
Development (TOD) along the rail corridor near Wilkinson Boulevard. When compared to land
values in Uptown and the immediate airport area, the study area’s real estate is generally
valued at lower levels (on a per acre basis) and is comprised of multiple properties (and owners)
of smaller sizes and scattered undeveloped parcels.
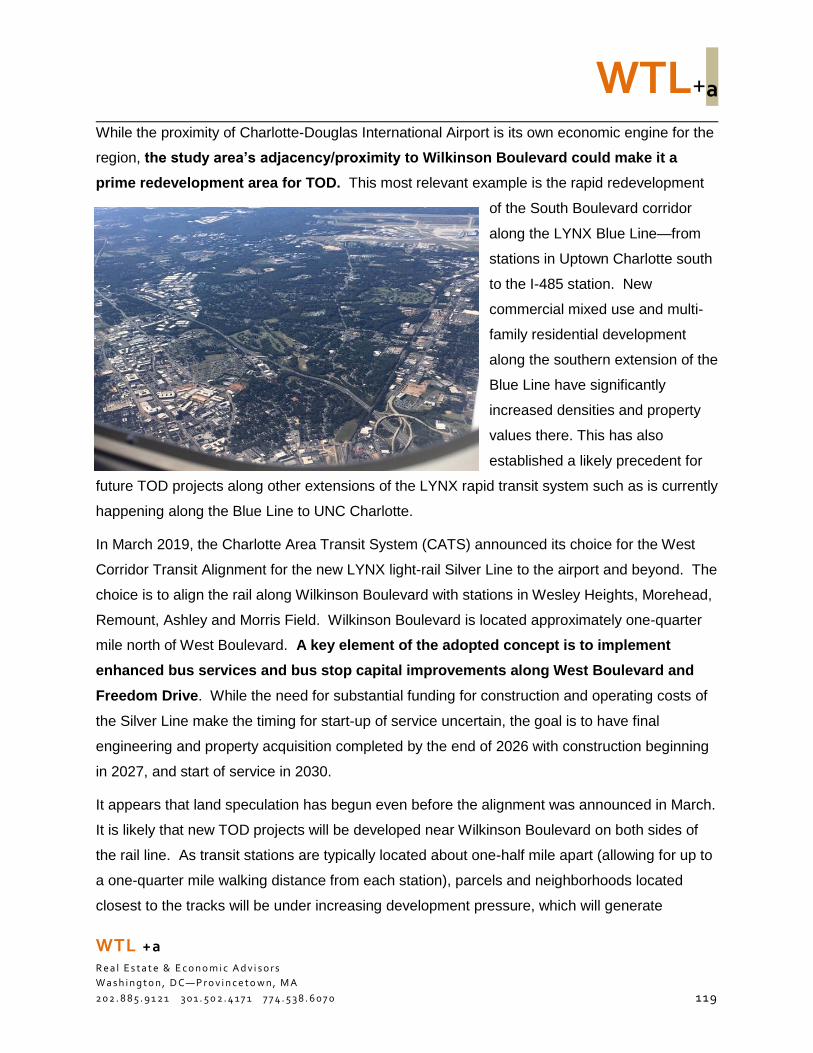
WTL+a
WTL +a
R e a l E s t a t e & E c o n o m i c A d v i s o r s
W a s h i n g t o n , D C—P r o v i n c e t o w n , M A
2 0 2 . 8 8 5 . 9 1 2 1 3 0 1 . 5 0 2 . 4 1 7 1 7 7 4 . 5 3 8 . 6 0 7 0 119
While the proximity of Charlotte-Douglas International Airport is its own economic engine for the
region, the study area’s adjacency/proximity to Wilkinson Boulevard could make it a
prime redevelopment area for TOD. This most relevant example is the rapid redevelopment
of the South Boulevard corridor
along the LYNX Blue Line—from
stations in Uptown Charlotte south
to the I-485 station. New
commercial mixed use and multi-
family residential development
along the southern extension of the
Blue Line have significantly
increased densities and property
values there. This has also
established a likely precedent for
future TOD projects along other extensions of the LYNX rapid transit system such as is currently
happening along the Blue Line to UNC Charlotte.
In March 2019, the Charlotte Area Transit System (CATS) announced its choice for the West
Corridor Transit Alignment for the new LYNX light-rail Silver Line to the airport and beyond. The
choice is to align the rail along Wilkinson Boulevard with stations in Wesley Heights, Morehead,
Remount, Ashley and Morris Field. Wilkinson Boulevard is located approximately one-quarter
mile north of West Boulevard. A key element of the adopted concept is to implement
enhanced bus services and bus stop capital improvements along West Boulevard and
Freedom Drive. While the need for substantial funding for construction and operating costs of
the Silver Line make the timing for start-up of service uncertain, the goal is to have final
engineering and property acquisition completed by the end of 2026 with construction beginning
in 2027, and start of service in 2030.
It appears that land speculation has begun even before the alignment was announced in March.
It is likely that new TOD projects will be developed near Wilkinson Boulevard on both sides of
the rail line. As transit stations are typically located about one-half mile apart (allowing for up to
a one-quarter mile walking distance from each station), parcels and neighborhoods located
closest to the tracks will be under increasing development pressure, which will generate
WTL+a
WTL +a
R e a l E s t a t e & E c o n o m i c A d v i s o r s
W a s h i n g t o n , D C—P r o v i n c e t o w n , M A
2 0 2 . 8 8 5 . 9 1 2 1 3 0 1 . 5 0 2 . 4 1 7 1 7 7 4 . 5 3 8 . 6 0 7 0 1 20
speculation and increases in land values due to the increased densities that mixed-use projects
create. It is likely that the West Boulevard corridor will be affected by this development and the
WSCLT could be a tool to help manage these impacts in positive ways.
Funding for Community Land Trusts
CLTs require considerable funding for operations, capital investments (including land
acquisition, construction, and rehabilitation), and subsidies. Subsidies, in the form of land,
bonus densities and/or additional funds, are used to make the initial home/building affordable to
target home buyers and remains with each property as a sunk cost. As a CLT’s portfolio of
homes under its stewardship increases (owned/occupied by lessees), its revenues increase and
it becomes less dependent on outside funding for operational costs. The start-up stage of a
CLT is challenging as it needs to raise initial funding capital to enable establishment of the CLT
and sufficient funding to:
Allow for professional staffing;
Accept land title transfers and the legal mechanisms necessary to complete transactions;
Provide for early strategic land acquisitions (often of vacant land to prevent speculation);
Consider joint development of neighborhood-serving uses; and
Continue ongoing operations while the program grows.
In some CLTs, initial funding has been provided by private charitable foundations or individual
donors, by corporate foundations, and by local government.
The Charlotte community is galvanized around the need for affordable housing as one of the
key components of creating better opportunities for social mobility of its poorest residents and
meeting the housing needs generated by a rapid influx of new residents. Since its
establishment, the WSCLT has been supported by $136,000 in private donations. Up to this
point, the City of Charlotte and Mecklenburg County have funded some small grants for some of
its specific activities. The WSCLT’s recently completed Business Plan (2019—2023) defines its
near-term goals and the operational and capital funding required to achieve them. One
important source of support that other CLTs have relied on is donation of county- or city-owned
vacant lots or potential tax foreclosure properties before they go to auction. While it appears
that the City of Charlotte and Mecklenburg County are reviewing these options, the WSCLT has
WTL+a
WTL +a
R e a l E s t a t e & E c o n o m i c A d v i s o r s
W a s h i n g t o n , D C—P r o v i n c e t o w n , M A
2 0 2 . 8 8 5 . 9 1 2 1 3 0 1 . 5 0 2 . 4 1 7 1 7 7 4 . 5 3 8 . 6 0 7 0 1 21
not yet been a recipient of any such properties. The WSCLT should continue to actively explore
sources of financial and in-kind (e.g. property, building materials) support.
One potential source of funding is the private sector. Charlotte has a number of major financial
and other corporations headquartered in either the city or county. In fact, the area is the
headquarters of six Fortune 500 companies (Bank of America, Lowes, Nucor, Sealed Air,
Sonic Automotive and Duke Energy); by contrast, Raleigh has only one headquarters. Charlotte
is also the location of the intended headquarters of recently merged BB&T Bank and SunTrust
Banks, and has a very large presence of Wells Fargo Bank (although the headquarters is in San
Francisco).
According to Fortune magazine, at least half of all Fortune 500 Companies have a presence in
the Charlotte area. The racing industry is also in Charlotte and the rapidly-growing Charlotte-
Douglas International Airport is ranked seventh in passenger volume in the United States, with
over 45 million passengers in 2018. Due to the concentration of large financial institutions,
the Charlotte area offers advantages in seeking corporate and company foundation
support for innovative approaches to community redevelopment, such as the
recommendations proposed for West Boulevard including the WSCLT.
As noted previously, as a CLT’s portfolio of occupied properties increases, it will become
increasingly able to cover most of its operating costs. These latter stage revenues are
produced by several categories of income:
Annual ground lease fees paid by participating property owners;
Fees resulting from resale of CLT-owned properties to income-qualified buyers;
Rental income generated by CLT-owned properties; and
Other management income such as development fees.
The CLTs in Carrboro and Chapel Hill have partnered with affordable housing developers to
create for sale and affordable rental residential projects on CLT-held land.
Despite increasing revenues to cover operating costs as its portfolio grows, the WSCLT will
have an on-going need for capital funds to subsidize new and affordable homes for low-income
buyers and renters. Fortunately, CLT homes retain subsidy requiring a one-time investment in
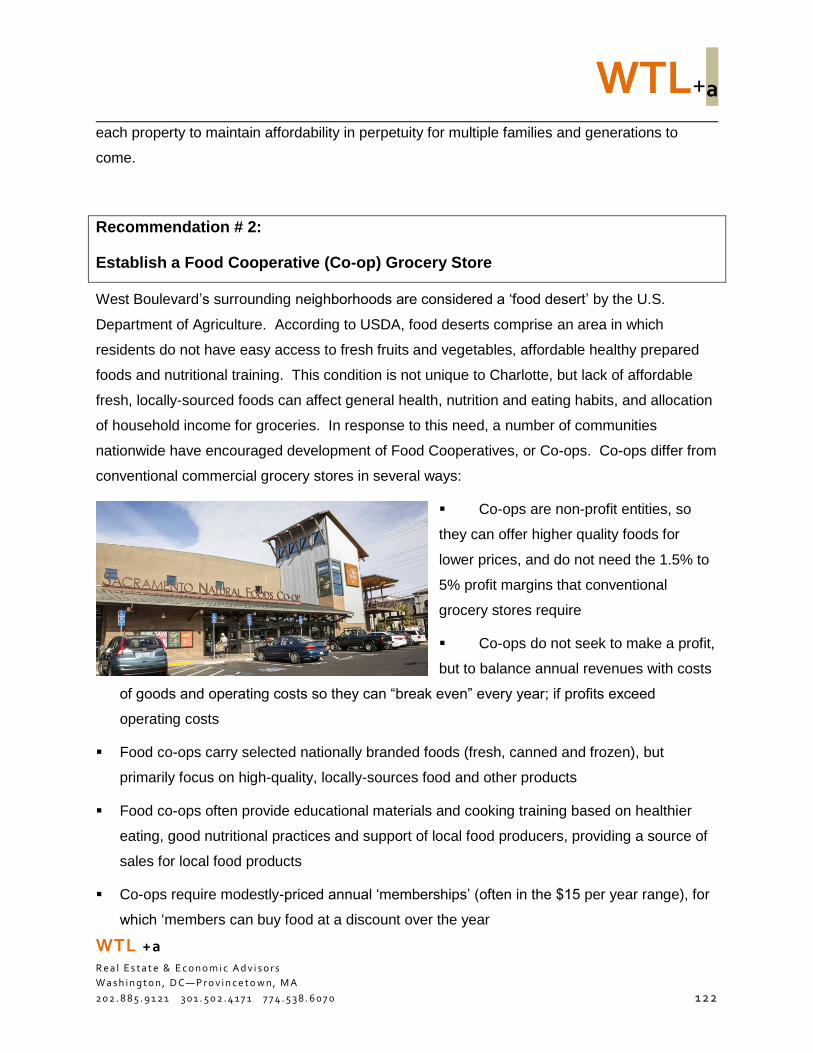
WTL+a
WTL +a
R e a l E s t a t e & E c o n o m i c A d v i s o r s
W a s h i n g t o n , D C—P r o v i n c e t o w n , M A
2 0 2 . 8 8 5 . 9 1 2 1 3 0 1 . 5 0 2 . 4 1 7 1 7 7 4 . 5 3 8 . 6 0 7 0 1 22
each property to maintain affordability in perpetuity for multiple families and generations to
come.
Recommendation # 2:
Establish a Food Cooperative (Co-op) Grocery Store
West Boulevard’s surrounding neighborhoods are considered a ‘food desert’ by the U.S.
Department of Agriculture. According to USDA, food deserts comprise an area in which
residents do not have easy access to fresh fruits and vegetables, affordable healthy prepared
foods and nutritional training. This condition is not unique to Charlotte, but lack of affordable
fresh, locally-sourced foods can affect general health, nutrition and eating habits, and allocation
of household income for groceries. In response to this need, a number of communities
nationwide have encouraged development of Food Cooperatives, or Co-ops. Co-ops differ from
conventional commercial grocery stores in several ways:
Co-ops are non-profit entities, so
they can offer higher quality foods for
lower prices, and do not need the 1.5% to
5% profit margins that conventional
grocery stores require
Co-ops do not seek to make a profit,
but to balance annual revenues with costs
of goods and operating costs so they can “break even” every year; if profits exceed
operating costs
Food co-ops carry selected nationally branded foods (fresh, canned and frozen), but
primarily focus on high-quality, locally-sources food and other products
Food co-ops often provide educational materials and cooking training based on healthier
eating, good nutritional practices and support of local food producers, providing a source of
sales for local food products
Co-ops require modestly-priced annual ‘memberships’ (often in the $15 per year range), for
which ‘members can buy food at a discount over the year
WTL+a
WTL +a
R e a l E s t a t e & E c o n o m i c A d v i s o r s
W a s h i n g t o n , D C—P r o v i n c e t o w n , M A
2 0 2 . 8 8 5 . 9 1 2 1 3 0 1 . 5 0 2 . 4 1 7 1 7 7 4 . 5 3 8 . 6 0 7 0 1 23
As public entities, food co-ops are community-based, controlled and operated, and are
positioned to fill affordability gaps, offer community-centered activities and programming to
encourage healthier eating and food preparation, and
Based on the examples described in the two food co-op case studies below, these programs
can attract financial and technical support from corporate, university/educational,
philanthropic and other sources.
As part of the West Boulevard market study, the City requested that two previous reports,
commissioned by the West Boulevard Neighborhood Coalition, on the feasibility of a grocery
store and/or a food co-op be reviewed. Both studies analyzed a potential grocery/co-op location
at the intersection of Clanton Road and West Boulevard.
The first study was completed in 2016 by MTN Retail Consultants of Salt Lake City, UT, and
tested the feasibility of five different grocery store concepts ranging in size from about 15,000
sq. ft. to 22,000 sq. ft. Identified grocery concepts included conventional grocery stores through
to the location and performance criteria for smaller chain grocery stores active in the
Southeastern United States, Aldi and Lidl.
The second study was completed in 2018 by G2G Research Group, and focused more directly
on the potential to develop a food co-op. The analysis tested two store concepts, of 7,200 and
10,000 sq. ft. The sales analysis projected stabilized third-year gross sales of $4.11 million for
the 7,200 sq. ft. prototype (equating to sales of $570 per sq. ft. per year), and of $4.89 million for
the 10,000 sq. ft. model (or $489 per sq. ft. per year). Both reports commented on the smaller
population and lower disposable incomes among West Boulevard households. Notably,
suggested trade areas were large—reaching from west of the airport (MTN Retail Consultants)
almost to Uptown/downtown Charlotte. The reports also identified potential “retail capture
rates”, noting that capture rates are likely to be highest in the central portion of West Boulevard,
and lower at the eastern and western edges, in particular because of the limited supply on the
west end of the West Boulevard corridor.
To complement the analyses in these two reports, WTL+a and RDS LLC conducted research
into proven models in which locally-sourced, healthier foods are made available to similar
neighborhoods, both in North Carolina and in the Washington, DC area. The purpose of these
case study analyses is to (a) consider actual performance for a similarly located food co-op in a
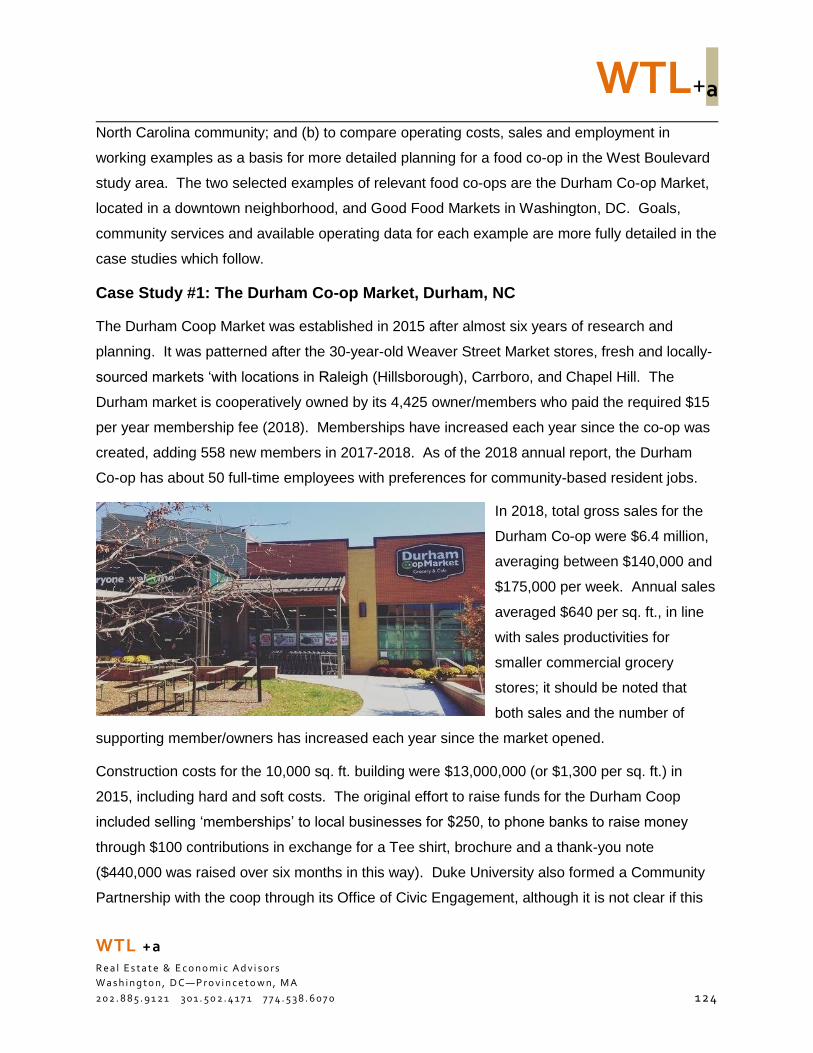
WTL+a
WTL +a
R e a l E s t a t e & E c o n o m i c A d v i s o r s
W a s h i n g t o n , D C—P r o v i n c e t o w n , M A
2 0 2 . 8 8 5 . 9 1 2 1 3 0 1 . 5 0 2 . 4 1 7 1 7 7 4 . 5 3 8 . 6 0 7 0 1 24
North Carolina community; and (b) to compare operating costs, sales and employment in
working examples as a basis for more detailed planning for a food co-op in the West Boulevard
study area. The two selected examples of relevant food co-ops are the Durham Co-op Market,
located in a downtown neighborhood, and Good Food Markets in Washington, DC. Goals,
community services and available operating data for each example are more fully detailed in the
case studies which follow.
Case Study #1: The Durham Co-op Market, Durham, NC
The Durham Coop Market was established in 2015 after almost six years of research and
planning. It was patterned after the 30-year-old Weaver Street Market stores, fresh and locally-
sourced markets ‘with locations in Raleigh (Hillsborough), Carrboro, and Chapel Hill. The
Durham market is cooperatively owned by its 4,425 owner/members who paid the required $15
per year membership fee (2018). Memberships have increased each year since the co-op was
created, adding 558 new members in 2017-2018. As of the 2018 annual report, the Durham
Co-op has about 50 full-time employees with preferences for community-based resident jobs.
In 2018, total gross sales for the
Durham Co-op were $6.4 million,
averaging between $140,000 and
$175,000 per week. Annual sales
averaged $640 per sq. ft., in line
with sales productivities for
smaller commercial grocery
stores; it should be noted that
both sales and the number of
supporting member/owners has increased each year since the market opened.
Construction costs for the 10,000 sq. ft. building were $13,000,000 (or $1,300 per sq. ft.) in
2015, including hard and soft costs. The original effort to raise funds for the Durham Coop
included selling ‘memberships’ to local businesses for $250, to phone banks to raise money
through $100 contributions in exchange for a Tee shirt, brochure and a thank-you note
($440,000 was raised over six months in this way). Duke University also formed a Community
Partnership with the coop through its Office of Civic Engagement, although it is not clear if this
WTL+a
WTL +a
R e a l E s t a t e & E c o n o m i c A d v i s o r s
W a s h i n g t o n , D C—P r o v i n c e t o w n , M A
2 0 2 . 8 8 5 . 9 1 2 1 3 0 1 . 5 0 2 . 4 1 7 1 7 7 4 . 5 3 8 . 6 0 7 0 1 25
included direct funding. Other charitable organizations such as the Self Help Ventures Fund
also contributed.
According to the 2018 annual report, more than 60% of the staff are people of color, 15%
identify as LGBTQ, and 15% have primary or native languages other than English, a testament
to the Durham Co-op’s commitment to hire locally and to create job training to accommodate all
people. The benefit of participating as a member/owner is that food prices are discounted by
20% over comparable products in other stores, adding value and affordability to other operating
goals for area consumers. A $3 dinner and a $5 lunch are offered in the store weekly, both as a
service and as a way to build community among members. Based on five years of operations,
the Durham Co-op has reorganized both its back-of-house and front-of-house spaces to modify
an expanded products list and improve the flow of goods through the store.
In addition to wellness and nutritional training and products for member/owners, the Durham
Co-op has also created a series of sustainability projects, including: a dry creek storm water
management system, a pollinator garden with native and environmentally friendly plants for
bees and butterflies, food waste recycling and refilling stations for soaps and cleansers to allow
for re-use of household product containers.
Because the co-op is a non-profit enterprise, its goal is to break even over the year, balancing
sales and revenues with operating costs and their ability to discount the price of their products.
Table 28 below illustrates the shares of revenues and operating costs for the Durham Co-op as
of June 30, 2018. Negative net income represents a successful outcome, as a modest “loss”
against total revenues achieves the ‘break even’ objective for the operating year. Non-profit
cooperatives seek to have a small operating loss each year, as one of their objectives is to pass
along the benefit of no-profit sales as discounts to their customers.
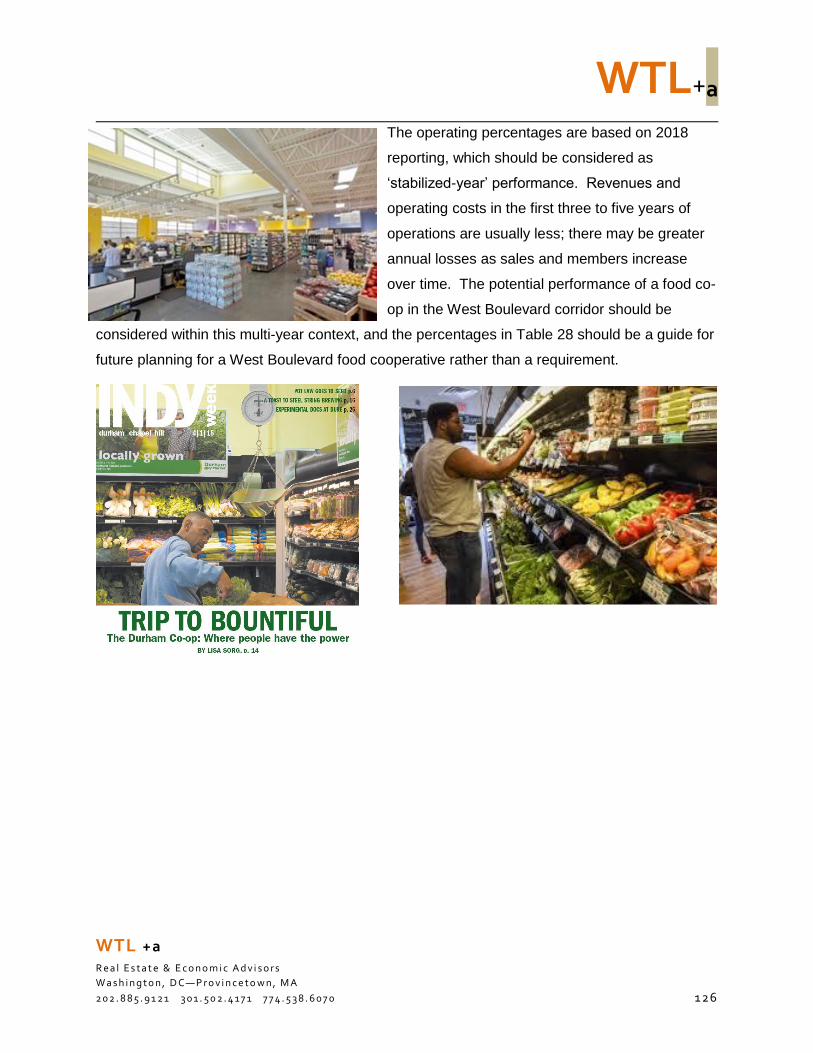
WTL+a
WTL +a
R e a l E s t a t e & E c o n o m i c A d v i s o r s
W a s h i n g t o n , D C—P r o v i n c e t o w n , M A
2 0 2 . 8 8 5 . 9 1 2 1 3 0 1 . 5 0 2 . 4 1 7 1 7 7 4 . 5 3 8 . 6 0 7 0 1 26
The operating percentages are based on 2018
reporting, which should be considered as
‘stabilized-year’ performance. Revenues and
operating costs in the first three to five years of
operations are usually less; there may be greater
annual losses as sales and members increase
over time. The potential performance of a food co-
op in the West Boulevard corridor should be
considered within this multi-year context, and the percentages in Table 28 should be a guide for
future planning for a West Boulevard food cooperative rather than a requirement.
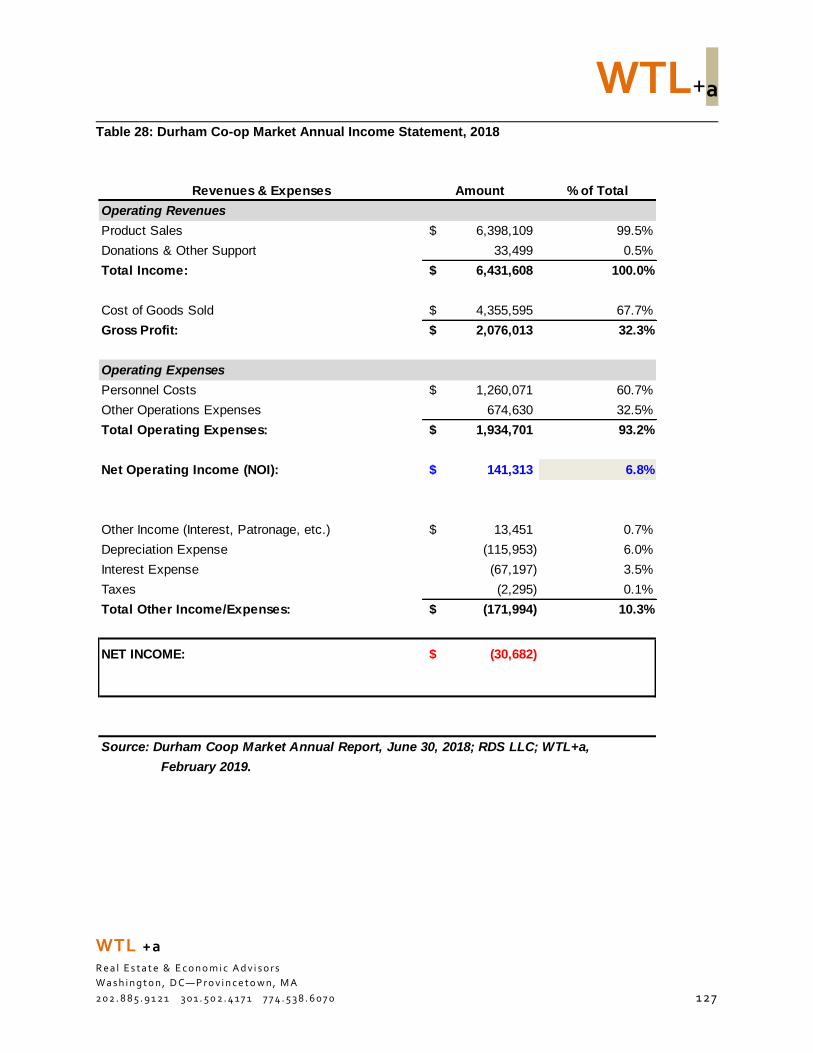
WTL+a
WTL +a
R e a l E s t a t e & E c o n o m i c A d v i s o r s
W a s h i n g t o n , D C—P r o v i n c e t o w n , M A
2 0 2 . 8 8 5 . 9 1 2 1 3 0 1 . 5 0 2 . 4 1 7 1 7 7 4 . 5 3 8 . 6 0 7 0 1 27
Table 28: Durham Co-op Market Annual Income Statement, 2018
Revenues & Expenses Amount % of Total
Operating Revenues
Product Sales 6,398,109$ 99.5%
Donations & Other Support 33,499 0.5%
Total Income: 6,431,608$ 100.0%
Cost of Goods Sold 4,355,595$ 67.7%
Gross Profit: 2,076,013$ 32.3%
Operating Expenses
Personnel Costs 1,260,071$ 60.7%
Other Operations Expenses 674,630 32.5%
Total Operating Expenses: 1,934,701$ 93.2%
Net Operating Income (NOI): 141,313$ 6.8%
Other Income (Interest, Patronage, etc.) 13,451$ 0.7%
Depreciation Expense (115,953) 6.0%
Interest Expense (67,197) 3.5%
Taxes (2,295) 0.1%
Total Other Income/Expenses: (171,994)$ 10.3%
NET INCOME: (30,682)$
Source: Durham Coop Market Annual Report, June 30, 2018; RDS LLC; WTL+a,
February 2019.
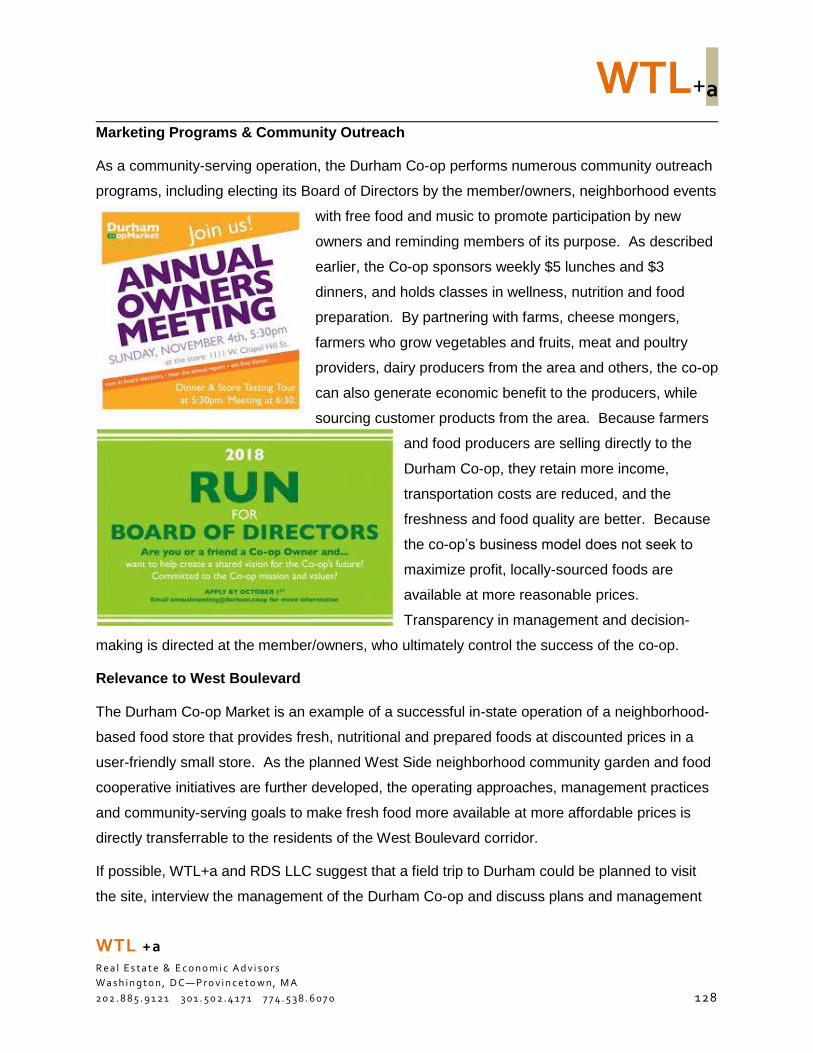
WTL+a
WTL +a
R e a l E s t a t e & E c o n o m i c A d v i s o r s
W a s h i n g t o n , D C—P r o v i n c e t o w n , M A
2 0 2 . 8 8 5 . 9 1 2 1 3 0 1 . 5 0 2 . 4 1 7 1 7 7 4 . 5 3 8 . 6 0 7 0 1 28
Marketing Programs & Community Outreach
As a community-serving operation, the Durham Co-op performs numerous community outreach
programs, including electing its Board of Directors by the member/owners, neighborhood events
with free food and music to promote participation by new
owners and reminding members of its purpose. As described
earlier, the Co-op sponsors weekly $5 lunches and $3
dinners, and holds classes in wellness, nutrition and food
preparation. By partnering with farms, cheese mongers,
farmers who grow vegetables and fruits, meat and poultry
providers, dairy producers from the area and others, the co-op
can also generate economic benefit to the producers, while
sourcing customer products from the area. Because farmers
and food producers are selling directly to the
Durham Co-op, they retain more income,
transportation costs are reduced, and the
freshness and food quality are better. Because
the co-op’s business model does not seek to
maximize profit, locally-sourced foods are
available at more reasonable prices.
Transparency in management and decision-
making is directed at the member/owners, who ultimately control the success of the co-op.
Relevance to West Boulevard
The Durham Co-op Market is an example of a successful in-state operation of a neighborhood-
based food store that provides fresh, nutritional and prepared foods at discounted prices in a
user-friendly small store. As the planned West Side neighborhood community garden and food
cooperative initiatives are further developed, the operating approaches, management practices
and community-serving goals to make fresh food more available at more affordable prices is
directly transferrable to the residents of the West Boulevard corridor.
If possible, WTL+a and RDS LLC suggest that a field trip to Durham could be planned to visit
the site, interview the management of the Durham Co-op and discuss plans and management
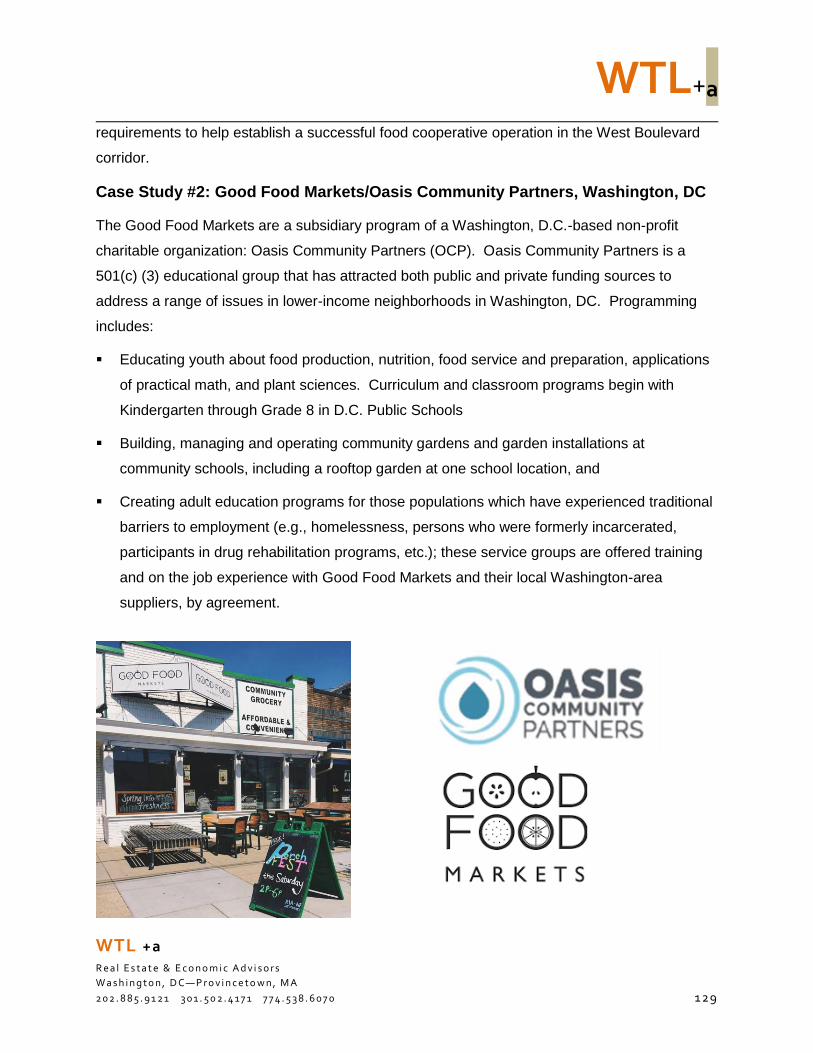
WTL+a
WTL +a
R e a l E s t a t e & E c o n o m i c A d v i s o r s
W a s h i n g t o n , D C—P r o v i n c e t o w n , M A
2 0 2 . 8 8 5 . 9 1 2 1 3 0 1 . 5 0 2 . 4 1 7 1 7 7 4 . 5 3 8 . 6 0 7 0 1 29
requirements to help establish a successful food cooperative operation in the West Boulevard
corridor.
Case Study #2: Good Food Markets/Oasis Community Partners, Washington, DC
The Good Food Markets are a subsidiary program of a Washington, D.C.-based non-profit
charitable organization: Oasis Community Partners (OCP). Oasis Community Partners is a
501(c) (3) educational group that has attracted both public and private funding sources to
address a range of issues in lower-income neighborhoods in Washington, DC. Programming
includes:
Educating youth about food production, nutrition, food service and preparation, applications
of practical math, and plant sciences. Curriculum and classroom programs begin with
Kindergarten through Grade 8 in D.C. Public Schools
Building, managing and operating community gardens and garden installations at
community schools, including a rooftop garden at one school location, and
Creating adult education programs for those populations which have experienced traditional
barriers to employment (e.g., homelessness, persons who were formerly incarcerated,
participants in drug rehabilitation programs, etc.); these service groups are offered training
and on the job experience with Good Food Markets and their local Washington-area
suppliers, by agreement.
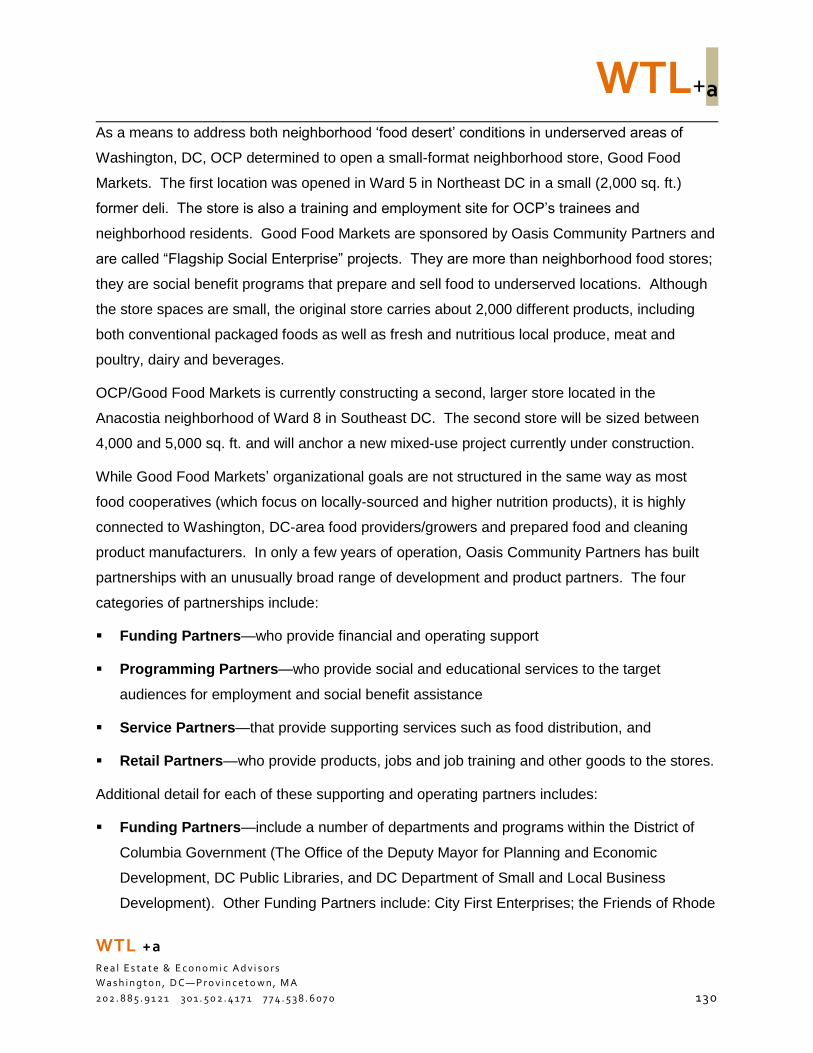
WTL+a
WTL +a
R e a l E s t a t e & E c o n o m i c A d v i s o r s
W a s h i n g t o n , D C—P r o v i n c e t o w n , M A
2 0 2 . 8 8 5 . 9 1 2 1 3 0 1 . 5 0 2 . 4 1 7 1 7 7 4 . 5 3 8 . 6 0 7 0 130
As a means to address both neighborhood ‘food desert’ conditions in underserved areas of
Washington, DC, OCP determined to open a small-format neighborhood store, Good Food
Markets. The first location was opened in Ward 5 in Northeast DC in a small (2,000 sq. ft.)
former deli. The store is also a training and employment site for OCP’s trainees and
neighborhood residents. Good Food Markets are sponsored by Oasis Community Partners and
are called “Flagship Social Enterprise” projects. They are more than neighborhood food stores;
they are social benefit programs that prepare and sell food to underserved locations. Although
the store spaces are small, the original store carries about 2,000 different products, including
both conventional packaged foods as well as fresh and nutritious local produce, meat and
poultry, dairy and beverages.
OCP/Good Food Markets is currently constructing a second, larger store located in the
Anacostia neighborhood of Ward 8 in Southeast DC. The second store will be sized between
4,000 and 5,000 sq. ft. and will anchor a new mixed-use project currently under construction.
While Good Food Markets’ organizational goals are not structured in the same way as most
food cooperatives (which focus on locally-sourced and higher nutrition products), it is highly
connected to Washington, DC-area food providers/growers and prepared food and cleaning
product manufacturers. In only a few years of operation, Oasis Community Partners has built
partnerships with an unusually broad range of development and product partners. The four
categories of partnerships include:
Funding Partners—who provide financial and operating support
Programming Partners—who provide social and educational services to the target
audiences for employment and social benefit assistance
Service Partners—that provide supporting services such as food distribution, and
Retail Partners—who provide products, jobs and job training and other goods to the stores.
Additional detail for each of these supporting and operating partners includes:
Funding Partners—include a number of departments and programs within the District of
Columbia Government (The Office of the Deputy Mayor for Planning and Economic
Development, DC Public Libraries, and DC Department of Small and Local Business
Development). Other Funding Partners include: City First Enterprises; the Friends of Rhode
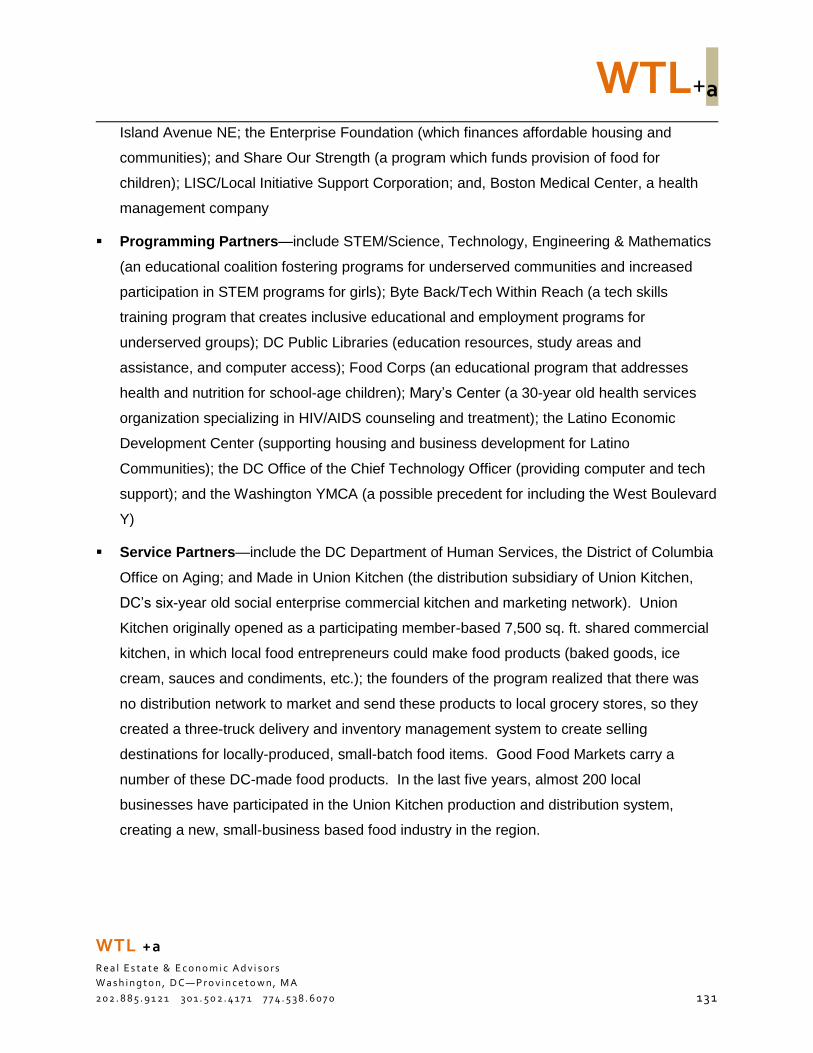
WTL+a
WTL +a
R e a l E s t a t e & E c o n o m i c A d v i s o r s
W a s h i n g t o n , D C—P r o v i n c e t o w n , M A
2 0 2 . 8 8 5 . 9 1 2 1 3 0 1 . 5 0 2 . 4 1 7 1 7 7 4 . 5 3 8 . 6 0 7 0 131
Island Avenue NE; the Enterprise Foundation (which finances affordable housing and
communities); and Share Our Strength (a program which funds provision of food for
children); LISC/Local Initiative Support Corporation; and, Boston Medical Center, a health
management company
Programming Partners—include STEM/Science, Technology, Engineering & Mathematics
(an educational coalition fostering programs for underserved communities and increased
participation in STEM programs for girls); Byte Back/Tech Within Reach (a tech skills
training program that creates inclusive educational and employment programs for
underserved groups); DC Public Libraries (education resources, study areas and
assistance, and computer access); Food Corps (an educational program that addresses
health and nutrition for school-age children); Mary’s Center (a 30-year old health services
organization specializing in HIV/AIDS counseling and treatment); the Latino Economic
Development Center (supporting housing and business development for Latino
Communities); the DC Office of the Chief Technology Officer (providing computer and tech
support); and the Washington YMCA (a possible precedent for including the West Boulevard
Y)
Service Partners—include the DC Department of Human Services, the District of Columbia
Office on Aging; and Made in Union Kitchen (the distribution subsidiary of Union Kitchen,
DC’s six-year old social enterprise commercial kitchen and marketing network). Union
Kitchen originally opened as a participating member-based 7,500 sq. ft. shared commercial
kitchen, in which local food entrepreneurs could make food products (baked goods, ice
cream, sauces and condiments, etc.); the founders of the program realized that there was
no distribution network to market and send these products to local grocery stores, so they
created a three-truck delivery and inventory management system to create selling
destinations for locally-produced, small-batch food items. Good Food Markets carry a
number of these DC-made food products. In the last five years, almost 200 local
businesses have participated in the Union Kitchen production and distribution system,
creating a new, small-business based food industry in the region.
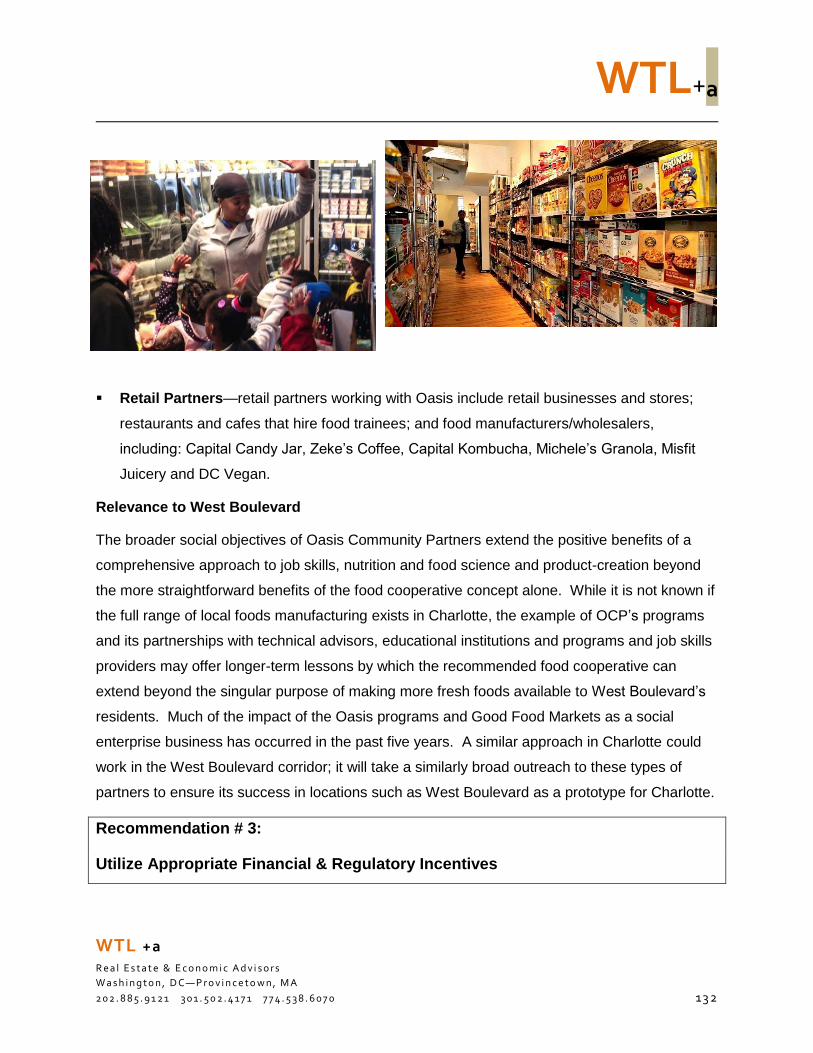
WTL+a
WTL +a
R e a l E s t a t e & E c o n o m i c A d v i s o r s
W a s h i n g t o n , D C—P r o v i n c e t o w n , M A
2 0 2 . 8 8 5 . 9 1 2 1 3 0 1 . 5 0 2 . 4 1 7 1 7 7 4 . 5 3 8 . 6 0 7 0 13 2
Retail Partners—retail partners working with Oasis include retail businesses and stores;
restaurants and cafes that hire food trainees; and food manufacturers/wholesalers,
including: Capital Candy Jar, Zeke’s Coffee, Capital Kombucha, Michele’s Granola, Misfit
Juicery and DC Vegan.
Relevance to West Boulevard
The broader social objectives of Oasis Community Partners extend the positive benefits of a
comprehensive approach to job skills, nutrition and food science and product-creation beyond
the more straightforward benefits of the food cooperative concept alone. While it is not known if
the full range of local foods manufacturing exists in Charlotte, the example of OCP’s programs
and its partnerships with technical advisors, educational institutions and programs and job skills
providers may offer longer-term lessons by which the recommended food cooperative can
extend beyond the singular purpose of making more fresh foods available to West Boulevard’s
residents. Much of the impact of the Oasis programs and Good Food Markets as a social
enterprise business has occurred in the past five years. A similar approach in Charlotte could
work in the West Boulevard corridor; it will take a similarly broad outreach to these types of
partners to ensure its success in locations such as West Boulevard as a prototype for Charlotte.
Recommendation # 3:
Utilize Appropriate Financial & Regulatory Incentives
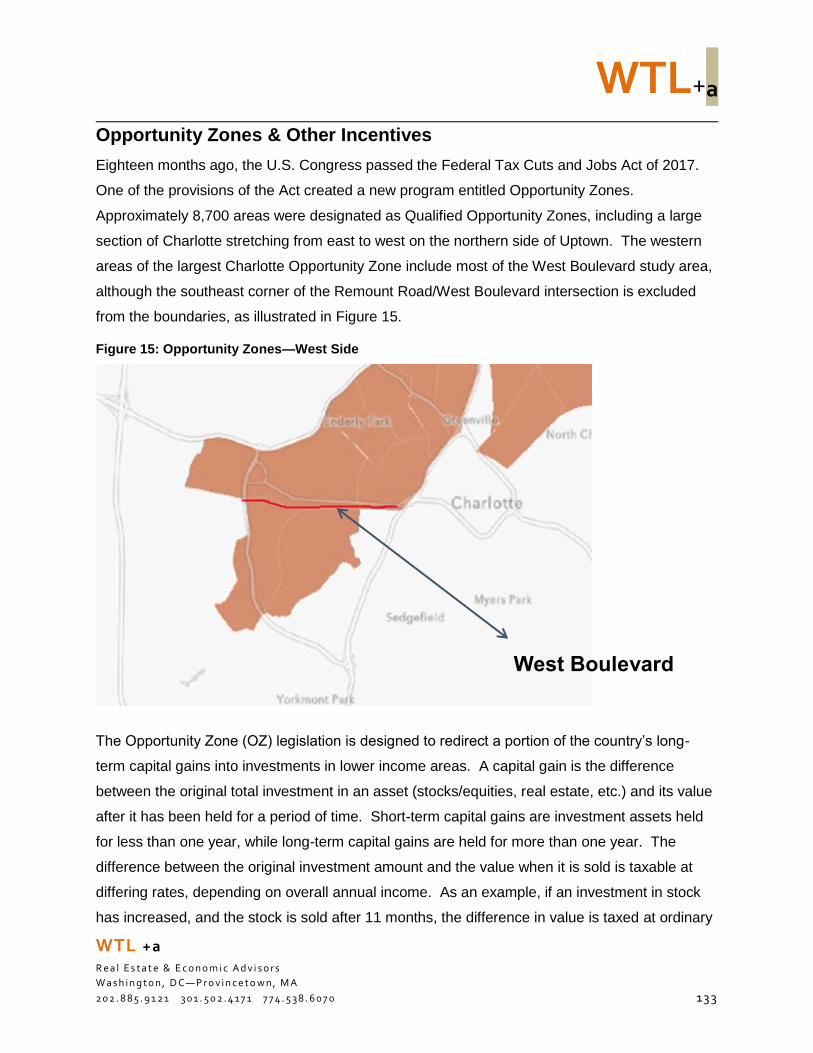
WTL+a
WTL +a
R e a l E s t a t e & E c o n o m i c A d v i s o r s
W a s h i n g t o n , D C—P r o v i n c e t o w n , M A
2 0 2 . 8 8 5 . 9 1 2 1 3 0 1 . 5 0 2 . 4 1 7 1 7 7 4 . 5 3 8 . 6 0 7 0 133
Opportunity Zones & Other Incentives
Eighteen months ago, the U.S. Congress passed the Federal Tax Cuts and Jobs Act of 2017.
One of the provisions of the Act created a new program entitled Opportunity Zones.
Approximately 8,700 areas were designated as Qualified Opportunity Zones, including a large
section of Charlotte stretching from east to west on the northern side of Uptown. The western
areas of the largest Charlotte Opportunity Zone include most of the West Boulevard study area,
although the southeast corner of the Remount Road/West Boulevard intersection is excluded
from the boundaries, as illustrated in Figure 15.
Figure 15: Opportunity Zones—West Side
The Opportunity Zone (OZ) legislation is designed to redirect a portion of the country’s long-
term capital gains into investments in lower income areas. A capital gain is the difference
between the original total investment in an asset (stocks/equities, real estate, etc.) and its value
after it has been held for a period of time. Short-term capital gains are investment assets held
for less than one year, while long-term capital gains are held for more than one year. The
difference between the original investment amount and the value when it is sold is taxable at
differing rates, depending on overall annual income. As an example, if an investment in stock
has increased, and the stock is sold after 11 months, the difference in value is taxed at ordinary
West Boulevard
WTL+a
WTL +a
R e a l E s t a t e & E c o n o m i c A d v i s o r s
W a s h i n g t o n , D C—P r o v i n c e t o w n , M A
2 0 2 . 8 8 5 . 9 1 2 1 3 0 1 . 5 0 2 . 4 1 7 1 7 7 4 . 5 3 8 . 6 0 7 0 134
income rates. The same investment held for more than 12 months would be taxed at the 15%
long-term capital gains rate. This tax policy therefore encourages forms of long-term investment
and savings by reducing the tax rate on increased value.
Because most stocks and real estate investments are held by high-income investors and their
values have generally increased, there are huge amounts of capital gains in-place, potentially
totaling in the trillions of dollars. More recent guidance from the IRS has capped the total
amount of capital gain revenue ‘offset’ to a maximum of $100 billion. Capital gains taxes are
lower for longer-term investments, but the profit at sale is taxable, both as income and is subject
to an additional 3.8% Investment Income Tax. Depending how long the Qualified Opportunity
Zone investment is held, up to ALL of the capital gains tax requirements can be eliminated.
Some commentators have called Opportunity Zones a “once-in-a-generation chance to shelter
taxable income.”
The Opportunity Zone program creates an alternative to provide tax shelter of long-term capital
gains by allowing those investments to be placed into Qualified Opportunity Funds (QOFs),
which will invest at least 90% of their resources in designated Qualified Opportunity Zones.
Based on income data in lower-income areas proposed by each state, the U.S. Department of
Treasury approved thousands of Opportunity Zones (this is what constitutes a ‘Qualified
Opportunity Zone). Across the country, investment service companies like accountants and
investment advisory companies are offering training on how to take advantage of OZs for
investors and for creators of the QOFs. Although the Tax Cut Act was passed in November
2017, it has taken over a year for IRS Guidance (rules of eligibility) to be determined; the most
recent guidance was issued in April 2019. Qualified Opportunity Zone Funds are defined
simply in the IRS Guidance as: “an investment vehicle that is set up as either a partnership or
corporation for investing in eligible property that is located in a Qualified Opportunity Zone.”
For investors, the benefits of shifting capital gains funds into the QOFs can be substantial over
time. If investments in a QOF are held for five years, the reduction in capital gains is 10% of the
profit/gain. If the investment is held for seven years, the reduction in taxable gains becomes
15% and is capped at that level until year 10. For investments held for 10 years or longer, all
capital gains are permanently excluded. While investments in stocks and equities often require
more frequent sales during the capital gains period to remain viable, real estate asset
WTL+a
WTL +a
R e a l E s t a t e & E c o n o m i c A d v i s o r s
W a s h i n g t o n , D C—P r o v i n c e t o w n , M A
2 0 2 . 8 8 5 . 9 1 2 1 3 0 1 . 5 0 2 . 4 1 7 1 7 7 4 . 5 3 8 . 6 0 7 0 135
investments are well-suited for longer-term investments; that characteristic could attract
substantial Opportunity Zone funds into emerging areas perceived as ‘undervalued’.
Because of West Boulevard’s location between Uptown Charlotte and CLT Airport and its
proximity to a future light rail commuter line (and associated Transit-Oriented
Development opportunities along a potential light rail route), portions of the study area
demonstrate current designation of ‘distressed’ (because specific Census Tracts meet
OZ demographic criteria, such as lower incomes) and ‘undervalued’ (when compared to
overall redevelopment potentials).
Although the Opportunity Zone program is just getting underway, it is certain to attract billions of
dollars, nationally and locally, into real estate investment, and is therefore worth consideration of
the possible impacts on areas such as West Boulevard.
The language of the Tax Cut Act of 2017 and of the Opportunity Zone legislation does not
specifically require that the investments have a measurable impact on local areas. West
Boulevard is already attracting speculative real estate investment and creating
immediate value prospects for long-time owners and residents to sell and relocate, as
evidenced by increasing in housing values in the adjacent Wilmore neighborhood as well
as increases in sales prices in the study area. The creation of Opportunity Funds will
assemble ready investment capital to accelerate speculation and redevelopment/increased
density in the study area.
Moreover, once the CATS Lynx Silver Line extension is planned, similar redevelopment
patterns (such as has occurred along South Boulevard/Blue Line) are highly likely. The
Tax Act does not require any community engagement with residents and property owners, nor
does it require long-term planning and regulation to mitigate wholesale change. Projects are not
required to provide affordable housing or other community-based economic development
opportunities to create jobs.
A Cautionary Comment: The Opportunity Zone program is based on the use of tax-sheltered
gains into designated areas requiring investment. As such, its central function is intended to
generate long-term profitability for the investors. As yet, IRS guidance for Opportunity Zones
has not included specific controls to address community or social benefits. As the program is
developed, these issues will likely be part of local implementation of Opportunity Zones.
WTL+a
WTL +a
R e a l E s t a t e & E c o n o m i c A d v i s o r s
W a s h i n g t o n , D C—P r o v i n c e t o w n , M A
2 0 2 . 8 8 5 . 9 1 2 1 3 0 1 . 5 0 2 . 4 1 7 1 7 7 4 . 5 3 8 . 6 0 7 0 136
The City of Charlotte has realized both the opportunity and the risks associated with Opportunity
Zones and has initiated this study to consider community needs and risks of future growth in the
West Boulevard corridor. A degree of caution and an awareness about the potential
gentrification effects of Opportunity Zones on older and lower-income neighborhoods should be
part of the equation of how change is to be managed, how land use decisions are made, and
who will be affected by those decisions. There is a strong opportunity to finance redevelopment
in the West Boulevard neighborhoods, but that opportunity should be tempered by maintaining
the interests of residents and property owners with policies that manage that reinvestment. As
the OZ program is new, there are no precedents in other communities.
Other Incentives Available in Charlotte
The City of Charlotte has several incentive programs that can assist West Boulevard property
owners and residents. As described below, each program is currently available, while the
Aging-in-Place program was only recently implemented by the City.
Business Matching Grant Security Improvement Grant
The intent of this program is to allow businesses to improve safety and the environments around
their buildings for employees and customers. Owners and tenants of existing for-profit
commercial buildings can apply for matching grants up to 50% of the cost for installation of
security equipment and improvements to their properties. A security analysis by a certified
Charlotte-Mecklenburg entity must be completed and prioritized recommendations determined
before applying for the matching grant. Any work undertaken prior to the security analysis is
ineligible for the match, and the property owner or tenant must then complete the work at their
cost.
The City will contract for reimbursement based on provision of approved receipts and
inspection. Reimbursement of up to 60% of costs may be approved for Minority, Women and
Small Business Enterprises (MWSBE) applicants. If the costs exceed the available grants,
eligible costs can be re-applied for until all approved costs are covered. New construction
projects are not eligible for this grant, and the building must meet all required codes and be
current on property taxes. Ineligible businesses are not permitted (such as adult businesses,
gambling (including sweepstakes and cyber/internet cafes, businesses operating from
WTL+a
WTL +a
R e a l E s t a t e & E c o n o m i c A d v i s o r s
W a s h i n g t o n , D C—P r o v i n c e t o w n , M A
2 0 2 . 8 8 5 . 9 1 2 1 3 0 1 . 5 0 2 . 4 1 7 1 7 7 4 . 5 3 8 . 6 0 7 0 137
residential properties or uses, non-conforming uses or properties owned by non-profit
institutions). Applications are to be submitted to the City of Charlotte Economic Development
Department.
Eligible costs as approved by the Charlotte-Mecklenburg Police Department (CMPD) for these
matching grants include:
Alarm Systems (up to $500)
Security Lighting
Locking Devices
Ironwork
Fencing
Security Camera
Gates
Doors
Windows
Selected Other Modifications
The maximum grant awards (per round) are:
All buildings (except shopping centers) $ 5,000
Owners of Shopping Centers (with 3 or more tenants) $20,000
Individual Tenants of Shopping Centers $ 2,000
Business Matching Grant Façade Improvement Program
The Façade Improvement Matching Grant program assists building owners and businesses to
make improvements in building facades appearances as well as bringing signs, parking and
landscaping into compliance with current building codes. The program provides up to 50%
reimbursement grants for improvements to commercial and industrial buildings for eligible
renovation costs. Up to a 60% reimbursement may be made available to certified Minority,
Women or Small Business Enterprise (MWSBE) companies. Similar to the Security Grant
WTL+a
WTL +a
R e a l E s t a t e & E c o n o m i c A d v i s o r s
W a s h i n g t o n , D C—P r o v i n c e t o w n , M A
2 0 2 . 8 8 5 . 9 1 2 1 3 0 1 . 5 0 2 . 4 1 7 1 7 7 4 . 5 3 8 . 6 0 7 0 138
program describe above, eligibility is based on whether the following conditions apply to
applicants:
Owners or tenants of for-profit commercial buildings; building uses must conform to all
applicable codes and ordinances and be current on real property taxes
National/regional chains headquartered in Charlotte are eligible
Certain businesses as building uses are prohibited from participating in the program,
including adult businesses, gaming (including sweepstakes and cyber/internet cafes, new
construction projects, businesses operating from residential properties or residential uses,
properties owned by non-profit institutions and any non-conforming uses
Owners of for-profit vacant buildings may apply if (a) the purpose of the project is to
rehabilitate the building to attract eligible businesses, and (b) no portion of the building is
occupied by non-conforming or ineligible businesses. Buildings owned by non-profits are
ineligible
Eligible expenses include:
Approved architectural renovations to the building façade
Improvements to bring “grandfathered” signs, parking and landscapes into compliance with
current codes and ordinances
A 50% reimbursement of eligible architectural fees up to $3,000 in addition to the maximum
award amount
Infrastructure improvements to the public right-of-way for a change of use permit
Maximum grant awards are based upon the square footage of the eligible buildings:
Up to 3,000 square feet $ 20,000
3,001 - 6,000 square feet $ 30,000
Over 6,000 square feet $ 40,000
Shopping Centers up to 30,000 Sq. Ft. with 3 tenants $ 90,000
Shopping Centers over 30,000 Sq. Ft. with 4 tenants $130,000
WTL+a
WTL +a
R e a l E s t a t e & E c o n o m i c A d v i s o r s
W a s h i n g t o n , D C—P r o v i n c e t o w n , M A
2 0 2 . 8 8 5 . 9 1 2 1 3 0 1 . 5 0 2 . 4 1 7 1 7 7 4 . 5 3 8 . 6 0 7 0 139
According to the City of Charlotte, a total of $248,099 has been awarded in façade and security
grants to 10 projects throughout the larger study area since 2010. These grants have leveraged
$1,106,507 in private investment in those projects, reflecting a leverage ratio of $1: $4.45 in
private investment. Of these 10 projects, two façade grants were approved for businesses
located specifically on West Boulevard, for a total of $23,242. Compared to other corridors
in the City’s Business Revitalization Geography, the City considers the West Boulevard study
area to have low utilization of the program.
City of Charlotte Aging in Place Assistance Program
This new program was created by the City to assist senior homeowners who want to continue to
live in their homes, but who are experiencing substantial property tax increases due to property
revaluation. The program provides grants to low- and moderate-income property owners who
are age qualified (age 65 or older by the end of the year for which assistance is being
requested). The current year program would grant the difference between the assessed
valuation tax in 2018 and 2019. The grant will be the lesser of two calculations: the percentage
tax burden increase over 2018 or a maximum of $1,000, whichever is less. Applicants cannot
be participating in any Mecklenburg County Tax Relief Program and cannot have any
outstanding encumbrances on the property, such as back property taxes, pending legal actions,
or easement disputes. After application and approval, the grants are paid directly to
Mecklenburg County on behalf of the senior homeowner.
Applicants must be 65 or older during 2019. The property must be the applicant’s primary
residence (as only one applicant per residence is allowed). The applicant’s property must be
located within the City of Charlotte city limits, and the applicants name must be on the title or
deed of the property. The resident must have lived in the home for at least 5 years prior to
application for the relief, and applicants must demonstrate that they are income-qualified as low-
or moderate-income levels. The documented gross household yearly income must be more
than $30,200 but cannot exceed 80% of the Area Median Income (AMI). Maximum grant
amounts are calculated depending upon how many residents are in the property. The 80% of
AMI maximums are illustrated below:
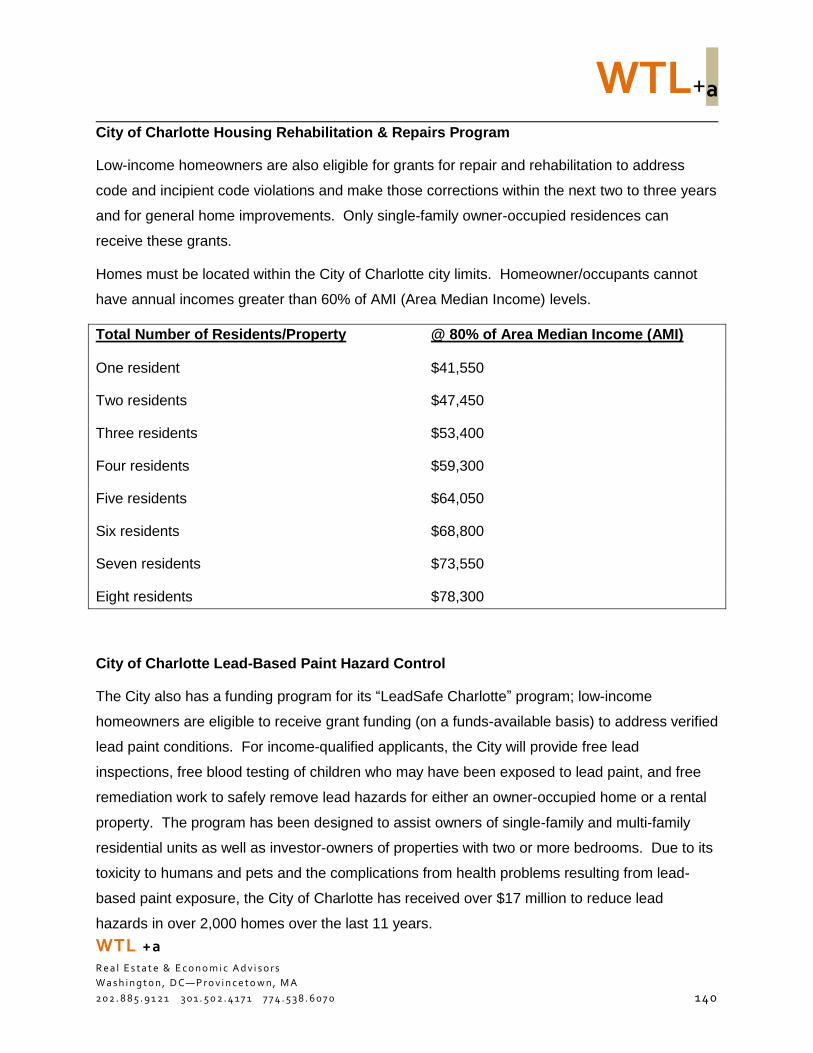
WTL+a
WTL +a
R e a l E s t a t e & E c o n o m i c A d v i s o r s
W a s h i n g t o n , D C—P r o v i n c e t o w n , M A
2 0 2 . 8 8 5 . 9 1 2 1 3 0 1 . 5 0 2 . 4 1 7 1 7 7 4 . 5 3 8 . 6 0 7 0 140
City of Charlotte Housing Rehabilitation & Repairs Program
Low-income homeowners are also eligible for grants for repair and rehabilitation to address
code and incipient code violations and make those corrections within the next two to three years
and for general home improvements. Only single-family owner-occupied residences can
receive these grants.
Homes must be located within the City of Charlotte city limits. Homeowner/occupants cannot
have annual incomes greater than 60% of AMI (Area Median Income) levels.
Total Number of Residents/Property @ 80% of Area Median Income (AMI)
One resident $41,550
Two residents $47,450
Three residents $53,400
Four residents $59,300
Five residents $64,050
Six residents $68,800
Seven residents $73,550
Eight residents $78,300
City of Charlotte Lead-Based Paint Hazard Control
The City also has a funding program for its “LeadSafe Charlotte” program; low-income
homeowners are eligible to receive grant funding (on a funds-available basis) to address verified
lead paint conditions. For income-qualified applicants, the City will provide free lead
inspections, free blood testing of children who may have been exposed to lead paint, and free
remediation work to safely remove lead hazards for either an owner-occupied home or a rental
property. The program has been designed to assist owners of single-family and multi-family
residential units as well as investor-owners of properties with two or more bedrooms. Due to its
toxicity to humans and pets and the complications from health problems resulting from lead-
based paint exposure, the City of Charlotte has received over $17 million to reduce lead
hazards in over 2,000 homes over the last 11 years.
WTL+a
WTL +a
R e a l E s t a t e & E c o n o m i c A d v i s o r s
W a s h i n g t o n , D C—P r o v i n c e t o w n , M A
2 0 2 . 8 8 5 . 9 1 2 1 3 0 1 . 5 0 2 . 4 1 7 1 7 7 4 . 5 3 8 . 6 0 7 0 14 1
Other Potential Sources of Funding
Other potential funding sources for the West Side Community Land Trust, a potential Food Co-
operative and other economic development projects include the following:
Public Sources
The City of Charlotte—selected specific programs are outlined above, but the City will also
have a critical role in overall physical and development planning policies, administration of
incentives and regulatory obligations and other responsibilities
Mecklenburg County—Police and Fire protection and other services, plus the Community
Resources Center (CRC) planned for a portion of the YMCA site
The Charlotte-Mecklenburg Housing Partnership and Charlotte Housing Authority—as
sources for financing, planning, development and management of affordable housing
The Local Initiatives Support Corporation/LISC—for sources of financing and
development assistance
North Carolina Small Business & Technology Development Office—for business
development, technical assistance and skills development programs and targeted industry
recruitment
Private Sources
As described previously, Charlotte is the headquarters location for six Fortune 500 Companies
(as compared to one in Raleigh). The headquarters of the Bank of America and the recently
announced merger of SunTrust Banks and BB&T (relocating from Winston-Salem after the
consolidation), plus the East Coast headquarters of Wells Fargo Bank reinforces the city’s role
as a potential testing ground for innovative financing for community development and affordable
housing initiatives.
The City of Charlotte is also part of the Knight Foundation’s network of “Knight Cities”; the
Knight Foundation only awards grants in cities in which it has Knight-Ridder owned newspapers,
or once published newspapers there. Nationwide, Knight awarded grants of almost $118 million
in 2017, and its endowment assets total almost $2.5 billion. The Knight Foundation is
complemented by other charitable foundations in Charlotte, including the Charlotte-Mecklenburg
WTL+a
WTL +a
R e a l E s t a t e & E c o n o m i c A d v i s o r s
W a s h i n g t o n , D C—P r o v i n c e t o w n , M A
2 0 2 . 8 8 5 . 9 1 2 1 3 0 1 . 5 0 2 . 4 1 7 1 7 7 4 . 5 3 8 . 6 0 7 0 14 2
Community Foundation. Corporate and other charitable foundations can be approached for
additional project and program funding.
At a smaller scale, some efforts like food co-operatives have raised funds from on-line sources
such as Go Fund Me, Kickstarter, JustGiving and others.
Long-term Implementation Recommendations (Year 4 & Beyond)
While the focus of this analysis has been on near-term actions and recommendations, it will also
be important to plan for continuity, growth and expansion into new opportunity areas that are
likely to affect revitalization opportunities along West Boulevard. Longer-term goals and
strategies should be considered to achieve the following:
1. Provide residents the option to remain in their homes and to age-in-place, if they wish
2. Implement strategies for an expanded Community Land Trust and other approaches to
stabilize real estate speculation and gentrification pressures in West Boulevard’s residential
neighborhoods
3. Complete design and implementation of new streetscape and roadway improvements that
will also enhance pedestrian and bike routes, pathways and non-vehicular circulation
4. Focus new residential and selected commercial development in mixed-use formats at under-
activated intersections (particularly at Remount Road and Clanton Road)
5. Coordinate with Mecklenburg County on development of the Community Resource Center to
expand the range of destination activities near the YMCA, the future new Public Library, and
potentially, co-located projects to house the food co-operative, community gardens and
limited professional office uses for neighborhood-serving consumer services such as
banking, legal and medical professionals. (WTL+a notes that the planning and development
schedule for the CRC was not available at the time of this analysis; depending on how the
project is prioritized and funded, the CRC may transition as a short-term recommendation)
6. Work closely with CATS in planning the future commuter rail line between West Boulevard
and Wilkinson Boulevard. As detailed below, planning should allow for increases in
densities and scale near future rail stations, but without negatively affecting the balance in
surrounding neighborhoods. (As with the CRC, depending upon available funding and
WTL+a
WTL +a
R e a l E s t a t e & E c o n o m i c A d v i s o r s
W a s h i n g t o n , D C—P r o v i n c e t o w n , M A
2 0 2 . 8 8 5 . 9 1 2 1 3 0 1 . 5 0 2 . 4 1 7 1 7 7 4 . 5 3 8 . 6 0 7 0 143
planning schedules, coordination on the new LYNX Silver Line project could become a near-
term recommendation)
7. Explore how to create airport and airport business-related jobs training for area residents as
CLT Airport continues to expand
8. Explore long-range possibilities for a future investment-grade hotel at the intersection of
West Boulevard and Billy Graham Parkway, and
9. Continue to develop practical strategies and utilize incentives to attract businesses and
consumer services tailored to better meet community needs.
Because CATS is considering an extension of the Lynx system along the CSX rail line between
Uptown and the Charlotte-Douglas International Airport, WTL+a recommends that the following
be incorporated into the analysis of the impacts and benefits of this future transit connection:
CATS should work with the WSCLT and the City to develop a TOD plan that will do more
than stimulate purely market-driven infill development, such as that which has occurred over
the past 10 years along South Boulevard. The planning paradigm that suggests up to a
quarter-mile walking radius from station locations is appropriate for higher-density residential
and commercial development should be mapped and shown where it will impact existing
neighborhoods/residents, densities under current zoning, parcel sizes, building conditions
and adaptability for new uses, utility capacity and other factors;
The WSCLT should consider acquisition (through partnership and/or purchase, depending
on available funding) to acquire and control selected parcels related to TOD. By owning
property in these locations, it may be possible to incorporate affordable/mixed-income
housing for current and future residents, receive land lease income to further activities of
WSCLT, and keep the organization central to the ongoing discussions about TOD planning
and development along the West Boulevard corridor;
There are two large assembled properties adjacent to the south side of the Norfolk Southern
rail line in the study area. The Carolina Golf Club is considered one of the most convenient
locations for golf in the Charlotte area; it is a short drive from Uptown and is reportedly
considered the third- or fourth-ranked course in an area with an unusually large number of
golf courses. The original course was designed by famed golf course designer Donald Ross
and opened as the first 18-hole golf course in Charlotte in the 1930s. The club is reportedly
WTL+a
WTL +a
R e a l E s t a t e & E c o n o m i c A d v i s o r s
W a s h i n g t o n , D C—P r o v i n c e t o w n , M A
2 0 2 . 8 8 5 . 9 1 2 1 3 0 1 . 5 0 2 . 4 1 7 1 7 7 4 . 5 3 8 . 6 0 7 0 144
in solid financial footing and is appealing to younger members attracted by its location and
beauty of the course. Across Ashley Road from the northeast corner of the golf course is
another large (35.7 acre) parcel that is currently in use as the Southern Metals Recycling
facility.
Neither site appears to be available for sale (the Carolina Golf Club may never be sold).
However, from a long-term planning perspective, it is noteworthy that the club is the largest
single land owner in the study area, with just over 174 acres of assembled property adjacent
to the proposed Lynx Line, and the Southern Metals site is also adjacent to the proposed
Ashley Road north-south connector realignment. The Southern Metals site may require
environmental remediation, as is often the case with scrap metal facilities. Given the
increase in property values along South Boulevard when the Lynx Blue Line was extended
(particularly since 2010), these properties may, over time, become potential TOD
redevelopment sites as Lynx is extended to and beyond the airport.
WTL+a recommends that these, and other larger assembled sites be incorporated by CATS
into a long-term TOD redevelopment plan along the rail corridor as a basis for concentrating
future density within a half-mile of station locations. Incremental development should also
balance the opportunity for new infill development with the scale, composition and
population of existing neighborhoods. WSCLT and WBNC should each be involved in
creating the TOD plan. The purchase of multiple single-family detached houses into larger
assembled parcels would potentially alter neighborhood composition more than
redevelopment of already assembled larger parcels.
Other Tools & Incentives for West Boulevard
There are a range of other economic development tools and incentives that could potentially be
useful as neighborhood stabilization programs and strategies for the West Boulevard study
area. Among the many tools available are the following:
1. Specialized Land Use Controls & Overlay Zones
2. Better Access to Capital, and
3. Establishment of a Neighborhood-based Tax Increment Finance (TIF) District
Each is discussed below.
WTL+a
WTL +a
R e a l E s t a t e & E c o n o m i c A d v i s o r s
W a s h i n g t o n , D C—P r o v i n c e t o w n , M A
2 0 2 . 8 8 5 . 9 1 2 1 3 0 1 . 5 0 2 . 4 1 7 1 7 7 4 . 5 3 8 . 6 0 7 0 145
Specialized Land Use Controls/Overlay Zone
As Charlotte is currently developing the Charlotte 2040 Comprehensive Plan update, it is timely
to consider both the real estate forces affecting the West Boulevard corridor and surrounding
neighborhoods as well as appropriate strategies to sustain both the ability of residents to stay in
their homes, and to afford additional forms of protection through strategies in the new Comp
Plan designed to prevent displacement. One approach that may be considered is to work with
the WBNC to develop a conservation overlay district, a model of neighborhood planning
that has been applied across the country to measure how growth occurs, what types of
economic development are compatible with neighborhood scale and character, and as a
vehicle to manage change over time.
Often used in historic preservation or rapidly changing older neighborhoods, conservation
overlays are based on neighborhood priorities and objectives. By working through the physical
and land use conditions affecting current patterns, conservation overlays use zoning and land
use policies to determine how new structures will best fit into the existing context, and through
zoning, planning and land use mechanisms, manage issues resulting from development
pressures. These community consensus goals are applied through zoning, site development
and land use controls such as maximum allowable site-coverage (to direct the introduction and
placement of higher-density development within existing neighborhoods), building heights and
setbacks, parking requirements for residential and commercial development and preservation of
open spaces. Storm water runoff controls, provision of utility infrastructure and other traditional
public sector responsibilities such as streetscape enhancements, street lighting and street
furniture, transit network and structures, and sustainability goals can also be integrated into the
overlay zone.
The West Boulevard market study and strategic assessment is a first step in defining
opportunities for growth, site-specific recommendations to introduce new uses and densities
that will not overwhelm the current residential mix (e.g., selected townhouse and stacked flat
multi-family housing alternatives illustrated in the report). The critical factor in overlay
districts is to base the final outcome and strategies on comprehensive neighborhood
input about what residents and property owners want to see changed, and what they
wish to conserve during a period of change.
WTL+a
WTL +a
R e a l E s t a t e & E c o n o m i c A d v i s o r s
W a s h i n g t o n , D C—P r o v i n c e t o w n , M A
2 0 2 . 8 8 5 . 9 1 2 1 3 0 1 . 5 0 2 . 4 1 7 1 7 7 4 . 5 3 8 . 6 0 7 0 146
Review and management of an overlay district can occur within city government, as a
separately appointed neighborhood commission, or as a combination of both. In North Carolina,
this approach is possible under Home Rule authority or can be integrated within an existing
zoning authority. The most effective approach should be determined after ongoing discussions
with West Boulevard residents, the WBNC and WSCLT, whose function is to participate as
ownership partners to manage speculative real estate increases in value, and to provide
alternatives to current property owners. The timing of the Comprehensive Plan update is
appropriate to undertake this suggestion, as it can be an integral part of a community-based
vision for Charlotte 2040. With the goal of completing the Comprehensive Plan draft by August
2020, consideration of how to establish, monitor and manage a potential West Boulevard
Conservation Overlay District should begin as a follow-on to this market study.
Better Access to Capital
Both in Charlotte and in cities across North Carolina, older low-income (by comparison to other
parts of their cities) neighborhoods are frequently limited in their access to capital, whether for
financing home purchases, funding rehabilitation of existing homes, redevelopment of older
commercial buildings, or capitalization of small businesses. In order for the West Boulevard
study area to move to the next level in participating in its future within the context of a rapidly
growing Charlotte area, it will be critical to explore every possible source and mechanism to
provide more capital to area residents, businesses and organizations. As one example included
in this report, the West Side Community Land Trust has been created, has an established
purpose and a Board and staff, but lacks the working capital and availability of financing to
execute its work plan.
As noted previously, “The State of Housing in Charlotte”, prepared by UNC Charlotte’s
Childress Klein Center for Real Estate, documents the over-weighted pressure on
neighborhoods such as West Boulevard in terms of property values and the vulnerability to
redevelopment that lower values represent, as well as the pressure of declining supply and
growing demand. This combination of factors bring special need to the West Boulevard
neighborhood, in particular because of its location between Uptown Charlotte and the Charlotte-
Douglas International Airport, and the intent to expand the Lynx system between the two
destinations. While traditional land use tools can help, the permanency of property ownership
provides the greatest degree of control to local property owners. Property owners in these
WTL+a
WTL +a
R e a l E s t a t e & E c o n o m i c A d v i s o r s
W a s h i n g t o n , D C—P r o v i n c e t o w n , M A
2 0 2 . 8 8 5 . 9 1 2 1 3 0 1 . 5 0 2 . 4 1 7 1 7 7 4 . 5 3 8 . 6 0 7 0 147
areas are often neglected by banks and financial institutions because incomes do not provide
opportunities for profit that other, lower-risk areas present. However, it is increasingly
recognized that this is a social inequity that can result in displacement and lack of opportunity
for neighborhoods to invest in themselves.
The WSCLT is one good model, and is primarily focused on partnerships between the Trust and
neighborhood property owners. In light of pressures on pricing and demand, the Trust needs
working capital to execute its other responsibilities (property acquisition, etc.) during the critical
early years as it becomes established. Provision of capital can come from business,
philanthropic and governmental sources; accessing that capital quickly should be a priority for
the Trust and all its partners.
In addition to the Land Trust model, other communities such as Providence, RI and Boston have
created non-profit Revolving Loan Funds to assist local property owners and developers
working in lower-income areas to improve existing housing stock and make improvements
available as affordable housing. These funds, which are managed by preservation/conservation
oriented non-profit organizations in these two cases, have invested targeted funds in strategic
buildings, sites and locations to provide catalytic improvements while maintaining low-income
and affordable housing for residents of neighborhoods and older commercial districts. The
difference in the Revolving Fund model is that, once the improved properties are sold, the
investment capital ‘revolves’ back into the fund for re-use at another property. The social goals
of preserving a neighborhood context are funded through non-conventional sources. In the
case of neighborhoods that have traditionally not been able to attract financing and
redevelopment capital, the case can be made to local financial institutions (a particular
opportunity in Charlotte as one of the nation’s financial capitals) to allocate a share of their
Community Reinvestment Act (CRA) funding as a basis for a revolving fund. That type of fund
can be administered by a non-profit organization, but will need to have expertise in real estate
investment, development and renovation to maximize the benefits of such a fund.
Federal funding for revolving funds has also been used through Community Development Block
Grant (CDBG) funding, granted through the US Department of Housing and Urban
Development. CDBG funding is a financing tool that provides flexibility in its uses, but as
Federal allocations have focused on use of CDBG dollars for disaster relief in Puerto Rico and
other areas affected by storm damage, cities have had less funding available. The Federal
WTL+a
WTL +a
R e a l E s t a t e & E c o n o m i c A d v i s o r s
W a s h i n g t o n , D C—P r o v i n c e t o w n , M A
2 0 2 . 8 8 5 . 9 1 2 1 3 0 1 . 5 0 2 . 4 1 7 1 7 7 4 . 5 3 8 . 6 0 7 0 148
allocation of CDBG funds to Charlotte for Fiscal Year 2019 is $5.827 million. If any of
those funds could be used to capitalize one or more of these programs for the West
Boulevard study area, they could help to leverage other corporate, charitable or
philanthropic matched contributions.
Charlotte is a “Knight Foundation” community (The Charlotte Observer newspaper was formerly
owned by Knight Corp. newspapers), and the location of one of eight regional offices for the
Foundation. The Knight Foundation has funded $58 million to the Local Initiatives Support
Corporation (LISC) in Charlotte and has directly supported the Historic West End Partnership
and the West Side Community Land Trust. The Foundation’s $2.4 billion endowment provides
millions of dollars annually in Knight-designated communities. Funding a revolving community
preservation fund may be possible, or West Boulevard study area residents could explore other
partnerships to address their capital needs for neighborhood-based economic development
funding.
Establish a Neighborhood-based TIF District
While the idea of a Tax Increment Finance district in the West Boulevard Study area may seem
aggressive at this point in the neighborhood’s renewal process, there is already speculative
investment occurring through acquisition of property and houses, potentially for consolidation of
sites for larger development projects. It is suggested that the study area be considered for the
creation of a neighborhood-based Tax Increment Finance (TIF) district to capture a share of the
new investment that may occur over the next 10 years and beyond. While most of the near-
term new project funding will be public (the County CRC, the new library, etc.), over time there
will be new private investment in the form of infill housing and mixed use projects resulting from
extension of the Lynx system to (and beyond) the airport. Establishment of a TIF district for the
benefit of the neighborhood would allow the incremental property tax increases resulting from
new development to flow back into the community. According to the 2004 state enabling
legislation in North Carolina, TIF revenues can be a flexible source of funding for a range of
community projects and goals, including:
Streets, sidewalks and streetscape enhancements
Arts, cultural and entertainment facilities
Public transportation and parking facilities
WTL+a
WTL +a
R e a l E s t a t e & E c o n o m i c A d v i s o r s
W a s h i n g t o n , D C—P r o v i n c e t o w n , M A
2 0 2 . 8 8 5 . 9 1 2 1 3 0 1 . 5 0 2 . 4 1 7 1 7 7 4 . 5 3 8 . 6 0 7 0 149
Sanitary sewer system improvements
Storm water management and flood control projects
Water system improvements
Industrial development
New schools and community college facilities
Low- and moderate-income housing programs
It should be noted that, under North Carolina’s TIF provisions, no more than 20% of TIF-funded
projects can be allocated to retail sales, hotels, banking and financial services and other
commercial spaces (not including offices). Because the neighborhood is undersupplied with
retail and professional services, this limitation should have little effect on appropriately scaled
commercial projects. TIF can also be problematic for parks and school systems, since the basis
for the increment means that properties in a designated boundary area have their taxable value
“frozen” at a fixed level. Because parks and schools are funded through property tax revenues,
allocation of a TIF can bring funding pressure on future growth for these uses.
As a funding mechanism, TIF has been utilized less often in North Carolina in general. The
state was one of the last two in the U.S. to adopt statewide enabling legislation, and the
legislation passed by only 51% of voters, so it was a close decision. Nonetheless, TIF is a
legal and usable tool to allow the West Boulevard neighborhood to recapture a share of
future incremental property tax revenues from new growth to fund neighborhood priority
projects.