Assessment of Cumulative Impacts of Hydroelectric Projects ...
Upload
khangminh22Category
view
1download
0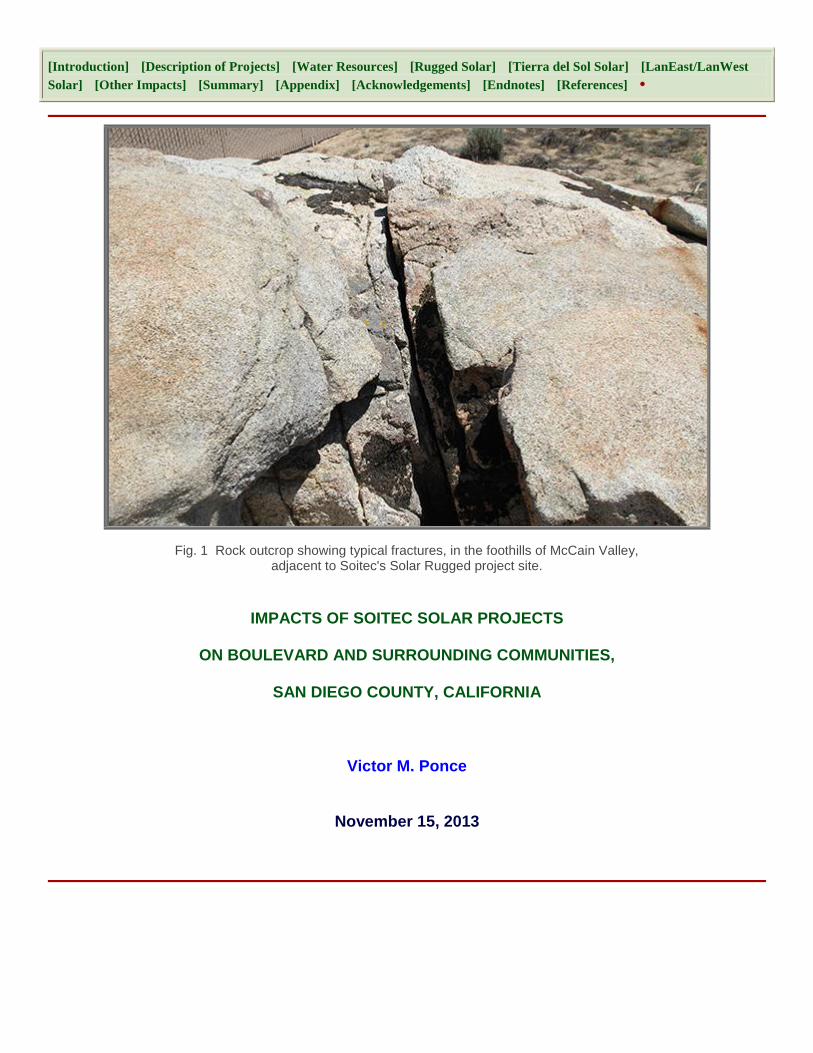
[Introduction] [Description of Projects] [Water Resources] [Rugged Solar] [Tierra del Sol Solar] [LanEast/LanWest
Solar] [Other Impacts] [Summary] [Appendix] [Acknowledgements] [Endnotes] [References] •
Fig. 1 Rock outcrop showing typical fractures, in the foothills of McCain Valley, adjacent to Soitec's Solar Rugged project site.
IMPACTS OF SOITEC SOLAR PROJECTS
ON BOULEVARD AND SURROUNDING COMMUNITIES,
SAN DIEGO COUNTY, CALIFORNIA
Victor M. Ponce
November 15, 2013
EXECUTIVE SUMMARY
The planned industrial-scale development of solar energy in Boulevard and surrounding communities is likely
to permanently change the essentially rural character of these East San Diego County communities. While
the negative impacts of energy development will be felt locally, its benefits will accrue somewhere else, very
likely in distant urban settings. Boulevard has an arid climate, with limited precipitation, an avowed scarcity of
surface water, and often highly destructive floodwaters. Over the years, the lack of reliable surface water has
forced local people to rely on groundwater for their survival.
Groundwater is the only source of potable water in the Boulevard area. Yet the prevailing arid climate
effectively means that groundwater recharge is very limited. In addition, calculations of groundwater
recharge are generally flawed due to the uncertainty regarding the applicable control volume. Thus,
excessive reliance on limited groundwater resources, over and above current consumption, is bound to place
at risk existing uses and users, both natural and anthropogenic. Domestic groundwater users on both sides
of the U.S.-Mexico border are likely to be affected.
At this juncture, the issues of groundwater sustainability are, unfortunately, not very well defined. Sustainable
yield is reckoned to be a moving target, subject to adaptive management. To remain comprehensive,
sustainable yield must include hydrological, ecohydrological, and socioeconomic considerations. In the case
of the Boulevard Soitec projects, it is difficult to reconcile the planned/postulated amounts of groundwater
capture with the demonstrated needs of riparian and upland ecosystems, which provide valuable natural
services. No development, no matter how lofty its aim, should place at risk existing natural ecosystems.
Other considerations notwithstanding, the Boulevard Soitec projects must resort to imported water to satisfy
their needs.
1. INTRODUCTION
[Description of Projects] [Water Resources] [Rugged Solar] [Tierra del Sol Solar] [LanEast/LanWest Solar] [Other
Impacts] [Summary] [Appendix] [Acknowledgements] [Endnotes] [References] • [Top]
1.1 Background
Soitec Solar Development LLC (herein Soitec) is a manufacturer and supplier of solar energy
components. In association with San Diego Gas and Electric (SDG&E), Soitec is planning to develop
four (4) solar farm projects in Boulevard and surrounding communities. Boulevard is a census-
designated place (CDP) in the Mountain Empire area of Southeastern San Diego County. The
Boulevard Planning Area is a rural semiarid desert adjacent to the U.S.-Mexico border, comprising
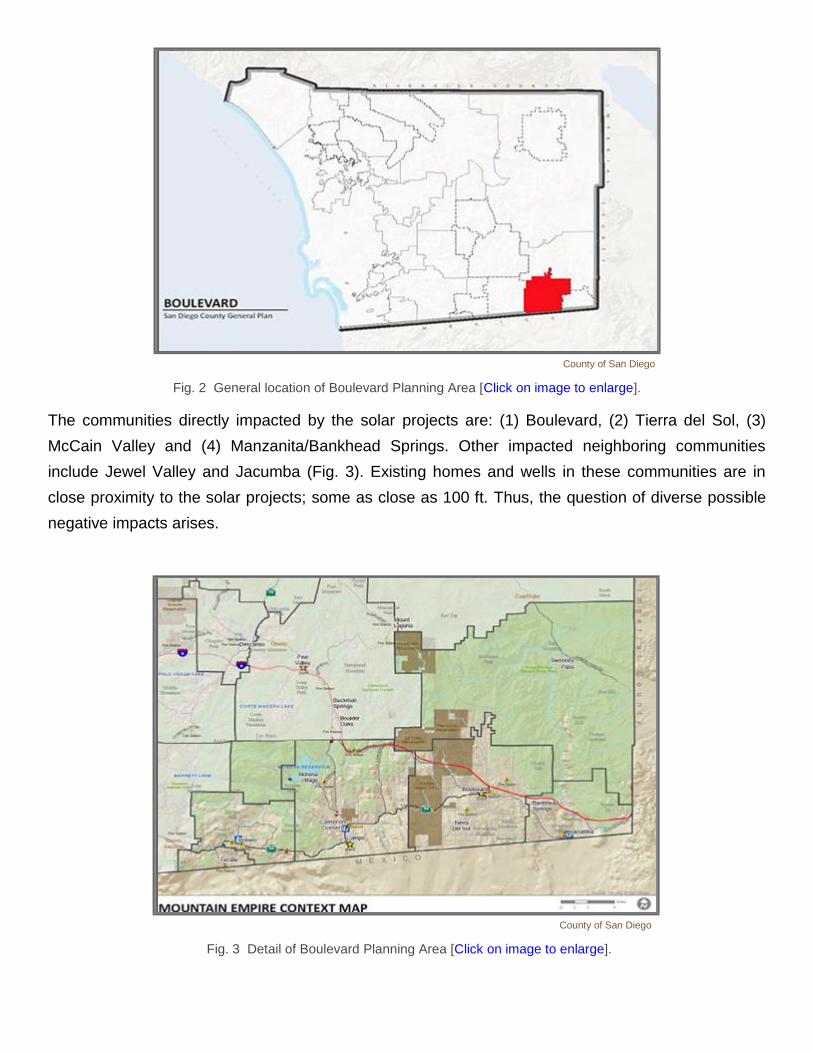
55,350 acres (Fig. 2).
County of San Diego
Fig. 2 General location of Boulevard Planning Area [Click on image to enlarge].
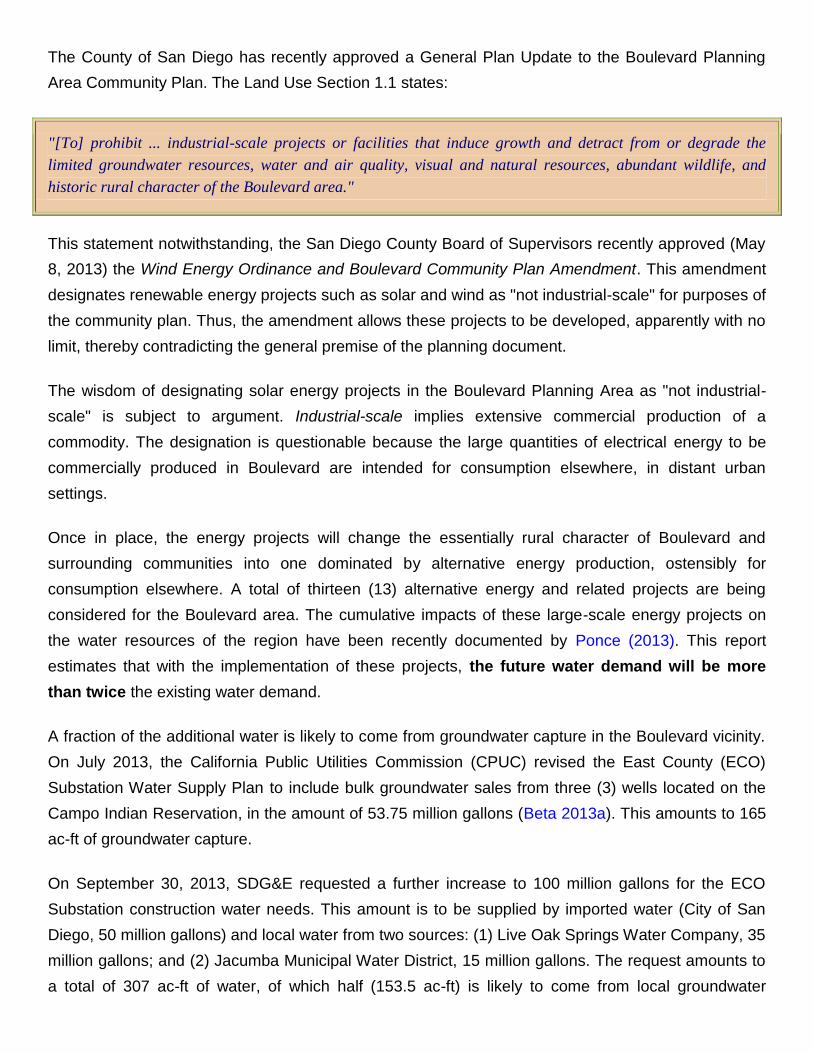
The communities directly impacted by the solar projects are: (1) Boulevard, (2) Tierra del Sol, (3)
McCain Valley and (4) Manzanita/Bankhead Springs. Other impacted neighboring communities
include Jewel Valley and Jacumba (Fig. 3). Existing homes and wells in these communities are in
close proximity to the solar projects; some as close as 100 ft. Thus, the question of diverse possible
negative impacts arises.
County of San Diego
Fig. 3 Detail of Boulevard Planning Area [Click on image to enlarge].
The County of San Diego has recently approved a General Plan Update to the Boulevard Planning
Area Community Plan. The Land Use Section 1.1 states:
"[To] prohibit ... industrial-scale projects or facilities that induce growth and detract from or degrade the
limited groundwater resources, water and air quality, visual and natural resources, abundant wildlife, and
historic rural character of the Boulevard area."
This statement notwithstanding, the San Diego County Board of Supervisors recently approved (May
8, 2013) the Wind Energy Ordinance and Boulevard Community Plan Amendment. This amendment
designates renewable energy projects such as solar and wind as "not industrial-scale" for purposes of
the community plan. Thus, the amendment allows these projects to be developed, apparently with no
limit, thereby contradicting the general premise of the planning document.
The wisdom of designating solar energy projects in the Boulevard Planning Area as "not industrial-
scale" is subject to argument. Industrial-scale implies extensive commercial production of a
commodity. The designation is questionable because the large quantities of electrical energy to be
commercially produced in Boulevard are intended for consumption elsewhere, in distant urban
settings.
Once in place, the energy projects will change the essentially rural character of Boulevard and
surrounding communities into one dominated by alternative energy production, ostensibly for
consumption elsewhere. A total of thirteen (13) alternative energy and related projects are being
considered for the Boulevard area. The cumulative impacts of these large-scale energy projects on
the water resources of the region have been recently documented by Ponce (2013). This report
estimates that with the implementation of these projects, the future water demand will be more
than twice the existing water demand.
A fraction of the additional water is likely to come from groundwater capture in the Boulevard vicinity.
On July 2013, the California Public Utilities Commission (CPUC) revised the East County (ECO)
Substation Water Supply Plan to include bulk groundwater sales from three (3) wells located on the
Campo Indian Reservation, in the amount of 53.75 million gallons (Beta 2013a). This amounts to 165
ac-ft of groundwater capture.
On September 30, 2013, SDG&E requested a further increase to 100 million gallons for the ECO
Substation construction water needs. This amount is to be supplied by imported water (City of San
Diego, 50 million gallons) and local water from two sources: (1) Live Oak Springs Water Company, 35
million gallons; and (2) Jacumba Municipal Water District, 15 million gallons. The request amounts to
a total of 307 ac-ft of water, of which half (153.5 ac-ft) is likely to come from local groundwater
capture (Beta 2013b). Of the 100 million gallons requested, 90 million were approved on October 1,
2013, of which 50 million are likely to come from groundwater (State of California Public Utilities
Commission 2013).
This report focuses on the impacts of the Soitec solar projects on the natural resources of the region,
including water, soil, and vegetation. Other impacts, such as impacts to ecological and aesthetic
resources, are also considered.
1.2 Soitec solar projects
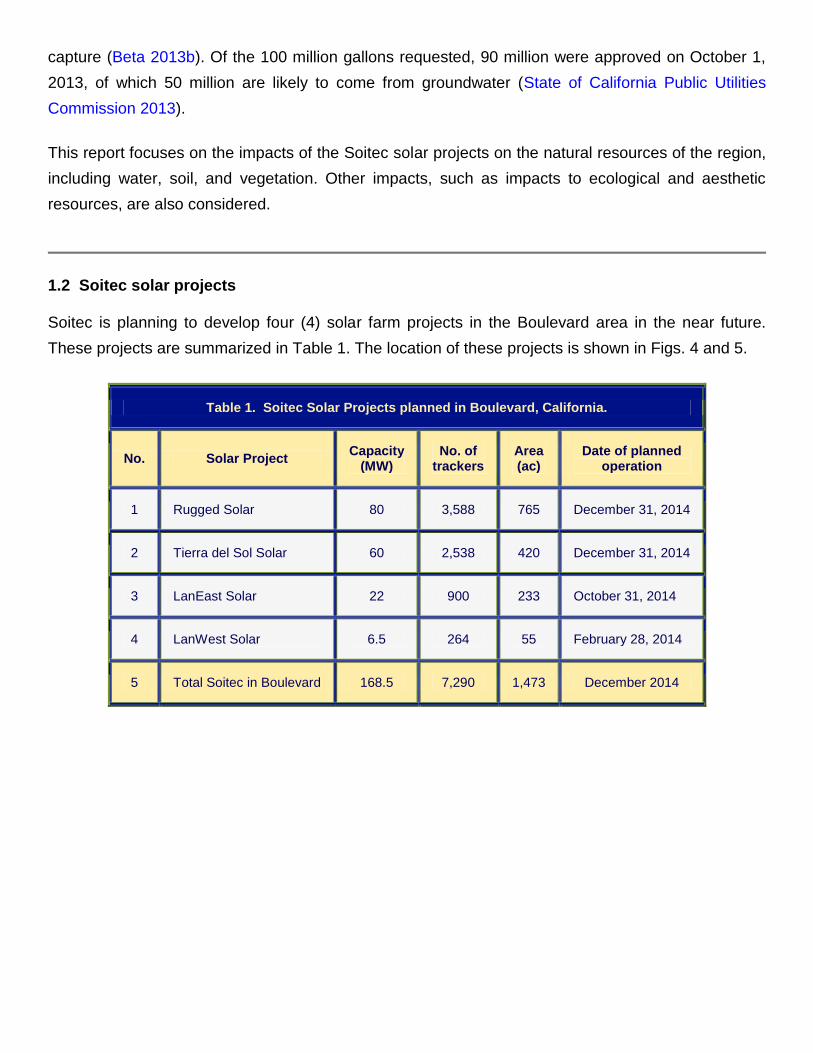
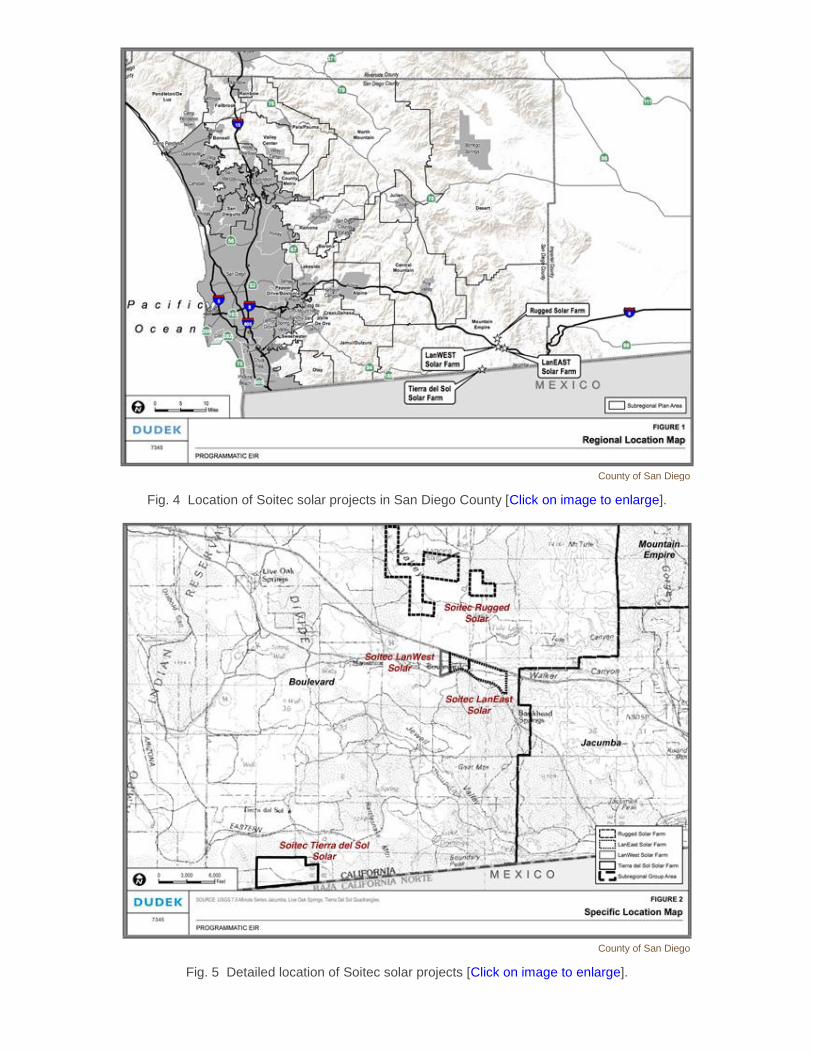
Soitec is planning to develop four (4) solar farm projects in the Boulevard area in the near future.
These projects are summarized in Table 1. The location of these projects is shown in Figs. 4 and 5.
Table 1. Soitec Solar Projects planned in Boulevard, California.
No. Solar Project Capacity
(MW) No. of
trackers Area (ac)
Date of planned operation
1 Rugged Solar 80 3,588 765 December 31, 2014
2 Tierra del Sol Solar 60 2,538 420 December 31, 2014
3 LanEast Solar 22 900 233 October 31, 2014
4 LanWest Solar 6.5 264 55 February 28, 2014
5 Total Soitec in Boulevard 168.5 7,290 1,473 December 2014
County of San Diego
Fig. 4 Location of Soitec solar projects in San Diego County [Click on image to enlarge].
County of San Diego
Fig. 5 Detailed location of Soitec solar projects [Click on image to enlarge].
2. DESCRIPTION OF PROJECTS
[Water Resources] [Rugged Solar] [Tierra del Sol Solar] [LanEast/LanWest Solar] [Other Impacts] [Summary]
[Appendix] [Acknowledgements] [Endnotes] [References] • [Top] [Introduction]
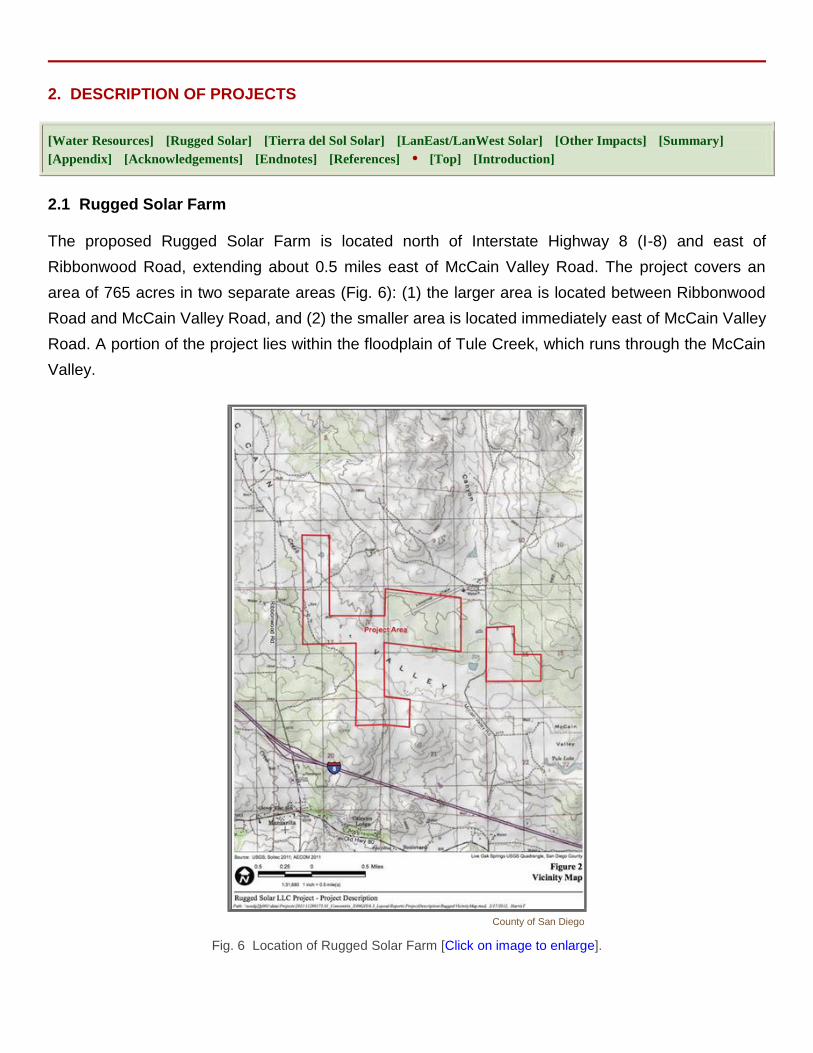
2.1 Rugged Solar Farm
The proposed Rugged Solar Farm is located north of Interstate Highway 8 (I-8) and east of
Ribbonwood Road, extending about 0.5 miles east of McCain Valley Road. The project covers an
area of 765 acres in two separate areas (Fig. 6): (1) the larger area is located between Ribbonwood
Road and McCain Valley Road, and (2) the smaller area is located immediately east of McCain Valley
Road. A portion of the project lies within the floodplain of Tule Creek, which runs through the McCain
Valley.
County of San Diego
Fig. 6 Location of Rugged Solar Farm [Click on image to enlarge].
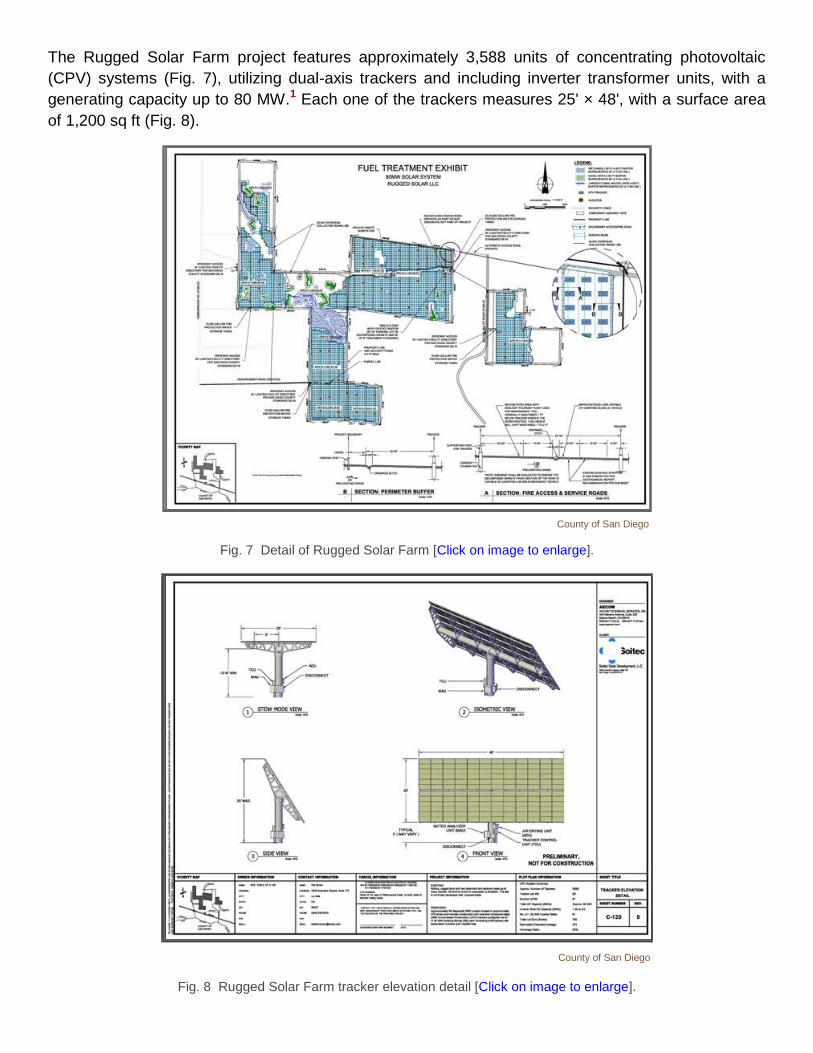
The Rugged Solar Farm project features approximately 3,588 units of concentrating photovoltaic
(CPV) systems (Fig. 7), utilizing dual-axis trackers and including inverter transformer units, with a
generating capacity up to 80 MW.1 Each one of the trackers measures 25' × 48', with a surface area
of 1,200 sq ft (Fig. 8).
County of San Diego
Fig. 7 Detail of Rugged Solar Farm [Click on image to enlarge].
County of San Diego
Fig. 8 Rugged Solar Farm tracker elevation detail [Click on image to enlarge].
Other project elements include:
An electrical collection system linking the trackers to the onsite substation, A 7,500-sq ft O&M building, A 2-ac onsite private collector substation site, Sixty-one (61) inverter/transformer enclosures, 3 miles of overhead generator transmission line, 20.5 miles of newly constructed load-bearing on-site access roads, 46.5 miles of graded, non-load-bearing dirt service roads, Three (3) permanent on-site water wells, Five 20,000-gallon water storage tanks for fire suppression and tracker washing, A septic tank and leach field, and A 6-ft perimeter fencing topped with 1-ft of security barbed wire.
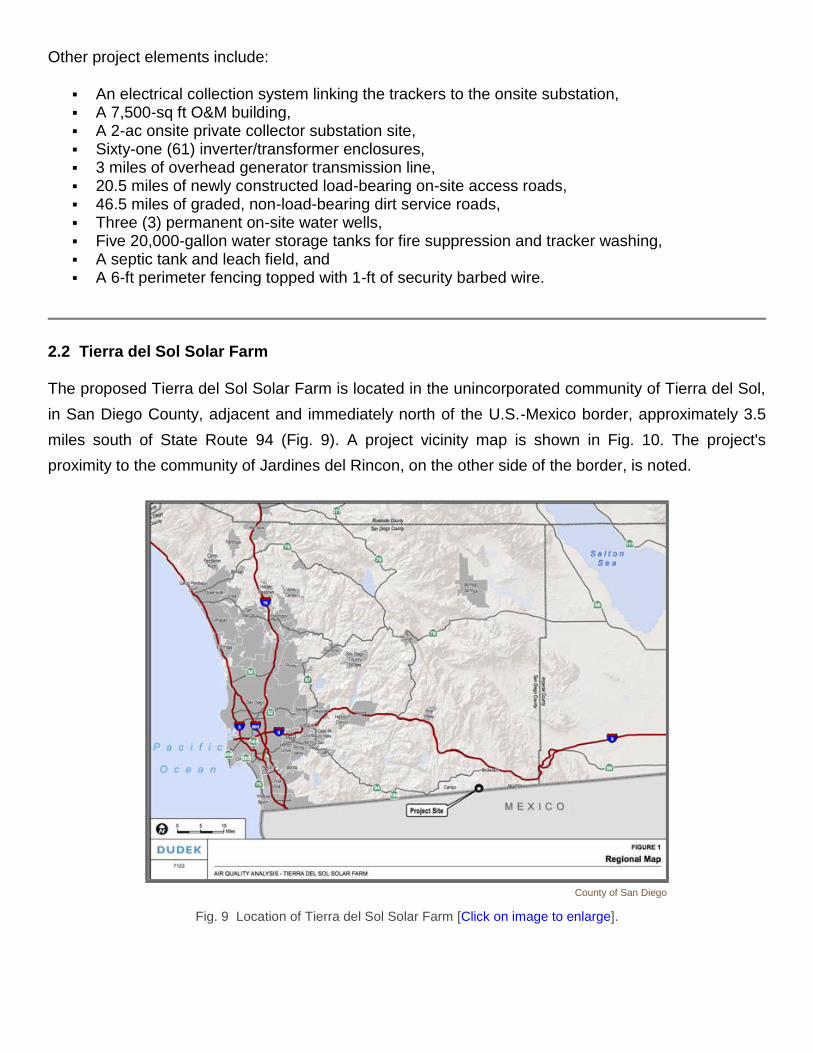
2.2 Tierra del Sol Solar Farm
The proposed Tierra del Sol Solar Farm is located in the unincorporated community of Tierra del Sol,
in San Diego County, adjacent and immediately north of the U.S.-Mexico border, approximately 3.5
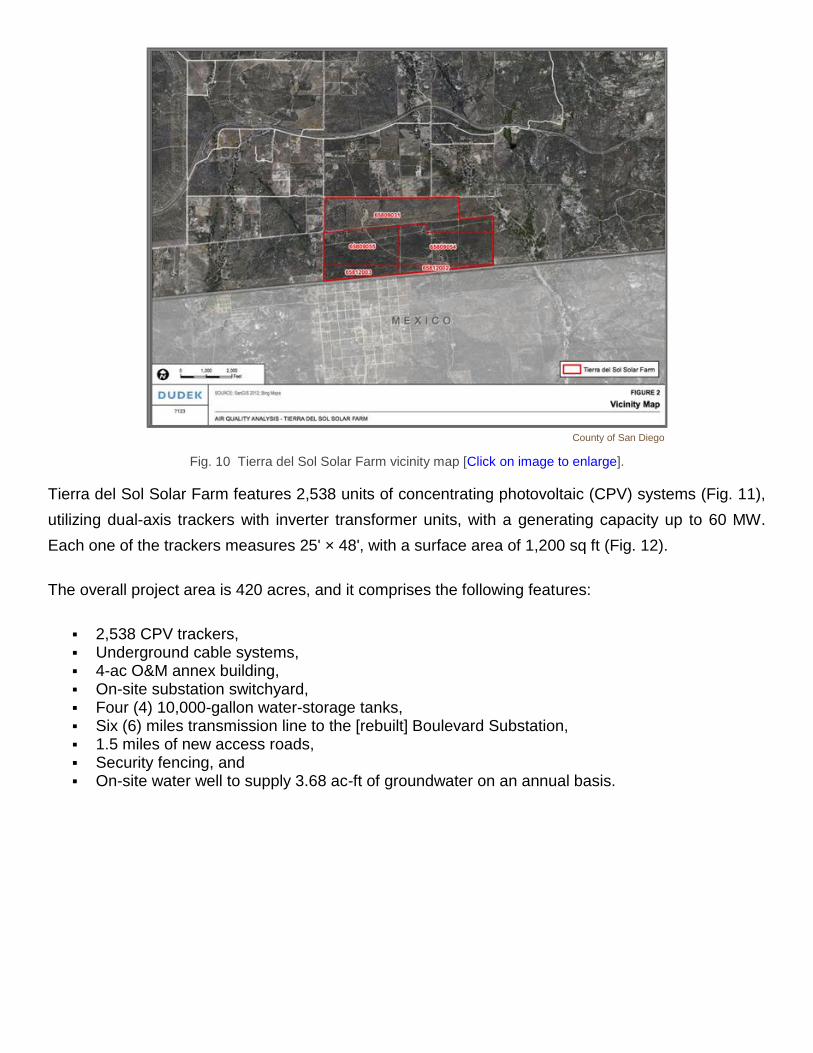
miles south of State Route 94 (Fig. 9). A project vicinity map is shown in Fig. 10. The project's
proximity to the community of Jardines del Rincon, on the other side of the border, is noted.
County of San Diego
Fig. 9 Location of Tierra del Sol Solar Farm [Click on image to enlarge].
County of San Diego
Fig. 10 Tierra del Sol Solar Farm vicinity map [Click on image to enlarge].
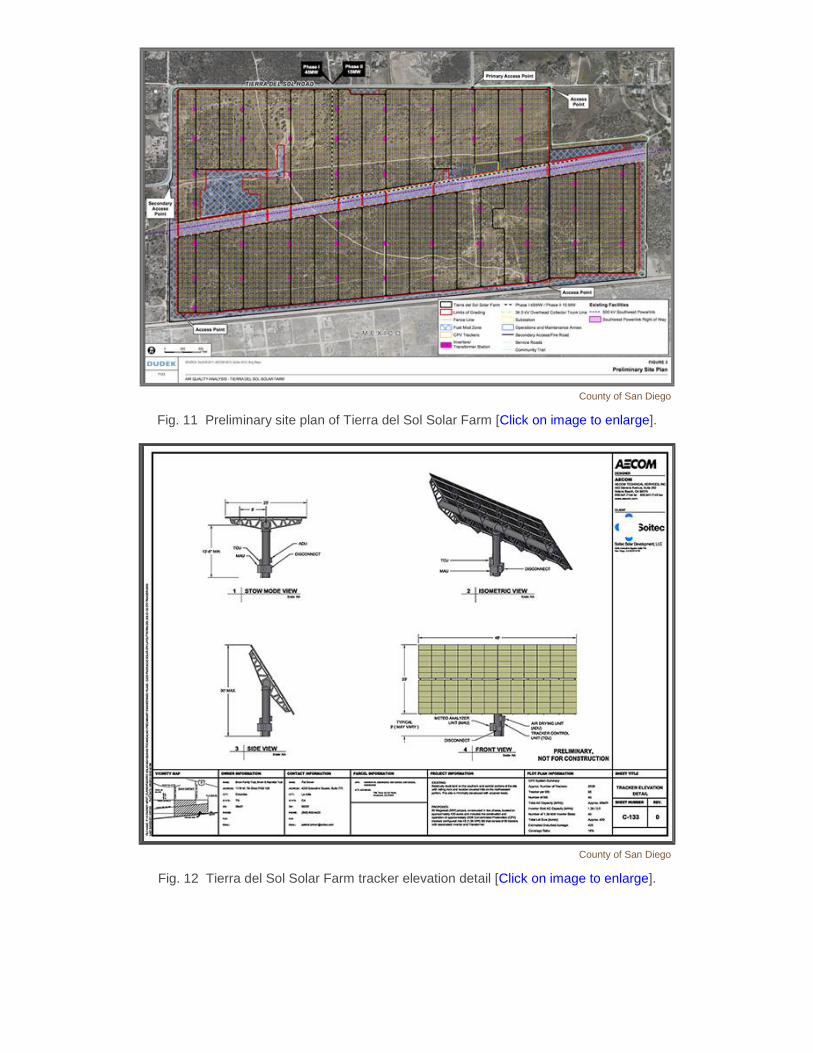
Tierra del Sol Solar Farm features 2,538 units of concentrating photovoltaic (CPV) systems (Fig. 11),
utilizing dual-axis trackers with inverter transformer units, with a generating capacity up to 60 MW.
Each one of the trackers measures 25' × 48', with a surface area of 1,200 sq ft (Fig. 12).
The overall project area is 420 acres, and it comprises the following features:
2,538 CPV trackers, Underground cable systems, 4-ac O&M annex building, On-site substation switchyard, Four (4) 10,000-gallon water-storage tanks, Six (6) miles transmission line to the [rebuilt] Boulevard Substation, 1.5 miles of new access roads, Security fencing, and On-site water well to supply 3.68 ac-ft of groundwater on an annual basis.
County of San Diego
Fig. 11 Preliminary site plan of Tierra del Sol Solar Farm [Click on image to enlarge].
County of San Diego
Fig. 12 Tierra del Sol Solar Farm tracker elevation detail [Click on image to enlarge].
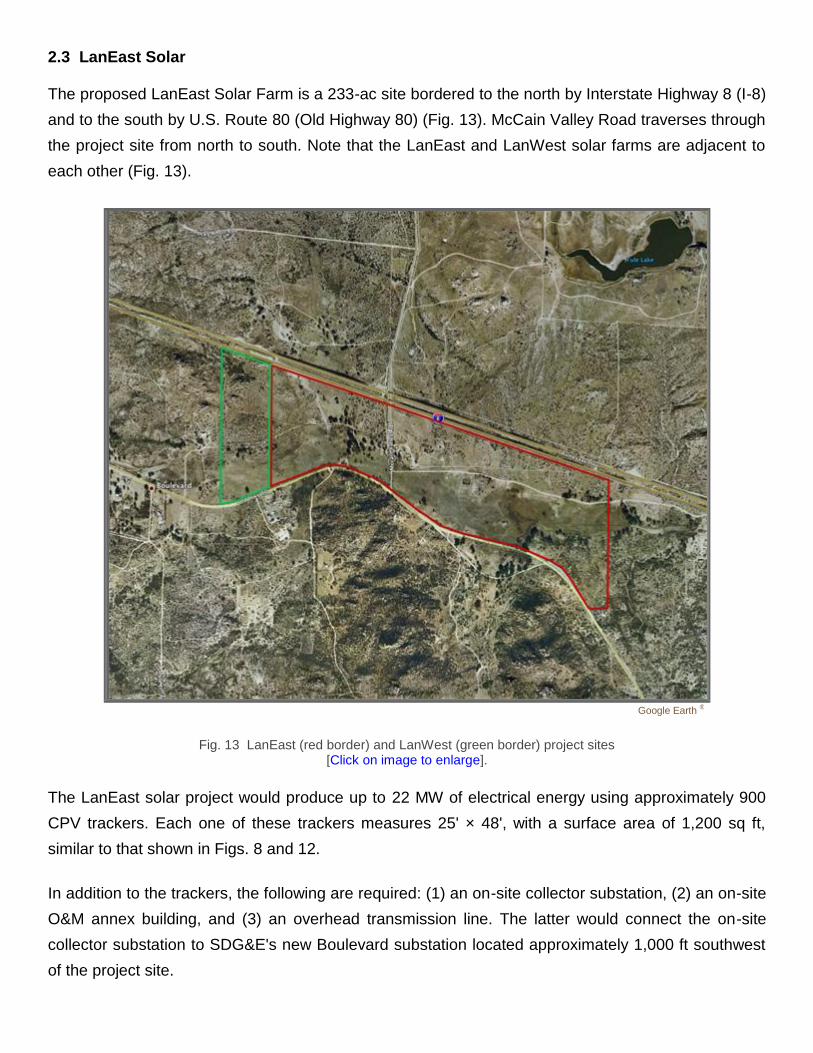
2.3 LanEast Solar
The proposed LanEast Solar Farm is a 233-ac site bordered to the north by Interstate Highway 8 (I-8)
and to the south by U.S. Route 80 (Old Highway 80) (Fig. 13). McCain Valley Road traverses through
the project site from north to south. Note that the LanEast and LanWest solar farms are adjacent to
each other (Fig. 13).
Google Earth ®
Fig. 13 LanEast (red border) and LanWest (green border) project sites [Click on image to enlarge].
The LanEast solar project would produce up to 22 MW of electrical energy using approximately 900
CPV trackers. Each one of these trackers measures 25' × 48', with a surface area of 1,200 sq ft,
similar to that shown in Figs. 8 and 12.
In addition to the trackers, the following are required: (1) an on-site collector substation, (2) an on-site
O&M annex building, and (3) an overhead transmission line. The latter would connect the on-site
collector substation to SDG&E's new Boulevard substation located approximately 1,000 ft southwest
of the project site.
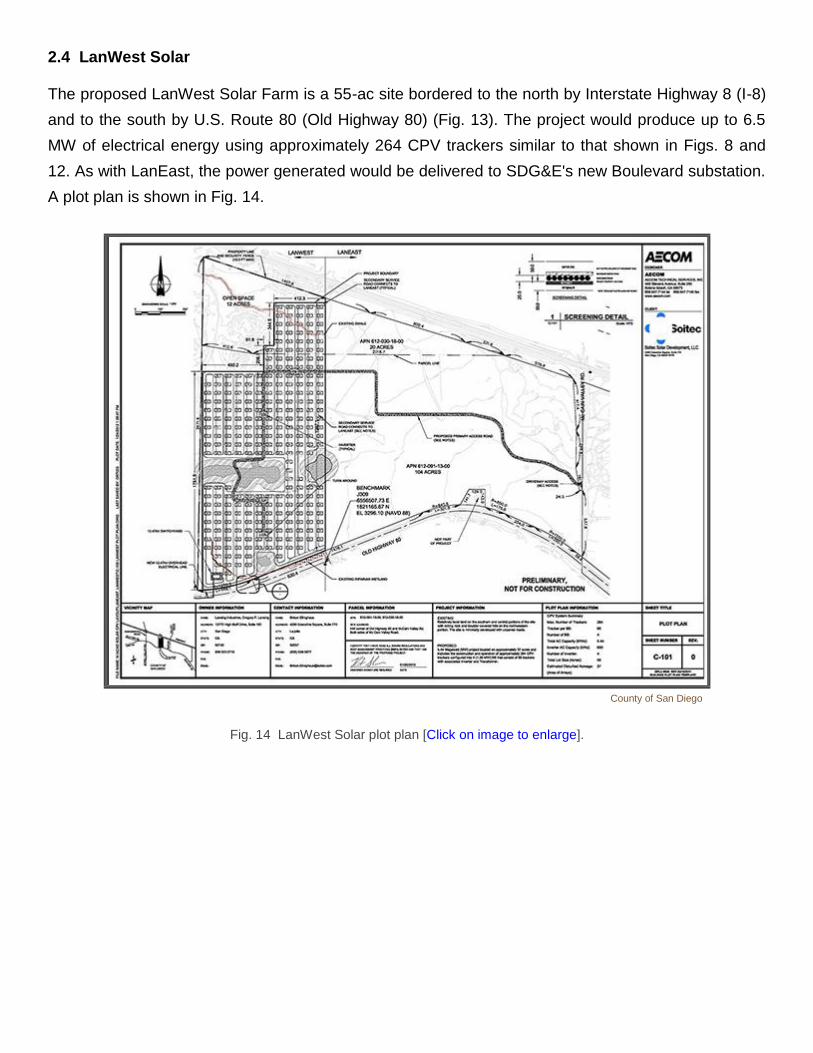
2.4 LanWest Solar
The proposed LanWest Solar Farm is a 55-ac site bordered to the north by Interstate Highway 8 (I-8)
and to the south by U.S. Route 80 (Old Highway 80) (Fig. 13). The project would produce up to 6.5
MW of electrical energy using approximately 264 CPV trackers similar to that shown in Figs. 8 and
12. As with LanEast, the power generated would be delivered to SDG&E's new Boulevard substation.
A plot plan is shown in Fig. 14.
County of San Diego
Fig. 14 LanWest Solar plot plan [Click on image to enlarge].
3. WATER RESOURCES
[Rugged Solar] [Tierra del Sol Solar] [LanEast/LanWest Solar] [Other Impacts] [Summary] [Appendix]
[Acknowledgements] [Endnotes] [References] • [Top] [Introduction] [Description of Projects]
3.1 Surface water
All water resources, including surface and groundwater, originate in precipitation. Boulevard and
surrounding communities are located in southeast San Diego County, where there is no import of
surface water. Thus, the area is forced to rely solely on groundwater, which is replenished only from
precipitation.
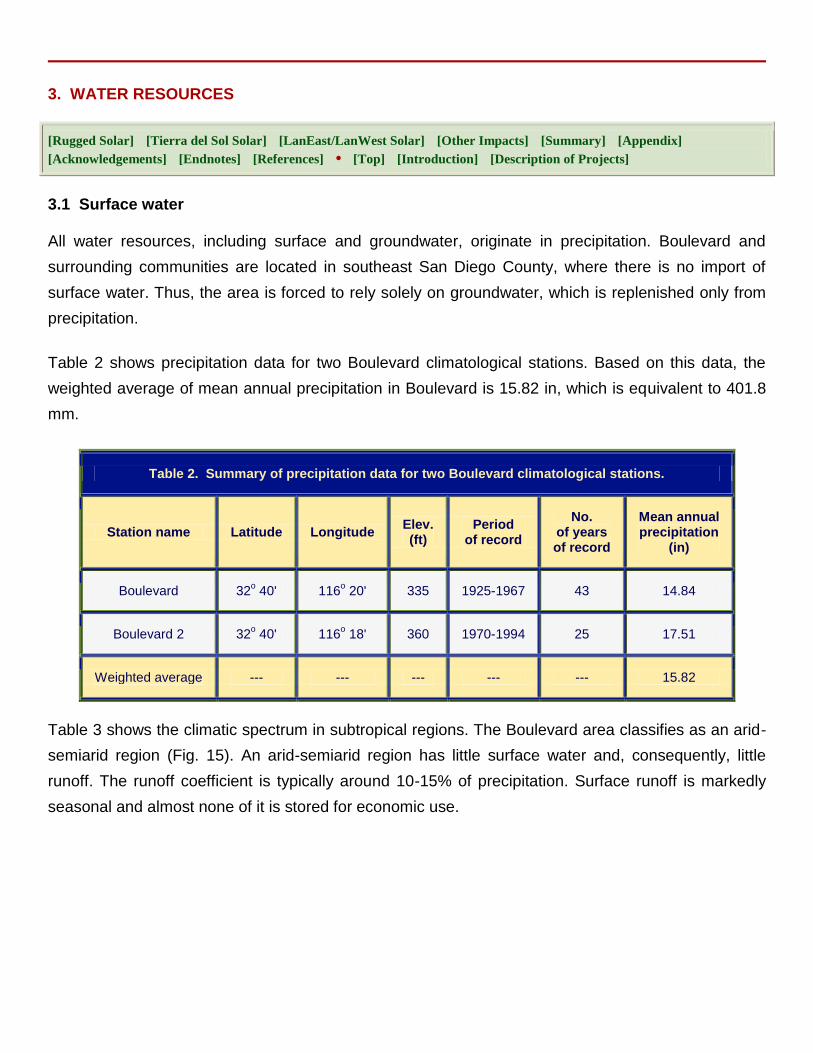
Table 2 shows precipitation data for two Boulevard climatological stations. Based on this data, the
weighted average of mean annual precipitation in Boulevard is 15.82 in, which is equivalent to 401.8
mm.
Table 2. Summary of precipitation data for two Boulevard climatological stations.
Station name Latitude Longitude Elev. (ft)
Period of record
No. of years of record
Mean annual precipitation
(in)
Boulevard 32o 40' 116
o 20' 335 1925-1967 43 14.84
Boulevard 2 32o 40' 116
o 18' 360 1970-1994 25 17.51
Weighted average --- --- --- --- --- 15.82
Table 3 shows the climatic spectrum in subtropical regions. The Boulevard area classifies as an arid-
semiarid region (Fig. 15). An arid-semiarid region has little surface water and, consequently, little
runoff. The runoff coefficient is typically around 10-15% of precipitation. Surface runoff is markedly
seasonal and almost none of it is stored for economic use.
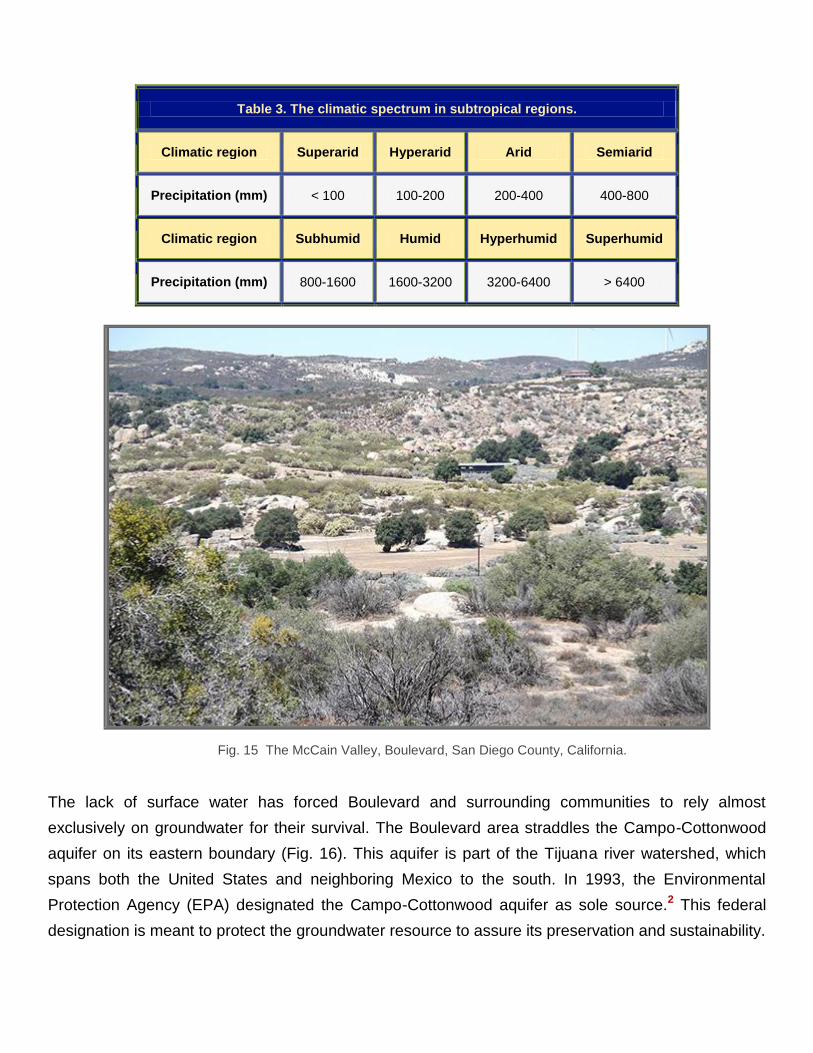
Table 3. The climatic spectrum in subtropical regions.
Climatic region Superarid Hyperarid Arid Semiarid
Precipitation (mm) < 100 100-200 200-400 400-800
Climatic region Subhumid Humid Hyperhumid Superhumid
Precipitation (mm) 800-1600 1600-3200 3200-6400 > 6400
The lack of surface water has forced Boulevard and surrounding communities to rely almost
exclusively on groundwater for their survival. The Boulevard area straddles the Campo-Cottonwood
aquifer on its eastern boundary (Fig. 16). This aquifer is part of the Tijuana river watershed, which
spans both the United States and neighboring Mexico to the south. In 1993, the Environmental
Protection Agency (EPA) designated the Campo-Cottonwood aquifer as sole source.2 This federal
designation is meant to protect the groundwater resource to assure its preservation and sustainability.
Fig. 15 The McCain Valley, Boulevard, San Diego County, California.
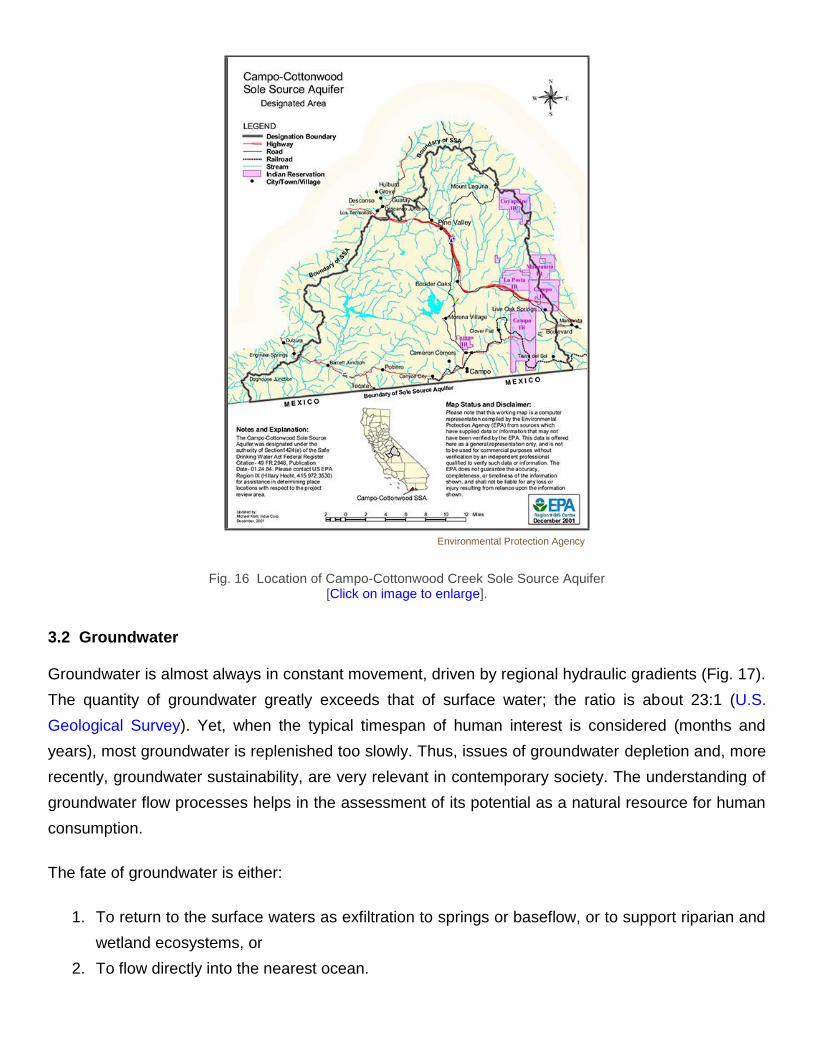
Environmental Protection Agency
Fig. 16 Location of Campo-Cottonwood Creek Sole Source Aquifer [Click on image to enlarge].
3.2 Groundwater
Groundwater is almost always in constant movement, driven by regional hydraulic gradients (Fig. 17).
The quantity of groundwater greatly exceeds that of surface water; the ratio is about 23:1 (U.S.
Geological Survey). Yet, when the typical timespan of human interest is considered (months and
years), most groundwater is replenished too slowly. Thus, issues of groundwater depletion and, more
recently, groundwater sustainability, are very relevant in contemporary society. The understanding of
groundwater flow processes helps in the assessment of its potential as a natural resource for human
consumption.
The fate of groundwater is either:
1. To return to the surface waters as exfiltration to springs or baseflow, or to support riparian and
wetland ecosystems, or
2. To flow directly into the nearest ocean.
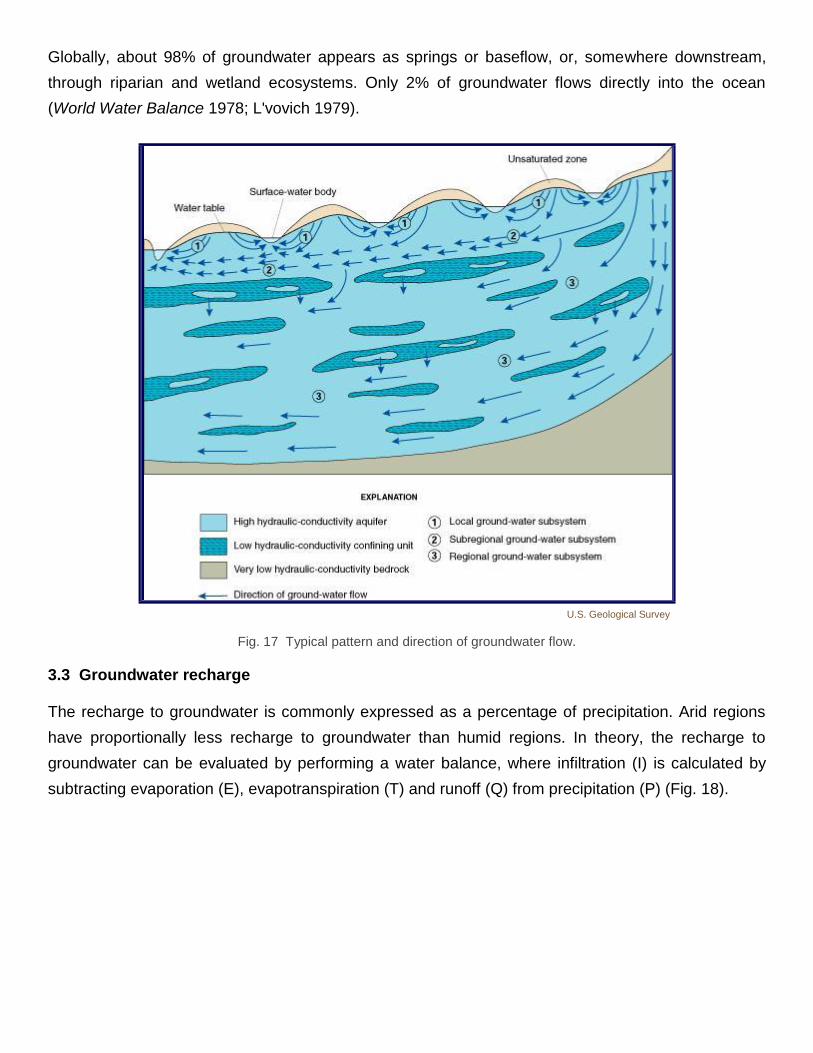
Globally, about 98% of groundwater appears as springs or baseflow, or, somewhere downstream,
through riparian and wetland ecosystems. Only 2% of groundwater flows directly into the ocean
(World Water Balance 1978; L'vovich 1979).
U.S. Geological Survey
Fig. 17 Typical pattern and direction of groundwater flow.
3.3 Groundwater recharge
The recharge to groundwater is commonly expressed as a percentage of precipitation. Arid regions
have proportionally less recharge to groundwater than humid regions. In theory, the recharge to
groundwater can be evaluated by performing a water balance, where infiltration (I) is calculated by
subtracting evaporation (E), evapotranspiration (T) and runoff (Q) from precipitation (P) (Fig. 18).
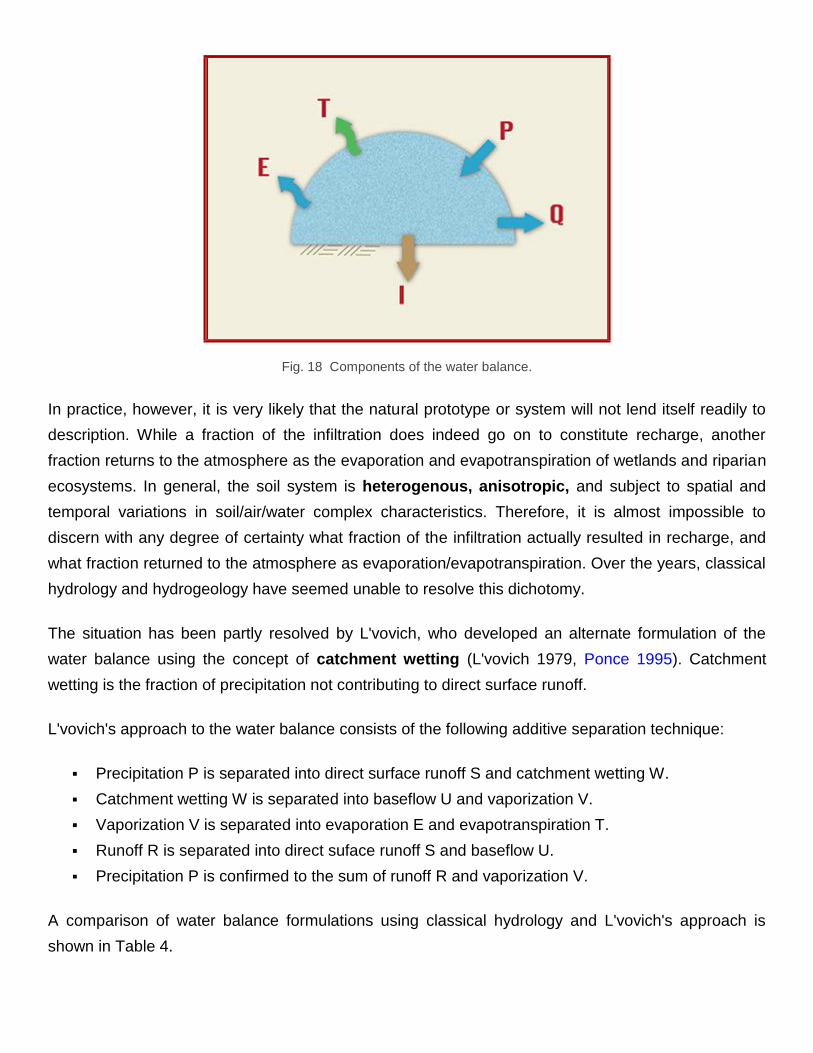
Fig. 18 Components of the water balance.
In practice, however, it is very likely that the natural prototype or system will not lend itself readily to
description. While a fraction of the infiltration does indeed go on to constitute recharge, another
fraction returns to the atmosphere as the evaporation and evapotranspiration of wetlands and riparian
ecosystems. In general, the soil system is heterogenous, anisotropic, and subject to spatial and
temporal variations in soil/air/water complex characteristics. Therefore, it is almost impossible to
discern with any degree of certainty what fraction of the infiltration actually resulted in recharge, and
what fraction returned to the atmosphere as evaporation/evapotranspiration. Over the years, classical
hydrology and hydrogeology have seemed unable to resolve this dichotomy.
The situation has been partly resolved by L'vovich, who developed an alternate formulation of the
water balance using the concept of catchment wetting (L'vovich 1979, Ponce 1995). Catchment
wetting is the fraction of precipitation not contributing to direct surface runoff.
L'vovich's approach to the water balance consists of the following additive separation technique:
Precipitation P is separated into direct surface runoff S and catchment wetting W.
Catchment wetting W is separated into baseflow U and vaporization V.
Vaporization V is separated into evaporation E and evapotranspiration T.
Runoff R is separated into direct suface runoff S and baseflow U.
Precipitation P is confirmed to the sum of runoff R and vaporization V.
A comparison of water balance formulations using classical hydrology and L'vovich's approach is
shown in Table 4.
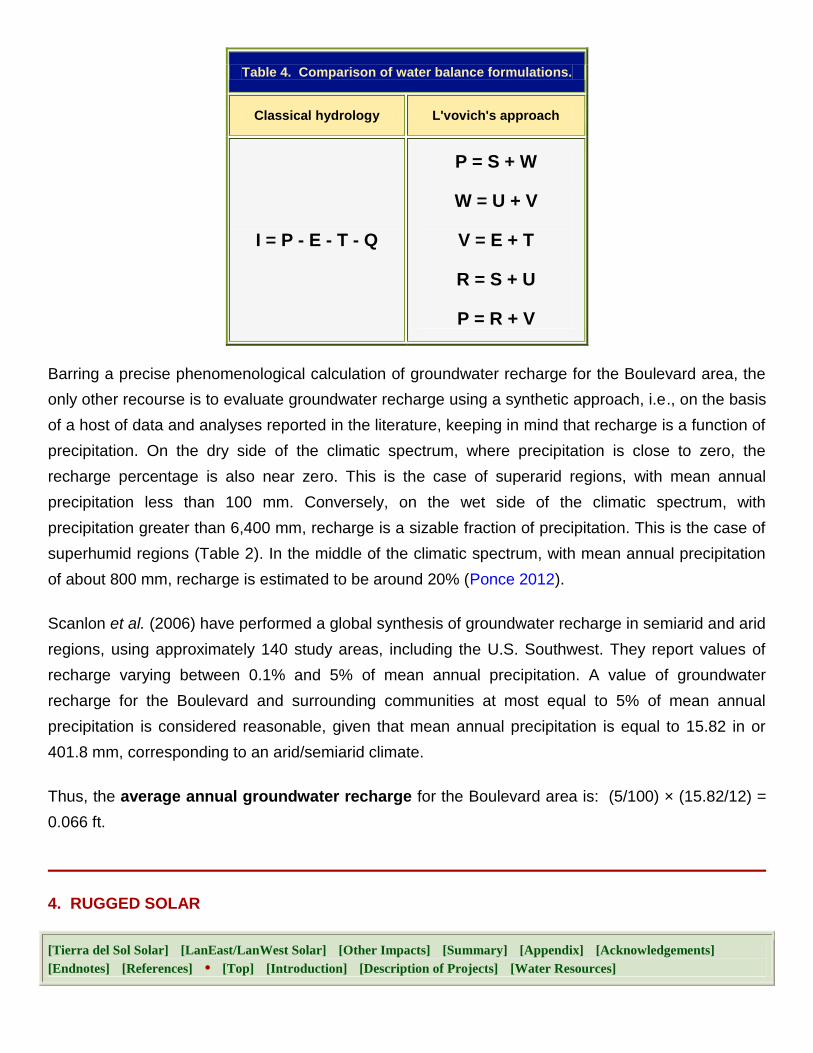
Table 4. Comparison of water balance formulations.
Classical hydrology L'vovich's approach
I = P - E - T - Q
P = S + W
W = U + V
V = E + T
R = S + U
P = R + V
Barring a precise phenomenological calculation of groundwater recharge for the Boulevard area, the
only other recourse is to evaluate groundwater recharge using a synthetic approach, i.e., on the basis
of a host of data and analyses reported in the literature, keeping in mind that recharge is a function of
precipitation. On the dry side of the climatic spectrum, where precipitation is close to zero, the
recharge percentage is also near zero. This is the case of superarid regions, with mean annual
precipitation less than 100 mm. Conversely, on the wet side of the climatic spectrum, with
precipitation greater than 6,400 mm, recharge is a sizable fraction of precipitation. This is the case of
superhumid regions (Table 2). In the middle of the climatic spectrum, with mean annual precipitation
of about 800 mm, recharge is estimated to be around 20% (Ponce 2012).
Scanlon et al. (2006) have performed a global synthesis of groundwater recharge in semiarid and arid
regions, using approximately 140 study areas, including the U.S. Southwest. They report values of
recharge varying between 0.1% and 5% of mean annual precipitation. A value of groundwater
recharge for the Boulevard and surrounding communities at most equal to 5% of mean annual
precipitation is considered reasonable, given that mean annual precipitation is equal to 15.82 in or
401.8 mm, corresponding to an arid/semiarid climate.
Thus, the average annual groundwater recharge for the Boulevard area is: (5/100) × (15.82/12) =
0.066 ft.
4. RUGGED SOLAR
[Tierra del Sol Solar] [LanEast/LanWest Solar] [Other Impacts] [Summary] [Appendix] [Acknowledgements]
[Endnotes] [References] • [Top] [Introduction] [Description of Projects] [Water Resources]
4.1 Flood risk
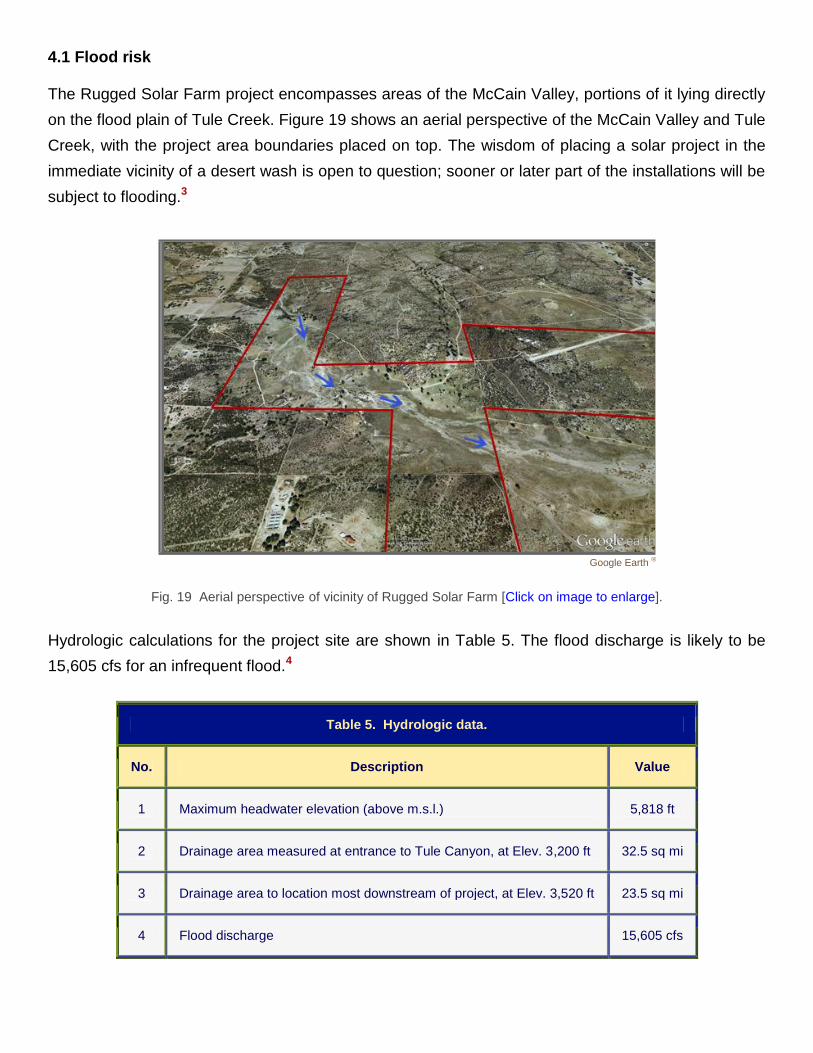
The Rugged Solar Farm project encompasses areas of the McCain Valley, portions of it lying directly
on the flood plain of Tule Creek. Figure 19 shows an aerial perspective of the McCain Valley and Tule
Creek, with the project area boundaries placed on top. The wisdom of placing a solar project in the
immediate vicinity of a desert wash is open to question; sooner or later part of the installations will be
subject to flooding.3
Google Earth ®
Fig. 19 Aerial perspective of vicinity of Rugged Solar Farm [Click on image to enlarge].
Hydrologic calculations for the project site are shown in Table 5. The flood discharge is likely to be
15,605 cfs for an infrequent flood.4
Table 5. Hydrologic data.
No. Description Value
1 Maximum headwater elevation (above m.s.l.) 5,818 ft
2 Drainage area measured at entrance to Tule Canyon, at Elev. 3,200 ft 32.5 sq mi
3 Drainage area to location most downstream of project, at Elev. 3,520 ft 23.5 sq mi
4 Flood discharge 15,605 cfs
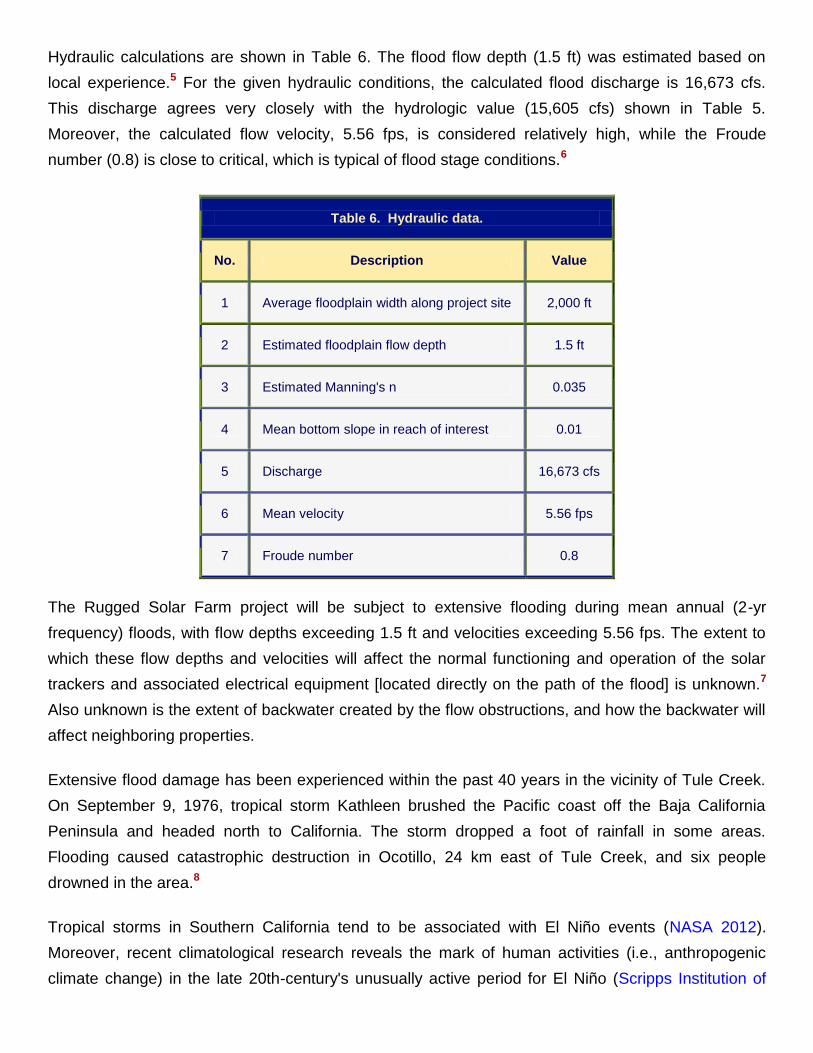
Hydraulic calculations are shown in Table 6. The flood flow depth (1.5 ft) was estimated based on
local experience.5 For the given hydraulic conditions, the calculated flood discharge is 16,673 cfs.
This discharge agrees very closely with the hydrologic value (15,605 cfs) shown in Table 5.
Moreover, the calculated flow velocity, 5.56 fps, is considered relatively high, while the Froude
number (0.8) is close to critical, which is typical of flood stage conditions.6
Table 6. Hydraulic data.
No. Description Value
1 Average floodplain width along project site 2,000 ft
2 Estimated floodplain flow depth 1.5 ft
3 Estimated Manning's n 0.035
4 Mean bottom slope in reach of interest 0.01
5 Discharge 16,673 cfs
6 Mean velocity 5.56 fps
7 Froude number 0.8
The Rugged Solar Farm project will be subject to extensive flooding during mean annual (2-yr
frequency) floods, with flow depths exceeding 1.5 ft and velocities exceeding 5.56 fps. The extent to
which these flow depths and velocities will affect the normal functioning and operation of the solar
trackers and associated electrical equipment [located directly on the path of the flood] is unknown.7
Also unknown is the extent of backwater created by the flow obstructions, and how the backwater will
affect neighboring properties.
Extensive flood damage has been experienced within the past 40 years in the vicinity of Tule Creek.
On September 9, 1976, tropical storm Kathleen brushed the Pacific coast off the Baja California
Peninsula and headed north to California. The storm dropped a foot of rainfall in some areas.
Flooding caused catastrophic destruction in Ocotillo, 24 km east of Tule Creek, and six people
drowned in the area.8
Tropical storms in Southern California tend to be associated with El Niño events (NASA 2012).
Moreover, recent climatological research reveals the mark of human activities (i.e., anthropogenic
climate change) in the late 20th-century's unusually active period for El Niño (Scripps Institution of
Oceanography 2013). Thus, it is to be expected that stronger El Niño events and, therefore, more
frequent tropical storms will hit Southern California and the Boulevard area in the foreseeable future.
4.2 Water demands of natural ecosystems
The riparian and spring-fed upland ecosytems (grasses, shrubs, and trees) of the Boulevard area are
fully dependent on groundwater. The region has a pronounced arid climate; therefore, surface water
is strongly seasonal and surface runoff is ephemeral. Typically, groundwater levels do not intersect
streams; therefore, baseflow is almost nonexistent and local streams (washes) carry flow only in
direct response to precipitation. Groundwater is replenished only from precipitation, and precipitation
generally increases with altitude.
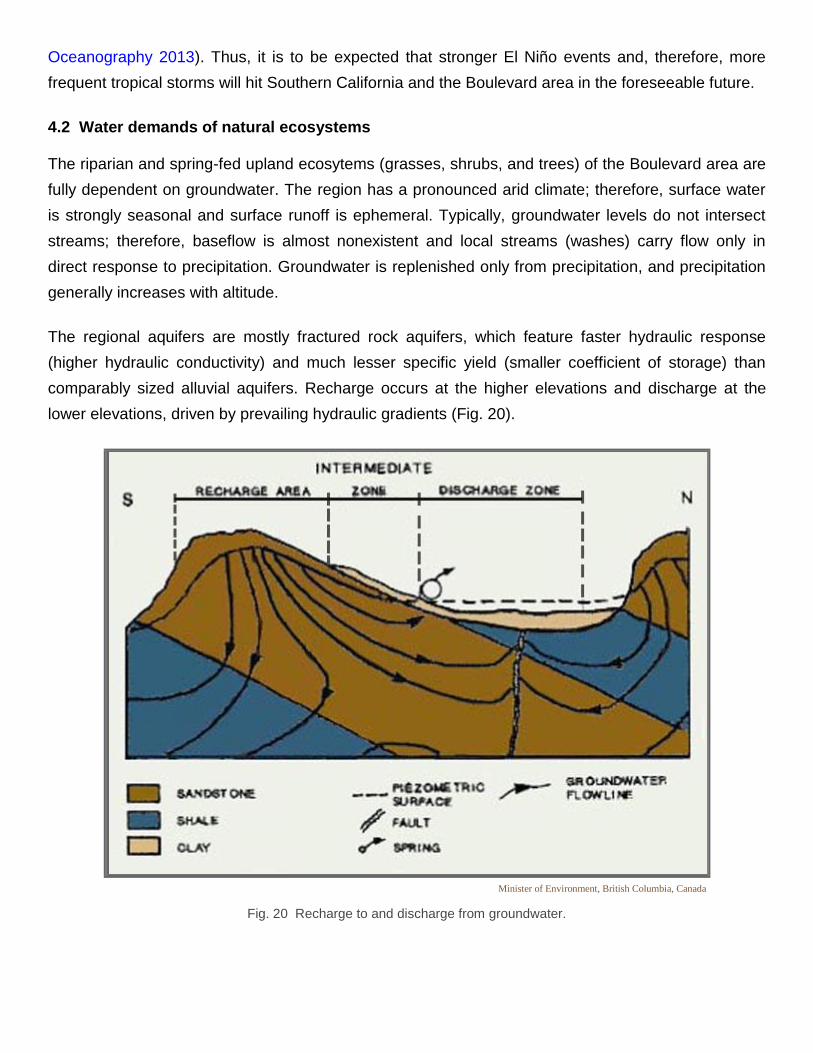
The regional aquifers are mostly fractured rock aquifers, which feature faster hydraulic response
(higher hydraulic conductivity) and much lesser specific yield (smaller coefficient of storage) than
comparably sized alluvial aquifers. Recharge occurs at the higher elevations and discharge at the
lower elevations, driven by prevailing hydraulic gradients (Fig. 20).
Minister of Environment, British Columbia, Canada
Fig. 20 Recharge to and discharge from groundwater.
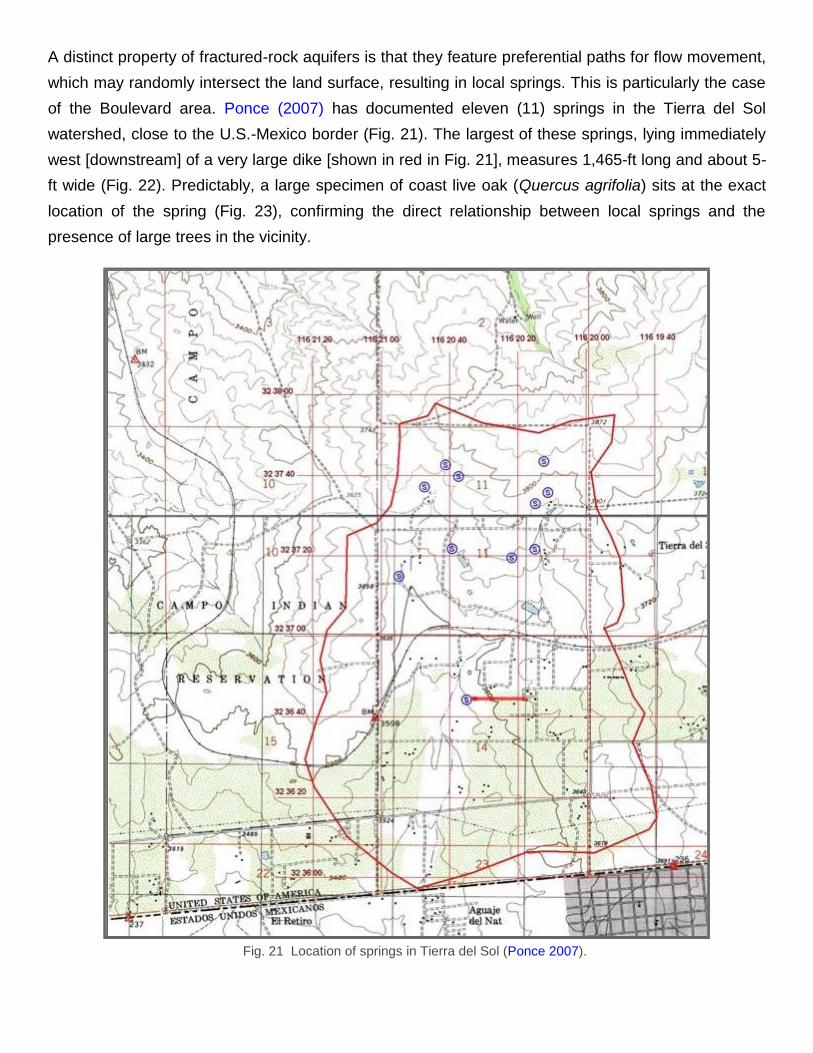
A distinct property of fractured-rock aquifers is that they feature preferential paths for flow movement,
which may randomly intersect the land surface, resulting in local springs. This is particularly the case
of the Boulevard area. Ponce (2007) has documented eleven (11) springs in the Tierra del Sol
watershed, close to the U.S.-Mexico border (Fig. 21). The largest of these springs, lying immediately
west [downstream] of a very large dike [shown in red in Fig. 21], measures 1,465-ft long and about 5-
ft wide (Fig. 22). Predictably, a large specimen of coast live oak (Quercus agrifolia) sits at the exact
location of the spring (Fig. 23), confirming the direct relationship between local springs and the
presence of large trees in the vicinity.
Fig. 21 Location of springs in Tierra del Sol (Ponce 2007).
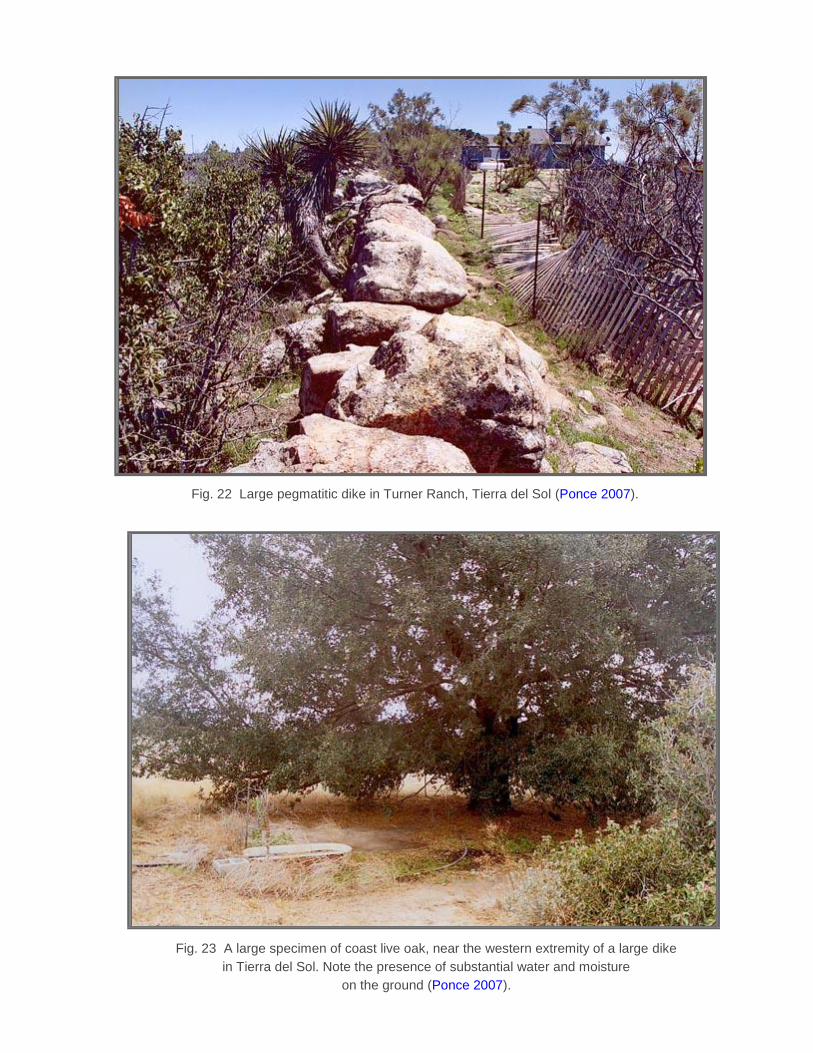
Fig. 22 Large pegmatitic dike in Turner Ranch, Tierra del Sol (Ponce 2007).
Fig. 23 A large specimen of coast live oak, near the western extremity of a large dike
in Tierra del Sol. Note the presence of substantial water and moisture
on the ground (Ponce 2007).
4.3 Water needs of natural ecosystems in the Rugged Solar site
The Rugged Solar site lies within the confines of McCain Valley, being crossed by Tule Creek from
northwest to southeast (Fig. 19). The maximum headwater elevation, at the Tecate Divide, is 5,618 ft,
while the elevation of Tule Creek proper varies from about 4,200 ft near the entrance to McCain
Valley, to 3,200 ft near the entrance to Tule Canyon, a drop of 1,000 ft in the valley, and 2,418 ft in
total. The underlying aquifer is a fractured rock aquifer, with characteristically fast response and
relatively small storage capacity (Freeze and Cherry 1979).
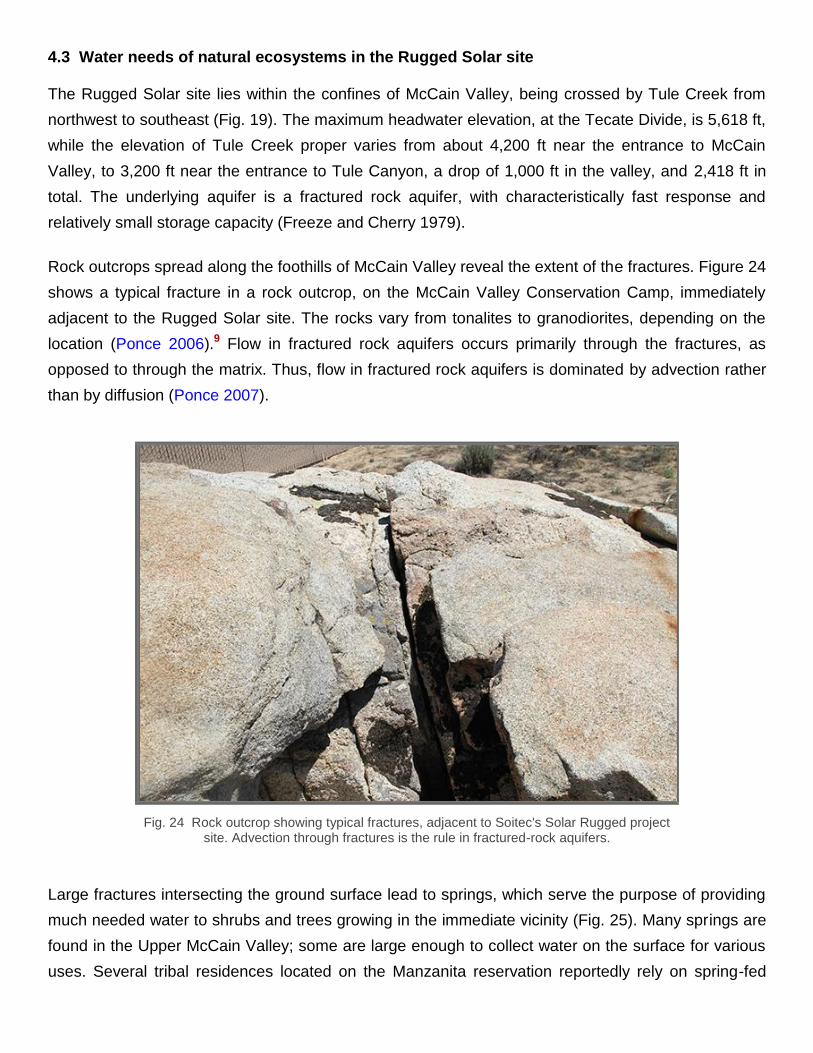
Rock outcrops spread along the foothills of McCain Valley reveal the extent of the fractures. Figure 24
shows a typical fracture in a rock outcrop, on the McCain Valley Conservation Camp, immediately
adjacent to the Rugged Solar site. The rocks vary from tonalites to granodiorites, depending on the
location (Ponce 2006).9 Flow in fractured rock aquifers occurs primarily through the fractures, as
opposed to through the matrix. Thus, flow in fractured rock aquifers is dominated by advection rather
than by diffusion (Ponce 2007).
Fig. 24 Rock outcrop showing typical fractures, adjacent to Soitec's Solar Rugged project site. Advection through fractures is the rule in fractured-rock aquifers.
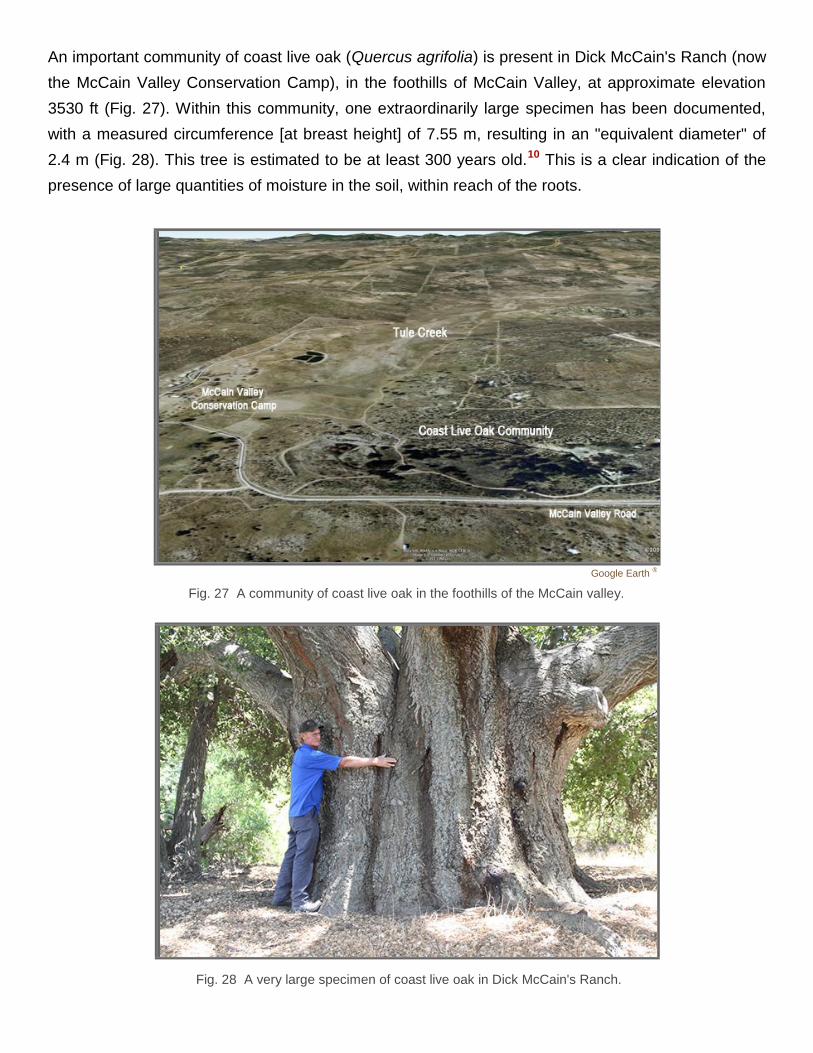
Large fractures intersecting the ground surface lead to springs, which serve the purpose of providing
much needed water to shrubs and trees growing in the immediate vicinity (Fig. 25). Many springs are
found in the Upper McCain Valley; some are large enough to collect water on the surface for various
uses. Several tribal residences located on the Manzanita reservation reportedly rely on spring-fed
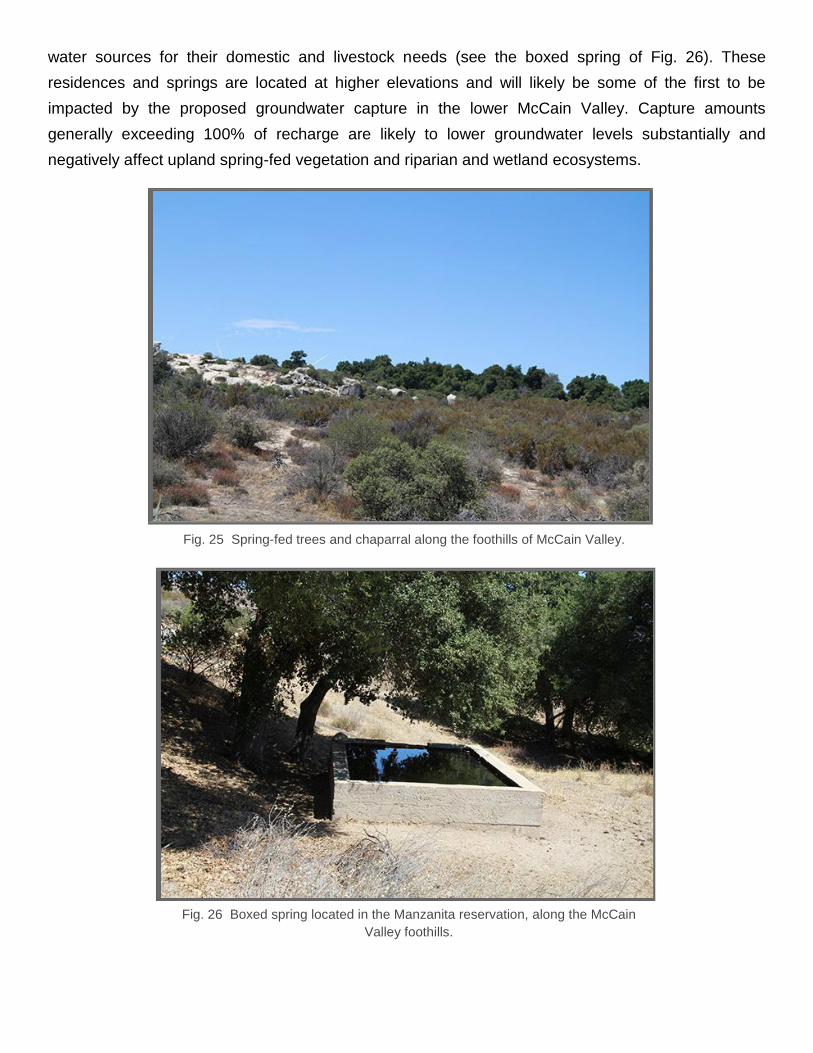
water sources for their domestic and livestock needs (see the boxed spring of Fig. 26). These
residences and springs are located at higher elevations and will likely be some of the first to be
impacted by the proposed groundwater capture in the lower McCain Valley. Capture amounts
generally exceeding 100% of recharge are likely to lower groundwater levels substantially and
negatively affect upland spring-fed vegetation and riparian and wetland ecosystems.
Fig. 25 Spring-fed trees and chaparral along the foothills of McCain Valley.
Fig. 26 Boxed spring located in the Manzanita reservation, along the McCain
Valley foothills.
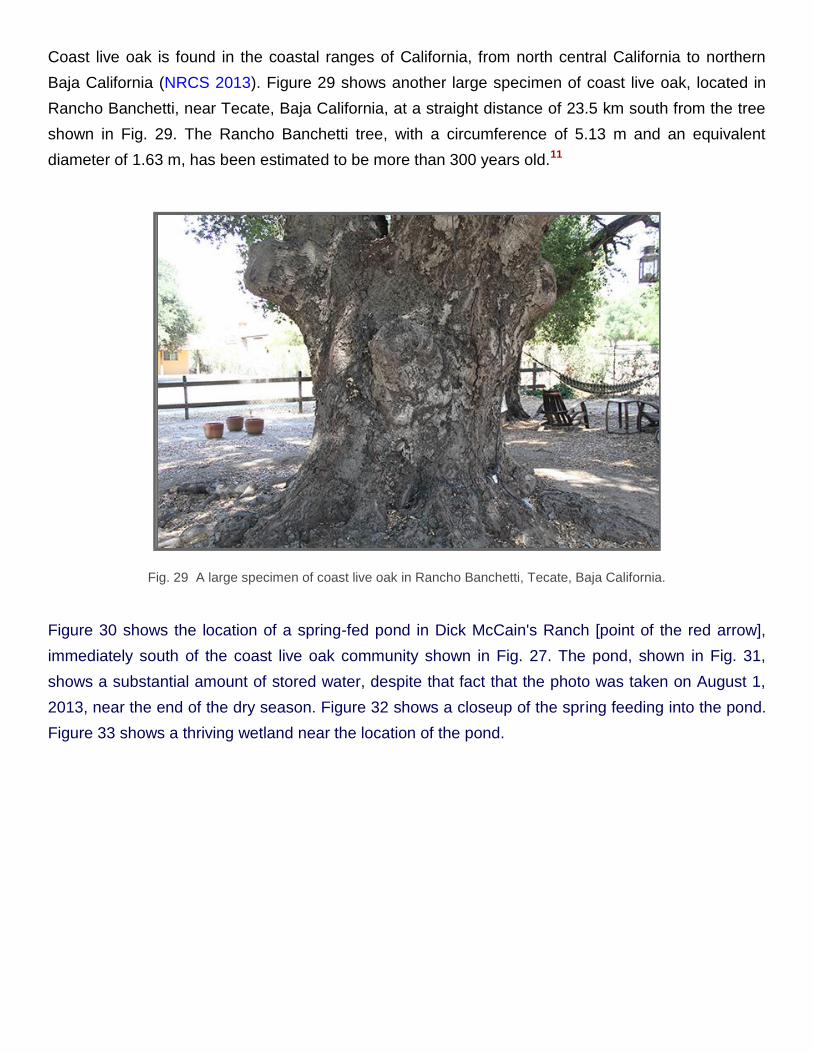
An important community of coast live oak (Quercus agrifolia) is present in Dick McCain's Ranch (now
the McCain Valley Conservation Camp), in the foothills of McCain Valley, at approximate elevation
3530 ft (Fig. 27). Within this community, one extraordinarily large specimen has been documented,
with a measured circumference [at breast height] of 7.55 m, resulting in an "equivalent diameter" of
2.4 m (Fig. 28). This tree is estimated to be at least 300 years old.10 This is a clear indication of the
presence of large quantities of moisture in the soil, within reach of the roots.
Google Earth ®
Fig. 27 A community of coast live oak in the foothills of the McCain valley.
Fig. 28 A very large specimen of coast live oak in Dick McCain's Ranch.
Coast live oak is found in the coastal ranges of California, from north central California to northern
Baja California (NRCS 2013). Figure 29 shows another large specimen of coast live oak, located in
Rancho Banchetti, near Tecate, Baja California, at a straight distance of 23.5 km south from the tree
shown in Fig. 29. The Rancho Banchetti tree, with a circumference of 5.13 m and an equivalent
diameter of 1.63 m, has been estimated to be more than 300 years old.11
Fig. 29 A large specimen of coast live oak in Rancho Banchetti, Tecate, Baja California.
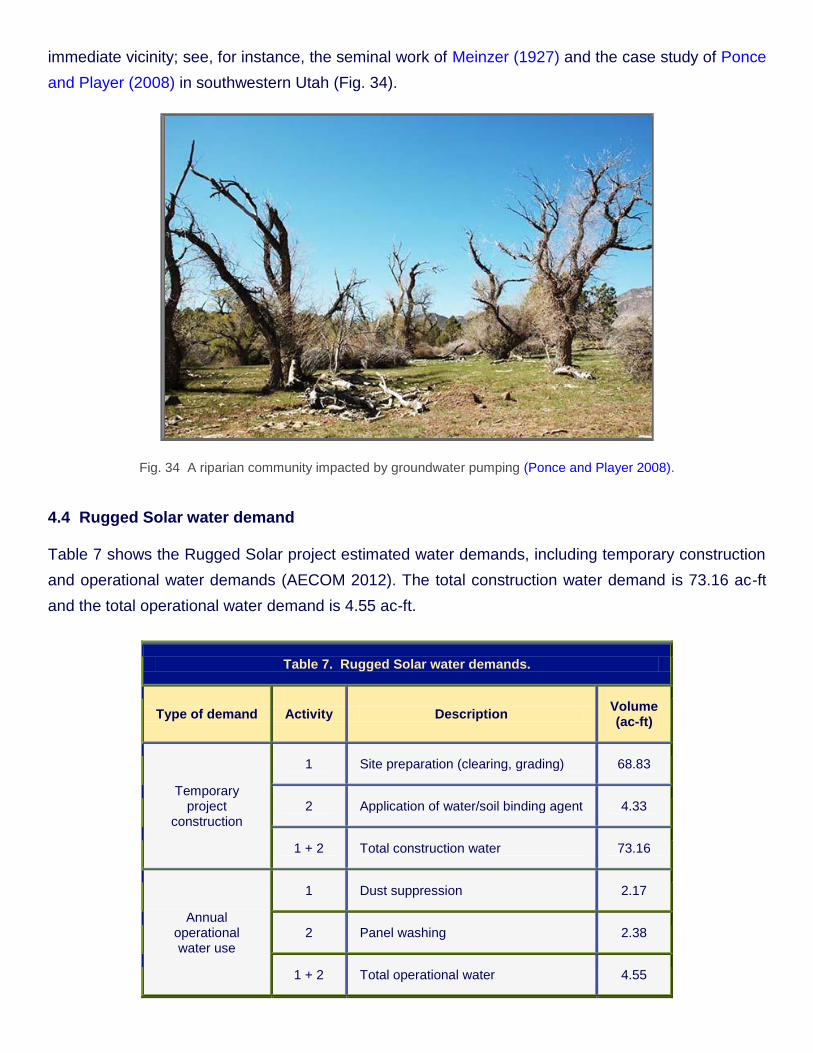
Figure 30 shows the location of a spring-fed pond in Dick McCain's Ranch [point of the red arrow],
immediately south of the coast live oak community shown in Fig. 27. The pond, shown in Fig. 31,
shows a substantial amount of stored water, despite that fact that the photo was taken on August 1,
2013, near the end of the dry season. Figure 32 shows a closeup of the spring feeding into the pond.
Figure 33 shows a thriving wetland near the location of the pond.

Google Earth ®
Fig. 30 Location of pond in Dick McCain's Ranch in Boulevard country.
Fig. 31 Large pond in Dick McCain's Ranch [photo taken August 1, 2013].
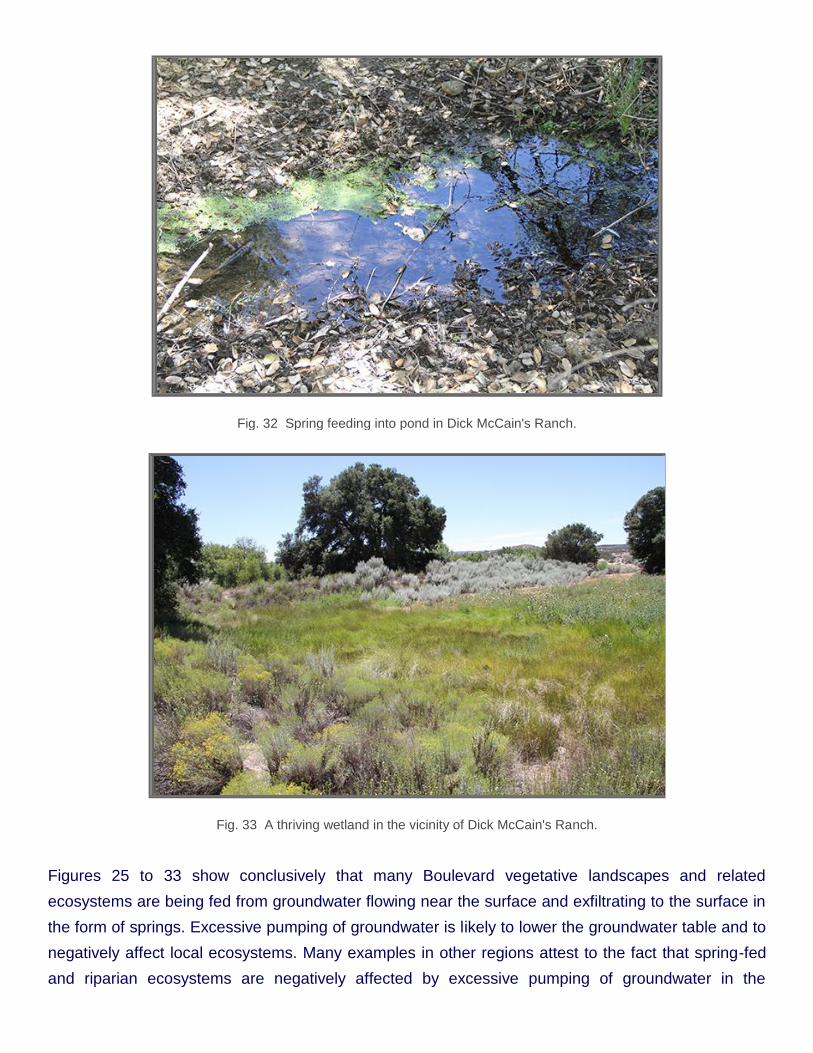
Fig. 32 Spring feeding into pond in Dick McCain's Ranch.
Fig. 33 A thriving wetland in the vicinity of Dick McCain's Ranch.
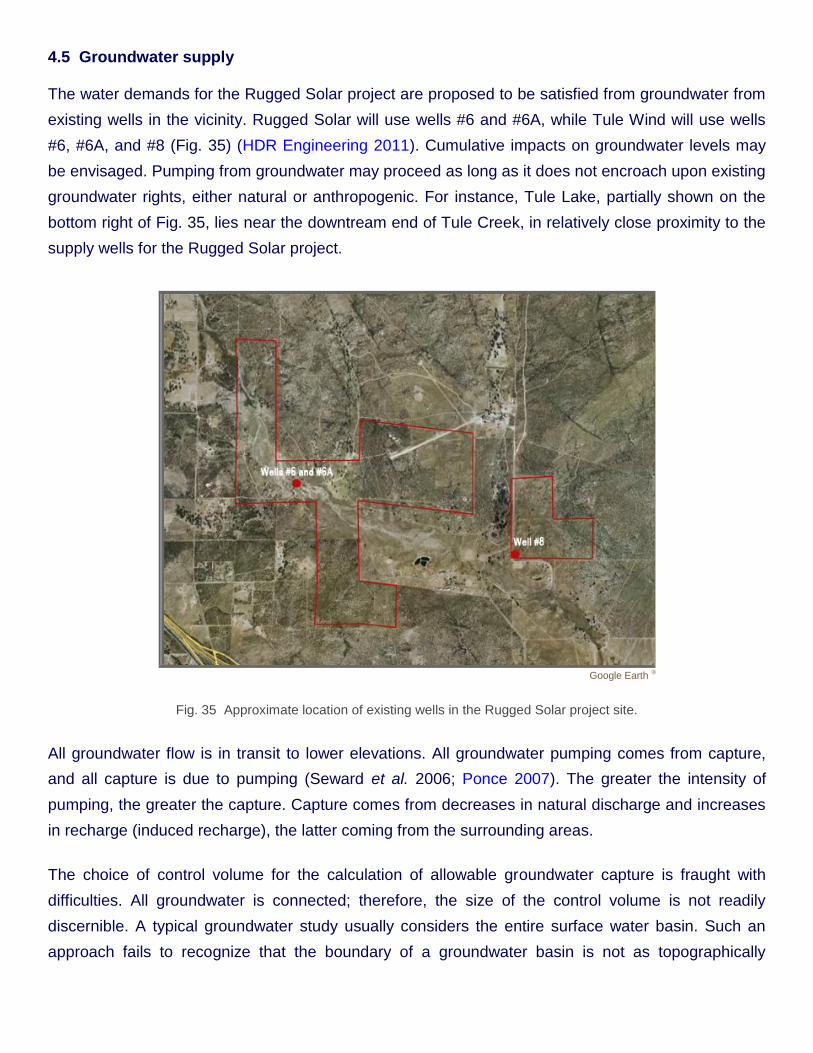
Figures 25 to 33 show conclusively that many Boulevard vegetative landscapes and related
ecosystems are being fed from groundwater flowing near the surface and exfiltrating to the surface in
the form of springs. Excessive pumping of groundwater is likely to lower the groundwater table and to
negatively affect local ecosystems. Many examples in other regions attest to the fact that spring-fed
and riparian ecosystems are negatively affected by excessive pumping of groundwater in the
immediate vicinity; see, for instance, the seminal work of Meinzer (1927) and the case study of Ponce
and Player (2008) in southwestern Utah (Fig. 34).
Fig. 34 A riparian community impacted by groundwater pumping (Ponce and Player 2008).
4.4 Rugged Solar water demand
Table 7 shows the Rugged Solar project estimated water demands, including temporary construction
and operational water demands (AECOM 2012). The total construction water demand is 73.16 ac-ft
and the total operational water demand is 4.55 ac-ft.
Table 7. Rugged Solar water demands.
Type of demand Activity Description Volume (ac-ft)
Temporary project
construction
1 Site preparation (clearing, grading) 68.83
2 Application of water/soil binding agent 4.33
1 + 2 Total construction water 73.16
Annual operational water use
1 Dust suppression 2.17
2 Panel washing 2.38
1 + 2 Total operational water 4.55
4.5 Groundwater supply
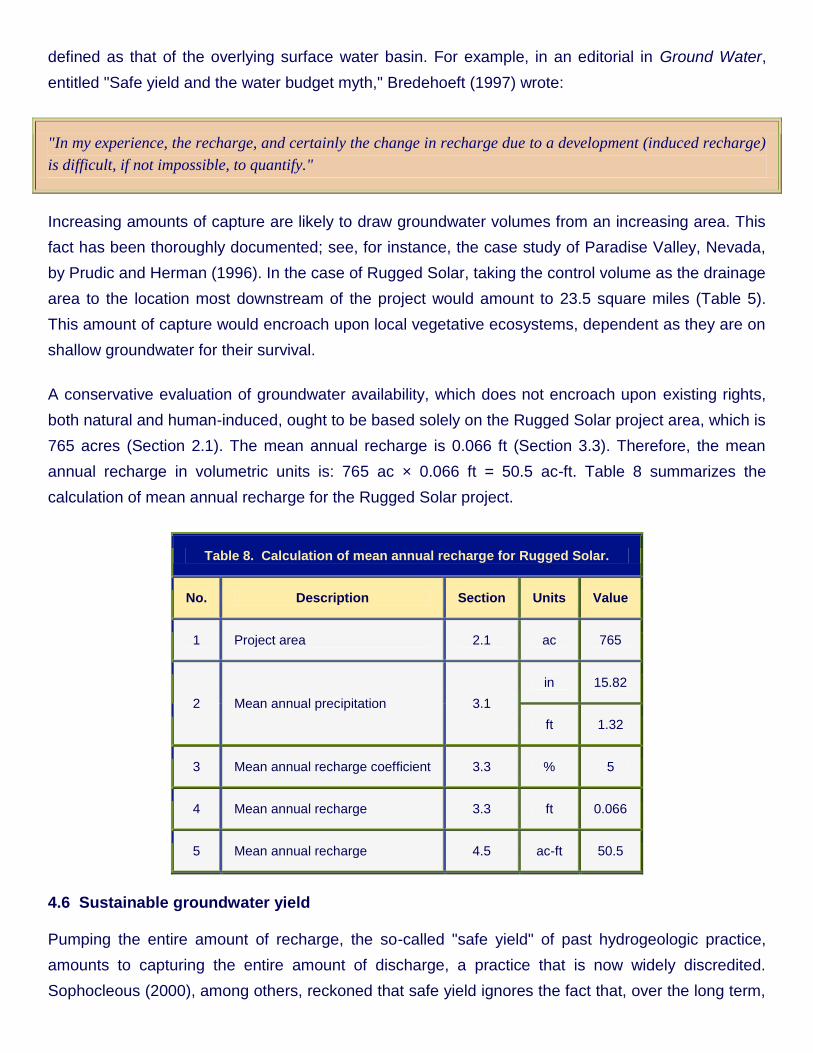
The water demands for the Rugged Solar project are proposed to be satisfied from groundwater from
existing wells in the vicinity. Rugged Solar will use wells #6 and #6A, while Tule Wind will use wells
#6, #6A, and #8 (Fig. 35) (HDR Engineering 2011). Cumulative impacts on groundwater levels may
be envisaged. Pumping from groundwater may proceed as long as it does not encroach upon existing
groundwater rights, either natural or anthropogenic. For instance, Tule Lake, partially shown on the
bottom right of Fig. 35, lies near the downtream end of Tule Creek, in relatively close proximity to the
supply wells for the Rugged Solar project.
Google Earth ®
Fig. 35 Approximate location of existing wells in the Rugged Solar project site.
All groundwater flow is in transit to lower elevations. All groundwater pumping comes from capture,
and all capture is due to pumping (Seward et al. 2006; Ponce 2007). The greater the intensity of
pumping, the greater the capture. Capture comes from decreases in natural discharge and increases
in recharge (induced recharge), the latter coming from the surrounding areas.
The choice of control volume for the calculation of allowable groundwater capture is fraught with
difficulties. All groundwater is connected; therefore, the size of the control volume is not readily
discernible. A typical groundwater study usually considers the entire surface water basin. Such an
approach fails to recognize that the boundary of a groundwater basin is not as topographically
defined as that of the overlying surface water basin. For example, in an editorial in Ground Water,
entitled "Safe yield and the water budget myth," Bredehoeft (1997) wrote:
"In my experience, the recharge, and certainly the change in recharge due to a development (induced recharge)
is difficult, if not impossible, to quantify."
Increasing amounts of capture are likely to draw groundwater volumes from an increasing area. This
fact has been thoroughly documented; see, for instance, the case study of Paradise Valley, Nevada,
by Prudic and Herman (1996). In the case of Rugged Solar, taking the control volume as the drainage
area to the location most downstream of the project would amount to 23.5 square miles (Table 5).
This amount of capture would encroach upon local vegetative ecosystems, dependent as they are on
shallow groundwater for their survival.
A conservative evaluation of groundwater availability, which does not encroach upon existing rights,
both natural and human-induced, ought to be based solely on the Rugged Solar project area, which is
765 acres (Section 2.1). The mean annual recharge is 0.066 ft (Section 3.3). Therefore, the mean
annual recharge in volumetric units is: 765 ac × 0.066 ft = 50.5 ac-ft. Table 8 summarizes the
calculation of mean annual recharge for the Rugged Solar project.
Table 8. Calculation of mean annual recharge for Rugged Solar.
No. Description Section Units Value
1 Project area 2.1 ac 765
2 Mean annual precipitation 3.1
in 15.82
ft 1.32
3 Mean annual recharge coefficient 3.3 % 5
4 Mean annual recharge 3.3 ft 0.066
5 Mean annual recharge 4.5 ac-ft 50.5
4.6 Sustainable groundwater yield
Pumping the entire amount of recharge, the so-called "safe yield" of past hydrogeologic practice,
amounts to capturing the entire amount of discharge, a practice that is now widely discredited.
Sophocleous (2000), among others, reckoned that safe yield ignores the fact that, over the long term,
natural recharge is balanced by discharge from the aquifer by evapotranspiration, or by discharge into
streams, springs, or seeps. Consequently, if pumping equals recharge, eventually streams, marshes
and springs dry up (Ponce 2012). Continued pumping in excess of recharge may eventually deplete
the aquifer.
It has now become clear that the practice of capturing 100% of the recharge is unsustainable (Ponce
2007). This fact has been demonstrated again and again, in both theory and practice. A significant
amount of capture in one location, resembling the entire gross recharge, will eventually encroach
upon other established rights.
Enlightened concepts of groundwater management presently argue that sustainable yield should be
taken as a suitable fraction of recharge, the fraction varying between a conservative value of 10%
and a compromise midrange value of 30%. Values exceeding 30% require detailed hydrological and
ecohydrological studies to assure that pumping levels exceeding that threshold are not likely to affect
baseflow and/or riparian/upland/wetland ecosystems in the vicinity (Maimone 2004).
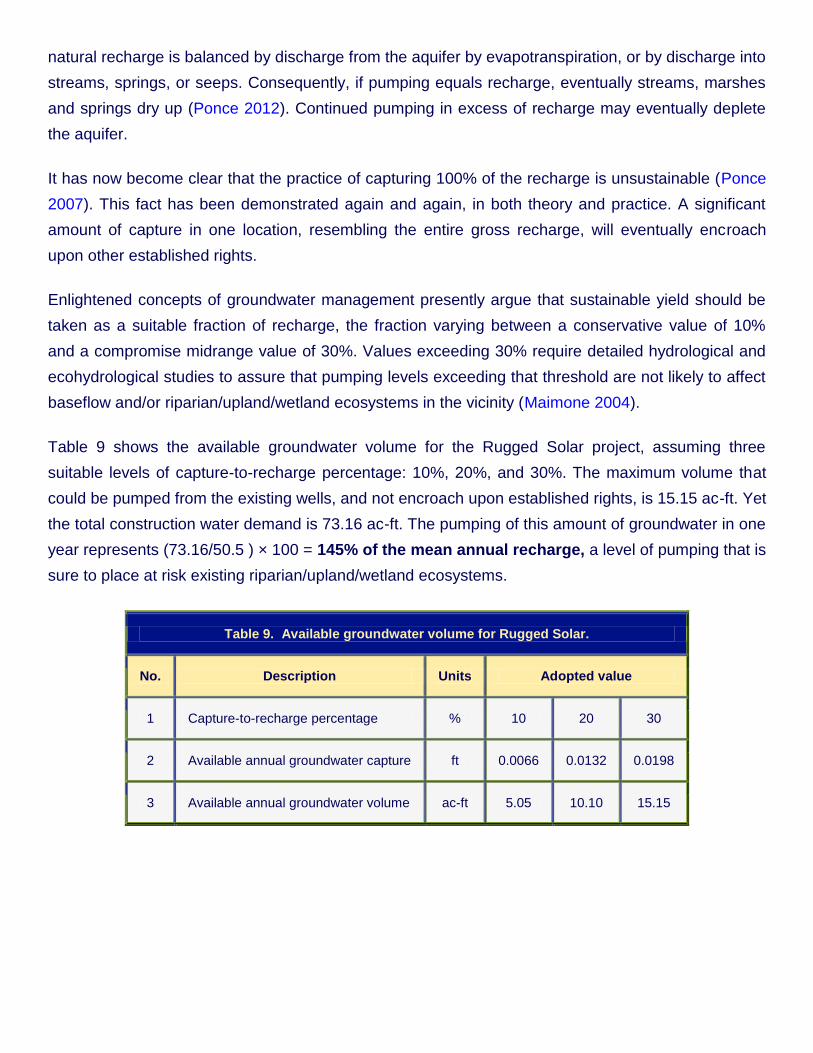
Table 9 shows the available groundwater volume for the Rugged Solar project, assuming three
suitable levels of capture-to-recharge percentage: 10%, 20%, and 30%. The maximum volume that
could be pumped from the existing wells, and not encroach upon established rights, is 15.15 ac-ft. Yet
the total construction water demand is 73.16 ac-ft. The pumping of this amount of groundwater in one
year represents (73.16/50.5 ) × 100 = 145% of the mean annual recharge, a level of pumping that is
sure to place at risk existing riparian/upland/wetland ecosystems.
Table 9. Available groundwater volume for Rugged Solar.
No. Description Units Adopted value
1 Capture-to-recharge percentage % 10 20 30
2 Available annual groundwater capture ft 0.0066 0.0132 0.0198
3 Available annual groundwater volume ac-ft 5.05 10.10 15.15
5. TIERRA DEL SOL SOLAR
[LanEast/LanWest Solar] [Other Impacts] [Summary] [Appendix] [Acknowledgements] [Endnotes] [References] •
[Top] [Introduction] [Description of Projects] [Water Resources] [Rugged Solar]
5.1 Location
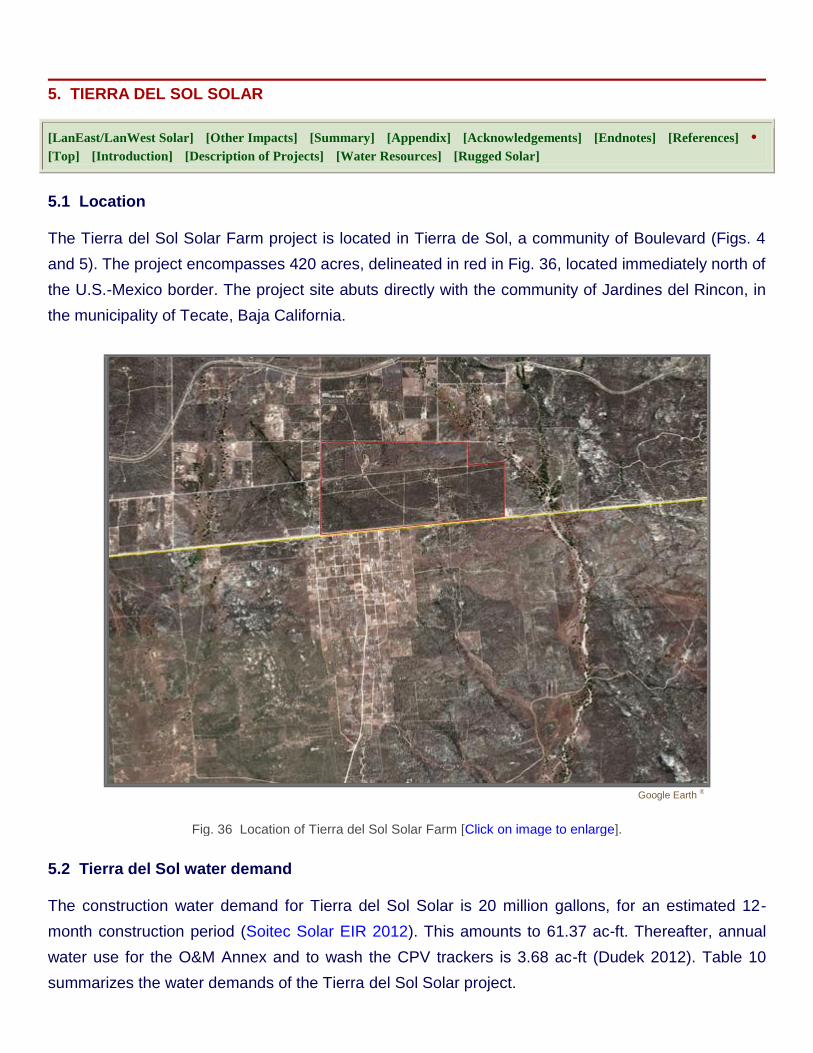
The Tierra del Sol Solar Farm project is located in Tierra de Sol, a community of Boulevard (Figs. 4
and 5). The project encompasses 420 acres, delineated in red in Fig. 36, located immediately north of
the U.S.-Mexico border. The project site abuts directly with the community of Jardines del Rincon, in
the municipality of Tecate, Baja California.
Google Earth ®
Fig. 36 Location of Tierra del Sol Solar Farm [Click on image to enlarge].
5.2 Tierra del Sol water demand
The construction water demand for Tierra del Sol Solar is 20 million gallons, for an estimated 12-
month construction period (Soitec Solar EIR 2012). This amounts to 61.37 ac-ft. Thereafter, annual
water use for the O&M Annex and to wash the CPV trackers is 3.68 ac-ft (Dudek 2012). Table 10
summarizes the water demands of the Tierra del Sol Solar project.
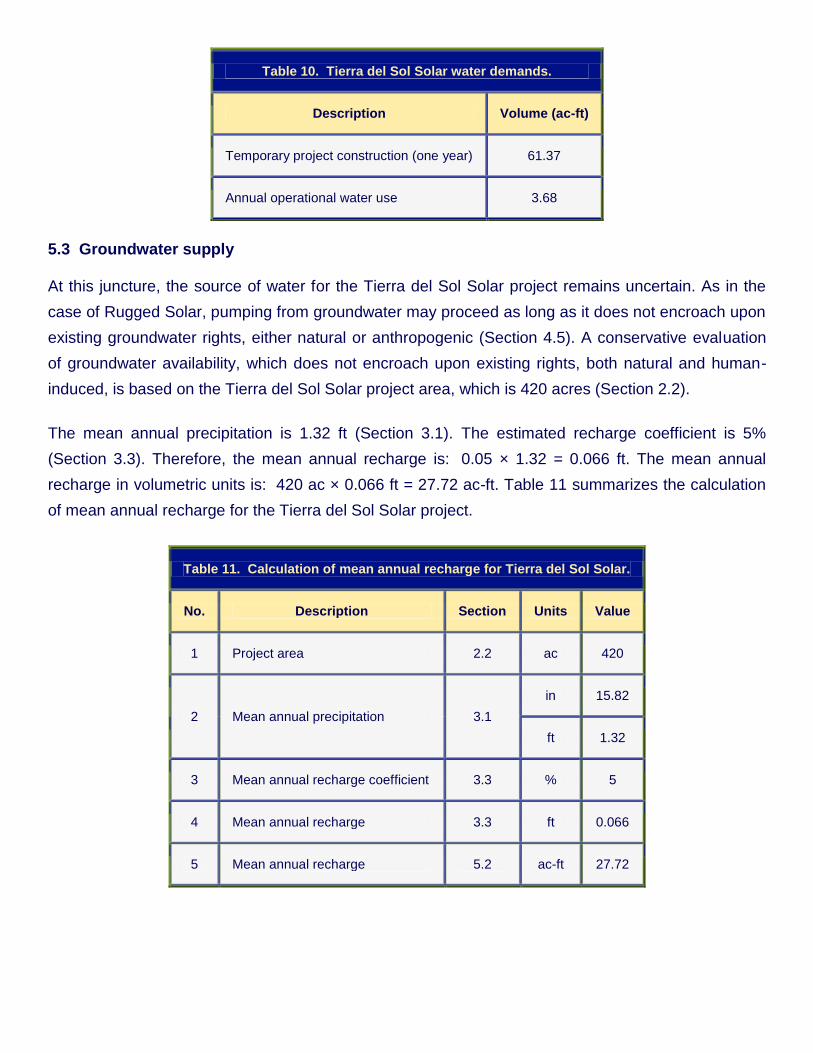
Table 10. Tierra del Sol Solar water demands.
Description Volume (ac-ft)
Temporary project construction (one year) 61.37
Annual operational water use 3.68
5.3 Groundwater supply
At this juncture, the source of water for the Tierra del Sol Solar project remains uncertain. As in the
case of Rugged Solar, pumping from groundwater may proceed as long as it does not encroach upon
existing groundwater rights, either natural or anthropogenic (Section 4.5). A conservative evaluation
of groundwater availability, which does not encroach upon existing rights, both natural and human-
induced, is based on the Tierra del Sol Solar project area, which is 420 acres (Section 2.2).
The mean annual precipitation is 1.32 ft (Section 3.1). The estimated recharge coefficient is 5%
(Section 3.3). Therefore, the mean annual recharge is: 0.05 × 1.32 = 0.066 ft. The mean annual
recharge in volumetric units is: 420 ac × 0.066 ft = 27.72 ac-ft. Table 11 summarizes the calculation
of mean annual recharge for the Tierra del Sol Solar project.
Table 11. Calculation of mean annual recharge for Tierra del Sol Solar.
No. Description Section Units Value
1 Project area 2.2 ac 420
2 Mean annual precipitation 3.1
in 15.82
ft 1.32
3 Mean annual recharge coefficient 3.3 % 5
4 Mean annual recharge 3.3 ft 0.066
5 Mean annual recharge 5.2 ac-ft 27.72
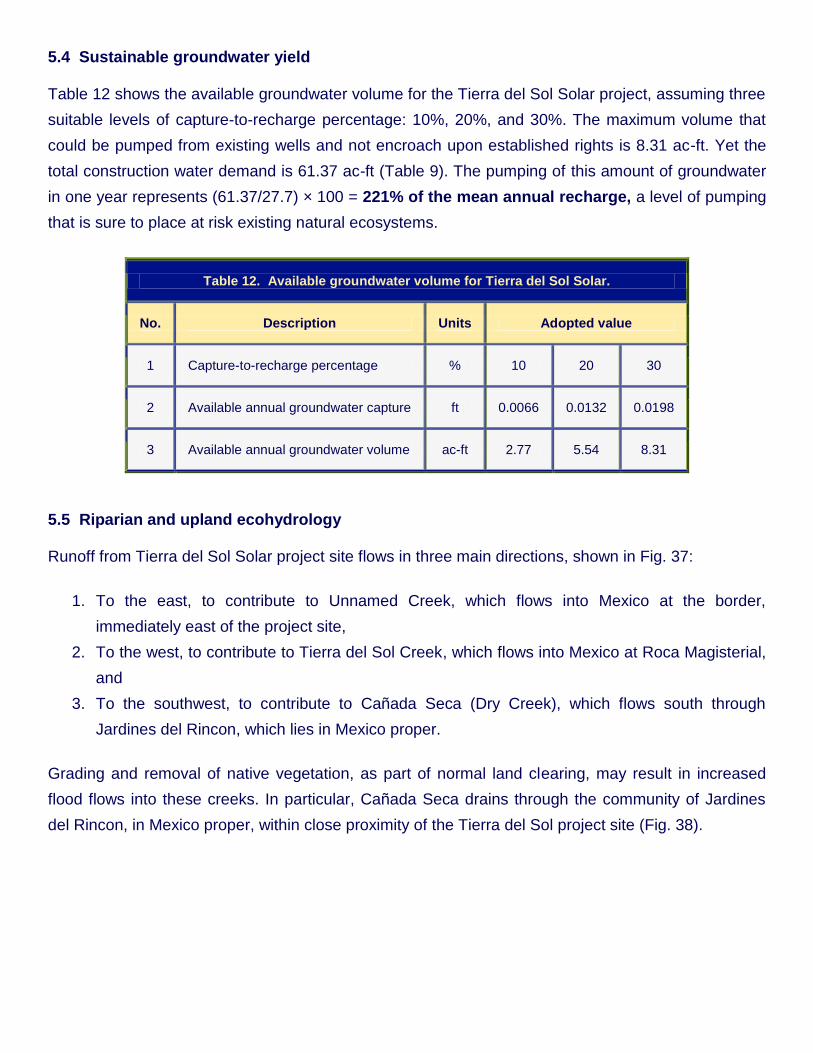
5.4 Sustainable groundwater yield
Table 12 shows the available groundwater volume for the Tierra del Sol Solar project, assuming three
suitable levels of capture-to-recharge percentage: 10%, 20%, and 30%. The maximum volume that
could be pumped from existing wells and not encroach upon established rights is 8.31 ac-ft. Yet the
total construction water demand is 61.37 ac-ft (Table 9). The pumping of this amount of groundwater
in one year represents (61.37/27.7) × 100 = 221% of the mean annual recharge, a level of pumping
that is sure to place at risk existing natural ecosystems.
Table 12. Available groundwater volume for Tierra del Sol Solar.
No. Description Units Adopted value
1 Capture-to-recharge percentage % 10 20 30
2 Available annual groundwater capture ft 0.0066 0.0132 0.0198
3 Available annual groundwater volume ac-ft 2.77 5.54 8.31
5.5 Riparian and upland ecohydrology
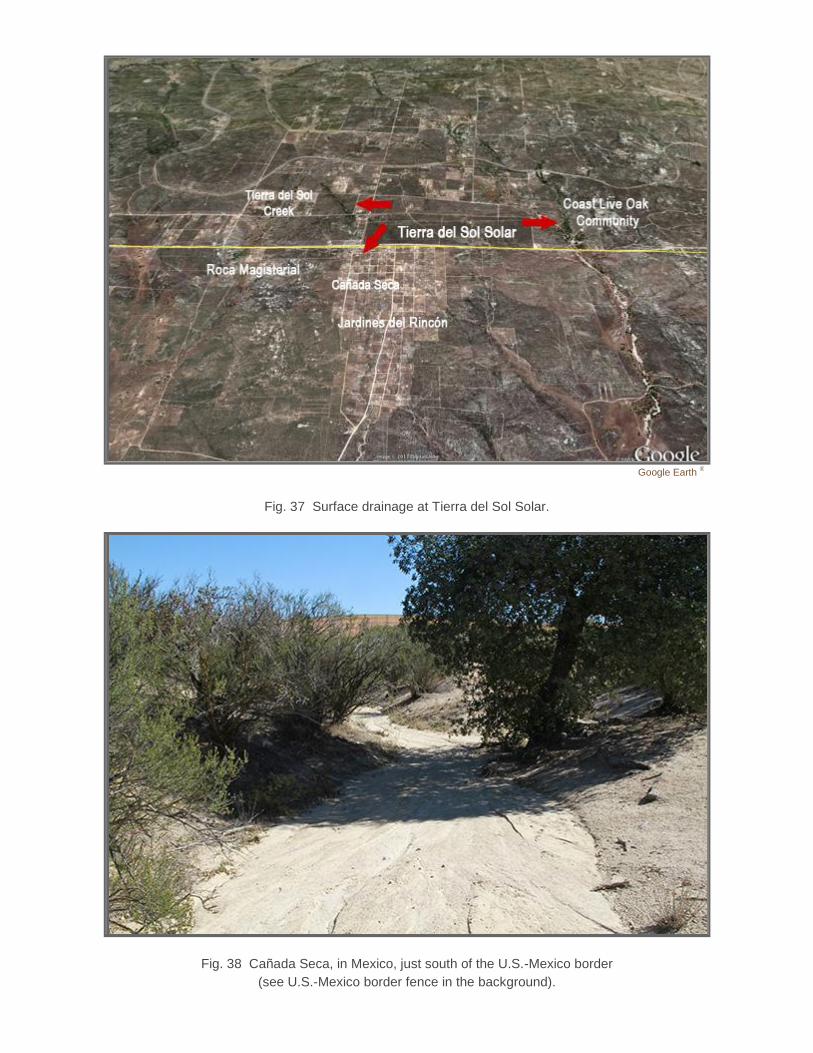
Runoff from Tierra del Sol Solar project site flows in three main directions, shown in Fig. 37:
1. To the east, to contribute to Unnamed Creek, which flows into Mexico at the border,
immediately east of the project site,
2. To the west, to contribute to Tierra del Sol Creek, which flows into Mexico at Roca Magisterial,
and
3. To the southwest, to contribute to Cañada Seca (Dry Creek), which flows south through
Jardines del Rincon, which lies in Mexico proper.
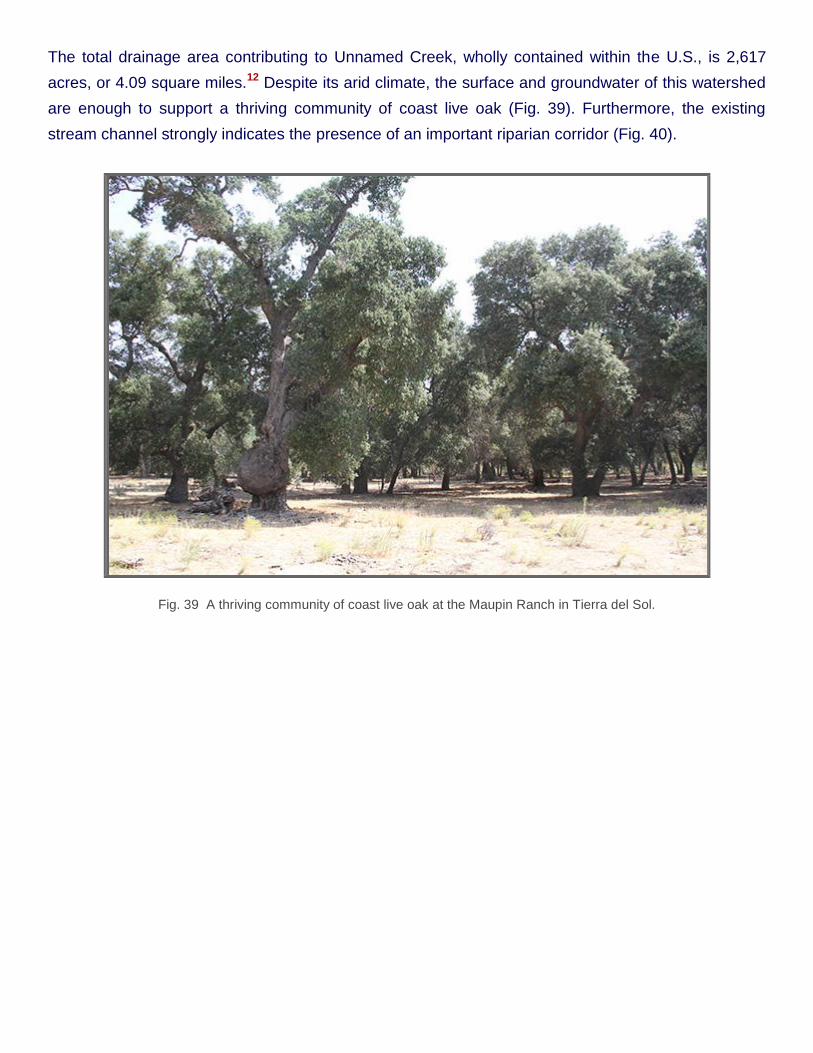
Grading and removal of native vegetation, as part of normal land clearing, may result in increased
flood flows into these creeks. In particular, Cañada Seca drains through the community of Jardines
del Rincon, in Mexico proper, within close proximity of the Tierra del Sol project site (Fig. 38).
Google Earth ®
Fig. 37 Surface drainage at Tierra del Sol Solar.
Fig. 38 Cañada Seca, in Mexico, just south of the U.S.-Mexico border
(see U.S.-Mexico border fence in the background).
The total drainage area contributing to Unnamed Creek, wholly contained within the U.S., is 2,617
acres, or 4.09 square miles.12 Despite its arid climate, the surface and groundwater of this watershed
are enough to support a thriving community of coast live oak (Fig. 39). Furthermore, the existing
stream channel strongly indicates the presence of an important riparian corridor (Fig. 40).
Fig. 39 A thriving community of coast live oak at the Maupin Ranch in Tierra del Sol.
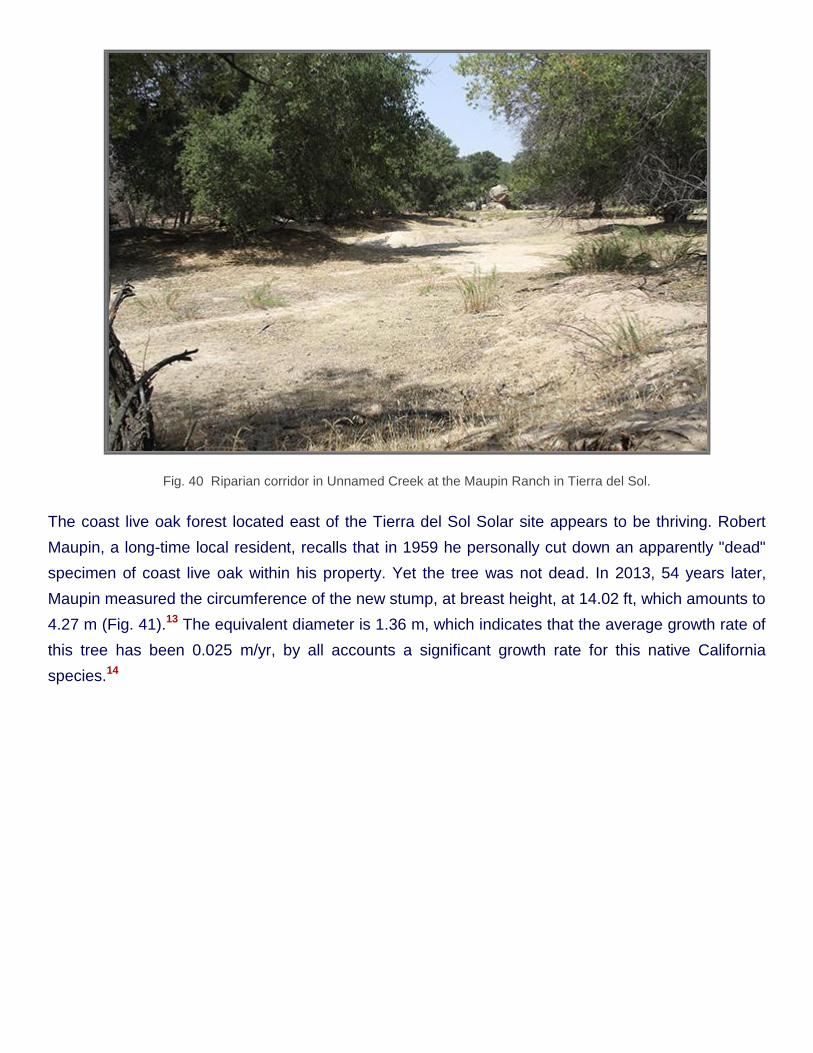
Fig. 40 Riparian corridor in Unnamed Creek at the Maupin Ranch in Tierra del Sol.
The coast live oak forest located east of the Tierra del Sol Solar site appears to be thriving. Robert
Maupin, a long-time local resident, recalls that in 1959 he personally cut down an apparently "dead"
specimen of coast live oak within his property. Yet the tree was not dead. In 2013, 54 years later,
Maupin measured the circumference of the new stump, at breast height, at 14.02 ft, which amounts to
4.27 m (Fig. 41).13 The equivalent diameter is 1.36 m, which indicates that the average growth rate of
this tree has been 0.025 m/yr, by all accounts a significant growth rate for this native California
species.14
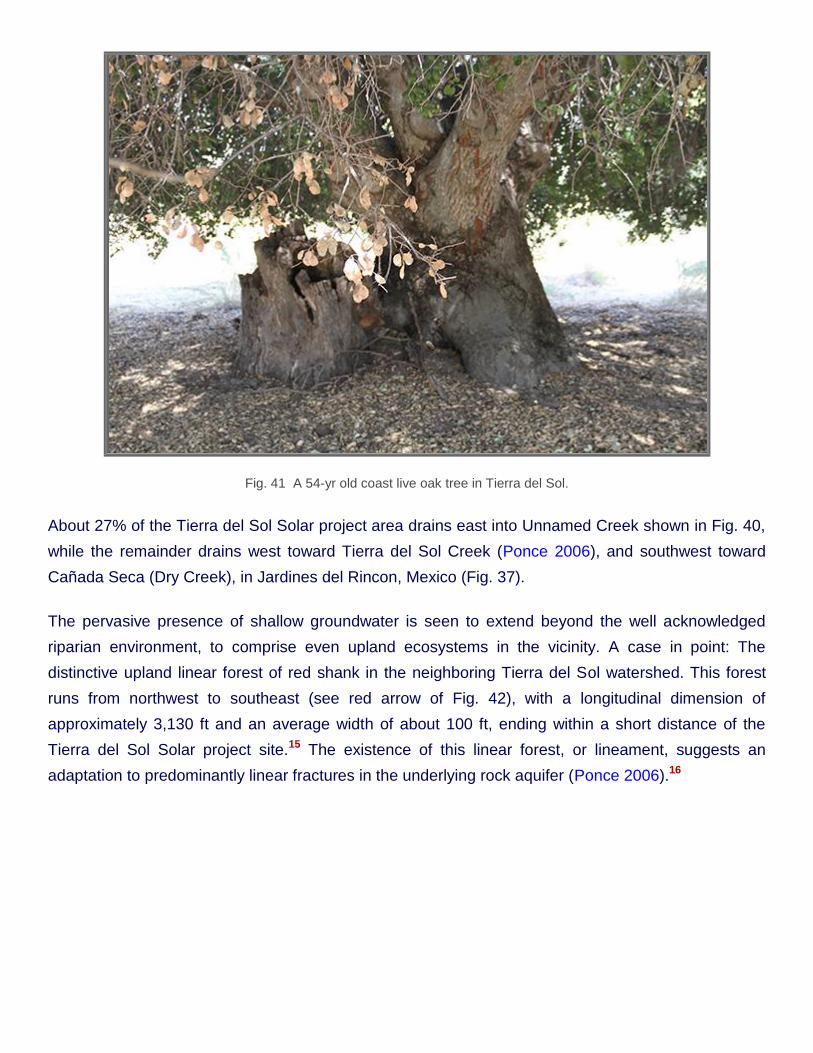
Fig. 41 A 54-yr old coast live oak tree in Tierra del Sol.
About 27% of the Tierra del Sol Solar project area drains east into Unnamed Creek shown in Fig. 40,
while the remainder drains west toward Tierra del Sol Creek (Ponce 2006), and southwest toward
Cañada Seca (Dry Creek), in Jardines del Rincon, Mexico (Fig. 37).
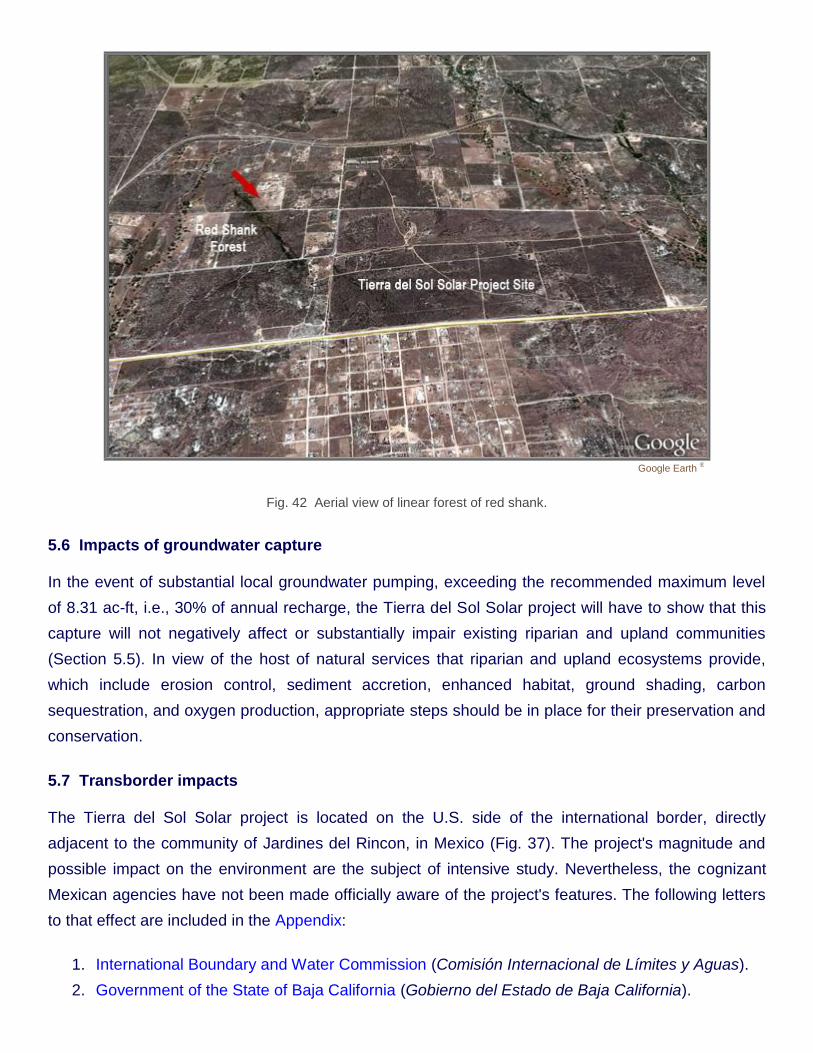
The pervasive presence of shallow groundwater is seen to extend beyond the well acknowledged
riparian environment, to comprise even upland ecosystems in the vicinity. A case in point: The
distinctive upland linear forest of red shank in the neighboring Tierra del Sol watershed. This forest
runs from northwest to southeast (see red arrow of Fig. 42), with a longitudinal dimension of
approximately 3,130 ft and an average width of about 100 ft, ending within a short distance of the
Tierra del Sol Solar project site.15 The existence of this linear forest, or lineament, suggests an
adaptation to predominantly linear fractures in the underlying rock aquifer (Ponce 2006).16
Google Earth ®
Fig. 42 Aerial view of linear forest of red shank.
5.6 Impacts of groundwater capture
In the event of substantial local groundwater pumping, exceeding the recommended maximum level
of 8.31 ac-ft, i.e., 30% of annual recharge, the Tierra del Sol Solar project will have to show that this
capture will not negatively affect or substantially impair existing riparian and upland communities
(Section 5.5). In view of the host of natural services that riparian and upland ecosystems provide,
which include erosion control, sediment accretion, enhanced habitat, ground shading, carbon
sequestration, and oxygen production, appropriate steps should be in place for their preservation and
conservation.
5.7 Transborder impacts
The Tierra del Sol Solar project is located on the U.S. side of the international border, directly
adjacent to the community of Jardines del Rincon, in Mexico (Fig. 37). The project's magnitude and
possible impact on the environment are the subject of intensive study. Nevertheless, the cognizant
Mexican agencies have not been made officially aware of the project's features. The following letters
to that effect are included in the Appendix:
1. International Boundary and Water Commission (Comisión Internacional de Límites y Aguas).
2. Government of the State of Baja California (Gobierno del Estado de Baja California).
3. Municipality of Tecate, Baja California (Ayuntamiento de Tecate, Baja California).
All three agencies, the federal agency (International Boundary and Water Commission, on August 8,
2013), the state agency (Government of the State of Baja California, on August 8, 2013) and the local
agency (Municipality of Tecate, Baja California, on July 31 and August 6, 2013), state on and for the
record that "to this date, they have not been officially informed about the Tierra del Sol
project."
A project as massive as Tierra del Sol Solar, as close to the border as planned, and with significant,
diverse and far-ranging impacts, must be communicated in a timely fashion to all stakeholders likely
to be affected.
5.8 Border security impacts
The County of San Diego has a "Land Use Policy for Discretionary Permits Adjacent to the
International Border" (Policy I-111) (County of San Diego 2013). This policy states specific conditions
that apply for discretionary permits requested for properties located within 150 ft from the
International Border. Figure 11 shows that the Tierra del Sol Solar project site is located within 150 ft
from the International Border. Thus, it is presumed that Tierra del Sol Solar must comply with San
Diego County Policy I-111.
6. LANEAST/LANWEST SOLAR
[Other Impacts] [Summary] [Appendix] [Acknowledgements] [Endnotes] [References] • [Top] [Introduction]
[Description of Projects] [Water Resources] [Rugged Solar] [Tierra del Sol Solar]
6.1 Location
The LanEast and LanWest Solar Farms are two adjacent projects planned in the Walker Creek
watershed, in Boulevard (Fig. 13). The Walker Creek watershed is located immediately south of the
McCain valley. The headwaters of Walker Creek are on the Tecate Divide, at elevation 4,251 ft. From
its headwaters, Walker Creek flows in a southeastern direction, flowing through Walker Creek
meadow toward Walker Canyon. Eventually, the latter flows north through Carrizo Gorge into Carrizo
Creek, and then east into the Salton Sea.
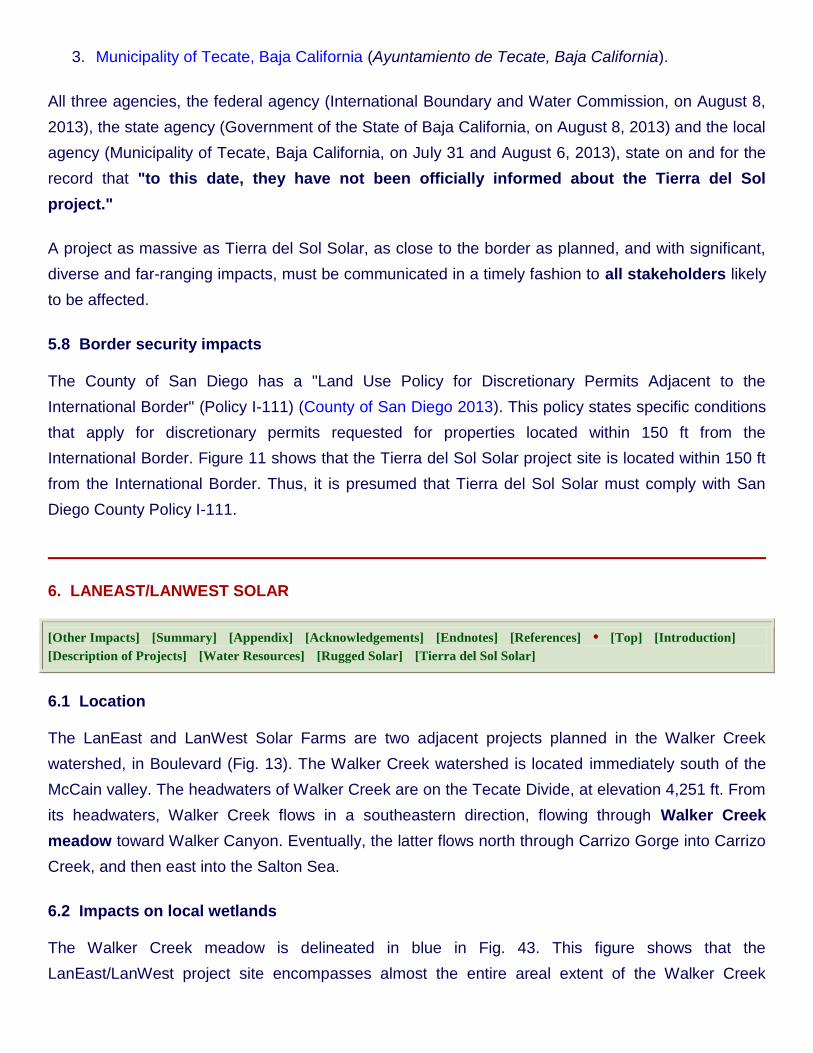
6.2 Impacts on local wetlands
The Walker Creek meadow is delineated in blue in Fig. 43. This figure shows that the
LanEast/LanWest project site encompasses almost the entire areal extent of the Walker Creek
meadow. The drainage area of Walker Creek, measured to the furthest downstream point of the
meadow, is 10.8 square miles.
Google Earth ®
Fig. 43 Walker Creek meadow relative to LanEast/LanWest Solar [Click on image to enlarge].
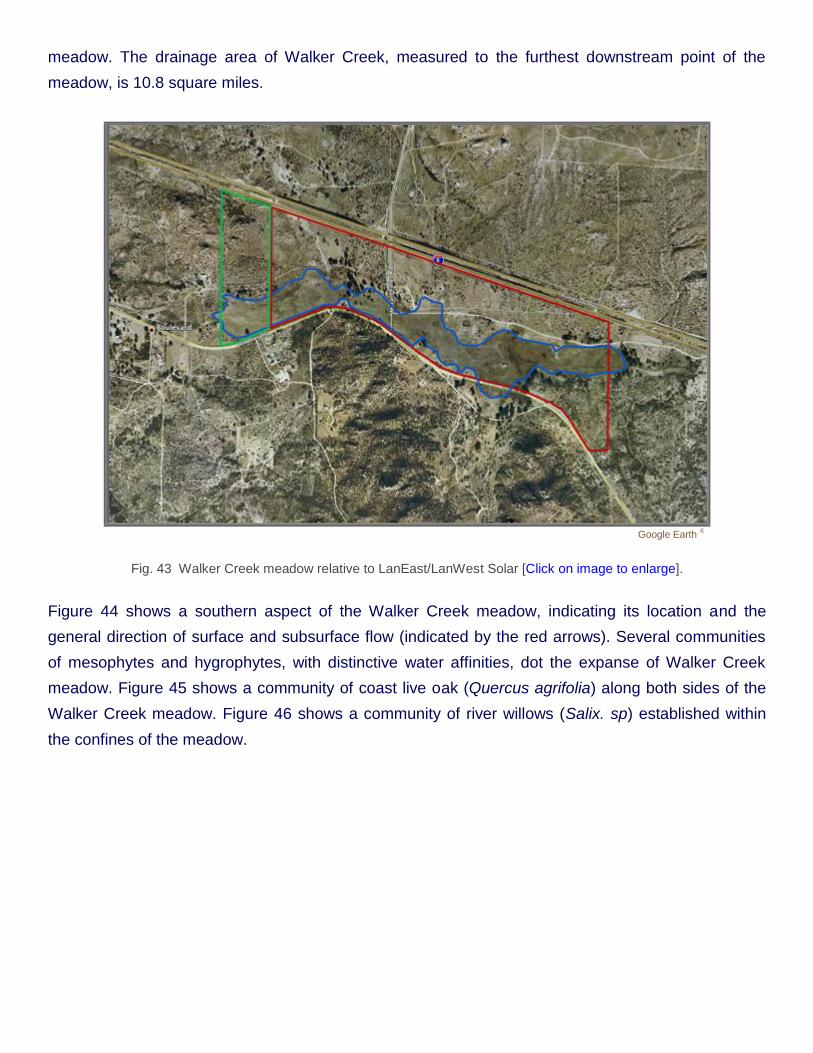
Figure 44 shows a southern aspect of the Walker Creek meadow, indicating its location and the
general direction of surface and subsurface flow (indicated by the red arrows). Several communities
of mesophytes and hygrophytes, with distinctive water affinities, dot the expanse of Walker Creek
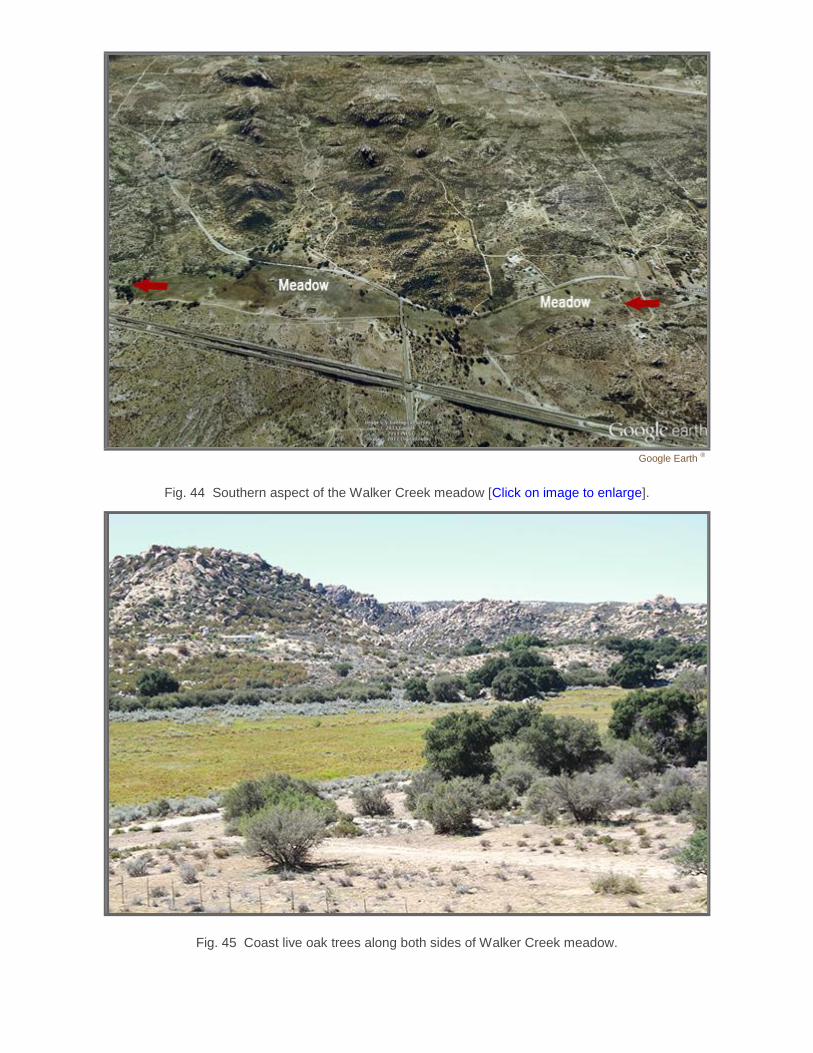
meadow. Figure 45 shows a community of coast live oak (Quercus agrifolia) along both sides of the
Walker Creek meadow. Figure 46 shows a community of river willows (Salix. sp) established within
the confines of the meadow.
Google Earth ®
Fig. 44 Southern aspect of the Walker Creek meadow [Click on image to enlarge].
Fig. 45 Coast live oak trees along both sides of Walker Creek meadow.
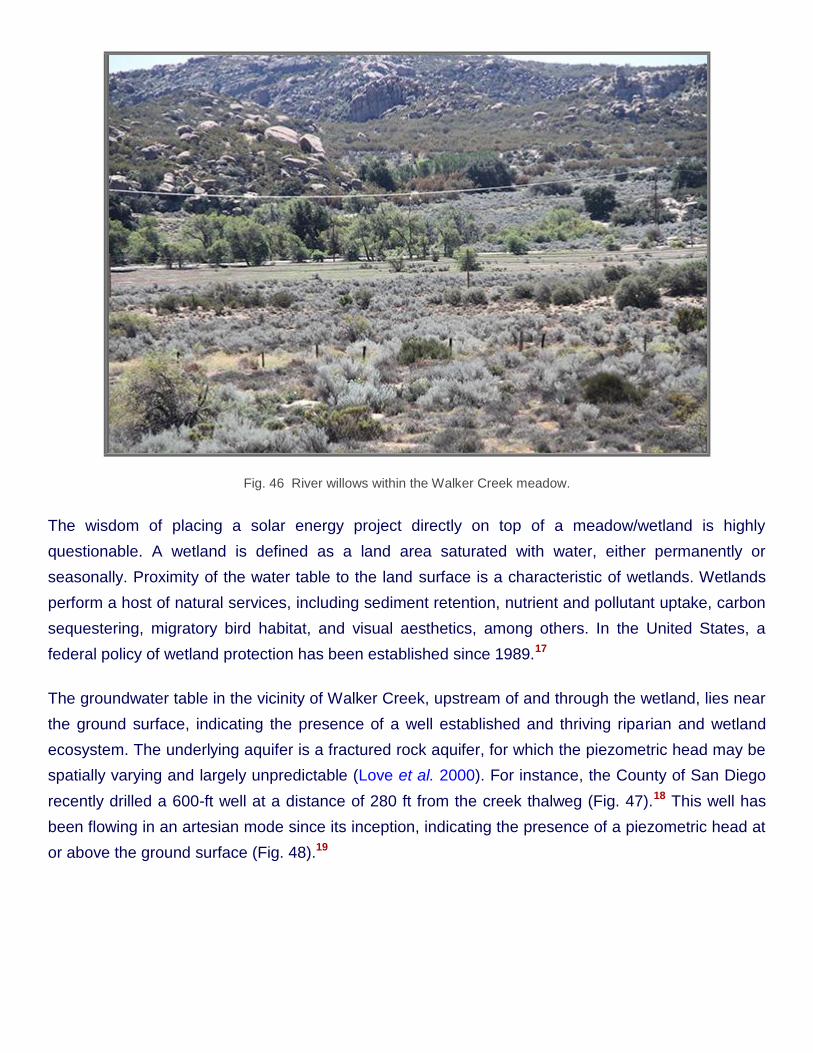
Fig. 46 River willows within the Walker Creek meadow.
The wisdom of placing a solar energy project directly on top of a meadow/wetland is highly
questionable. A wetland is defined as a land area saturated with water, either permanently or
seasonally. Proximity of the water table to the land surface is a characteristic of wetlands. Wetlands
perform a host of natural services, including sediment retention, nutrient and pollutant uptake, carbon
sequestering, migratory bird habitat, and visual aesthetics, among others. In the United States, a
federal policy of wetland protection has been established since 1989.17
The groundwater table in the vicinity of Walker Creek, upstream of and through the wetland, lies near
the ground surface, indicating the presence of a well established and thriving riparian and wetland
ecosystem. The underlying aquifer is a fractured rock aquifer, for which the piezometric head may be
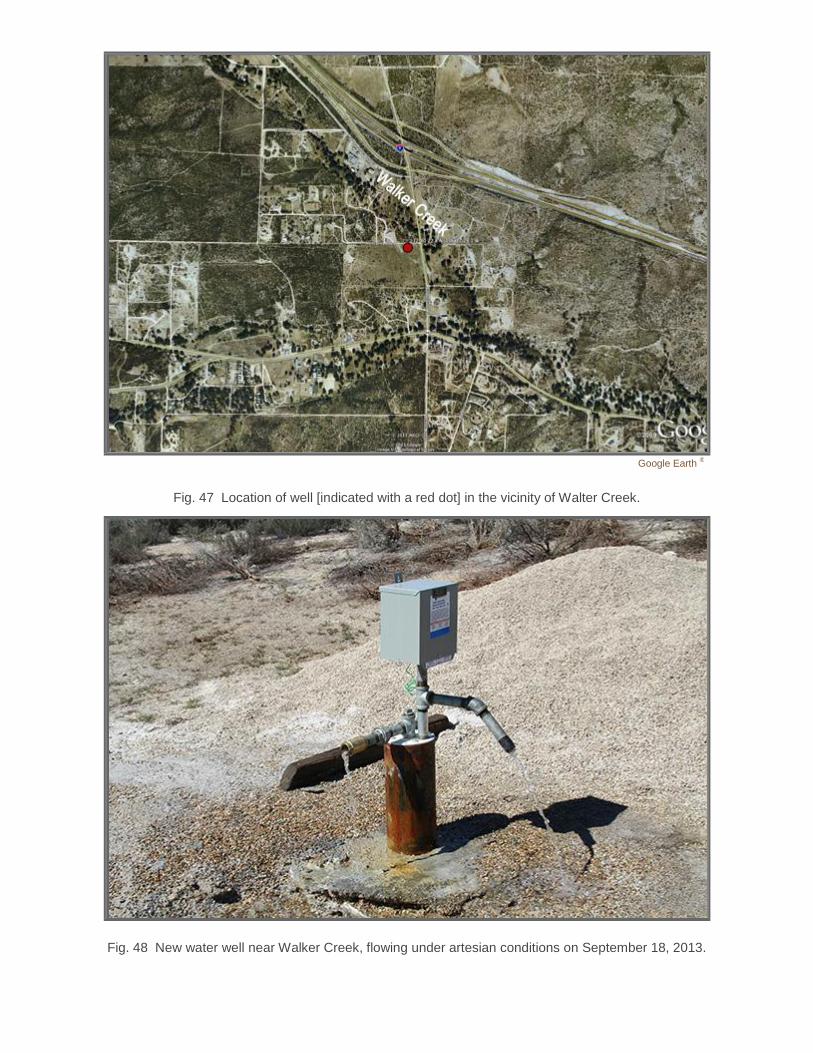
spatially varying and largely unpredictable (Love et al. 2000). For instance, the County of San Diego
recently drilled a 600-ft well at a distance of 280 ft from the creek thalweg (Fig. 47).18 This well has
been flowing in an artesian mode since its inception, indicating the presence of a piezometric head at
or above the ground surface (Fig. 48).19
Google Earth ®
Fig. 47 Location of well [indicated with a red dot] in the vicinity of Walter Creek.
Fig. 48 New water well near Walker Creek, flowing under artesian conditions on September 18, 2013.
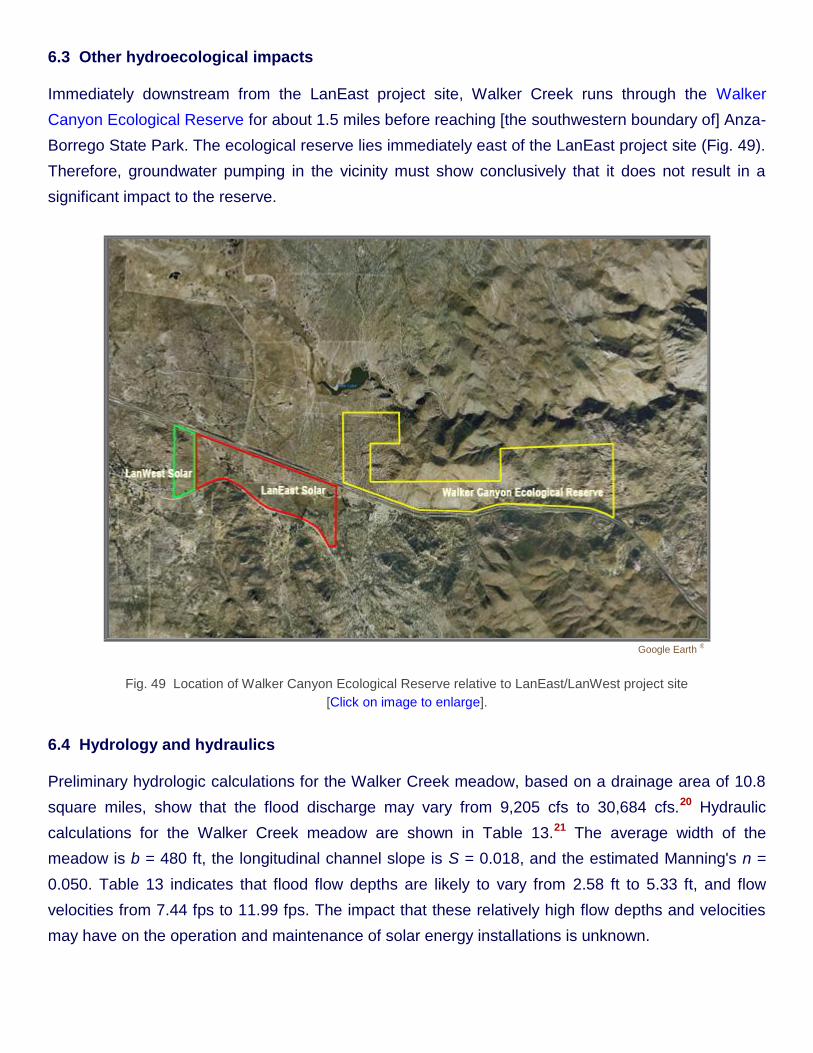
6.3 Other hydroecological impacts
Immediately downstream from the LanEast project site, Walker Creek runs through the Walker
Canyon Ecological Reserve for about 1.5 miles before reaching [the southwestern boundary of] Anza-
Borrego State Park. The ecological reserve lies immediately east of the LanEast project site (Fig. 49).
Therefore, groundwater pumping in the vicinity must show conclusively that it does not result in a
significant impact to the reserve.
Google Earth ®
Fig. 49 Location of Walker Canyon Ecological Reserve relative to LanEast/LanWest project site
[Click on image to enlarge].
6.4 Hydrology and hydraulics
Preliminary hydrologic calculations for the Walker Creek meadow, based on a drainage area of 10.8
square miles, show that the flood discharge may vary from 9,205 cfs to 30,684 cfs.20 Hydraulic
calculations for the Walker Creek meadow are shown in Table 13.21 The average width of the
meadow is b = 480 ft, the longitudinal channel slope is S = 0.018, and the estimated Manning's n =
0.050. Table 13 indicates that flood flow depths are likely to vary from 2.58 ft to 5.33 ft, and flow
velocities from 7.44 fps to 11.99 fps. The impact that these relatively high flow depths and velocities
may have on the operation and maintenance of solar energy installations is unknown.
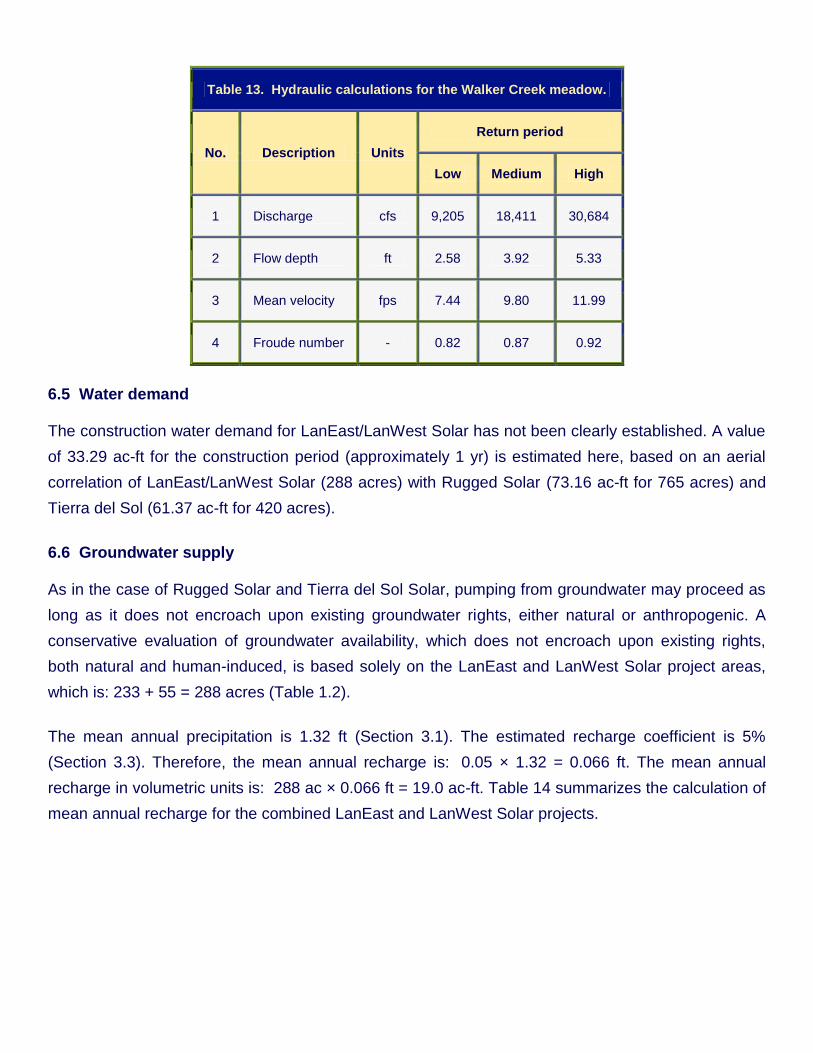
Table 13. Hydraulic calculations for the Walker Creek meadow.
No. Description Units
Return period
Low Medium High
1 Discharge cfs 9,205 18,411 30,684
2 Flow depth ft 2.58 3.92 5.33
3 Mean velocity fps 7.44 9.80 11.99
4 Froude number - 0.82 0.87 0.92
6.5 Water demand
The construction water demand for LanEast/LanWest Solar has not been clearly established. A value
of 33.29 ac-ft for the construction period (approximately 1 yr) is estimated here, based on an aerial
correlation of LanEast/LanWest Solar (288 acres) with Rugged Solar (73.16 ac-ft for 765 acres) and
Tierra del Sol (61.37 ac-ft for 420 acres).
6.6 Groundwater supply
As in the case of Rugged Solar and Tierra del Sol Solar, pumping from groundwater may proceed as
long as it does not encroach upon existing groundwater rights, either natural or anthropogenic. A
conservative evaluation of groundwater availability, which does not encroach upon existing rights,
both natural and human-induced, is based solely on the LanEast and LanWest Solar project areas,
which is: 233 + 55 = 288 acres (Table 1.2).
The mean annual precipitation is 1.32 ft (Section 3.1). The estimated recharge coefficient is 5%
(Section 3.3). Therefore, the mean annual recharge is: 0.05 × 1.32 = 0.066 ft. The mean annual
recharge in volumetric units is: 288 ac × 0.066 ft = 19.0 ac-ft. Table 14 summarizes the calculation of
mean annual recharge for the combined LanEast and LanWest Solar projects.
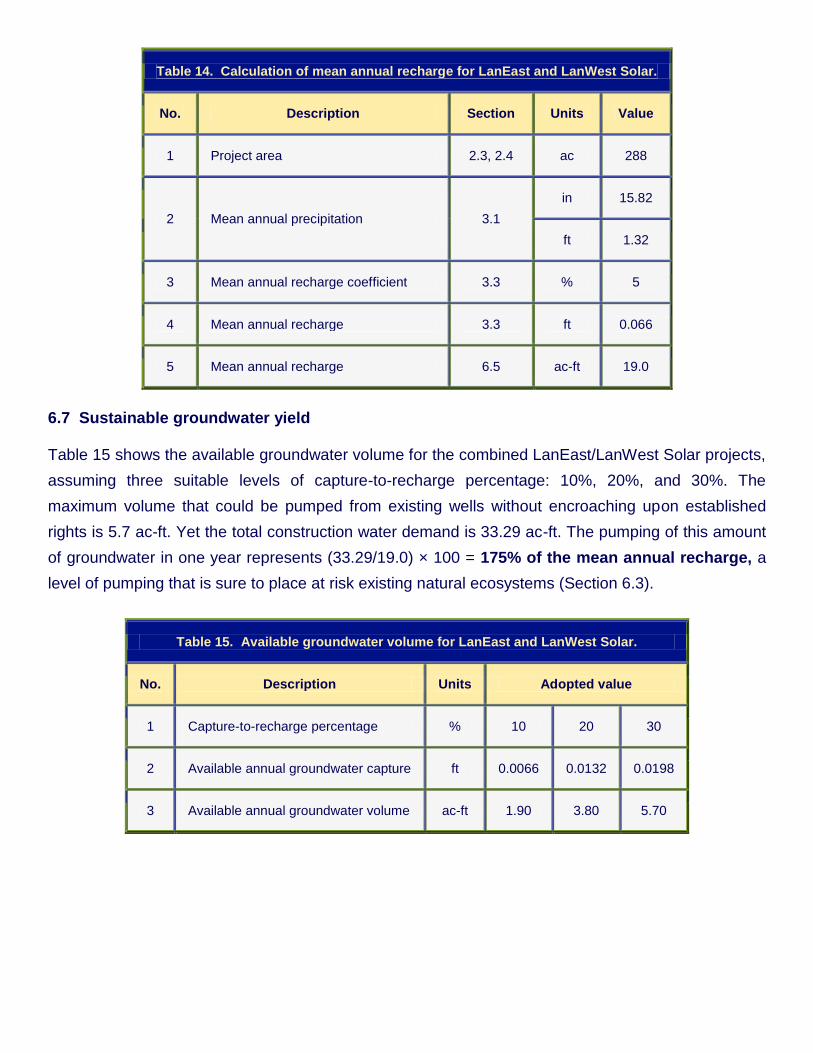
Table 14. Calculation of mean annual recharge for LanEast and LanWest Solar.
No. Description Section Units Value
1 Project area 2.3, 2.4 ac 288
2 Mean annual precipitation 3.1
in 15.82
ft 1.32
3 Mean annual recharge coefficient 3.3 % 5
4 Mean annual recharge 3.3 ft 0.066
5 Mean annual recharge 6.5 ac-ft 19.0
6.7 Sustainable groundwater yield
Table 15 shows the available groundwater volume for the combined LanEast/LanWest Solar projects,
assuming three suitable levels of capture-to-recharge percentage: 10%, 20%, and 30%. The
maximum volume that could be pumped from existing wells without encroaching upon established
rights is 5.7 ac-ft. Yet the total construction water demand is 33.29 ac-ft. The pumping of this amount
of groundwater in one year represents (33.29/19.0) × 100 = 175% of the mean annual recharge, a
level of pumping that is sure to place at risk existing natural ecosystems (Section 6.3).
Table 15. Available groundwater volume for LanEast and LanWest Solar.
No. Description Units Adopted value
1 Capture-to-recharge percentage % 10 20 30
2 Available annual groundwater capture ft 0.0066 0.0132 0.0198
3 Available annual groundwater volume ac-ft 1.90 3.80 5.70
7. OTHER IMPACTS
[Summary] [Appendix] [Acknowledgements] [Endnotes] [References] • [Top] [Introduction] [Description of
Projects] [Water Resources] [Rugged Solar] [Tierra del Sol Solar] [LanEast/LanWest Solar]
7.1 Type of Impacts
In addition to the impacts to geohydrological [groundwater] and ecohydrological [riparian and upland]
resources described in Sections 4 to 6, utility-scale solar development in the San Diego backcountry
will have a pronounced impact on other related natural resources. Impacts to the following natural
resources or services are briefly described in this report:
1. Soils 2. Nutrients 3. Flora 4. Fauna 5. Carbon sequestration 6. Landscape.
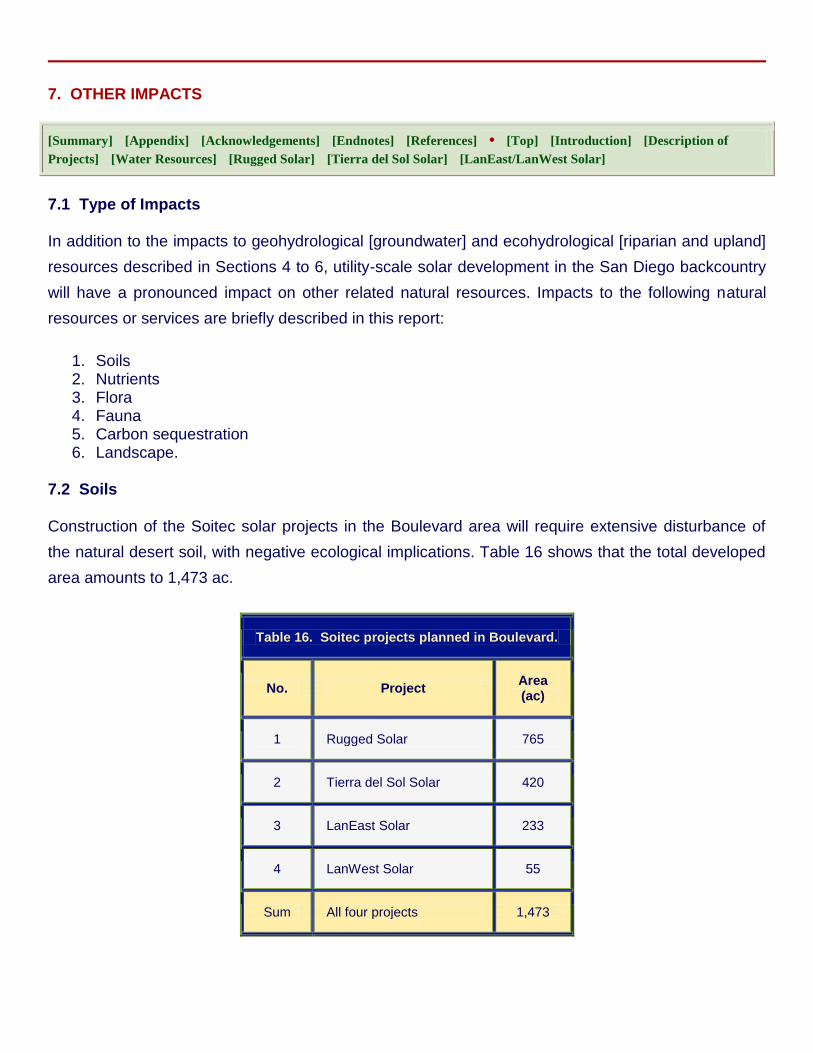
7.2 Soils
Construction of the Soitec solar projects in the Boulevard area will require extensive disturbance of
the natural desert soil, with negative ecological implications. Table 16 shows that the total developed
area amounts to 1,473 ac.
Table 16. Soitec projects planned in Boulevard.
No. Project Area (ac)
1 Rugged Solar 765
2 Tierra del Sol Solar 420
3 LanEast Solar 233
4 LanWest Solar 55
Sum All four projects 1,473
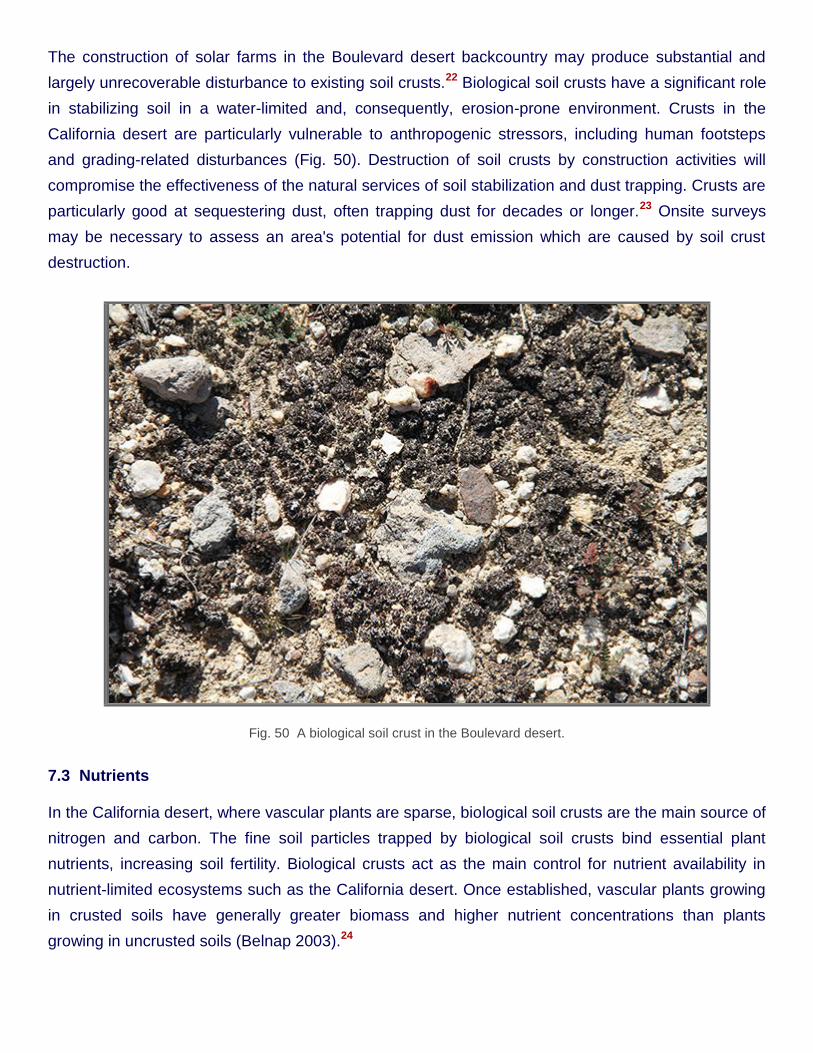
The construction of solar farms in the Boulevard desert backcountry may produce substantial and
largely unrecoverable disturbance to existing soil crusts.22 Biological soil crusts have a significant role
in stabilizing soil in a water-limited and, consequently, erosion-prone environment. Crusts in the
California desert are particularly vulnerable to anthropogenic stressors, including human footsteps
and grading-related disturbances (Fig. 50). Destruction of soil crusts by construction activities will
compromise the effectiveness of the natural services of soil stabilization and dust trapping. Crusts are
particularly good at sequestering dust, often trapping dust for decades or longer.23 Onsite surveys
may be necessary to assess an area's potential for dust emission which are caused by soil crust
destruction.
Fig. 50 A biological soil crust in the Boulevard desert.
7.3 Nutrients
In the California desert, where vascular plants are sparse, biological soil crusts are the main source of
nitrogen and carbon. The fine soil particles trapped by biological soil crusts bind essential plant
nutrients, increasing soil fertility. Biological crusts act as the main control for nutrient availability in
nutrient-limited ecosystems such as the California desert. Once established, vascular plants growing
in crusted soils have generally greater biomass and higher nutrient concentrations than plants
growing in uncrusted soils (Belnap 2003).24
7.4 Flora
The land disturbed within a solar project site could lead to changes in dominant flora. Extensive
habitat disturbances can facilitate the colonization of natural areas by invasive plants (Brooks 2009).
Construction machinery and other earth-moving equipment could carry invasive plant material and
seeds from other construction sites to the solar site (San Diego State University et al. 2002). The
invasive plants will also likely benefit from water used to suppress dust during solar farm construction.
Landscape disturbances that facilitate the spread of invasive grasses can increase the length of the
fire season and may also increase the probability of ignition during the heart of the fire season. Alien
grasses have a different phenology that the native herbaceous flora. Alien grasses germinate in the
fall and dry by early spring, in contrast to the native flora, which germinates in the winter and remains
green much longer (Brooks et al. 1999). Decomposition of organic matter is slow in arid regions; thus,
thick layers of annual plant litter often develop where annual grasses are abundant. The accumulation
of litter can lead to increased size and intensity of fires and can shorten the time between events
(Brooks 1999).
Invasive annual species and the frequency and size of fires are positively correlated. Invasive species
provide a more persistent and uniformly distributed fuel than is normally supplied by native plants
(Brooks and Matchett 2006). Fires were historically uncommon in the California desert due to the
sparsely populated vegetative fuel. Therefore, native perennial shrubs are poorly adapted to the
increasing frequency of anthropogenic fires (Brooks 2002).25
A shift in the natural fire regime triggered by industrial-scale solar energy generation facilities could
give invasive plants an advantage over native plants. Once a fire regime that favors invasive annuals
over native plants is established, restoration of preinvasion conditions could be difficult (Brooks et al.
2004). Years of competition from annual grasses may reduce the seed banks of native plants,
possibly causing fundamental changes in natural plant community structure and food web dynamics
(Brooks 2000).
7.5 Fauna
Fencing surrounding a solar facility removes the habitat for species that cannot penetrate the fencing.
For species with limited range, loss of habitat can directly affect species survival. While species may
be able to survive by traveling farther distances to access forage, fencing that directly removes a vital
habitat patch could severely limit their ability to survive. Fencing can also act as a barrier, restricting
or completely blocking the movement of certain species.
7.6 Carbon sequestration
The solar trackers are typically installed in areas were vegetation has been substantially removed or
altogether eliminated. The removal of native vegetation effectively removes its carbon sequestration
capacity. In essence, global warming is also caused by a decrease in the carbon sequestration
capacity of degraded or eliminated ecosystems. The reduction in carbon sequestration capacity must
be included as part of an appropriate greenhouse gas analysis (Zhu et al. 2012; Dudek 2012). The
loss of other natural services (Section 7.2) which may accrue as a result of vegetation removal could
be exceedingly difficult to quantify.
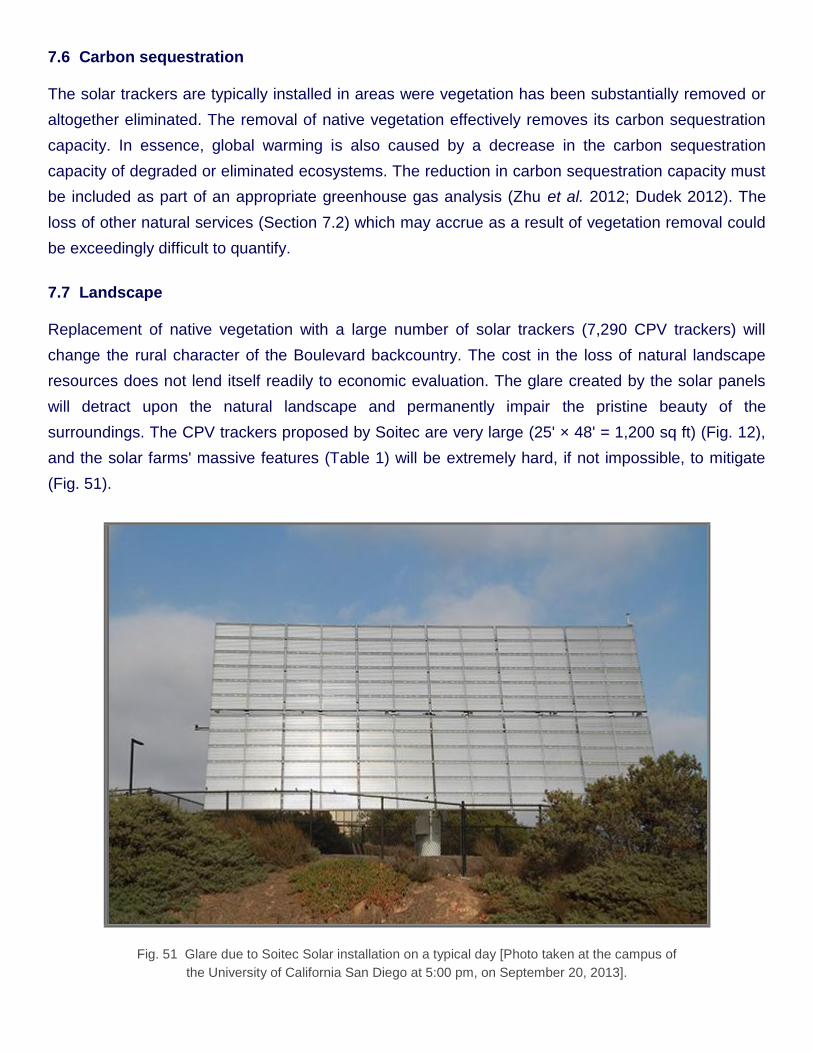
7.7 Landscape
Replacement of native vegetation with a large number of solar trackers (7,290 CPV trackers) will
change the rural character of the Boulevard backcountry. The cost in the loss of natural landscape
resources does not lend itself readily to economic evaluation. The glare created by the solar panels
will detract upon the natural landscape and permanently impair the pristine beauty of the
surroundings. The CPV trackers proposed by Soitec are very large (25' × 48' = 1,200 sq ft) (Fig. 12),
and the solar farms' massive features (Table 1) will be extremely hard, if not impossible, to mitigate
(Fig. 51).
Fig. 51 Glare due to Soitec Solar installation on a typical day [Photo taken at the campus of
the University of California San Diego at 5:00 pm, on September 20, 2013].
8. SUMMARY
[Appendix] [Acknowledgements] [Endnotes] [References] • [Top] [Introduction] [Description of Projects] [Water
Resources] [Rugged Solar] [Tierra del Sol Solar] [LanEast/LanWest Solar] [Other Impacts]
8.1 Groundwater recharge
The planned industrial-scale development of solar energy in the Boulevard area will have significant
negative impacts on the surrounding environment, its water resources and other related natural
resources, such as soil and vegetation. The area has an arid/semiarid climate, with 15.82 in of mean
annual precipitation (Section 3.1). The prevailing ecosystem is the chaparral, which thrives under the
arid/semiarid conditions of the Coastal Range of Southern California. Surface runoff and surface
storage are nearly nonexistent; thus, the only available water for domestic or industrial consumption
is groundwater. The local aquifers are fractured-rock aquifers, of fast hydraulic response and low
specific yield (Section 4.3; Fig. 24).
The use of groundwater in arid regions, where the supply is scarce, is subject to important theoretical
and practical considerations, which to this date remain largely unresolved. The first issue is the
method of evaluation of groundwater recharge. In Nature, all groundwater is connected; therefore, the
control volume in a specific application cannot be readily ascertained. It follows that any recharge
calculation must be arbitrary to some extent (Section 4.5). Taking the contributing surface
[watershed] drainage area as the control volume effectively converts the groundwater resource into a
commons and, thus, subject to The Tragedy of the Commons (Hardin 1968). Overexploitation by one
or more users will perforce mean the eventual demise of the commons and the consequent ruin to all.
Thus, a limit must be imposed on the groundwater capture if the resource is to remain sustainable. In
addition to hydrogeology, this limit must include hydrological, ecohydrological, and socioeconomic
considerations.
The second issue is the method of evaluation of net groundwater recharge. All groundwater is in
constant movement, driven by regional hydraulic gradients. Groundwater flow originates in regions of
recharge, usually at higher elevations, and moves toward regions of discharge, typically where the
water table intersects the ground surface (Section 4.2). Most groundwater discharges into the surface
waters, either to constitute the baseflow of streams and rivers, or to sustain nearby lakes and feed
riparian/upland/wetland ecosystems (Sophocleous 2000). Very little groundwater manages to bypass
the surface waters altogether, discharging into the nearest ocean (Section 3.2). Under pristine
conditions, recharge is equal to discharge; therefore, net groundwater recharge is effectively zero.
This fact was clearly expounded by Theis (1940) in his early seminal paper on groundwater.26
Capture through pumping increases the recharge and decreases the discharge. Eventually, capture is
bound to affect other users in the vicinity, either natural uses (baseflow, riparian, upland, lake, or
wetland) or anthropogenic.
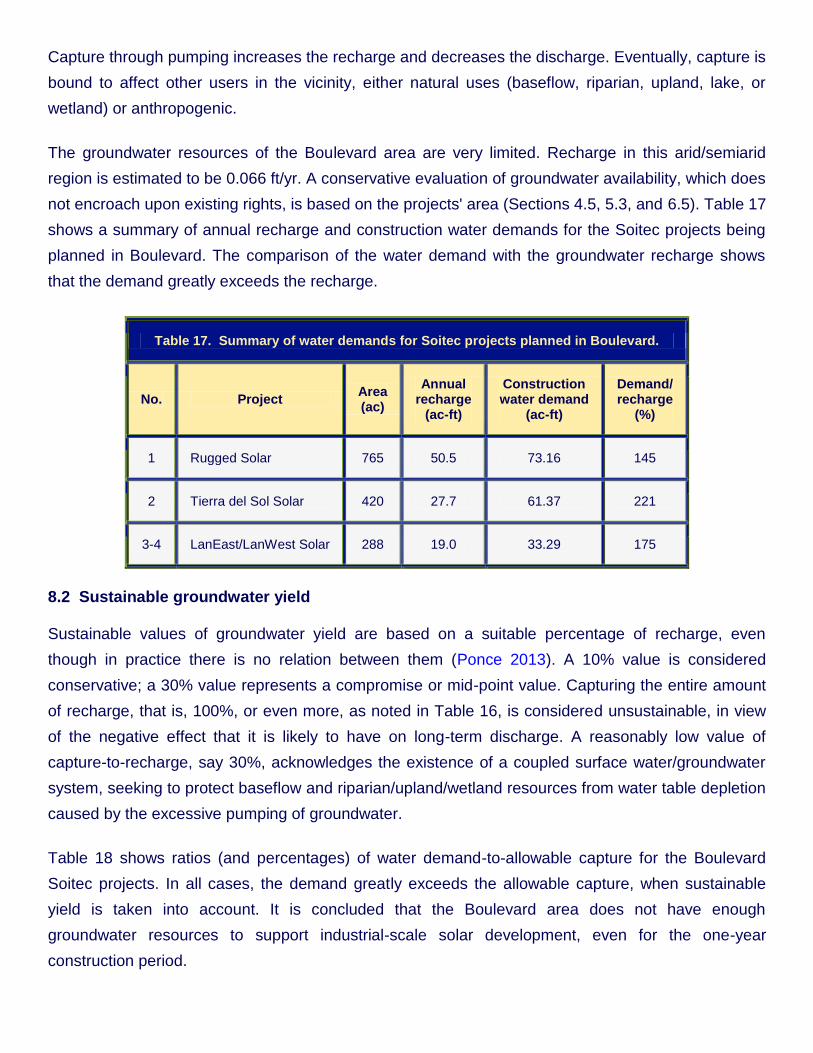
The groundwater resources of the Boulevard area are very limited. Recharge in this arid/semiarid
region is estimated to be 0.066 ft/yr. A conservative evaluation of groundwater availability, which does
not encroach upon existing rights, is based on the projects' area (Sections 4.5, 5.3, and 6.5). Table 17
shows a summary of annual recharge and construction water demands for the Soitec projects being
planned in Boulevard. The comparison of the water demand with the groundwater recharge shows
that the demand greatly exceeds the recharge.
Table 17. Summary of water demands for Soitec projects planned in Boulevard.
No. Project Area (ac)
Annual recharge
(ac-ft)
Construction water demand
(ac-ft)
Demand/ recharge
(%)
1 Rugged Solar 765 50.5 73.16 145
2 Tierra del Sol Solar 420 27.7 61.37 221
3-4 LanEast/LanWest Solar 288 19.0 33.29 175
8.2 Sustainable groundwater yield
Sustainable values of groundwater yield are based on a suitable percentage of recharge, even
though in practice there is no relation between them (Ponce 2013). A 10% value is considered
conservative; a 30% value represents a compromise or mid-point value. Capturing the entire amount
of recharge, that is, 100%, or even more, as noted in Table 16, is considered unsustainable, in view
of the negative effect that it is likely to have on long-term discharge. A reasonably low value of
capture-to-recharge, say 30%, acknowledges the existence of a coupled surface water/groundwater
system, seeking to protect baseflow and riparian/upland/wetland resources from water table depletion
caused by the excessive pumping of groundwater.
Table 18 shows ratios (and percentages) of water demand-to-allowable capture for the Boulevard
Soitec projects. In all cases, the demand greatly exceeds the allowable capture, when sustainable
yield is taken into account. It is concluded that the Boulevard area does not have enough
groundwater resources to support industrial-scale solar development, even for the one-year
construction period.
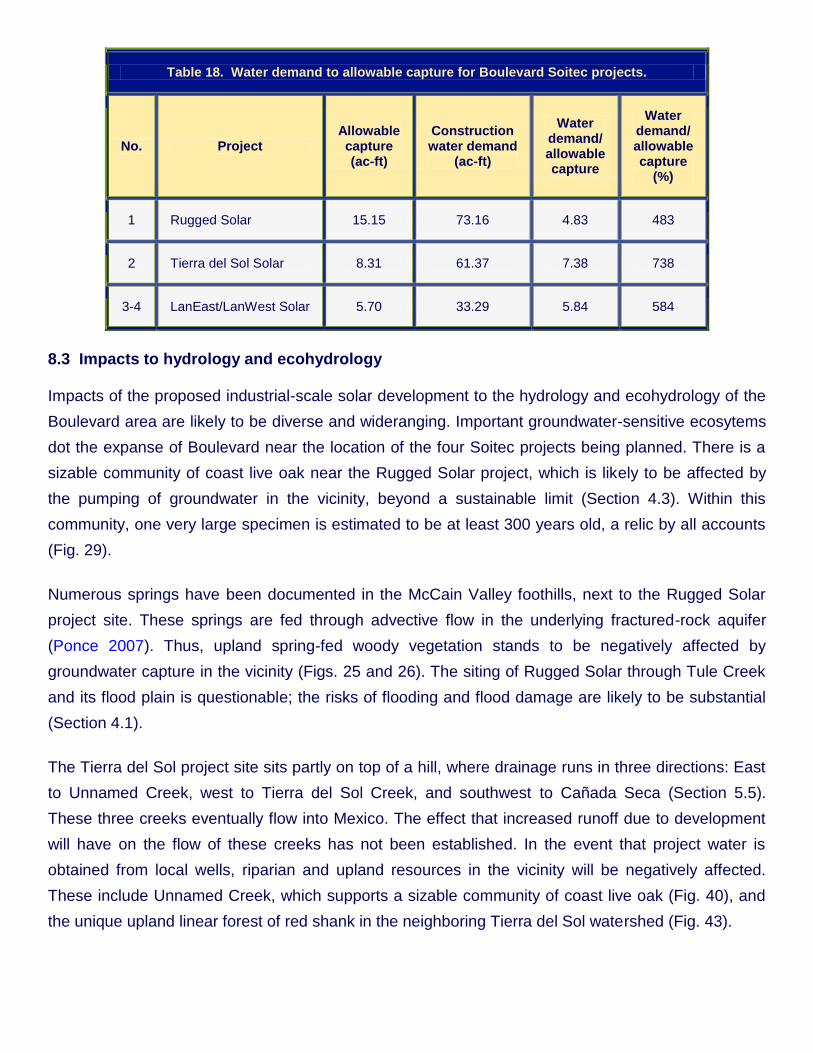
Table 18. Water demand to allowable capture for Boulevard Soitec projects.
No. Project Allowable capture (ac-ft)
Construction water demand
(ac-ft)
Water demand/ allowable capture
Water demand/ allowable capture
(%)
1 Rugged Solar 15.15 73.16 4.83 483
2 Tierra del Sol Solar 8.31 61.37 7.38 738
3-4 LanEast/LanWest Solar 5.70 33.29 5.84 584
8.3 Impacts to hydrology and ecohydrology
Impacts of the proposed industrial-scale solar development to the hydrology and ecohydrology of the
Boulevard area are likely to be diverse and wideranging. Important groundwater-sensitive ecosytems
dot the expanse of Boulevard near the location of the four Soitec projects being planned. There is a
sizable community of coast live oak near the Rugged Solar project, which is likely to be affected by
the pumping of groundwater in the vicinity, beyond a sustainable limit (Section 4.3). Within this
community, one very large specimen is estimated to be at least 300 years old, a relic by all accounts
(Fig. 29).
Numerous springs have been documented in the McCain Valley foothills, next to the Rugged Solar
project site. These springs are fed through advective flow in the underlying fractured-rock aquifer
(Ponce 2007). Thus, upland spring-fed woody vegetation stands to be negatively affected by
groundwater capture in the vicinity (Figs. 25 and 26). The siting of Rugged Solar through Tule Creek
and its flood plain is questionable; the risks of flooding and flood damage are likely to be substantial
(Section 4.1).
The Tierra del Sol project site sits partly on top of a hill, where drainage runs in three directions: East
to Unnamed Creek, west to Tierra del Sol Creek, and southwest to Cañada Seca (Section 5.5).
These three creeks eventually flow into Mexico. The effect that increased runoff due to development
will have on the flow of these creeks has not been established. In the event that project water is
obtained from local wells, riparian and upland resources in the vicinity will be negatively affected.
These include Unnamed Creek, which supports a sizable community of coast live oak (Fig. 40), and
the unique upland linear forest of red shank in the neighboring Tierra del Sol watershed (Fig. 43).
The Tierra del Sol project site abuts with the community of Jardines del Rincon, in Mexico. To this
date, there is no record of any input having been sought from stakeholders on the Mexican side of the
border (see Appendix).
The LanEast/LanWest projects are being sited, for the most part, on top of the Walker Creek meadow
(Fig. 44). This is an unfortunate tactical decision (Section 6.2). This meadow performs a host of
natural services, which will be eliminated or greatly compromised in the event that industrial-scale
solar development takes place as planned (Figs. 44 to 46). In the event that the needed amount of
project water is obtained from local wells, there is a high risk that the groundwater table may drop
below historic levels, with consequent negative effects on the Walker Creek meadow and associated
riparian ecosystems.
The current LanWest plot plan assures the risk of flooding in the event that Walker Creek were to
reach flood stage (Section 6.3). With the everpresent threat of global climate change, a heightened
flood risk remains a distinct possibility. This is particularly the case during strong El Niño events,
which have hit California with recurring frequency in the recent past (Section 4.1).
8.4 Concluding remarks
The planned industrial-scale development of solar energy in Boulevard and surrounding communities
is bound to permanently change the rural character of these East San Diego County communities.
While the negative impacts of energy development will be felt locally, its benefits will accrue
somewhere else, very likely in distant urban settings. Boulevard has an arid/semiarid climate, with
limited precipitation, an avowed scarcity of surface water, and often highly destructive floodwaters.
Over the years, the lack of reliable surface water has forced local people to rely on groundwater for
their survival.
Groundwater is the only source of potable water in the Boulevard area. Yet the prevailing climate
effectively means that groundwater recharge is very limited. In addition, calculations of groundwater
recharge are generally flawed due to the uncertainty regarding the applicable control volume.
Excessive reliance on limited groundwater resources, over and above current consumption, is bound
to place at risk existing uses and users, both natural and anthropogenic. Domestic groundwater users
on both sides of the U.S.-Mexico border are likely to be affected.
At this juncture, the issues of groundwater sustainability are, unfortunately, not very well defined.
Sustainable yield is reckoned to be a moving target, subject to adaptive management (Seward et al.
2006). To remain comprehensive, sustainable yield must include hydrological, ecohydrological, and
socioeconomic considerations. In the case of the Boulevard Soitec projects, it is difficult to reconcile
the planned/postulated amounts of groundwater capture with the demonstrated needs of riparian and
upland ecosystems, which provide valuable natural services. No development, no matter how lofty its
aim, should place at risk existing natural ecosystems. Other considerations notwithstanding, the
Boulevard Soitec projects must resort to imported water to satisfy their needs.
APPENDIX
[Acknowledgements] [Endnotes] [References] • [Top] [Introduction] [Description of Projects] [Water Resources]
[Rugged Solar] [Tierra del Sol Solar] [LanEast/LanWest Solar] [Other Impacts]
Letters from Mexican agencies (In Spanish).
International Boundary and Water Commission (Comisión Internacional de Límites y Aguas
entre México y los Estados Unidos).
Government of the State of Baja California (Gobierno del Estado de Baja California).
Municipality of Tecate, Baja California, Mexico (Ayuntamiento de Tecate, Baja California,
México).
ACKNOWLEDGEMENTS
[Endnotes] [References] • [Top] [Introduction] [Description of Projects] [Water Resources] [Rugged Solar]
[Tierra del Sol Solar] [LanEast/LanWest Solar] [Other Impacts] [Summary] [Appendix]
The author wishes to acknowledge the support of Donna Tisdale and the people of the community of
Boulevard, in southeast San Diego County. The assistance of Aleksandr Gostomelskiy, San Diego
State University civil engineering graduate student, is gratefully recognized. Henry Alberto Castro
Garcia communicated with local government agencies in Mexico to secure their input regarding the
Tierra del Sol Solar project.
ENDNOTES
[References] • [Top] [Introduction] [Description of Projects] [Water Resources] [Rugged Solar] [Tierra del Sol
Solar] [LanEast/LanWest Solar] [Other Impacts] [Summary] [Appendix] [Acknowledgements]
1 The engineering plans prepared by AECOM Technical Services Inc. [2/1/2013] specify 84 MW of generating capacity
located on approximately 474 acres and includes 3,588 [sic] CPV trackers configured into 61 building blocks, each consisting of 58 trackers, amounting to: 61 × 58 = 3,538 units.
2 The Campo-Cottonwood Creek Sole-Source Aquifer was designated as such on May 28, 1993, under the authority of
Section 1424(e) of the Safe Drinking Water Act (Federal Register Citation-49 FR 2948, January 24, 1984).
3 John Mauris, a local Ribonwood Road resident, reports witnessing heavy rains that caused flooding and failure of
earthen dams in the Upper McCain Valley (personal communication, August 1, 2013).
4 The hydrologic calculations shown in Table 5 were performed using the Creager formula (Ponce 1989). This formula
provides an envelope of measured peak discharges, per unit of drainage area, as a function of drainage area.
5 Anecdotal evidence of flood conditions at Tule Creek was provided by Mark Ostrander during a field interview on August
1, 2013. Ostrander indicated that the flood depth in the Tule Creek floodplain may reach 1.5 ft under typical flood flow conditions. He served as Captain and Batallion Chief at McCain Valley Conservation Camp for 15 years, prior to his retirement from CalFire. The Camp comprises the central part of the Tule Creek floodplain. He mentioned that he had spent 27 years fighting fires along the U.S.-Mexico border area, and professed to be very familiar with the Tule Creek site. He stated to have observed flood conditions at Tule Creek at least 12 times during his 27-yr tenure. This would indicate that the 2-yr flood has a flow depth of about 1.5 ft, confirming the hydraulic calculations performed for this report.
6 The hydraulic calculations shown in Table 6 were performed using ONLINECHANNEL01.
7 Project documents state that a fraction of the solar trackers (339 out of the 3,588, or about 10%) will be subject to some
degree of flooding, with depths varying between 2-4 ft and 10-12 ft.
8 The overall damage was $160 million (1976 USD). Twelve (12) deaths were blamed on tropical storm Kathleen
(Wikipedia).
9 Tonalites and granodiorites are similar in mineral composition. A tonalite is a plutonic (intrusive) rock where the
percentage of plagioclase feldspar, relative to the combined content of alkali and plagioclase feldspars, is greater than 90; in a granodiorite, the percentage varies between 65 and 90 (American Geological Institute, 1997).
10 Other studies suggest that the giant tree shown in Fig. 29 may be much older than 300 years. For instance, a specimen
of coast live oak at Stanford University, with a trunk diameter of 55 in (1.4 m) was estimated to be 300 years old. The average rate of annual growth for the Stanford tree would be 0.0047 m. At this average rate of growth, the Boulevard tree would be: 2.4 m / 0.0047 m/yr = 510 years old (Encyclopedia of Stanford trees, shrubs, and vines).
11 Personal communication with Mario Banchetti during the field visit and inspection of August 31, 2013.
12 A preliminary calculation using the Creager formula shows flood discharges ranging from 4,477 cfs to 14,924 cfs.
13 Robert Maupin, personal communication, August 23, 2013.
14 Coast live oak, Quercus agrifolia, is an evergreen oak, highly variable and often shrubby, native to the California
Floristic Province. It grows west of the Sierra Nevada from Mendocino County, California, south to northern Baja California, in Mexico (Wikipedia).
15 Red shank (Adenostoma sparsifolium) is unique among the chaparral in that it violates several definitions of
sclerophyllous plants. First, red shank remains physiologically active during summer drought; thus, it is drought tolerant without being drought dormant (Hanes, 1965). Secondly, its shallow root system suggests that its moisture for summer growth must come from the top layers of the substrate. Red shank seems to be a type of shrub well adapted to drought conditions, but lacking the obvious morphological characteristics suggesting such adaptability (Shreve, 1934).
16 A lineament is a linear feature in a landscape which is an expression of an underlying geological structure such as a
fault. Fracture zones, shear zones and igneous intrusions such as dykes can also give rise to lineaments (Wikipedia).
17 The North American Wetlands Conservation Act (P.L. 101-233) (December 13, 1989) authorizes a wetlands habitat
program, administered by the United States Fish and Wildlife Service, which provides grants to protect and manage wetland habitats for migratory birds and other wetland wildlife in the United States, Mexico, and Canada.
18 The well was recently drilled by the County of San Diego to support the planned new Boulevard Fire Station. On
September 3, 2014, county staff estimated the free flow of this well at 3 gallons per minute (Donna Tisdale, personnal communication).
19 On September 18, 2014, inspection of this well by the author of this report revealed the presence of groundwater
flowing out of the ground under artesian conditions (Fig. 48).
20 The flood discharge calculations were performed using the Creager formula (Ponce 1989).
21 The hydraulic calculations shown in Table 13 were performed using ONLINECHANNEL01.
22 According to Belnap (2003), in the California desert full recovery of soil crusts will take over 1,000 years. Other studies
have suggested that cyanobacteria may take 20 to 50 years to recover, while lichens and mosses may take 100 to over 1,000 years (Webb et al. 2010).
23 Rich Reynolds, a senior scientist with the U.S. Geological Survey, stated in an interview: "These kinds of deserts, and
almost all deserts, sequester dust. They are not only areas where dust is emitted, but they are areas where dust is deposited, and this dust, over a few decades to hundreds of years to thousands of years, works its way down, gets down into the cracks in the soils, and accumulates in these desert soils. In this way, deposited dust can be concentrated in shallow soil, just below the surface, and deeper." (Personal communication on September 25, 2013).
24 There are many ways in which biological soil crusts can influence soil fertility and plant nutrient concentrations: (1)
contributing carbon and nitrogen to the soils; (2) exuding sticky, negatively charge polysaccharides which bind and prevent leaching loss of positively charge nutrients essential to plants; (3) secreting ring-shaped chemical compounds called chelators that keep nutrients available for plants, despite high soil pH; (4) increasing soil temperatures and nutrient uptake rates; (5) increasing dust capture and soil stabilization, thereby improving fertility and water-holding capacity; and (6) increasing soil aggregation (Belnap 2003).
25 This is because abundant aliens with superior dispersal and reproductive abilities such as Bromus rubens are likely to
establish sooner and possibly preempt later colonization of native annuals through competitive exclusion (Brooks 2000; 2002).
26 For a biographical account of C. V. Theis' contributions to hydrogeology, see White and Clebsch (1994).
REFERENCES
• [Top] [Introduction] [Description of Projects] [Water Resources] [Rugged Solar] [Tierra del Sol Solar]
[LanEast/LanWest Solar] [Other Impacts] [Summary] [Appendix] [Acknowledgements] [Endnotes]
AECOM. 2012. Rugged Solar LLC Project, Climate change and greenhouse gas emission analysis, Major Use Permit 3300-12-007, prepared for County of San Diego, Department of Planning and Land Use, December.
American Geological Institute (1997). Glossary of Geology. Julia A. Jackson, editor, Alexandria, Virginia.
Alley, W. M., T. E. Reilly, and. O. E. Franke. 1999. Sustainability of ground-water resources. U.S. Geological Survey Circular 1186, Denver, Colorado, 79 p.
Belnap, J. 2003. The world at your feet: Desert biological soil crusts. Frontiers in Ecology and the Environment, Vol. 1, No. 4, 181-189.
Beta. 2013a. East County Substation Project Ammended Construction Water Supply Plan. Prepared for San Diego Gas and Electric, Revised July 3, 2013.
Beta. 2013b. East County Substation Project Ammended Construction Water Supply Plan. Prepared for San Diego Gas and Electric, Revised September 30, 2013.
Brooks, M. L. 1999. Alien annual grasses and fire in the Mojave desert. Madroño, 46, No. 1, 13-19.
Brooks, M. L. 2000. Competition between alien annual grasses and native annual plants in the Mojave desert. American Midland Naturalist, 144, 2000, 92-108.
Brooks, M. L. 2002. Peak fire temperatures and effects on annual plants in the Mojave desert. Ecological Applications, 12, No. 4, 1088-1102.
Brooks, M. L., C. M. D'Antonio, D. M. Richardson, J. B. Grace, J. E. Kelley, J. M. DiTomaso, R. J. Hobbs, M. Pellant, and D. Pyke. 1999. Effects of invasive alien plants on fire regimes. Bioscience, 54, No. 7, 677-688.
Brooks, M. L., and J. R. Matchett. 2006. Spatial and temporal patterns of wildfires in the Mojave Desert, 1980-2004. Journal of Arid Environments, 67, 148-164.
County of San Diego. 2013. Land Use Policy for Discretionary Permits Adjacent to the International Border. Board of Supervisors Policy I-111.
Dudek. 2012. Greenhouse Gas Analysis Technical Report, Tierra del Sol Solar Farm Project, Major Use Permit 3300-12-010, Boulevard, San Diego County, California. 605 Third Street, Encinitas, California 92024, December.
Brooks, M. L. 2009. "Spatial and temporal distribution of nonnative plants in upland areas of the Mojave desert," in The Mojave desert: Ecosystem processes and sustainability, R. H. Webb and others, editors, The University of Nevada Reno, 343-377.
Fernandes, J., N. Flynn, S. Gibbes, et al. 2010. Renewable energy in the California desert: Mechanisms for evaluating solar development on public lands. M.S. Thesis, School of Natural Resources and Environment, The University of Michigan, April.
Freeze, R. A., and J. A. Cherry. 1979. Groundwater. Prentice-Hall, Inc., Englewoord Cliffs, New Jersey.
Hanes, T. L. 1965. Ecological studies of two closely related chaparral shrubs in Southern California. Ecological Monographs, 35, No. 2, 213-235.
Hardin, G. 1968. The Tragedy of the Commons. Science, Vol. 162, 1143-1148.
HDR Engineering 2011. Tule Wind Project - General Plan Ammendment Report. November.
Love, A. J., P. G. Cook, G. A. Harrington, and C. T. Simmons. 2001. Groundwater flow in the Clare Valley. Department of Water Resources, Government of South Australia, Adelaide, Australia.
L'vovich, M. I. 1979. World water resources and their future. Translation of the original Russian edition (1974), American Geophysical Union, Washington, D.C.
Maimone, M. 2004. Defining and managing sustainable yield. Ground Water, Vol. 42, No. 6, November-December, 809-814.
NASA. 2012. Could a hurricane ever strike Southern California?. Feature.
Pillsbury, N. H., and J. P. Joseph. Coast live oak thinning studies in the Central Coast of California --- Fifth-year results. USDA Forest Service General Technical Report PSW-126. 320-332.
Ponce, V. M. 1989. Engineering Hydrology: Principles and Practices. Prentice Hall, Englewood Cliffs, New Jersey.
Ponce, V. M., and A. V. Shetty. 1995a. A conceptual model of catchment water balance. 1. Formulation and calibration. Journal of Hydrology, 173, 27-40.
Ponce, V. M. 2006. Impact of the proposed Campo landfill on the hydrology of the Tierra del Sol watershed. Online report.
Ponce, V. M. 2007. Sustainable yield of groundwater. Online report.
Ponce, V. M. 2012. Thompson Creek Groundwater Sustainability Study. Online report.
Ponce, V. M. 2013. Cumulative impacts on water resources of large-scale energy projects in Boulevard and surrounding communities, San Diego County, California. Online report.
Prudic, D. E., and M. E. Herman. 1996. Ground-water flow and simulated effects of development in Paradise Valley, a basin tributary to the Humboldt River, in Humboldt County, Nevada. U.S. Geological Survey Professional Paper 1409-F.
San Diego State University, et al. 2002. Three issues of sustainable management in the Ojos Negros valley, Baja California, Mexico. Online report.
Scanlon, B. R., K. E. Keese, A. L. Flint, L. E. Flint, C. B. Gaye, W. M. Edmunds, and I. Simmers. 2006. Global synthesis of groundwater recharge in semiarid and arid regions. Hydrological Processes, 20, 3335-3370.
Scripps Institution of Oceanography. 2013. High-accuracy climate reconstruction reveals mark of human activities on late 20th-century El Niños. News, June 30, 2013.
Seward, P., Y. Xu, and L. Brendock. 2006. Sustainable groundwater use, the capture principle, and adaptive management. Water SA, Vol. 32, No. 4, October, 473-482.
Shreve, F. 1934. The problems of the desert. The Scientific Monthly, 38, No. 3, March, 199-209.
Sophocleous, M. 2000. From safe yield to sustainable development of water resources - The Kansas experience. Journal of Hydrology, Vol. 235, 27-43.
State of California Public Utilities Commission. 2013. Letter from Amy Baekr to Don Houston.
Theis, C. V. 1940. The source of water derived from wells: Essential factors controlling the response of an aquifer to development. Civil Engineering,, Vol. 10, No. 5, May, 277-280.
Webb, R. H., J. Belnap, and K. A. Thomas. 2009. Natural revovery from severe disturbance in the Mojave Desert. In The Mojave Desert: Ecosystem Processes and Sustainability, Richard Webb and others, editors, The University of Nevada Press, 343-377.
White, R. R., and A. Clebsch. 1994. C. V. Theis: The Man and His Contributions to Hydrogeology.
World Water Balance and Water Resources of the Earth. 1978. U.S.S.R. Committee for the International Hydrological Decade, UNESCO, Paris, France.
Zhu, Z., B. M. Sleeter, G. E. Griffith, S. M. Stackpoole, T. J. Hawbaker, and B. A. Bergamaschi. 2012. An assessment of carbon sequestration in ecosystems of the Western United States - Scope, methodology, and geography. U.S. Geological Survey Professional Paper 1797.
About the author
Dr. Victor M. Ponce has taught hydrology at San Diego State University since 1980.
He has more than forty (40) years of experience in the water resources field. His
extensive record of research and practice may be browsed at ponce.sdsu.edu
http://boulevardsoitec.sdsu.edu PDF file
131115
Copyright © 2022 FDOKUMEN