Neighborhood Social Disorganization, Families, and the ...
23
JOURNAL OF ADOLESCENT RESEARCH / September 2002 Bowen et al. / NEIGHBORHOODS, FAMILIES, AND ADOLESCENTS Neighborhood Social Disorganization, Families, and the Educational Behavior of Adolescents Natasha K. Bowen Gary L. Bowen William B. Ware University of North Carolina at Chapel Hill Using data on 1,757 middle and high school students from a nationally representative sample, relationships among youth perceptions of neighborhood characteristics, parenting processes, and their own school behavior, attendance, and grades were tested using structural equation modeling. A model with direct neighborhood effects on self- reported educational behavior as well as indirect effects mediated through perceptions of supportive parenting and parental educational support fit the data well in calibration and validation samples. Perceived neighborhood social disorganization exerted a larger effect than did family processes on self-reported educational behavior. The importance of including measures of neighborhood environment in future research on educational outcomes is discussed in the context of their substantial contribution in the present investigation. School success, defined as maintaining the academic and social perfor- mance necessary to complete high school, is a crucial minimum requirement for future education, employment, and earning opportunities (National Cen- ter for Education Statistics [NCES], 1999a; Richman & Bowen, 1997; Vernez, Krop, & Rydell, 1999). Young adults who do not finish high school are less likely to be employed than those with high school diplomas, GEDs or higher levels of education. They also earn substantially lower incomes than high school completers. In addition, going beyond high school to complete a college education remains a strong positive predictor of employment and 468 This article was prepared with grant support from the John S. and James L. Knight Foundation, Miami, Florida. The authors wish to thank Dr. Abigail Panter, associate professor of psychology, University of North Carolina at Chapel Hill, for her helpful comments on an earlier draft of this manuscript. Address correspon- dence to Natasha K. Bowen, School of Social Work, University of North Carolina at Chapel Hill, 301 Pittsboro Street, CB# 3550, Chapel Hill, NC 27599-3550; [email protected]. Journal of Adolescent Research, Vol. 17 No. 5, September 2002 468-490 © 2002 Sage Publications
-
Upload
khangminh22 -
Category
Documents
-
view
2 -
download
0
Transcript of Neighborhood Social Disorganization, Families, and the ...

JOURNAL OF ADOLESCENT RESEARCH / September 2002Bowen et al. / NEIGHBORHOODS, FAMILIES, AND ADOLESCENTS
Neighborhood Social Disorganization,Families, and the Educational
Behavior of AdolescentsNatasha K. Bowen
Gary L. BowenWilliam B. Ware
University of North Carolina at Chapel Hill
Using data on 1,757 middle and high school students from a nationally representativesample, relationships among youth perceptions of neighborhood characteristics,parenting processes, and their own school behavior, attendance, and grades were testedusing structural equation modeling. A model with direct neighborhood effects on self-reported educational behavior as well as indirect effects mediated through perceptionsof supportive parenting and parental educational support fit the data well in calibrationand validation samples. Perceived neighborhood social disorganization exerted a largereffect than did family processes on self-reported educational behavior. The importanceof including measures of neighborhood environment in future research on educationaloutcomes is discussed in the context of their substantial contribution in the presentinvestigation.
School success, defined as maintaining the academic and social perfor-mance necessary to complete high school, is a crucial minimum requirementfor future education, employment, and earning opportunities (National Cen-ter for Education Statistics [NCES], 1999a; Richman & Bowen, 1997;Vernez, Krop, & Rydell, 1999). Young adults who do not finish high schoolare less likely to be employed than those with high school diplomas, GEDs orhigher levels of education. They also earn substantially lower incomes thanhigh school completers. In addition, going beyond high school to complete acollege education remains a strong positive predictor of employment and
468
This article was prepared with grant support from the John S. and James L. Knight Foundation, Miami,Florida. The authors wish to thank Dr. Abigail Panter, associate professor of psychology, University of NorthCarolina at Chapel Hill, for her helpful comments on an earlier draft of this manuscript. Address correspon-dence to Natasha K. Bowen, School of Social Work, University of North Carolina at Chapel Hill, 301 PittsboroStreet, CB# 3550, Chapel Hill, NC 27599-3550; [email protected].
Journal of Adolescent Research, Vol. 17 No. 5, September 2002 468-490© 2002 Sage Publications
income level. Yet, between October 1996 and October 1997, almost 5% ofhigh school students between ages 15 and 24 dropped out, joining the 11% ofAmericans between 16 and 24 who were high school dropouts (NCES,1999b). Substantial racial and ethnic differences existed in the figures, withHispanic and low-income students most likely to drop out.
Ecological theory posits that characteristics of the multiple social-environmental domains in which youth function contribute to their behaviorand developmental outcomes (Bronfenbrenner, 1979; Garbarino, 1992),including school success. According to this theory, knowledge of individualcharacteristics alone, or an individual’s experiences in any one microsystemis not sufficient for understanding behavior. Consistent with the assumption ofmultiple ecological determinants of behavior, educational researchers havelooked beyond the school microsystem for factors influencing school-relatedoutcomes. Studies that look beyond the school environment, however, havefocused almost exclusively on the family or school-family relationships.
Meanwhile, the body of evidence demonstrating and explicating theeffects of neighborhood characteristics on family members is growing (e.g.,Brooks-Gunn, Duncan, & Aber, 1997). Adolescent behavior and psychologi-cal functioning have been the primary dependent variables in studies ofneighborhood effects on youth. However, because factors that have negativeeffects on youth behavior and psychological functioning at home and in thecommunity are also likely to affect their school functioning, testing theeffects of neighborhood on school-related outcomes—such as grades, socialbehavior, and attendance—is warranted.
Structural equation modeling was used in the current study to examine thecontribution of neighborhood characteristics to a model of family effects onthe school performance and behavior of middle and high school students. Inaddition to permitting a concurrent test of the direct effects of two ecologicaldomains on educational outcomes, this approach permitted an examinationof how processes in the two ecological domains may be interrelated. Thestudy also examined the possibility that ecological effects and interrelation-ships between domains differed for middle and high school students.
SOCIAL DISORGANIZATION THEORY
After focusing primarily on neighborhood status variables, such as neigh-borhood poverty rates and racial and ethnic composition, studies of neighbor-hood effects on youth behavior and mental health are focusing increasinglyon explanatory neighborhood process variables (e.g., Elliott et al., 1996;
Bowen et al. / NEIGHBORHOODS, FAMILIES, AND ADOLESCENTS 469

Sampson, 1997; Stern, Smith, & Jang, 1999). Social disorganization (Shaw &McKay, 1969) is a notable example of these process variables.
Social disorganization theory posits that adolescent outcomes are influ-enced by the degree to which residents of neighborhoods have shared values,social relationships, and an ability to achieve shared goals (Nash & Bowen,1999; Sampson, Raudenbush, & Earls, 1997). Structural characteristics, suchas neighborhood poverty and residential turnover, are predictive of out-comes, but the lower levels of social cohesion and social control of youngpeople often associated with structural variables explain outcomes. Break-downs in neighborhood organization and culture affect youth outcomesdirectly through reduced opportunities for prosocial activities and increasedopportunities for delinquent activity (Elliott et al., 1996) and indirectlythrough the weakening of norms for social support and social control thatsupport effective family and parenting processes (Elliott et al.). Crime, vio-lence, delinquency, and a lack of human and physical resources are indicativeof neighborhood social disorganization.
MODEL
Neighborhood Social Disorganization
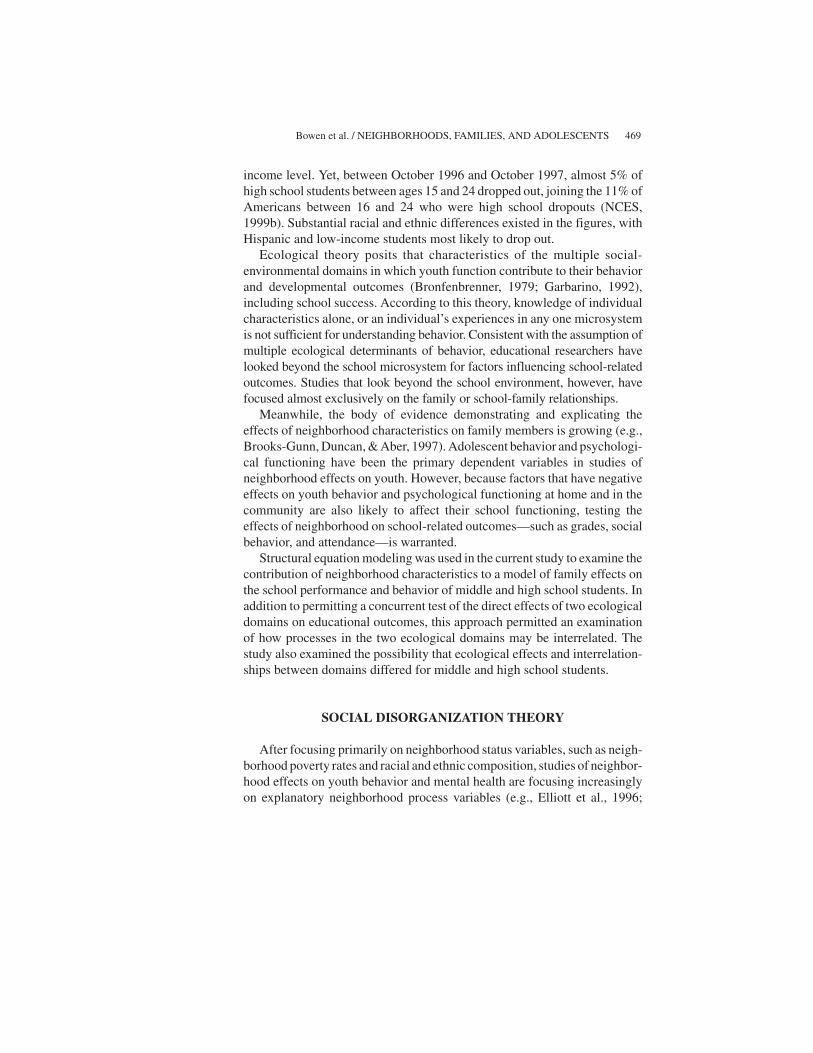
The model tested in the current study is depicted in Figure 1. The neigh-borhood environment is viewed as an exogenous variable representing apotential set of risk or protective factors related to social disorganization thatdirectly and indirectly influence youth functioning (Kupersmidt, Griesler,DeRosier, Patterson, & Davis, 1995). As a preliminary investigation of gen-eral neighborhood effects on educational behavior in a model containingfamily process variables, the current study used a composite of three domainsrelated to perceived neighborhood social disorganization—lack of neighbor-hood support, negative peer behavior, and crime and violence. Higher levelsof neighborhood social disorganization represent a risk factor that has a nega-tive impact on adolescent functioning. Lower levels represent greater neigh-borhood organization, which operates as a protective factor associated withbetter educational outcomes.
Direct Effects of NeighborhoodSocial Disorganization
Numerous studies have documented the direct effects of each of the threeindicators of neighborhood social disorganization, either positively or nega-
470 JOURNAL OF ADOLESCENT RESEARCH / September 2002
tively framed, on adolescent behavior and psychological functioning. Forexample, measures of shared parenting and mutual support among residentshave been shown to mediate the effects of neighborhood structural character-istics on adolescent behavior (Elliott et al., 1996; Sampson, 1997). Using aterm from Coleman (1988), Furstenberg and Hughes (1995) suggested thatshared parenting among adults in a community represents social capital foryouth, increasing their chances of achieving “conventionally successful out-comes” (p. 582) above and beyond the effects of social capital within the fam-ily alone. Positive and negative peer behaviors have been consistently linkedto the behavior of individual adolescents (Williams, Ayers, & Arthur, 1997).Others have documented the effects of neighborhood crime and violence onbehavior and psychological health (Jenkins & Bell, 1994; Simcha-Fagan &Schwartz, 1986).
A limited amount of evidence exists for the association between exposureto violence and school behavior and performance. Jenkins and Bell (1994)found small to moderate correlations between witnessing violence and self-reports of trouble in school for female African American high school stu-dents and between personal victimization and reports of trouble in school formale African American high school students. N. K. Bowen and G. L. Bowen
Bowen et al. / NEIGHBORHOODS, FAMILIES, AND ADOLESCENTS 471
ParentalEducational
Support
NeighborhoodSocial
Disorganization
SupportiveParenting
EducationalBehavior
FamilyPoverty
Respondent’sRace/ethnicity
Figure 1. Model of Hypothesized Relationships Among Neighborhood Charac-teristics, Family Processes, and Youth Educational Behavior.

(1999) reported significant relationships between indicators of neighbor-hood danger and school-related problems among middle and high school stu-dents.
Parenting Processes
Two aspects of family process related to parenting practices are includedin the model: emotionally supportive parenting and parental educational sup-port. Although it is not surprising that parents’ educationally supportivestrategies contribute directly to school performance and behavior (N. K.Bowen & G. L. Bowen, 1998; Teachman, Paasch, & Carver, 1996), studieshave also found that more general parenting characteristics are predictive ofeducational outcomes. Specifically, three components of authoritativeparenting—promoting psychological autonomy, parental acceptance andinvolvement, and establishing behavioral control—have been found to pro-mote positive school behavior and performance both individually and incombination (Gray & Steinberg, 1999; Steinberg, Elmen, & Mounts, 1989).The components of authoritative parenting have been defined to include awide variety of behaviors, including those consistent with the measure ofeducational support used in this study. Therefore, the current model exam-ines the relationship between these two aspects of parenting as well as theireffects on educational behavior.
Neighborhood Social Disorganization’sIndirect Effects Through Parenting
The model contains an indirect path from neighborhood social disorgani-zation to educational outcomes through the parenting measures. Researchfindings suggest that the ability of parents to employ supportive parentingstrategies depends in part on the levels of social support and stress they expe-rience in microsystems external to the family (Furstenberg, 1993; McLoyd,1990). Neighborhood support may include the availability of institutionalresources and informal assistance with the tasks of regulating adolescentbehavior (Elliott et al., 1996). The availability of other adults to provideinformation and feedback about parenting contribute to effective parentingpractices (Furstenberg, 1993; McLoyd, 1990). Social support to parents alsomay reduce the negative impact of stressors on parenting behaviors(McLoyd, 1990).
Crime and violence in neighborhoods are stressors that may impedeparenting functions in numerous ways. They may, for example, cause emo-tional strain on parents (McLoyd, 1990), increase the likelihood of irritable
472 JOURNAL OF ADOLESCENT RESEARCH / September 2002

parent-child exchanges (Patterson, 1983), induce parents to limit severely theinteraction of family members with other neighborhood residents and institu-tions, and increase demands on parents who decide they should physicallyaccompany their children whenever they venture out of the home (Brodsky,1996; Furstenberg, 1993).
Negative neighborhood peer culture may also have a deleterious impacton parenting by (a) representing an additional stressor that reduces parentingefficacy, and (b) causing parents to attempt to exert greater control on theiradolescent children at a developmental stage when youth are increasinglyinterested in autonomy (Brodsky, 1996; Furstenberg, 1993). This orientationhas been found to be negatively associated with desirable school outcomes.
Educational Behavior
Few studies have examined the effects of neighborhood characteristics onschool performance and behavior. Exceptions include studies that examinedthe association between neighborhood structural characteristics, such as thepresence of affluent neighbors, and school dropout rates (e.g., Brooks-Gunn,Duncan, Klebanov, & Sealand, 1993). The current study examined the effectsof neighborhood and family processes on the social and academic perfor-mance of adolescents who were still in school.
Demographic Characteristicsof Sample Members
Measures of individual-level race/ethnicity and poverty are included inthe model. By allowing these two variables to be correlated with characteris-tics of the neighborhood and to influence educational behavior outcomes, themodel controls for the potential effects of families’ self-selection into differ-ent types of neighborhood.
Multiple Group Analysis
A multiple group structural equation model analysis was used to deter-mine if the model illustrated in Figure 1 differed statistically for middle andhigh school students. Middle school students are viewed as more vulnerableto stressors or risk factors because they typically enter larger, more imper-sonal schools at the same time they undergo other potentially stressful transi-tions (e.g., biological, cognitive, and social changes) (Simmons, Burgeson, &Carlton-Ford, 1987). Evidence also suggests that middle and high school stu-dents’ perceptions of environments with similar characteristics—for
Bowen et al. / NEIGHBORHOODS, FAMILIES, AND ADOLESCENTS 473

example, schools and neighborhoods—may differ (G. L. Bowen, N. K.Bowen, & Richman, 1998). Given the deleterious effects of multiple stress-ors in children’s lives, we expected the relationship between perceived neigh-borhood characteristics and educational behavior to be stronger for middleschool students than high school students.
METHOD
Source of Data
Data were collected from a nationally representative sample of 2,099 mid-dle and high school students between October 31, 1996, and February 15,1997, by Louis Harris and Associates, Inc. First, a sample of 93 public middleand high schools in the United States was selected. Then, a representativesample of students from the schools was selected. Due to the multistage sam-ple design, the standard errors for the parameter estimates may underestimatethe true standard errors within clusters and increase the probability of Type Ierror.
Data were collected using the School Success Profile (SSP) (Richman &Bowen, 1997), a self-administered survey instrument designed for use byparticipants in the nationwide Communities In Schools (CIS) program.Based on an ecological perspective, the SSP assesses students’ perceptionsof their family, school, peers, and neighborhood, and dimensions of indi-vidual adaptation, such as physical and psychological well-being andschool functioning.
Sample Profile
Cases with missing data on any of the analyzed variables (16.3% of theoriginal sample) were excluded, leaving 1,757 cases for analysis. The data setwas then divided into separate files for middle and high school cases. Each ofthese files was randomly divided into a calibration file (for initial testing ofthe model) and a validation file (for confirming the model). The demographiccharacteristics of the calibration and validation samples for each age groupdid not differ substantially. In addition, the demographic breakdowns of theanalyzed samples did not differ substantially from the original, nationallyrepresentative sample of 2,099 students. The middle school samples wereabout evenly split between boys and girls. About two thirds of each of themiddle school samples were White. Approximately 10% of each samplewere in each of the following racial/ethnic categories: African American,
474 JOURNAL OF ADOLESCENT RESEARCH / September 2002

Hispanic, and “Other.” About 45% of the two high school samples weremales, and about 55% were females. About 60% of each of the high schoolsamples were White; 15% were African American; approximately 9% wereHispanic; and about 14% were in the Other racial/ethnic category.
Measures
The relationships among aspects of three primary domains in which ado-lescents function—the neighborhood, family, and school—as perceived andreported by the youths were of central interest in the study. Researchers havedocumented the validity of self-report data collected from adolescents(Garbarino, Stott, & Faculty of the Erikson Institute, 1989), and cognitivemediational models stress the salience of the active interpretive role of indi-viduals within their social context. In spite of the desirability of assessingyouth perceptions for the purposes of the current study, however, potentialbiases in the self-report data due to social desirability and attention limita-tions of adolescents should be kept in mind when interpreting them. Correla-tions and descriptive statistics for observed variables are presented in Table 1.Latent constructs were based on established scales from the SSP and werevalidated through the confirmatory factor analysis component of this study.
Neighborhood social disorganization. Three composites were used toassess the latent neighborhood social disorganization construct. The firstmeasure, labeled lack of neighborhood support, was based on six items (α =.66). Four items assessed respondents’ perceptions of how interested adultneighbors were in young people, how much neighbors helped each other out(two items), and the availability of neighborhood activities for youths. Twoadditional items assessed how satisfied respondents were with their neigh-borhood and how safe they felt in their neighborhood (adapted from Small,1991). This variable is a measure of the success of adult residents in makingyoung people feel safe. A dichotomous response format was used: agree ordisagree. The scale ranged from 0 to 6. Higher values represented less neigh-borhood support.
The second measure of neighborhood social disorganization was based ona seven-item scale (α = .85) assessing perceptions of the prosocial behaviors(get good grades, graduate from high school, work or go to college after highschool) and negative behaviors (trouble with police, drug use, gang member-ship, alcohol consumption) of neighborhood peers. Respondents evaluatedeach item as either likely or unlikely. The scale ranged from 0 to 7, withhigher values representing more negative peer behaviors and fewer prosocialbehaviors.
Bowen et al. / NEIGHBORHOODS, FAMILIES, AND ADOLESCENTS 475

TABLE 1: Descriptive Statistics, Correlations With Demographic Variables, and Correlations With Other Indicators of Latent Variablesfor 21 Indicators of Latent Variables
Race/ FamilyM SD Ethnicity Poverty 1 2 3 4 5 6 7 8 9 10 11 12 13 14 15 16 17 18 19 20 21
1. Lackneighborsupport 1.84 1.56 .08 .07 .44 .25 –.22 –.21 –.23 –.32 –.31 –.27 -–.23 –.21 –.26 –.17 –.17 –.17 –.03 –.17 –.15 –.22 –.15 –.27
2.50 1.58 .09 .002. Negative
peerbehavior 1.51 2.03 .19 .24 .39 .47 –.15 –18 –.17 –.23 –.20 –.20 –.18 –.20 –.22 –.10 –.19 –.13 –.09 –.15 –.15 –.27 –.20 –.31
2.34 2.22 .14 .103. Crime and
violence 1.18 2.07 .23 .18 .22 .37 –.18 –.14 –.14 –.23 –.19 –.18 –.19 –.15 –.20 –.10 –.16 –.12 –.09 –.16 –.10 –.36 –.28 –.331.88 2.55 .19 .09
4. SP1 1.87 0.34 .05 .02 –.22–.06 –.13 .42 .54 .49 .48 .49 .34 .42 .42 .13 .22 .23 .15 .13 .13 .15 .09 .121.77 0.42 –.02 .04
5. SP2 1.88 0.33 –.03 –.04 –.27–.17 –.18 .45 .55 .45 .44 .44 .46 .42 .48 .24 .24 .24 .19 .17 .13 .16 .11 .191.77 0.42 –.13 –.04
6. SP3 1.82 0.39 .01 .02 –.20–.06 –.08a .60 .46 .52 .47 .46 .46 .48 .54 .18 .19 .25 .15 .13 .18 .16 .14 .221.67 0.47 –.04 .06
7. SP4 2.47 0.69 .06 .04 –.22–.02 –.13 .46 .37 .53 .64 .63 .49 .55 .51 .25 .26 .32 .24 .30 .21 .23 .21 .182.25 0.73 –.05 .04
8. SP5 2.72 0.55 .03 .03 –.16–.07 –.08a .38 .36 .41 .61 .63 .55 .52 .55 .20 .26 .33 .20 .23 .20 .25 .20 .202.54 0.66 –.08 –.03
9. SP6 2.45 0.70 –.03 .04 –.22–.07 –.12 .45 .35 .46 .60 .54 .51 .55 .50 .22 .27 .29 .26 .31 .25 .21 .15 .172.30 0.75 –.04 .08
10. SP7 2.64 0.59 .00 –.08a –.22–.18 –.15 .44 .43 .49 .45 .44 .43 .70 .75 .29 .26 .35 .25 .31 .18 .21 .19 .172.48 0.68 –.13 –.01
476

11. SP8 2.56 0.64 .06 .01 –.16–.07 –.06 .47 .32 .48 .47 .44 .47 .65 .78 .26 .24 .33 .29 .28 .28 .19 .16 .182.38 0.71 .02 .08
12. SP9 2.60 0.62 .05 .06 –.23–.15 –.11 .41 .39 .49 .49 .40 .51 .66 .71 .29 .25 .32 .28 .31 .23 .19 .18 .212.37 0.73 –.04 .00
13. ES1 1.33 0.47 .10 .03 –.05 .01 –.03 .17 .08a .10 .10 .13 .09 .06 .07 .04 .40 .44 .29 .31 .31 .13 .23 .101.49 0.50 –.02 –.02
14. ES2 1.63 0.48 .04 –.01 –.16–.11 –.02 .10 .12 .07 .16 .12 .12 .15 .14 .15 .27 .39 .22 .29 .28 .21 .29 .131.63 0.48 –.13 –.11
15. ES3 1.67 0.47 –.02 –.03 –.13–.12 –.05 .22 .13 .20 .25 .21 .23 .26 .27 .31 .24 .39 .45 .35 .29 .14 .20 .121.65 0.48 –.20 –.09
16. ES4 1.57 0.50 .06 .03 –.12–.01 .00 .12 .02 –.02 .11 .12 .02 .04 .11 .10 .18 .25 .26 .20 .24 .03 .03 .071.65 .048–.11 –.06
17. ES5 1.41 .49 .03 .02 –.13–.10 –.06 .16 .12 .22 .21 .15 .17 .23 .18 .24 .21 .23 .33 .21 .27 .18 .22 .121.43 .50 –.09 .00
18. ES6 1.58 0.49 .17 .04 –.15–.09 –.01 .16 .18 .21 .15 .10 .19 .16 .18 .21 .29 .28 .23 .10 .30 .20 .21 .051.71 0.46 –.02 –.01
19. Schoolsocialbehavior 11.23 1.31 –.15 –.18 –.10–.27 –.36 .09 .12 .08a .07 .06 .11 .16 .15 .15 –.02 .05 .18 –.06 .08a .00 .42 .41
11.38 1.23 –.04 .0420. Grades 10.11 2.10 –.10 –.19 –16 –.17 –.19 .05 .17 .10 .12 .10 .11 .22 .17 .15 .08 .12 .23 .02 .19 .13 .46 .33
9.93 2.32 –.08 –.0321. Attendance 4.58 0.73 –.13 –.15 –.10–.20 –.24 .04 .12 .03 .06 .04 .03 .13 .06 .06 .05 .03 .03 –.03 .16 –.01 .41 .28
4.06 1.12 –.07 –.09
NOTES: In cells with two values, top values are for middle school sample, and lower values are for high school sample.Correlation coefficients be-low the diagonal are for themiddle school sample; coefficients above the diagonal and italicized are for the high school sample.Correlations of .083(rounded to .08) or higher were significant in the middle school sample at p ≤ .05.Correlations of .075 (rounded to .08) or higher were significant inthe high school sample at p ≤ .05.a. Middle school correlations of .08 that were not significant.
477

The third measure of neighborhood social disorganization was based onrespondents’ perceptions of 12 indicators of crime and violence in theirneighborhoods (α =.84). Indicators assessed personal experiences (such asbeing threatened with a weapon) and other knowledge of or exposure tocrime and violence (such as hearing gunshots or witnessing a drug sale).Respondents answered either no or yes to each item. The scale ranged from 0to 12, with higher numbers indicating more crime and violence.
Supportive parenting. Supportive parenting was assessed with nine ques-tionnaire items (α = .90) drawn from three highly correlated scales on theSSP. The specific items were “I’m satisfied that I can turn to my family forhelp when something is bothering me” (SP1 in the table and figures); “I’msatisfied with the way my family supports me in doing new and differentthings” (SP2); “I’m satisfied with the way my family responds to my feel-ings” (SP3); “People in my home give each other plenty of time and atten-tion” (SP4); “People in my home feel loved and cared for by one another”(SP5); “People in my family work together to solve problems” (SP6); “Adultsin my home gave me encouragement in the past 30 days” (SP7); and “Adultsin my home gave me helpful advice in the past 30 days” (SP8); and “Adults inmy home made me feel important in the past 30 days” (SP9). Satisfactionitems were adapted from the Family APGAR scale (Smilkstein, Ashworth, &Montano, 1982). SP4, SP5, and SP6 were adapted from the Family ValueProfile (G. L. Bowen, 1991). Three of the items were dichotomous, and sixhad three response options. All were coded in the positive direction.
Educational support. Educational support was assessed with a six-itemscale (α = .71) focusing on parent-child educational discussions. Respon-dents were asked if, in the past 30 days, they and adults in their home had dis-cussed school courses or programs (ES1); school activities or events (ES2);study topics from class (ES3); attendance, homework, or problems with ateacher (ES4); politics or current events (ES5); or their future plans (ES6).The dichotomous response options were coded in the positive direction.Items were adapted from the National Educational Longitudinal Study of1988 (National Opinion Research Center [NORC], 1988).
Educational behavior. The educational behavior construct was based ontwo established scales and an index related to school social behavior, grades,and attendance. The social behavior measure (α =.66) was derived from fouritems assessing how often in the past 30 days the youth was sent out of classfor misbehavior, fought with another student, was suspended or expelled, andwhether the youth’s parents received a warning about attendance, behavior,
478 JOURNAL OF ADOLESCENT RESEARCH / September 2002

or grades (adapted from NORC, 1988). Responses included never, once ortwice, or more than twice. The scale ranged from 4 to 12 and was codedpositively.
The grades measure ranged from 3 to 12, with 12 representing the bestgrades. The scale (α = .80) was a composite based on the youth’s perceptionof his or her grades in general (e.g., mostly Bs and Cs), number of Ds and Fson the last report card, and grades relative to other students. The questionswere adapted from the Teenage Assessment Project (Small, 1991).
The attendance measure was based on responses to five questions aboutwhether the youth cut a class, cut an entire school day, was tardy, missedschool due to sickness, or missed school due to family concerns in the past 7days. Respondents answered either no or yes. The attendance measureranged from 0 to 5, with 5 indicating that the child had not been tardy ormissed any classes. Because the attendance construct did not represent alatent construct with effect indicators, this measure was treated as a countindex and not a scale.
Demographic characteristics. Two individual-level demographic vari-ables were included in the model. Respondent’s race/ethnicity was a dummyvariable for which White was coded as 0 and Other was coded as 1. Familypoverty was also a dummy variable based on responses to the question “Doyou receive free or reduced price lunches at school?” Responses of no anddon’t know were coded 0; affirmative responses were coded 1.
Data Analysis Procedures
Multigroup, structural equation model analyses were conducted usingAmos, Version 3.6 (Arbuckle, 1997). Anderson and Gerbing’s (1988) recom-mended two-step analysis procedure was used, meaning that first the mea-surement model was tested to determine if the hypothesized factor patternexisted for both middle and high school youth. Then, after determining that agroup-invariant factor loading pattern existed in the measurement model, thefull model was tested to determine if the hypothesized structural relation-ships among factors adequately fit the data with (a) the structural paths freelyestimated for the middle and high school samples (Model I), or (b) the struc-tural paths constrained to be equal for younger and older adolescents (ModelII). We hypothesized that the relationships among factors would vary formiddle school and high school students, i.e., that Model I would have betterfit than Model II. Alpha was set at .05.
The final step of the analysis was to retest the model identified by theabove calibration analyses using the validation samples for the two groups. It
Bowen et al. / NEIGHBORHOODS, FAMILIES, AND ADOLESCENTS 479
is highly desirable to validate structural equation models with separate sam-ples especially when model modifications have been made based on empiri-cal findings from the first sample (Hoyle & Panter, 1995).
Estimation procedures. Analyses in the current study were first conductedusing the default Maximum Likelihood (ML) procedure. Because of possibleestimation biases due to nonnormality in the observed variables, ML parame-ter estimates were compared to results obtained using the bootstrap proce-dure available in Amos (Arbuckle, 1997). Bootstrap results revealed minimalbiases in the ML estimates, therefore, bootstrap findings are reported onlywhen they indicated a change in the significance of a ML-derived parameter.
Assessing model fit. Several commonly reported fit indices were used toassess the model: the ratio of χ2 to degrees of freedom (χ2/df), the Goodnessof Fit Index (GFI), the Incremental Fit Index (IFI), the Comparative Fit Index(CFI), and the Root Mean Square Error of Approximation (RMSEA). Indiceswere selected to ensure that a variety of statistical approaches to assessing fitwere represented. Values of 2.0 or lower are considered desirable for χ2/dfratio. A cutoff of .90 was used for the GFI, IFI, and CFI. A value of less than.05 was sought for the RMSEA. See Hoyle and Panter (1995) for more infor-mation about these and other fit indices.
RESULTS
Calibration Samples
Measurement model. Output from the first analysis of the measurementmodel indicated that all indicators had statistically significant loadings on thehypothesized factors (standardized loadings were between .393 and .812 forthe middle school sample, and between .477 and .840 for the high school sam-ple). Model fit, however, was poor according to all reported fit measures: χ2/df =3.680 (1409.330/383); GFI = .848; IFI = .846; CFI = .846; RMSEA = .055.
Modification indices suggested that three sets of indicators for the sup-portive parenting factor were correlated (SP1-3, SP4-6, and SP7-9).Allowing the indicators to be correlated in the model resulted in acceptablemodel fit according to all of the indices presented: χ2/df = 1.962 (716.191/365); GFI = .927; IFI = .948; CFI = .947; RMSEA = .033. Some researchersargue that modifying models based on suggestions generated by SEM soft-
480 JOURNAL OF ADOLESCENT RESEARCH / September 2002

ware is acceptable if the modifications (a) are minimal, (b) are theoreticallysound, and (c) do not result in significant changes to the model’s parameters(Byrne, Shavelson, & Muthen, 1989). These criteria were met in the currentstudy. In addition, the results were tested with a validation sample. The mea-surement model with constrained factor loadings for the middle and highschool samples and correlated errors among three subsets of indicators in theparenting construct was therefore considered appropriate for the next stage ofanalysis.
Full model. To test the hypothesis that middle school students would bemore vulnerable to the effects of negative neighborhood characteristics,Model I, with structural paths allowed to vary for middle and high school stu-dents, was compared to Model II, in which the structural paths were con-strained to be equal for the two groups. Results indicated that allowing themiddle and high school samples to have different structural parameter esti-mates did not significantly improve model fit (change in χ2 = 9.35 for 10 df,p > .05). The hypothesis that the relationships among neighborhood and fam-ily environments and educational performance and behavior differed signifi-cantly for middle and high school students was not supported.
Based on the calibration samples, Model II, with constrained factor load-ings and structural paths and correlated errors among three subsets of sup-portive parenting indicators, fit the data well: χ2/df = 1.943 (880.175/453);GFI = .919; IFI = .938; CFI = .938; RMSEA = .033. To validate the findings,the model was retested using the high school and middle school validationsamples. Complete analysis results are reported only for the validation sam-ple. Significant differences between results obtained with the calibration andvalidation samples are described, as are bootstrap results that differed signifi-cantly from ML results.
Validation Sample Analysis
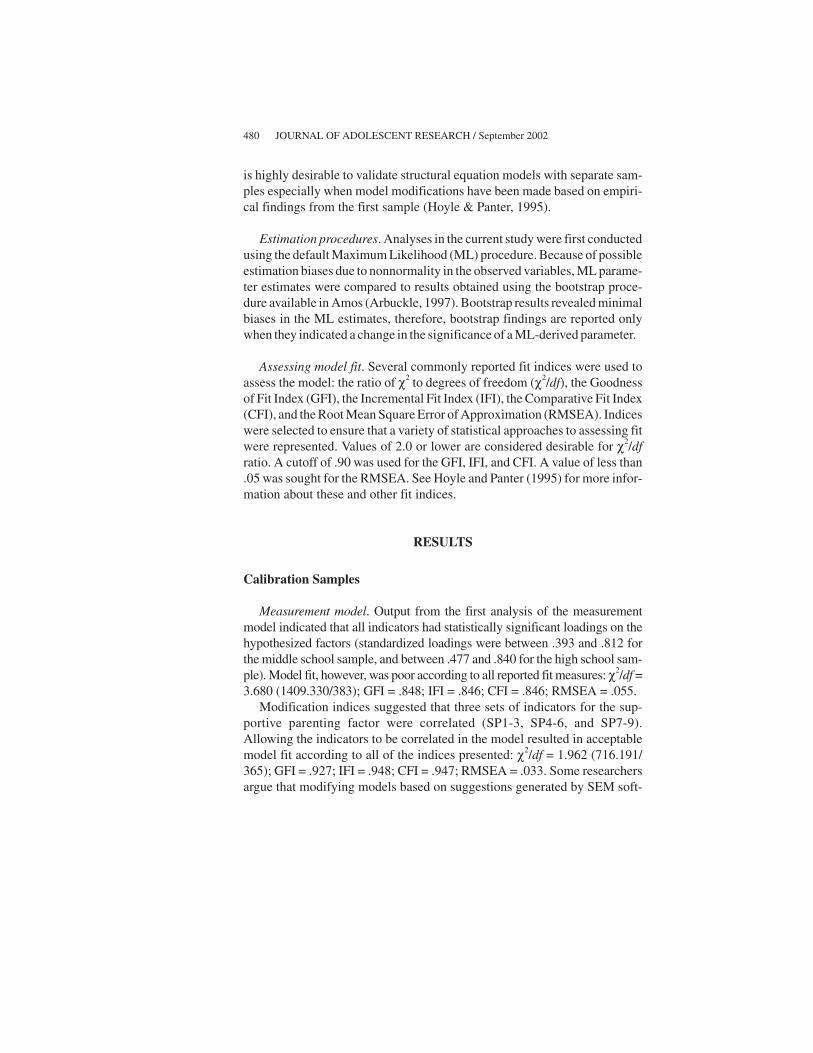
Model fit. According to all reported fit measures, model fit improved whenModel II was retested using the validation samples (as compared to model fitobtained with the calibration sample): χ2/df = 1.795 (813.114/453); GFI =.927; IFI = .945; CFI = .944; RMSEA = .030. The hypothesized model, there-fore, was supported using two independent samples of the population. Figure2 presents the standardized factor loadings and path coefficients derived fromtesting Model II using the middle school and high school validation samples.
Bowen et al. / NEIGHBORHOODS, FAMILIES, AND ADOLESCENTS 481

Parental
Educational
Support
.267^
.332
SP2 SP4SP3 SP5 SP6 SP7 SP8SP1 SP9 ES1 ES2 ES3 ES4 ES5 ES6
Educational
Behavior
.339^
.436
Respondent’s
Race/ethnicity
Family
Poverty
Social
Behavior
at school
Grades
Attendance
Neighborhood
Social
Disorganization
Supportive
Parenting
.139^
.163
Negative
Peer
Behavior
Crime and
Violence
Lack of
Neighborhood
Support
.516*
.577*
.032
.035-.373*
-.404*
.173*.166*
-.499*
-.578*.015
-.044
-.039
.014
.453* .444*
.278*
.205*
.208*
.167*
.449
.559
.636
.738
.605
.633
.668
.748
.590
.587
.613
.478
.639+
.609
.599
. .580
.680
.659.685
.760
.664
.710
.660
.737.689
.699
.679
.726
.711
.727.521
.562
.654
.703
.416
.474
.499
.523.432
.492
.543
.577
Figure 2. Standardized Results of Maximum Likelihood Estimation For Middle and High School Validation Samples, Measurement andStructural Models.
NOTE:Path coefficients are standardized (unstandardized path coefficients are equal).Middle school coefficients are in roman font.High school co-efficients are in italics.* = path statistically significant at .05 level;+ = all factor loadingswere significant at .05 level or below;^ = squaredmultiple cor-relation of endogenous variable or percent of variance explained.
482

All factor loadings were significant and exceeded .40 for middle and highschool student samples. Although the middle and high school standardizedvalues vary slightly, it should be remembered that the loadings and pathswere constrained to be equal and the unstandardized values were identical forthe two groups. Figure 2 indicates that, among the latent independent vari-ables examined, perceptions of neighborhood social disorganization had thestrongest direct relationship to the dependent variable. Its standardized mid-dle and high school coefficients (–.499 and –.578, respectively) were largerthan the coefficients for perceptions of supportive parenting (.032, .035) andeducational support (.173, .166). The standardized weights for the path fromneighborhood social disorganization to self-reported educational behaviorwere substantially higher in the calibration samples: –.680 and –.666, respec-tively (not shown in figure). Neighborhood social disorganization also had asmall indirect effect on educational behavior through perceived levels of sup-portive parenting and parental educational support (–.033 for middle schooland –.039 for high school). Values for the construct underlying school behav-ior, grades, and attendance decreased as neighborhood social disorganizationincreased.
Perceptions of neighborhood social disorganization also exhibited thehypothesized negative effects on perceptions of supportive parenting, with astandardized path coefficient of –.373 for the middle school sample and –.404for the high school sample. The greater the level of neighborhood disorgani-zation, the less likely youth were to view parenting practices as supportive.Supportive parenting, in turn, had a large and statistically significant effect onparental educational support, with standardized path coefficients of .516 and.577 for the middle and high school samples, respectively. Increasingly sup-portive parenting was associated with greater educational support in terms ofadult-child conversations related to schooling.
Perceptions of neighborhood social disorganization also exerted an indi-rect effect on perceived levels of parental educational support through itseffects on supportive parenting. The standardized indirect effect was –.192for middle schools and –.233 for high school students.
A statistically significant direct path from parental educational support toeducational behavior was revealed when the model was tested with the vali-dation sample. The standardized path coefficients were .173 and .166 for themiddle and high school samples respectively. These results differed from thecalibration sample results in which the path was not significant.
The significant path (in the validation sample) from educational support toeducational behavior completed an indirect path from supportive parenting
Bowen et al. / NEIGHBORHOODS, FAMILIES, AND ADOLESCENTS 483

to educational behavior. The indirect effect was about .09 in both groups. Thedirect path from parenting support to educational behavior was not signifi-cant for either the calibration or validation sample.
Neither race or ethnicity nor poverty was a significant predictor of self-reported educational behavior in the model. Both variables were significantlycorrelated with neighborhood social disorganization, however, indicatingthat non-Whites and students in low-income families were more likely to livein disorganized neighborhoods. By removing the effects of these two demo-graphic variables on neighborhood social disorganization and educationalbehavior, the model controlled for potential neighborhood selection biasesand potential confounded effects of neighborhood social disorganization andrace/ethnicity or poverty on educational outcomes. The effects of social dis-organization on educational behavior in the current study, therefore, cannotbe attributed to the fact that both may be affected by family poverty levels orrace/ethnicity.
Bootstrap results. ML biases for the standardized regression weights,error correlations, error variances, and squared multiple correlations werevery small for both school-age groups, ranging from less than .001 to .032(absolute values), with about 90% of the differences less than .01. The criticalratio for one correlated error estimate in each sample that was significantaccording to ML results was nonsignificant according to bootstrap results. Inaddition, one error correlation in each sample was nonsignificant accordingto both ML and bootstrap estimates, reflecting the instability of empiricallybased model modifications.
Variance explained. The squared multiple correlation estimates inside theSupportive Parenting oval in Figure 2 indicate that between 14% and 16% ofthe variance of the adolescent samples’ perceptions of supportive parentingwas explained by neighborhood social disorganization. In turn, neighbor-hood disorganization and supportive parenting explained about 27% and33% of the variance in perceptions of parental educational support in the mid-dle and high school samples, respectively.
The model as a whole explained 34% of the variance in educational behav-ior for the middle school sample and 44% for the high school sample.Although model fit was superior in the validation sample, the amount of vari-ance of educational behavior explained with the validation samples wassmaller than in the calibration samples. Over half of the variance in educa-tional behavior was explained by the model tested with the middle (54%) andhigh school (52%) calibration samples.
484 JOURNAL OF ADOLESCENT RESEARCH / September 2002

DISCUSSION
Neighborhood characteristics are becoming increasingly recognized asfactors that have an impact on the families and youth that live within them. Inthe current study, neighborhood social disorganization as perceived by ado-lescents made a substantial contribution to a model of family effects on edu-cational behavior. Independent direct effects of neighborhood social disorga-nization on adolescent educational behavior were not only documented butalso shown to be greater than the effects of two family process variables thatare consistent predictors of educational behavior. The findings held for mid-dle and high school students. This study contributes to the scarce literatureabout neighborhood effects on educational behavior of adolescents who arestill in school and offers support for the use of ecological models that exam-ine simultaneously the effects of multiple domains on youth outcomes. Thestudy also contributes to the growing evidence that neighborhood character-istics related to social disorganization—the presence or absence of resourcesand support for families, crime, violence, and norms for peer behavior—arean important complement to studies that focus their attention on structuralcharacteristics in neighborhoods.
The observed strong direct effect of neighborhood social disorganizationon supportive parenting lends credence to the hypothesis that parents are lessable to respond to the emotional needs of their adolescent children when theneighborhood environment contains negative peer influences, crime, vio-lence, and a dearth of human and material resources for youth. These findingssuggest that programs and policies addressing social disorganization inneighborhoods may promote warmer parent-adolescent relationships, moreeffective parenting practices, and greater educational support in addition tohaving direct effects on educational behavior.
The weak relationships found between parenting constructs and educa-tional behavior suggest that home effects on school outcomes previouslydocumented in the literature should be reexamined in the context of theneighborhood environment. Including the neighborhood environment infamily-focused models predicting educational behavior may contribute to amore complete understanding of the nature and magnitude of the effects ofparenting processes on school outcomes.
The model indicated that supportive family relationships facilitate educa-tionally supportive parenting behaviors. All of the effect of supportiveparenting on educational behavior was mediated by perceptions of educa-tional support. Although Steinberg et al. (1989) found that the components ofauthoritative parenting, including a measure of supportiveness, had directpositive effects on educational behavior, no direct path was found in the cur-
Bowen et al. / NEIGHBORHOODS, FAMILIES, AND ADOLESCENTS 485
rent study. Steinberg et al., however, did not include parental educational sup-port in the model as a mediator of the components of authoritative parenting.
When taking into account their correlation with neighborhood social dis-organization, respondents’ race/ethnicity and poverty status, as measured inthe current study, did not exert a significant independent influence on educa-tional outcomes. This result may indicate that neighborhood quality has morepotential for accounting for variation in educational behavior than individualdemographic characteristics, which have predictive rather than explanatorypower. Because of disagreement among researchers about the effects ofdemographic controls (Gray & Steinberg, 1999), however, the finding shouldbe interpreted with caution. In addition, the moderate correlation betweenrace/ethnicity and poverty suggests that a composite demographic measuremay have been preferable to the two separate measures.
Contrary to the hypothesis that middle school students would be more vul-nerable to negative environmental characteristics because of their develop-mental status (Simmons et al., 1987), the structural relationships amongneighborhood, family, and educational behavior did not differ significantlyfor younger and older adolescents in the current study. This finding suggeststhat negative neighborhood characteristics may differ from other potentialadolescent stressors, such as those studied by Simmons and colleagues(1987). The uniformly negative impact of neighborhood disorganizationacross the two age groups may be due to its indirect effect on parenting inaddition to its deleterious direct effect on educational behavior. Future analy-ses should continue to explore similarities and differences in the two agegroups.
Structural equation modeling is a tool for testing models with strong theo-retical foundations. Theory rather than statistical significance dictates thedirection of effects in models based on cross-sectional data. Furthermore,passing the test for a well-fitting model does not represent proof that a modelis true or that it best represents the relationships among variables, only thatthe model is consistent with the data. In the current study, one model wastested for two age groups using two independent samples from the popula-tion. It is also desirable, however, to test alternative models. Future studiesshould examine and compare models representing other possible relation-ships among the measures used in the current study, such as a direct relation-ship between neighborhood social disorganization and parental educationalsupport. In addition, as an initial examination of the relative effects of neigh-borhood and family on school-related outcomes, the current study used broadmeasures of neighborhood characteristics and school outcomes. More elabo-rate multivariate models may be tested in future studies by disaggregatingmeasures so their individual effects can be examined.
486 JOURNAL OF ADOLESCENT RESEARCH / September 2002

The findings in the current study indicate how adolescents’ school out-comes are related to reported experiences in their families and neighbor-hoods. The primary interest of the current study was to examine relationshipsamong self-reported experiences and educational outcomes. The use ofinformation from parents and teachers and objective data on certain vari-ables, however, would also provide valuable insights into the relationshipsexamined.
The findings from the current study suggest the need to develop morecomplex models of adolescent educational behavior. In addition to includingneighborhood and family processes that have demonstrated strong relation-ships to educational outcomes, other salient domains should also be includedin future models. Including the quality of peer relationships and peer behav-ior patterns, for example, as well as perceptions of teacher support and theschool environment would be consistent with an ecological perspective andprior research identifying these variables as predictors of outcomes. Simulta-neous examination of the major ecological domains of adolescent function-ing (neighborhood, school, peer, family) will contribute to an understandingof how each influences educational behavior individually and in combinationwith the others. Although the current study contributes to the growing evi-dence that neighborhood social disorganization has an impact on youths’school outcomes, the effects of neighborhood environment will be morecompletely understood when they are examined in the context of all four pri-mary domains of adolescent functioning.
REFERENCES
Anderson, J. C., & Gerbing, D. W. (1988). Structural equation modeling in practice: A reviewand recommended two-step approach. Psychological Bulletin, 103, 411-423.
Arbuckle, J. L. (1997). Amos users’ guide, Version 3.6. Chicago: SmallWaters Corp.Bowen, G. L. (1991). Navigating the marital journey: MAP, a corporate support program for
couples. New York: Praeger.Bowen, G. L., Bowen, N. K., & Richman, J. M. (1998). Students in peril: Crime and violence in
neighborhoods and schools. Chapel Hill: Jordan Institute for Families, School of SocialWork, University of North Carolina at Chapel Hill.
Bowen, N. K., & Bowen, G. L. (1998). The mediating role of educational meaning in the rela-tionship between home academic culture and academic performance. Family Relations, 47,45-51.
Bowen, N. K., & Bowen, G. L. (1999). Effects of crime and violence in neighborhoods andschools on the school behavior and performance of adolescents. Journal of AdolescentResearch, 14, 319-342.
Brodsky, A. E. (1996). Resilient single mothers in risky neighborhoods: Negative psychologicalsense of community. Journal of Community Psychology, 24, 347-363.
Bowen et al. / NEIGHBORHOODS, FAMILIES, AND ADOLESCENTS 487

Bronfenbrenner, U. (1979). The ecology of human development. Cambridge, MA: Harvard Uni-versity Press.
Brooks-Gunn, J., Duncan, G. J., & Aber, J. L. (Eds.). (1997). Neighborhood poverty: Vol. 1.Context and consequences for children. New York: Russell Sage.
Brooks-Gunn, J., Duncan, G. J., Klebanov, P. K., & Sealand, N. (1993). Do neighborhoods influ-ence adolescent development? American Journal of Sociology, 99, 353-395.
Byrne, B. M., Shavelson, R. J., & Muthen, B. (1989). Testing for the equivalence of factorcovariance and mean structures: The issue of partial measurement invariance. PsychologicalBulletin, 105, 456-466.
Coleman, J. S. (1988). Social capital in the creation of human capital. American Journal of Soci-ology, 94(Supplement), S95-S120.
Elliott, D. S., Wilson, W. J., Huizinga, D., Sampson, R. J., Elliott, A., & Rankin, B. (1996). Theeffects of neighborhood disadvantage on adolescent development. Journal of Research inCrime and Delinquency, 33, 389-426.
Furstenberg, F. F., Jr. (1993). How families manage risk and opportunity in dangerous neighbor-hoods. In W. J. Wilson (Ed.), Sociology and the public agenda (pp. 231-258). Newbury Park,CA: Sage.
Furstenberg, F. F., & Hughes, M. E. (1995). Social capital and successful development among at-risk youth. Journal of Marriage and the Family, 57, 580-592.
Garbarino, J. (1992). Children and families in the social environment (2nd ed.). New York:Aldine de Gruyter.
Garbarino, J., Stott, F. M., & Faculty of the Erikson Institute. (1989). What children can tell us:Eliciting, interpreting, and evaluating information from children. San Francisco: Jossey-Bass.
Gray, M. R., & Steinberg, L. (1999). Unpacking authoritative parenting: Reassessing a multidi-mensional construct. Journal of Marriage and the Family, 61, 574-587.
Hoyle, R. H., & Panter, A. (1995). Writing about structural equation models. In R. H. Hoyle(Ed.), Structural equation modeling: Concepts, issues, and applications (pp. 158-176).Thousand Oaks, CA: Sage.
Jenkins, E. J., & Bell, C. C. (1994). Violence among inner city high school students and post-traumatic stress disorder. In S. Friedman (Ed.), Anxiety disorders in African Americans(pp. 76-88). New York: Springer.
Kupersmidt, J. B., Griesler, P. C., DeRosier, M. E., Patterson, C. J., & Davis, P. W. (1995). Child-hood aggression and peer relations in the context of family and neighborhood factors. ChildDevelopment, 66, 360-375.
McLoyd, V. C. (1990). The impact of economic hardship on Black families and children: Psy-chological distress, parenting, and socioemotional development. Child Development, 61,311-346.
Nash, J. K., & Bowen, G. L. (1999). Perceived crime and informal social control in the neighbor-hood as a context for adolescent behavior: A risk and resilience perspective. Social WorkResearch, 23, 171-186.
National Center for Education Statistics. (1999a). The condition of education, 1999. RetrievedJanuary 3, 2000, from http://www.nces.ed.gov/pubs99/condition99
National Center for Education Statistics. (1999b). Dropout rates in the United States: 1997.Retrieved January 3, 2000, from http://www.nces.ed.gov/pubs99/quarterlyjul/3-Elem-Sec/3-esp12-g.html
National Opinion Research Center. (1988). National Educational Longitudinal Study of 1988: Afollow-up student questionnaire (OMB No. 1850-0593). Washington, DC: U.S. Departmentof Education, National Center for Education Statistics.
488 JOURNAL OF ADOLESCENT RESEARCH / September 2002

Patterson, G. R. (1983). Stress: A change agent for family process. In N. Garmezy & M. Rutter(Eds.), Stress and coping, and development in children (pp. 235-264). New York: McGraw-Hill.
Richman, J. M., & Bowen, G. L. (1997). School failure: An ecological-interactional-developmentalperspective. In M. W. Fraser (Ed.), Risk and resilience in childhood: An ecological perspec-tive (pp. 95-116). Washington, DC: NASW Press.
Sampson, R. J. (1997). Collective regulation of adolescent misbehavior: Validation results fromeighty Chicago neighborhoods. Journal of Adolescent Research, 12, 227-244.
Sampson, R. J., Raudenbush, S. W., & Earls, F. (1997). Neighborhoods and violent crime: Amultilevel study of collective efficacy. Science, 277, 918-923.
Shaw, C. R., & McKay, H. D. (1969). Juvenile delinquency and urban areas (Rev. ed.). Chicago:University of Chicago Press.
Simcha-Fagan, O., & Schwartz, J. E. (1986). Neighborhood and delinquency: An assessment ofcontextual effects. Criminology, 24, 667-703.
Simmons, R. G., Burgeson, R., & Carlton-Ford, S. (1987). The impact of cumulative change inearly adolescence. Child Development, 58, 1220-1234.
Small, S. (1991). Teenage assessment project question bank. Madison: University of Wis-consin-Madison, School of Family Resources and Consumer Sciences.
Smilkstein, G., Ashworth, C., & Montano, D. (1982). Validity and reliability of the FamilyAPGAR as a test of family function. Journal of Family Practice, 15, 303-311.
Steinberg, L., Elmen, J. D., & Mounts, N. S. (1989). Authoritative parenting, psycho-socialmaturity, and academic success among adolescents. Child Development, 60, 1424-1436.
Stern, S. B., Smith, C. A., & Jang, S. J. (1999). Urban families and adolescent mental health.Social Work Research, 23, 15-27.
Teachman, J. D., Paasch, K., & Carver, K. (1996). Social capital and dropping out of schoolearly. Journal of Marriage and the Family, 58, 773-383.
Vernez, G., Krop, R. A., & Rydell, C. P. (1999). Closing the education gap: Benefits and costs.Santa Monica, CA: RAND.
Williams, J. H., Ayers, C. D., & Arthur, M. W. (1997). Risk and protective factors in the develop-ment of delinquency and conduct disorder. In M. W. Fraser (Ed.), Risk and resiliency inchildhood: An ecological perspective (pp. 140-170). Washington, DC: NASW Press.
Natasha K. Bowen, M.S.W., Ph.D., is an assistant professor in the School of Social Work,University of North Carolina at Chapel Hill. Her research interests include child andadolescent mental health, behavioral problems, and risk and protective factor assess-ments. Publications have appeared in the Journal of the American Academy of Child andAdolescent Psychiatry, Journal of Adolescent Research, Family Relations, and SocialWork in Education (now Children and Schools).
Gary L. Bowen, Ph.D., A.C.S.W., is Kenan Distinguished Professor in the School of So-cial Work, University of North Carolina at Chapel Hill, where he also holds a joint ap-pointment in the Department of Communication Studies. He is particularly interested inhow features of the social environment, including both its structural and normative fea-tures, inform and constrain the adjustment and academic achievement of adolescents.His published works have appeared in Family Relations, Journal of Family Issues, Jour-nal of Family and Economic Issues, Research on Social Work Practice, and Social Work.
Bowen et al. / NEIGHBORHOODS, FAMILIES, AND ADOLESCENTS 489

William B. Ware, Ph.D. is a professor in the School of Education, University of NorthCarolina at Chapel Hill. His research interests include testing departures from normal-ity, bootstrapping and randomization tests, and double bootstrapping. His publishedworks have appeared in American Educational Research Journal, Journal of EducationalMeasurement, Psychological Bulletin, Journal of Counseling Psychology, Educationaland Psychological Measurement, Science Education, Journal of Special Education, andDevelopmental Psychology.
490 JOURNAL OF ADOLESCENT RESEARCH / September 2002