Black carbon physical and optical properties across northern ...
18
Atmos. Chem. Phys., 19, 13079–13096, 2019 https://doi.org/10.5194/acp-19-13079-2019 © Author(s) 2019. This work is distributed under the Creative Commons Attribution 4.0 License. Black carbon physical and optical properties across northern India during pre-monsoon and monsoon seasons James Brooks 1 , Dantong Liu 2 , James D. Allan 1,3 , Paul I. Williams 1,3 , Jim Haywood 4,5 , Ellie J. Highwood 6 , Sobhan K. Kompalli 7 , S. Suresh Babu 7 , Sreedharan K. Satheesh 8 , Andrew G. Turner 3,6 , and Hugh Coe 1 1 Centre for Atmospheric Science, School of Earth and Environmental Sciences, University of Manchester, Manchester, UK 2 Department of Atmospheric Sciences, School of Earth Sciences, Zhejiang University, Hangzhou, Zhejiang, China 3 National Centre for Atmospheric Science, Manchester, UK 4 Observation Based Research, Met Office, Exeter, UK 5 College of Engineering, Mathematics & Physical Sciences, Exeter, UK 6 Department of Meteorology, University of Reading, Reading, UK 7 Space Physics Laboratory, Vikram Sarabhai Space Centre, Thiruvananthapuram, Kerala, India 8 Centre for Atmospheric & Oceanic Sciences, Indian Institute of Science, Bengaluru, India Correspondence: Hugh Coe ([email protected]) Received: 28 May 2019 – Discussion started: 3 June 2019 Revised: 8 September 2019 – Accepted: 15 September 2019 – Published: 23 October 2019 Abstract. Black carbon (BC) is known to have major im- pacts on both climate and human health and is therefore of global importance, particularly in regions close to large pop- ulations that have strong sources. The size-resolved mixing state of BC-containing particles was characterised using a single-particle soot photometer (SP2). The study focusses on the Indo-Gangetic Plain (IGP) during the pre-monsoon and monsoon seasons. Data presented are from the UK Facility for Airborne Atmospheric Measurements BAe-146 research aircraft that performed flights during the pre-monsoon (11 and 12 June) and monsoon (30 June to 11 July) seasons of 2016. Over the IGP, BC mass concentrations were greater (1.95 μg m -3 ) compared to north-west India (1.50 μg m -3 ) and north-east India (0.70 μg m -3 ) during the pre-monsoon season. Across northern India, two distinct BC modes were recorded; a mode of small BC particles (core diameter < 0.16 μm and coating thickness < 50 nm) and a mode of mod- erately coated BC (core diameter < 0.22 μm and coating thickness of 50–200 nm). The IGP and north-east India loca- tions exhibited moderately coated black carbon particles with enhanced coating thicknesses, core sizes, mass absorption cross sections, and scattering enhancement values compared to much lower values present in the north-west. The coating thickness and mass absorption cross section increased with altitude (13 %) compared to those in the boundary layer. As the monsoon arrived across the region, mass concentration of BC decreased over the central IGP and north-east loca- tions (38 % and 28 % respectively), whereas for the north- west location BC properties remained relatively consistent. Post-monsoon onset, the coating thickness, core size, mass absorption cross section, and scattering enhancement values were all greatest over the central IGP much like the pre- monsoon season but were considerably reduced over both north-east and north-west India. Increases in mass absorp- tion cross section through the atmospheric column were still present during the monsoon for the north-west and central IGP locations, but less so over the north-east due to lack of long-range transport aerosol aloft. Across the Indo-Gangetic Plain and north-east India during the pre-monsoon and mon- soon seasons, solid-fuel (wood burning) emissions form the greatest proportion of BC with moderately coated particles. However, as the monsoon develops in the north-east there was a switch to small uncoated BC particles indicative of traffic emissions, but the solid-fuel emissions remained in the IGP into the monsoon. For both seasons in the north-west, traffic emissions form the greatest proportion of BC parti- cles. Our findings will prove important for greater understand- ing of the BC physical and optical properties, with important Published by Copernicus Publications on behalf of the European Geosciences Union.
-
Upload
khangminh22 -
Category
Documents
-
view
0 -
download
0
Transcript of Black carbon physical and optical properties across northern ...
Atmos. Chem. Phys., 19, 13079–13096, 2019https://doi.org/10.5194/acp-19-13079-2019© Author(s) 2019. This work is distributed underthe Creative Commons Attribution 4.0 License.
Black carbon physical and optical properties across northern Indiaduring pre-monsoon and monsoon seasonsJames Brooks1, Dantong Liu2, James D. Allan1,3, Paul I. Williams1,3, Jim Haywood4,5, Ellie J. Highwood6,Sobhan K. Kompalli7, S. Suresh Babu7, Sreedharan K. Satheesh8, Andrew G. Turner3,6, and Hugh Coe1
1Centre for Atmospheric Science, School of Earth and Environmental Sciences, University of Manchester, Manchester, UK2Department of Atmospheric Sciences, School of Earth Sciences, Zhejiang University, Hangzhou, Zhejiang, China3National Centre for Atmospheric Science, Manchester, UK4Observation Based Research, Met Office, Exeter, UK5College of Engineering, Mathematics & Physical Sciences, Exeter, UK6Department of Meteorology, University of Reading, Reading, UK7Space Physics Laboratory, Vikram Sarabhai Space Centre, Thiruvananthapuram, Kerala, India8Centre for Atmospheric & Oceanic Sciences, Indian Institute of Science, Bengaluru, India
Correspondence: Hugh Coe ([email protected])
Received: 28 May 2019 – Discussion started: 3 June 2019Revised: 8 September 2019 – Accepted: 15 September 2019 – Published: 23 October 2019
Abstract. Black carbon (BC) is known to have major im-pacts on both climate and human health and is therefore ofglobal importance, particularly in regions close to large pop-ulations that have strong sources. The size-resolved mixingstate of BC-containing particles was characterised using asingle-particle soot photometer (SP2). The study focusses onthe Indo-Gangetic Plain (IGP) during the pre-monsoon andmonsoon seasons. Data presented are from the UK Facilityfor Airborne Atmospheric Measurements BAe-146 researchaircraft that performed flights during the pre-monsoon (11and 12 June) and monsoon (30 June to 11 July) seasons of2016.
Over the IGP, BC mass concentrations were greater(1.95 µgm−3) compared to north-west India (1.50 µgm−3)and north-east India (0.70 µgm−3) during the pre-monsoonseason. Across northern India, two distinct BC modes wererecorded; a mode of small BC particles (core diameter <0.16 µm and coating thickness< 50 nm) and a mode of mod-erately coated BC (core diameter < 0.22 µm and coatingthickness of 50–200 nm). The IGP and north-east India loca-tions exhibited moderately coated black carbon particles withenhanced coating thicknesses, core sizes, mass absorptioncross sections, and scattering enhancement values comparedto much lower values present in the north-west. The coatingthickness and mass absorption cross section increased with
altitude (13 %) compared to those in the boundary layer. Asthe monsoon arrived across the region, mass concentrationof BC decreased over the central IGP and north-east loca-tions (38 % and 28 % respectively), whereas for the north-west location BC properties remained relatively consistent.Post-monsoon onset, the coating thickness, core size, massabsorption cross section, and scattering enhancement valueswere all greatest over the central IGP much like the pre-monsoon season but were considerably reduced over bothnorth-east and north-west India. Increases in mass absorp-tion cross section through the atmospheric column were stillpresent during the monsoon for the north-west and centralIGP locations, but less so over the north-east due to lack oflong-range transport aerosol aloft. Across the Indo-GangeticPlain and north-east India during the pre-monsoon and mon-soon seasons, solid-fuel (wood burning) emissions form thegreatest proportion of BC with moderately coated particles.However, as the monsoon develops in the north-east therewas a switch to small uncoated BC particles indicative oftraffic emissions, but the solid-fuel emissions remained in theIGP into the monsoon. For both seasons in the north-west,traffic emissions form the greatest proportion of BC parti-cles.
Our findings will prove important for greater understand-ing of the BC physical and optical properties, with important
Published by Copernicus Publications on behalf of the European Geosciences Union.
13080 J. Brooks et al.: BC physical and optical properties during pre-monsoon and monsoon seasons
consequences for the atmospheric radiative forcing of BC-containing particles. The findings will also help constrain theregional aerosol models for a variety of applications such asspace-based remote sensing, chemistry transport modelling,air quality, and BC source and emission inventories.
1 Introduction
Increased anthropogenic emissions into the atmosphere, es-pecially over south Asia, have led to severe air quality is-sues (Schnell et al., 2018). Understanding, identifying, andcharacterising air pollution sources and their effect on lo-cal and regional areas is important for health impact studiesas well as radiative forcing assessments on local and globalscales (Lawrence et al., 2007). Black carbon (BC) is one ofthe crucial components of ambient aerosol released into theatmosphere due to the incomplete combustion of fossil fu-els, biofuels, and biomass burning (IPCC, 2013; Bansal etal., 2018). Due to its strong absorption at a wide range ofwavelengths, BC is considered to be a prime contributor toradiative heating of the atmosphere (Marinoni et al., 2010;Bond et al., 2013). Strong light absorption from BC coupledwith its longer atmospheric lifetime makes BC an importantaerosol constituent affecting regional climate (Bansal et al.,2018).
India is currently the second-largest BC emitter in theworld after Africa (Bond et al., 2013), with emissions pro-jected to rise steadily in the coming decades (Rana et al.,2019). Unlike the USA, UK, and Europe, where aerosol BCis predominantly sourced from on-road and off-road dieselengines (Bond et al., 2013) with a shift towards solid-fuelburning in winter (Liu et al., 2014), Indian BC emissionsare overwhelmingly from low-efficiency combustion of do-mestic fuels (47 %) followed by industrial emissions (22 %),transportation (17 %), and open burning (12 %), which isdominated by crop residue burning (Paliwal et al., 2016).The Indo-Gangetic Plain (IGP) in northern India is one suchpolluted region in south Asia (Pawar et al., 2015; Singh etal., 2017) that undergoes these significant seasonal variations(Banerjee et al., 2015; Singh et al., 2017) with dust dom-inating during pre-monsoon months (Gautam et al., 2009;Vaishya et al., 2018). Regional BC emission inventories haveconsiderable variability owing to the emission factors, un-reliability of fuel consumption estimates, and general lackof detailed in situ measurements (Bond et al., 2013; Ranaet al., 2019). Most previous emission inventory studies pro-vide yearly emission analysis but lack the seasonal temporalemission variability, as explained by Paliwal et al. (2016) andMoorthy et al. (2013). Additional uncertainties are sourcedfrom variable physio-chemical and optical properties of BCaerosol (Koch et al., 2009; Lee et al., 2013). The ageingand internal mixing of BC aerosol in the atmosphere withcomponents such as sulfate, organic carbon, and secondary
organic aerosol can enhance BC light absorption by 30 %–100 % compared to an external mixture (Liu et al., 2017;Rana et al., 2019). Therefore, the BC mixing properties areof importance for further study and clarification across In-dia, especially northern India where BC mass concentrationsare known to be significant (Bond et al., 2013; Brooks et al.,2019).
Environmental regulation targeted emissions from fossilfuel combustion by transport, power plants, and a variety ofindustrial activities. However, residential solid-fuel burningfor space-heating purposes (such as coal or wood burning)has received less attention in terms of enforcement or reg-ulation during the past decade (Liu et al., 2014). Especiallyfor Europe, there have been a growing number of studies thathighlight the importance of residential burning and their con-tribution to particulate matter (PM) loadings, with empha-sis on wintertime studies when domestic heating activitiesare high and boundary layer mixing is suppressed (Herichet al., 2011; Liu et al., 2011; Laborde et al., 2013; Crippaet al., 2014). Organic mass fractions in submicron aerosolscontributed by solid-fuel sources reported in these studiesranged from 15 % to 50 % consistently using receptor-basedsource apportionment methodologies, highlighting the im-portance of wood burning as a source contribution (Herichet al., 2014). The methodologies outlined above have mostlyfocussed on the organic carbon content of solid-fuel sources.However, as Liu et al. (2014) explains, the source informa-tion for black carbon (BC) aerosols is sparse in part due tothe difficulties of measuring the refractory component in theaerosols. Given BC is the principal source of particulate lightabsorption in the atmosphere (Bond et al., 2013) with ad-verse effects on human health (e.g. Jansen et al., 2005; Mor-dukhovich et al., 2009), it is of great importance to under-stand BC sources and how its properties are dictated by thosesources.
Prior to our study, only a few surface-based measurementsof BC using a single-particle soot photometer (SP2) had beenmade (Raatikainen et al., 2017; Thamban et al., 2017; Kom-palli et al., 2019). The data presented in this work representthe first vertically resolved measurements of BC mass andmixing state using an SP2 during the pre-monsoon and mon-soon seasons over northern India. Previous studies (Rana etal., 2019) have been unable to identify particular sources ofBC from ambient measurements, though some insight intolarger BC particles has been possible (Kumar et al., 2011;Vadrevu et al., 2012; Kaskaoutis et al., 2014). Previously SP2data from urban environments such as London and Chinahave been used to determine contributions to BC from dif-ferent sources based on the core size and coating thickness,the latter being represented as scattering enhancement (Liuet al., 2014, 2019). Over London during winter, two distinctBC sources were observed, one of small BC core diameterswith low scattering enhancement that was identified as beingfrom traffic emissions and the second of larger BC core diam-eters with increased scattering enhancement (solid-fuel-type
Atmos. Chem. Phys., 19, 13079–13096, 2019 www.atmos-chem-phys.net/19/13079/2019/

J. Brooks et al.: BC physical and optical properties during pre-monsoon and monsoon seasons 13081
Figure 1. Flight tracks of the BAe-146 aircraft for the campaignacross India during the pre-monsoon and monsoon seasons of 2016.The flight paths considered by this analysis are described in themain text and Table 1. Straight-level run (SLR) boundary layer sec-tions are split by region (A) west of IGP in NW India, (B) IGP,and (C) south-east of IGP in NE India. Map terrain created usingGlobal multi-resolution terrain elevation data 010 (GMTED2010)(http://www.usgs.gov, last access: 21 October 2019).
emissions). These sources could be clearly separated sincethe measurements were made in close proximity and the BCtypes were distinctly different (Liu et al., 2014, 2019).
In view of the large variations associated with BC emis-sion inventories in the Indian region, model outputs of BCmass and single site location studies need to be validatedagainst high-temporal and spatial airborne atmospheric mea-surements (Rana et al., 2019). This paper presents the firstairborne measurements of BC physical properties over north-ern India using the SP2 instrument and is the first time thatBC physical properties are measured quantitatively at suchtemporal and spatial scales, providing detailed insights intosource-specific BC properties during the pre-monsoon andmonsoon seasons.
2 Methodology
A total of 10 science flights form this study and were con-ducted by the UK Facility for Airborne Atmospheric Mea-surement (FAAM) BAe-146 research aircraft with the flighttracks highlighted in Fig. 1 and flight summaries in Table 1.The flights took place during two periods: the pre-monsoonseason (11 and 12 June 2016) and the monsoon onset pe-riod (30 June to 11 July 2016), based at Lucknow (LKN;26.85◦ N, 80.95◦ E). The aircraft flew with a comprehen-sive instrument suite, capable of measuring aerosols, cloudphysics, chemical tracers, radiative fluxes, and meteorologi-cal fields; however only instruments used in this analysis arediscussed further. The FAAM BAe-146 has a typical rangeof ∼ 3000 km and an altitude ceiling of over 10 km, withan aircraft science speed of ∼ 100 ms−1. From the operatingbase, the aircraft typically covered radial distances of∼ 200–
300 km in 4.5–5 h of flight time, resulting in over 120 h offlying completed throughout the campaign (89 h of sciencemeasurement flying). Based on the likely synoptic and localconditions on the day, different types of science flights wereconducted: radiation flights and survey flights. Both flighttypes consisted of long-leg duration flights covering the NEBay of Bengal (BBA) area and Indo-Gangetic Plain (IGP)regions, delivering the main part of the aerosol characterisa-tion. In addition, profiles to high altitudes when taking offfrom Lucknow and in selected other locations were carriedout in order to build up a statistical picture of the verticalstructure. Low-altitude straight-level runs (SLRs) were alsocarried out at heights of around 0.5–1.0 km.
Instrumentation
The physical properties of individual refractory BC (rBC;Petzold et al., 2013) particles were characterised usinga single-particle soot photometer (SP2) manufactured byDroplet Measurement Technologies (DMT) Inc. (Boulder,CO, USA). The SP2 data were corrected to standard tem-perature and pressure (STP) of 273.15 K and 1013.25 hParespectively. The instrument operation and data interpreta-tion procedures are covered in detail elsewhere (Liu et al.,2010; McMeeking et al., 2010). Briefly, the SP2 uses anintra-cavity Nd:YAG laser at 1064 nm to determine the op-tical size of a single particle by light scattering and, if ma-terial within the particle absorbs at the laser wavelength, therefractory mass of the particle is quantified by detection ofthe laser-induced incandescence radiation. In the atmospherethe main light-absorbing component at this wavelength is BC(Liu et al., 2014). The SP2 incandescence signal was to ob-tain single-particle rBC mass after calibration using Aquadagsample black carbon particle standards (Aqueous Defloc-culated Acheson Graphite, manufactured by Acheson Inc.,USA), with a correction value of 0.75 required to fully rep-resent ambient particles (Moteki and Kondo, 2010; Labordeet al., 2012; Baumgardner et al., 2012). The measured rBCmass is converted to a mass equivalent diameter (1.8 gcm−3
for atmospheric BC; Bond and Bergstrom, 2006), which istermed the BC core diameter (Dc), which is the diameter ofa sphere containing the same mass of rBC as measured inthe particles. The scattering signal of a BC particle will bedistorted during its transit through the laser beam becauseof the mass loss of a BC particle by laser heating; thus theleading-edge scattering signal before the onset of volatilisa-tion is extrapolated to reconstruct the scattering signal of aBC-containing particle (Gao et al., 2007).
The physical properties, such as the coating thickness fora given single BC particle, are obtained by using an inverseMie scattering model in conjunction with the BC core size.As described by Taylor et al. (2014), this technique will ob-tain the equivalent diameter of a sphere with the BC assumedto be a concentric spherical inclusion with the same scat-tering cross section as the measured particle after leading-
www.atmos-chem-phys.net/19/13079/2019/ Atmos. Chem. Phys., 19, 13079–13096, 2019
13082 J. Brooks et al.: BC physical and optical properties during pre-monsoon and monsoon seasons
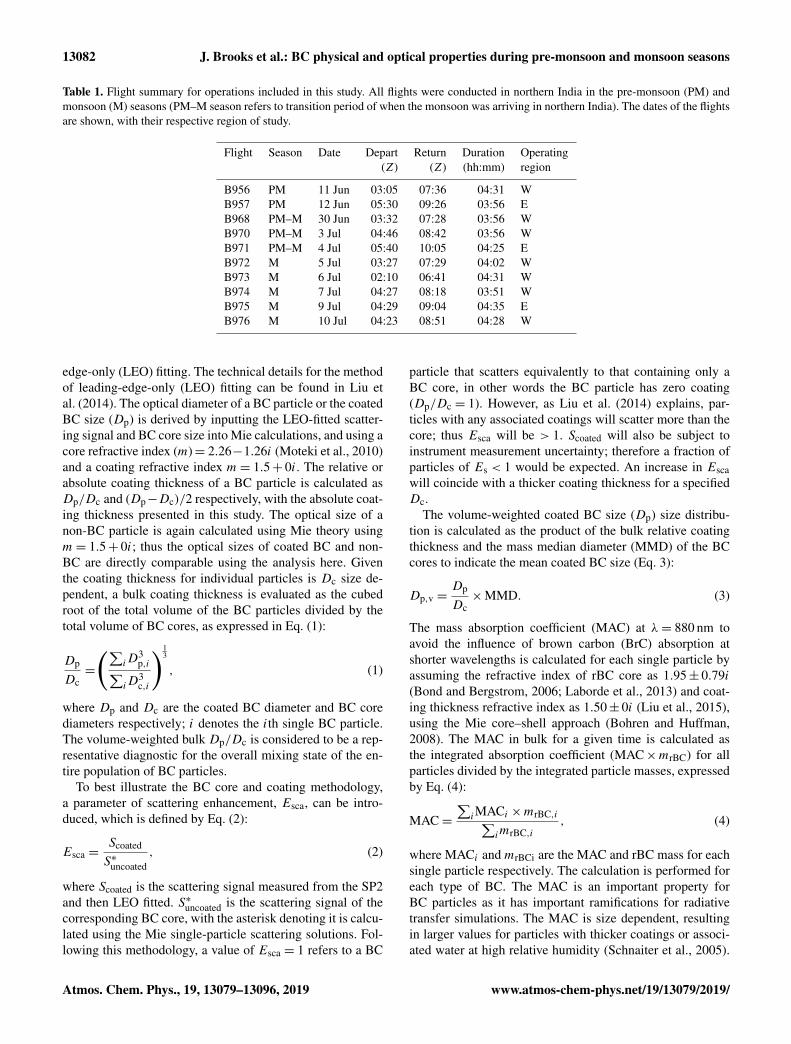
Table 1. Flight summary for operations included in this study. All flights were conducted in northern India in the pre-monsoon (PM) andmonsoon (M) seasons (PM–M season refers to transition period of when the monsoon was arriving in northern India). The dates of the flightsare shown, with their respective region of study.
Flight Season Date Depart Return Duration Operating(Z) (Z) (hh:mm) region
B956 PM 11 Jun 03:05 07:36 04:31 WB957 PM 12 Jun 05:30 09:26 03:56 EB968 PM–M 30 Jun 03:32 07:28 03:56 WB970 PM–M 3 Jul 04:46 08:42 03:56 WB971 PM–M 4 Jul 05:40 10:05 04:25 EB972 M 5 Jul 03:27 07:29 04:02 WB973 M 6 Jul 02:10 06:41 04:31 WB974 M 7 Jul 04:27 08:18 03:51 WB975 M 9 Jul 04:29 09:04 04:35 EB976 M 10 Jul 04:23 08:51 04:28 W
edge-only (LEO) fitting. The technical details for the methodof leading-edge-only (LEO) fitting can be found in Liu etal. (2014). The optical diameter of a BC particle or the coatedBC size (Dp) is derived by inputting the LEO-fitted scatter-ing signal and BC core size into Mie calculations, and using acore refractive index (m)= 2.26−1.26i (Moteki et al., 2010)and a coating refractive index m= 1.5+ 0i. The relative orabsolute coating thickness of a BC particle is calculated asDp/Dc and (Dp−Dc)/2 respectively, with the absolute coat-ing thickness presented in this study. The optical size of anon-BC particle is again calculated using Mie theory usingm= 1.5+ 0i; thus the optical sizes of coated BC and non-BC are directly comparable using the analysis here. Giventhe coating thickness for individual particles is Dc size de-pendent, a bulk coating thickness is evaluated as the cubedroot of the total volume of the BC particles divided by thetotal volume of BC cores, as expressed in Eq. (1):
Dp
Dc=
(∑iD
3p,i∑
iD3c,i
) 13
, (1)
where Dp and Dc are the coated BC diameter and BC corediameters respectively; i denotes the ith single BC particle.The volume-weighted bulk Dp/Dc is considered to be a rep-resentative diagnostic for the overall mixing state of the en-tire population of BC particles.
To best illustrate the BC core and coating methodology,a parameter of scattering enhancement, Esca, can be intro-duced, which is defined by Eq. (2):
Esca =Scoated
S∗uncoated, (2)
where Scoated is the scattering signal measured from the SP2and then LEO fitted. S∗uncoated is the scattering signal of thecorresponding BC core, with the asterisk denoting it is calcu-lated using the Mie single-particle scattering solutions. Fol-lowing this methodology, a value of Esca = 1 refers to a BC
particle that scatters equivalently to that containing only aBC core, in other words the BC particle has zero coating(Dp/Dc = 1). However, as Liu et al. (2014) explains, par-ticles with any associated coatings will scatter more than thecore; thus Esca will be > 1. Scoated will also be subject toinstrument measurement uncertainty; therefore a fraction ofparticles of Es < 1 would be expected. An increase in Escawill coincide with a thicker coating thickness for a specifiedDc.
The volume-weighted coated BC size (Dp) size distribu-tion is calculated as the product of the bulk relative coatingthickness and the mass median diameter (MMD) of the BCcores to indicate the mean coated BC size (Eq. 3):
Dp,v =Dp
Dc×MMD. (3)
The mass absorption coefficient (MAC) at λ= 880 nm toavoid the influence of brown carbon (BrC) absorption atshorter wavelengths is calculated for each single particle byassuming the refractive index of rBC core as 1.95± 0.79i(Bond and Bergstrom, 2006; Laborde et al., 2013) and coat-ing thickness refractive index as 1.50± 0i (Liu et al., 2015),using the Mie core–shell approach (Bohren and Huffman,2008). The MAC in bulk for a given time is calculated asthe integrated absorption coefficient (MAC×mrBC) for allparticles divided by the integrated particle masses, expressedby Eq. (4):
MAC=∑iMACi ×mrBC,i∑
imrBC,i, (4)
where MACi and mrBCi are the MAC and rBC mass for eachsingle particle respectively. The calculation is performed foreach type of BC. The MAC is an important property forBC particles as it has important ramifications for radiativetransfer simulations. The MAC is size dependent, resultingin larger values for particles with thicker coatings or associ-ated water at high relative humidity (Schnaiter et al., 2005).
Atmos. Chem. Phys., 19, 13079–13096, 2019 www.atmos-chem-phys.net/19/13079/2019/

J. Brooks et al.: BC physical and optical properties during pre-monsoon and monsoon seasons 13083
Instrument limitations have in the past led to large discrep-ancies in MAC values throughout the literature (Bond andBergstrom, 2006); however the SP2 measures the refractoryBC mass independently of the mixing state (Laborde et al.,2013). Our analysis involving BC properties is not affectedby coarse-mode dust; the possible coating of BC on coarse-mode dust is not applicable to this study. The largest size binhas been removed from the analysis due to any potential dustparticles measured that exceed the size cut-off maximum ofwhich the SP2 is capable. This would only have a minimaleffect on the pre-monsoon flights due to dust washout as themonsoon arrives. More information on this can be found inLiu et al. (2018) regarding removal of haematite dust influ-ence on BC data.
3 Results
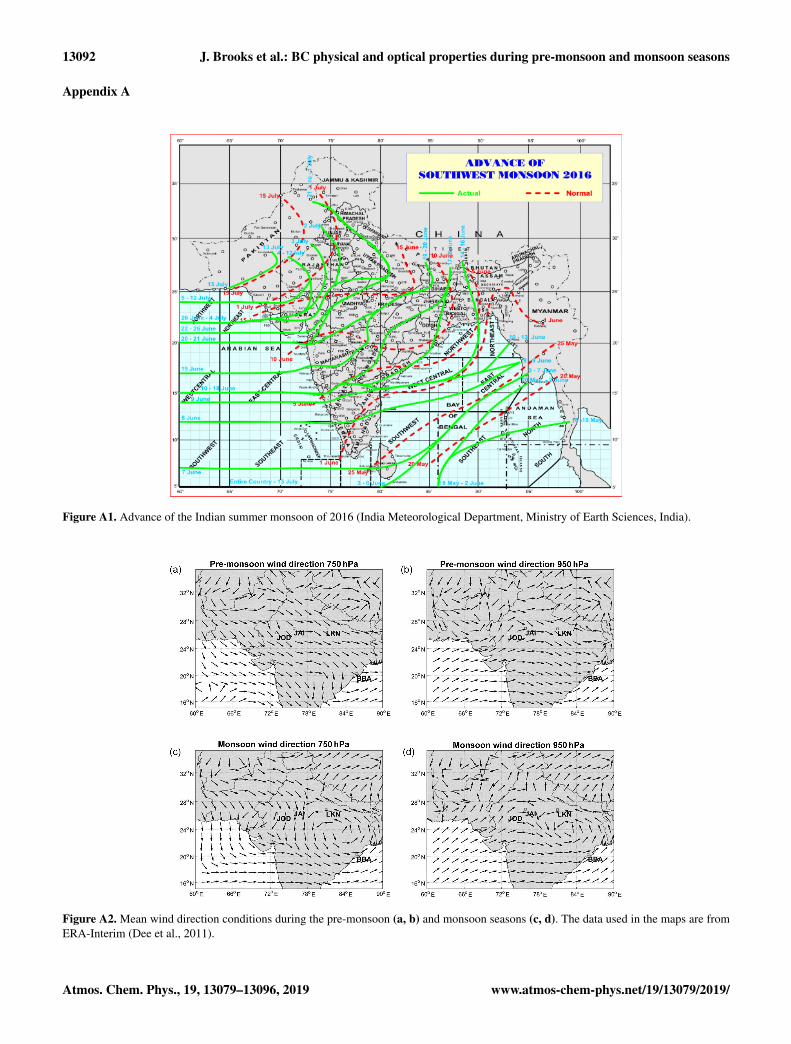
The analysis presented below first outlines the BC character-istics within the boundary layer from the straight-level run(SLR) measurements during the pre-monsoon-to-monsoontransition period across northern India, followed by the ver-tical profile analysis (Sect. 3.1). Further analysis presents thesemi-direct climatic impact potential of the BC across north-ern India, highlighting the various properties and scatteringenhancement potential the BC exhibits (Sect. 3.2) along withthe BC mass absorption cross section (MAC; Sect. 3.3). Thepre-monsoon (11–12 June, flights of B956 and B957) andmonsoon (30 June–11 July, flights of B968-B976) seasonsare considered separately. Of this second category, the firstfew flights can be regarded as occurring during the monsoontransition phase, since the monsoon has arrived at some loca-tions but not others. For example, during B968 (30 June) themonsoon was seen to be influencing the IGP but not Jaipurin NW India. More information on the monsoon developmentcan be seen in Appendix Fig. A1 (in this example for 30 June,the monsoon progression isochrone for 2016 still lies to thesouth and east of Jaipur), Fig. A2 for mean pre-monsoon andmonsoon wind directions in and above the boundary layer,and in Brooks et al. (2019).
As highlighted in Brooks et al. (2019), the aerosol bur-den over northern India has a distinct structure in the pre-monsoon season. An elevated aerosol layer is present be-tween 3 and 6 km, particularly over north-west India withsomewhat decreased extent in the far north-east of India. Theaerosol chemical composition remained largely similar as themonsoon season progressed (sulfate aerosol dominating out-side the IGP compared to organic aerosol inside the IGP), butthe total aerosol mass concentrations decreased by ∼ 50 %as the rainfall arrived; the pre-monsoon average total massconcentration was 30 µgm−3 compared to a monsoon aver-age total mass concentration of 10–20 µgm−3. However, thismass concentration decrease was less noteworthy (∼ 20 %–30 %) over the IGP, likely due to the strength of emissionsources in this region. In the aerosol vertical profile, inside
the IGP during the pre-monsoon, organic aerosol and ab-sorbing aerosol species dominated in the lower atmosphere(< 1.5 km) with sulfate, dust, and other scattering aerosolspecies enhanced in an elevated aerosol layer above 1.5 kmwith maximum aerosol height ∼ 6 km. As the monsoon pro-gressed into this region, the elevated aerosol layer dimin-ished, the aerosol maximum height reduced to ∼ 2 km, andthe total mass concentrations decreased by ∼ 50 %.
3.1 BC physical properties
3.1.1 Boundary layer BC
Summary statistics of boundary layer aerosol chemical com-position for northern India can be found in Fig. 2, and moredetailed analysis can be found in Fig. 4. The boundary layerwas predominantly above 1500 m, such that the straight-level run (SLR) data presented are within the boundary layerthroughout.
The greatest black carbon mass concentrations werepresent inside the IGP (average 1.95 µgm−3), with decreasedmass concentrations outside in both the NW (1.5 µgm−3) andNE of India (0.7 µgm−3). The BC core MMD was larger in-side the IGP (0.25 µm) compared to the NW (0.22 µm) andNE (0.22 µm) of India. The coating thickness of the BC parti-cles shows some similarity between the NW and IGP regions,with a slightly larger average outside the IGP in the NW (1.7)compared to inside the IGP (1.65). Over NE India, the coat-ing thickness was significantly larger with an average of 1.9witnessed. A reason for these large coating thicknesses maybe due to the air mass arriving in the north-east having beenstrongly influenced by long-range transport that has under-gone significant ageing mechanisms, as well as entrainmentof solid-fuel aerosol particles as the air mass travels acrossthe IGP.
Moving into the monsoon onset period, there werechanges but also similarities seen in the BC physical prop-erties across northern India. Black carbon mass concentra-tions decreased somewhat across all regions but remainedrelatively consistent compared to the pre-monsoon season.Over the IGP, mass concentrations decreased by ∼ 25 %–40 % as the monsoon progresses across the region, with av-erage mass concentrations of ∼ 1.2 µgm−3. In NW India,mass concentrations fluctuated significantly between flightsbut overall no significant decrease in average concentrationsoccurred. This is potentially due to the NW region witnessingconsistent wind directions from the west from Pakistan andbeyond, therefore bringing similar air masses from the samesource to the region. In the NE region of India, the BC massconcentrations were lower than over the IGP, with decreaseswitnessed as the monsoon progressed. Concentrations weresomewhat elevated over locations close to the built-up regionof Bhubaneswar (0.50 µgm−3) and close to the IGP boundaryduring B975 (0.50 µgm−3) compared to mass concentrationsof ∼ 0.25 µgm−3 in between.
www.atmos-chem-phys.net/19/13079/2019/ Atmos. Chem. Phys., 19, 13079–13096, 2019

13084 J. Brooks et al.: BC physical and optical properties during pre-monsoon and monsoon seasons
Figure 2. Pre-monsoon (a) and monsoon (b) average boundary layer (BL) black carbon optical and physical properties, across northernIndia. The BC core and coating information is presented for NW India between Jaipur and Jodhpur, the central IGP, and NE India nearBhubaneswar. The IGP boundary (white line) is from Kumar et al. (2018). Map terrain created using Global multi-resolution terrain elevationdata 010 (GMTED2010) (http://www.usgs.gov).
With monsoon progression came increases in the coatingthicknesses of particles across northern India, especially overthe IGP. Increases of up to 35 % were witnessed in the abso-lute coating thicknesses of BC particles from ∼ 1.6 to ∼ 2.An increase in absolute coating thicknesses was also wit-nessed over NW India, albeit smaller than the increases overthe IGP, with coating thickness averages increasing from∼ 1.7 to ∼ 1.8. Over NE India close to the IGP boundary,coating thicknesses were similar to the central IGP coat-ing thickness values (∼ 2), whereas over Bhubaneswar thecoating thicknesses were much smaller, ∼ 1.6, during themonsoon flights. This could be due to the wind directionsbetween the locations, with NE India influenced by localsources as the wind originates mostly from the Bay of Ben-gal, whereas closer to the IGP the air mass had greater influ-ence from the larger, solid-fuel-type sources of the IGP.
Regarding core size regional characteristics, outside theIGP in the NW, core mass median diameters were relativelyconstant with averages of ∼ 0.2 µm throughout the monsoonprogression period, likely due to a consistent wind directionfrom west of the region. Over the IGP, no significant changeswere seen in core size, with averages in both the PM andmonsoon progression period at 0.25 µm. Over the NE of In-dia, core MMD values varied with monsoon progression withaverages of ∼ 0.22 µm during the PM and ∼ 0.20 µm in themonsoon period.
3.1.2 Vertical distribution of BC
Vertical profiles were also carried out using the aircraft inNW India (Jaipur (26.91◦ N 75.79◦ E) and Jodhpur (26.24◦ N73.02◦ E)), the IGP (Lucknow (26.85◦ N 80.95◦ E)), and NEIndia (Bhubaneswar (20.30◦ N 85.83◦ E)) during both thepre-monsoon and monsoon transition periods, as shown in
the summary plots for the boundary layer (BL, Fig. 3) andaloft (Fig. 4), and in Fig. 5. The BL height during the pre-monsoon season is chosen as 2 km and during the monsoonis 1.5 km, following the explanation in Brooks et al. (2019).
Throughout the vertical profile, distinct structure can beseen in the black carbon mass concentration and the blackcarbon physical properties. In the pre-monsoon season inNW India, black carbon mass concentrations were consistentthrough the profile with averages of ∼ 0.25 µgm−3. Blackcarbon core MMD also showed consistent values throughthe aerosol profile in NW India, with averages of ∼ 0.22 µm.Black carbon coating thickness, however, displayed increas-ing values with altitude, with values of ∼ 1.60 in the bound-ary layer compared to∼ 1.9 aloft at 3 km. Inside the IGP, theblack carbon mass concentration in an elevated aerosol layer(EAL) was of a similar order to NW India with an averageof 0.50 µgm−3, with a core MMD average of 0.25 µm andcoating thickness average of 1.85. A similar pattern occurredover NE India at Bhubaneswar, with black carbon mass con-centrations of ∼ 0.6 µgm−3 in the boundary layer, with sim-ilar concentrations aloft. Aloft, however, there was a clearEAL highlighted in the black carbon core MMD and coatingthickness information. In the BL, core MMD was ∼ 0.19 µmand coating thickness was 1.80. In the EAL increases werewitnessed in both parameters with core MMD of ∼ 0.21 µmand coating thickness of 1.90.
Progressing into the monsoon onset period, variationswere witnessed in the mass concentrations and the physicalproperties of BC. In the NW region, however, few changesare seen to the BC properties and mass due to the later mon-soon arrival. Mass concentrations were consistent at pre-monsoon levels ∼ 0.25 µgm−3 with core MMD averagesalso similar at 0.22 µm. Coating thickness, however, did show
Atmos. Chem. Phys., 19, 13079–13096, 2019 www.atmos-chem-phys.net/19/13079/2019/
J. Brooks et al.: BC physical and optical properties during pre-monsoon and monsoon seasons 13085
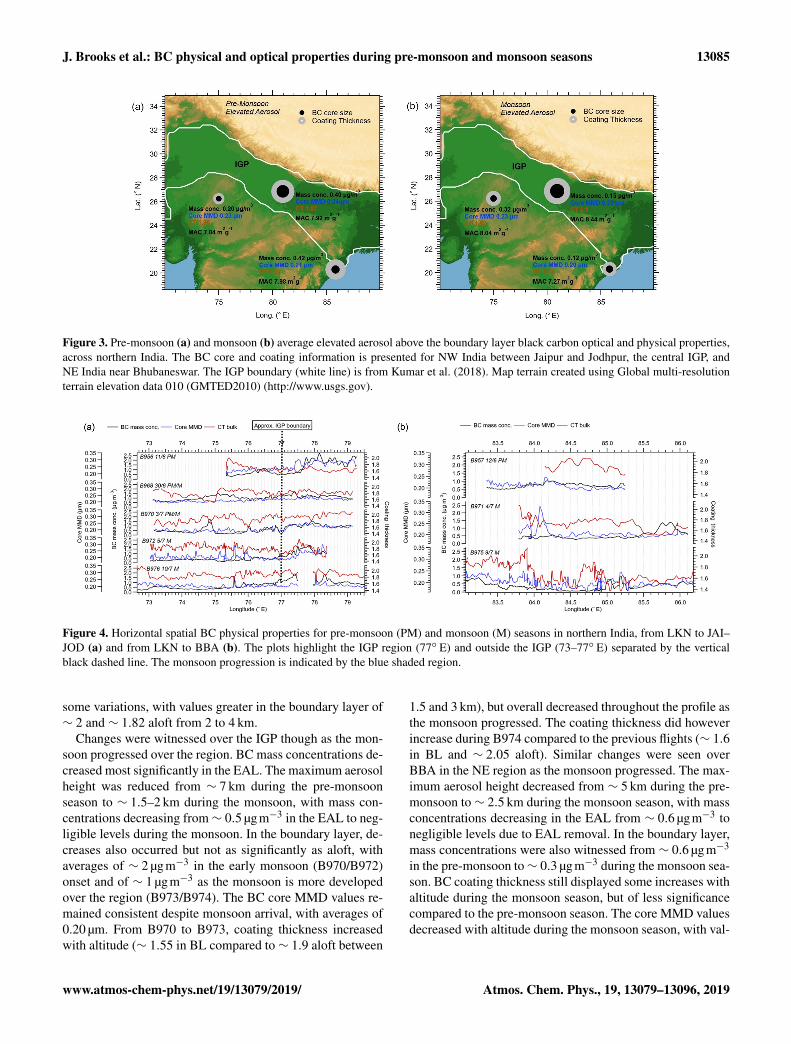
Figure 3. Pre-monsoon (a) and monsoon (b) average elevated aerosol above the boundary layer black carbon optical and physical properties,across northern India. The BC core and coating information is presented for NW India between Jaipur and Jodhpur, the central IGP, andNE India near Bhubaneswar. The IGP boundary (white line) is from Kumar et al. (2018). Map terrain created using Global multi-resolutionterrain elevation data 010 (GMTED2010) (http://www.usgs.gov).
Figure 4. Horizontal spatial BC physical properties for pre-monsoon (PM) and monsoon (M) seasons in northern India, from LKN to JAI–JOD (a) and from LKN to BBA (b). The plots highlight the IGP region (77◦ E) and outside the IGP (73–77◦ E) separated by the verticalblack dashed line. The monsoon progression is indicated by the blue shaded region.
some variations, with values greater in the boundary layer of∼ 2 and ∼ 1.82 aloft from 2 to 4 km.
Changes were witnessed over the IGP though as the mon-soon progressed over the region. BC mass concentrations de-creased most significantly in the EAL. The maximum aerosolheight was reduced from ∼ 7 km during the pre-monsoonseason to ∼ 1.5–2 km during the monsoon, with mass con-centrations decreasing from∼ 0.5 µgm−3 in the EAL to neg-ligible levels during the monsoon. In the boundary layer, de-creases also occurred but not as significantly as aloft, withaverages of ∼ 2 µg m−3 in the early monsoon (B970/B972)onset and of ∼ 1 µg m−3 as the monsoon is more developedover the region (B973/B974). The BC core MMD values re-mained consistent despite monsoon arrival, with averages of0.20 µm. From B970 to B973, coating thickness increasedwith altitude (∼ 1.55 in BL compared to∼ 1.9 aloft between
1.5 and 3 km), but overall decreased throughout the profile asthe monsoon progressed. The coating thickness did howeverincrease during B974 compared to the previous flights (∼ 1.6in BL and ∼ 2.05 aloft). Similar changes were seen overBBA in the NE region as the monsoon progressed. The max-imum aerosol height decreased from ∼ 5 km during the pre-monsoon to∼ 2.5 km during the monsoon season, with massconcentrations decreasing in the EAL from ∼ 0.6 µgm−3 tonegligible levels due to EAL removal. In the boundary layer,mass concentrations were also witnessed from ∼ 0.6 µgm−3
in the pre-monsoon to∼ 0.3 µgm−3 during the monsoon sea-son. BC coating thickness still displayed some increases withaltitude during the monsoon season, but of less significancecompared to the pre-monsoon season. The core MMD valuesdecreased with altitude during the monsoon season, with val-
www.atmos-chem-phys.net/19/13079/2019/ Atmos. Chem. Phys., 19, 13079–13096, 2019
13086 J. Brooks et al.: BC physical and optical properties during pre-monsoon and monsoon seasons
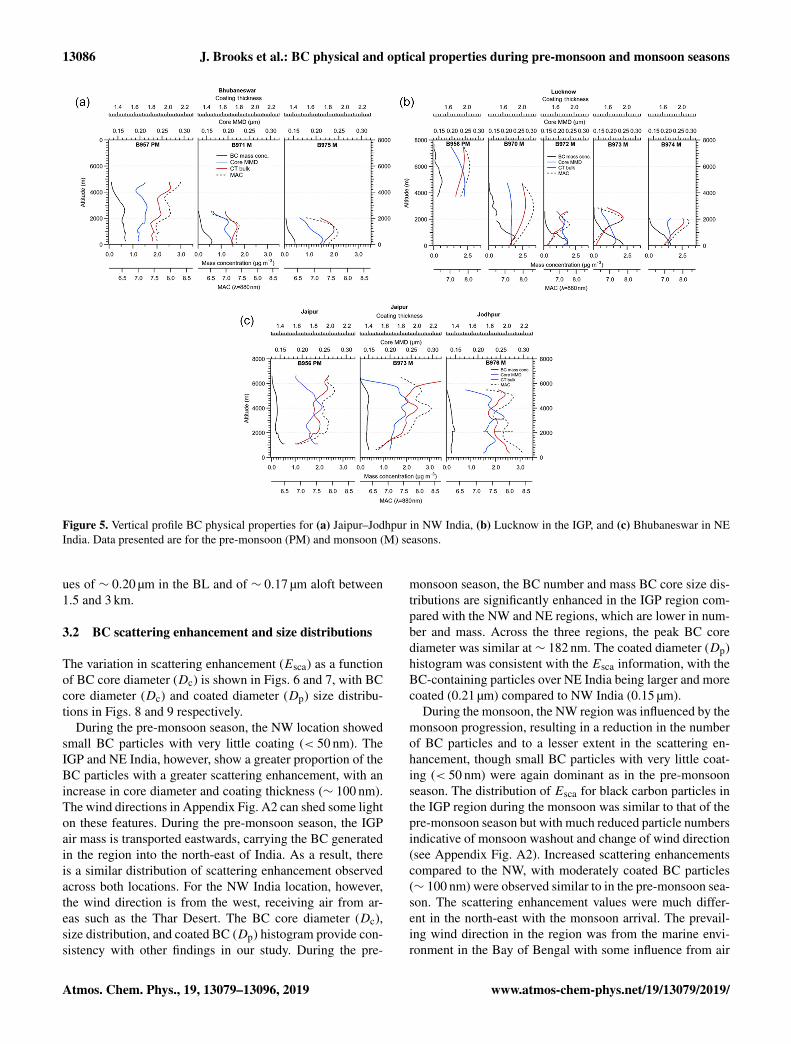
Figure 5. Vertical profile BC physical properties for (a) Jaipur–Jodhpur in NW India, (b) Lucknow in the IGP, and (c) Bhubaneswar in NEIndia. Data presented are for the pre-monsoon (PM) and monsoon (M) seasons.
ues of ∼ 0.20 µm in the BL and of ∼ 0.17 µm aloft between1.5 and 3 km.
3.2 BC scattering enhancement and size distributions
The variation in scattering enhancement (Esca) as a functionof BC core diameter (Dc) is shown in Figs. 6 and 7, with BCcore diameter (Dc) and coated diameter (Dp) size distribu-tions in Figs. 8 and 9 respectively.
During the pre-monsoon season, the NW location showedsmall BC particles with very little coating (< 50 nm). TheIGP and NE India, however, show a greater proportion of theBC particles with a greater scattering enhancement, with anincrease in core diameter and coating thickness (∼ 100 nm).The wind directions in Appendix Fig. A2 can shed some lighton these features. During the pre-monsoon season, the IGPair mass is transported eastwards, carrying the BC generatedin the region into the north-east of India. As a result, thereis a similar distribution of scattering enhancement observedacross both locations. For the NW India location, however,the wind direction is from the west, receiving air from ar-eas such as the Thar Desert. The BC core diameter (Dc),size distribution, and coated BC (Dp) histogram provide con-sistency with other findings in our study. During the pre-
monsoon season, the BC number and mass BC core size dis-tributions are significantly enhanced in the IGP region com-pared with the NW and NE regions, which are lower in num-ber and mass. Across the three regions, the peak BC corediameter was similar at ∼ 182 nm. The coated diameter (Dp)histogram was consistent with the Esca information, with theBC-containing particles over NE India being larger and morecoated (0.21 µm) compared to NW India (0.15 µm).
During the monsoon, the NW region was influenced by themonsoon progression, resulting in a reduction in the numberof BC particles and to a lesser extent in the scattering en-hancement, though small BC particles with very little coat-ing (< 50 nm) were again dominant as in the pre-monsoonseason. The distribution of Esca for black carbon particles inthe IGP region during the monsoon was similar to that of thepre-monsoon season but with much reduced particle numbersindicative of monsoon washout and change of wind direction(see Appendix Fig. A2). Increased scattering enhancementscompared to the NW, with moderately coated BC particles(∼ 100 nm) were observed similar to in the pre-monsoon sea-son. The scattering enhancement values were much differ-ent in the north-east with the monsoon arrival. The prevail-ing wind direction in the region was from the marine envi-ronment in the Bay of Bengal with some influence from air
Atmos. Chem. Phys., 19, 13079–13096, 2019 www.atmos-chem-phys.net/19/13079/2019/

J. Brooks et al.: BC physical and optical properties during pre-monsoon and monsoon seasons 13087
Figure 6. BC optical properties the pre-monsoon (PM) season with the location sampled highlighted in the plot title. The plots presentthe scattering enhancement (Es) as a function of BC core diameter (Dc). The image plot is a two-dimensional histogram for the detectedparticles. The dashed grey contours show the absolute coating thickness (nm, (Dp−Dc)/2). The solid grey line, with corresponding scale onright axis, shows the number fraction of BC particles that were successfully determined according to their scattering signal at each Dc size.
Figure 7. BC optical properties for the monsoon (M) season with the location sampled highlighted in the plot title. The plots present thescattering enhancement (Es) as a function of BC core diameter (Dc). The image plot is a two-dimensional histogram for the detected particles.The dashed grey contours show the absolute coating thickness (nm, (Dp−Dc)/2). The solid grey line, with corresponding scale on rightaxis, shows the number fraction of BC particles that were successfully determined according to their scattering signal at each Dc size.
masses travelling from middle India and there was little in-fluence from the IGP region. This is reflected in the scatter-ing enhancements, with much lower quantities of moderatelycoated BC particles, with the environment of Bhubaneswardominated by small BC particles with small absolute coat-ing thicknesses (< 50 nm). The BC core diameter (Dc) sizedistribution and coated BC (Dp) histogram present changesas the monsoon developed in the regions sampled. For NEIndia during the monsoon, the BC core diameter mass sizedistributions are consistent across B971 and B975 (182 nmrespectively), with the IGP BC core MMD larger at 210 nm.This is similar to the other IGP BC core diameter mass sizedistributions for the monsoon transition and monsoon flights,due in part to the consistent wind direction. During B975compared to B971, however, decreases were seen in the BCmass concentration and core diameter size distribution dur-ing the monsoon period, a feature also observed in the BCcore diameter number concentrations. The BC coated diam-eter (Dp) histogram is consistent with this, with the peak inthe distribution occurring at a diameter of 0.25 µm in the IGPcompared to 0.12 µm for both monsoon flights over NE In-
dia. This highlights the stark differences in BC properties be-tween NE India and the central IGP locations.
We have shown that increased scattering enhancements arepresent over the IGP and NE India during the pre-monsoonseason, compared to lower scattering enhancements over alllocations during the monsoon season. Instances of high (low)scattering enhancement coincide with large (small) MAC andCT values. We have presented sources similar to those inprevious research in our dataset (Liu et al., 2014, 2019), butwith clear increased mixing between sources due to the highamounts of secondary aerosol formation and photochemicalageing across northern India.
In the north-west region, the BC properties highlight thatthe greatest proportion of particles are small in core diame-ter and thinly coated. These types of BC particles have beenshown to be traffic-dominated emissions in previous research(Liu et al., 2014). The north-east of India BC in the mon-soon season sees a large proportion from such traffic emis-sions due to the prevailing wind direction from the Bay ofBengal, meaning that BC particles witnessed are likely tobe from the urban environment around Bhubaneswar where
www.atmos-chem-phys.net/19/13079/2019/ Atmos. Chem. Phys., 19, 13079–13096, 2019

13088 J. Brooks et al.: BC physical and optical properties during pre-monsoon and monsoon seasons
Figure 8. BC core diameter (Dc) size distributions classified by (a) pre-monsoon, (b) monsoon transition, and (c) monsoon season. Theshading is the square root (%) errors for each distribution. Orange represents the IGP, with blue representing NW India (JAI–JOD) and blackNE India (BBA).
Figure 9. BC coated diameter (Dp) histograms for (a) pre-monsoon season, (b) monsoon transition, and (c) monsoon season. The shadingshows the square root (%) errors for data series. Orange represents the IGP, with blue representing NW India (JAI–JOD) and black NE India(BBA).
the aerosol was sampled. Previous research has highlightedwhich showed that traffic emissions can form a large pro-portion of BC particles in east coast regions (Ramachan-dran, 2005). In the IGP during the pre-monsoon and mon-soon seasons, and north-east India during the pre-monsoonseason, moderately coated BC particles are present in ouranalysis. This BC source can be appointed to solid-fuel(wood burning) emissions, as explained in Liu et al. (2014,2019). Despite monsoon arrival, the IGP BC characteristicsremained similar despite some BC removal, with moder-ately coated BC particles prevailing. This is consistent withthe fuel use patterns (including forest fires/biomass-burningepisodes) across the IGP at this time of year (Kumar et al.,2011; Vadrevu et al., 2012; Kaskaoutis et al., 2014).
A source of BC that is not presented in the Esca plotsacross northern India is the large-core-size, thinly coatedBC particles (BC core size > 180 nm and coating thickness< 50 nm). Work by Liu et al. (2019) in China explains thatthese BC particles have large core diameters with low scat-tering enhancements and are indicative of coal-burning emis-sions. These do not appear to be present across northern In-dia during the pre-monsoon and monsoon seasons in signifi-
cant quantities. A reason could be that the BC particles fromcoal combustion are different from the China coal emissionsin characteristics. Coal-burning characteristics may vary be-tween countries, so more detailed in situ analysis would berequired to understand more regarding Indian coal burning.Liu et al. (2019) do explain that this type of BC particle maybe uniquely present in urban Beijing, as it is not present inthe UK or surrounding areas.
3.3 Mass absorption coefficient
The mass absorption coefficient (MAC) observed for the dif-ferent regions across northern India is shown in Fig. 2. Dur-ing the pre-monsoon season, the three locations of NW India,the central IGP, and NE India show distinct MAC proper-ties. In the NW boundary layer, MAC averaged 7.39 m2 g−1
(σ0.36 m2 g−1) compared to 6.76 m2 g−1 (σ0.47 m2 g−1) in-side the IGP and 8.08 m2 g−1 (σ0.33 m2 g−1) over NE India.The MAC was lower in the IGP compared to other locationspotentially due to the close proximity to the aerosol sources,with the MAC value being high in the NE due to the long-distance transport of IGP aerosol to the NE in the prevailingpre-monsoon flow. A distinct vertical structure in the MAC
Atmos. Chem. Phys., 19, 13079–13096, 2019 www.atmos-chem-phys.net/19/13079/2019/
J. Brooks et al.: BC physical and optical properties during pre-monsoon and monsoon seasons 13089
was observed during the PM. Throughout all locations sam-pled in northern India, greater MAC values were observedaloft (∼ 7.5 to 8.5 m2 g−1) compared to the BL (∼ 6.5 to7.5 m2 g−1; see Fig. 4). Knox et al. (2009) explain that coat-ings that build up on BC can act as a lens, focussing light intothe BC core, increasing absorption per mass of BC. Also,mixing state is a function of particle age amongst other fac-tors. Aloft over the IGP the BC present will have undergoneatmospheric ageing and experienced long-range transport,therefore providing a potential reason for the larger MACvalues.
As the monsoon developed, changes in the MAC wereevident for some but not all locations. For the NW re-gion, BC MAC was consistent with pre-monsoon valuesat 7.44 m2 g−1 (σ0.23 m2 g−1), likely due to the lack offull monsoon development in this region and consistencyin emission sources, as stated in Brooks et al. (2019).Conversely, the central IGP and NE regions showed sig-nificant changes as the monsoon progressed. The MACin the central IGP increases by 15 % with an average of7.97 m2 g−1 (σ0.29 m2 g−1) in the monsoon compared to thepre-monsoon values, whereas NE India witnessed decreasesin MAC by 17 % to 6.91 m2 g−1 (σ0.38 m2 g−1). During themonsoon the vertical profiles of MAC at the NW India loca-tions and the IGP increased aloft compared to the BL. How-ever, over the NE there was clear removal of aerosol aloft soBC mass concentrations, and therefore MAC values, are onlyretrieved inside the BL (see Fig. 5).
4 Discussions
During the pre-monsoon season, Kompalli et al. (2014)showed that strong thermal convection increases the bound-ary layer height compared to other seasons, and coupled withhigh wind speed, results in highly dispersed aerosol particlesin both the vertical and horizontal directions, reducing near-surface concentrations. Our observations show that the BCmass concentrations are less than half over NE India thanthose are in the central IGP during the pre-monsoon season(0.70 and 1.95 µgm−3 respectively), a spatial pattern con-sistent with Thamban et al. (2017). The IGP BC mass con-centrations are elevated somewhat compared to other loca-tions across northern India due to the strength of the emis-sions sources as well as being in close proximity to the localemissions (Brooks et al., 2019). Our BC mass concentrationsare comparable to mean values reported for urban regions,by Kompalli et al. (2019) in north-east India (∼ 0.8 µgm−3)and Liu et al. (2014) in London (∼ 1.3 µgm−3), and greaterthan values in the city of Paris (∼ 0.9 µgm−3) in Laborde etal. (2013). However, they are much lower than those reportedin Chinese cities, such as Beijing (∼ 5.5 µgm−3; Wu et al.,2016) and Shenzhen (∼ 4.1 µgm−3; Huang et al., 2012),though the earlier studies are from urban surface sites andnot regional aircraft measurements.
Our study provides new information on aerosol absorp-tion over NE India. Previous work by Vaishya et al. (2018)observed moderately high single-scattering albedo (SSA)values (0.8) decreasing with altitude, indicating increasedaerosol absorption in the lower free troposphere. BC physicaland optical properties are important in the quantification ofthe aerosol semi-direct effect, with large coating thicknessesand the associated absorption enhancement being particu-larly implicated (Bond et al., 2013). Larger, thickly coatedBC particles with large MAC values over the IGP could havean increased warming potential, affecting the climate im-pact of BC over northern India, particularly if present at el-evated altitudes. Our observations show that thickly coatedBC particles are present at high altitudes in the vertical pro-files over the IGP and NE India in the pre-monsoon season(see Fig. 5) and are therefore likely to exert a strong warm-ing effect. We observe that the BC layer is associated withan increase in coating thickness, core size, and MAC overNE India during the pre-monsoon season coincident with thelarger particles observed by Vaishya et al. (2018). Taken to-gether these observations suggest that solid-fuel burning isthe likely source of these BC particles that are subsequentlytransported long distances from the IGP across to the NEIndia region. Vaishya et al. (2018) showed that the absorp-tion over Bhubaneswar in the pre-monsoon season was en-hanced. However, since their measurements were carried outusing an Aethalometer they were unable to account for coat-ing thickness or lensing effects. Liu et al. (2014) showed thatenhanced BC coating thickness and increased lensing effectsresulted in increased absorption. Our measurements there-fore highlight that the absorption occurring over BBA couldbe of even greater magnitude than those presented by Vaishyaet al. (2018).
The scattering enhancement (Esca) results are consistentwith the BC optical properties presented, and aid in rein-forcing the BC sources outlined. The BC mass absorptioncoefficient (MAC) is one such optical property that presentsconsistencies with the Esca and coating thickness. Laborde etal. (2013) explain that MAC is often< 7.5 when under stronginfluence from urban emissions and > 8 for aged air masses.During periods where Esca presents strong traffic emissionsources, such as in the north-west during pre-monsoon andmonsoon seasons and the north-east during the monsoon,the Esca values suggest an urban influence due to the smallcoating thicknesses on the small-core-diameter BC particles,consistent with MAC values < 7.5. Inside the IGP for thepre-monsoon and monsoon seasons, Esca analysis suggestssolid-fuel sources of BC with the moderately coated particlesand large MAC values. During the shift in air mass directionover the north-east as the monsoon progresses, the BC op-tical properties change as the Esca undergoes changes withthe aerosol aloft removed. Rather than an air mass arrivingover north-east India from the north-west travelling throughthe IGP, south-easterly winds from the marine background ofthe Bay of Bengal prevailed; therefore the aerosol measured
www.atmos-chem-phys.net/19/13079/2019/ Atmos. Chem. Phys., 19, 13079–13096, 2019
13090 J. Brooks et al.: BC physical and optical properties during pre-monsoon and monsoon seasons
over north-east India was likely to be from local urban emis-sion sources. This could explain the reduction in MAC fromaged air mass values (> 8) to more urban emissions (< 7.5),the reduction in core diameter, and reduced coating thick-ness, all indicative of urban traffic emissions (Laborde et al.,2013). The BC optical properties also prove useful for iden-tifying the solid-fuel-burning BC particles over the IGP, con-sistent with previous literature where wood-burning stoves,open fires, and agricultural-residue-based stoves are knownto be widespread across the IGP (Banerjee et al., 2015; Pali-wal et al., 2016; Singh et al., 2017; Fleming et al., 2018).Solid fuel, as outlined by Liu et al. (2014), is characteristicof larger core sizes, thicker coating thicknesses, and largerMAC values. All these features listed are present in the IGP,as shown in Figs. 2 and 3, for the pre-monsoon and monsoonseasons, producing the large proportion of solid-fuel BC par-ticles.
Most previous studies analysing BC properties and char-acteristics over India have been based on analysis of satellitedata, ground-based remote sensing, or climate model sim-ulations. However, there is currently large model-to-modelvariability suggestive of considerable uncertainty in modelaerosol representation. A model comparison carried out byMyhre et al. (2013) found a wide range of direct radiativeforcing scenarios in modelling efforts. It was concluded thatthis ambiguity arose from uncertainty behind the vertical dis-tribution of aerosol, especially absorbing aerosol, and its dis-tribution relative to cloud cover. In addition to large model-to-model variability, model analysis when compared to ob-servational studies has shown underprediction of variousvariables over India. It has been found that BC mass concen-trations and radiative forcing estimates need significant ad-justments in model work (Bond et al., 2013), and aerosol op-tical depth (AOD) values are often underestimated by mod-els (Govardhan et al., 2019; Xian et al., 2019) and whencompared to remote sensing studies (Pan et al., 2015). Thework of this paper builds upon recent experimental data onthe mixing state of BC from the eastern coast of India fromKompalli et al. (2019) and includes new information on BCthroughout northern India. By providing high-temporal- andhigh-spatial-resolution data for the pre-monsoon and mon-soon seasons, future model work will have better informedmass concentrations and mixing state information. The dataalso help improve understanding of regional BC characteris-tics and their climate implications.
5 Conclusions
The observations of the physical properties of atmosphericblack carbon in India presented in this work are the first oftheir kind over the Indian subcontinent but the results areconsistent and build upon previous understanding regardingBC properties over northern India. An aircraft campaign wasconducted from 11 June to 11 July 2016 to characterise black
carbon optical and physical properties, during both the pre-monsoon and monsoon seasons. The study represented thenorth-west, central IGP, and north-east of India across thetwo seasons. Exhaustive measurements of the black carbonmass concentration, mixing state, and source properties werecarried out. As we move from outside to inside the IGP, theBC mass concentrations increase from 0.70 µgm−3 in thenorth-east and 1.50 µgm−3 in the north-west to 1.95 µgm−3
in the IGP region. As the monsoon progressed over northernIndia, BC mass concentration decreased over the IGP andnorth-east India (by 38 % and 28 % respectively), except fornorth-west India where mass concentrations remained rela-tively consistent.
BC aerosol across the IGP presented thinly coated parti-cles (1.65), core size (0.25 µm), and mass absorption coef-ficient (6.76 m2 g−1), indicative of solid-fuel-burning parti-cles. In the north-east the BC particles display small coresizes (0.20 µm) and moderately coated particles (1.82). Inthe north-west, however, the BC particles are small (0.22 µm)with moderate coating (1.70) and a low mass absorption co-efficient (7.39), suggestive of traffic emissions. As the mon-soon progressed over northern India, alterations in the atmo-spheric BC properties were witnessed. Over the north-eastregion, BC underwent changes to small particles (0.20 µm)with very little coating (1.60), mainly due to a switch in winddirection from the Bay of Bengal, resulting in very few solid-fuel particles being transported from the IGP compared to thepre-monsoon season. The IGP presented moderately coatedBC particles (2.0) showing solid-fuel sources into the mon-soon season due to strong emission sources, with the north-west dominated by small BC particles (0.20 µm) from trafficsources consistent with the pre-monsoon environment. Ver-tical structure was found in the BC properties with the coat-ing thickness and mass absorption cross section increasingby 13 % with altitude compared to the boundary layer acrossnorthern India, during the pre-monsoon and monsoon sea-sons. Relating this to previous research highlights the largeabsorption potential of the BC aerosol over northern India,especially aloft.
The spatial distribution of black carbon properties hasbeen characterised here based upon airborne measurementsthroughout the vertical column across northern India, dur-ing the pre-monsoon and monsoon seasons. Aerosol sourceanalysis in the literature can provide useful context for theblack carbon presented. As Brooks et al. (2019) explain,across the IGP the residential sector provides the great-est particulate emissions, over double the emissions fromlarge industry and transport (Pandey et al., 2014). Black car-bon aerosol (kerosene lamps, woodstoves, and agricultural-residue-based stoves) is known to arise largely from residen-tial fuel-burning activities (Fleming et al., 2018), consistentwith our findings as these practices are seen widely acrossthe IGP region where BC mass concentrations are greatestand reflect solid-fuel-type emissions.
Atmos. Chem. Phys., 19, 13079–13096, 2019 www.atmos-chem-phys.net/19/13079/2019/
J. Brooks et al.: BC physical and optical properties during pre-monsoon and monsoon seasons 13091
This BC source information, coupled with the extensivein situ measurements, will prove pivotal in improving under-standing of potential radiative forcing from BC-containingparticles over India and emission inventory work.
Data availability. Processed data are available through theSWAAMI and parent FAAM archives at the Centre for Environ-mental Data Analysis (CEDA) (http://data.ceda.ac.uk/badc/faam,last access: 21 October 2019, FAAM, 2016).
www.atmos-chem-phys.net/19/13079/2019/ Atmos. Chem. Phys., 19, 13079–13096, 2019
13092 J. Brooks et al.: BC physical and optical properties during pre-monsoon and monsoon seasons
Appendix A
Figure A1. Advance of the Indian summer monsoon of 2016 (India Meteorological Department, Ministry of Earth Sciences, India).
Figure A2. Mean wind direction conditions during the pre-monsoon (a, b) and monsoon seasons (c, d). The data used in the maps are fromERA-Interim (Dee et al., 2011).
Atmos. Chem. Phys., 19, 13079–13096, 2019 www.atmos-chem-phys.net/19/13079/2019/
J. Brooks et al.: BC physical and optical properties during pre-monsoon and monsoon seasons 13093
Author contributions. JB was responsible for the SP2 instrumentoperation in the field, data processing, data analysis, and the writ-ing of this paper. HC contributed to the writing of the paper. JDAand PIW were responsible for the maintenance and running of theAMS prior to and during the campaign. DL supplied expertise andoperation of the SP2 prior to and during the campaign and assistedwith the data analysis. SKK also contributed to the operation of theSP2 in the field. JH, EJH, SSB, SKS, AGT, and HC were the projectinvestigators for this campaign.
Competing interests. The authors declare that they have no conflictof interest.
Special issue statement. This article is part of the special issue “In-teractions between aerosols and the South West Asian monsoon”. Itis not associated with a conference.
Acknowledgements. We would like to thank those involved in theSWAAMI project, which is part of the larger MONSOON project.This includes the Facility for Airborne Atmospheric Measurements(FAAM) and Airtask, who manage and operate the BAe-146 At-mospheric Research Aircraft, which is jointly funded by the Natu-ral Environmental Research Council (NERC) and the Met Office.SWAAMI conducted a major aircraft study of aerosol propertiesacross the Indo-Gangetic Plain and northern Bay of Bengal immedi-ately before the monsoon onset (May 2016) and during its develop-ment (June 2016), to determine the key aerosol physical and chem-ical properties and assess their spatial distribution. Bringing thesetogether provides an improved characterisation of aerosol pollutionacross India. SWAAMI will also seek to quantify the radiative effectof aerosol across the region, to allow testing of model predictionsagainst in situ measurements. Aircraft, ground-based, and satelliteplatforms were utilised during SWAAMI. A number of institutionswere involved in logistics, planning, and support of the MONSOONcampaign: the Met Office, University of Reading, Vikram SarabhaiSpace Centre India, and the Indian Institute of Science India. ERA-Interim wind field data were provided courtesy of ECMWF.
Financial support. This research has been supported by the NERC(grant nos. NE/L002469/1, NE/L013886/1, NR/L01386X/1, andNE/P003117/1).
Review statement. This paper was edited by B. V. Krishna Murthyand reviewed by two anonymous referees.
References
Banerjee, T., Murari, V., Kumar, M., and Raju, M. P.: Source ap-portionment of airborne particulates through receptor modeling:Indian scenario, Atmos. Res., 164, 167–187, 2015.
Bansal, O., Singh, A., and Singh, D.: Characteristics of Black Car-bon aerosols over Patiala Northwestern part of the IGP: Source
apportionment using cluster and CWT analysis, Atmos. Pol-lut. Res., 10, 244–256, https://doi.org/10.1016/j.apr.2018.08.001,2018.
Baumgardner, D., Popovicheva, O., Allan, J., Bernardoni, V., Cao,J., Cavalli, F., Cozic, J., Diapouli, E., Eleftheriadis, K., Gen-berg, P. J., Gonzalez, C., Gysel, M., John, A., Kirchstetter, T. W.,Kuhlbusch, T. A. J., Laborde, M., Lack, D., Müller, T., Niess-ner, R., Petzold, A., Piazzalunga, A., Putaud, J. P., Schwarz,J., Sheridan, P., Subramanian, R., Swietlicki, E., Valli, G., Vec-chi, R., and Viana, M.: Soot reference materials for instru-ment calibration and intercomparisons: a workshop summarywith recommendations, Atmos. Meas. Tech., 5, 1869–1887,https://doi.org/10.5194/amt-5-1869-2012, 2012.
Bohren, C. F. and Huffman, D. R.: Absorption and scattering oflight by small particles, John Wiley & Sons, USA, 2008.
Bond, T. C. and Bergstrom, R. W.: Light absorption by carbona-ceous particles: An investigative review, Aerosol Sci. Technol.,40, 27–67, 2006.
Bond, T. C., Doherty, S. J., Fahey, D. W., Forster, P. M.,Berntsen, T., Deangelo, B. J., and Zender, C. S.: Bound-ing the role of black carbon in the climate system: A sci-entific assessment, J. Geophys. Res.-Atmos., 118, 5380–5552,https://doi.org/10.1002/jgrd.50171, 2013.
Brooks, J., Allan, J. D., Williams, P. I., Liu, D., Fox, C., Hay-wood, J., Langridge, J. M., Highwood, E. J., Kompalli, S. K.,O’Sullivan, D., Babu, S. S., Satheesh, S. K., Turner, A. G.,and Coe, H.: Vertical and horizontal distribution of submicronaerosol chemical composition and physical characteristics acrossnorthern India during pre-monsoon and monsoon seasons, At-mos. Chem. Phys., 19, 5615–5634, https://doi.org/10.5194/acp-19-5615-2019, 2019.
Crippa, M., Canonaco, F., Lanz, V. A., Äijälä, M., Allan, J. D., Car-bone, S., Capes, G., Ceburnis, D., Dall’Osto, M., Day, D. A., De-Carlo, P. F., Ehn, M., Eriksson, A., Freney, E., Hildebrandt Ruiz,L., Hillamo, R., Jimenez, J. L., Junninen, H., Kiendler-Scharr,A., Kortelainen, A.-M., Kulmala, M., Laaksonen, A., Mensah,A. A., Mohr, C., Nemitz, E., O’Dowd, C., Ovadnevaite, J., Pan-dis, S. N., Petäjä, T., Poulain, L., Saarikoski, S., Sellegri, K.,Swietlicki, E., Tiitta, P., Worsnop, D. R., Baltensperger, U., andPrévôt, A. S. H.: Organic aerosol components derived from 25AMS data sets across Europe using a consistent ME-2 basedsource apportionment approach, Atmos. Chem. Phys., 14, 6159–6176, https://doi.org/10.5194/acp-14-6159-2014, 2014.
Dee, D. P., Uppala, S. M., Simmons, A. J., Berrisford, P., Poli,P., Kobayashi, S., Andrae, U., Balmaseda, M. A., Balsamo, G.,Bauer, D. P., and Bechtold, P.: The ERA-Interim reanalysis: Con-figuration and performance of the data assimilation system, Q. J.Roy. Meteor. Soc., 137, 553–597, 2011.
Fleming, L. T., Lin, P., Laskin, A., Laskin, J., Weltman, R., Ed-wards, R. D., Arora, N. K., Yadav, A., Meinardi, S., Blake, D.R., Pillarisetti, A., Smith, K. R., and Nizkorodov, S. A.: Molec-ular composition of particulate matter emissions from dung andbrushwood burning household cookstoves in Haryana, India, At-mos. Chem. Phys., 18, 2461–2480, https://doi.org/10.5194/acp-18-2461-2018, 2018.
Gao, R. S., Schwarz, J. P., Kelly, K. K., Fahey, D. W., Watts, L.A., Thompson, T. L., Spackman, J. R., Slowik, J. G., Cross, E.S., Han, J. H., Davidovits, P., Onasch, T. B., and Worsnop, D.R.: A novel method for estimating light-scattering properties of
www.atmos-chem-phys.net/19/13079/2019/ Atmos. Chem. Phys., 19, 13079–13096, 2019

13094 J. Brooks et al.: BC physical and optical properties during pre-monsoon and monsoon seasons
soot aerosols using a modified single-particle soot photometer,Aerosol Sci. Technol., 41, 125–135, 2007.
Gautam, R., Liu, Z., Singh, R. P., and Hsu, N. C.: Twocontrasting dust-dominant periods over India observed fromMODIS and CALIPSO data, Geophys. Res. Lett., 36,https://doi.org/10.1029/2008GL036967, 2009.
Govardhan, G., Satheesh, S. K., Moorthy, K. K., and Nanjun-diah, R.: Simulations of black carbon over the Indian region:improvements and implications of diurnality in emissions, At-mos. Chem. Phys., 19, 8229–8241, https://doi.org/10.5194/acp-19-8229-2019, 2019.
Herich, H., Hueglin, C., and Buchmann, B.: A 2.5 year’s source ap-portionment study of black carbon from wood burning and fossilfuel combustion at urban and rural sites in Switzerland, Atmos.Meas. Tech., 4, 1409–1420, https://doi.org/10.5194/amt-4-1409-2011, 2011.
Herich, H., Gianini, M. F. D., Piot, C., Mocnik, G., Jaffrezo, J.-L.,Besombes, J.-L., Prévôt, A. S. H., and Hueglin, C.: Overview ofthe impact of wood burning emissions on carbonaceous aerosolsand PM in large parts of the Alpine region, Atmos. Environ., 89,64–75, 2014.
Huang, X. F., Sun, T. L., Zeng, L. W., Yu, G. H., and Luan, S. J.:Black carbon aerosol characterization in a coastal city in SouthChina using a single particle soot photometer, Atmos. Envi-ron., 51, 21–28, https://doi.org/10.1016/j.atmosenv.2012.01.056,2012.
IPCC: Climate Change 2013: The Physical Science Basis. Contri-bution of Working Group I to the Fifth Assessment Report of theIntergovernmental Panel on Climate Change, United Kingdomand New York, 1535 pp., 2013.
Jansen, K. L., Larson, T. V., Koenig, J. Q., Mar, T. F., Fields, C.,Stewart, J., and Lippmann, M.: Associations between health ef-fects and particulate matter and black carbon in subjects with res-piratory disease, Environ. Health Persp., 113, 1741–1746, 2005.
Kaskaoutis, D. G., Kumar, S., Sharma, D., Singh, R. P., Kharol, S.K., Sharma, M., Singh, A. K., Singh, S., Singh, A., and Singh,D.: Effects of crop residue burning on aerosol properties, plumecharacteristics, and long-range transport over northern India, J.Geophys. Res.-Atmos., 119, 5424–5444, 2014.
Knox, A., Evans, G. J., Brook, J. R., Yao, X., Jeong, C. H., Godri,K. J., Sabaliauskas, K., and Slowik, J. G.: Mass absorption cross-section of ambient black carbon aerosol in relation to chemicalage, Aerosol Sci. Technol., 43, 522–532, 2009.
Koch, D., Schulz, M., Kinne, S., McNaughton, C., Spackman, J.R., Balkanski, Y., Bauer, S., Berntsen, T., Bond, T. C., Boucher,O., Chin, M., Clarke, A., De Luca, N., Dentener, F., Diehl, T.,Dubovik, O., Easter, R., Fahey, D. W., Feichter, J., Fillmore,D., Freitag, S., Ghan, S., Ginoux, P., Gong, S., Horowitz, L.,Iversen, T., Kirkevåg, A., Klimont, Z., Kondo, Y., Krol, M., Liu,X., Miller, R., Montanaro, V., Moteki, N., Myhre, G., Penner,J. E., Perlwitz, J., Pitari, G., Reddy, S., Sahu, L., Sakamoto, H.,Schuster, G., Schwarz, J. P., Seland, Ø., Stier, P., Takegawa, N.,Takemura, T., Textor, C., van Aardenne, J. A., and Zhao, Y.: Eval-uation of black carbon estimations in global aerosol models, At-mos. Chem. Phys., 9, 9001–9026, https://doi.org/10.5194/acp-9-9001-2009, 2009.
Kompalli, S. K., Babu, S. S., Moorthy, K. K., Manoj, M. R., Kumar,N. K., Shaeb, K. H. B., and Joshi, A. K.: Aerosol black carbon
characteristics over Central India: Temporal variation and its de-pendence on mixed layer height, Atmos. Res., 147, 27–37, 2014.
Kompalli, S. K., Suresh Babu, S. N., Satheesh, S. K., Krishna Moor-thy, K., Das, T., Boopathy, R., Liu, D., Darbyshire, E., Allan, J.,Brooks, J., Flynn, M., and Coe, H.: Seasonal contrast in size dis-tributions and mixing state of black carbon and its associationwith PM1.0 chemical composition from the eastern coast of In-dia, Atmos. Chem. Phys. Discuss., https://doi.org/10.5194/acp-2019-376, in review, 2019.
Kumar, R., Naja, M., Satheesh, S. K., Ojha, N., Joshi, H., Sarangi,T., Pant, P., Dumka, U. C., Hegde, P., and Venkataramani, S.:Influences of the springtime northern Indian biomass burningover the central Himalayas, J. Geophys. Res.-Atmos., 116, D19,https://doi.org/10.1029/2010JD015509, 2011.
Kumar, M., Parmar, K. S., Kumar, D. B., Mhawish, A., Broday, D.M., Mall, R. K., and Banerjee, T.: Long-term aerosol climatologyover Indo-Gangetic Plain: Trend, prediction and potential sourcefields, Atmos. Environ., 180, 37–50, 2018.
Laborde, M., Mertes, P., Zieger, P., Dommen, J., Baltensperger, U.,and Gysel, M.: Sensitivity of the Single Particle Soot Photometerto different black carbon types, Atmos. Meas. Tech., 5, 1031–1043, https://doi.org/10.5194/amt-5-1031-2012, 2012.
Laborde, M., Crippa, M., Tritscher, T., Jurányi, Z., Decarlo, P. F.,Temime-Roussel, B., Marchand, N., Eckhardt, S., Stohl, A., Bal-tensperger, U., Prévôt, A. S. H., Weingartner, E., and Gysel,M.: Black carbon physical properties and mixing state in theEuropean megacity Paris, Atmos. Chem. Phys., 13, 5831–5856,https://doi.org/10.5194/acp-13-5831-2013, 2013.
Lawrence, M. G., Butler, T. M., Steinkamp, J., Gurjar, B. R., andLelieveld, J.: Regional pollution potentials of megacities andother major population centers, Atmos. Chem. Phys., 7, 3969–3987, https://doi.org/10.5194/acp-7-3969-2007, 2007.
Lee, Y. H., Lamarque, J.-F., Flanner, M. G., Jiao, C., Shindell,D. T., Berntsen, T., Bisiaux, M. M., Cao, J., Collins, W. J.,Curran, M., Edwards, R., Faluvegi, G., Ghan, S., Horowitz,L. W., McConnell, J. R., Ming, J., Myhre, G., Nagashima,T., Naik, V., Rumbold, S. T., Skeie, R. B., Sudo, K., Take-mura, T., Thevenon, F., Xu, B., and Yoon, J.-H.: Evaluation ofpreindustrial to present-day black carbon and its albedo forcingfrom Atmospheric Chemistry and Climate Model Intercompar-ison Project (ACCMIP), Atmos. Chem. Phys., 13, 2607–2634,https://doi.org/10.5194/acp-13-2607-2013, 2013.
Liu, D., Quennehen, B., Darbyshire, E., Allan, J. D., Williams, P.I., Taylor, J. W., Bauguitte, S. J.-B., Flynn, M. J., Lowe, D., Gal-lagher, M. W., Bower, K. N., Choularton, T. W., and Coe, H.: Theimportance of Asia as a source of black carbon to the EuropeanArctic during springtime 2013, Atmos. Chem. Phys., 15, 11537–11555, https://doi.org/10.5194/acp-15-11537-2015, 2015.
Liu, D., Flynn, M., Gysel, M., Targino, A., Crawford, I., Bower,K., Choularton, T., Jurányi, Z., Steinbacher, M., Hüglin, C., Cur-tius, J., Kampus, M., Petzold, A., Weingartner, E., Baltensperger,U., and Coe, H.: Single particle characterization of black car-bon aerosols at a tropospheric alpine site in Switzerland, At-mos. Chem. Phys., 10, 7389–7407, https://doi.org/10.5194/acp-10-7389-2010, 2010.
Liu, D., Allan, J., Corris, B., Flynn, M., Andrews, E., Ogren, J.,Beswick, K., Bower, K., Burgess, R., Choularton, T., Dorsey, J.,Morgan, W., Williams, P. I., and Coe, H.: Carbonaceous aerosolscontributed by traffic and solid fuel burning at a polluted rural site
Atmos. Chem. Phys., 19, 13079–13096, 2019 www.atmos-chem-phys.net/19/13079/2019/
J. Brooks et al.: BC physical and optical properties during pre-monsoon and monsoon seasons 13095
in Northwestern England, Atmos. Chem. Phys., 11, 1603–1619,https://doi.org/10.5194/acp-11-1603-2011, 2011.
Liu, D., Allan, J. D., Young, D. E., Coe, H., Beddows, D., Fleming,Z. L., Flynn, M. J., Gallagher, M. W., Harrison, R. M., Lee, J.,Prevot, A. S. H., Taylor, J. W., Yin, J., Williams, P. I., and Zot-ter, P.: Size distribution, mixing state and source apportionmentof black carbon aerosol in London during wintertime, Atmos.Chem. Phys., 14, 10061–10084, https://doi.org/10.5194/acp-14-10061-2014, 2014.
Liu, D., Whitehead, J., Alfarra, M. R., Reyes-Villegas, E.,Spracklen, D. V., Reddington, C. L., Kong, S., Williams, P. I.,Ting, Y. C., Haslett, S., and Taylor, J. W.: Black-carbon absorp-tion enhancement in the atmosphere determined by particle mix-ing state, Nat. Geosci., 10, 184–188, 2017.
Liu, D., Taylor, J. W., Crosier, J., Marsden, N., Bower, K. N.,Lloyd, G., Ryder, C. L., Brooke, J. K., Cotton, R., Marenco,F., Blyth, A., Cui, Z., Estelles, V., Gallagher, M., Coe, H.,and Choularton, T. W.: Aircraft and ground measurements ofdust aerosols over the west African coast in summer 2015 dur-ing ICE-D and AER-D, Atmos. Chem. Phys., 18, 3817–3838,https://doi.org/10.5194/acp-18-3817-2018, 2018.
Liu, D., Joshi, R., Wang, J., Yu, C., Allan, J. D., Coe, H., Flynn,M. J., Xie, C., Lee, J., Squires, F., Kotthaus, S., Grimmond, S.,Ge, X., Sun, Y., and Fu, P.: Contrasting physical properties ofblack carbon in urban Beijing between winter and summer, At-mos. Chem. Phys., 19, 6749–6769, https://doi.org/10.5194/acp-19-6749-2019, 2019.
Marinoni, A., Cristofanelli, P., Laj, P., Duchi, R., Calzolari, F.,Decesari, S., Sellegri, K., Vuillermoz, E., Verza, G. P., Villani, P.,and Bonasoni, P.: Aerosol mass and black carbon concentrations,a two year record at NCO-P (5079 m, Southern Himalayas), At-mos. Chem. Phys., 10, 8551–8562, https://doi.org/10.5194/acp-10-8551-2010, 2010.
McMeeking, G. R., Hamburger, T., Liu, D., Flynn, M., Mor-gan, W. T., Northway, M., Highwood, E. J., Krejci, R., Allan,J. D., Minikin, A., and Coe, H.: Black carbon measurementsin the boundary layer over western and northern Europe, At-mos. Chem. Phys., 10, 9393–9414, https://doi.org/10.5194/acp-10-9393-2010, 2010.
Moorthy, K. K., Beegum, S. N., Srivastava, N., Satheesh, S. K.,Chin, M., Blond, N., Babu, S. S., and Singh, S.: Performanceevaluation of chemistry transport models over India, Atmos. En-viron., 71, 210–225, 2013.
Mordukhovich, I., Wilker, E. H., Suh, H., Wright, R. O., Sparrow,D., Vokonas, P. S., and Schwartz, J.: Black carbon exposure, ox-idative stress genes, and blood pressure in a repeated measuresstudy, Environ. Health Persp., 117, 1767–1772, 2009.
Moteki, N. and Kondo, Y.: Dependence of Laser-Induced Incandes-cence on physical properties of black carbon aerosols: measure-ments and theoretical interpretation, Aerosol Sci. Technol., 44,663–675, 2010.
Moteki, N., Kondo, Y., and Nakamura, S.: Method to measure re-fractive indices of small nonspherical particles: application toblack carbon particles, J. Aerosol. Sci., 41, 513–521, 2010.
Myhre, G., Samset, B. H., Schulz, M., Balkanski, Y., Bauer, S.,Berntsen, T. K., Bian, H., Bellouin, N., Chin, M., Diehl, T.,Easter, R. C., Feichter, J., Ghan, S. J., Hauglustaine, D., Iversen,T., Kinne, S., Kirkevåg, A., Lamarque, J.-F., Lin, G., Liu, X.,Lund, M. T., Luo, G., Ma, X., van Noije, T., Penner, J. E., Rasch,
P. J., Ruiz, A., Seland, Ø., Skeie, R. B., Stier, P., Takemura, T.,Tsigaridis, K., Wang, P., Wang, Z., Xu, L., Yu, H., Yu, F., Yoon,J.-H., Zhang, K., Zhang, H., and Zhou, C.: Radiative forcing ofthe direct aerosol effect from AeroCom Phase II simulations, At-mos. Chem. Phys., 13, 1853–1877, https://doi.org/10.5194/acp-13-1853-2013, 2013.
Paliwal, U., Sharma, M., and Burkhart, J. F.: Monthly and spa-tially resolved black carbon emission inventory of India: un-certainty analysis, Atmos. Chem. Phys., 16, 12457–12476,https://doi.org/10.5194/acp-16-12457-2016, 2016.
Pan, X., Chin, M., Gautam, R., Bian, H., Kim, D., Colarco, P. R.,Diehl, T. L., Takemura, T., Pozzoli, L., Tsigaridis, K., Bauer,S., and Bellouin, N.: A multi-model evaluation of aerosolsover South Asia: common problems and possible causes, At-mos. Chem. Phys., 15, 5903–5928, https://doi.org/10.5194/acp-15-5903-2015, 2015.
Pandey, A., Sadavarte, P., Rao, A. B., and Venkataraman,C.: Trends in multi-pollutant emissions from a technology-linked inventory for India: II. Residential, agricultural andinformal industry sectors, Atmos. Environ., 99, 341–352,https://doi.org/10.1016/j.atmosenv.2014.09.080, 2014.
Pawar, H., Garg, S., Kumar, V., Sachan, H., Arya, R., Sarkar,C., Chandra, B. P., and Sinha, B.: Quantifying the con-tribution of long-range transport to particulate matter (PM)mass loadings at a suburban site in the north-western Indo-Gangetic Plain (NW-IGP), Atmos. Chem. Phys., 15, 9501–9520,https://doi.org/10.5194/acp-15-9501-2015, 2015.
Petzold, A., Ogren, J. A., Fiebig, M., Laj, P., Li, S.-M., Bal-tensperger, U., Holzer-Popp, T., Kinne, S., Pappalardo, G., Sug-imoto, N., Wehrli, C., Wiedensohler, A., and Zhang, X.-Y.: Rec-ommendations for reporting “black carbon” measurements, At-mos. Chem. Phys., 13, 8365–8379, https://doi.org/10.5194/acp-13-8365-2013, 2013.
Raatikainen, T., Brus, D., Hooda, R. K., Hyvärinen, A.-P., Asmi,E., Sharma, V. P., Arola, A., and Lihavainen, H.: Size-selectedblack carbon mass distributions and mixing state in polluted andclean environments of northern India, Atmos. Chem. Phys., 17,371–383, https://doi.org/10.5194/acp-17-371-2017, 2017.
Ramachandran, S.: Aerosol radiative forcing over Bay of Ben-gal and Chennai: Comparison with maritime, continental, andurban aerosol models, J. Geophys. Res.-Atmos., 110, 1–9,https://doi.org/10.1029/2005JD005861, 2005.
Rana, A., Jia, S., and Sarkar, S.: Black carbon aerosolin India: A comprehensive review of current sta-tus and future prospects, Atmos. Res., 218, 207–230,https://doi.org/10.1016/j.atmosres.2018.12.002, 2019.
Schnaiter, M., Linke, C., Mohler, O., Naumann, K.H., Saathoff,H., Wagner, R., Schurath, U., and Wehner, B.: Absorp-tion amplification of black carbon internally mixed withsecondary organic aerosol. J. Geophys. Res., 110, D19204,https://doi.org/10.1029/2005JD006046, 2005.
Schnell, J. L., Naik, V., Horowitz, L. W., Paulot, F., Mao, J., Ginoux,P., Zhao, M., and Ram, K.: Exploring the relationship betweensurface PM2.5 and meteorology in Northern India, Atmos. Chem.Phys., 18, 10157–10175, https://doi.org/10.5194/acp-18-10157-2018, 2018.
Singh, N., Mhawish, A., Deboudt, K., Singh, R. S., and Banerjee,T.: Organic aerosols over Indo-Gangetic Plain: Sources, distri-
www.atmos-chem-phys.net/19/13079/2019/ Atmos. Chem. Phys., 19, 13079–13096, 2019
13096 J. Brooks et al.: BC physical and optical properties during pre-monsoon and monsoon seasons
butions and climatic implications, Atmos. Environ., 157, 69–74,https://doi.org/10.1016/j.atmosenv.2017.03.008, 2017.
Taylor, J. W., Allan, J. D., Allen, G., Coe, H., Williams, P. I.,Flynn, M. J., Le Breton, M., Muller, J. B. A., Percival, C. J.,Oram, D., Forster, G., Lee, J. D., Rickard, A. R., Parrington,M., and Palmer, P. I.: Size-dependent wet removal of blackcarbon in Canadian biomass burning plumes, Atmos. Chem.Phys., 14, 13755–13771, https://doi.org/10.5194/acp-14-13755-2014, 2014.
Thamban, N. M., Tripathi, S. N., Moosakutty, S. P., Kuntamukkala,P., and Kanawade, V. P.: Internally mixed black carbon in theIndo-Gangetic Plain and its effect on absorption enhancement,Atmos. Res., 197, 211–223, 2017.
Vadrevu, K. P., Ellicott, E., Giglio, L., Badarinath, K. V. S., Ver-mote, E., Justice, C., and Lau, W. K.: Vegetation fires in thehimalayan region–Aerosol load, black carbon emissions andsmoke plume heights, Atmos. Environ., 47, 241–251, 2012.
Vaishya, A., Babu, S. N. S., Jayachandran, V., Gogoi, M. M., Lak-shmi, N. B., Moorthy, K. K., and Satheesh, S. K.: Large con-trast in the vertical distribution of aerosol optical propertiesand radiative effects across the Indo-Gangetic Plain during theSWAAMI–RAWEX campaign, Atmos. Chem. Phys., 18, 17669–17685, https://doi.org/10.5194/acp-18-17669-2018, 2018.
Wu, Y., Zhang, R., Tian, P., Tao, J., Hsu, S.-C., Yan, P., Wang,Q., Cao, J., Zhang, X., and Xia, X.: Effect of ambient hu-midity on the light absorption amplification of black carbon inBeijing during January 2013, Atmos. Environ., 124, 217–223,https://doi.org/10.1016/j.atmosenv.2015.04.041, 2016.
Xian, P., Reid, J. S., Hyer, E. J., Sampson, C. R., Rubin, J. I., Ades,M., Asencio, N., Basart, S., Benedetti, A., Bhattacharjee, P. S.,and Brooks, M. E.: Current state of the global operational aerosolmulti-model ensemble: An update from the International Coop-erative for Aerosol Prediction (ICAP), Q. J. Roy. Meteor. Soc.,145, 176–209, https://doi.org/10.1002/qj.3497, 2019.
Atmos. Chem. Phys., 19, 13079–13096, 2019 www.atmos-chem-phys.net/19/13079/2019/