Birth Weight Effects on Children's Mental, Motor, and Physical Development: Evidence from Twins Data
25
Birth Weight Effects on Children’s Mental, Motor, and Physical Development: Evidence from Twins Data Ashlesha Datar, PhD and RAND Corporation, 1776 Main Street, Santa Monica, CA 90407, [email protected], Phone: (310) 393 0411 x 7367, Fax: (310) 260 8161 Alison Jacknowitz, PhD, MPP American University, Department of Public Administration and Policy, 4400 Massachusetts Avenue, NW, Washington, DC 20016, [email protected], Phone: (202) 885 2137, Fax: (202) 885 2347 Abstract Objective—To determine the effect of very low birth weight (VLBW; <1500g) and moderately low birth weight (MLBW; 1500–2499g) on children’s mental and motor development and physical growth during the first two years of life and whether VLBW and MLBW babies catch up to normal birth weight (NBW; >=2500g) children by age 2. Methods—We use data on dizygotic (DZ) and monozygotic (MZ) twins and singleton births from the first two waves of the Early Childhood Longitudinal Study – Birth Cohort (ECLS-B), a nationally representative dataset of children born in the U.S. in 2001. We estimate the effects of VLBW and MLBW on children’s mental and motor development scores, weight-for-age, weight-for- length, weight-for-height, and length-for-age z-scores at 9 months and 2 years. We examine whether differences in outcomes within twin pairs are related to differences in their birth weights. The within-twins analysis is conducted on samples of DZ and MZ twins. For comparison, we also estimate birth weight effects on child outcomes from multivariate linear regression models using the full singleton and twins sample. We also estimate the effect of being small-for- gestational age (SGA; birth weight<10 th percentile for gestation) using the same set of models in order to separate out the effects of fetal growth restriction from prematurity. Results—Evaluation of all births showed that VLBW and MLBW have large negative effects on mental development, motor development, and growth at 9 months and 2 years of age. However, results from within-twin models with DZ twins that control for shared maternal and environmental factors showed much less effect of birth weight on mental or motor development, but continued large effects on growth for the VLBW group. Within-twin models with MZ twins that control for shared maternal, environmental, and genetic factors showed statistically insignificant effects of birth weight on mental and motor development, but continued effects on growth. Similar patterns were found when examining the effects of SGA. Correspondence to: Ashlesha Datar. NIH Public Access Author Manuscript Matern Child Health J. Author manuscript; available in PMC 2010 April 16. Published in final edited form as: Matern Child Health J. 2009 November ; 13(6): 780–794. doi:10.1007/s10995-009-0461-6. NIH-PA Author Manuscript NIH-PA Author Manuscript NIH-PA Author Manuscript
Transcript of Birth Weight Effects on Children's Mental, Motor, and Physical Development: Evidence from Twins Data
Birth Weight Effects on Children’s Mental, Motor, and
Physical Development: Evidence from Twins Data
Ashlesha Datar, PhD andRAND Corporation, 1776 Main Street, Santa Monica, CA 90407, [email protected], Phone:(310) 393 0411 x 7367, Fax: (310) 260 8161
Alison Jacknowitz, PhD, MPPAmerican University, Department of Public Administration and Policy, 4400Massachusetts Avenue, NW, Washington, DC 20016, [email protected], Phone: (202)885 2137, Fax: (202) 885 2347
AbstractObjective—To determine the effect of very low birth weight (VLBW; <1500g) andmoderately low birth weight (MLBW; 1500–2499g) on children’s mental andmotor development and physical growth during the first two years of life andwhether VLBW and MLBW babies catch up to normal birth weight (NBW; >=2500g)children by age 2.
Methods—We use data on dizygotic (DZ) and monozygotic (MZ) twins andsingleton births from the first two waves of the Early Childhood LongitudinalStudy – Birth Cohort (ECLS-B), a nationally representative dataset of childrenborn in the U.S. in 2001. We estimate the effects of VLBW and MLBW onchildren’s mental and motor development scores, weight-for-age, weight-for-length, weight-for-height, and length-for-age z-scores at 9 months and 2 years.We examine whether differences in outcomes within twin pairs are related todifferences in their birth weights. The within-twins analysis is conducted onsamples of DZ and MZ twins. For comparison, we also estimate birth weighteffects on child outcomes from multivariate linear regression models using thefull singleton and twins sample. We also estimate the effect of being small-for-gestational age (SGA; birth weight<10th percentile for gestation) using the sameset of models in order to separate out the effects of fetal growth restrictionfrom prematurity.
Results—Evaluation of all births showed that VLBW and MLBW have largenegative effects on mental development, motor development, and growth at 9months and 2 years of age. However, results from within-twin models with DZtwins that control for shared maternal and environmental factors showed muchless effect of birth weight on mental or motor development, but continued largeeffects on growth for the VLBW group. Within-twin models with MZ twins thatcontrol for shared maternal, environmental, and genetic factors showedstatistically insignificant effects of birth weight on mental and motordevelopment, but continued effects on growth. Similar patterns were foundwhen examining the effects of SGA.
Correspondence to: Ashlesha Datar.
NIH Public AccessAuthor ManuscriptMatern Child Health J. Author manuscript; available in PMC 2010 April 16.
Published in final edited form as:Matern Child Health J. 2009 November ; 13(6): 780–794. doi:10.1007/s10995-009-0461-6.
NIH
-PA A
uthor M
anuscript
NIH
-PA A
uthor M
anuscript
NIH
-PA A
uthor M
anuscript
Conclusions—After controlling for the influence of maternal, environmental,and genetic factors, low birth weight has at most a small negative effect onchildren’s mental and motor development in their first two years of life.However, low birth weight is a major risk factor for children’s physical growthin the early years and there is no evidence of catch-up by age 2.
Keywords
Birth weight; Twins; Mental development; Motor development; Growth
INTRODUCTIONIn 2004, 8.1 percent of all newborns in the U.S. were born at a low birthweight (LBW); conventionally defined as birth weight less than 2500 grams.This is the highest percentage since the early 1970s1. A significant body ofresearch finds a strong association between LBW and a wide variety ofdevelopmental and health outcomes in childhood and adulthood. LBW hasbeen associated with adult conditions such as Type 2 diabetes, hypertension,and coronary heart disease2–4. Among children, LBW has been linked tohigh blood pressure, cerebral palsy, deafness, blindness, asthma, lungdisease, poor cognitive and physical performance, and mortality5–14.
Most of this literature, however, is based on cross-sectional study designsthat have limited ability to control for maternal, environmental, andgenetic factors that are also correlated with birth weight and lateroutcomes. Therefore, it is unclear whether these associations are caused byintrauterine malnutrition per se or whether they are mediated by geneticand/or shared environmental effects.
Studies based on twins data have made a significant contribution to thisliterature because of their ability to address such concerns. Differences inbirth weight within twin pairs reflect differences in fetal growth but notgestational age. Within-twins analyses based on fraternal (dizygotic; DZ)twin pairs allow matching on all observed and unobserved maternal factors(e.g., maternal height, maternal nutritional status, maternal diseases) andenvironmental factors that are shared by twins, and within-twins analysesbased on identical (monozygotic, MZ) twin pairs additionally allow matchingon genetic factors.
However, studies based on differences in birth weight within twin pairs arerelatively few and are typically based on samples that have limitedgeographic variability and, hence, have limited generalizeability. Further,these studies have focused on the effect of being LBW on adult diseases (seeIliadou et al15 and Hubinette et al16,17 for an overview of these studies). Inchildren, studies based on within twin pair differences are limited and havemixed findings. A group of studies done in the 1960s and 1970s examinedwhether within twin pair differences in birth weight among MZ twins werecorrelated with within twin pair differences in IQ18–21. While most studiesfound the heavier twin to have higher IQ, one study found no significantdifference in IQ between the heavier and lighter twin. Most recently,Newcombe et al22 examined the same question using a large sample of MZtwin pairs born in the United Kingdom and found that the heavier twin hadsignificantly higher IQ compared to the lighter twin.
Datar and Jacknowitz Page 2
Matern Child Health J. Author manuscript; available in PMC 2010 April 16.
NIH
-PA A
uthor M
anuscript
NIH
-PA A
uthor M
anuscript
NIH
-PA A
uthor M
anuscript
A recent national survey of a birth cohort allows examination of this issuein a sample of U.S. twins. We use data from the first 2 waves of the EarlyChildhood Longitudinal Study – Birth Cohort (ECLS-B) to examine theindependent effect of very low birth weight (VLBW; <1500g) on children’smental and motor development and physical growth during the first 2 yearsof life and whether VLBW children catch up to normal birth weight (NBW;>=2500g) children by age 2. We also examine the independent effect of beingmoderately low birth weight (MLBW; 1500–2499g) since less is known aboutchildren in this range of birth weight23. We use a “within-group” estimatorto examine whether differences in outcomes within twin pairs are relatedto differences in their birth weights. The within-twins analyses areconducted on samples of fraternal and identical twins. We compare theestimates from within-twin models to those from multivariate linearregression models estimated on the full sample of singleton and twin births(hereafter referred to as “cross-sectional” models). This comparison allowsus to assess the contribution of unobserved maternal, environmental, andgenetic factors in determining birth weight and children’s developmentaland growth outcomes. We also estimate the effect of being small-for-gestational age (SGA; birth weight < 10th percentile for gestation) on thesame set of outcomes using the same set of models. These estimates capturethe effects of low birth weight on children’s developmental and growthoutcomes resulting from fetal growth restriction rather than prematurity.
METHODSSample
We use data from the ECLS-B, a longitudinal nationally representative dataset that was collected by the National Center for Education Statistics (NCES),U.S. Department of Education24. The ECLS-B follows a nationallyrepresentative cohort of children born in 2001 in the U.S. from birththrough kindergarten with data collection occurring when the child isapproximately nine-months of age, two-years of age, four-years of age (atpre-school), and at kindergarten entry. To date, the first two waves ofsurvey data are available and used in this study. Children were primarilysampled via registered births from the National Center for Health Statistics(NCHS) vital statistics system. Births were sampled within a set of primarysampling units, which were individual counties or groups of contiguouscounties. The survey oversampled VLBW and MLBW babies, multiple births,and Asian and American Indian births. The baseline sample consists of 10,221births that participated in the child assessments. Of the 10,221 children whoparticipated in the first wave of the survey, 8,944 (87.5 percent) of themparticipated in the second wave. Children who attrited from the samplebetween the first two waves are relatively similar in terms of maternaleducation, region of residence, and child’s race/ethnicity to those whoremained in the sample25.
Our analysis sample consists of about 6,750 singleton births, 625 twin pairs(fraternal pairs = 525, identical pairs = 100), and 50 twins and other higher-order births whose siblings were not included in the ECLS-B. The reportedsample sizes for subgroups of the data have been rounded to the nearest 50per NCES restrictions regarding disclosure of restricted use data. However,the analyses and statistics presented in the tables and text are generatedusing all observations in each subsample. Births were excluded from the
Datar and Jacknowitz Page 3
Matern Child Health J. Author manuscript; available in PMC 2010 April 16.
NIH
-PA A
uthor M
anuscript
NIH
-PA A
uthor M
anuscript
NIH
-PA A
uthor M
anuscript

analysis sample using the following five criteria; the number ofobservations excluded for each criterion are in parentheses. First, birthswhose survey respondent was not their biological mother were excluded(150). Second, births that did not participate in the child assessments in eachwave were excluded (1,700). Third, births that did not have completeinformation on birth weight, small-for-gestation, twin status, and type oftwin were excluded (400). Fourth, births born with a congenital anomalywere excluded (300). Fifth, births with missing information for any of thecontrol variables were excluded with the exception of the following fourvariables: first birth, adequacy of prenatal care, presence of pregnancy riskfactors, and presence of labor and delivery complications (100). Each of thesefour variables had more than 150 missing values before the fifth samplerestriction; therefore, after implementing the final data restriction weassigned the remaining missing data points the modal value. All modelsincluded variables that indicated whether the observation included a valuethat was mode-replaced for each of these four variables.
Measures
Identification of Twin Type—Twin type in the ECLS-B is identified usingparent and interviewer reports. Opposite-sex twin pairs were classified asdizygotic. For same-sex twin pairs, the ECLS-B asked both parents andinterviewers questions drawn from existing research that attempt toreliably distinguish identical from fraternal twins26–28. Specifically, bothparents and observers were asked whether the twins differed in their hairtexture, shades of hair colors, eye color, complexion, facial appearance, andshape of ear lobes. Parents were additionally asked about the similarity ofthe twins when their first teeth erupted, whether the twins were evermistaken for each other by either parent, other family members, orstrangers and, if yes, how frequently, and whether there were any physicaldifferences between the twins. Parents were also asked about the twins’blood types and RH factors. Using these questions, approximately 16 percentof twins were classified as monozygotic.
Birth Weight Measures—The ECLS-B obtained birth weight informationfrom birth certificates. We created binary variables for VLBW, defined asbirth weight less than 1500 grams, and MLBW, defined as birth weightgreater than or equal to 1500 grams and less than 2500 grams, to include asthe primary explanatory variables of interest. The omitted category is NBWdefined as 2500 grams and above. Categorical variables were chosen insteadof a continuous birth weight variable since these cutoffs have beentraditionally used in the medical literature and this specification allowscomparison of our findings with other studies. In alternate models, we usedsmall-for-gestational age (SGA), defined as birth weight less than the 10th
percentile for gestational age29, as an alternate measure of low birth weight.Although not accurate, SGA has traditionally been used to captureintrauterine growth restriction (IUGR)30.
Mental and Motor Development Scores—Data on children’s mental and motordevelopment are collected through direct child assessments using the BayleyShort Form – Research Edition (BSF-R) in both waves of data. Thisinstrument was specifically designed for the ECLS-B and is derived fromthe Bayley Scales of Infant Development, Second Edition (BSID-II)31, which
Datar and Jacknowitz Page 4
Matern Child Health J. Author manuscript; available in PMC 2010 April 16.
NIH
-PA A
uthor M
anuscript
NIH
-PA A
uthor M
anuscript
NIH
-PA A
uthor M
anuscript

is a standardized assessment of developmental status for children frombirth to 42 months of age (More details about the assessments are availableat <http://nces.ed.gov/pubs2005/2005100.pdf>). The BSF-R administered at9 months consisted of a 31-item mental scale (33 items at 2 years) and a 35-item motor scale (32 items at 2 years). Each scale included a set of core itemsthat all children were administered as well as a set of basal and ceiling itemsthat were administered depending upon the child’s responses on the coreitems. The mental scale assesses early cognitive and language ability asmanifested in memory, habituation, preverbal communication, problemsolving, and concept attainment. The motor scale captures gross and finemotor abilities (e.g., picking up objects, crawling, walking), perceptual-motor integration, and problem solving.
Responses on the BSF-R scale were first weighted to adjust for oversamplingand nonresponse and subsequently equated to the full BSID-II scale using ItemResponse Theory (IRT)31. This makes it possible to compare the BSF-R scoresto those obtained using the full set of BSID-II items. There are a total of 178mental items and 111 motor items on the full BSID-II, which means that theECLS-B mental scale scores could range from 0–178 and the motor scalescores could range from 0–111, although in reality all scores lie well withinthese intervals since the items are designed for children from birththrough 42 months. At 9-months the mental scale scores range from 32 to131 and the motor scale scores range from 21 to 87 in the full sample. At 2years the mental scale scores range from 92 to 174; while the motor scalescores range from 56 to 109. These scale scores are not age-normed andsimply measure the number of items a child would have answered correctlywere she administered the full set of BSID-II mental and motor developmentscale items. However, this is not a concern in our within-twins analyses sinceboth children within the twin pair are assessed at the same age. Thereliability of the BSF-R scale scores in the ECLS-B is high; for example, inthe 9-month wave the IRT reliability coefficient is 0.80 for the mental scaleand 0.93 for the motor scale24. The corresponding numbers in the 2-yearwave are 0.88 and 0.73, respectively.
Growth—Children’s weight and length/height were measured by the ECLS-B interviewers in both waves of data. Standard procedures were followed toobtain the physical measurements to ensure that all measurements wereobtained in the same way for all children. A Seca digital bathroom scale(accuracy = 0.1 kilogram) was used to measure the child’s weight in bothwaves. The mother first stood on the scale and her weight was recorded. Theinterviewer then handed the child to the mother and the scale’s tare feature(in which the child’s weight is automatically subtracted from the combinedweight of the mother and child) then displayed the child’s weight alone. Thechild’s recumbent length was measured at the 9-month interview using aSeca pediatric measure mat. At the 2-year interview, a stadiometer (SecaModel 214 Road Rod) was used to measure the child’s height. Assessors weretrained to understand the purpose of the measurements and were madefamiliar with the equipment prior to the study by practicing with trainingstaff as well as infants and 2-year old children specifically recruited forstaff training. The reliabilities of the physical measurements were quitehigh; the correlation between the first and second recordings was r = .81for both weight and height measurements.
Datar and Jacknowitz Page 5
Matern Child Health J. Author manuscript; available in PMC 2010 April 16.
NIH
-PA A
uthor M
anuscript
NIH
-PA A
uthor M
anuscript
NIH
-PA A
uthor M
anuscript

Each of these physical measurements was obtained twice to minimizemeasurement error. If the two measures were more than 5 percent apart athird measurement was taken. Composite values for height and weight werecreated by using the two measurements that were closest together: the valueof the composite was the average of these two values. If the threemeasurements were equidistant from one another, the value that wasfurthest from the weighted average of the smallest and largest value wasdiscarded and the composite took the value of the average of the remainingtwo measures. If the child had two height or weight values that were lessthan 5 percent apart, the average of the two values was computed and usedas the composite value.
We examine weight-for-age (9-month and 2-year data), weight-for-length(9-month data), weight-for-height (2-year data), and length-for-age (9-month data) z-scores. The parameters necessary to calculate these z-scoresare from the Centers for Disease Control (CDC) website at<http://www.cdc.gov/nchs/about/major/nhanes/growthcharts/datafiles.htm>. Physical anthropometry protocols call for the measurementof recumbent length up to 2 years of age, and standing height from thisage onwards. However, only height data and not recumbent length data werecollected at the 2-year wave regardless of the toddler’s age at the time ofassessment. At the 2-year survey, variation in assessment age across childrenresulted in roughly half the assessed sample being below 24 months. Hence,the corresponding values (length/height) and z-scores were used dependingon the availability of data and the range of the indices (e.g., gender, age)necessary to merge in the information from the CDC. For example, weight-for-height is indexed by height and gender; therefore, we can createweight-for-height z-scores for all births with non-missing data regardlessof age at assessment. In comparison, height-for-age is indexed by age andgender starting at 24 months, thus prohibiting the calculation of z-scoresfor toddlers less than 24 months.
Other Explanatory Variables—Data on child, maternal, household, andpregnancy-related characteristics collected from birth certificates and thenine-month and the two-year surveys are included as explanatory variables.Note that these controls are used only in the cross-sectional models sincethey compare outcomes across children who differ in maternal,environmental, and genetic factors. Child-level controls include indicatorsfor female, race/ethnicity (non-Hispanic White, non-Hispanic Black,Hispanic, other), first birth, and whether the child was a twin or higher-order birth. In addition, age at the time of assessment in weeks is includedbecause some of our outcome measures such as mental and motor scale scoresare not age-normed. The age of assessment for wave 1 is included whenexamining an outcome measured using the 9-month data and the age ofassessment for wave 2 is measured when investigating an outcome measuredusing the 2-year data. We also include a continuous variable for gestationalage, measured in weeks. Controlling for age at assessment and gestationalage is critical since mental and motor outcomes are measured at differentpost conceptual ages. We do not include variables capturing an infant’s laterhealth conditions as they may be the result of birth weight status and wouldprevent us from measuring the total effect of birth weight status on ouroutcomes.
Datar and Jacknowitz Page 6
Matern Child Health J. Author manuscript; available in PMC 2010 April 16.
NIH
-PA A
uthor M
anuscript
NIH
-PA A
uthor M
anuscript
NIH
-PA A
uthor M
anuscript

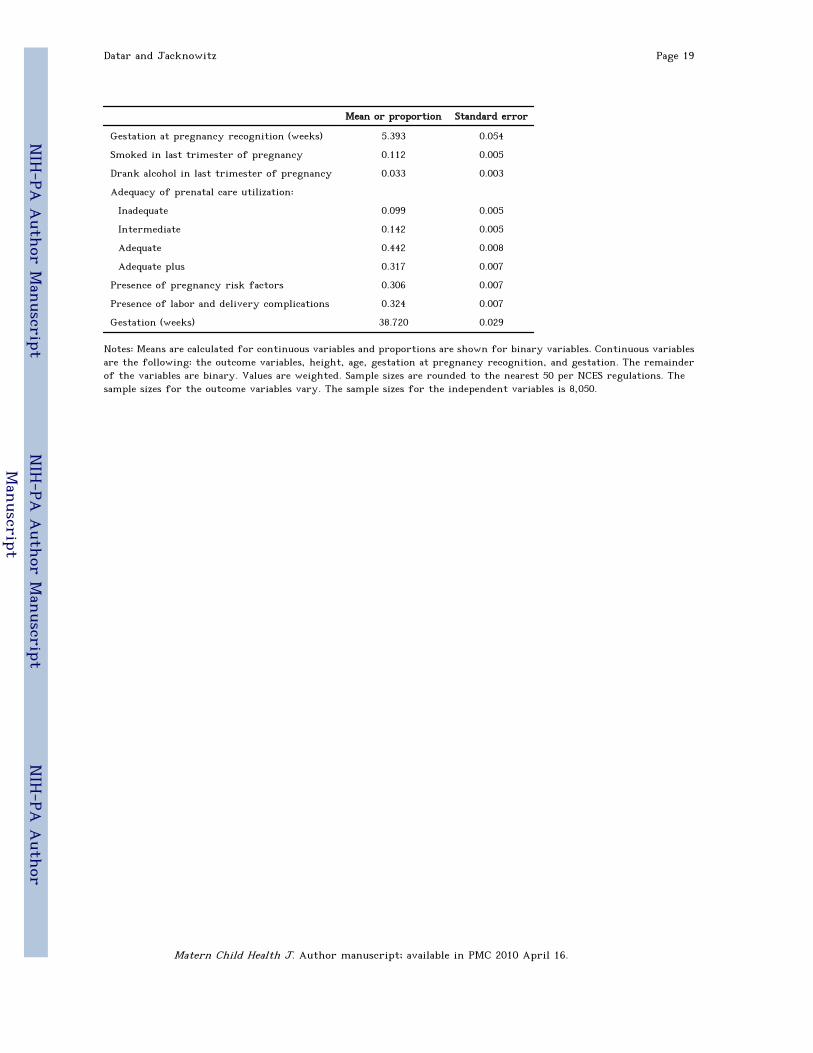
Maternal characteristics include height in inches and indicator variables forage (less than 20 years, between 20 and 24.99 years, between 25 and 29.99years, between 30 and 34.99 years, at least 35 years), education (less thanhigh school diploma, high school diploma or equivalent, some college or voc/tech program, bachelors degree or higher), and married at birth. Householdcharacteristics include indicator variables for income (less than or equal to$20000, between $20001 and $40000, between $40001 and $75000, between$75001 and $100000, $100001 or higher), region (Northeast, Midwest, South,West), and urbanicity (population less than 2,500, population of 2,500 to49,999, population at least 50,000), When examining outcomes at 2 years,variables capturing changes in income and marital status are included.Pregnancy characteristics include gestation in weeks at pregnancyrecognition and as mentioned earlier, gestation in weeks. Other pregnancy-related variables include indicators for whether mother smoked in the lasttrimester, whether mother drank alcohol in the last trimester, adequacy ofprenatal care utilization (inadequate, intermediate, adequate, adequate plus),whether the pregnancy was at-risk, and presence of labor and/or deliverycomplications. Adequacy of prenatal care is measured by the Adequacy ofPrenatal Care Utilization Index33, which is a function of the month prenatalcare began (i.e., adequacy of initiation of prenatal care) and the proportionof the number of visits recommended by the American College ofObstetricians and Gynecologists that a mother received from the timeprenatal care began until the time of delivery (i.e., adequacy of receivedservices). Table 1 reports means or proportions and standard errors for theoutcome variables, birth weight measures, and selected explanatoryvariables.
Statistical Analysis
We estimate 3 linear regression models for each of the nine outcomevariables discussed above. The first model is a linear regression of theoutcome variable on indicators of VLBW and MLBW using the full sample ofsingletons and twins. This model controls for the child, maternal,household, and pregnancy-related characteristics described in the previoussection and mimics the cross-sectional study design typically seen in studiesof birth weight effects. The remaining 2 models estimate “within-group”estimates of birth weight effects using samples of fraternal and identicaltwin pairs, respectively. These within-twins models essentially use one twinas the control for the other twin by regressing within twin pair differencesin outcomes on within twin pair differences in birth weight (model (3)described in Carlin et al34). When relating outcomes differences to birthweight differences within fraternal twin pairs, we include a control forchild’s gender. Controls for gestational age are not needed in within-twinmodels since both children in the twin pair have the same gestation.Comparing outcomes of fraternal twins allowed us to control for allmaternal and environmental factors shared by the twins. The final modelregresses outcome differences within identical twin pairs on differences intheir birth weights. Comparing outcomes of identical twins allowed us toadditionally control for genetic differences between the twins. The effectsof SGA on all the outcomes are also estimated using the 3 models describedabove.
Datar and Jacknowitz Page 7
Matern Child Health J. Author manuscript; available in PMC 2010 April 16.
NIH
-PA A
uthor M
anuscript
NIH
-PA A
uthor M
anuscript
NIH
-PA A
uthor M
anuscript

The exact sample size used to estimate each model varies across differentoutcomes due to different number of missing values for the dependentvariable. For each outcome we include only those births in the sample forwhom data on the outcome are available at 9 months and 2 years to allowtesting for any catch up between LBW and NBW births at age 2. To ensurethat the results from the 2 twins-based models are comparable for eachoutcome, we only include twin-pairs that have non-missing values for agiven outcome in the final 2 models.
All analyses are conducted using the statistical program STATA version 9.2(StataCorp, College Station, TX). All estimates are weighted using the ECLS-B provided weight, W2C0. For the cross-sectional model, we adjust thestandard errors from the regression to account for within-twin paircorrelations in the outcomes using the cluster option in STATA.
RESULTSDescriptive Statistics
Table 2 reports descriptive statistics for the outcome variables, birth weightmeasures, and selected explanatory variables in our analysis for singletonbirths, twin births, identical twins, and fraternal twins. Two tailed t-testsfor differences in means for continuous variables and proportions forbinary variables between singletons and all twins and between fraternal andidentical twins are conducted, and those with p<0.01 are discussed below.Twins are more likely to be VLBW and MLBW than singleton births;although they are not more likely to be SGA. Twins tend to be born tomothers who are more advantaged. Mothers of twins are more likely to benon-Hispanic White, be older at birth, have a bachelor’s degree or higher,have higher income, be married at the time of birth, and receive adequateplus prenatal care compared to mothers of singleton births. As expected,pregnancies with twins tend to be more complicated than those that lead tosingleton births, with twin pregnancies more likely to be at risk, toexperience labor and delivery complications, and to have shorter meangestation in weeks. Upon comparing fraternal and identical twins, we seethat fraternal twins are born to more advantaged mothers, with mothersof fraternal twins more likely to be non-Hispanic White, married at thetime of birth, older at the time of birth, more educated, have higherincome, and receive adequate plus prenatal care.
Bivariate Results
Table 2 also reports the means for all the outcomes for singleton births, alltwins, fraternal twins, and identical twins. Two-tailed t-tests for meandifferences between singletons and twins, and between fraternal andidentical twins are conducted. Singletons score significantly higher on alloutcomes compared to twins (p<0.01) with the exception of weight-for-length at 9 months (p=0.02). However, there is no statistically significantdifference in outcomes between fraternal and identical twins using anα=0.01.
Datar and Jacknowitz Page 8
Matern Child Health J. Author manuscript; available in PMC 2010 April 16.
NIH
-PA A
uthor M
anuscript
NIH
-PA A
uthor M
anuscript
NIH
-PA A
uthor M
anuscript
Regression Results
Table 3 reports regression coefficients on VLBW and MLBW for mental andmotor development scores. Table 4 reports corresponding estimates forgrowth outcomes.
Mental Development—Columns 1 and 2 in Table 3 report estimates of VLBWand MLBW on children’s mental development scale scores at 9 months and 2years, respectively, from the 3 models described in the previous section.Cross-sectional estimates using the full sample (Panel A) show that VLBWand MLBW confer a significant disadvantage at 9 months in the form oflower mental development scores compared to NBW, with VLBW having alarger negative effect compared to MLBW. VLBW infants score 9.1 pointslower (p<0.01), i.e., about 9 fewer correct items, compared to NBW infants.MLBW infants score 3.3 points lower (p<0.01), i.e., about 3 fewer correctitems compared to NBW infants. At 2 years, the effects of VLBW and MLBWon mental scores remain statistically significant at −7.6 points (p<0.01) and−2.6 points, respectively, but the change in the estimates from 9-monthsto 2-years is not statistically significant at α=0.01.
Within-twin estimates from the sample of fraternal twins (Panel B) showmuch smaller, yet statistically significant, effects of VLBW and MLBW onmental scores compared to the cross-sectional estimates, suggesting thatunobserved maternal and environmental factors not controlled for in thecross-sectional regressions are important in determining birth weight andchildren’s mental development. VLBW infants score 2.6 points lower(p=0.021) and MLBW infants score 2.0 points lower (p<0.01) on the mentaldevelopment scale at 9 months compared to their NBW twin. At 2 years, theeffects of VLBW and MLBW appear to have increased, however, the changein coefficients is not statistically significant at α=0.01.
Within-twin estimates from the sample of identical twins are reported inTable 3, Panel C. The effect of VLBW and MLBW on mental developmentscores at 9 months is about −3.1 points (p=0.38) and −2.51 points (p=0.05),respectively. A difference of 2 or 3 correct items on the BSID-II testbetween low birth weight and NBW infants is a very small effect incomparison to the mean number of items answered correctly (77 items). At2 years, the point estimates for VLBW (0.54 points; p=0.84) and MLBW (1.01points; p=0.65) become small and statistically insignificant. This suggeststhat when maternal, environmental, and genetic factors are controlled for,differences in mental development of VLBW, MLBW, and NBW children at2 years do not differ significantly.
Motor Development—Columns 3 and 4 in Table 3 report estimates of VLBWand MLBW on children’s motor development scale scores at 9 months and 2years, respectively. The cross-sectional results in Panel A are similar to thoseseen for mental development. At 9 months, the effects of VLBW (−8.8points; p<0.01) and MLBW (−2.9 points; p<0.01) are large and statisticallysignificant. At 2 years, however, the cross-sectional estimates of VLBW andMLBW become considerably smaller and this change is statisticallysignificant at α=0.01. Therefore, the cross-sectional estimates suggest somecatch-up taking place between LBW and NBW children by age 2.
Datar and Jacknowitz Page 9
Matern Child Health J. Author manuscript; available in PMC 2010 April 16.
NIH
-PA A
uthor M
anuscript
NIH
-PA A
uthor M
anuscript
NIH
-PA A
uthor M
anuscript
Within-twins estimates using the sample of fraternal twins (Panel B) showthat only the effect of VLBW at 9 months is statistically significant (−3.8points; p<0.01). Within-twins estimates from the sample of identical twins(Panel C) show that the effect of VLBW on motor development scores at 9months is −2.5 points (p=0.06) but becomes smaller and statisticallyinsignificant at 2 years (−0.52 points; p=0.78). In contrast, the effect ofMLBW on motor development scores is small and statistically insignificantat 9 months (−0.93 points; p=0.22), increases slightly at 2 years (−1.64 points;p=0.08). However, the differences between the 9-month and 2-year estimatesare not statistically significant. Again, these estimates suggests that whenmaternal, environmental, and genetic factors are controlled for,differences in motor development of VLBW, MLBW, and NBW children at9 months and 2 years are of small magnitude and do not differ statistically.
Weight-for-Age—Columns 1 and 2 in Table 4 report estimates of VLBW andMLBW on children’s weight-for-age z-scores at 9 months and 2 years,respectively. In all the three models, VLBW and MLBW children havesignificantly lower weight-for-age compared to NBW children. The effectsare larger in the cross-sectional models compared to the within-twinsmodels.
Estimates from cross-sectional regressions on the full sample (Panel A) showthat VLBW infants have 1.64 SD (p<0.01) lower weight-for-age and MLBWinfants have 0.77 SD (p<0.01) lower weight-for-age than NBW infants at 9months. Estimates from within-twins analysis on fraternal twins (Panel B)show that VLBW infants have 1.24 SD (p<0.01) lower weight-for-age andMLBW infants have 0.33 SD (p<0.01) lower weight-for-age than NBW infantsat 9 months. Estimates from within-twins analysis on identical twins (PanelC) show that VLBW infants have 0.96 SD (p<0.01) lower weight-for-age andMLBW infants have 0.40 SD (p=0.02) lower weight-for-age than NBW infantsat 9 months. There is no statistically significant change in the effects ofVLBW and MLBW at 2 years in any of the three models.
Weight-for-Length/Height—Column 3 in Table 4 reports estimates of theeffect of VLBW and MLBW on children’s weight-for-length z-scores at 9months. Estimates from the cross-sectional model (Panel A) show thatweight-for-length at 9 months is significantly lower for VLBW (−0.53 SD;p<0.01) and MLBW (−0.31 SD; p<0.01) infants compared to NBW infants.
Within-twins estimates from the sample of fraternal twins show that theeffect of VLBW is strong and negative (−0.63 SD; p=0.014) but the effect ofMLBW becomes smaller (−0.15 SD; p=0.16). Within-twins estimates from thesample of identical twins show that the effects of VLBW (−0.13; p=0.74) andMLBW (−0.25; p=0.22) are small and statistically insignificant at 9 months.At 2 years, the effects of VLBW and MLBW increase across all the threemodels. In fact, the within-twins estimates of VLBW (−0.53; p=0.03) andMLBW (−0.46; p=0.03) from the identical twins sample are significant at the5% level, but not at the 1% level.
Length-for-Age—Column 5 in Table 4 reports estimates of the effect ofVLBW and MLBW on length-for-age z-scores at 9 months. In all 3 of themodels, VLBW and MLBW are associated with significantly lower length-for-age than NBW at 9 months (p=0.06 for MLBW effect in identical twins
Datar and Jacknowitz Page 10
Matern Child Health J. Author manuscript; available in PMC 2010 April 16.
NIH
-PA A
uthor M
anuscript
NIH
-PA A
uthor M
anuscript
NIH
-PA A
uthor M
anuscript
model; p<0.01 for all other estimates). The estimates are largest in the cross-sectional models, followed by the within-twins estimates from thefraternal twins sample. The estimates from the identical twins sample arethe smallest, although statistically significant in the case of VLBW. Thecross-sectional estimates from the full sample (Panel A) indicate that VLBWinfants have 1.75 SD (p<0.01) lower length-for-age and MLBW infants have0.75 SD (p<0.01) lower length-for-age compared to NBW infants at 9 months.Estimates from the within-twins analysis on the sample of identical twins(Panel C) show that VLBW infants have about 1.1 SD (p<0.01) lower length-for-age compared to their NBW twin. MLBW infants also have a lowerlength-for-age compared to their NBW twin (−0.26 SD; p=0.06).
To examine catch-up for this outcome, we also estimated similar modelsusing height-for-age at 2 years as the outcome. For reasons described earlier,we estimated models for length-for-age (at 9 months) and height-for-age(at 2 years) for the sample of children for whom both measures could beconstructed. These results are reported in the Appendix. There is asubstantial drop in the coefficients between 9 months and 2 years, however,this change is only statistically significant for the VLBW estimates in thecross-sectional models and not in the within-twins models.
Effects of small-for-gestational age—Estimates of the effect of SGA ondevelopmental and growth outcomes at 9 months and 2 years from each ofthe three models are reported in Table 5. Cross-sectional estimates suggestthat SGA infants answer about 1.6 (p<0.01) and 1.3 (p<0.01) fewer correctitems on the mental and motor developmental scales, respectively, comparedto non-SGA infants at 9 months. There is no statistically significant changeat a 1 percent level in these estimates at 2 years. However, within-twinsestimates of the effects of SGA on mental and motor development are notsignificant at either 9 months or 2 years at a 1 percent level.
The effects of SGA on weight-for-age in all 3 models are large and negativeat 9 months and remain large even at 2 years. Within-twins estimates fromthe identical twins sample are smaller compared to estimates from the cross-sectional and fraternal twins models. Estimates from identical twin modelsshow that SGA infants have 0.59 SD (p<0.01) lower weight-for-age at 9months and 0.41 SD (p=0.02) lower weight-for-age at 2 years compared totheir non-SGA twins. The effects of SGA on weight-for-stature/height at9 months and 2 years are statistically significant (p<0.01) and sizeable in thecross-sectional and within-fraternal twins models. However, the effects ofSGA are insignificant in the within-identical twins models (9 months: −0.34SD; p=0.10; 2 years: −0.31 SD; p=0.09). The effect of SGA on length-for-agez-scores at 9 months is large and statistically significant (p<0.01) in all thethree models. The within-identical twins estimate, which controls formaternal, environmental, and genetic factors shows that SGA infants have0.47 SD (p<0.01) lower length-for-age compared to their non-SGA identicaltwin.
DISCUSSIONThis study examined whether VLBW and MLBW confer a sizeabledisadvantage in terms of mental and motor development and physicalgrowth during the first two years of life based on a within-twins analysis
Datar and Jacknowitz Page 11
Matern Child Health J. Author manuscript; available in PMC 2010 April 16.
NIH
-PA A
uthor M
anuscript
NIH
-PA A
uthor M
anuscript
NIH
-PA A
uthor M
anuscript

of a nationally representative data set. Conventional cross-sectional modelsthat only controlled for sociodemographic and observable maternal riskfactors, including gestational age, showed large detrimental effects ofVLBW and MLBW. However, as discussed earlier, when comparing theoutcomes of LBW to NBW children, one can only control for a limited setof potential confounders. Other unobserved maternal, environmental, andgenetic factors that are correlated with LBW and child development couldlead to biased estimates of LBW effects if they are not controlled for. Weaddressed this concern by using the sample of twins in our data to controlfor these unobserved influences. We used a “within-group” estimator toexamine whether within twin pair differences in mental, motor, andphysical growth are related to differences in their birth weight. As such,the within-twins analyses offered a powerful strategy for estimating birthweight effects that are independent of maternal, environmental, andgenetic influences.
Similar to findings from twins-based studies that have examined the effectsof birth weight on adult health outcomes35–42 results from this studysuggest that maternal, environmental, and genetic factors play animportant role in determining LBW and early life developmental outcomesand that birth weight effects tend to be overstated when these factors arenot controlled for. We found that estimates from our within-twins analyseswere generally much smaller than what the conventional cross-sectionalanalysis on the full sample suggested. Moreover, estimates from the within-fraternal twins analyses tended to be generally larger relative to estimatesfrom the within-identical twins analyses. This is not surprising sincewithin-identical twins analyses also control for genetic influences on birthweight and infant outcomes. Within-identical twins analyses did not findany statistically significant effects on children’s mental and motordevelopment in the first two years. However, there was a large andstatistically significant effect of VLBW and MLBW on physical growth at 9months that remained even at the end of 2 years. Moreover, the effects ofVLBW tended to be larger than the effects of MLBW.
We also examined whether SGA infants had worse developmental andphysical growth outcomes compared to non-SGA infants. Although notperfect, SGA (i.e,. birth weight below the 10th percentile for gestation) hastraditionally been used to measure low birth weight that results from IUGR.Our results for SGA were qualitatively similar to those for VLBW andMBLW. After controlling for maternal, environmental, and genetic factors,SGA did not have a statistically significant effect on mental and motordevelopment outcomes in the first two years. However, SGA did have largeand statistically significant negative effects on children’s growth at 9months without any evidence of a catch-up at 2 years.
Case-control studies based on longer follow-up of non-twin samples havefound significant differences in height, weight, motor development, and IQbetween VLBW and NBW children even in adolescence43–48, suggesting slowcatch-up between VLBW and NBW children. However, as mentioned before,these studies are limited by their inability to control for unobservedmaternal, environmental, and genetic confounders. A recent study lookingat within-twin differences in birth weight and IQ found birth weight waspositively correlated with IQ scores in a sample of 5 year old twins in the
Datar and Jacknowitz Page 12
Matern Child Health J. Author manuscript; available in PMC 2010 April 16.
NIH
-PA A
uthor M
anuscript
NIH
-PA A
uthor M
anuscript
NIH
-PA A
uthor M
anuscript
UK22. As more waves of the ECLS-B data become available, we will be able toexamine whether the effects on physical growth persist beyond age 2 andwhether the effects on mental and motor development become salient overtime for a sample of U.S. born twins.
Despite the advantages that twins-based analyses possess, there are someconcerns regarding the generalizeability and interpretation of twins-basedestimates of birth weight effects. First, twins have been known to bedifferent from singleton births on a variety of dimensions, which maymake it difficult to generalize these results to singleton births. Twins aremore likely to have congenital anomalies, adult cancers, and some childhoodconditions such as autism49. Moreover, most twin births are preterm andexperience compromised growth in the last trimester of pregnancycompared to singletons. Another concern as illustrated in Table 2, is thattwinning may be the result of fertility treatments that are more commonamong higher socioeconomic populations. Fertility treatments might alsoincrease the incidence of fraternal twining relative to identical twinning,which may affect comparability between fraternal twins-based estimatesand identical twins-based estimates. Second, a twin may not always be aperfect control for the other twin. Recent studies suggest that evenmonozygotic twins may be discordant for complex genetic traits anddisorders50. The ECLS-B collected information on the presence of congenitalanomalies and we dropped children with them from our sample.
There are other limitations of our study that should be noted. First, eventhough comparison of the sample that attrited between the two waves withthe sample that remained in the study showed small differences based onsocioeconomic status, it is possible that differential attrition of lowersocioeconomic status mothers from the sample may have contributed to theattenuation of low birth weight effects. Families of higher socioeconomicstatus may be able to provide increased stimulation along with a goodenvironment (e.g., diet) that may prevent malnourished or underweightinfants from being cognitively delayed. Second, the ECLS-B is limitedbecause the data come from a national survey and therefore lackinformation on details that may be available from clinical samples of lowbirth weight children. For example, there is no information in these dataabout chorionicity of the twins which may determine the specificmechanisms that lead to birth weight discordance within twin pairs such astwin-to-twin transfusion and cord compromise. These differentmechanisms may have different implications for children’s developmentaloutcomes. Larger samples of twins will be needed to separately examine theeffects of each of these pathways. The ECLS-B also lacks comprehensiveinformation about fertility treatments used, which may in turn influencethe pathways leading to birth weight discordance within twins andconsequently have implications for whether twins based estimates can begeneralized to singletons.
Notwithstanding concerns about generalizeability to singleton births, ourfindings help to understand the effects of LBW in the rapidly growingpopulation of twins in the U.S. Between 1980 and 2004, the twin birth rateincreased 70% from 18.9 to 32.2 per 1000 births51, and this rise is likely tocontinue if current trends in use of Assisted Reproductive Technologies andmaternal age of child bearing persist. Consequently, estimates based on
Datar and Jacknowitz Page 13
Matern Child Health J. Author manuscript; available in PMC 2010 April 16.
NIH
-PA A
uthor M
anuscript
NIH
-PA A
uthor M
anuscript
NIH
-PA A
uthor M
anuscript

twins data will become increasingly important. The prevalence of LBW hasalso risen steadily during the same period, from 6.8 percent in 1980 to 8.2percent in 2005, capturing both the increased prevalence of multiple birthsin the population as well as increased survival among LBW singleton births.Understanding the consequences of LBW and the role of maternal,environmental, and genetic factors in determining LBW and subsequentdevelopmental outcomes is, therefore, important for designing effectivepublic health strategies.
CONCLUSIONMaternal, environmental, and genetic factors play an important role indetermining birth weight as well as children’s mental, motor, and physicaldevelopment in the first two years of life. Consequently, the effects ofVLBW and MLBW are significantly reduced when these factors arecontrolled for. Nevertheless, VLBW and MLBW remain major risk factorsfor children’s physical growth in the early years. Future studies need toexamine the longer term developmental effects of VLBW and MLBW usingtwins data.
List of Abbreviations
BSF-R Bayley Short Form – Research Edition
CDC Centers for Disease Control
DZ Dizygotic
ECLS-B Early Childhood Longitudinal Study – Birth Cohort
IRT Item Response Theory
IUGR Intrauterine growth restriction
LBW Low birth weight
MLBW Moderately low birth weight
MZ Monozygotic
NBW Normal birth weight
NCES National Center for Education Statistics
NCHS National Center for Health Statistics
SGA Small-for-gestational age
US United States
VLBW Very low birth weight
AcknowledgmentsThe authors thank Dr. Homero Martinez, Dr. Jennifer Park, three anonymous referees, andparticipants at the Early Childhood Longitudinal Study – Birth Cohort (ECLS-B) First ReleaseConference: Development from Birth through Age Two for helpful comments. This researchwas funded by a National Institute for Child Health and Human Development grant(R03HD051578). All opinions expressed are those of the authors and not of the funding agency.
Datar and Jacknowitz Page 14
Matern Child Health J. Author manuscript; available in PMC 2010 April 16.
NIH
-PA A
uthor M
anuscript
NIH
-PA A
uthor M
anuscript
NIH
-PA A
uthor M
anuscript

REFERENCES1. National Center for Health Statistics (NCHS). Health, United States, 2006 with
Chartbook on Trends in the Health of Americans. U.S. Department of Health andHuman Services; 2006. DHHS 2006-1232
2. Barker DJ. Fetal origins of coronary heart disease. British Medical Journal1995;311:171–174. [PubMed: 7613432]
3. Barker, D. Mothers, Babies and Health Later in Life. Edinburgh: ChurchillLivingston; 1998.
4. Barker DJ. The malnourished baby and infant. British Medical Bulletin 2001;60:69–88. [PubMed: 11809619]
5. Aylward GP, Pfeiffer SI, Wright A, Verhulst SJ. Outcome Studies of Low BirthWeight Infants Published in the Last Decade: A Meta-analysis. Journal of Pediatrics1989;115:515–520. [PubMed: 2795341]
6. Brooks AM, Byrd RS, Weitzman M, Auinger P, McBride JT. Impact of Low BirthWeight on Early Childhood Asthma in The United States. Archives of Pediatricsand Adolescent Medicine 2001;155(3):401–406. [PubMed: 11231809]
7. Lee H, Barratt M. Cognitive Development of Preterm Low Birth Weight Childrenat 5 to 8 Years Olds. Developmental Behavioral Pediatrics 1993;14:242–248.
8. McCormick MC. The Contribution of Low Birth Weight to Infant Mortality andChildhood Morbidity. The New England Journal of Medicine 1985;312:82–90.[PubMed: 3880598]
9. McCormick MC, Gortmaker SL, Sobol AM. Very Low Birth Weight Children:Behavior Problems and School Difficulty in a National Sample. Journal ofPediatrics 1990;117:687–693. [PubMed: 2231200]
10. Paneth NS. The Problem of Low Birth Weight. The Future of Children 1995;5(1):19–34. [PubMed: 7633862]
11. Richards M, Hardy RJ, Kuh D, Wadsworth MEJ. Birth Weight and CognitiveFunction in the British 1946 Birth Cohort: Longitudinal Population Based Study.British Medical Journal 2001;322:199–203. [PubMed: 11159613]
12. Wu YW, Croen LA, Shah SJ, Newman TB, Najjar DV. Cerebral palsy in a termpopulation: Risk factors and neuroimaging findings. Pediatrics 2006;118:690–697.[PubMed: 16882824]
13. Korhonen P, Tammela O, Koivisto AM, Laippala P, Ikonen S. Frequency and riskfactors in bronchopulmonary dysplasia in a cohort of very low birth weightinfants. Early Human Development 1999;54(3):245–258. [PubMed: 10321791]
14. Hack M, Taylor HG, Drotar D, Schluchter M, Cartar L, Andreias L, Wilson-CostelloD, Klein N. Chronic Conditions, Functional Limitations, and Special Health CareNeeds of School-aged Children Born With Extremely Low-Birth-Weight in the1990s. Journal of the American Medical Association 2005;294:318–325. [PubMed:16030276]
15. Iliadou A, Cnattingius S, Lichtenstein P. Low birthweight and Type 2 diabetes: Astudy on 11,162 Swedish twins. International Journal of Epidemiology2004;33:948–953. [PubMed: 15166205]
16. Hubinette A, Cnattingius S, Ekbom A, de Faire U, Kramer M, Lichtenstein P.Birthweight, early environment, and genetics: a study of twins discordant foracute myocardial infarction. Lancet 2001;357:1997–2001. [PubMed: 11438130]
17. Hubinette A, Cnattingius S, Johansson AL, Henriksson C, Lichtenstein P. Birthweight and risk of angina pectoris: analysis in Swedish twins. European Journalof Epidemiology 2003;18:539–544. [PubMed: 12908719]
18. Babson SC, Kangas J, Young N, Bramhall JL. Growth and development of twinsof dissimilar size at birth. Pediatrics 1964;33:327. [PubMed: 14129079]
19. Churchill JA. The relationship between intelligence and birth weight in twins.Neurology 1965;4:341. [PubMed: 14280597]
Datar and Jacknowitz Page 15
Matern Child Health J. Author manuscript; available in PMC 2010 April 16.
NIH
-PA A
uthor M
anuscript
NIH
-PA A
uthor M
anuscript
NIH
-PA A
uthor M
anuscript
20. Scarr S. Effects of birthweight on later intelligence. Soc. Biol 1969;16:249.[PubMed: 5392814]
21. Willerman L, Churchill JA. Intelligence and birth weight in identical twins. ChildDevelop 1967;38:623. [PubMed: 6049626]
22. Newcombe R, Milne BJ, Caspi A, Poulton R, Moffitt TE. Birthweight Predicts IQ:Fact or Artefact? Twin Research and Human Genetics 2007;Volume 10(Number 4):581–586. [PubMed: 17708699]
23. Stein REK, Seigel MJ, Bauman LJ. Are Children of Moderately Low Birth Weightat Increased Risk for Poor Health? A New Look at an Old Question. Pediatrics2006;118:217–223. [PubMed: 16818568]
24. National Center for Education Statistics (NCES). User's Manual for the ECLS-BNine Month Restricted-Use Data File and Electronic Codebook. U.S. Department ofEducation. Institute of Education Sciences; 2004. Early Childhood LongitudinalStudy, Birth Cohort (ECLS-B). NCES 2004-092
25. National Center for Education Statistics. Early Childhood Longitudinal Study,Birth Cohort (ECLS-B), User’s Manual for the ECLS-B Longitudinal 9-Month–2-Year Data File and Electronic Codebook. U.S. Department of Education. Instituteof Education Sciences; 2006. NCES 2006-046
26. Goldsmith HH. A zygosity questionnaire for young twins: A research note. BehavGenet 1991;21:257–269. [PubMed: 1863259]
27. Nichols RC, Bilbro WC. The diagnosis of twin zygosity. Acta Genet Stat Med1966;16:265–275. [PubMed: 4959152]
28. Cohen DJ, Dibble E, Grawe JM, Pollin W. Reliably separating identical fromfraternal twins. Arch Gen Psychiatry 1975;32:1371–1375. [PubMed: 1239251]
29. Alexander GH, Himes JH, Kaufman RB, Mor J, Kogan M. A United States nationalreference for fetal growth. Obstetrics and Gynecology 1996;87(2):163–168.[PubMed: 8559516]
30. Resnick R. Intrauterine growth restriction. Obstetrics and Gynecology 2002;99(3):490–496. [PubMed: 11864679]
31. Bayley, N. The Psychological Corporation. 2nd Edition. San Antonio, TX: 1993.Bayley Scales of Infant Development. Manual
32. Hambleton, RK.; Swaminathan, H.; Rogers, HJ. Fundamentals of Item ResponseTheory. Newbury Park, CA: Sage Press; 2000.
33. Kotelchuck M. The Adequacy of Prenatal Care Utilization Index: Its USDistribution and Association with Low Birthweight. American Journal of PublicHealth 1994;84(9):1486–1489. [PubMed: 8092377]
34. Carlin JB, Gurrin LC, Sterne JAC, Morley R, Dwyer T. Regression models fortwin studies: a critical review. International Journal of Epidemiology2005;34:1089–1099. [PubMed: 16087687]
35. Baird J, Osmond C, MacGregor A, Snieder H, Hales CN, Phillips DI. Testing thefetal origins hypothesis in twins: the Birmingham twin study. Diabetologia2001;44:33–39. [PubMed: 11206409]
36. Christensen K, Stovring H, McGue M. Do genetic factors contribute to theassociation between birth weight and blood pressure? Journal of Epidemiologyand Community Health 2001;55:583–587. [PubMed: 11449017]
37. Dwyer T, Blizzard L, Morley R, Ponsonby AL. Within pair association betweenbirth weight and blood pressure at age 8 in twins from a cohort study. BritishMedical Journal 1999;319:1325–1329. [PubMed: 10567134]
38. Ijzerman R, Stehouwer CD, Boomsma DI. Evidence for genetic factors explainingthe birth weight-blood pressure relation. Analysis in twins. Hypertension2000;36:1008–1012. [PubMed: 11116116]
39. Johansson-Kark M, Rasmussen F, De Stavola B, Leon DA. Fetal growth and systolicblood pressure in young adulthood: the Swedish Young Male Twins Study.Paediatric and Perinatology Epidemiology 2002;16:200–209.
Datar and Jacknowitz Page 16
Matern Child Health J. Author manuscript; available in PMC 2010 April 16.
NIH
-PA A
uthor M
anuscript
NIH
-PA A
uthor M
anuscript
NIH
-PA A
uthor M
anuscript

40. Loos RJ, Fagard R, Beunen G, Derom C, Vlietinck R. Birth weight and bloodpressure in young adults: a prospective twin study. Circulation 2001;104:1633–1638. [PubMed: 11581141]
41. Nowson CA, MacInnis RJ, Hopper JL, et al. Association of birth weight andcurrent body size to blood pressure in female twins. Twin Research 2001;4:378–384. [PubMed: 11869492]
42. Poulter NR, Chang CL, MacGregor AJ, Snieder H, Spector TD. Association betweenbirth weight and adult blood pressure in twins: historical cohort study. BritishMedical Journal 1999;319:1330–1333. [PubMed: 10567135]
43. Zhang J, Brenner RA, Klebanoff MA. Differences in birth weight and bloodpressure at age 7 years among twins. American Journal of Epidemiology2001;153:779–782. [PubMed: 11296150]
44. Ford GW, Doyle LW, Davis NM, Callanan C. Very low birth weight and growthinto adolescence. Arch Pediatr Adolesc Med 2000 Aug;154(8):778–784. [PubMed:10922273]
45. Hack M, Schluchter M, Cartar L, Rahman M, Cuttler L, Borawski E. Growth ofvery low birth weight infants to age 20 years. Pediatrics 2003 Jul;112(1 Pt 1):e30–e38. [PubMed: 12837903]
46. Evensen KA, Vik T, Helbostad J, Indredavik MS, Kulseng S, Brubakk AM. Motorskills in adolescents with low birth weight. Arch Dis Child Fetal Neonatal Ed 2004Sep;89(5):F451–F455. [PubMed: 15321969]
47. Whitaker AH, Feldman JF, Lorenz JM, Shen S, McNicholas F, Nieto M, McCullochD, Pinto-Martin JA, Paneth N. Motor and cognitive outcomes in nondisabled low-birth-weight adolescents: early determinants. Arch Pediatr Adolesc Med 2006 Oct;160(10):1040–1046. [PubMed: 17018463]
48. Martinez-Cruz CF, Poblano A, Fernandez-Carrocera LA, Jimenez-Quiroz R, Tuyu-Torres N. Association between intelligence quotient scores and extremely lowbirth weight in school-age children. Arch Med Res 2006 Jul;37(5):639–645.[PubMed: 16740436]
49. Hall JG. Twinning. The Lancet 2003;362(9385):735–743.50. Hall JG. Twinning: mechanisms and genetic implications. Current Opinions in
Genetic Development 1996 Jun;6(3):343–347.51. Martin, JA.; Hamilton, BE.; Sutton, PD., et al. National vital statistics reports.
Vol. vol 55. Hyattsville, MD: National Center for Health Statistics; 2006. Births:Final data for 2004.
Datar and Jacknowitz Page 17
Matern Child Health J. Author manuscript; available in PMC 2010 April 16.
NIH
-PA A
uthor M
anuscript
NIH
-PA A
uthor M
anuscript
NIH
-PA A
uthor M
anuscript

NIH
-PA A
uthor M
anuscript
NIH
-PA A
uthor M
anuscript
NIH
-PA A
uthor
Man
uscript
Datar and Jacknowitz Page 18
Table 1
Means and Proportions for Key Variables
Mean or proportion Standard error
Outcomes
Mental development scale scores at 9-months 76.724 0.151
Mental development scale scores at 2-years 127.280 0.160
Motor development scale scores at 9-months 55.962 0.144
Motor development scale scores at 2-years 81.497 0.076
Weight-for-age z-scores at 9-months 0.046 0.021
Weight-for-age z-scores at 2-years 0.199 0.020
Weight-for-length z-scores at 9-months 0.293 0.028
Weight-for-height z-scores at 2-years 0.508 0.023
Length-for-age z-scores at 9-months 0.117 0.016
Birth weight measures
Normal birth weight 0.928 0.002
Moderately low birth weight 0.060 0.002
Very low birth weight 0.012 0.000
Small-for-gestational age 0.102 0.004
Child characteristics
Female 0.490 0.008
Race/ethnicity:
Non-Hispanic White 0.546 0.007
Non-Hispanic Black 0.141 0.005
Hispanic 0.242 0.007
Other race/ethnicity 0.071 0.003
First birth 0.406 0.008
Maternal characteristics
Height (inches) 64.520 0.047
Age (years) 27.338 0.091
Education:
Less than high school diploma 0.262 0.007
High school diploma or equivalent 0.220 0.006
Some college or voc/tech program 0.271 0.007
Bachelors degree or higher 0.247 0.006
Married at birth 0.680 0.007
Household characteristics
Income:
Less than or equal to $20000 0.251 0.006
Between $20001 and $40000 0.296 0.007
Between $40001 and $75000 0.247 0.007
Between $75001 and $100000 0.101 0.005
$100001 or higher 0.104 0.005
Pregnancy characteristics
Matern Child Health J. Author manuscript; available in PMC 2010 April 16.
NIH
-PA A
uthor M
anuscript
NIH
-PA A
uthor M
anuscript
NIH
-PA A
uthor
Man
uscript
Datar and Jacknowitz Page 19
Mean or proportion Standard error
Gestation at pregnancy recognition (weeks) 5.393 0.054
Smoked in last trimester of pregnancy 0.112 0.005
Drank alcohol in last trimester of pregnancy 0.033 0.003
Adequacy of prenatal care utilization:
Inadequate 0.099 0.005
Intermediate 0.142 0.005
Adequate 0.442 0.008
Adequate plus 0.317 0.007
Presence of pregnancy risk factors 0.306 0.007
Presence of labor and delivery complications 0.324 0.007
Gestation (weeks) 38.720 0.029
Notes: Means are calculated for continuous variables and proportions are shown for binary variables. Continuous variablesare the following: the outcome variables, height, age, gestation at pregnancy recognition, and gestation. The remainderof the variables are binary. Values are weighted. Sample sizes are rounded to the nearest 50 per NCES regulations. Thesample sizes for the outcome variables vary. The sample sizes for the independent variables is 8,050.
Matern Child Health J. Author manuscript; available in PMC 2010 April 16.

NIH
-PA A
uthor M
anuscript
NIH
-PA A
uthor M
anuscript
NIH
-PA A
uthor
Man
uscript
Datar and Jacknowitz Page 20
Tabl
e 2
Mea
ns
and
Prop
orti
ons
for
Key
Var
iabl
es b
y T
win
Sta
tus
Singl
eton
birt
hs
All t
win
sp-
valu
eFr
ater
nal
twin
sId
enti
cal
twin
sp-
valu
e
Out
com
es
Men
tal de
velo
pmen
t sc
ale
scor
es (9
mos
)76
.863
72.0
820.
000
72.0
2972
.334
0.68
5
Men
tal de
velo
pmen
t sc
ale
scor
es (2
yrs
)12
7.39
812
3.41
20.
000
123.
587
122.
585
0.19
7
Mot
or d
evel
opm
ent
scal
e sc
ores
(9
mos
)56
.091
51.7
390.
000
51.9
1850
.902
0.21
3
Mot
or d
evel
opm
ent
scal
e sc
ores
(2
yrs
)81
.542
80.1
470.
000
80.1
6780
.054
0.77
7
Wei
ght-
for-
age
z-sc
ores
(9
mos
)0.
059
−0.
337
0.00
0−0.
378
−0.
153
0.04
4
Wei
ght-
for-
age
z-sc
ores
(2
yrs
)0.
208
−0.
095
0.00
0−0.
132
0.07
40.
101
Wei
ght-
for-
lengt
h z
-sco
res
(9 m
os)
0.29
80.
161
0.02
20.
115
0.36
90.
024
Wei
ght-
for-
hei
ght
z-sc
ores
(2
yrs
)0.
514
0.30
90.
000
0.27
00.
486
0.10
7
Lengt
h-f
or-a
ge z
-sco
res
at (9
mos
)0.
131
−0.
303
0.00
0−0.
321
−0.
217
0.31
6
Birt
h w
eigh
t m
easu
res
Nor
mal
bir
th w
eigh
t0.
942
0.47
60.
000
0.48
00.
460
0.64
7
Mod
erat
ely low
bir
th w
eigh
t0.
048
0.45
40.
000
0.44
80.
481
0.44
9
Ver
y low
bir
th w
eigh
t0.
010
0.07
00.
000
0.07
20.
059
0.37
1
Smal
l-fo
r-ge
stat
ional
age
0.10
20.
107
0.59
80.
103
0.12
80.
401
Child
char
acte
rist
ics
Fem
ale
0.48
90.
510
0.23
20.
505
0.53
30.
512
Rac
e/et
hnic
ity:
Non
-Hispa
nic
Whit
e0.
543
0.63
30.
000
0.66
10.
499
0.00
0
Non
-Hispa
nic
Bla
ck0.
141
0.13
60.
602
0.13
40.
145
0.69
4
Hispa
nic
0.24
40.
172
0.00
00.
149
0.28
30.
001
Oth
er r
ace/
ethnic
ity
0.07
10.
059
0.10
00.
056
0.07
30.
411
Firs
t bi
rth
0.40
60.
419
0.46
70.
444
0.29
80.
001
Mat
erna
l ch
arac
teri
stic
s
Hei
ght
(inch
es)
64.5
0764
.989
0.00
065
.161
64.1
890.
000
Age
(yea
rs)
27.2
8029
.299
0.00
029
.619
27.8
050.
000
Educ
atio
n:
Le
ss t
han
hig
h s
choo
l di
plom
a0.
264
0.20
10.
000
0.16
50.
367
0.00
0
Matern Child Health J. Author manuscript; available in PMC 2010 April 16.

NIH
-PA A
uthor M
anuscript
NIH
-PA A
uthor M
anuscript
NIH
-PA A
uthor
Man
uscript
Datar and Jacknowitz Page 21
Singl
eton
birt
hs
All t
win
sp-
valu
eFr
ater
nal
twin
sId
enti
cal
twin
sp-
valu
e
Hig
h s
choo
l di
plom
a or
equ
ival
ent
0.22
10.
178
0.00
20.
184
0.15
00.
235
So
me
colleg
e or
voc
/tec
h p
rogr
am0.
271
0.27
60.
723
0.28
70.
228
0.09
1
Bac
hel
ors
degr
ee o
r hig
her
0.24
50.
344
0.00
00.
363
0.25
40.
002
Mar
ried
at
birt
h0.
678
0.74
40.
000
0.77
60.
596
0.00
0
Hou
seho
ld c
hara
cter
isti
cs
Inco
me:
Le
ss t
han
or
equa
l to
$20
000
0.25
30.
203
0.00
10.
185
0.28
60.
014
Bet
wee
n $
2000
1 an
d $4
0000
0.29
70.
255
0.00
50.
241
0.31
70.
049
Bet
wee
n $
4000
1 an
d $7
5000
0.24
60.
254
0.60
00.
262
0.22
10.
230
Bet
wee
n $
7500
1 an
d $1
0000
00.
101
0.11
60.
160
0.12
40.
078
0.04
7
$1
0000
1 or
hig
her
0.10
30.
172
0.00
00.
188
0.09
90.
000
Preg
nanc
y c
hara
cter
isti
cs
Ges
tati
on a
t pr
egnan
cy r
ecog
nit
ion (w
eeks)
5.40
35.
086
0.00
75.
016
5.41
10.
172
Smok
ed in las
t tr
imes
ter
of p
regn
ancy
0.11
20.
110
0.87
40.
100
0.16
20.
040
Dra
nk a
lcoh
ol in las
t tr
imes
ter
of p
regn
ancy
0.03
40.
024
0.07
30.
029
0.00
00.
000
Ade
quac
y o
f pr
enat
al c
are
utiliz
atio
n:
In
adeq
uate
0.09
90.
095
0.76
50.
076
0.18
30.
003
In
term
edia
te0.
145
0.04
50.
000
0.04
30.
054
0.51
0
Ade
quat
e0.
451
0.16
90.
000
0.16
10.
207
0.20
5
Ade
quat
e pl
us0.
306
0.69
10.
000
0.72
00.
555
0.00
0
Pres
ence
of
preg
nan
cy r
isk f
acto
rs0.
301
0.44
10.
000
0.44
70.
410
0.38
3
Pres
ence
of
labo
r an
d de
live
ry c
ompl
icat
ions
0.31
80.
519
0.00
00.
528
0.47
80.
246
Ges
tati
on (w
eeks)
38.8
1335
.850
0.00
035
.834
35.9
260.
660
Sam
ple
size
for
inde
pende
nt
vari
able
s67
5012
5010
5020
0
Not
es: M
eans ar
e ca
lcul
ated
for
con
tinuo
us v
aria
bles
and
prop
orti
ons ar
e sh
own f
or b
inar
y v
aria
bles
. Con
tinuo
us v
aria
bles
are
the
follow
ing:
the
outc
ome
vari
able
s, h
eigh
t,ag
e, g
esta
tion
at
preg
nan
cy r
ecog
nit
ion, an
d ge
stat
ion. Th
e re
mai
nde
r of
the
vari
able
s ar
e bi
nar
y. Val
ues
are
wei
ghte
d. S
ampl
e size
s ar
e ro
unde
d to
the
nea
rest
50
per
NCES
reg
ulat
ions. T
he
sam
ple
size
s fo
r th
e ou
tcom
e va
riab
les
vari
es. P-
valu
es a
re r
epor
ted
for
two-
tailed
t-t
ests
of
diff
eren
ces
in m
eans
or p
ropo
rtio
ns.
Matern Child Health J. Author manuscript; available in PMC 2010 April 16.

NIH
-PA A
uthor M
anuscript
NIH
-PA A
uthor M
anuscript
NIH
-PA A
uthor
Man
uscript
Datar and Jacknowitz Page 22
Tabl
e 3
Mul
tiva
riat
e Li
nea
r Reg
ress
ion E
stim
ates
of
Bir
th W
eigh
t Ef
fect
s on
Men
tal an
d M
otor
Dev
elop
men
t
Men
tal de
velo
pmen
t sc
ale
scor
esM
otor
dev
elop
men
t sc
ale
scor
es
9-m
onth
s2-
yea
rs9-
mon
ths
2-yea
rs
(1)
(2)
(3)
(4)
A).
Cros
s-se
ctio
nal re
gres
sion
using
ful
l sa
mpl
e
VLB
WCoe
ffic
ient
−9.
069
−7.
627
−8.
764
−4.
123
P-va
lue
[0.0
00]
[0.0
00]
[0.0
00]
[0.0
00]
MLB
WCoe
ffic
ient
−3.
252
−2.
550
−2.
901
−1.
383
P-va
lue
[0.0
00]
[0.0
00]
[0.0
00]
[0.0
00]
n80
0080
0079
5079
50
B). W
ithi
n-tw
ins
regr
ession
using
fra
tern
al t
win
s
VLB
WCoe
ffic
ient
−2.
581
−5.
101
−3.
784
−1.
340
P-va
lue
[0.0
21]
[0.0
00]
[0.0
03]
[0.1
66]
MLB
WCoe
ffic
ient
−2.
007
−2.
367
−0.
917
0.01
5
P-va
lue
[0.0
00]
[0.0
02]
[0.0
93]
[0.9
70]
n10
5010
5010
0010
00
C). W
ithi
n-tw
ins
regr
ession
using
ide
ntic
al t
win
s
VLB
WCoe
ffic
ient
−3.
130
0.54
4−2.
503
−0.
519
P-va
lue
[0.3
78]
[0.8
41]
[0.0
62]
[0.7
83]
MLB
WCoe
ffic
ient
−2.
506
1.00
8−0.
931
−1.
641
P-va
lue
[0.0
51]
[0.6
48]
[0.2
16]
[0.0
75]
n20
020
020
020
0
Not
es: Not
es: VLB
W=v
ery low
bir
th w
eigh
t; M
LBW
=mod
erat
ely low
bir
th w
eigh
t. C
oeff
icie
nt
esti
mat
es c
aptu
re t
he
num
ber
of a
ddit
ional
cor
rect
ite
ms
on t
he
BSI
D-II
men
tal or
mot
or d
evel
opm
ent
scal
e th
at V
LBW
and
MLB
W c
hildr
en o
btai
n r
elat
ive
to N
BW
childr
en. R
esul
ts a
re w
eigh
ted.
P-v
alue
s fr
om M
odel
A a
re a
djus
ted
to a
ccou
nt
for
wit
hin
tw
ins
corr
elat
ions. S
ampl
e size
s ar
e ro
unde
d to
the
nea
rest
50
per
NCES
reg
ulat
ions. C
ontr
ol v
aria
bles
in m
odel
A incl
ude: f
emal
e, a
sses
smen
t ag
e in
mon
ths,
race
/eth
nic
ity, fi
rst
birt
h, tw
in o
r hig
her
-ord
er b
irth
, hei
ght
in inch
es, ag
e at
bir
th, ed
ucat
ion, m
arri
ed a
t bi
rth, hou
sehol
d in
com
e, r
egio
n o
f re
side
nce
, ur
banic
ity,
gest
atio
n a
t pr
egnan
cy r
ecog
nit
ion in w
eeks,
sm
oked
in las
t tr
imes
ter
of p
regn
ancy
, dr
ank a
lcoh
ol in las
t tr
imes
ter
of p
regn
ancy
, ad
equa
cy o
f pr
enat
al c
are
utiliz
atio
n,
pres
ence
of
preg
nan
cy r
isk f
acto
rs, pr
esen
ce o
f la
bor
and
delive
ry c
ompl
icat
ions,
and
gest
atio
n in w
eeks. Indi
cato
rs f
or m
issing
valu
es a
re a
lso
incl
uded
in t
hes
ere
gres
sion
s fo
r th
e fo
llow
ing
vari
able
s: f
irst
bir
th, ad
equa
cy o
f pr
enat
al c
are
utiliz
atio
n, pr
esen
ce o
f pr
egnan
cy r
isk f
acto
rs, an
d pr
esen
ce o
f la
bor
and
delive
ryco
mpl
icat
ions. V
aria
bles
mea
sure
d at
2-y
ear
wav
e an
d th
ose
that
rep
rese
nt
chan
ges
betw
een w
aves
are
only
incl
uded
in r
egre
ssio
ns
exam
inin
g ou
tcom
es m
easu
red
two
yea
rs a
fter
bir
th. Fe
mal
e is t
he
contr
ol v
aria
ble
in P
anel
B. Bol
d in
dica
tes
that
the
9-m
onth
coe
ffic
ient
is s
tati
stic
ally
dif
fere
nt
from
the
2-yea
r co
effi
cien
t at
a 1
%le
vel.
Matern Child Health J. Author manuscript; available in PMC 2010 April 16.
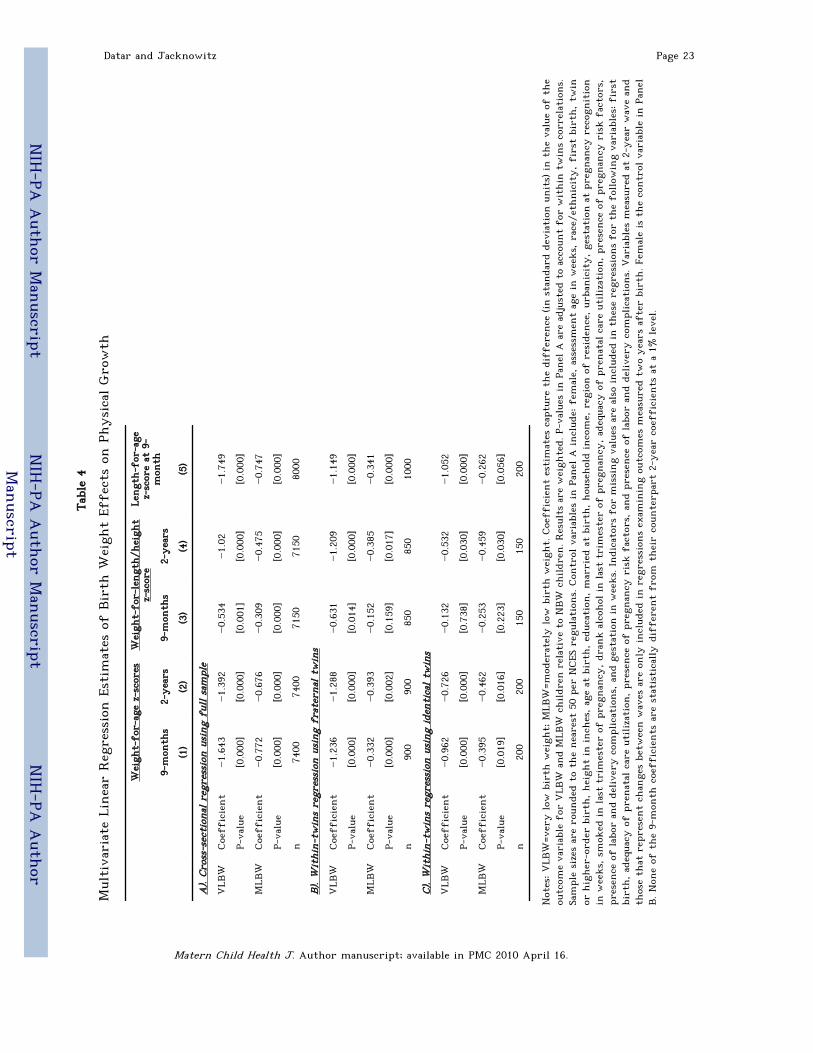
NIH
-PA A
uthor M
anuscript
NIH
-PA A
uthor M
anuscript
NIH
-PA A
uthor
Man
uscript
Datar and Jacknowitz Page 23
Tabl
e 4
Mul
tiva
riat
e Li
nea
r Reg
ress
ion E
stim
ates
of
Bir
th W
eigh
t Ef
fect
s on
Physica
l Gro
wth
Wei
ght-
for-
age
z-sc
ores
Wei
ght-
for-
lengt
h/h
eigh
tz-
scor
eLe
ngt
h-f
or-a
gez-
scor
e at
9-
mon
th9-
mon
ths
2-yea
rs9-
mon
ths
2-yea
rs
(1)
(2)
(3)
(4)
(5)
A).
Cros
s-se
ctio
nal re
gres
sion
using
ful
l sa
mpl
e
VLB
WCoe
ffic
ient
−1.
643
−1.
392
−0.
534
−1.
02−1.
749
P-va
lue
[0.0
00]
[0.0
00]
[0.0
01]
[0.0
00]
[0.0
00]
MLB
WCoe
ffic
ient
−0.
772
−0.
676
−0.
309
−0.
475
−0.
747
P-va
lue
[0.0
00]
[0.0
00]
[0.0
00]
[0.0
00]
[0.0
00]
n74
0074
0071
5071
5080
00
B). W
ithi
n-tw
ins
regr
ession
using
fra
tern
al t
win
s
VLB
WCoe
ffic
ient
−1.
236
−1.
288
−0.
631
−1.
209
−1.
149
P-va
lue
[0.0
00]
[0.0
00]
[0.0
14]
[0.0
00]
[0.0
00]
MLB
WCoe
ffic
ient
−0.
332
−0.
393
−0.
152
−0.
385
−0.
341
P-va
lue
[0.0
00]
[0.0
02]
[0.1
59]
[0.0
17]
[0.0
00]
n90
090
085
085
010
00
C). W
ithi
n-tw
ins
regr
ession
using
ide
ntic
al t
win
s
VLB
WCoe
ffic
ient
−0.
962
−0.
726
−0.
132
−0.
532
−1.
052
P-va
lue
[0.0
00]
[0.0
00]
[0.7
38]
[0.0
30]
[0.0
00]
MLB
WCoe
ffic
ient
−0.
395
−0.
462
−0.
253
−0.
459
−0.
262
P-va
lue
[0.0
19]
[0.0
16]
[0.2
23]
[0.0
30]
[0.0
56]
n20
020
015
015
020
0
Not
es: VLB
W=v
ery low
bir
th w
eigh
t; M
LBW
=mod
erat
ely low
bir
th w
eigh
t. C
oeff
icie
nt
esti
mat
es c
aptu
re t
he
diff
eren
ce (in
sta
nda
rd d
evia
tion
unit
s) in t
he
valu
e of
the
outc
ome
vari
able
for
VLB
W a
nd
MLB
W c
hildr
en r
elat
ive
to N
BW
childr
en. R
esul
ts a
re w
eigh
ted.
P-v
alue
s in
Pan
el A
are
adj
uste
d to
acc
ount
for
wit
hin
tw
ins co
rrel
atio
ns.
Sam
ple
size
s ar
e ro
unde
d to
the
nea
rest
50
per
NCES
reg
ulat
ions. C
ontr
ol v
aria
bles
in P
anel
A incl
ude: f
emal
e, a
sses
smen
t ag
e in
wee
ks,
rac
e/et
hnic
ity, fi
rst
birt
h, tw
inor
hig
her
-ord
er b
irth
, hei
ght
in inch
es, ag
e at
bir
th, ed
ucat
ion, m
arri
ed a
t bi
rth, hou
sehol
d in
com
e, r
egio
n o
f re
side
nce
, ur
banic
ity, ge
stat
ion a
t pr
egnan
cy r
ecog
nit
ion
in w
eeks,
sm
oked
in las
t tr
imes
ter
of p
regn
ancy
, dr
ank a
lcoh
ol in las
t tr
imes
ter
of p
regn
ancy
, ad
equa
cy o
f pr
enat
al c
are
utiliz
atio
n, pr
esen
ce o
f pr
egnan
cy r
isk f
acto
rs,
pres
ence
of
labo
r an
d de
live
ry c
ompl
icat
ions,
and
gest
atio
n in w
eeks. Indi
cato
rs f
or m
issing
valu
es a
re a
lso
incl
uded
in t
hes
e re
gres
sion
s fo
r th
e fo
llow
ing
vari
able
s: f
irst
birt
h, ad
equa
cy o
f pr
enat
al c
are
utiliz
atio
n, pr
esen
ce o
f pr
egnan
cy r
isk f
acto
rs, an
d pr
esen
ce o
f la
bor
and
delive
ry c
ompl
icat
ions. V
aria
bles
mea
sure
d at
2-y
ear
wav
e an
dth
ose
that
rep
rese
nt
chan
ges
betw
een w
aves
are
only
incl
uded
in r
egre
ssio
ns
exam
inin
g ou
tcom
es m
easu
red
two
yea
rs a
fter
bir
th. F
emal
e is t
he
contr
ol v
aria
ble
in P
anel
B. Non
e of
the
9-m
onth
coe
ffic
ients
are
sta
tist
ical
ly d
iffe
rent
from
thei
r co
unte
rpar
t 2-
yea
r co
effi
cien
ts a
t a
1% lev
el.
Matern Child Health J. Author manuscript; available in PMC 2010 April 16.

NIH
-PA A
uthor M
anuscript
NIH
-PA A
uthor M
anuscript
NIH
-PA A
uthor
Man
uscript
Datar and Jacknowitz Page 24
Tabl
e 5
Mul
tiva
riat
e Li
nea
r Reg
ress
ion E
stim
ates
of
Smal
l-fo
r-Ges
tati
onal
Age
on M
enta
l an
d M
otor
Dev
elop
men
t an
d Ph
ysica
l Gro
wth
Men
tal de
velo
pmen
tsc
ale
scor
esM
otor
dev
elop
men
tsc
ale
scor
esW
eigh
t-fo
r- a
ge z
-sc
ores
Wei
ght-
for-
lengt
h/h
eigh
t z-
scor
e
Lengt
h-
for-
age
z-sc
ore
at 9
-m
onth
9-m
onth
s2-
yea
rs9-
mon
ths
2-yea
rs9-
mon
ths
2-yea
rs9-
mon
ths
2-yea
rs
(1)
(2)
(3)
(4)
(5)
(6)
(7)
(8)
(9)
A).
Cros
s-se
ctio
nal re
gres
sion
using
ful
l sa
mpl
e
Coe
ffic
ient
−1.
613
−1.
665
−1.
309
−0.
751
−0.
699
−0.
701
−0.
328
−0.
556
−0.
654
P-va
lue
[0.0
00]
[0.0
00]
[0.0
00]
[0.0
02]
[0.0
00]
[0.0
00]
[0.0
01]
[0.0
00]
[0.0
00]
n80
0080
0079
5079
5074
0074
0071
5071
5080
00
B). W
ithi
n-tw
ins
regr
ession
using
fra
tern
al t
win
s
Coe
ffic
ient
−0.
020
−2.
531
−0.
315
−0.
270
−0.
855
−0.
861
−0.
645
−0.
910
−0.
555
P-va
lue
[0.9
82]
[0.0
44]
[0.7
04]
[0.6
67]
[0.0
00]
[0.0
00]
[0.0
01]
[0.0
00]
[0.0
00]
n10
5010
5010
0010
0090
090
085
085
010
00
C). W
ithi
n-tw
ins
regr
ession
using
ide
ntic
al t
win
s
Coe
ffic
ient
−2.
568
0.88
7−0.
870
−0.
667
−0.
585
−0.
409
−0.
336
−0.
312
−0.
472
P-va
lue
[0.0
78]
[0.6
67]
[0.4
01]
[0.4
64]
[0.0
00]
[0.0
15]
[0.1
03]
[0.0
90]
[0.0
00]
n20
020
020
020
020
020
015
015
020
0
Not
es: F
or m
enta
l an
d m
otor
dev
elop
men
t sc
ores
, co
effi
cien
t es
tim
ates
cap
ture
the
num
ber
of a
ddit
ional
cor
rect
ite
ms on
the
BSI
D-II m
enta
l or
mot
or d
evel
opm
ent
scal
eth
at s
mal
l fo
r ge
stat
ional
age
childr
en o
btai
n r
elat
ive
to c
hildr
en w
ho
are
not
sm
all fo
r ge
stat
ional
age
. For
the
physica
l gr
owth
out
com
es, co
effi
cien
t es
tim
ates
cap
ture
the di
ffer
ence
(in sta
nda
rd d
evia
tion
unit
s) in
the va
lue of
the ou
tcom
e va
riab
le f
or sm
all f
or g
esta
tion
al age
childr
en r
elat
ive to
childr
en w
ho
are not
sm
all f
or g
esta
tion
alag
e. R
esul
ts a
re w
eigh
ted.
P-v
alue
s in
Pan
el A
are
adj
uste
d to
acc
ount
for
wit
hin
tw
ins
corr
elat
ions. S
ampl
e size
s ar
e ro
unde
d to
the
nea
rest
50
per
NCES
reg
ulat
ions.
Con
trol
var
iabl
es in P
anel
A incl
ude: f
emal
e, a
sses
smen
t ag
e in
wee
ks,
rac
e/et
hnic
ity, fi
rst
birt
h, tw
in o
r hig
her
-ord
er b
irth
, hei
ght
in inch
es, ag
e at
bir
th, ed
ucat
ion,
mar
ried
at
birt
h, hou
sehol
d in
com
e, r
egio
n o
f re
side
nce
, ur
banic
ity, ge
stat
ion a
t pr
egnan
cy r
ecog
nit
ion in w
eeks,
sm
oked
in las
t tr
imes
ter
of p
regn
ancy
, dr
ank a
lcoh
olin
las
t tr
imes
ter
of p
regn
ancy
, ad
equa
cy o
f pr
enat
al c
are
utiliz
atio
n, pr
esen
ce o
f pr
egnan
cy r
isk f
acto
rs, pr
esen
ce o
f la
bor
and
delive
ry c
ompl
icat
ions,
and
gest
atio
n in
wee
ks. Indi
cato
rs f
or m
issing
valu
es a
re a
lso
incl
uded
in t
hes
e re
gres
sion
s fo
r th
e fo
llow
ing
vari
able
s: f
irst
bir
th, ad
equa
cy o
f pr
enat
al c
are
utiliz
atio
n, pr
esen
ce o
fpr
egnan
cy r
isk f
acto
rs, an
d pr
esen
ce o
f la
bor
and
delive
ry c
ompl
icat
ions. V
aria
bles
mea
sure
d at
2-y
ear
wav
e an
d th
ose
that
rep
rese
nt
chan
ges
betw
een w
aves
are
only
incl
uded
in r
egre
ssio
ns
exam
inin
g ou
tcom
es m
easu
red
two
yea
rs a
fter
bir
th. Fe
mal
e is t
he
contr
ol v
aria
ble
in P
anel
B. Non
e of
the
9-m
onth
coe
ffic
ients
are
sta
tist
ical
lydi
ffer
ent
from
thei
r co
unte
rpar
t 2-
yea
r co
effi
cien
ts a
t a
1% lev
el.
Matern Child Health J. Author manuscript; available in PMC 2010 April 16.
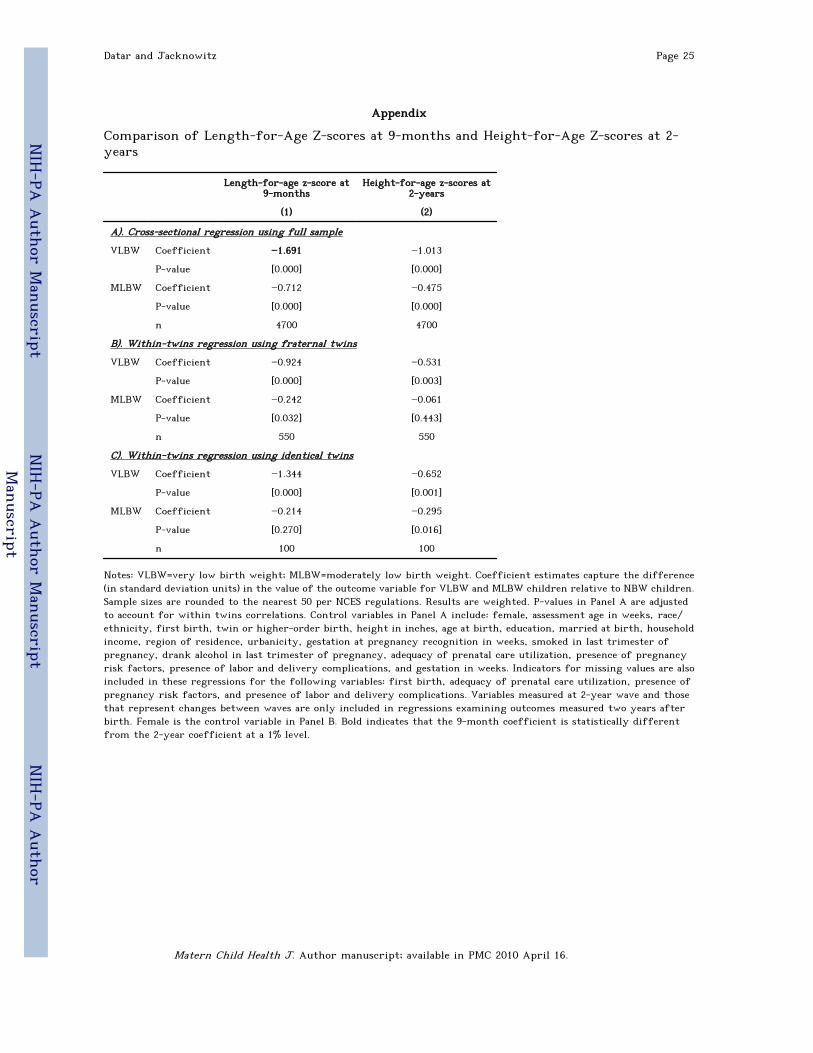
NIH
-PA A
uthor M
anuscript
NIH
-PA A
uthor M
anuscript
NIH
-PA A
uthor
Man
uscript
Datar and Jacknowitz Page 25
Appendix
Comparison of Length-for-Age Z-scores at 9-months and Height-for-Age Z-scores at 2-years
Length-for-age z-score at9-months
Height-for-age z-scores at2-years
(1) (2)
A). Cross-sectional regression using full sample
VLBW Coefficient −1.691 −1.013
P-value [0.000] [0.000]
MLBW Coefficient −0.712 −0.475
P-value [0.000] [0.000]
n 4700 4700
B). Within-twins regression using fraternal twins
VLBW Coefficient −0.924 −0.531
P-value [0.000] [0.003]
MLBW Coefficient −0.242 −0.061
P-value [0.032] [0.443]
n 550 550
C). Within-twins regression using identical twins
VLBW Coefficient −1.344 −0.652
P-value [0.000] [0.001]
MLBW Coefficient −0.214 −0.295
P-value [0.270] [0.016]
n 100 100
Notes: VLBW=very low birth weight; MLBW=moderately low birth weight. Coefficient estimates capture the difference(in standard deviation units) in the value of the outcome variable for VLBW and MLBW children relative to NBW children.Sample sizes are rounded to the nearest 50 per NCES regulations. Results are weighted. P-values in Panel A are adjustedto account for within twins correlations. Control variables in Panel A include: female, assessment age in weeks, race/ethnicity, first birth, twin or higher-order birth, height in inches, age at birth, education, married at birth, householdincome, region of residence, urbanicity, gestation at pregnancy recognition in weeks, smoked in last trimester ofpregnancy, drank alcohol in last trimester of pregnancy, adequacy of prenatal care utilization, presence of pregnancyrisk factors, presence of labor and delivery complications, and gestation in weeks. Indicators for missing values are alsoincluded in these regressions for the following variables: first birth, adequacy of prenatal care utilization, presence ofpregnancy risk factors, and presence of labor and delivery complications. Variables measured at 2-year wave and thosethat represent changes between waves are only included in regressions examining outcomes measured two years afterbirth. Female is the control variable in Panel B. Bold indicates that the 9-month coefficient is statistically differentfrom the 2-year coefficient at a 1% level.
Matern Child Health J. Author manuscript; available in PMC 2010 April 16.