Maternal body size and birth weight: can insulin or adipokines do better
Upload
independentCategory
view
1download
0
REVIEW
Birth weight and adult bone mass: a systematicliterature review
M. M. Schlüssel & J. dos Santos Vaz & G. Kac
Received: 5 November 2009 /Accepted: 1 March 2010# International Osteoporosis Foundation and National Osteoporosis Foundation 2010
AbstractSummary This systematic literature review comprised 16studies. The association of birth weight with bone param-eters was much more evident for bone mineral content(BMC) rather than bone mineral density (BMD). This is animportant finding since a reduction in BMC is stronglyassociated with an increased risk of fractures.Introduction The purpose of this study was to conduct asystematic literature review of studies that have investigated theassociation between birth weight (BW) and adult bone mass.Methods The search included English language articles,indexed in MEDLINE, using the key words: (“birth size”OR “birth weight” OR birthweight) AND (osteoporosis OR“bone mass” OR “bone density” OR “bone mineraldensity” OR “bone mineral content” OR “bone area”). Amethodological quality appraisal of the reviewed studieswas performed.Results Sixteen articles were reviewed. Eleven of 13studies that measured BMC verified a positive effect ofBW on this parameter, and nine even after adjustment foradult body size. Among the ten studies that found anunadjusted association between BW and BMD, two reportedthat the significance remained after adjustment for current
body size. Interaction between prenatal and postnatalvariables on the determination of adult bone mass was onlytested by two studies. The results must be interpreted withcaution due to the existence of few papers on the issue, aswell as heterogeneous sample characteristics, investigatedbone sites, and implemented analysis procedures. The aspectsof methodological quality that frequently fail are as follows:representativeness of the planned and actually measuredsample as well as proper adjustment for confounding.Conclusion Based on the amount of accumulated evidence,it is probable that BW have a positive association with adultBMC rather than BMD, which is an important finding forclinical and public health policies since a reduction in BMCis strongly associated with an increased fracture risk.
Keywords Birth weight . Bone mass . Epidemiology . Fetalprogram . Nutrition . Prospective studies
Introduction
Scientific evidence derived from prospective studiesdemonstrates that malnourished individuals during intra-uterine life, and consequently with lower weight at birth,presents a higher risk for coronary heart disease, hyper-tension, type 2 diabetes, and hypercholesterolemia in laterlife [1, 2]. Such studies, relating low weight at birth withthe development of chronic diseases in adulthood, origi-nated the “Developmental Origins of Health and Diseases”(DOHaD) theory [3].
In brief, the biological basis for this theory postulatesthat certain types of stimuli in critical moments ofdevelopment, particularly nutritional deprivation duringfetal growth, “program” the individual organism, perma-nently changing his structure and function [4, 5]. In other
M. M. Schlüssel : J. dos Santos Vaz :G. KacInstitute of Nutrition Josué de Castro,Federal University of Rio de Janeiro,Rio de Janeiro, Brazil
G. Kac (*)Department of Social and Applied Nutrition, Institute of NutritionJosué de Castro, Federal University of Rio de Janeiro,Avenida Brigadeiro Trompowsky, s/nº CCS – Bloco J – 2º andar,sala 29 Cidade Universitária – Ilha do Fundão,21941-590 Rio de Janeiro, RJ, Brazile-mail: [email protected]: [email protected]
Osteoporos IntDOI 10.1007/s00198-010-1236-z
words, a genotype may create different phenotypes,according to the (adverse) conditions to which it wasexposed during intrauterine development [6]. Such nutri-tional insults would be reflected, therefore, in the reducedsize (weight) at birth.
Recently, lower weight at birth has been related withseveral diseases such as depression, schizophrenia, hyper-thyroidism, cancer, and osteoporosis [2, 3]. In relation toosteoporosis, evidence derived from longitudinal studies(birth cohorts) has demonstrated that its risk might bemodified by early environmental influences reflected inbirth weight, which is positively associated with bone massduring adulthood [7, 8]. Other studies corroborate thehypothesis that osteoporosis may be programmed in earlydevelopment. According to Cooper et al. [9], these studiesmay be classified in three groups: 1) those that explored therelationship between the physiological system of individu-als who may have been “programmed” and the rate of boneloss due to aging; 2) studies that investigated the influenceof body constitution, nutrition, and mothers' lifestyle onbone mass of their offspring; and 3) studies relating thegrowth rate of individuals during childhood and adoles-cence with the risk of fractures in adulthood.
From a clinical point of view, considering that bone lossis a natural and irreversible process that occurs with aging,one of the best strategies for the prevention of osteoporosisis to optimize the peak bone mass of an individual [10–13].From an epidemiological point of view, the earlier the startof a preventive procedure, the better is its chance to achievedesirable results. Therefore, the objective of the currentstudy was to conduct a systematic literature review (SLR)of studies on the association between birth weight and adultbone mass, aiming to elucidate whether improving fetalnutrition and adequate intrauterine growth might be astrategy for early prevention of future osteoporosis.
Methods
The study design comprised an SLR conducted accordingto the most recent guidelines [14]. The search wasconducted through September 2009 and updated in January2010 on MEDLINE, using the following keywords: (“birthsize” OR “birth weight” OR birthweight) AND (osteopo-rosis OR “bone mass” OR “bone density” OR “bonemineral density” OR “bone mineral content” OR “bonearea”). Selection criteria for the studies included (1)published in English; (2) abstract available on-line; (3)refer to original work (instead of literature reviews); (4)include among one of the main investigated outcomes theestimate of adult bone mass, measured by some of thefollowing parameters: bone area (BA), bone mineralcontent (BMC), or bone mineral density (BMD); (5)
include the weight at birth among one of the investigateddeterminants; (6) studied humans; and (7) include onlyadults and/or elderly individuals in the analysis.
The selection process involved a search of references,initially based only on the key words, which retrieved 419articles. The list with the 419 articles was refined on-line,using as filters the following inclusion criteria: papers withavailable abstracts (403), published in English (382), andregarding original works (330).
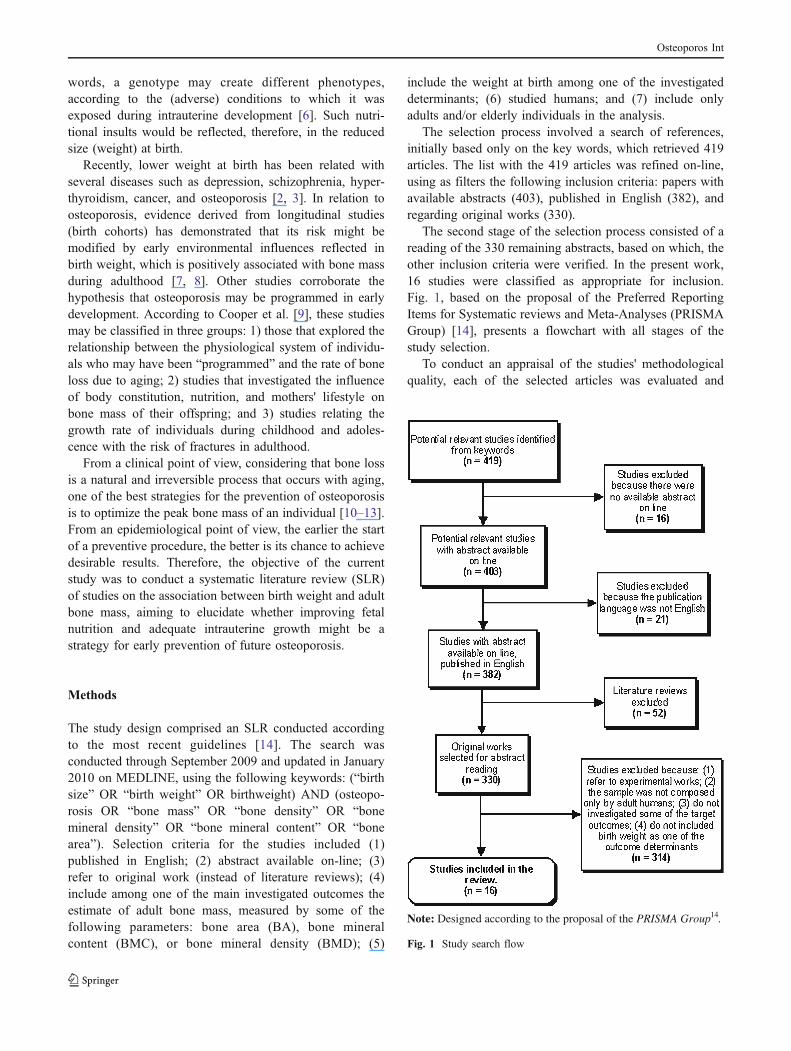
The second stage of the selection process consisted of areading of the 330 remaining abstracts, based on which, theother inclusion criteria were verified. In the present work,16 studies were classified as appropriate for inclusion.Fig. 1, based on the proposal of the Preferred ReportingItems for Systematic reviews and Meta-Analyses (PRISMAGroup) [14], presents a flowchart with all stages of thestudy selection.
To conduct an appraisal of the studies' methodologicalquality, each of the selected articles was evaluated and
Note: Designed according to the proposal of the PRISMA Group14.
Fig. 1 Study search flow
Osteoporos Int

received a score, according to the criteria proposed byDowns and Black [15]. The original checklist was adapted,ruling out the criteria related exclusively to interventionstudies. Nineteen items were thus evaluated, allowing amaximum score of 20 points. Table 1 shows the itemsactually evaluated.
Each published paper was evaluated independently bytwo authors of the present SLR (MMS and JSV). Theagreement between evaluations was assessed using intra-class correlation coefficients (ICC). The result was classi-fied according to the scale proposed by Shrout [16] tomeasure agreement between different evaluators. This scaleconsists of five categories: virtually no agreement (<0.10),weak (0.11–0.40), reasonable (0.41–0.60), moderate (0.61–0.80), and substantial (0.81–1.00). To settle eventualdisagreements in assigned scores, a third author's opinion(GK) was consulted. No article was rejected due tomethodological limitations, but the findings of studies thatreceived higher scores were considered more consistent.
The studies were organized according to the followingfactors: year of publication, country where the study wasconducted, sample size, sex and subject age, instrumentused to measure bone mass, study design, study aims,parameters of bone mass evaluated and studied bone sites,main results, estimator used in the analysis, and themethodological quality score.
Finally, we grouped in a graph the studies that presentedsimilar results for a given parameter of bone mass, with theobjective of summarizing and facilitating understanding of
the review findings. For each investigated parameter (BA,BMC, and BMD), the possible associations with birthweight were attributed as follows: without association,unadjusted association (association only between birthweight and the specific parameter), or adjusted association(for body size in adulthood). Only studies that evaluated theindividuals' bone mass by DXA were considered.
Results
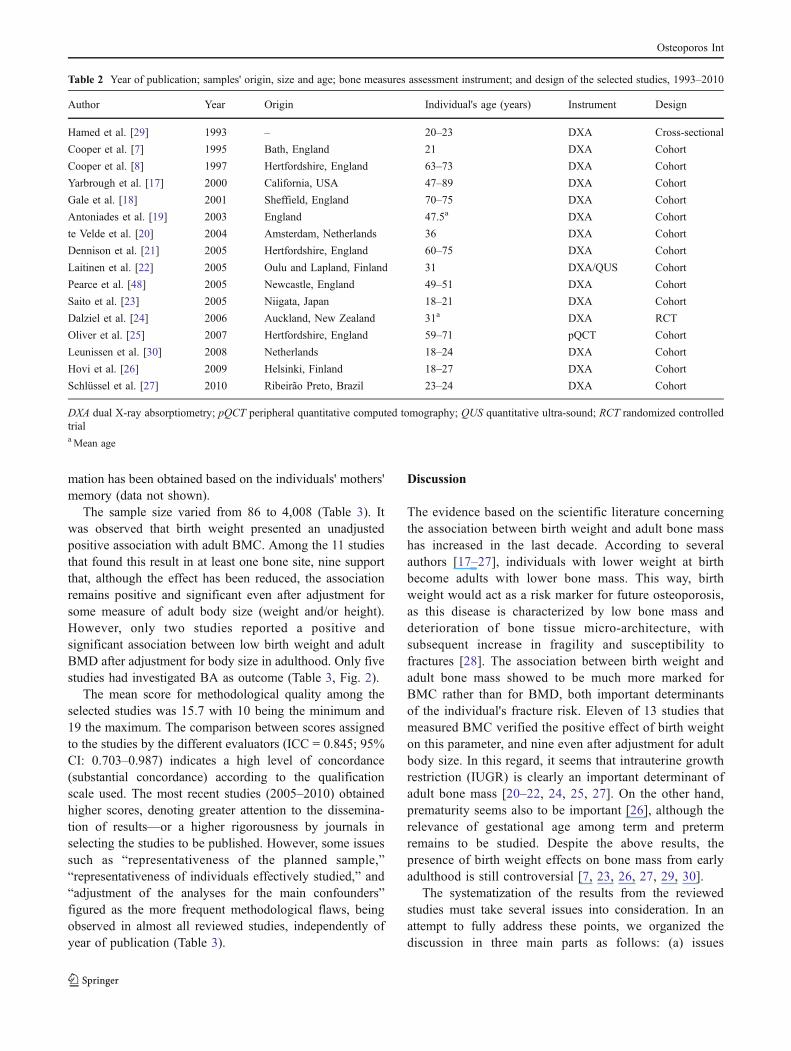
The majority of studies (13/16) were published after 2000and nine of them since 2005, which point to a recentgrowing trend of investigations on the issue. Most of thestudies originated from Europe (12/16) and, of these, sevenof 12 were conducted in England. The non-Europeanstudies were developed in the USA, Japan, New Zealand,and Brazil (Table 2).
Eleven of the reviewed studies included both men andwomen in their samples, and five studies included onlywomen. In relation to the individuals' ages, six studiesincluded young adults (18–27 years), three adults between30 and 36 years, and seven adults above 45 years. Of 16studies, 15 used DXA to estimate bone mass. Fourteenstudies referred to birth cohorts; one employed a cross-sectional design; and one, a randomized controlled trial(Table 2).
The more common source of information on birth weightwas the birth records, although in some cases this infor-
Table 1 Downs and Black [15] criteria used in the methodological quality evaluation of the reviewed studies
Clear description of study's hypothesis or objective(s)
Definition of the main outcomes in the introduction or methods section
Clear characteristics description of the individuals included in the study
Description of principal confounders
Clear description of the study's principal findings
Information on random data variability for the main outcomes
Characteristics description for the individuals lost to follow-up
Information on the real probability values for the main outcomes
Representativeness of the planned sample
Representativeness of the individuals actually included in the final sample
Clear description of results not based on a priori hypotheses (data dreading)
Adjustment of the analyses for different lengths of follow-up
Adequacy of the statistical tests used to evaluate the main outcomes
Accuracy of the main outcomes measures
Comparability of the individuals included in all comparison groups in relation to the population they were recruited from
Comparability of the individuals included in all comparison groups in relation to the period of time when they were recruited
Adequate adjustment for principal confounders in the analysis from which the main findings were drawn
Consideration of losses to follow-up in the analysis
Sufficient study power to detect an important effect, with a 5% significance level
All items scored 0 or 1, except “description of principal confounders”, which scored 0, 1, or 2
Osteoporos Int
mation has been obtained based on the individuals' mothers'memory (data not shown).
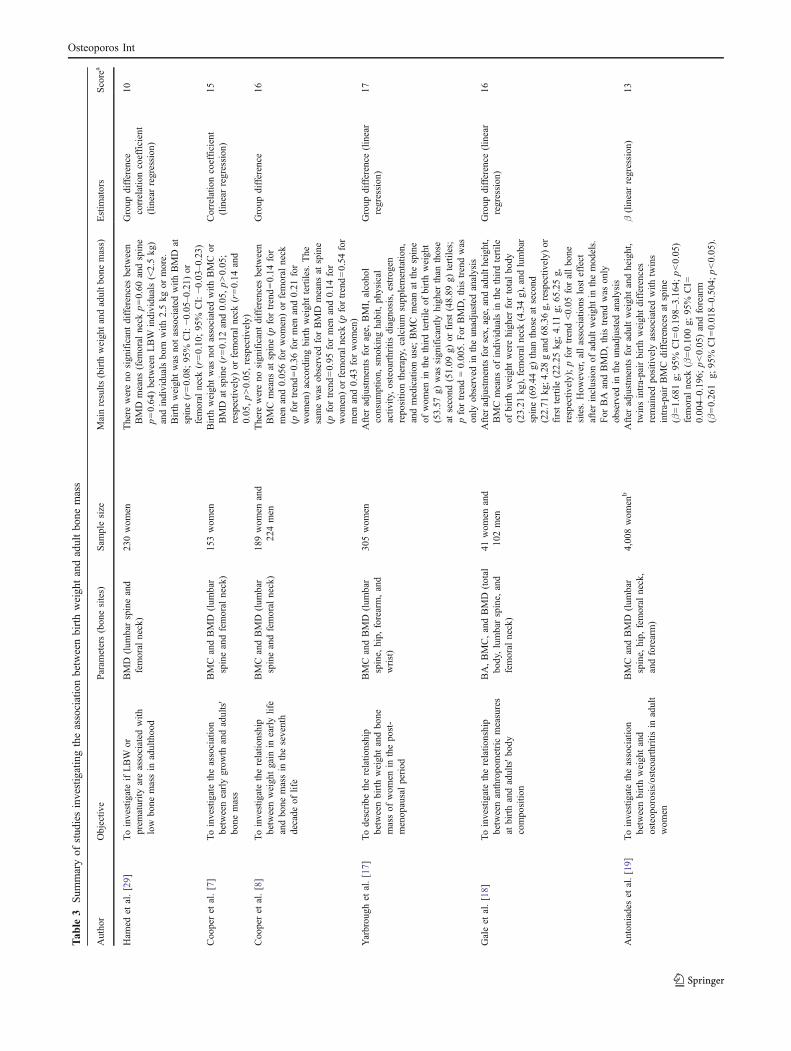
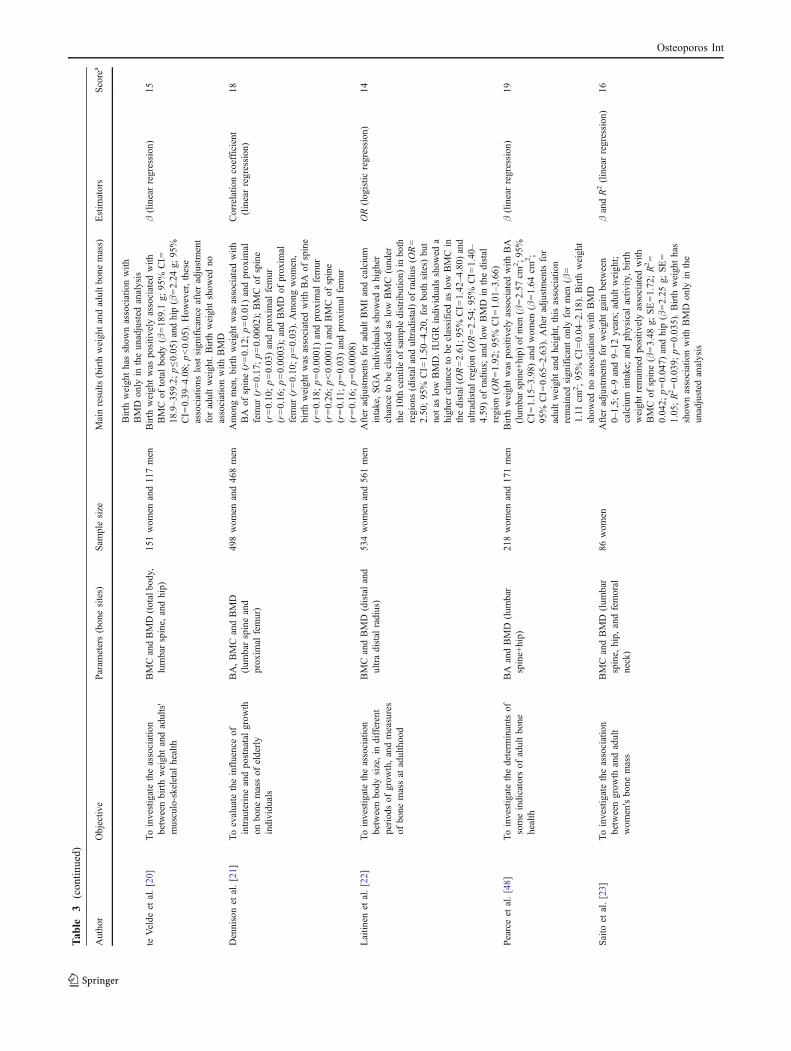
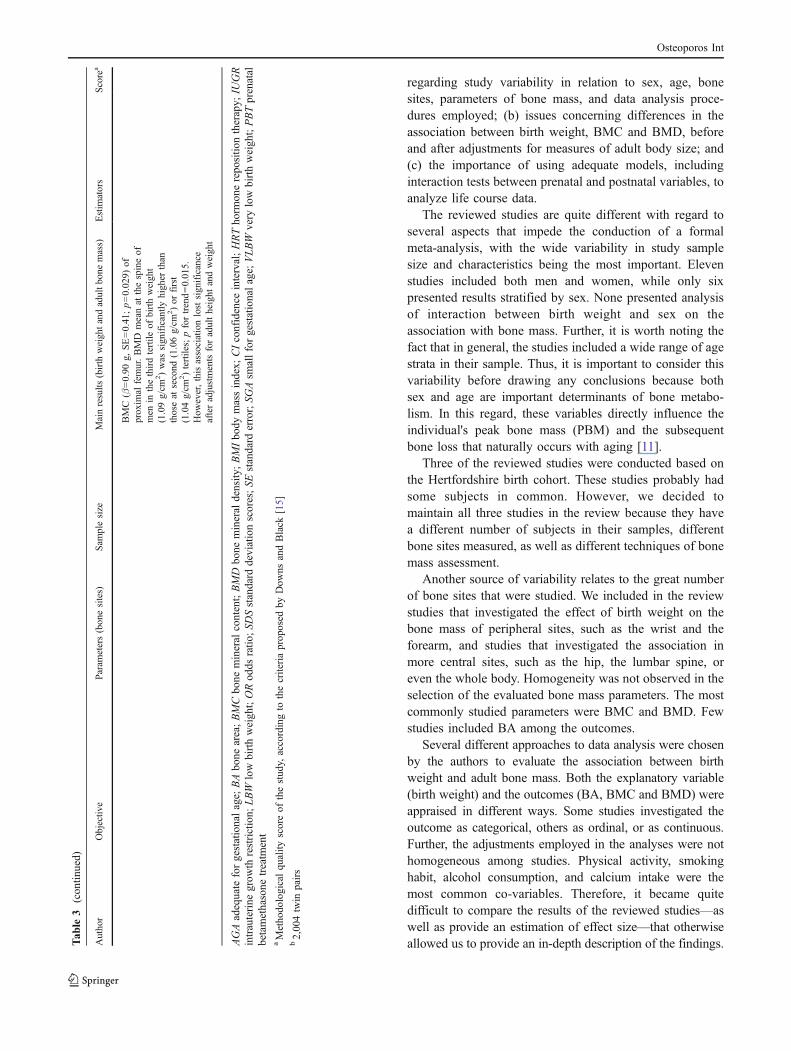
The sample size varied from 86 to 4,008 (Table 3). Itwas observed that birth weight presented an unadjustedpositive association with adult BMC. Among the 11 studiesthat found this result in at least one bone site, nine supportthat, although the effect has been reduced, the associationremains positive and significant even after adjustment forsome measure of adult body size (weight and/or height).However, only two studies reported a positive andsignificant association between low birth weight and adultBMD after adjustment for body size in adulthood. Only fivestudies had investigated BA as outcome (Table 3, Fig. 2).
The mean score for methodological quality among theselected studies was 15.7 with 10 being the minimum and19 the maximum. The comparison between scores assignedto the studies by the different evaluators (ICC = 0.845; 95%CI: 0.703–0.987) indicates a high level of concordance(substantial concordance) according to the qualificationscale used. The most recent studies (2005–2010) obtainedhigher scores, denoting greater attention to the dissemina-tion of results—or a higher rigorousness by journals inselecting the studies to be published. However, some issuessuch as “representativeness of the planned sample,”“representativeness of individuals effectively studied,” and“adjustment of the analyses for the main confounders”figured as the more frequent methodological flaws, beingobserved in almost all reviewed studies, independently ofyear of publication (Table 3).
Discussion
The evidence based on the scientific literature concerningthe association between birth weight and adult bone masshas increased in the last decade. According to severalauthors [17–27], individuals with lower weight at birthbecome adults with lower bone mass. This way, birthweight would act as a risk marker for future osteoporosis,as this disease is characterized by low bone mass anddeterioration of bone tissue micro-architecture, withsubsequent increase in fragility and susceptibility tofractures [28]. The association between birth weight andadult bone mass showed to be much more marked forBMC rather than for BMD, both important determinantsof the individual's fracture risk. Eleven of 13 studies thatmeasured BMC verified the positive effect of birth weighton this parameter, and nine even after adjustment for adultbody size. In this regard, it seems that intrauterine growthrestriction (IUGR) is clearly an important determinant ofadult bone mass [20–22, 24, 25, 27]. On the other hand,prematurity seems also to be important [26], although therelevance of gestational age among term and pretermremains to be studied. Despite the above results, thepresence of birth weight effects on bone mass from earlyadulthood is still controversial [7, 23, 26, 27, 29, 30].
The systematization of the results from the reviewedstudies must take several issues into consideration. In anattempt to fully address these points, we organized thediscussion in three main parts as follows: (a) issues
Table 2 Year of publication; samples' origin, size and age; bone measures assessment instrument; and design of the selected studies, 1993–2010
Author Year Origin Individual's age (years) Instrument Design
Hamed et al. [29] 1993 – 20–23 DXA Cross-sectional
Cooper et al. [7] 1995 Bath, England 21 DXA Cohort
Cooper et al. [8] 1997 Hertfordshire, England 63–73 DXA Cohort
Yarbrough et al. [17] 2000 California, USA 47–89 DXA Cohort
Gale et al. [18] 2001 Sheffield, England 70–75 DXA Cohort
Antoniades et al. [19] 2003 England 47.5a DXA Cohort
te Velde et al. [20] 2004 Amsterdam, Netherlands 36 DXA Cohort
Dennison et al. [21] 2005 Hertfordshire, England 60–75 DXA Cohort
Laitinen et al. [22] 2005 Oulu and Lapland, Finland 31 DXA/QUS Cohort
Pearce et al. [48] 2005 Newcastle, England 49–51 DXA Cohort
Saito et al. [23] 2005 Niigata, Japan 18–21 DXA Cohort
Dalziel et al. [24] 2006 Auckland, New Zealand 31a DXA RCT
Oliver et al. [25] 2007 Hertfordshire, England 59–71 pQCT Cohort
Leunissen et al. [30] 2008 Netherlands 18–24 DXA Cohort
Hovi et al. [26] 2009 Helsinki, Finland 18–27 DXA Cohort
Schlüssel et al. [27] 2010 Ribeirão Preto, Brazil 23–24 DXA Cohort
DXA dual X-ray absorptiometry; pQCT peripheral quantitative computed tomography; QUS quantitative ultra-sound; RCT randomized controlledtriala Mean age
Osteoporos Int
Tab
le3
Sum
maryof
stud
iesinvestigatingtheassociationbetweenbirthweigh
tandadultbo
nemass
Author
Objectiv
eParam
eters(bonesites)
Sam
plesize
Mainresults
(birth
weightandadultbone
mass)
Estim
ators
Score
a
Ham
edet
al.[29]
ToinvestigateifLBW
orprem
aturity
areassociated
with
low
bone
massin
adulthood
BMD
(lum
barspineand
femoral
neck)
230wom
enThere
wereno
significantdifferencesbetween
BMD
means
(fem
oral
neck
p=0.60
andspine
p=0.64)betweenLBW
individuals(<2.5kg)
andindividualsborn
with
2.5kg
ormore.
Birth
weightwas
notassociated
with
BMD
atspine(r=0.08;95%
CI:−0
.05–
0.21)or
femoral
neck
(r=0.10;95%
CI:−0
.03–0.23)
Group
difference
correlationcoefficient
(linearregression)
10
Cooperet
al.[7]
Toinvestigatetheassociation
betweenearlygrow
thandadults'
bone
mass
BMCandBMD
(lum
bar
spineandfemoral
neck)
153wom
enBirth
weightwas
notassociated
with
BMCor
BMD
atspine(r=0.12
and0.05,p>0.05;
respectiv
ely)
orfemoral
neck
(r=0.14
and
0.05,p>0.05,respectiv
ely)
Correlatio
ncoefficient
(linearregression)
15
Cooperet
al.[8]
Toinvestigatetherelatio
nship
betweenweightgain
inearlylife
andbone
massin
theseventh
decade
oflife
BMCandBMD
(lum
bar
spineandfemoral
neck)
189wom
enand
224men
There
wereno
significantdifferencesbetween
BMCmeans
atspine(p
fortrend=0.14
for
men
and0.056forwom
en)or
femoral
neck
(pfortrend=0.36
formen
and0.21
for
wom
en)accordingbirthweighttertiles.The
samewas
observed
forBMD
means
atspine
(pfortrend=0.95
formen
and0.14
for
wom
en)or
femoralneck
(pfortrend=0.54
for
men
and0.43
forwom
en)
Group
difference
16
Yarbrough
etal.[17]
Todescribe
therelatio
nship
betweenbirthweightandbone
massof
wom
enin
thepost-
menopausalperiod
BMCandBMD
(lum
bar
spine,
hip,
forearm,and
wrist)
305wom
enAfter
adjustmentsforage,
BMI,alcohol
consum
ption,
smokinghabit,physical
activ
ity,osteoarthritisdiagnosis,estrogen
repositio
ntherapy,
calcium
supplementatio
n,andmedicationuse;
BMCmeanat
thespine
ofwom
enin
thethirdtertile
ofbirthweight
(53.57
g)was
significantly
higher
than
those
atsecond
(51.09
g)or
first(48.89
g)tertiles;
pfortrend=0.005.
For
BMD,thistrendwas
only
observed
intheunadjusted
analysis
Group
difference
(linear
regression)
17
Galeet
al.[18]
Toinvestigatetherelatio
nship
betweenanthropometricmeasures
atbirthandadults'b
ody
compositio
n
BA,BMC,andBMD
(total
body,lumbarspine,
and
femoral
neck)
41wom
enand
102men
After
adjustmentsforsex,
age,andadulth
eight,
BMCmeans
ofindividualsin
thethirdtertile
ofbirthweightwerehigher
fortotalbody
(23.21
kg),femoralneck
(4.34g),and
lumbar
spine(69.44
g)than
thoseat
second
(22.71
kg;4
.28gand68.36g,
respectiv
ely)
orfirsttertile
(22.25
kg;4.11
g;65.25g,
respectiv
ely);pfortrend<0.05
forallbone
sites.How
ever,allassociations
losteffect
afterinclusionof
adultweightin
themodels.
For
BA
andBMD,thistrendwas
only
observed
intheunadjusted
analysis
Group
difference
(linear
regression)
16
Antoniadeset
al.[19]
Toinvestigatetheassociation
betweenbirthweightand
osteoporosis/osteoarthritis
inadult
wom
en
BMCandBMD
(lum
bar
spine,
hip,
femoral
neck,
andforearm)
4,008wom
enb
After
adjustmentsforadultweightandheight,
twinsintra-pairbirthweightdifferences
remainedpositiv
elyassociated
with
twins
intra-pairBMC
differencesat
spine
(β=1.681g;
95%
CI=
0.198–
3.164;
p<0.05)
femoral
neck
(β=0.100g;
95%
CI=
0.004–0.196;
p<0.05)andforearm
(β=0.261
g;95%
CI=
0.018–
0.504;
p<0.05).
β(linearregression)
13
Osteoporos Int
Tab
le3
(con
tinued)
Author
Objectiv
eParam
eters(bonesites)
Sam
plesize
Mainresults
(birth
weightandadultbone
mass)
Estim
ators
Score
a
Birth
weighthasshow
nassociationwith
BMD
only
intheunadjusted
analysis
teVelde
etal.[20]
Toinvestigatetheassociation
betweenbirthweightandadults'
musculo-skeletalhealth
BMCandBMD(totalbody,
lumbarspine,
andhip)
151wom
enand117men
Birth
weightwas
positiv
elyassociated
with
BMCof
totalbody
(β=189.1g;
95%
CI=
18.9–3
59.2;p≤0
.05)
andhip(β=2.24
g;95%
CI=
0.39–4
.08;
p<0.05).How
ever,these
associations
lostsignificance
afteradjustment
foradultweight.Birth
weightshow
edno
associationwith
BMD
β(linearregression)
15
Dennisonet
al.[21]
Toevaluate
theinfluenceof
intrauterine
andpostnatalgrow
thon
bone
massof
elderly
individuals
BA,BMCandBMD
(lum
barspineand
proxim
alfemur)
498wom
enand468men
Amongmen,birthweightwas
associated
with
BA
ofspine(r=0.12;p=0.01)andproxim
alfemur
(r=0.17;p=0.0002);BMCof
spine
(r=0.10;p=0.03)andproxim
alfemur
(r=0.16;p=0.0003);andBMD
ofproxim
alfemur
(r=0.10;p=0.03).Amongwom
en,
birthweightwas
associated
with
BA
ofspine
(r=0.18;p=0.0001)andproxim
alfemur
(r=0.26;p<0.0001)andBMCof
spine
(r=0.11;p=0.03)andproxim
alfemur
(r=0.16;p=0.0008)
Correlatio
ncoefficient
(linearregression)
18
Laitin
enet
al.[22]
Toinvestigatetheassociation
betweenbody
size,in
different
periodsof
grow
th,andmeasures
ofbone
massat
adulthood
BMCandBMD
(distaland
ultradistal
radius)
534wom
enand561men
After
adjustmentsforadultBMIandcalcium
intake,SGA
individualsshow
edahigher
chance
tobe
classified
aslow
BMC
(under
the10th
centile
ofsampledistributio
n)in
both
regions(distalandultradistal)of
radius
(OR=
2.50;95%
CI=
1.50
–4.20,
forboth
sites)
but
notas
low
BMD.IU
GRindividualsshow
eda
higher
chance
tobe
classified
aslow
BMCin
thedistal(O
R=2.61;95%
CI=
1.42
–4.80)
and
ultradistalregion
(OR=2.54;95%
CI=
1.40
–4.59)of
radius;andlow
BMD
inthedistal
region
(OR=1.92;95%
CI=
1.01
–3.66)
OR(logistic
regression)
14
Pearceet
al.[48]
Toinvestigatethedeterm
inantsof
someindicators
ofadultbone
health
BA
andBMD
(lum
bar
spine+hip)
218wom
enand171men
Birth
weightwas
positiv
elyassociated
with
BA
(lum
barspine+hip)
ofmen
(β=2.57
cm2;9
5%CI=
1.15–3
.98)
andwom
en(β=1.64
cm2;
95%
CI=
0.65
–2.63).After
adjustmentsfor
adultweightandheight,thisassociation
remainedsignificantonly
formen
(β=
1.11
cm2;95%
CI=
0.04–2
.18).Birth
weight
show
edno
associationwith
BMD
β(linearregression)
19
Saito
etal.[23]
Toinvestigatetheassociation
betweengrow
thandadult
wom
en'sbone
mass
BMCandBMD
(lum
bar
spine,
hip,
andfemoral
neck)
86wom
enAfter
adjustmentsforweightgain
between
0–1,5;
6–9and9–
12years;adultweight;
calcium
intake;andphysical
activ
ity,birth
weightremainedpositiv
elyassociated
with
BMCof
spine(β=3.48
g;SE=1.72;R2=
0.042;
p=0.047)
andhip(β=2.25
g;SE=
1.05;R2=0.039;
p=0.035).Birth
weighthas
show
nassociationwith
BMD
only
inthe
unadjusted
analysis
βandR2(linearregression)
16
Osteoporos Int

Tab
le3
(con
tinued)
Author
Objectiv
eParam
eters(bonesites)
Sam
plesize
Mainresults
(birth
weightandadultbone
mass)
Estim
ators
Score
a
Dalziel
etal.[24]
Toinvestigatetheeffect
ofintrauterine
exposure
toglucocorticoids,low
birthweight,
andprem
aturity
onpeak
bone
massandfemoral
geom
etry
ofadults
BA,BMC,andBMD
(total
body,lumbarspine,
proxim
alfemur,and
femoral
neck)
86wom
enand88
men
After
adjustmentsforsex,
gestationalage,PBT,
andadultleglength
Z-score,b
irth
weightwas
positiv
elyassociated
with
BA
(β=0.56
cm2;
SE=0.22;p=0.013)
ofproxim
alfemur.Birth
weightZ-score
was
positiv
elyassociated
with
BMC(β=64
g;SE=29;p=0.029)
andBMD
(β=0.02
g/cm
2;SE=0.01;p=0.033)
oftotal
body
afteradjustmentsforsex,
gestational
age,PBT,
andadultheight
Z-score;andBMC
(β=1.24
g;SE=0.51;p=0.016)
andBMD
(β=0,03
g/cm
2;SE=0,01;p=0,031)
ofprox-
imal
femur,afteradjustmentsforsex,
gesta-
tionalage,
PBT,
andadultleglength
Z-score.
Allassociations
wereabolishedafteradjust-
mentsforadultsize
β(linearregression)
16
Oliv
eret
al.[25]
Toinvestigatetherelatio
nship
betweengrow
thandbone
strength
BA
andBMD
(forearm
)318wom
enand313men
After
adjustmentsforage,BMI,sm
okinghabit,
alcoholconsum
ption,
physical
activ
ity,
calcium
intake,social
status,HRT,
and
numberof
yearsaftermenopause;birth
weightwas
associated
with
BA
oftotalbody
(r=0.18;p
<0.01)andtib
ia(r=0.29;p
<0.001)
andtrabecular
BMD
ofradius
(r=−0
.15;
p<0.05),am
ongwom
en.Amongmen,birth
weightwas
associated
with
BA
oftotalbody
(r=0.13;p<0.05)andtib
ia(r=0.13;p<0.05)
andtrabecular
BMD
oftib
ia(r=−0
.13;
p<0.05)
Pearson
correlation
coefficient
15
Leunissen
etal.[30]
Toinvestigatetheassociation
betweenbirthsize
(weightand
length)andadultbone
mass
BMCandBMD
(total
body
andlumbarspine)
121wom
enand191men
After
correctio
nforadultheight,individuals
born
SGAwith
(−1.29
SDS)andwith
out
catch-up
grow
th(−0.38
SDS)presentedlower
totalbody
BMCthan
AGA
individualswith
adequate
postnatalgrow
th(p<0.02).Birth
weightZ
-score
was
negativ
elyassociated
with
BMD
atthespine,
afteradjustmentforadult
height
(β=−1
.80;
p=0.026)
andweight
(β=−1
.65;
p=0.037).How
ever,thisassocia-
tionlostsignificance
afteradjustmentsfor
adultheight
andbirthlength
Z-score
differ-
ence,as
wellas
foradultweightandbirth
weightZ-score
difference
Group
difference
β(linearregression)
15
Hoviet
al.[26]
Toevaluate
whether
individuals
born
with
VLBW
becameadults
with
reducedbone
mass
BMCandBMD(totalbody,
lumbarspine,andfemoral
neck)
168wom
enand115men
After
adjustmentsforsex,
currentheight,and
exercise
intensity,VLBW
individuals
presentedlower
BMD
atlumbarspine
(β=−0
.26Z-score
units;95%
CI=
−0.51
to−0
.01;
p=0.04)andfemoral
neck
(β=−0
.40
Z-score
units;95%
CI=
−0.64to
−0.17;
p<
0.001)
andtotalbody
BMC(β=−6
9g;
95%
CI=
−138
to−1
;p=0.05)than
theirAGApeers
Group
Differenceβ
(linearregression)
17
Schlüssel
etal.[27]
Toexploretheassociationbetween
birthweight,postnatallin
ear
grow
th,andbone
massin
young
adults
BA,BMC,andBMD
(lum
barspine,
proxim
alfemur,andfemoral
neck)
250wom
enand246men
After
adjustmentsforsex,
skin
color,
gestationalage,
physical
activ
ity,sm
oking
habit,alcohol,calcium
andproteinintake,
adultweight,andheight
Z-score,birthweight
Z-score
remainedpositiv
elyassociated
with
BA
(β=0.62
cm2,SE=0.2;
p=0.002)
and
β(linearregression)
19
Osteoporos Int
regarding study variability in relation to sex, age, bonesites, parameters of bone mass, and data analysis proce-dures employed; (b) issues concerning differences in theassociation between birth weight, BMC and BMD, beforeand after adjustments for measures of adult body size; and(c) the importance of using adequate models, includinginteraction tests between prenatal and postnatal variables, toanalyze life course data.
The reviewed studies are quite different with regard toseveral aspects that impede the conduction of a formalmeta-analysis, with the wide variability in study samplesize and characteristics being the most important. Elevenstudies included both men and women, while only sixpresented results stratified by sex. None presented analysisof interaction between birth weight and sex on theassociation with bone mass. Further, it is worth noting thefact that in general, the studies included a wide range of agestrata in their sample. Thus, it is important to consider thisvariability before drawing any conclusions because bothsex and age are important determinants of bone metabo-lism. In this regard, these variables directly influence theindividual's peak bone mass (PBM) and the subsequentbone loss that naturally occurs with aging [11].
Three of the reviewed studies were conducted based onthe Hertfordshire birth cohort. These studies probably hadsome subjects in common. However, we decided tomaintain all three studies in the review because they havea different number of subjects in their samples, differentbone sites measured, as well as different techniques of bonemass assessment.
Another source of variability relates to the great numberof bone sites that were studied. We included in the reviewstudies that investigated the effect of birth weight on thebone mass of peripheral sites, such as the wrist and theforearm, and studies that investigated the association inmore central sites, such as the hip, the lumbar spine, oreven the whole body. Homogeneity was not observed in theselection of the evaluated bone mass parameters. The mostcommonly studied parameters were BMC and BMD. Fewstudies included BA among the outcomes.
Several different approaches to data analysis were chosenby the authors to evaluate the association between birthweight and adult bone mass. Both the explanatory variable(birth weight) and the outcomes (BA, BMC and BMD) wereappraised in different ways. Some studies investigated theoutcome as categorical, others as ordinal, or as continuous.Further, the adjustments employed in the analyses were nothomogeneous among studies. Physical activity, smokinghabit, alcohol consumption, and calcium intake were themost common co-variables. Therefore, it became quitedifficult to compare the results of the reviewed studies—aswell as provide an estimation of effect size—that otherwiseallowed us to provide an in-depth description of the findings.T
able
3(con
tinued)
Author
Objectiv
eParam
eters(bonesites)
Sam
plesize
Mainresults
(birth
weightandadultbone
mass)
Estim
ators
Score
a
BMC(β=0.90
g,SE=0.41;p=0.029)
ofproxim
alfemur.BMD
meanat
thespineof
men
inthethirdtertile
ofbirthweight
(1.09g/cm
2)was
significantly
higher
than
thoseat
second
(1.06g/cm
2)or
first
(1.04g/cm
2)tertiles;pfortrend=0.015.
How
ever,thisassociationlostsignificance
afteradjustmentsforadultheight
andweight
AGAadequate
forgestationalage;
BAbo
nearea;BMCbo
nemineral
content;BMD
bone
mineral
density
;BMIbo
dymassindex;
CIconfidence
interval;HRTho
rmon
erepo
sitio
ntherapy;
IUGR
intrauterine
grow
threstriction;
LBW
low
birthweigh
t;ORod
dsratio
;SD
Sstandard
deviationscores;SE
standard
error;SG
Asm
allforgestationalage;VLBW
very
low
birthweigh
t;PBTprenatal
betamethasone
treatm
ent
aMethodologicalquality
scoreof
thestudy,
accordingto
thecriteriaproposed
byDow
nsandBlack
[15]
b2,004twin
pairs
Osteoporos Int
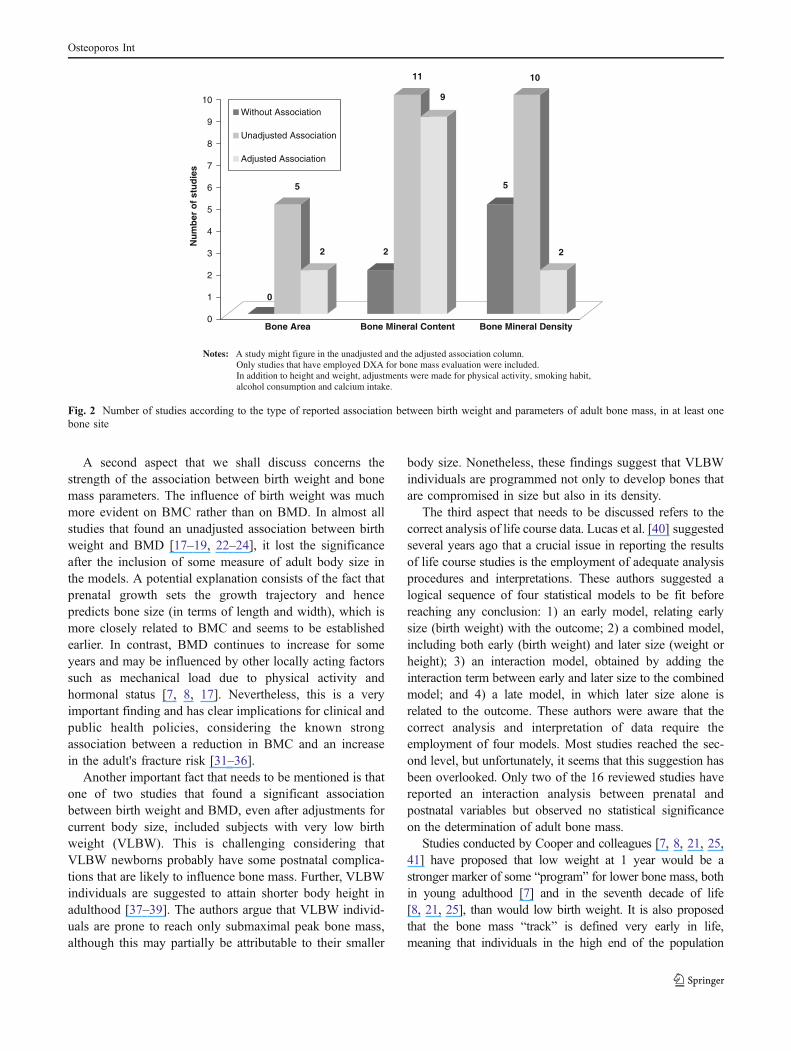
A second aspect that we shall discuss concerns thestrength of the association between birth weight and bonemass parameters. The influence of birth weight was muchmore evident on BMC rather than on BMD. In almost allstudies that found an unadjusted association between birthweight and BMD [17–19, 22–24], it lost the significanceafter the inclusion of some measure of adult body size inthe models. A potential explanation consists of the fact thatprenatal growth sets the growth trajectory and hencepredicts bone size (in terms of length and width), which ismore closely related to BMC and seems to be establishedearlier. In contrast, BMD continues to increase for someyears and may be influenced by other locally acting factorssuch as mechanical load due to physical activity andhormonal status [7, 8, 17]. Nevertheless, this is a veryimportant finding and has clear implications for clinical andpublic health policies, considering the known strongassociation between a reduction in BMC and an increasein the adult's fracture risk [31–36].
Another important fact that needs to be mentioned is thatone of two studies that found a significant associationbetween birth weight and BMD, even after adjustments forcurrent body size, included subjects with very low birthweight (VLBW). This is challenging considering thatVLBW newborns probably have some postnatal complica-tions that are likely to influence bone mass. Further, VLBWindividuals are suggested to attain shorter body height inadulthood [37–39]. The authors argue that VLBW individ-uals are prone to reach only submaximal peak bone mass,although this may partially be attributable to their smaller
body size. Nonetheless, these findings suggest that VLBWindividuals are programmed not only to develop bones thatare compromised in size but also in its density.
The third aspect that needs to be discussed refers to thecorrect analysis of life course data. Lucas et al. [40] suggestedseveral years ago that a crucial issue in reporting the resultsof life course studies is the employment of adequate analysisprocedures and interpretations. These authors suggested alogical sequence of four statistical models to be fit beforereaching any conclusion: 1) an early model, relating earlysize (birth weight) with the outcome; 2) a combined model,including both early (birth weight) and later size (weight orheight); 3) an interaction model, obtained by adding theinteraction term between early and later size to the combinedmodel; and 4) a late model, in which later size alone isrelated to the outcome. These authors were aware that thecorrect analysis and interpretation of data require theemployment of four models. Most studies reached the sec-ond level, but unfortunately, it seems that this suggestion hasbeen overlooked. Only two of the 16 reviewed studies havereported an interaction analysis between prenatal andpostnatal variables but observed no statistical significanceon the determination of adult bone mass.
Studies conducted by Cooper and colleagues [7, 8, 21, 25,41] have proposed that low weight at 1 year would be astronger marker of some “program” for lower bone mass, bothin young adulthood [7] and in the seventh decade of life[8, 21, 25], than would low birth weight. It is also proposedthat the bone mass “track” is defined very early in life,meaning that individuals in the high end of the population
0
5
2 2
11
9
5
10
2
0
1
2
3
4
5
6
7
8
9
10
Nu
mb
er o
f st
ud
ies
Bone Area Bone Mineral Content Bone Mineral Density
Without Association
Unadjusted Association
Adjusted Association
Notes: A study might figure in the unadjusted and the adjusted association column. Only studies that have employed DXA for bone mass evaluation were included. In addition to height and weight, adjustments were made for physical activity, smoking habit,alcohol consumption and calcium intake.
Fig. 2 Number of studies according to the type of reported association between birth weight and parameters of adult bone mass, in at least onebone site
Osteoporos Int
distribution are likely to remain there over time [42–45].Other authors have also shown the positive effect of earlypostnatal growth on adult bone mass [23, 46, 47]. Therefore,if both prenatal and early postnatal growth play a role inbone mass improvement, it is important to determine moreprecisely which period of postnatal development marks thecritical point that programs the achievement of adult bonemass.
No study reached the maximum score in the methodo-logical quality evaluation. Although displaying someimportant limitations, several studies received high scoresfor their methodological quality. The internal consistency ofthe scores assigned to the studies gave greater robustness tothis evaluation. Among the criteria considered here, thefinal sample's representativeness was defective in allreviewed studies. Birth cohorts, particularly those withlarge follow-up periods, have final samples that were rarelyrepresentative of the sample's initial drift. Furthermore,since this review was conducted in a database with rigorousindexing criteria and incorporated only articles published inEnglish, publication and language bias cannot be ruled out.Therefore, it is under the light of these considerations thatthe results described here should be considered.
In conclusion, based on the amount of accumulatedevidence, it is probable that birth weight has a positiveassociation with adult bone mass. The association is muchmore evident for BMC rather than BMD. As stated above,this represents an important finding for clinical and publichealth policies since a reduction in BMC is stronglyassociated with an increased fracture risk. However, interac-tion between prenatal and postnatal growth must be ade-quately investigated as well as reported more often, to identifywhich stage (or stages) of growth are the real critical windowfor bone mass accrual. Further, despite adequate adjustments,the results of studies investigating the association betweenbirth weight and bone mass in early adulthood are scanty aswell as still controversial. These issues remain difficult, andmore studies aiming to answer these questions are needed.
Funding Gilberto Kac is a research fellow from the “NationalCouncil for Scientific and Technological Development” (CNPq).Michael Maia Shlüssel was a recipient of a scholarship from the“Brazilian Coordination Body for the Training of University LevelPersonnel” (CAPES).
Conflicts of interest None.
References
1. Barker DJP (2007) The origins of the developmental originstheory. J Intern Med 261:412–417
2. Kajantie E (2008) Early-life events. Effects on aging. Hormones7:101–113
3. DeBoo HA, Harding JE (2006) The developmental origins ofadult disease (Barker) hypothesis. Aust NZ J Obstet Gynaecol46:4–14
4. Bateson P (2001) Fetal experience and good adult design. Int JEpidemiol 30:928–934
5. Harding JE (2001) The nutritional basis of the fetal origins ofadult disease. Int J Epidemiol 30:15–23
6. Bateson P, Barker D, Clutton-Brock T, Deb D, D’Udine B, FoleyRA, Gluckman P et al (2004) Developmental plasticity and humanhealth. Nature 430:419–421
7. Cooper C, Cawlay M, Bahalla A, Egger P, Ring F, Mortn L,Barker D (1995) Childhood growth, physical activity, and peakbone mass in women. J Bone Miner Res 10:940–947
8. Cooper C, Fall C, Egger P, Hobbs R, Eastell R, Barker D (1997)Growth in infancy and bone mass in later life. Ann Rheum Dis56:17–21
9. Cooper C, Westlake S, Harvey N, Javaid K, Dennison E, HansonM (2006) Developmental origins of osteoporotic fracture. Osteo-poros Int 17:337–347
10. Heaney RP, Abrams S, Dawson-Hughes B, Looker A, Marcus R,Matkovic V, Weaver C (2000) Peak bone mass. Osteoporos Int11:985–1009
11. Mora S, Gilsanz V (2003) Establishment of peak bone mass.Endocrinol Metab Clin N Am 32:39–63
12. Hernandez CJ, Beaupré GS, Carter DR (2003) A theoreticalanalysis of the relative influences of peak BMD, age-related boneloss and menopause on the development of osteoporosis.Osteoporos Int 14:843–847
13. Bonjour JP, Chevalley T, Ferrari S, Rizzoli R (2009) Theimportance and relevance of peak bone mass in the prevalenceof osteoporosis. Salud Publica Mex 51(S1):S5–S17
14. Moher D, Liberati A, Tetzlaff J, Altman DG, The PRISMA Group(2009) Preferred reporting items for systematic reviews and meta-analyses: the PRISMA Statement. PloS Med 6(7):e1000097, Epub2009 Jul 21
15. Downs SH, Black N (1998) The feasibility of creating a checklistfor the assessment of the methodological quality both ofrandomized and non randomized studies of health care interven-tions. J Epidemiol Community Health 52:377–384
16. Shrout PE (1998) Measurement reliability and agreement inpsychiatry. Stat Methods Med Res 7:301–317
17. Yarbrough DE, Barrett-Connor E, Morton DJ (2000) Birth weightas a predictor of adult bone mass in postmenopausal women: theRancho Bernardo Study. Osteoporos Int 11:626–630
18. Gale CR, Martyn CN, Kellingray S, Eastell R, Cooper C (2001)Intrauterine programming of adult body composition. J ClinEndocrinol Metab 86:267–272
19. Antoniades L, MacGregor AJ, Andrew T, Spector TD (2003)Association of birth weight with osteoporosis and osteoarthritis inadult twins. Rheumatology 42:791–796
20. te Velde SJ, Twisk JWR, van Mechelen W, Kemper HCG (2004)Birth weight and musculoskeletal health in 36-years-old men andwomen: results from the Amsterdam Growth and Health Longi-tudinal Study. Osteoporos Int 15:383–388
21. Dennison EM, Syddall HE, Sayer AA, Gilbody HJ, Cooper C(2005) Birth weight and weight at 1 year are independentdeterminants of bone mass in the seventh decade: the Hertford-shire cohort study. Pediatr Res 57:582–586
22. Laitinen J, Kuikaanniemi K, Heikkien J, Koiranen M,Nieminen P, Sovio U, Keinanen-Kiukaanniemi S, JärvelinMS (2005) Body size from birth to adulthood and bonemineral content and density at 31 years of age: results fromthe northern Finland 1966 birth cohort study. Osteoporos Int16:1417–1424
Osteoporos Int

23. Saito T, Nakamura K, Okuda Y, Nashimoto M, Yamamoto N,Yamamoto M (2005) Weight gain in childhood and bone mass infemale college students. J Bone Miner Metab 23:69–75
24. Dalziel SR, Fenwick S, Cundy T, Parag V, Beck TJ, Rodgers A,Harding JE (2006) Peak bone mass after exposure to antenatalbetamethasone and prematurity: follow-up of a randomizedcontrolled trial. J Bone Miner Res 21:1175–1186
25. Oliver H, Jameson KA, Sayer AA, Cooper C, Dennison EM, TheHertfordshire Cohort Study Group (2007) Growth in early lifepredicts bone strength in late adulthood: the Hertfordshire CohortStudy. Bone 41:400–405
26. Hovi P, Andersson S, Järvenpää A, Eriksson JG, Strang-KarlssonS, Kajantie E, Mäkitie O (2009) Decreased bone mineral densityin adults born with very low birth weight: a cohort study. PLoSMed 6(8):e1000135. doi:10.1371/journal.pmed.1000135
27. Schlüssel MM, Castro JAS, Kac G, Silva AAM, Cardoso VC,Bettiol H et al (2010) Birth weight and bone mass in young adultsfrom Brazil. Bone 46:957–963
28. Genant HK, Cooper C, Poor G, Reid I, Ehrlich G, Kanis J et al (1999)Interim report and recommendations of the World Health Organiza-tion Task-Force for Osteoporosis. Osteoporos Int 10:259–264
29. Hamed HM, Purdie DW, Ramsden CS, Carmichael B, Steel SA,Howey S (1993) Influence of birth weight on adult mineraldensity. Osteoporos Int 3:1–2
30. Leunissen RWJ, Stijnen T, Boot AM, Hokken-Koelega ACS(2008) Influence of birth size and body composition on bonemineral density in early adulthood: the PROGRAM study. ClinEndocrinol (Oxf) 69:386–392
31. Wasnich RD, Ross PD, Heilbrun LK, Vogel JM (1985) Predictionof postmenopausal fracture risk with use of bone mineralmeasurements. Am J Obstet Gynecol 1(153):745–751
32. Wasnich RD, Ross PD, Heilbrun LK, Vogel JM (1987) Selectionof the optimal skeletal site for fracture risk prediction. Clin OrthopRelat Res 216:262–269
33. Gärdsell P, Johnell O, Nilsson BE (1989) Predicting fractures inwomen by using forearm bone densitometry. Calcif Tissue Int44:235–242
34. Wasnich RD, Ross PD, Davis JW, Vogel JM (1989) A comparisonof single and multi-site BMC measurements for assessment ofspine fracture probability. J Nucl Med 30:1166–1171
35. Gärdsell P, Johnell O, Nilsson BE, Gullberg B (1993) Predictingvarious fragility fractures in women by forearm bone densitom-etry: a follow-up study. Calcif Tissue Int 52:348–353
36. Melton LJ 3rd, Crowson CS, O’Fallon WM, Wahner HW, RiggsBL (2003) Relative contributions of bone density, bone turnover,and clinical risk factors to long-term fracture prediction. J BoneMiner Res 18:312–318
37. Ericson A, Kallen B (1998) Very low birthweight boys at the ageof 19. Arch Dis Child Fetal Neonatal Ed 78:F171–F174
38. Hack M, Schluchter M, Cartar L, Rahman M, Cuttler L, BorawskiE (2003) Growth of very low birth weight infants to age 20 years.Pediatrics 112:e30–e38
39. Cooke RW (2004) Health, lifestyle, and quality of life for youngadults born very preterm. Arch Dis Child 89:201–206
40. Lucas A, Fewtrell MS, Cole TJ (1999) Fetal origins of adultdisease—the hypothesis revisited. Br Med J 319:245–249
41. Javaid MK, Lekamwasam S, Clark J, Dennison EM, SyddallHE, Loveridge N, Reeve J, Beck TJ, Cooper C, TheHertfordshire Cohort Study Group (2006) Infant growthinfluences proximal femoral geometry in adulthood. J BoneMiner Res 21:508–512
42. Ferrari S, Rizzoli R, Slosman D, Bonjour JP (1998) Familialresemblance for bone mineral mass is expressed before puberty. JClin Endocrinol Metab 83:358–361
43. Loro ML, Sayre J, Roe TF, Goran MI, Kaufman FR, Gilsanz V(2000) Early identification of children predisposed to low peakbone mass and osteoporosis later in life. J Clin Endocrinol Metab85:3908–3918
44. Ruff C (2005) Growth tracking of femoral and humeral strengthfrom infancy through late adolescence. Acta Paediatr 94:1030–1037
45. Foley S, Quinn S, Jones G (2009) Tracking of bone mass fromchildhood to adolescence and factors that predict deviation fromtracking. Bone 44:752–757
46. Weiler HA, Yuen CK, Seshia MM (2002) Growth and bonemineralization of young adults weighing less than 1500 g at birth.Early Hum Dev 67:101–112
47. Jensen RB, Vielwerth S, Frystyk J, Veldhuis J, Larsen T,Mølgaard C, Greisen G, Juul A (2008) Fetal growth velocity,size in early life and adolescence, and prediction of bonemass: association to the GH–IGF axis. J Bone Miner Res23:439–446
48. Pearce MS, Birrell FN, Francis RM, Rawlings DJ, Tuck SP,Parker L (2005) Lifecourse study of bone health at age 49–51years: the Newcastle thousand families cohort study. J EpidemiolCommunity Health 59:475–480
Osteoporos Int
Copyright © 2022 FDOKUMEN