Biosynthesis, structural characterization and antimicrobial activity of gold and silver...
9
(This is a sample cover image for this issue. The actual cover is not yet available at this time.) This article appeared in a journal published by Elsevier. The attached copy is furnished to the author for internal non-commercial research and education use, including for instruction at the authors institution and sharing with colleagues. Other uses, including reproduction and distribution, or selling or licensing copies, or posting to personal, institutional or third party websites are prohibited. In most cases authors are permitted to post their version of the article (e.g. in Word or Tex form) to their personal website or institutional repository. Authors requiring further information regarding Elsevier’s archiving and manuscript policies are encouraged to visit: http://www.elsevier.com/copyright
-
Upload
independent -
Category
Documents
-
view
0 -
download
0
Transcript of Biosynthesis, structural characterization and antimicrobial activity of gold and silver...
(This is a sample cover image for this issue. The actual cover is not yet available at this time.)
This article appeared in a journal published by Elsevier. The attachedcopy is furnished to the author for internal non-commercial researchand education use, including for instruction at the authors institution
and sharing with colleagues.
Other uses, including reproduction and distribution, or selling orlicensing copies, or posting to personal, institutional or third party
websites are prohibited.
In most cases authors are permitted to post their version of thearticle (e.g. in Word or Tex form) to their personal website orinstitutional repository. Authors requiring further information
regarding Elsevier’s archiving and manuscript policies areencouraged to visit:
http://www.elsevier.com/copyright
Author's personal copy
Colloids and Surfaces B: Biointerfaces 107 (2013) 227– 234
Contents lists available at SciVerse ScienceDirect
Colloids and Surfaces B: Biointerfaces
jou rn al h om epage: www.elsev ier .com/ locate /co lsur fb
Biosynthesis, structural characterization and antimicrobial activity ofgold and silver nanoparticles
Tokeer Ahmada,∗, Irshad A. Wania, Nikhat Manzoorb,1, Jahangeer Ahmedc,Abdullah M. Asirid
a Nanochemistry Laboratory, Department of Chemistry, Jamia Millia Islamia, New Delhi 110025, Indiab Department of Biosciences, Jamia Millia Islamia, New Delhi 110025, Indiac Department of Chemistry, Michigan State University, East Lansing, MI 48824, USAd Department of Chemistry, Faculty of Science, King Abdulaziz University, Jeddah 21589, Saudi Arabia
a r t i c l e i n f o
Article history:Received 3 December 2012Received in revised form 9 February 2013Accepted 11 February 2013Available online xxx
Keywords:BiosynthesisNanoparticlesTransmission electron microscopySurface areaAntimicrobial activity
a b s t r a c t
An eco friendly simple biosynthetic route was used for the preparation of monodisperse and highlycrystalline gold and silver nanoparticles using cell free extract of fungus, Candida albicans. Transmissionelectron microscopic studies show the formation of gold and silver nanocrystals of average size of 5 nmand 30 nm with the specific surface areas of 18.9 m2/g and 184.4 m2/g respectively. The interaction of goldand silver nanoparticles with proteins has been formulated by FT-IR spectroscopy and thermal gravimet-ric analysis. The formation of gold and silver nanoparticles was also confirmed by the appearance of asurface plasmon band at 540 nm and 450 nm respectively. The antimicrobial activity of the synthesizedgold and silver nanoparticles was investigated against both Staphylococcus aureus and Escherichia coli.The results suggest that these nanoparticles can be used as effective growth inhibitors against the testmicroorganisms. Greater bactericidal activity was observed for silver nanoparticles. The E. coli, a gramnegative bacterium was found to be more susceptible to gold and silver nanoparticles than the S. aureus,a gram positive bacterium.
© 2013 Elsevier B.V. All rights reserved.
1. Introduction
Nanochemistry deals with the basic research of the synthesis ofnanoparticles in different chemical compositions, sizes with con-trolled morphology and to study their size and shape dependentphysical and chemical properties. Nanomaterials have shown theirkeen interest in electronic as well as in medicinal industries becauseof their fundamental properties, organization to form superstruc-tures and applications [1–5]. The nanoparticles have also shownpotential applications in various fields such as optoelectronics [5,6],catalysis [7,8], reprography [9], single-electron transistors (SETs)and light emitters [10,11], nonlinear optical devices [12], biosens-ing [13], recording media [14] and photo-electrochemical devices[15].
The noble metal nanoparticles especially silver and gold havereceived considerable attention due to their attractive physico-chemical properties [16]. The surface plasmon resonance (SPR) andlarge effective scattering cross section of these nanoparticles makes
∗ Corresponding author. Tel.: +91 11 26981717x3261; fax: +91 11 26980229.E-mail address: [email protected] (T. Ahmad).
1 Contributed to the antifungal activity of gold and silver nanoparticles.
them an ideal choice for molecular labeling, where phenomenasuch as surface enhance Raman scattering (SERS) can be exploited[17]. Very recently silver nanoparticles have been shown to possesspotent anti HIV activity [18]. Gold nanoparticles have also beenused as radiosensitizers [19], chemotherapy [20] and in targetingand imaging [21].
Metal nanostructures of different sizes and shapes can be syn-thesized by various chemical and physical methods, however, mostof the starting materials used in these methods are toxic andpotentially hazardous [22]. Therefore, an environmentally benignprocedure for nanoparticle synthesis is required which avoid theuse of toxic chemicals and solvents. As a result, researchers inthe field of nanoparticle synthesis and assembly have turnedto biological systems [23,24]. In the past decade several groupshave successfully synthesized Ag, Au, and Pd nanoparticles usingextracts of unicellular organisms like bacteria [25,26] and fungi[27,28] as well as extracts from plants e.g., geranium leaves [29],lemon grass [30], neem leaves [31] and aloevera [32], etc. The goldand silver nanoparticles have been successfully prepared using fun-gus Verticillium and Fuserium semitectum respectively [28,33,34].Seed mediated method has also been used for the synthesis of silvernanoparticles in which tannin was used to reduce Ag salt in aque-ous solution [35]. Recently, silver and gold nanoparticles have been
0927-7765/$ – see front matter © 2013 Elsevier B.V. All rights reserved.http://dx.doi.org/10.1016/j.colsurfb.2013.02.004
Author's personal copy
228 T. Ahmad et al. / Colloids and Surfaces B: Biointerfaces 107 (2013) 227– 234
reported using various chemical methods viz. solvothermal [36,37],sonochemical [38,39] and reverse microemulsion [40] methods.These reports exhibit the excellent antimicrobial activity of silverand gold nanoparticles [37,39,40].
In this paper, we report the synthesis of gold and silver nanopar-ticles for the first time using cell free extract obtained fromthe fungus, Candida albicans. Biologically developed gold and sil-ver nanoparticles have been studied by X-ray diffraction, TEMand UV–visible spectroscopy. The interaction of the proteins andenzymes present in the extract with the surface of the synthesizedsilver and gold nanoparticles was confirmed by Fourier trans-form infrared (FT-IR) spectroscopy and the TGA studies. The goldand silver nanoparticles were tested for their antibacterial activ-ity against both gram positive (Staphylococcus aureus) and gramnegative (Escherichia coli) bacteria.
2. Experimental
2.1. Materials and methods
Gold and silver nanoparticles were synthesized by the reductionof their salts with the cell free extract obtained from the fungusnamed C. albicans. The details of the steps involved in the synthesisof gold and silver nanoparticles are given below.
Cell free extract of Candida was prepared as per the describedprocedure with minor modifications [41]. Cells grown to mid expo-nential phase in YPD (Yeast extract Peptone Dextrose) medium(1 g wt/vol) which were suspended in 2 ml grinding medium(250 mM sucrose, 10 mM [Tris (hydroxymethyl) aminomethanehy-drochloride] (Tris HCl), pH 7.5, 1 mM polymethyl sulfonyl fluoride(PMSF) and 2 g glass beads (0.45 mm)). The suspension wasmechanically disrupted in cell homogenizer (MSK, Braun) by agi-tating it for a total of nine cycles of 10 s each at 4000 vibrationsper minute. Homogenate was collected and centrifuged at 1000 × gfor 5 min at 4 ◦C to remove unbroken cells and glass beads and fur-ther centrifuged for 40 min at 15,000 × g at 4 ◦C. The supernatantobtained was used as cell free extract.
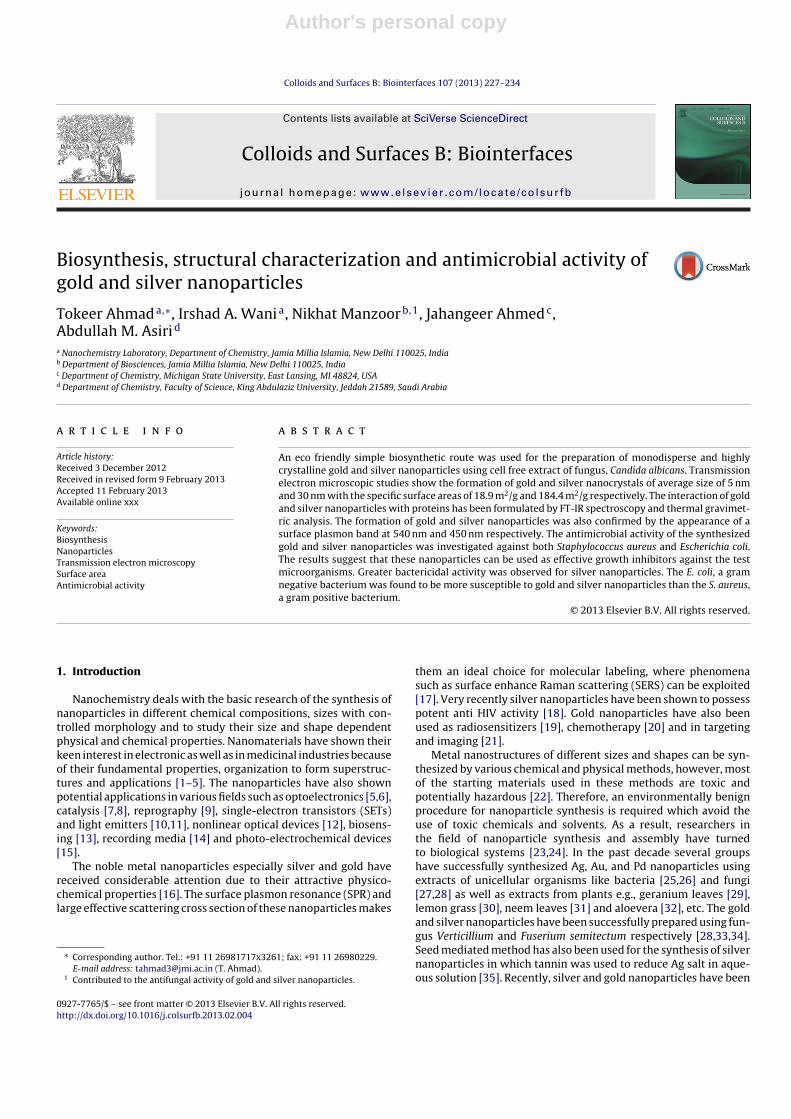
In order to prepare gold nanoparticles, 15 ml of 10−2 M aqueousHAuCl4 solution (Spectrochem, Mumbai, India) was taken in a 50 mlcuvette to which about 15 ml of the above prepared cell free extractwas added. The mixture was diluted by adding 20 ml of distilledwater. After mixing, the resultant system was kept in a shaker at35 ◦C and the changes were observed at regular intervals till 48 h.The observed light yellow color was changed to light purple, fairlypurple and deep purple after the reaction intervals of 15 min, 20 hand 48 h respectively (inset of Fig. 1a). The reaction mixture at thisstage was centrifuged and the product obtained was washed thricewith double distilled water.
Silver nanoparticles were also synthesized in a similar proce-dure by replacing aqueous gold salt solution with silver nitrate(Rankem, 99.9%) of the same molar concentration. After 15 min ofshaking, the white cloudy mass appeared in the system. The reac-tion was monitored and the color was found to be pale yellow, winered and dark brown at a time interval of 15 h, 30 h and 48 h as shownin the inset of Fig. 1b. The reaction mixture obtained at this stagewas centrifuged to obtain the silver nanoparticles.
2.2. Micro-organisms and culture conditions
2.2.1. Strains and mediaStock cultures of (E. coli) MTCC 443 and (S. aureus) MTCC 902
were cultured in Maconky agar (HiMedia, India). To initiate growthfor experimental purposes, one loop full of cells from an agar cul-ture was inoculated into 25 ml of respective nutrient media andincubated at 30–37 ◦C for 24 h i.e., up to stationary phase (primary
Fig. 1. X-ray diffraction patterns of biologically synthesized (a) gold and (b) silvernanoparticles. Inset shows the colors of gold and silver nanosuspensions respec-tively with the progress of the reaction.
culture). The cells from primary culture (108 cells ml−1) were re-inoculated into 100 ml fresh YPD medium and grown for 8–10 hi.e., up to mid-log phase (106 cells ml−1).
E. coli, a gram-negative bacterium, was used due to its popularityof being selected as a test organism and its resistance to commonantimicrobial agents. S. aureus, a pathogenic gram-positive bac-terium, was used because it is the major cause of cross-infectionin hospitals and it is the most frequently evaluated species.
2.2.2. Microdilution assayIn vitro susceptibility tests were performed to evaluate MICs
using the standard methods described in the guidelines of docu-ment NCCLS/CLSI M11-A6 [42] guidelines for gram negative anddocument CLSI M100-S15 [43] for gram positive bacteria.
2.2.3. Antimicrobial assayAntimicrobial activity of as prepared gold and silver nanopar-
ticles was determined using the disk diffusion method with somemodification which was as follows. Inoculum was prepared withfresh cultures of microbial strains, cultured on tryptic-soy agar(Himedia) for 18 h at 37 ± 1 ◦C using physiological saline with3 × 106 cells ml−1. Inoculum density was compared with Mac-Farlands standard solution of BaSO4 (0.1 ml of 1% BaCl2 +9.9 mlof 1% H2SO4). One ml of inoculum was mixed with 22 ± 5 ml of
Author's personal copy
T. Ahmad et al. / Colloids and Surfaces B: Biointerfaces 107 (2013) 227– 234 229
Muller–Hinton agar for both the bacterial strains. Filter discs werekept on solid agar and test nano-particles were spotted on the disc.The diameter of zone of inhibition was recorded in millimeters after48 h and was compared with that of control. Values were shown interms of mean ± standard error of mean (SEM).
2.2.4. Growth studiesGrowth studies of both the tested microorganisms were done
as described earlier [44] with slight modifications. Prior to testing,the bacterial cultures were sub-cultured at least twice and grownfor 24 h at 35 ◦C on agar plates. For growth studies, 106 cells (opticaldensity A600 = 0.1) of test strains were grown aerobically in 50 mlmedia on automated shaker set at 35 ◦C with agitation of 200 rpm.Gold and silver nanoparticles with final concentrations of 0 × MIC,0.5 × MIC and 1 × MIC for each test isolate were also added to thecultures. At pre-determined time points (0, 2, 4, 6, 8, 10 and 24 h)aliquots were removed and growth was followed turbidometricallyat 595 nm using Lab Med Spectrophotometer (USA). Optical densitywas recorded for each concentration against time (h).
2.3. Instrumental techniques
To characterize and investigate the structure of the samples, theas-prepared products were analyzed on a Bruker D8 advance X-ray diffractometer using Ni-filtered Cu-K� X-rays of wavelength(�) = 1.54056 A. The X-ray diffraction data was recorded in the 2�range of 10–70◦ with the step size of 0.05◦ and step time of 1 s. Rawdata was subjected to background corrections and K�2-lines werestripped off using stripping procedure.
The grain size and morphology of the sample was examined onFEI Technai G2 20 transmission electron microscope (TEM) with anaccelerating voltage of 200 kV. The TEM specimen was prepared bytaking a small amount of the powder dispersed in absolute ethanolwith the help of an ultrasonic bath and sonicated for 30 min. Adrop from an eye dropper of this dispersion sample was placedon a copper grid coated with carbon film. The samples were placedin an oven to dry at ambient temperature before examining. TheN2 adsorption–desorption isotherm, surface area and pore param-eter of the samples at liquid nitrogen temperature (78 K) wererecorded with B.E.T. surface area analyzer (Model Nova 2000e,Quantachrome Instruments Limited, USA) by using multiple pointBET method. The pore parameter analysis was carried out with thehelp of DA (Dubinin–Astakhov) and BJH (Barrett–Joyner–Halenda)models. UV–visible spectra of the nanoparticles were recorded byOcean- Optics Lambda-25 Spectrophotometer. The presence of theorganic moieties such as enzymes and proteins adsorbed on the sur-face of the silver and gold nanoparticles was confirmed by recordingthe IR (Perkin-Elmer model 1600, FT-IR). The thermal decompo-sition of the samples was studied by thermogravimetry with aEXSTAR 6000 instrument in nitrogen atmosphere at the heatingrate of 10 ◦C per minute with alumina as a reference sample.
3. Results and discussion
3.1. X-ray diffraction studies
The X-ray diffraction pattern of as prepared gold nanoparticlesis shown in Fig. 1a. Three peaks are observed at 2� values of 38.46◦,44.65◦ and 64.73◦ and indexed as (1 1 1), (2 0 0) and (2 2 0) respec-tively, which confirmed the monophasic nature of pure gold withface centered cubic symmetry (JCPDS No. 011174). The peaks arebroad with fair intensity indicating the nanocrystalline nature ofgold powder. However, X-ray diffraction pattern of silver nanopar-ticles is shown in Fig. 1b. Here the reflections of moderate intensityare observed which belong to the plane families of face centeredsilver and indexed with [1 1 1], [2 0 0] and [2 2 0] planes (JCPDS No.
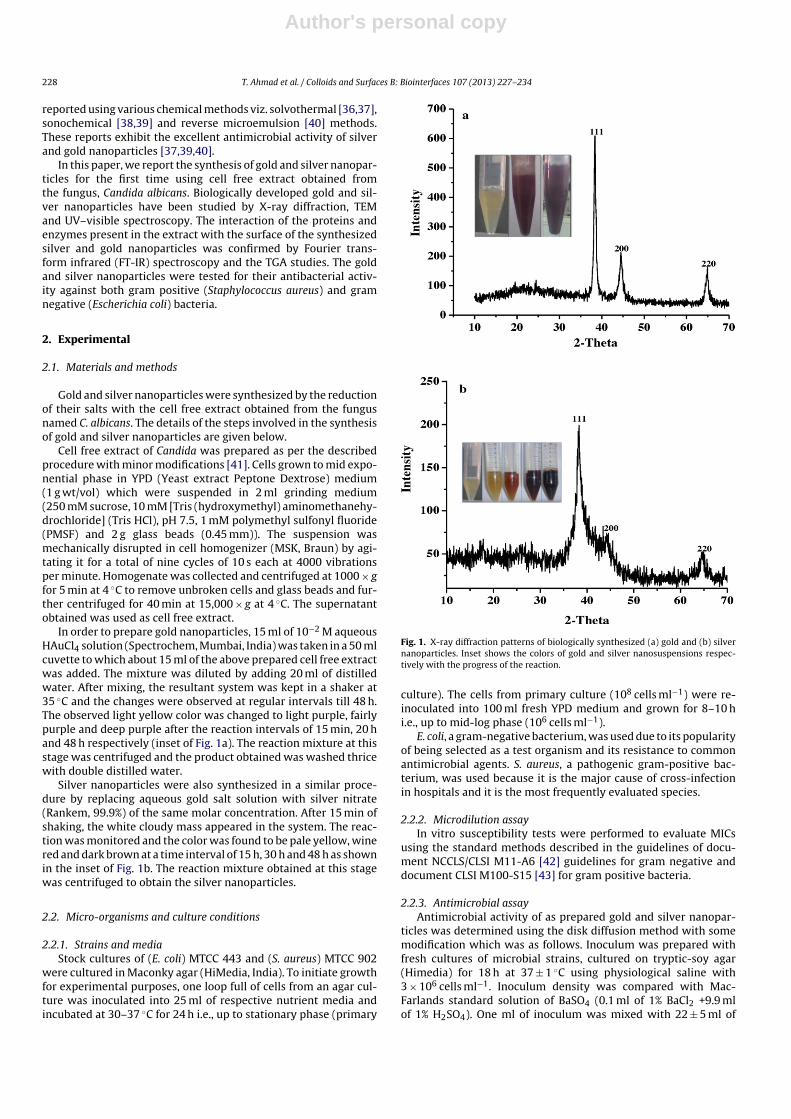
Fig. 2. TEM images of (a) gold and (b) silver nanoparticles.
040783). No impurity peak is observed which confirm the highphase purity of the samples.
3.2. Transmission electron microscopic (TEM) studies
The particle size and morphology of the as prepared gold andsilver nanoparticles were examined by transmission electronmicroscopy (TEM). Fig. 2a shows the TEM micrograph of goldnanoparticles in which bimodal distribution of sizes could beobserved. Nonspherical particles are bigger in size where as thespherical particles are smaller in size. The TEM image showsthat the size of the particles ranges from 4 nm to 10 nm with anaverage size of 5 nm. The TEM image of silver nanoparticles isshown in Fig. 2b. As can be seen from the micrograph, the smallernearly isotropic silver nanoparticles have agglomerated to yieldnonspherical and slightly bigger particles. The average particlesize was calculated and found to be 30 nm. The agglomeration mayhave appeared due to possible sedimentation at the latter stage ofthe reaction.
3.3. UV–visible spectroscopy
The formation and stability of as prepared gold and silvernanoparticles was monitored on UV–visible spectrophotometer

Author's personal copy
230 T. Ahmad et al. / Colloids and Surfaces B: Biointerfaces 107 (2013) 227– 234
Fig. 3. UV–visible absorption spectrum of (a) gold and (b) silver nanoparticles.
which is one of the most important technique used for the struc-tural characterization of metal nanoparticles. Fig. 3a shows theUV–visible spectrum recorded from the chloroauric acid (AuCl4−)and cell free extract as a function of progress of the reaction. It canbe seen from the spectrum, gold nanoparticles show surface plas-mon resonance peak at 540 nm [37,39]. The intensity of this peaksteadily increases with increase in the reaction time which maybe attributed to the formation of the gold nanoparticles with theprogress of the reaction because the intensity of the surface plas-mon peak is directly proportional to the density of the nanoparticlesin solution. Maximum intensity is achieved after 48 h of the reac-tion which indicates the complete reduction of the AuCl4− ions. Anintense purple color of the reaction mixture (inset of Fig. 1a) furthersupports our claim of complete reduction of AuCl4− ions and theformation of gold nanoparticles.
Similarly the formation and stability of the silver nanoparticlesby the reduction of Ag+ ions in the cell free extract was also mon-itored by the UV–visible spectroscopy which is shown in Fig. 3b.The spectrum shows the band located at 450 nm corresponding tothe surface plasmon resonance of the spherical silver nanoparti-cles [36,38,40], indicating the formation of silver nanoparticles inthe reaction mixture. Here again, the intensity increase linearly asthe function of the reaction time and the maximum intensity isachieved after 48 h of the reaction which indicates the completionof the reaction. It is also confirmed by the intense brown color ofthe reaction mixture as observed at the end of the reaction (insetof Fig. 1b). Since the reactions were carried out in dark withoutthe use of any foreign reductant thus giving the strong evidence ofbioreduction of the gold and silver ions by the enzymes and pro-teins present in the cell free extract. The surface plasmon resonance
peaks observed for gold and silver nanoparticles are comparableto the literature reports [36–40] which may be attributed to thefact that nanoparticles are well dispersed in the aqueous solutionswithout any aggregation [1].
3.4. Fourier transform infrared (FT-IR) spectroscopy
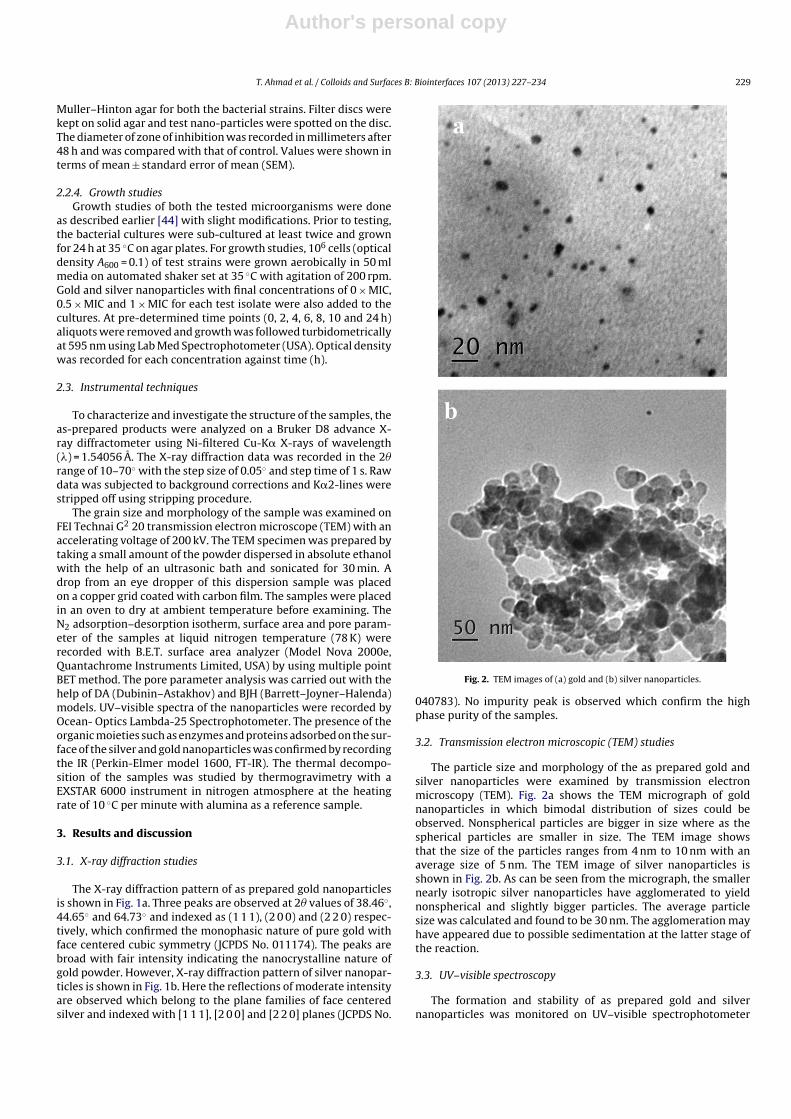
The suspension of nanoparticles was found to be stable for along period of time which shows that these nanoparticles werestabilized in solution by the biomolecules present in the cell freeextract. The stability of the as synthesized gold and silver nanopar-ticles was confirmed by carrying out the FT-IR measurements onthese samples. Fig. 4a and b shows the FT-IR spectra of the goldand silver nanoparticles respectively. A weak band appears around3740 cm−1 may be due to the stretching frequency of the O H bondpossibly arising from the carbohydrates or proteins present in thesample. It may also arise due to the presence of some adsorbedwater molecules in the sample. The weak bands at 3225 cm−1 and2850 cm−1 may be assigned due to N H stretching of the pri-mary amide NH2 group and aldehydic C H stretching respectivelywhich possibly arise from the sugars and proteins present in theextract. A peak around 2355 cm−1 can be assigned to the nitrogencompounds featuring triple or cumulative double bonds such asnitriles ( CN) and cyanates ( O CN) which exhibit intense absorp-tion band in this region. The bands at ∼1656 cm−1 and 1520 cm−1
are due to C O stretching and N H bending modes of amide groupsin the protein molecules respectively. The weak bands appear at1371 cm−1 (Fig. 4a) and 1380 cm−1 (Fig. 4b) may be due to C Ostretching of the carboxylate ions present in the amino acid residue.A strong peak at ∼509 cm−1 in Fig. 4a and b, may be assigned to themetal–ligand stretching frequency arising due to the interactionof biomolecules to the nanoparticle surfaces. The bands observedin the IR spectra of the synthesized gold and silver nanoparti-cles showing the presence of the biomolecules like proteins andenzymes on the nanoparticle surface have been identified andreported earlier [45,46]. IR spectroscopic study has thus proved thatthe carbonyl group from amino acid residues and peptides of pro-teins has the stronger ability to bind metal and produced cappedgold and silver nanoparticles to prevent agglomeration and stabi-lizing the nanoparticles in the medium. This evidence suggests thatthe biological molecules could perform the function for the forma-tion and stabilization of the Au and Ag nanoparticles in aqueousmedium. It is well known that proteins can bind to Ag nanoparti-cles through free amine groups in the proteins [47] and therefore,stabilization of the silver nanoparticles by surface-bound proteins[48].
3.5. Thermogravimetric analysis (TGA)
The capping action of the biomolecules present in the cell freeextract on the surface of as prepared gold and silver nanoparticleswas further confirmed by TGA. The analysis was carried under inertN2 atmosphere. Inset of Fig. 4a and b shows the thermograms of asprepared gold and silver nanoparticles respectively. Two weightlosses were observed in the thermogram recorded in the temper-ature range of 40 ◦C to 600 ◦C. The first weight loss was observedat ∼100 ◦C due to the loss of adsorbed water molecules presentin the samples. The second weight loss appeared in the tempera-ture range of 300–350 ◦C. This weight loss was found to be around55% for gold nanoparticles and around 45% for silver nanoparticles.The observed two step desorption curve in the thermo gravimetricanalysis (TGA) plots is most likely as a consequence of desorp-tion of bioorganic compounds like proteins and enzymes presenton the surface of the gold and silver nanoparticles which is alsosupported by the earlier literature reports [49]. Thus, the fungalextract-stabilized nanoparticles are expected to be made up of
Author's personal copy
T. Ahmad et al. / Colloids and Surfaces B: Biointerfaces 107 (2013) 227– 234 231
Fig. 4. FT-IR spectra of as prepared nanoparticles of (a) gold and (b) silver from the fungal cell free extract. Inset of the figures give the corresponding thermo gravimetric(TG) plots.
molecules responsible for the reduction of metal ion and stabilizingparticles in the solution.
3.6. B.E.T. surface area analysis
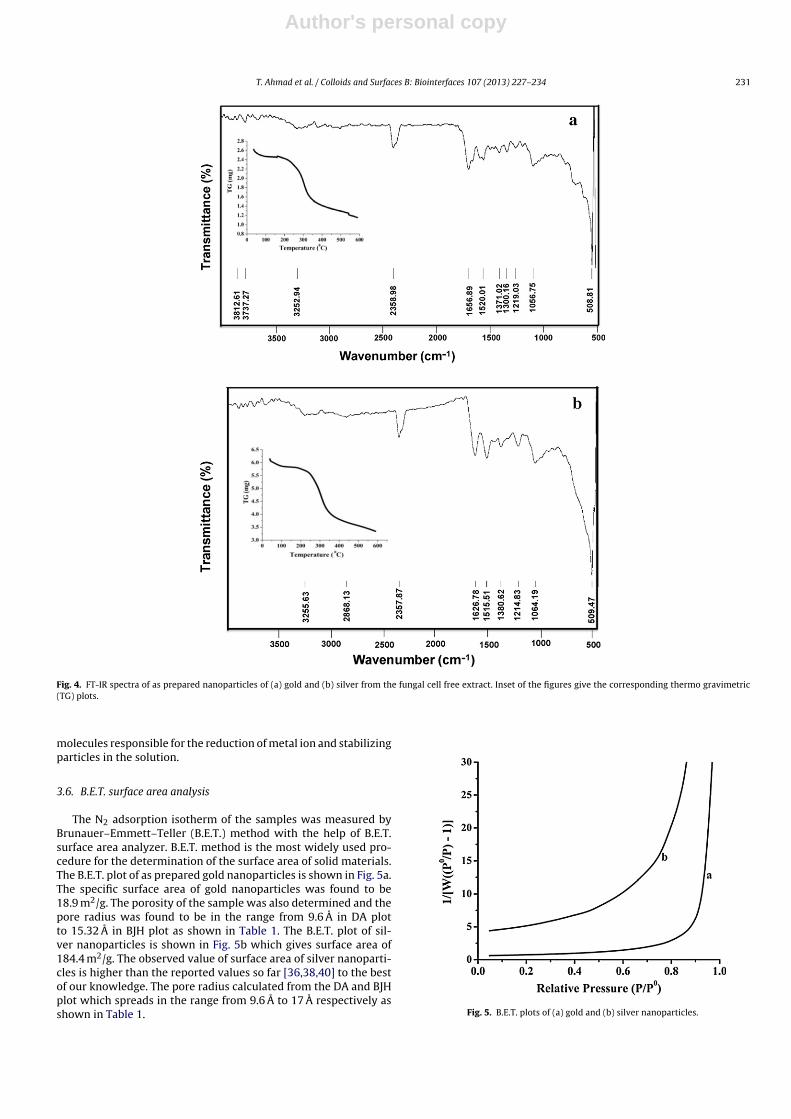
The N2 adsorption isotherm of the samples was measured byBrunauer–Emmett–Teller (B.E.T.) method with the help of B.E.T.surface area analyzer. B.E.T. method is the most widely used pro-cedure for the determination of the surface area of solid materials.The B.E.T. plot of as prepared gold nanoparticles is shown in Fig. 5a.The specific surface area of gold nanoparticles was found to be18.9 m2/g. The porosity of the sample was also determined and thepore radius was found to be in the range from 9.6 A in DA plotto 15.32 A in BJH plot as shown in Table 1. The B.E.T. plot of sil-ver nanoparticles is shown in Fig. 5b which gives surface area of184.4 m2/g. The observed value of surface area of silver nanoparti-cles is higher than the reported values so far [36,38,40] to the bestof our knowledge. The pore radius calculated from the DA and BJHplot which spreads in the range from 9.6 A to 17 A respectively asshown in Table 1. Fig. 5. B.E.T. plots of (a) gold and (b) silver nanoparticles.
Author's personal copy
232 T. Ahmad et al. / Colloids and Surfaces B: Biointerfaces 107 (2013) 227– 234
Table 1Summary of the particle size, specific surface area and the pore radius obtained by the DA and BJH models for gold and silver nanoparticles.
Nanoparticle type Average TEM size Specific surfacearea (m2/g)
Size obtained by s. areaequation (DBET = 6000/S�)
DA poreradius (A)
BJH poreradius (A)
Gold nanoparticles 5 nm 18.9 16 nm 9.6 15.32Silver nanoparticles 30 nm 184.4 3 nm 9.6 17
The specific surface area of as prepared gold and silver nanopar-ticles can also be related to the average equivalent particle size bythe equation DBET = 6000/S�, where DBET is the average diameterof the spherical nanoparticle (nm), S is the measured specific sur-face area in m2/g and � is the density of the nanoparticle in g/m3
[36]. The particle size was calculated using the above equation andcame out to be 16 nm and 3 nm for gold and silver nanoparticlesrespectively. The high value of particle size (16 nm) of the goldnanoparticles obtained by the surface area equation as compared tothat obtained from the TEM image (5 nm) may be due to the aggre-gation of the smaller gold nanoparticles during degassing processwhich takes place at higher temperature (150 ◦C) for the determi-nation of surface area. Whereas the smaller particle size of 3 nmobtained by the B.E.T. surface area equation for the silver nanopar-ticles as compared to that obtained by the calculation based onthe TEM micrograph (Fig. 2b) is due to the fact that the surface areaequation used above hold good only for the spherical nanoparticlesof uniform size. For nonspherical nanoparticles, the shape factor hasto be taken into consideration while calculating the surface area[50]. Since TEM image (Fig. 2b) shows the formation of agglomer-ated nonspherical nanoparticle, hence the particle size calculatedby the surface area equation shows deviation from that obtainedby the TEM.
3.7. Antimicrobial activity
The minimum inhibitory concentration was defined as the low-est concentration of the test nanoparticles that causes 80% decreasein absorbance (MIC80) compared with that of the control (no testcompound). The MIC80 of the gold and silver nanoparticles againstthe gram negative bacterium was 128 �g/ml and 8 �g/ml, respec-tively; while as for gram positive bacterium were 512 �g/ml and32 �g/ml respectively. It is important to note that the gram positivebacteria were found to be less susceptible than the gram negativebacteria in both gold and silver nanoparticles.
3.8. Growth studies
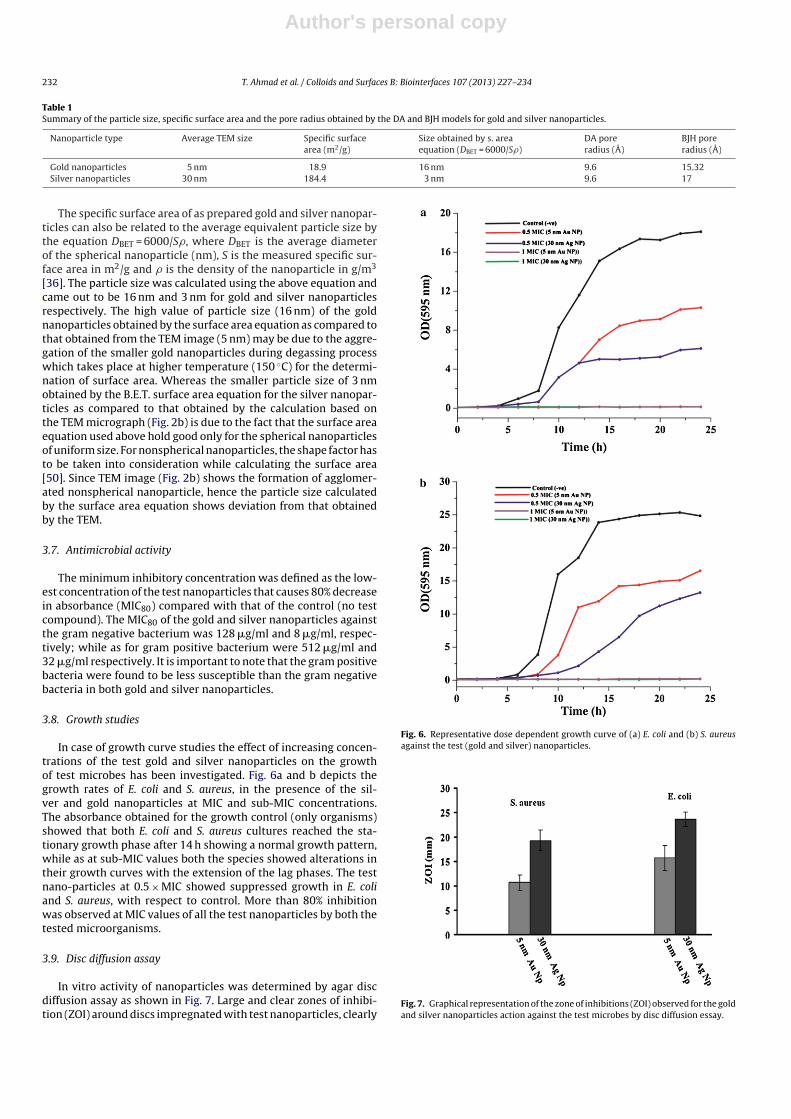
In case of growth curve studies the effect of increasing concen-trations of the test gold and silver nanoparticles on the growthof test microbes has been investigated. Fig. 6a and b depicts thegrowth rates of E. coli and S. aureus, in the presence of the sil-ver and gold nanoparticles at MIC and sub-MIC concentrations.The absorbance obtained for the growth control (only organisms)showed that both E. coli and S. aureus cultures reached the sta-tionary growth phase after 14 h showing a normal growth pattern,while as at sub-MIC values both the species showed alterations intheir growth curves with the extension of the lag phases. The testnano-particles at 0.5 × MIC showed suppressed growth in E. coliand S. aureus, with respect to control. More than 80% inhibitionwas observed at MIC values of all the test nanoparticles by both thetested microorganisms.
3.9. Disc diffusion assay
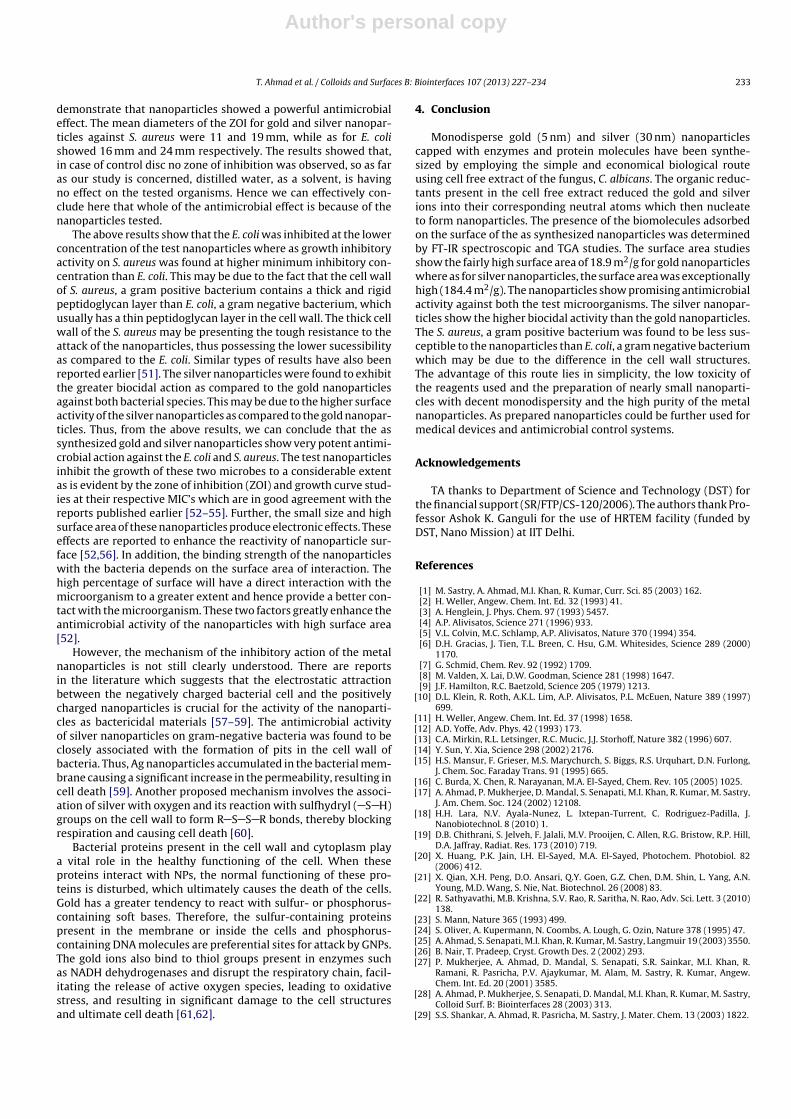
In vitro activity of nanoparticles was determined by agar discdiffusion assay as shown in Fig. 7. Large and clear zones of inhibi-tion (ZOI) around discs impregnated with test nanoparticles, clearly
Fig. 6. Representative dose dependent growth curve of (a) E. coli and (b) S. aureusagainst the test (gold and silver) nanoparticles.
Fig. 7. Graphical representation of the zone of inhibitions (ZOI) observed for the goldand silver nanoparticles action against the test microbes by disc diffusion essay.
Author's personal copy
T. Ahmad et al. / Colloids and Surfaces B: Biointerfaces 107 (2013) 227– 234 233
demonstrate that nanoparticles showed a powerful antimicrobialeffect. The mean diameters of the ZOI for gold and silver nanopar-ticles against S. aureus were 11 and 19 mm, while as for E. colishowed 16 mm and 24 mm respectively. The results showed that,in case of control disc no zone of inhibition was observed, so as faras our study is concerned, distilled water, as a solvent, is havingno effect on the tested organisms. Hence we can effectively con-clude here that whole of the antimicrobial effect is because of thenanoparticles tested.
The above results show that the E. coli was inhibited at the lowerconcentration of the test nanoparticles where as growth inhibitoryactivity on S. aureus was found at higher minimum inhibitory con-centration than E. coli. This may be due to the fact that the cell wallof S. aureus, a gram positive bacterium contains a thick and rigidpeptidoglycan layer than E. coli, a gram negative bacterium, whichusually has a thin peptidoglycan layer in the cell wall. The thick cellwall of the S. aureus may be presenting the tough resistance to theattack of the nanoparticles, thus possessing the lower sucessibilityas compared to the E. coli. Similar types of results have also beenreported earlier [51]. The silver nanoparticles were found to exhibitthe greater biocidal action as compared to the gold nanoparticlesagainst both bacterial species. This may be due to the higher surfaceactivity of the silver nanoparticles as compared to the gold nanopar-ticles. Thus, from the above results, we can conclude that the assynthesized gold and silver nanoparticles show very potent antimi-crobial action against the E. coli and S. aureus. The test nanoparticlesinhibit the growth of these two microbes to a considerable extentas is evident by the zone of inhibition (ZOI) and growth curve stud-ies at their respective MIC’s which are in good agreement with thereports published earlier [52–55]. Further, the small size and highsurface area of these nanoparticles produce electronic effects. Theseeffects are reported to enhance the reactivity of nanoparticle sur-face [52,56]. In addition, the binding strength of the nanoparticleswith the bacteria depends on the surface area of interaction. Thehigh percentage of surface will have a direct interaction with themicroorganism to a greater extent and hence provide a better con-tact with the microorganism. These two factors greatly enhance theantimicrobial activity of the nanoparticles with high surface area[52].
However, the mechanism of the inhibitory action of the metalnanoparticles is not still clearly understood. There are reportsin the literature which suggests that the electrostatic attractionbetween the negatively charged bacterial cell and the positivelycharged nanoparticles is crucial for the activity of the nanoparti-cles as bactericidal materials [57–59]. The antimicrobial activityof silver nanoparticles on gram-negative bacteria was found to beclosely associated with the formation of pits in the cell wall ofbacteria. Thus, Ag nanoparticles accumulated in the bacterial mem-brane causing a significant increase in the permeability, resulting incell death [59]. Another proposed mechanism involves the associ-ation of silver with oxygen and its reaction with sulfhydryl ( S H)groups on the cell wall to form R S S R bonds, thereby blockingrespiration and causing cell death [60].
Bacterial proteins present in the cell wall and cytoplasm playa vital role in the healthy functioning of the cell. When theseproteins interact with NPs, the normal functioning of these pro-teins is disturbed, which ultimately causes the death of the cells.Gold has a greater tendency to react with sulfur- or phosphorus-containing soft bases. Therefore, the sulfur-containing proteinspresent in the membrane or inside the cells and phosphorus-containing DNA molecules are preferential sites for attack by GNPs.The gold ions also bind to thiol groups present in enzymes suchas NADH dehydrogenases and disrupt the respiratory chain, facil-itating the release of active oxygen species, leading to oxidativestress, and resulting in significant damage to the cell structuresand ultimate cell death [61,62].
4. Conclusion
Monodisperse gold (5 nm) and silver (30 nm) nanoparticlescapped with enzymes and protein molecules have been synthe-sized by employing the simple and economical biological routeusing cell free extract of the fungus, C. albicans. The organic reduc-tants present in the cell free extract reduced the gold and silverions into their corresponding neutral atoms which then nucleateto form nanoparticles. The presence of the biomolecules adsorbedon the surface of the as synthesized nanoparticles was determinedby FT-IR spectroscopic and TGA studies. The surface area studiesshow the fairly high surface area of 18.9 m2/g for gold nanoparticleswhere as for silver nanoparticles, the surface area was exceptionallyhigh (184.4 m2/g). The nanoparticles show promising antimicrobialactivity against both the test microorganisms. The silver nanopar-ticles show the higher biocidal activity than the gold nanoparticles.The S. aureus, a gram positive bacterium was found to be less sus-ceptible to the nanoparticles than E. coli, a gram negative bacteriumwhich may be due to the difference in the cell wall structures.The advantage of this route lies in simplicity, the low toxicity ofthe reagents used and the preparation of nearly small nanoparti-cles with decent monodispersity and the high purity of the metalnanoparticles. As prepared nanoparticles could be further used formedical devices and antimicrobial control systems.
Acknowledgements
TA thanks to Department of Science and Technology (DST) forthe financial support (SR/FTP/CS-120/2006). The authors thank Pro-fessor Ashok K. Ganguli for the use of HRTEM facility (funded byDST, Nano Mission) at IIT Delhi.
References
[1] M. Sastry, A. Ahmad, M.I. Khan, R. Kumar, Curr. Sci. 85 (2003) 162.[2] H. Weller, Angew. Chem. Int. Ed. 32 (1993) 41.[3] A. Henglein, J. Phys. Chem. 97 (1993) 5457.[4] A.P. Alivisatos, Science 271 (1996) 933.[5] V.L. Colvin, M.C. Schlamp, A.P. Alivisatos, Nature 370 (1994) 354.[6] D.H. Gracias, J. Tien, T.L. Breen, C. Hsu, G.M. Whitesides, Science 289 (2000)
1170.[7] G. Schmid, Chem. Rev. 92 (1992) 1709.[8] M. Valden, X. Lai, D.W. Goodman, Science 281 (1998) 1647.[9] J.F. Hamilton, R.C. Baetzold, Science 205 (1979) 1213.
[10] D.L. Klein, R. Roth, A.K.L. Lim, A.P. Alivisatos, P.L. McEuen, Nature 389 (1997)699.
[11] H. Weller, Angew. Chem. Int. Ed. 37 (1998) 1658.[12] A.D. Yoffe, Adv. Phys. 42 (1993) 173.[13] C.A. Mirkin, R.L. Letsinger, R.C. Mucic, J.J. Storhoff, Nature 382 (1996) 607.[14] Y. Sun, Y. Xia, Science 298 (2002) 2176.[15] H.S. Mansur, F. Grieser, M.S. Marychurch, S. Biggs, R.S. Urquhart, D.N. Furlong,
J. Chem. Soc. Faraday Trans. 91 (1995) 665.[16] C. Burda, X. Chen, R. Narayanan, M.A. El-Sayed, Chem. Rev. 105 (2005) 1025.[17] A. Ahmad, P. Mukherjee, D. Mandal, S. Senapati, M.I. Khan, R. Kumar, M. Sastry,
J. Am. Chem. Soc. 124 (2002) 12108.[18] H.H. Lara, N.V. Ayala-Nunez, L. Ixtepan-Turrent, C. Rodriguez-Padilla, J.
Nanobiotechnol. 8 (2010) 1.[19] D.B. Chithrani, S. Jelveh, F. Jalali, M.V. Prooijen, C. Allen, R.G. Bristow, R.P. Hill,
D.A. Jaffray, Radiat. Res. 173 (2010) 719.[20] X. Huang, P.K. Jain, I.H. El-Sayed, M.A. El-Sayed, Photochem. Photobiol. 82
(2006) 412.[21] X. Qian, X.H. Peng, D.O. Ansari, Q.Y. Goen, G.Z. Chen, D.M. Shin, L. Yang, A.N.
Young, M.D. Wang, S. Nie, Nat. Biotechnol. 26 (2008) 83.[22] R. Sathyavathi, M.B. Krishna, S.V. Rao, R. Saritha, N. Rao, Adv. Sci. Lett. 3 (2010)
138.[23] S. Mann, Nature 365 (1993) 499.[24] S. Oliver, A. Kupermann, N. Coombs, A. Lough, G. Ozin, Nature 378 (1995) 47.[25] A. Ahmad, S. Senapati, M.I. Khan, R. Kumar, M. Sastry, Langmuir 19 (2003) 3550.[26] B. Nair, T. Pradeep, Cryst. Growth Des. 2 (2002) 293.[27] P. Mukherjee, A. Ahmad, D. Mandal, S. Senapati, S.R. Sainkar, M.I. Khan, R.
Ramani, R. Pasricha, P.V. Ajaykumar, M. Alam, M. Sastry, R. Kumar, Angew.Chem. Int. Ed. 20 (2001) 3585.
[28] A. Ahmad, P. Mukherjee, S. Senapati, D. Mandal, M.I. Khan, R. Kumar, M. Sastry,Colloid Surf. B: Biointerfaces 28 (2003) 313.
[29] S.S. Shankar, A. Ahmad, R. Pasricha, M. Sastry, J. Mater. Chem. 13 (2003) 1822.
Author's personal copy
234 T. Ahmad et al. / Colloids and Surfaces B: Biointerfaces 107 (2013) 227– 234
[30] S.S. Shankar, A. Rai, A. Ahmad, M. Sastry, J. Colloid Interface Sci. 275 (2004) 496.[31] S.S. Shankar, A. Rai, A. Ahmad, M. Sastry, Chem. Mater. 17 (2005) 566.[32] S.P. Chandran, M. Chaudhary, R. Pasricha, A. Ahmad, M. Sastry, Biotechnol. Prog.
22 (2006) 577.[33] P. Mukherjee, A. Ahmad, D. Mandal, S. Senapati, S.R. Sainkar, M.I. Khan, R.
Parischa, P.V. Ajayakumar, M. Alam, R. Kumara, M. Sastry, Nano Lett. 1 (2001)515.
[34] S. Basavaraja, S.D. Balaji, L. Arunkumar, A.H. Rajasab, A. Venkataraman, Mater.Res. Bull. 43 (2008) 1164.
[35] X. Tian, W. Wang, G. Cao, Mater. Lett. 61 (2007) 130.[36] I.A. Wani, S. Khatoon, A. Ganguly, J. Ahmed, A.K. Ganguli, T. Ahmad, Mater. Res.
Bull. 45 (2010) 1033.[37] T. Ahmad, I.A. Wani, I.H. Lone, A. Ganguly, N. Manzoor, A. Ahmad, J. Ahmed, A.S.
Al-Shihri, Mater. Res. Bull. 48 (2013) 12.[38] I.A. Wani, A. Ganguly, J. Ahmed, T. Ahmad, Mater. Lett. 65 (2011) 520.[39] I.A. Wani, T. Ahmad, Colloid Surf. B: Biointerfaces 101 (2013) 162.[40] I.A. Wani, S. Khatoon, A. Ganguly, J. Ahmed, T. Ahmad, Colloid Surf. B: Biointer-
faces 101 (2013) 243.[41] D. Jethwaney, M. Hofer, K. Raj, Microbiology 143 (1997) 397.[42] CLSI/NCCLS, Methods for antimicrobial susceptibility testing of anaerobic
bacteria; Approved Standard, 6th ed. M11-A6, 2004.[43] CLSI, Performance Standards for Antimicrobial Susceptibility Testing, approved
standard M100-S15, Clinical and Laboratory Standards Institute, Wayne, PA,2005.
[44] A. Khan, A. Ahmad, N. Manzoor, L.A. Khan., Nat. Prod. Commun. 5 (2010)345.
[45] N.S. Shaligram, M. Bule, R. Bhambure, R.S. Singhal, S.K. Singh, G. Szakacs, A.Pandey, Process Biochem. 44 (2009) 939.
[46] M. Gajbhiye, J. Kesharwani, A. Ingle, A. Gade, M. Rai, Nanomed. Nanotechnol.Biol. Med. 5 (2009) 382.
[47] A. Gole, C. Dash, V. Ramachandran, A.B. Mandale, S.R. Sainkar, M. Rao, M. Sastry,Langmuir 17 (2001) 1674.
[48] D.S. Balaji, S. Basavaraja, R. Deshpandeb, D.B. Maheshb, B.K. Prabhakara, A.Venkataraman, Colloid Surf. B: Biointerfaces 68 (2009) 88.
[49] T. Serizawa, Y. Hirai, M. Aizawa, Langmuir 25 (2009) 12229.[50] T. Allen, Particle Size Measurement, Volume 1 – Powder Sampling and Parti-
cle Size Measurement, Volume 2 – Surface Area Measurement, fifth edition,Chapman and Hall, London, 1997.
[51] J. Kim, E. Kuk, K.N. Yu, J.H. Kim, S.J. Park, H.J. Lee, Nanomed. Nanotechnol. Biol.Med. 3 (2007) 95.
[52] J.R. Morones, J.L. Elechiguerra, A. Camacho, K. Holt, J.B. Kouri, J.T. Ramirez, M.J.Yacaman, Nanotechnology 16 (2005) 2346.
[53] A. Rai, A. Prabhuneb, C.C. Perry, J. Mater. Chem. 20 (2010) 6789.[54] J.S. Kim, E. Kuk, K.N. Yu, J.H. Kim, S.J. Park, H.J. Lee, S.H. Kim, Y.K. Park, Y.H. Park,
C.Y. Hwang, Y.K. Kim, Y.S. Lee, D.H. Jeong, M.H. Cho, Nanomed. Nanotechnol.Biol. Med. 3 (2007) 95.
[55] G.L. Burygin, B.N. Khlebtsov, A.N. Shantrokha, L.A. Dykman, V.A. Bogatyrev, N.G.Khlebtsov, Nanoscale Res. Lett. 4 (2009) 794.
[56] F. Raimondi, G.G. Scherer, R. Kotz, A. Wokaun, Angew. Chem. Int. Ed. Engl. 44(2005) 2190.
[57] P.K. Stoimenov, R.L. Klinger, G.L. Marchin, K.J. Klabunde, Langmuir 18 (2002)6679.
[58] T. Hamouda, J.R. Baker, J. Appl. Microbiol. 89 (2003) 97.[59] I. Sondi, B.S. Sondi, J. Colloid Interface Sci. 275 (2004) 177.[60] V.S. Kumar, B.M. Nagaraja, V. Shashikala, A.H. Padmasri, S.S. Madhavendra, B.D.
Raju, J. Mol. Catal. A 223 (2004) 313.[61] Q.L. Feng, J. Wu, G.Q. Chen, F.Z. Cui, T.M. Kim, J.O. Kim, J. Biomed. Mater. Res. 52
(2000) 662.[62] S. Kumar, R. Amutha, P. Arumugam, S. Berchmans, ACS Appl. Mater. Interfaces
3 (2011) 1418.