
Biological availability and efficacy of folates from ...
208
Biological availability and efficacy of folates from bioengineered rice Filip Kiekens Master in Industrial Engineering – Chemistry Master in Environmental Management and Sanitation Promoters: Prof. Dr. Christophe P. Stove Prof. Dr. Willy E. Lambert Prof. Dr. Dominique Van Der Straeten Thesis submitted to obtain the degree of Doctor in Pharmaceutical Sciences 2016
-
Upload
khangminh22 -
Category
Documents
-
view
3 -
download
0
Transcript of Biological availability and efficacy of folates from ...
Biological availability and efficacy of folates
from bioengineered rice
Filip Kiekens
Master in Industrial Engineering – Chemistry
Master in Environmental Management and Sanitation
Promoters: Prof. Dr. Christophe P. Stove
Prof. Dr. Willy E. Lambert
Prof. Dr. Dominique Van Der Straeten
Thesis submitted to obtain the degree of Doctor in Pharmaceutical Sciences
2016

Ghent University
Faculty of Pharmaceutical Sciences
Department of Bioanalysis
Laboratory of Toxicology
Biological availability and efficacy of folates
from bioengineered rice
Filip Kiekens
Master in Industrial Engineering – Chemistry
Master in Environmental Management and Sanitation
Promoters: Prof. Dr. Christophe P. Stove
Prof. Dr. Willy E. Lambert
Prof. Dr. Dominique Van Der Straeten
Thesis submitted to obtain the degree of Doctor in Pharmaceutical Sciences
2016

Copyright
The author and promotors give authorization to consult and copy parts of this thesis for
personal use only. Any other use is limited by the laws of copyright, especially concerning the
obligation to refer to the source whenever results are cited from this thesis.
De auteur en promotoren geven de toelating dit proefschrift voor consultatie beschikbaar te
stellen en delen ervan te kopiëren voor persoonlijk gebruik. Elk ander gebruik valt onder de
beperkingen van het auteursrecht, in het bijzonder met betrekking tot de verplichting
uitdrukkelijk de bron te vermelden bij het aanhalen van resultaten uit dit proefschrift.
Gent, 2016,
The promoters,
Prof. Dr. Christophe P. Stove
Prof. Dr. Willy. E. Lambert
Prof. Dr. Dominique Van Der Straeten
The author,
Filip Kiekens


Acknowledgments/dankwoord
Eerst en vooral wens ik professoren Willy Lambert en Christophe Stove te bedanken voor de
kans om te kunnen doctoreren aan het Laboratorium voor Toxicologie. Ook wens ik mijn
promotoren te bedanken voor de wijze raad en om me de mogelijkheid te geven om aan
internationale symposia deel te nemen. Uiteraard ook bedankt voor alle moeite en geduld bij
het nalezen van mijn doctoraat.
Mijn dank gaat ook uit naar de Universiteit Gent voor de omkadering en de financiële
ondersteuning.
Ook de bijdrage van professor Dominique Van Der Straeten, Dieter en Sergei kan niet
onderschat worden. Bedankt voor de samenwerking en het begrijpbaar maken van de soms
bijzonder complexe biotechnologische materie. Professoren Veronique Stove en Joris
Delanghe, Lindsey, Hilde, Kim en Fabienne wens ik ook te bedanken voor hun hulp bij het
uitvoeren van de proefdierstudie.
Tijdens mijn doctoraat had ik ook de eer om samen te werken, soms lang, soms maar kort,
met een groep mensen die er steeds voor me waren als ik ze nodig hadden. Veerle, Ann-Sofie,
Jeroen, Pieter, Nele, Annelies, Jolien, Sara, Phebe, Sofie, Lars, Gaby, Christa, Ann, Goedele,
Valerie, Jens, Hanife en Justine, bedankt voor de leuke koffiepauzes, drinks, boeiende
discussies en absurde humor. Ook gaat mijn dank uit naar Benoit, Rozemien en Ekaterina die
ik heb mogen begeleiden tijdens hun thesis.
Verder wens ik ook mijn familie te bedanken voor alle steun die ik de voorbije jaren van hen
heb mogen ontvangen. Mama en papa, bedankt om me mijn ding te laten doen en in mij te
blijven geloven. Sylvie, bedankt om mijn voorbeeld te zijn.
Als laatste natuurlijk Eline, bedankt voor de steun tijdens al het schrijven en om me af en toe
van mijn computer weg te trekken om even op adem te komen.
Dit was een unieke ervaring die ik altijd met me zal meedragen.
Bedankt.


Samenvatting - Summary

Samenvatting - Summary
2
Samenvatting - Summary
3
Biologische beschikbaarheid en impact van folaten aanwezig in genetisch gewijzigde
rijst
Het basisidee achter de ontwikkeling van een genetisch gewijzigde rijstvariant met een sterk
verhoogde folaatconcentratie is te vinden in de beperkte mogelijkheid om voldoende folaten
op te nemen uit het dieet in afgelegen agrarische regio’s. Omwille van de relatie tussen een
tekort aan folaten en het voorkomen van neuraalbuisdefecten, die in ernst variëren van een
lichte rugpijn tot een niet levensvatbare foetus, is een folaatrijk dieet aangewezen. Eén
mogelijkheid om de folaatstatus te verhogen is door synthetisch foliumzuur te verwerken in
alledaagse voedingswaren zoals ontbijtgranen en brood. Dergelijke geïndustrialiseerde
technieken zijn echter niet beschikbaar in afgelegen regio’s. Folaatrijst kan echter lokaal
verbouwd worden en kan in deze regio’s als een belangrijke bron van folaten in de voeding
fungeren.
Echter, aangezien folaatrijst een genetisch gewijzigde rijstvariant is, is het noodzakelijk om
wetenschappelijk onderbouwd bewijs voor te leggen dat deze rijstvariant inderdaad een
waardevolle bron van folaten is. Dit aangezien enkele genetisch gewijzigde voedingsmiddelen
recent bekritiseerd werden omwille van hun beperkte bijdrage tot de totale vitamine- of
mineraalinname.
Er werd voor een dierenproef gekozen omwille van wettelijke verplichtingen en omdat dit een
strikte controle van de studieparameters mogelijk maakt. Gezien de complexiteit van het
folaatmetabolisme en de verdeling in het lichaam, werd voor een langdurige studie gekozen.
Tijdens deze studie werden het folaatgehalte in het bloed, andere folaatgerelateerde klinische
parameters en de algemene gezondheid van de dieren periodiek bekeken. Om de resultaten te
kunnen evalueren werden de dieren opgesplitst in verschillende groepen die ofwel geen
folaten, een beetje folaten uit ‘normale’ rijst, een grotere hoeveelheid foliumzuur uit
gefortifieerde rijst of natuurlijke folaten uit folaatrijst of een grote hoeveelheid foliumzuur
kregen.
Om het biologisch effect van de verschillende diëten op het folaatgehalte in het bloed
zichtbaar te maken, werd een analysemethode ontwikkeld om de hoeveelheid folaten te
bepalen in 2 bloedfracties, namelijk in plasma en rode bloedcellen. Aangezien de term folaten
enkele chemisch verschillende moleculen omvat die in zeer lage concentraties voorkomen,
werd gebruik gemaakt van vloeistofchromatografie gekoppeld aan massaspectrometrie. Deze
methode is in staat om de verschillende folaten van elkaar te onderscheiden en de concentratie
individueel te bepalen.
Tevens werd een specifieke analysemethode ontwikkeld voor de bepaling van individuele
folaten in knaagdiervoeders om de mogelijke invloed van folaten aanwezig in het gebruikte
knaagdiervoeder uit te sluiten.
Bovendien werd de invloed van het folaatgehalte in de bloedbaan op de werking van het
immuunsysteem onderzocht. Dit gebeurde door het uitvoeren van een studie naar de invloed
van het gehalte van individuele folaten op de deling van witte bloedcellen.
Samenvatting - Summary
4
Biological availability and efficacy of folates from bioengineered rice
The basic concept of folate rice is to develop a means for rural areas to combat folate
deficiency. Folate deficiency is of concern given the relation between folate status and birth
defects, ranging in severity from mild back ache to stillbirth, due to a malformation of the
neural tube. While western populations benefit from diverse and nutrient rich diets, even these
populations are at risk for folate deficiency. One method to alleviate the health burden
associated with folate deficiency is to add synthetic folic acid to commonly consumed food
items such as breakfast cereals or bread. However, remote, mostly rural communities, do not
have free access to folic acid fortification. As such, a rice variety with a high natural folate
content that could be grown locally may serve to achieve an adequate folate status.
However, since folate rice is a genetically engineered rice variety, public and governmental
acceptance depends on scientific evidence that the folates contained within these rice grains
are released into the bloodstream when consumed. This is because some genetically
engineered food items have been criticized as a result of their limited influence on nutrient
status. It is therefore of paramount importance to evaluate the impact of folate rice
consumption on folate status.
Given the need for strict control of nutrient intake and regulatory constraints, a rodent feeding
trial was devised to evaluate the efficacy of folate rice as a dietary folate source. Due to the
complexity of folate metabolism and body distribution, a long term study was performed
including regular evaluation of folate status, folate related clinical parameters and general
health. These results were compared between groups receiving no folate, a small amount of
folate present in ‘normal’ rice, a larger amount of folate in either folate rice or folic acid
fortified rice or ample folate as an optimal scenario.
To quantify the biological outcome of folate rice consumption, an analytical method was
developed to measure the amount of folates in 2 separate blood fractions, i.e. plasma and red
blood cells. Given the low concentrations in which folates are present, a sensitive method
using liquid chromatography coupled to tandem mass spectrometry was used. Since the term
folate signifies several different molecules with different chemical and biological properties,
the developed method required the measurement of individual folate species.
Also, to exclude the influence of folates which might be present in the rodent diets used
during the rodent trial, a separate method was developed to determine the folate concentration
in the rodent diets used.
Due to the necessity of folates for DNA-synthesis in white blood cells, the influence of folate
concentration and speciation on the functioning of the immune system was investigated as
well.

Structure

Structure
6
Structure
7
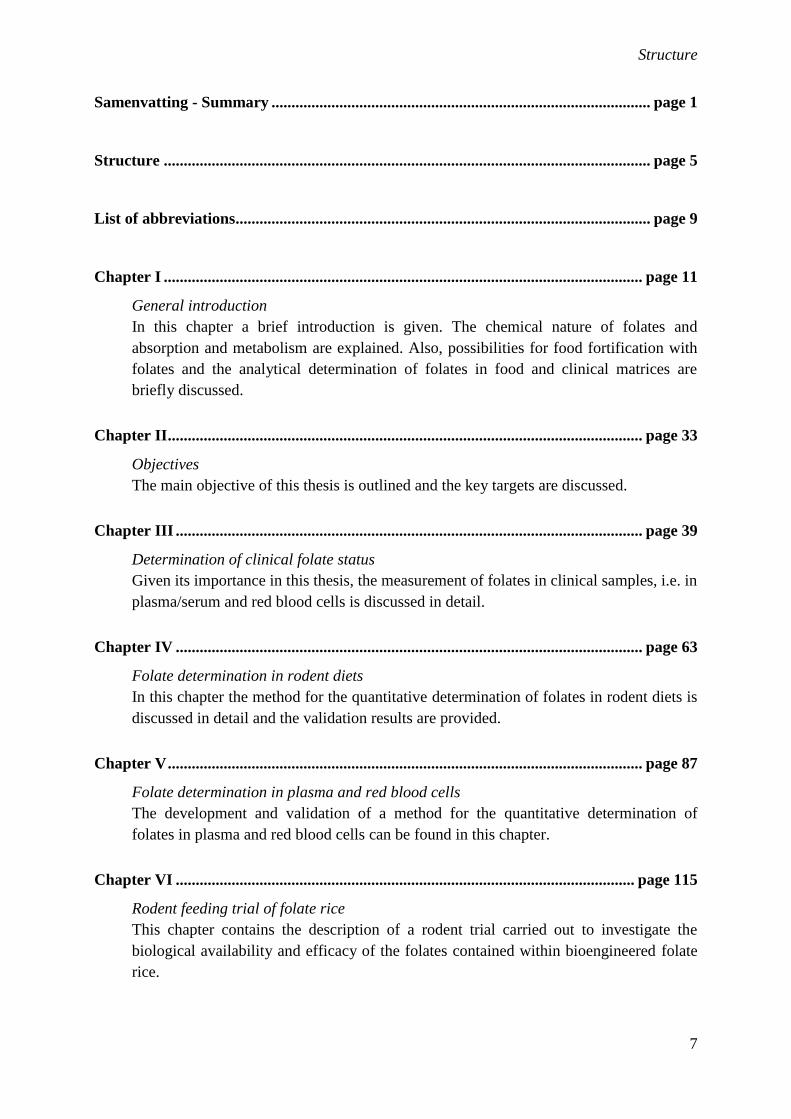
Samenvatting - Summary ............................................................................................... page 1
Structure .......................................................................................................................... page 5
List of abbreviations ........................................................................................................ page 9
Chapter I ........................................................................................................................ page 11
General introduction
In this chapter a brief introduction is given. The chemical nature of folates and
absorption and metabolism are explained. Also, possibilities for food fortification with
folates and the analytical determination of folates in food and clinical matrices are
briefly discussed.
Chapter II ....................................................................................................................... page 33
Objectives
The main objective of this thesis is outlined and the key targets are discussed.
Chapter III ..................................................................................................................... page 39
Determination of clinical folate status
Given its importance in this thesis, the measurement of folates in clinical samples, i.e. in
plasma/serum and red blood cells is discussed in detail.
Chapter IV ..................................................................................................................... page 63
Folate determination in rodent diets
In this chapter the method for the quantitative determination of folates in rodent diets is
discussed in detail and the validation results are provided.
Chapter V ....................................................................................................................... page 87
Folate determination in plasma and red blood cells
The development and validation of a method for the quantitative determination of
folates in plasma and red blood cells can be found in this chapter.
Chapter VI ................................................................................................................... page 115
Rodent feeding trial of folate rice
This chapter contains the description of a rodent trial carried out to investigate the
biological availability and efficacy of the folates contained within bioengineered folate
rice.
Structure
8
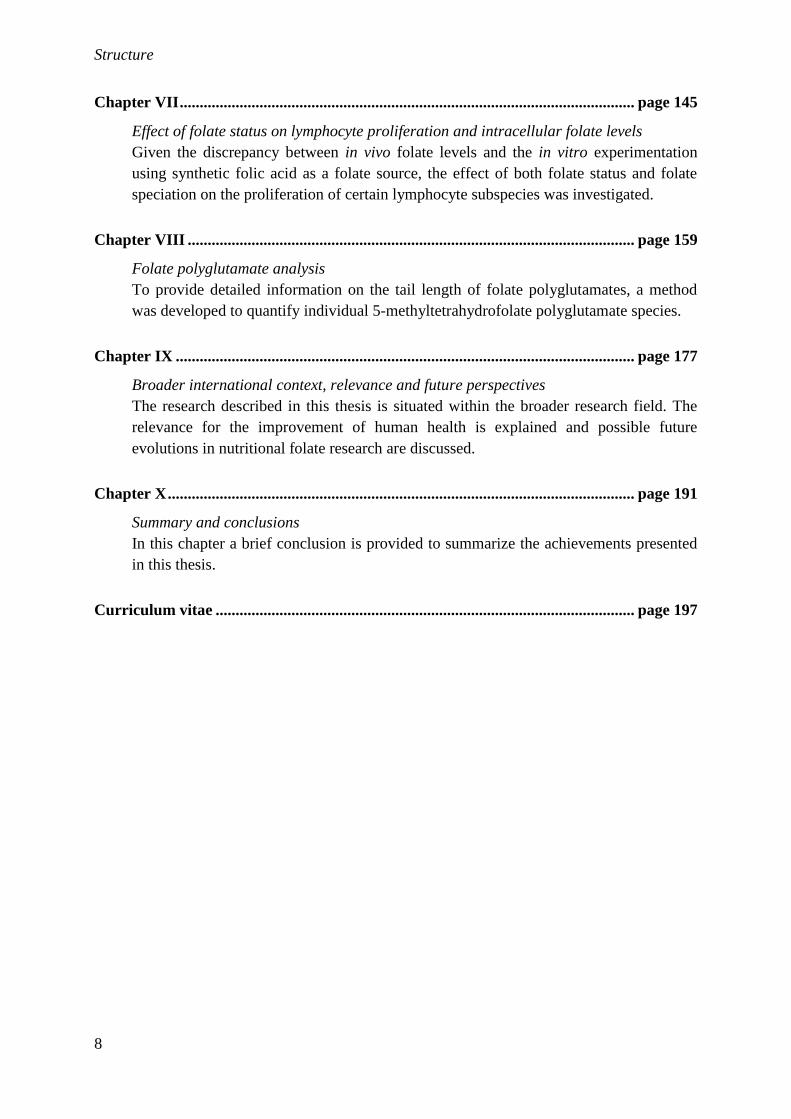
Chapter VII .................................................................................................................. page 145
Effect of folate status on lymphocyte proliferation and intracellular folate levels
Given the discrepancy between in vivo folate levels and the in vitro experimentation
using synthetic folic acid as a folate source, the effect of both folate status and folate
speciation on the proliferation of certain lymphocyte subspecies was investigated.
Chapter VIII ................................................................................................................ page 159
Folate polyglutamate analysis
To provide detailed information on the tail length of folate polyglutamates, a method
was developed to quantify individual 5-methyltetrahydrofolate polyglutamate species.
Chapter IX ................................................................................................................... page 177
Broader international context, relevance and future perspectives
The research described in this thesis is situated within the broader research field. The
relevance for the improvement of human health is explained and possible future
evolutions in nutritional folate research are discussed.
Chapter X ..................................................................................................................... page 191
Summary and conclusions
In this chapter a brief conclusion is provided to summarize the achievements presented
in this thesis.
Curriculum vitae ......................................................................................................... page 197
List of abbreviations
9
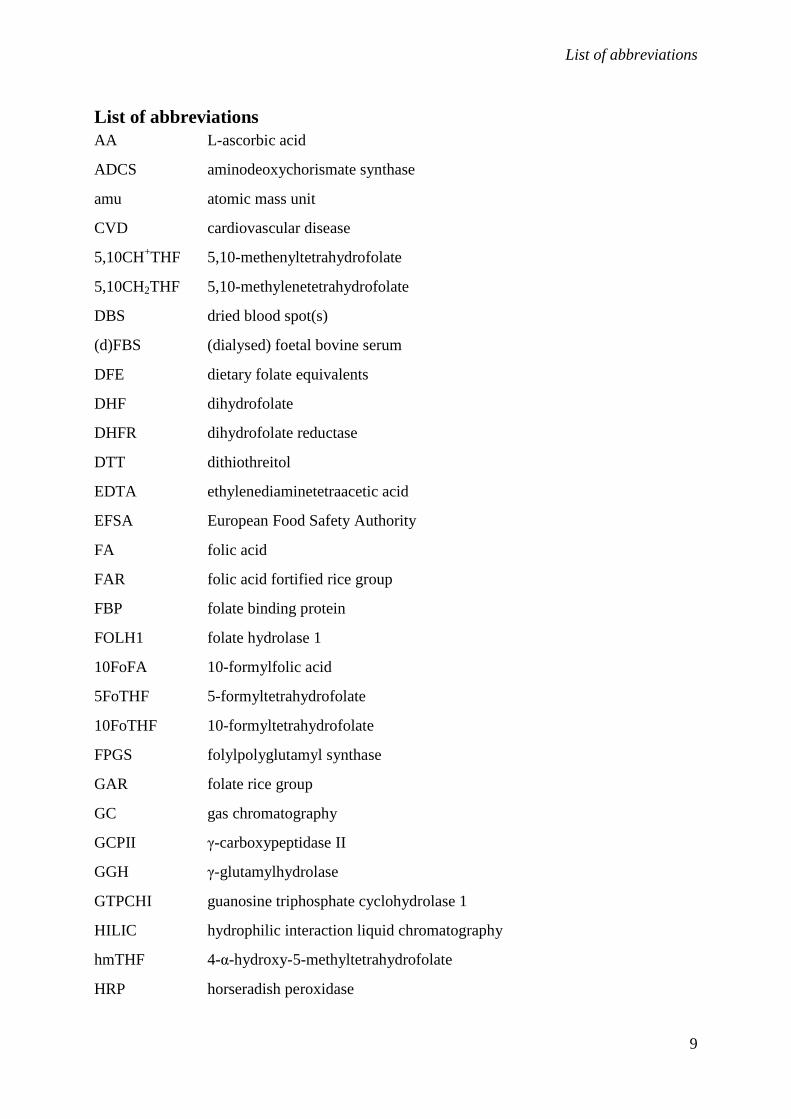
List of abbreviations
AA L-ascorbic acid
ADCS aminodeoxychorismate synthase
amu atomic mass unit
CVD cardiovascular disease
5,10CH+THF 5,10-methenyltetrahydrofolate
5,10CH2THF 5,10-methylenetetrahydrofolate
DBS dried blood spot(s)
(d)FBS (dialysed) foetal bovine serum
DFE dietary folate equivalents
DHF dihydrofolate
DHFR dihydrofolate reductase
DTT dithiothreitol
EDTA ethylenediaminetetraacetic acid
EFSA European Food Safety Authority
FA folic acid
FAR folic acid fortified rice group
FBP folate binding protein
FOLH1 folate hydrolase 1
10FoFA 10-formylfolic acid
5FoTHF 5-formyltetrahydrofolate
10FoTHF 10-formyltetrahydrofolate
FPGS folylpolyglutamyl synthase
GAR folate rice group
GC gas chromatography
GCPII γ-carboxypeptidase II
GGH γ-glutamylhydrolase
GTPCHI guanosine triphosphate cyclohydrolase 1
HILIC hydrophilic interaction liquid chromatography
hmTHF 4-α-hydroxy-5-methyltetrahydrofolate
HRP horseradish peroxidase
List of abbreviations
10
IL-2 interleukin 2
IS internal standard
LC liquid chromatography
LLOQ lower limit of quantitation
LOD limit of detection
MA microbiologic assay
MeFox pyrazino-s-triazine derivative of 4-α-hydroxy-5-methyltetrahydrofolate
5MeTHF 5-methyltetrahydrofolate
MS(/MS) (tandem) mass spectrometry
MTHFR methylenetetrahydrofolate reductase
MTR 5-methyltetrahydrofolate-homocysteine methyltransferase
NEG negative control group
NTD neural tube defect
pABA para-aminobenzoic acid
PBA protein binding assay
PBMC peripheral blood mononuclear cell
PBS phosphate-buffered saline
PCFT proton-coupled folate transporter
PHA phytohaemagglutinin
POS positive control group
RBC(s) red blood cell(s)
RFC reduced folate carrier
SNP single-nucleotide polymorphism
SPE solid-phase extraction
THF tetrahydrofolate
UHPLC ultra high performance/pressure liquid chromatography
ULOQ upper limit of quantitation
WHO World Health Organisation
WTR wild type rice group

Chapter I: General introduction

Chapter I: General introduction
12
Chapter I: General introduction
13
Table of contents
I.1. What are folates? ........................................................................................................ 14
I.2. Folates: biological accessibility and availability........................................................ 15
2.1. Release of folates from food items ........................................................................ 15
2.2. Absorption in the small intestine ........................................................................... 16
2.3. Folate absorption in the large intestine .................................................................. 17
2.4. Portal circulation and the liver .............................................................................. 17
2.5. Systemic circulation and storage pools ................................................................. 17
I.3. Folates: key players in human health ......................................................................... 18
3.1. Intracellular metabolism ........................................................................................ 18
3.2. Folate status ........................................................................................................... 19
I.4. Folate fortification ...................................................................................................... 21
4.1. Traditional fortification strategies ......................................................................... 21
4.2. Biofortification ...................................................................................................... 23
4.3. Folate rice, a recipe for success? ........................................................................... 23
I.5. Analytical determination of folates ............................................................................ 24
5.1. Plants and foodstuffs ............................................................................................. 24
5.2. Clinical matrices .................................................................................................... 25
I.6. References .................................................................................................................. 27
Chapter I: General introduction
14
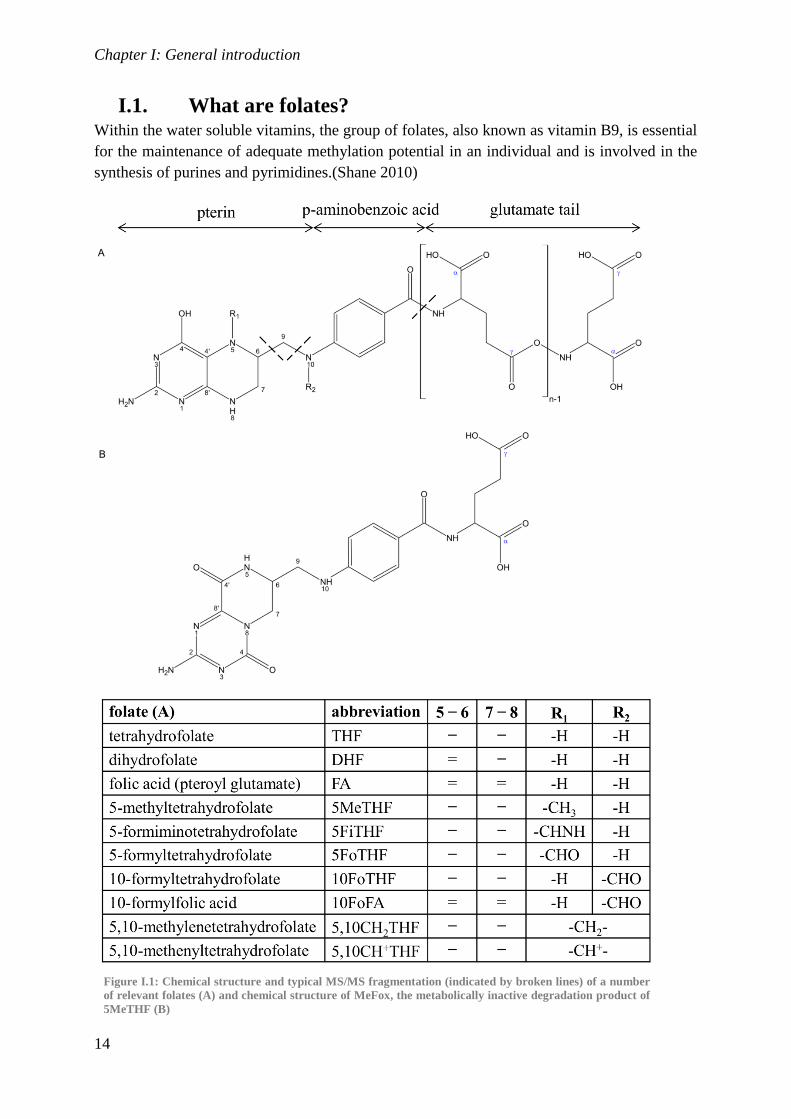
I.1. What are folates? Within the water soluble vitamins, the group of folates, also known as vitamin B9, is essential
for the maintenance of adequate methylation potential in an individual and is involved in the
synthesis of purines and pyrimidines.(Shane 2010)
Figure I.1: Chemical structure and typical MS/MS fragmentation (indicated by broken lines) of a number
of relevant folates (A) and chemical structure of MeFox, the metabolically inactive degradation product of
5MeTHF (B)
Chapter I: General introduction
15
Folates consist of three distinct parts: a pterin moiety with a varying oxidation state, a para-
aminobenzoic acid (pABA) molecule and a tail of repeating glutamic acid molecules bound at
the γ-position. Based on the latter, mono-, oligo- and polyglutamates can be differentiated. As
shown in Figure I.1, different functional groups may be bound at either or both the 5 and 10
position.(De Brouwer et al. 2007) Folates can be present in 3 oxidation states, i.e. a fully
oxidized form, known as folic acid (FA), a fully reduced form, known as tetrahydrofolate
(THF), and an intermediate form, known as dihydrofolate (DHF). Stability of folates depends
on both the oxidation state and the substitution with a methyl- or formyl group at the 5 and/or
10-position. Folate polyglutamylation is an important factor for both intracellular folate
retention and enzyme binding.(Osborne et al. 1993) FA is the fully oxidized synthetic form,
commonly used in food fortification. It is, however, 5-methyltetrahydrofolate (5MeTHF) that
is the predominant species in both natural food items and in clinical samples.
I.2. Folates: biological accessibility and availability While plants and microorganisms are able to form folates de novo from pterin, p-
aminobenzoic acid and glutamate, most vertebrates, including humans, lack the enzymes
necessary to perform folate synthesis. As a result, folates are essential vitamins and food
items rich in folates should be an integral part of the human diet to assure an adequate folate
intake.(Klipstein and Samloff 1966; Hoffbrand et al. 1971)
Prior to the release in the systemic circulation, the absorption of folates from food items
requires a multistep process which involves several enzyme systems to transport the
molecules through membranes and change the oxidative state and substitution.(Shane 2010)
While the term bioavailability may be used to describe different processes, in this thesis, the
term bioavailability is used to indicate the fraction of a compound which is released in the
gastro-intestinal (GI) tract, transferred to the systemic circulation and takes part in a
metabolism. The term bioaccessibility only includes the release of the compound prior to
absorption by the bowel epithelium. Biological efficacy describes the ability of a compound
to induce a certain effect.
2.1. Release of folates from food items
Food items are chewed, mixed with saliva and swallowed, releasing a food bolus into the
esophagus. Saliva contains an amylase and lipase activity and therefore marks the start of the
digestion of the food matrix into smaller components. Upon passage through the stomach
proteases and hydrochloric acid are released to turn the food bolus into a semifluid substance
called chyme which is released into the small intestine.(Pedersen et al. 2002)
In the small intestine folate polyglutamates present in the food item are cut to folate
monoglutamates by the glutamate carboxypeptidase II-enzyme (GCPII), a γ-glutamyl
hydrolase enzyme (GGH), present in the brush border of the bowel mucosa. This is important
since only folate monoglutamates can be transported across the membrane by folate carrier
proteins.(Chandler et al. 1986)
Chapter I: General introduction
16
Several factors influence the accessibility of folates from dietary food sources. The effect of
fats, acids and fibers on the absorption of folates in the bowel has been investigated, as has the
structure of the food item. In general, acidic food items such as orange juice seem to reduce
the activity of the GCPII-enzyme, thereby reducing the bioaccessibility of folate
polyglutamates. Also, folates can remain trapped within the plant cells.(Ball 2005; Gregory
3rd
2001)
2.2. Absorption in the small intestine
The reduced folate carrier (RFC) and the proton coupled folate transporter (PCFT) are known
folate carriers.(Chandler et al. 1986) The latter of both transporters is most active at an acidic
pH and is ubiquitously present in the small intestine. It has a similar affinity for both reduced
folates and FA (binding affinity 0.5 to 0.8 µM at pH 5.5).(Shane 2010) The RFC-protein is
largely inactive at acidic pH (< 6.5). As such, it is unlikely to be a major transporter due to the
low pH, i.e. ±6, in the small intestine.(Shane 2010)
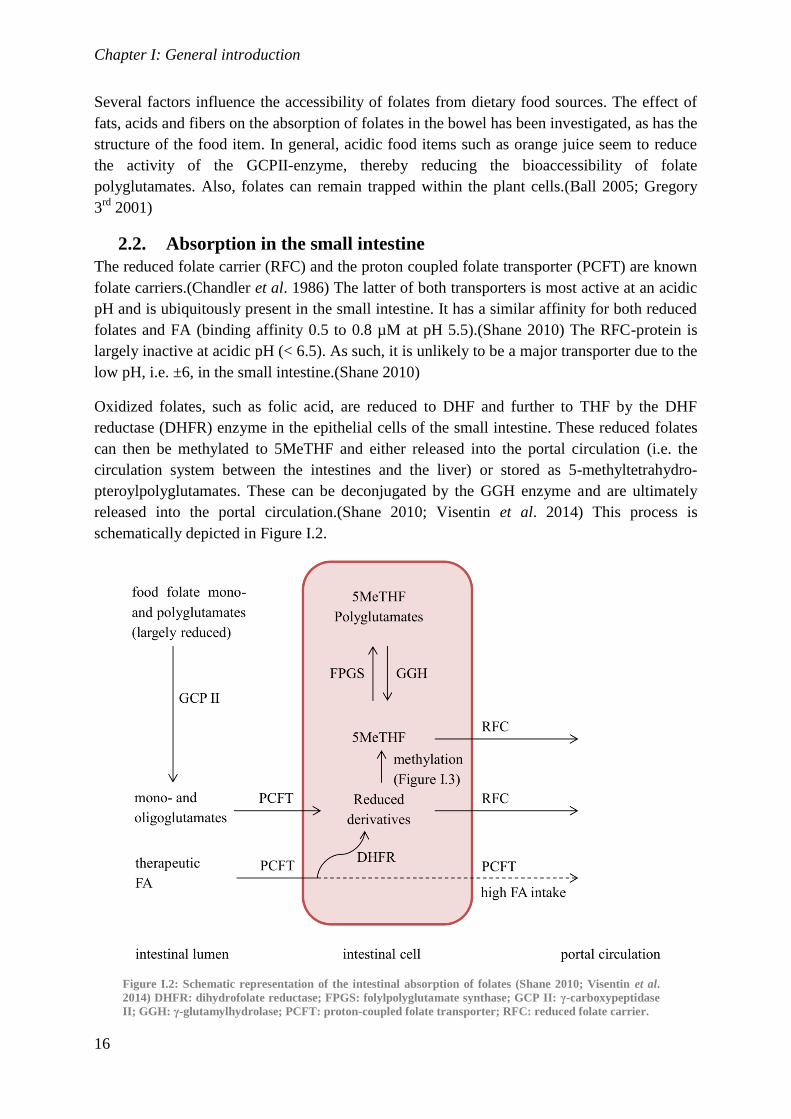
Oxidized folates, such as folic acid, are reduced to DHF and further to THF by the DHF
reductase (DHFR) enzyme in the epithelial cells of the small intestine. These reduced folates
can then be methylated to 5MeTHF and either released into the portal circulation (i.e. the
circulation system between the intestines and the liver) or stored as 5-methyltetrahydro-
pteroylpolyglutamates. These can be deconjugated by the GGH enzyme and are ultimately
released into the portal circulation.(Shane 2010; Visentin et al. 2014) This process is
schematically depicted in Figure I.2.
Figure I.2: Schematic representation of the intestinal absorption of folates (Shane 2010; Visentin et al.
2014) DHFR: dihydrofolate reductase; FPGS: folylpolyglutamate synthase; GCP II: γ-carboxypeptidase
II; GGH: γ-glutamylhydrolase; PCFT: proton-coupled folate transporter; RFC: reduced folate carrier.
Chapter I: General introduction
17
2.3. Folate absorption in the large intestine
Apart from dietary intake, folates produced by the microflora in the bowel provide a minimal
source of folate which is absorbed into the circulatory system. This can account for up to 5%
of the average folate requirement for a healthy adult.(Aufreiter et al. 2009) As such, it is clear
that the bowel microflora is not capable of maintaining an adequate folate status. However,
under normal conditions, the folate intake can never be zero.
2.4. Portal circulation and the liver
Folates absorbed through the lumen of the small intestine are transported to the liver where
they are either transported to the systemic circulation or undergo what is called an
enterohepatic recirculation. Here, the folates are released into the bile and are excreted
through the gall bladder back into the small intestine. These folates are then reabsorbed by the
lumen carrier enzymes and return to the portal circulation. This cycle repeats itself until the
concentration of folates near the carrier proteins is too low for effective transport across the
membrane to occur.(Visentin et al. 2014)
2.5. Systemic circulation and storage pools
When folates are released into the systemic circulation by the liver, a portion is captured by
folate carrier proteins freely circulating in the plasma fraction of the blood. Most specific is
the folate binding protein (FBP). Other carriers are less specific, such as serum albumin.
However, as this protein forms a significantly larger fraction of the total amount of protein
present, it is capable of retaining far greater amounts of folate. The retention of folates by
carrier proteins is of great importance to prevent the renal excretion of this vitamin.(Shane
2010)
Unlike in the small intestine, the RFC is responsible for the uptake of folates from plasma into
the cytoplasm of the cells. It has, however, a significantly lower affinity (Kt= 3 µM) for the
reduced folates than for FA (Kt= 200 µM).(Matherly and Goldman 2003)
While folates take part in key metabolic processes, body storage of folates is limited. Clifford
et al. investigated the distribution of folates in rats fed various levels of FA. In this study, the
liver was found to contain the largest folate storage pool, with 26% of total body folate in case
of prolonged (25 days) zero folate intake, to 44% of total body folate in case of ample folate
intake. This indicates that the liver is capable of releasing folates in case of periodic low folate
intake. The kidneys (5-6%), testes (2-1%), lungs (0.2-0.4%), spleen (0.1-0.3%) and heart (0.1-
0.2%) contain smaller fractions of the total body folate pool. Red blood cells (RBCs) also
serve as a folate storage pool, with 8 (limited folate intake) to 3% (ample folate intake) of
total body folate. While the absolute concentration in the RBCs rose, it was not possible to
match the speed of the rise in the liver, likely due to the average lifespan of the RBCs of
approximately 90 days. Distributing folate across the body, plasma also serves as a readily
available storage pool, containing 0.03 to 0.3% of the total body folate. The GI tract can be
seen as a folate storage pool since the bowel microflora contains approximately 3% of the
total body folate.(Clifford et al. 1990)
Chapter I: General introduction
18
I.3. Folates: key players in human health
3.1. Intracellular metabolism
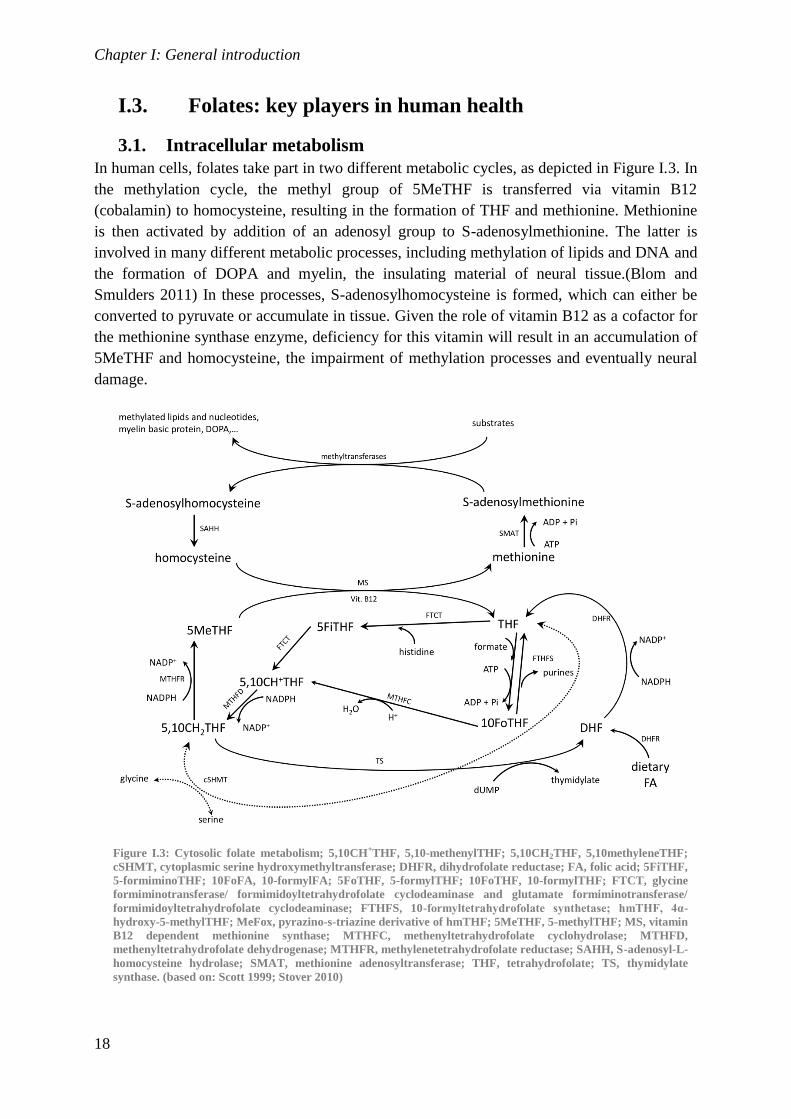
In human cells, folates take part in two different metabolic cycles, as depicted in Figure I.3. In
the methylation cycle, the methyl group of 5MeTHF is transferred via vitamin B12
(cobalamin) to homocysteine, resulting in the formation of THF and methionine. Methionine
is then activated by addition of an adenosyl group to S-adenosylmethionine. The latter is
involved in many different metabolic processes, including methylation of lipids and DNA and
the formation of DOPA and myelin, the insulating material of neural tissue.(Blom and
Smulders 2011) In these processes, S-adenosylhomocysteine is formed, which can either be
converted to pyruvate or accumulate in tissue. Given the role of vitamin B12 as a cofactor for
the methionine synthase enzyme, deficiency for this vitamin will result in an accumulation of
5MeTHF and homocysteine, the impairment of methylation processes and eventually neural
damage.
Figure I.3: Cytosolic folate metabolism; 5,10CH+THF, 5,10-methenylTHF; 5,10CH2THF, 5,10methyleneTHF;
cSHMT, cytoplasmic serine hydroxymethyltransferase; DHFR, dihydrofolate reductase; FA, folic acid; 5FiTHF,
5-formiminoTHF; 10FoFA, 10-formylFA; 5FoTHF, 5-formylTHF; 10FoTHF, 10-formylTHF; FTCT, glycine
formiminotransferase/ formimidoyltetrahydrofolate cyclodeaminase and glutamate formiminotransferase/
formimidoyltetrahydrofolate cyclodeaminase; FTHFS, 10-formyltetrahydrofolate synthetase; hmTHF, 4α-
hydroxy-5-methylTHF; MeFox, pyrazino-s-triazine derivative of hmTHF; 5MeTHF, 5-methylTHF; MS, vitamin
B12 dependent methionine synthase; MTHFC, methenyltetrahydrofolate cyclohydrolase; MTHFD,
methenyltetrahydrofolate dehydrogenase; MTHFR, methylenetetrahydrofolate reductase; SAHH, S-adenosyl-L-
homocysteine hydrolase; SMAT, methionine adenosyltransferase; THF, tetrahydrofolate; TS, thymidylate
synthase. (based on: Scott 1999; Stover 2010)
Chapter I: General introduction
19
Disruption of the methylation cycle as a result of a vitamin B12 and/or folate deficiency is
clinically measured as an elevated plasma homocysteine concentration, known as
hyperhomocysteinemia. This is associated with an increased risk for cardiovascular diseases
(CVD).(Ueland et al. 2000; Blom and Smulders 2011) Supplementation with folates is the
method of choice to treat hyperhomocysteinemia. However, folate supplementation may
promote cell proliferation and inflammation, which are crucial processes in atherosclerotic
plaque formation and would therefore lessen the effects of a decrease in homocysteine
concentrations.(Blom and Smulders 2011) Hyperhomocysteinemia has also been associated
with an increased risk for neural diseases including dementia and Alzheimer’s
disease.(Reynolds 2006) Best established is undoubtedly the profound influence of the folate
status on the prevalence of neural tube defects (NTDs). During early pregnancy, a low folate
status can lead to failure of the neural tube to close in the developing fetus, resulting -
depending on the severity- in disability or death.(Iyer and Tomar 2009)
Secondly, 5,10-methylenetetrahydrofolate (5,10CH2THF) and 10-formyltetrahydrofolate
(10FoTHF) take part in the de novo synthesis of pyrimidines and purines, respectively.
Especially the methylation of uracil to thymidine is strongly influenced by the folate status.
Folate deficiency has for instance been implicated in uracil incorporation in DNA, leading to
chromosomal damage.(Blount et al. 1997) Severe folate deficiency also inhibits cell
replication because it results in an inability to synthesize new DNA. This leads to the presence
of enlarged RBCs in the bloodstream, called megaloblastic anemia. The presence of these
enlarged cells is also used as an indicator for vitamin B12 deficiency. This deficiency leads to
a halted folate cycle with accumulation of 5MeTHF. The use of FA as a folate supplement is
problematic in this respect, since the presence of FA in the bloodstream leads to a bypass of
the methionine synthase enzyme. Although this allows DNA replication to be maintained,
alleviating megaloblastic anemia, the formation of methionine is still blocked, potentially
leading to neural damage. (Molloy 2010)
In cells, folates accumulate as polyglutamate derivatives, which are active in cellular
metabolism.(Osborne et al. 1993) The folylpolyglutamate synthase (FPGS) activity is
reported to be the highest in liver, while activity appears to be negligible in muscular tissue
and mature blood cells.(Moran and Colman 1984) However, in RBCs folates are nearly
completely present in the polyglutamate form.(van Haandel et al. 2012; Kiekens et al. 2015a)
Although methods do exist for distinguishing individual folate polyglutamate species (Wang
et al. 2010), the lack of pure reference standards limits the use of these methods for true
quantitative folate determination in clinical matrices.
3.2. Folate status
Folate deficiency has received interest from a medical point-of-view since Minot and Murphy
found, in 1923, that consumption of large amounts of liver cured pernicious anemia and since
Lucy Wills’ discovery, in 1931, of a factor in yeast that corrected macrocytic anemia during
pregnancy. In the 1930’s and 40’s, this factor, now known to be folate, was isolated from
spinach, receiving its name from the Latin word for leaf: folium.(Hoffbrand and Weir 2001)
Chapter I: General introduction
20
Since then, folate deficiency and related health issues have been intensely studied. While
several anemias and neural tube defects can be directly linked to an inadequate folate status,
direct proof of the role of folate in cardiovascular diseases, neural disorders and cancer
remains elusive.(Stover 2004)
In 2012, the World Health Organization (WHO) released an updated guideline on the use of
folate concentrations in serum (or plasma) and red blood cells (RBCs) to assess the folate
status in different populations. Such an assessment is useful to monitor trends in folate status
and to evaluate the impact of public health interventions.(WHO 2012) A quantitative value
for an adequate folate status is not easily determined since this depends on the metabolic
indicator used to define the cut-off value. Since the 1970’s the prevalence of macrocytic
anemia, a hematological indicator of folate deficiency, was used to categorize patients with
various blood folate concentrations. While patients with serum or plasma folate
concentrations below 6.8, between 6.8 and 13.4, between 13.5 and 45.3, or above 45.3 nM
were respectively categorized as deficient, possibly deficient, normal and elevated, only a cut-
off value of 226.5 nM in RBCs was used to indicate folate deficiency.(WHO 1972; WHO
1975) In 2005, the elevation of plasma homocysteine concentrations was chosen as a marker
for folate deficiency, based on National Health and Nutrition Examination Survey (NHANES)
III data. This population survey investigated the effect of dietary intake on folate status,
related clinical parameters and health outcomes. The cut-off levels indicating folate
deficiency (i.e. the folate concentrations below which homocysteine concentrations started to
rise) were set at 10 and 340 nM for serum (plasma) and RBCs, respectively.(Selhub et al.
2008; de Benoist 2008; Pfeiffer et al. 2012) As folate requirements are increased during
pregnancy and lactation, a 2015 WHO guideline for women of reproductive age recommends
in this population a RBC folate concentration above 906 nM to achieve the greatest reduction
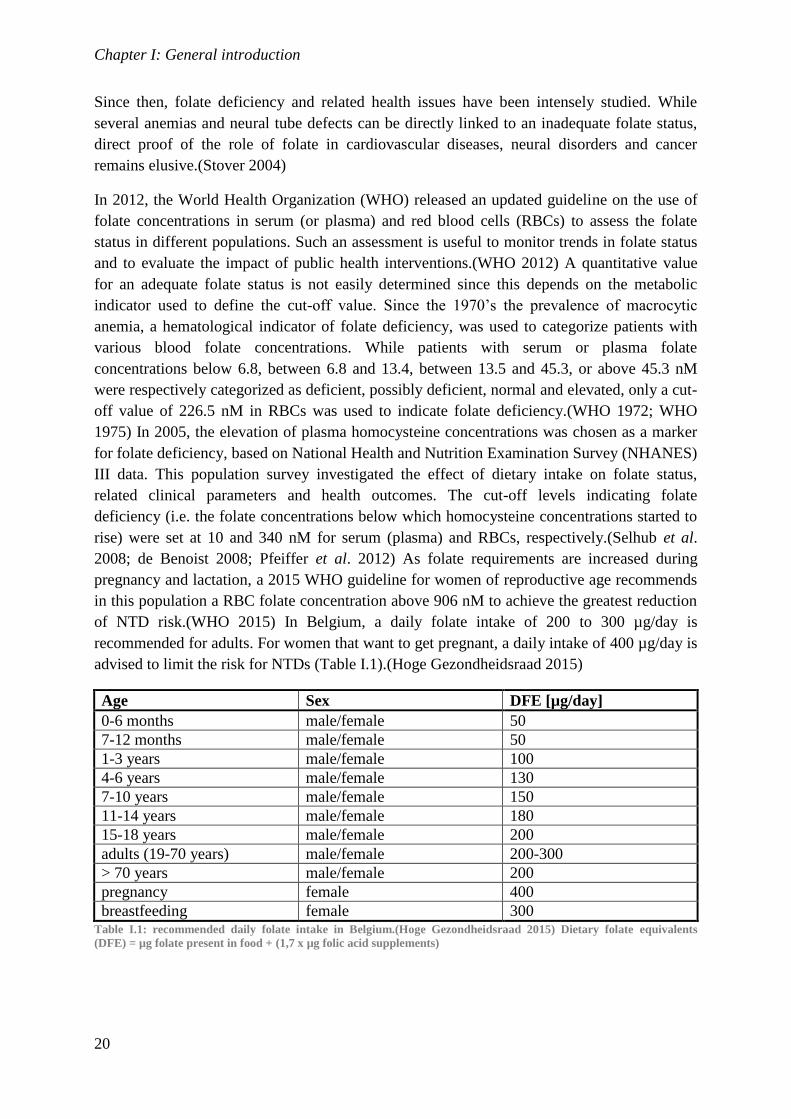
of NTD risk.(WHO 2015) In Belgium, a daily folate intake of 200 to 300 µg/day is
recommended for adults. For women that want to get pregnant, a daily intake of 400 µg/day is
advised to limit the risk for NTDs (Table I.1).(Hoge Gezondheidsraad 2015)
Age Sex DFE [µg/day]
0-6 months male/female 50
7-12 months male/female 50
1-3 years male/female 100
4-6 years male/female 130
7-10 years male/female 150
11-14 years male/female 180
15-18 years male/female 200
adults (19-70 years) male/female 200-300
> 70 years male/female 200
pregnancy female 400
breastfeeding female 300 Table I.1: recommended daily folate intake in Belgium.(Hoge Gezondheidsraad 2015) Dietary folate equivalents
(DFE) = µg folate present in food + (1,7 x µg folic acid supplements)
Chapter I: General introduction
21
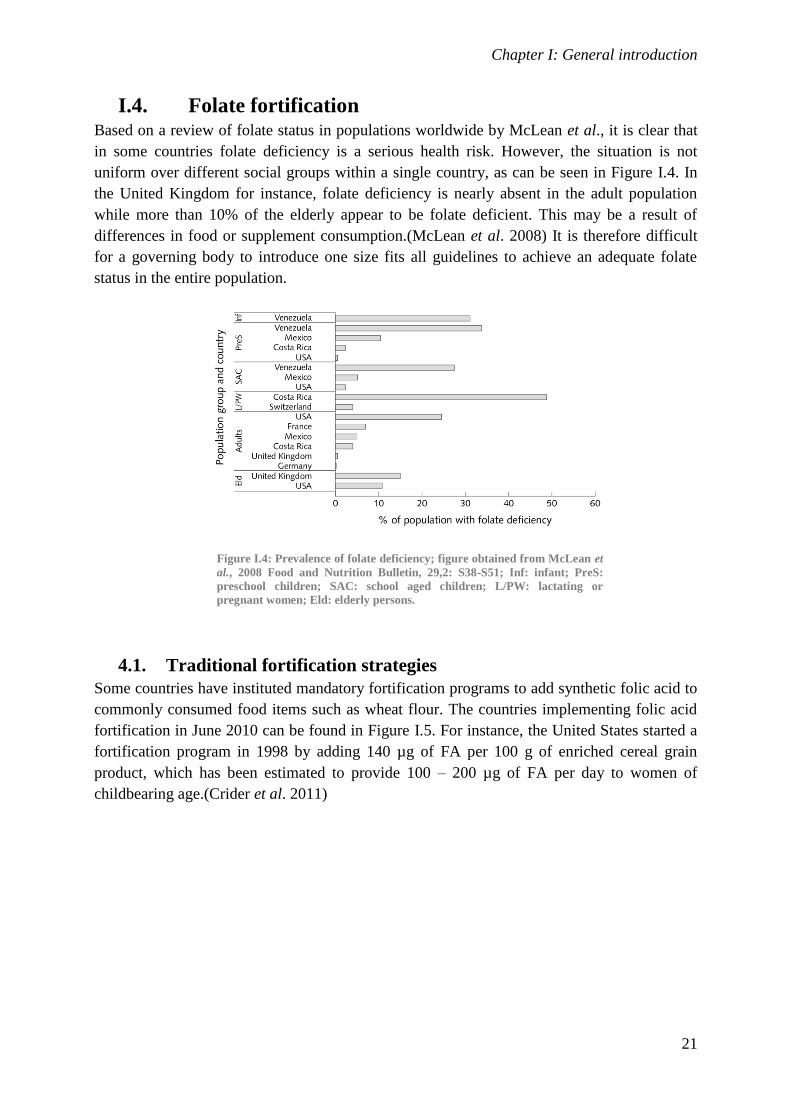
I.4. Folate fortification Based on a review of folate status in populations worldwide by McLean et al., it is clear that
in some countries folate deficiency is a serious health risk. However, the situation is not
uniform over different social groups within a single country, as can be seen in Figure I.4. In
the United Kingdom for instance, folate deficiency is nearly absent in the adult population
while more than 10% of the elderly appear to be folate deficient. This may be a result of
differences in food or supplement consumption.(McLean et al. 2008) It is therefore difficult
for a governing body to introduce one size fits all guidelines to achieve an adequate folate
status in the entire population.
Figure I.4: Prevalence of folate deficiency; figure obtained from McLean et
al., 2008 Food and Nutrition Bulletin, 29,2: S38-S51; Inf: infant; PreS:
preschool children; SAC: school aged children; L/PW: lactating or
pregnant women; Eld: elderly persons.
4.1. Traditional fortification strategies
Some countries have instituted mandatory fortification programs to add synthetic folic acid to
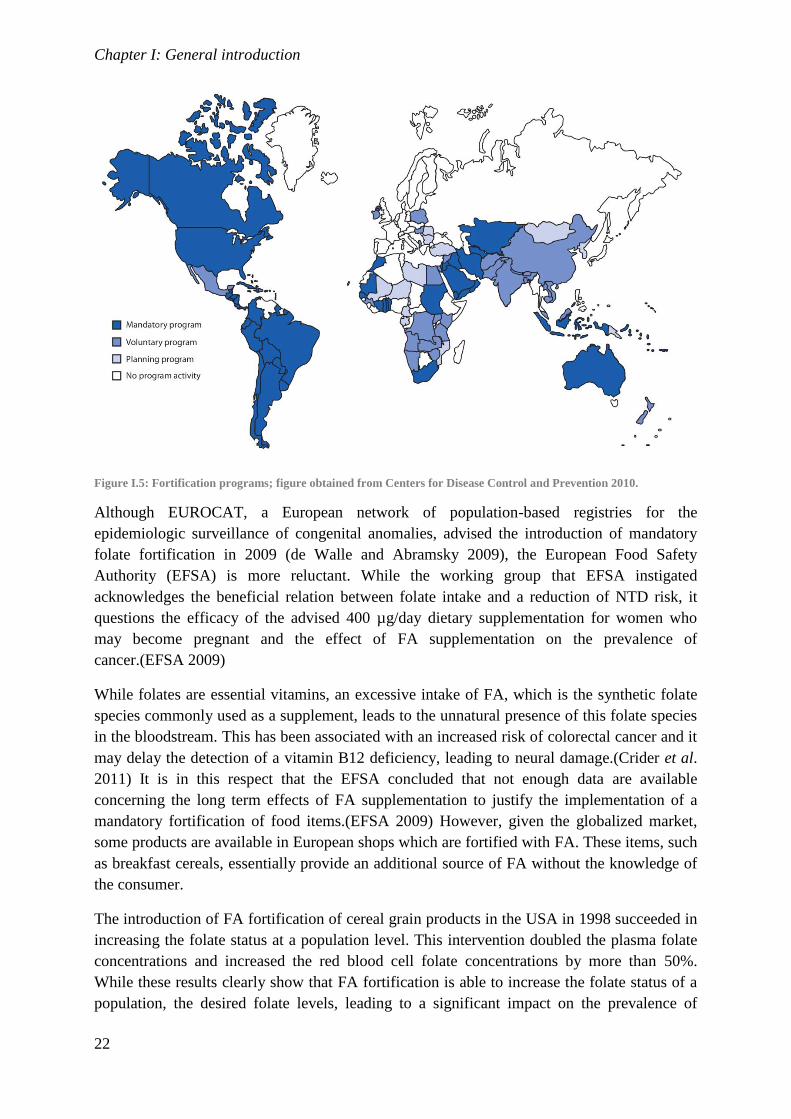
commonly consumed food items such as wheat flour. The countries implementing folic acid
fortification in June 2010 can be found in Figure I.5. For instance, the United States started a
fortification program in 1998 by adding 140 µg of FA per 100 g of enriched cereal grain
product, which has been estimated to provide 100 – 200 µg of FA per day to women of
childbearing age.(Crider et al. 2011)
Chapter I: General introduction
22
Figure I.5: Fortification programs; figure obtained from Centers for Disease Control and Prevention 2010.
Although EUROCAT, a European network of population-based registries for the
epidemiologic surveillance of congenital anomalies, advised the introduction of mandatory
folate fortification in 2009 (de Walle and Abramsky 2009), the European Food Safety
Authority (EFSA) is more reluctant. While the working group that EFSA instigated
acknowledges the beneficial relation between folate intake and a reduction of NTD risk, it
questions the efficacy of the advised 400 µg/day dietary supplementation for women who
may become pregnant and the effect of FA supplementation on the prevalence of
cancer.(EFSA 2009)
While folates are essential vitamins, an excessive intake of FA, which is the synthetic folate
species commonly used as a supplement, leads to the unnatural presence of this folate species
in the bloodstream. This has been associated with an increased risk of colorectal cancer and it
may delay the detection of a vitamin B12 deficiency, leading to neural damage.(Crider et al.
2011) It is in this respect that the EFSA concluded that not enough data are available
concerning the long term effects of FA supplementation to justify the implementation of a
mandatory fortification of food items.(EFSA 2009) However, given the globalized market,
some products are available in European shops which are fortified with FA. These items, such
as breakfast cereals, essentially provide an additional source of FA without the knowledge of
the consumer.
The introduction of FA fortification of cereal grain products in the USA in 1998 succeeded in
increasing the folate status at a population level. This intervention doubled the plasma folate
concentrations and increased the red blood cell folate concentrations by more than 50%.
While these results clearly show that FA fortification is able to increase the folate status of a
population, the desired folate levels, leading to a significant impact on the prevalence of
Chapter I: General introduction
23
neural tube defects, were not reached.(Dietrich et al. 2005) However, when evaluating the
effectiveness of FA fortification in the USA, the prevalence of neural tube defects decreased
by 20 to 30%. This vastly exceeded the 2 to 10% decline expected to result from fortification
at the 140 µg/100g level. A possible reason for this discrepancy is the higher than expected
intake due to a large consumption of products containing fortified wheat flour.(Grosse et al.
2005)
4.2. Biofortification
An alternative strategy for folate fortification is the introduction of ‘natural’ folates in
common food items. These mostly reduced folates resemble natural food items rich in folates
and are unlikely to negatively impact colorectal cancer and do not bypass the methylation
cycle. Therefore they do not influence the detection of vitamin B12 deficiency by the
appearance of megaloblasts (immature large RBCs) in the bloodstream.(Crider et al. 2011)
While careful selection and consumption of food items rich in folates can increase individual
folate intake, it requires a change to the daily diet. As such, focus has shifted towards
alteration of recipes and bioprocessing including fermentation. Wine, beer, bread and yoghurt
are examples of food items in which the folate content can be increased by using folate rich
cereal strains or fermentation by yeast and lactic acid producing bacteria. Although this can
double or quadruple the folate content within these food items (Jägerstad et al. 2005), the
absolute increase in folate content remains rather limited.
Another alternative is biofortification of food items, which aims at increasing the nutrient
content by modifying the expression of metabolic enzymes. This can be performed either by
increasing the expression level of naturally present metabolic enzymes or by introducing
exogenous enzymes which are, for instance, not feedback regulated. This approach aims at
eliminating bottlenecks in folate synthesis and ultimately, at increasing the folate
concentration within the edible part of the plant. This technique has now been applied to
increase folate concentrations in tomato fruit (Díaz de la Garza et al. 2007), wheat and rice
seeds.(Storozhenko et al. 2007, Blancquaert et al. 2015, Piironen et al. 2008)
Food fortification by genetic engineering is not limited to folate. To alleviate β-carotene
deficiencies, a rice variety was developed, by introducing phytoene synthase and lycopene β-
cyclase genes from Narcissus pseudonarcissus and later from maize, which contains up to 37
µg/g of β-carotene.(Beyer et al. 2002 and Paine et al. 2004) This rice variety, also referred to
as golden rice, is undoubtedly the best known example of a vitamin-fortified crop, and has
already been shown to be an effective source of β-carotene in a human study.(Tang et al.
2009)
4.3. Folate rice, a recipe for success?
Already well over a decade, since 2004, a consortium within Ghent University, composed of
the Laboratory of Functional Plant Biology, the Laboratory of Toxicology and the Department
of Agricultural Economics, focuses on a better understanding of the folate pathway and the
improvement of the folate content in crops. The role of the different partners lies in i) the
generation of transgenic crops and their molecular and functional characterization, ii) the set-
Chapter I: General introduction
24
up and deployment of validated analytical strategies to steer and evaluate the success of the
genetic modifications, as well as to monitor the biological effectiveness in vivo, and iii) the
evaluation of economic aspects, amongst which the market potential and cost effectiveness.
Being the most consumed staple crop worldwide, rice was an obvious candidate for
biofortification. The metabolically engineered rice or folate rice was created in the
Nipponbare variety. Several genetic interventions have been evaluated during the
development of this rice variety. Arabidopsis GTP cyclohydrolase I (GTPCHI) and
aminodeoxychorismate synthase (ADCS) genes from Arabidopsis thaliana were introduced
into the rice genome as part of a co-expression strategy. The enzymes encoded by these genes
are responsible for an increased formation of the deoxyneopterin and p-aminobenzoic acid
building blocks, respectively (see Figure I.1), which, upon combination, yield a vast increase
in folates, especially 5MeTHF.(Storozhenko et al. 2007 and Blancquaert et al. 2014)
The success of this concerted effort can be deduced from the generation of rice lines with a
>100-fold increased folate levels in seeds (Storozhenko et al., 2007) and from the scientific
output, with currently 4 publications in Nature Biotechnology, in addition to many other
publications in high-ranking (top 5-10%) peer-reviewed journals. One of the prime aims of
this consortium is to offer a feasible alternative for folate supplementation, by developing
folate rice as a valuable source of dietary folate, to decrease the prevalence of neural tube
defects in severely affected regions.
I.5. Analytical determination of folates The analytical determination of a folate concentration in a matrix largely depends on the
objective of the method (i.e. measurement of total folate concentration versus the
concentration measurement of individual folate species) and the properties of the matrix. Also
the appropriate procedure for method validation is largely matrix dependent and no folate
specific procedures are available. Given the substantial difference between food and clinical
matrices, the determination of folates in these distinct matrices is discussed separately below.
For both, the classical guidelines for bioanalytical method validation, as issued by EMA
and/or FDA, can be followed.(European Medicines Agency 2011, U.S. Department of Health
and Human Services 2015) More particularly, these guidelines state that the following should
be included in a bioanalytical method validation: evaluation of selectivity, carry-over, limit of
detection (LOD) and lower limit of quantification (LLOQ), linearity, precision (including
incurred sample reanalysis), accuracy, matrix effect, recovery and stability.
5.1. Plants and foodstuffs
While most data on folate concentrations in food databases originate from microbiologic
assays (MA) which only allow to determine the total folate content, hyphenated liquid
chromatography – (tandem) mass spectrometry (LC-MS(/MS)) based methods have been
developed to determine individual folate species. To determine the success of fortification of
a food item with FA, methods using ultraviolet detection are used most.(Strandler et al. 2015)
Chapter I: General introduction
25
Although the same analytical techniques are used to determine folates in various food items,
the sample preparation needed varies widely between different food matrices. For starchy
matrices like rice, a classical trienzyme treatment is performed, including i) α-amylase to
hydrolyze starch into sugars and thereby facilitate the extraction of the folates from the
matrix; ii) a protease to reduce or eliminate the protein binding of folates and iii) a folate
conjugase to cut the folate polyglutamates to monoglutamates which can be assayed.(Tamura
et al. 1997) This classical trienzyme treatment is adapted and optimized for each individual
matrix. For the determination of folates in spinach for instance, the use of α-amylase is not
strictly necessary since green leafy vegetables contain little starch.
Since the start of the folate biofortification project at Ghent University, the measurement of
folates in food items has been important to steer the genetic modifications. Starting with a
method in which the folates were oxidized and cleaved into pABA to determine the total
folate content using LC coupled to fluorescence detection, experience was gained within the
lab and the research group in the field of food folate determination. (Zhang et al. 2003) Later,
the introduction of MS detection increased method sensitivity and allowed to determine
individual folate species. At this time, the trienzyme treatment was developed and used for
folate determination in rice.(De Brouwer et al. 2008) The introduction of ultra-high pressure
liquid chromatography (UHPLC) led to a further decrease of the minimal quantifiable
concentrations and allowed a higher sample throughput. (De Brouwer et al. 2010)
Lately, research into the determination of food folates has been oriented towards folate
profiling in potatoes, in the context of an effort to increase the folate content also in this
common staple crop (Van Daele et al. 2014) and a better understanding of the biofortification
process by developing ways to quantitatively determine pterins, one of the folate building
blocks.(Van Daele et al. 2016) Additionally, a method was developed for folate determination
in rodent diets (Kiekens et al. 2015b; described in Chapter IV) as part of the bioavailability
study described in Chapter VI.(Kiekens et al. 2015c) Also within the context of the
determination of folates in food matrices, we developed a method for the determination of
folate polyglutamates, as described in Chapter VIII.
5.2. Clinical matrices
Over the past decade, the quantitation of clinical folate status using a MA or a protein binding
assay (PBA) has been evaluated based on emerging LC-MS/MS assays. These
chromatographic assays provide an orthogonal determination strategy, focusing on exact
chemical determination rather than relying on biological activity or on recognition by a folate
binding protein. While the MA currently remains the gold standard method for the
determination of biologically active folates, the PBA is susceptible to differences between the
folate species present in the sample and the species, mostly FA, used for assay
calibration.(Pfeiffer et al. 2004)
The accuracy and precision obtained using LC-MS/MS and the possibility to quantify
individual folate species has led to an increased interest to implement this technology for
clinical folate research. The implementation of this technique in a routine clinical laboratory
will depend on the automation of the sample preparation steps and the availability of LC-
Chapter I: General introduction
26
MS/MS equipment. PBAs are currently used most to determine the amount of folates in
patient samples, primarily owing to the ease of these assays and their automatability.
Comparability of analytical results with other labs is not a major concern for the clinician
since the use of reference intervals specific for the assay will suffice to distinguish folate
deficient patients from those with an adequate folate status. For scientific research purposes,
however, method comparability is necessary to compare findings with those obtained by other
research groups. As such, for research purposes, as well as for any other scenario where
insight into the distinct folate species is required, LC-MS/MS is the method of choice.
Whole blood or RBC folate analysis is not yet regularly performed for the determination of
long term folate status over the lifetime of the RBCs, i.e. approximately 3 months. As this
measurement is not influenced by recent folate intake, contrary to plasma or serum folate
determination, a fasting period is not strictly necessary.
Since plasma and RBC folate concentrations provide complementary information,
respectively for acute and chronic folate deficiency, we opted to develop a method that could
analyze both, using a very comparable sample treatment procedure to limit the use of
resources, i.e. time, equipment and reagents. If routine clinical analysis using an LC-MS/MS
assay is considered, such an approach should make a cost effective procedure achievable.
Given the importance of folate determination in plasma and RBCs for the bioavailability trial
discussed in Chapter VI and the novelty of this method within the research group, this subject
is discussed further in Chapter III.
Chapter I: General introduction
27
I.6. References Aufreiter, S., Gregory, J.F.III, Pfeiffer, C.M., Fazili, Z., Kim, Y.-I., Marcon, N., Kamalaporn,
P., Pencharz, P.B. and O’Connor, D.L. 2009. “Folate Is Absorbed across the Colon of
Adults: Evidence from Cecal Infusion of (13)C-Labeled [6S]-5-Formyltetrahydrofolic
Acid.” Am J Clin Nutr 90 (1): 116–23.
Ball, G.F.M. 2005. Vitamins In Foods: Analysis, Bioavailability, and Stability. Vol. 1. CRC
Press.
Beyer, P., Al-Babili, S., Xudong, Y., Lucca, P., Schaub, P., Welsch, R. and Potrykus, I. 2002.
“Golden Rice: Introducing the β-Carotene Biosynthesis Pathway into Rice Endosperm
by Genetic Engineering to Defeat Vitamin A Deficiency.” J Nutr (132 (3): 506S-10S.
Blancquaert, D., De Steur, H., Gellynck, X., Van Der Straeten, D. 2014. “Present and future
of folate biofortification of crop plants.” J Exp Bot 65 (4): 895–906.
Blancquaert, D., Van Daele, J., Strobbe, S., Kiekens, F., Storozhenko, S., De Steur, H.,
Gellynck, X., Lambert, W.E., Stove, C.P. and Van Der Straeten, D. 2015. “Improving
Folate (vitamin B9) Stability in Biofortified Rice through Metabolic Engineering.” Nat
Biotechnol 33 (10): 1076–8.
Blom, H.J. and Smulders, Y. 2011. “Overview of Homocysteine and Folate Metabolism. With
Special References to Cardiovascular Disease and Neural Tube Defects.” J Inherit Metab
Dis 34 (1): 75–81.
Blount, B.C., Mack, M.M., Wehr, C.M., MacGregor, J.T., Hiatt, R.A., Wang, G.,
Wickramasinghe, S.N., Everson, R.B. and Ames, B.N. 1997. “Folate Deficiency Causes
Uracil Misincorporation into Human DNA and Chromosome Breakage: Implications for
Cancer and Neuronal Damage.” Proc Natl Acad Sci USA 94 (7): 3290–5.
Centers for Disease Control and Prevention 2010. ‘CDC Grand Rounds: Additional
Opportunities to Prevent Neural Tube Defects with Folic Acid Fortification’ Morbidity
and Mortality Weekly Report 59 (31): 980-4.
Chandler, C.J., Wang, T.T., and Halsted, C.H. 1986. “Pteroylpolyglutamate Hydrolase from
Human Jejunal Brush Borders. Purification and Characterization.” J Biol Chem 261 (2):
928–33.
Clifford, A.J., Heid, M.K., Muller, H.G. and Bills, N.D. 1990. “Tissue Distribution and
Prediction of Total Body Folate of Rats.” J Nutr 120 (12): 1633–9.
Crider, K.S, Bailey, L.B. and Berry, R.J. 2011. “Folic Acid Food Fortification-Its History,
Effect, Concerns, and Future Directions.” Nutrients 3 (3): 370–84.
de Benoist, B. 2008. “Conclusions of a WHO Technical Consultation on Folate and Vitamin
B12 Deficiencies.” Food Nutr Bull 29 (2 Suppl): S238–44.
De Brouwer, V., Zhang, G.F., Storozhenko, S., Van Der Straeten, D. and Lambert, W.E.
2007. “pH Stability of Individual Folates during Critical Sample Preparation Steps in
Prevision of the Analysis of Plant Folates.” Phytochem Anal 18 (6): 496–508.
Chapter I: General introduction
28
De Brouwer, V., Storozhenko, S., Van De Steene, J., Wille, S., Van Der Straeten, D. and
Lambert, W.E. 2008. “Optimisation and validation of a liquid chromatography-tandem
mass spectrometry method for folates in rice.” J Chrom A 1215 (1-2): 125-32.
De Brouwer, V., Storozhenko, S., Stove, C., Van Daele, J., Van Der Straeten, D. and
Lambert, W.E. 2010. “Ultra-performance liquid chromatography–tandem mass
spectrometry (UPLC–MS/MS) for the sensitive determination of folates in rice.” J
Chrom B 878 (3-4): 509-13.
de Walle, H. and Abramsky L.. 2009. “Prevention of Neural Tube Defects with
Periconceptional Folic Acid Supplementation in Europe.” http://www.eurocat-
network.eu/content/Special-Report-NTD-3rdEd-2009.pdf (consulted: 01/30/2016).
Díaz de la Garza, R.I., Gregory, J.F.III and Hanson, A.D. 2007. “Folate Biofortification of
Tomato Fruit.” Proc Natl Acad Sci USA 104 (10): 4218–22.
Dietrich, M., Brown, C.J.P. and Block, G. 2005. “The Effect of Folate Fortification of Cereal-
Grain Products on Blood Folate Status, Dietary Folate Intake, and Dietary Folate Sources
among Adult Non-Supplement Users in the United States.” J Am Coll Nutr 24 (4): 266–
74.
EFSA. 2009. “ESCO Report Prepared by the EFSA Sc Ientific Cooperation Working Group
on Analysis of Risks and Benefits of Fortification of Food with Folic Acid.”
http://www.efsa.europa.eu/sites/default/files/scientific_output/files/main_documents/3e.p
df (Consulted: 01/30/2016).
European Medicines Agency. 2011. “Guideline on Bioanalytical Method Validation.” Edited
by Committee for Medicinal Products for Human Use (CHMP).
Gregory J.F.III 2001. “Case Study: Folate Bioavailability.” J Nutr 131 (4 Suppl): 1376S –
82S.
Grosse, S.D., Waitzman, N.J., Romano, P.S. and Mulinare, J. 2005. “Reevaluating the
Benefits of Folic Acid Fortification in the United States: Economic Analysis, Regulation,
and Public Health.” Am J Public Health 95 (11): 1917–22.
Hoffbrand, A.V., Tabaqchali, S., Booth, C.C. and Mollin, D.L. 1971. “Small Intestinal
Bacterial Flora and Folate Status in Gastrointestinal Disease.” Gut 12 (1): 27–33.
Hoffbrand, A.V., and Weir, D.G. 2001. “The History of Folic Acid.” Br J Haematol 113 (3):
579–89.
Hoge Gezondheidsraad. 2015. “Voedingsaanbevelingen Voor België - Partim i: Vitaminen en
Sporenelementen”
http://www.health.belgium.be/sites/default/files/uploads/fields/fpshealth_theme_file/hgr_
9164_9174_advies_voedingsaanbevelingen.pdf (Consulted: 05/15/2016)
Iyer, R. and Tomar, S.K. “Folate: A Functional Food Constituent.” J Food Sci 74 (9): R114–
22.
Jagerstad, M., Piironen, V., Walker, C., Ros, G., Carnovale, E., Holasova, M. and Nau, H.
2005. “Increasing Natural Food Folates through Bioprocessing and Biotechnology.”
Trends Food Sci Technol 16 (6-7): 298–306.
Chapter I: General introduction
29
Kiekens, F., Van Daele, J., Blancquaert, D., Van Der Straeten, D., Lambert, W.E. and Stove,
C.P. 2015a. “A Validated Ultra-High-Performance Liquid Chromatography-Tandem
Mass Spectrometry Method for the Selective Analysis of Free and Total Folate in Plasma
and Red Blood Cells.” J Chromatogr A 1398: 20–28.
Kiekens, F., Van Daele, J., Blancquaert, D., Van Der Straeten, D., Lambert, W.E. and Stove,
C.P. 2015b. “Determination of five folate monoglutamates in rodent diets.” J Agric Food
Chem 63 (45): 10089–95.
Kiekens, F., Blancquaert, D., Devisscher, L., Van Daele, J., Stove, V., Delanghe, J., Lambert,
W.E. and Stove, C.P. 2015c. “Folates from metabolically engineered rice: a long-term
study in rats.” Mol Nutr Food Res 59 (3): 490–500.
Klipstein, F A, and Samloff, I.M.. 1966. “Folate Synthesis by Intestinal Bacteria.” Am J Clin
Nutr 19 (4): 237–46.
Matherly, L.H, and Goldman, D.I. 2003. “Membrane Transport of Folates.” Vitamins and
Hormones 66 (January): 403–56.
McLean, E., de Benoist, B. and Allen, L.H. 2008. “Review of the Magnitude of Folate and
Vitamin B12 Deficiencies Worldwide.” Food Nutr Bull 29 (2 Suppl): S38–51.
Molloy, A.M. 2010. “Folate-Vitamin B12 Interrelationships Links to Disease Risk” In Folate
in Health and Disease, edited by L.B. Bailey, 2nd ed., 381–408. Boca Raton, FL: CRC
Press, Taylor & Francis Group.
Moran, R.G. and Colman, P.D. 1984. “Measurement of Folylpolyglutamate Synthetase in
Mammalian Tissues.” Anal Biochem 140 (2): 326–42.
Osborne, C.B., Lowe, K.E. and Shane, B. 1993. “Regulation of Folate and One-Carbon
Metabolism in Mammalian Cells. I. Folate Metabolism in Chinese Hamster Ovary Cells
Expressing Escherichia Coli or Human Folylpoly-Gamma-Glutamate Synthetase
Activity.” J Biol Chem 268 (29): 21657–64.
Paine, J.A., Shipton, C.A., Chaggar, S., Howells, R.M., Kennedy, M.J., Vernon, G., Wright,
S.Y., Hinchliffe, E., Adams, J.L., Silverstone, A.L. and Drake, R. 2005. “Improving the
nutritional value of Golden Rice through increased pro-vitamin A content.” Nat
Biotechnol 23: 482-87.
Pedersen, A.M., Bardow, A., Beier Jensen, S. and Nauntofte, B. 2002. “Saliva and
Gastrointestinal Functions of Taste, Mastication, Swallowing and Digestion.” Oral Dis 8
(3): 117–29.
Pfeiffer, C.M., Fazili, Z., McCoy, L., Zhang, M. and Gunter, E.W. 2004. “Determination of
Folate Vitamers in Human Serum by Stable-Isotope-Dilution Tandem Mass
Spectrometry and Comparison with Radioassay and Microbiologic Assay.” Clin Chem
50 (2): 423–32.
Pfeiffer, C.M., Hughes, J.P., Lacher, D.A., Bailey, R.L., Berry, R.J., Zhang, M., Yetley, E.A.,
Rader, J.I., Sempos, C.T. and Johnson, C.L. 2012. “Estimation of Trends in Serum and
RBC Folate in the U.S. Population from Pre- to Postfortification Using Assay-Adjusted
Data from the NHANES 1988-2010.” J Nutr 142 (5): 886–93.
Chapter I: General introduction
30
Piironen, V., Edelmann, M., Kariluoto, S., Bedo, Z. 2008. “Folate in wheat genotypes in the
HEALTHGRAIN diversity screen.” J Agric Food Chem 56: 9726–31.
Reynolds, E. 2006. “Vitamin B12, Folic Acid, and the Nervous System.” Lancet Neurol 5
(11): 949–60.
Scott, J.M. 1999. “Folate and Vitamin B12.” P Nutr Soc 58 (02): 441–8.
Selhub, J., Jacques, P.F., Dallal, G., Choumenkovitch, S. and Rogers, G. 2008. “The Use of
Blood Concentrations of Vitamins and Their Respective Functional Indicators to Define
Folate and Vitamin B12 Status.” Food Nutr Bull 29 (2 Suppl): S67–73.
Shane, B. 2010. “Folate Chemistry and Metabolism.” In Folate in Health and Disease, edited
by L.B. Bailey, 2nd ed., 1–24. Boca Raton, FL: CRC Press, Taylor & Francis Group.
Storozhenko, S., De Brouwer,V., Volckaert, M., Navarrete, O., Blancquaert, D., Zhang, G.F.,
Lambert, W.E. and Van Der Straeten, D. 2007. “Folate Fortification of Rice by
Metabolic Engineering.” Nat Biotechnol 25 (11): 1277–9.
Stover, P.J. 2004. “Physiology of Folate and Vitamin B12 in Health and Disease.” Nutr Rev
62 (suppl 1): S3–12.
Stover, P.J. 2010. “Folate Biochemical Pathways and Their Regulation.” In Folate in Health
and Disease, edited by L.B. Bailey, 2nd ed., 49–74. Boca Raton, FL: CRC Press, Taylor
& Francis Group.
Strandler, H.S., Patring, J., Jagerstad, M. and Jastrebova, J. 2015. “Challenges in the
Determination of Unsubstituted Food Folates: Impact of Stabilities and Conversions on
Analytical Results.” J Agric Food Chem 63: 2367−77.
Tamura, T., Mizuno, Y., Johnston, K.E. and Jacob, R.A. 1997. “Food Folate Assay with
Protease, α-Amylase, and Folate Conjugase Treatments.” J Agric Food Chem 45:135-9.
Tang, G., Qin, J., Dolnikowski, G.G., Russell, R.M. and Grusak, M.A. 2009. “Golden Rice is
an effective source of vitamin A.” Am J Clin Nutr 89 (6): 1776-83.
Ueland, P.M., Refsum, H., Beresford, S.A. and Vollset. S.E. 2000. “The Controversy over
Homocysteine and Cardiovascular Risk.” Am J Clin Nutr 72 (2): 324–32.
U.S. Department of Health and Human Services. 2015. “Analytical Procedures and Methods
Validation for Drugs and Biologics.”
Van Daele, J., Blancquaert, D., Kiekens, F., Van Der Straeten, D., Lambert, W., Stove, C.
2014. “Folate profiling in potato (Solanum tuberosum) tubers by ultrahigh-performance
liquid chromatography-tandem mass spectrometry.” J Agric Food Chem 62 (14): 3092-
100.
Van Daele, J., Blancquaert, D., Kiekens, F., Van Der Straeten, D., Lambert, W., Stove, C.
2016. “Degradation and Interconversion of Plant Pteridines during Sample Preparation
and Ultra-High Performance Liquid Chromatography-Tandem Mass Spectrometry.”
Food Chem 194: 1189-98.
Chapter I: General introduction
31
van Haandel, L., Becker, M.L., Williams, T.D., Stobaugh, J.F. and Leeder, J.S. 2012.
“Comprehensive Quantitative Measurement of Folate Polyglutamates in Human
Erythrocytes by Ion Pairing Ultra-Performance Liquid Chromatography/tandem Mass
Spectrometry.” Rapid Commun Mass Spectrom 26 (14): 1617–30.
Visentin, M., Diop-Bove, N., Zhao, R. and Goldman, I.D. 2014. “The Intestinal Absorption of
Folates.” Annu Rev Physiol 76: 251–74.
Wang, C., Riedl, K.M., and Schwartz, S.J. 2010. “A Liquid Chromatography-Tandem Mass
Spectrometric Method for Quantitative Determination of Native 5-
Methyltetrahydrofolate and Its Polyglutamyl Derivatives in Raw Vegetables.” J
Chromatogr B 878 (29): 2949–58.
WHO. 1972. “Nutritional Anemias. Report of WHO Group of Experts.” World Health Organ
Tech Rep Ser 503: 1–29.
WHO. 1975. “Control of Nutritional Anemia with Special Reference to Iron Deficiency.
Report of an IAEA/USAIS/WHO Joint Meeting.” World Health Organ Tech Rep Ser
580: 5–71.
WHO. 2012. “Serum and Red Blood Cell Folate Concentrations for Assessing Folate Status
in Populations.” World Health Organization.
http://apps.who.int/iris/bitstream/10665/75584/1/WHO_NMH_NHD_EPG_12.1_eng.pdf
(consulted: 01/30/2016)
WHO. 2015. “Guideline: Optimal Serum and Red Blood Cell Folate Concentration in Women
of Reproductive Age for Prevention of Neural Tube Defects.” World Health
Organization.
http://apps.who.int/iris/bitstream/10665/161988/1/9789241549042_eng.pdf?ua=1
(consulted: 01/30/2016)
Zhang, G.-F., Maudens, K.E., Storozhenko, S., Mortier, K.A., Van Der Straeten, D., Lambert,
W. 2003. “Determination of Total Folate in Plant Material by Chemical Conversion into
para-Aminobenzoic Acid Followed by High Performance Liquid Chromatography
Combined with On-Line Postcolumn Derivatization and Fluorescence Detection.” J
Agric Food Chem 51 (27): 7872-78.

Chapter I: General introduction
32

Chapter II: Objectives

Chapter II: Objectives
34
Chapter II: Objectives
35
Main objective
Already well over a decade, a consortium within Ghent University, composed of the
Laboratory of Functional Plant Biology, the Laboratory of Toxicology and the Department of
Agricultural Economics, focuses on a better understanding of the folate pathway and the
improvement of the folate content in crops. The role of the different partners lies in i) the
generation of transgenic crops and their molecular and functional characterization, ii) the set-
up and deployment of validated analytical strategies to steer and evaluate the success of the
genetic modifications, as well as to monitor the biological effectiveness in vivo, and iii) the
evaluation of economic aspects, amongst which the market potential and cost effectiveness.
The success of this concerted effort can e.g. be deduced from the generation of rice lines with
a >100-fold increased folate levels in seeds (Storozhenko et al., 2007).
One of the prime aims of the consortium is to offer a feasible alternative for folate
supplementation, by developing folate rice as a valuable source of dietary folate, to decrease
the prevalence of neural tube defects in severely affected regions. However, although the
ability to increase folate concentrations in rice grains represents a major achievement, this
does not necessarily imply that this rice variety is a good source of dietary folate. To
investigate whether the folates in folate rice are bio-accessible and bio-effective, an in vivo
trial was necessary. As a means to quantify the effect of folate supplementation by providing
folate rice, a method for the quantification of folates in plasma and red blood cells was
necessary. Also, to prevent that folates present in rodent diet could influence the obtained
results, a method had to be developed to determine the folate content in these diets.
Hence, within this thesis, we developed and validated the analytical tools that were required
to evaluate the biological effect of folate rice consumption. This was done within the context
of the available knowledge concerning folate determination in food matrices using liquid-
chromatography with ultraviolet and fluorescence detection in spinach (Zhang et al. 2003)
and liquid chromatography with mass spectrometric detection in rice (De Brouwer et al.
2010), Arabidopsis thaliana and green leafy vegetables and alongside the development of
methods for the LC-MS/MS-based determination of folates in potato (Van Daele et al. 2014)
and pterins (Van Daele et al. 2016) in plant matrices.
Chapter II: Objectives
36
Outline and detailed objectives
In Chapter I, which gave a general background on folates, their relevance for human health,
fortification and the relevance of folate determination, it was already pointed out that the
analytical determination of a folate concentration can be looked at from different viewpoints.
While in some instances knowledge about the (order of magnitude of a) total folate
concentration might suffice, in other instances quantitative measurement of individual folate
species is required. In the work described in this thesis, quantitative determination of
individual folate species was required for both rodent feed (to be used in a rodent feeding
trial), as for plasma and red blood cells (sampled following the rodent feeding trial). In the
context of the latter, Chapter III points out the distinct points of attention that need to be
taken into account when embarking upon folate determination in a clinical context, with
special attention to LC-MS/MS.
Consumption of wild type rice only results in a very limited folate intake. Therefore, in the
rodent feeding trial we performed, the determination of folates in rodent diets required limits
of detection and quantitation that were as low as possible to assure that only rice was the
source of folate in the diet. A wide applicability of this method was also necessary since
different ingredients may require different sample treatments, e.g. a protease treatment to
disrupt the protein binding of folates. Using this method, the details of which can be found in
Chapter IV, a truly folate free diet was selected for use during the rodent feeding trial.
Since folate concentrations in plasma and red blood cells are key to study the outcome during
the bioavailability trial, the development of a method for folate quantification in plasma and
red blood cells, described in Chapter V, was required. While the LC-MS/MS settings were
available from the determination of folates in food matrices, a new sample treatment
procedure had to be developed. Given that both plasma (or serum) and red blood cell folates
provide complementary information on folate status, the development of a method to measure
the folate concentration in both matrices allows to obtain the maximal amount of information
from a rodent feeding trial. A factor complicating the development of such a method was the
limited amount of whole blood that can be obtained from periodic sampling of rats. Therefore,
a method was required that allowed to determine both plasma and red blood cell folates from
only one 300 µl aliquot of whole blood instead of two separate samples commonly used in
literature. Ease of use was also a priority during method development since large amounts of
samples would need to be processed periodically during the feeding trial. To treat plasma and
RBC samples simultaneously, a sample treatment procedure including similar steps for both
plasma and red blood cell folate analysis was required. Also, the implementation of a 96-well
solid-phase extraction format was to be evaluated to increase sample throughput.
The evaluation of the biological availability and efficacy of folate rice consumption was
performed by means of a rodent feeding study, described in Chapter VI. In contrast to
traditional studies, only recording the pharmacokinetics of a bolus folate intake, a long-term
Chapter II: Objectives
37
study was to devised to evaluate the efficacy of folate rice consumption on both short and
long term. However, this required that an appropriate feeding strategy was set up and a
feasible manner for sample collection was found. Using the rodent feeding trial, we aimed at
answering the simple question “is folate rice able to maintain an adequate folate status when it
is part of the diet?” To have a benchmark for the folate levels measured, we compared the
results obtained from rats that were fed folate rice with those obtained from rats fed wild type
or folic acid fortified rice. Also a positive and negative control group, receiving respectively
ample and no folate in their diet, were included. Over a period of three months, we not only
determined the folate levels in plasma and RBCs, but also the homocysteine levels
(a metabolic marker linked to folate status), as well as other parameters.
As we could observe in our rodent trial, folates are essential for maintaining a healthy status,
by their effects on many physiological processes. One of the systems whose function is
influenced by folate status is the immune system. Although this was evaluated to a limited
extent by others (Courtemanche et al. 2004), the question remained whether a low folate
status leads to low intracellular folate concentrations and whether or not the folate species
used during in vitro incubation influences the intracellular folate concentrations and the
proliferation rate of the cells. As we had the analytical tools at hand, we decided to investigate
this relationship, and added either folic acid or 5-methyltetrahydrofolate to in vitro cultures of
peripheral blood mononuclear cells, at different concentration levels. To determine the
intracellular folate concentration, an adapted method for folate determination in lymphocyte
lysates and the development of procedures for cell incubation and the selective isolation of
different cell types were required. How these experiments were performed can be found in
Chapter VII.
For biofortified rice, information on the degree of folate polyglutamylation was available via
the determination of folate monoglutamates and total folates (monoglutamates +
polyglutamates). However, the measurement of individual folate polyglutamate species was to
be investigated since this would provide further information on the folate polyglutamate chain
length in rice samples with varying gene expression. Since not all folate polyglutamate
standards were commercially available, the in house synthesis of the necessary reference
materials was required to achieve a method able to quantify all relevant polyglutamate
species. The analytical method and procedure for the preparation of the reference standards
can be found in Chapter VIII.
In Chapter IX, the broader international context, relevance and future perspectives are
described. A comparison between folate rice and traditional folate fortification strategies and
the prevalence of folate deficiency can be found in this chapter.
A summary of the project described in this thesis, as well as the conclusions, can be found in
Chapter X.
Chapter II: Objectives
38
References
Courtemanche, C., Elson-Schwab, I., Mashiyama, S.T., Kerry, N. and Ames, B.N. 2004.
“Folate Deficiency Inhibits the Proliferation of Primary Human CD8+ T Lymphocytes in
Vitro.” J Immunol 173 (5): 3186–92.
De Brouwer, V., Storozhenko, S., Stove, C., Van Daele, J., Van Der Straeten, D., Lambert,
W. 2010. “Ultra-performance liquid chromatography–tandem mass spectrometry
(UPLC–MS/MS) for the sensitive determination of folates in rice.” J Chrom B 878 (3-4):
509-13.
Storozhenko, S., De Brouwer,V., Volckaert, M., Navarrete, O., Blancquaert, D., Zhang, G.F.,
Lambert, W.E. and Van Der Straeten, D. 2007. “Folate Fortification of Rice by
Metabolic Engineering.” Nat Biotechnol 25 (11): 1277–79.
Van Daele, J., Blancquaert, D., Kiekens, F., Van Der Straeten, D., Lambert, W., Stove, C.
2014. “Folate profiling in potato (Solanum tuberosum) tubers by ultrahigh-performance
liquid chromatography-tandem mass spectrometry.” J Agric Food Chem 62 (14): 3092-
100.
Van Daele, J., Blancquaert, D., Kiekens, F., Van Der Straeten, D., Lambert, W., Stove, C.
2016. “Degradation and Interconversion of Plant Pteridines during Sample Preparation
and Ultra-High Performance Liquid Chromatography-Tandem Mass Spectrometry.”
Food Chem 194: 1189-98.
Zhang, G.-F., Maudens, K.E., Storozhenko, S., Mortier, K.A., Van Der Straeten, D., Lambert,
W. 2003. “Determination of Total Folate in Plant Material by Chemical Conversion into
para-Aminobenzoic Acid Followed by High Performance Liquid Chromatography
Combined with On-Line Postcolumn Derivatization and Fluorescence Detection.” J Agric
Food Chem 51 (27): 7872-78.
Chapter III: Determination of clinical folate
status
Based on:
Kiekens, F., Blancquaert, D., Van Daele, J., De Steur, H., Gellynck, X.,
Van Der Straeten, D., Lambert, W.E. and Stove, C.P. 2016. “Determination of folate status:
practical considerations”

Chapter III: Determination of clinical folate status
40
Chapter III: Determination of clinical folate status
41
Table of contents
III.1. Abstract ...................................................................................................................... 42
III.2. Clinical folate analysis ............................................................................................... 43
2.1. Introduction ........................................................................................................... 43
2.2. Reference range ..................................................................................................... 43
2.3. Genetic variation vs. folate status .......................................................................... 43
2.4. The measurement of folates in clinical matrices ................................................... 44
2.4.1. Sample preparation ........................................................................................... 44
2.4.2. Anticoagulant vs sample stability ..................................................................... 45
2.4.3. Stability during sample preparation .................................................................. 45
2.4.4. Enzyme treatment ............................................................................................. 46
2.4.5. Microbiological assay ....................................................................................... 47
2.4.6. Protein binding assay ........................................................................................ 47
2.4.7. LC-MS/MS analysis ......................................................................................... 48
2.4.8. Method comparability ....................................................................................... 51
III.3. Conclusion ................................................................................................................. 55
III.4. References .................................................................................................................. 56
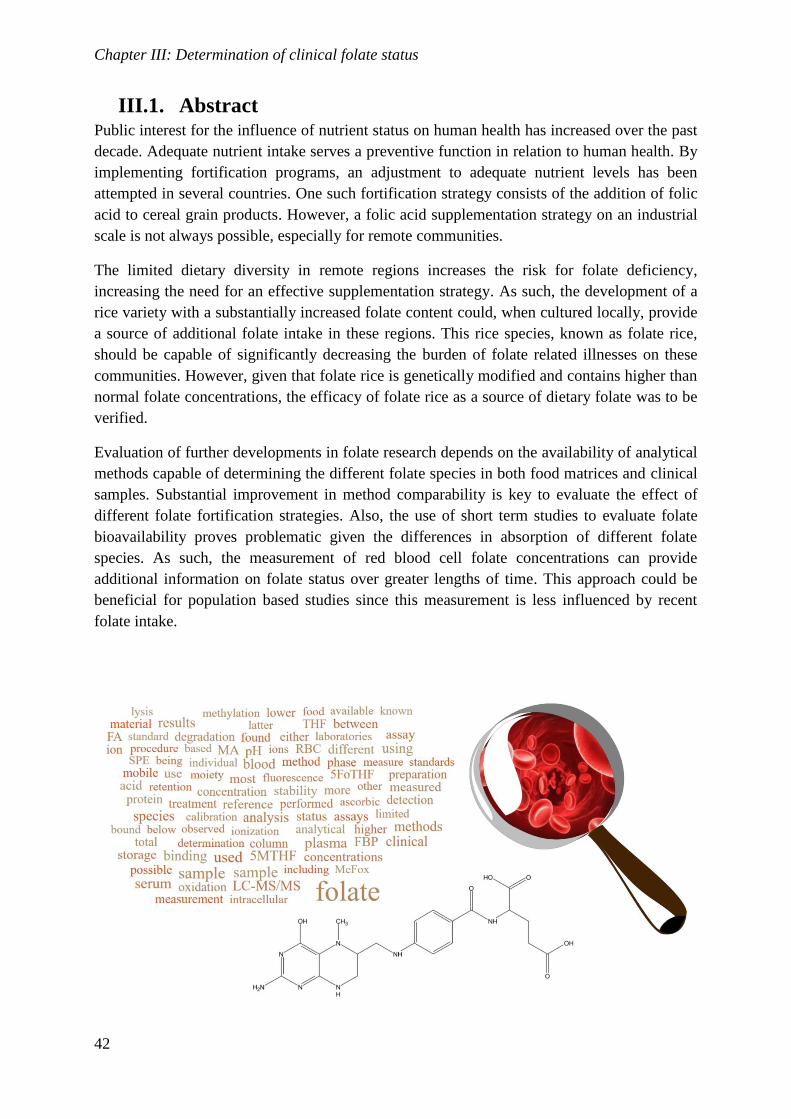
Chapter III: Determination of clinical folate status
42
III.1. Abstract Public interest for the influence of nutrient status on human health has increased over the past
decade. Adequate nutrient intake serves a preventive function in relation to human health. By
implementing fortification programs, an adjustment to adequate nutrient levels has been
attempted in several countries. One such fortification strategy consists of the addition of folic
acid to cereal grain products. However, a folic acid supplementation strategy on an industrial
scale is not always possible, especially for remote communities.
The limited dietary diversity in remote regions increases the risk for folate deficiency,
increasing the need for an effective supplementation strategy. As such, the development of a
rice variety with a substantially increased folate content could, when cultured locally, provide
a source of additional folate intake in these regions. This rice species, known as folate rice,
should be capable of significantly decreasing the burden of folate related illnesses on these
communities. However, given that folate rice is genetically modified and contains higher than
normal folate concentrations, the efficacy of folate rice as a source of dietary folate was to be
verified.
Evaluation of further developments in folate research depends on the availability of analytical
methods capable of determining the different folate species in both food matrices and clinical
samples. Substantial improvement in method comparability is key to evaluate the effect of
different folate fortification strategies. Also, the use of short term studies to evaluate folate
bioavailability proves problematic given the differences in absorption of different folate
species. As such, the measurement of red blood cell folate concentrations can provide
additional information on folate status over greater lengths of time. This approach could be
beneficial for population based studies since this measurement is less influenced by recent
folate intake.
Chapter III: Determination of clinical folate status
43
III.2. Clinical folate analysis Since the introduction of liquid chromatography tandem-mass spectrometry (LC-MS/MS) in
clinical laboratories, folate analysis has shifted from microbiological (MA) or protein binding
assays (PBA) to chromatographic methods. Although several chromatographic methods have
been developed, validated and published, interlaboratory variability limits the comparability
of the results. In this chapter we provide an overview of the strategies for sample treatment
and analysis and how these may influence the final analytical result. Analyte stability in
function of pH and temperature, measures taken to counter oxidation and the use of
anticoagulants will all be covered. Also the use of certified reference materials is discussed.
2.1. Introduction
The multitude of sample treatment procedures preceding LC-MS/MS hinders comparability of
clinical and scientific data on one hand and of international reference ranges on the other.
This has proven to be the Achilles’ heel of current folate determinations in clinical samples.
In this chapter, we focus on the use of LC-MS/MS for folate quantitation in blood, plasma and
serum, by providing a non-exhaustive overview of methods improving the existing analytical
procedures since the year 2000. We will focus especially on strategies and trends that have
emerged during the last 5 to 10 years to address the issues concerning folate quantitation in
these matrices.
2.2. Reference range
Based on the homocysteine response, the cut-off levels indicating folate deficiency (i.e. the
folate concentrations below which homocysteine concentrations started to rise) were set at 10
and 340 nM for serum (plasma) and RBCs, respectively. Since these reference concentrations
encompass different folate species, the quantification of these different species requires the
utmost sensitivity for the less abundant folate species. Under normal conditions, total folate
concentrations are unlikely to exceed 100 and 1000 nM for plasma and RBCs respectively
(see also Chapter V and VI).(Selhub et al. 2008; de Benoist 2008; Pfeiffer et al. 2010)
2.3. Genetic variation vs. folate status
Given the complexity of the folate pathway and the numerous enzymes involved, it is not
surprising that several genetic polymorphisms in the human genome have been identified that
play a role in the folate biosynthesis pathway. The most studied is a single nucleotide
polymorphism (SNP) in the methylene tetrahydrofolate reductase gene at nucleotide 677
(MTHFR 677 C>T), changing an alanine to a valine, which results in a thermolabile and less
efficient enzyme.(Huang et al. 2008) This SNP is very rare in the African population but
approximately 10% of Caucasians and 20% of Asians are homozygous for this functional
polymorphism.(Franco et al. 1998) While intracellular folates in 677C homozygotes and in
heterozygotes mostly consist of 5MeTHF, 677T homozygotes have a much lower fraction of
5MeTHF and are at higher risk for low folate status, leading to hyperhomocysteinemia and
related CVDs, and posing a higher risk for NTDs.
Chapter III: Determination of clinical folate status
44
Additionally, other polymorphisms have been described that may influence folate status. As
described by DeVos et al., SNPs can occur in nearly all metabolically relevant enzymes such
as FPGS and GGH enzymes governing polyglutamylation, MTHFR, as well as methionine
synthetase (5MeTHF-homocysteine methyltransferase, MTR). Also the folate carriers PCFT
and RFC, as well as the folate hydrolase 1 (FOLH1) present in the brush border, are subject to
polymorphic variation.(DeVos et al. 2008) However, not all polymorphisms have a
significant influence on the intracellular folate profile and/or concentration. Ideally, a method
for the analysis of folates in plasma or serum and RBCs should be able to discern differences
in concentrations of all relevant folate species, including the degree of polyglutamylation.
2.4. The measurement of folates in clinical matrices
The relevant folate species are 5MeTHF, THF, DHF, 5,10CH2THF and 10FoTHF.(Bailey and
Gregory 3rd 1999) However, as a result of folate instability and interconversions, not all of
these can be quantified directly. Moreover, oxidation of 5MeTHF leads to the formation of 4’-
hydroxy-5-methyltetrahydrofolate (hmTHF), which structurally rearranges to a pyrazino-s-
triazine derivative known as MeFox. This folate species is metabolically inactive. However,
since it may be formed during sample treatment or storage and may interfere with
determination of other folates, it is of interest to measure this compound as well when aiming
at an accurate folate profiling of a sample.(Pfeiffer et al. 2015)
Plasma or serum folate measurement is widely applied in clinical laboratories and, to this day,
provides clinicians with an indication of the folate status. However, this method relies on an
adequate (overnight) fasting period to assure that steady-state folate concentrations are
measured, since only these correlate with folate stores elsewhere in the body. Absorption
following ingestion of chemically pure 5MeTHF is rapid, with peak plasma concentrations
readily occurring after one hour. Food 5MeTHF is absorbed more slowly, with peak plasma
concentrations after only 2 hours. Following consumption of oxidized folate, i.e. FA, peak
plasma concentrations are reached after only 3 hours because a reduction by DHFR is
required prior to release in the portal circulation.(Konings et al. 2002)
2.4.1. Sample preparation
Samples for clinical folate analysis are typically obtained following venepuncture. Serum
samples are more commonly used for folate analysis than plasma samples.
Ethylenediaminetetraacetic acid (EDTA) is the most used anticoagulant to generate plasma as
well as for whole blood folate analysis. An alternative sampling strategy, limiting the burden
on the patient, is the collection of dried blood spots (DBS), obtained following a finger or heel
prick.(Velghe et al. 2016) Already in 1999, O’Broin and Gunter reported on the use of a MA
for screening the folate status in neonates in DBS.(O’Broin and Gunter 1999) Recently, Kopp
and Rychlik published a stable isotope dilution assay using LC-MS/MS to determine
5MeTHF in dried blood and serum spots.(Kopp and Rychlik 2015) Hereby, aliquots of blood,
plasma or serum were spotted on paper pretreated with L-ascorbic acid (AA). The folates
were extracted from 3 mm punches by sonication in a buffer containing 2-(N-morpholino)-
ethanesulfonic acid, Triton X-100 and dithiothreitol (DTT). To measure total folate, whole
blood spot extracts were treated with rat serum and chicken pancreas GGH. Plasma folates
could be determined from whole blood spots by first performing heat denaturation to abolish
Chapter III: Determination of clinical folate status
45
endogenous GGH activity. These authors found that 5MeTHF could be determined at LOD’s
of 1.5, 2.2 and 9.1 nM for serum, plasma and whole blood, respectively, and that spotted
samples were stable for 11 days when kept desiccated at -20°C. During storage and
extraction, the presence of labeled internal standards compensated for the degradation of the
folates present. Pretreating the paper with AA did not provide adequate stabilization of THF,
which consequently could not be quantified.(Kopp and Rychlik 2015) For longer storage,
lower storage temperatures (-80°C) are required, as shown by Zimmerman et al.(Zimmerman
et al. 2013)
2.4.2. Anticoagulant vs sample stability
Using a variety of analytical methods, Hannisdal et al. investigated the influence of
anticoagulants on folate stability during storage at room temperature. Strikingly, these authors
found a significant impact of EDTA-treatment on the stability of 5MeTHF. During the first
hours of storage a significant oxidation of this folate to MeFox was observed. Given its
biological inactivity, this compound is not measured using a MA. However, the total folate
content (including MeFox), either measured via LC-MS/MS or gas chromatography mass
spectrometry (GC-MS) analysis of pABA-glutamate(s), is not influenced by this oxidation
reaction.(Hannisdal et al. 2009a) In a study investigating the stability of fat- and water-soluble
vitamins during long term storage at -20°C, a similar pattern was observed for EDTA-plasma
samples analyzed by a competitive binding assay. Based on the data obtained, storage was
considered acceptable up to 6 months, provided that samples were kept at -20°C.(Ocké et al.
1995) Serum samples as well as citrate or heparin treated plasma samples showed less
oxidation and should therefore be preferred when long term storage is foreseen.(Hannisdal et
al. 2009a) However, depending on the anticoagulant used, measured plasma folate
concentrations may differ to a limited extent.(Fazili and Pfeiffer 2004) Also the folate
concentration in erythrocytes was found to be influenced by the anticoagulant. O’Broin et al.
found substantial losses of folate activity (assessed by MA) in the presence of EDTA during
storage at room temperature, which were observed to a lesser extent in heparinized samples.
While heparinization may improve sample stability upon storage, fresh heparinized samples
readily had a slightly lower (3.61%) folate activity as compared to fresh EDTA-treated
samples.(O’Broin et al. 1980)
2.4.3. Stability during sample preparation
Erythrocyte folate analysis is commonly performed by 10-fold dilution of whole blood with a
1% AA solution in deionized water (pH=±3). The use of an antioxidant during cell lysis
ensures immediate protection against oxidative damage of intracellular folates. Also when an
alternative lysis procedure is performed, for instance using a selective ammonia based buffer
(Kiekens et al. 2015; Chapter V), the addition of AA is required to protect the intracellular
folates against degradation. However, the utilized procedure differs between labs and is
mentioned as a possible source of variability between methods due to incomplete lysis. This
was shown in a comparative study, in which lysis with a 1% AA solution without
neutralization provided complete and reproducible lysis.(O’Broin and Kelleher 2001)
Chapter III: Determination of clinical folate status
46
Addition of a thiol such as DTT or 2-mercaptoethanol is required to capture the formaldehyde
released by degradation of AA at elevated temperature. This is relevant since free
formaldehyde causes the methylation of THF to 5,10-methenyltetrahydrofolate
(5,10CH+THF) and, as such, influences the measured folate distribution.(De Brouwer et al.
2007)
Though performed in a food matrix, Patring et al. investigated the effect of different reducing
agents on the stability of folates during sample preparation. The addition of 2-
mercaptoethanol, DTT, 2,3-dimercapto-1-propanol and 2-thiobarbituric acid in combination
with sodium ascorbate was evaluated for different experimental conditions. The choice of
antioxidant had an effect on the measurement of THF following various sample treatment
procedures including heat treatment, freeze-thawing and frozen storage. While 2,3-
dimercapto-1-propanol was most effective, these authors suggested to evaluate the stability of
all folates for each specific sample treatment procedure, a suggestion we concur.(Patring et al.
2005)
Whole blood or RBC samples are commonly incubated at 37 °C for extended periods of time
to deconjugate the folate polyglutamates present, enabling determination of total folate
content. Since folates are relatively sensitive to elevated temperatures and oxidative stress,
their stabilization during this step is critical. De Brouwer et al. investigated the influence of
pH on folate recovery following 2 hours of incubation in a phosphate buffer with a pH
ranging between 4 and 8.(De Brouwer et al. 2007) While most folates proved stable at the
different pH levels, some degradation was observed for THF at acidic pH. Both DHF and
5,10CH2THF are extremely sensitive to incubation at a pH lower than 8. Though Strandler et
al. suggest the possible occurrence of 5,10CH2THF in living cells, this compound -being the
active intermediary for enzymatic methylation of uridylate to thymidylate- has yet to be
observed in clinical samples due to its limited stability.(Strandler et al. 2015) This property
implies that 5,10CH2THF, as well as DHF, cannot be measured in RBC samples using the
currently available methods.(De Brouwer et al. 2007; Strandler et al. 2015) Likewise,
10FoTHF, a possible intermediary during the purine biosynthesis, cannot be detected when
acidic conditions (e.g. a mobile phase with a pH<8) are employed, since it converts to
5,10CH+THF.(De Brouwer et al. 2007)
Akhtar et al. studied the influence of light on the stability of FA in aqueous solutions and
found that a high pH, exceeding 10.0, was optimal to minimize degradation.(Akhtar et al.
1999) However, since most sample treatment steps are performed at or below neutral pH,
sample treatment is best performed under subdued light.
2.4.4. Enzyme treatment
Theoretically, no enzyme treatment is necessary for the analysis of folates in serum or plasma
samples: while intracellular folate retention depends on polyglutamylation, only mono-
glutamates have been observed in plasma.(Shane 2010) This is owing to the presence of GGH
in plasma, an exopeptidase that deconjugates any polyglutamate that would be released in
plasma following cell lysis.(Galivan et al. 2000)
Chapter III: Determination of clinical folate status
47
Large quantities of proteins capable of binding folates, most importantly FBP, are found in
clinical samples, rendering folates unavailable for analysis. Total folate measurement requires
release of these bound folates via protease treatment or via gentle acidification, since both the
specific (FBP) and non-specific binding capacity is negligible below pH 4.(Kamen and
Caston 1986) In folate binding assays, strong alkali in combination with reducing agents like
DTT are used to denature all endogenous folate binding proteins.(Beggs et al. 1995)
2.4.5. Microbiological assay
The oldest, though still used, method for clinical folate analysis consists of the incubation of
diluted serum with the bacterium Lactobacillus rhamnosus (formerly known as Lactobacillus
casei). The growth rate of this bacterium, measured as optical density, can be correlated to the
folate concentration in the cellular environment.(Hoffbrand et al. 1966; O’Broin et al. 1973)
This method remains the benchmark for clinical folate analysis given its clear correlation with
a biological outcome. Though originally developed to measure folates in serum samples
(O’Broin et al. 1973), this method is also applied to whole blood lysates as a measure of RBC
folates. In 2011 Pfeiffer et al. published the results of a sample exchange study between 3
laboratories performing the MA.(Pfeiffer et al. 2011) The results were found to be
significantly influenced by the bacterial strain used during the assay (chloramphenicol
resistant ATCC 27773 vs. wild-type ATCC 7469) and even more by the folate species used to
construct the calibration curve. FA, which is relatively stable and therefore relatively easy to
manipulate, is predominantly used to calibrate the assay. However, bacterial growth is ±25%
lower, and therefore analytical results ±25% higher, compared to calibration with 5MeTHF.
Although calibration with 5MeTHF, the main folate species in clinical samples, likely
resembles actual samples more closely, its limited stability complicates calibration. Last, it
should be remarked that the presence of antibiotics -inhibiting bacterial growth- will
negatively influence the results.(Shane 2011)
2.4.6. Protein binding assay
While the MA requires overnight to 2 days of incubation, the protein binding assay does not.
This significantly speeds up the procedure, allowing compatibility with high-throughput
systems readily available in clinical labs. Additionally, in contrast to the MA this assay is not
influenced by the presence of antibiotics in the sample. The assay was originally performed as
a competitive binding radiolabel assay using 3H-FA.(Archibald et al. 1972) More recent
assays use ruthenium labeled FBP (Elecsys® Folate III) or FBP coated paramagnetic
microparticles (Abbott Architect Folate) in a competition reaction to measure folates in the
sample. Following incubation of the sample with the respective FBP preparation, biotinylated
FA and magnetic microparticle-bound streptavidin (Elecsys® Folate III) or a FA – acridinium
conjugate are added. The readout is based on chemiluminescence, the light emission being
inversely proportional to the folate concentration in the sample. As such, high signal
intensities are measured at low concentrations, improving sensitivity. While both are
automated assays, a similar principle - with either colorimetric or chemiluminescent readout-
can be applied off-line (e.g. in a 96-well format). In these assays, endogenous folates and a
FA – horseradish peroxidase (HRP) conjugate compete for binding to immobilized FBP (e.g.
VAST CLIA Microwells® and VAST ELISA Microwells
® Folate Test System from
Chapter III: Determination of clinical folate status
48
Monobind Inc. and AccuDiag™ Folate from Cortez Diagnostics).(Roche Diagnostics
International 2014; Abbott Ireland 2010; Monobind Inc. 2015a; Monobind Inc. 2015b;
Diagnostic Automation/ Cortez Diagnostics Inc. 2014)
Following a comparison of 5 binding assays to the reference radiolabel assay, Owen and
Roberts found that although comparable results were obtained for serum folate, results of
RBC samples strongly varied between different methods. These authors suggested that the
obtained results strongly depend on the lysis procedure, utilizing AA solutions with differing
concentration or detergents such as saponin or Triton X-100.(Owen and Roberts 2003)
Moreover, as protein binding assays rely on the selective binding of folates to FBP that is
added in the assay, an optimized sample pretreatment step is necessary to release folates from
endogenous FBP. Finally, it should also be noted that FBP has a different affinity towards
distinct folate species, which may lead to a bias.(Dakshinamurti 1994)
2.4.7. LC-MS/MS analysis
Multiple chromatographic methods have been developed for the measurement of 5MeTHF
and other folate species. The availability of LC-MS(/MS) equipment has fueled the
development of higher-order assays to measure folates in both serum or plasma and RBCs.
Below, we focus on the most recent developments for clinical folate analysis. For an in-depth
overview of other methods, we refer to Pfeiffer et al.(Pfeiffer et al., 2010)
GC-MS based methods rely on the cleavage of the 9-10 bond between the pterin and the
pABA-Glu moiety, followed by derivatization.(Santhoshkumar et al. 1995) Though these
methods allow for a total folate measurement, they do not allow for individual folate
speciation and rely on a quantitative (i.e. complete and selective) folate cleavage.
While most LC-MS/MS methods attempt to quantify the different folate species as they occur
at the time of phlebotomy, some methods explicitly interconvert some folate species. By
acidifying the final sample, both Wang et al. and van Haandel et al. determined 10FoTHF and
5FoTHF as 5,10CH+THF.(Wang et al. 2010; van Haandel et al. 2012) While at a pH below
10, almost instantaneous conversion of 10FoTHF to 5,10CH+THF will occur, it is possible to
determine 5FoTHF and 5,10CH+THF separately (cfr. Fazili and Pfeiffer 2004, Smith et al.
2006, De Brouwer et al. 2007, Kirsch et al. 2010, Fazili et al. 2013a, and Kiekens et al. 2015
(Chapter V)).
2.4.7.1. Sample Cleanup
To limit the presence of matrix compounds and assure method selectivity, sample cleanup is
performed prior to LC-MS/MS analysis. This can range from simple protein precipitation to
combined affinity and solid phase extraction (SPE). As with any sample cleanup procedure,
simplicity and robustness need to be balanced against the sensitivity and throughput that will
eventually be required.
While extensive sample treatment is often preferred to obtain purified extracts, some methods
simply use protein precipitation with an organic solvent, like methanol or acetonitrile,
followed by evaporation to dryness and reconstitution in mobile phase.(Garbis et al. 2001)
Chapter III: Determination of clinical folate status
49
For serum or plasma, this approach seems feasible since these are relatively clean matrices.
For RBCs, however, either SPE alone or SPE combined with affinity extraction is needed.
Given its selectivity, FBP is ideally suited to extract folates from complex matrices. While
FBP is now commercially available in purified form, it can also be obtained from bovine
milk. For affinity extraction procedures, FBP is bound to agarose beads and stored
refrigerated in the presence of sodium azide as a preservative.(Hart et al. 2002; Nelson et al.
2004) Sample preparation is performed in a column configuration, with elution under acidic
conditions since FBP shows little folate retention at a pH below 4. The fact that FBP does not
have equal affinity for all folate species necessitates a substantial excess of binding sites to
quantitatively retain all folates.(Dakshinamurti 1994) The number of samples which can be
purified using one column is limited due to degradation of and irreversible binding to the
protein. As such, there is a gradual decrease of binding capacity, which has to be controlled to
avoid erroneous sample handling.(Nygren-Babol and Jägerstad 2012)
Recently developed methods have shown the value of SPE. Especially for the analysis of
numerous samples, SPE is preferred over FBP columns. For low-throughputs, manual
column-format SPE can be used, while for higher throughputs, the different SPE steps can be
automated and/or 96-well formats can be used.(Fazili et al. 2013a) Both reversed phase and
ion exchange sorbents can be used to separate folates from matrix constituents, the former
being used more frequently. Phenyl and octadecyl sorbents are most frequently used and
elution is often performed using a small percentage of organic solvent, either methanol or
acetonitrile, acidified to correspond to the mobile phase. Samples can be concentrated prior to
injection by evaporation or by using a vacuum system, followed by reconstitution in the initial
mobile phase or in another appropriate solvent.(Garbis et al. 2001; Hart et al. 2002; Pfeiffer et
al. 2004; Nelson et al. 2004; Smith et al. 2006; Owens et al. 2007; Thorpe et al. 2007;
Hannisdal et al. 2009b; Kirsch et al. 2010; Monch et al. 2010; Kirsch et al. 2012; Fazili and
Pfeiffer 2013b; Kiekens et al. 2015 (Chapter V))
2.4.7.2. Chromatographic separation
Both standard HPLC and UHPLC have been applied for the separation of folate species in
clinical samples. Using traditional reversed phase columns, typically C8 or C18, folate species
can relatively easily be separated. MeFox, despite being an oxidation product of 5MeTHF, is
also worth measuring as it allows insight into possible oxidative stress the sample was subject
to during e.g. sample storage or treatment. However, care should be taken to differentiate
MeFox from its isobar 5FoTHF, which requires optimization of chromatography.(Fazili and
Pfeiffer 2013b; Hannisdal et al. 2009a) Alternatively, when using MS/MS-based detection, it
is possible to distinguish both folate species by selecting certain product ions (see 2.4.7.3),
although maximal sensitivity may not be achieved this way.(Fazili and Pfeiffer 2013b)
Separation is mostly achieved by applying gradient elution with acidic mobile phases
containing either acetic or formic acid in ultrapure water and methanol, acetonitrile or a
combination of both. The use of salt buffers is not common and mainly reserved for HILIC
chromatography.(Garbis et al. 2001) In 2006, Patring et al. investigated the elution pattern of
folates when varying the stationary phase and the mobile phase constituents. The ionization of
Chapter III: Determination of clinical folate status
50
the α- (pKa= 3.1 - 3.5) and γ- (pKa= 4.6 - 4.8) carboxyl groups of the glutamate part of the
folate molecule was found to influence the retention behavior. A pH<3 is needed to
completely suppress the ionization of both carboxyl groups. At higher pH (>3), the retention
of the folates decreases to a varying extent depending on the column chemistry. This also
negatively impacts peak symmetry and peak width. This effect is also noticed when the
amount of organic solvent at the time of injection is increased. High retention of folates was
achieved on columns with either polar endcapping or with a high carbon content. When
volatile modifiers are used, i.e. either acetic or formic acid, retention is generally increased
while peak shape deteriorates, though this effect was most pronounced using polar endcapped
columns.(Patring et al. 2006) As evidenced by column usage of the methods shown in Table
III.1, it is hard to predict which column will work best, based on column characteristics.
2.4.7.3. Detection methodology
Both ultraviolet, fluorescence (Vahteristo et al. 1996; Ndaw et al. 2001) and electrochemical
(Bagley and Selhub 2000) detection have been applied for folate analysis in food items.
Reduced folates show strong fluorescence (290-295 nm→ 356 nm), making this type of
detection highly efficient and specific for the detection of THF, 5MeTHF and 5FoTHF in
food matrices and for quality control purposes. Typical methods using fluorescence detection
for 5MeTHF in food items have an LOD of 20 to 40 fmol on column. (Vahteristo et al. 1996;
Ndaw et al. 2001) Oxidized folates do not fluoresce but all folates can be detected using a UV
detector (±280 nm), albeit at the expense of sensitivity, which drops with a factor 50 to 100
compared to fluorescence detection.(Ndaw et al. 2001) With detection limits down to 0.2 to
0.4 fmol on column, recent LC-MS methods for the determination of folates in plasma or
serum are 50 to 100 times more sensitive than fluorescence detection. As such, the use of
fluorescence detection for clinical folate analysis would be limited to the quantification of
RBC or whole blood folates due to the higher folate concentration in these samples. UV and
electrochemical detection are not able to match the sensitivity of fluorescence detection and
cannot be used for clinical samples as they would require vast sample volumes.(Bagley and
Selhub 2000)
For clinical analyses, MS (and more particularly MS/MS) is most used as detection technique
hyphenated with liquid chromatography. Folates, containing both alkaline (pterin moiety) and
acidic (glutamate moiety) sites, can be positively and negatively charged in the pH range of
mobile phases containing volatile modifiers such as acetic and formic acid. As such, MS
systems can be operated both in positive and negative mode. Electrospray ionization (ESI) is
most commonly used as an interface system to vaporize the mobile phase. To achieve high
ionization efficiencies, a modifier (i.e. formic or acetic acid) is commonly used and is either
included in the mobile phase (cfr. 2.4.7.2) or infused post column.(Owens et al. 2007) In
general, folates show predominant single ionization in either negative or positive mode, with
the latter being used most. However, double ionization can occur, though more in positive
than in negative mode. As such, singly charged ions are typically used as Q1 ions (MW+1 or
MW-1) during MS/MS-analysis. Generally, 2 fragment ions are monitored, as this allows to
add the ion ratio as an extra identification criterion. In positive mode, the most abundant
fragment ion, used as quantifier, generally consists of the ionized remainder (pterin-pABA+●
),
Chapter III: Determination of clinical folate status
51
following neutral loss of the glutamic acid● moiety.(Smith et al. 2006; Patring and Jastrebova
2007) 5,10CH+THF differs from the other folates in that the glutamate moiety is not split off
due to the withdrawal of electrons from the nitrogen atom at the 10 position and the resulting
influence on ion stabilization.(Smith et al. 2006) During fragmentation, the formyl groups
bound to the nitrogen at the 5 or 10 position have a tendency to split off. This phenomenon,
the expulsion of CO, does not influence the charge of the remaining ion and has little
influence on the signal intensity of the ion which is monitored.(Freisleben et al. 2003) The
second fragment ion is typically formed via cleavage of the bond between position 6 and 9 or
9 and 10, yielding ions of 166 (representing the reduced pterin cation), 176 or 194 Da (the
latter two resulting from loss of both Glu and pABA). For 5,10CH+THF, the second fragment
ion that is typically followed is formed after the loss of glutamate-C=O.(De Brouwer et al.
2008) The quantitative LC-MS/MS determination of 5FoTHF and MeFox is complicated by
their identical molecular mass of 474 amu and the fact that both are predominantly
fragmented to a fragment ion of 327 amu. Both compounds also have a tendency to coelute.
Though baseline resolution is achievable, the less abundant ions of 284 and 299 amu, specific
for MeFox and 5FoTHF, respectively, can be used as quantifiers.(Fazili and Pfeiffer 2013b)
2.4.8. Method comparability
Method comparability has remained a substantial issue hindering folate analysis because of
the influence of several procedural aspects such as the use of calibrators, strains of micro-
organisms and antioxidants. To this day, the MA, despite its limitations, is still considered the
gold standard for folate measurement. As such, the performance of alternative methods such
as PBA and LC-MS/MS assays is measured against this MA.(Yetley et al. 2011) For serum or
plasma, the total folate results obtained using the MA (calibrated with 5MeTHF) and LC-
MS/MS analysis were found to be in good agreement, although slightly higher concentrations
were found with LC-MS/MS. Results obtained using a PBA (calibrated with FA) were much
(i.e. close to 30%) lower than those of either the MA or LC-MS/MS assay. This is likely due
to a lower recovery of certain folate species, amongst which 5MeTHF, in the PBA.(Fazili et
al. 2007) As such, results depend on whether 5MeTHF or FA is used as a calibrator. (Fazili et
al. 2007) For RBC folates, a good agreement was found between results obtained by MA and
those obtained by LC-MS/MS, although here total folates determined by LC-MS/MS were
10% lower than those scored by MA. Again, a substantial difference was seen between the
results obtained by MA and PBA, the results in the latter being 45% lower. Importantly, this
difference was genotype dependent, with as an underlying cause a differential recovery of
different folate species.(Fazili et al. 2008) As such, the MA was maintained as reference
method for whole blood or RBC folate measurement.(Yetley et al. 2011)
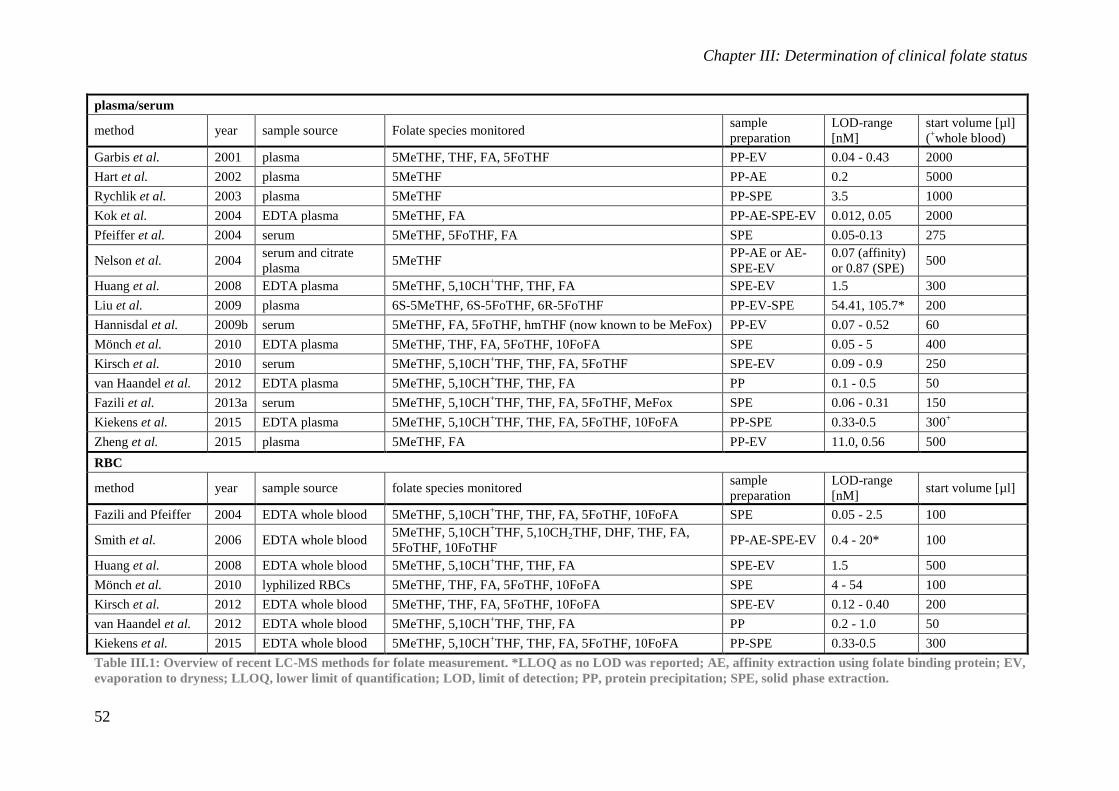
Chapter III: Determination of clinical folate status
52
plasma/serum
method year sample source Folate species monitored sample
preparation
LOD-range
[nM]
start volume [µl]
(+whole blood)
Garbis et al. 2001 plasma 5MeTHF, THF, FA, 5FoTHF PP-EV 0.04 - 0.43 2000
Hart et al. 2002 plasma 5MeTHF PP-AE 0.2 5000
Rychlik et al. 2003 plasma 5MeTHF PP-SPE 3.5 1000
Kok et al. 2004 EDTA plasma 5MeTHF, FA PP-AE-SPE-EV 0.012, 0.05 2000
Pfeiffer et al. 2004 serum 5MeTHF, 5FoTHF, FA SPE 0.05-0.13 275
Nelson et al. 2004 serum and citrate
plasma 5MeTHF
PP-AE or AE-
SPE-EV
0.07 (affinity)
or 0.87 (SPE) 500
Huang et al. 2008 EDTA plasma 5MeTHF, 5,10CH+THF, THF, FA SPE-EV 1.5 300
Liu et al. 2009 plasma 6S-5MeTHF, 6S-5FoTHF, 6R-5FoTHF PP-EV-SPE 54.41, 105.7* 200
Hannisdal et al. 2009b serum 5MeTHF, FA, 5FoTHF, hmTHF (now known to be MeFox) PP-EV 0.07 - 0.52 60
Mönch et al. 2010 EDTA plasma 5MeTHF, THF, FA, 5FoTHF, 10FoFA SPE 0.05 - 5 400
Kirsch et al. 2010 serum 5MeTHF, 5,10CH+THF, THF, FA, 5FoTHF SPE-EV 0.09 - 0.9 250
van Haandel et al. 2012 EDTA plasma 5MeTHF, 5,10CH+THF, THF, FA PP 0.1 - 0.5 50
Fazili et al. 2013a serum 5MeTHF, 5,10CH+THF, THF, FA, 5FoTHF, MeFox SPE 0.06 - 0.31 150
Kiekens et al. 2015 EDTA plasma 5MeTHF, 5,10CH+THF, THF, FA, 5FoTHF, 10FoFA PP-SPE 0.33-0.5 300
+
Zheng et al. 2015 plasma 5MeTHF, FA PP-EV 11.0, 0.56 500
RBC
method year sample source folate species monitored sample
preparation
LOD-range
[nM] start volume [µl]
Fazili and Pfeiffer 2004 EDTA whole blood 5MeTHF, 5,10CH+THF, THF, FA, 5FoTHF, 10FoFA SPE 0.05 - 2.5 100
Smith et al. 2006 EDTA whole blood 5MeTHF, 5,10CH
+THF, 5,10CH2THF, DHF, THF, FA,
5FoTHF, 10FoTHF PP-AE-SPE-EV 0.4 - 20* 100
Huang et al. 2008 EDTA whole blood 5MeTHF, 5,10CH+THF, THF, FA SPE-EV 1.5 500
Mönch et al. 2010 lyphilized RBCs 5MeTHF, THF, FA, 5FoTHF, 10FoFA SPE 4 - 54 100
Kirsch et al. 2012 EDTA whole blood 5MeTHF, THF, FA, 5FoTHF, 10FoFA SPE-EV 0.12 - 0.40 200
van Haandel et al. 2012 EDTA whole blood 5MeTHF, 5,10CH+THF, THF, FA PP 0.2 - 1.0 50
Kiekens et al. 2015 EDTA whole blood 5MeTHF, 5,10CH+THF, THF, FA, 5FoTHF, 10FoFA PP-SPE 0.33-0.5 300
Table III.1: Overview of recent LC-MS methods for folate measurement. *LLOQ as no LOD was reported; AE, affinity extraction using folate binding protein; EV,
evaporation to dryness; LLOQ, lower limit of quantification; LOD, limit of detection; PP, protein precipitation; SPE, solid phase extraction.
Chapter III: Determination of clinical folate status
53
2.4.8.1. Assay calibration
One of the major issues complicating folate analysis is the comparability of analytical results
between labs throughout the world. Therefore, correct calibration of an assay is of paramount
importance to obtain correct results.
Perhaps the most important part of an assay is its calibration using pure reference standards.
These can be obtained from various sources, such as Merck Eprova (Schaffenhausen,
Switzerland), Schircks Laboratories (Jona, Switzerland) or Sigma-Aldrich (Saint-Louis, MO,
USA). As mentioned above, several authors have indicated that the calibrator choice can
strongly influence analytical results.(Pfeiffer et al. 2004; Fazili et al. 2007) More specifically,
owing to a difference in recovery for individual folate species, the protein-binding assay is not
able to match the results of both an LC-MS/MS assay or MA. In LC-MS/MS, the actual panel
of folates that is measured will determine the eventual total folate concentration, as the latter
is derived from the sum of the individual folate species. On the other hand, the composition of
the panel of folates that can be reliably quantified, depends on the availability of pure
reference standards.
While the use of MS allows to differentiate individual folate species, the technique does
suffer from matrix-associated effects, including differences between individual samples
influencing the measured signal. For this reason, isotopically labeled internal standards are
commonly used for LC-MS/MS folate analyses, then named stable isotope dilution assays, to
compensate for the influence of the matrix on recovery and ionization efficiency. For this
purpose, isotopologues of the parent compounds are used in which either carbon or hydrogen
atoms are replaced with 13
C or 2H atoms. A mass difference of 4 to 5 atomic mass units (amu)
ensures that the analyte and the IS can be monitored separately, given the presence of natural
isotopologues in samples (up to +2 amu).(Freisleben et al. 2002) While deuterated ISs are
easier to manufacture, deuterium ions from the IS and hydrogen atoms from the aqueous
solvent can interchange, which impacts the isotopic purity of the IS and may influence the
analytical result. Also, given their location at the outside edge of the molecule, deuteration
can change the charge density of the molecule, thereby slightly influencing its retention
time.(Stokvis et al. 2005) For this reason, 13
C-labeled ISs are preferred over deuterium
labeled ISs. Unfortunately, not every folate form has its own labeled IS commercially
available. In that case, the nearest folate species in terms of stability and elution time is used
as an IS. However, it should be evaluated on a case-by-case basis which IS is most
appropriate for a specific folate.
The limited stability of folates also requires careful storage of prepared calibrators and, if
these are gravimetrically prepared, likewise careful storage of the powder form. Reduced
folates are susceptible to oxidative degradation while some, like 5FoTHF, are very
hygroscopic. Therefore, it is advised to verify the purity of the standard material as part of the
preparation of stock solutions. This can be performed spectrophotometrically based on the
molar extinction measured by Blakley.(Blakley 1969) In addition, it is worth bearing in mind
that AA, commonly used to stabilize folates in solutions, absorbs light at the same
wavelengths as folates, making the spectrophotometric verification of folate concentrations in
the presence of this antioxidant impossible.(Karayannis et al. 1977)
Chapter III: Determination of clinical folate status
54
2.4.8.2. Possible certified reference materials and the values measured
Key to the evaluation of method performance is the use of reference materials with a known
folate content. These are commercially available samples that allow the comparison of results
obtained in different laboratories. Ideally, the concentration obtained should match, although
for sensitive compounds, such as folates, this may be a tall order.
To accurately assess the performance of an entire method, a certified reference material
(CRM) should resemble a real sample as close as possible. The spiking of folates to samples
can be problematic due to differences in protein binding and may lead to divergent extraction
behavior. It is therefore preferred to mix different blood pools to obtain a certain folate
concentration. However, this is not always possible due to the limited and unpredictable
presence of non-5MeTHF-folates.
Two WHO international standards are available for folates through The National Institute for
Biological Standards and Control (NIBSC), one consisting of lyophilized serum (03/178) and
the other of a lyophilized whole blood lysate (95/528). The NIBSC serum reference material
has been assigned reference values for total folate, as well as for 5MeTHF, 5FoTHF and FA.
The consensus concentrations were reached following the analysis of the standard material by
24 laboratories in 7 different countries, published by Thorpe et al. in 2007.(Thorpe et al.
2007) These included 19 protein binding assays, 3 MA and 2 LC-MS/MS assays. Though
significant variability was observed between the results obtained using the different assays,
this study showed the potential of such a reference material. When the reference standard
03/178 for folates in serum was used to correct for the systematic error between the
laboratories, significant gains in comparability were obtained.(Thorpe et al. 2007)
Also NIST (National Institute of Standards and Technology, Gaithersburg, MD, USA) has
issued a standard for folates in serum, the standard reference material (SRM) 1955.(Satterfield
et al. 2006) To replace the SRM 1955 when stocks were depleted, a new standard reference
material was prepared, i.e. the SRM 3949. This is a set of three serum samples, devised to
contain, apart from 5MeTHF and FA, the minor folate species THF, 5FoTHF, MeFox and
5,10CH+THF. Given the limited availability of analytical results, consensus concentrations for
the different folate species using a variety of methods have not been reached yet.(Camara et
al. 2015)
For whole blood lysate (95/528), a consensus value was assigned following a study in which
13 laboratories participated for a total of 34 assay results. Unfortunately, only MA and PBAs
were used.(Thorpe et al. 2004) However, recently we published an LC-MS/MS method for
the analysis of folates in RBC samples which includes data obtained using this reference
material.(Kiekens et al. 2015; Chapter V) Table III.2 lists the consensus concentrations for the
reference materials (serum and whole blood) for the different analytical techniques, where
available.
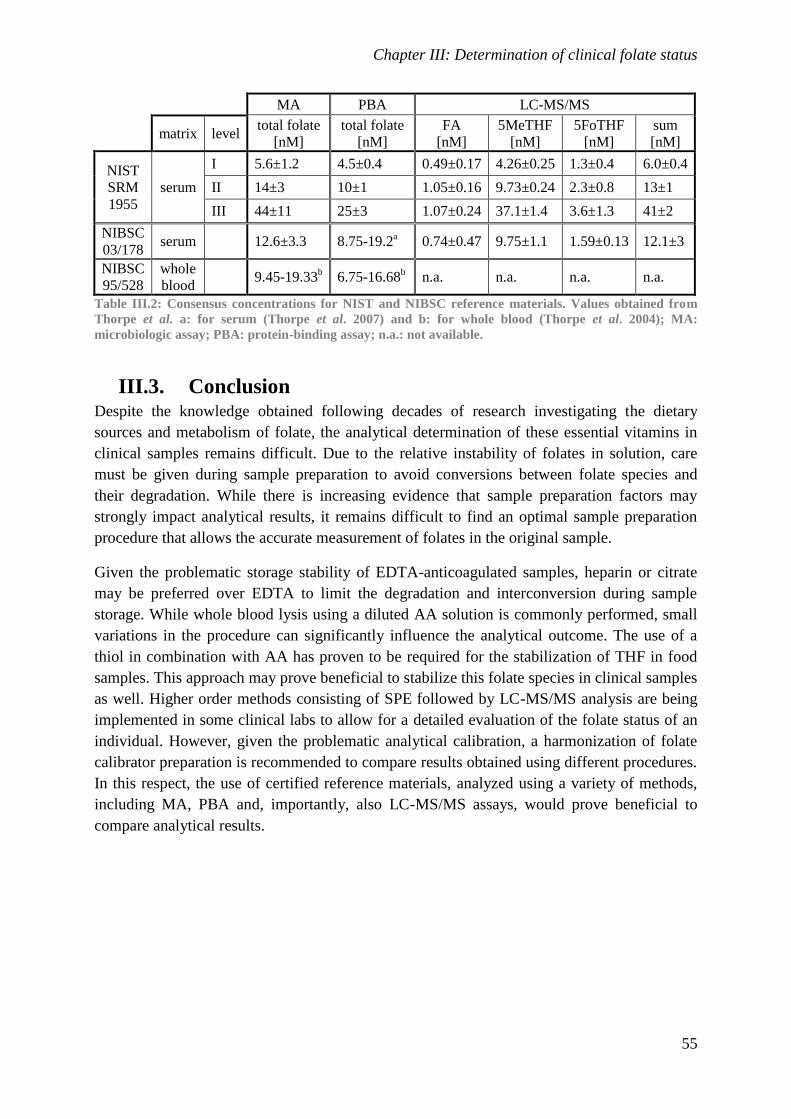
Chapter III: Determination of clinical folate status
55
MA PBA LC-MS/MS
matrix level
total folate
[nM]
total folate
[nM]
FA
[nM]
5MeTHF
[nM]
5FoTHF
[nM]
sum
[nM]
NIST
SRM
1955
serum
I 5.6±1.2 4.5±0.4 0.49±0.17 4.26±0.25 1.3±0.4 6.0±0.4
II 14±3 10±1 1.05±0.16 9.73±0.24 2.3±0.8 13±1
III 44±11 25±3 1.07±0.24 37.1±1.4 3.6±1.3 41±2
NIBSC
03/178 serum
12.6±3.3 8.75-19.2
a 0.74±0.47 9.75±1.1 1.59±0.13 12.1±3
NIBSC
95/528
whole
blood
9.45-19.33
b 6.75-16.68
b n.a. n.a. n.a. n.a.
Table III.2: Consensus concentrations for NIST and NIBSC reference materials. Values obtained from
Thorpe et al. a: for serum (Thorpe et al. 2007) and b: for whole blood (Thorpe et al. 2004); MA:
microbiologic assay; PBA: protein-binding assay; n.a.: not available.
III.3. Conclusion Despite the knowledge obtained following decades of research investigating the dietary
sources and metabolism of folate, the analytical determination of these essential vitamins in
clinical samples remains difficult. Due to the relative instability of folates in solution, care
must be given during sample preparation to avoid conversions between folate species and
their degradation. While there is increasing evidence that sample preparation factors may
strongly impact analytical results, it remains difficult to find an optimal sample preparation
procedure that allows the accurate measurement of folates in the original sample.
Given the problematic storage stability of EDTA-anticoagulated samples, heparin or citrate
may be preferred over EDTA to limit the degradation and interconversion during sample
storage. While whole blood lysis using a diluted AA solution is commonly performed, small
variations in the procedure can significantly influence the analytical outcome. The use of a
thiol in combination with AA has proven to be required for the stabilization of THF in food
samples. This approach may prove beneficial to stabilize this folate species in clinical samples
as well. Higher order methods consisting of SPE followed by LC-MS/MS analysis are being
implemented in some clinical labs to allow for a detailed evaluation of the folate status of an
individual. However, given the problematic analytical calibration, a harmonization of folate
calibrator preparation is recommended to compare results obtained using different procedures.
In this respect, the use of certified reference materials, analyzed using a variety of methods,
including MA, PBA and, importantly, also LC-MS/MS assays, would prove beneficial to
compare analytical results.
Chapter III: Determination of clinical folate status
56
III.4. References Abbott Ireland. 2010. “Architect System - Folate.”
http://www.ilexmedical.com/files/PDF/Folate_ARC.pdf. (consulted: 02/21/2016)
Akhtar, M., Jamil, M., Ataullah, K., and Iqbal, A. 1999. “Photodegradation of Folic Acid in
Aqueous Solution.” J Pharmaceut Biomed 19 (3–4): 269–75.
Archibald, E.L., Mincey, E.K., and Morrison, R.T. 1972. “Estimation of Serum Folate Levels
by Competitive Protein Binding Assay.” Clin Biochem 5 (4): 232–41.
Bagley, P.J. and Selhub, J. 2000. “Analysis of Folate Form Distribution by Affinity Followed
by Reversed- Phase Chromatography with Electrical Detection.” Clin Chem 46 (3): 404–
11.
Bailey, L.B. and Gregory, J.F.III 1999. “Folate Metabolism and Requirements.” J Nutr 129
(4): 779–82.
Beggs, M.J., Sohn, L.J., Herrmann, R.J., Hsu, S., Hawksworth, D.J. and Pinkus, M.S. 1995.
“Folate Immunoassay Utilizing Folate Binding Protein in a Multiclonal Antibody
Format.” Google Patents. http://www.google.com/patents/US5434087. (consulted:
03/11/2016)
Blakley, R.L. 1969. The Biochemistry of Folic Acid and Related Pteridines. North-Holland
Publishing Company.
Camara, J.E., Pritchett, J.S., Daniels, Y.C., Phinney, K.W., Sander, L.C., and Lowenthal,
M.S. 2015. “Value Assignment of Candidate Standard Reference Material® 3949 Folate
Vitamers in Frozen Human Serum by Isotope-Dilution LC-MS/MS.” Edited by The
Association for Mass Spectrometry: Applications to the Clinical Lab. MSACL 2015 US.
San Diego, CA.
Dakshinamurti, K. 1994. Vitamin Receptors: Vitamins as Ligands in Cell Communication -
Metabolic Indicators. Cambridge University Press, Cambridge, UK.
de Benoist, B. 2008. “Conclusions of a WHO Technical Consultation on Folate and Vitamin
B12 Deficiencies.” Food Nutr Bull 29 (2 Suppl): S238–44.
De Brouwer, V., Zhang, G.F., Storozhenko, S., Van Der Straeten, D. and Lambert, W.E.
2007. “pH Stability of Individual Folates during Critical Sample Preparation Steps in
Prevision of the Analysis of Plant Folates.” Phytochem Anal 18 (6): 496–508.
De Brouwer, V., Storozhenko, S., Van De Steene, J.C., Wille, S.M.R, Stove, C.P., Van Der
Straeten, D. and Lambert, W.E. 2008. “Optimisation and Validation of a Liquid
Chromatography–tandem Mass Spectrometry Method for Folates in Rice.” J
Chromatogr A 1215 (1–2): 125–32.
DeVos, L., Chanson, A., Liu, Z., Ciappio, E.D., Parnell, L.D., Mason, J.B., Tucker, K.L. and
Crott, J.W. 2008. “Associations between Single Nucleotide Polymorphisms in Folate
Uptake and Metabolizing Genes with Blood Folate, Homocysteine, and DNA Uracil
Concentrations.” Am J Clin Nutr 88 (4): 1149–58.
Chapter III: Determination of clinical folate status
57
Diagnostic Automation/ Cortez Diagnostics Inc. 2014. “AccuDiagTM Folate ELISA Kit.”
http://www.rapidtest.com/pdf/Folate_3127-15%2808-21-2014%29.pdf. (consulted:
02/21/2016)
Fazili, Z. and Pfeiffer, C.M. 2004. “Measurement of Folates in Serum and Conventionally
Prepared Whole Blood Lysates: Application of an Automated 96-Well Plate Isotope-
Dilution Tandem Mass Spectrometry Method.” Clin Chem 50 (12): 2378–81.
Fazili, Z. and Pfeiffer, C.M. 2013b. “Accounting for an Isobaric Interference Allows Correct
Determination of Folate Vitamers in Serum by Isotope Dilution-Liquid
Chromatography-Tandem MS.” J Nutr 143 (1): 108–13.
Fazili, Z., Pfeiffer, C.M. and Zhang, M. 2007. “Comparison of Serum Folate Species
Analyzed by LC-MS/MS with Total Folate Measured by Microbiologic Assay and Bio-
Rad Radioassay.” Clin Chem 53 (4): 781–4.
Fazili, Z., Pfeiffer, C.M., Zhang, M., Jain, R.B. and Koontz, D. 2008. “Influence of 5,10-
Methylenetetrahydrofolate Reductase Polymorphism on Whole-Blood Folate
Concentrations Measured by LC-MS/MS, Microbiologic Assay, and Bio-Rad
Radioassay.” Clin Chem 54 (1): 197–201.
Fazili, Z., Whitehead, R.D.Jr., Paladugula, N., and Pfeiffer, C.M. 2013a. “A High-Throughput
LC-MS/MS Method Suitable for Population Biomonitoring Measures Five Serum Folate
Vitamers and One Oxidation Product.” Anal Bioanal Chem 405 (13): 4549–60.
Franco, R.F., Araujo, A.G., Guerreiro, J.F., Elion, J. and Zago, M.A. 1998. “Analysis of the
677 C--> T Mutation of the Methylenetetrahydrofolate Reductase Gene in Different
Ethnic Groups.” Thromb Haemostasis 79 (1): 119–21.
Freisleben, A., Schieberle, P. and Rychlik, M. 2002. “Syntheses of Labeled Vitamers of Folic
Acid to Be Used as Internal Standards in Stable Isotope Dilution Assays.” J Agric Food
Chem 50 (17): 4760–8.
Freisleben A., Schieberle P. and Rychlik M. 2003. “Specific and Sensitive Quantification of
Folate Vitamers in Foods by Stable Isotope Dilution Assays Using High-Performance
Liquid Chromatography-Tandem Mass Spectrometry.” Anal Bioanal Chem 376 (2):
149–56.
Galivan, J., Ryan, T.J., Chave, K., Rhee, M., Yao, R. and Yin, D. 2000. “Glutamyl Hydrolase:
Pharmacological Role and Enzymatic Characterization.” Pharmacol Therapeut 85 (3):
207–15.
Garbis, S.D., Melse-Boonstra, A., West, C.E. and van Breemen, R.B. 2001. “Determination of
Folates in Human Plasma Using Hydrophilic Interaction Chromatography-Tandem Mass
Spectrometry.” Anal Chem 73 (22): 5358–64.
Hannisdal, R., Ueland, P.M., Sven Jens Eussen, S.J., An Svardal, A. and Hustad, S. 2009.
“Analytical Recovery of Folate Degradation Products Formed in Human Serum and
Plasma at Room Temperature.” J Nutr 139 (7): 1415–8.
Hannisdal, R., Ueland, P.M. and Svardal, A.. 2009. “Liquid Chromatography-Tandem Mass
Spectrometry Analysis of Folate and Folate Catabolites in Human Serum.” Clin Chem 55
(6): 1147–54.
Chapter III: Determination of clinical folate status
58
Hart, D.J., Finglas, P.M., Wolfe, C.A., Mellon, F., Wright, A.J.A. and Southon, S. 2002.
“Determination of 5-Methyltetrahydrofolate (13C-Labeled and Unlabeled) in Human
Plasma and Urine by Combined Liquid Chromatography Mass Spectrometry.” Anal
Biochem 305 (2): 206–13.
Hoffbrand, A.V., Newcombe, F.A. and Mollin, D.L. 1966. “Method of Assay of Red Cell
Folate Activity and the Value of the Assay as a Test for Folate Deficiency.” J Clin
Pathol 19 (1): 17–28.
Huang, Y., Khartulyari, S., Morales, M.E., Stanislawska-Sachadyn, A., Von Feldt, J.M.,
Whitehead, A.S. and Blair, I.A . 2008. “Quantification of Key Red Blood Cell Folates
from Subjects with Defined MTHFR 677C>T Genotypes Using Stable Isotope Dilution
Liquid Chromatography/mass Spectrometry.” Rapid Commun Mass Spectrom 22 (16):
2403–12.
Kamen, B.A. and Caston J.D. 1986. “Properties of a Folate Binding Protein (FBP) Isolated
from Porcine Kidney.” Biochem Pharmacol 35 (14): 2323–9.
Karayannis, M.I., Samios, D.N. and Gousetis, C.H.P. 1977. “A Study of the Molar
Absorptivity of Ascorbic Acid at Different Wavelengths and pH Values.” Anal Chim
Acta 93: 275–9.
Kiekens, F., Van Daele, J., Blancquaert, D., Van Der Straeten, D., Lambert, W.E. and Stove,
C.P. 2015. “A Validated Ultra-High-Performance Liquid Chromatography-Tandem Mass
Spectrometry Method for the Selective Analysis of Free and Total Folate in Plasma and
Red Blood Cells.” J Chromatogr A 1398: 20–8.
Kirsch, S.H, Knapp, J.P., Herrmann, W. and Obeid, R. 2010. “Quantification of Key Folate
Forms in Serum Using Stable-Isotope Dilution Ultra Performance Liquid
Chromatography-Tandem Mass Spectrometry.” J Chromatogr B 878 (1): 68–75.
Kirsch, S.H., Herrmann, W., Geisel, J. and Obeid, R. 2012. “Assay of Whole Blood (6S)-5-
CH3-H4folate Using Ultra Performance Liquid Chromatography Tandem Mass
Spectrometry.” Anal Bioanal Chem 404 (3): 895–902.
Kok, R.M., Smith, D.E., Dainty, J.R., Van Den Akker, J.T., Finglas, P.M., Smulders, Y.M.,
Jakobs, C., De Meer, K. 2004. “5-Methyltetrahydrofolic acid and folic acid measured in
plasma with liquid chromatography tandem mass spectrometry: applications to folate
absorption and metabolism.” Anal Biochem 326 (2):129-38.
Konings, E.J., Troost, F.J., Castenmiller, J.J., Roomans, H.H., Van Den Brandt, P.A. and
Saris, W.H. 2002. “Intestinal Absorption of Different Types of Folate in Healthy
Subjects with an Ileostomy.” Br J Nutr 88 (3): 235–42.
Kopp, M. and Rychlik, M. 2015. “Quantitation of 5-Methyltetrahydrofolic Acid in Dried
Blood Spots and Dried Plasma Spots by Stable Isotope Dilution Assays.” PloS One 10
(11): e0143639.
Liu, K., Dai, X., Zhong, D., Deng, P., Ma, J., Chen, X. 2009. “Simultaneous determination of
6R-leucovorin, 6S-leucovorin and 5-methyltetrahydrofolate in human plasma using solid
phase extraction and chiral liquid chromatography-tandem mass spectrometry.” J Chrom
B 877(10):902-10
Chapter III: Determination of clinical folate status
59
Mönch, S., Netzel, M. Netzel, G. and Rychlik, M. 2010. “Quantitation of Folates and Their
Catabolites in Blood Plasma, Erythrocytes, and Urine by Stable Isotope Dilution
Assays.” Anal Biochem 398 (2): 150–60.
Monobind Inc. 2015a. “VAST CLIA Microwells Folate/Vitamin B12.”
https://system.netsuite.com/core/media/media.nl?id=579735&c=445858&h=6278ee8823
cc8e196510&_xt=.pdf&ck=UfNFrcwCAs0Uon0M&vid=UfNFrcwCAtEUoirZ&cktime=
131788&addrcountry=US. (consulted: 02/21/2016)
Monobind Inc. 2015b. “VAST ELISA Microwells Folate/Vitamin B12.”
https://system.netsuite.com/core/media/media.nl?id=443113&c=445858&h=e31908ec17
f31fa16bf8&_xt=.pdf&ck=UfNFrcwCAs0Uon0M&vid=UfNFrcwCAtEUoirZ&cktime=
131788&addrcountry=US. (consulted: 02/21/2016)
Ndaw, S., Bergaentzle, M.,Aoude-Werner, D.,Lahely, S. and Hasselmann, C. 2001.
“Determination of Folates in Foods by High-Performance Liquid Chromatography with
Fluorescence Detection after Precolumn Conversion to 5-Methyltetrahydrofolates.” J
Chromatogr A 928 (1): 77–90.
Nelson, B.C., Pfeiffer, C.M., Margolis, S.A. and Nelson, C.P. 2004. “Solid-Phase Extraction-
Electrospray Ionization Mass Spectrometry for the Quantification of Folate in Human
Plasma or Serum.” Anal Biochem 325 (1): 41–51.
Nygren-Babol, L., Jägerstad, M. 2012. “Folate-binding protein in milk: a review of
biochemistry, physiology, and analytical methods.” Crit Rev Food Sci Nutr 52 (5):410-
25.
O’Broin, J.D., Scott, J.M. and Temperley, I.J. 1973. “A Comparison of Serum Folate
Estimations Using Two Different Methods.” J Clin Pathol 26 (1): 80–1.
O’Broin, J.D., Temperley, I.J. and Scott, J.M. 1980. “Erythrocyte, Plasma, and Serum Folate:
Specimen Stability before Microbiological Assay.” Clin Chem 26 (3): 522–4.
O’Broin, S.D. and Gunter, E.W. 1999. “Screening of Folate Status with Use of Dried Blood
Spots on Filter Paper.” Am J Clin Nutr 70 (3): 359–67.
O’Broin, S., and Kelleher, B. 2001. “Optimization of Erythrocyte Folate Extraction.” Clin
Chem 47 (12): 2181–2.
Ocké, M.C., Schrijver,J., Obermann-De Boer, G.L., Bloemberg, B.P.M., Haenen, G.R.M.M.
and Kromhout, D. 1995. “Stability of Blood (pro) Vitamins during Four Years of Storage
At− 20 C: Consequences for Epidemiologic Research.” J Clin Epidemiol 48 (8): 1077–
85.
Owen, W.E. and Roberts, W.L. 2003. “Comparison of Five Automated Serum and Whole
Blood Folate Assays.” Am J Clin Pathol 120 (1): 121–6.
Owens, J.E., Holstege, D.M., and Clifford, A.J. 2007. “High-Throughput Method for the
Quantitation of Total Folate in Whole Blood Using LC-MS/MS.” J Agric Food Chem 55
(9): 3292–7.
Patring, J.D.M., Johansson, M.S., Yazynina, E. and Jastrebova, J.A. 2005. “Evaluation of
Impact of Different Antioxidants on Stability of Dietary Folates during Food Sample
Preparation and Storage of Extracts prior to Analysis.” Anal Chim Acta 553 (1): 36–42.
Chapter III: Determination of clinical folate status
60
Patring, J.D., Lanina, S.A. and Jastrebova, J.A. 2006. “Applicability of Alkyl-Bonded Ultra-
Pure Silica Stationary Phases for Gradient Reversed-Phase HPLC of Folates with
Conventional and Volatile Buffers under Highly Aqueous Conditions.” J Sep Sci 29 (6):
889–904.
Patring, J.D. and Jastrebova, J.A. 2007. “Application of Liquid Chromatography-Electrospray
Ionisation Mass Spectrometry for Determination of Dietary Folates: Effects of Buffer
Nature and Mobile Phase Composition on Sensitivity and Selectivity.” J Chromatogr A
1143 (1-2): 72–82.
Pfeiffer, C.M, Fazili, Z., McCoy, L., Zhang, M. and Gunter, E.W. 2004. “Determination of
Folate Vitamers in Human Serum by Stable-Isotope-Dilution Tandem Mass
Spectrometry and Comparison with Radioassay and Microbiologic Assay.” Clin Chem
50 (2): 423–32.
Pfeiffer, C.M., Fazili, Z., and Zhang, M. 2010. “Folate Analytical Methodology.” In Folate in
Health and Disease, edited by L.B. Bailey, 2nd ed., 517–574. Boca Raton, FL: CRC
Press, Taylor & Francis Group.
Pfeiffer, C.M., Zhang, M., Lacher, D.A., Molloy, A.M., Tamura, T., Yetley, E.A., Picciano,
M.F. and Johnson, C.L. 2011. “Comparison of Serum and Red Blood Cell Folate
Microbiologic Assays for National Population Surveys.” J Nutr 141 (7): 1402–9.
Pfeiffer, C.M., Sternberg, M.R., Fazili, Z., Lacher, D.A., Zhang, M., Johnson, C.L., Hamner,
H.C. et al. 2015. “Folate Status and Concentrations of Serum Folate Forms in the US
Population: National Health and Nutrition Examination Survey 2011–2.” Br J Nutr 113
(12): 1965–77.
Roche Diagnostics International Ltd. 2014. “Elecsys® Folate III.” http://www.roche-
diagnostics.ch/content/dam/corporate/roche-
dia_ch/documents/broschueren/professional_diagnostics/serumarbeitsplatz/immunologie
/anamie/EN_Anemia_Factsheet_Folate.pdf. (consulted: 02/21/2016)
Rychlik, M., Netzel, M., Pfannebecker, I., Frank, T., Bitsch, I. 2003. “Application of stable
isotope dilution assays based on liquid chromatography-tandem mass spectrometry for
the assessment of folate bioavailability.” J Chromatogr B 792 (2):167-76.
Santhoshkumar, C.R., Deutsch, J.C., Hassell, K.L., Kolhouse, N.M. and Kolhouse, J.F. 1995.
“Quantitation of Red Blood Cell Folates by Stable Isotope Dilution Gas
Chromatography-Mass Spectrometry Utilizing a Folate Internal Standard.” Anal
Biochem 225 (1): 1–9.
Satterfield, M.B., Sniegoski, L.T., Sharpless, K.E., Welch, M.J., Hornikova, A., Zhang, N.-F.
Pfeiffer, C.M., Fazili, Z., Zhang, M. and Nelson, B.C. 2006. “Development of a New
Standard Reference Material: SRM 1955 (homocysteine and Folate in Human Serum).”
Anal Bioanal Chem 385 (3): 612–22.
Selhub, J., Jacques, P.F., Dallal, G., Choumenkovitch, S. and Rogers, G. 2008. “The Use of
Blood Concentrations of Vitamins and Their Respective Functional Indicators to Define
Folate and Vitamin B12 Status.” Food Nutr Bull 29 (2 Suppl): S67–73.
Shane, B. 2010. “Folate Chemistry and Metabolism.” In Folate in Health and Disease, edited
by L.B. Bailey, 2nd ed., 1–24. Boca Raton, FL: CRC Press, Taylor & Francis Group.
Chapter III: Determination of clinical folate status
61
Shane, B. 2011. “Folate Status Assessment History: Implications for Measurement of
Biomarkers in NHANES.” Am J Clin Nutr 94 (1): 337S – 342S.
Smith, D. E., Kok, R.M., Teerlink, T., Jakobs, C. and Smulders, Y.M. 2006. “Quantitative
Determination of Erythrocyte Folate Vitamer Distribution by Liquid Chromatography-
Tandem Mass Spectrometry.” Clin Chem Lab Med 44 (4): 450–9.
Stokvis, E., Rosing, H. and Beijnen, J.H. 2005. “Stable Isotopically Labeled Internal
Standards in Quantitative Bioanalysis Using Liquid Chromatography/mass
Spectrometry: Necessity or Not?” Rapid Commun Mass Spectrom 19 (3): 401–7.
Strandler, H.S., Patring, J., Jagerstad, M., and Jastrebova, J. 2015. “Challenges in the
Determination of Unsubstituted Food Folates: Impact of Stabilities and Conversions on
Analytical Results.” J Agric Food Chem 63 (9): 2367–77.
Thorpe, S.J., Sands, D., Heath, A.B. Hamilton, M.S., Blackmore, S. and Barrowcliffe, T.
2004. “An International Standard for Whole Blood Folate: Evaluation of a Lyophilised
Haemolysate in an International Collaborative Study.” Clin Chem Lab Med 42 (5): 533–
9.
Thorpe, S.J., Heath, A., Blackmore, S., Lee, A. Hamilton, M., O’broin, S., Nelson, B.C. and
Pfeiffer, C.M. 2007. “International Standard for Serum Vitamin B(12) and Serum Folate:
International Collaborative Study to Evaluate a Batch of Lyophilised Serum for B(12)
and Folate Content.” Clin Chem Lab Med 45 (3): 380–6.
Vahteristo, L.T., Ollilainen, V., Koivistoinen, P.E. and Varo, P. 1996. “Improvements in the
Analysis of Reduced Folate Monoglutamates and Folic Acid in Food by High-
Performance Liquid Chromatography.” J Agric Food Chem 44 (2). 477–82.
van Haandel, L., Becker, M.L., Williams, T.D., Stobaugh, J.F. and Leeder, J.S. 2012.
“Comprehensive Quantitative Measurement of Folate Polyglutamates in Human
Erythrocytes by Ion Pairing Ultra-Performance Liquid Chromatography/tandem Mass
Spectrometry.” Rapid Commun Mass Spectrom 26 (14): 1617–30.
Velghe, S., Capiau, S. and Stove, C.P. 2016. “Opening the Toolbox of Alternative Sampling
Strategies in Clinical Routine: A Key-Role for (LC-)MS/MS.” Trends Anal Chem
(accepted for publication) doi:10.1016/j.trac.2016.01.030
Wang, C., Riedl, K.M., and Schwartz, S.J. 2010. “A Liquid Chromatography-Tandem Mass
Spectrometric Method for Quantitative Determination of Native 5-
Methyltetrahydrofolate and Its Polyglutamyl Derivatives in Raw Vegetables.” J
Chromatogr B 878 (29): 2949–58.
Yetley, E.A., Pfeiffer, C.M., Phinney, K.W., Fazili, Z., Lacher, D.A. Bailey, R.L., Blackmore,
S., et al. 2011. “Biomarkers of Folate Status in NHANES: A Roundtable Summary.” Am
J Clin Nutr 94 (1): 303S – 312S.
Zheng, X.H., Jiang, L.Y., Zhao, L.T., Zhang, Q.Y., Ding, L. 2015. “Simultaneous quantitation
of folic acid and 5-methyltetrahydrofolic acid in human plasma by HPLC–MS/MS and
its application to a pharmacokinetic study” J Pharm Anal 5 (4):269-75.
Zimmerman, R.K., Slater, M.E., Langer, E.K., Ross, J.A. and Spector, L.G. 2013. “Long-
Term Stability of Folate in Dried Blood Spots Stored in Several Conditions.” J Pediatr
163 (2): 596–97.

Chapter III: Determination of clinical folate status
62
Chapter IV: Folate determination in rodent
diets
Based on:
Kiekens, F., Van Daele, J., Blancquaert, D., Van Der Straeten, D., Lambert, W.E., Stove, C.P.
2015. “Determination of five folate monoglutamates in rodent diets” J Agric Food Chem
63:10089-95
Chapter IV: Folate determination in rodent diets
64
Author contributions
FK, CPS and WEL designed the research; FK conducted the research; DB and DVS provided
essential materials; FK analyzed the data and conducted statistical analysis; JVD reviewed the
data; FK and CPS wrote the paper, which was revised by DVDS, WEL, JVD, and DB; FK
and CPS are responsible for the final content.
Chapter IV: Folate determination in rodent diets
65
Table of contents
IV.1. Abstract ...................................................................................................................... 66
IV.2. Introduction ................................................................................................................ 67
IV.3. Objectives ................................................................................................................... 68
IV.4. Materials and methods ............................................................................................... 68
4.1. Reagents and materials .......................................................................................... 68
4.2. Calibrator and QC-matrix ...................................................................................... 69
4.3. Method optimization ............................................................................................. 69
4.4. Sample preparation ................................................................................................ 70
4.5. Tri-enzyme treatment ............................................................................................ 70
4.6. Sample cleanup ...................................................................................................... 71
4.7. LC-MS/MS analysis .............................................................................................. 71
4.8. Validation .............................................................................................................. 74
4.8.1. Selectivity and carry-over ................................................................................. 74
4.8.2. Linearity, accuracy and precision ..................................................................... 74
4.8.3. Recovery and matrix effects ............................................................................. 74
4.8.4. Stability ............................................................................................................. 75
4.9. Application ............................................................................................................ 75
IV.5. Results and discussion ............................................................................................... 75
5.1. Method optimization ............................................................................................. 75
5.2. Optimization of polyglutamate deconjugation ...................................................... 75
5.2.1. Separation of oils and fats................................................................................. 76
5.3. Solid phase extraction ........................................................................................... 76
5.4. Method validation .................................................................................................. 76
5.4.1. Selectivity and carry-over ................................................................................. 76
5.4.2. Linearity, accuracy and precision ..................................................................... 77
5.4.3. Recovery and matrix effects ............................................................................. 79
5.4.4. Stability ............................................................................................................. 81
5.5. Application ............................................................................................................ 82
IV.6. Conclusion ................................................................................................................. 84
IV.7. References .................................................................................................................. 85
Chapter IV: Folate determination in rodent diets
66
IV.1. Abstract
A method for the quantitative determination of folates in rodent diets is very important for
correct interpretation of folate intake during feeding trials, given the possible discrepancy
between the actual folate concentration in the diet and that mentioned on the product sheet.
This discrepancy may be accounted for by e.g. inaccurate folic acid (FA) supplementation
and/or the presence of endogenous reduced and substituted folates. Liquid chromatography
tandem-mass spectrometry (LC-MS/MS) is the method of choice to differentiate and quantify
the individual folate species present. We developed a method, validated based on Food and
Drug Administration (FDA) guidelines, that allows the measurement of added and
endogenous folates by quantitative determination of 5 folate monoglutamates with linear
ranges from 8 µg to 2 mg/kg feed. This information, combined with feed intake data, allows
insight into the actual folate intake in animal feeding studies. The relevance of this method
was illustrated by the analysis of several feed samples of varying composition, by the
investigation of the effect of casein incorporation and by evaluating the variability of the
folate content between pellets and production batches.
Chapter IV: Folate determination in rodent diets
67
IV.2. Introduction
Deficiencies of folates have been related to several health disorders such as neural tube
defects (NTDs) (Zeisel 2009), neural damage (Crider et al. 2012) and an increased cancer
risk.(Laird and Jaenisch 1996) Animal studies investigating the relation between folate intake
and health disorders, e.g. studies in which mice receive a folate depleted diet to investigate the
prevalence of NTDs (Heid et al. 1992), typically use an amino acid based diet, supplemented
with various amounts of FA. However, due to a variety of factors, such as a limited chemical
stability, the presence of endogenous folates in feed ingredients and analytical inaccuracies ,
the actual folate concentration may differ from the concentration mentioned on the product
sheet. Also, folate concentrations may vary as a result of differences in production and storage
conditions or feed formulation. Therefore, it is key to quantify the exact amount of folates
ingested by the animals as determined in the diet at time of consumption.
Rodent diets used for animal studies can generally be subdivided into three categories. Firstly,
unrefined diets are composed of primary ingredients obtained from natural sources. Second,
and most used, are purified diets in which the ingredients are purified or consist of refined
forms of natural sugars, proteins and oils and purified micronutrients. A third class of diets is
composed of chemically pure ingredients such as peptides and reagent grade
micronutrients.(Reeves 1997) Though for open diets the exact formulation is known, i.e.
disclosed by the manufacturer, this is not the case for a closed formula diet. However, its
basic components remain the same and will include some form of proteins, peptides, starches,
sugars, fibers, oils and fats. These ingredients are ground when not in powdered form,
homogenized and pressed into pellets.
Though FA is generally added to the rodent diet as a source of folate, the addition of natural
food constituents such as plant starches and animal or plant based protein can result in the
presence of endogenous folates.(Reeves et al. 1993) The presence of these non-FA folates
may impede a correct interpretation of short term feeding trials due to a difference in
absorption characteristics, as observed by Castorena-Torres et al.(Castorena-Torres et al.
2014) We recently demonstrated that during long term studies, it is essential to precisely
determine the folate content to accurately interpret the clinical data resulting from a specific
folate intake.(Kiekens et al. 2015; Chapter VI) Another factor possibly hindering correct
interpretation of data from a feeding trial is the labile nature of folates. Due to oxidative and
thermal degradation during production and transport, the folate content as specified by the
manufacturer may deviate substantially from that actually consumed by the animals.(Scott et
al. 2000)
Chapter IV: Folate determination in rodent diets
68
Several methods have been developed for the analysis of other compounds in rodent diets, for
instance for quantification of estrogenic isoflavones (Degen et al. 2002) or the vitamins A and
E.(Rushing et al. 1991) To our knowledge, we are the first to report a method that not only
allows the total folate content to be measured, but also enables folate speciation in rodent
feed. However, publications describing analytical methods for the analysis of folates in food
items are plentiful. One such method for food analysis, i.e. the analysis of folates in potato
(Van Daele et al. 2014), features a tri-enzyme treatment followed by ultrafiltration and ultra-
high pressure/performance LC-MS/MS (UPLC®
-MS/MS) analysis. Though a tri-enzyme
treatment is indispensable (Tamura et al. 1997), ultrafiltration is not adequate for feed analysis
due to the presence of loosely bound minerals, triglycerides and proteins within the feed
matrix. This can be solved by incorporation of a solid phase extraction (SPE) step to purify
the raw samples, as was also used for specific food analyses.(Vahteristo et al. 1996; Doherty
and Beecher 2003) Moreover, an optimized method should have a wide linear range to allow
quantification of both high concentrations of FA, when added to the diet, and the endogenous
folates, which are present at far lower concentrations.
IV.3. Objectives
When performing a bioavailability study, all sources of dietary folate must be taken into
account to evaluate the observed results. Since rodent diets often incorporate natural
ingredients such as casein, starches and cellulose, it is conceivable that the folate
concentration in a diet is not zero even without added folate. To investigate the presence of
folates in commercial rodent diets, an analytical method was developed.
IV.4. Materials and methods
4.1. Reagents and materials
Tetrahydrofolate (THF), 5-methyltetrahydrofolate (5MeTHF), 5,10-methenyltetrahydrofolate
(5,10CH+THF), 10-formylfolic acid (10FoFA), 5-formyltetrahydrofolate (5FoTHF) and FA
were purchased from Schircks Laboratories (Jona, Switzerland). 13
C-labeled internal
standards (ISs), with a labeling yield higher than 98%, were obtained from Merck Eprova
(Glattbrugg, Switzerland). 13
C5-FA was used as internal standard for FA, 10FoFA and
5FoTHF, while 13
C5-THF, 13
C5-5MeTHF and 13
C5-5,10CH+THF were used as ISs for their
respective isotopologues. All calibrators and IS solutions were prepared in a final
concentration of 100 µg/ml in a 50 mM sodium phosphate buffer, pH 7.4, containing 1% L-
ascorbic acid (AA) and 0.5% DL-dithiothreitol (DTT) / methanol (MeOH) (50/50 v/v%).
Deionized water (H2O-MQ) was produced in house by means of a Synergy UV water-
purification system from Millipore (Billerica, MA, USA). Acetonitrile (ACN) and MeOH of
LC-MS quality were purchased from Biosolve (Valkenswaard, The Netherlands). Ammonium
acetate, phosphoric acid and ammonium hydroxide were obtained from Merck & Cie.
(Darmstadt, Germany). Formic acid, trisodium phosphate, AA and DTT, α-amylase (Type Ia,
Chapter IV: Folate determination in rodent diets
69
700-1400 U/mg protein; E.C. 3.2.1.1) and protease type XIV (>3.5 U/mg; E.C. 3.4.24.31)
were purchased from Sigma Aldrich (Diegem, Belgium). The protease powder was dissolved
at a concentration of 5 mg/ml in deionized water. As a source of γ-glutamylhydrolase enzyme
(GGH; E.C. 3.4.19.9), non-sterile, non-hemolyzed rat serum was obtained from Harlan
Laboratories (Horst, The Netherlands), while lyophilized chicken pancreas powder was
obtained from Pel-Freez Biologicals (Rogers, AR, USA). Both the protease solution and the
rat serum were stirred on ice for 1 hour with 100 mg/ml of activated charcoal (Sigma-Aldrich)
to remove endogenous folates.(De Brouwer et al. 2008) Following removal of the activated
charcoal by centrifugation at 4500 g for 15 minutes at 4 °C, the solutions were filtered over a
0.45 µm syringe filter (CA-S 30/0.45, Whatman, GE Healthcare, Little Chalfont, UK),
divided into aliquots (1.5 ml) and frozen at -20 °C. The chicken pancreas solution was
prepared by dissolving 400 mg powder in 25 ml of a 0.2 M phosphate buffer (pH 4.6) to
which a suspension of 0.5 g activated charcoal and 0.05 g dextran in 5 ml of H2O-MQ were
added. After a 30 minute incubation, centrifugation and filtration were performed as described
for protease and rat serum, after which the pH was adjusted to 6.1 and the solution was
aliquoted and frozen at -20 °C.(Pedersen 1988) SPE was performed using Bond Elut SAX
tubes containing 500 mg sorbent in 3 ml tubes, purchased from Agilent (Palo Alto, CA,
USA).
Five different feed samples were used in this study. TD.06691 is a closed formula chemically
pure diet in which casein is replaced by single peptides to remove all endogenous folates. The
TD.95247 FA deficient diet is a purified diet in which the casein has been extracted with
ethanol while TD.94045 is an AIN-93G diet in which standard casein is used as a protein
source, with FA added in a concentration of 2 mg/kg. The 7012 diet is an unrefined diet using
primary ingredients without casein and 7 mg/kg added FA. To evaluate the influence of casein
on the folate speciation in a rodent diet both standard casein and ethanol-extracted casein
were tested. All these samples were obtained from Teklad Diets (Harlan Laboratories,
Madison, WI, USA). As a standard unrefined diet using primary ingredients and casein, a rat
& mice maintenance diet (Carfil Quality, Oud-Turnhout, Belgium) was used.
4.2. Calibrator and QC-matrix
The blank amino acid defined diet (TD.06691) was used to prepare both the calibrators and
QC-samples. This diet also contains 1% succinylsulfathiazole which is used in many rodent
feeding trials to inhibit the de novo synthesis of folates by intestinal bacteria. The
concentration of calibrators, quality controls and validation samples can be found in Table
IV.1.
4.3. Method optimization
To evaluate the optimal pH during deconjugation with rat serum (5.3 to 7.4), equal amounts
of 5MeTHF di-, tri-, tetra- and hexaglutamate (Schircks Laboratories) were spiked to blank
rodent feed at a total concentration of 500 µg 5MeTHF/kg while the pH was altered using an
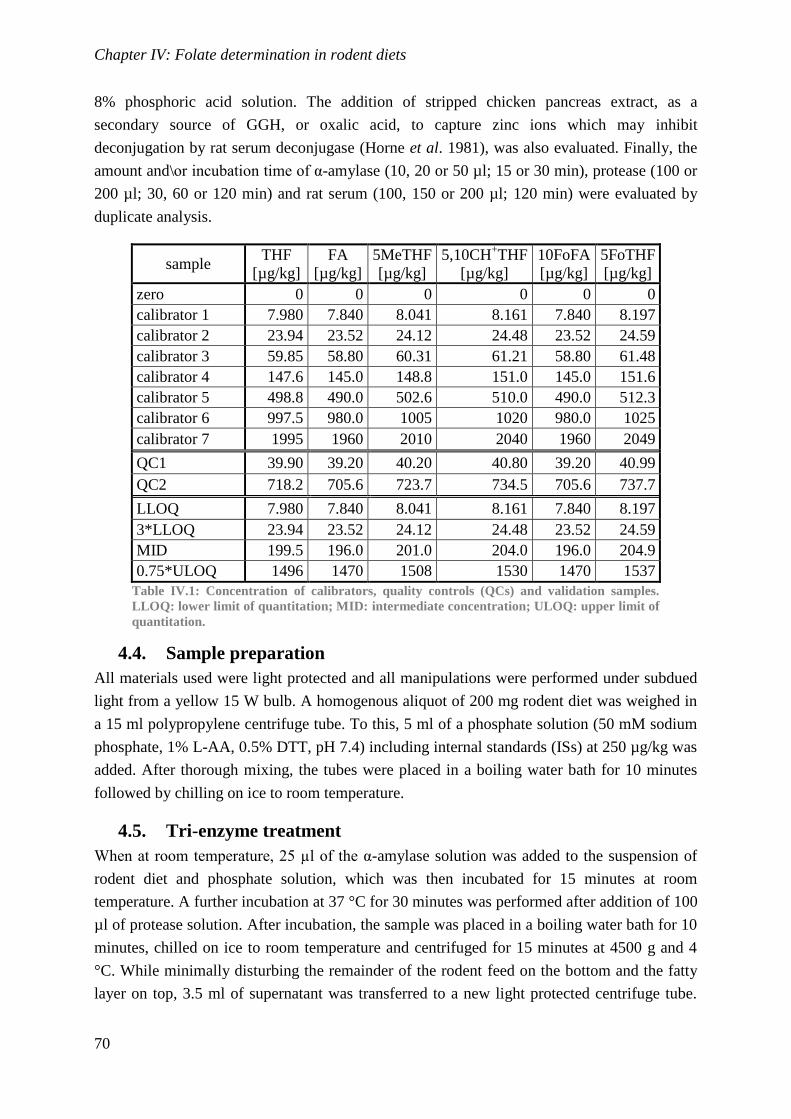
Chapter IV: Folate determination in rodent diets
70
8% phosphoric acid solution. The addition of stripped chicken pancreas extract, as a
secondary source of GGH, or oxalic acid, to capture zinc ions which may inhibit
deconjugation by rat serum deconjugase (Horne et al. 1981), was also evaluated. Finally, the
amount and\or incubation time of α-amylase (10, 20 or 50 µl; 15 or 30 min), protease (100 or
200 µl; 30, 60 or 120 min) and rat serum (100, 150 or 200 µl; 120 min) were evaluated by
duplicate analysis.
sample THF
[µg/kg]
FA
[µg/kg]
5MeTHF
[µg/kg]
5,10CH+THF
[µg/kg]
10FoFA
[µg/kg]
5FoTHF
[µg/kg]
zero 0 0 0 0 0 0
calibrator 1 7.980 7.840 8.041 8.161 7.840 8.197
calibrator 2 23.94 23.52 24.12 24.48 23.52 24.59
calibrator 3 59.85 58.80 60.31 61.21 58.80 61.48
calibrator 4 147.6 145.0 148.8 151.0 145.0 151.6
calibrator 5 498.8 490.0 502.6 510.0 490.0 512.3
calibrator 6 997.5 980.0 1005 1020 980.0 1025
calibrator 7 1995 1960 2010 2040 1960 2049
QC1 39.90 39.20 40.20 40.80 39.20 40.99
QC2 718.2 705.6 723.7 734.5 705.6 737.7
LLOQ 7.980 7.840 8.041 8.161 7.840 8.197
3*LLOQ 23.94 23.52 24.12 24.48 23.52 24.59
MID 199.5 196.0 201.0 204.0 196.0 204.9
0.75*ULOQ 1496 1470 1508 1530 1470 1537
Table IV.1: Concentration of calibrators, quality controls (QCs) and validation samples.
LLOQ: lower limit of quantitation; MID: intermediate concentration; ULOQ: upper limit of
quantitation.
4.4. Sample preparation
All materials used were light protected and all manipulations were performed under subdued
light from a yellow 15 W bulb. A homogenous aliquot of 200 mg rodent diet was weighed in
a 15 ml polypropylene centrifuge tube. To this, 5 ml of a phosphate solution (50 mM sodium
phosphate, 1% L-AA, 0.5% DTT, pH 7.4) including internal standards (ISs) at 250 µg/kg was
added. After thorough mixing, the tubes were placed in a boiling water bath for 10 minutes
followed by chilling on ice to room temperature.
4.5. Tri-enzyme treatment
When at room temperature, 25 µl of the α-amylase solution was added to the suspension of
rodent diet and phosphate solution, which was then incubated for 15 minutes at room
temperature. A further incubation at 37 °C for 30 minutes was performed after addition of 100
µl of protease solution. After incubation, the sample was placed in a boiling water bath for 10
minutes, chilled on ice to room temperature and centrifuged for 15 minutes at 4500 g and 4
°C. While minimally disturbing the remainder of the rodent feed on the bottom and the fatty
layer on top, 3.5 ml of supernatant was transferred to a new light protected centrifuge tube.
Chapter IV: Folate determination in rodent diets
71
The pH was adjusted to 6±0.15 by adding phosphoric acid. The sample was incubated for 2
hours at 37°C after the addition of 200 µl of stripped rat serum. After deconjugation, the pH
was adjusted to 7.4, using 5 N NaOH, after which the samples were again placed in a boiling
water bath for 10 minutes and subsequently chilled on ice. Prior to centrifugation for 15
minutes at 4500 g and 4 °C, 3.25 ml of H2O-MQ was added to reduce the ionic strength.
4.6. Sample cleanup
SPE was performed using Bond Elut SAX tubes containing 500 mg sorbent per 3 ml tube.
The sorbent was activated with 3 ml of hexane followed by 3 ml of MeOH and conditioned
with 4 x 2.5 ml of 1.22 mM sodium phosphate (pH 7.4). Next, 5.5 ml of the supernatant
obtained after tri-enzyme treatment (cfr. 4.5) was loaded onto the sorbent. To remove
interferences, the sorbent was washed twice with 1.5 ml of 25 mM sodium phosphate, 0.5%
L-AA, 0.25% DTT and 10% MeOH. The folates were eluted in two steps of 1 ml 0.52M
ammonium acetate, 1% AA, 0.5% DTT and 5% MeOH (pH 7.4).
4.7. LC-MS/MS analysis
Samples were analyzed using a Waters Acquity UPLC® system coupled to an ABSciex API
4000TM
triple quadrupole mass spectrometer equipped with a TurboIonSpray®
probe. The
autosampler was equipped with a 10 µl sample loop and samples were kept at 4 °C prior to
injection. After injection the needle was cleaned with 600 µl of 10/90 v/v% H2O-MQ/ACN
followed by 1200 µl of 90/10 v/v% H2O-MQ/ACN. Chromatographic separation was
achieved using a mobile phase composed of H2O-MQ (A) and ACN (B), each containing
0.1% of formic acid, with a flow rate of 0.6 ml/min on a Waters HSS T3-column (150 mm x
2.1 mm; 1.8 µm, equipped with Vanguard pre-column) held at 60 °C. The composition of the
mobile phase starts with 100% solvent A and was kept constant for 1 minute. Thereafter the
amount of solvent B was increased linearly to 10% in 2 minutes and to 12% in 1 minute after
which the column was cleaned for 1 minute with 95% solvent B and equilibrated to initial
solvent composition for 3 minutes. This amounts to a total time of approximately 8.5 minutes
between injections. Mass spectrometric detection was performed in scheduled multiple-
reaction monitoring mode. Electrospray ionization was used to ionize the analytes with the
ion spray voltage set at 2500 V and a temperature of 600 °C. Nitrogen was used as curtain
gas, gas 1 and gas 2, with respective pressure settings at 25, 75 and 90 psig, and as collision
gas at setting 11. The interface heater was switched on. In Figure IV.1 chromatograms of a
blank diet, a blank diet spiked at LLOQ level and a standard rodent diet are shown. The signal
obtained for 5MeTHF in the blank diet originates from incomplete removal of this folate
species from stripped rat serum and is lower than 20% of the LLOQ. The transitions
monitored per compound were the same as described before (Van Daele et al. 2014), specific
transitions and settings can be found in Table IV.2.
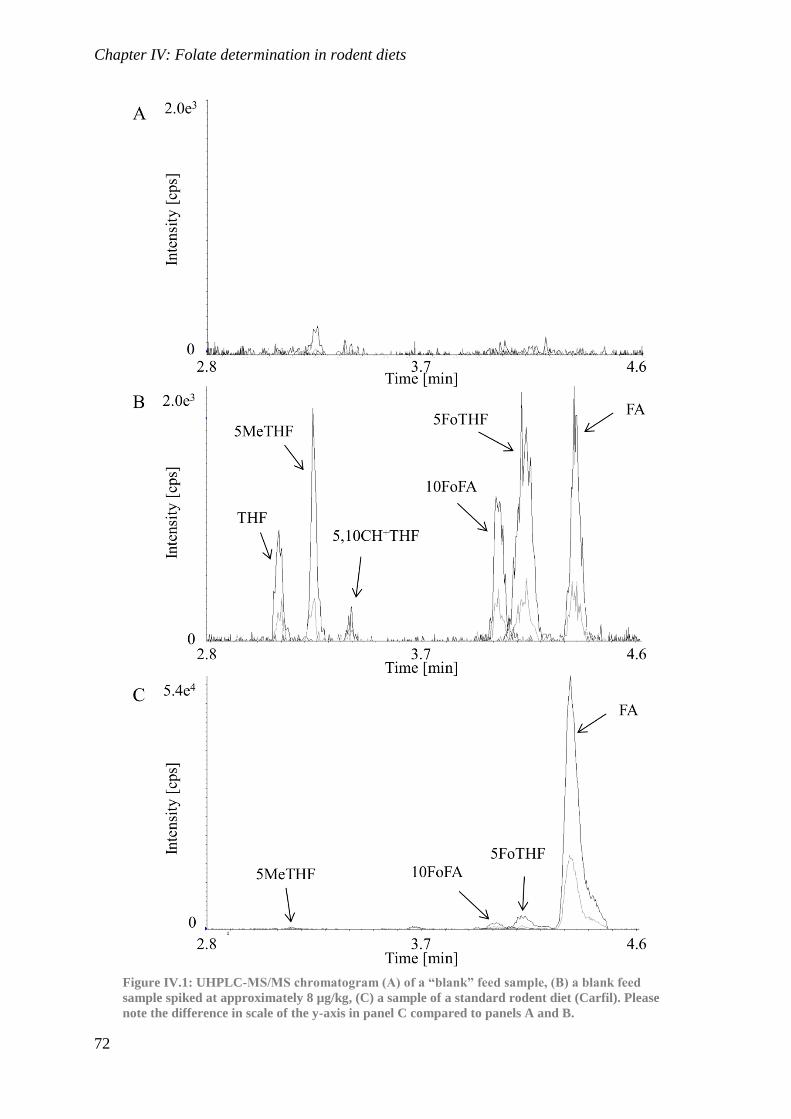
Chapter IV: Folate determination in rodent diets
72
Figure IV.1: UHPLC-MS/MS chromatogram (A) of a “blank” feed sample, (B) a blank feed
sample spiked at approximately 8 µg/kg, (C) a sample of a standard rodent diet (Carfil). Please
note the difference in scale of the y-axis in panel C compared to panels A and B.
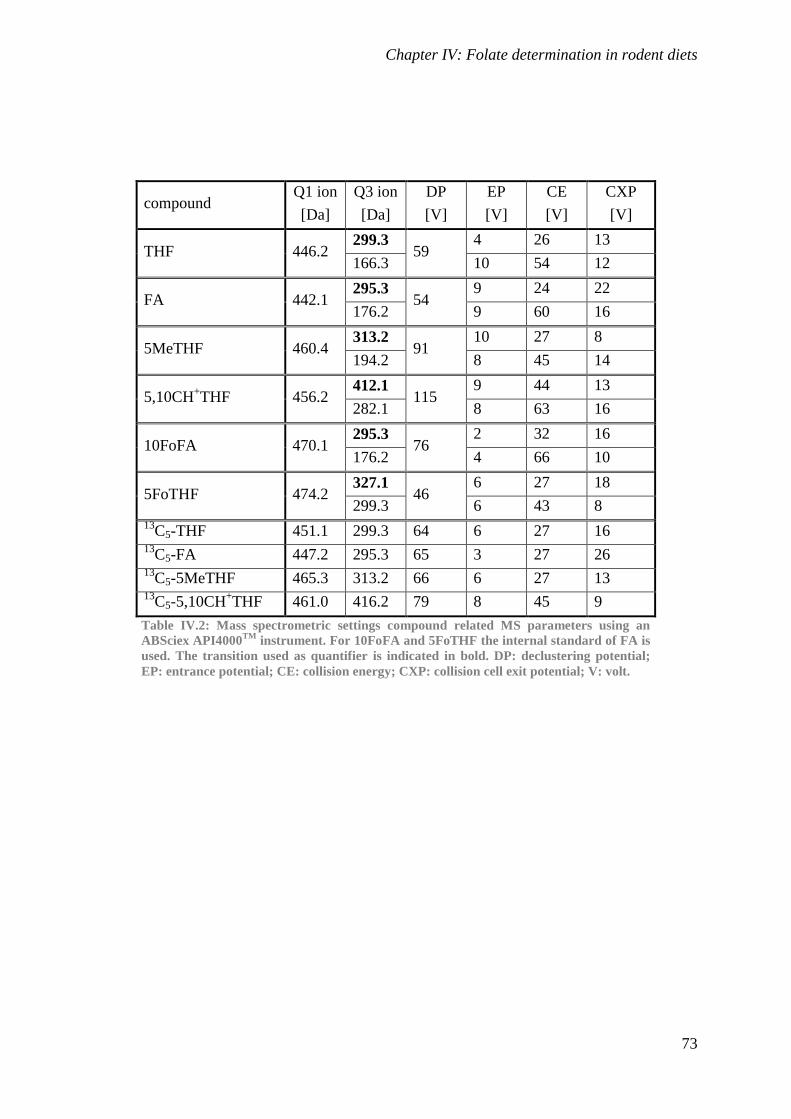
Chapter IV: Folate determination in rodent diets
73
compound Q1 ion
[Da]
Q3 ion
[Da]
DP
[V]
EP
[V]
CE
[V]
CXP
[V]
THF 446.2 299.3
59 4 26 13
166.3 10 54 12
FA 442.1 295.3
54 9 24 22
176.2 9 60 16
5MeTHF 460.4 313.2
91 10 27 8
194.2 8 45 14
5,10CH+THF 456.2
412.1 115
9 44 13
282.1 8 63 16
10FoFA 470.1 295.3
76 2 32 16
176.2 4 66 10
5FoTHF 474.2 327.1
46 6 27 18
299.3 6 43 8 13
C5-THF 451.1 299.3 64 6 27 16 13
C5-FA 447.2 295.3 65 3 27 26 13
C5-5MeTHF 465.3 313.2 66 6 27 13 13
C5-5,10CH+THF 461.0 416.2 79 8 45 9
Table IV.2: Mass spectrometric settings compound related MS parameters using an
ABSciex API4000TM
instrument. For 10FoFA and 5FoTHF the internal standard of FA is
used. The transition used as quantifier is indicated in bold. DP: declustering potential;
EP: entrance potential; CE: collision energy; CXP: collision cell exit potential; V: volt.
Chapter IV: Folate determination in rodent diets
74
4.8. Validation
The method was validated based on the FDA guidelines for bioanalytical method validation.
Selectivity, carry-over, precision, accuracy, linearity, matrix effect, recovery and stability
were evaluated.(U.S. Department of Health and Human Services 2001)
4.8.1. Selectivity and carry-over
Method selectivity was tested using blank rodent diet (TD.06691) obtained from Harlan. This
is a purified diet without casein, which should therefore contain no endogenous folates. Cross-
interferences were evaluated by adding 6 folates and 4 labelled ISs individually to this diet in
a concentration of 2 mg/kg. For the analytes, the acceptance criterion for the selectivity
assessment was set at 20% of the peak area corresponding to the LLOQ level, while for the
labelled ISs only 5% was considered acceptable. Carry-over was evaluated by injecting blank
samples after calibrators with identical concentrations and acceptance criteria as for the
evaluation of selectivity.
4.8.2. Linearity, accuracy and precision
The actual LLOQ was verified as the concentration which could be measured with a %bias
and relative standard deviation (%RSD) below 20%. Duplicate analysis of 1 zero sample and
7 calibrators was performed on 4 non-consecutive days to evaluate linearity.
Homoscedasticity was evaluated by plotting the residuals versus the nominal values. The sum
of the residual error was used to evaluate the need for a weighted or transformed model (1/x,
1/x², 1/y, 1/y², √x, ln(x), log(x)). For the selected model to be acceptable, back-calculated
mean concentrations should be within 15% of the nominal value (20% at LLOQ-level).
Accuracy and precision were evaluated using 4 spiked samples (LLOQ - 0.75*ULOQ, Table
IV.1), prepared and analyzed in duplicate on 4 non-consecutive days. A single-factor
ANOVA was used to calculate intra- and interbatch variability (%RSD). Accuracy (%bias)
was calculated as the measured value divided by the nominal value. Acceptance criteria for
%bias and %RSD are 15%, except at LLOQ, where they are 20%. Also, the dilution integrity
of samples exceeding the ULOQ was verified by fivefold dilution of blank matrix spiked at a
concentration of 8 mg/kg with sample buffer prior to solid phase extraction (n=2).
4.8.3. Recovery and matrix effects
Matrix effect and recovery were evaluated at 3 concentration levels (3*LLOQ – 0.75*ULOQ,
Table IV.1) in blank matrix material TD.06691 according to Matuszewski et al.(Matuszewski
et al. 2003) The analytes were spiked in duplicate either before (A) or after (B) the extraction
and SPE procedure. Also, analytes were spiked in SPE elution buffer to obtain a sample free
of matrix (C). Absolute recovery was calculated as the percent ratio of peak areas A over B,
while absolute matrix effect was calculated as the percent ratio of the peak areas B over C.
Relative recovery and matrix effect are expressed as %RSD of the absolute recovery and
matrix effect values and should not exceed 15%.
Chapter IV: Folate determination in rodent diets
75
4.8.4. Stability
To investigate the stability of folates in rodent diets, six folate monoglutamates were spiked to
blank matrix at a 100 and 1 000 µg/kg level. Triplicate analysis of samples stored at 4 or
-20 °C was performed weekly over a total period of 4 weeks. Autosampler stability, at 4 °C,
was assessed by reinjection of samples stored for 24 hours in the autosampler while
concentrations were calculated based on fresh calibrators. Also, the effect of up to three
freeze-thaw cycles was evaluated by freezing and thawing the samples in cycles of 1 hour.
Stability is acceptable if the concentration measured does not deviate more than 15% from
that measured initially.
4.9. Application
The accuracy of the method was evaluated via the measurement of a certified reference
material, namely: BCR 121 Wholemeal Flour issued by the Institute for Reference Materials
and Measurements of the European Commission.(Unit for Reference Materials EC-JRC-
IRMM 2007) Also, the folate content was evaluated in five different rodent diets with varying
composition and expected folate content. To evaluate the reproducibility of the folate
concentration between different feed batches and between different pellets within one batch,
pellets of two different production batches were obtained of which 4 individual pellets were
analyzed in duplicate per batch. Also, casein and ethanol extracted casein (Fonterra,
Auckland, New Zealand), used as a protein source in many diets, were analyzed to evaluate
the efficacy of the ethanol extraction. To correlate the results between feed analysis and
casein treatment, casein samples consisted of only 40 mg instead of 200 mg for rodent diets
since the rodent diets used in this study contain on average 20% protein.
IV.5. Results and discussion
5.1. Method optimization
Due to the application of LC-MS/MS analysis, the results are not influenced by preservatives
and anti-microbial agents which may be present in rodent feed. This is a major improvement
over microbiologic assays commonly used for food and feed analysis. Sample preparation
encompasses classical tri-enzyme treatment with an amylase, protease and folate conjugase
treatment to degrade starches and proteins and to hydrolyze folate polyglutamates,
respectively. However, since the feed matrix may have an effect on the activity of the
enzyme, the amount of enzyme and length of incubation were optimized.
5.2. Optimization of polyglutamate deconjugation
Though GGH is reported to have a pH optimum between 6.2 and 7.2 (Horne et al. 1981),
deconjugation was found to be optimal at a pH of approximately 6.00 with an optimal range
between 5.85 and 6.15 (see Figure IV.2). No compounds exerting an inhibitory effect could
be inferred based on literature.(Galivan et al. 2000) Neither the addition of oxalate nor
chicken pancreas extract improved polyglutamate deconjugation and was therefore not
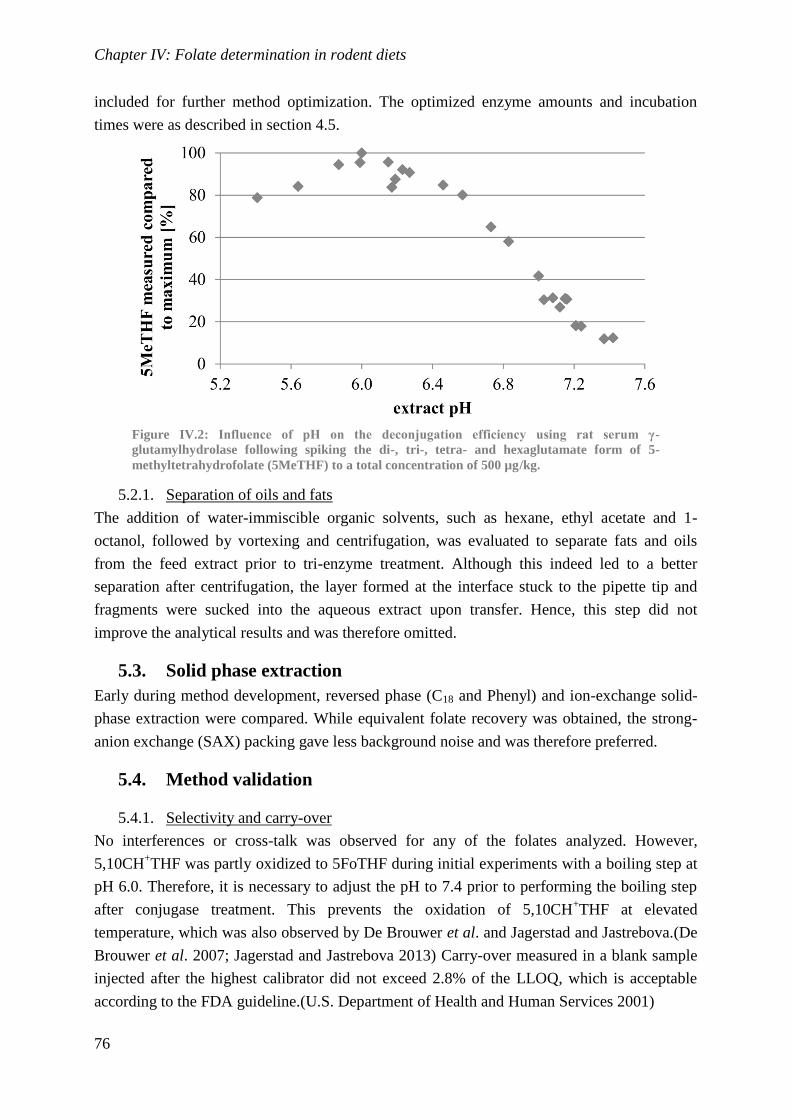
Chapter IV: Folate determination in rodent diets
76
included for further method optimization. The optimized enzyme amounts and incubation
times were as described in section 4.5.
Figure IV.2: Influence of pH on the deconjugation efficiency using rat serum γ-
glutamylhydrolase following spiking the di-, tri-, tetra- and hexaglutamate form of 5-
methyltetrahydrofolate (5MeTHF) to a total concentration of 500 µg/kg.
5.2.1. Separation of oils and fats
The addition of water-immiscible organic solvents, such as hexane, ethyl acetate and 1-
octanol, followed by vortexing and centrifugation, was evaluated to separate fats and oils
from the feed extract prior to tri-enzyme treatment. Although this indeed led to a better
separation after centrifugation, the layer formed at the interface stuck to the pipette tip and
fragments were sucked into the aqueous extract upon transfer. Hence, this step did not
improve the analytical results and was therefore omitted.
5.3. Solid phase extraction
Early during method development, reversed phase (C18 and Phenyl) and ion-exchange solid-
phase extraction were compared. While equivalent folate recovery was obtained, the strong-
anion exchange (SAX) packing gave less background noise and was therefore preferred.
5.4. Method validation
5.4.1. Selectivity and carry-over
No interferences or cross-talk was observed for any of the folates analyzed. However,
5,10CH+THF was partly oxidized to 5FoTHF during initial experiments with a boiling step at
pH 6.0. Therefore, it is necessary to adjust the pH to 7.4 prior to performing the boiling step
after conjugase treatment. This prevents the oxidation of 5,10CH+THF at elevated
temperature, which was also observed by De Brouwer et al. and Jagerstad and Jastrebova.(De
Brouwer et al. 2007; Jagerstad and Jastrebova 2013) Carry-over measured in a blank sample
injected after the highest calibrator did not exceed 2.8% of the LLOQ, which is acceptable
according to the FDA guideline.(U.S. Department of Health and Human Services 2001)
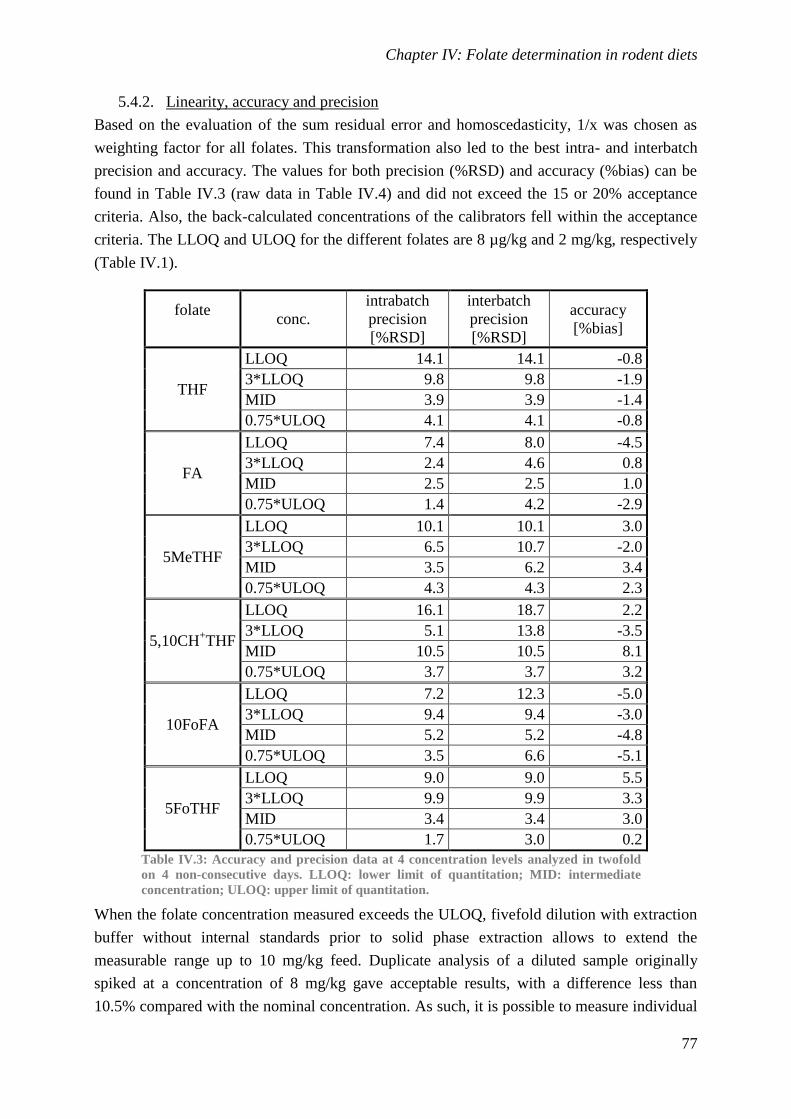
Chapter IV: Folate determination in rodent diets
77
5.4.2. Linearity, accuracy and precision
Based on the evaluation of the sum residual error and homoscedasticity, 1/x was chosen as
weighting factor for all folates. This transformation also led to the best intra- and interbatch
precision and accuracy. The values for both precision (%RSD) and accuracy (%bias) can be
found in Table IV.3 (raw data in Table IV.4) and did not exceed the 15 or 20% acceptance
criteria. Also, the back-calculated concentrations of the calibrators fell within the acceptance
criteria. The LLOQ and ULOQ for the different folates are 8 µg/kg and 2 mg/kg, respectively
(Table IV.1).
folate conc.
intrabatch
precision
[%RSD]
interbatch
precision
[%RSD]
accuracy
[%bias]
THF
LLOQ 14.1 14.1 -0.8
3*LLOQ 9.8 9.8 -1.9
MID 3.9 3.9 -1.4
0.75*ULOQ 4.1 4.1 -0.8
FA
LLOQ 7.4 8.0 -4.5
3*LLOQ 2.4 4.6 0.8
MID 2.5 2.5 1.0
0.75*ULOQ 1.4 4.2 -2.9
5MeTHF
LLOQ 10.1 10.1 3.0
3*LLOQ 6.5 10.7 -2.0
MID 3.5 6.2 3.4
0.75*ULOQ 4.3 4.3 2.3
5,10CH+THF
LLOQ 16.1 18.7 2.2
3*LLOQ 5.1 13.8 -3.5
MID 10.5 10.5 8.1
0.75*ULOQ 3.7 3.7 3.2
10FoFA
LLOQ 7.2 12.3 -5.0
3*LLOQ 9.4 9.4 -3.0
MID 5.2 5.2 -4.8
0.75*ULOQ 3.5 6.6 -5.1
5FoTHF
LLOQ 9.0 9.0 5.5
3*LLOQ 9.9 9.9 3.3
MID 3.4 3.4 3.0
0.75*ULOQ 1.7 3.0 0.2
Table IV.3: Accuracy and precision data at 4 concentration levels analyzed in twofold
on 4 non-consecutive days. LLOQ: lower limit of quantitation; MID: intermediate
concentration; ULOQ: upper limit of quantitation.
When the folate concentration measured exceeds the ULOQ, fivefold dilution with extraction
buffer without internal standards prior to solid phase extraction allows to extend the
measurable range up to 10 mg/kg feed. Duplicate analysis of a diluted sample originally
spiked at a concentration of 8 mg/kg gave acceptable results, with a difference less than
10.5% compared with the nominal concentration. As such, it is possible to measure individual
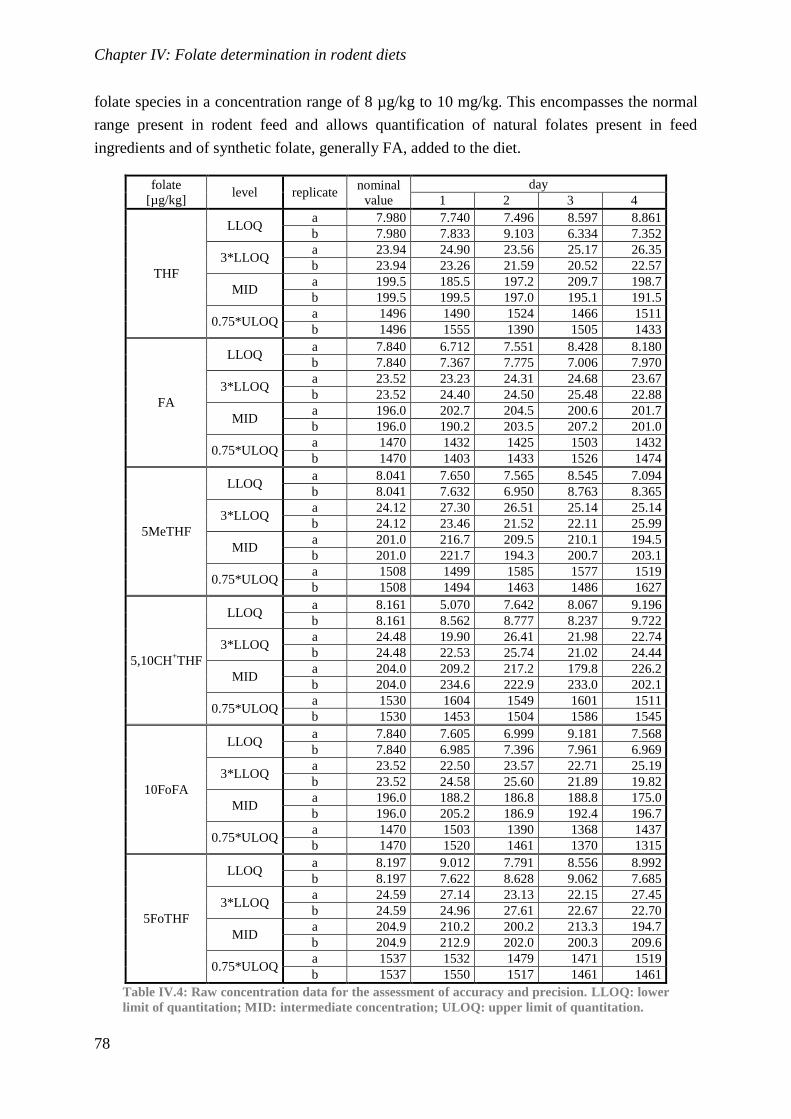
Chapter IV: Folate determination in rodent diets
78
folate species in a concentration range of 8 µg/kg to 10 mg/kg. This encompasses the normal
range present in rodent feed and allows quantification of natural folates present in feed
ingredients and of synthetic folate, generally FA, added to the diet.
folate
[µg/kg] level replicate
nominal
value
day
1 2 3 4
THF
LLOQ a 7.980 7.740 7.496 8.597 8.861
b 7.980 7.833 9.103 6.334 7.352
3*LLOQ a 23.94 24.90 23.56 25.17 26.35
b 23.94 23.26 21.59 20.52 22.57
MID a 199.5 185.5 197.2 209.7 198.7
b 199.5 199.5 197.0 195.1 191.5
0.75*ULOQ a 1496 1490 1524 1466 1511
b 1496 1555 1390 1505 1433
FA
LLOQ a 7.840 6.712 7.551 8.428 8.180
b 7.840 7.367 7.775 7.006 7.970
3*LLOQ a 23.52 23.23 24.31 24.68 23.67
b 23.52 24.40 24.50 25.48 22.88
MID a 196.0 202.7 204.5 200.6 201.7
b 196.0 190.2 203.5 207.2 201.0
0.75*ULOQ a 1470 1432 1425 1503 1432
b 1470 1403 1433 1526 1474
5MeTHF
LLOQ a 8.041 7.650 7.565 8.545 7.094
b 8.041 7.632 6.950 8.763 8.365
3*LLOQ a 24.12 27.30 26.51 25.14 25.14
b 24.12 23.46 21.52 22.11 25.99
MID a 201.0 216.7 209.5 210.1 194.5
b 201.0 221.7 194.3 200.7 203.1
0.75*ULOQ a 1508 1499 1585 1577 1519
b 1508 1494 1463 1486 1627
5,10CH+THF
LLOQ a 8.161 5.070 7.642 8.067 9.196
b 8.161 8.562 8.777 8.237 9.722
3*LLOQ a 24.48 19.90 26.41 21.98 22.74
b 24.48 22.53 25.74 21.02 24.44
MID a 204.0 209.2 217.2 179.8 226.2
b 204.0 234.6 222.9 233.0 202.1
0.75*ULOQ a 1530 1604 1549 1601 1511
b 1530 1453 1504 1586 1545
10FoFA
LLOQ a 7.840 7.605 6.999 9.181 7.568
b 7.840 6.985 7.396 7.961 6.969
3*LLOQ a 23.52 22.50 23.57 22.71 25.19
b 23.52 24.58 25.60 21.89 19.82
MID a 196.0 188.2 186.8 188.8 175.0
b 196.0 205.2 186.9 192.4 196.7
0.75*ULOQ a 1470 1503 1390 1368 1437
b 1470 1520 1461 1370 1315
5FoTHF
LLOQ a 8.197 9.012 7.791 8.556 8.992
b 8.197 7.622 8.628 9.062 7.685
3*LLOQ a 24.59 27.14 23.13 22.15 27.45
b 24.59 24.96 27.61 22.67 22.70
MID a 204.9 210.2 200.2 213.3 194.7
b 204.9 212.9 202.0 200.3 209.6
0.75*ULOQ a 1537 1532 1479 1471 1519
b 1537 1550 1517 1461 1461
Table IV.4: Raw concentration data for the assessment of accuracy and precision. LLOQ: lower
limit of quantitation; MID: intermediate concentration; ULOQ: upper limit of quantitation.
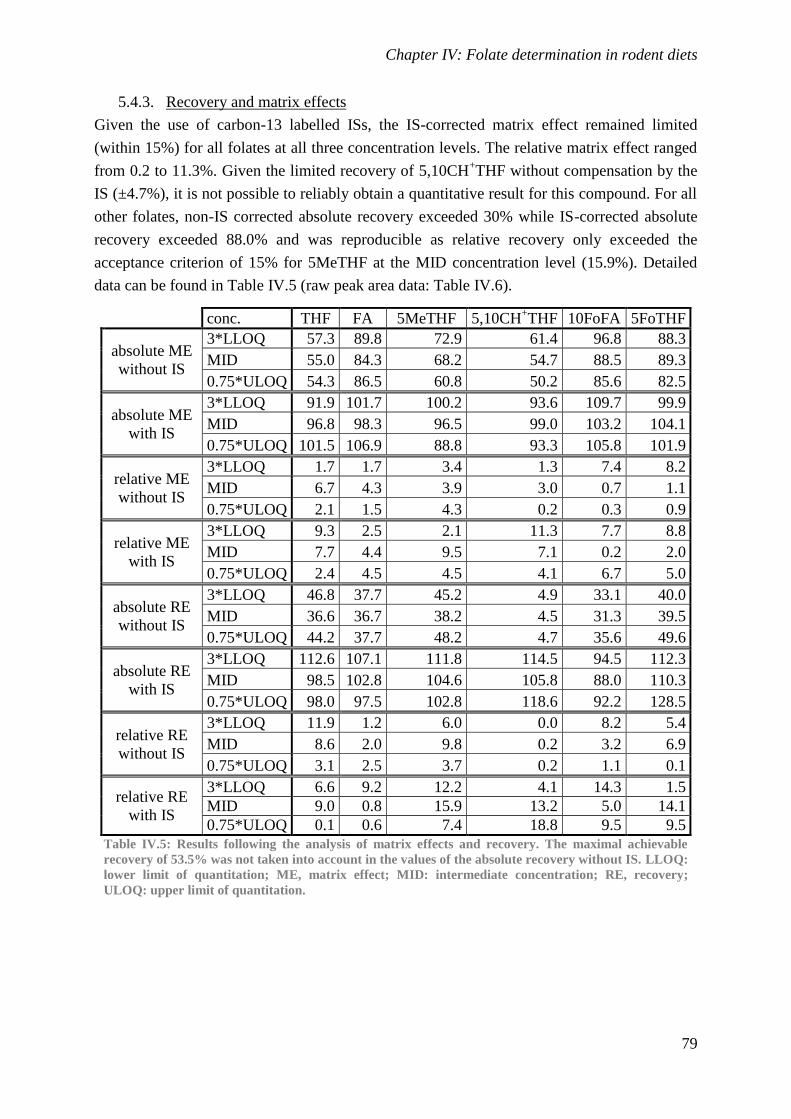
Chapter IV: Folate determination in rodent diets
79
5.4.3. Recovery and matrix effects
Given the use of carbon-13 labelled ISs, the IS-corrected matrix effect remained limited
(within 15%) for all folates at all three concentration levels. The relative matrix effect ranged
from 0.2 to 11.3%. Given the limited recovery of 5,10CH+THF without compensation by the
IS (±4.7%), it is not possible to reliably obtain a quantitative result for this compound. For all
other folates, non-IS corrected absolute recovery exceeded 30% while IS-corrected absolute
recovery exceeded 88.0% and was reproducible as relative recovery only exceeded the
acceptance criterion of 15% for 5MeTHF at the MID concentration level (15.9%). Detailed
data can be found in Table IV.5 (raw peak area data: Table IV.6).
conc. THF FA 5MeTHF 5,10CH+THF 10FoFA 5FoTHF
absolute ME
without IS
3*LLOQ 57.3 89.8 72.9 61.4 96.8 88.3
MID 55.0 84.3 68.2 54.7 88.5 89.3
0.75*ULOQ 54.3 86.5 60.8 50.2 85.6 82.5
absolute ME
with IS
3*LLOQ 91.9 101.7 100.2 93.6 109.7 99.9
MID 96.8 98.3 96.5 99.0 103.2 104.1
0.75*ULOQ 101.5 106.9 88.8 93.3 105.8 101.9
relative ME
without IS
3*LLOQ 1.7 1.7 3.4 1.3 7.4 8.2
MID 6.7 4.3 3.9 3.0 0.7 1.1
0.75*ULOQ 2.1 1.5 4.3 0.2 0.3 0.9
relative ME
with IS
3*LLOQ 9.3 2.5 2.1 11.3 7.7 8.8
MID 7.7 4.4 9.5 7.1 0.2 2.0
0.75*ULOQ 2.4 4.5 4.5 4.1 6.7 5.0
absolute RE
without IS
3*LLOQ 46.8 37.7 45.2 4.9 33.1 40.0
MID 36.6 36.7 38.2 4.5 31.3 39.5
0.75*ULOQ 44.2 37.7 48.2 4.7 35.6 49.6
absolute RE
with IS
3*LLOQ 112.6 107.1 111.8 114.5 94.5 112.3
MID 98.5 102.8 104.6 105.8 88.0 110.3
0.75*ULOQ 98.0 97.5 102.8 118.6 92.2 128.5
relative RE
without IS
3*LLOQ 11.9 1.2 6.0 0.0 8.2 5.4
MID 8.6 2.0 9.8 0.2 3.2 6.9
0.75*ULOQ 3.1 2.5 3.7 0.2 1.1 0.1
relative RE
with IS
3*LLOQ 6.6 9.2 12.2 4.1 14.3 1.5
MID 9.0 0.8 15.9 13.2 5.0 14.1
0.75*ULOQ 0.1 0.6 7.4 18.8 9.5 9.5
Table IV.5: Results following the analysis of matrix effects and recovery. The maximal achievable
recovery of 53.5% was not taken into account in the values of the absolute recovery without IS. LLOQ:
lower limit of quantitation; ME, matrix effect; MID: intermediate concentration; RE, recovery;
ULOQ: upper limit of quantitation.
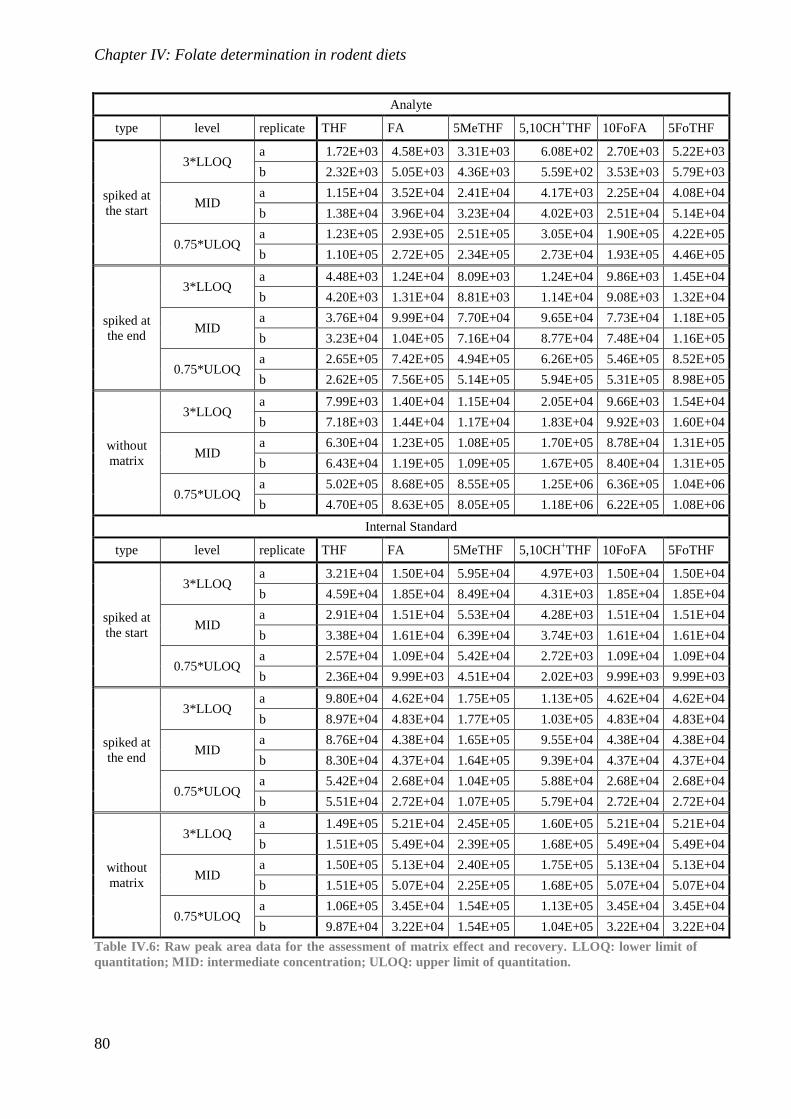
Chapter IV: Folate determination in rodent diets
80
Analyte
type level replicate THF FA 5MeTHF 5,10CH+THF 10FoFA 5FoTHF
spiked at
the start
3*LLOQ a 1.72E+03 4.58E+03 3.31E+03 6.08E+02 2.70E+03 5.22E+03
b 2.32E+03 5.05E+03 4.36E+03 5.59E+02 3.53E+03 5.79E+03
MID a 1.15E+04 3.52E+04 2.41E+04 4.17E+03 2.25E+04 4.08E+04
b 1.38E+04 3.96E+04 3.23E+04 4.02E+03 2.51E+04 5.14E+04
0.75*ULOQ a 1.23E+05 2.93E+05 2.51E+05 3.05E+04 1.90E+05 4.22E+05
b 1.10E+05 2.72E+05 2.34E+05 2.73E+04 1.93E+05 4.46E+05
spiked at
the end
3*LLOQ a 4.48E+03 1.24E+04 8.09E+03 1.24E+04 9.86E+03 1.45E+04
b 4.20E+03 1.31E+04 8.81E+03 1.14E+04 9.08E+03 1.32E+04
MID a 3.76E+04 9.99E+04 7.70E+04 9.65E+04 7.73E+04 1.18E+05
b 3.23E+04 1.04E+05 7.16E+04 8.77E+04 7.48E+04 1.16E+05
0.75*ULOQ a 2.65E+05 7.42E+05 4.94E+05 6.26E+05 5.46E+05 8.52E+05
b 2.62E+05 7.56E+05 5.14E+05 5.94E+05 5.31E+05 8.98E+05
without
matrix
3*LLOQ a 7.99E+03 1.40E+04 1.15E+04 2.05E+04 9.66E+03 1.54E+04
b 7.18E+03 1.44E+04 1.17E+04 1.83E+04 9.92E+03 1.60E+04
MID a 6.30E+04 1.23E+05 1.08E+05 1.70E+05 8.78E+04 1.31E+05
b 6.43E+04 1.19E+05 1.09E+05 1.67E+05 8.40E+04 1.31E+05
0.75*ULOQ a 5.02E+05 8.68E+05 8.55E+05 1.25E+06 6.36E+05 1.04E+06
b 4.70E+05 8.63E+05 8.05E+05 1.18E+06 6.22E+05 1.08E+06
Internal Standard
type level replicate THF FA 5MeTHF 5,10CH+THF 10FoFA 5FoTHF
spiked at
the start
3*LLOQ a 3.21E+04 1.50E+04 5.95E+04 4.97E+03 1.50E+04 1.50E+04
b 4.59E+04 1.85E+04 8.49E+04 4.31E+03 1.85E+04 1.85E+04
MID a 2.91E+04 1.51E+04 5.53E+04 4.28E+03 1.51E+04 1.51E+04
b 3.38E+04 1.61E+04 6.39E+04 3.74E+03 1.61E+04 1.61E+04
0.75*ULOQ a 2.57E+04 1.09E+04 5.42E+04 2.72E+03 1.09E+04 1.09E+04
b 2.36E+04 9.99E+03 4.51E+04 2.02E+03 9.99E+03 9.99E+03
spiked at
the end
3*LLOQ a 9.80E+04 4.62E+04 1.75E+05 1.13E+05 4.62E+04 4.62E+04
b 8.97E+04 4.83E+04 1.77E+05 1.03E+05 4.83E+04 4.83E+04
MID a 8.76E+04 4.38E+04 1.65E+05 9.55E+04 4.38E+04 4.38E+04
b 8.30E+04 4.37E+04 1.64E+05 9.39E+04 4.37E+04 4.37E+04
0.75*ULOQ a 5.42E+04 2.68E+04 1.04E+05 5.88E+04 2.68E+04 2.68E+04
b 5.51E+04 2.72E+04 1.07E+05 5.79E+04 2.72E+04 2.72E+04
without
matrix
3*LLOQ a 1.49E+05 5.21E+04 2.45E+05 1.60E+05 5.21E+04 5.21E+04
b 1.51E+05 5.49E+04 2.39E+05 1.68E+05 5.49E+04 5.49E+04
MID a 1.50E+05 5.13E+04 2.40E+05 1.75E+05 5.13E+04 5.13E+04
b 1.51E+05 5.07E+04 2.25E+05 1.68E+05 5.07E+04 5.07E+04
0.75*ULOQ a 1.06E+05 3.45E+04 1.54E+05 1.13E+05 3.45E+04 3.45E+04
b 9.87E+04 3.22E+04 1.54E+05 1.04E+05 3.22E+04 3.22E+04
Table IV.6: Raw peak area data for the assessment of matrix effect and recovery. LLOQ: lower limit of
quantitation; MID: intermediate concentration; ULOQ: upper limit of quantitation.
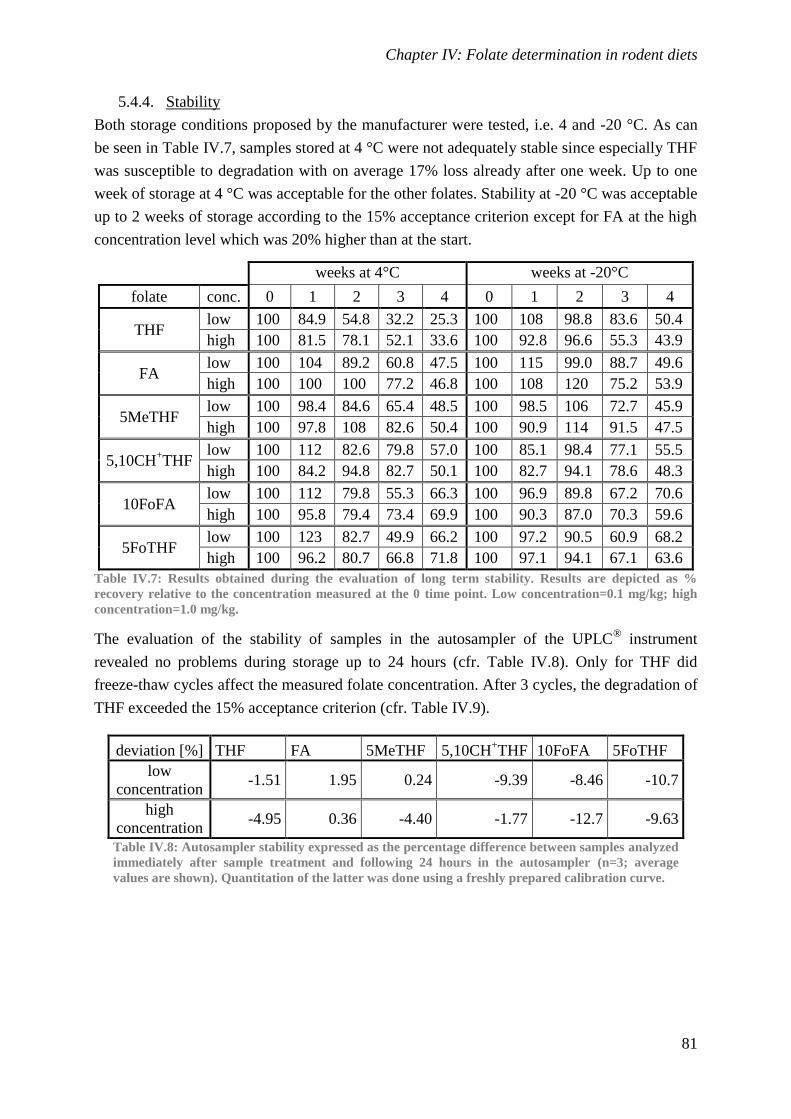
Chapter IV: Folate determination in rodent diets
81
5.4.4. Stability
Both storage conditions proposed by the manufacturer were tested, i.e. 4 and -20 °C. As can
be seen in Table IV.7, samples stored at 4 °C were not adequately stable since especially THF
was susceptible to degradation with on average 17% loss already after one week. Up to one
week of storage at 4 °C was acceptable for the other folates. Stability at -20 °C was acceptable
up to 2 weeks of storage according to the 15% acceptance criterion except for FA at the high
concentration level which was 20% higher than at the start.
weeks at 4°C weeks at -20°C
folate conc. 0 1 2 3 4 0 1 2 3 4
THF low 100 84.9 54.8 32.2 25.3 100 108 98.8 83.6 50.4
high 100 81.5 78.1 52.1 33.6 100 92.8 96.6 55.3 43.9
FA low 100 104 89.2 60.8 47.5 100 115 99.0 88.7 49.6
high 100 100 100 77.2 46.8 100 108 120 75.2 53.9
5MeTHF low 100 98.4 84.6 65.4 48.5 100 98.5 106 72.7 45.9
high 100 97.8 108 82.6 50.4 100 90.9 114 91.5 47.5
5,10CH+THF
low 100 112 82.6 79.8 57.0 100 85.1 98.4 77.1 55.5
high 100 84.2 94.8 82.7 50.1 100 82.7 94.1 78.6 48.3
10FoFA low 100 112 79.8 55.3 66.3 100 96.9 89.8 67.2 70.6
high 100 95.8 79.4 73.4 69.9 100 90.3 87.0 70.3 59.6
5FoTHF low 100 123 82.7 49.9 66.2 100 97.2 90.5 60.9 68.2
high 100 96.2 80.7 66.8 71.8 100 97.1 94.1 67.1 63.6
Table IV.7: Results obtained during the evaluation of long term stability. Results are depicted as %
recovery relative to the concentration measured at the 0 time point. Low concentration=0.1 mg/kg; high
concentration=1.0 mg/kg.
The evaluation of the stability of samples in the autosampler of the UPLC® instrument
revealed no problems during storage up to 24 hours (cfr. Table IV.8). Only for THF did
freeze-thaw cycles affect the measured folate concentration. After 3 cycles, the degradation of
THF exceeded the 15% acceptance criterion (cfr. Table IV.9).
deviation [%] THF FA 5MeTHF 5,10CH+THF 10FoFA 5FoTHF
low
concentration -1.51 1.95 0.24 -9.39 -8.46 -10.7
high
concentration -4.95 0.36 -4.40 -1.77 -12.7 -9.63
Table IV.8: Autosampler stability expressed as the percentage difference between samples analyzed
immediately after sample treatment and following 24 hours in the autosampler (n=3; average
values are shown). Quantitation of the latter was done using a freshly prepared calibration curve.
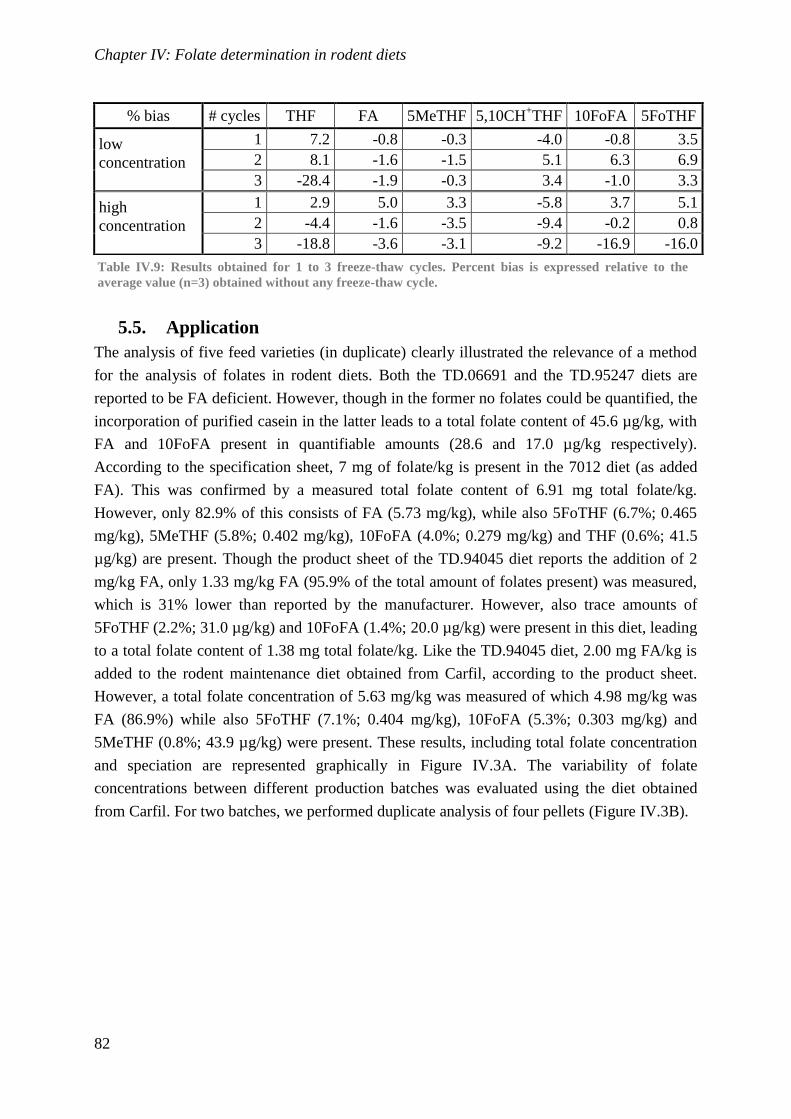
Chapter IV: Folate determination in rodent diets
82
5.5. Application
The analysis of five feed varieties (in duplicate) clearly illustrated the relevance of a method
for the analysis of folates in rodent diets. Both the TD.06691 and the TD.95247 diets are
reported to be FA deficient. However, though in the former no folates could be quantified, the
incorporation of purified casein in the latter leads to a total folate content of 45.6 µg/kg, with
FA and 10FoFA present in quantifiable amounts (28.6 and 17.0 µg/kg respectively).
According to the specification sheet, 7 mg of folate/kg is present in the 7012 diet (as added
FA). This was confirmed by a measured total folate content of 6.91 mg total folate/kg.
However, only 82.9% of this consists of FA (5.73 mg/kg), while also 5FoTHF (6.7%; 0.465
mg/kg), 5MeTHF (5.8%; 0.402 mg/kg), 10FoFA (4.0%; 0.279 mg/kg) and THF (0.6%; 41.5
µg/kg) are present. Though the product sheet of the TD.94045 diet reports the addition of 2
mg/kg FA, only 1.33 mg/kg FA (95.9% of the total amount of folates present) was measured,
which is 31% lower than reported by the manufacturer. However, also trace amounts of
5FoTHF (2.2%; 31.0 µg/kg) and 10FoFA (1.4%; 20.0 µg/kg) were present in this diet, leading
to a total folate content of 1.38 mg total folate/kg. Like the TD.94045 diet, 2.00 mg FA/kg is
added to the rodent maintenance diet obtained from Carfil, according to the product sheet.
However, a total folate concentration of 5.63 mg/kg was measured of which 4.98 mg/kg was
FA (86.9%) while also 5FoTHF (7.1%; 0.404 mg/kg), 10FoFA (5.3%; 0.303 mg/kg) and
5MeTHF (0.8%; 43.9 µg/kg) were present. These results, including total folate concentration
and speciation are represented graphically in Figure IV.3A. The variability of folate
concentrations between different production batches was evaluated using the diet obtained
from Carfil. For two batches, we performed duplicate analysis of four pellets (Figure IV.3B).
% bias # cycles THF FA 5MeTHF 5,10CH+THF 10FoFA 5FoTHF
low
concentration
1 7.2 -0.8 -0.3 -4.0 -0.8 3.5
2 8.1 -1.6 -1.5 5.1 6.3 6.9
3 -28.4 -1.9 -0.3 3.4 -1.0 3.3
high
concentration
1 2.9 5.0 3.3 -5.8 3.7 5.1
2 -4.4 -1.6 -3.5 -9.4 -0.2 0.8
3 -18.8 -3.6 -3.1 -9.2 -16.9 -16.0
Table IV.9: Results obtained for 1 to 3 freeze-thaw cycles. Percent bias is expressed relative to the
average value (n=3) obtained without any freeze-thaw cycle.
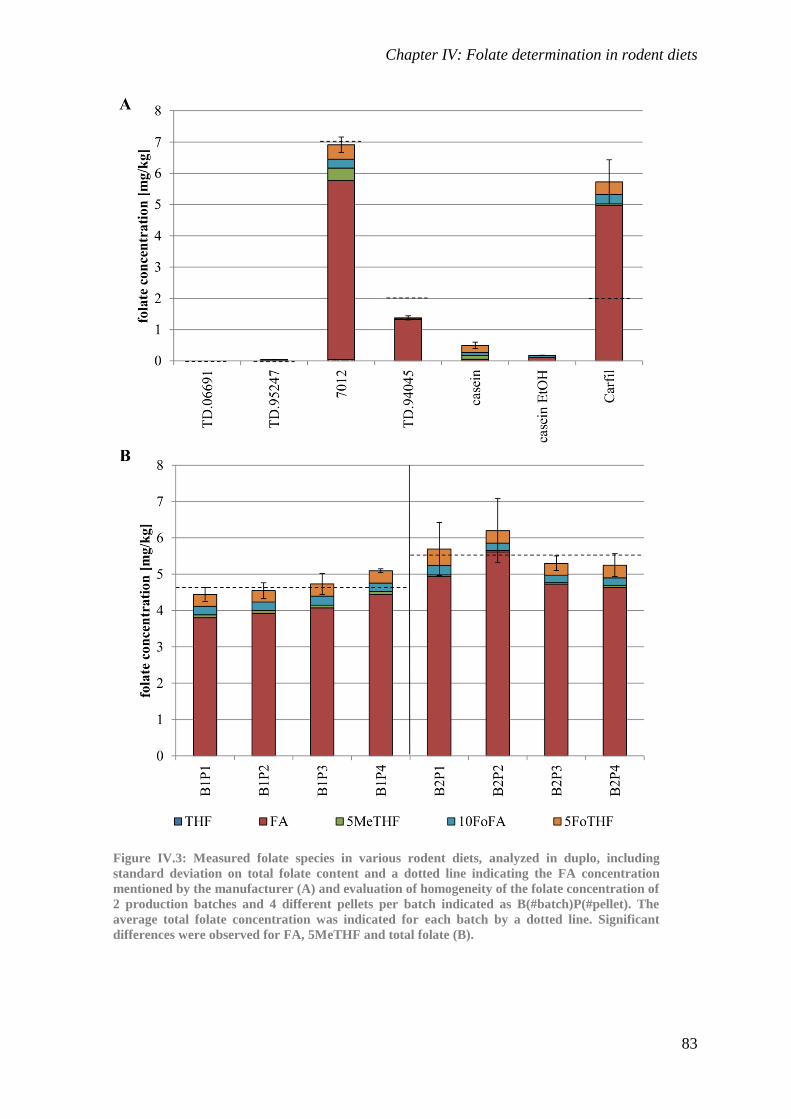
Chapter IV: Folate determination in rodent diets
83
Figure IV.3: Measured folate species in various rodent diets, analyzed in duplo, including
standard deviation on total folate content and a dotted line indicating the FA concentration
mentioned by the manufacturer (A) and evaluation of homogeneity of the folate concentration of
2 production batches and 4 different pellets per batch indicated as B(#batch)P(#pellet). The
average total folate concentration was indicated for each batch by a dotted line. Significant
differences were observed for FA, 5MeTHF and total folate (B).
Chapter IV: Folate determination in rodent diets
84
Though no appreciative difference was observed between pellets of each production batch,
there was a significant difference between these batches for FA (p=0.002), 5MeTHF
(p=0.000) and total folate (p=0.002), analyzed using an independent t-test at the 95%
confidence level. An 18.9% difference in FA concentration was measured between both
batches (4.98 and 4.04 mg/kg) while the 5MeTHF concentration differed by 41.2% (45.7 and
79.5 µg/kg, respectively), as can be seen in Figure IV.3B. As such, the use of pellets from
different production batches during a long term feeding trial may exert an influence because
of variable folate concentrations, especially since the concentrations of the distinct folates do
not differ equally. These results again illustrate the importance of an analytical method
capable of quantifying individual folate species.
When analyzing casein without the rest of the ingredients present, a total folate concentration
of 494 µg/kg casein was found. Here, mainly 5FoTHF (45.5%; 225 µg/kg), 5MeTHF (24.3%;
120 µg/kg), 10FoFA (19.5%; 101 µg/kg) and FA (10.8%; 53.2 µg/kg) were present. While
commonly performed to remove endogenous compounds, amongst which folates, ethanol
extraction only succeeds partly in removing folates from casein, with a measured remaining
total folate concentration of 179 µg/kg. While 5FoTHF was the major folate form present in
untreated casein, only FA (63.4%; 114 µg/kg) and 10FoFA (36.6%; 65.5 µg/kg) could be
quantified in ethanol extracted casein. As such, ethanol extraction is demonstrated to be
insufficient to completely remove all endogenous folates.
The BCR 121 certified reference material consists of a ground wholemeal flour with a
certified total folate concentration of 500 µg/kg with an uncertainty of 70 µg/kg. Though
wholemeal flour differs from rodent feed in terms of fat, protein and starch content and
consistency, it was used to evaluate the accuracy of the method. Following duplicate analysis,
we measured a total folate content of 443 µg/kg with a standard deviation of 4 µg/kg, which
corresponds to the certified range. Also, individual folate concentrations (59, 25, 48, 111 and
199 µg/kg for THF, FA, 5MeTHF, 10FoFa and 5FoTHF respectively) were comparable to
those found in literature.(Doherty and Beecher 2003; Pawlosky et al. 2003; Van Daele et al.
2014)
IV.6. Conclusion
It is clear that for the correct interpretation of results obtained during animal feeding trials, it
is very important to determine the actual feed intake and the folate concentration at the time
of feeding. This conclusion is supported by our analysis of various feed samples, in which we
observed substantial differences between the specified folate content and the actual folate
content and the presence, up to 17%, of reduced and substituted folates.
Chapter IV: Folate determination in rodent diets
85
IV.7. References
Castorena-Torres, F., Ramos-Parra, P.A., Hernandez-Mendez, R.V., Vargas-Garcia, A.,
Garcia-Rivas, G. and de la Garza, R.I. 2014. “Natural Folates from Biofortified Tomato
and Synthetic 5-Methyl-Tetrahydrofolate Display Equivalent Bioavailability in a Murine
Model.” Plant Foods Hum Nutr 69 (1): 57–64.
Crider, K.S., Yang, T.P., Berry, R.J. and Bailey, L.B. 2012. “Folate and DNA Methylation: A
Review of Molecular Mechanisms and the Evidence for Folate’s Role.” Adv Nutr 3 (1):
21–38.
De Brouwer, V., Zhang, G.F., Storozhenko, S., Van Der Straeten, D. and Lambert, W.E.
2007. “pH Stability of Individual Folates during Critical Sample Preparation Steps in
Prevision of the Analysis of Plant Folates.” Phytochem Anal 18 (6): 496–508.
De Brouwer, V., Storozhenko, S., Van De Steene, J.C., Wille, S.M.R., Stove, C.P., Van Der
Straeten, D. and Lambert, W.E. 2008. “Optimisation and Validation of a Liquid
Chromatography–tandem Mass Spectrometry Method for Folates in Rice.” J
Chromatogr A 1215 (1–2): 125–32.
Degen, G.H., Janning, P., Diel, P. and Bolt, H.M. 2002. “Estrogenic Isoflavones in Rodent
Diets.” Toxicol Lett 128 (1–3): 145–57.
Doherty, R.F., and Beecher, G.R. 2003. “A Method for the Analysis of Natural and Synthetic
Folate in Foods.” J Agric Food Chem 51 (2): 354–61.
Galivan, J., Ryan, T.J., Chave, K., Rhee, M., Yao, R. and Yin, D. 2000. “Glutamyl Hydrolase:
Pharmacological Role and Enzymatic Characterization.” Pharmacol Therapeut 85 (3):
207–15.
Heid, M.K., Bills, N.B., Hinrichs, S.H. and Clifford, A.J. 1992. “Folate Deficiency Alone
Does Not Produce Neural Tube Defects in Mice.” J Nutr 122 (4): 888–94.
Horne, D.W., Krumdieck, C.L. and Wagner, C. 1981. “Properties of Folic Acid Gamma-
Glutamyl Hydrolase (conjugase) in Rat Bile and Plasma.” J Nutr 111 (3): 442–9.
Jagerstad, M. and Jastrebova, J. 2013. “Occurrence, Stability, and Determination of Formyl
Folates in Foods.” J Agric Food Chem 61 (41): 9758–68.
Kiekens, F., Blancquaert, D., Devisscher, L., Van Daele, J., Stove, V.V., Delanghe, J.R., Van
Der Straeten, D., Lambert, W.E. and Stove, C.P. 2015. “Folates from Metabolically
Engineered Rice: A Long-Term Study in Rats.” Mol Nutr Food Res 59 (3): 490–500.
Laird, P.W., and Jaenisch, R. 1996. “The Role of DNA Methylation in Cancer Genetic and
Epigenetics.” Annu Rev Genet 30: 441–64.
Matuszewski, B.K., Constanzer, M.L. and Chavez-Eng, C.M. 2003. “Strategies for the
Assessment of Matrix Effect in Quantitative Bioanalytical Methods Based on HPLC-
MS/MS.” Anal Chem 75 (13): 3019–30.
Pawlosky, R.J., Flanagan, V.P. and Doherty, R.F. 2003. “A Mass Spectrometric Validated
High-Performance Liquid Chromatography Procedure for the Determination of Folates
in Foods.” J Agric Food Chem 51 (13): 3726–30.
Chapter IV: Folate determination in rodent diets
86
Pedersen, J.C. 1988. “Comparison of γ-Glutamyl Hydrolase (conjugase; EC 3. 4. 22. 12) and
Amylase Treatment Procedures in the Microbiological Assay for Food Folates.” Br J
Nutr 59 (2): 261–71.
Reeves, P.G. 1997. “Components of the AIN-93 Diets as Improvements in the AIN-76A
Diet.” J Nutr 127 (5 Suppl): 838S –41S.
Reeves, P.G., Nielsen, F.H. and Fahey G.C.Jr. 1993. “AIN-93 Purified Diets for Laboratory
Rodents: Final Report of the American Institute of Nutrition Ad Hoc Writing Committee
on the Reformulation of the AIN-76A Rodent Diet.” J Nutr 123 (11): 1939–51.
Rushing, L.G., Cooper, W.M. and Thompson, H.C. 1991. “Simultaneous Analysis of
Vitamins A and E in Rodent Feed by High-Pressure Liquid Chromatography.” J Agric
Food Chem 39 (2): 296–9.
Scott, J., Rébeillé, F. and Fletcher, J. 2000. “Folic Acid and Folates: The Feasibility for
Nutritional Enhancement in Plant Foods.” J Sci Food Agric 80 (7): 795–824.
Tamura, T., Mizuno, Y., Johnston, K.E. and Jacob, R.A. 1997. “Food Folate Assay with
Protease, α-Amylase, and Folate Conjugase Treatments.” J Agric Food Chem 45 (1):
135–9.
U.S. Department of Health and Human Services. 2001. “Guidance for Industry, Bioanalytical
Method Validation.” http://www.fda.gov/downloads/Drugs/Guidance/ucm070107.pdf
(Consulted: 05/14/2016)
Unit for Reference Materials EC-JRC-IRMM. 2007. “Certified Reference Material BCR
121.” https://ec.europa.eu/jrc/sites/default/files/rm/BCR-121_cert.pdf (consulted:
01/30/2016).
Vahteristo, L.T., Ollilainen, V., Koivistoinen, P.E. and Varo, P. 1996. “Improvements in the
Analysis of Reduced Folate Monoglutamates and Folic Acid in Food by High-
Performance Liquid Chromatography.” J Agric Food Chem 44 (2): 477–82.
Van Daele, J., Blancquaert, D., Kiekens, F., Van Der Straeten, D., Lambert, W.E. and Stove,
C.P. 2014. “Folate Profiling in Potato (Solanum Tuberosum) Tubers by Ultrahigh-
Performance Liquid Chromatography-Tandem Mass Spectrometry.” J Agric Food Chem
62 (14): 3092–100.
Zeisel, S.H. 2009. “Importance of Methyl Donors during Reproduction.” Am J Clin Nutr 89
(2): 673S – 7S.
Chapter V: Folate determination in plasma
and red blood cells
Based on:
Kiekens F., Van Daele J., Blancquaert D., Van Der Straeten D., Lambert W.E., Stove C.P.
2015. “A validated ultra-high-performance liquid chromatography-tandem mass spectrometry
method for the selective analysis of free and total folate in plasma and red blood cells” J
Chromatogr A, 1398, 20-8
Chapter V: Folate determination in plasma and red blood cells
88
Author contributions
FK, CPS and WEL designed the research; FK conducted the research; FK analyzed the data
and conducted statistical analysis; JVD reviewed the data; FK and CPS wrote the paper,
which was revised by DVDS, WEL, JVD, and DB; FK and CPS are responsible for the final
content.
Chapter V: Folate determination in plasma and red blood cells
89
Table of contents
V.1. Abstract ...................................................................................................................... 90
V.2. Introduction ................................................................................................................ 91
V.3. Objectives ................................................................................................................... 92
V.4. Materials and methods ............................................................................................... 93
4.1. Reagents and materials .......................................................................................... 93
4.2. Preparation of stripped calibrator and QC-matrix ................................................. 93
4.3. Sample preparation ................................................................................................ 93
4.4. Enzyme treatment and protein precipitation ......................................................... 94
4.5. Sample clean-up .................................................................................................... 94
4.6. LC-MS/MS analysis .............................................................................................. 96
4.7. Validation .............................................................................................................. 97
4.7.1. Selectivity and carry-over ................................................................................. 97
4.7.2. Linearity, accuracy and precision ..................................................................... 97
4.7.3. Recovery and matrix effects ............................................................................. 99
4.7.4. Stability ............................................................................................................. 99
4.8. Application ............................................................................................................ 99
V.5. Results and discussion ............................................................................................... 99
5.1. Method optimization ............................................................................................. 99
5.1.1. Sample treatment .............................................................................................. 99
5.1.2. Folate deconjugation ....................................................................................... 100
5.1.3. Protein precipitation ....................................................................................... 100
5.1.4. Solid phase extraction ..................................................................................... 101
5.2. Method validation ................................................................................................ 101
5.2.1. Selectivity and carry-over ............................................................................... 101
5.2.2. Linearity, accuracy and precision ................................................................... 101
5.2.3. Recovery and matrix effects ........................................................................... 103
5.2.4. Stability ........................................................................................................... 105
5.3. Application .......................................................................................................... 108
V.6. Conclusion ............................................................................................................... 111
V.7. References ................................................................................................................ 112
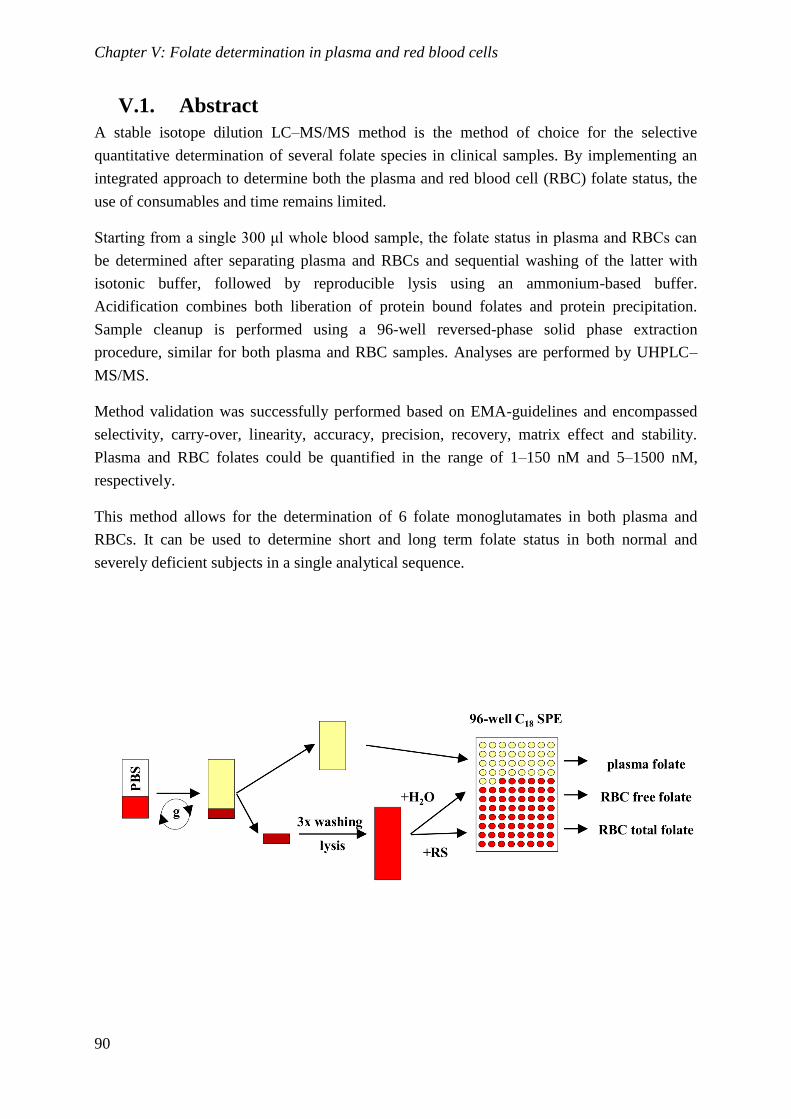
Chapter V: Folate determination in plasma and red blood cells
90
V.1. Abstract
A stable isotope dilution LC–MS/MS method is the method of choice for the selective
quantitative determination of several folate species in clinical samples. By implementing an
integrated approach to determine both the plasma and red blood cell (RBC) folate status, the
use of consumables and time remains limited.
Starting from a single 300 μl whole blood sample, the folate status in plasma and RBCs can
be determined after separating plasma and RBCs and sequential washing of the latter with
isotonic buffer, followed by reproducible lysis using an ammonium-based buffer.
Acidification combines both liberation of protein bound folates and protein precipitation.
Sample cleanup is performed using a 96-well reversed-phase solid phase extraction
procedure, similar for both plasma and RBC samples. Analyses are performed by UHPLC–
MS/MS.
Method validation was successfully performed based on EMA-guidelines and encompassed
selectivity, carry-over, linearity, accuracy, precision, recovery, matrix effect and stability.
Plasma and RBC folates could be quantified in the range of 1–150 nM and 5–1500 nM,
respectively.
This method allows for the determination of 6 folate monoglutamates in both plasma and
RBCs. It can be used to determine short and long term folate status in both normal and
severely deficient subjects in a single analytical sequence.
Chapter V: Folate determination in plasma and red blood cells
91
V.2. Introduction
Folates, a group of essential water-soluble B-vitamins (B9), are key cofactors in both the
methylation cycle and DNA-synthesis. Folate deficiency has been implicated in several health
disorders, with a proven link between periconceptional folate deficiency and the prevalence of
neural tube defects.(Zeisel 2009) Other health issues such as increased cancer risk due to a
disruption of DNA methylation and misincorporation of uracil may be related to folate
deficiency.(Laird and Jaenisch 1996) Also, an impaired or halted methylation cycle causes
neural damage through the reduced myelination of the nervous system (Crider et al. 2012)
and leads to increased plasma homocysteine concentrations.(Shane 2010; Kiekens et al. 2015
(Chapter VI)) Following several decades of research it is evident that knowledge of nutrient
status, including folate concentrations, is of paramount importance for the evaluation of
individual health.
Clinical folate status is traditionally determined in serum by a competitive folate binding
protein (FBP) assay or a microbial assay. However, more recently developed liquid
chromatographic tandem mass spectrometric (LC–MS/MS) methods allow to discriminate
between different metabolically active folate species for which the microbial and ligand
binding assays are not equally specific.(Owen and Roberts 2003; Yetley et al. 2011; Pfeiffer
et al. 2011)
For LC–MS/MS analysis of folates in plasma or serum, several methods have been published,
differing in certain steps. Nelson et al. showed that affinity extraction with FBP led to lower
detection limits, compared to reversed-phase solid phase extraction (SPE).(Nelson et al. 2004)
However, Hannisdal et al. omitted the purification step and simply used protein precipitation
and evaporation as sample cleanup technique, yielding similar results.(Hannisdal et al. 2009a)
Also, Garbis et al. showed that hydrophilic interaction liquid chromatography can be used to
separate four different folate species.(Garbis et al. 2001) Using an automated phenyl-based
SPE system, a sensitive and high-throughput method for the measurement of serum folates
was devised by Fazili et al.(Fazili et al. 2013)
Lysis of whole blood samples for folate analysis is commonly performed using an
L-ascorbic acid (AA) solution as a lysing agent.(Fazili and Pfeiffer 2004; Smith et al. 2006;
Kirsch et al. 2012) However, this strategy was criticized due to differences in the assayable
folate concentrations, attributable to differences in solution strength, which may lead to
incomplete lysis, non-linear dilution curves and variable lysis times.(Wright et al. 2000) The
addition of AA to whole blood lysates causes deoxygenation of hemoglobin due to the
acidification of the sample. Since folates are trapped within the structure of oxyhemoglobin,
deoxygenation is required for deconjugation.(Wright et al. 1998) Alternatively, lyophilized
RBCs have also been used as a starting material to which an extraction buffer is
added.(Monch et al. 2010)
Chapter V: Folate determination in plasma and red blood cells
92
Since most LC–MS/MS procedures only measure folate monoglutamates, it is necessary to
incubate the lysate at 37 °C for 2–12 h to allow human γ-glutamylhydrolase (GGH), present
in plasma, to deconjugate the folate polyglutamates present in the sample. Mostly heat
inactivation is used to stop this reaction.(Smith et al. 2006) Samples can be purified using
affinity extraction with FBP, followed by SPE to concentrate the sample.(Smith et al. 2006)
However, most used is ion-exchange or reversed-phase SPE without affinity extraction.(Fazili
et al. 2005; Monch et al. 2010) Mixed-mode sorbents (i.e. reversed phase + ion-exchange
interaction) can be used, though this necessitates an evaporation-dissolution step to remove
the organic solvent from the sample.(Kirsch et al. 2012)
For plasma and RBCs it is difficult to obtain a blank matrix. A surrogate matrix, consisting of
lyophilized egg white and sunflower oil in an isotonic sodium chloride solution, is sometimes
used.(Monch et al. 2010) Another approach is to serially dilute samples with water in order to
estimate the detection limits of the method.(Fazili et al. 2005) In both approaches, the
obtained results may not be a true reflection of actual method performance. A better approach,
as applied by e.g. Kirsch et al., may be to use a matrix treated with activated charcoal to
assess method performance, although it should be noted that this matrix also differs in many
aspects from non-treated matrix since other compounds are also removed from the
matrix.(Kirsch et al. 2012)
To selectively quantify plasma, RBC free and RBC total folate, we developed a new LC–
MS/MS method, with the focus on the sample preparation steps. This method was set up as
such, that most of the treatment steps, consumables and solvents were shared for both plasma
and RBC analyses, thereby optimizing the workflow and augmenting sample throughput.
Also, reproducible RBC lysis, an obstacle troubling previously published methods, was
achieved using a lysis buffer specific for RBCs, while addition of dithiothreitol (DTT) assures
the release of folates from hemoglobin. To assess method performance, a full validation was
performed, based upon European Medicines Agency (EMA) guidelines, including selectivity,
carry-over, linearity, accuracy, precision, recovery, matrix effects and stability in whole
blood, prepared extracts and while being in the autosampler.(European Medicines Agency
2011) Additionally, certified reference materials for both plasma and RBCs were analyzed to
assure interlaboratory accuracy.
V.3. Objectives
To determine the folate status (e.g. following consumption of folate rice), a method was
needed to measure folates in both plasma (short term status) and RBC (long term status).
However, since in a rodent study only a small volume of whole blood can be obtained
following (periodic) sampling, the method should be able to determine both plasma and RBC
folates from a limited volume of whole blood.
Chapter V: Folate determination in plasma and red blood cells
93
V.4. Materials and methods
4.1. Reagents and materials
The six folate monoglutamates studied are: tetrahydrofolate (THF), 5-methyltetrahydrofolate
(5MeTHF), 5,10-methenyltetrahydrofolate (5,10CH+THF), 10-formylfolic acid (10FoFA), 5-
formyltetrahydrofolate (5FoTHF) and folic acid (FA). The folate reference standards were
obtained from Schircks Laboratories (Jona, Switzerland), while the labeled internal standards
(ISs), with a labelling yield higher than 98%, were obtained from Merck Eprova (Glattbrugg,
Switzerland). At the pH values reached during sample preparation and analysis, the
metabolically active 10-formyltetrahydrofolate (10FoTHF) is detected as 5,10CH+THF. Also,
5,10-methylenetetrahydrofolate (5,10CH2THF) is unstable at acidic pH and is measured as
THF.(De Brouwer et al. 2007; Jagerstad and Jastrebova 2013) All calibrators and 13
C5
labelled IS solutions were prepared at a final concentration of 200 µM in a 50 mM sodium
phosphate buffer, pH 7.5, containing 1% AA and 0.5% DTT/methanol (50/50 v/v%). 13
C5-FA
was used as IS for FA, 5FoTHF and 10FoFA, whereas 13
C5-THF, 13
C5-5MeTHF and 13
C5-
5,10CH+THF were used as IS for their respective isotopologues. Stripped rat serum was
obtained starting from non-sterile, non-hemolyzed rat serum, obtained from Harlan (Horst,
The Netherlands), which was stirred on ice for 1 h with 100 mg/ml of activated charcoal
(Sigma–Aldrich, Schnelldorf, Germany) to remove endogenous folates. Following removal of
the activated charcoal by centrifugation at 4500 × g for 15 min at 4 °C, the solution was
filtered over a 0.45 μm syringe filter (GD/X CA 25/0.45, Whatman, GE Healthcare, Little
Chalfont, UK), divided into aliquots (1.5 ml) and frozen at −80 °C. Acetonitrile (ACN) and
methanol of LC–MS quality were purchased from Biosolve (Valkenswaard, The
Netherlands). Formic acid, trisodium phosphate, AA and DTT were obtained from Sigma–
Aldrich. SPE was performed in a 96-well format with Bond Elut C18 100 mg sorbent,
purchased from Agilent (Palo Alto, CA, USA). Deionized water (H2O-MQ) was produced in
house by means of a Synergy UV water-purification system from Millipore (Billerica, MA,
USA).
4.2. Preparation of stripped calibrator and QC-matrix
EDTA-anticoagulated blood samples were obtained from healthy volunteers, 4 male and 2
female, aged 25–37. To remove endogenous folates, plasma and RBC extracts were treated
with activated charcoal as described for rat serum in Section 4.1.
4.3. Sample preparation
Folate analysis was performed starting from 300 μl EDTA-anticoagulated venous blood.
Plasma extracts were prepared by adding 500 μl of phosphate buffered saline (PBS) to the
whole blood sample. After centrifugation at 1000 × g for 5 min at 4 °C, 500 μl of supernatant
was withdrawn. To this aliquot 50 μl of a 1% AA, 0.5% DTT solution (containing all ISs in a
final concentration of 3.0 nM) was added to stabilize the folates. Following 15 min of
incubation at room temperature, the samples were either analyzed immediately or frozen at
Chapter V: Folate determination in plasma and red blood cells
94
−80 °C. To the remainder of the samples, containing the RBCs, 1 ml of PBS at room
temperature was added, followed by resuspension, centrifugation at 1000 × g for 5 min at 4
°C and removal of 1 ml supernatant. This washing procedure was repeated two more times.
After the final removal of 1 ml supernatant, 800 μl of lysis buffer (168 mM NH4Cl; 10 mM
KHCO3; 0.1 mM EDTA) was added.(Chernyshev et al. 2008) Selective RBC lysis occurred
during a 10-min incubation at room temperature, after which cell residues were spun down by
centrifugation at 2500 × g for 10 min at 4 °C. One milliliter of supernatant was withdrawn and
100 μl of IS/AA/DTT solution was added. After incubation for 15 min at room temperature,
these samples were analyzed further or frozen at −80 °C. A flowchart describing the sample
preparation procedure is shown in Figure V.1.
4.4. Enzyme treatment and protein precipitation
To measure the total folate content in RBCs, 100 μl of stripped rat serum was added to 500 μl
of RBC lysate and incubated for 2 h at 37 °C. This stripped rat serum serves as an exogenous
source of GGH to deconjugate the folate polyglutamates present in RBC samples. The
reaction was halted by addition of 300 μl of 10 vol% acetic acid in water. This acidification of
the sample also liberates protein-bound folates and causes protein precipitation.(Kamen and
Caston 1986) While no enzyme treatment is necessary to measure free monoglutamates in
plasma and RBCs, these samples were also acidified by adding 275 µl or 300 μl of 10% acetic
acid, respectively. The acidified samples were incubated for 20 min at 4 °C prior to
centrifugation at 11,000 × g for 15 min at 4 °C.
4.5. Sample clean-up
SPE was performed using a Bond Elut 96-well plate containing 100 mg C18 sorbent per well.
The sorbent was activated with 2 × 600 μl of methanol and conditioned with 2 × 600 μl of
1.67/30.30/68.03 v/v/v% CH3COOH/PBS/H2O-MQ including 303 mg AA and 30,3 mg DTT
per 100 ml. Next, plasma and RBC samples were diluted with an equal volume of water of
which 1 ml for plasma extracts and 800 μl for RBC extracts was loaded onto the sorbent. The
sorbent was then washed with 2 × 600 μl of conditioning buffer prior to elution with 450 μl of
elution buffer (7.5/92.5 v/v% ACN/50 mM trisodium phosphate with 1% AA and 0.1% DTT;
pH = 7.3). The SPE procedure is also summarized in Figure V.1.
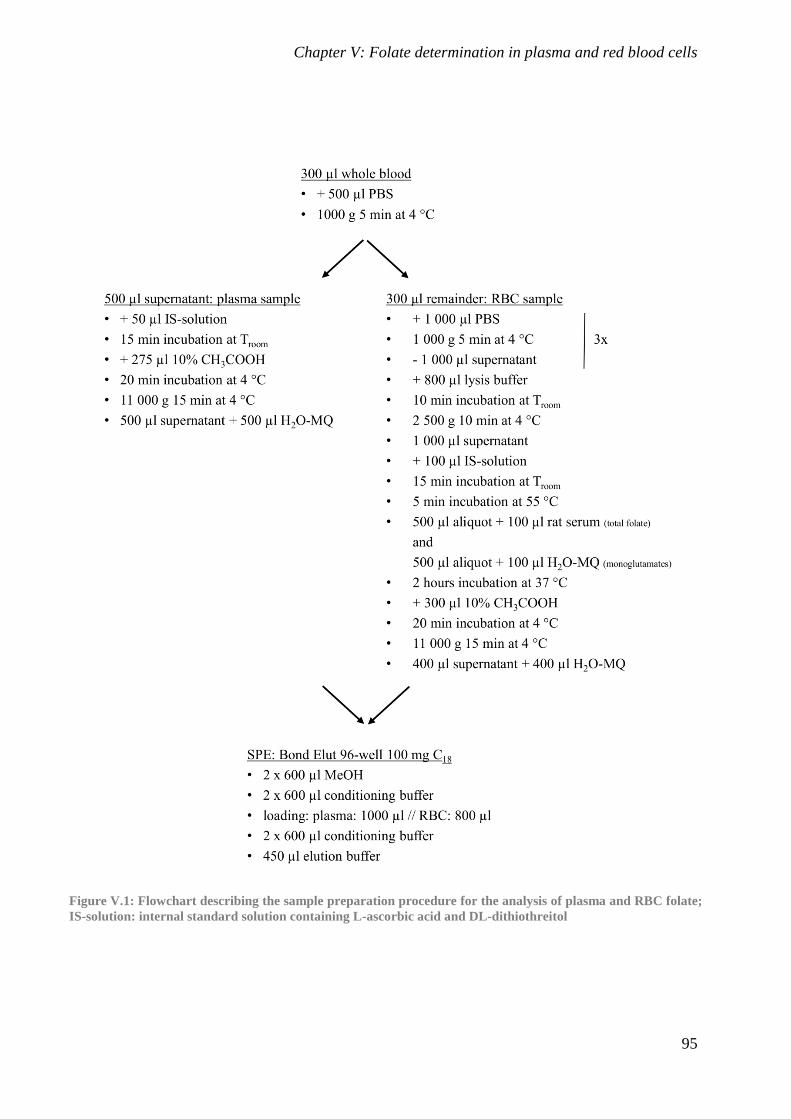
Chapter V: Folate determination in plasma and red blood cells
95
Figure V.1: Flowchart describing the sample preparation procedure for the analysis of plasma and RBC folate;
IS-solution: internal standard solution containing L-ascorbic acid and DL-dithiothreitol
Chapter V: Folate determination in plasma and red blood cells
96
4.6. LC-MS/MS analysis
Samples were analyzed using a Waters Acquity UPLC® system coupled to an ABSciex API
4000™ triple quadrupole mass spectrometer equipped with a TurboIonSpray®
probe. The
autosampler was equipped with a sample loop of 10 μl and samples were kept at 4 °C prior to
injection. After injection the needle was cleaned with 600 μl of 10/90 v/v% H2O-MQ/ACN
followed by 800 μl of 90/10 v/v% H2O-MQ/ACN. Chromatographic separation was achieved
using a mobile phase composed of H2O-MQ (A) and ACN (B), each containing 0.1% of
formic acid, with a flow rate of 0.6 ml/min on a Waters HSS T3-column (150 mm × 2.1 mm;
1.8 μm) held at 60 °C. The composition of the mobile phase starts with 100% solvent A and is
kept constant for 1.6 min. Thereafter the amount of solvent B is increased to 10% in 1.2 min
and to 16% in another 0.7 min after which the column is cleaned for 1.5 min with 95%
solvent B and equilibrated to initial solvent composition for 3 min. This amounts to a total
time of approximately 9 min between injections. Mass spectrometric detection was performed
in scheduled multiple-reaction monitoring mode. Electrospray ionization was used to ionize
the analytes with the ion spray voltage set at 2500 V and a temperature of 600 °C. Nitrogen
was used as curtain gas, gas 1 and gas 2, with respective pressure settings at 25, 75 and 90
psig, and as collision gas at setting 11. The interface heater was switched on. The transitions
monitored per compound were the same as described before (De Brouwer et al. 2008) and can
be found together with the settings in Table V.1.
Compound Retention
time [min]
Molecular
ion [Da]
Fragment
ion [Da]
DP
[V]
EP
[V]
CE
[V]
CXP
[V]
THF 3.36 446.2 299.3 59 4 26 13
3.36 166.3 59 10 54 12
FA 3.97 442.1 295.3 54 9 24 22
3.97 176.2 54 9 60 16
5MeTHF 3.45 460.3 313.2 52 5 25 20
3.45 194.2 62 2 54 14
5,10CH+THF
3.57 456.2 412.1 115 9 44 13
3.57 282.1 113 8 63 16
10FoFA 3.84 470.1 295.3 76 2 32 16
3.84 176.2 70 4 66 10
5FoTHF 3.89 474.2 299.3 54 12 46 8
3.89 166.3 52 12 52 14 13
C5-THF 3.36 451.1 299.3 64 6 27 16 13
C5-FA 3.97 447.2 295.3 65 3 27 26 13
C5-5MeTHF 3.45 465.3 313.2 66 6 27 13 13
C5-5,10CH+THF 3.57 461.0 416.2 79 8 45 9
Table V.1: Compound related MS parameters as used for the instrument programming. For
10FoFA and 5FoTHF the internal standard of FA is used. DP: declustering potential; EP: entrance
potential; CE: collision energy; CXP: collision cell exit potential; V: volt.
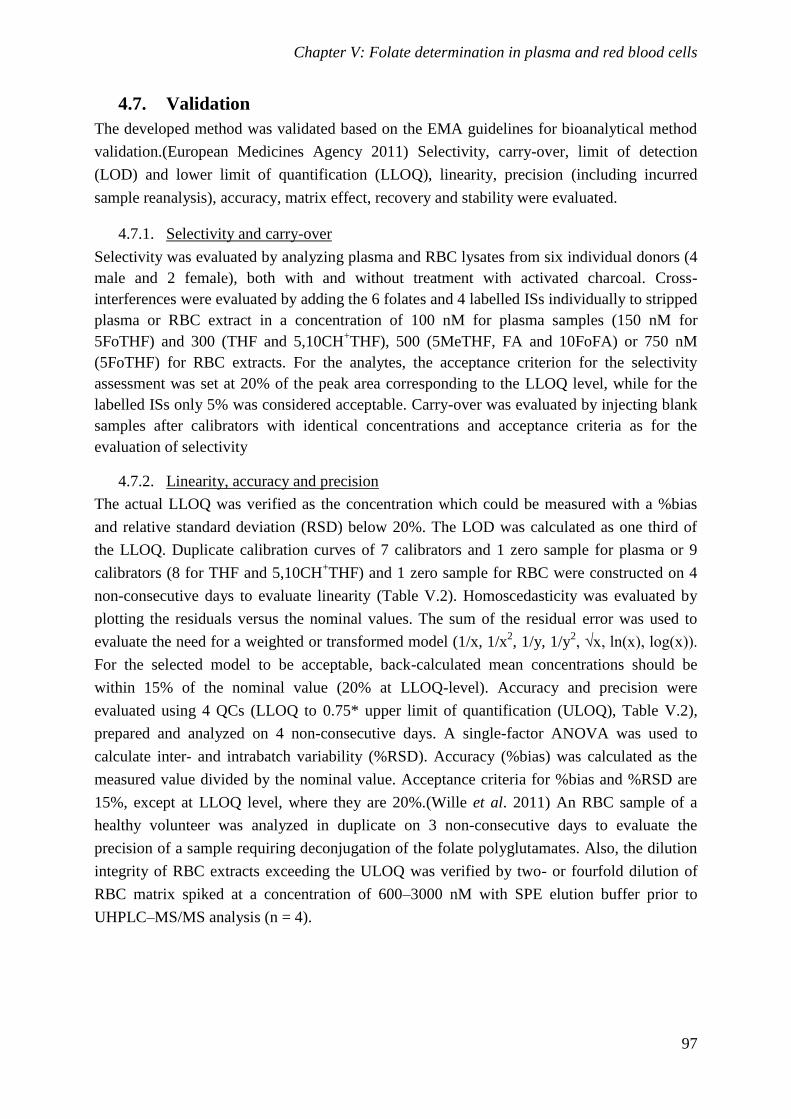
Chapter V: Folate determination in plasma and red blood cells
97
4.7. Validation
The developed method was validated based on the EMA guidelines for bioanalytical method
validation.(European Medicines Agency 2011) Selectivity, carry-over, limit of detection
(LOD) and lower limit of quantification (LLOQ), linearity, precision (including incurred
sample reanalysis), accuracy, matrix effect, recovery and stability were evaluated.
4.7.1. Selectivity and carry-over
Selectivity was evaluated by analyzing plasma and RBC lysates from six individual donors (4
male and 2 female), both with and without treatment with activated charcoal. Cross-
interferences were evaluated by adding the 6 folates and 4 labelled ISs individually to stripped
plasma or RBC extract in a concentration of 100 nM for plasma samples (150 nM for
5FoTHF) and 300 (THF and 5,10CH+THF), 500 (5MeTHF, FA and 10FoFA) or 750 nM
(5FoTHF) for RBC extracts. For the analytes, the acceptance criterion for the selectivity
assessment was set at 20% of the peak area corresponding to the LLOQ level, while for the
labelled ISs only 5% was considered acceptable. Carry-over was evaluated by injecting blank
samples after calibrators with identical concentrations and acceptance criteria as for the
evaluation of selectivity
4.7.2. Linearity, accuracy and precision
The actual LLOQ was verified as the concentration which could be measured with a %bias
and relative standard deviation (RSD) below 20%. The LOD was calculated as one third of
the LLOQ. Duplicate calibration curves of 7 calibrators and 1 zero sample for plasma or 9
calibrators (8 for THF and 5,10CH+THF) and 1 zero sample for RBC were constructed on 4
non-consecutive days to evaluate linearity (Table V.2). Homoscedasticity was evaluated by
plotting the residuals versus the nominal values. The sum of the residual error was used to
evaluate the need for a weighted or transformed model (1/x, 1/x2, 1/y, 1/y
2, √x, ln(x), log(x)).
For the selected model to be acceptable, back-calculated mean concentrations should be
within 15% of the nominal value (20% at LLOQ-level). Accuracy and precision were
evaluated using 4 QCs (LLOQ to 0.75* upper limit of quantification (ULOQ), Table V.2),
prepared and analyzed on 4 non-consecutive days. A single-factor ANOVA was used to
calculate inter- and intrabatch variability (%RSD). Accuracy (%bias) was calculated as the
measured value divided by the nominal value. Acceptance criteria for %bias and %RSD are
15%, except at LLOQ level, where they are 20%.(Wille et al. 2011) An RBC sample of a
healthy volunteer was analyzed in duplicate on 3 non-consecutive days to evaluate the
precision of a sample requiring deconjugation of the folate polyglutamates. Also, the dilution
integrity of RBC extracts exceeding the ULOQ was verified by two- or fourfold dilution of
RBC matrix spiked at a concentration of 600–3000 nM with SPE elution buffer prior to
UHPLC–MS/MS analysis (n = 4).
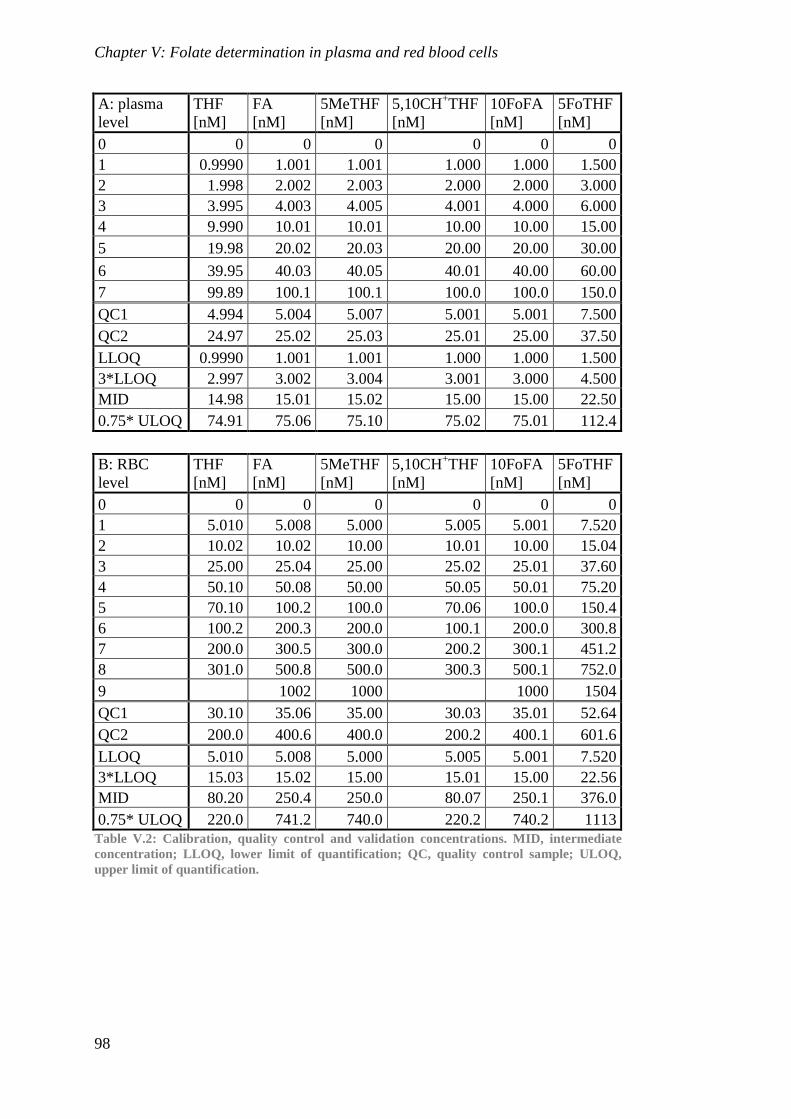
Chapter V: Folate determination in plasma and red blood cells
98
A: plasma
level
THF
[nM]
FA
[nM]
5MeTHF
[nM]
5,10CH+THF
[nM]
10FoFA
[nM]
5FoTHF
[nM]
0 0 0 0 0 0 0
1 0.9990 1.001 1.001 1.000 1.000 1.500
2 1.998 2.002 2.003 2.000 2.000 3.000
3 3.995 4.003 4.005 4.001 4.000 6.000
4 9.990 10.01 10.01 10.00 10.00 15.00
5 19.98 20.02 20.03 20.00 20.00 30.00
6 39.95 40.03 40.05 40.01 40.00 60.00
7 99.89 100.1 100.1 100.0 100.0 150.0
QC1 4.994 5.004 5.007 5.001 5.001 7.500
QC2 24.97 25.02 25.03 25.01 25.00 37.50
LLOQ 0.9990 1.001 1.001 1.000 1.000 1.500
3*LLOQ 2.997 3.002 3.004 3.001 3.000 4.500
MID 14.98 15.01 15.02 15.00 15.00 22.50
0.75* ULOQ 74.91 75.06 75.10 75.02 75.01 112.4
B: RBC
level
THF
[nM]
FA
[nM]
5MeTHF
[nM]
5,10CH+THF
[nM]
10FoFA
[nM]
5FoTHF
[nM]
0 0 0 0 0 0 0
1 5.010 5.008 5.000 5.005 5.001 7.520
2 10.02 10.02 10.00 10.01 10.00 15.04
3 25.00 25.04 25.00 25.02 25.01 37.60
4 50.10 50.08 50.00 50.05 50.01 75.20
5 70.10 100.2 100.0 70.06 100.0 150.4
6 100.2 200.3 200.0 100.1 200.0 300.8
7 200.0 300.5 300.0 200.2 300.1 451.2
8 301.0 500.8 500.0 300.3 500.1 752.0
9
1002 1000
1000 1504
QC1 30.10 35.06 35.00 30.03 35.01 52.64
QC2 200.0 400.6 400.0 200.2 400.1 601.6
LLOQ 5.010 5.008 5.000 5.005 5.001 7.520
3*LLOQ 15.03 15.02 15.00 15.01 15.00 22.56
MID 80.20 250.4 250.0 80.07 250.1 376.0
0.75* ULOQ 220.0 741.2 740.0 220.2 740.2 1113
Table V.2: Calibration, quality control and validation concentrations. MID, intermediate
concentration; LLOQ, lower limit of quantification; QC, quality control sample; ULOQ,
upper limit of quantification.
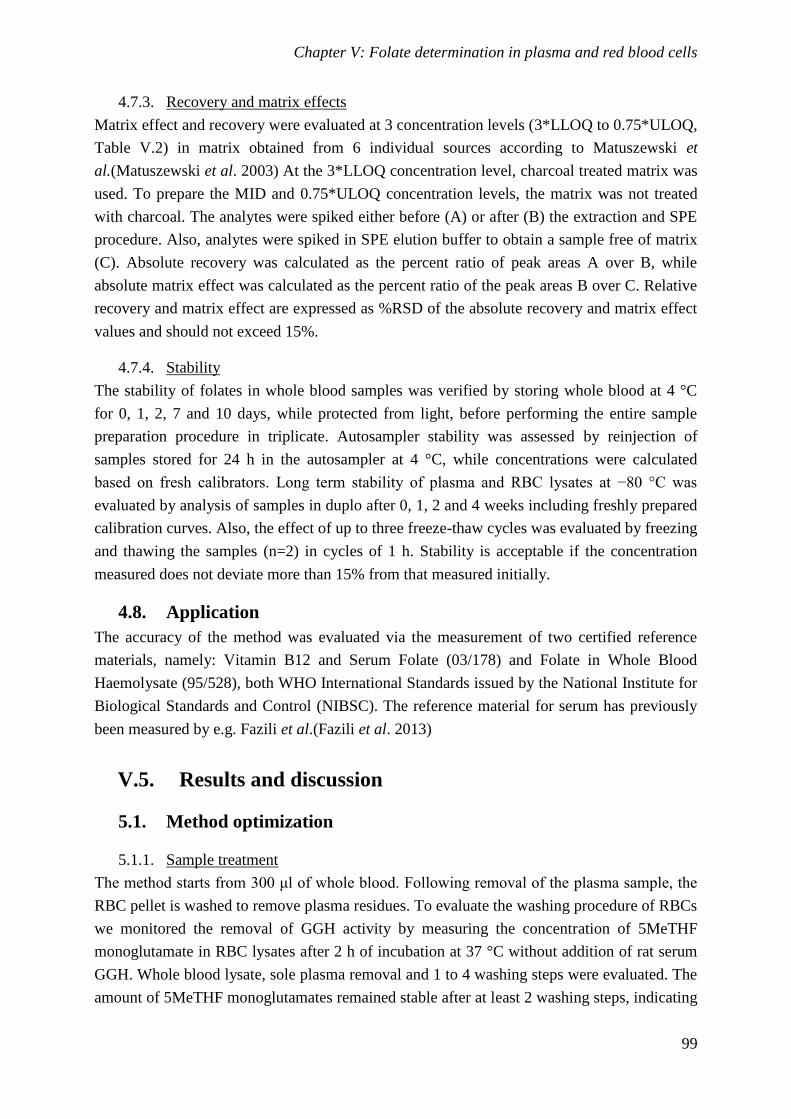
Chapter V: Folate determination in plasma and red blood cells
99
4.7.3. Recovery and matrix effects
Matrix effect and recovery were evaluated at 3 concentration levels (3*LLOQ to 0.75*ULOQ,
Table V.2) in matrix obtained from 6 individual sources according to Matuszewski et
al.(Matuszewski et al. 2003) At the 3*LLOQ concentration level, charcoal treated matrix was
used. To prepare the MID and 0.75*ULOQ concentration levels, the matrix was not treated
with charcoal. The analytes were spiked either before (A) or after (B) the extraction and SPE
procedure. Also, analytes were spiked in SPE elution buffer to obtain a sample free of matrix
(C). Absolute recovery was calculated as the percent ratio of peak areas A over B, while
absolute matrix effect was calculated as the percent ratio of the peak areas B over C. Relative
recovery and matrix effect are expressed as %RSD of the absolute recovery and matrix effect
values and should not exceed 15%.
4.7.4. Stability
The stability of folates in whole blood samples was verified by storing whole blood at 4 °C
for 0, 1, 2, 7 and 10 days, while protected from light, before performing the entire sample
preparation procedure in triplicate. Autosampler stability was assessed by reinjection of
samples stored for 24 h in the autosampler at 4 °C, while concentrations were calculated
based on fresh calibrators. Long term stability of plasma and RBC lysates at −80 °C was
evaluated by analysis of samples in duplo after 0, 1, 2 and 4 weeks including freshly prepared
calibration curves. Also, the effect of up to three freeze-thaw cycles was evaluated by freezing
and thawing the samples (n=2) in cycles of 1 h. Stability is acceptable if the concentration
measured does not deviate more than 15% from that measured initially.
4.8. Application
The accuracy of the method was evaluated via the measurement of two certified reference
materials, namely: Vitamin B12 and Serum Folate (03/178) and Folate in Whole Blood
Haemolysate (95/528), both WHO International Standards issued by the National Institute for
Biological Standards and Control (NIBSC). The reference material for serum has previously
been measured by e.g. Fazili et al.(Fazili et al. 2013)
V.5. Results and discussion
5.1. Method optimization
5.1.1. Sample treatment
The method starts from 300 μl of whole blood. Following removal of the plasma sample, the
RBC pellet is washed to remove plasma residues. To evaluate the washing procedure of RBCs
we monitored the removal of GGH activity by measuring the concentration of 5MeTHF
monoglutamate in RBC lysates after 2 h of incubation at 37 °C without addition of rat serum
GGH. Whole blood lysate, sole plasma removal and 1 to 4 washing steps were evaluated. The
amount of 5MeTHF monoglutamates remained stable after at least 2 washing steps, indicating
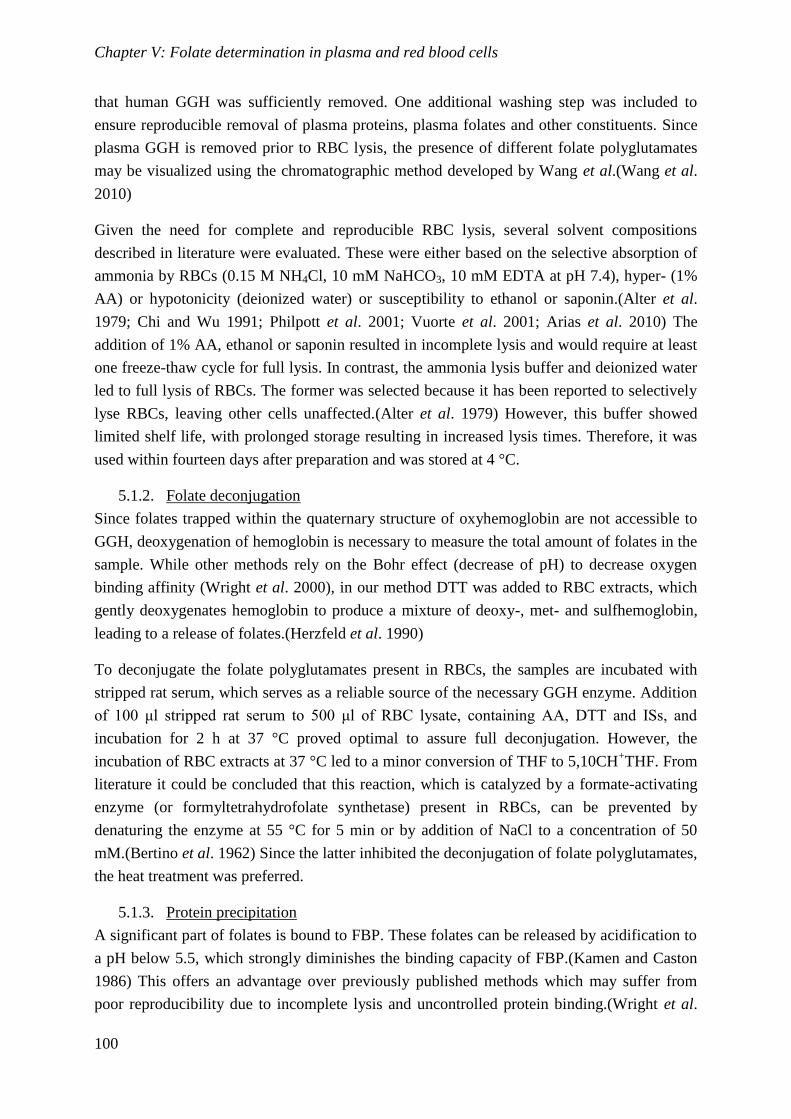
Chapter V: Folate determination in plasma and red blood cells
100
that human GGH was sufficiently removed. One additional washing step was included to
ensure reproducible removal of plasma proteins, plasma folates and other constituents. Since
plasma GGH is removed prior to RBC lysis, the presence of different folate polyglutamates
may be visualized using the chromatographic method developed by Wang et al.(Wang et al.
2010)
Given the need for complete and reproducible RBC lysis, several solvent compositions
described in literature were evaluated. These were either based on the selective absorption of
ammonia by RBCs (0.15 M NH4Cl, 10 mM NaHCO3, 10 mM EDTA at pH 7.4), hyper- (1%
AA) or hypotonicity (deionized water) or susceptibility to ethanol or saponin.(Alter et al.
1979; Chi and Wu 1991; Philpott et al. 2001; Vuorte et al. 2001; Arias et al. 2010) The
addition of 1% AA, ethanol or saponin resulted in incomplete lysis and would require at least
one freeze-thaw cycle for full lysis. In contrast, the ammonia lysis buffer and deionized water
led to full lysis of RBCs. The former was selected because it has been reported to selectively
lyse RBCs, leaving other cells unaffected.(Alter et al. 1979) However, this buffer showed
limited shelf life, with prolonged storage resulting in increased lysis times. Therefore, it was
used within fourteen days after preparation and was stored at 4 °C.
5.1.2. Folate deconjugation
Since folates trapped within the quaternary structure of oxyhemoglobin are not accessible to
GGH, deoxygenation of hemoglobin is necessary to measure the total amount of folates in the
sample. While other methods rely on the Bohr effect (decrease of pH) to decrease oxygen
binding affinity (Wright et al. 2000), in our method DTT was added to RBC extracts, which
gently deoxygenates hemoglobin to produce a mixture of deoxy-, met- and sulfhemoglobin,
leading to a release of folates.(Herzfeld et al. 1990)
To deconjugate the folate polyglutamates present in RBCs, the samples are incubated with
stripped rat serum, which serves as a reliable source of the necessary GGH enzyme. Addition
of 100 μl stripped rat serum to 500 μl of RBC lysate, containing AA, DTT and ISs, and
incubation for 2 h at 37 °C proved optimal to assure full deconjugation. However, the
incubation of RBC extracts at 37 °C led to a minor conversion of THF to 5,10CH+THF. From
literature it could be concluded that this reaction, which is catalyzed by a formate-activating
enzyme (or formyltetrahydrofolate synthetase) present in RBCs, can be prevented by
denaturing the enzyme at 55 °C for 5 min or by addition of NaCl to a concentration of 50
mM.(Bertino et al. 1962) Since the latter inhibited the deconjugation of folate polyglutamates,
the heat treatment was preferred.
5.1.3. Protein precipitation
A significant part of folates is bound to FBP. These folates can be released by acidification to
a pH below 5.5, which strongly diminishes the binding capacity of FBP.(Kamen and Caston
1986) This offers an advantage over previously published methods which may suffer from
poor reproducibility due to incomplete lysis and uncontrolled protein binding.(Wright et al.
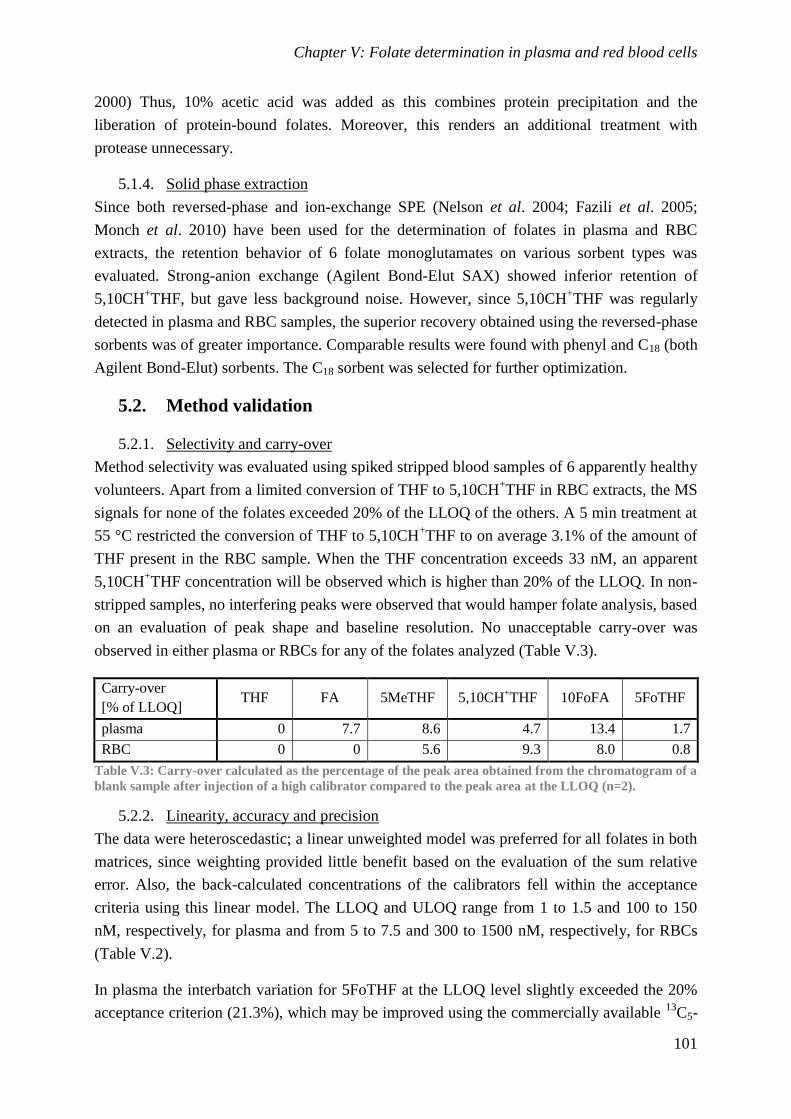
Chapter V: Folate determination in plasma and red blood cells
101
2000) Thus, 10% acetic acid was added as this combines protein precipitation and the
liberation of protein-bound folates. Moreover, this renders an additional treatment with
protease unnecessary.
5.1.4. Solid phase extraction
Since both reversed-phase and ion-exchange SPE (Nelson et al. 2004; Fazili et al. 2005;
Monch et al. 2010) have been used for the determination of folates in plasma and RBC
extracts, the retention behavior of 6 folate monoglutamates on various sorbent types was
evaluated. Strong-anion exchange (Agilent Bond-Elut SAX) showed inferior retention of
5,10CH+THF, but gave less background noise. However, since 5,10CH
+THF was regularly
detected in plasma and RBC samples, the superior recovery obtained using the reversed-phase
sorbents was of greater importance. Comparable results were found with phenyl and C18 (both
Agilent Bond-Elut) sorbents. The C18 sorbent was selected for further optimization.
5.2. Method validation
5.2.1. Selectivity and carry-over
Method selectivity was evaluated using spiked stripped blood samples of 6 apparently healthy
volunteers. Apart from a limited conversion of THF to 5,10CH+THF in RBC extracts, the MS
signals for none of the folates exceeded 20% of the LLOQ of the others. A 5 min treatment at
55 °C restricted the conversion of THF to 5,10CH+THF to on average 3.1% of the amount of
THF present in the RBC sample. When the THF concentration exceeds 33 nM, an apparent
5,10CH+THF concentration will be observed which is higher than 20% of the LLOQ. In non-
stripped samples, no interfering peaks were observed that would hamper folate analysis, based
on an evaluation of peak shape and baseline resolution. No unacceptable carry-over was
observed in either plasma or RBCs for any of the folates analyzed (Table V.3).
Carry-over
[% of LLOQ] THF FA 5MeTHF 5,10CH
+THF 10FoFA 5FoTHF
plasma 0 7.7 8.6 4.7 13.4 1.7
RBC 0 0 5.6 9.3 8.0 0.8
Table V.3: Carry-over calculated as the percentage of the peak area obtained from the chromatogram of a
blank sample after injection of a high calibrator compared to the peak area at the LLOQ (n=2).
5.2.2. Linearity, accuracy and precision
The data were heteroscedastic; a linear unweighted model was preferred for all folates in both
matrices, since weighting provided little benefit based on the evaluation of the sum relative
error. Also, the back-calculated concentrations of the calibrators fell within the acceptance
criteria using this linear model. The LLOQ and ULOQ range from 1 to 1.5 and 100 to 150
nM, respectively, for plasma and from 5 to 7.5 and 300 to 1500 nM, respectively, for RBCs
(Table V.2).
In plasma the interbatch variation for 5FoTHF at the LLOQ level slightly exceeded the 20%
acceptance criterion (21.3%), which may be improved using the commercially available 13
C5-
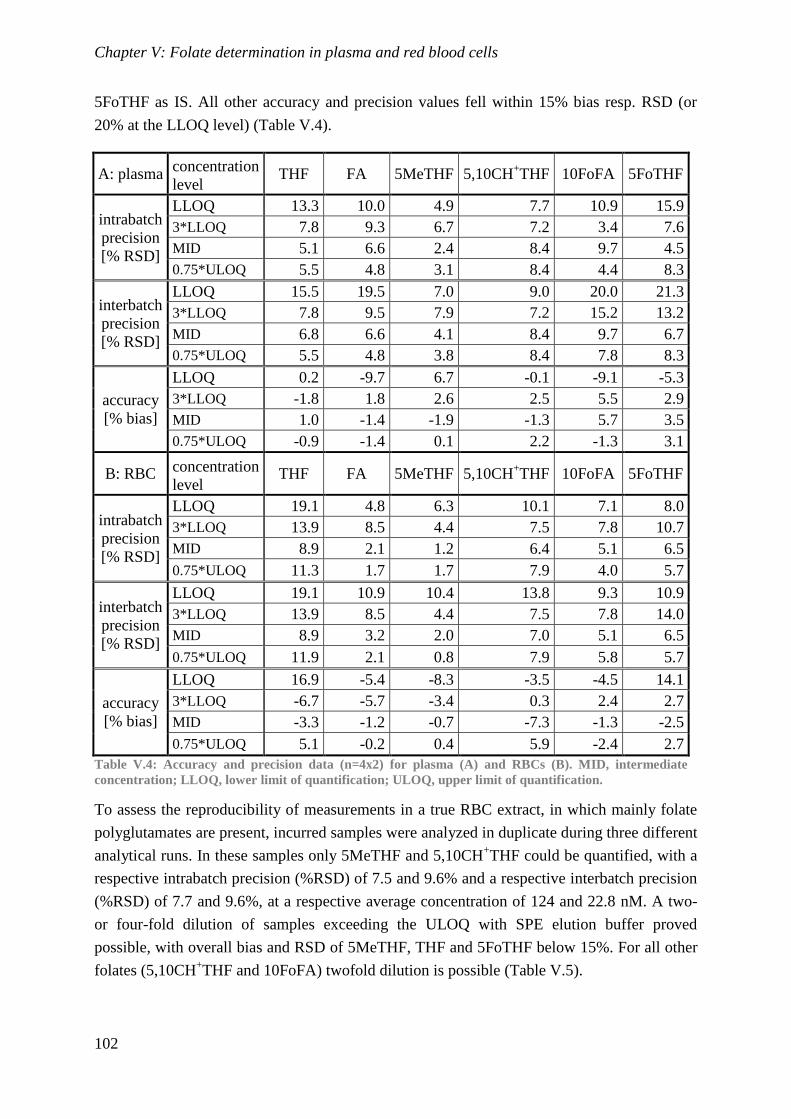
Chapter V: Folate determination in plasma and red blood cells
102
5FoTHF as IS. All other accuracy and precision values fell within 15% bias resp. RSD (or
20% at the LLOQ level) (Table V.4).
A: plasma concentration
level THF FA 5MeTHF 5,10CH
+THF 10FoFA 5FoTHF
intrabatch
precision
[% RSD]
LLOQ 13.3 10.0 4.9 7.7 10.9 15.9
3*LLOQ 7.8 9.3 6.7 7.2 3.4 7.6
MID 5.1 6.6 2.4 8.4 9.7 4.5
0.75*ULOQ 5.5 4.8 3.1 8.4 4.4 8.3
interbatch
precision
[% RSD]
LLOQ 15.5 19.5 7.0 9.0 20.0 21.3
3*LLOQ 7.8 9.5 7.9 7.2 15.2 13.2
MID 6.8 6.6 4.1 8.4 9.7 6.7
0.75*ULOQ 5.5 4.8 3.8 8.4 7.8 8.3
accuracy
[% bias]
LLOQ 0.2 -9.7 6.7 -0.1 -9.1 -5.3
3*LLOQ -1.8 1.8 2.6 2.5 5.5 2.9
MID 1.0 -1.4 -1.9 -1.3 5.7 3.5
0.75*ULOQ -0.9 -1.4 0.1 2.2 -1.3 3.1
B: RBC concentration
level THF FA 5MeTHF 5,10CH
+THF 10FoFA 5FoTHF
intrabatch
precision
[% RSD]
LLOQ 19.1 4.8 6.3 10.1 7.1 8.0
3*LLOQ 13.9 8.5 4.4 7.5 7.8 10.7
MID 8.9 2.1 1.2 6.4 5.1 6.5
0.75*ULOQ 11.3 1.7 1.7 7.9 4.0 5.7
interbatch
precision
[% RSD]
LLOQ 19.1 10.9 10.4 13.8 9.3 10.9
3*LLOQ 13.9 8.5 4.4 7.5 7.8 14.0
MID 8.9 3.2 2.0 7.0 5.1 6.5
0.75*ULOQ 11.9 2.1 0.8 7.9 5.8 5.7
accuracy
[% bias]
LLOQ 16.9 -5.4 -8.3 -3.5 -4.5 14.1
3*LLOQ -6.7 -5.7 -3.4 0.3 2.4 2.7
MID -3.3 -1.2 -0.7 -7.3 -1.3 -2.5
0.75*ULOQ 5.1 -0.2 0.4 5.9 -2.4 2.7
Table V.4: Accuracy and precision data (n=4x2) for plasma (A) and RBCs (B). MID, intermediate
concentration; LLOQ, lower limit of quantification; ULOQ, upper limit of quantification.
To assess the reproducibility of measurements in a true RBC extract, in which mainly folate
polyglutamates are present, incurred samples were analyzed in duplicate during three different
analytical runs. In these samples only 5MeTHF and 5,10CH+THF could be quantified, with a
respective intrabatch precision (%RSD) of 7.5 and 9.6% and a respective interbatch precision
(%RSD) of 7.7 and 9.6%, at a respective average concentration of 124 and 22.8 nM. A two-
or four-fold dilution of samples exceeding the ULOQ with SPE elution buffer proved
possible, with overall bias and RSD of 5MeTHF, THF and 5FoTHF below 15%. For all other
folates (5,10CH+THF and 10FoFA) twofold dilution is possible (Table V.5).
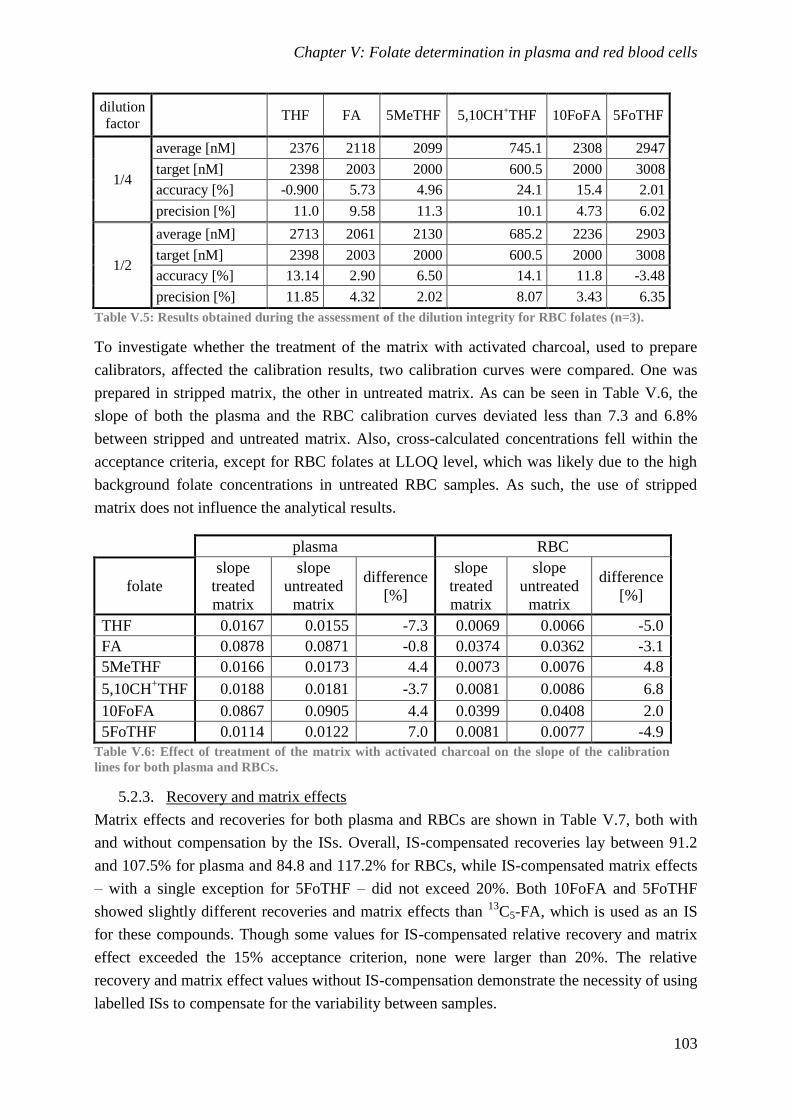
Chapter V: Folate determination in plasma and red blood cells
103
dilution
factor THF FA 5MeTHF 5,10CH
+THF 10FoFA 5FoTHF
1/4
average [nM] 2376 2118 2099 745.1 2308 2947
target [nM] 2398 2003 2000 600.5 2000 3008
accuracy [%] -0.900 5.73 4.96 24.1 15.4 2.01
precision [%] 11.0 9.58 11.3 10.1 4.73 6.02
1/2
average [nM] 2713 2061 2130 685.2 2236 2903
target [nM] 2398 2003 2000 600.5 2000 3008
accuracy [%] 13.14 2.90 6.50 14.1 11.8 -3.48
precision [%] 11.85 4.32 2.02 8.07 3.43 6.35
Table V.5: Results obtained during the assessment of the dilution integrity for RBC folates (n=3).
To investigate whether the treatment of the matrix with activated charcoal, used to prepare
calibrators, affected the calibration results, two calibration curves were compared. One was
prepared in stripped matrix, the other in untreated matrix. As can be seen in Table V.6, the
slope of both the plasma and the RBC calibration curves deviated less than 7.3 and 6.8%
between stripped and untreated matrix. Also, cross-calculated concentrations fell within the
acceptance criteria, except for RBC folates at LLOQ level, which was likely due to the high
background folate concentrations in untreated RBC samples. As such, the use of stripped
matrix does not influence the analytical results.
plasma RBC
folate
slope
treated
matrix
slope
untreated
matrix
difference
[%]
slope
treated
matrix
slope
untreated
matrix
difference
[%]
THF 0.0167 0.0155 -7.3 0.0069 0.0066 -5.0
FA 0.0878 0.0871 -0.8 0.0374 0.0362 -3.1
5MeTHF 0.0166 0.0173 4.4 0.0073 0.0076 4.8
5,10CH+THF 0.0188 0.0181 -3.7 0.0081 0.0086 6.8
10FoFA 0.0867 0.0905 4.4 0.0399 0.0408 2.0
5FoTHF 0.0114 0.0122 7.0 0.0081 0.0077 -4.9
Table V.6: Effect of treatment of the matrix with activated charcoal on the slope of the calibration
lines for both plasma and RBCs.
5.2.3. Recovery and matrix effects
Matrix effects and recoveries for both plasma and RBCs are shown in Table V.7, both with
and without compensation by the ISs. Overall, IS-compensated recoveries lay between 91.2
and 107.5% for plasma and 84.8 and 117.2% for RBCs, while IS-compensated matrix effects
– with a single exception for 5FoTHF – did not exceed 20%. Both 10FoFA and 5FoTHF
showed slightly different recoveries and matrix effects than 13
C5-FA, which is used as an IS
for these compounds. Though some values for IS-compensated relative recovery and matrix
effect exceeded the 15% acceptance criterion, none were larger than 20%. The relative
recovery and matrix effect values without IS-compensation demonstrate the necessity of using
labelled ISs to compensate for the variability between samples.
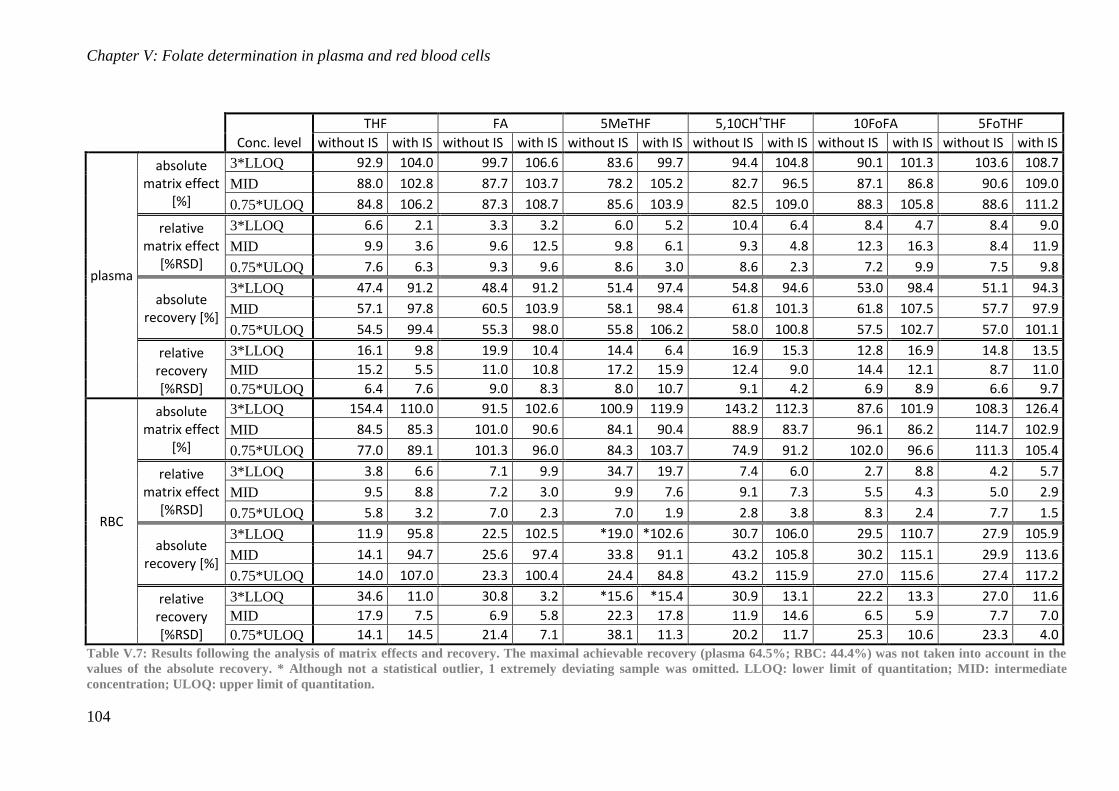
Chapter V: Folate determination in plasma and red blood cells
104
Conc. level
THF FA 5MeTHF 5,10CH+THF 10FoFA 5FoTHF
without IS with IS without IS with IS without IS with IS without IS with IS without IS with IS without IS with IS
plasma
absolute matrix effect
[%]
3*LLOQ 92.9 104.0 99.7 106.6 83.6 99.7 94.4 104.8 90.1 101.3 103.6 108.7
MID 88.0 102.8 87.7 103.7 78.2 105.2 82.7 96.5 87.1 86.8 90.6 109.0
0.75*ULOQ 84.8 106.2 87.3 108.7 85.6 103.9 82.5 109.0 88.3 105.8 88.6 111.2
relative matrix effect
[%RSD]
3*LLOQ 6.6 2.1 3.3 3.2 6.0 5.2 10.4 6.4 8.4 4.7 8.4 9.0
MID 9.9 3.6 9.6 12.5 9.8 6.1 9.3 4.8 12.3 16.3 8.4 11.9
0.75*ULOQ 7.6 6.3 9.3 9.6 8.6 3.0 8.6 2.3 7.2 9.9 7.5 9.8
absolute recovery [%]
3*LLOQ 47.4 91.2 48.4 91.2 51.4 97.4 54.8 94.6 53.0 98.4 51.1 94.3
MID 57.1 97.8 60.5 103.9 58.1 98.4 61.8 101.3 61.8 107.5 57.7 97.9
0.75*ULOQ 54.5 99.4 55.3 98.0 55.8 106.2 58.0 100.8 57.5 102.7 57.0 101.1
relative recovery [%RSD]
3*LLOQ 16.1 9.8 19.9 10.4 14.4 6.4 16.9 15.3 12.8 16.9 14.8 13.5
MID 15.2 5.5 11.0 10.8 17.2 15.9 12.4 9.0 14.4 12.1 8.7 11.0
0.75*ULOQ 6.4 7.6 9.0 8.3 8.0 10.7 9.1 4.2 6.9 8.9 6.6 9.7
RBC
absolute matrix effect
[%]
3*LLOQ 154.4 110.0 91.5 102.6 100.9 119.9 143.2 112.3 87.6 101.9 108.3 126.4
MID 84.5 85.3 101.0 90.6 84.1 90.4 88.9 83.7 96.1 86.2 114.7 102.9
0.75*ULOQ 77.0 89.1 101.3 96.0 84.3 103.7 74.9 91.2 102.0 96.6 111.3 105.4
relative matrix effect
[%RSD]
3*LLOQ 3.8 6.6 7.1 9.9 34.7 19.7 7.4 6.0 2.7 8.8 4.2 5.7
MID 9.5 8.8 7.2 3.0 9.9 7.6 9.1 7.3 5.5 4.3 5.0 2.9
0.75*ULOQ 5.8 3.2 7.0 2.3 7.0 1.9 2.8 3.8 8.3 2.4 7.7 1.5
absolute recovery [%]
3*LLOQ 11.9 95.8 22.5 102.5 *19.0 *102.6 30.7 106.0 29.5 110.7 27.9 105.9
MID 14.1 94.7 25.6 97.4 33.8 91.1 43.2 105.8 30.2 115.1 29.9 113.6
0.75*ULOQ 14.0 107.0 23.3 100.4 24.4 84.8 43.2 115.9 27.0 115.6 27.4 117.2
relative recovery [%RSD]
3*LLOQ 34.6 11.0 30.8 3.2 *15.6 *15.4 30.9 13.1 22.2 13.3 27.0 11.6
MID 17.9 7.5 6.9 5.8 22.3 17.8 11.9 14.6 6.5 5.9 7.7 7.0
0.75*ULOQ 14.1 14.5 21.4 7.1 38.1 11.3 20.2 11.7 25.3 10.6 23.3 4.0
Table V.7: Results following the analysis of matrix effects and recovery. The maximal achievable recovery (plasma 64.5%; RBC: 44.4%) was not taken into account in the
values of the absolute recovery. * Although not a statistical outlier, 1 extremely deviating sample was omitted. LLOQ: lower limit of quantitation; MID: intermediate
concentration; ULOQ: upper limit of quantitation.
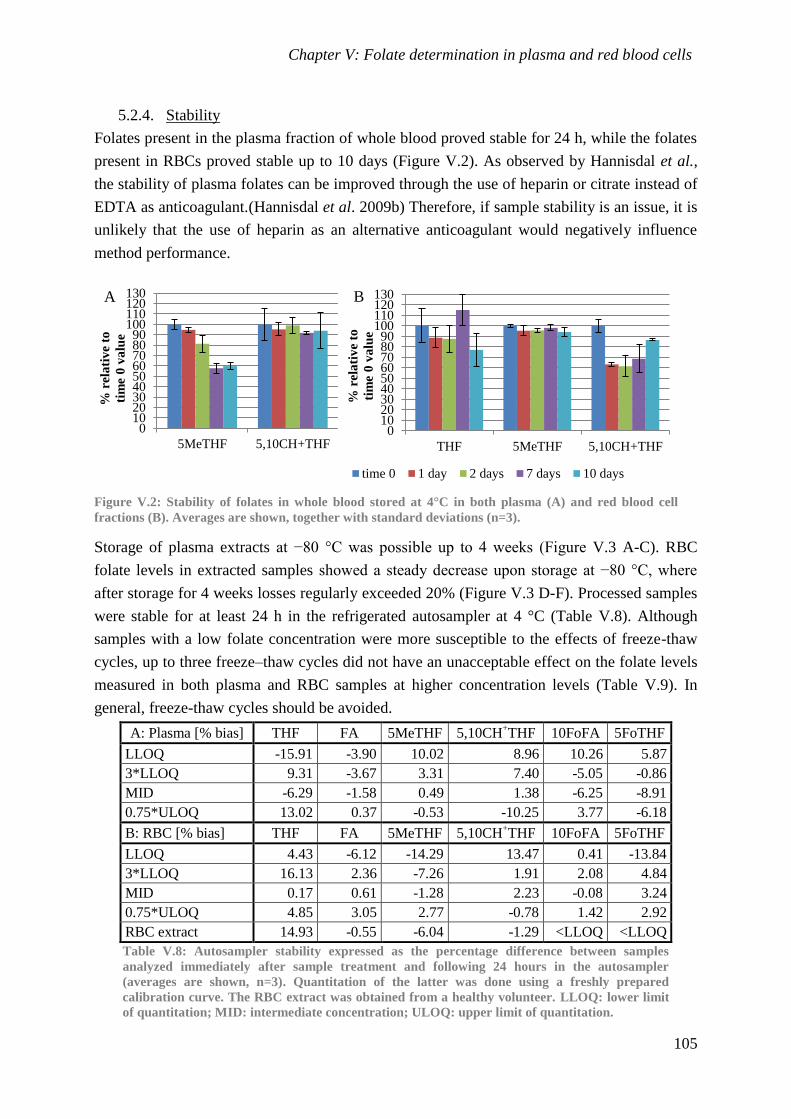
Chapter V: Folate determination in plasma and red blood cells
105
5.2.4. Stability
Folates present in the plasma fraction of whole blood proved stable for 24 h, while the folates
present in RBCs proved stable up to 10 days (Figure V.2). As observed by Hannisdal et al.,
the stability of plasma folates can be improved through the use of heparin or citrate instead of
EDTA as anticoagulant.(Hannisdal et al. 2009b) Therefore, if sample stability is an issue, it is
unlikely that the use of heparin as an alternative anticoagulant would negatively influence
method performance.
Figure V.2: Stability of folates in whole blood stored at 4°C in both plasma (A) and red blood cell
fractions (B). Averages are shown, together with standard deviations (n=3).
Storage of plasma extracts at −80 °C was possible up to 4 weeks (Figure V.3 A-C). RBC
folate levels in extracted samples showed a steady decrease upon storage at −80 °C, where
after storage for 4 weeks losses regularly exceeded 20% (Figure V.3 D-F). Processed samples
were stable for at least 24 h in the refrigerated autosampler at 4 °C (Table V.8). Although
samples with a low folate concentration were more susceptible to the effects of freeze-thaw
cycles, up to three freeze–thaw cycles did not have an unacceptable effect on the folate levels
measured in both plasma and RBC samples at higher concentration levels (Table V.9). In
general, freeze-thaw cycles should be avoided.
A: Plasma [% bias] THF FA 5MeTHF 5,10CH+THF 10FoFA 5FoTHF
LLOQ -15.91 -3.90 10.02 8.96 10.26 5.87
3*LLOQ 9.31 -3.67 3.31 7.40 -5.05 -0.86
MID -6.29 -1.58 0.49 1.38 -6.25 -8.91
0.75*ULOQ 13.02 0.37 -0.53 -10.25 3.77 -6.18
B: RBC [% bias] THF FA 5MeTHF 5,10CH+THF 10FoFA 5FoTHF
LLOQ 4.43 -6.12 -14.29 13.47 0.41 -13.84
3*LLOQ 16.13 2.36 -7.26 1.91 2.08 4.84
MID 0.17 0.61 -1.28 2.23 -0.08 3.24
0.75*ULOQ 4.85 3.05 2.77 -0.78 1.42 2.92
RBC extract 14.93 -0.55 -6.04 -1.29 <LLOQ <LLOQ
Table V.8: Autosampler stability expressed as the percentage difference between samples
analyzed immediately after sample treatment and following 24 hours in the autosampler
(averages are shown, n=3). Quantitation of the latter was done using a freshly prepared
calibration curve. The RBC extract was obtained from a healthy volunteer. LLOQ: lower limit
of quantitation; MID: intermediate concentration; ULOQ: upper limit of quantitation.
0102030405060708090
100110120130
5MeTHF 5,10CH+THF
% r
ela
tiv
e to
tim
e 0
va
lue
A
0102030405060708090
100110120130
THF 5MeTHF 5,10CH+THF
% r
ela
tiv
e to
tim
e 0
va
lue
time 0 1 day 2 days 7 days 10 days
B
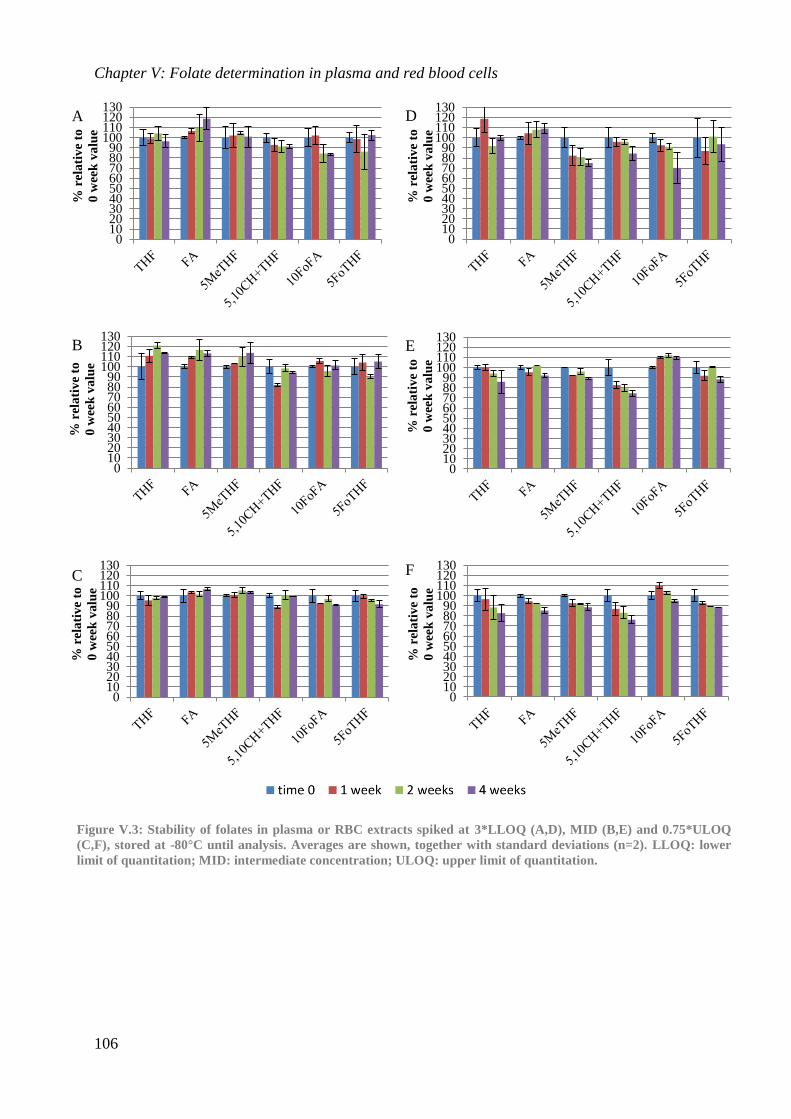
Chapter V: Folate determination in plasma and red blood cells
106
0102030405060708090
100110120130
% r
ela
tiv
e to
0 w
eek
va
lue
0102030405060708090
100110120130
% r
ela
tiv
e to
0 w
eek
va
lue
0102030405060708090
100110120130
% r
ela
tiv
e to
0 w
eek
va
lue
A
B
C
0102030405060708090
100110120130
% r
ela
tiv
e to
0 w
eek
va
lue
0102030405060708090
100110120130
% r
ela
tiv
e to
0 w
eek
va
lue
0102030405060708090
100110120130
% r
ela
tiv
e to
0 w
eek
va
lue
F
D
E
Figure V.3: Stability of folates in plasma or RBC extracts spiked at 3*LLOQ (A,D), MID (B,E) and 0.75*ULOQ
(C,F), stored at -80°C until analysis. Averages are shown, together with standard deviations (n=2). LLOQ: lower
limit of quantitation; MID: intermediate concentration; ULOQ: upper limit of quantitation.
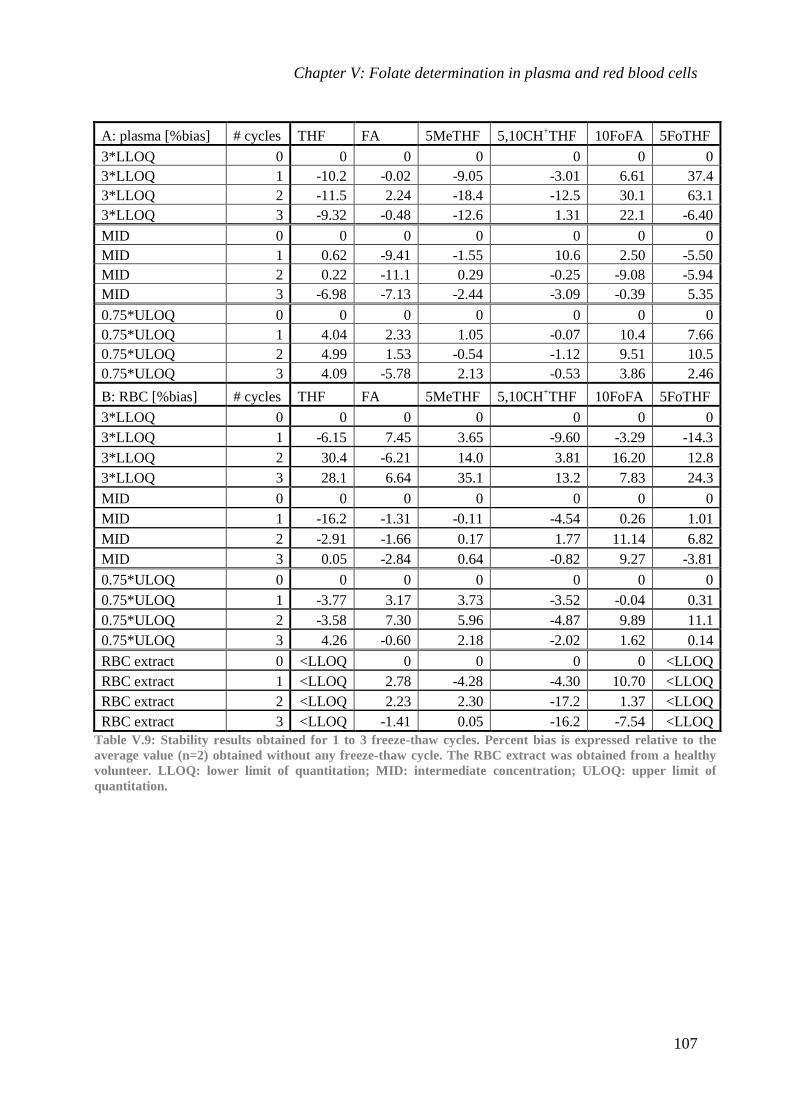
Chapter V: Folate determination in plasma and red blood cells
107
A: plasma [%bias] # cycles THF FA 5MeTHF 5,10CH+THF 10FoFA 5FoTHF
3*LLOQ 0 0 0 0 0 0 0
3*LLOQ 1 -10.2 -0.02 -9.05 -3.01 6.61 37.4
3*LLOQ 2 -11.5 2.24 -18.4 -12.5 30.1 63.1
3*LLOQ 3 -9.32 -0.48 -12.6 1.31 22.1 -6.40
MID 0 0 0 0 0 0 0
MID 1 0.62 -9.41 -1.55 10.6 2.50 -5.50
MID 2 0.22 -11.1 0.29 -0.25 -9.08 -5.94
MID 3 -6.98 -7.13 -2.44 -3.09 -0.39 5.35
0.75*ULOQ 0 0 0 0 0 0 0
0.75*ULOQ 1 4.04 2.33 1.05 -0.07 10.4 7.66
0.75*ULOQ 2 4.99 1.53 -0.54 -1.12 9.51 10.5
0.75*ULOQ 3 4.09 -5.78 2.13 -0.53 3.86 2.46
B: RBC [%bias] # cycles THF FA 5MeTHF 5,10CH+THF 10FoFA 5FoTHF
3*LLOQ 0 0 0 0 0 0 0
3*LLOQ 1 -6.15 7.45 3.65 -9.60 -3.29 -14.3
3*LLOQ 2 30.4 -6.21 14.0 3.81 16.20 12.8
3*LLOQ 3 28.1 6.64 35.1 13.2 7.83 24.3
MID 0 0 0 0 0 0 0
MID 1 -16.2 -1.31 -0.11 -4.54 0.26 1.01
MID 2 -2.91 -1.66 0.17 1.77 11.14 6.82
MID 3 0.05 -2.84 0.64 -0.82 9.27 -3.81
0.75*ULOQ 0 0 0 0 0 0 0
0.75*ULOQ 1 -3.77 3.17 3.73 -3.52 -0.04 0.31
0.75*ULOQ 2 -3.58 7.30 5.96 -4.87 9.89 11.1
0.75*ULOQ 3 4.26 -0.60 2.18 -2.02 1.62 0.14
RBC extract 0 <LLOQ 0 0 0 0 <LLOQ
RBC extract 1 <LLOQ 2.78 -4.28 -4.30 10.70 <LLOQ
RBC extract 2 <LLOQ 2.23 2.30 -17.2 1.37 <LLOQ
RBC extract 3 <LLOQ -1.41 0.05 -16.2 -7.54 <LLOQ
Table V.9: Stability results obtained for 1 to 3 freeze-thaw cycles. Percent bias is expressed relative to the
average value (n=2) obtained without any freeze-thaw cycle. The RBC extract was obtained from a healthy
volunteer. LLOQ: lower limit of quantitation; MID: intermediate concentration; ULOQ: upper limit of
quantitation.
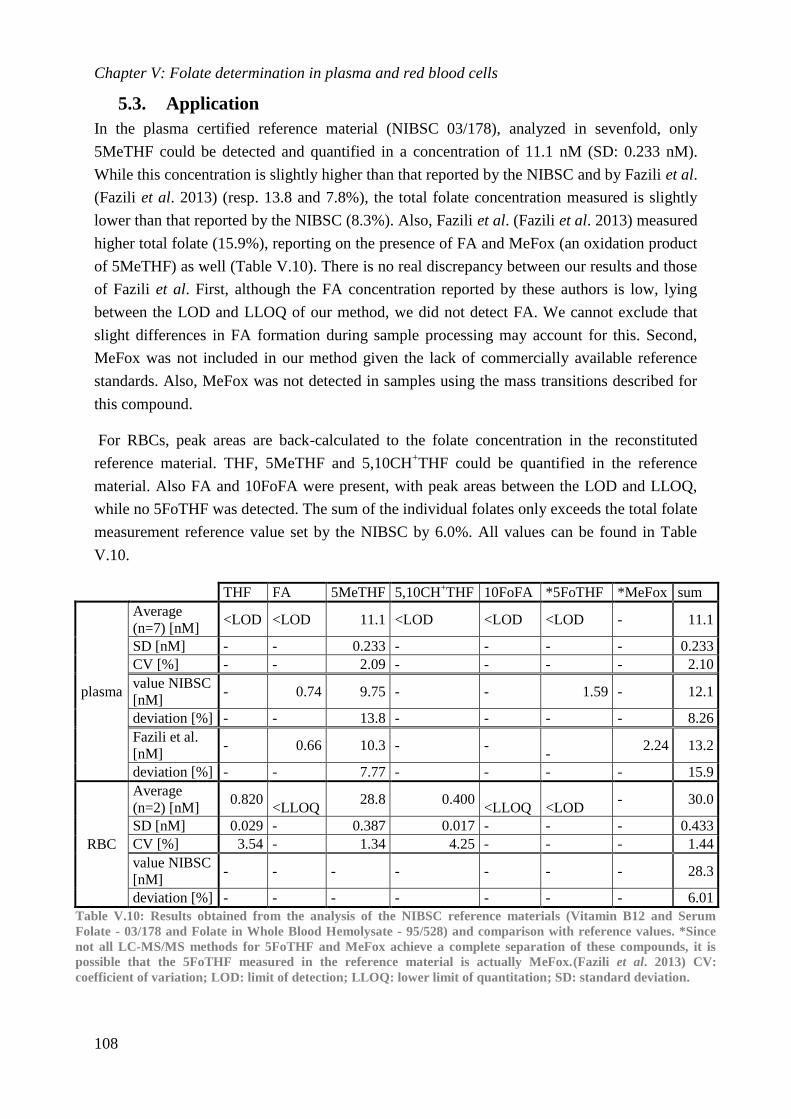
Chapter V: Folate determination in plasma and red blood cells
108
5.3. Application
In the plasma certified reference material (NIBSC 03/178), analyzed in sevenfold, only
5MeTHF could be detected and quantified in a concentration of 11.1 nM (SD: 0.233 nM).
While this concentration is slightly higher than that reported by the NIBSC and by Fazili et al.
(Fazili et al. 2013) (resp. 13.8 and 7.8%), the total folate concentration measured is slightly
lower than that reported by the NIBSC (8.3%). Also, Fazili et al. (Fazili et al. 2013) measured
higher total folate (15.9%), reporting on the presence of FA and MeFox (an oxidation product
of 5MeTHF) as well (Table V.10). There is no real discrepancy between our results and those
of Fazili et al. First, although the FA concentration reported by these authors is low, lying
between the LOD and LLOQ of our method, we did not detect FA. We cannot exclude that
slight differences in FA formation during sample processing may account for this. Second,
MeFox was not included in our method given the lack of commercially available reference
standards. Also, MeFox was not detected in samples using the mass transitions described for
this compound.
For RBCs, peak areas are back-calculated to the folate concentration in the reconstituted
reference material. THF, 5MeTHF and 5,10CH+THF could be quantified in the reference
material. Also FA and 10FoFA were present, with peak areas between the LOD and LLOQ,
while no 5FoTHF was detected. The sum of the individual folates only exceeds the total folate
measurement reference value set by the NIBSC by 6.0%. All values can be found in Table
V.10.
THF FA 5MeTHF 5,10CH+THF 10FoFA *5FoTHF *MeFox sum
plasma
Average
(n=7) [nM] <LOD <LOD 11.1 <LOD <LOD <LOD - 11.1
SD [nM] - - 0.233 - - - - 0.233
CV [%] - - 2.09 - - - - 2.10
value NIBSC
[nM] - 0.74 9.75 - - 1.59 - 12.1
deviation [%] - - 13.8 - - - - 8.26
Fazili et al.
[nM] - 0.66 10.3 - -
- 2.24 13.2
deviation [%] - - 7.77 - - - - 15.9
RBC
Average
(n=2) [nM] 0.820
<LLOQ 28.8 0.400
<LLOQ <LOD - 30.0
SD [nM] 0.029 - 0.387 0.017 - - - 0.433
CV [%] 3.54 - 1.34 4.25 - - - 1.44
value NIBSC
[nM] - - - - - - - 28.3
deviation [%] - - - - - - - 6.01
Table V.10: Results obtained from the analysis of the NIBSC reference materials (Vitamin B12 and Serum
Folate - 03/178 and Folate in Whole Blood Hemolysate - 95/528) and comparison with reference values. *Since
not all LC-MS/MS methods for 5FoTHF and MeFox achieve a complete separation of these compounds, it is
possible that the 5FoTHF measured in the reference material is actually MeFox.(Fazili et al. 2013) CV:
coefficient of variation; LOD: limit of detection; LLOQ: lower limit of quantitation; SD: standard deviation.
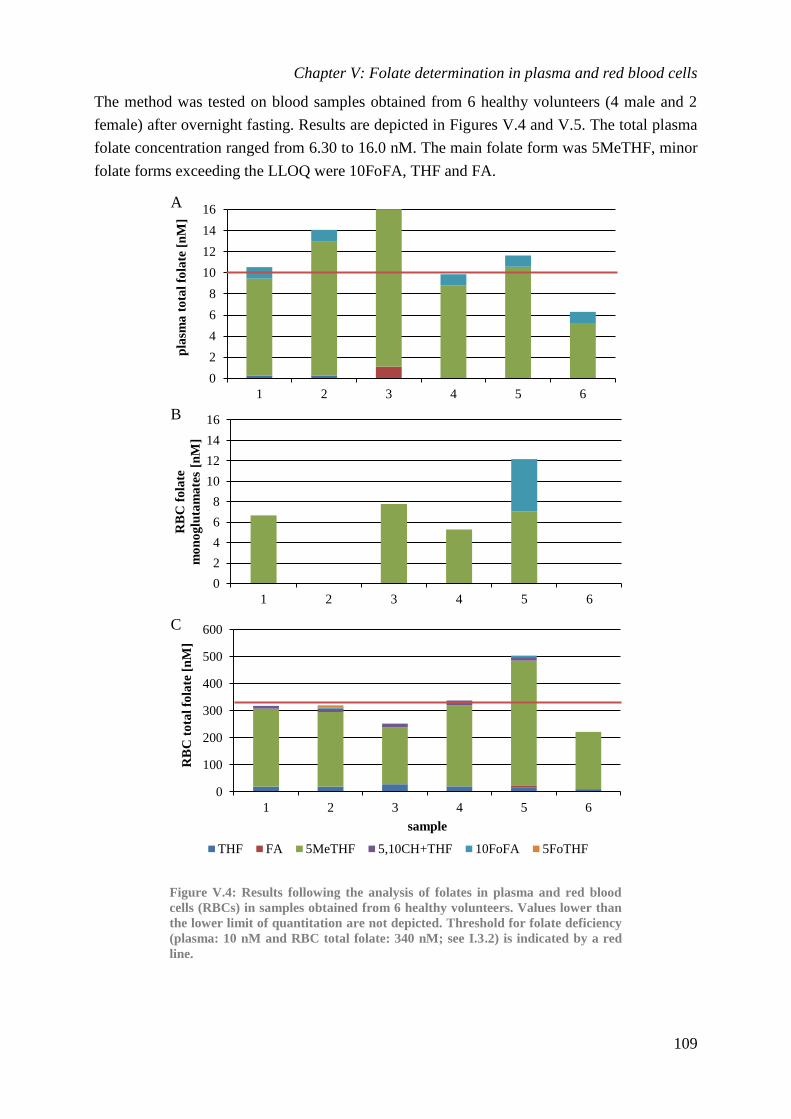
Chapter V: Folate determination in plasma and red blood cells
109
The method was tested on blood samples obtained from 6 healthy volunteers (4 male and 2
female) after overnight fasting. Results are depicted in Figures V.4 and V.5. The total plasma
folate concentration ranged from 6.30 to 16.0 nM. The main folate form was 5MeTHF, minor
folate forms exceeding the LLOQ were 10FoFA, THF and FA.
Figure V.4: Results following the analysis of folates in plasma and red blood
cells (RBCs) in samples obtained from 6 healthy volunteers. Values lower than
the lower limit of quantitation are not depicted. Threshold for folate deficiency
(plasma: 10 nM and RBC total folate: 340 nM; see I.3.2) is indicated by a red
line.
0
2
4
6
8
10
12
14
16
1 2 3 4 5 6
pla
sma
to
tal
fola
te [
nM
]
0
2
4
6
8
10
12
14
16
1 2 3 4 5 6
RB
C f
ola
te
mo
no
glu
tam
ate
s [n
M]
0
100
200
300
400
500
600
1 2 3 4 5 6
RB
C t
ota
l fo
late
[n
M]
sample
THF FA 5MeTHF 5,10CH+THF 10FoFA 5FoTHF
A
B
C
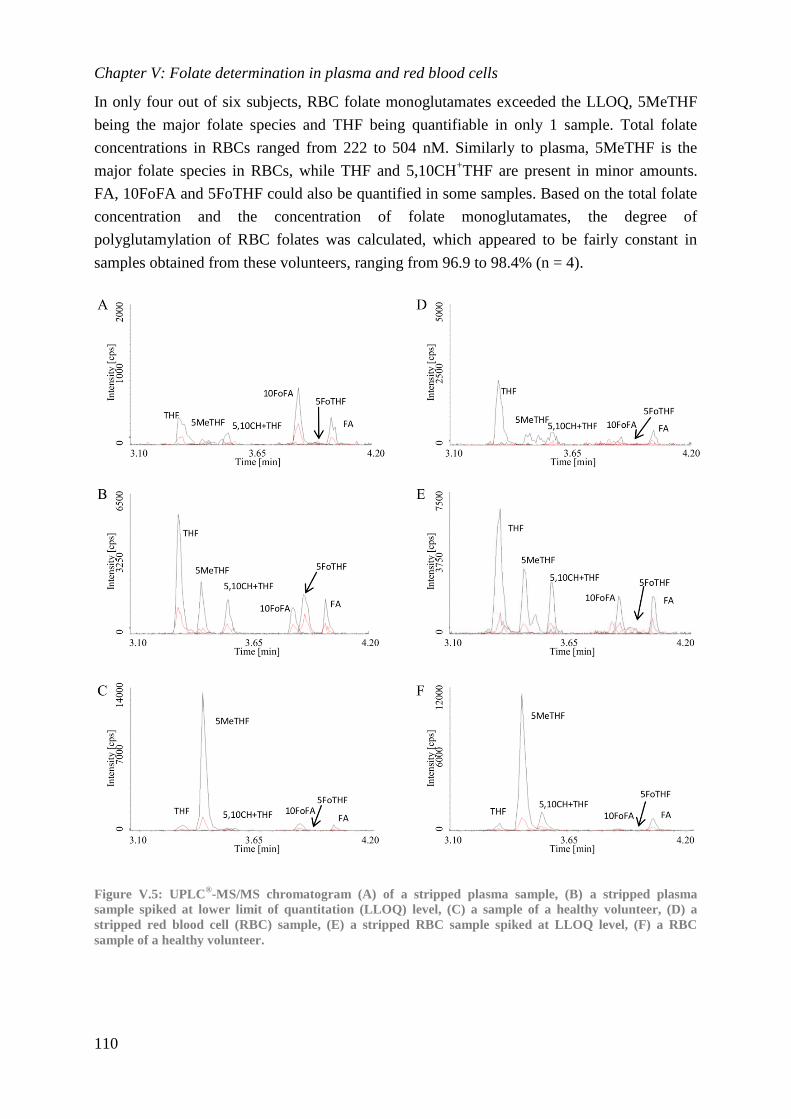
Chapter V: Folate determination in plasma and red blood cells
110
In only four out of six subjects, RBC folate monoglutamates exceeded the LLOQ, 5MeTHF
being the major folate species and THF being quantifiable in only 1 sample. Total folate
concentrations in RBCs ranged from 222 to 504 nM. Similarly to plasma, 5MeTHF is the
major folate species in RBCs, while THF and 5,10CH+THF are present in minor amounts.
FA, 10FoFA and 5FoTHF could also be quantified in some samples. Based on the total folate
concentration and the concentration of folate monoglutamates, the degree of
polyglutamylation of RBC folates was calculated, which appeared to be fairly constant in
samples obtained from these volunteers, ranging from 96.9 to 98.4% (n = 4).
Figure V.5: UPLC®-MS/MS chromatogram (A) of a stripped plasma sample, (B) a stripped plasma
sample spiked at lower limit of quantitation (LLOQ) level, (C) a sample of a healthy volunteer, (D) a
stripped red blood cell (RBC) sample, (E) a stripped RBC sample spiked at LLOQ level, (F) a RBC
sample of a healthy volunteer.
Chapter V: Folate determination in plasma and red blood cells
111
V.6. Conclusion
Due to the similarity between the plasma and RBC analyses, these can be performed
simultaneously, thus optimizing workload and sample throughput while minimizing the
consumption of solvents and consumables.
Starting from a single sample of 300 μl EDTA-anti-coagulated whole blood, the fully
validated analytical method presented here allows to quantitatively determine 6 folate species
in plasma and RBC extracts. The validation data showed linearity of the method from 1 to 150
nM for plasma samples and 5 to 1500 nM for RBC samples, encompassing the clinically
relevant ranges. Our method includes selective and reproducible ammonia-based RBC lysis,
the addition of DTT to all solvents and acidic protein precipitation. In RBCs, both free folate
monoglutamates and total folate (monoglutamates + polyglutamates) can be quantified. From
this, the degree of polyglutamylation can be calculated. This may provide information on the
efficacy of the FPGS enzyme responsible for the intracellular accumulation of folate
polyglutamates. Our method can also be used to identify individuals with a polymorphism in
the gene encoding the methylenetetrahydrofolate reductase enzyme, based on the
determination of individual folate species. A significant difference in folate speciation has
been observed in blood samples obtained from these individuals.(Bagley and Selhub 1998)
For instance, individuals homozygous for the 677T polymorphism will have lower 5MeTHF
concentrations and higher THF and 5,10CH+THF concentrations compared to heterozygotes
and 677C homozygotes.
Chapter V: Folate determination in plasma and red blood cells
112
V.7. References
Alter, B.P., Metzger, J.B., Yock, P.G., Rothchild, S.B. and Dover, G.J. 1979. “Selective
Hemolysis of Adult Red Blood Cells: An Aid to Prenatal Diagnosis of
Hemoglobinopathies.” Blood 53 (2): 279–87.
Arias, M., Quijano, J.C., Haridas, V., Gutterman, J.U. and Lemeshko, V.V. 2010. “Red Blood
Cell Permeabilization by Hypotonic Treatments, Saponin, and Anticancer Avicins.”
BBA-Biomembranes 1798 (6): 1189–96.
Bagley, P.J., and Selhub, J. 1998. “A Common Mutation in the Methylenetetrahydrofolate
Reductase Gene Is Associated with an Accumulation of Formylated Tetrahydrofolates in
Red Blood Cells.” Proc Natl Acad Sci USA 95 (22): 13217–20.
Bertino, J.R., Simmons, B. and Donohue, D.M. 1962. “Purification and Properties of the
Formate-Activating Enzyme from Erythrocytes.” J Biol Chem 237: 1314–8.
Chernyshev, A.V., Tarasov, P.A., Semianov, K.A., Nekrasov, V.M., Hoekstra, A.G. and
Maltsev, V.P. 2008. “Erythrocyte Lysis in Isotonic Solution of Ammonium Chloride:
Theoretical Modeling and Experimental Verification.” J Theor Biol 251 (1): 93–107.
Chi, L.M. and Wu, W.G. 1991. “Mechanism of Hemolysis of Red Blood Cell Mediated by
Ethanol.” Biochim Biophys Acta 1062 (1): 46–50.
Crider, K.S., Yang, T.P., Berry, R.J. and Bailey, L.B. 2012. “Folate and DNA Methylation: A
Review of Molecular Mechanisms and the Evidence for Folate’s Role.” Adv Nutr 3 (1):
21–38.
De Brouwer, V., Zhang, G.F., Storozhenko, S., Van Der Straeten, D. and Lambert, W.E.
2007. “pH Stability of Individual Folates during Critical Sample Preparation Steps in
Prevision of the Analysis of Plant Folates.” Phytochem Anal 18 (6): 496–508.
De Brouwer, V., Storozhenko, S., Van De Steene, J.C., Wille, S.M.R., Stove, C.P., Van Der
Straeten, D. and Lambert, W.E. 2008. “Optimisation and Validation of a Liquid
Chromatography–tandem Mass Spectrometry Method for Folates in Rice.” J
Chromatogr A 1215 (1–2): 125–32.
European Medicines Agency. 2011. “Guideline on Bioanalytical Method Validation.” Edited
by Committee for Medicinal Products for Human Use (CHMP).
Fazili, Z., and Pfeiffer, C.M. 2004. “Measurement of Folates in Serum and Conventionally
Prepared Whole Blood Lysates: Application of an Automated 96-Well Plate Isotope-
Dilution Tandem Mass Spectrometry Method.” Clin Chem 50 (12): 2378–81.
Fazili, Z., Pfeiffer, C.M., Zhang, M., and Jain, R. 2005. “Erythrocyte Folate Extraction and
Quantitative Determination by Liquid Chromatography-Tandem Mass Spectrometry:
Comparison of Results with Microbiologic Assay.” Clin Chem 51 (12): 2318–25.
Fazili, Z., Whitehead, R.D.Jr., Paladugula, N. and Pfeiffer, C.M. 2013. “A High-Throughput
LC-MS/MS Method Suitable for Population Biomonitoring Measures Five Serum Folate
Vitamers and One Oxidation Product.” Anal Bioanal Chem 405 (13): 4549–60.
Chapter V: Folate determination in plasma and red blood cells
113
Garbis, S.D., Melse-Boonstra, A., West, C.E. and van Breemen, R.B. 2001. “Determination of
Folates in Human Plasma Using Hydrophilic Interaction Chromatography-Tandem Mass
Spectrometry.” Anal Chem 73 (22): 5358–64.
Hannisdal, R., Ueland, P.M. and Svardal, A. 2009a. “Liquid Chromatography-Tandem Mass
Spectrometry Analysis of Folate and Folate Catabolites in Human Serum.” Clin Chem 55
(6): 1147–54.
Hannisdal, R., Ueland, P.M., Eussen, S.J., Svardal, A. and Hustad, S. 2009b. “Analytical
Recovery of Folate Degradation Products Formed in Human Serum and Plasma at Room
Temperature.” J Nutr 139 (7): 1415–8.
Herzfeld, J., Seidel, N.E., Taylor, M.P., Droupadi, P.R. and Wang, N.E. 1990. “Gentle
Chemical Deoxygenation of Hemoglobin Solutions.” Hemoglobin 14 (4): 399–411.
Jagerstad, M. and Jastrebova, J. 2013. “Occurrence, Stability, and Determination of Formyl
Folates in Foods.” J Agric Food Chem 61 (41): 9758–68.
Kamen, B.A., and Caston, J.D. 1986. “Properties of a Folate Binding Protein (FBP) Isolated
from Porcine Kidney.” Biochem Pharmacol 35 (14): 2323–9.
Kiekens, F., Blancquaert, D., Devisscher, L., Van Daele, J., Stove, V.V., Delanghe, J.R., Van
Der Straeten, D., Lambert, W.E. and Stove, C.P. 2015. “Folates from Metabolically
Engineered Rice: A Long-Term Study in Rats.” Mol Nutr Food Res 59 (3): 490-500.
Kirsch, S.H., Herrmann, W., Geisel, J. and Obeid, R. 2012. “Assay of Whole Blood (6S)-5-
CH3-H4folate Using Ultra Performance Liquid Chromatography Tandem Mass
Spectrometry.” Anal Bioanal Chem 404 (3): 895–902.
Laird, P.W. and Jaenisch, R. 1996. “The Role of DNA Methylation in Cancer Genetic and
Epigenetics.” Annu Rev Genet 30: 441–64.
Matuszewski, B.K., Constanzer, M.L. and Chavez-Eng, C.M. 2003. “Strategies for the
Assessment of Matrix Effect in Quantitative Bioanalytical Methods Based on HPLC-
MS/MS.” Anal Chem 75 (13): 3019–30.
Monch, S., Netzel, M., Netzel, G. and Rychlik, M. 2010. “Quantitation of Folates and Their
Catabolites in Blood Plasma, Erythrocytes, and Urine by Stable Isotope Dilution
Assays.” Anal Biochem 398 (2): 150–60.
Nelson, B.C., Pfeiffer, C.M., Margolis, S.A. and Nelson, C.P. 2004. “Solid-Phase Extraction-
Electrospray Ionization Mass Spectrometry for the Quantification of Folate in Human
Plasma or Serum.” Anal Biochem 325 (1): 41–51.
Owen, W.E. and W.L. Roberts. 2003. “Comparison of Five Automated Serum and Whole
Blood Folate Assays.” Am J Clin Pathol 120 (1): 121–6.
Pfeiffer, C.M., Zhang, M., Lacher, D.A., Molloy, A.M., Tamura, T., Yetley, E.A., Picciano,
M.F. and Johnson, C.L. 2011. “Comparison of Serum and Red Blood Cell Folate
Microbiologic Assays for National Population Surveys.” J Nutr 141 (7): 1402–9.
Philpott, N., Kelleher, B.P., Smith, O.P. and O’Broin, S.D. 2001. “High Serum Folates and
the Simplification of Red Cell Folate Analysis.” Clin Lab Haematol 23 (1): 15–20.
Chapter V: Folate determination in plasma and red blood cells
114
Shane, B. 2010. “Folate Chemistry and Metabolism.” In Folate in Health and Disease, edited
by L.B. Bailey, 2nd ed., 1–24. Boca Raton, FL: CRC Press, Taylor & Francis Group.
Smith, D.E., Kok, R.M., Teerlink, T., Jakobs, C. and Smulders, Y.M. 2006. “Quantitative
Determination of Erythrocyte Folate Vitamer Distribution by Liquid Chromatography-
Tandem Mass Spectrometry.” Clin Chem Lab Med 44 (4): 450–9.
Vuorte, J., Jansson, S.E. and Repo, H. 2001. “Evaluation of Red Blood Cell Lysing Solutions
in the Study of Neutrophil Oxidative Burst by the DCFH Assay.” Cytometry 43 (4): 290–
6.
Wang, C., Riedl, K.M. and Schwartz, S.J. 2010. “A Liquid Chromatography-Tandem Mass
Spectrometric Method for Quantitative Determination of Native 5-
Methyltetrahydrofolate and Its Polyglutamyl Derivatives in Raw Vegetables.” J
Chromatogr B 878 (29): 2949–58.
Wille, S.M.R., Peters, F.T., Di Fazio, V. and Samyn, N. 2011. “Practical Aspects Concerning
Validation and Quality Control for Forensic and Clinical Bioanalytical Quantitative
Methods.” Accredit Qual Assur 16 (6): 279–92.
Wright, A.J., Finglas, P.M. and Southon, S. 1998. “Erythrocyte Folate Analysis: A Cause for
Concern?” Clin Chem 44 (9): 1886–91.
Wright, A.J., Finglas, P.M. and Southon, S. 2000. “Erythrocyte Folate Analysis: Saponin
Added during Lysis of Whole Blood Can Increase Apparent Folate Concentrations,
Depending on Hemolysate pH.” Clin Chem 46 (12): 1978–86.
Yetley, E.A., Pfeiffer, C.M., Phinney, K.W., Fazili, Z., Lacher, D.A., Bailey, R.L.,
Blackmore, S. et al. 2011. “Biomarkers of Folate Status in NHANES: A Roundtable
Summary.” Am J Clin Nutr 94 (1): 303S – 12S.
Zeisel, S.H. 2009. “Importance of Methyl Donors during Reproduction.” Am J Clin Nutr 89
(2): 673S – 7S.
Chapter VI: Rodent feeding trial of folate rice
Based on:
Kiekens F., Blancquaert D., Devisscher L., Van Daele J., Stove, V., Delanghe J.R., Van Der
Straeten D., Lambert W.E., Stove C.P. 2015. “Folates from metabolically engineered rice: a
long-term study in rats” Mol Nutr Food Res 59: 490-500
Chapter VI: Rodent feeding trial of folate rice
116
Author contributions
FK, CPS and WEL designed the research; FK, LD, VS and JRD conducted the research; DB
and DVDS provided essential materials; FK analyzed the data and conducted statistical
analysis; JVD reviewed the data; FK and CPS wrote the paper, which was revised by DVDS,
JVD, WEL, LD, VS and JRD; FK and CPS are responsible for the final content.
Chapter VI: Rodent feeding trial of folate rice
117
Table of contents
VI.1. Abstract .................................................................................................................... 118
VI.2. Introduction .............................................................................................................. 119
VI.3. Objectives ................................................................................................................. 120
VI.4. Materials and methods ............................................................................................. 120
4.1. Reagents and materials ........................................................................................ 120
4.2. Blood sampling .................................................................................................... 123
4.3. Sample analysis ................................................................................................... 124
4.4. Statistical analysis ............................................................................................... 125
VI.5. Results and discussion ............................................................................................. 126
5.1. Food consumption, animal weight and general health status .............................. 127
5.2. Folate status ......................................................................................................... 129
5.3. Homocysteine and vitamin B12 concentrations ................................................... 135
5.4. Dried blood spot hematocrit estimation .............................................................. 136
5.5. Hematological analysis ........................................................................................ 138
VI.6. Conclusion ............................................................................................................... 139
VI.7. References ................................................................................................................ 140
Chapter VI: Rodent feeding trial of folate rice
118
VI.1. Abstract
The biological impact of folates from folate rice, a metabolically engineered (biofortified) rice
line, rich in folates, was investigated. Its consumption may be helpful to fight folate
deficiency. Our objective was to investigate the potential of folate rice to supply the organism
with folates and evaluate its biological effectiveness using a rat model.
Five groups of 12 Wistar rats were monitored during a 7/12-week depletion/repletion trial.
Animals receiving folate-free diet (0 µg/rat/day) and those additionally receiving wild type
rice (on average 0.11 µg/rat/day) suffered from decreased hematocrit and lower folate
concentrations in both plasma and red blood cells (RBCs). This resulted in serious morbidity
and even lethality during the trial. In contrast, all animals receiving a daily supplement of
folate rice or folic acid fortified rice (on average 3.00 µg/rat/day and 3.12 µg/rat/day,
respectively) and those receiving a positive control diet (11.4 to 25.0 µg/rat/day), survived. In
these groups, the hematocrit normalized, plasma and RBC folate concentrations increased and
pronounced hyperhomocysteinemia was countered.
Using an animal model, we demonstrated that biofortified folate rice is a valuable source of
dietary folate, as evidenced by folate determination in plasma and RBCs, the alleviation of
anemia and counteraction of pronounced hyperhomocysteinemia.
Chapter VI: Rodent feeding trial of folate rice
119
VI.2. Introduction
In 2007, our research consortium presented a metabolically engineered rice variety, known as
folate rice, which contains approximately a hundredfold the folate content of wild type
rice.(Storozhenko et al. 2007) Locally grown folate rice could be a valuable asset to reduce
the health burden caused by folate deficiency in poor rural regions where other ways of
sustained supplementation are difficult to implement. These regions, like the Shanxi province
of China, are confronted with a prevalence of neural tube defects (60.9/10 000 live births;
38% folate deficient individuals) far above that found in more developed regions (±2.9/10 000
live births; <10% folate deficient individuals).(De Steur et al. 2010; De Steur et al. 2012) In
2010, De Steur et al. theoretically investigated the potential health impact and willingness to
accept folate rice in China and found that the implementation of this modified crop could have
a positive effect on the health and economic burden of folate deficiency. However, an
improved nutrient status of a consumer cannot be simply inferred from the intake of food with
an increased nutrient content. First, the biological effectiveness of this genetically modified
crop needs to be demonstrated, which is a pivotal step towards public acceptance.(De Steur et
al. 2010; Jeong and Guerinot 2008)
Several studies have investigated the potential health benefits of genetically modified crops
with modified nutritional characteristics as functional food. Best known and most thoroughly
studied is Golden Rice, in which genes are expressed that lead to a higher provitamin A
content.(Beyer et al. 2002) A human trial has been conducted with this rice variety,
demonstrating bio-accessibility and bio-availability (via retinol in plasma) in human
volunteers.(Tang et al. 2009) In 2005, Haas et al. investigated the potential of a high-iron rice
variety to improve the iron intake of Filipino women by measuring serum-ferritin, total body
iron and hemoglobin during a 9-month trial with modest results.(Haas et al. 2005)
Furthermore, Morris et al. investigated whether the increase of calcium accumulation in
carrots leads to an increase in calcium intake upon consumption in both humans and
mice.(Morris et al. 2008) Recently, Castorena-Torres et al. reported on the folate bio-
availability from lyophilized biofortified tomatoes using a murine model, making a
comparison with orally dosed synthetic 5-methyltetrahydrofolate (5MeTHF) and folic acid
(FA). These authors found that folates from tomato had a comparable bioavailability as
synthetic 5MeTHF but were absorbed more slowly into the bloodstream than synthetic FA.
FA was also found to be less bioavailable (±50%). (Castorena-Torres et al. 2014) However,
although demonstrating a proof-of-principle of bio-availability, only one single administration
was performed, with only a 12-h follow-up. Much more relevant to support a potential benefit
for human health is a long term evaluation, in which repeated administration of biofortified
food is performed, meanwhile periodically evaluating the long term RBC folate status, as well
as the short term folate status in plasma.(Shane 2010; Visentin et al. 2014) This is only
possible in a long term study spanning at least one full RBC life cycle, which in rats takes
about 67 days.(Kurata et al. 1993)
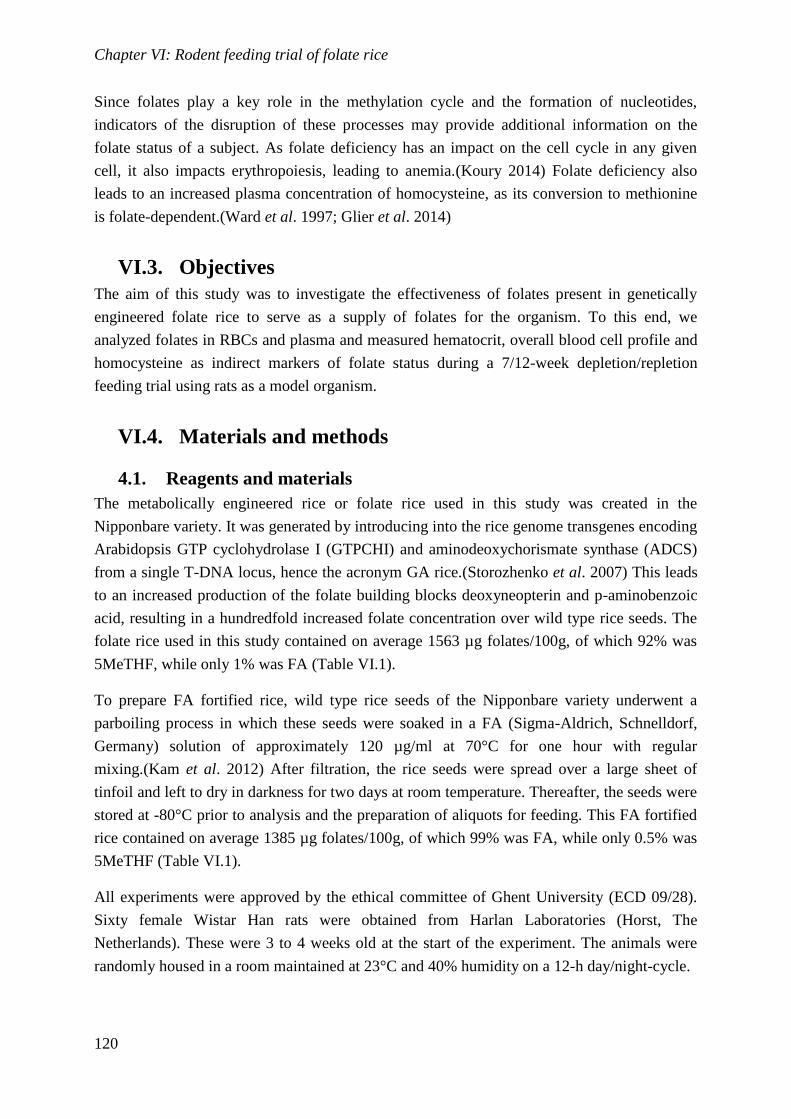
Chapter VI: Rodent feeding trial of folate rice
120
Since folates play a key role in the methylation cycle and the formation of nucleotides,
indicators of the disruption of these processes may provide additional information on the
folate status of a subject. As folate deficiency has an impact on the cell cycle in any given
cell, it also impacts erythropoiesis, leading to anemia.(Koury 2014) Folate deficiency also
leads to an increased plasma concentration of homocysteine, as its conversion to methionine
is folate-dependent.(Ward et al. 1997; Glier et al. 2014)
VI.3. Objectives
The aim of this study was to investigate the effectiveness of folates present in genetically
engineered folate rice to serve as a supply of folates for the organism. To this end, we
analyzed folates in RBCs and plasma and measured hematocrit, overall blood cell profile and
homocysteine as indirect markers of folate status during a 7/12-week depletion/repletion
feeding trial using rats as a model organism.
VI.4. Materials and methods
4.1. Reagents and materials
The metabolically engineered rice or folate rice used in this study was created in the
Nipponbare variety. It was generated by introducing into the rice genome transgenes encoding
Arabidopsis GTP cyclohydrolase I (GTPCHI) and aminodeoxychorismate synthase (ADCS)
from a single T-DNA locus, hence the acronym GA rice.(Storozhenko et al. 2007) This leads
to an increased production of the folate building blocks deoxyneopterin and p-aminobenzoic
acid, resulting in a hundredfold increased folate concentration over wild type rice seeds. The
folate rice used in this study contained on average 1563 µg folates/100g, of which 92% was
5MeTHF, while only 1% was FA (Table VI.1).
To prepare FA fortified rice, wild type rice seeds of the Nipponbare variety underwent a
parboiling process in which these seeds were soaked in a FA (Sigma-Aldrich, Schnelldorf,
Germany) solution of approximately 120 µg/ml at 70°C for one hour with regular
mixing.(Kam et al. 2012) After filtration, the rice seeds were spread over a large sheet of
tinfoil and left to dry in darkness for two days at room temperature. Thereafter, the seeds were
stored at -80°C prior to analysis and the preparation of aliquots for feeding. This FA fortified
rice contained on average 1385 µg folates/100g, of which 99% was FA, while only 0.5% was
5MeTHF (Table VI.1).
All experiments were approved by the ethical committee of Ghent University (ECD 09/28).
Sixty female Wistar Han rats were obtained from Harlan Laboratories (Horst, The
Netherlands). These were 3 to 4 weeks old at the start of the experiment. The animals were
randomly housed in a room maintained at 23°C and 40% humidity on a 12-h day/night-cycle.
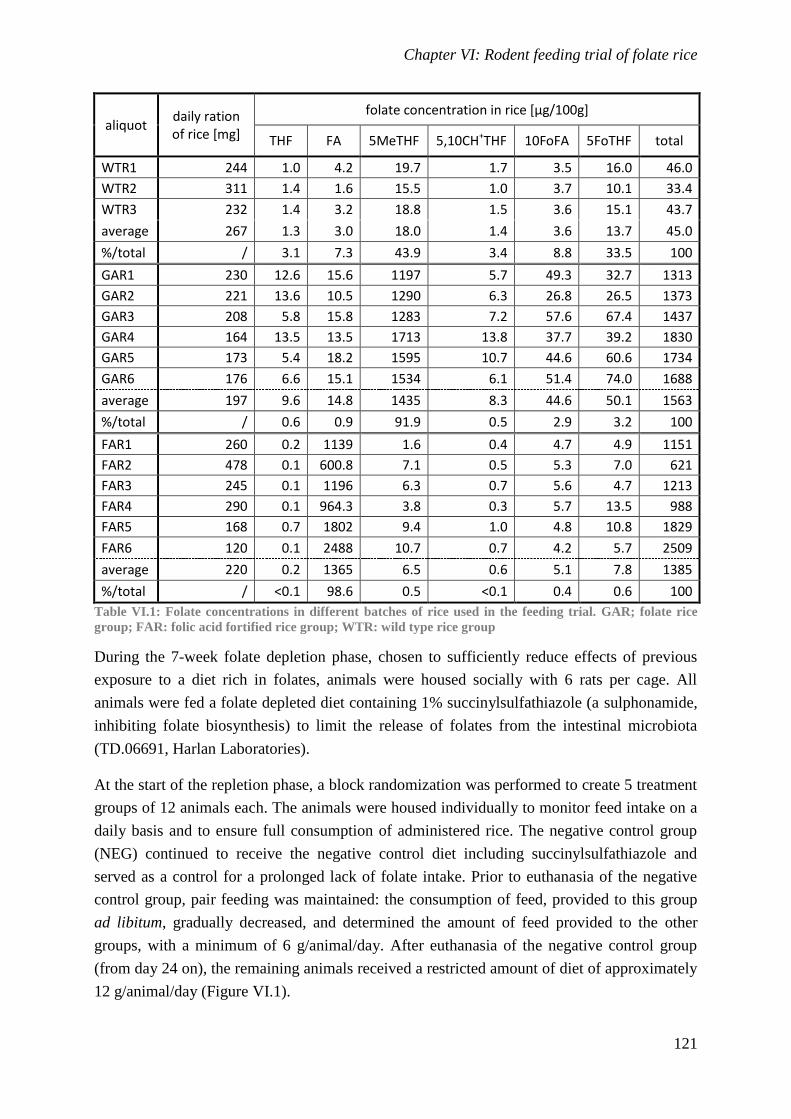
Chapter VI: Rodent feeding trial of folate rice
121
aliquot daily ration of rice [mg]
folate concentration in rice [µg/100g]
THF FA 5MeTHF 5,10CH+THF 10FoFA 5FoTHF total
WTR1 244 1.0 4.2 19.7 1.7 3.5 16.0 46.0
WTR2 311 1.4 1.6 15.5 1.0 3.7 10.1 33.4
WTR3 232 1.4 3.2 18.8 1.5 3.6 15.1 43.7
average 267 1.3 3.0 18.0 1.4 3.6 13.7 45.0
%/total / 3.1 7.3 43.9 3.4 8.8 33.5 100
GAR1 230 12.6 15.6 1197 5.7 49.3 32.7 1313
GAR2 221 13.6 10.5 1290 6.3 26.8 26.5 1373
GAR3 208 5.8 15.8 1283 7.2 57.6 67.4 1437
GAR4 164 13.5 13.5 1713 13.8 37.7 39.2 1830
GAR5 173 5.4 18.2 1595 10.7 44.6 60.6 1734
GAR6 176 6.6 15.1 1534 6.1 51.4 74.0 1688
average 197 9.6 14.8 1435 8.3 44.6 50.1 1563
%/total / 0.6 0.9 91.9 0.5 2.9 3.2 100
FAR1 260 0.2 1139 1.6 0.4 4.7 4.9 1151
FAR2 478 0.1 600.8 7.1 0.5 5.3 7.0 621
FAR3 245 0.1 1196 6.3 0.7 5.6 4.7 1213
FAR4 290 0.1 964.3 3.8 0.3 5.7 13.5 988
FAR5 168 0.7 1802 9.4 1.0 4.8 10.8 1829
FAR6 120 0.1 2488 10.7 0.7 4.2 5.7 2509
average 220 0.2 1365 6.5 0.6 5.1 7.8 1385
%/total / <0.1 98.6 0.5 <0.1 0.4 0.6 100
Table VI.1: Folate concentrations in different batches of rice used in the feeding trial. GAR; folate rice
group; FAR: folic acid fortified rice group; WTR: wild type rice group
During the 7-week folate depletion phase, chosen to sufficiently reduce effects of previous
exposure to a diet rich in folates, animals were housed socially with 6 rats per cage. All
animals were fed a folate depleted diet containing 1% succinylsulfathiazole (a sulphonamide,
inhibiting folate biosynthesis) to limit the release of folates from the intestinal microbiota
(TD.06691, Harlan Laboratories).
At the start of the repletion phase, a block randomization was performed to create 5 treatment
groups of 12 animals each. The animals were housed individually to monitor feed intake on a
daily basis and to ensure full consumption of administered rice. The negative control group
(NEG) continued to receive the negative control diet including succinylsulfathiazole and
served as a control for a prolonged lack of folate intake. Prior to euthanasia of the negative
control group, pair feeding was maintained: the consumption of feed, provided to this group
ad libitum, gradually decreased, and determined the amount of feed provided to the other
groups, with a minimum of 6 g/animal/day. After euthanasia of the negative control group
(from day 24 on), the remaining animals received a restricted amount of diet of approximately
12 g/animal/day (Figure VI.1).
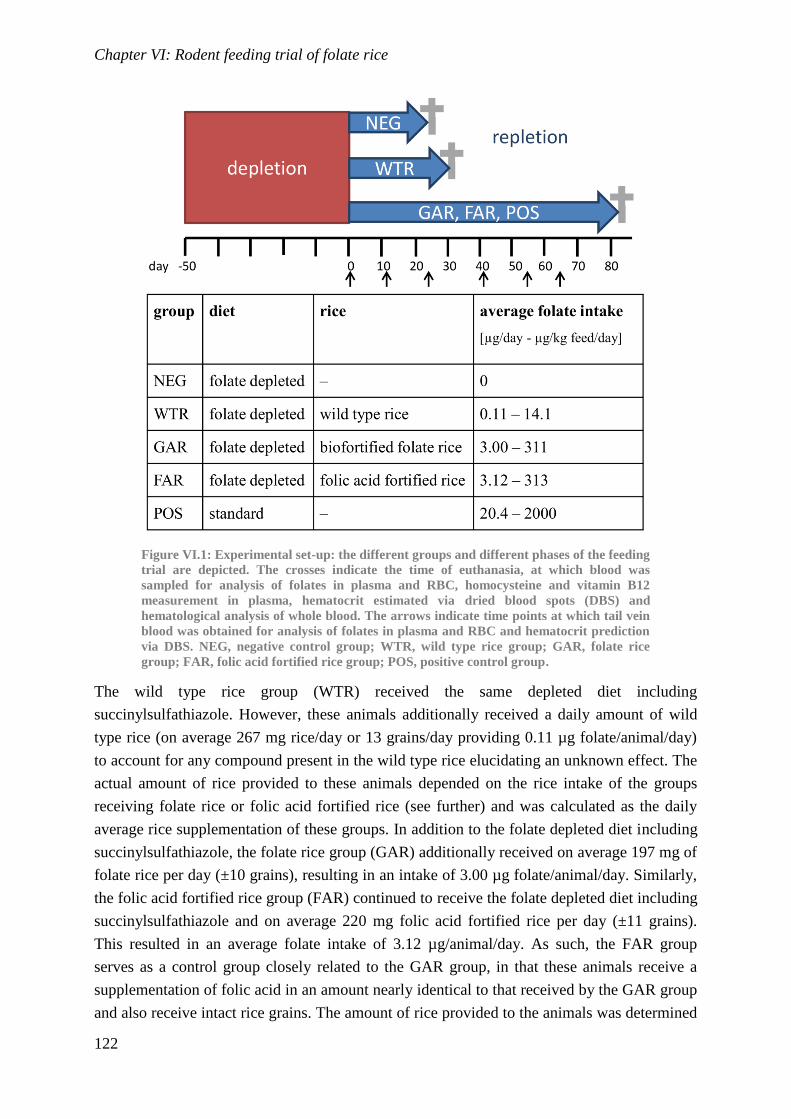
Chapter VI: Rodent feeding trial of folate rice
122
Figure VI.1: Experimental set-up: the different groups and different phases of the feeding
trial are depicted. The crosses indicate the time of euthanasia, at which blood was
sampled for analysis of folates in plasma and RBC, homocysteine and vitamin B12
measurement in plasma, hematocrit estimated via dried blood spots (DBS) and
hematological analysis of whole blood. The arrows indicate time points at which tail vein
blood was obtained for analysis of folates in plasma and RBC and hematocrit prediction
via DBS. NEG, negative control group; WTR, wild type rice group; GAR, folate rice
group; FAR, folic acid fortified rice group; POS, positive control group.
The wild type rice group (WTR) received the same depleted diet including
succinylsulfathiazole. However, these animals additionally received a daily amount of wild
type rice (on average 267 mg rice/day or 13 grains/day providing 0.11 µg folate/animal/day)
to account for any compound present in the wild type rice elucidating an unknown effect. The
actual amount of rice provided to these animals depended on the rice intake of the groups
receiving folate rice or folic acid fortified rice (see further) and was calculated as the daily
average rice supplementation of these groups. In addition to the folate depleted diet including
succinylsulfathiazole, the folate rice group (GAR) additionally received on average 197 mg of
folate rice per day (±10 grains), resulting in an intake of 3.00 µg folate/animal/day. Similarly,
the folic acid fortified rice group (FAR) continued to receive the folate depleted diet including
succinylsulfathiazole and on average 220 mg folic acid fortified rice per day (±11 grains).
This resulted in an average folate intake of 3.12 µg/animal/day. As such, the FAR group
serves as a control group closely related to the GAR group, in that these animals receive a
supplementation of folic acid in an amount nearly identical to that received by the GAR group
and also receive intact rice grains. The amount of rice provided to the animals was determined
Chapter VI: Rodent feeding trial of folate rice
123
by three aspects: i) the amount of rice that can be grown on a lab scale is limited; ii) this
amount should be sufficient to maintain a viable folate status(Clifford et al. 1989; Bailey and
Gregory 3rd 1999; House et al. 2003); iii) administration of too high amounts may mask
subtle differences between groups. From the start of the repletion phase on, the positive
control group (POS) received a rodent diet containing 2000 µg folic acid/kg feed resulting in
a folate intake of 11.4 to 25.0 µg folate/animal/day, depending on the amount of feed
provided and consumed, with an average folate intake of 20.4 µg/animal/day (see Table VI.2).
While the FAR group served as a control group for the supplementation of a limited amount
of folic acid through the feeding of fortified rice, the POS group served as a reference for the
effects of a non-restricted folate intake. Due to the high amount of folate present in this
positive control feed, these animals present the clinical parameters associated with an
adequate folate status. Optimal erythropoiesis is expected to lead to a normal hematocrit while
homocysteine concentrations should be fully reduced to baseline levels due to the high
availability of 5-methyltetrahydrofolate in the circulation. Both the folate depleted diet and
the positive control diet are standardized AIN-93G diets, similar in carbohydrate, fat and
protein content. The letter G indicates that this diet is specially formulated to be used during
the growth phase of the rodents’ life.
Irrespective of feed limitations, wild type rice, folate rice and folic acid fortified rice were
provided to the animals prior to providing the rest of the feed. Non-ground, intact grains were
provided separately from the feed in a porcelain bowl to allow evaluation of the bio-
accessibility of the rice folates. At all stages we visually confirmed that all animals fully
consumed the rice grains provided.
4.2. Blood sampling
Blood sampling was performed in a random order after overnight fasting. After 50 days of
folate depletion and at days 11, 24, 41, 55 and 65 of the supplementation period, blood
samples of approximately 300 µl were obtained from the lateral tail vein under isoflurane
anaesthesia using a 30G needle (BD MicrolanceTM
3) and a 2-ml disposable syringe
(Terumo). Blood samples were immediately transferred to an amber-colored microcentrifuge
tube containing 20 µl of a 6% EDTA solution (Sigma-Aldrich). At the time of euthanasia a 1-
ml sample was obtained via cardiac puncture using an 18G needle (BD MicrolanceTM
3) and a
10-ml disposable syringe (Terumo). Blood samples were immediately transferred to a 5-ml
tube containing 100 µl of a 6% EDTA solution. Samples were immediately stored on ice in a
light-protecting box. At every time point, a dried blood spot (DBS) was collected on
Whatman 903 filter paper (Novolab) after the needle was withdrawn from the vein, to
determine the haematocrit (HCT) through potassium measurement.(Capiau et al. 2013) Figure
VI.1 gives a schematic overview of the sampling schedule.
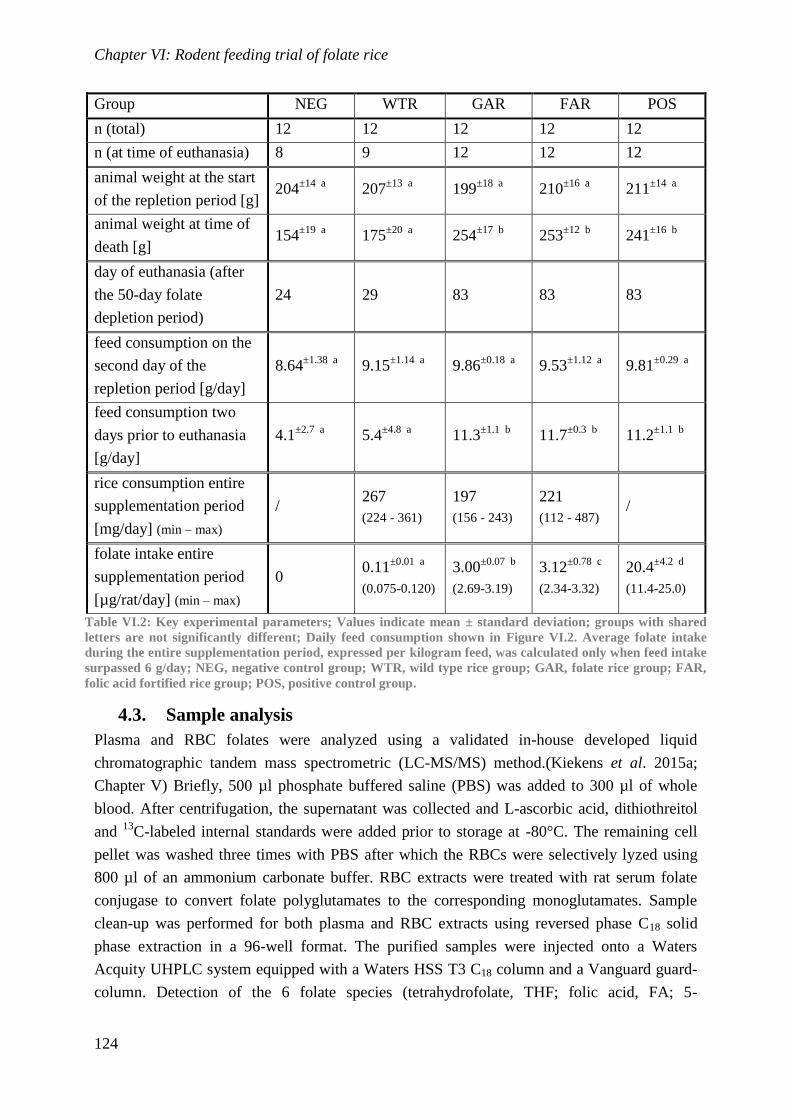
Chapter VI: Rodent feeding trial of folate rice
124
Group NEG WTR GAR FAR POS
n (total) 12 12 12 12 12
n (at time of euthanasia) 8 9 12 12 12
animal weight at the start
of the repletion period [g] 204
±14 a 207
±13 a 199
±18 a 210
±16 a 211
±14 a
animal weight at time of
death [g] 154
±19 a 175
±20 a 254
±17 b 253
±12 b 241
±16 b
day of euthanasia (after
the 50-day folate
depletion period)
24 29 83 83 83
feed consumption on the
second day of the
repletion period [g/day]
8.64±1.38 a
9.15±1.14 a
9.86±0.18 a
9.53±1.12 a
9.81±0.29 a
feed consumption two
days prior to euthanasia
[g/day]
4.1±2.7 a
5.4±4.8 a
11.3±1.1 b
11.7±0.3 b
11.2±1.1 b
rice consumption entire
supplementation period
[mg/day] (min – max)
/ 267
(224 - 361)
197
(156 - 243)
221
(112 - 487) /
folate intake entire
supplementation period
[µg/rat/day] (min – max)
0 0.11
±0.01 a
(0.075-0.120)
3.00±0.07 b
(2.69-3.19)
3.12±0.78 c
(2.34-3.32)
20.4±4.2 d
(11.4-25.0)
Table VI.2: Key experimental parameters; Values indicate mean ± standard deviation; groups with shared
letters are not significantly different; Daily feed consumption shown in Figure VI.2. Average folate intake
during the entire supplementation period, expressed per kilogram feed, was calculated only when feed intake
surpassed 6 g/day; NEG, negative control group; WTR, wild type rice group; GAR, folate rice group; FAR,
folic acid fortified rice group; POS, positive control group.
4.3. Sample analysis
Plasma and RBC folates were analyzed using a validated in-house developed liquid
chromatographic tandem mass spectrometric (LC-MS/MS) method.(Kiekens et al. 2015a;
Chapter V) Briefly, 500 µl phosphate buffered saline (PBS) was added to 300 µl of whole
blood. After centrifugation, the supernatant was collected and L-ascorbic acid, dithiothreitol
and 13
C-labeled internal standards were added prior to storage at -80°C. The remaining cell
pellet was washed three times with PBS after which the RBCs were selectively lyzed using
800 µl of an ammonium carbonate buffer. RBC extracts were treated with rat serum folate
conjugase to convert folate polyglutamates to the corresponding monoglutamates. Sample
clean-up was performed for both plasma and RBC extracts using reversed phase C18 solid
phase extraction in a 96-well format. The purified samples were injected onto a Waters
Acquity UHPLC system equipped with a Waters HSS T3 C18 column and a Vanguard guard-
column. Detection of the 6 folate species (tetrahydrofolate, THF; folic acid, FA; 5-
Chapter VI: Rodent feeding trial of folate rice
125
methyltetrahydrofolate, 5MeTHF; 5,10-methenyltetrahydrofolate, 5,10CH+THF; 10-
formylfolic acid, 10FoFA and 5-formyltetrahydrofolate, 5FoTHF) was performed using an
ABSciex API 4000TM
triple quadrupole mass spectrometer in scheduled MRM-mode. The
method was validated based on EMA guidelines and the acceptance criteria specified therein.
This validation encompassed selectivity, accuracy, precision, linearity, matrix effect and
recovery, as well as long term stability during sample storage at -80°C and autosampler
stability.
The folate content in both folate rice and FA fortified rice was verified with the same
equipment as described above, using an existing validated LC-MS/MS method, with minor
modifications.(De Brouwer et al. 2010) Four hundred rather than 200 units of α-amylase were
added to further reduce the viscosity of the sample. In addition, scheduled multiple reaction
monitoring (sMRM) was applied, allowing the acquisition of more data points per analyte.
Although a presence, up to 10.9%, of 10-formyldihydrofolate was reported in white rice, its
accurate quantification is not possible due to the lack of a pure reference standard.(Pfeiffer et
al. 1997) When following the mass transitions of this compound, we could not detect it in
wild type rice and folic acid fortified rice, while it was present at trace amounts (<1% of total
folate) in GA rice. Folate concentrations in rodent diets were determined using the method
described in Chapter IV.(Kiekens et al. 2015b)
Haematological analysis was performed using a Sysmex XE-5000 Automated Haematology
System. Quantification of potassium in DBS extracts (which allows to estimate the HCT) was
performed using a Cobas® 8000 Modular Analyser (Roche Diagnostics). Briefly, a 3-mm
punch was collected and extracted twice with 50 µl of 2.5 mM of KCl. After centrifugation
for 1 minute at 5000 g, respectively 40 and 50 µl of supernatant were collected into an
injection cup. Calibrators were prepared by removal or addition of rat plasma, starting from a
pool of rat whole blood with a HCT of 0.39, as verified by haematological
measurement.(Capiau et al. 2013)
Homocysteine and vitamin B12 measurements were performed with a homocysteine Liquid
Stable Reagent Kit enzymatic assay (Axis-Shield) and Vitamin B12 immunoassay (Roche
Diagnostics) using a Modular-P and Modular Analytics E170 system (Roche Diagnostics),
respectively. Because of the limited sample volume, all samples were diluted 3-fold with PBS
prior to analysis.(Kellogg et al. 2005)
4.4. Statistical analysis
All statistical analyses were performed using IBM SPSS22. Multiple comparisons were
performed using the Dunnett’s T3 algorithm as nearly all groups show differences in sample
size and variance. Results below the limit of quantification were not included into the
statistical analysis. When less than 6 results remained, this was mentioned since this
compromises the power of the statistics. The treatment groups were compared at the 5%
significance level. Where possible the 95% confidence interval was indicated in the graphs.
Chapter VI: Rodent feeding trial of folate rice
126
All box-and-whisker plots, composed of the first, second (=median) and third quartiles as well
as the minimal and maximal values, were made in Microsoft Excel®.
VI.5. Results and discussion
Folates present in the diet are transported from the small intestine to the portal circulation.
Upon arrival in the liver, they are either polyglutamylated and stored in the hepatocytes or are
released into the systemic circulation or the bile.(Steinberg et al. 1979) The latter causes an
enterohepatic recirculation and reabsorption into the portal circulation.(Kurata et al. 1993)
Every study evaluating biological efficacy of a food item in laboratory animals has the
intrinsic shortcoming that animals can never fully replace humans. With respect to folates, a
relevant difference is e.g. that rats release bile into the intestine through a bile duct, causing a
difference in the enterohepatic recirculation. Also, in rats the activity of intestinal folate
conjugase is lower than that observed in humans. However, since 90% of folates in folate rice
are present as monoglutamates, the effect of this limitation in enzymatic deconjugation should
be negligible.(Wang et al. 1985; McKillop et al. 2006; Storozhenko et al. 2007) In this study,
using a folate-depleted rat model, we determined whether or not folates, present in folate rice
are released in the gastrointestinal system and can reach the systemic circulation.
A first factor determining the biological availability of a compound is its bioaccessibility, or
its availability for absorption in the GI-tract. This was nicely demonstrated for ferulic acid,
the most abundant phenolic acid in wheat, which has very low bioaccessibility from wheat
and derived products but high bioaccessibility when added in free form to e.g. flour.(Mateo
Anson et al. 2009) In addition, in animal studies investigating the biological availability of a
compound of interest from a natural crop, these crops are usually ground or lyophilized and
the resulting powder is mixed into food pellets. This can possibly influence the liberation of
nutrients through the destruction of the natural barriers. In the case of rice, the nutrients
contained within the endosperm, such as folates, can easily be released when the rice is
ground into a fine powder. This was clearly observed by O’Dea et al. in an in vitro
digestibility study of ground and unground rice. These authors found that after 30 minutes of
incubation with pancreatic amylase, ground polished rice was 71.8% hydrolyzed while
unground polished rice was only 30.8% hydrolyzed. In unpolished rice, the difference was
even greater with a respective hydrolysis rate of 68.2 and 17.6% of ground versus non-ground
rice. Since folates are contained within the endosperm, or the starchy interior, of the rice
grain, the use of ground rice would affect the speed by which folates are released from the
grain.(O’Dea et al. 1981; Gregory 3rd 2001) To avoid this potential artefact in this study, we
provided the animals with intact rice grains. Full consumption of these rice grains was
observed before providing the daily amount of rodent diet to the animal. Following this
procedure, the folates are absorbed from the rice grains in a more realistic way.
Chapter VI: Rodent feeding trial of folate rice
127
5.1. Food consumption, animal weight and general health status
Over the 50-day depletion period the animals consumed on average 12.1 grams of folate
depleted rodent feed per day, with a minimum of 9.6 and a maximum of 13.8 g/animal/day.
From 37 days of folate depletion on, a decreased feed intake was observed in all animals. This
feed intake continued to decrease in the negative control and wild type rice group, with a
respective average feed consumption of only 4.1 (day 22) and 5.4 (day 27) grams of feed per
animal per day (Table VI.2, Figure VI.2). A paired feeding approach was applied, in which
the negative control group, which consumed least feed -provided to this group ad libitum-
determined how much feed the other groups received, with a minimum of 6 g/day. After
euthanasia of the negative control group (day 24), the amount of diet given to the remaining
animals was augmented again to 12 g/day per animal. The wild type rice group showed a
transient increase in feed consumption, before a sharp drop shortly prior to euthanasia (day
29). In the other groups, the food was entirely consumed, although a slight decrease in food
consumption was observed during the later stage of the study, possibly due to the fact that the
animals neared their mature body weight while a growth diet was provided to them. Animal
weight showed strong correlation with feed intake (Figures VI.2 and VI.3). At the time of
euthanasia of the negative control group, the average weight of these animals had dropped
more than 20%, from 204 to 160 grams (weight of animals that died spontaneously was not
taken into consideration). Given the paired feeding approach, also all other groups had lost
weight, although less pronounced. After euthanasia of the negative control group, the 12
gram/day diet per animal allowed the average bodyweight to increase gradually to
approximately 250 grams at the end of the trial. Neither at the time of euthanasia of the wild
type rice group, after 24 days of supplementation (p≥0.06), nor at the end of the trial, after 83
days of supplementation (p≥0.18), was there a significant difference in bodyweight of the
animals assigned to different treatment groups.
On day 11 of supplementation the first visual symptoms of folate deficiency appeared.
Animals from both the group receiving folate depleted diet and the group additionally
receiving wild type rice suffered from hemorrhagic lesions at the mouth and front paw region,
leading to lethality, starting at day 18. Seven animals died spontaneously during the trial: 4 in
the negative control group and 3 in the wild type rice group. In some animals a lesion at the
corners of the eyes was observed. For ethical reasons, to limit the distress of the animals,
euthanasia was performed on day 24 for the negative control group and on day 29 for the
animals receiving wild type rice.
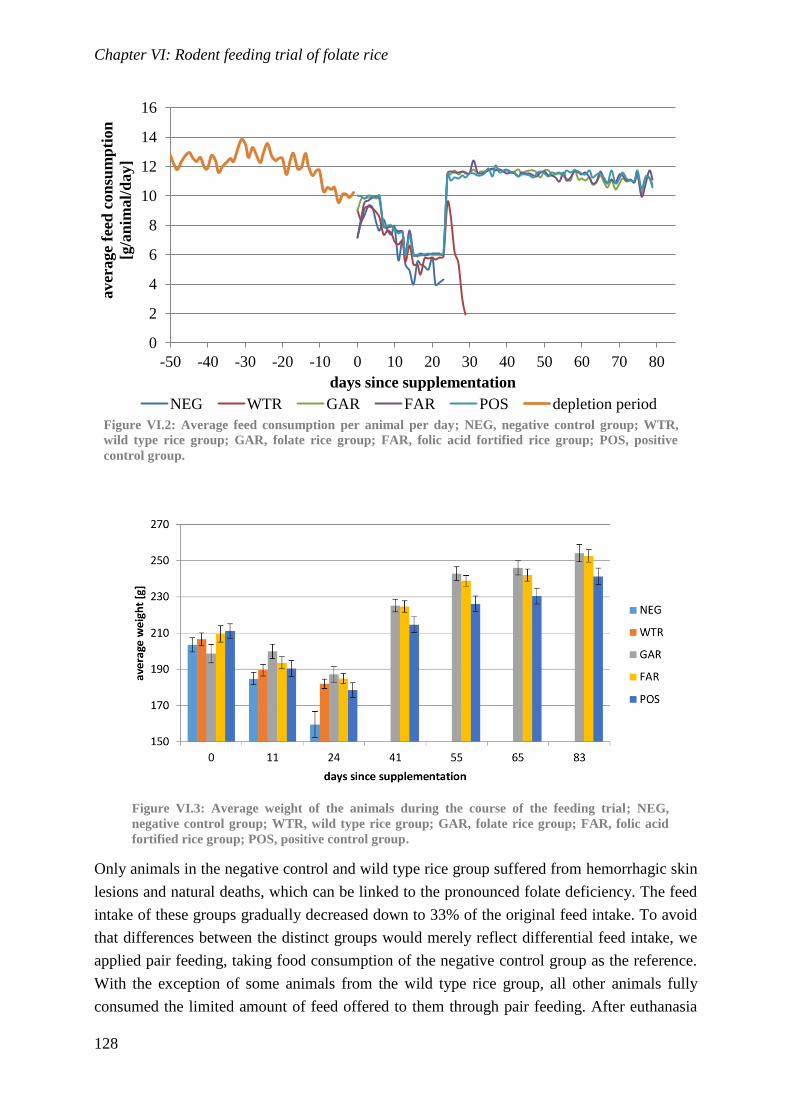
Chapter VI: Rodent feeding trial of folate rice
128
Figure VI.2: Average feed consumption per animal per day; NEG, negative control group; WTR,
wild type rice group; GAR, folate rice group; FAR, folic acid fortified rice group; POS, positive
control group.
Figure VI.3: Average weight of the animals during the course of the feeding trial; NEG,
negative control group; WTR, wild type rice group; GAR, folate rice group; FAR, folic acid
fortified rice group; POS, positive control group.
Only animals in the negative control and wild type rice group suffered from hemorrhagic skin
lesions and natural deaths, which can be linked to the pronounced folate deficiency. The feed
intake of these groups gradually decreased down to 33% of the original feed intake. To avoid
that differences between the distinct groups would merely reflect differential feed intake, we
applied pair feeding, taking food consumption of the negative control group as the reference.
With the exception of some animals from the wild type rice group, all other animals fully
consumed the limited amount of feed offered to them through pair feeding. After euthanasia
0
2
4
6
8
10
12
14
16
-50 -40 -30 -20 -10 0 10 20 30 40 50 60 70 80
aver
age
feed
con
sum
pti
on
[g/a
nim
al/
day]
days since supplementation
NEG WTR GAR FAR POS depletion period
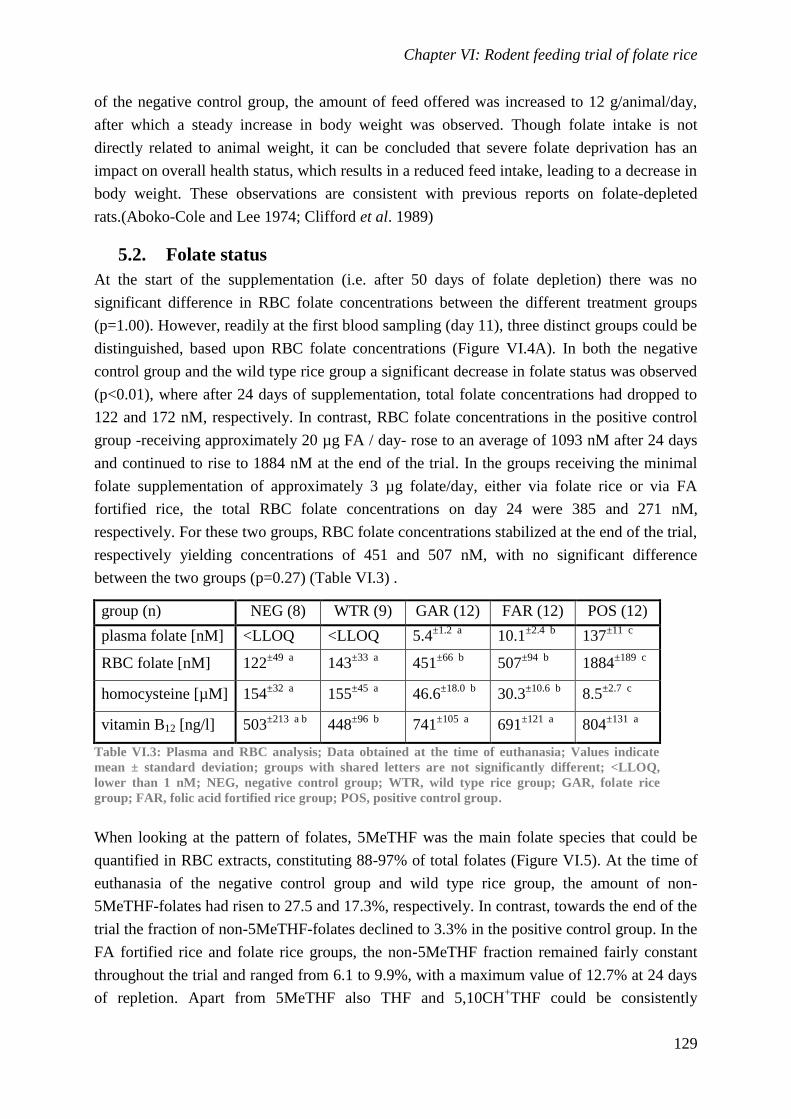
Chapter VI: Rodent feeding trial of folate rice
129
of the negative control group, the amount of feed offered was increased to 12 g/animal/day,
after which a steady increase in body weight was observed. Though folate intake is not
directly related to animal weight, it can be concluded that severe folate deprivation has an
impact on overall health status, which results in a reduced feed intake, leading to a decrease in
body weight. These observations are consistent with previous reports on folate-depleted
rats.(Aboko-Cole and Lee 1974; Clifford et al. 1989)
5.2. Folate status
At the start of the supplementation (i.e. after 50 days of folate depletion) there was no
significant difference in RBC folate concentrations between the different treatment groups
(p=1.00). However, readily at the first blood sampling (day 11), three distinct groups could be
distinguished, based upon RBC folate concentrations (Figure VI.4A). In both the negative
control group and the wild type rice group a significant decrease in folate status was observed
(p<0.01), where after 24 days of supplementation, total folate concentrations had dropped to
122 and 172 nM, respectively. In contrast, RBC folate concentrations in the positive control
group -receiving approximately 20 µg FA / day- rose to an average of 1093 nM after 24 days
and continued to rise to 1884 nM at the end of the trial. In the groups receiving the minimal
folate supplementation of approximately 3 µg folate/day, either via folate rice or via FA
fortified rice, the total RBC folate concentrations on day 24 were 385 and 271 nM,
respectively. For these two groups, RBC folate concentrations stabilized at the end of the trial,
respectively yielding concentrations of 451 and 507 nM, with no significant difference
between the two groups (p=0.27) (Table VI.3) .
group (n) NEG (8) WTR (9) GAR (12) FAR (12) POS (12)
plasma folate [nM] <LLOQ <LLOQ 5.4±1.2 a
10.1±2.4 b
137±11 c
RBC folate [nM] 122±49 a
143±33 a
451±66 b
507±94 b
1884±189 c
homocysteine [µM] 154±32 a
155±45 a
46.6±18.0 b
30.3±10.6 b
8.5±2.7 c
vitamin B12 [ng/l] 503±213 a b
448±96 b
741±105 a
691±121 a
804±131 a
Table VI.3: Plasma and RBC analysis; Data obtained at the time of euthanasia; Values indicate
mean ± standard deviation; groups with shared letters are not significantly different; <LLOQ,
lower than 1 nM; NEG, negative control group; WTR, wild type rice group; GAR, folate rice
group; FAR, folic acid fortified rice group; POS, positive control group.
When looking at the pattern of folates, 5MeTHF was the main folate species that could be
quantified in RBC extracts, constituting 88-97% of total folates (Figure VI.5). At the time of
euthanasia of the negative control group and wild type rice group, the amount of non-
5MeTHF-folates had risen to 27.5 and 17.3%, respectively. In contrast, towards the end of the
trial the fraction of non-5MeTHF-folates declined to 3.3% in the positive control group. In the
FA fortified rice and folate rice groups, the non-5MeTHF fraction remained fairly constant
throughout the trial and ranged from 6.1 to 9.9%, with a maximum value of 12.7% at 24 days
of repletion. Apart from 5MeTHF also THF and 5,10CH+THF could be consistently
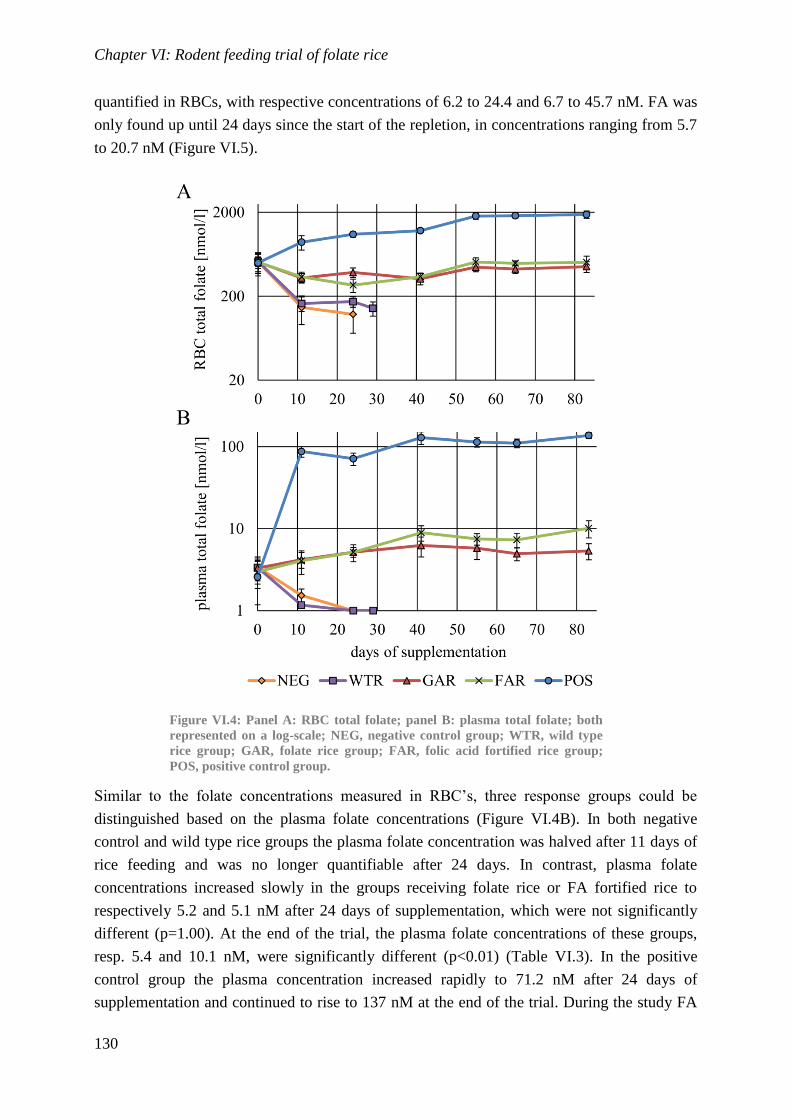
Chapter VI: Rodent feeding trial of folate rice
130
quantified in RBCs, with respective concentrations of 6.2 to 24.4 and 6.7 to 45.7 nM. FA was
only found up until 24 days since the start of the repletion, in concentrations ranging from 5.7
to 20.7 nM (Figure VI.5).
Figure VI.4: Panel A: RBC total folate; panel B: plasma total folate; both
represented on a log-scale; NEG, negative control group; WTR, wild type
rice group; GAR, folate rice group; FAR, folic acid fortified rice group;
POS, positive control group.
Similar to the folate concentrations measured in RBC’s, three response groups could be
distinguished based on the plasma folate concentrations (Figure VI.4B). In both negative
control and wild type rice groups the plasma folate concentration was halved after 11 days of
rice feeding and was no longer quantifiable after 24 days. In contrast, plasma folate
concentrations increased slowly in the groups receiving folate rice or FA fortified rice to
respectively 5.2 and 5.1 nM after 24 days of supplementation, which were not significantly
different (p=1.00). At the end of the trial, the plasma folate concentrations of these groups,
resp. 5.4 and 10.1 nM, were significantly different (p<0.01) (Table VI.3). In the positive
control group the plasma concentration increased rapidly to 71.2 nM after 24 days of
supplementation and continued to rise to 137 nM at the end of the trial. During the study FA
Chapter VI: Rodent feeding trial of folate rice
131
could occasionally be quantified in samples of all groups, in a concentration ranging from 1.3
to 3.8 nM (Figure VI.6).
The plasma folate concentrations were clearly related with folate intake. Concentrations in
both the negative control and wild type rice group continued to decline after the folate
depletion phase of the trial. This shows that the limited amount of folates present in wild type
rice is too low to serve as a considerable folate source, since no folates were measurable at the
time of euthanasia. The positive control group did show a strong increase in plasma folate
concentrations, as could be expected from the large amount of FA present in the diet. After 24
days, plasma folate concentrations in groups receiving folate rice and FA fortified rice were
significantly different from both the positive control group, the negative control group and the
group receiving wild type rice (p<0.01). At the end of the trial (day 83) there was also a
significant difference between the groups receiving either folate rice or FA fortified rice, with
an almost double plasma folate concentration (Figure VI.4B) in the latter group (p<0.01).
Several reasons may underlie this result. First, a difference between the GAR and FAR groups
could be explained by a somewhat lower bio-availability of natural folates.(Lewis et al. 1999)
Second, a difference in kinetics between FA and 5MeTHF may also lead to this observation.
As described in literature, there is a difference in absorption and absorption rate of FA and
food-derived THF species: while FA requires reduction and methylation in the bowel
epithelium or in the liver, 5MeTHF does not and is thus readily transferred to the systemic
circulation.(Wright et al. 2005; Caudill 2010; Castorena-Torres et al. 2014) As a result, the
plasma response to FA may be slower and, in our case, may still be increased to a higher
extent at the time of sampling than the response following ingestion of natural folates
(primarily 5MeTHF).(Wright et al. 2005) While cut-off values for rodents are lacking,
Clifford et al. reported on animal weight and serum and liver folate concentrations. These
authors found that 125 to 500 µg FA/kg diet resulted in serum folate concentrations of
approximately 16 nM, somewhat higher than the concentrations we observed with GA or FA
rice supplementation (resp. 5.4 and 10.1 nM), while a higher supplementation led to a drastic
increase of the serum folate concentration, similar to what we observed in the positive control
group.(Clifford et al. 1989) Although FA in serum has been reported when high amounts of
FA are consumed (Kelly et al. 1997), we could only occasionally quantify FA in plasma
samples. As these FA-positive samples appeared in all groups, FA presence was not related to
FA intake. These findings are in accordance with literature: while a peak concentration of FA
in serum occurs rapidly after intake of FA (< 2h) in both rats and humans (Steinberg et al.
1979; Castorena-Torres et al. 2014), we performed sampling after overnight starving of the
animals, to rule out short-term differences that could be related to very recent feed intake.
Similar to plasma, the RBC folate concentrations were not significantly different between the
negative control group and the group receiving wild type rice, with respective average RBC
folate concentrations measured prior to euthanasia of 121.7 and 143.4 nM (p=0.33). These
concentrations correspond with a severe depletion of folate stores in these groups. It is clear
that this will strongly impair nucleotide synthesis, thus disrupting homeostasis (e.g. normal
Chapter VI: Rodent feeding trial of folate rice
132
erythropoiesis), leading to symptoms of severe folate deficiency and eventually death.(Bills et
al. 1992; Stabler 2010) In contrast, repletion with a folate-rich positive control diet after the
50-day depletion period resulted in a quick re-establishment of RBC folate concentrations,
with an average measured total folate concentration of 1884 nM at the end of the trial. Also
the groups receiving folate rice or FA fortified rice were able to maintain an adequate RBC
total folate concentration, at the end of the trial stabilizing to a concentration of respectively
450.7 and 507.3 nM. Although these concentrations were not significantly different (p=0.27),
the lower concentrations in the folate rice group are likely the result of the reported
approximate 80% bioavailability of food folates, as compared to FA in humans.(Winkels et
al. 2007) However, a small part of the difference between these two groups may also originate
from the slightly lower average folate intake of the animals in the folate rice group (3.00
compared to 3.12 µg/animal/day; see Table VI.2). The RBC-folate concentrations measured -
though not as high as those observed in the positive control group- are above the 340 nM cut-
off value for folate deficiency in humans, as suggested by the World Health Organization
using homocysteine as a metabolic indicator.(WHO 2012) Also, it is possible that the FA does
not penetrate the rice grain completely during the parboiling process. This could also facilitate
the release of FA from fortified rice in the bowel.
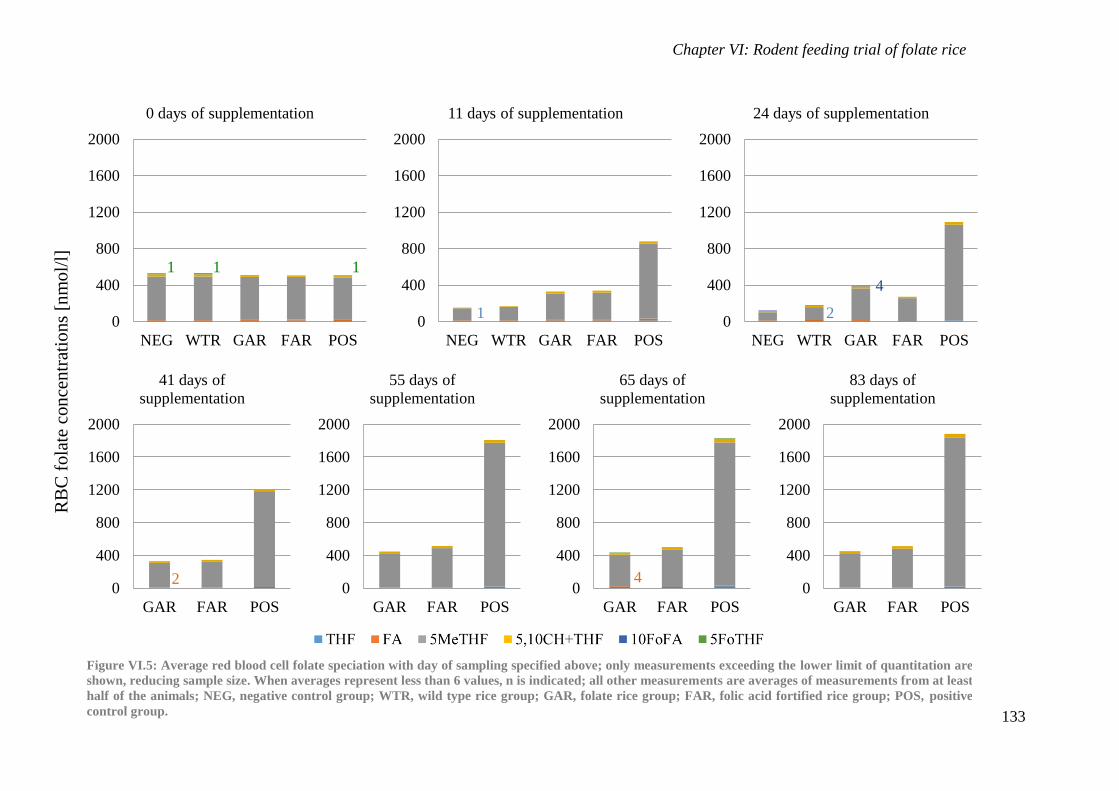
Chapter VI: Rodent feeding trial of folate rice
133
0
400
800
1200
1600
2000
NEG WTR GAR FAR POS
0 days of supplementation
0
400
800
1200
1600
2000
NEG WTR GAR FAR POS
11 days of supplementation
0
400
800
1200
1600
2000
NEG WTR GAR FAR POS
24 days of supplementation
0
400
800
1200
1600
2000
GAR FAR POS
41 days of
supplementation
0
400
800
1200
1600
2000
GAR FAR POS
55 days of
supplementation
0
400
800
1200
1600
2000
GAR FAR POS
65 days of
supplementation
0
400
800
1200
1600
2000
GAR FAR POS
83 days of
supplementation
Figure VI.5: Average red blood cell folate speciation with day of sampling specified above; only measurements exceeding the lower limit of quantitation are
shown, reducing sample size. When averages represent less than 6 values, n is indicated; all other measurements are averages of measurements from at least
half of the animals; NEG, negative control group; WTR, wild type rice group; GAR, folate rice group; FAR, folic acid fortified rice group; POS, positive
control group.
1 1 1
1 2
4
2 4
RB
C f
ola
te c
on
centr
atio
ns
[nm
ol/
l]
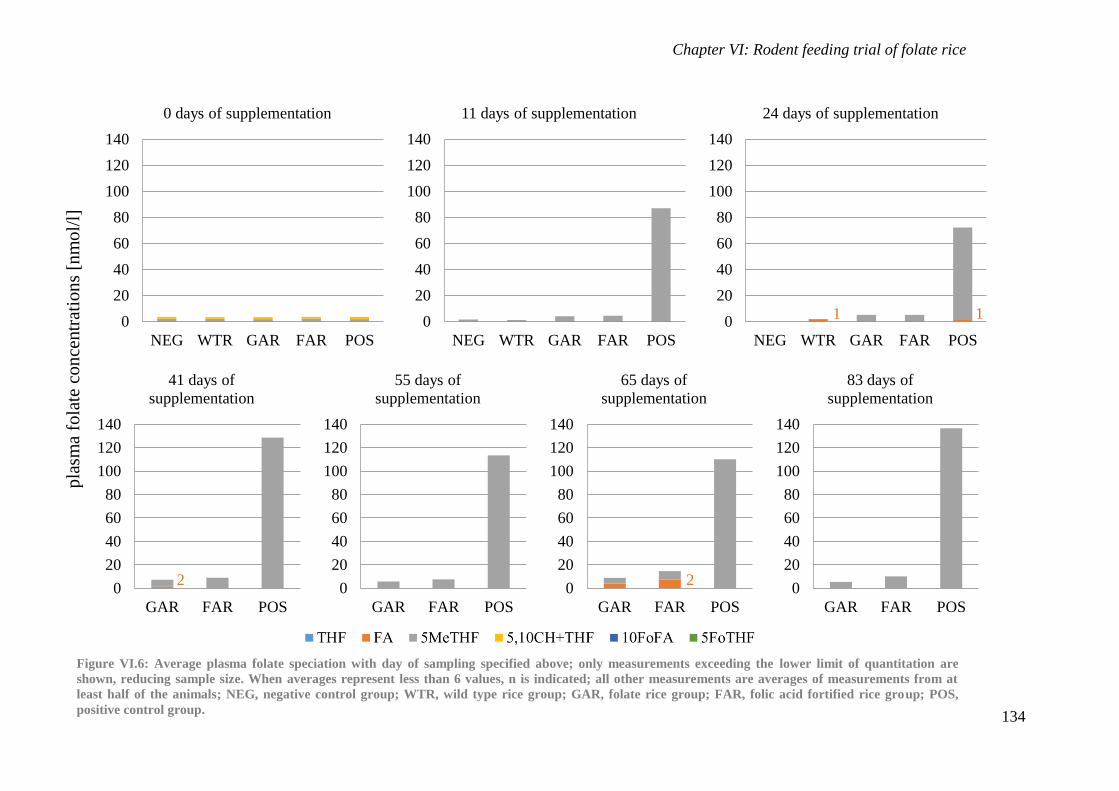
Chapter VI: Rodent feeding trial of folate rice
134
0
20
40
60
80
100
120
140
NEG WTR GAR FAR POS
0 days of supplementation
0
20
40
60
80
100
120
140
NEG WTR GAR FAR POS
11 days of supplementation
0
20
40
60
80
100
120
140
NEG WTR GAR FAR POS
24 days of supplementation
0
20
40
60
80
100
120
140
GAR FAR POS
41 days of
supplementation
0
20
40
60
80
100
120
140
GAR FAR POS
55 days of
supplementation
0
20
40
60
80
100
120
140
GAR FAR POS
65 days of
supplementation
0
20
40
60
80
100
120
140
GAR FAR POS
83 days of
supplementation
Figure VI.6: Average plasma folate speciation with day of sampling specified above; only measurements exceeding the lower limit of quantitation are
shown, reducing sample size. When averages represent less than 6 values, n is indicated; all other measurements are averages of measurements from at
least half of the animals; NEG, negative control group; WTR, wild type rice group; GAR, folate rice group; FAR, folic acid fortified rice group; POS,
positive control group.
1 1
2 2
pla
sma
fola
te c
on
centr
atio
ns
[nm
ol/
l]
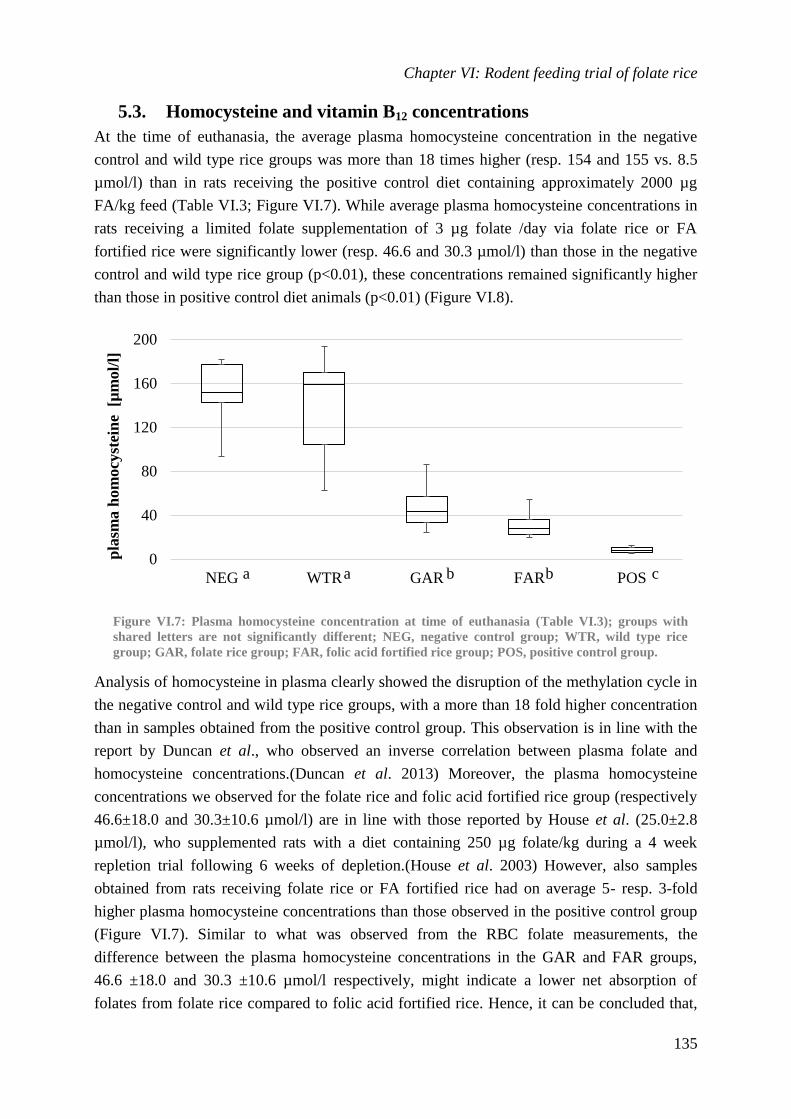
Chapter VI: Rodent feeding trial of folate rice
135
5.3. Homocysteine and vitamin B12 concentrations
At the time of euthanasia, the average plasma homocysteine concentration in the negative
control and wild type rice groups was more than 18 times higher (resp. 154 and 155 vs. 8.5
µmol/l) than in rats receiving the positive control diet containing approximately 2000 µg
FA/kg feed (Table VI.3; Figure VI.7). While average plasma homocysteine concentrations in
rats receiving a limited folate supplementation of 3 µg folate /day via folate rice or FA
fortified rice were significantly lower (resp. 46.6 and 30.3 µmol/l) than those in the negative
control and wild type rice group (p<0.01), these concentrations remained significantly higher
than those in positive control diet animals (p<0.01) (Figure VI.8).
Figure VI.7: Plasma homocysteine concentration at time of euthanasia (Table VI.3); groups with
shared letters are not significantly different; NEG, negative control group; WTR, wild type rice
group; GAR, folate rice group; FAR, folic acid fortified rice group; POS, positive control group.
Analysis of homocysteine in plasma clearly showed the disruption of the methylation cycle in
the negative control and wild type rice groups, with a more than 18 fold higher concentration
than in samples obtained from the positive control group. This observation is in line with the
report by Duncan et al., who observed an inverse correlation between plasma folate and
homocysteine concentrations.(Duncan et al. 2013) Moreover, the plasma homocysteine
concentrations we observed for the folate rice and folic acid fortified rice group (respectively
46.6±18.0 and 30.3±10.6 µmol/l) are in line with those reported by House et al. (25.0±2.8
µmol/l), who supplemented rats with a diet containing 250 µg folate/kg during a 4 week
repletion trial following 6 weeks of depletion.(House et al. 2003) However, also samples
obtained from rats receiving folate rice or FA fortified rice had on average 5- resp. 3-fold
higher plasma homocysteine concentrations than those observed in the positive control group
(Figure VI.7). Similar to what was observed from the RBC folate measurements, the
difference between the plasma homocysteine concentrations in the GAR and FAR groups,
46.6 ±18.0 and 30.3 ±10.6 µmol/l respectively, might indicate a lower net absorption of
folates from folate rice compared to folic acid fortified rice. Hence, it can be concluded that,
0
40
80
120
160
200
NEG WTR GAR FAR POS
pla
sma h
om
ocy
stei
ne
[µ
mo
l/l]
a a c b b
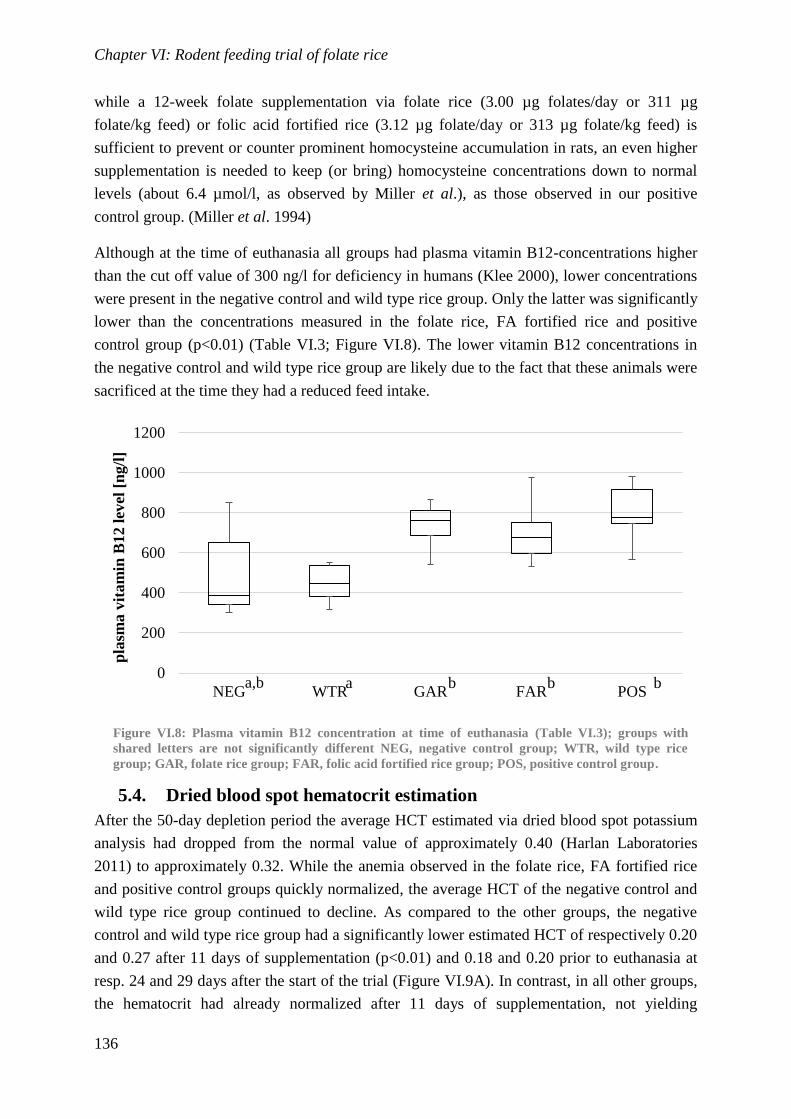
Chapter VI: Rodent feeding trial of folate rice
136
while a 12-week folate supplementation via folate rice (3.00 µg folates/day or 311 µg
folate/kg feed) or folic acid fortified rice (3.12 µg folate/day or 313 µg folate/kg feed) is
sufficient to prevent or counter prominent homocysteine accumulation in rats, an even higher
supplementation is needed to keep (or bring) homocysteine concentrations down to normal
levels (about 6.4 µmol/l, as observed by Miller et al.), as those observed in our positive
control group. (Miller et al. 1994)
Although at the time of euthanasia all groups had plasma vitamin B12-concentrations higher
than the cut off value of 300 ng/l for deficiency in humans (Klee 2000), lower concentrations
were present in the negative control and wild type rice group. Only the latter was significantly
lower than the concentrations measured in the folate rice, FA fortified rice and positive
control group (p<0.01) (Table VI.3; Figure VI.8). The lower vitamin B12 concentrations in
the negative control and wild type rice group are likely due to the fact that these animals were
sacrificed at the time they had a reduced feed intake.
Figure VI.8: Plasma vitamin B12 concentration at time of euthanasia (Table VI.3); groups with
shared letters are not significantly different NEG, negative control group; WTR, wild type rice
group; GAR, folate rice group; FAR, folic acid fortified rice group; POS, positive control group.
5.4. Dried blood spot hematocrit estimation
After the 50-day depletion period the average HCT estimated via dried blood spot potassium
analysis had dropped from the normal value of approximately 0.40 (Harlan Laboratories
2011) to approximately 0.32. While the anemia observed in the folate rice, FA fortified rice
and positive control groups quickly normalized, the average HCT of the negative control and
wild type rice group continued to decline. As compared to the other groups, the negative
control and wild type rice group had a significantly lower estimated HCT of respectively 0.20
and 0.27 after 11 days of supplementation (p<0.01) and 0.18 and 0.20 prior to euthanasia at
resp. 24 and 29 days after the start of the trial (Figure VI.9A). In contrast, in all other groups,
the hematocrit had already normalized after 11 days of supplementation, not yielding
0
200
400
600
800
1000
1200
NEG WTR GAR FAR POS
pla
sma v
itam
in B
12 l
evel
[n
g/l
]
a,b a b b b
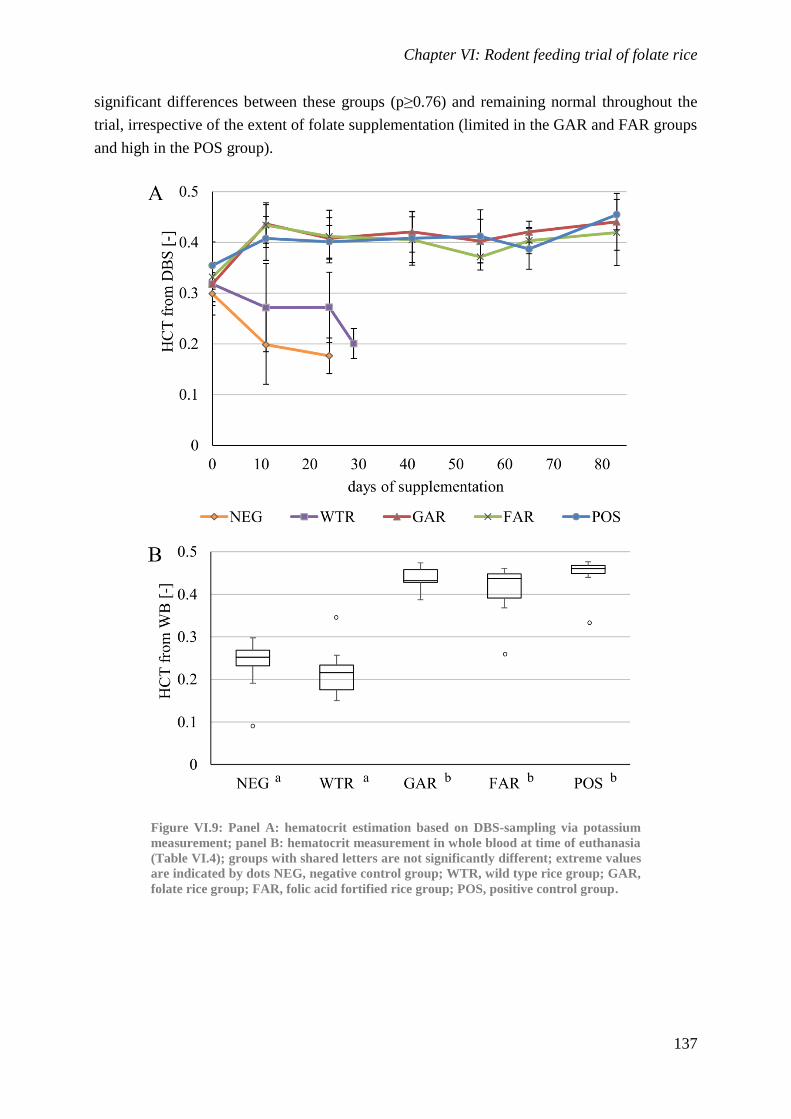
Chapter VI: Rodent feeding trial of folate rice
137
significant differences between these groups (p≥0.76) and remaining normal throughout the
trial, irrespective of the extent of folate supplementation (limited in the GAR and FAR groups
and high in the POS group).
Figure VI.9: Panel A: hematocrit estimation based on DBS-sampling via potassium
measurement; panel B: hematocrit measurement in whole blood at time of euthanasia
(Table VI.4); groups with shared letters are not significantly different; extreme values
are indicated by dots NEG, negative control group; WTR, wild type rice group; GAR,
folate rice group; FAR, folic acid fortified rice group; POS, positive control group.
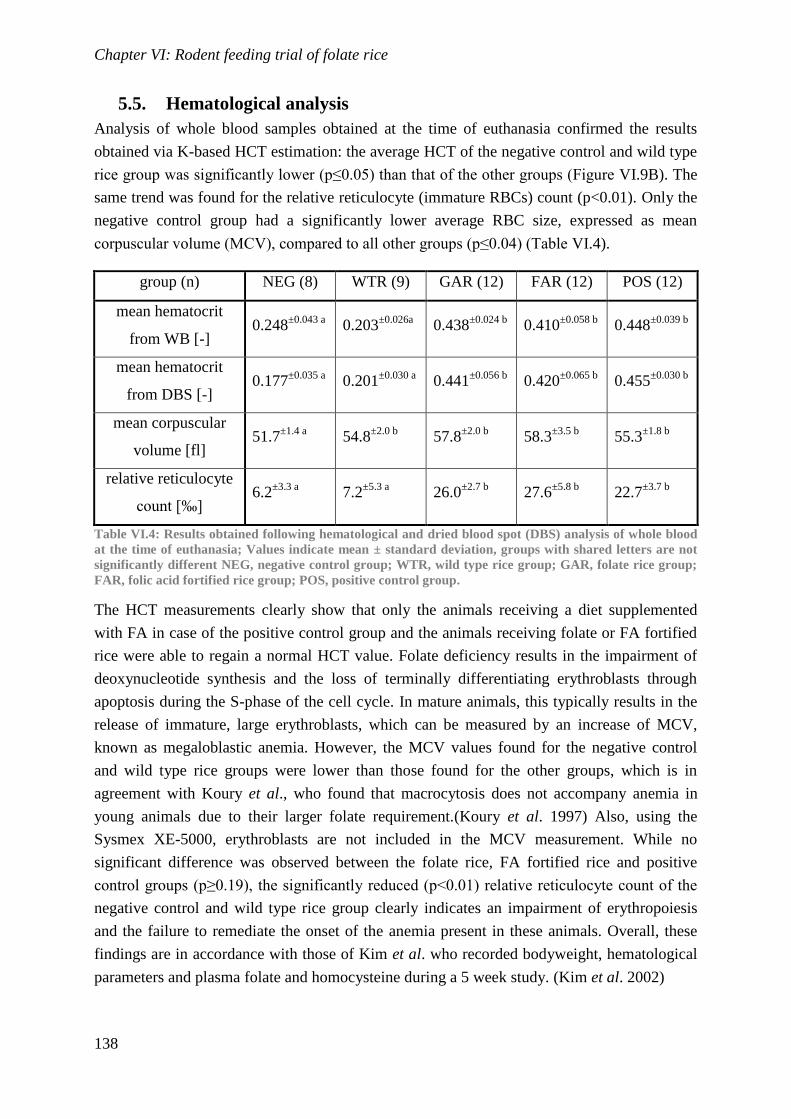
Chapter VI: Rodent feeding trial of folate rice
138
5.5. Hematological analysis
Analysis of whole blood samples obtained at the time of euthanasia confirmed the results
obtained via K-based HCT estimation: the average HCT of the negative control and wild type
rice group was significantly lower (p≤0.05) than that of the other groups (Figure VI.9B). The
same trend was found for the relative reticulocyte (immature RBCs) count (p<0.01). Only the
negative control group had a significantly lower average RBC size, expressed as mean
corpuscular volume (MCV), compared to all other groups (p≤0.04) (Table VI.4).
group (n) NEG (8) WTR (9) GAR (12) FAR (12) POS (12)
mean hematocrit
from WB [-] 0.248
±0.043 a 0.203
±0.026a 0.438
±0.024 b 0.410
±0.058 b 0.448
±0.039 b
mean hematocrit
from DBS [-] 0.177
±0.035 a 0.201
±0.030 a 0.441
±0.056 b 0.420
±0.065 b 0.455
±0.030 b
mean corpuscular
volume [fl] 51.7
±1.4 a 54.8
±2.0 b 57.8
±2.0 b 58.3
±3.5 b 55.3
±1.8 b
relative reticulocyte
count [‰] 6.2
±3.3 a 7.2
±5.3 a 26.0
±2.7 b 27.6
±5.8 b 22.7
±3.7 b
Table VI.4: Results obtained following hematological and dried blood spot (DBS) analysis of whole blood
at the time of euthanasia; Values indicate mean ± standard deviation, groups with shared letters are not
significantly different NEG, negative control group; WTR, wild type rice group; GAR, folate rice group;
FAR, folic acid fortified rice group; POS, positive control group.
The HCT measurements clearly show that only the animals receiving a diet supplemented
with FA in case of the positive control group and the animals receiving folate or FA fortified
rice were able to regain a normal HCT value. Folate deficiency results in the impairment of
deoxynucleotide synthesis and the loss of terminally differentiating erythroblasts through
apoptosis during the S-phase of the cell cycle. In mature animals, this typically results in the
release of immature, large erythroblasts, which can be measured by an increase of MCV,
known as megaloblastic anemia. However, the MCV values found for the negative control
and wild type rice groups were lower than those found for the other groups, which is in
agreement with Koury et al., who found that macrocytosis does not accompany anemia in
young animals due to their larger folate requirement.(Koury et al. 1997) Also, using the
Sysmex XE-5000, erythroblasts are not included in the MCV measurement. While no
significant difference was observed between the folate rice, FA fortified rice and positive
control groups (p≥0.19), the significantly reduced (p<0.01) relative reticulocyte count of the
negative control and wild type rice group clearly indicates an impairment of erythropoiesis
and the failure to remediate the onset of the anemia present in these animals. Overall, these
findings are in accordance with those of Kim et al. who recorded bodyweight, hematological
parameters and plasma folate and homocysteine during a 5 week study. (Kim et al. 2002)
Chapter VI: Rodent feeding trial of folate rice
139
VI.6. Conclusion
The use of an accepted fortification technique, the fortification of rice with synthetic FA by
parboiling, served as a benchmark for synthetic folate-fortified food. From the data gathered
here, it is clear that both folate rice and FA fortified rice could sustain a folate status that
allowed the animals to grow and remain apparently healthy. The observed difference in
plasma folate concentrations is likely the result of a difference in absorption rates between FA
present in FA fortified rice and 5MeTHF and other folates present in folate rice. Even the
limited folate supplementation of 3 µg folate/day, supplied either via folate rice or via FA
fortified rice allowed rapid normalization of HCT values. The resulting folate concentrations
were sufficient to counter the major rise in plasma homocysteine concentrations, although not
yet optimal, as a result of the limited folate supplementation as compared to normal rat feed.
All together, we have provided evidence that folates from folate rice are released in the
gastrointestinal system following consumption by rats, reach the systemic circulation, are
incorporated in RBCs and are biologically active, as evidenced by folate determination in
plasma and RBCs, the alleviation of anemia and counteraction of pronounced
hyperhomocysteinemia. Pending confirmation of these findings in a human trial, locally
grown folate rice may serve as a source of folate in regions of the world where traditional
fortification techniques are not feasible.
Chapter VI: Rodent feeding trial of folate rice
140
VI.7. References
Aboko-Cole, G.F. and Lee, C.M. 1974. “Trypanosoma Lewisi: Body Weight Gains and Food
Consumption of Folate-Deficient Rats.” Int J Biochem 5 (9-10): 703–6.
Bailey, L.B., and Gregory, J.F.III 1999. “Folate Metabolism and Requirements.” J Nutr 129
(4): 779–82.
Beyer, P., Al-Babili, S., Ye, X., Lucca, P., Schaub, P., Welsch, R. and Potrykus, I. 2002.
“Golden Rice: Introducing the Beta-Carotene Biosynthesis Pathway into Rice
Endosperm by Genetic Engineering to Defeat Vitamin A Deficiency.” J Nutr 132 (3):
506S – 10S.
Bills, N.D., Koury, M.J., Clifford, A.J. and Dessypris, E.N. 1992. “Ineffective Hematopoiesis
in Folate-Deficient Mice.” Blood 79 (9): 2273–80.
Capiau, S., Stove, V.V., Lambert, W.E. and Stove, C.P. 2013. “Prediction of the Hematocrit
of Dried Blood Spots via Potassium Measurement on a Routine Clinical Chemistry
Analyzer.” Anal Chem 85 (1): 404–10.
Castorena-Torres, F., Ramos-Parra, P.A., Hernandez-Mendez, R.V., Vargas-Garcia, A.,
Garcia-Rivas, G. and de la Garza, R.I. 2014. “Natural Folates from Biofortified Tomato
and Synthetic 5-Methyl-Tetrahydrofolate Display Equivalent Bioavailability in a Murine
Model.” Plant Foods Hum Nutr 69 (1): 57–64.
Caudill, M.A. 2010. “Folate Bioavailability: Implications for Establishing Dietary
Recommendations and Optimizing Status.” Am J Clin Nutr 91 (5): 1455S – 60S.
Clifford, A.J., Wilson, D.S. and Bills, N.D. 1989. “Repletion of Folate-Depleted Rats with an
Amino Acid-Based Diet Supplemented with Folic Acid.” J Nutr 119 (12): 1956–61.
De Brouwer, V., Storozhenko, S., Stove, C.P., Van Daele, J., Van der Straeten, D. and
Lambert, W.E. 2010. “Ultra-Performance Liquid Chromatography-Tandem Mass
Spectrometry (UPLC-MS/MS) for the Sensitive Determination of Folates in Rice.” J
Chromatogr B 878 (3-4): 509–13.
De Steur, H., Gellynck, X., Blancquaert, D., Lambert, W.E., Van Der Straeten, D. and Qaim,
M. 2012. “Potential Impact and Cost-Effectiveness of Multi-Biofortified Rice in China.”
N Biotechnol 29 (3): 432–42.
De Steur, H., Gellynck, X., Storozhenko, S., Liqun, G., Lambert, W.E., Van Der Straeten, D.
and Viaene, J. 2010. “Health Impact in China of Folate-Biofortified Rice.” Nat
Biotechnol 28 (6): 554–6.
Duncan, T.M., Reed, M.C. and Nijhout, H.F. 2013. “The Relationship between Intracellular
and Plasma Levels of Folate and Metabolites in the Methionine Cycle: A Model.” Mol
Nutr Food Res 57 (4): 628–36.
Glier, M.B., Green, T.J. and Devlin, A.M. 2014. “Methyl Nutrients, DNA Methylation, and
Cardiovascular Disease.” Mol Nutr Food Res 58 (1): 172–82.
Gregory J.F.III 2001. “Case Study: Folate Bioavailability.” J Nutr 131 (4 Suppl): 1376S –
82S.

Chapter VI: Rodent feeding trial of folate rice
141
Haas, J.D., Beard, J.L., Murray-Kolb, L.E., del Mundo, A.M., Felix, A. and Gregorio, G.B.
2005. “Iron-Biofortified Rice Improves the Iron Stores of Nonanemic Filipino Women.”
J Nutr 135 (12): 2823–30.
Harlan Laboratories. 2011. “HsdHanWIST_datasheet_(03-11).pdf.”
http://www.harlan.com/download.axd/3848f9a445614166814c4b26a31c81e2.pdf?d=Hsd
HanWIST datasheet (consulted: 01/30/2016).
House, J.D., O’Connor, C.P. and Guenter, W. 2003. “Plasma Homocysteine and Glycine Are
Sensitive Indices of Folate Status in a Rodent Model of Folate Depletion and Repletion.”
J Agric Food Chem 51 (15): 4461–67.
Jeong, J. and Guerinot, M.L. 2008. “Biofortified and Bioavailable: The Gold Standard for
Plant-Based Diets.” Proc Natl Acad Sci USA 105 (6): 1777–78.
Kam, K., Arcot, J. and Adesina, A.A. 2012. “Folic Acid Fortification of Parboiled Rice:
Multifactorial Analysis and Kinetic Investigation.” J Food Eng 108 (1): 238–43.
Kellogg, M.D., Parker, R., Ricupero, A. and Rifai, N. 2005. “Evaluation of an Enzymatic
Homocysteine Assay for the Hitachi Series Chemistry Analyzer.” Clin Chim Acta; 354
(1-2): 117–22.
Kelly, P., McPartlin, J., Goggins, M., Weir, D.G. and Scott, J.M. 1997. “Unmetabolized Folic
Acid in Serum: Acute Studies in Subjects Consuming Fortified Food and Supplements.”
Am J Clin Nutr 65 (6): 1790–5.
Kiekens, F., Van Daele, J., Blancquaert, D., Van Der Straeten, D., Lambert, W.E. and Stove,
C.P. 2015a. “A Validated Ultra-High-Performance Liquid Chromatography-Tandem
Mass Spectrometry Method for the Selective Analysis of Free and Total Folate in Plasma
and Red Blood Cells.” J Chromatogr A 1398: 20–28.
Kiekens, F., Van Daele, J., Blancquaert, D., Van Der Straeten, D., Lambert, W.E., Stove, C.P.
2015b. “Determination of five folate monoglutamates in rodent diets” J Agric Food
Chem 63:10089-95
Kim, Y.-I., Hayek, M., Mason, J.B. and Nikbin Meydani, S. 2002. “Severe Folate Deficiency
Impairs Natural Killer Cell-Mediated Cytotoxicity in Rats.” J. Nutr. 132 (6): 1361–67.
Klee, G.G. 2000. “Cobalamin and Folate Evaluation: Measurement of Methylmalonic Acid
and Homocysteine vs Vitamin B(12) and Folate.” Clin Chem 46 (8 Pt 2): 1277–83.
Koury, M.J. 2014. “Abnormal Erythropoiesis and the Pathophysiology of Chronic Anemia.”
Blood Rev 28 (2):49–66
Koury, M.J., Horne, D.W., Brown, Z.A., Pietenpol, J.A., Blount, B.C., Ames, B.N., Hard, R.
and Koury, S.T. 1997. “Apoptosis of Late-Stage Erythroblasts in Megaloblastic Anemia:
Association with DNA Damage and Macrocyte Production.” Blood 89 (12): 4617–23.
Kurata, M., Suzuki, M. and Agar, N.S. 1993. “Antioxidant Systems and Erythrocyte Life-
Span in Mammals.” Comp Biochem Physiol B 106 (3): 477–87.
Lewis, C.J., Crane, N.T., Wilson, D.B. and Yetley, E.A. 1999. “Estimated Folate Intakes:
Data Updated to Reflect Food Fortification, Increased Bioavailability, and Dietary
Supplement Use.” Am J Clin Nutr 70 (2): 198–207.
Chapter VI: Rodent feeding trial of folate rice
142
Mateo Anson, N., van den Berg, R., Havenaar, R., Bast, A. and Haenen, G.R.M.M. 2009.
“Bioavailability of Ferulic Acid Is Determined by Its Bioaccessibility.” J Cereal Sci 49
(2): 296–300.
McKillop, D.J., McNulty, H., Scott, J.M., McPartlin, J.M., Strain, J.J., Bradbury, I., Girvan,
J., et al. 2006. “The Rate of Intestinal Absorption of Natural Food Folates Is Not Related
to the Extent of Folate Conjugation.” Am J Clin Nutr 84 (1): 167–73.
Miller, J.W., Nadeau, M.R., Smith, J., Smith, D. and Selhub, J. 1994. “Folate-Deficiency-
Induced Homocysteinaemia in Rats: Disruption of S-Adenosylmethionine’s Co-Ordinate
Regulation of Homocysteine Metabolism.” Biochem J 298 (Pt2): 415-9
Morris, J., Hawthorne, K.M., Hotze, T., Abrams, S.A. and Hirschi, K.D. 2008. “Nutritional
Impact of Elevated Calcium Transport Activity in Carrots.” Proc Natl Acad Sci USA 105
(5): 1431–5.
O’Dea, K., Snow, P. and Nestel, P. 1981. “Rate of Starch Hydrolysis in Vitro as a Predictor of
Metabolic Responses to Complex Carbohydrate in Vivo.” Am J Clin Nutr 34 (10): 1991–
3.
Pfeiffer, C.M.,Rogers, L.M. and Gregory, J.F.III 1997. “Determination of Folate in Cereal-
Grain Food Products Using Trienzyme Extraction and Combined Affinity and Reversed-
Phase Liquid Chromatography.” J Agric Food Chem 45 (2): 407–13.
Shane, B. 2010. “Folate Chemistry and Metabolism.” In Folate in Health and Disease, edited
by Bailey, L.B. 2nd ed., 1–24. Boca Raton, FL: CRC Press, Taylor & Francis Group.
Stabler, S.P. 2010. “Clinical Folate Deficiency.” In Folate in Health and Disease, edited by
Bailey, L.B. 2nd ed., 409–28. Boca Raton, FL: CRC Press, Taylor & Francis Group.
Steinberg, S.E., Campbell, C.L. and Hillman, R.S. 1979. “Kinetics of the Normal Folate
Enterohepatic Cycle.” J Clin Invest 64 (1): 83–8.
Storozhenko, S., De Brouwer, V., Volckaert, M., Navarrete, O., Blancquaert, D., Zhang, G.F.,
Lambert, W. and Van Der Straeten, D. 2007. “Folate Fortification of Rice by Metabolic
Engineering.” Nat Biotechnol 25 (11): 1277–9.
Tang, G., Qin, J., Dolnikowski, G.G., Russell, R.M. and M.A. Grusak. 2009. “Golden Rice Is
an Effective Source of Vitamin A.” Am J Clin Nutr 89 (6): 1776–83.
Visentin, M., Diop-Bove, N., Zhao, R. and Goldman, I.D. 2014. “The Intestinal Absorption of
Folates.” Annu Rev Physiol 76: 251–74.
Wang, T.T., Reisenauer, A.M. and Halsted, C.H. 1985. “Comparison of Folate Conjugase
Activities in Human, Pig, Rat and Monkey Intestine.” J Nutr 115 (6): 814–9.
Ward, M., McNulty, H., McPartlin, J., Strain, J.J., Weir, D.G. and Scott, J.M. 1997. “Plasma
Homocysteine, a Risk Factor for Cardiovascular Disease, Is Lowered by Physiological
Doses of Folic Acid.” Q J Med 90 (8): 519–24.
WHO. 2012. “Serum and Red Blood Cell Folate Concentrations for Assessing Folate Status
in Populations.” http://www.who.int/vmnis/indicators/serum_RBC_folate/en/ (consulted:
01/30/2016)
Chapter VI: Rodent feeding trial of folate rice
143
Winkels, R.M., Brouwer, I.A., Siebelink, E., Katan, M.B. and Verhoef, P. 2007.
“Bioavailability of Food Folates Is 80% of that of Folic Acid.” Am J Clin Nutr 85 (2):
465–73.
Wright, A.J., Finglas, P.M., Dainty, J.R., Wolfe, C.A., Hart, D.J., Wright, D.M. and Gregory,
J.F.III 2005. “Differential Kinetic Behavior and Distribution for Pteroylglutamic Acid
and Reduced Folates: A Revised Hypothesis of the Primary Site of PteGlu Metabolism
in Humans.” J Nutr 135 (3): 619–23.

Chapter VI: Rodent feeding trial of folate rice
144
Chapter VII: Effect of folate status on
lymphocyte proliferation and intracellular
folate levels

Chapter VII: Effect of folate status on lymphocyte proliferation and intracellular folate levels
146
Chapter VII: Effect of folate status on lymphocyte proliferation and intracellular folate levels
147
Table of contents
VII.1. Abstract .................................................................................................................... 148
VII.2. Introduction .............................................................................................................. 149
VII.3. Objectives ................................................................................................................. 149
VII.4. Materials and methods ............................................................................................. 150
4.1. Reagents and materials ........................................................................................ 150
4.2. CD2+ proliferation in response to folate status ................................................... 151
4.3. Stability of folates in growth media .................................................................... 152
VII.5. Results and discussion ............................................................................................. 152
5.1. CD2+ proliferation in response to folate status ................................................... 152
5.2. Stability of FA and 5MeTHF during incubation in growth medium .................. 153
5.3. CD4+/CD8+ proliferation in response to folate status ........................................ 155
VII.6. Conclusion ............................................................................................................... 157
VII.7. References ................................................................................................................ 158
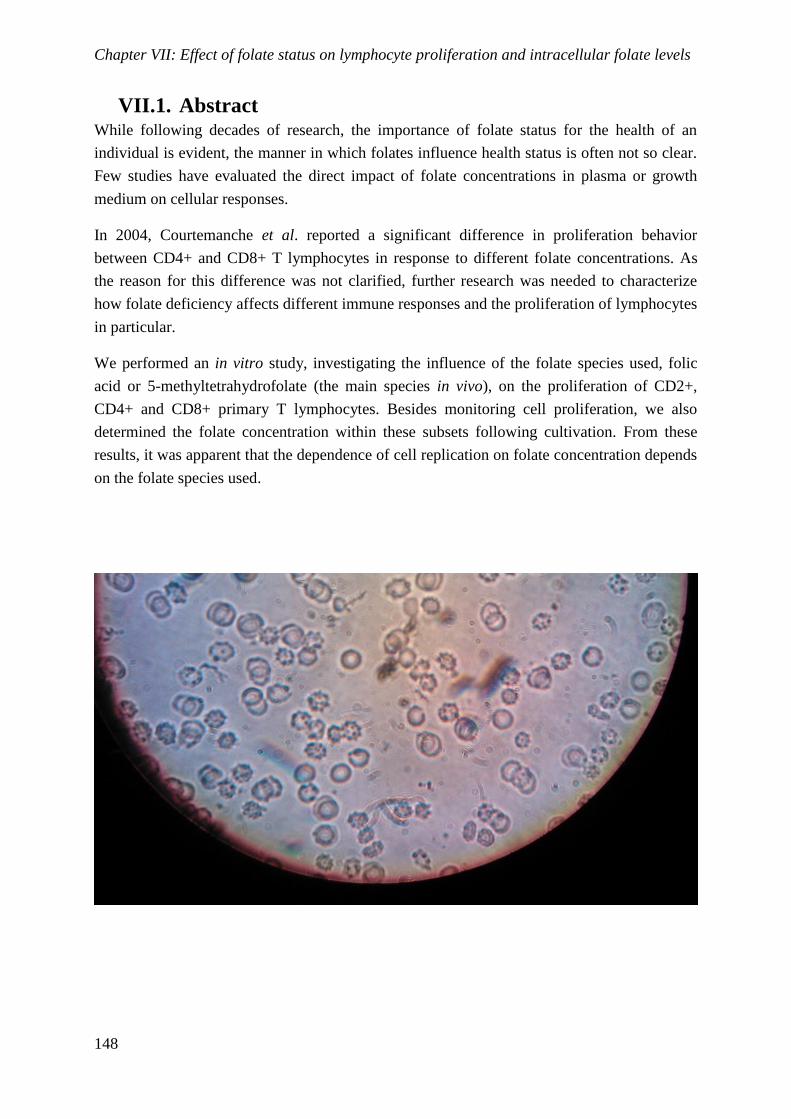
Chapter VII: Effect of folate status on lymphocyte proliferation and intracellular folate levels
148
VII.1. Abstract While following decades of research, the importance of folate status for the health of an
individual is evident, the manner in which folates influence health status is often not so clear.
Few studies have evaluated the direct impact of folate concentrations in plasma or growth
medium on cellular responses.
In 2004, Courtemanche et al. reported a significant difference in proliferation behavior
between CD4+ and CD8+ T lymphocytes in response to different folate concentrations. As
the reason for this difference was not clarified, further research was needed to characterize
how folate deficiency affects different immune responses and the proliferation of lymphocytes
in particular.
We performed an in vitro study, investigating the influence of the folate species used, folic
acid or 5-methyltetrahydrofolate (the main species in vivo), on the proliferation of CD2+,
CD4+ and CD8+ primary T lymphocytes. Besides monitoring cell proliferation, we also
determined the folate concentration within these subsets following cultivation. From these
results, it was apparent that the dependence of cell replication on folate concentration depends
on the folate species used.
Chapter VII: Effect of folate status on lymphocyte proliferation and intracellular folate levels
149
VII.2. Introduction
Cellular metabolism relies on a continuous supply of folate, a group of water soluble B-
vitamins (B9), to maintain DNA-synthesis and proper cell proliferation. Folate deficiency has
been implicated in several health disorders including cancers, neural damage and cardio-
vascular disease as a result of hyperhomocysteinemia. To date, only the link with neural tube
defects has been formally proven.(Stover 2004; Blom and Smulders 2011; Jagerstad 2012)
Since folate status impacts nucleotide synthesis and therefore cell proliferation, folate
deficiency hypothetically impacts the functioning of the immune system by arresting the cell
cycle in the S-phase. This was demonstrated by Courtemanche et al. through in vitro culturing
of peripheral blood mononuclear cells (PBMCs). Interestingly, these authors found an inverse
relation between the CD4+/CD8+ lymphocyte ratio and folic acid (FA) concentrations in
vitro.(Courtemanche et al. 2004) This was primarily owing to the fact that the proliferation of
activated CD8+ cells appeared to be more sensitive to differences in FA concentrations.
However, Kishimoto et al. investigated the immune function of a patient suffering from
hereditary folate malabsorption prior to and after treatment. Apart from a low general
lymphocyte proliferation rate due to the morbidly low folate status of the patient, no
difference was observed in the relative presence of CD4+ and CD8+ lymphocytes before and
after intravenous administration of 12 mg 5FoTHF/day.(Kishimoto et al. 2014) In a study
investigating the influence of folate supplementation on age-related immune suppression
using a rat model, cell proliferation was improved when dietary folate intake was increased,
however, no significantly different CD4+/CD8+ ratio was observed between the treatment
and the control group.(Field et al. 2006) While 5-methyltetrahydrofolate (5MeTHF) has been
used as an in vitro folate source to investigate the effect of folate status on DNA stability,
only the use of high FA concentrations in the growth medium increased cell viability after 9
days of incubation.(Wang and Fenech 2003) In this chapter, we investigated the influence of
the folate concentration in the growth medium on the in vitro cell proliferation of CD2+,
CD4+ and CD8+ lymphocytes and quantified the resulting intracellular folate concentration.
VII.3. Objectives
Based on an in vitro study performed by Courtemanche et al., we wanted to evaluate whether
the intracellular folate concentration correlates with the extracellular folate concentration (i.e.
the concentration in the growth medium) or remains constant, which is important to maintain
DNA methylation. As such, the relationship between the proliferation rate and the
intracellular folate concentration could be evaluated. Also, the use of 5MeTHF instead of FA
as a folate source should be evaluated since the former more closely resembles in vivo
circulating folate speciation.
Chapter VII: Effect of folate status on lymphocyte proliferation and intracellular folate levels
150
VII.4. Materials and methods
4.1. Reagents and materials
4.1.1. Cell separation
The basic procedure proposed by Courtemanche et al. was upscaled to obtain a larger amount
of cells for intracellular folate analysis.(Courtemanche et al. 2004) Concentrated buffy coats
were obtained from the Belgian Red Cross and treated as described by Meyer et al.(Meyer et
al. 2005) Briefly, 10 ml of concentrated buffy coat was mixed with 10 ml of sterile PBS. This
mixture was then layered carefully on top of 15 ml Ficoll-PaqueTM
Plus (GE Healthcare Bio-
Sciences AB, Uppsala, Sweden). Following centrifugation at 445 g for 35 minutes at room
temperature, the cells at the interface of the Ficoll and plasma/PBS layer were transferred to a
sterile tube. To remove remaining traces of Ficoll, these cells were washed twice with 20 ml
of sterile PBS and centrifuged at 200 g for 15 minutes.
4.1.2. Cell culture
Cells were cultured at 37°C and a CO2 concentration of 5 vol% in 20 ml folate free RPMI
1640 medium (Life Technologies, Carlsbad, CA, USA) at an initial density of 106 cells/ml.
This medium was supplemented with 10% dialyzed fetal bovine serum to sustain cell viability
(dFBS, Life Technologies) and Pen-Strept 5000U (Life Technologies) as antibiotic. At the
start of the incubation, phytohemagglutinin (PHA, Sigma-Aldrich, Darmstadt, Germany) and
interleukin 2 (IL-2, ED 50 range = 0.08-0.5 ng/ml, Life Technologies) were added in
concentrations of 22 µg/ml and 0.01 µg/ml, respectively. The medium was refreshed every 3
days, at which time the cells were spun down at 200 g for 5 minutes at 21 °C and 90% of
medium was replaced by fresh medium. While fresh IL-2 was added to promote cell
proliferation, PHA was only necessary for initial cell activation and was only included at the
start of incubation. At the second time of refreshing, the cells were counted and returned to
the original density to prevent too high cell densities.
FA (Sigma-Aldrich) or (6S)-5MeTHF (Schircks Laboratories, Jona, Switzerland) were
weighed, dissolved and diluted in deoxygenated PBS to a final concentration of 4.4 and 4.6
µg/ml (9.98 and 10.0 µM), respectively. This solution was sterilized using a 0.22 µm syringe
filter. Aliquots were stored at -80 °C and discarded after use.
4.1.3. Cell sorting and lysis
Positive cell selection was performed using EasysepTM
kits for human cells expressing the
CD2, CD4 and CD8 antigens, which were obtained from Stemcell Technologies (Grenoble,
France). This selection was performed as prescribed by the manufacturer. Briefly, cells were
suspended at a concentration of 108 cells/ml in 10/90 v/v% dFBS/PBS. Then, 50 µl/ml (CD4)
or 100 µl/ml (CD2 and CD8) of positive selection cocktail was added, followed by incubation
at room temperature for 3 (CD4 and CD8) or 5 minutes (CD2). Then, 50 µl/ml of magnetic
microparticle suspension was added and incubated for 3 (CD4 and CD8) or 10 minutes (CD2)
Chapter VII: Effect of folate status on lymphocyte proliferation and intracellular folate levels
151
at room temperature. After adding 10/90 v/v% dFBS/PBS to a total volume of 2.5 ml, the
sample was placed in an EasysepTM
-magnet for 3 minutes, after which the supernatant was
poured off. The cells were washed twice with 2.5 ml of 10/90 v/v% dFBS/PBS. The
supernatant was either collected after each step pending the selection of another cell type or
transferred to waste.
The selected cells were washed twice with and resuspended in PBS to remove any
extracellular folates due to the presence of dFBS. Cell counting was performed manually
using a Bürker counting chamber following staining with trypan blue. For intracellular folate
analysis, the cells were lysed using 200 µl of Focus Whole proteome lysis buffer
(GBioscience, St. Louis, MO, USA). To this, 250 µl of PBS and 50 µl of 100 mg L-ascorbic
acid and 50 mg DL-dithiothreitol (Sigma-Aldrich)/ml, pH 7 was added. The internal standards
(ISs, 13
C5-THF, 13
C5-FA, 13
C5-5MeTHF, 13
C5-5,10CH+THF) were added to the antioxidant
solution in a concentration of 0.1 µg/ml.
4.1.4. Extract purification and LC-MS/MS analysis
Further analysis of the samples was performed as described earlier for the analysis of folates
in plasma and red blood cells (RBCs).(Kiekens et al. 2015; Chapter V) Due to the need for
enzymatic polyglutamate deconjugation, the sample treatment procedure for RBCs was
applied to the cell extract. The efficacy of the rat serum conjugase (Harlan Laboratories,
Horst, The Netherlands) treatment was verified by spiking 5MeTHF di-, tri- and
tetraglutamate (Schircks Laboratories) to a mixture of cell lysis buffer, PBS and antioxidant
solution and was found not to be hindered by the lysis buffer. However, due to the incomplete
removal of endogenous folates from rat serum by treatment with activated charcoal (as
described in Chapter V paragraph 4.1), the treatment was performed twice to further remove
this folate background and increase sensitivity.
4.1.5. Calibration
Similar to the standard preparation procedure described in Chapter V for plasma folate, the
calibration curves were generated by spiking individual folates (tetrahydrofolate (THF), FA,
5MeTHF, 5,10-methenylTHF (5,10CH+THF), 10-formylFA (10FoFA) and 5-formylTHF
(5FoTHF)) to a mixture of cell lysis buffer (200 µl), PBS (250 µl) and antioxidant solution
(50 µl), matching the sample matrix. Apart from a zero sample (blank + ISs), 7 calibrators
were used with concentrations of each folate individually ranging from 0.26 to 26 nmol/l.
4.2. CD2+ proliferation in response to folate status
Following Ficoll separation of PBMCs, 2*107 cells were brought in 20 ml of folate free
culture medium supplemented with 0, 10 or 100 nM of either FA or 5MeTHF. To verify the
amount of folates in the growth medium, samples were collected after 3 days of incubation.
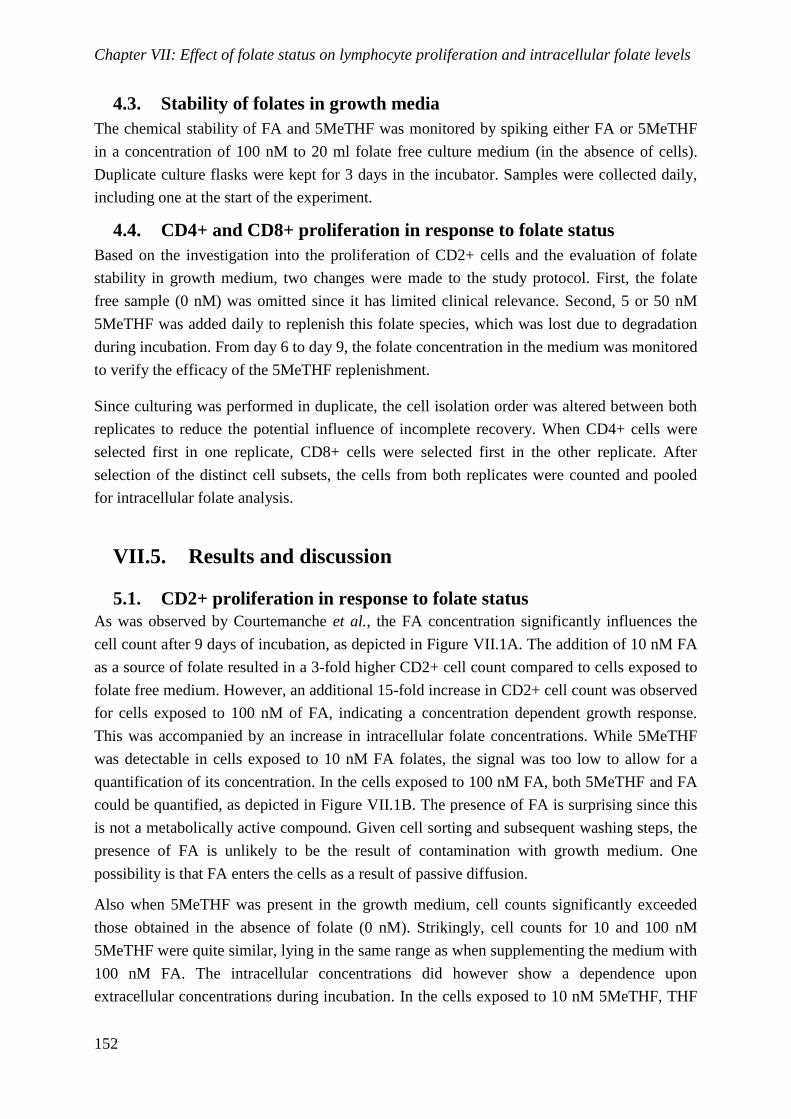
Chapter VII: Effect of folate status on lymphocyte proliferation and intracellular folate levels
152
4.3. Stability of folates in growth media
The chemical stability of FA and 5MeTHF was monitored by spiking either FA or 5MeTHF
in a concentration of 100 nM to 20 ml folate free culture medium (in the absence of cells).
Duplicate culture flasks were kept for 3 days in the incubator. Samples were collected daily,
including one at the start of the experiment.
4.4. CD4+ and CD8+ proliferation in response to folate status
Based on the investigation into the proliferation of CD2+ cells and the evaluation of folate
stability in growth medium, two changes were made to the study protocol. First, the folate
free sample (0 nM) was omitted since it has limited clinical relevance. Second, 5 or 50 nM
5MeTHF was added daily to replenish this folate species, which was lost due to degradation
during incubation. From day 6 to day 9, the folate concentration in the medium was monitored
to verify the efficacy of the 5MeTHF replenishment.
Since culturing was performed in duplicate, the cell isolation order was altered between both
replicates to reduce the potential influence of incomplete recovery. When CD4+ cells were
selected first in one replicate, CD8+ cells were selected first in the other replicate. After
selection of the distinct cell subsets, the cells from both replicates were counted and pooled
for intracellular folate analysis.
VII.5. Results and discussion
5.1. CD2+ proliferation in response to folate status
As was observed by Courtemanche et al., the FA concentration significantly influences the
cell count after 9 days of incubation, as depicted in Figure VII.1A. The addition of 10 nM FA
as a source of folate resulted in a 3-fold higher CD2+ cell count compared to cells exposed to
folate free medium. However, an additional 15-fold increase in CD2+ cell count was observed
for cells exposed to 100 nM of FA, indicating a concentration dependent growth response.
This was accompanied by an increase in intracellular folate concentrations. While 5MeTHF
was detectable in cells exposed to 10 nM FA folates, the signal was too low to allow for a
quantification of its concentration. In the cells exposed to 100 nM FA, both 5MeTHF and FA
could be quantified, as depicted in Figure VII.1B. The presence of FA is surprising since this
is not a metabolically active compound. Given cell sorting and subsequent washing steps, the
presence of FA is unlikely to be the result of contamination with growth medium. One
possibility is that FA enters the cells as a result of passive diffusion.
Also when 5MeTHF was present in the growth medium, cell counts significantly exceeded
those obtained in the absence of folate (0 nM). Strikingly, cell counts for 10 and 100 nM
5MeTHF were quite similar, lying in the same range as when supplementing the medium with
100 nM FA. The intracellular concentrations did however show a dependence upon
extracellular concentrations during incubation. In the cells exposed to 10 nM 5MeTHF, THF
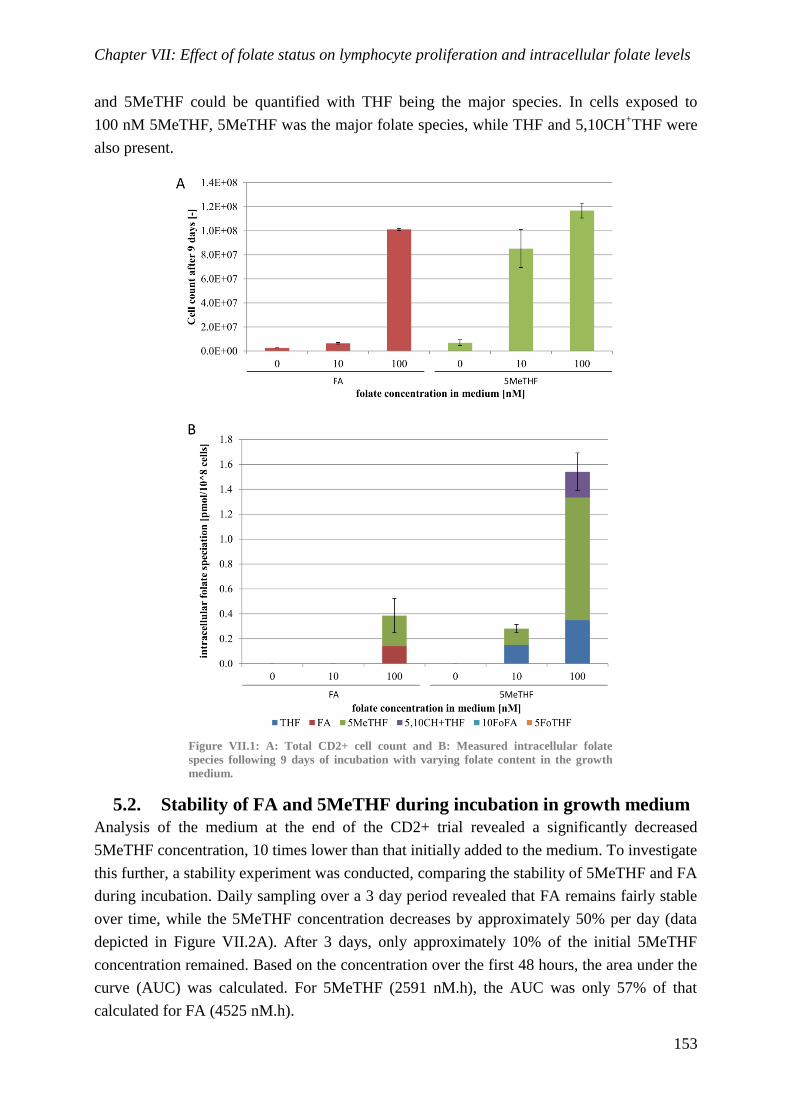
Chapter VII: Effect of folate status on lymphocyte proliferation and intracellular folate levels
153
and 5MeTHF could be quantified with THF being the major species. In cells exposed to
100 nM 5MeTHF, 5MeTHF was the major folate species, while THF and 5,10CH+THF were
also present.
Figure VII.1: A: Total CD2+ cell count and B: Measured intracellular folate
species following 9 days of incubation with varying folate content in the growth
medium.
5.2. Stability of FA and 5MeTHF during incubation in growth medium
Analysis of the medium at the end of the CD2+ trial revealed a significantly decreased
5MeTHF concentration, 10 times lower than that initially added to the medium. To investigate
this further, a stability experiment was conducted, comparing the stability of 5MeTHF and FA
during incubation. Daily sampling over a 3 day period revealed that FA remains fairly stable
over time, while the 5MeTHF concentration decreases by approximately 50% per day (data
depicted in Figure VII.2A). After 3 days, only approximately 10% of the initial 5MeTHF
concentration remained. Based on the concentration over the first 48 hours, the area under the
curve (AUC) was calculated. For 5MeTHF (2591 nM.h), the AUC was only 57% of that
calculated for FA (4525 nM.h).
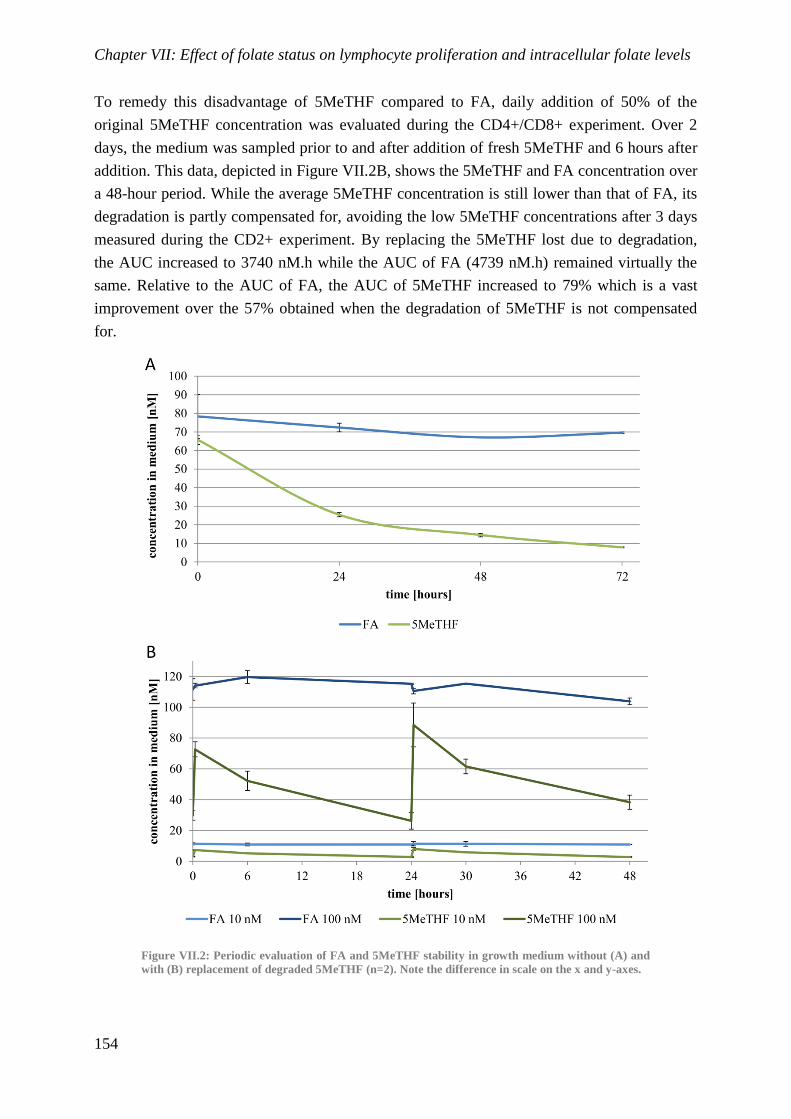
Chapter VII: Effect of folate status on lymphocyte proliferation and intracellular folate levels
154
To remedy this disadvantage of 5MeTHF compared to FA, daily addition of 50% of the
original 5MeTHF concentration was evaluated during the CD4+/CD8+ experiment. Over 2
days, the medium was sampled prior to and after addition of fresh 5MeTHF and 6 hours after
addition. This data, depicted in Figure VII.2B, shows the 5MeTHF and FA concentration over
a 48-hour period. While the average 5MeTHF concentration is still lower than that of FA, its
degradation is partly compensated for, avoiding the low 5MeTHF concentrations after 3 days
measured during the CD2+ experiment. By replacing the 5MeTHF lost due to degradation,
the AUC increased to 3740 nM.h while the AUC of FA (4739 nM.h) remained virtually the
same. Relative to the AUC of FA, the AUC of 5MeTHF increased to 79% which is a vast
improvement over the 57% obtained when the degradation of 5MeTHF is not compensated
for.
Figure VII.2: Periodic evaluation of FA and 5MeTHF stability in growth medium without (A) and
with (B) replacement of degraded 5MeTHF (n=2). Note the difference in scale on the x and y-axes.
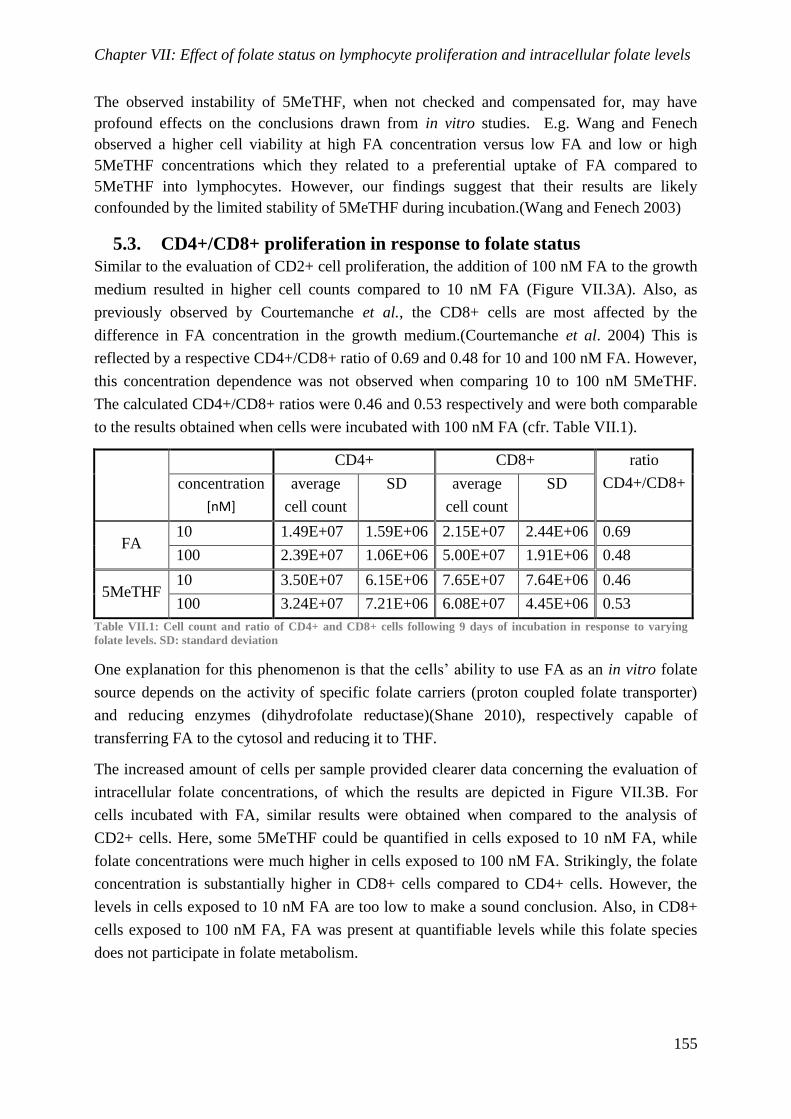
Chapter VII: Effect of folate status on lymphocyte proliferation and intracellular folate levels
155
The observed instability of 5MeTHF, when not checked and compensated for, may have
profound effects on the conclusions drawn from in vitro studies. E.g. Wang and Fenech
observed a higher cell viability at high FA concentration versus low FA and low or high
5MeTHF concentrations which they related to a preferential uptake of FA compared to
5MeTHF into lymphocytes. However, our findings suggest that their results are likely
confounded by the limited stability of 5MeTHF during incubation.(Wang and Fenech 2003)
5.3. CD4+/CD8+ proliferation in response to folate status
Similar to the evaluation of CD2+ cell proliferation, the addition of 100 nM FA to the growth
medium resulted in higher cell counts compared to 10 nM FA (Figure VII.3A). Also, as
previously observed by Courtemanche et al., the CD8+ cells are most affected by the
difference in FA concentration in the growth medium.(Courtemanche et al. 2004) This is
reflected by a respective CD4+/CD8+ ratio of 0.69 and 0.48 for 10 and 100 nM FA. However,
this concentration dependence was not observed when comparing 10 to 100 nM 5MeTHF.
The calculated CD4+/CD8+ ratios were 0.46 and 0.53 respectively and were both comparable
to the results obtained when cells were incubated with 100 nM FA (cfr. Table VII.1).
CD4+ CD8+ ratio
CD4+/CD8+ concentration
[nM]
average
cell count
SD average
cell count
SD
FA 10 1.49E+07 1.59E+06 2.15E+07 2.44E+06 0.69
100 2.39E+07 1.06E+06 5.00E+07 1.91E+06 0.48
5MeTHF 10 3.50E+07 6.15E+06 7.65E+07 7.64E+06 0.46
100 3.24E+07 7.21E+06 6.08E+07 4.45E+06 0.53
Table VII.1: Cell count and ratio of CD4+ and CD8+ cells following 9 days of incubation in response to varying
folate levels. SD: standard deviation
One explanation for this phenomenon is that the cells’ ability to use FA as an in vitro folate
source depends on the activity of specific folate carriers (proton coupled folate transporter)
and reducing enzymes (dihydrofolate reductase)(Shane 2010), respectively capable of
transferring FA to the cytosol and reducing it to THF.
The increased amount of cells per sample provided clearer data concerning the evaluation of
intracellular folate concentrations, of which the results are depicted in Figure VII.3B. For
cells incubated with FA, similar results were obtained when compared to the analysis of
CD2+ cells. Here, some 5MeTHF could be quantified in cells exposed to 10 nM FA, while
folate concentrations were much higher in cells exposed to 100 nM FA. Strikingly, the folate
concentration is substantially higher in CD8+ cells compared to CD4+ cells. However, the
levels in cells exposed to 10 nM FA are too low to make a sound conclusion. Also, in CD8+
cells exposed to 100 nM FA, FA was present at quantifiable levels while this folate species
does not participate in folate metabolism.
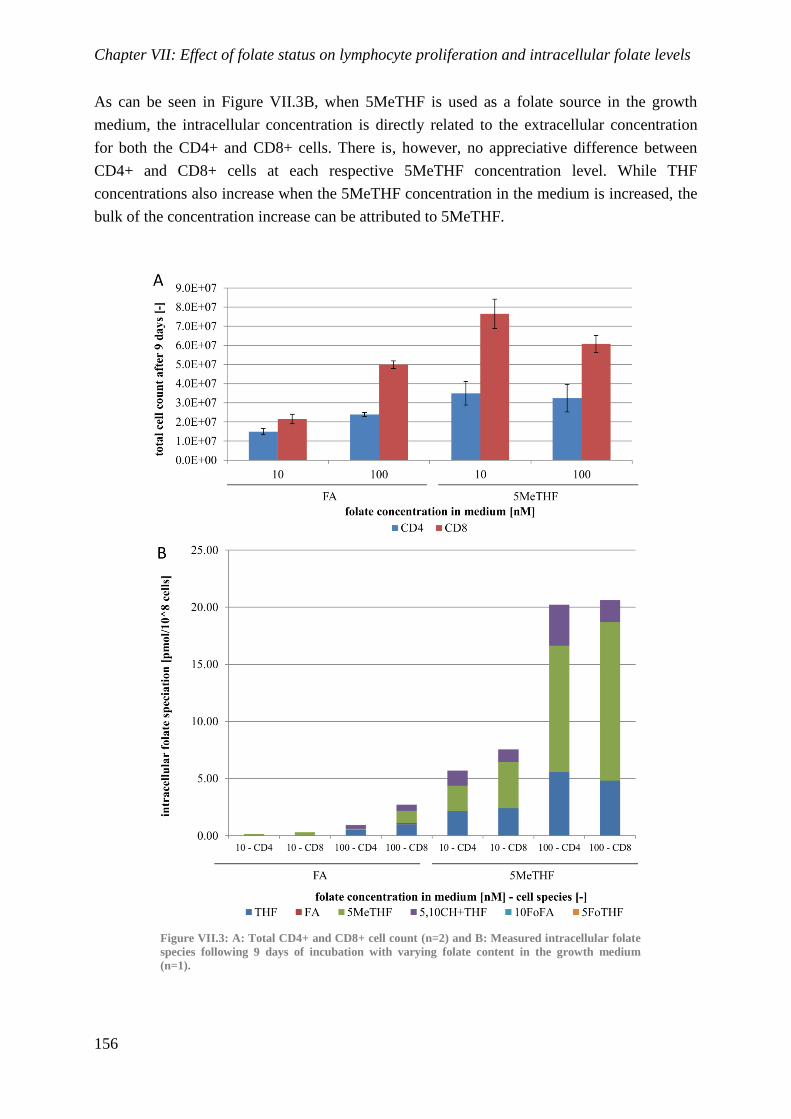
Chapter VII: Effect of folate status on lymphocyte proliferation and intracellular folate levels
156
As can be seen in Figure VII.3B, when 5MeTHF is used as a folate source in the growth
medium, the intracellular concentration is directly related to the extracellular concentration
for both the CD4+ and CD8+ cells. There is, however, no appreciative difference between
CD4+ and CD8+ cells at each respective 5MeTHF concentration level. While THF
concentrations also increase when the 5MeTHF concentration in the medium is increased, the
bulk of the concentration increase can be attributed to 5MeTHF.
Figure VII.3: A: Total CD4+ and CD8+ cell count (n=2) and B: Measured intracellular folate
species following 9 days of incubation with varying folate content in the growth medium
(n=1).
Chapter VII: Effect of folate status on lymphocyte proliferation and intracellular folate levels
157
VII.6. Conclusion
We were able to successfully replicate the results obtained by Courtemanche et al., by using
FA as a folate source during incubation. However, we provide evidence that the obtained
results depend on the folate species that is used. The use of FA in cell cultures is easy because
of its stability and its lower cost compared to 5MeTHF. However, if the carrier proteins or
metabolic enzymes are not or inadequately expressed or if they present a rate limiting step,
the results of the study will be influenced by the folate species used during incubation.
While 5MeTHF is the main circulating folate species in vivo, its chemical instability poses a
problem in in vitro experimentation. While not perfect, periodic addition of 5MeTHF to the
growth medium can help to stabilize the 5MeTHF concentration. By replacing the degraded
5MeTHF on a daily basis, we were able to show that the relationship between the
proliferation rate of CD8+ versus CD4+ cells and the folate status, might not be as dramatic
as reported by other authors.
Chapter VII: Effect of folate status on lymphocyte proliferation and intracellular folate levels
158
VII.7. References
Blom, H.J. and Smulders, Y. 2011. “Overview of Homocysteine and Folate Metabolism. With
Special References to Cardiovascular Disease and Neural Tube Defects.” J Inherit Metab
Dis 34 (1): 75–81.
Courtemanche, C., Elson-Schwab, I., Mashiyama, S.T., Kerry, N. and Ames, B.N. 2004.
“Folate Deficiency Inhibits the Proliferation of Primary Human CD8+ T Lymphocytes in
Vitro.” J Immunol 173 (5): 3186–92.
Field, C.J., Van Aerde, A., Drager, K.L., Susan Goruk, S. and Basu, T. 2006. “Dietary Folate
Improves Age-Related Decreases in Lymphocyte Function.” J Nutr Biochem 17 (1): 37–
44.
Jagerstad, M. 2012. “Folic Acid Fortification Prevents Neural Tube Defects and May Also
Reduce Cancer Risks.” Acta Paediatr 101 (10): 1007–12.
Kiekens, F., Van Daele, J., Blancquaert, D., Van Der Straeten, D., Lambert, W.E. and Stove,
C.P. 2015. “A Validated Ultra-High-Performance Liquid Chromatography-Tandem Mass
Spectrometry Method for the Selective Analysis of Free and Total Folate in Plasma and
Red Blood Cells.” J Chromatogr A 1398: 20–8.
Kishimoto, K., Kobayashi, R., Sano, H., Suzuki, D., Maruoka, H., Yasuda, K., Chida, N.,
Yamada, M. and Kobayashi, K. 2014. “Impact of Folate Therapy on Combined
Immunodeficiency Secondary to Hereditary Folate Malabsorption.” Clin Immunol 153
(1): 17–22.
Meyer, T.P.H., Zehnter, I., Hofmann, B., Zaisserer, J., Burkhart, J., Rapp, S., Weinauer, F.,
Schmitz, J. and Illert, W.E. 2005. “Filter Buffy Coats (FBC): A Source of Peripheral
Blood Leukocytes Recovered from Leukocyte Depletion Filters.” J Immunol Methods
307 (1-2): 150–66.
Shane, B. 2010. “Folate Chemistry and Metabolism.” In Folate in Health and Disease, edited
by L.B. Bailey, 2nd ed., 1–24. Boca Raton, FL: CRC Press, Taylor & Francis Group.
Stover, P.J. 2004. “Physiology of Folate and Vitamin B12 in Health and Disease.” Nutr Rev
62 (suppl 1): S3–12.
Wang, X. and Fenech, M. 2003. “A Comparison of Folic Acid and 5-Methyltetrahydrofolate
for Prevention of DNA Damage and Cell Death in Human Lymphocytes in Vitro.”
Mutagenesis 18 (1): 81–6.
Chapter VIII: Folate polyglutamate analysis

Chapter VIII: Folate polyglutamate analysis
160
Chapter VIII: Folate polyglutamate analysis
161
Table of contents
VIII.1. Abstract .................................................................................................................... 162
VIII.2. Introduction .............................................................................................................. 163
VIII.3. Objectives ................................................................................................................. 164
VIII.4. Materials and methods ............................................................................................. 164
4.1. Preparation of reference materials ....................................................................... 164
4.2. Enzyme preparation ............................................................................................. 166
4.3. Chromatographic separation and detection ......................................................... 166
4.3.1. HPLC separation of folate polyglutamates to evaluate standard purity ......... 166
4.3.2. UHPLC separation of folate polyglutamates .................................................. 167
4.3.3. Mass spectrometric detection of folate polyglutamates.................................. 167
4.4. Sample preparation .............................................................................................. 168
VIII.5. Results and discussion ............................................................................................. 169
5.1. Preparation of reference materials ....................................................................... 169
5.2. Chromatographic separation and detection ......................................................... 170
5.2.1. HPLC separation of folate polyglutamates to evaluate standard purity ......... 170
5.2.2. UHPLC separation of folate polyglutamates .................................................. 171
5.2.3. Mass spectrometric detection of folate polyglutamates.................................. 172
5.3. Sample preparation .............................................................................................. 172
VIII.6. Conclusion ............................................................................................................... 174
VIII.7. References ................................................................................................................ 175
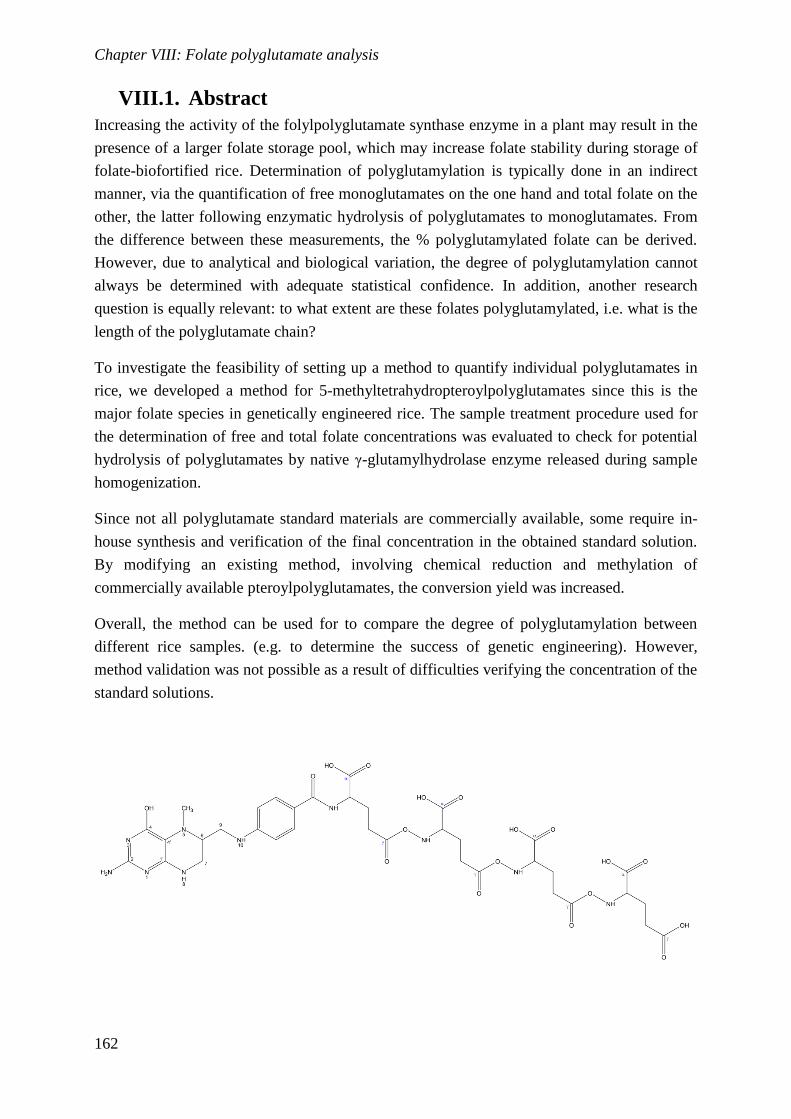
Chapter VIII: Folate polyglutamate analysis
162
VIII.1. Abstract
Increasing the activity of the folylpolyglutamate synthase enzyme in a plant may result in the
presence of a larger folate storage pool, which may increase folate stability during storage of
folate-biofortified rice. Determination of polyglutamylation is typically done in an indirect
manner, via the quantification of free monoglutamates on the one hand and total folate on the
other, the latter following enzymatic hydrolysis of polyglutamates to monoglutamates. From
the difference between these measurements, the % polyglutamylated folate can be derived.
However, due to analytical and biological variation, the degree of polyglutamylation cannot
always be determined with adequate statistical confidence. In addition, another research
question is equally relevant: to what extent are these folates polyglutamylated, i.e. what is the
length of the polyglutamate chain?
To investigate the feasibility of setting up a method to quantify individual polyglutamates in
rice, we developed a method for 5-methyltetrahydropteroylpolyglutamates since this is the
major folate species in genetically engineered rice. The sample treatment procedure used for
the determination of free and total folate concentrations was evaluated to check for potential
hydrolysis of polyglutamates by native γ-glutamylhydrolase enzyme released during sample
homogenization.
Since not all polyglutamate standard materials are commercially available, some require in-
house synthesis and verification of the final concentration in the obtained standard solution.
By modifying an existing method, involving chemical reduction and methylation of
commercially available pteroylpolyglutamates, the conversion yield was increased.
Overall, the method can be used for to compare the degree of polyglutamylation between
different rice samples. (e.g. to determine the success of genetic engineering). However,
method validation was not possible as a result of difficulties verifying the concentration of the
standard solutions.
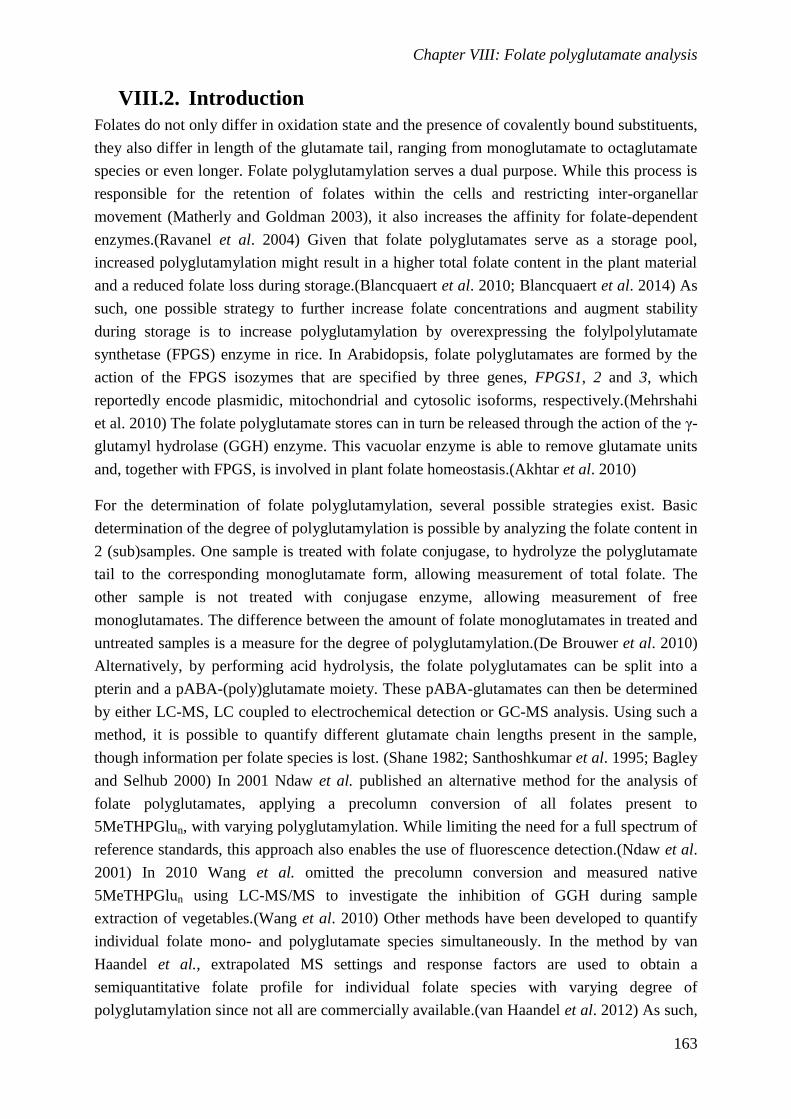
Chapter VIII: Folate polyglutamate analysis
163
VIII.2. Introduction
Folates do not only differ in oxidation state and the presence of covalently bound substituents,
they also differ in length of the glutamate tail, ranging from monoglutamate to octaglutamate
species or even longer. Folate polyglutamylation serves a dual purpose. While this process is
responsible for the retention of folates within the cells and restricting inter-organellar
movement (Matherly and Goldman 2003), it also increases the affinity for folate-dependent
enzymes.(Ravanel et al. 2004) Given that folate polyglutamates serve as a storage pool,
increased polyglutamylation might result in a higher total folate content in the plant material
and a reduced folate loss during storage.(Blancquaert et al. 2010; Blancquaert et al. 2014) As
such, one possible strategy to further increase folate concentrations and augment stability
during storage is to increase polyglutamylation by overexpressing the folylpolylutamate
synthetase (FPGS) enzyme in rice. In Arabidopsis, folate polyglutamates are formed by the
action of the FPGS isozymes that are specified by three genes, FPGS1, 2 and 3, which
reportedly encode plasmidic, mitochondrial and cytosolic isoforms, respectively.(Mehrshahi
et al. 2010) The folate polyglutamate stores can in turn be released through the action of the γ-
glutamyl hydrolase (GGH) enzyme. This vacuolar enzyme is able to remove glutamate units
and, together with FPGS, is involved in plant folate homeostasis.(Akhtar et al. 2010)
For the determination of folate polyglutamylation, several possible strategies exist. Basic
determination of the degree of polyglutamylation is possible by analyzing the folate content in
2 (sub)samples. One sample is treated with folate conjugase, to hydrolyze the polyglutamate
tail to the corresponding monoglutamate form, allowing measurement of total folate. The
other sample is not treated with conjugase enzyme, allowing measurement of free
monoglutamates. The difference between the amount of folate monoglutamates in treated and
untreated samples is a measure for the degree of polyglutamylation.(De Brouwer et al. 2010)
Alternatively, by performing acid hydrolysis, the folate polyglutamates can be split into a
pterin and a pABA-(poly)glutamate moiety. These pABA-glutamates can then be determined
by either LC-MS, LC coupled to electrochemical detection or GC-MS analysis. Using such a
method, it is possible to quantify different glutamate chain lengths present in the sample,
though information per folate species is lost. (Shane 1982; Santhoshkumar et al. 1995; Bagley
and Selhub 2000) In 2001 Ndaw et al. published an alternative method for the analysis of
folate polyglutamates, applying a precolumn conversion of all folates present to
5MeTHPGlun, with varying polyglutamylation. While limiting the need for a full spectrum of
reference standards, this approach also enables the use of fluorescence detection.(Ndaw et al.
2001) In 2010 Wang et al. omitted the precolumn conversion and measured native
5MeTHPGlun using LC-MS/MS to investigate the inhibition of GGH during sample
extraction of vegetables.(Wang et al. 2010) Other methods have been developed to quantify
individual folate mono- and polyglutamate species simultaneously. In the method by van
Haandel et al., extrapolated MS settings and response factors are used to obtain a
semiquantitative folate profile for individual folate species with varying degree of
polyglutamylation since not all are commercially available.(van Haandel et al. 2012) As such,
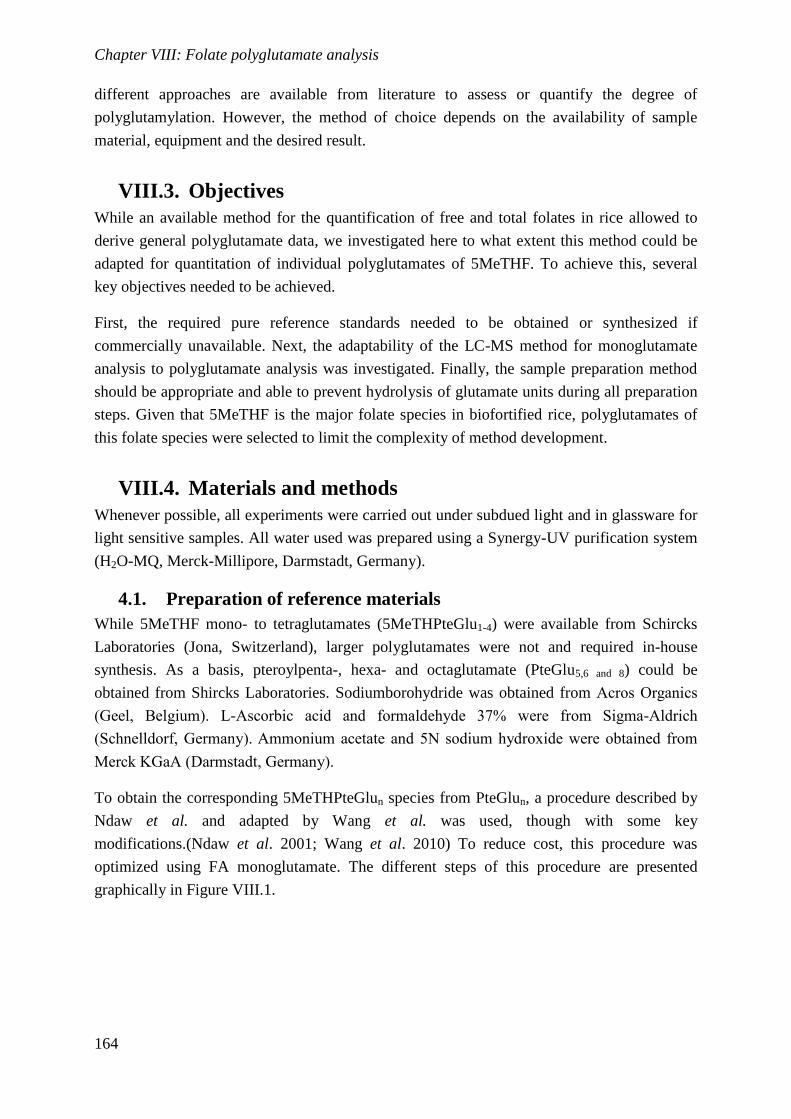
Chapter VIII: Folate polyglutamate analysis
164
different approaches are available from literature to assess or quantify the degree of
polyglutamylation. However, the method of choice depends on the availability of sample
material, equipment and the desired result.
VIII.3. Objectives
While an available method for the quantification of free and total folates in rice allowed to
derive general polyglutamate data, we investigated here to what extent this method could be
adapted for quantitation of individual polyglutamates of 5MeTHF. To achieve this, several
key objectives needed to be achieved.
First, the required pure reference standards needed to be obtained or synthesized if
commercially unavailable. Next, the adaptability of the LC-MS method for monoglutamate
analysis to polyglutamate analysis was investigated. Finally, the sample preparation method
should be appropriate and able to prevent hydrolysis of glutamate units during all preparation
steps. Given that 5MeTHF is the major folate species in biofortified rice, polyglutamates of
this folate species were selected to limit the complexity of method development.
VIII.4. Materials and methods
Whenever possible, all experiments were carried out under subdued light and in glassware for
light sensitive samples. All water used was prepared using a Synergy-UV purification system
(H2O-MQ, Merck-Millipore, Darmstadt, Germany).
4.1. Preparation of reference materials
While 5MeTHF mono- to tetraglutamates (5MeTHPteGlu1-4) were available from Schircks
Laboratories (Jona, Switzerland), larger polyglutamates were not and required in-house
synthesis. As a basis, pteroylpenta-, hexa- and octaglutamate (PteGlu5,6 and 8) could be
obtained from Shircks Laboratories. Sodiumborohydride was obtained from Acros Organics
(Geel, Belgium). L-Ascorbic acid and formaldehyde 37% were from Sigma-Aldrich
(Schnelldorf, Germany). Ammonium acetate and 5N sodium hydroxide were obtained from
Merck KGaA (Darmstadt, Germany).
To obtain the corresponding 5MeTHPteGlun species from PteGlun, a procedure described by
Ndaw et al. and adapted by Wang et al. was used, though with some key
modifications.(Ndaw et al. 2001; Wang et al. 2010) To reduce cost, this procedure was
optimized using FA monoglutamate. The different steps of this procedure are presented
graphically in Figure VIII.1.
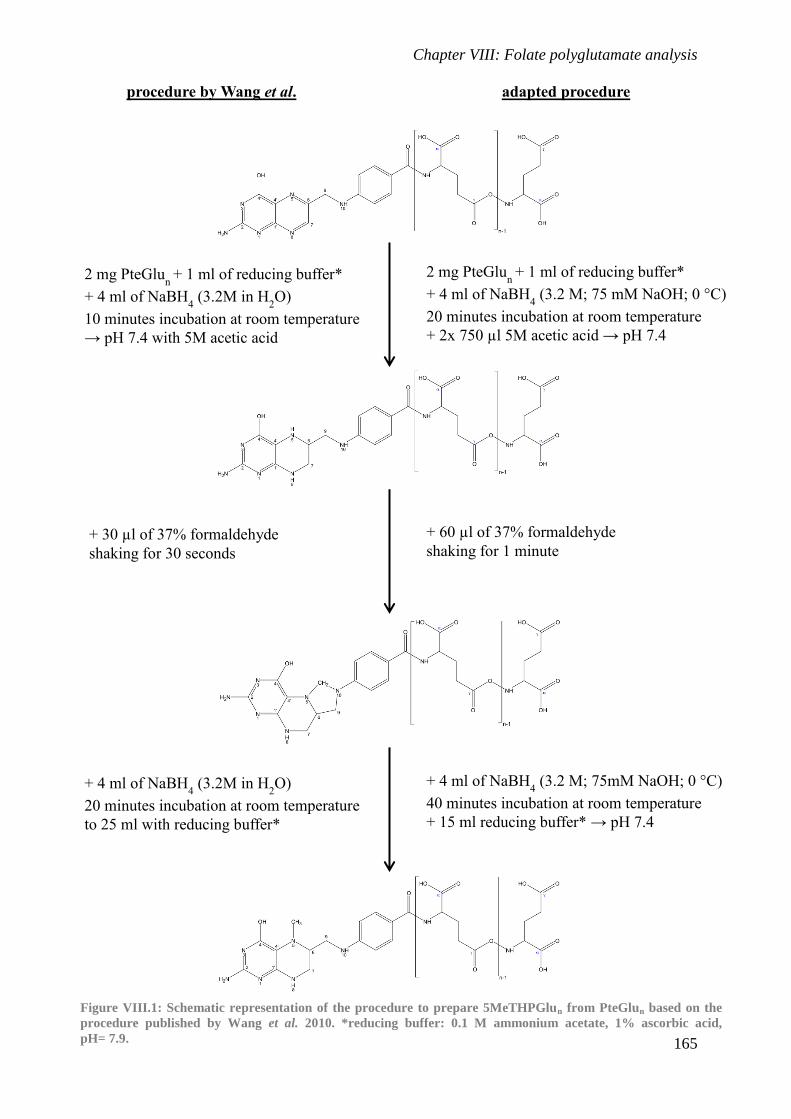
Chapter VIII: Folate polyglutamate analysis
165
2 mg PteGlun
+ 1 ml of reducing buffer*
+ 4 ml of NaBH4 (3.2 M; 75 mM NaOH; 0 °C)
20 minutes incubation at room temperature
+ 2x 750 µl 5M acetic acid → pH 7.4
+ 60 µl of 37% formaldehyde
shaking for 1 minute
+ 4 ml of NaBH4 (3.2 M; 75mM NaOH; 0 °C)
40 minutes incubation at room temperature
+ 15 ml reducing buffer* → pH 7.4
adapted procedure procedure by Wang et al.
2 mg PteGlun
+ 1 ml of reducing buffer*
+ 4 ml of NaBH4 (3.2M in H
2O)
10 minutes incubation at room temperature
→ pH 7.4 with 5M acetic acid
+ 30 µl of 37% formaldehyde
shaking for 30 seconds
+ 4 ml of NaBH4 (3.2M in H
2O)
20 minutes incubation at room temperature
to 25 ml with reducing buffer*
Figure VIII.1: Schematic representation of the procedure to prepare 5MeTHPGlun from PteGlun based on the
procedure published by Wang et al. 2010. *reducing buffer: 0.1 M ammonium acetate, 1% ascorbic acid,
pH= 7.9.
Chapter VIII: Folate polyglutamate analysis
166
The final procedure was successful in converting FA to 5MeTHF and was also successfully
used to convert PteGlu5,6 and 8 to 5MeTHPteGlu5,6 and 8, respectively. First, 2 mg of standard
powder was weighed and transferred to a 30 ml brown glass bottle. Next, 1 ml of reducing
buffer (0.1 M ammonium acetate, 1% ascorbic acid, pH= 7.9) was added and the folate
powder was dissolved. 1.2 grams of NaBH4 powder was weighed and transferred to a similar
glass bottle. To this, 10 ml of 75 mM NaOH was added and the crystals were dissolved. This
solution was kept on ice while capped less than hand tight. 5 M acetic acid was prepared by
diluting pure acetic acid obtained from Merck. Under a fume hood, 4 ml of NaBH4 solution
was added to the standard solution, mixed and allowed to stand for 20 minutes at room
temperature. To halt the reaction, 1.5 ml of 5M acetic acid was added in two aliquots to avoid
the solution bubbling over. As hydrogen gas was escaping, ignition sources were kept well
clear. When the reaction had stopped, the pH was adjusted to 7.4. Then, 60 µl of 37%
formaldehyde was added, the bottle was capped and shaken for 1 minute. Next, another 4 ml
of the alkaline NaBH4 solution was added and left uncapped for 40 minutes at room
temperature. To halt the reaction, 15 ml of reducing buffer was added and the pH was adjusted
to 7.4 using 5 M acetic acid. To remove the solid sodium metaborate (NaBO2) formed during
the reaction, the solution was filtered using a 0.22 µm syringe filter prior to aliquoting and
storage at -80 °C.
4.2. Enzyme preparation
Enzymes α-amylase (Type Ia, 700-1400 U/mg protein; E.C. 3.2.1.1) and protease type XIV
(>3.5 U/mg; E.C. 3.4.24.31) were purchased from Sigma Aldrich (Diegem, Belgium). The
protease powder was dissolved at a concentration of 5 mg/ml in deionized water. As a source
of γ-glutamylhydrolase enzyme (GGH; E.C. 3.4.19.9), non-sterile, non-hemolyzed rat serum
was obtained from Harlan Laboratories (Horst, The Netherlands). Both the protease solution
and the rat serum were stirred on ice for 1 hour with 100 mg/ml of activated charcoal (Sigma-
Aldrich) to remove endogenous folates.(De Brouwer et al. 2008) Following removal of the
activated charcoal by centrifugation at 4500 g for 15 minutes at 4 °C, the solutions were
filtered over a 0.45 µm syringe filter (CA-S 30/0.45, Whatman, GE Healthcare, Little
Chalfont, UK), divided into aliquots and frozen at -20 °C.
4.3. Chromatographic separation and detection
4.3.1. HPLC separation of folate polyglutamates to evaluate standard purity
The final method to evaluate the purity of the reference standard concentrations consisted of
HPLC-UV analysis using an Agilent Zorbax Eclipse XDB-C8 (150x4.6 mm; 5 µm, Santa
Clara, CA, USA) column and a LaChrom HPLC system from Merck Hitachi (Tokyo, Japan)
with a binary pump (type L-7100), autosampler (type L-7200) and interface module (type D-
7000). The detector was a DAD-detector also from Merck Hitachi (type LaChrom L-7455).
The mobile phase consisted of 0.1% formic acid in H2O-MQ and acetonitrile at a flow rate of
1.0 ml/minute and a column temperature of 40°C. The injection volume was 50 µl. Gradient
elution was performed as described in Table VIII.1. UV detection was performed at a
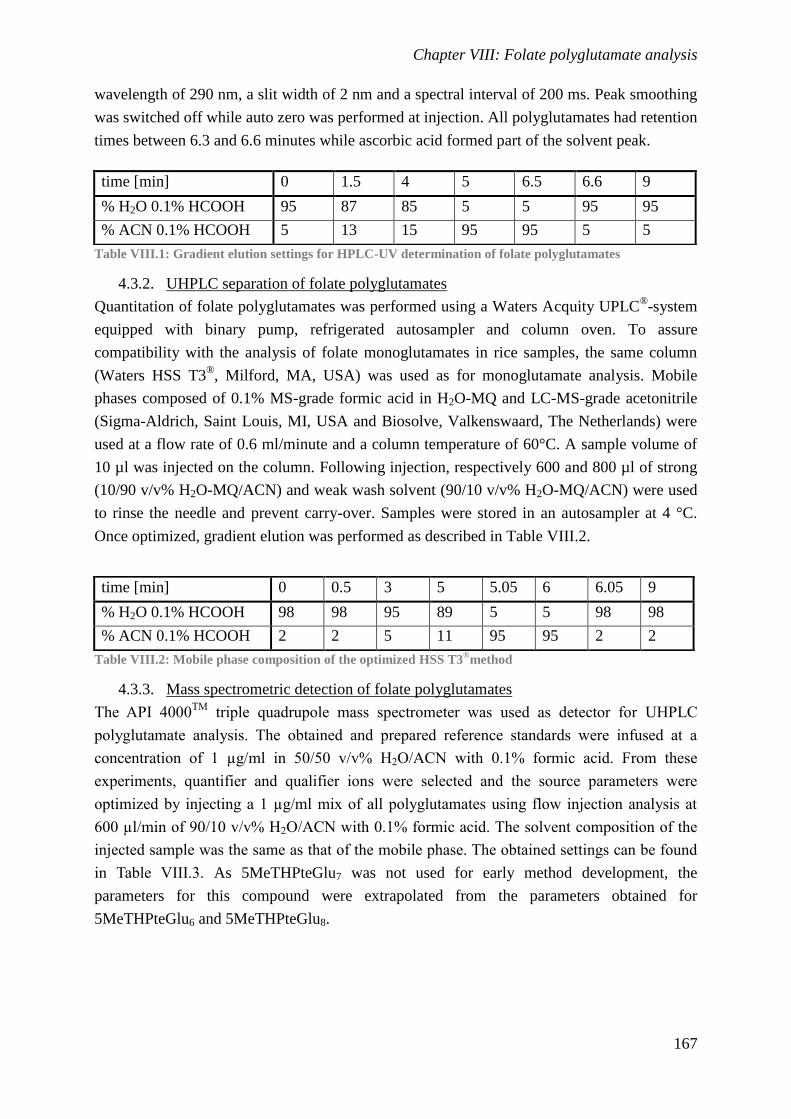
Chapter VIII: Folate polyglutamate analysis
167
wavelength of 290 nm, a slit width of 2 nm and a spectral interval of 200 ms. Peak smoothing
was switched off while auto zero was performed at injection. All polyglutamates had retention
times between 6.3 and 6.6 minutes while ascorbic acid formed part of the solvent peak.
Table VIII.1: Gradient elution settings for HPLC-UV determination of folate polyglutamates
4.3.2. UHPLC separation of folate polyglutamates
Quantitation of folate polyglutamates was performed using a Waters Acquity UPLC®-system
equipped with binary pump, refrigerated autosampler and column oven. To assure
compatibility with the analysis of folate monoglutamates in rice samples, the same column
(Waters HSS T3®, Milford, MA, USA) was used as for monoglutamate analysis. Mobile
phases composed of 0.1% MS-grade formic acid in H2O-MQ and LC-MS-grade acetonitrile
(Sigma-Aldrich, Saint Louis, MI, USA and Biosolve, Valkenswaard, The Netherlands) were
used at a flow rate of 0.6 ml/minute and a column temperature of 60°C. A sample volume of
10 µl was injected on the column. Following injection, respectively 600 and 800 µl of strong
(10/90 v/v% H2O-MQ/ACN) and weak wash solvent (90/10 v/v% H2O-MQ/ACN) were used
to rinse the needle and prevent carry-over. Samples were stored in an autosampler at 4 °C.
Once optimized, gradient elution was performed as described in Table VIII.2.
Table VIII.2: Mobile phase composition of the optimized HSS T3®
method
4.3.3. Mass spectrometric detection of folate polyglutamates
The API 4000TM
triple quadrupole mass spectrometer was used as detector for UHPLC
polyglutamate analysis. The obtained and prepared reference standards were infused at a
concentration of 1 µg/ml in 50/50 v/v% H2O/ACN with 0.1% formic acid. From these
experiments, quantifier and qualifier ions were selected and the source parameters were
optimized by injecting a 1 µg/ml mix of all polyglutamates using flow injection analysis at
600 µl/min of 90/10 v/v% H2O/ACN with 0.1% formic acid. The solvent composition of the
injected sample was the same as that of the mobile phase. The obtained settings can be found
in Table VIII.3. As 5MeTHPteGlu7 was not used for early method development, the
parameters for this compound were extrapolated from the parameters obtained for
5MeTHPteGlu6 and 5MeTHPteGlu8.
time [min] 0 1.5 4 5 6.5 6.6 9
% H2O 0.1% HCOOH 95 87 85 5 5 95 95
% ACN 0.1% HCOOH 5 13 15 95 95 5 5
time [min] 0 0.5 3 5 5.05 6 6.05 9
% H2O 0.1% HCOOH 98 98 95 89 5 5 98 98
% ACN 0.1% HCOOH 2 2 5 11 95 95 2 2
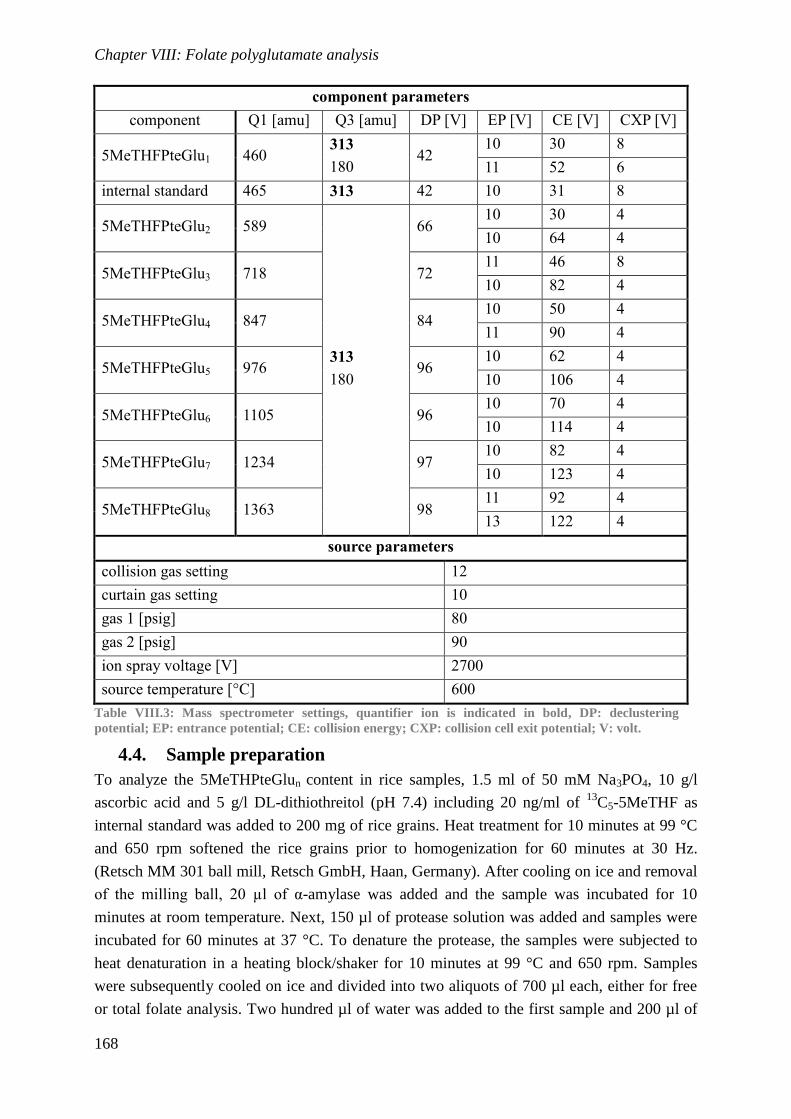
Chapter VIII: Folate polyglutamate analysis
168
component parameters
component Q1 [amu] Q3 [amu] DP [V] EP [V] CE [V] CXP [V]
5MeTHFPteGlu1 460 313
180 42
10 30 8
11 52 6
internal standard 465 313 42 10 31 8
5MeTHFPteGlu2 589
313
180
66 10 30 4
10 64 4
5MeTHFPteGlu3 718 72 11 46 8
10 82 4
5MeTHFPteGlu4 847 84 10 50 4
11 90 4
5MeTHFPteGlu5 976 96 10 62 4
10 106 4
5MeTHFPteGlu6 1105 96 10 70 4
10 114 4
5MeTHFPteGlu7 1234 97 10 82 4
10 123 4
5MeTHFPteGlu8 1363 98 11 92 4
13 122 4
source parameters
collision gas setting 12
curtain gas setting 10
gas 1 [psig] 80
gas 2 [psig] 90
ion spray voltage [V] 2700
source temperature [°C] 600
Table VIII.3: Mass spectrometer settings, quantifier ion is indicated in bold, DP: declustering
potential; EP: entrance potential; CE: collision energy; CXP: collision cell exit potential; V: volt.
4.4. Sample preparation
To analyze the 5MeTHPteGlun content in rice samples, 1.5 ml of 50 mM Na3PO4, 10 g/l
ascorbic acid and 5 g/l DL-dithiothreitol (pH 7.4) including 20 ng/ml of 13
C5-5MeTHF as
internal standard was added to 200 mg of rice grains. Heat treatment for 10 minutes at 99 °C
and 650 rpm softened the rice grains prior to homogenization for 60 minutes at 30 Hz.
(Retsch MM 301 ball mill, Retsch GmbH, Haan, Germany). After cooling on ice and removal
of the milling ball, 20 µl of α-amylase was added and the sample was incubated for 10
minutes at room temperature. Next, 150 µl of protease solution was added and samples were
incubated for 60 minutes at 37 °C. To denature the protease, the samples were subjected to
heat denaturation in a heating block/shaker for 10 minutes at 99 °C and 650 rpm. Samples
were subsequently cooled on ice and divided into two aliquots of 700 µl each, either for free
or total folate analysis. Two hundred µl of water was added to the first sample and 200 µl of
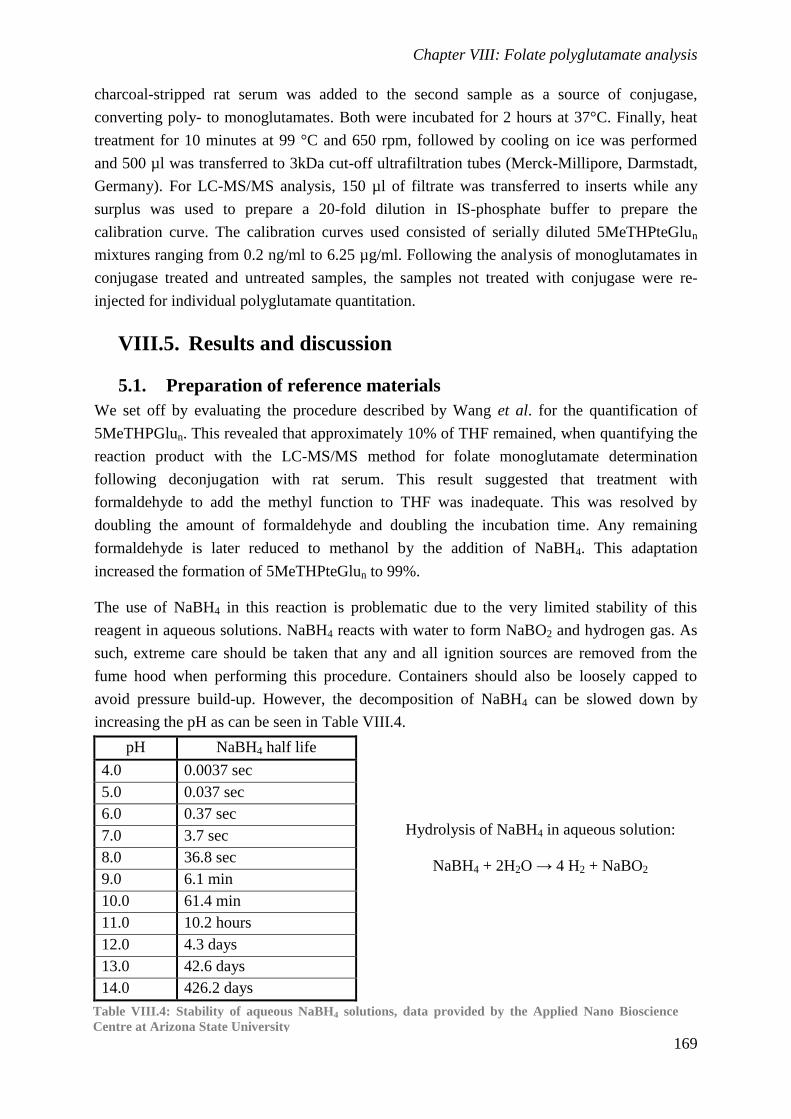
Chapter VIII: Folate polyglutamate analysis
169
charcoal-stripped rat serum was added to the second sample as a source of conjugase,
converting poly- to monoglutamates. Both were incubated for 2 hours at 37°C. Finally, heat
treatment for 10 minutes at 99 °C and 650 rpm, followed by cooling on ice was performed
and 500 µl was transferred to 3kDa cut-off ultrafiltration tubes (Merck-Millipore, Darmstadt,
Germany). For LC-MS/MS analysis, 150 µl of filtrate was transferred to inserts while any
surplus was used to prepare a 20-fold dilution in IS-phosphate buffer to prepare the
calibration curve. The calibration curves used consisted of serially diluted 5MeTHPteGlun
mixtures ranging from 0.2 ng/ml to 6.25 µg/ml. Following the analysis of monoglutamates in
conjugase treated and untreated samples, the samples not treated with conjugase were re-
injected for individual polyglutamate quantitation.
VIII.5. Results and discussion
5.1. Preparation of reference materials
We set off by evaluating the procedure described by Wang et al. for the quantification of
5MeTHPGlun. This revealed that approximately 10% of THF remained, when quantifying the
reaction product with the LC-MS/MS method for folate monoglutamate determination
following deconjugation with rat serum. This result suggested that treatment with
formaldehyde to add the methyl function to THF was inadequate. This was resolved by
doubling the amount of formaldehyde and doubling the incubation time. Any remaining
formaldehyde is later reduced to methanol by the addition of NaBH4. This adaptation
increased the formation of 5MeTHPteGlun to 99%.
The use of NaBH4 in this reaction is problematic due to the very limited stability of this
reagent in aqueous solutions. NaBH4 reacts with water to form NaBO2 and hydrogen gas. As
such, extreme care should be taken that any and all ignition sources are removed from the
fume hood when performing this procedure. Containers should also be loosely capped to
avoid pressure build-up. However, the decomposition of NaBH4 can be slowed down by
increasing the pH as can be seen in Table VIII.4.
pH NaBH4 half life
4.0 0.0037 sec
5.0 0.037 sec
6.0 0.37 sec
7.0 3.7 sec
8.0 36.8 sec
9.0 6.1 min
10.0 61.4 min
11.0 10.2 hours
12.0 4.3 days
13.0 42.6 days
14.0 426.2 days
Hydrolysis of NaBH4 in aqueous solution:
NaBH4 + 2H2O → 4 H2 + NaBO2
Table VIII.4: Stability of aqueous NaBH4 solutions, data provided by the Applied Nano Bioscience
Centre at Arizona State University
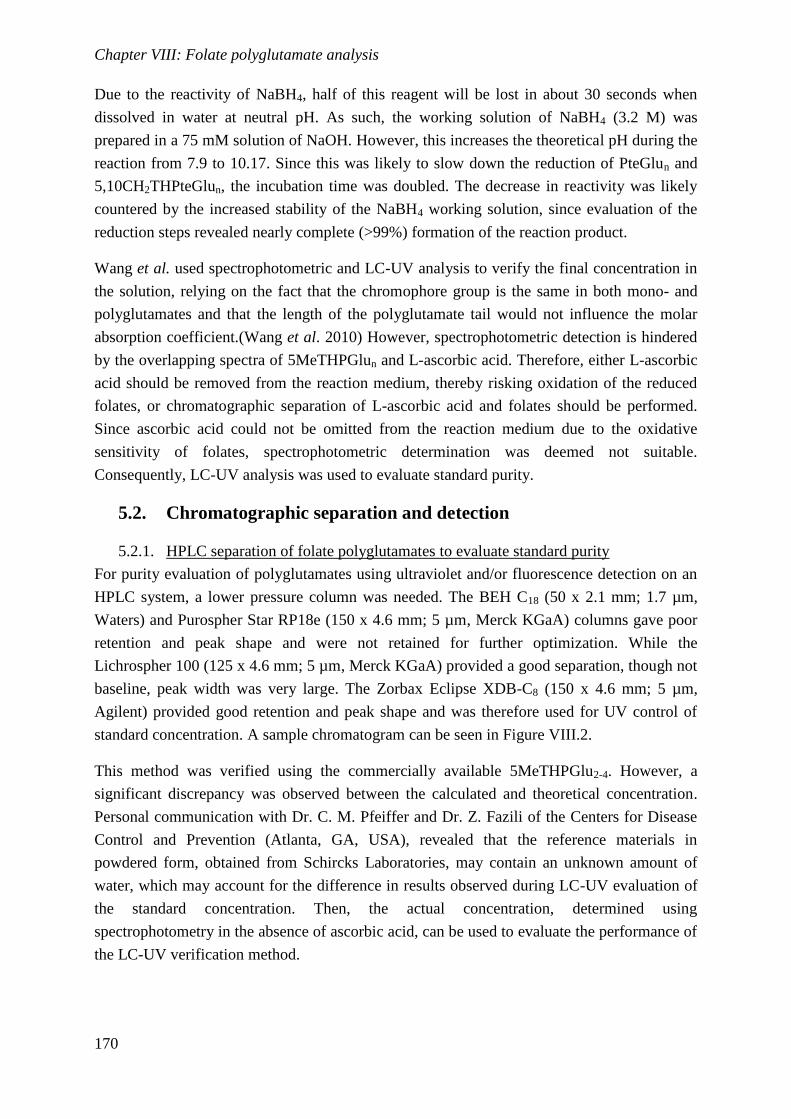
Chapter VIII: Folate polyglutamate analysis
170
Due to the reactivity of NaBH4, half of this reagent will be lost in about 30 seconds when
dissolved in water at neutral pH. As such, the working solution of NaBH4 (3.2 M) was
prepared in a 75 mM solution of NaOH. However, this increases the theoretical pH during the
reaction from 7.9 to 10.17. Since this was likely to slow down the reduction of PteGlun and
5,10CH2THPteGlun, the incubation time was doubled. The decrease in reactivity was likely
countered by the increased stability of the NaBH4 working solution, since evaluation of the
reduction steps revealed nearly complete (>99%) formation of the reaction product.
Wang et al. used spectrophotometric and LC-UV analysis to verify the final concentration in
the solution, relying on the fact that the chromophore group is the same in both mono- and
polyglutamates and that the length of the polyglutamate tail would not influence the molar
absorption coefficient.(Wang et al. 2010) However, spectrophotometric detection is hindered
by the overlapping spectra of 5MeTHPGlun and L-ascorbic acid. Therefore, either L-ascorbic
acid should be removed from the reaction medium, thereby risking oxidation of the reduced
folates, or chromatographic separation of L-ascorbic acid and folates should be performed.
Since ascorbic acid could not be omitted from the reaction medium due to the oxidative
sensitivity of folates, spectrophotometric determination was deemed not suitable.
Consequently, LC-UV analysis was used to evaluate standard purity.
5.2. Chromatographic separation and detection
5.2.1. HPLC separation of folate polyglutamates to evaluate standard purity
For purity evaluation of polyglutamates using ultraviolet and/or fluorescence detection on an
HPLC system, a lower pressure column was needed. The BEH C18 (50 x 2.1 mm; 1.7 µm,
Waters) and Purospher Star RP18e (150 x 4.6 mm; 5 µm, Merck KGaA) columns gave poor
retention and peak shape and were not retained for further optimization. While the
Lichrospher 100 (125 x 4.6 mm; 5 µm, Merck KGaA) provided a good separation, though not
baseline, peak width was very large. The Zorbax Eclipse XDB-C8 (150 x 4.6 mm; 5 µm,
Agilent) provided good retention and peak shape and was therefore used for UV control of
standard concentration. A sample chromatogram can be seen in Figure VIII.2.
This method was verified using the commercially available 5MeTHPGlu2-4. However, a
significant discrepancy was observed between the calculated and theoretical concentration.
Personal communication with Dr. C. M. Pfeiffer and Dr. Z. Fazili of the Centers for Disease
Control and Prevention (Atlanta, GA, USA), revealed that the reference materials in
powdered form, obtained from Schircks Laboratories, may contain an unknown amount of
water, which may account for the difference in results observed during LC-UV evaluation of
the standard concentration. Then, the actual concentration, determined using
spectrophotometry in the absence of ascorbic acid, can be used to evaluate the performance of
the LC-UV verification method.
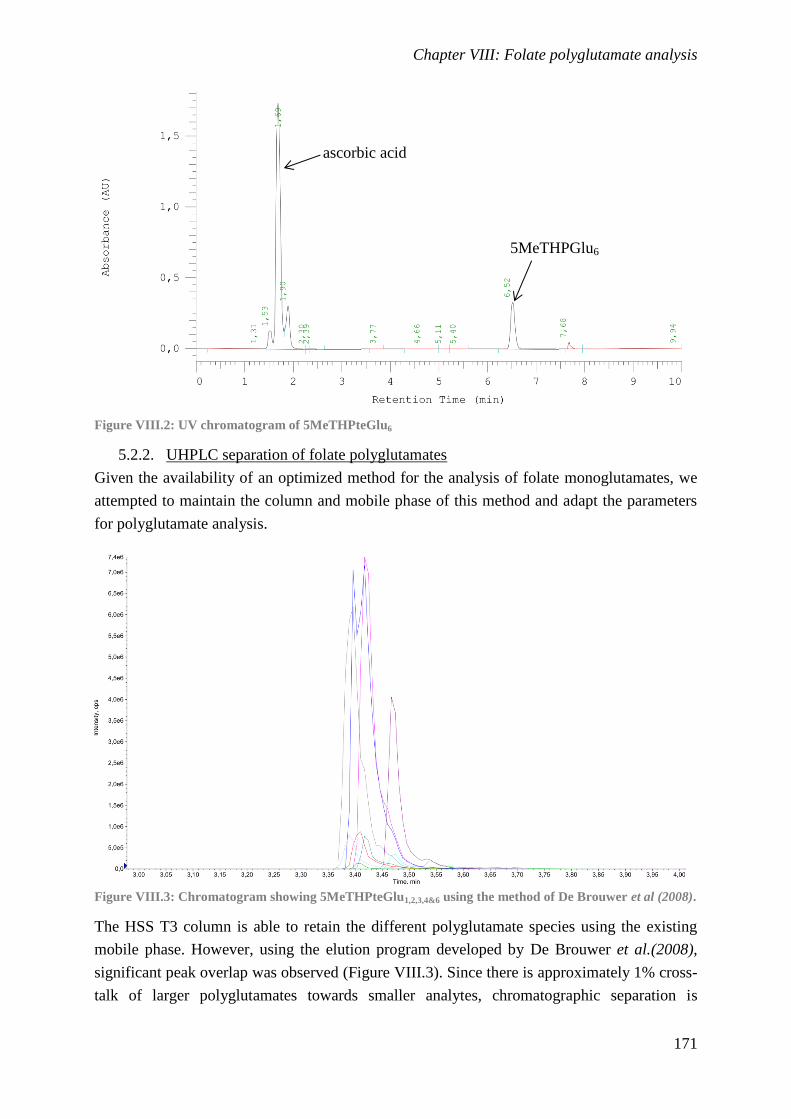
Chapter VIII: Folate polyglutamate analysis
171
Figure VIII.2: UV chromatogram of 5MeTHPteGlu6
5.2.2. UHPLC separation of folate polyglutamates
Given the availability of an optimized method for the analysis of folate monoglutamates, we
attempted to maintain the column and mobile phase of this method and adapt the parameters
for polyglutamate analysis.
Figure VIII.3: Chromatogram showing 5MeTHPteGlu1,2,3,4&6 using the method of De Brouwer et al (2008).
The HSS T3 column is able to retain the different polyglutamate species using the existing
mobile phase. However, using the elution program developed by De Brouwer et al.(2008),
significant peak overlap was observed (Figure VIII.3). Since there is approximately 1% cross-
talk of larger polyglutamates towards smaller analytes, chromatographic separation is
5MeTHPGlu6
ascorbic acid
Chapter VIII: Folate polyglutamate analysis
172
important to achieve acceptable selectivity. However, some tailing was observed, with peak
shape deteriorating as polyglutamate length increased. This decreases method sensitivity.
By altering the gradient elution scheme, the different polyglutamate species could be further
separated, though baseline separation was not possible, especially for 5MeTHPteGlu1 and
5MeTHPteGlu2. In this case, the cross-talk effect will result in an additional signal for
5MeTHPteGlu1 originating from 5MeTHPteGlu2-ions. As such, the evaluation of cross talk
requires extra attention during method validation. Chromatograms for a standard mix, rice and
red blood cell (RBC) sample are provided in Figure VIII.4.
5.2.3. Mass spectrometric detection of folate polyglutamates
From the mass spectrometric settings specified in Table VIII.3 it is clear that the declustering
potential (DP) reaches its maximal settings for ions larger than tetraglutamates. This voltage
is applied to prevent the ions from clustering together. As such, it is possible that cluster
formation of larger polyglutamates exceeds the capacity of the ion source, leading to low
sensitivity. This problem should be remediated to achieve the lowest possible quantitation
limit required for polyglutamate analysis in samples with a low degree of folate
polyglutamylation.
5.3. Sample preparation
Wang et al. found that the release of GGH-enzymes during sample homogenization caused
the deconjugation of polyglutamates prior to LC-MS analysis. These authors proposed a
steaming step prior to homogenization to denature the GGH-enzymes and preserve the
polyglutamates during homogenization.(Wang et al. 2010) In line with this, the boiling step
performed prior to homogenization can serve as a means to denature the GGH-enzymes and
preserve the folate polyglutamylation in the sample.(De Brouwer et al. 2008) This was
verified by adding 5MeTHPteGlu2-6 to wild type rice samples prior to and after sample
preparation. No indication of deglutamylation was observed.
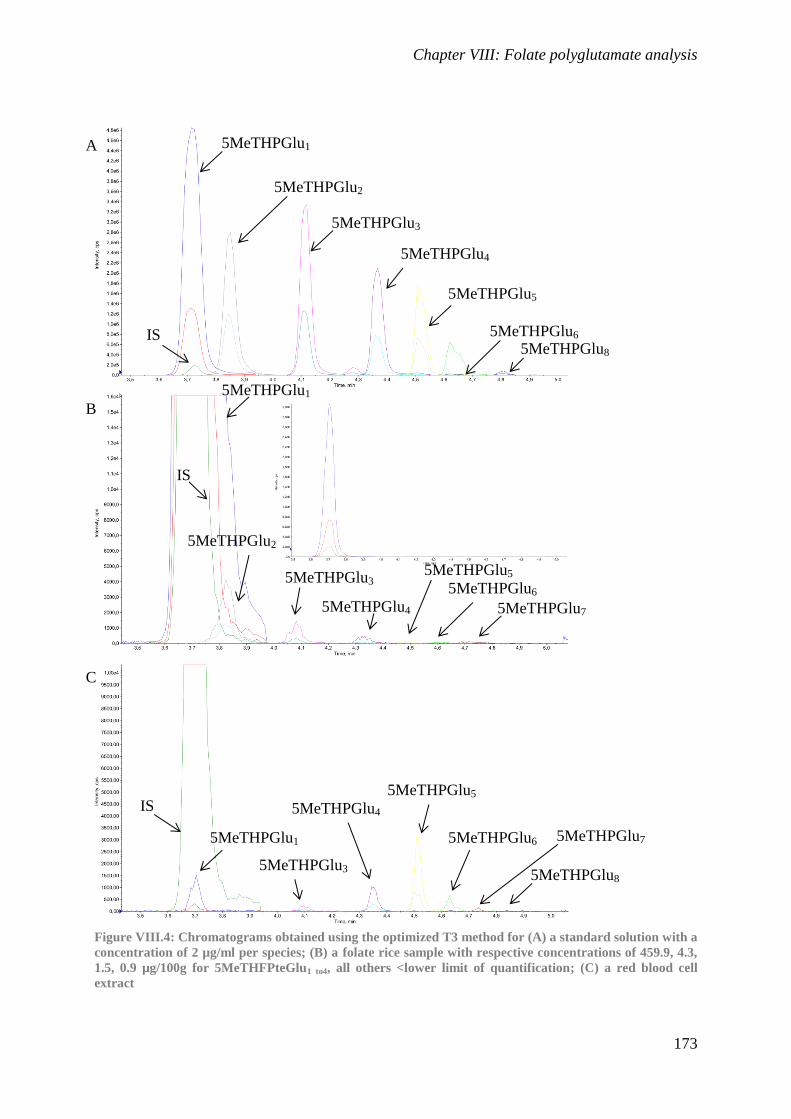
Chapter VIII: Folate polyglutamate analysis
173
Figure VIII.4: Chromatograms obtained using the optimized T3 method for (A) a standard solution with a
concentration of 2 µg/ml per species; (B) a folate rice sample with respective concentrations of 459.9, 4.3,
1.5, 0.9 µg/100g for 5MeTHFPteGlu1 to4, all others <lower limit of quantification; (C) a red blood cell
extract
A
B
C
5MeTHPGlu1
5MeTHPGlu2
5MeTHPGlu3
5MeTHPGlu4
5MeTHPGlu5
5MeTHPGlu6 5MeTHPGlu8
5MeTHPGlu1
5MeTHPGlu2
5MeTHPGlu3
5MeTHPGlu4
5MeTHPGlu5
5MeTHPGlu6
5MeTHPGlu7
5MeTHPGlu1
5MeTHPGlu3
5MeTHPGlu4
5MeTHPGlu5
5MeTHPGlu6
5MeTHPGlu8
5MeTHPGlu7
IS
IS
IS
Chapter VIII: Folate polyglutamate analysis
174
VIII.6. Conclusion
Accurate quantitation of individual polyglutamates was not possible due to the lack of
standards with accurate concentrations. As a result of an observed difference between the
measured and theoretical concentration for the commercially available 5MeTHPteGlu2-4, the
LC-UV procedure proved unreliable and should be evaluated further based on purity data for
the commercially available 5MeTHPteGlu2-4. 5MeTHPteGlu5-8 can be reproducibly prepared
using the adapted method described in this chapter. However, to use the obtained solutions for
calibration, the actual concentration should also be reliably determined using the LC-UV
method.
Further optimization of the LC-MS/MS procedure could be possible if cluster formation
during ionization can be prevented. This phenomenon limits the sensitivity of the method for
folates with larger polyglutamate-tail length. Since the degree of polyglutamylation in rice is
limited, utmost sensitivity is required to compare different rice varieties. Yet, when sufficient
material is available, comparative profiling may be achieved.
Chapter VIII: Folate polyglutamate analysis
175
VIII.7. References
Akhtar, T.A., Orsomando, G., Mehrshahi, P., Lara-Núñez, A., Bennett, M.J., Gregory, J.F.III
and Hanson, A.D. 2010. “A Central Role for Gamma-Glutamyl Hydrolases in Plant
Folate Homeostasis.” Plant J 64 (2): 256–66.
Bagley, P.J., and Selhub J. 2000. “Analysis of Folate Form Distribution by Affinity Followed
by Reversed- Phase Chromatography with Electrical Detection.” Clin Chem 46 (3): 404–
11.
Blancquaert, D., De Steur, H., Gellynck, X. and Van Der Straeten, D. 2014. “Present and
Future of Folate Biofortification of Crop Plants.” J Exp Bot 65 (4): 895–906.
Blancquaert, D., Storozhenko, S., Loizeau, K., De Steur, H., De Brouwer, V., Viaene, J.,
Ravanel, S., Rébeillé, F., Lambert, W.E. and Van Der Straeten, D. 2010. “Folates and
Folic Acid: From Fundamental Research Toward Sustainable Health.” CRC Crit Rev
Plant Sci 29 (1): 14-35.
De Brouwer, V., Storozhenko, S., Stove, C.P., Van Daele, J., Van der Straeten, D. and
Lambert, W.E. 2010. “Ultra-Performance Liquid Chromatography-Tandem Mass
Spectrometry (UPLC-MS/MS) for the Sensitive Determination of Folates in Rice.” J
Chromatogr B 878 (3-4): 509–13.
De Brouwer, V., Storozhenko, S., Van De Steene, J.C., Wille, S.M.R., Stove, C.P., Van Der
Straeten, D. and Lambert, W.E. 2008. “Optimisation and Validation of a Liquid
Chromatography–tandem Mass Spectrometry Method for Folates in Rice.” J
Chromatogr A 1215 (1–2): 125–32.
Matherly, L.H. and Goldman, D.I. 2003. “Membrane Transport of Folates.” Vitam Horm 66:
403–56.
Mehrshahi, P., Gonzalez-Jorge, S., Akhtar, T.A., Ward, J.L., Santoyo-Castelazo, A., Marcus,
S.E., Lara-Núñez, A., et al. 2010. “Functional Analysis of Folate Polyglutamylation and
Its Essential Role in Plant Metabolism and Development.” Plant J 64 (2): 267–79.
Ndaw, S., Bergaentzle, M., Aoude-Werner, D., Lahely, S. and Hasselmann, C. 2001.
“Determination of Folates in Foods by High-Performance Liquid Chromatography with
Fluorescence Detection after Precolumn Conversion to 5-Methyltetrahydrofolates.” J
Chromatogr A 928 (1): 77–90.
Ravanel, S., Block, M.A., Rippert, P., Jabrin, S., Curien, G., Rébeillé, F. and Douce, R. 2004.
“Methionine Metabolism in Plants: Chloroplasts Are Autonomous for de Novo
Methionine Synthesis and Can Import S-Adenosylmethionine from the Cytosol.” J Biol
Chem 279 (21): 22548–57.
Santhoshkumar, C.R., Deutsch, J.C., Hassell, K.L., Kolhouse, N.M. and Kolhouse, J.F. 1995.
“Quantitation of Red Blood Cell Folates by Stable Isotope Dilution Gas
Chromatography-Mass Spectrometry Utilizing a Folate Internal Standard.” Anal
Biochem 225 (1): 1–9.
Shane, B. 1982. “High Performance Liquid Chromatography of Folates: Identification of
Poly-Gamma-Glutamate Chain Lengths of Labeled and Unlabeled Folates.” Am J Clin
Nutr 35 (3): 599–608.
Chapter VIII: Folate polyglutamate analysis
176
van Haandel, L., Becker, M.L., Williams, T.D., Stobaugh, J.F. and Leeder, J.S. 2012.
“Comprehensive Quantitative Measurement of Folate Polyglutamates in Human
Erythrocytes by Ion Pairing Ultra-Performance Liquid Chromatography/tandem Mass
Spectrometry.” Rapid Commun Mass Spectrom 26 (14): 1617–30.
Wang, C., Riedl, K.M., and Schwartz, S.J. 2010. “A Liquid Chromatography-Tandem Mass
Spectrometric Method for Quantitative Determination of Native 5-
Methyltetrahydrofolate and Its Polyglutamyl Derivatives in Raw Vegetables.” J
Chromatogr B 878 (29): 2949–58.
Chapter IX: Broader international context,
relevance and future perspectives

Chapter IX: Broader international context, relevance and future perspectives
178
Chapter IX: Broader international context, relevance and future perspectives
179
Table of contents
IX.1. Achievements of this PhD project............................................................................ 180
1.1. Determination of folates in rodent diets .............................................................. 180
1.2. Determination of folates in plasma and RBCs .................................................... 180
1.3. Folate rice feeding trial ........................................................................................ 181
1.4. Lymphocytes and folate status ............................................................................ 181
1.5. Folate polyglutamate determination .................................................................... 182
IX.2. GMO’s in Europe and throughout the world ........................................................... 182
2.1. European policies on GMO’s .............................................................................. 182
2.2. GMO’s throughout the world .............................................................................. 185
IX.3. Folate rice, a recipe for success! .............................................................................. 186
3.1. Folate rice and folate status ................................................................................. 186
3.2. Economic aspects of folate rice use..................................................................... 186
3.3. Recent developments of folate rice ..................................................................... 186
IX.4. What the future might bring ..................................................................................... 187
IX.5. Conclusion ............................................................................................................... 188
IX.6. References ................................................................................................................ 189
Chapter IX: Broader international context, relevance and future perspectives
180
IX.1. Achievements of this PhD project The prime achievement of this PhD project lies in the demonstration of the biological
effectiveness of folate rice following its consumption, using an animal model. To achieve this
aim, also tools needed to be developed that allow the determination of folates in rodent diets,
as well as in red blood cells and plasma. These tools, as well as other achievements of this
thesis, are relevant for future development in the field of folate research.
1.1. Determination of folates in rodent diets
While methods for the quantitative determination of folates in several different food matrices
existed, no method had been developed to measure individual folate species in rodent diets.
Though these diets are commonly used for folate research purposes, the supplier generally
only mentions the amount of folic acid (FA) added to the diet. However, when we applied our
method to folate deficient diets, we observed that these contained an amount of natural folates
originating from various feed ingredients. As such, the development of a method for folate
determination provides a tool for future researchers to also account for folate intake from the
rodent feed.(Chapter IV, Kiekens et al. 2015a)
1.2. Determination of folates in plasma and RBCs
While microbiologic or protein binding assays are widely used for the determination of
clinical folate status, emerging LC-MS/MS assays provide an orthogonal determination
strategy focusing on exact chemical determination instead of biological activity. While the
microbiologic assay currently remains the gold standard method for the determination of
biologically active folates, the protein binding assay is susceptible to differences between the
folate species present in the sample and the species, mostly FA, used for assay
calibration.(Pfeiffer et al. 2004)
The accuracy and precision obtained using LC-MS/MS and the possibility to quantify
individual folate species has led to an increased interest to implement this technology for
clinical folate research. The implementation of this technique in a routine clinical laboratory
will depend on the automation of the sample preparation steps and the availability of LC-
MS/MS equipment. Due to the ease of the assay and possible automation, protein binding
assays are currently used most to determine the amount of folates in patient samples.
Comparability of analytical results with other labs is not a major concern for the clinician
since the use of reference intervals specific for the assay will suffice to distinguish folate
deficient patients from those with an adequate folate status. For scientific research purposes,
however, method comparability is necessary to compare findings with those obtained by other
research groups and as such, LC-MS/MS is the method of choice in folate research.
Whole blood or red blood cell folate analysis is not yet regularly performed for the
determination of long term folate status over the lifetime of the RBCs, i.e. approximately 3
months. This measurement is not influenced by recent folate intake so, contrary to plasma or
serum folate determination, a fasting period is not strictly necessary.
Since plasma and red blood cell folate concentrations provide complementary information,
respectively for acute and chronic folate deficiency, we opted to develop a method to analyze
Chapter IX: Broader international context, relevance and future perspectives
181
both using a very comparable sample treatment procedure to limit the use of resources, i.e.
time, equipment and reagents.(Chapter V, Kiekens et al. 2015b) If routine clinical analysis
using an LC-MS/MS assay is considered, such an approach should make a cost effective
procedure achievable. To evaluate our method for clinical folate determination, we
successfully participated in a round-robin test organized by Fazili and Pfeiffer of the Centers
for Disease Control in Atlanta, GA, USA. These results should be published soon.
1.3. Folate rice feeding trial
Since the folates in folate rice originate from genetic manipulations of the rice genome,
resulting in supraphysiological accumulation of folates within the rice grain, it is clear that
sound scientific evidence must be provided to prove the usefulness of folate rice as a source
of dietary folate. Recently, Castorena-Torres et al. investigated the relationship between
feeding of a folate-biofortified tomato variety on folate status using a murine model. These
authors chose to apply an area under the curve approach. Following a single intake of folates,
the area under the plasma response curve was used to calculate the degree to which the folates
in this biofortified tomato are bioavailable.(Castorena-Torres et al. 2014) Apart from this
study, no other study had evaluated the impact of folate-biofortified food on folate status.
We chose a different approach due to the complex nature of folate metabolism in vivo and the
absence of a zero folate level at the start of the experiment. In contrast to the study on
biofortified tomato, we performed a long term feeding study to allow for the necessary time to
reach steady-state levels, indicating the ability of folates in folate rice to maintain a certain
folate status. More particularly, the blood folate concentrations measured during and at the
end of our feeding trial provided the information needed to evaluate the efficacy of folate rice
as a source of dietary folate. As folate metabolism is intertwined with various other metabolic
cycles, we also monitored other metabolic indicators, i.e. homocysteine and the hematological
indices of erythropoiesis. (Chapter VI, Kiekens et al. 2015c)
With this long term study in rodents we have demonstrated that the folates from folate rice
can be released (i.e. are bio-accessible), are bioavailable (i.e. result in increased folate levels)
and have biological effects.
1.4. Lymphocytes and folate status
This study was ignited by a publication of Courtemanche et al. These authors hypothesized
that if folate deficiency impairs the proliferation of CD8+ T-cells, it could impair the capacity
of CD8 cells to eliminate infected or tumor cells. Although these authors found a different
response between lymphocyte subsets, more research was needed, as readily indicated by
these authors, to investigate the underlying reason for this difference. (Courtemanche et al.
2010)
Besides replicating the experimental set-up performed by Courtemanche et al. (using FA), we
also used 5-methyltetrahydrofolate (5MeTHF), ubiquitously present in vivo, as a folate source
in the growth medium of isolated immune cells. The addition of this folate species on a daily
basis to replace the amount lost due to degradation shows that it is possible to perform in vitro
experiments using 5MeTHF as a folate source.
Chapter IX: Broader international context, relevance and future perspectives
182
We were able to demonstrate that there is a concentration dependence between the intra- and
extracellular folate concentration and that cell replication is likely to be less dependent on
folate status than was concluded by Courtemanche et al.
1.5. Folate polyglutamate determination
The classical approach to determine the degree of polyglutamylation of folates in rice samples
is not able to discriminate between folates with a different number of glutamate units.(De
Brouwer et al. 2010) To precisely evaluate the effect an increased expression of folate
polyglutamate synthase enzyme (FPGS) has on polyglutamate content, a new method was
developed to quantify individual folate polyglutamate species.
Folate polyglutamylation is a possible factor influencing both folate stability in the food item
and bioavailability following consumption. Therefore, a method which allows to quantify
individual folate polyglutamate species is useful to investigate the effect of this factor on
stability and bioavailability.
IX.2. GMO’s in Europe and throughout the world In the European Union, the view towards the use of genetically modified organisms,
commonly known under the acronym GMO’s, is rather negative. However, in the United
States and China, genetically engineered crops are common. Local GMO legislation tends to
reflect the acceptance of the general public of crops which contain genes that would not be
present by natural processes.
2.1. European policies on GMO’s
The European Food Safety Authority uses the following definition to describe GMO’s:
“In recent times, it has become possible to modify the genetic make-up of living cells and
organisms using techniques of modern biotechnology called gene technology. The genetic
material is modified artificially to give it a new property (e.g. a plant's resistance to a disease,
insect or drought, a plant's tolerance to a herbicide, improving a food's quality or nutritional
value, increased yield).”
(European Commission. 2016a)
At this time, only one genetically engineered crop has been cultivated in the European Union,
the MON 810 maize variety (Figure IX.1). The cultivation license for this maize variety
expired in November 2013 and the procedure for renewal is ongoing. By introducing a gene
from Bacillus thuringiensis, the maize plant produces Bt toxin, which is toxic to butterflies
and moths, including the European Maize Borer. The caterpillars of these moths chew tunnels
through the stalks of the plants, causing them to fall over. When Bt Maize is cultivated, the
Maize Borer Caterpillar dies due to the Bt toxin present in the tissues of the plant. Thus,
productivity per hectare is increased. However, increasing resistance to Bt toxin is reducing
the effectiveness of this genetic modification.(Tabashnik et al. 2013)
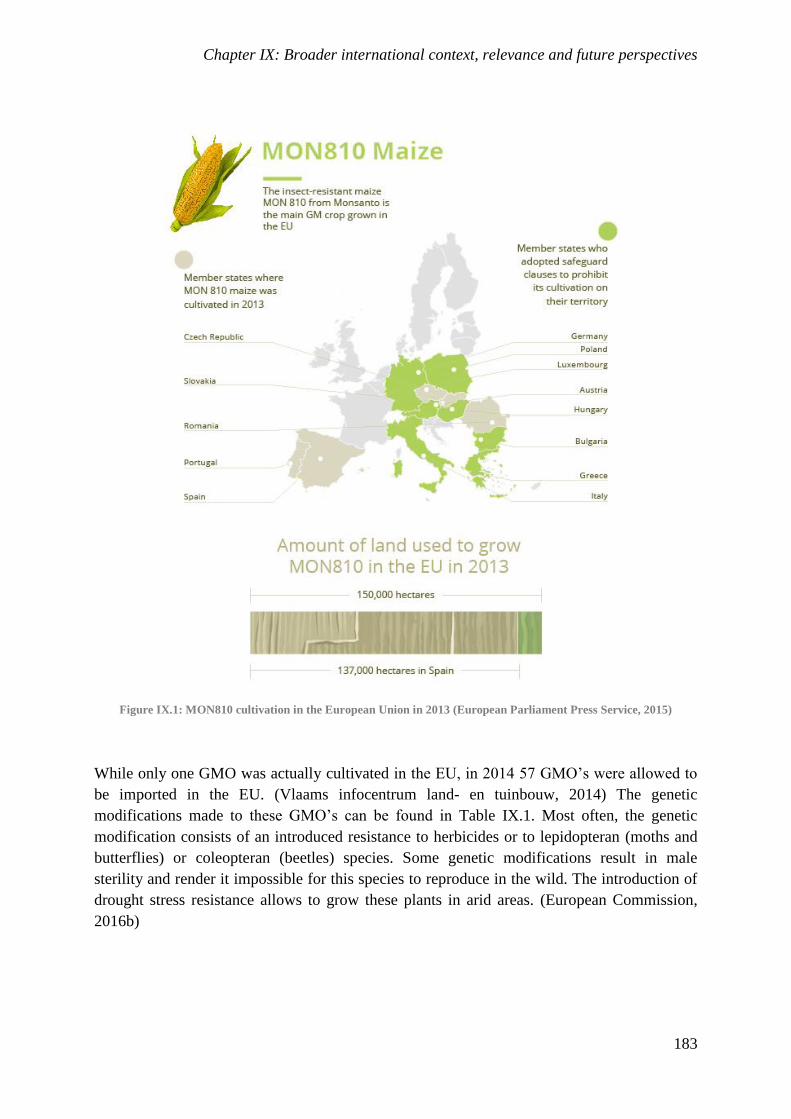
Chapter IX: Broader international context, relevance and future perspectives
183
Figure IX.1: MON810 cultivation in the European Union in 2013 (European Parliament Press Service, 2015)
While only one GMO was actually cultivated in the EU, in 2014 57 GMO’s were allowed to
be imported in the EU. (Vlaams infocentrum land- en tuinbouw, 2014) The genetic
modifications made to these GMO’s can be found in Table IX.1. Most often, the genetic
modification consists of an introduced resistance to herbicides or to lepidopteran (moths and
butterflies) or coleopteran (beetles) species. Some genetic modifications result in male
sterility and render it impossible for this species to reproduce in the wild. The introduction of
drought stress resistance allows to grow these plants in arid areas. (European Commission,
2016b)
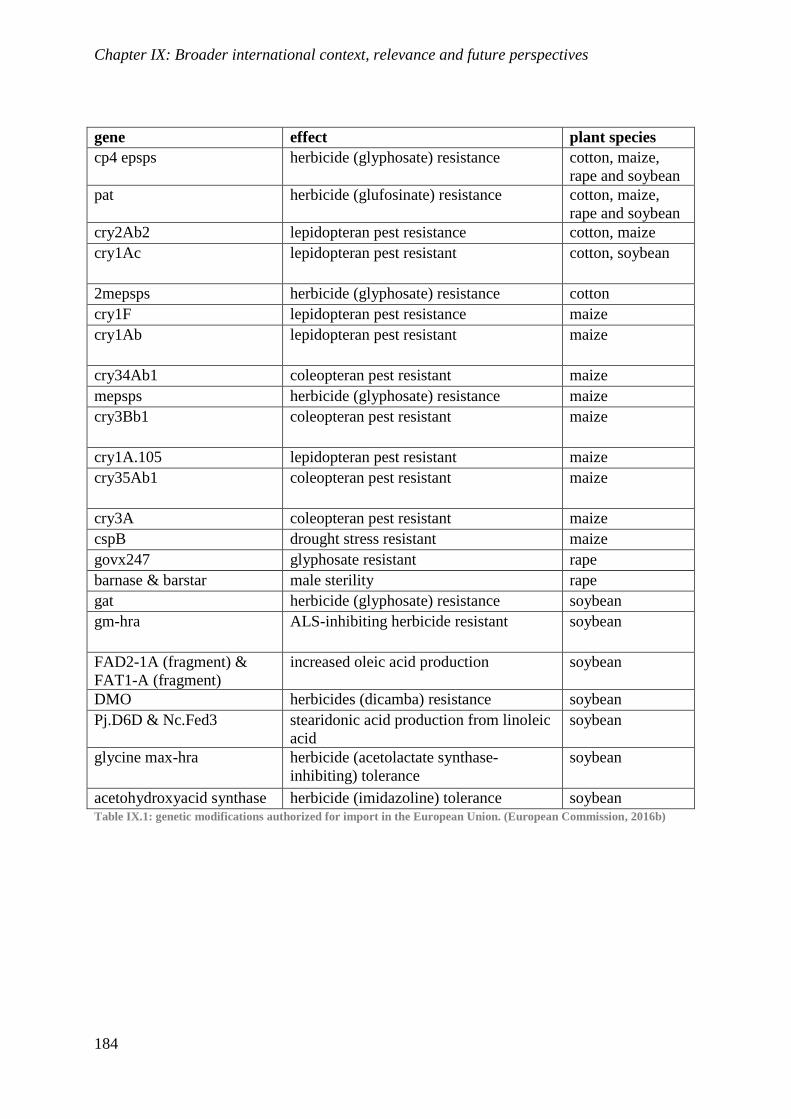
Chapter IX: Broader international context, relevance and future perspectives
184
gene effect plant species
cp4 epsps herbicide (glyphosate) resistance cotton, maize,
rape and soybean
pat herbicide (glufosinate) resistance cotton, maize,
rape and soybean
cry2Ab2 lepidopteran pest resistance cotton, maize
cry1Ac lepidopteran pest resistant cotton, soybean
2mepsps herbicide (glyphosate) resistance cotton
cry1F lepidopteran pest resistance maize
cry1Ab lepidopteran pest resistant maize
cry34Ab1 coleopteran pest resistant maize
mepsps herbicide (glyphosate) resistance maize
cry3Bb1 coleopteran pest resistant maize
cry1A.105 lepidopteran pest resistant maize
cry35Ab1 coleopteran pest resistant maize
cry3A coleopteran pest resistant maize
cspB drought stress resistant maize
govx247 glyphosate resistant rape
barnase & barstar male sterility rape
gat herbicide (glyphosate) resistance soybean
gm-hra ALS-inhibiting herbicide resistant soybean
FAD2-1A (fragment) &
FAT1-A (fragment)
increased oleic acid production soybean
DMO herbicides (dicamba) resistance soybean
Pj.D6D & Nc.Fed3 stearidonic acid production from linoleic
acid
soybean
glycine max-hra herbicide (acetolactate synthase-
inhibiting) tolerance
soybean
acetohydroxyacid synthase herbicide (imidazoline) tolerance soybean Table IX.1: genetic modifications authorized for import in the European Union. (European Commission, 2016b)
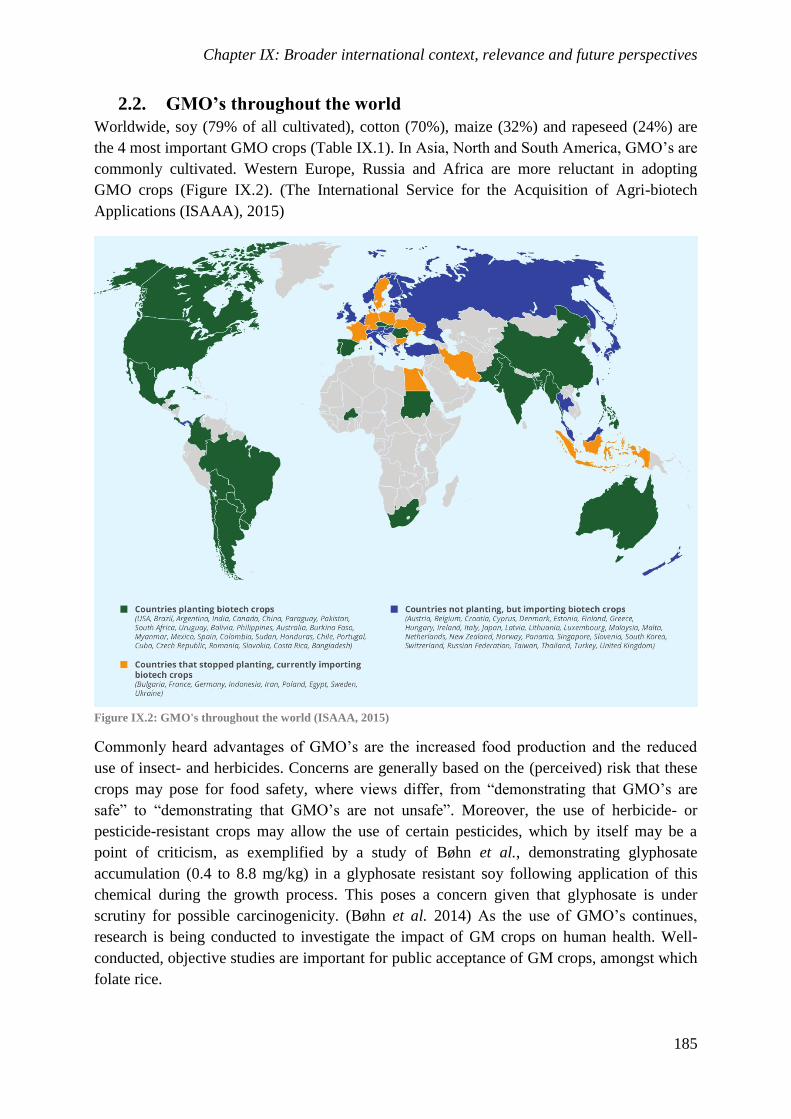
Chapter IX: Broader international context, relevance and future perspectives
185
2.2. GMO’s throughout the world
Worldwide, soy (79% of all cultivated), cotton (70%), maize (32%) and rapeseed (24%) are
the 4 most important GMO crops (Table IX.1). In Asia, North and South America, GMO’s are
commonly cultivated. Western Europe, Russia and Africa are more reluctant in adopting
GMO crops (Figure IX.2). (The International Service for the Acquisition of Agri-biotech
Applications (ISAAA), 2015)
Figure IX.2: GMO's throughout the world (ISAAA, 2015)
Commonly heard advantages of GMO’s are the increased food production and the reduced
use of insect- and herbicides. Concerns are generally based on the (perceived) risk that these
crops may pose for food safety, where views differ, from “demonstrating that GMO’s are
safe” to “demonstrating that GMO’s are not unsafe”. Moreover, the use of herbicide- or
pesticide-resistant crops may allow the use of certain pesticides, which by itself may be a
point of criticism, as exemplified by a study of Bøhn et al., demonstrating glyphosate
accumulation (0.4 to 8.8 mg/kg) in a glyphosate resistant soy following application of this
chemical during the growth process. This poses a concern given that glyphosate is under
scrutiny for possible carcinogenicity. (Bøhn et al. 2014) As the use of GMO’s continues,
research is being conducted to investigate the impact of GM crops on human health. Well-
conducted, objective studies are important for public acceptance of GM crops, amongst which
folate rice.
Chapter IX: Broader international context, relevance and future perspectives
186
IX.3. Folate rice, a recipe for success!
3.1. Folate rice and folate status
In this PhD project we were able to demonstrate that folate rice is able to supply folates to rats
consuming it. Even though, in absolute amounts, the folate supplementation used in our study
was minimal because of limitations in available folate rice, the rats remained apparently
healthy during the long term feeding trial. This was in strong contrast to the animals receiving
wild type rice. While the latter animals showed clear signs of folate deficiency and some even
perished during the trial, the animals receiving a supplement in the form of folate rice thrived.
A similar result was observed for the feeding strategy using FA fortified rice. This shows that
folate rice is able to provide similar results when compared to traditional fortification
strategies. (Chapter VI, Kiekens et al. 2015c)
3.2. Economic aspects of folate rice use
Apart from the investigation into the biological effect of the consumption of folate rice, the
economic impact of the introduction of folate rice on a population with a high prevalence of
folate deficiency has been investigated. De Steur et al. calculated the effect of folate rice
consumption on the health status in China. While rice consumption is lower in the northern
regions which are confronted with a high impact of folate deficiency compared to southern
regions, the required folate intake can still be achieved and a significant reduction of the
health burden related to folate deficiency is possible. Based on a disability-adjusted life years
approach, implementing folate rice in China would save 37 to 82% of the health burden
related to folate deficiency.(De Steur et al. 2010) The results obtained in our rodent study,
demonstrating the adequacy of folate rice, lend further support to the health claims made by
De Steur et al. (Chapter VI, Kiekens et al. 2015c)
However, public perception of bioengineered food items can be negative, which may impact
public acceptance of folate rice. Public acceptance and willingness-to-pay were investigated
using a technique of experimental auctions of folate rice. While the nutritional effect of folate
rice is valued positively by the consumers in the Shanxi province in Northern China, educated
consumers tend to be more negative towards bioengineered rice. The willingness to pay a
premium for the perceived higher quality rice demonstrates that genetic engineering is
accepted by a public in need for folate fortification.(De Steur et al. 2012)
3.3. Recent developments of folate rice
The usefulness of folate rice also depends on the stability of the folates present in this
biofortified rice variety during storage after harvest. From a stability experiment it was
concluded that approximately 50% of folates were lost following 4 months of storage at
temperatures of 21 and 28 °C. Only 40% of folates present at the time of harvest were still
present after 8 months of storage. Also, a generation effect was inferred following analysis of
rice seeds from different generations of this rice species. While in a rice line (GA9.15), up to
1700 µg of folates were present per 100 g of fresh weight in the fourth generation, this
concentration decreased to 700 µg / 100 g fresh weight in the seventh generation.(Blancquaert
et al. 2015)
Chapter IX: Broader international context, relevance and future perspectives
187
A possible solution for the stability issue and the generation effect was to increase either the
degree of folate polyglutamylation, through the increase of folylpolyglutamate synthase
(FPGS) expression, or to introduce the genes necessary for the expression of folate binding
protein (FBP) in the rice plant. The increased expression of the FPGS enzyme did not succeed
in augmenting the degree of polyglutamylation due to a concurrent increase of the γ-
glutamylhydrolase enzyme expression opposing the function of FPGS. The introduction of
FBP in the rice genome resulted in lines with a higher and more stable folate concentration.
(Blancquaert et al. 2015)
IX.4. What the future might bring Further biofortification of staple crops might extend the use of these food items to more than
just a source of energy. By adding different vitamins and nutrients, these functional foods can
support the health status of the individual consuming it. For instance, by further engineering
of the rice genome, a rice species could be created with an increased concentration of other B-
vitamins such as thiamin (B1). Also a combination with iron biofortification might prove
beneficial, especially to counteract anemia. Following this approach, true functional foods
could be created that provide the consumer with a sufficient nutrient intake, irrespective of the
food diversity available to this consumer. While, apart from extreme cases, a low nutrient
status may not be all that significant in a clinical context, an optimal intake of essential
vitamins should increase the overall health status of the population by optimizing in vivo
metabolism and biosynthesis. By doing so, many illnesses can be prevented before requiring
medical attention.
Though it is unlikely that LC-MS/MS will completely replace the microbiologic and binding
assays used for clinical folate measurement, these higher order assays will be very useful to
evaluate the systematic differences between different assays to achieve comparability of assay
results. Since an evaluation of the folate status of different populations depends on the
comparability of reference values (not biased by systematic differences), the importance of
certified reference materials, verified using LC-MS/MS, will only increase. LC-MS/MS is
definitely required when quantitative information on the individual folate monoglutamate and
polyglutamate species is needed. As such, it is possible to study the enzymes taking part in
folate metabolism in greater detail, thus allowing to obtain the most information possible from
complex experiments.
Although our understanding of folates as an essential nutrient is rapidly growing, much is still
to be learned on the actual function of different folate monoglutamate and polyglutamate
species. For instance, the effect that low folate status has on immune response has not been
thoroughly investigated. While the use of FA is common practice in folate research, this may
result in biased results, as FA is not an appropriate folate source for in vitro studies. In this
thesis, we demonstrated that cells exposed to FA behave differently than cells exposed to
5MeTHF (Chapter VII). While this is an important finding, our understanding of intracellular
processes involving folate remains limited. With the gradual and ongoing increase in LC-
MS/MS sensitivity, it should be possible to further characterize intracellular folate
Chapter IX: Broader international context, relevance and future perspectives
188
metabolism. This could be helpful to relate the cause and onset of certain illnesses to folate
status. A causal relation between folate status and illnesses remains largely elusive to this day.
IX.5. Conclusion The importance of nutrient intake for an optimal overall health status is gaining interest due to
the distribution of the knowledge gained following decades of scientific research. While the
quality of the western diet is improving and fruits and vegetables rich in nutrients are
promoted by the government, an optimal nutrient status may not easily be achieved.
Especially prior to and during pregnancy an additional folate intake is necessary to minimize
the risk for neural tube defects. FA supplementation, either as a pill or as food fortification,
can provide the additional folate intake needed to achieve an adequate folate status. However,
not in all parts of the world preventive healthcare or food fortification on an industrial scale is
available to the general public. In this respect, biofortified folate rice can provide a source of
dietary folate which can be farmed locally.
One of the steps towards public acceptance of this genetically modified crop is the proof that
the folates accumulated within the rice grains are effectively biologically available and that
folate rice helps to maintain an adequate folate status. Using a rat model and by providing the
rice on a daily basis during a long term feeding trial with periodic monitoring of short and
long term folate status and other biological indices, we were able to demonstrate that folate
rice is able to serve as an adequate source of dietary folate.
Chapter IX: Broader international context, relevance and future perspectives
189
IX.6. References Blancquaert, D., Van Daele, J., Strobbe, S., Kiekens, F., Storozhenko, S., De Steur, H.,
Gellynck, X., Lambert, W.E., Stove, C.P. and Van Der Straeten, D. 2015. “Improving
Folate (vitamin B9) Stability in Biofortified Rice through Metabolic Engineering.” Nat
Biotechnol 33 (10): 1076–8.
Bøhn, T., Cuhra, M., Traavik, T., Sanden, M., Fagan, J., Primicerio, R. 2014. “Compositional
differences in soybeans on the market: Glyphosate accumulates in Roundup Ready GM
soybeans.” Food Chem 153: 207-15
Castorena-Torres, F., Ramos-Parra, P.A., Hernández-Méndez, R.V., Vargas-García, A.,
García-Rivas, G. and de la Garza, R.I.D. 2014. “Natural Folates from Biofortified
Tomato and Synthetic 5-methyl-tetrahydrofolate Display Equivalent Bioavailability in a
Murine Model.” Plant Foods Hum Nutr 69: 57–64
Courtemanche, C., Elson-Schwab, I., Mashiyama, S.T., Kerry, N. and Ames, B.N. 2004.
“Folate Deficiency Inhibits the Proliferation of Primary Human CD8+ T Lymphocytes in
Vitro.” J Immunol 173 (5): 3186–92.
De Brouwer, V., Storozhenko, S., Stove, C.P., Van Daele, J., Van der Straeten, D. and
Lambert, W.E. 2010. “Ultra-Performance Liquid Chromatography-Tandem Mass
Spectrometry (UPLC-MS/MS) for the Sensitive Determination of Folates in Rice.” J
Chromatogr B 878 (3-4): 509–13.
De Steur, H., Gellynck, X., Storozhenko, S., Liqun, G., Lambert, W.E., Van Der Straeten, D.
and Viaene, J. 2010. “Health Impact in China of Folate-Biofortified Rice.” Nat
Biotechnol 28 (6): 554–6.
De Steur, H., Gellynck, X., Feng, S., Rutsaert, P. and Verbeke, W. 2012. “Determinants of
Willingness-to-Pay for GM Rice with Health Benefits in a High-Risk Region: Evidence
from Experimental Auctions for Folate Biofortified Rice in China.” Food Qual Prefer 25
(2): 87–94.
European Commission. 2016a. “Genetically Modified Organisms.”
http://ec.europa.eu/food/plant/gmo/index_en.htm (Consulted: 04/26/2016)
European Commission. 2016b. “EU Register of authorised GMOs.”
http://ec.europa.eu/food/dyna/gm_register/index_en.cfm (Consulted: 05/01/2016)
European Parliament Press Service. 2015. “Eight things you should know about GMOs.”
http://www.europarl.europa.eu/news/en/news-room/20151013STO97392/Eight-things-
you-should-know-about-GMOs (Consulted: 05/01/2016)
The International Service for the Acquisition of Agri-biotech Applications (ISAAA). 2015.
“19 Years of Biotech Crops in the World.”
http://www.isaaa.org/resources/infographics/19yearsofbiotechcrops/19%20Years%20of%
20Biotech%20Crops%20in%20the%20World.pdf (Consulted: 05/01/2016)
Kiekens, F., Van Daele, J., Blancquaert, D., Van Der Straeten, D., Lambert, W.E. and Stove
C.P. 2015a. “Determination of Five Folate Monoglutamates in Rodent Diets.” J Agric
Food Chem 63(45):10089-10095
Chapter IX: Broader international context, relevance and future perspectives
190
Kiekens, F., Van Daele, J., Blancquaert, D., Van Der Straeten, D., Lambert, W.E. and Stove,
C.P. 2015b. “A Validated Ultra-High-Performance Liquid Chromatography-Tandem
Mass Spectrometry Method for the Selective Analysis of Free and Total Folate in Plasma
and Red Blood Cells.” J Chromatogr A 1398: 20–8.
Kiekens, F., Blancquaert, D., Devisscher, L., Van Daele, J., Stove, V.V., Delanghe, J.R., Van
Der Straeten, D., Lambert, W.E. and Stove, C.P. 2015c. “Folates from metabolically
engineered rice: a long-term study in rats.” Mol Nutr Food Res 59(3):490-500.
Pfeiffer, C.M., Fazili, Z., McCoy, L., Zhang, M. and Gunter, E.W. 2004. “Determination of
Folate Vitamers in Human Serum by Stable-Isotope-Dilution Tandem Mass
Spectrometry and Comparison with Radioassay and Microbiologic Assay.” Clin Chem
50 (2): 423–32.
Tabashnik, B.E., Brévault, T. and Carrière, Y. 2013. “Insect resistance to Bt crops: lessons
from the first billion acres.” Nat Biotechnol 31 (6): 510-21.
Vlaams infocentrum land- en tuinbouw. 2014. “Oppervlakte ggo’s is sinds 1996 vergroot met
factor 100”
http://www.vilt.be/Oppervlakte_ggos_is_sinds_1996_vergroot_met_factor_100
(Consulted: 04/28/2016)

Chapter X: Summary and Conclusions

Chapter X: Summary and Conclusions
192
Chapter X: Summary and Conclusions
193
In this thesis, an in vivo study is described that aimed at investigating the nutritional value of
folate rice, a bioengineered rice species with an increased folate content compared to wild
type rice. However, to obtain the data necessary for a complete evaluation of folate status, a
method for folate determination in small blood samples was developed and validated. Also a
method to assess the presence of folates in rodent diets was developed to exclude constituents
of these diets as a confounding factor.
As described in Chapter IV, the development of a method for the analysis of folates in rodent
diets proved more challenging than initially expected. The synthetic nature of the rodent diets
resulted in the release of oils and fats during sample extraction, which complicated the
manipulation of the samples. Though the separation of these oils and fats using an organic
water-immiscible solvent was evaluated, it provided no improvement. The pH was of key
importance for the optimal deconjugation of folate polyglutamates. While a pH of 7.4 is
optimal for the determination of folates in rice, for rodent diet, the optimal pH was 6.0. As
such, a pH adjustment was introduced as part of the tri-enzyme treatment. Also, a solid-phase
extraction (SPE) procedure was introduced to remove interfering peaks and assure method
selectivity. By opting for an orthogonal separation technique using a strong-anion exchange
sorbent, the remaining triglycerides could be removed prior to the analysis of the samples
using a reversed phase analytical column. This method, once fully validated based on the
guideline of the Food and Drug Administration, was published in the Journal of Agricultural
and Food Chemistry.
Similarly, a method for the analysis of folates in plasma and red blood cells (RBCs) was
developed based on the method for folates in rice. However, an all-new sample preparation
procedure was needed. The limited amount of whole blood (±300 µl) available from the
periodic sampling of laboratory animals necessitated the use of one aliquot of whole blood to
measure both the plasma and the RBC folate. To achieve this, a washing procedure was
devised. First, the plasma fraction is removed after which the RBCs are washed 3 times and
then lysed using a selective ammonia-based buffer. The sample clean-up procedure, including
deconjugation for RBC extracts, protein precipitation and SPE was similar for both matrices.
This allowed simultaneous analysis of both plasma and RBC samples. To increase sample
throughput, the SPE-procedure was adapted from a 12-port manifold to a 96-well system.
This method, as described in Chapter V and published in Journal of Chromatography A, was
fully validated based on the guidelines for method validation of the European Medicine
Agency. This method was also used during a collaborative study with C.M. Pfeiffer and Z.
Fazili of the Centers for Disease Control and Prevention (Atlanta, GA, USA) to assess method
comparability in the first ever LC-MS/MS based round-robin test for folates (unpublished
data).
Chapter X: Summary and Conclusions
194
To evaluate the bioavailability and biological efficacy of folates from folate rice, a rodent
study was performed. Devised as a long term feeding trial, the animals received either wild
type, folate or folic acid fortified rice on a daily basis for a period of 12 weeks (cfr. Chapter
VI). This allowed for the stabilization of the RBC folate levels and allowed to evaluate the
efficacy of prolonged folate rice consumption. Also, the rice was provided as intact grains to
avoid artefacts when the rice grains would be ground to a powder and incorporated in the
rodent diet. As such, daily rice rations were provided to the animals in porcelain bowls, a
procedure, though uncommon, that allowed visual confirmation that the entire ration of rice
was consumed. During the trial, the animals in the negative control group (only receiving a
folate free diet) and the animals in the wild type rice group (receiving both wild type rice and
a folate free diet) fared less well than animals in the other groups. Following the death of
some animals in these affected groups, the remaining animals were euthanized and the
samples were collected as would be the case later on for the groups with folate supplemented
diets. At the end of the feeding trial, none of the animals receiving folate rice suffered from
folate deficiency as evidenced by normal plasma and RBC folate levels, moderate plasma
homocysteine levels and a normal hematology. As such, we concluded that folate rice as a
food source is able to provide folates to the organism.
As can be observed from the results obtained during the feeding trial, 5-
methyltetrahydrofolate (5MeTHF) is the main circulating folate species in the bloodstream
and not folic acid (FA). However, common understanding of the effect of folate status on the
functioning of the immune system relies on in vitro studies using FA as a folate source (i.e.
Courtemanche et al. 2004 J Immunol 173 (5): 3186-3192.). In Chapter VII, we investigated
the difference in both cell proliferation and intracellular folate concentrations in response to
differences in folate concentrations and the folate species used as a folate source. Due to the
limited stability of 5MeTHF during incubation, daily replenishment of this folate species was
necessary to maintain the desired folate levels during the 9-day incubation period. While the
observations of Courtemanche et al. could be replicated using FA as a folate source, the
proliferation of CD2+, CD4+ and CD8+ lymphocytes proved less susceptible to concentration
differences when 5MeTHF was used as a folate source.
Finally, the quantitative determination of individual folate polyglutamate species was
investigated. The chromatography and mass detection described in Chapter VIII was
optimized for the determination of 5-methyltetrahydropteroylpolyglutamates (5MeTHPGlun).
Given the lack of commercially available reference standards, the chemical synthesis of these
compounds was optimized. However, although the confirmation of the standard using an
HPLC-UV procedure did not match the theoretical concentrations of commercially available
5MeTHPGlun, it has since been clarified that the commercial folates in powdered form
contain crystalline water due to their hygroscopic nature. Therefore, this procedure should be
re-evaluated after measurement of the purity of the commercial polyglutamate standards.
Chapter X: Summary and Conclusions
195
As described in this thesis, we demonstrated that folate rice serves as a valuable source of
dietary folate and that it may have the potential of reducing the prevalence of folate deficiency
in regions where traditional folic acid fortification is not feasible. While the methods
described in this thesis were purposely developed for the bioavailability trial, these can be
used in a wider research context. Especially the method for folate determination in plasma
and red blood cells provides several improvements over existing methods.

Chapter X: Summary and Conclusions
196

197
Curriculum vitae
Filip Kiekens
Born in Aalst on February 7th
, 1987
Education and work experience
1999 – 2005
Industrial Sciences – Vrij Technisch Instituut Aalst
2005 – 2008
Bachelor in Industrial Engineering (Chemistry) – KaHo Sint-Lieven (KULeuven)
2008 – 2009
Master in Industrial Engineering (Chemistry) – KaHo Sint-Lieven (KULeuven)
2009 – 2010
Master in Environmental Management and Sanitation – Ghent University
2010 – 2015
PhD at the Laboratory of Toxicology, Faculty of Pharmaceutical Sciences, Ghent University
A1 publications as first author
Folates from metabolically engineered rice: a long-term study in rats.
Kiekens, F., Blancquaert, D., Devisscher, L., Van Daele, J., Stove, V.V., Delanghe, J.R.,
Van Der Straeten, D., Lambert, W.E. and Stove, C.P.
Molecular Nutrition & Food Research; 2015 ;59(3):490-500
impact factor (year): 4.603 (2014)
category (ranking): Food Science & Technology (4/123) D1/Q1
Curriculum vitae
198
A validated ultra-high-performance liquid chromatography-tandem mass spectrometry
method for the selective analysis of free and total folate in plasma and red blood cells.
Kiekens, F., Van Daele, J., Blancquaert, D., Van Der Straeten, D., Lambert, W.E. and
Stove C.P.
Journal of Chromatography A; 2015; 1398:20-28
impact factor (year): 4.169 (2014)
category (ranking): Chemistry, Analytical (6/74) D1/Q1
Determination of Five Folate Monoglutamates in Rodent Diets.
Kiekens, F., Van Daele, J., Blancquaert, D., Van Der Straeten, D., Lambert, W.E. and
Stove C.P.
Journal of Agricultural and Food Chemistry; 2015; 63(45):10089-10095
impact factor (year): 2.912 (2014)
category (ranking): Agriculture, Multidisciplinary (2/56) D1/Q1
Determination of clinical folate status: practical considerations.
Kiekens, F., Blancquaert, D., Van Daele, J., De Steur, H., Gellynck, X.,
Van Der Straeten, D., Lambert, W.E. and Stove, C.P.
To be submitted to: Journal of Chromatography B
A1 publications as co-author
Folate Profiling in Potato (Solanum tuberosum) Tubers by Ultrahigh-Performance Liquid
Chromatography-Tandem Mass Spectrometry.
Van Daele, J., Blancquaert, D., Kiekens, F., Van Der Straeten, D., Lambert, W.E. and
Stove C.P.
Journal of Agricultural and Food Chemistry. 2014; 62(14):3092–3100
impact factor (year): 2.912 (2014)
category (ranking): Agriculture, Multidisciplinary (2/56) D1/Q1
Food Science & Technology (13/123)
Chemistry, Applied (11/72)
Improving folate (vitamin B9) stability in biofortified rice through metabolic engineering.
Blancquaert, D., Van Daele, J., Strobbe, S., Kiekens, F., Storozhenko, S., De Steur, H.,
Gellynck, X., Lambert, W.E., Stove, C.P. and Van Der Straeten, D.
Nature Biotechnology. 2015; 33(10):1076-1078
impact factor (year): 41.514 (2014)
category (ranking): Biotechnology and Applied Microbiology (2/163) D1/Q1
Curriculum vitae
199
Degradation and interconversion of plant pteridines during sample preparation and ultra-
high performance liquid chromatography-tandem mass spectrometry.
Van Daele, J., Blancquaert, D., Kiekens, F., Van Der Straeten, D., Lambert, W.E. and
Stove, C.P.
Food Chemistry. 2016; 194:1189-1198
impact factor (year): 3.391 (2014)
category (ranking): Food Science & Technology (8/123) D1/Q1
Proceedings
Development of a chromatographic method for the analysis of folates in rodent diets.
Kiekens, F., Van Daele, J., Blancquaert, D., Storozhenko, S., Van Der Straeten, D.,
Lambert, W.E. and Stove, C.P.
Pteridines. 2012; 23(1):165
impact factor (year): 0.520 (2012)
category (ranking): Biophysics (69/72) Q4
Oral Presentations
15th
International Symposium on Pteridines and Folates
Development of a chromatographic method for the analysis of folates in rodent diets
comprising biofortified rice
Kiekens, F., Van Daele, J., Blancquaert, D., Storozhenko, S., Van Der Straeten, D.,
Lambert, W.E. and Stove C.P.
Antalya, Turkey, 2012
1st Caparica Christmas Conference on Sample Treatment
Sensitive and selective determination of folates in plasma and red blood cell extracts:
pitfalls and possibilities
Kiekens, F. and Stove, C.P.
Lisbon, Portugal, 2014
Curriculum vitae
200
Poster and Short Presentation
2nd
International Vitamin Conference
Development of an UPLC®-MS/MS method for the analysis of folates in rodent diets
comprising biofortified rice
Kiekens, F., Van Daele, J., Blancquaert, D., Storozhenko, S., Van Der Straeten, D.,
Lambert, W.E. and Stove, C.P.
Copenhagen, Denmark, 2012
Poster Presentation
3rd
International Vitamin Conference
Demonstration of bioaccessibility, bioavailability and biological activity of natural folates
from metabolically engineered rice: a long-term study in rats
Kiekens, F., Devisscher, L., Blancquaert, D., Van Der Straeten, D., Lambert, W.E. and
Stove, C.P.
Washington D.C., USA, 2015
Educational work
Support of practical courses Toxicology: 2010 - 2015
overseeing practical experiments and teaching a session on sample preparation
Support of demonstrations for courses Chemical Criminalistics: 2010 - 2015
providing an introduction in sample preparation methodology and the principle of
chromatography
Support for Bachelor Project: 2013
tutor and point of contact for Bachelor Project sessions
Support of Master dissertations:
Benoit Louage – 2010 - 2011 – “Ontwikkeling Staalvoorbereiding voor Folaatbepaling in
Plasma en Rode Bloedcellen via LC-MS/MS.”
Rozemien Lemey – 2011 - 2012 – “Ontwikkeling Staalvoorbereiding voor Bepaling van 5-
Methyltetrahydrofolaat Polyglutamaten in Rode Bloedcellen via LC-MS/MS.”
Ekaterina Ulyanava – 2011 - 2012 – “Methodevalidatie voor de Bepaling van Folaten in
Knaagdiervoeder”