Biofuels bonanza? Sugarcane production and poverty in villages surrounding Budongo Forest, Uganda
20
This article was downloaded by: [the Bodleian Libraries of the University of Oxford] On: 10 May 2012, At: 05:52 Publisher: Routledge Informa Ltd Registered in England and Wales Registered Number: 1072954 Registered office: Mortimer House, 37-41 Mortimer Street, London W1T 3JH, UK Journal of Eastern African Studies Publication details, including instructions for authors and subscription information: http://www.tandfonline.com/loi/rjea20 Biofuels bonanza? Sugarcane production and poverty in villages surrounding Budongo Forest, Uganda Zinta A. Zommers a , Paul J. Johnson a & David W. Macdonald a a Wildlife Conservation Research Unit, Department of Zoology, University of Oxford, The Recanati-Kaplan Centre, Tubney House, Tubney, OX13 5QL, UK Available online: 10 May 2012 To cite this article: Zinta A. Zommers, Paul J. Johnson & David W. Macdonald (2012): Biofuels bonanza? Sugarcane production and poverty in villages surrounding Budongo Forest, Uganda, Journal of Eastern African Studies, 6:2, 177-195 To link to this article: http://dx.doi.org/10.1080/17531055.2012.669569 PLEASE SCROLL DOWN FOR ARTICLE Full terms and conditions of use: http://www.tandfonline.com/page/terms-and- conditions This article may be used for research, teaching, and private study purposes. Any substantial or systematic reproduction, redistribution, reselling, loan, sub-licensing, systematic supply, or distribution in any form to anyone is expressly forbidden. The publisher does not give any warranty express or implied or make any representation that the contents will be complete or accurate or up to date. The accuracy of any instructions, formulae, and drug doses should be independently verified with primary sources. The publisher shall not be liable for any loss, actions, claims, proceedings, demand, or costs or damages whatsoever or howsoever caused arising directly or indirectly in connection with or arising out of the use of this material.
Transcript of Biofuels bonanza? Sugarcane production and poverty in villages surrounding Budongo Forest, Uganda

This article was downloaded by: [the Bodleian Libraries of the University of Oxford]On: 10 May 2012, At: 05:52Publisher: RoutledgeInforma Ltd Registered in England and Wales Registered Number: 1072954 Registeredoffice: Mortimer House, 37-41 Mortimer Street, London W1T 3JH, UK
Journal of Eastern African StudiesPublication details, including instructions for authors andsubscription information:http://www.tandfonline.com/loi/rjea20
Biofuels bonanza? Sugarcaneproduction and poverty in villagessurrounding Budongo Forest, UgandaZinta A. Zommers a , Paul J. Johnson a & David W. Macdonald aa Wildlife Conservation Research Unit, Department of Zoology,University of Oxford, The Recanati-Kaplan Centre, Tubney House,Tubney, OX13 5QL, UK
Available online: 10 May 2012
To cite this article: Zinta A. Zommers, Paul J. Johnson & David W. Macdonald (2012): Biofuelsbonanza? Sugarcane production and poverty in villages surrounding Budongo Forest, Uganda,Journal of Eastern African Studies, 6:2, 177-195
To link to this article: http://dx.doi.org/10.1080/17531055.2012.669569
PLEASE SCROLL DOWN FOR ARTICLE
Full terms and conditions of use: http://www.tandfonline.com/page/terms-and-conditions
This article may be used for research, teaching, and private study purposes. Anysubstantial or systematic reproduction, redistribution, reselling, loan, sub-licensing,systematic supply, or distribution in any form to anyone is expressly forbidden.
The publisher does not give any warranty express or implied or make any representationthat the contents will be complete or accurate or up to date. The accuracy of anyinstructions, formulae, and drug doses should be independently verified with primarysources. The publisher shall not be liable for any loss, actions, claims, proceedings,demand, or costs or damages whatsoever or howsoever caused arising directly orindirectly in connection with or arising out of the use of this material.

Biofuels bonanza? Sugarcane production and poverty in villagessurrounding Budongo Forest, Uganda
Zinta A. Zommers*, Paul J. Johnson and David W. Macdonald
Wildlife Conservation Research Unit, Department of Zoology, University of Oxford,The Recanati-Kaplan Centre, Tubney House, Tubney OX13 5QL, UK
(Received 15 April 2011; final version received 2 February 2012)
In 2006 the Ugandan government attempted to give a large portion of MabiraForest Reserve to the Sugar Corporation of Uganda Limited. The governmentargued the rainforest ‘‘give away’’ would contribute to economic developmentand create the opportunity for biofuel production. The proposal faced massiveopposition from Ugandan civil society, which countered that deforestation wouldincrease hunger and poverty. In order to help resolve the debate, this studyexamines the livelihoods of villagers living near a sugar factory and forest reservein rural Uganda. We interviewed 821 households seeking to explore possible linksbetween poverty and participation in sugarcane production at both the villageand household level. Villages closest to the factory appeared wealthier thanvillages closer to the reserve. However, households pursued different livelihoodstrategies and invested in different components of wealth. It is therefore unclearwhether the benefits of sugar or biofuel production outweigh the environmentalcosts of forest loss.
Keywords: Africa; Uganda; livelihoods; sugarcane; biofules; poverty
Introduction
During the past decade biofuels have been described as a ‘‘miracle in waiting’’ � a
means to reduce dependence on fossil fuels, limit carbon emissions and a mechanism
to spur economic growth and poverty reduction.1 However, sceptics have argued that
biofuel production contributes to an array of environmental and social problems,
including water shortages, deforestation and biodiversity loss, as well as food
insecurity.2 Biofuel production has generated heated debate in Uganda in particular.
In 2006 the Ugandan government attempted to give 71 km2 of Mabira Forest
Reserve to the Sugar Corporation of Uganda Limited (SCOUL). The government
argued the rainforest ‘‘give away’’ would contribute to economic development and
create the opportunity for biofuel production. Uganda’s president Yoweri Museveni
described the proposal as an economic ‘‘goldmine’’, stating that, ‘‘a sugar cane
plantation is also an oilfield’’.3 ‘‘The problem of Africa is not lack of forests but lack
of factories,’’ he claimed.4 Nevertheless, the government proposal faced massive
*Corresponding author. Email: [email protected]
Journal of Eastern African Studies
Vol. 6, No. 2, May 2012, 177�195
ISSN 1753-1055 print/ISSN 1753-1063 online
# 2012 Taylor & Francis
http://dx.doi.org/10.1080/17531055.2012.669569
http://www.tandfonline.com
Dow
nloa
ded
by [
the
Bod
leia
n L
ibra
ries
of
the
Uni
vers
ity o
f O
xfor
d] a
t 05:
52 1
0 M
ay 2
012

opposition from Ugandan civil society, which countered that deforestation would
increase hunger and poverty.
This study attempts to help resolve the debate by evaluating livelihoods near a
similar forest reserve, Budongo Forest, which lies adjacent to a sugar factory,
Kinyara Sugar Works Limited (KSWL). We seek to identify levels of poverty in
villages near the forest reserve and sugar factory, and to determine if households with
income from the sugar factory are wealthier than households without. We
hypothesize that if the presence of KSWL has a local development benefit, villages
closest to the factory should be wealthier than villages further from the factory.5
Additionally, within villages, individuals employed by KSWL should be wealthier
than individuals without such employment. By investigating local livelihoods we
hope to provide an empirical basis with which to develop future policies regarding
sugarcane and biofuels production.
Debating biofuels
Biofuels are defined by the Food and Agriculture Organization (2000) as, ‘‘organic
primary and/or secondary fuels derived from biomass which can be used for the
generation of thermal energy by combustion or by other technology. They comprise
both purpose-grown energy crops, as well as multipurpose plantations and by-
products (residues and wastes)’’.6 This article focuses on ethanol, an alcohol derived
by fermentation of crops such as sugar beets and sugarcane, and a biofuel of growing
importance. The International Energy Agency predicts that ethanol alone may make
up 10% of world gasoline use by 2025 and 30% by 2050.7 Proponents of ethanol
production cite a variety of positive impacts such as the diversification of rural
economies, large-scale job creation, poverty reduction, energy security and potential
for green house gas savings.8 Opponents of ethanol production raise concerns over
insufficient land availability, destruction of rainforests and wetlands, biodiversity
loss, and other environmental costs such as increased soil erosion and increased
water use.9
Arguments for and against ethanol production were raised in Uganda during
debates over the fate of Mabira Forest Reserve. Mabira Forest is the largest
remaining stand of indigenous forest in central Uganda. The reserve covers over
300km2.10 In 2006 the Government of Uganda proposed giving 71km2 of Mabira
Forest Reserve to SCOUL to grow sugarcane.11 The Minister of Water and
Environment claimed, ‘‘This will increase the sugar production in addition to
benefiting the communities with social services like schools, clinics, staff houses and
access roads.’’12 The government further argued that the proposal would contribute
to the development of the biofuels industry and reduce dependence on imported
oil.13 ‘‘It is in our interest to diversify the energy mix in order to reduce dependence,’’
argued Daudi Migereko, the Ugandan Energy Minister.14 The Ugandan Minister for
Water and Environment explained the benefits of the proposal to Parliament as
follows:
By providing additional land to SCOUL, increased sugar production will save foreignexchange of US $20�25 million per annum. In addition, SCOUL will produceadditional 10�12MW of electricity, which can be supplied to . . . the national Grid.Furthermore, [an] additional 3,500 jobs will be created with an annual earning of 3billion Ugandan shillings and infrastructure investment (schools, houses, dispensaries)
178 Z.A. Zommers et al.
Dow
nloa
ded
by [
the
Bod
leia
n L
ibra
ries
of
the
Uni
vers
ity o
f O
xfor
d] a
t 05:
52 1
0 M
ay 2
012

worth 3.5 billion Ugandan shillings . . .. Besides financial and infrastructure benefits,SCOUL is planning to produce power alcohol (ethanol) which is a biofuel which can bemixed with petrol to the extent of 10�15%. This initiative will enable us to diversifyenergy production.15
With promises of jobs, wealth creation, schools and infrastructure, the conversion
of Mabira Forest was depicted as a development bonanza. In a letter to UgandanMembers of Parliament, President Museveni explained his reasons for supporting
the proposal, ‘‘Employment creation is one of my main interests when I support
manufacturers and hotels in acquiring land . . . How long shall we go on with this
problem of educated people without jobs?’’16 The president labelled opponents of the
proposal as ‘‘criminals’’ and ‘‘charlatans’’. In a statement to his caucus, Museveni
wrote:
Those opposing industrialization, apart from being enemies of NRM, are, in particular,enemies of the youth because they are the ones who need these jobs. I can no longertolerate this. I will mobilize the youth to smash politically all these cliques obstructingthe future of the youth and the country.17
Government statements implied that the environment had to be sacrificed for the
benefit of development. The Minister of State for the Lwero Triangle claimed, ‘‘Even
if Mehta or Madhvani ‘destroyed’ part of the natural vegetation, they would
contribute more to the national coffers and offer employment to thousands of
Ugandans.’’18
Nevertheless, the proposal faced massive opposition from civil society, high-
lighting the tension between economic and environmental needs. Opponents argued
that the ‘‘forest give away’’ would hurt the tourism industry, reduce biodiversity anddestroy a source of food and income for the people living around the forest,
increasing hunger and poverty.19 An anti-government demonstration on 12 April
2007 resulted in the death of several people. It was the largest street protest ever held
in Uganda.20
While the Mabira Forest proposal was eventually abandoned due to mounting
pressure, continued interest exists in both sugar plantation expansion and in biofuels.
In November 2007, the Ugandan Ministry of Energy published a Renewable Energy
Policy, which set a goal of blending 20% biofuel into all gasoline fuel.21 Kakira SugarWorks planned to start ethanol production in late 2009.22 Concerns have also been
raised that the Ugandan cabinet is reassessing the Mabira proposal.23 As these
debates continue, it is valuable to examine the livelihoods of households living near
sugar plantations and forest reserves.
Budongo Forest and KSWL
Budongo Forest offers an illuminating case study in which to examine these issues
further. Like Mabira, Budongo is a protected forest reserve near a large sugar
factory, KSWL. Budongo is located in Masindi District, Western Uganda (between18 37’ N to 28 03’ N and 318 22’ E to 318 46’ E) on an escarpment of the Western Rift
Valley, approximately 39 km west of the town of Masindi. It covers an area of 435
km2 and consists of medium-altitude moist semi-deciduous tropical forest.24
KSWL lies directly south of Budongo Forest. In 1975, it was the largest sugar
factory in Uganda with 260 km2 of sugar cane.25 Production ceased during Uganda’s
Journal of Eastern African Studies 179
Dow
nloa
ded
by [
the
Bod
leia
n L
ibra
ries
of
the
Uni
vers
ity o
f O
xfor
d] a
t 05:
52 1
0 M
ay 2
012
civil conflicts, but the factory was formally rehabilitated in 1995. Between 1988 and
2002 the area under sugarcane cultivation by both KSWL and its outgrowers
increased over 18 fold, from 6.9 km2 to 127.29 km2, with a corresponding loss of 46.8
km2 of forest. 26 In 2002 Kinyara produced 50,000 of the 120,000 tonnes of sugarproduced in Uganda every year.27 Plantation size and sugar production have
continued to increase since then. In 2007 the cane fields covered approximately 140
km2.28 While KSWL is not currently engaged in ethanol production, it does burn
excess cane waste, baggase, to produce energy, feeding 5 MW into the Ugandan grid.
KSWL plans to upgrade its capacity to 10 MW.29
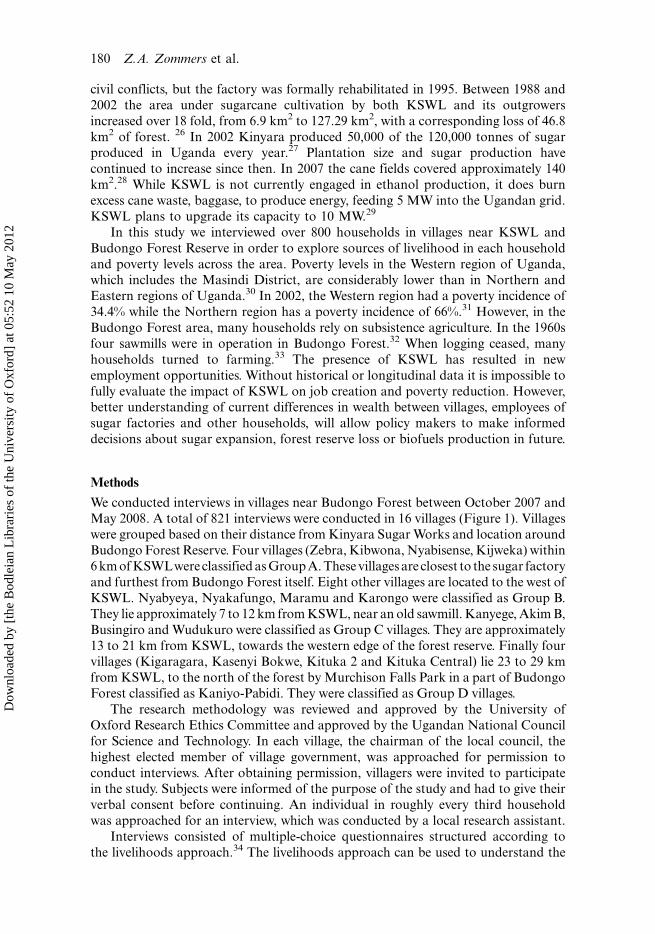
In this study we interviewed over 800 households in villages near KSWL and
Budongo Forest Reserve in order to explore sources of livelihood in each household
and poverty levels across the area. Poverty levels in the Western region of Uganda,which includes the Masindi District, are considerably lower than in Northern and
Eastern regions of Uganda.30 In 2002, the Western region had a poverty incidence of
34.4% while the Northern region has a poverty incidence of 66%.31 However, in the
Budongo Forest area, many households rely on subsistence agriculture. In the 1960s
four sawmills were in operation in Budongo Forest.32 When logging ceased, many
households turned to farming.33 The presence of KSWL has resulted in new
employment opportunities. Without historical or longitudinal data it is impossible to
fully evaluate the impact of KSWL on job creation and poverty reduction. However,better understanding of current differences in wealth between villages, employees of
sugar factories and other households, will allow policy makers to make informed
decisions about sugar expansion, forest reserve loss or biofuels production in future.
Methods
We conducted interviews in villages near Budongo Forest between October 2007 and
May 2008. A total of 821 interviews were conducted in 16 villages (Figure 1). Villageswere grouped based on their distance from Kinyara Sugar Works and location around
Budongo Forest Reserve. Four villages (Zebra, Kibwona, Nyabisense, Kijweka) within
6 km of KSWLwere classified as Group A. These villages are closest to the sugar factory
and furthest from Budongo Forest itself. Eight other villages are located to the west of
KSWL. Nyabyeya, Nyakafungo, Maramu and Karongo were classified as Group B.
They lie approximately 7 to 12 km from KSWL, near an old sawmill. Kanyege, Akim B,
Busingiro and Wudukuro were classified as Group C villages. They are approximately
13 to 21 km from KSWL, towards the western edge of the forest reserve. Finally fourvillages (Kigaragara, Kasenyi Bokwe, Kituka 2 and Kituka Central) lie 23 to 29 km
from KSWL, to the north of the forest by Murchison Falls Park in a part of Budongo
Forest classified as Kaniyo-Pabidi. They were classified as Group D villages.
The research methodology was reviewed and approved by the University of
Oxford Research Ethics Committee and approved by the Ugandan National Council
for Science and Technology. In each village, the chairman of the local council, the
highest elected member of village government, was approached for permission to
conduct interviews. After obtaining permission, villagers were invited to participatein the study. Subjects were informed of the purpose of the study and had to give their
verbal consent before continuing. An individual in roughly every third household
was approached for an interview, which was conducted by a local research assistant.
Interviews consisted of multiple-choice questionnaires structured according to
the livelihoods approach.34 The livelihoods approach can be used to understand the
180 Z.A. Zommers et al.
Dow
nloa
ded
by [
the
Bod
leia
n L
ibra
ries
of
the
Uni
vers
ity o
f O
xfor
d] a
t 05:
52 1
0 M
ay 2
012

total portfolio of activities and assets that contribute to a household’s survival.
Livelihoods are assessed by examining: 1) assets; 2) how access to assets is modified
by social relations, institutions, and organizations; and 3) how trends and shocks
influence livelihood strategies.35 Questionnaires therefore focused on these three
areas, as well as on forest use. Questions referred to the activities of an individual’s
household. All forms of assistance, including remittances, were recorded.
We adopted a multidimensional approach to poverty, conceiving poverty as a
composite of economic wellbeing, capability, and social inclusion.36 Economic
wellbeing was determined by assessing assets, such as land and livestock ownership.
It was not possible to obtain exact income figures from respondents. Instead, a
variety of locally relevant indicators were chosen as proxies for wealth. Where
possible, indicators were based on results of previous studies conducted in Uganda.
For example, Pouw concludes that food items can also be used as a proxy for wealth
in Ugandan villages; wealthier individuals regularly add foods such as fish, meat,
milk and eggs to their diet.37 Ellis and Bahiigwa identified three different wealth
classes in Ugandan villages, based on assets:
(1) The well-off own above 2 ha or 5 acres of land, four or more cattle, five or
more goats, a bicycle or motorcycle, employ non farm labour, send their
children to primary and secondary school and may have a salaried job;
(2) Middle wealth categories have fewer assets, sell labour rather than buy it, or
engage in smaller scale non-farm activities such as trading and bicycle taxis;
Figure 1. Location of different villages in which interviews were conducted. Budongo Forest
Reserve is shaded in grey. Kinyara Sugar Works Limited (KSWL) is indicated by the star.
Circles represent Group A villages (ZB, Zebra; KB, Kibwona; NS, Nyabisense; KJ, Kijweka).
Squares represent Group B villages (NY, Nyabyeya; NK, Nyakafungo; MR, Maramu; KR,
Karongo). Triangles represent Group C villages (KN, Kanyege; AB, Akim B; BS, Busingiro;
WD, Wudukuro). Diamonds represent Group D villages (KA, Kasenyi Bokwe; KG,
Kigaragara; KT, Kituka 2; KC, Kituka).
Journal of Eastern African Studies 181
Dow
nloa
ded
by [
the
Bod
leia
n L
ibra
ries
of
the
Uni
vers
ity o
f O
xfor
d] a
t 05:
52 1
0 M
ay 2
012

(3) The poorest own little or no land, no cattle or bicycles, sell their labour to
others, have few non-farm employment options, aside from beer brewing, and
are unable to pay school fees.38
We used these criteria to evaluate economic wellbeing in this study.
Capabilities and social inclusion were probed by examining household school
enrolment and participation in village activities. Respondents were asked whether or
not they, or other household members, participated in drinking societies, burial
societies, the local council, sports teams, village church, saving societies or other
community organizations. Answers where tallied to provide a score of civic
participation, which could range from 0 to 14. Zero indicates no member of a
household is involved in any organization. Fourteen indicates that at least twomembers from the household are each involved in seven different organizations.
Data were analysed using the computer programme SPSS 17. Differences
between villages and households were compared using Analysis of Variance tests
(ANOVAs). Chi-square and Fisher’s Exact Test (Monte Carlo 2 sided significance
based on 10,000 sampled tables) were used to explore categoric data. In an effort to
summarize components of wealth, a principal component analysis (PCA) was
conducted on seven assets.39 The resulting factor scores of households with different
forms of employment were compared using a Generalized Linear Model (GLM) toidentify associations between employment type and components of wealth.
Statistical interactions between village and KSWL employment were examined
using a logistic regression where employment by KSWL was treated as a binary
response.
Results
Summary statistics
On average, 51 people (SD�6.28) were interviewed per village. Household size
ranged between one and 13 individuals, with a median size of four individuals (Table
1). Household size differed significantly across villages (Welch F (15, 297.595)�3.994,p�0.000). A Games Howell Post-hoc test revealed that households in Zebra, the
village closest to the factory, were significantly smaller than other villages.
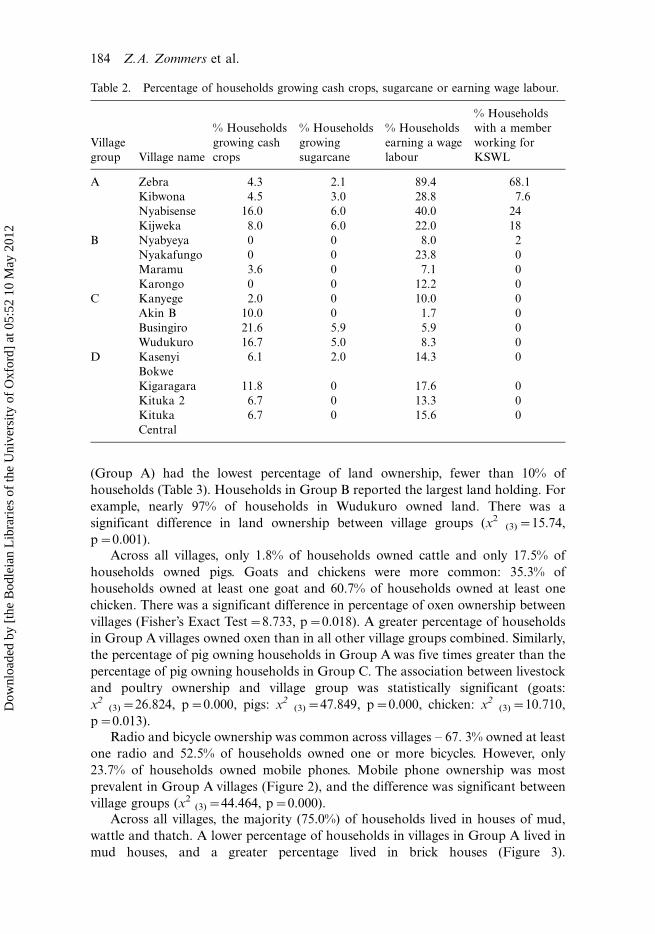
Across all villages, few households (7.5%) grew cash crops and only 1.9% of
households grew sugar cane. Near KSWL a slightly higher percentage of households
grew sugarcane (Table 2). Only one-fifth of households (20%) gained income from
wage labour, even fewer (7%) from work at KSWL. Villages differed significantly in
this respect (Fisher’s Exact Test�186.504, p�0.00). Nearly three times as many
households in Group A (43.2%) earned a wage as in Group D (15.3%) and over seventimes as many as in Group C (6.3%). Employment by KSWL also differed between
villages (x2(15)�204.51, p�0.000). Nearly all interview subjects employed by
KSWL resided in Group A villages ( 98.3%, n�58).
Differences in poverty across villages
Assets and nutritional intake
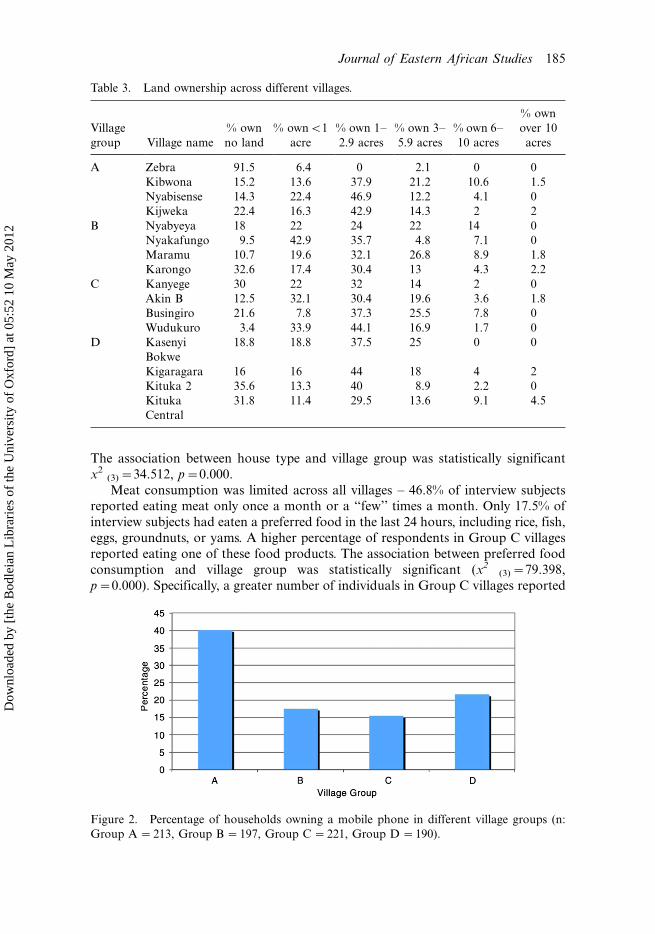
Across all the villages land ownership was limited. Of all households surveyed, 24%
owned no land, and an additional 53% owned less than three acres of land. Zebra
182 Z.A. Zommers et al.
Dow
nloa
ded
by [
the
Bod
leia
n L
ibra
ries
of
the
Uni
vers
ity o
f O
xfor
d] a
t 05:
52 1
0 M
ay 2
012

Table 1. Characteristics of interview subjects and households by village. While individual subjects were interviewed, questions referred to the whole
household.
Village
group Village name
Ranked
proximity to
KSWL
Approximate distance of
households in village to
KSWL (km)
# People
interviewed
%
Male
%
Female
Average age of
interview
subjects
Min
age Max age
Mean
household
size
A Zebra 1 2.54�3.30 47 55.3 44.7 29.62 14 50 2.9892.027
Kibwona 2 3.89�6.13 66 50 50 37.77 16 70 5.3592.787
Nyabisense 3 4.32�5.44 50 46 54 33.00 19 65 4.2091.895
Kijweka 4 4.68�5.50 50 58 42 33.98 16 76 3.8892.096
B Nyabyeya 5 7.44�8.02 50 48 52 36.94 16 92 4.5692.643
Nyakafungo 6 9.77�10.25 42 50 50 41.85 19 75 4.2192.976
Maramu 7 10.66�11.11 56 42.9 57.1 38.98 14 84 3.6892.081
Karongo 8 11.60�12.24 49 53.2 46.8 36.17 18 70 4.6692.315
C Kanyege 9 12.91�14.42 50 56 44 34.58 16 64 4.1492.241
Akin B 10 18.19�19.57 60 57.6 42.4 35.5 15 70 4.9792.846
Busingiro 11 19.2�20.53 51 56.9 43.1 37.92 19 72 4.3792.607
Wudukuro 12 20.2�21.38 60 50 50 36.85 18 87 5.2592.33
D Kasenyi
Bokwe
13 23.13�24.20 49 61.2 38.8 31.9 17 56 5.0292.65
Kigaragara 14 24.48�25.25 51 56.9 43.1 36.35 17 77 4.4192.515
Kituka 2 15 25.02�26.87 45 80 20 32.84 19 63 3.3891.957
Kituka
Central
16 27.08�28.87 45 60 40 32.91 16 71 5.3393.104
Jou
rna
lo
fE
astern
Africa
nS
tud
ies1
83
Dow
nloa
ded
by [
the
Bod
leia
n L
ibra
ries
of
the
Uni
vers
ity o
f O
xfor
d] a
t 05:
52 1
0 M
ay 2
012
(Group A) had the lowest percentage of land ownership, fewer than 10% of
households (Table 3). Households in Group B reported the largest land holding. For
example, nearly 97% of households in Wudukuro owned land. There was a
significant difference in land ownership between village groups (x2(3)�15.74,
p�0.001).
Across all villages, only 1.8% of households owned cattle and only 17.5% of
households owned pigs. Goats and chickens were more common: 35.3% of
households owned at least one goat and 60.7% of households owned at least one
chicken. There was a significant difference in percentage of oxen ownership between
villages (Fisher’s Exact Test�8.733, p�0.018). A greater percentage of households
in Group A villages owned oxen than in all other village groups combined. Similarly,
the percentage of pig owning households in Group A was five times greater than the
percentage of pig owning households in Group C. The association between livestock
and poultry ownership and village group was statistically significant (goats:
x2(3)�26.824, p�0.000, pigs: x2
(3)�47.849, p�0.000, chicken: x2(3)�10.710,
p�0.013).
Radio and bicycle ownership was common across villages � 67. 3% owned at least
one radio and 52.5% of households owned one or more bicycles. However, only
23.7% of households owned mobile phones. Mobile phone ownership was most
prevalent in Group A villages (Figure 2), and the difference was significant between
village groups (x2(3)�44.464, p�0.000).
Across all villages, the majority (75.0%) of households lived in houses of mud,
wattle and thatch. A lower percentage of households in villages in Group A lived in
mud houses, and a greater percentage lived in brick houses (Figure 3).
Table 2. Percentage of households growing cash crops, sugarcane or earning wage labour.
Village
group Village name
% Households
growing cash
crops
% Households
growing
sugarcane
% Households
earning a wage
labour
% Households
with a member
working for
KSWL
A Zebra 4.3 2.1 89.4 68.1
Kibwona 4.5 3.0 28.8 7.6
Nyabisense 16.0 6.0 40.0 24
Kijweka 8.0 6.0 22.0 18
B Nyabyeya 0 0 8.0 2
Nyakafungo 0 0 23.8 0
Maramu 3.6 0 7.1 0
Karongo 0 0 12.2 0
C Kanyege 2.0 0 10.0 0
Akin B 10.0 0 1.7 0
Busingiro 21.6 5.9 5.9 0
Wudukuro 16.7 5.0 8.3 0
D Kasenyi
Bokwe
6.1 2.0 14.3 0
Kigaragara 11.8 0 17.6 0
Kituka 2 6.7 0 13.3 0
Kituka
Central
6.7 0 15.6 0
184 Z.A. Zommers et al.
Dow
nloa
ded
by [
the
Bod
leia
n L
ibra
ries
of
the
Uni
vers
ity o
f O
xfor
d] a
t 05:
52 1
0 M
ay 2
012
The association between house type and village group was statistically significant
x2(3)�34.512, p�0.000.
Meat consumption was limited across all villages � 46.8% of interview subjectsreported eating meat only once a month or a ‘‘few’’ times a month. Only 17.5% of
interview subjects had eaten a preferred food in the last 24 hours, including rice, fish,
eggs, groundnuts, or yams. A higher percentage of respondents in Group C villages
reported eating one of these food products. The association between preferred food
consumption and village group was statistically significant (x2(3)�79.398,
p�0.000). Specifically, a greater number of individuals in Group C villages reported
Table 3. Land ownership across different villages.
Village
group Village name
% own
no land
% ownB1
acre
% own 1�2.9 acres
% own 3�5.9 acres
% own 6�10 acres
% own
over 10
acres
A Zebra 91.5 6.4 0 2.1 0 0
Kibwona 15.2 13.6 37.9 21.2 10.6 1.5
Nyabisense 14.3 22.4 46.9 12.2 4.1 0
Kijweka 22.4 16.3 42.9 14.3 2 2
B Nyabyeya 18 22 24 22 14 0
Nyakafungo 9.5 42.9 35.7 4.8 7.1 0
Maramu 10.7 19.6 32.1 26.8 8.9 1.8
Karongo 32.6 17.4 30.4 13 4.3 2.2
C Kanyege 30 22 32 14 2 0
Akin B 12.5 32.1 30.4 19.6 3.6 1.8
Busingiro 21.6 7.8 37.3 25.5 7.8 0
Wudukuro 3.4 33.9 44.1 16.9 1.7 0
D Kasenyi
Bokwe
18.8 18.8 37.5 25 0 0
Kigaragara 16 16 44 18 4 2
Kituka 2 35.6 13.3 40 8.9 2.2 0
Kituka
Central
31.8 11.4 29.5 13.6 9.1 4.5
Figure 2. Percentage of households owning a mobile phone in different village groups (n:
Group A �213, Group B �197, Group C �221, Group D �190).
Journal of Eastern African Studies 185
Dow
nloa
ded
by [
the
Bod
leia
n L
ibra
ries
of
the
Uni
vers
ity o
f O
xfor
d] a
t 05:
52 1
0 M
ay 2
012

consuming fish: 12.3% of respondents in Group C reported eating fish in the last 24
hours food vs. 3.4% of respondents in Group A, 4.5% in Group B, and 2.6% in
Group D.
Education and civic participation
Across all villages, households participated in approximately 4.3792.07 social
activities. Mean participation was highest in Kibwona (Group A), and lowest in the
village of Busingiro (Group C). Participation levels differed significantly between
villages (Welch’s F(15, 300)�2.406, p�0.003). However participation did not differ
significantly between village groups (Group A�4.4391.50, Group B�4.5191.44,
Group C�4.2091.31, Group D�4.3591.51) (Welch’s F(3, 448)�1.188, p�0.132).Of the 584 households that gave information about school enrolment, 125
(21.4%) enrolled all their children in school. In 28.8% of households children did not
attend school at all. A greater percentage of children attended school in villages in
Group A and Group D (Table 4). However, this is mainly a reflection of high
attendance in two villages, Zebra and Kituka Central.
Differences in poverty between households according to employment status
The assets of the households with income from KSWL were compared to households
without anyone working for KSWL. No statistically significant difference was found
in the number of oxen, pigs or goats or in preferred food consumption. However a
significant difference was found in the frequency of meat consumption (Welch’s
F (1, 103)�30.871, p�0.000), the number of radios (Welch’s F (1, 69)�16.080,
p�0.000), bicycles (Welch’s F (1, 67)�30.148, p�0.000), and mobile phones
(Welch’s F (1, 62)�40.322, p�0.000). Individuals working for KSWL ate meat
more often and owned a greater number of radios, bicycles and mobile phones. The
Figure 3. Distribution of housing types in different village groups. While the majority of
houses are made of mud, Group A has a greater proportion of brick houses. Other includes a
variety of rare housing types including houses of cement and iron sheets and tents or plastic.
186 Z.A. Zommers et al.
Dow
nloa
ded
by [
the
Bod
leia
n L
ibra
ries
of
the
Uni
vers
ity o
f O
xfor
d] a
t 05:
52 1
0 M
ay 2
012

number of school-aged children attending school was not significantly different from
non-KSWL households (F (1, 582)�3.554, p�0.060).
Individuals earning a wage labour but not working for KSWL (n�100), hadsignificantly greater number of mobile phones and radios (Welch’s F (1, 195)�34.323,
p�0.000 and Welch’s F (1, 241)�18.241, p�0.000), ate a greater number of preferred
foods (Welch’s F (1, 211)�4.937, p�0.028) and had a higher percentage of children in
school (F (1, 582)�4.063, p�0.044) than those not earning a wage.
The assets of households growing sugarcane (n�16) were compared to other
farmers. Households growing sugarcane had significantly more chickens
(F (1, 697)�5.618, p�0.018), bicycles (Welch’s F (1, 15.642)�7.182, p�0.017), and
a greater proportion of children in school (Welch’s F (1, 15.046)�6.956, p�0.019).However, no difference was found between households growing sugarcane (n�14)
and households growing other cash crops (n�47).
A PCA indicated that several components of wealth clustered together, and GLMs
indicated that component scores were associated with different forms of employment.
Bicycle, chicken, goat and radio ownership clustered with the size of land owned and
farmed (Component 1). Sugarcane growing had a significant main effect on this
component of wealth (F (1, 716)�14.036, p�0.000). Employment by KSWL, or other
forms of wage labour, had no significant effect on Component 1 (F (1, 718)�1.487,p�0.223; F (1, 683)�0.861, p�0.354). Mobile phone ownership was negatively
associated with the size of land owned and farmed (Component 2). However, this
component of wealth was associated with KSWL employment (F(1, 718)�6.727,
p�0.01) and with other forms of wage labour (F (1, 683)�31.29, p�0.000).
Do differences in poverty reflect differences between villages or differences inemployment status?
Employment status did not predict whether or not a household had goats, pigs,
chicken, radios, or ate preferred foods (logistic regression, Table 5). However,
Table 4. Percentage of school-aged children attending school.
Village group Village name % of school-aged children in school
A Zebra 63.2
Kibwona 38.98
Nyabisense 40.66
Kijweka 46.16
B Nyabyeya 38.44
Nyakafungo 49.24
Maramu 38.15
Karongo 43.78
C Kanyege 41.26
Akin B 37.88
Busingiro 39.1
Wudukuro 42.64
D Kasenyi Bokwe 31.98
Kigaragara 39.77
Kituka 2 44.79
Kituka Central 73.09
Journal of Eastern African Studies 187
Dow
nloa
ded
by [
the
Bod
leia
n L
ibra
ries
of
the
Uni
vers
ity o
f O
xfor
d] a
t 05:
52 1
0 M
ay 2
012
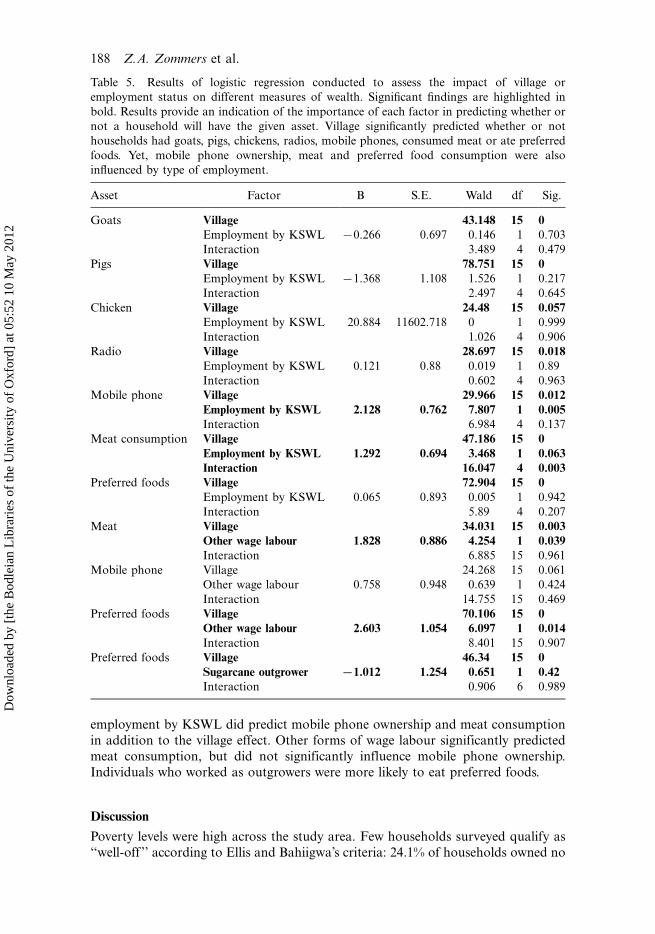
employment by KSWL did predict mobile phone ownership and meat consumption
in addition to the village effect. Other forms of wage labour significantly predicted
meat consumption, but did not significantly influence mobile phone ownership.
Individuals who worked as outgrowers were more likely to eat preferred foods.
Discussion
Poverty levels were high across the study area. Few households surveyed qualify as
‘‘well-off ’’ according to Ellis and Bahiigwa’s criteria: 24.1% of households owned no
Table 5. Results of logistic regression conducted to assess the impact of village or
employment status on different measures of wealth. Significant findings are highlighted in
bold. Results provide an indication of the importance of each factor in predicting whether or
not a household will have the given asset. Village significantly predicted whether or not
households had goats, pigs, chickens, radios, mobile phones, consumed meat or ate preferred
foods. Yet, mobile phone ownership, meat and preferred food consumption were also
influenced by type of employment.
Asset Factor B S.E. Wald df Sig.
Goats Village 43.148 15 0
Employment by KSWL �0.266 0.697 0.146 1 0.703
Interaction 3.489 4 0.479
Pigs Village 78.751 15 0
Employment by KSWL �1.368 1.108 1.526 1 0.217
Interaction 2.497 4 0.645
Chicken Village 24.48 15 0.057
Employment by KSWL 20.884 11602.718 0 1 0.999
Interaction 1.026 4 0.906
Radio Village 28.697 15 0.018
Employment by KSWL 0.121 0.88 0.019 1 0.89
Interaction 0.602 4 0.963
Mobile phone Village 29.966 15 0.012
Employment by KSWL 2.128 0.762 7.807 1 0.005
Interaction 6.984 4 0.137
Meat consumption Village 47.186 15 0
Employment by KSWL 1.292 0.694 3.468 1 0.063
Interaction 16.047 4 0.003
Preferred foods Village 72.904 15 0
Employment by KSWL 0.065 0.893 0.005 1 0.942
Interaction 5.89 4 0.207
Meat Village 34.031 15 0.003
Other wage labour 1.828 0.886 4.254 1 0.039
Interaction 6.885 15 0.961
Mobile phone Village 24.268 15 0.061
Other wage labour 0.758 0.948 0.639 1 0.424
Interaction 14.755 15 0.469
Preferred foods Village 70.106 15 0
Other wage labour 2.603 1.054 6.097 1 0.014
Interaction 8.401 15 0.907
Preferred foods Village 46.34 15 0
Sugarcane outgrower �1.012 1.254 0.651 1 0.42
Interaction 0.906 6 0.989
188 Z.A. Zommers et al.
Dow
nloa
ded
by [
the
Bod
leia
n L
ibra
ries
of
the
Uni
vers
ity o
f O
xfor
d] a
t 05:
52 1
0 M
ay 2
012
land, 98.2% of households did not own oxen, 64.7% did not own goats, 47.5% of
households did not own bicycles, and 97.2% of households did not own motorcycles.
In fact, only five households meet all of Ellis and Bahiigwa’s criteria and can be
classified as ‘‘well-off ’’. Households varied along different dimensions of poverty.For example, a relatively large percentage of the landless sent all their children to
school (24.5%) or owned mobile phones (30%). While these households appeared to
have fewer assets they had greater capabilities. This unexpected result appears to
indicate that landless households are not entirely destitute and may choose to invest
in different components of wealth.
Two livelihood strategies could be identified. Households that pursue agriculture
tend to invest in assets related to farming. For example, sugarcane outgrowers scored
highly on the component of wealth related to land ownership and livestockaccumulation (see PCA results). Secondly, households with individuals working for
KSWL appear to invest in assets such as mobile phones, better housing, and
education. How or why households choose different livelihood strategies is unclear.
Perhaps households in which individuals work for KSWL do not have available
labour for agriculture or do not have access to land. Alternatively, cultural or
migration patterns may explain livelihood choices. A greater percentage of forced
migrants, including refugees and internally displaced people, work for KSWL than
do socioeconomic migrants or non-migrants.40 However, few forced or socio-economic migrants cite employment by KSWL as a primary reason for settling in
Budongo Forest area.41
Does KSWL contribute to poverty reduction?
Employment by KSWL, or work as an outgrower, appears to provide a variety of
benefits. For example, households that grew sugarcane consumed more preferred
foods. They had a greater number of chickens, bicycles and sent more children toschool than other farmers. However, village level differences, rather than employ-
ment status or outgrowing, also explains variation in wealth (Table 5). Controlling
for village, employment by KSWL significantly predicted only mobile phone
ownership and meat consumption. Other forms of wage labour also predicted
meat consumption. Thus, the clearest benefit of work at KSWL, beyond benefits
bestowed by wage labour in general, appeared to be mobile phone ownership.
Does mobile phone ownership represent a significant step towards development
and poverty reduction? Opinions vary. Mobile phones can be used to providefinancial services to those without access to traditional banks.42 Phones can provide
information about market prices for agricultural crops. Non-economic benefits
include the empowerment of women, improved law enforcement and more rapid and
effective communications during disasters.43 However, other studies conclude that
mobile phones contribute only to additional expenditure. While they are a
dependable way to contact family members, and as such surely a good thing, they
do not contribute to improved livelihoods.44 It is unclear whether or not individuals
near Budongo Forest use phones for personal communication, to promote farming,or for business. Nearly a third (30.7%) of mobile phone owners do not even own
land. This fact suggests that they are unlikely to use mobile phones to promote
farming. In short, individuals who can afford mobile phones as a result of
employment by KSWL may not be able to capitalize on phones because they do
not pursue livelihood strategies based on agriculture.
Journal of Eastern African Studies 189
Dow
nloa
ded
by [
the
Bod
leia
n L
ibra
ries
of
the
Uni
vers
ity o
f O
xfor
d] a
t 05:
52 1
0 M
ay 2
012

The evaluation of poverty levels in this study is limited by the fact that income or
longitudinal data were not available. In future, it may also be useful to focus
interviews on sugarcane outgrowers or KSWL staff, particularly those living on the
commercial estate. They may earn higher salaries, or benefit from housing providedby KSWL, and may therefore contribute disproportionately to the economy of the
area. While such data would be important, it would not affect the purpose of this
study, which was to assess livelihoods in villages around Budongo Forest and
evaluate the broader impact of KSWL on the surrounding area. Any remittances
sent by KSWL employees living on the estate to family or friends in surrounding
villages were recorded in our questionnaires.
Does sugarcane production constitute a development bonanza?
Villages close to the sugar factory were wealthier by some measures than villages
further away from the factory. For example, a greater percentage of households in
Group A villages had assets such as mobile phones and oxen, and lived in superior
housing (Table 6). One village in Group A, Zebra, stands out as particularly unusual.
Nearly 70% of households in this village were employed by KSWL. While very few
households there owned land or livestock, a greater percentage of households had
superior quality housing and owned mobile phones. Meat and preferred foods wereconsumed more often and a high percentage of children attended school.
While poverty may be reduced in the vicinity of KSWL, the presence of a sugar
factory does not appear to have led to a ‘‘development bonanza’’ in the broader
Budongo area. Employment by KSWL was limited. Only 7% of interview subjects
had a household member employed by KSWL, and less than 2% of households grew
sugarcane. Most households continue to rely on subsistence agriculture.
Conclusion
In conclusion, it appears that employment in the sugar industry can bring benefits to
some households around Budongo Forest. However it is questionable if such
employment results in meaningful improvements in quality of life across a large
number of villages. It is clearly simplistic to portray the expansion of the sugar
industry and development of biofuels production as an economic goldmine. It is
unclear whether the benefits of expanded sugar production, and possible biofuels
production, outweigh the costs of destroying forests. The world’s poorest peopledepend primarily on environmental goods and services for their livelihoods.45 As a
result of this dependence on ecosystem services, poor households are particularly
sensitive and vulnerable to environmental changes. Unless biofuel production can
greatly increase opportunities for wage labour or outgrower farming, the destruction
of forest reserves could undermine access to natural resources and benefit only a
limited minority of wage labourers living closest to the sugar estate.
If the presence of a sugar factory does not generate widespread development and
poverty reduction, is it prudent for the Ugandan government to push for theexpansion of the biofuels industry at the expense of forests? Ethanol production may
have positive spillovers into the greater economy, boosting state and local tax
receipts.46 However, serious ethical questions are raised if the benefits of biofuel
production accrue to consumers, not to local producers, who may further be harmed
by losing access to forest resources.47 During debates about Mabira Forest, the
190 Z.A. Zommers et al.
Dow
nloa
ded
by [
the
Bod
leia
n L
ibra
ries
of
the
Uni
vers
ity o
f O
xfor
d] a
t 05:
52 1
0 M
ay 2
012
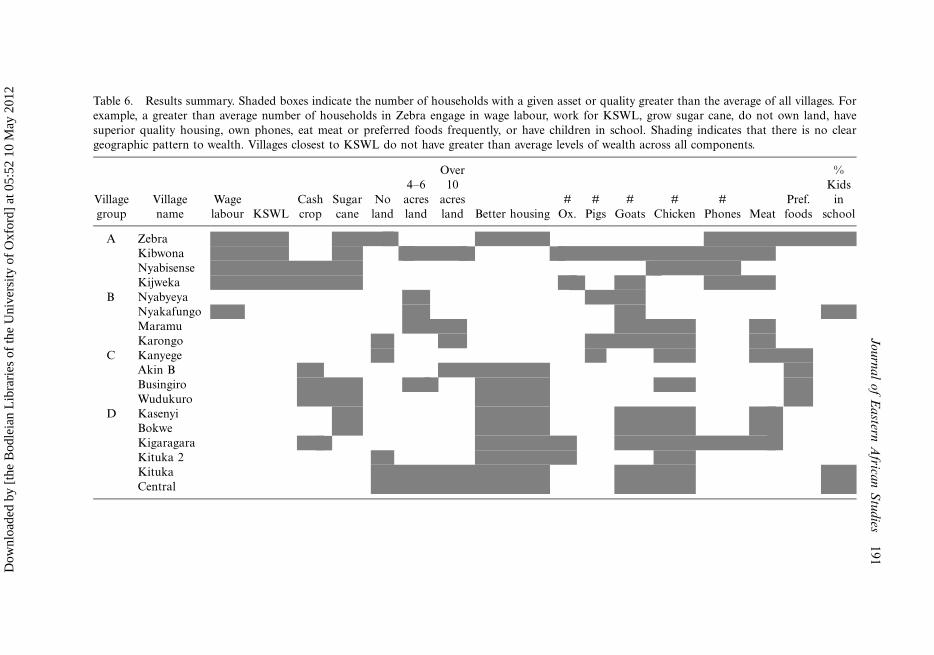
Table 6. Results summary. Shaded boxes indicate the number of households with a given asset or quality greater than the average of all villages. For
example, a greater than average number of households in Zebra engage in wage labour, work for KSWL, grow sugar cane, do not own land, have
superior quality housing, own phones, eat meat or preferred foods frequently, or have children in school. Shading indicates that there is no clear
geographic pattern to wealth. Villages closest to KSWL do not have greater than average levels of wealth across all components.
Village
group
Village
name
Wage
labour KSWL
Cash
crop
Sugar
cane
No
land
4�6
acres
land
Over
10
acres
land Better housing
#
Ox.
#
Pigs
#
Goats
#
Chicken
#
Phones Meat
Pref.
foods
%
Kids
in
school
A Zebra
Kibwona
Nyabisense
Kijweka
B Nyabyeya
Nyakafungo
Maramu
Karongo
C Kanyege
Akin B
Busingiro
Wudukuro
D Kasenyi
Bokwe
Kigaragara
Kituka 2
Kituka
Central
Jou
rna
lo
fE
astern
Africa
nS
tud
ies1
91
Dow
nloa
ded
by [
the
Bod
leia
n L
ibra
ries
of
the
Uni
vers
ity o
f O
xfor
d] a
t 05:
52 1
0 M
ay 2
012

National Forest Authority cautioned the Ugandan government against the proposal
and several senior managers resigned over the issue.48 They warned that Mabira’s
contribution to rain formation, soil conservation, and other environmental services
could be lost as a result of the conversion. As Pender et al. write, ‘‘Substituting
other forms of capital for natural capital may be the most effective way to pursue
development in the near term . . . but the costs of depleting natural capital may not be
fully accounted for.’’49 Before expanding sugarcane production into forest reserves,
the Ugandan government must carefully evaluate the importance of ecosystem
services to local livelihoods. Households in villages closest to Budongo Forest
benefited least from the presence of the factory and may rely most on natural capital.
If forests such as Mabira and Budongo support the subsistence of rural communities,
biofuel expansion will result in social costs, and further endanger species such as
chimpanzees.50
Ultimately, if sugarcane farming and ethanol production is to assist poverty
reduction, a larger share of benefits must be passed to all the communities
surrounding sugar estates. A variety of steps may be taken to maximize economic
and environmental benefits. Greater development of credit institutions could help
small farmers meet the set-up costs of entering the sugarcane market. Education
projects could be developed to teach farmers how to grow both sugarcane and food
crops. Smallholder outgrower based sugarcane bioenergy could minimize forest loss,
contribute to broader poverty reduction and provide energy benefits.51
Acknowledgements
We thank A. Hannington Fani, A. Geoffrey, and O. Katwesige for their help conductinginterviews, and are grateful to K. Grounds and U. Zommers for entering data. We alsoappreciate the suggestions provided by two anonymous readers. Research was supported bythe Commonwealth Scholarship Commission, the Cleveland Metroparks Zoo, and theCanadian Centennial Scholarship Fund.
Notes
1. Abbott, Sugar: A Bittersweet History.2. De Keyser and Hongo, ‘‘Farming for Energy for Better Livelihoods in Southern Africa’’;
Service, ‘‘Another Biofuels Drawback.’’3. Child, ‘‘Civil Society in Uganda.’’, 248�249.4. C. Obore, ‘‘Why I Decided to Give Mabira Away,’’ Daily Monitor, April 16, 2007, http://
www.lexisnexis.com/5. The majority of KSWL employees live on the KSWL estate, or in villages within walking
or cycling distance from KSWL. Thus we expect differences in wealth between villagesbased on distance from KSWL.
6. FAO, ‘‘The Energy and Agriculture Nexus.’’, 767. Amigun, Sigamoney, and Blottnitz, ‘‘Commercialisation of Biofuel Industry.’’8. Ibid.; Blessing Mangoyana, ‘‘Bioenergy for Sustainable Development’’; Bringezu et al.,
‘‘Towards Sustainable Production and Use of Resources’’; FAO, Food Energy and Climate;UN Energy, Sustainable Bioenergy; Wang, Me, and Huo, ‘‘Life-cycle Energy andGreenhouse Gas Emission.’’
9. Mullera et al. ‘‘Some Insights in the Effect of Growing Bio-energy’’; Robertson et al.‘‘Sustainable Biofuels Redux’’; WWF, Sugar and the Environment.
10. Briggs, Uganda: The Bradt Travel Guide.11. M. Mutagamba, ‘‘Cabinet Paper on Giving Mabira Forest to SCOUL.’’ New Vision, April
2, 2007, http://allafrica.com/stories/200704030561.html12. Ibid.
192 Z.A. Zommers et al.
Dow
nloa
ded
by [
the
Bod
leia
n L
ibra
ries
of
the
Uni
vers
ity o
f O
xfor
d] a
t 05:
52 1
0 M
ay 2
012

13. ‘‘Deaths in Uganda Forest Protest.’’ BBC News, April 12, 2007, http://news.bbc.co.uk/1/hi/world/africa/6548107.stm
14. L. Namubiru, ‘‘Uganda: Is Biofuel the Solution to Our Energy Problem.’’ New Vision,February 8, 2008, http://allafrica.com/stories/200802110019.html
15. M. Mutagamba, ‘‘Cabinet Paper on Giving Mabira Forest to SCOUL.’’ New Vision, April2, 2007, http://allafrica.com/stories/200704030561.html
16. ‘‘Why I Support Mabira give-away�Museveni.’’ New Vision, April 18, 2007, http://www.newvision.co.ug/D/8/12/560612
17. ‘‘Ugandan President Says Controversial Forest Conversion not Resolved.’’ Daily Monitor,December 21, 2007.
18. ‘‘Poverty, not Investors, is Mabira’s Biggest Enemy.’’ New Vision, May 9, 2007, http://allafrica.com/stories/200705090984.html. The Mehta Group is the company that ownsSCOUL.
19. D. Howden, ‘‘African Forest under Threat from Sugar Cane Plantation,’’ The Independent,July 10, 2007, http://www.independent.co.uk/environment/african-forest-under-threat-from-sugar-cane-plantation-456601.html
20. H. Bogere and M. Nalugo, ‘‘Police File Murder Charges over Mabira ForestDemonstrations,’’ The Daily Monitor, April 16, 2007, http://www.lexisnexis.com/
21. F. Nakhooda, ‘‘Sugar Companies Have Answer to Fuel Shortages,’’ New Vision, June 12,2008, http://www.newvision.co.ug/D/8/459/633240
22. Ibid.23. ‘‘Cabinet Plots Fresh Mabira Giveaway,’’ Daily Monitor, June 26, 2008, http://www.
lexisnexis.com/24. Reynolds, The Chimpanzees of Budongo Forest, 9.25. Ogendo and Obiero, ‘‘East African Sugar Industry.’’26. Mwavu and Witkowski, ‘‘Land-Use and Cover Changes (1988�2002) around Budongo
Forest Reserve.’’ The figures quoted include data about sugarcane cultivated by KSWLand by outgrowers; private farmers that grow and sell sugarcane to the factory at a rate of40,000 Ugandan shillings per tonne of sugarcane.
27. ‘‘Uganda to Sell off Sugar Works.’’ BBC News, March 11, 2002, http://news.bbc.co.uk/1/hi/business/1867484.stm
28. Gerard Harel, a manager at KSWL, pers. comm.29. ‘‘Museveni Outlines Priorities in State-of-the-Nation Address,’’ New Vision, June 4, 2009.
http://www.lexisnexis.com/30. Uganda Bureau of Statistics, Spatial Trends of Poverty and Inequality.31. Uganda Bureau of Statistics and the International Livestock Research Institute, Nature,
Distribution and Evolution of Poverty.32. Reynolds, The Chimpanzees of Budongo Forest, 11.33. Lauridsen, ‘‘Workers in a Forest.’’34. Ellis, Rural Livelihoods and Diversity.35. Ibid.36. Wagle, Multidimensional Poverty Measurement.37. Pouw, ‘‘Food Priorities and Poverty.’’38. Ellis and Bahiigwa, ‘‘Livelihoods and Rural Poverty Reduction in Uganda.’’, 100139. The Kaiser-Meyer-Olkin measure verified the sampling adequacy for the analysis, KMO
� 0.715, and KMO values for individual items were � 0.611, above the acceptable limitof 0.5 (Field, Discovering Statistics Using SPSS). Bartlett’s test of sphericity x2 (759) �1119.680, p � 0.000, indicated that correlations between items were sufficiently large forPCA. An initial analysis was run to obtain eigenvalues for each component in the data.Two components had eigenvalues over Kaiser’s criterion of 1, and in combinationexplained 57.07% of the variance.
40. Zommers and Macdonald, ‘‘Protected Areas as Frontiers for Migration.’’41. Ibid.42. Donner and Telles, ‘‘Mobile Banking and Economic Development’’; Mendoza and
Thelen, ‘‘Innovations to Make Markets More Inclusive.’’43. Bayes, ‘‘Infrastructure and Rural Development.’’44. Ureta, ‘‘Mobilising Poverty?’’45. WRI, The Wealth of the Poor.
Journal of Eastern African Studies 193
Dow
nloa
ded
by [
the
Bod
leia
n L
ibra
ries
of
the
Uni
vers
ity o
f O
xfor
d] a
t 05:
52 1
0 M
ay 2
012

46. Evans, ‘‘Economic Impact of Demand for Ethanol.’’47. Martino et al., ‘‘Environment for Development.’’48. ‘‘More NFA Managers Resign Over Mabira,’’ The Monitor, March 25, 2007. http://www.
lexisnexis.com/49. Pender et al., ‘‘Development Pathways and Land Management.’’, 78650. Rist et al., ‘‘Hunter Reporting of Catch.’’51. Ejigu, ‘‘Toward Energy and Livelihoods Security.’’
References
Abbott, E. Sugar: A Bittersweet History. Toronto: Penguin Canada, 2008.Amigun, B., R. Sigamoney, and H. von Blottnitz. ‘‘Commercialisation of Biofuel Industry in
Africa: A Review.’’ Renewable and Sustainable Energy Reviews 12 (2008): 690�711.Bayes, A. ‘‘Infrastructure and Rural Development: Insights from a Grameen Bank Village
Phone Initiative in Bangladesh.’’ Agricultural Economics 25 (2001): 261�72.Blessing Mangoyana, R. ‘‘Bioenergy for Sustainable Development: An African Context.’’
Physics and Chemistry of the Earth 34 (2009): 59�64.Briggs, P. Uganda: The Bradt Travel Guide. Guilford, CT: Globe Pequot Press, 2007.Bringezu, S., H. Schutz, M. O?Brien, L. Kauppi, R.W. Howarth, and J. McNeely. ‘‘Towards
Sustainable Production and Use of Resources: Assessing Biofuels’’. Nairobi: UnitedNations Environment Programme, 2009.
Child, K. ‘‘Civil Society in Uganda: The Struggle to Save the Mabira Forest Reserve.’’ Journalof Eastern African Studies 3 (2009): 240�58.
De Keyser, S., and H. Hongo. ‘‘Farming for Energy for Better Livelihoods in Southern Africa� FELISA.’’ Paper presented at Policy Dialogue Conference on the Role of RenewableEnergy for Poverty Alleviation and Sustainable Development in Africa, Dar-es-Salaam,2005.
Donner, J., and C.A. Telles. ‘‘Mobile Banking and Economic Development: LinkingAdoption, Impact, and Use.’’ Asian Journal of Communication 18 (2008): 318�32.
Ejigu, M. ‘‘Toward Energy and Livelihoods Security in Africa: Smallholder Production andProcessing of Bioenergy as a Strategy.’’ Natural Resources Forum 32 (2008): 152�62.
Ellis, F. Rural Livelihoods and Diversity in Developing Countries. Oxford: Oxford UniversityPress, 2000.
Ellis, F., and G. Bahiigwa. ‘‘Livelihoods and Rural Poverty Reduction in Uganda.’’ WorldDevelopment 31 (2003): 997�1013.
Evans, M. ‘‘The Economic Impact of the Demand for Ethanol.’’ Paper presented atMidwestern Governors’ Conference, Lombard, Illinois, 1997.
Field, A. Discovering Statistics Using SPSS, 3rd ed. London: Sage, 2009.Food and Agriculture Organization (FAO). ‘‘The Energy and Agriculture Nexus.’’
Environment and Natural Resource Working Paper 4. Annex 1, 2000.Food and Agriculture Organization (FAO). Food Energy and Climate: A New Equation. Rome:
FAO, 2008.Lauridsen, M. ‘‘Workers in a Forest: Understanding the Complexity of Incorporating Local
People in Modern Management.’’ MSc diss., Institute of Anthropology, University ofCopenhagen, 1999.
Martino, D., Z. Zommers, K. Bowman, D. Brown, F. Comim, P. Kouwenhoven, T. Manders,P. Milimo, J. Mohamed-Katere, and T. De Oliveira. ‘‘Environment for Development.’’ InFourth Global Environment Outlook, ed. UNEP, 6�36. Nairobi: United Nations Environ-ment Programme, 2007.
Mendoza, R., and N. Thelen. ‘‘Innovations to Make Markets More Inclusive for the Poor.’’Development Policy Review 4 (2008): 427�58.
Mullera, A., J. Schmidhuberb, J. Hoogeveenc, and P. Stedutoc. ‘‘Some Insights in the Effect ofGrowing Bio-energy Demand on Global Food Security and Natural Resources.’’ WaterPolicy 10 (2008): 83�94.
Mwavu, E.N., and E.T.F. Witkowski. ‘‘Land-Use and Cover Changes (1988�2002) AroundBudongo Forest Reserve, NW Uganda: Implications for Forest and Woodland Sustain-ability.’’ Land Degradation and Development 19 (2008): 606�24.
194 Z.A. Zommers et al.
Dow
nloa
ded
by [
the
Bod
leia
n L
ibra
ries
of
the
Uni
vers
ity o
f O
xfor
d] a
t 05:
52 1
0 M
ay 2
012
Ogendo, R.B., and J.C.A. Obiero. ‘‘The East African Sugar Industry.’’ GeoJournal 2 (1978):343�54.
Pender, J., P. Jagger, E. Nkonya, and D. Sserunkuuma. ‘‘Development Pathways and LandManagement in Uganda.’’ World Development 32 (2004): 767�92.
Pouw, N. ‘‘Food Priorities and Poverty: The Case of Smallholder Farmers in Rural Uganda.’’Journal of African Economies 18 (2008): 39.
Reynolds, V. The Chimpanzees of the Budongo Fores. t. Oxford: Oxford University Press, 2005.Rist, J., E. Milner-Gulland, G. Cowlishaw, and M. Rowcliffe. ‘‘Hunter Reporting of Catch per
Unit Effort as a Monitoring Tool in a Bushmeat-Harvesting System.’’ Conservation Biology24 (2010): 489�99.
Robertson, G., O. Doering, S. Hamburg, J. Melillo, M. Wander, W. Parton, P. Adler, et al.‘‘Sustainable Biofuels Redux.’’ Science Magazine 322 (2009): 49�50.
Service, R ‘‘Another Biofuels Drawback: The Demand for Irrigation.’’ Science Magazine 326(2009): 516�7.
Uganda Bureau of Statistics. Spatial Trends of Poverty and Inequality in Uganda: 2002�2005.Uganda Bureau of Statistics. http://www.ugandaclusters.ug/PVRTY-INQLTY/home.html
Uganda Bureau of Statistics and the International Livestock Research Institute. NatureDistribution and Evolution of Poverty in Uganda. Nairobi: The Regal Press Kenya, 2007.
UN Energy. Sustainable Bioenergy: A Framework for Decision Makers. New York: UnitedNations, 2007.
Ureta, S. ‘‘Mobilising Poverty?: Mobile Phone Use and Everyday Spatial Mobility AmongLow-Income Families in Santiago, Chile.’’ The Information Society 24 (2008): 83�92.
Wagle, U. Multidimensional Poverty Measurement: Concepts and Applications. New York:Springer, 2008.
Wang, M., M. Me, and H. Huo. ‘‘Life-cycle Energy and Greenhouse Gas Emission Impacts ofDifferent Corn Ethanol Plant Types.’’ Environmental Research Letters 2 (2007): doi:10.1088/1748-9326/2/2/024001.
World Resource Institute (WRI). The Wealth of the Poor: Managing Ecosystems to FightPoverty. Washington: United Nations Development Programme, United Nations Environ-ment Programme, World Bank, WRI, 2005.
World Wildlife Fund (WWF). Sugar and the Environment: Encouraging Better ManagementPractices in Sugar Production. Netherlands: WWF Global Freshwater Programme, 2008.
Zommers, Z., and D. Macdonald, ‘‘Protected Areas as Frontiers for Human Migration.’’Conservation Biology (2012): in press.
Journal of Eastern African Studies 195
Dow
nloa
ded
by [
the
Bod
leia
n L
ibra
ries
of
the
Uni
vers
ity o
f O
xfor
d] a
t 05:
52 1
0 M
ay 2
012