High-affinity neurotrophin receptors and ligands promote leukemogenesis
Upload
khangminh22Category
view
1download
0
10':>'''' VVLI-;::1U/.)
VOL. 539 NO.2 FEBRUARY 22, 1991
THIS ISSUE COMPLETES VOL. 539
Biochromatography and MolecularAffinityDijon, May 22-25, 1990
EDITORSR. W. Giese (Boston, MA)J. K. Haken (Kensington, N.S,W.)K. Macek (Prague)L. R. Snyder (Orinda, CAl
EDITORS. SYMPOSIUM VOLUMES.E. Heftillann (Orind,.. (' ',), Z. Deyl (Prague)
EDITORIAL BOARDD. W. Armstrong (Rolla. MO)W, A Aue (Halifax)P, Bocek (Brno)A A. Boulton (Saskatoon)P W Carr (Minneapolis. M N)N H. l Lt ') (~'" "llon, CAl\/. A. Dilvankov (MoscowZ. Deyl (Prague)S Dilli (Kensington, N.S.V\H. Engelhardt (SaarbrtickelF. Erni (Basle)M. B. Evans (Hatfield).J L. GlaJch (N Billerir:a. M!'G, A Guiochon (Knoxville, Tf'\)P R Haddad (Kensington. NS \N.)I. M. Hais (Hradec Kralove)W. S. Hancock (San Francisco, CA)S. Hjerten (Uppsala)Cs. Horvath (New Haven, CT),J. r,. K. Huber (Vienncl)K,-P Hupe (Waldbronn)T. W. Hutchens (Houston. TX)J Janak (Srno)P. Jandera (Pardubice)B, L. Karger (Boston. MAlE. SZ. Kovats (Lausalll1e)A J. P. Martin (Cambridge)L. W McLaughlin (Chestnut Hill. MA)E. D. Morgan (Keele)J. D. Pearson (Kalamazoo. MI)H Poppe (Amsterdam)F, E, Regnier (Wesl Lafayette, I r-J)P G. Righetti (Milan)P Schoen"'lakers (Eindh,JVen)G S.I' . A . (f\;'ul~,...:hll/Ruhl')
r.. S·I v.' ~(-)ba;,!: (O'.lb1)ndod)R l. Sho'~p '.West L2·!~.vette, IN)A. M. SiO\lffl (Marseille)D J. Siryrlom (Boston. MAlK K. Unger (Maim)R Vernoorte (Lelden)(~'f Vlgh (,:::C'ri~~l~ StafiQr.r\~)
...; T. 'fValso~· .f~·,~ Lan:+;I'g .rA r13, D. Westerilmd (UpPs('~<i. .
EDITORS, BIBLIOGRAPHY SECTIONz. Deyl (Prague), J, Jan;ik (Brno). v, Schwarz (Prague), K Macp.k (Prague)
ELSEVIER
JOURNAL OF CHROMATOGRAPHY
Scope. The Journal of Chromatography publishes papers on all aspects of chromatography, electrophoresisand related methods. Contributions consist mainly of research papers' dealing with-chromatographic theory, instrumental development and their applications. The section Biomedical Applications, which is underseparate editorship, deals with the following aspects: developments in and applications of chromatographic and electrophoretic techniques related to clinical diagnosis or alterations during medical treatment;screening and profiling of body fluids or tissues with special reference to metabolic disorders; results frombasic medical resea'rch with direct consequences in clinical practice; drug level monitoring and pharmacokinetic studies; clinical toxicology; analytical studies in occupational medicine.
Submission of Papers. Manuscripts (in English; four copies are required) should be submitted to: EditorialOffice of Journal of Chromatography, P.O. Box 681, 1000 AR Amsterdam, The Netherlands, Telefax(+ 31-20) 5862304, or to: The Editor of Journal of Chromatography, Biomedical Applications, P.O. Box681. 1000 AR Amsterdam, The Netherlands. Review articles are invited or proposed by letter to the Editors.An outline of the proposed review should first be forwarded to the Editors for preliminary discussion priorto preparation. Submission of an article is understood to imply that the article is original and unpublishedand is not being considered for publication elsewhere. For copyright regulations, see below.
Subscription Orders. Subscription orders should be sent to: Elsevier Science Publishers B.V., P.O. Box211, 1000 AE Amsterdam, The Netherlands. Tel. (+ 31-20) 5803911, Telex 18582 ESPA N L, Telefax(+ 31-20) 5803 598. The Journal of Chromatography and the Biomedical Applications section can besubscribed to separately.
Publication. The Journal of Chromatography (incl. Biomedical Applications) has 38 volumes in 1991. Thesubscription prices for 1991 are:
J. Chromatogr. (incl. Cum. Indexes. Vols. 501-550) + Biomed. Appl. (Vols. 535-572):Ofl. 7220.00 plus Ofl. 1140.00 (p.p.h.) (total ca. USS 4696.50)
J. Chromatogr. (incl. Cum. Indexes, Vols. 501-550) only (Vols. 535-561):Ofl. 5859.00 plus Ofl. 810.00 (p.p.h.) (total ca. USS 3746.50)
Biomed. Appl. only (Vols. 562-572):Ofl. 2387.00 plus Ofl. 330.00 (p.p.h.) (total ca. USS 1526.50).
Our p.p.h. (postage, package and handling) charge includes surface delivery of all issues, except to subscribers in Argentina, Australia, Brasil, Canada. China, Hong Kong. India, Israel. Malaysia, Mexico, NewZealand, Pakistan, Singapore. South Africa, South Korea, Taiwan, Thailand and the U.S.A. who receive allissues by air delivery (S.A.L. - Surface Air lifted) at no extra cost. For Japan, air delivery requires 50%additional charge; for all other countries airmail and S.A.L. charges are available upon request. Back volumes of the Journal of Chromatography (Vols. 1-534) are available at Ofl. 208.00 (plus postage). Claimsfor missing issues will be honoured, free of charge. within three months after publication of the issue.Customers in the U.S.A. and Canada wishing information on this and other Elsevier journals, please contactJournal Information Center, Elsevier Science Publishing Co. Inc .. 655 Avenue of the Americas, New York.NY 10010, U.S.A., Tel. (+ 1-212) 6333750, Telefax (+ 1-212) 6333990.
Abstracts/Contents lists published in Analytical Abstracts, Biochemical Abstracts, Biological Abstracts,Chemical Abstracts, Chemical Titles, Chromatography Abstracts, Clinical Chemistry Lookout, Current Contents/Life Sciences, Current Contents/Physical, Chemical & Earth Sciences, Deep-Sea Research/Part B:Oceanographic Literature Review, Excerpta Medica, Index Medicus, Mass Spectrometry Bulletin,PASCAL-CNRS, Pharmaceutical Abstracts, Referativnyi Zhurnal, Research Alert, Science Citation Indexand Trends in Biotechnology.
See inside back cover for Publication Schedule, Information for Authors and information on Advertisements.
© ELSEVIER SCIENCE PUBLISHERS BV. -1991 0021-9673/91/503.50
All rights reserved. No part of this publication may be reproduced, stored in a retrieval system or transmitted in any form or by any means,electronic. mechanical, photocopying. recording or otherwise. without the prior written permission of !he puhlisher. Elsevier Science Publishers
B.V.• P.O. Box 330. 1000 AH Amsterdam, The Netherlands.Upon acceptance of an article by the journal. the author($) will be asked to transfer copyright of the article to the publisher. The transfer Will ensure
the widest possible dissemination of information.Submission of an article for publication entails the authors' irrevocable and exclusive authorization of the publisher to collect any sums orconsiderations for copying or reproduction payable by third parties (as mentioned in article 17 paragraph 2 of the Dutch Copyright Act of 1912and the Royal Decree of June 20.1974 (5. 351) pursuant to article 16 b of the Dutch Copyright Act of 1912) and/or to act in or out of Court in
connection therewith.Special regulations for readers in the U.S.A. This journal has been registered with the Copyright Clearance Center, Inc. Consent is given forcopying of articles for personal or internal use. or for the personal use of specific clients. This consent is given on the condition that the copier paysthrough the Center the per-copy fee stated in the code on the first page of each article for copying beyond that permitted by Sections 107 or 108 ofthe U.S. Copyright Law. The appropriate fee should be forwarded with a copy of tile first page of the article to the Copyright Clearance Center.Inc .. 27 Congress Street. Salem. MA 01970, U.S.A. If no code appears in an article. the author has not given broad consent to copy and permissionto copy must be obtained directly from the author. Ali articles fJubli,;hed prior to '1980 may be copied for a per·copy fee of USS 2.25. also payablethrough the Center. This consent does not extend ;0 cH,a' kinds vf c(Jpy:ng. SUGh as for general distribution, resale, advertising and promotion
purposes. or for creating new collective wor{<s Speci~1 written p~rmisslon must be obtained from the publisher for such copying.No responsibility is assumed b,:, the Publisher for any injury ::lnd/or damage to persons or property as a matter of products liability. negligence orotherwise, or from any use or opeJration of any methods. products. instructions or ideas contained in the materials herein. Because of rapid
advances in the medical sciences, the Publi:.her recommends that independent verification of diagnoses and drug dosages should be made.Although all advertising material i.i f.:X}leClel.· to c<.mfurrl tel et"lcal (medical) st~ndard'ii. ()c1usion in this publication does not constitute a
guarantee or endorscmer.t':.,· t:1t; oll.Jlity or value of such produc:t or of thp. claIms made of it by its manufacturer.This issuE.: is. printed on dcid-frE.e paj:.er.
Printed in The Netherlands
For Contents, see p. III

SPECIAL ISSUE
BIOCHROMATOGRAPHY AND MOLECULAR AFFINITY
THIRD MEETING OF THE FRENCH SOCIETY OF BIOCHROMATOGRAPHY
Dijon (France), May 22-25,1990
Guest Editors
ANTE M. KRSTULOVIC(Paris)
JEAN-PIERRE DANDEU(Paris)


VOL. 539, NO.2 JOURNAL OF CHROMATOGRAPHY
CONTENTS
FEBRUARY 22,1991
BIOCHROMATOGRAPHY AND MOLECULAR AFFINITY, 3rd MEETING OF THE FRENCHSOCIETY OF BIOCHROMATOGRAPHY, DIJON, MAY 22-25,1990
Prefaceby A. M. Krstulovic and J.-P. Dandeu (Paris, France)
Investigation of liquid phase cooperative binding interactions on the capacity of insoluble affinityadsorbentsby A. G. Mayes, J. Hubble and R. Eisenthal (Bath, U.K.)
Kinetic behaviour of a novel matrix ion exchanger, carboxymethyl-HVFM operated at high flow-rateby F. Ming and J. A. Howell (Bath, U.K.)
Immobilized metal ion affinity partitioning, a method combining metal-protein interaction and partitioning of proteins in aqueous two-phase systemsby G. Birkenmeier (Leipzig, Germany), M. A. Vijayalakshmi (Compiegne, France), T. Stigbrand (Umcii, Sweden) and G. Kopperschliiger (Leipzig, Germany) . . . . .
Interactions of the mitochondrial membrane rat liver D-3-hydroxybutyrate dehydrogenase with glassbeads during adsorption chromatography. Relationships with the activation of the enzyme byphospholipidsby P. Adami, B. Nasser (Besanc;on, France) and N. Latruffe (Dijon, France)
Immobilization of dermatan sulphate on a silica matrix and its possible use as an affinity chromatography support for heparin cofactor II purificationby V. Sinniger and 1. Tapon-Bretaudicre (Paris, France), F. L. Zhou (Villetaneuse, France),A. Bros (Paris, France), D. Muller and J. Jozefonvicz (Villetaneuse, France) and A. M.Fischer (Paris, France) . . . . . . . . . . . . . .
Polymer ligands for mild hydrophobic interaction chromatography -principles, achievements andfuture trends (Review)by P. Hubert, R. Mathis and E. Dellacherie (Nancy, France) . . . . . . .
Comparative affinity chromatographic studies using novel grafted polyamide and poly(vinyl alcohol)mediaby D. Miiller-Schulte (Aachen, Germany) and S. Manjini and A. Vijayalakshmi (Compiegne,France) . . . . . . . . . . . . . . . . . . . . . . . .
Microfiltration membranes as pseudo-affinity adsorbents: modification and comparison with gelbeadsby B. Champluvier and M.-R. Kula (Jiilich, Germany)
Recognition of phosphate groups by immobilized aluminium(IIl) ionsby L. Andersson (Uppsala, Sweden)
Highly active enzyme preparations immobilized via matrix-conjugated anti-Fe antibodiesby B. Solomon, E. Hadas, R. Koppel, F. Schwartz and G. Fleminger (Tel-Aviv, Israel)
Purification of E. coli 30S ribosomal proteins by high-performance liquid chromatography undernon-denaturing conditionsby C. Cachia, P.-J. Flamion and J.-P. Schreiber (Dijon, France)
Immobilized Cibacron Blue -leachables, support stability and toxicity on cultured cellsby 1. Hulak (Villeneuve la Garenne, France), C. Nguyen (Chaponost, France) and P. Girotand E. Boschetti (Villeneuve la Garenne, France) . . . . . . . . .
Tandem immunoaffinity and reversed-phase high-performance liquid chromatography for the identification of the specific binding sites of a hapten on a proteic carrierby M. Yvon and J. M. Wal (Jouy-en-Josas, France) . . . . . . . . . . . . . . . . .
"'" r! "'""\O~t'I'1J ~mlJ1V1'(.r,fnt'l'\'l1UJf)11q
HiJjle! ~~ .. ~
243
245
255
267
279
289
297
307
315
327
335
343
355
363

lV CONTENTS
455
Purification of DNA and group separation of normal and modified DNA components by sizeexclusion chromatographyby M. Polverelli, L. Voituriez, F. Odin, J.-F. Mouret and J. Cadet (Grenoble, France). 373
Unfolding of truncated and wild type aspartate aminotransferase studied by size-exclusion chromatographyby M. Herold (Waldbronn, Germany) and B. Leistler (BasIe, Switzerland) 383
Isolation and characterization of two different molecular forms of basic fibroblasts growth factorextracted from human placental tissueby S. Uhlrich, J. Tiollier, M. Tardy and J.-L. Tayot (Chaponost, France) 393
High-performance anion-exchange chromatographic study of desialylated human (X,-acid glycopro-tein variants. Development of a fractionation method for the protein slow variantsby F. Herve, J.-c. Duche, N. Sportes and J.-P. Tillement (Crcteil, France) 405
AfJlnity chromatography of fibroblast growth factors on coated silica supports grafted with heparinby M. A. Jacquot-Dourges, F. L. Zhou, D. Muller and J. Jozefonvicz (Villetaneuse, France) 417
Immobilized Fe3 + affinity chromatographic isolation of phosphopeptidesby P. Scanff, M. Yvon and J. P. Pelissier (Jouy en Josas, France) 425
High-performance liquid chromatographic analysis of the unusual pathway of oxidation of L-argi-nine to citrulline and nitric oxide in mammalian cellsby B. Chenais, A. Yapo, M. Lepoivre and J. P. Tenu (Orsay, France) 433
Simple equilibrium dialyses-high-performance liquid chromatographic method for the in vitro assess-ment of 5-methoxypsoralen bound to human albuminby S. Makki, P. Muret, A. Renaud, P. Agache and P. Magnin (Besan~on, France) 443
Scaling up in isolation of medium-size uraemic toxinsby P. M. Gallice, A. D. Crevat and Y. F. Berland (Marseille, France) 449
Selective extraction of native [J-Iactoglobulin from wheyby E. Chiancone and M. Gattoni (Rome, ltaly)
Puritlcation and characterization of recombinant tropomyosinsby C. Ferraz, J. Sri Widada and J.-P. Liautard (Montpellier, France)
Isolation and purification of cat albumin from cat serum by copper ion affinity chromatography:further analysis of its primary structureby J.-P. Dandeu, J. Rabillon, J. L. Guillaume, L. Camoin, M. Lux and B. David (Paris,France) .
Purification of a hybrid plasminogen activator proteinby J. Deistung, D. M. Forde, J. P. O'Connell, K. A. Proudfoot, D. Eaton, F. Willenbrock, R.O. Kingaby, B. Hughes, S. Angal, C. Catterall, S. Carne and J. Spencer Emtage (Slough,U.K.) . . . . . . . . . .. ..... . .....
Purification of heparin cofactor Il from human plasmaby P. Toulon, G. Chadeuf and M. Aiach (Paris, France)
465
475
485
493
Purification of cloned trypanosomal calmodulin and preliminary NMR studiesby P. J. Sweeney and J. M. Walker (Hatfield, U.K.) and D. G. Reid and N. Elshourbagy(Welwyn, U.K.) . . . . . . . .. 501
Use of dye pseudo-affinity chromatography in the purification of homoserine dehydrogenaseby M. Costa-Ferreira and J. C. Duarte (Queluz de Baixo, Portugal) . . . . . . .. 507
Purification on poly(U)-Sepharose 4B of human breast cancer cell line T-47D DNA polymerasesby D. Bernard, C. Moyrct and J. C. Maurizis (Clermont-Ferrand, France) . 511
Purification of NAD glycohydrolase from Neurospora crassa conidia by a polyclonal immunoadsorbentby M. Pace, D. Agnellini, G. Lippoli, P. G. Pietta, P. L. Mauri and S. Cinquanta (Milan,Italy) .. 517

CONTENTS V
Use of immobilized triazine dyes in the purification of DNA topoisomerase I (Topo 1) and terminaldeoxynucleotidyl transferase (TdT) from calf thymusby A. Markauskas, V. Tiknius and R. Marcisauskas (Vilnius, U.S.S.R.) 525
Affinity purification of plasminogen by radial-flow affinity chromatographyby Y. Planques and H. Pora (Cergy-Pontoise, France) and F. D. Menozzi (Lille, France) 531
Author Index Vol. 539 . .. . . . . . .. 535
******************************************************************************************* *:: In articles with more than one author. the name of the author to whom correspondence should be addressed is indicated in the ::: article heading by a 6-pointed asterisk (*) ::
* *******************************************************************************************


Journal o/Chromatography, 539 (1991) 243Elsevier Science Publishers B.Y., Amsterdam
CHROM. 22918
PREFACE
Recent advances in the fields of molecular biochemistry, biotechnology andgene technology have been made possible by the continuous developments in theseparation sciences, which are becoming increasingly sophisticated in order to meetthe required needs. Among the techniques which have been playing a key role in theanalysis and isolation of biomolecules and the understanding of interactions on themolecular level, liquid chromatography has been particularly useful.
Therefore, it is not surprising that the 4-day Third European Meeting of theGroupe Fran(:ais de Bio-Chromatographie, organized jointly with the InternationalSociety of Biorecognition Technology, and held in the beautiful capital of Burgundy,Dijon, renowned for its history, art and gastronomy, attracted some 300 prominentresearchers from France, Belgium, Germany, Israel, Italy, Sweden, U.K., U.S.A.,U.S.S.R. and The Netherlands.
Following a brilliant introduction on "Supramolecular chemistry: from molecular recognition towards molecular devices and self-organization", delivered by theFrench Nobel Laureate Professor Jean-Marie Lehn, the themes discussed were biochromatography (supports and derivatization, hydrophobic interactions), molecularrecognition and affinity chromatography (biospecific affinity, immunoaffinity), pseudospecific affinity, protein conformation and chromatographic behaviour and miscellaneous topics.
In addition to the very informative lectures and posters on the latest developments in these areas, this conference also provided an ideal podium for informalexchange of experiences, much appreciated by the participants. The concurrent instrument display demonstrated state-of-the-art technological advances.
It is hoped that this special issue will be a useful source of information toresearchers in this field, and an additional stimulus for the work that remains to bedone for a better understanding of the intriguing facets of life.
We acknowledge the kind assistance of Professors Sebille and Muller, and asthat of the reviewers, for their prompt and expert evaluation of the manuscripts.
Paris (France) ANTE M. KRSTULOVIC
JEAN-PIERRE DANDEU


Journal of Chromatography, 539 (1991) 245-254Elsevier Science Publishers B.Y., Amsterdam
CHROM. 22873
Investigation of liquid phase cooperative binding interactionson the capacity of insoluble affinity adsorbents
A. G. MAYES
Biochemistry Department, University of Bath, Claverton Down, Bath BA2 7AY (U.K.)
1. HUBBLE*
School of Chemical Engineering, University of Bath, Claverton Down, Bath SA2 7A Y (U.K.)
and
R. EISENTHAL
Biochemistry Department, University ofSath, Claverton Down, Bath BA2 7A Y (U.K.)
ABSTRACT
Experimental data is presented to support the theoretical prediction of an enhancement of adsorption arising from a positively cooperative liquid phase interaction between a multivalent adsorbate andfree ligand. The results obtained with glyceraldehyde 3-phosphate dehydrogenase show a 4-fold increase inadsorption to 5'-adenosine monophosphate cellulose in the presence of 3 liM nicotinamide adenine dinucleotide compared with that obtained in the absence of cofactor. Although the magnitude of the effect, andthe optimal free ligand concentration do not correspond to those predicted in the original model, thediscrepancies may at least in part be accounted for by a maldistribution of immobilised ligand, leading tomultiple cooperative interactions between adsorbate and affinity matrix. This can be qualitatively predictedby an extension to the original model.
[NTRODUCTION
Separation techniques based on affinity adsorption have great potential for theproduction of high value, high purity bioproducts, This results from the high degree ofselectivity and the consequently large purification factors which can be achieved.However, as affinity adsorption is adopted as a process scale operation theoptimisation of empirically developed laboratory-scale methodology becomes important for maximising yield and quality of the end product.
Although much effort has been directed towards optimisation of the solid phase,i.e., investigation of ligand immobilisation chemistry and the effect of both the lengthand nature of spacer arms, there appears to have been little consideration given to thepossible contribution of the liquid phase to the overall performance of a system, forexample the possible gains achievable by using free ligand in the liquid phase toenhance the binding of a positively cooperative enzyme to the solid phase,
The property of positive cooperativity, whereby proteins show sigmoid ligandbinding isotherms is a fairly common feature of multimeric proteins in free solution.
0021-9673/91/$03.50 © [991 Elsevier Science Publishers B.Y.
oJ -<0, r! "\,"'0~au Cfl'fl)1J')Vl~'$1~1}'ilHn11
•

246 A. G. MAYES, J. HUBBLE, R. EISENTHAL
The performance and capacity of affinity adsorbents is strongly influenced by theaffinity of the protein for the immobilised ligand. It therefore seems likely that addingfree ligand to positively cooperative protein in the presence of immobilised ligand willincrease the affinity of the protein for all available ligand and hence lead to tighterbinding of protein to matrix ligand. This hypothesis was examined quantitatively incomputer simulations by Hubble [1], which suggested that significant gains could beachieved in an appropriate system. In this paper we report attempts to obtainexperimental evidence for this behaviour and compare the results with the theoreticalpredictions obtained from computer simulation.
MATERIALS
N 6-(6-aminohexyl)AMP, N 6-(6-aminohexyI)NAD +, long fibrous cellulose powder, glyceraldehyde 3-phosphate dehydrogenase (GAPDH), glyceraldehyde 3-phosphate diethyl acetal and NAD+ were obtained from Sigma (Poole, Dorset, U.K.).
Free glyceraldehyde 3-phosphate was liberated from the diethyl acetal (Sigma)by heating an aqueous solution in the presence of Dowex 50 H + resin, and was assayedusing GAPDH and NAD+ to check for complete hydrolysis of the acetal. This wasstored in aliquots at - 20°C until required.
Sepharose 4B came from Pharmacia (Uppsala, Sweden). All other chemicalswere of analytical grade.
METHODS
Preparation of nucleotide matrix derivativesSepharose 4B or long fibrous cellulose was activated with cyanogen bromide
using the method of March et at. [2]. The final wash was with 0.1 M sodiumbicarbonate pH 8.9 (buffer A). Matrix was resuspended in an equal volume of buffer Aand sufficient N 6 -(6-aminohexyl)AMP or N6 -(aminohexyl)NAD+ added to give thedesired concentration of matrix ligand. This was agitated gently for 16 h at 4°C. Thematrix was washed with buffer A and the washings retained for spectrophotometricdetermination ofunbound ligand. The washed matrix was added to 1 M ethanolamineand left at room temperature for 2 h to block any remaining reactive groups, thenwashed with water, 1 M sodium chloride and water again before storage at 4°C asa moist cake. Ethanolamine-Sepharose was prepared by activation followed byimmediate blocking with ethanolamine.
Ligand bound to the matrices was estimated by calculation of the differencebetween ligand added and ligand remaining in the washings. Absorbance wasmeasured at 267 nm and a molar absorptivity of 17.7 mM- 1cm -1 used for calculations[3]. Ligand bound to Sepharose was also estimated by direct spectroscopy of a 10%suspension of matrix in glycerol-water (50:50, w/w) using a similar suspension ofunderivatised Sepharose as a blank. The wavelength maximum and molar absorptivityof the coupled ligand were assumed to be the same as for the free ligand. The twomethods showed close agreement.
Coupling was consistently found to be 94-96% for Sepharose and 50-60% forcellulose.

LIQUID PHASE COOPERATIVE BINDING INTERACTIONS 247
Nucleotide removal from GAPDHNucleotides were removed by charcoal treatment using the method ofGennis [4].
Treated GAPDH had an A 280 nm/A 260 nm ratio of about 2 and was stored as anammonium sulphate suspension at 4°C until required.
Assay ofGAPDHGAPDH was assayed at pH 8.5 and 25°C in I ml of a buffer containing (final
concentrations) 50 mM sodium pyrophosphate, 5 mM EDTA, 10 mM sodiumdihydrogen orthophosphate, 0.1 M potassium chloride, 10 mM cysteine, 1 mMNAD+, and 1 mM o-glyceraldehyde 3-phosphate (2 mM OL racemate) which wasadded last to initiate the reaction. Enzyme (about 0.005 LU.) was preincubated for8 min in the assay buffer to ensure complete reduction of active site thiol groups.Increase in absorbance at 340 nm was followed using a Cecil 272 UV spectrophotometer fitted with a jacketed cuvette holder. Temperature was maintained usinga recirculating water bath and cuvettes were left for 15 min to equilibrate prior to use.
Equilibrium batch adsorptionA quantity of matrix equal to 4 ml settled volume was added to 20 ml 50 mM
sodium pyrophosphate buffer pH 8.5 containing I mM 2-mercaptoethanol and 1 mMEDTA. The total volume was measured and the suspension added to a water jacketedvessel maintained at 25 ± 0.3°C, stirred with an overhead stirrer to minimise physicalmatrix degradation. A known amount of GAPDH was added and allowed toequilibrate for about 10 min.
A 100-lll sample was withdrawn, spun briefly to sediment the matrix and 20-lllsamples of supernatant removed for triplicate enzyme assays. The total added ligandconcentration in the vessel was increased by adding a small volume ofNAD+ solutionand the system allowed to re-equilibrate for 8 min before repeating the cycle. This wascontinued until the desired range of added ligand had been covered.
The concentration of free enzyme is found from the assays so, knowing the totalamount of enzyme initially added and the system volume (recalculated after eachcycle), bound enzyme can be calculated from the enzyme mass balance for eachconcentration of added ligand.
RESULTS AND DISCUSSION
Fig. I shows the simulated effect of free ligand concentration on GAPDHadsorption using theory developed by Hubble [I] and literature values for the bindingconstants [4]. In contrast Fig. 2a--e shows plots of bound enzyme/total enzyme againstlog added NAD + from batch adsorption experiments using AMP-Sepharose matriceswith different ligand densities. In order to keep the bulk average matrix ligandconcentration comparable the volume of the highest ligand density AMP-Sepharoseused was lower than that used in the other two experiments. As might be expected thefractional binding in the absence of free NAD + (arbitrarily plotted at - 6.5) increasedwith increasing ligand density but the predicted enhancement of binding on adding freeNAD+ was not apparent under the experimental conditions adopted for any of thematrix ligand densities tested. Similar results were obtained for NAD+-Sepharosematrices (data not shown).

248 A. G. MAYES, J. HUBBLE, R. EISENTHAL
0.9 45 • 10-
-2-3-5 -4LOG NAD+
-6
-55 • 10
-41 • 10
-51 • 10_6
0.1 5. 10
o -6-71 • 10
0.2
C 0.7"0- 0.6w
0.8
" 0.5"0l:
~ 0.4J:l
W0.3.
Fig. 1. The predicted effect of matrix ligand concentration on the relationship between free ligandconcentration and the fraction of enzyme bound for glyceraldehyde 3-phosphate dehydrogenase. Theaffinity constants used were derived from the data of Gennis [4]. K, = 2.6' 103 , K 2 = 1.5' 104
, K 3 = 1.9'105, K4 = 5.7' 103 M- 1 • The matrix ligand concentrations were: 1 . 10- 6 ,5' 10- 6 ,1' 10- 5,5' 10- 5 , I . 10- 4 ,
5' 10- 4 M.
The data obtained using AMP cellulose is shown in Fig. 3. Due to the low levelsof binding observed in this system the scatter of points in individual experiments wasgreater than for the Sepharose experiments since the magnitudes of the changes inbound enzyme were similar to the magnitudes of the errors. All the individualexperiments suggested that some enhancement of binding was occurring, with controlexperiments using blank cellulose and ethanolamine-derivatised cellulose showing no
0.5
... a0.4
...CJ
:8w 0.3 ...'-.'D ...COJ0
0.2.0
w ......
0.1 ......
0-6.50 -6.00 -5.50 -5.00 -4.50 -4.00 -3.50 -3.00
LOG NAD+
Fig. 2.

LIQUID PHASE COOPERATIVE BINDING INTERACTIONS 249
0.2
0.18 b
o:§w
"
"C::Jo
.D
W
0.16
0.14
0.12
0.1
0.08
... ...
0.06
0.04
0.02
-3.5-4oL-------------------------6.5 -6 -5.5 -5 -4.5
LOG NAO+
0.12
c0.1
o:§
0.08 ...... ...w"
"C::Jo
.D
W
0.06
0.04
·0.02
o
-3.50-4.00-4.50-5.00-5.50-6.00
-0.02 L- _
-6.50
LOG NAO+
Fig. 2. Effect of added NAD+ on the fraction of enzyme (GAPDH) bound to AMP-Sepharose. (a) Highdensity: bulk average ligand concentration I 10- 4 M. Matrix volume 6.5% of total. Matrix ligandconcentration 1.5 . 10- 3 M. (b) Medium density: bulk average ligand concentration 9.3 . 10- 5 M. Matrixvolume 18% of total. Matrix ligand concentration 5.2 . 10- 4 M. (c) Low density: bulk average ligandconcentration 2.5' 10- 5 M. Matrix volume 18% of tota!. Matrix ligand concentration 1.4' 10- 4 M. Valuesfor no added NAD+ are arbitarily plotted at -6.5.
effect. On combining the data from several runs with AMP cellulose the enhancementis quite clearly seen (Fig. 3). An approximately 4-fold increase in binding was apparenton adding free ligand and this compared well with that predicted for the bulk averagematrix ligand concentration used. In two other respects, however, the data were notcomparable with the predicted behaviour. The fractional binding of enzyme to matrix

250
o
:8w"
"cOJo.!l
W
A. G. MAYES, J. HUBBLE, R. EISENTHAL
0.12
0.1 :II: 1I0.08
I I I0.06
0.04
0.02
~
0-6.50 -6.00 -5.50 -5.00 -4.50 -4.00 -3.50
LOG NAO+
Fig. 3. Effect of added NAD+ on the fraction of enzyme bound for GAPDH binding to AMP cellulose. Thebulk average ligand concentration was 7.8' 10~5 M and the matrix volume = 20% oftota] (matrix ligandconcentration 3.9 . 1O~4 M). Values plotted are means ± standard errors (/1 = 3). Values for no addedNAD + are arbitarily plotted at - 6.5.
ligand was about 1O-fold lower than predicted. This observation probably results fromrestrictions imposed on ligand accessibility by the support matrix, and/or changes inbinding constants arising from the chemical effects of immobilisation. The seconddeviation from the theoretical prediction is that the maximum observed bindingenhancement occurs at a lower free ligand concentration. This can in part be explainedby the effects of immobilised ligand maldistribution.
The difference in the behaviour of the cellulose and Sepharose matrices probablyarises as a result of their different physical structures and consequent differences in thepattern of derivatisation. Sepharose beads are approximately spherical with a sizerange of60-140 {tm. Fibrous cellulose approximates to cylinders oflength 100-250 ILmand diameter about 25 {tm. Sepharose 4B beads are known to be porous with pore sizes80-230 nm, averaging about 170 nm [5]. The porosity of the cellulose used is unknowndue to batch to batch variation of this natural product. It is generally composed ofporous "amorphous" regions, with greater porosity than cross-linked polysaccharideslike Sepharose 4B interspersed with compact "microcrystalline" regions [6]. Thus bothmatrices used should be freely permeable to both small molecules and GAPDH. Henceit does not appear that differences in accessibility could be a major contributor to thedifferent behaviour of cellulose and Sepharose matrices.
The diffusional path length to the centre of a particle is up to 6 times longer forSepharose assuming similar degrees of contortion in both matrices. Since bothactivating chemicals and coupling ligands must diffuse into the particle from the liq uidphase it is likely that the end product will not be a uniformly derivatised particle butone with a "shell" of high ligand density at the surface and a concentration gradientrunning to a minimum at the centre of the particle. The shorter the path length the less

LIQUID PHASE COOPERATIVE BINDING INTERACTIONS 25\
pronounced this would be expected to be. The result of this will be that the cellulosematrix will have a more uniform ligand distribution, more closely approximating thebulk average concentration than will the Sepharose matrix where the majority of theligand will be concentrated towards the external surface of the beads. This would havetwo possible repercussions.
(1) The Sepharose matrix will behave as one with a higher ligand density thustending to swamp out the cooperative effect.
(2) The higher ligand density in the Sepharose matrix will lead to an increasedprobability of multivalent interactions between protein and immobilised ligand.
This behaviour has been observed for a number of proteins with multiplebinding sites [7-9]. A bivalent interaction will have a higher affinity constant thana monovalent one and if this is greater than or equal to the enhanced affinity ofenzymemolecules partially saturated with free ligand then this will also swamp out anyenhancement which might have been achieved due to the cooperative effect.
The effect of localised high concentrations of matrix ligand together with theconsequences of multivalant interaction between macromolecule and resin can bequalitatively considered using an extension to the model described by Hubble [I]. Inthe original theoretical assessment of liquid phase cooperativity the assumption wasmade that with low matrix ligand densities only monovalent interactions would bepossible between adsorbate and support. However, if localised high concentrations ofimmobilised ligand occur the possibility of multivalent interactions between enzymeand support cannot be discounted. The original model can easily be extended toconsider all theoretically possible interactions between a tetravalent enzyme and bothfree and immobilised ligand. The broader model can be used to give a qualitativeindication of the effects that these multivalent surface interactions might be expectedto have on observed binding enhancements.
Development of the revised model leads to the formulation offourteen equilibriadescribing interactions between individual complex species. For interaction withsoluble ligand:
[E][L] ~ [EL]
A similar set of equilibria can be formulated for the interactions of E withimmobilised ligand (M) using association constants Km1 - Km4 . Binding betweenenzyme and both soluble and immobilised ligand can be described in terms of sixfurther association constants:
[EM][L] ~ [EML]

252 A. G. MAYES, J. HUBBLE, R. EISENTHAL
Fractional binding ofenzyme to the affinity support can be described in terms of:
1': = L[EM i] + L[EM;Lj ]
m [E] + L[ELj ] + L[EM;] + L[EM;LJ
where i denotes number of sites bound to immobilised ligand andj denotes number ofsites bound to free ligand (for a tetramer I ~ (i + j) ~ 4).
This equation can be expressed in terms of the equilibrium concentrations ofLand M together with appropriate products of the individual association constants.Where the association constants are known this relationship can be used to predict theeffect of free ligand concentrations on fractional binding as previously described.However, the more general form allows the effect of permitting progressively morecomplex multiple interactions between enzyme and adsorbate to be predicted. Anexample of a prediction of this type is given in Fig. 4 using the same association
T
0.9D
'5(;- 0.8w
"-'0c6 0.7.!l
w
0.6
0.5 +----,-----,-----,------,------11 2 345 6
FREE LIGAND (mol/l X 105)
Fig. 4. The predicted effect of multivalent interactions between enzyme and matrix ligand on the relationshipbetween free ligand concentration and fractional binding (association constants as for Fig. I, bulk averageligand concentration 5' 10- 5 M). M denotes monovalent interaction, D divalent and T tri- and tetravalent.Arrows denote the free ligand concentration giving maximal fractional binding.

LIQUID PHASE COOPERATIVE BINDING INTERACTIONS 253
constants for GAPDH as detailed for Fig. 1. The curves obtained as the number ofpermitted interactions with immobilised ligand is increased from I to 4 clearly showa shift towards a lower optimal free ligand concentration together with a masking ofthe enhancement effect. This was clearly observed in the Sepharose experiments wheremasking of enhanced binding prevented the identification of an optimum free ligandconcentration.
The optimum free ligand concentration in the cellulose experiment was lowerthan that predicted, indicating perhaps, that even in this case some multivalentinteractions were occurring.
No quantitative observations can be made at this stage concerning the levels ofbinding (which should increase if multivalent interactions are occurring), since thelevels observed are much lower than those predicted. This may be due to changes in theintrinsic affinity constants for the interaction of protein with immobilised ligandrelative to free ligand, as a result of the immobilisation process. Analysis is furthercomplicated as onlyl a proportion of the immobilised ligand molecules will be insufficiently close proximity to allow multiple simultaneous interactions with theenzyme. It does, however, clearly demonstrate the trends produced by multipleinteractions.
CONCLUSIONS
The results presented demonstrate the occurrence of a liquid phase modificationof adsorption capacities arising from the cooperative interaction of free ligand witha multivalent macromolecule. The effect observed is unlikely to be of significance incurrently available affinity supports given that it is only observed under conditions oflow immobilised ligand density and sub-optimal pH for binding (GAPDH showsoptimal binding at about pH 7, but shows no cooperativity in the liquid phase at thispH). However, as both theoretical predictions, and the experimental results presentedhere suggest that cooperative effects are masked by high localised concentrations ofimmobilised ligand, it is possible that more significant capacity enhancements might beobserved with the soluble supports used in aqueous two-phase partition [10].
In formulating the theoretical relationships described we have only consideredthe intrinsic cooperative properties of the adsorbate molecule. A more rigourousmodelling approach would be needed to take account of the surface cooperative effectsas described by Yon [11]. These arise from an increased valency of interaction evenwhere there is no intrinsic molecular cooperativity. The concept of cooperative surfaceinteractions resulting from immobilised ligand "clusters" in orientations suitable formultivalent interactions with a multimeric enzyme has been used to describe thebinding of aldolase to phosphocellulose [11,12]. The increased apparent affinity arisingfrom multiple surface interactions is an additional factor which will tend to mask theconsequences of liquid phase cooperativity and lead to deviations from the responsepredicted by simple models. In generating the predictions used in this work we haveassumed that the association constants between enzyme and insoluble ligands aresimilar to those describing the interactions with soluble ligands. Clearly this is a grosssimplification even in the case of monovalent interactions with the support. Whenpolyvalent interactions are possible determination of appropriate surface associationconstants becomes extremely complicated and requires much further work if accuratepredictive models are to be developed.

254
ACKNOWLEDGEMENT
A. G. MAYES, J. HUBBLE, R. EISENTHAL
The authors wish to acknowledge the financial support of the British SERe(Grant No. GR/E 32717).
REFERENCES
1 J. Hubble, Biotechnol. Bioeng., 30 (1987) 208-215.2 S. C. March, I. Parikh and P. Cuatrecasus, Anal. Biochem., 60 (1974) 149-152.3 D. B. Craven, M. J. Harvey, C. R. Lowe and P. D. G. Dean, Eur. J. Biochem., 41 (1974) 329-333.4 L. S. Gennis, Proc. Nat!. Acad. Sci., 73 (1976) 3928-3932.5 A. Demiroglou, W. Kerlin and H. P. Jennissen, in T. W. Hutchens (Editor), Protein Recognitioll of
Immobilised Ligands, Alan R. Liss, New York, 1989, pp. 71-82.6 Whatman Technical Bulletin 1£2, 48-54.7 D. Eilat and I. M. Chaiken, Biochemistry, 18 (1979) 790-794.8 P. J. Hogg and D. J. Winzor, Arch. Biochem. Biophys., 240 (1985) 70-76.9 Y.-c. Liu and E. Stellwagen, J. Bioi. Chem., 262 (1987) 583-588.
10 J. M. Harris and M. Yalpani, in H. Walter, D. E. Brooks and D. Fisher (Editors), Partitioning ill AqueousTwo-Phase Systems, Academic Press, Orlando, FL, 1985, p. 590-620.
II R. J. Yon, J. Chromatogr., 457 (1988) 13-23.12 R. J. Yon, Biochem. Soc. Trans., 16 (1988) 53.

Journal 0/ Chromatography, 539 (1991) 255-266Elsevier Science Publishers B.Y., Amsterdam
CHROM. 22871
Kinetic behaviour of a novel matrix ion exchanger,carboxymethyl-HVFM operated at high flow-rate
FANG M1NG and JOHN A. HOWELL"
School ol Chemica! Engineering, University ol Bath, C!averton DOlvn, Bath BA2 7A Y (U.K.)
ABSTRACT
The kinetic behaviour of a novel coherent ion-exchange matrix, CM-HYFM, a carboxymethyl derivative of cross-linked regenerated cellulose, was investigated using lysozyme as a model protein. The resultsobtained were compared with those for two other commercial carboxymethyl cellulosic ion exchangers,HC2 (Phoenix) and eM-52 (Whatman). The flow properties of the new matrix were by far superior tothose for the other materials whilst thc adsorption and desorption kinetics were also faster. The new resinwas able to sustain a superficial velocity of up to 8.78 m h -1 in a 147-mm J.D. column. In a 26-mm 1.0.column, an only slightly faster velocity of 10m h - 1 was obtained. This contrasted with a limiting flow ofless than 1.5 m h - I with the other two packings. It was found that the kinetic rates of adsorption anddesorption depended on the /low-rate through the matrix improving as the /low-rate increased. It wasconcluded that the highest flow-rates external mass-transfer resistances had been virtually removed andany remaining transfer resistance was due to diffusion through the matrix. [n adsorption it was possible toachieve 90'Yo adsorption within 8 min and 90% desorption within 5 min. Whilst the Whatman material hadsimilar desorption rates neither of the other materials were close on the adsorption rates taking almostthree times as long at the fastest sustainable superficial velocity for the CM-52 resin. These fast kineticswere achieved with a high capacity ranging from over 800 mg per dry g at a relative high salt concentrationto over 2 g lysozyme per dry g for the unsalted lysozyme solution. Finally, no obvious swelling andshrinking was observed when the CM-HYFM column of 110 x 10 mm J.D. was regenerated by 2 M NaClor 0.7 M NaOH solution for 40 min.
INTRODUCTION
The high separation efficiency and low energy requirements of ion-exchangechromatography have led to its routine use in biochemical separation processes [1,2],In 1986 Bonnerjea et al. [3] studied the published purification protocols and found thation exchange was used in 75% of all purifications. Traditional synthetic ionexchangers have a high charge density, a high degree ofcross-linking and hydrophobiccharacter that lead to low protein capacities and denaturation of adsorbed biomolecules [4]. A series of ion exchangers based on naturally occurring organicmacromolecules are better at separating macromolecules as they possess macroporesand a hydrophilic surfaces with lower charge density which tends not to denature theproteins. The ion exchangers based on polysaccharides possess moderately goodhydraulic properties but relatively poor kinetics. Those based on cellulose, fast kineticsbut poorer flow properties and those based on inorganic supports, good flow
0021-9673/91/$03.50 © 1991 Elsevier Science Publishers B.Y.

256 F. MING, 1. A. HOWELL
properties but poor capacities. There are difficulties in using several of these materialson the large scale [5].
There are few publications referring to the use of high flow-rates. M icrogranularmaterials usually use superficial velocities of around 0.3-0.4 m h- 1
• Levison el al. [6],using the Whatman microgranular QA-52, or DE-52 in a 100-ml axial flow column (66x 44 mm J.D.) achieved a flow-rate of up to 25 ml min-1
, 0.99 m h-1 superficialvelocity, beyond which higher flow was impossible due to the compressibility of theresin. Levison el al. [7] also reported that they used a 160 x 450 mm J.D. columnpacked with DE-52, a microgranular cellulose anionexchanger, at a volumetricflow-rate ofabout 800 ml min-1
, i.e., only 0.3 m h-1 superficial velocity to separate eggwhite proteins. Only in analytical-scale columns significantly higher velocities areused, sometimes reaching 6 m h-1
•
Flow-rates used with cross-linked dextran exchangers are even slower. Anexample of industrial ion-exchange chromatography to produce egg white lysozymeused CM-Sephadex C-25 to adsorb the enzyme which was then eluted with I M NaCI.The cycle time depended on whether the ionic strength was adjusted by dilution or bydesalting on Sephadex G-25. In the former case, the cycle time was 42 h and in thesecond case 15 h [8]. Both cases indicated that one of the main reasons which causedsuch long) cycle time was the low flow-rate.
Flow-rates through ion exchangers are usually limited by the compressibility ofthe matrix. The granular materials with larger particle sizes can allow fast flows but thelarge particles create internal transfer resistances which control the overall process.The productivity of these processes for production purposes is thus limited by eitherthe diffusion within the particles or the flow through the bed. It will be shown in thispaper that the effect oflow flow-rates through the bed is to reduce further the inherentvelocity of the process leading to a potential reduction in throughput and henceefficiency of use of the system.
In addition, the ion exchangers based on the cross-linked cellulose and dextranin the physical form offibre, microgranular and sphericity show swelling and shrinkingwhen the ionic strength and pH of the carrier fluids are varied. This leads to the resinbed being deformed and cracked and causes channeling and subsequent loss ofperformance.
An ideal ion exchanger is sought with the characteristics of fast kinetics, highflow-rate and stable physical form when varying the ionic strength and pH value. Thenovel ion-exchanger, carboxymethyl-HVFM, (CM-HVFM) supplied by Biotechnology Process Services (Durham, U.K.) is based on cross-linked regenerated celluloseand is ina coherent rather than particulate form. It is shown in this paper to exhibithigh flow-rates at low pressures, and a high capacity. Because of its coherent form it isnot possible to form cracks in the bed when it is subjected to changing ionic strengths.
Here we report some of these characteristics of the new matrix and leavea theoretical development for a future paper. Firstly, we examined the adsorption anddesorption kinetic behaviour of CM-HVFM under a variable column flow-rate. Thedifferential bed technique was used which allows us to assume the whole column (4 mmlong) was at the same condition.

KINETIC BEHAVIOUR OF CM-HVFM
MATERIALS AND METHODS
257
Lysozyme (Sigma, Dorset, O.K.) was dissolved in 0.01 M acetic acid-sodiumacetate buffer of pH 5.0.
A novel cross-linked cellulosic ion-exchanger (batch Wl) (BiotechnologyProcess Services) was obtained in the carboxymethyl form (CM-HVFM). It was foundto have a maximum lysozyme capacity of 2100 mg per dry at pH 5.0. The 3-mm highdiscs were supplied in diameter 2% larger than the LD. of the columns, which wereused to pack the columns. Two other carboxymethyl cellulosic ion-exchange resinswere obtained commercially. CM-52, a microgranular CM ion-exchanger, waspurchased from Whatman BioSystems (Kent, O.K.) and Indion HC2 (CM resin, sizebetween 350-400 ,urn, batch 1246) was obtained from Phoenic Chemical, Waitaki NZRefrigerating (Nelson, New Zealand).
A Sartorius (Surrey, U.K.) 0-3400 filter holder with distributor was packed witheither 2.7 g (0.3 g dry weight) CM-HVFM or 5 g of 1:1 slurry ofCM-52 or 4.3 g of 1:0.8slurry of HC2. This produced a short 5.8-ml column (4 mm x 43 mm LD.
A 160 x 10 mm LD. adjustable glass column (Amicon, Stonehouse, U.K.)packed with 0.5 g (dry weight) CM-HVFM was used for the 110 x 10 mm LD. columnof 8.64 ml volume. A gear micropump (Micropump, Concord, CA, U.S.A.) was usedfor the higher flow-rates otherwise a Millipore (Bedford, MA, US.A.) peristalticpump or Autoclude peristalic pump (F.T. Scientific Instruments, Tewkesbury, U.K.)were used. A LKB (Bromma, Sweden) Uvicord II monitor was used on-line to detectthe lysozyme concentration at 280 nm.
The experiments were carried out using the systems shown in Fig. 1. The sample
o
4x43 mm1. D.
r-<t::r-i uvpump
H
eeo-xo--
pump
a
pump
b
Fig. I. Experimental devices. (a) Short column; (b) long column.

258 F. MING, J. A. HOWELL
to be loaded was placed in a stirred beaker from which it was pumped upwards throughthe column. With the short column (Fig. la) a separate stream was pumped from thebeaker to the UV monitor and back to the beaker at a velocity of 1800 m h-I whilst forthe longer column (Fig. I b) the stream passed from the top of the column through theUV detector. The short column was operated at a fast recycle rate and acted asa differential bed in order to study the kinetics ofadsorption and desorption on the ionexchangers. Before each adsorption run, the ion exchanger was equilibrated with pH5.0 of0.01 M sodium acetate buffer then the whole system (Fig. la) was drained beforestarting the run. Washing with pH 5.0 of0.01 M sodium acetate buffer was followed bythe adsorption and then desorption with 0.7 M NaCl solution. The CM-HVFM wasregenerated by 2 MNaCI or 0.7 MNaOH solution. A load-wash-elution process wasalso performed on the longer column.
Two other larger diameter columns were used to measure the relationshipbetween flow-rate and pressure drop through the columns. These were both about 100mm long x 26 mm or 147 mm J.D. Pressure was increased by increasing flow.
RESULTS AND DISCUSSION
The CM-HVFM isothermal adsorption curves shown in Fig. 2 were obtained forlysozyme solutions adjusted to different ionic strengths with salt. The curve for 0.767mS cm-1 ionic concentration was fitted to a Langmuir [9] isotherm with a dissociationconstant, Kd , of 0.08 mgjml and a lysozyme capacity (qrn) of 2010 mgjg. Such highprotein capacity might result from the large surface area to volume ratio of the openirregualor network structure of the CM-HVFM. At a very low lysozyme concentrationthe CM-HVFM showed a high equilibrium protein capacity, i.e. 1300 mg g-I inequilinium with 0.2 mgjmllysozyme. When the ionic concentration was increased 21
2500
~"0 2000
-;-'"enE
1500i;uroa.ro
1000u
"E>-N
s:>-
500:r....>::c,:r'-'
5 6 7 8 9 10
Equilibrium lysozyme concentration, mg ml- 1
Fig. 2. CM-HVFM adsorption isotherms. Effect of ionic concentration. Curves; 1 = 0.767 mS em-I;2 = 5.66 mS em-I; 3 = 16.3 mS em-I.
KINETIC BEHAVIOUR OF CM-HVFM 259
times to 16.3 mScm- l, theqm value ofCM-HVFM only dropped to 863 mgg- l . Thus it
is suggested from Fig. 2 that CM-HVFM could be used to recover protein fromrelatively low concentration streams at moderate ionic concentrations between 0.7 and8 mS em-I.
When applying the CM-HVFM to low protein concentration streams of largevolume, there are two other performance factors, kinetic process and flow-rate, whichhave to be considered and those will be discussed below.
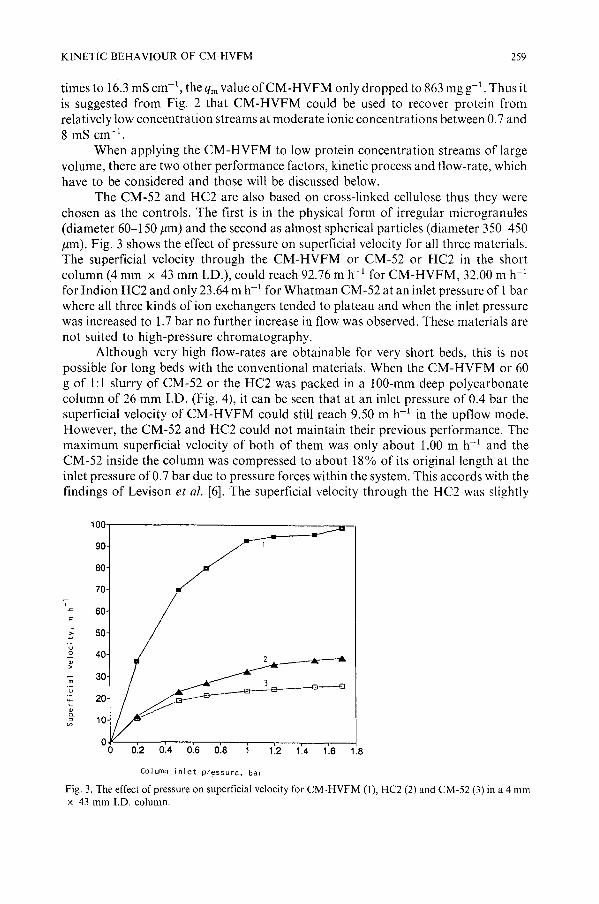
The CM-52 and HC2 are also based on cross-linked cellulose thus they werechosen as the controls. The first is in the physical form of irregular microgranules(diameter 60-150 pm) and the second as almost spherical particles (diameter 350-450pm). Fig. 3 shows the effect of pressure on superficial velocity for all three materials.The superficial velocity through the CM-HVFM or CM-52 or HC2 in the shortcolumn (4 mm x 43 mm I.D.), could reach 92.76 m h- l for CM-HVFM, 32.00 m h- l
for Indion HC2 and only 23.64 m h-1 for Whatman CM-52 at an inlet pressure of 1barwhere all three kinds of ion exchangers tended to plateau and when the inlet pressurewas increased to 1.7 bar no further increase in flow was observed. These materials arenot suited to high-pressure chromatography.
Although very high flow-rates are obtainable for very short beds, this is notpossible for long beds with the conventional materials. When the CM-HVFM or 60g of 1:1 slurry of CM-52 or the HC2 was packed in a 100-mm deep polycarbonatecolumn of 26 mm I.D. (Fig. 4), it can be seen that at an inlet pressure of 0.4 bar thesuperficial velocity of CM-HVFM could still reach 9.50 m h-1 in the upflow mode.However, the CM-52 and HC2 could not maintain their previous performance. Themaximum superficial velocity of both of them was only about 1.00 m h- l and theCM-52 inside the column was compressed to about 18% of its original length at theinlet pressure of 0.7 bar due to pressure forces within the system. This accords with thefindings of Levison et al. [6]. The superficial velocity through the HC2 was slightly
100
90
80
70-;-
-'= 60E
t' 50u2 40v>
rn 30u~ 20vCL
10"V>
0.2 0.4 0.6 0.8
Column inlet pr~ssure, bar
1.2 1.4 1.6 1.8
Fig. 3. The effect of pressure on superficial velocity for CM-HVFM (I), HC2 (2) and CM-52 (3) in a 4 mmx 43 mm LD. column.

260
1200
1000
800';"
.c
5600
;:-u0
400.u
'<-
v 200~~
F. MING, 1. A. HOWELL
0.1 0.2 0.3 0.4 0.5 0.6 0.7 0.8 0.9
Column inlet pressure. bar
Fig. 4. The effect of column diameter and pressure on superficial velocity for CM-HYFM and comparisonwith 26 mm diameter columns containing CM-52 or He. 0 = 100 x 147mm J.D. CM-HVFM, up-flowmode; 0 = 100 x 147 mm I.D. CM-HYFM, down-flow mode; ... = 100 x 26 mm J.D. CM-HYFM,up-flow mode; x = 100 X 26111111 J.D. CM -52, up-flow mode; • = 100 x 26 mm J.D. HC2, up-flow mode.
higher than that ofCM-52 since the particle size ofHC2 was 3-4 times larger than thatof CM-52. It did not seem practical to examine the effect of increased columndiameters as this would have decreased performance of these exhangers still further. Itwas also decided to examine the adsorption and desorption kinetics only up toa flow-rate that could be sustained in the llO-mm long column for the latterexchangers.
Scaling the column diameter up 5.7-fold to 147 mm J.D. would be expected tocreate a serious flow problem as the effect of the wall support is lost. Data fromLevison et al. [7] shows that with DEAE-cellulose DE-52 the most practicableflow-rate for diameters above 100 mm is 300 mm h-1
. With CM-HVFM (Fig. 4) theincrease in diameter only caused a further loss offlow ofabout 15% depending slightlyon whether the flow was up or down through the column. The superficial velocity wasnot affected at 0.1 bar, and at 0.4 bar reached 7 m h-1 which suggests that a superficialvelocity of 5-7 m h-1 might be applied on the process scale.
Figs. 5 and 6 show the relationship between the kinetic rates of adsorption anddesorption and flow-rate for 5.8 ml of CM-HVFM in the differential bed (4 x 43 mmJ.D. column) when first fed with 180 ml of 0.5 mg ml-1 of lysozyme in 0.01 M sodiumacetate buffer at pH 5.0 to adsorb the lysozyme and then eluted with 180 ml of 0.7M NaCI to desorb the adsorbed lysozyme at various superficial velocities. The sameelution volume as adsorption was llsed so that an indication of the overall massbalance and the percentage adsorption can be gauged readily from the UV chart trace.
By using the differential bed column the column wall effect, axial dispersion anduneven distribution could be neglected due to the recycle mode of the differential bed.It is also possible to show directly how flow can affect the kinetics by altering the

KINETIC BEHAVIOUR OF CM-HVFM
1.0
261
<:o.......,~..,~uguUlUl111
.....<:o.....Ul<:1118.....'0
o 10 20 30 40 50 min
Fig. 5. The adsorption of 180 ml of 0.5 mg ml- ' lysozyme in 0.01 M sodium acetatc buffcr pH 5 in a 4 mmx 43 mm I.D. column A = 297 cm h- ' ; B = 644 cm h- ' ; C = 1388 cm h- ' ; D = 4443 cm h- ' ; E = 9276 cmh- ' .
external mass transfer coefficient. This demonstrates the significant effect which masstransfer external to the particles has on chromatographic kinetics. It is also clear that toachieve these effects on a large scale it is important to have a matrix which will sustainhigh velocities on a wide diameter column.
From Figs. 5 (curves A-E) and 6 (curves A-E) with the superficial velocityvarying from 2.97 m h- 1 to 92.76 m h- 1
, it can be seen that the rates of adsorption anddesorption increased with increasing superficial velocity. 80% of the total lysozymewas adsorbed in 14 min and 90% of adsorbed lysozyme was eluted in 10 min ata superficial velocity of 2.97 m h-1 (Figs. 5 and 6, curves A), while at a superficialvelocity of 13.88 m h-1
. 90% of lysozyme was adsorbed in 8 min and 90% of adsorbedlysozyme was eluted in 6 min (Figs. 5 and 6, curves C), further increasing the superficialvelocity to 44.43 m h- 1 at the inlet pressure 0.21 bar required only 3.5 min for 90% oflysozyme to be adsorbed and only 5 min for 90% of the adsorbed lysozyme to bedesorbed (Figs. 5 and 6, curves D). These times ofadsorption and desorption were onlyslightly improved when the flow velocity was increased to 92.76 m h- 1 at an inletpressure of 1 bar (Figs. 5 and 6, curves E). It appears that the flow-rate is no longer themain limiting factor above about 50 m h-1
, and that at this flow-rate external film mass

262
1,0D E
F. MING, J. A. HOWELL
0,75
l::0.......<U
tJ0.5l::
Q)Ul::0U
IIIIIIQ).....c:0
0.25....IIIc:~....
'1:l
0,00 min
Fig. 6. The desorption of the adsorbed lysozyme with 180 ml of0.7 M NaCl in a 4 mm x 43 mm J.D. columnat various superficial velocities. A = 297 cm h-1
; B = 644 em h-1; C = 1388 em h-1
; D = 4443 em h-\E = 9276 em h-'.
transfer is no longer very significant. Conversely, at lower flow-rates the fastestkinetics are not attainable due to increased mass transfer in the fluid phase. Theadsorption time for 90% lysozyme adsorption and desorption of 90% adsorbedlysozyme was reduced by factors of 5.7 and 2 respectively by increasing the superficialvelocity 15-fold, from 2.97 to 44.43 m h-1
.
It is interesting to note that the desorption of CM-HVFM is less influenced byexternal mass transfer (Fig. 6). Since the commercially useful flow-rates ofCM-52 andHC2 are constrained (Fig. 4), the kinetic behaviour of adsorption and desorption ofCM-52 and HC2 is only described at flow velocity less than 1 m h-1
. Superficialvelocities of 0.99 and 0.51 m h-1 were used but otherwise the loading and processconditions for the kinetics study of both CM-52 and HC2 were exactly the same as forCM-HVFM.
Figs. 7a and b illustrate that the kinetic processes ofCM-52 are faster than thoseof HC2 in both cases due to the large surface area to volume ratio of microgranularmaterial. With the same loading conditions as for the CM-HVFM, it needed 17 and 31min to adsorb 80% ofloaded lysozyme for CM-52 at the superficial velocities 0.99 and0.51 m h-l, respectively, whilst for HC2 it needed 27 min and 37 min under the sameconditions (Fig. 7a). Although the CM-52 exhibits faster desorption than HC2, it stillneeded 10 and 14 min to elute 90% of the adsorbed lysozyme at 0.99 and 0.51 m h-1 ,

KINETIC BEHAVIOUR OF CM-HVFM
1.0
263
c::o
•.-1...IIIk...c::~c::8UlUlOJ....c::o
•.-1Ulc::
.~'tl
a
o.oL_---+---=::::::::=~~~~=:;:=~~ ___o 10 20 30 40 50 60 70 80 90 min
1.0
0.75c::0
•.-1...IIIk...c::Q) 0.50u8uUlUlQ)....6 0,25•.-1Ulc::
.~'tl
0.00a 10 20 30 40 50 60
b
70 min
Fig. 7. (a) The adsorption of 180 ml of 0.5 mg ml- 1 of lysozyme in 0.01 M sodium acetate duffer at pH 5 ina4mm x 43 mm J.D. column at various superficial velocities. (b) The desorption ofadsorbed lysozyme with180ml of0.7 MNaCI in a 4 mm x 43 mm J.D. column at various superficial velocities. Curves: A = HC2, 51cm h-1; B = CM-52, 51 cm h-1;C = HC2, 99 cm h-1; D = CM-52, 99 cm h-1 .

264 F. MING, J. A. HOWELL
respectively. The HC2 needed more than 40 min to elute the same amount of protein.This is attributed to the larger particle sizes. The experiment described earlier (Fig. 4)indicated that it was difficult to operate the 100 x 26 mm J.D. column packed withCM-52 at a superficial velocity of more than 0.90 m h-1 because the microgranularmaterial was getting increasingly compressible. This resulted in higher and higherpressures with the same flow-rates. It is apparent from the above data that this wouldresult in significant mass transfer limitation in the external film. It was thus notpossible to use the microgranular CM-52 or HC2 at their optimum kinetic rate owingto the flow restrictions.
The higher flow velocities attainable through the new matrix, CM-HVFM, allowmuch faster kinetics to be exhibited. Even this material has reduced flows on thelarger-scale columns and whilst 40 m h-1 would be kinetically optimum only 7 m h-1
can be sustained on the 100 x 147 mm J.D. column. This is about 20 times faster thanattainable on the Whatman and Indion materials.
By loading 50 mg lysozyme to the 110 x 10 mm J.D. column and then elutingwith I MNaCI at various superficial velocity from 0.910 to 13.750 m h-1 (Fig. 8) it isfound that desorption times decrease monotonically with increasing velocity. There isa point, around 5.0 m h-1
, in both curves beyond which the time for eluting 80% and90% of total lysozyme is reduced only slowly.
The advantages of very high velocities and fast kinetics can be realised ina practical application. In Fig. 9, a complete adsorption desorption cycle that has notbeen optimised is show for 0.5 g dry weight CM-HVFM packed into the longercylindrical column (110 x 10 mm J.D.). The feed was 340 ml of 0.588 mg ml-1 oflysozyme in 0.01 M sodium acetate buffer at pH 5.0 with a superficial velocity of 8.87m h-1
, 1.7 bed volumes/min. After loading the column was washed for 2 min with 2.7bed volumes of buffer at the same flow-rate and then eluted with I M NaCI fed at 8.41m h-1
• A sharp peak and short tail for the elution are observed with complete absence
25
20
15c:
E
,jE
'"10
c:0
'"e-5: 5"'"
141210864O+---,.-----r----r---....,---.,-----.---jo 2
Superficial velocity, m h- 1
Fig. 8. Desorption time of80% (EI) and 90% (0) of total elution lysozyme at various superficial velocities.

KINETIC BEHAVIOUR OF CM-HVFM
oQ)N
A B
265
o 10 20 30 ~o min
Fig. 9. Protein concentration in the column eluent. Adsorption started time 0, washing started at A, elutionat B. CM-HVFM in a 110 mm x 10 mm J.D. column, loaded with 340 ml of 0.588 mgjml lysozyme.Superficial velocity 8.87 ml h - l.
of any measurable breakthrough even though the column was loaded to 50% of itstotal capacity with 200 mg of protein on 8.6 ml or 0.5 g of matrix. The whole processtook less than 40 min. In a later experiment breakthrough was observed only when the110 x 10 mm J.D. column had adsorbed 43 bed volumes or 365 ml of I mg ml-1
lysozyme at a superficial velocity 6.34 m h- 1• The column capacity at the breakthrough
point was thus 365 mg of protein or 42 mg protein ml-1 of column. At this flow-ratethat took only 45 min for the adsorption. It was thus possible to load a solutioncontaining 1 mg ml- 1 of protein at nearly 1 bed volume/min with total adsorption ona bed only 110 mm long.
During the above operation, the 110 x 10 mm 1.0. column was regenerated by2 M NaCI or 0.7 M NaOH for 40 min and there was no obvious swelling and shrinkingobserved which indicates a potential further advantage of the CM-HVFM matrix.
CONCLUSION
The new CM-HVFM matrix has several advantages over the microgranular andspherical cellulosic ion exchangers:
(1) The kinetics of adsorption of proteins by carboxymethyl cellulosic ionexchangers are controlled by external mass transfer at normal operational flow-rates.Higher flow velocities allow faster adsorption and desorption kinetics.
(2) The bed of the CM-HVFM matrix maintains an open structure at high
266 F. MING, J. A. HOWELL
flow-rates, whilst the beds of microgranular and spherical matrix tend to becompressed and block. The new matrix can thus sustain a superficial velocity of over7 m h-1 in a 100 mm x 147 mm LD. column which is over five times the velocity thatcan be sustained by the other materials. Flow-rates are normally restricted bycompression which tends to become worse in larger diameter columns leading toslower kinetics in large-scale columns than small-scale columns. The faster flows meanthat longer beds are needed and thus it is important to have fast flow even in long beds.A bed of 110 mm is long enough to avoid breakthrough when over 30 column volumeshave been loaded at 1 bed volume/min. The new material can thus be used to treat largevolumes of solution.
(3) It is suggested that the new matrix possesses an open structure for flow whichis not easily compressed but is clearly not rigid yet there are sufficiently short diffusionpathways within the material that kinetics ofdesorption are not slowed down. The finestructure of the new matrix is such that there are short diffusion pathways within thecellulose and a very high percentage of the surface is accessible to direct convectiveflow which leads to rapid kinetics that also are commensurate with the flow rateallowing very fast large scale separations. The desorption rates are intrinsically fasterthan adsorption and less influenced by mass transfer for the HVFM and HC2 althoughthe large particles of HC2 are influenced by mass transfer in the external phase.
(4) CM-HVFM can withstand changes of ionic strength and pH without obviousswelling and shrinking, which can avoid the column bed being deformed and cracked.
ACKNOWLEDGEMENT
The work was supported by the SERC and Biolsolates Ltd. under a collaborative grant.
REFERENCES
1 S. Yamamoto, K. Nakaniskik and R. Matsamo, Ion Exchange Chromatography o/Proteins (Chromatographic Science Series, Vo!. 43), Marcel Dekker, New York, 1988, p. 3.
2 G. Sofer and 1. Nystrom (Editors), Process Chromatography -A Practical Guide. Academic Press,London, 1989, Foreword.
3 J. Bonnerjea, S. Oh, M. Hoare and P. DunniIJ, Bio/Technology, No.4 (1986) 954, 958.4 H. A. Chase, in D. Naden and M. Streat (Editors), Ion Exchange Technology, Ellis Horwood,
Chichester, 1984, pp. 400-406.5 G. 1. Skidmore and H. A. Chase, in D. Naden (Editor), Ion ExchangefiH Industry, EIJis Horwood,
Chichester 1988. pp. 520-532.6 P. R. Levison, E. T. Butts, M. 1. Koscie1y and 1. Lane, in Y. Briand, C. Doimel and A. Faure (Editors),
Technologies de Purificotion des Proteins, Vo!. 4, G.R.B.P., Clermont-Ferrand, 1990, pp. 137-142.7 P. R. Levison, S. E. Badger, D. W. Toome, D. Carcary and E. Butts, in Advances in Separation Processes
(Symposium Series, No.1 18), The Institution of Chemical Engineers, U.K. Hemisphere Pub!., 1990, pp.6.1-6.11.
8 J.-c. Janson and P. Hedman, in A. Fiechter (Editor), Advances in Biochemical Engineering, Vo!. 25,Springer, New York, 1982, pp. 64-99.
9 Sigma Diagostics Procedure No. 690: Microprotein Determination, Sigma, Poole, 1985.10 I. Langmuir, J. Am. Chem. Soc., 38 (1916) 2221.

Journal of Chromatography, 539 (1991) 267~277
Elsevier Science Publishers B.V., Amsterdam
CHROM. 22 876
Immobilized metal ion affinity partitioning, a methodcombining metal-protein interaction and partitioning ofproteins in aqueous two-phase systemsa
G. BIRKENMEIER'
Institute 0( Biochemistry, Karl-Marx-Universitiit Leipzig, Liebigstrasse 16, 7010 Leipzig (Germany)
M. A. VIJAYALAKSHMI
Laboratoire de Technologie des Separations, Universite de Technologie de Compiegne, B.P. 649, 60206Compiegne (France)
T. STIGBRAND
Institute of Physiological Chemistry, University of Umea, S-90187 Umea (Sweden)
and
G. KOPPFRSCHLAGFR
Institute of Biochemistry, Karl-Marx-Universitiit Leipzig, Liebigstrasse 16, 7010 Leipzig (Germany)
ABSTRACT
Immobilized metal ions were used for the affinity extraction of proteins in aqueous two-phase systems composed of polyethylene glycol (PEG) and dextran or PEG and salt. Soluble chelating polymerswere prepared by covalent attachment of metal-chelating groups to PEG. The effect on the partitioning ofproteins of such chelating PEG derivatives coordinated with different metal ions is demonstrated. Theproteins studied were 0(2-macroglobulin, tissue plasminogen activator, superoxide dismutase and monoclonal antibodies. The results indicate that immobilized metal ion affinity partitioning provides excellentpotential for the extraction of proteins.
INTRODUCTION
Immobilized metal ion affinity chromatography (IMAC), which makes use ofthe selective retention of proteins on transition metal ions chelated to an insolublematrix such as agarose, was introduced by Porath et at. [I]. The importantcontribution of Sulkowski [2] to the understanding of the underlying mechanism ofthis selective recognition has made this concept one of the best suited in separationtechnology, as evidenced by the increasing number of papers appearing in this field.While the concept of protein affinity for metal chelates has been extensively studied bythe chromatography of proteins [3], peptides [4] and, more recently, of whole cells [5],very few attempts have been made to introduce this affinity principle to the otheranalytical and preparative separation methods [6]. The utilization of aqueous
a This paper is dedicated to Professor P.-A. Albertsson on the occasion of his 60th birthday.
0021-9673/91/$03.50 © 1991 Elsevier Science Publishers B.V.

268 G. B1RKENMEIER et al.
two-phase systems for the affinity purification of many molecules, using pseudospecific ligands such as triazine dyes, is now well established [7]. Hence, it is ofconsiderable interest to exploit the affinity of proteins for immobilized (chelated)metals in such partitioning systems. Both of these aspects are the subject of this paper.
However, certain requirements have to be met in order to exploit successfully theIMA principle in affinity partitioning. First, an appropriate chemistry must bedeveloped for the preparation of soluble polymers with covalently coupled chelatinggroups. Second, the impact of the protein surface topography on their recognition bymetal chelates has to be considered. Moreover, the microenvironment of the electrondonor grouping [5] on the protein surface may result in a variable mechanism ofprotein recognition by a metal ligand.
EXPERIMENTAL
Polyethylene glycol (PEG) 6000 and 1540 were obtained from Serva (Heidelberg, Germany). Dextran T-70 was obtained from Pharmacia (Uppsala, Sweden) andbromoacetic acid from Aldrich (Steinheim, Germany).
C(z-Macroglobulin (C(z-M) was purified from fresh plasma [8]. Copper-zincsuperoxide dismutase (SOD) was a gift from Symbicom (Umea, Sweden). Single-chaintissue plasminogen activator (t-PA) was kindly provided by Professor P. Wallen,University of Umea, Sweden.
Preparation of metal chelate PEGIminodiacetate-PEG (IDA-PEG) was synthesized by reaction of bromoacetic
acid with aminomonomethoxy-PEG (amino-M-PEG) 5000. Amino-M-PEG wasprepared according to Cordes [9]. Briefly, 60 g ofM-PEG 5000 (Sigma) were melted at65°C and water was removed under vacuum. After addition of3 ml of distilled thionylchloride, the sample was rotated for 6 h at 65°C under a nitrogen atmosphere toexclude moisture. After removing excess of thionyl chloride by evaporation, theresidue was dissolved in 3 I of absolute ethanol and precipitated at 4°C. The driedCl-M-PEG was dissolved in 150 ml of water and 150 ml of ammonia solution (25%)were added. The solution was placed in a sealed plastic tube and left for 100 h at 55°C ina dry oven. After evaporation of the solvent, 53 g of amino-M-PEG were obtained.
For the preparation oflDA-PEG, 15 g ofamino-M-PEG dissolved in 100 ml ofwater were reacted with 15 g of bromoacetic acid at pH 8.5 for 12 h and roomtemperature. Then, 100 ml of water were added and the IDA-M-PEG was extractedthree times with 300 ml of chloroform. Phase separation was accelerated bycentrifugation. The combined chloroform phases were dried over anhydrous sodiumsulphate and the solvent was removed by distillation. After two crystallizations inabsolute ethanol, 12-13 g of IDA-PEG were obtained.
Metal charging oflDA-PEG was done by dissolving 2 g ofIDA-PEG in 10 ml of50 mM sodium acetate (pH 4.0) containing the respective metal ions (Cu2+, Zn2+,Ni2+, Fe3+) in a 1O-20-molar excess over the IDA-PEG. The solution was stirred for1 h and then extracted with chloroform. The chloroform was dried and evaporated,yielding 1.9 g of metal-IDA-PEG.
The metal content in solutions was determined by flame photometry usingappropriate standards.

IMMOBILIZED METAL ION AFFINITY PARTITIONING 269
Preparation of two-phase systemsThe two-phase systems were prepared from stock solutions of polymers in
water-40% (wjw) PEG and 20% (wjw) dextran. The polymer solutions were mixedwith buffer, water and protein sample to give the final concentration as indicated in thelegends to the figures. Affinity partitioning was performed by replacing part of thetotal PEG with metal-IDA-PEG. The systems were equilibrated by 40 inversions atn°e. Phase separation was accelerated by centrifugation at 2000 g for 2 min. Aliquotswere withdrawn from the top and bottom phases and analysed for the metal or proteincontent. Similarly, two-phase systems composed of PEG and salt were prepared fromstock solutions and treated as described above.
Determination of the partition coeffIcientThe partition coefficient, K, was calculated as the ratio of the concentration or
radioactivity of a species in the upper and lower phase. The effect of the affinity ofa protein for the metal-IDA-PEG was expressed in terms of LllogK, given by LllogK= log Karr - log Ko, where Karr and Ko are the partition coefficients of the protein inthe presence and absence of metal-IDA-PEG in the system, respectively, otherconditions being identical. The concentrations of arM and monoclonal antibodieswere determined by enzyme-linked immunoadsorbent assay (ELISA).
IodinationSOD and t-PA were iodinated with 0.5 mC of 1251(Amersham, U.K.), applying
the lodobeads technique [10].
RESULTS
Preparation of metal-IDA-PEGThe soluble chelating polymer was synthesized by three steps starting from
monomethoxy-PEG as outlined in Fig. I. Under the conditions used, mostlymonosubstituted chelating PEG was formed. The nitrogen content of IDA-PEG asdetermined by elemental analysis was 0.32%, which is higher than expected(theoretical value 0.28%). Partial dimethylation during the reaction may account forthis discrepancy.
The tridentate IDA-PEG may occupy a maximum of three coordination sites inthe metal coordination sphere, leaving three coordination sites free for interactionwithe water or proteins at least in the case of a hexacoordinate central metal ion. Theamounts of the metal ions such as Cu2 +, ZnH , NiH and Fe3+ chelated by theIDA-PEG are given in Table I. With Cu2 + and Zn 2 +, about I mol of metal ion ischelated per mol of the polymer; NiH and Fe3+ gave lower binding ratios.
Partitioning of metal-IDA-PEG in two-phase systemsThe partition coefficients of metal-IDA-PEG complexes in PEG-dextran and
PEG-salt sysems are compared in Table II. In PEG-dextran systems, the metal ionspartition in favour of the PEG-rich top phase owing to chelation with IDA-PEG. Evenin PEG-salt systems, a high partition coefficient was observed at least for Cu2 +. Onthe other hand, ZnH , NiH and Fe3+ are probably released from the chelatingpolymer, as deduced from their low K values in systems containing high concentrationsof phosphate.

270 G. B1RKENMEIER el al.
(IDA-PEG)
Metal
/CH2-COO\
M-~N- - - - - - - - Metal (Metal-lOA-PEG)
"'CH2-COO/
Fig. 1. Synthesis of metal-IDA-PEG.
(M = methoxy)
Effect of metal-IDA-PEG on partitioning of rJ.2-MThe proteinase inhibitor rJ.2-M was used as a model protein to study the
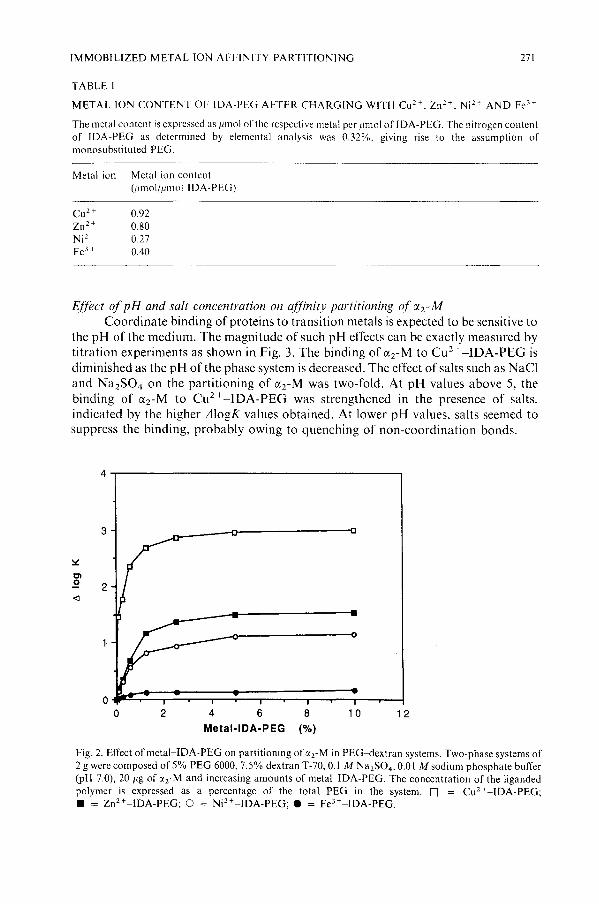
principles of metal chelate affinity partitioning. When rJ.rM was added to a systemcontaining increasing concentrations of metal-IDA-PEG, different extraction curveswere obtained (Fig. 2). Cu 2 +-IDA-PEG causes a change in the partition coefficient ofmore than lOOO-fold (Ko = 0.085; Kaff = 85) yielding a maximum LllogKofca. 3.0. Thecomplexed metals Zn2+ and Ni2+ give rise to lower efficacy; Fe3+ seems to havea negligible affinity to the protein.
IMMOBILIZED METAL ION AFFINITY PARTITIONING 271
TABLE I
METAL ION CONTENT OF IDA-PEG AFTER CHARGING WITH CUH. Zn H . NiH AND Fe3+
The metal content is expressed as Ilmol of the respective metal per Illnol oflDA-PEG. The nitrogen contentof IDA-PEG as determined by elemental analysis was 0.32%. giving rise to the assumption ofmonosubstituted PEG.
Metal ion Metal ion content(1Imol!lllno! IDA-PEG)
cu H 0.92Zn 2 + 0.80Ni' + 0.27Fe3 + 0.40
Effect of pH and salt concentration on affinity partitioning of rJ.z- MCoordinate binding of proteins to transition metals is expected to be sensitive to
the pH of the medium. The magnitude of such pH effects can be exactly measured bytitration experiments as shown in Fig. 3. The binding of rJ.z-M to Cuz+-IDA-PEG isdiminished as the pH of the phase system is decreased. The effect of salts such as NaCIand Na ZS04 on the partitioning of rJ.z-M was two-fold. At pH values above 5, thebinding of arM to Cu2+~IDA-PEG was strengthened in the presence of salts,indicated by the higher L1logK values obtained. At lower pH values. salts seemed tosuppress the binding, probably owing to quenching of non-coordination bonds.
4-r----------------------,
3
::.::01
.2 2<l
2 4 6 8Metal-lOA-PEG (%)
10 12
Fig. 2. Effect of metal-IDA-PEG on partitioning of a2-M in PEG-nextran systems. Two-phase systems of2 g were composed of 5% PEG 6000, 7.5% dextran T-70, O. I M Na2S04, 0.0 I M sodium phosphate buffer(pH 7.0), 20 Ilg of arM and increasing amounts of metal-lOA-PEG. The concentration of the ligandedpolymer is expressed as a percentage of the total PEG in the system. 0 = CUH-IDA-PEG;• = Zn2 +-IDA-PEG; 0 = NiH-IDA-PEG;. = Fe3 +-IDA-PEG.

272 G. BIRKENMEIER et al.
TABLE II
PARTITION COEFFICIENTS OF METAL-IDA-PEG COMPLEXES IN PEG-DEXTRAN ANDPEG-SALT SYSTEMS
PEG-dextran system: 5% PEG 6000, 7.5% dextran T-70, 0.1 M Na2S0., 0.01 M sodium phosphate buffer(pH 7.0); 20°1., of the total PEG 6000 was replaced with different metal-IDA-PEG derivatives. PEG-saltsystem: I 1'Yo PEG 1540,13.5% K 2HPO.-KH zPO. (pH 7.0),2% PEG 6000; 20% of the total PEG 6000 wasreplaced with different metal-IDA-PEG derivatives. The partitioning was performed at 22vC. Aliquots wereremoved from the top and bottom phases, appropriately diluted and subjected to flame photometry. Blankswere systems without metal-IDA-PEG.
Metal-IDA-PEG K
Cu2+ -IDA-PEGZn2+-IDA-PEGNi z+-IDA-PEGFeJ+-IDA-PEG
PEG-dextran
1115.5
10.611.3
PEG-salt
10.20.550.250.44
Partitioning of arM in PEG-salt systems in the presence of metal-IDA-PEGAqueous two-phase systems may also be formed by mixing PEG with high
concentrations of salts such as sodium sulphate or sodium phosphate. In such systemsthe polymer is highly concentrated in the top phase, whereas the bottom phase isformed by the salt solution. Even there, Cuz+-fDA-PEG was found to be veryeffective in extracting the protein from the salt-rich bottom phases (Fig. 4A and B).The highest LllogK values obtained are comparable to that yielded in PEG-dextransystems. The difference in the steepness of the partition curves indicates that theaffinity of arM for Cuz+-IDA-PEG is obviously higher in PEG-sulphate thanPEG-phosphate systems. This may reflect different effects of these salts on the waterstructure in the medium.
Dissociation of protein-metal-IDA complexesTransition metal ions. particularly CuH , Zn H and NiH, bind with electron
donor atoms such as N, 0 and S in available amino acid residues in proteins. Hence, itwould be expected that the dissociation of the metal chelate-protein complexes couldbe accomplished by competing electron donors, e.g., free amino acids. As shown inFig. 5, cysteine strongly diminished the binding of arM to CuH -IDA-PEG withincreasing concentration in the two-phase system. In comparison, imidazole andtryptophan were less effective. No influence on the affinity partitioning of az-M wasobserved by the addition ofammonium ions at the pH ofthe experiment. As one wouldexpect, the addition of EDTA at concentrations above 2 mM abolished the binding ofarM to CuH -IDA-PEG.
Immobilized metal ion alfnity partitioning of other proteinsThe binding properties of different proteins towards selected chelated transition
metals are compared in Table III. The partitioning experiments were conducted inPEG-dextran and PEG-salt systems. Apparently, uncharged IDA-PEG had only

IMMOBILIZED METAL ION AFFINITY PARTITIONING 273
3.,-----------------,A
03 4 5 6 7 8 9
pH
3
C
2::II::
01.2<l
03 4 5 6 7 8 9
pH
3B
2::II::
01.2<l
2
01.2<l
o +--r--Q'=;::-...,r---r--.,---r---,---.----,-~
3456789
pH
Fig. 3. Effect of pH and salt on affinity partitioning of cx,-M. Two-phase systems of 12 g, composed of 5%PEG 6000,7.5% dextran T-70, 240 fig of cxrM in the presence or absence of salt and Cu' +-IDA-PEG, wereadjusted to pH 8.0 with 0.1 M NaOH with continuous stirring at 22°C. After 5 min of equilibration, the pHwas decreased stepwise by adding 0.1 or 0.01 M HC1, and aliquots of I ml were withdrawn, immediatelycentrifuged and analysed for the protein in the top and bottom phases. Composition of the systems: (A)2.5% Cu2+-IDA-PEG, no salt; (B) 2.5% Cu2+ -IDA-PEG, I M NaCI; (C) 2.5% Cu2+-IDA-PEG, 0.1M Na,S04'

274 G. BIRKENMElER el al.
A
2
12010080604020O-Q---r-...,.-r-r-~-r--'--r---'---,r-~----l
o
Metal-lOA-PEG (%J
B
2
12010080604020O-¢---r-.,.--r-,-~-",--'--",--'---,r-~----l
o
Metal-lOA-PEG (%J
Fig. 4. Effect of metal-IDA-PEG on partitioning of ()(,-M in PEG-salt systems. Two-phase systems of2 g were composed of either (A) 10% PEG 1540, 10% Na,S04, 2% PEG 6000, 10 111M sodium phosphatebuffer (pH 7.0) and 20 pg of ()(rM or (B) 11 % PEG 1540, 13.5% K,HP04-KH2P04, 2')10 PEG 6000 and 20pg of ()(,-M. The given percentage of liganded PEG expresses that part of the total PEG 6000 which wasreplaced with eu' +-IDA-PEG. Log K for ()(,·M was -1.17 and -1.1 for the PEG-sulphate andPEG-phosphate systems, respectively.
marginal effects on the partitioning of the proteins in both kinds of two-phase systems.As expected, the binding properties of the proteins differed significantly owing to theirdifferent surface properties. In general, CuH -IDA-PEG was found to be the mosteffective ligand with both PEG-dextran and PEG-salt systems. Zn2 + -, NiH-andFe3 +-IDA-PEG were less effective, especially when used in conjunction withPEG-phosphate systems. This is probably due to the formation of metal phosphatesbecause Zn2 + and NiH are known to be bound less strongly than Cu2 + by

IMMOBILIZED METAL ION AFFINITY PARTITIONING 275
4-r--------------------,
302010
3 r- --tt---_--__- ___
Concentration (mM)
Fig. 5. Dissociation of the protein-metal-IDA-PEG complexes. The two-phase systems of 2 g werecomposed of 5% PEG 6000 including 2.5% Cu2+-IDA-PEG, 7.5% dextran T-70, 0.1 M Na2S04, 0.01M sodium phosphate buffer (pH 7.0),20 lig of Gi2-M and different additives in the concentrations given onthe abscissa. 0 = Imidazole; • = tryptophan; 0 = cysteine; 6 = EDTA; • = ammonium ion. TheLllogK values were calculated in comparison with systems of the same composition but withoutCu2 +-IDA-PEG (log Ko)·
iminodiacetate chelator. Among the proteins tested, C(z-M displayed the strongestbinding to metal-IDA-PEG. t-PA interacted preferentially with chelated CuH . Itsaffinity to chelated NiH was higher than that to chelated ZnH . SOD bound fairlyselectively to CuH -IDA-PEG whereas no interaction was found with chelated ZnH
TABLE III
EFFECT OF METAL-lOA-PEG ON PARTITIONING OF DIFFERENT PROTEINS IN PEGDEXTRAN AND PEG-SALT SYSTEMS
PEG-dextran system: 5% PEG 6000, 7.5% dextran T-70,0.1 M Na2S04, 0.01 M sodium phosphate buffer(pH 7.0); for the calculation of LllogK, 20% of the total PEG was replaced with uncharged IDA-PEG ormetal-lOA-PEG. PEG-salt system: II % PEG 1540, 2% PEG 6000,13.5% K 2HP04-KH 2P04 (pH 7.0); forthe calculation of Lllog K, 50% of the total PEG 6000 was replaced with uncharged IDA-PEG ormetal-IDA-PEG.
Protein Lllog K
PEG-dextran: metal-IDA-PEG PEG-salt: metal-IDA-PEG
Cu2+ Zn2+ Ni2+ None Cu2+ Zn2+ Ni2+ None
Gi2-Macroglobulin 3.00 1.50 1.10 0.17 2.4 0.06 0.18 0.02Tissue plasminogen
activator 1.59 0.78 1.20 0.14 1.23 0.46 0.31 0.03Superoxide dismutase 1.30 0.05 0.18 0.08 0.83 0.10 0.20 0.05Monoclonal antibody
(IgG1J !.I 5 0.12 0.05 0.10 n.d." n.d. n.d. n.d.
a n.d. = Not determined.
276 G. BIRKENMEIER el al.
and Ni2+. When we tested a range of monoclonal antibodies, different partitioncoeffients were obtained. However, all displayed the strongest binding to chela tedCu 1 +, as exemplified for a monoclonal antibody of the immunoglobulin (Ig) G 1K type.No correlation was found between the magnitude of binding (LllogK) to chelated metalions and a certain class or subclass specificity.
DISCUSSION
In this study the feasibility of complexation of proteins with chelated metal ionswas exploited for affinity extraction in aq ueous two-phase systems; so far the onlypublished application is the extraction of haemoglobin [II].
Using al-M as a model protein, the effect of the transition metal ions Cu 1+,
Zn2+, Ni2+ and Fe3+ chelated to IDA-PEG on the partitioning of this protein wasclearly shown. The results reveal that the type and concentration of the chelated metalions are important parameters which influence the partition coefficient of the protein.The strong effect exerted by chelated Cu1 + on the partitioning of proteins incomparison with other metal ions parallels its strong tendency to coordinatepredominantly with histidine residues on the protein surface. It is fairly clear that theaccessibility of surface-exposed histidine residues is the dominant factor governing thebinding strength of metal chelates to proteins [12]. Accordingly, the differences in theLllogK values obtained for arM, t-PA, SOD and a monoclonal antibody may accountfor this fact.
To perform affinity partitioning, specific or pseudo-biospecific ligands such asinhibitors, antibodies or dyes were used [7]. However, the difficulty of reversing theligand-protein interaction is often encountered with this technique. In the case ofimmobilized metal ion affinity partitioning (IMAP), several possibilities exist fordissociating the metal-protein complex under nondenaturing conditions. The additionof free electron-donating amino acids or EDTA was as effective as lowering the pH ofthe two-phase system (Figs. 3 and 5).
As shown in Fig. 4 and Table III, the binding of proteins to chela ted metal ionsoccurs at high concentrations of salts in the phase system. In addition, a promotingeffect of the water structure-forming salts such as sodium phosphate and sodiumsulphate on binding of al-M to Cu2 +-IDA-PEG was observed. This offers interestingpossibilities for performing IMAP also in PEG-salt systems, which can be handled andscaled up more easily than PEG-dextran systems.
Liquid-liquid partitioning in conjunction with metal affinity extraction shouldbe an interesting approach for downstream processing of proteins including those ofclinical and industrial interest. The growing use of recombinant DNA technologyallows the modification ofprotein products in order to facilitate their purification. Theintroduction of "affinity tails" of desirable chromatographic properties, such ashistidine-containing peptides, will make the use oflMAP a very attractive alternativefor large-scale purifications [13].
ACKNOWLEDGEMENTS
Part of this work was carried out under the collaborative research programmebetween Karl-Marx-University of Leipzig, and the University of Technology of

IMMOBILIZED METAL ION AFFINITY PARTITIONING 277
Compiegne. G.B. gratefully acknowledges the hospitality offered to him at UmeaUniversity. T.S. was supported by the Swedish Medical Research and CancerResearch Council. We acknowledge useful discussions with Dr. E. Sulkowski duringthe preparation of the manuscript.
REFERENCES
I J. Porath, J. Carlsson, I. Olsson and G. Belfrage, Nature (London), 258 (1975) 598.2 E. Sulkowski, Trends Biotechno!., 3 (1985) I.3 E. Sulkowski, BioEssays, 10 (1989) 170.4 M. Belew, T. T. Yip, L. Andersson and.J. Porath, 1. Chromatogr., 403 (1987) 197.5 H. Goubran-Botros and M. A. Vijayalakshmi, 1. Chromatogr.. 495 (1989) 113.6 S. S. Suh and F. H. Arnold, Biotechno!. Sioeng., 35 (1990) 682.7 G. Birkenmeier, G. Kopperschliiger and G. Johansson, Biomed. Chronwtogr., I (1986) 64.8 F. Van Leuven, J.-J. Cassiman and H. Van den Berghe, 1. Bio!. Chem .. 256 (1981) 9016.9 A. Cordes, Thesis, Technical University Carozo-Wilhelmina, Braunschweig, 1985.
10 Pierce Manual: fmmunoTechnology Catalog and Handbook. Pierce, Rockford, IL, 1989. p. C-53.II S. D. Plunkett and F. H. Arnold, BiotechI/O!. Tech., 4 (1990) 45.12 E. S. Hemdan, Y.-J. Zhao, E. Sulkowski and J. Porath, Proc. Nat!. Acad. Sci. U.S.A., 86 (1989) 1811.13 C. Ljungquist, A. Breitholtz, H. Brink-Nilsson, T. Moks, M. Uhlcn and B. Nilsson, Eur. 1. Biochem.•
186 (1989) 563.


Journal of Chromatography, 539 (1991) 279-287Elsevier Science Publishers B.V., Amsterdam
CHROM. 22898
Interactions of the mitochondrial membrane rat liver n-3hydroxybutyrate dehydrogenase with glass beads duringadsorption chromatography
Relationships with the activation of the enzyme byphospholipids
P. ADAMI and B. NASSER
Laboratoire de Biochimie et Biologie Moleeulaire (UA CNRS 531). Universite de Franche Comte. 25030Besan,'oll Cedex (France)
and
N. LATRUFFE*"
Laboratoire de Biologie Moleclilaire et Celllllaire. Universite de BOllrgogne. B.P. 138. 21004 Dijon (France)
ABSTRACT
D-3-Hydroxybutyrate dehydrogenase (BDH) is an NAD+ -dependent dehydrogenase of the mitochondrial inner membrane involved in the energetic balance between the liver and peripheral organs inmammals. It allows the conversion of ketone bodies (acetoacetate and D-3-hydroxybutyrate) and it is oneof the best documented lipid-requiring enzymes with a dependence on lecithins. After release of proteinsfrom the membrane by phospholipase A2 treatment of salt-treated mitochondria, the rat liver enzyme isabsorbed on controlled-pore glass beads. After batch washing, the enzyme, devoid of lipids (apoBDH), isspecifically eluted at pH 8.05-8.15 with a 0.1 M Tris-I M LiBr buffer under reducing conditions (5 mMdithiothreitol). It appears that during BDH absorption, the glass beads mimic the phospholipid surface ofbiomembranes.
INTRODUCTION
o-3-Hydroxybutyrate dehydrogenase (BDH), EC 1.1.1.30, is a ketone bodyconverting enzyme (for a review, see ref. 1). This mammalian NAD(H)-dependentenzyme plays a central role in the energetic balance between hepatic and peripheraltissues under physiological and pathological conditions. Indeed, the concentrations ofthe ketone bodies (acetoacetate and o-3-hydroxybutyrate) in the plasma and in thecells depend on the interrelationships between the metabolic pathways of lipids, of
" Present address: Laboratoire de Biologic Moleculaire et Cellulaire, Faculte des Sciences de laVie-Mirande, Universite de Bourgogne, B.P. 138,21004 Dijon, France.
0021-9673/91/$03.50 © 1991 Elsevier Science Publishers B.V.

280 P. ADAMI, B. NASSER, N. LATRUFFE
carbohydrates and of some ketogenic amino acids [2]. Under normal conditions,D-3-hydroxybutyrate dehydrogenase is essential in the oxidization of D-3-hydroxybutyrate in the brain of newborns, providing energy and biosynthetic precursors(acetyl-CoA) of cholesterol and myelin. Tn addition, extrahepatic tissues such as thekidney, heart and skeletal muscle use ketone bodies preferentially as energy fuels. Tt isalso well known that an overproduction of ketone bodies appears in diseases ornon-physiological conditions, e.g., diabetes mellitus, starvation or hyperlipidic diet [3].
Lehninger et al. [4] showed that D-3-hydroxybutyrate dehydrogenase is locatedin the inner mitochondrial from mammalian tissue. Later, it was found that theorientation of the catalytic site is on the matrix side of the inner membrane [5].
BOH is one of the few enzymes so far known which show a specific lipiddependence (absolute requirement for phosphatidylcholine for enzymatic activity).
The enzyme cannot be released from the membrane by sonication, osmoticshock or high ionic strength [4]. Three methods have been used to solubilize the SOHfrom mitochondrial membrane: cholate treatment [6], phospholipid hydrolysis bysnake venom phospholipase A2 [7] which released SOH almost completely, althoughonly 30-40% of phospholipids were hydrolysed whatever the nature of the hydrolysedphospholipid, and incubation of mitochondria at high pH which partially released theenzyme [8].
In order to understand the phospholipid-apoBOH interaction at the molecularlevel, it was necessary to obtain a purified homogeneous and lipid-free apoenzyme.With this aim, Fleischer's group [9] proposed an original technique for purifying beefheart apoBOH based on the release of the enzyme by treatment of mitochondria withphospholipase A 2 , adsorption of the enzyme on untreated controlled-pore glass beads(CPG) and selective elution of the protein from the column by lithium bromide,a chaotropic agent, at defined pH. Purified beef heart apoBOH, devoid of phopholipids and water soluble under defined conditions, consists of a single polypeptidechain of 31 500 dalton as shown by sodium dodecyl sulphate polyacrylamide gelelectrophoresis (SOS-PAGE) [9]. Several purification procedures, partial or complete,were successively proposed by different groups in order to improve the purity,stability, yield, time required or simplicity, or to adapt the technique to BOH fromdifferent species [10~18].
However, some of these purification procedures were not suitable for studyinglipid-protein interactions as BOH was purified as a mitochondrial phospholipidcomplex and not as apoBOH [10-14]. To our knowledge, no-one has tried to explainthe nature of specific interactions between BOH and the glass surface of CPG whichare essential in the purification process. Tn this paper, we describe the purificationprocedure adapted in our laboratory for the rat liver mitochondrial membrane-boundBOH and show a relationship between phospholipid-BOH interaction and glass~
BOH adsorption.
EXPERIMENTAL
Material.\·Controlled-pore glass beads (CPG-IO-350; mesh size 120-200; pore diameter ca.
350 A) were obtained from Electro-Nucleonics (Fairfield, NJ, U.S.A.). These beadswere not treated with polyethylene glycol or polyethylene oxides as indicated for
INTERACTIONS OF BDH WITH GLASS BEADS 281
exclusion chromatography [19]. Chemicals were of the highest grade available.Solutions were prepared in ultrapure water.
MethodsRat liver mitochondria were prepared on a large scale as described previously
[20] and were stored frozen (- 70°C) at 40 mg ml- 1 in 0.25 M sucrose until used.Protein was determined as described by Lowry et al. [21] and modified by Ross andSchatz [22] for assays containing free thiols. Lipid phosphorus was determinedaccording to Chen et al. [23].
Mitochondrial lipids (MPL) were extracted from rat liver mitochondria.Aqueous dispersions of MPL were prepared by the dialysis or the sonicationprocedures described previously [24].
SDS-PAGE was performed according to Laemmli [25].D-3-Hydroxybutyrate dehydrogenase activity was measured spectrophotome
trically at 334 nm at 20 or 37°C as described previously [26], in a "cocktail medium"containing 10 mM potassium phosphate, 0.05 mM EDTA, 0.04% bovine serumalbumin, 1.27% (vjv) ethanol, 0.3 mM dithiothreitol (OTT) and 2 mM NAO+ (finalvolume 450 ,ul). The reaction was started by addition of 50,u1 of 0.2 M D,L-3-hydroxybutyrate.
Preparation oj "crude intrinsic mitochondrial membrane proteins Faction"Frozen-thawed mitochondria were submitted to a high ionic strength (I volume
of 3 M KCI) in order to remove soluble and membrane-associated proteins. Crudeintrinsic mitochondrial membrane proteins fraction (about 20% of the originalprotein) was obtained after ultracentrifugation for 30 min at 100000 g. This pellet wasfrozen at -SO°C
Solubilization and purification 0[' n-3-hydroxybutyrate apodehydrogenaseFrozen crude intrinsic mitochondrial membrane protein fraction (20 g of
original mitochondrial protein) from about ISO rats was thawed by gentle swirling ina water-bath at 37°C. This suspension (ca. 0.51) was added to a beaker containing 0.1M Tris-HCI (pH 7.4), I mM NAO+, 3 mM CaClz, 5 mM DDT and water to givea final volume of I I at 30°C. The mitochondrial membrane fraction was digested byaddition of 80 ml (eq uivalent to 80 mg of original snake venom) of phospholiphase Az[8], i.e., in a ratio of 4 {tl per milligram oforiginal mitochondrial protein, at 30°C for theoptimum time (usually 3-4 min) previously determined in a trial digestion [8],Digestion was terminated by adding the mixture to a cold carboy (ca. 5 I capacity)containing 36.66 ml of 0.3 M EDTA, 55 ml of 2 M KCI and 125 ml of "ice cubes"(-20°C) consisting of 0.1 MKCI, 20 mM EDTA and 2 mM OTT, to cool the mixturerapidly to ca. 8°C. The pH was reduced by addition of 30,66 ml of 2 M potassiumphosphate (pH 6.5).
An aliquot was removed to determine the amount of solubilized D-3-hydroxybutyrate apodehydrogenase in the supernatant after ultracentrifugation (3 min) at140000 g in a Beckman Airfuge. The digested suspension was stirred slowly witha paddle and 100 ml (packed volume) of untreated CPG previously degassed in waterand stored under nitrogen were added with an equal volume of buffer VI (see Table I).Adsorption of the apodehydrogenase on the glass beads was nearly complete (90%)after 30 min.

282 P. ADAMI, B. NASSER, N. LATRUFFE
The glass beads with bound enzyme were recovered in I-I centrifuge bottles bycentrifugation for 30 s at 1000 rpm in a Sorvall RC58 and GS3 rotor. The first fivewashed with potassium phosphate buffers (buffers I-VI; see Table I) were carried outbatchwise in the centrifuge bottles so as to remove mitochondrial membrane fragmentstrapped in the sedimented glass beads.
The glass beads were then packed into a column (ca. 20 cm x 8 cm I.D.) alreadycontaining 50 ml of packed CPG as scavenger, under a nitrogen atmosphere, andwashing was continued with buffer VII at a flow-rate of ca. 3 ml cm-2 min-1
.
The enzyme was eluted (see Table I) using 1.0 M LiBr-O.! M Tris-HCI-2.5 mMDTT elution buffer with an initial pH of 8.00 and a flow-rate of ca. 3 ml cm-2 min- t
,
then with pH 8.05 buffer until enzymatic activity was detected in the effluent (usuallyafter 5-7 column volumes). Elution was continued with buffer in the pH range8.10-8. I5 until the activity began to decrease, at which point the pH of the effluent wasincreased to a maximum of 8.15. Elution was terminated when the enzymatic activityper litre fell below I% of the initial activity solubilized by phospholipase A 2 . A smallamount of additional enzymatic activity could be eluted at higher pH (8.20-8.30), butelution of contaminants began to predominate, attended by a yellow band whichmigrated slowly down the second column during the course of elution of the enzyme.
When the activity was first detected in the eluate from the purification column,the eluate was passed directly into a I-I stirred vessel and titrated with I M HC] to pH7.2. This titrated effluent was applied directly to a second column [concentrationcolumn, consisting of 50 ml of CPG-lO packed in buffer A (see Table I), columndimensions ca. 18 cm x 3.5 cm I. D.] at a flow-rate to match the elution rate of the
TABLE I
BUFFERS USED FOR PURIFICATION OF D-3-HYDROXYBUTYRATE APODEHYDROGENASE ON CONTROLLED-PORE GLASS BEADS
Buffer BulTer composition pH Elution volumc (ml)dcscription (containing 2.5 mM DTT)
Purification Conccntrationcolumn columll
Washing btl/lersI = A I M potassium phosphatc 6.5 1500 200IT 1.5 M potassiunl phosphatc 8.15 1500 OmittedB I M potassium phosphatc 7.5 Omittcd 200III = C I M potassium phosphatc 8.15 3000 600IV = D 0.75 M potassium phosphate 6.5 1500 600V = E 0.2 M potassium phosphate 6.5 1500 200VI = F 0.02 M potassium phosphate 6.5 750 200VII = G 0.01 M Tris 7.75 750 200
Elulion blfffers8.00 0.1 M Tris-I M LiBr 8.00 at 4°C 750 2008.05 0.1 M Tris-l M LiBr 8.05 at 4°C 750 4008.10 0.1 M Tris-l M LiBr 8.IOat4°C 750 4008.15 0.1 M Tris-I M LiBr 8.15 at 4°C 3000 14008.20 0.1 M Tris-I M LiBr 8.20 at 4°C 750 6008.30 0.1 M Tris-I M LiBr 8.30 at 4°C 500 600

INTERACTIONS OF BDH WITH GLASS BEADS 283
purification column. After all the eluate had been applied, the column was washed withbuffers A-G.
The second (concentration) column was then eluted with I M LiBr-o.lM Tris-HCI-5 mM OTT (pH 8.00-8.15) buffers. Fractions containing enzymaticactivity were pooled, adjusted to 5 mM 4-(2-hydroxyethyl)-I-piperazineethanesulphonic acid (HEPES), titrated to pH 7.0 with I M HCI and concentrated toa volume of ca. 50 ml using 400-ml Amicon stirred cells with a PM-I 0 membrane. Theenzyme solution was adjusted to 0.4 M LiBr, 5 mM HEPES (pH 7.0) and 5 mM OTTas essential reducing agent to prevent BOH disulphide bond formation, andconcentrated to a final volume of 4-5 ml (ca. 1-2 mg protein/ml) in a 60-ml Amiconstirred cell using a PM 10 membrane.
The concentrated enzyme was ultracentrifuged (Type 40 rotor for 30 min at105000 g). A small opalescent glass bead pellet was obtained which had a low proteincontent. The supernatant, containing the purified apodehydrogenase, was quickfrozen in small aliquots and stored in a liquid nitrogen refrigerator.
RESULTS AND DISCUSSION
Purification scheme and properties of pur(fied apoBDHThe purification of D-3-hydroxybutyrate dehydrogenase from rat liver mito
chondria has been adapted from methods described 15 years ago for beef heartmitochondria BOH [9,19] and for other proteins [27]. Although the basic elements ofthe method have remained unchanged, the procedure has been improved andsimplified: a previous treatment of mitochondria with a high ionic strength of KCIalready removes 80% ofcontaminating proteins. The enzyme is then released from themitochondrial inner membrane with the use of phospholipase A z. The ammoniumsulphate precipitation step [8] has been omitted. BOH solubilized in the supernatant isnow directly adsorbed in batch to controlled pore glass beads (CPG-I 0), which arethen washed to remove the mitochondrial membranes and any other non-adsorbedproteins. The first five elution buffers are applied batchwise prior to packing theCPG-IO with adsorbed proteins into a column for the chromatographic elution. From20 g of rat liver mitochondrial protein, we obtain more than 10 mg of the purifiedenzyme with a specific activity at 37°C of about 80 /lmol min-I mg protein-I whenreactivated with mitochondrial phospholipids. The procedure has been appreciablyshortened; the entire preparation now takes ca. 18-20 h with an additional 8 h forconcentration and centrifugation.
Fig. 1 shows the elution profile of apoBOH from the CPG concentrationcolumn. The purification procedure results in the elution of two separate fractions ofenzyme (apoBOH) from the second column. The first fraction elutes in the pH 8.15,I M phosphate buffer (contaminated phosphate fraction) and the second (highestactivity) in the 1.0 M LiBr-o.1 M Tris-HCI (pH 8.05-8.15) buffer (called pure"LiBr-BOH fraction").
After diafiltration and concentration, the pooled "LiBr-BOH" active fractionsare checked for purity and for lipid dependence. Fig. 2 shows that after two CPGadsorption-elution cycles (purification column and concentration column), BOHappears to be at least 95% pure. Fig. 3 indicates that the purified lipid-free apoBOH iscatalytically inactive and requires reassociation with either total mitochondrial

284 P. ADAMI, B. NASSER, N. LATRUFFE
300
~ 270·2~ 240
~ 210~~ 180.0~ 150
>. 120-.;; 90
~ 60
::I: 30oca 01~~g::t3::f-}-H~~1=r-H:±±±±~~:::!fJ~
ABC D E F G BOO 8.05 8.10 8.15 8.20 8.30
Fractions of washing and elution buffers
Fig. I. Elution profile ofapoBDH from a controlled-pore glass bead concentration column. Buffers A-G arewashing buffers and buffers 8.00-8.30 correspond to elution buffers (see Table I). Each bar on the abscissacorresponds to a fraction of 200 ml. BDH activity is expressed in arbitrary units and corresponds to 40 JlI offraction reactivated with 1.8 Jlg of lipid phosphorus MPL and measured as described under Experimental.
Fig. 2. Purified apoBDH separated by 10% SDS-PAGE and stained with Coomassie Brilliant Blue. Forconditions, see Experimental. kDa = Kilodalton.

INTERACTIONS OF BDH WITH GLASS BEADS 285
120.,-----------------,
100
80::;a..
~ 60.~>.~
40:r:0al
20
300 400 500 600200100O"9-O:::;::-r---'---,--'---r-'---r---'--r--r-~
o
)Jg lipid phosphoruslmg prot.
Fig. 3. BDH reactivation by differents amounts of natural [MPL (I), mitoPC (2)] or synthetic DMPC (3)phospholipids. The apoBDH (10 IIg) was incubated lor 10 min at room temperature in 100 III (final volume)containing 20 mM Tris-HCH 111M EDTA-5 111M OTT (pH X.I) and the appropriate phospholipidconcentrations. Thc IOO-pl aliquot was added at 37 C to a cuvette containing 450 III of "'cocktail"' medium asdescribed under Experimental. Then the enzyme reaction was started by addition of 50 III of o.~
kf DL-(i-hydroxybutyrate at 37c C and the activity was followed by measuring the increase in absorbance at334 nm.
phospholipid containing lecithin (MPL), or pure mitochondrial lecithin (mitoPC), orsynthetic lecithin (dimyristoylphosphatidylcholine, OMPC). The different extents ofreactivation according to the nature of the lipid have been explained previously[28-32].
Several other attempts to purify rat liver apoBOH by different methods havebeen tried in our laboratory. All of them failed, including Burnett and Khorana'smethod involving OEAE-cellulose chromatography [17] or an immunoaffinityprocedure based on the use of rabbit monospecific anti-rat liver BOH antibody [33].
Relationships between glass beads-BDH adsorption and phospholipid-BD H reactil'GtionTaking into account the specificity of BOH for either CPG or phospholipids it
was important to estahlish whether there was any relationship between the twointeracting mechanisms.
Fig. 4 shows that the addition of CPG prevents the reactivation of purifiedapoBOH by phospholipids while not modifying the enzymatic activity of BOHpreviously reconstituted with MPL. These results indicate that the interaction betweenCPG and the BOH polypeptide chain changes the conformation of the enzyme or,more probably, that the glass surface interacts with phospholipid-binding sites ofBOH. However, there is an important difference between glass beads and membranephospholipid surfaces, as only the latter is able to reactivate BDH.
On the other hand, Fig. 5 shows that LiBr is needed to reactivate BOH bylecithin (PC) or phospholipid containing lecithin (MPL), previously associated withphospholipid containing no lecithin [phosphatidylethanolamine-diphosphatidylglycerol-phosphatidylinositol (PE-OPG-PI)]. This displacement of BOH from a nonreactivating phospholipid surface to a reactivating phospholipid surface is due to the

286
120
100
;f!.80~.:;
U'"n; 60""0·in~:I: 400co
20
P. ADAMI, B. NASSER, N. LATRUFFE
added CPG volume (PI)
Fig. 4. Effect of controlled-pore glass beads (CPG) on BDH cnzyme activity. Thc untreatcd glass heads(CPG) were added at room temperature to a cuvette containing 20 mMTris-HCI-I mM EDTA··5 mM OTT(pH 8.1) and 20.4 fig of the enzyme (apoBDH or BDH-MPL complex), final volume 450 III. After 15 min ofgentle shaking, the enzyme activity was measured at 334 nm either immediately for BDH-MPL complexassay (I), or after previous incubation (10 min) of MPL (80 fig of lipid phosphorus per mg protein) in theassay containing CPG-apoBDH (2).
ionic strength and to the chaotropic effect of LiBr in addition to the alkaline pH. Anevid~nt similarity is found with BDH elution from the glass bead column (Fig. I). Toour knowledge, such a relationship between SOH reactivation by phosholipid andSOH purification by glass beads adsorption has not been reported before.
400300100 200
UBr{mM)
Fig. 5. Displacement of the non-active complex BDH-PE-DPG-PI by reactivating phospholipid [PC (2) orMPL (I)] in the presence of LiBr. ApoBDH (35 pg) was incuhated for IS min at room temperature ina medium (650 pI) containing a microdispersed PE-DPG-PI preparation (200 pg lipid phosphorus per mgprotein) and 20 mM Tris-HCl-I mM EDTA-5 mM OTT (pH 8.1). At the end of incubation, 50 pI of themixture were removed and added to a medium (650 pi final volume) containing the same buffer and a fixedamount (180 lig lipid phosphorus per mg protein) of reactivating phospholipid (MPL or PC) and anincreasing concentration of LiBr. After incubation for 15 min at room temperature, an aliquot of 70 iii wasremoved and measured as descrihed under Experimental.
1.0
.~c:"2:-.~:[
0.5~
:~.,:I:0co

INTERACTIONS OF BDH WITH GLASS BEADS 287
It appears that glass beads mimic phospholipids in their interaction with BDH.Indeed. it is well known that a phospholipid membrane is amphipathic and showsa polar surface mostly negatively charged and a hydrophobic domain. On the otherhand, untreated glass beads show a negatively polarized surface of the silicate networkin addition to a hydrophobic character.
The combination of a high pH (8.05-8.15), high ionic strength and thechaotropic effect of LiBr is able to break the bonds between surface negative chargesand positive amino groups of the BDH amino acid side-chain.
This work extends our knowledge of both the basic principles of the adsorptionchromatography of membrane proteins and the mechanism of lipid-protein interactions.
ACK NOWLEDGEM ENTS
This work was supported by grants from CNRS (040531), INSERM (877005)and the Fondation pour la Recherche Medicale. Thanks are due to Drs. J. M. Berrezand M. S. El Kebbaj (Besanc;on) and Drs. J. O. Mcintyre and S. Fleischer (Nashville)for advice and initial experiments.
REFERENCES
I N. Latruffe. J. M. Berrez and M. S. EI Kehhaj, Biochimie, 68 (1986) 481.2 A. Page, H. A. Krehs and D. H. Williamson, Biochelll. J., 121 (1971) 49.3 A. Kante. M. Cherkaoui Malki. C. Coquard and N. Latruffe, Biochim. Biophvs. Acta, 1033 (1990) 291.4 A. L. Lehninger, H. C. Sudduth and J. B. Wise, J. Bioi. Chem., 235 (1960) 2450.5 Y. Gaudemer and N. Latruffe, FEBS Lelt., 54 (1975) 30.6 I. SekuZll, P. Jurtshuk and D. E. Green, J. Bioi. Chelll., 238 (1963) 975.7 S. Fleischer and B. Fleischer, Methods ElEvmol., 10 (1967) 406.8 G. S. Gotterer, Biochemistry, 6 (1967) 2139.9 H. G. O. Bock and S. Fleischer, Methods El1zvmol., 32 (1974) 374.
10 N. C. Nielsen and S. Fleischer, J. Bioi. Chem .. 248 (1973) 2549.II H. M. Menzel and G. G. Hammes, J. BioI. Chem., 248 (1973) 4885.12 C. S. Hextcr and R. Goldman, Biochim. Biophys. Acta, 307 (1973) 421.13 A. K. Grover and G. G. Hammcs, Biochilil. Biophys. Acta, 356 (1974) 309.14 M. Levy. M. Joncourt and J. Thiessard, Biochilll. Biophys. Acta, 424 (1976) 57.15 J. C. Vidal, EA. Gugliclmucci and A. O. M. Stoppani, Mol. Cell. Biochem., 16 (1977) 153.16 M. Miyahara, K. Utsumi and D. W. Deamer, Biochilll. Biophys. Acta, 641 (1981) 220.17 B. K. Burnetl and H. G. Khorana, Biochim. Biophys. Acta, 815 (1985) 51.18 J. O. Mcintyre, N. Latruffe, S. C. Brenner and S. Flcischcr, Arch. Biochem. Biophys., 262 (1988) 85.19 H. G. O. Bock and S. Fleischer, J. Bioi. Chem .. 250 (1975) 5774.20 S. Fleischer, J. O. Mcintyre and J. C. Vidal, Methods Enzymol., 55 (1979) 32.21 O. M. Lowry, N. J. Rosebrough, A. L. Farr and R. J. Randall, J: Bioi. Chem., 193 (1951) 265.22 E. Ross and G. Schatz, Anal. Biochem., 32 (1973) 91.23 P. S. Chen, T. Toribara and H. Warner, Allal. Chem .. 28 (1956) 1756.24 G. Rouser and S. Fleischer, Methods EII7:.I'IIIOI., 10 (1967) 385.25 U. K. Lacmmli, Nature (London), 227 (1970) 680.26 M. S. EI Kebbaj, N. Latruffe and Y. Gaudemer, Biochem. Biophys. Res. Conmul/1., 108 (1982) 42.27 H. G. O. Bock, P. Skene, P. Cassidy, S. Fleischcr and S. Harshman, Sciellce, 191 (1976) 380.28 J. M. Bcrrez, N. Latruffe and Y. Gaudemcr, Biochimie, 66 (1984) 717.29 J. M. Berrez, F. Patlus and N. Latruffe, Arch. Biochem. Biophys., 243 (1985) 62.30 M. S. EI Kebbaj, J. M. Berrez, T. Lakhlifi, C. Morpain and N. Latruffe, FEBS Lett., 182 (1985) 176.31 M. S. EI Kcbbaj and N. Latrufle, Arch. Biochem. Biophvs., 244 (1986) 622.32 M. S. EI Kebbaj, N. Latruffe, M. Monsigny and A. Obrenovitch, Biochem. J., 237 (1986) 359.33 C. Coquard, P. Adami. M. Cherkaoui Malki, D. Fellmann and N. Latrufle, Bioi. Cell, 59 (1987) 137.


Journal at Chromatography, 539 (1991) 289-296Elsevier Science Publishers B.Y., Amsterdam
CHROM. 22 893
Immobilization of dermatan sulphate on a silica matrix andits possible use as an affinity chromatography support forheparin cofactor II purification
Y. SINNIGER and J. TAPON-BRETAUOIERE
Labora!oire d'Hhna!ologie, C. H. U. Necker-En/im!s Malades, /56 rue de Vaugirard, 750/5 Paris C('(lex 15(France)
F. L ZHOU
LahoralOire de Recherche sur les Maeroma/i'cu/cs, Universili' Paris-Nord, AI' . .l.B. C1hncnl, 93430 Villef(/neuse (Frm/ce)
A. BROS
Laboratoire d'Hcmatologie, CH.U. Necker-Entan!s Malades, /56 /'lie de Vauf{irard, 75015 Paris Ccdex 15(France)
O. MULLER and J, JOZEFONVICZ
LaboralOire de Recherche sur les Macrmno!l;cules, Universi!e Paris-Nord, AI'. J,B. Clcmelll, 93430 Villetaneuse ( France)
and
A. M. FISCHER'
LaboralOire d'Hi'malolvgie, C.H.U. Necker-En/im!s Malades, /56 me de Vaugirard, 75730 Paris Ccdex 15( France)
ABSTRACT
Oermatan sulphate (OS) is a glycosaminoglycan which catalyses specifically thrombin inhibition hy aplasmatic inhihitor, Heparin cofactor II (HClI). OS was insolubilizcd on a silica matrix to study itsinteraction with HCIL The immobilization of OS was performed with a good yield on a silica previouslycoated with polysaccharides in order to neutralize the negatively charged silanol groups. The value of theamnity constant of insoluhilized OS for HCIl, measured hy the adsorption isotherm, is consistent with thevalue obtained for soluble OS. The OS hound to the silica matrix was also tested as a chromatographicsupport for the purification of HCII from human plasma: the optimum conditions for HCII adsorptionand desorption were determined. The eluted HCII was obtained with a good yield (21 %) and with nocontamination by antithrombin II!. the other main plasmatic inhibitor of thrombin.
INTRODUCTION
Heparin cofactor II (HCII) is a human plasma glycoprotein, the properties ofwhich were reported in the 1980s [1,2], Although its physiological role is not yet wellestablished, it is known that HCrr inhibits thrombin in the presence of heparin ordermatan sulphate (OS) [2,3], HCrr has a structure and a mechanism of inhibition
0021-9673/91/$03.50 © 1991 Elsevier Science Publishers B.Y.

290 V. SJNNJGER el al.
close to those of antithrombin III (ATIll), a well known potent thrombin inhibitor.However, these two plasmatic inhibitors have different properties: whereas ATlllinhibits all the serine proteases of the intrinsic coagulation cascade [4], HClI activityis specific to thrombin. The inhibition by HCIl is specifically catalysed by DS, aglycosaminoglycan (GAG) of the vascular endothelium, which has no effect onthrombin inhibition by ATIlT.
The potentiation ofHCll by DS is related to a specific polysaccharide sequence[5,6], as a minimum of twelve residues is required for the HCll catalysis whereas anoctasaccharide is sufficient to bind to HCll. The presence of sulphate groups in theDS structure appears to be of importance in HCll catalysis [7]. One Lys and four Argresidues are involved in the GAG binding site of HCll [8,9]. However, the precisemechanism oof interaction between HCll and DS is not yet known. The low plasmaconcentration of HCll and its chemical properties close to those of ATill do notallow an easy purification process. Most of the procedures used to isolate HCll[2,9,10] involve several steps (at least five) including a first step of protein fractionation followed by ion-exchange and gel permeation chromatography; HCII andATTII are separated by their different affinities for heparin on an insolubilized heparin sorbent. The contaminating ATIlI can also be eliminated on an anti-ATill immunoabsorbent.
In this work, we studied the interaction between insolubilized DS and HCIl inorder to understand better the specificity and binding mechanism between this GAGand HCIl. DS was insolubilized on a dextran- or agarose-coated silica support whichcombines all the advantages of traditional supports and the important mechanicalproperties of silica [11]. The affinity of the immobilized DS for HCll was determinedfrom the adsorption isotherm under static conditions. Then, preliminaty studies ofthe isolation ofHCIl from human plasma were carried out in order to set up an easy,fast and efficient purification procedure.
EXPERJMENTAL
MaterialsSilica beads XOI5M, purchased from lBF Biotechnics (Villeneuve la Garenne,
France), had an average pore diameter of 1250 A and were spherical (40-100 !lm).The polysaccharides used for the coating were dextrans T500 (Pharmacia France,Bois d'Arcy, France) and Indubiose agarose A37 HAA (lBF Biotechnics). The activating agents were I,4-butanediol diglycidyl ether (BDGE) and I,I'-carbonyldiimidazole (CDI). Dermatan sulphate NF 112 from bovine intestinal mucosa was providedby Pharmuka (Gennevilliers, France). Human purified thrombin, chromothrombinand monospecific antibodies against HCn were purchased from Diagnostica Stago(Asnieres, France); bovine factor Xa from Biotrol (Diagnostic Reagents, U.K.) andchromogenic substrate, S2222 from Kabi-Vitrum (Stockholm, Sweden). A pool ofplatelet-poor plasma was prepared by centrifugation at 2000 g of blood from fifteennormal subjects, collected on 0.13 M sodium citrate. This pool was used to establishthe adsorption isotherm and the calibration graphs for Hen and ATllI assays.
Preparation of coated silica supports and immobilization of DSThe synthesis of the active supports was realized in two successive steps. In the

IMMOBILIZATION OF DS ON A SILICA MATRIX 291
first, silica beads were coated with dextran or agarose substituted with OEAE functions in order to neutralize the ion-exchange capacity of native silica, as describedpreviously [11,12]. Two types of coated silica were prepared: the silica with a singlelayer of substituted polysaccharides as described above, and the same silica with adouble coating in which the second layer consisted of a neutral polysaccharide [13].Silica with a double coating is a new type of support; preliminary studies have demonstrated a decrease in the non-specific interactions with these supports. The amount ofpolysaccharides was determined by elemental analysis of carbon. In the second step,the coated silica phases were activated and coupled with OS. Before immobilizationof OS, the contaminating heparin was removed from OS by a deamination treatmentwith nitrous acid [14]. The coated silica supports were then activated by hydroxylgroups with either 0.3 g of COlor 3 pI of BOGE per gram of coated silica. OScoupling was performed by using 3 g of activated support and 250 mg of GAGsuspended in 14.5 ml of 0.1 M sodium carbonate (pH 8.7). The amount of bound DSwas determined by elemental analysis of the sulphur content.
Adsorption isotherm and determination of affinity constantAdsorption experiments were performed at 4°C to prevent the loss of HCIr
activity. The isotherm was established from measurement of Hcn adsorption usingthe following procedure: 400 {tl of the support suspension were incubated with 0.02 MTris-HCl (pH 7.4)-0.05 M NaCl buffer. Several dilutions of plasma, correspondingto different Hcn concentrations (0.02-0.4 U/ml), were incubated with the supportsuspension for 90 min at 4°C. After sedimentation, the amount of residual HCIl inthe supernatant was determined by an HCIl assay, as described under Chromatographic experiments. The amount of adsorbed protein corresponds to the differencebetween the initial and remaining concentrations of active Hcn in the supernatant.The adsorption isotherm was then established. The affinity constant was calculatedfrom the initial slope and plateau of the isotherm and the binding capacity of thesupport was measured from the plateau value.
Chromatographic experimentsThe chromatographic experiments were performed using an LKB system. A 13
x 1.1 cm 1.0. column containing 5 ml (2.5 g dry weight) of the affinity sorbent waspacked using a slurry method. Each support was washed with 25 ml of initial buffer.In order to define the optimum conditions for the interaction between Hcn and itsligand, different buffers (0.02 or 0.05 M Tris-HCl) with pH values of 6.5, 7.4 or 8.5and NaCl concentrations of 0 or 0.05 M were tested. A 5-ml aliq uot of human plasmawas loaded on the column. Elution was performed at a flow-rate of 20 mllh at 4°Cusing a 40-mllinear gradient increasing from the molarity of the initial buffer used to1 M NaCl. The eluted proteins were detected at 280 nm and the chromatographicfractions collected to perform ATIlI and HCIl assays. The protein concentration wasmeasured by Lowry's method [15]. The biological activity of HCn in the elutedfractions was assayed at 37°C by measuring the thrombin inhibition in the presence ofOS as follows: 150 pI of a diluted sample were added to 150 {tl of 0.05 M Tris-HCl(pH 8.4)-0.1 M NaCl containing 0.2 gil of DS. After incubation for 2 min with 150 pIof human purified thrombin (3 U/ml), 150 pI of chromothrombin (1.5 pM) wereadded and the amidolysis of the substrate was measured at 405 nm. The results were

292 V. SINNIGER ('I al.
reported with respect to a calibration graph established under the same conditions,with dilutions of a normal plasma. By definition, the concentration of plasmatic HCnis I unit/m!. The biological activity of ATIlI was determined by measuring its antifactor Xa activity in the presence of heparin: 100 III of a diluted sample were added to100 III of 0.05 M Tris-HCI (pH 8.4)-0.05 M NaCI containing 6 D/ml of heparin andincubated for 2 min. Then 100 III of bovine factor Xa were added and after incubationfor I min 100 III of S2222 (4 mM) were added. Hydrolysis of the substrate wasmeasured at 405 nm. The calibration graph was established under the same conditions, using the same pool of normal plasma as previously described. The concentration ofHCII antigen was measured by electroimmunodiffusion [16] with monospecific antibodies raised against human HCII. HCII purity was checked byimmunoelectrophoresis [17] with anti-human HCII and anti-human serum antibodiesand by sodium dodecyl sulphate polyacrylamide gel electrophoresis (SDS-PAGE)[18].
RESULTS AND DISCUSSION
Characterization oj the affinity supportsTo neutralize the negatively charged silanol groups on the silica surface, a
polysaccharide (dextran or agarose) was used to coat the silica. The characteristics ofthe coated silica are presented in Table 1. A larger amount of polymer is bound to thesilica when the coating polysaccharide is dextran. However, the coverage of the silicasurface is more efficient with agarose, which has a greater number of OEAE groups.
The immobilization of OS was performed using CDI or BDGE as activatingagents. Table 11 shows the amounts of immobilized OS for three differents supports.Coupling of OS by BOGE seems more efticient than that by COl. BGOE mainlyactivates hydroxyl groups whereas COl acts essentially on primary amino groups.The greater efficiency of BOGE shows that OS is mainly immobilized by its hydroxylgroups rather than by its primary amino groups. This is certainly due to the largenumber of hydroxyl groups on the OS compared with the small number of primaryamino groups, which are mostly acetylated amino groups.
The affinity of insolubilized DS for HCII was studied by measuring the affinityconstant from the Langmuir isotherm. Fig. I shows the adsorption of HCll on theaffinity support. The adsorption isotherm obtained corresponds to the Langmuirmode!. The value of the affinity constant for HCII is 7.105 1/11101, which is consistentwith the published value for soluble OS of 6.6· 105 1/11101 according to Pratt et al. [19].
TAHLE I
CHARACTERISTICS OF COATED SILICA SUPPORTS
Support
SiD-DS ISiD-DS 2ASiA-DS 1
Coating polymcr
DEAE-dcxtranDEAE-dextranDEAE-agaroseAgarosc
4410
Amount of fixcdpolymcr (mgjg silica)
1211384535

IMMOBILIZATION OF OS ON A SILICA MATRIX 293
TABLE II
INSOLUBILIZATION OF DERMATAN SULPHATE ON COATED SILICA
Support
SiD-OS ISiD-OS 2ASiA-OS I
Activating Amount or Amount or Yieldagent dcrmalan used dermalan fixed (%,)
(mg) (mgl
BDGE 250 195 78COl 250 133 53COl 250 94 38
these similar values indicate that the non-specific interactions make only a smallcontribution to the overall adsorption process. Moreover, it seems that the bindingsites for HCn in the OS structure are not masked or are not involved in the immobilization of OS on the coated silica. Compared with the affinity constant of soluble OSfor ATIII, which is I . 1031/mol [19], the affinity constant of HCII is higher and showsthat OS has a very weak affinity for ATIlI. However, the affinity constant of insolubilized OS for HCn is not in the range of 107 or 108 I/mol, which would demonstratea very high affinity for HCII. As reported in the literature, the native OS used in thisstudy has a weak affinity for HCII; this could be explained, as was noted by GritTIthand Marbet [20], by the fact that perhaps only a small fraction of the OS is involved inthe HCII binding. The binding capacity of the tested supports was of 0.5 U of HCIIper gram of support.
A-__2
~
E~
N
10
;:; A
U .I:l:
Q<oJIIIQ(Q
/r.nQ
<
01
0.0 0.1 0.2 0.3 0.4 0.5 0.6
INITIAL Hell <UtmJ)
Fig. l. Adsorption isotherm or HCII on the insolubilized OS support.

294 V. SINNIGER et al.
TABLE 1lI
INFLUENCE OF INITIAL BUFFER ON THE HCll AND ATllI ADSORPTION ON AFFINITYSORBENT
Initial buffer ATllI adsorbed HCII adsorbed(U/ml) (U/ml)
0.02 M Tris (pH 7.4) 0 0.300.05 M Tris (pH 7.4) 0 0.810.02 M Tris (pH 7.4)- 0 0.84
0.05 M NaCI0.02 M Tris (pH 6.5)- 0.03 0.01
0.05 MNaCI0.02 M Tris (pH 8.5)- 0 0
0.05 M NaCI
Isolation of HelI/rom human plasmaSeveral initial buffers were used to determine the optimum conditions of ad
sorption of HCn on the affinity sorbent (Table III). A minimum concentration of0.05 M is required for optimum adsorption of HCII on the insolubilized DS. A bufferof 0.02 M [0.02 M Tris-HC! (pH 7.4) led to a very weak adsorption ofHCn whereasbuffers of 0.05 M Tris-HCI (pH 7.4) and 0.07 M [0.05 M Tris-HCI (pH 7.4)-0.02 MNaCI] allow a better adsorption of HCII. From these results and those of Sculy et al.[7], who showed that a maximum activity of HCII, in the presence of soluble DS,was obtained with 0.05 M NaCI, it seems that the optimum buffer for HCII adsorption is 0.02 M Tris-HCI (pH 7.4)-0.05 M NaCI. Under these optimum conditions, up to 21 % of the initial HCII is adsorbed on the insolubilized DS. This lowmolarity required to obtain optimum adsorption of HClI is consistent with the weakaffinity constant of the support for this inhibitor. At pH 8.5, the total activity ofATIII and Hcn is recovered in the washing buffer, showing that at a basic pH neitherHCII nor ATIII is adsorbed on the affinity sorbent. In contrast, when the pH islowered to 6.5, the two inhibitors adsorbed on the insolubilized DS. The influence ofpH and molarity on the adsorption ofHCIl on DS seems to indicate that the interaction between the inhibitor and the DS is mainly an ionic interaction. This interactionis probably due to the negative sulphate and carboxyl groups of DS, and also to thepositive amino groups of HCII Lys residues.
In all the chromatographic experiments, under conditions of optimum pH andmolarity, ATIIl was never adsorbed on the affinity sorbent. The total amount ofATIll loaded on the column was always recovered in the washing buffer. Under thesedynamic conditions, insolubilized DS has no affinity for ATIlI, which is not adsorbedon the support. Thus, on our supports, we can separate HCIl from ATIlT. WhereasATIlT is totally recovered in the washing buffer, HCII binds to the support and can beeluted with a buffer gradient. HCIl is eluted in a range from 0.12 to 0.48 M NaCI(Table TV) from the immobilized DS whereas is eluted from insolubilized heparinbetween 0.13 and 0.28 M NaCI. A higher molarity seems to be required to desorbHell from insolubilized DS than from insolubilized heparin, which means that insolubilized DS has a greater affinity for HCn than for insolubilized heparin. The specificactivities of the eluted HCII (mean of three experiments for each support) were 0.05

IMMOBILIZATION OF OS ON A SILICA MATRIX
TABLE IV
CONDITIONS AND YIELD OF HCII ELUTION
295
Support Molarity of HCII yieldHCIl desorption (%J"(M NACl)
ATIII yield(%)
SiD-OS ISiD-OS 2ASiA-OS 1
0.12-0.380.28-0.400.21-0.48
157
17
ooo
a Mean values of three experiments.
Ujmg for SiO-OS2, 0.22 Ujmg for ASiA-OSl and 0.34 Ujmg for SiD-OS!. Thehighest specific activity of the eluted HOI is obtained with the SiO-DSI support; thisis probably due to a lower non-specific interaction of this support than the others.However, the specific activities of the eluted HCII are not very high compared withthose obtained in the classical purification processes in which specific activities of 0.9[10] to 10 Ujmg [2] were obtained. The HCn activity yields obtained with our supports were 7% for SiO-OS2, 17.5% for SiD-DS I and 21 % for ASiA-DSI, whereas noATIII activity was found in the elution gradient. These yields are in the same range asthose obtained in the previously described purification procedures of 3-30% yields[9,10]. Although SiO-OSI and ASiA-OS I were not prepared under the same conditions, these two supports gave comparable yields and specific activities.
The purified HCn was tested by e1ectroimmunodiffusion. The HClI activityjHCll antigen ratio was between 0.6 and I; a ratio of less than I indicates partialinactivation of the HCII after the elution with a salt gradient. The eluted Hcn wasalso tested by SDS-PAGE and immunoelectrophoresis, which revealed two contaminating proteins, IgA and an iXz-globulin, which has not been identified as anothercoagulation inhibitor (ATII I or iXz-macroglobulin).
CONCLUSIONS
The interaction between OS and Hcn is not well understood. It was interestingto study this interaction by immobilizing this GAG on a silica support. OS has beeninsolubilized on a silica phase, a synthesis which has never been achieved before.Silica beads were previously coated with polysaccharides in order to neutralize silanolgroups, according to data obtained in our laboratory [13]. DS can be immobilized onsilica, regardless of the coating polymer used, dextran or agarose. The GAG seems tobind to the matrix by its hydroxyl groups more than by its amino groups.
Under static conditions, the affinity constant of insolubilized OS for HOI issimilar to that of soluble OS. When used as a chromatographic support under optimum conditions of pH and molarity, insolubilized OS has no affinity for ATIll. HCnis adsorbed on the affinity sorbent and can be eluted by a salt gradient between 0.12and 0.48 M NaCI. With only one chromatographic step, the yield of the eluted HOIis identical with those obtained in previously described purification processes, with nocontaminating ATIll. However, the specific activity is lower than those given byother published procedures.

296 V. SINNIGER et al.
We have shown that insolubilized OS, used as an affinity chromatographysupport, may allow the separation of HCII from ATIIl, which is important for thestudy of each ·inhibitor. However, the native OS, soluble or insolubilized, has a weakaffinity for HCII and it will be of interest to isolate a fraction of this GAG with a highaffinity for HCIL The insolubilization of such a fraction might allow a very efficientisolation procedure for HCll in a single chromatographic run.
ACKNOWLEDGEMENTS
The authors thank M. Oelvallee for expert secreterial help and C. Millien andC. Sternberg for technical assistance. This work was in part supported by grant No.885006 from INSERM and by a grant from the Groupement d'Interet Public "Therapeutiques Substutives".
REFERENCES
I D. M. Tollefsen and M. K. Blank, J. C!in. invest., 68 (1981) 589.2 D. M. Tollefsen, P. W. Majerus and M. K. Blank, J. Bioi. Chem., 257 (1982) 2162.3 D. M. Tollefsen, C. A. Pestka and W. J. Monafo, 1. Bioi. Chem., 258 (1983) 6713.4 R. D. Rosenberg, Semin. Haematol., 14 (1977) 427.5 D. M. Tollefsen, M. E. Peacock and W. J. Monafo, 1. Bioi. Chem., 261 (1986) 8854.6 H. Munakata, C. C. Hsu, C. Kodama, J. Aikawa, M. Sakurada, N. Ototani, M.lsemura, Z. Yosizawa
and N. Hayashi, Biochim. Biophys. Acta, 925 (1987) 325.7 M. F. Scully, V. Ellis and V. V. Kakkar, Thromb. Res., 46 (1987) 491.8 F. C. Church, G. B. Villanueva and M. J. Griffiith, Arch. Biochem. Biophys., 246 (1986) 175.9 R. Yamagishi, T. Koide and N. Sakuragawa, FEBS Lett., 225 (1987) 109.
10 P. Wunderwald, W. J. Shrenk and H. Port, Thromb. Res., 25 (1982) 177.II F. L. Zhou, D. Muller, X. Santarelli and J. Jozefonvicz, 1. Chromatogr., 476 (1989) 195.12 X. Santarelli, F. L. Zhou, D. Muller and J. Jozefonvicz, Colloq. INSERM, 175 (1989) 155.13 F. L. Zhou, D. Muller and J . .lozefonvicz. .I. Chromatogr .• 510 (1990) 71.14 D. Lagunoff and G. Warren, Arch. Biochem. Biophys., 99 (1962) 396.15 O. Lowry, N. Rosenberg, A. Farr and R. Randall, 1. BioI. Chem., 193 (1951) 265.16 C. B. Laurell, Anal. Biochem., 15 (1966) 45.17 P. Grabar and C. A. Williams, Biochim. Biophys. Acta, 10 (1953) 193.18 U. K. LaemmJi, Nature (London), 227 (1970) 681.19 C. W. Pratt, H. C. Whinna, J. B. Meade, R. E. Treanor and F. C. Church, Ann. N. Y. Acad. Sci., 556
(1989) 104.20 M. .I. Griffith and G. A. Marbet, Biochem. Biophys. Res. Commun., 112 (1983) 663.
Journal o(Chromafography, 539 (1991) 297~306
Elsevier Seience Pu blishers B. V., Amsterdam
CHROM. 22870
Review
Polymer ligands for mild hydrophobic interactionchromatography -principles, achievements and future trends
P. HUBERT*. R MATHIS and E. DELLACHERJE
LahoralOire de Chill/ie-Physique Macro!noleculaire. URA CNRS 494. ENSIC, B.P. 451, 54001 NancyCedex (France)
ABSTRACT
Mildly hydrophobic polymers, such as those generally used in the "partition between aqueous twophase systems" technique, can be immobilized on inert supports to afford stationary phases which are lessdenaturing towards biomolecules than those involved in traditional hydrophobic chromatography. Various aspects of this technique are reviewed. Examples of successful fractionations are presented to illustrateits principles. and the main trends for future studies in this field are discussed.
CONTENTS
I. Introduction . . . . . . . . . . .2. Stationary phases: synthesis and physico-chemical characterization3. Quantification of immobilized polyethers4. Fractionation achievements5. Future trendsReferences
I. INTRODUCTION
297298300301303305
Since the initial work of Er-el et al. [I], hydrophobic interaction chromatography(HIC) on agarose gels has become an important separation method [2-6], Hydrophobic ligands, such as n-alkyl or phenyl groups, are chemically attached to theagarose matrix and the separations are based on differences in the surface hydrophobicity of proteins [7]. However, strong hydrophobic interactions sometimes resultin almost irreversible adsorption [3,6,8] or denaturation during the elution with oftenharsh mobile phase conditions (e.g., low pH, chaotropic agents, detergents, organicsolvents, etc,).
Therefore, it can be envisaged that ligands with intermediate hydrophobiccharacter would be of interest, as they would provide an adequate binding strength
0021-9673/91/$03.50 © 1991 Elsevier Science Publishers B.V.

298 P. HUBERT, R. MAnns, E. DELLACHERIE
without the above drawbacks. "Partition between aqueous two-phase systems",a separation technique extensively described by Albertsson [9], exploits these mildhydrophobic interactions. The systems are composed of either two polymers, ora polymer and a salt. Poly(vinyl alcohol)-dextran, polyethylene glycol-dextran andpolyethylene glycol-MgS04 are among the most widely used biphasic systems.However, although many successful purification experiments have been reported, it isclear that the high viscosity of the solutions affords one likely explanation, amongothers, for its limited practical use. Recent improvements might, however, result insome revival of this technique in the near future [10,11].
Its seems logical that the principles of the partition technique could betransposed to a chromatographic procedure if one of these polymers were immobilizedon the chromatographic support. This idea is not totally new, as Morris [12] and morerecently Anker [13] exploited this concept many years ago. However, probably owingto the difficulties caused by the fact that the aqueous polymer phase was merely soakedup by the support beads, the idea received no further attention for about 10 years.
It was only in the early 1980s that different groups revived this concept [14-19]and started to immobilize covalently various mildly hydrophobic polymers onchromatographic supports, to produce stationary phases less denaturing towardsbiomolecules than those used in traditional HIe.
This paper is intended to review our own work in this field over the past few years[20-24]. The synthesis and physico-chemical characterization of the stationary phases,fractionation achievements and future trends will be discussed.
2. STATIONARY PHASES: SYNTHESIS AND PHYSICO-CHEMICAL CHARACTERIZATION
Water-soluble polymers, such as those involved in aqueous two-phase systems,are generally regarded as hydrophilic species, obviously because of their solubility inthis solvent. However, a closer look at thermodynamics-related parameters, such assurface tension, reveals the relative nature of the hydrophilicity-hydrophobicityconcept. The surface tension of polyethylene glycols (PEGs) for instance, in the rangeYsv ;::::; 42-46 mJ/m 2 [25], is situated mid-way between those of water (i'sv ;::::; 70 mJ/m 2
)
and of low-energy materials such as C6-C16 alkanes (Ysv ;::::; 18-28 mJ/m 2) [26]. PEGs
are slightly more hydrophobic than various other water-soluble polymers such aspoly(vinyl alcohol) (PVA), polyvinylpyrrolidone (PVP), polyacrylamide or dextran[27], but less hydrophobic than, for instance, polystyrene (Ysv ;::::; 32 m]1m2
) [28] anda fortiori than the C6-C16 alkanes, which are the most commonly used ligands intraditional HIC.
From this point of view, it is clear that PEGs, and also the other polymers used inthe partition technique, and which all fall within a narrow range on the hydrophobicityscale, may definitely be considered as hydrophobic materials. Conversely, whencompared with alkyl chains, their designation as "mild hydrophobic ligands" [15] isperfectly justifiable (Fig. 1).
As many other groups, we selected the polyethers as ligands for mildhydrophobic chromatography studies. PVA is the only other polymer, used in a fewinstances in this field [15,19].
The polyether class includes the following: polyethylene glycols (PEGs),HO(CH2CH20)nH; polypropylene glycols (PPGs), HO[CH2(CH3)CHO]nH; poly-

POLYMER LIGANDS FOR HIe
Gi-C16 Alkanes y sv - 18-28 mJ/m 2
299
tHYDROPHOBICCHARACTER
PolystyrenePEGsPYA
PVPDextran
WATER
y sv - 32 mJ/m 2
y sv - 42-46 mJ/m 2
y sv - 70 mJ/m 2
Surface tension ( y sv)
Fig. l. Schematic hydrophobicity scale based on surface tension of various chemicals.
tetramethylene glycols (PTMGs), HO(CHzCHzCHzCHzO)lIH; and various PEGPPG copolymers which are also commercially available as Pluronics (Serva) orleffamines (Texaco).
The hydrophobic character of these polymers increases with increasing numberof carbon atoms (2-4) in the repeating unit: PEGs < PEG-PPG copolymers <PPGs < PTMGs. Further, as all these polymers are available with a large range ofmolecular masses, the polyethers thus form a family of wide potential.
Covalent immobilization of polyethers on Sepharose requires a preliminaryactivation of either the matrix or the polymer. As we are dealing with mildhydrophobic interactions, much care should obviously be taken not to introducestrongly interacting spacer arms on the gels, as they would lead to erroneousinterpretations of the phenomena observed.
This was effectively experienced [20,21] when performing the activation reactionwith certain commonly used bisepoxides such as 1,4-butanediol diglycidyl ether orethylene glycol diglycidyl ether (Fig. 2). In fact, these activation groups remained inlarge amounts on the gel after the coupling step and, owing to the presence of (CH z)lIunits in their structure (n = 2 or 4), acted as hydrophobic ligands, to afford stronglyadsorbing stationary phases, even in the absence of any immobilized polyether. No
l,,;.•:...::,~i~·....:~.~,;.,;.~...: O-CH2-:t:-CH2-0- (CH,). -O-CH
2
-;;-CH
2
-OH
:.: O-CH2-CH-CH2·O· (CH,). ·O-CH2'CH-CH2.O- PolyetherI I
OH OH
n; 0, 2 or 4Sepharose
Fig. 2. Schematic representation of the stationary phases obtained by coupling a polyether to Sepharosepreviously activated by various bisepoxides.

300 P. HUBERT, R. MATHIS, E. DELLACHERIE
such undesirable side-effect was observed when (± )-1 ,3-btitadiene diepoxide was used(n = 0) (Fig. 2).
Unambiguous immobilization of polyethers on chromatographic supports, bymeans of spacer arms not liable to interfere in the hydrophobic interaction, can beobtained using carbonyldiimidazole (COl) or p-nitrophenyl chloroformate as activation reagents. However, the reaction of the matrix thus activated, with polyethers,directly via their terminal hydroxyl groups, would result in both instances in carbonatespacer arms which are sensitive to hydrolysis. More stable immobilization is affordedby the urethane group, formed when the coupling of the activated matrix is carried outwith the polyethers, after prior transformation into their corresponding aminoderivatives [29].
3. QUANTIFICATION OF IMMOBILIZED POLYETHERS
Obviously, the quantification of polyethers immobilized on inorganic supportssuch as siliceous materials presents no major difficulties, as their high content ofcarbon atoms allows their direct measurement by elemental analysis. Conversely, withpolysaccharide supports such as agarose, no such distinctive feature can be exploited,and one must therefore turn to more sophisticated methods.
The agarose thermoreversible gel results from the rigid helical conformationadopted by the molecule when the solution conditions (temperature, ionic strength,solvent, etc.) are no longer favourable to the coil state [30]. A direct non-destructiveNMR analysis in solvents [dimethyl sulphoxide (DMSO) or hot water] preventing theformation of the ordered conformation may, therefore, be considered, provided thatimmobilized polyethers contain distinctive CH3 or CH z groups, resulting in signalssufficiently resolved from the peaks corresponding to the saccharide backbone. Allpolyethers, except PEGs, fullfil this condition.
This approach affords perfect calibration graphs when artificial mixtures ofSepharose and various amounts of polyethers are analysed. Unfortunately, all theSepharose-polyether stationary phases obtained are no longer soluble, either in hotwater or in DMSO. This phenomenon can be explained either by a profoundmodification of the physico-chemical properties of the Sepharose (water solubilitycannot be re-established even on addition of strong aggregation-disrupting agentssuch as urea or NaSCN [31]) or by a cross-linking phenomenon, due to the bifunctionalcharacter of the polyethers and despite their large excess used during the coupling step.The synthesis of a stationary phase starting from strictly monofunctional polyethers(such as monomethoxy PEGs) would allow one to distinguish between these twohypotheses. However, the commercially available "monofunctional compounds" havebeen proved to be contaminated by various amounts of difunctional species,sometimes as high as 20% [32].
As ether bonds are sensitive to acidic c1eavage, many degradation techniques canbe considered. We attempted to hydrolyse our stationary phases with formic orhydrochloric acid treatment and subsequently analyse the resulting mixture by 1HoI'13C NMR, according to the procedure described by Shibusawa et al. [18]. Theconstruction of a calibration graph is a prerequisite for this approach. It permitsa comparison of the integral of the distinctive CH 3 (or CHz) signal of the polyether inthe hydrolysed stationary phase spectra with those obtained with artificial mixtures

POLYMER LIGANDS FOR HIC 30l
containing Sepharose and known amounts of polyether. In our own experience,reproducible linear correlations are difficult to obtain for the calibration graph itself.This unreliability is due, in our opinion, to the experimental conditions under whichthe crude hydrolysis mixture is prepared for the NMR sample. It seems likely thatsome of the hydrolysis fragments are sufficiently volatile to be eliminated along withthe solvent during its removal at 70°C under reduced pressure. Clearly, a far betterapproach consists in performing the hydrolysis experiment in dilute 2H 2S04 ,
according to the procedure described by Andrade [33]. In fact, in this instance, thehydrolysis mixture can be directly analysed by NMR, without further work-up liableto produce undesirable effects.
In order to determine the PEG content of Sepharose-PEG samples, we testedanother method, based on degradation by boron tribromide (BBr3), proposed byDrevin and Johansson [34]. The cleavage fragments (e.g., for PEGs, 2-bromoethanoland 1,2-dibromoethane) are subsequently analysed by gas chromatography (GC).Satisfactory results were reproducibly obtained with our own Sepharose-PEGsamples with this method. Its ability to afford reliable results with more complexmixtures resulting from BBr3 cleavage of PPGs (three types of fragments) orPEG-PPG copolymers (five types of fragments) is currently under investigation.
4. FRACTIONATION ACHIEVEMENTS
Up to now, most of the work devoted to mild HIC by other groups has beencarried out on standard protein mixtures or simple extracts, and has been mainlyintended for physico-chemical or thermodynamic investigations. Obviously, thisapproach is of great value for a better understanding of the principles governing thisnew technique.
We started with a different strategy, attempting to investigate the ability of thisnon-specific technique to cope with actual fractionation problems with complexmixtures, and to afford high purification ratios together with a high recovery ofenzymatic activities. Fractionation challenges concerning enzymes acting on hydrophobic substrates were selected in the steroid and lipid fields.
A crude extract of Pseudomonas testosteroni, containing L15~4 3-oxosteroidisomerase (isomerase), was chromatographed on a Sepharose-PEG stationary phasewith various concentrations ofdextran T70 in the mobile phase. The chromatographicbehaviour of this enzyme, and that of contaminants, may be correlated with batchpartition studies in PEG-dextran two-phase systems. Earlier experiments [35] showedthat contaminants favoured the dextran-rich bottom phase (partition coefficientKcontaminants :::::: 0.4), whereas isomerase established preferential interactions with thePEG-rich top phase (Kisomrase :::::: 4). The chromatographic elution profile was inagreement with this partition result.
An increased dextran concentration in the mobile phase resulted in an enhancedseparation of the peaks corresponding to isomerase and contaminants. Completeresolution could even be obtained with high concentrations of dextran in the mobilephase (Fig. 3).
Solutions of potassium phosphate [20], a salt known to produce two-phasesystems with PEG, may advantageously be used as the mobile phase instead of theviscous dextran solutions. In this instance, total retention of isomerase was obtained

302 P. HUBERT, R. MATHIS, E. DELLACHERIE
• enzymeactivity
0.4
0.3
400
0.2300
2000.1
100
6"Fig. 3. Extraction of isomerase from a Pseudomonas leslOSleroni crude extract on Sepharose-PEG, with12% (wjv) dextran T70 in the mobile phase. See ref. 20 for more detailed experimental conditions.
OD280
0.7
.. ..0.8 Q 0-
0U U....l'll ~
0.5 '§. -arn.8
rn0
Q, -a0.4 f ~
0.3 1 ,J.
Q,2
0.1
o
enzymeactivitY
•1400
1200
1000
800
600
400
200
h"-Fig. 4. Stepwise elution of the isomerase-containing sample with various potassium phosphate concentrations on Sepharose-PEG stationary phase. See ref. 20 for more detailed experimental conditions.

POLYMER LIGANDS FOR HIe 303
(potassium phosphate ca. 10%), whereas this enzyme was only retarded in the previousexperiment with dextran. Stepwise elution with a decreased potassium phosphateconcentration (ca. 1%) resulted in the recovery of isomerase in good yield (ca. 60%)and the removal of most of contaminants (ca. 7 J.1g compared with ca. 5 mg in theinjected sample) (Fig. 4).
Similar purification results were obtained for an esterase from Bacillus pumilus(86% yield, 140-fold purification) on a Sepharose-Pluronic stationary phase [22].
Further, more sophisticated fractionations were attempted on Sepharose~PEG
and Sepharose-Pluronic with three different enzymes [isomerase, 3a-hydroxysteroiddehydrogenase (a-HSD) and 313,17f3-hydroxysteroid dehydrogenase (f3-HSD)] contained in the same Pseudomonas testosteroni crude extract. According to thehydrophobicity scale proposed by Bigelow [36], the purification of these three enzymesrepresents a real challenge [37].
Their chromatographic behaviours were predicted using "partition betweenaqueous two-phase systems" experiments [24]. These two-phase systems wereprepared by mixing potassium phosphate (final concentration 10, 15 or 20%, w/w)with PEG and Pluronic mixtures of various compositions. The resulting systems arethus composed of a phosphate-rich bottom phase and a polyether-rich top phase, ofincreasing hydrophobicity with its Pluronic content. The partition coefficient of anyconsidered enzyme therefore gives a direct estimation of its ability to establishpreferential interactions with the polyethers. Consequently, when chromatography iscarried out using Sepharose-PEG or Sepharose-Pluronic stationary phases anda potassium phosphate mobile phase, high partition coefficients (K > 1) shouldcorrespond to retention or retardation. Conversely, biomolecules with low partitioncoefficients (K < 1) favour the phosphate-rich bottom phase and should be eluted withno retardation.
The main information obtained from batch partition analysis was as follows: (1)Kisornerase > K 13-HSO » K a- HSO in all experiments; (2) the possibility of shifting thepartition coefficient of a-HSD above 1 by increasing the phosphate concentration or(and) the hydrophobic character (i.e., the Pluronic content) of the top phase; and (3)enhanced LlK (Kisornerase - K 13-HSO) as the hydrophobic character of the polyether-richtop phase is increased. This perfectly paralleled the chromatographic experiments, i.e.,(1) elution in the order a-HSD, f3-HSD, then isomerase; (2) retention or not ofa-HSD,according to the ionic strength in the mobile phase and the nature of the stationaryphase (PEG or Pluronic); and (3) better separation of f3-HSD from isomerase onSepharose-Pluronic than on Sepharose-PEG.
This preliminary information allowed us to develop a strategy for optimumchromatographic resolution (Fig. 5). Good enzymatic activity recovery (a-HSD, 60%;f3-HSD, 40%; isomerase, 65%) together with almost quantitative removal ofcontaminants in each fraction could thus be obtained (residual contaminantsexpressed as a percentage of total protein in the starting crude extract: a-HSD, 1.5%;f3-HSD, 2%; isomerase, not detectable).
5. FUTURE TRENDS
As mild HIC has already proved to be very efficient for sophisticatedfractionation problems with complex mixtures, our future concern in this field ought

304
0.4
OD280
a-HSD
isomerase1500
P. HUBERT, R. MATHIS, E. DELLACHERIE
0.2
14% 10.5% 6.5%
1000
500
Fig. 5. Stepwise elution of the Pseudomonas lesloSleroni crude extract on Sepharose-Pluronic with variouspotassium phosphate concentrations. See ref. 24 for more detailed experimental conditions.
to turn to physico-chemical characterizations, rather than to additional biologicalstudies. However, other polyethers such as PPOs or PTMGs have been immobilized onSepharose and the resulting stationary phases should be tested, in order to obtaina complete study through the whole polyether family.
Further, the determination of immobilized polymers remains an importantquestion, as the ligand concentration on the gel plays a prominent role in theinteraction process. The solutions already exist but, in our opinion, should be morethoroughly investigated.
Ultimately, it would be of interest to quantify the hydrophobic character of thestationary phases. If the hydrophobicity of the polyethers is an important parameter,the interaction of the solute with the stationary phase is probably a global process, inwhich not only the nature of the immobilized polyether, but also the support itself andthe amount of hydrophobic ligands, also playa role.
Surface tension is one of the most indicative measure of this hydrophobiccharacter. Whereas the measurement of surface tension of liquids in straightforward,that of solid surface and especially of beads is far more complicated. However, certainmethods already exist, such as contact angle measurements [38], reverse GC [39] andthe sedimentation volume technique [40,41], and we are currently working on theirapplication to the problems posed by our stationary phases.
This determination of the surface tension of the stationary phase (Ysv) could bethe first step in characterizing, in terms of thermodynamics, a three-component(sorbent-mobile phase-protein) system. In fact, the adsorption of a protein on

POLYMER LIGANDS FOR HIC 305
a sorbent being comparable to an adhesion process, the free energy of association maybe given by the expression [42]
LlFsmp = Ysp - Ysm - Ymp
where Yis the interfacial tension and the subscripts s, m and p represent sorbent, mobilephase and protein, respectively. All these interfacial tensions may be calculatedthrough an equation of state [43] from the measurable individual surface tensions ofthe stationary phase (Ysv), the protein (Ypv) and the mobile phase (Ymv). This makespossible explicit thermodynamic predictions of the relative extent of adhesion of theconsidered biomolecule (p) to a given sorbent (s), under various mobile phase (m)conditions.
In addition, as the measurement of chromatographic parameters such asretention volumes and capacity factors also leads to the determination of theassociation constant or the free energy of association [19,44], a second approach istherefore available for characterizing the three-component system in terms ofthermodynamics.
REFERENCES
I Z. Er-el, Y. Zaidenzaig and S. Shaltiel, Biochem. Biophys. Res. Commun., 49 (1972) 383.2 S. Hjerten, Adv. Chromatogr., 19 (1981) Ill.3 B. H. J. Hofstee, Pure Appl. Chern., 51 (1979) 1537.4 1. Porath, L. Sundberg, N. Fornstedt and P. Ohlsson, Nature (London), 245 (1973) 465.5 G. Halperin, M. Breitenbach, M. Tauber-Finkelstein and S. Shaltiel, 1. Chromatogr., 215 (1981) 211.6 R. J. Yon, Int. J. Biochem., 9 (1978) 373.7 W. Melander and Cs. Horvath, Arch. Biochem. Biophys., 183 (1977) 200.8 T. Laas, J. ChromC/togr., III (1975) 373.9 P. A. Albertsson, Partition ofCell Particles and Macromolecules, Almqvist & Wiksell, Stockholm, and
Wiley-Interscience, New York, 2nd ed., 1971.10 T. G. 1. Ling, H. Nilsson and B. Mattiasson, Carbohydr. Res., II (1989) 43.II A. Foucault and K. Nakanishi, J. Liq. Chromatogr., II (1988) 2455.12 C. J. O. R. Morris, Protides Bioi. Fluids, 10 (1963) 325.13 H. S. Anker, Biochim. Biophys. Acta, 229 (1971) 290.14 S. H. Chang, K. M. Gooding and F. E. Regnier, J. Chromatogr., 120 (1976) 321.IS T. G. 1. Ling and B. Mattiasson, J. Chromatogr., 254 (1983) 83.16 N. T. Miller and B. L. Karger, J. Chromatogr., 326 (1985) 45.17 J. P. Chang, Z. El Rassi and Cs. Horvath, 1. Chromatogr., 319 (1985) 396.18 Y. Shibusawa, U. Matsumoto and M. Takatori, J. Chromatogr., 398 (1987) 153.19 T. Suzuki, N. Muroi and T. Tomono, J. Biomater. Sci. Polym. Ed., 1 (1989) 3.20 R. Mathis, P. Hubert and E. Dellacherie, J. Chromatogr., 319 (1985) 43.21 R. Mathis, P. Hubert and E. Dellacherie, J. Chromatogr., 347 (1985) 291.22 R. Mathis, A. Mourey and P. Hubert, Appl. Environ. Microbiol., 54 (1988) 1307.23 R. Mathis, P. Hubert and E. Dellacherie, J. Chromatogr., 474 (1989) 396.24 R. Mathis, P. Hubert and E. Dellacherie, J. Chromatogr., 538 (1991) 456.25 G. Kiiriisi and E. Kovats, J. Chern. Eng. Data, 26 (1981) 323.26 N. Jarvis, R. B. Fox and W. A. Zesnian, in Contact Angle, Wettability and Adhesion (Advances in
Chemistry Series), American Chemical Society, Washington, DC, 1979, p. 323.27 B. Yu. Zalavsky, A. V. Baevskii, S. V. Rogozhin, A. V. Gedrovich, A. V. Shishkov, A. A. Gasanov and
A. A. Masimov, 1. Chromatogr., 285 (1984) 63.28 S. N. Omenyi, A. W. Neumann and C. J. van ass, J. Appl. Phys., 52 (1981) 789.29 A. F. Buckmann, M. Morr and G. Johansson, Makromol. Chern., 182 (1981) 1379.30 S. Arnott, A. Fulmer, W. E. Scott, 1. C. M. Dea, R. Moorhouse and D. A. Rees, J. Mol. Bioi., 90 (1974)
269.

306 P. HUBERT, R. MATHIS, E. DELLACHERIE
31 C. Rochas.and M. Lahaye, Carbohydr. Polym., 10 (1989) 289.32 R. de Vas and E. J. Goethals, Polym. Bull., 15 (1986) 547.33 J. D. Andrade, in J. D. Andrade (Editor), Surface and Interfacial Aspects of Biomedical Polymers
(Surface Chemistry and Physics, Vol. I), Plenum Press, New York, 1985, p. 61.34 I. Drevin and B. 1. Johansson, J. Chromatogr., 295 (1984) 210.35 P. Hubert, E. Dellacherie, J. Neel and E. E. Baulieu, FEBS Leu., 65 (1976) 169.36 C. C. Bigelow, J. Theor. BioI., 16 (1967) 187.37 J. Boyer, D. N. Baron and P. Talalay, Biochemistry, 4 (1965) 1825.38 A. W. Neumann, R. J. Good, C. J. Hope and M. Sejpal, J. Colloid Interface Sci., 49 (1974) 291.39 E. Papirer, H. Balard, Y. Rahmani, A. P. Legrand, L. Facchini and H. Hommel, Chromatographia, 23
(1987) 639.40 D. R. Absolom and R. A. Barford, Anal. Chem., 60 (1988) 210.41 E. I. Vargha-Butler, T. K. Zubovitz, H. A. Hamza and A. W. Neumann, J. Dispersion Sci. Technol.,
6 (1985) 357.42 J. Visser, Adv. Colloid Interfacial Sci., 15 (1981) 157.43 C. A. Ward and A. W. Neumann, J. Colloid Interface Sci., 49 (1974) 286.44 Cs. Horvath, W. Melander and I. Molnar, Anal. Chem., 49 (1977) 142.

Journal of Chromatography, 539 (1991) 307-314Elsevier Science Publishers B.V., Amsterdam
CHROM. 22874
Comparative affinity chromatographic studies using novelgrafted polyamide and poly(vinyl alcohol) media
D. MULLER-SCHULTE*
Institut fur Organische Chemie der RWTH Aachen, Prof-Pirlet-Strasse 1, W-5100 Aachen (Germany)
and
S. MANJINI and M. A. VIJAYALAKSHMI
Universite de Technologie de Compiegne, Departement Genie Biologique, B.P. 649, 60206 Compiegne Cedex( France)
ABSTRACT
Radiation-grafted polyamide in microparticulate form was used for the affinity chromatographicseparation offibronectin, human immunoglobulin IgG I and human serum albumin using gelatin, histidineand Cibacron Blue F3G-A as affinity ligands. The chromatographic properties, in particular the proteinadsorption capacities of the grafted carriers, were tested in comparison with several commercial media(Sepharose, Spherosil, Eupergit, Fractogel, VA-Epoxy). As a result of grafting, long molecular spacers areintroduced into the polymer carrier, leading to high ligand binding and protein loading capacities wellabove those achieved with commercial media. A novel support based on poly(vinyl alcohol) carrying ablood group-specific trisaccharide ligand for the removal of blood group antibodies from human serum isdescribed. The poly(vinyl alcohol) carrier exhibits excellent antibody binding capacities when comparedwith supports carrying protein G and protein A ligands. New perspectives opened up by the new supportwith regard to in vivo haemoperfusion are discussed.
INTRODUCTION
A number of carrier media based on silica gels, polysaccharides or syntheticorganic materials have been described for diverse chromatographic applications [I].The increasing importance of separation technology in different areas has led toimproved chromatographic media which are mainly used for the production ofbiologically active substances. Prominent examples include the purification ofantibodies, blood components, growth factors, interferon, insulin and fibronectin. Ifone considers technical applications, affinity chromatography offers enormousadvantages over other separation methods.
Depending on the degree of biorecognition of the ligand, the separation ofbiomolecules can be obtained in a single step, thereby simplifying the commonly usedseparation procedures which generally require several purification steps. Affinitychromatography can therefore offer a significant reduction in cost, time and technicaleffort.
Despite the enormous effort invested in the field of affinity chromatography,
0021-9673/91/$03.50 © 1991 Elsevier Science Publishers B.V.

308 D. MOLLER-SCHULTE, S. MANJINI, M. A. VIJAYALAKSHMI
a few aspects still remain critical, including insufficient ligand binding capacity of thesupport, the cost, the physical and chemical stability and the lack of biospecificity ofthe affinity ligand [2]. Another essential point is the different coupling method, thedrawbacks of which have been critically discussed [I].
We have demonstrated recently that radiation-grafted polyamide-6 in microparticulate form and newly developed poly(vinyl alcohol) carriers exhibit distinctlyhigher protein and ligand binding capacities than those achieved with well establishedcommercial media [2,3].
In this work, the performances of grafted polyamide-6 (Biograft) and poly(vinylalcohol) (PVA) gels as carriers were tested in comparison with several commercialmedia.
Gelatin, Cibacron Blue F3G-A and I-histidine were used as affinity ligands forthe separation of human fibronectin (Fn), human serum albumin (HSA) and humanimmunoglobulin IgG I. Likewise, a trisaccharide hapten specific against blood groupA antibodies was coupled to different supports, the aim being to assess the feasibility ofthese carriers for in vivo haemoperfusion.
EXPERIMENTAL
MaterialsThe materials were purchased from the following sources: Sepharose and
Superose media, Pharmacia-LKB (Freiburg, Germany); Fractogel TSK HW-75F,Merck (Darmstadt, Germany); Eupergit C, Rahm Pharma (Darmstadt, Germany);VA-Epoxy and VA-Hydroxy, Riedel-de Haen (Seize, Germany); Synsorb A and bloodgroup A trisaccharide, Chembiomed (Edmonton, Canada); Spherosil, Rhone Poulenc(Paris France); IgG I protein solution from human placenta, Institut Merieux (Lyon,France); and PYA, Hoechst (FrankfurtjM, Germany). All other chemicals weresupplied by Fluka (Freiburg, Germany) and Merck._
Preparation of grafted polyamide and poly (vinyl alcohol) carriersThe grafting of polyamide-6 and the synthesis of the PVA carriers were carried
out according to previously described procedures [4,5]. For grafting, 2-hydroxyethylmethacrylate together with N-vinylpyrrolidone and acrylamide were used, resulting ina graft uptake of 74% (wjw). Activation was carried out with epichlorohydrin inI M sodium hydroxide solution [4].
PVA was synthesized as follows [5]: PVA was dissoved with heating in ethyleneglycol to obtain a 5% solution. The hot solution was dispersed in vegatable oil withstirring at 400-1000 rpm. The suspension was cooled and the beads formed wereseparated from the oil by several extractions with acetone. The diameter of the beadsdepends on the stirring speed, and ranges from 50 to 500 J.lm. Cross-linking wasperformed using epichlorohydrin in 3 M sodium hydroxide solution. Epoxy-activationwith epichlorohydrin was performed as for the grafted polyamide.
Preparation of affinity supportsGelatin support. Ten millilitres of a 1% gelatin (porcine skin, Fluka) solution in
I M potassium phosphate (pH 7.5) were added to 3 ml of epoxy-activated support(Biograft, Eupergit C or VA-Epoxy) and the mixture was left for 30 h at 30°C with

AFFINITY CHROMATOGRAPHY USING POLYAMIDE AND PVA 309
gentle stirring. The excess of protein was removed by washing with 0.5 M potassiumphosphate. The remaining oxirane groups were blocked by incubation for 2 h withI M ethanolamine solution (pH 8.0). The support was stored in 0.05 M Tris-HClbuffer (pH 7.5) containing 0.02% sodium azide.
Fractogel TSK HW-75F was activated for coupling with gelatin using 2-fluorol-methylpyridinium toluenesulphonate according to the method described by Ngo [6].
Cibacron Blue support. Coupling of Cibacron Blue F3G-A to 3 ml of Biograftand PVA was effected in a solution containing 20% sodium chloride and I M sodiumcarbonate for 2 days at 40°C [7]. In order to ensure maximum binding, a high dyeconcentration (100 mg/ml resin) was used. Extensive washing with water and4 M sodium chloride solution containing 40% (v/v) ethylene glycol followed until allunbound dye had been removed. Before use, the matrices were equilibrated in 0.01M potassium phosphate (pH 7.5).
Histidine support. Histidine was covalently coupled to epoxy-activated Biograftas described elsewhere [8]. Two coupling agents were used, epichlorohydrin and1,4-butanediol diglycidyl ether.
Bloodgroup A immunoadsorbent. For the preparation of the immunoadsorbents,0.5 ml of epoxy carrier (Biograft or Eupergit C) was incubated with I ml of boratebuffer (pH 9.5) containing 0.5 mg of the blood group hapten. After reaction for 20 h atroom temperature, the adsorbent was washed several times with I M sodium chloridesolution. Fractogel TSK HW-75F was activated with 2-fluoro-l-methylpyridiniumtoluenesulphonate as described above.
The activation of PYA using 1,6-hexamethylene diisocyanate dissolved indimethyl sulphoxide and the subsequent coupling of the blood group hapten werecarried out as described previously [2]. After the reaction, the matrix was washed withwater and dimethyl sulphoxide. Before use, all supports were equilibrated withphysiological sodium chloride solution.
Determination oj'immobilized Cibacron BlueThe amount of Cibacron Blue F3G-A coupled to the support was determined
spectrophotometrically by measuring the differences in absorbance at 610 nm betweenadded and unbound dye [7].
Chromatographic proceduresGelatin support. Gelatin affinity support (3 ml) was packed into a chromato
graphic column (5 x 0.9 cm J.D.). After equilibration with 50 ml of phosphatebuffered saline (pH 7.5) containing 0.01 M citric acid and 0.02% sodium azide (bufferA), 20 ml of freshly prepared pooled citric human plasma (obtained by centrifugationfor 10 min at 3000 g) were loaded on the column at a flow-rate of 50 cm/h. After themajor unretained peak had eluted and the absorbance monitored at 279 nm hadreached zero, the Fn was eluted with 3 M urea in buffer A. The Fn content of the elutedfraction was determined by a standard turbidimetric immunoassay test [9]. Briefly,antiserum to human Fn is added to the plasma sample and the absorbance is measuredwith a Behring laser nephelometer. The Fn content is automatically evaluated from thecorresponding protein concentration of a standard dilution [9].
Cibacron Blue support. Cibacron Blue F3G-A affinity resin (3 ml) was packedinto the column described above and equilibrated in 0.05 M sodium phosphate buffer

310 D. MOLLER-SCHULTE, S. MANJINI, M. A. VIJAYALAKSHMI
(pH 7.0) at a flow-rate of 25 em/h. A 10-ml volume of sample solution containing 30mg ofHSA was loaded on the column. Unadsorbed protein was washed off the columnwith 20 ml of buffer solution. The bound HSA was subsequently eluted with 10 ml of4 M sodium chloride and the fractions were collected at a flow-rate of 25 em/h. Theprotein content was determined spectrophotometrically at 280 nm.
Histidine support. A 20 x I em J.D. column was packed with I ml of support.Adsorption and washing were performed in 0.025 M Tris-HCI buffer (pH 7.4). Thesame buffer containing 0.2 M sodium chloride was used for desorption. Theexperiments were conducted at 4°C, except for Spherosil columns, for which theoptimum retention was obtained at room temperature. The concentration of the elutedIgGI was determined spectrophotometrically at 280 nm.
Bloodgroup immunoadsorbent. Pooled human serum type 0 (I ml) was added for10 min at room temperature to a given amount of support (batch procedure; for detailssee Table IV). The content of antibody adsorbed was determined by the agglutinationtest as described previously [2].
RESULTS AND DISCUSSION
The performance of Biograft and PVA carriers was tested in comparison withseven different commercial supports: Sepharose, Superose, Fractogel, Eupergit C,VA-Epoxy, Synsorb A and Spherosil. As the commercial matrices chosen here arefrequently used in practice, the results obtained should provide important data withregard to the performance of Biograft and PVA.
All supports were coupled under identical conditions, with the exception ofgelatin Sepharose, protein A/protein G Sepharose and Synsorb A, which were used assupplied by the manufacturer.
As shown in Table I, the Fn adsorption capacity ofgelatin Biograft is about 80%higher than that of Gelatin Sepharose. VA-Epoxy shows the best performance amongthe commercial media, which is in line with recent findings regarding the performanceof this matrix in immunoaffinity chromatography [2]. Although the study of thedifferent supports under identical test conditions is the main topic, it should be stressedthat the performance of the separation can still be optimized by modifying certain test
TABLE I
ADSORPTION CAPACITY OF FIBRONECTIN ON DIFFERENT GELATIN AFFINITY RESINS
Human plasma (20 ml) was applied to 3 ml of adsorbent at a linear flow-rate of 50 cm/h at roomtemperature. The Fn concentration in the elution fraction was determined using an immunoturbidimetricstandard test method [9]
Support Approximate Capacitybead size (/lm) (mg Fn/ml gel)
Biograft 150Gelatin Sepharose 4B 70Fractogel TSK HW-75F 40Eupergit C 150VA-Epoxy 110
2.80.60.91.42.1

AFFINITY CHROMATOGRAPHY USING POLYAMIDE AND PVA
TABLE II
ADSORPTION CAPACITY OF HSA ON DIFFERENT CIBACRON BLUE F3G-A GELS
Flow-rate: 25 cm/h.
311
Support matrix Approximate Ligand boundbead size (/lm) (mg/ml gel)
HSA adsorbed(mg/ml gel)
Biograft 150PVA 80Sepharose CL-6B 70Fractogel TSK HW-75F 40VA-Hydroxy 110
0.51.40.20.30.3
0.590.810.190.650.21
parameters, e.g., amount of ligand bound, flow-rate, temperature and amount ofprotein loaded onto the column, as recently demonstrated by Regnault et al. [10] forthe separation of Fn. This leaves room for further improvements when using graftedpolyamide carriers.
HSA adsorption capacities on different Cibacron Blue resins are given in TableII. Biograft binds about three times as much HSA as VA-Hydroxy and SepharoseCL-6B. This correlates directly with the ligand uptake of these supports: 0.5 mg/ml(Biograft), 0.3 mg/ml (VA-Hydroxy) and 0.2 mg/ml Cibacron Blue (Sepharose) underthe chosen test conditions. PVA shows the highest protein adsorption with 0.81 mg/ml,yet this amount is relatively low considering the large amount of the ligand bound (1.4mg/ml). The performance of Fractogel TSK HW-75F is not in accordance with theother results of this test series, insofar as it adsorbs relatively large amounts of HSA(0.65 mg/ml), which is in contrast to its low Cibacron Blue uptake. An explanation ofthis could be the non-specific adsorptions due to the partly non-polar nature of the
TABLE III
COMPARISON OF IgGl ADSORPTION CAPACITIES OF DIFFERENT HISTIDINE-COUPLEDAFFINITY RESINS
For details see Experimental.
Support Approximate Capacitybead size (/lm) (mg IgCI/ml gel)
Biograft 150 0.69Sepharose 4B
Without spacer" 70 0.05With spacerb 0.23
Superose 12 with spacerb 30 0.29Spherosil
Without spacer 80 0.15With spacerd 0.28
a Activated with epichlorohydrin.b Activated with 1,4-butanediol diglycidyl ether., Activated with y-glycidyloxypropyltrimethoxysilane.d Activated with y-glycidyloxypropyltrimethoxysilane and subsequently reacted with aminocaproic
acid; coupling of histidine was conducted using carbodiimide [8].

312 D. MOLLER-SCHULTE, S. MANJINI, M. A. VIJAYALAKSHMI
Fractogel structure. A reason for the relatively low protein adsorption achieved withPVA regarding the very high ligand binding density could be that a high ligand density,owing to steric effects, prevents an appropriate interaction of the non-polar moiety ofthe ligand with the non-polar region of HSA [11].
A comparison of the IgGl binding capacities on different histidine affinitysupports is shown in Table III. Grafted polyamide adsorbs about three times moreIgGl than Sepharose 4B, Superose 12 and Spherosil. The influence ofa spacer moleculeon the protein binding efficacy is demonstrated by comparing the results obtained with1,4-butanediol diglycidyl ether, which functions as a spacer, and epichlorohydrin. Thedifferences between these two coupling modes are obvious, especially with Sepharose4B: 0.05 mg IgGljml bound without spacer and 0.23 mg IgGljml bound with spacer. Tncontrast, the grafted support does not require an additional spacer-like coupling agent,which would also contribute to the overall high costs of affinity media.
The above-described ligands have one common feature, namely that they are allpseudo-specific. However, as they are inexpensive and are readily available, they arefrequently used in the laboratory. This applies especially to the use of some textile dyessuch as Cibacron Blue, Remazol Yellow and Procion Red (I2]. Although these ligandsinteract with a number of proteins [7], Cibacron Blue F3G-A has been appliedsuccessfully to the separation of HSA, enzymes, growth and coagulation factors andinterferon [12]. HSA is technically produced by a chromatographic process usingCibacron Blue columns [13]. A comparison of the performances of different CibacronBlue supports is hence of fundamental interest with regard to technical applications.
By adopting defined adsorption or desorption modes, a resolution and degree ofpurification comparable to those of immunoadsorption can be obtained withpseudo-specific ligands. This applies especially to histidine, which interacts through itscarboxyl, amino and imidazole groups with several proteins at or around theirisoelectric point and has shown particular efficacy in separating IgG subclasses [14].This mode of chromatography also has some potential if one considers its technicalapplication [15].
TABLE IV
REMOVAL OF BLOOD GROUP A ANTIBODIES FROM HUMAN SERUM
Pooled human serum type 0 (I m!) was incubated for 10 min at room temperature (batch procedure). Theantibody content was determined by agglutination test [3].
Support Sample volume Approximate Antibody bound(m!) bead size (/lm) (%)
PYA 1.0 500 >90Biograft 0.5 150 >90Eupergit C 0.5 150 >90Fractogel TSK HW-75F 0.5 40 <30Synsorb A 1.0 500 <50Protein ASepharose CL-4Ba 0.3 70 <10Protein GSepharose 4a 0.3 70 <10
a Used as supplied by the manufacturer without blood group hapten.

AFFINITY CHROMATOGRAPHY USING POLYAMIDE AND PYA 313
The reason for the overall superior performance of the grafted supports incomparison with well established media lies in their special molecular structure.Grafting leads to long tentacle-like molecular chains which function automatically asspacer arms [4]. These grafted chains obviously possess a high accessibility for ligandsand proteins, as shown in recent enzyme and antibody immobilization tests [3,16].
Affinity chromatography has also been successfully used in the medical field. Inbone marrow transplantation, ABO incompatibilities can be circumvened by anti-Aand anti-B antibody removal from blood and serum. For this purpose, a novel PYAcarrier was developed to which a specific blood group oligosaccharide was attached
Fig. I. Scanning electron micrographs of (a) PYA and (b) Synsorb A immunosorbent carriers, showing thesmoothness of the surface morphology of PVA beads in comparison with Synsorb.

314 D. MOLLER-SCHULTE, S. MANJINI, M. A. VIJAYALAKSHMI
[2,17]. A comparative study of the blood group antibody adsorption capacities ondifferent immunosorbents is shown in Table IV.
PYA, Biograft and Eupergit C bind over 90% of the antibody, whereasFractogel and Protein A and Protein G Sepharose adsorb relatively low proteincontents « 30% and < 10%, respectively). The PYA protein binding ability isoutstanding ifone considers the large bead size of this gel (ca. 500 )lm). This underlinesboth the efficacy of the isocyanate coupling technique and the suitability of PVA as anaffinity support. Further, it becomes obvious that the blood group trisaccharide ligandexhibits distinctly better specificity and hence binding properties than protein A andprotein G, ligands frequently used for IgG separations [18].
Although Biograft and Eupergit C also show good protein adsorptions, thesecarriers are only suitable for in vitro usage owing to their small bead sizes. Synsorb A,a commercial immunosorbent based on silica gel [19], also has a bead size of ca. 500 )lmand shows reasonable adsorption properties. However, this support might not beuseful for in vivo application as it consists of very small single building blocks (Fig. I)which produce a rough surface morphology. The surface morphology, however, isvital for biocompatibility as it directly influences the mode of blood flow. Roughsurfaces can cause micro turbulences and thus promote thrombus formation [20].Another detrimental reaction is the activation of the complement system [21]. HencePVA remains the only choice for practical haemoperfusion because of its excellentadsorption capacity, smooth surface morphology (Fig. I) and good blood compatibility, which is superior to that of common carrier types [21].
Apart from the biochemical performance, the newly developed media possessexcellent chemical stability. Treatments in 1-6 M sodium hydroxide are possiblewithout detectable destruction [5]. This is a unique feature among all commonchromatographic supports and it seems that these media are useful alternatives tocurrently used supports.
REFERENCES
I J-X. Huang and G. Guiochon, J. Chromatogr., 492 (1989) 431.2 D. Muller-Schulte, J. Chromatogr., 510 (1990) 115.3 D. Muller-Schulte and H. G. Thomas, Radiat. Phys. Chem., 35 (1990) 93.4 D. Muller-Schulte, Continuation in part USA, Patent, Serial Number 07150, 417 (1988).5 D. Muller-Schulte, Ger. Pal. Appl., P3900945.9-43 (1989).6 T. T. Ngo, Makromol. Chem. Macromol. Symp., 17 (1988) 229.7 P. D. G. Dean and D. H. Watson, J. Chromatogr., 165 (1979) 301.8 M. A. Vijayalakshmi, These, Docteur es Science, Universite Technologie de Compiegne, 1980, p. 95.9 lmmunoturbidimetric Assay, Behring Werke, Marburg, 1988.
10 V. Regnault, C. Rivat and J.F. Stoltz, J. Chromatogr., 432 (1988) 93.II G. Kopperschliiger, H. J. B6hme and E. Hofmann, Adv. Biochem. Eng., 10 (1982) 101.12 Y. D. Clonis, Bio/Technology, 5 (1987) 1290.13 Products for Biotechnology, Institut Biologique Fran~ais (lBF), La Garenne, 1987.14 S. Kanoun, L. Amourache, S. Krishnan and M. A. Vijayalakshmi, J. Chromatogr., 376 (1986) 259.15 M. A. Vijayalakshmi, Trends Biotechnol., 7 (1989) 71.16 D. Muller-Schulte and F. A. Horster, Polym. Bull., 7 (1982) 395.17 R. U. Lemieux, Chem. Soc. Rev., 7 (1978) 423.18 S. Ohlson, R. Nilsson, U. Niss, B. M. Kjellberg and C. Freiburghaus, J.lmmunol. Methods, 114 (1988)
175.19 Product Brochure, Chembiomed, Edmonton, Canada, 1989.20 B. D. Ratner, A. B. Johnston and T. J. Lenk, J. Biomed. Mater. Res., 21 (1987) 59.21 H. Meltzer, Technical University Aachen, unpublished results.

Journal o/Chromatography, 539 (1991) 315-325Elsevier Science Publishers B.V., Amsterdam
CHROM. 22 875
Microfiltration membranes as pseudo-affinity adsorbents:modification and comparison with gel beads
B. CHAMPLUVIER and M.-R. KULA'
Institutfiir Enzymtechnologie, Heinrich-Heine Universitiit Diisseldorf; P.O. Box 2050, W-5170 Jiilich (Germany)
ABSTRACT
Microfiltration membranes were studied as alternative adsorbents to the usual spherical hydrogelsbeads for the purification of proteins. Assumption of monolayer adsorption onto the internal area allowedthe capacity measured by adsorption of model proteins to be predicted. The membrane could be modifiedwith triazine dyes to yield an affinity-like support. The capacity of the dyed membrane was similar to thecapacity of dyed Sepharose and the membrane could be used repeatedly. Enzymes from a crude extract ofbaker's yeast were selectively adsorbed in both batch and continuous experiments, allowing purificationfactors of at least ten.
INTRODUCTION
Dye ligand chromatography has long been known as a versatile and robust toolfor purifying proteins from the analytical to the preparative scale [I]. In order toshorten the process time, more efficient adsorbents have been sought. The applicationof beads with small diameters allows the restrictions set by diffusive transport of theproteins to the ligand to be reduced considerably [2]. However, high operatingpressures are required. Alternatively, porous polymer matrices modified as ionexchangers (Memsep, Millipore; Zetaprep, Cuno) have been introduced recentlybecause of their high surface area, convective solute transport and low pressuredrops [3].
Microfiltration membranes are potentially attractive adsorbents because theyoffer the same advantages as the matrices mentioned above together with mechanicalstrength, a highly porous structure and a large range of configurations for operation.Moreover, membranes are capable of handling unclarified solutions. Capillarymembrane modules modified to yield affinity supports allowed, for instance,antibodies to be isolated from a cell culture medium [4].
In this work, microfiltration membranes made of nylon were tested asaffinity-like adsorbents. The available capacity of the basic material was evaluated intwo ways: from measurements of the inner surface area available in principle foradsorption and from experiments involving adsorption of model proteins. Modification of a nylon membrane with various pseudo-affinity ligands (triazine dyes) was
0021-9673/91/$03.50 © 1991 Elsevier Science Publishers B.V.

316 B. CHAMPLUVIER, M.-R. KULA
performed and the modified membranes were tested as adsorbents. A proprietary dyeligand membrane was used for enrichment of enzymes from a crude yeast extract.Batch and filtration mode experiments were compared with the different membranesand their reusability was assessed. The results were compared with those obtained withpseudo-affinity agarose gels.
EXPERIMENTAL
MaterialsMicrofiltration membranes (Vltipor) were obtained from Pall (Dreieich,
Germany). According to technical information from the manufacturer, Vltipor areisotropic membranes made of nylon 66 with a high surface concentration ofamine andcarboxylate groups in a I: 1 ratio. Modified nylon membranes with a positively chargedsurface, Zetapor (0.2 pm) and Zetabind (0.45 pm), were acquired from Cuno Europe(Cergy-Pontoise, France). Zetabind is intended for DNA and protein blotting.Samples from a proprietary nylon-based membrane modified with triazine dyes werea gift from Sartorius (G6ttingen, Germany).
Cibacron Blue F3G-A was purchased from Ciba Geigy (Basle, Switzerland),Procion dyes from ICI (Frankfurt, Germany), polyethylenimine (PEl) from SigmaChemie (Deisenhofen, Germany) and glutaraldehyde from Fluka (Neu-Vlm, Germany). All other reagents were of analytical-reagent grade.
Bovine serum albumin (BSA), fraction V (Boehringer Mannheim, Tutzing,Germany) was dissolved in water and hen egg lysozyme (Fluka) in I mM potassiumphosphate buffer (pH 7.0).
A crude enzyme extract was prepared from commercial baker's yeast (Saccharomyces cerevisiae). A 40% (wjv) suspension in 100 mMpotassium phosphate buffer(pH 6.0)-1 mM EDTA-5 mM mercaptoethanol was disintegrated in a high-pressurehomogenizer, centrifuged and filtered through a 0.2-pm filter. The extract was storedat - 20°e. Before use, samples were again clarified by centrifugation and diluted4-fold with a 1 mM EDTA solution.
Dye ligand immobilizationThe dye ligands were coupled to Vltipor membranes (OJ-pm nominal pore size)
either directly or using PEl as spacer. The latter was first bound to membranespreviously activated by glutaraldehyde at pH 8.0 [5J. The dyeing was carried out in twosteps: a I-h dye adsorption at room temperature from 6% NaCI solution, followed byreaction for 1 h at 50°C after raising the pH to 10.8 with carbonate buffer. A largeexcess of reagents were used and the membranes were rinsed repeatedly after everyreaction step. After a final rinse with water and methanol, the membranes were storeddry at room temperature. The amount of dye coupled to the membrane wasdetermined spectrophotometrically after dissolution of samples in phenol-methanol.Dyeing of Sepharose CL-4B was performed as described for the membranes.
Batch adsorption experimentsSamples of membrane were contacted with the solution of proteins in a shaken
vessel for about 3 h. No significant change in protein concentration in the liquidoccurred typically after 90 min up to 24 h. The amount adsorbed was calculated from

MICROFILTRATION MEMBRANES AS ADSORBENTS 317
the mass balance. The experiments were performed in flasks for BSA and lysozyme andin micro test-tubes (Eppendorf) for yeast extract. The support volume was about 2%of the solution volume. Blanks without membranes were incubated in parallel to checkthat no deactivation or unexpected losses occurred. Before the adsorption experiments, the membranes were equilibrated with the corresponding solution withoutprotein.
Adsorption and desorption in filtration modeMembranes discs of 25 mm diameter were used; the effective filtration area was
3.3 cm z.To perform the adsorption experiments with lysozyme, filter holders (Sartorius,
SM16517E) connected to a syringe were used. The following solutions (5 ml) weresuccessively passed through the filter: buffer, 0.1 gil lysozyme, I M sodium chlorideand then 10 ml buffer. Residual liquids were flushed out of the holder with air.Lysozyme adsorption was measured by the decrease in concentration on filtration. Theabove cycle was performed three times.
For the experiments with the yeast extract, a filter holder with a minimum deadvolume was constructed and inserted into an a fast protein liquid chromatography(FPLC) system (Pharmacia, Uppsala, Sweden). One to ten membranes could be fittedin the holder. Samples of500 J11 were injected. The membrane was washed with 10 ml ofbuffer. Unless stated otherwise, elution was carried out with a 10-mllinear gradientfrom 0 to 0.25 M KCl, a 5-ml step with 2 M KCI in buffer and a 5-ml step with startingbuffer. Fractions of 5 ml were collected. Before the next run, a few milliliters of startingbuffer were passed through the module without collecting the fractions.
AssaysLysozyme concentrations were measured at 280 nm. BSA and yeast proteins
were assayed with the Coomassie or with the micro-BCA test using kits purchasedfrom Pierce (Oud Beijerland, The Netherlands). Malate dehydrogenase (MDH) andglucose-6-phosphate dehydrogenase (G6PDH) activities were measured according toBergmeyer [6] and adenylate kinase according to Ito et al. [7].
RESULTS
Preliminary evaluation of membrane capacity for model proteinsThe capacity of the membranes considered as adsorbents for proteins was
evaluated in two ways: first by calculating the amount that could be adsorbed ina close-packed monolayer using literature data for the physical dimensions of modelproteins and measuring the surface area available within the matrix; and second bymeasuring the adsorption of BSA under conditions favourable to adsorption.
The internal surface areas of the membranes were measured by nitrogenadsorption [8] using a Sorptomatic apparatus (Carlo Erba, Milan, Italy). The resultsfor Ultipor membranes of various nominal pore sizes are shown in Fig. I. Togetherwith monolayer adsorption values calculated from the BSA and lysozyme dimensions(3.8 nm diameter x 15.0 nm length and 4.5 x 4.4 x 3.0 nm, respectively [9,10)), theoverall surface would allow ca. 150 J1g of lysozyme and 150-600 J1g of BSA to bind toa I-cmz piece of membrane with O.I-Ilm nominal pore size. The two values for BSA

318
800
Q)700
c2.0
E 600Q)
E'"E 500
uLQ)n. 400'"Euc
3000
~0
0 200
E2c 100
00.1 0.2 0.45
Nominal pore size (pm)
B. CHAMPLUVIER, M.-R. KULA
1.2
Fig. I. Inner surface area ofmicrofiltration membranes (Ultipor, Pall) with differents pore sizes, determinedby nitrogen adsorption.
refer to adsorption of the protein molecule with its main axis parallel or perpendicularto the support surface.
The adsorption measured with BSA in aqueous solution at concentrations of0.25 and 0.5 gil on two positively charged membranes (Zetapor, Zetabind) and anamphoteric membrane (Ultipor) are shown in Table I. At the end of the experiment, anexcess ofBSA remained in solution. On doubling the initial concentration, the increasein the amount adsorbed was small relative to the concentration left in solution forUltipor and Zetapor, therefore indicating saturation.
Immobilization of dye ligands to Ultipor membraneThe amounts ofcrude dye immobilized on the Ultipor membrane in two batches
were in good agreement (Table II). A five to ten times higher dye concentration wasbound when PEl was used as spacer. Dye concentrations in the same range wereobtained with mono- (Cibacron, Procion H) and dichlorotriazinyl (Procion MX) dyes.
Adsorption of lysozyme to dyed Ultipor membraneBatch adsorption was performed in duplicate. Adsorption in the filtration mode
was repeated three times with every membrane specimen, the membrane being washedwith sodium chloride solution and buffer between runs. As the amounts adsorbed didnot show any trend, the averages from three data are reported. The amounts of
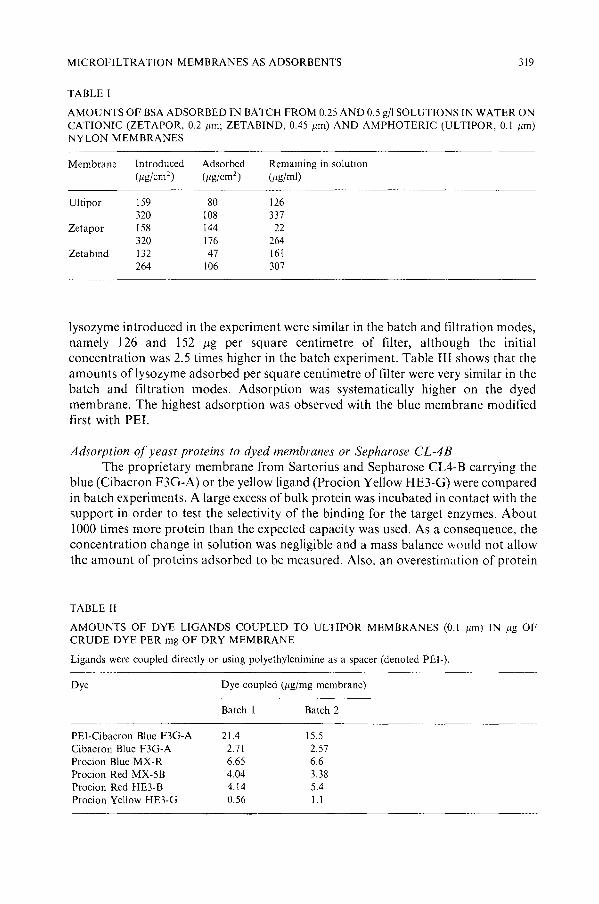
MICROFILTRATION MEMBRANES AS ADSORBENTS 319
TABLE I
AMOUNTS OF BSA ADSORBED IN BATCH FROM 0.25 AND 0.5 gil SOLUTIONS IN WATER ONCATIONIC (ZETAPOR. 0.2 /lm; ZETABIND, 0.45 /lm) AND AMPHOTERIC (ULTIPOR, 0.[ lim)NYLON MEMBRANES
Membrane Introduced Adsorbed Rcmaining in solution(/lg/cm 2
) (Itg/cm2) (/lg/ml)
Ultipor 159 80 126320 108 337
Zetapor 158 144 22320 176 264
Zetabind 132 47 161264 106 307
lysozyme introduced in the experiment were similar in the batch and filtration modes,namely 126 and 152 f.1g per square centimetre of filter, although the initialconcentration was 2.5 times higher in the batch experiment. Table III shows that theamounts of lysozyme adsorbed per square centimetre of filter were very similar in thebatch and filtration modes. Adsorption was systematically higher on the dyedmembrane. The highest adsorption was observed with the blue membrane modifiedfirst with PEL
Adsorption of yeast proteins to dyed membranes or Sepharose CL-4BThe proprietary membrane from Sartorius and Sepharose CL4-B carrying the
blue (Cibacron F3G-A) or the yellow ligand (Procion Yellow HE3-G) were comparedin batch experiments. A large excess of bulk protein was incubated in contact with thesupport in order to test the selectivity of the binding for the target enzymes. About1000 times more protein than the expected capacity was used. As a consequence, theconcentration change in solution was negligible and a mass balance would not allowthe amount of proteins adsorbed to be measured. Also, an overestimation of protein
TABLE II
AMOUNTS OF DYE LIGANDS COUPLED TO ULTIPOR MEMBRANES (0.1 lim) IN lig OFCRUDE DYE PER mg OF DRY MEMBRANE
Ligands were coupled directly or using polyethylenimine as a spacer (denoted PEI-).
Dye Dye coupled (/lg/mg membrane)
PEI-Cibacron Blue F3G-ACibacron Blue F3G-AProcion Blue MX-RProcion Red MX-5BProcion Red HE3-BProcion Yellow HE3-G
Batch I
21.42.716.654.044.140.56
Batch 2
15.52.576.63.385.4l.l

320 B. CHAMPLUVIER, M.-R. KULA
TABLE IIf
AMOUNTS OF LYSOZYME ADSORBED ON DYED MEMBRANES FROM A BUFFER SOLUTION (POTASSIUM PHOSPHATE, pH 7.0,1 mM) IN BATCH AND FLOW-THROUGH MODES
The amounts introduced were 126 and 152 /lg/cm 2 membrane, respectively. Membrane sample: Ultipor(0.1 /lm). Average and standard deviation are from duplicate and triplicate experiments, respectively.
Dye Amount of lysozyme adsorbed(/lg/cm 2 membrane)
PEI-Cibacron Blue F3G-ACibacron Blue F3G-AProcion Blue MX-RProcion Red MX-5BProcion Red HE3-BProcion Yellow HE3-GNot dyed
Batch
122 ± 478 ± 290 ± 2285 ± 1594 ± 2187 ± 440 ± 13
Flow-through
110 ± 1883 ± 492 ± II81 ± 38
102 ± 287 ± 862 ± 6
desorption values (about 50%) was caused by the transfer of a significant amount ofbulk proteins with interstitial liquids in the supports. Desorption was attempted byresuspending the drained support in buffer containing 0.5 M KCI. The amount ofproteins and enzyme activity adsorbed or desorbed were related to the unit volume ofsupport derived from the membrane dimensions or from weighing the drained gel andassuming a density of unity, respectively.
TABLE IV
COMPARISON OF PROPRIETARY DYE LIGAND MEMBRANES WITH SEPHAROSE CL-4B ASCARRIERS WITH BLUE OR YELLOW LIGANDS, FOR THE ADSORPTION OF ENZYMESFROM A CLARIFIED YEAST HOMOGENATE
Amounts ofMDH, adenylate kinase, G6PDH activities and protein adsorbed and desorbed per millilitre ofsupport. Variations are standard deviations.
Support MDH Adenylate G6PDH Proteins(U/ml) kinase (U/ml) (mg/ml)
(U/ml)
Adl'OrptionSartorius blue 800 ± 100 350 ± 60 120 ± 10 nd"Sartorius yellow 990 ± 120 260 ± 70 70 ± 10 ndSepharose blue 250 ± 50 430 ± 30 20 ± 10 ndSepharose yellow 780 ± 140 100 ± 70 20 ± 10 nd
DesorptionSartorius blue 200 ± 30 50 ± I 5 ± 0.5 10.7 ± 0.5Sartorius yellow 610 ± 30 50 ± 10 10 ± I 12.0 ± 0.9Sepharose blue 240 ± 10 210 ± 10 2 ± 0.4 13.4 ± 1.3Sepharose yellow 620 ± 10 140 ± 10 4 ± 0.3 14.1 ± 1.0
" nd = Not determined.

MICROFILTRATION MEMBRANES AS ADSORBENTS 321
The results in Table IV show that the amounts of proteins or individual enzymesinvolved in adsorption or desorption were of the same order regardless of the supportmaterial. The ligand had no general effect on the binding. However, more MDH wasbound to the yellow ligand on both supports and more adenylate kinase to the blue gel.
On desorption, a low recovery (below 20%) was found for G6PDH on all thesupports and for adenylate kinase on the membranes. The MDH recovery was higherthan that of the other enzymes, and better with the gel supports.
The comparison of the specific activities in the original extract and thecorresponding values in the desorption solutions (data not shown) revealed thatsignificant enrichments occurred for MDH irrespective of the support, with a factor of5 on the blue ligand and 12-14 on the yellow ligand. Enrichment factors for adenylatekinase were about 3 with membranes and 6-9 with gels, as a result of the betterrecovery on the latter. No significant enrichment of G6PDH could be measured.
Binding of yeast proteins to dyed membranes in filtration modeThe reusability of the dyed membrane was tested by repeated loading and elution
(0 to 0.25 M KCl gradient and then a step with 2 M KCI) of proteins from the yeast
80
70
60
0E 50
"CJl
~40
1/1C
IV+'0 .30I..
0-
20
10
00 4 8 12 16 20 24 28
Elution volume (ml)
Fig. 2. Repeated use of a stack of ten membranes as stationary phase for binding proteins from the yeastextract. A 500-ltl aliquot of the extract was loaded on the membrane, previously equilibrated with startingbuffer; the membrane was washed with 10 ml of starting buffer followed by a 10-ml KCl gradient up to 0.25M, a 5-ml step with 2 M KCl and a 5-ml step with starting buffer. Linear velocity, 0.3 em/min. Succession ofruns: D, 0, 6, x, V.

322 B. CHAMPLUVIER, M.-R. KULA
TABLE V
REUSABlLlTY OF A MEMBRANE SPECIMEN (3.3 cm 2) FOR BlNDING ENZYMES FROM THEYEAST EXTRACT
A SOO-Ill aliquot of the extract was loaded on the membrane previously equilibrated with starting buffer; themembrane was washed with 20 ml of starting buffer followed by a 40-ml KCI gradient up to 2 M. Proteins,G6PDH, MDH and adenylate kinase .recovered in the eluted peak.
Run Proteins G6PDH MDH Adenylate kinaseNo. (Ilg) (U) (U) (U)
I 308 0.21 16.36 1.892 319 0.21 12.24 1.693 294 0.28 12.24 0.05
crude extract. A stack of ten membranes was used in the FPLC system. The elutionprofiles observed in five successive runs were highly reproducible (Fig. 2). The amountof proteins recovered was constant within 3% error. However, the elution peak wasspread over about 7.5 ml.
The same kind ofexperiment was repeated with only one disc ofmembrane in theholder and using 20 ml of starting buffer to wash unbound proteins and a 40-mllineargradient up to 2 M for elution. A frontal application of the sample was used tooverload the support capacity as in the batch adsorption experiments. The flow-ratefor elution was 1.0 mllmin in the first two runs and 0.05 mllmin in the third. MDH,G6PDH, adenylate kinase and the bulk of the eluted proteins were recovered ina typical broad peak without apparent separation from each other. The amount ofproteins and enzymes found in the gradient was stable, in general (Table V). However,the recovery of adenylate kinase was lower in the third run, possibly because ofdeactivation over several hours.
The data in Table V, when related to the support volume, yield 3.6 U/mlG6PDH, 205 U/ml MDH and 27 U/ml adenylate kinase (first two runs only), in goodagreement with the desorption from the blue membrane in the batch mode (Table IV).The desorption of protein, yielding 4.65 mglml, was notably lower than in the batchmode, but the latter value was biased, as mentioned above. In consequence, theenrichment factors were found to be about twice as high as in the batch mode.
DISCUSSION
Preliminary evaluation of the capacity of microfiltration membranes asadsorbents for proteins showed that experimental values obtained with BSA were ingood agreement with the calculated value of 150 /lg/cm 2 membrane, based on theactual inner area of the support and the assumption of adsorption in a monolayer ofBSA on the surface. Under the conditions chosen, namely a low ionic strength,electrostatic attraction of protein to the support with the cationic membranes wasexpected to yield a high affinity of BSA for the support (Table I). The positivelycharged membrane Zetapor showed prompt saturation, as a very small increase inadsorption was observed while the remaining concentration in solution differed bya factor of about lO. On the other hand, the small residual concentration left in

MICROFILTRATION MEMBRANES AS ADSORBENTS 323
solution with the smallest amount ofBSA introduced showed that the affinity was veryhigh. In fact, the concentration in the support matrix was about 470 times higher thanthat in the solution. The Ultipor membrane showed saturation to a lesser extent, butthe amphoteric nature of the membrane made a net electrostatic attraction less evidentas the unadjusted pH of the aqueous solution was close to the isoelectric point of themembrane, reported as 6.5 [II]. The Zetabind membrane surprisingly showed nosaturation at all, despite the excess of BSA remaining in the solution. The latter showsthat the affinity for BSA was low in comparison with the other two membranes.Gershoni and Palade [12] found a steady increase in BSA binding up to 500 /lg/cm2
when a large excess (up to 37 mg/cm2) was contacted with a Zetabind membrane,
which was then rinsed before counting the 112s-labelled BSA. The requirement forsuch a high concentration to achieve high adsorption values and the resistance torinsing are contradictory if one assumes an equilibrium between adsorbed and solubleBSA. The binding mechanism on that membrane could therefore be particular, i.e.,a form oflow affinity but irreversible insolubilization on the surface. Our experimentalset-up based on mass balance to determine adsorption did not allow that range ofconcentrations to be investigated. Nevertheless, the high concentrations of BSAremaining in solution (Table I) indicated that no binding sites with high affinity wereleft on any of the membranes.
The lysozyme capacity on dyed membranes (Table III) was consistent with themonolayer capacity calculated for the Ultipor membrane. Moreover, the monolayervalues predicted well the capacity measured on the proprietary ligand membrane (seeTable V, values for 3.3 cm 2 sample area) with a protein mixture.
Fig. I suggests that the capacity of Ultipor membranes with larger pore sizes upto 1.2 /lm would correspond to only a three times reduction in capacity.
The modification of nylon membranes with triazine dyes is reproducible,regardless of the dye reactivity (Table II). Concentrations of 0.5-3.6 /lmol/mlmembrane can be calculated for Cibacron Blue without and with PEl as spacer. Thevalues reported for agarose gels were in the range 1-10 /lmol/ml [1].
The adsorption of lysozyme under conditions favourable to electrostaticattraction showed the positive effect of the dye ligand on the membrane capacity(Table III) as a 2-fold adsorption was observed compared with the parent membrane.The value measured on the latter cannot be considered as a background for dyedmembranes as the original binding sites could be masked by dye ligands. Themaximum values in Table III can be converted to a concentration of 8.6 mg/mlsupport, which corresponds to about 60% of the maximum concentration reported onblue Sepharose CL-6B [13].
The good correlation between batch and flow-through data for lysozymeadsorption (Table III) indicated two important properties of the membranes as dyeligand adsorbents: first, no irreversible binding occurred, as washing of the supportwith 1 M NaCI restored the initial capacity; second, flow-through conditions allowedthe adsorption to be achieved in a few minutes, even with a more dilute solution. Thefirst point was confirmed with the proprietary dye ligand membrane and yeast proteinsand enzymes (Fig. 2, Table V).
Batch and flow-through experiments with the latter membrane showed theapplicability of the support to the isolation of specific enzymes from crude mixtures.The amounts of enzymes recovered were similar in both procedures (Tables IV and V).

324 B. CHAMPLUVIER, M.-R. KULA
Enrichment factors in the region of 10 would be very attractive in early separations asa large proportion of the bulk proteins would be discarded.
The volumetric capacity of the membranes was found to be comparable to thatof the corresponding Sepharose gels, at least as measured by enzyme adsorption orprotein desorption (Table IV).
The method adopted here to desorb enzymes showed a poor performance; inbatch adsorption the recovery was not complete and notably inferior on membranesthan on gels; in the flow-through mode, extensive peak spreading occurred. The lattermay reflect sequential desorption ofdifferent proteins or axial dispersion in the holderor the lines. However, individual enzyme peaks were fairly broad also, covering at least5 ml for the data in Table IV, and axial dispersion would account only for peaks of2.5ml duration as measured in complementary experiments (data not shown). In fact, nooptimization of the desorption step has been attempted so far. Several possibilitiesexist for improving the desorption behaviour: optimization of the buffer compositionand pH for a particular enzyme or eluting specifically with substrate or cofactor.
This paper demonstrates that the inner surface of microfiltration membranesmade of nylon could be modified with dye ligands and used for adsorption of proteins,yielding volumetric capacities close to those ofthe corresponding agarose support. Thebinding capacity could be used repeatedly and no irreversible fouling was apparent.However, desorption using high salt concentrations was not satisfactory and notablyworse than with dye ligand gels. Optimizing the desorption step is still possible.
Interestingly, the available area was not dramatically reduced when membraneswith larger nominal pore sizes were considered. This might yield a very favourableopportunity to optimize the space-time yield of membrane adsorbents, as membraneswith high permeabilities could be chosen without affecting the capacity.
ACKNOWLEDGEMENTS
B.C. was supported by a grant from the European Commission, DG XII. Wethank Cuno, Pall and Sartorius for the gift of membranes. R. Regenbogen (DeutschesWollforschung Institut, Aachen, Germany) is gratefully acknowledged for thenitrogen adsorption measurements.
REFERENCES
Y. D. Clonis, T. Atkinson, C. J. Bruton and C. R. Lowe (Editors), Reactive Dyes in Protein and EnzymeTechnology, Stockton Press, New York, 1987.
2 P. Hedman, J. C. Janson, B. Arve and J. G. Gustafsson, in G. Durand, L. Bobicnon and J. Florent(Editors), Proceedings of the 8th International Biotechnology Symposium, Paris, 1988, Vol. 1, SocieteFralwaise de Microbiologie, Paris, 1988, pp. 623-643.
3 H. A. Chase, in A. E. Rodrigues, M. D. Le Van and D. Tondeur (Editors), Adwrption: Science andTechnology, K1uwer, Dordrecht, 1989, p. 539.
4 S. Brandt, R. A. Goffe, S. B. Kessler, J. L. O'Connor and S. E. Zale, Bio/Technology, 6 (1988) 779.5 P. D. G. Dean, W. S. Johnson and F. A. Middle (Editors), AfJinity Chromatography -A Practical
Approach, IRL Press, Oxford, 1985, Ch. 3, p. 64.6 H. U. Bergmeyer, Methods of Enzymatic Analysis, Vol. 11, Verlag Chemie, Weinheim, 1983, p. 246.7 Y. Ito, A. G. Tomasselli and L. H. Noda, Eur. J. Biochem., 105 (1980) 85.8 S. J. Gregg and K. S. W. Sing, Adsorption, Surface Area and Porosity, Academic Press, London, 1st ed.,
1967, Ch. 2, p. 35.

MICROFILTRATION MEMBRANES AS ADSORBENTS 325
9 F. MacRitchie, J. Colloid Interface Sci., 38 (1972) 484.10 T. Imoto, L. N. Johnson, A. C. T. North, D. C. Phillips and J. A. Rupley, in P. D. Boyer (Editor), The
Enzymes, Academic Press, London, 3rd ed., 1972, Ch. 21, p. 666.II A. C. J. Orchard, in Proceedings of International Conference on Membrane Separation Processes.
Brighton, May 24-26,1989, BHRA Information Services, Bedford, U.K., and Springer, Berlin, 1989, p.79.
12 1. M. Gershoni and G. E. Palade, Anal. Biochem .. 124 (1982) 396.13 H. A. Chase, J. Chromatogr., 297 (1984) 179.


Journal o/Chromatography, 539 (1991) 327-334Elsevier Science Publishers B.Y., Amsterdam
CHROM. 22907
Recognition of phosphate groups by immobilizedaluminium(III) ions
LENNART ANDERSSON
Biochemical Separation Centre, Biomedical Centre, University of Uppsala. P.O. Box 577, S-751 23 Uppsala(Sweden)
ABSTRACT
Aluminium ions, immobilized on iminodiacetate-agarose, were used as a chromatographic adsorbent. At pH 6.0, in strong salt solution, phosphoamino acids, phosphopeptides, phosphoproteins andnucleotides that contained terminally bound phosphate were retained. At pH 7.5 most of the phosphoruscompounds were desorbed. Conversely, phosphate-free compounds were unretained at both pHs and thesame behaviour was displayed by nucleotides which contained only internally bound phosphate. Thesefindings might be useful as a basis for the development of a procedure for isolating phosphoproteins.
INTRODUCTION
Studies of the chromatographic behaviour on immobilized Cu(ll), Ni(II), Zn(II)and Co(II) ions of selected thiol-free model proteins have demonstrated that surfacehistidyl groups are the primary electron donors in the interaction between metal andprotein [I]. Other metals, such as Fe(III) and especially AI(III), can be assumed to havea higher affinity for oxygen as the electron donor [2]. Chromatography of modelcompounds on immobilized Fe(III) seems to support this hypothesis. For instance,phosphate compounds are strongly bound, presumably via oxygen [3,4]. ImmobilizedAI(III) has limited use for the separation of biological molecules. The free metal ion isknown to form strong complexes with phosphate, citrate and other oxygen-richcompounds [5]. This property is the basis upon which a new separation method hasbeen attempted. This paper describes the properties of Al(III) immobilized on agarosegel and its possible utility as an adsorbent for phosphorus-containing compounds.
EXPERIMENTAL
Iminodiacetic acid(IDA)-agarose (Chelating Sepharose Fast Flow) was obtained from Pharmacia-LKB (Uppsala, Sweden), or was prepared in this laboratory[6]. The Cu(II)-binding capacity was 30 and 70 ,umol/ml wet gel, respectively. A glasscolumn (20 x 10 mm 1.D.) containing Chelating Superose was purchased fromPharmacia. The gel consists of the high-performance matrix Superose 12 onto whichiminodiaetic acid is coupled. Carboxymethylaspartyl-agarose (CM-asp-agarose) was
0021-9673/91/$03.50 © 1991 Elsevier Science Publishers B.Y.

328 L. ANDERSSON
described previously [7] and tris(carboxymethyl)ethylenediamine (TED)-agarose weresynthesized according to a previous report [8]. Binding capacities were 42 and 90 ,umolof Cu ions per millilitre, respectively. However, CM-asp-agarose displayed pooraluminium binding and was not studied further. Aluminium binding to TED-agarosewas strong but neither the model compounds, i.e., phosphoprotein and phosphoaminoacids, nor the other proteins used in this work were bound to TED-AI(lII)-agarose.Those results confirm some observations made earlier [9].
Ovalbumin, pepsin (4300 U/mg protein), pepsinogen (porcine stomach, gradeI-S, 3900 U/mg protein), rabbit muscle phosphorylase a and phosphorylase b werepurchased from Sigma (St. Louis, MO, U.S.A.). Chicken muscle glycogen phosphorylase was prepared following the procedure of Petell et al. [10]. Assays for phosphorylase a and phosphorylase b activity were carried out according to the procedureof Hedrick and Fischer [11], slightly modified. It was found that the chicken muscleextract contained high phosphorylase b activity. Alkaline phosphatase (calf intestine,grade I) was obtained from Boehringer (Mannheim, Germany). Ovalbumin wasfractionated on immobilized IDA-Fe(III) into components containing no, one andtwo phosphate groups, according to an earlier report [3]. L-Amino acids, phospho-Lserine, phospho-L-threonine, phospho-L-tyrosine, nucleotides and nucleotide derivatives were of analytical-reagent grade. The synthetic peptides Arg-Arg-Ala-Ser-ValAla and its phosphorylated analogue Arg-Arg-Ala-P-Ser-Val-Ala were a gift fromDr. B. Fransson of this institute.
The aluminium concentration in the column eluates was determined accordingto a procedure in which the metal is complexed with Alizarin S [12]. Dephosphorylation of ovalbumin and pepsinogen was done by incubation with alkaline phosphatase(1-2 units/mg protein). Protein samples were analysed by sodium dodecyl sulphatepolyacrylamide gel electrophoresis (SDS-PAGE) on microplates (Phast System,Pharmacia), or by electrophoresis in 1% agarose gel slabs. Staining was done insolutions of Coomassie Brilliant Blue.
Preparation of columns and chromatographyMetal-free gel was suspended in water, degassed and poured into a chromato
graphic column (60 x 10 mm J.D., bed volume 5 ml). Columns were charged witha solution of aluminium chloride (50 mM) in distilled water. The charging wasconsidered to be complete when a precipitate of aluminium hydroxide was formedfrom a small aliquot of the eluate after addition of one drop of 5% sodium carbonatesolution. After washing out unbound metal with three column volumes of water, thecolumn was equilibrated with five column volumes ofstarting buffer. Freeze-dried andsalt-free samples were dissolved in starting buffer; in some instances they were desaltedin this buffer on a small Sephadex G-25 column prior to chromatography. Runs weremade at room temperature with a flow-rate of 15-20 ml/h. Fractions of 1.0 or 1.5 mlwere analysed for protein and enzymic activity. The metal was removed after each runwith 0.1 M EDTA (0.5 M NaCI; pH 7) and occasionally with a portion of 0.1M sodium hydroxide. Chromatographic runs on Chelating Superose were accomplished using an LKB high-performance liquid chromatographic system consisting ofpump (Model 2150), a controller (Model 2152) and a two-channel recorder (Model2210).
The following buffer systems were used, unless indicated otherwise: pH 5.0, 0.05

RECOGNITION OF PHOSPHATE GROUPS BY Al(I1I) IONS 329
M acetic acid-NaOH (1 M NaCl); pH 6.0, 0.05 M MES-NaOH (1 M NaCl); pH 7.0,0.05 M PIPES-HCI (1 M NaCI); and pH 8.0, 0.05 M Tris-HCI (1 M NaCI), whereMES = 4-morpholinoethanesulphonic acid and PIPES = 1,4-piperazinodiethanesuiphonic acid.
RESULTS AND DISCUSSION
Aluminium binding and stability of the chelating gelThe binding capacity was determined by frontal analysis. The copper- and
aluminium-binding capacities were 30 and 14 /lmol per millilitre wet gel, respectively,for Chelating Sepharose or Superose and 70 and 32 /lmol/ml, respectively, for the"home-made" [DA-agarose. The stability of the metal chelates was checked bymeasuring the aluminium ion concentration at pH 5.0, 6.0, 7.0 and 8.0 in eluates froma column that was completely loaded with metal. The leakage from ChelatingSepharose was found to be 0.015, <0.004, <0.004 and 0.020 /lmol/ml, respectively,which indicates good stability in this pH range. From TED-agarose it was less than0.004 /lmol/ml eluate at these pH values.
Chromatography of low-molecular-mass compoundsAmounts of 0.5-1 mg of compounds containing bound phosphate and
phosphate-free analogues, amino acids, nucleosides, nucleotides and peptides weredissolved in starting buffer and chromatographed, one by one, on AI(III)-IDAagarose at different pH values. The results are given in Table I. Evidently none of thephosphate-free substances was retained. All the substances that were retained at pH6.0 (I M NaCI) contain an external (terminal) phosphate group. The absence ofretention ofGpU, ApG, NAD and UDPG indicates that internal phosphate groups donot contribute significantly to adsorption. The increased affinity of ADP, GTP andATP might be due to metal chelation. Strong chelating of AI(III) ions to ADP has beenreported [2]. Compounds adsorbed on AI(IU)-IDA-agarose and containing monoesterified phosphate group(s) could be desorbed either by increasing the pH to 8 or byadding 20 mM phosphate. ADP, ATP and GDP, once adsorbed, resisted desorption atpH 8 or 9, but their elution proceeded reasonably well at pH 11.
Chromatography of model proteinsPorcine pepsinogen and pepsin are single-chain polypeptides composed of 370
and 329 amino acid residues, respectively. In each protein there is a singlephosphorylated serine that is positioned fairly near the amino-terminus. On activation, pepsinogen loses its 41-residue N-terminal peptide. Both pepsinogen and pepsinwere weakly retained in MES buffer (pH 6.0) (1 MNaCI). The retention became strongif 0.5 M potassium phosphate was substituted for 1 M sodium chloride. Both enzymeswere desorbed with good recoveries «90% for pepsinogen, 70% for pepsin) by 20mM phosphate buffer (0.5 M K 2S04). In a control experiment, dephosphorylatedpepsinogen was run under similar conditions. Fig. 1 shows that pepsinogen wasstrongly retained but the dephosphorylated enzyme unretained at pH 6. Presumably,little or no conformational change takes place after the dephosporylation becausethere is no significant loss in activity. These results suggest that immobilized AI(III)can recognize a seryl-phosphate group among more than 300 residues.

330 L. ANDERSSON
TABLE I
RETENTION OF LOW-MOLECULAR-MASS SUBSTANCES ON Al(lll) IONS IMMOBILIZED ONCHELATING SEPHAROSE FAST FLOW
Substance" pH of buffers in I M NaCl
5.0 6.0 7.0 8.0
L-Amino acidsPhosphoserine + +Phosphothreonine + +Phosphotyrosine + +Arg-Arg-Ala-Ser-Val-AlaArg-Arg-Ala-P-Ser-Val-Ala + +NucleosidesAMP + + +ADP + + + +-ATP + + + +-GMP + + +GDP + + + +-CMP + + +NAD+ n.d.NADP n.d. +FADGpUApGUDPGcAMP
" Standard abbreviations; also GMP = guanosine 5'-phosphate; CMP = cytidine 5'-monophosphate; NADP = nicotinamide adenine dinucleotide phosphate; FAD = flavin adenine dinucleotide;GpU = guanosine phosphate uridine; ApG = adenosine phosphate guanosine; UDPG = uridinediphosphate glucose; cAMP = cyclic adenosine 3',5'-monophosphate.
3-r--------------,-8
8coC\J~
<{
2
o 20 40 60 80
7
6
100
J:C.
EFFLUENT VOLUME (m!)
Fig. I. Chromatography of pepsinogens on Al(lll)-IDA y-agarose. A sample of 4 mg ofpepsinogen in 5 mlwas applied and the column was washed with 45 ml of 0.05 M MES-NaOH (0.5 M K 2S04 ) (pH 6.0). Thecolumn was then rinsed with 20 mM phosphate buffer (0.5 M K2S04 ) (pH 7); the buffer change is indicatedby an arrow. D = Porcine pepsinogen; • = dephosphorylated porcine pepsinogen.

RECOGNITION OF PHOSPHATE GROUPS BY Al(III) IONS 331
Fig. 2. Recorder trace from chromatography of ovalbumin on AI(III)~IDA-Superose column. 2 mg ofovalbumin were dissolved in 0.05 M MES-NaOH (I M NaCl) buffer (pH 6.0) and injected into the column.The column was then rinsed with starting buffer and developed with a pH gradient formed by mixingstarting buffer with 0.05 M PIPES-HCI (I M NaCl) buffer (pH 7.2). The flow-rate was 0.25 ml/min. Timescale: I em = 10 min.
Native ovalbumin was chromatographed on AI(III)-Chelating Superose. A2-mg amount was dissolved in MES buffer (pH 6.0) (I M NaCl) and applied. Afterwashing out weakly bound protein, the column was developed with a pH gradientfrom 6.0 to 7.3. The results are il1ustrated in Fig. 2. Purified ovalbumins with no, oneand two phosphate groups were chromatographed, one by one, in the same way. Bycomparison, the first peak in Fig. 2 was identified as ovalbumin with no phosphate, thesecond peak as the monophosphate ovalbumin and the third peak as the diphosphateovalbumin. The poor retention of the monophosphate ovalbumin might be due topartial masking of the phosphate group. The resolution was greatly dependent on the

332 L. ANDERSSON
flow-rate, which suggests slow desorption kinetics. The overall protein recovery wasalways near 100%. It was found, by analysis, that diphosphate ovalbumin scavengedsome aluminium from the adsorbent.
Muscle glycogen phosphorylase may exist in the form of phosphorylase a, whichis produced from phosphorylase b phosphorylation of one seryl residue per subunit,A priori, this enzyme seems rather complicated to choose as a model protein. Both thea and b forms contain one bound pyridoxal phosphate; however, this group iscontained deep within the interior of the protein. Depending on the conditions, thea and b enzyme may be built up of two four subunits. Phosphorylase b was unretainedwhen chromatographed on Al(III)-IDA-agarose under the usual conditions. Phosphorylase a, on the other hand, was always adsorbed. However, depending on theenzyme source, the adsorption was sometimes strong and sometimes weak. Thisvariation might be due to the different aggregation and/or conformational states thathave been reported [13]. These states are assayed only with difficulty and therefore anyfurther interpretation seems impossible. However, the outcome of these experimentsdoes not contradict the hypothesis that binding occurs via phosphate groups.
Some other model proteins that are known to interact through histidyl groupswith Cu(II)- and Ni(II)-IDA-agarose gel were chromatographed using the sameprocedure. None of them, i.e., horse cytochrome c, human serum albumin, whalemyoglobin and hen's egg lysozyme was, however, adsorbed at pH 6.0, 7.0 or 8.0. Thismeans that immobilized AI(III) does not recognize one or several surface histidylside-chains.
Adsorption of proteins in crude extractsA 3-ml volume of dialysed human serum were chromatographed on Al(IIJ)
Chelating Sepharose at pH 6.0 in the presence of I or 2 M sodium chloride or 0.5M potassium sulphate. After washing with 25 ml of starting buffer desorption waseffected with 20 mM phosphate (I M NaCl) (pH 7) and subsequently with 0.1M EDTA (0.5 M NaCl). However, only small amounts of protein (0.1-0.5%) weredesorbed and therefore no attempt was made to analyse this material. Hen's egg whitewas filtered and diluted 10-fold with 0.05 MMES (l MNaCl) (pH 6.0). A I-ml volumewas applied, the column was washed with buffer and proteins were desorbed with 0.05M Pipes (1 M NaCl) (pH 7.2) (Fig. 3a). The desorbed material was analysed bySDS-PAGE and was found to be homogeneous with the same molecular mass asstandard ovalbumin (not shown). Agarose gel electrophoresis revealed that thematerial behaved as diphosphate ovalbumin (Fig. 3b). The experiments on extractssuggest that Al(JII)-Chelating Sepharose has a high selectivity for the phosphoprotein.
Rat liver acetone powder (Sigma L 1380) was extracted with MES buffer(pH 6.0) (l M NaCl) at room temperature for 20 min. After centrifugation the extractwas applied to the Al(IJI) column and chromatographed. A large amount of UVabsorbing material was desorbed on increasing the pH. The UV spectrum and proteinanalysis showed that this material contained a mixture of nucleotides but no protein.
Extracts ofchicken muscle were transferred to MES buffer (pH 6.0) (l M NaCl)to remove EDTA and phosphate ions. Ten milIilitres were chromatographed onAI(IIJ)-IDA-agarose gel in the same buffer. There was virtually no adsorption ofprotein and all of the applied phosphorylase b activity appeared in the breakthrough

RECOGNITION OF PHOSPHATE GROUPS BY Al(lII) IONS
0.5 a b0.4
0.3,....0tot\I..... 0.2<
0.1 ~ ~
Ii bo 'h-.0
\0 20 40 60 80
333
, .EFFLUENT (m!)
Fig. 3. (a) Chromatography of crude egg white on Al(I1I)--IDA l'-agarose. A I-ml sample of diluted eggwhite extract was applied and the column was rinsed with 25 ml of starting buffer. The column was thendeveloped with a pH gradient formed by mixing 25 ml of starting buffer with 25 ml of 0.05 M PIPES-HCI(1 M NaCl) buffer (pH 7.2). Finally, the column was rinsed with the second buffer. (b) Agarose electrophoresis ofhen's egg-white proteins. Lanes: 1 = crude extract ofegg white; 2 = pooled fractions from peak 2(at 55 ml) in (a).
peak. In another experiment the extraction procedure was done in the absence ofEDTA but in the presence Mn(II) ions. This extract displayed phosphorylasea activity. After chromatography on Al(III}-IDA y-agarose gel in the same buffer asbefore, all of the phosphorylase a was found to be adsorbed. It was, however, difficultto recover the enzyme in the usual manner. However, even in this complicated case,immobilized Al(III) appears to recognize bound phosphate groups.
In summary, it seems that aluminium ions can recognize a phosphate grouphaving an external position within a molecule. With proper handling, the adsorbentmight be useful for the group isolation of certain compounds, including proteins,containing a small number ofexternally bound phosphate groups. All evidence in thiswork suggests that the specificity for phosphorylated protein among other proteins isremarkably high, let alone the possible interference of nucleotides containing anexternal phosphate group that may be present in biological extracts.
The data from this and from previous studies [3,8,14,15] allow some comparisonbetween the properties of immobilized Fe(III) and immobilized Al(III). Obviously, thelatter adsorbent has a superior selectivity for phosphoprotein. On the other hand,binding of phosphorylated proteins to Al(III}-IDA y-agarose gel seems comparativelyweaker and therefore requires the presence of high concentrations ofsalt. Therefore, itmay be advantageous that both adsorbents, combined, be used for ~he purpose ofpurifying proteins, especially phosphoproteins. .
ACKNOWLEDGEMENT
This work was financially supported by the Swedish Natural Science ResearchCouncil.

334
REFERENCES
L. ANDERSSON
I E. S. Hemdan, Y.-J. Zhao, E. Sulkowski and J. Porath, Proc. Natl. Acad. Sci. U.S.A., 86 (1989) 181!.2 R. G. Pearson, J. Am. Chem. Soc., 85 (1968) 643.3 L. Andersson and J. Porath, Anal. Biochem., 154 (1986) 250.4 G. Muszynska, L. Andersson and J. Porath, Biochemistry, 25 (1986) 6850.5 R. B. Martin, Clin. Chem., 32 (1986) 1797.6 J. Porath, J. Carlsson, I. Olsson and G. Belfrage, Nature (London), 258 (1975) 598.7 J. Porath, Trends Anal. Chem., 7 (1988) 254.8 J. Porath and B. Olin, Biochemistry, 22 (1983) 1621.9 J. Porath, B. Olin and B. Granstrand, Arch. Biochem. Biophys., 225 (1983) 543.
10 J. K. Petell, M. S. Sardo and H. G. Lebherz, Prep. Biochem., II (1981) 69.II J. L. Hedrick and E. Fischer, Biochemistry, 4 (1965) 1337.12 C. A. Parker and A. P. Goddard, Anal. Chim. Acta, 4 (1950) 517.13 R. J. Fletterick and N. B. Madsen, Annu. Rev. Biochem., 49 (1980) 3!.14 E. Sulkowski, Macromol. Chem. Macromol. Symp., 17 (1988) 335.15 G. Chaga, L. Andersson, B. Ersson and J. Porath, Biotechnol. Appl. Biochem., II (1989) 424.

Journal oj Chromatography, 539 (1991) 335-341Elsevier Science Publishers B.Y., Amsterdam
CHROM. 22 896
Highly active enzyme preparations immobilized via matrixconjugated anti-Fe antibodies
BEKA SOLOMON', ERAN HADAS, RELA KOPPEL, FIDI SCHWARTZ and GIDEON FLEMINGER
Department of Biotechnology, Tel-Aviv University, Ramat Aviv, Tel-Aviv 69978 (Israel)
ABSTRACT
A novel method for enzyme immobilization to achieve highly active enzyme preparations is described. The enzyme is first reacted in solution with a specific monoclonal antibody (mAb) which does notinterfere with its enzymic activity and which possesses a high affinity towards the enzyme. The immunocomplex is then reacted with immobilized anti-Fc antibodies which are coupled to the matrix by methodsthat preserve maximum immunological activity. Horseradish peroxidase (HRP) immobilization on epoxyactivated beads (CB6200) was chosen as a model system for this approach. Coupling of HRP via its mAbsto anti-Fc antibodies immobilized yielded the best results, corresponding to binding of 325 ng of fullyactive enzyme per bead. Binding of the enzyme to anti-HRP mAb directly immobilized on the beads wasconsiderably lower.
INTRODUCTION
During the last two decades, reactions which involve catalysis by immobilizedenzymes have been widely used on both the laboratory and industrial scales withpreparative, analytical and diagnostic applications. Many matrices and covalentbinding methods have been developed in order to achieve highly active enzyme-matrixconjugates [1]. However, enzymes often tend to lose their biological activity oncoupling to a matrix owing to masking of their active sites or multi-point attachmentswhich restrict local movements necessary for the activity of the enzyme. In such cases,coupling of the enzymes via monoclonal antibodies (mAbs) which do not affect theiractivity and possess a high binding affinity towards the enzyme may be advisable [2].
Previously we have shown that the binding of such antibodies to insolublecarriers, e.g., Eupergit C, yields matrix-conjugated mAb preparations which efficientlybind the corresponding enzymes to yield highly active immobilized enzymes [3]. Insuch preparations, the enzyme is bound via specific preselected and well defined sites.Apparently, in this instance, mAbs form an extended spacer separating the enzymefrom the carrier. In addition, the mAbs bind the respective enzymes via epitopesremote from the active site so that the active sites face the outer solution. Multi-pointattachments are also eliminated and the enzymes are relatively free to move to expresshigher activity.
0021-9673/91/$03.50 © 1991 Elsevier Science Publishers B.Y.

336 B. SOLOMON el al.
Since, in principle mAbs, which do not affect enzymatic activity and which bindthe enzymes at high affinity, may be prepared against almost any enzyme, thistechnique may represent a general solution to the preservation of high activity ofimmobilized enzymes. At present, the main restriction on the use ofmAbs is their highcost, but improvements of the techniques for their large-scale production is expected tolead to a marked decrease in price [4].
We expected that the formation of soluble complexes of enzymes with specificmAbs, followed by immobilization via reaction with anti-Fe antibodies, should lead toa higher capacity for enzyme binding than direct coupling of the enzyme toimmobilized antibodies. Further, optimization of anti-Fe immobilization onto thesolid carrier with respect to antigen binding activity should eventually lead to evenhigher activity of the immobilized enzyme. We have tested various methods forantibody immobilization in order to achieve the highest antigen binding activity.
The carrier used in this study was Eupergit ClZ-coated poly(methyl methacrylate) beads (6 mm, CB6200). These beads are especially suitable for application inimmunodiagnostic assays. Immunoassays performed with such beads are expected tobe more reproducible and reliable than those performed with enzyme-linkedimmunosorbent assay (ELISA) microtitre plates owing to the covalent binding, ratherthan hydrophobic adsorption, of the first antibody to the surfact of the matrix.Nevertheless, assays based on these beads have to be optimized with respect toprotein-binding capacity, antigen-binding activity of the immobilized antibodies andreproducibility of the results.
As a model system we chose immobilization of horseradish peroxidase (HRP)via specific mAbs. Two approaches were examined and compared; (a) binding ofHRPto immobilized mAband (b) binding of a soluble complex of HRP with its mAb toimmobilized anti-Fe antibodies. This enzyme, which is commonly used in immunodiagnostics as a reporter enzyme, contains only a small number of lysine residues anda blocked N-terminus [5] and, therefore, does not react directly with the oxirane groupsof the matrix. Thus any matrix-associated enzymatic activity may be attributed toantibody-modulated immobilization of the enzyme.
EXPERIMENTAL
MaterialsEupergit CIZ-coated poly(methyl methacrylate) beads (6 mm, CB6200) were
obtained from Rohm-Pharma (Darmstadt, Germany). Horseradish peroxidase (HRP)was purchased from Sigma (St. Louis, MO, U.S.A.).
Chemical mod(fication of CB6200 beadsFifty beads were incubated with 25 ml of 0.1 M adipic dihydrazide (ADH),
hexarnethyIenediamine (HMD) or hydrazine hydrate (HH) in 0.2 M phosphate buffer(pH 8.8) for 16 h at room temperature. The beads were then extensively washed andunreacted oxirane groups were blocked with 0.2 M p-mercaptoethanol. The modifiedbeads were extensively washed and kept for further use in phosphate-buffered saline(pH 7.4) (PBS) at 4°C.

ENZYME IMMOBILIZATION VIA ANTI-Fe ANTIBODIES 337
Assay oj the enzymic activity oj horseradish peroxidaseHRP (l0-100 Ill, 0.1-10 ng) was incubated in ELISA microtitre plates with
100 III of HRP substrate solution [2 mg/ml of o-phenylenediamine (Fluka, Buchs,Switzerland) and 0.008% hydrogen peroxide in 50 mM citrate buffer (pH 5.0)] for1 min at room temperature. Colour development was stopped by the addition of4 M hydrochloric acid (50 Ill) into each well. The intensity of the colour developed wasmeasured with an ELISA reader (SLT, Grodig, Austria) at 492 nm (with a referencebeam at 405 nm).
Preparation and purification oj monoclonal antibodiesThe preparation of anti-HPR antibodies has been described previously [6].
A monoclonal antibody (HRP2) which did not interfere with the enzymic activities ofHRP was selected using the microassay described above. This antibody was purified byhigh-performance immunoaffinity chromatography using Eupergit C-bound HRP asdescribed previously [7]. The apparent binding constant of this antibody wasdetermined according to the procedure of Pinckard and Weir [8], i.e., as derived fromthe reciprocal of the free monoclonal antibody concentration at which 50% of themaximum binding to HRP was achieved.
Immobilization of anti-Fe antibodies on CB6200 beadsPolyclonal anti-Fe antibodies were coupled to oxirane groups of the beads either
directly or after reversible protection of their amino groups by reaction withdimethylmaleic anhydride (DMA). By the direct immobilization procedure theantibodies (0.1 mg) were incubated with ten beads in 5ml of 1 M potassium phosphatebuffer (pH 7.4) for 16 h at 4°C. Blocking ofunreacted oxirane groups was achieved byincubation with 0.2 M f3-mercaptoethanol (pH 8.0) for an additional 4 h at roomtemperature. By the DMA procedure the antibodies (0.1 mg) were incubated first withDMA for 1 h and then coupled to the beads as described previously [9].
Alternatively, oriented immobilization of anti-Fe antibodies was achieved bycoupling of periodate-oxidized antibodies to ADH-, HH- or HMD-modified CB6200beads as described previously [6].
Anti-Fe antibodies were also coupled to chemically modified CB6200 byincubation of the antibodies (0.1 mg) with ten beads in the presence of 10%glutaraldehyde in water for 16 h at room temperature.
Immobilization of the monoclonal antibody HRP2 on CB6200 beadsMonoclonal antibody HRP2 was coupled to CB6200 beads either directly (as
described above for the anti-Fe antibodies) or via its immunological reaction with theimmobilized anti-Fe antibodies. Beads containing anti-Fe antibodies were incubatedwith increasing amounts ofmAb HRP2 (l-IO Ilg per bead) for 1h at 37°C. The amountof antibodies bound to the beads was determined by the difference in the amounts ofprotein measured before and after coupling by a microassay described by Bradford[10].
Immobilization of horseradish peroxidase on CB6200 beadsTwo approaches were used for the coupling ofHRP to CB6200. First, HRP was
coupled to matrix-conjugated anti-HRP mAb (see above). Alternatively, the enzyme

338 B. SOLOMON et at.
was reacted with the antibody in solution and then the immunocomplex wasimmobilized onto the CB6200 beads via reaction with immobilized anti-Fe antibodies.
Coupling of HRP to the beads by immunological reaction with immobilizedmAb HRP2 was carried out by incubation of the enzyme (5 fJ.g in 200 fJ.1 oflow-fat milk)with the beads containing increasing amounts of antibody (0.3-1000 fJ.g pr bead) for1 h at room temperature with gentle agitation. For coupling of HRP to solubleantibody, 5 fJ.g of the enzyme were incubated with 10 fJ.g of antibody in PBS for 1 hat37°C. The immunocomplex formed was the incubated with immobilized anti-Fe fora further 1 h in PBS at 37°C with gentle agitation. In a control experiment, the directbinding of HRP to the beads was tested. A 5-fJ.g amount of HRP was incubated witheach bead in 1 M potassium phosphate buffer (pH 7.4) for 16 h at 4°C, followed bywashing with 1% Triton X-100 in PBS. The enzymic activity of bound HRP wasdetermined by incubation ofeach of the beads with 0.5 ml ofa-phenylenediamine [2 mgper ml of 0.1 M phosphate buffer (pH 8.0) containing 0.008 % hydrogen peroxide for1 min at room temperature. Colour development was stopped by the addition of4 M hydrochloric acid (0.5 ml) to each test-tube. The intensity of the colour developedwas measured with the ELISA reader using a calibration graph based on the activity ofknown amounts of soluble HRP measured under the same experimental conditions.
RESULTS AND DISCUSSION
Binding of HRP via specific antibodies immobilized on CB6200 beadsImmobilization of HRP on CB6200 beads via its mAb HRP2, which does not
interfere with its enzymic activity and binds to the enzyme with a high binding constant(1 091/mol), provides an efficient model system for immobilization ofenzymes. In orderto determine the protein-binding capacity of CB6200 beads, increasing amounts of125I-labelled immunoglobulin G (IgG) were incubated with the beads. The beads werethen extensively washed with a solution of 10% SDS in 8 M urea in order to removeany non-covalently bound protein. The amount of covalently linked antibodies wasdetermined by measuring the gamma irradiation of the beads. As shown in Table I, theamount of bound IgG increased with protein input up to 2.2 fJ.g bound to each bead.
Increasing amounts of anti-HRP antibody (HRP2) were coupled to the CB6200
TABLE I
BINDING OF HORSERADISH PEROXIDASE ON mAb HRP2 DIRECTLY IMMOBILIZED ONCB6200 BEADS
mAb HRP2
Input Bound(/lg)
/lg %
0.3 0.3 1001.0 0.9 903.0 1.3 43
10.0 1.8 1830.0 2.2 7
HRP bound HRP/mAb HRP2(/lg) (mol/mol)
0.055 0.730.110 0.490.175 0.540.100 0.220.025 0.05

ENZYME IMMOBILIZATION VIA ANTI-Fe ANTIBODIES 339
beads and its immunological activity was determined by the ability to bind HRP. Asshown in Table I, when HRP was immobilized via bound mAb HRP2, the amount ofenzyme bound to the beads increased with the amount of matrix-conjugated antibodyup to 1.3 pg per bead. The specific antigen-binding activity of the immobilizedantibody decreased markedly with increasing amount of antibody bound to the beads(Table I). Even at a low antibody concentration (0.3 pg per bead) the molar ratio ofbound antigen to antibody did not exceed 0.73, compared with 2.0 mol/mol obtainedfor the same antigen-antibody complex in solution (see below). At higher antibodyconcentrations, the amount of bound enzyme decreased, apparently owing to sterichindrance effects (see Fig. I).
In order to improve the antigen-binding capacity of the bound antibodies andincrease the activity of the immobilized enzyme, different binding methods wereattempted. Binding ofmAb HRP2 via its carbohydrate moieties [6] or after reversibleblocking of its most reactive amino groups [9] did not improve the antigen-bindingactivity of the immobilized antibody.
Binding of HRP-anti-HRP immunoeomplex to anti-Fe antibodies immobilized onCB6200 beads
Oriented immobilization ofmAb HRP2 via anti-Fc antibodies led to a considerable enhancement of the enzymic activity of immobilized HRP. Anti-Fc antibodieswere immobilized on CB6200 beads using various immobilization methods. Immunocomplexes between mAb HRP2 and HRP were formed in solution to achieve thehighest antigen-binding capacity (2 mol enzyme/mol antibody) and then incubatedwith anti-Fc immobilized on the beads by various methods, as presented in Table II. Bythis procedure the enzymic activity of immobilized HRP was expected to be dependenton the immunological capability of the immobilized anti-Fc antibodies to bind theimmunocomplex between HRP and its mAb. The enzymic activity of bound HRP wasdetermined by a specific microassay using a calibration graph constructed with solubleenzyme under the same experimental conditions. As shown in Table II, immobilizationof anti-Fc antibodies via a small spacer (hydrazine hydrate) failed to improve theirimmunological activity. The activity of anti-Fc antibodies immobilized via large
200.00
'0
"Q).LlIt...l~,OO
Q)a.'0c6100.00
.Ll
n..ocI 50.00
'"C
0.00 +--~~~'''''''O~~~'''''''01:-r~''''''''''0'
HRP2 offered per bead CjJg)
Fig.!. Effect of amount of antibody offered per bead on the activity of the immobilized antibody. Increasingamounts ofHRP2 (anti-HRP mAb) were offered to the beads. Following washing, the beads were incubatedwith HRP and the amount of immobilized HRP was determined as described under Experimental.

340 B. SOLOMON et af.
TABLE II
ENZYMIC ACTIVITY OF THE COMPLEX OF HORSERADISH PEROXIDASE WITH mAb HRP2IMMOBILIZED ON CB6200 BEADS VIA ANTI-Fe ANTIBODIES
Immobilization method"
Oxirane (no anti-Fe)Oxirane + anti-FeOxirane + DMA-anti-Fe
Hydrazine hydrate + oxidized anti-FeHydrazine hydrate + GA + anti-Fe
HMD + GA + anti-Fe
ADH + oxidized anti-FeADH + GA + anti-Fe
HRP
Enzymic activity(O.D.492)
0.0201.0601.949
0.7281.083
2.600
1.1452.596
Bound enzyme(ng)
2132244
91135
325
143324
a Abbreviations: ADH, adipic dihydrazide; HMD, hexamethylenediamine; DMA, dimethy1maleieanhydride; GA, glutaraldehyde.
spacers, e.g., glutaraldehyde coupled to ADH or HMD, was found to be considerablyhigher than the activity of antibodies bound direclty via oxirane groups.
Binding of anti-Fe antibodies to oxirane groups of the matrix by using thereversible blocking with DMA led also to preparations which possessed highimmunological activity. The method [9] is based on reversible blocking of mostreactive amino groups of the antibodies, usually located on Fab regions, with DMAprior to the coupling reaction. After coupling to matrix via another amino group thatremained unblocked during reaction with DMA, the blocking agent was removed bychanging the pH and the active amino groups were available for the immunologicalreaction with the antigen.
The amount ofHRP coupled to the various preparations ofCB6200-conjugatedanti-Fe varied between 90 and 325 ng per bead, depending on the immunologicalactivity of the anti-Fe antibodies.
We have shown that enzymes may be immobilized via anti-Fe antibodies bya two-step reaction. First, the enzyme is allowed to react in solution with a properlyselected specific monoclonal antibody, which binds it with high affinity and which doesnot interfere with its activity. Then the immunocomplex formed is bound to highlyactive anti-Fe antibodies. The resulting preparation of immobilized enzyme shouldpossess high enzymic activity.
The soluble immunocomplex ofenzymes and its monoclonal antibodies functionas markers to quantify and purify the antibodies, and also to determine small amountsofenzymes present in the biological fluids. The use ofother soluble immunocomplexes,such as glucose oxidase-antibodies for the immunohistochemical detection of antigen[II], alkaline phosphatase-antibodies in quantitative immunoassay [12] or f3-galactosidase-antibodies for the purification ofenzymes or antibodies [13], has been reportedpreviously. The smaller amounts of antibodies or enzymes detected in these systemsdepend on the affinity of the antibody tested and on the location of the antigenic site on

ENZYME IMMOBILIZATION VIA ANTI-Fe ANTIBODIES 341
the enzyme molecule. The method is applicable using crude preparations of enzymesand unpurified ascitic fluids containing the desired antibodies which decrease the costof the test considerably. The immobilized immunocomplex of monoclonal antibodiesand enzymes offers a streamlined purification system for the commercial-scaleisolation of specific proteins (enzymes) found in complex mixtures. Utilization ofotherEupergit C derivatives, such as the 30 N type, which possess high flow-rates andoperating pressures suitable for high-performance liquid chromatography, for bindingof enzymes and antibodies, provides an excellent chromatographic system [7]. Theisolation of the soluble immunocomplex from the reaction mixtures or other biologicalfluids, using the highly active anti-Fe antibodies immobilized on the above system, isunder investigation.
REFERENCES
I K. Mosbach, Method~ Enzymol., 136 (1987) 117.2 B. Solomon, R. Koppel and E. Katchalski-Katzir, Biotechnology, 2 (1984) 709.3 B. Solomon, R. Koppel, G. Pines and E. Katchalski-Katzir, Biotechnol. Bioeng., 28 (1986) 1213.4 S. C. Roberts and A. R. Rees, Nature (London), 332 (1987) 323.5 K. G. Welinder, FEBS Lett., 72 (1976) 19.6 G. Flcminger, E. Hadas, T. Wolf and B. Solomon, Appl. Biochem. Biotechnol., 23 (1990) 123.7 G. Flcminger, T. Wolf, E. Hadas and B. Solomon, J. Chromatogr., 510 (1990) 271.8 R. N. Pinckard and D. M. Weir, in D. M. Weir (Editor), Handbook oj' Experimental Immunology,
Blackwell Scientific, Oxford, 1978, p. 16.1.9 E. Hadas, R. Koppel, F. Schwartz, O. Raviv and G. Flemingcr, 1. Chromatogl'., 510 (1990) 303.
10 M. Bradford, Anal. Biochem., 72 (1976) 248.II C. A. Clark, E. C. Downs and F. J. Primus, 1. Histochem. Cytochem., 30 (1982) 17.12 J. E. Butler, P. L. McGiven and P. Swanson, 1. Im/nullol. Methods, 20 (1978a) 365.13 T. Ternynk, J. Gregoire and S. Avrameas, 1. Immunol. Methods, 58 (1983) 109.


Journal of Chromatography, 539 (1991) 343-353Elsevier Science Publishers B.V., Amsterdam
CHROM. 22 872
Purification of E. coli 308 ribosomal proteins by highperformance liquid chromatography under non-denaturingconditions
CLAIRE CACHIA, PIERRE-JACQUES FLAMION* and JEAN-PIERRE SCHREIBER
Laboratoire de Biophysique, U.F.R. des Sciences Pharmaceutiques et Biologiques, 7 Boulevard Jeanne d'Arc,21000 Dijon (France)
ABSTRACT
High-performance ion-exchange chromatography was applied to the separation of proteins from the30S ribosomal subunit under non-denaturing conditions. It was shown that a single chromatographic steponly allows the purification of nine proteins. To increase the number of separated proteins, a prefractionation step was added that depends on the physical characteristics of the proteins to be purified. Sixteen outof 21 proteins could be purified by using prefractionation (gel permeation and lithium chloride salt washing). This method is well suited to preparing fresh samples on demand for optical studies owing to thesimplicity of the buffers used and the amounts of proteins recovered in the eluted peaks (0.05-0.1 mg/ml).
INTRODUCTION
The extraction and separation methods used in the preparation of isolatedproteins are ofcrucial importance for the study of their structures, in particular for the30S ribosomal proteins which have a prominent role in l6S rRNA and 30S subunitconformations [1-6], Structural studies require a biological material that is as native aspossible without denaturing during extraction, purification and preservation processesfor sample preparation. To achieve this goal, it is now well established that proteinshave to be extracted from 30S subunits by LiCI salt washing [7,8] (instead of with 3.5M LiCI-4 M urea or 66% acetic acid, which are harsh extraction conditions). It hasbeen shown, by nuclear magnetic resonance (NMR) and circular dichroism studies,that salt-extracted 30S ribosomal proteins have a better defined tertiary structure thanurea-treated proteins [9,10]. Dijk and Littlechild [11] published a purificationprocedure involving traditional chromatographic methods, based on this salt extraction. Unfortunately, it required large amounts of 30S subunits, large volumes ofsolvents and was also time consuming.
In recent years, high-performance liquid chromatographic (HPLC) techniqueshave been developed, and numerous separations of 30S ribosomal proteins havebeen published using high-performance size-exclusion chromatography (HPSEC)[12,13], high-performance ion-exchange chromatography (HPIEC) [14,15] and re-
0021-9673/91/$03.50 © 1991 Elsevier Science Publishers B.V.

344 C. CACHIA, P.-J. FLAMION, J.-P. SCHREIBER
versed-phase HPLC (RP-HPLC) [16-18]. HPSEC separations are generally performed under native conditions but lead to poor resolution in contrast to HPIEC andRP-HPLC, which offer higher resolution but under denaturing conditions, by using'Urea for HPIEC and tritluoroacetic acid (TFA) mixed with solvents for RP-HPLC.Apart from HPSEC, no HPLC separation of total 30S ribosomal proteins has beencarried out under non-denaturing conditions.
We recently described the use of HPLC in the ion-exchange mode for theseparation ofeight "core" E. coli 30S ribosomal proteins (S4, S7, S8, SIS, S16, S17, S18and S19) under non-denaturing conditions [19]. In contrast to the conventionalpreparation [II], we have shown that HPIEC is a fast preparation method using smallamounts of material with only a few purification steps. In this paper, we demonstratethe advantage of using two chromatographic steps to prepare pure proteins fromspecific groups (e.g., high-molecular mass protein group or core proteins) withacceptable yield and purity and without the need to recover the other groups.
EXPERIMENTAL
ChemicalsSpectroscopic-grade TFA and HPLC-grade acetonitrile were purchased from
Merck (Darmstadt, Germany) and Aldrich-Chimie (Strasbourg, France) respectively.Urea was for biochemical use (Merck) and all other chemicals were of analyticalreagent grade (Merck).
BuffersThe following buffers were used: TSM [0.01 M tris(hydroxymethyl)amino
methane-0.03 M succinic acid-o.OI M MgCl z (pH 8)]; TMK [0.03 M Tris-0.02M MgClz-0.35 M KCI-0.006 M j3-mercaptoethanol (pH 7.4)]; buffer A [0.05M ammonium acetate (pH 5.6)] and buffer B (buffer A + 1 M NaCl).
Isolation of ribosomal proteinsThe 30S subunits of E. coli MRE 600 ribosomes were isolated by zonal sucrose
gradient centrifugation as described previously [20] and stored in TSM at - 80°C insmall aliquots (200 A Z60 units/ml).
Extraction of total proteins (TP30) was carried out on 30S subunits with 4.5M LiCI-6 mM j3-mercaptoethanol for 20 h at 4°C. The precipitate of 16S rRNA wasremoved by centrifugation (5000 g, 5 min). It has been shown that the residual proteinin the precipitate is less than 1.5% [19]. The supernatant is used as it is for applicationto the permeation column, or equilibrated in buffer A with 0.15 or 0.25 M NaCI usinga Pharmacia POW column (Pharmacia-LKB, Uppsala, Sweden) before application tothe ion-exchange column.
Fractionation of 30S subunits into two main groups (core particles and splitproteins) was done with 3.5 M LiCI-6 mM j3-mercaptoethanol as described previously[19,21]. Both groups can be recovered in two different ways. For quantitativepreparations (up to IS mg of 30S), centrifugation (300 000 g, 10 h) was used and theresulting pellets of core particles were dissolved in TSM, whereas split proteinsremained in the supernatant. HPSEC was preferred for analytical preparations: ina single run of 2 h, core particles which migrate in the void volume and split proteins

HPLC PURIFICAnON OF RIBOSOMAL PROTEINS 345
were separated. Before application to the ion-exchange column, the core proteins wereextracted and treated as for TP30 whereas the split proteins were equilibrated in bufferA with 0.15 or 0.25 M NaCI using the Pharmacia PD I0 column.
ChromatographyChromatography was performed using a Pharmacia fast protein liquid chroma
tography (FPLC) system. The absorbance of the eluate was monitored witha Pharmacia UV-I detector or a Waters Assoc. Model 480 spectrophotometer at 254or 280 nm. All separations were carried out at room temperature. Sample volumesgreater than I ml were injected with a 10-ml superloop obtained from Pharmacia.
HPSECHPSEC was performed using a Pharmacia Superose 12 column (300 x 10 mm
LD.) or a Pharmacia Superdex XK 16/70 column (60 x 1.6 cm LD.). Generally,sample solutions were eluted in TMK or in buffer A with 0.15 or 0.25 M NaCI atflow-rates of 0.5 ml/min for the Superose column and 1.0 mllmin for the Superdexcolumn. The volumes of the collected fractions were 0.5 ml for the Superose columnand I ml for the Superdex column. Before application to the ion-exchange column, thecollected fractions were pooled and concentrated in Sartorius Centrisart (cut-off 5000)to 1-5 ml if the recovered volumes were greater than 10 ml.
HPIECHPIEC was carried out using a LKB Ultropac TSK CM-3SW (150 x 7.5 mm
LD.). Samples in buffer A containing 0.15 or 0.25 M NaCI to prevent precipitationwere eluted at a flow-rate of 1.0 mllmin using a gradient from buffers A and B. Thegradient shape is shown in Fig. I. Changing the gradient shape at 0.4 M increases theresolution in the range 0.4-0.65 M where most of proteins are eluted.
RP-HPLCRP-HPLC was performed using a Pharmacia ProRPC HR 5/10 column (5-,um
silica, 300 Apore size, Ct/Cs-bonded phase) (100 x 5 mm LD.). Solvent I was 0.1 %TFA in water (pH 2.0) and solvent II was 0.1 % TFA in acetonitrile-water (1:1, v/v).Proteins were eluted at room temperature using a linear gradient from 30% to 90% IIin 120 min at a flow-rate of 0.2 ml/min. Before injection, the column was equilibratedwith 30% II, and then the fractions from HPIEC were loaded directly onto the column.The optimum protein concentration injected was 0.1 mg per 100 Ill.
Identification of ribosomal proteinsRP-HPLC was used in combination with polyacrylamide gel electrophoresis
(PAGE) at pH 4.5 [22] and urea HPIEC [14] to assess the identity of chromatographicfractions.
Degrees of purification and yieldsDegrees of purification and yields were calculated from spectrophotometric
measurements. The amounts of proteins recovered were determined from absorbancesdetermined from peak areas on the chromatograms or by direct measurements ofeluted peaks on a Varian Cary 2200 spectrophotometer (Varian, Mulgrave, Australia).

346 C. CACHIA, P.-I. FLAMION, J.-P. SCHREIBER
The protein concentrations were determined by using the molar absorptivities of eachprotein calculated from the composition oftryptophans, tyrosines and cysteines in thecorresponding protein and with respective values of the molar absorptivities of 5600,1400 and 127 I/mol' cm at 278 nm [23]. It has been shown that these residues are theonly ones that contribute significantly to absorbance over the range 276-282 nm [23]and that the molar absorptivities calculated on this basis are very close to the measuredvalues, with an average relative standard deviation of 3.8% [24]. Purification yieldswere calculated from ion-exchange chromatograms with reference to the amount of30S subunits used. Degrees of purity were determined from reversed-phase chromatograms by comparing the amounts of all the other eluted proteins with the amount ofwanted protein.
RESULTS AND DISCUSSION
TP30 were extracted from subunits with 4.5 M LiCI, which is the upper limit ofLiCI concentration that can be employed for salt washing without denaturation ofproteins [25,26]. The 21 salt-extracted 30S proteins were resolved into sixteen majorpeaks by using HPIEC with buffers A and B. Samples ranging from 50 to 200 /lg ofproteins gave typical chromatograms such as that presented in Fig. I. Peak fractionswere analysed by both RP-HPLC and one-dimensional PAGE. Under non-denaturingconditions, the elution was performed with a ionic strength 20% higher than thatunder denaturing conditions for the same duration of elution. The elution orders forcation-exchange HPLC on carboxymethyl (CM) supports eluted with 6 M urea buffers[13,17] are very similar to the conventional orders. Under non-denaturing conditions,a more pronounced difference exists (Table I). Because HPLC produces selective andrapid separations, it was expected that a single run would be sufficient to purify themajor part of total ribosomal proteins but, as can be seen from Table I, only threepeaks are pure (S4, S5 and S8). Attempts to increase the resolution by using a shallowergradient were unsuccessful. As has been reported previously using traditional methods[II], HPIEC offers higher resolution than classical chromatography, in which proteinsdisturb the chromatography, mainly S2, S3, S5 and SI7 which are not eluted as singlepeaks, owing to complex formation or partial precipitation. It was found that only S4,S8, SIO, SI4 and SI6 can be recovered with acceptable degrees of purity and yields bythis method (see Table III).
To isolate the other proteins in a simple way with only two purification steps wecarried out an initial fractionation of TP30 into two groups of various compositionsaccording to the selected proteins. The choice of the prefractionation method is veryimportant because it determines the final yield of the prepared proteins (see Table III).Two methods are generally used to split TP30 [11,21], HPSEC and LiCI salt washing,which are poorly selective and just allow the concentrations of the wanted proteins toincrease in one of the groups to the detriment of the other. We shall give two examplesto illustrate the purification methods with prefractionation.
Fractionation of TP30 by HPSEC is well suited to purifying the ribosomalproteins with a molecular mass ranging from 15 000 to 40 000 daltons. Fig. 2A showsa typical eiution profile obtained from the Pharmacia Superose 12 column (theSuperdex column gave similar results), where TP30 migrate in three groups (G I, G2and G3). Table II presents the elution characteristics and the composition of the three

HPLC PURIFICAnON OF RIBOSOMAL PROTEINS
0.1S3
S16S7 S4
347
0.6
A 260
S17S8
S12
S21
S19§:
S17 S9 zS15
0
S14
~Sl1
S13 I>!l<.>
S2 z0<.>
t:lS2 S17
..z
S6S10
S18
S20 0.15
o
40RETENTION TIME (min)
260
Fig. 1. HPlEC on TSK CM-3SW (150 x 7.5 mm 1.0.) of TP30 under non-denaturing conditions. 50-200Ilg ofTP30 in 5-10 ml of buffer A with 0.15 M NaC1 were applied to the CM column. Following a 30-minequilibration with buffer A--{).I5 M NaCI, gradients were applied from 0.15 to 0.4 Mover 50 min and from0.4 to 0.6 Mover 140 min. Note that absorbance scale (AlSo) was changed to 0.2 unit after 145 min (elutiontime of SI6).
selected groups, the first group consisting only of protein Sl. Proteins are elutedroughly according to their molecular masses (Mr), with some exceptions. The principalanomaly is the presence ofS7 (Mr = 19732 [21]) in the third group, which is mainlyconstituted by proteins with molecular masses ranging from 8000 to 14 000 daltons. Itshould be noted that the resolution on silica-based columns such as TSK G2000 SWseems higher than that on organic-based material such as Pharmacia Superose or

348 C. CACHIA, P.-J. FLAMION, J.-P. SCHRE.lBER
TABLE I
CHARACTERISTICS OF ION-EXCHANGE HPLC OF TP30 PROTEINS UNDER NON-DENATURING CONDITIONS
Elution conditions as in Fig. I.
Proteins Peak No.
2 3 4 5 6 7 8 9 10 II 12 13 14 15 16
Main" S8 S5 S6 SI7 S2 SI7 SI6 SIO SI7 S3 S7 SI9 SI5 SI4 SI8 S4(I) (3) (2) (5) (I) (4) (6) (7)
Others S2 S2 SI7 S2 S2 S3 S3 S17 S21 SI5 SI4 SI8 520S6 S5 S5 SI4 SI2 S9 SI3
NaCI (%)' 23 26 32 34 37 40 41 42 45 46 47 51 52 54 56 57
a Previous results in parentheses [II].
, NaCl concentration in buffer B as reference.
Superdex [27]. It has been demonstrated [28] that the elution on a silica-based columnnot only depends on the protein sizes but also is strongly affected by the electrostaticinteractions between the proteins and the support. This could explain the observeddifferences in resolution and elution order between the two types of supports, but herethe difference is mainly due to the extraction methods for TP30, which was native inthis work and denaturing in the studies of Kamp and Wittmann-Liebold [27].
Groups G2 and G3 were then rechromatographed by HPIEC as describedabove, to obtain purified proteins. Fig. 2B and C show the elution profiles of groupsG2 and G3, respectively. Group G2 gives S2, S3, S4, S5 and S6 with degrees of puritybetter than 90% calculated from reversed-phase chromatograms and a small amountofSI9-S13 complex. Group G3, mainly constituted ofS7, SlO, S14, SIS, S16, SI7, SI8,SI9 and S20, is more complicated to resolve because many proteins migrate together,e.g., S7, S2I, SI2 and SI9, SIS, S13. If proteins of group G3 are wanted, a moresuitable prefractionation must be applied using HPSEC to simplify the ion-exchangeHPLC, by only collecting the fractions where the wanted proteins are eluted.
Fractionation ofTP30 by LiCl salt washing was performed with concentrationsofLiCI ranging from 1.5 to 3.5 M, which allowed the removal of increasing amounts ofproteins from the subunits [7,8]. The major problem is that the composition of thegroups is not well defined because it depends not only on LiCI concentration but alsoon Mg2 + concentration and ribosome subunit preparation. In addition, thisfractionation is not selective and several proteins are present in two groups in variousamounts. An example is 3.5 M LiCI treatment of 30S subunits. The two resultinggroups are the core particles which are constituted of 16S rRNA in association with S4,S7, S8, SIS, SI6 and SI7 and in reduced amounts with S6, SII, SI8 and SI9, and thesplit proteins, i.e., SI, S2, S3, S5, S9, SIO, SI2, S13, SI4, S20, S21 and S6, SII, S18, S19.Small amounts of core proteins S4, S7, SI6 and SI7 were always recovered in the splitfraction. As shown previously (Fig. 3 [19]), from the group of core proteins we canpurify S8, S17, S16, S7, S4, SIS, S19 and S18 by using one HPSEC and one HPIECstep, but the purification of the other proteins from the split group was not greatlyfacilitated by this procedure owing to the bad selectivity of salt washing. To purify

HPLC PURIFICATION OF RIBOSOMAL PROTEINS 349
0.5
A
150ELUTION TIME (min)
oL- --=~
o150oOl!--------__--==
ELUTION TIME (min)
A 260
0
0 ELUTION TIME (min) 100
0.05 83 0.04 87 819B 815 0.6
g0.7 z
0
g~z
0 l'<l
~ '-'z0
A 260 ~ A 280 '-'
82 t:l'-' asZ Z0S4 '-'
<;j 0.25z
86 0.25
Fig. 2. (A) HPSEC ofTP30 on Pharmacia Superdex XK 16/70 (60 x 1.6 cm 1.0.) under non-denaturingconditions. About 1-10 mg ofTP30 extract were injected in 4 ml of 4.5 M LiCl~TMK mixture. The proteinswere eluted in TMK or buffer A with 0.15 M NaCl at a constant flow-rate of 1.0 mljmin. (B) Ion-exchangeHPLC of the G2 proteins under non-denaturing conditions. 1-10 ml of concentrated G2 proteins in bufferA with 0.25 M NaCI were applied to the CM column. The gradient was started with eluent A-0.25 M NaCiover 30 min and then linearly increased to 0.4 Mover 40 min and to 0.6 Mover 80 min. (C) Ion-exchangeHPLC of the G3 proteins under the same conditions in (B).

350 C. CACHIA, P.-J. FLAMION, J.-P. SCHREIBER
TABLE II
CHARACTERISTICS OF GEL PERMEATION HPLC OF TP30 UNDER NON-DENATURINGCONDITIONS
Protein Elution volume (ml)(molecularmass) GI G2 G3
52" 62 68 70 73 75 77 79 81 83 85 87 89 91
SI (61 159) **bS2 (26 613) *b ** **S2 (25 852) ** ** **S4 (23 138) ** ** **S5 (17 514) * ** ** *S6 (15 200) * ** ** *S7 (19 732) * ** ** *S8 (12 196) * ** ** *S9 (14 569) * * * * * * *SIO (II 736) * ** ** *SII (13788) * ** ** *SI2 (13 608) * ** ** *SI3 (12 968) * * * * * * *S14 (II 200) * ** ** *SI5 (10000) * ** ** *S16 (9192) * ** ** *SI7 (9573) * ** ** *SI8 (8896) * ** ** *S19 (10 239) * ** ** *S20 (9553) * ** ** *S2l (8369) * ** ** *
" Elution volume corresponding to the maximum value of A28o .
bThe presence of large amounts of protein is indicated by two asterisks and of smaller amounts byone asterisk.
proteins of the split group more easily, a lower LiC] concentration must be used duringthe salt-washing step to reduce the number of split proteins and the concentrationvalue adjusted with respect to the wanted proteins.
Table III lists the isolation conditions, yields and 'degrees of purity of sixteenproteins of the 30S subunit. It is clear that the core proteins are the easiest to prepareunder non-denaturing conditions because of their good solubilities (1-5 mg/ml) andweak interactions between them, a single HPIEC run on TP30 can give S4, S8, SI0, S14and SI6 and also S3, S5 and SI7 with a degree of purity better than 90% but with pooryields because of co-migrations, the pre-fractionation by gel permeation leads to thepurification of SI, S2, S3, S4, S5 and S6 with a lower yield than by direct HPIEC owingto the loss ofmaterial during HPSEC and the additional concentration step before theion-exchange separation, the prefractionation by LiCI salt washing allows thepurification of core proteins with yields greater than those obtained by the classicalmethod and S9, SII, S12, S13 and S21 were not recovered in a pure form under theseconditions.

HPLC PURIFICAnON OF RIBOSOMAL PROTEINS
0.05S16
A 280
S17
S7
S19 S15
S4
0.6
351
40 ELUTION TIME (min) 260
0.15
Fig. 3. HPIEC of core proteins under non-denaturing conditions. 50 A 2BO of core proteins (obtained bycentrifugation) in 2-3 ml of buffer A with 0.15 MNaCl were applied 10 the CM column. An elution gradientidentical with that in Fig. 1 was used.
CONCLUSIONS
We have shown that it is possible to prepare fresh samples of sixteen 30S proteinsunder non-denaturing conditions. Under these conditions, HPIEC is the most suitabletechnique for the isolation of 30S proteins. RP-HPLC was only used here as ananalytical technique. Although the selectivity and rapidity of HPIEC improved theseparation in comparison with conventional chromatographic methods, this was notsufficient to eliminate completely co-migration along the column owing to complex

352 C. CACHIA, P.-J. FLAM ION, J.-P. SCHREIBER
TABLE III
SEPARATION METHODS FOR TP30 WITH YIELDS AND DEGREES OF PURITY
Protein lon-exchange on TP30 Size-exclusion + Salt washing" +ion exchange ion exchange(groups GI, G2, G3) (core proteins)
Yield (%) Purity (%) Yield (%) Purity (%) Yield (%) Purity (%)
SI 24 >95S2 23 >95S3 25 >90 26 >95S4 70 >95 15 >95 50 >95S5 25 >95 10 >95S6 5 >95 15 >95S7 20 >90 60 >95S8 95 >95 90 >95S9SIO 44 >95SIISI2SJ3SI4 70 >95SI5 >50 >90S16 90 >95 22 >95 100 >95SI7 25 >90 40 >95SI8 50 >95SI9 40 >90S20 27 >95S21
" Previous results [19].
formation and partial precipitation. It was found that prefractionation of the proteinsinto groups by salt washing or by HPSEC improves significantly the fraction purity,but this does not lead to major simplification of the procedure, but only allows thecomposition of one group to be made suitable in relation to the proteins to be purified.Protein recoveries are generally higher than those obtained by the conventionalmethod (see Table III), with values ranging from 10 to 90%. Further, it was possible topurify several proteins such as S7, SIS and SI8 that are not recovered by traditionalmethods in good yield.
Samples prepared by this method can be used directly for optical studies, inparticular for circular dichroism spectroscopy, owing to the simplicity of the buffersused. The amounts recovered, ranging from 0.05 to 0.1 mg/ml, allow the direct use ofthe peak fractions for these optical studies, whereas NMR studies requiring largeramounts of proteins need a preparative-scale separation.
REFERENCES
I A. Liljas, Prog. Biophys. Mol. Bioi., 210 (1982) 161.2 V. Mandiyan, S. Tumminia, J. S. Wall, J. F. Hainfeld and M. Boublik, J. Mol. Bioi., 210 (1989) 323.3 V. D. Vasiliev and V. E. Koteliansky, FEBS Lett" 76 (1977) 125.

HPLC PURIFICAnON OF RIBOSOMAL PROTEINS 353
4 R. A. Zimmerman, in G. Chambliss, G. R. Craven, J. Davies, K. Davis, L. Kahan and M. Nomura(Editors), Ribosomes, Structure, Functions and Genetics, University Park Press, Baltimore, 1980, p. 135.
5 R. Brimacombe, J. Atmadja, W. Stiege and D. Schuler, J. Mol. Bioi., 199 (1988) 115.6 S. Stern, B. Weiser and H. F. Noller, 1. Mol. Bioi., 204 (1988) 447.7 T. Itoh, E. Otaka and S. Osawa, J. Mol. Bioi., 33 (1968) 109.8 A. Atsmon, P. Spitnik-Elson and D. Elson, 1. Mol. Bioi., 25 (1967) 161.9 J. Dijk, 1. A. Littlechild, A. M. Freund, J. Pouyet, M. Daune and S. W. Provencher, Biochim. Biophys.
Acta, 874 (1986) 227.lO J. A. Littlechild, A. Malcolm, K. Paterakis, I. Ackermann and J. Dijk, Biochim. Biophys. Acta, 913
(1987) 245.II J. Dijk and J. A. Littlechild, Methods Enzymol., 59 (1979) 481.12 A. R. Kerlavage, C. J. Weitzmann, T. Hasan and B. S. Cooperman, J. Chromatogr., 266 (1983) 225.13 R. M. Kamp, A. Bosserhoff, D. Kamp and B. Wittmann-Liebold, 1. Chromatogr., 317 (1984) 181.14 P. J. Flamion and J. P. Schreiber, Anal. Biochem., 147 (1985) 458.15 M. Capel, D. Datta, C. R. Nierras and G. R. Craven, Anal. Biochern., 158 (1986) 179.16 B. S. Cooperman, C. J. Weitzmann and M. A. Buck, Methods Enzymol., 164 (1988) 523.17 R.1. Ferris, C. A. Cowgill and R. R. Traut, Biochemistry, 23 (1984) 3434.18 P. Stiegler, M.-L. Hartmann and J.-P. Ebel, Biochimie, 68 (1986) 587.19 C. Cachia, P.-J. Flamion and J.-P. Schreiber, J. Chromatogr., 498 (1990) 417.20 S. J. S. Hardy, C. G. Kurland, P. Voynow and G. Mora, Biochemistry, 8 (1969) 2897.21 S. Yu. Venyaminov and Z. V. Gogia, Eur. J. Biochem., 126 (1982) 299.22 P. S. Leboy, E. C. Cox and 1. G. Flaks, Proc. Natl. Acad. Sci. U.S.A., 52 (1964) 1367.23 H. Edelhoch, Biochemistry, 6 (1967) 1948.24 S. C. Gill and P. H. Von Hippe!, Anal. Biochem., 182 (1989) 319.25 S. Maruyama, K. Kuwajima, K. Nitta and S. Sugai, Biochim. Biophys. Acta, 494 (1977) 343.26 F. Ahmad, J. Bioi. Chern., 258 (1983) 11143.27 R. M. Kamp and B. Wittmann-Liebold, Methods Enzymol., 164 (1988) 542.28 F. Regnier, Methods Enzymol., 91 (1983) 137.


Journal o[Chromatography, 539 (1991) 355-362Elsevier Science Publishers B.Y., Amsterdam
CHROM. 22905
Immobilized Cibacron Blue -leachables, support stabilityand toxicity on cultured cells
I. HULAK
IBF-Biotechnics. 35 Avenue Jean Jaures. 92390 Villeneuve la Garenne (France)
C. NGUYEN
IAfEDEX, B.P. 38, 69630 Chaponost (France)
and
P. GIROT and E. BOSCHETTI*
IBF-Biotechnics, 35 Avenue Jean Jaures, 92390 Villeneuve la Garenne (France)
ABSTRACT
Although immobilized dyes are widely used on the laboratory scale and have good potential forindustrial applications, they are still subject to some reservations. Little information is available about dyeleakage and toxicity, which seriously hinders the use of such supports in the production of pure proteins.Investigations of the leakage mechanism and the in vitro toxicity of the native dye and of that leached fromthe column are reported. The possible presence of traces of dye in the purified biological materials necessitates the availability of sensitive analytical tests. The preparation and preliminary isolation of dye antibodies as a first step in the development of an immunohistochemical assay of leached dyes are also described.
INTRODUCTION
Chromatography is probably the most widely used method for the purificationof enzymes and proteins. Interest is linked to the possibility of obtaining very puresubstances, not only on the laboratory scale but also at the industrial level. Today,process chromatography is applied to the purification of many biological materialsused in diagnostics and therapeutics.
It is obvious that at the level of industrial exploitation leading to the purificationof a therapeutic product, the polymeric chromatographic support must be sufficientlystable and not release oligomers or other trace chemicals that could be toxic or havea secondary action. From this point of view, a number of experiments were performedin our laboratories to determine the level of leachables and undesirable products thatmight be present in the chromatographic supports.
An example of studies of leaching and toxicity is provided by immobilized dyes.Cibacron Blue F3 GA (Ciba Geigy) immobilized on a solid matrix provides adsorbentswith high efficiency and specificity such that these supports are very attractive forapplication at the preparative level [1,2]. However, the dye may be leached undercertain physico-chemical conditions and it is then necessary not only to determine the
0021-9673/91/$03.50 © 1991 Elsevier Science Publishers B.Y.

356 1. HULAK el al.
amount ofligand in the column effluents but also to establish its possible toxicity. Thispaper reports results on measurements of leached dye on agarose-based sorbents, thein vitro toxicity of the leached dye and preliminary results on the preparation andpurification of specific antibodies against the dye.
EXPERIMENTAL
Native Cibacron Blue F3 GA was obtained from Fluka (Buchs, Switzerland),immobilized dyes on agarose-cross-linked beads from suppliers such as PharmaciaLKB (Uppsala, Sweden) and Amicon (Danvers, MA, U.S.A.), foetal bovine serumculture media and all other chemicals for eukaryotic cell culture from Gibco-BRL(Paisley, U.K.) and biological materials such as bovine serum albumin (BSA), humanhaemoglobin and antibodies from Sigma (St. Louis, MO, U.S.A.). All other chemicalswere of analytical-reagent grade. Chromatographic sorbents such as DEAE-TrisacrylPlus, protein A-Spherodex and Blue-Trisacryl were supplied by IBF-Biotechnics(Villeneuve la Garenne, France).
Determination and collection of leached dyeAgarose-immobilized Cibacron Blue was washed repeatedly on a Buchner
funnel with water and packed into 50-ml columns. The sorbent was then perfused withacidic, neutral and alkaline solutions for several hours at room temperature and theeffluents were collected. The dye present in the effluents was determined byspectrophotometry at 608 nm using a calibration curve from native Cibacron Blue.The sensitivity of this determination was close to I mg/l of dye.
In vitro cell cultureMRC-5 human cells were cultured in classical conditions in DMEM medium
containing 10% foetal bovine serum at 37°C. Following WHO recommendations,MRC-5 cells were taken at the 29th passage and cultured over 25 days up to the 35thpassage. Parallel cultures were realized: in the absence of any additive (standardculture), in the presence of 25 /lg/ml of native Cibacron Blue and in the presence of 25/lg/ml ofleached dye from agarose beads. Growth curves were determined by countingthe cells and by calculating the cell division rate. The morphology ofMRC-5 cells wasalso checked during the in vitro culture.
Determination ofpolyploidia levelAt the 36th passage and after 72 h, cultured MRC-5 cells were submitted to
another passage during which the mitosis were blocked. Under these conditions andafter a hypotonic shock, chromosomes were fixed and spread out, then submitted to anacidic hydrolysis and subsequently stained. The proportion of polyploidic cells wasdetermined on each culture slide.
Determination of in vitro genotoxic effectThe genotoxic effect of free Cibacron Blue was determined using the SOS
Chromotest. The standard genotoxic agent used was 4-NQO (4-nitroquinoline oxide)as recommended by the in vitro test supplier.
IMMOBILIZED CIBACRON BLUE 357
Preparation ofpolyclonal antibodiesPolyClonal antibodies of Cibacron Blue were prepared using a protein-dye
conjugate. The free dye is actually non-antigenic and the preparation ofantibodies canbe accomplished only with an appropriate carrier.
As carrier we used BSA, which was first mannosylated and then couped with thedye. The latter operation was effected by simple contact of albumin and the dye(Cibacron is a preactivated dye) under alkaline conditions overnight. The solution wasthen neutralized and desalted by gel filtration through a Trisacryl GF 05 column toremove the excess of free dye. The resulting albumin-dye covalent complex was usedfor the immunization of rabbits under classical conditions and in association withFreund's additive. The methodology of immunization used was classical: injection ofI mg ofan tigen per week for 3 weeks. Another injection was also effected after 3 weeksof rest. The antibodies were detected in the rabbit blood by an enzyme-linkedimmunosorbent assay (ELISA) test using as competitor a complex of humanhaemoglobin and Cibacron Blue obtained as described above for BSA.
Purification of Cibacron Blue antibodiesThe chromatographic strategy followed to separate antibodies from hyper
immunized rabbit serum was based on three principles: whole rabbit immunoglobulinsG (IgG) could be separated from plasma in one step on DEAE-Trisacryl Plus aspreviously described [3]; whole rabbit immunoglobulins G could be separatedspecifically in a single step using immobilized protein A; and antibodies againstCibacron Blue should be biospecifically adsorbed on immobilized dye and thenseparated from other proteins.
In the first series of trials rabbit immunized serum was injected directly ontoa column of DEAE-Trisacryl Plus previously equilibrated with 0.025 M Tris-HClbuffer (pH 8.5) containing 25 mM sodium chloride. Different fractions obtained undera salt elution gradient were collected and then analysed (Fig. 3A).
In a second series of trials, an affinity purification was effected on a column ofprotein A-Spherodex. The whole immunized rabbit serum was first diluted with anequal volume of 1.5 M glycine-NaOH buffer containing 2 M sodium chloride (pH 8.9)and then injected into the affinity column previously equilibrated with the same buffer.After washing, the adsorbed immunoglobulin G was eluted by injecting I M acetic acid(Fig. 3B).
As a third approach, a column containing 7 ml of Blue-Trisacryl wasequilibrated with phosphate-buffered saline (PBS) and then the whole immunizedrabbit serum was injected after PBS equilibration (2 ml of rabbit serum). After washingwith PBS until elimination of non-adsorbed proteins, a first elution was done using 0.1M sodium chloride. A second elution using the same buffer containing I M sodiumchloride followed (Fig. 3C). All the fractions collected from the three columns wereanalysed by gel electrophoresis and by Ouchterlony double diffusion [4] againstCibacron Blue-substituted haemogolobin and BSA.
RESULTS AND DISCUSSION
It has been clearly demonstrated that most of the leached dye resulted from theacidic washings of the agarose-based sorbents. The amount of leached dye was

358 1. HULAK et al.
between 0.2 and 1.7 f.1g per millilitre ofsorbent (depending on the pH). In comparison,a dye coupled to a synthetic sorbent did not show any leakage effect when exposed tothe same acidic conditions. This phenomenon was correlated with the sensitivity ofagarose to acidic media (pH < 4) as demonstrated previously [5]. An NMR spectrumof the column effluent showed that the dye containd a certain number of osidiclinkages (i.e. linkages between sugars) related to the presence ofa glycosidic part on thedye [6] (results not shown). This result indicates that the dye leakage was in fact theresult of partial hydrolysis of the agarose chain supporting a molecule of dyecovalently immobilized.
The in vitro cell culture ofMRC-5 human cells showed that the lethal dose ofdyewas ca. 200-250 f.1g/ml. At this concentration, the cells did not adhere to the surface ofthe dish and then died. This is why we used 25 f.1g/ml of dye in the culture medium,which was compatible with cell adherence. At this concentration, the MRC-5 culturestudy showed a significant decrease in the division time when the medium contained 25f.1g/ml of leached dye (Fig. I). The size of the cells at the end of the culture was smallerwhen compared with a standard culture (microscopic observation). Conversely, thenative dye did not seem to influence the cell division. The growth curve was very similarto the standard one. In addition, no morphological modification was detected [6].A chromosome analysis (polyploidia) ofMRC-5 collected after the 36th passage (after22 days of culture) over thousands of metaphases indicated that no modification wasinduced in the presence of the native Cibacron Blue. The polyploidia level was actuallyof6/512 (average) and was very close to the standard cell culture (7/520 on average).Both results were significantly lower than the WHO reommendations (17/520). ThepolypIoidia level of the cells cultured in the presence of leached dye was significantlyhigher, however, above the limits of acceptance (see Table I).
Genotoxic studies performed with the SOS-Chromotest indicated the absence ofany toxicity at concentrations far higher than those usually utilized. The dye genotoxicactiviy, when compared with that of 4-NQO, was about three orders of magnitudelower (Fig. 2).
These studies were carried out at high concentrations of dye (from 25 to 500
5 7'iii
~ 6
3 5
4
3
2
2 6 10 14Days
18 22
Fig. I. Growth curves of MRC-5 human cells in vitro over six passages in classical conditions (from the 29thto the 35th passage). Cultures were effected in DMEM medium containing 10% offoetal bovine serum in thepresence of 25 Jig/ml of (II) native Cibacron Blue (NCB) or (e) leached dye (LCB). (0) Standard curveobtained in the absence of dye (FBS).

IMMOBILIZED CIBACRON BLUE 359
TABLE I
POLYPLOIDIA RESULTS FOR CULTURED MRC-5 CELLS IN THE PRESENCE OF CIBACRONBLUE AT THE 36th PASSAGE
Slide No.
I234
Average
Standard curve
9/5385/5038/5105/529
7/520
MRC-5 + NCBa
(251Ig/ml)
5/5366/5039/5135/502
6/513
MRC-5 + LCBb
(25 flg/ml)
23/52815/51217/52218/508
18/517
a NBC = Native Cibacron Blue.b LBC = Leached Cibacron Blue.
Jig/ml) whereas the amounts that possibly leaked during a chromatographic run wereusually less than I Itg/ml.
These preliminary data made it clear that the toxicity studies whould be extendedto other determinations in vitro and/or in vivo. However, to improve the accuracy ofthese investigations, we thought that a more sensitive method of dye detection wasessential, because the spectrophotometry is not sensitive enough and there is no easymeans of localizing the dye once it has been incorporated into the cell. Hence thepreparation of antibodies against Cibacron Blue was investigated. It was found thatwhen the dye coupled with BSA was injected directly into rabbits, no antibodyresponse was detected. However, in association with Freund's additive, a positiveresponse was obtained in three out of four rabbits. The amount of secreted antibodies(determined empirically by measurement of the detection limit) was not constant from
A.61Onm1
0.5
o5 2.5 1.25
4-NQ°1'9/ml
500100 10
NCBI'9/ml
I...m-.500100 10
DCBI'9/ml
Fig. 2. Genotoxic results obtained using SOS-Chromotest. The standard genotoxic agent was 4-NQO. NBC= native Cibacron Blue; DCB = deactivated Cibacron Blue. The absorbance at 610 nm was the result of thefinal enzymatic activity induced by the genotoxic effect of the chemicals.

360 I. HULAK el al.
TABLE II
DETECTION DILUTION LIMITS OF SECRETED ANTI-CIBACRON BLUE ANTIBODIES
Days of immunization Dilution limit of antibody detection
517085
105140189
Rabbit I
800800800
160032003200
Rabbit 2
8001600320032006400N.D.
rabbit to rabbit (see Table II), but in more than 50% of the rabbits the secretion levelwas acceptable and increased week after week.
Table III and Fig. 3 show the main results of the isolation of anti-Cibacron Blueantibodies using three different approaches. Whole immunoglobulins G with goodpurity were obtained using DEAE-Trisacryl Plus, protein A-Spherodex or BlueTrisacryl. In the first instance, most of the IgG, including specific Cibacron Blueantibodies, were present in the flow-through as expected [3]. This fraction containedonly a few contaminants in small amounts; the purity determined by electrophoresiswas in fact 95%. In the second instance the IgG fraction, obtained by acidic elution,contained most of the rabbit IgG and all Cibacron Blue antibodies. The purity of thisfraction was similar to those obtained by ion exchange; however, the yield was higher(about 60%) than in the DEAE-Trisacryl Plus fractionation.
Blue-Trisacryl allowed us to obtain fairly pure antibodies (about 95% byelectrophoresis) in one step using the described conditions. The fraction containing theCibacron Blue antibodies was obtained by elution with 0.1 M sodium chloride. Thisfraction was not contaminated by the presence of albumin, which is known to havea high affinity for Cibacron Blue [7,8]; albumin was actually eluted quantitatively by1M sodium chloride washing. The agarose double diffusion experiments show that the
TABLE III
MAIN RESULTS ON THE SEPARATION OF IgG FROM IMMUNIZED RABBIT BY VARIOUSCHROMATOGRAPHlC PROCEDURES
Protein fraction
Whole serumFlow-through DEAE
TrisacrylFraction adsorbed on
protein A-Spherodex0.1 M NaCI elution on
Blue-Trisacryl
Chromatography IgG purity Presence of Cibacron IgG Yield(average) Blue antibodies (average)(%) (%)
18-20 + 100
Ion-exchange 95 + >40Affinity Fc 95 + >60fragmentAffinity Fab 90 + >90fragment

IMMOBILIZED CIBACRON BLUE 361
100 ml80604020o~~"'=:;::=:~::::~~-=::::='--o
Fig. 3. Chromatographic profiles of IgG separation from immunized rabbit serum against Cibacron Blue.(A) Fractionation obtained by ion-exchange chromatography on DEAE-Trisacryl Plus; (B) fractionationobtained by affinity chromatography of IgG on protein A-Spherodex; (C) fractionation of anti-CibacronBlue antibodies by affinity chromatography on Blue-Trisacryl. The sample in all instances was whole rabbitserum, previously equilibrated with the starting buffer. The grey areas indicate the localization ofanti-Cibacron Blue antibodies. For further details, see Experimental.
anti-Cibacron Blue antibodies present in the flow-through of the DEAE-Trisacryl Pluscolumn and in the absorbed fraction of protein A-Spherodex were contaminated byanti-BSA antibodies and other immunoglobulins. These sorbents in fact do notdiscriminate between the different categories of immunoglobulins G. On the otherhand the Blue-Trisacryl active fraction (Fig. 3C) did not show any cross-reaction withBSA, demonstrating the absence of BSA antibodies. The latter were found in theflow-through of this column.
These antibodies of different purity will be used for the preparation of anELISA-like or immunometric detection assay for free and leached dye from specificaffinity sorbents.
362
CONCLUSION
I. HULAK e/ al.
This preliminary work demonstrated that at acidic pH, the agarose-basedimmobilized dyes are not stable. This instability seems to be related more to the matrixinstability than to linkage breaking between the dye and the support. The leaked dye,which seemed to be associated with a small part of polysaccharide, modified thegrowth rate of the in vitro human MRC-5 cell culture and increased significantly thenumber of polyploidic cells. As these effects were not observed with a free native dye,a preliminary conclusion could be made that the osidic part of the leached dye wasresponsible for the difference. At this stage, models ofdyes coupled with sugars shouldbe synthesized and submitted to similar tests. On the other hand, we demonstrated thatit was possible to synthesize and purify active antibodies against dyes, which representsa useful alternative to a spectrophotometric assay for the determination of traces ofdyes.
ACKNOWLEDGEMENTS
This work was partially supported by a grant from the French Minister ofResearch and Technology as a part of EUREKA project EU-384.
REFERENCES
I R. K. Scopes, Anal. Bioclzem., J65 (1987) 235.2 R. F. Sherwood, R. G. Melton, S. H. Alwan and P. Hugues, Eur. 1. Biochem., 148 (1985) 447.3 G. Corthier, E. Bochetti and J. Charley-Poulain, J. lmmunol. Me/hods, 66 (1984) 75.4 O. Ouchterlony, Prog. Allergy, 5 (1958) I.5 E. Boschetti in C. Doinel (Editor), Pro/ein Puriflca/ion Technologies.G.R.B.P., Paris, Vol. 3, 1988, p. 23.6 S. Oulieu, F. Viliamier, M. Allary, E. Boschetti and C. Nguyen, preliminary communication, Proc.
Symp. Pro/ein-Dye lnlerac/ions, Compiegne, 1988, unpublished results.7 J. Travis and R. Pannell, Clin. Chim. Acta, 49 (1973) 49.8 J. Saint-Blancard, E. Boschetti, P. Riberon, P. Claude!, P. Girot and M. Allary, Sci. Tools, 32 (1985) 37.

Journal o/Chromatography, 539 (199[) 363-37[Elsevier Science Publishers B.V., Amsterdam
CHROM. 22894
Tandem immunoaflinity and reversed-phase highperformance liquid chromatography for the identification ofthe specific binding sites of a hapten on a proteic carrier
M.YVON
Station de Recherches Laitieres. CRJ-IN RA, 78352 Jouy-en-Josas (France)
and
J. M. WAL*
Laboratoire de Nutrition et Securite Alimentaire, CRJ-INRA, 78352 Jouy-en-Josas (France)
ABSTRACT
Immunoaffinity (IA) and reversed-phase (RP) high-performance liquid chromatography were combined for the identification of the specific binding sites of benzylpenicilloyl (BPO) groups on human serumalbumin (HSA). Tryptic hydrolysates of BPO-HSA were loaded on the IA column. BPO-peptides weredesorbed and concentrated directly on the RP column, coupled via a switching valve, then separated byusing gradient elution and identified by the amino acid sequences. This single-step procedure permittedmore than 95% recovery of the BPO-peptides present in minute amounts, with good specificity.
INTRODUCTION
Like most drugs, penicillin is not immunogenic by itself. Allergic accidentsoccurring after penicillin therapy or consumption of food from penicillin-treatedanimals are mainly due to benzylpenicilloyl (BPO)-protein conjugates. Theseallergenic compounds result from the cleavage of the fi-lactam ring of penicillin G andformation of covalent bond between the carbonyl of BPO and e-amino groups ofproteins. In man or animals treated with penicillin, the main proteic carrier for BPO isthe serum albumin. In vitro, under physiological conditions of pH and temperature,human serum albumin (HSA) can also be penicilloylated to form HSA-BPOconjugates similar to those occurring in vivo. The mechanism of protein penicilloylation, based on a nucleophilic attack of penicillin by NH 2 groups of albumin,needed to be confirmed as previous observations suggested that among the various (ca.60) e-amino groups of lysine present in albumin, only a few of them were available forpenicillin aminolysis [1].
The study of the specific binding sites of a ligand (such as a hapten) covalentlybound on a proteic carrier needs first the preparation and the chromatographicseparation and purification of peptides from the original conjugate and second haptendetection on each peptide using a specific method. This procedure was used by Walker
002[-9673/9 [/$03.50 © 199[ E[sevier Science Publishers B.V.
364 M. YVON, J. M. WAL
[2] to identify the binding site ofacetylsalicylic acid on human serum albumin. We havelocalized BPO groups on a fragment ofalbumin from a penicillin-treated patient by thesame method, which needs numerous steps and is time consuming [3].
Several workers have used a two-step approach; the first is affinity chromatography and the second. reversed-phase high-performance liquid chromatography(RP-HPLC) to separate the peptides retained on the affinity column. This approachwas used by Iberg and Fliickiger [4] to identify the glycosylated sites on albumin froma diabetic patient and by Lafaye and Lapresle [5] to search for BPO-binding sites onHSA from penicillin-treated patients. However, the separation of peptides ona low-pressure affinity column takes several hours and often needs large amounts ofmaterial (100-300 mg of proteins).
Tandem immunoaffinity and RP-HPLC have already been used for variousstudies such as the determination of recombinant leucocyte interferon a-2 in complexmixtures [6] and to discriminate between similar structural forms of proteins [7]. Wehave tried to use this method to isolate specifically penicilloylated peptides fromhydrolysates ofBPO~HSA conjugates obtained from penicillin-treated patients. Onlyvery small amounts of such samples were available. We compared this binding withthat occurring on a conjugate prepared in vitro.
EXPERIMENTAL
Reagents and penicilloylated albumins
For HPLC, all the chemicals used were ofHPLC grade. For amino acid analysisand for recurring Edman degradation, the chemicals used were of Sequanal grade(Pierce). Other reagents were of analytical-reagent grade.
Penicilloylated albumins prepared from sera from three penicillin-treatedpatients [1,3] were obtained from the Institut Pasteur (Paris, France). A BPO-HSAconjugate was prepared in vitro as described [3].
Approximately two BPO groups were covalently fixed per mole of HSA in thecase of the in vitro conjugate. Concerning the penicilloylated albumins obtained fromthe patients, 2.8-3 BPO groups were determined per mole ofHSA. However, it shouldbe noted that in each instance, these penicilloylation rates are mean valuescorresponding to the average number of BPO groups measured on the wholepopulation of penicilloylated albumin molecules. It does not mean that all themolecules have fixed two (or three) BPO groups; some might have fix,ed more BPOgroups whereas others might have fixed only one group.
Digestion of penicilloylated albumins
Cyanogen bromide digestion of penicilloylated albumins and HPLC separation offragments
Cyanogen bromide (CNBr) cleavage was carried out on 2 mg of BPO-albuminand separation of fragments A299-585, B l - 123 and C124-298 was performed byRP-HPLC as described previously [8].

IDENTIFICATION OF BINDING SITES OF A HAPTEN 365
Reduction and carboxymethylation of the CNEr fragment CDenaturation, disulphide cleavage and alkylation were performed as described
by Swenson et al. [9]. A IO-nmol sample offragment C was dissolved in 1 MTris-HClbuffer (pH 8.0) containing 6 M urea and a 10-fold molar excess of dithiothreitol overthe SH concentration and kept overnight at 40°C under a nitrogen atmosphere.
Iodoacetic acid in 1 MNaOH (l.3-fold molar excess over total thiols) was addedand the mixture was maintained in the dark for 4 h, before the reaction was stopped byaddition of 5 ,ul of p-mercaptoethanol. Desalting of the mixture was performed byRP-HPLC: 100,ul were injected onto an Aquapore RP-300 (7 ,urn) column (30 x 4.6mm I.D.) (Brownlee), equilibrated in a mixture of 50% solvent A [0.05% aqueoussolution of trifluoroacetic acid (TFA)] and 50% solvent B [acetonitrile-2-propanol0.05% TFA in water (2: 1:2, v/v/v)]. Elution of fragment C was achieved with a 30-minlinear gradient from 50 to 100% of solvent B at a flow-rate of 1.0 ml/min. Runs wereperformed at room temperature and peptides were detected at 215 nm. The reducedC-containing fractions were pooled and the solvent was removed using a Speed-Vacevaporator.
Tryptic digestionTryptic digestion was performed on reduced fragment C in 0.1 M phosphate
buffer (pH 7.8) overnight at room temperature using L-l-tosylamide-2-phenylethylchloromethyl ketone (TPCK)-trypsin (Sigma) (molar ratio enzyme/substrate, E/S =
1/50). The enzymatic reaction was stopped by heating at 100°C for 10 min.
Isolation and separation of the penicilloylated fragments from tryptic digest
Preparation of immunoaffinity column (lAC)Purification of antipenicilloyl antibodies. Rabbit anti-BPO antisera were ob
tained as described previously [10]. An HSA~BPO conjugate (5 mol BPO/mol HSA)was prepared at alkaline pH and in the presence of a 10-fold molar excess of penicillin.
An Ultraffinity-EP column (50 x 46 mm I.D.) (Beckman) was derivatized byrecycling a solution of HSA-BPO conjugate (200 mg) in 20 ml of 1 M potassiumphosphate buffer (pH 7.0) at 0.2 ml/min for 18 h. The derivatized column was thenwashed with 0.1 M potassium phosphate (pH 7.0) at 1.0 ml/min for 1 h and convertedto the loading buffer [0.02 M phosphate-0.2 M NaCI (pH 7.0)].
Rabbit anti-BPO antisera were dialysed with the loading buffer and 5-10 mlwere loaded onto the column at 1.0 ml/min. The column was washed with 10 ml ofloading buffer at the same flow-rate. The anti-BPO antibodies were eluted with 7 ml of0.01 M HCl (pH 2) at the same flow-rate. The column was then re-equilibrated withloading buffer.
Column derivatization with antipenicilloyl antibodies. A 13-mg sample ofantipenicilloyl antibodies purified as described before was dissolved in 18 ml of1 M phosphate buffer (pH 7.0) and recycled through an Ultraffinity-EP column (50x 4.6 mm I.D.) overnight at 0.2 ml/min. An 8-mg sample of antibodies was thenimmobilized. The column was washed with 1 M phosphate buffer (pH 7.0) at 1.0ml/min for 1 h and stored in the same buffer until needed. It was equilibrated with 10mM phosphate buffer (pH 7) containing 8 gil NaCl [phosphate-buffered saline (PBS)]before use.

366 M. YVON, J. M. WAL
ApparatusThe immunoaffinity column was connected to a reversed-phase column
(Nucleosil 5C18 , 250 x 46 mm J.D.) (Societe Franl;aise Chromato Colonne,Neuilly-Plaisance, France) via a six-way valve (Rheodyne, Cotati, CA, U.S.A.) asdescribed by Rybacek et al. [6]. The switching valve contained the affinity column inplace of a sample loop. The position of the switching valve determined whether theimmunoaffinity and analytical columns would be used in series or separately.
Production and separation of the penicilloylatedfragmentsThe tryptic digests of peptides C were loaded onto the affinity column in PBS at
a flow-rate of 1.0 mljmin. The column was then washed with 10-15 ml of PBS at thesame flow-rate. Non-retained peptides were collected to check the absence of BPa,then the valve was switched to place both columns in-line. The bound antigens weredesorbed from the immunoaffinity column into the analytical column with 0.1 % TFAsolution at a flow-rate of 1.0 mljmin. After 10 min, the valve was switched, placing theimmunoaffinity column off-line to permit the analysis of the antigens by gradientelution on the analytical column. The reversed-phase chromatographic separation wasperformed with a 30-min linear gradient from 0 to 100% of acetonitri1e~isopropanol0.1 % TFA in water (2: 1:2, vjvjv) at a flow-rate of 1.0 mljmin. All runs were performedat room temperature and peptides were detected at 215 nm. Fractions were collectedevery 0.25 min and analysed for BPa concentration. Simultaneously, the affinitycolumn was equilibrated with loading buffer.
RP-HPLC at pH 7.0 was performed on the same column equilibrated with 0.01M phosphate buffer (pH 7.0). Elution was achieved with a 30-min linear gradient fromoto 100% of acetonitrile-O.Ol M phosphate buffer (pH 7) (60:40, vjv) at a flow-rate of1.0 mljmin.
Detection of penicilloyl groups
BPa detection was performed using an enzyme immunoassay (EIA) directlyderived from the radioimmunoassay as described [10].
Ident(!ication ofpeptides and location of BPO-binding sites
Sequencing was achieved using a Model 477 Sequanator connected to a Model120 A PTH HPLC analyzer (Applied Biosystems).
A recurring Edman degradation using Tau's procedure [11] was performed oneach peptide and the EIA for BPa detection was realized at each cycle on thephenylthiohydantoin (PTH) derivative
RESULTS
lwlation and separation ofpenicilloylated peptides
The isolation and separation of penicilloylated peptides from C tryptic digests wereachieved using the dual-column chromatographic system described above. Fig.1 shows the RP-HPLC patterns of (a) the entire tryptic hydrolysate generated on the

IDENTlFICAnON OF BINDING SITES OF A HAPTEN 367
Absorbance at 215nm100
(a)
0.5
o(b)
50
0.5
o(c)
2015105
f..-.--=;~~~=====;:=='-~~~:=::::=j 0
25oa
Retention time (min)
Fig. l. RP-HPLC profile of (a) the entire tryptic hydrolysate of HSA fragment C, (b) the non-retainedfraction and (c) the retained fraction on the immunoaffinity column. See text for the chromatographicconditions. The dotted line indicates the gradient of solvent B.
reversed-phase column alone, (b) the non-retained fraction on the lAC and (c) theretained fraction. Almost all the peptides of the hydrolysate did not bind to the lAC, asthe chromatograms of the entire hydrolysate and of the non-retained fraction werenearly identical. The immunoenzymatic assay applied to the non-retained fractionshowed no BPO present in this fraction whereas the loaded sample contained 1.2 pg ofBPO.The chromatogram of the retained peptides and the BPO assay in the collectedfractions (Fig. 2) show two major BPO-containing peaks, i.e., Pep 17 and Pep 21 atretention times of 17.1 and 21.1 min, respectively. The sum of the BPO in all thecollected fractions was 1.12 pg, which represents about 95% of the loaded amount.
Identification of peptides and location of BPO-binding sites
Each of the BPO-peptides was analysed for its amino acid sequence. In order toconfirm the BPO-binding site, BPO determinations were performed again at each cycleof the Edman degradation. The amino acid sequencing permitted the followingpeptides to be identified.
Pep 17 consists of a mixture of two peptides corresponding to the sequences187-195 and 191-197 ofHSA. They can be separated by RP-HPLC at pH 7.0 into two

Absorbance at 215nm SPO concentration (nglml)
368
0.06
0.04
0.02
o -+-_.......nu15 17.5 20 22.5
400
300
200
100
o25
M. YVON, 1. M. WAL
Retention time (min)
Fig. 2. RP-HPLC separation of the retained fraction on the immunoaffinity column. Columns and runningconditions as in Fig. I. Solid line, absorbance at 215 nm; hatched peaks, BPO concentration in each fraction.
peaks with retention times of 12.0 min (Pep 12) and 15.0 min (Pep 15). The sequence ofPep 21 corresponds to that of fragment 198-205.
No amino acid could be detected in the fourth cycle of Pep 12 and in the fifth cycle ofPep 15 during the sequencing whereas BPO was found in these fractions. These dataindicate that binding of BPO occurs at Lys 190 and Lys 195.
It should be emphasized that no tryptic cleavage occurs on a penicilloylatedlysine and that lysine 190 and 195 are never found penicilloylated at the same time (oron the same peptide). On Pep 12 only Lys 190 is penicilloylated and not Lys 195,whereas when Lys 195 is penicilloylated (on Pep 15) Lys 190 is not penicilloylated. Thepeptide 187-197 where both lysine 190 and 195 could be penicilloylated is neverobserved.
In Pep 21 no amino acid is detected at the second cycle of the sequencing whileBPO is found in the corresponding fraction, proving that the BPO binding site islocated on lysine residue 199.

IDENTIFICATION OF BINDING SITES OF A HAPTEN
DISCUSSION
369
The in situ derivatization of the prepacked Ultraffinity-EP column is very easyand very fast. This column can also be used for the preparation ofseveral milligrams ofproteins in addition to the isolation of micro amounts of peptides. For the purificationofantipenicilloyl antibodies, a large amount (30 mg) ofHSA-BPO conjugate has beenimmobilized. This derivatized column permitted in each run (e.g., 30 min), 6 mg ofimmunoglobulins to be purified from about 10 ml serum. The same type ofcolumn canalso be derivatized with a much smaller amount of ligand. Only 13 mg ofantipenicilloyl antibodies were used to prepare the immunoaffinity column.
In the preparation of the affinity column no chemical agent was used forblocking excess reactive groups on the Ultraffinity support, although this technique isclassically used in low-pressure chromatography to prevent irreversible loss of samplematerials on remaining active sites. We only verified that such a procedure was notnecessary in the present instance as the BPO recovery was good and the non-specificbinding ofprotein material on the column was small. In HPLC the elution time is muchshorter than that in low-pressure chromatography, so that the contact between thesample material and the support might be too short to allow a non-specific reactionwith the formation of a covalent bond. This would not be a difficulty when highspecificity and affinity occur between the phase and the ligand such as in anantigen-antibody binding.
All the penicilloylated peptides appeared to bind to this column as no BPO wasdetected in the non-retained fraction. The recovery of these peptides was very good, as95% of the amount ofpenicilloylloaded were obtained in the fractions eluted from thereversed-phase column. Moreover, in order to establish the effect of the previous steps(i.e., CNBr cleavage, subsequent trypsin treatment and heating) on the binding of BPOto protein fragments, total BPO was determined in each of these different steps in theoverall procedure.
CNBr cleavage is known to occur specifically on methionine residues, whichshould not affect BPO bound to lysine residues. No data are available concerning thestability of the pseudo peptidic BPO-protein bond in formic acid, but under the acidicconditions in which sequencing is operated (TFA, HCl and heating) the bond appearsto be stable and no BPO is lost. However, during the repeated steps of samples drying,evaporation of residual CNBr and formic acid and then redissolution of the driedhydrolysate, part of the protein material is lost. This loss (ca. 40%) is accompanied bythe same loss of total BPO. The BPO recovery is therefore not complete during theCNBr cleavage but no particular peptidic fragment or binding site appears to bespecifically involved.
Trypsin cleavage occurs on peptidic bonds involving a lysine or an arginineresidue but not on pseudo peptidic bonds such as BPO-Lys. This was checked usinga standard conjugate, i.e., BPO-B-aminocaproate. After trypsin hydrolysis, performedunder the experimental conditions, more than 80% of the intact conjugate wasrecovered, which can be considered to be quantitative. Moreover, during theseparation and identification of penicilloylated peptides, cleavage never occurred ona BPO-Lys. Trypsin cleaves neither the peptidic bond ofpenicilloylated lysine residuenor the pseudo peptidic BPO-Iysine bond.
The chromatograms of the entire digest and of the peptides which were not

370 M. YVON, J. M. WAL
bound by the immunoaffinity column were nearly identical. This indicates that thenon-specific binding of peptides was very low. However, the chromatogram of theretained fraction observed at a much greater sensitivity (e.g., 0.06 a.uJ.s.) showed thatsome peptides which were bound to the immunoaffinity column did not contain a BPOgroup as detected by EIA. These peptides only represent a few percent (1-2%) of thoseinjected. Janis and Regnier [7] also observed a non-specific binding of peptides ona covalently immobilized immunoaffinity column. This non-specific binding ofpeptides was probably more important than in our study, as they observed significantdifferences between the chromatogram of the non-retained peptides and the chromatogram of the entire tryptic digest. They indicated that treatment with Tween 20 of theimmunoaffinity column decreased the non-specific binding of peptides but did nottotally eliminate it. The non-specific binding of peptides is common in affinitychromatography and it is necessary to check the presence of hapten on peptides whichbind to the lAC by a specific test applied subsequently.
However, the immunoaffinity step permits most of the non-penicilloylatedpeptides which represent about 98% of the peptides in the entire digest to be discarded.Ina previous study, the isolation and separation of penicilloylated peptides from thetryptic digest of HSA fragment C needed three steps of HPLC purification. The firstwas a reversed-phase separation at pH 7.0. Each of the three penicilloylated fractionswas then purified by ion-exchange chromatography and a third step of purificationand desalting was done by reversed-phase chromatography using TFA-acetonitrile-isopropanol as the eluent. In each step all the eluted fractions must be collectedand analysed for BPO. This means a total of seven chromatographic analyses and ofabout 700 samples to be analysed for BPO. Taking into account drying steps, dilutionsteps, etc., it took more than 6---7 days to obtain the purified penicilloylated peptides.
Moreover, it must be noted that very often the contamination of one peptide byanother is only detected in the last step of the analysis during the identification. Anentirely new procedure for the separation, detection and identification of each BPOpeptide is then necessary, which means much more work. Using the dual columnsystem, the same three penicilloylated peptides were obtained in a single step.
As the HSA molecule cannot be digested directly by trypsin because of itscompact structure, we used several steps for its digestion. The CNBr cleavagepermitted the molecule to be cut into three fragments and then to obtain tryptic digestscontaining a smaller number of peptides As the penicilloylated peptides represent onlya few percent (1-2%) of the peptides, it is better to work on hydrolysates which are nottoo complex in order to decrease the proportion of non-specific contamination and therisk of eluting several peptides at an identical retention time.
The tryptic hydrolysates of the CNBr fragments A and B ofHSA were analysedby this methodology [12] and three new binding sites for penicilloyl groups wereunequivocally established: Lys 432, Lys 541 and Lys 545. It is worth noting that thesame sites have been identified for the three in vivo and for the in vitro penicilloylatedalbumins, hence BPO-binding sites appear to be located only on lysine residues andonly six different Lys residues out of a total of 59 can be penicilloylated.
As noted, all these potential binding sites cannot be penicilloylated at the sametime (e.g., on the same albumin molecule). This explains why six sites could have beendetected while the measured average penicilloylation rate among the total populationofpenicilloylated albumin molecules was "only" two or three BPO groups per mole ofHSA.
IDENTIFICATION OF BINDING SITES OF A HAPTEN 371
The data obtained give indications of the possible mechanism in penicillinallergy. A nucleophilic attack of the drug and then a covalent binding of BPO groupsto proteins, e.g., serum albumin, are necessary for the formation of the allergenicmetabolite. However, this binding needs particular amino acid sequences and/orconformation of the protein molecule that are constant and somehow universal as theyhave also been described in several fJ-Iactamases and protein-binding proteins [13].
It can be observed that four BPO-Lys out of six are located near serine fromwhich they are separated by two amino acids. This position represents the configuration in which in an a-helix, Lys and Ser residues are the nearest. These results suggesta cooperation between these two residues in the mechanism of formation of theallergen metabolite of penicillin and therefore support the mechanism of penicilloylation proposed by Yamana et al. [14].
The BPO-binding sites are very few, located in small regions of the albuminmolecule where they are concentrated, which certainly limits their bioavailability forspecific antibodies. Some of them are not specific for penicillin: Lysine 199 is site ofglycosylation, acetylation and aspirin binding.
All these considerations could suggest that under normal conditions the reactingmolecules could rather be masked inside the protein carrier which would protect theorganism against immunological disorders. Diseases and therapeutic, nutritional orenvironmental factors could unmask these determinants. Competition betweenligands and modifications of the spatial structure ofalbumin can increase the number,the presentation and the chemical reactivity of reacting sites and thus permit an allergicprocess to be triggered.
CONCLUSION
The combination of affinity and RP-HPLC methods provides a rapid techniquefor the analysis of the binding sites of a hapten and more generally of any ligandcovalently bound to a proteic carrier, and thus it provides a methodological approachfor studying mechanisms of formation of allergenic determinants from drugs. Thesensitivity of this association permits the analyses of very small amount of samples (ca.100-200 ,ul of serum) which is especially useful for clinical studies in man.
REFERENCES
I C. Lapresle and J. M. Wal, Biochirn. Biophys. Acta, 586 (1979) 106.2 J. E. Walker, FEBS Lett., 66 (1976) 173.3 M. Yvon, P. Anglade and J. M. Wal, FEBS Lett., 247 (1989) 273.4 N. Iberg and R. Fliickiger, J. Bioi. Chern., 261 (1986) 13542.5 P. Lafaye and C. Lapresle, FEBS Lett., 234 (1988) 305.6 L. Rybacek, M. D'Andrea and S. J. Tarnowski, J. Chrornatogr.. 397 (1987) 355.7 L. J. Janis and F. E. Regnier, J. Chrornatogr., 444 (1988) l.8 M. Yvon and J. M. Wal, FEBS Lett., 239 (1988) 237.9 R. P. Swenson, M. Williams, V. Massey, S. Rouchi, Minchiotti, M. Galliano and B. Curti, J. Bioi.
Chern., 257 (1982) 8817.10 J. M. Wal, G. Bories, S. Mamas and F. Dray, FEBS Lett. 57 (1975) 9.II G. E. Tan, in M. Elzinga (Editor), Methods in Protein Sequence Analysis, Humana Press, Clifton,
NJ, 1982, p. 223.12 M. Yvon, P. Anglade and J. M. Wal, FEBS Lett., 263 (1990) 237.13 B. Joris, J. M. Ghuysen, G. Dive, A. Renard, O. Dideberg and P. Charlier, Biochern. J., 250 (1988) 313.14 T. Yamana, A. Tsuji, E. Miyamoto and E. Kiya, J. Pharrn. Pharmacal., 27 (1975) 771.


Journal of Chromatography, 539 (1991) 373-381Elsevier Science Publishers B.V., Amsterdam
CHROM.22877
Purification of DNA and group separation of normal andmodified DNA components by size-exclusionchromatography
M. POLVERELLl, L. VOITURIEZ, F. ODIN, J.-F. MOURET and J. CADET*
Laboratoires de Chimie, DRF, Centre d'Etudes Nucleaires, 85 X, F-38041 Grenoble Cedex (France)
ABSTRACT
DNAs and their normal or modified constituents are separated in one chromatographic run on aTSK HW 55F column with a 0.1 M ammonium formate (pH 6.5) volatile solvent. A group separationbetween 2'-deoxyribonucleotides, 2'-deoxyribonucleosides and nucleobases was achieved. A good resolution of photoinduced decomposition products of (pyrimidine) nucleobases was obtained on a TSK G 1000PW column. Separation of nucleic acid components is thought to be governed by mechanisms involvingboth size exclusion, weak hydrophobic interactions and ionic repulsion between the matrix and the chargedmolecules.
INTRODUCTION
Purification of chemically modified DNA is required prior to analysis fora specific type of base damage, Ultracentrifugation [I], electrophoresis [2] and liquidchromatography on various supports [3] are techniques generally used to obtain pureDNA. Once purified, DNA may be submitted to acidic hydrolysis [4] or enzymaticdigestion [5]. Whatever the hydrolytic method choosen, a reliable measurement ofa specific modified nucleoside is possible only after simple monitoring of thecompleteness of DNA hydrolysis. Subsequently, the separation of the biopolymerfrom the released low-molecular-mass components is generally achieved by precipitation of the macromolecule using ethanol-salt mixtures [6].
When analysed with a Fractogel TSK HW 55F column eluted with 0.1M ammonium formate (pH 6.5), DNAs (with molecular masses of above 105 dalton)are excluded in the void volume (Vo). With this volatile solvent, the excluded DNAmay be digested enzymatically directly in the chromatographic eluate, adding onlya concentrated nuclease buffer and metallic cofactors. The enzymatic hydrolysate maybe analysed with the same chromatographic system.
We achieved a separation of the finally remaining unhydrolysed DNA from itsdigestion products (2'-deoxyribonucleotides or nucleosides) in a single chromatographic run. Whereas DNAs are excluded according to the well known size-exclusionmechanism, Fractogel TSK HW 55F and TSK G 1000 PW columns may be used for
0021-9673/91/$03.50 © 1991 Elsevier Science Publishers B.V.

374 M. POLVERELLI et al.
the separation of DNA components and pyrimidine photoproducts in the partitionmode.
EXPERIMENTAL
ChemicalsAmmonium formate and calcium chloride were obtained from Eastman Kodak
(Rochester, NY, U.S.A.) and Merck (Darmstadt, Germany), respectively. Alkalinephophatase, micrococcal nuclease, nuclease P1, RNAse A and tARNMet were providedby Boehringer (Mannheim, Germany). 2'-Deoxyribonucleosides were purchased fromGenofit (Geneva, Switzerland) and thymidine 5'-monophosphate (Na salt) andnucleobases from Sigma (St. Louis, MO, U.S.A.). 8-0xo-7,8-dihydro-2'deoxyguanosine was synthesized from 2'-deoxyguanosine according to Lin et al. (7] and2'-deoxyadeosine N-I-oxide according to Mouret et al. [8].
Synthesis of the two cis diastereoisomers of 5,6-dihydroxy-5,6-dihydrothymidine 5'-monophosphate was adapted from Rajagopalan et al. [9] with the followingmodifications suggested by Berger [10]. Briefly, thymidine 5'-monophosphate (Na salt)(1 mM) was dissolved in water (10 ml, room temperature), pure bromine (0.1 ml) wasadded and the solution was stirred for 30 min at room temperature. The excess ofbromine was eliminated by a continuous flow of air throughout the solution.Substitution of bromine was carried out by overnigh treatment with NH4 HC03 (0.1g per 50 ml) (37°C).
After quantitative dephosphorylation with alkaline phosphatase (1 h, 37°C,5 units, pH 8.5, 0.2 M, in NH4HC03), thymidine glycol diastereoisomers were purifiedand characterized according to Cadet et al. [II]. The cis-syn-cyclobutadithymine(Thy < > Thy) and 5-hydroxy-6-4'-(5'-methylpyrimidin-2'-one)-5,6-dihydrothyminewere generated by far-UV irradiation of thymine in frozen aqueous solution [12].
BiopolymersThe following deoxyribonucleic acids were used: E. coli, salmon testes, phage
X 174, phage lambda hind III fragments, calf thymus tARNMet and poly-dA(Boehringer, Mannheim, Germany).
Purification and enzymatic digestion of DNADry seeds ofLactuca sativa (500 mg) precooled in dry nitrogen were disrupted by
mechanical grinding in a porcelain mortar and suspended in a ready-made lysis buffer(10 ml) (Applied Biosystems, Foster City, CA, U.S.A.). After thawing for at least 45min, the lysate was centrifuged at 5000 g for 30 min at room temperature in order toeliminate the cellulosic residues. The brownish supernatant was deproteinized byreaction with proteinase K (100 /lg/ml, 2 h, 65°C) with occasional shaking. The DNAand RNA pool was precipitated overnight at -20°C by adding 0.5 volume of 7.5M ammonium acetate and 1 volume of 2-propanol in ten siliconized Eppendorf tubes(2 mI). The major part of the hydrolysed peptides and phenolic compounds waseliminated by centrifugation at 104 g for 1hat O°C.The resulting brownish precipitatewas rinsed with 70% ethanol. Without excessive drying, the pellets were resuspendedin distilled water. Prepurification was carried out on a small bed of Fractogei HW 55F(l cm high, 1 cm diameter) equilibrated with distilled water before RNAse treatment[13].

SEC OF DNA 375
Digestions of DNA into 5'-nucleotides or 3'-nucleotides were achieved withnuclease PI [14] and with a mixture of micrococcal nuclease and spleen phosphodiesterase [15], respectively.
Size-exclusion chromatography (SEC)Fractogel HW 55F was packed in a Superformance glass column (300 mm x 10
or 16 mm J.D., as specified) (Merck). The columns were packed at a flow-rate of2 ml/min until the level of gel remained constant in the prefilling column. Molecularweight operating ranges for HW 55F are between 103 and 105 dalton.
High-performance liquid chromatography (HPLC)A stainless-steel column (600 x 7.5 mm LD.) prefilled with TSK G 1000 PW was
supplied by LKB (Bromma, Sweden). The chromatographic solvents [0.1 M ammonium formate (pH 6.5) or water] were degassed by filtration on a Millipore filter(HAWP, 0.45 Jlm; Millipore, Bedford, MA, U.S.A.). Samples were injected into thechromatographic system with a Rheodyne Model 7125 injector equipped with a 0.5-mlloop. Delivery of the solvents was achieved using a Merck L 6200 pump (fastsize-exclusion chromatography) or a Waters Assoc. Model 501 pump with a flow-rateof 1.0 ml/min.
RESULTS
Chromatographic purification ofnucleic acids and polynucleotides on the Fractogel HW55E column
DNAs of different masses (> 105 dalton) are excluded in the void volume (Vo)and easily separated from RNA hydrolysate or smaller molecules (102-103 dalton),which are eluted with higher retention times (Fig. 1). An interesting application is thepurification of nucleic acids extracted from dry seeds of Lactuca sativa, provided thatthe detergent is eliminated before the chromatographic run as it coelutes asa macromolecule with DNA in the void volume [16]. Further, Fractoge1 HW 55F isuseful for removing polymerized phenolic compounds [17].
Separation of nucleic acids componentsEnzymatic digestion of DNA is generally preferred to acidic hydrolysis because
it may provide some insight into the stereochemical structure ofthe hydroxyl-mediatedoxidative adducts [5]. As expected, unhydrolysed DNA is excluded in the void volumebefore nucleotides, for which the capacity factors (k') remain almost identicalregardless of the position of the remaining phosphate (3'- or 5'-).
The nucleotide pool may be dephosphorylated and the resulting 2'-deoxyribonucleosides are further separated on the same column (Fig. 2, Table I). 2'-Deoxycytidine and thymidine partially overlap on Fractoge1 HW 55F (Fig. 2, Table I) and onTSK G 1000 PW (Table I). Acidic hydrolysis gives rise to nucleobases withconcomitant degradation of the polynucleotide chain [18]. A complete separation ofthe nucleobases was only achieved by liquid chromatography on a TSK G 1000 PWcolumn (Fig. 5, Table I). It should be noted that a faster separation is obtained witha Fractogel HW 55F that permits the separation only of adenine and guanine.

376
2
0.5
2
M. POLVERELLI et al.
3
o 15TIME (min) 30 TIME (min)
Fig. I. SEC of (I) DNA and (2) RNA (from Lactuca sativa). Column, Fractogel HW 55F (30 x I em J.D.);eluent, 0.1 M ammonium formate (pH 6.5); flow-rate, 1.0 ml/min; detection, 254 nm.
Fig. 2. SEC of Salmon testes (I) DNA and into (2) PI hydrolysate, (3) 2'-deoxycytidine and thymidine, (4)2'-deoxyguanosine and (5) 2'-deoxyadenosine. Chromatographic conditions as in Fig.!.
It is worth noting that TSK G 1000 PW easily discriminates nucleobases fromthe corresponding 2'-deoxyribonucleosides (Table I).
Separation ofradiation- and photoinduced decomposition products ofDNA componentsRadiation-induceddecomposition ofnucleosides. ThefoUf cis and trans diastereo
isomers of 5,6-dihydroxy-5,6-dihydrothymidine have long been recognized as the mostimportant hydroxyl radical-mediated decomposition products of thymidine [II].These compounds may be produced by gamma irradiation of DNA in aqueoussolutions [19] or by reactive species arising from the reduction of hydrogen peroxide bytransition metals (Fe2 +, etc.) (Fenton reaction) [20].
Thymidine glycols, which coeluted as a single peak, have a lower retention timethan thymidine (Fig. 3, Table I). Another important hydroxyl radical oxidationproduct of 2'-deoxyguanosine, 8-oxo-7,8-dihydro-2'-deoxyguanosine [21], coeluteswith the unmodified nucleoside.
Conversely, 2'-deoxyadenosine N1-oxide, obtained from 2'-deoxyadenosine inhydrogen peroxide oxidation from a non-Fenton radical pathway [8], was completelyseparated from its parent compound (Fig. 4).
Photoinduced decomposition products. cis-syn-Cyclobutadipyrimidines, pyrimidine (6-4) pyrimidone photoadducts and 5,6-dihydro-5-(a-thyminyl)thymine, the

SEC OF DNA 377
TABLE I
CAPACITY FACTORS (k') OF NORMAL AND MODIFIED NUCLEIC ACID CONSTITUENTS
Compound k'
HW 55F TSK G 1000 PW
tRNAMot and phenolic compounds 0.47Deoxyribonucleoside 3'-monophosphates 1.66Deoxyribonucleoside 5'-monophosphates 1.362'-Deoxyadenosine 4.212'-Deoxycytidine 2.422'-Deoxyguanosine 3.30Thymidine 2.40(+ )trans(5R,6R),( - )trans(5S,6S),(+ )cis(5S,6R),cis( - )(5R,6S)-5,6-Dihydroxy-5,6-dihydrothymidine 1.46( - )cis(5R,6S)- and (+ )cis(5S,6R)-5,6Dihydroxy-5,6-dihydrothymidine-5'-monophosphate 1.50Adenine 2.61Cytosine 2.42Guanine 2.31Uracil 2.40Thymine 2.412'-Deoxyadenosine N'-oxide 2.018-0xo-7,8-dihydro-2'-deoxyadenosine 3.35cis-5,6-Dihydroxy-5,6-dihydrothymine 1.605-Hydroxy-6-4'-(5'-methylpyrimidin-2'-one)-5,6-dihydrothymine5,6-Dihydro-5-(iX-thyminyl)thymine5-Hydroxy-5-methylbarbituric acid 1.555,6-Dihydrothymine 1.55cis-syn-Thy< >Thy, Thy< > Ura, Ura< > Ura 1.21
15.104.50
16.756.25
16.034.25
14.507.007.00
3.25
8.509.00
15.50
so-called "spore photoproduct", constitute the three main classes of DNA pyrimidinedimeric far-ultraviolet photoproducts [22].
The three cis-syn isomers of DNA cyclobutadipyrimidine involving thyminedimers (Thy < > Thy), thymine-uracil dimer (Thy < > Ura) or uracil dimers(Ura< > Ura) are eluted inasinglepeakona TSK G 1000 PW column (Fig. 5, TableI).
The other dimeric products of thymine, i.e., 5-hydroxy-6-4'-(5'-methylpyridine2'-one)-5,6-dihydrothymine and 5,6-dihydro-5-(a-thyminyl)thymine, which have oneof the two pyrimidines still unsaturated, exhibit higher retention times (Fig. 5, Table I).
DISCUSSION
SEC is generally carried out for purification and/or separation of DNAs ofdifferent size [23-28]. Fractogel HW 55F allows the separation of biopolymers in therange 103_10 5 dalton (SEC mechanism) and the separation of low-molecular-masscompounds « 103 dalton) in the partition mode. All biopolymers (> 105 dalton) areeluted in a single peak (void volume, Va).

378
0.5
o
1
15
2
3
4
TIME (min)
M. POLVERELLI et al.
Fig. 3. SEC of (I) phage), hind III fragments, (2) (+ )cis(5S,6R)- and (- )cis(5R,6S)-diastereoisomers of5,6-dihydroxy-5,6-dihydrothymidine 5'-monophosphate, (3) (+ )cis(5S,6R)-, (- )cis(5R,6S)-, (- )trans(5S,6S)- and (+ )trans(5R,6R)-diastereoisomers of 5,6-dihydroxy-5-6-dihydrothymidine and (4) thymidine.Chromatographic conditions as in Fig. I, except for the column (30 x 1.6 cm J.D.).
Liquid chromatography in the partition mode with TSK G 1000 PW is limited tolow-molecular-mass products (up to 103 dalton). Fast SEC on Fractoge1 HW 55F wasparticularly useful for the clean-up of DNA to remove undesirable polymerizedphenolic compounds which always coprecipitated with the nucleic pool from the crudecell lysate.
The group separation of the nucleic acid components [29-32] has receivedattention in the past. However, it should be noted that only a few papers have reported
0.5
2
o 15 45 TIME (min)
Fig. 4. SEC of (I) 2'-deoxyadenosine N'-oxide, (2) 2'-deoxyadenosine and (3) adenine. Chromatographicconditions as in Fig. 2.

SEC OF DNA
34
7
8
379
o 8 16 24 32 40 6'0 ' 6'8TIME (min)
Fig. 5. HPLC of photoinduced decomposition products ofnucleobases. Column, TSK G LOOO P (30 x 0.75cm 1.0.); eluent, water; flow-rate, 1.0 ml/min; detection, 230 nm. (I) cis-5,6-dihydroxy-5,6-dihydrothymine;(2) cytosine; (3) cys-syn-Thy < > Thy, cis-syn-Ura< > Thy, cis-syn-Ura < > Ura; (4) uracil + thymine; (5)5-hydroxy-6-4-(5'-methylpyrimidin-2'-one)-5,6-dihydrothymine; (6) 5-dihydro-5-(0(-thyminyl)thymine; (7)guanine; (8) adenine.
chromatographic systems that permit the separation of DNA from its digestionproducts [33-35].
The matrix of these gels can be roughly described as a copolymer ofpolyacrylamide and poly(vinyl alcohol) the hydrophilicity of which can be attributedto hydroxyl groups (0.5-1 mequiv./ml) and to carboxylic groups (0.001-0.02mequiv./ml) for TSK HW 55F according to the supplier's information.
In a previous study [29], the chromatographic behaviour of purine andpyrimidine compounds was explained in terms ofcharge effects. With a gel of the sametype, Aoyagi et al. [36] assumed that the elution order of DNA compounds is governedby hydrophobic properties. In agreement with Wada [37] and, more recently, withNoguchi et al. [38], the fast elution properties of deoxyribonucleotides can beexplained by a repulsive interaction between the carboxylic groups of the matrix andthe free anionic groups of 2'-deoxyribonucleotides.
The chromatographic behaviour of 2'-deoxyadenosine N1-oxide may be accounted for in terms of "ion-repulsion" interactions, taking into account the apparentnegative charge in the oxygen atom of the N-oxide: N+ ~O- [39]. Weak hydrophobicinteractions exist between the polyvinyl structure of the gel matrix and the aromaticring of purine and pyrimidine compounds [37]. This explains the higher retention ofpurine nucleobases with respect to the corresponding pyrimidine components (TableI).
Further confirmation of the involvement of weak hydrophobic interactions inthe retention mechanism of purine and pyrimidine components was provided by thechromatographic behaviour of the three cis-syn-cylobutadipyrimidines involvingThy< > Thy, Thy< > Ura and Ura< > Ura, which exhibit similar capacity factors onthe TSK G 1000 PW column (Fig. 5, Table I). This contrasts with the efficient

380 M. POLVERELLI et al.
separationofthesecompoundsonanoctadecylsilyIsilicagelcolumnin thereversed-phasemode [40], for which the order ofelution Ura < > Ura, Ura < > Thy and Thy < > Thyis directly related to the presence ofone or two methyl groups. This confirms the lack ofany strong hydrophobic interactions of the TSK G 1000 PW matrix with the methylgroups of Thy < > Ura and Thy< > Thy.
Solvophobicity of the (6-4) thymine photoadduct and "spore photoproduct"may explain their longer retention times. This is due to the interactions of theunsaturated pyrimidine ring of the photoproducts with the hydrophobic part of thematrix.
CONCLUSION
SEC is an efficient method for purifying DNAs with molecular masses abovethose limiting the exclusion limit of the fractionation range (i.e., > 105 dalton for TSKHW 55F). TSK HW 55F gel columns used with a volatile solvent (0.1 M ammoniumformate, pH 6.5) may separate DNAs from their constituents in a single chromatographic run.
Low-molecular-mass nucleic acid components can be separated on FractogelTSK HW 55F and on TSK G 1000 PW in a non-exclusion mode. The separation isgoverned by a balance between "ionic repulsion" interactions which are predominantfor anionic compounds and weak hydrophobic affinities developed through aromaticsolutes and the polyvinyl structure of the matrix. An interesting application of the TSKG 1000 PW column in the partition mode is the ability to separate pyrimidinephotoproducts by classes. This will allow the separation of groups of particularcompounds from a complex mixture which will be further resolved by using anotherappropriate chromatographic system, such as reversed-phase HPLC [12,40].
ACKNOWLEDGEMENTS
This work was supported in part by grants from the Centre National d'EtudesSpatiales (89/130J) and l'Ofl~al.
REFERENCES
1 W. Szybalski, Methods Enzymol., 12 (1968) 33.2 R. C. Ogden imd D. A. Adams, Methods Enzymol., 152 (1987) 61.3 O. Mikes, High-Performance Liquid Chromatography of Biopolymers and Biooligomers (Journal of
Chromatography Library, Vol. 41B), Elsevier Amsterdam, 1988, p. BI77.4 A. F. Fucciarelli, B. J. Wegher, E. Gajewsiki, M. Dizdaroglu and W. F. Blakely, Radiat. Res., 119 (1989)
219.5 G. Teebor, A. Cummings, K. Frenkel, A. Shaw, L. Voituriez and J. Cadet, Free Rad. Res. Commun.,
2 (1987) 303.6 D. M. Wallace, Methods Enzymol., 152 (1987) 41.7 T. S. Lin, J. C. Cheng, K. Ishigura and A. C. Sartorelli, J. Med. Chem., 28 (1985) 1194.8 J. F. Mouret, F. Odin, M. Polverelli and J. Cadet, Chem. Res. Toxicol., 3 (1990) 102.9 R. Rajagopalan, R. J. Melamede, M. F. Laspia, B. F. Erlanger and S. S. Wallace, Radiat. Res., 97 (1984)
499.10 M. Berger, These 3eme Cycle, Universite de Grenoble, 1981.11 J. Cadet, J. Ulrich and R. Houle, Tetrahedron, 31 (1975) 2057.12 L. Voituriez, C. Voisin, L. S. Kan and J. Cadet, Book of Abstracts, 10th International Congress of
Photobiology, Jerusalem, 1988, p. 83.

SEC OF DNA 3RI
1J 1. Marmur, J. Bioi Chern., 3 (1960) 208.14 K. C. Kuo, R. A. McCume and C. W. Gehrke, Nucleic Acids Res., 8 (1980) 4763.15 K. Randerath, M. V. Reddy and R. C. Gupta, Proc. Natl. Acad. Sci. U.S.A., 78 (1981) 6126.16 P. F. Rao and T. Takagi, Anal. Biochem., 174 (1988) 251.17 W. D. Loomis, Methods Enzymol., 31 (1974) 529.18 R. Teoule, C. Bert and A. Bonicel, Radiat. Res., 72 (1977) 190.19 S. S. Wallace, Br. J. Cancer, 55 Supp!. VIII (1987) 118.20 M. Kaneko, A. Leadon and T. Ito, Muta/. Res., 207 (1988) 17.21 H. Kasai and S. Nishimura, Gann, 75 (1984) 565.22 1. Cadet and P. Vigny, in H. Morrison (Editor), Bioorganic Photochemistry, Vol. 1, Wiley, New York,
1990, p. I.23 1. Besson, M. Berger and 1. Radisson, Biochimie, 57 (1972) 121.24 Y. Kato, M. Sasaki, T. Hashimoto, T. Murotsu, S. Fukushige and K. Matsubara, J. Chromatogr., 266
(1983) 341.25 1. M. Schmitter, Y. Mechulam and G. Fayat, J. Chromatogr., 378 (1986) 462.26 N. Moreau, X. Tabary and F, Le Goffic, Anal, Biochem., 166 (1987) 188.27 H. Ellengren and T. Liiiis, J. Chromatogr., 467 (1989) 217.28 A. Fori6rs, B. Rombaut and A. Boeye, J. Chromatogr., 498 (1990) 105.29 1. N. Khym and M. Uziel, J. Chromatogr" 47 (1970) 9.30 1. X. Khym, Anal. IJiochem., 58 (1974) 638.31 C. D. Lothrop, 1r., and M. Uziel, Anal. Biochem., 109 (1980) 160.32 R. T. Pon and K. K. Ogilvie, J. Chromatogr., 205 (1981) 202.33 H. S. Brown and R. Shapiro, Biochim. Biophys. Acta, 475 (1977) 241.34 T. Hatayama and 1. M. Goldberg, Biochemistry, 19 (1980) 5890.35 D. 1. Cecchini, K. L. Guan and R. W. Giese, J. Chromatogr., 44 (1988) 97.36 S. Aoyagi, K. Hirayanagi, T. Yoshimura and T. Ishikawa, J. Chromatogr., 252 (1982) 133.37 H. Wada, J. Chromatogr., 332 (1985) 265.38 K. Noguchi, Y. Yanaghiara, M. Kasai and N. Hirta, J. Chromatogr., 506 (1990) 145.39 M. A. Stevens, D. 1. Magrath, L. W. Smith and G. B. Brown, J. Am. Chern. Soc., 80 (1958) 2755.40 1. Cadet, N. E. Gentner, B. Rozga and M. C. Paterson, J. Chromatogr., 280 (1983) 99.


Journal o.fChromatography, 539 (1991) 383-391Elsevier Science Publishers RV., Amsterdam
CHROM. 22878
Unfolding of truncated and wild type aspartateaminotransferase studied by size-exclusion chromatography
MARZELL HEROLD*
Hewlett-Packard GmbH, Waldbronn Analytical Division, P.O. Box 1280, W-7517 Waldbronn 2 (Germany)
and
BERND LEISTLER
Abteilungfur Biophysikalische Chemie, Biozentrum, Universitiit Basel, CH-4056 Basle (Switzerland)
ABSTRACT
The reversible unfolding of globular proteins with increasing concentration of guanidinium chloride(GuCl) can be analysed by size-exclusion chromatography, because the hydrodynamic volume of theproteins increases during unfolding. The dimeric enzyme aspartate aminotransferase (AAT) shows anuncoupled dissociation of the identical subunits followed by the unfolding of the monomers. During themonomer unfolding formation of an intermediate is observed. A monomeric mutant of AAT unfolds witha similar shape of the unfolding transition phase, but is less stable, as shown by a shift of the transitionmid-point from 1.7 M GuCl for the wild type to 1.3 M GuCl for the mutant.
INTRODUCTION
It has been demonstrated for many globular proteins that reversible unfoldingcan be studied by size-exclusion chromatography (SEC). Fundamental work in thisfield [1,2] showed that the guanidinium chloride (GuCI)-dependent unfoldingtransition monitored by SEC is the same as the unfolding transition observed bycolumn-independent spectroscopic methods. The hydrodynamic radius, i.e., theStoke's radius, of proteins clearly increases during denaturation by chaotropic saltssuch as urea or GuCl. In this study, GuCl was used because it is more chaotropic andcomparison with previous GuCl-dependent unfolding studies is possible.
High-performance liquid chromatography (HPLC) is a rapid and powerfulmethod for comparing the conformational stability of site-directed mutants with thatof the wild type proteins. Isoenzymes from different organisms can also be easilycompared with this method. Moreover, the refolding conditions of proteins whichprecipitate in "inclusion bodies" during overexpression in the cell can be analysed.Recently, many refolding studies have shown (for a review, see ref. 3) that mostglobular proteins can be refolded in vitro, which is a prerequisite for reproduciblestability studies.
The enzyme AAT (aspartate aminotransferase, E.C. 2.6.1.1) from Escherichia
002 I-9673/9 1/$03.50 © 1991 Elsevier Science Publishers B.V.

384 M. HEROLD, B. LEISTLER
coli has a relative molecular mass of 87146 (sequence data). It is a dimer consisting oftwo identical subunits. The crystal structure of the enzyme is known [4,5]. AATcatalyses the reversible transamination ofL-amino acids into the corresponding ex-ketoacids by its covalently bound cofactor pyridoxal 5'-phosphate (PLP). AAT can bereversibly unfolded with GuCI up to protein concentrations of 1 mg/ml [6]. Theuncoupled dissociation and unfolding of the dimeric AAT can be analysed by SEC,which is difficult to do by conventional methods. Each subunit of AAT consists of twodomains containing no S-S bridges. It has a pI value of 4.6. The large domain of AAT,the PLP binding domain (P-domain) [7], was constructed and isolated by site-directedmutagenesis [8]. The P-domain consists of283 amino acids and has a molecular mass of32,367 dalton (sequence data). In this paper we compare the stability and GuCldependent unfolding of the isolated P-domain with wild type AAT.
EXPERIMENTAL
MaterialsAll reagents of the purest available grade were purchased from Fluka (Buchs,
Switzerland). Water was purified by filtration through an ion-exchange system.AAT and the mutated protein called "P-domain" were isolated as described
previously [6]. The proteins used for column calibration were purchased from Sigma(St. Louis, MO, U.S.A.).
Instrumentation and columnsAll experiments were carried out on a Hewlett-Packard (HP) 1050 Ti Series
quaternary HPLC pump. To avoid crystallization ofsalt on the pump pistons, the sealwash option was used with filtered water. A gradient pump was necessary so that theGuCI concentration could be changed automatically by mixing two different solvents.The samples were injected with an HP 1050 Ti Series autosampler and the signals weremeasured with an HP 1050 Series multiple wavelength detector. The data weretransferred from the detector via an HP Series 35900 analog-digital converter to an HPHPLC ChemStation Series 9000. The column used was a TSK 3000 SWXL (300 x 7.5mm J.D.) packed with 5-/lm particles (Tosoh, Yamaguchi, Japan).
Buffers and chromatographic conditionsAAT and P-domain were stored at concentrations of 1.3 and 0.7 mg/ml,
respectively, in the following buffer: 10 mM HEPES [4-(2-hydroxyethyl)piperazine-lethanesulphonic acid] (pH 7.4)-5 mM DTE (dithioerythritol)-l mM EDTA (ethylenediaminetetraacetate)-lO /lM PLP (100 /lM PLP for the P-domain)-l mM2-oxoglutarate. PLP was added to ensure that the enzymes were always saturated withthe coenzyme. The size-exclusion column was calibrated with the following proteins ofknown molecular mass: thyroglobulin (660000), aldolase (160000), AAT (87000),bovine serum albumin (67000), ovalbumin (45000) and RNase A (13700). Theflow-rate was 0.5 ml/min.
Solvent A used for the calibration was 10 M HEPES (pH 7.0)-1 mM DTE-1mM EDTA-300 mM NaCI. For the unfolding studies solvent B contained the samecomponents plus 6 M GuCl. All experiments were carried out at room temperature (23± 2°C). The absorbance of the eluate was monitored at 230 and 280 nm, band width8 nm, and a reference wavelength of 550 nm, band width 100 nm.

SEC STUDY OF ASPARTATE AMINOTRANSFERASE 385
Fluorescence urifolding studiesFluorescence measurements were carried out with an SLM 8000 single·photon
counting recording fluorimeter. For equilibrium studies the protein was preincubatedin solvent A containing the different concentrations of GuCl for at least 3 h. Themeasurements were performed at 20°e. All solutions were sterilized by filtrationdirectly before use. The measured protein fluorescence spectra were corrected for thesmall apparent fluorescence of the solutions of GuCl in solvent A. The shift of theprotein fluorescence emission maximum (excitation at 280 nm) was monitoreddepending on the GuCl concentration.
RESULTS AND DISCUSSION
Unfolding of AATIn each analysis, 26 J1g (20 J11) of native AAT were injected onto a TSK 3000
SWXL column which was equilibrated with different GuCl concentrations by mixingsolvents A and B. The procedure was automated with the following step gradient fromoto 6 M GuCl: X% increase of solvent B every 50 min with automatic injection ofprotein 20 min after changing %8. Each chromatogram was measured at least threetimes. The relative standard deviation of the elution volume was 1%.
At 0 M GuCl AAT had a retention volume of8.45 ml, which is consistent with anapparent molecular mass of 86000. This demonstrates that AAT is in the dimerconformation. With increasing GuCl concentration the retention volume of theprotein increased owing to the dissociation of AAT into monomers. The retentionvolume at 0.7 M GuCl was 9.3 ml (see Figs. I and 2) which gives an apparent molecular
Nallve Dlmer140
120OM GuCI
100 0.12 M
0.48 M
E0.72 M
c 800 1.08 MIII 1.44 M(II
:J 601 1.8 M
2.1M
40 2.7 M
3.6 M
20 4.2 M
5.4 M
6.0 M
14 16 18 20Ti me (mi n. )
Fig. 1. Elution profiles of holo-AAT at the indicated concentrations of Guel. Flow-rate, 0.5 ml/min;detection, 280 nm; injection, 20 III (26 Ilg) automatically every 20 min after changing the concentration of B.

Average valueof two peaks
M. HEROLD, B. LEISTLER
6543
GuCI[M]
2
386
10.0
9.5
9.0
g 8.5Q)
E8.0:::J
'0>c: 7.50
5w 7.0
6.5
6.0
0
Fig. 2. Change in elution volume ofholo-AAT as a function ofGuCI concentration. x, Average value of theretention volume and peak area if two peaks were observed.
mass of 48000. The true molecular mass of the subunit is 43573. The apparentmolecular mass indicates that the subunits are in a globular conformation, althoughthey are not as compact as in the dimer conformation. The dissociation of the enzymeat 0.7 M GuCl into monomers of slightly relaxed globular conformation has beenconfirmed independently by analytical ultracentrifugation [6].
Further increase in the GuCI concentration beyond 1.2 M led to a gradualdecrease in elution volume, which is due to the increase in the hydrodynamic volumeduring the unfolding of the monomers. The transition phase between 1.2 and 3.5M GuCI does not fit to a two-state process and has an overall transition mid-point at1.7 M GuCl (Fig. 2). At concentrations higher than 3.5 M GuCl, the change in elutionvolume is almost linear, indicating that the protein is in the random coil state. Thereason for the further decrease in the elution volume is not completely clear. Because ithas been observed with all proteins studied so far [2,9,10], this effect seems to be dueonly to the high GuCl concentration. Even proteins being folded or unfolded over thewhole concentration range of GuCl and the small molecule vitamin B12 displayeda continuous small decrease in the elution volume with increasing GuCl concentration[9]. Therefore, it is evident that the linear part of the elution volume decrease is not dueto a conformational change of the protein. The increase in the GuCl concentrationresults in an increase in viscosity and might inhibit the diffusion of the molecules intothe pores. Shalongo et al. [9]assumed a short-time binding of the protein to the columnmatrix which is diminished with increasing denaturant concentrations. A Superose 12column (Pharmacia) also showed this effect [6].
In the first part of the monomer unfolding transition, two peaks at 1.44 M GuClwere observed simultaneously (see Fig. 1), which indicates the transiently accumulated"structured monomers". The GuCI concentration range with two peaks observed at

SEC STUDY OF ASPARTATE AMINOTRANSFERASE 387
1.1 ml/mlno
0.1 ml/mln
Ec0 0.2 ml/mln(')C\I
::J<E
0.5 ml/mln
7 8 9 10
volume [mil
Fig. 3. Elution profiles of AAT in 1.44 M GuCI at four flow-rates.
a flow-rate of0.5 ml/min is shadowed in the unfolding curve in Fig. 2. The formation ofthe intermediate is relatively slow at room temperature; during the retention time of 18min only about 50% intermediate is formed. In order to obtain more informationabout the rate of the intermediate formation, the runs at 1.44 M GuCl were repeatedwith different flow-rates. At the fastest flow-rate of 1.1 ml/min, a small amount ofintermediate is formed (ca. 15%). In contrast, at the very slow flow-rate of 0.1 ml/minthe intermediate is formed to the extent of 90% during 87 min (see Fig. 3). The datawere used for a rough estimation of the rate constant of intermediate formation, whichgave a value of about 1.1 . 10-3 S-l.
This strategy can always be used to determine the rate constants of a change ofprotein conformation provided that the species with different conformations can beseparated on the column and that the process is in the time range of the retention timeof the column. Generally this requires HPLC size-exclusion columns with a highpressure resistance to allow short retention times and a high separation performance,which is the case with the TSK 3000 SWXL column. A further possibility of detectingfolding intermediates is to slow the rate of intermediate formation by decreasing thecolumn temperature.
Unfolding of the P-domainThe conformational stability of mutant proteins compared with the wild type is
always ofgreat interest. The AAT subunit consists oftwo domains. The larger one, thecoenzyme binding domain, is compactly folded [7] and binds the coenzyme PLP evenin the absence of the truncated small domain [8]. Two questions are of interestconcerning the isolated mutated protein: first, is the isolated P-domain still a dimer,and second, how stable is the P-domain compared with the wild type?
The retention volume of 9.6 ml (Fig. 4) clearly indicates that the P-domain is

388
oMGuCI
0.1 0.2 M
0.5 M
0.75 M
E0.9 M
C 1.25 M
0 1.75 MIIW
2M
2.25 M
2.5 M
3M
4M
05M
10 12 14 15 18 20Time (min. )
M. HEROLD, B. LEISTLER
Fig. 4. Elution profiles of P-domain at the indicated concentrations of QuC!. Flow-rate, 0.5 ml/min;detection, 280 nm; injection, 20 Jll (14 Jlg) automatically every 20 min after changing the concentration ofQuCI in solvent B.
10.0
9.5
9.0
E 8.5CJ)
E:::l 8.00>c:
7.50
~UJ
7.0
6.5
6.0
0 2 3 4 5 6
GuCI[M)
Fig. 5. Change in elution volume of P-domain as a function of QuCI concentration.

SEC STUDY OF ASPARTATE AMINOTRANSFERASE 389
monomeric. The apparent molecular mass is 33 500 dalton, which is close to the truevalue of 32367 dalton (sequence data). The retention volume of the P-domainincreases slightly on adding 0.3 M GuCl (see Figs. 4 and 5), suggesting increasingcompactness. It is known that the salt concentration in the elution buffer can influencethe elution volume of proteins owing to the change in their "viscosity radius" [11]. Theexplanation given [11] was that the surrounding counter-ion layer of proteins in bufferbecomes negligibly small at high ionic strength. Therefore, the elution volume of manyproteins increases slightly with increasing salt concentration.
To evaluate the influence of the salt concentration in solvent A, the unfoldingexperiment shown in Fig. 5 was repeated in the presence of 0.1 M instead of 0.3MNaCI (data not shown). Also under these conditions the elution volume increases upto 0.3 M GuCl and then decreases with the same unfolding transition phase starting atconcentrations higher than 0.5 M GuCl. Unfolding was completed at about 3.5M GuCl. The transition mid-point was at 1.3 M GuCl, as shown by the normalizedcurve in Fig. 6. The curve shows the relative change in elution volume; theconformation-independent decrease in the elution volume due to the increase in thesalt was subtracted graphically (see als legend of Fig. 6). The measurements repeated ata flow-rate of 0.9 ml/min gave the same transition curve, demonstrating that theexperiments were carried out at the thermodynamic equilibrium.
To rule out a column dependent influence on the unfolding curve, the unfoldingwas additionally monitored by the GuCl-dependent change of the protein fluorescenceemission maximum (Fig. 6). The red shift of the fluorescence emission maximummonitors the exposure of the buried tryptophan residues to the solvent during theunfolding of the proteins [12]. Both methods displayed an identical unfoldingtransition mid-point, whereas the fluorescence method was not able to detect the firstconformational change of the protein. This is a further example of the accuratedetermination of the unfolding transition of a protein by SEC.
E
E 0.0OJ
<5>c:
~-0.5a;
15
'"g' -1.0oLu
'".~E -15'" .a:
1.0 2.0 3.0 4.0
[GuCI] (M)
5.0 6.0
Fig. 6. Normalized unfolding curve of the P-domain. The curve was normalized by extrapolating the linearchange in elution volume above 3.5 M GuCI to zero GuCl concentration. The relative change in elutionvolume is the apparent deviation from this baseline. Normalized change in elution volume (.A.) comparedwith the change of the fluorescence emission maximum ( - . -, excitation at 280 nm).

390 M. HEROLD, B. LEISTLER
Comparison of the stability of AAT and P-domainThe unfolding transition curve measured in the presence of increasing concen
trations of a strong denaturant aspect is a measure of the conformational stability ofthe protein [13]. The unfolding curves revealed by GuCl-dependent SEC can thereforebe used to compare the stabilities of related proteins. The P-domain is monomericunder all conditions tested. The small increase in the elution volume of the P-domain atconcentrations up to 0.3 M GuCI may be due to a conformational change of theprotein. This effect has to be confirmed by an independent method. The mainunfolding phase is characterized by a strong increase in the hydrodynamic radiusbetween 0.5 and 3.5 M GuCI (see Figs. 5 and 6). The transition phase does not fit toa two-phase process, indicating that unfolding of the P-domain is not a simpletwo-state mechanism. The shape of the unfolding curve looks very similar to thesecond phase of the unfolding of wild type AAT (the unfolding of the monomers;compare Figs. 2 and 5), indicating that the unfolding of AAT monomers is mainly dueto the unfolding of the large PLP-binding domain. The main difference is the shift ofthe overall transition mid-point from 1.7 M (AAT) to 1.3 M GuCl (P-domain),demonstrating the lower stability of the isolated P-domain.
Both unfolding curves were confirmed with column-independent spectroscopicmethod~ (ref. 6 and Fig. 6), demonstrating that the SEC unfolding curves show theequilibrium state.
CONCLUSIONS
Protein folding studies with SEC are fast and easy ifautomated inject and mixingof two solvents are available. Thermodynamic studies do not depend on the type ofSEC column. However, for kinetic studies, a column with a high pressure resistanceand low elution volume is recommended to facilitate the resolution of time-dependentprocesses. The following properties of the HPLC system are prerequisites forreproducible results: (i) the pump should work reliably at low pressure and withviscous solutions; (ii) the system should be resistant to corrosion for maximumreliability with very high salt concentrations; a seal washing feature is recommended;and (iii) a gradient system is necessary to allow precise automatic changes of the saltconcentration.
ACKNOWLEDGEMENTS
We appreciate critical comments from Gerard Rozing, Heinz G6tz, GinnyCurtis and Kasper Kirschner and thank Miriam Hannert for the preparation of thedrawings. The work ofB. L. was supported by the Swiss National Science Foundation,grant No. 31.25711.88.
REFERENCES
I S. Endo, Y. Saito and A. Wada, Anal. Biochem., 131 (1983) 108.2 Y. Saito and A. Wada, Biopolymers, 22 (1983) 2123.3 R. Jaenicke, Prog. Biophys. Mol. Bioi., 49 (1987) 117.4 G. C. Ford, G. Eichele and 1. N. Jansonius, Proc. Nat!. Acad. Sci. U.S.A., 77 (1980) 2559.5 J. Jaeger, E. Kohler, P. Tucker, U. Sauder, Z. Housley-Markovic, 1. Fotheringham, M. Edwards, M.
Hunter. K. Kirschner and J. N. Jansonius, J. Mol. Bioi., 209 (1989) 499.

SEC STUDY OF ASPARTATE AMINOTRANSFERASE 391
6 M. Herold and K. Kirschner, Biochemistry, 29 (1990) 1907.7 J. N. Jansonius and M. G. Vincent, in F. A. Jurnak and A. McPherson (Editors), Biological
Macromolecules and Assemblies, Vol. 3, Wiley, New York, 1987, pp. 187-285.8 M. Herold, B. Leistler, A. Hage, K. Luger and K. Kirschner, in preparation.9 W. Shalongo, M. V. Jagannadham, C. Flynn and E. Stellwagen, Biochemistry, 28 (1989) 4820.
10 M. Herold, Application Note, Publ. No. 12-5952-1428, Hewlett-Packard, Waldbronn, 1990.II M. Potschka, 1. Chromatogr., 441 (1988) 239.12 J. W. Teipel and D. E. Koshland, Jr., Biochemistry, 10 (1971) 798.13 C. N. Pace, Methods Enzymol., 131 (1986) 266.


Journal of Chromatography, 539 (1991) 393-403Elsevier Science Publishers RV., Amsterdam
CHROM. 22879
Isolation and characterization of two different molecularforms of basic fibroblast growth factor extracted fromhuman placental tissue
SYLVIE UHLRICH*, JEROME TIOLLIER, MICHEL TARDY and JEAN-LOUIS TAYOT
IMEDEX, Z.I. Les Troques, B.P. 38, 69630 Chaponost (France)
ABSTRACT
Basic fibroblast growth factor (bFGF) was purified to homogeneity from human placental tissue on asemi-large scale. Placental bFGF consists of two proteins of apparent molecular masses 16 000 and 18 000dalton, as determined by sodium dodecyl sulphate polyacrylamide gel electrophoresis under non-reducingconditions. Microsequence analysis showed that both proteins have the same N-terminal sequence ProAla-Leu-Pro-Glu-Asp-Gly-Gly-Ser-Gly-Ala-Phe... , which is identical with that of (1-146) bFGF extracted from human brain. After reduction by dithiothreitol or mercaptoethanol, placental bFGF appearsas a single protein of 16 000 dalton. The reduced protein displays the same ability to stimulate the proliferation of CCL39 fibroblasts as the non-reduced doublet. These data indicate that bFGF extracted fromplacental tissue consists of two proteins with different apparent molecular masses which do not differ intheir N-terminal sequence but in their oxidation state.
INTRODUCTION
Basic fibroblast growth factor (bFGF) is a heparin-binding polypeptide mitogenfor a wide variety of mesodermal and neuroectodermal cells [1,2]. It was first isolatedfrom bovine pituitary as a single-chain 16 500-dalton protein composed of 146 aminoacids [3]. A number of N-terminal modified forms of bFGF have been identified,depending on the source and the method of isolation: bFGF extracted from bovinebrain, retina and human brain under acidic conditions had 146 amino acids [4-6]whereas extraction of bovine kidney, adrenal, corpus luteum and testis [7-10] underacidic conditions yielded a truncated form of bFGF lacking the first fifteen aminoacids. N-Terminal extended forms ofbFGF have been described: an eight amino acidextension on extraction of human prostate under basic conditions [11] and a thirteenamino acid extension on extraction of human placenta after brief acidification [12].A 25000-dalton form has also been purified from guinea pig brain [13] anda 22 OOO-dalton immunoreactive form has been isolated from rat brain [14]. Theseobservations indicate that bFGF consists of different molecular forms. These formsmay be naturally occurring processed forms or may be generated by proteases releasedduring the purification procedure.
Elucidation of the molecular heterogeneity of bFGF was also done by studying
0021-9673/91/$03.50 © 1991 Elsevier Science Publishers B.V.

394 S. UHLRICH el al.
the role of the four cysteines contained in bFGF. By using site-directed mutagenesis,Arakawa et al. [15] demonstrated that the analogue protein deprived of all fourcysteines exhibited mitogenic activity on NIH 3T3 cells which was indistinguishablefrom natural sequence protein. In a same manner, Seno et al. [16] showed that selectivesubstitution of cysteine residue 69 or 87 by serine did not affect the heparin-bindingability of the protein but reduced its heterogeneity, recognized as several peaks ofbFGF eluted from a heparin affinity column.
We report here for the first time the molecular heterogeneity of naturallyoccurring bFGF due to different oxidation states. Whereas all variations in apparentmolecular mass of extracted bFGF which have been described up to now could beattributed to N-terminal variations, we show here that bFGF extracted from placentaltissue under acidic conditions consists of a doublet of proteins which display the sameN-terminal sequence but differ from each other in their oxidation state.
EXPERIMENTAL
Purification ofplacental bFGFPlacentas were collected at delivery and immediately frozen at - 20°e. Pools of
500-600 placentas were mechanically ground into small pieces and then stirred, untilcompletely thawed, in an 8% (vjv) ethanol-water solution. Placental blood wasseparated from the tissue on a press. The placental tissue pulp underwent further acidextraction at pH 3.2 at 4°C for 30 min. The acid extract was separated from the residualplacental pulp on a press, neutralized and precipitated with 15% ethanol. Thesupernatant was recovered by centrifugation, concentrated by ultrafiltration andfinally diafiltered against 0.1 M sodium phosphate (pH 6.0) with 10 OOO-dalton cut-offmembranes. One litre of final placental tissue crude extract corresponded to ca. 15 kgof placental tissue pulp. The extract (198 g of proteins) was then applied to a 30 x10 cm J.D. column ofCM-Trisacryl (IBF Biotechnics, Villeneuve la Garenne, France)and eluted with the above-mentioned buffer until the absorbance at 280 nm dropped tothe baseline at 2.0 a.u.f.s. The unretained fraction was discarded. The CM-Trisacrylcolumn was eluted with 0.1 M sodium phosphate (pH 6.0) containing 0.15 MNaCl andthen with 0.6 M NaCI buffer. The 0.15 M NaCI eluate showed of three successiveabsorbance peaks, denoted CM-1, CM-2 and CM-3. Fractions CM-2 and CM-3contained most bFGF and were further purified on heparin-Sepharose (Pharmacia,Uppsa1a, Sweden). Each fraction was adjusted to 0.1 M sodium phosphate-0.65 M~aCI (pH 7.2) and pumped onto a heparin-Sepharose column (11 x 9 mm J.D.) thathad previously been equilibrated with 6.5 mM NazHPOc 1.5 mM KHzP04-2.7 mMKCI-0.65 M NaCI (pH 7.2). The heparin-Sepharose column was washed with thesame buffer until the absorbance at 206 nm dropped to the baseline at 0.5 a.u.f.s. andthen eluted with the same buffer containing successively 1 and 2 M NaCl. Both2 M NaCl eluates obtained from the CM-2 and CM-3 fractions were analysed andfurther stored at - 70°e.
Protein determinationProtein concentrations were determined with the Bio-Rad Protein Assay
(Bio-Rad Labs., Richmond, CA, U.S.A.) using human albumin (Pasteur MerieuxSerums et Vaccins, Lyon, France) as a standard.

ISOLATION OF BASIC FIBROBLAST GROWTH FACTOR 395
Analytical sodium dodecyl sulphate polyacrylamide gel electrophoresis (SDS- PAGE)Proteins were analysed by SDS-PAGE following standard techniques [17] in the
presence or absence of2% (vjv) mercaptoethanol in l-mm thick 20% acrylamide gelsstained with silver nitrate [18]. About I Ilg of each sample was desalted on a PDIOcolumn (Pharmacia) and lyophilized before SDS-PAGE. Molecular mass standards(Boehringer, Mannheim, Germany) were lXz-macroglobulin (170 000), phosphorylase B (97 400), glutamate dehydrogenase (55 400), lactate dehydrogenase (36 500),trypsin inhibitor (21 500), cytochrome c (12 500) and aprotinin (6500 dalton).
Preparative SDS-PAGEProteins (typically 5-10 Ilg per lane) were loaded on the same SDS-polyacryl
amide gels as for analytical purposes (see above). After electrophoresis, the gels weredipped for a few seconds in water and then reversibly stained by gentle rocking in250 ml of 0.3 M CuCl z solution for 5 min at room temperature [19]. The gels were thenwashed in water to remove excess of reagent. The protein bands appeared as negativelystained areas. Each band of the bFGF doublet (namely 16K and 18K, where K =
kilodalton) was excised from the gel. Copper stain was eliminated by incubation inthree changes (10 min each) of 0.25 M EDTA-0.25 M Tris-HCI (pH 9.0). Proteinswere then eluted from the gels by vigorous rocking for 72 h at 4°C in 20 mMTris-HCI-0.15 M glycine-O.OI% SDS. The recovery was between 10 and 20%.
Reversed-phase high-performance liquid chromatography (HPLC)A Waters Model 600 HPLC system was used, coupled with a Waters 490
programmable multi-wavelength detector (Millipore-Waters, Milford, MA, U.S.A.).Samples were loaded onto a C4 reversed-phase HPLC column (Vydac 214TP54)(250 x 4.6 mm I.D.) equilibrated with 10% acetonitri1e-0.05% trifluoroacetic acid ata flow-rate of 1.0 mljmin. The column was washed with 30 ml of this solvent and boundproteins were eluted with a 60-ml gradient of 10-50% acetonitri1e-0.05% trifluoroacetic acid. Proteins were detected by monitoring the absorbance at 215 nm. Fractionsof I ml were collected. For 16K and 18K chromatography after elution fromSDS-polyacrylamide gels, samples were submitted to a first run as described. The mainpeak was collected, lyophilized, resuspended in 20 mM Tris-0.15 M glycine-O.O 1%SDS and rechromatographed under the same conditions before sequencing.
Protein sequence analysisProtein sequence analysis was carried out at the Laboratoire Central d'Analyses
(CNRS, Solaise, France) on a Model 470A gas-phase sequencer (Applied Biosystems,Foster City, CA, U.S.A.) connected "on-line" with a Model 120A phenylthiohydantoin amino acid analyser (Applied Biosystems).
Growth factor assaysThe biological characterization of growth factor activities was performed by
proliferation assays on bovine corneal endothelial cells and CCL39 fibroblasts.Corneal endothelial cells (EC) were isolated from bovine eye corneal endothelium bytrypsinization and scraping. Once cultures had been established, EC were grown andmaintained in culture flasks using Minimum Essential Medium (MEM) containing6% foetal calf serum (FCS) and 100 Ilgjml of crude placental extract. CCL39

396 S. UHLRICH et al.
fibroblasts (ATCC, Rockville, MO, U.S.A.) were subcultivated in MacCoy's mediumsupplemented with 20% FCS.
For both types of cells, proliferation assays were performed in 24-well plates(Falcon), in serum-free medium (OMEM/F12) supplemented with insulin, transferrin,albumin and selenite and with increasing amounts ofbFGF fractions to be tested. ForEC, 10 000 cells were seeded at day 0 (DO) and stimulation with bFGF fractions wereperformed at 00,01,02,03 and 04. Medium changes occurred at 02 and 04 andthe total number of cells was determined after trypsinisation at 07. For CCL39fibroblasts, 50 000 cells per well were seeded at DO. Stimulation with bFGF fractionswas performed at DO, 01, 02 and 03. The medium was changed at 02 and the finaltotal number of cells was determined at 04.
Reduction of bFGFA 30-flg sample of bFGF was adjusted in 0.1 M Tris (pH 8)-1.5 mM EDTA
10 mM dithiothreitol and incubated for 1.5 h at 37°C. Reduced sulphydryl groups werethen blocked with 20 mM iodoacetamide for 30 min at 37°C. Samples were then eitherdesalted against water for SOS-PAGE or desalted against PBS-0.02% Tween 20 andassayed for biological activity.
RESULTS
Purification ofplacental bFGFPlacental tissue was processed after separation of the placental blood on a press.
The extraction of placental tissue at pH 3.2 yielded a final placental extract whichcontained ca. 2.6 g of proteins per kilogram of tissue. When applied to a CM-Trisacrylin 0.1 M phosphate at pH 6.0, 90-95% of the proteins were recovered in the unretainedfraction. bFGF was bound to the gel and eluted with 0.15 MNaC!. The 0.15 MNaCIeluate showed of three successive absorbance peaks (namely CM-I-3) (Fig. I). Aftera second chromatography on heparin-Sepharose, only fractions CM-2 and CM-3appeared to contain bFGF, which was eluted from heparin-Sepharose by stepwiseelution at 2 M NaC!. The final bFGF fractions obtained from either CM-2 or CM-3(namely HS-CM-2 and HS-CM-3), were analysed by SOS-PAGE (Fig. 2) undernon-reducing conditions and consisted of two proteins of ca. 16K and 18K. Therecovery was quantitative with a yield ofpurification of 15 flg ofbFGF per kilogram ofplacental tissue.
The biological activity of placental bFGF was characterized on endothelial cells(Fig. 3): both bFGF fractions HS-CM-2 and HS-CM-3 stimulated the proliferation ofbovine corneal endothelial cells. The EOso (concentration of proteins necessary toinduce half-maximum stimulation) was equivalent for both fractions and ca. 0.5 ng/m!.Cell growth depended on the concentration of bFGF in the medium and reacheda plateau at 20 ng/m!.
Further characterization ofplacental bFGFSeparation of 16K and 18K proteins. We tried to separate the 16K and 18K
proteins contained in the bFGF fraction by reversed-phase HPLC with an acetonitrilegradient, but both proteins coeluted in the same peak at 35% acetonitrile. However,both proteins could be separated by SOS-PAGE. The bFGF fraction was applied to an

ISOLATION OF BASIC FIBROBLAST GROWTH FACTOR
2
1CM2"--'CM3........
0.6
Ec0 0.4 ~CD
'"w
0.2 ~~1
caZ
§ 0en-<
0·-4-------....-------r------r-
397
o 5 10elution volume (I)
Fig. I. Purification of crude acid placental extract by cation-exchange chromatography on CM-Trisacryl(30 x 10 cm I.D.) in 0.1 M sodium phosphate (pH 6.0). Stepwise elution with NaCI (0.15 and 0.6 M);flow-rate, 1.4 I/h.
Fig. 2. SDS-PAGE (20%) under non-reducing conditions. Lanes a--{j = molecular mass standards;b = placental bFGF purified from CM-2 eluate (HS-CM-2); c = placental bFGF purified from CM-3eluate (HS-CM-3). kD = Kilodalton.

398
70
50a;~
".!!!a;<..l
(') 30~•
10
0.1
proteins n9 I ml
10
S. UHLRICH et al.
Fig. 3. Biological activity of placental bFGF HS-CM-2 (e) and HS-CM-3 (0) eluate on proliferation ofbovine corneal endothelial cells. 10 000 cells at day 0; stimulation with bFGF fractions at day 1,2,3 and 4;medium changes at day 2 and 4; determination of total number of cells at day 7.
SDS-PAGE (20%) gel. The bands were reversibly stained with copper chloride, cut outfrom the gel and eluted by incubation in Tris-glycine buffer. The two proteins werefurther chromatographed by reversed-phase HPLC. Each protein eluted as a sharppeak at 44% acetonitrile (Fig. 4). SDS-PAGE of each HPLC eluate (Fig. 5) showedthat the main peak consisted of the homogeneous protein, but the presence of dimeric(Fig. 5, lanes d and j) and oligomeric structures (Fig. 5, lanes e-f and k-l) was detectedin the tail of the peak. This observation could be made for both 16K and 18K,indicating that both proteins are able to make aggregates (either by covalent ornon-covalent bonds) under the physico-chemical conditions of reversed-phase HPLCelution. The amino-terminal sequence analysis of 16K and 18K showed that bothproteins .have the same sequence, Pro-Ala-Leu-Pro-Glu-AsIrGly-Gly-Ser-GlyAla-Phe-Pro-Pro-Gly-His-Phe-Lys-, which is identical with that of (1-146) bFGFextracted from human brain (Table I). Moreover, for both proteins, microsequenceanalysis showed the presence of degraded polypeptides lacking the last amino acid(Pro) and the last four amino acids (Pro-Ala-Leu-Pro).
Effect ofreducing agents on 16K and 18Kproteins. The placental bFGF fraction,which consists of a 16K-18K doublet, was submitted to reduction by dithiothreitolfollowed by iodoacetamide alkylation. SDS-PAGE of the reduced fraction (Fig. 6,lane d) showed a single band at 16000 dalton. Moreover, the direct analysis of thebFGF fraction in the presence of mercaptoethanol confirmed that the 18K bFGFform is transformed into the 16K bFGF form by reduction (Fig. 6, lane c). Thebiological activity of placental bFGF was also determined after reductive alkylationon CCL39 fibroblasts. As shown in Fig. 7, the bFGF fraction was equally active after

ISOLATION OF BASIC FIBROBLAST GROWTH FACTOR 399
0.2 0,.Z 44%
~ IE :I:c: U
'"NUl
~0.1«alII:
~«
-00 30 60
ELUTION VOLUME ml
0.2®,.
z~:I:U
44 ".Ec: 50 IIt)
N
Ul
~0.1«alII:0jg«
-00 30 60
ELUTION VOLUME ml
Fig. 4. Purification of 16K and 18K placental bFGF by reversed-phase HPLC on a Vydac C4 column (250 x4.6 mm I.D.). Flow-rate, 1.0 ml/min; 60-min gradient elution from 10 to 50% acetonitrile in water--{).05%trilluoroacetic acid. Elution profiles of (A) 16K and (B) 18K protein.
and before reduction, ED so values ranging between 0.7 and 1 ng/ml as determinedfrom four different experiments.
DISCUSSION
After extracting placental tissue by brief exposure to an acidic pH, we purifiedplacental bFGF with two chromatographic steps involving cation-exchange chromatography followed by affinity chromatography on immobilized heparin. The resultingbFGF fraction consists of two proteins ofapparent molecular masses 16K and 18K, asdetermined by SDS-PAGE under non-reducing conditions. Two molecular forms ofbFGF have already been described in human placenta: the classical (1-146) bFGFidentical with human brain bFGF [20] with a molecular mass of 16 400 dalton anda thirteen amino acid N-terminally extended form [12] with a molecular mass of

400 S. UHLRICH et al.
Fig. 5. SDS-PAGE (20%) under non-reducing conditions. Lanes: a = molecular mass standards;b = ooginning ofl8K peak on HPLC; c = 18K HPLCpeak;d,e,f = tail of 18K HPLC peak; g = placentalbFGF; i = 16K HPLC peak; j,k,1 = tail of 16K HPLC peak. kD = Kilodalton.
17 500 dalton. However, in our case, N-terminal amino acid sequence analysis of the16K and 18K proteins revealed that both proteins have the same N-terminal sequence,which is identical with that of brain (1-146) bFGF. Moreover, we showed that the16K-18K doublet appears as a single 16K protein after reductive alkylation or bySDS-PAGE under reducing conditions. (1-146) bFGF contains four cysteines atpositions 25, 69, 87 and 92, among which only residues 25 and 92 are conservedthrough the whole FGF family [21]. By site-directed mutagenesis and replacement ofcysteine with serine residues, it was shown that substitution of cysteine residues atpositions 69 and 87 did not affect the biological activity and heparin-binding ability ofbFGF [16]. Moreover, in contrast to the natural sequence form, SDS-PAGE of theserine-69, 87 analogue under non-reducing conditions revealed little dimer formation[22]. Our data show that placental bFGF is equally active before and after reductivealkylation, indicating that the 18K protein displays the same biological activity as the16K reduced form. Reversed-phase HPLC of each protein revealed the presence ofdimers and oligomers in both instances, which disappeared on analysis in the presenceofreducing agent (data not shown). These observations suggest that the 16K and 18Kproteins differ from each other only in their oxidation state. The observation that theyare both able to form intermolecular bonds supports the hypothesis that both proteins

ISOLATION OF BASIC FIBROBLAST GROWTH FACTOR 401
TABLE I
AMINO-TERMINAL SEQUENCE ANALYSIS OF BOTH PLACENTAL bFGF MOLECULARFORMS
Cycle PTH-amino bFGF 16K bFGF 18K Cycle PTH-amino bFGF 16K bFGF 18Kacid yield (pmol) yield (pmol) acid yield (pmol) yield (pmol)
I Pro 42 22 11 Ala 10 42 Ala 18 7 12 Phe 10 43 Leu 16 6 13 Pro 6 44 Pro 15 8 14 Pro 5 I5 Glu 15 5 15 Gly 4 ?6 Asp 10 4 16 His 3 27 Gly 3 4 17 Phe 6 28 Gly 7 0, 5 18 Lys 4 29 Ser n.d." n.d." 19 Asp 3
10 Gly 7 2 20 Pro 2
" n.d. = Not determined.
Fig. 6. SDS-PAGE (20%) in the presence (+) or absence (- ) of mercaptoethanol. Lanes: a = molecularmass standards; b,c = native placental bFGF; d = placental bFGF after reductive alkylation(dithiothreitol + iodoacetamide). kD = Kilodalton.

402
1000
S. UHLRICH et al.
0.1 10
proteins ng I ml
Fig. 7. Biological activity of placental bFGF native (e) or after reduction by dithiothreitol (0) onproliferation ofCCL39 fibroblasts. 50000 cells at day 0; stimulation with bFGF fractions at day 0, 1,2 and3; medium changes at day 2 and 4; determination of total number of cells at day 7.
contain free sulphydryl groups, the 16K protein containing all four cysteines freewhereas the 18K protein contains at least one disulphide bridge. Moreover, the fullbiological potential of the 16K reduced form is consistent with the findings ofArakawaet al. [15], who showed that human bFGF analogue in which all four cysteines havebeen replaced with serine exhibited mitogenic activity on NIH 3T3 cell which wasindistinguishable from the natural sequence molecule.
ACKNOWLEDGEMENTS
The authors thank Marielle Barthoux, Ginette Bouchut, Marie-Pierre Freychetand Marc Morel for excellent technical assistance and Isabelle Mercier for typing themanuscript.
REFERENCES
I D. Gospodarowicz and J. S. Moran, Annu. Rev. Biochem., 45 (1976) 531.2 A. Baird, F. Esch, P. Normede, N. Ueno, N. Ling, P. Bohlen, S. Y. Ying, W. B. Wehrenberg and R.
Guillemin, Recent Prog. Horm. Res., 42 (1986) 143.3 F. Esch, A. Baird, N. Ling, N. Ueno, F. Hill, L. Denoroy, R. Klepper, D. Gospodarowicz, P. Bohlen and
R. Guillemin, Proc. Natl. Acad. Sci. U.S.A., 82 (1985) 6507.4 D. Gospodarowicz, J. Cheng, G. M. Lui, A. Baird and P. Bohlen, Proc. Natl. Acad. Sci. U.S.A., 81
(1984) 6963.5 A. Baird, F. Esch, D. Gospodarowicz and R. Guillemin, Biochemistry, 24 (1985) 7856.6 P. Bohlen, F. Esch, A. Baird, K. L. Jones and D. Gospodarowicz FEBS Lell., 185 (1985) 177.7 A. Baird, F. Esch, P. Bohlen, N. Ling and D. Gospodarowicz, Regul. Pept.. 12 (1985) 201.8 D. Gospodarowicz, A. Baird, J. Cheng, G. M. Lui, F. Esch and P. Bohlen, Endocrinology, 118 (1986) 82.9 D. Gospodarowicz, J. Cheng, G. M. Lui, A. Baird, F. Esch and P. Bohlen, Endocrinology, 117 (1985)
2383.

ISOLATION OF BASIC FIBROBLAST GROWTH FACTOR 403
10 N. Ueno, A. Baird, F. Esch, N. Ling and R. Guillemin, Mol. Cell. Endocrinol., 49 (1987) 189.11 M. T. Story, F. Esch, S. Shimasaki, J. Sasse, S. C. Jacobs and R. K. Lawson, Biochem. Biophys. Res.
Commun., 142 (1987) 702.12 A. Sommer, M. T. Brewer, R. C. Thompson, D. Moscatelli, M. Presta and D. B. Rifkin, Biochem.
Biophys. Res. Commun., 144 (1987) 543.13 A. Sommer, D. Moscatelli and D. B. Rifkin, Biochem. Biophys. Res. Commun., 160 (1989) 1267.14 M. Presta, M. Rusnati, J. A. M. Maier and G. Ragnotti, Biochem. Biophys. Res. Commun., 155 (1988)
1161.15 T. Arakawa, Y. R. Hsu, S. G. Schiffer, L. B. Tsai, C. Curless and G. M. Fox, Biochem. Biophys. Res.
Commun., 161 (1989) 335.16 M. Seno, R. Sasada, M. Iwane, K. Sudo, T. Kurokawa, K. Ito and K. Igarashi, Biochem. Biophys. Res.
Commun., 151 (1988) 701.17 U. K. Laemmli, Nature (London), 227 (1970) 680.18 W. Wray, T. Boulikas, V. P. Wray and R. Hancock, Anal. Biochem., 118 (1981) 197.19 C. Lee, A. Levin and D. Branton, Anal. Biochem., 166 (1987) 308.20 D. Gospodarowicz, J. Cheng, G. M. Lui, D. K. Fujii, A. Baird and P. Bohlen, Biochem. Biophys. Res.
Commun., 12 (1985) 554.21 T. Yoshida, K. Miyagawa, H. Odagiri, H. Sakamoto, P. F. R. Little, M. Terada and T. Sugimura, Proc.
Nat!. Acad. Sci. U.S.A., 84 (1987) 7305.22 G. M. Fox, S. G. Schiffer, M. F. Rohde, L. B. Tsai, A. R. Banks and T. Arakawa, J. Bioi. Chem., 263
(1988) 18452.


Journal o/Chromatography, 539 (1991) 405-416Elsevier Science Publishers B.V., Amsterdam
CHROM. 22885
High-performance anion-exchange chromatographic study ofdesialylated human a1-acid glycoprotein variants
Development of a fractionation method for the protein slowvariants
FRAN<;:OISE HERVE', JEAN-CLAUDE DUCHE, NATHALIE SPORTES and JEAN-PAULTILLEMENT
Service Hospitalo-Universitaire de Pharmacologie de Paris XIl, Centre Hospitalier Intercommunal de Cretei/, 40 Avenue de Verdun, 94010 Cretei/ Cedex (France)
ABSTRACT
The three main desialylated variants (FI, S and A) of human IXt-acid glycoprotein (AAG), a serumacute-phase reactant, were analysed by high-performance anion-exchange chromatography in ordcr todetermine their optimum separation conditions. The analysis consisted of three steps, as follows: (I) Adesialylated commercial AAG was separated into one "fast"- and one "slow"-migrating fraction by preparative isoelectrofocusing. The "fast" and "slow" fractions were shown to contain the Fl variant and amixture of the S and A variants, respectively. (2) The pH titration curves of these two fractions were thenmeasured by strong anion-exchange chromatography with several buffer systems of increasing pH. Fromthe data obtained, it was not possible to select the optimum conditions to separate the "fast" variant FIfrom the "slow" variants A and S. However, the S and A variants were shown to ionize very differently. (3)The specific fractionation of the S and A variants was therefore carried out by anion-exchange chromatography under operating conditions based on the data obtained from the study of their pH titration curves.This was performed both with the "slow"-migrating fraction obtained by preparative isoelectrofocusing ofcommercial AAG and with an AAG (containing only variants S and A) purified from an individual serumon immobilized Cibacron Blue F3G-A. Identification of the fractionated proteins was achieved by analytical isoelectrofocusing.
INTRODUCTION
ai-Acid glycoprotein (AAG), or orosomucoid, is an acute-phase reactant whoseserum concentration increases in association with inflammatory states (for a review,see ref. 1). Its physiological function is still unknown but it is thought to act asa transport protein for basic drugs such as antidepressant drugs, neuroleptics and{3-blockers, and also plays a role in immunoregulation (for a review, see ref. 1),
It has been well documented that AAG, which has a high carbohydrate contentand a large number of sialyl residues,- is very heterogeneous, consisting of subpopulations of different size, charge [2] and lectin-binding behaviour [3].
0021-9673(91($03.50 © 1991 Elsevier Science Publishers B.V.

406 F. HERVE et al.
One extensively studied case of the heterogeneity of AAG is the existence, afterdesialylation of the protein, of three main variants, distinguished by their electrophoretic migration in analytical isbelectrofocusing (IEF) as one "fast" and two "slow"bands [4], corresponding to the FI and to the S and A variants, respectively. Thesevariants differ in that numerous amino acids are substituted in the peptide chain [5].This microheterogeneity is genetically determined and, depending on the relativeconcentrations of the variants in desialylated serum, three main phenotypes areobserved for AAG in a general population: Fl S/A, Fl/A and S/A, with expectedfrequencies of 47.9,35.1 and 16.4%, respectively [4].
Elucidation of this heterogeneity, especially in the light of the possibility offunctional differences between AAG variants, has recently been attempted. Commercial human AAG containing the three variants was fractionated after its desialylation,into a "fast" (F-AAG) and a "slow" AAG (S-AAG) by a preparative IEF technique[6,7]. The F- and S-AAG were shown to contain the FI and a mixture of the SandA variants, respectively. Comparison of their drug-binding properties showed thatS-AAG exhibits a higher binding capacity (n' k, where n is the number of binding sitesand k is the intrinsic affinity constant) than F-AAG for most of the drugs tested [6,7]. Itwas also proposed that only one of the two S-AAG variants was responsible for thehigh-affinity binding site. However, it was impossible to determine which variant, S orA, is involved, as they cannot be fractionated electrophoretically without denaturation, and because commercial AAG is a mixture of the phenotypes and contains equalproportions of the A and S variants.
Using high-performance ion-exchange chromatography (HPIEC), we studiedthe pH titration curves of the AAG variants in order to optimize their separation bythis method. The results enabled us to develop an HPIEC method for the fractionationof S-AAG into its two charge variants and this fractionation was compared with theelectrophoretic heterogeneity of S-AAG as shown by analytical IEF. The HPIECmethodology was also applied to the fractionation of an AAG purified in thelaboratory from an individual serum of phenotype S/A by chromatography onimmobilized Cibacron Blue F3G-A [8].
EXPERIMENTAL
MaterialsHuman serum contammg AAG with the S/A phenotype (S/A-AAG) was
obtained from a healthy donor and was frozen until use.Materials were obtained from the following sources: human AAG (from Cohn
fraction VI), Clostridium perjringens neuraminidase type X, Norite A charcoaland 1,3-bis[tris(hydroxymethyl)methylamino]propane (Bis-Tris-propane) were fromSigma (St. Louis, MO, U.S.A.), bovine serum albumin (grade A) from Calbiochem(San Diego, CA, U.S.A.), Cibacron Blue F3G-A from Fluka (Buchs, Switzerland),Sephadex G-I00, DEAE-Sephadex, Mono Q HR 5/5 prepacked column, gradient gelsPAA 4/30, low-molecular-mass marker protein kit, immobiline (pK 4.6 and pK 9.3),Gelbond PAG films, acrylamide and N,N'-methylenebisacrylamide from PharmaciaLKB (Uppsala, Sweden), Coomassie Brilliant Blue R 250, urea and 2-mercaptoethanol from Merck (Darmstadt, Germany) and YM 10 membrane filter and Centricon 10 microconcentrator from Amicon (Danvers, MA, U.S.A.). All other reagentswere of grade A or analytical-reagent grade and were purchased from local suppliers.

HPIEC OF lXI-ACID GLYCOPROTEIN VARIANTS 407
Purification of the SjA-AAG on immobilized Cibacron Blue F3G-AThe covalent coupling of Cibacron Blue F3G-A to Sephadex G-IOO was
performed according to B6hme et al. [9], with 0.85 g ofdye per gram ofdry gel at 80°C,in order to obtain maximum dye substitution. The determination of the amount ofdyecovalently bound to the matrix was carried out according to Chambers [10]. TheSjA-AAG was purified from the serum essentially by the one-step chromatographicprocedure on immobilized Cibacron Blue F3G-A described by Birkenmeier andKopperschUiger [8] in 10 mM sodium phosphate buffer (pH 5.8) and at 4°C. Thepurified protein was concentrated on a YM 10 membrane filter and dialysed againstdeionized water.
Charcoal treatment and desialylation of AAGBefore use, the pure SjA-AAG preparation and the commercial AAG were
delipidated by charcoal treatment at pH 3.0 according to Evenson and Deutsch [II]and then lyophilized. Both proteins were then desialylated with neuraminidase asdescribed by Eap et al. [6], dialysed against deionized water and lyophilized.
Prior to analytical IEF, the human whole serum used in the chromatographicprocedure on immobilized Cibacron Blue was desialylated with neuraminidase asdescribed by Eap et al. [4].
Spectrophotometry and protein assayAbsorbance determinations or spectral scans were performed on a Beckman
Model DU-3 single-path recording spectrophotometer. Total protein concentrationswere determined by the method of Lowry et al. [12] with bovine serum albumin(grade A) as a standard. The specific assay of AAG was carried out by animmunonephelometric method using a Beckman assay kit and instrument.
Electrophoretic techniquesThe purity of the SjA-AAG preparation was checked by sodium dodecyl
sulphate-polyacrylamide gel electrophoresis (SDS-PAGE) [13] using a PharmaciaG E 2-4jLS vertical gel electrophoresis apparatus. Analytical and preparative IEF wereperformed using an LKB 2117 Multiphor II electrophoresis apparatus.
Separation of the S- and F-AAG from the desialylated commercial AAG wasperformed by a preparative IEF technique in an immobilized pH 4.4-5.4 polyacrylamide gel gradient [6,7]. The separated F- and S-AAG were detected in strips of the gelby trichloroacetic acid fixation and Coomassie Brilliant Blue staining. The protein ineach band was recovered from the remainder of the gel by electrophoretic elution intoDEAE-Sephadex. After recovery from Sephadex, the two fractions were dialysedextensively against deionized water and lyophilized.
Analytical IEF of the desialylated AAG variants and AAG phenotyping of thedesialylated whole serum were performed essentially as described by Eap andBaumann [14] in an immobilized pH 4.4-5.4 polyacrylamide gel gradient with 8 M ureaand 2% (vjv) 2-mercaptoethanol. Detection of the variants was made by immun.oblotting with two antibody steps [14] or by staining with Coomassie Brilliant Blue. Theanalytical IEF of the desialylated proteins also permitted the determination of theextent of desialylation. The relative. proportion of each protein band in the gels wasdetermined by scanning with an LKB 2202 Ultroscan laser densitometer.

408 F. HERVE et al.
High-performance ion-exchange chromatography (HPIEC)HPIEC was performed on a Waters Assoc. liquid chromatography system
equipped with two Model 6000-A pumps and a Model 660 solvent programmercapable of generating a gradient or step elution profile. Sample injections were carriedout with a Waters Assoc. Model U6K injector and chromatograms were recorded bymonitoring the absorbance of the eluent at 280 nm using a single-path UV monitor(Cecil Instruments, Cambridge, U.K.) fitted with a 10-mm path-length flow cell. Theabsorbance units full-scale (a.u.f.s.) were set between 0.02 and 0.5 as appropriate.Fractions were collected with a Gilson Model 203 fraction collector. The HPIECsystem was operated at room temperature.
HPIEC of the desialylated AAGs was carried out using a Pharmacia Mono Qstrong anion-exchange column (50 x 5 mm J.D.; 10 J1m particle size).
In initial experiments, the pH titration curves of the AAG variants weredetermined using buffer systems of pH 7.0-10.0 (adjusted with 1M hydrochloric acid),with the starting and final buffers containing 6.25 mM Bis-Tris-propane and with 0.15or 0.35 M sodium chloride in the final buffer. The F- and S-AAG, obtained by thepreparative IEF technique, were chromatographed with each buffer system.
Fractionation of the S-AAG and of the SfA-AAG preparation was carried outon the same anion-exchange column. The starting and final buffers were 6.25 mMBis-Tris-propane chloride adjusted to pH 9.75 with 1 Mhydrochloric acid, with thefinal buffer containing 0.15 M sodium chloride. A preprogrammed linear gradient wasused for the chromatography and the appropriate peak fractions were collected,concentrated and re-equilibrated in deionized water or start buffer, using Centricon 10microconcentrators, prior to their study by analytical IEF or their rechromatography.
RESULTS AND DISCUSS10N
Purification of AAG from an individual serum on immobilized Cibacron Blue F3G-AMeasurement of the absorption spectrum of the Cibacron Blue F3G-A used
showed a broad peak at 595-630 nm and the calculated molar absorptivity was10.3 1 . mmol- 1 cm -1. This was compared with a value of 13.6 1 . mmol- 1 cm- I
obtained by Thompson and Stellwagen [15] using especially purified Cibacron BlueF3G-A, and a purity of 75.7% was calculated for the dye sample used in ourexperiments. This value was used to correct the values obtained for dye release insubsequent experiments.
Under the experimental coupling conditions used, a maximum of 150 J1g of dyecovalently bound per milligram of dry Cibacron Blue-Sephadex was found byhydrolysis of the substituted gel in 6 M hydrochloric acid [10). This loading density isless than that used by Birkenmeier and KopperschHiger [8] in their chromatographicpurification procedure for human AAG. Nevertheless, when the individual serum,dialysed against 10 mM sodium phosphate buffer (pH 5.8), was applied to theCibacron Blue-Sephadex column, the only constituent detected in the breakthroughfraction was AAG. Fig. 1 shows the elution pattern obtained by chromatography ofthe individual serum and the presence of two peaks can be observed, a major peak anda minor "retarded" peak. Each peak was separately concentrated on an AmiconYM 10 membrane filter. The total protein concentration and the specific AAGconcentration were determined in each peak and identical results were obtained with

HPIEC OF (XI-ACID GLYCOPROTEIN VARIANTS 409
0.3
io 0.200...v
..uc
".a..oOft.a<
i pool IAAG major peak
pool IAAG minor peak
'i' 0.1o,J
10 20 30 40 50 60 1 0 8 0 90
(a)
(b)
(c)
(d)
(e)(f)
Fraction number
Fig. I. Elution of AAG by chromatography of a single human serum sample on Cibacron Blue F3G-ASephadex G-IOO gel at pH 5.8. The dye substitution in the gel was 150 Ilg ofdye permg ofSephadex. A 50-mlvolume of the human serum was dialysed against 10 mM sodium phosphate buffer (pH 5.8) and applied tothe gel column (50 x 5 cm I.D.) equilibrated with the same buffer at 4°C. The unbound protein was eluted in10 mM sodium phosphate buffer (pH 5.8). The flow-rate was 50 ml/h and fractions of6.8 ml were collected.The absorbance of each fraction was determined spectrophotometrically at 280 nm. The major and minorpeaks of AAG were pooled separately as indicated and concentrated prior to their subjection toSDS-polyacrylamide gel electrophoresis. Inset: SDS-PAGE of the pooled fraction of AAG. Lanes: I and5 = molecular mass (dalton) markers [(a) phosphorylase b (94 000), (b) albumin (67 000), (c) ovalbumin(43000), (d) carbonic anhydrase (30 000), (e) trypsin inhibitor (20 000) and (f) a-lactalbumin (14000)];2 = standard commercial AAG (5 Ilg); 3 = AAG major peak (5 Ilg); 4 = AAG minor peak (5 Ilg).
410 F. HERVE el al.
both assays. The major and minor peaks were shown to contain 88 and 12%,respectively, of the total amount of AAG purified on immobilized Cibacron BlueF3G-A. SDS-PAGE showed that the two peaks seemed to be composed of at least90% pure AAG because, in both peaks, a single protein band was detected (Fig. I,inset) and a molecular mass of 44 000 dalton was calculated, identical with that ofa standard commercial AAG.
A similar fractionation of "native" AAG into more than one peak has alreadybeen described by Gianazza and Arnaud [16] during the chromatography of plasmaproteins on commercially available immobilized Cibacron Blue (Affi-gel Blue). Theorigin of the existence ofmore than one peak for AAG in dye-affinity chromatographycould be due to differences in the sugar chains of the protein sub-populations (forinstance, the existence of partially desialylated "old" forms of AAG, physiologicallypresent in the serum). This minor peak requires further study.
The major AAG peak corresponded to 70-75% of the total serum AAG asdetermined by immunospecific assays of the serum and the chromatographic peak.Hence the chromatography of the serum (50 ml) yielded 18 mg of AAG from a totalamount of 25 mg of AAG.
This purified AAG (major peak) was dialysed against deionized water anddelipidated. It was then desialylated with neuraminidase and subjected to analyticalIEF on an immobilized pH 4.4-5.4 polyacrylamide gel gradient with 8 Murea and 2%(vjv) mercaptoethanol. The SjA-AAG was found to contain only the "slow" variantsA and S (Fig. 2). This result agreed with the AAG phenotyping of the serum used (notshown). Several faint, more anodic bands were also observed after staining withCoomassie Brilliant Blue (Fig. 2), indicating the presence of a small proportion (lessthan 5%) of incompletely desialylated protein. The relative proportions of eachvariant in the SjA-AAG were 63 and 37% for the S and A variants, respectively, asfound by scanning. These values agree with the relative proportions of the SandA variants in desialylated whole serum (60 and 40%, respectively).
Separation of S-AAG and F-AAG from desialylated commercial AAG by preparativeIEF
The preparative IEF of commercial AAG, previously desialylated with neuraminidase, on an immobilized pH 4.4-5.4 polyacrylamide gel gradient allowed theseparation of a "slow" S-AAG from a "fast" F-AAG [6,7]. The respectiveelectrophoretic patterns of the F- and S-AAG, and that of the desialylatedunfractionated commercial AAG, obtained by analytical IEF in the presence of 8 Murea and 2% (vjv) 2-mercaptoethanol are shown in Fig. 2. It can be seen that, whereasthe F-AAG is homogeneous and contains only the FI variant, the S-AAG is heterogeneous and is composed of the two A and S variants. The relative proportions ofthe FI,S and A variants in the commercial AAG were 32, 38 and 32%, respectively, as foundby scanning. The relative proportions of the "slow" S and A variants were 50% each inthe S-AAG and are in accordance with those found with the unfractionated protein.
Chromatographic pH titration curves of the desialylated AAG variantsIn the ion-exchange chromatography of proteins, there is a correlation between
the ionic strength needed for elution and the net charge of the protein. As the proteincharge, and consequently the ionic strength at which it will be eluted, varies with pH,

HPIEC OF (XI-ACID GLYCOPROTEIN VARIANTS 411
Fig. 2. Electrophoretic patterns of the different desialylated AAG samples on immobilized pH 4.4-5.4polyacrylamide (4.85%, w/v) gel gradient with 8 M urea and 2% (v/v) 2-mercaptoethanol. Detection of thedesialylated variants in the gel after fixation of the proteins in 11.5% (w/v) trichloroacetic acid and 3.5%(w/v) sulphosalicylic acid and staining with a 0.115% (w/v) Coomassie Brilliant Blue R 250 solution. Tracks:I = F-AAG isolated from desialylated commercial AAG by preparative IEF (20 Jlg); 2 = S-AAG isolatedfrom desialylated commercial AAG by preparative IEF (20 Jlg); 3 = peak 2 (variant A) fractionated byHPIEC from S/A-AAG or S-AAG (20 Jlg); 4 = peak I (variant S) fractionated by HPIEC from S/A-AAGor S-AAG (20 Jlg); 5 = S/A-AAG purified on immobilized Cibacron Blue F3G-A (20 Jlg); 6 = desialylatedcommercial AAG (20 Jlg). The pH scale and the approximate isoionic point (PI) value for each variant areindicated.
titration curves are of great interest for predicting the elution pattern over a range ofpH. The titration curves of F- and S-AAG were therefore determined separately bystrong anion-exchange chromatography with buffer systems of different pH values,ranging from 7.0 to 10.0, to find the pH at which their titration curves are furthestapart and thus their separation will be optimum. The resolution of each buffer systemwas compared by plotting pH versus the amount of sodium chloride needed for elution(Fig. 3). The amounts ofsodium chloride were deduced from the elution volume for themajor peaks of interest. It can be seen that all the desialylated variants had a lownegative charge because, even at pH 10, they eluted at a relatively low ionic strength.S-AAG began to be fractionated at pH 8.5 and, at higher pH, two well differentiatedpH titration curves were observed, the lower curve corresponding to the titration oftheA variant and the upper curve to that of the S variant.
The pH titration curve ofF-AAG shows that, at lower pH, the "fast" variant FIseems to be slightly more negatively charged than the "slow" variants. This result

412
7.0o [".I I
30
8.0 9.0
pH
F. HERVE el al.
10.0 ..
40
50
60
u
"z 70
til
•o~ 80
90
100
Fig. 3. pH titration curves for the desialylated AAG variants. The pH titration curves of the variants (A) FI,(.) S and (e) A were determined in 6.25 mM Bis-Tris-propane (starting and final) buffer systems, withdifferent pH values ranging from 7.0 to 10.0, adjusted with I M hydrochloric acid. The final buffer contained0.15 or 0.35 M sodium chloride. The F- and S-AAG (100-200 jlg), purified by preparative IEF, were run ona prepacked Mono Q HR 5/5 column with a 20-min gradient time. The flow-rate was 1.0 ml/min and thea.u.f.s. was set to O.05-{).2. The pH was plotted versus millimoles of sodium chloride, which were deducedfrom the elution volume of each major peak of interest.
agrees with the more anodic migration of the FI variant in IEF electrophoresis. It canalso be seen that, over the pH range considered, the titration curve of the FI variantparallels that of the 8 variant. Consequently, at pH 9.0, the titration curve of the FIvariant falls between the upper (8) and the lower (A) titration curves.
Analysis of the pH titration curves of the AAG variants showed that these curvespresent different inflexion points. Three different inflexion points can be observed inFig. 3, at pH 8-8.5, 9 and 9.5-9.75. The sharp drops at pH 9 and pH 9.5-9.75 aresimilar for the three titration curves, indicating that the AAG variants may not differ

HPIEC OF (X,-ACID GLYCOPROTEIN VARIANTS 413
greatly in their contents of amino acids ionizing at these pH values. However, theinflexion between pH 8 and 8.5 with variant A was not found with the Fl and Svariants. The pH at which this change occurs could correspond to the ionization ofa cysteine residue, present in variant A but not in variants Fl and S.
These data agree with the differences between the primary structures of thevariants. Human AAG is encoded by two different genes [17], thus explaining themultiple amino acid substitutions found in the primary sequence of AAG [5]. Geneticstudies at the protein level in population [4] have shown that variants Fl and S areencoded by two different alleles of the same gene, and would differ only by few (five)amino acids, thus explaining their very similar pH titration curves. Variant A isencoded by the other gene and would differ from the other two variants by more aminoacids (at least 22). Examination of the possible amino acid substitutions described forAAG [5] shows that only eight of them would be significant from an ionization point ofview and, as most of these involve arginine residues which would not be negativelycharged at pH values lower than 10, it becomes obvious why the pH titration curves ofthe three variants are similar. Given these data, it has not been possible to findoptimum conditions for the separation of the "fast" F1 variant from the "slow" SandA variants by strong anion-exchange chromatography. Nevertheless, the specificchange in the pH titration curve of the A variant between pH 8 and 8.5 couldcorrespond to the titration of the lone cysteine residue at position 149, which could besubstituted by arginine residues in the Fl and S variant molecules. Therefore, themajor difference between the titration curves for the S and A variants could be used tooptimize their fractionation.
Fractionation of S-AAG and of the pure S/A-AAG preparationWe applied the resolving power of HPIEC to the resolution of S-AAG and
S/A-AAG variants. It was found that fractionation of the two proteins at pH 9.75 onthe strong anion-exchange column resolves two major peaks, 1 and 2, correspondingto the "slow" variants S and A (Fig. 4). This pH was used, rather than pH 10, becausethe proteins lost structural integrity at pH 10.5.
Integration showed that these peaks comprised ca. 50% each for the totalS-AAG and 62.5 and 37.5%, respectively, for the S/A-AAG. The relative proportionof peak 2 in S/A-AAG is less than that in S-AAG. This seems to be due to the fact that,whereas S/A-AAG was purified from an individual serum containing a geneticallydetermined proportion of each variant, S-AAG was prepared from a standardcommercial protein which corresponds to a mixture of AAGs of different phenotypes.
The elution diagram also showed the presence of a minor "retarded" peak,which seems to correspond to an incompletely desialylated protein (faint anodic bandin Fig. 2, track 3), thus explaining its delayed elution from the anion-exchange column.
Peaks 1and 2 were isolated and rechromatography showed that they are genuinepeaks with different elution volumes (Fig. 5). Characterization of peaks 1 and 2 byanalytical IEF (Fig. 2) shows they are essentially pure: peak 1 comigrates with theS variant and peak 2 with the A variant. The elution volumes needed to elute thevariant S in peak 1 and the variant A in peak 2 are in accordance with their respectivepH titration curves.

414
2
E~,Ic I
0 IIX) I('oj I
II
CIl Iu I
,C I \.. I
~ I0 I
'" \.J:J I« I
~\
'\
\\
\\
" ....,I
--_ ... __ ... _1
0 4 12
Volume (ml)
F. HERVE et al.
0.15
u..z
16
Fig. 4. HPIEC fractionation of S- or S/A-AAG on a prepacked Mono Q HR 515 column. S-AAG (dashedline) was isolated by preparative JEF of commercial AAG and S/A-AAG (solid line) was purified from theindividual serum by chromatography on immobilized Cibacron Blue F3G-A. The starting buffer was6.25 mM Bis-Tris-propane (pH 9.75) and final buffer was starting buffer containing 0.15 M sodiumchloride; flow-rate, 1.0 ml/min; a.uJ.s., 0.5. Peaks I and 2 were collected as indicated by hatch marks in theelution profile.
CONCLUSION
This method allows the simple and rapid purification of large amounts of the"slow" variants of desialylated AAG. As these variants appear to be the moreinteresting with respect to drug binding [6,7], this purification method would greatlyaid the study of their individual drug-binding properties.
Depending on the phenotype (FIjA or SjA or Fl SjA) of AAG preparationsfrom individuals, the HPIEC method described here could be used to separate theS from the A variant and the preparative IEF technique could be used to separate theFI from the A variant, but both techniques are required for the Fl SjA phenotype andcommercial mixtures.
It was also found that the one-step chromatographic procedure on immobilized

HPIEC OF lXI-ACID GLYCOPROTEIN VARIANTS 415
2
0.15
UIIIZ
0.05
0.1
------ - ----
~
,I,.I I, I, ,,I ,,I I, II I: II I, II II II I,•IIIII,,
I,,-",-"
L-J1L...-_-L_---JL.-_-L.__.L-_--L.__.J-_..-L__...L.--4 0.0 0
GIUCIII.0..oon.0<l:
EcoCXlN
o 4 8 12 16
Volume (ml)
Fig. 5. HPIEC re-injection of peaks I (dashed line) and 2 (solid line) isolated li"om S/A-AAG in Fig. 4.Starting and final buffers and flow-rate as in Fig. 4; a.u.Cs., 0.1 and 0.05 for peaks I and 2, respectively. Priorto their injection, the proteins were re-equilibrated in starting buffer on a Centricon 10 microconcentrator.
Cibacron Blue F3G-A [8] is a valuable tool for purifying a "native" AAG with highyield from an individual serum. This procedure could be useful for comparing thedrug-binding properties of individual "native" proteins corresponding to the differentAAG phenotypes.
ACKNOWLEDGEMENTS
This research was supported in part by research grants from the InstitutNational de la Sante et de la Recherche Medicale (C.R.E. No. 872014), Reseau dePharmacologie Clinique (Ministere de la Sante) and Ministere de la Recherche et deI'Enseignement Superieur (No. 87C0320). The authors are indebted to M. Erdei forexpert technical assistance.

416
REFERENCES
F. HERVE et al.
I J. M. H. Kremer, J. Wilting and L. M. H. Janssen, Pharmacol. Rev., 40 (1988) 1.2 D. Tinguely, P. Baumann and J. Schopf, J. Chromatogr., 229 (1982) 319.3 J. Agneray, in P. Baumann, C. B. Eap, W. E. Muller and J. P. Tillement (Editors), Alpha,-Acid
Glycoprotein: Genetics, Biochemistry, Physiological Functions and Pharmacology, Alan R. Liss,New York, 1989, p. 47.
4 C. B. Eap, C. Cuendet and P. Baumann, Hum. Genet., 80 (1988) 183.5 K. Schmid, in F. W. Putnam (Editor), The Plasma Proteins, Structure, Function and Genetic Control,
Vol. I, Academic Press, New York, 2nd ed., 1975, p. 183.6 C. B. Eap, C. Cuendet and P. Baumann, Naunyn Schmiedeberg's Arch. Phannacol., 337 (1988) 220.7 C. B. Eap, C. Cuendet and P. Baumann, J. Pharm. Pharmacol., 40 (1988) 767.8 G. Birkenmeier and G. Kopperschliiger, J. Chromatogr., 235 (1982) 237.9 H. J. Bohme, G. Kopperschliiger, 1. Schulz and E. Hofmann, J. Chromatogr., 69 (1972) 209.
10 G. K. Chambers, Anal. Biochem., 83 (1977) 551.11M. A. Evenson and H. F. Deutsch, Clin. Chim. Acta, 89 (1978) 341.12 O. H. Lowry, N. J. Rosebrough, A. L. Farr and R. J. Randall, 1. Bioi. Chem., 193 (1951) 265.13 Polyacrylamide Gel Electrophoresis Laboratory Techniques, Pharmacia, Uppsala, 1980, p. 25.14 C. B. Eap and P. Baumann, Electrophoresis, 9 (1988) 650.15 S. T. Thompson and E. Stellwagen, Proc. Natl. Acad. Sci. U.S.A., 73 (1976) 361.16 E. Gianazza and P. Arnaud, Biochem. J., 203 (1982) 637.17 L. Dente, M. G. Pizza, A. Metspalu and R. Cortese, EMBO J., 6 (1987) 2289.

Journal of Chromatography, 539 (1991) 417-424Elsevier Science Publishers B.V., Amsterdam
CHROM. 22892
Affinity chromatography of fibroblast growth factors oncoated silica supports grafted with heparin
M. A. JACQUOT-DOURGES, F. L. ZHOU, D. MULLER* and J. JOZEFONVICZ
L.R.M. CNRS URA 502, Universite Paris-Nord, Avenue J. B. Clement, 93430 Villetaneuse (France)
ABSTRACT
Dextran-coated silica beads are excellent supports for affinity chromatography of proteins. They canbe easily grafted using conventional coupling methods with different active ligands, such as heparin.Fibroblast growth factors develop specific interactions with heparin through well-defined amino acidssequences. The heparin-dextran coated silica phases exhibit an affinity for these growth factors. Under ourexperimental conditions, the basic form can be absorbed on the solid support at a moderate salt concentration (0.5 M sodium chloride) and can be selectively desorbed by increasing the ionic strength of the eluent.The purification performances of such phases are com paired to those obtained on the heparin grafted softgels. Because of their mechanical properties, the dextran-coated silica supports were also used in highperformance affinity chromatography to purify fibroblast growth factors from a bovine brain crude extract.
INTRODUCTION
Growth factors, known as fibroblast growth factors (FGF) [I] or heparinbinding growth factors [2], are implicated in the growth of different types of cells,particularly fibroblasts and endothelial cells [3,4]. Among their biological activities,angiogenic and wound-healing properties are known and have been studied in order touse fibroblast growth factors in therapy [4,5].
Fibroblast growth factors are able to develop specific interactions with heparinthrough well defined amino acid sequences and the two forms of FGF, acidic FGF(aFGF) and basic FGF (bFGF), are generally purified by affinity chromatography onheparin-grafted soft gels.
In a previous paper [6], we demonstrated that polystyrene resins can befunctionalized in order to obtain a specific affinity for fibroblast growth factors. Thesesynthetic supports can also be used for the purification of FGF by affinitychromatography [7].
However, coated silica supports are excellent stationary phases for thehigh-performance affinity chromatography (HPAC) ofproteins [8]. The passivation ofnative silica can be achieved by covering the inorganic surface with a layer ofa hydrophilic polymer (agarose) substituted with a calculated amount of positivelycharged diethylaminoethyl (DEAE) functions. Thus the non-specific adsorption of
0021-9673(91/$03.50 © 1991 Elsevier Science Publishers B.V.
418 M. A. JACQUOT-DOURGES et al.
proteins is minimized. Because of their polymeric coating, these supports can easily begrafted with functional derivatives, in particular with heparin, using conventionalcoupling methods. These affinity phases possess the mechanical properties of thestarting silica and the hydrophilicity of the coating polysaccharide [9] and they can beused with low-pressure or high-performance liquid chromatographic (HPLC) elutionconditions in order to separate or purify fibroblast growth factors. The chromatographic performances of these new affinity supports can be compared with the resultsobserved under, the same elution conditions on the conventional heparin-Sepharoseaffinity phase [10].
EXPERIMENTAL
Growth factorsCrude extracts and radiolabelled fibroblast growth factors were obtained as
described previously [11]. Briefly, crude extract is prepared from a bovine brain byammonium sulphate fractionation (the active fraction was found to be between 20 and60%) at 4°C, followed by dialysis against acetic acid and phosphate buffer solutions.The sample is then centrifuged (20000 g, 30 min, 4°C) and the ionic strength of thesupernatant containing aFGF and bFGF is adjusted to 0.65 MNaCI. Acidic and basicfibroblast growth factors are purified from bovine brain crude extract by affinitychromatography on heparin-Sepharose support, and are radiolabelled with 125iodine using the chloramine T method [6].
All reagents were of analytical-reagent grade and all solutions and buffers wereprepared with doubly distilled water, which was degassed and filtered througha 0.22-{(m membrane.
Heparin-silica supportsThe silica-based (Hep-SiA) supports are prepared in two stages as described
previously [9]. Agarose Indubiose A37 HAA, kindly provided by IBF Biotechnics(Villeneuve la Garenne, France), are modified by a controlled substitution with2-diethylaminoethyl hydrochloride (Janssen Chemica, Pantin, France). First, silicabeads X015 M (porosity 1250 A, particle size 40-100 {(m) from IBF Biotechnics areimpregnated with a concentrated solution of DEAE-polysaccharide and the polymercoating is cross-linked in order to prevent leakage of the polymeric layer and to obtaina polymeric coverage of 4.5 g per 100 g of dry support. In the second step, heparin (101LV./mg), supplied by Institut Choay (Paris, France), is coupled using l,l'-carbonyldiimidazole (CDI) as activating agent [10]. The yield of the coupling is 68%,corresponding to 34 mg of heparin per 1 g of support.
Low-pressure affinity chromatographyTwo columns (30 x 11.4 mm LD.) are packed, one with 4 ml of heparin
Sepharose (Pharmacia) and the other with 4 ml of heparin-dextran-coated silica phasein phosphate buffer solution (PBS) adjusted to 0.5 M NaCI (pH 7.4). This saltconcentration (0.5 M NaCI) was chosen because aFGF could be retained by thesupport with a lower salt concentration and other proteins could be desorbedsimultaneously by the salt gradient. Similarly, it is impossible to obtain pure aFGF byaffinity chromatography on the heparin-Sepharose support if the initial salt concen-

AFFINITY CHROMATOGRAPHY OF FGFs 419
tration of the eluent is lower than 0.5 M. A 5-ml sample of crude bovine brain extractmixed with radiolabelled FGFs (106 cpm) is injected into the columns. Thenon-adsorbed compounds are eliminated by washing with ISO ml of 10 mM PBS-3mM KCI-0.5 M NaCI, pH 7.4). Next, the adsorbed proteins are desorbed using a saltgradient from 0.5 to 2.5 M NaCI (150 ml) at a flow-rate of 24 ml/h at roomtemperature. The absorbance at 280 nm and the ionic strength of the eluent aremeasured using an Alli UV detector (Gilson, Villiers Ie Bel, France) and an ion andpH detector (IBF Biotechnics), respectively. The amount of eluted radiolabeledfibroblast growth factor is determined using a gamma counter.
High-performance affinity chromatographyThe HPLC apparatus is a Merck-Hitachi 655 A-12 system from Labs.
Merck-Clevenot (Nogent sur Marne, France). A stainless-steel column (70 x 7 mmJ.D.) is packed using a slurry method with 2.6 ml of heparin-silica phase in phosphatebuffer solution (pH 7.4) adjusted to 0.5 M NaCI. A 5-ml aliquot of crude bovine brainextract is injected onto the column and the non-adsorbed compounds are eluted withthe initial buffer (10 mM PBS-0.5 M NaCl, pH 7.4) at a flow-rate of 1.0 ml/min. Theadsorbed proteins are then eluted by a linear salt gradient from 0.5 to 2 M NaCI in 0.0 IM PBS (pH 7.4). The elution is followed using a variable-wavelength UV monitor at280 nm. The eluted fractions are collected and characterized.
Characterization of eluted fractionsThe collected fractions from low-pressure or HPLAC runs are dialysed,
concentrated and analysed by sodium dodecyl sulphate polyacrylamide gel electrophoresis (SDS-PAGE) (20% acrylamide) according to Laemmli [12], using a Pharmacia Phast System (Pharmacia-LKB, Uppsala, Sweden). Proteins are revealed bysilver staining [13].
Fractions are also tested for mitogenic activity on Chinese hamster lungfibroblasts (CCL39, American Type Culture Collection) by reinitiation of DNAsynthesis as described previously [6].
RESULTS AND DISCUSSION
The heparin-silica supports interact with fibroblast growth factors in solution.The mixture of crude extract and radiolabelled aFGF and bFGF is eluted onheparin-silica (Fig. 1) and heparin-Sepharose (Fig. 2) in a low-pressure affinitychromatography procedure. The elution profiles of radiolabelled FGFs indicate thatthey are mainly retained by the solid phases at lower ionic strength and desorbed by thesalt gradient.
The rates of radiolabelled FGFs reversibly adsorbed on the two supports arepresented in Table I. The comparison with heparin-Sepharose support shows that,under our experimental conditions, bFGF exhibits a similar behaviour on bothsupports (Table I). However, under the same conditions aFGF is not well retained onthe silica phases. It is also important to note that both fibroblast growth factors, whenthey are adsorbed on the affinity phases, are more easily desorbed from theheparin-silica supports by the salt gradient, probably indicating a smaller contributionof ionic interactions in the affinity mechanism on this support. A similar effect has

420 M. A. JACQUOT-DOURGES el al.
a.01
Ti5'~<l:
15
10
15
T[<l:
.00510
~N~CI1.5
11.0
0.5
20 40 60 80 100 120 140 160 180 200 220",I
125 IFGF.01
%20
20 40 60 80 100 120 lAO 160 180
0.5
200 ",FO
Fig. 1. Low-pressure chromatographic assay of bovine brain crude extract (5 ml) containing radiolabelledaFGF (a) or bFGF (b) on heparin-agarose-coated silica support.
been described for bFGF eluted from heparin affinity HPLC supports [14]. Thisweaker affinity is probably the reason for the low adsorption ofaFGF under our initialeluting conditions (0.01 M PBS-O.S M NaCl). Nevertheless, a complete comparisonbetween the two types ofaffinity supports is difficult because of the non-equivalence ofthe biological activities of the grafted heparin. First, heparin fixed on commercialSepharose support is presumably different from the heparin grafted on our silicaphases: the molecular mass, the specific anticoagulant activity and the distribution ofsugar groups along the network are probably different. Moreover, the coupling of thepolysaccharide also depends on the grafting reactions. The macromolecular chain can

AFFINITY CHROMATOGRAPHY OF FGFs 421
a.01
30
20.005
10
15
10
20 '0
b
60 80 100 120 140 160
NoCIM
1.5
1.0
0.5
180 200 220ml
·01
20 '0 60 80 100 120 '40 160 180
f
NOCI'M
1.5
11.0
0.5
200 mPOFig. 2. Low-pressure chromatographic assay of bovine brain crude extract (5 ml) containing radiolabeledaFGF (a) or bFGF (b) on heparin-Sepharose support.
be attached to the Sepharose or agarose structure in different ways with differentcovalent bonds and consequently the active sequence of heparin is not necessaryaccessible to aFGF. It is reasonable to assume that the affinity for aFGF could bereinforced by grafting more active heparin fractions.
The HPLAC elution profile ofbovine brain crude extract on silica-based resins ispresented in Fig. 3. Under our experimental conditions, the proteins are mainly elutedin the washing buffer. When the ionic strength of the eluent is increased, a smallamount of proteins (15 f.1.g) is desorbed in a large peak (fraction F). The presence ofaFGF and bFGF in this eluted peak is revealed by SDS-PAGE. It should be noted thatmany other proteins are simultaneously eluted and they can disturb the adsorption

422 M. A. JACQUOT-DOURGES et al.
TABLE I
ADSORPTION CONDITIONS OF GROWTH FACTORS ON ACTIVE SUPPORTS
Resina FGF NA (%)b RA (%)b NaCI (M)'
Hep-Seph aFGF I 89 1.0Hep-Seph bFGF 36 29 1.5Hep-SiA aFGF 86 9 0.8Hep-SiA bFGF 46 31 1.2
a Hep-Seph = heparin-Sepharose support; Hep-SiA = heparin-agarose-coated silica support.b NA (%) = percentage ofFGFwashed under the initial conditions; RA (%) = percentage ofFGF
retained and desorbed by the gradient,, NaCl concentration of the gradient corresponding to the maximum of the eluted peak.
process. However, these fractions also stimulate the cellular growth of fibroblastCCL39 (Fig. 4). The stimulation unit of these fractions, which is the concentrationneeded to obtain 50% of the maximum stimulation, is weaker (2 ng/ml) than thoseobserved under the same conditions with pure aFGF (10 ng/l) and bFGF (3.8 ng/ml).As observed, the eluted fractions obtained from the crude extract are more effective;this could be explained by a smaller deactivation of fibroblast growth factors duringthe chromatography owing to a faster separation process. This purification procedureis efficient for bFGF but the initial conditions of elution have to be optimized withaFGF. It is also possible to increase the affinity of the heparin-grafted support foraFGF by modifying the coupling method. Moreover, the mechanical properties of thesilica phases allow the use of higher flow-rate leading to faster purification.
~--"'1"2.5
2.0
Ec:o00N
cd
o 20 40
F
60Ve(mll
1.5
1.0 ~z
0.5
80
Fig. 3. HPLC of crude bovine brain extract (9 ml) on heparin-agarose-coated silica support.

AFFINITY CHROMATOGRAPHY OF FGFs 423
cpm.IC1<f3
80
3000020100
> '14400
60
.~.~40~
Fig. 4. Effect of(.) aFGF, (0) bFGF and (.) eluted fraction F on the incorporation of[3H]thymidine onCCL39 fibroblast. Inset: SDS-PAGE of (8) bFGF eluted from heparin-Sepharose and of (A) fractionF eluted from heparin-dextran-coated silica; (C) molecular mass markers.
CONCLUSION
The affinity of fibroblast growth factors for heparin is used in chromatographyfor the purification of these factors. These growth factors are generally purified onheparin-Sepharose support under low-pressure elution conditions. The purification offibroblast growth factors can be also achieved on agarose-coated silica supportsgrafted with heparin directly from a bovine brain crude extract. The stimulating effectofeluted fractions on fibroblast growth shows that an important amount of fibroblastgrowth factor is retained and desorbed from the affinity stationary phase. In fact, theelution of radiolabelled pure FGF demonstrates that on both supports the basic form(bFGF) is strongly adsorbed at low ionic strength and selectively desorbed by the saltgradient. In contrast, aFGF seems to exhibit a weaker affinity for the heparin-agarosecoated silica support. Under our initial elution conditions, this growth factor is mainlyunretained and eluted by the washing eluent. In order to improve the affinity of aFGFfor the heparin-agarose-coated silica support with minimum adsorption of otherproteins, the initial conditions of the separation have to be optimized. However, themechanical properties of such silica-based affinity phases are excellent, they allow fastseparations and the purification procedure of fibroblast growth factors can easily bescaled up.
ACKNOWLEDGEMENTS
The authors thank D. Barritault and co-workers for their assistance and for thegift of fibroblast growth factors. This work was supported by the Association

424 M. A. JACQUOT-DOURGES et al.
Nationale pour la Valorisation de la Recherche (ANVAR) and Sanofi Recherche,Centre Choay (Gentilly, france).
REFERENCES
1 D. Gospodarowicz, Methods Enzymol., 147 (1987) 106.2 R. R. Lobb, J. W. Harper and J. W. Fett, Anal. Biochem., 154 (1986) I.3 D. Gospodarowicz, N. Ferrara, L. Schweigerer and G. Neufeld, Endocrine Rev., 8 (1987) 95.4 A. Baird and P. A. Wa1icke, Br. Med. Bull., 45 (1989) 438.5 J. Van Brunt and A. Klausner, Biotechnology, 6 (1988) 25.6 M. A. Jacquot-Dourges, D. Gulino, J. Courty, J. Badet, D. Barritault and J. Jozefonvicz, J.
Chromatogr., 526 (1990) 35.7 M. A. Jacquot-Dourges, D. Muller, D. Barritault and J. Jozefonvicz, J. Chromatogr., 510 (1990) 141.8 F. L. Zhou, D. Muller, X. Santarelli and J. Jozefonvicz, J. Chromatogr., 476 (1989) 195.9 X. Santarelli, D. Muller and J. Josefonvicz, J. Chromatogr., 443 (1989) 55.
10 F. L. Zhou, D. Muller and J. Jozefonvicz, J. Chromatogr., 510 (1990) 71.11 J. Courty, C. Loret, M. Moenner, B. Chevalier, O. Lagente, Y. Courtois and D. Barritault, Biochimie, 67
(1985) 265.12 U. K. Laemmli, Nature (London), 277 (1970) 680.13 J. Henskeshoven and R. Demick, Electrophoresis, 6 (1985) 103.14 M. Iwane, T. Kurokawa, R. Sasada, M. Seno, S. Nakagawa and K. Garashi, Biochem. Biophys. Res.
Commun., 146 (1987) 470.

Journal of Chromatography, 539 (1991) 425-432Elsevier Science Publishers B.V., Amsterdam
CHROM. 22902
Immobilized Fe3 + affinity chromatographic isolation ofphosphopeptides
P. SCANFF*, M. YVON and J. P. PELISSIER
Station de Recherches Laitil'!res, INRA. DomainI' de Vilvert. 78350 Jouy en Josas (France)
ABSTRACT
Immobilized Fe3+ affinity chromatography is suggested as a means of concentrating phosphopeptides that are present in too Iowa proportion in a complex mixture to be purified by a single-step method. Ahigh-performance liquid chromatographic system and a chelating Superose HR 10(2 column were used.The chromatographic conditions were optimized using a tryptic hydrolysate of whole casein. The unboundfractions did not contain any phosphorylated peptide. All caseinophosphopeptides were retained. Onlyfour other strongly basic peptides were also retained. The quantitative accuracy of the method was evaluated. This method allowed the' isolation of phosphopeptides in gastric effluents of calves fed with milk.
INTRODUCTION
Casein phosphopeptides (CPPs) display the interesting property of being able toform soluble complexes with di- or trivalent metal ions [1,2]. This has led to speculationthat CPPs might have a physiological role and could enhance calcium intestinalsolubilization and absorption. Naito and co-workers [3,4] reported the occurrence ofsuch phosphopeptides in the distal small intestine of rats during the course of theluminal digestion of a diet containing caseins. Moreover, the amount of solublecalcium in the distal small intestine was higher with caseins than with other dietaryproteins [5]. In 1986, Sato et al. [6] demonstrated that CPPs enhanced both Ca2 +
intraluminal solubilization and absorption. Gerber and lost [7] reported an increase inthe calcium bioavailability with CPPs with in vitro cultured embryonic rat bone. Incontrast, Pointillart and Gueguen [8] demonstrated in vivo that calcium absorption andbone parameters of pigs fed CPP-enriched diets were not modified. This Ca2+solubilizing effect of CPPs on its absorption is still much debated. Moreover, the wayin which they are introduced to the intestine could also be a determining factor. Henceit would be interesting to know how and when theyare released from the stomach aftera meal.
The identification of such peptides in the digestive tract is relatively difficultbecause they are mixed with a number ofother peptides and consequently are found intoo Iowa proportion to be purified by a single-step method. Meisel and Frister [9]enriched the CPP fraction of intestinal chyme by affinity chromatography usingiron(III) ions immobilized on a chelating Sepharose 6B (Pharmacia-LKB, Uppsala,
0021-9673(91/$03.50 © 1991 Elsevier Science Publishers B.V.
426 P. SCANFF, M. YVON, J. P. PELISSIER
Sweden) column according to the method described by Andersson and Porath [10].This allowed them to show the occurrence of a phosphopeptide in the chyme from thesmall intestine of minipigs (G6ttinger Miniaturschweine) after ingestion of a caseindiet. However, their chromatographic method is time consuming.
In order to study the kinetics of gastric emptying of CPPs in calves fed milk, wedeveloped a faster immobilized metal affinity chromatographic (IMAC) method toconcentrate phosphopeptides using a fast protein liquid chromatographic (FPLC)system and a chelating Superose HR 10/2 column (Pharmacia-LKB). The separationof each phosphopeptide was performed in a second step by high-performance liquidchromatography (HPLC) on a CiS reversed-phase column. In order to adjust thechromatographic conditions we used a tryptic hydrolysate of bovine whole casein.
EXPERIMENTAL
ChemicalsAll buffers were prepared with deionized water purified with a Milli-Q system
(Millipore, Bedford, MA, U.S.A.). Sodium acetate, sodium dihydrogenphosphate andiron(III) chloride were purchased from Prolabo (Paris, France). Trifluoroacetic acid(TFA) was purchased from Pierce (Rockford, IL, U.S.A.) and acetonitrile from Baker(Deventer, The Netherlands). All mobile phases were deaerated with helium.
Preparation of samplesThe chromatographic conditions were adjusted using a casein tryptic hydro
lysate. This hydrolysate was obtained by incubating a 1% casein solution in phosphatebuffer (0.1 M, pH 7.4) with trypsin (Sigma, St. Louis, MO, U.S.A.) for 24 h at 37°C.The enzyme/substrate (E/S) ratio was 1:100 by weight. The reaction was stopped byadding HCI to a final pH of 2.0.
Gastric effluents of preruminant calves fed bovine raw skim milk were collectedover 7 h after the meal, fractions being taken during 10-min intervals for the first 30min and then at 30-min intervals. To each sample trichloroacetic acid was immediatelyadded to a final concentration of 12% to stop the enzyme action. After centrifugation,the pellet was resuspended in water and solubilized by increasing the pH to 7.0. Analiquot of this solution was brought to pH 5.0 and centrifuged. The supernatant (l00pI) was applied to the affinity column.
Preparative chromatographyThe preparative step of phosphopeptide recovery was carried out with an FPLC
system consisting of an LCC 500 controller, two pumps and a chelating Superose HR10/2 column (2 x 1 em I.D.). The absorbance was monitored at 220 nm. The chelatingligand of the column is iminodiacetate covalently bound to a Superose 12 matrix.Iron(III) ions were immobilized on this support to give a group-specific sorbent forphosphorylated amino acid side-chains. Iron(III) ions were loaded by applying a 20mM iron(III) chloride solution in water at a flow-rate of 1.0 ml/min until the metalappeared in the eluate. After washing off the unbound metal with water, the columnwas equilibrated with a loading buffer.
The chelating Superose column was run at 37°C. It was first equilibrated with 10ml of 20 mM sodium acetate buffer (A) adjusted to pH 5.0 at 1.0 ml/min. The tryptic

AFFINITY CHROMATOGRAPHY OF PHOSPHOPEPTIDES 427
hydrolysate was then applied and the column was washed with 10 ml of buffer A. Theelution was carried out with 10ml of 100 mM sodium dihydrogenphosphate in A at thesame flow-rate for 10 min. The column was then recequilibrated with buffer A forfurther use.
Analytical chromatographyAnalytical chromatography of the chelating chromatographic fractions was
carried out with a Waters Assoc. HPLC system on a lO-l1m Nucleosil CiS column(250 x 4.6 mm LD.) (SFCC, Neuilly-Plaisance, France). The absorbance wasmonitored at 220 nm. The column was equilibrated in solvent A (0.115% TFA) andelution was effected with a linear gradient from 0 to 100% solvent B (0.1 % TFA-60%acetonitrile). The column and solvents were kept at 40°C. The elution rate was 1.0ml/min.
Peptide identificationThe HPLC fractions were collected and dried with a Speed-Vac evaporator
(Savant, France). The peptides were identified from their amino acid composition.These were determined after acid hydrolysis (llO°C, 24 h, 5.7 M HCI, under vacuum)using the method of Spackman et al. [II] with a Biotronik LC 5000 analyser.
A
0.4
0.2
UBF BF
100% B
50
20
o
~====='----!!! ~==d. ao 10
Retention Time (min)
Fig. I. Preparative affinity chromatography of a tryptic digest of whole casein on Fe3 +-ehelating SuperoseHR 10/2. Temperature, 37°C; flow-rate, 1.0 ml/min; detection, UV (220 nm). Eluents: A = 20 mM sodiumacetate (pH 5.0); B = A + 100 mM sodium dihydrogenphosphate.

428 P. SCANFF, M. YVON, J. P. PELISSIER
RESULTS
Fig. 1 shows the IMAC pattern of the tryptic hydrolysate of whole casein. Thefirst peak corresponds to the unbound material and the second peak to the retainedmaterial.
The whole casein tryptic hydrolysate (CTH) and the unbound (UBF) and bound(BF) fractions were analysed on the reversed-phase column under exactly the sameconditions. The elution patterns are superimposed in Fig. 2. The UBF did not containany phosphorylated peptide. The peptides of the BF were collected (Fig. 3) andidentified by their amino acid composition (Table I). Nine peptides containingphosphoserine residues were found, ofwhich seven could be identified. The amino acidcomposition of the other two (indicated with asterisks in Fig. 3) did not permit theiridentification. Peaks 1-4 corresponded to non-phosphorylated small peptides (four orfive residues) which contained one His residue.
The quantitative response of the method was tested in each step. In the analyticalstep (reversed-phase HPLC), the relationship between peak area and amount ofphosphopeptides injected was linear up to 10 nmol. In the affinity step the peak area ofthe BF was also directly proportional to the amount injected up to 1.75 mg of
100
80
40
20
60
%8
28.5199.5
A2
ol::=:~~~~~~~==~===:=Jo
1.5
0.5
retention time (min)
Fig. 2. Superimposition of the chromatograms of the tryptic digest (CTH), the bound fraction (BF) and theunbound fraction (UBF) on an Fe3+ affinity column. Column, CIS Nucleosil (10 /lm); temperature, 40°C;flow-rate, 1.0 ml/min; detection, UV (220 nm). Eluents: A=0.115% TFA; B=O.I% TFA-60%acetonitrile. The dotted line indicates the %B gradient.

AFFINITY CHROMATOGRAPHY OF PHOSPHOPEPTIDES 429
A0.35
0.3
0.25
0.2
0.157
6
10 11
%B100
80
60
40
0.1
0.05
20
o'------"--.'--'------"--------'------' 0
o 10 20 30 40
retention time (min)
Fig. 3. Analytical RP chromatography of the BF. Conditions as in Fig. 2. For amino acid composition ofthe peaks I-II see Table I.
A %B100
80
60S
0.540
UBF
BF 20
0
00 9.5 19 28.5 38 47.5
retention time (min)
Fig. 4. Superimposition of the chromatograms of a gastric effluent (S), the bound fraction (BF) and theunbound fraction (UBF) on an Fe3 + affinity column. The amounts injected for the three chromatogramswere different. Conditions as in Fig. 2 except for the gradient. The dotted line indicates the %B gradient.


AFFINITY CHROMATOGRAPHY OF PHOSPHOPEPTIDES 431
phosphopeptide. However, during this step the recovery was not the same for all thetested phosphopeptides, i.e., 65% for peptides 6, 7 and 8 and 80% for peptide II.
This method was then applied to gastric effluents of calves fed bovine raw skimmilk. The three chromatograms of the sample (S), the BF and UBF are superimposedin Fig. 4. A group of three peptides was particularly retained on the chelating Superosecolumn. They were eluted at a retention time of30 min on the C I8 column. The aminoacid compositions of these peptides are similar and correspond approximately to thesequence 110-145 from as,-casein. Their N- and C-terminal residues have to becidentified in order to establish the exact seq uence of these peptides.
DISCUSSION
This study demonstrated that a chelating Superose gel loaded with Fe3+ can beemployed successfully to concentrate phosphopeptides from a mixture in which theyare present in too Iowa proportion to be purified by a single-step method. Thistechnique has the advantage of being faster than that used by Meisel and Frister [9],only 30 min, including the equilibration time, being required. Only one run on each ofthe two chromatographic systems is necessary to collect enough peptide foridentification. The column can be used immediately after a run since regeneration isnot necessary. No modification of retention was observed after repeated separations.
Chromatographic conditions were chosen according to the conditions describedpreviously [10]. Phosphoserine was strongly retained at pH 3.1 or 5.0 and recoveredfrom the Fe 3 + column with 20 mM phosphate. The loading was therefore performedat pH 5.0. Some peptides were not desorbed by 50 mM sodium dihydrogenphosphatein sodium acetate (pH 5.0). The phosphate concentration was too low and 100 mMphosphate was necessary for complete desorption. A gradient of phosphate concentration gave a poor separation. Desorption with EDTA was possible but the column hadto be reloaded with iron(III) ions between each run.
All peptides were eluted independently of their phosphate content and theirstrength of binding on the column and the analytical step in the reversed-phase modeallows their separation. Eleven phosphopeptides were theoretically present in thetryptic hydrolysate. Seven phosphopeptides were identified: all phosphopeptides fromas,- and /i-caseins were found and one phosphopeptide from as2-casein was alsoidentified. Two others phosphopeptides were found but have not been completelyidentified. One of them was probably the phosphopeptide NHz-terminus ofas,-casein,but it was not pure. Two small phosphopeptides (twelve and thirteen residues) were notfound, probably because the proportion in the mixture was too small and theirabsorbaf,lce at 220 nm too low.
The observed recoveries vary with the phosphopeptides. The phosphate contentof the peptides might be responsible for these differences, as Muszynska et at. [12]showed with IDA-Fe3+ gel that the strength of binding was dependent on thephosphate content: peptide 11 (80% recovery) contains four phosphate groupswhereas peptide 7 contains five phosphate groups and was obtained with 65%recovery. The recoveries for peptides 6 and 8, containing three and two phosphategroups, respectively, were the same as for peptide 7. Because of these differences inrecovery, an internal standard of each peptide to be analysed must be used inquantitative assays.

432 P. SCANFF, M. YVON, J. P. PELISSIER
The IMAC step provides a good enrichment of the phosphopeptide fraction.Phosphopeptides represented 12% by number of the peptides present in the caseintryptic hydrolysate. Tn the enriched fraction, they were predominant. Moreover, theywere eluted later than the non-phosphorylated peptides in HPLC. This made theirpurification easier.
The non-phosphorylated peptides retained on the Chelating Superose columnwere small peptides containing one His and one Lys residue. Some tests wereperformed by adding 10 or 20 mMimidazole (Kodak, Rochester, NY, U.S.A.) to theloading buffer (the pH being readjusted to 5.0 with acetic acid). No change wasobser~ed and His-containing peptides and phosphopeptides were always retained onthe chelating Superose gel. This result shows that binding is not due to coordination viahistidine. Other tests were also made by adding LOO mM NaCl sodium chloride to theloading buffer. His-containing peptides were not retained on the chelating Superosebut the retention of some phosphopeptides slightly decreased. These observationscould be consistent with electrostatic interactions. His- and Lys-containing peptides(strongly basic) could interact with the iminodiacetate groups of the chelatingSuperose. Binding of phosphopeptides probably occurs via the oxygen of thephosphate group by coordination with Fe3 +. Secondary, electrostatic interactions canalso occur and explain the different recoveries of the phosphopeptides.
The proposed method could be optimized by coupling the two columns viaa six-way valve as described by Rybacek et al. [13]. Some tests were made using thechelating Superose column and a pepRPC column (Pharmacia-LKB), but the majorproblem was the different pressure resistances of the two gels and consequently thecolumns cannot be used in series.
The method described is suitable for concentrating phosphopeptides fromcomplex mixtures and for identifying them in gastric effluents of animals. It istherefore now possible to study the kinetics of the gastric emptying of phosphopeptides.
REFERENCES
1 R. Oesterberg, Thesis, University of Uppsala Almqvist & Wiksell, Stockholm, 1963.2 W. Manson and J. Cannon, J. Dairy Res., 45 (1978) 59.3 H. Naito, A. Kawakami and T. Imamura, Agric. Bioi. Chel11., 36 (1972) 409.4 H. Naito and H. Suzuki, Agric. Bioi. Chel11., 38 (1974) 1543.5 Y. S. Lee, T. Noguchi and H. Naito, Agric. Bioi. Chem., 43 (1979) 2009.6 R. Sato, T. Noguchi and H. Naito, J. NUlr. Sci. Vitaminol., 32 (1986) 67.7 H. G. Gerber and R. Jost, Calif Tissue Int., 38 (1986) 350.8 A. Pointillart and L. Gueguen, Reprod. Nutr. Dev., 29 (1989) 477.9 H. Meisel and H. Frister, Bioi. Chem. Hoppe-Seyler, 369 (1988) 1275.
10 L. Andersson and J. Porath, Anal. Biochel11., 154 (1986) 250.II D. H. Spackman, W. H. Stein and S. Moore, Anal. Chern., 30 (1958) 1190.12 G. Muszynska, L. Andersson and J. Porath, Biochemistry, 25 (1986) 6850.13 L. Rybacek, M. D'Andrea and J. Tarnowski, J. Chromalogr. Sci., 397 (1987) 355.

Journal oj Chromatography, 539 (1991) 433-441Elsevier Science Publishers B.Y., Amsterdam
CHROM. 22 903
High-performance liquid chromatographic analysis of theunusual pathway of oxidation of L-arginine to citrulline andnitric oxide in mammalian cells
B. CHENA1S, A. YAPO, M. LEPOIYRE and J. P. TENU*
CNRS URA 1116, Bariment 432. Univl!I'site Paris-Sud. 91405 Orsay Culex (France)
ABSTRACT
A very unusual pathway of the oxidation of L-arginine to citrulline and nitric oxide has been discovercd reccntly in cytotoxic macrophages. In an attempt to detect molecules gencratcd through this mctabolicpathway, a fast radio high-performance liquid chromatographic mcthod was developed to analyse thewhole set of radiolabelled L-arginine-derived metabolites produced by mammalian cells after appropriateinduction. A new intermediate which might be NG-hydroxy-L-arginine was found.
INTRODUCTION
It has recently been shown that mammalian cells can synthesize the highlyreactive nitric oxide molecule (NO'), which was then identified as an importantmediator in cellular communication [I]. NO' biosynthesis has been demonstrated in,for example, cytotoxic macrophages [2] and stimulated endothelial cells [3]. Thenitrogen atom of NO' is derived from one of the two guanidino nitrogens of L-argininevia an unusual metabolic route. A proposed scheme, still speculative, is shown in Fig.I. Citrulline and nitrite/nitrate, the oxidation products of NO', are the stable productsof the pathway [4]. In addition to macrophages and endothelial cells various cell lines,including the EMT6 [5] and TA3 murine adenocarcinomas [6], can generate theseL-arginine-derived molecules after induction with appropriate cytokines such asinterferon-y [5]. The triggering of the NO'-generating pathway is associated withantiproliferative effects [5]. It has been involved, for instance, as an effector of theextracellular antiproliferative function exerted by cytotoxic macrophages againsttumour cells [7,8].
The L-arginine: NO' synthase activity responsible for the NO'-generatingpathway has been found in 150000 g cytosolic supernatants isolated from cytotoxicmacrophages. It is activated by Mg2+ or Ca2+, requires L-arginine, NADPH andtetrahydrobiopterin (BH4) as cofactors [8,9] and is specifically inhibited by NG
_
monomethyl-L-arginine (L-NMMA) [7,10,11] (Fig. I).In an attempt to detect molecules generated through this metabolic pathway and
to investigate their role, we have developed a fast radio high-performance liquid
0021-9673/91/$03.50 © 1991 Elsevier Science Publishers B.Y.

434
L·arginine N"-hydroxY·L·arglnine N"-oxo...·arglnine
B. CHENAIS et al.
L-citrulline
R~acrio1J JCM~ (5/~pS 1-5) fOT 1M COflv~r
sion of L-a'g;nin~ to -N=O. NO;. NO) andci/,ul/in~.
Fig. 1. Proposed scheme for the NO'-citrulline-generating pathway, according to Marietta [I].
chromatographic (HPLC) method to analyse the whole set of radiolabelled L-argininederived metabolites produced by suitable mammalian cells after appropriate induction.
EXPERIMENTAL
Chemicals and cytokinesNG-Monomethyl-L-arginine (L-NMMA) was obtained from Calbiochem (La
Jolla, CA, U.S.A.), 6-(R,S)-5,6,7,8-tetrahydro-L-biopterin from Serva (Heidelberg,Germany), L-arginine and 4-(2-hydroxyethyl)-1-piperazineethanesulphonic acid(HEPES) from Merck (Darmstadt, Germany), dithioerythritol (DTE) from Sigma (St.Louis, MO, U.S.A.) and lipopolysaccharide (LPS) from Salmonella enteritidis fromDifco (Detroit, MI, U.S.A.). L-[U-14C]Arginine (11.1 GBqjmmol), L-[guanidino14C]arginine (1.85 GBqjmmol), DL-[1-14C]ornithine (1.72 GBqjmmol) and [14C]urea(2.2 GBqjmmol) were purhased from CEA (Saclay, France) and L-[ureido- 14C]citrulline (2.0 GBqjmmol) from NEN (Boston, MA, U.S.A.). Human recombinant tumournecrosis factor-alpha (TNF-o:) and murine recombinant gamma interferon (IFN-y),kindly provided by Dr. G. M. Adolf (Vienna, Austria), were from Gennentech (SanFrancisco, CA, U.S.A.). RPMI 1640 medium (containing 1.45 mM L-arginine) wasobtained from Gibco (Cergy-Pontoise, France).
HPLC analysis of arginine metabolismWe chose a strong cation exchanger (sulphonate) linked to silica particles, viz.,
a Zorbax 300 SCX column (250 x 4.6 mm I.D.) (Societe Franyaise ChromatoColonne, Neuilly Plaisance, France). The HPLC device included a Waters Assoc.Model 600 multi-solvent delivery system and the detector was a Berthold 506 Col
HPLC OF OXIDATION OF L-ARGININE 435
radioactivity monitor connected to J:<:pson PC AX microcomputer running under theBerthold HPLC program version 9.6. The following elution conditons were used:flow-rate, 1.0 ml/min; O~7 min, isocratic, 0.02 M sodium citrate (pH 2.2); 7-17 min,linear gradient to 0.1 M sodium citrate (pH 3.0); 17-27 min, linear gradient to 0.2M sodium citrate (pH 3.0); 27~35 min, isocratic, 0.2 M sodium citrate (pH 3.0).
Cell linesThe hydroxyurea-resistant TA3 M2 clone was obtained as described previously
[12]. The EMT6 cell line is a murine mammary adenocarcinoma from BALB/c mice,kindly provided by Dr. G. Lopez-Berenstein (Tumor Institute, Houston, TX, U.S.A.).
TA3 M2 cytosolic extractsThese were prepared as described previously [6]. Briefly, TA3 M2 cells were
treated for 24 h with appropriate additives. Lysates were centrifuged for 20 min at 4°Cin a Beckman TL-100.2 rotor at 150.000 g. The supernatant was rapidly frozen inliquid nitrogen and stored at - 80°e.
Determination of L-Arginine: NO· synthase activityThe following reagents were incubated in a final volume of 90 j11: 100 mM
HEPES (pH 7.6),15 mMmagnesium acetate, 10 mMDTE, 130 j1MNADPH, 500 j1MBH4 , 8 kBq L-[guanidino- 14C]arginine (1.85 GBq/mmol) and the indicated concentrations of L-arginine to which appropriate amounts of cell extract were added.Where indicated, L-NMMA was used at a final concentration of 2.2 mM. Sampleswere incubated for 50 min at 30°C and then heated at 90°C for 2 min. Precipitates werepelleted and 200 j11 of 0.02 M sodium citrate (pH 2.2) were added to the supernatant,which was filtered through a YM-IO ultrafiltration membrane (Mr cut-off 10000;Amicon, Danvers, MA, U.S.A.). A 50-j11 aliquot of the filtrate was loaded onto theanalytical column.
Analysis of EMT6 culture mediumEMT6 cell monolayers were obtained as described previously [5]. The medium
was washed out and replaced with I ml of fresh medium RPMI 1640 supplementedwith IFN-y and LPS if the cells were to be induced. In some experiments, L-NMMA(2.2 mM) was added. Radiolabelled precursors were then added: 100 kBq ofL-[U14C]arginine (ILl GBq/mmol) or 80 kBq of L-[guanidino- 14C]arginine (1.85kBq/mmol) or 37 kBq ofL-[ureido- 14C]citrulline (2.0 GBq/mmol). Supernatants werecollected after 18 h and kept frozen at - 80°C until anaysis. They were diluted with thestarting elution buffer and processed in the same way as TA3 M2 cytosilic extracts:50-100-j11 samples were injected.
RESULTS
The low pH of the buffers (2.2-3.0) was chosen taking into account the pKvaluesof the a-carboxyl groups of amino acids to control partly their ionization state(ornithine 2.0, arginine 2,2 citrulline 2.4). Typical retention times for authenticmarkers were urea 3.8 min, citrulline 11.5 min, ornithine 21 min and arginine 31 min(Fig. 2).

436
3000
dpm
urea
citrulline
ornithine
B. CHENATS el at.
arginine
o
o
\.-10
\-20
\-30 time (min)
Fig. 2. Chromatogram of radiolabelled amino aeid standards. Column: strong cation exehanger on siliea,Zorbax 300 SCX (250 X 4.6mm I.D.). Elution as follows: 0~7min, isocratic with 0.02 M sodium citrate (pH2.2), 7~17 min, linear gradient to 0.1 M sodium citrate (pH 3.0) 17-27 min, linear gradient to 0.2 M sodiumcitrate (pH 3.0); 27-35 min, isoeratie with 0.2 M sodium eitrate (pH 3.0). Flow-rate: 1.0 ml(min.
An intermediate of the NO'~generating pathway found in induced EMT6 cells culturesupernatants
Induced EMT6 cells were obtained by incubation overnight with IFN-y (40Vlml) and LPS (100 ng/ml). We first used L-[V- 14C]arginine as a precursor in order tolabel as many metabolites as possible. An extra metabolite refered to as X was found inthe culture medium, eluting between ornithine and arginine. This compound andcitrulline were not observed in the culture medium of untreated EMT6 cells (Fig. 3).The formation of this metabolite and of citrulline was inhibited by L-NMMA,a specific inhibitor of the NO'-generating pathway (Fig. 4). We then used L-[guanidino- 14C]arginine to obtain more information about compound X, as shown in Fig. 5.Ornithine disappeared, as expected, but compound X and citrulline were still detected.Hence X is not involved in the urea cycle. We also observed a new derivative (retentiontime ca. 15 min) which also did not belong to the urea cycle and might be anintermediate in the creatine biosynthetic pathway. The [X]/[citrulline] concentrationratio was about 0.2 with both types of labelling (Fig. 5).
The metabolite X, closely related to the production of citrulline, did not seem tobe a degradation product ofcitrulline. When induced EMT6 cells were incubated in thepresence ofL-[ureido-14C]citrulline, a small amount of arginine was generated throughthe urea cycle and a trace amount ofX. Its concentration was more closely related to

HPLC OF OXIDATION OF L-ARGININE
200EMT6 cells
l-(U- I 4c) ArginIne
dpm
ornithIneureo
A
orglnlne
437
-200
citrullIne B
dpm
o 10
x
30 time (min)
Fig. 3. HPLC analysis of untreated and induced EMT6 cell culture media. L-[U- '4C]Arginine: 100 kBq/ml.(A) EMT6 monolayers in 35-mm dishes (N undon) were incubated in I ml of RPM I 1640 medium for 18 h.(B) induced EMT6 cells were incubated for 18 h in Iml of RPMI 1640 supplemented with IFN-'Y(40 U/ml)and LPS 100 ng/ml).
the concentration of arginine produced than to that of added citrulline. Moreover, theproduction of X and not that of arginine was again inhibited by L-NMMA (Fig. 6). Itmust be pointed out that X was not found in cell Iysates. This metabolite was alsodemonstrated in cytosols of induced TA3 M2 cells supplemented with cofactors of theNO·-generating pathway (BH4, NADPH).
The NO·-generating pathway was induced in TA3 M2 cells by incubation for 24h with IFN-y (40 D/ml), TNF-(X (150 D/ml) and LPS (10 ,ug/ml). When cytosols ofinduced cells were supplemented with BH4 and NADPH, in the presence ofL-[guanidino- 14C]arginine, the NO·-generating pathway was triggered and citrullineand metabolite X were generated. They were not detected in induced cells in theabsence of cofactors or in non-induced cytosols even in the presence of cofactors. Theproduction of citrulline and of metabolite X by induced cytosols was also here

438
400
dpm
urec
Et1T6 cells
Hu- l 4cl Arginine
CIT
A
ARG
B. CHENAIS et al.
o
400
dpm
o400
dpm
B
c
l-NMMA 2.2 mM
o 10 20 30 ttme (mIn)
Fig. 4. Effect ofL-NMMA on the production ofL-arginine-derived metabolites by induced EMT6 cells in theculture medium. Cells were cultivated as described in Fig. 3. (A) EMT6-induced cells; (B) untrated EMT6cells; (C) EMT6-induced cells cultivated in the presence of 2.2 mM L-NMMA.
inhibited by L-NMMA. The generation of the metabolite referred to as "creatinederivative" was also found in cytosols ofTA3 M2 cells to the same extent regardless ofwhether the cells had been induced or not; this was not inhibited by L-NMMA (Fig. 7).The dependence of the formation of citrulline and X on arginine concentration wasstudied and we again found a nearly constant [X]/[citrulline] concentration ratio,which was close to 0.2. We failed to observe compound X in either lysates orsupernatants of cytotoxic macrophages, although we could easily detect the production of citrulline.
The metabolite X was not very stable even when kept frozen at - 80aC. It was

6000
l-NI1
/1A
dpm
::r: "0 t'""
(J o 'T] o >< 6 ~ o z o "T1
t'" ;l> ::0 Cl Z Z tr1
A II
Et1T
6ce
lls
L-(u
reid
o-1 4
c)C
itru
llin
e
ole
...
I\..
..,\.
dpm
9000
400
,Et
1T6
cell
sI
IA
L-(U
-1 4
c)A
rgin
ine
dpm
XAR
Gur
eaCI
T
0I1~
1lDr
ooiJ
lJ
"'-cr
eati
ne16
00I
II
deri
vati
veB
l-(g
uanl
dinO
-14c
)Arg
inin
e
IIl'
1\I\
dpm
x
.j:>. w '"
oo
o10
2030
time
(m
in)
010
2030
time
(mfn
)
Fig,
5,C
ompa
riso
no
fra
diol
abel
led
L-a
rgin
ine-
deri
ved
met
abol
ites
gene
rate
din
indu
ced
EM
T6
cell
cult
ure
med
iain
the
pres
ence
of
(A)
L-[
U'4
C]a
rgin
ine
or
(B)
L-[
guan
idin
o-'4 C
]arg
inin
e,
Fig,
6,R
adio
labe
lled
L_[
urei
do_
14C
]cit
rull
ine-
deri
ved
met
abol
ites
gene
rate
din
indu
ced
EM
T6
cell
cult
ure
med
ia,
Add
edra
dio
labe
lled
citr
ulli
ne:
37kB
q,(A
)in
the
abse
nce
of
L-N
MM
A;
(B)
inth
epr
esen
ceo
f2,
2m
ML
-NM
MA
,

440
3000
dpm
INDUCED TA3 M2 CELLS
L-(guanidino- 14[:) ArgininE
CIT'
x
L-erginine 250 11M
BH4 500llM NADPH 130 11M
A
ARG
B. CHENAIS el al.
5000
dpm
INDUCED TA3 M2 CELLS
L-erglnlne 250 11M L-NMMA 2.2 mM
creeline derivetive
CIT
B
ARG
o 10 20 30 time (min)
Fig. 7. HPLC analysis ofcytosolic extracts from induced TA3 M2 cells. (A) In the absence ofL-NMMA; (B)in the presence of 2.2 mM L-NMMA. Cytosolic extracts from induced cells were processed as indicatedunder Experimental in the presence of cofactors of the NO'-generating pathway (NADPH, BH 4 ) and of8 kBg of L-[guanidino- 14C]arginine.
first transformed into a less basic compound. It was very labile at alkaline pH, leadingto urea as a detectable product when L-[guanidino- 14C]arginine was used.
DISCUSSION
We have found in culture media orcytosols of cells, in which the NOO-generatingpathway has been induced, a metabolite, X, generated at the same time as citrulline(inhibition by L-NMMA, triggering by BH4 ). Metabolite X, unlike citrulline, was notfound in cytotoxic macrophages, probably because of the intense metabolism of thesecells (e.g., very active arginase) and the lability of X. An additional product fromL-arginine metabolism wa~ found and is possibly linked to the creatine pathway. Moreinformation on this could be obtained by incubating the cells with [3H]glycine (aprecursor).
Metabolite X is eluted between ornithine and arginine and is therefore more

HPLC OF OXIDATION OF L-ARGININE 441
basic than ornithine and less so than arginine. It may be assumed that NG-hydroxyarginine or NG-oxoarginine would be less basic than arginine because of the loss ofresonance energy which stabilizes the guanidinium cation. Thus, taking into accountthe chromatographic properties of X and the location of its radiolabeliing (guanidino- 14C), it may be hypothesized that X is probably either NG-hydroxyarginine orNG-oxoarginine, the intermediates which have been postulated (Fig. I). We arecurrently trying to obtain large amounts of the compound to check this hypothesis bymass spectrometry.
The metabolites of the NO"-generating pathway (NO", NG-hydroxyarginine)might be direct inhibitors of a key enzyme of DNA synthesis ribonucleotide red uctase.This would explain the antiproliferative effects obtained through the induction of theNO"-generating pathway [6].
REFERENCES
1 M. A. MarIetta, Trends Biochem. Sci., 14 (\989) 489.2 D. J. Stuehr and M. A. Marietta, Proc. Natl. Acad. Sci. U.S.A., 82 (\ 985) 7739.3 R. M. J. Palmer, A. G. Ferridge and S. Moncada, Nature (London), 327 (1987) 524.4 M. A. Marietta, P. S. Yoon, R. lengar, C. D. Leaf and J. S. Wishnok, Biochemistry 27 (1988) 8706.5 M. Lepoivre, H. Boudbid and J. F. Petit, Cancer Res., 49 (1989) 1970.6 M. Lepoivre, B. Chenais, A. Yapo. G. Lemaire, L. Thelander and J. P. Tenu, 1. Bioi. Chem., 265 (1990)
14 143.7 1. B. Hibbs, Jr., Z. Vavrin and R. R. Taintor, 1. [mmunol., 138 (1987) 550.8 J. B. Hibbs, Jr., R. R. Taintor and Z. Vavrin, Science, 235 (1987) 473.9 M. A. Tayeh and M. A. Marietta, 1. Bioi. Chem., 264 (1989) 19654.
10 N. S. Kwon, C. F. Nathan and D. J. Stuehr, J. Bioi. Chem., 264 (\989) 20496.II S. Moncada, R. M. J. Palmer and E. A. Higgs, Biochem. Pharmacol., 38 (1989) 1709.12 S. Eriksson, A. Graslund, S. Skog, L. Thelander and B. Tribukait, J. Bioi. Chem.. 260 (1984) 9\14.

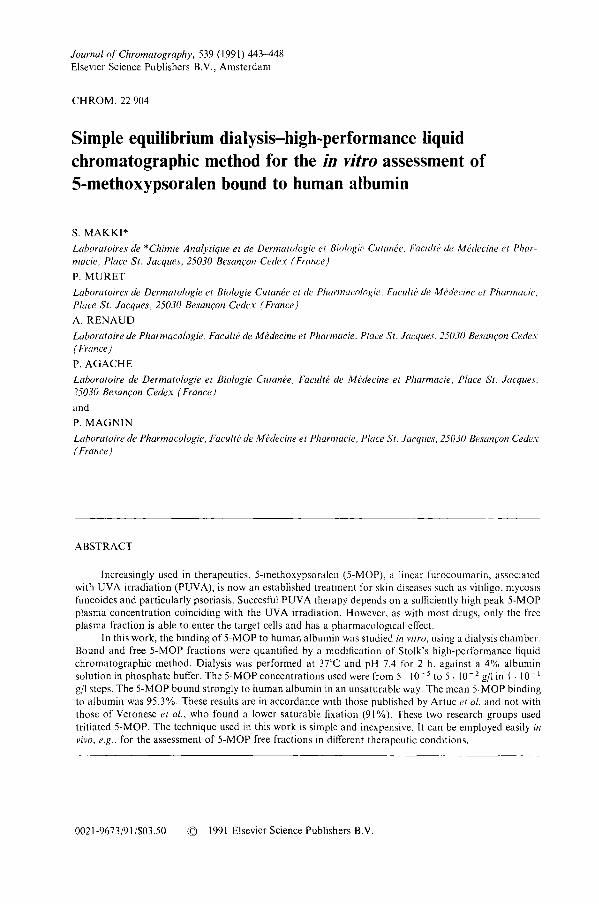
Journal o(Chromatography, 539 (1991) 443-448Elsevier Science Publishers B.V., Amsterdam
CHROM. 22904
Simple equilibrium dialysis-high-performance liquidchromatographic method for the in vitro assessment of5-methoxypsoralen bound to human albumin
S. MAKKI*
Laboratoires de *Chimie Analytique et de Dermatologie et Biologic Cutance. Facultc dc Mcdecine et Pharmacie, Place St. Jacques, 25030 Besan~on Cedex (France)
P. MURET
Laboratoires de Dermatologie et Biologie Cutance et de Pharmacologie. Faculte de Mcdecine et Pharmacie.Place St. Jacques, 25030 Besan~on Cedex (France)
A. RENAUD
Laboratoire de Pharmacologie, Facultc de Medecine et Pharmacie. Place SI. Jacques. 25030 Besan~'on Cedex( France)
P. AGACHE
Laboratoire de Dermalologie et Biologie Cutanee, Faculle de Medecine et Pharmacie. Place St. Jacques,25030 Besan~on Culex (France)
and
P. MAGNIN
Laboraloire de Pharmacologie, Facultc de Medecine el Pharnwcie, Place SI. Jacques, 25030 Besan~on Cedex( France)
ABSTRACT
Increasingly used in therapeutics, 5-methoxypsoralen (5-MOP), a linear furocoumarin, associatedwith UVA irradiation (PUVA), is now an established treatment for skin diseases such as vitiligo, mycosisfuncoides and particularly psoriasis. Succesful PUVA therapy depends on a sufficiently high peak 5-MOPplasma concentration coinciding with the UVA irradiation. However, as with most drugs, only the freeplasma fraction is able to enter the target cells and has a pharmacological effect.
In this work, the binding of 5-MOP to human albumin was studied in vitro, using a dialysis chamber.Bound and free 5-MOP fractions were quantified by a modification of Stolk's high-performance liquidchromatographic method. Dialysis was performed at 37'C and pH 7.4 for 2 h, against a 4% albuminsolution in phosphate buffer. The 5-MOP concentrations used were from 5.10- 5 to 5. 10- 2 gil in I . 10- 1
gil steps. The 5-MOP bound strongly to human albumin in an unsaturable way. The mean 5-MOP bindingto albumin was 95.3%. These results are in accordance with those published by Artuc el al. and not withthose of Veronese el al., who found a lower saturable fixation (91 %). These two research groups usedtritiated 5-MOP. The technique used in this work is simple and inexpensive. It can be employed easily invivo, e.g., for the assessment of 5-MOP free fractions in different therapeutic conditions.
0021-9673191/$03.50 © 1991 Elsevier Science Publishers B.V.

444
INTRODUCTION
S. MAKKI et al.
The psoralens, linear furocoumarins, are increasingly used in therapeutics. Thepsoralens employed in dermatology are 8-methoxypsoralen (8-MOP), 5-methoxypsoralen (5-MOP) and trimethylpsoralen (TMP). The PUVA therapy, association ofpsoralens (P) with ultraviolet radiation (UVA) is one of the main treatments forpsoriasis and vitiligo. 5-MOP (Fig. 1), the last to be introduced in this therapy, is theleast studied, especially regarding its binding to serum albumin, the principal carrier ofthe molecule to the skin.
z "'0
Fig. I. 5-Methoxypsoralen (5-MOP).
Artuc el al. [I] and Veronese et al. [2] studied the relationship between 5-MOPand albumin. They used radiolabelled 5-MOP to determine its fixation to humanalbumin. However, their results concerning the saturation of the binding of 5-MOP tothe albumin were contradictory.
In this paper, we present a simple method which employs equilibrium dialysis forthe study of 5-MOP fixed to human albumin and the detection of the remainingnon-linked, free drug. The determination of these fractions was carried out byhigh-performance liquid chromatography (HPLC). No radiolabelled 5-MOP wasemployed. Our results are in agreement with those reported by Artuc el al. [I].
EXPERIMENTAL
Equilibrium dialysisThe binding of 5-MOP was accomplished with a Dianonn apparatus [3]. The
drug was placed in one half of each cell and the human albumin in the other half. Thetwo halves were separated by a semi-permeable cellulose membrane (Diachema). Theexperiments were carried out under the following conditions: 37°e, pH 7.4, phosphatebuffer (0.2 M) and incubation for 2h with constant rotation at 20 rpm.
Extraction procedureSample volumes of 0.5 ml were withdrawn at different time intervals (0, 0.25,
0.50, 1,2 and 18 h) from the two sides (halves) of the cells: the free 5-MOP from the firsthalf of the cell and the free and bound 5-MOP from the second half. Each sample wasextracted with 5 ml of heptane-methylene chloride (4:1, vjv). The mixture was stirredfor 5 min and centrifuged at 1700 g for about 7 min. The organic layer was transferredto a test-tube and evaporated to dryness on a water-bath at 50 0 e under a stream ofnitrogen [4].

HPLC OF 5-METHOXYPSORALEN 445
HPLCHPLC separations were carried out with a Merck-Hitachi Model 655A-II
instrument. The method was based on Stolk's technique [4], with some modifications.To increase the sensitivity, a spectrotluorimeter (excitation at 312 nm, emission at490 nm [5]) was used instead of a UV detector. The mobile phase was methanol-water(60:40, v/v). The column was LiChrospher 100 RP-8 (5 pm) in LiChrocart 125-4(Merck, Darmstadt, Germany). After having established the calibration graph withsolutions of known concentrations, psoralens, extracted from phosphate buffer, wereinjected into the HPLC system.
Calibration graphBasic solutions were prepared with 200 pg/ml of 5-MOP and 8-MOP in ethanol.
The calibration graph was obtained by adding 25,50, 75, 100,300 and 600 ng/ml of5-MOP and 200 ng/ml of 8-MOP to six human serum samples of I ml each, free ofdrug. 8-MOP was used as an internal standard. The calibration graph was a plot ofpeak-height ratios (5-MOP/8-MOP) versus 5-MOP concentrations in differentsamples.
RESULTS AND DISCUSSION
Detennination olFee (F) and bound ( B) 5- MO P at different timesTable I shows the concentrations of F- and B-5-MOP as a function of time. It is
noticeable that by the second hour (Fig. 2), an equilibrium between the two halves ofthe cell was obtained with equal concentrations of F-5-MOP and stabilization of5-MOP bound to human albumin. The standard deviations are small. This demonstrates little variation and good reproducibility. The concentration of 5-MOP used forthis study was 196 ng/mi. The free active fraction of 5-MOP was 8 ng/ml (about 5%)and there was no change in this value between 2 hand 18 h.
Assessment F- and 8-5-MOP in reLation to increasing concentrationsTable n shows that at a concentration of 50 ng/ml, the proportion of the 5-MOP
bound to albumin was small. From 200 to 5 . 104 ng/ml the binding of 5-MOP to
TABLE rDETERMINATION OF FREE (F) AND BOUND (B) 5-MOP AS A FUNCTION OF TIME
Each value represents the average of three dialyses. All samples were analysed twice hy HPLC
Time 5-MOP (ng/ml)(h)
Free Bound + free Bound (B),(f) (B + f) calculated
o 1960.25 63.8 ± 0.80.50 27.7 ± 0.8I 14.0 ± 1.42 8.0 ± 1.3
18 7.8 ± 1.2
85.8 ± 0.6138.8 ± 2.0152.7 ± 0.1173.0 ± 0.1170.8 ± 1.0
22.4 ± 1.6111.2 ± 2.0138.0 ± 0.5165.0 ± 0.7162.8 ± 1.0

446
F
2
~o ~
min
B+ F
3
2
~o 5
min
S. MAKKI et al.
Fig. 2. Chromatograms ofpsoraJens, detected for the determination of free 5-MOP (F-, peak 3) and boundand free 5-MOP (B + F-, peak 3) at equilibrium (2 h). Peaks: 1 = solvent (ethanol); 2 = 8-MOP (internalstandard); 3 = 5-MOP.
albumin was stabilized at about 95% and B-5-MOP/F-5-MOP ratio remainedconstant (20.00 ± 0.36). The lower binding ability at low concentrations of 5-MOPcould be due to fixation on a first type of receptor on the albumin molecule, quicklysaturated, and hidden by the very large binding ability of a second receptor. Sucha phenomenon has been described for some drugs bound to albumin in an unsaturableway such as weak acids [6].
TABLE II
ASSESSMENT OF F- AND B-5-MOP IN RELATION TO INCREASING CONCENTRATION
Concentration F B + F B B/F % ofB(ng/ml) (ng/ml) (ng/ml)
50 4.1 41 36.9 9 90200 8.1 173.2 165.1 20.38 95.3
1 . 103 40.3 851.4 811.1 20.12 95.2I· 104 435.2 9438.6 9003.4 20.68 95.45· 104 2230.6 47 320.7 45090.1 20.21 95.2

HPLC OF 5-METHOXYPSORALEN
DISCUSSION
447
The aim of this work was to devise a simple technique for the in vitrodetermination of 5-MOP bound to human albumin. This would be of help in assessingthe free 5-MOP concentration, which is the fraction responsible for the therapeuticeffect.
The binding to human serum albumin of8-MOP, the most commonly employedpsoralen in PUVA therapy [7], has been evaluated by several investigations usingliquid scintillation counting, and showed saturable binding [8-11]. For 5-MOP onlya few studies are available, in which radio-labelled psoralen was used. Whereas Artucet at. [1] found an unsaturable binding of 5-MOP to human albumin in the 5 ng/ml230 ~lg/ml, Veronese el at. [2] reported saturable binding using a more limited range ofconcentration (30 ng/ml-30 ~g/ml) (Table III). However, in the latter work, there wasonly a trend towards a saturation process visible at higher concentrations.
TABLE 1II
SUMMARY OF METHODS AND RESULTS
Step Parameter Artuc et al. [I] Veronese et al. [2] This work
Dialysis Timc (h) 3Cr50 14 2equilibrium Temperature caC) 4 37 37
Apparatus Rotating Agitated RotatingBuffer 0.1 M phosphate 0.05 M phosphate 0.2 M phosphate
(pH 7.2) (pH 7.4) (pH 7.4)
5-MOP Liquid scintillation Liquid scintillation HPLCdetermination counting counting
Results Binding ('Yo) 98-99 91 95.3Saturation Non-saturable Saturable Non-saturableConcentration range 5 ng(ml-230 ,ug(ml 30 ng(ml-30 ILg(ml 50 ng(ml-50 ,ug(ml
The method proposed here is simple and rapid and does not require labelleddrug. In 1984, Prognon [5] used this technique to study 3-carbethoxypsoralen fixationto albumin. Using this method, the in vivo fixation of psoralens on albumin can beassessed in clinical practice. This is of major importance as the strong correlationobserved between 5-MOP plasma concentration and PUVA therapy efficiency [7] maybe related only to the free 5-MOP concentration. Investigations of the influence oflowand high-fat meals on the fixation of 5-MOP to human albumin are in progress.
ACKNOWLEDGEMENTS
The authors thank Mr. G. Pannetton (Iconographie, Faculte de Medecine et dePharmacie, Besanc;on) for technical assistance and Bergaderm Laboratories (Paris) forproviding the chemicals.

448
REFERENCES
S. MAKKI el al.
1 M. Artuc, G. Stueltgen, W. Schalla, H. Schaffer and J. Gazith, Br. J. Dermalol., 101 (1979) 669.2 F. M. Veronese, R. Bevilaequa, O. Schiavon and G. Rodighiero, Farmaca, Ed. Sci., 34 (1979) 716.3 M. Lecomte, R. Zini, P. d'Athis and J. P. Tillement, Ear. J. Drag Melab. Pharmacakinel., I (1979) 23.4 L. M. Stolk, Pharm. Weekbl., 2 (1980) 281.5 P. Prognon, Tlulse Serie E, No. 194, Universite Paris Sud, Paris, 1984.6 R. Zini, P. d'Athis, J. Barre and 1. P. Tillement, Biachem. Plwrmacol., 28 (1979) 2661.7 E. Andrew, A. Nilsen, P. Thune and I. Wilk, Clin. Exp. Dermalol., 6 (1981) 591.8 F. M. Veronese, R. Bevilacqua, O. Schiavon and G. Rodighiero, FarmaCl!, Ed. Sci., 33 (1978) 667.9 R. Bevilacqua, C. A. Benassi, O. Schiavon and F. M. Veronese, FarmaCl!, Ed. Sci., 36 (1981) 598.
10 O. Schiavon, C. A. Benassi and F. M. Veronese, Farmam, Ed. Sci., 39 (1984) 109.11 M. Pibonin, R. Zini, P. Nguyen, A. Renouard and J. P. Til1ement, Br. 1. Dermalol., 117 (1987) 207.

Journal o!,Chromatography, 539 (1991) 449-453Elsevier Science Publishers B.V., Amsterdam
CHROM. 22906
Scaling up in isolation of medium-size uraemic toxins
PHILIPPE M. GALLICE* and AIME D. CREVAT
Laboratoire de Biophysique, Faculti! de Pharmacie, 27 Boulevard Jean Moulin, 13385 Marseille Cedex 5(France)
and
YVON F. BERLAND
Centre d'Hemodialyse, Hopital Sainte-Marguerite, Boulevard de Sainte Marguerite, Marseille (France)
ABSTRACT
Plasmatic accumulation of uraemic toxins in the middle molecular mass range has been reported tobe associated with several pathologies observed in uraemic patients. The very low concentration of thesetoxins in uraemic body Huids makes classical chromatography techniques inadequate in isolating sullkientamounts of these endogenous substances, thus precluding their identitication. A scaling up of gel permeation and ion-exchange chromatographies was therefore developed. This considerably increased the amollntof uraemic toxins isolated, thus allowing the study of their chemical nature and facilitating understandingof their biological activities.
INTRODUCTION
Uraemic haemodialysed patients classically develop several associated disorderssuch as uraemic neuropathy and disturbances of ionic metabolism (Na +, Ca2 + , etc.).These pathologies are commonly attributed to plasmatic accumulation of endogenoussubstances in the molecular mass range 200-2000, the so-called uraemic middlemolecules (UMM) [1].
In previous papers [2,3] we demonstrated that UMM, isolated by successive gelpermeation and anion-exchange chromatography, exhibit some biological effectscorrelated with several pathologies such as neuropathy and Na + metabolism disorderswhich are associated with end-stage renal failure treated by haemodialysis,
However the concentrations of these toxins in uraemic body fluids are very low.Hence the standard chromatographic technique described previously [4] is inadequatefor isolating sufficient amounts of these active molecules, thus precluding theiridentification and a better understanding of their biological activities. We thereforescaled up the standard chromatographic process to increase the amounts of UMMisolated. In this paper we report the UMM separations obtained using scale-up andstandard chromatographic conditions simultaneously for comparison.
0021-9673(91($03.50 © 199 I Elsevier Science Publishers B. V.

450
EXPERIMENTAL
P. M. GALLICE, A. D. CREVAT, Y. F. BERLAND
Biological samplesUltrafiltrates of plasma from uraemic patients (UF) were obtained at the
beginning of dialysis by applying a negative pressure (400 mmHg) in the dialysercompartment before the dialysis fluid was run through the dialyser. Samples werestored at - 20°C until use.
Gel permeation chromatography (GPC)Preparative scale. A 100-ml volume of UF was separated on a glass column
(900 x 50 mm J.D.) packed with Sephadex G-15. The column was eluted withTris-HCI buffer (10- 2 M, pH 8.6) at a flow-rate of296 ml h -1 (linear velocity 15.07 cmh- 1
). The absorbance was monitored at 254 nm and the eluate was collected in 9-mlaliquots.
Standard conditions. A 20-ml volume of UF was chromatographed on a 900 x26 mm J.D. column of Sephadex G-15 eluted with Tris buffer at a flow-rate of 80 mlh -1.
Ion-exchange chromatography (IEC)Preparative scale. A UMM sample (corresponding to 400 ml ofUF) was injected
onto a glass column (230 x 26 mm J.D.) packed with DEAE-Sephadex A-25 andequilibrated with Tris-HCI buffer (10- 2 M, pH 8.6) at a flow-rate of 275 ml h -1.
The column was eluted for 60 min with the same buffer, followed by a 12-hexponential gradient of NaCI at the same flow-rate. At any time the NaCIconcentration was
Ct = Cr[1 - exp( - Qt/V)]
where Ct represents the NaCI concentration at time t, Cr the final NaCI concentration(0.13 M), Q the flow-rate and V the volume of the gradient mixing chamber (1000 ml).The absorbance was monitored continuously at 254 nm and aliquots (13 ml) werecollected.
Standard lEe. A UMM sample from 40 ml of UF was separated using a 23cm x 8 mm J.D. column (DEAE-Sephadex A-25) equilibrated with Tris-HCl bufferat a flow-rate of 26 ml h -1. Elution was carried out with an exponential gradient ofNaCI (0-0.15 M) using a 125-ml mixing volume chamber.
RESULTS
Fig. 1 shows typical elution profiles of 100 ml and 20 ml ofUF separated by GPC(Sephadex G-15) according to preparative (top) and standard (bottom) conditions,respectively. The elution profiles obtained with the preparative procedure andstandard chromatographic method(s) were identical. Thus, GPC provided 8-10fractions. Peak 2 is observed in uraemic but not in normal plasma ultrafiltrates [4]. Theapparent molecular mass of the peak is about 1000 dalton,'hence this compound fallsin the molecular mass range of the so-called "uraemic middle molecules" [5], whichhave been suggested to be connected with various uraemic disorders [1,6,7]. Thus peak

ISOLATION OF URAEMIC TOXINS 451
7 8
Ec
""'C'J
W()z«ena::o(f)en«
410
106 8ELUTION TIME (h)
Fig. I. Typical GPC of uraemic plasmatic ultratiltrates: scale up (top) and standard procedures (bottom).The hatched fraction represents the elution of UMM (peak 2). For peaks, see Results section.
2-5
2-1 2-4
Ec
""'C'J
W()z«ena::o(f)en«
2-6
o 2 4 6 8 10
RETENTION TIME (h)
Fig. 2. Typical IEC elution profiles of crude UMM (peak 2): scale up (top) and standard procedures(bottom).

452 P. M. GALLlCE, A. D. CREVAT, Y. F. BERLAND
2 was called "crude UMM". It contains compounds which have been reported to betoxic [2,3]. lEC separation was therefore performed on this peak.
Fig. 2 represents lEC separations of crude UMM (peak 2). As in GPC, thechromatograms obtained were identical. lEC allows the separation of peak 2 into sixfractions numbered in order of elution 2-1, ... , 2-6. The method of peak labelling isbased on the decimal system, where 1,2,3, etc., refer to the primary peaks obtainedwith GPc. Next, sub-peaks obtained in the subsequent separation of peak 2 by IEC aredesigned in order of elution: 2-1, 2-2, 2-3, etc. This numbering system followspreviously established nomenclature [8].
DISCUSS10N
Separation of UMM by the standard technique using two successive chromatographic steps is an efficient method but it does not allow the isolation of sufficientamounts of compounds. Therefore, in order to obtain a greater amount of thesesubstances, we scaled up the GPC and lEC procedures.
For GPC an increase in productivity was achieved by increasing the columndiameter (from 26 mm to 50 mm), which increased the stationary phase volume (from478 to 1767 ml) and allowed the separation of an increased sample volume (from 20 to100 ml). In order to preserve the chromatographic resolution and the separation time,the flow-rate was increased (from 80 to 296 ml h -]) to obtain a constant linear velocityof eluent (15.07 em h-]).
The comparative results obtained (Fig. I) show that scaling up in GPC allowsa five-fold increase in sample volume treated per chromatographic run.
For the scaling up in IEC, the column size was adapted to the sample volumetreated. To select an appropriate column, we used the equation
where S.F. is the scale factor for separation, J.D' 2 is the 1.0. of the preparative columnand L 2 is its length, J.D.] is the J.D. of the standard column and L 1 is its length.
To preserve the resolution we maintained the column length (L I = L 2 = 23em). Because the sample volume to be processed per chromatographic run increasesfrom 40 to 400 ml, the S.F. value was 10. Under these conditions, as J.D. I was 8 mm,the calculated J.D' 2 was about 26 mm. Therefore, the preparative column selected forlEC was 230 x 26 mm LD. (see Experimental). In addition, to preserve the separationtime, we adjusted the flow-rate to 275 ml h -] to maintain a constant linear velocity of51.8 em h- 1
.
As elution was achieved using an increasing exponential NaCI gradient (seeExperimental), modification of the flow-rate modified the slope of the gradient.Therefore, in order to preserve a similar gradient curve, we recalculated the othergradient parameters taking into account the new flow-rate. The mixing gradientchamber volume was therefore increased from 125 to 1000 ml and the final NaCIconcentration was 0.13 M.
Under these optimized conditions, the separation of UMM (peak 2) by scalingup in IEC is comparable to the separation carried out under the standard conditions
ISOLATION OF URAEMIC TOXINS 453
(Fig. 2). Moreover, scaling up makes it possible to process ten times more UMMsample volume per run.
Consequently, this scaling up in the isolation steps of UMM considerablyincreases the amount of compounds isolated, thus making it possible to study theirchemical nature and biological activity.
ACKNOWLEDGEMENTS
The authors are grateful to M. Vidalin and H. Bouteille for skillful technicalassistance.
REFERENCES
J. Bergstrom and P. Fi'trst, in W. Drukker. F. M. Parsons and J. M. Maher (Editors), Replacemen/ ofRenal Func/ion by Dia/.i'sis. Martinus Nijhoff, Boston, MA. 1983, Ch. 19. p. 354.
2 D. Braguer, P. Gallice. J. P. Monti, A. Murisasco and A. CrcvaL Clin. Nephrol., 25 (1986) 4.3 P. Gallice, J. P. Monti, M. Baz. A. Murisasco and A. Crcvat. Clin. Chem .. 34 (1988) 2044.4 P. Gallice, N. Fournier. A. Crevat, M. Briot, R. Frayssinet and A. M urisasco, Kidnev 1m., 23 (1983) 764.5 A. L. Babb. P. C. Farrell, D. A. Uvelli and B. H. Scribner. Trans. AnI. Soc. Artit: Organs, 18 (1980)98.6 H. Klinkmann, J. Bergstrom, R. Dzurik and J. L. Funck-Brcntano (Editors). Middle Molecules in
Uremia and O/her Diseases, Proceedings of Syrnposium on Presem Status and Fu/ure Orien/a/ioll ofMiddle Molecules ill Uremia and Other Diseme.l', Avignoll. hallce. November 28-29. 1980. InternationalSociety Artificial Organs, Cleveland, OH. 1980, pp. 59-119.
7 S. Ringoir, R. Vanholder and S. G. Massry (Editors). Uremic Toxills. Proceedillgs ofGhen/ Symposium011 Uremic Toxins. Ghell/, Belgium, Oe/ober 3-4,1986, Plenum Press, New York, 1987.
8 H. Klinkmanll, AI'/if Organs, 4, Suppl. (1980) 188.


Journal 01' Chromatography, 539 (1991) 455-463Elsevier Science Publishers B.Y., Amsterdam
CHROM. 22 880
Selective extraction of native jJ-Iactoglobulin from whey
EMILIA CHIANCONE* and MAURIZIO GATTONI
CNR Centre of Molecular Biology. Department ol'Biochernical Sciences, University of Rome "'La Sapienza ",00i85 Rome (italy)
ABSTRACT
A method is proposed for the selective extraction from whey of fJ-lactoglobulin, the major allergeniccomponent of cow milk. It represents an application of subunit exchange chromatography, which exploitsthe tendency of fl-Iactoglobulin to undergo reversible association-dissociation equilibria at slightly acidicpH values. Immobilized A and B fl-lactoglobulin subunits are capable of interacting in a highly specific andreversible way with the soluble protein and can be used to extract A and B fJ-lactoglobulin from wheyunder conditions that favour subunit association. The soluble protein retained by the immobilized proteincan be recovered under conditions that promote dissociation into subunits. The subunit exchange column,if coupled to an anion-exchange column, allows the complete deproteinization of whey. All the wheyproteins are extracted in their native form and are of high purity; their functional properties are intact evenafter lyophilization. This important characteristic and the possibility of removing fJ-lactoglobulin selectively render the proposed method a potentiHlly powerful tool in the processing of whey to produce hUI11Hnfood products for specific end-uses such as hypoHllergenic milk formulas.
INTRODUCTION
In recent years, the attitude towards whey proteins has changed and they are nolonger considered as waste products, but rather as valuable nutrients that can be usedby the food industry. However, this use is dependent on, among other factors, thepossibility of tailoring whey proteins for specific end-uses and recovering them withintact functional properties [1]. Their use in the baby-food industry, for example, forthe production of hypoallergenic infant milk formulas, requires the selective removalof ,B-Iactoglobulin, the major allergenic component of cow milk [2].
,B-Lactoglobulin, which represents half of whey proteins, occurs in the form oftwo genetic variants, A and B, plus a minor variant, C, of different electrophoreticmobility; it is a dimer of relative molecular mass 36 000. At pH < 3.7 and> 5.4, the twomain genetic variants dissociate reversibly into single polypeptide chains; the extent ofdissociation increases with increasing temperature. Between pH 3.7 and 5.2 in the cold,the native dimeric molecule undergoes a reversible tetramerization which in theA variant is maximum in the pH range 4.40-4.65; the tendency to tetramerize issignificantly less marked with the B variant [3-8]. In mixtures of A and B ,B-Iactoglobulin all molecules can aggregate with three types of bonds of different strengthsand mixed A-B tetramers are also formed [9].
0021-9673/91/$03.50 © 1991 Elsevier Science Publishers B.Y.

456 E. CHIANCONE, M. GATTON]
The occurrence of association-dissociation phenomena in {i-lactoglobulinsuggested the application of subunit exchange chromatography for its selectiveextraction from whey. This is a bioaffinity chromatographic method which exploits thefact that immobilized subunits of polymeric and self-associating proteins retain thecapacity to interact in a very specific and reversible way with soluble subunits of thesame or of a homologous protein. Hence, under experimental conditions where thesoluble protein is in self-association equilibrium, subunits are exchanged between theliquid and the solid phase and part of the protein, that was initially in solution, isbound to the matrix. The amount of matrix-bound polymer thus formed is governedby the law ofmass action and depends on several parameters, i.e., on the concentrationof immobilized and soluble protein, on the association constants in the liquid and inthe solid phase and on the stoichiometry of the association reaction [10-12]. Inprinciple, therefore, one may achieve purification of the polymerizing protein in twosteps by changing the state of association in an appropriate way. In the first, theprotein is extracted from the medium and bound to the immobilized subunits underconditions that favour polymer formation. In the second step, the' specifically boundprotein is eluted under conditions that promote dissociation of the polymer intosubunits [13-15].
The data reported in this paper show that subunit exchange chromatographycan be employed for the selective extraction of A and B {i-lactoglobulin from whey.Moreover, the experimental conditions used in the bioaffinity column are such thatother whey proteins can be recovered easily in a concentrated from by means of ananion-exchange column. A major advantage of the proposed method is that all theproteins are obtained in their native form and hence are amenable to a variety ofuses inthe food industry.
EXPERIMENTAL
ChemicalsThe different {i-lactoglobulins, i.e., the genetic species A and Band their mixture,
were crystallized products from Sigma (St. Louis, MO, U.S.A.). Whey was obtainedfrom fresh cow milk (Centrale del Latte, Rome, Italy) after precipitation of casein atpH 4.65. Milk and a sodium acetate buffer of ionic strength, (1) 0.1 M at pH 4.65 weremixed in equal volumes and stirred for IS min at room temperature while maintainingthe pH constant by addition of I M acetic acid in small amounts. The precipitatedcasein was removed by centrifugation for 10 min at 15000 g in a Sorvall centrifuge andthe supernatant (whey) was dialysed against the same acetate buffer. After dialysis,whey was clarified by filtration through a Millipore filter.
EquipmentGel electrophoresis experiments were performed according to Davis [16].
Sedimentation velocity experiments were carried out in a Spinco ModelE ultracentrifuge equipped with an RTIC unit at 52000 rpm and 10°C; the sedimentationcoefficients were corrected to S20,w (sedimentation coefficient corrected to the value itwould have in a solvent with the viscosity and density of water at 20°C) by standardprocedures.

EXTRACTION OF If-LACTOGLOBULIN 457
Protein immobilizationThe mixture of A and B fi-lactoglobulin was immobilized under different
experimental conditions (such as pH of immobilization and coupling time, extent ofmatrix activation, concentration of added protein). After the coupling step, the matrixwas washed with coupling buffer; subsequently, any non-covalently bound protein'was removed with a dissociating buffer at acidic pH, namely 0.1 M NaCI~HCl at pH2.0. The concentration of immobilized protein was determined spectrophotometricallyby using the specific absorbance (A ty,~m) of 9.6 at 278 mm [5]. The turbidity of thematerial was minimized with the use of protein-free gel in the reference beam.
Determination of the associating capacity of the immobilized proteinThe capacity of immobilized (i-lactoglobulin to bind the protein in solution was
measured by frontal analysis of the eluate from a thermostated chromatographiccolumn containing ca. 5 ml of immobilized protein and equilibrated with associatingbuffer (0.1 M sodium acetate buffer, pH 4.65) at a constant flow-rate of about 10 ml/h.fi-Lactoglobulin solutions in the same buffer were percolated through the column untila steady state was reached, i.e., until the absorbance of the effluent was the same as thatof the in-flowing solution. The effluent absorbance was monitored at 278 nm witha Gilford 2000 spectrophotometer equipped with a flow cell. The elution volume of theprotein, V, was calculated by constructing the equivalent sharp boundary [10]. Thecolumn was freed from the retained protein with dissociating buffer, 0.1 M NaCI-HCI(pH 2.0), unless stated otherwise. The same buffer was used to measure the voidvolume of the column, Va.
RESULTS AND DISCUSSION
Application of subunit exchange chromatography to purified fi-lactoglobulinThe effects of the pH of immobilization, extent of matrix activation and
concentration of added protein, on the amount of A and B fi-Iactoglobulinimmobilized per millilitre of added gel are shown in Table I. It is worth pointing outthat pH values above 7.0 were avoided owing to the slow denaturation processes thattake place under these pH conditions [4].
fi-Lactoglobulin immobilized under all the conditions given in Table 1 is stablefor several months when kept at pH 4.65 in the presence of 0.2% sodium azide. The
TABLE I
IMMOBILIZATION OF A AND B !1-LACTOGLOBULIN ON SEPHAROSE 4B
Coupling reaction carried out using 0.05 M phosphate buffer; coupling time, 18 h at 6°C.
Sample pH of mg BrCN/mI mg If-lactoglobulin mg If-lactoglobulinNo. immobilization Sepharose added/mI Sepharose immobilized/m1 Sepharose
1 6.0 50 8 1.52 6.7 50 8 3.83 6.7 100 14 4.84 6.7 50 14 4.1

458 E. CHIANCONE, M. GATTONI
leakage of the protein from the matrix was found to correspond to about 2'/'0 of theimmobilized material 8 months after the coupling reaction.
The associating capacity of the immobilized samples was measured as describedunder Experimental. A typical experiment in 0.1 M acetate buffer (pH 4.65) at 8°C isshown in Fig. 1. The establishment of a reversible association-dissociation equilibri urnbetween the liquid and the solid phase results in the specific binding of soluble{3-lactoglobulin to the immobilized subunits and hence in the retardation of the elutionof {3-lactoglobulin (V) with respect to an inert protein (Va). The difference in elutionvolume, Ll V = V - Va (Fig. 1), is related to the amount of protein bound to the matrixunder steady-state conditions, [Y], by the expression [Y] = Ll Vc, where c is thesteady-state concentration of the protein in solution. It is useful to define the quantity[Y]jR-Xt> where R-X( is the amount of immobilized monomer, which may be calledthe binding number as its limiting value at infinite concentration of soluble proteinequals n-l, n being the degree of polymerization [11].
50
ml
Fig. I. Elution profile of A and B {i-lactoglobulin from a column containing Sepharose-bound A andB {i-lactoglobulin. The protein in the solid phase was 4.8 mglml of settled gel and the bed volume was 5.0 ml.The column was equilibrated with 0.1 M acetate buffer (pH 4.65) at 8°C. Arrows indicate the application of(A) the {i-lactoglobulin solution at 2 mglml, (B) equilibrating buffer and (C) 0.1 M NaCl-HCl dissociatingbuffer (pH 2.0). Dashed lines represent the position of the hypcrsharp front of the boundaries ofIi-lactoglobulin (V) and of a non-interacting protein (Vo)·
{3-Lactoglobulin is probably immobilized on the matrix as the monomer ofrelative molecular mass of 18 kilodalton, as the coupling reaction is expected to shiftthe association-dissociation equilibrium of the native dimeric species [4,7] towardsmonomer formation. In line with this expectation, no traces of protein were found inthe eluate on extensive washing of the immobilized protein with dissociating bufferafter the coupling reaction.
Table II reports the results obtained in experiments of this kind in whichsolutions of A and B {3-lactoglobulin at a concentration of2mgjml in acetate buffer ofI = 0.1 M were allowed to interact with the same protein mixture immobilized underthe conditions detailed in Table 1. The associating capacity of the Sepharose-boundprotein varies as a function of the coupling conditions. In particular, a change in theimmobilization pH from 6.7 to 6.0 (samples 1 and 2) and a high extent of matrixactivation (samples 3 and 4) decrease the associating capacity of the immobilizedprotein; in the latter instance the effect is probably due to multi-point attachment tothe matrix.

EXTRACTION OF fl-LACTOGLOBULIN 459
TABLE II
AMOUNT OF fl-LACTOGLOBULIN RETAINED ON A COLUMN OF IMMOBILIZED A ANDB fl-LACTOGLOBULIN
A column (5 ml) was saturated with fl-Iactoglobulin or whey at a concentration of 2 mg/ml in 0.1 M acetatebuffer (pH 4.65 or 6.0) at the indicated temperatures; elution with 0.1 M NaCI-HCI (pH 2.0).
Solution
A and B fl-Iactoglobulin
Whey
Immobilized mg bound fl-Iactoglobulin/mgprotein" immobilized protein'
SoC 23°C, pH 6.0
pH 4.65 pH 6.0
I 0.132 0.30 0.233 0.22 0.324 0.44 0.36
2 0.31 0.213 0.19 0.37 0.23'4 0.53 0.41'
a Samples have the same numbering as in Table I.b Amount of protein recovered after application of dissociating buffer." Protein eluted with 0.2 M acetate buffer (pH 3.6).
As mentioned above, the law of mass action requires the value of [Y], andtherefore the elution volume V, to depend on the concentations of soluble andimmobilized protein and on the association constants in solution and on the solidphase. The dependence of V and [Y]/R - X t on the steady-state concentration ofsoluble protein was measured for sample 4 and is depicted in Figs. 2 and 3, respectively.Fig. 2 shows the significant increase in elution volume when the concentration ofsoluble protein is low (< 2 mg/ml), a typical feature of subunit exchange chromatography. Fig. 3 shows that the data are consistent with a dimerization constant of 250dl/g both in solution and on the solid phase. It also shows that at high proteinconcentrations (above 4 mg/ml), although dimer formation is still predominant, higherpolymers are formed. In line with these findings, sedimentation velocity experimentscarried out with the same A and B fi-Iactoglobulin mixture at a protein concentrationof 5 mg/ml yielded a single peak with szo,w = 2.9S, a value which corresponds to theweight-average relative molecular mass (34 kilodalton) calculated with the dimerization constant given above using a partial specific volume V = 0.750 andf!f~ = 1.2.
Selective extraction of fi-Iactoglobulin from wheyThe high capacity and affinity of immobilized A and B fi-Iactoglobulin for the
protein in solution can be exploited for its selective extraction from whey. Whey, in theassociating buffer 0.1 M acetate (pH 4.65), was percolated through a column ofimmobilized A and B fi-Iactoglobulin equilibrated with the same buffer in sufficientvolume to ensure the establishment of a steady state (Fig. 4, top). The elution patternshows two distinct sigmoidal profiles: the first (at Vo) corresponds to the elution of all

460 E. CHIANCONE, M. GATTONI
ol--...l..-__~__--'-----l
-1 0 +1
log c (mg/ml)
V(mil
40
o0!:---~----:2:--~~4-~"'"'"*6c Img/mlJ
1.0L, = 250dllg o -
Fig. 2. Elution volume of A and B Ii-lactoglobulin li'om a column containing Sepharosc-bound A andB [l-Iactoglobulin as a function of protein concentration in solution. 0 = Mixture of both genetic variants;• = variant A; D = variant B. The protein in the solid phase was 4.lmg/ml and the bed volume 5.0 ml. Thecolumn was equilibrated with 0.1 M acetate buffer (pH 4.65) at 8uC. Thc dashcd Iinc rcpresents the elutionvolume (Vo) of a non-interacting protein.
Fig. 3. Binding of A and B [l-Iactoglobulin in solution to a column containing Sepharose-bound A andB Ii-lactoglobulin as a function of the protein concentration in solution. The ordinates correspond to thebinding number, i.e., to the amount of soluble protein bound under steady-state conditions to the matrix, Y,divided by the amount of immobilized monomer, R - X" The continuous curve was calculated according toeqns. 5 and 6 in ref. 10. Experimcntal conditions and symbols as in Fig. 2.
inert whey proteins and the second to the elution of{i-lactoglobulin. After clearing thecolumn with the equilibrating acetate buffer, the specifically bound protein was elutedby application of the dissociating buffer. The amount of eluted protein closelycorresponds to that expected on the basis of the amount ofwhey applied to the column.The inset in Fig. 4 shows the quality of the separation achieved. Table II summarizesthe results obtained with the samples described in Table I.
Fig. 4 (bottom) shows an experiment carried out at 20DC and pH 6.0. Theseconditions were tested because they allow complete deproteinization of whey to beachieved simply by applying the inert proteins that are eluted in the void volume of thesubunit affinity column onto an ion-exchange column (see below). The elution profileis very similar to that obtained at pH 4.65, indicating that the subunit affinity column isefficient also at higher pH. In this experiment elution of the specifically boundf3-lactoglobulin was attempted at pH 3.6, where the matrix is more stable than at pH2.0; the recovery of the protein corresponds to about 80% of the column capacity.
Deproteinization of wheyComplete deproteinization of whey can be obtained easily by assoCIatmg
a DEAE-cellulose column [4,17,18] to the subunit exchange column. To this end, wheyin 0.1 M acetate buffer (pH 6.0) was percolated through the column containing
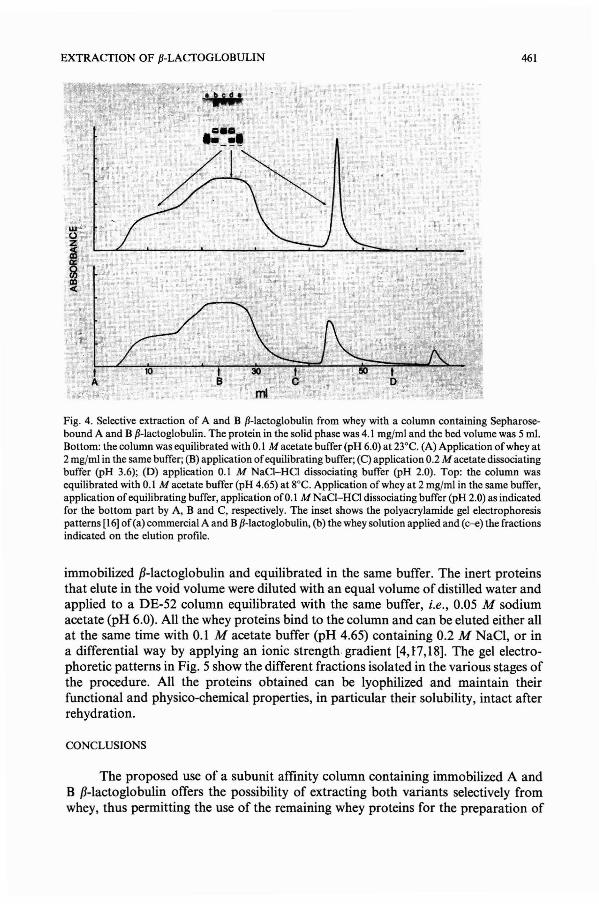
EXTRACTION OF p-LACTOGLOBULIN 461
Fig. 4. Selective extraction of A and B p-lactoglobulin from whey with a column containing Sepharosebound A and B p-lactoglobulin. The protein in the solid phase was 4.1 mgjml and the bed volume was 5 m!.Bottom: the column was equilibrated with 0.1 M acetate buffer (pH 6.0) at 23°C. (A) Application ofwhey at2 mgjml in the same buffer; (B) application ofequilibrating buffer; (C) application 0.2 M acetate dissociatingbuffer (pH 3.6); (0) application 0.1 M NaCI-HCl dissociating buffer (pH 2.0). Top: the column wasequilibrated with 0.1 M acetate buffer (pH 4.65) at goC. Application of whey at 2 mgjml in the same buffer,application ofequilibrating buffer, application of0.1 MNaCI-HCl dissociating buffer (pH 2.0) as indicatedfor the bottom part by A, Band C, respectively. The inset shows the polyacrylamide gel electrophoresispatterns [16] of(a) commercial A and Bp-lactoglobulin, (b) the whey solution applied and (c~) the fractionsindicated on the elution profile.
immobilized fJ-lactoglobulin and equilibrated in the same buffer. The inert proteinsthat elute in the void volume were diluted with an equal volume of distilled water andapplied to a DE-52 column equilibrated with the same buffer, i.e., 0.05 M sodiumacetate (pH 6.0). All the whey proteins bind to the column and can be eluted either allat the same time with 0.1 M acetate buffer (pH 4.65) containing 0.2 M NaC!, or ina differential way by applying an ionic strength gradient [4,17,18]. The gel electrophoretic patterns in Fig. 5 show the different fractions isolated in the various stages ofthe procedure. All the proteins obtained can be lyophilized and maintain theirfunctional and physico-chemical properties, in particular their solubility, intact afterrehydration.
CONCLUSIONS
The proposed use of a subunit affinity column containing immobilized A andB fJ-lactoglobulin offers the possibility of extracting both variants selectively fromwhey, thus permitting the use of the remaining whey proteins for the preparation of

462 E. CHIANCONE, M. GAITONI
Fig. 5. Polyacrylamide gel electrophoresis patterns of whey proteins purified by the combined use ofsubunit-exchange and ion-exchange chromatography. (a) Commercial A and B p-lactoglobulin; (b) whey;(c) A and B p-Iactoglobulin purified by subunit-exchange chromatography; (d-g) protein fractions elutedfrom a DEAE-cellulose column as described in the text.
special diet food, e.g., hypoallergenic infant milk formulas. The combined use of thebioaffinity column with a DEAE column allows the complete deproteinization ofwheyand the recovery of the remaining whey protein in a concentrated form. A furtheradvantage of the proposed method is that all the proteins can be lyophilized and arefully soluble and functional after rehydration.
Immobilized {J-lactoglobulin can also be used to extract the protein directly frommilk [19].
ACKNOWLEDGEMENTS
This work was supported in part by the CNR Target Project on Biotechnologyand Bioinstrumentation.
REFERENCES
K. R. Marshall, in K. K. Fox (Editor), Developments of Dairy Chemistry, Applied Science Pub!.,Barking, 1982, p. 339.
2 L. M. J. Heppel, A. J. Cant and P. J. Kilshaw, Br. J. Nutr., 29 (1984) 51.3 K. A. Piez, E. W. Davie, T. E. Folk and J. A. Gladner, J. Bioi. Chern., 236 (1861) 2912.

EXTRACTION OF {J-LACTOGLOBULIN 463
4 H. A. McKenzie, in H. A. McKenzie (Editor), Milk Protein Chemistry and Molecular Biology, Vol. Il,Academic Press, New York, 1971, p. 257.
5 R. Townend, L. Weinberger and S. N. Timasheff, J. Am. Chem. Soc., 82 (1960) 3175.6 S. N. Timasheff and R. Townend, J. Am. Chem. Soc., 83 (1961) 470.7 H. A. McKenzie and W. H. Sawyer, Nature (London), 214 (1967) 1101.8 H. E. Swaisgood, in P. F. Fox (Editor), Developments of Dairy Chemistry, Applied Science Publ.,
Barking, 1982, p. 1.9 T. F. Kumosinski and S. N. Timasheff, J. Am. Chem. Soc., 88 (1966) 5635.
10 E. Antonini, M. R. Rossi Fanelli and E. Chiancone, in H. Sund and G. Blauer (Editors), Protein-LigandInteractions, Walter de Gruyter, Berlin, 1975, p. 45.
11 E. Chiancone, M. Gattoni and E. Antonini, in 1. M. Chaiken, M. Wilchek and 1. Parikh (Editors),Affinity Chromatography and Biological Recognition, Academic Press, Orlando, FL, 1983, p. 103.
12 E. Chiancone and M. Gattoni, Methods Enzymol., 135 (1987) 487.13 G. Carrea, P. Pasta and E. Antonini, Biotechnol. Bioeng., 27 (1985) 704.14 S. Shuder, J. B. Wittenberg, B. Haseltine and B. A. Wittenberg, Anal. Biochem., 92 (1979) 473.15 J. Bode and K. G. Wagner, Biochim. Biophys. Res. Commun., 62 (1975) 868.16 B. J. Davis, Ann. N.Y. Acad. Sci., 121 (1964) 404.17 M. L. Groves, Biochim. Biophys. Acta, 100 (1965) 154.18 F. Cervone, 1. D. Brito, G. Di Prisco, F. Garofano, L. Norona, S. Traniello and R. Zito, Biochim.
Biophys. Acta, 295 (1973) 555.19 E. Chiancone and M. Gattoni, ltal. Pat., No. 47785 A/87; Eur. Pat., No. 88830115.7 (1990); U.S. Pat.
Appl., No. 07/173.384 (under consideration).


Journal of Chromatography, 539 (1991) 465-473Elsevier Science Publishers B.V., Amsterdam
CHROM. 22881
Purification and characterization of recombinanttropomyosins
CONCHITA FERRAZ, JOANNES SRI WIDADA and JEAN-PIERRE LIAUTARD*
CRBM du CNRS, INSERM U-249, Route de Mende, B.P. 5051, 34033 Montpellier Cedex (France)
ABSTRACT
The cloning of a cDNA coding for the skeletal human {i-tropomyosin in the bacterial expressionvector pKK233-2 is reported. Deletion mutants were also constructed. pCF-Tl088 was obtained by elimination of exon 9 and pCF-Tl089 was built by deleting 2/3 of the first exon. The recombinant tropomyosinswere synthesized in E. coli after induction by IPTG. The mutant proteins were characterized by westernhlot using antibodies raised against native tropomyosin. The amount of the human protein synthesized inE. coli varies with each mutant, suggesting the involvement of the structure of the protein or of the mRNAon the synthesis or the stability of the recombinant protein. After precipitation of most of the bacterialproteins at 100·C, purification was achieved by high-performance liquid chromatography (HPLC) usingTSK-DEAE, hydroxyapatite and reversed-phase columns. The chromatographic behaviour of the mutantswere compared. Characterization of the mutated tropomyosins was achieved by tryptic digestion andanalysis of the peptide composition by reversed-phase HPLC. A computer program for predicting theretention times of the peptides generated was written. It is shown that it is possible to identify the mutationssolely by comparing the chromatogram of the tryptic digest with the profile obtained by computer simulation.
INTRODUCTION
Tropomyosin is a major muscular protein involved in the regulation of musclecontraction by Ca2+ [I]. The mechanisms of this regulation are still a matter ofdebate [1]. Muscle tropomyosin is a two-stranded elongated molecule, having virtually 100% a-helix conformation. It winds along the long-pitch grooves of the F-actinhelix. This rod-like fibril1ar molecule is considered to be a good model to investigatethe nature of protein stability and particularly to understand the respective roles ofhydrogen bonds and inter-helix interactions in the formation of the tertiary structureof proteins [2].
Tropomyosin genes from different species and different tissues have alreadybeen cloned (for reviews see Colote et al. [3] and Sri Widada et al. [4]). Muscletropomyosin gene is constituted of nine exons, three of which arise from alternativesplicing. Using an evolutionary approach, we have shown that the alternativelyspliced exons are conserved, suggesting an important role in the function of theseparts of the molecule. Tropomyosin presents numerous elementary functions such astroponin binding, head-to-tail interactions or actin binding. None of them is definedat the molecular level [1].
0021-9673/91/$03.50 © 1991 Elsevier Science Publishers B.V.

466 C. FERRAZ, J. SRI WIDADA, J.-P. LIAUTARD
To understand the function of tropomyosin better, it is therefore necessary todissect the mechanisms that it involves at the submolecular level. Protein engineeringpermits such an approach. We have cloned and expressed in E. coli the human skeletal muscle f3-tropomyosin. Two deletion mutants were performed, expressed in E. coliand purified using high-performance liquid chromatography (HPLC). In this paperwe describe the purification behaviours of these proteins and compare their chromatographic patterns. Tryptic digests were analysed by reversed-phase HPLC. We showthat a computer simulation can be used to identify the resulting peptides and thusrapidly characterize the mutants.
EXPERIMENTAL
MaterialsHPLC analyses were performed with a Gilson (Paris, France) apparatus. Ab
sorbances at 280 and 220 nm were monitored with a Holochrom spectrophotometer(Gilson).
ADEAE-TSKcolumn(150 x 21.5 mm J.D.) and aTSKcolumn (60 x 21.5 emJ.D.) for gel permeation were obtained from LKB (Uppsala, Sweden). A hydroxyapatite column (Hypatite-C) (100 x 12.5 mm J.D.) was purchased from SFCC (Paris,France). The column containing RP-18 (5-llm spherical particles) (130 x 4.0 mmJ.D.) was obtained from Brownlee Labs. (Santa Clara, CA, U.S.A.).
Open chromatography was carried out on an HA-Ultrogel column from IBF(France). Acetonitrile (Chromasol Gradient) was purchased from SDS (Peypin,France).
Recombinant DNA constructionsConstruction of the expression vector containing f3-skeletal tropomyosin has
been described previously [5]. Briefly, the human tropomyosin clone exhibiting anNcol site at its start codon was inserted into the NcoI site of the PKK 233-2, thusunder the control of isopropyl thiogalactoside (IPTG)-inducible trc promoter. Thisconstruction produces a complete unfusioned tropomyosin TMI [5]. A deletion mutant lacking the last 31 amino acids of the C-terminus (TM [C3l]) was obtained bytaking advantage of a Cia I restriction site at this position. Another deletion mutantof 21 amino acids of the N-terminus (TM [N2l]) was obtained after cutting withFnuDII restriction enzyme and addition of initiation codon. TM 1, TM[C3l] andTM[N2l] were produced respectively in HBlOl, HBlOl and JMlO9 bacteria strains.
Production and extraction of tropomyosin mutantsE. coli containing the different vectors were grown in 20 I ofculture medium in a
fermenter under controlled conditions. Recombinant protein synthesis was inducedby IPTG. Bacteria were centrifuged and then disrupted in a French press, and thesupernatant was heated in a boiling water-bath for 5 min. The mixture was centrifuged for 15 min at 10 000 g. Tropomyosin present in the supernatant was concentrated by ammonium sulphate fractionation. After precipitation of the nucleic acidsat 35% saturation (209 gil) of ammonium sulphate, f3-tropomyosin was precipitatedat 60% saturation (addition of a further 164 gil). The pellet was resuspended anddialysed against buffer D [20 mM Tris-HCI (pH 7.5)-0.5 mM dithiothreitol (DTT)].

PURIFICATION OF RECOMBINANT TROPOMYOSINS 467
HPLC on DEAE-TSK columnA 250-mg sample of protein in buffer 0 was applied to the OEAE-TSK col
umn. Elution was performed by increasing the salt concentration to 0.6 M ammonium acetate in buffer 0 with an increase of 10 mM/min using a flow-rate of 4.0 ml/min.Absorbance was measured at 220 and 280 nm.
Chromatography on hydroxyapatite columnWe employed either open-column chromatography using HA-Ultrogel or
HPLC using Hypatite-C. Proteins eluted from the OEAE-TSK column were adjustedto I M NaCI and I mM phosphate (pH 7.0)-0.5 mM OTT. Proteins were adsorbedon HA-Ultrogel (100 ml) equilibrated with the same buffer. Elution was performed at100 ml/h with a 400-mllinear gradient from I to 300 mM phosphate (pH 7) containing I M NaCI and 0.5 mM OTT. Alternatively, the mixture was deposited on a 100x 12.5 mm LO. HPLC column containing hydroxyapatite. Elution was performed at1.0 ml/min using a gradient of the following solutions: solution A, 10 mM NaH2P04
(pH 6.9)-0.2 M sodium acetate-0.5 mM OTT; and solution B, 300 mM NaH 2POC
0.2 M sodium acetate-0.5 mM OTT.
Simulation of tryptic digestion pattern and chromatogramWe have written a program that simulates the tryptic digestion pattern of a
protein. The retention of peptides on the reversed-phase column was calculated usingthe algorithm of Meek [6] as modified by Guo et al. [7] It nevertheless appears that thecorrelation between the calculated retention times and the experimental results isgood when the peptides are composed of more than six amino acids.
Oigestion of 0.2 mg of protein in 0.1 M Tris-HCI (pH 8.1) was performed with10 pg of trypsin (TPCK-treated) (Sigma) for 2 hat 3rc. Reversed-phase chromatography was performed on a C ts column using an acetonitrile gradient (1 % /min)containing 0.1 % trifluoroacetic acid.
Other methodsImmunoblot analysis. Sodium dodecyl sulphate polyacrylamide gel electropho
resis (SOS-PAGE) was performed essentially as described by Laemmli [8], using12.5% acrylamide. Proteins were transferred from SOS polyacrylamide slab gels tonitrocellulose (Schleicher & Schull) using a Bio-Rad transfer apparatus in the presence of 0.02% SOS. The nitrocellulose sheets were blocked with 8% dry milk inphosphate-buffered saline (PBS). The nitrocellulose was incubated with anti-tropomyosin antibodies raised against chicken gizzard tropomyosin diluted at I: 100 in PBSsupplemented with 5% bovine serum albumin (BSA). The antibody was revealedusing a protein A-peroxidase system containing 0.06% of chloronaphthol.
Protein sequence determination. The sequence of the NH 2 terminus was determined with 120 pmol of protein using an Applied Biosystems Model 470A gas-phasesequencer coupled with a Model 12A phenylthiohydantoin analyser.
Amino acid composition. The purified protein was hydrolysed by heating at110°C in 5.7 M hydrochloric acid for 24 h. Composition was determined in a Beckman 7300 system.

468
RESULTS
C. FERRAZ, J. SRI WIDADA, J.-P. LIAUTARD
Preparation and concentration of recombinant tropomyosinsThe same purification scheme was used for the three recombinant tropomyo
sins, i.e., TMI, TM[C31] and TM[N21]. The heat precipitation step is very interestingbecause a large amount of material can easily be processed. Most of the bacterialproteins were precipitated whereas the three tropomyosin mutants remained in thesupernatant. We did not note any loss of recombinant protein in this step. As tropomyosin is denatured at temperatures above 50°C [9], the solubilization is due to a veryrapid and efficient renaturation. The fact that the mutated proteins were resistant toheat treatment implies that the spatial structure is at least partially conserved. Analysis of the purified mutants by circular dichroism confirmed this fact (data not shown).
Although most of the bacterial proteins were removed by heat treatment, thenucleic acid still remained in the supernatant. Some of them were removed by precipitation with 30% ammonium sulphate. Tropomyosin was then precipitated by increasing the ammonium sulphate concentration to 60%. In this step the recovery wasgenerally greater than 90%.
Chromatography on DEAE-TSKProteins concentrated by ammonium sulphate precipitation were dialysed
against buffer D and quantified using the Bradford reaction. A 250-mg sample ofproteins was chromatographed on the DEAE-TSK column as described underExperimental. The chromatogram of each mutant is presented in Fig. I.
The chromatographic profile is very reproducible for a given preparation. Theyield in this step was ca. 60%. Nevertheless, the efficiency of the heat precipitation ofbacterial proteins varied with the amount of the extract. A better yield was achievedwith a smaller amount. The yield of the engineered proteins also depended on thebacterial strain used. Finally, the amount produced varied from one mutant to another.
Fig. I shows that mutant TM[C31] was eluted earlier than the other two. Thisbehaviour is in agreement with the number ofcharges contained within the molecules.TM[C31] possesses only 21 negative charges whereas TM1 and TM[N21] have 26 and28 negative charges, respectively. Although TM[N21] eluted slightly (but reproducibly) earlier than TM1, this difference is not very important, probably owing to thehigh number of charges (53 positive and 81 negative charges for TMI and 43 positiveand 69 negative charges for TM[N21]). However, this result also implies that thecharges are mainly located at the surface of the molecule. This, in turn, is in goodagreement with the spatial model proposed by Phillips et al. [10].
Chromatography on hydroxyapatiteTropomyosin is known to bind Ca2+. We therefore used hydroxyapatite for
further purification. Fig. 2 shows the results obtained with the three mutants. Theresolution of the column is not as good as with DEAE-TSK. However, becausetropomyosin eluted at the end of the gradient (300 mM phosphate), it is generallyelectrophoretically pure after this step. The fact that the three mutants eluted at thesame concentration of phosphate strongly suggests that the calcium binding site onthe tropomyosin is situated in the middle of the molecule and is not removed from themutants.

PURIFICATION OF RECOMBINANT TROPOMYOSINS
EcoCON-C
CI)uCC
..Q...oIII
..QC
469
Fig. I. Chromatographic profile on TSK-DEAE obtained for the three mutants of tropomyosin. Proteinswere extracted from E. coli containing expression plasmids, heat treated and fractionated by ammoniumsulphate precipitation as described. Protein mixtures (250 mg) containing (A) complete tropomyosin(TMI), (B) deletion mutants TM[C31] or (C) TM[N21] (see text) were chromatographed on a TSK-DEAEcolumn as described. Eluted fractions were analysed by SDS-PAGE. The localization of the tropomyosinmutants is shown by bars and the maxima are indicated with arrows.
A further purification was sometimes needed. This was done by gel permeationon a TSK-G300 column. However, the recovery was very low and we carried out thisprocedure no often than was strictly necessary. We also tried reversed-phase chromatography but the resolution for large molecules was very poor. We performed insteada pI precipitation at pH 4.1 to remove the remaining contaminants.
Tryptic digestion analysisOne major problem in site-directed mutagenesis lies in the way one has to
control whether the protein produced in E. coli is the one desired. As no selectivepressure is exerted on this kind of protein, the possibility of mutation or deletion isvery high. This makes the control of its sequence essential. To perform this task weused the tryptic digest analysis by taking advantage of the possibility of predicting theelution time of peptides using the algorithm of Meek [6] and the coefficient of Guo etal. [7].

470
Ec A
000C'l-CGluCC~..0en~C
c60 120
t
C. FERRAZ, J. SRI WIDADA, J.-P. LIAUTARD
min
Fig. 2. Hydroxyapatite purification. Fractions from the DEAE-TSK chromatography containing tropomyosin were pooled and purified on hydroxyapatite as described. The eluted fractions were then analysedby SDS-PAGE. The position of the tropomyosin mutants is shown by bars (the broken arows indicate thestart of gradient. Chromatograms of (A) TMl; (B) TM[C31] and (C) TM[N21].
Fig. 3 shows the analysis of tryptic digest by reversed-phase HPLC and compares the pattern obtained with that predicted by computer simulation. The presenceof tyrosine or phenylalanine in a peptide was monitored by the absorbance at 280 nmand is indicated by black spots in the computer simulation (Fig. 3, AI, Bl, Cl). First,agreement between the experimental result and the simulation was good for longpeptides. This allowed the identification of the peptides that were lost in the TM[C3l]mutant. They are missing in the chromatogram of TM[C3l] shown in Fig. 3B (thesepeptides are indicated by black triangles in Fig. 3A, on the chromatogram of TM l).This result clearly demonstrates that the TM[C3l] mutant is correct. The case of theTM[N2l] mutant was more difficult to resolve by this method. Peptides arising fromthe deleted region are very small because of the high content of lysine and cannot beidentified accurately. Only a new peptide arising from the NHrterminus is characteristic of this mutant, and is shown by the black diamond in Fig. 3C.
Further biochemical characterizationFurther analyses were carried out to confirm the reality of each mutation. First,
the purity and the antigenicity of the protein were checked by western blot analysis.

"tl c: ~ "rl () ~ :l o z o "rl
;:tl ~ o ~ I:l:l Z ~ z ...., ...., ~ "tl o ~ -< o C
/} Z C/}
40
'3
0m
in20
10
u I.C
1
'I~~
tIl
lli~JL
Il_
h"--
J·1\
f
...
...
.
C2
~4'
0
81 82
30'W:~
u I
min
u
,~
o2
0
hU
• 403
0m
in2
0
u
10
iE c: o CX)
C'l cu u c: <II
,Q o Ul
,Q <II
A2
Fig.
3.C
ompa
riso
no
fch
rom
atog
raph
icbe
havi
ours
and
com
pute
rsi
mul
atio
no
ftr
ypti
cdi
gest
s.A
fter
com
plet
epu
rifi
cati
on,
asco
ntro
lled
byS
DS
-PA
GE
,th
etr
opom
yosi
nm
utan
tsw
ere
dige
sted
bytr
ypsi
nan
dth
etr
ypti
cdi
gest
sw
ere
then
chro
mat
ogra
phed
,as
desc
ribe
d.T
heel
utio
npr
ofile
s(A
I,B
I,C
Ifo
rTM
I,T
M[C
3Ij,
TM
[N2l
j,re
spec
tivel
y)ar
egi
ven
inpa
rall
elw
ithth
ere
sults
ofc
ompu
ter
sim
ulat
ion
(A2,
B2,
C2)
.Pe
ptid
esno
tfo
und
inT
M[C
31jd
elet
ion
mut
ant
are
indi
cate
dby
:e;bl
ack
tria
ngle
son
the
chro
mat
ogra
mo
fTM
I(A
I)an
da
new
pept
ide
aris
ing
from
TM
[N21
jis
indi
cate
dby
abl
ack
diam
ond
(Cl)
.O
nth
esi
mul
atio
nsc
hem
e,th
epe
ptid
esco
ntai
ning
aty
rosi
neor
aph
enyl
alan
ine
are
indi
cate
dby
blac
kci
rcle
s.U
repr
esen
tsun
iden
tifie
dm
ajor
pept
ides
.

472 C. FERRAZ, I. SRI WIDADA, I.-P. LIAUTARD
The results are shown in Fig. 4. Amino acid analysis was also performed, althoughthe results were difficult to interpret because the sensitivity of the method is verylow. However, the amino acid composition coincided with the theoretical results(result not shown). We also sequenced the NHz-terminus. This is particularly important for the TM[N21] mutant. The results in Table I clearly confirm that the purifiedprotein actually exhibits the desired mutation. The extra alanine at the N-terminus ofTM[N21] is due to the cloning procedure. Further, it must be pointed out that methionine was removed only from the TM[N2I] mutant. This is due to the size of theamino acid immediately adjacent to the methionine initiator. Methionine is removedby the bacteria if this amino acid is small, as with the TM[21] mutant.
Fig. 4. Purity and antigenicity of proteins. The purified tropomyosin mutants were analysed by SDSPAGE (I) and controlled by western blotting (2). TMI is shown as track A, TM[C31] as track BandTM[N21] as track C.

PURIFICATION OF RECOMBINANT TROPOMYOSINS 473
TABLE I
SEQUENCE OF THE NHz-TERMINUS OF THE PROTEINS
The NHz sequences were determined as described under Experimental. The sequence of TM 1 andTM[C31] is identical with the N-terminus sequence of genuine tropomyosin. In contrast, as expected,TM[N21] exhibits the sequence of the tropomyosin devoid of the first N-terminal20 amino acids. Singleletter code used for amino acids; Ac = Acetyl.
Protein
Genuine fJ-tropomyosinTMITM[C31]TM[N21]
CONCLUSION
Sequence
Ac- MDAIKKKMQMLKLDKENAID RAEQAEADKKQAEMDAIKKKMQMLKLDKEMDAIKKKMQMLKLDKE-
AAEQAEADK KQAE-
We have shown that recombinant tropomyosins can be rapidly purified usingHPLC. Although the purification was performed at room temperature, very littledegradation was observed, probably owing to the very rapid separation. The spatialstructure of tropomyosin was conserved. This is worth noting because mutant proteins are often less stable than native proteins. The mutant proteins moreover retained their activity in the regulation of muscle contraction (to be published elsewhere). We have also shown that the use of simulation of tryptic digestion analysis isa powerful tool for rapidly controlling the preparation of proteins. One drawback ofthis method is that the identification of small peptides is very difficult.
ACKNOWLEDGEMENTS
We are indebted to J. Derancourt for performing the sequencing of the mutants. This work was supported by the Association Fran9aise contre les Myopathiesand the Association pour la Recherche contre Ie Cancer (ARC).
REFERENCES
I P. C. Leavis and J. Gergely, CRC Crit. Rev. Biochem., 16 (1984) 235.2 S. Pothekin and P. L. Privalov, J. Mol. Bioi., 159 (1982) 519.3 S. Colote, J. Sri Widada, C. Ferraz, F. Bonhomme, J. Marti and J. P. Liautard, J. Mol. Evol., 27 ([988)
228.4 1. Sri Widada, C. Ferraz, S. Colote, J. P. Liautard and J. Marti, in B. A. F. Rousset (Editor), Cellular
and Molecular Biology of Muscle Development, Alan R. Liss, New York, 1989, pp. 503-5[2.5 C. Ferraz, J. Sri Widada, J. Derancourt and J. P. Liautard, Biochimie, 71 (1989) 307.6 J. Meek, Proc. Natl. Acad Sci. U.S.A., 77 (1980) 1632.7 D. Guo, C. Mant, A. Taneja, R. Parker and R. J. Hodges, J. Chromatogr., 359 (1986) 499.8 U. K. Laemli, Nature (London), 227 (1970) 680.9 D. Betteridge and S. S. Lehrer, J. Mol. Bioi., 167 (1983) 481.
10 G. N. Phillips, 1. P. Fillers and C. Cohen, J. Mol. Bioi., 192 (1986) II.


Journal of Chromatography, 539 (1991) 475--484Elsevier Science Publishers B.V., Amsterdam
CHROM. 22882
Isolation and purification of cat albumin from cat serum bycopper ion affinity chromatography: further analysis of itsprimary structure
J. P. DANDEU* and J. RABILLON
Unite d'lmmuno-Allergie, lnstitut Pasteur, 28 Rue du Dr. Roux, 75015 Paris (France)
J. L. GUILLAUME and L. CAMOIN
Laboratoire d'lmmuno-pharmacologie Moleculaire, 1nstitut Cochin de Genetique Moleculaire, 22 rue Mechin, 75014 Paris (France)
and
M. LUX and B. DAVID
Unite d'lmmuno-Allergie, lnstitut Pasteur, 28 Rue du Dr. Roux, 75015 Paris (France)
ABSTRACT
Proteins, regardless of their origin, have to be highly purified, particularly from the immunochemicalpoint of view, if they are to be used to study their allergenicity. It is shown that cat albumin, a highly potentallergen for cat-sensitive humans, can be isolated and purified from cat serum using immobilized metal ionaffinity chromatography (copper ions) instead of a salting-out process or precipitation with alcohol, techniques generally used for the preparation of serum proteins. During the process described, immunoglobulins are concomitantly isolated in a relatively pure form. Cat albumin amino acid composition and sequence were analysed after an ultimate purification by ion-exchange chromatography. The highesthomology (>80%) was found with the rat serum albumin.
INTRODUCTION
Previous studies have shown that several allergens [1-3] may be extracted fromcat pelts. One of them is the major feline allergen Fel dI [4] and the others, to whichcat-sensitive patients are less frequently sensitive, are albumin [2,3,5] and immunoglobulins [5,6]. Nevertheless, cat albumin is a very potent allergen, hence a highlypurified form is obviously useful. Pure allergens are needed either for diagnosis or fortherapy of hypersensitivity,
A better knowledge of the allergen structures could lead to a better understanding of their allergenic potency, The purpose of this work was to prepare a highlypurified cat albumin, to analyse its primary structure and to compare it with othermammalian albumins for which cross-reactions have been reported either versus rabbitIgG antibodies or versus human IgE antibodies [5,7],
The cat serum albumin (CSA) purification process described here is essentially
0021-9673/91/$03.50 © 1991 Elsevier Science Publishers B.V.

476 J. P. DANDEU et al.
based on immobilized metal ion affinity chromatography (IMAC). We chose IMACtaking in account the previous observations by other workers during human serumprotein fractionation [8,9], who stated that the adsorption capacity of the metalchelates for serum proteins, particularly for albumin, decreased in the orderCu > Zn > Ni > Mn [10]. We examined a Cu2 + charged chelating Sepharose fastflow gel packed in a glass column, the ligand-exchange principle being involved in theelution process.
EXPERIMENTAL
MaterialsCat sera were a kind gift from Dr. Prel, a veterinary clinician.Rabbit IgG antibodies against cat serum were purchased from Sigma (St. Louis,
MO, U.S.A.).As standard references for cat serum proteins, cat albumin (Cohn fraction V)
and cat immunoglobulins were purchased from Sigma.
Immobilized metal ion affinity chromatographyIMAC was performed on a cross-linked agarose gel to which imminodiacetate
was coupled, i.e., chelating Sepharose fast flow from Pharmacia (Uppsala, Sweden).After being washed according to the manufacturer's suggestions, the gel was packed inan HR 10/10 column and charged until saturation with copper ions from 0.5% (w/v)copper(II) chloride solution. After thorough rinsing with water to eliminate unboundcopper ions, the column was washed again with a solution containing I mM imidazoleand 1 M sodium chloride buffered with 0.02 M sodium phosphate buffer (pH 7.0).Saturation with imidazole was performed by injecting 30 ml of 10 mM imidazoledissolved in the same salt-buffered solution.
A pre- and a post-column packed with the chelating gel without metal ions wereincorporated in the system to remove any free metal ions that might interfere with thechelating process; the columns used were of the HR 5/5 type.
After loading the cat serum sample onto the column, elution was performed inthree steps: first an isocratic run, then either a linear concentration gradient ofimidazole followed by a plateau at 100% solution B, or stepwise elution with differentsolutions of increasing imidazole concentration. The compositions of the solutionswere as follows: solution A, 1mM imidazole in 1MNaCI buffered with 0.02 M sodiumphosphate (pH 7.0) (see above); solution B, 20, 40 or 50 mM imidazole in 1 M NaCIbuffered with 0.02 M sodium phosphate (pH 7.0).
The whole process was controlled by a fast protein liquid chromatographysystem (FPLC) (Pharmacia).
ChromatofocusingA Mono P column of the HR 5/20 type (Pharmacia) was used after being
equilibrated with 0.025 M sodium acetate buffer (pH 5.58). The protein of interest wasdissolved in the same buffer and loaded onto the column. Elution was effected witha Servalytes 2-4 solution at 40% (Serva, Heidelberg, Germany), diluted with water to0.2% and adjusted to pH 2.05 with 1 M hydrochloric acid. The pH gradient wasrecorded using a pH monitor (Pharmacia).

ISOLATION AND PURIFICATION OF CAT ALBUMIN 477
Anion-exchange chromatographyA Mono Q column of the HR 10/10 type (Pharmacia) was previously
equilibrated with 0.03 M NaCI solution, buffered with a 0.02 M Tris-HCI (pH 8.00)(solution).
Protein sample dissolved in solution A was loaded onto the column. Elutionbegan with an isocratic run with solution A, followed by a linear concentrationgradient ofNaCI from 0.03 to 1M (50% solution B). Solution B consisted of2 MNaCIsolution buffered with 0.02 M Tris-HCI (pH 8.00). The third run was a plateau at100% B to desorb all the strongly bound material. Thereafter, the Mono Q column canbe washed and equilibrated with solution A to make it ready for the next separationprocess.
Sodium dodecyl sulphate polyacrylamide gel electrophoresis (SDS-PAGE)Analyses were performed with a PHAST apparatus using PHAST gels 8-25
(Pharmacia) according to the manufacturer's instructions.
Amino acid analysisThe amino acid composition was determined with a Beckman 7300 amino acid
analyser after acid hydrolysis. Hydrolysis was performed in the vapour phase with6 M hydrochloric acid containing 0.1% phenol for 24 h at 1l0°C in vacuo [II].
Micro-sequencingProteins were sequenced on a Model 470 A gas-phase protein sequencer
(Applied Biosystems, Roissy, France). Phenylthiohydantoin (PTH) derivatives ofamino acids were separated and identified by on-line reversed-phase high-performanceliquid chromatography with a Model 120 A-PTH analyser (Applied Biosystems)added to prevent wash-out and to improve the initial yields [12].
An exhaustive search of homology cases was performed on the PSEQIPdatabase.
Crossed immunoelectrophoresis methodsTo follow the purification steps of the cat serum albumin (CSA), crossed
immunoelectrophoresis (CIE) methods were used as previously described [13], usingrabbit IgG raised against the whole cat serum (Sigma). Each fraction obtained bychromatographic techniques was tested by crossed line rocket immunoelectrophoresis(CLRIE), i.e., the intermediate gel of a crossed line immunoelectrophoresis (CUE)was lengthened on the right-hand part, allowing a rocket-line experiment (RUE) to beperformed, leading to an easy identification of each antigen [14].
RESULTS
Immobilized metal ion ajjinity chromatographyA I-ml volume of cat serum was loaded onto a copper column, prepared as
described under Experimental. For identification purposes this method was namedcopper chelate chromatography (CCC).
In a first series of experiments we applied, after an isocratic run of 40 min withsolution A (I mM imidazole), a linear concentration gradient of imidazole from I to 20

478 J. P. DANDEU et al.
mM. Two peaks were eluted at 6 and 8 mM, the strongly bound material being elutedduring the last run at 100% B, i.e., 20 mM imidazole. The last peak was broad withpronounced tailing. We therefore increased the imidazole concentration up to 50 mMand a sharper peak without tailing was obtained. Finally, the complete process wasdefined as a stepwise elution at 0, 12, 16 and 100% B (Fig. 1).
Fractions of 1 m1 were collected and pooled according to the recorded elutionscheme, dialysed against neutral distilled water and freeze-dried.
Using cat albumin and immunoglobulins from Sigma chromatographed underthe same conditions, we were able to identify peak Cu3 as probably being cat albuminand Cu4 as essentially being cat immunoglobulins.
ChromatofocusingIn order to compare the degree of purity of cat albumin from a Cohn fraction
V (Sigma) and that of cat albumin prepared by IMAC (fraction Cu3), we performeda chromatofocusing as described under Experimental on the two protein batches at thesame concentration, i.e., 20 mg/ml, of 200 III were loaded onto the column.
Fig. 2 shows that cat albumin obtained by copper chelate chromatography(CSA-CCC) is as pure as that obtained by the Cohn method. It should be noted thatthe last peaks on the chromatogram correspond to ampholytes in the pH 2 zone, whichabsorb in the UV region at 280 nm.
SDS-PAGEHomogeneity of the cat albumin Cu3 was compared with that of Cohn fraction
V (Sigma) by SDS-PAGE in an 8-25% gradient gel (PHAST gel). Fig. 3 shows thatCu3 is at least as pure as the Cohn fraction.
Anion-exchange chromatographyConsidering the results obtained either by chromatofocusing or by SDS-PAGE,
and also those obtained by immunochemica1 analysis, we concluded that some otherunidentified proteins contaminate cat albumin preparations whatever the purification
6048
Albumin
24
50mM,--------------------,
;,i c:.Q
llmmuno- E! globuli ...
i ~
I 88mM !r· __····_·· ·.J
6mM !r--·· .-. _... ....,!
1
OD280nm2
Fig.!. Copper chelate chromatography. Column, HR 10/10 packed with chelating Sepharose fast flow(Pharmacia), charged with Cu2 +, washed with I mM imidazole in I M NaCI solution buffered with 0.02M sodium phosphate buffer (pH 7.0), saturated with 10 mM imidazole in the same buffered salt solution.A I-ml volume of cat serum, previously dialysed against I mM imidazole, was loaded onto the column.Stepwise elution was performed at a flow-rate of 1.0 ml/min.

ISOLATION AND PURIFICATION OF CAT ALBUMIN
OD280nm2
pH 5.6.- PH 4.7
pH 2.0.-
479
Fig. 2. Chromatofocusing with a Mono P HR 5/20 column equilibrated with 0.025 M sodium acetate buffer(pH 5.58). A 200-jll aliquot (4 mg ofCSA) was loaded onto the column. Elution was performed at a flow-rateof 1.0 ml/min with a Servalytes 2-4 solution (Serva) at 0.2% adjusted to pH 2.05. The pH gradient wasrecorded using a pH monitor (Pharmacia). Solid curve, CSA-CCC; dashed curve, CSA Cohn fraction V.
process used. To eliminate these contaminants from the CSA-CCC, anion-exchangechromatography was carried out on Cu3. A 20-mg amount of lyophilized Cu3,solubilized in I ml of solution A (0.03 M NaCI), was loaded on the Mono Q columnpreviously equilibrated with the same buffered salt solution. After a short isocraticelution during which no material was eluted, a linear concentration gradient of NaClwas applied, which gave five elution peaks (Fig. 4). Fractions from four of them, thequantitatively most important, i.e., P2, P3, P4 and P5 were pooled, then dialysedagainst neutral water and freeze-dried.
Analyses were performed by SDS-PAGE and CLRIE, the results of which areshown in Figs. 3 and 5, respectively. P4 appears as a highly pure cat albuminpreparation, while P5, found to be pure in CLRIE, contains two components, asshown by SDS-PAGE, with M r 67 and 90 kilodalton, respectively.
Fig. 3. SDS-PAGE using PHAST gels 8-25 on a PHAST apparatus (Pharmacia). Lanes I and 8, standardprotein markers; lane 2, cat albumin CCC, 1.20 jlg; lane 3, fraction P2, 0.40 jlg; lane 4, fraction P3, 0.35 jlg;lane 5, fraction P4, 0.64 jlg; lane 6, fraction P5, 1.65 jlg; lane 7, cat albumin (Sigma), 1.20 jlg.

480
OD280nm1
0.5
o O%B6 18
50%B
24 ml/min
J. P. DANDEU el al.
Fig. 4. Anion-exchange chromatography on Mono Q HR 10/10 column equilibrated with 0.03 M NaCIsolution buffered with 0.02 M Tris-HCI (pH 8.00) (solution A). Elution was performed at a flow-rate of 1.0ml/min with a linear concentration gradient of NaCl from 0.03 to I M (50% solution B). SolutionBconsisted of2 M NaCI solution buffered with 0.02 MTris-HCI (pH 8.00). A I-ml volume ofCSA-CCC (20mg) was loaded onto the column.
Immunochemical analysesThe above results on the immunochemical purity of the different fractions
obtained in the purification of cat albumin from cat serum were obtained using themethod described under Experimental (Fig. 5). Rabbit IgG raised against whole catserum was used in a CLIE, the LIE part was lengthened on the righ-hand part androckets were included which allowed the proteins of interest to be identifiedcommercially available preparations were used to identify albumin and immunoglobulins.
From an immunological point of view, albumin from fraction Cu3 seems to beless contaminated than the Cohn fraction V and P4, the most homogeneous catalbumin that we prepared, appears to be totally free from contaminants, at least underthe conditions ofthis experiment, i.e., antigen concentrations as indicated in Fig. 5 andusing rabbit IgG antibodies.
Amino acid analysisAs Cu3P4 could be considered as a highly pure cat albumin, its amino acid
composition was determined (Table I) and it showed differences in comparison withthree other serum albumin amino acid compositions cited in the literature [15], e.g.,glycine is twice as concentrated and tryptophan seems to be absent.
Sequencing of the N-terminal peptideThe amino acid sequence ofa 30-residue N-terminal peptide was determined and
homologies were investigated (Table II).The highest homologies were observed with RSA (83%), then with BSA (80%)
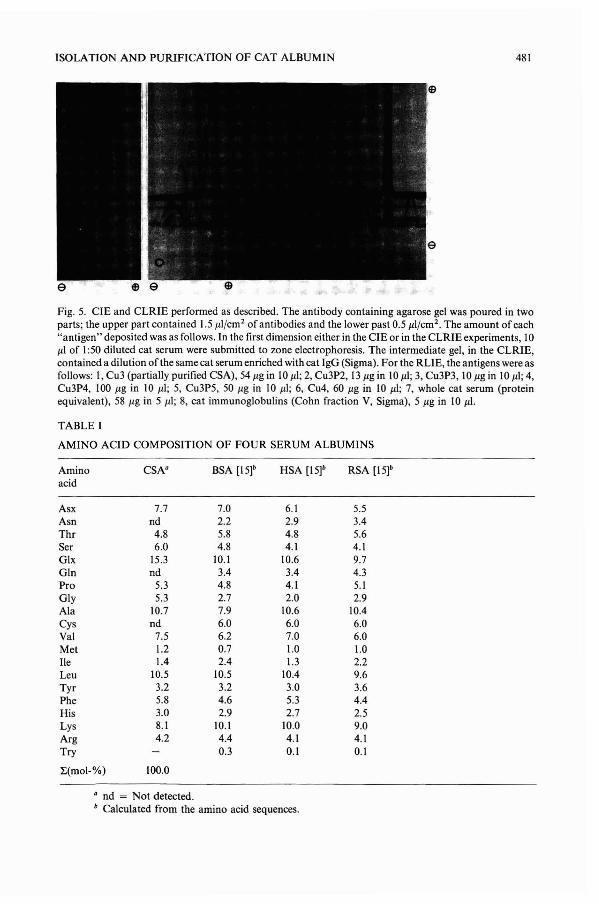
ISOLATION AND PURIFICATION OF CAT ALBUMIN 481
Fig. 5. CYE and CLRIE performed as described. The antibody containing agarose gel was poured in twoparts; the upper part contained 1.5 Jl.1/cm 2 of antibodies and the lower past 0.5 Jl.1/cm2
. The amount of each"antigen" deposited was as follows. In the first dimension either in the CIE or in the CLRIE experiments, 10Jl.I of 1:50 diluted cat serum were submitted to zone electrophoresis. The intermediate gel, in the CLRIE,contained a dilution of the same cat serum enriched with cat IgG (Sigma). For the RUE, the antigens were asfollows: I, Cu3 (partially purified CSA), 54 Jl.g in 10 Jl.I; 2, Cu3P2, 13 Jl.g in 10 Jl.1; 3, Cu3P3, 10 Jl.g in 10 Jl.1; 4,Cu3P4, 100 Jl.g in 10 Jl.1; 5, Cu3P5, 50 Jl.g in 10 Jl.I; 6, Cu4, 60 Jl.g in 10 Jl.l; 7, whole cat serum (proteinequivalent), 58 Jl.g in 5 Jl.I; 8, cat immunoglobulins (Cohn fraction V, Sigma), 5 Jl.g in 10 Jl.l.
TABLE I
AMINO ACID COMPOSITION OF FOUR SERUM ALBUMINS
Amino CSA" BSA [1St HSA [1St RSA [1stacid
Asx 7.7 7.0 6.1 5.5Asn nd 2.2 2.9 3.4Thr 4.8 5.8 4.8 5.6Ser 6.0 4.8 4.1 4.1Glx 15.3 10.1 10.6 9.7GIn nd 3.4 3.4 4.3Pro 5.3 4.8 4.1 5.1Gly 5.3 2.7 2.0 2.9Ala 10.7 7.9 10.6 10.4Cys nd 6.0 6.0 6.0Val 7.5 6.2 7.0 6.0Met 1.2 0.7 1.0 1.0lie 1.4 2.4 I.3 2.2Leu 10.5 10.5 10.4 9.6Tyr 3.2 3.2 3.0 3.6Phe 5.8 4.6 5.3 4.4His 3.0 2.9 2.7 2.5Lys 8.1 10.1 10.0 9.0Arg 4.2 4.4 4.1 4.1Try 0.3 0.1 0.1
:E(mol-%) 100.0
a nd = Not detected.b Calculated from the amino acid sequences.

482 J. P. DANDEU et al.
TABLE II
CAT SERUM ALBUMIN HOMOLOGIES (N-TERMINUS): N-TERMINUS COMPARISONS
COMMON RESIDUES a
BSA1
D T~K~'A H R F K D L G E
E H~KG L V L
'~S~HSA2 ,3 D A H K S E V A H R F K D L G E E N F K A L V L I A F A Q Y
RSA4 E A H K S E I A H R F K D L G E Q H F K G L V L I A F S Q Y
CSA E A H Q S E I A H R F N D L G E E H F R G L V LVA S QY
HOMOLOGOUS RESIDUES TO THOSE OF CSAa
BSA1K
HSA2,3 K
RSA4
CSA Q
S E I A H R F
S Eff}A H R F
S E I A H R F
S E I A H R F
K D L GEE H F
KDLGE..!ffiJF
K D L G El£lH F
N D L GEE H F
K G L V L I A F S Q Y
K A L V L I A F A Q Y
L V L I A F S Q Y
R G L V L V A F S Q Y
a I = Albusbovin, serum albumin precursor, bovine (bos taurus) [16]; 2 = Albushuman, serumalbumin precursor, human (homo sapiens) [17]; 3 = Base8, preproalbumin human serum [18]; 4 = Albusrat,serum albumin precursor, rat (rattus norvegicus) [19].
and HSA (70%). For the RSA, three lysine residues are changed into glutamine,asparagine and arginine in positions 4, 12 and 20, respectively. The isoleucine inposition 25 was replaced by a valine residue and glutamine in position 17 by a glutamicacid residue. The residues at position 28 in HSA and CSA are different.
DISCUSSION
Although cat albumin was stated to be a less important allergen than the majorfeline allergen Fel dI [2], it remains a protein ofinterest for the human patients sensitiveto this albumin [7].
Identifying structures of allergenic molecules responsible for IgE antibodysynthesis induction, apart their specific epitopes, is a difficult task and requires theavailability of allergenic molecules of the highest degree of purity.
Sometimes, cloning of an allergenic protein as Der pI, a major allergen fromDermatophagoidespteronyssinus mite, is possible [20]. Otherwise, a major allergen suchas Fel dI, the major feline allergen, can be purified either by using monoclonalantibody immunosorbent [21] or metal chelate chromatography [14].
Some proteins, such as albumins and immunoglobulins, have been obtained ina relatively pure form by a salting-out procedure, precipitation with alcohol or gelpermeation. In order to improve their purification, we tried to use IMAC, a suitablechromatographic process for the large-scale fractionation and purification ofproteins.IMAC has certainly already been used for serum protein fractionation [7,22] but, toour knowledge, copper chelate chromatography with a ligand-exchange process hasnever been used to isolate and purify cat serum albumin. Only human albumin waspurified from a Cohn fraction on immobilized nickel by Andersson et al. [23].
TMAC, a method for protein fractionation. was developed about 15 years ago

ISOLATION AND PURIFICATION OF CAT ALBUMIN 483
[10]. It was essentially based on metal and amino acid interactions first described byGurd and Wilcox [24], i.e., histidine and cysteine, which have an electron donor atomin their side-chains, form fairly stable complexes with copper and zinc ions in nearlyneutral aqueous solutions. That imidazole side-chains of histidine residues play therole of a ligand for divalent metal ions such as Cu2 + was further studied for HSA byPeters [15], since it was previously stated by Hearon [25] that exposed imidazole andthiol groups of the proteins, more particularly albumins, were involved in theprotein-metal ions interactions. Subsequently a hydrophilic gel such as Sepharose,a cross-linked agarose, activated by a chelating agent (immunodiacetate) charged withmetal ions, was shown to be a selective adsorbent for cysteine- and histidine-containingproteins [10]; although a relationship between the number of transition metal ionsbound and the number of imidazole side-chains has never been clearly demonstrated[26], their chromatographic behaviour could be governed by the surface number ofimidazole and/or thiol groups [9]. Consequently, and as it has been shown that theadsorption capacity of the metal chelate for serum proteins decreased in the orderCu > Zn > Ni > Mn [10], we chose copper chelate chromatography for the isolationand purification of cat serum albumin.
It is known that proteins can be eluted from IDA-M 2 + columns (M = metal) atnearly neutral pH by a competing electron donor solute such as imidazole, whichforms a stable metal complex with IDA-M 2 +. However, the copper chelate gel has tobe previously saturated with imidazole before an increasing concentration gradient ofimidazole can be applied to the column [27].
The results reported show that cat serum loaded on a copper ion-chargedchelating Sepharose fast flow column can be fractionated into four fractions, one ofthem relatively strongly bound to the IDA-Cu2+ containing a highly pure albumin,purer than a Cohn fraction V (Sigma), as judged by chromatofocusing, SDS-PAGEand immunochemical methods. Nevertheless, as we wished to analyse furtherstructures of this potent allergen at chemical and immunological levels, we furtherpurified this CSA preparation by anion-exchange chromatography. The resultingCSA was shown to be suitable for amino acid analysis and sequencing, and wetherefore undertook an exhaustive search for homologies. It seemed that the CSAamino acid sequence, at least for tHe amino-terminal peptide, displayed only somesmall differences and showed the highest homology first with the rat serum albumin(83%), second with the bovine serum albumin (80%) and then the human serumalbumin (70%).
If the primary structure of a protein is not totally responsible for its antigenicand/or allergenic potency, it is an important part of the constitution of its epitopes. Itmay be assumed that proteins having a high level of homologies in their amino acidsequence, even if the three-dimensional structures of homologous proteins aregenerally better conserved than primary ones, could display very important crossreactions when tested against polyclonal and monoclonal antibodies, whatever theirorigin, e.g., rabbit or human. It was recently shown that dog albumin and CSAcross-react with human IgE antibodies from cat-sensitive sera [7]; hence it would beinteresting to analyse their homologies and also to test cross-reactions between RSAand CSA against the same IgE antibodies. This is currently under study.

484
REFERENCES
J. P. DANDEU et al.
I J. L. Ohman, Jr., F. C. Lowell and K. J. Bloch, J. Allergy Clin. Immunol., 52 (1973) 31.2 J. L. Ohman, Jr., F. C. Lowell and K. J. Bloch, J. Immunol., 113 (1974) 1668.3 M. C. Anderson and H. Baer, J. Immunol., 127 (1981) 972.4 K. Leitermann and J. L. Ohman, Jr., J. Allergy Clin. Immunol., 74 (1984) 147.5 H. Lowenstein, P. Lind and B. Weeke, Allergy, 40 (1985) 430.6 J. L. Ohman and B. Sundin, Clin. Rev. Allergy, 5 (1987) 37.7 Y. Boutin, J. Hebert, E. R. Vrancker and W. Mourad, Clin. Exp. Immunol., 77 (1989) 440.8 J. Porath and B. Olin, Biochemistry, 22 (1983) 1621.9 J. Porath, J. Chromatogr., 443 (1988) 3.
10 J. Porath, J. Carlsson, I. Olsson and G. Belfrage, Nature (London), 258 (1975) 598.II S. Moore and W. H. Stein, J. Bioi. Chem., 176 (1948) 367.12 G. E. Tarr, J. F. Beecher, M. Bell and D. McKean, Anal. Biochem., 84 (1978) 622.13 N. H. Axelsen, J. Kroll and B. Weeke, Scand. J. Immunol., 2, Supp!. I (1973) 47.14 J.-P. Dandeu, J. Rabillon, M.-J. Beltrand, M. Lux and B. David, J. Chromatogr., 512 (1990) 177.15 T. Peters, Jr., Adv. Protein Chem., 37 (1985) 161.16 R. T. A. MacGillivray, D. W. Chung and E. W. Davie, Eur. J. Biochem., 98 (1979) 477.17 R. M. Lawn, J. Adelman, S. C. Bock, A. E. Franke, C. M. Houck, R. C. Najarian, P. H. Seeburg and K.
L. Wion, Nucleic Acid Res., 9 (1981) 6103.18 T. D. Sargent, M. Yang and J. Bonner, Proc. Nat!. Acad. Sci. U.S.A., 78 (1981) 243.19 A. Dugaiczyk, S. W. Law and O. E. Dennison, Proc. Natl. Acad. Sci. U.S.A., 79 (1982) 71.20 K. Y. Chua, G. A. Stewart, W. R. Thomas, R. J. Simpson, R. J. Dilworth, T. M. Plozza and K. J. Turner,
J. Exp. Med., 167 (1988) 175.21 M. D. Chapman, R. C. Aalberse, M. J. Brown and T. A. E. Platts-Mills, J. Immunol., 140 (1988) 812.22 H. Hanson and L. Kagedal, J. Chromatogr., 215 (1981) 333.23 L. Andersson, E. Sulkowski and J. Porath, J. Chromatogr., 421 (1987) 141.24 F. R. N. Gurd and P. E. Wilcox, Adv. Protein Chem., IJ (1956) 311.25 A. J. Z. Hearon, J. Natl. Cancer Inst., 9 (1948) I.26 U. Kragh-Hensen, Pharmacol. Rev., 33 (1981) 17.27 E. Sulkowski, Trends Biotechnol., 3 (1985) I.

Journal of Chromatography, 539 (1991) 485-492Elsevier Science Publishers B.V., Amsterdam
CHROM. 22 883
Purification of a hybrid plasminogen activator protein
JANET DEISTUNG*, DEIRDRE M. FORDE, JAMES P. O'CONNELL, KAREN A. PROUDFOOT,DIANE EATON, FRANCIS WILLENBROCK, ROSALINE O. KINGABY, BERNADETTEHUGHES, SAROJANI ANGAL, CATH CATTERALL, SANDY CARNE and JOHN SPENCEREMTAGE
Celltech Limited, 216 Bath Road, Slough, Berks. SLI 4EN (U.K.)
ABSTRACT
Recombinant DNA technology has been employed to produce a hybrid gene in which the kringle andserine protease domains of tissue plasminogen activator are linked to the heavy-chain Fd region of afibrin-specific antibody. The hybrid gene is co-expressed with antibody light chains. This communicationdescribes a purification procedure for the hybrid protein, involving affinity and ion-exchange chromatography. The purified hybrid protein has been used in vivo and in vitro clot lysis experiments and has beenshown to be effective at clot dissolution.
INTRODUCTION
It is well known that the presence of blood clots in blood vessels can be lifethreatening and can lead to acute cardiovascular diseases. A particular class of agentswhich could be used to treat such diseases are plasminogen activators. These agents actby converting plasminogen to plasmin, which then acts on the firbrin in blood clots,causing it to break down and be dissolved (see Fig. 1). There are three well knownplasminogen activators, these being streptokinase, urokinase and tissue plasminogenactivator (t-PA); only t-PA will be discussed in this communication. Recombinantt-PA has been marketed by Genentech under the name of "Activase" as a thrombolyticfor clinical use. The unique property of t-PA is its ability to selectively activateplasminogen bound to fibrin which minimises systemic fibrinolysis. However, it isimpossible to differentiate between fibrin in the thrombus or the heamostatic plug andhence its use may cause undesired bleeding. t-PA has a relatively short half life ofapproximately 6 min [I], and therefore treatment requires large and lengthy doses tomaintain biological effect.
Although t-PA is being used as a thrombolytic it would be desirable to improveits half-life and its specificity or to produce a novel molecule having thrombolyticproperties, but having an improved half-life and specificity as compared to t-PA. Inorder to achieve this end, recombinant DNA technology has been employed toproduce novel plasminogen activators. Various approaches include: domain shuffling,i.e., deleting domains from existing plasminogen activators or combining different
0021-9673/91/$03.50 © 1991 Elsevier Science Publishers B.V.

486
SC D-PA
.... - - - - - - - FIBRIN?
J. DEISTUNG el al.
T-PA
FIBRIN - - •• - - - - ~
D-PA
PLASMINOGEN ------------------------------~ ..~ PLASMIN
1 FIBRIN
,,~,~w i ~ ,,=, ---------------------------... ~~~~*;ION
THROMBIN
Fig. I. A schematic representation of the fibrinolytic system. -- = Major fibrinolytic pathways;- - - = site of cofactor action; SC U-PA = single chain urokinase; U-PA = urokinase; T-PA = tissueplasminogen activator.
domains from different activators [2]; linking a plasminogen activator to a moleculewith high fibrin binding activity [3,4] or producing an antibodyjplasminogen activatormolecule using a monoclonal antibody having a specificity for fibrin [5]. Our approachhas involved the use of recombinant DNA technology to combine the clot dissolutionproperties of a plasminogen activator with the fibrin specificity of an antibody in theform of a hybrid molecule (see Fig. 2). This communication is primarily concernedwith the development of a purification procedure for such a hybrid protein.
MATERIALS AND METHODS
Recombinant DNA techniques and cell cultureMethods used for the production ofexpression vectors and to transfeet cell lines
were as described by Maniatis et al. [6] and Bebbington and Hentschel [7]. A Chinesehamster ovary cell line was established and cultured at 100-1 scale using AirliftFermenter (ALF) technology as described by Rhodes and Birch [8]. Fermenterharvests containing hybrid protein were clarified by continuous centrifugation andconcentrated lO-fold by ultrafiltration.
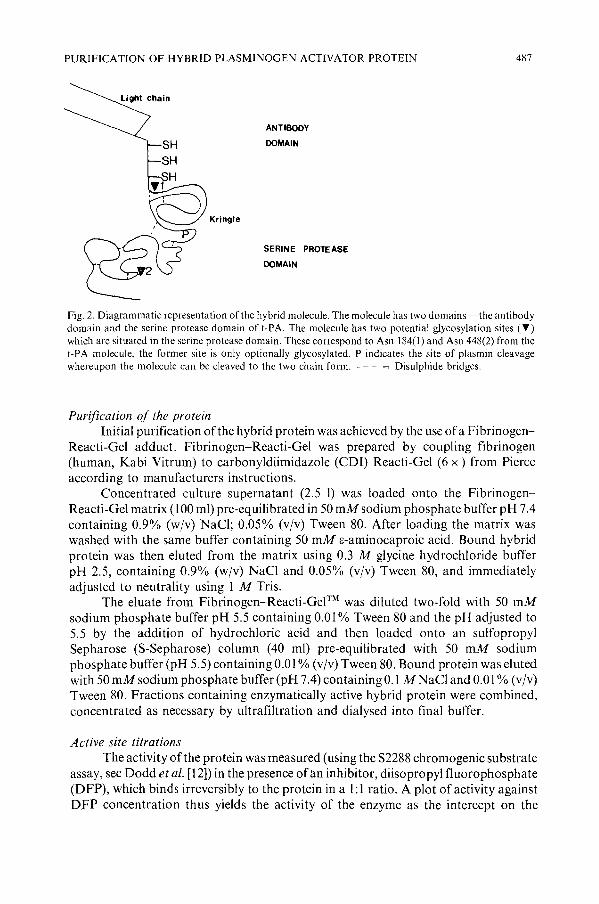
PURIFICATION OF HYBRID PLASMINOGEN ACTIVATOR PROTEIN 487
ANTIBODY
DOMAIN
Kringle
SERINE PROTEASE
DOMAIN
Fig. 2. Diagrammatic representation of the hybrid molecule. The molecule has two domains -the antibodydomain and the serine protease domain of t-PA. The molecule has two potential glycosylation sites (T)which are situated in the serine protease domain. These correspond to Asn 184(1) and Asn 448(2) from thet-PA molecule, the former site is only optionally glycosylated. P indicates the site of plasmin cleavagewhereupon the molecule can be cleaved to the two chain form. - - - = Disulphide bridges.
Purification of the proteinInitial purification of the hybrid protein was achieved by the use ofa Fibrinogen
Reacti-Gel adduct. Fibrinogen-Reacti-Gel was prepared by coupling fibrinogen(human, Kabi Vitrum) to carbonyldiimidazole (CDI) Reacti-Gel (6 x) from Pierceaccording to manufacturers instructions.
Concentrated culture supernatant (2.5 I) was loaded onto the FibrinogenReacti-Gel matrix (100 ml) pre-equilibrated in 50 mM sodium phosphate buffer pH 7.4containing 0.9% (w/v) NaCI; 0.05% (v/v) Tween 80. After loading the matrix waswashed with the same buffer containing 50 mM e-aminocaproic acid. Bound hybridprotein was then eluted from the matrix using 0.3 M glycine hydrochloride bufferpH 2.5, containing 0.9% (w/v) NaCI and 0.05% (v/v) Tween 80, and immediatelyadjusted to neutrality using 1 M Tris.
The eluate from Fibrinogen-Reacti-GeI™ was diluted two-fold with 50 mMsodium phosphate buffer pH 5.5 containing 0.01 % Tween 80 and the pH adjusted to5.5 by the addition of hydrochloric acid and then loaded onto an sulfopropylSepharose (S-Sepharose) column (40 ml) pre-equilibrated with 50 mM sodiumphosphate buffer (pH 5.5) containing 0.01 % (v/v) Tween 80. Bound protein was elutedwith 50 mM sodium phosphate buffer (pH 7.4) containing 0.1 MNaCI and 0.01 % (v/v)Tween 80. Fractions containing enzymatically active hybrid protein were combined,concentrated as necessary by ultrafiltration and dialysed into final buffer.
Active site titrationsThe activity of the protein was measured (using the S2288 chromogenic substrate
assay, see Dodd et al. [12]) in the presence ofan inhibitor, diisopropyl fluorophosphate(DFP), which binds irreversibly to the protein in a I: 1 ratio. A plot of activity againstDFP concentration thus yields the activity of the enzyme as the intercept on the

488 J. DEISTUNG et al.
ordinate and the concentration of the enzyme as the intercept on the abscissa. Thetitration was calibrated using commercially available t-PA (American Diagnostics) ofknown concentration. Both the standard and hybrid protein were converted to theirtwo chain forms by incubation with plasmin before titration. This ensures thatmixtures of single and two chain species are not present in the titration.
In vitro and in vivo clot lysisIn vitro clot lysis by the hybrid protein was tested using fresh human blood
labelled with 1251according to the method described by Zamarron et al. [9]. The in vivoclot lysis was tested using the rabbit jugular vein model using the method described byCollen et al. [10].
MiscellaneousSodium dodecyl sulphate-polyacrylamide gel electrophoresis (SDS-PAGE) was
carried out essentially according to Laemmli [II]. Fibrin zymography and amidolyticactivity assays using S2288 chromogenic substrate were carried out as described byDodd et al. [12].
RESULTS AND DISCUSSIONS
Purification of the hybrid proteinThe hybrid protein was purified as described in the Materials and Methods
section and monitored throughout using the assay systems described previously.Table 1shows that 32 mg of purified protein (calculated from S2288 activity assay) wasobtained from the process, corresponding to a 39% recovery of activity units. Themajor loss in recovery for the process occurred upon chromatography usingFibrinogen-Reacti-Gel. This reflects the removal of degraded protein which contributes to the S2288 chromogenic substrate activity of culture supernatants. Analysisofeluates throughout the purification was carried out using SDS-PAGE (reducing andnon-reducing) and zymography.
Analysis by zymography is shown in Fig. 3. Strong clearance of the fibrin agargel was observed at a single spot indicating that most of the enzymic activity wasassociated with a single species, identified as the hybrid protein by N-terminalsequence analysis. The relative molecular mass (Mr) of this species was determined by
TABLE I
YIELD TABLE FOR THE PURIFICATION OF THE HYBRID PROTEIN
Total yield (mg) obtained from each step in the process was calculated from S2288 activity assay data usinga conversion factor of 444 000 IV = I mg.
Total recovery(mg)
Culture supernatant (10 x concentrate) 92Fibrinogen-Reacti-Gel 39.5S-Sepharose 34.5Dialylsis 32
Cumulativeyield (%)
100 (assumed)433735

PURIFICATION OF HYBRID PLASMINOGEN ACTIVATOR PROTEIN
Mr(x1030a)
489
2 3 4 5 6 7
-ill
-35
8
Fig. 3. Analysis ofeluates from th~ purification of the hybrid protein using zymography and SDS-PAGE.Lanes: I = culture supernatant (10 x concentrate); 2,3 = eluate from Fibrinogen-Reacti-Gel; 4,5 = eluatefrom S-Sepharose; 6,7 = final product after dialysis; 8 = final product after analysis by Coomassie bluestaining of SDS-PAGE (non-reducing).
Coomassie blue-stained SOS-PAGE (non-reduced) to be approximately 97 000 dalton(Oa) and constitutes ~90% of total protein as determined by scanning densitometry.Slight clearing of the zymogram was also observed at approximately 35 000 dalton,which is consistent with some cleavage of the serine protease domain of the molecule.
Analysis of eluates across the purification using Coomassie blue staining ofSOS-PAGE (reducing) is shown in Fig. 4. From this figure it can be seen that most ofthe contaminant protein elutes in the flow through from the Fibrinogen-Reacti-Gelstep with remainder being eluted from the matrix in the subsequent wash steps.Chromatography using S-Sepharose serves as a final polishing step and remove traceamounts of albumin present after chromatography on Fibrinogen-Reacti-Gel.
Bands for the heavy and light chain moieties of the hybrid protein (Mr 67 000and 30 000 dalton, respectively) can be observed as well as three additional bands(Mr 40000, 38 000 and 35000 dalton) which have been subjected to N-terminalsequence analysis to identify their origin. The 40 000- and 38 ODD-dalton bandscorrespond to the molecule without light chain and serine protease domains. Thedifference in molecular mass is a result of differential glycosylation of glycosylation

490
94
67
Mr 43
(1(103Da)
30
20
14
2 3 4 5 6 7 8
J. DEISTUNG et at.
Fig. 4. Analysis of eluates from the purification of the hybrid protein using SDS-PAGE (reducing). Lanes:1 = molecular mass markers; 2 = culture supernatant; 3 = flow through from Fibrinogen-Reacti-Gel;4,5 = wash eluates from Fibrinogen-Reacti-Gel; 6 = eluates from Fibrinogen-Reacti-Gel; 7 = eluate fromS-Sepharose; 8 = final purified hybrid protein.
site 1 (Fig. 2). The 35 OOO-dalton band corresponds to cleaved serine protease. The67 OOO-dalton band appears as a doublet which is a result of differential glycosylationof the heavy chain moiety. This cleavage is not observed by SDS-PAGE undernon-reducing conditions as internal disulphide bonds hold the molecule together(Fig. 2).
Active site titration ofpurified hybrid proteinActive site titrations of the purified hybrid protein were carried out as described
in the Materials and Methods and compared to t-PA. The intrinsic activities of thesemolecules towards the low-molecular-mass substrate (S2288) were determined. Theresults of these measurements are shown in Table II. It can be seen from these data thatthe activity ofthe hybrid molecule towards the low-molecular-mass substrate S2288 issimilar to that oft-PA and appears to be unaffected by the removal of part of the t-PAmolecule and addition of the antibody variable region.
Activity of the hybrid protein in vitroA comparison of in vitro clot lysis activity of t-PA and the hybrid protein was

PURIFICATION OF HYBRID PLASMINOGEN ACTIVATOR PROTEIN 491
TABLE II
ACTIVITY OF HYBRID PROTEIN TOWARDS ITS LOW-MOLECULAR-WEIGHT SUBSTRATE82288
This compares the activity of the hybrid protein with that of t-PA towards the low-molecular-masssubstrate, Ile-Pro-Arg-pNA (S2288).
Enzyme
t-PAWhole hybrid
Concentrationof enzyme (nM)
4.64.3
Enzyme activity(AU/min)"
8.308.15
Specific activity(AU/min/nM enzyme)
1.81.89
" AU = Activity units.
carried out. The hybrid protein and t-PA were present at 500 units/ml in plasma (asdetermined using the 82288 chromogenic substrate assay). Fig. 5 shows the results ofthis experiment. From this preliminary study it is apparent that the hybrid protein hascomparable clot lysing activity in vitro to that of t-PA.
Activity of the hybrid protein in vivoThe results of preliminary experiments giving a local infusion of the hybrid
protein via the ipsilateral ear vein (10 ml over a period of 10 min) are shown in
100
90
80
70
60
% LySis50
40
30
2.0
10
-/"/'
--------//
//
//
/I
I
II
II
II
II
II
I
------- --------
2 3 4 5 6 7 8 9
Time (H)
Fig. 5. Activity of the hybrid protein in vitro. Activity of the hybrid protein in in vitro clot lysis experimentsand compared to that of t-PA. - - - =. t-PA; -- = hybrid protein.

492
TABLE III
ACTIVITY OF THE HYBRID PROTEIN IN VIVO
J. DEISTUNG et al.
This table compares the activity of the hybrid protein and t-PA in vivo at two dose levels (calculated usingS2288 assay). Each data point was obtained using a separate rabbit (n = 3).
Dose (IVjkg)
50000500000
% Lysis (t-PA)
17.53 ± 5.1750.9 ± 1.85
% Lysis (hybrid)
20.03 ± 3.5241.7 ± 8.79
Table III. Lytic activity was compared with that oft-PA. These results indicate that thehybrid protein is thrombolytically active in vivo and that its activity is broadly similarto that of t-PA. However, further experiments will be required to fully evaluate theefficacy of the hybrid protein in vivo.
CONCLUSIONS
A purification procedure has been described for the hybrid plasminogenactivator molecule from Chinese hamster ovary (CHO) culture supernatant, whichincludes both an affinity chromatography and an ion-exchange chromatography step.The purified material has been obtained with an overall yield of 35% with a purity~ 90%. The hybrid plasminogen activator molecule has been shown to be effective atclot dissolution in both in vitro and in vivo clot lysis experiments. Further experimentsare necessary to fully evaluate this molecule as a potential thrombolytic agent.
ACKNOWLEDGEMENTS
We would like to thank Drs. Nieuwenhuizen and Kluft at the Gaubius Institutefor their contribution to the in vivo clot lysis experiments. We would also like to thankDr. E. L. V. Harris for helpful discussions and comments on the manuscript.
REFERENCES
1 M. Verstraete and D. Collen, Blood, 67 (1986) 1529.2 T. J. R. Harris, Protein Eng., 1 (1987) 449.3 K. C. Robbins and Y. Tanaka, Biochemistry, 25 (1986) 3603.4 K. C. Robbins and I. G. Boreisha, Biochemistry, 26 (1987) 4661.5 J. M. Schnee, M. S. Runge, G. R. Matseuda, N. W. Hudson, J. G. Seidman, E. Haber and T.
Quartermous, Proc. Natl. Acad. Sci. U.S.A., 84 (1987) 6904.6 T. Maniatis, E. F. Fritsch and J. Sambrook, Molecular Cloning: A Laboratory Manual, Cold Spring
Harbour Laboratory, Cold Spring Harbour, NY, 1982.7 C. Bebbington and C. Hentschel, in D. M. Glover (Editor), DNA Cloning, Vol. 3, American Society for
Microbiology, Washington, DC, 1987, p. 163.8 P. M. Rhodes and J. Birch, Biotechnology, 6 (1988) 518.9 C. Zamarron, H. R. Lijnen and D. Collen, Throm. Res., 35 (1984) 335.
10 D. Collen, J. M. Stassen and H. J. Verstraete, Clin. Invest., 71 (1983) 368.11 U. K. Laemmli, Nature (London), 227 (1970) 680.12 I. Dodd, R. Fears and J. H. Robinson, Throm. Haemostas., 55 (1986) 94.

Journal o/Chromatography, 539 (1991) 493-500Elsevier Science Publishers RV., Amsterdam
CHROM. 22 884
Purification of heparin cofactor II from human plasma
P. TOULON"", G. CHADEUF and M. AIACH
Laboratoire d'Hemostase. Hopital Broussais. Paris (France)
ABSTRACT
Heparin cofactor II (HCII) is an inhibitor of thrombin in human plasma whose activity is enhancedby heparin and dermatan sulphate. HCII was purified to homogeneity from normal human plasma with anoverall yield of 7.5%. After treatment with barium chloride, precipitation with 50% saturated ammoniumsulphate and dialysis of the resuspended precipitate against 0.02 M Tris-HCI (pH 7.4), the sample waschromatographed on a heparin-Sepharose CL 6B affinity column, DEAE-Sepharose CL 6B ion-exchangegel and an AcA 34 gel permeation column. For the final steps, a high-performance liquid chromatographicsystem was used which included ion-exchange chromatography on a Mono-Q column and gel permeationusing a Superose column. The purified protein was homogeneous by sodium dodecyl sulphate-polyacrylamide gel electrophoresis. The specific activity of purified HCII was 12.2 U/mg. The HCII activity wasevaluated as antithrombin dermatan sulphate cofactor activity. A specific antiserum against HCII wasraised in the rabbit.
INTRODUCTION
Heparin cofactor n (HCII) is a recently described plasma inhibitor of thrombin[1,2], the activity of which is potentiated by heparin and more specifically by dermatansulphate, another glycosaminoglycan [3]. HCIl displays structural and biologicalsimilarities with antithrombin III (ATIII) [4,5], the main plasma cofactor of heparin[6]. Nevertheless, whereas ATIll is active towards most of the activated clotting factors[6], Hcn is a specific inhibitor of thrombin [1,2,7].
We report here the purification to homogeneity of HCn from human plasmaand the production of a specific antiserum against the inhibitor raised in the rabbit.
EXPERIMENTAL
MaterialsAll reagents were of analytical-reagent grade and were obtained from Merck
(Darmstadt, Germany) unless stated otherwise. Heparin-Sepharose CL6B andDEAE-Sepharose CL6B were purchased from Pharmacia (Uppsala, Sweden). The
• Present address: Laboratoiree d'Hematologie, Hopital Cochin, 27 Rue du Faubourg Saint Jacques,F-75674 Paris Cedex 14, France.
0021-9673/91/$03.50 © 1991 Elsevier Science Publishers B.V.

494 P. TOULON, G. CHADEUF, M. AIACH
anion-exchange chromatographic Mono-Q column and the gel permeation Superosecolumn were obtained prepacked from Pharmacia. The fast protein liquid chromatography (FPLC) system (Pharmacia) was used. The AcA-34 gel permeation column wasobtained from IBF (Villeneuve la Garenne, France).
Collection ofplasmaVenous blood was collected from at least 30 healthy individuals in evacuated
tubes containing 0.129 M trisodium citrate (1:9) (Vacutainer 606608; BecktonDickinson, Orangeburg, NJ, V.S.A.). Blood samples were immediately centrifuged at2300 g and 3°C for 15 min. Plasma samples were pooled and stored frozen at - 70°Cuntil used.
Purification of HCllThe thawed plasma (485 ml) was treated with 1 M barium chloride solution
(1:10, v/v) with constant magnetic stirring for 15 min at room temperature. Aftera IO-min centrifugation at 5000 g, the precipitate was discarded. All subsequent stepswere carried out at 4°C, except the two final steps performed using the FPLC system.The supernatant was treated with 50% saturated ammonium sulphate (final concentration) for 20 min with constant magnetic stirring and centrifuged at 10000 g for20 min. The precipitate was dissolved in 65 ml of 0.02 M Tris-HCI buffer (pH 7.4),dialysed overnight against the same buffer, and the solution was centrifuged at 10 000g for 20 min.
The supernatant was applied to a column (20 x 2.5 cm LD.) of heparinSepharose CL6B equilibrated in 0.02 M Tris-HCI (pH 7.4). The column wasextensively washed with this buffer until the absorbance of the effluent was zero. Thecolumn was eluted with 350 ml of a linear gradient from 0.0 to 0.4 M NaCI in 0.02M Tris-HCI (pH 7.4). Fractions of 4.2 ml were collected at a flow-rate of 13 ml/h.Fractions containing more than 1.5 V Iml of dermatan sulphate (DS) cofactor activitywere pooled (volume v = 29.4 ml) and diluted 1:3 in 0.02 M Tris-HCI (pH 7.4) toreduce the ionic strength.
This protein solution was applied to a column (30 x 1.5 cm LD.) of DEAESepharose equilibrated in 0.02 M Tris-HCI (pH 7.4). The column was extensivelywashed until the absorbance of the effluent was zero and eluted with 150 ml ofa lineargradient from 0 to 0.4 MNaCI in 0.02 MTris-HCI (pH 7.4). Fractions of 1.5 ml werecollected at a flow-rate of 9 ml/h. Fractions containing more than 1.5 Vlml of DScofactor activity were pooled (v = 10.5 ml) and concentrated against polyethyleneglycol (PEG) to a final volume of 3 m!.
The solution was applied to a column (80 x 1.5 cm LD.) ofAcA-34 equilibratedwith 0.15 M NaCI buffered with 0.02 M Tris-HCI (pH 7.4). Gel permeationchromatography was carried out in this buffer at a flow-rate of6 ml/h. Fractions of 1.2ml were collected. Fractions containing more than 2.0 Vlml DS cofactor activity werepooled (v = 8.4 m1).
The final steps were performed using the FPLC system at room temperature.The protein solution was applied to a Mono-Q ion-exchange column equilibrated with0.02 MTris-HCI (pH 7.4). The elution was carried out using a linear gradient from 0.0to 0.5 M NaCI in 0.02 M Tris-HCI (pH 7.4). Fractions of 1.0 ml were collected ata flow-rate of 1.0 ml/min. Fractions containing the peak of DS cofactor activity were

PURIFICATION OF HEPARIN COFACTOR II 495
pooled (v = 3 ml), concentrated against PEG and applied to a gel permeation(Superose) column equilibrated in 0.02 M Tris-HCI (pH 7.4) containing 0.3 M NaCI.The chromatography was performed using this buffer and 1.0-ml fractions werecollected at a flow-rate of 0.10 ml/min. Fractions containing the peak of DS cofactoractivity were pooled (v = 4 ml). This preparation was stored frozen at -70°C inaliqilots.
Electrophoretic techniquesSodium dodecyl sulphate-polyacrylamide gel electrophoresis (SDS-PAGE) was
performed, according to Laemmli [8], in 7.5% polyacrylamide slab gels containing0.1 % (vjv) SDS. Apparent relative molecular masses (Mr) were obtained bycomparison with a mixture of reduced reference proteins (Bio-Rad Labs., Richmond,CA, U.S.A.): f1-galactosidase (Mr 116000 dalton), phosphorylase B (Mr 92 000dalton), bovine serum albumin (Mr 66 000 dalton), ovalbumin (Mr 45 000 dalton),carbonic anhydrase (Mr 31 000 dalton) and soybean trypsin inhibitor (Mr 22 000dalton). All gels were stained with Coomassie Brillant Blue R.
Crossed immunoelectrophoresis was performed according to Ganrot [9] in 1%agarose gel containing I% antisera against HCII.
Determination of proteinsThe protein concentrations in the chromatographic fractions were determined
by measuring the absorbance at 280 nm [10] in a cell of l-cm light path. The extinctioncoefficients at 280 nm (A~~'b) used were 10 for a mixture of proteins and 11.7 forpurified HCII [2].
HCll activity assayHcn activity was assayed as antithrombin dermatan sulphate cofactor activity
[11 ].
Production of specific antiserum against HCllA 50-,ug sample of the purified protein mixed with 1 ml of complete Freund's
adjuvant was injected subcutaneously into rabbits. The animals received threesubsequent injections of 50 ,ug of HCII mixed with 1 ml of Freund's incompleteadjuvant at I-week intervals. The rabbits were bled 1week after the last injection. Theblood was allowed to clot at 37°C for 3 h and the serum, obtained by centrifugation at2300 g for 15 min, was stored frozen at -30°C in aliquots.
RESULTS
Purification of HCllAs shown in Fig. 1, the peak of DS cofactor activity was eluted from the
heparin-Sepharose column with a mean concentration of 0.18 M NaCl in 0.02M Tris-HCl (pH 7.4). The fractions containing more than 1.5 Vlml were pooled,diluted in buffer to reduce the ionic strength and applied to a DEAE-Sepharosecolumn and eluted with a linear gradient from 0 to 0.4 MNaCl in 0.02 MTris-HCI (pH7.4). Fractions containing a DS activity ofmore than 1.5 UIml were eluted with a meansodium concentration of0.18 M, as shown in Fig. 2. These fractions were then pooled,

496 P. TOULON, G. CHADEUF, M. AIACH
20 14.00
</-'////<//
~....15 a
= 3.000 -I 0 ::IE
0 :!co 10 0
N 0 2.GO« -E..0.III:r
1.00
.0
Fig. 1. Elution of HCII activity from heparin-Sepharose. The column (20 x 2.5 cm I.D.) was eluted witha 350-mllinear gradient from 0.0 to 0.4 M NaCl in 0.02 M Tris-HCl (pH 7.4). Fractions of 4.2 ml werecollected at a flow-rate of 13 ml/h.• = Absorbance at 280 nm; ... = HCII cofactor activity evaluated asantithrombin dermatan sulphate cofactor activity. Pooled fractions are indicated by a solid bar.
concentrated against PEG and gel chromatographed on an AcA-34 column. Theelution profile is shown in Fig. 3. The DS cofactor activity was eluted with an elutionvolume of 54.0 mI. This protein solution was then applied to a Mono-Q ion-exchangecolumn connected to the FPLC system. The column was eluted with a linear gradientfrom 0.0 to 0.5 M NaCI in 0.02 M Tris-HCl (pH 7.4). As shown in Fig. 4, the peak ofDS cofactor activity was eluted with a mean concentration of 0.28 M NaC!. The finalstep consisted ofgel permeation using a Superose column. The elution profile is shownin Fig. 5.
0.1
U
0.2~
G.31
.060
...•..... .
20
4
1a.o
3 ~a=0
6.0
I 0..0 8coN
'E4.G
« ..i:r
Fig. 2. Elution of HCII activity from DEAE-Sepharose. The column (30 x 1.5 cm I.D.) was eluted witha 150-mllinear gradient from 0.0 to 0.4 M NaCI in 0.02 M Tris-Hel (pH 7.4). Fractions of 1.5 ml werecollected at a flow-rate of 9 ml/h. Symbols as in Fig. I.

PURIFICATION OF HEPARIN COFACTOR II 497
t~
o.s ! s.oa=
0.4... 4.00U
t ..'0
0 0.3 0 3110c::CIO 'faN
« CoG>
0.2 1: 2.00
0.\ \00
\0 20 30
Fig. 3. Gel permeation ofHClI activity on AcA 34. The proteins were chromatographed on a column (80 x1.5 cm I. D.) equilibrated with 0.15 M NaCl in 0.02 M Tris-HCI (pH 7.4). Fractions of 1.2 ml were collectedat a flow-rate of 6 ml/h. Symbols as in Fig. I.
HCll was purified 760-fold from human plasma with an overall yield of 7.5%(Table I). The final product was homogeneous in SDS-PAGE (Fig. 6). No anti-Xaactivity or immunoreactive ATill could be detected in the protein preparation. Thusthe purified HCll preparation was devoid of ATIII. HCII was eluted from the columnofheparin-Sepharose (Fig. I) with a much lower ionic strength (0.18 M) than ATIII,which appeared in the effluent at higher saline concentrations (0.80 M) (not shown).
I.'1.6
1~
E12 3
I =0\0
...0
CIO U';-01 ..
'00c::
0.6 .~
i'0.4 1:
10.0
•••.......
..'
0.4
OJ
Fig. 4. Elution of HCII activity from a Mono-Q anion-exchange column. The column was eluted witha 35-mllinear gradient from 0.0 to 0.5 M NaCI in 0.02 M Tris-HCI (pH 7.4). Fractions of 1.0 ml werecollected at a flow-rate of 1.0 mljmin. Symbols as in Fig. I:

498
OA
1~ 10.0E....
I Cl6 a=
0 ..CXl 0N b
c( III0,4 '0
0c:iQ.CD
0.2 :J:
10
P. TOULON, G. CHADEUF, M. AIACH
Fig. 5. Gel permeation of heparin cofactor n on a Superose column. The column was eluted with 0.3M NaCI in 0.02 M Tris-HCI (pH 7.4). Fractions of 1.0 ml were collected at a flow-rate of 0.10 ml/min.Symbols as in Fig. I.
Specificity of the antiserum against HellThe antiserum was found to be monospecific, as evidenced by the single peak
pattern ofnormal human plasma in crossed immunoelectrophoresis (CrE) as shown inFig. 7. When purified ATIll was submitted to CrE, no immunoreactive protein couldbe found (not shown).
DISCUSSION
Functionally active heparin cofactor II was purified to homogeneity fromhuman plasma with a recovery of 7.5%. The specific activity of the purified protein
TABLE I
PURIFICATION OF HEPARIN COFACTOR II FROM HUMAN PLASMA
Step Volume Total Total Specific Yield Purification(m1) protein HCn activity (%) factor
(mg) (U/ml) (U/mg)
Starting plasma 485 26389 418.5 0.016 100 IBarium chloride-treated plasma 495 25533 413.2 0.016 98.7 IAmmonium sulphate precipitate 110 5809 176.0 0.030 42.1 1.88Heparin-Sepharose 29.4 71.3 85.8 1.201 20.5 75.1DEAE-Sepharose 10.5 12.8 61.5 4.805 14.6 300AcA-34 8.4 6.8 46.0 6.765 11.0 422Mono-Q 3 4.1 42.7 10.41 10.2 650Superose 4 2.57 31.4 12.20 7.5 763

PURIFICATION OF HEPARIN COFACTOR II 499
Fig. 6. SDS-PAGE of the final preparation of HCII. The final' product was homogeneous and migratedwith M, 66 500 dalton (lane B). The molecular mass standards (M, in kilodaltons) are in lane A.
Fig. 7. Crossed immunoelectrophoresis of a plasma sample. The antiserum was used at a concentration of1% (vjv) in the second dimension. A single peak pattern was found, suggesting the monospecificity of theantiserum.

500 P. TOULON, G. CHADEUF, M. AIACH
was 12.2 Ujmg. These results are similar to those obtained with previously publishedpurification procedures [2,12-14], which gave purified HCn with a overall yieldbetween 3% [2] and 30% [13].
The physiological role ofHCII is still unknown. Even though cases of hereditaryHCn deficiency were reported in patients with thrombophilia [15,16], the correlationbetween HCII deficiency and thrombosis is still controversial [17,18]. In addition tothe quantitative deficiencies, a hereditary HCII variant, HCII OSLO (Arg-189-His)was recently found [19] in a clinically asymptomatic subject; the plasma HCII activity,measured as dermatan sulphate cofactor activity, was decreased whereas the HCnantigen concentration was normal. The specific antiserum against HCn, raised in therabbit, can be a useful tool for the measurement of HCn antigen concentrations inclinical studies.
REFERENCES
I G. F. Briginshaw and J. N. Shanberge, Arch. Biochem. Biophys., 161 (1974) 683.2 D. M. Tollefsen, D. W. Majerus and M. K. Blank, J. Bioi. Chem., 257 (1982) 2162.3 D. M. Tollefsen, C. A. Pestka and W. J. Monafo, J. Bioi. Chem., 258 (1983) 6713.4 M. J. Griffith, C. M. Noyes and F. C. Church, J. Bioi. Chem., 260 (1985) 2218.5 M. A. Blinder, J. C. Marasa, C. H. Reynolds, L. L. Deaven and D. M. Tollefsen, Biochemistry, 27 (1988)
752.6 R. D. Rosenberg and P. S. Damus, J. Bioi. Chem., 248 (1973) 6490.7 K. A. Parker and D. M. Tollefsen, J. Bioi. Chem., 260 (1985) 3501.8 U. K. Laemmli, Nature (London), 227 (1970) 680.9 P. O. Ganrot, Scand. J. C/in. Lab. Invest., 29, Suppl. 124 (1972) 39.
10 J. Babul and E. Stellwagen, Anal. Biochem., 28 (1969) 216.II P. Toulon, C. Jacquot, L. Capron, M. O. Frydman, D. Vignon and M. Aiach, Thromb. Haemostas., 57
(1987) 263.12 R. Yamagishi, M. Niwa, S. I. Kondo, N. Sakuragawa and T. Koide, Thromb. Res., 36 (1984) 633.13 T. H. Tran, B. Liimmle, B. Zbinden and F. Duckert, Thromb. Haemostas., 55 (1986) 19.14 F. C. Church, C. M. Noyes and M. J. Griffith., Proc. Natl. Acad. Sci. U.S.A., 82 (1985) 6431.15 T. H. Tran, G. A. Marbet and F. Duckert, Lancet, ii, (1985) 413.16 P. Sie, D. Dupouy, J. Pichon and B. Boneu, Lancet, ii, (1985) 414.17 R. M. Bertina, I. K. van der Linden, L. Engeser, H. P. Muller and E. J. P. Brommer, Thromb.
Haemostas., 57 (1987) 196.18 P. A. Toulon, J. F. Vitoux, J. N. Fiessinger, Y. Sultan and M. Aiach, Circulation, 78, Suppl. II (1987)
326.19 M. A. Blinder, T. R. Anderson, U. Abildgaard and D. M. Tollefsen, J. Bioi. Chem., 264 (1989) 5128.

Journal o.fChromatography, 539 (1991) 501-505Elsevier Science Publishers B.Y., Amsterdam
CHROM. 22 895
Purification of cloned trypanosoma} calmodulin andpreliminary NMR studies
P. J. SWEENEY* and J. M. WALKER
Division of Biological Sciences, Hatfield Polylechnic, College Lane, Hatfield, Herlfordshire ALiO 9AB( U.K.)
andD. G. REID and N. ELSHOURBAGY
Deparlmenl of Chemislry, SmilhKline Beecham Pharmaceulicals Lid., The Fry/he, Welwyn, HerlfordshireAU 9AR (U.K.)
ABSTRACT
Cloned trypanosomaI calmodulin was expressed in E~cherichia coli and purified to homogeneityusing hydrophobic interaction chromatography on phenyl-Sepharose. The purified protein was subjectedto NMR analysis which allows detailed changes to be observed when, firstly, calcium, and secondly, thedrug calmidazolium bind. These spectral changes are the result of conformational changes in the proteinand proximity effects due to the drug.
INTRODUCTION
Calmodulin is a 17 ODD-dalton, multifunctional, universal regulator of calciumfunctions, which is present in all eukaryotic cells. The protein detects free calcium andtranslates changes in calcium concentrations into altered states of metabolism [1].Calcium-bound calmodulin interacts with and regulates a large number of enzymes,particularly those of nucleotide phosphate transfer and hydrolysis [2].
Calmodulin has been purified to homogeneity from a wide variety of sources,including vertebrates, invertebrates, plants and protozoans [3,4]. The size, abundance,heat stability and ability of the calcium-bound protein to bind drugs and targetproteins have provided the basis for a number of isolation procedures [5,6]. NMRstudies on human and bovine calmodulins have yielded much information on theconformational transitions associated with calcium binding and drug interactions [7].
We report here the purification of cloned trypanosomal calmodulin usinghydrophobic interaction chromatography. Calmodulin is a highly conserved protein.However, the trypanosomal protein contains 22 amino acid substitutions whencompared to the human protein. Substitutions at positions 77 and 79 are unique totrypanosomal calmodulin and are in a region thought to be involved in drug and targetprotein interaction.
0021-9673/91/$03.50 © 1991 Elsevier Science Publishers B.Y.

502 P. J. SWEENEY et al.
The purpose of these investigations is to study drug interactions with thetrypanosomal protein and eventually compare assignments of human and trypanosomal calmodulins with a view to the design of trypanosomal calmodulin-specificdrugs. We therefore also report preliminary NMR studies on the trypanosomalprotein.
MATERIALS AND METHODS
E. coli strain AR58, containing the cDNA clone of trypanosomal calmodulininserted into the expression vector pMG/Nco, was cultured in 25 250-ml conical flasks,each containing 100 ml of media, at 30°C, with shaking. The medium was a minimalbacterial medium, containing the following: 5 gil sodium acetate, 2.5 gil ammoniumchloride, 1.9 gil disodium hydrogen phosphate, 0.75 gil potassium dihydrogenphosphate, 0.13 gil sodium sulphate, 0.05 gil magnesium sulphate, 0.2 ml LB brothand 0.05 ml trace element solution. When the cultures reached an absorbance of0.4-0.6 at 550 nm, the flasks were transferred to a 42°C shaking water bath for 2 h toinduce expression of calmodulin. The cells were then recovered by centrifugation,washed in 40 mM Tris-HCl, pH 7.5, resuspended in 250 ml of 50 mM Tris-HCl(pH 7.5), 1mM mercaptoethanol, 1mM EDTA (buffer 1), disrupted by sonication for6 min, and the solution was clarified by centrifugation at 15 000 g for 15 min.
Calmodulin was purified from the clarified supernatant according to a methodbased on that described by Gopalakrishna and Anderson [8]. The soluble E. coliextract was passed through a phenyl-Sepharose (Pharmacia) column (14 cm x 1.6 cm1.0.), equilibrated with buffer 1, and the unbound fraction collected and made 5 mMin CaCho It was then applied to a second phenyl-Sepharose column (14 cm x 1.6 cm1.0.), equilibrated with buffer 2 (50 mM Tris-HCI, pH 7.5, 1 mM mercaptoethanol,0.1 mM CaCI2) and the column washed with 15 column volumes of buffer 2, followedby 3 column volumes of buffer 3 (buffer 2 containing 0.5 M NaCl). The boundcalmodulin was then eluted by washing the column with buffer I. This fraction wasmade 50 mM in EDTA to remove calcium and the calcium free protein was then passedthrough a G-25 Sephadex (Pharmacia) column (45 cm x 1.6 cm 1.0.), equilibratedwith 100 mM ammonium bicarbonate, to remove EDTA, the calmodulin fractionswere collected, pooled, freeze-dried and stored at - 70°C.
Sodium dodecyl (lauryl) sulphate-polyacrylamide gel electrophoresis (SDSPAGE) was performed according to the method of Laemmli [9]. N-Terminalsequencing was determined by sample application to an Applied Biosystems 477pulsed liquid phase sequencer, with a 120A phenylthiohydantoin analyser fordetection (Applied Biosystems).
Proton NMR spectra were acquired at 37°C and 360 MHz on a Bruker AM360spectrometer. A 25-mg sample of trypanosomal calmodulin was dissolved in 0.4 ml2H20 (Aldrich), which was 0.1 M and 0.05 Mwith respect to potassium chloride andpotassium phosphate and adjusted to pH 7.0. 43CaCh was used for the calciumtitration experiments and calmidazolium was the compound chosen to perform thedrug titration experiments. Calmidazolium (R24571) (Roche) was dissolved indeuterated methanol (Aldrich). One thousand scans were collected at each titrationpoint and resolution enhancement was achieved using a convolution difference,procedure (LB = 2.5) followed by exponential multiplication (LB = I).

PURIFICATION OF CLONED TRYPANOSOMAL CALMODULIN 503
Absorbance 220 nm40r------------------------,
30
Buffer 2
25020015010050
oL- ..L- ..L-~"'*"".L...Jb*=t"""'="="='...!.,d........b.._.....=_l
o
20
Fraction Number
Fig. 1. Phenyl-Sepharose chromatography elution profile for trypanosomal calmodulin (second chromatography, see Results and Discussion).
Fig. 2. SDS-PAGE analysis of E. coli extracts and purified trypanosomal calmodulin. From left to right,lanes 1,3: E. coli extract at point of induction, lanes 2,4: E. coli extract 12 h after induction, lanes 5,6: 12-hextracts in I roM EDTA (showing altered electrophoretic mobility ofcalmodulin in the absence ofcalcium),lanes 7-11: purified calmodulin fractions from column.

504
RESULTS AND DISCUSSION
P. J. SWEENEY et af.
Calmodulin was purified to homogeneity at a yield of 12-13 mg/I culture. Theelution profile is illustrated in Fig. 1. The protein migrated as a single band onSDS-PAGE (Fig. 2) and N-terminal sequencing revealed a single N terminus. The firstfifteen residues were identified by sequencing and agreed with the published sequence(single-letter code for amino acids): A-D-Q-L-S-N-E-Q-I-S-E-F-K-E-A.
d
c
b
a
IB.O
I7.0
PPM
r6.0
I5.0
I3.0
I2.0
I1.0
PPM
i0.0
Fig. 3. NMR spectra of aromatic (4.5-9.0 ppm) and aliphatic (-1.0-3.0 ppm) regions of trypanosomalcalmodulin. (a) 25 mg of calcium-free calmodulin, (b) 2: I calcium--{;almodulin complex, (c) 4: Icalcium--{;almodulin complex, (d) 1:1 calmidazolium--{;alcium-saturated calmodulin complex.

PURIFICATION OF CLONED TRYPANOSOMAL CALMODULIN 505
The binding of calcium takes place in two distinct phases, corresponding tobinding the two high-affinity, and the two low-affinity sites, respectively. As reportedfor bovine calmodulin [10], these two phases are characterized by slow exchange(discrete signals observed for CaH -free and Ca2 + -bound protein) and fast exchange(time-averaged single resonances observed for both forms of the protein) on the NMRtime scale, corresponding to successive occupation of the two high-affinity and twolow-affinity sites. As shown in Fig. 3a, band c, the interaction produces majorconformational changes which are reflected in dramatic differences in the protonNMR spectra at each stage of the titration. Further changes accompany drug binding(Fig. 3d), corresponding, firstly, to the appearance ofdrug signals in the 6.5 to 7.5 ppmspectral region, and, secondly, to chemical shift and line-width changes in signals fromthe protein. The latter reflect both the effects of the drug on residues close to its bindingsite, and long range drug-induced conformational changes. The appearance of thearomatic region of trypanosomal calmodulin is very similar to that of the bovineprotein, with the exception of the absence of the doublet corresponding to tyrosine,which may be accounted for by the Y-99-F-99 change in the former. However, spectralchanges induced by the addition ofone equivalent ofcalmidazolium are quite differentfrom those observed in bovine calmodulin [11], although the compound still binds withhigh affinity, reflected in the slow exchange nature of most of the changes.
We are currently analysing the nature of the drug binding site by nuclearOverhauser effect experiments, assisted by selective and total deuteration of theprotein, to allow drug signals to be observed in isolation, and assigned unambiguously.
REFERENCES
I C. B. Klee and T. C. Vanaman, Adv. Protein Chem., 35 ([982) 213.2 P. Harris, in J. R. Jeter, I. L. Cameron, G. M. Madilla and A. M. Zimmerman (Editors), Cell Cycle
Regulation. Academic Press, New York. 1978, p. 75.3 Y. M. Lin, Mol. Cell. Biochem., 45 (1982) \01.4 L. Ruben, C. Egwuagu and C. L. Patton, Biochim. Biophys. Acta, 758 (1983) 104.5 D. L. Newton. M. H. Krinks, 1. B. Kaufman, J. Shilaoch and G. B. Klee, Prep. Biochem., 18 (1988) 247.6 G. A. Jamieson, Jr. and T. C. Vanaman, Biochem. Biophys. Res. Commun .. 90 ([979) 1048.7 J. S. Evans, B. A. Levine, R. J. P. Williams and M. R. Wormald. in P. Cohen and C. B. Klee (Editors),
Molecular Aspects of Cellular Regulation, Vol. 5. Elsevier. Amsterdam. 1988. p. 57.8 R. Gopalakrishna and W. B. Anderson, Biochem. Bioph)'s. Res. Commun .. 104 (1982) 830.9 U. K. Laemmli, Nature (London), 277 (1970) 680.
10 K. B. Seamon, Biochemistry. 19 (1980) 207.II D. G. Reid, L. K. MacLachlan. K. Gajjar. M. Voyle. R. J. King and P. J. England, J. BioI. Chem.. 265
([990) 9744.


Journal oj Chromatography, 539 (1991) 507-510Elsevier Science Publishers B.Y., Amsterdam
CHROM. 22 897
Use of dye pseudo-affinity chromatography in thepurification of homoserine dehydrogenase
M. COSTA-FERREIRA' and J. C. DUARTE
Biotechnology Unit, National Laboratory jor Industrial Engineering and Technology (LNETI/ DTlQ), Estrada das Palmeiras, 2745 Queluz de Baixo (Portugal)
ABSTRACT
Homoserine dehydrogenase (E.C. 1.1.1.3) from a mutant strain of Corynebacterium glutamicum waspurified using the pseudo-specific affinity dye Cibacron Blue F3G-A. The triazine dye was coupled eitherdirectly or via 1,4-diaminobutane to Sepharose 4B. Both the recovery and purification factor were significantly higher when the dye was coupled to the gel matrix via the spacer. Using this configuration, arecovery of about 62% was obtained with a purification factor of about 95-fold, achieved in a rapidone-step protocol.
INTRODUCTION
Procedures for the purification ofhomoserine dehydrogenase (E.C. 1.1.1.3) havebeen reported for various microorganisms [1-4] but these early procedures sufferedfrom various limitations in that they were time consuming and consisted of severaltedious steps. More recently, improved purification scheme have been reported for theE. coli enzyme using Sepharose substituted with alkyl chains of varying length [5].Also, a Green A-agarose dye affinity column has been used as the final step ina purification scheme that involved a total of five steps [6].
Our interest in the improvement of Corynebacterium glutamicum strains thatover-produce amino acids of the aspartate family [7,8] led us to undertake thepurification ofthis key regulatory enzyme. We report here a simple one-step procedurefor the purification of homoserine dehydrogenase using the pseudo-specific triazinedye Cibacron Blue F3G-A. A comparison is made between the purification achievedwhen the dye was immobilized to Sepharose 4B directly and that obtained whenimmobilized via 1,4-diaminobutane.
EXPERIMENTAL
ReagentsSepharose 4B was purchased from Pharmacia (Uppsala, Sweden) and Cibacron
Blue F3G-A (Reactive Blue), tresyl chloride, 1,4-diaminobutane and Coomassie
0021-9673/91/$03.50 © 1991 Elsevier Science Publishers B.Y.

508 M. COSTA-FERREIRA, J. C. DUARTE
Brilliant Blue from Sigma (St. Louis, MO, U.S.A.). All other reagents were ofanalytical-reagent grade.
Immobilization of Cibacron Blue F3G-AIn the absence of the spacer arm, coupling was effected by mixing Cibacron Blue
(10 flmol/ml gel) with Sepharose 4B suspended in sodium carbonate, using essentiallythe procedure described previously [9]. The reaction was allowed to proceed for 2 h at80°e. In the second aternative, the spacer arm, 1,4-diaminobutane, was added inten-fold excess to tresyl-activated Sepharose 4B [10] and the coupling was run for I hatroom temperature. After extensive washing, the gel was mixed with Cibacron Blue asdescribed above except that the reaction was allowed to proceed for I h at 40°e.
Extraction of homoserine dehydrogenase .from Corynebacterium glutamicumThe C. glutamicum mutant was grown as described previously [7]. Cells were
harvested in the late log phase by centrifugation. The cell pellet was suspended in 100mM potassium phosphate buffer (pH 7.0)-100 mM KCl-I mM dithiothreitol(DTT)-I mM EDTA at 4°e. This cell suspension [4% w/v (wet weight)] was disruptedby ultrasonic homogenization (200 W for 4 min). The homogenate was centrifuged(10000 g for 20 min) and the resultant supernatant filtered (0.22-flm filter; Millipore).The cell-free extract (1 ml) was diluted (1:1) with 100 mM Tris-HCI (pH 7.0)containing 100mMKCI, 0.5mMDTT,0.1 mMEDTAand 5mM cysteine and appliedimmediately to a column (30 x I cm J.D.) packed with Sepharose 4B-Cibacron Bluepreviously equilibrated with the same buffer and washed at a flow-rate of20 ml/h untilthe absorbance at 280 nm was less than 0.03. Homoserine dehydrogenase was elutedfrom the column with three column volumes of 2 mM nicotinamide-adeninedinucleotide phosphate, oxidized (NADP) in the same buffer system.
Homoserine dehydrogenase activity [II] and protein concentrations [12] weredetermined using published procedures.
RESULTS AND DISCUSSION
Homoserine dehydrogenase was eluted from the pseudo-affinity column byforming a stable ternary complex [13] with NADP and the competitive inhibitorcysteine [6]. Homoserine dehydrogenase activity was detected in a single essentiallysymmetrical peak. No homoserine dehydrogenase activity was detected in the largepeak containing unbound protein that appeared in the void volume (results notshown).
The results presented in Table I show that the use of Cibacron Blue coupled toSepharose 4B via the spacer arm gave a significantly higher recovery than when the dyewas coupled directly to the gel matrix. In the latter instance the total enzyme activitywas about 62%, suggesting incomplete elution. However, neither increasing theNADP concentration lO-fold nor eluting with up to five column volumes resulted inincreased recovery. Despite some loss of activity, the yield nevertheless comparesfavourably with the 24% yield obtained by other workers [6] who used GreenA-agarose as the final stage in a multi-step purification scheme.
When Cibacron blue was coupled to the gel via the spacer arm, a 95-foldpurification of homoserine dehydrogenase was obtained in. a single step. This

PURIFICATION OF HOMOSERINE DEHYDROGENASE 509
TABLE I
PURIFICATION OF HOMOSERINE DEHYDROGENASE FROM CORYNEBACTERIUM GLUTAMICUM
Parameter Crude extract Cibacron Blue-Sepharose 4B
Without spacer With spacer
Total protein (mg) 8133 75 53Total activity (U) 244 93 151Specific activity
(U/mg protein) 0.03 1.24 2.85Recovery (%) 100 38.1 61.9Purification (-fold) I 41 95
purification factor is about double than that obtained in the absence ofthe spacer arm.In order to exclude the possibility that the higher yield observed may have
resulted from higher dye loading on the dye-spacer-Sepharose matrix, the absorbances at 600 nm of the two matrices were determined after gentle heating. As nosignificant difference was observed between the two matrices, it appears that the totaldye load was the same in both instances (Fig. I).
The higher yield observed in the presence of the spacer suggests that, as has beenreported previously for various enzymes such as alcohol dehydrogenase [9], a spacerarm that renders the ligand more flexible is necessary for correct spatial orientation to",
645616
~>->--:>
1O~0 w
Vl
E <l:<: as2 8N
~
~>-IW
<l: 0CD
5 w~ 0.5 NADP z
~1i"w<l: Vl0
0I
Fraction No.
Fig. I. Dye pseudo-affinity purification of homoserine dehydrogenase. An extract of C. g/utamicum (244units of enzyme) was applied to a column of Cibacron Blue F3G-A immobilized onto Sepharose 4B via1,4-diaminobutane. The homoserine dehydrogenase was eluted with 2 mMNADP (as indicated by arrow) in100 mM Tris-HCI (pH 7.0) containing 100 mM KCI, 0.5 mM DTT, 0.1 mM EDTA and 5 mM cysteine.Fractions (2 ml) were collected and enzyme activity was assayed as described under Experimental.

510 M. COSTA-FERREIRA, 1. C. DUARTE
homoserine dehydrogenase, whereas in the absence of the spacer steric factors hinderaccess to the ligand.
Work is in progress to optimize the purification by avoiding problems associatedwith the use ofunpurified dyes [14], studying the effect ofusing longer spacer arms suchas diaminohexane and studying the many other factors that affect purificationefficacy.
ACKNOWLEDGEMENTS
We thank Dr. Torbj6rn Ling of the Department of Biotechnology, University ofLund, Sweden, for helpful advice on the use of triazine dyes.
REFERENCES
I N. Guiso and P. Truffa-Bachi, Eur. J. Biochem., 42 (1974) 401.2 M. Shailaja and M. R. Raghavendra Rao, Mol. Cell. Biochem., 12 (1976) ]5.3 P. Datta, J. Bioi. Chem., 245 (1970) 5779.4 M. Jenkins and V. Woodward, Biochim. Biophys. Acta, 212 (1970) 21.5 L. Broussard, W. Harms and W. Shive, Anal. Biochem., 72 (1976) 16.6 W. Karsten, J. Hunsley and R. Viola, Anal. Biochem., 147 (1985) 336.7 M. Costa-Ferreira and J. C. Duarte, Appl. Biochem. Biotechnol., (1991) in press.8 M. Costa-Ferreira and J. C. Duarte, Port. Pat. Appl., No. 91 207, 1989.9 B. Mattiasson and T. G. I. Ling, J. Chromatogr., 376 (1986) 235.
10 K. Nilsson and K. Mosbach, Methods Enzymol., 104 (1984) 56.I I P. Datta and H. Guest, Methods Enzymol., 2 (1970) 703.12 M. Bradford, Anal. Biochem., 72 (1976) 248.13 G. Svanas and H. Weiner, Anal. Biochem., 124 (1982) 314.14 B. Weber, K. Willeford, J. G. Moe and D. Piszkiewicz, Biochem. Biophys. Res. Commun., 86 (1979) 252.

Journal of Chromatography, 539 (1991) 511-516Elsevier Science Publishers B.Y., Amsterdam
CHROM. 22899
Purification on poly(U)-Sepharose 4B of human breastcancer cell line T-47D DNA polymerases
D. BERNARD* and C. MOYRET
Laboratoire d'Oncologie Moleculaire, Centre Jean Perrin, Place Henri Dunant, B.P. 392, 6301 I ClermontFerrand Cedex (France)
and
J. C. MAURIZIS
INSERM U 71. Rue Montalembert. 63005 Clermont-Ferrand Cedex (France)
ABSTRACT
The purification of DNA polymerases (RNA-directed DNA polymerases and DNA-directed DNApolymerases) on poly(U)~Sepharose 4B from a breast tumour cell line (TA7D) is reported. The elution ofthese enzymes was followed in each fraction by activity measurements with the four primer-templates poly(rA)~oligo(dT)[2_[S' poly(dA) oligo(dT)12_[S' poly(rC)-oligo(dG)[ 2-[ 8 and poly(rCm)-oligo(dG)12_[8' The control of the polymerase purification by chromatography was performed by sodiumdodecyl sulphate-polyacrylamide gel electrophoresis of the pooled active enzymatic fractions.
INTRODUCTION
DNA polymerase (RNA-directed DNA and DNA-directed DNA polymerase)activities have been detected in Rous sarcoma [I] and in different human neoplasias,such as leukaemias [2-4] and breast tumours [5].
The DNA polymerases have been purified using glycerol gradient centrifugation[6], a combination of sucrose gradient and ion-exchange column chromatography [7]or extraction of retroviruses with a detergent followed by an oligo(dT)12_18-eellulosecolumn and non-dissociating gel electrophoresis [8]. These procedures are cumbersome and their yields are often poor. This paper demonstrates that highly pure DNApolymerase can be readily prepared by a single chromatographic step on a polyuridylicacid [poly(U)]-Sepharose 4B column.
EXPERIMENTAL
Chemical and reagentsPoly(riboadenylic acid)-oligo(deoxythymidylic acid) 12-18 [poly(rA)-oligo
(dT) 12-18], poly(deoxyadenylic acid)~oligo(deoxythymidylic acid) 12-18 [poly(dA)0Iigo(dTL2_18], poly(ribocytidylic acid)-oligo(deoxyguanylic acid)12_18 [poly(rC)0Iigo(dG)12_18], poly(2'-O-methylribocytidylic acid)-oligo(deoxyguanylic acid)12_18-
0021-9673/91/$03.50 © 1991 Elsevier Science Publishers B.Y.

512 D. BERNARD, C. MOYRET, 1. C. MAURIZIS
[poly(rCm)-0Iigo(dG)12_1S] and poly(uridylic acid) [poly(U)]-Sepharose 4B werepurchased from Pharmacia (Uppsala, Sweden). Nonidet P 40 (NP 40) and trichloroacetic acid (TCA) were purchased from Sigma (St. Louis, MO, U.S.A.). Deoxy[3H]methylthymidine 5'-triphosphate ([3H]-dTTP) and deoxy[8-3H]guanosine 5'-triphosphateWH]-dGTP) were purchased from Amersham International (Amersham,U.K.). Filters were obtained from Millipore (Bedford, MA, U.S.A.) and T75 flasksfrom Corning (Corning, NY, U.S.A.). RPMI 1640 medium was purchased from GibcoEurope (Renfrewshire, U.K.). Foetal calf serum (FCS) and phosphate-buffered saline(PBS) were obtained from Boehringer (Mannheim, Germany).
Cell culture and harvestingT-47D cell line originated from a pleural effusion of a patient with intraductal
and invasive breast carcinoma [9]. Cells were grown in closed plastic T75 flasks ingrowth medium composed of RPMI 1640 buffered with sodium hydrogencarbonate (2gil) supplemented with 2 mM glutamine, gentamycin (20 .ug/ml) and 10% heatinactived FCS. Cells were grown in a humidified incubator with 5% carbon dioxide at37°C. Cultures were re-fed every 2~3 days. Culturing (after growth for I week)involved trypsin digestion (7.5 mg/ml PBS per flask), to obtain monocellularsuspensions, followed by the plating of 3 x 10⁶ cells per flask. Cultures were confluentafter 5-6 days (ca. 107 cells per flask). Ten flasks were used.
Preparation of NP 40 extractThe growth medium was removed from each flask and cells were washed in the
flask with PBS. Protein solubilization was performed with 3 ml of 0.5% NP 40 in TBS[150 mM NaCl-50 mM Tris-0.02% NaN3 (pH 7.0)] for 15 min at 4°C. The insolublematerial was removed by centrifugation at 30000 g for 30 min. The collected extractwas used immediately.
Affinity chromatography on poly (U)-Sepharose 4BThe NP 40 extract was poured onto a poly(U)-Sepharose 4B column (10 x 0.9
cm J.D.), previously equilibrated with 2-3 volumes of buffer A [50 mM Tris-HCl (pH7.5)-0.1 M EDTA-3 mM dithiothreitol-0.02% (v/v) NP 40-10% (v/v) glycerol]. NP40 extract precycling was performed for DNA-polymerase adsorption on the affinitygel. The enzyme was eluted with a linear gradient from 0 to 0.8 M KCl in buffer A at 10ml/h. Fractions (1.5 ml) were collected with an automatic fraction collector andaliquots (100 .ul) were taken and assayed for DNA polymerase activity [10].
Sodium dodecyl sulphate~polyacrylamidegel electrophoresis (SDS-PAGE)Control of the purification of the DNA polymerases was performed by
SDS-PAGE after their elution on poly(U)-Sepharose. Fractions exhibiting anenzymatic activity were pooled, then concentrated by ultrafiltration (Millipore CX 10immersible ultrafilters, cut-off 10 000 dalton) to a final volume of 500 .ul.
A sample of 50 .ul was denatured by heating for 2 min at 100°C with addition of50 .ul SDS gel sample buffer [60 mM Tris-HCl (pH 6.8)-11.2% glycerol-3%SDS-O.Ol % bromophenol blue-5% p-mercaptoethanol]. The sample was thenanalysed on a 12.5% SDS-polyacrylamide gel together with molecular mass standards(phosphorylase b, M r 94 000; bovine serum albumin, M r 67 000; ovalbumin, M r 43 000;

PURIFICATION OF T-47D DNA POLYMERASES 513
carbonic anhydrase, M r 30000; soybean trypsin inhibitor, M r 20 100; :x-lactalbumin,M r 14400; Pharmacia). Electrophoresis was performed at 20 mA for 3 h. The gel wasthen fixed in 20% TCA (0.5 h), stained with 0.04% (w/v) Serva Blue W (Serva,Heidelberg, Germany) in water (0.5 h), destained with water (I h) and 20% glycerol (12h) and dried on a slab dryer (Protean II; Bio-Rad Labs.) under vacuum.
Assays for DNA-polymerase activityBefore assay with the primer templates poly(rA)-oligo(dT)12_18 and poly
(dA)-oligo(dTh2_18' samples were dialysed for 5 h against buffer B [40 mM Tris-HCI(pH 7.8)-60 mM KCI-2.2 mM dithiothreitol-IO mM MgCI 2-O.1 % Triton X-IOO].Before assay with the primer-templates poly(rCm)-oligo(dG)12_18 and poly(rC)oligo(dGh2_18, samples were dialysed in buffer C, which was buffer B with 0.8 mMMnCI2 in place of 10 mM MgCI 2 [II]. The assay was run to a final volume of 130,u1containing 8 ,uCi of [3H]-dTTP (specific activity 2.07 TBq/mmol) and 1.6 lig ofpoly(rA)-oligo(dTb_l8 or poly(dA)-oligo(dT) 12-18, or 8 ,uCi ofeH]-dGTP (specificactivity 518 GBq/mmol) with 1.6 ,ug of poly(rCm)-oligo(dG)12_18 or poly(rC)oligo(dG)12_18' Aliquots of the solubilized proteins (100 ItI) and buffer B or C (14 ,ul)were then added. Controls were performed in the same reaction medium withouta primer-template. Each assay was performed in triplicate. The reaction wasconducted for 30 min at 37°C and stopped by precipitation of the polymerized materialwith a mixture of 5% TCA, 0.05 M sodium pyrophosphate and 0.5 M HCI (4 ml).Precipitates were collected by filtration on 0.22-,um filters, washed, dried and theirradioactivity measured in a liquid scintillation counter (Packard Tri-Carb 4530) afterdissolution in Ready Solv MP (Beckman) scintillation medium.
RESULTS AND DISCUSSION
We have demonstrated the purification of DNA polymerases (RNA-directedDNA polymerase and DNA-directed DNA polymerase) on poly(U)-Sepharose 4B(gives a high yield of purified enzyme) in comparison with more conventional methods,such as sucrose gradient centrifugation followed by phosphocellulose [8] or oligo(dTh2_18---eellulose [12] columns, which are time consuming (and give a limitedamount of purified enzyme).
The cellular DNA polymerases can be obtained with poly(U)-Sepharose 4Bfrom different cell sources such as cell lines, surgical biopsies or peripheral blood. Themethod allows the identification of the DNA polymerases in the eluted fractions usinga synthetic primer-template. Ross et al. [13] have demonstrated that poly(rA)-oligo(dT)12_18 was copied by DNA polymerases. Later, it was demonstrated thatpoly(dA)-oligo(dT)12_18 was copied by DNA-DNA polymerases and RNA-DNApolymerases [14]. Other workers have demonstrated that RNA-DNA polymeraseactivity was more specific with poly(rC)-oligo(dG)12_18 than with poly(rA)oligo(dT)12_18 [15]. Gerard et al. [7] have demonstrated that poly(rCm)-oligo(dGh2-18 was highly specific for RNA-DNA polymerases.
In this work, we determined in each fraction the DNA polymerase activitiesfrom T-47D cells after chromatography of the extract on poly(U)-Sepharose 4B, withthe four primer-templates poly(rA)-oligo(dTh2_18' poly(dA)-oligo(dT)12_18' poly(rC)-oligo(dG)12-18 and poly(rCm)-oligo(dG)12_18' in order to establish an activity

514 D. BERNARD, C. MOYRET, J. C. MAUR1Z1S
spectrum allowing enzyme characterization. The reactions were conducted as follows.After incubation of the 3H-labelled nucleotide with primer-template complex, thehigh-molecular-mass polydeoxyribonucleotides obtained, insoluble in 5% TCA, wereseparated from the TCA-soluble labelled starting materials by filtration. Theincorporated radioactivity was determined by dissolution in a scintillation liquid andcounting.
The results for the primer-templates poly(rA)-0Iigo(dT)12_1s and poly(dA)0Iigo(dT)12_1s are plotted in Fig. I. Each value corresponds to the arithmetic mean ofthe three different assays for each eluted fraction. Significant incorporation ofeH]-dTTP into poly(dA)-0Iigo(dTL2_1s, corresponding to a DNA-DNA polymeraseactivity, was measured. Fractions 8-19 were concentrated and submitted to SDSPAGE as described above. Between fractions 10 and 15 was measured a lowincorporation of [3H]-dTTP into poly(rA)-0Iigo(dT)12_1s, corresponding to a lowspecificity of DNA-DNA polymerase against this primer-template, which confirmsthe findings of Ross et al. [13]. Conversely, no incorporation of eH]-dGTP with theprimer-templates poly(rC)-oligo(dGL2_1S and poly(rCm)-oligo(dG)12_1s, whichusually corresponds to an RNA- directed DNA polymerase activity, was measured.This result shows the absence of RNA-DNA polymerase in the solubilized proteinsfrom non-stimulated T-47D cells. This enzyme, characteristic of the retroviruses andretrovirus-like particles, was not found because the cells were not stimulated by17f1-estradiol and progesterone, which are necessary for the activation of the retroviruslife cycle [9].
Fig. 1. Elution pallern on poly(U)-Sepharose 4B of DNA polymerases oblained from T-47D lumour cells.Flow-rate, 10 ml/h with a linear gradient ofKCI from 0 to 0.8 M in buffer A. Aliquots (1 00 Ill) ofeach 1.5-mlfracti6n were assayed for incorporation of [3H]-dTTP into (.) po]y(dA)-oligo(dT)12_1S and (0)poly(rA)-oligo(dT)12_1 S'

PURIFICATION OF T-47D DNA POLYMERASES
KDa
94
515
70-"
50 -...
67.1.-j
43
30
20.1
14.4
A B.
Fig. 2. SDS-PAGE ofDNA polymerases after purification on poly(U}-Sepharose 4B (A). Molecular massstandards were phosphorylase b (M, 94000), bovine serum albumin (M, 67000), ovalbumin (M, 43000),carbonic anhydrase (M, 30000), soybean trypsin inhibitor (M, 20100), lX-lactalbumin (M, 14400) (B).Staining was performed with Serva Blue W. KDa = Kilodalton.
The purification yield on poly(U)-Sepharose of DNA polymerases from 108
cells as starting material was about 54% when the incorporation of radioactivity wasmeasured with the primer-template poly(rA)-oligo(dT)lz_18 and about 67% when theincorporation of radioactivity was measured with poly(dA)-oligo(dThz_18' Moreover, the degree of purity of DNA polymerases after purification on poly(U)-Sepharose was demonstrated after SDS-PAGE of pooled active enzymatic fractions. Onemajor band was obtained at 70000 dalton, and less intense bands between 70000 and50000 dalton (Fig. 2). These results are in agreement with the findings of Hesselwoodet at. [16] on calf thymus ct-DNA polymerase and De Recondo et at. [17] on rat liver.Similar results were obtained by Grurnmt et al. [18], who demonstrated that calfthymus ct-DNA polymerase was constituted of an association of seven polypeptidechains between 64000 and 52000 dalton.
In conclusion, poly(U)-Sepharose 4B chromatography enables DNA poly-

516 D. BERNARD, C. MOYRET, J. C. MAURIZIS
merases (RNA- and DNA-directed DNA polymerases) to be isolated from cellextracts with a good yield and high purity. Their enzymatic activities can bedetermined in the eluted fractions by measuring the incorporation of [3H]nucleotidesin their corresponding primer-templates. In this way, DNA polymerases can beobtained from cells and from retroviruses secreted in the culture medium.
ACKNOWLEDGEMENTS
We thank Lucien Veyssade for the illustrations and Michelle Labonde for typingthe manuscript. C. M. was supported by a grant from the Association de la Recherchecontre Ie Cancer Region Grand Centre.
REFERENCES
I H. Temin and S. Mizutani, Nature (London), 266 (1970) 1211.2 N. R. Rice, R. M. Stephens, A. Burny and R. V. Gilden, Virology, 142 (1985) 357.3 T. Thompson and H. Fan, Virus Genes, 2 (1988) 83.4 M. T. Boyd, N. McLean and D. G. Oscier, Lancet, i (\989) 814.5 C. F. Moyret, D. J. Bernard, J. C. Maurizis, J. Chassagne, M. de Latour, G. Betail, R. Plagne and P.
Chollet, In Vivo, 4 (\990) 101.6 H. Rainer, K. Moser and E. Deutsch, Lancet, ii (1974) 357.7 G. F. Gerard, P. M. Loewenstein and M. Green, Nalure (London), 256 (1975) 140.8 G. F. Gerard, P M. Loewenstein and M. Green, Cancer Res., 38 (1978) 1008.9 I. Keydar, L. Chen, S. Karhy, R. Weiss, J. Delarea, M. Radu, S. Chaitcik and H. J. Brenner, Eur. J.
Cancer, 15 (1979) 659.10 D. P. Grandgenett, J. Virol., 20 (\ 976) 348.11 K. Ono, A. Ohashi, A. Yamamoto, A. Matsukage, N. Nishioka, T. Takhashi, C. Nakayama and S.
Saneyoshi, Cell. Mol. Bioi., 25 (1980) 323.12 B. I. Gerwin and J. B. Milstien, Proc. Natl. Acad. Sci. U.S.A., 69 (1972) 2599.13 J. Ross, E. M. Scolnick, G. J. Todaro and S. A. Aaronson, Nature (London), 231 (1971) 163.14 A. M. Wu and R. C. Gallo, CRC Crit. Rev. Biochem., 3 (1975) 289.15 P. D. Boyer, in P. D. Boyer (Editor), The Enzymes, Vol. 10, Academic Press, London, 3rd ed., 1974, p.
205.16 I. P. Hesselwood, A. M. Holmes, W. F. Wakeling and I. R. Johnson, Eur. J. Biochem., 84 (\978) 123.17 A. M. de Recondo, J. A. Lepesant, O. Fichot, L. Grasset, J. M. Rossignol and M. Cazillis,J. Bioi. Chem.,
248 (1973) 131.18 F. Grummt, C. Waltll, H. M. Jantzen, K. Hamprecht, V. Hulscher and C. C. Kuenzle, Proc. Natl. Acad.
Sci. U.S.A., 76 (1979) 6081.

Journal oj Chromatography, 539 (1991) 517-523Elsevier Science Publishers B.Y., Amsterdam
CHROM. 22 900
Purification of NAD glycohydrolase from Neurospora crassaconidia by a polyclonal immunoadsorbent
MARIO PACE·, DARIO AGNELLlNI, GUIDO LlPPOLl, PIER GIORGIO PIETTA and PIER LUIGI MAURI
DipartimenlO di Scienze e Tecnologie Biomediche. Sez. Chimica Organica. University oj Milan. Via G.Celoria 2.20133 Milan (Italy)
and
SERGIO CINQUANTA
CNR. c/o 1st. Patologia Vegetale. University oj Milan. Via G. Celoria 2.20133 Milan (Italy)
ABSTRACT
NAD glycohydrolase from Neurospora crassa conidia was purified by affinity chromatography on acolumn of polyclonal antibodies bound to an agarose matrix. The procedure was easy, non-denaturatingand suitable for repetitive use of the gel. The enzyme obtained appeared homogeneous by sodiumdodecylsulphate-polyacrylamide gel electrophoresis.
INTRODUCTION
NAD glycohydrolase (NADase, E.C. 3.2.2.5) from Neurospora crassa conidia isa hydrolytic enzyme which uses NAD+ as a substrate, catalysing the reaction
NADaseNAD+ + H 20 ) nicotinamide + ADPR + H+ (1)
NADase is a glycoprotein of 33000 dalton and was purified by affinitychromatography [I] using a competitive inhibitor, 4-methyl-NAD, bound to a Sepharose-4B gel through a hydrophilic spacer arm. The enzyme possesses hydrophobiccharacteristics which were used for its immobilization onto propyl-Sepharose [2] andfor the isolation of the protein by hydrophobic chromatography [3]. However, bothpurification methods used show some disadvantages:
(a) 4-methyl-NAD is not a commercial nucleotide and its preparation is a longand cumbersome process;
(b) the crude extract of conidia contains pyrophosphatases and nucleotidaseswhich hydrolyse the ligand and shorten the life of the affinity column;
(c) hydrophobic chromatography can be performed only under weU establishedconditions, i.e., with a propylic residue as a ligand and a gel capacity in the range0.09-0.17 mmol/g; and
0021-9673/91/$03.50 © 1991 Elsevier Science Publishers B.Y.

518 M. PACE et al.
(d) the elution of the protein from propyl-Sepharose gels can be accomplishedonly under the conditions that lead to a high percentage of denaturation (6 M urea orI M n-propylamine).
For these reasons, we prepared a new column with a polyclonal antibody toNADase bound to an agarose gel and in this paper we report the results obtained forthe purification of the enzyme.
EXPERIMENTAL
NAD+ was purchased from Boehringer (Mannheim, Germany) and adenosinediphosphoribose (ADPR) from Sigma (St. Louis, MO, U.S.A.). Acrylamide, N,N-bisacrylamide and sodium dodecyl sulphate ofelectrophoresis grade and Affi-Gel 10 wereobtained from Bio-Rad Labs. (Richmond, CA, U.S.A.). All other reagents were ofanalytical-reagent or high-performance liquid chromatographic (HPLC) grade. Acrude extract ofNADase was obtained by washing the Neurospora crassa conidia withwater and centrifuging the suspension at 5000 g for 15 min at 2°e.
NADase was previously purified by affinity chromatography [I] in order toobtain polyclonal antibodies.
NAD glycohydrolase activity was assayed by HPLC [4] when the enzyme was inphosphate buffer, or by titrating the hydrogen ions produced in the reaction with5 mM sodium hydroxide through a pH-Stat apparatus (Radiometer) when a dialysedsolution was used.
HPLC was carried out on a CIS Resolve column (Waters Assoc., Milford, MA,U.SA.) (150 x 4.5 mm J.D.; 5 J1.m average particle size) with a Corasil precolumn (35x 3.9 mm 1.0.), eluted with 4% (v/v) methanol in 0.1 M phosphate buffer (pH 6.2)using a Waters Assoc. apparatus. The instrument consisted of a Model 590 pumpequipped with a Model U6K universal injector, a Lambda-Max Model 480 UVdetector and a Model 730 data module. The chromatographic assay was accomplishedat a flow-rate of2.0 ml/min and the eluent was monitored by UV absorption at 254 nm(0.05 a.u.f.s.).
One NAD glycohydrolase unit is defined as the amount of enzyme whichcatalyses the hydrolysis of I J1.mol of NAD+ per minute at 37°C and pH 7.0.
Preparation of the polyclonal antibodies of NADaseAntisera were obtained in rabbits by a series of4-weekly injections ofNADase,
previously purified by affinity chromatography, emulsified with complete Freund'sadjuvant and bleeding I week after the last injection. Antibodies against NADase fromNeurospora crassa conidia were purified according to the rivanol method [5], andlinked to alkaline phosphatase by means of glutaraldehyde [6] in order to assay theirspecificity. For extended storage the derivatives were kept frozen in working aliquotsand each sample was assayed by enzyme-linked immunosorbent assay (ELISA) usingp-nitrophenyl phosphate as substrate. The working dilution of each stock solution ofenzyme-antibody conjugate in the ELISA assay was 1:100 and the reaction lasted 30min.
ELISA assayEach well of a polystyrene plate was filled with 200 J1.l of antibody solution [I

PURIFICATION OF NAD GLYCOHYDROLASE 519
J.Lg/ml in phosphate buffer (pH 7.5)] and allowed to stand at 4°C for 18 h. After washingthree times with phosphate buffer (pH 7.5) containing 0.9% NaCI [phosphatebuffered saline (PBS)] and 0.05% (v/v) Tween-20, 200 J.LI ofNADase (1 J.Lg/ml) in PBSwas added to each well and the plate incubated for I h at 37°C. The wells were thenwashed three times with PBS-Tween-20 and 200 J.LI (5 J.Lg/ml) of antibody, linked toalkaline phosphatase by means ofglutaraldehyde, were added to some of the wells. Thewells containing no antigen were filled with conjugate as a control and the plate wasincubated for I h at 37°C. After addition of 200 J.LI of p-nitrophenyl phosphate (Img/ml) in 10% diethanolamine (pH 9.8), containing I mM MgClz, the plate wasincubated at 3rC for 30 min. For each determination, triplicate wells were pooled andthe absorbance at 405 nm was measured.
Immobilization of antibodies onto Affi~Gei 10A 7.5-ml aliquot of the N-hydroxysuccinimide ester of derivatized cross-linked
agarose gel beads (Affi-Gel 10) was washed with 23 ml of isopropanol and 23 ml ofchilled water, according to the procedure ofIkura et al. [7]. To the gel was added I ml of0.1 M phosphate buffer (pH 8.0), containing 48 mg of antibodies; after reaction for4 h with gentle shaking at 4°C, the gel was washed with 23 ml of0.1 M phosphate buffer(pH 8) and 1 ml of0.1 M lysine (pH 8.0) was added. After I h at room temperature withshaking, the gel was washed with 10 mM Tris-HCI buffer (pH 7.5) containing 0.15M NaCI, 0.1 mM dithiothreitol and 1 mM EDTA.
Chromatography of NADase on the polyclonal antibody-Affi-GeI10 columnFive small columns were filled with 1.5 ml of polyclonal antibody conjugated
with Affi-GeIIO, and each column was loaded with 3 ml of the extract of Neurosporacrassa conidia in water (4 mg/ml) according to the following procedure: 1 ml ofextractwas adsorbed into each gel at a flow-rate of 0.5 ml/min and allowed to rest in thecolumn for 10 min, then the gels were washed with a second portion of 1 ml of extractand after 10 min replaced with the remaining enzyme solution. The eluate from eachgel was applied again to the column according to the same procedure.
The gels were then washed with 7 ml of 0.1 M phosphate buffer and eluted withthe following solutions:
1st gel: 9 ml of 0.1 M citrate buffer (pH 2.2) containing 1 M NaCI;2nd gel: 9 ml of 0.1 M phosphate buffer containing 0.5% ,Triton X-100;3rd gel: 9 ml of 10% dioxane in water (pH 7.0);4th gel: 9 ml of 10% dioxane in 20 mM HCl (pH 2.5);5th gel: 9 ml of 50% ethylene glycol in 20 mM HCI (pH 2.5).The entire process was carried out at 4°C.Sodium dodecyl sulphate-polyacrylamide gel electrophoresis (SDS-PAGE) was
performed according to the procedure of Weber and Osborn [8] after concentration ofthe eluate from the immunoadsorbent gel by means of Centricon (Amicon, Danvers,MA, U.S.A.).
RESULTS AND DISCUSSION
Polyclonal antibodies obtained from active and denatured NADase crossreacted with both types of enzyme and were mixed before their immobilization ontoAffi-Gel lOin order to recognize all the forms of the enzyme.

520 M. PACE et al.
TABLE I
EFFECT OF VARIOUS SOLUTIONS ON THE CATALYTIC ACTIVITY OF NAD GLYCOHYDROLASE AFTER STORAGE FOR I h AT 4°C AND 25°C
The samples in citrate and in Triton X-IOQ-phosphate buffer were assayed by HPLC and the other sampleswere tested by automatic titration.
Solution
WaterCitrate-NaCI (pH 2.2)Triton-phosphate (pH 7.0)Ethylene glycol (pH 2.2)10% dioxane in water10% dioxane (pH 2.2)
Activityafter storageat 4°C
3.25 (100%)2.0 (61%)3.9 (120%)3.45 (106%)3.1 (95%)2.6 (80%)
Activityafter storageat 25°C
2.5 (100%)2.75 (110%)2.7 (108%)2.45 (98%)2.25 (90%)1.85 (74%)
The total amount of polyclonal antibody obtained was 62.5 mg, as calculatedspectrophotometrically by the extinction coefficient 1.4 for 1mg proteinJml at 280 nm,whereas the amount of antibody bound to Affi-Gel 10 was 5.9 mgJml of gel (92%yield).
The eluents for the immunoaffinity column were chosen from recommendationsin the literature [9-11]. However, before the chromatography of the enzyme, thesolutions chosen were tested in order to assess their effect on the NADase activity, afterexposure for 1 h at 4 and 25°C. The behaviours of the five solutions described aboveat both temperatures tested were similar, whereas at alkaline pH (pH 10.5) (datanot shown here) the enzyme was completely inactivated. The results are reported inTable I.
After elution ofthe gels with the solutions described above, NADase activity wasassayed in the eluates and in the gels. Table II shows the recovery of the activity fora typical experiment.
The data in Table II show that no enzyme activity was found in the 0.1M citrate-I M NaCI eluate and virtually all NADase remained immobilized in the gel.
TABLE II
NADase ACTIVITY IN THE GELS DETERMINED BY AUTOMATIC TITRATION AFTEREXHAUSTIVE WASHING WITH DOUBLY DISTILLED WATER
The enzyme in the column washing and in the eluate was assayed by HPLC and then checked with thepH-Stat method after dialysis against water.
Eluent
Citrate-NaCI (pH 2.2)Triton-phosphate (pH 7.0)Ethylene glycol (pH 2.2)10% dioxane in water10% dioxane (pH 2.2)
Activity Activity Activityin the gel in the in the(units) washings eluate
6.62 0.3 0.00.28 3.1 2.81.93 3.5 0.752.33 3.75 0.12.59 3.82 0.05

PURIFICATION OF NAD GLYCOHYDROLASE 521
TABLE III
NADase ACTIVITY DETERMINED BY AUTOMATIC TITRATION AFTER DIALYSIS OF THESAMPLES AGAINST WATER
Run NADase NADaseNo. activity in activity in
the washings (%) the eluate (%)
1 51 452 54 473 40 514 54 485 34 666 55 407 51 458 50 44
80S-PAGE
7.. 6
~5 2.... 4.. 3<II 4~3...~ 5~2~
60
::l
0·2 0·4 0·6 0·8MOBILITY
B
Fig. 1. (A) SDS-PAGE of the eluate with Triton X-I~phosphatebuffer (pH 7.0). (B) Mobility ofNADase(3) compared with (1) bovine serum albumin (M, 66 2(0), (2) ovalbumin (M, 45 000), (4) carbonic anhydrase(M, 31000), (5) soybean trypsin inhibitor (M, 21000) and (6) lysozyme (M, 14500).

522 M. PACE el al.
Most of the NADase activity was similarly found in the gels eluted with 10% dioxaneboth in water and in 20 mM HCI and with ethylene glycol in 20 mM HCI, whereas theireluates contained only traces of activity. In contrast, the gel eluted with 0.5% TritonX-IOO in 0.1 M phosphate buffer (pH 7.0) showed a minimum of NADase activityadsorbed, and most of the enzyme was found in the eluate and in the washings with 0.1M phosphate buffer (pH 7.0).
The last column was repeatedly used for a total of eight runs and the resultsobtained were similar in each instance, as shown in Table III.
The purity of the samples eluted by Triton X-I Oo-phosphate buffer was assessedby SDS-PAGE and by the spectrum of the eluate in the ultraviolet region.
SDS-PAGE showed only one band, corresponding to a protein of about 33000dalton (Fig. I), as determined by comparison with standard proteins.
The UV spectrum showed the characteristic maximum of NADase at 234 nm[12], with a ratio A234/A280 of 5.1, while the enzyme purified by affinity chromatography had a ratio of 5.6. The difference may be due to the presence ofTriton X-I 00 inthe eluate.
CONCLUSIONS
The purification method for NADase reported here seems to have someadvantages over previous procedures. First, the immunoadsorbent can be used manytimes without a loss of efficiency, as showed in Table III. Moreover, a uniqueextraction with water ofNeurospora crassa conidia is sufficient for loading the column,whereas affinity chromatography on 4-methyl-NAD-Sepharose needs at least twokinds of extraction (water and 0.17 M KCI) in order to prolong the life of the column[I]. The entire procedure causes no denaturation, in contrast to elution from thehydrophobic gel [3], because it is done under milder conditions. The capacity of theimmunoadsorbent gel is not very high, as shown by the ratio of enzyme held by thecolumn to enzyme washed with buffer, when only a few units were loaded onto 1.5 mlof gel (see Table II). On the other hand, the possibility of reusing the gel many timesmakes it suitable to the purification of larger amounts ofNADase. The enzyme elutedwith Triton X-IOO in phosphate buffer (pH 7.5) is apparently homogeneous bySDS-PAGE and seems to be analogous to that purified by affinity chromatography.
ACKNOWLEDGEMENTS
This work was supported by the CNR Target Project on Biotechnology andBioinstrumentation.
REFERENCES
1 F. Menegus and M. Pace, Eur. J. Biochem., 113 (1981) 485.2 M. Pace, D Agnellini, P. G. Pietta, A. Cocilovo and L. Bonizzi, Prep. Biochem., 14 (1984) 349.3 M. Pace, P. G. Pietta, D. Agnellini and P. L. Mauri, in O. M. Nejissel, R. R. van der Meer and K. Ch. A.
M. Luyben (Editor), Proceedings of the 4th European Congress of Biotechnology, Vol. 2, Elsevier,Amsterdam, 1987, pp. 142-145.
4 P. G. Pietta, M. Pace and F. Menegus, Anal. Biochem., 131 (1983) 533.5 J. Horejsi and R. Smetana, Acta Med. Scand., 155 (1956) 65.
PURIFICATION OF NAD GLYCOHYDROLASE 523
6 S. Avrameas, immunochemistry, 6 (1969) 43.7 K. Ikura, K. Okumura, M. Yoshikawa, R. Sasaki and H. Chiba, J. Appl. Biochem., 6 (1984) 222.8 K. Weber and M. Osborn, J. Bioi. Chem., 244 (1969) 4406.9 K. K. Andersson, Y. Benyamin, P. Dozou and C. Balny, J. immunol. Methods, 25 (1979) 375.
10 H. D. Caldwell and c.-c. Kuo, J. Immunol., 118 (1977) 437.II Y. Ikeda and M. Steiner, J. Bioi. Chem., 251 (1976) 6135.12 M. Pace, D. Agnellini, P. G. Pietta, P. L. Mauri, F. Menegus and R. L. Berger, Plant Physiol. (Life Sei.
Ad!'.), 7 (1988) 115.


Journal of Chromatography, 539 (1991) 525-529Elsevier Science Publishers B.V., Amsterdam
CHROM. 22901
Use of immobilized triazine dyes in the purification of DNAtopoisomerase I (Topo I) and terminal deoxynucleotidyltransferase (TdT) from calf thymus
ALGIMANTAS MARKAUSKAS*, VITALIS TIKNIUS and ROMAS MARCISAUSKAS
Institute of Applied Enzymology FERMENTAS, Fermentu 8, Vilnius-28, Lithuania (US.S.R.)
ABSTRACT
The interaction between TdT and Topo I, and twelve various triazine dyes immobilized on SepharoseCL-6B was studied. Yellow lightproof 2KT-Sepharose and Bordeaux 4ST-Scpharose were used to purifyTdT and Topo I, respectively. The principal role of copper ions, complexed to the dye molecules, in thedye-protein interaction was evaluated.
INTRODUCTION
Terminal deoxynucleotidyl transferase (TdT) and DNA topoisomerase I(Topo I) from calf thymus gland are widely used in molecular biology, TdT is a uniqueDNA polymerase requiring no template and catalysing the addition of deoxynucleoside triphosphates at the 3'-end of poly- or oligodeoxynucleotide initiator andreleasing inorganic pyrophosphate. This enzyme is generally used in genetic engineering for elongation of the DNA chains and for 3'-end labelling [1,2]. Topo Icatalyses the relaxation of duplex DNA, knotting of single-stranded rings andintertwining of complementary single-stranded rings, and forms catenanes betweenone nicked and one closed circular duplex. This enzyme is employed in structuralstudies of DNA and in modelling of genetic processes [3].
In order to develop an efficient routine method for the purification of theseproteins, a variety of adsorbents should be available. As the use of immobilizedtriazine dyes for this purpose has not previously been reported, we studied theinteraction between these enzymes and adsorbents based on twelve triazine dyes, andtwo of them proved to be suitable for use in purifcation,
EXPERIMENTAL
MaterialsAll immobilized triazine dyes were kindly provided by the Laboratory of
Adsorbent Synthesis and pBR 322 DNA by the Laboratory of Genetic Engineering of
0021-9673/91/$03.50 © 1991 Elsevier Science Publishers B. V.

526 A. MARKAUSKAS, V. TIKNIUS, R. MARCISAUSKAS
this Institute. Tris and EDTA were purchased from Serva (Heidelberg, Germany) andall other reagents from Merck (Darmstadt, Germany).
Preparation of initial extractsA 500-g sample of thymus glands freed from debris and clotted blood were
minced with a meat grinder and homogenized with an equal volume of 100 mMTris-HCl (pH 6.8)-0.3 M KCI-2.5 mM K 3-EDTA-50 mM NazSOrl mMPMSF-lO% (vjv) ethylene glycol-14 mM 2-mercaptoethanol-IO mM KF-IO mMNAD five times for 30 s each in a Waring-type blender. After centrifugation at 30 000 gfor 1 h, the supernatant was diluted with 50 mM Tris-HCI (pH 6.8)~2 mMK r EDTA--I4 mM 2-mercaptoethanol-l0% ethylene glycol to a volume of 1.4 I, andthe 35-70% ammonium sulphate fraction precipitate was dissolved in 40 mMTris-HCl (pH 8.0)-1.6 mM K r EDTA-I4 mM 2-mercaptoethanol-lO% ethyleneglycol. This extract, dialysed overnight against the same buffer but containing glycerolinstead of ethylene glycol, was applied to a Servacel DEAE-52 column (30 x 5 cmLD.), and the flow-through fractions were collected. Further fractionation was doneon a Bio-Rex 70 column (30 x 2.6 cm LD.) in the same buffer. The column wasdeveloped with a 500-ml KCl gradient from 0 to 1M. TdT activity eluted at 0.1-0.15 MKCl and Topo I at 0.18-0.22 MKCI. These preparations were used for further studies.
Screening procedureA 0.I5-ml aliquot of an appropriate adsorbent, equilibrated with 20 mM
Tris-HCl (pH 8.0)-10 mM MgClz-O.I mM KrEDTA-IO mM 2-mercaptoethanol10% glycerol, and 0.5 ml ofenzyme preparation dialysed against the same buffer, werethoroughly mixed in Eppendorftubes. After incubation for 30 min in an ice-bath, thesuspension was centrifuged for 30 s at 15 000 g and supernatants were collected forfurther analysis.
Enzyme assaysTdT activity was assayed according to Coleman [4] and Topo I as indicated by
Ferro et al. [5].
Protein assayA Bio-Rad Labs. protein assay kit was used to determine protein concentrations.
RESULTS
The supernatants after screening were subjected to analysis, and both proteinconcentration and enzyme activity were determined. The results are summarized inTable 1. Two adsorbents were selected for further studies: Yellow Lightproof2KT-Sepharose CL-6B and Bordeaux 4ST-Sepharose CL-6B (Fig. 1).
After optimization of the chromatographic conditions, the following parameterswere obtained: Topo I, elution at 0.12-0.21 M KCl, purification Il.2-fold, yield 67%,specific activity (3-4) x 105 Ujmg (Fig. 2); TdT, elution at 0.22-0.55 M, purification1O.5-fold, yield 80%, specific activity (5-7) x 104 Ujmg (Fig. 3).
It should be noted that complexed Cuz+ ions are present in the molecules ofbothdyes thus selected, and that these ions pl<lv <l crucial role in the affinity interaction. As

PURIFICATION OF Tapa I AND TdT
TABLE I
DATA ON DYE-ENZYME INTERACTIONS
527
Triazine dye immobilized on TdTSepharose CL-6B
AU Bb
Tapa I
AU Bb
Red-Brown 2KScarlet 6SPharmacia RedPharmacia BlueOrange 5KYellow Bright 5ZBordeaux 4STScarlet 2ZGolden 2KXActive Orange KXScarlet 4ZTYellow Lightproof 2KT
94.0 +68.2 +79.8 +83.9 +77.5 +81.6 +94.1 +74.7 +20.248.219.724.6 +
56.2 +42.5 +43.8 +32.5 +62.4 +34.7 +15.4 +28.534.742.3 +51.219.5
U Fraction of protein bound (%).b + = Target enzyme bound; - = target enzyme not bound.
R2
IN
/ "-0- Cu--O-C N9--=._11_11- R3
Hl
ISepharose CL-6B
(1)
0--- eu---
9-'=:Hl
o R2
R3
(2)
Sepharose CL-6B
Fig. 1. Essential part of the chelating ring structure: (1) Yellow Lightproof 2KT; (2) Bordeaux 4ST.RI-R4 = reactive groups.

528 A. MARKAUSKAS, V. TlKNIUS, R. MARCISAUSKAS
r2 t--r----.---------------, OA I1:0.15 0,3 Lc %o 0~ ~
~~ M:~ ~
u zZ w
::i 0.05 D.l ~~ uo~ ~
<C ° O~---::'::--~~".,L0:-----::6:'::0----:8'=0---1:-:00°x
FRACTION N°,
Fig. 2. Purification of Topo I on Bordeaux 4ST-Sepharose CL-6B. The 45-ml column was equilibrated with20 mM Tris-HCl (pH 8.0)-10 mM MgClrD.l mM EDTA-I0 mM 2-mercaptoethanol-10% (v/v) glycerol.KCl gradient from 0 to 0.4 M. Flow-rate, 15 ml/h.
6050
I id/ I E
/ 1.0 I 10 ...../ L :l
/ 0.8 ~. 8'"/ ;= e
/ O.G! ..6 >/ ~
/ z :;;0.4 ~ 4 ;:
u0 <C
O.2.~ 2 l-
x ~0
2010o o 30 40
FRACTION N~
Fig. 3. Purification of TdT on Yellow Lightproof 2KT-Sepharose CL-6B. The 60-ml column wasequilibrated with 20 mM Tris-HCl (pH 7.0)-2 mM MgC12-2 mM ZnC1 2-o.5 mM EDTA-14 mM2-mercaptoethanol-lO% (v/v) glycerol. KCl gradient from 0 to 1.2 M. Flow-rate, 20 ml/h.
f1.2
1.0E~ Q8
""~Q.&u
'"':i 0."~
~ 0.2llJ<C
TdT enzyme is sensitive to copper ions, we were forced to replace this ligand by zinc,and a Zn Z + jMgZ + jEDTA ratio of 2:2: 1 in the chromatographic buffer was found to besatisfactory, because in the absence of the transition metals we observed nointeraction. The complete replacement ofcopper with zinc in the dye was accomplishedby extensive washing of the adsorbent with several volumes of 100 mMEDTA (pH 5),deionized water and finally 15 mM ZnClz,
In contrast, Topo I is stable in the presence ofcopper complexed in the Bordeaux4ST molecule. However, this enzyme showed only partial binding, but the addition of10 mM MgClz solved this problem. When the copper ions had been washed out withEDTA, the interaction, in contrast to that with TdT, was so strong that we were unableto elute the active enzyme under any conditions.
These results clearly demonstrate the pseudo-affinity nature of the interaction inboth instances, i.e., the interaction in the vicinity of active centre, and undoubtedlyfurther studies are required to verify this conclusion,

PURIFICATION OF Tapa I AND TdT
REFERENCES
529
F. J. Bollum, in P. D. Boyer (Editor), The Enzymes, Vol. 10, Academic Press, New York, 3rd ed., 1974,p. 145.
2 R. L. Ratliff, in P. D. Boyer (Editor), The Enzymes, Vol. 14, Academic Press, New York, 1981, p. 105.3 M. Gellert, Annu. Rev. Biochem., 50 (1981) 879.4 M. S. Coleman, Arch. Biochem. Biophys., 182 (1977) 525.5 A. M. Ferro, N. P. Higgins and B. M. Olivera, J. Bioi. Chem., 258 (1983) 6000.

Journal of Chromatography, 539 (1991) 531-533Elsevier Science Publishers B.V., Amsterdam
CHROM. 22908
Affinity purification of plasminogen by radial-flow affinitychromatography
YASMINE PLANQUES* and HELENE PORA
Cuno Europe, I Boulevard de rOise, 95030 Cergy-Pontoise (France)
and
FRANCO D. MENOZZI
Institut Pasteur, Laboratoire de Microbiologie Moleculaire, I Rue du Professeur Calmelle, 59019 Lille( France)
ABSTRACT
A method for the purification of plasminogen using immobilized L-Iysine on a membrane, the wholesystem being constructed in a radial flow cartridge, is described. Human plasma was applied to the cartridge at 20 ml/min. The results showed that under the chromatographic conditions chosen, in a single pass,> 85% recovery of plasminogen was attained with a IIO-fold increase in specific activity.
INTRODUCTION
With the recent advances in biotechnology, there is a large demand forpurification methods that can achieve high product purity in a few simple steps.Affinity chromatography has become a method of choice as high purity can beobtained in a single step [1,2].
Plasminogen is the inactive precursor of the proteolytic enzyme plasmin, whichis responsible for the dissolution of fibrin clots in the blood. The purification ofplasminogen using L-lysine bound on Sepharose has been reported [3]. Although, themethod proved to be satisfactory, the flow-rates were very low (75 ml/h) and it wastime consuming. Bound L-lysine has been used in many other applications, and isa very useful ligand for the purification of plasmin and plasminogen of various species[4,5], plasminogen activator [6] and ribonucleic acids [7].
This paper describes a method for purifying plasminogen from human plasmawith L-lysine immobilized on a radial-flow membrane cartridge system. The methodprovides a new means of obtaining large amounts of plasminogen within a few hoursand could be easily extended owing to the linear scale-up capability of this system,which has been demonstrated previously using p-aminobenzamidine as a ligand [8].
0021-9673/91($03.50 © 1991 Elsevier Science Publishers B.V.

532
EXPERIMENTAL
Y. PLANQUES, H. PORA, F. D. MENOZZI
L-Lysine couplingA Zetaffinity 250 cartridge (Cuno, Cergy-Pontoise, France) containing modified
cellulose was used as chromatographic medium. The hydroxyl derivative was used forligand coupling. The activation of hydroxyl functions was accomplished with a 1.5%metaperiodate solution. Lysine was dissolved in 0.05 M sodium phosphate containing0.25 M NaCI and recycled overnight through the cartridge. After reduction withNaBH4 , the cartridge was drained and the unbound reactive sites were blocked with2% glycine ethyl ester hydrochloride solution.
Plasminogen purification from human plasmaThe cartridge containing bound lysine was equilibrated with 0.1 M sodium
phosphate (pH 7.4) containing 0.05 M NaCI and 0.01 % Tween 80. After centrifugation and filtration, the plasma was diluted with equilibration buffer (0.5 v/v) andapplied to the cartridge at 20 ml/min. The cartridge was washed with equilibrationbuffer until the absorbance at 280 nm reached the baseline, then elution was carried outwith 0.2 M 6-aminocaproic acid in equilibration buffer. Before analysis, boundfractions were dialysed overnight at 4°C against 0.01 M 6-aminocaproic acid inequilibration buffer. The protein content was measured using the Bio-Rad proteinassay and the plasminogen activity with the Kabi substrate S-2251. Purity wasevaluated by 7.5% sodium dodecyl sulphate polyacrylamide gel electrophoresis.
Ql j c
E.Q
c "5VI --a;
35
12800
"Cr
30 2400 »ens::Z
25 02000 G)m
E zc
20 »0 1600 ()co -l'" ~ci0 15 1200 -l
-<2
10 =.800
~
5 400 !
20 40 60 80 100 120
TIME (min)
Fig. I. Chromatogram of the purification of plasminogen from human plasma using lysine bound ona radial-flow cartridge. Chromatography was performed as described under Experimental.

AFFINITY PURIFICATION OF PLASMINOGEN 533
TABLE I
RESULTS OF PLASMINOGEN PURIFICATION FROM HUMAN PLASMA USING LYSINEBOUND ON A RADIAL-FLOW CARTRIDGE
Device Plasma Plasminogen Specific Purification Totalvolume activity activity recovery(ml) eluted (units) eluted ("!o)
No. 60 disco 50 2452 406 100 x 88No. 250 capsuleb 400 8948 358 144x 57No. 250 capsule' 250 6045 410 124 x 74
° Entire fractionation done at 4°C.h 400 ml of plasma diluted to 600 ml in equilibration buffer., 250 1111 of plasma diluted to 500 ml in equilibration buffer.
RESULTS AND DISCUSSION
The chromatograms (Fig. 1) shows that plasminogen was retained by the boundlysine. Electrophoretic analysis demonstrated that the eluted fractions were devoid ofany visible protein contamination. The results in Table I show that in a single passa very good increase of purity was obtained with satisfactory recoveries. Thispurification procedure is a very convenient method for fast and easy recovery ofplasminogen, as a whole chromatographic cycle could be performed within 2 h.
This radial-flow chromatographic method has been used in many applicationsinvolving ion exchange and has proved to be extremely useful, particularly when theproduct of interest is present at low concentration in a very large sample, e.g.,monoclonal antibodies from hybridoma cell culture supernatant [9] or recombinantproteins [10]. Moreover, the linear scale-up capability of these radial-flow cartridgeshas already been demonstrated with ion exchangers [11] and affinity chromatography[8]. Hence the method described here could easily be scaled up to very large amountswithin a short period of time.
REFERENCES
I P. Cuatrecasas, Adv. Enzymol., 36 (1972) 29.2 S. Ostrove, Methods Enzymol., 182 (1990) 357.3 D. G. Deutsch and E. T. Mertz, Science (Washington, D.C.), 170 (1970) 1095.4 R. Gonzalez, M. Gronow, B. N. Violand and F. J. Castellino, J. BioI. Chem., 252 (1977) 2175.5 N. F. Paoni, B. N. Violand and F. J. Castellino, 1. BioI. Chem., 252 (1977) 7725.6 R. Radcliffe and T. Heinze, Arch. Biochem. Biophys., 189 (1978) 185.7 D. S. Jones, H. K. Lundgren and F. T. Jay, Nucleic Acids Res., 3 (1978) 1589.8 S. H. Huang, S. Roy, K. C. Hou and G. T. Tsiao, Biotechnology Prog., 4 (1985) 159.9 F. B. Menozzi, P. Vanderpoorten, C. Dejaiffe and A. O. A. Miller, J. fmmunol. Methods, 99 (1987) 229.
10 M. C. Casagli, M. G. Borri, C. d'Ettore, C. L. Caleoti and C. D. Liegro, Prep. Biochem., 19 (1989) 23.II A. Jungbauer, F. Unterluggauer, K. Uhl, A. Buchacher, F. Steindl, B. Pettauer and E. Wenish,
Biotechnol. Bioeng., 32 (1988) 326.


JOURNAL OF CHROMATOGRAPHY
Author Index Vol. 539
Adami, P., Nasser, B. and Latruffe, N.Interactions of the mitochondrial membranerat liver D-3-hydroxybutyrate dehydrogenasewith glass beads during adsorptionchromatography. Relationships with theactivation of the enzyme by phospholipids539( 199 [)279
Agache, P., see Makki, S. 539(1991)443Agnellini, D., see Pace, M. 539(1991)517Aiach, M., see Toulon, P. 539(1991)493Amati, D. and Li, Y.
Gas chromatographic determination oftlumetralin in tobacco 539(1991)237
Andersson, L.Recognition of phosphate groups byimmobilized aluminium(III) ions539( 1991)327
Angal, S., see Deistung, i. 539(1991)485Armstrong, D. W., Chang, C.-D. and Lee, S. H.
(R)- and (S)-Naphthylethylcarbamatesubstituted Ji-cyclodextrin bonded stationaryphases for the reversed-phase liquidchromatographic separation of enantiomers539( 1991 )83
Aubert, M.-C., see Lee, C. R. 539(1991)55Berland, Y. F., see Gallice, P. M. 539(1991)449Bernad, P., see Blanco, C. G. 539(1991)157Bernard, D., Moyret, C. and Maurizis, i. C.
Purification on poly(U)-Sepharose 4B ofhuman breast cancer cell line T-47D DNApolymerases 539(1991 )511
Birkenmeier, G., Vijayalakshmi, M. A.,Stigbrand, T. and Kopperschliiger, G.Immobilized metal ion affinity partitioning, amethod combining metal-protein interactionand partitioning of proteins in aqueoustwo-phase systems 539(1991)267
Blanco, C. G., Blanco, i., Bernad, P. and Guillen,M.D.Capillary gas chromatographic andcombined gas chromatography-massspectrometric study of the volatile fractionof a coal tar pitch using OV-1701 stationaryphase 539(1991)157
Blanco, i., see Blanco, C. G. 539(1991)157Boschetti, E., see Hulak, I. 539(1991)355Bros, A., see Sinniger, V. 539(1991)289Bruns, R. E., see Faigle, i. F. 539(1991)123Bush, E., see Hale, R. C. 539(1991)149
535
Cachia, c., Flamion, P.-i. and Schreiber, i.-P.Purification of E. coli 30S ribosomal proteinsby high-performance liquid chromatographyunder non-denaturing conditions539( 199 I)343
Cadet, i., see Polverelli, M. 539(1991)373Camoin, L., see Dandeu, i. P. 539(1991)475Cardellina, II, i. H., sec West, R. R.
539(1991)15Carne, S., see Deistung, i. 539(1991)485Catterall, c., sec Deistung, i. 539(1991)485Chadeuf, G., sec Toulon, P. 539(1991)493Champluvier, B. and Kula, M.-R.
Microfiltration membranes as pseudo-affinityadsorbents: modification and comparisonwith gel beads 539(1991)315
Chang, C.-D., see Armstrong, D. W.539(1991 )83
Chenais, 8., Yapo, A., Lepoivre, M. and Tenu, i.P.High-performance liquid chromatographicanalysis of the unusual pathway of oxidationof L-arginine to citrulline and nitric oxide inmammalian cells 539(1991)433
Chervet, i.-P.Troubleshooting LC systems: acomprehensive approach to troubleshootingLC equipment and separations (by i.W.Doland and L. R. Snyder) (Book Review)539(1991 )241
Chiancone, E. and Gattoni, M.Selective extraction of native {i-lactoglobulinfrom whey 539(1991)455
Chmelik, i.Isoelectric focusing field-flow fractionation.Experimental study of the generation of pHgradient 539(1991)111
Cinquanta, S., see Pace, M. 539(1991)517Costa-Ferreira, M. and Duarte, i. C.
Use of dye pseudo-affinity chromatographyin the purification of homoserinedehydrogenase 539(1991 )507
Crevat, A. D., see Gallice, P. M. 539(1991)449Crews, T., see Garland, W. A. 539(1991)133Dandeu, i. P., Rabillon, i., Guillaume, i. L.,
Camoin, L., Lux, M. and David, B.Isolation and purification of cat albuminfrom cat serum by copper ion affinitychromatography: further analysis of itsprimary structure 539(1991)475
David, B., see Dandeu, i. P. 539(1991)475

536
Deistung, J., Forde, D. M., O'Connell, J. P.,Proudfoot, K. A., Eaton, D., Willenbrock ,F., Kingaby, R. 0., Hughes, B., Angal, S.,Catterall, C, Carne, S. and Emtage, J. S.Purification of a hybrid plasminogenactivator protein 539(1991)485
Dellacherie, E., see Hubert, P. 539(1991)297Duarte, J. C, see Costa-Ferreira, M.
539( 1991 )507Duche, J.-C, see Herve, F. 539(1991)405Eaton, D., see Deistung, J. 539(1991)485Eisenthal, R., see Mayes, A. G. 539(1991)245Elshourbagy, N., see Sweeney, P. J.
539(1991)501Emtage, J. S., see Deistung, J. 539(1991)485Faigle, J. F., Poppi, R. J., Scarminio, 1. S. and
Bruns, R. E.Multi-component principal componentregression and partial least-squares analysesof overlapped chromatographic peaks539(1991)123
Ferraz, C, Sri Widada, J. and Liautard, J.-P.Purification and characterization ofrecombinant tropomyosins 539(1991 )465
Fischer, A. M., sec Sinniger, V. 539(1991)289Flamion, P.-J., see Cachia, C 539(1991)343Fleminger, G., see Solomon, B. 539(1991)335Forde, D. M., see Deistung, J. 539(1991)485Fujimura, N., see Nishi, H. 539(1991)71Fukuda, E. K., see Garland, W. A.
539(1991)133Fukuyama, T, see Nishi, B. 539(1991)71Gallagher, K., see Hale, R. C. 539(1991)149Gallice, P. M., Crevat, A. D. and Berland, Y. F.
Scaling up in isolation of medium-sizeuraemic toxins 539(1991)449
Garland, W. A., Crews, T and Fukuda, E. K.Effect of noise on peak heights calculatedusing an exponentially modified gaussianpeak shape model 539(1991)133
Gasparrini, F., Misiti, D., Villani, C and LaTorre, F.Chromatographic resolution of 1,2-aminoalcohols on a chiral stationary phasecontaining N,N'-(3,5-dinitrobenzoyl)trans-I,2-diaminocyclohexane. Theoreticaland practical aspects 539(1991 )25
Gattoni, M., see Chiancone, E. 539(1991)455Girot, P., see Bulak, 1. 539(1991)355Guillaume, J. L., see Dandeu, J. P. 539(1991)475Guillen, M. D., see Blanco, C G. 539(1991)157Gundersen, J. L., see Hale, R. C. 539(1991)149Hadas, E., see Solomon, B. 539(1991)335
AUTHOR INDEX
Hale, R. C, Bush, E., Gallagher, K., Gundersen,J. L. and Mothershead, II, R. F.Separation of polychlorinated terphenylsfrom lipoidal material by preparative gelpermeation chromatography and gaschromatography 539(1991) 149
Hambling, S. G., see Lisseter, S. G.539(1991 )207
Harding, D. R. K., sec Poll, D. J. 539(1991)37Helboe, 1'., see Kryger, S. 539(1991)186Herold, M. and Leistler, B.
Unfolding of truncated and wild typeaspartate aminotransferase studied bysize-exclusion chromatography539(1991 )383
Herve, F., Duche, J.-C., Sportes, N. andTillement, J.-P.High-performance anion-exchangechromatographic study of desialylatedhuman !Xl-acid glycoprotein variants.Development of a fractionation method forthe protein slow variants 539(199\ )405
Hidaka, T, see Suemitsu, R. 539(1991)211Horiuchi, K., see Suemitsu, R. 539(1991)211Horiuchi, M., see Suemitsu, R. 539(1991)211Howell, J. A., see Ming, F. 539(1991)255Hubble, J., see Mayes, A. G. 539(1991)245Hubert, P., Mathis, R. and Dellacherie, E.
Polymer ligands for mild hydrophobicinteraction chromatography -principles,achievements and future trends (Review)539(1991 )297
Hughes, B., see Deistung, J. 539(1991)485Huhtikangas, A., see Martinsen, A.
539(1991 )232Hulak, 1., Nguyen, C, Girot, P. and Boschetti, E.
Immobilized Cibacron Blue -Ieachables,support stability and toxicity on culturedcells 539(1991 )355
Ishida, K., Ninomiya, S., Uchida, Y. and Osawa,M.Thin-layer chromatographic behaviour andseparation of zirconium(IV) and hafnium(IV) on silica gel in mineral acid-hydrogenperoxide media 539( \991) 169
Jacquot-Dourges, M. A., Zhou, F. L., Muller, D.and Jozefonvicz, J.Affinity chromatography of fibroblastgrowth factors on coated silica supportsgrafted with heparin 539(1991)417
Jozefonvicz, J., see Jacquot-Dourges, M. A.539(1991)417
Jozefonvicz, J., see Sinniger, V. 539(1991)289Katsumata, Y, see Moore, C M. 539(1991)215Kingaby, R. 0., see Deistung, J. 539(1991)485Koppel, R., see Solomon, B. 539(1991)335

AUTHOR INDEX
Kopperschliiger, G., see Birkenmeier, G.539(1991)267
Krstulovic, A. M., see Lee, C R. 539(1991 )55Krull, 1. S., see Stuting, H. H. 539(1991)91Kryger, S. and Helboe, P.
Determination of impurities indextropropoxyphene hydrochloride byhigh-performance liquid chromatography ondynamically modified silica 539(1991)[86
Kula, M.-R., see Champluvier, B. 539(1991)3[5Kumamaru, T., see Okamoto, Y. 539(1991)221La Torre, F., see Gasparrini, F. 539(1991)25Latruffe, N., see Adami, P. 539(1991)279Lee, CR., Porziemsky, J.-P., Aubert, M.-C and
Krstulovic, A. M.Liquid and high-pressure carbon dioxidechromatography of P-blockers. Resolutionof the enantiomers of nadolol 539(1991)55
Lee, S. H., see Armstrong, D. W. 539(199[)83Leistler, 8., see Herold, M. 539(1991)383Leon-Gonzalez, M. E. and Townshend, A.
Determination of organophosphorus andcarbamate pesticide standards by liquidchromatography with detection by inhibitionof immobilized acetylcholinesterase539( [991)47
Lepoivre, M., see Chenais, B. 539(1991)433Li, Y., see Amati, D. 539(1991)237Liautard, J.-P., see Ferraz, C 539(1991)465Lippoli, G., see Pace, M. 539(1991)517Lisseter, S. G. and Hambling, S. G.
Chiral high-performance liquidchromatography of synthetic pyrethroidinsecticides 539(1991)207
Liu, T-Y. and Robbat, Jr., A.High-performance liquid chromatographyretention index and detection of nitratedpolycyclic aromatic hydrocarbons539(1991)1
Lux, M., see Dandeu, J. P. 539(199[)475Magnin, P., see Makki, S. 539(1991)443Makki, S., Muret, P., Renaud, A., Agache, P.
and Magnin, P.Simple equilibrium dialysis-highperformance liquid chromatographic methodfor the in vitro assessment of 5methoxypsoralen bound to human albumin539(1991 )443
Manjini, S., see Miiller-Schulte, D. 539(1991)307Marcisauskas, R., see Markauskas, A.
539(1991)525Markauskas, A., Tiknius, V. and Marcisauskas,
R.Use of immobilized triazine dyes in thepurification of DNA topoisomerase I (TopoI) and terminal deoxynucleotidyl transferase(TdT) from calf thymus 539(1991)525
537
Martinsen, A. and Huhtikangas, A.Gas chromatographic analysis of tropic,benzoic and cinnamic acids, biosynthetictropane alkaloid precursors 539(1991 )232
Mathis, R., see Hubert, P. 539(1991)297Mauri, P. L., see Pace, M. 539(1991)517Maurizis, J. C, see Bernard, D. 539(1991 )511Mayes, A. G., Hubble, J. and Eisenthal, R.
Investigation of liquid phase cooperativebinding interactions on the capacity ofinsoluble affinity adsorbents 539(1991)245
Menozzi, F. D., see Planques, Y. 539(1991)531Mihara, M., see Shimizu, T 539(1991)193Ming, F. and Howell, J. A.
Kinetic behaviour of a novel matrix ionexchanger, carboxymethyl-HVFM operatedat high flow-rate 539(1991)255
Misiti, D., see Gasparrini, F. 539(1991)25Moore, C. M., Sato, K. and Katsumata, Y.
High-performance liquid chromatographicdetermination of cephalosporin antibioticsusing 0.3 mm I.D. columns 539(1991)215
Moreno, 0., see Nolasco, H. 539(1991)198Mothershead, II, R. F., see Hale, R. C.
539(1991)149Mouret, J.-F., see Polverelli, M. 539(1991)373Moyret, C, see Bernard, D. 539([991)511Muller, D., see Jacquot-Dourges, M. A.
539(1991)417Muller, D., see Sinniger, V. 539(1991)289Miiller-Schulte, D., Manjini, S. and
Vijayalakshmi, M. A.Comparative affinity chromatographicstudies using novel grafted polyamide andpoly(vinyl alcohol) media 539(1991)307
Muret, P., see Makki, S. 539(1991)443Nasser, B., see Adami, P. 539(1991)279Nguyen, C, see Hulak, 1. 539(1991)355Nielsen, R. G., Rickard, E. C, Santa, P. F.,
Sharknas, D. A. and Sittampalam, G. S.Separation of antibody-antigen complexesby capillary zone electrophoresis, isoelectricfocusing and high-performance sizeexclusion chromatography 539(1991) [77
Ninomiya, S., see Ishida, K. 539(199[)169Nishi, H., Fujimura, N., Yamaguchi, H. and
Fukuyama, TReversed-phase high-performance liquidchromatographic separation of theenantiomers of trimetoquinol hydrochlorideby derivatization with 2,3,4,6-tetra-0-acetylP-D-glucopyranosyl isothiocyanate andapplication to the optical purity testing ofdrugs 539(1991)71

538
Nolasco, H. and Moreno, O.Rapid detection and quantification ofperoxidase activity in liquidchromatography 539(1991) 198
O'Connell, J. P" see Deistung, J. 539(1991)485Odin, F., see Polverelli, M. 539(1991)373Ohashi, H., Uehara, N. and Shijo, Y.
Simultaneous determination of molybdenum,vanadium, gallium, copper, iron and indiumas 8-quinolinolate complexes by highperformance liquid chromatography539(1991 )225
Ohnishi, K., seeSuemitsu, R. 539(1991)211Okamoto, Y., Sakamoto, N., Yamamoto, M. and
Kumamaru,T.Electrodialysis pretreatment system for ionchromatography of strongly acidic samplesand its application to the determination ofmagnesium and calcium 539(1991)221
Osawa, M., see Ishida, K. 539(1991)169Pace, M., Agnellini, D., Lippoli, G., Pietta, P. G.,
Mauri, P. L. and Cinquanta, S.Purification of NAD glycohydrolase fromNeurospora crassa conidia by a polyclonalimmunoadsorbent 539(1991)517
Pelissier, J. P., see Scanff, P. 539(1991)425Pfundstein, B., Tricker, A. R. and Preussmann,
R.Determination of primary and secondaryamines in foodstuffs using gaschromatography and chemiluminescencedetection with a modified thermal energyanalyser 539(1991) 141
Pietta, P. G., see Pace, M. 539(1991)517Planques, Y., Pora, H. and Menozzi, F. D.
Affinity purification of plasminogen byradial-flow affinity chromatography539(1991)531
Poll, D. J. and Harding, D. R. K.Column-friendly reversed-phase highperformance liquid chromatography ofpeptides and proteins using formic acid withsodium chloride and dynamic columncoating with crown ethers 539(1991)37
polverelli, M., Voituriez, L., Odin, F., Mouret,J.-F. and Cadet, J.Purification of DNA and group separationof normal and modified DNA componentsby size-exclusion chromatography539(1991 )373
Poppi, R. J., see Faigle, J. F. 539(1991)123Pora, H., see Planques, Y. 539(1991)531Porziemsky, J.-P., see Lee, C. R. 539(1991)55Preussmann, R., see Pfundstein, B. 539(1991)141Proudfoot, K. A., see Deistung, J. 539(1991)485Rabillon, 1., see Dandeu, J. P. 539(1991)475Reid, D. G., see Sweeney, P. J. 539(1991)501
AUTHOR INDEX
Renaud, A., see Makki, S. 539(1991)443Rickard, E. c., see Nielsen, R. G. 539(1991)177Robbat, Jr., A., see Liu, T.-Y. 539(1991)1Sakamoto, N., see Okamoto, Y. 539(1991)221Santa, P. F., see Nielsen, R. G. 539(1991)177Sato, K., see Moore, C. M. 539(1991)215Scanff, P., Yvon, M. and Pelissier, J. P.
Immobilized Fe3+ affinity chromatographicisolation of phosphopeptides 539(1991 )425
Scarminio, I. S., see Faigle, J. F. 539(1991)123Schreiber, J.-P., see Cachia, C. 539(1991)343Schwartz, F., see Solomon, B. 539(1991)335Sharknas, D. A., see Nielsen, R. G.
539(1991 )177Shijo, Y., see Ohashi, H. 539(1991)225Shimizu, T., Mihara, M. and Takeda, N.
High-performance liquid chromatography ofbiogenic amines in the corpus cardiacum ofthe American cockroach, Periplanetaamericana 539(1991) 193
Sinniger, V., Tapon-Bretaudiere, J., Zhou, F. L.,Bros, A., Muller, D., Jozefonvicz, J. andFischer, A. M.Immobilization of dermatan sulphate on asilica matrix and its possible use as anaffinity chromatography support for heparincofactor II purification 539(1991 )289
Sittampalam, G. S., see Nielsen, R. G.539(1991)177
Solomon, B., Hadas, E., Koppel, R., Schwartz, F.and Fleminger, G.Highly active enzyme preparationsimmobilized via matrix-conjugated anti-Fcantibodies 539(1991 )335
Sportes, N., see Herve, F. 539(1991)405Sri Widada, J., see Ferraz, C. 539(1991)465Stigbrand, T., see Birkenmeier, G. 539(1991)267Stuting, H. H. and Krull, I. S.
Determination of pituitary and recombinanthuman growth hormone molecular weightsby modern high-performance liquidchromatography with low angle laser lightscattering detection 539(1991)91
Suemitsu, R., Horiuchi, K., Ohnishi, K., Hidaka,T. and Horiuchi, M.High-performance liquid chromatographicdetermination of tentoxin in fermentation ofAlternariaporri (Ellis) Ciferri 539(1991)211
Sweeney, P. J., Walker, J. M., Reid, D. G. andElshourbagy, N.Purification of cloned trypanosomalcalmodulin and preliminary NMR studies539(1991 )50 I
Takeda, N., see Shimizu, T. 539(1991)193Tapon-Bretaudiere, J., see Sinniger, V.
539(1991 )289Tardy, M., see Uhlrich, S. 539(1991)393

AUTHOR INDEX
Tayot, 1.-L., see Uhlrich, S. 539(1991)393Tenu,1. P., see Chenais, B. 539(1991)433Tiknius, V., see Markauskas, A. 539(1991)525Tillement, 1.-P., see Herve, F. 539(1991 )405Tiollier, 1., see Uhlrich, S. 539(1991)393Toulon, P., Chadeuf, G. and Aiach, M.
Purification of heparin cofactor II fromhuman plasma 539(1991)493
Townshend, A., see Leon-Gonzalez, M. E.539(1991)47
Tricker, A. R., see Pfundstein, B. 539(1991)141Uchida, Y, see Ishida, K. 539([991)169Uehara, N., see Ohashi, H. 539(199[)225Uhlrich, S., Tiollier, 1., Tardy, M. and Tayot,
J.-L.Isolation and characterization of twodifferent molecular forms of basic flbroblastgrowth factor extracted from humanplacental tissue 539(199[)393
Vijayalakshmi, M. A., see Birkenmeier, G.539(1991 )267
Vijayalakshmi, M. A., see Muller-Schulte, D.539(1991)307
539
Villani, C., see Gasparrini, F. 539(199[)25Voituriez, L., see Polverelli, M. 539(1991)373Wal, 1. M., see Yvon, M. 539(1991)363Walker, 1. M., see Sweeney, P. 1. 539(1991)501West, R. R. and Cardellina, II, 1. H.
Semi-preparative separation ofpolyhydroxylated sterols using af3-cyclodextrin high-performance liquidchromatography column 539( 1991) 15
Willenbrock, F., see Deistung, 1. 539(1991)4"85Yamaguchi, H., see Nishi, H. 539(1991)71Yamamoto, M., see Okamoto, Y. 539(1991)221Yapo, A., see Chenais, B. 539(1991)433Yvon, M. and Wal, 1. M.
Tandem immunoaffinity and reversed-phasehigh-performance liquid chromatography forthe identification of the specific binding sitesof a hapten on a proteic carrier539( 199 [)363
Yvon, M., see Scanff, P. 539(199[)425Zhou, F. L., see 1acquot-Dourges, M. A.
539(1991)417Zhou, F. L., see Sinniger, V. 539(1991)289


PUBLICATION SCHEDULE FOR 1991
Journal of Chromatography and Journal of Chromatography, Biomedical Applications
MONTH D J F M A1990
Journal of 535/1 + 2 536/1 + 2 538/2 540Chromatography 537/1 +2 539/1 541/1 +2 The publication schedule for further
538/1 539/2 542/1 issues will be published later
CumulativeIndexes,Vols. 501-550
BibliographySection 560/1
/
Biomedical 562/1 + 2 563/2 564/1 564/2Applications 563/1 565/1 + 2
INFORMATION FOR AUTHORS
(Detailed Instructions to Authors were published in Vol. 522, pp. 351-354. A free reprint can be obtained byapplication to the publisher, Elsevier Science Publishers BV, P.O. Box 330, 1000 AH Amsterdam, The·Netherlands.) .
Types of Contributions. The following types of papers are published in the Journal of Chromatographyand the section on Biomedical Applications: Regular research papers (Full-length papers). Review articlesand Short Communications. Short Communications are usually descriptions of short investigations, orthey can report minor technical improvements of previously published procedures; they reflect the samequality of research as Full-length papers, but should preferably not exceed six printed pages. For Reviewarticles, see inside front cover under Submission of Papers.
Submission. Every paper must be accompanied by a letter from the senior author, stating that he/she issubmitting the paper for publication in the Journal of Chromatography.
Manuscripts. Manuscripts should be typed in double spacing on consecutively numbered pages of uniformsize. The manuscript should be preceded by a sheet of manuscript paper carrying the title of the paper andthe name and full postal address of the person to whom the proofs are to be sent. As a rule, papers shouldbe divided into sections, headed by a caption (e.g., Abstract, Introduction, Experimental, Results, Discussion, etc.). All illustrations, photographs, tables, etc., should be on separate sheets.
Introduction. Every paper must have a concise introduction mentioning what has been done before on thetopic described, and stating clearly what is new in the paper now submitted.
Abstract. All articles should have an abstract of 50-100 words which clearly and briefly indicates what isnew, different and significant.
Illustrations. The figures should be submitted in a form suitable for reproduction, drawn in Indian ink ondrawing or tracing paper. Each illustration should have a legend, all the legends being typed (with doublespacing) together on a separate sheet. If structures are given in the text, the original drawings should besupplied. Coloured illustrations are reproduced at the author's expense, the cost being determined by thenumber of pages and by the number of colours needed. The written permission of the author and publishermust be obtained for the use of any figure already published. Its source must be indicated in the legend.
References. References should be numbered in the order in which they are cited in the text, and listed innumerical sequence on a separate sheet at the end of the article. Please check a recent issue for the layoutof the reference list. Abbreviations for the titles of journals should follow the system used by ChemicalAbstracts. Articles not yet published should be given as "in press" (journal should be specified), "submitted for publication" (journal should be specified), "in preparation" or "personal communication".
Dispatch. Before sending the manuscript to the Editor please check that the envelope containsfour copies of the paper complete with references. legends and figures. One of the sets offigures must be the originals suitable for direct reproduction. Please also ensure that permission to publish has been obtained from your institute.
Proofs. One set of proofs will be sent to the author to be carefully checked for printer's errors. Correctionsmust be restricted to instances in which the proof is at variance with the manuscript. "Extra corrections"will be inserted at the author's expense.
Reprints. Fifty reprints of Full-length papers and Short Communications will be supplied free of charge.Additional reprints can be ordered by the authors. An order form containing price quotations will be sent tothe authors together with the proofs of their article.
Advertisements. Advertisement rates are available from the publisher on request. The Editors ofJhe journalaccept no responsibility for the contents of the advertisements.

Ion ChromatographyPrinciples and Applications
by P.R Had~d,University ofNew South Wales, Kerisington,N.SJ'l.,Australia andP.E.Jackson, Waters Chromatography Division, Milford, MA, USA
'(Journal ofChromatography Library, 46)
Ion chromatography (Ie) was first introduced in1975,for the determination of inorganic anionsand cations and water soluble organic acids andbases; Since then, the technique has grown inusage at a phenomenal rate. The growth of IChas been accompanied by a blurring of theoriginal definition of the technique, so that itnow embraces a very wide range of separationand detection methods, many of which bearlittle resemblance to the initial concept ofion-exchange separation coupled withconductivity detection.
Ion Chromatography is the first book to providea comprehensive treatise on all aspects of ionchromatography. Ion-exchange, ion-interaction,ion-exclusion and other pertinent separationmodes are included, whilst the detectionmethods discussed includeconductivhy,amperometry, potentiometry, spectroscopicmethods (both molecular and atomic) and postcolumn reactions. The theoretical backgroundand operating principles of~ch separation anddetection mode are discussed in detail. Auniqueextensive compilation ofpracticill applicationsofIC (1250 literature citations) is presented intabular form. All relevant details ofeachapplication are given to accommodatereproduction of the method in the laboratorywithout access to the original publication.
This truly comprehensive text on ionchromatography should prove tobe the standardreference work for researchers and thoseinvolved in the use of the subject in practicalsituations.
Contents: Chapter 1. Introduction. PARTI~Ion-Exchange Separation Methods. Chapter 2.An introduction to ion-exchange tpethods.Chapter 3. Ion-exchange stationarY phases for ionchromatography. Chapter 4. Eluerit:S for .ion-exc!tange separations. ChapterS. Retentionmodels for ion-exchange. PART U. .Ion~Interaction, Ion-Exclusion andMiscellaneous SeparationMethodS. Chapter 6.lon-interaction chromatography. Chapter 7.Ion-exclusion chromatography. Chapter 8.Miscellaneous separation methods. PARTm.Detection Methods. Chapter 9. Conductivitydetection. Chapter 10. Electrochemieal detection(amperometry, voltammetry andcoulometry).Chapter 11. Poten'tiometric detection. Chapter 12.Spectroscopic detection methods. Chapter 13.Detection by post-colwnn reaction. PART IV.Practical Aspects. Chapter 14. Sample handlingin ion chromatography. Chapter 15. Methodsdevelopment PART V. Applications orIonChromatography. Overview of the applicationssection. Chapter 16. Environmental applications.Chapter 17. Industrial applications. Chapter 18.Analysis offoods and plants. Chapter 19. Clinicaland pharfuaceutical applications:Chapter 20.Analysis of metals and metallurgical solutions.Chapter 21. Analysis of treated waters. Chapter22. Miscellaneous applications. Appendix A.Statistical information on ion chromatographypublications. Appendix B. Abbreviations and
.symbols. Index.
1990 798 pagesPrice: US$ 191.50/ Dfl. 335.00ISBN 0-444-88232-4
Elsevier Science PublishersP.O. Box 211, 1000 AE Amsterdam, The NetherlandsP.O. Box 882, Madison Square Station, New York, NY 10159, USA
Copyright © 2022 FDOKUMEN