Biochemical and microbial features of shallow marine sediments along the Terra Nova Bay (Ross Sea,...
12
Biochemical and microbial features of shallow marine sediments along the Terra Nova Bay (Ross Sea, Antarctica) Franco Baldi a,n , Davide Marchetto a , Francesco Pini a,1 , Renato Fani b , Luigi Michaud c , Angelina Lo Giudice c , Daniela Berto d , Michele Giani d a Department of Environmental Sciences, C a Foscari University, Calle Larga S. Marta Dorsoduro 2137, 30123 Venezia, Italy b Department of Evolutionary Biology, Florence University, via Romana 17-19, 50125 Firenze, Italy c Department of Animal Biology and Marine Ecology, University of Messina, Salita Sperone 31, 98166 Messina, Italy d Istituto Nazionale di Oceanografia e Geofisica Sperimentale, via A. Piccard 54, 34010 Trieste, Italy article info Article history: Received 8 February 2010 Received in revised form 11 June 2010 Accepted 18 June 2010 Available online 30 June 2010 Keywords: Coastal sediments Biopolymeric carbon Ectoenzymatic activity T-RFLP Clone libraries abstract Shallow marine sediments were collected from seven stations (three of which located at Gerlache Inlet, two at Tethys Bay, one at Adelie Cove and one just beneath the Italian Research Base) along the Terra Nova Bay coast (Ross Sea, Antarctica). Their chemical, biochemical and microbiological properties were studied in order to provide further insights in the knowledge of this Antarctic benthic ecosystem. Overall, the organic carbon (OC) represented the major fraction of total carbon (TC) and displayed concentrations similar to or slightly lower than those previously measured in Antarctic bottom sediments. The biopolymeric carbon within OC ranged from 4.1% to 19.9% and showed a wide trophic range (65–834 mgg 1 d.w.). Proteins (PRT) represented on average the main biochemical class contributing to labile organic carbon, followed by lipids (LIP) and carbohydrates (CHO). The activity of aminopeptidase, b-D-glucosidase, alkaline phosphatase and esterase was checked, giving the highest values at Tethys Bay and at the deepest water sediments. The principal component analysis, which was computed considering physical, chemical (elemental and biochemical sedimentary composition) and microbiological parameters (including bacterial abundance, ectoenzymatic activities, T-RFs richness and diversity indices), allowed to obtain two main clusters (‘‘Tethys Bay’’ and ‘‘other stations’’). Based on data obtained, two representative 16S rRNA clone libraries using samples from Tethys Bay and Gerlache Inlet were constructed. The sequences of 171 clones were compared to those available in public databases to determine their approximate phylogenetic affiliations. Both aerobic and anaerobic bacteria were disclosed, with the majority of them affiliated with the Gamma- and Deltaproteobacteria, Bacteroidetes and Acidobacteria. The occurrence of strictly anaerobic bacteria suggests that sediments might also undergo anoxic conditions that, in turn, could favor the accumulation of PRT in respect to CHO, assuming that fermentation of amino acids is slower than that of sugars from decomposing polysaccharides. & 2010 Elsevier Ltd. All rights reserved. 1. Introduction Like other continental shelf systems, polar shelves are regions of intense biological activity and biogeochemical cycling. They are characterized by seasonally high primary production, large drawdowns of pCO 2 , and intense sedimentation rates (Ducklow et al., 2008; Fonda Umani et al., 2005). In Antarctica, settling particulate matter is underexploited along the water column due to low temperature and low microbial activities (Christian and Karl, 1995; Fabiano and Pusceddu, 1998; Vetter and Deming, 1994), therefore resulting in the accumulation of organic detritus in the coastal belt. This, in turn, potentially supports high microbial biomass and activity (Fabiano and Danovaro, 1998). Both the consistence and quality of organic matter that accumu- lates in Antarctic marine may fuel the benthic biota, including microorganisms, during the whole year (Isla et al., 2006). This relies on the fact that the particle supply is restricted to a short- period of the spring–summer time, when primary production blooms and sea-ice release their solid load, rich in labile compounds (Fischer et al., 1988; Fabiano and Pusceddu, 1998; Isla et al., 2006; Nedwell et al., 1993; Pusceddu et al., 1999). Thus, the carbon cycling is modulated by pulsed organic inputs to sediments, which are strongly dependent on dramatic seasonal shifts in pelagic primary production (Mincks et al., 2005). In Contents lists available at ScienceDirect journal homepage: www.elsevier.com/locate/csr Continental Shelf Research 0278-4343/$ - see front matter & 2010 Elsevier Ltd. All rights reserved. doi:10.1016/j.csr.2010.06.009 n Corresponding author. Tel.: + 39 041 2348901; fax: + 39 041 2348565. E-mail address: [email protected] (F. Baldi). 1 Present address: Department of Evolutionary Biology, Florence University, via Romana 17-19, 50125 Firenze, Italy. Continental Shelf Research 30 (2010) 1614–1625
-
Upload
independent -
Category
Documents
-
view
5 -
download
0
Transcript of Biochemical and microbial features of shallow marine sediments along the Terra Nova Bay (Ross Sea,...
Continental Shelf Research 30 (2010) 1614–1625
Contents lists available at ScienceDirect
Continental Shelf Research
0278-43
doi:10.1
n Corr
E-m1 Pr
via Rom
journal homepage: www.elsevier.com/locate/csr
Biochemical and microbial features of shallow marine sediments alongthe Terra Nova Bay (Ross Sea, Antarctica)
Franco Baldi a,n, Davide Marchetto a, Francesco Pini a,1, Renato Fani b, Luigi Michaud c,Angelina Lo Giudice c, Daniela Berto d, Michele Giani d
a Department of Environmental Sciences, C �a Foscari University, Calle Larga S. Marta Dorsoduro 2137, 30123 Venezia, Italyb Department of Evolutionary Biology, Florence University, via Romana 17-19, 50125 Firenze, Italyc Department of Animal Biology and Marine Ecology, University of Messina, Salita Sperone 31, 98166 Messina, Italyd Istituto Nazionale di Oceanografia e Geofisica Sperimentale, via A. Piccard 54, 34010 Trieste, Italy
a r t i c l e i n f o
Article history:
Received 8 February 2010
Received in revised form
11 June 2010
Accepted 18 June 2010Available online 30 June 2010
Keywords:
Coastal sediments
Biopolymeric carbon
Ectoenzymatic activity
T-RFLP
Clone libraries
43/$ - see front matter & 2010 Elsevier Ltd. A
016/j.csr.2010.06.009
esponding author. Tel.: +39 041 2348901; fa
ail address: [email protected] (F. Baldi).
esent address: Department of Evolutionary
ana 17-19, 50125 Firenze, Italy.
a b s t r a c t
Shallow marine sediments were collected from seven stations (three of which located at Gerlache Inlet,
two at Tethys Bay, one at Adelie Cove and one just beneath the Italian Research Base) along the Terra
Nova Bay coast (Ross Sea, Antarctica). Their chemical, biochemical and microbiological properties were
studied in order to provide further insights in the knowledge of this Antarctic benthic ecosystem.
Overall, the organic carbon (OC) represented the major fraction of total carbon (TC) and displayed
concentrations similar to or slightly lower than those previously measured in Antarctic bottom
sediments. The biopolymeric carbon within OC ranged from 4.1% to 19.9% and showed a wide trophic
range (65–834 mg g�1 d.w.). Proteins (PRT) represented on average the main biochemical class
contributing to labile organic carbon, followed by lipids (LIP) and carbohydrates (CHO). The activity of
aminopeptidase, b-D-glucosidase, alkaline phosphatase and esterase was checked, giving the highest
values at Tethys Bay and at the deepest water sediments. The principal component analysis, which was
computed considering physical, chemical (elemental and biochemical sedimentary composition) and
microbiological parameters (including bacterial abundance, ectoenzymatic activities, T-RFs richness
and diversity indices), allowed to obtain two main clusters (‘‘Tethys Bay’’ and ‘‘other stations’’). Based
on data obtained, two representative 16S rRNA clone libraries using samples from Tethys Bay and
Gerlache Inlet were constructed. The sequences of 171 clones were compared to those available in
public databases to determine their approximate phylogenetic affiliations. Both aerobic and anaerobic
bacteria were disclosed, with the majority of them affiliated with the Gamma- and Deltaproteobacteria,
Bacteroidetes and Acidobacteria. The occurrence of strictly anaerobic bacteria suggests that sediments
might also undergo anoxic conditions that, in turn, could favor the accumulation of PRT in respect to
CHO, assuming that fermentation of amino acids is slower than that of sugars from decomposing
polysaccharides.
& 2010 Elsevier Ltd. All rights reserved.
1. Introduction
Like other continental shelf systems, polar shelves are regionsof intense biological activity and biogeochemical cycling. They arecharacterized by seasonally high primary production, largedrawdowns of pCO2, and intense sedimentation rates (Ducklowet al., 2008; Fonda Umani et al., 2005). In Antarctica, settlingparticulate matter is underexploited along the water column dueto low temperature and low microbial activities (Christian and
ll rights reserved.
x: +39 041 2348565.
Biology, Florence University,
Karl, 1995; Fabiano and Pusceddu, 1998; Vetter and Deming,1994), therefore resulting in the accumulation of organic detritusin the coastal belt. This, in turn, potentially supports highmicrobial biomass and activity (Fabiano and Danovaro, 1998).Both the consistence and quality of organic matter that accumu-lates in Antarctic marine may fuel the benthic biota, includingmicroorganisms, during the whole year (Isla et al., 2006). Thisrelies on the fact that the particle supply is restricted to a short-period of the spring–summer time, when primary productionblooms and sea-ice release their solid load, rich in labilecompounds (Fischer et al., 1988; Fabiano and Pusceddu, 1998;Isla et al., 2006; Nedwell et al., 1993; Pusceddu et al., 1999). Thus,the carbon cycling is modulated by pulsed organic inputs tosediments, which are strongly dependent on dramatic seasonalshifts in pelagic primary production (Mincks et al., 2005). In
TERRA NOVABAY
D
GerlacheInlet
B
A
E
GF90°E
South Pole+
0°
90°W
180°
74°45’S
164°30’E
C
F. Baldi et al. / Continental Shelf Research 30 (2010) 1614–1625 1615
Antarctic coastal waters significant interannual variations in thesource of organic carbon (OC) inputs to sediments have been alsoobserved (Nedwell et al., 1993). However, in general OC isexported to deeper waters by pycnoclinic currents (Frignaniet al., 2003). According to Smetacek et al. (1990), coastal waters atTerra Nova Bay function as a ‘‘loss-type’’ system, which is mainlydependent on the vertical flux of primary organic matter and fecalpellets. In this area, the organic carbon (OC) is likely of marineorigin and the particle flux may enable the entire particulatematter pool to reach sediments within 2–3 days (Albertelli et al.,1998). According to Frignani et al. (2003), OC is mainly producedby autotrophic eukaryotes, especially diatoms, which grow atboth the ice–water interface and in the water column. A large andpersistent Phaeocystis bloom was detected at Terra Nova Bay inDecember–January, after which the community compositionshifted towards a diatom-dominated assemblage, in relation withthe shoaling of the mixed layer (Fonda Umani et al., 2005). In theRoss Sea, the biogenic silica flux from diatoms frustules wasestimated around 11–17 g m2 yr�1; it is by far the mostimportant biological contribution to sediments in this marinesystem (Frignani et al., 2003) and may represent the main sourceof labile organic carbon for heterotrophic bacteria growth. Inparticular, a substantial part of such a carbon is excreted asexo-polysaccharides (EPS) and glycoproteins (Bahulikar andKroth, 2008). According to Pusceddu et al. (2000), whilst theorganic matter quantity in sediments depended on the influxesfrom the water column, temporal changes of its biochemicalcomposition were related to processes occurring within thebenthic trophic chain. In polar shelves, the cold-adapted micro-biota displayed mineralization rates and pathways comparable tothose of temperate communities (Kostka et al., 1999), thusplaying important roles in nutrient recycling and diagenesis(Bowman et al., 2003). The uptake of organic matter by thebenthic community strongly depends on its species composition.Nevertheless, whilst the sedimentary biochemical composition,bacterial biomass and ectoenzymatic activities have been con-currently investigated in Antarctica (Fabiano and Danovaro,1998), the bacterial community structure has never beenconsidered as an additional ecologically important factor.
In this context, the present work was mainly aimed atunderstanding the relationship between the labile organic matterand the bacterial communities in Antarctic shallow sedimentsalong the Terra Nova Bay coast, in order to provide furtherinsights toward the knowledge of this Antarctic benthicecosystem. The experimental strategy adopted in this work useda combination of chemical, biochemical and biomoleculartechniques (T-RFLP and clone libraries), allowing the furtherintegration of data coming from the characterization of organicmatter, the determination of ectoenzymatic activities and theidentification of the main bacterial groups inhabiting shallowsediments.
164°00’E
74°50’SMario ZucchelliStation
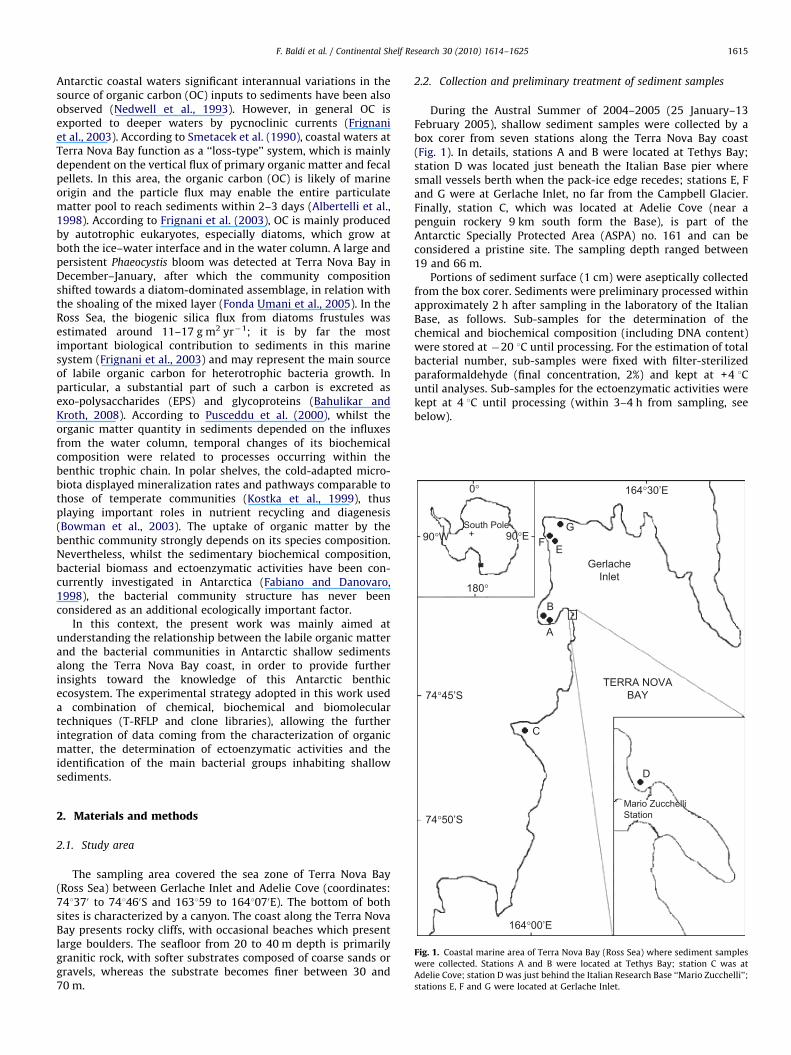
Fig. 1. Coastal marine area of Terra Nova Bay (Ross Sea) where sediment samples
were collected. Stations A and B were located at Tethys Bay; station C was at
Adelie Cove; station D was just behind the Italian Research Base ‘‘Mario Zucchelli’’;
stations E, F and G were located at Gerlache Inlet.
2. Materials and methods
2.1. Study area
The sampling area covered the sea zone of Terra Nova Bay(Ross Sea) between Gerlache Inlet and Adelie Cove (coordinates:741370 to 741460S and 163159 to 1641070E). The bottom of bothsites is characterized by a canyon. The coast along the Terra NovaBay presents rocky cliffs, with occasional beaches which presentlarge boulders. The seafloor from 20 to 40 m depth is primarilygranitic rock, with softer substrates composed of coarse sands orgravels, whereas the substrate becomes finer between 30 and70 m.
2.2. Collection and preliminary treatment of sediment samples
During the Austral Summer of 2004–2005 (25 January–13February 2005), shallow sediment samples were collected by abox corer from seven stations along the Terra Nova Bay coast(Fig. 1). In details, stations A and B were located at Tethys Bay;station D was located just beneath the Italian Base pier wheresmall vessels berth when the pack-ice edge recedes; stations E, Fand G were at Gerlache Inlet, no far from the Campbell Glacier.Finally, station C, which was located at Adelie Cove (near apenguin rockery 9 km south form the Base), is part of theAntarctic Specially Protected Area (ASPA) no. 161 and can beconsidered a pristine site. The sampling depth ranged between19 and 66 m.
Portions of sediment surface (1 cm) were aseptically collectedfrom the box corer. Sediments were preliminary processed withinapproximately 2 h after sampling in the laboratory of the ItalianBase, as follows. Sub-samples for the determination of thechemical and biochemical composition (including DNA content)were stored at �20 1C until processing. For the estimation of totalbacterial number, sub-samples were fixed with filter-sterilizedparaformaldehyde (final concentration, 2%) and kept at +4 1Cuntil analyses. Sub-samples for the ectoenzymatic activities werekept at 4 1C until processing (within 3–4 h from sampling, seebelow).
F. Baldi et al. / Continental Shelf Research 30 (2010) 1614–16251616
2.3. Chemical characterization of sediment samples
Sub-samples for chemical and biochemical analyses werefreeze-dried and homogenized prior to be analyzed, payingattention to remove gravel and shell debris.
Sedimentary water content was estimated as the differencebetween wet and dry weight, determined by drying samples at60 1C to constant weight.
2.3.1. Elemental composition of sediments
Total carbon (TC) and nitrogen (N) were determined by CHNSOelement analyzer (Fisons 1108EA). Organic carbon (OC) wasdetermined as total carbon after removal of carbonates with 8 NHCl. Inorganic carbon (IC) was calculated as the differencebetween TC and OC. N and P were determined in non-acidifiedsamples. Acetanilide was used as standard for C and Ndeterminations. Reproducibility was r3% for C, and r5% for N.P was determined by inductively coupled plasma atomic emissionspectroscopy (ICP-AES) at 177 nm on 1 mol l�1 HCl extracts ofcombusted samples (Aspila et al., 1976). Accuracy evaluated onmarine sediment reference material (BCSS) was 98.8%74.8;reproducibility of 5 mineralizations was r5%.
2.3.2. Biochemical composition of sediment organic matter
Sediment samples were analyzed for total protein (PRT),carbohydrate (CHO) and lipid (LIP) content to evaluate thepolymeric components of organic matter.
PRT content was determined spectrophotometrically usingCoomassie Brilliant Blue (Bradford, 1976; Mayer et al., 1986) afterextraction of 4 g of freeze-dried sediment with 8 ml 0.5 N NaOHin an ultrasonic bath for 2 h at 40 1C (Nunn and Keil, 2006). Afterreaction with dye, absorbance was determined spectrophotome-trically at 595 nm. PRT concentrations are reported in bovineserum albumin (BSA, Biorad) equivalents.
CHO content was determined by the Dubois method (Duboiset al., 1956) after extraction of 2.5 g sediment with 50 ml 1 NCH3COOH for 4 h at 20–30 1C in ultrasonic bath (Mecozzi et al.,2000). Concentration of CHO was expressed in D(+)-glucoseequivalents after reaction with 96% sulphuric acid and 5% phenolfollowed by spectrophotometric detection at 485 nm.
LIP were extracted overnight from 2 g of dried sediment bydirect elution with chloroform and methanol (2:1 v/v) at 4 1C(Bligh and Dyer, 1959); LIP analysis was carried out by thecharring method with H2SO4 at 200 1C for 15 min (Marsh andWeistein, 1966). Tripalmitin was used for standard solutions andthe absorbance was determined at 375 nm.
All analyses were carried out in three replicates per sedimentsample. For each biochemical class, results are expressed as per
gram of sediment dry weight (d.w.).For the evaluation of labile components of OC due to the three
main biochemical classes, PRT, CHO and LIP were converted intocarbon equivalents, assuming the respective conversion factors of0.49, 0.40 and 0.75, respectively (Fichez, 1991). The sum of carbonequivalents of PRT, CHO and LIP constituted biopolymeric carbon(BPC) and was expressed as mgC g�1 sediment d.w.
2.4. Bacterial abundance and activity
2.4.1. Total cell counts
Before analysis, sediment slurries were prepared by dilutingsediments 1000-fold in particle-free tetrasodium-pyrophosphatedispersing solution (0.1 M, 0.2 mm filtered), and shaking thor-oughly. A 1–3 ml aliquot of the suspension was incubatedwith 4,6-diamidino-2-phenylindole (DAPI, final concentration1 mg ml�1) for 15 min in the dark, and filtered through a black
polycarbonate membrane (0.2 mm pore size, 25 mm diameter,Isopore, Millipore, Milan, Italy). Cell counts were determined bycounting stained cells in 20 randomly selected fields using a ZeissAxioplan epifluorescence microscope with 365/420 nm excita-tion/emission filters. Data obtained were expressed as cells g�1 ofsediment d.w.
2.4.2. Ectoenzymatic activities
The determination of the ectoenzymatic activities (EEAs) insediment samples was performed immediately after samplingusing fluorogenic substrates based on methylumbelliferone(MUF) (Hoppe, 1983; King, 1986) and methylcoumarinylamide(MCA) (Mayer, 1989). Aminopeptidase (Amp), b-D-glucosidase(Glu), alkaline phosphatase (AkP) and esterase (Est) wereanalyzed using the following substrates at a final concentrationof 50 mM: leucine-MCA, b-D-glucopyranoside-MUF, phosphate-MUF and butyrate-MUF, respectively. The enzyme assays werecarried on slurries prepared by diluting freeze-dried sediment1:10 (w/v) in artificial seawater under continuous stirring andincubation in the dark at 5 1C. In particular, sediment sub-samplesfrom the station A at Thetis Bay were used to test the influence oftemperature on the potential hydrolysis rates; analyses werecarried out at 5, 10, 15 and 30 1C. Five ml aliquots of each slurrywere collected at five different fixed times in 2 h, boiled at 100 1Cfor 2 min, cooled in ice to stop the hydrolytic reaction, andcentrifuged at 4000 g to recover the fluorescent dye released inthe supernatant. Substrate hydrolysis rate was calculated intriplicate from slope of regression line. Solutions of MUF or MCAat different concentrations were added to slurries of each sampleto build standard curves. Fluorescence was measured with aluminescence spectrometer (Perkin-Elmer LS 55) at 380/480 nmexcitation/emission wavelength. Data obtained were expressed asnmoles of hydrolyzed substrate g�1 d.w. h�1.
2.5. Bacterial population structure and composition
2.5.1. DNA extraction and PCR amplification of 16S rRNA genes
Total DNA from environmental samples for terminal restric-tion fragment length polymorphism (T-RFLP) analysis and clonelibraries (see below) was extracted from 250 mg of startingmaterial using a bead beating kit (Power Clean soil extraction kit,MOBIO laboratories) following the manufacturer’s instructions.Three replicates were performed for each sample. DNA wasquantified by a fluorimetric assay (Zipper et al., 2003, 2004).Genes coding for 16S rRNA were amplified by PCR in a reac-tion mixture (final volume of 50 ml) containing the following(final concentration): 1�PCR buffer (Polymed), 2 mM MgCl2,2.5 mM of each deoxynucleotide triphosphate (Fermentas),30 pmol (each) forward and reverse primers (MWG, Germany)and 2U Taq DNA polymerase (Polymed). Universal bacterial 16SrRNA primers 27F (50-GAGAGTTTGATCCTGGCTCAG-30) and 1492R(50-CTACGGCTACCTTGTTACGA-30) were used to amplify nearlyfull-length 16S rRNA genes from a combination of three differentDNA preparations. The primer 27F was labelled with tetrachloro-fluorescein (TET) for T-RFLP analysis. Two ml (about 10 ng)of genomic DNA was used as template in the PCR reactions.PCR reaction conditions were as described by Di Cello et al. (1997)and Michaud et al. (2004). A PTC-100 Peltier Thermal Cycler(MJ Research Celbio) was used to perform PCR reactions.Amplification products of three parallel PCR reactions werecombined and purified with the Wizard SV Gel and PCR Clean-Up system (Promega) prior to cloning and/or T-RFLP analysis, asdescribed in the following sections.

F. Baldi et al. / Continental Shelf Research 30 (2010) 1614–1625 1617
2.5.2. T-RFLP analysis
The T-RFLP fingerprinting technique was used to estimate thegenetic diversity of bacterial communities as described by Lukowet al. (2000) and Luna et al. (2006). We used two separaterestriction digests for bacterial communities in order to obtain thefingerprinting information from different enzymes per sample.Approximately 300 ng of amplified 16S rRNA genes from eachDNA sample were digested in duplicate with 10U of therestriction endonucleases HinfI or TaqI (Fermentas) for 3 h at 37and 65 1C, respectively. One ml of each sample was mixed with12.5 ml of formamide and 0.5 ml of standard Rox 500 (AppliedBiosystems). Reaction mixtures were denatured by heating at95 1C for 3 min followed by an incubation at 0 1C for 5 min.Denatured DNA was loaded onto an automatic DNA sequencer(model ABI310, Applied Biosystems). T-RF profiles were analyzedwith Genescan version 3.7 (Applied Biosystems). Only profileswith a cumulative peak height Z5000 fluorescence units wereused for the analysis. The detection threshold applied to T-RFLPprofiles was calculated according to the approach suggested byLuna et al. (2006) and in our case was 0.32% of the totalfluorescence.
The ‘‘abundance percentage’’ (Ap) of each T-RF was calculatedas Ap¼ni/N�100 where ni represents the peak area of onedistinct T-RF and N is the sum of all peak areas in a given T-RFLPpattern (Lukow et al., 2000). The size of each T-RF was estimatedby reference to the internal standard. Both sample replicates per
enzyme were used when running the web-based tool T-Align(Smith et al., 2005) in order to generate a consensus profilecontaining only T-RFs present in both replicates by removal ofnon-common peaks. T-RFLP consensus profiles from differentsamples were subsequently aligned by using T-Align. Numbersand heights of peaks were used to characterize the microbialcommunity diversity patterns. After enzymatic digestion of PCRamplicons, each T-RF can be defined as an operational taxonomicunit (OTU) within a community (Engebretson and Moyer, 2003).
2.5.3. Construction and screening of 16S rRNA gene libraries
To construct a library of PCR amplified 16S rRNA genes fromDNA extracted from sediments, amplicons were ligated overnightat 4 1C into the pGEM-T Easy vector (Promega) and introducedby transformation into Escherichia coli DH5a competent cells.Ligation and transformation were carried out as recommended bythe manufacturer (Promega). Transformed cells were selectedonto Luria Bertani (LB) plates containing 100 mg ampicillin ml�1
(sodium salt), X-gal (80 mg ml�1), and IPTG (0.5 mM), andincubated at 37 1C for 16 h. One-hundred white colonies fromeach library were randomly chosen and used for plasmidextraction with QIAprep spin miniprep kit (QIAgen). Purifiedplasmids were used in sequencing reactions with primer 27F.Sequencing reactions were performed using the BigDye termi-nator cycle sequencing reaction kit v1.1 (Applied Biosystems) andan ABI 3700 automated DNA sequencer (Applied Biosystems).
Electropherograms were visually inspected and sequenceswere assembled with BioEdit (http://www.mbio.ncsu.edu/BioEdit/bioedit.html) sequence alignment editor freeware (version7.0.5.3). All assembled sequences were examined for chimericartifacts using CHIMERA CHECK from the Ribosomal DatabaseProject II (RDP) (Cole et al., 2005) and potentially chimericsequences were discarded. Sequences were aligned on theRibosomal Database Project (RDP-II) server and groupedaccording to sequence similarity using DOTUR software (Schlossand Handelsman, 2005), applying the furthest neighbor assign-ment algorithms with a PHYLIP distance matrix as input file.Sequences with 97% similarity were treated as a single OTU.Sequences (one for each OTU) were aligned with the 16S rDNA
sequences of their closest cultured organisms from RibosomalDatabase Project (RDP-II) and NCBI databases, using ClustalW(Thompson et al., 1994). Program alignments were evaluated byneighbor-joining using MEGA3 (Kumar et al., 2004). Phylogeneticinference and evolutionary distance calculations were generatedusing the Jukes–Cantor distance model; 1000 bootstrap replicateswere used to obtain confidence estimates for the phylogenetictrees.
2.6. Nucleotide sequence accession numbers
The nucleotide sequences obtained were deposited in Gen-Bank/DDBJ/EMBL databases under accession numbers fromEU857836 to EU858006.
2.7. Data analysis
2.7.1. Statistical analysis
Comparison between groups for a significant difference ofmean or rank values were performed after normality and variancetests by analysis of variance (ANOVA, Krustal–Wallis method) andthe relative importance of each treatment group was investigatedby ad hoc pairwise multiple comparison procedure (Tukey test).Calculations were carried out using SigmaStat software forWindows, version 3.1 (Copyright 1992–1995, Jandel Corporation).Data were also correlated to measure the associations betweenpairs of variable.
Physical (depth), chemical (elemental and biochemical com-position), biological (enzymatic activities, log transformed bacter-ial abundances as well as richness, and the diversity indicescomputed on T-RFLP results) data were used for the principalcomponent analysis (PCA).
Analysis of similarities (ANOSIM) was also carried out. Suchanalysis provides a method to assess statistical differencesbetween groups in multivariate data sets, and produces a samplestatistic, R, which represents the degree of separation betweentest groups (Clarke, 1993). A value close to 1 indicates thecommunity composition is totally different, whereas a value of 0indicates no difference. ANOSIM was used with the geographicallocation as factor.
Moreover, the influence of abiotic variables on the communitystructure was assessed using the BEST analysis in PRIMER 6(Clarke and Gorley, 2006). The BEST analysis selects the environ-mental variables that may explain biotic patterns by using everypossible combination of abiotic and biotic variables until it findsthe ‘best’ fit.
2.7.2. Diversity indices
In order to investigate the bacterial diversity both for T-RFLPand clones outputs, the Margalef richness index (d; Margalef,1958) as well as the Shannon–Wiener index (H0; Magurran, 1996),were calculated assuming that the number of peaks representedan indication of species distribution (ribotype richness) and thatthe peak heights represented the relative abundance of eachbacterial species (Hughes et al., 2001). The Shannon index is ageneral diversity index that is positively correlated with speciesrichness and evenness, and is more sensitive to change inabundance of rare species. Margalef richness index standardizesthe number of species encountered against the total number ofindividuals encountered. Finally, the evenness (Pielou index, J),which reflects the relative importance of each taxon within theentire assemblage, was also computed (Danovaro et al., 2006).
In particular, for T-RFLP bacterial phylotype/genotype richnesswas expressed as the total number of peaks within eachelectropherogram, and the two indices were computed on the
F. Baldi et al. / Continental Shelf Research 30 (2010) 1614–16251618
basis of peak heights of each T-RF used as an estimator of relativeabundance of each detected genotype. These calculations wereperformed using Primer 6 software, version 6b R6 (Copyright2004, PRIMER-E Ltd.).
Coverage values were calculated in order to determine howefficiently the clone libraries described the complexity of theoriginal bacterial community. The coverage (Good, 1953) value isgiven as C¼1�(n1/N) where n1 is the number of clones whichoccurred only once in the library (singletons).
Species richness based on the non-parametric richness estimatorChao1 (Chao, 1987) and abundance-based coverage estimators (ACE)(Chao and Lee, 1992) were calculated for the two clone libraries byEstimateS program (Version 7.5, http://viceroy.eeb.uconn.edu/EstimateS) (Colwell, 2005). Clone libraries diversity calculations weremade on the basis of 3% difference between sequences.
3. Results
3.1. Sediment characterization
3.1.1. Elemental composition of sediment
The grain-size of sediments ranged from coarse to fine sands(Dunbar et al., 1985). Overall, water content ranged from 12.0% to35.8% at station D and E, respectively. Low concentrations of bothTC (range 0.15–1.08%) and N (0.01–0.12%) were detected in allsamples (Table 1). The highest and lowest OC and TC values weredetermined at Gerlache Inlet (0.91% and 0.11% at stations E and F,respectively) with a significant increase with water depth, due tonatural carbon exportation by pycnoclinic currents (Frignani et al.,2003). IC concentration was negligible at almost all the stations.P amounts resulted between 252 (station C at Adelie Cove) and1425 mg g�1 d.w. (station A at Tethys Bay). The organic molarcarbon/nitrogen (C/N) ratio ranged from 6.88 to 20.99 (mean11.3174.64). N content was correlated with OC (r¼0.971;Po0.001; n¼7) and PRT (r¼0.919; Po0.005; n¼7).
3.1.2. Biochemical composition of sediment organic matter
Biochemical features of Antarctic sediments are reported inTable 1. The highest values were measured at Tethys Bay (stationsA and B). PRT concentrations ranged from 6075 mg (mean7standard deviation; MD7SD) to 1042745 mg in BSA equivalentsg�1 d.w. LIP concentrations ranged from 5074 to 306719 mg intripalmitin equivalents, while CHO values ranged from 570.5 to284721 mg in D(+)-glucose equivalents. For all the three
Table 1Elemental and biochemical composition of Antarctic shallow sediments along the Terr
Station Bottom
depth (m)
Elemental composition a
WC (%) TC (%) OC (%) IC (%) N (%) C
Tethys Bay
A 20 28.0 0.50 0.50 nd 0.07
B 20 26.8 0.42 0.42 nd 0.07
Adelie cove
C 27 22.3 0.31 0.35 nd 0.04
Malippo pier
D 19 12.0 0.29 0.18 0.11 0.01 2
Gerlache inlet
E 66 35.8 1.08 0.91 0.17 0.12
F 31 14.8 0.15 0.11 0.04 0.01 1
G 48 24.9 0.73 0.53 0.20 0.06 1
a WC: water content; TC: total carbon (TC); OC: organic carbon; IC: inorganic carb
nd: not detectable.b PTR: protein content (mg BSA g�1 d.w.); CHO: carbohydrate content (mg D-(+)-g
(mg DNA g�1 d.w.).
analyses, ANOVA data indicated that there was a statisticallysignificant difference (Po0.001). The PRT:CHO ratio was always41, ranging from 1.4 to 12.1, whereas the LIP/CHO ratio wasbetween 0.9 and 10.0.
DNA content resulted higher at Tethys Bay (stations A and B)than at the other stations, with the minimum value (0.05 mgDNA g�1 d.w.) recorded at station F at Gerlache Inlet.
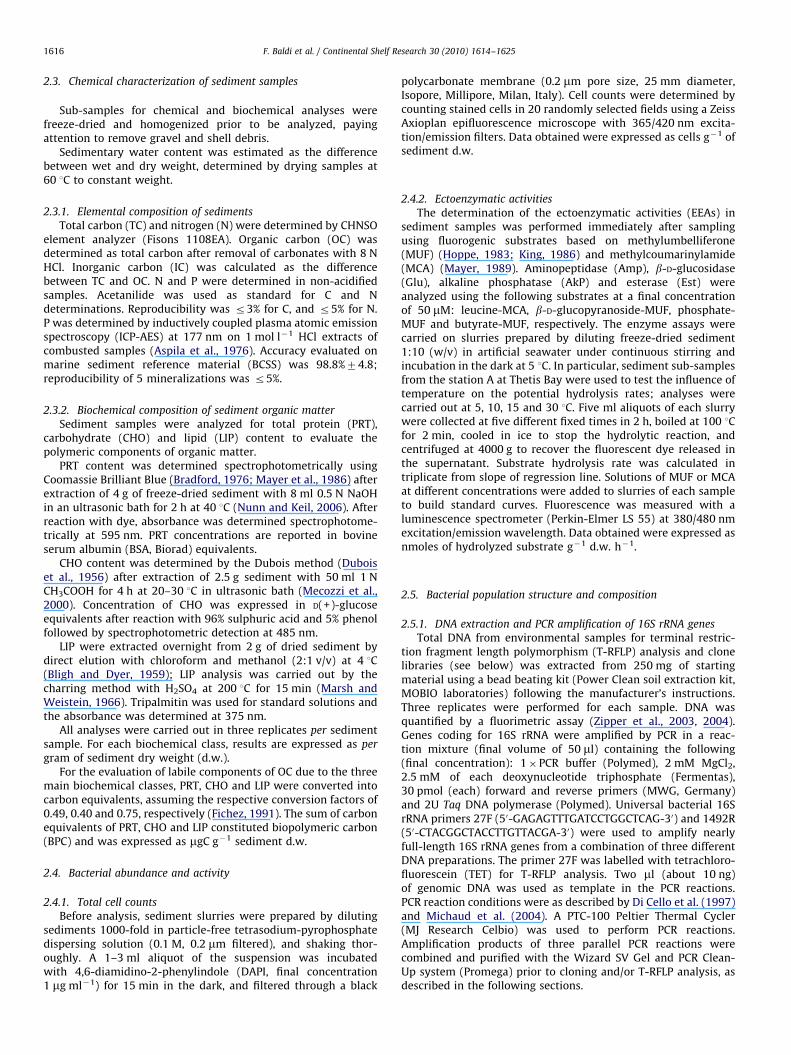
The fraction of BPC in OC ranged from 4.1% to 19.9% at stationsB and E, respectively, and the average was 9.6%76.0. The highestBPC values were detected in sediments from stations A(790.9736.7 mg C g�1 d.w.) and B (834.4740.0 mg C g�1 d.w.),where concentrations were approximately 2.5 times higher thanin sediments from C, E and G, and approximately 10 times higherthan in samples from D and F (Fig. 2).
When considering the whole dataset on the biochemicalcomposition of sediment organic matter, PRT represented thedominant biochemical class contributing to labile organic carbon.This general trend was obtained for all stations. The averagepercentage composition of BPC was as regard to PRT 52.2%710.7,with a range from 33.9% to 64.6% (stations D and A, respectively).LIP accounted for 25.1–52.7% (stations A and F, respectively)(mean 36.5%710.7); the average of CHO was 11.3%76.7, with arange from 3.0% to 20.1% (stations F and C, respectively).
A significant correlation was found between PRT and LIP(r¼0.957; Po0.001; n¼7).
3.2. Bacterial abundance and activity
3.2.1. Total cell counts
Higher bacterial abundances were determined at Tethys Bay(station A: 3.6�10778.5�104 cells g�1 d.w.; station B:4.3�10771.2�105 cells g�1 d.w.), Adelie Cove (station C:3.9�10771.3�105 cells g�1 d.w.) and Malippo pier(station D: 3.3�10776.8�104 cells g�1 d.w.). By contrast, allstations located at Gerlache Inlet were characterized by slightlylower values (station E: 2.2�10771.8�105 cells g�1 d.w.;station F: 6.1�10671.1�104 cells g�1 d.w.; station G:1.4�10774.2�104 cells g�1 d.w.). ANOVA results highlightedthat there was a statistically significant difference (Po0.001), andthe subsequent pairwise multiple comparison test (Tukey Test)confirmed that all samples were significantly different (Po0.05).
At almost all stations, a significant positive correlation wascomputed between total bacterial counts and both CHO (r¼0.838;Po0.05; n¼7) and PRT (r¼0.954; Po0.01; n¼5), with theexception in the latter case of stations C and D.
a Nova Bay.
Biochemical compositionb
/N P (mg g�1) PRT CHO LIP DNA
8.51 1425 1042745 204710 284721 2.4770.92
6.88 1007 1034744 284719 306719 1.2170.21
9.37 252 312723 157710 13777 0.6670.01
0.99 839 6975 4876 6775 0.0370.00
8.57 721 445728 7773 17278 0.3370.01
0.69 536 6075 570.5 5074 0.0570.00
0.30 641 395730 4178 216719 0.9170.11
on (IC); N: total nitrogen; carbon/nitrogen molar ratio (C/N); P: total phosphorus;
lucose g�1 d.w.); LIP: lipid content (mg tripalmitin g�1 d.w.); DNA: DNA content
A
B
C
D
E
F
G
Sta
tion
BPC (µg C g-1 d.w.)
PRT
CHO
LIP
0 200 400 600 800 1000
Fig. 2. Stacked histograms of sedimentary (1 cm) concentrations at each sampling
station of three biochemical classes: proteins (PRT), carbohydrates (CHO) and
lipids (LIP). Results are expressed as carbon equivalents to obtain biopolymeric
content (BPC; mgC g�1 sedimentary dry weight). Bars represent standard
deviations of triplicate measurements.
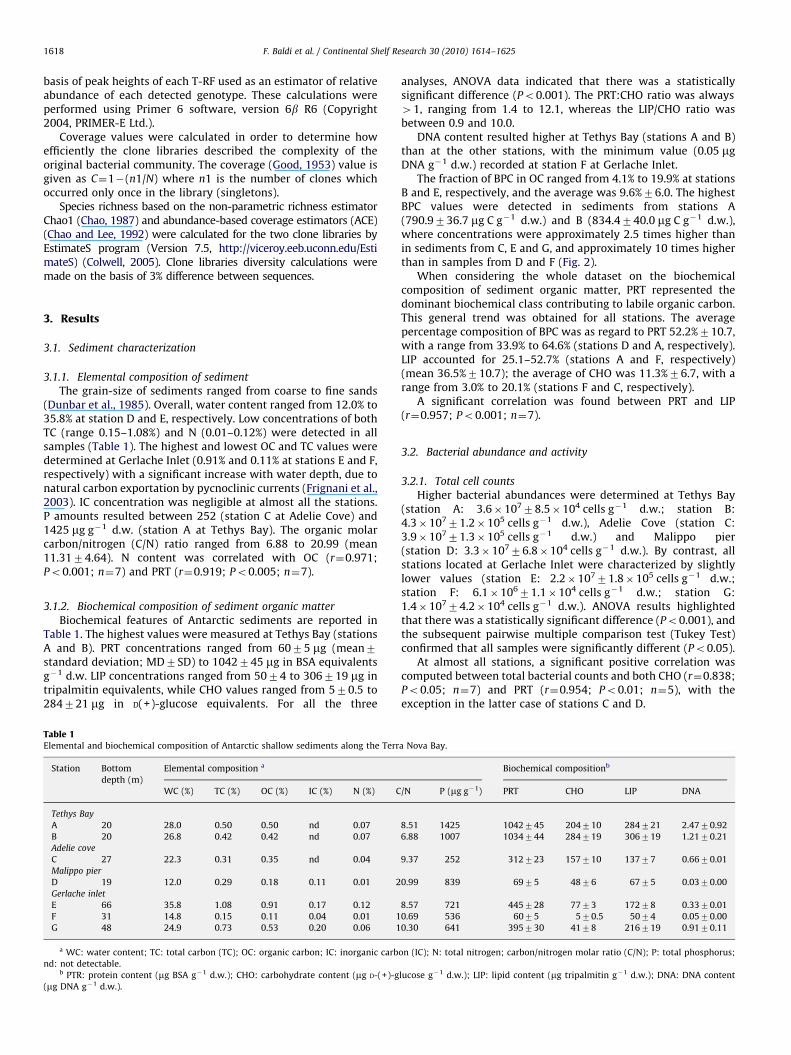
Fig. 3. Determination at 5 1C of ectoenzymatic activities (nmoles g�1 h�1) in
sediments collected along Terra Nova Bay. (a) amino-peptidase (Amp); (b) beta-
glucosidase (Glu); (c) esterase (Est); (d) alkaline phosphatase (AkP). Bars represent
standard deviations of triplicate measurements. Note the different scales.
F. Baldi et al. / Continental Shelf Research 30 (2010) 1614–1625 1619
3.2.2. Ectoenzymatic activities
Results on the EEAs are presented in Fig. 3. The highestpotential Amp activities were found on average at stations A and Bat Tethys Bay with 9.770.7 and 10.670.6 nmoles g�1 h�1,respectively (Fig. 3a). Conversely, the lowest activities weredetected at station F at Gerlache Inlet (0.3 nmoles g�1 h�1 d.w.),which was characterized by coarse sand and showed the lowestbacterial abundance, and at station D at Malippo pier(0.7 nmoles g�1 h�1 d.w.).
A similar pattern was followed by the Glu activities (Fig. 3b).The highest values were again determined in samples fromstations A and B (7.070.3 and 7.270.4 nmoles g�1 h�1 d.w.,respectively) which were characterized by the highest carbohy-drate content.
Est activities resulted about one order of magnitude higherthan those of Amp, Glu and AkP in each sample (Fig. 3c). TheEst:Glu ratio ranged from 25:1 (station A at Tethys Bay) to 947:1(station D at Malippo pier); the Est:Amp ratio was 18:1 (station Aat Tethys Bay) to 116:1 (station D at Malippo pier); finally, theEst:AkP ratio resulted between 8:1 and 55:1 (stations E and Fat Gerlache Inlet, respectively). The highest Est values werefound at stations A and B at Tethys Bay (205.078.9 and176.4714.1 nmoles g�1 h�1 d.w., respectively), and at thedeepest station G at Gerlache Inlet (164.878.1 nmoles g�1 h�1
d.w.). At stations C, D and E the average Est activity was98.876.1 nmoles g�1 h�1 d.w. The lowest rate was measured atstation F (28.273.8 nmoles g�1 h�1 d.w.) which was character-ized by the lowest bacterial abundance.
Contrary to the other ectoenzymatic activities analyzedthroughout this study, the highest AkP activity was found atstations B at Tethys Bay and E at Gerlache Inlet (13.971.3 and13.570.5 nmoles g�1 h�1 d.w., respectively) (Fig. 3d). The lowestactivity (0.570.1 nmoles g�1 h�1 d.w.) was measured at stationF. The average AkP activity at the remaining stations (A, C, D andG) was 4.171.4 nmoles g�1 h�1 d.w.
The ANOVA data computed for each individual EEA highlightedthat there was an overall statistically significant difference(Po0.001); the further pairwise multiple comparison test (TukeyTest) confirmed that almost all samples were significantlydifferent (Po0.05).
The EEAs determined at 5 1C provided the potential hydrolyticactivity that may occur at each station in relation to the BPCbiochemical classes. Furthermore, data obtained at four different
F. Baldi et al. / Continental Shelf Research 30 (2010) 1614–16251620
temperatures (5, 10, 15 and 30 1C) on sediments from station A(Tethys Bay) are presented as an Arrhenius plot (Fig. S1). Such atest revealed that between 5 and 15 1C the Q10 was 3.1 for AkP,2.78 for Glu, 2.51 for Est and 2.49 for Amp. Values determined at30 and 15 1C were very similar one to each other.
3.3. Bacterial populations structure and composition
3.3.1. T-RFLP analysis
The size of fragments obtained by T-RFLP analysis rangedbetween 30 and 500 bp (not shown). The highest numbers ofT-RFs were retrieved in sample G from Gerlache Inlet (79 and 70with HinfI and TaqI, respectively), whereas the lowest ones weredisclosed in sample A from Tethys Bay (26 and 31 for with HinfIand TaqI, respectively). The number of T-RFs found in the otherstations was comprised between 29 and 70, and between 33 and52 for HinfI and TaqI, respectively (not shown).
All T-RFLP patterns were aligned as described in Section 2. Thematrices obtained from the dataset of the two restrictiondigestions were used to calculate the Jaccard similarity coeffi-cients that were used to perform clustering.
Cluster analysis computed for the HinfI T-RF pattern revealedthat the two Tethys Bay sampling stations (A and B) formed aunique cluster (Jaccard¼0.19), while other stations (namely G, C,E and F) constituted a more heterogeneous group. Within thislatter cluster, stations E and F were the most similar(Jaccard¼0.23). Lastly, station D clustered as an outgroup beingthe most dissimilar sample with an average Jaccard index of 0.13.
Two well definite clusters were observed for the TaqI T-RFpatterns. The first included stations A, B and F. Among these, thefirst two fell into a subcluster (Jaccard¼0.33). The second cluster,that included stations C, D, E and G, was composed of twosubclusters: one composed of stations D and E (Jaccard¼0.32) andthe second composed of stations C and G (Jaccard¼0.25).
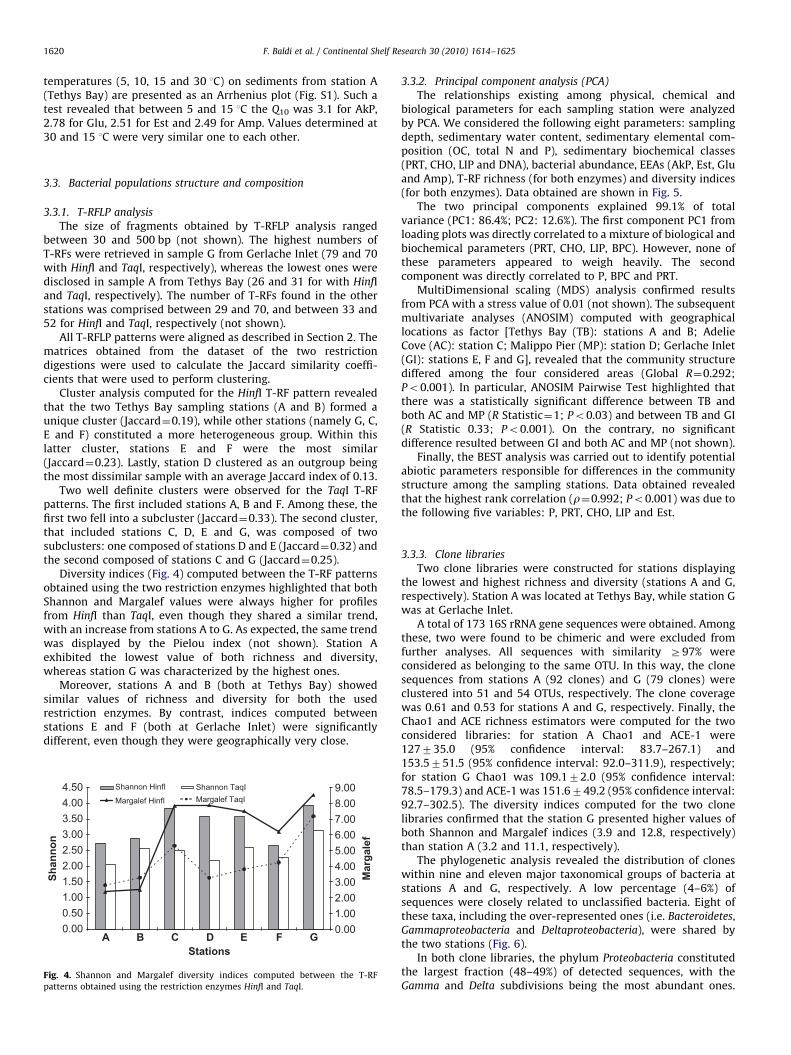
Diversity indices (Fig. 4) computed between the T-RF patternsobtained using the two restriction enzymes highlighted that bothShannon and Margalef values were always higher for profilesfrom HinfI than TaqI, even though they shared a similar trend,with an increase from stations A to G. As expected, the same trendwas displayed by the Pielou index (not shown). Station Aexhibited the lowest value of both richness and diversity,whereas station G was characterized by the highest ones.
Moreover, stations A and B (both at Tethys Bay) showedsimilar values of richness and diversity for both the usedrestriction enzymes. By contrast, indices computed betweenstations E and F (both at Gerlache Inlet) were significantlydifferent, even though they were geographically very close.
0.000.501.001.502.002.503.003.504.004.50
AStations
Shannon
0.001.002.003.004.005.006.007.008.009.00
Margalef
Shannon HinfI Shannon TaqI
Margalef HinfI Margalef TaqI
B C D E F G
Fig. 4. Shannon and Margalef diversity indices computed between the T-RF
patterns obtained using the restriction enzymes HinfI and TaqI.
3.3.2. Principal component analysis (PCA)
The relationships existing among physical, chemical andbiological parameters for each sampling station were analyzedby PCA. We considered the following eight parameters: samplingdepth, sedimentary water content, sedimentary elemental com-position (OC, total N and P), sedimentary biochemical classes(PRT, CHO, LIP and DNA), bacterial abundance, EEAs (AkP, Est, Gluand Amp), T-RF richness (for both enzymes) and diversity indices(for both enzymes). Data obtained are shown in Fig. 5.
The two principal components explained 99.1% of totalvariance (PC1: 86.4%; PC2: 12.6%). The first component PC1 fromloading plots was directly correlated to a mixture of biological andbiochemical parameters (PRT, CHO, LIP, BPC). However, none ofthese parameters appeared to weigh heavily. The secondcomponent was directly correlated to P, BPC and PRT.
MultiDimensional scaling (MDS) analysis confirmed resultsfrom PCA with a stress value of 0.01 (not shown). The subsequentmultivariate analyses (ANOSIM) computed with geographicallocations as factor [Tethys Bay (TB): stations A and B; AdelieCove (AC): station C; Malippo Pier (MP): station D; Gerlache Inlet(GI): stations E, F and G], revealed that the community structurediffered among the four considered areas (Global R¼0.292;Po0.001). In particular, ANOSIM Pairwise Test highlighted thatthere was a statistically significant difference between TB andboth AC and MP (R Statistic¼1; Po0.03) and between TB and GI(R Statistic 0.33; Po0.001). On the contrary, no significantdifference resulted between GI and both AC and MP (not shown).
Finally, the BEST analysis was carried out to identify potentialabiotic parameters responsible for differences in the communitystructure among the sampling stations. Data obtained revealedthat the highest rank correlation (r¼0.992; Po0.001) was due tothe following five variables: P, PRT, CHO, LIP and Est.
3.3.3. Clone libraries
Two clone libraries were constructed for stations displayingthe lowest and highest richness and diversity (stations A and G,respectively). Station A was located at Tethys Bay, while station Gwas at Gerlache Inlet.
A total of 173 16S rRNA gene sequences were obtained. Amongthese, two were found to be chimeric and were excluded fromfurther analyses. All sequences with similarity Z97% wereconsidered as belonging to the same OTU. In this way, the clonesequences from stations A (92 clones) and G (79 clones) wereclustered into 51 and 54 OTUs, respectively. The clone coveragewas 0.61 and 0.53 for stations A and G, respectively. Finally, theChao1 and ACE richness estimators were computed for the twoconsidered libraries: for station A Chao1 and ACE-1 were127735.0 (95% confidence interval: 83.7–267.1) and153.5751.5 (95% confidence interval: 92.0–311.9), respectively;for station G Chao1 was 109.172.0 (95% confidence interval:78.5–179.3) and ACE-1 was 151.6749.2 (95% confidence interval:92.7–302.5). The diversity indices computed for the two clonelibraries confirmed that the station G presented higher values ofboth Shannon and Margalef indices (3.9 and 12.8, respectively)than station A (3.2 and 11.1, respectively).
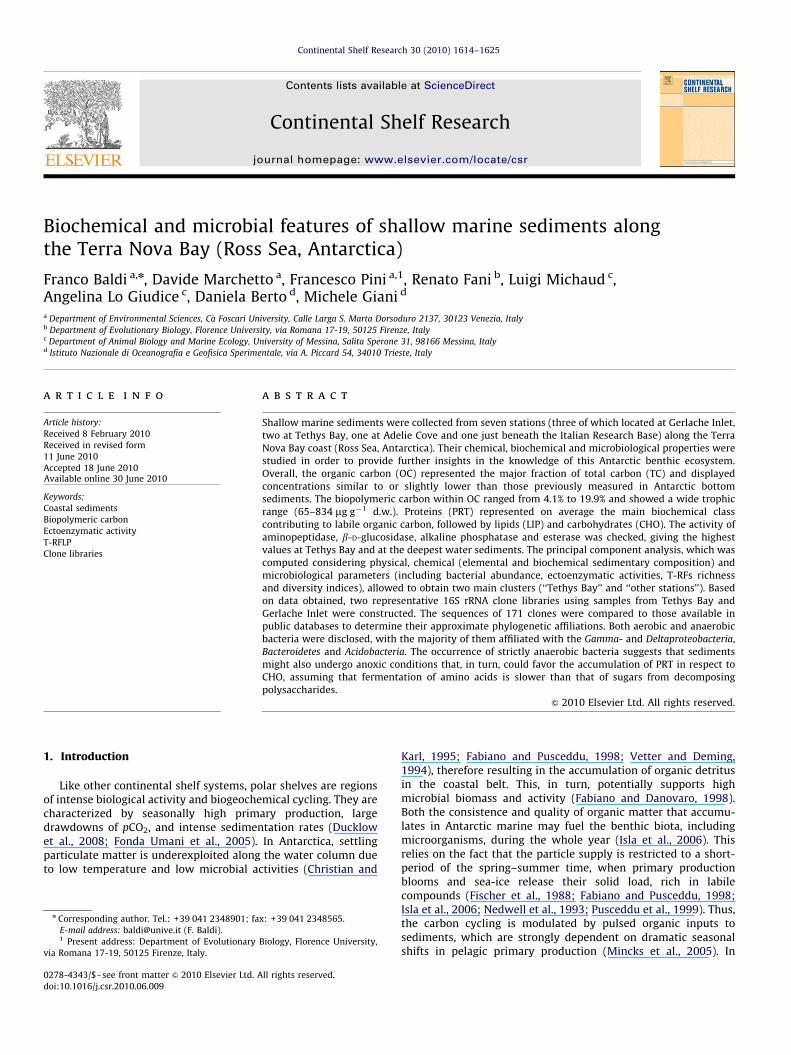
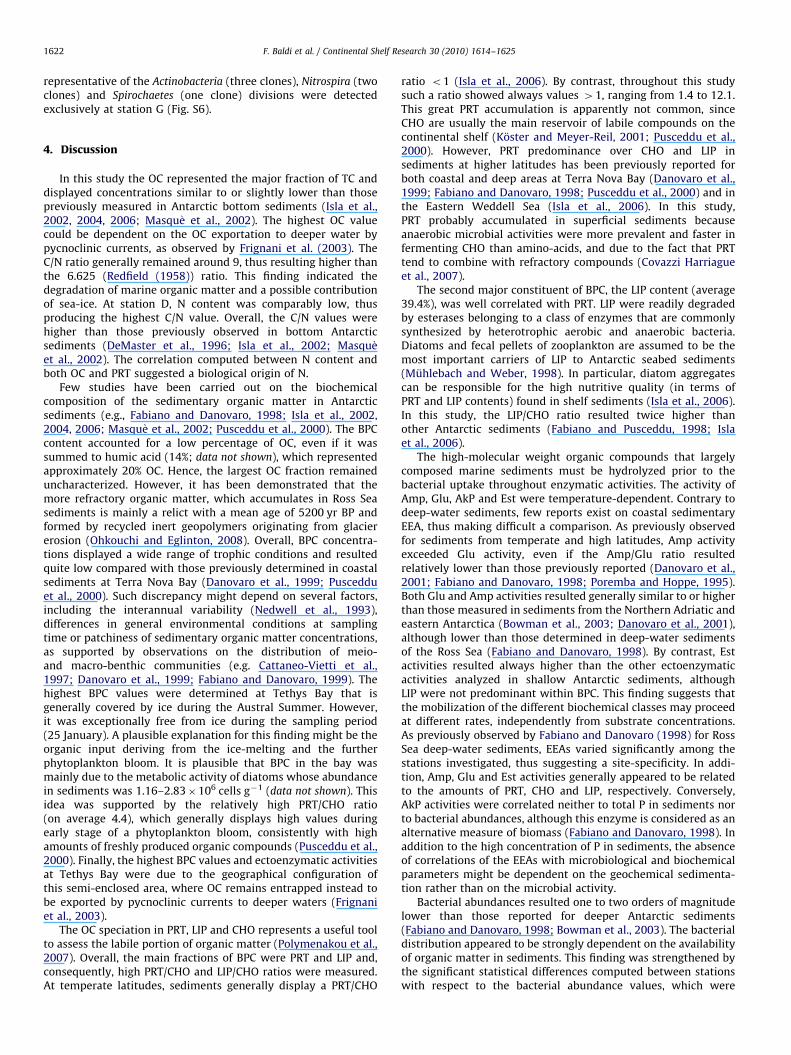
The phylogenetic analysis revealed the distribution of cloneswithin nine and eleven major taxonomical groups of bacteria atstations A and G, respectively. A low percentage (4–6%) ofsequences were closely related to unclassified bacteria. Eight ofthese taxa, including the over-represented ones (i.e. Bacteroidetes,Gammaproteobacteria and Deltaproteobacteria), were shared bythe two stations (Fig. 6).
In both clone libraries, the phylum Proteobacteria constitutedthe largest fraction (48–49%) of detected sequences, with theGamma and Delta subdivisions being the most abundant ones.
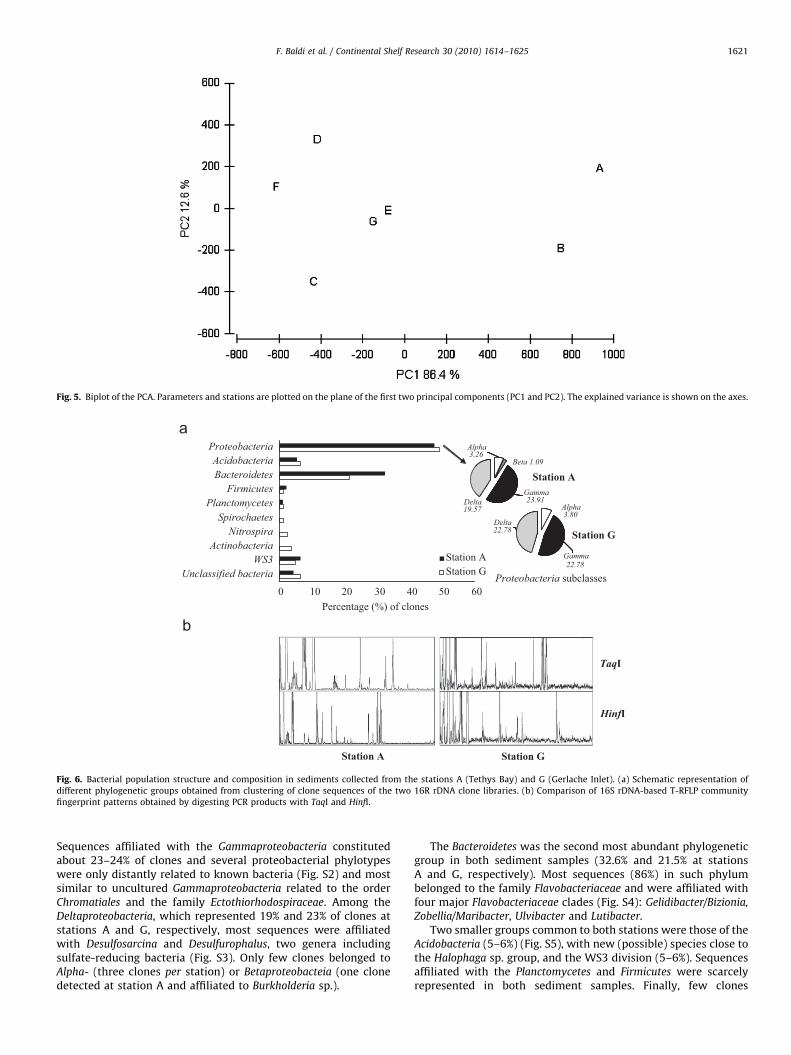
Fig. 5. Biplot of the PCA. Parameters and stations are plotted on the plane of the first two principal components (PC1 and PC2). The explained variance is shown on the axes.
Station A Station G
TaqI
HinfI
Percentage (%) of clones 0
WS3
ProteobacteriaAcidobacteriaBacteroidetes
FirmicutesPlanctomycetes
SpirochaetesNitrospira
Actinobacteria
Unclassified bacteriaStation AStation G
Delta 19.57
Beta 1.09
Alpha 3.26
Gamma23.91
Delta 22.78
Alpha 3.80
Gamma 22.78
Station G
Station A
Proteobacteria subclasses10 20 30 40 50 60
Fig. 6. Bacterial population structure and composition in sediments collected from the stations A (Tethys Bay) and G (Gerlache Inlet). (a) Schematic representation of
different phylogenetic groups obtained from clustering of clone sequences of the two 16R rDNA clone libraries. (b) Comparison of 16S rDNA-based T-RFLP community
fingerprint patterns obtained by digesting PCR products with TaqI and HinfI.
F. Baldi et al. / Continental Shelf Research 30 (2010) 1614–1625 1621
Sequences affiliated with the Gammaproteobacteria constitutedabout 23–24% of clones and several proteobacterial phylotypeswere only distantly related to known bacteria (Fig. S2) and mostsimilar to uncultured Gammaproteobacteria related to the orderChromatiales and the family Ectothiorhodospiraceae. Among theDeltaproteobacteria, which represented 19% and 23% of clones atstations A and G, respectively, most sequences were affiliatedwith Desulfosarcina and Desulfurophalus, two genera includingsulfate-reducing bacteria (Fig. S3). Only few clones belonged toAlpha- (three clones per station) or Betaproteobacteia (one clonedetected at station A and affiliated to Burkholderia sp.).
The Bacteroidetes was the second most abundant phylogeneticgroup in both sediment samples (32.6% and 21.5% at stationsA and G, respectively). Most sequences (86%) in such phylumbelonged to the family Flavobacteriaceae and were affiliated withfour major Flavobacteriaceae clades (Fig. S4): Gelidibacter/Bizionia,
Zobellia/Maribacter, Ulvibacter and Lutibacter.Two smaller groups common to both stations were those of the
Acidobacteria (5–6%) (Fig. S5), with new (possible) species close tothe Halophaga sp. group, and the WS3 division (5–6%). Sequencesaffiliated with the Planctomycetes and Firmicutes were scarcelyrepresented in both sediment samples. Finally, few clones
F. Baldi et al. / Continental Shelf Research 30 (2010) 1614–16251622
representative of the Actinobacteria (three clones), Nitrospira (twoclones) and Spirochaetes (one clone) divisions were detectedexclusively at station G (Fig. S6).
4. Discussion
In this study the OC represented the major fraction of TC anddisplayed concentrations similar to or slightly lower than thosepreviously measured in Antarctic bottom sediments (Isla et al.,2002, 2004, 2006; Masqu�e et al., 2002). The highest OC valuecould be dependent on the OC exportation to deeper water bypycnoclinic currents, as observed by Frignani et al. (2003). TheC/N ratio generally remained around 9, thus resulting higher thanthe 6.625 (Redfield (1958)) ratio. This finding indicated thedegradation of marine organic matter and a possible contributionof sea-ice. At station D, N content was comparably low, thusproducing the highest C/N value. Overall, the C/N values werehigher than those previously observed in bottom Antarcticsediments (DeMaster et al., 1996; Isla et al., 2002; Masqu�eet al., 2002). The correlation computed between N content andboth OC and PRT suggested a biological origin of N.
Few studies have been carried out on the biochemicalcomposition of the sedimentary organic matter in Antarcticsediments (e.g., Fabiano and Danovaro, 1998; Isla et al., 2002,2004, 2006; Masqu�e et al., 2002; Pusceddu et al., 2000). The BPCcontent accounted for a low percentage of OC, even if it wassummed to humic acid (14%; data not shown), which representedapproximately 20% OC. Hence, the largest OC fraction remaineduncharacterized. However, it has been demonstrated that themore refractory organic matter, which accumulates in Ross Seasediments is mainly a relict with a mean age of 5200 yr BP andformed by recycled inert geopolymers originating from glaciererosion (Ohkouchi and Eglinton, 2008). Overall, BPC concentra-tions displayed a wide range of trophic conditions and resultedquite low compared with those previously determined in coastalsediments at Terra Nova Bay (Danovaro et al., 1999; Puscedduet al., 2000). Such discrepancy might depend on several factors,including the interannual variability (Nedwell et al., 1993),differences in general environmental conditions at samplingtime or patchiness of sedimentary organic matter concentrations,as supported by observations on the distribution of meio-and macro-benthic communities (e.g. Cattaneo-Vietti et al.,1997; Danovaro et al., 1999; Fabiano and Danovaro, 1999). Thehighest BPC values were determined at Tethys Bay that isgenerally covered by ice during the Austral Summer. However,it was exceptionally free from ice during the sampling period(25 January). A plausible explanation for this finding might be theorganic input deriving from the ice-melting and the furtherphytoplankton bloom. It is plausible that BPC in the bay wasmainly due to the metabolic activity of diatoms whose abundancein sediments was 1.16–2.83�106 cells g�1 (data not shown). Thisidea was supported by the relatively high PRT/CHO ratio(on average 4.4), which generally displays high values duringearly stage of a phytoplankton bloom, consistently with highamounts of freshly produced organic compounds (Pusceddu et al.,2000). Finally, the highest BPC values and ectoenzymatic activitiesat Tethys Bay were due to the geographical configuration ofthis semi-enclosed area, where OC remains entrapped instead tobe exported by pycnoclinic currents to deeper waters (Frignaniet al., 2003).
The OC speciation in PRT, LIP and CHO represents a useful toolto assess the labile portion of organic matter (Polymenakou et al.,2007). Overall, the main fractions of BPC were PRT and LIP and,consequently, high PRT/CHO and LIP/CHO ratios were measured.At temperate latitudes, sediments generally display a PRT/CHO
ratio o1 (Isla et al., 2006). By contrast, throughout this studysuch a ratio showed always values 41, ranging from 1.4 to 12.1.This great PRT accumulation is apparently not common, sinceCHO are usually the main reservoir of labile compounds on thecontinental shelf (Koster and Meyer-Reil, 2001; Pusceddu et al.,2000). However, PRT predominance over CHO and LIP insediments at higher latitudes has been previously reported forboth coastal and deep areas at Terra Nova Bay (Danovaro et al.,1999; Fabiano and Danovaro, 1998; Pusceddu et al., 2000) and inthe Eastern Weddell Sea (Isla et al., 2006). In this study,PRT probably accumulated in superficial sediments becauseanaerobic microbial activities were more prevalent and faster infermenting CHO than amino-acids, and due to the fact that PRTtend to combine with refractory compounds (Covazzi Harriagueet al., 2007).
The second major constituent of BPC, the LIP content (average39.4%), was well correlated with PRT. LIP were readily degradedby esterases belonging to a class of enzymes that are commonlysynthesized by heterotrophic aerobic and anaerobic bacteria.Diatoms and fecal pellets of zooplankton are assumed to be themost important carriers of LIP to Antarctic seabed sediments(Muhlebach and Weber, 1998). In particular, diatom aggregatescan be responsible for the high nutritive quality (in terms ofPRT and LIP contents) found in shelf sediments (Isla et al., 2006).In this study, the LIP/CHO ratio resulted twice higher thanother Antarctic sediments (Fabiano and Pusceddu, 1998; Islaet al., 2006).
The high-molecular weight organic compounds that largelycomposed marine sediments must be hydrolyzed prior to thebacterial uptake throughout enzymatic activities. The activity ofAmp, Glu, AkP and Est were temperature-dependent. Contrary todeep-water sediments, few reports exist on coastal sedimentaryEEA, thus making difficult a comparison. As previously observedfor sediments from temperate and high latitudes, Amp activityexceeded Glu activity, even if the Amp/Glu ratio resultedrelatively lower than those previously reported (Danovaro et al.,2001; Fabiano and Danovaro, 1998; Poremba and Hoppe, 1995).Both Glu and Amp activities resulted generally similar to or higherthan those measured in sediments from the Northern Adriatic andeastern Antarctica (Bowman et al., 2003; Danovaro et al., 2001),although lower than those determined in deep-water sedimentsof the Ross Sea (Fabiano and Danovaro, 1998). By contrast, Estactivities resulted always higher than the other ectoenzymaticactivities analyzed in shallow Antarctic sediments, althoughLIP were not predominant within BPC. This finding suggests thatthe mobilization of the different biochemical classes may proceedat different rates, independently from substrate concentrations.As previously observed by Fabiano and Danovaro (1998) for RossSea deep-water sediments, EEAs varied significantly among thestations investigated, thus suggesting a site-specificity. In addi-tion, Amp, Glu and Est activities generally appeared to be relatedto the amounts of PRT, CHO and LIP, respectively. Conversely,AkP activities were correlated neither to total P in sediments norto bacterial abundances, although this enzyme is considered as analternative measure of biomass (Fabiano and Danovaro, 1998). Inaddition to the high concentration of P in sediments, the absenceof correlations of the EEAs with microbiological and biochemicalparameters might be dependent on the geochemical sedimenta-tion rather than on the microbial activity.
Bacterial abundances resulted one to two orders of magnitudelower than those reported for deeper Antarctic sediments(Fabiano and Danovaro, 1998; Bowman et al., 2003). The bacterialdistribution appeared to be strongly dependent on the availabilityof organic matter in sediments. This finding was strengthened bythe significant statistical differences computed between stationswith respect to the bacterial abundance values, which were
F. Baldi et al. / Continental Shelf Research 30 (2010) 1614–1625 1623
generally reflected by the BPC content. Based on the significantpositive correlation obtained between total bacterial counts andPRT, it could assumed that part of N was very likely originatedfrom microbial abundance.
In the present study, we report for the first time on thebiodiversity and community structure of benthic microbialcommunity inhabiting Terra Nova Bay, thus gaining furtherunderstanding of the under-investigated microbiology of coastalpolar sediments. The analysis of the 16S rRNA gene clone librariesrevealed a rich phylogenetic diversity and an evident sequences-sharing between stations. Overall, sequences fell into twelvemajor bacterial phylogenetic lineages including Alpha-, Beta-,Delta- and Gammaproteobacteria, Acidobacteria, Bacteroidetes,Actinobacteria, Firmicutes, Planctomycetes, Spirochaetes, Nitrospira
and WS3. Among these, clones affiliated to Spirochaetes, Nitrospira
and Actinobacteria occurred only in the Gerlache Inlet library. Atboth stations, Proteobacteria and Bacteroidetes were over-repre-sented. These data are in agreements with previous observationson Arctic (Li et al., 2009; Ravenschlag et al., 1999; Tian et al.,2009) and Antarctic (Bowman et al., 2003; Bowman and McCuaig,2003) sediments. The predominance of Proteobacteria wasreported in most surface marine sediments in polar environ-ments, where they represent 450% of the microbial biomass(Bowman et al., 2003; Li et al., 2009; Ravenschlag et al., 2001).Almost half of the proteobacterial clones were allocated in theDelta subclass (about 20% of the libraries). This finding is indisagreement with other investigations revealing Gammaproteo-
bacteria as the most significant clades in marine sedimentsworldwide (Bowman and McCuaig, 2003; Inagaki et al., 2003;Li et al., 2009; Polymenakou et al., 2005). However, members ofthe Deltaproteobacteria are mainly sulfate-reducers and sulfatereduction may account for up to 50% of organic matter degrada-tion in coastal marine sediments (Jørgensen, 1982). They wereprobably responsible for the sulfur, iron and phosphorousprecipitates which coated the siliceous and alumino-silicatesediments analyzed throughout this study (as determined byenergy dispersive X-ray analysis; data not shown). In particular,sequences were mainly affiliated with two genera, Desulforhopalus
and Desulfosarcina, whose members have been detected inAntarctica (Bowman and McCuaig, 2003; Purdy et al., 2003),Svalbard (Arctic) (Knoblauch et al., 1999; Ravenschlag et al., 1999)and Japan Trench (Li et al., 1999), highlighting their ubiquitouspresence in low-temperature marine sediments. The occurrenceof such strictly anaerobic bacteria suggests that sediments mightalso undergo anoxic conditions that could favor the accumulationof PRT in respect to CHO, assuming that fermentation of aminoacids is slower than that of sugars from decomposing poly-saccharides (Neira et al., 2001). The anoxia at surface sediments isstrengthened by the abundance of sequences affiliated toGammaproteobacteria Chromatiales and Ecthothiorhodospiraceae.Sulfides from Deltaproteobacteria are probably metabolized bysuch anaerobic photosynthetic bacteria of the sulfur cycle. Modestmicrobial productivity may therefore contribute to BPC produc-tivity, when shallow-water sediments are irradiated during theaustral summer.
In both 16S rRNA gene libraries, a conspicuous presence ofsequences affiliated with four Flavobacteriaceae marine clades wasdetermined. This finding suggests that in vivo degradation oforganic polymers in shallow-water Antarctic sediments may bemainly carried out by these bacteria, which are known for theirability to efficiently degrade many types of polysaccharides(Bowman and Nichols, 2005). Therefore, the concomitantoccurrence of low CHO content, scarce Glu activity and highabundance of Flavobacteria may derive from previous carbohy-drate consumption during the early summer algal bloom. Besides,low enzyme activity might be explained by the not prevalent
concentration of cellulose-like polysaccharides (substrate forbeta-glucosidase) in the analyzed sediments.
In conclusion, even though the highest concentrations of TC insediments were determined at higher water depths, the chemicalspeciation of OC within BPC indicated that major differencesbetween sediments were observed in the semi-enclosed TethysBay, where BPC accumulate due to its scarce exportation todeeper waters. The complex population structure consisted ofaerobic and anaerobic heterotrophic bacteria with the occurrenceof chemolithotrophs. Such a mixture demonstrated that surfacesediments may alternate from oxidizing to anoxic conditions andviceversa, thus affecting BPC degradation. However, the in situ
occurrence of a bacterial productivity based on S-cycle, especiallyduring dark period, cannot be a priori excluded. Iron and sulphurprecipitation on sediment particles was detected by EDX-SEManalysis (data not shown), suggesting that they might representsubstrata supplying energy to chemolithotrophic bacteria.
Acknowledgements
L. Michaud and A. Lo Giudice wish to thank Prof. GaetanoOdierna (University of Naple, Italy) and the crew of the boat‘‘Malippo’’, for assistance with sample collections, and to all of thestaff at ‘‘Mario Zucchelli’’ Station, for the logistic help and support,which made possible the Expedition. We are also grateful to twoanonymous reviewers for their helpful comments in improvingthe manuscript. This research was supported by grants from PNRA(Programma Nazionale di Ricerche in Antartide), Italian Ministryof Education and Research (PEA 2004, Research Project PNRA2004/1.6).
Appendix A. Supplementary Materials
Supplementary data associated with this article can be foundin the online version at doi:10.1016/j.csr.2010.06.009.
References
Albertelli, G., Cattaneo-Vietti, R., Chiantore, M., Pusceddu, A., Fabiano, M., 1998.Food availability to an Adamussium bed during the austral summer 1993/94(Terra Nova Bay, Ross Sea). J. Mar. Syst. 17, 425–434.
Aspila, K.I., Agemian, H., Chau, A.S.Y., 1976. A semi-automated method for thedetermination of inorganic, organic and total phosphate in sediments. Analyst101, 187–197.
Bahulikar, R.A., Kroth, P.G., 2008. The complex extracellular polysaccharide ofmainly chain-forming freshwater diatom species from epilithic biofilms. J.Phycol. 44, 1465–1475.
Bligh, E.G., Dyer, W.J., 1959. A rapid method of total lipid extraction andpurification. Can. J. Biochem. Phisiol. 37, 911–917.
Bowman, J.P., McCuaig, R.D., 2003. Biodiversity, community structural shifts, andbiogeography on prokaryotes within Antarctic continental shelf sediment.Appl. Environ. Microbiol. 69, 2463–2483.
Bowman, J.P., Nichols, D.S., 2005. Novel members of the family Flavobacteriaceaefrom Antarctic maritime habitats including Subsaximicrobium wynnwilliamsiigen. nov., sp. nov., Subsaximicrobium saxinquilinus sp. nov., Subsaxibacterbroadyi gen. nov., sp. nov., Lacinutrix copepodicola gen. nov., sp. nov., and novelspecies of the genera Bizionia, Gelidibacter and Gillisia. Int. J. Syst. Evol.Microbiol. 55, 1471–1486.
Bowman, J.P., McCammon, S.A., Gibson, J.A.E., Robertson, L., Nichols, P.D., 2003.Prokaryotic metabolic activity and community structure in Antarctic con-tinental shelf sediments. Appl. Environ. Microbiol. 69, 2448–2462.
Bradford, M.M., 1976. A rapid and sensitive method for quantitation of microgramquantities of protein utilizing the principle of protein-dye binding. Anal.Biochem. 72, 248–254.
Cattaneo-Vietti, R., Chiantore, M., Albertelli, G., 1997. The population structure andecology of the Antarctic scallop Adamussium colbecki at Terra Nova Bay (RossSe, Antarctica). Sci. Mar. 61, 15–24.
Chao, A., 1987. Estimating the population size for capture–recapture data withunequal catchability. Biometrics 43, 783–791.
F. Baldi et al. / Continental Shelf Research 30 (2010) 1614–16251624
Chao, A., Lee, S.-M., 1992. Estimating the number of classes via sample coverage. J.Am. Stat. Assoc. 87, 210–217.
Christian, J.-R., Karl, D.M., 1995. Bacterial ectoenzymes in marine waters: activityratios and temperature responses in three oceanic provinces. Limnol.Oceanogr. 40, 1042–1049.
Clarke, K.R., 1993. Non-parametric multivariate analyses of changes in communitystructure. Aust. J. Ecol. 18, 117–143.
Clarke, K.R., Gorley, R.N., 2006. PRIMER v6: User manual/tutorial, PRIMER-E,Plymouth.
Cole, J.R., Chai, B., Farris, R.J., Wang, Q., Kulam, S.A., McGarrell, D.M., Garrity, G.M.,Tiedje, J.M., 2005. The Ribosomal Database Project (RDP-II): sequences andtools for high-throughput rRNA analysis. Nucleic Acids Res., D294–D296.
Colwell, R.K., 2005. EstimateS: Statistical estimation of species richness and sharedspecies from samples. Version 7.5. User’s Guide and application published at:/http://purl.oclc.org/estimatesS.
Covazzi Harriague, A., Misic, C., Petrillo, M., Albertelli, G., 2007. Stressors affectingthe macrobenthic community in Rapallo Harbour (Ligurian Sea, Italy). Sci. Mar.71, 705–714.
Danovaro, R., Luna, G.M., Dell’Anno, A., Pietrangeli, B., 2006. Comparison of twofingerprinting techniques, terminal restriction fragment length polymorphismand automated ribosomal intergenic spacer analysis, for determination ofbacterial diversity in aquatic environments. Appl. Environ. Microbiol. 72,5982–5989.
Danovaro, R., Manini, E., Fabiano, M., 2001. Exoenzymatic activity and organicmatter composition in sediments of the Northern Adriatic Sea: response to ariver plume. Microb. Ecol. 44, 235–251.
Danovaro, R., Pusceddu, A., Mirto, S., Fabiano, M., 1999. Miofaunal assemblagesassociated with scallop beds (Adamussium colbecki) in the coastal sediments ofTerra Nova Bay (Ross Sea, Antarctica). Antarct. Sci. 11, 415–418.
DeMaster, D.J., Ragueneau, O., Nittrouer, C., 1996. Preservation efficiencies andaccumulation rates for biogenic silica and organic C, N and P in high-latitudesediments: the Ross Sea. J. Geophys. Res. 101, 18501–18518.
Di Cello, F., Pepi, M., Baldi, F., Fani, R., 1997. Molecular characterization of an n-alkane-degrading bacterial community and identification of a new species,Acinetobacter venetianus. Res. Microbiol. 148, 237–249.
Dubois, M., Gilles, K.A., Hamilton, J.K., Rebers, P.A., Smith, F., 1956. Colorimetricmethod for determination of sugars and related substances. Anal. Chem. 28,350–356.
Ducklow, H.W., Erickson, M., Kelly, J., Montes-Hugo, M., Ribic, C.A., Smith, R.C.,Stammerjohn, S.E., Karl, D.M., 2008. Particle export from the upper ocean overthe continental shelf of the west Antarctic Peninsula: a long-term record,1992–2007. Deep Sea Res. 55, 2118–2131.
Dunbar, R.B., Anderson, J.B., Domack, E.W., Jacobs, S.S., 1985. Oceanographicinfluences on sedimentation along the Antarctic continental shelf. Antarct. Res.Ser. 43, 291–312.
Engebretson, J.J., Moyer, C.L., 2003. Fidelity of select restriction endonucleases indetermining microbial diversity by terminal-restriction fragment lengthpolymorphism. Appl. Environ. Microbiol. 69, 4823–4829.
Fabiano, M., Danovaro, R., 1998. Enzymatic activity, bacterial distribution, andorganic matter composition in sediments of the Ross Sea (Antarctica). Appl.Environ. Microbiol. 64, 3838–3845.
Fabiano, M., Danovaro, R., 1999. Meiofauna distribution and mesoscale variabilityin two sites of the Ross Sea (Antarctica) with contrasting food supply. PolarBiol. 22, 115–123.
Fabiano, M., Pusceddu, A., 1998. Total and hydrolizable particulate organic matter(carbohydrates, proteins and lipids) at a coastal station in Terra Nova Bay (RossSea, Antarctica). Polar Biol. 19, 125–132.
Fichez, R., 1991. Composition and fate of organic matter in submarine cavesediments; implication for the biogeochemical cycle of organic carbon.Oceanol. Acta 14, 369–377.
Fischer, G., Futterer, D., Gersonde, R., Honjo, S., Ostermann, D., Wefer, G., 1988.Seasonal variability of particle flux in the Weddell Sea and its relation to icecover. Nature 306, 363–365.
Fonda Umani, S., Montia, M., Bergamasco, A., Cabrini, M., De Vittor, C., Burba, N.,Del Negro, P., 2005. Plankton community structure and dynamics versusphysical structure from Terra Nova Bay to Ross Ice Shelf (Antarctica). J. Mar.Syst. 55, 31–46.
Frignani, M., Giglio, F., Accornero, A., Langone, L., Ravaioli, M., 2003. Sedimentcharacteristics at selected sites of the Ross Sea continental shelf: does thesedimentary record reflect water column fluxes? Antarct. Sci. 15, 133–139.
Good, I.J., 1953. The population frequencies of species and the estimation ofpopulation parameters. Biometrika 40, 237–264.
Hoppe, H.G., 1983. Significance of exoenzymatic activities in the ecology ofbrackish water: measurements by means of methylumbelliferyl-substrates.Mar. Ecol. Prog. Ser. 11, 299–308.
Hughes, J.B., Hellmann, J.J., Ricketts, T.H., Bohannan, B.J., 2001. Counting theuncountable: statistical approaches to estimating microbial diversity. Appl.Environ. Microbiol. 67, 4399–4406.
Inagaki, F., Suzuki, M., Takai, K., Oida, H., Sakamoto, T., Aoki, K., Neaslon, K.H.,Horikoshi, K., 2003. Microbial communities associated with geologicalhorizons in coastal subseafloor sediments from the Sea of Okhotsk. Appl.Environ. Microbiol. 69, 7224–7235.
Isla, E., Masque, P., Palanques, A., Guillen, J., Puig, P., Sanchez-Cabeza, J.A., 2004.Sedimentation of biogenic constituents during the last century in westernBransfield and Gerlache Straits, Antarctica: a relation to currents, primaryproduction, and sea floor relief. Mar. Geol. 209, 265–277.
Isla, E., Masque, P., Palanques, A., Sanchez-Cabeza, J.A., Bruach, J.M., Guillen, J., Puig,P., 2002. Sediment accumulation rates and carbon burial in the bottomsediment in a high-productivity area: Gerlache Strait (Antarctica). Deep SeaRes. 49, 3275–3287.
Isla, E., Rossi, S., Palanques, A., Gili, J.M., Gerdes, D., Amtz, W., 2006. Biochemicalcomposition of marine sediment from the eastern Weddel Sea (Antarctica):high nutritive value in a high benthic-biomass environment. J. Mar. Syst. 60,255–267.
Jørgensen, B.B., 1982. Mineralisation of organic matter in the sea-bed—the role ofsulfate reduction. Nature 296, 643–645.
King, M.G., 1986. Characterization of b-glucosidase activity in intertidal marinesediments. Appl. Environ. Microbiol. 51, 373–380.
Knoblauch, C., Sahm, K., Jørgensen, B.B., 1999. Psychrophilic sulfate-reducingbacteria isolated from permanently cold Arctic marine sediments: descriptionof Desulfofrigus oceanense gen. nov., sp. nov., Desulfofrigus fragile sp.nov., Desulfofaba gelida gen. nov., sp. nov., Desulfotalea psychrophila gen.nov., sp. nov., and Desulfotalea arctica sp. nov. Int. J. Syst. Bacteriol. 49,1631–1643.
Koster, M., Meyer-Reil, L.-H., 2001. Characterization of carbon and microbialbiomass pools in shallow water coastal sediments of the southern Baltic Sea(Nordrugensche Bodden). Mar. Ecol. Prog. Ser. 214, 25–41.
Kostka, J.E., Thamdrup, B., Glud, R.N., Canfield, D.E., 1999. Rates and pathways ofcarbon oxidation in permanently cold Arctic sediments. Mar. Ecol. Prog. Ser.180, 7–21.
Kumar, S., Tamura, K., Nei, M., 2004. MEGA3: integrated software for molecularevolutionary genetics analysis and sequence alignment. Brief Bioinform. 5,150–163.
Li, L., Kato, C., Horikoshi, K., 1999. Microbial diversity in sediments collected fromthe deepest cold-seep area, the Japan Trench. Mar. Biotechnol. 1, 391–400.
Li, H., Yu, Y., Luo, W., Zeng, Y., Chen, B., 2009. Bacterial diversity in surfacesediments from the Pacific Arctic Ocean. Extremophiles 13, 233–246.
Lukow, T., Dunfield, P.F., Liesack, W., 2000. Use of the T-RFLP technique to assessspatial and temporal changes in the bacterial community structure within anagricultural soil planted with transgenic and non-transgenic potato plants.FEMS Microbiol. Ecol. 32, 241–247.
Luna, G.M., Dell’Anno, A., Danovaro, R., 2006. DNA extraction procedure: a criticalissue for bacterial diversity assessment in marine sediments. Environ.Microbiol. 8, 308–320.
Magurran, A.E., 1996. Ecological Diversity and its Measurement. Chapman andHall, London.
Margalef, R., 1958. Information theory in ecology. Gen. Syst. 3, 36–71.Marsh, J.B., Weistein, D.B., 1966. Simple charring methods for determination of
lipids. J. Lipid Res. 7, 574–576.Masqu�e, P., Isla, E., Sanchez-Cabeza, J.A., Palanques, A., Bruach, J.M., Puig, P.,
Guill�en, J., 2002. Sediment accumulation rates and carbon fluxes tobottom sediments at the Western Bransfield Strait (Antarctica). Deep SeaRes. 49, 921–933.
Mayer, L.M., 1989. Extracellular proteolytic enzyme activity in sediments of anintertidal mudflat. Limnol. Oceanogr. 34, 973–981.
Mayer, L.M., Shick, L.L., Setchell, F.W., 1986. Measurement of protein in nearshoremarine sediments. Mar. Ecol. Prog. Ser. 30, 159–165.
Mecozzi, M., Dragone, P., Amici, M., Pietrantonio, E., 2000. Ultrasound assistedextraction and determination of carbohydrate fraction in marine sediments.Org. Geochem. 31, 1797–1803.
Michaud, L., Di Cello, F., Brilli, M., Fani, R., Lo Giudice, A., Bruni, V., 2004.Biodiversity of cultivable psychrotrophic marine bacteria isolated from TerraNova Bay (Ross Sea, Antarctica). FEMS Microbiol. Lett. 230, 67–71.
Mincks, S.L., Smith, C.R., DeMaster, D.J., 2005. Persistence of labile organic matterand microbial biomass in Antarctic shelf sediments: evidence of a sediment‘‘food bank’’. Mar. Ecol. Prog. Ser. 300, 3–19.
Muhlebach, A., Weber, K., 1998. Origin and fate of dissolved sterols in the WeddellSea, Antarctica. Org. Geochem. 29, 1595–1607.
Nedwell, D.B., Walker, T.R., Ellis-Evans, J.C., Clarke, A., 1993. Measurements ofseasonal rates and annual budgets of organic carbon fluxes in an Antarcticcoastal environment at Signy Island, South Orkney Islands, suggest a broadbalance between production and decomposition. Appl. Environ. Microbiol. 59,3989–3995.
Neira, C., Sellanes, J., Levin, L.A., Arntz, W.E., 2001. Meiofaunal distributions on thePeru margin: relationship to oxygen and organic matter availability. Deep SeaRes. 48, 2453–2472.
Nunn, B.L., Keil, R.G., 2006. A comparison of non-hydrolytic methods for extractingamino acids and proteins from coastal marine sediments. Mar. Chem. 98,31–42.
Ohkouchi, N., Eglinton, T.I., 2008. Compound specific radicarbon dating of Ross Seasediments: a prospect for constructing chronologies in high-latitude oceanicsediments. Quat. Geochronol. 3, 235–243.
Polymenakou, P.N., Bertilsson, S., Tselepides, A., Stephanou, E.G., 2005. Bacterialcommunity composition in different sediments from the eastern Mediterra-nean Sea: a comparison of four 16 S ribosomal DNA clone libraries. Microb.Ecol. 50, 447–462.
Polymenakou, P.N., Fragkioudaki, G., Tselepides, A., 2007. Bacterial and organicmatter distribution in the sediments of the Thracian Sea (NE Aegean Sea).Cont. Shelf Res. 27, 2187–2197.
Poremba, K., Hoppe, H.G., 1995. Spatial variation of benthic microbiol productionand hydrolytic enzymatic activity down the continental slope of the Celtic Sea.Mar. Ecol. Prog. Ser. 118, 237–245.
F. Baldi et al. / Continental Shelf Research 30 (2010) 1614–1625 1625
Purdy, K.J., Nedwell, D.B., Embley, T.M., 2003. Analysis of the sulfate-reducingbacterial and methanogenic archaeal populations in contrasting Antarcticsediments. Appl. Environ. Microbiol. 69, 3181–3191.
Pusceddu, A., Cattaneo-Vietti, R., Alberelli, G., Fabiano, M., 1999. Origin,biochemical composition and vertical flux of particulate organic matter underthe pack ice in Terra Nova Bay (Ross Sea, Antarctica) during late summer 1995.Polar Biol. 22, 124–132.
Pusceddu, A., Dell’Anno, A., Fabiano, M., 2000. Organic matter composition incoastal sediments at Terra Nova Bay (Ross Sea) during summer 1995. PolarBiol. 23, 288–293.
Ravenschlag, K., Sahm, K., Amann, R., 2001. Quantitative molecular analysis of themicrobial community in marine arctic sediments (Svalbard). Appl. Environ.Microbiol. 67, 387–395.
Ravenschlag, K., Sahm, K., Pernthaler, J., Amann, R., 1999. High bacterial diversity inpermanently cold marine sediments. Appl. Environ. Microbiol. 65, 3982–3989.
Redfield, A.C., 1958. The biological control of chemical factors in the environment.Am. Sci. 46, 205–220.
Schloss, P.D., Handelsman, J., 2005. Introducing DOTUR, a computer program fordefining operational taxonomic units and estimating species richness. Appl.Environ. Microbiol. 71, 1501–1506.
Smetacek, V., Scharek, R., Nothig, E.-M., 1990. Seasonal and regional variation inthe pelagial and its relationship to the life history cycle of krill. In: Kerry, K.R.,
Hempel, J. (Eds.), Antarctic Ecosystems, Ecological Change and Conservation.Springer, Berlin Heidelberg, New York, pp. 103–114.
Smith, C.J., Danilowicz, B.S., Clear, A.K., Costello, F.J., Wilson, B., Meijer, W.G., 2005.T-Align, a web-based tool for comparison of multiple terminalrestriction fragment length polymorphism profiles. FEMS Microbiol. Ecol. 54,375–380.
Thompson, J.D., Higgins, D.G., Gibson, T.J., 1994. CLUSTAL W: improving thesensitivity of progressive multiple sequence alignment through sequenceweighting, position-specific gap penalties and weight matrix choice. NucleicAcids Res. 22, 4673–4680.
Tian, F., Yu, Y., Chen, B., Li, H., Yao, Y.-F., Guo, X.-K., 2009. Bacterial, archeal andeukaryotic diversity in Arctic sediment as revealed by 16S rRNA and 18S rRNAgene clone libraries analysis. Polar Biol. 32, 93–103.
Vetter, Y.A., Deming, J.W., 1994. Extracellular enzyme activity in the Arcticnortheast water polynya. Mar. Ecol. Prog. Ser. 114, 23–34.
Zipper, H., Brunner, H., Bernhagen, J., Vitzthum, F., 2004. Investigations on DNAintercalation and surface binding by SYBR Green I, its structure determinationand methodological implications. Nucleic Acids Res. 32, e103.
Zipper, H., Buta, C., Lammle, K., Brunner, H., Bernhagen, J., Vitzthum, F., 2003.Mechanisms underlying the impact of humic acids on DNA quantification bySYBR Green I and consequences for the analysis of soils and aquatic sediments.Nucleic Acids Res. 31, e39.