ROSS CASEBOOK 2019 - Bloch Career Center
1093
ROSS CASEBOOK 2019 1
-
Upload
khangminh22 -
Category
Documents
-
view
8 -
download
0
Transcript of ROSS CASEBOOK 2019 - Bloch Career Center

ROSS CASEBOOK 2019
1

Table of Contents - Overview# Content Page
1 Note from the Board 4
2 Consulting Club @ Ross Board Members 5
3 Acknowledgements 6
4 Administering Cases 7
5 Case Structure 8
6 Key Formulas Review 9 – 10
7 Industry Overview 11 - 23
2

Table of Contents - Cases# Case Industry Type Page
1 American Bank ATM Dilemma Financial Services Profitability Improvement 24
2 Harrison Energy EV Goals Power & Utilities Market Entry 40
3 Bailey Brothers Bancorp Financial Services Profitability Improvement 52
4 Orange Bank Co Financial Services M&A 60
5 ShopOn Retail Profitability Improvement 68
6 Ferris Wheel Entertainment New Investment Analysis 76
7 6PAQ P.E. Firm Entertainment Private Equity &
Profitability Improvement
83
8 Hamm’s University Higher Ed / Non-Profit Profitability Improvement 94
9 Allsafe Insurance M&A 102
10 Mega Pharma Retail M&A 108
11 Mike Apparel Consumer Goods Market Entry 119
12 PharmaDeliver Pharma Growth Strategy 127
13 Single Cup of Coffee Consumer Products Market Sizing 139
14 Cheesy Situation Food and Beverage Growth Strategy 147
3
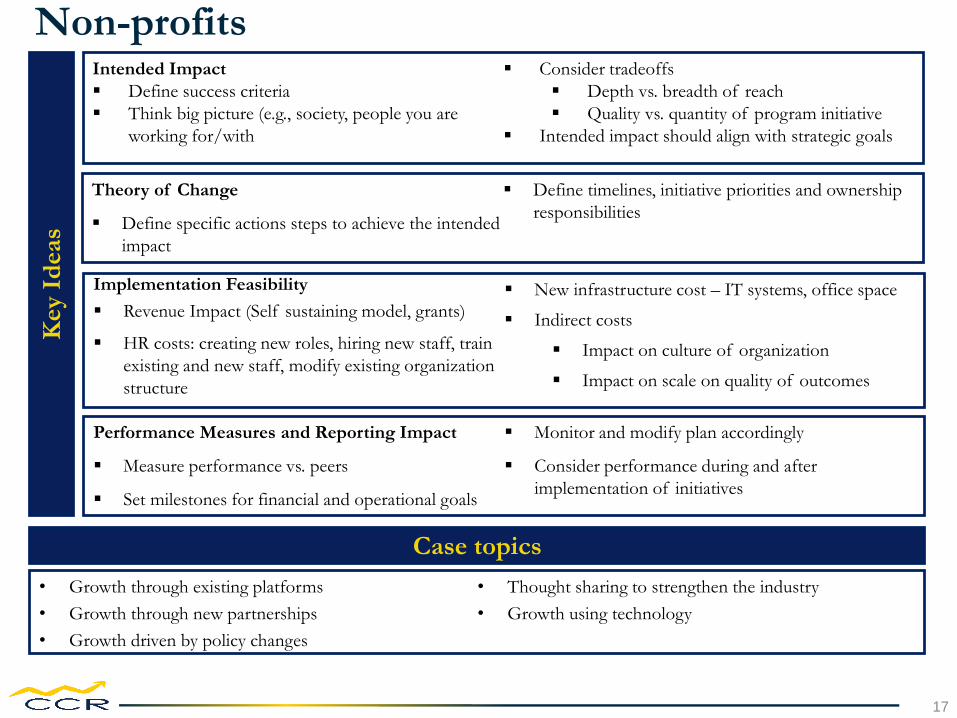
Dear CC@R Member,
If you are reading this, then you are interested in pursuing a consulting career upon graduating from business school. In order to increase
your familiarity with the consulting interview format, the Consulting Club at Ross has established a robust wrap-around training program
focusing on the different parts of the recruiting and interviewing process. This book focuses on the ‘case-interview’ portion of the
consulting interview and is to be used in conjunction with other case-oriented club training materials.
The elements tested in a case interview are core to firms’ hiring decisions. These cases, or mini-business problems, are a glimpse into a
consultant’s (and often the interviewer’s) life and are frequently drawn from real client experiences. Given practice and experience, cases
become a natural way of thinking about how you would structure approaches and solutions to nearly any type of problem. Along the way,
we hope you will find that you enjoy solving problems in this manner, and that you would find this type of work gratifying.
In order to facilitate your preparation, your fellow club members have recorded their real-life case interview experiences and their
customized frameworks and solution elements. These cases act as a strong reference point for what to expect during a consulting interview
but are in no way all-encompassing. Each case comes down to a conversation between the interviewer and the candidate, so it is very
possible that two candidates could have two very different conversations about the same business problem. In fact, we encourage this.
Finally, you may have noticed that you are reading this compilation in landscape format. This is intentional. Consultants think in terms of
PowerPoint slides much more often than essay-style documents. You will find this format dovetails well with how you write your notes in
cases, and how you will convey information as a consultant.
Remember that regardless of how you perform on individual cases or in recruiting writ large, you are smart, capable, and you’d be an asset
to any firm, consulting or otherwise. Good luck and remember your fellow club members are always here to help.
Sincerely,
2019-2020 Board
Consulting Club @ Ross
Note from the Board
4

Consulting Club @ Ross Board Members
Jordan Morris – Co-President
Ashley Perkins – Co-President
Nick Campbell – SVP Finance & Tech
Mitch Polelle – SVP Education
Erin Ford – SVP Sponsorship & Firm
Relations
Eric Wang – VP Technology
Christine Barringer – VP Education
Sankalp Damani – VP Education
Justin Long – VP Peer Coaches
Maneel Grover – VP Casebook
Peiqin Wu – VP International Recruiting
Chaitanya Balla – VP Part-time Recruiting
Sara Oliphant – VP Women’s Recruiting
Jake Corness – VP Forum
Tyler Chaitoff – VP Firm Relations
Tim Bier – VP Firm Relations
AVPs:
Alex Lowy, Liz Kane, Elise Goodhue, Julie
Sohn, Amirah Aziz, Arvind Sivakumaran,
Taylor Li, Mohit Kabra, Marites Seitz,
Esenam Dogoe, Arshaq Razack, Jacob
Supron, Eric Hoffman
5

Pulling together the casebook was a huge undertaking and we are grateful to everyone who
contributed, especially our case writers and editors.
Acknowledgements
Case Writers:
Christine Barringer – PharmaDeliver
Jordan Morris – 6PAQ PE
Junior Louis – Single Cup of Coffee
Manas Kulkarni – Ferris Wheel
Maneel Grover – Mega Pharma, Mike
Apparel
Mitch Polelle – Hamm’s University
Nick Campbell – Bailey Brothers Bancorp
Rajat Goel – Orange Bank Co.
Sankalp Damani – American Bank ATM,
Harrison Energy
Sarah Blythe – Cheesy Situation
Sara Oliphant – Allsafe
Shivani Gupta – ShopOn
Case Editors:
Jake Corness, Justin Long, Jordan Morris,
Mitch Polelle, Sankalp Damani
Casebook Editors:
Maneel Grover & Alex Lowy
6

Preparing for Interview
During Interview After Interview
• Read the case over 2-3 times,
familiarizing yourself with the
relevant numbers and details
• Understand what candidate
wants to improve
• Determine your ‘character’ e.g.
rushed partner or
disinterested client rep
• Prepare for how you will
address irrelevant questions or
requests for data you do not
have, i.e. will you make up
fake data and let candidate go
fishing, or let them know it is
irrelevant?
• Track time (about 25 minutes is average)-
balance finishing case and letting
candidate struggle
• Candidates can often think of very
different approaches to the same case.
Before discounting questions as wrong,
ask the candidate for their thinking... If it
makes sense, go with it
• Consider what a consultant would be
looking for in the candidate
• Presentation: can I put this person in
front of a client?
• Aptitude: Can this person do the work?
• Interest: Does this person like what they
are doing?
• Provide feedback
• This is possibly the most
critical step of the case
interview process
• Honestly let the candidate
know strengths, but more
importantly areas for
improvement
• Without honest feedback and
constructive criticism, it is
very difficult to improve
Great case experiences are not determined solely by strong candidates cranking out detailed issue and financial-based
analyses. The interviewer-interviewee interaction and the candidate’s ability to convey information can very easily change
the style of a case. Given the interviewer’s position of power in the discussion, there are several things to keep in mind
prior to, during, and after a case interview.
Administering Cases
7

Understand the Question
(~1-2 minutes)
Develop
Framework
(~1-2 minutes)
Analyze
(~20 minutes)
Form
Recommendation
(~1-2 minutes)
• LISTEN
• Summarize the
problem statement
to make sure you
understand the
situation and
objectives
• Ask 1-2 clarifying
questions around
the topic and/or
metrics to be used
for the analysis
• The questions
posed should
necessitate a short
response
• Ask for a moment to
plan your structure
• Develop 3-4 areas to
analyze along with a few
tailored sub-topics
• Structure the framework
in a logical fashion – it
should open with the
most important topic
and provide the
interviewer with a
roadmap of where you
plan to take the case
• Engage the interviewer
by turning the
framework towards
them
• Refer to the
framework as you
move through each of
the main areas
• Use one sheet of
paper per topic – think
of the case as a
PowerPoint deck
• Relate each piece of
analysis to the main
objective/problem
statement
• Walk through
calculations /analysis
• Drive first and second-
level insights whenever
possible!
• State your
recommendation as a
direct response to the
problem/objective –
it should not come as
a surprise to the
interviewer
• Incorporate key
metrics/findings as a
part of your
recommendation
• Include risks and next
steps
Case StructureHow to Case
8

Key Formulas Review
Topic Formula
NPV or Valuing Money Over Time𝑉𝑎𝑙𝑢𝑒 𝑡𝑜 𝑃𝑒𝑟𝑝𝑒𝑡𝑢𝑖𝑡𝑦 =
𝑉𝑎𝑙𝑢𝑒 𝑜𝑓 𝐴𝑠𝑠𝑒𝑡
𝐷𝑖𝑠𝑐𝑜𝑢𝑛𝑡 𝑅𝑎𝑡𝑒
𝑁𝑃𝑉 =
𝑡=0
𝑛𝐴𝑛𝑛𝑢𝑎𝑙 𝐶𝑎𝑠ℎ 𝐹𝑙𝑜𝑤
(1 + 𝑟)𝑡
Rule of 72𝑇𝑖𝑚𝑒 𝑓𝑜𝑟 𝐼𝑛𝑣𝑒𝑠𝑡𝑒𝑑 𝑃𝑟𝑖𝑛𝑐𝑖𝑝𝑙𝑒 =
72
𝑟r = Rate of Return
Little’s Law 𝐼𝑛𝑣𝑒𝑛𝑡𝑜𝑟𝑦 = 𝑇ℎ𝑟𝑜𝑢𝑔ℎ𝑝𝑢𝑡 × 𝐹𝑙𝑜𝑤 𝑇𝑖𝑚𝑒
Inventory𝐼𝑛𝑣𝑒𝑛𝑡𝑜𝑟𝑦 𝑇𝑢𝑟𝑛𝑠 =
𝐶𝑂𝐺𝑆
𝐴𝑣𝑒𝑟𝑎𝑔𝑒 𝐼𝑛𝑣𝑒𝑛𝑡𝑜𝑟𝑦Days of Inventory = Inventory Turns * 365
Profitability 𝜋 = 𝑄 𝑃 − 𝑉𝐶 − 𝐹𝐶
Breakeven 𝐵𝑟𝑒𝑎𝑘𝑒𝑣𝑒𝑛 = 𝐼𝑛𝑣𝑒𝑠𝑡𝑚𝑒𝑛𝑡 𝑃𝑟𝑖𝑐𝑒 − 𝐶𝑜𝑠𝑡
Margin 𝐺𝑟𝑜𝑠𝑠 𝑀𝑎𝑟𝑔𝑖𝑛 =𝑅𝑒𝑣𝑒𝑛𝑢𝑒−𝐶𝑜𝑠𝑡
𝑅𝑒𝑣𝑒𝑛𝑢𝑒𝑁𝑒𝑡 𝑀𝑎𝑟𝑔𝑖𝑛 =
𝑁𝑒𝑡 𝐼𝑛𝑐𝑜𝑚𝑒
𝑆𝑎𝑙𝑒𝑠 𝑅𝑒𝑣𝑒𝑛𝑢𝑒
Markup𝑀𝑎𝑟𝑘𝑢𝑝 =
𝑃𝑟𝑖𝑐𝑒 − 𝐶𝑜𝑠𝑡
𝐶𝑜𝑠𝑡
9

Key Formulas Review
Topic Formula
Return on Assets (ROA) 𝑅𝑂𝐴 =𝑁𝑒𝑡 𝐼𝑛𝑐𝑜𝑚𝑒
𝑇𝑜𝑡𝑎𝑙 𝐴𝑠𝑠𝑒𝑡𝑠
Return on Equity (ROE)
DuPont Analysis
𝑅𝑂𝐸 =𝑁𝑒𝑡 𝐼𝑛𝑐𝑜𝑚𝑒
𝑇𝑜𝑡𝑎𝑙 𝑆ℎ𝑎𝑟𝑒ℎ𝑜𝑙𝑑𝑒𝑟𝑠′𝐸𝑞𝑢𝑖𝑡𝑦
𝑅𝑂𝐸 =𝑁𝑒𝑡 𝑃𝑟𝑜𝑓𝑖𝑡
𝑆𝑎𝑙𝑒𝑠×
𝑆𝑎𝑙𝑒𝑠
𝐴𝑠𝑠𝑒𝑡𝑠×𝐴𝑠𝑠𝑒𝑡𝑠
𝐸𝑞𝑢𝑖𝑡𝑦
ROE = Operating Efficiency * Asset Utilization * Leverage
Working Capital 𝑅𝑂𝐼 =𝜋
𝐾
K = Capital Invested (Assets, Working Capital, etc.)Working Capital = Assets - Liability
Income Statement Sales – COGS= Gross Profit
- SG&A= EBITDA
- Depreciation/Amortization= Operating Profit
- Interest Expense= EBIT
- Tax Expense= Net Income
10

INDUSTRY OVERVIEW
11

▪ Consolidation in industry
▪ Low cost carriers and fare
competition on competitive
routes
▪ Online booking and check-in
▪ Expansion of domestic and
international routes
▪ Capacity optimization (Load
Factor)
Key Ideas
Airlines
Revenue Streams Cost Drivers
Customer
Segments
Channels
▪ Ticket sales to economy and
business passengers
▪ Charges for baggage and on-
board services (up-selling)
▪ Cargo transportation
▪ Credit cards
▪ Fuel
▪ Labor
▪ Marketing
▪ Terminal fees and hangar rentals
▪ Insurance/legal fees
▪ Internet - online travel sites, airline websites
▪ Airline sales team: call centers, online, or kiosk
▪ Travel management companies (TMCs) serving corporate clients, travel agents
▪ Government regulation and dramatic risk of equipment failure (e.g. Boeing 737 MAX)
▪ Labor unrest, strikes and work slowdowns
▪ An intensely competitive market with many foreign airlines partly government subsidized
Risk
Key
Economic
Drivers
▪ Leisure travelers – (generally price sensitive)
▪ Business travelers – (very important to airlines due to margins and services purchased)
▪ Freight/Cargo Transportation
▪ World Price of Crude Oil
▪ Trips by US residents
▪ Optimization of capacity
▪ Per capita disposable income
12
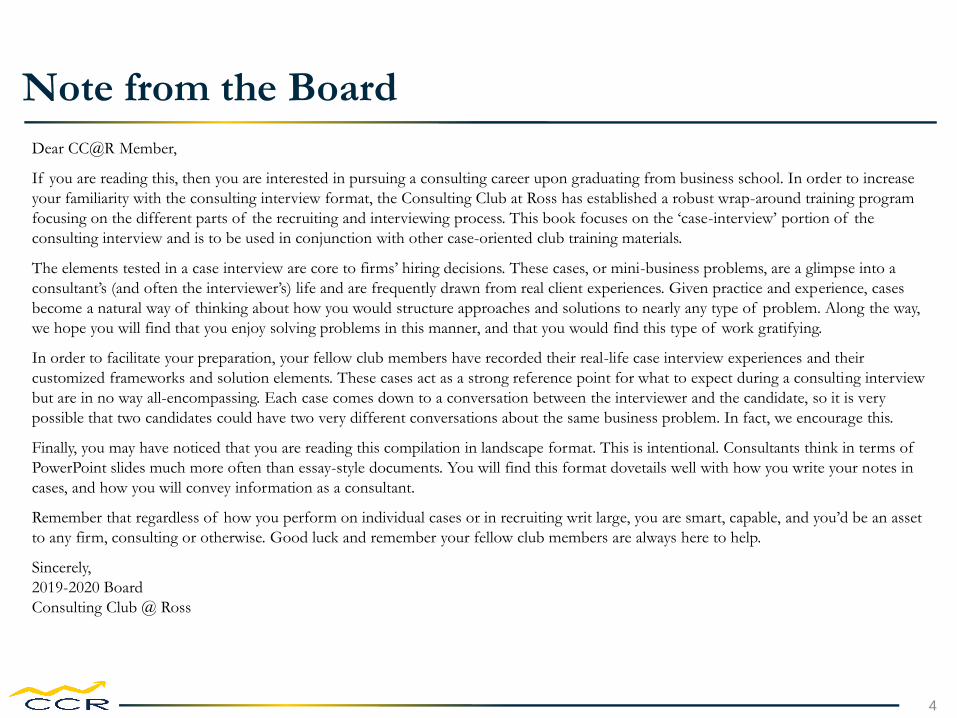
▪ Automakers, Original Equipment
Manufacturers (OEMs),
Replacement Parts Production,
Rubber Fabrication
▪ Highly capital and labor intensive
▪ Extensive competition due to
foreign automakers
▪ Unions
▪ Commitment to Electric Vehicles
Key Ideas
Automotive/Manufacturing
Revenue Streams Cost Drivers
Customer
Segments
Channels
▪ New car sales
▪ Auto part sales
▪ Services offered with vehicle
purchase
▪ Financing
▪ Extended warranties
▪ Leasing
▪ Labor
▪ Materials
▪ Advertising
▪ Financing costs
▪ Recall costs
▪ Research & Development
▪ Automobile dealers
▪ Secondary automobile market
▪ Automotive parts/services outlets
▪ Globalization of the industry enables more ease of foreign competition
▪ New entrants in the electric vehicle or mobility as a service sectors
▪ Changes in consumer trends and tastes
Risk
Key
Economic
Drivers
▪ Cars, vans, pickup trucks and SUVs
▪ Personal car buyers
▪ Rental car companies
▪ Commercial purchasers
▪ Government purchasers
▪ GPD growth
▪ Income growth/disposable income
▪ Price of crude
▪ Steel prices
▪ Consumer confidence index
▪ Yield on Treasury note
13

▪ Consolidation/acquisitions
▪ Increased mobile banking
▪ Channel innovation in digital and
physical channels
▪ Customer attrition rate
▪ Offshoring of call centers, back
office functions
▪ Digitization of processes
▪ Cross-selling
Key Ideas
Commercial Banking
Revenue Streams Cost Drivers
Customer
Segments
Channels
▪ Loan interest
▪ Loan types
▪ Real estate
▪ Auto
▪ Personal
▪ Education
▪ Service Fees
▪ Spread between interest rate
charged and Fed rates
▪ Credit cards
▪ Wages
▪ Bad debt expense
▪ Interest rates on deposits
▪ Branch and compliance costs
▪ Overhead costs - paper fee; error
rate costs for manual processing
▪ Change in savings behavior
▪ Loan default, interest rates and federal funds rates
▪ New entrants from non-banks and FinTech companies (i.e. Robinhood, SoFi, etc)
Risk
Key
Economic
Drivers
▪ Wealth: deposit balances, income
▪ By lifestyle: buying behavior
▪ Size: small businesses and consumers
▪ Age: under 35 adapt to technology better
▪ Savings and loan
▪ Credit union
▪ Traditional checking
▪ Online banking
▪ Microfinance
▪ Consumer confidence
▪ Household debt
▪ Employment statistics
▪ Urbanization
▪ Home and car buys
▪ Disposable income
▪ Interest rate
▪ Government Regulation

▪ Affordable Care Act
▪ Highly fragmented care networks
▪ Employers pushing health care
costs onto employees
▪ Aging Baby Boomer population
driving increased revenues
Key Ideas
Health Care
Revenue Streams Cost Drivers
Customer
Segments
Channels
▪ Hospital care
▪ Physician and clinical services
▪ Prescription drugs
▪ Nursing
▪ Dental services
▪ Research, Equipment, Investment
▪ Dependent on segment
▪ Significant costs related to new
technology implementation
▪ Often inefficient organizational
structures
▪ New legislation and shifting regulations
▪ Funding availabilityRisk
Key
Economic
Drivers
▪ Hospitals
▪ Doctors offices
▪ Nursing homes
▪ Outpatient surgery centers
▪ Pharmacies
▪ Medical equipment
▪ Patients/consumers
▪ All generations and segments of the population require different products/services
▪ Regulation for health & medical insurance
▪ Federal funding for Medicare and Medicaid
▪ Aging population
▪ Advances in medical care and technology
15

▪ Cloud based platforms vs on-
premise infrastructure
▪ User centric IT solutions – IT
depts want to enhance usage and
productivity
▪ Open platforms / integrating and
partnering with other providers
Key Ideas
IT / Infrastructure
Revenue Streams Cost Drivers
Customer
Segments
Channels
▪ Hardware sales
▪ Maintenance contracts
▪ Implementation consulting
services
▪ SaaS
▪ Labor
▪ R&D/Engineering of
products
▪ Sales/Marketing teams -
huge front-end expense
▪ Hardware manufacturing
▪ Cybersecurity
▪ Startups and new entrants
▪ Bring your own device initiatives
▪ Tariffs
Risk
Key
Economic
Drivers
▪ Enterprise (SME / Large)
▪ Consumer
▪ Third party resellers (SHI, CDW)
▪ Cyber security
▪ Demand for enterprises to go digital
▪ Mobility
▪ Data & Analytics
▪ Direct
▪ Partnership
▪ Reseller
16
Key I
deas
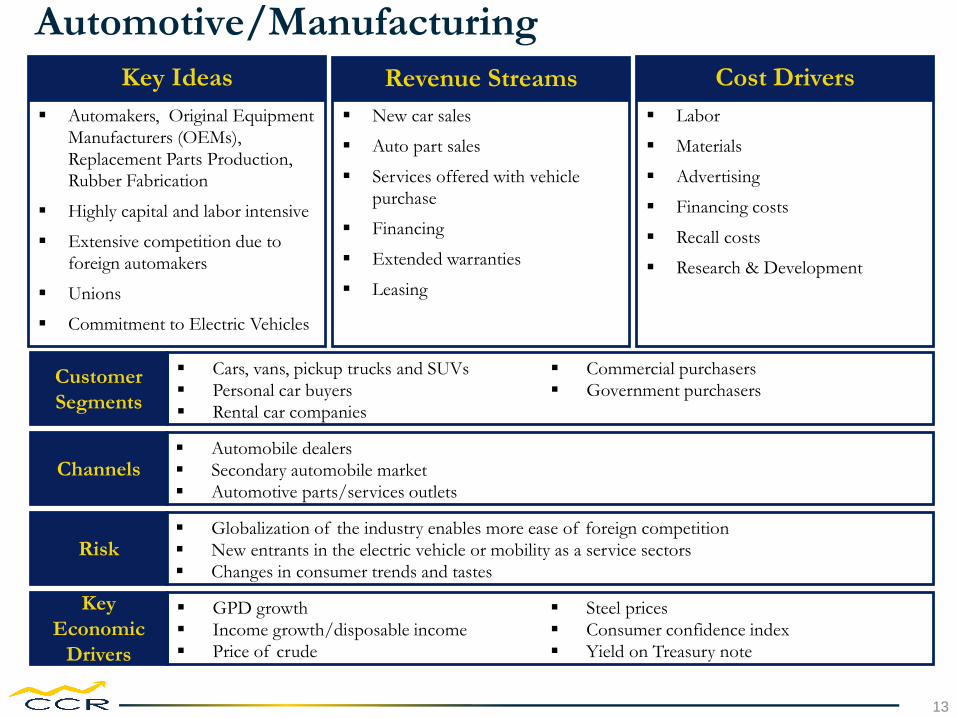
Non-profits
Case topics
• Growth through existing platforms
• Growth through new partnerships
• Growth driven by policy changes
• Thought sharing to strengthen the industry
• Growth using technology
Theory of Change
▪ Define specific actions steps to achieve the intended
impact
▪ Define timelines, initiative priorities and ownership
responsibilities
Implementation Feasibility
▪ Revenue Impact (Self sustaining model, grants)
▪ HR costs: creating new roles, hiring new staff, train
existing and new staff, modify existing organization
structure
▪ New infrastructure cost – IT systems, office space
▪ Indirect costs
▪ Impact on culture of organization
▪ Impact on scale on quality of outcomes
Performance Measures and Reporting Impact
▪ Measure performance vs. peers
▪ Set milestones for financial and operational goals
▪ Monitor and modify plan accordingly
▪ Consider performance during and after
implementation of initiatives
Intended Impact
▪ Define success criteria
▪ Think big picture (e.g., society, people you are
working for/with
▪ Consider tradeoffs
▪ Depth vs. breadth of reach
▪ Quality vs. quantity of program initiative
▪ Intended impact should align with strategic goals
17

▪ Upstream, midstream,
downstream
▪ PV-10
▪ Cost per gallon
▪ OPEC
▪ GDP growth
▪ Renewable energy
▪ Fracking
Key Ideas
Oil & Gas
Revenue Streams Cost Drivers
Customer
Segments
Channels
▪ Crude oil
▪ Gasoline
▪ Natural Gas
▪ Refining products such as
lubricants
▪ Gas stations: gasoline, food
market, car wash
▪ Exploration: seismic studies,
drilling rigs and labor
▪ Production: refining
▪ Pipelines
▪ Gas station: oil, labor, insurance,
licenses
Risk
Key
Economic
Drivers
▪ Petroleum refiners
▪ Electricity generators
▪ Domestic and commercial users
▪ Other industries
▪ Access to reserves
▪ Energy policies
▪ OPEC decisions
▪ Political pressures
▪ Substitutes/renewable energy
▪ Offshore drilling
▪ Government regulation
▪ International oil production and demand
▪ Retail
▪ Wholesale
▪ Commercial
18

▪ Affordable Care Act
▪ Aging population
▪ Patents and generics
▪ Research & Development
▪ Insurance
▪ FDA
▪ Market penetration
▪ Contract v. in-house salesforce
Key Ideas
Pharmaceutical
Revenue Streams Cost Drivers
Customer
Segments
Channels
▪ Insurance payments
▪ The federal government provides
certain grants to subsidize R&D
▪ Due to significant R&D lead
times revenue is highly volatile
▪ Seasonality is high on certain
products (vaccines and cold
medicine) and low on other
products (pain medicines)
▪ Research & Development
▪ Manufacturing cost (the largest
share of the industry’s costs)
▪ Marketing costs
▪ Wages
▪ Liability insurance and legal fees
▪ Litigation
Risk
Key
Economic
Drivers
▪ Medical patients
▪ Prescribing doctors
▪ Government insurance programs
▪ Health insurance companies
▪ Over-the-counter
▪ Prescription drugs: Hospitals, pharmacies
▪ Mail order pharmacy: Express Scripts, Walgreens
▪ Generic manufacturers pose a major competitive threat following patent expiration
▪ Tariff barriers are no longer a relevant form of protection
▪ Unfavorable government healthcare regulations and CMS rates
▪ Median age of population
▪ Research and development expenditure
▪ Insurance and regulatory landscape
▪ Patent protection
19

▪ Components of the revenue
charge
▪ Invested capital
▪ Transaction and advisory
fees
▪ Carried interest
▪ Divestures
Key Ideas
Private Equity & Hedge Funds
Revenue Streams Cost Drivers
Investors
Averages in
industry
▪ Wages and profit-sharing
▪ Administrative costs(regulatory
filings, record keeping, accounting
and travel)(sub-bullets)
▪ Outsourcing of capital intensive
IT functions for algorithmic
trading
▪ Value creation: sell under-
performing assets, optimize price,
diversify customer base,
operations efficiency
▪ Exit: strategic or IPO
▪ Synergies
▪ Stability of cash flows(IRR, NPV)
▪ Targeted returns ~ 40%+
▪ Un-invested capital vs. invested
Risk
Key
Economic
Drivers
▪ Pension funds (largest share)
▪ Private investors (e.g. High net-worth individuals)
▪ Banks, sovereign funds and life insurance companies
▪ New regulation -> compliance costs, Rising competition -> decreasing industry fees
▪ Competition also exists with sovereign wealth funds and corporate buyers
▪ Changes in tax structure
▪ Investor uncertainty/Pension demand
▪ Access to credit/interest rates
▪ Regulations
▪ Exit opportunities
▪ GDP/Investment returns
▪ Large firms focus on deals ~ $1.0B; middle market firms cover deals between $15.0M- $1.0B
▪ Average holding period before sale has increased from 3 years to 6 years in the past 15 years
▪ Borrowing can typically range from 65.0% to 85.0% of the purchase price of the firm
20

▪ Same store sales
▪ Sales per square foot
▪ Inventory turn-over
▪ Seasonality/recessions
▪ Trends
Key Ideas
Retail
Revenue Streams Cost Drivers
Customer
Segments
Channels
▪ Women’s apparel sale
▪ Drugs & cosmetics
▪ Furniture & household appliances
▪ Children apparel
▪ Men's apparel
▪ Toys
▪ Footwear
▪ Misc. items
▪ Cost of Goods Sold
▪ Transportation
▪ Wages
▪ Rent and utilities
▪ Marketing
Risk
Key
Economic
Drivers
▪ The industry is consumer-oriented and, due to the spectrum of products, its markets are generally
segmented into different income, demographics and age
▪ Changes in disposable income
▪ Demand and supply issues
▪ Overstock
▪ Easy entry invites competition
▪ Tariffs and trade disruptions
▪ Consumer Confidence index
▪ Per capita disposable income
▪ International Export/Import
▪ Gross Domestic product/inflation
▪ Households > 100,000 income(luxury goods)
▪ Commodity prices(e.g. : gold price for jewelry)
▪ Department Stores/Big box retailers
▪ Discount retailers
▪ E-commerce
▪ Demographic retailers
▪ Shopping malls
▪ Subscription boxes and services
21

▪ Deregulation led to spur of new
companies
▪ Bottlenecks: High capital, scarce
operating skills and management
experience
▪ Shift from telephones to internet
based services for mobile
▪ Bundling of services
Key Ideas
Telecommunications
Revenue Streams Cost Drivers
Customer
Segments
Channels
▪ Voice calls
▪ Additional lines/family plans
▪ Text and image communication
▪ Data subscriptions
▪ Accessories
▪ Additional add-ins (e.g. spam
blocking)
▪ Infrastructure and line
maintenance (5G investments)
▪ Labor
▪ Marketing and advertising
Risk
Key
Economic
Drivers
▪ Residential and Small Business (Price sensitive)
▪ Large multinationals (Price insensitive)
▪ Retail stores - carriers and mass retailers
▪ Online
▪ Investment in rising technology services
▪ Number of subscriptions to additional services
▪ Number of broadband and mobile internet connections
▪ Rapid development of technology
▪ High exit barriers
▪ Systems not reusable across industries
▪ New low-cost entrants driving prices down
▪ Cord cutting
22

▪ Increase in energy consumption
▪ High investment costs and
regulations
▪ Industry structure disintegrating
into smaller supplier segments
▪ Seasonality
▪ Gov. incentives for sustainable
initiatives
▪ Bundling services w/renewable
Key Ideas
Utilities
Revenue Streams Cost Drivers
Customer
Segments
Channels
▪ Transmitted electricity: base load
and intermittent electricity
▪ Base load (95% of industry)
▪ Coal, natural gas, nuclear, other
▪ Intermittent: renewable energy
▪ Purchased power accounts (nearly
half of total costs)
▪ Infrastructure
▪ Wages
▪ Marketing
▪ Maintenance contracts
Risk
Key
Economic
Drivers
▪ Commercial and Industrial
▪ Residential
▪ Transmission lines/pipelines
▪ Upstream electricity generators
▪ Economies of scale
▪ Industrial production index
▪ Climate/seasonality
▪ Clean energy threatens the future of traditional power generation methods
▪ Seasonal demand leads to uncertain estimates
▪ Energy efficient appliances decrease consumption
23

Case 1: American Bank ATM DilemmaFinancial Services | Profitability Improvement
24

Case 1: American Bank ATM DilemmaFinancial Services | Profitability Improvement
Case Prompt
Our client, American Bank, is a national retail bank operating in the US. ATMs have
traditionally been a profitable channel, but the bank has started seeing declining operating
profits from its ATMs. The CEO has hired your firm to help her analyze the reasons for this
decline and solutions to improve usage.
How would you approach this problem?
Interviewer Guidance
This is an interviewee led case. Throughout the case, let the interviewee ask for specific data
points before presenting exhibits.
You should gauge the interviewee’s potential for going granular into the problem.
Concepts Tested Graph reading, Setting up calculations, Brainstorming
25

Clarifying Information
• Profits have been declining over the last 5 years
• ATMs contribute to 12% of the bank’s revenues.
• ATMs operated in the US only
• 12000 ATMs – no change in number of ATMs or
operating structure in the last 5 years (2013 – 2018)
• The bank operates the ATMs itself or through
vendors - three operating structures:
- Bank owned and operated
- Bank owned and vendor operated
- Vendor owned and operated (Bank gets
commission on transactions)
• Up to 5 competitors observed in vicinity of any
ATM
• Any person (Own bank customers and other bank
customers) can use any American Bank ATM
Possible Framework
Problem: Declining profitability of ATMs
• Revenues falling –
- Average transaction (txn) price falling
- Overall txn prices decreased
- Transaction mix towards cheaper txns
- Fewer customers using ATMs
- Decrease in overall volume of customers
- Higher revenue customers (Own
customers) not using
- Customers moving to competition /
substitutes such as online banking
- No newer sources of revenue from ATMs
introduced apart from core transaction revenues
• Costs increasing –
- Avg variable cost of operating increased:
- Avg cost of operating ATMs increased
- Shift towards expensive operated ATMs
- Fixed costs increased:
- Cost of purchasing new ATMs increased
Case 1: American Bank ATM DilemmaFinancial Services | Profitability Improvement
26

Case 1: American Bank ATM DilemmaFinancial Services | Profitability Improvement
Interviewer Guidance for case flow
Drive Insight/Calculations → Candidate Data Request → Exhibit
Framework → Profitability numbers → 1
Ex.1: Revenue problem → Revenue breakdown → 2 and 3
Ex. 2 and 3: Northeast and West-Pacific facing problems.
Both vendor-operated heavy →
Reasons and breakdown for fall in
hits for vendor operated ATMs →4 and 5
Ex. 4 and 5: Calculate extra possible hits in vendor
ATMs →Revenue earned per hit → 6
Ex. 6: Calculate extra revenue
Ex 6: Brainstorm with candidate for other areas of
improvement → drive insight for $0.5 extra in “other”
customers and financial transactions each →
Improve ratio of “other” and fin.
transactions by benchmarking →6A
Ex: 6A: Calculate additional revenue potential by taking
best-case competitor scenarios
Give interviewer led question on breakeven (optional)
Ask for final recommendation
27

Case 1: American Bank ATM DilemmaFinancial Services | Profitability Improvement
Exhibit 1 – American Bank ATM usage, profits and revenues in last 5 years
9694
9289
8785
0
10
20
30
40
50
60
70
80
90
100
2013 2014 2015 2016 2017 2018
# daily hits1 per ATM across US
Own Customer Other Customer Total daily hits
$1.15$1.09
$1.04$0.99
$0.94$0.89
$1.88$1.83
$1.78$1.72
$1.67$1.62
$0.0
$0.2
$0.4
$0.6
$0.8
$1.0
$1.2
$1.4
$1.6
$1.8
$2.0
2013 2014 2015 2016 2017 2018
Mill
ion
s
Total Profits and Revenue from ATMs
Profit Revenue
Note: Own customers are customers of American Bank, while Other customers are not customers of American Bank
1. hits = number of unique times an ATM was used (the word hits is used interchangeably with the word transactions)
28

Case 1: American Bank ATM DilemmaFinancial Services | Profitability Improvement
Exhibit 2 – American Bank ATM fall in hits across US (2018)
WA
OR
CA
MT
ID
NV
AZ
UT
WY
CO
NM
TX
OK
KS
NE
SD
ND
MN
IA
MO
AR
LA
MSAL
GA
FL
SCTN
NC
IL
WIMI
OHIN
KY
WV VA
PA
NY
ME
VTNH
NJDE
MD
Washington D.C.
MA
CTRI
AK
HI
Fall in average daily hits1
per ATM (2013-2018)
30 hits
20 hits
10 hits
0 hits (Constant)
<0 hits (Increase in hits)
Legend
1. hits = number of unique times an ATM was used
Region - States:
Northeast – CT, ME, MA, NH, RI, VT, NJ, NY, PA
Midwest – IL, IN, MI, OH, WI, IA, KS, MN, MO, NE, ND, SD
South - Atlantic – DE, FL, GA, MD, NC, SC, VA, DC, WV
South – Central – AL, KY, MS, TN, AR, LA, OK, TX
West - Mountain – AZ, CO, ID, MT, NV, NM, UT, WY
West - Pacific – AK, CA, HI, OR, WA
29

Case 1: American Bank ATM DilemmaFinancial Services | Profitability Improvement
Exhibit 3 – Operating costs for American Bank ATMs (2018)
Region
Operating Structure
BO-BO BO-VO VO-VO
# ATMs
Northeast 250 750 1000
Midwest 1000 800 200
South - Atlantic 1500 250 250
South - Central 1500 350 150
West - Mountain 1200 500 300
West - Pacific 0 500 1500
Daily Operating Cost to bank per ATM ($)
Operating Cost $100 $60 $0
Operating Structure:
BO-BO = Bank Owned, Bank Operated
BO-VO = Bank Owned, Vendor Operated
VO-VO = Vendor Owned, Vendor Operated
Owner pays rent, utilities
Operator pays for maintenance, cash mgmt.
Region - States:
Northeast – CT, ME, MA, NH, RI, VT, NJ, NY, PA
Midwest – IL, IN, MI, OH, WI, IA, KS, MN, MO, NE, ND, SD
South - Atlantic – DE, FL, GA, MD, NC, SC, VA, DC, WV
South – Central – AL, KY, MS, TN, AR, LA, OK, TX
West - Mountain – AZ, CO, ID, MT, NV, NM, UT, WY
West - Pacific – AK, CA, HI, OR, WA
30

Case 1: American Bank ATM DilemmaFinancial Services | Profitability Improvement
Exhibit 4 – Reasons for reduction in hits in vendor operated1 ATMs
Price correlation2
$1.00
$1.01
$0.99
$1.00
$1.01
$1.02
94 95 96 97 98 99 100 101Pri
ce p
er t
xn (
$)
Number of daily transactions
Uptime3 correlation
100
80
70
80
90
100
70 80 90 100 110
Up
tim
e (%
)
Number of daily transactions
Competition correlation
0
4
012345
85 90 95 100 105
# C
om
pet
ito
rs
in v
icin
ity
Number of daily transactions
1. Vendor operated ATMs are ATMs where operations are outsourced to a vendor
2. American Bank cannot reduce transaction prices further from current levels
3. Uptime is the % of time the ATM is functional; Downtime = 100% - Uptime
31

Case 1: American Bank ATM DilemmaFinancial Services | Profitability Improvement
Exhibit 5 – Downtime pattern and causes in vendor operated1 ATMs
25%
20%
50%
5%
Downtime Causes (2018)
Cash-out (Operator)
Power outage (Owner)
Machine tech problems (Operator)
Other technical issues (Operator)
0%
10%
20%
30%
40%
50%
60%
70%
80%
90%
100%
2014 2015 2016 2017 2018
Average Downtime
Uptime Downtime
1. Vendor operated ATMs are ATMs where operations are outsourced to a vendor (a vendor is the operator)
Note: Cash-out = Amount of time the ATM is out of cash to dispense ; Power outage = Amount of time the ATM does not have electricity to run
Note: (Operator) = Operator responsibility ; (Owner) = Owner responsibility
32

Case 1: American Bank ATM DilemmaFinancial Services | Profitability Improvement
Exhibit 6 – Revenues from ATMs (2018)
Customer Type
Operating Structure
BO-BO BO-VO VO-VO
Fin. Non-fin. Fin. Non-fin. Fin. Non-fin.
Revenue for American Bank from each hit2
American Bank (Own) customer1 $2.0 $1.5 $1.5 $1.0 $1.0 $0.5
Other customer $2.5 $2.0 $2.0 $1.5 $1.5 $1.0
Own : Other Ratio 1 : 1
Region # Average Daily Hits (Own + Other)
Northeast 12 10 12 8 8 12
Midwest 127 173 97 73 48 62
South - Atlantic 43 57 22 48 56 34
South - Central 35 55 35 20 15 40
West - Mountain 32 48 21 16 19 11
West - Pacific 0 0 18 2 6 14
Operating Structure:
BO-BO = Bank Owned, Bank Operated | BO-VO = Bank Owned, Vendor Operated | VO-VO = Vendor Owned, Vendor Operated
Transaction type: Fin. = Financial transactions | Non-fin. = Non financial transactions
1. While American Bank does not charge its own customers, revenue is calculated as estimated savings because customer is not using the branch
2. For vendor-operated ATMs, revenue for American Bank is calculated after deducting vendor commissions on transactions
33

Case 1: American Bank ATM DilemmaFinancial Services | Profitability Improvement
Exhibit 6A – Metrics comparison with competition (2018)
0
0.1
0.2
0.3
0.4
0.5
0.6
0.7
0.8
0.9
1
AmericanBank
PNK Bank Townbank Bells Cargo
Proportion of Own : Other customers
Own Customers Other Customers
0
0.1
0.2
0.3
0.4
0.5
0.6
0.7
0.8
0.9
1
AmericanBank
PNK Bank Townbank Bells Cargo
Proportion of Fin : Non-Fin transactions
Financial Non-Financial
34

Case 1: American Bank ATM DilemmaFinancial Services | Profitability Improvement
Exhibit 1 Insights Exhibit 2 Insights Exhibit 3 Insights
1. Hits (txns) falling – main
problem for exploration
2. Other customers smaller
portion of transactions
3. Costs are constant across
all 5 years
1. Maximum decline in
average daily ATM hits
in 2 regions - Northeast
and West-Pacific
1. Downtime major reason
2. Price increase is not
helpful due to high
demand elasticity
3. Competitors not
affecting transactions
Exhibit 4 Insights Exhibit 5 Insights Exhibit 6/6A Insights
1. Downtime increased by
25% in last 5 years
2. Operator contributing to
80% of downtime issues
3. Vendor management and
contracts to be explored
1. Ex.6 - $0.5 more revenue
from other customers
2. Ex.6 - $0.5 more revenue
from financial txns
3. Ex.6A – competition
better at both metrics
1. Northeast and West-
pacific have high vendor
operated ATMs =>
2. Problem with Vendor
Operated ATMs (BO-
VO and VO-VO)
35

Case 1: American Bank ATM DilemmaFinancial Services | Profitability Improvement
Ideas for profitability improvement and revenue potential (1)
1. Manage vendors in Northeast and West-Pacific regions to eliminate downtime:
• Vendor management will increase uptime by 80% (% operator responsibility) * 25% (uptime increase) = 20%
• 20% increase in uptime -> Increase in 20 transactions (hits) per ATM in both regions for –VO ATMs
• 20 additional daily hits to be allocated proportionally to financial and non-financial transactions:
• Calculating additional revenue from new hits –
• Northeast (BO-VO) increase = [12 (Fin)*$1.75 + 8 (Non-Fin)*$1.25] * 750 ATMs = $23,250
• Northeast (VO-VO) increase = [8 (Fin)*$1.25 + 12 (Non-Fin)*$0.75] * 1000 ATMs = $19,000
• West-Pacific (BO-VO) increase = [18 (Fin)*$1.75 + 2 (Non-Fin)*$1.25] * 500 ATMs = $17,000
• West-Pacific (VO-VO) increase = [6 (Fin)*$1.25 + 14 (Non-Fin)*$0.75] * 1500 ATMs = $27,000
• Total increase in revenue (and therefore profits) = $23,250 + $19,000 + $17,000 + $27,000 = $86,250
Region
Given info - Operating Structure (# hits) Calculation - Allocation of 20 new hits
BO-VO VO-VO BO-VO VO-VO
Fin. Non-Fin. Fin. Non-Fin. Fin. Non-Fin. Fin. Non-Fin.
Northeast 12 8 8 12 12 8 8 12
West - Pacific 18 2 6 14 18 2 6 14
Avg Rev. / hit $1.75 $1.25 $1.25 $0.75 $1.75 $1.25 $1.25 $0.75
36

Case 1: American Bank ATM DilemmaFinancial Services | Profitability Improvement
Ideas for profitability improvement and revenue potential (2)
2. Increase proportion of other customers using ATMs to Bells Cargo levels and proportion of financial transactions to
PNK bank levels
• Additional average revenue per hit from new financial and “other” customer transactions =>
= $0.04 + $0.08 + $0.00 + $0.08 = $0.2
(Easier method: 20%*$0.5 + 20%*$0.5 = $0.2)
• Total Additional revenue potential = $0.2 * (85 hits {Exhibit 1} * 12000 ATMs {Exhibit 4}) = $204,000
Total revenue increase = (1) + (2) = $86,250 + $204,000 = $290,250
Since there are no cost implications, total profit increase potential from both ideas = $290,250
BankRefer
Exhibit% Fin txns
% Other
Customers
American Bank 6A 45% 50%
Best-in-class competitor 6A 65% 70%
Improvement potential - 20% 20%
Extra revenue per txn 6 $0.5 $0.5
20% * 80% of all hits
$0.5 extra rev
20%*80%*$0.5 = $0.08
20% * 20% of all hits
$0.5 + $0.5 = $1 extra rev
20%*20%*$1 = $0.04
80% * 80% of all hits
$0 extra rev
80%*80%*$0 = $0
20% * 80% of all hits
$0.5 extra rev
20%*80%*$0.5 = $0.08
Extra Fin. txns
No-change in txn type
Extra Other customersNo-change in customer type>
37

Case 1: American Bank ATM DilemmaFinancial Services | Profitability Improvement
Interviewer question: What is the average break-even number of daily hits?
Calculation:
• Interviewer to ask interviewee to assume both financial : non-financial transactions and
own : other customer ratios as 1:1 for simplicity in calculations
• Interviewee must identify that this only applies to bank-owned ATMs, since operating costs to
American bank for vendor-owned ATMs is $0.
• BO-BO Breakeven = $100 (cost) / [0.5*0.5*($1.5+$2+$2+$2.5)] (avg. rev. per hit) = 50 hits
• BO-VO Breakeven = $60 (cost) / [0.5*0.5*($1.0+$1.5+$1.5+$2.0)] (avg. rev. per hit) = 40 hits
Follow-on question -> What can we do with loss making ATMs? (after all tries of improving hits):
• Add other transaction types to ATM (functionalities such as check deposit, cash deposit, etc.)
• Allocate intangible revenues to ATMs in prime locations (marketing of bank, etc.)
• Negotiate operating costs with vendor (if vendor operated)
• Relocate ATM to better spot
• Shut down ATM / Sell off ATM to vendor
38

Recommendations Risks Next Steps
Two recommendations to
increase revenue (and profits):
1. Improve vendor management
practices and look into
vendor contract structures in
Northeast and West-Pacific
regions
- Impact of $86,250
2. Increase proportion of
financial and other customer
transactions to best-in-class
competitor levels
- Impact of $204,000
Total revenue (and profit)
potential = $290,250
Risks include:
1. Costs to manage vendors and
change transaction types
(marketing, etc.) can be very
high
2. More ATM usage might lead
to branch employees going
out of work resulting in the
need for firing of employees
3. Investment in ATMs may
reduce attention on channels
such as online banking which
are growing more rapidly
American Bank should:
1. Start looking into vendor
contract structures in
Northeast and West-Pacific
regions
2. Identify loss-making ATMs
and take appropriate action
3. Study customer usage
patterns to improve
transaction mix
Case 1: American Bank ATM DilemmaFinancial Services | Profitability Improvement
39

Case 2: Harrison Energy EV GoalsPower & Utilities | Market Entry
40

Case 2: Harrison Energy EV GoalsPower & Utilities | Market Entry
Case Prompt
Our client, Harrison Energy, is one of the largest power & utilities companies in the US. You
are in the year 2018, and the CEO sees electric vehicles as an attractive market and wants to
enter the space. She needs help understanding how and when to enter the market, and the
associated ROI. She has hired your firm to help formulate a strategy.
Interviewer Guidance
This is an interviewee led case. Brainstorm with interviewee to answer the following questions:
1. What factors will you consider to formulate a market entry strategy? (framework)
2. When should we enter the market? (Hand Exhibit 1).
3. Which parts of the value chain should we enter and how? (Hand Exhibit 2). Brainstorm to
lead interviewee to ask for Exhibit 3.
4. What other considerations should the client have to prioritize market entry?
Concepts Tested Problem structuring, Brainstorming, Graph reading
41

Clarifying Information
• Goal/objective is to be present in a new market and
add more sources of revenue and eventually profits.
• Scope limited to the US market only
• Client is not currently involved in the EV market
• Client wants to know when to enter the market
• Harrison Energy does not know where in the EV
value chain it wants to play
• Harrison Energy wants to break-even on any
investment in 5 years
Possible Framework
Problem: Enter electric vehicle market
• Market –
- Market size across EV components
- Growth rate
- Maturity of EV market (Is tech still developing?)
- Competitors and market share
- Regulations / policies in EV space
• Financials –
- Potential revenue (market size, share)
- Potential costs (set up, operations)
• Proposition –
- Value chain components of EV
- Synergies with current business
- Customer segments – individual vehicle owners
/ business owners
- Supplier concentration (how difficult is it to
provide product/services?)
• Entry strategy (for different value chain elements) –
- Merge/Acquire smaller players
- Build from scratch (in-house/outsourced)
Case 2: Harrison Energy EV GoalsPower & Utilities | Market Entry
42

Case 2: Harrison Energy EV GoalsPower & Utilities | Market Entry
Brainstorm when to enter the EV Market
The EV market will be best to enter when:
A. Internal Readiness
i. Harrison Energy has developed capabilities in the segments it wants to enter
ii. Harrison Energy has been able to raise the capital needed to enter the market (internal
cash or external debt or equity)
B. External Readiness
i. The costs of owning EV vehicles is lower than that of regular (ICE1) vehicles
ii. There is adequate infrastructure such as charging stations, maintenance services for
electric vehicle models
iii. Large companies such as Harrison Energy would prefer to enter in the growth phase
vs. introduction phase (in the market maturity curve)
Once the interviewee arrives at these points, say that external readiness is the bottleneck and
hand Exhibit 1 to calculate the right time to enter the market.
1. ICE vehicle = Internal Combustion Engine vehicle (most commonly found type of vehicle today)
43

Case 2: Harrison Energy EV GoalsPower & Utilities | Market Entry
Exhibit 1 – Market maturity and Total Cost of Ownership
2010 2020 2030 2040 2050
EV Market Maturity Curve
Introduction Growth Maturity Saturation
$50,000
$40,000
2,000,000 4,000,000
Price ($ TCO) to demand (#) correlation
$100,000
$92,500
$85,000
$77,500$75,000
$90,0002
$0
$20,000
$40,000
$60,000
$80,000
$100,000
$120,000
2010 2020 2030 2040 2050
Total Cost of Ownership (TCO1) of EV vehicle for 10 years
Vehicles Batteries Maintenance
Electricity Total ICE Vehicle
1. Total Cost of Ownership (TCO) includes all costs of owning, running and maintaining a vehicle (includes vehicle cost, fuel/electricity cost, maintenance)
2. ICE vehicle = Internal Combustion Engine vehicle (most commonly found type of vehicle today)
44

Case 2: Harrison Energy EV GoalsPower & Utilities | Market Entry
Calculations / Working for when to enter EV Market
Time of entry:
Exhibit 1: TCO of ICE vehicle - $90,000. TCO of EV in 2020 is $92,500 and in 2030 is $85,000.
The demand will spike when total cost of owning an EV is less than the total cost of owning an ICE vehicle.
Doing a quick linear regression, TCO of EV = $90,000 in 2023, and goes further down after that.
Calculation:
2020 + ($92,500 - $90,000)/($92,500 - $85,000) * (2030 - 2020)
2020 + ($2,500 / $7,500) * 10
2020 + 10/3
2023
This is when demand will spike and is the best time for entry. 2023 is 5 years from current date (2018).
Comparing with maturity curve, we see that 2023 lies in the growth phase and is the best time to enter the market.
The TCO – demand correlation curve also supports a high price elasticity, implying that it is best to enter when the price is
lower and the demand is high.
45
Case 2: Harrison Energy EV GoalsPower & Utilities | Market Entry
Interviewer Guidance for segment / proposition selection
• Brainstorm with interviewee on next steps -> drive interviewee to think about which
segment of the market should Harrison Energy enter. Hand Exhibit 2.
• After calculations on Exhibit 2, ask interviewee about other options for non-feasible value
chain elements. Once interviewee arrives at the conclusion that Harrison Energy could
acquire other players, hand Exhibit 3.
46

Case 2: Harrison Energy EV GoalsPower & Utilities | Market Entry
Exhibit 2 – Harrison Energy Capability Analysis
$3
$4
$5
$3
$25
$0
$10
$2
$3
$80
$3
$0
$12
$10
$400
Software/Mgmt Services
Power Generation
Charging Stations
Batteries
Vehicles
Market Size $B (2023)
Build Sell Operate
Harrison Energy Capability Analysis
Capability Level Time to build inhouse Cost to build
15 years
10 years
10 years
10 years
2 years
4 years
2 years
Capable
3 years
N/A
Capable
Capable
1 year
Capable
1 year
$30B
$5B
$1B
$600M
$50M
$100M
$500M
$0
$300M
N/A
$0
$0
$300M
$0
$200M
Note: Assume that in the best-case scenario, Harrison Energy can capture 10% market share and make 10% EBITDA margins on each value chain item.
Harrison Energy wants a 5 year payback period on any investment. Assume stagnant market from entry to 5-year period for calculations.
47

Case 2: Harrison Energy EV GoalsPower & Utilities | Market Entry
Exhibit 3 – Options for acquisition
ComponentValue
Chain
Brand
Alignment
Option #1 (cheaper) Option #2 (faster)
Cost ($) Time (years) Cost ($) Time (years)
Vehicles
Build
●$20B 10 $40B 5
Sell $6B 8 $8B 6
Operate $1.1B 7 $1.2B 5
Batteries
Build
●$400M 8 $550M 5
Sell $100M 3 $150M 1
Operate $50M 7 $150M 2
Charging Stations
Build
●$400M 4 $800M 1
Sell
Operate $200M 4 $400M 2
Power Generation
Build
●Sell
Operate
Software / Mgmt.
Services
Build
●$100M 3 $200M 2
Sell
Operate $100M 3 $200M 2
Note: Assume that in the best-case scenario, Harrison Energy can capture 10% market share and make 10% EBITDA margins on each value chain item.
Harrison Energy wants a 5 year payback period on any investment. Assume stagnant market from entry to 5-year period for calculations.
● Low | ● Medium | ● High
48
Case 2: Harrison Energy EV GoalsPower & Utilities | Market Entry
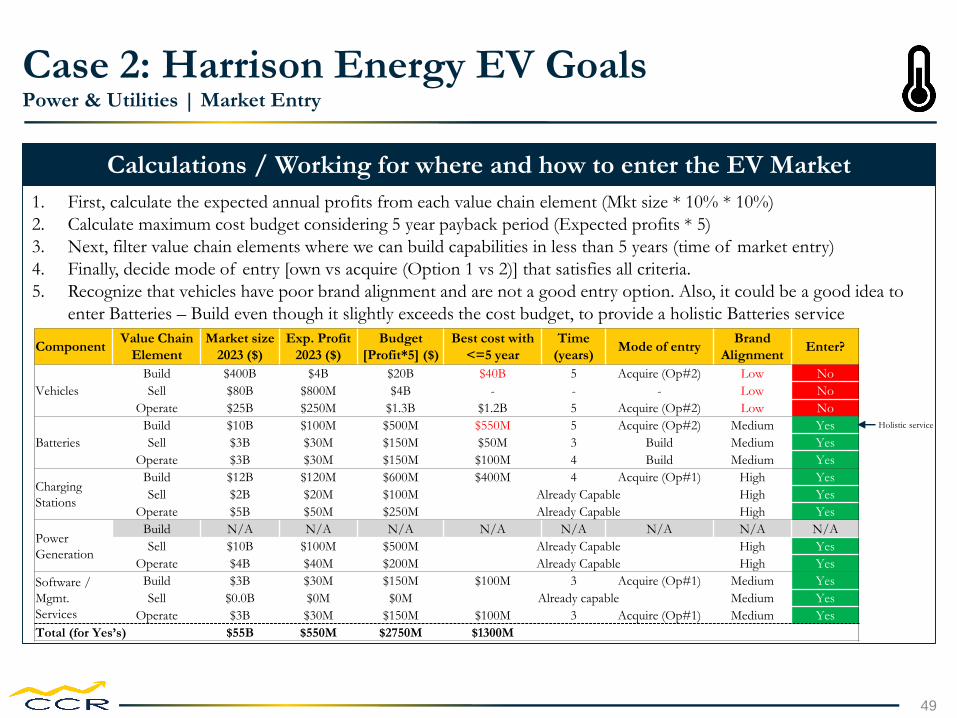
Calculations / Working for where and how to enter the EV Market
1. First, calculate the expected annual profits from each value chain element (Mkt size * 10% * 10%)
2. Calculate maximum cost budget considering 5 year payback period (Expected profits * 5)
3. Next, filter value chain elements where we can build capabilities in less than 5 years (time of market entry)
4. Finally, decide mode of entry [own vs acquire (Option 1 vs 2)] that satisfies all criteria.
5. Recognize that vehicles have poor brand alignment and are not a good entry option. Also, it could be a good idea to
enter Batteries – Build even though it slightly exceeds the cost budget, to provide a holistic Batteries service
ComponentValue Chain
Element
Market size
2023 ($)
Exp. Profit
2023 ($)
Budget
[Profit*5] ($)
Best cost with
<=5 year
Time
(years)Mode of entry
Brand
AlignmentEnter?
Vehicles
Build $400B $4B $20B $40B 5 Acquire (Op#2) Low No
Sell $80B $800M $4B - - - Low No
Operate $25B $250M $1.3B $1.2B 5 Acquire (Op#2) Low No
Batteries
Build $10B $100M $500M $550M 5 Acquire (Op#2) Medium Yes
Sell $3B $30M $150M $50M 3 Build Medium Yes
Operate $3B $30M $150M $100M 4 Build Medium Yes
Charging
Stations
Build $12B $120M $600M $400M 4 Acquire (Op#1) High Yes
Sell $2B $20M $100M Already Capable High Yes
Operate $5B $50M $250M Already Capable High Yes
Power
Generation
Build N/A N/A N/A N/A N/A N/A N/A N/A
Sell $10B $100M $500M Already Capable High Yes
Operate $4B $40M $200M Already Capable High Yes
Software /
Mgmt.
Services
Build $3B $30M $150M $100M 3 Acquire (Op#1) Medium Yes
Sell $0.0B $0M $0M Already capable Medium Yes
Operate $3B $30M $150M $100M 3 Acquire (Op#1) Medium Yes
Total (for Yes’s) $55B $550M $2750M $1300M
Holistic service
49

Case 2: Harrison Energy EV GoalsPower & Utilities | Market Entry
Brainstorm other considerations/prioritizations to enter the EV market
1. Target customer segments – go after business/industrial customers who are working towards electrifying their fleets
(for sustainability) first (e.g.: UPS, PepsiCo, etc.)
2. Geographies to enter – Power & utility companies typically operate as monopolies in few states. Entering their own
states first makes most sense.
3. Regulations – Tax incentives, rebates by government to encourage switch to electric vehicles (govt. promoting
sustainability)
4. Competition – Cost/Product advantage of Harrison Energy over specialized players in each value chain element
• Established customer base (easier marketing / lower marketing costs)
• Leverage existing manufacturing and distribution network to scale easily (easier scaling)
• Better supplier relations (higher bargaining power)
• Better customer usage understanding (more targeted propositions)
• Better government relations (can work with government authorities to leverage incentives in EV market)
50
Recommendations Risks Next Steps
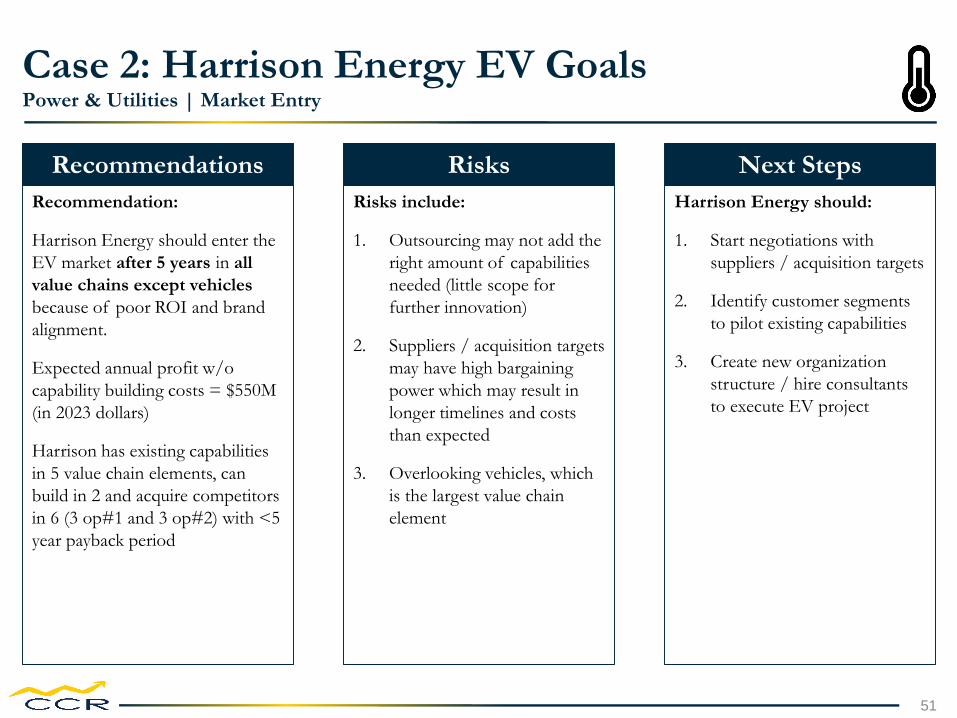
Recommendation:
Harrison Energy should enter the
EV market after 5 years in all
value chains except vehicles
because of poor ROI and brand
alignment.
Expected annual profit w/o
capability building costs = $550M
(in 2023 dollars)
Harrison has existing capabilities
in 5 value chain elements, can
build in 2 and acquire competitors
in 6 (3 op#1 and 3 op#2) with <5
year payback period
Risks include:
1. Outsourcing may not add the
right amount of capabilities
needed (little scope for
further innovation)
2. Suppliers / acquisition targets
may have high bargaining
power which may result in
longer timelines and costs
than expected
3. Overlooking vehicles, which
is the largest value chain
element
Harrison Energy should:
1. Start negotiations with
suppliers / acquisition targets
2. Identify customer segments
to pilot existing capabilities
3. Create new organization
structure / hire consultants
to execute EV project
Case 2: Harrison Energy EV GoalsPower & Utilities | Market Entry
51

Case 3: Bailey Brothers BancorpFinancial Services | Profitability Improvement
52

Case 3: Bailey Brothers BancorpFinancial Services | Profitability Improvement
Case Prompt
Our client, Bailey Brothers, is a retail bank with several branches in Ann Arbor, Michigan. Their
main competitor is Potter & Co., a regional bank that also operates in and around the Ann
Arbor area. The CEO of Bailey Brothers, George Bailey, would like us to recommend ways to
improve overall profitability in the face of an increasingly modernized industry.
Information provided upon request:
• Bailey Brothers and Potter both offer checking, savings, and retirement accounts, as well as
mortgages and auto loans, CDs, and investment accounts.
• Bailey Brothers and Potter both have well developed mobile apps and online capabilities.
• Bailey Brothers has eight equally sized branches, has been in Washtenaw County for several
decades, and is not considering expanding its footprint at this time.
• George would like to bring his profit margin to that of Potter’s within two years.
Concepts Tested Graph reading, Setting up calculations, Brainstorming
53

Case 3: Bailey Brothers BancorpFinancial Services | Profitability Improvement
Interviewer Guidance
Exhibits: Candidate may ask for data specifically, but feel free to dump all the exhibits on them
at once without context to allow the candidate to work through it on their own.
Exhibit 1: Given that the target is to match profit margin, the candidate should recognize that
the exact number is given by the graph. A strong candidate will also note that the two firms
were similar until recent years.
Exhibit 2: Candidate should identify that A) Online access is increasing, and B) In-person,
branch interaction is not displayed here but can be implied to be dropping as online interaction
rises. 2018 data indicates that 85% of customers to interact with BB primarily through online
means, so it can be inferred that only 15% primarily use a physical branch.
Exhibit 3: Each line-item for Potter is exactly 8X that of Bailey Brothers, with the exception of
branch expenses. Since branch interaction is falling, the cost-saving solution would be to reduce
the number of branches in the Bailey Brothers footprint. A reduction in branches from 8
(annual cost of $12M) to 4 (annual cost of $6M) will bring Bailey in line with Potter in relative
expenses and therefore profit (which a good candidate will notice), however if the candidate
begins to calculate the new margin, let them.
54

Framework
A solid framework would include both
revenue (new product offerings, pricing,
account size, etc.) and cost (salaries,
marketing, client acquisition expense)
buckets. Bonus points if the candidate
recognizes that a bank likely won’t have
variable costs in the same way a CPG or
industrial company will. After sufficient
brainstorming of profitability factors, guide
the candidate toward costs as this will be the
focus of the case.
Recalculated Income Statement
Case 3: Bailey Brothers BancorpFinancial Services | Profitability Improvement
Revenue $50
Salaries and Wages $20
Branch Expenses $6
Marketing $8
Website/App $6
Total Operating
Expenses $46
Profit Margin 20%
EBITDA $10
55

Case 3: Bailey Brothers BancorpFinancial Services | Profitability Improvement
Exhibit 1
56
0%
5%
10%
15%
20%
25%
2010 2012 2014 2016 2018
Profit Margin
Bailey Potter

Case 3: Bailey Brothers BancorpFinancial Services | Profitability Improvement
Exhibit 2
57
0%
5%
10%
15%
20%
25%
30%
35%
40%
2010 2012 2014 2016 2018
Primary Point of Contact for BB Clients
Website Alone Mobile App Alone Website and Mobile

Case 3: Bailey Brothers BancorpFinancial Services | Profitability Improvement
Exhibit 3
Income Statements, FY18 (MM)
Potter & Co Bailey Brothers
Revenue $400 $50
Salaries and Wages $160 $20
Branch Expenses $48 $12
Marketing $64 $8
Website/App $48 $6
Total Operating Expenses $320 $46
EBITDA $80 $4
58

Case 3: Bailey Brothers BancorpFinancial Services | Profitability Improvement
59
Recommendations Risks Next Steps
Recommendation:
Bailey Brothers should close 4 of
its 8 branches. The brick and
mortar presence is no longer
necessary and the cost savings will
boost margins from 8% to 20%.
Risks include:
1. Loss of remaining clientele
that doesn’t use online
resources
2. Possibility of longer term
leases on branch properties
that can’t be exited
immediately
3. PR/morale erosion from
layoffs of employees working
at branches
Bailey Brothers Bancorp
should:
1. Further analysis into which
branches to close to
minimize customer impact
2. Exploration of leasing
contracts and/or selling
property assets
3. Campaign to educate
remaining 15% of offline
customers in online
capabilities
4. Retraining (or buying
out/shifting location of)
branch employees

Case 4: Orange Bank CoFinancial Services | M&A
60

Case 4: Orange Bank CoFinancial Services | M&A
Case Prompt
Our client, an Amsterdam based retail bank, has seen exceptional growth in the last 5 years.
They are involved in commercial banking, investment banking and wealth management.
Currently, they are looking to acquire another bank in Europe. The CEO of Bank Co has hired
our firm to help identify an ideal acquisition target.
Interviewer Guidance
This is a typical McKinsey style case. After the prompt, let the interviewee ask clarifying
questions and then begin testing the interviewee’s capability of creating a structure to solve the
problem. After that, move onto the other questions as listed below. This case is about
comparing various acquisition targets from a financial and non-financial synergies standpoint.
Concepts Tested Graph reading, Setting up calculations, Brainstorming
61
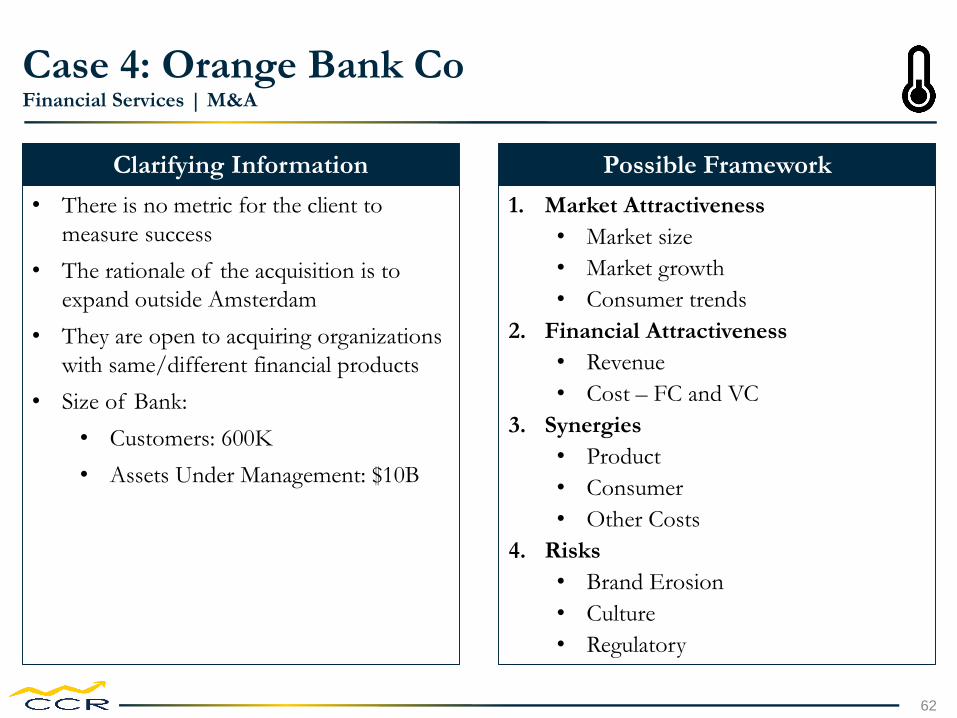
Clarifying Information
• There is no metric for the client to
measure success
• The rationale of the acquisition is to
expand outside Amsterdam
• They are open to acquiring organizations
with same/different financial products
• Size of Bank:
• Customers: 600K
• Assets Under Management: $10B
Possible Framework
1. Market Attractiveness
• Market size
• Market growth
• Consumer trends
2. Financial Attractiveness
• Revenue
• Cost – FC and VC
3. Synergies
• Product
• Consumer
• Other Costs
4. Risks
• Brand Erosion
• Culture
• Regulatory
Case 4: Orange Bank CoFinancial Services | M&A
62

Case 4: Orange Bank CoFinancial Services | M&A
Exhibit Insights & Brainstorming
Initial Insights: The candidate should start with at least some of these:
• We are looking at the variety of sizes – from smaller than us to bigger than us
• There is a visible trend that smaller the firm, higher the number of average products sold/
customer
• Average profitability/ customer doesn’t follow a particular trend so there are some
differences in the way these firms operate
Please drive the candidate to at least 2 of the above insights then ask deep dive questions
regarding each of these questions:
Question 1: What do you think are the advantages and disadvantages of acquiring these firms
based on size? Expected answers:
• Acquiring a smaller firm will be easier to manage vs. larger
• Difference in financial capital required
• Market perception would vary
• Larger firm would enable faster market entry
• Any other logical reason is also acceptable
63

Case 4: Orange Bank CoFinancial Services | M&A
Exhibit Insights & Brainstorming
Question 2: Why do you think the average products sold differ? Expected answers:
• Better customization at smaller size
• Larger company might have higher number of products covering large customer segments
• Better customer service/ salesforce
• Better products
• Any other logical reason is also acceptable
Question 3: Why does the profitability differ? Expected answers:
• Higher price per product
• Better costs (ask the candidate to split costs)
• Better talent productivity
• Better financial management
• Better overhead management
• Any other logical reason is also acceptable
64

Case 4: Orange Bank CoFinancial Services | M&A
Questions
Question 4: Ask the customer
based on the data they have –
if you have to choose one
bank to acquire – which one
are you inclined towards? Any
answer is acceptable with a
sound logic.
Question 5: If the # of
customers for Bank Co is
600K and the average
profitability is $160. What
would be our increased
profitability if we acquire Bank
A vs. Bank B vs. Bank C?
Assume there are no synergies.
Calculation
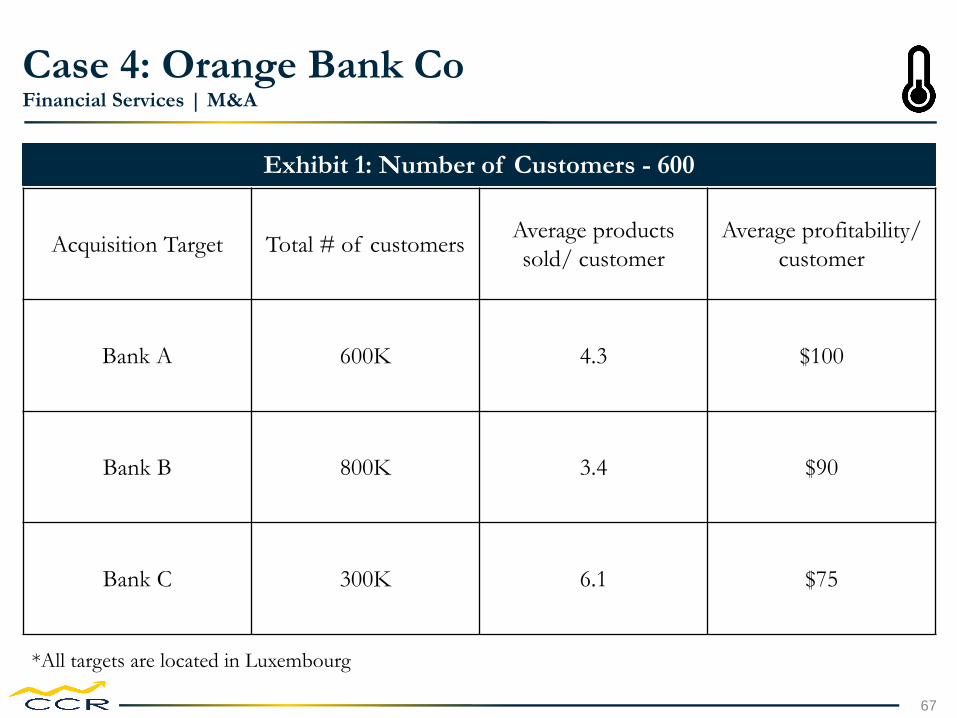
Bank Co profitability: $600K * $160 = $96M
Bank A profitability: $600K * $100 = $60M
Bank B profitability: $800K * $90 = $72M
Bank C profitability: $300K * $75 = $22.5M
Increase in profitability
Bank Co. + Bank A: ($96M + $60M)/(600K + 600K) = ~$130/
customer
Bank Co. + Bank B: ($96M + $72M)/(600K + 800K) = ~$120/
customer
Bank Co. + Bank C: ($96M + $22.5M)/(600K + 300K) = ~$130$/
customer
Thus Bank A or Bank C gives us the same profitability
65

Case 4: Orange Bank CoFinancial Services | M&A
Questions
Question 6: Now that Bank A
and Bank C are giving us the
same profitability – what other
factors will you look at to
decide between them?
Answer: Synergies & Risks
Synergies
Financial synergies
• Increase in revenue: ease of capturing customers, different
products might present cross-sell/up-sell opportunities, price
increase possible in case of monopoly, etc.
• Reduction in cost: consolidation of branches, better
management of finances, consolidation of labor, less overheads
Non-financial synergies
• Specialization sharing: If there are differences in specialization,
these could be leveraged such as customer service, product
innovation etc.
• Process optimization: Larger processes present an optimization
opportunity
• Brand presence: Bank Co will become a multi-national bank
leading to increase in stock price
Any other logical reason is acceptable
Risks
Regulations will need to verified in
the new geography to understand
its impact on the bank operations
Integration of culture will need to
be worked on
Brand perception will need to be
considered if the target bank’s
current reputation is not good
66
Case 4: Orange Bank CoFinancial Services | M&A
Exhibit 1: Number of Customers - 600
Acquisition Target Total # of customersAverage products
sold/ customer
Average profitability/
customer
Bank A 600K 4.3 $100
Bank B 800K 3.4 $90
Bank C 300K 6.1 $75
67
*All targets are located in Luxembourg

Case 5: ShopOnRetail | Profitability Improvement
68

Case 5: ShopOnRetail | Profitability Improvement
Case Prompt
Our client, a US based e-commerce company, ShopOn, has seen a rise in customer returns over
the last few quarters. Even though its revenue and market share have been increasing every
quarter, the CEO is concerned that customer returns will start impacting the margins soon. The
CEO of ShopOn wants your help to identify the reasons behind the high rate of returns and
create a mitigation strategy.
Interviewer Guidance
This is a typical McKinsey style case. After the prompt, let interviewee ask clarifying questions
and then begin with testing the interviewee’s ability to build a framework for an industry with
high growth and disruption. After that, move onto exhibits, followed by a brainstorm question.
The case has a lot of exhibits and the interviewee will have to identify reasons for rising
customer returns and recommendations from those.
Concepts Tested Graph reading, Setting up calculations, Brainstorming
69

Clarifying Information
• Customer returns refer to products returned
by customers post-delivery and not order
cancellations before delivery.
• The return period for any ShopOn product is
30 days from the day of delivery.
• Even though new competitors keep entering
the market, there has been no new competitor
in the last few quarters that could bring about
any significant change to ShopOn. ShopOn is
ranked #3 in the e-commerce space
• ShopOn holds 50% of the product inventory
in its warehouses and 50% is a marketplace for
sellers.
• The mitigation strategy should focus on both
short-term (next 1-3 quarters) and long-term
action items (next 2-3 years)
• No investment guidance has been provided.
Case & Exhibit Guidance
1. After the interviewee prepares and explains
the framework, the interviewer will prompt
the interviewee to move forward with
Exhibits, which cover the most important
reason for increase in return % i.e. change in
product mix.
2. After the interviewee has answered the math
question, the interviewer will lead the
interviewee to brainstorming.
3. Finally, the interviewer will prompt for a
recommendation.
Case 5: ShopOnRetail | Profitability Improvement
70

Possible Framework
5. Others
• Inaccurate website description
• No longer needed
• Bought by mistake
• Desirable product was out of stock then
and now it is back in stock
• Fraudulent behavior by customers i.e.
used the product and returned within
the return policy
Case 5: ShopOnRetail | Profitability Improvement
Possible Framework
1. Change in product mix
2. Product issues
• Apparels - Size/fit/color
• Electronics –
Damaged/malfunctioning/perceived
defect
• Household – Damaged/color/size
• Food – expired/seal broken
3. Pricing issues
• Better price available elsewhere
• Better price available on ShopOn now
4. Delivery issues
• Product arrived late
• Wrong product delivered
• Shipping box damaged
71

Case 5: ShopOnRetail | Profitability Improvement
Question 1
Looking at the below exhibits, what was the customer returns % of ShopOn in the last 2
quarters and what led to the change?
Exhibits
72
Product
Category Returns %
Electronics 2%
Apparel 5%
Household 4%
Food 2%
Others 3%
Electronics35%
Apparel15%
Food10%
Others25%
% UNITS SOLD Q1
Household
15%
Electronics25%
Apparel30%
Household20%
Food10%
Others15%
% UNITS SOLD Q2

Case 5: ShopOnRetail | Profitability Improvement
Solution
The reason for change in the return % is the change in product mix. More units of Apparel and
Household are being sold that have a return % higher than that of the company average.
Qtr. 1 % Units
Sold
Returns % Total
Returns
Qtr. 2 % Units
Sold
Returns % Total
Returns
Electronics 35% 2% 0.70% Electronics 25% 2% 0.50%
Apparel 15% 5% .75% Apparel 30% 5% 1.50%
Household 15% 4% 0.60% Household 20% 4% 0.80%
Food 10% 2% 0.2% Food 10% 2% 0.20%
Other 25% 3% 0.75% Other 15% 3% 0.45%
Total 3% Total 3.45%
73
Case 5: ShopOnRetail | Profitability Improvement
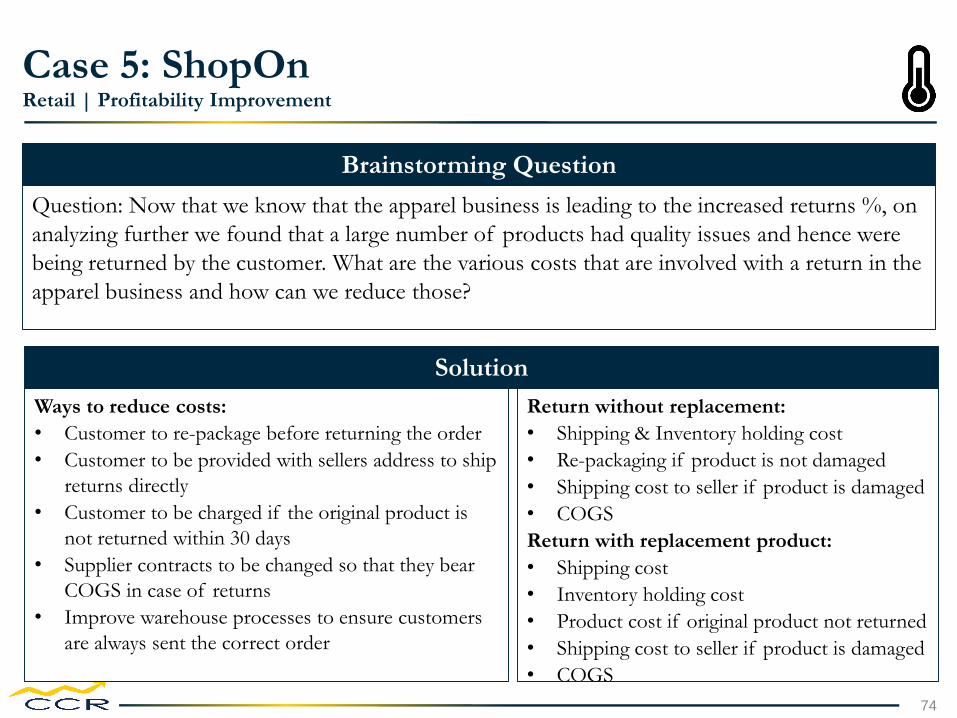
Brainstorming Question
Question: Now that we know that the apparel business is leading to the increased returns %, on
analyzing further we found that a large number of products had quality issues and hence were
being returned by the customer. What are the various costs that are involved with a return in the
apparel business and how can we reduce those?
Solution
Ways to reduce costs:
• Customer to re-package before returning the order
• Customer to be provided with sellers address to ship
returns directly
• Customer to be charged if the original product is
not returned within 30 days
• Supplier contracts to be changed so that they bear
COGS in case of returns
• Improve warehouse processes to ensure customers
are always sent the correct order
Return without replacement:
• Shipping & Inventory holding cost
• Re-packaging if product is not damaged
• Shipping cost to seller if product is damaged
• COGS
Return with replacement product:
• Shipping cost
• Inventory holding cost
• Product cost if original product not returned
• Shipping cost to seller if product is damaged
• COGS
74
Case 5: ShopOnRetail | Profitability Improvement
75
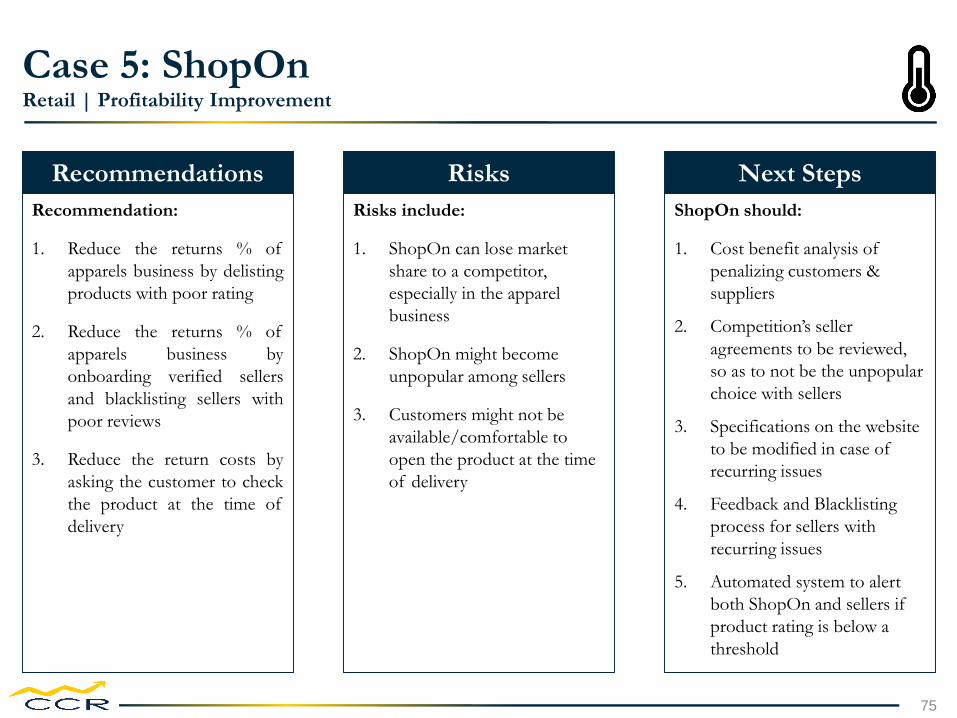
Recommendations Risks Next Steps
Recommendation:
1. Reduce the returns % of
apparels business by delisting
products with poor rating
2. Reduce the returns % of
apparels business by
onboarding verified sellers
and blacklisting sellers with
poor reviews
3. Reduce the return costs by
asking the customer to check
the product at the time of
delivery
Risks include:
1. ShopOn can lose market
share to a competitor,
especially in the apparel
business
2. ShopOn might become
unpopular among sellers
3. Customers might not be
available/comfortable to
open the product at the time
of delivery
ShopOn should:
1. Cost benefit analysis of
penalizing customers &
suppliers
2. Competition’s seller
agreements to be reviewed,
so as to not be the unpopular
choice with sellers
3. Specifications on the website
to be modified in case of
recurring issues
4. Feedback and Blacklisting
process for sellers with
recurring issues
5. Automated system to alert
both ShopOn and sellers if
product rating is below a
threshold

Case 6: Ferris WheelEntertainment | New Investment Analysis
76

Case 6: Ferris WheelIndustry: Entertainment| New Investment Analysis
Case Prompt
A friend of mine is super rich and is always looking into interesting investment opportunities. To raise funds
for renovation, Ferris Wheel management in Chicago is considering inviting bids from High Net Worth
Individuals (HNIs) to let them run the Wheel for a whole year, 7 years later.
As a fan of Chicago and the Wheel, my friend wants to bid on this opportunity and wants to know how to
go thinking about this.
Interviewer Guidance
▪ Level: Easy, Round 1 Case
▪ Interviewee led case
▪ No charts/graphs
Concepts Tested Brainstorming, Setting up calculations, Math
77

Clarifying Information
• Desired ROI : 10%
• If the bid is won, the friend would be CEO of
the company and run the operations
• The friend also has some interesting
investments in the food and beverage space
• No funding limitations
Good Framework
▪ Good framework could include:
▪ Revenue analysis
▪ Ticket sales
▪ Other revenues
▪ Cost analysis
▪ Salaries
▪ Marketing
▪ Rent, Energy and Maintenance
▪ Insurance
▪ Other aspects
▪ Capabilities to operate
▪ Risks of not knowing 7-year future
▪ Synergies from F&B businesses
▪ Funding for bid amount
▪ Opportunity cost
Case 6: Ferris WheelIndustry: Entertainment| New Investment Analysis
Interviewer Guidance
• After framework development, let the
candidate drive the case but course correct if
necessary:
1. Brainstorm and calculate revenues
2. Brainstorm costs
3. Calculate margin, discount for NPV and
maximum Bid amount
4. Recommendation to friend
78

Case 6: Ferris WheelIndustry: Entertainment| New Investment Analysis
Brainstorm and calculate revenues
1. Ask candidate to brainstorm how we’d calculate ticket revenues
• Should settle on Price of tickets, capacity of the wheel, # of days ride operates, # of hours a day
2. Ask candidate how they would think about pricing the tickets?
• Good factors to consider would be peak pricing on holidays and weekends
• Seasonal variation due to being in Chicago – less footfall in winter, heavy crowds in summer
• Push the candidate for more pricing ideas (combined packages, multi-ride pass, corporate rates)
3. Finally ask the candidates what are some other/alternate revenues that could be earning?
• Good answers would include Food & Beverage, photo memories, private cabins, memorabilia,
advertising partnerships, synergy benefits etc.
Interviewer Guidance
1. This section to entirely facilitate brainstorming for the candidates
2. Creativity in pricing and alternate revenue streams is encouraged (can also be drawn from candidates
personal experiences)
3. Can push candidates with the “What else?”
79

Case 6: Ferris WheelIndustry: Entertainment| New Investment Analysis
Ticket Sale Revenue Calculation
1. Provide the candidate these numbers to run the calculations:
• Runs 52 weeks, 11 hours/day, capacity: 200 people/hour, $15 tickets (weekend 30% premium)
• Utilization: Spring/Summer/Fall weekdays (80%) and weekends (100%) | Winter weekdays (50%)
and weekends (75%)
• Other revenues + synergy benefits : $4.5M
2. Good candidate will lay out the math in a 2 by 2 matrix (Summer & Winter, Weekend & Weekday)
3. If a candidate does 2 buckets of calculation quickly – you can give them revenues from other 2 buckets
Assume 26 weeks each (it's Chicago after all)
Spring/Summer/Fall Winter
Weekday
- # of days = 26 weeks*5 = 130 days
- # of hours working = 130 days*11 = 1430 hours
- Utilization (80%) = 1144 hours
- Total People = 1144 hours *200 = 228,800
- Sales = 228,800*$15/ticket = $3.432M
- # of days = 26 weeks*5 = 130 days
- # of hours working = 130 days*11 = 1430 hours
- Utilization (50%) = 715 hours
- Total People = 715 hours *200 = 143,000
- Sales = 143,000*$15/ticket = $2.145M
Weekend
- # of days = 26 weeks*2 = 52
- # of hours working = 52 days*11 = 572 hours
- Utilization (100%) = 572 hours
- Total People = 572 hours *200 = 114,400
- Sales = 114,400*$20/ticket = $2.288M
- # of days = 26 weeks*2 = 52
- # of hours working = 52 days*11 = 572 hours
- Utilization (75%) = 429 hours
- Total People = 429 hours *200 = 85,800
- Sales = 85,800*$20/ticket = $1.716M
Total from ticket sales: $9.521M + Other $4.5M = Total Revenues is $14M
80

Case 6: Ferris WheelIndustry: Entertainment| New Investment Analysis
Brainstorm costs and calculate margin + bid amount
1. Let the candidate suggest that now let’s look at the costs of running the Ferris Wheel
2. Ask candidate to brainstorm some of the those costs:
• Good answers include: Salaries/Labor, Marketing, Rent, Energy, Maintenance, Insurance, etc.
• Provide the candidates total costs needed for a year : $3M
3. Good candidates would proceed to calculating margin / net income (if not, guide them to this):
• Revenues – Costs = $14M - $3M = $11M Net Income
4. Good candidates would consider time value of money, since this margin would be earned 7 years later
• Rule of 72 discounting: 72/rate of return (10%) = ~7 years to double money or NPV is half
• Therefore, net income in today’s value = $11M/2 = $5.5M
• If candidates are unaware to consider discounting or how to discount – do prompt and guide
5. Good candidates will proceed to calculate maximum bid amount for today:
• Max bid amount for 10% ROI = $5.5M/110% = $5M
6. Ask candidate to make a recommendation
81

Case 6: Ferris WheelIndustry: Entertainment| New Investment Analysis
Recommendation Risks Next Steps
• Make a bid for a
maximum amount of $5M
to ensure an ROI of 10%
would be achieved for
NPV of $5.5M
• Any lower bid would
increase ROI to >10%
Risks include:
1. These projections may
not stay constant for over
7 years and we should
consider possible changes
in market trends /
competition
2. With no prior experience
in managing such a
venture previously, there
may be hiccups and your
friend should consider
hiring a CEO to run this
3. Are opportunity costs of
other investments >10%?
Your friend should:
1. Ensure appropriate liquid
funds are available to bid
2. Plan a bidding strategy to
help succeed in the
auction by wining it with
a less than <$5M bid
3. Think of other synergy
benefitting investments
could be made over next
few years
82

Case 7: 6PAQ P.E. FirmEntertainment | Private Equity & Profitability Improvement
83

Case 7: 6PAQ P.E. FirmEntertainment | Private Equity & Profitability Improvement
Case Prompt
Your client, 6PAQ, is a small-market P.E. firm that specializes in suburban business
development.
One of its analysts identified two movie theaters in a small suburban area that separately or
together might prove to be a good investment. Should your client, 6PAQ, purchase these movie
theaters?
Interviewer Guidance
This is an interviewer-led case, but the interviewer should gauge the candidate’s ability to drive.
The interviewer should assess the interviewee’s potential for structuring math, making
calculations easier, and bringing up relevant industry trends (e.g. Netflix, MoviePass, etc.).
Concepts Tested Market Sizing, Setting Up Calculations, Brainstorming
84

Case 7: 6PAQ P.E. FirmEntertainment | Private Equity & Profitability Improvement
85
Clarifying Information
• Theater Specific Info:
• The movie theaters are somewhat dilapidated
• Competition: None, they are the only two in the
suburb and surrounding suburbs
• Revenue Streams:
• Tickets (tix)-movies leased through distributors
• Concessions (cns)-purchased from distributors
• P.E. Company 6PAQ Info:
• Portfolio: Suburban recreational facilities and
entertainment (swimming pools, shopping malls,
bowling alleys, laser tag facilities, etc.)
• Objectives:
• 6PAQ has a standard of 100% ROI for all
investments
• Sell in five years
• Evaluate modernization project
• Industry-wide Trends from 2010-181:
• Ticket sales have declined by 1.18%
• Average Ticket Price Increased by 15.46%
Possible Framework
Problem: Improve Profitability and Investment Valuation
• Financials
• Rev (can include ways to improve here)
• Tickets (P * Q)
• Concessions (P * Q)
• Cost
• FC- movie leases, labor, rent, taxes, electricity
(HVAC), cleaning materials, insurance, maintenance
• VC- concession costs
• Revenue Improvement Opportunities (and list of them)
• Marketing/Customer Analysis
• Price Sensitivity Analysis
• SKU Analysis (Concessions and Tix)
• Gap analysis
• Advertising/Discount Spends
• Entrance & Exit
• Purchase Price & Exit Price
• Valuation Methods- Multiple, NPV, Comparables
• Buyers
• Other
• Synergies
• Bundle opportunities w/ portfolio companies (cross-sell)
• Cost (back-office, increased buying power, etc)
A good candidate will consider possibility for localized monopoly, exit
opportunities, synergies with existing portfolio, and innovative ways to
improve revenue and decrease costs
1 https://www.the-numbers.com/market/ and individual analysis

Interviewer Guidance (pt. 1)Revenue: The candidate should drive towards understanding revenues first. If not, guide them there. Show
Exhibit 1 and explain, “We do not know revenues for Theaters A and B for certain but 6PAQ obtained this
exhibit. What does it tell you?”
Key insights: 1) Revenue has been consistent for both Theaters and they have similar net profits
2) Theater A has much higher revenue
3) Theater A’s costs are much higher as a percentage of revenue, indicating its cost structure could be improved
Once the candidate nails these insights, indicate, “6PAQ plans to send the same analyst to each theater for a
month to estimate the number of yearly visitors and revenue. Neither theater offers demographic discounts
(e.g. senior discounts) and the analyst cannot sit at the front of the theaters and count customers or be in
multiple places at once. What instructions would you give to the analyst and how would you calculate it?”
Important Note: All numbers necessary for calculations should be provided and candidates can round to the
tens of thousands $x.xx million (see Calculations – Revenue and Profitability by Theater pg. 88)
• After having candidate calculate revenues, ask them to brainstorm ways to improve them (see Ansoff
Matrix in Brainstorming Guidance, pg. 89)
• Next, tell them that you believe there are significant synergies and that total costs for theaters as a
function of revenue are: Theater A) 50% Theater B) 20%
• Ask candidate what could be driving the difference in cost and afterwards, to calculate profitability. (see
Brainstorming Guidance, pg. 7, Revenue Calculations pg. 90)
Case 7: 6PAQ P.E. FirmEntertainment | Private Equity & Profitability Improvement
86
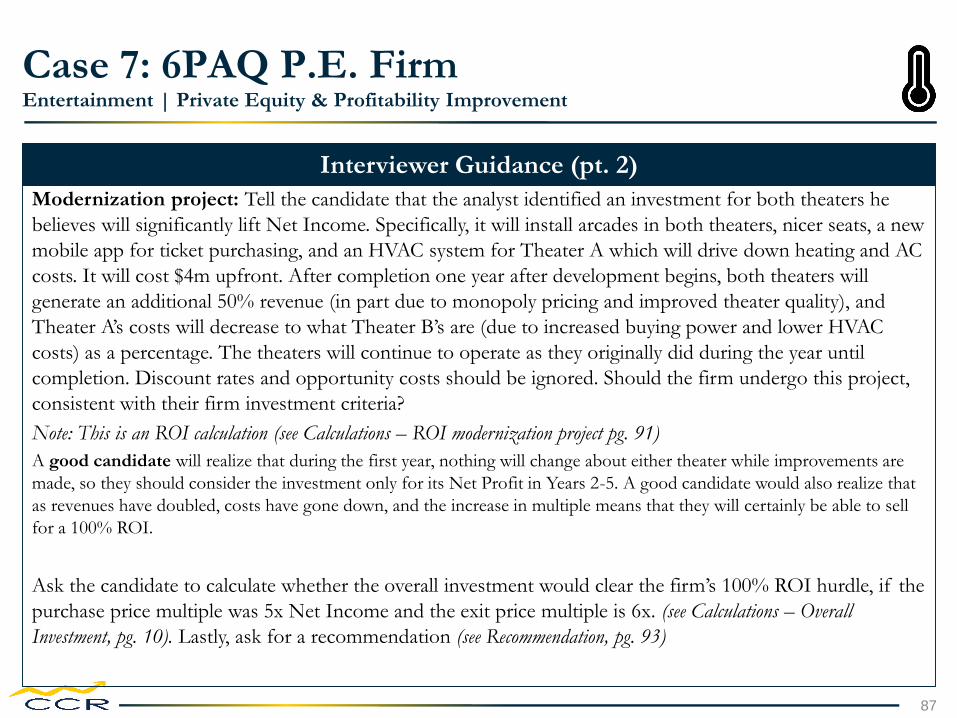
Interviewer Guidance (pt. 2)
Modernization project: Tell the candidate that the analyst identified an investment for both theaters he
believes will significantly lift Net Income. Specifically, it will install arcades in both theaters, nicer seats, a new
mobile app for ticket purchasing, and an HVAC system for Theater A which will drive down heating and AC
costs. It will cost $4m upfront. After completion one year after development begins, both theaters will
generate an additional 50% revenue (in part due to monopoly pricing and improved theater quality), and
Theater A’s costs will decrease to what Theater B’s are (due to increased buying power and lower HVAC
costs) as a percentage. The theaters will continue to operate as they originally did during the year until
completion. Discount rates and opportunity costs should be ignored. Should the firm undergo this project,
consistent with their firm investment criteria?
Note: This is an ROI calculation (see Calculations – ROI modernization project pg. 91)
A good candidate will realize that during the first year, nothing will change about either theater while improvements are
made, so they should consider the investment only for its Net Profit in Years 2-5. A good candidate would also realize that
as revenues have doubled, costs have gone down, and the increase in multiple means that they will certainly be able to sell
for a 100% ROI.
Ask the candidate to calculate whether the overall investment would clear the firm’s 100% ROI hurdle, if the
purchase price multiple was 5x Net Income and the exit price multiple is 6x. (see Calculations – Overall
Investment, pg. 10). Lastly, ask for a recommendation (see Recommendation, pg. 93)
Case 7: 6PAQ P.E. FirmEntertainment | Private Equity & Profitability Improvement
87

Exhibit 1 – Revenue and Profitability by Theater
Case 7: 6PAQ P.E. FirmEntertainment | Private Equity & Profitability Improvement
88
2013 2014 2015 2016 2017 2018
Theatre A Revenue Theatre A Profitability
Theatre B Revenue Theatre B Profitability

Brainstorming Guidance
Cost DriversRevenue Improvement
Case 7: 6PAQ P.E. FirmEntertainment | Private Equity & Profitability Improvement
89
• Alter SKUs
• Implement special/discounts
(senior, students, etc)
• Increase prices (w/ new local
monopoly)
• Show more movies
• Additional trailers
• Offer other types of
entertainment (e.g. local
plays)
• Increase ad spend
• Offer theme nights or
diversify customer-targeted
movies (e.g. cult classics
reruns)
• Open additional theater
• Cross-sell to customers of
other portfolio companies
Existing Products
Exis
ting C
usto
mers
New
Custo
mers
• Open alternative space (e.g.
arcade)
• Charge for parking if lot
owned
• New food or alcohol
• Start movie pass
• Offer premium seating
New Products • Electricity/HVAC
• Movie leases
• Rent/real estate
• SKU choices
• Unionized labor
• Taxes if on larger property
• Poor relationships with distributors

Case 7: 6PAQ P.E. FirmEntertainment | Private Equity & Profitability Improvement
Calculations – Revenue and Profitability by Theater
90
Tickets:
# of Screens * # of Seats/Screen * Avg Fill Capacity * # of movies played per screen/month =Total Monthly Visitors
Theater A) 10 screens * 80 seats per screen * 75% average fill capacity * 20 movies played per screen per month = 12,000 Total Monthly
Visitors
Theater B) 10 screens * 80 seats per screen * 50% average fill capacity * 20 movies played per screen per month = 8,000 Total Monthly Visitors
Total Monthly Visitors * Percentage of Movies Matinee (or Premium) * Price of Matinee (or Premium) ticket * 12 months/year = Total Monthly Matinee Revenue
(or Premium)
Theater A) 12,000 Total Monthly Visitors * 90% Premium * $10 Premium Price * 12 months/year = $1.296m (round to $1.29m)
12,000 Total Monthly Visitors * 10% Premium * $5 Matinee Price * 12 months/year = $.072m (round to ($.07m)
Total Theater A Ticket Revenue = $1.36m
Theater B) 8,000 Total Monthly Visitors * 80% Premium * $10 Premium Price * 12 months/year = $.768m (round to $.77m)
8,000 Total Monthly Visitors * 20% Premium * $5 Matinee Price * 12 months/year = $.096m (round to ($.1m)
Total Theater B Ticket Revenue = $870k (round to $870k)
Concessions:
Total Monthly Visitors * Average Spend Per Customer * Percentage of Customers who buy concessions * 12 months/year = Total Yearly Concession Revenue
Theater A) 12k Monthly Visitors * $6 Avg Cust. Spend * 75% of Cust. Purchase Concessions * 12 Months/year = $648k (round to $650k)
Theater B) 8k Monthly Visitors * $7 Avg Cust. Spend * 75% of Cust. Purchase Concessions * 12 Months/year = $504k (round to $500k)
Total Revenues: Total Costs: Total Profitability:
Theater A) 1.36m+.65m=$2.01m 50% * 2.01m=~$1m 2.01m-1m=$1.01m (round to $1m)
Theater B) .87m+.5m=$1.37m 20% * 1.37m=$.27m 1.37m-.27m=$1.1m
For both theaters: $2.1M

Calculations – ROI Sub-Investment
Case 7: 6PAQ P.E. FirmEntertainment | Private Equity & Profitability Improvement
91
Modernization Project: Incremental Profit = (Total New Profit – Total current Profit) * Years
Incremental Profit = ((150% Current Revenue – New Costs) – (Current Revenue – Current Costs)) * 4 Years
Incremental Profit = ($5.07m – 20% * ($5.07m)) – ($3.38m – $1. 27m)) * 4 years
= ($4.06m – $2.11m) * 4 years
~ $2m * 4 years = $8m
ROI: $8m-$4m / $4m = 100%
Y0 Y5Y1 Y2 Y3 Y4
Initial Cost:
$4m investment
Yearly Revenue Improvement: $1.7m
Yearly Cost Improvement: $.27m
Yearly N.I. Improvement:: ~$2m
ROI Calculations: Formula: Net Profit/Invested Capital

Case 7: 6PAQ P.E. FirmEntertainment | Private Equity & Profitability Improvement
Calculations – Overall Investment
92
New RevenuesCurrent Revenues * (1+Revenue Increase Percentage) = New Revenues
Current Revenues: $2.01m + $1.37m = $3.38m
New Revenues: $3.38m * 150% = $ 5.07m
New Total CostsNew Revenues * New Total Cost Percentage = New Total Costs (exc.
Current Costs: $1m + $.27m = $1.27m
New Costs: $5.07m * 20% = $1.01m
New Net Income
New Revenues – New Total Costs = New N.I.
Total: $5.07m-$1.01m=$4.06m
Overall Investment:
Valuation =N.I.*N.I multiple
Purchase Price =$2.1m * 5 = $10.5m
Exit Price $4.06m * 6 = ~ $24.4m
ROI $24.4m-$10.5/$10.5m
= 132%

Case 7: 6PAQ P.E. FirmEntertainment | Private Equity & Profitability Improvement
93
Recommendations Risks Next Steps
Recommendation:
6PAQ P.E. Firm should invest in both
theaters and undergo the modernization
project
With its new improvements and
monopoly powers, it could make over
100% ROI on both the initial and
modernization project
On the modernization project, 6PAQ
could make a 100% ROI while on the
overall theater investment, 6PAQ could
make a 132% ROI
Risks include:
1. Substitutes and Threats
• New local entrants
• Netflix and streaming
services
2. Accuracy of assumptions
• NI multiple increase
• Improved NI from
investment
• No opportunity cost or
discount rate
• 100% ROI on
modernization project
leaves little room for error
3. Theater owners’ unstated intent to
sell
6PAQ should:
1. Conduct analysis:
• Use its existing
relationships in the
industry to conduct
intelligence gathering
• Purchase market research
reports to identify time
horizon of threats trends
• Further analyze and
triangulate assumptions
2. Approach theater owners to gauge
interest and initiate discussions

Case 8: Hamm’s UniversityHigher Ed / Non-Profit| Profitability Improvement
94
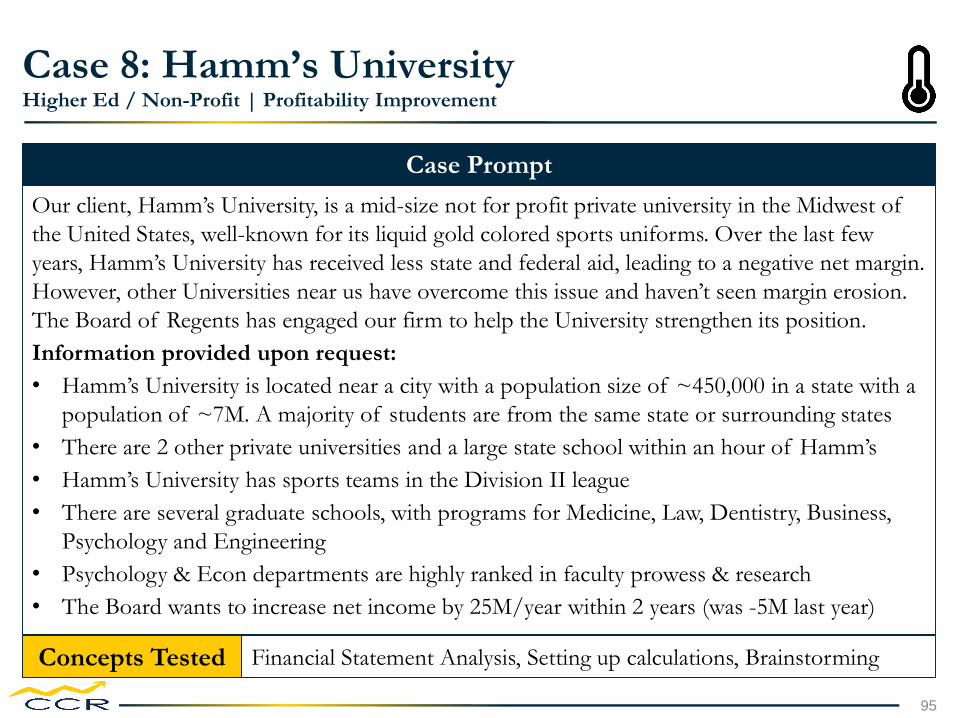
Case 8: Hamm’s UniversityHigher Ed / Non-Profit | Profitability Improvement
Case Prompt
Our client, Hamm’s University, is a mid-size not for profit private university in the Midwest of
the United States, well-known for its liquid gold colored sports uniforms. Over the last few
years, Hamm’s University has received less state and federal aid, leading to a negative net margin.
However, other Universities near us have overcome this issue and haven’t seen margin erosion.
The Board of Regents has engaged our firm to help the University strengthen its position.
Information provided upon request:
• Hamm’s University is located near a city with a population size of ~450,000 in a state with a
population of ~7M. A majority of students are from the same state or surrounding states
• There are 2 other private universities and a large state school within an hour of Hamm’s
• Hamm’s University has sports teams in the Division II league
• There are several graduate schools, with programs for Medicine, Law, Dentistry, Business,
Psychology and Engineering
• Psychology & Econ departments are highly ranked in faculty prowess & research
• The Board wants to increase net income by 25M/year within 2 years (was -5M last year)
Concepts Tested Financial Statement Analysis, Setting up calculations, Brainstorming
95

Case 8: Hamm’s UniversityHigher Ed / Non-Profit| Profitability Improvement
Case Guidance
Case Guidance:
Through exhibits 1 & 2, the interviewee should note that both private schools 1 and 2 are
relatively similar to our school, but private school 2 has a revenue structure that we can more
easily replicate.
Reason to not replicate private school 1: Endowment and gift campaigns are difficult to
replicate, especially given our lower starting endowment and less active alumni donor base.
Starting a campaign to make our alumni more active can be difficult to do and wouldn’t
necessarily have a high success factor.
Reason to replicate private school 2: University grants for research are generally a function of
how successful that school is at research and how many faculty research staff and grant writing
staff they employ. Given the already prestigious nature of Hamm’s University psychology
department, Hamm’s university should look to increase grant revenue by hiring more staff.
96

Framework
A solid framework would include detail on the financials of the University and an examination
of the other universities in our area. Points to consider are included below.
Case 8: Hamm’s UniversityHigher Ed / Non-Profit| Profitability Improvement
Costs
• Instruction
• Research
• Operations (+ depr)
• Scholarships
• Administration
• Materials + Supplies
Revenue
• Undergrad tuition
(including R&B),
by students and tuition
rates
• Federal & State Aid
• Grants & Contracts
• Endowment Income
• Athletics
• Gifts (for immediate
use)
Industry
• Public
• Private
• Financial Statement
Analysis
• Student body composition
• Learn from how they
improved
97

Case 1: Hamm’s UniversityFinancial Services | Profitability Improvement
Exhibit 1
YOY Statement of Activities (2017 & 2018) and KPIs
All $ in MM 2018 2017
Total Revenue $545 $580
• Net Tuition (incl. Scholarships + Room and
Board)
• Federal and State Aid
• Grants and Contracts
• Endowment Income
• Athletics
• Alumni Gifts
404
65
30
11
21
14
350
100
80
15
20
15
Total Cost $550 $530
• Instruction
• Research
• Operations
• Administration
• Materials + Supplies
222
20.5
97.5
112
98
200
20
100
110
100
Net Margin $ -5 $ 50
Selected KPIs
• Undergraduate attendance
• Graduate attendance
• Faculty Researchers
• Grants Awarded
• Endowment Balance
• Active Alumni Donors
13,800
2,150
50
85
$195M
20,000
13,500
2,200
50
84
$200M
20,00098

Case 1: Hamm’s UniversityFinancial Services | Profitability Improvement
Exhibit 2
Schools Comparison (2018 Data)
All $ in MM Public 1 Private 1 Private 2
Total Revenue1,765 580 571
• Net Tuition (incl. Scholarships +
Room and Board)
• Federal and State Aid
• Grants and Contracts
• Endowment Income
• Athletics
• Alumni Gifts
1,100
200
180
90
110
85
380
60
30
60
15
35
320
55
150
20
15
11
Total Cost1,685 555 536
• Instruction
• Research
• Operations
• Administration
• Materials + Supplies
640
65
311
357
312
211
22
102
118
103
204
35
92
105
99
Net Margin80 25 35
Selected KPIs
• Undergraduate attendance
• Graduate attendance
• Faculty Researchers
• Grants Awarded
• Endowment Balance
• Active Alumni Donors
24,500
8,000
110
195
$3B
100,000
16,000
0
50
85
$1.1B
35,000
11,000
2,000
85
145
$300M
18,00099

Case 8: Hamm’s UniversityHigher Ed / Non-Profit| Profitability Improvement
Additional Math Problem
Addt’l Problem / Math:
The interviewee should note that research revenue is roughly $1M per grant awarded and grants
are awarded at a roughly 1.6 grants / researcher rate. Each researcher at Hamm’s costs roughly
$400,000, and there is also an additional 50,000 in administration costs / researcher. Tell them
to assume these are fixed numbers.
“Assuming these numbers hold true and grants are awarded on average 1 year after
application, how many faculty researchers do we need to hire to achieve our goal?”
25M NI Goal = (Researchers to Hire) * 1.6 * 1M – (Researcher to Hire) * 450K
25M NI Goal = Researchers to Hire * 1.15M average Margin
25 / 1.15 = ~22 more faculty researchers to achieve 25M NI Goal
100

Case 8: Hamm’s UniversityHigher Ed / Non-Profit| Profitability Improvement
101
Recommendations Risks Next Steps
Recommendation:
Hamm’s University should hire at
least 22 more researchers to
increase it’s NI to make up for
State and Federal Aid shortfalls
Risks include:
1. New researcher’s won’t be as
successful as historical
2. Total grant market isn’t big
enough to support receiving
this much money
3. Potential dilution of brand
image from hiring more
researchers
Hamm’s University should:
1. Potentially hire more than 22
researchers, explore space
constraints at University
2. Market research on how big
total Psychology grant
market is and if we can
increase share in that market
3. Begin setting up hiring team
to start identifying which
candidates to interview

Case 9: AllsafeInsurance| M&A
102

Case 9: AllsafeInsurance| M&A
Case Prompt
Our client, Allsafe, a large insurance company, provides home, auto, renter’s and life insurance.
Recently, Allsafe acquired a technology firm specializing in data analytics software. As part of
the acquisition, Allsafe also acquired a smaller subsidiary, MarketMaven, a marketing analytics
software-as-a-service firm. Our firm has been engaged a few years post-acquisition and Allsafe
would like to know how to proceed with MarketMaven – AllSafe already has an acquisition offer
of $1.1B for MarketMaven and the choice is between taking the deal (i.e. divesting
MarketMaven) or integrating it with AllSafe.
Information provided upon request:
• Allsafe is a large insurance conglomerate that employs an outside marketing agency for all
marketing services
• MarketMaven is small firm, but has experienced growth over the last 5 years.
Concepts Tested Valuation, Financial Analysis
103

Case 9: AllsafeInsurance| M&A
Interviewer Guidance
In this case, the candidate will explore whether Allsafe should integrate or divest MarketMaven. Due to the
fact that there are no synergies between Allsafe and MarketMaven, the candidate should decide that Allsafe
should sell the firm. This case requires the candidate to then ask for the information necessary to value
MarketMaven.
Only when the candidate asks for MarketMaven’s financials should the following information be provided.
The candidate will need to build out an income statement based off the following financials in order to
determine the cash flows to value MarketMaven.
• 2018 Revenues: $200M
• Cost of Revenue: 25% of Revenue
• SG&A: 40% of Gross Profit
• Depreciation + Amortization: $5M
The candidate needs to value the firm. Have them build out an income statement to EBIT as adding in Tax
and Interest make the numbers a little messy. This may not be fundamentally correct in terms of finding the
FCF for the NPV, so if you want to finesse the numbers further feel free to do so.
104

Calculated Income Statement
Case 9: AllsafeInsurance| M&A
Revenue $200M
Cost of Revenue 200*25% = $45M
Gross Profit $155M
Operating Expenses 155*40%=$60M
EBITDA $95M
D+A $5M
EBIT $90M
105
Possible Framework
Problem: Integrate or Divest MarketMaven
• Integrate
- Firm Synergies: MarketMaven + AllSafe
- AllSafe capabilities -- have they been able to
successfully integrate a firm in the past
- Marketing Analytics Market
- # of key players
- # of customers
- MarketMaven's position in current market
• Divest
- MarketMaven's current financials
- Potential buyers
- Comparable firm transactions in the past
- Risks
- Integration Risks
- Divestiture Risks

Case 9: AllsafeInsurance| M&A
Interviewer Guidance
After the candidate finds the EBIT of the MarketMaven, use that amount as the free cash flow
to value the firm and brainstorm potential firm strategies. The candidate should be directed to
value the firm in perpetuity with the following parameters.
• Growth Rate: 5% (growth will slow due to increased market competition)
• Discount Rate: 15%
NPV = FCF/r-g=90/(15%-5%)=$900M
The ideal insight into the NPV calculation should be that since the buy offer for MarketMaven
($1.1B) has a $200M premium over the NPV, it should be sold off.
Brainstorming: What could AllSafe use MarketMavens platform for? Examples could be:
• Track advertising and media insights in-house
• Bring all advertising efforts in-house
• Use it for Market Intelligence and PR purposes to track what is being said about AllSafe in
the media
106

Case 9: AllsafeInsurance| M&A
107
Recommendations Risks Next Steps
Recommendation:
Allsafe should divest
MarketMaven for a $200M
premium.
• $900M NPV, $1.1B deal size
• Use the cash from the sale to
reinvest in programming or
platforms within their firm
• Cost of integration and to
keep on MarketMaven not
worth it to AllSafe
Risks include:
1. Potential undervaluation of
MarketMaven’s intellectual
property
2. Negative impact on Allsafe
company morale if
divestiture news leaks
AllSafe should:
1. Assemble internal team to
begin the divestiture process
2. Engage a bank to begin the
process of divesting
MarketMaven
3. Build MarketMavens sell
story

Case 10: Mega PharmaRetail| M&A
108

Case 10: Mega PharmaRetail| M&A
Case Prompt
Our client Mallgreens is a large pharma retail company. It wants to acquire a smaller pharmacy
retailer, BrightAid. The operational footprint of the two companies looks like this:
Mallgreens wants us to assess this acquisition, and understand potential risks.
Information provided upon request:
• Mallgreens provides pharmacy, clinical, photography and convenience store services
• BrightAid provides pharmacy and clinical services
• The two companies have very different distribution models
Concepts Tested Brainstorming, Consolidation, Acquisition Strategy
Company States Stores Employees
Mallgreens 50 5000 2000
BrightAid 13 (Coasts) 2000 1000
109

Case 10: Mega PharmaRetail| M&A
Framework
1. Synergies
• Revenue Synergies
• Selling Power
• Newer Locations for Photography
and Convenience
• Cost Synergies
• Buying Power with manufacturers
• Retail footprint consolidation
• Corporate functions & Executive
team
2. Acquisition & Integration Costs
• People:
• Lock-in Bonuses for Retained
Employees
• Severance Packages for Fired
Employees
• Operational
• IT
• Marketing / Branding
• Long-term: Capital Gains Tax
3. Risks
• FTC: Market share too high?
• Customer, Vendor & Competitor
response
110

Case 10: Mega PharmaRetail| M&A
Brainstorming Questions
Interviewer Guidance: A good setup before getting into actual questions would be to
brainstorm the mechanics of an acquisition. Important factors to brainstorm are:
1. The companies have different distribution models. On a high level, how can switching to
either of them for the combined entity help reduce costs.
2. If the core product (pharmaceutical retail and clinical services) is the same for both
companies, and the market is saturated, do cross/up-selling opportunities exist for the
combined entity? If the revenue cannot be augmented, is the acquisition worth it?
3. Types of purchase: stock purchase vs. asset purchase. Pros and cons of both in the current
deal.
These are open questions and can run depending on the quality of the
framework and brainstorming in the interview.
111

Case 10: Mega PharmaRetail| M&A
Question 1
The store footprint of both companies in selected states looks like this:
In which states will you consolidate stores, and why?
State Mallgreens BrightAid
CA 400 250
WA 280 65
NY 350 200
MI 280 0
IN 220 0
TX 350 180
112

Case 10: Mega PharmaRetail| M&A
Question 1: Interviewer Guidance
Brainstorm about cost reduction from a retail location consolidation perspective. What factors
will drive this consolidation?
Answer to question (next slide): Stores should be consolidated in California, New York and
Texas. This is because both companies have a large retail footprint in both the states and
therefore this is the scope for consolidation.
113

Case 10: Mega PharmaRetail| M&A
Question 2
The client has created a summary of stores in California based on the (i) Distance from the
nearest Mallgreens / BrightAid store, and (ii) Profit / Loss status. It is as follows:
Which of these stores do you recommend that our client close? What do you recommend for
the rest of the stores?
Distance Profit-making
Stores
Loss-making Stores
< 0.5 mile 200 100
0.5 – 2 miles 80 60
> 2 miles 70 40
114

Case 10: Mega PharmaRetail| M&A
Question 2: Interviewer Guidance
In retail, a key success factor is retail presence (‘footprint’). Sometimes, to achieve a footprint on
scale, some loss-making locations also have to be retained.
To answer this question (next slide):
• All loss making stores which are <0.5 miles from another store should be closed.
• For all loss making stores which are 0.5 – 2 miles from another store:
• Customers should be surveyed – is brand stickiness enough to make them travel 2 miles
if the current store closes
• Can these stores be turned profitable with short to mid-term transformation measures
• For all loss making stores >2 miles, the company should invest in long term profitability
transformation measures
115

Case 10: Mega PharmaRetail| M&A
Question 3
1. What are key questions that the market regulator can raise?
2. How will you ensure that the deal and the combined entity adhere to legal requirements?
116

Case 10: Mega PharmaRetail| M&A
Question 3: Interviewer Guidance
An important factor in understanding regulatory market share concerns in an acquisition is to
understand the type of purchase:
• Stock purchase: the target company’s stock (complete or partial) is bought from its current
shareholders. All vendor, customer and employee contracts typically continue, and all assets
and liabilities transfer to the acquiring entity.
A stock purchase would typically be more complicated. In this case, the acquiring company will
have to commit to divesting/selling parts of the combined business after the deal to bring it
below the market regulator (FTC)’s defined levels. In this case, Mallgreens can decide to sell its
photography and convenience store business after the acquisition.
• Asset purchase: only selected assets (retail locations, manufacturing/warehousing facilities
etc.) are purchased. Contracts and liabilities do not transfer.
In an asset purchase, the acquiring company can choose to buy only selected assets from the
target. In this case, Mallgreens can buy only selected BrightAid stores and remain within FTC’s
threshold.
117

Case 10: Mega PharmaRetail| M&A
118
Recommendations Risks Next Steps
Recommendation:
Mallgreens should acquire
BrightAid and:
• Close 100 loss-making stores
within 0.5 miles of other
Malgreens stores
• Survey customers of 60 loss
making stores within 0.5 - 2
miles of other Malgreens
stores
• Invest in long-term
profitability of 40 loss-making
stores more than 2 miles of
other Malgreens stores
Risks include:
1. Potential concerns from
Market Regulators on market
share of combined entity
2. Competitor and Supplier
response
Mega Pharma should:
1. Start integration planning –
systems, procurement,
distribution being the focus
areas
2. Define communication plan
for customers and employees

Case 11: Mike ApparelConsumer Goods| Market Entry
119

Case 11: Mike ApparelConsumer Goods| Market Entry
Case Prompt
Our client, Mike Apparel, is a large apparel and sporting goods company. The client is interested
in entering the women’s golf apparel market and is looking for guidance on whether this is a
good idea.
Information provided upon request:
• Mike makes both produces and retails the goods in its own stores
• The objective is to invest extra cash (amount undefined) in a profitable project
• Scope of the launch is the United States
Concepts Tested Brainstorming, Structure, Basic Quant & Financials
120

Case 11: Mike ApparelConsumer Goods| Market Entry
Framework
1. Market Size
• Population of the United States
• Ratio of women
• Percentage of golf players
• Achievable market share
• Customer $ purchases/year
2. Costs
• R&D
• Fixed Costs
• Variable Costs
• Marketing & Advertising
3. Risks
• Cannibalization of existing
products/shelf space
A strong framework will hinge on two factors:
Market Size or Revenue Potential, and the costs of
the launch and ongoing operations.
Basic cost numbers available are as follows:
• R&D (one-time): $255M
• Fixed Costs (yearly): $5M
121

Case 11: Mike ApparelConsumer Goods| Market Entry
Questions
1. What does the market size and revenue potential look like?
2. When can breakeven be achieved?
Data Available
• Buying Frequency, Selling Price
• Variable Cost to produce
Item Buying Frequency Selling Price
Shirt 2 / year $60
Hat 1 / year $80
Item Variable Cost
Shirt $15
Hat $20
122

Case 11: Mike ApparelConsumer Goods| Market Entry
Interviewer Guidance and Solution: Question 1
Market Sizing (nudge the interviewee towards the following numbers)
• Population of US 300M
• Women (50%) – 150M
• ~80% people in age ranges that play golf: 80% * 150M = 120M
• Golf is an affluent sport, only rich can play. Rich = 10%. 10% * 120M = 12M
• Percentage of people who actually play Golf 25% (a fourth of affluent people is a
reasonable assumption) = 3M
• Market Penetration (20%) = 600K
123
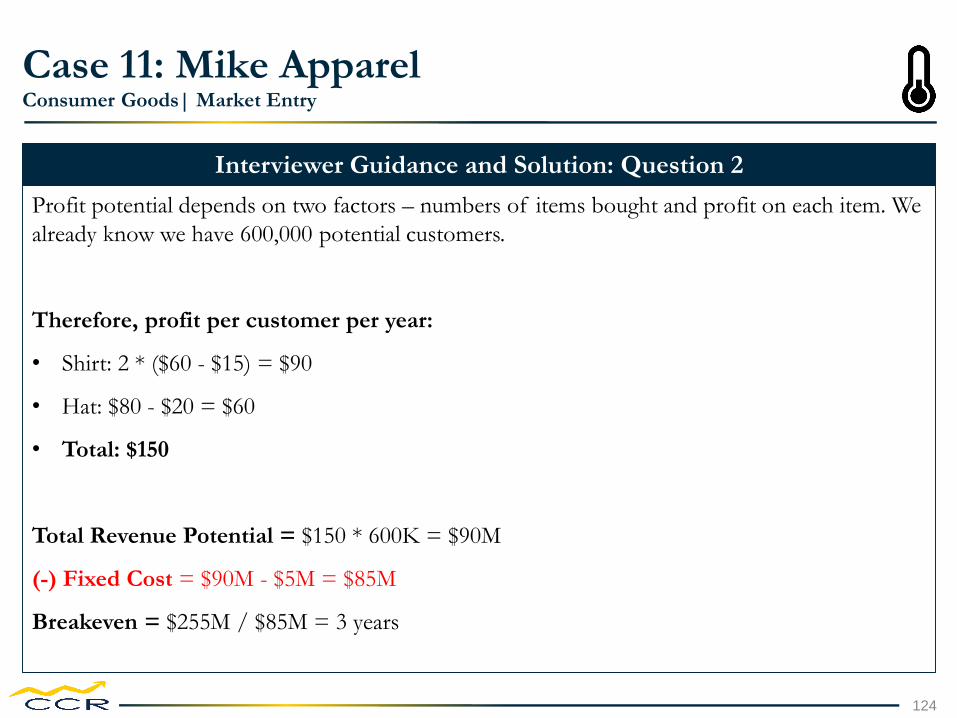
Case 11: Mike ApparelConsumer Goods| Market Entry
Interviewer Guidance and Solution: Question 2
Profit potential depends on two factors – numbers of items bought and profit on each item. We
already know we have 600,000 potential customers.
Therefore, profit per customer per year:
• Shirt: 2 * ($60 - $15) = $90
• Hat: $80 - $20 = $60
• Total: $150
Total Revenue Potential = $150 * 600K = $90M
(-) Fixed Cost = $90M - $5M = $85M
Breakeven = $255M / $85M = 3 years
124

Case 11: Mike ApparelConsumer Goods| Market Entry
Interviewer Guidance: Recommendation
Recommendation: Enter Market – 3 year breakeven
• $85M annual profit, quick breakeven
• Tap new customer base – women, may have been untapped by industry before
• Women-focused product promotes diversity in sporting, also good for branding/PR
Risks
• Bad launch may affect other products
• Some cannibalizing of standard products (e.g. non-golf specific shirts and hats)
Next Steps
• Setup manufacturing
• Sign brand ambassador: a professional woman golfer
• Research which products to replace on shelves
125

Case 11: Mike ApparelConsumer Goods| Market Entry
126
Recommendations Risks Next Steps
Recommendation:
Enter Market – 3 year breakeven
• $85M annual profit, quick
breakeven
• Tap new customer base –
women, may have been
untapped by industry before
• Women-focused product
promotes diversity in sporting,
also good for branding/PR
Risks include:
1. Bad launch may affect other
products
2. Some cannibalizing of
standard products (e.g. non-
golf specific shirts and hats)
Mike Apparel should:
1. Setup a manufacturing facility
2. Sign brand ambassador: a
professional woman golfer
3. Research which products to
replace on shelves

Case 12: PharmaDeliverPharma| Growth Strategy
127

Case 12: PharmaDeliverPharma| Growth Strategy
Case Prompt
Your client, PharmaDeliver, is a large pharmacy that provides both prescription and over the
counter medications to patients. With many new entrants in the healthcare industry, the
company is evaluating ways to both improve the customer experience and invest in the future.
In one initiative related to this, PharmaDeliver is exploring the use of drone delivery for its’
customers. The company has hired us to evaluate the potential use of drone delivery.
Information provided upon request:
• They distribute a wide variety drugs directly to customers through both retail and home
delivery channels. 80% of non-controlled prescription substances are delivered via home
delivery
• The company only operates in the US
• The company wants to increase their deliveries by at least 15% and have total profits of at
least $7B per year by using drones.
• The company wants this increase in the first year
Concepts Tested Brainstorming, Structuring, Quant
128

Case 12: PharmaDeliverPharma| Growth Strategy
Framework
A good framework will include an analysis of the pharmacy market (including competitive
trends, future technological advances, etc.), a breakout of how they will both increase deliveries
and hit $7B in total profit internally, and a consideration of mode of entry for using drones
(merger, acquisition, partnership). Candidates should also note regulatory risk for moving into
this space, since it is not a mature industry.
129
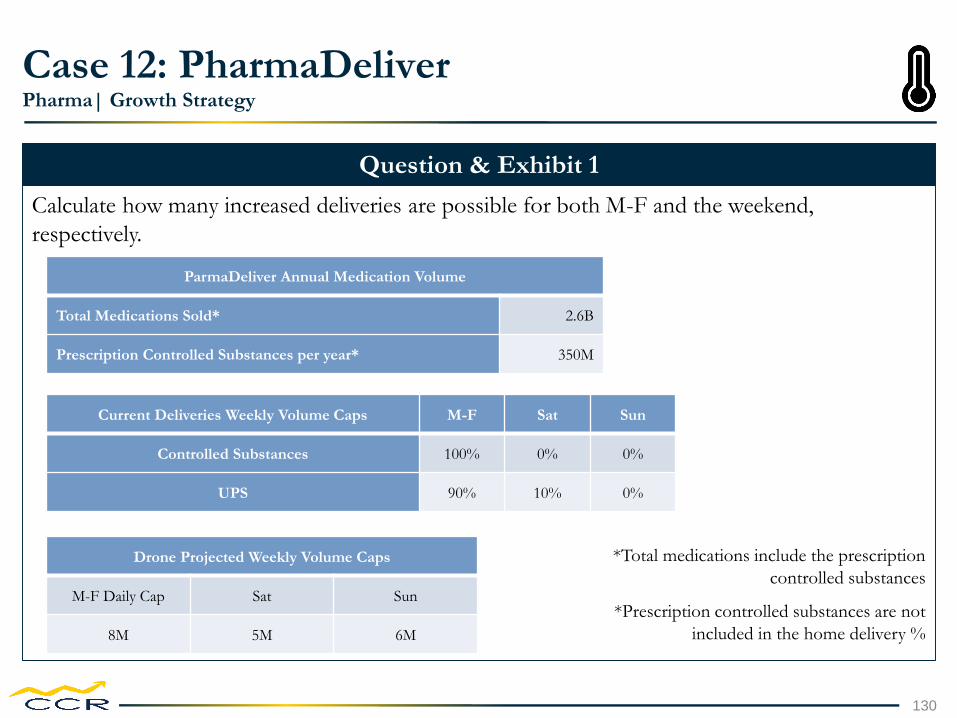
Case 12: PharmaDeliverPharma| Growth Strategy
Question & Exhibit 1
Calculate how many increased deliveries are possible for both M-F and the weekend,
respectively.
ParmaDeliver Annual Medication Volume
Total Medications Sold* 2.6B
Prescription Controlled Substances per year* 350M
Current Deliveries Weekly Volume Caps M-F Sat Sun
Controlled Substances 100% 0% 0%
UPS 90% 10% 0%
Drone Projected Weekly Volume Caps
M-F Daily Cap Sat Sun
8M 5M 6M
*Total medications include the prescription
controlled substances
*Prescription controlled substances are not
included in the home delivery %
130

Case 12: PharmaDeliverPharma| Growth Strategy
Answer 1
Assume 50 weeks per year. Candidate should ask for the home delivery % (80% of NON prescription
controlled substances)
1. Calculate the number of home deliveries per year: (Total Medications – Prescription Controlled
Substances)* % Home Delivery of Non-Prescription Controlled Substance Medications = (2600 –
350)*.8 = 1.8B
2. Calculate the weekly number of deliveries assuming 50 weeks per year. 1.8B/50 = 36M
3. Calculate the number of deliveries for each of the days of the week.
• M-F Deliveries % * total =90% * 36M = 32.4M; Deliveries / # days = 32.4M/5 = 6.48M
• Sat Deliveries % * total = 10% * 36M = 3.6M
4. Find the difference for both M-F and the weekend between current and new. For M-F, multiply it by 5
and then by 50 to find the increased annual deliveries. M-F: 8M-6.48M = 1.52M * 5 * 50 = 380M; S/S
= 10-3.6 = 6.4 * 50 = 320M. Finally, take 320M+380M = 700M and confirm that this is 15% higher
than the number of deliveries currently (1.8B * 1.15 = 2.07B). Great answers will also acknowledge that
the demand increases may not match this increased capacity.
131

Case 12: PharmaDeliverPharma| Growth Strategy
Question & Answer 2
Question: Please brainstorm possible ways to expand into using drone delivery.
Answer: A good answer will include an analysis of exploring new clients, partnerships, or
acquisitions to go into this business. Commentary on the benefits of each can lead to a great
answer. A great answer will also acknowledge options other than drone delivery to possibly
explore (i.e. autonomous vehicles, uber, etc.)
132

Case 12: PharmaDeliverPharma| Growth Strategy
Question 3
PharmaDeliver has identified a potential partner, DroneCo, for future shipments. As part of
the agreement, DroneCo will take 10% of the profit for each shipment in exchange for its’
services. Please calculate the annual projected profit by utilizing DroneCo to deliver all
packages. Calculate the expected NPV of this using the projected profit.
Tip for interviewer: This profit is inclusive of all potential costs/revenues that the candidate
likely covered in the framework.
133
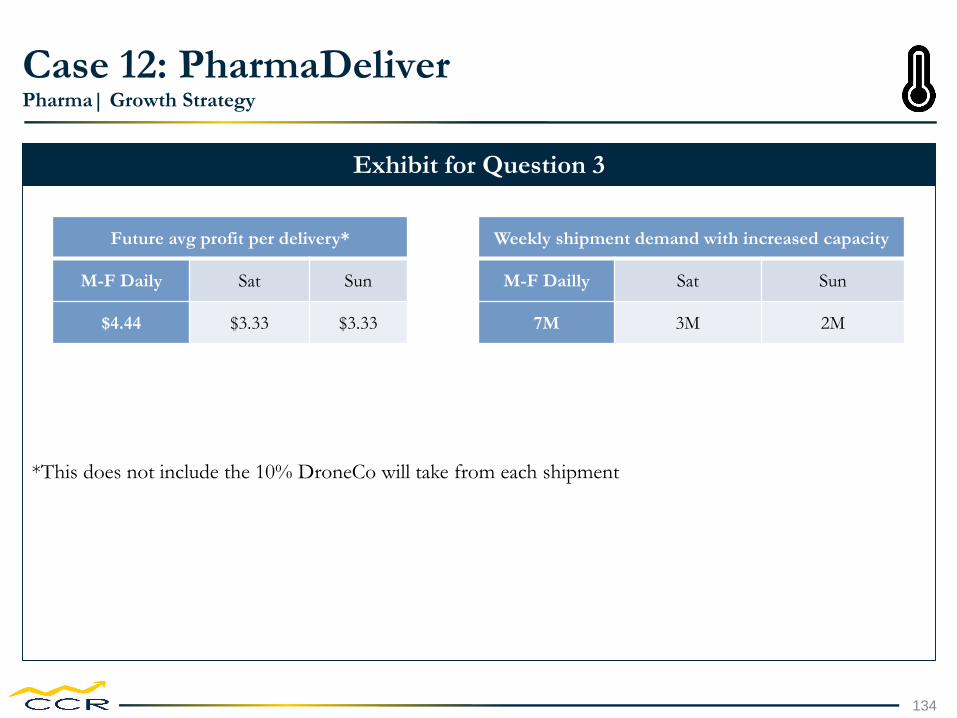
Case 12: PharmaDeliverPharma| Growth Strategy
Exhibit for Question 3
*This does not include the 10% DroneCo will take from each shipment
Future avg profit per delivery*
M-F Daily Sat Sun
$4.44 $3.33 $3.33
Weekly shipment demand with increased capacity
M-F Dailly Sat Sun
7M 3M 2M
134
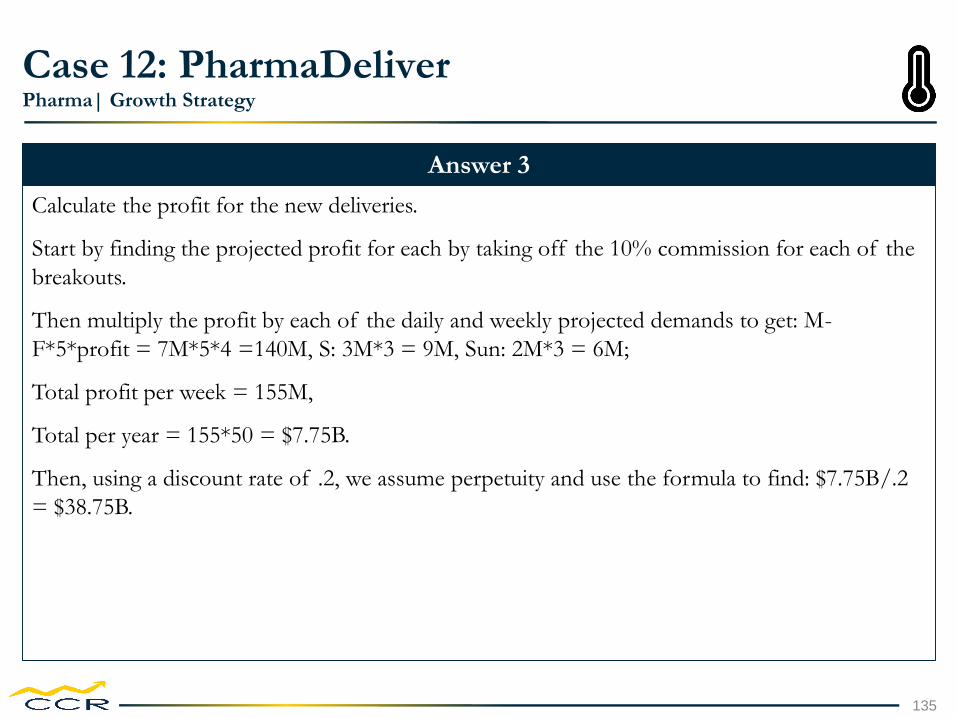
Case 12: PharmaDeliverPharma| Growth Strategy
Answer 3
Calculate the profit for the new deliveries.
Start by finding the projected profit for each by taking off the 10% commission for each of the
breakouts.
Then multiply the profit by each of the daily and weekly projected demands to get: M-
F*5*profit = 7M*5*4 =140M, S: 3M*3 = 9M, Sun: 2M*3 = 6M;
Total profit per week = 155M,
Total per year = 155*50 = $7.75B.
Then, using a discount rate of .2, we assume perpetuity and use the formula to find: $7.75B/.2
= $38.75B.
135

Case 12: PharmaDeliverPharma| Growth Strategy
Question & Exhibit 4
We are also exploring the acquisition of a similar company, Fly Away, for $9B. Using the new
profit information, please calculate the NPV of this acquisition.
These numbers are inclusive of all post-merger synergies.
Estimated future avg profit per delivery with acquisition*
M-F Daily Sat Sun
5 4 4
136
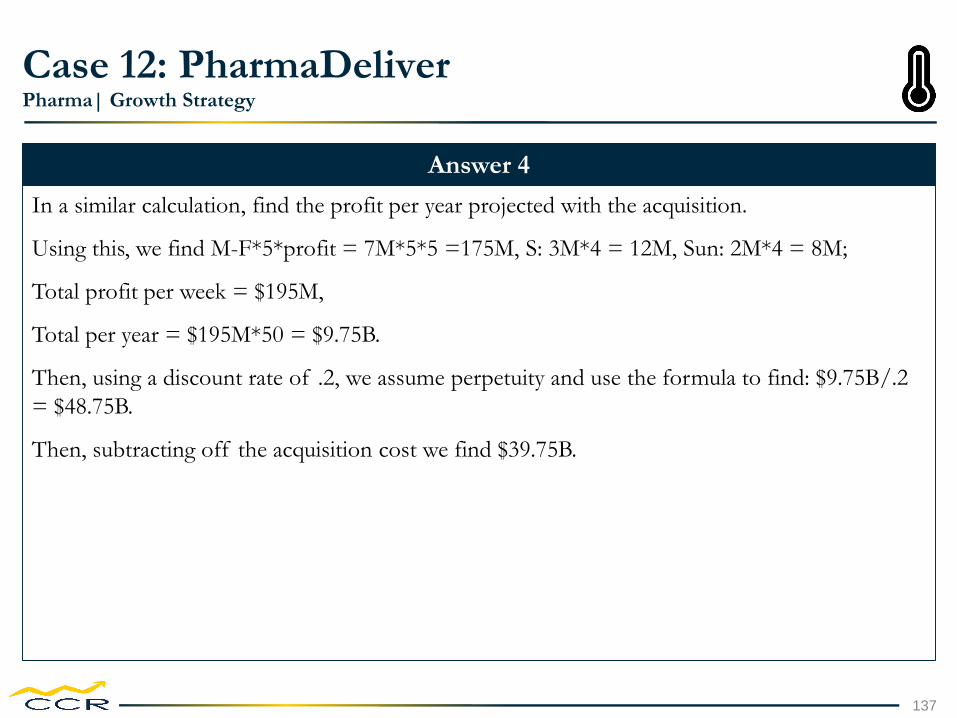
Case 12: PharmaDeliverPharma| Growth Strategy
Answer 4
In a similar calculation, find the profit per year projected with the acquisition.
Using this, we find M-F*5*profit = 7M*5*5 =175M, S: 3M*4 = 12M, Sun: 2M*4 = 8M;
Total profit per week = $195M,
Total per year = $195M*50 = $9.75B.
Then, using a discount rate of .2, we assume perpetuity and use the formula to find: $9.75B/.2
= $48.75B.
Then, subtracting off the acquisition cost we find $39.75B.
137
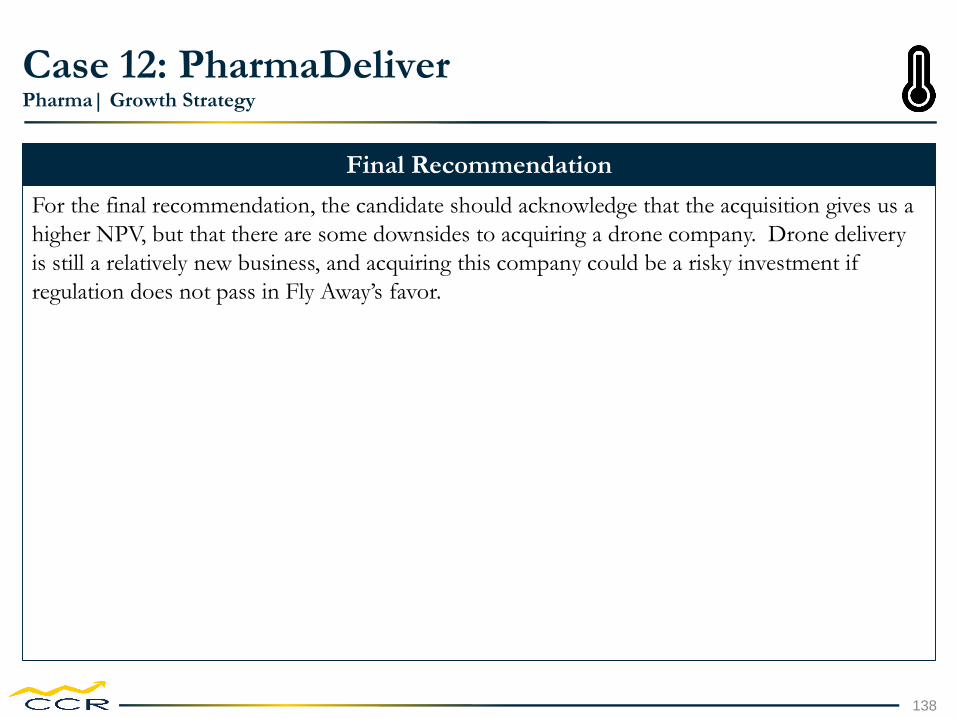
Case 12: PharmaDeliverPharma| Growth Strategy
Final Recommendation
For the final recommendation, the candidate should acknowledge that the acquisition gives us a
higher NPV, but that there are some downsides to acquiring a drone company. Drone delivery
is still a relatively new business, and acquiring this company could be a risky investment if
regulation does not pass in Fly Away’s favor.
138

Case 13: Single Cup of CoffeeConsumer Products | Market Sizing
139

Case 13: Single Cup of CoffeeConsumer Products | Market Sizing
Case Prompt
Our client is a PE firm who is considering making an investment in a coffee equipment
company that services office buildings. The company makes machines that use single cups
(same thing as K-Cups) and sells the pods needed to make coffee. What is the market
opportunity for this investment?
Interviewer Guidance
This is an interviewee led case. This case is about market sizing so the interviewee should lay
out a clear framework on how to size the market and be creative and detailed with their
assumptions. This case will be a market sizing exercise on the amount of coffee drinkers in the
market and the amount of machines needed to service coffee consumption.
Concepts Tested Math, Market sizing, Brainstorming
140

Clarifying Information
• The company looks to service all office buildings
nationally (U.S. only)
o The target market are white collar
professionals
• The PE shop has experience working in the beverage
service market
• Price of each single pod is $0.75 a pod
• Price of a coffee machine is $100
• The company currently offers a machine that can
only make coffee. There is a variety of coffee flavors
Possible Framework
Problem: Estimate market size for coffee pods and
machines
• How often each machine is needed
- Estimate number of office workers
- Avg number of workers in each office
- How many machines per office
or
- Estimate number of coffee drank in a day
- Busiest periods in the day and how much coffee
is being consumed in that period
- How long it takes each cup to brew
• Number of coffee pods used each year
- Estimate number of office workers
- How many office workers drink coffee
- How often each person drink coffee
Case 13: Single Cup of CoffeeConsumer Products | Market Sizing
141

Case 13: Single Cup of CoffeeConsumer Products | Market Sizing
Question #1
What is the market opportunity for office coffee drinkers and single pod usage?
Information to give if requested: Each coffee drinker drinks 1.5 cups of coffee a day; 350 working days in a year
320m people in the U.S. 320m
Life span of 80 with an equal distribution between ages 320m/80 = 4m
Avg work life is 21 - 70 (70-21)*4m = 196m people in the workforce
Eliminate teachers, blue collar workers, gov’t employees etc.
to get to an estimate of 40% office workers
196m * .40 = 54.8m office workers
Round to 55m
Estimate 60% of office workers drink coffee 55m*.60 = 33m coffee drinkers
33m coffee drinkers* 1.5 cups a day 33m*1.5 = 49.5m; Round to 50m cups of coffee per day
50m coffee per day* 350 days in a year 50m*350= 1.75b cups of coffee a year
1.75b cups * $0.75 a cup 1.75b*$0.75 = $1.3b
Recommended Answer
Interviewee does not have to use the above approach, as long as they use sound assumptions and get to a similar number
142

Case 13: Single Cup of CoffeeConsumer Products | Market Sizing
Question #2
Based on the amount of coffee drinkers, how many coffee machines can be sold in the market to accommodate the office
workers with minimal wait time?
Candidate should first brainstorm ideas and layout their structure. After brainstorm session, show Exhibit 1
Recommended Answer
Key Questions: When will the coffee machine be most active/how many people will be using it? Exhibit 1
• How much does the machine take to brew a cup of coffee? 1.5 mins
Since the morning time frame is the busiest it should be used as a benchmark for the # of machines needed
50m cups in a day * 65% of cups 50m * 65% = 32.5m cups between 8am – 10am
60 mins in an hour/1.5 minutes to brew 1 cup 60mins/1.5cups per hour = 40 cups in an hour
40 cups * 2 hour span 40*2 = 80 cups between 8am – 10am
32.5m cups in time span/ 80 cups in time span provides
how many machines are needed
32.5m/80= 406,250 machines = ~400,000 machines
400k machines *$100 a machine 400k * $100 = $40m
143

Case 13: Single Cup of CoffeeConsumer Products | Market Sizing
Exhibit 1
Time of day % of coffee cups
Morning 8am – 10am 65%
Afternoon 1pm – 3pm 25%
Evening 5pm – 7pm 10%
Busiest time in the office kitchen
144

Case 13: Single Cup of CoffeeConsumer Products | Market Sizing
Question #3
Other than selling the coffee pods and machines, what are some other ways the target company
can generate revenues?
Recommended AnswerPossible answers:
• Began to offer more than coffee with their machine (latte, hot chocolate, tea)
• Allow other companies to make pods for their machine and receive a royalty fee
• Expand to home services and to non-corporate employees
• Provide servicing for the machines
145

Recommendations Risks Next Steps
Market is attractive with combined
revenue potential of $1.34bn
($1.3b cups, $0.04bn machines),
therefore worth investing. Also
revenue upside by servicing
machines or outsourcing pods.
Market potential is driven by
assumptions, which can be wrong
(ex. We assumed the 1.5 cups
people drink in a day will come
from office coffee machine and
not home or local coffee shop),
we don’t have a clear view of the
competitive landscape in the
market as well as the cost to
produce and ship coffee machines
and cups. Additionally,
competitors could sell cups for
client’s machines if cup shape and
size aren’t patented.
Examine competitors in the
market, market trends (shift to
teas/energy drinks/any other
substitutes), and triangulate
market sizing data.
Case 13: Single Cup of CoffeeConsumer Products | Market Sizing
146

Case 14: Cheesy SituationFood and Beverage| Growth Strategy
147

Case 14: Cheesy SituationFood & Beverage| Profitability
Case Prompt
Our client is a cheese producer based in Vermont. Currently, they produce two types of cheese:
Cheddar and Gouda. While revenues have grown, their profits have been decreasing. They have
asked us to help them understand why and what they can do to increase profits.
Interviewer Guidance
This is an interviewee led case. The case is about profitability and the candidate should lay out a
clear framework to analyze revenues and costs for different products to calculate annual profits.
The candidate should then brainstorm recommendations for increasing profits.
Additional info:
-The market is stable, with no major changes in competition in recent years
-They sell some cheese to wholesalers and a very small amount direct to consumer
Concepts Tested Math, Profitability, Brainstorming
148

Case 14: Cheesy SituationFood & Beverage| Profitability
Framework
Return to
Profitability
Costs Revenue
Quantity
-Number of
pounds sold
through each
changel
-Product Mix
Price
-Price to wholesalers
-price to consumers
-elasticity of demand
Fixed
-PPE
-SGA
-Marketing
Variable
-Milk
-labor
-utilities
-storage
Market
Competitors
-New entrants
-New competition
from abroad
-Channels
Trends
-Customer preferences
changing (organic, etc)
-Move toward artisanal
producs
149

Case 14: Cheesy SituationFood & Beverage| Profitability
Exhibit 1
Cheddar Gouda Cost
Milk .75 gallons 1 gallon 3.75/gallon
Labor 1.5 hours/100 lbs 2.5 hours/100 lbs $16/hour
Energy .8 kwh .5 kwh $.10/kwh
Time to age 1 year 6 months
Note: Each lb of cheese takes up one square foot while aging. Rent for the 50,000 sq. ft. warehouse is $20,000/month
Q4 2018 Q4 2019 Price
Lbs Cheddar Sold 6000 6500 $8.99/lb
Lbs Gouda Sold 6000 5500 $7.99/lb
150

Case 14: Cheesy SituationFood & Beverage| Profitability
Exhibit 1: Answers
Cheddar (per pound) Gouda (per pound)
Milk $3 $4
Labor $.24 $.40
Energy $.08 $.05
Time to age $4.8 $2.4
Total cost $8.12 $6.85
Profit $.87 $1.14
Q4 2018 Q4 2019 CHANGE
Profit $12060 $11925 $(135)
151

Case 14: Cheesy SituationFood & Beverage| Profitability
Brainstorming Question
What can our client do to increase sales of Gouda cheese?
Answers should be structured and MECE. Example answer:
Product: Sell a version of the cheese only aged for 3 months, saving $1.2/lb.
Place: Sell to high end restaurants to increase brand awareness
Promotion: Run an ad at local grocery store, partner with influencers
Price: Examine price elasticity to understand effect on changes in price
152

Recommendations Risks Next Steps
• Client should plan to
increase sales of gouda
through increased
brand awareness and
better product
positioning
• Risks could include
decreased sales of
cheddar, poor customer
reception, poor ROI on
advertising
• Next steps could
include hiring an ad
agency, running
promotions, changing
the aging time for the
cheese, etc.
Case 14: Cheesy SituationFood & Beverage| Profitability
153

1
Darden 2020-2021 CasebookNot for External Distribution
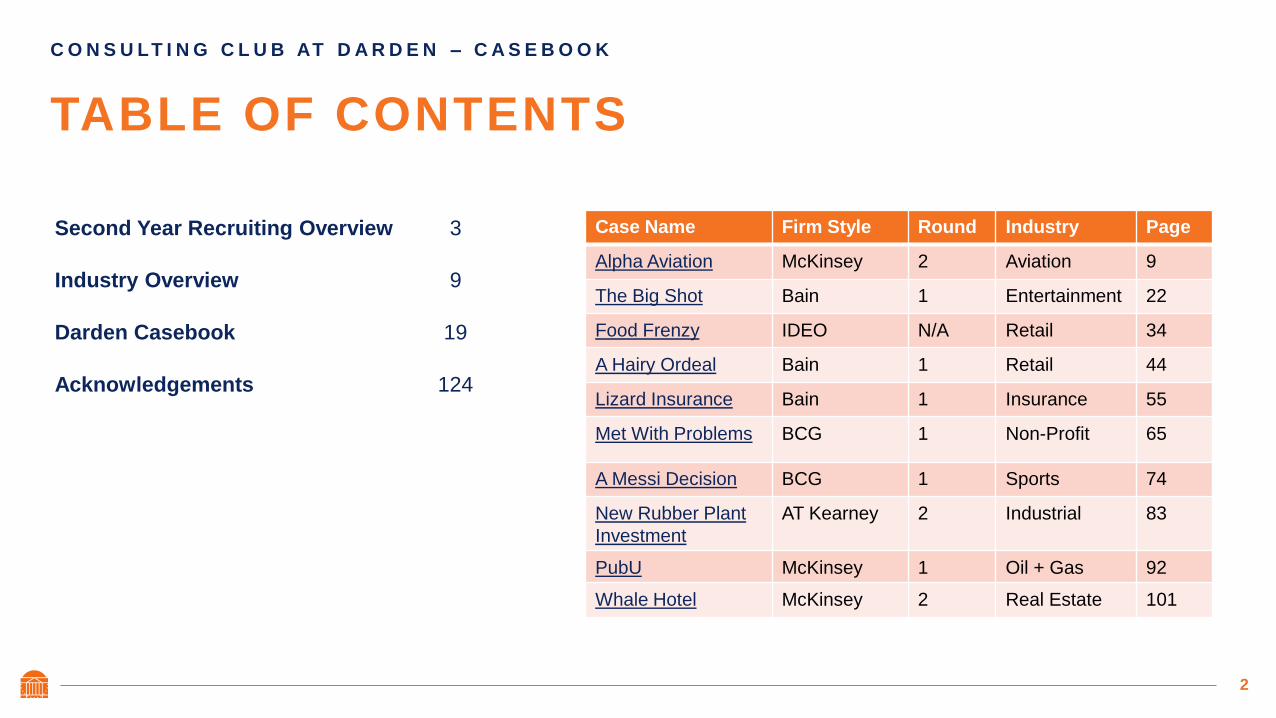
2
C O N S U LT I N G C L U B AT D A R D E N – C A S E B O O K
TABLE OF CONTENTS
Second Year Recruiting Overview 3
Industry Overview 9
Darden Casebook 19
Acknowledgements 124
Case Name Firm Style Round Industry Page
Alpha Aviation McKinsey 2 Aviation 9
The Big Shot Bain 1 Entertainment 22
Food Frenzy IDEO N/A Retail 34
A Hairy Ordeal Bain 1 Retail 44
Lizard Insurance Bain 1 Insurance 55
Met With Problems BCG 1 Non-Profit 65
A Messi Decision BCG 1 Sports 74
New Rubber Plant
Investment
AT Kearney 2 Industrial 83
PubU McKinsey 1 Oil + Gas 92
Whale Hotel McKinsey 2 Real Estate 101

3
Second Year Recruiting
Overview

4
THOUGHTS ON FALL RECRUITING
• Expect Competition – very high intern conversion rates this summer;
limited spots available and only in specific offices (for certain firms); but
other firms only recruit for full-time positions
• Know your Value Proposition – create your personal brand to be
adaptable (think practice areas, boutiques, etc.) so you can pivot as a
variety of opportunities arise for which you may be a strong fit given your
interests and experiences
• Stay flexible – expect excellent opportunities (through job postings or
OGR) coming in the winter/spring as companies decide to wait until they
have a clearer financial picture before hiring
S E C O N D Y E A R R E C R U I T I N G

5
S E C O N D Y E A R R E C R U I T I N G
OVERVIEW OF FALL
ON-GROUNDS RECRUITING
(CONTINUED)
Full-Time MBA Recruiting Fall 2020
Fall 2020Interview
DatesDay:
Student
Resume
Deadline
Day:
Employer
Invite List
Due
Day:Student Bid
DeadlineDay:
Schedule
Available to
Employer
Week 1 Oct 5 - 6 MO 21-Sep TH 24-Sep TU 29-Sep TH 1-Oct
EXAMS Oct 7-11
Week 2 Oct. 12 - 15 MO 28-Sep TH 1-Oct MO 5-Oct TH 8-Oct
Week 3 Oct. 19 - 22 WE 30-Sep TU 6-Oct MO 12 Oct. TH 15-Oct
Week 4 Oct. 26 - 29 TU 6-Oct TH 15-Oct TU 20-Oct TH 22-Oct
Week 5 Nov. 2 - 6 WE 14 Oct. TU 20-Oct TU 27-Oct TH 29-Oct
Week 6 Nov. 9 - 13 WE 21-Oct TH 29-Oct TU 3-Nov TH 5-Nov
Week 7 Nov. 16 - 19 WE 21-Oct TH 29-Oct TU 3-Nov TH 5-Nov

6
S E C O N D Y E A R R E C R U I T I N G
WHO’S INTERVIEWING?
On-Ground Interviews Key Considerations (check DCL for latest information)
Accenture • Office hours 9/10; SY Career Fair 9/10; interviews on 10/5
Alix Partners • Well known in the restructuring/turnaround space
• SY company briefing 9/21; office hours 9/24
Bain • Application deadline 9/15; virtual first round interviews managed by offices
BCG • Application deadline 9/1; virtual first round interviews managed by offices
DHL Consulting • DCL job posting
Everest Group • SY Virtual Connect 9/9; job posting on DCL
• Known for IT-enabled business breakthroughs in strategy, execution, and digital transformation
EY (SC&O and TT) • SY Virtual Connect 9/1; Tech Transformation and Supply Chain are typical roles available; Interviews 10/1
Note: All events subject to change so check DCL often!

7
S E C O N D Y E A R R E C R U I T I N G
WHO’S HIRING? (CONTINUED)
Note: All events subject to change so check DCL often!
On-Ground Interviews Key Considerations (check DCL for latest information)
Fidelity Business Consulting • SY Office Hours 9/14; Interviews 10/20
Innosight • SY Office Hours 9/28; Interviews 10/20; Boston-based innovation consulting boutique
L.E.K. Consulting • SY webinar on Aug 26th; Current posting in DCL
McKinsey • No events prior to 10/5 interviews
Oliver Wyman • Hires into functional areas; current posting for Life Sciences/Healthcare and Energy practice
Samsung Global Strategy • ~ 4 yr. rotational program based in Korea and then regional HQs; strategic project-based work
• SY Virtual Connect 9/22; interviews likely in Oct.
Siemens Advanta Consulting • FY and SY Company Briefing 9/29
ZS Associates • FY and SY Company Briefing 9/24; Office Hours on 9/24; interviews 10/20
• Research-oriented marketing/research/analysis service offerings across multiple industries

8
S E C O N D Y E A R R E C R U I T I N G
WHICH FIRMS HAVE ROLES OPEN TO
INTERNATIONAL STUDENTS THIS YEAR?
Company NameInternational
Hiring?
AlixPartners Yes
Bain Yes
BCG Yes
DHL Consulting Yes
Ernst & Young Yes
Everest Group Yes
Fidelity Business Consulting Yes
LEK Consulting Yes
McKinsey & Company Yes
Samsung Global Strategy Group Yes
Siemens Advanta Consulting Yes
Note: Subject to change so check DCL
Company NameInternational
Hiring?
Accenture No
Innosight No
Oliver Wyman No
ZS Associates No

9
Industry Overview
Please note that these are commonly tested industries; This list is not exhaustive
of all the industries tested

10
Important Calculations
1. Inventory Turnover:
= (Sales / Inventory)
2. Gross Margin:
= (Revenues – COGS)
Revenues
3. Contribution Margin (CM):
= (Sales – Variable Costs)
CM Rate = (CM)
(Sales)
Industry Overview – Consumer / Retail
Key Industry Trends
Important Terminology
• Digital Marketing: CPG (Consumer Packaged Goods) companies are pivoting to digital marketing
solutions like Facebook and YouTube more than ever for smarter and more targeted advertising.
• Big Data: Consumer companies & retailers are ramping up the use of consumer shopping behavior data
now more than ever to create curated/ personalized shopping experiences and targeted advertisements
• Retail Omnichannel: Large brick & Mortar retailers are pivoting to an “order online, pick-up in store” mix
while also building out their online fulfillment capabilities to cater to the consumer. and keep up with
Amazon). Store foot-prints are also getting smaller to reduce inventory
• Private Label & Amazon Effect: Private label consumer products are eroding market share of large name
brand products. This is partially driven by “the Amazon effect” of quick and cheap replacement
fulfillments. -Brand loyalty is getting harder and harder to win.
• Direct to Consumer vs. In-store Experience: Brand names are slowly shifting resources to sell directly to
consumers as some retailers struggle. Retailers with large brick & mortar footprints are focusing on in-
store experiences to attract customers
• SKU: Stock Keeping Unit – Refers to a unique item sold in a store
• In-stock: Percent of items that are on the shelves and available for sale vs. what the total display can
hold
• CRM: Customer Relationship Management: Strategy & tools designed to boost profitability and
strengthen customer loyalty by using data – also the name for software that facilitates this
• Loss Leader: Merchandise sold at a loss to attract new customers or stimulate other profitable sales
• Mark-up: Percentage added to the cost of product to get selling price
*Please note that not all trends, terminologies, and calculations are listed above

11
Important Calculations
1. Return on Investment (ROI)
= (Profits – Cost of Investment)
Cost of Investment
2. Breakeven Point
= ______(Fixed Costs)____
Contribution Margin (CM)
Important Considerations:
• Transportation / Distribution costs
• Storage Costs
• Production Costs: Labor + Materials
• Plant Development Costs
• Depreciation & Taxes
• Overhead
Industry Overview – Energy
Key Industry Trends
Important Terminology
• Clean Renewable Energy: Wind, solar, and biomass power are increasingly replacing the use of fossil
fuels in developed and developing countries with some projections indicating 80% of the worlds energy
needs being met by renewable energy by 2050
• Technology: Advancements in drilling techniques like “fracking” and horizontal drilling have significantly
boosted the output of US oil companies and substantially reduced the cost and risks associated with
drilling for oil
• Shale: Newly found abundance of shale basins in the USA has helped to boost US oil production output
and has almost eliminated US dependence on foreign oil
• Natural Gas: Given its cheap and abundant supply, natural gas has become the primary source of energy
in the US, replacing crude oil and coal
• (Important) Petroleum Products: Gasoline, jet fuel, natural gas, fertilizer, plastics, detergent, propane,
diesel, lubricant
• Upstream (E&P): Exploration and Production – Process involving the finding, drilling, and producing
of crude oil and natural gas or liquified natural gas (LNG)
• Midstream: Focuses on the processing, storage, marketing, and transportation of oil and natural gas.
(Most pipe-line companies fall in this category)
• Downstream: Includes oil refineries, petrochemical plants, petroleum products distributors, retail
outlets and natural gas distribution companies
• OPEC: Organization of Petroleum Exporting Countries – Cartel of 14 nations that coordinate
petroleum policies. –Often influences output and thus oil prices
*Please note that not all trends, terminologies, and calculations are listed above

12
Important Calculations
1. Potential Savings by Switching
Equipment
= {New Profit – Old Profit} or
{ [(New Capacity x Price) – (New
efficiency x cost)] – [(Old Capacity x
Price) – (Old efficiency x cost)]}
Important Considerations:
• Gasoline / Fuel Prices
• Carrying Capacity
• Range / Distance
• Destination Routes
• Maintenance Costs
• Depreciation
Industry Overview – Transportation
Key Industry Trends
Important Terminology
• Airline Capacity Additions: Airline ticket prices have been steadily on the decline driven by companies
adding more routes to cities across the globe –led by low-cost carriers such as JetBlue, Southwest
• Fuel Efficiency: Airline companies have been investing heavily in upgrading their fleet to more fuel
efficient aircrafts to reduce their biggest cost driver
• EV (Electric Vehicles): Auto manufacturers are all racing to create battery powered vehicles
• Autonomous Vehicles: Autonomous vehicles are expected to hit the road as early as 2019 and will cause
major disruption to auto manufacturers, bus systems, taxis, insurance companies
• Shortage of Truckers: Transportation companies have been struggling to keep up with the booming
demand for cargo shipments due to a massive shortage of truck drivers –thus causing significant
increases in labor costs
• Load Factor: Measures the capacity utilization of transportation services and is equal to the average
actual utilization divided by the maximum capacity
• PRASM: Passenger Revenue per Average Seat Mile –Or RASM (revenue) is the revenue generated per
available set miles in which ASM = number of seats available x number of miles flown.
• Logistics: The detailed coordination of complex operations involving many people, facilities, or supplies.
• FOB: Free On Board –Represents the point at which the sale of a freight cargo is considered complete.
“FOB shipping” means ownership is transferred once the product is shipped of, “FOB shipping point”
means ownership is transferred once the product is delivered
• LTL & FTL: LTL (Less than Load) – Small freight that doesn’t fill a truck which is generally more expensive
to ship, (FTL) Full Truck Load) – Large shipments that fill a trailer and are thus cheaper to ship
*Please note that not all trends, terminologies, and calculations are listed above

13
Important Calculations
1. Potential Savings with New
Equipment
= (New Equip. Expenses – Old Equip.
Expenses)
[(Old Time x Old Labor) + (Raw Material
Cost x Old Quantity) + Old Depreciation)]
- [(New Time x New Labor) + (Raw Material
Cost x New Quantity) + New Depreciation)
Important Considerations:
• Raw Material Costs
• Labor & Wages
• Capacity Constraints / Bottlenecks
• Commodity or Not?
• Overhead Costs
• Supplier & Buyer Relationships
• Depreciation
Industry Overview – Manufacturing / Agriculture
Key Industry Trends
Important Terminology
• D2C: Direct to Consumer: More manufacturers are leveraging their own sales platform to market, sell,
and ship their products to the customer rather than use third party distributers or retailers to boost
profitability
• Data Driven Analytics: Manufacturers are using predictive analytics and algorithms to improve product
design, optimize production cycles, and improve demand forecasting
• Trade-war & Tariffs: In response to the US tariff on steel and more, Canada, the European Union, and
China have all implemented retaliatory tariffs of close to 25% on agricultural and automobile goods
produced in the US.
• Sustainable Food Systems: Vertical farming has been a growing trend in urban locations to minimize
environmental foot-prints and bring produce to major cities
• (JIT) Just-in Time Inventory: “Pull demand” inventory system in which assembly materials and support
items are delivered as needed to minimize raw material inventory
• Commodity: An interchangeable non-differentiated product or material that is sold freely. (Most
agricultural products are commodities)
• Bottleneck: The resource in a manufacturing process that is working at max capacity and thus limits the
output of the entire production
• Bushel: A unit of dry measure (1 cubic foot) for grain, fruit, etc., equivalent to 8 gallons of liquid
• Out-source: Process of contracting an outside party to complete a production or service task for a
business. –Typically done to save cost or due to a lack of expertise
*Please note that not all trends, terminologies, and calculations are listed above

14
Important Calculations
1. NPV (Net Present Value)
= (CF) x ___1 ___
(1+i)n Where n = # of periods
2. Pay Back Period
= _____(Fixed Costs)_______
Contribution Margin (CM)
Important Considerations:
• Current Portfolio
• Exit Strategy & Time Horizon
• Acquisition Price
• Employee & Customer Relationships
• Market Trends
• Tax & Regulatory Implications
• Client Risk Profile
Industry Overview – Financial Services
Key Industry Trends
Important Terminology
• AI, Block-Chain & Crypto Currencies: Digital distributed ledgers offer a cheaper and more efficient way
for firms to verify and facilitate transactions. Crypto currencies have proven themselves to be an
alternative set of asset investments that rival equities, precious metals, and debt holdings
• Digital-Only Banks & Payments: The prevalence of more digital transactions have eroded the need for
cash for most daily use, which has in turn lead to the proliferation of online banks that offer higher
savings account interest rates and comparable services
• Financial De-regulation: Congress passed legislation easing some of the restrictions from Dodd- Frank
that exempts smaller banks from certain capital requirements which frees up room for more loans
• More Transparency in PE Funds: With greater pressure to produce results that outperform their
benchmarks, more PE investors have been demanding greater transparency within their funds and firms
have been using transparency to attract investors
• AUM: Assets Under Management: Market value of all the financial assets that a firm manages on
behalf of all of their clients and themselves. –Includes capital raised by investors and leaders of a firm
• Private Equity: Composed of investors and funds that invest directly into private companies or
convert public companies to private companies to improve the target company’s operations and
financials with the goal of extracting a financial return from the company and reselling it another firm
or the public at a profit
• M&A: Mergers & Acquisition: Mergers are when two companies comes together to make a new
entity (Dow Chemical & Dupont) = DowDuPont, while an acquisition is where the smaller company is
consumed by the larger company (Amazon + Wholefoods) = Amazon
*Please note that not all trends, terminologies, and calculations are listed above

15
Important Calculations
1. Addressable Market size:
Top-Down: Total Population >>> Number
of users >>> Market share >>> # of Units
per User x Price per Unit
Bottom-Up: Current Customer Population
>>> Potential Customer Base (Estimated
using consensus data or industry info) >>>
Future user base x units per user x price
2. Customer Acquisition Cost:
_______Marketing Expenses_____
Newly Acquired Customers (Yearly)
Industry Overview – Information Technology
Key Industry Trends
Important Terminology
• Artificial Intelligence (AI)/ Machine Learning: Artificial intelligence is the ability for a computer program
to think and learn. The emergence of AI has enabled the rise of self-driving cars, smart homes, advanced
search algorithms, and smart digital assistants
• Cloud Computing: Is the practice of using a network of remote servers hosted on the Internet to store,
manage, and process data, rather than a local server or a personal computer. More companies are
moving to this platform for security, convenience, and cost savings
• Internet of Things (IOT): Smart devices that are all connected and communicate with each other via the
internet are rising in demand due to value of strategic data that they provide
• Blockchain: a digital ledger in which transactions made and recorded chronologically and publicly. –
Important for security and transfer verification purposes. Ex. include Bitcoin, and other cryptocurrencies
• GDPR: General Data Protection Regulation: Data protection regulation protecting privacy for all
individuals in the European Union.
• IP (Intellectual Property): A category of property that includes intangible creations protected by
trademarks and copyrights (e.g. software, code, algorithms, etc.)
• Unicorn: a start-up company valued at more than a billion dollars, typically in the software or
technology sector
• Freemium: A pricing model used by many digital services, a “freemium” model is one where the
majority of users are able to engage with a product or service entirely for free (perhaps in exchange
for data collection or being served advertisements)
• SaaS: “Software as a service” - a software distribution model in which a third-party provider hosts
applications and makes them available to customers over the Internet –Like Salesforce or Workday
*Please note that not all trends, terminologies, and calculations are listed above

16
Important Calculations
1. Profitability
(Revenues – Costs)
(Price x Quantity) – (Quantity x Var. Cost)
– (Fixed Costs)
Important Considerations:
• Revenue Factors
• Advertising Rev.
• Ticket sales (Price x Quantity)
• Merchandising
• Tours / licensing / Endorsements
• Cost Factors
• Artist fees
• Commission
• Promotion advertising
• Venues
• Content creation costs
Industry Overview – Media & Entertainment
Key Industry Trends
• Cord Cutting / Over the Top Streaming: The rise of Hulu, Netflix, YouTube, & Amazon Prime video has left
many to abandon traditional cable and opt for online streaming services to get the content they want
• Content is King: Media giants have been spending heavily to curate high quality content to hook
subscribers to their service and maintain and grow their subscriber base
• Ad-model Shift: Cable advertisement has been trending downward while digital online advertisements
have been trending up. As online viewers opt for ad-blockers, AI and big data are helping marketing
agencies personalize advertisements and increase user engagement
• Augmented Realty (AR)/ Virtual Reality (VR): While still in their early stages, AR and VR capabilities have
been gaining traction in the industry as a way to enhance storytelling and improve sporting coverage
• Music Streaming: The rise of Spotify, Apple Music, & YouTube Music has almost eliminated the physical
disc music market as most artist now prioritize online platforms to release albums and new songs
• Gaming & E-Sports: The video gaming industry has been one of the fastest growing segments in
entertainment led by mobile gaming and game streaming experiences via Twitch and E-sports. Many
video game creators are focused on a “games as a service model” as they monetize video games
overtime by selling in-game customizable perks
Important Terminology
• Digital vs. Linear: Linear is traditional broadcast or cable television. Digital is online (streaming, etc.)
• Ratings: A measure of viewers of a particular program or time segment in television. Nielsen is the
largest provider of ratings data in the US, but has been slow to provide digital ratings
• Box-Office: The total revenue generated by movies shown at theaters
*Please note that not all trends, terminologies, and calculations are listed above

17
Important Calculations
1. Market sizing:
Top-Down: Total Population >>> Number
with Illness >>> Number Diagnosed >>>
Market share of Drug >>>> (Dosage per
Time Frame) x Price per Dosage = Market
Size per Time Frame
Important Considerations:
• Regulations
• FDA Approvals
• Patent Rights
• Foreign Government Laws
• Competition / Cannibalization
• Drug Effectiveness
• Cure vs. Treatment
• Time to Market
• Side Effects
• Manufacturing Capabilities
• Pricing, Costs (Fixed / Var.), Dosage
Industry Overview – Healthcare & Life Sciences
Key Industry Trends
Important Terminology
• Wearable Medical Devices: Activity trackers help patients stay more active and healthier on their own
while also monitoring health metrics reducing the need to visit doctors frequently
• Smart Technology & Data: Data on a patient’s background and conditions allow more personalization
options, targeted treatments, and faster recommendations at hospitals
• Gene Therapy: The transplantation of normal genes into cells in place of missing or defective ones in
order to correct genetic disorders. –Growing trend using CRISPR to treat previously uncurable diseases
• Price Transparency: As drug companies receive criticism on the rising cost of their drugs, more states are
considering independent efforts to improve transparency in drug pricing and cost controls
• Government: With the repeal of the Affordable Care Act (ACA), legislation has stagnated on fixing the
rising cost of healthcare and Medicaid in the US, thus leaving a continued rise in insurance premiums
• Bundled payment, episode-of-care payment, etc.: Generally describes paying for the whole treatment at
once, rather than by individual tests or visits – an attempt to incentivize improved outcomes
• Orphan Drug: A pharmaceutical drug that remains commercially undeveloped due limited potential for
profitability as a result of a small curable population size
• FDA: “Food & Drug Administration” Federal organization tasked with protecting and promoting the
safety of food and pharmaceuticals in the US. FDA approval is needed for almost all drugs sold in the US
• Generic Drugs: A prescription drug that has the same active-ingredient formula as a brand-name drug
but sold at a cheaper cost. –Typically occurs when name branded drugs lose patents
• Biotech vs. Pharmaceutical: Biotech firms use live organisms like bacteria and enzymes to manufacture
their medicines while pharmaceutical companies primarily use chemicals synthesis
• Auto-immune Diseases: A disease in which the body's immune system attacks healthy cells
*Please note that not all trends, terminologies, and calculations are listed above

18
Important Calculations
1. Return on Investment (ROI):
(Future Profits – Cost of Investment)
(Cost of Investment)
2. Customer Acquisition Cost:
_______Marketing Expenses_____
Newly Acquired Customers (Yearly)
Important Considerations:
• Regional Competition
• Competitors
• New Entrants
• Barriers to Entry
• Substitutability
• Contract lengths & stipulations
• Infrastructure
Industry Overview – Telecommunications
Key Industry Trends
Important Terminology
• 5G Network Service: Next generation of mobile internet connectivity with faster speeds, more reliable
connections, and 100x more bandwidth capacity than 4G.
• Network operates mainly on the cloud
• Allows for “network slicing:” Creates separate wireless networks on the cloud for users to have
their own personalized network
• Roll-out may be 2020 in North America due to high infrastructure costs associated with
development
• Network Consolidation: The third and fourth largest cell phone carriers T-Mobile and Sprint are in the
process of merging, a move that will consolidate the telecom market to 3 major players
• Content Integration: High profile acquisition like AT&T of Time Warner and Verizon of Yahoo illustrate a
push to either get into the content creation game or to build out their advertising network
• Carrier: A company that is authorized by regulatory agencies to operate a telecommunications service
system: AT&T, Verizon, T-Mobile
• OEM: Original Equipment Manufacturer – A company whose goods are used as components in the
product of another company that sells the finished goods to users
• LAN: Local Area Network: Locally owned and administered data network that runs primarily through
cables –ex. Ethernet connection
• Fiber Optic: Transmission connectivity via glass strands which are 100x more faster than traditional
copper wires for more efficient cell phone and internet connections
*Please note that not all trends, terminologies, and calculations are listed above

19
Darden Casebook

20
C O N S U LT I N G C L U B AT D A R D E N
CASEBOOK INDEX
Case Name Firm Style Round Industry Page
Alpha Aviation McKinsey 2 Aviation 9
The Big Shot Bain 1 Entertainment 22
Food Frenzy IDEO N/A Retail 34
A Hairy Ordeal Bain 1 Retail 44
Lizard Insurance EY – Parthenon 2 Insurance 55
Met With Problems BCG 1 Non-Profit 65
A Messi Decision BCG 1 Sports 74
New Rubber Plant Investment AT Kearney 2 Industrial 83
PubU McKinsey 2 Oil + Gas 92
Whale Hotel McKinsey 2 Real Estate 101

21
Alpha Aviation
McKinsey | Round 2 | Aviation

22
McKinsey | Round 2 | Aviation
0 1 | C A S E : A L P H A AV I AT I O N
CASE NAME
B E H AV I O R A L
I N T E R V I E W
Q U E S T I O N :
1 . W h y
M c K i n s e y ?
2 . W h a t ’ s y o u r
p r o u d e s t
a c h i e v e m e n t ?
UVA Darden School of Business 2019-20 Casebook
Clarifying Information: Note: Provide this only if corresponding questions are asked.
1. What is the timeline for the project? ASAP – financial investments for the airline typically warrant a payback
period of 3 years.
2. How is the rest of the airline industry performing? Our client’s profitability is declining slightly faster than the
industry – but is in line with other airlines within its class of service.
3. Any specific goals? Take operating margin positive.
Prompt:
Your client is a large US-based commercial airline that has lost profitability
and market share. The company is under pressure to regain its foothold in
the industry and grow its balance sheet. Can you brainstorm some areas you
would like to investigate on behalf of the airline?

23
Framework Guidance:
Note: There are many possible alternatives to this framework. These are only provided as possible suggestions.
0 1 | C A S E : A L P H A AV I AT I O N
How to Move Forward:
The interviewer should identify key revenue and cost considerations for route planning and highlight other potential strategic considerations.
To move forward, the interviewee should call out the existing financial forecasts or market research provided.
Revenue Opportunities
• Ticket Fares
• Upselling Opportunities
• Cargo Fees
• Airline partnerships
• Credit Card sponsors
Cost Management
• Upfront Investment
• Airport Investment
• Equipment
• Initial Training
• Marketing & Advertising
• Variable Costs
• Fuel Costs
• SG&A
• Maintenance
Other Considerations
• Creation of a new domestic
hub
• Seasonal Risk
• Competitive Response
• Fuel Efficiency + Prices
UVA Darden School of Business 2019-20 Casebook

24
Question 1
The airline has evaluated your options and decided to re-examine and add additional routes. The flight
dispatch office has presented three routes and would like your guidance on which to choose.
0 1 | C A S E : A L P H A AV I AT I O N
Exhibit or Question Guidance:
Show candidate Exhibits 1 and 2 and ask for key strategic takeaways or pros/cons. Interviewer guidance below.
UVA Darden School of Business 2019-20 Casebook
Route 1 Route 2 Route 3SEA - MINN FAY - DALL NYC - DC
PRO
Potential for Growth PRO
Risk of Disruption PRO
Competition for Route PRO
Time to Establish Operations PRO PRO
CON
Potential for Growth CON
Risk of Disruption CON
Competition for Route CON CON
Time to Establish Operations CON
Key: there is no automatic choice – each route
has major tradeoffs. You can urge the interviewer
to pick a route and rationalize their choice, OR ask
about any additional data they would want/need to
make the best decision. At that point, provide
Exhibits 3 and 4.

25
EXHIBIT 1
0 1 | C A S E : A L P H A AV I AT I O N
Route Map
UVA Darden School of Business 2019-20 Casebook
Route 1
Seattle → Minneapolis
1,400 mi
1 roundtrip/day
240 passenger capacity
Route 2
Fayetteville → Dallas
550 mi
1 roundtrip/day
120 passenger capacity
Route 3
New York → DC
200 mi
3 roundtrips/day
120 passenger capacity

26
EXHIBIT 2
0 1 | C A S E : A L P H A AV I AT I O N
Route Research
UVA Darden School of Business 2019-20 Casebook
Route 1Seattle → Minneapolis
Route 2Fayetteville → Dallas
Route 3NYC → DC
Potential for Growth* Low High Medium
Risk of Flight Disruption** Low High Medium
Competition for Route*** High Low High
Time to Establish Operations 3 months 2 months 12 months
* Projected 5-year increase in passenger volume
** Historical data on flight cancellations due to weather and operations
*** Current competitors flying the same route
27
Question 2
Keeping in mind your strategic analysis, the airline has provided financial projections and for each route.
What are your initial reactions to their data? And can you quantify each route’s profitability?
0 1 | C A S E : A L P H A AV I AT I O N
Exhibit or Question Guidance:
Show candidate Exhibits 3 and 4 and guide them toward creating a financial forecast. Interviewer guidance below.
Exhibit 3 – If time allows, have the interviewer brainstorm potential upfront costs.
Exhibit 4 – Best practice is to combine revenue and cost to get CM/ASM for each route. Interviewee can either weight the
CM based on the projected fill rate OR reference the passenger capacity in Exhibit 1 to get average passengers per route.
Note: ASM stands for Available Seat Miles; standard aviation practice to denote financial metrics.
Forecast calculations on next page.
UVA Darden School of Business 2019-20 Casebook

28
EXHIBIT 5 – CALCULATIONS FOR INTERVIEWER
0 1 | C A S E : A L P H A AV I AT I O N
UVA Darden School of Business 2019-20 Casebook
Route 1 Route 2 Route 3
SEA - MINN FAY - DALL NYC - DC
# of Seats per Plane 240 120 120
x Average % Filled 90% 60% 80%
Average # of Passengers 216 72 96
x Average Flight Distance (mi) 1,400 550 200
A Available Seat Miles (ASM) 302,400 39,600 19,200
Revenue/ASM 0.12$ 0.22$ 0.18$
- Cost/ASM 0.11$ 0.09$ 0.12$
B CM/ASM 0.01$ 0.13$ 0.06$
ASM 302,400 39,600 19,200
x CM/ASM 0.01$ 0.13$ 0.06$
A x B CM/flight 3,024$ 5,148$ 1,152$
x Flights per day 2 2 6
x Flying days per year 300 300 300
C Annual CM/route 1,814,400$ 3,088,800$ 2,073,600$
What is the CM potential of each route?
Route 1 Route 2 Route 3
SEA - MINN FAY - DALL NYC - DC
Terminal Construction 100,000$ 2,500,000$ 5,000,000$
+ Equipment Purchase 1,000,000$ 3,000,000$ 1,000,000$
+ Additional Staff Required 10.00 100.00 50.00
* Training per Staff Member 100,000$ 1,000,000$ 500,000$
D Total Upfront Cost 1,200,000$ 6,500,000$ 6,500,000$
Total Upfront Cost 1,200,000$ 6,500,000$ 6,500,000$
/ Annual CM/route 1,814,400$ 3,088,800$ 2,073,600$
D / C Payback (Years) 0.7 2.1 3.1
Payback (Months) 8 25 38
What is the payback period?
Key: weigh the shorter payback period with the
riskiness of the investment (passenger availability,
competition, start-up time, operational considerations)

29
EXHIBIT 3
0 1 | C A S E : A L P H A AV I AT I O N
Upfront Costs
UVA Darden School of Business 2019-20 Casebook
Route 1Seattle → Minneapolis
Route 2Fayetteville → Dallas
Route 3NYC → DC
Terminal Construction 100k 2.5M 5M
Equipment Purchase 1M 3M 1M
Additional Staff Required* 10 100 50
* 10k/person will be required for training

30
EXHIBIT 4
0 1 | C A S E : A L P H A AV I AT I O N
Route Financials (Per ASM)
UVA Darden School of Business 2019-20 Casebook
$0.12
$0.22 $0.18
$0.11 $0.09 $0.12
Route 1 Route 2 Route 3
Route Financials per Filled Seat
Revenue Cost
Route’s Average
% Seat Fill Rate90% 60% 80%
Seattle – Minneapolis Fayetteville – Dallas NYC - DC

31
In-flight amenities
• Upgraded WiFi
• Extra legroom and business class
cabins (lower price sensitivity)
• Priority boarding for business
travelers
0 1 | C A S E : A L P H A AV I AT I O N
UVA Darden School of Business 2019-20 Casebook
Best candidates display:
Ability to integrate disparate data on route mapping with brainstorming ideas – i.e. how can the client best design the selected route to appeal
to business travelers in that destination. If time allows, the interviewer should ask the candidate why an airline would grow its base of business
travelers.
Brainstorming Guidance:
Note: This is just one possible set of categories and answers. Many more are possible, and interviewers should assess both the volume and relevance of answers.
External partnerships
• Preferred status with Concur and
other corporate booking sites
• Alliance networks with smaller,
regional airlines (continuous
service)
Flight structure
• Early morning and late afternoon
time slots to accommodate
business schedule
• No penalty rebook or cancellation
Misc.
• Revenue-based loyalty program
• Perks for Elite Status
BRAINSTORMING
Your client has identified that attracting business travelers will be key to long-term growth and profitability.
Please brainstorm some ideas on how your client can increase business travelers in the next 3 years.

32
CONCLUSION
0 1 | C A S E : A L P H A AV I AT I O N
UVA Darden School of Business 2010-20 Casebook
To conclude, the interviewee should provide the following:
Recommendation:
• No clear “right answer” – the case is meant to test a candidate’s ability to deal with ambiguity. A good answer will consider
both the quantitative and qualitative advantages of the three routes, and how each aligns with the client’s long-term goals.
The information in the case is purposely spread out and difficult to interpret, so candidates should maintain composure
and organization when providing their final recommendation.
Risks:
• Competitive activity at destination airport – possibility of a price war
• Pending local legislation at destination city – could prevent or hinder monopolistic activity or make airline travel
prohibitively expensive for carriers and passengers
• Decrease in passenger interest in destination cities
Next Steps:
• Regulatory and operational planning schedule to implement route.

33
I N T E R V I E W E R F E E D B A C K F O R M
Case Execution:
❑ Clarifying Questions + Framework
❑ Good Questions
❑ Structured
❑ MECE
❑ Creativity
1 2 3 4 5
Case Name _________________________ Interviewer ___________________________
Case Book ____________________ Case Type ____________ Difficulty ____________
Feedback:
❑ Exhibits + Quantitative Ability
❑ Accuracy
❑ Speed
❑ Insights Presented
❑ Errors / Guidance Needed
1 2 3 4 5 Feedback:
❑ Brainstorm + Conclusion
❑ Creative & Structured
❑ Good Business Judgment
❑ Recommendation Strength
1 2 3 4 5 Feedback:
❑ Presence & Non-Verbal
❑ Confidence
❑ Poise / Posture
❑ Clear & Concise
❑ Body Language
❑ Coachability
1 2 3 4 5Feedback:
Total: _____ / 20

34
The Big Shot
Bain | Round 1 | Media/Entertainment

35
Bain | Round 1 | Media/Entertainment
0 2 | C A S E : T H E B I G S H O T
THE BIG SHOT B E H AV I O R A L
I N T E R V I E W
Q U E S T I O N :
1 . D e s c r i b e t h e
b e s t l e a d e r w i t h
w h o m
y o u ' v e w o r k e d .
2 . Te l l m e a b o u t
a t i m e w h e n y o u
w o r k e d o n a
p r o j e c t w i t h a n
u n d e f i n e d g o a l
o r s c o p e .
UVA Darden School of Business 2019-20 Casebook
Clarifying Information: Note: Provide this only if corresponding questions are asked.
1. What is LCA’s business model? LCA is a production house in the US but release movies across major global
markets. They have a distribution network of single and multi-screen theatres and get a share of the ticket sales.
2. What movies do they produce? They've been in the business for the past decade and have a good mix of movies
across different genres.
3. What happened over summer? The COVID-19 pandemic has wreaked havoc on the movie industry.
4. What is the financial situation of the company? Even though the company did not have a major hit over summer,
the company has ample cash reserves from investors. The board has indicated, however, that they expect a hit soon,
or else the CEO will be looking for a new job.
5. Do they have any financial target? The board is concerned about ROI after the recent flops and has classified a hit
as a movie that has an ROI > 50%.
Prompt:
Our client, Lights Camera Action Entertainment (LCA), is a major movie
production house. After a disappointing summer filled with numerous box
office flops, the CEO of LCA has approached us to decide which movie the
company should release next.

36
Framework Guidance:
Note: There are many possible alternatives to this framework. These are only provided as possible suggestions.
0 2 | C A S E : T H E B I G S H O T
How to Move Forward:
The candidate should recognize that this is a profitability case. Good candidates will also realize that there are other factors
that determine the success of movies.
A good understanding of the breakdown of tickets sales at a theatre level is key to moving forward – the interviewer should
push candidates to get granular while calculating revenue (theaters * seats * fill rate * ticket sales).
Once you get to this point, hand the student Exhibit 1 and 2.
Revenues
• Number of theaters at
release
• Price of tickets
• Fill rate at theater
• Merchandise licensing
• Sequel potential
Costs
• Actors
• Sets
• Special effects
• Advertising
• Editing
• Sound
• Production Design
Internal
• Sequel of prior hit
• Saturation of series
• Expertise in a genre
• Exclusive deals with actors
• Adaption from popular novels/books
UVA Darden School of Business 2019-20 Casebook
External
• Macroeconomic trends
• Actor popularity
• Genre reach
• Trending theme for the season/pop culture
• Clashes with other movie release dates
• Competition from Netflix and other
streaming media
Financial Non-Financial

37
EXHIBIT 1
0 2 | C A S E : T H E B I G S H O T
UVA Darden School of Business 2019-20 Casebook
Movie Name GenreTotal Production Costs
(Millions $)
Forecasted Theatre
Attendance (%)
Project Huntington Comedy 50 80
Life at Ivy Drama 100 60
Case Wars Action 75 75
Paws at Pav Animation 90 80
LCA movie options

38
EXHIBIT 2
0 2 | C A S E : T H E B I G S H O T
UVA Darden School of Business 2019-20 Casebook
Global Movie Industry Statistics
0 500 1000 1500 2000 2500
Animated
Action
Drama
Comedy
Anticipated Theater Demand By Genre*
Domestic International
*Average theater run of 30 days

39
Question 1
• Which of the genres is the most profitable option for the production house?
0 2 | C A S E : T H E B I G S H O T
Exhibit or Question Guidance:
Hand the student Exhibits 1 and 2. The candidate should realize that they cannot do a profitability analysis without number of seats in a
theatre and price of a ticket. Provide Exhibit 3, when the candidate asks for the above information.
Provide only when asked – Assume 30 days of revenue.
LCA revenue from each theatre type:
UVA Darden School of Business 2019-20 Casebook
Theatre typeLCA
revenues/ticket
No. of
shows/day
No. of
seats/showMonthly earnings
Single screen $1 5 400 $1 * 5 * 400 * 30 = $60,000
Multi-screen $1.5 10 200 $1.5 * 10 * 200 * 30 = $90,000
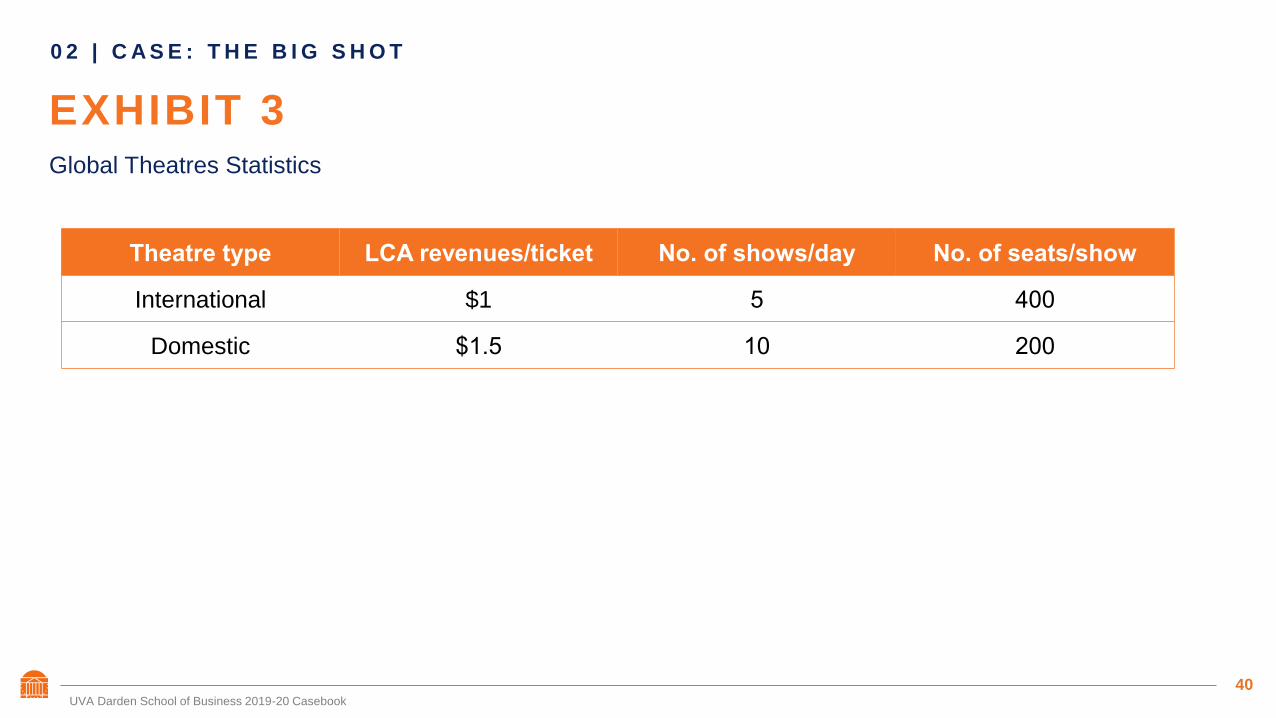
40
EXHIBIT 3
0 2 | C A S E : T H E B I G S H O T
Global Theatres Statistics
UVA Darden School of Business 2019-20 Casebook
Theatre type LCA revenues/ticket No. of shows/day No. of seats/show
International $1 5 400
Domestic $1.5 10 200

41
0 2 | C A S E : T H E B I G S H O T
Exhibit/Question Solution Guidance:
Total Monthly earnings
UVA Darden School of Business 2019-20 Casebook
Genres Single Screen Multi-Screen Total
Comedy80%*1,000*60,000 =
48,000,000
80%*1,500*90,000 =
108,000,00048M + 108M = 156M
Drama60%*500*60,000 =
18,000,000
60%*1000*90,000 =
54,000,00018M + 54M = 72M
Action75%*1,500*60,000 =
67,500,000
75%*2,000*90,000 =
135,000,00067.5M + 135M = 202.5M
Animation80%*750*60,000 =
36,000,000
80%*1,000*90,000 =
72,000,00036M + 72M = 108M
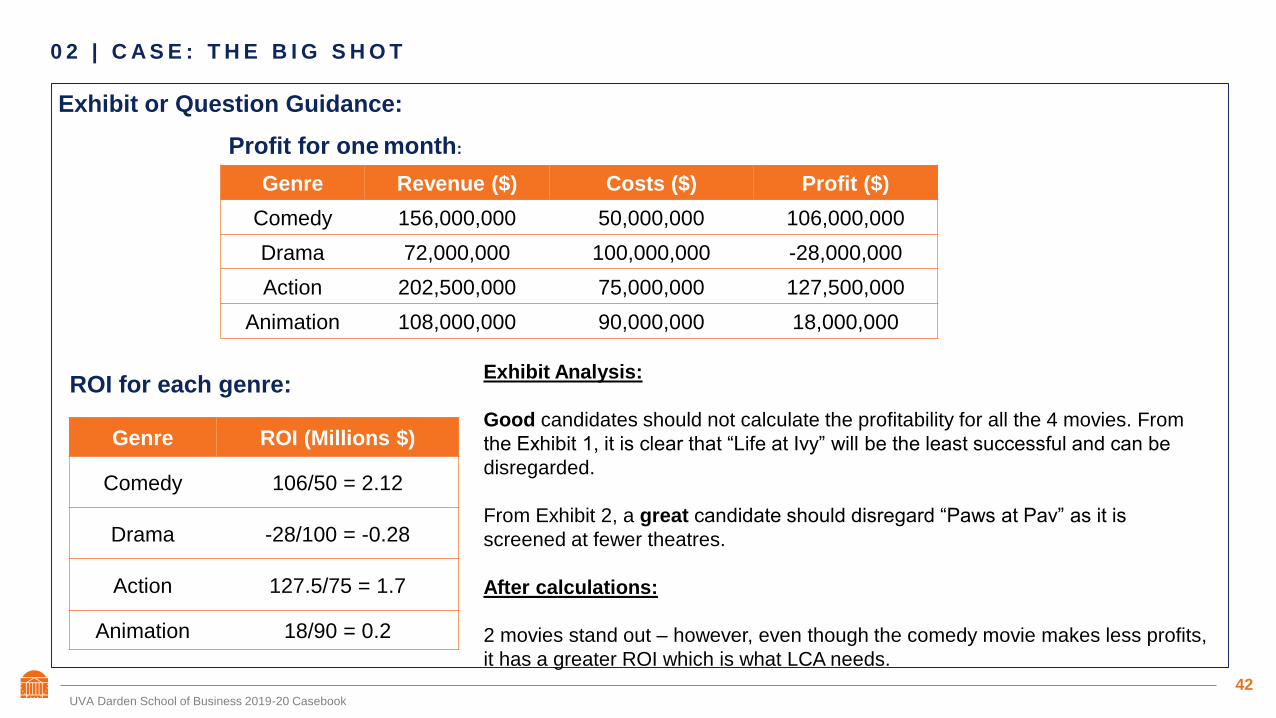
42
0 2 | C A S E : T H E B I G S H O T
Exhibit or Question Guidance:
Profit for one month:
UVA Darden School of Business 2019-20 Casebook
Genre Revenue ($) Costs ($) Profit ($)
Comedy 156,000,000 50,000,000 106,000,000
Drama 72,000,000 100,000,000 -28,000,000
Action 202,500,000 75,000,000 127,500,000
Animation 108,000,000 90,000,000 18,000,000
ROI for each genre:
Genre ROI (Millions $)
Comedy 106/50 = 2.12
Drama -28/100 = -0.28
Action 127.5/75 = 1.7
Animation 18/90 = 0.2
Exhibit Analysis:
Good candidates should not calculate the profitability for all the 4 movies. From
the Exhibit 1, it is clear that “Life at Ivy” will be the least successful and can be
disregarded.
From Exhibit 2, a great candidate should disregard “Paws at Pav” as it is
screened at fewer theatres.
After calculations:
2 movies stand out – however, even though the comedy movie makes less profits,
it has a greater ROI which is what LCA needs.

43
Release Timing:
• Strategic release dates to coincide with
holidays/popular events, such as romcom during
Valentine’s weekend, Holiday films over Christmas
• Avoiding clashes with other popular movies or large
sporting events during the release
0 2 | C A S E : T H E B I G S H O T
UVA Darden School of Business 2019-20 Casebook
Brainstorming Guidance:
Note: This is just one possible set of categories and answers. Many more are possible, and interviewers should assess both the volume and relevance of answers.
Monetization:
• Merchandise sales from these movie category,
e.g.: water tumblers, limited edition gadgets, t-
shirts etc.
• Potential for movie sequels based on popularity
• Releasing the movie on other platforms such as
Netflix, Hulu, and obtaining television streaming
rights.
• Impact of initial reviews on the theatre fill rates
for subsequent weeks.
BRAINSTORMING
Other than the profitability analysis, what are the other strategic decisions that LCA should consider for the success of their next
movie?
Content/Marketing:
• Using the marketing budget to drive
awareness and buzz for the movie using
appropriate channels
• Casting the right actors, production and
direction, sound crew
• Theme/story of the movie to align with
ongoing social and pop culture, macro-
economic trends
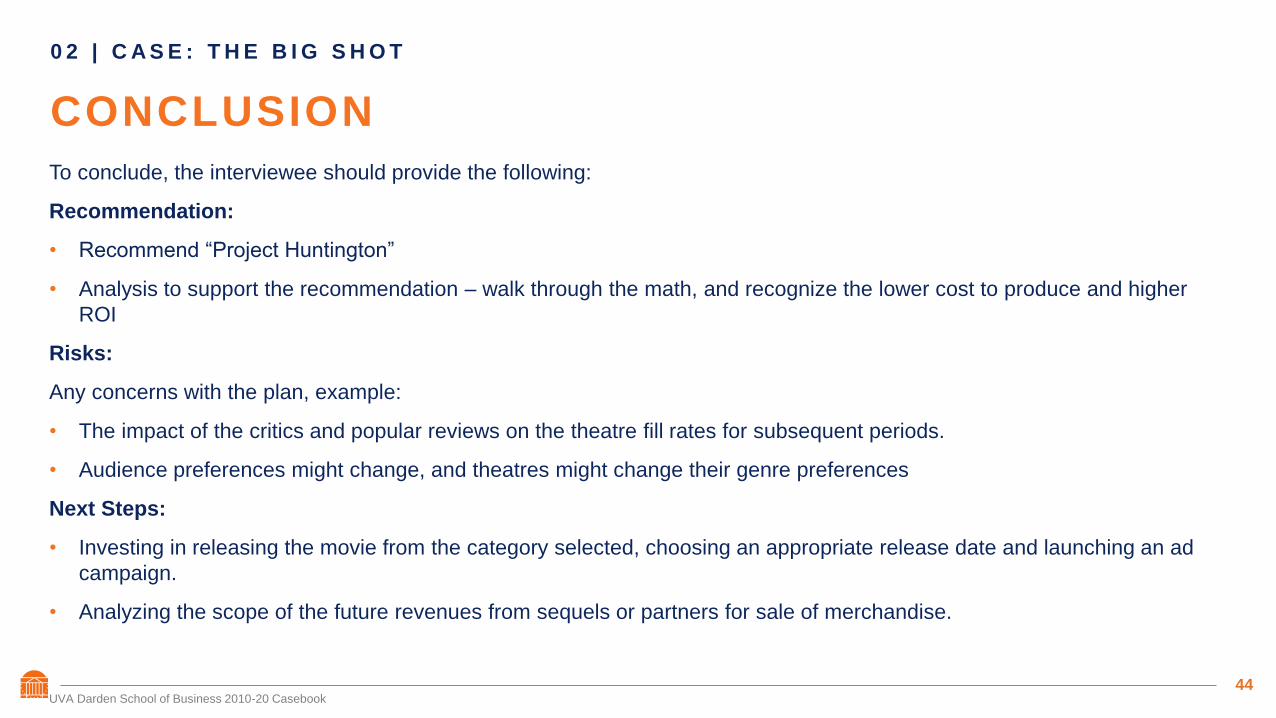
44
CONCLUSION
0 2 | C A S E : T H E B I G S H O T
UVA Darden School of Business 2010-20 Casebook
To conclude, the interviewee should provide the following:
Recommendation:
• Recommend “Project Huntington”
• Analysis to support the recommendation – walk through the math, and recognize the lower cost to produce and higher
ROI
Risks:
Any concerns with the plan, example:
• The impact of the critics and popular reviews on the theatre fill rates for subsequent periods.
• Audience preferences might change, and theatres might change their genre preferences
Next Steps:
• Investing in releasing the movie from the category selected, choosing an appropriate release date and launching an ad
campaign.
• Analyzing the scope of the future revenues from sequels or partners for sale of merchandise.

45
I N T E R V I E W E R F E E D B A C K F O R M
Case Execution:
❑ Clarifying Questions + Framework
❑ Good Questions
❑ Structured
❑ MECE
❑ Creativity
1 2 3 4 5
Case Name _________________________ Interviewer ___________________________
Case Book ____________________ Case Type ____________ Difficulty ____________
Feedback:
❑ Exhibits + Quantitative Ability
❑ Accuracy
❑ Speed
❑ Insights Presented
❑ Errors / Guidance Needed
1 2 3 4 5 Feedback:
❑ Brainstorm + Conclusion
❑ Creative & Structured
❑ Good Business Judgment
❑ Recommendation Strength
1 2 3 4 5 Feedback:
❑ Presence & Non-Verbal
❑ Confidence
❑ Poise / Posture
❑ Clear & Concise
❑ Body Language
❑ Coachability
1 2 3 4 5Feedback:
Total: _____ / 20

46
Food Frenzy*
IDEO/frog | N/A | Food Accessibility & Design
*Note – this case is designed for IDEO / Mural style interviews. It is different from a classic case.

47
IDEO | Round 2 | Food Accessibility & Design
0 3 | C A S E : F O O D F R E N Z Y
DESIGN FOR FOOD B E H AV I O R A L
I N T E R V I E W
Q U E S T I O N :
1 . Te l l m e a b o u t
a t i m e y o u h a v e
r e c e i v e d a t o u g h
p i e c e o f
f e e d b a c k . H o w
d i d y o u
r e s p o n d ?
2 . W h a t d o y o u
h o p e t o g a i n
f r o m y o u r
i n t e r n s h i p t h i s
s u m m e r ?
UVA Darden School of Business 2019-20 Casebook
Clarifying Information: Note: Provide this only if corresponding questions are asked.
1. Reforma has no history or experience in the B2C space but has extensive distribution networks and expects
refining their operations and scaling will not be insurmountable challenges.
2. Reforma currently operates in Mexico, Chile, and Colombia. While the company operates across the entirety of
these countries, the majority of their distribution capabilities are concentrated in Mexico City, Santiago, and Bogota.
3. Their goal is to enter the market in an innovative way. Reforma believes there is whitespace in the food services
industry for an unmet customer need, but is currently unsure what that looks like in practice.
4. A primary focus of the engagement should be to ensure the proposed market entry strategy embodies the voice
of the customer, addressing customer needs and frustrations.
Prompt:
Mercado Reforma is a large B2B grocery supplier in Latin America that wants
to expand into the B2C space. You are the project leader, ideate ways to
investigate the opportunity and bring the concept to life. Walk me through
how you would approach the project.
Suggested interview length: ~45 minutes due to the amount of brainstorming and Q&A

48
Framework Guidance:
Note: There are many possible alternatives to this framework. These are only provided as possible suggestions.
0 3 | C A S E : F O O D F R E N Z Y
Candidates should propose a project plan – if they begin to structure a traditional framework, prompt them to structure a project plan. If they
still struggle, prompt them to explain why they are structuring the project in such a manner. This should be all verbal and very collaborative –
writing during this phase is not required as this could be verbally delivered if they want.
Research
Customer engagement strategy –
address how the voice of the
customer would be captured.
Candidate should be able to expound
on a strategy for each of the following
as well as note their different uses:
• Ethnographic interviewing
• Focus group execution
• Ethnographic observation
• Stakeholder interviews
Synthesis & Design Products
Putting the pieces together – candidate
should be able to address how each of
the research inputs is used to distill
insights, create design artifacts, and
describe the use cases of each artifact
• Synthesis process and collaboration
practices for processing research
outputs
• Artifact examples: CX journey map,
service design blueprint, personas
UVA Darden School of Business 2019-20 Casebook
Co-Creation
Insights & ideation with clients/users –
candidates should be able to build
workshop ideas for presenting to
clients/users and facilitating an ideation
session.
• Empathy building exercises
• Creative presentation of research
• Rapid synthesis ideas for reactions or
insights from research
• Small group solutioning/brain storming
Prototyping & Scaling
Iterate, refine, and scale – candidates
should be able to outline a scrappy
and rough strategy for testing
solutions they discover through
research and co-creation
• Low budget, easy ideas
• Service design simulation
• Wire frame testing
• A/B testing
• Pilot market testing
• Tell me more about your research plan – how do you plan to source
users/customers?
• What kind of questions will you ask them?
• How do you envision using your design artifacts?
• Describe how you would lead a synthesis process with a team? How would
you make sure it is collaborative?
Sample Questions for Framework Drilldown:1. Press the candidate extensively on their framework using the sample
questions.
2. Prompt the candidate to begin a brainstorm of insights they might uncover
from their research and synthesis products
3. Stress test candidates and continue to ask for additional hypotheses.
How to Move Forward

49
EXHIBIT 1
0 3 | C A S E : F O O D F R E N Z Y
Customer Persona: Millennials on the Move
UVA Darden School of Business 2019-20 Casebook
NEEDS
• Accessible food options when on the go out in the city
• Food options that better cater to their dietary preferences
• Ability to pick-up up cooked food or bundled ingredients when pressed for time
• Options that allow for a quick and efficient shopping or pick-up experience
FRUSTRATIONS
• Feeling pressed for time and unable to attend to little chores like grocery
shopping, laundry, or cleaning their apartments
• Feeling unable to find the specialty food items they like in convenient places
• Lack of diversity of food options around their office
Millennial urban customers. This segment typically works in
professional services (CDMX residents pictured here).
Millennial customers in Latin American megacities are moving into positions of leadership within the
economy and are increasingly pressed for time due the demands of their professional, personal,
and social lives. These customers crave an efficient option that will satisfy their needs within the
structure of their current commuting and professional routine during the work week.
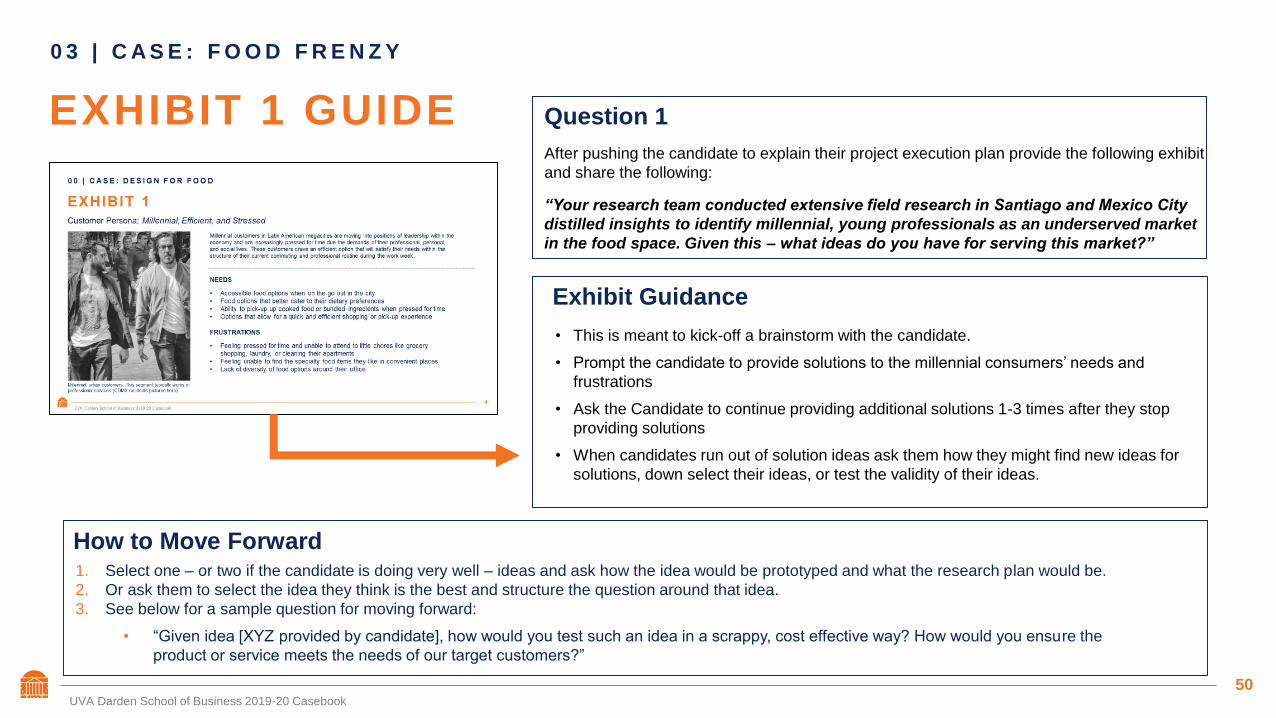
50
EXHIBIT 1 GUIDE
0 3 | C A S E : F O O D F R E N Z Y
UVA Darden School of Business 2019-20 Casebook
Exhibit Guidance
• This is meant to kick-off a brainstorm with the candidate.
• Prompt the candidate to provide solutions to the millennial consumers’ needs and
frustrations
• Ask the Candidate to continue providing additional solutions 1-3 times after they stop
providing solutions
• When candidates run out of solution ideas ask them how they might find new ideas for
solutions, down select their ideas, or test the validity of their ideas.
1. Select one – or two if the candidate is doing very well – ideas and ask how the idea would be prototyped and what the research plan would be.
2. Or ask them to select the idea they think is the best and structure the question around that idea.
3. See below for a sample question for moving forward:
• “Given idea [XYZ provided by candidate], how would you test such an idea in a scrappy, cost effective way? How would you ensure the
product or service meets the needs of our target customers?”
How to Move Forward
Question 1
After pushing the candidate to explain their project execution plan provide the following exhibit
and share the following:
“Your research team conducted extensive field research in Santiago and Mexico City
distilled insights to identify millennial, young professionals as an underserved market
in the food space. Given this – what ideas do you have for serving this market?”

51
Question 2 (The location of these question slides in your case is completely up to you)
• “Given idea [XYZ provided by candidate], how would you test such an idea in a scrappy, cost effective way? How
would you ensure the product or service meets the needs of our target customers?”
• Provide Exhibit 2 to candidates only if they struggle to generate ideas.
0 3 | C A S E : F O O D F R E N Z Y
Exhibit or Question Guidance:
UVA Darden School of Business 2019-20 Casebook
Tools & Tactics
• Wireframe mock ups and interaction simulations for app or digital based solutions
• Paper prototypes for low fidelity digital product simulation, cardboard prototypes for
physical product prototypes, A/B testing for either of these ideas
• Facilitators acting to simulate service interactions
• Other examples: Sketches, hand made constructions, virtual models, role play,
videos
Example answer
Idea: small, express, organic markets positioned in/around metro stations in Mexico
City
Prototype: Build a simulated cardboard storefront and have a sampling of food
products you believe the target customers would enjoy. Position 2 facilitators to
provide service while a team of 2-3 observers note how selected customers interact
with the service from afar and record video of the interactions. Collect feedback on
the service, food selection, and positioning of the store. Test idea with volunteers
during off-peak hours. (See next page for a similar test situation from IDEO for a
bakery)
Candidates should recognize this as a request for a prototyping
strategy and identify that to successfully conduct a usability test of a
prototype the following are required:
• Sample users
• Interactive prototype with test-friendly features
• A facilitator
• Observers
The best candidates will note on their own that outputs from the
prototyping exercise with customers will be used to improve the idea.
Excellent candidates will also note that feedback from usability testing
could cause the team to throw out the idea.
Decision point following the test can be thought of as – Adapt,
Adopt, or Abandon?

52
EXHIBIT 2
0 3 | C A S E : F O O D F R E N Z Y
Prototyping examples
UVA Darden School of Business 2019-20 Casebook
Cardboard prototype for a Dyson
vacuum cleaner.
Paper interaction testing for apps.
Cardboard boxes designed to create a fake “store”
with facilitators acting as employees to simulate and
test a new service design.
2nd iteration IDEO service design prototype for a new bakery/restaurant concept.

53
Question 3
• Given your idea and the target customer for such an idea, please size the market for the opportunity in Reforma’s
major urban markets. Once you size the opportunity, what do you think about these numbers?
0 3 | C A S E : F O O D F R E N Z Y
Exhibit or Question Guidance:
Candidates should either ask you for information to be able to size the market or ask to make assumptions and create their own numbers based off some logic,
either is fine as long as they work with you to confirm assumptions.
UVA Darden School of Business 2019-20 Casebook
City Total Population Millennial PopulationAnticipated
Penetration RateMillennial Pop. % x
PenetrationPop. x (Penetration x
Millennial Pop. %)
Bogota 7,500,000 30% 50% 15.0% 1,125,000 (round to 1.1M)
Mexico City 8,500,000 27% 20% 5.4% 459,000 (round to 0.5M)
Santiago 5,500,000 30% 65% 19.5% 1,072,500 (round to 1M)
Once candidates arrive at the millennial
population number and penetration number,
they should ask for some kind of estimated
spend, provide the following
City Rounded Pop. Monthly Spend Monthly Revenue
Bogota 1.1 M $50 $55 M
Mexico City 0.5 M $300 $150 M
Santiago 1 M $220 $220 M

54
CONCLUSION
0 3 | C A S E : F O O D F R E N Z Y
UVA Darden School of Business 2010-20 Casebook
To conclude, the interviewee should provide the following:
Recommendation:
• Reforma should continue prototyping and testing their new product/service for B2C grocery services and work to test the
ideas as much as possible in the Santiago market given the large size of the opportunity.
Risks:
• Penetration rate is purely and estimate and the calculations are particularly sensitive to this percentage
• Santiago’s population is the smallest as compared to Mexico City and Bogota
• Distribution costs could be higher in Santiago given its positioning in the Andes Mountains
Next Steps:
• Prototype the service in all three cities to identify nuanced differences between consumers
• Investigate how consumer needs vary across the cities
• Deploy research team to Santiago, Mexico City, and Bogota to conduct further prototyping

55
0 0 | C A S E : F O O D F R E N Z Y
Case Execution:
❑ Clarifying Questions + Framework
❑ Good Questions
❑ Structured
❑ MECE
❑ Creativity
1 2 3 4 5
Case Name _________________________ Interviewer ___________________________
Case Book ____________________ Case Type ____________ Difficulty ____________
Feedback:
❑ Exhibits + Quantitative Ability
❑ Accuracy
❑ Speed
❑ Insights Presented
❑ Errors / Guidance Needed
1 2 3 4 5 Feedback:
❑ Brainstorm + Conclusion
❑ Creative & Structured
❑ Good Business Judgment
❑ Recommendation Strength
1 2 3 4 5 Feedback:
❑ Presence & Non-Verbal
❑ Confidence
❑ Poise / Posture
❑ Clear & Concise
❑ Body Language
❑ Coachability
1 2 3 4 5Feedback:
Total: _____ / 20

56
A Hairy Ordeal
Bain | Round 1 | Consumer

57
Bain | Round 1 | Retail
0 4 | C A S E : A H A I R Y O R D E A L
A HAIRY ORDEALB E H AV I O R A L
I N T E R V I E W
Q U E S T I O N :
1 . W h a t i s t h e
g r e a t e s t a s s e t
t h a t y o u w i l l
b r i n g t o o u r
f i r m ?
2 . W h y
c o n s u l t i n g ?
UVA Darden School of Business 2019-20 Casebook
Clarifying Information: Note: Provide this only if corresponding questions are asked.
1. What is balayage? Balayage is a technique that “paints” the hair to achieve a more natural looking hair dye
experience.
2. What Is Salon Deluxe’s business model? The salon is a high-end hair salon that specializes in balayage. The
business has two segments, services and products. Appointments are booked centrally, through the salon’s booking
portal, and clients see 1 of 4 contractor employee stylists.
2. What does a balayage appointment consist of? A balayage appointment has 3 parts: hair & product prep (10
mins), hair painting (90 minutes), drying & styling (50 minutes)
3. Does Megan have specific metrics or goals related to this project? Her goal is primarily to evaluate which
business has the greatest NPV.
Prompt: Your friend Megan Black calls you to ask for your advice. Megan had been working in
the beauty industry as an independent hair stylist for 2 years when the owner of Salon
Deluxe approached her and asked her to buy the salon. It has always been her dream
to own a hair salon, but she isn’t sure if she should do it, or focus on her current
business, Megan Black Balayage (MBB). She wants your help to figure out what she
should do.

58
Framework Guidance:
Note: There are many possible alternatives to this framework. These are only provided as possible suggestions.
0 4 | C A S E : A H A I R Y O R D E A L
How to Move Forward:
To move forward, the interviewee should talk about wanting to understand the client’s current business. If the candidate asks about the new Salon (Salon Deluxe) tell
them that the client is still collecting data on Salon Deluxe, and we can review the information later.
NPV Meg Black Balayage
• Profit
• # of clients
• Average price/service
• Product Sales
• Product Costs
• Rent
• Labor
• Discount rate
NPV Salon Deluxe
• Profit
• Selling Price/Service
• # of chairs
• Avg. Revenue/stylist
• Product Sales
• Rent
• Inventory
• Interest
• Discount rate
Other Considerations (Internal)
• Buy vs build new salon
• Initiatives to improve NPV
• Grow clientele through
physical
expansion/marketing
• Increased efficiencies,
/lower costs
• Megan’s risk profile
• Managerial experience
• Culture fit with new team and
clients
UVA Darden School of Business 2019-20 Casebook
Other Considerations
(External)
• Local competition
• Customer preferences
• Local talent pool

59
Services Revenue Product Prices
0 4 | C A S E : A H A I R Y O R D E A L
EXHIBIT 1: MEGAN BLACK BALAYAGE P&L
# of clients 200
Visit frequency Quarterly
Average spend per visit $150
Services Margin 60%
Rent $500 monthly
60
55
0
10
20
30
40
50
60
70
Products
Shampoo Conditioner
*Product margins all 50%

60
Question 1 (The location of these question slides in your case is completely up to you)
• What is MBB’s (Megan Black Balayage’s) NPV?
0 4 | C A S E : A H A I R Y O R D E A L
Exhibit or Question Guidance:
Exhibit 1 provides revenue and margin details for the services and product segments of the existing business. The candidate should perform the calculations to find
out the client’s bottom line. Provide missing information when prompted by candidates:
Services:
200 clients X 4 visits per year (quarterly) = 800 X $150 per visit = 120,000 X 60% margins = $72,000
Products:
The candidate does not have enough information to solve the question. Great candidates will recognize this and ask how many units of the products are sold, or the
percentage penetration on average. When prompted, provide the following figures:
Shampoo: 25%, Conditioner: 20%, Hurdle rate: 5%
Calculations:
Shampoo: 800 visits (200 X 4) X 25% = 200 bottles X $60/bottle = $12,000 X 50% margin = $6,000
Conditioner: 800 visits X 20% = 160 bottles X $55/bottle = $8,800 X 50% margin = $4,400
Total product profit = $10,400
Sum total: $72,000 + $10,400 - $6,000 (rent) = 76,400
NPV: $76,400/.05 = $1,52,800 OR $1.52MM
So what?: Candidates should recognize that the current net income serves only as a benchmark against the value of the potential acquisition. Proceed to exh. 2
UVA Darden School of Business 2019-20 Casebook

61
Question 2
• What is the NPV of owning Salon Deluxe?
0 4 | C A S E : A H A I R Y O R D E A L
Exhibit or Question Guidance:
When the candidate asks for information about the salon, provide BOTH Exhibits 2 and 3 and ask them to tell you what they think. Many candidates will be drawn to
the second exhibit, exceptional candidates will note that the floor plan shows unused space within the salon that could be used to increase revenues. Other
observations may include the difference in profit from product sales, or the difference in rent between the 2 businesses (8X). Note: If candidate asks what happens to
Megan’s current customers, tell them she will need to give up her clients to focus on operating the Salon Deluxe
NPV Calculation: Service Profit + Product Profit/Discount Rate
Services:
(Salon Capacity x Occupancy Rate x Rev. per appt x Profit Margin) – Rent
- To determine salon capacity and occupancy rate, candidate will need to perform calculations from the information given. For salon capacity:
8 hours per day / 2.5 hours per appt = 3.2 appt/day (on average) x 250 days = 800 appt per year x 4 stylists = 3200 appt capacity
- For occupancy rate: 6,000 appt > 2,800 appts OR 100% capacity
- Rev. per appt x profit margin – ($150 x 35% margin)
- Services total – (3200 x $150 x 35% - 48,000 (4,000 x 12 months)) = $120,000
Products
$10,000
NPV Calculation
$120k + $10k / 10% = $1.3M
The candidate should note that the current NPV of the business is lower than that of the original business. The candidate should also note that there may be
opportunities to improve the NPV of the business. If the candidate does not, prompt them to think about what they might do next. Excellent candidates will note that
requested appointments are nearly 2x the current capacity, which would nearly double NPV by repurposing storage rooms.
UVA Darden School of Business 2019-20 Casebook

62
EXHIBIT 2: SELECTED SALON INFORMATION
0 4 | C A S E : A H A I R Y O R D E A L
UVA Darden School of Business 2019-20 Casebook
Salon Hours
10 AM – 7 PM*, 5 days per week
Average appt. duration
2.5 hours
Average spend per appt
$150
Stylist Profit Share
65% of service revenue
*Stylists take daily 1 hour break
Total requested appts
6,000
Rent
$4k/month
Net Profit from Product Sales
$10k/year
Salon Discount Rate
10%

63
EXHIBIT 3: SALON DELUXE FLOOR PLAN
0 4 | C A S E : A H A I R Y O R D E A L
UVA Darden School of Business 2019-20 Casebook
STORAGE STORAGE
WAITING
AREA/RECEPTIONHAIR STATIONS
BREAK ROOM

64
Increase Service Revenue
• Increase salon capacity
• Loyalty program (more frequent
visits)
• Raise prices (more spend per visit)
• Build or buy 2nd salon
0 4 | C A S E : A H A I R Y O R D E A L
UVA Darden School of Business 2019-20 Casebook
Best candidates display:
The best candidates will examine the levers with the largest potential impact. This would include increasing revenues and decreasing costs for
the service portion of the business. Good candidates should look at renegotiating rent prices, increasing salon capacity to fit more customers,
and great candidates will mention looking at borrowing rates, to see if the salon can lower its interest expense.
Brainstorming Guidance:
Note: This is just one possible set of categories and answers. Many more are possible, and interviewers should assess both the volume and relevance of answers.
Decrease Service Costs
• Cut low margin services
• New product vendor (lower COGS)
• Renegotiate rent prices
• Evaluate profit share labor costs
Increase Product Profitability
• Discounts (more sales)
• Add complementary
products/bundle (hairspray, styling
creams)
• Smaller bottle sizes (lower costs)
• New vendors (lower costs)
• Website SEO investments
Financing
• Pay down debt
• Refinance at lower rate
BRAINSTORMING
Insert brainstorming question here. What are some levers we could pull to make Salon Deluxe a more attractive business? Which of these
ideas might have the largest impact?

65
Question 3 (optional)
• What are some levers we could pull to make Salon Deluxe a more attractive business?
0 4 | C A S E : A H A I R Y O R D E A L
Exhibit or Question Guidance:
Engage in a conversation about which levers the client could pull to make it more profitable. Here are a few ideas, and potential responses:
- Decreasing costs, Rent, Margin, etc. Response: We’re locked into a long-term contract, we will not be able to consider it at this time
- Increasing Service revenues, Price. Response: This is a competitive marketplace, and we believe will be difficult in the market.
- Increasing Service revenues, quantity: Response: Salon Deluxe is currently turning away clients, and does not feel it makes sense to increase marketing, offer
discounts for more frequent appts, offer loyalty programs, etc.
The candidate should realize that the salon is currently offering services at its full capacity, and cannot accommodate more customers. If the candidate does not
inquire about unused space in the salon, guide them to mention it. When the candidate mentions utilizing the excess space, tell them the following:
• Our client believes she can transform the unused space to create a drying and styling station. This will allow stylists to perform the prep and painting portions of
the appointment, before sending their customers to the drying station to wait. After their hair dries, the clients are styled by an assistant, before finishing the
appointment. She projects this change will allow each stylist to increase capacity by 37.5%. She estimates it will cost $100k to renovate the space and hire an
assistant for styling.
• Question 4: What is the new projected NPV of the business?
- $168k (service revenue) x 1.375 = $231k + $10k (product profit) - $10k (interest) - $48k (rent) = $183k / 10% = $1.83M - $100k = $1.73M
- BONUS: $1.73M - $1.52M = $210k (Maximum price that she should pay for the salon)
UVA Darden School of Business 2019-20 Casebook

66
I N T E R V I E W E R F E E D B A C K F O R M
Case Execution:
❑ Clarifying Questions + Framework
❑ Good Questions
❑ Structured
❑ MECE
❑ Creativity
1 2 3 4 5
Case Name _________________________ Interviewer ___________________________
Case Book ____________________ Case Type ____________ Difficulty ____________
Feedback:
❑ Exhibits + Quantitative Ability
❑ Accuracy
❑ Speed
❑ Insights Presented
❑ Errors / Guidance Needed
1 2 3 4 5 Feedback:
❑ Brainstorm + Conclusion
❑ Creative & Structured
❑ Good Business Judgment
❑ Recommendation Strength
1 2 3 4 5 Feedback:
❑ Presence & Non-Verbal
❑ Confidence
❑ Poise / Posture
❑ Clear & Concise
❑ Body Language
❑ Coachability
1 2 3 4 5Feedback:
Total: _____ / 20

67
Lizard Insurance
Bain | Round 2 | Acquisition
68
Bain | Round 2 | Acquisition
0 5 | C A S E : L I Z A R D I N S U R A N C E
LIZARD INSURANCEB E H AV I O R A L
I N T E R V I E W
Q U E S T I O N :
1 . W h a t i s t h e
g r e a t e s t a s s e t
t h a t y o u w i l l
b r i n g t o o u r
f i r m ?
2 . W h e r e d o y o u
s e e y o u r s e l f
i n 5 y e a r s ?
UVA Darden School of Business 2019-20 Casebook
Clarifying Information: Note: Provide this only if corresponding questions are asked.
1. Does Lizard Insurance have any experience in the software space? No – they would need to develop
capability.
2. What is TechSize? The techsize software makes it easier to comply with government regulations when a
customer moves from state to state
3. Does Lizard Insurance have plans for TechSize? No – they bought MediumSure for other reasons and don’t
have plans for TechSize.
4. How does Lizard Insurance make money? They sell auto-insurance direct to consumer and collect monthly
premiums.
5. How does TechSize make money? They sell B2B services helping insurance providers comply with
government regulations.
Prompt: Our client, Lizard Insurance, is a US. based auto insurance provider that recently
acquired a rival auto-insurance company MediumSure. As a part of the acquisition,
Lizard Insurance also acquired a subsidiary of MediumSure named TechSize, that
provides software for many insurance companies. Lizard Insurance wants to know
what they should do with TechSize, and they’ve brought us in to help.

69
Framework Guidance: There are other ways to approach this framework but a strong candidate will
realize that there is a binary choice with this asset – to hold it or to sell it.
Note: There are many possible alternatives to this framework. These are only provided as possible suggestions.
• Keep – and invest or hold
• Sell – either spinning off part or all of TechSize
0 5 | C A S E : L I Z A R D I N S U R A N C E
How to Move Forward:
• If the candidate has a more traditional profitability framework, lead them to the initial question of Keep or Sell. Then ask the candidate to analyze the keep option.
UVA Darden School of Business 2019-20 Casebook
Keep
Do NothingTry to Grow
Grow Inorganically
Acquire Additional Players
Grow Organically
Cross-sell / up-sell
Sell
Partial Sale
License IP
Joint Venture
Full Sell
Spin off into new company
Find a buyer

70
Discussing the keep option:
• Present the following information if/when asked:
• TechSize requires substantial investments and upgrades in the next 2 years to maintain market position
• Given the vastly different nature of the subsidiary’s product, there are no cross-selling or up-selling
opportunities between TechSize (a B2B business) and Lizard Insurance Co. (a B2C business).
• Switching our services over to utilize TechSize would be costly, and would not reduce processing costs by
any significant amount (no real cost synergies introduced with TechSize).
• There is no appetite for additional acquisitions by Lizard Insurance of companies in TechSize’s industry.
• There was a recent acquisition by a competitor for a company in the same industry as TechSize
• If the candidate asks for market information – give them exhibits 1 and 2
• From the exhibits, the candidate should realize that the market is not attractive, as it is stagnant and
fragmented.
0 5 | C A S E : L I Z A R D I N S U R A N C E
How to Move Forward:
At this point, the candidate should realize that the Keep option is unpalatable and decide to move into sale. .
UVA Darden School of Business 2019-20 Casebook

71
0%
5%
10%
15%
20%
25%
30%
Software Guru Insurance App Co TechSize Goggle Next Ten Players
Insurance Software Market Share
EXHIBIT 1: INSURANCE SOFTWARE MARKET
SHARE
0 5 | C A S E : L I Z A R D I N S U R A N C E
Services Revenue

72
$0.00
$1.00
$2.00
$3.00
$4.00
$5.00
$6.00
2011 2012 2013 2014 2015 2016 2017 2018 2019 2020
Insurance Software Market Size ($B)
EXHIBIT 2: INSURANCE SOFTWARE MARKET
SIZE
0 5 | C A S E : L I Z A R D I N S U R A N C E

73
Discussing the sale option:
• Ask the candidate to brainstorm some ways they might be able to determine a sale value for TechSize,
options should include:
• DCF
• Industry Multiples
• Comparable transactions
• Lead them to ask for company values. Once they do, present them with Exhibit 3.
0 5 | C A S E : L I Z A R D I N S U R A N C E
How to Move Forward:
At this point, the candidate should realize that the Keep option is fairly unpalatable and decide to move into sale. .
UVA Darden School of Business 2019-20 Casebook
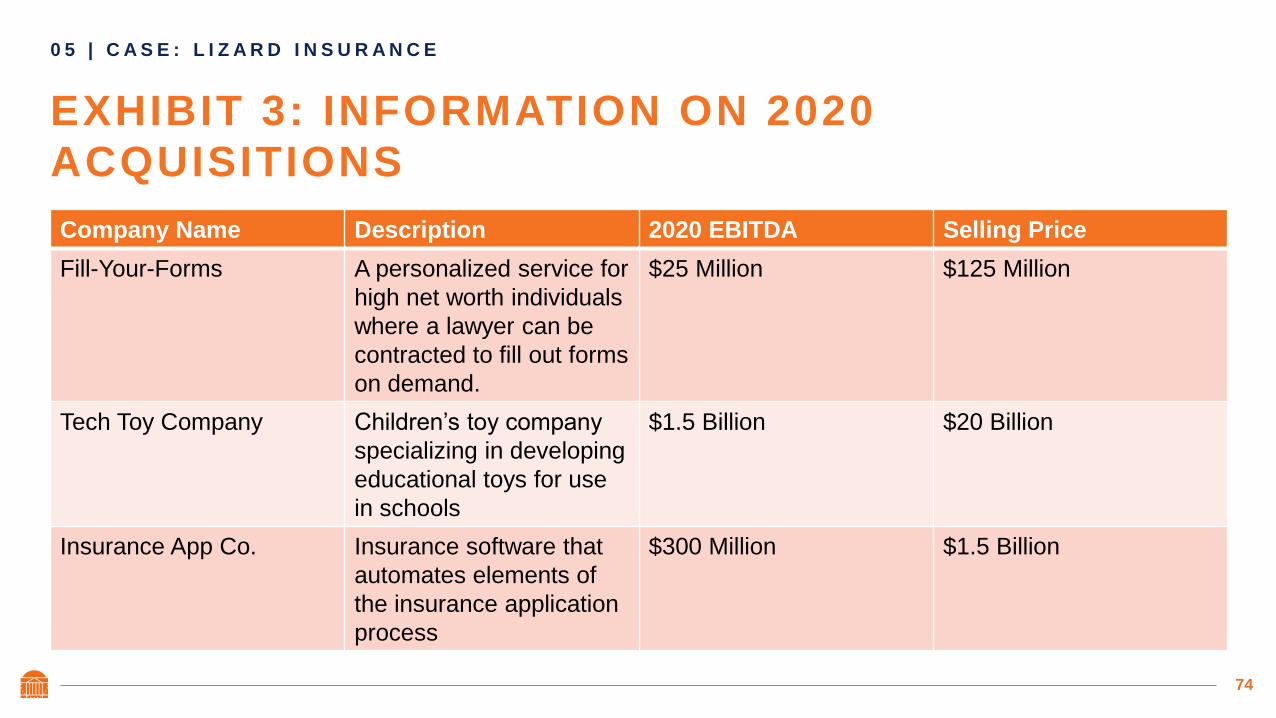
74
EXHIBIT 3: INFORMATION ON 2020
ACQUISITIONS
0 5 | C A S E : L I Z A R D I N S U R A N C E
Company Name Description 2020 EBITDA Selling Price
Fill-Your-Forms A personalized service for
high net worth individuals
where a lawyer can be
contracted to fill out forms
on demand.
$25 Million $125 Million
Tech Toy Company Children’s toy company
specializing in developing
educational toys for use
in schools
$1.5 Billion $20 Billion
Insurance App Co. Insurance software that
automates elements of
the insurance application
process
$300 Million $1.5 Billion

75
Guidance on Exhibit 3:
• The candidate should realize that they can use the information in exhibit 3 to find EBITDA multiples.
• A great candidate will also recognize that Tech Toys Co is not a comparable company and exclude that from
any analysis.
• Using the remaining information, the candidate should deduce that they can sell TechSize for 5 x EBITDA.
• A great candidate will realize that they can find TechSize’s revenue using Exhibits 1 and 2. By taking 15%
market share * the total market of $5.5B in 2020, they can get a revenue of $825M.
• The candidate will need to ask for an operating margin (or EBITDA as a % of revenue) – tell them 25%
• EBITDA = $825 * 25% = $206M
• Sale value @ 5x EBITDA = $206 * 5 = $1.03B
• Ask the candidate to provide their recommendation
0 5 | C A S E : L I Z A R D I N S U R A N C E
How to Move Forward:
UVA Darden School of Business 2019-20 Casebook
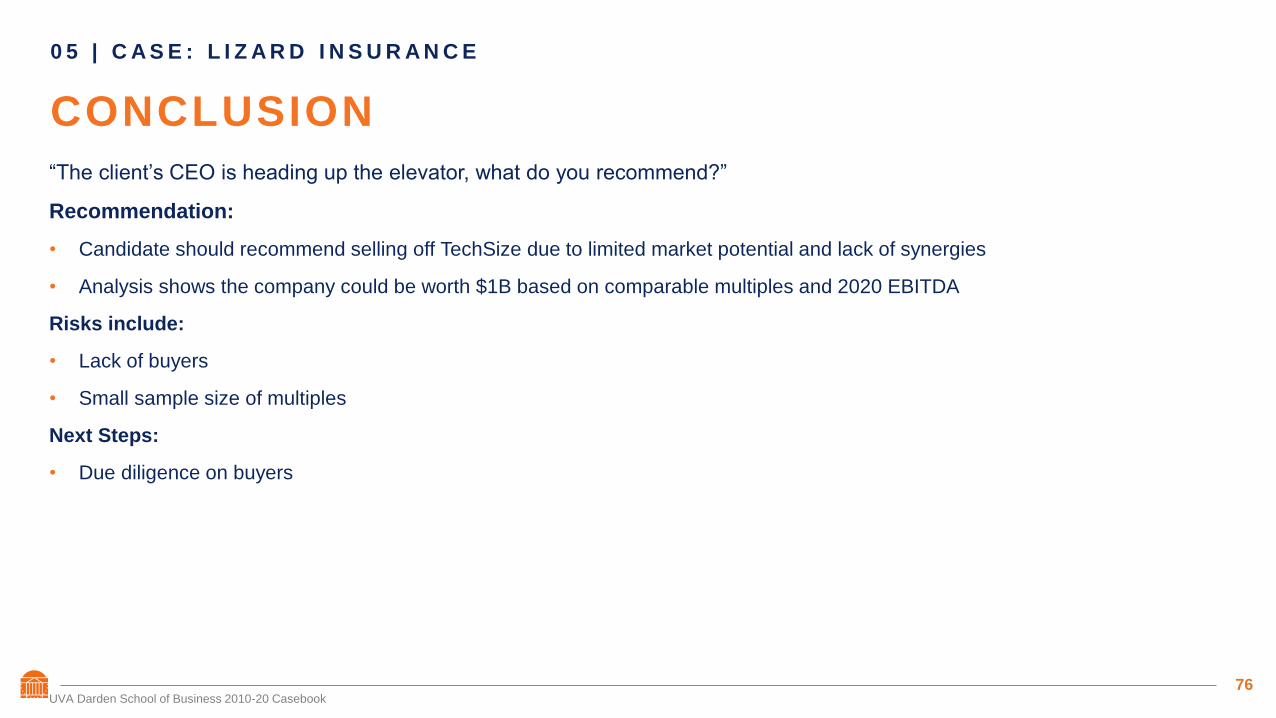
76
CONCLUSION
0 5 | C A S E : L I Z A R D I N S U R A N C E
UVA Darden School of Business 2010-20 Casebook
“The client’s CEO is heading up the elevator, what do you recommend?”
Recommendation:
• Candidate should recommend selling off TechSize due to limited market potential and lack of synergies
• Analysis shows the company could be worth $1B based on comparable multiples and 2020 EBITDA
Risks include:
• Lack of buyers
• Small sample size of multiples
Next Steps:
• Due diligence on buyers

77
Met with Problems
BCG | Round 1 | Non-profit

78
Round 1 | Human Capital | Non-profit
0 6 | C A S E : M E T W I T H P R O B L E M S
MET WITH PROBLEMSB E H AV I O R A L
I N T E R V I E W
Q U E S T I O N :
1 . Te l l m e a b o u t
a t i m e w h e n y o u
h a d a d i f f i c u l t
c o n v e r s a t i o n
w i t h a d i r e c t
m a n a g e r o r
d i r e c t r e p o r t .
2 . W h y
c o n s u l t i n g ?
UVA Darden School of Business 2019-20 Casebook
Clarifying Information: Note: Provide this only if corresponding questions are asked.
1. What is the current structure of The Met’s staff? There are four main staff departments at the Met: 1) artistic, 2)
security, 3) administrative and 4) executive. The artistic staff are salaried and responsible for the art collection. They
decide what works of art to show each season. The security staff are hired on a part-time, hourly basis and are
responsible for protecting the art 24/7. The administrative staff are salaried and work behind the scenes to ensure the
museum operations run smoothly. The executive staff are the museums’ top leaders and includes C-suite staff.
2. How does The Met hire staff? Your client uses a mix of online postings, direct referrals and occasionally hires an
executive search firm. Amy describes the process as sourcing, interviewing, onboarding, retaining then turnover.
3. Does the client have a specific goal? Not really. For now, the client wants to know where to focus and how to plan
for cost reductions in the short term.
4. How does The Met make money? The Met is a non-profit and generates revenue from government grants, donations
and admission tickets. The client does not want your insight on improving these revenue streams.
Prompt: Your client is Amy Sherald, the Chief People Officer at the Metropolitan Museum of Art
(“The Met”). Located in New York City, the Met is one of the world’s largest art museum
with 250 gallery rooms and a collection of more than 2 million works of art. This mega-
museum welcomes over 6 million visitors annually. Your client’s department reported
unusually high human resources (HR) costs last year and has come under scrutiny by
the Executive team and Board of Directors. Amy has hired your team to help her
address this problem.

79
Framework Guidance:
Note: There are many possible alternatives to this framework. These are only provided as possible suggestions.
A good candidate will focus on costs and will not build in revenue considerations into their framework.
A great candidate will build incorporate differences between salary/hourly employees or even differences among the four types of staff (from
the clarifying questions). Another framework option below. Candidate could fill in the table as case unfolds.
0 6 | C A S E : M E T W I T H P R O B L E M S
How to Move Forward:
To move forward, the candidate should call out different types of staff the client must hire for The Met. Ideally, the candidate points to turnover costs or cost of hiring as
a potential lever to investigate further. Provide Exhibit 1 and let candidate respond to the table.
Direct Costs
• Wages and Benefits
• Recruiting (ex. applicant tracking
system)
• Training/education
• Retention/enrichment
• Turnover/severance packages
• Overhead and HR team capacity
Indirect Costs
• Opportunity cost
(underperformance of hired staff)
• Loss of knowledge with turnover
• Decline in morale with turnover or
poor management
External Factors
• Economic Cycle
• Competition
• New museum openings?
• Labor Force (supply vs. demand)
• Education patterns?
• Union?
UVA Darden School of Business 2019-20 Casebook
Artistic Executive Administrative Security
Department Size Medium Small Medium Big
Wages and Benefits $$ $$$ $ $
Training/education High High Medium Low
Turnover/retention
Severance Low High Low N/A
External Factors
• Economic Cycle
• Competition
• Labor Force
People Cost ConsiderationsIndirect:
• Opportunity cost (hours
sunk)
• Loss of knowledge
• Decline in morale
Direct:

80
EXHIBIT 1
0 6 | C A S E : M E T W I T H P R O B L E M S
2019 Museum Department Snapshot
UVA Darden School of Business 2019-20 Casebook
Artistic Executive Administrative Security
Cost per Staff Turnover $30,000 $95,000 $10,000 $5,000
Average Time-to-fill1 3 months 6 months 2 months 2 weeks
Staff Count2 500 20 1,000 1,200
% Turnover 2.2% 10% 5.7% ~16.67%
Compensation Type Salary Salary + Bonus Salary Hourly
1. Time-to-fill counts the days from the date when you’ve published your new job opening. This metric answers the question: How long is your whole recruitment process?
2. Numbers as of 01/01/2019

81
Question 1
• How much did turnover cost The Met in 2019? We know that turnover cost $1.5M in 2018.
0 6 | C A S E : M E T W I T H P R O B L E M S
Exhibit or Question Guidance:
A good candidate will compare and contrast the departments then quickly realize the table provides unnecessary information for answering
the question at hand. He/she should use staff count, % turnover and cost per staff turnover to solve for the turnover costs per department.
Solution below (note, 16.67% = 1/6)
A great candidate will build out a clear structure for solving for each department’s costs. He/she will also connect the total cost to the $1.5M
in 2018 - pointing out a 39% or ~33% increase in turnover costs.
UVA Darden School of Business 2019-20 Casebook
How to Move Forward:
The candidate should call out the security department as the most expensive and recommend focusing on turnover cost reductions there. If the candidate does not
suggest the security department, ask “where would you like the client to focus in 2020?”
Artistic Executive Administrative Security
Staff Count 500 20 1,000 1,200
% Turnover 2.2% 10% 5.7% 16.67%
Turnover Count 11 2 57 200
Cost per Staff Turnover $30K $95K $10K $5K
Turnover Cost per Department $330K $190K $570K $1M
Total Turnover Cost $2.09M (or ~$2M)

82
Sourcing• Cut unnecessary advertising (cut subscriptions to
channels that do not result in applications)
• Optimize criteria (for faster and more effective
screening)
• Employee referral program (to save search costs)
0 6 | C A S E : M E T W I T H P R O B L E M S
UVA Darden School of Business 2019-20 Casebook
Brainstorming Guidance: Note: This is just one possible set of categories and answers.
Interviewing/Onboarding• Streamline applicant tracking system (across
departments) for efficiency in long-term
• First-round phone interviews
• University/community college partnerships (security
staff for credit)
• Online training for onboarding (upfront cost but long-
term savings and consistency)
Retaining/Turnover• Fire underperforming (or surplus) of security staff
• Less security staff per gallery during slower days/seasons
• No severance and limit overtime pay
• Good management and predictability in schedule
• Tiered benefits based on tenure
• Low-cost staff perks (museum pass, gift store discount,
exclusive tours of new exhibitions, family day, awards)
• Priority consideration for other full-time, salaried positions in
artistic and administrative departments
BRAINSTORMING
“Amy wants to explore ways to cut HR cost in the security department overall. Brainstorm some ideas for
her.”
How to Move Forward:
The candidate should come up with distinct buckets (example above uses hiring pipeline for structure) and 2-3 items under each bucket. Variable costs/fixed costs vs.
short-term/long-term is one example of a 2x2 structure for this brainstorm. If candidate falls short, ask “how else could you cut costs in the security department.” A
great candidate will mention some risks behind their cost cutting ideas and may even star low risk options the client should prioritize.
At this point, the interviewer may move to the end recommendation or they may ask a follow-up question (to further test math analysis).

83
Question 2 (OPTIONAL IF TIME ALLOWS)
• Does Amy have the optimal number of security staff members?
Supply only when asked:
- Security staff only allowed to work 35 hours max (or average of 5 hours per day)
- 250 galleries under surveillance (also stated in the prompt)
- Museum hours 10am-6pm
- Museum open 350 days/year
- 2 security staff needed per gallery rooms when museum is open
- 1 security staff needed per 4 gallery rooms when museum is closed
0 6 | C A S E : M E T W I T H P R O B L E M S
Exhibit or Question Guidance:
UVA Darden School of Business 2019-20 Casebook
Calculations on Daily Basis
When Open When Closed
Security staff/room 2 0.25
# of gallery rooms 250 250
# security staff positioned 500 62.5
Hrs/day 8 open 16 closed
Security hrs/day needed 4,000 1,000
Average hrs/day per staff 35/7 = 5 35/7 = 5
Security staff needed 800 200
Total security staff needed 1,000
There are a number of ways to calculate 1,000. Math could be done on weekly or
annual basis. Encourage candidate to stick with a daily basis (or weekly basis).
• A good candidate will calculate 1,000 security staff as the optimal number
and realize Amy has too many people staffed in that department. A candidate
may mention that having The Met should consider having a “reserve” of staff
beyond the 1,000 required under the current assumptions.
• A great candidate will state that the Met has overstaffed the security
department by 200 people (1,200-1,000) and realize this number equals the
2019 turnover number for security staff – and recommend not filling vacant
security positions in 2020 to save on costs.

84
CONCLUSION
0 6 | C A S E : M E T W I T H P R O B L E M S
UVA Darden School of Business 2010-20 Casebook
“The phone is ringing. Amy has called to ask for your recommendation. What would you say?”
Recommendation:
• The Met faced an overall ~33% increase in turnover costs from 2018 to 2019. Through analyzing the turnover costs per
department, I’ve identified some opportunities for cost savings in the security department, which is responsible for almost half of
2019’s turnover cost. I propose Amy…
• Lower the minimum # of security staff per room on low visitation hours/days (ex. weekday mornings)
• Disregard replacing 100-200 security staff positions in 2020 (Question 2 reveals Amy only needs 1,000 people staffed in the
security department)
Risks with decreasing security staff concentration or size:
• Less oversight (potential damage from visitors or even art theft)
• Decreased job satisfaction (job becomes more stressful if security staff must cover more gallery rooms)
Next Steps:
• Quantify cost savings at different reductions of the security staff and weigh those savings against potential risks
• Schedule an in-person meeting on Monday to prioritize cost-savings options for the Executive team and Board of Directors

85
I N T E R V I E W E R F E E D B A C K F O R M
Case Execution:
❑ Clarifying Questions + Framework
❑ Good Questions
❑ Structured
❑ MECE
❑ Creativity
1 2 3 4 5
Case Name _________________________ Interviewer ___________________________
Case Book ____________________ Case Type ____________ Difficulty ____________
Feedback:
❑ Exhibits + Quantitative Ability
❑ Accuracy
❑ Speed
❑ Insights Presented
❑ Errors / Guidance Needed
1 2 3 4 5 Feedback:
❑ Brainstorm + Conclusion
❑ Creative & Structured
❑ Good Business Judgment
❑ Recommendation Strength
1 2 3 4 5 Feedback:
❑ Presence & Non-Verbal
❑ Confidence
❑ Poise / Posture
❑ Clear & Concise
❑ Body Language
❑ Coachability
1 2 3 4 5Feedback:
Total: _____ / 20

86
A Messi Situation
BCG | Round 1 | Sports and Entertainment

87
BCG | Round 1 | Sports
0 7 | C A S E : A M E S S I D E C I S I O N
A MESSI DECISION
B E H AV I O R A L
I N T E R V I E W
Q U E S T I O N :
1 . D e s c r i b e y o u r
w o r k i n g s t y l e .
2 . W h a t ’ s y o u r
f a v o r i t e t h i n g
a b o u t D a r d e n ?
UVA Darden School of Business 2019-20 Casebook
Clarifying Information: Note: Provide this only if corresponding questions are asked.
1. What is the team’s goal? To win the European Championship within 3 seasons. Due to recent financial restrictions,
all of their player acquisitions must be offset with new revenue within 5 years.
2. How do soccer teams acquire players? In soccer transfers, the acquiring team buys out the new player for an
agreed upon fee. After they pay that fee, they then agree a new annual contract with the player.
3. How does the team make money? If asked this question, have the candidate brainstorm revenue streams. Full
guidance appears later on.
4. What is soccer? Soccer is a global sport where a team strives to score more goals then their opponent.
5. How good is Messi? He is in the conversation for greatest of all time. He contributed (scored or assisted) 55 goals
last season.
Prompt:
Your client is the CEO of a major English soccer team. He’s called you while
brimming with excitement after receiving news that Lionel Messi was looking
for a new team. Players of Messi’s quality rarely became available, and
would surely improve any team. However, with COVID-19 restricting budgets,
money would be tight and would need to generate a return. He would like
you to figure out what the right amount of money to offer would be.

88
Framework Guidance:
Note: There are many possible alternatives to this framework. These are only provided as possible suggestions.
0 7 | C A S E : A M E S S I D E C I S I O N
How to Move Forward:
A great candidate should recognize that they can value Messi like any type of asset, through a number of approaches including incremental cash flows or comparable
players.
If the candidate gets stuck, encourage them to think about how they would value a different type of asset. Have them brainstorm cash flows and comps.
Ask the candidate to review Exhibit 1.
Financials
Revenue
• Incremental Ticket Sales
• Jersey sales
• TV/AD Revenue
• Costs
• Acquisition Fee
• Salary Cost
Competitors
• How will they respond?
• Could this start a talent
arms race?
Messi
• How good is he?
• Age / Career Arc? – How many
years
• Will he want to come?
• Are there cheaper
alternatives?
• Language barriers?
UVA Darden School of Business 2019-20 Casebook
Risks
• Injury risk (could increase with
age)
• Could he ask to leave our club
in a few years?
• Style of play doesn’t adjust to
our league

89
EXHIBIT 1
0 7 | C A S E : A M E S S I D E C I S I O N
UVA Darden School of Business 2019-20 Casebook
Recent Transfers of Top Forwards
Name Age (at time of
transfer)
Goal
Contributions*
Transfer Fee Transfer Year
Christiano Ronaldo 33 62 $117M 2018
Neymar 25 24 $225M 2017
Kylian Mbappe 19 31 $310M 2017
Pierre Emerick
Aubameyang
29 28 $56M 2018
Diego Costa 27 28 $62M 2018
*Goal contributions include goals and assists – key offensive metrics. The European average for attacking players is 12, over 30 is considered elite.
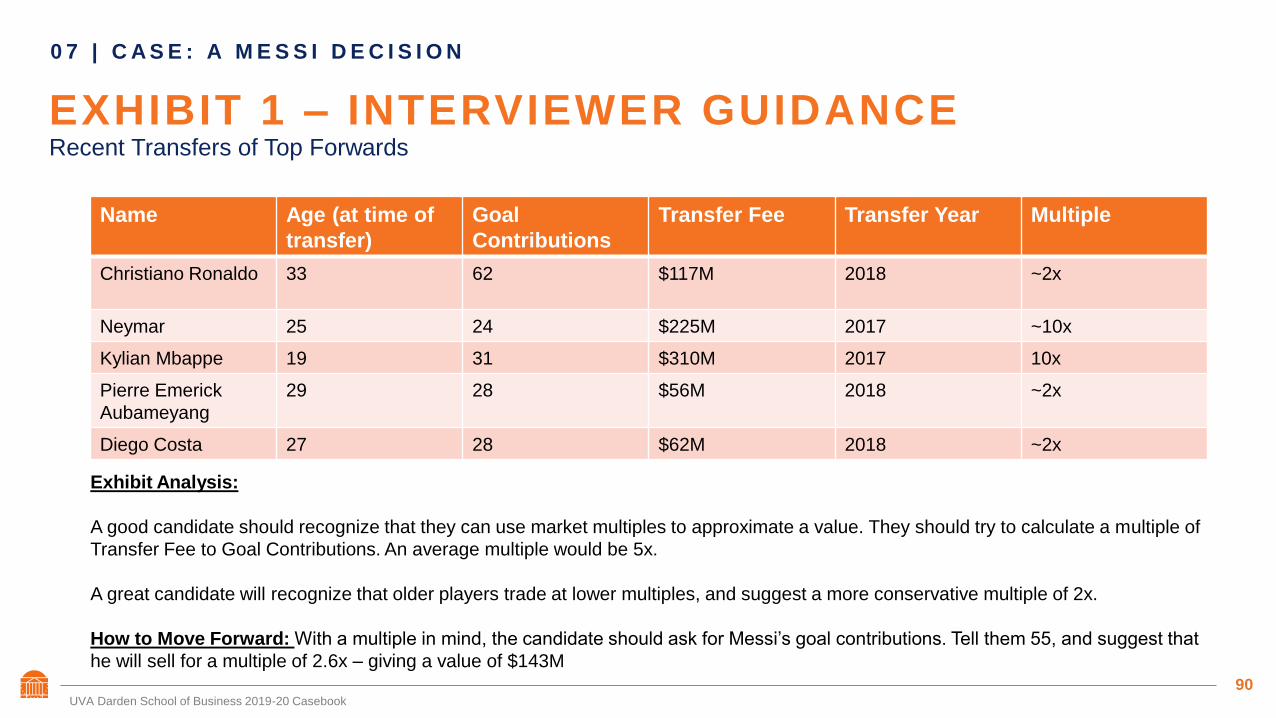
90
EXHIBIT 1 – INTERVIEWER GUIDANCE
0 7 | C A S E : A M E S S I D E C I S I O N
UVA Darden School of Business 2019-20 Casebook
Recent Transfers of Top Forwards
Name Age (at time of
transfer)
Goal
Contributions
Transfer Fee Transfer Year Multiple
Christiano Ronaldo 33 62 $117M 2018 ~2x
Neymar 25 24 $225M 2017 ~10x
Kylian Mbappe 19 31 $310M 2017 10x
Pierre Emerick
Aubameyang
29 28 $56M 2018 ~2x
Diego Costa 27 28 $62M 2018 ~2x
Exhibit Analysis:
A good candidate should recognize that they can use market multiples to approximate a value. They should try to calculate a multiple of
Transfer Fee to Goal Contributions. An average multiple would be 5x.
A great candidate will recognize that older players trade at lower multiples, and suggest a more conservative multiple of 2x.
How to Move Forward: With a multiple in mind, the candidate should ask for Messi’s goal contributions. Tell them 55, and suggest that
he will sell for a multiple of 2.6x – giving a value of $143M

91
ROI Calculation:
With the value of $143M on the table, the candidate should pivot towards looking at the incremental revenue Messi will bring in and whether
the transfer will break even. Ask the candidate to brainstorm how the client makes money. Push them until they find the following:
• Ticket revenue
• Food + Beverage Revenue
• TV and streaming broadcast revenue
• Sponsorship & partnership revenue
• Jersey and merchandise sales
0 7 | C A S E : A M E S S I D E C I S I O N
Once the candidate has established the revenue streams – they should ask for information on current performance of each channel. When they
do, provide them with the following information:
• The team plays 25 home matches per year, with an average ticket price of $50. The stadium has 60,000 seats and is 83.33% full.
• Each fan typically spends $10 on food and beverages.
• TV rights are assigned based on popularity – the team currently receives $150M per year in revenue.
• Sponsors currently pay $50M a year
• In the past, the team has sold 1M jerseys at a price of $100 each, but only receives a 25% margin
• Given that information, the candidate should attempt to calculate the current revenue.
UVA Darden School of Business 2019-20 Casebook

92
ROI Calculation (continued):
• Current revenue calculations:
• 60,000 seats * 83.33% (5/6) fill rate * $50 ticket * 25 games = $62.5M
• 60,000 seats * 83.33% * $10 food and beverage * 25 games = $12.5M
• Broadcast ($150M) + Sponsorship ($50M) = $200M
• 1M jerseys * $100 jersey * 25% margin = $25 M
• Total Revenue = $300M
0 7 | C A S E : A M E S S I D E C I S I O N
Once the candidate has completed those calculations, they should ask for the incremental costs and benefits associated the transfer. Give
them the following.
• Given Messi’s significant commercial draw, the team would expect to sell out every home game, and charge $15 more per ticket.
• Broadcast revenue would increase by 10% and sponsorship would double
• Last year, Messi had the highest selling jersey in the world. Selling 2M units. The team expects to sell that many each year of his contract,
but it would cannibalize 50% of their current jersey sales. Pricing and margins would remain the same.
• Messi is the second highest player in the world, with a salary of $100M per year. His agents take a 10% fee annually.
UVA Darden School of Business 2019-20 Casebook

93
ROI Calculation (continued):
• Future revenue calculations:
• 60,000 seats * 100% fill rate * $65 ticket * 25 games = $97.5M
• 60,000 seats * 100% * $10 food and beverage * 25 games = $15M
• Broadcast ($150M*110% = $165M) + Sponsorship ($100M) = $265M
• 2M new jerseys + 1M old jerseys * (50% cannibalization rate) = 2.5M total jerseys * $100 * 25% margin = $62.5M
• Total New Revenue = $440M
• New Revenue($440M) – Old Revenue ($300M) = $140M incremental per year
• Incremental Costs = $110M in new salary and fees
• Incremental Profit = $140M - $110M = $30M
• Upfront costs = $143M
• Payback period is just under 5 years
• A good candidate will realize that this investment will break even in just under five years.
• A great candidate will realize that the transfer breaks even but will want to dive into the risks. S/he might suggest that
there might be issues with high wages for an older player, risk of injury, etc.
0 7 | C A S E : A M E S S I D E C I S I O N
UVA Darden School of Business 2019-20 Casebook

94
CONCLUSION
0 7 | C A S E : A M E S S I D E C I S I O N
UVA Darden School of Business 2010-20 Casebook
“The CEO and the world soccer community are waiting, what will you tell them”
Recommendation:
• Our client is interested in determining a fair market value for Lionel Messi
• Based on a market multiples approach, we found it fair to offer ~$140M for his contract
• Even with an annual salary of $100M, incremental revenues will allow this transfer to break even in 5 years
• Players of Messi’s quality are rare, and he could help the client achieve their goal of a European championship
Risks:
• Financial projections show an aggressive uptick in revenue that could be hard to obtain.
• Huge investment for an older player who may not have lasting value on the field
Next Steps:
• Do further diligence on the feasibility and sensitivity on the revenue model
• Lock in additional sponsorship dollars from corporations who might want to align their brand with Messi

95
New Rubber Plant Investment
BCG | Round 2 | Industrial

96
BCG | Round 2 | Industrial
0 8 | C A S E : N E W R U B B E R P L A N T
NEW RUBBER PLANT INVESTMENTB E H AV I O R A L
I N T E R V I E W
Q U E S T I O N :
1 . H o w d o y o u
t h i n k a b o u t
r a n k i n g
c o m p e t i n g
p r i o r i t i e s d u r i n g
s t r e s s f u l t i m e
p e r i o d s ?
2 . W h y
c o n s u l t i n g ?
UVA Darden School of Business 2019-20 Casebook
Clarifying Information: Note: Provide this only if corresponding questions are asked.
1. How is rubber made? Gum resin is refined. Need 3lbs of gum resin to produce 1 lb of rubber
2. How do we get resin? By train from the capital. Up to 4 trains can be used for this purpose.
3. How much can we sell rubber for? $20 per pound. Gum resin costs $5 per pound.
4. How many suppliers are there? We have identified one gum supplier
5. Who are our customers? Rubber is highly commoditized. We would sell on the global markets.
6. What is the government’s goal? Profitability, job creation, and economic development.
Prompt:
The federal government of a foreign country is investigating whether to
reopen a rubber factory in a western part of the country. The factory was
operational in the past, but has not been used for 7 years. The plant was
closed due to terrorism in the area. If rejuvenated, it may become a target for
the rebels. All the equipment is usable, but the government would need to
spend $12M on upgrades, which would allow the plant to produce 10M lbs of
rubber per month. The demand for rubber is strong, but rubber must be
transported by train to a port. Two trains a day can be used for this.

97
Framework Guidance:
Note: There are many possible alternatives to this framework. These are only provided as possible suggestions.
0 8 | C A S E : N E W R U B B E R P L A N T
How to Move Forward:
• Push the candidate to calculate the ROI of the plant.
• If the candidate asks for demand, tell them that rubber demand worldwide is strong enough that all rubber produced by the plant can get sold.
Financials
Revenue
• Rubber pounds
• Rubber price
• Costs
• Up front investment
• Variable costs
• Gum resin
• Fixed costs
• Overhead
• SG & A
Operational Considerations
• Can we ship and receive the
required amount of finished
goods and raw materials
Non-Financial Benefits
• Job creation
• Economic development
• Community improvement
• Positive PR
• Improved trade relations
UVA Darden School of Business 2019-20 Casebook
Risks
• Supply chain
• Labor shortage
• Terrorism
• Commodity price changes

98
ROI Calculation Guidance:
• Before the candidate starts calculating, encourage them to think about where the bottleneck lies. If they start to use the 10M pounds per
month figure, ask them about the trains.
• Once the candidate asks you how much rubber the train can carry, give them the following:
• 25 operating days a month
• 2 trains / day
• 8 bogies / train
• 25 cases / bogie
• 500 lbs / case
• Expected calculation:
• 2 * 8 * 25 * 500 = 200,000 lbs a day
• 200,000 * 25 = 5 M lbs a month
0 8 | C A S E : N E W R U B B E R P L A N T
UVA Darden School of Business 2019-20 Casebook
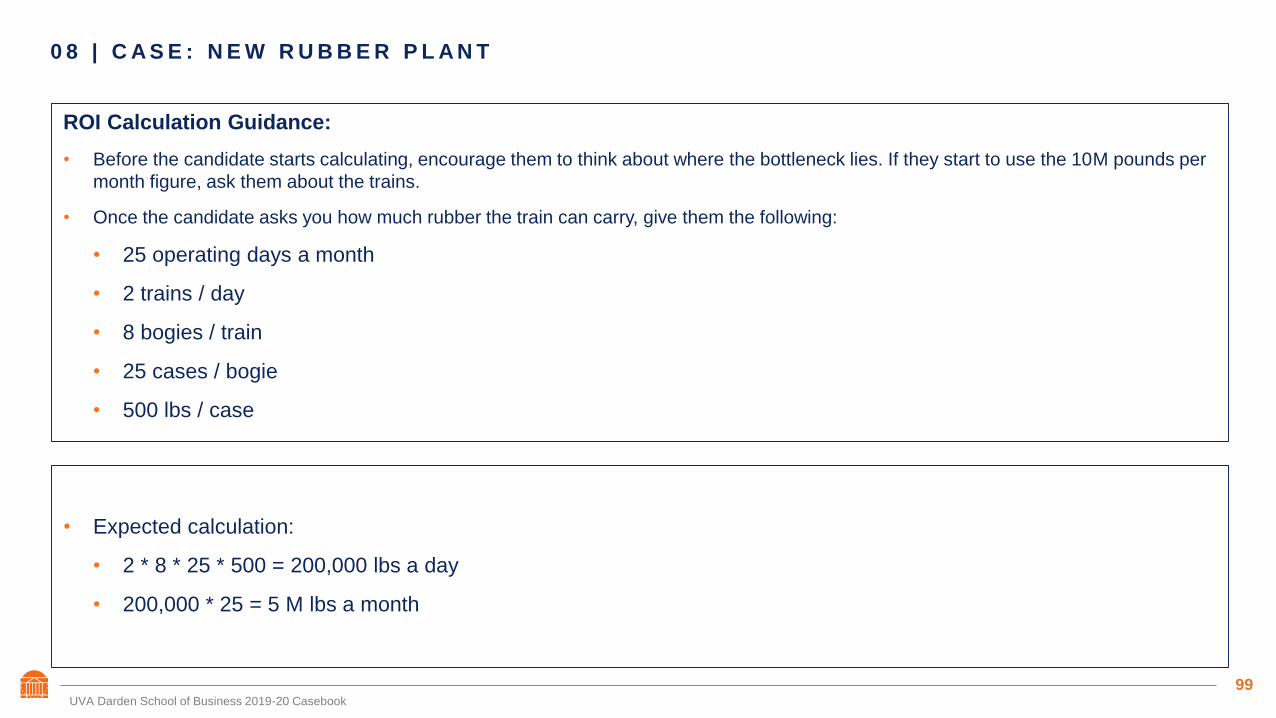
99
ROI Calculation Guidance:
• Before the candidate starts calculating, encourage them to think about where the bottleneck lies. If they start to use the 10M pounds per
month figure, ask them about the trains.
• Once the candidate asks you how much rubber the train can carry, give them the following:
• 25 operating days a month
• 2 trains / day
• 8 bogies / train
• 25 cases / bogie
• 500 lbs / case
• Expected calculation:
• 2 * 8 * 25 * 500 = 200,000 lbs a day
• 200,000 * 25 = 5 M lbs a month
0 8 | C A S E : N E W R U B B E R P L A N T
UVA Darden School of Business 2019-20 Casebook

100
ROI Calculation Guidance (continued):
• Now that the candidate has realized that there production is limited by the amount of rubber they can ship out – they should also realize
there is a limit to the raw material they can bring in. An astute candidate will ask about the capacity of the trains bringing resin in.
• Resin train information:
• 25 operating days a month
• 4 trains / day
• 10 bogies / train
• 25 barrels / bogie
• 640 lbs / barrel
• Expected calculation:
• 4 * 10 * 25 * 640 = 6400,000 lbs a day
• 640,000 * 25 = 16 M lbs of resin a month – since it takes 3 lbs of resin to produce 1 lb of rubber – they can produce
$5.3 M lbs of rubber from raw materials
• The candidate should realize that they can produce 5M barrels a month based on the limiting factor – the
outbound trains
0 8 | C A S E : N E W R U B B E R P L A N T
UVA Darden School of Business 2019-20 Casebook

101
ROI Calculation Guidance (continued):
• Other Financial Information:
- Labor - $8M per month
- Other overhead - $10M per month
- Trains - $40k per trip
• Expected calculation:
• Transport Cost:
• $40K * (4 + 2) [trains per day] * 25 [days per month] = $6M
• Revenue
• 5M lbs rubber * $20 per pound = $100M
• Material Cost
• 15M lbs resin * $5 per pound = $75M
0 8 | C A S E : N E W R U B B E R P L A N T
UVA Darden School of Business 2019-20 Casebook

102
ROI Calculation Guidance (continued):
• Final Income Statement (monthly)
• Revenue - $100M
• COGS - $75M
• Labor - $8M
• Overhead - $10M
• Transport - $6M
• Operating Profit - $1M (or 1% margin)
• Given the above, a good candidate will recognize the plant has an operating profit of $1M monthly. Given an initial
investment of $12M, that would have a payback period of 1 year.
• A great candidate will notice that the margins are wafer thin at 1%. Given that rubber is a commodity, a small dip in price
could easily force this investment into the negative territory.
• Ask them what additional factors they should consider.
0 8 | C A S E : N E W R U B B E R P L A N T
UVA Darden School of Business 2019-20 Casebook

103
Cash Flow Improvements• Plant is at 50% capacity, if we improve
transportation – can we bolster profit
• Can we lock in a long-term price or hedge on
resin prices
0 8 | C A S E : N E W R U B B E R P L A N T
UVA Darden School of Business 2019-20 Casebook
Brainstorming Guidance: Note: This is just one possible set of categories and answers.
Economic Development• Can we utilize an uptick in local wages to support
other development priorities
• Could be used to help with reelection message
Risks• Terrorism
• Fall in the rubber market price
• Scarcity of gum resin
• Mechanical failures on train tracks cause a shut down
• Local pushback against the project
BRAINSTORMING
“What other factors could we consider when making a decision with this investment?
How to Move Forward:
Feel free to push the candidate on any of their brainstorming ideas. Make sure they at least touch on the fact that the government has multiple criteria for
success, including ROI, job creation, and economic developments. This could also be a good time to ask them to detail some of the risks involved.

104
PubU Footprint
McKinsey | Round 2 | Energy

105
McKinsey | Round 2 | Energy
0 9 | C A S E : P U B U F O O T P R I N T
PUBU FOOTPRINT B E H AV I O R A L
I N T E R V I E W
Q U E S T I O N :
1 . A s a
c o n s u l t i n g
p r o f e s s i o n a l ,
y o u w i l l o f t e n
h a v e t o r e s o l v e
c o n f l i c t w i t h i n
t e a m s . Te l l m e
a b o u t a t i m e y o u
s u c c e s s f u l l y
r e s o l v e d c o n f l i c t
i n a t e a m
s e t t i n g .
2 . W h y s h o u l d I
h i r e y o u ?
UVA Darden School of Business 2019-20 Casebook
Clarifying Information: Note: Provide this only if corresponding questions are asked.
1. How big is PubU? PubU is a large research institution consisting of an undergrad (35k students), graduate
school (10k) and various professional schools (~2k). Number in student body is expected to be stable. The
university is very large and requires an extensive diesel-powered bus system for students to commute all over
campus.
2. How much money does PubU have available / where does it come from? The average operating budget of
PubU is $2B. Of that $2B, roughly 30% comes from the state, 10% from alumni donations, 20% from the university
endowment (fund that pays out money each year) and 40% from student fees.
3. How does PubU currently get electricity? From the local grid (which uses a mix of coal, gas, wind, and solar).
The local utility is transitioning to 100% carbon-free by 2030.
4. What does net-zero waste mean? Net Zero means consuming only as much energy as produced, achieving a
sustainable balance between water availability and demand, and eliminating solid waste sent to landfills.
5. What is PubU’s goal? As noted in the prompt, a plan to reach net-zero by 2040.
Prompt:
You are the Dean of a large public university in the Midwest. Your tenure has focused
on raising the profile of the university through various initiatives. Recently, the Board
of Regents has requested a plan that outlines the university’s environmental footprint
and a goal to reach net-zero waste by 2040. As a former business executive, you are
familiar with the principles of ESG, but need to understand what the major drivers of
environmental impact at PubU.

106
Framework Guidance:
Note: There are many possible alternatives to this framework. These are only provided as possible suggestions.
A good framework here will hypothesize sources of waste and make preliminary estimates of relative size. A great framework will begin to hypothesize possible solutions and the
considerations that a public university must have when evaluating these projects, particularly regarding impact on reputation / rankings and ability to fund initiatives.
0 9 | C A S E : P U B U F O O T P R I N T
How to Move Forward:
The interviewee should call out the many possible sources of waste and make a justified guess as to which waste stream has the largest impact for the university.
Push the interviewee to flesh out the framework to include specific details to the university (for instance, dining halls) during framework discussion. While cost is
certainly a consideration, this case does not revolve around the estimated return.
To move forward, the interviewee should call out the public transit system of the university. A great answer will include mentioning the inefficiency of diesel buses and
the possibility of electrification.
Solid Waste
• Sources
• Dining halls
• Dormitories
• Laboratories
• University Building
• Possible Strategies
• Reduction
• Recycling
• Elimination
Energy
• Electricity
• Add renewable
generation
• Negotiate with local
utilities
• Reduce usage
• University Transit
• Bus fleet – diesel
Water
• Landscaping
• Plumbing and other Uses
• Athletic Facilities including golf
courses, athletic fields
• Fountains throughout campus
UVA Darden School of Business 2019-20 Casebook
Other Considerations
• State funding for waste-
reduction efforts?
• Use current budget / re-
allocate budget
• Positive impact on university
recruiting both students and
faculty.
• Leverage existing faculty
know-how to get
recommendations
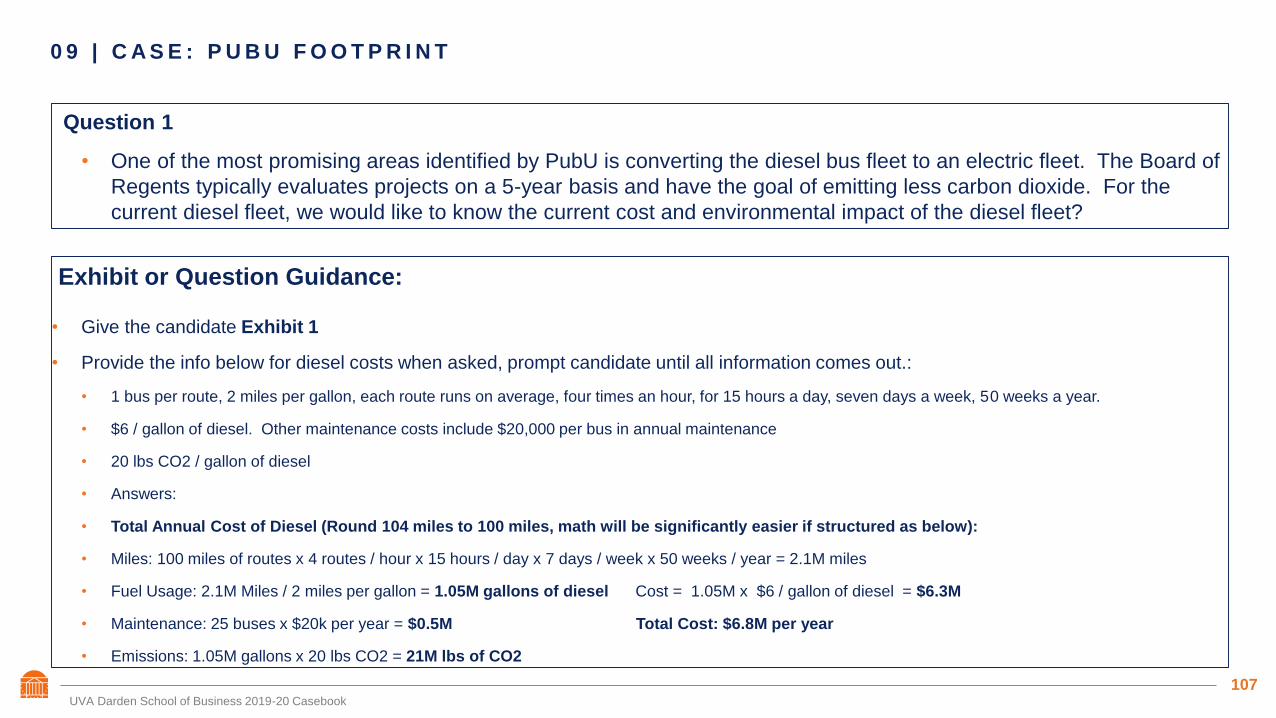
107
Question 1
• One of the most promising areas identified by PubU is converting the diesel bus fleet to an electric fleet. The Board of
Regents typically evaluates projects on a 5-year basis and have the goal of emitting less carbon dioxide. For the
current diesel fleet, we would like to know the current cost and environmental impact of the diesel fleet?
• Give the candidate Exhibit 1
• Provide the info below for diesel costs when asked, prompt candidate until all information comes out.:
• 1 bus per route, 2 miles per gallon, each route runs on average, four times an hour, for 15 hours a day, seven days a week, 50 weeks a year.
• $6 / gallon of diesel. Other maintenance costs include $20,000 per bus in annual maintenance
• 20 lbs CO2 / gallon of diesel
• Answers:
• Total Annual Cost of Diesel (Round 104 miles to 100 miles, math will be significantly easier if structured as below):
• Miles: 100 miles of routes x 4 routes / hour x 15 hours / day x 7 days / week x 50 weeks / year = 2.1M miles
• Fuel Usage: 2.1M Miles / 2 miles per gallon = 1.05M gallons of diesel Cost = 1.05M x $6 / gallon of diesel = $6.3M
• Maintenance: 25 buses x $20k per year = $0.5M Total Cost: $6.8M per year
• Emissions: 1.05M gallons x 20 lbs CO2 = 21M lbs of CO2
0 9 | C A S E : P U B U F O O T P R I N T
Exhibit or Question Guidance:
UVA Darden School of Business 2019-20 Casebook

108
EXHIBIT 1
0 9 | C A S E : P U B U F O O T P R I N T
Current Bus Routes and Costs
UVA Darden School of Business 2019-20 Casebook
Area of Campus # of Routes Average Miles Per
Route
Main Campus 8 6
Athletic Fields 8 3
Med Center 4 3
Downtown Mall 5 4
Note: Buses run each route 4 times per hour, 15 hours per day.

109
Question 2
• PubU has received preliminary information from an electric bus manufacturer and the company has promised that their
internal calculations show PubU will save significant amounts of money by switching to electric. We would like to
independently verify the company’s claims. How much money will PubU save by switching to electric?
0 9 | C A S E : P U B U F O O T P R I N T
Exhibit or Question Guidance:
Interviewee should ask about the following: Cost per bus: $1M
Annual Maintenance Cost: $4,000 / bus
Bus Efficiency: 4 miles / gallon of diesel equivalent (gallon of diesel equivalent is a measure of energy)
Electric to Diesel Conversion: 25 gallon of diesel equivalent / megawatt-hour (MW-h)
Grid Stats: $100 / MW-h generated, 1000 lbs CO2 / MW-h generated (currently, future is 0)
A great caser should recognize that maintenance cost is 1/5th the diesel cost. The bus efficiency is 2x. This will simplify math. Interviewee should drive case
towards five-year savings and recognize a negative ROI. From an emissions standpoint, this won’t immediately affect carbon emissions. But as mentioned earlier,
the grid is moving to a zero-carbon state.
Answers:
Electricity: 2.1M Miles / 4 miles per gallon of diesel equivalent = 525k gallons of diesel equivalent
525k gallons of diesel equivalent (gde) / 25 gde / MW-h = 21k MW-h
21k MW-h x $100 MW-h =$2.1M / year
Annual Maintenance: 25 buses x $4000 / bus = $100,000 per year
Total Cost = $2.2M / year
Emissions:
21k MW-H x 1000 = 21M lbs of CO2
Cost Savings Per Year: $6.8M – $2.2M = $4.6M Total Investment = $25M…over five years, Save $23M, ROI of (23-25)/25 = -8%.
UVA Darden School of Business 2019-20 Casebook

110
Local Impact
• Reduced noise
• Reduced fumes
• Increased student wellness
(improved air quality
• Increased public safety (more
advanced, sensors ala Tesla)
0 9 | C A S E : P U B U F O O T P R I N T
UVA Darden School of Business 2019-20 Casebook
Best candidates display:
Candidate should provide a structure to their thinking and focus on other potential impacts on the university. Universities have multiple
stakeholders including the students, faculty, employees, community and state and local governments. The best candidates will think about
impact on multiple stakeholders.
Brainstorming Guidance:
Note: This is just one possible set of categories and answers. Many more are possible, and interviewers should assess both the volume and relevance of answers.
Reputation Boost
• Increased Student Attraction
• Increased Faculty Attraction
• Increased Research funding
Future Impacts
• Reduced maintenance staff
• Opportunity to automate
• Buses as energy storage
BRAINSTORMING
It seems like the electric bus fleet might not successfully lower emissions. What are some other benefits of switching to an electric bus fleet
outside the framework of carbon emissions?

111
CONCLUSION
0 9 | C A S E : P U B U F O O T P R I N T
UVA Darden School of Business 2010-20 Casebook
To conclude, the interviewee should provide the following:
Recommendation:
• Either PubU should invest in electric buses or not. Either decision can be justified.
• Should Not Invest: ROI in 5 years is negative, no major change in emissions in short-term. Technology likely to get
cheaper in coming years.
• Should Invest: In 6 years, ROI becomes positive. Eventual path to zero emissions. Significant other benefits.
Risks:
• First Adopter Risk – What are unknowns around the technology that have yet to be identified?
• Infrastructure Requirements – Need to build out significant other infrastructure and training (charging infrastructure, new
maintenance training)
Next Steps:
• Prepare bid documentation and go forward with project.

112
I N T E R V I E W E R F E E D B A C K F O R M
Case Execution:
❑ Clarifying Questions + Framework
❑ Good Questions
❑ Structured
❑ MECE
❑ Creativity
1 2 3 4 5
Case Name _________________________ Interviewer ___________________________
Case Book ____________________ Case Type ____________ Difficulty ____________
Feedback:
❑ Exhibits + Quantitative Ability
❑ Accuracy
❑ Speed
❑ Insights Presented
❑ Errors / Guidance Needed
1 2 3 4 5 Feedback:
❑ Brainstorm + Conclusion
❑ Creative & Structured
❑ Good Business Judgment
❑ Recommendation Strength
1 2 3 4 5 Feedback:
❑ Presence & Non-Verbal
❑ Confidence
❑ Poise / Posture
❑ Clear & Concise
❑ Body Language
❑ Coachability
1 2 3 4 5Feedback:
Total: _____ / 20

113
Whale Hotel
McKinsey | Round 2 | Consumer

114
McKinsey | Round 2 | Retail
1 0 | C A S E : W H A L E H O T E L
WHALE HOTEL
B E H AV I O R A L
I N T E R V I E W
Q U E S T I O N :
1 . A s a
c o n s u l t i n g
p r o f e s s i o n a l ,
y o u w i l l o f t e n
h a v e t o r e s o l v e
c o n f l i c t w i t h i n
t e a m s . Te l l m e
a b o u t a t i m e y o u
s u c c e s s f u l l y
r e s o l v e d c o n f l i c t
i n a t e a m
s e t t i n g .
2 . W h a t w o u l d
y o u r l e a r n i n g
t e a m m a t e s s a y
a b o u t y o u ?
UVA Darden School of Business 2019-20 Casebook
Clarifying Information: Note: Provide this only if corresponding questions are asked.
1. What’s the payback period? 5 years
2. How long is the construction period? 2 years
3. What is the tourism industry in Dubai like? Very ritzy and highly seasonal (25% increase in the summer)
4. Does the company currently own hotels in Dubai? No – ignore cannibilization
5. Are there any similar resorts in Dubai? Yes, the King’s Palace, the Belzor, and the Egyptian
Prompt:
Our client is a real estate company that owns and operates luxury hotels around the
world. They’ve previously owned 3 resorts in Dubai and are considering building a
fourth, targeted specifically at high net worth individuals – called whales.

115
Question 1 – Hand the candidate Exhibit 1
• After looking at Exhibit 1, calculate the total number of whales at expected at each hotel each night.
• Prompt the candidate to do Peak and Off-Peak separately
• Interviewee should identify that:
• Correlation between whale % and swimming pool quality
• Impact of seasonality on overall demand (great candidates will notice that Belzor is at 100% utilization, meaning that there could be
additional demand (for a hotel with an excellent pool) that is not being met
• Steer the interviewee towards the conclusion that the hotel must have an excellent quality pool
• Ask the interviewee what a reasonable rate to charge a whale for a new hotel would be – any rate is acceptable as long as it is supported
logically
1 0 | C A S E : W H A L E H O T E L
Exhibit Guidance:
UVA Darden School of Business 2019-20 Casebook
Whales Per Night, Off-Peak Whales Per Night, Peak
King’s Palace 5000 * 80% * 25% = 1000 5000 * 80% * 25% = 1000
Egyptian 4000 * 75% * 25% = 750 4000 * 95% * 37.5% = 1425
Belzor 8000 * 75% * 33.3% = 2000 8000 * 100% * 50% = 4000
Total 3750 6425

116
Question 2 : Market research indicates that a hotel with an excellent quality pool charging $2,500 a night would capture
100% of the whales who stay at the King’s Palace and the Egyptian as well as an additional 250 whales per night during the
off-season and 1575 during the peak season. What is the expected demand for the potential new hotel?
• Nightly Whale Demand, Off-Peak = 2000
• 1000 (King’s Palace) + 750 (Egyptian) = 2000
• Nightly Whale Demand, Peak = 4000
• 1000 (King’s Palace) + 1425 (Egyptian) + 1575 (new) = 4000
1 0 | C A S E : W H A L E H O T E L
Exhibit Guidance:
UVA Darden School of Business 2019-20 Casebook

117
Question 3 – Hand the Candidate Exhibit 2
How many stories will the new hotel require?
• Interviewee should recognize that, in order to meet demand of 4000 rooms per night in peak season, the hotel must be at
least 3 stories tall
1 0 | C A S E : W H A L E H O T E L
Exhibit Guidance:
UVA Darden School of Business 2019-20 Casebook

118
Question 4: Annual operating expenses are $250M per 1500 rooms. Land acquisition is $2B. What is the total initial
investment and would you recommend moving forward with the hotel.
• Initial investment:
• Land - $2B
• Rooms - $3B – (3 stories)
• Pool - $.5B – (excellent quality)
• Total - $5.5B
• Annual Revenue:
• $2,500/night * 30 nights = $75K per whale monthly
• 4000 whales * $75K per whale = $300M (peak, monthly) * 3 Month Peak Season = $900M Peak
• 2000 whales * $75k per whale = $150M (off – peak, monthly * 9 Months = $1.35B Off – Peak
• Total Annual Revenue = $2.25B Annually
1 0 | C A S E : W H A L E H O T E L
Exhibit Guidance:
UVA Darden School of Business 2019-20 Casebook

119
Question 4 (continued): Annual operating expenses are $250M per 1500 rooms. Land acquisition is $2B. What is the total
initial investment and would you recommend moving forward with the hotel.
• Annual Profit:
• Annual Revenue - $2.25B
• Annual Opex - $750M ($250M per 1500 rooms * 3)
• Annual Operating Profit - $1.5B
• Payback Period:
• 2 years of construction
• 3 years of revenue (3*$1.5B) = $4.5B
• After 5 – years, $5.5B cost - $4.5B revenue
1 0 | C A S E : W H A L E H O T E L
Exhibit Guidance:
UVA Darden School of Business 2019-20 Casebook
• A good candidate will realize that:
• We don’t break even in 5-years
• We will turn a profit, 8 months into year 5
• We haven’t considered additional revenue
sources or a potential exit opportunity
• If time allows – consider asking them how to
raise additional revenue

120
Question 5: The real estate company’s CEO is on his way in – what do you recommend?
• A candidate can recommend either moving forward with the deal or foregoing the opportunity,
• If they recommend moving forward, they should include that they are evaluating additional revenue streams that will
bring the company closer to a 5-year payback period
• A candidate might choose to turn-down the hotel because of:
• Issues with the payback period
• Competitive response from the King’s Palace, Egyptian, or Belzor
1 0 | C A S E : W H A L E H O T E L
Exhibit Guidance:
UVA Darden School of Business 2019-20 Casebook

121
EXHIBIT 1
1 0 | C A S E : W H A L E H O T E L
UVA Darden School of Business 2010-20 Casebook
Resort # of
Rooms
Off-Peak
Utilization
Off-Peak
Whales %
Rate Pool
Quality
Peak*
Utilization
Peak*
Whales %
King’s
Palace
5000 80% 25% $2000/night Poor 80% 25%
Egyptian 4000 75% 25% $2000/night Good 95% 37.5%
Belzor 8000 75% 33.3% $2500/night Excellent 100% 50%
Note: Peak season runs from June – August

122
EXHIBIT 2
1 0 | C A S E : W H A L E H O T E L
UVA Darden School of Business 2010-20 Casebook

123
I N T E R V I E W E R F E E D B A C K F O R M
Case Execution:
❑ Clarifying Questions + Framework
❑ Good Questions
❑ Structured
❑ MECE
❑ Creativity
1 2 3 4 5
Case Name _________________________ Interviewer ___________________________
Case Book ____________________ Case Type ____________ Difficulty ____________
Feedback:
❑ Exhibits + Quantitative Ability
❑ Accuracy
❑ Speed
❑ Insights Presented
❑ Errors / Guidance Needed
1 2 3 4 5 Feedback:
❑ Brainstorm + Conclusion
❑ Creative & Structured
❑ Good Business Judgment
❑ Recommendation Strength
1 2 3 4 5 Feedback:
❑ Presence & Non-Verbal
❑ Confidence
❑ Poise / Posture
❑ Clear & Concise
❑ Body Language
❑ Coachability
1 2 3 4 5Feedback:
Total: _____ / 20

124
C O N S U LT I N G C L U B AT D A R D E N – C A S E B O O K
ACKNOWLEDGEMENTS
Thank you to everyone who wrote or submitted cases for their year’s book including: Chai Lu Clark, Adele Hunter,
Tejaswi Kambalapally, Robby O’Brien, Adam Potrzebowski, Greg Schwartz, Rohan Sehgal, Supriya Shah Deo, Dan Shi,
Kathryn Sullivan, Casey Ward, Parke Whitley, Jesse Wilkinson

Kellogg Consulting Club
2020 Casebook
23rd October 2019

2
Welcome to the Kellogg Consulting Club 2020 Casebook!
Rohan MainiKellogg 2020KCC VP Training
Over the summer of 2019, we made both major and minor changes to the Casebook. Changes have been made in response to feedback in the
Spring 2019 KCC survey from 2019 and 2020 consulting candidates. The headline objective has been to bring more structure to the cases to
benefit both interviewees and interviewers alike. A sample of changes is provided below:
• Fit questions: Appropriate Fit or Experience questions have been introduced at the beginning of every case.
• Case navigation: The first page of every case features a numbered list that now clearly aligns with subsequent case solving steps.
• Print-friendly: Exhibits now immediately follow the Case title page to facilitate economical printing of the most critical pages only.
• Case curriculum: A curated list of 25 cases and proposed timeline for traditional internship candidates (page 7).
• References: Easily searchable 3-character reference numbers simplify identification of desired cases by industry, business concept etc.
• Hyperlinks: Case contents now link to the relevant page of the Casebook.
• Difficulty ratings: Subjective case difficulty ratings have been removed with the intention to introduce evidence-based ratings next year.
• Cases archived: Removal of several cases deemed unpopular or out-of-date.
• Clear call-outs: For McKinsey-style interviewer-led cases, prompts to hand candidates Exhibits etc.
• Eco-friendly: Reduction in number of full-color pages and introduction of low-ink exhibits that are easy to read in black and white.
Please don’t hesitate to contact us with any questions, suggestions or corrections that you may have regarding the Casebook.

Welcome to the KCC 2020 Casebook! 2
How to use this book 6
Planning your case preparation 7
Understanding individual case pages 9
Finding cases 13
Getting the most out of a case 17
Evaluating case performance 20
2020 Cases* 22
3
Contents
All contents
*See next page for detailed case contents

Case Page Case type Industry Format (interview lead)
Busch’s Barber Shop NEW! 23 Market entry Hospitality & Leisure
Chic Cosmetology 34 Market entry Hospitality & Leisure
Chicouver Cycle 43 Market entry Transportation & Logistics
Dark Sky 55 New product Aerospace & Defense
DigiBooks 66 Market entry Retail & CPG Interviewer-led
Events.com NEW! 76 Profitability Technology
Garthwaite Healthcare 86 Profitability Healthcare Interviewer-led
Health Coaches 94 Operations Healthcare
Healthy Foods 104 Growth Strategy Retail & CPG
High Q Plastics 115 Profitability Engineering & Construction
Kellogg in India 127 Market entry Government & Public Sector
Maine Apples 138 New product Agriculture & Food
Money Bank Call Center 144 Cost reduction Legal & Professional Services
Montoya Soup 151 Profitability Retail & CPG
Mustard Clinic NEW! 163 Operations Healthcare Interviewer-led
Orrington Office Supplies 173 Operations Engineering & Construction
Plastic World 183 Mergers & Acquisitions Private Equity
Rotisserie Ranch 192 New product Retail & CPG Interviewer-led
Salty Sole Shoe 199 Profitability Retail & CPG
Contents
Detailed case contents
4

Contents
Detailed case contents (continued)
Case Page Case type Industry Format (interview lead)
Sosland Sports NEW! 209 Market entry Hospitality & Leisure Interviewer-led
Tactole 217 Profitability Agriculture & Food
Vitality Insurance 233 Profitability Financial Services
Wildcat Wings 243 Operations Transportation & Logistics
Wine & Co 253 Opportunity Assessment Agriculture & Food
Winter Olympics Bidding 263 Opportunity Assessment Entertainment & Media
Zephyr Beverages 271 Mergers & Acquisitions Retail & CPG
Zoo Co 278 Mergers & Acquisitions Financial Services
5

How to use this book
6

7
Planning your case preparation
Case curriculum
• New in the 2020 casebook, the Case Curriculum provides a list of cases curated by the KCC Exec team to give candidates a wide range of ‘classic’ and ‘unusual’ cases from a variety of industries and Casebooks
• The curriculum is provided to support case selection for practice but is completely optional and in no way required
• The Curriculum features 25 cases, but this is by no means a minimum nor a maximum number of suggested cases
• Cases are of increasing difficulty (as determined subjectively by the KCC Exec team) so don’t feel dejected if you feel as though you’re not getting better at casing
Case Casebook
Sep
tem
ber /
Oct
ober
EasyCases selected to build familiarity with the case interview process (primarily profitability and cost cutting)
DigiBooks Kellogg 2020
Dark Sky Kellogg 2020
Zephyr Beverages Kellogg 2020
Sosland Sports Kellogg 2020
Orange Yoga Studio Fuqua 2014
ModerateStraightforward cases that challenge candidates’ reliance on pre-canned case-frameworks
Maine Apples Kellogg 2020
Chic Cosmetology Kellogg 2020
Nov
embe
r
Goodbye Horses Fuqua 2016
LifeRenew Haas 2015
California Parking Lot Columbia 2017
Tacotle Kellogg 2020
HardComplex ‘pressure’ cases that challenge multiple skills and cannot be solved with traditional frameworks.
Orrington Office Supply Kellogg 2020B
reak
Mexico City Airport Taxi Services Wharton 2009
Garthwaite Healthcare Kellogg 2020
Salty Sole Kellogg 2020
Win
ter B
reak Mustard Clinic Kellogg 2020
Desert City Yale 2013
Coyotes Fuqua 2014
Rock Band Columbia 2017
Ear
ly J
an
Confidence BoostersCases selected to encourage custom framework creation. No major complexity ahead of impending interviews.
Ski Resort BCG
Contact Lens Manufacturer Darden 2011
Supermarket Deli Turnaround BCG
Maldovian Coffins McKinsey
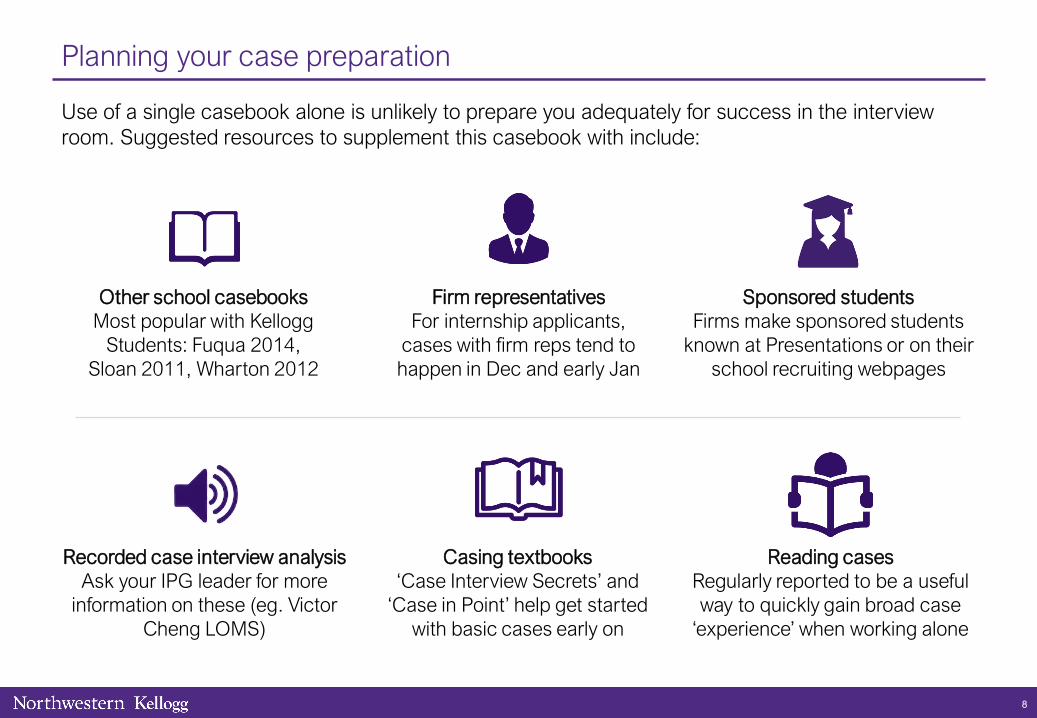
8
Planning your case preparation
Use of a single casebook alone is unlikely to prepare you adequately for success in the interview room. Suggested resources to supplement this casebook with include:
Other school casebooksMost popular with Kellogg
Students: Fuqua 2014, Sloan 2011, Wharton 2012
Firm representativesFor internship applicants,
cases with firm reps tend to happen in Dec and early Jan
Sponsored studentsFirms make sponsored students
known at Presentations or on their school recruiting webpages
Recorded case interview analysisAsk your IPG leader for more
information on these (eg. Victor Cheng LOMS)
Reading casesRegularly reported to be a useful way to quickly gain broad case
‘experience’ when working alone
Casing textbooks‘Case Interview Secrets’ and
‘Case in Point’ help get started with basic cases early on

Understanding individual case pages
The Case title page contains details that help inform case selection
Format Calls out interviews that follow the McKinsey-style, interviewer-led case format
Concepts tested Provides a reference to the main concepts that the case tests (see page 16 for more information)
Primary sectors Provides a reference to the primary sectors involved in the case (see page 14 for more information)
Case type Provides a reference to the predominant case type (see page 15 for more information)
Similar cases Provides examples of cases that test similar concepts as this case
Additional information Contains miscellaneous information about the case
1
2
3
45
6
1
2
3
4
5
6
9

Understanding individual case pages
The Interviewer guide provides interviewers with a summary of the case structure
Case prompt This is the information that is provided up front to the interviewee; it introduces the key case context and headline problem that the interviewee is to answer in the course of the case
Interviewer guide This section provides a 30-second summary on how the case can be solved. Numbered list not only provides an ideal list of steps to solve the case, but aligns exactly with subsequent areas of the case that may be covered during the course of the interview
2
1
2
1
10

Understanding individual case pages
The Interview prompt page contains all pre-structure information
Fit/Experience question New this year, fit questions (experience for Interviewer-led cases) are provided ahead of each case
Case prompt As summarized on the previous slide, this section introduces the key case context and headline problem
Clarifying information Provides additional pieces of information that should be provided to the interviewee if requested
2
3
1
2
3
1
11

Understanding individual case pages
Case solving pages are broken down into numbered parts
Part number New to the 2020 Casebook, each part number aligns with the numbered list on the interviewer guide (see page 10 for more information)
Interviewer prompts Above the dotted line, interviewer guidance (including instructions about when to provide the interviewee with Exhibits) and contextual / problem voiceover is provided.
Solution Below the dotted line: full working, part solutions, takeaways and interviewee assessment criteria are provided.
1
2
3
1
2
3
12

• Consultancies hiring for generalists typically issue a wide range of cases from random industries, functions or problem areas.
• If you are interviewing with a boutique consultancy or specific practice area, you should expect to see a higher proportion of cases that are directly related to the type of work they do. For example…
– ‘ZS Associates’ cases skew towards pharmaceutical industry clients
– ‘BCG Digital Ventures’ cases typically involve a technology problem
• In the KCC Casebook, each ‘Case title page’ contains details that help inform case selection to aid easy searching for cases that test a certain industry sector, case type or concept. The casebook uses three character references to aid ‘Ctrl+F’ searching across ‘Case title pages’ (see page 9 for more information). A list of references is provided in the next three pages.
13
Finding cases
Introduction

Finding cases
Industry sectors
Industries Description
X01 Aerospace & DefenseProduction, sale, and service of commercial vehicles, military weapons and systems designed to operate on land, sea, and air. Also includes production of aircraft and space vehicles (usually satellites) for both military and commercial use.
X02 Agriculture & Food Agriculture, husbandry or farming, is activity of cultivating plants, animals, and other life forms for food, fiber, and fuel.
X03 Energy, Utilities & MiningUtilities provide basic amenities, such as water, sewage services, electricity and natural gas. Mining companies locate and extract metal and mineral reserves, then used in jewelry-making, industrial applications, and investments.
X04 Engineering & ConstructionConstruction of buildings, civil engineering projects, and other industrial plant construction. The industry includes highway, tunnel, bridge, and other civil engineering operations, as well as commercial, residential and industrial buildings.
X05 Entertainment & MediaComprised of businesses that produce and distribute motion pictures, television programs and commercials, streaming content, music and audio recordings, broadcast, radio, book publishing, video games and supplementary services
X06 Financial ServicesFinancial services are provided by the finance industry, which encompasses a broad range of businesses that manage money, including banks, credit-card companies, insurers, accountancies, stock brokerages and investment funds.
X07 Government & Public sector Includes public goods and governmental services such as law enforcement, public infrastructure, transit, and education,
X08 HealthcareThe healthcare sector consists of companies that provide medical services, manufacture medical equipment or drugs, provide medical insurance, or otherwise facilitate the provision of healthcare to patients
X09 Hospitality & LeisureThe leisure and hospitality industry sector includes a broad category of fields within the service industry such as lodging, food services, event planning, theme parks, transportation and other tourism oriented products and services.
X10 Legal & Professional ServicesProfessional services are occupations in the tertiary sector of the economy requiring special training in the arts or sciences. Some professional services require holding professional licenses such as architects or lawyers.
X11 PharmaceuticalsThe pharmaceutical industry discovers, develops, produces, and markets drugs for use as medications to be administered to patients, with the aim to cure them, vaccinate them, or alleviate the symptoms.
X12 Retail & CPGRetailers sell products, mainly consumer packaged goods (CPG) to end users/consumers. CPG refers to a broad spectrum of manufacturers, sellers, and marketers of (typically packaged) physical goods.
X13 TechnologyBusinesses involved in manufacturing of electronics, creation of software, computers or products and services relating to IT. The technology sector offers a wide arrange of products and services for consumers and businesses.
X14 Telecommunications Comprised of companies that make wireless or wired communication possible on a global scale, (eg. phone, internet)
X15 Transportation & Logistics Transportation and logistics involves planning, implementing, and controlling movement and storage of goods.
14

Finding cases
Case types
Case Type Description
Y01 Cost reduction Identifying internal or external costs that are out of line
Y02 Growth strategy Identifying ways in which a firm can optimally grow
Y03 Mergers & Acquisitions Evaluating whether a firm should merge or purchase another company
Y04 New product / Market entry Analyzing a firm’s opportunity to expand into a new product, business or segment
Y05 Operations Identifying problems in internal or customer-facing processes
Y06 Opportunity assessment Examining the potential purchase / sale of a new or existing business or installation / abandonment of infrastructure
Y07 Profitability Analyzing causes for recent drop in profits / ways to increase profits
15

Finding cases
Business concepts
Business Concept Description
Z01 AccountingTests some aspect of accounting. Typically, this will be a simple Income Statement, Balance Sheet or Statement of Cash flows. Most common concept tested is depreciation/amortization.
Z02 Net Present ValueTests ability to calculate the net present value of cash flows over time (or at a point in time). Usually in the context of investment, market entry or company acquisition case.
Z03 Breakeven analysisGenerally used in market entry cases, break-even analysis tends to test ability to determine how many units (or what price) a product should sell in order to cover a fixed cost.
Z04 Capacity Tests understanding of production capacity, in particular long and short run considerations.
Z05 ElasticityTests understanding of price elasticity of demand or supply, usually in the context of price changes’ impact on quantity sold and by extension revenue.
Z06 MacroeconomicsTests understanding of macroeconomic variables trends than affect businesses including: inflation, foreign exchange rates, recessions, international trade.
Z07 Market shareTests understanding of the client and its competitors’ market share. This may include understanding of typical features of concentrated and fragmented markets.
Z08 Market sizingTests ability to develop a structured approach to sizing a market. Emphasis is on mathematical approach rather than accurate estimation of market size or dependent variables.
Z09 Microeconomics Tests understanding of microeconomics, for example the role of demand and supply in market pricing.
Z10 Customer marketing strategy Tests understanding of marketing to customer segments. May involve analyzing their needs, WTP, buying decision, preferred distribution channel etc.
Z11 Competitive analysis Tests ability to analyze relevant aspects of the competition in relation to the client’s business situation.
Z12 Creativity Tests ability to develop creative options, usually as part of a brainstorming exercise.
Z13 Organizational changes Tests ability to develop recommendations around the organizational structure, people and/or culture.
Z14 Pricing strategy Tests ability to develop options and methodologies to price a new product or reprice an existing one.
Z15 Supply/value chainTests understanding of players and activities involved in sale of a product, from the delivery of source materials from suppliers to manufacturers, to delivery to the end user.
Z16 Vertical integration Tests ability to develop a practical solution involving vertical integration of the supply chain.
Qua
ntita
tive
Qua
litat
ive
16

17
Getting the most out of a case
Best practices before a case
Share focus areasInform your interviewer of any specific areas that you would
like feedback on
Share your caselogShare an up-to-date caselogwith your interviewer so you
don’t accidently repeat a case
Don’t sneak a peek!Replicate a real-life case
interview experience by going in completely in the dark
Bring materialsBring several sheets of blank paper and a pen or pencil to
the meeting
Print exhibitsInterviewers should bring printed out copies of any
exhibits needed for the case
Review the caseFamiliarize yourself with the case ahead of time to avoid having to check guidance
Do the math beforehandGain practice with the math
required and understand where common traps may lie
Interviewer
Interviewee
Brush up on the industryReview unfamiliar industries
with KCC’s industry primers or online (eg. Vault.com)

18
Getting the most out of a case
Best practices during a case
Take it seriouslyYou might be interviewing with a friend, but a formal atmosphere will be more valuable and provide a realistic interview experience
Keep quiet!While silence may be uncomfortable, resist the urge to jump in with pointers, hints, or additional information
Ask fit questionsAlmost all interviews start with fit or Experience questions, so the KCC now provides such a suggested question before each case prompt
Interviewer
Interviewee

19
Getting the most out of a case
Best practices after a case
Interviewer
Interviewee
Provide high-level performance assessmentBe honest with the interviewee about their performance. If it was a good case, tell them. If it was poor, it’s even more important to tell them!
Provide detailed feedbackAfter providing a high-level performance assessment, explain why by running the interviewee through each part of their case
Give feedback!A case is a two-sided conversation. Tell the interviewer how they could do anything differently in terms of case or performance assessment delivery

20
Evaluating case performance
Evaluation criteria
Case skills and driving the case Grade
Problem definition Clearly understands and defines the problem/ question; summarizes the essence of the issue
Problem breakdown Breaks problem into most important components
StructureUses a structured and thoughtful approach to solve the problem (e.g. draw issue tree with critical pieces of analysis)
Prioritization Identifies critical path to the recommendation and most important issues/components
Information Identifies and addresses key pieces of information and assumptions needed to solve the problem
Solution oriented Formulates hypothesis when needed and maintains focus on the recommendation
80-20 approach Deep dives into identified critical issues to develop a recommendation (80% of solution with 20% of analysis)
Recommendation Ends up with a pragmatic/ realistic solution that answers the initial question; supported with the analysis
Communication skills Grade
Structure Shares thinking process throughout the case and aligns his communications with the structure of the case
Focus Highlights key insights, important findings and critical issues
Questions Ask clear questions related to the case process and solution
Engagement Engages with the interviewer during the solution of the case
Support Clearly supports any conclusion or important claim with relevant arguments
Business language Feels comfortable discussing the case with business terminology
Body language Communicates naturally and uses body language to support the communication process

21
Evaluating case performance
Evaluation criteria (continued)
Polish and interpersonal skills Grade
Self confidence Shows confidence when solving and attacking the case without sounding arrogant
Quantitative skills Feels comfortable handling complex calculations and analytics; shows clear calculations and data framing
Analysis Deep dives in identified critical issues or components and comes up with a solution for each issue
Interpersonal skills Drive a conversation and acts naturally
Balance Good balance of quantitative and qualitative analysis during the solution
Business sense and high level thinking Grade
CreativityIdentifies or uses different approaches to solve the problem. Out of the box thinking; uses creative methods and arrives at creative solutions
SynthesisSummarizes key findings through the solution of the case and translates them into insights or important take-aways
Concepts Clearly understands and uses the key business concepts to solve the case
“So what” thinkingClearly addresses and articulates what each analysis, conclusion or recommendation means to the case, solution or the client
Testing Frequently tests assumptions and conclusions with reality checks or other quick analysis
AssessmentAssesses risks and consequences for the recommendations; identifies key next steps to further prove the solution
Business senseUses common sense and realistic thinking to get to pragmatic recommendations; has the ability to think from different perspectives (e.g. client, competitor, consumer, etc.)

2020 Cases
22

23
Case author(s): Michael Eidem (Kellogg 2020)Edited by: Rohan Maini (Kellogg 2020)
Case 01
Busch’s Barber Shop
Primary sector(s)
• X09 Hospitality & Leisure
Concepts tested
• Z08 Market sizing (2)
• Z12 Creativity (5)
Similar cases
• Snack Foods Acquisition (Columbia 2017)
• Surfboard Wax in Hawaii (Fuqua 2014)
• Chic Cosmetology (Kellogg 2020)
Case type
• Y04 Market entry
• Y06 Opportunity assessment

Busch’s Barber Shop
Case Question
• Your friend, a current MBA student, has his heart set on starting a barbershop in Evanston after graduation.
• There are plenty of barbershops and salons near the Northwestern campus, but your eager friend argues they are either (A) vastlyoverpriced or (B) cheap, but really low quality.
• He wants your help coming up with a plan.
Interviewer guide
• Problem: Develop a market entry strategy for Busch’s Barber Shop
• Key case steps:
1. Develop a structure to address the problem
2. Confirm market attractiveness (size)
3. Calculate revenue and costs for two potential locations
4. Evaluate profitability of potential loyalty program
5. Brainstorm other areas of consideration
6. Provide client recommendation
Interviewer guide
24

Busch’s Barber Shop
Case Question
• Your friend, a current MBA student, has his heart set on starting a barbershop in Evanston after graduation.
• There are plenty of barbershops and salons near the Northwestern campus, but your eager friend argues they are either (A) vastlyoverpriced or (B) cheap, but really low quality.
• He wants your help coming up with a plan.
Clarifying information
• Customers: For this analysis, your friend wants to focus solely on a target market of the male population of Evanston.
• Competitive dynamics: Highly competitive, segmented into two distinct groups (high price & low price). Friend believes there is a profitable space in between these two segments.
• Market: Growing at GDP the past five years.
• Your Friend: No specific experience in the cosmetology area, has enough savings to fund initial upfront costs and early ongoing costs. Profitability is the main goal in the short term (wants to be profitable in year one to justify his decision not to take a high-paying consulting job).
• Product: Barbershop only intends to initially sell haircut service. Any other additional products or services can be considered in the future.
Fit: Tell me something about yourself that is not on your resume.
25

26
Busch’s Barber Shop
Exhibit A – Market analysis
$, 67%
$$$, 33%
Where do men in Evanston get their haircut?
Notes:
• Men’s haircut market split between two groups, high-end (avg price $50) and low-end (avg price $20).
• Evanston Adult Population: 60k (50% male)
30%
30%
20%
10%
10%
40%
35%
25%
0%
20%
40%
60%
80%
100%
Low-end High-end
Competitors’ market share
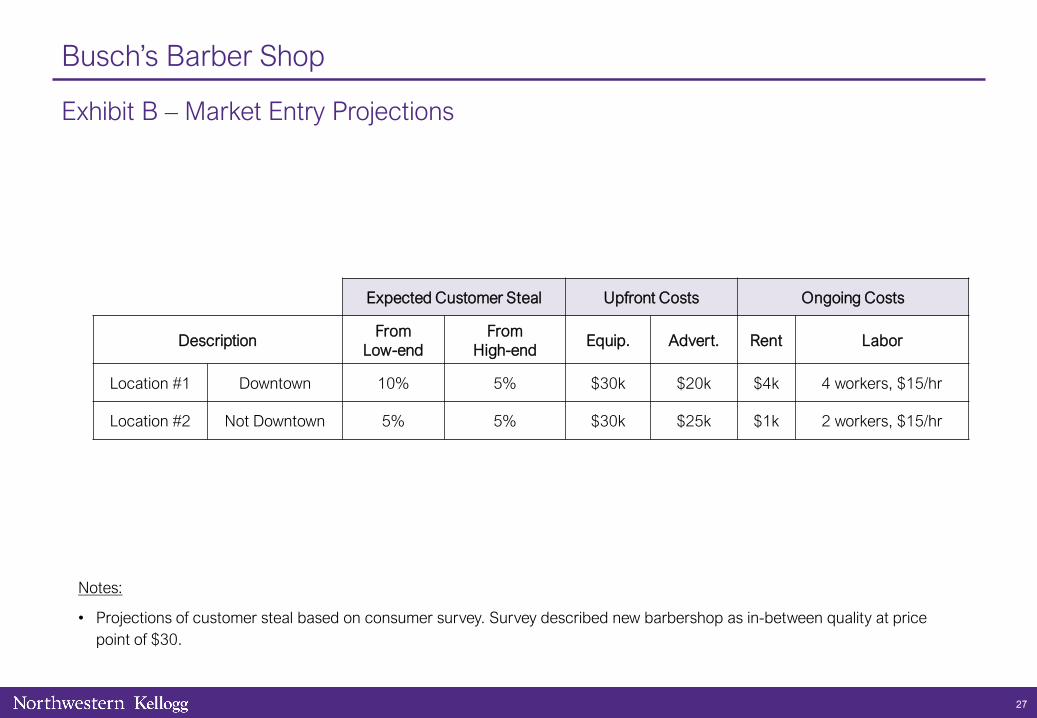
27
Busch’s Barber Shop
Exhibit B – Market Entry Projections
Expected Customer Steal Upfront Costs Ongoing Costs
DescriptionFrom
Low-endFrom
High-endEquip. Advert. Rent Labor
Location #1 Downtown 10% 5% $30k $20k $4k 4 workers, $15/hr
Location #2 Not Downtown 5% 5% $30k $25k $1k 2 workers, $15/hr
Notes:
• Projections of customer steal based on consumer survey. Survey described new barbershop as in-between quality at price point of $30.

28
Busch’s Barber Shop
Part 1
1. Develop framework for how to approach this new venture
A sample case structure would include the following:
• Client: Specific goals, strengths, capabilities, resources
• Market: Size, growth, competition, customer segmentation
• Profitability
• Expected customer volume, target customers
• Price elasticity, pricing method (ex: loyalty), service mix
• Costs: Fixed costs (rent, equipment, merchandise, advertising), variable costs (labor)
• Go-to strategy: Build, acquire, partner with additional co-owner
• Barriers: Capital, local regulations, attracting talent
• Risks: Competitive response, no differentiation, opportunity cost
Following discussion of framework, interviewee should be asked to briefly market size the adult men’s haircut market in Evanston
(See next page)

29
Busch’s Barber Shop
Parts 2-3
2. Confirm market attractiveness (size) 3. Calculate revenue and costs for two potential locations
Interviewee should make educated guesses regarding:
• City population size (~60k)
• Male/female ratio (~50/50)
• What % of male population pays for haircuts (i.e. likely omitting young kids, those who cut their own hair, bald men)
• What % of men in Evanston get their haircut in Evanston vs downtown Chicago near their place of work.
• Average annual haircuts per person being considered
• Price segmentation (average price for cut, high end vs low end portions of the market and distribution between the two)
• End result should be a total annual dollar amount spent on haircuts by men in Evanston.
There is no correct answer to this exercise. A good interviewee will show creativity, structure, and intuition regarding making educated guesses. Push interviewee to move quickly since this is not the primary purpose of the overall case.
Your friend thinks there is a profitable middle ground between the low cost/low quality cut and the high cost/high quality cut markets.
Additional information:
• An average male in Evanston pays for 10 haircuts per year
• Barbershop will be open 10 hours/day, 360 days/year
• Assume customers stay with the same barbershop once they make a decision (i.e. customers don’t switch back and forth between shops).
Lead interviewee towards calculating 1st year profit in each location to determine optimal choice [see next page for solution].
Provide Exhibits A & B

30
Busch’s Barber Shop
Part 3 (continued)
3. Calculate revenue and costs for two potential locations (Exhibit A & B)
Adult male population count in each segment:Market Adult Male CustomersLow-end = 60k * 50% * 2/3 = 20kHigh-end = 60k * 50% * 1/3 = 10k
Projected revenue calculation of each location:Location Total Customers Stolen RevenueDowntown = 20k*10% + 10k*5% = 2.5k = 2.5k * 10 cuts/yr * $30/haircut = $750kNot Downtown = 20k*5% + 10k*5% = 1.5k = 1.5k * 10 cuts/yr * $30/haircut = $450k
Cost calculations of each location:Location Upfront Costs Rent Labor TotalDowntown = 30k+20k = 50k = 48k = 4*$15/hr*10hr/day*360days = $216k $314kNot Downtown = 30k+25k = 55k = 12k = 2*$15/hr*10hr/day*360days = $108k $175k
First year profitability:Location Revenue - Total Cost = ProfitDowntown = $750k - $314k = $436kNot Downtown = $450k - $175k = $275k
Takeaway: Downtown location has higher projected first year profits.
Optional brainstorming question: What other factors should be considered when choosing a potential shop location?
Potential answers: Long term plans, proximity to other stores, ease of transportation to location, visibility, layout of store, capacity constraint for future growth, preference of target demographic

31
Busch’s Barber Shop
Part 4
4. Evaluate profitability of potential loyalty program
Your friend (after having chosen the downtown location) is considering implementing a loyalty reward system as part his marketing strategy. He’s decided that such a system would reward customers by giving them their 10th haircut for free. He projects this will result in a 10% increase in total first year customers. Is this a profitable decision?
One method is to calculate the new annual customer count, determine expected annual revenue, and compare with previously calculated revenue. Costs assumed to remain constant since no marginal costs for additional haircuts (employees paid hourly, assume no additional employees required).
New expected annual customer count:
= (Previously calculated total customers) * 110% = 2500 * 1.1 = 2750 customers
Expected revenue with loyalty program:
= (# of expected customers) * (average # haircuts paid for annually) * (price) = 2750 * (10 – 1) * $30 = $742.5k
Takeaway: Revenue without loyalty program was $750k. Since costs do not change, not profitable decision.
Additional insight: Revenue decline is minimal (~1%), are there potential advantages of increasing customer base by 10% that would still make implementing loyalty program attractive? (example: implement loyalty program for only the first year to build customer base, upsell products such as shampoo/additional services to this larger customer base, etc.)

32
Busch’s Barber Shop
Part 5
5. Brainstorm other areas of consideration (optional)
Additional optional brainstorm questions:
1. What changes could be made to make this loyalty program profitable?
• Decrease frequency of freebies, make reward 50% off instead of free cut, etc.
2. Instead of the loyalty program, your friend is considering introducing a membership-based pricing. In this system, a customer would pay a set price every month for unlimited haircuts. What are pros and cons of such a system, and if it was implemented,how would you think about setting the price?
• Pros (more predictable revenue stream, potentially increased data on customers, differentiation)
• Cons (adverse selection likely to occur with only customers who would overuse membership signing up, potentially unhappy employees if tips reduce based on different payment scheme)
3. One key to success will be finding quality employees without having to pay as high of a base wage as high end competition. What are some possible methods of attracting and retaining talent in this scenario?
• Possible options: more flexible work schedule, end of year profit sharing to make employees feel invested in store’s success,finding rising stars in the lower end market who haven’t had the chance to move to the high-end yet, etc.

33
Busch’s Barber Shop
Part 6
6. Provide client recommendation
Overall:
• Your friend should choose the downtown location for starting his new barbershop without the loyalty program.
• Projected first year profits of ~$430k
• Implementing free 10th haircut results in decreased revenue at current growth expectations.
Risks:
• Numbers assume immediate customers acquisition: unrealistic without effective marketing campaign.
• Competitive response: high end stores may offer discounts or decrease price if they experience large loss of customers, although, projected market steal from this segment is only 5%, unlikely to cause drastic response.
• Customers might not find quality increase enough to justify increased price compared to other low-end options.
• Opportunity costs: what other business options could your friend be pursuing with his saved capital? Are there other locations better suited than Evanston? Would it be more efficient to buy a current existing shop instead of starting a new one?
Next steps:
• Perform due diligence on buying an existing shop.
• Perform more extensive customer surveys to confirm existing projections.
• Research how to hire qualified barbers to meet expectations of improved quality compared to low level shops.
• Sign lease, purchase equipment, bring on advisor (since friend has no previous experience), develop marketing strategy.
• Evaluate changes to proposed loyalty program to improve profitability.

34
Case author(s): Peter Manoogian (Kellogg 2012)Edited by: Rohan Maini (Kellogg 2020)
Case 02
Chic Cosmetology
Primary sector(s)
• X09 Hospitality & Leisure
Concepts tested
• Z03 Breakeven analysis (1)
• Z12 Creativity (2)
• Z07 Market share (3)
Similar cases
• Busch’s Barber Shop (Kellogg 2020)
• Yumy Co (Yale 2012)
Case type
• Y04 Market entry

35
Chic Cosmetology
Interviewer guide
Case prompt
• Our client is a for-profit, specialty college named Chic Cosmetology University (CCU). Founded in 2005, CCU is a program for high school graduates seeking their professional cosmetology license. CCU is currently the market leader for cosmetology educationwith campuses in ten major metropolitan areas in the US.
• CCU has capital to invest in a new campus and is considering Chicagoland as a location – should they do it?
Interviewer guide
• Problem: Will CCU be able to enroll enough students to offset the initial investment and achieve positive profit?
• Key case steps:
1. Evaluate CCU revenue and cost structures
2. Brainstorm CCU customers
3. Project CCU’s market share
4. Provide client recommendation
• Note: It is critical that the interviewee lands on the figures presented (or is course corrected toward them before proceeding)

36
Chic Cosmetology
Case prompt
• Our client is a for-profit, specialty college named Chic Cosmetology University (CCU). Founded in 2005, CCU is a program for high school graduates seeking their professional cosmetology license. CCU is currently the market leader for cosmetology educationwith campuses in ten major metropolitan areas in the US.
• CCU has capital to invest in a new campus and is considering Chicagoland as a location – should they do it?
Clarifying information
• Goal: Achieve positive operating profit for the new campus two years after opening
• Format: Enrolled students take classes at a physical campus for one school year to earn degree (FY begins on 9/1)
• Reputation: CCU has the best campuses and equipment in the industry, and boasts strong job placement into top local slaons
• Growth: CCU and industry enrollments growing at 5% per year
• Competitors: 2-3 other large specialty colleges, and lower-cost community colleges
• Industry: H.S. Diploma and cosmetology degree required to enter the field
• Students: 98% of cosmetologists are women
Fit: What would be the hardest part about starting at our firm?

Chic Cosmetology
Exhibit A – CCU 2010 financials (31-Aug-2010)
Student enrollments (all campuses) 10Revenue from enrollments $150,000
Total fixed campus costs $48,000Buildings and equipment $32,000Recruiting, general, and administrative $16,000
Total variable campus costs $80,000Instructors $40,000Student supplies $40,000
Operating profit $22,000
Notes:
• All units in ‘000s
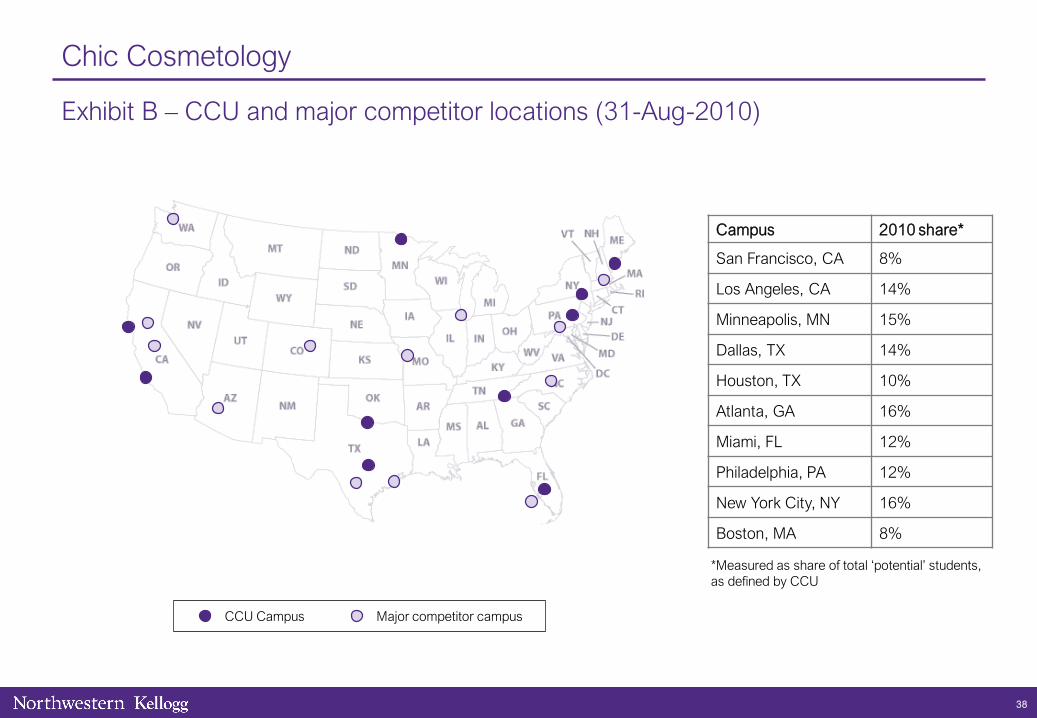
38
Chic Cosmetology
Exhibit B – CCU and major competitor locations (31-Aug-2010)
Campus 2010 share*
San Francisco, CA 8%
Los Angeles, CA 14%
Minneapolis, MN 15%
Dallas, TX 14%
Houston, TX 10%
Atlanta, GA 16%
Miami, FL 12%
Philadelphia, PA 12%
New York City, NY 16%
Boston, MA 8%
*Measured as share of total ‘potential’ students, as defined by CCU
CCU Campus Major competitor campus

39
Chic Cosmetology
Part 1
1. Evaluate CCU revenue and cost structures
• How many students will CCU need to break-even in year 1?
• If asked, the investment initial Chicagoland campus cost is $4.5M in initial building costs to renovate its chosen site. These costs can be amortized evenly over a three year period. Assume fixed costs remain flat per year.
• Interviewee should calculate
• Total fixed costs per year = $6.3M ($4.8M + $1.5M from amortization).
• Gross profit per student = $7K
• Average revenue per enrollment = $15K (revenue / total enrollments)
• Total annual fixed cost per campus = $4.8M ($48M / 10)
• Total variable cost per student = $8K ($80M / 10K)
• Gross profit per student = $7K ($15K - $8K)
• Break-even number of enrollments per year = 900 ($6.3M / $7K)
• Next step: Interviewee should tackle the overall opportunity in the area and how many year 1 enrollments CCU could expect
Provide Exhibit A after interviewee asks about revenues or costs

40
Chic Cosmetology
Part 2
2. Brainstorm CCU customers
• What types of schools / students do you think CCU targets?
• Possible responses (schools):
• Public schools (private HS more likely to have grads go to 4yr univ)
• HS’s in middle-class cities (may be an affordability issue w/lo income)
• Closest to the campus (geography)
• Possible responses (students)
• Female HS graduates
• Not attending 4yr college
• Interested in cosmetology
• After a few of the above criteria are noted, share:
• CCU has identified 1,000 targeted high schools in the Chicagoland area
• Within these HS, CCU’s market research estimates that on average 6 students per HS have “potential” for CCU enrollment

41
Chic Cosmetology
Part 3
3. Project CCU’s market share
• 80% of enrolled students come directly from high school, the other 20% of students come from the “Adult” market
• What is the highest share we could expect CCU Chicago to capture in Y1?
• Campuses w/competitors present tend to have a lower share (10%) than those w/out (15%)
• However, presence of >1 competitor does not have an increased negative impact on market share (Boston has 8% share w/only one competitor)
• Interviewee should assume a projected 10% market share for a Chicago campus (one competitor)
• 10% market share equals 750 enrollments
• Takeaway: CCU cannot break even based on the enrollment number estimated
Provide Exhibit B to the interviewee

42
Chic Cosmetology
Part 4
4. Provide client recommendation
• Overall, our client should NOT enter the Chicago market under the current cost structure. Even with a 10% market share assumption in year 1, the Chicago campus will enroll only 750 students, this is 150 fewer than the 900 required to break-even.
• The client should also consider several qualitative issues:
• Consider offering scholarships to increase the number of potential students and/or conversion rate of potential students
• Consider other cities beyond Chicagoland that currently do not have a CCU presence, or add a second campus to a city such as NYC that has high market share and potentially low capacity
• Perform market research in other cities to understand if there is a greater potential per target high school to increase ROI
• Consider ways to reduce fixed costs (e.g., transporting equipment / materials from campuses that are not at capacity)
• Strong interviewees identify several of the qualitative issues listed above as ways in which CCU could proceed
• Outstanding interviewees will recognize that the 10% market share is for campuses that have been in place for at least three years, therefore Chicago is unlikely to achieve that share in year 1 or 2; this rules out the feasibility of the follow-up question that suggests the possibility of reducing the one-time investment from $4.5M to $300K.

43
Case authors: John Ng (Kellogg 2018)Edited By: Michael Eidem (Kellogg 2020)
Case 03
Chicouver Cycle
Primary sector(s)
• X15 Transportation & Logistics
Concepts tested
• Z12 Creativity (1)
• Z02 Net Present Value (2)
• Z03 Breakeven analysis (3)
Similar cases
• Fast Food Co. (Columbia 2017)
• Duck Island Beer Co. (Fuqua 2016)
Case type
• Y04 New product / Market entry

44
Chicouver Cycle
Case prompt
• Our client, Chicouver Cycle (pronounced “Chai-cover”), is a bikesharing startup. Like other bikeshare operators in cities around the world, Chicouver Cycle owns bicycles and rents them out to users one trip at a time.
• Chicouver Cycle wants to know how they should launch operations in the city of Chicouver. They have specifically asked us to recommend one or more of Chicouver’s neighborhoods to enter.
Interviewer guide
• This case test the interviewee’s ability to move beyond the typical market entry framework to consider practical issues of launching a sharing economy business.
• Key case steps:
1. Develop a structure to address the problem - identify factors for comparing different neighborhoods as potential launching grounds.
2. Analyze cost and revenue drivers for different neighborhoods and trip types.
3. Compute profitability for different operating models (docking versus dockless bikeshare systems)
4. Provide client recommendation
Interviewer Guide

45
Chicouver Cycle
Case prompt
• Our client, Chicouver Cycle (pronounced “Chai-cover”), is a bikesharing startup. Like other bikeshare operators in cities around the world, Chicouver Cycle owns bicycles and rents them out to users one trip at a time.
• Chicouver Cycle wants to know how they should launch operations in the city of Chicouver. They have specifically asked us to recommend one or more of Chicouver’s neighborhoods to enter.
Clarifying information
• Customers: Chicouver residents are avid bicyclists. The city is also a popular tourist destination
• Competitive Dynamics: There is currently no existing bikeshare system in Chicouver.
• Company: Our client wants to generate cash from initial launch to fund further growth. Profitability is important.
• Product: Most bikeshare systems charge $1 per trip. Our client will charge the same. Our client is choosing between two models of bikesharing systems: docking and dockless.
• Other: The city of Chicouver has worked with other sharing economy platforms before; permitting will not be an issue. Chicouver has reasonable weather for biking all year round.
Fit: You’re interviewing for a generalist role, however, are there particular industries or functions that you’re especially interested in?

46
Chicouver Cycle
Exhibit A – Chicouver’s Neighborhoods
1 mile
Population density
Low High
Wetlands
Swanville
Bayside Heights
Capitol Hill
Historic District
Nightlife District
Recreation District
CBD
Ritzy residential neighborhood, home to Chicouver’s titans of industry
Chicouver’s main tourist district
Popular with locals Monday through Saturday
Business district where all of Chicouver’s residents
commute to work
Gyms, museums, nature parks frequented by local
residents after work
Newly gentrified residential neighborhood popular with
young professionals
Mid-income residential neighborhood for
Chicouver’s working adults
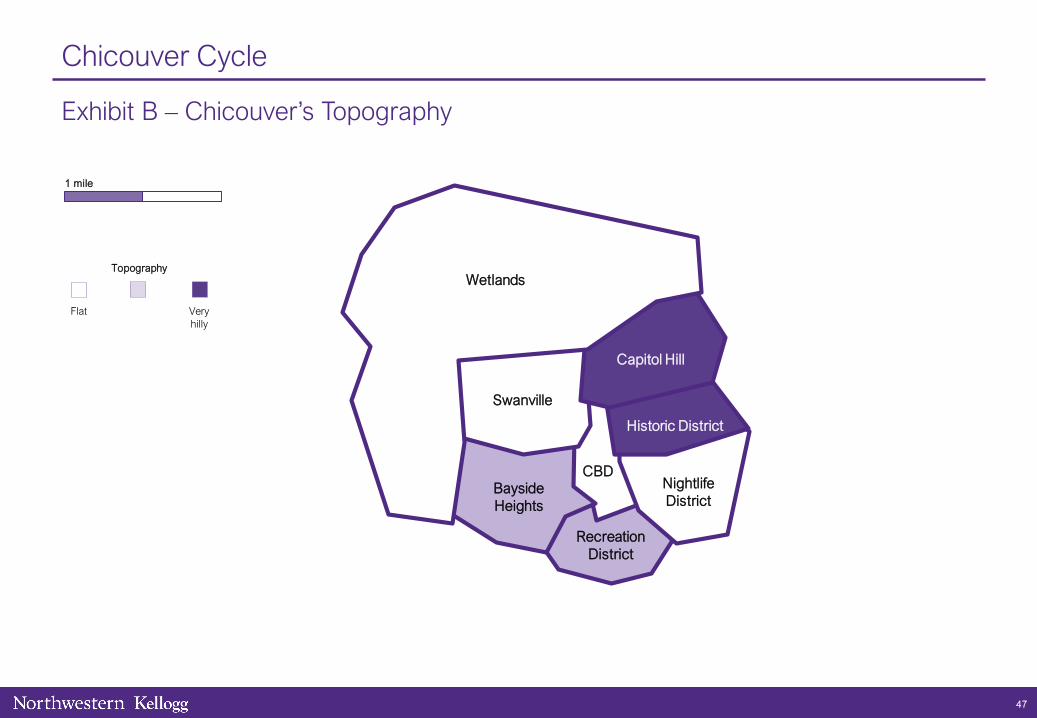
47
Chicouver Cycle
Exhibit B – Chicouver’s Topography
1 mile
Topography
Flat Veryhilly
Wetlands
Swanville
Bayside Heights
Capitol Hill
Historic District
Nightlife District
Recreation District
CBD

48
Chicouver Cycle
Exhibit C – Projections by Type of Bikeshare Trip
Trip TypeExpected No. of
Trips Per Week (K)No. of Bikes Needed to Meet Demand (K)
Utilization (%)
Commuting 500 50 4%
Tourism 400 5 24%
Recreation 300 4 22%
Nightlife 600 30 7%
Notes:
• Utilization = # hours bike is used each week / total # hours in a week

49
Exhibit D – Bikeshare Systems
Chicouver Cycle
DOCKING System DOCKLESS System
Users must start and end trips at a
docking station.Users pick up any available bike and end a trip
anywhere within the service area.

50
Chicouver Cycle
Exhibit E – Projected Costs
Costs Docking System Dockless System
Annual cost per bike $200 $200
Annual cost per docking station* $10,000 n/a
Annual distribution cost per bike
Flat $100 $200
Moderately Hilly $500 $1,000
Very Hilly $2,000 $4,000
*Notes:
• Each docking station holds 20 bikes
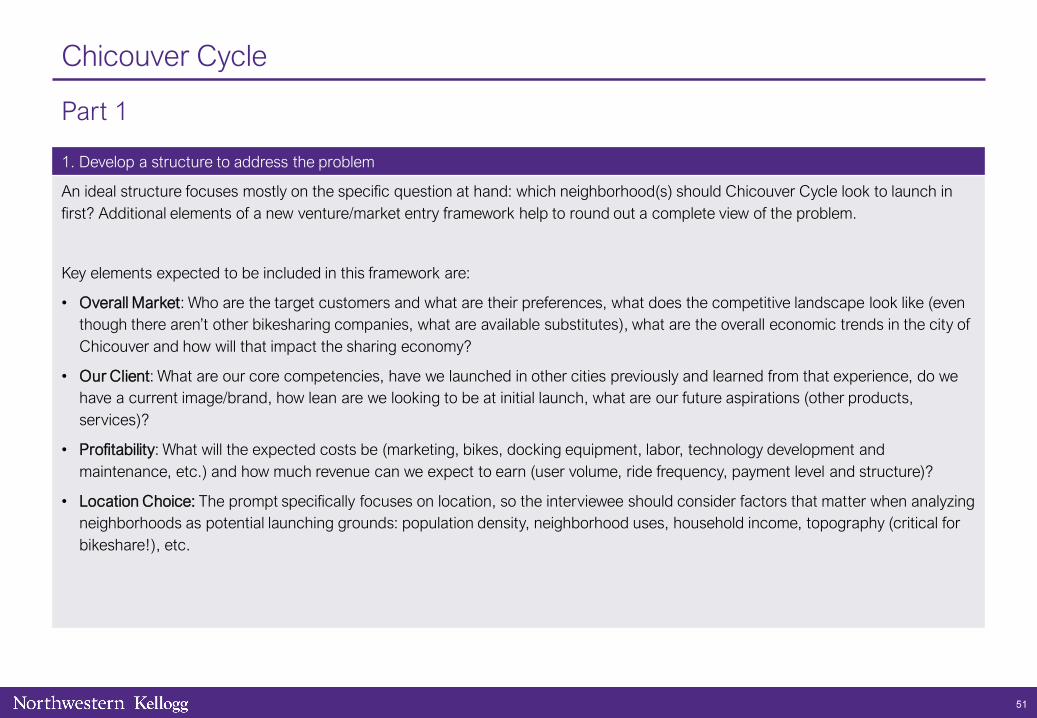
51
Chicouver Cycle
Part 1
1. Develop a structure to address the problem
An ideal structure focuses mostly on the specific question at hand: which neighborhood(s) should Chicouver Cycle look to launch in first? Additional elements of a new venture/market entry framework help to round out a complete view of the problem.
Key elements expected to be included in this framework are:
• Overall Market: Who are the target customers and what are their preferences, what does the competitive landscape look like (even though there aren’t other bikesharing companies, what are available substitutes), what are the overall economic trends in the city of Chicouver and how will that impact the sharing economy?
• Our Client: What are our core competencies, have we launched in other cities previously and learned from that experience, do we have a current image/brand, how lean are we looking to be at initial launch, what are our future aspirations (other products,services)?
• Profitability: What will the expected costs be (marketing, bikes, docking equipment, labor, technology development and maintenance, etc.) and how much revenue can we expect to earn (user volume, ride frequency, payment level and structure)?
• Location Choice: The prompt specifically focuses on location, so the interviewee should consider factors that matter when analyzing neighborhoods as potential launching grounds: population density, neighborhood uses, household income, topography (critical for bikeshare!), etc.

52
Chicouver Cycle
Part 2
2. Analyze cost and revenue drivers for different neighborhoods and trip types.
After discussing initial framework, when interviewee raises questions regarding how to evaluate which neighborhood to enter…
• There is a lot of info in Exhibit A: population density, what takes place in each neighborhood, and who is in each neighborhood.
• There are 3 residential neighborhoods where people commute from home to work in CBD. After work, residents travel from the CBD to the recreation and nightlife districts. Tourists tend to stay within the historic district.
• Terrain matters: it’s easier to bike on flat terrain than hilly terrain, and this may affect our revenues or our costs.
• Interviewee should discuss how these different characteristics of neighborhoods affect the attractiveness of each for market entry.
• Interviewee may need help seeing that there are different types of trips taking place within and between neighborhoods.
• Exhibit C lays out 4 types of trips that people take in Chicouver. Interviewee may note that while commuting and nightlife have the greatest number of trips, they require many bikes to provide an acceptable level of service, leading to low utilization.
• No calculations needed at this time, but interviewee should raise issue of revenues and costs. If asked about revenues, tell interviewee that our client will charge $1 per trip. When asked about costs, ask interviewee to quickly brainstorm major cost items.
Provide Exhibit A & B
Provide Exhibit C

53
Chicouver Cycle
Part 3
3. Compute profitability for different operating models (docking versus dockless bikeshare systems)
• When the interviewee raises the need to look at costs and revenues…
Calculate revenue and costs for each distinct trip type to determine which neighborhoods should be targeted:
• Revenue = ($1) * (# of weeks) * (# of trips) (Assume 50 weeks in a year)
• Cost of bikes = ($200) * (# bikes)
• Number of stations = (# bikes) / 20 Cost of Stations = ($10,000) * (# stations)
• Distribution costs = (distribution costs) * (# bikes)
Provide Exhibit D & E
Type # Trips
# Bikes
Terrain Revenue Bike Cost # Stations Station Cost Dist. Cost (docking)
Dist. Cost (dockless)
Docking Profits Dockless Profits
Commute 500 50K All 3 (use flat)
$1 * 500K * 50 = 25M
$200 * 50K = 10M
50K / 20 = 2500
2500 * $10K = 25M
$100 * 50K = 5M
5M * 2 = 10M
25 – 10 – 25 – 5 = -15M
25 – 10 – 10 = 5M
Tourism 400 5K Very hilly $1 * 400K * 50 = 20M
$200 * 5K = 1M
5K / 20 = 250
250 * $10K = 2.5M
$2000 * 5K = 10M
10M * 2 = 20M
20 – 1 – 2.5 – 10 = 6.5M
20 – 1 – 20 = -1M
Recreation 300 4K Moderate $1 * 500K * 50 = 15M
$200 * 4K = 0.8M
4K / 20 = 200
200 * $10K = 2M
$500 * 4K = 2M
2M * 2 = 4M
15 – 0.8 – 2 – 2 = 10.2M
15 – 0.8 – 4 = 10.2M
Nightlife 600 30K Flat $1 * 500K * 50 = 30M
$200 * 30K = 6M
30K / 20 = 1500
1500 * $10K = 15M
$100 * 30K = 3M
3M * 2 = 6M
30 – 6 – 15 – 3 = 6M
30 – 6 – 6 = 18M
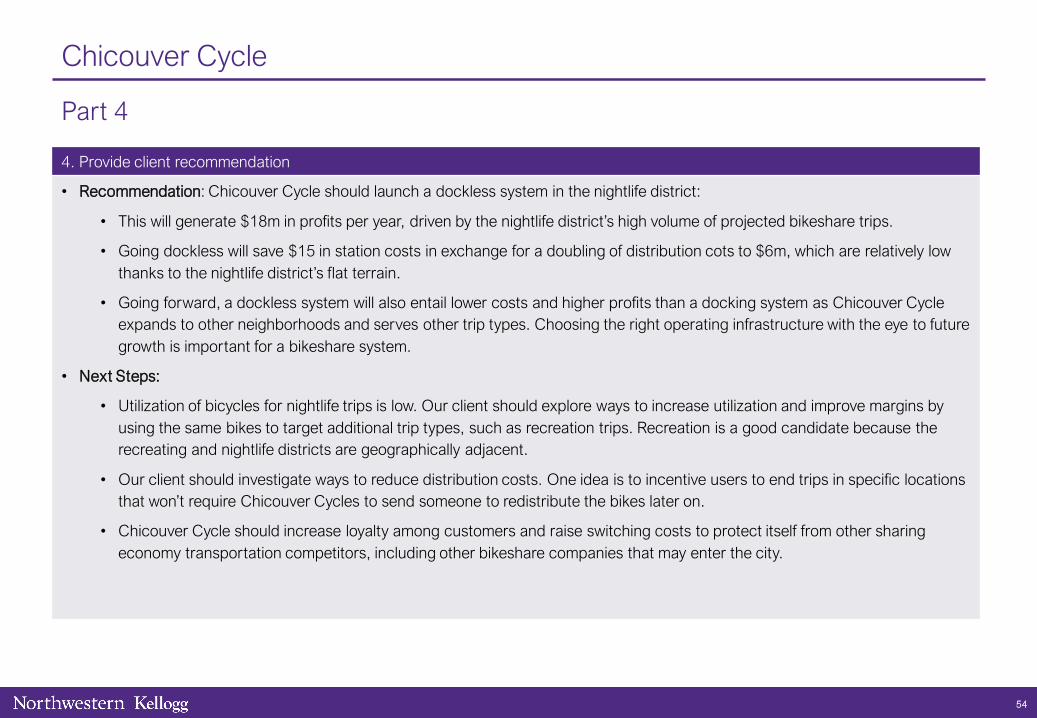
54
Chicouver Cycle
Part 4
4. Provide client recommendation
• Recommendation: Chicouver Cycle should launch a dockless system in the nightlife district:
• This will generate $18m in profits per year, driven by the nightlife district’s high volume of projected bikeshare trips.
• Going dockless will save $15 in station costs in exchange for a doubling of distribution cots to $6m, which are relatively low thanks to the nightlife district’s flat terrain.
• Going forward, a dockless system will also entail lower costs and higher profits than a docking system as Chicouver Cycle expands to other neighborhoods and serves other trip types. Choosing the right operating infrastructure with the eye to future growth is important for a bikeshare system.
• Next Steps:
• Utilization of bicycles for nightlife trips is low. Our client should explore ways to increase utilization and improve margins by using the same bikes to target additional trip types, such as recreation trips. Recreation is a good candidate because the recreating and nightlife districts are geographically adjacent.
• Our client should investigate ways to reduce distribution costs. One idea is to incentive users to end trips in specific locations that won’t require Chicouver Cycles to send someone to redistribute the bikes later on.
• Chicouver Cycle should increase loyalty among customers and raise switching costs to protect itself from other sharing economy transportation competitors, including other bikeshare companies that may enter the city.

55
Case author(s): Sean Burrow (Kellogg 2011)Edited by: Eugene Kim (Kellogg 2015), Rohan Maini (Kellogg 2020)
Case 04
Dark Sky
Primary sector(s)
• X01 Aerospace & Defense
Concepts tested
• Z12 Creativity (1)
• Z05 Elasticity (2)
• Z14 Pricing strategy (2)
Similar cases
• Fruit Cart Vendor (Stern 2012)
• Sgt. Slaughter (Fuqua 2010)
• Ice Cream Dream (Darden 2016)
Case type
• Y04 New product / Market entry

56
Dark Sky
Case prompt
• Our client, Dark Sky, is a small manufacturer of unmanned (ie. remotely piloted) data collection aircraft.
• Dark Sky produces the Assessor, an aircraft originally designed for unmanned weather exploration.
• In 2006, the United States military began purchasing Assessors for use in Intelligence, Surveillance and Reconnaissance (ISR)missions. The Assessor is profitable, but sales have stagnated and the client wishes to grow.
• What are some steps Dark Sky could take to achieve growth?
Interviewer guide
• This case intentionally uses terminology that may not be familiar to the typical MBA student. This is meant to challenge the interviewee to dismiss superfluous information and to focus on the business problem.
1. Analyze historical growth and brainstorm growth strategies
2. Explore attractiveness of prototype products
3. Brainstorm other product selection considerations
4. Provide client recommendation
Interviewer guide

57
Dark Sky
Case prompt
• Our client, Dark Sky, is a small manufacturer of unmanned (ie. remotely piloted) data collection aircraft.
• Dark Sky produces the Assessor, an aircraft originally designed for unmanned weather exploration.
• In 2006, the United States military began purchasing Assessors for use in Intelligence, Surveillance and Reconnaissance (ISR)missions. The Assessor is profitable, but sales have stagnated and the client wishes to grow.
• What are some steps Dark Sky could take to achieve growth?
Clarifying information
• Customer / Price: Dark Sky’s only customer is the US Military, with which they have a Cost-Plus-Fixed-Fee contract. The contract has been extended in the past and is up for renegotiation; the Military has agreed to a marginal inflationary price increase
• Company: Dark Sky has additional capacity to manufacture. They are too small to acquire competitors.
• Product: Dark Sky designs a unique aircraft that is launched from a catapult device; the aircraft can be launched from ships at sea or from harsh terrain (e.g. desert, mountains). Dark Sky only sells the Assessor, but has other prototypes designed.
• Competition: There are approximately 20 competitors that manufacture unmanned aircraft.
Fit: What is your greatest weakness? Tell me about a team experience when you where hampered by this weakness.

58
Dark Sky
Exhibit A – Historical revenue (2014 – 2019)
Revenue($ millions)
0.0
1.0
2.0
3.0
4.0
5.0
2014 2015 2016 2017 2018 2019

59
Dark Sky
Exhibit B – New product sales forecast (2020)
New Product Sales(units sold)
New Product Offering
Navy Army Price Per Aircraft
SeaBird 50 -- $220,000
SandBird -- 60 $210,000
JointBird 38 52 $180,000

60
Dark Sky
Exhibit C – Impact of new product on existing sales (2020)
New Product Sales(units sold)
New Product Offering
Navy Army Price Per AircraftAssessor unit sales lost
(cannibalized)
SeaBird 50 -- $220,000 40%
SandBird -- 60 $210,000 70%
JointBird 38 52 $180,000 90%

61
Dark Sky
Part 1
1. Analyze historical growth and brainstorm growth strategies
• The military started purchasing the Assessor in 2016. The price of the aircraft has remained constant at $100,000 per unit. Throughout the past decade, The Assessor has been Dark Sky’s only source of revenue.
• How many units were sold in 2019 and what was the growth rate from 2015 to 2019? How could Dark Sky grow?
• How many units were sold in 2019?
• $5,000k ÷ $100k/unit = 50 units
• What was the growth rate from 2015 to 2019?
• ($5,000k - $500k) ÷ ($500k ) x 100 = 900%
Provide Exhibit A when the interviewee asks about revenue
Organic Inorganic
• Increase penetration with US military
• Product development – develop new products for the military
• New market entry to new markets or customers
• Increase / reduce prices (based on demand elasticity)
• Joint Venture – to increase market accessibility or product offering.
• M&A – add additional capacity and/or products.

62
Dark Sky
Part 2a
2a. Explore attractiveness of prototype products
• Dark Sky has developed several aircraft prototypes designed specifically for military missions. The company has the capability to continue producing the Assessor and to introduce one new aircraft.
• To maximize short-term growth, which aircraft should Dark Sky produce?
• To calculate the revenue for each scenario, the interviewee should add Assessor sales to the sales of the new product.
• Assessor sales are based on:
• 50 units sold with no new product launch
• Cannibalization forecast specific to each new product launch
• $110,000 per aircraft
• New product sales can be easily calculated using shortcuts. For example:
• SeaBird: $220k * 100 = $22m… then half of this
• SandBird: $210k * 100 = $21m… then half of it and add (10% of $21m)
• JointBird: Add to get 90… then $180k*100 = $18m, subtract (10% of $18m)
Provide Exhibit B after Exhibit A asks about new products
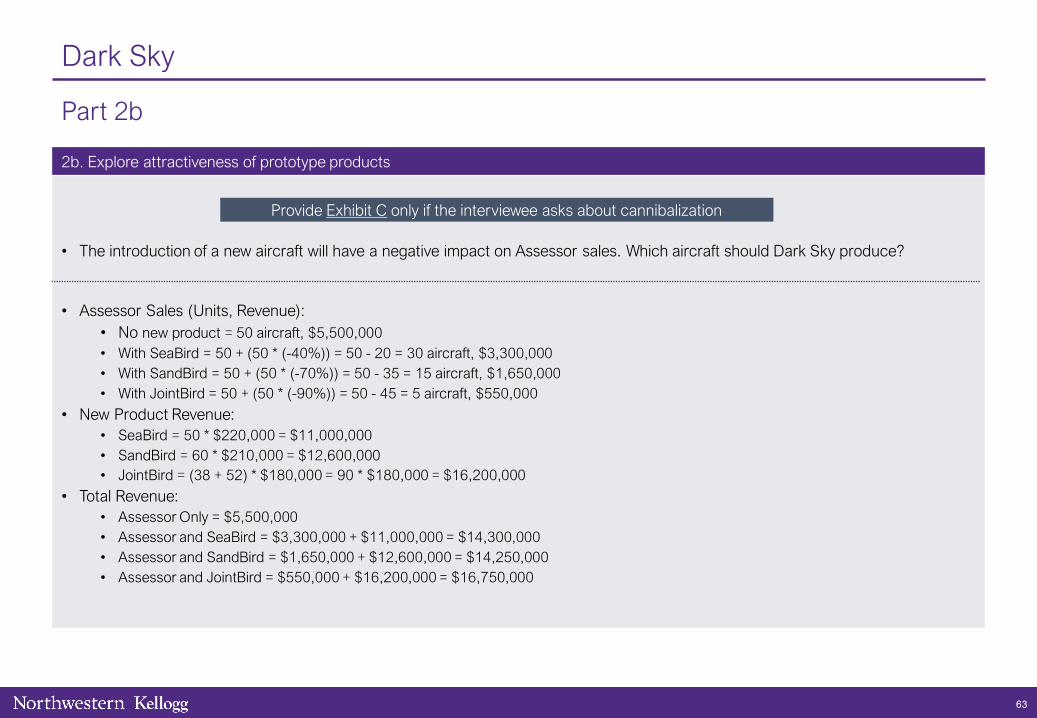
63
Dark Sky
Part 2b
2b. Explore attractiveness of prototype products
• The introduction of a new aircraft will have a negative impact on Assessor sales. Which aircraft should Dark Sky produce?
• Assessor Sales (Units, Revenue):• No new product = 50 aircraft, $5,500,000 • With SeaBird = 50 + (50 * (-40%)) = 50 - 20 = 30 aircraft, $3,300,000 • With SandBird = 50 + (50 * (-70%)) = 50 - 35 = 15 aircraft, $1,650,000 • With JointBird = 50 + (50 * (-90%)) = 50 - 45 = 5 aircraft, $550,000
• New Product Revenue:• SeaBird = 50 * $220,000 = $11,000,000 • SandBird = 60 * $210,000 = $12,600,000 • JointBird = (38 + 52) * $180,000 = 90 * $180,000 = $16,200,000
• Total Revenue: • Assessor Only = $5,500,000 • Assessor and SeaBird = $3,300,000 + $11,000,000 = $14,300,000 • Assessor and SandBird = $1,650,000 + $12,600,000 = $14,250,000 • Assessor and JointBird = $550,000 + $16,200,000 = $16,750,000
Provide Exhibit C only if the interviewee asks about cannibalization

64
Dark Sky
Part 3
3. Brainstorm other product selection considerations
• If the candidate doesn’t start by listing other considerations relevant to selection of a new aircraft, as them to brainstorm.
Development
• Speed: How quickly could Dark Sky start manufacturing a third model (i.e. can Dark Sky produce SandBird this year, and be producing SandBird and SeaBird the following year)? If so, what are the revenue implications?
• Costs: How profitable are the four aircraft models in comparison? Note: Because Dark Sky has a Cost-Plus-Fixed-Fee contract, profitability for each aircraft is likely equivalent. For this reason, Dark Sky should focus on maximizing the number of aircraft sold. • How much and how long is the payback period for the investment in manufacturing each type aircraft?
Portfolio
• If Dark Sky produces JointBird, is $550,000 in Assessor revenue worth the associated cost to produce the aircraft? Should resources be allocated to another project?
Customer
• Potential benefits of have two customer bases for new product (Navy and Army).

65
Dark Sky
Part 4
4. Provide client recommendation
• Based on 2020 forecasted revenue alone, Dark Sky should introduce the JointBird to the US Military in order to boost growth.
• Among the three new prototype product, the JointBird is forecasted to maximize short-term revenue
• However, there are several connected issues that Dark Sky should consider to include profitability, long-term revenue forecasts,competitive response, etc.
• Excellent interviewees will identify cannibalization as a consideration before beginning revenue calculations

Primary sector(s)
• X12 Retail & CPG
• X13 Technology
66
Concepts tested
• Z10 Customer strategy (2)
• Z10 Marketing strategy (3)
• Z12 Creativity (3)
• Z08 Market sizing (4)
Case authors: Shobhit Chugh (Kellogg ’11)Edited By: Adam Louras (Kellogg 2011), Rohan Maini (Kellogg 2020)
Case 05
DigiBooks
Similar cases
• Heavy Things Fitness (Fuqua 2014)
• High Peaks Jacket (Tuck 2009)
• Termite Control (Ross 2005)
Case type
• Z04 New product / Market entry
Interviewer-led

67
DigiBooks
Case prompt
• Our client, DigiBooks, is a manufacturer and seller of electronic book readers (tablets). DigiBooks also distributes e-books for the tablets through their website. The tablet is only compatible with books sold through the DigiBooks site.
• DigiBooks is planning the launch of its tablets in a country where no electronic book readers are currently sold. Only 1% of thepopulation has ever used an electronic book readers, though 50% is aware of the concept. The Chief Marketing Officer of DigiBooks has come to you to help determine:
• What factors should DigiBooks consider when launching and marketing DigiBook tablets in this new country?
Interviewer guide
• Problem: How should DigiBooks enter this new market?
• Key case steps
1. Develop a problem-solving structure
2. Analyze customer segments
3. Brainstorm market entry considerations
4. Estimated profits to identify optimal sales channel
5. Provide CEO recommendation
Interviewer Guide

68
DigiBooks
Case prompt
• Our client, DigiBooks, is a manufacturer and seller of electronic book readers (tablets). DigiBooks also distributes e-books for the tablets through their website. The tablet is only compatible with books sold through the DigiBooks site.
• DigiBooks is planning the launch of its tablets in a country where no electronic book readers are currently sold. Only 1% of thepopulation has ever used an electronic book readers though 50% is aware of the concept. The Chief Marketing Officer of DigiBooks has come to you to help determine:
• What factors should DigiBooks consider when launching and marketing DigiBook tablets in this new country?
Clarifying information
• Industry Definitions: Electronic book readers: Is a software, hardware and network platform that utilizes wireless connectivity to enable users to shop for, download, browse, and read e-books, newspapers, magazines, blogs, and other digital media.
• Client Characteristics: DigiBook’s Tablet: Uses an e-ink electronic paper display that features 16 shades of grey. This allows for a 12 hour long battery life and easy readability.
• Locations: DigiBook has never sold a product outside of the US.
• Competitive Dynamics: No competitors in the e-book or tablet space plan to enter this country
• Market Characteristics: Total population of the country 76MM, high literacy level
Experience: Tell me about a time that you lead a time to meet an aggressive deadline.

DigiBooks
Exhibit A – Market segments
1510
5
$200
$125
$175
0
50
100
150
200
250
0
5
10
15
20
25
Super Readers (SR) Occasional Readers (OR) Rare Readers (RR)
Books per year
eReader WTP
SegmentSuper Readers
(SR)Occasional Readers
(OR)Rare Readers
(RR)
Population 8M 20M 10M
69

70
DigiBooks
Exhibit B – Channel decisions
Channel Reach as a % of Total potential market
E book Gross Margin %
E-reader Gross Margin %
Penetration Overheads
Retail 50% 50% 30% 40% $20M
Internet 50% 50% 60% 10% $10M
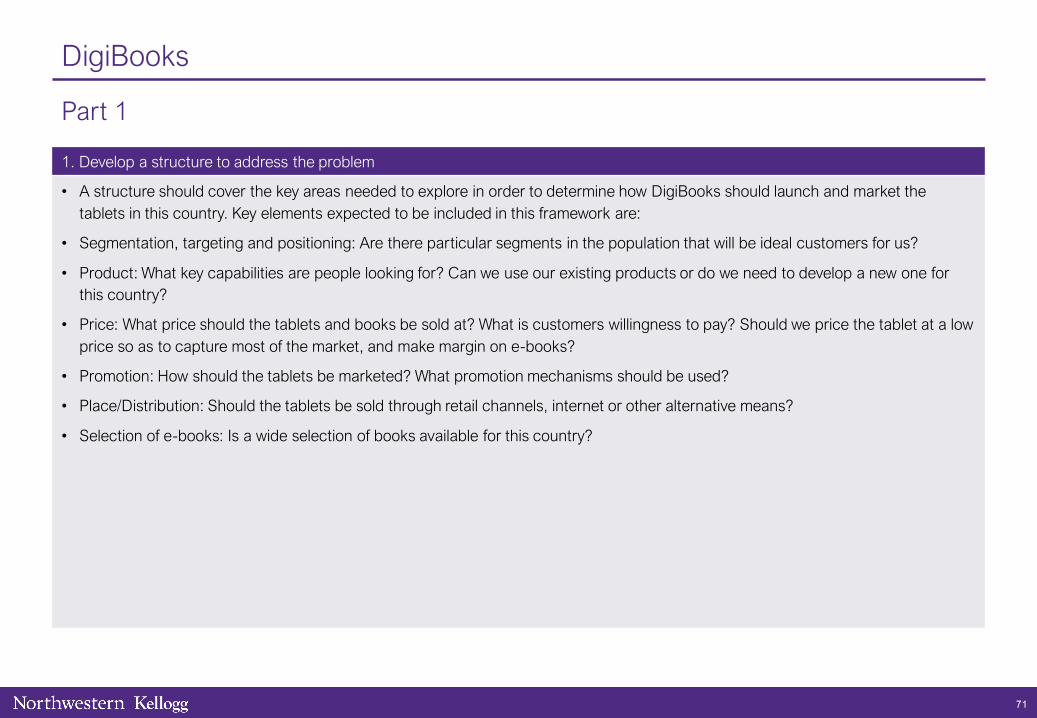
71
DigiBooks
Part 1
1. Develop a structure to address the problem
• A structure should cover the key areas needed to explore in order to determine how DigiBooks should launch and market the tablets in this country. Key elements expected to be included in this framework are:
• Segmentation, targeting and positioning: Are there particular segments in the population that will be ideal customers for us?
• Product: What key capabilities are people looking for? Can we use our existing products or do we need to develop a new one for this country?
• Price: What price should the tablets and books be sold at? What is customers willingness to pay? Should we price the tablet at a low price so as to capture most of the market, and make margin on e-books?
• Promotion: How should the tablets be marketed? What promotion mechanisms should be used?
• Place/Distribution: Should the tablets be sold through retail channels, internet or other alternative means?
• Selection of e-books: Is a wide selection of books available for this country?

72
DigiBooks
Part 2
2. Analyze customer segments
• Through research, we found several segments. We are only able to target one segment with our product.
• Using a 3-year projection, which segment should DigiBook target?
• If unclear, the interviewee should answer based on Revenue Potential (i.e. Ignore probability of purchase) assuming all tablet sales happen immediately (Ignore TVM).
• The missing data is that the average price of an e-book is $10, for each of the segments, and that e-books and tablets have the same margin
• Using Exhibit A, interviewee should calculate:
• SR Revenue = [(15 books x $10 X 3 Years) + ($200 x 1 tablet)] x 8M People = $5.2B
• OR Revenue = [(10 books x $10 x 3 Years) + ($125 x 1 tablet)] x 20M People = $8.5B
• RR Revenue = [(5 books x $10 x 3 Years) + ($175 x 1 tablet)] x 10M People = $3.25B
• Takeaway: Segment to be targeted = Occasional Readers (OR) with a Revenue Potential of $8.5B
Provide Exhibit A

73
DigiBooks
Part 3
3. Brainstorm market entry considerations
• DigiBooks is now considering how it should sell its e-book readers: through retail stores or through the internet.
• How would you go about evaluating this decision?
• Takeaway: We should do some sort of financial analysis to determine which channel is more attractive.
Pros Cons
Ret
ail
• Should encourage trial of the product
• Retailers can help with joint marketing campaigns
• Retailers can help with customer service, returns
• Lower margin due to value chain expansion
• Will take time and money to set up and adds training costs
Inte
rnet • Likely cheaper to establish, will result in
higher margins• Hard to encourage trial

74
DigiBooks
Part 4
4. Estimated profits to identify optimal sales channel
• Based on revised market estimates, we decided to price the e-reader at $100 and target the Occasional Reader segment.
• Using this information and Exhibit B, can you estimate the profit potential of each of these sales channels? Which should we choose?
• What segment would you recommend to your client?
• If unclear, the interviewee should answer this with a 1-year Profitability calculation for each of the Sales Channels and back out the Upfront Investment. They should ignore all other costs.
• There is no missing data; however, the Market Size of 20M people in the OR segment is needed from Exhibit A and the price per e-book of $10.
• Using Exhibit B, interviewee should calculate:
• Retail Profit = [(10 Books x $10/book x 50%) + ($100/tablet x 30%)] x (20M People x 50% reach X 40% Penetration) = $320M -$20M = $300M
• Internet Profit = [(10 Books x $10/book x 50%) + ($100/tablet x 60%)] x (10M People x 10% Penetration) = $110M - $10M = $100M
• Takeaway: Sales Channel to Use = Retail with a profit of $300M
Provide Exhibit B
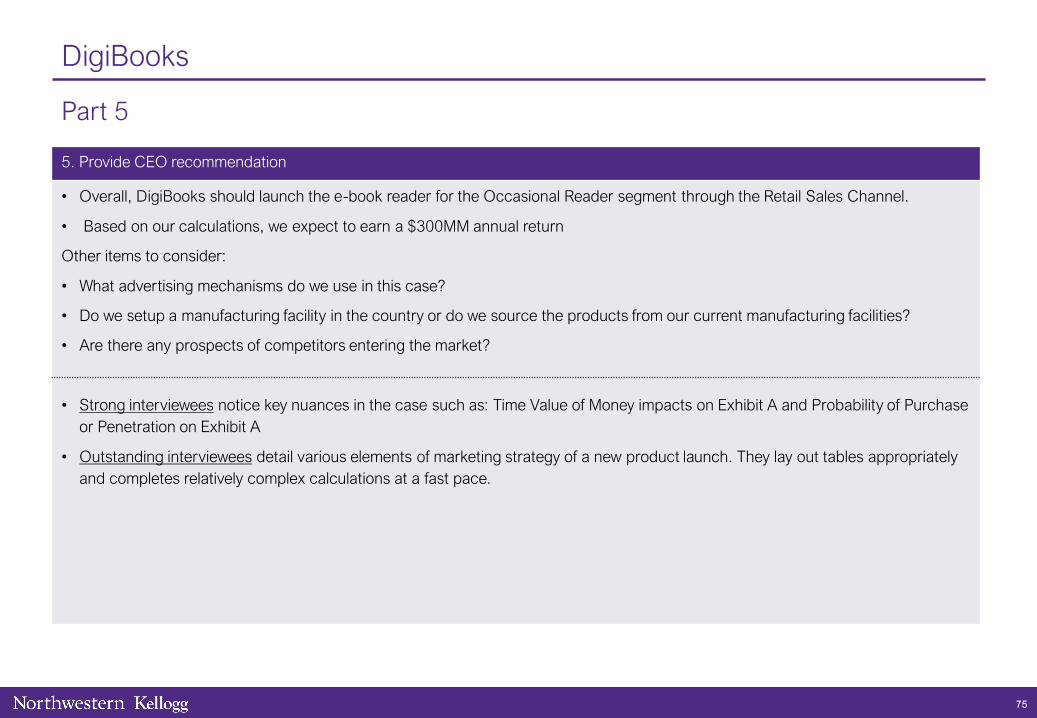
75
DigiBooks
Part 5
5. Provide CEO recommendation
• Overall, DigiBooks should launch the e-book reader for the Occasional Reader segment through the Retail Sales Channel.
• Based on our calculations, we expect to earn a $300MM annual return
Other items to consider:
• What advertising mechanisms do we use in this case?
• Do we setup a manufacturing facility in the country or do we source the products from our current manufacturing facilities?
• Are there any prospects of competitors entering the market?
• Strong interviewees notice key nuances in the case such as: Time Value of Money impacts on Exhibit A and Probability of Purchase or Penetration on Exhibit A
• Outstanding interviewees detail various elements of marketing strategy of a new product launch. They lay out tables appropriately and completes relatively complex calculations at a fast pace.
Case 06
Events.com
76
Primary sector(s)
• X13 Technology
Concepts tested
• Z14 Pricing strategy
• Z07 Market share
Case author(s): Alex Fabry (Kellogg 2020)
Similar cases
• Maine Apples (Kellogg 2020)
• Montoya Soup (Kellogg 2018)
Case type
• Y07 Profitability

77
Events.com
Interviewer guide
Case prompt
• Our client is Prospect Equity Partners (‘Prospect’), a prominent Private Equity firm that invests in the technology space. They have recently acquired Events.com due to strong commercial wins and momentum in the market
• Events.com is a leading SaaS-based registration/ticketing platform for Endurance events (5K runs, Marathons, Triathlons, Mud Runs, etc.). They make money by taking registrations and processing payments for events and charging a fee per transaction (similar to Ticketmaster or Eventbrite) ($100 registration price x 10% Fee = $10 in Revenue for Events.com)
• Events.com has doubled market share since 2015, but in the last two years revenue is flat and profits are down, despite growing share. Prospect wants you to determine what is causing this and come up with a plan to improve profitability
Interviewer guide
• Problem: Are the costs associated with the DM program justified by the savings?
• This case is about a PE-portfolio company in Tech that has been undergoing a decline in profitability, despite commercial wins and market share growth. Events.com made a pricing change that has harmed profitability and needs to make a change
1. Analyze profitability issues
2. Identify root cause of issue
3. Quantify price change impact
4. Provide client recommendation

78
Events.com
Case prompt
• Our client is Prospect Equity Partners (‘Prospect’), a prominent Private Equity firm that invests in the technology space. They have recently acquired Events.com due to strong commercial wins and momentum in the market
• Events.com is a leading SaaS-based registration/ticketing platform for Endurance events (5K runs, Marathons, Triathlons, Mud Runs, etc.). They make money by taking registrations and processing payments for events and charging a fee per transaction (similar to Ticketmaster or Eventbrite) ($100 registration price x 10% Fee = $10 in Revenue for Events.com)
• Events.com has doubled market share since 2015, but in the last two years revenue is flat and profits are down, despite growing share. Prospect wants you to determine what is causing this and come up with a plan to improve profitability
Clarifying information
• Market: The market has declined ~4% per year since 2015, driven by low participation in experiential runs like Color or Mud Runs
• Competition: Two main other players in space: Active Network and RunSignUp. No recent entrants.
• Customers: Customers are all in the US. Historically, local 5K events are targeted, but Events.com recently signed IRONMAN triathlon in Q4 2017, which has $125M in transaction volume per year, and other premium events
• Product: The product platform is called EventWorks Endurance, and has been around for 10+ years
• Company: No changes have been made to company since being acquired by Prospect
Fit: What has been the most risky project that you have worked on?

79
Events.com
Exhibit A – Historical P&L and Market Share
$m 2015 2016 2017 2018
Revenue 25.0 35.0 39.9 39.9
Variable Costs
Payment Processing Costs 3.3 4.7 8.0 11.9
Server Hosting Costs 3.8 5.3 4.8 4.8
Total Variable Costs 7.1 9.9 12.8 16.7
Fixed Costs
Headcount 5.0 5.3 5.5 5.5
Marketing 1.5 1.7 1.8 2.0
SG&A / Other Costs 2.0 2.1 2.2 2.2
Total Fixed Expenses 8.5 9.0 9.5 9.7
Operating Income 9.4 16.1 17.6 13.5
Operating Income Margin 38% 46% 44% 34%
17%
65%
6%
12%
2015 Market Share
34%
30%
28%
8%
2018 Market Share
RunSignUp
Events.com Active Network
Other

80
Events.com
Exhibit B – Payment Processing Breakdown
2017 2018
Number of events 4,023 5,051
Total registrations 8.0M 7.9M
Dollars processed $339M $595M
Events.com Revenue $39.9M $39.9M
Payment Processing Expenses $8.0M $11.9M

81
Events.com
Exhibit C – Pricing Structure
Old Pricing Structure
Fee per transaction 10.0%
New Pricing Structure
Price under $50 Price over $50
Fixed fee per transaction $3.00 $5.50

82
Events.com
Part 1
1. Analyze profitability issues
• Using Exhibit A, have a discussion around what is driving the decline in profitability
• Interviewee should note that market share growth is from stealing share from Active Network, but largely ignore the share data
• Interviewee should focus on 2017 and 2018 and notice that payment processing costs have increased drastically, hypothesizing that is due to an increase in processing volume or processing rate (since this is a variable expense), and ask for more information on payment processing
• Interviewee should ignore other expenses, as the growth is not material
Provide Exhibit A when asked about Profitability (or revenue/costs)

83
Events.com
Part 2
2. Identify root cause of issue
• Provide the additional information along with the exhibit:
• Price per Registration declined as higher priced customers (smaller events with fewer total registrations) were acquired (Ironman Triathlon) and lower priced customers did not renew
• If interviewee is stuck, start a discussion about pricing and how it affects revenue, and have the interviewee calculate the payment processing rate, average fee, and average price per registration in 2017 and 2018.
• Interviewee should now isolate whether the processing costs increase is driven by rate or volume, and should calculate the processing rate to confirm (Payment Processing Expenses / $’s Processed)
• 2017: $8m / $399m = 2%; 2018: $11.9m / $595m = 2%
• Interviewee should now realize cost increase is driven by volume and that registrations and volume are up, although revenue is down, leading to analysis of the components of revenue
• Avg. fee rate (Revenue / $’s Processed):
• 2017 = 10%; 2018= 6.7%
• Price per registration ($’s Processed/Registrations):
• 2017 = $50; 2018 = $75
Provide Exhibit B when about Payment Processing Costs or Revenue

84
Events.com
Part 3
3. Quantify price change impact
• Provide the additional information along with the exhibit:
• Pricing was changed due to competitive pressure
• Interviewee should realize that pricing was changed from variable (10% fee) to a tiered fixed fee pricing, and as the price per registration increased, this caused revenue to be flat, despite acquiring customers
• Candidate should realize ‘Over $50’ pricing should be changed, and when prompted, let interviewee know that customer surveys have indicated that a 2.25% “Credit Card Fee” can be added to “Over $50” tier with negligible customer losses, and that ~$375m of volume is over $50
• Interviewee should now calculate revenue increase from adding 2.25% fee
• 2.25% * $375m = $8,437,500
• Do not allow rounding
Provide Exhibit C when asked about Pricing

85
Events.com
Part 4
4. Provide client recommendation
• Interviewee should summarize that a change in pricing to fixed fee tiered pricing caused revenue to remain flat and profitability to decline. They should recommend adding a 2.25% variable fee to the ‘Over $30m’, which will add ~$8.4m of revenue and profitability
• Risks: Additional increases to average price per registration, customer reaction to pricing increases
• Next Steps: Roll-out strategy for pricing change, investigation of ways to further change pricing to guard against additional increases in average price per registrations (add additional pricing tiers, customer/market research to figure out customer willingness to pay, etc.); Could look at targeting new sets of lower priced customers; consider acquiring RunSignUp to take overstrong market position and stratify offerings; or exiting market due to its decline.
• Excellent interviewees demonstrate the ability to analyze a P&L and think through how variable costs and revenues are related, along with testing brainstorming on pricing strategy.
• Outstanding candidates will quickly focus on the correct items in the P&L and make the connections between pricing, revenue, and variable costs and how that has eroded profitability, despite being the market share leader.

86
Case author(s): Aaron Mowery (Kellogg 2013)Edited by: Rohan Maini (Kellogg 2020)
Case 07
Garthwaite Healthcare
Primary sector(s)
• X08 Healthcare
Concepts tested
• Z12 Creativity (2)
• Z15 Supply/value chain (4)
• Z16 Vertical integration (4)
Similar cases
• Mustard Clinic (Kellogg 2020)
• Insurance for Underserved (Wharton 2017)
Case type
• Y07 Profitability
Interviewer-led

87
Garthwaite Healthcare
Interviewer guide
Case prompt
• Our client is Garthwaite Healthcare Co (GHC), a health insurance firm located in the Midwest.
• Customers pay GHC a fixed monthly premium per person covered under the plan. In exchange, GHC pays for all health services that each member requires (eg. physician care, prescription medications, hospitalization).
• In recent years, GHC’s financial and competitive position has begun to decline, and the CEO has retained our firm to help them determine what is causing the problem and how to fix it.
Interviewer guide
• Problem: How can GHC reduce its total cost to serve its policy holders?
1. Develop a structure to address the problem
2. Brainstorm medical cost sources and solutions
3. Calculate administrative costs
4. Develop commission sharing arrangement
5. Provide client recommendation

88
Garthwaite Healthcare
Case prompt
• Our client is Garthwaite Healthcare Co (GHC), a health insurance firm located in the Midwest.
• Customers pay GHC a fixed monthly premium per person covered under the plan. In exchange, GHC pays for all health services that each member requires (eg. physician care, prescription medications, hospitalization).
• In recent years, GHC’s financial and competitive position has begun to decline, and the CEO has retained our firm to help them determine what is causing the problem and how to fix it.
Clarifying information
Client Characteristics
• GHC is a mutual insurance company, meaning profits are returned to members in the form of lower premiums the following year. As such, GHC does not seek to maximize profit – it seeks to minimize cost, but does expect to earn a 5% profit margin.
• GHC’s prices reflect underwriting of risk and the underlying cost to serve a customer
Competitive Dynamics
• Market share is steady, despite presence of major national health insurance company UHC (which has 30% share)
Industry Economics
• National medical cost inflation is 10% over the past 5 years. GHC’s cost increase in this period is 12% and UHC’s is 10%.
Experience: Tell me about a time when you had to come up with a creative solution for a problem.
Provide all Clarifying information even if the interviewee does not request it

89
Garthwaite Healthcare
Part 1
1. Develop a structure to address the problem
• The interviewee should lay out a structure for analyzing the case.
• The interviewee could have determined that revenue is not relevant to this case based on information given in the Case prompt, so the interviewee should focus on cost.
• Costs in this case break out into fixed costs and variable costs:
• Variable costs (medical costs – claims made by policyholders)
• Fixed costs (administrative costs – e.g., marketing & sales, underwriting, finance, HR)
• Specifically, we will need to understand how these costs have changed in recent years.

90
Garthwaite Healthcare
Part 2
2. Brainstorm medical cost sources and solutions
• Medical costs are the largest component of GHC’s costs. However, GHC’s medical costs are increasing faster than the national average. What are some potential reasons why this is taking place? What potential opportunities could you explore to reverse this trend?
• Medical cost = (Number of claims per customer) x (Number of claimants) x (Cost per claim)
Number of claims per customerNumber of claimants
(% of customers claiming)Cost per claim
Pro
blem
s
• GHC customers sicker on average • GHC customers older than average
• Low deductibles incentivize more claims on average
• GHC pays more per procedure than average
So
lutio
ns
• Enhance wellness programs
• Introduce pre-enrollment diagnosis diagnosis to improve cost estimates
• Increase marketing efforts toward younger customers
• Increase deductibles
• Conduct benchmarking study to determine competitors’ costs

91
Garthwaite Healthcare
Part 3
3. Calculate administrative costs
• GHC administrative costs are also higher than average. The biggest driver of this is high cost of sales. GHC policies are sold through independent agents, each of which works with a ‘General Agency’ that acts as a sales support organization.
• How much does GHC pay in commissions each year?
• What are some potential approaches GHC could take to reduce its cost of sales?
• What potential strategic issues exist with these approaches?
• After interviewee explains how they would calculate commission expense, provide the below:
• Commission (10% of annual premiums) is paid to the General Agency, which passes a share to the independent agent. Total commission paid is, on average, $25 per agent, per month. There are 500,000 agents.
• Total commission expense = $25 * 500,000 * 12 = $150,000,000
Approaches Issues
• Reduce commission percentage
• Cap commission to a certain level per year
• Change commissions from percent of premium to flat fee (% increases annually with inflation)
• Agents could shift business from GHC to another carrier that pays higher commission
• Agents would lose incentive to sell if their commission is capped

92
Garthwaite Healthcare
Part 4
4. Develop commission sharing arrangement
• The team has decided to pay a flat commission directly to agents, and to pay the General Agencies a separate fee for the supportservices they provide to agents. If the total commission paid to both parties is set at $20 per member per month, what share should be given to the General Agencies?
• If interviewee asks, explain they should find the maximum amount that should be allocated to the General Agencies.
Additional information
• General Agencies perform three activities: training, application processing, and performance management.
• If GHC were to perform these activities internally, they would cost:
• Training: $6,000,000
• Application processing: $9,000,000
• Performance management: $15,000,000
Potential approach
• The total cost of the activities that General agencies perform is $30,000,000 (=$6,000,000 + $9,000,000 + $15,000,000).
• There are 500,000 members and 12 months in a year.
• The maximum amount of money GHC should be willing to pay the General Agencies for the activities performed is the per member,per month cost of these activities ($30,000,000 / (500,000 x 12) = $5

93
Garthwaite Healthcare
Part 5
5. Provide client recommendation
• Taking into account what you’ve learned thus far as well as your own additional hypotheses, what initiatives would you recommendto the CEO at this point?
• Our client should take action to reduce both medical costs and administrative costs.
• At this point, the interviewee should synthesize the findings from the interview into several clear initiatives, for example:
• Enhance marketing efforts to attract more young customers and bring down the average claims per member.
• Conduct a benchmarking study to determine opportunities for reductions in payments for medical services.
• Change the commission structure to flat fee per member per month. This achieves the goal of reducing commission expense, while at the same time keeping an agent’s incentive to sell more business.
• Strong interviewees will demonstrate the ability to analyze issues using a clear structure and will draw out the implications of their analysis. The quantitative calculations in this case are elementary, but the process to get to them is somewhat more complicated

94
Case author(s): David Wellner (Kellogg 2011)Edited By: Craig DePriester (Kellogg 2012), Rohan Maini (Kellogg 2020)
Case 08
Health Coaches
Primary sector(s)
• X08 Healthcare
Concepts tested
• Z10 Customer strategy (2)
• Z08 Market sizing (3)
• Z12 Creativity (4)
Similar cases
• Mustard Clinic (Kellogg 2020)
• TV Screens (Wharton 2017)
• Vitality Insurance (Kellogg 2020)
Case type
• Y05 Operations
• Y06 Opportunity assessment

95
Health Coaches
Interviewer guide
Case prompt
• Our client is a large national healthcare payer (health insurance company, think Aetna) exploring the launch of a new diseasemanagement (‘DM’) program to better serve its 5 million members.
• The idea is to hire and train a team of ‘Health Coaches’ to manage a portfolio of patients to reduce the costs of overall healthexpenditures (eg. reminders to take drugs, provide limited medical advice, suggested diet, exercise etc). Studies show that once a month contact with each patient reduces health spending by 5% on average.
• Should our client launch the program? If so, what steps should it take?
Interviewer guide
• Problem: Are the costs associated with the DM program justified by the savings?
• Problem solving steps
1. Develop a structure to address the problem
2. Explore market segmentation
3. Calculate program profitability
4. Brainstorm other ideas to boost profitability
5. Provide client recommendation
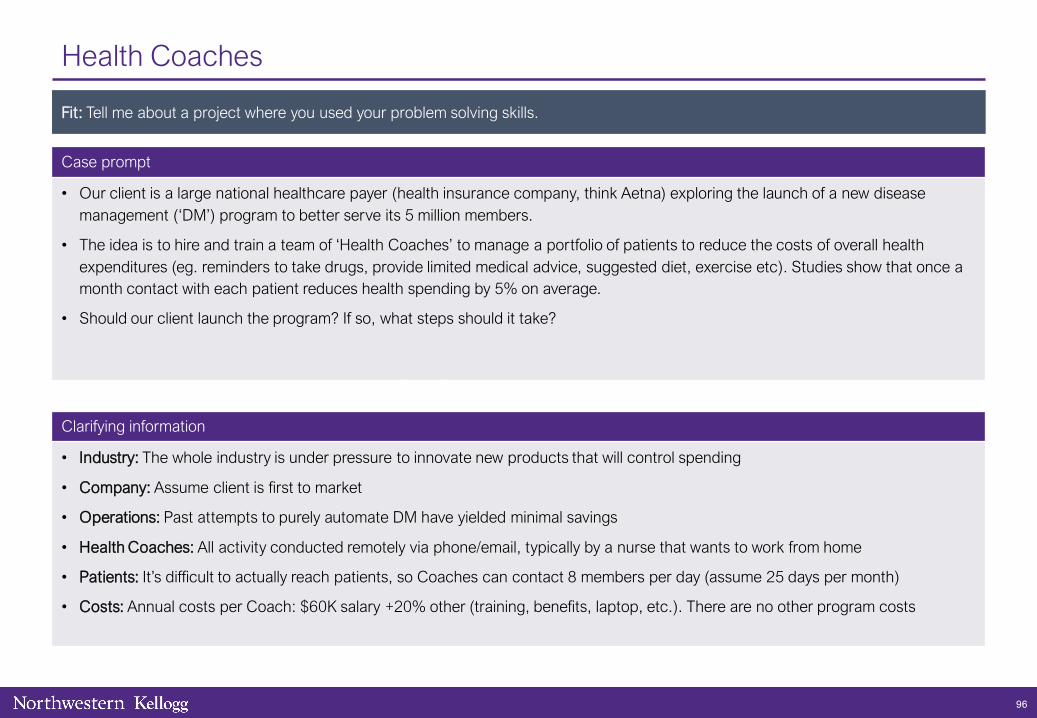
96
Health Coaches
Case prompt
• Our client is a large national healthcare payer (health insurance company, think Aetna) exploring the launch of a new diseasemanagement (‘DM’) program to better serve its 5 million members.
• The idea is to hire and train a team of ‘Health Coaches’ to manage a portfolio of patients to reduce the costs of overall healthexpenditures (eg. reminders to take drugs, provide limited medical advice, suggested diet, exercise etc). Studies show that once a month contact with each patient reduces health spending by 5% on average.
• Should our client launch the program? If so, what steps should it take?
Clarifying information
• Industry: The whole industry is under pressure to innovate new products that will control spending
• Company: Assume client is first to market
• Operations: Past attempts to purely automate DM have yielded minimal savings
• Health Coaches: All activity conducted remotely via phone/email, typically by a nurse that wants to work from home
• Patients: It’s difficult to actually reach patients, so Coaches can contact 8 members per day (assume 25 days per month)
• Costs: Annual costs per Coach: $60K salary +20% other (training, benefits, laptop, etc.). There are no other program costs
Fit: Tell me about a project where you used your problem solving skills.

97
Health Coaches
Exhibit A – Client’s member segmentation by disease type
0%
10%
20%
30%
40%
50%
60%
70%
80%
90%
100%
Individual Group 65+
Other
Degenerative
Hereditary
Lifestyle
Healthy
Segment Individual Group 65+
Segment size 15% 65% 20%

98
Health Coaches
Exhibit B – Average cost data
Average cost PMPM*
Segment Lifestyle Hereditary Degenerative
Individual $600 $150 $150
Group $400 $100 $100
65+ $1,200 $300 $300
*Notes:
• PMPM = Per Member Per Month

99
Health Coaches
Part 1
1. Develop a structure to address the problem
• The interviewee should drive towards quantifying the savings
• Consideration of qualitative issues is ideal.
Program Savings Program Costs Risks
• Customer segmentation by disease area and cost per member
• Communication systems
• Health Coach Salary
• Training
• Assumption accuracy
• Competitive response
• Regulatory, liabilities

100
Health Coaches
Part 2
2. Explore market segmentation
• Group are employee sponsored plans (e.g. ,if you work for our consultancy, you are in a group plan), Individual are non-groups (eg.private contractors, unemployed, etc). 65+ (see note below chart).
• Which disease area should we look at first?
• Interviewee should choose to focus on the 65+ segment
• 65+ patients are the sickest,
• Sicker patients are likely to drive higher costs
• Higher costs provides greatest benefit for DM
• Interviewee should choose to focus on lifestyle diseases
• Lifestyle diseases make up the largest portion of sick members
• As diseases primarily brought on by behavior, this segment is likely to benefit from DM
• Number of 65+ lifestyle = 20% segment x 40% lifestyle x 5m members = 400,000
Provide Exhibit A when the interviewee asks about segments or disease areas

101
Health Coaches
Part 3
3. Calculate program profitability
• Note: lead with Exhibit A. If the interviewee leads with profitability, steer him/her to first think about customer segmentation.
• What can we do with this information?
• Cost per Coach = $60k base + 20% = $72k
• Size of Portfolio = 8 patients per day x 25 days per month = 200 patients per year
• Savings for one portfolio = $1,200 cost per month x 12 months per year x 5% average savings x 200 patients = $144k
• Overall savings = ($144k savings - $72k costs) x 2,000 coaches = $144m profit per year
• Takeaway: Profit is $72K per Health Coach (double the cost of a coach)
• Based on PMPM lifestyle cost data, Individual segment is break-even (50% less savings), Group segment is a loss
Provide Exhibit B when the interviewee asks about medical costs

102
Health Coaches
Part 4
4. Brainstorm other ideas to boost profitability
• There are 650,000 Group members with lifestyle diseases left ‘uncoached.’ Is there a way to make the segment profitable?
More efficient DM program Seek additional revenue sources Client selection
• Coaching at work
• Bi-monthly contact
• Automated correspondence
• Better training for Health Coaches
• Employers might be willing to pay a fee to enroll in service
• Government support as a state-approved or sponsored program
• Target members who will respond with savings well above 5%

103
Health Coaches
Part 5
5. Provide client recommendation
• Client should launch the Health Coaching program, and first focus on lifestyle diseases in the 65+ segment
• Launch a pilot program to prove out assumptions (eg. 5% cost reduction, Coach portfolio capacity, etc.)
• First expand to entire 65+ lifestyle segment ($144M per year savings per coach, a 2x return on each Health Coach)
• Consider introducing to Individual lifestyle segment despite break-even (customer retention, moral rationale, etc.)
As first to the market, client plans to expand Health Coach program externally. Who should they target?
• The program yields the greatest savings in the 65+ lifestyle disease segment. However, the client should keep in mind that more lifestyle members will increase overall health care costs, considerably (still almost 4x after savings).
• As an alternative, the client could sell its Health Coach service to other payers.
• Excellent interviewees should use common sense to make reasonable assumptions before you provide required inputs.
• Outstanding interviewees are able to keep track of all units from a math perspective.

104
Case authors: Milija MedicEdited By: Mauricio Atri (Kellogg 2012), Tuhina Kapoor (Kellogg 2020)
Case 09
Healthy Foods
Primary sector(s)
• X12 Retail & CPG
Concepts tested
• Z10 Customer strategy (2)
• Z10 Marketing strategy (2, 3, 4)
• Z12 Creativity (3)
Similar cases
• Dark Sky (Kellogg 2020)
Case type
• Y02 Growth Strategy

105
Healthy Foods
Interviewer guide
Case prompt
• Our client is Healthy Foods, a wholesaler serving a variety of clients with Food products. The client is profitable but they want you to help them find revenue growth opportunities from their current business.
• How can we help Healthy Foods drive their revenue growth?
Interviewer guide
• Problem: How can Healthy Foods increase revenue?
• Problem solving steps:
1. Develop a structure to address the problem
2. Identify main customer types and their current contributions
3. Analyze client’s wallet share for different customers
4. Share of Wallet analysis and Wallet Size versus Share of Wallet
5. Provide client recommendation

106
Healthy Foods
Case prompt
• Our client is Healthy Foods, a wholesaler serving a variety of clients with Food products. The client is profitable but they want you to help them find revenue growth opportunities from their current business.
• How can we help Healthy Foods drive their revenue growth?
Clarifying information
• Customers: The client serves various customer categories (shown in Exhibit A).
• Customer sensitivities are (highest to lowest):
o Price
o Convenient delivery
o Help with location planning
o Help with menu
o Web site development
o Inventory
o Help with management optimization
• Competition: The client is one of the market leaders and is not losing the market share
Fit: Tell me about a time you had to lead a diverse team?

107
Healthy Foods
Exhibit A – Revenues by Customer Type
Independent Restaurants
Chain Restaurants
Hospitals
School Cafeterias
Grocery Stores
Other

108
Healthy Foods
Exhibit B – Client’s Share of Wallet
A
B
C
X
0% 10% 20% 30% 40% 50% 60% 70%
Client is Primary Food Supplier Client is one of many food suppliers
Cus
tom
er S
ize
Smallest
Largest

Healthy Foods
Exhibit C – Wallet Size vs. Share of Wallet for the Smaller-Revenue-Generating Customer Categories
0% 10% 20% 30% 40% 50% 60%0
100
200
300
400
500
600
Share of Wallet (%)
Wal
let
Siz
e ($
m)
Hospitals
Hotels
School Cafeterias
Grocery Stores
Chain Restaurants
109

110
Healthy Foods
Part 1
1. Develop a structure to address the problem
• A structure should cover the key areas needed to explore in order to determine how Healthy Foods can explore new revenue growth opportunities. Key elements expected to be included in this framework are:
• Market: Overall trends, offerings by competitors and customer preferences
• Segmentation, targeting and positioning: Are there particular segments in the population that will be ideal customers for us? How are positioned in the market?
• Product and channel mix: What is our current mix of products offered and what markets and channels do we service? What is the menu?
• Price: What price are our products sold at? Is there scope for increasing the price? Can we bundle any of our offerings?
• Promotion: How are our products marketed? What promotion mechanisms are being used?
• Volume: Who are our customers? How do we reach them? What is our wallet share with them?
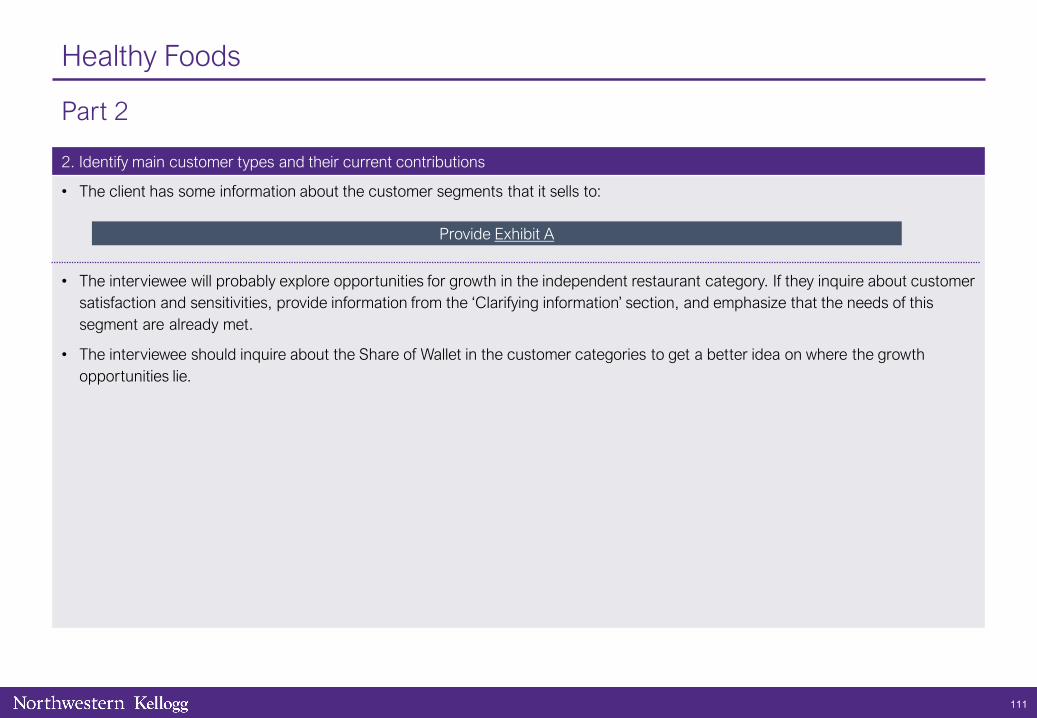
111
Healthy Foods
Part 2
2. Identify main customer types and their current contributions
• The client has some information about the customer segments that it sells to:
• The interviewee will probably explore opportunities for growth in the independent restaurant category. If they inquire about customer satisfaction and sensitivities, provide information from the ‘Clarifying information’ section, and emphasize that the needs of this segment are already met.
• The interviewee should inquire about the Share of Wallet in the customer categories to get a better idea on where the growth opportunities lie.
Provide Exhibit A

112
Healthy Foods
Part 3
3. Analyze client’s wallet share for different customers
• The interviewee should recognize that Share of Wallet in the highest-revenue-generating customer categories is already high, andthat the client is already a key provider for a lot of them.
• Ask the interviewees to list all options to increase revenue and the reasons behind (brainstorming exercise).
• Help interviewee to reach that the growth opportunity in the smaller revenue-generating customers, where client’s Share of Wallet is smaller. Now the interviewee should formulate the criteria to prioritize among the smaller revenue-generating customer types: the bigger their Share of Wallet and the smaller client’s Share of Wallet, the better.
Provide Exhibit B when the interviewee realizes they need to understand Share of Wallet

113
Healthy Foods
Part 4
4. Share of Wallet analysis and Wallet Size versus Share of Wallet
• Share Exhibit C when the interviewee realizes they will need to understand the Share of Wallet vis-à-vis Wallet Size
• The bigger the Size of Wallet and the smaller client's Share of Wallet, the larger the revenue growth opportunity for the client.
• Using Exhibit C, the interviewee should identify the hospitals and the hotels as the most promising candidates for revenue growth given their large wallets and small client’s Share of Wallet. The interviewee should identify the strongest sensitivities these clients would have and suggest ways to increase client’s Share of Wallet there.
Provide Exhibit C

114
Healthy Foods
Part 5
5. Provide client recommendation
• In the current business, the largest growth opportunities lie in customer segments: hospitals and hotels.
• The interviewee should suggest ways to better serve those customers and increase client's Share of Wallet there, capturing significant new revenues due to the large Wallet Size of those clients.
• Excellent interviewees identify Share of Wallet as an important parameter, quickly recognize that there is little opportunity for growth in the largest-revenue-generating customers, and come up with the size of wallet vs. Share of Wallet plot as a good prioritization tool for identifying promising customer categories for the client’s revenue growth.

115
Case Authors: Erin Brooks (Kellogg 2011)Edited By: Uri Kalir (Kellogg 2012), Tuhina Kapoor (Kellogg 2020)
Case 10
High Q Plastics
Primary sector(s)
• X04 Engineering & Construction
Concepts tested
• Z11 Competitive Analysis
• Z12 Creativity
Similar cases
Case type
• Y01 Cost reduction
• Y05 Operations
• Y07 Profitability

116
High Q Plastics
Interviewer guide
Case prompt
• Our client, High Q Plastics, is an automotive parts supplier in the U.S. They primarily manufacture and sell plastic injection-molded parts, such as grills, door handles, decorative trim etc., to automotive customers.
• The client has two primary revenue sources: large automotive OEMs, and aftermarket. The client has recently seen declining profits, primarily due to increased price competition from new overseas competitors in China. Annual profits have declined from $50M to $20M over the past few years.
• What is the reason behind declining profitability? How can High Q improve profits? Can they reach $100M in profits by 2014?
Interviewer guide
• Problem: How can High Q generate $100m in profits by 2014?
1. Develop a structure to address the problem
2. Brainstorm ideas to improve profits
3. Determine whether the profit goal can be met
4. Provide client recommendation
• An effective interviewee should demonstrate clear and MECE approach at dissecting profitability, structured brainstorming in improving profits (e.g., brainstorming in buckets) and effectively using exhibits to outline the correct approach to calculating 2014 profits.

High Q Plastics
Case prompt
• Our client, High Q Plastics, is an automotive parts supplier in the U.S. They primarily manufacture and sell plastic injection-molded parts, such as grills, door handles, decorative trim etc., to automotive customers.
• The client has two primary revenue sources: large automotive OEMs, and aftermarket. The client has recently seen declining profits, primarily due to increased price competition from new overseas competitors in China. Annual profits have declined from $50M to $20M over the past few years.
• What is the reason behind declining profitability? How can High Q improve profits? Can they reach $100M in profits by 2014?
Clarifying information
• Industry Characteristics/Market Economics
- Automotive sales overall still growing steadily, driven by emerging markets
- Automotive manufacturing is leaving the U.S.
• Client Characteristics
- Client is currently one of the leaders in this category
- Client has U.S.-based manufacturing
- Revenues have been slowly declining over last 5 years
- Client’s products are of a higher quality than most Chinese competitors’ products
• Competitive Dynamics
- Automotive OEM customers are looking to reduce cost, driving increased price competition among parts suppliers
Fit: Tell me about a time you had to navigate a conflict and come up with a creative solution.
117

118
High Q Plastics
Exhibit A – High Q’s 2010 Financials, By Facility
$m Plant A Plant B Plant C Plant D
Revenues 100 100 100 100
Labor 20 40 60 30
Material 55 40 20 35
Overhead 20 15 15 30
Net Profits 5 5 5 5

119
High Q Plastics
Exhibit B – 2010 U.S. Automotive Market
38%
42%
20%
Compact cars
Full-size cars
Trucks and SUVs
Additional Information:
• 2010 US Automotive Sales = 16 million units

120
High Q Plastics
Exhibit C – U.S. Truck / SUV Market Share (2010 – 2014)
33%31%
19%
10%
7%
21% 20%
14%
40%
5%
0%
5%
10%
15%
20%
25%
30%
35%
40%
45%
Ford GM Chrysler Toyota Nissan
2010
2014
Additional information:
• High Q supplies 70% of Toyota’s business
• Average price of High Q products sold to Toyota = $20

121
High Q Plastics
Part 1
1. Develop a structure to address the problem
What key questions would you ask an industry expert in order to better understand the reasons behind High Q’s declining profits?
An effective structure should address the following factors:
• Industry: What is the sales volume trend? What is the % of demand and growth of OEM vs. aftermarket segment? Is one of these segments more profitable than the other?
• Competitors: Who are they? What is their relative market share? What are their prices vs. our clients’? What is their cost structure vs. our clients’? Do they have a technology or quality competitive advantage relative to our client?
• Revenue: How have our clients’ prices changed in recent years? Have they declined across all customers and products?
• Costs: What trends is our client seeing in their cost structure? Increasing labor or material costs?

122
High Q Plastics
Part 2
2. Brainstorm ideas to improve profits
The CEO of High Q wants to know if $100M in annual profits is achievable by 2014. What would you need to know in order to determine this? What data would you ask for?
What ways can you think of to increase revenues? What ways can you think of to reduce costs?
After asking the interviewee the above questions, he / she should come up with 2-3 ways each for cost reduction and increasing revenues:
• Reduce Cost: find alternative material sources, invest in process automation to reduce labor, consolidate multiple manufacturing sites to reduce SG&A costs, relocate close to customers to reduce transportation costs.
• Increase Revenue: segment customers to determine sensitivity to price, increase marketing in aftermarket segment, negotiate long-term contracts with OEM customers.

123
High Q Plastics
Part 3
3. Determine whether the profit goal can be met
Our client is planning on implementing lean manufacturing across all 4 of it U.S. plants, in order to provide cost savings and increase profits.
• The client is expecting to produce 80% of 2010 volumes in 2014. They are also planning on reducing prices by 10% due to increased competition.
• Lean manufacturing implementation across all plants will provide an additional 20% savings in raw material, and 30% savings in labor. What is the change in profits the High Q CEO can expect from 2010 to 2014, based on this information?
• Please see solution on the next page.
Provide Exhibit A

124
High Q Plastics
Part 3 (Continued)
3. Determine whether the profit goal can be met
• The interviewee should use the information provided in Exhibit A to calculate the following profitability for each plant in 2014, and walk the interviewer through the calculation steps. It is important to first note that revenues, labor, and material will decrease by 20% due to the reduced quantity output from each plant, plus the additional 20% savings in material and 30% in labor. Revenue will decrease by an additional 10%, in a cost cutting maneuver. Overhead costs will not change.
• From this calculation, the interviewee should reference back to question 2. Even with the lean manufacturing implementation, High Q is still a long way from the CEO’s goal of $100M in annual profits, and this is therefore not a realistic target. A strong interviewee should note the importance of aligning a client’s expectations.
All figures in $m
Plant A Plant B Plant C Plant D
Revenues 72.0 72.0 72.0 72.0
Labor 11.2 22.4 33.6 16.8
Material 35.2 25.6 12.8 22.4
Overhead 20.0 15.0 15.0 30.0
Net Profits 5.6 9.0 10.6 2.8
Total 2014 Profits 28.0
Additional Profits 8.0

125
High Q Plastics
Part 3 (Continued)
3. Determine whether the profit goal can be met
• High Q ‘s CEO has also asked us to take a look at competitive dynamics among the automotive OEMs, in order to predict any increase in profits from increased sales. Hand out exhibits 2 and 3.
• Based on the information given, what do you expect High Q will see in additional profits due to Toyota’s predicted 30% increase in market share in truck and SUVs?
The interviewee should be able to use the information provided in the Exhibits to calculate the following revenue growth (“Sales” figures below are in units/vehicles). Rounded answers ($13 or $14M) are fine, given that interviewee has already demonstrate math proficiency.
Provide Exhibit B & C
2010 2014
US Auto Market 16,000,000
U.S. Truck & SUV Sales 3,200,000
Toyota Truck & SUV Sales 320,000 1,280,000
High Q's Toyota Qty. Sold 224,000 896,000
High Q's Toyota Revenues 4,480,000 17,920,000
Additional Revenue $13,440,000

126
High Q Plastics
Part 4
4. Provide client recommendation
Please summarize your findings to the CEO, including any other potential opportunities to increase High Q’s profits over the next few years.
The interviewee should concisely summarize the overall goal of the case (to increase High Q’s declining profitability due to new, low-cost competition), and main findings from each question, and a recommendation (yes, High Q should implement the lean manufacturing initiative, while recognizing that this initiative alone will not hit the CEO’s total profit goal in 2014). The interviewee should also generate a list of additional opportunities that were not explored in the case, including:
a) Consolidation of the 4 manufacturing plants (especially Plant D, with its high overhead costs)
b) Pursue growth in the aftermarket segment of their business
c) Diversify their business into plastic injection-molded parts for other industries (outside of automotive), with less price competition

127
Case author(s): Abhilash Sridharan (Kellogg 2015), Rashaad Jamaal (Kellogg 2015)Edited by: Rohan Maini (Kellogg 2020)
Case 11
Kellogg in India
Primary sector(s)
• X07 Government & Public Sector
Concepts tested
• Z08 Market sizing (2)
• Z07 Market share (3)
• Z03 Breakeven analysis (3)
Similar cases
• Big Public High School (Darden 2012)
• Busch’s Barber Shop (Kellogg 2020)
• Chic Cosmetology (Kellogg 2020)
Case type
• Y04 New product / Market entry

128
Kellogg in India
Case prompt
• Our client is the Dean of Kellogg School of Management. She has hired you to advise her on an idea, which struck her during the previous week – To consider starting a satellite campus of Kellogg in India. She has asked you to determine whether Kellogg should enter the Indian market.
Interviewer guide
• This case is a quintessential market entry case.
• The two main quantitative concepts on which the candidate is being tested are on market size estimation and breakeven analysis.
1. Develop a structure to address the problem
2. Confirm market attractiveness (sizing)
3. Market share and breakeven analysis
4. Conduct risk analysis
5. Provide client recommendation
Interviewer guide

129
Kellogg in India
Case prompt
• Our client is the Dean of Kellogg School of Management. She has hired you to advise her on an idea, which struck her during the previous week – To consider starting a satellite campus of Kellogg in India. She has asked you to determine whether Kellogg should enter the Indian market.
Clarifying information
• Strategic Rationale: India is a fast growing economy with huge demand for MBAs. Kellogg’s Dean believes that an India campus would help Kellogg become a Top 3 global MBA program. The caliber of India candidates is the same as in the US.
• Objective: The Dean wants the satellite campus to breakeven in 4 years
• Competition: Eight top-tier business schools: 7 IIMs and the ISB (ISB has a partnership with Kellogg, for its pedagogy).
• Candidate selection: IIMs select based on CAT test results. The ISB admits candidates based on the GMAT.
• Pricing: Indian MBAs cost $20k per year (US MBAs cost $70k). Indian schools don’t offer scholarships but banks offer loans.
• Product: Kellogg would only launch the 2Y MBA program in India.
Fit: Tell me about a time when you were provided feedback and what action you took.

130
Kellogg in India
Exhibit A – Indian business schools
Category Indian Institutes of Management (IIMs) Indian School of Business (ISB)
Description of program
• IIMs select via the Common Admission Test (CAT)
• IIM interviews candidates with the top 6% CAT scores
• 5 candidates are interviewed for every available seat
• 85% of admitted candidates matriculate
• 70% of admitted students
matriculate
• Two campuses with a total class
size of 1,400
Cost incurred by Student
• INR 1,200,000 per year*
• 1 USD = 60 INR
Notes:
• Assume the total cost incurred by a student annually at Kellogg is $70k per annum

131
Kellogg in India
Exhibit B – Admitted students
YearExpected admits per
year
1600
(7.5% of 8,000)
2 600
3 900
4 900
Notes:
• Only source of revenue is the fee charged to students

132
Kellogg in India
Exhibit C – Estimated cost structure
Fixed Costs Annual Variable Costs
Year 0 Year 1 Year 2 Year 3 Year 4
$100M (land)$50 (support infrastructure)
$30M $30M $30M $20M

133
Kellogg in India
Part 1
1. Develop a structure to address the problem
Market Entry
Qualitative
Quantitative
Impact on ranking
Brand Kellogg & Kellogg India
Revenue
# of students
CostsFixed
Cannibalisation
Job Prospects, ROI
Variable
- Salaries- Marketing- SGA
- Cost/student
Fee per annum
Mar
ket S
izin
g

134
Kellogg in India
Part 2
2. Confirm market attractiveness (size)
The candidate can choose to size the market either top-down or bottom-up. A top-down approach becomes too dependent on assumptions. Exhibit A can be used for a bottom-up approach.
A. Estimate the Total Addressable Market from competition1. IIMs• 500,000 applications per year• Top 6% are interviewed = 30,000 applicants• 1 in 5 are accepted = 6,000 eligible students
2. ISB• 1,400 matriculated students / 70% of total admitted students = 2,000 eligible students• If interviewee gets this wrong, ask which student pool are we most interested in: matriculated students or all accepted students.
Total Addressable Market = 6,000 + 2,000 = 8,000 high quality applicants
B. Market Size Fee to be charged annually needs to be calculated. A value somewhere in between $20,000 and $70,000 is acceptable. $50,000 per year for 2 years: 8,000 * $50,000 * 2 = $800M
Provide Exhibit A when the candidate requests any of the information that it contains

135
Kellogg in India
Part 3
3. Market share and breakeven analysis
• The candidate should mention a target market share in the year of launch. A lower number would be preferable to start with. After letting the candidate present their logic, ask them to assume 7.5% market share in the year of launch.
Provide the information below when requested:
• Breakeven Analysis: Expected breakeven in 4 years
• The candidate should note that from the second year onwards, last year’s fee should be included in the current year.
• Costs: Ask the candidate to brainstorm for costs
• The candidate must move towards a NPV Calculation:
• When asked for a discount rate, confirm there is none.
• Conclusion: The project should go ahead: by the 4th year, the project doesn’t breakeven by only $5M. Given rising revenues and declining costs, breakeven would be achieved in the first month of year 5.
Provide Exhibit B when asked about Revenue
Provide Exhibit C after Cost brainstorming
Y0 Y1 Y2 Y3 Y4
Number of students 600 600 900 900
Yearly Fee per student ($) 50,000 50,000 50,000 50,000
Revenue $m from students in year 1 30 30 45 45
Revenue $m from students in year 2 30 30 45
Total Revenue ($ M) 30 60 75 90
Costs ($ M) 150 30 30 30 20
Profits -150 0 30 45 70

136
Kellogg in India
Part 4
4. Conduct risk analysis
Ideally, the candidate will raise risks related to the project. If not, ask them to brainstorm:
Brand impact Rankings impact Cannibalization Brand parity Job prospects Support
• No top US schools is successful in India
• Satellite campus might dilute brand
• Diversity• International
presence• Proximity to
Asia• Job prospects
• 50-60 Indian students matriculate at Kellogg US
• Impact on US MBA candidate pool across Asia
• Kellogg US MBA = Kellogg India MBA
• Premium for Kellogg India versus IIM / ISB
• Parent campus pedagogical support for satellites

137
Kellogg in India
Part 4
6. Provide client recommendation
Overall• While starting a satellite campus makes financial sense, further scrutiny is needed on the impact of this move on Kellogg’s brand
and other factors that impact rankings• Other additional points, which the candidate may add, could be:
• Negotiate on the costs for initial investments, to lower it down from $150M. • Support from Indian government on subsidies to be offered• Develop additional sources of revenue, from supporting programs and corporate training sessions
Risks
• Brand dilution / considering the impact of a satellite campus on Brand Kellogg• Cannibalization of existing revenue from Indian students• Admission percentage is projected to increase from Year 2 to Year 3 by 50% (This is quite high)• The salaries of Indian graduates, as per Indian Market conditions, (considering Indian PPP) may influence the average salary of
Kellogg School of Management given global reporting, eventually impacting the ranking negatively• Given Kellogg’s new building being constructed, the $150M additional investment for a satellite campus, may require additional
rounds of fund raising for the India campus
Next Steps
• Employ a Brand agency / consultant to figure out the impact of starting a satellite campus on Brand Kellogg• Fund Raising for $150M to be worked out• Potential Partners for promoting the program and supporting with faculty initially• Discussions to be started with the government of India for the land, infrastructure investment and licenses.
138
Case author(s): Adam Borchert and Joep Knijn (Tuck 2004)Edited By: Peter Manoogian (Kellogg 2012), Rohan Maini (Kellogg 2020)
Case 12
Maine Apples
Primary sector(s)
• X02 Agriculture & Food
Concepts tested
• Z08 Market sizing (2)
• Z14 Pricing strategy (3,4)
• Z15 Supply/value chain (4)
Similar cases
• Antidepressant pricing (Sloan 2011)
• Jamaican Land Investment (Haas 2015)
• Mission Eternity (Fuqua 2016)
Case type
• Y04 New product / Market entry
• Y06 Opportunity assessment
• Y07 Profitability

139
Maine Apples
Interviewer guide
Case prompt
• Our client is a Korean conglomerate named Danut that has acquired a small Boston-based biotechnology firm
• The biotech firm has developed a chemical that helps control the ripening of produce. After testing, this chemical appears to work especially well with apples: it allows apple orchards to harvest earlier and it improves the overall quality of the harvest.
• Danut traditionally uses a test market to determine commercialization. Given Danut’s proximity to Boston and average apple yields, Maine has been chosen.
• Danut would like to know if they should attempt to commercialize this chemical.
Interviewer guide
• Problem: Is the market size large enough and the estimated profitability high enough for Danut to commercialize this chemical?
• Key case steps:
1. Confirm market attractiveness (size)
2. Quantify cost savings from earlier harvests
3. Quantify revenue growth from improved yields
4. Project farmers’ margins and pricing for Danut
5. Provide a recommendation and highlight risks

140
Maine Apples
Case prompt
• Our client is a Korean conglomerate named Danut that has acquired a small Boston-based biotechnology firm
• The biotech firm has developed a chemical that helps control the ripening of produce. After testing, this chemical appears to work especially well with apples: it allows apple orchards to harvest earlier and it improves the overall quality of the harvest.
• Danut traditionally uses a test market to determine commercialization. Given Danut’s proximity to Boston and average apple yields, Maine has been chosen.
• Danut would like to know if they should attempt to commercialize this chemical.
Clarifying information
• Product Benefits:
• Reduced costs through earlier harvesting• Improved apple yields• Improved juice yields (with higher quality apples)
• Client Characteristics: Only concerned about a “test-market” in the state of Maine
• Competitive Dynamics: No other competitive products on the market currently
• Industry: Growing at the rate of GDP
Fit: Analysis is not always perfect. Tell me a time when the analysis wasn't perfect but you still had to use it.
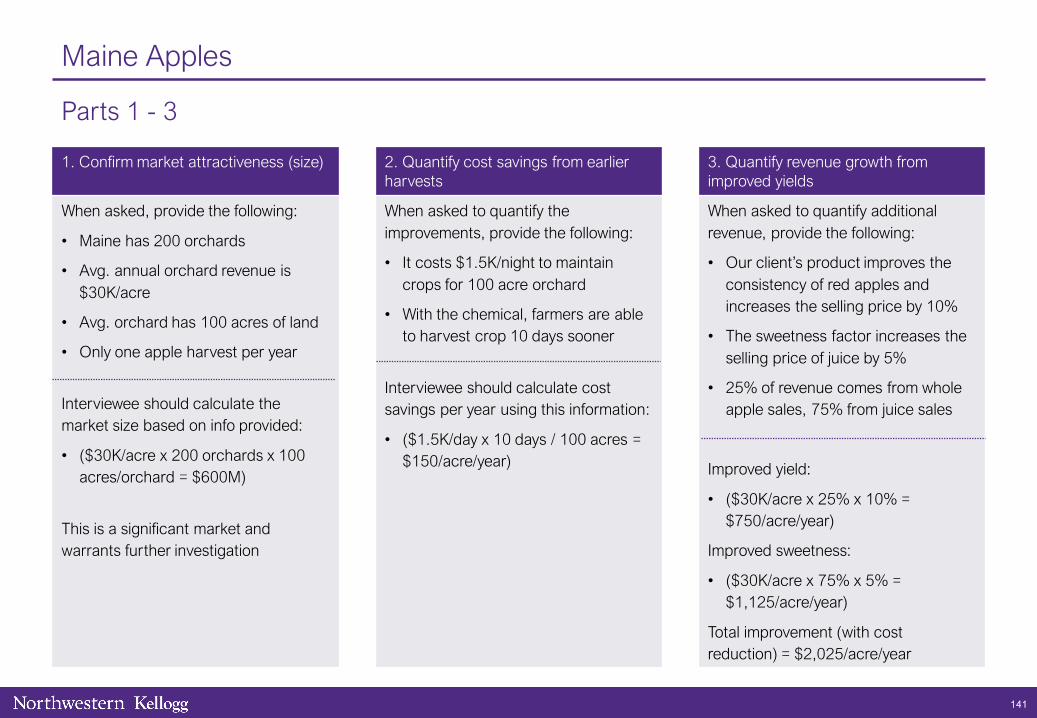
141
Maine Apples
Parts 1 - 3
1. Confirm market attractiveness (size) 2. Quantify cost savings from earlier harvests
3. Quantify revenue growth from improved yields
When asked, provide the following:
• Maine has 200 orchards
• Avg. annual orchard revenue is $30K/acre
• Avg. orchard has 100 acres of land
• Only one apple harvest per year
Interviewee should calculate the market size based on info provided:
• ($30K/acre x 200 orchards x 100 acres/orchard = $600M)
This is a significant market and warrants further investigation
When asked to quantify the improvements, provide the following:
• It costs $1.5K/night to maintain crops for 100 acre orchard
• With the chemical, farmers are able to harvest crop 10 days sooner
Interviewee should calculate cost savings per year using this information:
• ($1.5K/day x 10 days / 100 acres = $150/acre/year)
When asked to quantify additional revenue, provide the following:
• Our client’s product improves the consistency of red apples and increases the selling price by 10%
• The sweetness factor increases the selling price of juice by 5%
• 25% of revenue comes from whole apple sales, 75% from juice sales
Improved yield:
• ($30K/acre x 25% x 10% = $750/acre/year)
Improved sweetness:
• ($30K/acre x 75% x 5% = $1,125/acre/year)
Total improvement (with cost reduction) = $2,025/acre/year

142
Maine Apples
Part 4
4. Project farmers’ margins and pricing for Danut
When asked about product pricing, provide the following:
• Danut’s product costs $100k per 200 acre farm
Farmer’s incremental revenue/cost savings = $2,025/acre
Product costs = $100K/200 acres = $500/acre
Profit margin = ($2025-$500)/$2025= 75% [$1,525 per acre]
The interviewee should note that this is an extremely high profit margin for the farmer and realize that there is a significant opportunity for profits with this product.
• How much of this benefit can we capture in our pricing?
• Interviewee should provide a percentage between 25% and 50%. Anything higher than 50% should be questioned due to the novelty of the product and resulting lack of social proof.
A 50% profit margin for our client would also realize a 50% profit margin for farmers. This is absolutely a realistic price to set, if not a little low.
• Given the costs provided, will we make a profit? Yes
• Interviewee should calculate profit: ($100,000 / 200 acres = $500/acre). Assuming $1,000 price per acre, gross margin will be50%. [($1,000 - $500) / $1,000]

143
Maine Apples
Part 5
5. Provide a recommendation and highlight risks
• Overall, our client should commercialize this chemical and price it at approximately $1,000 per acre to make a 50% margin.
Risks/Next steps:
• Differentiation: What is our positioning?
• Environmental issues: Is there a risk of backlash and/or boycott from the general public? Could the U.S. government attempt to regulate our product?
• Operational reality check: Does the company have the resources to do this?
• Patenting: Is the product already patented? If yes, then when does it expire? If no, then is it possible to patent? If not, then can we patent the manufacturing process?
• Representativeness of test market: Does it cost less to cover apples in other states?
• Strategic fit: Is this opportunity too small relative to the size of the client?
• Strong interviewees share several qualitative issues listed above to supplement the recommendation to enter the market.
• Outstanding interviewees consider value-based pricing: the need to quantify added profits that our client’s product will make for its clients and how much of that money our client can capture.

Case 13
Money Bank Call Center
Primary sector(s)
• X10 Legal & Professional Services
• X06 Financial Services
144
Concepts tested
• Z01 Accounting
• Z05 Capacity
• Z13 Organizational changes
Case authors: Guruprasad Sankaranarayanan (Kellogg 2012)Edited by Nikola Jakić (Kellogg 2016), Elizabeth Henry (Kellogg 2020)
Case type
• Y01 Cost reduction
• Y05 Operations
Similar cases
• Call Center (Yale 2013)
• EasyNAV (Wharton 2009)

145
Money Bank Call Center
Interviewer guide
Case prompt
• Our client is a large financial services firm with multiple locations around the world. Part of their service offering includes a 24-hour helpline. The client has their call centers in New York and Paris.
• The client has recently acquired a small firm (Firm B) in order to expand its reach in a particular geography. Firm B provides asubset of the services and has its call center located in the Philippines.
• The client has asked us to determine its strategy going forward for handling customer calls. In particular they want us to look into the call center operations.
Interviewer guide
• This is an outsourcing case with the following elements:
• Use a framework that covers the most important areas of M&A and cost cutting
• Read the exhibits to assess the cost effectiveness and efficiency of the 3 locations
• Discuss qualitative information on the acquired company – products, culture, customers, etc.
• There is no right or wrong recommendation, as it will depend on the interviewees assessment of the qualitative concerns
• Key case steps:
1. Evaluate existing and potential cost structure
2. Explore alternative ideas for implementation
3. Provide client recommendation
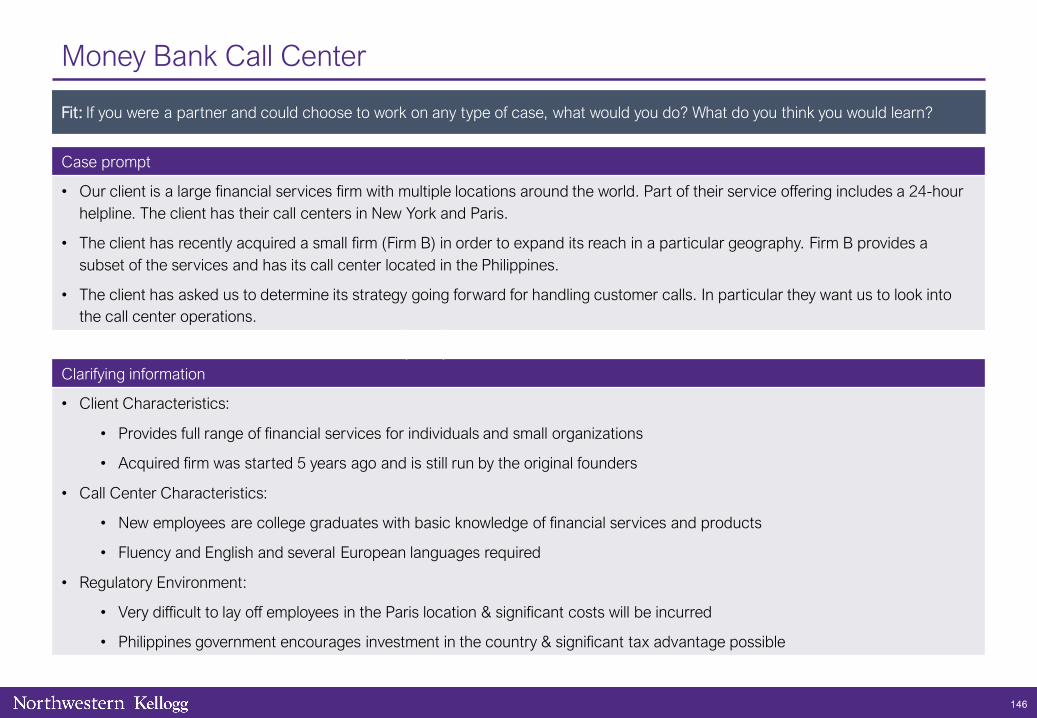
146
Money Bank Call Center
Case prompt
• Our client is a large financial services firm with multiple locations around the world. Part of their service offering includes a 24-hour helpline. The client has their call centers in New York and Paris.
• The client has recently acquired a small firm (Firm B) in order to expand its reach in a particular geography. Firm B provides asubset of the services and has its call center located in the Philippines.
• The client has asked us to determine its strategy going forward for handling customer calls. In particular they want us to look into the call center operations.
Clarifying information
• Client Characteristics:
• Provides full range of financial services for individuals and small organizations
• Acquired firm was started 5 years ago and is still run by the original founders
• Call Center Characteristics:
• New employees are college graduates with basic knowledge of financial services and products
• Fluency and English and several European languages required
• Regulatory Environment:
• Very difficult to lay off employees in the Paris location & significant costs will be incurred
• Philippines government encourages investment in the country & significant tax advantage possible
Fit: If you were a partner and could choose to work on any type of case, what would you do? What do you think you would learn?

147
Money Bank Call Center
Exhibit A – Call Center Performance FY 2010
Center Calls / YearEmployee Cost /
Year ($)Overhead Cost /
Year ($)# Employees
New York 600,000 50,000 450,000 75
Paris 400,000 50,000 600,000 60
Philippines 300,000 20,000 300,000 75

148
Money Bank Call Center
Part 1
1. Evaluate existing and potential cost structure
• Here, the interviewee needs to:
• Compare the efficacy of the three locations & possible explanations for variance;
• Identify the cost effective options & how it is impacted by integration cost
• Additional information:
• Total cost incurred by the 2 firms is $9.6M
• Philippines currently processes calls at half the efficiency of NY (per employee)
• Interviewee could ask about available slack at any of the call centers but should be advised that all call centers are currentlyoperating at capacity
• If asked, state that currently, we have space, infrastructure necessary to expand. Assume overhead is variable in this case. Thecandidate should be able to calculate that to process total call volume Philippines will need an additional 250 employees to handle the traffic (1.3M total calls/ 4000 calls/employee in Philippines). Operating cost after the change will be $7.8M; net savings of $1.8M.
• The interviewee should realize that this does not account for all the costs, including hiring and training costs. When prompted inform the interviewee about a 1 time cost of $5M (includes severance for NY and Paris, expanding the Philippines facility) implying that the move is not profitable
Provide Exhibit A when the interviewee asks about call center performance

149
Money Bank Call Center
Part 2
2. Explore alternative ideas for implementation
• Client will not budge on two-year breakeven
• Prompt the interviewee to explore ways to make outsourcing to the Philippines feasible
• Other options: decrease $5m investment cost; increase efficiency of Philippines employees (guide interviewee towards the latter)
• The interviewee needs to identify the difference in calls / employee between the New York and Philippines locations
• Ask the interviewee to assume that the best practices can be transferred and implemented within 3-6 months
• Potential cost savings if Philippines achieves same effectiveness as New York
• # employees required = 1.3M calls / 8,000 calls / employee / year = 162.5 (allow rounding to 160)
• New employee cost = 160 * $20,000 = $3.2M
• Ask interviewee to assume overheads double with the need for better equipment. Before the efficiency improvement, OH = $1.3M for 1.3M call. New OH = $2.6M
• New total cost = $3.2M + $2.6 = $5.8M ($3.8M savings from status quo and $2M better than pre-efficiency improved option)
• Other questions interviewee needs to consider
• Will the client be able to acquire sufficient talented personnel within the short time frame?
• How will customer satisfaction by impacted with the new labor base?
• Legal constraints / requirements in NY and Paris – how quickly can we lay off the staff?
• How will public opinion be impacted by the news of massive outsourcing?

150
Money Bank Call Center
Part 3
3. Provide client recommendation
• This is an open ended case. The interviewee needs to justify the recommendation based on the qualitative considerations
• A good recommendation would include 3 sections:
• Recommendation: If the recommendation is to outsource the interviewee needs to highlight the risks associated with outsourcing and nature of the acquired firm. If the recommendation uses any other approach sufficient justification needs to be given to overcome the cost savings
• Risks:
• Risks associated with increasing capacity by more than 200% in the Philippines – people, infrastructure, service quality, gaps in knowledge transfer, organizational changes, etc.
• Reputational impact – do customers notice a difference in service, can the competitor leverage this to steal customers?
• Next steps: If outsourcing, some of the next steps would be to analyze the infrastructure requirements and capabilities, findthe right talent, ensure smooth transfer and implementation of best practices, etc.
• The interviewee should explore the option of improving effectiveness of the Philippines location without being prompted
• Excellent interviewees need to address the qualitative information provided in the case: nature of merger, nature of markets being served, etc.

151
Case author(s): Nico Montoya (Kellogg 2016)Edited by: Michael Eidem (Kellogg 2020)
Case 14
Montoya Soup
Primary sector(s)
• X02 Agriculture & Food
• X12 Retail & CPG
Concepts tested
• Z14 Pricing strategy (2)
• Z10 Customer marketing strategy (3)
Similar cases
• Frozen Food Co (Columbia 2017)
• Dark Sky (Kellogg 2020)
• Orrington Office Supplies (Kellogg 2020)
Case type
• Y01 Cost Reduction
• Y07 Profitability

152
Montoya Soup
Case Question
• In F14, Montoya Soup, a business unit of Izzy’s Healthy Foods, grew revenue and increased the contribution margins on their traditional and light soups.
• However, a spike in fixed costs caused them to see a dip in profitability. To offset this effect in F15, they launched a line of premium soups to increase volume and generate economies of scale.
• Though they felt the new launch was a success, their profitability dropped again in F15. They have hired you to diagnose the problem and propose a solution for F16.
Interviewer guide
• Problem: Determine what is causing Montoya’s profitability decrease and analyze/recommend a method for improving it.
• Key case steps:
1. Develop a structure to address the problem
2. Deep dive – Why did profitability decline?
3. Deep dive – How do we fix profitability? (pricing strategy and potential cost reductions)
4. Provide client recommendation
Interviewer guide

153
Montoya Soup
Case Question
• In F14, Montoya Soup, a business unit of Izzy’s Healthy Foods, grew revenue and increased the contribution margins on their traditional and light soups.
• However, a spike in fixed costs caused them to see a dip in profitability. To offset this effect in F15, they launched a line of premium soups to increase volume and generate economies of scale.
• Though they felt the new launch was a success, their profitability dropped again in F15. They have hired you to diagnose the problem and propose a solution for F16.
Clarifying information
There is limited clarifying info up front, the interviewee will have to be comfortable making assumptions regarding the prompt and moving forward based on an inherent knowledge of the grocery industry.
• Client: Montoya sells cases of soup to buyers at grocery retailers who mark up the units inside to sell.
• Product: Traditional, Light, and Premium are the only product lines in Montoya Soup Co.’s product portfolio.
The prompt hints that revenue is up and fixed costs haven’t increased in 2015, so the candidate should be thinking about variable costs right away. That said, this is a portfolio pricing strategy case disguised as a cost reduction case and a strong candidate might recognize that possibility.
Fit: Tell me about your favorite class at business school thus far.
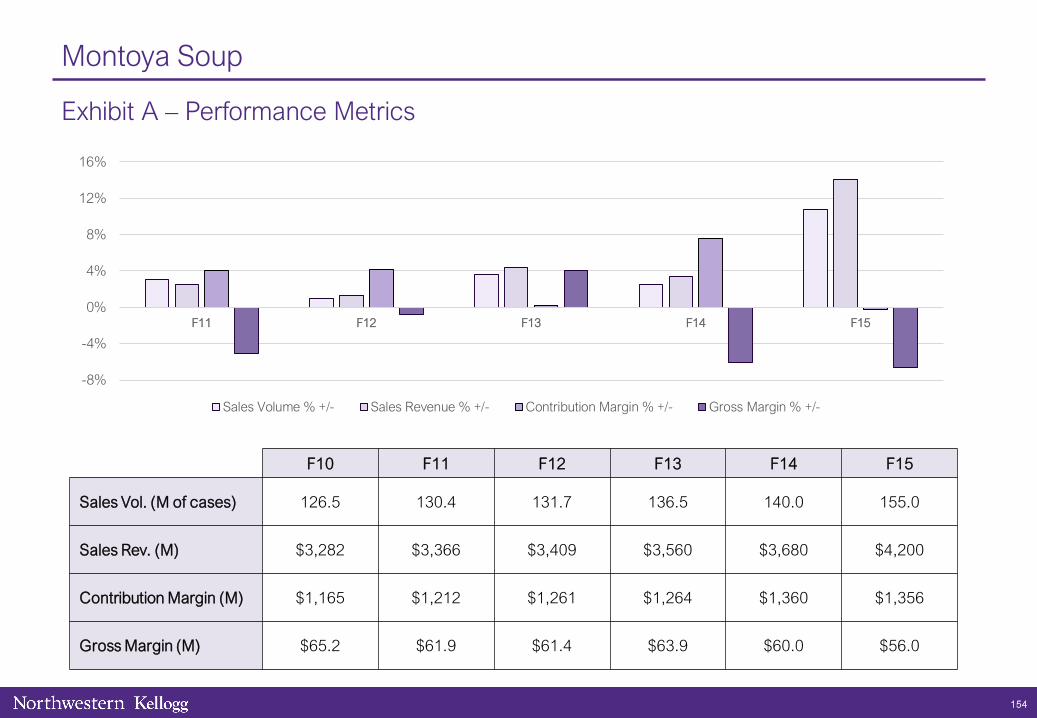
154
Montoya Soup
Exhibit A – Performance Metrics
F10 F11 F12 F13 F14 F15
Sales Vol. (M of cases) 126.5 130.4 131.7 136.5 140.0 155.0
Sales Rev. (M) $3,282 $3,366 $3,409 $3,560 $3,680 $4,200
Contribution Margin (M) $1,165 $1,212 $1,261 $1,264 $1,360 $1,356
Gross Margin (M) $65.2 $61.9 $61.4 $63.9 $60.0 $56.0
-8%
-4%
0%
4%
8%
12%
16%
F11 F12 F13 F14 F15
Sales Volume % +/- Sales Revenue % +/- Contribution Margin % +/- Gross Margin % +/-

155
Montoya Soup
Exhibit B – Product Lines
“Our research showed that many of our consumers were willing to pay more for a product with more meat and vegetable bounty in a carton (instead of a can). After testing several price points, we decided a lower margin and higher volume would help us reach the economies of scale we wanted to see. Consumers loved the product and thought it was a great bargain!”
Trad. Light Prem.
Wholesale Price
$28 $24 $30
F14 Vol. (M cases)
80 60 -
F15 Vol. (M cases)
60 55 40
$1 $1 $1
$7
$3
$8
$4
$4
$6 $1
$1
$1 $4
$4
$7
$1
$1
$1
$0
$5
$10
$15
$20
$25
Traditional Light Premium
Variable Input Cost Per Case
Broth Meat Vegetables
Spices Packaging Wages

156
Montoya Soup
Exhibit C – Demand Analysis
“We looked into moving premium out of cartons and into cans. On the plus side, it would gain us $3 of margin per case, but on the con side it would decrease demand by 20% and cannibalization of our Traditional line would spike to 75%.”
Last Year Increase Price
Premium Price $30 $33
Premium Demand (M cases) 40 20
Traditional Cannibalization Rate 50% 10%
Light Cannibalization Rate 12.5% 0%
“We could decrease our meat and vegetable bounty to be on par with Traditional. That would buy us $3 of margin points and consumers shouldn’t know the difference, in the short run at least.”
Cost Reduction Effect on Demand
Price Elasticity & Cannibalization

157
Montoya Soup
Exhibit D – Stakeholder Input
• “We really loved the new Premium Montoya Soup offering, it brought a new consumer to the shelf-stable soup category when all of the other players were introducing products that just stole from their competitors.”
• “We’re planning to give more shelf space to Montoya Soup in F16 after their successful premium launch this year. Our guests really loved the new packaging format and the higher meat and vegetable content. Product trial wasn’t extremely high, but we saw a lot of repeat purchases from the people who were buying.”
Customer Feedback Consumer Focus Group Excerpts
• “I’m trying to eat healthier, and I’m really nervous about canned products with their BPA lining. As soon as Montoya came out with their new carton soup, I switched right away from their Traditional line and I’m never going back!”
• “I definitely think their brand is rising with me, the old stuff was mostly broth, this new stuff is a huge bargain and it actually has actual stuff in it.”
• “Glad to see that when everyone else is trying to rip you off, Montoya is making soup that actually tastes like something I would make at home.”

158
Montoya Soup
Part 1
1. Develop framework for how to approach this problem
A sample case structure would include the following:
Question: Why is profitability down and what to do about it?
• Has Revenue decreased?
• Volume: Has volume of sales changed? Are we selling different quantities of different products? How can we increase sales of higher margin soups? Are there new customer types we could target (restaurants, convenience stores, etc.)?
• Price: Has price changed? How elastic is price to customers / is there room to increase it? Are we in line with our competition?
• Have Costs gone up?
• Fixed: How have fixed costs changed? Facilities, R&D, marketing spend, distribution systems, etc. How can we adjust costs?
• Variable: Have variable costs changed? Raw soup materials, labor, packaging, etc.
• Have there been changes in the Market?
• Is the soup market growing/shrinking? Are grocery store sales increasing/decreasing?
• Customers: Have shoppers’ tastes & preferences changed? Are shoppers shifting to freshly made soup instead of packed?
• Competition: Are there new companies competing with us? Have substitute products entered the market?
• Risks that need to be considered when making changes:
• Competitive response, cannibalization of our other soup product lines, upsetting major grocery chain customers, etc.

159
Montoya Soup
Part 2
Revenue Costs Product Mix
• Growth was driven by premium line. There was some cannibalization of traditional and light lines.
Question: “What trends do you see with regard to top line growth?”
Insights:
• Revenue grew significantly in F15, much faster than in any other year in recent history.
• Revenue outpaced volume, meaning that not only did revenue grow, but it grew even though avg price increased
• Input prices are the same as F14 for the traditional & light lines. No add’l wastage. No change in formulation.
Question:
• “What happed with fixed costs in F15? Variable costs?”
• “What could have driven up VC’s?”
Insights:
• FC’s were flat at $1.3B in F15 (GM – CM = FC’s), so profit decline was driven by an increase in VC’s.
• Increase in VC’s could have come from pricier mix of inputs, same inputs but increase in input prices, more waste, or change in demand mix.
Questions:
• “How can profitability be down if revenue is up, FC’s are flat, and the cost of our inputs have not changed?”
• “What info do you need to look into fixing the product mix to optimize profitability?”
Insights:
• Assuming no change in formulation or wastage, then the issue must be with cannibalization of higher margin products by lower margin ones.
• Candidates should want to look at the product lines’ prices, COGS, elasticity, and cannibalization rates.
2. Deep dive – Why did profitability decline?
Several potential paths a candidate might want to dig into. and then follow the below lines of thought:Provide Exhibit A
Provide Exhibit BProvide Exhibit B Provide Exhibit B

160
Montoya Soup
Part 3
Cost Reduction Pricing (Cannibalization / Elasticity) Stakeholder Value Proposition
• If asked: Competitors aren’t playing in the “premium” space, only in “value” and “super-premium.”
Question:
• “How much profit do we make per case of Premium? Traditional? Light?”
Insight:
• $10 contribution margin on Traditional & Light, $6 contribution margin on Premium (price – sum of VC’s).
• Largest opportunity for variable cost reduction would be in packaging, meat, and vegetable, but reducing these might erode value prop of premium product.
• (Math on following page)
• If we both raise prices and change packaging, we will lose enormous distribution.
Question:
• “What is the optimum price for profitability?”
Insights:
• Candidate should infer from Exhibit B that Premium cannibalized Traditional substantially.
• (Math on next page)
Questions:
• “What are the long-run effects on customers for changing packaging? For reducing meat/veg costs? For increasing prices?”
• “What about for the end consumer?”
Insights:
• Candidate should see that customers are willing to pay for a pricier product, but that reducing variable costs (and thereby reducing quality) is not a viable long run strategy and will hurt the brand.
3. Deep dive – How do we fix profitability?
There are several potential routes towards improving profits. When appropriate: Provide Exhibit B&C
Provide Exhibit D
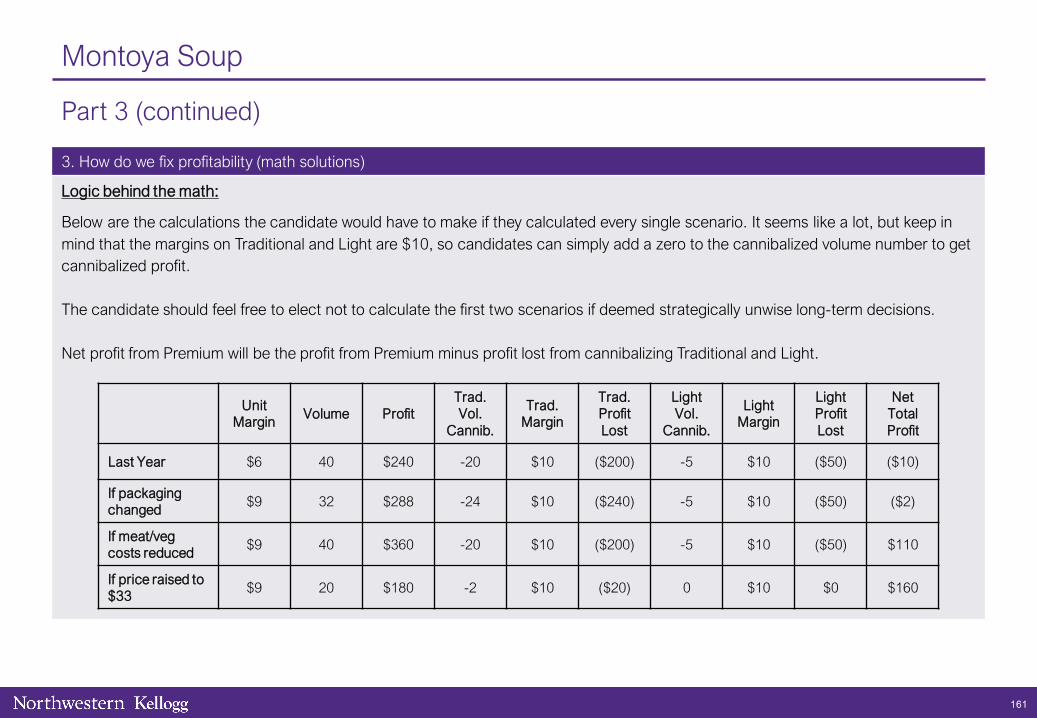
161
Montoya Soup
Part 3 (continued)
3. How do we fix profitability (math solutions)
Logic behind the math:
Below are the calculations the candidate would have to make if they calculated every single scenario. It seems like a lot, but keep in mind that the margins on Traditional and Light are $10, so candidates can simply add a zero to the cannibalized volume number to get cannibalized profit.
The candidate should feel free to elect not to calculate the first two scenarios if deemed strategically unwise long-term decisions.
Net profit from Premium will be the profit from Premium minus profit lost from cannibalizing Traditional and Light.
Unit Margin
Volume ProfitTrad. Vol.
Cannib.
Trad. Margin
Trad. Profit Lost
Light Vol.
Cannib.
Light Margin
Light Profit Lost
Net Total Profit
Last Year $6 40 $240 -20 $10 ($200) -5 $10 ($50) ($10)
If packaging changed
$9 32 $288 -24 $10 ($240) -5 $10 ($50) ($2)
If meat/veg costs reduced
$9 40 $360 -20 $10 ($200) -5 $10 ($50) $110
If price raised to $33
$9 20 $180 -2 $10 ($20) 0 $10 $0 $160

162
Montoya Soup
Part 4
4. Provide client recommendation
Overall:
• Profits have declined due to the introduction of a margin-dilutive product line that cannibalized higher margin products.
• Recommendation is to increase price of Premium product line to $33 per case to maximize profitability (Gross profit would more than quadruple). This recommendation:
• Increases margins (though volume will drop)
• Reduces cannibalization substantially
• Other alternative cost-reduction measures hurt value proposition and will cause long-run issues with brand equity.
Risks:
• Pricing measures didn’t consider competitive response (could competitor come in with a lower priced premium soup and force usout of the category?)
• Raising prices could upset some buyers and lose distribution
• Opportunity cost: could be better long-term strategy to keep prices low and start phasing out of old lines, ramping up Premium.
Next steps:
• Perform due diligence on long-term consumer preference forecast
• Launch advertising campaign to make sure we can justify higher prices and defend from competitors
• Look to reduce high fixed costs so we can protect against potentially price-aggressive competitors or increased commodity prices.

163
Edited by: Rohan Maini (Kellogg 2020)
Case 15
Mustard Clinic
Primary sector(s)
• X08 Healthcare
Concepts tested
• Z04 Capacity (3)
• Z12 Creativity (4)
Similar cases
• Alkaline Ash (Columbia 2017)
• Garthwaite Healthcare (Kellogg 2020)
• Princeton-Plainsboro (Wharton 2012)
• Orrington Office Supplies (Kellogg 2020)
Case type
• Y07 Profitability
• Y01 Cost reduction
• Y05 Operations
Interviewer-led

164
Mustard Clinic
Interviewer guide
Case prompt
• Your client is the CEO of the Mustard Clinic, a for-profit hospital in the United States.
• The hospital is known primarily for its leading care for babies and young children.
• Patients pay a fixed fee to access services on arrival, and all subsequent costs are borne by the Mustard Clinic.
• Sugar Magnolia does not deal with insurance providers. Instead, patients submit expense claims directly with their insurance provider(s).
• In the last few years, the hospital’s profitability has fallen, and they are facing bankruptcy. Last year they lost $1.4m
• The CEO asks you: “Why has profitability gone down and how can we turn it around?”
Interviewer guide
• Problem: How can the Mustard Clinic break even (increase profits by $1.4m)?
1. Analyze customer segments
2. Determine cost impact of shorter patient stays
3. Determine profit impact of shorter patient stays
4. Brainstorm ways to shorten patient stays
5. Provide client recommendation

165
Mustard Clinic
Case prompt
• Your client is the CEO of the Mustard Clinic, a for-profit hospital in the United States.
• The hospital is known primarily for its leading care for babies and young children.
• Patients pay a fixed fee to access services on arrival, and all subsequent costs are borne by the Mustard Clinic.
• Sugar Magnolia does not deal with insurance providers. Instead, patients submit expense claims directly with their insurance provider(s).
• In the last few years, the hospital’s profitability has fallen, and they are facing bankruptcy. Last year they lost $1.4m
• The CEO asks you: “Why has profitability gone down and how can we turn it around?”
Clarifying information
• Goal: The Mustard Clinic wants to at least break even.
• Customers: The Clinic cannot influence its patient mix in the short term.
• Services: The Clinic offers intrapartum (childbirth), neonatal (for newborns), pediatrics (for infants and children) and a small geriatrics (for the elderly) unit.
• Competitors: There aren’t any competitors that have contributed to the Mustard Clinic’s problem.
• Revenue model: Customers are charged a fixed fee at the time of checking-in. All subsequent costs are borne by the Mustard Clinic.
Experience: Tell me about a time you implemented a new way of doing things in an organization.

166
Mustard Clinic
Exhibit A – Key hospital unit metrics
Segment Description Annual volume(patients)
Average stay (nights)
Intrapartum Care of due and in-labor mothers (during labor and childbirth)
500 10
Neonatal Care of premature newborns (first 28 days of life)
300 7
Pediatrics Care of infants, children, and adolescents (up to age 21)
150 11
Geriatrics Care of elderly patients (aged 60 and over)
50 25

167
Mustard Clinic
Exhibit B – Cost structure
Fixed costs $1.4m
Variable costs $600/patient per night
Average stay (nights) 10
Patients per year 1,000
Capacity utilization* 100%
Notes:
• Capacity = Total number of patient nights per year that the Mustard Clinic can accommodate

168
Mustard Clinic
Part 1
1. Analyze customer segments
• Our team has conducted the following analysis on various groups of customers.
• Providing overnight care is expensive for the Mustard Clinic. In number of nights, what is the average stay duration for a Mustard Clinic patient?
• Average stay duration = Total nights / Number of patients = 10,000 / 1,000 = 10 nights
• Takeaway: Because we have a fixed fee arrangement, it might be worth looking to reduce the average patient stay duration.
Provide Exhibit A
Unit Volume Average stay (nights)
Total nights
Intrapartum 500 10 500 x 10 = 5,000
Neonatal 300 7 300 x 7 = 2,100
Pediatrics 150 11 150 x 11 = 1,650
Geriatrics 50 25 50 x 25 = 1,250
Total 1,000 10,000

169
Mustard Clinic
Part 2
2. Determine cost impact of shorter patient stays
• If the Mustard Clinic were to reduce the length of an average patient stay by two nights, what would be the cost saving?
Costs with 10 night stay
• Fixed costs: $1.4m
• Variable costs: 1,000 patients x 10 night stay x $500 per night = $6m
Costs with 8 night stay
• Fixed costs: $1.4m
• Variable costs: 1,000 patients x 9 night stay x $500 per night = $4.8m
• Takeaway: Shorter stays saves $1.2m, which is promising but doesn’t help the Mustard Clinic breakeven.
• But shorter stays also frees up capacity for new patients.
Provide Exhibit B

170
Mustard Clinic
Part 3
3. Determine profit impact of shorter patient stays
• Reducing the average stay length frees up space for new patients. How many additional patients can we serve and what would bethe impact on profit if the average revenue per patient is $6,000?
• Hospital capacity: 1,000 patients x 10 nights average stay = 10,000 patient nights
• Capacity made available from stay reduction: 1,000 patients x 2 night stay reduction = 2,000 patient nights
• Additional patients that could be served: 2,000 patient nights / 8 night average stay = 250 additional patients
• Revenue: 1,250 patients per year x $6,000 revenue per patient = $7.5m
• Fixed Cost: $1.4m
• Variable Cost: 1,250 patients per year x 8 night average stay x $600 variable costs per night = $6m
• Proft = $7.5m – ($1.4m + $6m) = $100k
• Takeaway: The Mustard Clinic can return to profitability by shortening patient stays by 2 nights and using the freed up capacity.

171
Mustard Clinic
Part 4
4. Brainstorm ways to shorten patient stays
• What are some ways in which the Mustard Clinic could reduce the average patient stay duration from 10 to 8 nights?
• The actual ideas are less important here than providing some approach to structuring the brainstorm. One example might be to usesteps in the patient journey to identify areas to optimize speed.
Patient Journey
Admittance Diagnosis Surgery Recovery Other
• Decrease/eliminate geriatrics unit
• More receptionists• Partner hospitals• Tele-diagnosis
• Technology• Doctor skill/quality• Operational delays?
• Tele-medicine• At-home care• Partner hospitals
• End fixed fee pricing• Drive awareness of cost
structure to doctors

172
Mustard Clinic
Part 5
5. Provide client recommendation
• Overall, the Mustard Clinic can meet their goal and return to profit.
• This is based on decreasing average patient stay duration from 10 to 8 days, which:
• Saves $1.2m in variable costs per patient night for all patients
• Frees up capacity for 250 additional patients
• Brings in $300k in profit from these additional patients
• One way to reduce patient stay duration would be to close the Geriatrics unit, which is not our core competency.
• Risks: Reducing average patient stay might affect revenues if patient care worsens or if Geriatrics is a complementary service.
• Next steps: Feasibility study into tactical ways to actually reduce average without impacting patient care.
• Strong candidates maintain organization well since there are several points in the case when they will need to refer back to previous clarifying information, exhibits or calculations.
• Outstanding candidates are able to think strategically about the impact of changes throughout the case. Structures math and finds quick ways to do calculations (eg. Q2 saving = 2 nights x 1,000 patients x $600 per night = $1.2m)

173
Case author(s): Andy Grieve (Kellogg 2001)Edited By: Peter Manoogian (Kellogg 2012), Rohan Maini (Kellogg 2020)
Case 16
Orrington Office Supplies
Primary sector(s)
• X04 Engineering & Construction
Concepts tested
• Z04 Capacity
Similar cases
• Alkaline Ash (Columbia 2017)
• Garthwaite Healthcare (Kellogg 2020)
• Princeton-Plainsboro (Wharton 2012)
• Mustard Clinic (Kellogg 2020)
Case type
• Y05 Operations
• Y07 Profitability

174
Orrington Office Supplies
Interviewer guide
Case prompt
• Our client, Orrington Office Supplies (OOS) is a leading manufacturer of office products in 1992, with sales of $275m in 1991. They have strong brands, invest heavily in marketing and advertising, and have grown through product line extensions and 4 key acquisitions.
• OOS is organized into 5 autonomous divisions, but shares manufacturing and marketing functions. Shared costs (45% of total) are allocated on a percentage share of sales method. There are three plants running at a current capacity utilization of 50%.
• Analysts predict OOS is a potential acquisition target given its strong balance sheet but weakening earnings. They are publicly traded and have little long-term debt. As a potential investor, how would you improve its profitability?
Interviewer guide
• Problem: How can OOS increase profits?
• Problem solving steps:
1. Identify trends in sales and profit
2. Analyze plant production operations
3. Determine financial impact of plant consolidation
4. Provide client recommendation

175
Orrington Office Supplies
Case prompt
• Our client, Orrington Office Supplies (OOS) is a leading manufacturer of office products in 1992, with sales of $275m in 1991. They have strong brands, invest heavily in marketing and advertising, and have grown through product line extensions and 4 key acquisitions.
• OOS is organized into 5 autonomous divisions, but shares manufacturing and marketing functions. Shared costs (45% of total) are allocated on a percentage share of sales method. There are three plants running at a current capacity utilization of 50%.
• Analysts predict OOS is a potential acquisition target given its strong balance sheet but weakening earnings. They are publicly traded and have little long-term debt. As a potential investor, how would you improve its profitability?
Clarifying information
Industry
• U.S. Office supplies market grew at 5% CAGR historically. In 1990 and 1991, the market declined at 5% per year.
• Superstore channel is becoming increasingly critical
• Gained 10 share pts in past 2 years
• Typically discount products 30% to small retailers/dealers
• Superstores are aggressively substituting private label products for traditional brand names
Client Characteristics
• Broader product line than competitors (12.5k SKUs vs. 4-5k for competitors)
• Distribution: 75% wholesalers, 15% superstores, 10% end customers
• Highest selling product is a high-end branded stapler
• Staples, Inc. is OOS’s largest customer
Fit: What role do you typically play in a team? Give me an example of this.

176
Orrington Office Supplies
Exhibit A – Historical revenues and profits
$-
$50
$100
$150
$200
$250
$300
$350
1980 1981 1982 1983 1984 1985 1986 1987 1988 1989 1990 1991
Mill
ions
Sales
Pre-tax Profit
1980 to 1989 1989 to 1991
Sales CAGR 15% -8%
Pre-tax Profit CAGR 15% -40%

4,500 5,000
3,000
7,500
3,500
2,500
0
2,000
4,000
6,000
8,000
10,000
12,000
14,000
Chihuahua, MEX Grand Rapids, MI Sayreville, NJ
Uni
ts
Unused capacity
SKU capacity utilization
177
Orrington Office Supplies
Exhibit B – Production plants

178
Orrington Office Supplies
Exhibit C – Plant operating costs
20
15
1818
39.5
25.5
0
5
10
15
20
25
30
35
40
45
Chihuahua, MEX Grand Rapids, MI Sayreville, NJ
Co
sts
($m
)
Fixed Costs
Variable Costs

179
Orrington Office Supplies
Part 1
1. Identify trends in sales and profit
• Why do the slopes for sales and profits differ as time elapses?
• The interviewee should not only be able to interpret the data on this slide, but also come up with two insights:
1. The fact profits have been declining more steeply than sales reflects the fixed-cost nature of this business, and;
2. The reason that sales did not grow at a faster clip than profitability during the 1980s likely reflects a strategy to grow through acquisitions, which prevented OOS from seeing the gains through economies of scale that one would normally expect in a business such as this
Provide Exhibit A after the candidate asks about profitability

180
Orrington Office Supplies
Part 2
2. Analyze plant production operations
• Qualitatively discuss the potential options for plant consolidation with the interviewee.
• The interviewee should recognize the Chihuahua plant is close to having capacity to produce OOS’s 12.5k SKUs. Either OOS can close that plant and move all production to the US, or it could close the US plants, discontinue 500 SKUs and move production toChihuahua.
• Strong interviewees will note that Chihuahua is the most feasible strategy, but will ask to see fixed and variable cost data.
Provide Exhibit B after the candidate asks about plant consolidation

181
Orrington Office Supplies
Part 3
3. Determine financial impact of plant consolidation
• How would this change revenues? (currently $275m/year)
• How would this change production costs? What are they now?
• How would this change pre-tax profits (currently $25m/year?)
• Revenues: Each SKU earns annual revenues of $22k ($275m divided by 12,500 SKUs) therefore, eliminating 500 SKUs will decrease annual revenue by $11m, or 4%
• Costs:
• Consolidating revenues to Chihuahua will reduce annual costs by 50% to:
• Chihuahua: $20m + ($4k * 12k SKUs) = $20m + $48m = $68.0m
• Profits: We increased profits by $57m ($68m - $11m) to $82m, which more than triples them.
Provide Exhibit C after the candidate asks about Costs
Each plant has the following variable cost per SLU:
Chihuahua: $18m / 4.5k SKUs = $4k per SKU
Michigan: $39.5m / 5k SKUs = $7.9k per SKU
New Jersey: $25.5m / 3k SKUs = $8.5k per SKU
Each plant currently has the following annual costs:
Chihuahua: $20m + $18m = $38.0m
Michigan: $15m + $39.5m = $54.5m
New Jersey: $18m + $25.5m = $43.5m
$136m

182
Orrington Office Supplies
Part 4
4. Provide client recommendation
• Overall, our client should eliminate 500 SKUs and consolidate all production to the Chihuahua plant to raise annual profits from$25m to $82m.
• The client should also consider several qualitative issues:
• Implementation: Long-term timeframe.
• Unionized labor: Whether organized labor exists at closing plants and the impact of that
• Distribution and Warehousing: We will need a carefully-developed transition plan.
• Purchasing: We will need to transition to a strong central purchasing department, rather than smaller local ones.
• Culture: Communicating the change properly is key, and we will need to ensure that morale does not take a nosedive.
• Excellent interviewees need to recognize what macroeconomic issues are beyond the scope of the client’s control and then quickly dive into the plant consolidation, then analyze the cost structures

Case 17
Plastic World
183
Primary sector(s)
• X06 Financial Services
Concepts tested
• Z13 Organizational changes
• Z07 Market share• Z10 Customer strategy
Case authors: Milija MedicEdited By: Peter Manoogian (Kellogg 2012), Laura Mast (Kellogg 2020)
Similar cases
• Snack Foods Acquisition (Wharton 2017)
• Steel Corp (Haas 2015)
• Soda Ash Producer (Columbia 2017)
Case type
• Y03 Mergers & Acquisitions

184
Plastic World
Interviewer guide
Case prompt
• Our client is a private equity firm interested in Plastic World, a plastic packaging manufacturer.
• Plastic World’s owners are requesting $25m. The offer is final. Should our client buy the company?
Interviewer guide
• Problem: Should the PE firm purchase Plastic World for $25m?
• Problem solving steps:
1. Examine financial statements
2. Explore feasibility of target’s profit margin improvement
3. Provide client recommendations

185
Plastic World
Case prompt
• Our client is a private equity firm interested in Plastic World, a plastic packaging manufacturer.
• Plastic World’s owners are requesting $25m. The offer is final. Should our client buy the company?
Clarifying information
• Company
• Makes plastic packaging for beverages, cosmetics, household and automotive chemicals
• Products are top quality, they have 350 sets of molds, with different materials, finish, colors, always innovating
• Overall product mix has not changed in recent years
• The sales force is “the best in breed”, they hold market share, and they are compensated on market share
• Two years ago they invested further in equipment for product innovation
• Customers
• Plastic Worlds’ customers exhibit strong loyalty
• They are experiencing increasing pressures in their industries to innovate the plastic packaging
Fit: Tell me about a time that you demonstrated entrepreneurial drive in a non-professional environment.
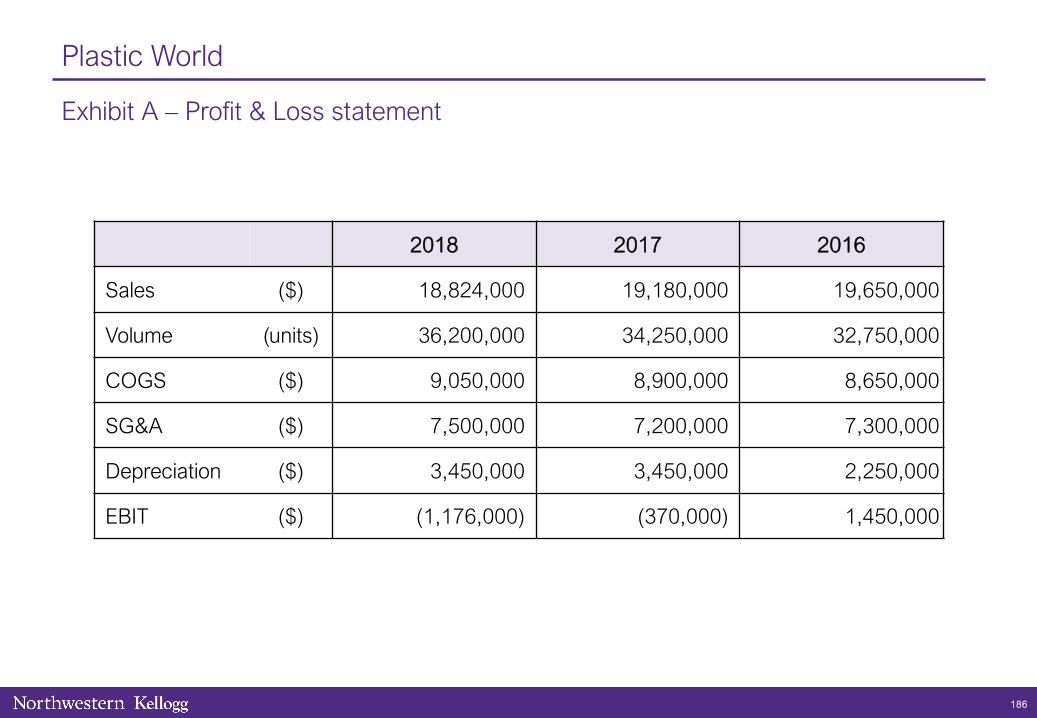
186
Plastic World
Exhibit A – Profit & Loss statement
2018 2017 2016
Sales ($) 18,824,000 19,180,000 19,650,000
Volume (units) 36,200,000 34,250,000 32,750,000
COGS ($) 9,050,000 8,900,000 8,650,000
SG&A ($) 7,500,000 7,200,000 7,300,000
Depreciation ($) 3,450,000 3,450,000 2,250,000
EBIT ($) (1,176,000) (370,000) 1,450,000

187
Plastic World
Exhibit B – Competitor Profit Margins
-10 -5 0 5 10 15
PlasticWorld
Competitor F
Competitor E
Competitor D
Competitor C
Competitor B
Competitor A

188
Plastic World
Exhibit C – Valuation by Profit Margin
0
5
10
15
20
25
30
35
40
45
50
-10 -5 0 5 10 15
Com
pany
Val
uatio
n ($
m)
Profit Margin (%)

189
Plastic World
Part 1
1. Examine financial statements
• What observations can be made from this P&L statement?
• Would could be the reasons behind what is in the data?
• Plastic World has experienced a steady drop in revenues while the sales volume has been growing.
• Profit margin is dropping and negative; Interviewee should calculate the profit margin (-6%)
• Given the unchanged product mix and increasing sales volume, the drop in revenues is caused by a reduction in prices;
• Depreciation change – it was equipment investment.
• To check if it’s an industry-wide or company-specific drop in profitability, they should request competition profitability data
• Interviewee should ask about the product quality and customer loyalty to discard price competition as the reason to drop prices.The products are high-quality and customers are loyal, so most of them would buy even at a higher price.
• The interviewee should find, asking independently or with your help, that sales force is compensated based on market share. Thisgives the sales force incentive to drop the prices.
Provide Exhibit A immediately after the interviewee runs through their problem-solving structure

190
Plastic World
Part 2
2. Explore feasibility of target’s profit margin improvement
• Exhibit B
• The candidate should identify the profitability problem is client-specific, all competitors are profitable
• Push the interviewee to discuss a realistic profit margin goal for Plastic World based on this industry profitability data
• Exhibit C
• The observation from the graph is that the company would be worth $25M if Plastic World increased profit margin from –6% to 0%. If the profit margin reached the industry average, the company would be worth $40M.
• Now the question is how easily can the profitability be increased above zero (making the company worth more than the $25M). The sales force incentive change is easy to make.
• Looking for other high-impact improvements, the dense product line and constant innovation is the next largest candidate. Eliminate some molds to cut costs, mindful of innovation pressures in PW’s clients’ industries.
• Interviewee should investigate the profitability drop and the low prices further and suggest options to get Plastic World’s profitability in line with the industry, and their feasibility
Provide Exhibit B when the interviewee requests information about Competitors
Provide Exhibit C after the interviewee starts talking about using Profit Margins in Valuation

191
Plastic World
Part 3
3. Provide client recommendation
• Our client should accept the $25M offer and boost the profitability (and value) of PlasticWorld.
• The client should engage in the following easy-to-implement changes:
• Compensate sales force based on company earnings instead of market share.
• Simplify the product line - eliminate some of the 350 molds to cut costs while leveraging the superior sales force to maintain client satisfaction.
• Examine the industry best practices to find other areas for improvement.
• Excellent interviewees will immediately notice that the company would be worth more than $25M if its profit margin was at the level of industry average.
• Outstanding interviewees will quickly identify the pricing as the issue behind the revenue decrease and lay out potential causes for the price drop, finding the sales force incentive. A framework comprehensive enough to find the product line size problem is a bonus.

192
Case author(s): Brian Fox (Kellogg 2004)Edited By: Adam Louras (Kellogg 2011), Rohan Maini (Kellogg 2020)
Case 18
Rotisserie Ranch
Primary sector(s)
• X02 Agriculture & Food
• X12 Retail & CPG
Concepts tested
• Z10 Customer marketing strategy
Similar cases
• Beverage Manufacturer (Wharton 2012)
• Botox (Stern 2012)
Case type
• Y04 New product
• Y06 Opportunity assessment
Interviewer-led

193
Rotisserie Ranch
Interviewer guide
Case prompt
• Our client is Rotisserie Ranch, a poultry farming company that specializes in growing chickens for rotisserie roasting. Its primary customer segment is comprised of large grocery chains that buy chickens to fresh roast in the meat departments of their grocery stores.
• Market research has revealed to Rotisserie Ranch that more and more consumers have begun buying flavored rotisserie chickens recently.
• Rotisserie Ranch is thinking of pre-flavoring some of its chickens for grocers, what would you consider in making this recommendation?
Interviewer guide
• Problem: Should Rotisserie Ranch pre-flavor its chickens?
• Problem solving steps:
1. Brainstorm value to customers of new product
2. Analyze results of market test
3. Provide client recommendation

194
Rotisserie Ranch
Case prompt
• Our client is Rotisserie Ranch, a poultry farming company that specializes in growing chickens for rotisserie roasting. Its primary customer segment is comprised of large grocery chains that buy chickens to fresh roast in the meat departments of their grocery stores.
• Market research has revealed to Rotisserie Ranch that more and more consumers have begun buying flavored rotisserie chickens recently.
• Rotisserie Ranch is thinking of pre-flavoring some of its chickens for grocers, what would you consider in making this recommendation?
Clarifying information
• Industry: Predicting demand for cooked chickens is difficult for grocers; any leftover cooked chickens at the end of the day are thrown out; unthawed chickens cannot be re-frozen
• Client: Client has patented process for sterilely packaging chicken, so that it will remain fresh for 30 days, making freezing unnecessary. Client is currently the industry market share leader in rotisserie-ready chicken
• Product: Four New “Flavored” Products to be introduced concurrently: Barbecue, lemon herb, tandoori and teriyaki
• Competitor: No competition in new product market due to patented process
Fit: Tell me about a time you had to deal with a difficult boss.

195
Rotisserie Ranch
Exhibit A – Store sales
Standard Rotisserie BBQ Seasoned Rotisserie
Store A B C D
Weekly Sales $1,000 $2,000 $1,600 $2,700
Retail Price $3.33 $2.50 $4.00 $3.00
Retailer Margin 30% 30% 25% 25%

196
Rotisserie Ranch
Part 1
1. Brainstorm value to customers of new product
• Do you think that grocery retailers would be interested in pre-seasoned chickens from Rotisserie Ranch?
• After the interviewee brainstorms, ask them:
• After several interviews, grocers are interested in Rotisserie Ranch’s proposed new product, but first they want to be sure thatthe chickens will sell well. How would you make sure?
• The candidate may begin going into detail on how this test would be run. Cut him or her off as soon as you are comfortable that they understand that: (a) a pilot test should be run and (b) the pilot needs to have some control or comparison group.
Yes No
• Labor Cost Reduction: Meat department workers; don’t need to spend time seasoning the chickens.
• Economies of Scale: Seasoning centralization; lower cost.
• Product Consistency: Centrally managed; able to spend more on R&D.
• Loss of Differentiation: Grocery chains differentiate by value-added .
• Attune to Local Needs: Likely to be better at gauging consumer tastes.
• Increases Inventory & SKUs.

197
Rotisserie Ranch
Part 1
2. Analyze results of market test
• A test market launch for the new Rotisserie Ranch BBQ chicken was administered. What is the overall profit for both Store A and B from the test market?
• Using Exhibit A, interviewee should calculate:
• Retailer profit for Seasoned Chicken compared to Standard Chicken
• Retailer profit = # of chickens sold * (price per chicken * retailer margin per chicken)
• Standard Chicken (total profit for retailers = $300 + $600 = $900/week)
• Store A: $1,000 (weekly sales) * 30% (retailer margin) = $300 overall profit
• Store B: $2,000 (weekly sales) * 30% (retailer margin) = $600 overall profit
• Test Market BBQ Seasoned Chicken (total profit for retailers = $400+ $675= $1,075/week)
• Store C: $1,600 (weekly sales) * 25% (retailer margin) = $400 overall profit
• Store D: $2,700 (weekly sales) * 25%* (retailer margin) = $675 overall profit
Provide Exhibit A once the interviewee identifies the need for market testing

198
Rotisserie Ranch
Part 3
3. Provide client recommendation
• Overall, our client should launch the Pre-Seasoned BBQ Chicken product and test other products because:
• Competitive Necessity: Consumers are spending more money on seasoned rotisserie chicken than traditional rotisserie chicken and the market is shifting in this direction
• Benefit to Grocers: Assuming test market was representative, Grocers can expect to earn $175 more gross profit using our client’s product relative to the standard rotisserie chicken
• Potential scale benefits to our Client over time as more pre-seasoned chickens are sold
Case 19
Salty Sole Shoe
Primary sector(s)
• X12 Retail and Consumer
• X06 Financial Services
199
Concepts tested
• Z12 Creativity
• Z01 Accounting (2/3)
• Z09 Microeconomics
Case authors: Meredith Tierney (Kellogg 2011)Edited By: Uri Kalir (Kellogg 2012), Derek Wiatrowski (Kellogg 2020)
Case type
• Y07 Profitability
Similar cases
• US Shoe Manufacturing (Wharton 2017)
• Kicks (Tuck 2009)
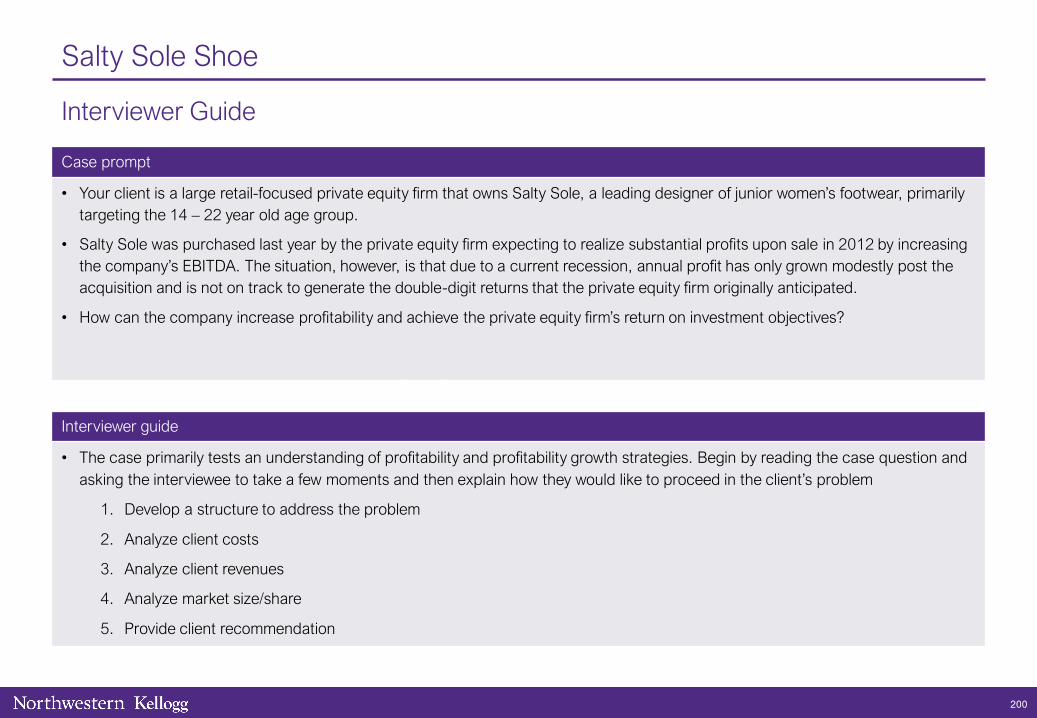
200
Salty Sole Shoe
Case prompt
• Your client is a large retail-focused private equity firm that owns Salty Sole, a leading designer of junior women’s footwear, primarily targeting the 14 – 22 year old age group.
• Salty Sole was purchased last year by the private equity firm expecting to realize substantial profits upon sale in 2012 by increasing the company’s EBITDA. The situation, however, is that due to a current recession, annual profit has only grown modestly post theacquisition and is not on track to generate the double-digit returns that the private equity firm originally anticipated.
• How can the company increase profitability and achieve the private equity firm’s return on investment objectives?
Interviewer guide
• The case primarily tests an understanding of profitability and profitability growth strategies. Begin by reading the case question and asking the interviewee to take a few moments and then explain how they would like to proceed in the client’s problem
1. Develop a structure to address the problem
2. Analyze client costs
3. Analyze client revenues
4. Analyze market size/share
5. Provide client recommendation
Interviewer Guide

201
Salty Sole Shoe
Case prompt
• Your client is a large retail-focused private equity firm that owns Salty Sole, a leading designer of junior women’s footwear, primarily targeting the 14 – 22 year old age group.
• Salty Sole was purchased last year by the private equity firm expecting to realize substantial profits upon sale in 2012 by increasing the company’s EBITDA. The situation, however, is that due to a current recession, annual profit has only grown modestly post theacquisition and is not on track to generate the double-digit returns that the private equity firm originally anticipated.
• How can the company increase profitability and achieve the private equity firm’s return on investment objectives?
Clarifying information
• Industry Characteristics/Market Economics: Client is the market leader in junior women’s footwear in the U.S. only. Apparel industry is characterized by cyclicality due to economy and consumer preferences.
• Client Characteristics: Client designs and distributes footwear to discount retailers (like Kohl’s) and is considered mid-priced. Client outsources all manufacturing on a fixed-contract basis (i.e. manufacturing costs with outsourced providers fall under Fixed Costs for simplicity).
• Competitive Dynamics: Client follows a “me-too” strategy and follows fashion rather than inventing it then offering lower prices than name brands (i.e. not subject to fashion risk). Client competes on the basis of trendy fashion and value pricing.
Fit: What is an example of when you showed initiative and leadership?

202
Salty Sole Shoe
Exhibit A – Salty Sole Financial Estimates
($ in millions)
2006A 2007A 2008A 2009E 2010E 2011E 2012E
Sales $ 50.0 65.0 60.0 61.0 62.0 65.0 70.0
Less Discounts/Allowances $ (0.5) (0.65) (0.60) (0.61) (0.62) (0.65) (0.7)
Net Sales $ 49.5 64.35 59.4 60.39 61.38 64.38 69.3
% Increase 20.0 30.0 (7.7) 1.7 1.6 4.8 7.7
COGS 24.75 32.18 29.70 30.20 30.69 32.18 34.65
Fixed Costs 15.00 15.00 15.00 15.00 15.00 15.00 15.00
Total Costs 39.75 47.18 44.70 45.20 45.69 47.18 49.65
EBITDA $ 9.75 17.18 14.70 15.20 15.69 17.18 19.65
Sale Multiple 6.5x 6.5x 6.5x 6.5x 6.5x 6.5x 6.5x
Purchase/Sale Price $ 111.64 95.55 98.77 101.99 111.64 127.73
Return on Investment % 2.7
Notes:
• Acquisition occurred on December 31, 2006
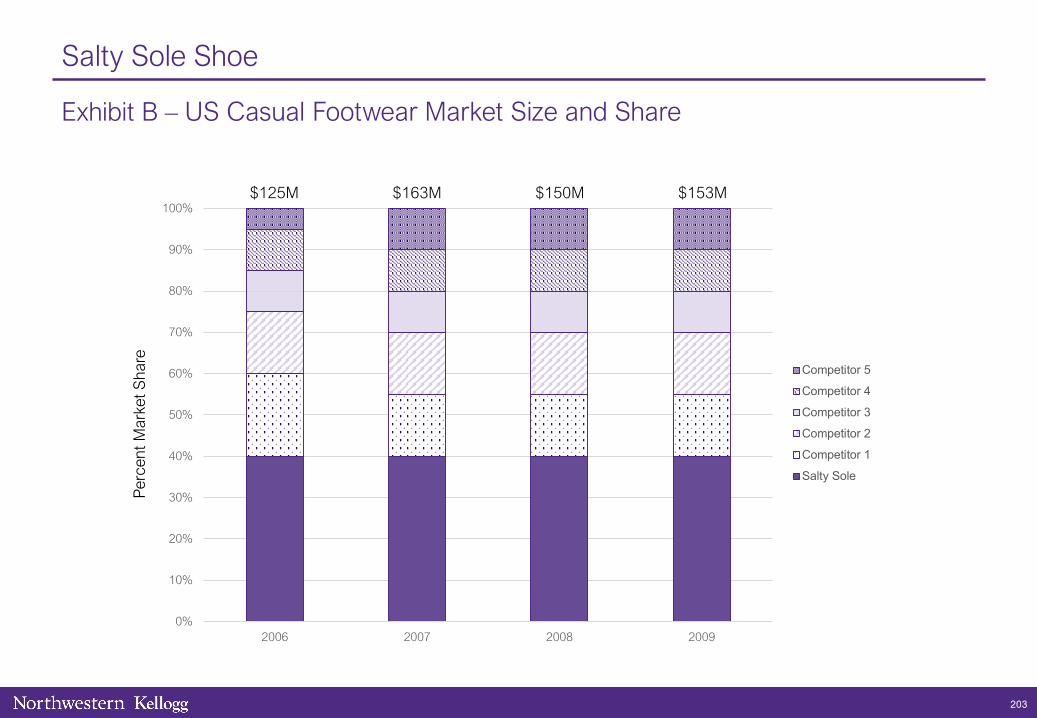
203
Salty Sole Shoe
Exhibit B – US Casual Footwear Market Size and Share
0%
10%
20%
30%
40%
50%
60%
70%
80%
90%
100%
2006 2007 2008 2009
Competitor 5
Competitor 4
Competitor 3
Competitor 2
Competitor 1
Salty Sole
$125M $163M $150M $153M
Per
cent
Mar
ket S
hare

204
Salty Sole Shoe
Part 1
1. Develop a structure to address the problem
• After asking the case question, the interviewee should draw a framework that outlines the basic concept that profit is driven byrevenue (price and volume) and cost (fixed and variable)
π
R C
Avg P
• Discounts• Channel variations• Product mix• Customer segments
Qty Sold
Share of market
• Specific category• Competitors
Size of market
F
• Factories• Marketing• SG&A
V
• Canvas• Rubber• Labor

205
Salty Sole Shoe
Part 2
2. Analyze client costs
• What observations can be made from this chart? Interviewee should point out that the company experienced significant growth during the pre-recession years, but a decline and only gradual pick-up following.
• Interviewee should pick-up on the fact that the change in net sales is not due to increased discounts/allowances (remains 1% throughout years).
• Have a quick discussion on the company’s cost structure
• On the cost side, interviewee should note that variable costs remained flat at 50% and fixed costs remained flat
• Fixed: Interviewee should note that fixed costs are not extremely high (about 23-25%), but could be an area for improvement. Ask how interviewee would reduce fixed costs? Examples include: renegotiate contracts, find cheaper manufacturing partners, etc.
• State that in-fact fixed costs cannot be adjusted based on the company’s research.
• Variable: Interviewee should note that variable costs are approximately 50% of sales. Ask how interviewee would think about reducing variable costs? Examples include: reduce labor/sales force, use technology, renegotiate / volume purchase materials
• State that variable costs are currently at the lowest possible rates based on market research.
Provide Exhibit A

206
Salty Sole Shoe
Part 3
3. Analyze client revenues
• Once interviewee determines that cost is not the issue, have a discussion on the components of revenue – price and volume.
• Price: Interviewee should ask if pricing has remained constant over time or if the company has adjusted its pricing to reflect lower consumer discretionary income.
• Ask what considerations the interviewee would have when considering adjusting price?
• Answers should be price sensitivity / elasticity, cost structure, brand equity (dilute brand through price decrease but compete with more upscale brands if increase).
• State that pricing has remained constant at an average of $25/unit. The company has determined that it would not be prudent to adjust pricing based on industry research. Interviewee can now determine the # of pairs sold for later in the case.
• Now that the interviewee has hopefully zeroed-in on the fact that the issue is volume, ask how many units must be sold by 2012 in order for the private equity firm to achieve a 20% return on the investment in Salty Sole Shoe, which equals approximately $300 million sale value (give this number). Note that interviewee should ignore discounts/allowances for simplicity.
• Interviewee should determine that if the sale value needs to be $300mm in 2012, then EBITDA will need to be $300 / 6.5 = $46.15 (round up to $50 million).
• The formula to determine how many pairs of shoes must be sold to reach that EBITDA level is as follows:
• $50,000,000 = $25*v – (.5 * 25 * v) – 15,000,000
• $65,000,000 = 12.5v
• V = 5,200,000 pairs of shoes
207
Salty Sole Shoe
Part 4
4. Analyze market size/share
• Interviewee should note that this is more than double the 2008 and 2009 volume levels. Ask what the interviewee would want toknow to determine if this volume is feasible? Answer: market size / share.
• Show the candidate Exhibit B when he/she notes that market size/share would be helpful.
• Candidate should note that the client is already the market leader with 40% and that the market size is not projected to increase.
• This should lead to the conclusion that the client can increase volume by stealing share and/or new products in other categories.
Provide Exhibit B
208
Salty Sole Shoe
Part 5
5. Provide client recommendation
• The interviewee should zero-in on the fact that since cost-structure is fixed and price is also fixed, volume is the only real way to increase profitability.
• However, volume must more than double in order to achieve the growth desired by the private equity firm for a 20% return, which could be difficult given recession and the fact that the industry as a whole isn’t growing.
• Interviewee should recommend potentials strategies for achieving that volume growth while outlining the risks of each: 1) Volume: new products / geographies / distribution channels (international?); increase marketing to steal share; acquire growth (brands);adjust product mix to higher-margin products. 2) Price: add value / features. 3) Risks: Capacity, cannibalization if new products.
• Excellent interviewees quickly identify that volume is the issue by ticking through the parts of the profitability equation.
• They will also ask about product mix and question the 50% gross margin. The interviewer should note that it’s assumed that all products have the same margin, but that’s a great question.
• Outstanding interviewees will note that since the company is not projected to have to adjust discounts / allowances, then it probably has a good product that is highly-valued by customers and/or this may be aggressive projecting.

209
Case source: PrepLounge (‘Fysikum’)Edited by: Rohan Maini (Kellogg 2020)
Case 20
Sosland Sports
Primary sector(s)
• X09 Hospitality & Leisure
Concepts tested
• Z03 Breakeven analysis (2)
• Z11 Competitive analysis (3a)
• Z12 Creativity (3b)
• Z10 Customer strategy (4)
Similar cases
• Thrill Park (Fuqua 2016)
• Tommy’s Tennis (WSO 2012)
• Snack Foods Acquisition (Wharton 2017)
Case type
• Y04 Market Entry

210
Sosland Sports
Interviewer guide
Case Question
• Your client, Sosland (pronounced sauce-land) Sports, is an operator of squash centers in Sweden. The squash centers include sauna, spa, pool, gym and - of course - the squash courts!
• Due to the extreme success in Sweden the company is considering expanding to other countries in Europe, in particular Germany.
• The founder and CEO, Felicity Sosland, has asked us to evaluate this possible expansion.
• What factors would you consider in order to estimate the outcomes of this expansion?
Interviewer guide
• Problem: Should Sosland Sports expand into Germany?
• Problem solving steps
1. Develop problem solving structure
2. Determine the breakeven point
3a. Conduct competitive analysis
3b. Brainstorm service differentiators
4. Provide client recommendation

211
Sosland Sports
Case Question
• Your client, Sosland (pronounced sauce-land) Sports, is an operator of squash centers in Sweden. The squash centers include sauna, spa, pool, gym and - of course - the squash courts!
• Due to the extreme success in Sweden the company is considering expanding to other countries in Europe, in particular Germany.
• The founder and CEO, Felicity Sosland, has asked us to evaluate this possible expansion.
• What factors would you consider in order to estimate the outcomes of this expansion?
Clarifying information
• Company: Sosland Sports centers are mid-range centers with medium-quality facilities. They only exist in Sweden.
• Goal: Breakeven at least. No timeframe.
• Revenue: Annual subscription based revenue model.
Experience: Tell me about your most meaningful career achievement to date.

212
Sosland Sports
Total annual cost €200,000
Number of courts 15
Opening hours 8am – 6pm
Days of use per week 7
Court use 1 hour per member per week
Usage capacity 70%
Exhibit A – Cost overview

213
Sosland Sports
Part 1
1a. Develop problem solving structure 1b. Determine data gathering approach
• This question should give an overview of the candidate’s ability to structure an answer. The best way to solve this is by using a “3C’s” or “Five Forces” analysis.
• The interviewee should recognize the question as an opportunity to brainstorm.
• The answer should include some of the following points:
Customers
• Market size and growth rate• Market segmentation (activity level, ages)• Cultural factors (ie. German sporting preferences)
Competitors
• Number and concentration, substitutes• Intensity• Positioning
Company
• Replication of business model• Economies of scale• Cost of expansion• Projected profitability
Good answers
• Purchase marketing analyses / research reports
• Internet research on competitors
• Contact real estate agent for real estate costs
• Contacting someone in the consulting company who has experience in the market or industry
Outstanding answer
• An outstanding candidate would structure their answer. For example: they would gather information (1) internally, using firm resources and within the client’s own organization, and (2) externally from third party sources.

214
Sosland Sports
Part 2
2a. Determine the breakeven point 2b. Sense check calculation
• Can you determine the minimum annual membership fee Sosland Sports has to charge in order to cover the running cost?
• Information that can be shared if inquired: If the candidate asks about revenues, tell him/her that they are equal to the annual costs.
• Courts are always used during operating hours.
• The candidate should think about the possibility of doubles. If they ask, they should assume 50% single and 50% double matches.
• Number of hours available per week = 10 hours/day x 7 days/week x 15 courts = 1,050
• Number of hours courts in use = 70% utilization x 1,050 = 735
• Average number of players per hour = (50% x 2) + (50% x 4) = 3
• Members = 735 hours x 3 members/hour = 2,205
• Membership = €200,000 / 2,205 = €90.70
Are you sure this is an annual fee and not a weekly one?
This is meant to be a tricky question to show the confidence of the interviewee. But as the annual costs are divided by the total number of members this is indeed an annual fee.
Ideally the candidate should note that the €90 membership fee seems low and look to compare against the competition.
Provide Exhibit A

215
Sosland Sports
Part 3
3a. Conduct competitive analysis 3b. Brainstorm service differentiators
The dominant market player for squash centers (70% market share in Germany) offers memberships for €70. Would you recommend entering the market?
Good answer
• Further investigation is required, in particular what the competitor is offering and if Sosland Sports can differentiate its services from this offering.
• For instance if the competitor is using a cost leadership strategy and offers a very cheap, but low-quality service, Sosland Sports could launch a premium, high quality squash center.
Outstanding answer
• There could be other outcomes of the investigation.
• If the competitor operates across all segments, from low-end to high quality, and has a lower cost base, Sosland Sports should not enter the market. An entrance would only lead to a price competition that our client cannot win.
What could Sosland Sports offer to customers to differentiate their service offering?
There are several possible solutions (some mentioned at the beginning of the case) but these should be structured by the interviewee:
• Providing high-quality courses
• Setting up cross-country tournaments between Sweden and Germany
• Advertise the squash center with famous people (celebrities)
• Offer longer opening-hours for members paying a higher fee
• Offer services like a café or a bar

216
Sosland Sports
Part 4
4. Provide client recommendation
• Overall, there is only a case for Sosland Sports to enter the German market if they can differentiate themselves from the dominant competitor.
• Sosland Sports needs to charge €90 for an annual membership to break-even
• The major incumbent charges €70 per year
• Sosland Sports needs to determine how they can differentiate themselves to charge this higher price
• Risks: Competitor reaction to a new entrant, differing consumer preferences/buying habits in Germany
• Next steps: Deeper dive into competitors’ businesses and market research into Germans’ leisure buying habits
• Strong interviewees quickly contextualize the €90 fee in terms of the client problem and look to compare in the market.
• Outstanding interviewees structure the math correctly and solve it in a simple and clear manner.

217
Case author(s): Ryan Sullivan (Kellogg 2016)Edited by: Rohan Maini (Kellogg 2020)
Case 21
Tacotle
Primary sector(s)
• X02 Agriculture & Food
Concepts tested
• Z06 Macroeconomics (2)
• Z01 Accounting (4,5)
• Z10 Customer strategy (6)
Similar cases
• Yumy Co (Yale 2013)
• Burger Chain (Ross 2012)
• Le Seine (Harvard 2015)
Case type
• Y07 Profitability
• Y05 Operations

218
Tacotle
Interviewer guide
Case prompt
• Your client is Tacotle, a leading national fast casual restaurant with $420m in revenue in 2019.
• Over the five years proceeding 2019, Tacotle has experienced steady revenue growth and industry leading profitability. But for the first time in its 15 year history, Tacotle has experienced three straight quarters of EBITDA erosion.
• Tacotle’s CEO has hired you to explore what is causing profits to drop and what can be done to reverse the tide.
Interviewer guide
• Problem: How can we return Tacotle to profit growth?
• Problem solving steps:
1. Develop a structure to address the problem
2. Analyze external market conditions
3. Identify trends in profitability over time
4. Deep dive into drivers of revenue change
5. Calculate change in units sold between 2018 and 2019
6. Analyze operational reasons for price increases
7. Provide client recommendation

219
Tacotle
Case prompt
• Your client is Tacotle, a leading national fast casual restaurant with $420m in revenue in 2019.
• Over the five years proceeding 2019, Tacotle has experienced steady revenue growth and industry leading profitability. But for the first time in its 15 year history, Tacotle has experienced three straight quarters of EBITDA erosion.
• Tacotle’s CEO has hired you to explore what is causing profits to drop and what can be done to reverse the tide.
Clarifying information
• Goal: Profitability (no specific milestones, looking for positive annual profit growth in the short term)
• Market: Defer until after the framework presentation
• EBITDA: Ensure interviewee understands that EBITDA is Earnings before interest, tax, depreciation and amortization (profit)
Fit: Tell me about a time you felt conflict in the workplace.

220
Tacotle
Exhibit A – Quarterly revenue and EBITDA
$0
$20
$40
$60
$80
$100
$120
$140
Q12012
Q22012
Q32012
Q42012
Q12013
Q22013
Q32013
Q42013
Q12014
Q22014
Q32014
Q42014
Mill
ions
Revenue EBITDA
PeriodQ1
2017Q2
2017Q3
2017Q4
2017Q1
2018Q2
2018Q3
2018Q4
2018Q1
2019Q2
2019Q3
2019Q4
2019
EBITDA (%) 44 45 44 46 45 45 44 46 39 40 39 40

221
Tacotle
Exhibit B – Average revenue per order
$3.00
$3.50
$4.00
$4.50
$5.00
$5.50
Avg. revenue per order
PeriodQ1
2017Q2
2017Q3
2017Q4
2017Q1
2018Q2
2018Q3
2018Q4
2018Q1
2019Q2
2019Q3
2019Q4
2019

222
Tacotle
Exhibit C – Income statement
2017 2018 2019
Revenue ($M) 364 377 420
Expenses ($M)
COGS 51 54 96
Wages 96 99 101
SG&A 11 10 10
Fixed Overhead 43 44 44
EBITDA ($M) 163 170 169

223
Tacotle
Exhibit D – Customer survey (2018)
4.8 4.74.5 4.5
3.4 3.33.1
0.0
1.0
2.0
3.0
4.0
5.0
Quality Speed ofService
Consistency ofProduct
Has a drivethrough
RestaurantCleanliness
Friendliness ofStaff
Ample Seating
Importance Performance
Notes:
• On a scale of 0-5, how important are the following characteristics when dining at fast casual restaurants?
• On a scale of 0-5, how well does Tacotle Co. perform against the following characteristics?
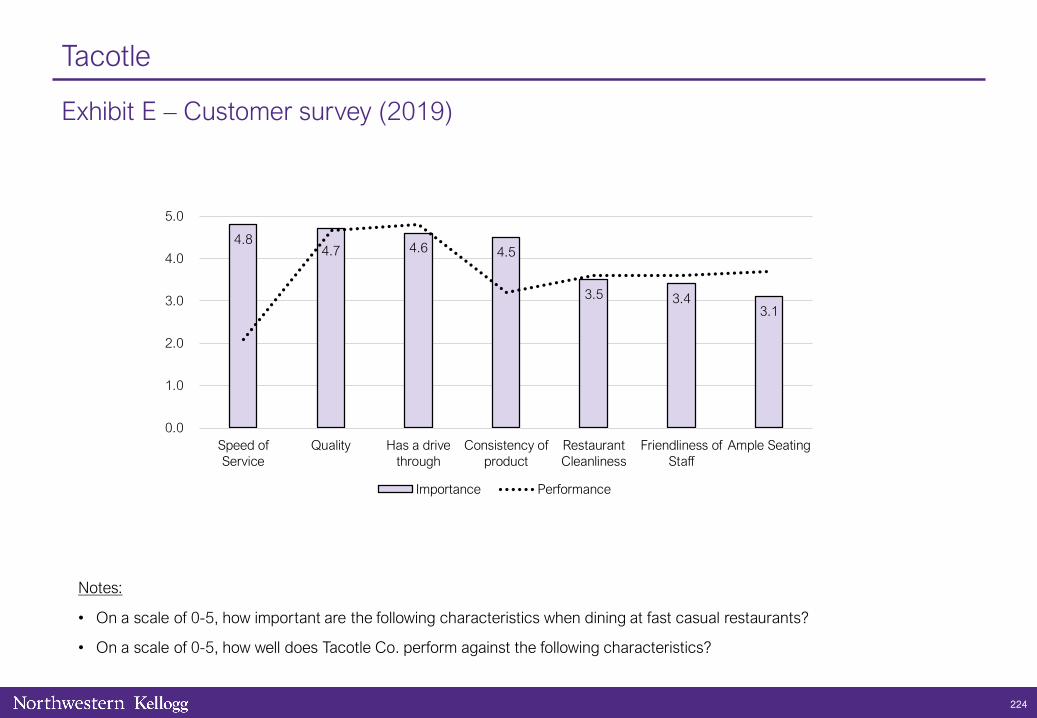
224
Tacotle
Exhibit E – Customer survey (2019)
4.84.7 4.6 4.5
3.5 3.43.1
0.0
1.0
2.0
3.0
4.0
5.0
Speed ofService
Quality Has a drivethrough
Consistency ofproduct
RestaurantCleanliness
Friendliness ofStaff
Ample Seating
Importance Performance
Notes:
• On a scale of 0-5, how important are the following characteristics when dining at fast casual restaurants?
• On a scale of 0-5, how well does Tacotle Co. perform against the following characteristics?

225
Tacotle
Part 1
1. Develop a structure to address the problem
• After framework review, Candidate should:
• Understand that the problem could originate from market conditions or company operations
• Discuss the basis profitability framework with some focus on anticipated fixed and variable cost drivers for Tacotle
π ↓
Operations Market Conditions
Δ Product Mix? Costs ↑
F
• Marketing• PP&E• SG&A
V
• COGS• Distribution• Labor
Competition ↑ Δ Customer PrefsRevenue ↓
Avg P ↓ Qty
↓ Market

226
Tacotle
Part 2
2. Analyze external market conditions
• When asked, provide the interviewee with the following information about the market, competitors and customers:
• Market growth
• Market is growing at the same rate as GDP
• Mature market
• Competition
• No major competitors have entered or exited
• No new substitutes introduced
• Tacotle currently has a 30% market share (by revenue) which it has maintained
• Customers
• Customers are beginning to stress the importance of ingredient quality and order customization
• Takeaway: the profitability issue is not one that is market wide. The problem seems to be specific to Tacotle.
• There are no major competition related factors that are driving the decreased profitability. The issue is most likely related to a change within Tacotle
• The change in customer preferences doesn’t seem like it is directly driving decreased profits but it may have influenced decisions made within Tacotle
227
Tacotle
Part 3
3. Identify trends in profitability over time
• What are potential drivers of:
• Revenue spike? (Increase in price or units sold)
• EBITDA erosion? (Increase in cost, decrease in rev.)
• EBITDA % decline? (Decrease in margin)
• Spike in revenue in Q1 2019 with relatively flat EBITDA and large decrease in EBITDA %. Followed by steady revenue decline
• Good response will hypothesize what could cause this, with the conclusion that either prices and/or purchases increased with costs increasing more than the additional revenue
• A good interviewee will take a deep dive into the profitability framework looking to determine why:
1. Revenue spiked then declined over the following quarters
2. Profitability (EBITDA) did not follow revenue
Provide Exhibit A once the interviewee requests information regarding Tacotle’s Revenue or Profitability

228
Tacotle
Part 4
4. Deep dive into drivers of revenue change
• Guide the candidate down the revenue side of the profitability framework if they do not do so.
• After interviewee has stated that price increased, interviewee should recognize that a change in price could lead to a change inquantity.
• Takeaways (Exhibit B):
• A good interviewee will quickly identify that Tacotle increased the average price of their orders.
• It should initially be ambiguous whether units sold increased or decreased. A good interviewee will not rush to a conclusion
• Takeaways (Exhibit C):
• Interviewee should evaluate the entire slide then attempt to answer the question posed regarding units sold in 2019
• Interviewee should refer back to the exhibit and notice that COGS nearly doubled from 2018 to 2019
Provide Exhibit B once the interviewee has hypothesized potential drivers of increased revenue
Provide Exhibit C once the interviewee asks how the units sold changed in 2019

Tacotle
Part 5
5. Calculate change in units sold between 2018 and 2019
• If the interviewee does not calculate the change in units sold themselves, ask them to
Takeaways:
• Although revenue increased sharply, the total number of orders decreased.
• As revenue continued to decline over the last three quarters of 2019, prices remained the same. Therefore, a decrease in the quantity sold is responsible for the eroding revenues and EBITDA
Units sold in 2018:
• Units sold = Revenue / (Avg. price per unit)
• 2018 Revenue = $377m (Round to 380M)
• 2018 Avg. price per unit = $4.05 (Round to $4)
• Units sold = $380m / $4 = 95m units sold
Units sold in 2019:
• Units sold = Revenue / (Avg. price per unit)
• 2019 Revenue = $420m
• 2019 Avg. price per unit = $5.25
• Units sold = $420m / $5.25 = 80m units sold
229
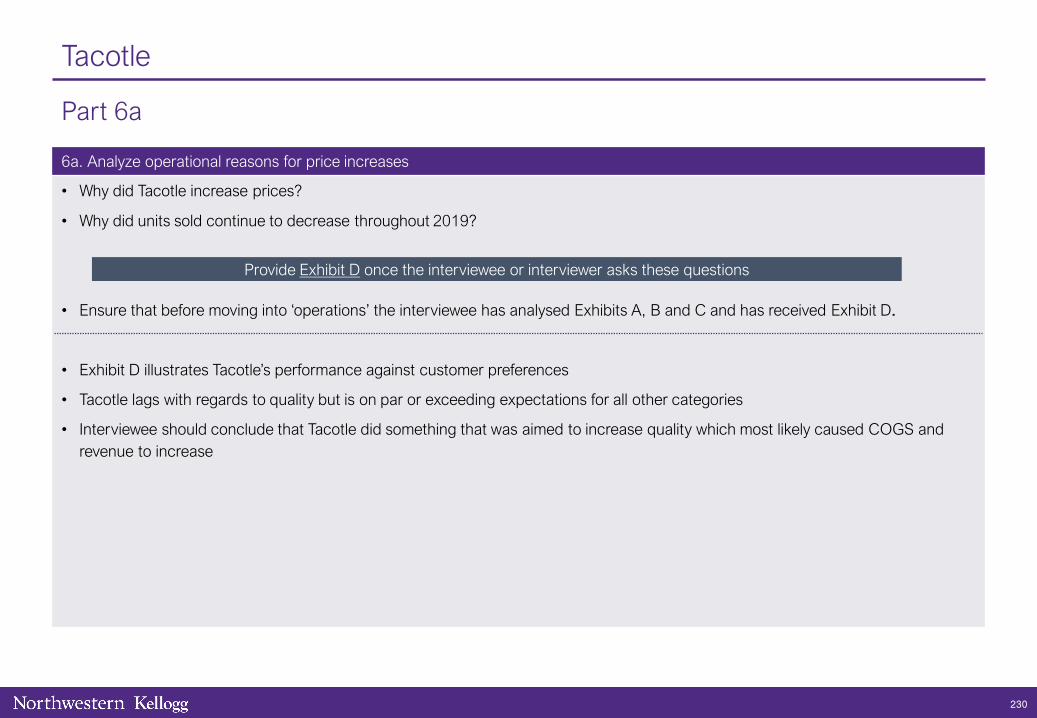
Tacotle
Part 6a
6a. Analyze operational reasons for price increases
• Why did Tacotle increase prices?
• Why did units sold continue to decrease throughout 2019?
• Ensure that before moving into ‘operations’ the interviewee has analysed Exhibits A, B and C and has received Exhibit D.
• Exhibit D illustrates Tacotle’s performance against customer preferences
• Tacotle lags with regards to quality but is on par or exceeding expectations for all other categories
• Interviewee should conclude that Tacotle did something that was aimed to increase quality which most likely caused COGS and revenue to increase
Provide Exhibit D once the interviewee or interviewer asks these questions
230

Tacotle
Part 6b
6b. Analyze operational reasons for price increases
• After interviewee has speculated on potential operational changes Tacotle could have implemented, inform them that Tacotleintroduced a new menu focused on allowing the consumer to customize their orders more and higher quality and selection of ingredients
• If asked for, the average time to serve a customer increased from ~1 minute to ~3.5 minutes.
• Interviewee should recognize that Exhibit E is the same survey as Exhibit D but for the next year (post menu upgrade)
• Interviewee should also recognize that the order of attributes has changed
• “Speed of Service” is now Tacotle’s weakest attribute
• This is due to the new menu which added complexity to food preparation
• “Consistency of Service” has also dropped below customer expectations due to the added complexity of food preparation
• Although Tacotle has met expectations with regard to “Quality”, the decline of ratings in “Speed of Service” and “Consistency of Service” have more than cancelled it out, resulting in a net decrease in customer satisfaction
• Takeaway: The menu change was not effective
Provide Exhibit D at this point
231

Tacotle
Part 7
7. Provide client recommendation
Overall: Scale back the menu changes that were implemented during 2019.
• The menu change led to a significant increase in COGS which decreased EBITDA %
• The menu change led to overall customer dissatisfaction, degrading brand equity
• The customer dissatisfaction lead to decreasing unit sales (quarter over quarter) which is driving the EBITDA erosion
Risks
• Scaling back the menu too much could lead to decrease in customer satisfaction for “Quality”
• Scaling back could disrupt relationships with suppliers require asset divesture relating to initial menu change
• A scale back that does not focus on margin improvement could lead to smaller revenues and profits, effectively downsizing thecompany.
Next steps
• Perform more detailed and focused customer surveys to gage what Tacotle customers expect from the chain
• Perform a scale back on the menu size that focuses on cost cutting balanced with customer needs
• Follow-on menu changes should be implemented on a smaller/trial basis at a small number of individual restaurants
232

233
Case author(s): Peter Manoogian (Kellogg 2012)Edited by: Matthew Heintz (Kellogg 2016), Rohan Maini (Kellogg 2020)
Case 22
Vitality Insurance
Primary sector(s)
• X06 Financial Services
Concepts tested
• Z13 Organizational changes (3)
Similar cases
• TV Screens (Wharton 2017)
Case type
• Y07 Profitability

234
Vitality Insurance
Interviewer guide
Case prompt
• Our client, Vitality Insurance, is a leading provider of supplemental insurance products in the United States.
• Vitality agents partner with companies to offer their employees optional, supplemental insurance for such conditions as life, long-term disability, etc.
• Vitality has undergone fairly steady growth in the past two years, but profit margin is decreasing. What should they do about it?
Interviewer guide
• Problem: How can Vitality improve its profit margins?
• Problem solving steps:
1. Identify cost trends
2. Determine root-cause of sales cost changes
3. Examine mis-aligned incentive programs
4. Provide client recommendation
235
Vitality Insurance
Case prompt
• Our client, Vitality Insurance, is a leading provider of supplemental insurance products in the United States.
• Vitality agents partner with companies to offer their employees optional, supplemental insurance for such conditions as life, long-term disability, etc.
• Vitality has undergone fairly steady growth in the past two years, but profit margin is decreasing. What should they do about it?
Clarifying information
• Client:
• Vitality is the leader in its category and has over 10,000 field sales agents (FSAs)
• Vitality sells all policies through FSAs who are solely compensated on a percentage commission of total new premium, (defined as premium from new customers or additional premium up-sell from existing policyholders)
• In addition to the commission, short term priorities are often communicated via sales contests that focus on a particular customer segment or activity and pay a bonus in addition to standard commission
• Major costs: sales, G&A, and advertising
• Competition: Few competitors in this mature market with similar growth. Vitality is a leader in the space; competition not the focus
• Industry: Agent turnover is very high on a yearly basis (though was lower during the recessionary period)
Fit: What role do you typically play in a team? Give me an example of this.

236
Vitality Insurance
Exhibit A – Results and Costs
Vitality insurance key results and costs (figures in ‘000s)
2008 2009 2010
Accounts converted 500 550 605
Total policyholders enrolled 1,500 1,650 1,815
Total premium from policyholders $2,500,000 $2,750,000 $3,025,000
Total costs
General and Administrative $50 $55 $58
Sales $250 $275 $400
Advertising $25 $28 $30
Profit margin 9.50% 9.40% 8.50%

237
Vitality Insurance
Exhibit B – Insurance sales process
Number of sales contests targeted at these leverage points on the selling process
New Agents Acquire new accounts(bonus based on # of accounts)
Keep accounts active(bonus based on # of
accounts)
Upsell active accounts(bonus based on # of
accounts)
Produce results (bonus based on total
premium $)
2008 n/a 2 4 1 2
2009 n/a 2 4 1 2
2010 n/a 4 0 1 4
Hire new agentsAcquire new
accountsUpsell active
accountsKeep accounts
active
Produce results
(Premium $)
Reactivating dormant account

238
Vitality Insurance
Exhibit C – Snapshot of ‘Sweeps Week’ contest results
238
0%
50%
100%
150%
200%
1 2 3 4 5 6 7 8 9 10 11 12 13 14 15 16 17 18 19 20 21 22 23 24 25 26 27
Week during Jan-Jun
200820092010
Ratio to Average Weekly Premium (2008-2010)
2010 ‘Sweeps Week’ (1) 2010 ‘Sweeps Week’ (2)

239
Vitality Insurance
Part 1
1. Identify cost trends
• Interviewee should recognize the following:
• All line items except for sales costs growing at 10% per year
• Sales costs grow at 10% from 2008 to 2009, but at 45% from 2009 to 2010 (while premium growth remains at 10%)
• Stronger interviewees will quickly note that something is strange with the 2010 sales costs, but will calculate to confirm
• Finally, profit margins are declining significantly from 2009-10, suggesting that the increase in sales costs is not paying off
Provide Exhibit A when the interviewee asks for cost information

240
Vitality Insurance
Part 2
2. Determine root-cause of sales cost changes
• If the interviewee asks about the new contests focused on premium, provide the following information:
• Vitality launched a contest called ‘Sweeps Week’ that aimed to drive increased premium in weeks that were traditionally low volume for the company. Vitality paid an extra 10% bonus on all premium booked in those two weeks.
• Sales agents thought ‘Sweeps Week’ was a great contest
• Assume the types of contests run in 2008 and 2009 were fairly similar
• Do not share Exhibit C until the interviewee recognizes this shift in mix and begins asking questions about the new programs
• As seen in Exhibit B; Vitality’s sales agents are engaged in several activities along the sales process, and that new premium can be generated in many ways.
• The interviewee should recognize the shift in contest mix from 2008/09 to 2010. Coupled with the additional information provided in the previous slide, the interviewee should realize that Vitality has shifted its focus more toward total premium and new accounts in 2010
Provide Exhibit B if the interviewee asks about the value chain or sales process

241
Vitality Insurance
Part 3
3. Examine mis-aligned incentive programs
• If asked, confirm that agents have authority to ‘book’ sales whenever they want by influencing the enrollment timing by up to one week
• Strong interviewees will also recognize that, despite not having charts to support it, a shift in customer focus toward acquiring new accounts in 2010 will likely also hinder profit margins, as acquiring a new customer costs considerably more than retaining (or up-selling) an existing customer
• Exhibit C shows weekly premiums for all of Vitality from 2008 – 2010. The chart is shown in a way that compares each year’s actual premium to the average of historical premium for that year, so as to provide for a ‘benchmark’ comparison.
• The ‘Sweeps Week’ contest launched in 2010 is shown in weeks 4 and 20 in the chart, and clearly yields high premium volume for those particular weeks. However, it is done at the expense of the weeks surrounding the sweeps week.
• This implies that agents may be ’gaming’ the system by pushing/pulling sales into that week to earn the contest rewards
Provide Exhibit C if the interviewee asks about the effectiveness of ‘Sweeps Week’

242
Vitality Insurance
Part 4
4. Provide client recommendation
• The interviewee should conclude that Vitality overspent in 2010 on the ‘Sweeps Week’ sales contest, thus hurting its profitability
• Exhibit C indicates that the contest influenced the sales force to conduct undesirable selling practices by pushing / pulling forward business to earn the extra commission
• Further, the contest’s focus, driving new premium was duplicative with that of the main commission system, therefore it did not add much value
• Recommendation: eliminate ‘Sweeps Week’ for 2011 and potentially repurpose those funds toward an activity that is not alreadycovered by the main commission structure
• It is unclear whether we should remove the increased contests on new accounts, as this could be a new customer focus that we do not know about
• Excellent candidates will make the following observations:
• Recognize that the likely decline in profit margin from 2009 to 2010 is linked to the abnormal increase to sales costs
• That the ‘contest mix’ in Exhibit B is similar to a firm’s marketing mix, especially given that the sales channel has already been established as the main marketing channel for these products
• Suggest that the added contests on acquiring new accounts will also decrease profitability because acquiring new customers is more costly than retaining existing ones.
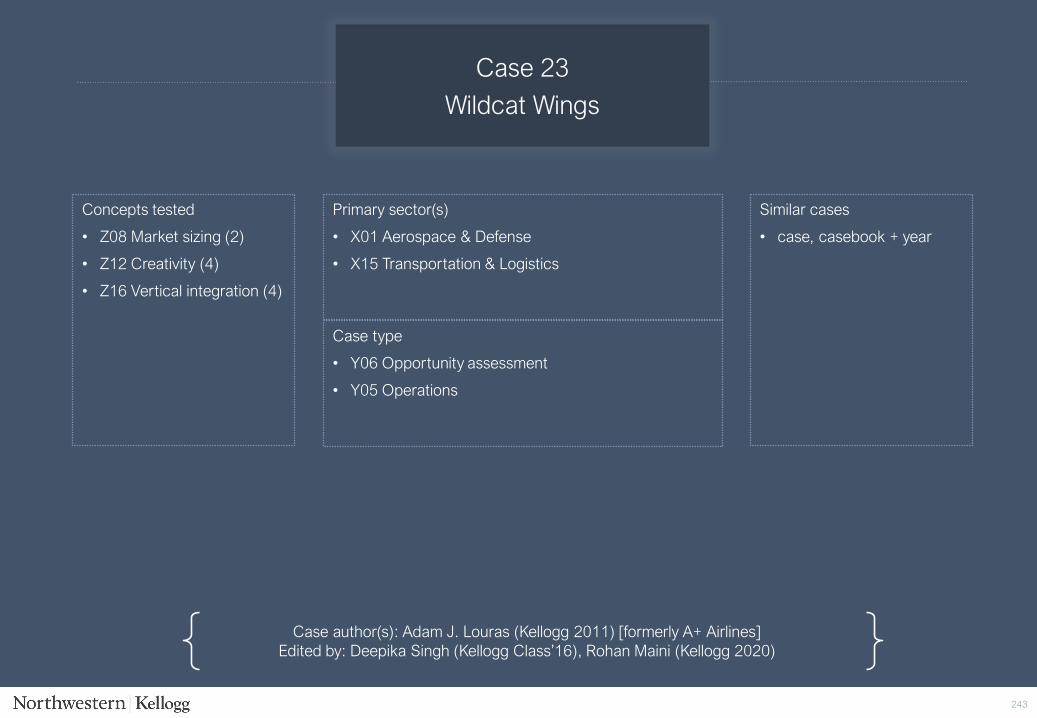
243
Case author(s): Adam J. Louras (Kellogg 2011) [formerly A+ Airlines]Edited by: Deepika Singh (Kellogg Class’16), Rohan Maini (Kellogg 2020)
Case 23
Wildcat Wings
Primary sector(s)
• X01 Aerospace & Defense
• X15 Transportation & Logistics
Concepts tested
• Z08 Market sizing (2)
• Z12 Creativity (4)
• Z16 Vertical integration (4)
Similar cases
• case, casebook + year
Case type
• Y06 Opportunity assessment
• Y05 Operations

244
Wildcat Wings
Interviewer guide
Case prompt
• Our client is Wildcat Wings, the third largest airline in the United States by passengers carried. This week, the CEO flew with our primary competitor, Phoenix Air, and she noticed something interesting: Phoenix has stopped accepting cash for in-flight food and beverage services and they now only accept major credit cards.
• The CEO of Wildcat Wings wants to know why Phoenix Air switched to Card only, and if Wildcat Wings should follow them.
Interviewer guide
• Problem: Should Wildcat Wings go cashless for in-flight purchases?
• Problem solving steps:
1. Develop a structure to address the problem
2. Analyze current in-flight purchases
3. Explore cost impacts of switching to card only
4. Brainstorm additional benefits
5. Provide client recommendation

245
Wildcat Wings
Case prompt
• Our client is Wildcat Wings, the third largest airline in the United States by passengers carried. This week, the CEO flew with our primary competitor, Phoenix Air, and she noticed something interesting: Phoenix has stopped accepting cash for in-flight food and beverage services and they now only accept major credit cards.
• The CEO of Wildcat Wings wants to know why Phoenix Air switched to Card only, and if Wildcat Wings should follow them.
Clarifying information
• Card Use: Roughly 99% of all consumers purchase their airline tickets using a credit card, i.e. all consumers on an airplane have a credit card available to them.
• Items Sold: Only food and alcoholic beverage items are sold on Wildcat flights.
• Competitive Dynamics: Phoenix is the only airline that has made the switch; however all other airlines are evaluating the switch.
• Competitors: For the purposes of this case, Phoenix and Wildcat should be considered to be exactly the same in all regards.
Fit: Tell me how about a time someone convinced you to take a differnet approach.

Wildcat Wings
Exhibit A – Flight economics
Fleet size: 50
Average Wildcat Wings flightBoeing 737-800
Total seats 200
CabinCabin share
of seats
Traveler type Seat utilizationBusiness Leisure
First Class 25% 100% 0% 100%
Economy 75% 50% 50% 80%
Traveler type Purchase rate Average purchase value
Business 40% $10
Leisure 25% $5
Method of payment
Cash 20%
Card 80%
246

247
Wildcat Wings
Exhibit A – Cash and Credit Card management processes
Wildcat Wings Cash Management Process*
Wildcat Wings Credit Card Process
On groundCash handler
loads plan with $50 in change
Cash handler collects flight lockbox from plane (EOD)
Cash handler collects flight lockbox from plane (EOD)
Flight lockboxes deposited to onsite cash processing
center
Armored car service collects
cash
Armored car service
reconciles cash for counterfeit
Cash (less fees) deposited to
Wildcat Wings bank account
In flight
Flight attendant collects cash
from passengers and issues
change
Flight attendant deposits cash
into flight lockbox
On ground
Merchant service receives and processes
card transaction
In flight
Flight attendant swipes credit
card in wireless terminal
Cash (less fees) deposited to
Wildcat Wings bank account
2% fee on all cash collected
End-to-end process: 31 days
End-to-end process: 24 hours
Additional information:
• 5 cash handlers per airport
• 2 employees onsite cash processing center at each airport where Wildcat operates

248
Wildcat Wings
Part 1
1. Develop a structure to address the problem
• Case Structure – Interviewee’s structure should be a before and after comparison of the switch from Cash & Card to Card only andshould include:
• Revenue Changes: Loss of Cash Only customers vs. Increase in Credit Card customers
• Cost Changes: Benefit of Cash Management Cost Removed vs. Incremental Cost (Fee) of Credit Card
• Cash Flow Changes: Interest and Time Value of Money (TVM), and Working Capital impacts due to an increase in collection speed

249
Wildcat Wings
Part 2
2. Analyze current in-flight purchases
• Ask the interviewee to determine the Total Market Size in ($) for food and beverage purchases on an average flight
• The interviewee should calculate the current allocation of purchases (Cash vs Card) for an average flight.
• The interviewee should begin with the correct assumption that revenue will be lost due to unhappy, cash-only passengers
• First class business passengers = 200 seats x 25% share x 100% utilization x 100% business = 50 passengers
• Economy business passengers = 200 seats x 75% share x 80% utilization x 50% business = 60 passengers
• Economy leisure passengers = 200 seats x 75% share x 80% utilization x 50% leisure = 60 passengers
• Business spend = (50 + 60) x 40% x $10 = $440
• Leisure spend = 60 x 25% x $5 = $75
• Cash payments = $515 x 20% = $103
• Card payments = $515 x 80% = $412
• Takeaway: Lost revenue = 1/3 x 103 = ~$35
Provide Exhibit A when the interviewee asks about market sizing
When asked, state we will lose 1/3 of cash customers when we move to card-only

250
Wildcat Wings
Part 3
3. Explore cost impacts of switching to card only
• Interviewee should make mention of Cost changes due to the shift to a Card Only strategy.
• The interviewee should notice the following information:
• Cash Management & Card Management both have 2% fees associated, so this is a “wash” in terms of savings.
• Cash Management requires additional overhead, 7 total employees per airport, that could be eliminated for further savings.
• Interviewee should notice that the $35 savings offsets the $35 loss in revenue. A good candidate will notice that savings go straight to the bottom line whereas revenue doesn’t.
Provide Exhibit B when the candidate after cash and credit card processing cost brainstorming
When asked, explain that the total, per flight, savings from eliminating overhead due to Cash Management Operations is $35/flight
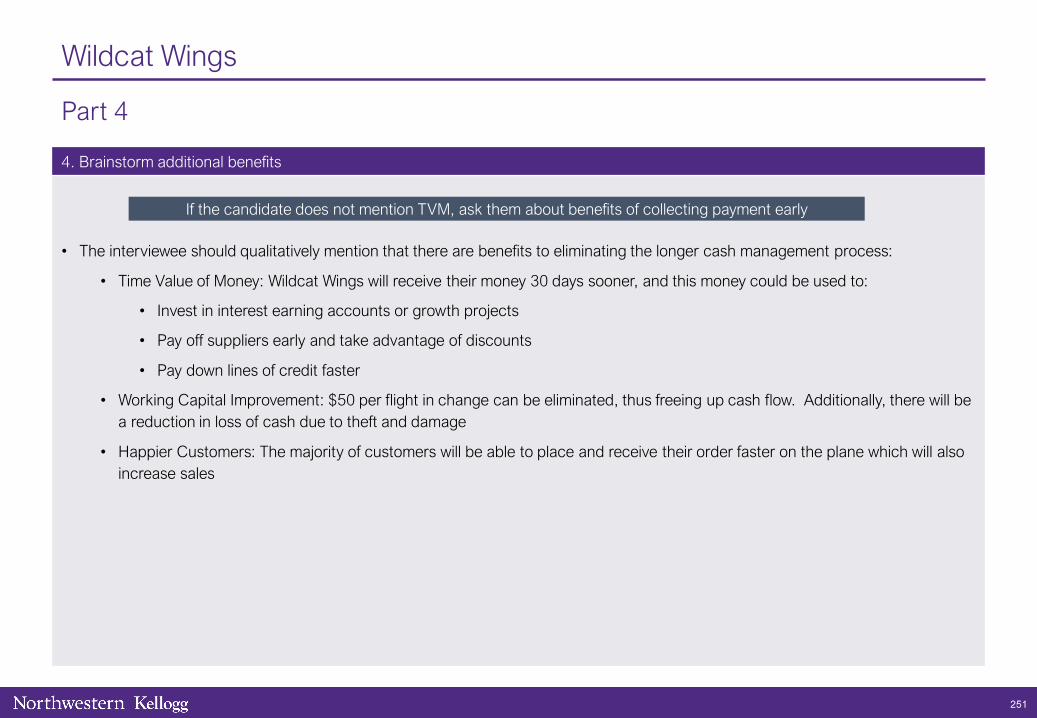
251
Wildcat Wings
Part 4
4. Brainstorm additional benefits
• The interviewee should qualitatively mention that there are benefits to eliminating the longer cash management process:
• Time Value of Money: Wildcat Wings will receive their money 30 days sooner, and this money could be used to:
• Invest in interest earning accounts or growth projects
• Pay off suppliers early and take advantage of discounts
• Pay down lines of credit faster
• Working Capital Improvement: $50 per flight in change can be eliminated, thus freeing up cash flow. Additionally, there will bea reduction in loss of cash due to theft and damage
• Happier Customers: The majority of customers will be able to place and receive their order faster on the plane which will also increase sales
If the candidate does not mention TVM, ask them about benefits of collecting payment early

252
Wildcat Wings
Part 5
5. Provide client recommendation
• Overall, our client Wildcat Wings, should switch to a Credit Card only system for in-flight food & beverage because:
• Quantitative Benefits: We calculated that there would be a loss of 3 business customers and 1 economy customer per flight which amounted to a Revenue loss of $35. We also found that we could save $35 in overhead expenses by eliminating the Cash Management process. In sum, the decision to switch is in favor because the savings are to the bottom line and the revenue losses are top line.
• Qualitative Benefits: We also found that we will receive payment 30 days sooner by only accepting credit cards. This improves our cash flow and could allow us to earn interest, pay down creditors, or invest in projects. Additionally, by reducing cashlosses and eliminating “Change” tied up on airplanes, we can improve our Working Capital and also put this money to work for us. Finally, it appears as though customers, in general, might actually be happier because the speed of transactions on the airplane will improve.
• Outstanding interviewees will note:
• Due to the increased transaction speed, probability of purchase for both Business and Economy passengers in the AFTER state should go up due to a reduction in frustration. The people on the back of the airplane often abandon a purchase if it takes too long to place an order. Making change takes a lot of time!
• Average purchase amount should also increase. There is a proven psychological phenomenon that shows how consumers who do not carry cash purchase less when a cash option is offered because they feel guilty using their card. A card-only option eliminates this guilt and consumers don’t mind using the card.
• Being creative when listing the change of costs as: Wifi cost (connect with banks and verify transaction), Fraud cost (increased chance of fraud to happen after implementing card only payment).

Case 24
Wine & Co
Primary sector(s)
• X02 Agriculture & Food
253
Concepts tested
• Z02 Net Present Value (2)
• Z10 Marketing strategy (3)
Case authors: Anil Goteti (Kellogg 2011)Edited By: Mauricio Atri (Kellogg 2012), Laura Mast (Kellogg 2020)
Similar cases
• Pharmacy in Supermarket (Sloan 2011)
• Rocky Resort (WSO 2012)
• Jamaican Land Investment (Haas 2015)
Case type
• Y06 Opportunity assessment
Interviewer-led

254
Wine & Co
Case prompt
• Wine & Co is a niche wine manufacturer in the San Francisco Bay area. Wine & Co recently acquired 12 acres of land outside San Francisco.
• The company wants to investigate opportunities to best use the land and needs a recommendation from you.
• What are the different ways in which Wine & Co can use the land?
Interviewer guide
• Problem: How can Wine Co maximize the
• Problem solving steps:
1. Develop a structure to address the problem
2. Identify most profitable product
3. Determine preferred product for manufacturing
4. Provide client recommendation
Interviewer Guide

255
Wine & Co
Case prompt
• Wine & Co is a niche wine manufacturer in the San Francisco Bay area. Wine & Co recently acquired 12 acres of land outside San Francisco.
• The company wants to investigate opportunities to best use the land and needs a recommendation from you.
• What are the different ways in which Wine & Co can use the land?
Clarifying information
• Product: Wine & Co only manufactures red wines. The company does not sell any other products.
• Customers: The company serves only the local market (the San Francisco Bay area).
• Company: The company is currently very healthy and does not face any problems.
Experience: Tell me about a time when you faced conflict in a team setting.

256
Wine & Co
Part 1
1. Develop a structure to address the problem
• The interviewee should create a framework and structure the problem. The interviewee should suggest options including manufacturing the wine, creating adjacent products (like wine tasting tours), using the land for other uses (commercial real estate/selling the land for a profit/other opportunity costs).
• A strong candidate would provide a detailed structure (eg. profitability framework for manufacturing feasibility with customization of the framework - yield of grapes, cost per liter of wine, etc.) and outline the risks or considerations involved in some of these options (like usability of land for manufacturing or company competency in pursuing in other opportunities unrelated to wine manufacturing).

257
Wine & Co
Part 2a
2. Determine most profitable product
• Wine & Co has decided to use the land to manufacture wine. Each acre of land produces 1,000kg of grapes annually. Wine & Co has an option to manufacture Merlot or Bordeaux.
• The two wines use different grapes and the grapes have varying yields. While the Merlot grapes yield 2 litres/kg, the Bordeaux grapes yield 1 litre/kg. Wine & Co can charge $20 per liter of Merlot and can charge $40 per liter of Bordeaux.
• Which wine yields more profits annually?
• When asked, provide the following information:
• Profit Margins on Merlot are 10% while the margins on Bordeaux are 15%.
• A good candidate would ask for the profit margins/costs without being prompted. Look for organization and structure when the candidate evaluates the annual profits for each wine (a good candidate would use a table like structure when doing the math). The revenues would be $480,000 for both wines annually but the margins would be higher for Bordeaux ($72,000 for Bordeaux versus $48,000 for Merlot). After the candidate arrives at the profits, look for interpretation.
• A strong candidate would recommend using Bordeaux while at the same time consider other factors (competency in manufacturing either of the wines, customer demand in the bay area, sensitivity to product yields, customer reservation price, etc.)
• A creative candidate might suggest that we compare the age of the two wines (and hence will impact when the profits might actually start)

258
Wine & Co
Part 2 (continued)
2. Determine most profitable product
• Math working for Part 2
Description Value
A Acres of Land 12
B kg of grapes produced/acre 1,000
C kg of grapes produced total [A x B] 12,000
Description Merlot Bordeaux
D Yield (Liter/kg) 2 1
E Total Yield (Liter) [C x D] 24,000 12,000
F Price / Liter $20 $40
G Total Revenue [E x F] $480,000 $480,000
H Profit Margin 10% 15%
I Total Profit [G x H] $48,000 $72,000

259
Wine & Co
Part 3
3. Determine preferred product for manufacturing
• Aging has an effect on the revenues and profitability. Merlot has to be stored for 6 years while Bordeaux has to be stored for 12 years before revenues can be generated. Which wine would you choose for manufacturing?
• When asked, provide the following information:
• Discount rate is 12% (strong candidates will use the ‘Rule of 72’ to discount
• Assume the costs are only incurred when the revenues are realized after aging (no costs until year 6 for Merlot and no costs until year 12 for Bordeaux).
• The interviewee should identify that the cash flows for Merlot would be $48,000 annually starting year 6. Cash flows for Bordeaux would start in year 12 ($72,000 annually). Then, consider TVM, calculating annual cash flow discounted to the same year:
• Merlot: Perpetuity value of cash flow (value in year 6) = $48,000/0.12 = $400,000
• Bordeaux: Perpetuity value of cash flow (value in year 12) = $72,000/0.12 = $600,000
Value of perpetuity in year 6 = $600,000 / (1.12^6) = $300,000 (Rule of 72).
• Provide help here if the candidate is struggling with the division. Look for the candidate's approach rather than the exact number. Since value of pursuing Merlot ($400,000) is higher than value of pursuing Bordeaux ($300,000), the company should manufacture Merlot.
• Strong interviewees interpret the results and suggest we consider factors like inventory costs, sensitivity to discount rate, etc.

260
Wine & Co
Part 3 (continued)
3. Determine preferred product for manufacturing
• Math working for Part 3
Merlot Bordeaux Comments
A Annual Profit $48,000 $72,000 See Part 2
B Years to Maturity 6 12
C Discount Rate 12% 12%
D Merlot NPV once ripe (at year 6) $400,000 A/C
E Bordeaux NPV once ripe (at year 12) $600,000 A/C
Method 1
F Bordeaux NPV at year 6 (using discount rate) $300,000 E/(1.12)6
G Comparison at year 6 $400,000 $300,000 D and F
Method 2
H Merlot NPV at year 12 (using discount rate) $800,000 $600,000 D x (1.12)6
I Comparable comparison at year 12 $800,000 $600,000 I and E
Method 3
J Discount rate 12% 12%
K Years to double value = 72/Discount Rate 6 6 72/12
L Value after 6 years $400,000 $300,000 Halve Bordeaux at 12 years
M Value after 12 years $800,000 $600,000 Double Merlot at 6 years

261
Wine & Co
Part 4
4. Recommend a marketing strategy
• Wine & Co has decided to manufacture Merlot. How should they market this product in the San Francisco Bay area?
• Customer segment currently served by Wine & Co is niche wine enthusiasts.
• Candidate should ask for the customer segments that the company might sell to and suggest appropriate marketing channels/strategies to consider. Look for a MECE structure here.
• Suggestions should include retail strategies, direct to consumer strategies (like wine clubs, wine tasting), traditional media and print advertising and online advertising.

262
Wine & Co
Part 5
5. Provide client recommendation
• Excellent interviewees would recommend a solution (manufacturing Merlot) but would detail out the risks/next steps associated with the recommendation. Next steps may involve market research, land usability testing, evaluation of opportunity costs. Risks have been discussed previously.
• Outstanding interviewees provide an answer that includes:
• Identification of opportunity costs, particularly of not selling/leasing the land, which might be more profitable considering the current value of land in the Bay Area and/or Napa
• Considering industry specific issues like aging of wine
• Considering time value of money/perpetuity of cash flow
• Considering risks like customer demand, land usability
• Potential benefits of diversifying the acreage and producing multiple types of grapes (compensate for shifts in consumer demand, broader appeal to local market, etc.)

263
Case author(s): Chris Dupre (Kellogg 2003)Edited By: Uri Kalir (Kellogg 2012), Rohan Maini (Kellogg 2020)
Case 25
Winter Olympics Bidding
Primary sector(s)
• X05 Entertainment & Media
Concepts tested
• Z02 Net Present Value (2)
• Z12 Creativity (3)
Similar cases
• World View (Harvard 2015)
• Mobilizing Your World (Fuqua 2015)
• Footloose (LBS 2012)
Case type
• Y06 Opportunity assessment
264
Winter Olympics Bidding
Interviewer guide
Case prompt
• Our client, a major US television network, is trying to figure out how much to bid for the exclusive right to broadcast the Winter Olympics Games in four years time
• The Winter Olympics are a huge deal and will require a significant amount of capital to secure the rights, so our client has brought us in to help them figure out the right bid amount after considering all relevant factors.
Interviewer guide
• This is a very quantitative case that requires the interviewee to run the numbers on an Olympics bid. The candidate will have todecide potential ad revenue/cost information, as well as the NPV, to determine bid size.
• The candidate will need to ask for additional information to solve the problem, rather than relying on the interviewer to dispense it. After getting the initial calculations right, there are a lot of implications that may change the level of the bid.
• Especially for less finance-minded interviewees, you may have to help nudge candidates through the math.
1. Develop a structure to address the problem
2. Calculate NPV
3. Brainstorm intangible benefits and risks
4. Provide client recommendation

265
Winter Olympics Bidding
Case prompt
• Our client, a major US television network, is trying to figure out how much to bid for the exclusive right to broadcast the Winter Olympics Games in four years time
• The Winter Olympics are a huge deal and will require a significant amount of capital to secure the rights, so our client has brought us in to help them figure out the right bid amount after considering all relevant factors.
Clarifying information
Revenues
• No subscription revenue, but can keep 100% of advertising revenue
• Ad rates are $400k per 30 second ad for prime time (weekends, weekdays 1900 - 2300) and $200k non-prime time
• Market research has shown that you can include no more than 10 minutes of advertising per hour.
Costs
• $482m of total production costs
• Opportunity cost: $1m/hour
• Time value of money: 4 year lag for receipt of revenue
Fit: Why do you want to join our consultancy in particular?
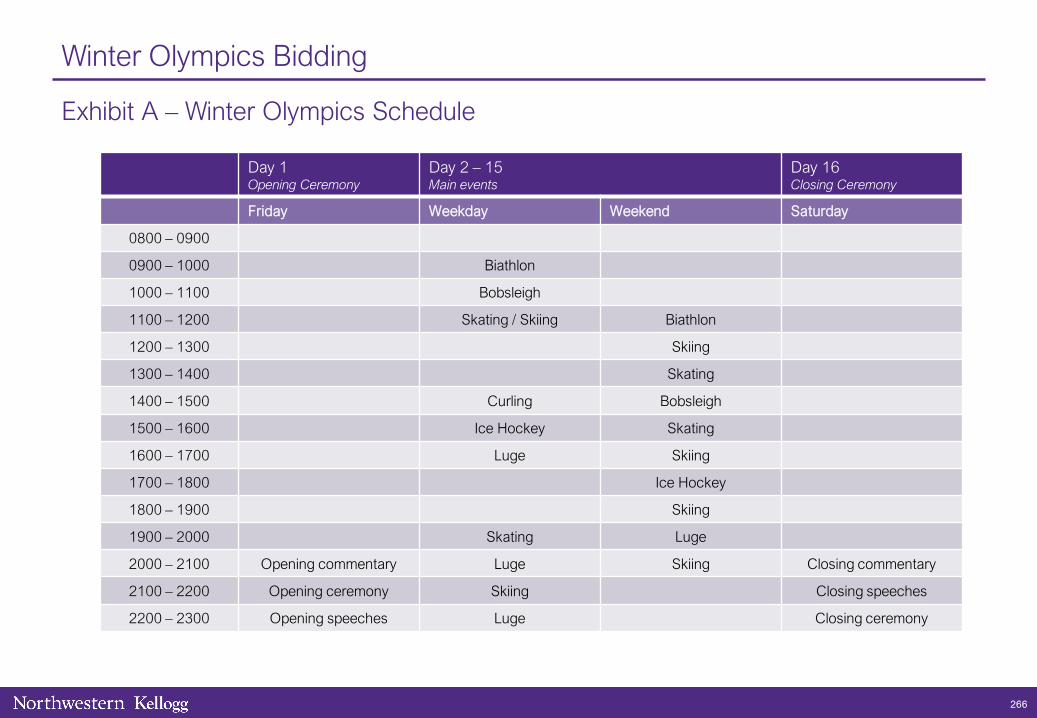
266
Winter Olympics Bidding
Exhibit A – Winter Olympics Schedule
Day 1Opening Ceremony
Day 2 – 15Main events
Day 16Closing Ceremony
Friday Weekday Weekend Saturday
0800 – 0900
0900 – 1000 Biathlon
1000 – 1100 Bobsleigh
1100 – 1200 Skating / Skiing Biathlon
1200 – 1300 Skiing
1300 – 1400 Skating
1400 – 1500 Curling Bobsleigh
1500 – 1600 Ice Hockey Skating
1600 – 1700 Luge Skiing
1700 – 1800 Ice Hockey
1800 – 1900 Skiing
1900 – 2000 Skating Luge
2000 – 2100 Opening commentary Luge Skiing Closing commentary
2100 – 2200 Opening ceremony Skiing Closing speeches
2200 – 2300 Opening speeches Luge Closing ceremony

267
Winter Olympics Bidding
Part 1
1. Develop a structure to address the problem
• Candidate should determine that this is a cost-benefit / NPV analysis.
• Candidate should identify potential revenue streams from hosting the Olympics, i.e. ad revenue, product placements, etc.
• Then, the candidate will have to figure out if this is a good investment. They should identify 3 costs (production costs, opportunity costs, and time value of money). By factoring in these costs, the candidate will find out if the Olympics are worth the investment.
• Some of the numbers and assumptions here are difficult, so nudge the candidate along if necessary.
Provide Exhibit A if the interviewee asks for TV schedules or identifies ad revenues in their structure

268
Winter Olympics Bidding
Part 2
2. Calculate NPV
• Total revenues should be equal to $928M for the project.
• Primetime: Weekdays (M-F): 10 weekdays x 4 hrs/day x 10 min/hr x 2 slots/min x $400,000/ad = $320M
• Non-prime: Weekdays (M-F): 10 weekdays x 6 hrs/day x 10 min/hr x 2 slots/min x $200K/ad = $240M
• Weekend: 4 days x 10 hrs/day x 10 min/hr x 2 slots/min x 400K/ad = $320M
• Opening/Closing: 2 days x 3 hrs/day x 10 min/hr x 2 slots/min x 400K/ad=$48M
• Total profit should be equal to $300M.
• Profit: Revenues $928m - $482m of total costs - $146m of opportunity cost (2 days x 3 hours x $1m/hr + 14 days x 10 hours x $1m/hr) = $300m
• NPV should be equal to $200m.
• Discount rate: 1.104 = 1.4641 (ask candidate to round to 1.50)
• $300m/1.5 = $200m
Revenues
• $400k/ad for prime time (M-F 7-11 PM, all weekend) and $200k/ad for non-prime time
• 10 minutes/hour of advertisements
Costs
• $482M of production costs
• Opportunity: $1m/hr
• WACC: 10%

269
Winter Olympics Bidding
Part 3
3. Brainstorm intangible benefits and risks
• Might give network access to new viewers
• There is prestige associated with hosting this event
• We can use the air time to promote other programming
• Opportunities for product tie-ins, supplemental revenue
• After finishing the discussion, ask the candidate for a recommendation

270
Winter Olympics Bidding
Part 4
4. Provide client recommendation
• While the NPV of the project is $200m, the fact that there are other intangibles (new viewers, plugging our programs, and prestige) the bid should just be $200m.
• While there is no one correct answer, most answers should be in the range of $200m. If there is significant fluctuation from $200m, the candidate will have to provide in-depth justifications and make a concrete argument.
• This case tests the interviewee’s comfort with numbers and understanding of how intangible factors may influence financial value. The bid process requires another level of understanding around game theory and what dynamics will ultimately determine the valueof the bid beyond NPV.
• Ultimately, the best interviewees will make a very strong argument using the facts provided and support their bid and explain why they moved their bid from the NPV figure.
• There is also a lot of room for creativity for the interviewee to discuss other factors, including supplemental streams of revenue, intangible factors, and things to consider during the bid process.

271
Case author(s): Edwin Van Dusen, Brian Fox and David Welch (Kellogg 2004)Edited by: Rohan Maini (Kellogg 2020)
Case 26
Zephyr Beverages
Primary sector(s)
• X12 Retail & CPG
Concepts tested
• Z10 Customer marketing strategy
• Z11 Competitive analysis
Similar cases
• ABC Conglomerate (Wharton 2005)
• InsureCo (Fuqua 2015)
Case type
• Y03 Mergers & Acquisitions

272
Zephyr Beverages
Interviewer guide
Case prompt
• Our client, Zephyr Beverages, is a division of a large consumer products company. The division produces fruit juices in three forms, all under the Zephyr name: chilled, juice boxes, and frozen concentrate. Zephyr had sales of $600 million last year, about 3% of the company’s overall sales of $20 billion.
• The chilled segment represents $120 million in sales per year. While juice boxes and frozen concentrate have been consistently profitable, chilled juices are only breaking even in good quarters and are losing money in bad quarters. Zephyr has received a proposal from upper management to sell the chilled juices business. We need to help them decide whether or not this is a goodidea.
Interviewer guide
• Problem: What does Zephyr do with an underperforming business?
• Problem solving steps:
1. Develop a structure to address the problem
2. Conduct competitive analysis
3. Determine product analysis
4. Provide client recommendation

273
Zephyr Beverages
Case prompt
• Our client, Zephyr Beverages, is a division of a large consumer products company. The division produces fruit juices in three forms, all under the Zephyr name: chilled, juice boxes, and frozen concentrate. Zephyr had sales of $600 million last year, about 3% of the company’s overall sales of $20 billion.
• The chilled segment represents $120 million in sales per year. While juice boxes and frozen concentrate have been consistently profitable, chilled juices are only breaking even in good quarters and are losing money in bad quarters. Zephyr has received a proposal from upper management to sell the chilled juices business. We need to help them decide whether or not this is a goodidea.
Clarifying information
Industry:
• It has been growing at GDP (~3%) the last few years and is projected to continue that growth rate.
• The market for chilled juices is dominated by mothers with young kids.
• Brand name is important in this market, as mothers tend to prefer reliable products. However, the brand premium must be in line with other branded products and all branded juices sell in the same price range.
• This is a highly price sensitive market that loves coupons, promotions, etc.
Competition: Highly concentrated market. There has not been a lot of change, technological progress or threat of new entrants
Fit: What do you think makes a good management consultant?
274
Zephyr Beverages
Part 1
1. Develop a structure to address the problem
• A sample case structure would include the following:
1. Identifying the options: sell chilled juice, sell all juice businesses, continue on with all businesses
2. Qualitative discussion of competitive dynamics
3. Discussion of product selection/components, as well as ways to cut costs
When asked, the interviewer can reveal the following additional information:
• Chilled beverages are a $1 billion worldwide industry

275
Zephyr Beverages
Part 2
2. Conduct competitive analysis
• Using basic information provided, interviewee should deep dive the competitive dynamics in further detail.
• Relevant info:
• Bad market position: 12% vs. 40% and 25%
• Assumed profitability differences
• Disadvantage on trade promotions
• The two largest players have market shares of 40% and 25%, respectively. Zephyr’s market share, 12% makes it third in the industry.
• The two market leaders are able to do more advertising, couponing, promotion, and trade than Zephyr is able to do. We do not know about their profitability, but assume it is positive
• Interviewee should be able to see that Zephyr is at a serious disadvantage on all fronts as a smaller company that is both less profitable and less engaged in the kinds of trade promotions that key customers covet. The overall conclusion should be that this is a weak competitive position.

276
Zephyr Beverages
Part 3
3. Determine product selection
• Using information about our products vs. our competitors, the interviewee should focus on discussion about how to cut costs.
• Relevant info (when asked):
• The market leaders produce pure orange juice/blends based on citrus juices. Zephyr uses more elaborate blends, usually with a base of pear or peach juice (60% of inputs) and flavor with cranberries, bananas, mangoes, etc. (the other 40%). Pear and peach juice are a similarly price to orange juice, but the other flavorings cost about twice as much.
• A plant in California produces all products; chilled, juice boxes and frozen. Each of the three products uses different machinery. It would be difficult to find another use for the plant without a major conversion.
• Additionally, there are currently synergies between chilled, frozen and juice boxes – mothers are slightly more likely to buy products from the same brand
• This indicates that, despite a disadvantage, divesting is not realistic and there may be room for cost reduction based on reformulation to make Zephyr profitable.

277
Zephyr Beverages
Part 4
4. Provide client recommendation
There are three possible solutions, with no right answer. The recommendation should be well-reasoned, comprehensive, and includeas much relevant information as possible.
• Sell the chilled juice business. This would, however, affect the juice and frozen concentrate businesses, as there are both advertising and manufacturing synergies.
• Sell all of the juice business. This may be more feasible, as the buyer could capture the synergies, but would not be too likely to turn the business around. The selling price is likely to be low.
• Keep the chilled juice business and rework the ingredients and costs. This is the most feasible option, as evidenced by the success of the competitors. We are probably developing extra features in our ingredient mix that the market does not want and is not willing to pay for. Eliminating or scaling back those features will probably allow us to cut costs without affecting revenue.
• Interviewees who do well on this case will have to be comfortable with ambiguity and with a lack of perfect information. They will quickly grasp the issues and delve into the underlying qualitative discussions, coming up with a lot of additional risks/potential benefits for each option.
• Creative solutions beyond those listed are possible and encouraged, though should be done within the framework of the information available.

278
Case authors: Aneri Jambusaria (Kellogg 2011)Edited By: Ron Mantel (Kellogg 2015), Matthew Heintz (Kellogg 2016), Michael Eidem (Kellogg 2020)
Case 27
Zoo Co
Primary sector(s)
• X06 Financial Services
Concepts tested
• Z12 Creativity (1)
• Z02 Net Present Value (2)
• Z02 Breakeven analysis (3)
Similar cases
• Car Wash Chain (Columbia 2017)
• National Zoo (Wharton 2011)
Case type
• Y03 Mergers & Acquisitions

279
Zoo Co
Case prompt
• Our client is a zoo that is thinking about acquiring a famous zebra from an African preserve.
• It’s a huge investment, but they believe the new zebra would be a great contribution to their animal community. You have beenengaged to help decide whether this is a good idea. What would you consider when trying to help your client make this decision?
Interviewer guide
• Even though the client is a zoo, we’re undertaking a similar process to what is done when underwriting an insurance policy. The case evaluates basic concepts but involves many calculations and the use of financial assessment techniques.
1. Develop a structure to address the problem
2. Investment valuation - Walk through the valuation process of an asset.
3. Breakeven analysis – Determine the revenue increase needed for a positive NPV
4. Risk assessment – Should the zoo use an insurance contract to hedge downside risk?
5. Provide CEO recommendation
• Note: Rounding numbers is generally okay but should not be done to the extreme as it will alter the results.
Interviewer Guide

280
Zoo Co
Case prompt
• Our client is a zoo that is thinking about acquiring a famous zebra from an African preserve.
• It’s a huge investment, but they believe the new zebra would be a great contribution to their animal community. You have beenengaged to help decide whether this is a good idea. What would you consider when trying to help your client make this decision?
Clarifying information
• Goal: Zoo’s primary concern is whether the zebra acquisition would be profitable. No specific timeline, but zebras do have a finitelifespan.
• Client Characteristics: Major zoo within the US. Majority of revenue generated through admission sales to daily zoo visitors.
• Competitive Dynamics: No other zoo within the local market.
Fit: Talk about a time when you had to influence someone who initially disagreed with you.
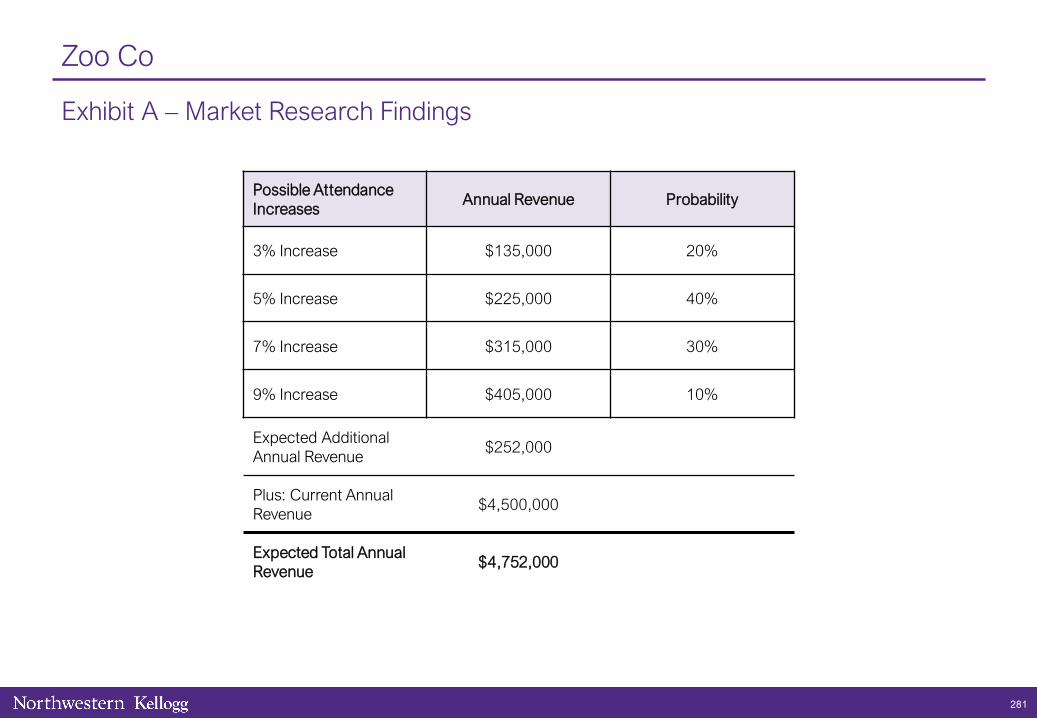
281
Zoo Co
Exhibit A – Market Research Findings
Possible Attendance Increases
Annual Revenue Probability
3% Increase $135,000 20%
5% Increase $225,000 40%
7% Increase $315,000 30%
9% Increase $405,000 10%
Expected Additional Annual Revenue
$252,000
Plus: Current Annual Revenue
$4,500,000
Expected Total Annual Revenue
$4,752,000
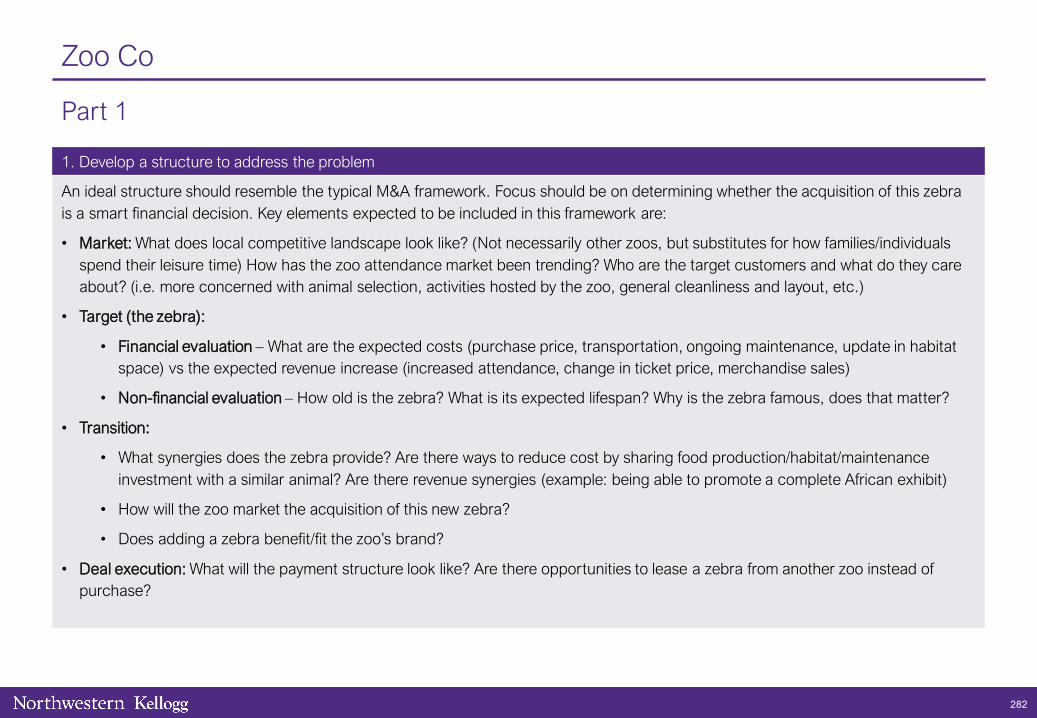
282
Zoo Co
Part 1
1. Develop a structure to address the problem
An ideal structure should resemble the typical M&A framework. Focus should be on determining whether the acquisition of this zebra is a smart financial decision. Key elements expected to be included in this framework are:
• Market: What does local competitive landscape look like? (Not necessarily other zoos, but substitutes for how families/individuals spend their leisure time) How has the zoo attendance market been trending? Who are the target customers and what do they careabout? (i.e. more concerned with animal selection, activities hosted by the zoo, general cleanliness and layout, etc.)
• Target (the zebra):
• Financial evaluation – What are the expected costs (purchase price, transportation, ongoing maintenance, update in habitat space) vs the expected revenue increase (increased attendance, change in ticket price, merchandise sales)
• Non-financial evaluation – How old is the zebra? What is its expected lifespan? Why is the zebra famous, does that matter?
• Transition:
• What synergies does the zebra provide? Are there ways to reduce cost by sharing food production/habitat/maintenance investment with a similar animal? Are there revenue synergies (example: being able to promote a complete African exhibit)
• How will the zoo market the acquisition of this new zebra?
• Does adding a zebra benefit/fit the zoo’s brand?
• Deal execution: What will the payment structure look like? Are there opportunities to lease a zebra from another zoo instead of purchase?

283
Zoo Co
Part 2
2. Walk through the valuation process of an asset.
Data to provide when asked more about expected revenues and costs:
Revenue:
• 300K people visit the zoo annually; admission is $15 per person
• Benefits from zebra acquisition could lead to increased attendance. Another zoo that acquired a similar zebra had an 8% increase.
Costs from zebra acquisition:
• Immediate costs: Acquisition cost ($235K), new facilities ($850K), transportation ($110K)
• Annual maintenances: Food, health costs, and additional trainers ($90K)
• Discount rate = 20%, Assume that the immediate costs are paid today, and annual costs and benefits are realized beginning next year and sustained into perpetuity, even though the Zebra will not live on to perpetuity.
The interviewee should use the above data to calculate the NPV of the acquisition:
• Assume that the attendance benefits are realized immediately and maintained thereafter
• Annual benefits = (300K)*($15)*(0.08) = $360K
• Upfront costs = $235K + $850K + $110K = $1.195M
• Annual costs = $90K
• NPV = -$1,195K + (($360K - $90K)/0.20) = $155K
• Takeaway: Acquisition is NPV positive. Financially (assuming assumptions are accurate), this is a smart decision.

284
Zoo Co
Part 3
3. Breakeven analysis – Determine the revenue increase needed for a positive NPV
• Additional prompt: Zoo Co is concerned about using the other zoo’s attendance benefits as a proxy. They think that attendance could increase by less than 8%. What analysis could you perform to address their concerns? What is the breakeven attendance increase required?
• The interviewee should think about performing a break-even and a sensitivity analysis. Afterwards, they need to think about performing a risk assessment.
Break-even Analysis:
• Break-even = 0 = -$1,195,000 + ((revenue - $90,000)/0.20)
($1,195,000) * 0.20 = revenue - $90,000
Revenue = $239,000 + $90,000 = $329,000 (this is the required additional revenue to break even)
$329,000 = (300,000) * (15) * (% increase in attendance)
% increase in attendance = ($329,000 / $4.5M) = 7.3%
• Takeaway: We already knew from the previous calculation that the acquisition of the zebra was profitable if attendance increased by 8%. This new calculation shows us that our 8% assumption is barely above the break-even calculation. If our attendance assumption is wrong be even 1%, the investment may end up NPV negative.

285
Zoo Co
Part 4
4. Risk assessment – Should the zoo use an insurance contract to hedge downside risk?
• Since the zoo is very risk-averse, they’re interested in hedging some of their downside risk. An insurance company has offered to provide the zoo with a constant revenue to increase revenue to $250K per year if attendance increases are less than or equal to 5% (example: If post-zebra acquisition is only 3% and thus revenue increases by only $135K, the insurance will give the zoo $115K to reach a total increase of $250K). In exchange, the insurance company wants the zoo to pay 1% of the zoo’s total annual revenues as a premium. What might you do to determine if this was a good deal?
• The interviewee should recognize that additional information is needed and that a market research study could aid in this process. Hand out exhibit after interviewee identifies this notion.
The interviewee should use the market research to determine the probable attendance increase:
• Annual cost to zoo: 1% of total zoo revenues = (0.01) * ($4,752,000) = $47,520
• Annual expected benefit to zoo: ($250,000 - $225,000) * (0.40) + ($250,000 - $135,000) * (0.20) = $33,000
• Takeaway: Costs > Benefits, so this is not a good deal.
Provide Exhibit A

286
Zoo Co
Part 5
5. Provide CEO recommendation
• It is unlikely that the zebra acquisition is a good idea for the zoo to undertake given the information provided. At other zoos,attendance has gone up substantially due to a new zebra; however, based upon our market research, it seems less likely that we can breakeven on the investment through increased attendance. We have received an insurance contract to help mitigate some ofthe downside risk; however, it is too expensive to create value.
Other items to consider:
• In order to make the investment more palatable, we may consider negotiating with the insurance company to either increase therevenue benefits provided or decrease the premium cost.
• There are other creative options to drive zebra related revenue (merchandise) or decrease cost (look for a less expensive zebra)
• Excellent interviewees:
• Identify that we can use another zoo’s attendance increase as a proxy for estimating our own attendance increases.
• Notice in Exhibit A that it is unlikely that attendance will increase sufficiently enough for the zoo to break even.
• Outstanding interviewees:
• Notice that the insurance company’s premiums and benefits are both impacted by attendance increases; so if attendance increases are always greater than 5%, the zoo will be paying even more but getting no benefit.
• Notice that the insurance company’s contract is essentially an option; so a different structure to the contract may be more suitable for the zoo.

287

The original version of the KCC casebook was originally written, edited, and designed by:
Historical KCC casebook owners:
288
Kellogg Case Book
2020 Edition
Adam J. LourasKellogg 2011
Bain alum, now COO at Iris Nova
Ameed MallickKellogg 2012
Bain alum, now VP at InfoArmor
Mauricio AtriKellogg 2012
BCG alum, now Director at Vista Equity Partners
Craig DePriesterKellogg 2012
Bain alum, now General Manager at DaVita Medical
Uri KalirKellogg 2012
Now Executive Director at JPMorgan Chase
Peter ManoogianKellogg 2012
Now Partner at ZS Associates
Derek CollinsKellogg 2019
Previously at DaVita, now Associate at McKinsey
Rohan MainiKellogg 2020
Previously at PwC, joining McKinsey as Associate
New VP TrainingKellogg 2021
Apply to join the KCC Exec team in Spring 2020!

This book is intended for internal use by members of the Kellogg Consulting Club (KCC). Distribution to individuals outside of the KCC is forbidden without express written consent by KCC.
Copyright 2019 © by the Kellogg Consulting Club. Copyright Act of 1976, no part of this publication may be reproduced or distributed in any form or by any means, or stored in a database or retrievalsystem, without the prior written permission of the publisher.

June 10, 2016
KCC Case Book 2016

Kellogg Case Book – 2016 EditionIf you have questions or concerns please write to Kyle Guilfoyle at [email protected] or Max Dreeben at [email protected]
This book is intended for internal use by members of the Kellogg Consulting Club (KCC). Distribution to individuals
outside of the KCC is forbidden without express written consent by KCC.
Copyright 2016 © by the Kellogg Consulting Club. Copyright Act of 1976, no part of this publication may be reproduced
or distributed in any form or by any means, or stored in a database or retrieval system, without the prior written
permission of the publisher.
This book was originally written, edited, and designed by:
Adam J. Louras (Kellogg Class of ‘11)
Ameed Mallick (Kellogg Class of ‘12)
Uri Kalir (Kellogg Class of ‘12)
Peter Manoogian (Kellogg Class of ‘12)
Craig DePriester (Kellogg Class of ‘12)
Mauricio Atri (Kellogg Class of ‘12)
This book was edited in 2016 by KCC
2

CONTENTS
3
13
22
251
How to use this book
Typical case flow
KCC 2016 cases
Industry primers

4
The title page for each case contains details that will inform case selection
Using the case book
1 Case tracker: Provides overview on case including industry, format, and concepts tested
2 Status bar: Includes ratings for quant intensity and structure (1 = lowest, 10 = highest), as well as industry and case format. Quant indicates how much math is involved and Structure represents the level of difficulty around developing frameworks.
3 Guide to interviewer: Contains the overview of the case and allows users to determine whether they should give the case based on its attributes
Overview of case title page
3
2
1

5
The “Clarifying answers” page contains supplemental information and a suggested guide to the case’s flow
1 Clarifying answers: Contains information that is less crucial to the main solution path. This is for supplementary information such as: “we do not know the competitive dynamics” or “the market has been growing at GDP.”
2 Guide to case: Lays out the ideal structure for the case and includes hints on how to walk through the interview/handouts, as well as when to show them to the interviewee.
Overview of clarifying answers and case guide page
1 2

6
The “Key elements to analyze” page contains the analysis of the key case concepts
1 Concept box: Includes the key question or objective associated with a main case concept tested. The interviewee should naturally move to asking or addressing the information in this box, but you may need to provide a little “push” at times.
2 Notes to interviewer: Contains additional information that you may provide to the interviewee during an investigation of the particular case concept. This information is CRITICAL to the interviewee solving the case both numerically and conceptually.
1
2
Overview of key elements to analyze page

7
Tips for effective pre- and post-case activities
• Ask the interviewee if they wish to focus on specific:
– Case formats / concepts
– Levels of difficulty
– Industries
• Inform interviewee which case you plan to deliver to confirm they have no prior knowledge of the case
• Spend at least 30 minutes to review the case
Interviewer (delivering case) Interviewee (receiving case)
• Inform your interviewer if you have specific areas for improvement
• Send the interviewer a list of cases you have already done
• DO NOT read the case ahead of time or discuss the case contents with peers!
• Bring plenty of paper to take notes!
Befo
re m
eeting
Aft
er
the c
ase
• Provide detailed feedback (both positive and constructive) to interviewee
• Seek feedback from the interviewee on your case delivery
• Seek feedback from the interviewer on your case performance
• Review the case and log your performance in a “case tracker”
• Provide detailed feedback (both positive and constructive) to interviewer

8
Additional tips for giving an effective case
While there is no single “right way” to give a case, here are a few suggestions:
Take the interview seriously; pretend that you are a real interviewer While your interviewee may be your friend, providing a formal atmosphere will be much
more valuable and provide a more realistic interview experience
Learn to be comfortable with silence While silence may be uncomfortable, resist the urge to jump in with pointers, hints, or
additional information
Solve the case math on your own beforehand Not only will you gain practice with the math required, thinking through the approach
may help you identify traps your interviewee may fall into
If you are not familiar with the industry, spend a few minutes quickly reviewing of the industry summaries (found in the back of this deck) or Vault.com

9
Case prep scoring: Provide tangible points that can be practiced and improved
1.- General feedback Needs
improvement
Good Strong
Quantitative: comfort with complex math; shows math and logically lays out data
Qualitative: conveys understanding of big picture takeaways; realistic thinking
Creative: identifies different approaches to solve the problem
Communication: strong listener, openly shares thought process, good body language
2.- Case specific Feedback Needs
improvement
Good Strong
Clearly understands and defines the problem/question; breaks problems into
components
Prioritizes analysis; Identifies critical path to the recommendation and most important
issues
Provides a structured and thoughtful approach to solve the problem (e.g. draw issue
tree with critical pieces of analysis)
Summarizes key findings through the solution of the case and translates them into
insights or important takeaways
Pragmatic/ realistic solution that answers the initial question with supporting evidence
Assesses risks and consequences for the recommendation; identifies key next steps
to further prove the solution

10
Feedback Reviewer Form
Strengths (circle 2) Weaknesses (circle 2)
Framework / Structure
Analytics / Data Interpretation
Qualitative Analysis
Synthesizing
Creativity/insights
Driving the Case
Conclusion
Other
Structure:
Score (8 is passing): 1 2 3 4 5 6 7 8 9 10
Framework / Structure
Analytics / Data Interpretation
Qualitative Analysis
Synthesizing
Creativity/insights
Driving the Case
Conclusion
Other
Quant: Business
Acumen:
Creativity: Recommendation: Client Presence:

11
Evaluation criteria (1/2)
Case skills and driving the case
Problem definition: Clearly understands and defines the
problem/ question; summarizes the essence of the issue
Problem breakdown: Breaks problem into most important
components
Structure: Uses a structured and thoughtful approach to solve
the problem (e.g. draw issue tree with critical pieces of
analysis)
Prioritization: Identifies critical path to the recommendation
and most important issues/components
Information: Identifies and addresses key pieces of information
and assumptions needed to solve the problem
Solution oriented: Formulates hypothesis when needed and
maintains focus on the recommendation
80-20 approach: Deep dives into identified critical issues to
develop a recommendation (80% of solution with 20% of
analysis)
Recommendation: Ends up with a pragmatic/ realistic solution
that answers the initial question; supported with the analysis
Communication skills
Structure: Shares thinking process throughout the case and
aligns his communications with the structure of the case
Focus: Highlights key insights, important findings and critical
issues
Questions: Ask clear questions related to the case process and
solution
Engagement: Engages with the interviewer during the solution
of the case
Support: Clearly supports any conclusion or important claim
with relevant arguments
Business language: Feels comfortable discussing the case with
business terminology
Body language: Communicates naturally and uses body
language to support the communication process

12
Evaluation criteria (2/2)
Polish and interpersonal skills
Self confidence: Shows confidence when solving and attacking
the case without sounding arrogant
Quantitative skills: Feels comfortable handling complex
calculations and analytics; shows clear calculations and data
framing
Analysis: Deep dives in identified critical issues or components
and comes up with a solution for each issue
Interpersonal skills: Drive a conversation and acts naturally
Balance: Good balance of quantitative and qualitative analysis
during the solution
Business sense and high level thinking
Creativity: Identifies or uses different approaches to solve the
problem. Out of the box thinking; uses creative methods and
arrives at creative solutions
Synthesis: Summarizes key findings through the solution of the
case and translates them into insights or important take-aways
Concepts: Clearly understands and uses the key business
concepts to solve the case
“So what” thinking: Clearly addresses and articulates what
each analysis, conclusion or recommendation means to the
case, solution or the client
Testing: Frequently tests assumptions and conclusions with
reality checks or other quick analysis
Assessment: Assesses risks and consequences for the
recommendations; identifies key next steps to further prove
the solution
Business sense: Uses common sense and realistic thinking to
get to pragmatic recommendations; has the ability to think
from different perspectives (e.g. client, competitor, consumer,
etc.)

CONTENTS
3
13
22
251
How to use this book
Typical case flow
KCC 2016 cases
Industry primers

Sample Business Concepts
Quantitative focus Qualitative focus
Accounting Customer strategy
Basic NPV Competitive analysis
Break-even analysis Creativity
Capacity expansion/Contraction Operations
Elasticity Marketing strategy
Investments Organizational changes
Macroeconomics Pricing strategy
Market share Supply/value chain
Market sizing Vertical integration
Microeconomics Brain teaser (rare)
Each case will follow a specific format and cover multiple business concepts
14
Broad Range of Business Concepts Evaluated

15
Case Topics Vary
The following represent the most common case topics on which a case
interview may be based (ranked in descending order of frequency)
Format Focus
Profit improvement Analyzing causes for recent drop in profits / ways to increase profits
Market entry Analyzing a firm’s opportunity to expand into a new business or segment
Opportunity assessmentExamining the potential purchase / sale of a new or existing
business or installation / abandonment of infrastructure
Increasing sales Identifying ways in which a firm can optimally increase sales
Merger / Acquisition Evaluating whether a firm should merge or purchase another company
Market sizing Determining the size, usually in terms of a firm’s revenue potential, of a market
Industry analysis Evaluating an industry’s structure and/or desirability
Starting a new business Similar to entering a new market; then taking an investment point of view
Growth strategies Determining the optimal ways to grow a company
Developing a new product Assessing a new product offering
Reducing costs Identifying internal or external costs that are out of line
Competitive response Evaluating ways to address a competitor’s action (e.g., new product launch)
Turnarounds Gathering info on why company is failing and then suggesting corrective action

16
A Typical Case Flow (Standard Case)
5-10
min
20-30
min5
min
Intro & Fit
InterviewCase Interview
Wrap
Up/Q&A
Structure the
problem
Develop
HypothesisDeep Dive
Develop
SolutionSynthesize
• Summarize the
essence of the
problem
• Ask clarifying
questions
• Structure
thoughts
• Develop a
hypothesis
• Prioritize
analyses
• Deep dive into
priority areas
• Make
connections
between
information
given
throughout case
• Refer back to
the initial
problem and
your
hypothesis
• Be creative
• Ask ‘so what?’
• Summarize
recommendation
for client
• Lay out risks and
next steps
5 -10 min 15 min 5 min
1 2 3 4 5

17
Structure the Problem
Structure the
problem
Develop
Hypothe-
sis
Deep
Dive
Develop
Solution
Synthesi-
ze
Get the facts right – ask clarifying questions
o Make 100% sure that you understand the objective: e.g. if the objective is to be the
market leader, clarify what this means (highest market share, revenue, profit?)
Summarize the essence of the problem
o Do not just repeat all of the facts back to the interviewer
Draw out your approach to solving the problem (i.e. framework)
o Try to include at least 2 levels of depth in your framework
o Customize your framework to the case
o Be MECE
Walk your interviewer through your framework
Remember: since every case is unique, don’t try to force fit standard frameworks!
Key Skills Tested:
Structured Thinking, Business
Judgement
1

18
Develop Hypothesis
Structure the
problem
Develop
Hypothe-
sis
Deep
Dive
Develop
Solution
Synthesi-
ze
Use the info provided to form an initial hypothesis
o For example, if the case asks you to determine whether to enter a new
market, take a position (e.g., enter), and list out the questions you would
need to answer in order to validate your hypothesis
Use your hypothesis to prioritize your analyses
o What is most important to look into first, second, and third?
Engage with the interviewer
2
Key Skills Tested:
Hypothesis Driven, Prioritization

19
Deep dive into 1 or 2 areas
Structure the
problem
Develop
Hypothe-
sis
Deep
Dive
Develop
Solution
Synthesi-
ze
Treat your notes as “slides”
o e.g. separate pages for revenue analysis, cost analysis, profit analysis
Link various data points together
o Look at the case holistically and tie together information provided at various
points in the case
Structure quantitative data “Excel-style” / in tables
o Before doing any calculations, write out your approach to solving the math
problem (e.g., write the formula in words)
o Turn the page around and walk the interviewer through your math structure
(similar to how you would walk them through your framework)
o Don’t start calculating numbers until you’ve received your interviewer’s buy-in
that your approach will lead you to the right solution
3
Key Skills Tested:
Quantitative Skills, Business Judgement

20
Develop Solution
Structure the
problem
Develop
Hypothe-
sis
Deep
Dive
Develop
Solution
Synthesi-
ze
Be sure to ask the ‘so what’ questions
o Don’t just state the obvious; explain what each
conclusion means for your client
Develop creative solutions
o Pressure test your solution
o If you think the goal is not achievable then
suggest alternatives
Always consider implementation implications,
risks and mitigation
Utilize your analysis to make a powerful
statement – take a stand, don’t hesitate
Always end your case with a succinct
recommendation
A good solution is:
1. Best among
alternatives
2. Practical
3. Based on facts
4
Key Skills Tested:
Creativity, Confidence

21
Synthesize
Structure the
problem
Develop
Hypothe-
sis
Deep
Dive
Develop
Solution
Synthesi-
ze
Take a moment to prepare your thoughts
o But be prepared for the “elevator test”(interviewer doesn’t allow you time to
prepare your thoughts)
Provide your recommend approach, backed up by facts
List out risks that the client should consider when evaluating your
recommendation
Recommend next steps for analysis
Tip: Highlight or circle main points as you go through the analysis to
facilitate a concise summary
5
Key Skills Tested:
Ability to Synthesize

CONTENTS
3
13
22
251
How to use this book
Typical case flow
KCC 2016 cases
Industry primers

23
Table of Contents (1/2)Kellogg Cases Page # Quant Structure Case Type Industry
Consumer Products
Education
Consumer Products
Industrial Goods
Transportation
Retail
Call Center
Consumer Products
Healthcare
Retail
Insurance
Real Estate
Aerospace and Defense
Consumer Products
Private Equity
Telecom
*Interviewer-led case
25
30
37
44
48
52
59
65
69
77
83
90
97
105
112
119
1. Maine Apples
2. Kellogg in India
3. Rotisserie Ranch*
4. Tarrant Fixtures
5. Portkey Inc.
6. Salty Sole Shoe Co
7. Money Bank Call Center
8. Zephyr Beverages
9. Shermer Pharma
10. Orange Retailer
11. Vitality Insurance
12. Realty Seattle
13. Dark Sky
14. Healthy Foods Co
15. Plastic World
16. GoNet
8
8
6
8
5
7
8
1
5
5
3
7
5
5
3
8
New product/market entry
Market entry
New product/market entry
Profitability
New product/market entry
Profitability
Cost Reduction and M&A
Opportunity Assessment
New product/market entry
Market Entry
Profitability
Profitability
Growth Strategy
Growth Strategy
M&A
Market Entry
6
5
5
7
4
6
9
5
5
5
7
4
5
6
4
4

24
Table of Contents (2/2)Kellogg Cases Page # Quant Structure Case Type Industry
Consumer Products
Media
Consumer Products
Tech
Healthcare
Industrial Goods
Financial Services
Tech
Healthcare
Energy
Education
Restaurant
Consumer Products
Airline
Tech
Consumer Products
Non-Profit
*Interviewer-led case
6
8
8
4
8
8
7
3
8
7
7
6
7
8
8
8
10
17. Orrington Office Supplies
18. Winter Olympics Bidding
19. Vindaloo Corporation
20. DigiBooks*
21. Health Coaches
22. High Q Plastics
23. Zoo Co
24. Syzygy Supercomputers
25. Thompson Healthcare*
26. Rock Energy
27. Chic Cosmetology
28. Tacotle
29. Wine and Co*
30. A+ Airline Co
31. Bell Computer
32. Montoya Soup
33. After School Programming*
7
4
4
7
6
5
5
7
9
5
8
5
5
8
10
5
10
Profitability
Opportunity Assessment
New product/market entry
New product/market entry
New product/market entry
Improving Profitability
M&A
Profitability
Cost Reduction
Opportunity Assessment
Opportunity Assessment
Profitability
Opportunity Assessment
Opportunity Assessment
Improving Profitability
Improving Profitability
Growth Strategy
124
132
137
145
151
157
165
171
178
187
192
199
212
219
225
232
241

25
Maine Apples
Case tracker
Industry: Consumer Goods
Case format: Developing a new product
Concepts being tested:
- Market sizing
- Investment
- Pricing Strategy
Case Question
Our client is a Korean conglomerate named Danut that has acquired a small Boston-based biotechnology firm
The biotech firm acquired has developed a chemical that helps control the ripening of produce. After testing, this chemical appears to work especially well with apples: it allows apple orchards to harvest earlier and it improves the overall quality of the harvest.
Danut traditionally uses a test market to determine commercialization. Given proximity to Boston and average apple yields, Maine has been chosen.
Danut would like to know if they should attempt to commercialize this chemical.
Guide to interviewer
After hearing the prompt, the interviewee should be able to develop a variant of the following question:
Is the market size large enough and the estimated profitability high enough for Danut to attempt to commercialize this chemical?
Key case steps:1. Confirm market attractiveness (size) 2. Evaluate orchard revenue and cost structures3. Project farmers margins and pricing for Danut4. Identify qualitative issues (Risks) to consider
By: Adam Borchert and Joep Knijn (Tuck Class of ‘04), Edited By: Peter Manoogian (Kellogg Class of ‘12)
Quant: 8
Structure: 6
Industry: CPG
Framework: Market Entry/
New Product

26
Clarifying answers and case guide
Guide to case / Guide to handouts
1. Calculate Market Size (determine attractiveness)
― Share market size information with interviewee after probing questions are received
― Is the market large enough to continue?
2. Evaluate orchard profitability – Share product benefit details – i.e. 10% increase (from calculation page)
― How much incremental profit does our product create for an apple orchard owner?
― Next, the interviewee should determine the profit margins for the farmers given the costs of purchasing the product. Additionally the interviewee should determine a reasonable price for the product
3. Risks & Other Considerations – Guide the interviewee to consider qualitative risks and issues before moving forward with commercialization
Clarifying answers to provide
Product Benefits― Reduced costs through earlier
harvesting
― Improved apple yields
― Improved juice yields (with higher quality apples)
Client Characteristics― Only concerned about a “test-
market” in the state of Maine
Competitive Dynamics― No other competitive products on
the market currently
Local industry Characteristics/Economics― Growing at the rate of GDP

27
Key elements to analyze
Market sizing
How big is the apple market in Maine?
Does this seem potentially large enough to continue investigating this product?
Cost savings
What are the cost savings from using the chemical?
The chemical allows the farmer to harvest 10 days sooner
Revenue increase
How much additional revenue will farmers be able to generate?
What is the total profitability increase (including cost savings)?
Note to interviewer
When asked, provide the following:
- Maine has 200 orchards- Avg. annual orchard revenue is
$30K/acre- Avg. orchard has 100 acres of land- Only one apple harvest per year
Interviewee should calculate the market size based on info provided: ($30K/acre x 200 orchards x 100 acres/orchard = $600M)
This is a significant market and warrants further investigation
Notes to interviewer
When asked to quantify the improvements, provide the following:
- It costs $1.5K/night to maintain crops for 100 acre orchard
- With the chemical, farmers are able to harvest crop 10 days sooner
Interviewee should calculate cost savings per year using this information:
($1.5K/day x 10 days / 100 acres = $150/acre/year)
Qualitative Assessment
When asked to quantify additional revenue, provide the following:
- Our client’s product improves the consistency of red apples and improves the yield by 10%
- The sweetness factor is estimated to improve the juice yield by 5%
- 25% of revenue comes from whole apple sales, 75% from juice sales
Improved yield: ($30K/acre x 25% x 10% = $750/acre/ year)
Improved sweetness: ($30K/acre x 75% x 5% = $1,125/acre/year)
Total improvement (with cost reduction) = $2,025/acre/year

28
Key elements to analyze (cont.)
Product Profitability
If our product costs $100K per 200 acre farm, what will the farmer’s profit margin be if they buy it at cost?
What should our client sell the product for? (If the candidate needs help, ask him/her what the max and min prices are for the product).
Is a 50% margin realistic?
Note to interviewer
Farmer’s incremental revenue/cost savings = $2,025/acre
Product costs = $100K/200 acres = $500/acre
Profit margin = ($2025-$500)/$2025= 75%
The interviewee should note that this is an extremely high profit margin for the farmer and realize that there is a significant opportunity for profits with this product.
- How much of this benefit can we capture in our pricing?
- Interviewee should provide a percentage between 25% and 50%. Anything higher than 50% should be questioned due to the novelty of the product and resulting lack of social proof.
A 50% profit margin for our client would also realize a 50% profit margin for farmers. This is absolutely a realistic price to set, if not a little low.
- Given the costs provided, will we make a profit? Yes
- Interviewee should calculate profit: ($100,000 / 200 acres = $500/acre). Assuming $1,000 price per acre, gross margin will be 50%. [($1,000 - $500) / $1,000]

29
Solution and recommendations
Solution & Recommendations
Overall, our client should commercialize this chemical and price it at approximately $1,000 per acre to make a 50% margin.
Ask the interviewee if there are other non-financial risks/benefits that our client should consider.
A potential answer would note that the client should consider several qualitative issues:
— Differentiation: What is our positioning?
— Environmental issues: Is there a risk of backlash and/or boycott from the general public? Could the U.S. government attempt to regulate our product?
— Operational reality check: Does the company have the resources to do this?
— Patenting: Is the product already patented? If yes, then when does it expire? If no, then is it possible to patent? If not, then can we patent the manufacturing process?
— Representativeness of test market: Does it cost less to cover apples in other states?
— Strategic fit: Is this opportunity too small relative to the size of the client?
Bonus/Guide to an Excellent Case
Excellent interviewees need to address value-based pricing: the need to quantify added profits that our client’s product will make for its clients and how much of that money our client can capture.
Additionally, a strong interviewee will share several qualitative issues listed above to supplement the recommendation to enter the market.
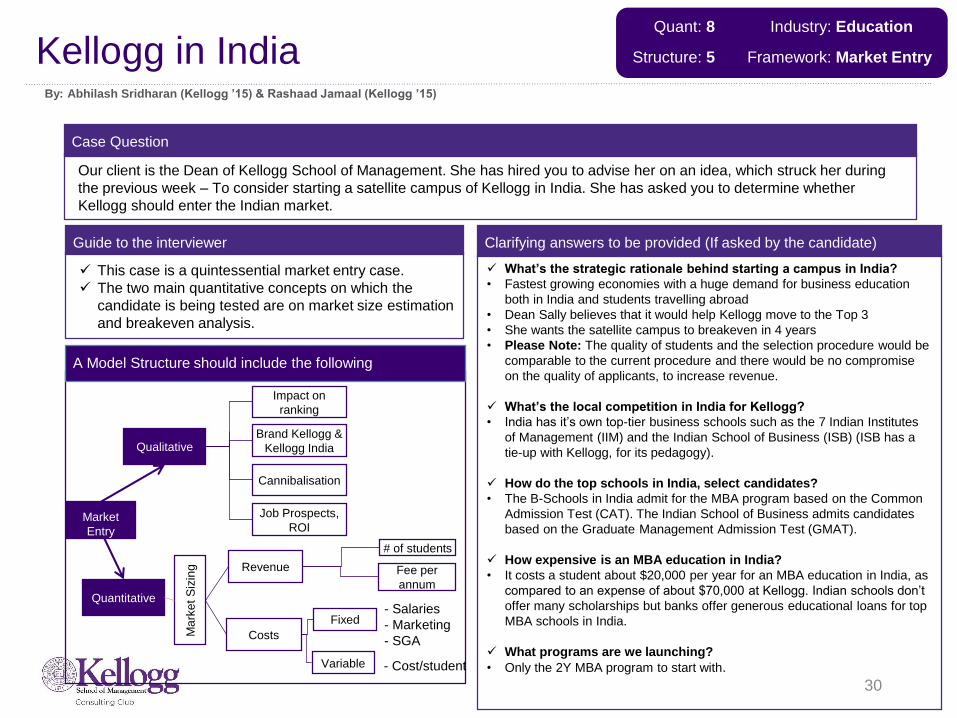
30
Kellogg in India
Case Question
Guide to the interviewer
Our client is the Dean of Kellogg School of Management. She has hired you to advise her on an idea, which struck her during
the previous week – To consider starting a satellite campus of Kellogg in India. She has asked you to determine whether
Kellogg should enter the Indian market.
This case is a quintessential market entry case.
The two main quantitative concepts on which the
candidate is being tested are on market size estimation
and breakeven analysis.
Clarifying answers to be provided (If asked by the candidate)
What’s the strategic rationale behind starting a campus in India?
• Fastest growing economies with a huge demand for business education
both in India and students travelling abroad
• Dean Sally believes that it would help Kellogg move to the Top 3
• She wants the satellite campus to breakeven in 4 years
• Please Note: The quality of students and the selection procedure would be
comparable to the current procedure and there would be no compromise
on the quality of applicants, to increase revenue.
What’s the local competition in India for Kellogg?
• India has it’s own top-tier business schools such as the 7 Indian Institutes
of Management (IIM) and the Indian School of Business (ISB) (ISB has a
tie-up with Kellogg, for its pedagogy).
How do the top schools in India, select candidates?
• The B-Schools in India admit for the MBA program based on the Common
Admission Test (CAT). The Indian School of Business admits candidates
based on the Graduate Management Admission Test (GMAT).
How expensive is an MBA education in India?
• It costs a student about $20,000 per year for an MBA education in India, as
compared to an expense of about $70,000 at Kellogg. Indian schools don’t
offer many scholarships but banks offer generous educational loans for top
MBA schools in India.
What programs are we launching?
• Only the 2Y MBA program to start with.
A Model Structure should include the following
Market
Entry
Qualitative
Quantitative
Impact on
ranking
Brand Kellogg &
Kellogg India
Revenue
# of students
Costs
Fixed
Cannibalisation
Job Prospects,
ROI
Variable
- Salaries
- Marketing
- SGA
- Cost/student
Fee per
annum
Ma
rke
t S
izin
g
By: Abhilash Sridharan (Kellogg ’15) & Rashaad Jamaal (Kellogg ’15)
Quant: 8
Structure: 5
Industry: Education
Framework: Market Entry

31
Case Guide
The candidate can choose to size the market, in anyway he wants – either
top-down or bottom-up. A problem with the top-down approach is that it
becomes too dependent on assumptions. Use Exhibit A for a bottom-up
approach. (Don’t hand it over right away – Let the candidate ask for it.)
A. Estimate the Total Addressable Market from competition
- Indian Institutes of Management (IIM)
- Indian School of Business (ISB)
- Students joining B-Schools abroad (negligible amount)
1. IIMs
- Every year, there are around 500,000 applications
- Top 6% get closed listed for an interview = 30,000 applicants
- 1 out of 5 are accepted = 6,000 eligible students
2. ISB
- 1,400 matriculated students / 70% of total admitted students = 2,000
eligible students
- If interviewee gets this wrong, ask which student pool are we most
interested in: matriculated students or all accepted students (some
students may not matriculate due to prestige level of school).
Total Addressable Market = 6,000 + 2,000 = 8,000 high quality applicants
B. Market Size
Fee to be charged annually needs to be calculated. A value somewhere in
between $20,000 and $70,000 is acceptable. Too low or high a value needs
to be challenged. Taking a value of $50,000 per year for 2 years.
Market Size = 8,000 * $50,000 * 2 = $800M (Good enough to proceed
ahead)
Topic 1 Being Tested: Market Sizing
- The candidate needs to mention a target market share in the
year of launch. A lower number would be preferable to start
with. After letting the candidate present his/her logic, ask
him/her to take an assumption of 7.5% market share in the
year of launch.
Breakeven Analysis
- Expected breakeven in 4 years
- Calculate the revenue and cost structure for 4 years
Revenue: (hand over exhibit B)
- Only source of revenue is the fee charged from students.
- Revenue each year = Number of students admitted * Fee/year
- From the second year onwards, add last year’s fee back
Costs:
- Initial Costs incurred
- Land acquisition / leasing
- Setting campus up
- Infrastructure costs
- Fixed Costs
- Salaries to Professors
- Infrastructure Maintenance
- Variable Costs
- Costs incurred per student
Handover Exhibit C at this time.
The candidate must move towards a NPV Calculation, as
explained in the next page, to understand the breakeven
possibility in 4 years.
Topic 2: Market Share & Breakeven Analysis

32
Breakeven Analysis & Qualitative Insights
Y0 Y1 Y2 Y3 Y4
Number of students 600 600 900 900
Yearly Fee per student ($) 50,000 50,000 50,000 50,000
Revenue from student in year 1 ($
M) 30 30 45 45
Revenue from student in year 2 ($
M) 30 30 45
Total Revenue ($ M) 30 60 75 90
Costs ($ M) 150 30 30 30 20
Profits -150 0 30 45 70
The Calculations are as follows:
Inferences from the above calculations:
- Candidate must ask for discount rate to do the NPV Calculation. However, there is no
discount rate and we could go ahead without it.
- From the above calculations, by the 4th year, it doesn’t breakeven
- A candidate could say that it doesn’t breakeven even without using discount
rates and to not go ahead with the market entry strategy
- A good candidate would conclude that the venture misses the breakeven mark
by only $5M. Given the rising revenues ($90M in Y4) and declining costs ($20M
in Y4, vis-à-vis $30M in Y3), the breakeven would be achieved in the first month
of year 5 itself.
- From a quantitative standpoint, the move makes sense
Qualitative Insights
In addition to the breakeven analysis, a good
candidate must discuss the qualitative factors,
before moving to a conclusion
Brand Impact / dilution
No Top B-School from the US (except for
INSEAD) has successfully ventured to start a
satellite campus in India. Whether a satellite
campus will dilute the Kellogg brand needs to be
studied in detail.
Influence on rankings
What are the factors which may be impacted by
the satellite campus:
- Diversity
- International Presence
- Proximity to other Asian countries
- Job prospects, in terms of % placements
Cannibalisation
Kellogg Evanston has about 50-60 students who
join every year from India . Will this cannibalise
that number? Additionally, there are other
students who join Kellogg from other Asian
countries. Will this result in those quality
applications moving out?
Brand Parity
Will global employers view an MBA from Kellogg
India on the same scale as they would view an
MBA from Kellogg Evanston?
Job Prospects & ROI
A huge premium is being charged on the joining
fee vis-à-vis IIMs and ISB. Will students
experience a similar increase in ROI?
Infra & pedagogy support
The support on Infra and pedagogy from the
parent campus to the satellite campus is critical

33
Suggested conclusion
Conclusion
Risks
Next steps
A good candidate must highlight that while starting a satellite campus makes financial sense, further scrutiny needs to be
done to check the impact of this move on brand Kellogg and other factors that impact the rankings (positively / negatively)
Other additional points, which the candidate may add, could be:
- Negotiate on the costs for initial investments, to lower it down from $150M.
- Support from Indian government on subsidies to be offered
- Develop additional sources of revenue, from supporting programs and corporate training sessions
- Brand dilution / considering the impact of a satellite campus on Brand Kellogg
- Cannibalization of existing revenue from Indian students
- Admission percentage is projected to increase from Year 2 to Year 3 by 50% (This is quite high)
- The salaries of Indian graduates, as per Indian Market conditions, (considering Indian PPP) may influence the average
salary of Kellogg School of Management given global reporting, eventually impacting the ranking negatively
- Given Kellogg’s new building being constructed, the $150M additional investment for a satellite campus, may require
additional rounds of fund raising for the India campus
- Employ a Brand agency / consultant to figure out the impact of starting a satellite campus on Brand Kellogg
- Fund Raising for $150M to be worked out
- Potential Partners for promoting the program and supporting with faculty initially
- Discussions to be started with the government of India for the land, infrastructure investment and licenses.

34
Exhibit A – B-Schools in India
Category Indian Institutes of Management (IIMs) Indian School of Business (ISB)
Description of
program
- IIMs select via the Common Admission Test (CAT)
- The CAT has 500,000 applications every year and the
Top 6 percentile gets closed listed for an interview by
the IIMs
- 5 candidates are interviewed for every slot available
- 85% of the admitted candidates end up joining an IIM
- 70% of admitted students matriculate
each year between the two campuses
for a total class size of 1,400
Cost incurred by
Student
INR 1,200,000 for each year (All expenses included)*
Use the conversion rate of 1 USD = 60 INR
*Assume the total cost incurred by a student annually at Kellogg, Evanston as $70,000 per annum

35
Exhibit B: Number of Admitted Students
Year
Expected Number of new
students to be admitted each
year
1600
(7.5% of 8,000)
2 600
3 900
4 900

36
Exhibit C: Intake and cost structure
Total Variable Costs per Year
Year 1 Year 2 Year 3 Year 4
$30M $30M $30M $20M
Initial Cost (Incurred in Year 0)
Acquiring land and setting up the campus = $100M
Support Infrastructure = $50M

37
Rotisserie Ranch
Case tracker
Industry: Consumer Goods
Case format: Developing a new product
Concepts being tested:
- Microeconomics
- Elasticity
- Customer strategy
Case Question
Our client is Rotisserie Ranch, a poultry farming company that specializes in growing chickens for rotisserie
roasting. Its primary customer segment is comprised of large grocery chains that buy its chickens to fresh roast
in the meat departments of their grocery stores. Market research has revealed to Rotisserie Ranch that more
and more consumers have begun buying flavored rotisserie chickens recently.
Rotisserie Ranch is thinking of pre-flavoring some of its chickens for grocers, what would you consider in
making this recommendation?
Guide to interviewer
This case is similar in style to a McKinsey &
Company 1st round case in that the Interviewer
should drive the case.
The case is primarily tests the ideas behind a new
product introduction and forces the interviewee to
consider market testing, profitability, etc. before
rolling out a new product.
Because this is a “Market Introduction” case, the
interviewee SHOULD ask questions about
competition.
For the purposes of this case, assume that
Rotisserie Ranch will only compete against
existing Private Label brands at grocery stores.
By: Brian Fox (Kellogg Class of ‘04), Edited By: Adam Louras (Kellogg Class of ‘11)
Interviewer-Led Case Quant: 6
Structure: 5
Industry: CPG
Framework: Market Entry/
New Product

38
Clarifying answers and case guide
Interviewer Guide to case and handouts
Case Structure – Interviewee’s structure should include:
- Value to customers (grocery chains) – Will they buy it?
- Revenue and Cost implications of new venture
- Cost increase to client is offset by price increase to grocers
- Competition
- None. Competition freezes chicken so can’t be pre-seasoned.
After Interviewee walks through structure, ask them:
- Prompt 1: Do you think that grocery retailers would be interested in pre-seasoned chickens from Rotisserie Ranch?
- Prompt 2: After several interviews, it turns out that the grocers are very interested in Rotisserie Ranch’s proposed new product, but first they want to be sure that the Rotisserie Ranch chickens will sell well. Suggestions?
- Prompt 3: After discussing Prompt 2, discuss the results of the market test.
Clarifying answers to provide if Asked
Industry Characteristics/Product Details
- Perishability: Predicting demand for cooked chickens is difficult for grocers; any leftover cooked chickens at the end of the day are thrown out; unthawed chickens cannot be re-frozen
Client Characteristics
- Competitive Advantage: Client has patented process for sterilely packaging chicken, so that it will remain fresh for 30 days, making freezing unnecessary
- Client is currently the industry market share leader in rotisserie-ready chicken
- Four New “Flavored” Products to be introduced concurrently: Barbecue, lemon herb, tandori and teriyaki
Competitive Dynamics
- No competition in new product market due to patented process

39
Prompt 1 – Value to Grocers
Prompt 1 - Value to Grocers
Do you think that grocery retailers would be interested in pre-seasoned chickens from Rotisserie Ranch?
Prompt 1 - Sample Answers
There is not correct answer here, what you should be looking for is how well reasoned the recommendation is:
Sample “YES” response:
Labor Cost Reduction: Meat department workers; don’t need to spend time seasoning the chickens.
Economies of Scale: Seasoning centralization; lower cost.
Product Consistency: Centrally managed; able to spend more on R&D.
Sample “No” response:
Loss of Differentiation: Grocery chains differentiate by value-added .
Attune to Local Needs: Likely to be better at gauging consumer tastes.
Increases Inventory & SKUs.

40
Prompt 2 – Market Testing
Prompt 2 - Market Testing
After several interviews, grocers are interested in Rotisserie Ranch’s proposed new product, but first they want to be sure that the chickens will sell well. How would you make sure?
Prompt 2 - Sample Answer
The correct answer is to run a test market for the new products.
The candidate may begin going into detail on how this test would be run. Cut him or her off as soon as you are comfortable that they understand that:
A pilot test should be run.
The pilot needs to have some control or comparison group.

41
Prompt 3 – Demand Elasticity
Prompt 3 - Demand Elasticity
A test market launch for the new Rotisserie Ranch BBQ chicken was administered (Hand interviewee Exhibit 1).
What is the overall profit for both Store A and B from the test market?
Prompt 3 - Sample Answer and Notes on Exhibit 1
Using Exhibit 1, interviewee should calculate:
Retailer profit for Seasoned Chicken compared to Standard Chicken Retailer profit = # of chickens sold * (price per chicken * retailer margin per chicken)
Standard Chicken (total profit for retailers = $300 + $600 = $900/week)• Store A:
• $1,000 (weekly sales) * 30% (retailer margin) = $300 overall profit• Store B:
• $2,000 (weekly sales) * 30% (retailer margin) = $600 overall profit
Test Market BBQ Seasoned Chicken (total profit for retailers = $400+ $675= $1,075/week)• Store C:
• $1,600 (weekly sales) * 25% (retailer margin) = $400 overall profit• Store D:
• $2,700 (weekly sales) * 25%* (retailer margin) = $675 overall profit

42
Solution and recommendations
Solution & Recommendations
Overall, our client should launch the Pre-Seasoned BBQ Chicken product and test other products because:
Competitive Necessity: Consumers are spending more money on seasoned rotisserie chicken than traditional rotisserie chicken and the market is shifting in this direction
Benefit to Grocers: Assuming test market was representative, Grocers can expect to earn $175 more gross profit using our client’s product relative to the standard rotisserie chicken
Potential scale benefits to our Client over time as more pre-seasoned chickens are sold

43
Exhibit #1: Store sales
Standard Rotisserie BBQ Seasoned Rotisserie
Store A B C D
Weekly Sales
$1,000 $2,000 $1,600 $2,700
Retail Price $3.33 $2.50 $4.00 $3.00
Retailer Margin
30% 30% 25% 25%

44
Tarrant Fixtures
Case tracker
Industry: Industrial goods
Case format: Improving profitability
Concepts being tested:
- Operations
- Accounting
Case Question
Our client, Tarrant Fixtures, is a low-intensity manufacturing company that produces display fixtures for retail clients. The company’s financial performance has deteriorated in each of the last three years. Specifically, they are concerned with the company’s falling Return on Investment (ROI).
The CEO has asked us to look into this problem. How can Tarrant Fixtures get back on track?
Guide to interviewer
This case is about improving ROI and requires a real understanding of finance to solve. There has been a massive increase in working capital due to inventory build-up from an increase in the number of SKUs.
This is a short case, designed to be solved in approximately 15-20 minutes. There are no slides.
The important steps are: Establishing a viable structure (Using ROI formula) Breaking down the problem into component parts Continuing to examine issues until the correct
ones are identified.
By: David Welch (Kellogg Class of ‘04), Edited By: Adam Louras (Kellogg Class of ‘11)
Quant: 8
Structure: 7
Industry: Industrials
Framework: Profitability

45
Clarifying answers and case guide
Interviewer Guide to Case
A sample case structure would include the following:
1) Start with the definition of ROI and identify the potential areas for problems
2) Identify differences in profits over the last three years
3) Identify capital employed and deep dive increase in working capital
Necessary Information that should be given only when specifically asked :
Product Types:
Custom displays (50% of Sales) - Produced only when an order is placed and the payment is received
Standard displays (50% of Sales) - Manufactured to “open standard” for display sizes/types and stored in inventory (Built-to-stock)
5 standardized products account for 80% of sales in standardized products; Number of standardized products increased from 5 to 12 over last 3 years
Past Three Years of Financial Performance:
Total Revenues: Grew by 25%, from $100M to $125M, equally across both types
Costs of production (COGS, labor, SG&A, etc.): Remained stable as a percentage of revenue [80%]
CAPEX: The company has no new investments in Property, Plant, & Equipment
Working Capital
Total Working Capital Employed three years ago = $80M
Total Working Capital Employed today = $130M
Inventory levels increased by 200% (primarily in finished goods), from $25 million to $75 million
Clarifying answers to provide if asked
Industry Characteristics/Market Economics
- The market has grown 25% in total over the past three years
Client Characteristics
- Client has remained the industry market share leader in displays over the past three years and has maintained 25% market share
Competitive Dynamics
- There are several players in the market, but everything has remained stable from a competitive standpoint

Key elements to analyze
Definition of ROI
To begin this case correctly, the interviewee must understand the components of ROI
If the interviewee doesn’t know the formula for ROI, the case is dead; however, you should guide the interviewer to help them practice
Net Profits
The interviewee will likely begin by discussing the “top line” of the ROI equation
Net Profit is not the cause of the ROI issue as shown from the calculation below
Capital Employed
The interviewee should examine Capital Employed to find that PP&E is constant as no CAPEX was employed, Inventory is the culprit
Once identified, follow up with, “What can management do to improve the Inventory Problem?”
Notes to Interviewer
The formula for ROI:
Notes to Interviewer
Net Profit can be calculated based on the information from the prior page as follows:
The company’s absolute level of profits have increased 25% during the last three years, so this is not the cause of the ROI issue
Notes to Interviewer
A line-by-by line examination of a typical Working Capital statement will indicate all of the relevant categories of capital for purposes of calculating ROI.
Based on the data from the prior page, following conclusion may then be drawn:
Total Working Capital increased by $50M because Inventory levels increased by $50M
PP&E, AR, AP, Cash etc. are all stable
Potential Causes/fixes for Inventory Increase:
Proliferation of standardized product lines. Rationalize product portfolio
Inaccurate demand forecasts resulting in excess safety stock
Obsolete inventories of outdated product lines
Year 1 Year 3
Revenue 100M 125M
Cost of Production $ 80M 100M
Net Profit 20M 25M
Cost of Production % of Revenue 80% 80%
46

47
Solution and recommendations
Solution & Recommendations
The client’s ROI has fallen over the past three years due to a $50M increase in Working Capital caused by a 200% increase in inventory. Inventory has grown because of:
The increase in the Total number of standardized product SKUs from 5 to 12
Inaccurate demand forecasts resulting in excess safety stock
Obsolete inventories of outdated products
To correct this issue, the client should work to reduce its inventory by:
Writing off or working down obsolete inventory (a write-off will cause an immediate hit on profits, so management may be reluctant)
Improving demand forecasting to set more realistic safety stock levels
Reducing the “Standard” product-line down to the top 5 products (80% of current sales)
Bonus/Guide to an Excellent Case
An excellent interviewee will:
Provide creative, logical reasons for the inventory increase
Provide creative, logical solutions to reduce Inventory
Detail a cohesive demand forecasting plan that would improve accuracy
Provide a plan to limit future product proliferation in the “Standard” product lines
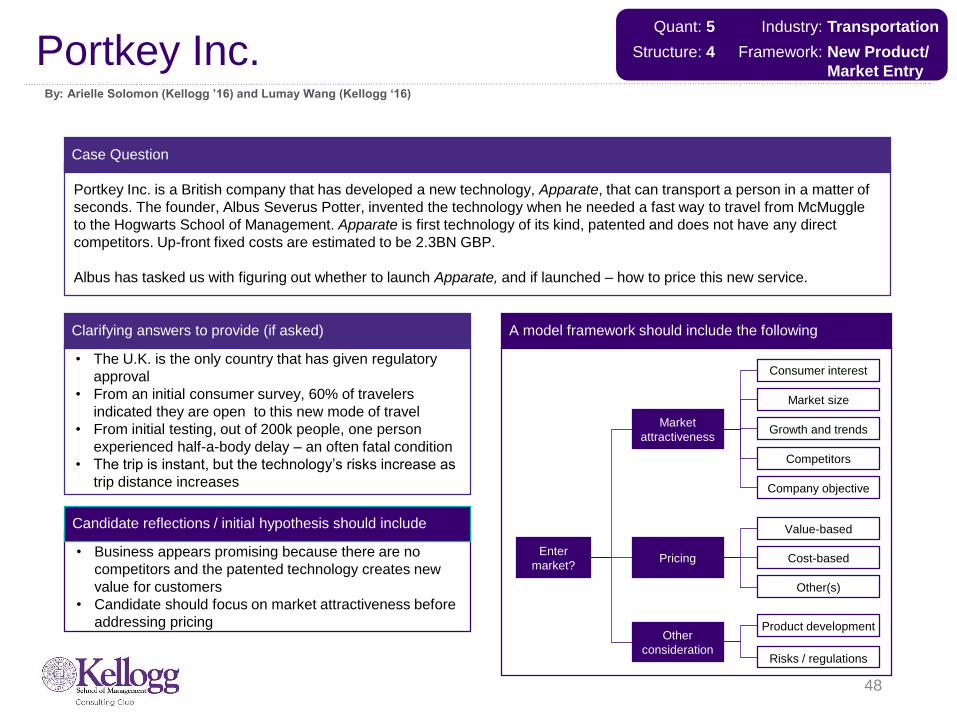
• Business appears promising because there are no
competitors and the patented technology creates new
value for customers
• Candidate should focus on market attractiveness before
addressing pricing
48
Portkey Inc.
Case Question
Clarifying answers to provide (if asked) A model framework should include the following
Enter
market?
Market
attractiveness
Pricing
Other
consideration
Market size
Value-based
Cost-based
Risks / regulations
Candidate reflections / initial hypothesis should include
Portkey Inc. is a British company that has developed a new technology, Apparate, that can transport a person in a matter of
seconds. The founder, Albus Severus Potter, invented the technology when he needed a fast way to travel from McMuggle
to the Hogwarts School of Management. Apparate is first technology of its kind, patented and does not have any direct
competitors. Up-front fixed costs are estimated to be 2.3BN GBP.
Albus has tasked us with figuring out whether to launch Apparate, and if launched – how to price this new service.
• The U.K. is the only country that has given regulatory
approval
• From an initial consumer survey, 60% of travelers
indicated they are open to this new mode of travel
• From initial testing, out of 200k people, one person
experienced half-a-body delay – an often fatal condition
• The trip is instant, but the technology’s risks increase as
trip distance increases Company objective
Product development
Growth and trends
Competitors
Consumer interest
Other(s)
By: Arielle Solomon (Kellogg ’16) and Lumay Wang (Kellogg ‘16)
Quant: 5
Structure: 4
Industry: Transportation
Framework: New Product/
Market Entry
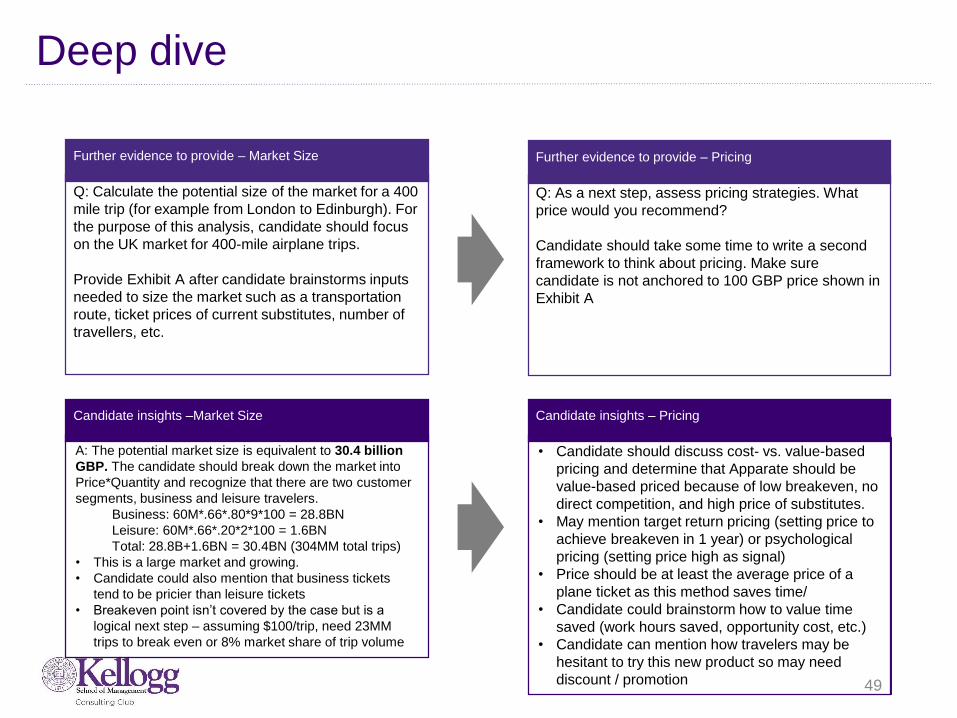
A: The potential market size is equivalent to 30.4 billion
GBP. The candidate should break down the market into
Price*Quantity and recognize that there are two customer
segments, business and leisure travelers.
Business: 60M*.66*.80*9*100 = 28.8BN
Leisure: 60M*.66*.20*2*100 = 1.6BN
Total: 28.8B+1.6BN = 30.4BN (304MM total trips)
• This is a large market and growing.
• Candidate could also mention that business tickets
tend to be pricier than leisure tickets
• Breakeven point isn’t covered by the case but is a
logical next step – assuming $100/trip, need 23MM
trips to break even or 8% market share of trip volume
• Candidate should discuss cost- vs. value-based
pricing and determine that Apparate should be
value-based priced because of low breakeven, no
direct competition, and high price of substitutes.
• May mention target return pricing (setting price to
achieve breakeven in 1 year) or psychological
pricing (setting price high as signal)
• Price should be at least the average price of a
plane ticket as this method saves time/
• Candidate could brainstorm how to value time
saved (work hours saved, opportunity cost, etc.)
• Candidate can mention how travelers may be
hesitant to try this new product so may need
discount / promotion 49
Deep dive
Q: Calculate the potential size of the market for a 400
mile trip (for example from London to Edinburgh). For
the purpose of this analysis, candidate should focus
on the UK market for 400-mile airplane trips.
Provide Exhibit A after candidate brainstorms inputs
needed to size the market such as a transportation
route, ticket prices of current substitutes, number of
travellers, etc.
Further evidence to provide – Market Size
Candidate insights –Market Size
Q: As a next step, assess pricing strategies. What
price would you recommend?
Candidate should take some time to write a second
framework to think about pricing. Make sure
candidate is not anchored to 100 GBP price shown in
Exhibit A
Further evidence to provide – Pricing
Candidate insights – Pricing

50
Suggested conclusion
Conclusion
Risks
Next steps
Portkey Inc. should move forward with launching Apparate:
• The market for short-haul trips is 30.4BN GBP and growing at 2% a year
• There are no other direct competitors and the technology is patented
• Portkey Inc. could pursue a value-based pricing strategy that would position the company for future growth while funding
new research and product development
Risks include:
• Safety risks of product malfunctioning
• Lack of consumer adoption of a new product
• Changes in the regulatory environment/restrictions in commercializing the technology in other geographic markets
• Competitive entry affecting value-based pricing
As next steps, Portkey Inc. could:
• Complete a rigorous study on the safety of Apparate that may be publically available to ensure consumer confidence
• Conduct market research to better understand consumer interest / needs and how to maximize value creation
• Choose pilot market and/or segment (e.g. business travelers) and conduct test

51
Exhibit A
Category Statistic
Population of UK 60 million
Percentage of UK population that
travels
66%
Average price of ticket (400 miles) 100 GBP (around $150 USD)
% of traveling population that fly for
business
80%
% of traveling population that fly for
leisure
20%
# trips/year for business travellers 9
# trips/year for leisure travellers 2
Year-on-year growth of travel 2%

52
Salty Sole Shoe Co.
Case tracker
Industry: Retail Apparel
Case Format: Improving profitability
Concepts Tested:
- Creativity
- Accounting
- Microeconomics
Case Question
Your client is a large retail-focused private equity firm that owns Salty Sole, a leading designer of junior women’s footwear, primarily targeting the 14 – 22 year old age group. Salty Sole was purchased last year by the private equity firm expecting to realize substantial profits upon sale in 2012 by increasing the company’s EBITDA. The situation, however, is that due to a current recession, annual profit has only grown modestly post the acquisition and is not on track to generate the double-digit returns that the private equity firm originally anticipated.
How can the company increase profitability and achieve the private equity firm’s return on investment objectives?
Guide to interviewer
The case primarily tests an understanding of profitability and profitability growth strategies
Begin by reading the case question and asking the interviewee to take a few moments and then explain how they would like to proceed in the client’s problem
By: Meredith Tierney (Kellogg Class of ’11), Edited By: Uri Kalir (Kellogg Class of ‘12)
Quant: 7
Structure: 6
Industry: Retail
Framework: Profitability

53
Clarifying answers and handout guide
Guide to handouts
• After asking the case question, the interviewee should draw a framework that outlines the basic concept that profit is driven by revenue (price and volume) and cost (fixed and variable)
• Exhibit 1 – Hand out after interviewee presents his/her framework.
- What observations can be made from this chart?
- Interviewee should point out that the company experienced significant growth during the pre-recession years, but a decline and only gradual pick-up following.
- Interviewee should pick-up on the fact that the change in net sales is not due to increased discounts/allowances (remains 1% throughout years).
- On the cost side, interviewee should note that variable costs remained flat at 50% and fixed costs remained flat
• Exhibit 2 – Hand out when discussing revenue / increasing volume.
- Note that the “casual” footwear market is used as a proxy for the junior women’s category in which the client competes and is the market leader.
- What observations can be made from this chart?
- Candidate should note that the client is already the market leader with greater than 35% share and that the industry is not projected to grow.
Clarifying answers to provide
Industry Characteristics/Market Economics
- Client is the market leader in junior women’s footwear in the U.S. only.
- Apparel industry is characterized by cyclicality due to economy and consumer preferences.
Client Characteristics- Client designs and distributes footwear
to discount retailers (like Kohl’s) and is considered mid-priced.
- Client outsources all manufacturing on a fixed-contract basis (i.e. manufacturing costs with outsourced providers fall under Fixed Costs for simplicity).
Competitive Dynamics- Client follows a “me-too” strategy and
follows fashion rather than inventing it then offering lower prices than name brands (i.e. not subject to fashion risk).
- Client competes on the basis of trendy fashion and value pricing.

54
Key elements to analyze
Costs
Using Exhibit 1, have a quick discussion about the company’s cost structure.
Revenue
Once interviewee determines that cost is not the issue, have a discussion on the components of revenue – price and volume.
Notes to interviewer
• Fixed: Interviewee should note that fixed costs are not extremely high (about 23-25%), but could be an area for improvement. Ask how interviewee would reduce fixed costs? Examples include: renegotiate contracts, find cheaper manufacturing partners, etc.
- State that in-fact fixed costs cannot be adjusted based on the company’s research.
• Variable: Interviewee should note that variable costs are approximately 50% of sales. Ask how interviewee would think about reducing variable costs? Examples include: reduce labor/sales force, use technology, renegotiate / volume purchase materials
- State that variable costs are currently at the lowest possible rates based on market research.
Notes to interviewer
Price: Interviewee should ask if pricing has remained constant over time or if the company has adjusted its pricing to reflect lower consumer discretionary income.
Ask what considerations the interviewee would have when considering adjusting price?
Answers should be price sensitivity / elasticity, cost structure, brand equity (dilute brand through price decrease but compete with more upscale brands if increase).
State that pricing has remained constant at an average of $25/unit. The company has determined that it would not be prudent to adjust pricing based on industry research. Interviewee can now determine the number of pairs of shoes sold for later in the case.

55
Key elements to analyze
Revenue (cont’d)
Now that the interviewee has hopefully zeroed-in on the fact that the issue is volume, ask how many units must be sold by 2012 in order for the private equity firm to achieve a 20% return on the investment in Salty Sole Shoe, which equals approximately $300 million sale value (give this number). Note that interviewee should ignore discounts/allowances for simplicity.
Notes to interviewer
• Interviewee should determine that if the sale value needs to be $300mm in 2012, then EBITDA will need to be $300 / 6.5 = $46.15 (round up to $50 million).
• The formula to determine how many pairs of shoes must be sold to reach that EBITDA level is as follows:
• $50,000,000 = $25*v – (.5 * 25 * v) – 15,000,000
• $65,000,000 = 12.5v
• V = 5,200,000 pairs of shoes
• Interviewee should note that this is more than double the 2008 and 2009 volume levels.
• Ask what the interviewee would want to know to determine if this volume is feasible? Answer: market size / share.
Market Size
• Show the candidate Exhibit 2 when he/she notes that market size/share would be helpful.
• Candidate should note that the client is already the market leader with 40% and that the market size is not projected to increase.
• This should lead to the conclusion that the client can increase volume by stealing share and/or new products in other categories.

56
Solution and recommendations
Solution & Recommendations
The interviewee should zero-in on the fact that since cost-structure is fixed and price is also fixed, volume is the only real way to increase profitability.
However, volume must more than double in order to achieve the growth desired by the private equity firm for a 20% return, which could be difficult given recession and the fact that the industry as a whole isn’t growing.
Interviewee should recommend potentials strategies for achieving that volume growth while outlining the risks of each: 1) Volume: new products / geographies / distribution channels (international?); increase marketing to steal share; acquire growth (brands); adjust product mix to higher-margin products. 2) Price: add value / features. 3) Risks: Capacity, cannibalization if new products.
Bonus/Guide to an Excellent Case
An excellent interviewee will quickly identify that volume is the issue by ticking through the parts of the profitability equation.
An excellent interviewee will also ask about product mix and question the 50% gross margin. Interviewer should note that it’s assumed that all products have the same margin, but that’s a great question.
An excellent interviewee will also note that since the company is not projected to have to adjust discounts / allowances, then it probably has a good product that is highly-valued by customers and/or this may be aggressive projecting.

57
Exhibit #1: Client Financial Estimates
Salty Sole Financial Estimates
($ in millions)
2006A 2007A 2008A 2009E 2010E 2011E 2012E
Sales 50.00 65.00 60.00 61.00 62.00 65.00 70.00
Less: Discounts/Allowances (0.50) (0.65) (0.60) (0.61) (0.62) (0.65) (0.70)
Net Sales $49.50 $64.35 $59.40 $60.39 $61.38 $64.35 $69.30
% Increase / Decrease 20.0% 30.0% (7.7%) 1.7% 1.6% 4.8% 7.7%
Cost of Goods Sold 24.75 32.18 29.70 30.20 30.69 32.18 34.65
Fixed Costs 15.00 15.00 15.00 15.00 15.00 15.00 15.00
Total Costs 39.75 47.18 44.70 45.20 45.69 47.18 49.65
EBITDA $9.75 $17.18 $14.70 $15.20 $15.69 $17.18 $19.65
Sale Multiple 6.50x 6.50x 6.50x 6.50x 6.50x 6.50x 6.50x
Purchase/Sale Price $111.64 $95.55 $98.77 $101.99 $111.64 $127.73
Return on Investment 2.7%
Note: Acquisition occurred on December 31, 2006.

58
Exhibit #2: Market Size and Share
0%
10%
20%
30%
40%
50%
60%
70%
80%
90%
100%
2006 2007 2008 2009
Pe
rce
nt
Mar
ket
Shar
eU.S. Casual Footwear Market Size and Share
$125M $163M $150M $153M
Competitor 5
Competitor 4
Competitor 3
Competitor 2
Competitor 1
Salty Sole

59
Money Bank Call Center
Case tracker
Industry: Operations / financial services
Case format: Cost optimization
Concepts being tested:
- Financial analysis
- Organizational fit
- Option evaluation
Case question
Our client is a large financial services firm with multiple locations around the world. Part of their service offering includes a 24-hour helpline. The client has their call centers in New York and Paris
The client has recently acquired a small firm (Firm B) in order to expand its reach in a particular geography. Firm B provides a subset of the services and has its call center located in the Philippines
The client has asked us to determine its strategy going forward for handling customer calls. In particular they want us to look into the call center operations
Guide to interviewer
This is an outsourcing case with the following elements: Use a framework that covers the most important
areas of M&A and cost cutting Read the exhibits to assess the cost effectiveness
and efficiency of the 3 locations Discuss qualitative information on the acquired
company – products, culture, customers etc There is no right or wrong recommendation, as it will
depend on the interviewees assessment of the qualitative concerns
Key case steps:1. Evaluate existing and potential cost structure2. Explore alternatives / ideas for implementation3. Make a recommendation based on the data
By: Guruprasad Sankaranarayanan (Kellogg Class’12); edited by Nikola Jakić (Kellogg Class ’16)
Quant: 8
Structure: 9
Industry: Call Center
Framework: Cost / M&A

60
Clarifying answers and case guide
Guide to case / Guide to handouts
Case structure – The interviewee should draft in a couple of minutes a framework that covers the most important areas in this case
Options
No changes – maintain all 3 call centers
Close Firm B’s call center and route calls to one of the exiting locations
Consolidate to a single location
Company
Comparison of services offered at the 3 call centers / product mix
Metrics for evaluating call center performance (cost / call, calls / rep, etc.)
Specifics to outsourcing – The interviewee should include specific concerns to the industry such as employment regulations, quality of call, infrastructure capabilities, etc.
Client goals – the client wants any proposed solution to be cash neutral by the end of year 2, and is not flexible on this requirement
Clarifying answers to provide
The following information can be provided to the interviewee if asked:
Client Characteristics- Provides full range of financial services
for individuals and small organizations- Acquired firm was started 5 years ago
and is still run by the original founders
Nature of call center- New employees are college graduates
with basic knowledge of financial services and products
- Fluency and English and several European languages required
Regulatory environment- Very difficult to lay off employees in the
Paris location – significant costs will be incurred
- Philippines government encourages investment in the country – significant tax advantage possible

61
Key elements to analyze
Outsourcing
Compare the efficiency of the 3 locations – possible explanations for variance
Identify the cost effective option – how is this impacted by integration cost
Note to interviewer
When asked, the interviewer should provide data from Exhibit 1. Key takeaways from the exhibit are:
Total cost incurred by the 2 firms is $9.6M
Philippines currently processes calls at half the efficiency of NY (per employee)
Interviewee could ask about available slack at any of the call centers but should be advised that all call centers are currentlyoperating at capacity
If asked, state that currently, we have space, infrastructure necessary to expand. Assume overhead is variable in this case. The candidate should be able to calculate that to process total call volume Philippines will need an additional 250 employees to handle the traffic (1.3M total calls/ 4000 calls/employee in Philippines). Operating cost after the change will be $7.8M; net savings of $1.8M.
The interviewee should realize that this does not account for all the costs, including hiring and training costs. When prompted inform the interviewee about a 1 time cost of $5M (includes severance for NY and Paris, expanding the Philippines facility) implying that the move is not profitable
Calls / employee / year Cost / call ($)
New York 8,000 7.00
Paris 6,667 9.00
Philippines 4,000 6.00

62
Key elements to analyze (cont.)
Outsourcing
Prompt the interviewee to explore ways to make outsourcing to Philippines feasible
Client will not budge on two-year breakeven
Other options include decrease $5M investment cost and increase efficiency of Philippines employees (guide the interviewee tothe latter)
Note to interviewer
The interviewee needs to identify the difference in calls / employee between the New York and Philippines locations
Ask the interviewee to assume that the best practices can be transferred and implemented within 3-6 months
Potential cost savings if Philippines achieves same effectiveness as New York
# employees required = 1.3M calls / 8,000 calls / employee / year = 162.5 (allow rounding to 160)
New employee cost = 160 * $20,000 = $3.2M
Ask interviewee to assume overheads double with the need for better equipment. Before the efficiency improvement, OH = $1.3M for 1.3M call. New OH = $2.6M
New total cost = $3.2M + $2.6 = $5.8M ($3.8M savings from status quo and $2M better than pre-efficiency improved option)
Other questions interviewee needs to consider
Will the client be able to acquire sufficient talented personnel within the short time frame?
How will customer satisfaction by impacted with the new labor base?
Legal constraints / requirements in NY and Paris – how quickly can we lay off the staff?
How will public opinion be impacted by the news of massive outsourcing?

63
Solution and recommendations
Solution & Recommendations
This is an open ended case. The interviewee needs to justify the recommendation based on the qualitative considerations
A good recommendation would include 3 sections:
1. Recommendations: if the recommendation is to outsource the interviewee needs to highlight the risks associated with outsourcing and nature of the acquired firm. If the recommendation uses any other approach sufficient justification needs to be given to overcome the cost savings
2. Risks:
• Risks associated with increasing capacity by more than 200% in the Philippines – people, infrastructure, service quality, gaps in knowledge transfer, organizational changes, etc.
• Reputational impact – do customers notice a difference in service, can the competitor leverage this to steal customers?
3. Next steps: If outsourcing, some of the next steps would be to analyze the infrastructure requirements and capabilities, find the right talent, ensure smooth transfer and implementation of best practices, etc.
Bonus/Guide to an Excellent Case
Excellent interviewees need to address the qualitative information provided in the case: nature of merger, nature of markets being served, etc.
The interviewee should explore the option of improving effectiveness of the Philippines location without being prompted to do so

64
Exhibit 1
Center Calls / year Employee
cost / year
($)
Overhead
cost / year
($)
#
Employees
New York 600,000 50,000 450,000 75
Paris 400,000 50,000 600,000 60
Philippines 300,000 20,000 300,000 75
Call center performance – FY2010

65
Zephyr Beverages
Case tracker
Industry: Consumer Goods
Case format: Opportunity assessment
Concepts being tested:
- Competitive analysis
- Capacity contraction
Case Question
Our client, Zephyr Beverages, is a division of a large consumer products company. The division produces fruit juices in three forms, all under the Zephyr name: chilled, juice boxes, and frozen concentrate. Zephyr had sales of $600 million last year, about 3% of the company’s overall sales of $20 billion.
The chilled segment represents $120 million in sales per year. While juice boxes and frozen concentrate have been consistently profitable, chilled juices are only breaking even in good quarters and are losing money in bad quarters. Zephyr has received a proposal from upper management to sell the chilled juices business. We need to help them decide whether or not this is a good idea.
Guide to interviewer
This is a relatively short case that requires the candidate to create a holistic structure for solving the problem: what does Zephyr do with an underperforming business? It can divest chilled juices, sell its whole juice division, or remain in all its business. Any of the three possible solutions listed at the end can be argued, but the third solution makes the most economic sense.
The candidate will need to ask for additional information that is necessary to solve the problem, rather than relying on the interviewer to dispense it all at once.
This case is not representative of the quantitative rigor of interview cases and therefore we recommend it only be given as a warm-up early in the process.
By: Edwin Van Dusen, Brian Fox and David Welch (Kellogg Class of ‘04), Edited By: Ameed Mallick (Kellogg Class of ‘12)
Quant: 1
Structure: 5
Industry: CPG
Framework: Opportunity
Assessment

66
Clarifying answers and case guide
Interviewer Guide to Case
A sample case structure would include the following:
1) Identifying the options: sell chilled juice, sell all juice businesses, continue on with all businesses
2) Qualitative discussion of competitive dynamics
3) Discussion of product selection/components, as well as ways to cut costs
When asked, the interviewer can reveal the following additional information:
• Chilled beverages are a $1 billion worldwide industry
• The two largest players have market shares of 40% and 25%, respectively. Zephyr’s market share, 12% makes it third in the industry.
• The two market leaders are able to do more advertising, couponing, promotion, and trade than Zephyr is able to do. We do not know about their profitability, but assume it is positive.
Clarifying answers to provide if Asked
Industry Characteristics/Market Economics
- It has been growing at GDP (~3%) the last few years and is projected to continue that growth rate.
- The market for chilled juices is dominated by mothers with young kids.
- Brand name is important in this market, as mothers tend to prefer reliable products. However, the brand premium must be in line with other branded products and all branded juices sell in the same price range.
- This is a highly price sensitive market that loves coupons, promotions, etc.
Competitive Dynamics
- This is a highly concentrated market. There has not been a lot of change, technological or otherwise, recently and there are no obvious entrants.

67
Key elements to analyze
Competitive Dynamics
Using basic information provided, interviewee should deep dive the competitive dynamics in further detail.
Product selection
Using information about our products vs. our competitors, the interviewee should focus on discussion about how to cut costs.
Notes to interviewer
• Relevant info:
• Bad market position: 12% vs. 40% and 25%
• Assumed profitability differences
• Disadvantage on trade promotions
• Interviewee should be able to see that Zephyr is at a serious disadvantage on all fronts as a smaller company that is both less profitable and less engaged in the kinds of trade promotions that key customers covet. The overall conclusion should be that this is a weak competitive position.
Notes to interviewer
• Relevant info (when asked):
• The market leaders produce pure orange juice/blends based on citrus juices. Zephyr uses more elaborate blends, usually with a base of pear or peach juice (60% of inputs) and flavor with cranberries, bananas, mangoes, etc. (the other 40%). Pear and peach juice are a similarly price to orange juice, but the other flavorings cost about twice as much.
• A plant in California produces all products; chilled, juice boxes and frozen. Each of the three products uses different machinery. It would be difficult to find another use for the plant without a major conversion.
• Additionally, there are currently synergies between chilled, frozen and juice boxes – mothers are slightly more likely to buy products from the same brand
• This indicates that, despite a disadvantage, divesting is not realistic and there may be room for cost reduction based on reformulation to make Zephyr profitable.

68
Solution and recommendations
Solution & Recommendations
There are three possible solutions, with no right answer. The recommendation should be well-reasoned, comprehensive, and include as much relevant information as possible.
Sell the chilled juice business. This would, however, affect the juice and frozen concentrate businesses, as there are both advertising and manufacturing synergies.
Sell all of the juice business. This may be more feasible, as the buyer could capture the synergies, but would not be too likely to turn the business around. The selling price is likely to be low.
Keep the chilled juice business and rework the ingredients and costs. This is the most feasible option, as evidenced by the success of the competitors. We are probably developing extra features in our ingredient mix that the market does not want and is not willing to pay for. Eliminating or scaling back those features will probably allow us to cut costs without affecting revenue.
Bonus/Guide to an Excellent Case
Prospects who do well on this case will have to be comfortable with ambiguity and with a lack of perfect information. They will quickly grasp the issues and delve into the underlying qualitative discussions, coming up with a lot of additional risks/potential benefits for each option.
Creative solutions beyond those listed are possible and encouraged, though should be done within the framework of the information available.

Case tracker
Industry: Health Care
Case format: Market entry
Concepts Tested:
- Break Even analysis
- Marketing strategies
- Organizational changes
Case Question
Our client, Shermer Pharma, is a venture backed start-up Pharmaceutical company. Over the past 15 years, Shermer has been developing a molecule that has been approved by the FDA to cure Alzheimer’s with 90% efficacy.
Shermer’s owners have hired us to determine:
How should we sell our product?
Is our product going to be profitable?
Guide to interviewer
This case is focused on 2 questions: can you determine what it takes to launch a new product profitably through a cost benefit analysis, and can you think through the implications of starting a Sales & Marketing organization from scratch. The case should be driven by the interviewee.
The interviewee should be guided towards 2 primary options for the Sales & Marketing question
1. Start your own sales force
2. Contract sales
Bonus sales force answer is sell Shermer to a larger firm
Profitability will center on the interviewees ability to read tables and data on the market and our market share.
69
Shermer PharmaBy: Ameed Mallick (Kellogg Class of ‘12)
Quants.
5
Structure
5
B/E
Mkt. Stgy
Org. Chg.
Quant: 5
Structure: 5
Industry: Healthcare
Framework: New Product/
Market Entry

70
Clarifying answers and case guide
Interviewer Guide to case and handouts
Case Structure – Interviewee should focus on the questions separately. First we will brainstorm how to sell our product and ask questions to get after the costs of a sales force (Exhibit 1). An optional middle step is a brain teaser to determine the size of the Alzheimer’s market. (provide answer of 5MM at the end of the exercise. They then need to ask about the costs and revenues from our new product (Exhibit 2).
Exhibit 1-3 – After Interviewee walks through structure, they should ask questions about the costs of sales and then ultimately the profit equation.
- Let the Interviewee drive the case. When you feel that they have asked enough information about the following topics, give them the exhibit that shows this information:
- Sales force options Exhibit 1
- Revenues vs Costs Exhibit 2
- If the interviewee isn’t getting to the question on the three Sales Force options, guide them back toward this and provide Exhibit 1.
- Have a conversation with the Interviewee to force them to talk through the essential components of the profit equation that are needed to answer the question.
Answer – The numbers reveal that our product will be profitable. However, a critical question will be the sales channel, which is why they need to determine to use contract sales in order to be profitable. It is also correct to state that Shermer should sell the product to a larger firm, but the second half of the case should be under the assumption that the owners decide to do contract sales.
Clarifying answers to provide if asked
Industry Definitions
- Our product is a pill that cures Alzheimer’s, an illness that currently has no treatment that cures or stops the progress of this disease
- Alzheimer’s is a degenerative, terminal disease that causes senility and dementia. 30 MM people suffer worldwide
- Sales would be focused on Neurologists and Geriatric psychiatrists (not the consumer of the product)
Client Characteristics
- We don’t have a Sales or Marketing organization, the company has purely been a research firm to this point.
- FDA approval, etc has been granted
Competitive Dynamics
- We will not focus on competitive response during this case as we are the only firm that has a cure for this illness and will be for the next 5 years

71
Key elements to analyze
Market Entry
Using Exhibits 1 the interviewee should be able to determine that contract sales is the best financial option
Profitability
Using Exhibit 2, the interviewee should determine that our product will be profitable utilizing either type of sales force.
Notes to interviewer
• The question boils down to realizing that our client’s competencies are rooted in developing a product, not Sales and Marketing. The correct approach is therefore to contract sales or sell the company
• The qualitative approach to the answer is appropriate, but once the interviewee has discussed enough of the inputs, exhibit 1 should be shared:
• There is missing data in the chart that should be easy to calculate (solutions provided)
• A third option with no attached data would be to sell the company to a larger firm, this is an appropriate discussion to have and if prompted the interviewee should discuss the tradeoffs of this more qualitatively
• A contract sales organization is typically less effective than internal sales, though most interviewers wont pick up on this and simply giving the financial answer is appropriate
Notes to interviewer
• You should let them try to size the market as a first step, but then provide the actual number of 5MM.
• The firm requires that R&D costs be recovered by Year 5 of the product (a window before which there will be no competitive response)
― We can ignore NPV for this question and just assume a straight line amortization…interviewee should come to this conclusion on their own, but course correcting is okay if they get stuck
• Critical information on the exhibit should be provided as the interviewee asks, though should only be volunteered if the interviewee is stuck
• We can ignore tax, however a good interviewee will ask about it, and doing so would realize we still hit our profit targets by year 5
• Manufacturing & Packaging costs are included in the Gross Margin

72
Math Solutions: Exhibit 1
Develop own Sales Force Contract Sales Force
Percent of visit focused on our product
100% 50%
Annual fully loaded cost per Sales Rep
$200k n/a
Cost per sales call $170 (($200k*85)/100) $60
Total calls required 100k (should be asked/given) 200k (100k*2)
Total Sales Reps needed 85 170 (85*2)
Total annual Selling Cost $17MM ($200k*85) $12MM ($60*200k)

73
Math Solutions: Exhibit 2
*Data at left to be provided as the questions are asked by interviewee
Year 1 Year 2 Year 3 Year 4 Year 5
Projected Market penetration
5% 10% 25% 40% 60%
Total Users 250k (5%*5M)
500k (10%*5M)
1.25MM (25%*5M)
2MM (40%*5M)
3MM (60%*5M)
Total Gross Margin $250MM(250*$1000)
$500MM (500*$1000)
$1.25B
(1.25MM*$1k)
$2B (2MM*$1k)
$3B (3MM*$1k)
Amortized R&D Costs $300MM ($1.5B/5)
$300MM ($1.5B/5)
$300MM ($1.5B/5)
$300MM ($1.5B/5)
$300MM ($1.5B/5)
Selling Costs $12 MM (from ex.1)
$12 MM (from ex.1)
$12 MM (from ex.1)
$12 MM (from ex.1)
$12 MM (from ex.1)
G & A Costs $25 MM $25 MM $25 MM $25 MM $25 MM
Net Income ($87MM) $163MM $913MM $1.663B $2.663B
Total Market 5MM
Annual gross margin per user $1000
R&D Cost $1.5B
G&A cost $25MM

74
Solution and recommendations
Solution & Recommendations
Shermer Pharma’s core competency is their research focus. The plausible argument can be made that they should sell the company to a larger firm that has the appropriate capabilities that it takes to market and sell a product. Though this might be the right answer, the client isn't always going to do take the optimal approach, particularly when it comes to ownership of the firm. We need to be flexible to account management’s wishes
Assuming the owners decide not to sell the company, contract sales is the next best option, that gives us the best scenario when determining overall profitability of our product.
The latter half of the case is simple math, determining a P & L for our product and coming up with the correct answer that Shermer can be profitable.
Ask for high level analysis at the end of the case, what else should be consider before engaging this plan?
Bonus/Guide to an Excellent Case
An excellent interviewee will note:
There is an option to sell the company, even though there is no data provided to support this conclusion
Some of the numbers give an obvious answer before needing the exact calculations
Challenging the interviewer on the effectiveness of a contract sales organization is a bonus. A qualitative argument can be made that for an additional $5MM a year, we can realize the benefit of a more effective sales force, this isn't the financially correct answer but may be the right tradeoff given the relatively minimal impact to the bottom line vs. revenues of $3B
$1000 per year for a life saving cure for a currently incurable ailment is definitely under priced!

75
Exhibit 1: Sales force options
Develop own Sales
Force
Contract Sales Force
Percent of visit focused
on our product
100% 50%
Fully loaded annual
cost of 1 sales rep
$200k n/a
Cost per sales call $60
Total calls required
Total Sales Reps
needed
85
Total annual Selling
Cost
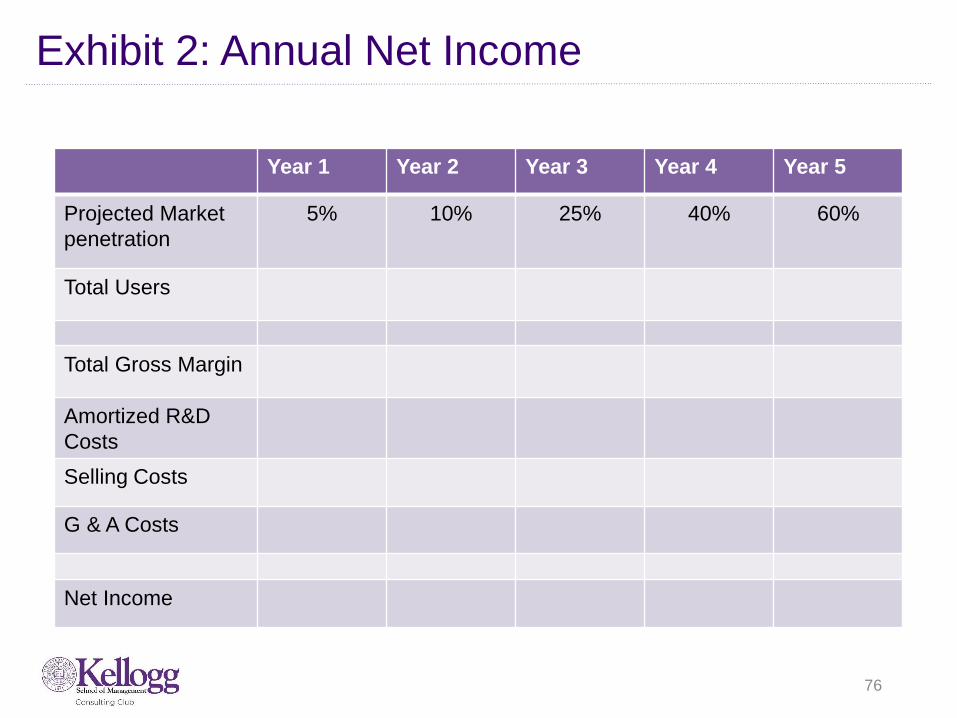
76
Exhibit 2: Annual Net Income
Year 1 Year 2 Year 3 Year 4 Year 5
Projected Market
penetration
5% 10% 25% 40% 60%
Total Users
Total Gross Margin
Amortized R&D
Costs
Selling Costs
G & A Costs
Net Income

Orange Retailer Co.
Case tracker
Case Question
Orange Retailer Co. (ORC) manufactures, import/exports and distributes high-end world known brands and conservative/traditional apparel brands in several countries in Latin America. ORC is considering entering a new country in Latin America, and you have been hired to determine whether they should enter this new market or not.
Don’t mention this until they have determined to enter the market: What would be the best entry strategy?
Guide to interviewer
This case tests the ability to understand business concepts and quantify the benefits and risks of entering a new market
The interviewee should be able to size the potential market, distinguish different type of customer segments, and identify entry strategy for Orange Retailer Co.
Additionally, the interviewee should identify some associated risks and potential ways to mitigate them
Hand out exhibit #1 – Size of potential market and customer segments
Hand out exhibit #2– Current players’ share and margins After quantifying the size of the opportunity and the ideal
strategy to enter this market, the interviewee should identify qualitative aspects of entering this new market
Consider doing this case as an interviewer led case for beginners, and interviewee driven case for advanced casers
77
Industry: Retail
Case Format: Market Entry
Concepts Tested:
- Market Sizing
- Marketing Strategy
- Creativity
By: Mauricio Atri (Kellogg Class of ‘12)
Quant: 5
Structure: 5
Industry: Retail
Framework: Market Entry

78
Clarifying answers and case guide
Guide to case / Guide to handouts
Part 1 – Hand out after introducing case
- Is there a market opportunity for ORC? What is the size of the relevant market? Interviewee should quantify the size of the market for fashion/high end and conservative/traditional apparel
- Additionally, what is the most attractive customer segment(s) to target
Part 2 – Hand out Exhibit 2 after solving Exhibit 1
- The data should lead the interviewer to recognize that the high-end fashion market is probably driven by brand and/or other factors besides price. The margins are more attractive. ORC should be able to leverage the “world known” brands to attract customers in this segment. Additionally, by targeting “young adults” and “teen & children” it can serve 70% of the market
- In the conservative/traditional market, there seems to be stronger competition, which is probably driven primarily by price. Achieving low costs in this market by importing would be unlikely due to tariffs, and local manufacturing would probably require significant fixed (plants, …) and variable (labor, …) costs
Part3 – What other elements should ORC consider in its decision to enter this market?
Clarifying answers to provide
Industry Characteristics/Market Economics
- Macroeconomic outlook is positive in the new market
- Distribution channels are primarily department stores, free standing points of sale, and online sales
Client Characteristics- Client is currently the third biggest
apparel retailer and has focused on F/H and T/C brands for over 30 years
- ORC has traditionally targeted High-End clients, men and women of ages 15-40

79
Key elements to analyze
Topic 1 being tested
What is the potential of the market for this apparel brand?
What segment of the apparel market, and customers should ORC target?
When asked, answer the following: ORC has traditionally targeted High-Endclients, men and women of ages 15-40
Topic 2 being tested
What could the client drivers be for each segment?
Should ORC compete in both segments, one or neither?
When asked, current players include local/domestic players
Topic 3 being tested
What channels would you use to enter the market
What other elements need to be considered?
What factors would impact how much market share we could get?
Notes to interviewer
Use Exhibit 1 to size each market: Value Driven (235M), Conservative (147M), Fashion & High-end (118M)
Exhibit 2 shows that margins are higher and there is less competition in the High-end market
Together, both Exhibits point to ORC targeting the High-End market
Note: Value Driven is not appealing since it is not an existing competency
Can target either Young Adults or Teens & Children, or both
Should size market opportunity for target segments
Notes to interviewer
Fashion/High-end market: Driven by factors such as brand, trendiness of items, aspiration aspects, etc. Assuming manufacturing costs are similar, players seem to be able to charge more for products that have a brand recognition
Traditional/Conservative market: appears to be more price sensitive market, driven by cost. Assuming that ORC has no cost advantages over local players, this seems like a less attractive market (tariffs or invest. cost would increase ORC’s costs)
Notes to interviewer
ORC can enter by: Creating standalone stores –
More control over branding, but higher costs and longer startup time
Distributing to department store – May work well if target mom as buyer for Teens & Children and lower fixed costs
Online only Other elements to consider:
Partnering with local partner, emerging market risks, delivery logistics, tariffs, foreign exchange risk

80
Solution and recommendations
Solution & Recommendations
ORC should enter the Fashion/High-end market. It should be able to leverage the “world known” brands to position itself in this market as an attractive option for either “young adults” or “teens & children” segments. If candidate recommends both segments, they should discuss synergies between the two segments that would make this feasible or examples of other brands that have successfully done this
To enter this market, ORC could focus on department stores first to test the market with low risk. It could enter the department stores and online channels without the need of a local partner. Conversely, ORC could build its own stores or acquire/form a JV with a local partner if they want greater control over their brand
Bonus/Guide to an Excellent Case
An excellent answer should mention investments costs, manufacturing costs, transportation costs, and exchange rate risks. If costs are expensed outside of the new market, there are options to mitigate exchange rate risks by buying currency financial options

81
Exhibit #1: Apparel market
47%
29%
24%
0%
10%
20%
30%
40%
50%
60%
70%
80%
90%
100%
Market Share
Fashion/High-end Traditional/Conservative Value Driven
Market Share (revenue)
$500M
70%
50% 45% 40%
24%
35%35%
20%
6%15%
20%
40%
0%
10%
20%
30%
40%
50%
60%
70%
80%
90%
100%
Seniors Adults Young Adults Teens &Children
Market share by customer segment (revenue)
Segment’s share of total revenue
10% 20% 40% 30%

82
Exhibit #2: Current players
Current players in the Fashion/High-end market
Conservative/Traditional Player 1 Player 2 Player 3 Player 4 Player 5Market share 21% 18% 19% 21% 21%Gross Margin 21% 22% 20% 23% 20%Operating Margin 11% 12% 10% 13% 10%
Current players in the Conservative/Traditional market
Fashion/High-end Player 1 Player 2 Player 3Market share 40% 26% 34%Gross Margin 70% 43% 55%Operating Margin 45% 18% 30%

83
Vitality Insurance, Inc.
Case tracker
Industry: Financial Services
Case Format: Improving profitability; Reducing Costs
Concepts Tested:
- Supply/value chain
- Marketing strategy
- Customer strategy
Case Question
Our client, Vitality Insurance, is a leading provider of supplemental insurance products in the United States.
Vitality agents partner with companies to offer their employees optional, supplemental insurance for such conditions as life, long-term disability, etc.
Vitality has undergone fairly steady growth in the past two years, but profit margin is decreasing. What should they do about it?
Guide to interviewer
This case is primarily about diagnosing the source of cost increases for an insurance firm and then determining whether those increases are justified by increased profits
The case is fairly structured in that the interviewee will need to “peel back” the layers of this case in the following process
Recognize that sales costs are rising drastically
Identify the shift in sales contest mix for 2010
Evaluate the effectiveness of the new contest mix
With any cost reduction case, an interviewee may seek information on other cost drivers. If this occurs, politely tell the interviewee nothing else exists and then refocus
By: Peter Manoogian (Kellogg Class of ‘12), Edited: Matthew Heintz (Kellogg Class of ‘16)
Quant: 3
Structure: 7
Industry: Insurance
Framework: Profitability

84
Clarifying answers and case guide
Guide to case / Guide to handouts
Exhibit 1– Provide once interviewee receives clarifying information (left pane) and asks for more detail on costs
Interviewee should recognize the following:
- All line items except for sales costs growing at 10% per year
- Sales costs grow at 10% from 2008 to 2009, but at 45% from 2009 to 2010 (while premium growth remains at 10%)
- Stronger interviewees will quickly note that something is strange w/the 2010 sales costs, but will calculate to confirm
- Finally, profit margins are declining significantly from 09-10, suggesting that the increase in sales costs is not paying off
Exhibit 2– Provide if interviewee asks about the value chain or selling process. If the interviewee asks about the new contests focused on premium, provide the following information:
- Vitality launched a contest called “Sweeps Week” that aimed to drive increased premium in weeks that were traditionally low volume for the company. Vitality paid an extra 10% bonus on all premium booked in those two weeks.
- Sales agents thought “Sweeps Week” was a great contest
- We have no info on the additional two contests on new accounts
Exhibit 3- Provide if interviewee asks for further detail on the effectiveness of “Sweeps Weeks”
Clarifying answers to provide
Client Characteristics- Vitality is the leader in its category and
has over 10K field sales agents - Vitality sells all policies through its field
sales agents who are solely compensated on a % commission of total new premium, defined as premium from new customers or additional premium (up-sell) from existing policyholders
- In addition to the commission, short term priorities are often communicated via sales contests that focus on a particular customer segment or activity and pay a bonus in addition to standard commission
- Major costs: sales, G&A, and advertisingCompetition- Vitality has a few other competitors in this
market who have seen similar growth, but Vitality is a leader in the space and thus competition is not the focus
Industry trends- Mature market - Agent turnover is very high on a yearly
basis (though was lower during the recessionary period)

85
Key elements to analyze
Supply/value chain
As seen in Exhibit 2; Vitality’s sales agents are engaged in several activities along the sales process, and that new premium can be generated in many ways.
The interviewee should recognize the shift in contest mix from 2008/09 to 2010. Coupled with the additional information provided in the previous slide, the interviewee should realize that Vitality has shifted its focus more toward total premium and new accounts in 2010
Marketing strategy
Exhibit 3 shows weekly premiums for all of Vitality from 2008 – 2010. The chart is shown in a way that compares each year’s actual premium to the average of historical premium for that year, so as to provide for a “benchmark” comparison.
The “Sweeps Week” contest launched in 2010 is shown in weeks 4 and 20 in the chart, and clearly yields high premium volume for those particular weeks. However, it is done at the expense of the weeks surrounding the sweeps week.
This implies that agents may be “gaming” the system by pushing/pulling sales into that week to earn the contest $$
Notes to interviewer
Assume the types of contests run in 2008 and 2009 were fairly similar
Do not share Exhibit 3 until the interviewee recognizes this shift in mix and begins asking questions about the new programs
Notes to interviewer
If asked, confirm that agents have authority to “book” sales whenever they want by influencing the enrollment timing by up to one week
Strong interviewees will also recognize that, despite not having charts to support it, a shift in customer focus toward acquiring new accounts in 2010 will likely also hinder profit margins, as acquiring a new customer costs considerably more than retaining (or up-selling) an existing customer

86
Solution and recommendations
Solution & Recommendations
The interviewee should conclude that Vitality overspent in 2010 on the “Sweeps Week” sales contest, thus hurting its profitability
Exhibit three indicates that the contest influenced the sales force to conduct undesirable selling practices by pushing / pulling forward business to earn the extra commission
Further, the contest’s focus, driving new premium was duplicative with that of the main commission system, therefore it did not add much value
Recommendation: eliminate “Sweeps Week” for 2011 and potentially repurpose those funds toward an activity that is not already covered by the main commission structure
It is unclear whether we should remove the increased contests on new accounts, as this could be a new customer focus that we do not know about
Bonus/Guide to an Excellent Case
Strong candidates will make the following observations:
Recognize that the likely decline in profit margin from 2009 to 2010 is linked to the abnormal increase to sales costs
That the “contest mix” in Exhibit two is similar to a firm’s marketing mix, especially given that the sales channel has already been established as the main marketing channel for these products
Suggest that the added contests on acquiring new accounts will also decrease profitability because acquiring new customers is more costly than retaining existing ones.

87
Exhibit 1: Vitality results and major costs
Vitality insurance key results and costs (Figures in 000s)
2008 2009 2010
Accounts converted 500 550 605
Total policyholders enrolled 1,500 1,650 1,815
Total premium from policyholders $2,500,000 $2,750,000 $3,025,000
Total costs
General and Administrative $50 $55 $58
Sales $250 $275 $400
Advertising $25 $28 $30
Profit margin 9.50% 9.40% 8.50%

88
Exhibit 2: Vitality insurance sales process
# of sales contests targeted at these leverage points on the selling process
New AgentsAcquire new accounts(bonus based on # of accounts)
Keep accounts active(bonus based on # of accounts)
Upsell active accounts(bonus based on # of accounts)
Produce results (bonus
based on total premium $)
2008 N/A 2 4 1 2
2009 N/A 2 4 1 2
2010 N/A 4 0 1 4
Hire new agents
Acquire new accounts
Upsell active accounts
Keep accounts active
Produce results
(Premium $)
Reactivating dormant account
Year

89
Exhibit 3: Snapshot of “Sweeps Week” contest results
0%
50%
100%
150%
200%
1 2 3 4 5 6 7 8 9 10 11 12 13 14 15 16 17 18 19 20 21 22 23 24 25 26 27
Week during Jan-Jun
Yr 2008
Yr 2009
Yr 2010
2010 “Sweeps
Week” (2)
Ratio to Average Weekly Premium (2008-2010)
2010 “Sweeps
Week” (1)

90
Realty Seattle
Case Question
Clarifying answers to provide A model framework should include the following
Profit
Revenue
Costs
Price trends, realtor
quality, commissions
More realtors in current
city; expand to new cities
Tech costs: web
design/server space
Marketing/advertising
costs; set up costs (email)
for each new agent
Candidate reflections / initial hypothesis should include
Realty Seattle has been one of the fastest growing real estate companies in Seattle with $2.625 billion in sales in 2014, with 250 agents.
In 2010, they became the 2nd-highest producing agency in Seattle after just 5 years in business, and by 2014 had grown to #1. They are
known primarily for their technology-based approach to real estate, with their website driving “leads” that they provide to their realtors.
They are expecting their growth to stagnate over the next few years, and have hired us to come up with successful growth opportunities.
What are your suggestions for how they can grow the bottom line?
• Realtor’s commissions are 3% of the sale price of the house.
Realty Seattle takes 30% of a realtor’s commission on up to
5M in sales in a year, and after that, they take 10%
• Realty Seattle has centralized marketing costs and charges
agents $500 per month
• They currently have 10 offices, all in Seattle
• This case is a profitability problem
• Customers don’t care what company their agent works for
• Should come up with expansion either in current city or in a
new city
• Realize that most costs are fixed, so revenue growth is
important
Company• Strengths
• Locations
• Turnover
• Funding
Competition• Landscape
• Consolidation
Customers• Type
• Reputation
matter?
Other• Regulatory
• Real estate
trends
By: Ryan Grandin (Kellogg Class of ‘16)
Quant: 7
Structure: 4
Industry: Real Estate
Framework: Profitability

91
Question 1: Brainstorming
Take me through what you think are Realty Seattle’s biggest drivers of profit and give me some ideas of what you might
come up with to improve profitability.
What are the Pros/Cons of Realty Seattle’s payment model?
Question to provide
A good candidate will have most of the following:
• Low variable costs/High fixed costs, therefore revenue growth is important
• Brand recognition is not a key driver for customers
• Options for profitability – grow market share or find a new market
Payment model:
Pros – incentive to sell more volume
Cons – does this incentive encourage volume sales at the expense of service?
Candidate insights – Expansion

92
Question 2: Employee Pay
How much does Realty Seattle receive from its realtors
in brokerage fees?
• Realtor’s commissions are 3% of the sale price of the
house. Realty Seattle takes 30% of a realtor’s
commission on up to 5M in sales in a year, and after
that, they take 10%.
• Average home price: $400,000
Further evidence to provide – Salary
• Realty Seattle receives an average of $61,500 per
agent per year
• 2.625B/250 Agents is an average of 10.5M in sales
per agent.
• 5M*3% realtor commission*30% Brokerage
fees=$45,000
• (10.5M-5M)*3% realtor commission*10% Brokerage
fees=$16,500
• Total is 45,000+16,500, or $61,500
Candidate insights – Salary
What is the realtor’s return on investment for marketing
charges? Assume all marketing charges are spent on
postcards mailed out to prospective buyers/sellers.
Hand over exhibit A
NOTE: This is an optional math problem – if you
think the person needs to focus more on math, ask
it. Alternatively, if the candidate solves the first math
problem very quickly, go ahead and ask this.
Further evidence to provide – Marketing Charges
• Realtors at Realty Seattle make a 740% ROI (or
980%, depending on whether they assume it is in the
first 5M of sales)
• 1000 postcards sent, .1% response rate = 1 sale per
month. Commission on 1 sale = 3% * 70% (or 90%)
• Candidate should analyze this number and suggest
reason why it is so high
• Pros: reduces employee turnover and makes
it an attraction for star realtors
• Cons: They may be able to charge more
money to the realtors and capture more of
the value
Candidate insights – Marketing Charges

93
Question 3: Expansion Plans
Realty Seattle is considering 3 options for expansion: Hiring more realtors in Seattle; Portland, Oregon; Vancouver, Canada – Which would you
suggest?
Hand over Exhibit B
• If candidates ask any questions about expected market share, ask them to discuss what they think is likely
• Any other brainstorming ideas that the candidate comes up with, ask them to justify and walk through their thinking
Further evidence to provide – Expansion
Candidate insights – Expansion
City Advantages Concerns
Seattle City knowledge, brand recognition,
leverage costs, dominant player
Overexposure, difficulty
to increase market share
Portland, Oregon Faster growing, similar market to Seattle,
fragmented market
No market knowledge,
no presence in the
market
Vancouver, BC Fastest growing market, highest home
price
Regulatory, currency,
financial institutions, very
concentrated market
Other Concerns
• City demographics
• Real estate trends
• Ability to cater to each market
• Financial ability to enter
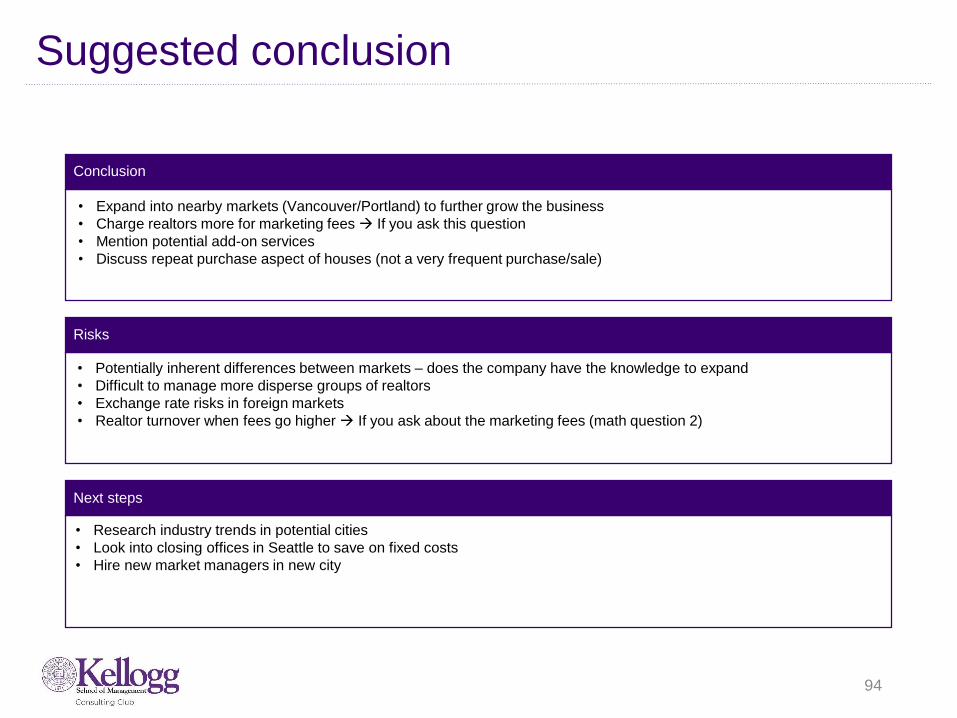
94
Suggested conclusion
Conclusion
Risks
Next steps
• Expand into nearby markets (Vancouver/Portland) to further grow the business
• Charge realtors more for marketing fees If you ask this question
• Mention potential add-on services
• Discuss repeat purchase aspect of houses (not a very frequent purchase/sale)
• Potentially inherent differences between markets – does the company have the knowledge to expand
• Difficult to manage more disperse groups of realtors
• Exchange rate risks in foreign markets
• Realtor turnover when fees go higher If you ask about the marketing fees (math question 2)
• Research industry trends in potential cities
• Look into closing offices in Seattle to save on fixed costs
• Hire new market managers in new city

95
Exhibit A
• Monthly Marketing Charge to Realtors: $500
• Cost per Postcard mailed: $0.50
• Response Rate: 0.10%
• % of responses that turn into Sales: 50%
• Average Home Price: $400,000
Monthly Marketing Statistics

96
Exhibit B
City Current
Market Share
Market Share
of Top 3
Companies
# of offices Expected
Market
Growth (5-yr
CAGR)
Average
Home Price
Seattle 40% 65% 10 10% $400,000
Portland,
Oregon
0% 52% 0 15% $435,000
Vancouver,
BC
0% 84% 0 20% $455,000

Dark Sky Co.
Case tracker
Industry: Industrial Goods – Aerospace and Defense
Case Format: Growth Strategy
Concepts Tested:
- Marketing Strategy
- Creativity
Case Question
Our client, Dark Sky, is a small manufacturer of unmanned (i.e. remotely piloted) data collection aircraft. Dark Sky produces the Assessor, an aircraft originally designed for unmanned weather exploration. In 2006, the United States military began purchasing Assessors for use in Intelligence, Surveillance and Reconnaissance (ISR) missions. The Assessor is profitable, but sales have stagnated and the client wishes to grow.
What are some steps Dark Sky could take to achieve growth?
Guide to interviewer
This case intentionally uses terminology that may not be familiar to the typical MBA student. This is meant to challenge the interviewee to dismiss superfluous information and to focus on the business problem.
After asking the initial question, engage in a qualitative discussion regarding organic and inorganic growth opportunities.
Knowledge of the Aerospace and Defense industry is not necessary – creativity is encouraged.
97
By: Sean Burrow (Kellogg Class of ‘11), Edited By: Eugene Kim (Kellogg Class of ‘15)
Quant: 5
Structure: 5
Industry: Aerospace
Framework: Growth Strat.

Clarifying answers and case guide
Interviewer Guide to case and handouts
This case is meant to stimulate the growth conversation and is designed to funnel the interviewee toward a new product launch.
Exhibit 1 – Provide following growth discussion
• The military started purchasing the Assessor in 2006. The price of the aircraft has remained constant at $100,000 per unit. Throughout the past decade, The Assessor has been Dark Sky’s only source of revenue.
Exhibit 2 – Provide following Exhibit 1 calculations
• Dark Sky has developed several aircraft prototypes designed specifically for military missions. The company has the capability to continue producing the Assessor and to introduce one new aircraft.
• SeaBird is specially designed for maritime (i.e. Naval) operations and can be sold to the Navy for $220,000 per aircraft.
• SandBird is specially designed for desolate land-based operations and can be sold to the Army for $210,000 per aircraft.
• JointBird is designed as a compromise for Army and Navy operations and can be sold to either service for $180,000 per aircraft.
• The Military has agreed to a 10% Assessor price increase.
Exhibit 3 – ONLY PROVIDE IF ASKED
• The introduction of a new aircraft will have a negative impact on Assessor sales.
- Continue to next page for further detail of the analysis to be performed
Clarifying answers to provide if asked
Customer / Price:- Dark Sky’s only customer is the U.S. Military.- Dark Sky has a Cost-Plus-Fixed-Fee contract with the U.S.
Military for Assessor sales:- The contract has been extended in the past and is up
for renegotiation; the Military has agreed to a marginal fee (i.e. price) increase to account for inflation
- Contracts for new aircraft will be structured similarlyCompany:- The firm has additional capacity and is positioned to
strengthen any division of the workforce, if required (e.g. sales force, manufacturing, R&D)
Product:- Dark Sky designs a unique aircraft that is launched from a
catapult device; the aircraft can be launched from ships at sea or from harsh terrain (e.g. desert, mountains).
- Dark Sky only sells the Assessor, but has designed prototypes specifically for military operations.
Competition:- There are approximately 20 competitors that
manufacture unmanned aircraft.- Though too small to purchase a competitor, Dark Sky has
been considered an acquisition target. Dark Sky’s lack of growth in recent years concerns potential buyers.
98
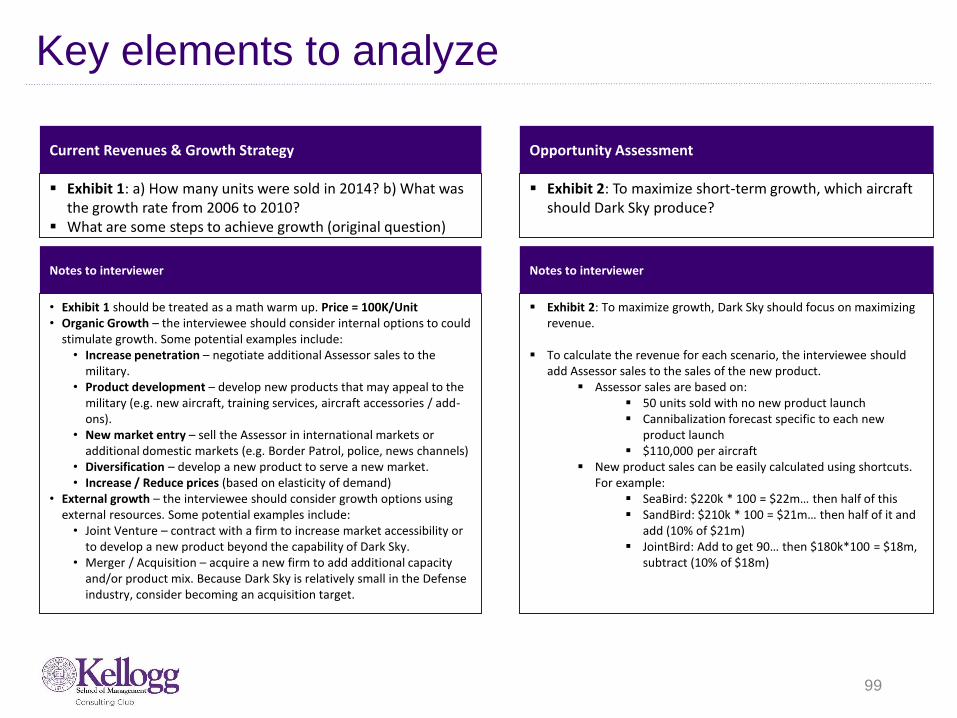
Key elements to analyze
Current Revenues & Growth Strategy
Exhibit 1: a) How many units were sold in 2014? b) What was the growth rate from 2006 to 2010?
What are some steps to achieve growth (original question)
Opportunity Assessment
Exhibit 2: To maximize short-term growth, which aircraft should Dark Sky produce?
Notes to interviewer
• Exhibit 1 should be treated as a math warm up. Price = 100K/Unit• Organic Growth – the interviewee should consider internal options to could
stimulate growth. Some potential examples include: • Increase penetration – negotiate additional Assessor sales to the
military.• Product development – develop new products that may appeal to the
military (e.g. new aircraft, training services, aircraft accessories / add-ons).
• New market entry – sell the Assessor in international markets or additional domestic markets (e.g. Border Patrol, police, news channels)
• Diversification – develop a new product to serve a new market.• Increase / Reduce prices (based on elasticity of demand)
• External growth – the interviewee should consider growth options using external resources. Some potential examples include:
• Joint Venture – contract with a firm to increase market accessibility or to develop a new product beyond the capability of Dark Sky.
• Merger / Acquisition – acquire a new firm to add additional capacity and/or product mix. Because Dark Sky is relatively small in the Defense industry, consider becoming an acquisition target.
Notes to interviewer
Exhibit 2: To maximize growth, Dark Sky should focus on maximizing revenue.
To calculate the revenue for each scenario, the interviewee should add Assessor sales to the sales of the new product.
Assessor sales are based on: 50 units sold with no new product launch Cannibalization forecast specific to each new
product launch $110,000 per aircraft
New product sales can be easily calculated using shortcuts. For example:
SeaBird: $220k * 100 = $22m… then half of this SandBird: $210k * 100 = $21m… then half of it and
add (10% of $21m) JointBird: Add to get 90… then $180k*100 = $18m,
subtract (10% of $18m)
99

• To maximize short-term growth, which aircraft should Dark Sky produce?
• Answer: JointBird• Assessor Sales (Units, Revenue):
• No new product = 50 aircraft, $5,500,000 • With SeaBird = 50 + (50 * (-40%)) = 50 - 20 =
30 aircraft, $3,300,000 • With SandBird = 50 + (50 * (-70%)) = 50 - 35 =
15 aircraft, $1,650,000 • With JointBird = 50 + (50 * (-90%)) = 50 - 45 =
5 aircraft, $550,000 • New Product Revenue:
• SeaBird = 50 * $220,000 = $11,000,000 • SandBird = 60 * $210,000 = $12,600,000 • JointBird = (38 + 52) * $180,000 = 90 *
$180,000 = $16,200,000 • Total Revenue:
• Assessor Only = $5,500,000 • Assessor and SeaBird = $3,300,000 +
$11,000,000 = $14,300,000 • Assessor and SandBird = $1,650,000 +
$12,600,000 = $14,250,000 • Assessor and JointBird = $550,000 +
$16,200,000 = $16,750,000
100
Math Solutions
Math Exhibit 1
• How many units were sold in 2014? • Answer: 50 units or $5,000k ÷ $100k/unit = 50 units
• What was the growth rate from 2006 to 2010? • Answer: 900% o ($5,000k - $500k) ÷ ($500k ) x 100 =
900%
Math Exhibit 2

101
Solution and recommendations
Solution & Recommendations
Based on 2015 forecasted revenue alone, Dark Sky should introduce the JointBird to the U.S. Military in order to boost short-term growth. However, there are several connected issues that Dark Sky should consider to include profitability, long-term revenue forecasts, competitive response, etc.
Bonus/Guide to an Excellent Case
An excellent interviewee will note:
How quickly could Dark Sky start manufacturing a third model (i.e. can Dark Sky produce SandBird this year, and be producing SandBird and SeaBird the following year)? If so, what are the revenue implications?
If Dark Sky produces JointBird, is $550,000 in Assessor revenue worth the associated cost to produce the aircraft? Should resources be allocated to another project?
How profitable are the four aircraft models in comparison? Note: Because Dark Sky has a Cost-Plus-Fixed-Fee contract, profitability for each aircraft is likely equivalent. For this reason, Dark Sky should focus on maximizing the number of aircraft sold. • How much and how long is the payback period for the investment in manufacturing each type aircraft?
Potential benefits of have two customer bases for new product (Navy and Army).

102
Exhibit #1
Revenue($, Million)
0
1
2
3
4
5
2004 2006 2008 2010 2012 2014

103
Exhibit #2
New Product Sales (# of aircrafts)
New Product Offering Navy Army Price Per Aircraft
SeaBird 50 -- $220,000
SandBird -- 60 $210,000
JointBird 38 52 $180,000
New Product Sales Forecast, 2015

104
Exhibit #3
Impact of New Product on Assessor Sales
New Product Sales (# of aircrafts)
New Product Offering Navy ArmyAssessor unit sales lost due to cannibalization
SeaBird 50 -- 40%
SandBird -- 60 70%
JointBird 38 52 90%
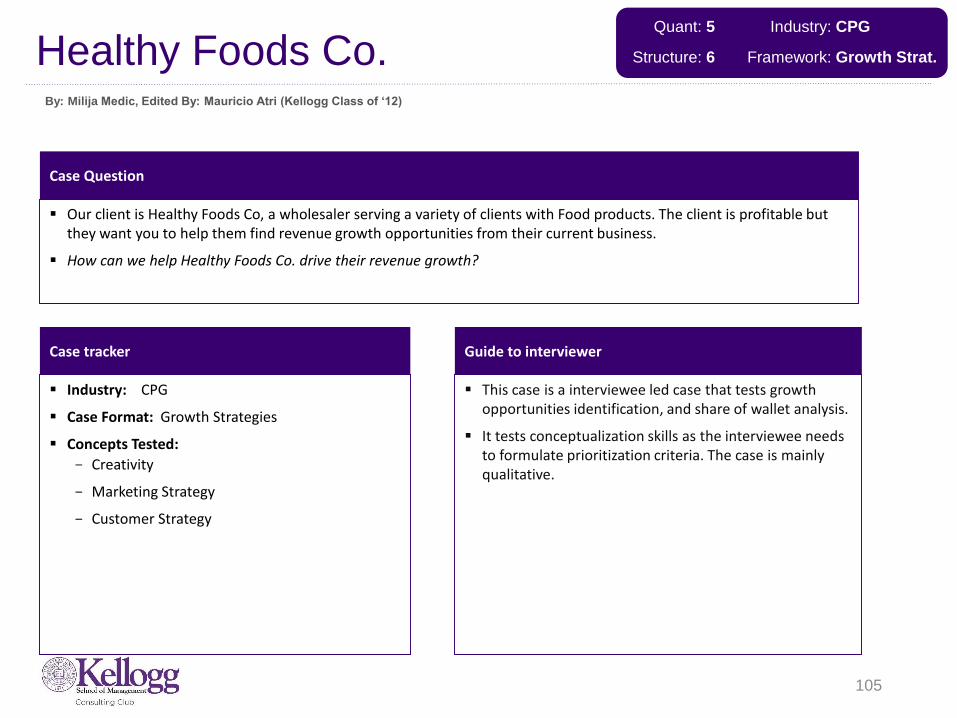
Case tracker
Industry: CPG
Case Format: Growth Strategies
Concepts Tested:
- Creativity
- Marketing Strategy
- Customer Strategy
Case Question
Our client is Healthy Foods Co, a wholesaler serving a variety of clients with Food products. The client is profitable but they want you to help them find revenue growth opportunities from their current business.
How can we help Healthy Foods Co. drive their revenue growth?
Guide to interviewer
This case is a interviewee led case that tests growth opportunities identification, and share of wallet analysis.
It tests conceptualization skills as the interviewee needs to formulate prioritization criteria. The case is mainly qualitative.
105
Healthy Foods Co.By: Milija Medic, Edited By: Mauricio Atri (Kellogg Class of ‘12)
Quant: 5
Structure: 6
Industry: CPG
Framework: Growth Strat.

106
Clarifying answers and case guide
Guide to case / Guide to handouts
Exhibit 1: Hand out when interviewee asks about customers or revenue by customer type. Interviewee should notice that independent restaurants are the largest customer category and revenue source, and that there is a number of other customer types of similar revenue contributions comprising the rest.
Exhibit 2: Hand out when interviewee identifies share of wallet as a relevant parameter, in search of revenue growth from existing customer types. Interviewee should generate a key insight that Healthy Foods Co'sshare of wallet is already large for the customers who bring in the largest revenues. The opportunity for growth therefore is in the smaller revenue-generating customers.
Exhibit 3: Hand out when interviewee recognizes that in order to find the smaller customer types with highest revenue growth potential, (s)he needs the plot of the size of the wallet vs. the current client's share of wallet for that customer. The customers with large wallets, where the client has small share of wallet, are at the moment the best candidates to achieve increase in revenue from. Interviewee should identify hospitals and hotels as the customers with largest potential for revenue growth.
Clarifying answers to provide
Customers
- The client serves various customer categories (shown in Exhibit 1).
- Customer sensitivities are (highest to lowest):
- price
- convenient delivery
- help with location planning
- help with menu
- web site development
- inventory
- help with management optimization
Competition
- The client is one of the market leaders and is not losing the market share

107
Key elements to analyze
Topic 1 being tested
Identify the main customer types and their current contributions to the client's revenues, using Exhibit 1
Topic 2 being tested
Share of wallet analysis, using Exhibit 2
Notes to interviewer
The interviewee will probably explore opportunities for growth in the independent restaurant category. If they inquire about customer satisfaction and sensitivities, provide information from the "clarifying information" section, and emphasize that the needs of this segment are already met.
The interviewee should inquire about the share of wallet in the customer categories to get a better idea on where the growth opportunities lie.
Notes to interviewer
The interviewee should recognize that share of wallet in the highest-revenue-generating customer categories is already high, and that the client is already a key provider for a lot of them.
Ask the interviewees to list all options to increase revenue and the reasons behind.
Help interviewee to reach that the growth opportunity in the smaller revenue-generating customers, where client's share of wallet is smaller. Now the interviewee should formulate the criteria to prioritize among the smaller revenue-generating customer types: the bigger their wallet and the smaller client's share of wallet, the better.
Topic 3 being tested
Wallet size vs. share of wallet
Notes to interviewer
The bigger their wallet and the smaller client's share of wallet, the larger the revenue growth opportunity for the client.
Using Exhibit 3, the interviewee should identify the hospitals and the hotels as the most promising candidates for revenue growth given their large wallets and small client's share of wallet. The interviewee should identify the strongest sensitivities these clients would have and suggest ways to increase client's share of wallet there.

108
Solution and recommendations
Solution & Recommendations
In the current business, the largest growth opportunities lie in customer segments:
hospitals and hotels.
The interviewee should suggest ways to better serve those customers and increase client's share of wallet there, capturing significant new revenues due to the large size of those clients' wallets.
Bonus/Guide to an Excellent Case
An excellent interviewee should identify share of wallet as an important parameter, quickly recognize that there is little opportunity for growth in the largest-revenue-generating customers, and come up with the size of wallet vs. share of wallet plot as a good prioritization tool for identifying promising customer categories for the client's revenue growth.

109
Exhibit #1: Total Market Revenues by Customer Type
Revenues by Customer Type
Independent restaurants
Chain restaurants
Hospitals
School cafeterias
Grocery stores
Other

110
Exhibit #2: Client’s Share of Wallet
0% 10% 20% 30% 40% 50% 60% 70%
X
C
B
A
Share of Wallet
Client is Primary foodproduct supplier
Client is one of manyfood productsuppliers
Customer Size (Customer A: Largest, Customer X: Smallest)

111
Exhibit #3: Wallet Size vs. Share of Wallet
Wallet Size vs. Share of Wallet for the Smaller-Revenue-Generating
Customer Categories
0
100
200
300
400
500
600
0 10 20 30 40 50 60
Share of Wallet [%]
Wallet Size [$M]
Hospitals
Hotels
School cafeterias
Grocery stores
Chain restaurants

112
Plastic World
Case tracker
Industry: Financial Services
Case Format: M&A
Concepts Tested:
- Organizational changes
- Market share
- Customer strategy
Case Question
Our client is a private equity firm interested in PlasticWorld, a plastic packaging manufacturer.
PlasticWorld’s owners are requesting $25M. The offer is final. Should our client buy?
Guide to interviewer
The case primarily tests the ability to gain insight from quantitative data , value a company and find potential improvements… As such, it is a little bit more data-driven than the average case.
The interviewee should focus on the company value –the recommendation regarding the offer depends on it –and on feasibility of identified profit-improving changes.
The interviewee should be able to come up with the key improvements if (s)he invests some effort in understanding the price drop and its relationship to the sales force incentives. S(he) should also come up with innovation-related costs from the pressure from the customers and how to push back.
By: Milija Medic, Edited By: Peter Manoogian (Kellogg Class of ‘12)
Quant: 3
Structure: 4
Industry: PE
Framework: M&A

113
Clarifying answers and case guide
Guide to handouts
Begin by handing out exhibit #1 after stating the case question.
Exhibit 1 – Hand out after introducing case
- What observations can be made from this P&L statement?
- Interviewee should calculate the profit margin (-6%), notice that sales volume is growing but revenues are dropping, and infer that the cause may be pricing (more detail on next page)
- To check if it’s an industry-wide or company-specific drop in profitability, they should request competition profitability data
Exhibit 2 – Hand out if the candidate requests competition data
- Note that it’s a company-specific problem
- Push the interviewee to postulate what would be a realistic profit margin goal for PlasticWorld based on this industry profitability data (more detail on next page)
Exhibit 3 – Hand out after discussion of Exhibit 2
- Sensitivity analysis indicates that the company would be worth the offered $25M if the profit margin was brought from –6% to 0%
- Interviewee should investigate the profitability drop and the low prices further and suggest options to get PlasticWorld’s profitability in line with the industry, and their feasibility
Clarifying answers to provide
PlasticWorld Characteristics
- Makes plastic packaging for beverages, cosmetics, household and automotive chemicals
- Products are top quality, they have 350 sets of molds, with different materials, finish, colors, always innovating
- Overall product mix has not changed in recent years
- The sales force is “the best in breed”, they hold market share, and they are compensated on market share
- Two years ago they invested further in equipment for product innovation
Customers
- PlasticWorlds’ customers exhibit strong loyalty
- They are experiencing increasing pressures in their industries to innovate the plastic packaging
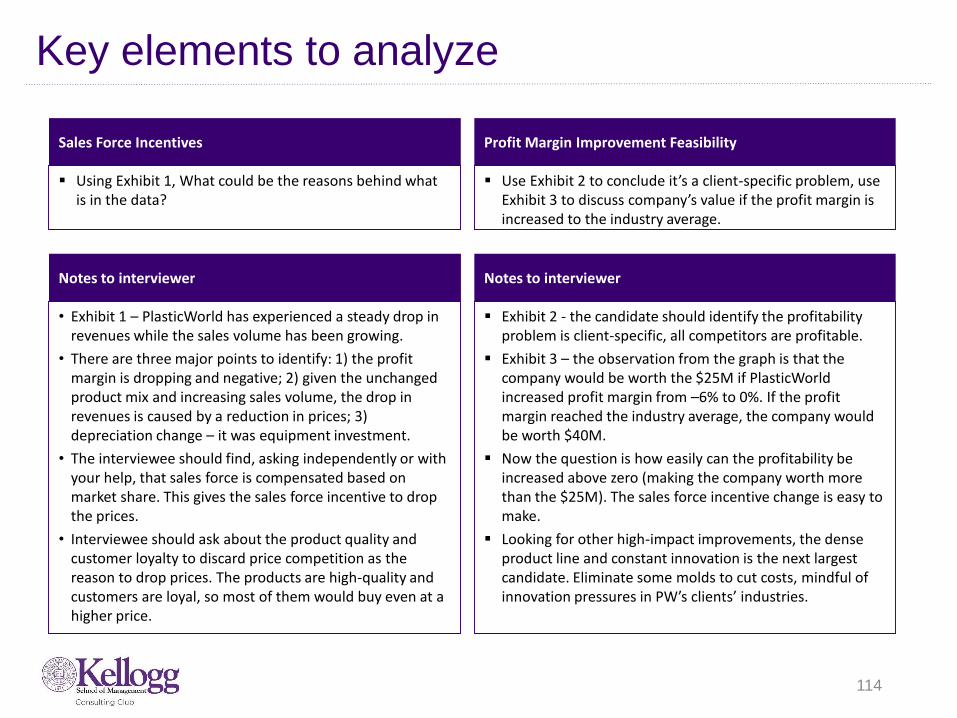
114
Key elements to analyze
Sales Force Incentives
Using Exhibit 1, What could be the reasons behind what is in the data?
Profit Margin Improvement Feasibility
Use Exhibit 2 to conclude it’s a client-specific problem, use Exhibit 3 to discuss company’s value if the profit margin is increased to the industry average.
Notes to interviewer
• Exhibit 1 – PlasticWorld has experienced a steady drop in revenues while the sales volume has been growing.
• There are three major points to identify: 1) the profit margin is dropping and negative; 2) given the unchanged product mix and increasing sales volume, the drop in revenues is caused by a reduction in prices; 3) depreciation change – it was equipment investment.
• The interviewee should find, asking independently or with your help, that sales force is compensated based on market share. This gives the sales force incentive to drop the prices.
• Interviewee should ask about the product quality and customer loyalty to discard price competition as the reason to drop prices. The products are high-quality and customers are loyal, so most of them would buy even at a higher price.
Notes to interviewer
Exhibit 2 - the candidate should identify the profitability problem is client-specific, all competitors are profitable.
Exhibit 3 – the observation from the graph is that the company would be worth the $25M if PlasticWorld increased profit margin from –6% to 0%. If the profit margin reached the industry average, the company would be worth $40M.
Now the question is how easily can the profitability be increased above zero (making the company worth more than the $25M). The sales force incentive change is easy to make.
Looking for other high-impact improvements, the dense product line and constant innovation is the next largest candidate. Eliminate some molds to cut costs, mindful of innovation pressures in PW’s clients’ industries.

115
Solution and recommendations
Solution & Recommendations
Our client should accept the $25M offer and boost the profitability (and value) of PlasticWorld.
The client should engage in the following easy-to-implement changes:
Compensate sales force based on company earnings instead of market share.
Simplify the product line - eliminate some of the 350 molds to cut costs while leveraging the superior sales force to maintain client satisfaction.
Examine the industry best practices to find other areas for improvement.
Bonus/Guide to an Excellent Case
An excellent interviewee will quickly identify the pricing as the issue behind the revenue decrease and lay out potential causes for the price drop, finding the sales force incentive.
Additionally, a strong interviewee will immediately notice that the company would be worth more than $25M if its profit margin was at the level of industry average.
A framework comprehensive enough to find the product line size problem would be a plus.

116
Exhibit 1: PlasticWorld P&L statement in the past three years
2009 2008 2007
Sales ($) 18,824,000 19,180,000 19,650,000
Volume (units) 36,200,000 34,250,000 32,750,000
COGS ($) 9,050,000 8,900,000 8,650,000
SG&A ($) 7,500,000 7,200,000 7,300,000
Depreciation ($) 3,450,000 3,450,000 2,250,000
EBIT ($) -1,176,000 -370,000 1,450,000

117
Exhibit 2: PlasticWorld and Industry Peers Profit Margins
Industry Peers Profit Margins [%]
-10 -5 0 5 10 15
Competitor A
Competitor B
Competitor C
Competitor D
Competitor E
Competitor F
PlasticWorld

118
Exhibit 3: PlasticWorld Valuation by Profit Margin
PlasticWorld Valuation Sensitivity Analysis
0
5
10
15
20
25
30
35
40
45
50
-10 -5 0 5 10 15
profit margin [%]
co
mp
an
y v
alu
ati
on
[$
M]

119
GoNet Internet Service Provider
Case tracker
Industry: Technology
Case format: Market entry
Concepts being tested:
- Market share
- Profitability
Case Question
Our client, GoNet, is a US-based Internet Service Provider (ISP) that is considering entering the European market. They are currently the dominant player in the US with two revenue streams: a subscription access fee and by taking a percentage of all e-commerce transactions from subscribers.
Examining the European market, GoNet has found that the market is highly fragmented and ripe for entry. You are going into a meeting with the CEO and have been asked to perform some quick “back of the envelope” calculations to determine the potential profitability of entering Europe.
Guide to interviewer
This is a very quantitative case that requires the interviewee to run the numbers on European profitability.
The candidate will need to ask for additional information to solve the problem. After getting the initial calculations right, there will be a number of market changes that the interviewee will have to react to.
After the quantitative portion is completed, there are some open-ended questions for the candidate to answer.
By: Adam Borchert and Joep Knijn (Tuck Class of ‘04), Edited By: Mauricio Atri (Kellogg Class of ‘12)
Quant: 8
Structure: 4
Industry: Telecom
Framework: Market Entry

120
Clarifying answers and case guide
Guide to case
Part 1 – Quantitative discussion
- This should be the meat of the case and should be completed before discussing any general or qualitative responses.
Part 2 – Qualitative discussion
- After navigating the math, ask the candidate the following questions:
- 1) How could we reduce the fixed costs of investment?
- 2) Would there be any reason to continue with the investment even if it looks like it will lose money?
- 3) Are there are any other risks/benefits that GoNet should consider?
- 4) How would you sum up the situation and what is your recommendation?
Clarifying answers to provide
(Provide this information on request)
Competitive dynamics
- Highly fragmented industry- No information about market leaders or
trends
European industry overview
- GoNet plans to capture a base of 10 million subscribers
- Subscriptions will cost $20/month- The average GoNet subscriber
purchases $1,800 of goods on the internet annually
- GoNet receives 3% commission- Fixed costs are $1 billion annually- Variable costs are $110/subscriber
annually
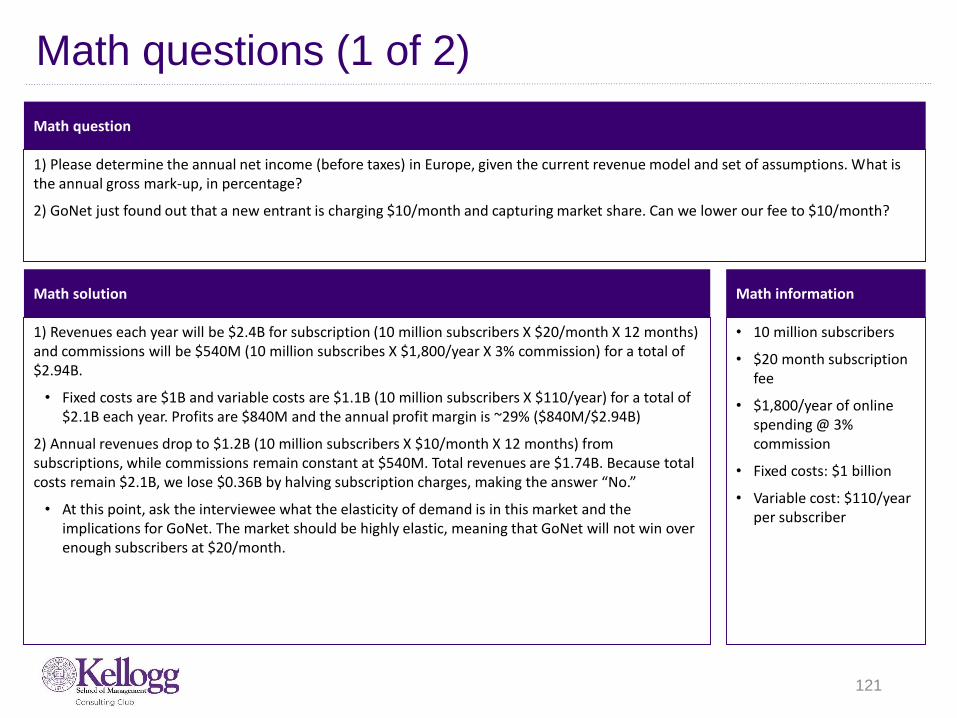
121
Math questions (1 of 2)
Math solution
1) Revenues each year will be $2.4B for subscription (10 million subscribers X $20/month X 12 months) and commissions will be $540M (10 million subscribes X $1,800/year X 3% commission) for a total of $2.94B.
• Fixed costs are $1B and variable costs are $1.1B (10 million subscribers X $110/year) for a total of $2.1B each year. Profits are $840M and the annual profit margin is ~29% ($840M/$2.94B)
2) Annual revenues drop to $1.2B (10 million subscribers X $10/month X 12 months) from subscriptions, while commissions remain constant at $540M. Total revenues are $1.74B. Because total costs remain $2.1B, we lose $0.36B by halving subscription charges, making the answer “No.”
• At this point, ask the interviewee what the elasticity of demand is in this market and the implications for GoNet. The market should be highly elastic, meaning that GoNet will not win over enough subscribers at $20/month.
Math question
1) Please determine the annual net income (before taxes) in Europe, given the current revenue model and set of assumptions. What is the annual gross mark-up, in percentage?
2) GoNet just found out that a new entrant is charging $10/month and capturing market share. Can we lower our fee to $10/month?
Math information
• 10 million subscribers
• $20 month subscription fee
• $1,800/year of online spending @ 3% commission
• Fixed costs: $1 billion
• Variable cost: $110/year per subscriber

122
Math questions (2 of 2)
Math solution
3) To keep profits at $840B, we know that costs remain at $2.1B so revenue will need to be $2.94B. Subscription revenue will be $1.2B, so commissions need to be $1.74B. There are 10 million subscribers, so each subscriber need to bring in $174/year of commission. At 3%, they will need to buy $5,800/year in goods ($174/3%).
• Ask the candidate if this realistic. The answer should be “No”.
4) To breakeven, we will need commission to be $900M over 10 million subscribers. That is $90/year per subscriber ($900M/10M), which means $3,000/year in goods purchased online ($90/3%). The candidate should identify that this is also unrealistic, representing more than a 50% increase from last year.
5) To find the answer here, we need to find incremental revenue per subscriber. Each subscriber brings in $174/year ($10/month X 12 months + $1800/year X 3%) at a cost of $110/year for a profit of $64/year. These profits must cover the fixed costs of $1B/year, so we must bring in 15.625 million customers ($1B/$64)
• Note: many people forget the variable costs during the completion of this case.
Math question
3) With high market elasticity, GoNet will not be able to charge more than $10/month. How much would each subscriber have to buy on the Internet to keep profits at the same level as $20/month subscription fees?
4) How much would each subscriber have to buy on the Internet to enable us to break even?
5) Given that we cannot charge more or realistically increase shopping significantly, how many subscribers would we need in order to maintain the same level of expected profits (at $10/month)?

123
Solution and recommendations
Solution & Recommendations
1) Some potential ways (not exhaustive) to reduce fixed cost: outsourcing capacity, leasing networks, working in specific geographies, etc.
2) GoNet may still be interested in this move as a way to break into Internet retailing and expanding its subscriber base. Based on the math though, this should not be an attractive option long-term either.
3) Very open ended and reliant on candidate’s creativity.
4) This is very open-ended and should be evaluated based on the candidate’s argument, not answer. Based on initial estimates, this is a very attractive market to enter, but with price pressures and high elasticity the market is far less attractive. If we are to undertake this initiative, GoNet needs to find ways to convert a much higher number of customers or differentiate its product, which both require market research. There is also potential to reduce costs or establish this foothold as a loss leader, but these require strong arguments from the candidate.
Bonus/Guide to an Excellent Case
This case tests two things – the interviewee’s comfort with numbers and ambiguity. An excellent case interview will result in anintuitive grasp on what is being asked quickly and solid execution on the quantitative portion of the case.
Ultimately, the best interviewees will make a very strong argument using the facts provided and support the decision to invest/not invest with a strong business sense about the costs and implications of the project.
Creative solutions beyond those listed are possible and encouraged, though should be done within the framework of the information available.

124
Orrington Office Supplies (OOS)
Case tracker
Industry: Consumer Products
Case format: Improving profitability
Concepts being tested:
- Capacity expansion /contraction
Case Question
Our client, OOS is a leading manufacturer of office products in 1992, with sales of $275M in 1991. They have strong brands, invest heavily in marketing / advertising, and have grown through product line extensions and 4 key acquisitions.
OOS is organized into 5 autonomous divisions, but shares manufacturing and marketing functions. Shared costs (45% of total) are allocated on a % of sales method. There are three plants running at a current capacity utilization of 50%.
Analysts predict OOS is a potential acquisition target given its strong balance sheet but weakening earnings. They are publicly traded and have little long-term debt. As a potential investor, how would you improve its profitability.
Guide to interviewer
This case combines public math with key qualitative insights. At its core, this is a case about rapidly declining profitability and finding ways (i.e. plant consolidation) to improve its future performance.
The interviewee should recognize that this is a performance improvement case and will look for ways to improve profitability. They will have to use the information provided up front to determine that capacity contraction is the prime means to improve profitability.
Because there are many potential avenues to explore, the interviewer may need to nudge along the interviewee.
By: Andy Grieve (Kellogg Class of ‘01), Edited By: Peter Manoogian (Kellogg Class of ‘12)
Quant: 6
Structure: 7
Industry: CPG
Framework: Profitability

125
Clarifying answers and case guide
Guide to case / Guide to handouts
A sample case structure would include the following:
1) Examination of OOS’s recent performance to deep-dive into declining profits.
2) Discussion of potential for plant consolidation.
3) A profitability analysis of plant consolidation.
Exhibit 1– Hand out after interviewee asks about profitability
Exhibit 2– Hand out after interviewee concludes that plant consolidation is a worthy area for a “deep-dive.” This should be evident from the case introduction, but provide hints if necessary.
Exhibit 3– Following the discussion of plant closures, the interviewee should ask about the cost structures about the various plants.
- If interviewee asks about revenues, gently suggest to calculate on a per SKU basis (e.g., total sales / total SKUs = $22K / SKU).
Clarifying answers to provide
Industry trends- U.S. Office supplies market grew at 5%
CAGR historically. In 1990 and 1991, the market declined at 5%/yr.
- Superstore channel is becoming increasingly critical
- Gained 10 share pts in past 2 yrs- Typically discount products 30%
to small retailers/dealers- Superstores are aggressively
substituting private label products for traditional brand names
Client Characteristics- Broader product line than competitors
(12.5K SKUs vs. 4-5K for competitors)- Distribution: 75% wholesalers, 15%
superstores, 10% end customers- Highest selling product is a high-end
branded stapler- Staples, Inc. is OOS’s largest customer

126
Key elements to analyze
Profitability
Using Exhibit 1, have a discussion about why the slopes for sales and profits differ as time elapses
Capacity utilization
Using Exhibit 2, qualitatively discuss the potential options for plant consolidation.
Notes to interviewer
Exhibit 1 - interviewee should not only be able to interpret the data on this slide, but also come up with two insights:
1) the fact profits have been declining more steeply than sales reflects the fixed-cost nature of this business, and
2) the reason that sales did not grow at a faster clip than profitability during the 1980s likely reflects a strategy to grow through acquisitions, which prevented OOS from seeing the gains through economies of scale that one would normally expect in a business such as this
Notes to interviewer
Interviewee should recognize the Chihuahua plant is close to having capacity to produce OOS’s 12.5K SKUs. Either OOS can close that plant and move all production to the US, or it could close the US plants, discontinue 500 SKUs and move production to Chihuahua.
Insightful interviewees will note that Chihuahua is the most feasible strategy, but will ask to see fixed and variable cost data; if so, then produce Exhibit 3.
Plant closures
Using Exhibit 3, crunch the numbers on the profitability of a possible plant closure?
Notes to interviewer
They should have identified that the Chihuahua plant is the most feasible, but there are some key considerations.
Key questions to ask:
How would this change revenues? (currently $275M / year)
How would this change production costs? What are they now?
How would this change pre-tax profits (currently $25M /year?)

127
Calculations
Math questions
1. How would consolidating to Chihuahua change revenues? (currently $275M / year)
2. How would this change production costs? What are they now?
3. How would this change pre-tax profits? (currently $25M /year)
Calculations
1. Revenues: Each SKU earns annual revenues of $22K ($275M divided by 12,500 SKUs) therefore, eliminating 500 SKUs will decrease annual revenue by $11M, or 4%
2. Prod. costs:
Consolidating revenues to Chihuahua will reduce annual costs by 50% to:
Chihuahua: $20M + ($4K * 12K SKUs) = $20M + $48M = $68.0M
3. Profits: We have reduced costs by $68M and lowered revenues by $11M, thus increasing profits by $57M, to a total of $82M, which more than triples them.
Each plant has the following variable cost per sku:
Chihuahua: $18M / 4.5K SKUs = $4K per sku
Michigan: $39.5M / 5K SKUs = $7.9K per sku
New Jersey: $25.5M / 3K SKUs = $8.5K per sku
$136M
Each plant currently has the following annual costs:
Chihuahua: $20M + $18M = $38.0M
Michigan: $15M + $39.5M = $54.5M
New Jersey: $18M + $25.5M = $43.5M

128
Solution and recommendations
Solution & Recommendations
Overall, our client should eliminate 500 SKUs and consolidate all production to the Chihuahua plant to raise annual profits from $25M to $82M.
The client should also consider several qualitative issues:
— Implementation Timeframe: Will not be done tomorrow.
— Relationships with Union: If organized labor is part of our production employee pool in the two plants that we are going to close, we will need to address that situation.
— Changes in Distribution and Warehousing: We will need a carefully-developed transition plan.
— Purchasing: We will need to transition to a strong central purchasing department, rather than smaller local ones.
— Culture: Communicating the change properly is key, and we will need to ensure that morale does not take a nosedive.
Bonus/Guide to an Excellent Case
Excellent interviewees need to recognize what macroeconomic issues are beyond the scope of the client’s control and then quickly dive into the plant consolidation, then analyze the cost structures
Additionally, common sense and basic familiarity with manufacturing operations should guide the successful interviewee to some or all of the qualitative issues provided

129
Exhibit 1: OOS Sales / profit trend

130
Exhibit 2: Overview of OOS production plants

131
Exhibit 3: Plant operating costs
18.0
15.0
20.0
25.5
39.5
18.0$20M
$30M
$40M
$10M
$0MChihuahua Michigan New Jersey
Fixed Annual Plant Operating Costs
Variable Annual Plant Cost

132
Winter Olympics Bidding
Case tracker
Industry: Media & Entertainment
Case format: Opportunity Assessment
Concepts being tested:
- Basic NPV
- Breakeven analysis
Case Question
Our client, a major US television network, is trying to figure out how much to bid for the exclusive right to broadcast the 2018 Winter Olympics Games in the U.S.
The Winter Olympics are a huge deal and will require a significant amount of capital to secure the rights, so our client has brought us in to help them figure out the right bid amount after considering all relevant factors.
Guide to interviewer
This is a very quantitative case that requires the interviewee to run the numbers on an Olympics bid. The candidate will have to decide potential ad revenue/cost information, as well as the NPV, to determine bid size.
The candidate will need to ask for additional information that is necessary to solve the problem, rather than relying on the interviewer to dispense it. After getting the initial calculations right, there are a lot of implications that may change the level of the bid.
Especially for less finance-minded interviewees, you may have to help nudge candidates through the math.
By: Chris Dupre (Kellogg Class of ‘03), Edited By: Uri Kalir (Kellogg Class of ‘12)
Quant: 8
Structure: 4
Industry: Media
Framework: Opportunity
Assessment

133
Clarifying answers and case guide
Guide to case
Part 1 – Quantitative discussion
- Candidate should determine that this is a cost-benefit / NPV analysis.
- Candidate should identify potential revenue streams from hosting the Olympics, i.e. ad revenue, product placements, etc.
- Then, the candidate will have to figure out if this is a good investment. They should identify 3 costs (production costs, opportunity costs, and time value of money). By factoring in these costs, the candidate will find out if the Olympics are worth the investment.
- Some of the numbers and assumptions here are difficult, so nudge the candidate along if necessary.
Exhibit 1 – Provide Winter Olympics schedule if asked
- Give to candidate once he/she identifies ad revenues
Part 2 – Qualitative discussion
- After finding the NPV of $200M, ask the candidate about intangible factors, benefits, and risks. Some critical factors:
- Might give network access to new viewers
- There is prestige associated with hosting this event
- We can use the air time to promote other programming
- Opportunities for product tie-ins, supplemental revenue
- After finishing the discussion, ask the candidate for a recommendation.
Clarifying answers to provide
Revenues- No subscription revenue, but can keep
100% of advertising revenue- Ad rates are $400K/30 second ad for
prime time (M-F 7-11 PM, all weekend) and $200K/ad for non-prime time
- Market research has shown that you can include no more than 10 minutes of advertising per hour.
Costs- $482M of total production costs- Opportunity cost: $1M/hour- Time value of money: 4 year lag for
receipt of revenue

134
Math questions
Math solution
1) Total revenues should be equal to $928M for the project.
• Primetime: Weekdays (M-F): 10 weekdays x 4 hrs/day x 10 min/hr x 2 slots/min x $400,000/ad = $320M
• Non-prime: Weekdays (M-F): 10 weekdays x 6 hrs/day x 10 min/hr x 2 slots/min x $200K/ad = $240M
• Weekend: 4 days x 10 hrs/day x 10 min/hr x 2 slots/min x 400K/ad = $320M
• Opening/Closing: 2 days x 3 hrs/day x 10 min/hr x 2 slots/min x 400K/ad=$48M
2) Total profit should be equal to $300M.
• Profit: Revenues $928M - $482M of total costs - $146M of opportunity cost (2 days x 3 hours x $1M/hr + 14 days x 10 hours x $1M/hr) = $300M
3) NPV should be equal to $200M.
• Discount rate: 1.104 = 1.4641 (ask candidate to round to 1.50)
• $300M/1.5 = $200M
Math question
1) Calculate the revenue from broadcasting the Winter Olympics.
2) Factoring in costs, is this a good investment? Find the NPV.
Math information
Revenues- $400K/ad for prime
time (M-F 7-11 PM, all weekend) and $200K/ad for non-prime time
- 10 minutes/hour of advertisements
Costs- $482M of production
costs- Opportunity: $1M/hr- WACC: 10%

135
Solution and recommendations
Solution & Recommendations
While the NPV of the project is $200M, the fact that there are other intangibles (new viewers, plugging our programs, and prestige) the bid should just be $200M.
While there is no one correct answer, most answers should be in the range of $200M. If there is significant fluctuation from $200M, the candidate will have to provide in-depth justifications and make a concrete argument.
Bonus/Guide to an Excellent Case
This case tests the interviewee’s comfort with numbers and understanding of how intangible factors may influence financial value. The bid process requires another level of understanding around game theory and what dynamics will ultimately determine the value of the bid beyond NPV.
Ultimately, the best interviewees will make a very strong argument using the facts provided and support their bid and explain why they moved their bid from the NPV figure.
There is also a lot of room for creativity for the interviewee to discuss other factors, including supplemental streams of revenue, intangible factors, and things to consider during the bid process.

Exhibit #1
Day 1
Opening Ceremonies (Friday)
Day 2-15 Day 16
Closing Ceremonies (Saturday)
8-11pm Weekday: 9am-12pm, 2-5pm, 7-
11pm
Weekend: 11am-9pm
8-11pm
Winter Olympics Schedule

137
Vindaloo Corporation
Case tracker
Industry: Consumer products
Case format: Developing a new product
Concepts being tested:
- Basic NPV
- Marketing Strategy
- Operations
Case Question
Our client, Vindaloo Corporation, is a small biotechnology company that has developed a new seed for sugar beets, which produces twice as much sugar as the seeds that are currently in use. Currently 100 beets produce 100 lbs of sugar or 1lb/beet while the new seeds will produce 200 lbs of sugar, or 2 lbs/beet.
Vindaloo now wants to sell the company, how would you think about pricing Vindaloo?
Guide to interviewer
This is a valuation case and, as such, has a lot of number crunching. To calculate the NPV, the interviewee will have to size its impact up and down the value chain and determine its value using assumptions about market penetration and growth rates.
There are also several important qualitative insights for the candidate to make, the main one of which is that the new technology will halve the land rather than doubling production, which would cause an immediate worldwide sugar glut and rapidly falling prices.
By: Ben Walter (Kellogg Class of ‘03), Edited By: Ameed Mallick (Kellogg Class of ‘12)
Quant: 8
Structure: 4
Industry: CPG
Framework: New Product/
Market Entry

138
Clarifying answers and case guide
Interviewer Guide to Case
A sample case structure would include the following:
1) Start with an understanding of the sugar industry and market economics
2) Analyze the product benefits and potential impacts for farmers
3) Identify the channel structure and assess the opportunities to minimize costs within the value chain
4) Calculate NPV of cost savings to value the company
Clarifying answers to provide if Asked
Industry Characteristics/Market Economics
- The market has grown at GDP over the past few years and is predicted to grow at 2% annually.
- Sugar is a mature commodity, in other words, there is enough supply to meet demand. The wholesale market is $2 billion worldwide per year.
- Farmland that is not used for sugar can be repurposed to grow cabbage, which is currently 1/5 as profitable as sugar.
Competitive Dynamics
- We can assume a 100% market penetration, since there are no competing products, and the efficacy of the product is proven.
- There is no imminent threat of competition and a patent would protect the investment for a number of years.
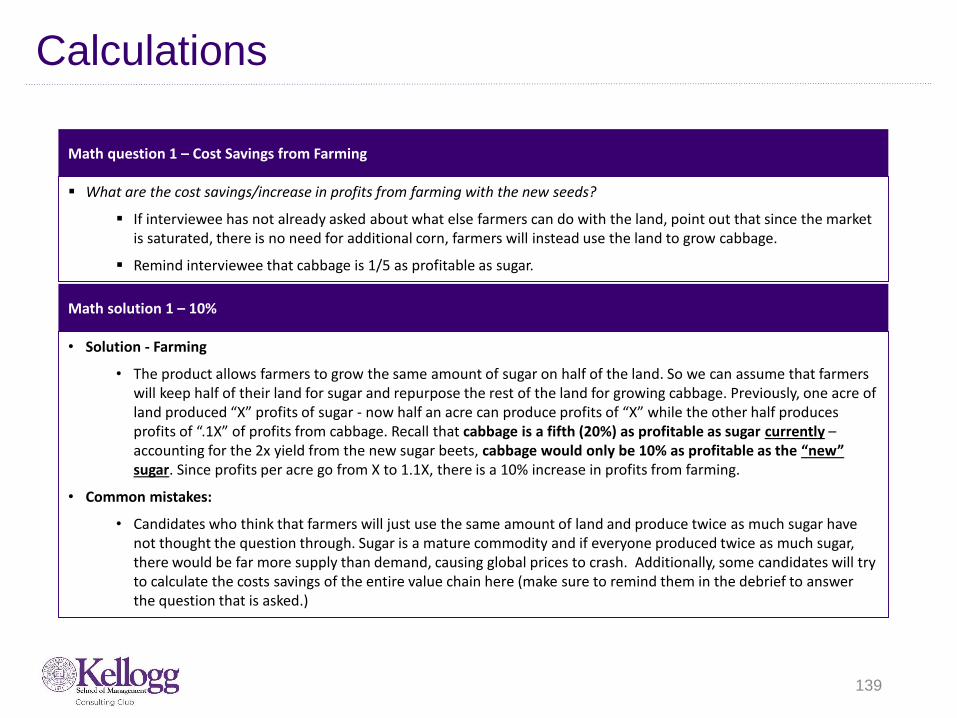
139
Calculations
Math solution 1 – 10%
• Solution - Farming
• The product allows farmers to grow the same amount of sugar on half of the land. So we can assume that farmers will keep half of their land for sugar and repurpose the rest of the land for growing cabbage. Previously, one acre of land produced “X” profits of sugar - now half an acre can produce profits of “X” while the other half produces profits of “.1X” of profits from cabbage. Recall that cabbage is a fifth (20%) as profitable as sugar currently –accounting for the 2x yield from the new sugar beets, cabbage would only be 10% as profitable as the “new” sugar. Since profits per acre go from X to 1.1X, there is a 10% increase in profits from farming.
• Common mistakes:
• Candidates who think that farmers will just use the same amount of land and produce twice as much sugar have not thought the question through. Sugar is a mature commodity and if everyone produced twice as much sugar, there would be far more supply than demand, causing global prices to crash. Additionally, some candidates will try to calculate the costs savings of the entire value chain here (make sure to remind them in the debrief to answer the question that is asked.)
Math question 1 – Cost Savings from Farming
What are the cost savings/increase in profits from farming with the new seeds?
If interviewee has not already asked about what else farmers can do with the land, point out that since the market is saturated, there is no need for additional corn, farmers will instead use the land to grow cabbage.
Remind interviewee that cabbage is 1/5 as profitable as sugar.

140
Calculations (cont.)
Math solution 2
• Solution - Trucking
• Variable trucking costs, which represent 95% of the total cost structure, will decrease by 50%, leading to an overall costs savings of 95% x 50% = 47.5%.
• Solution - Refining
• Refining costs have two components. Initially the costs will drop by 50% because only half as many sugar beets need to be refined. However, the variable cost/beat increases by 25% for the new sugar beets. In step the costs go from “X” to “.5X” to “.625X”, an overall cost savings of 37.5%.
• Solution – Distribution
• There are no cost savings in distribution.
Math question 2 – Value Chain
What do you think the value chain process looks like for Vindaloo?
Hand interviewee Exhibit 1 and have them walk through their initial thoughts.
What are the cost savings from Trucking, Refining, and Distribution using the new seeds?

141
Exhibit 1: Vindaloo Value Chain
Vindaloo Value Chain Processes
40% 10% 30%Percent of total cost
Fixed5%
Variable*95%
Variable100%
Variable cost is directly related to weight
Cost changes with new seeds
25% additional cost/beet with new
seeds
10% increase with new seeds
20%
No change
Farming Trucking Refining Distribution

142
Calculations (cont.)
Math solution 3 – 20%
Math question 3 – Total cost savings
What are the total cost savings in the value chain?
Step A – Cost Portion B – Cost Savings Weighted Cost Savings (A x B)
Farming 40% 10% 4%
Trucking 10% 47.5% 4.75%
Refining 30% 37.5% 11.25%
Distribution 20% 0% 0%
Total 100% 20%

143
Calculations (cont.)
Math solution - $4 Billion
• Solution – Net present value of cost savings
• Our client’s product will save 20% a year in sugar costs - multiplied by the $2 billion market size, that cost savings comes out to $400 million per year.
• Therefore the company can be valued at:
• Value = $400M / (12% - 2%)
= $4 Billion
Math question - NPV
How would you price Vindaloo to potential buyers?
Remind the interviewee that the market size is $2 billion; the growth rate is 2%; assume a 12% discount rate
If the interviewee cannot recall the perpetuity formula, provide it for them
Value = annual cash savings / (discount rate – growth rate)

144
Solution and recommendations
Solution & Recommendations
This product will only allow our client’s clients (sugar growers) to produce sugar more efficiently. It won’t cause the sugar to taste any better or cause consumers to demand more of it. Therefore the product cannot be expected to grow revenue, but it will reduce costs. The value of Vindaloo Corporation is directly related to cost savings.
After running the NPV analysis, Vindaloo Corporation should be valued at $4B.
The interviewee should also identify a number of risks and potential benefits along the way (i.e. adoption rates given the required change to farmland and likely capex for equipment, competitive response, other uses for sugar in adjacent or completely separate markets, other uses for newly acquired farmland, potential buyers, government intervention, etc.) before making their final recommendation.
Bonus/Guide to an Excellent Case
This is a quantitatively heavy case. A excellent interviewee can quickly identify the important drivers of cost and can crunch the numbers easily and with little error. Additionally, they will organize the data in a tabular form for ease of calculation and presentation.
Additionally, an good interviewee will synthesize each relevant cost savings, the final valuation, and next steps/risks as part of their final presentation.

145
DigiBooks Inc.
Case tracker
Industry: Tech/Telecom
Case Format: Developing a new product
Concepts Tested:
- Marketing Strategy
- Customer strategy
- Creativity
Case Question
Our client, DigiBooks, is a manufacturer and seller of electronic book readers (tablets). DigiBooks also distributes e-books for the tablets through their website. The tablet is only compatible with books sold through the DigiBooks site.
DigiBooks is planning the launch of its tablets in a country where no electronic book readers are currently sold. Only 1% of the population has ever used an electronic book readers , though 50% is aware of the concept. The Chief Marketing Officer of DigiBooks has come to you to help determine:
How should DigiBooks launch and market DigiBook tablets in this new country?
Guide to interviewer
The case primarily tests the understanding of marketing concepts, specifically a new product launch.
The case is written in McKinsey style format; the interviewer is expected to guide the interviewer step by step through each question.
Begin by laying out the situation and case question, allow the interviewee to layout their structure, and then jump immediately to question 1. The interviewer is expected to drive this case rather than the interviewee.
By: Shobhit Chugh (Kellogg Class of ’11), Edited By: Adam Louras (Kellogg Class of ’11)
Quant: 4
Structure: 7
Industry: Tech
Framework: New Product/
Market Entry
Interviewer-Led Case

146
Clarifying answers and case guide
Interviewer Guide to case and handouts
Case Structure – Interviewee’s structure should cover the key areas needed to explore in order to determine how DigiBooks should launch and market the tablets in this country.
• The interviewee should take a few minutes to sketch out a framework for analysis of the marketing plan
• Key elements expected to be included in this framework are:
• Segmentation, targeting and positioning: Are there particular segments in the population that will be ideal customers for us?
• Product: What key capabilities are people looking for? Can we use our existing products or do we need to develop a new one for this country?
• Price: What price should the tablets and books be sold at? What is customers willingness to pay? Should we price the tablet at a low price so as to capture most of the market, and make margin on e-books?
• Promotion: How should the tablets be marketed? What promotion mechanisms should be used?
• Place/Distribution: Should the tablets be sold through retail channels, internet or other alternative means?
• Selection of e-books: Is a wide selection of books available for this country?
Prompts 1-3 – After the interviewee has laid our their structure, begin by asking the question in Prompt 1. Once each prompt has been sufficiently covered, move to the next prompt. After all prompts are complete, ask the interviewee to summarize their findings. NOTE: Prompt 2 allows for creativity, so use your judgment when evaluating.
Clarifying answers to provide if Asked
Industry Definitions
- Electronic book readers: Is a software, hardware and network platform that utilizes wireless connectivity to enable users to shop for, download, browse, and read e-books, newspapers, magazines, blogs, and other digital media.
Client Characteristics
- DigiBook’s Tablet: Uses an e-ink electronic paper display that features 16 shades of grey. This allows for a 12 hour long battery life and easy readability.
- Locations: DigiBook has never sold a product outside of the US.
Competitive Dynamics
- No competitors in the e-book or tablet space plan to enter this country
Market Characteristics
- Total population of the country 76MM, high literacy level

If unclear, the interviewee should answer this with a 1-year Profitability calculation for each of the Sales Channels and back out the Upfront Investment. They should ignore all other costs.
There is no missing data; however, the Market Size of 20M people in the OR segment is needed from Exhibit 1 and the price per e-book of $10.
Using Exhibit 2, interviewee should calculate:
Retail Profit = [(10 Books x $10/book x 50%GM) + ($100/tablet x 30%GM)] x (20M People x 50% reach X 40% Penetration) = $320M - $20M II = $300M
Internet Profit = [(10 Books x $10/book x 50%GM) + ($100/tablet x 60%GM)] x (10M People x 10% Penetration) = $110M - $10M II = $100M
ANSWER: Sales Channel to Use = Retail with a profit of $300M
147
Key elements to analyze
Prompt #1: Cust. Strategy (Exhibit 1)
Through research, we found several segments. (Hand out Exhibit 1). We are only able to target one segment with our product.
Using a 3-year projection, which segment should DigiBook target?
Prompt #2: MKT Strategy
DigiBooks is now considering how it should sell its e-book readers: through retail stores or through the internet.
How would you go about evaluating this decision?
Prompt #3: MKT Strategy (Exhibit 2)
Based on revised market estimates, we decided to price the e-reader at $100 and target the Occasional Reader segment.
Using this information and Exhibit 2, can you estimate the profit potential of each of these sales channels? Which should we choose?
What segment would you recommend to your client?
Notes on Exhibit 1
If unclear, the interviewee should answer based on Revenue Potential (i.e. Ignore probability of purchase) assuming all tablet sales happen immediately (Ignore TVM).
The missing data is that the average price of an e-book is $10, for each of the segments, and that e-books and tablets have the same margin
Using Exhibit 1, interviewee should calculate:
SR Revenue = [(15 books x $10 X 3 Years) + ($200 x 1 tablet)] x 8M People = $5.2B
OR Revenue = [(10 books x $10 x 3 Years) + ($125 x 1 tablet)] x 20M People = $8.5B
RR Revenue = [(5 books x $10 x 3 Years) + ($175 x 1 tablet)] x 10M People = $3.25B
ANSWER: Segment to be targeted = occasional readers (OR) with a Revenue Potential of $8.5B
Notes on Prompt #2
• Retail Channel Sample Responses:
CONS:
Lower margin due to value chain expansion
Will take time and money to set up and adds training costs
PROS:
Should encourage Trial of the product
Retailers can help with joint marketing campaigns
Retailers can help with customer service, returns
• Internet channel Sample Reponses:
PROS: Likely cheaper to establish, will result in higher margins
CONS: Hard to encourage trial
Notes on Exhibit 2

148
Solution and recommendations
Solution & Recommendations
Overall, DigiBooks should launch the e-book reader for the Occasional Reader segment through the Retail Sales Channel.
Based on our calculations, we expect to earn a $300MM annual return
Other items to consider:
What advertising mechanisms do we use in this case?
Do we setup a manufacturing facility in the country or do we source the products from our current manufacturing facilities?
Are there any prospects of competitors entering the market?
Bonus/Guide to an Excellent Case
An better interviewee notices key nuances in the case such as: Time Value of Money impacts on Exhibit 1 and Probability of Purchase or Penetration on Exhibit 1
An excellent interviewee will detail various elements of marketing strategy of a new product launch
A key element of this case is being able to do relatively complex calculations at a fast pace. Laying out the tables appropriately for this case is essential to success

149
Exhibit #1: Market segments
Segment Size
Super Readers (SR) 8M
Occasional Readers (OR) 20M
Rare readers (RR) 10M
$200
$125
$175

150
Exhibit #2: Channel decisions
Channel Reach as a
% of Total
potential market
E book
Gross
Margin %
E-reader
Gross
Margin %
Penetration Overheads
Retail 50% 50% 30% 40% $20M
Internet 50% 50% 60% 10% $10M

151
Health Coaches
Case tracker
Case Question
Our client is a large national health care payer (health insurance company, think Aetna) exploring the launch of a new disease management (“DM”) program to better serve its 5 million members. The idea is to hire and train a team of “Health Coaches” to specialize in a single disease area (e.g., heart disease, diabetes, etc). Each Coach will manage a portfolio of patients to reduce the costs of overall health expenditures (e.g., reminders to take drugs, provide limited medical advice, suggested diet, etc). Studies show that once a month contact with each patient reduces health spending by 5%, on average.
Should our client launch the program? If so, what steps should it take?
Guide to interviewer
The case tests the interviewee’s ability to probe and develop a customer segmentation, digest a relatively complex chart, isolate the most critical information and determine profitability
The data provided by both exhibits should be requested; try not to show the exhibits until need for the data is demonstrated
Strong interviewees should use common sense to make reasonable assumptions before you provide required inputs
By: David Wellner (Kellogg Class of ‘11), Edited By: Craig DePriester (Kellogg Class of ‘12)
Industry: Healthcare
Case Format: Developing a new product/Service
Concepts Tested:
- Customer strategy
- Break-even analysis
Quant: 8
Structure: 6
Industry: Healthcare
Framework: New Product/
Market Entry

152
Clarifying answers and handout guide
Guide to handouts
Before showing exhibits, interviewee should convey the essence of the case: Are the costs associated with the DM program justified by the savings?
Sample set-up:
Exhibit 1 – Hand out when interviewee establishes need for understanding client’s membership segmentation and/or exposure to disease areas. If he/she is not headed there alone, you can ask “how would you segment the client’s members?” “What can we get out of this chart? Please let me know if you have questions” Definitions (if needed): Group are employee sponsored plans (e.g. ,if you work
for McKinsey, you are in a group plan), Individual are non-groups (e.g., private contractors, unemployed, etc). 65+ (see asterisk below chart).
“Which segment is likely to generate the greatest per member costs.? Why?” “Which disease area should we look at first?”
Exhibit 2 – Hand out when interviewee asks for medical cost data. Try to avoid handing out exhibit 2 until exhibit 1 has been discussed (hint: if interviewee leads with profitability, steer him/her to first think about the customer segmentation) “What can we do with this information?”
Clarifying answers to provide
Competitive dynamics (not core to case)
With spiraling health care costs, the industry is under pressure to innovate new products that will control spending
Assume client is first to market
Past attempts to purely automate DM have yielded minimal savings
Health Coaches
All activity conducted remotely via phone/email
Typical profile is registered nurse that wants to work from home
It’s difficult to actually reach patients, so Coaches can contact 8 members per day (assume 25 days per month)
Annual costs per Coach: $60K salary +20% other (training, benefits, laptop, etc)
- There are no other program costs
Program Savings
- Customer segmentation by disease area and cost per member
Program Costs
- Salary and other- Portfolio
size/capacity (members/coach)
Risks
- Do assumptions hold?- Competitive response- Regulatory, liabilities

153
Key elements to analyze
Segmentation and disease focus
Using Exhibit 1, discuss which segments and disease areas are most important to explore
Program profitability
Leveraging all data (Both Exhibits), interviewee should determine if Health Coaches are profitable in each of the three segments
Notes to interviewer
Interviewee should choose to focus on the 65+ segment
65+ (Medicare) patients are the sickest, followed by Individual
Group members are the healthiest (younger, working)
Sicker patients are likely to drive higher costs, which will make them riper candidates for the DM program (i.e., the 5% cost reduction will have a bigger impact)
Interviewee should choose to focus on diabetics (Assume all are Type 2 for the purposes of this case)
Diabetics make up the largest portion of sick members
As a chronic disease primarily brought on by behavior, T2 diabetics are most likely to benefit from DM program
Number of 65+ diabetics:
Notes to interviewer
Cost per Coach:
Size of Portfolio:
Savings for one portfolio of 65+ diabetics:
Overall savings:
Conclusion: Profit is $72K per Health Coach, 2x cost of a Coach Based on PMPM diabetic cost data, Individual segment is
break-even (50% less savings), Group segment is a loss
8𝑐𝑜𝑛𝑡𝑎𝑐𝑡𝑠 𝑝𝑒𝑟 𝑑𝑎𝑦
+ 25
𝑑𝑎𝑦𝑠 𝑝𝑒𝑟 𝑚𝑜𝑛𝑡ℎ
=𝟐𝟎𝟎
𝒎𝒂𝒙.𝒑𝒂𝒕𝒊𝒆𝒏𝒕 𝒑𝒐𝒓𝒕𝒇𝒐𝒍𝒊𝒐
$144𝐾
𝑠𝑎𝑣𝑖𝑛𝑔𝑠 −
$72𝐾
𝑐𝑜𝑠𝑡𝑠=
$72𝐾
𝑝𝑟𝑜𝑓𝑖𝑡𝑝𝑒𝑟 𝐶𝑜𝑎𝑐ℎ
𝑥 2,000
𝐻𝑒𝑎𝑙𝑡ℎ 𝐶𝑜𝑎𝑐ℎ𝑒𝑠
=$𝟏𝟒𝟒 𝑴𝑴
𝒑𝒓𝒐𝒇𝒊𝒕𝒑𝒆𝒓 𝒚𝒆𝒂𝒓
20%
𝑠𝑒𝑔𝑚𝑒𝑛𝑡 % 𝑥
40%
% 𝑑𝑖𝑎𝑏𝑒𝑡𝑖𝑐 𝑥
5MM
𝑚𝑒𝑚𝑏𝑒𝑟𝑠=
𝟒𝟎𝟎,𝟎𝟎𝟎
𝟔𝟓 +𝒅𝒊𝒂𝒃𝒆𝒕𝒊𝒄𝒔
$300𝑎𝑣𝑔.𝑃𝑀𝑃𝑀
𝑥 4
𝑑𝑖𝑎𝑏𝑒𝑡𝑖𝑐𝑓𝑎𝑐𝑡𝑜𝑟
𝑥 5%𝑎𝑣𝑔.
𝑠𝑎𝑣𝑖𝑛𝑔𝑠
= 60 𝑥 12
𝑚𝑜𝑠. 𝑥
200
𝑝𝑎𝑡𝑖𝑒𝑛𝑡𝑝𝑜𝑟𝑡𝑓𝑜𝑙𝑖𝑜
=$𝟏𝟒𝟒,𝟎𝟎𝟎
𝒔𝒂𝒗𝒊𝒏𝒈𝒔 𝒑𝒆𝒓 𝑪𝒐𝒂𝒄𝒉 𝒑𝒆𝒓 𝒚𝒓.
$60,000 + 20% = $72,000
Base Salary + other = per coach per year
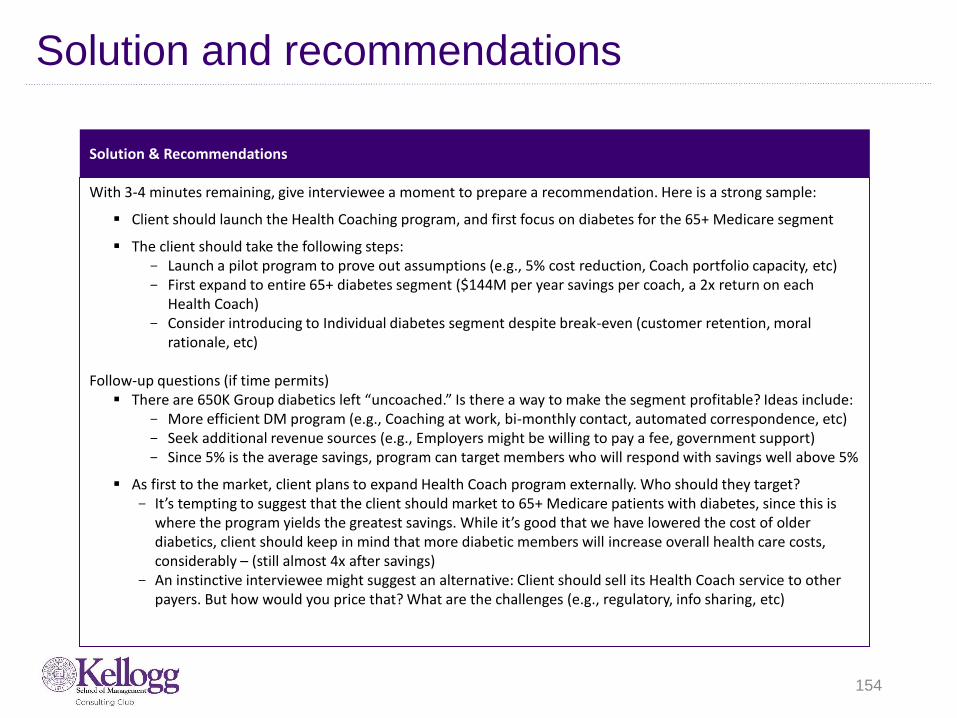
154
Solution and recommendations
Solution & Recommendations
With 3-4 minutes remaining, give interviewee a moment to prepare a recommendation. Here is a strong sample:
Client should launch the Health Coaching program, and first focus on diabetes for the 65+ Medicare segment
The client should take the following steps:- Launch a pilot program to prove out assumptions (e.g., 5% cost reduction, Coach portfolio capacity, etc)- First expand to entire 65+ diabetes segment ($144M per year savings per coach, a 2x return on each
Health Coach)- Consider introducing to Individual diabetes segment despite break-even (customer retention, moral
rationale, etc)
Follow-up questions (if time permits) There are 650K Group diabetics left “uncoached.” Is there a way to make the segment profitable? Ideas include:
- More efficient DM program (e.g., Coaching at work, bi-monthly contact, automated correspondence, etc)- Seek additional revenue sources (e.g., Employers might be willing to pay a fee, government support)- Since 5% is the average savings, program can target members who will respond with savings well above 5%
As first to the market, client plans to expand Health Coach program externally. Who should they target?- It’s tempting to suggest that the client should market to 65+ Medicare patients with diabetes, since this is
where the program yields the greatest savings. While it’s good that we have lowered the cost of older diabetics, client should keep in mind that more diabetic members will increase overall health care costs, considerably – (still almost 4x after savings)
- An instinctive interviewee might suggest an alternative: Client should sell its Health Coach service to other payers. But how would you price that? What are the challenges (e.g., regulatory, info sharing, etc)

155
Exhibit #1: Client’s member segmentation by health condition
* Members 65 years of age and above. Known as “Medicare Advantage”, premiums funded by government

156
Exhibit #2: Average cost data (Per Member Per Month)
Segment Average PMPM Average Diabetic
Individual $1504x
(Avg. PMPM)Group $100
65+ $300

High Q Plastics
Case Question
Our client, High Q Plastics, is an automotive parts supplier in the U.S. They primarily manufacture and sell plastic injection-molded parts, such as grills, door handles, decorative trim etc., to automotive customers.
The client has two primary revenue sources: large automotive OEMs, and aftermarket. The client has recently seen declining profits, primarily due to increased price competition from new overseas competitors in China. Annual profits have declined from $50M to $20M over the past few years.
What is the reason behind declining profitability? How can High Q improve profits? Can they reach $100M in profits by 2014?
Quants.
Structure
8
Comp. Als
Creativity
Ops.
5
157
By: Erin Brooks (Kellogg Class of ‘11), Edited By: Uri Kalir (Kellogg Class of ‘12)
Case tracker
Industry: Industrial Goods Case Format: Improving Profitability; Cost
Reduction Concepts Tested:
- Competitive Analysis- Creativity- Operations
Guide to interviewer
This case is interviewer led. It contains three portions:
1. Structuring a framework that helps to identify declining profitability
2. Brainstorming ideas to improve profits, on both the revenue and cost sides
3. Calculating whether or not the client can achieve $100M in profits in 2014, given the exhibits and trends
An effective interviewee should demonstrate clear and MECE approach at dissecting profitability, structured brainstorming in improving profits (e.g., brainstorming in buckets) and effectively using exhibits to outline the correct approach to calculating 2014 profits.
Quant: 8
Structure: 5
Industry: Industrials
Framework: Profitability

158
Clarifying answers and case guide
Clarifying answers to provide
Industry Characteristics/Market Economics
- Automotive sales overall still growing steadily, driven by emerging markets
- Automotive manufacturing is leaving the U.S.
Client Characteristics
- Client is currently one of the leaders in this category
- Client has U.S.-based manufacturing
- Revenues have been slowly declining over last 5 years
- Client’s products are of a higher quality than most Chinese competitors’ products
Competitive Dynamics
- Automotive OEM customers are looking to reduce cost, driving increased price competition among parts suppliers
Questions and Hand-out Guide
1. What key questions would you ask an industry expert in order to better understand the reasons behind High Q’s declining profits?
2. The CEO of High Q wants to know if$100M in annual profits is achievable by 2014. What would you need to know in order to determine this? What data would you ask for?
3. What ways can you think of to increase revenues? What ways can you think of to reduce costs?
4. Our client is planning on implementing lean manufacturing across all 4 of its U.S. plants, in order to provide cost savings and increase profits. Hand out exhibit 1.
• The client is expecting to produce 80% of 2010 volumes in 2014. They are also planning on reducing prices by 10% due to increased competition.
• Lean manufacturing implementation across all plants will provide an additional 20% savings in raw material, and 30% savings in labor.
• What is the change in profits the High Q CEO can expect from 2010 to 2014, based on this information?
5. High Q ‘s CEO has also asked us to take a look at competitive dynamics among the automotive OEMs, in order to predict any increase in profits from increased sales. Hand out exhibits 2 and 3.
• Based on the information given, what do you expect High Q will see in additional profits due to Toyota’s predicted 30% increase in market share in truck and SUVs?
6. Please summarize your findings to the CEO, including any other potential opportunities to increase High Q’s profits over the next few years.

159
Solution and recommendations
Solution & Recommendations
1. The interviewee should examine the following MECE questions about the competitive dynamics of the industry:
a) Industry: What is the sales volume trend? What is the % of demand and growth of OEM vs. aftermarket segment? Is one of these segments more profitable than the other?
b) Competitors: Who are they? What is their relative market share? What are their prices vs. our clients’? What is their cost structure vs. our clients’? Do they have a technology or quality competitive advantage relative to our client?
c) Revenue: How have our clients’ prices changed in recent years? Have they declined across all customers and products?
d) Costs: What trends is our client seeing in their cost structure? Increasing labor or material costs?
2. In order to understand if $100M in profits by 2014 is achievable, you would need to know the annual qty of units sold, the selling price, and the clients’ fixed and variable costs. Profit = Q*(P-VC) – FC
3. The interviewee should come up with 2-3 ways each for cost reduction and increasing revenues:
a) Reduce Cost: find alternative material sources, invest in process automation to reduce labor, consolidate multiple manufacturing sites to reduce SG&A costs, relocate close to customers to reduce transportation costs.
b) Increase Revenue: segment customers to determine sensitivity to price, increase marketing in aftermarket segment, negotiate long-term contracts with OEM customers.

160
Solution and recommendations (2)
Solution & Recommendations
4. The interviewee should use the information provided in Exhibit 1 to calculate the following profitability for each plant in 2014, and walk the interviewer through the calculation steps. It is important to first note that revenues, labor, and material will decrease by 20% due to the reduced quantity output from each plant, plus the additional 20% savings in material and 30% in labor. Revenuewill decrease by an additional 10%, in a cost cutting maneuver. Overhead costs will not change.
From this calculation, the interviewee should reference back to question 2. Even with the lean manufacturing implementation, High Q is still a long way from the CEO’s goal of $100M in annual profits, and this is therefore not a realistic target. A strong interviewee should note the importance of aligning a client’s expectations.
*all figures are in $ million USD.
Plant A Plant B Plant C Plant D
Revenues 72.0 72.0 72.0 72.0
Labor 11.2 22.4 33.6 16.8
Material 35.2 25.6 12.8 22.4
Overhead 20.0 15.0 15.0 30.0
Net Profits 5.6 9.0 10.6 2.8
Total 2014 Profits 28.0
Additional Profits 8.0

161
Solution and recommendations (3)
Solution & Recommendations
5. The interviewee should be able to use the information provided in the Exhibits to calculate the following revenue growth (“Sales” figures below are in units/vehicles). Rounded answers ($13 or $14M) are fine, given that interviewee has already demonstratedmath proficiency.
5. The interviewee should concisely summarize the overall goal of the case (to increase High Q’s declining profitability due to new,low-cost competition), and main findings from each question, and a recommendation (yes, High Q should implement the lean manufacturing initiative, while recognizing that this initiative alone will not hit the CEO’s total profit goal in 2014). The interviewee should also generate a list of additional opportunities that were not explored in the case, including:
a) Consolidation of the 4 manufacturing plants (especially Plant D, with its high overhead costs)
b) Pursue growth in the aftermarket segment of their business
c) Diversify their business into plastic injection-molded parts for other industries (outside of automotive), with less price competition
2010 2014
U.S. Auto Market 16,000,000
U.S. Truck & SUV Sales 3,200,000
Toyota Truck & SUV Sales 320,000 1,280,000
High Q's Toyota Qty. Sold 224,000 896,000
High Q's Toyota Revenues 4,480,000$ 17,920,000$
Additional Revenue 13,440,000$
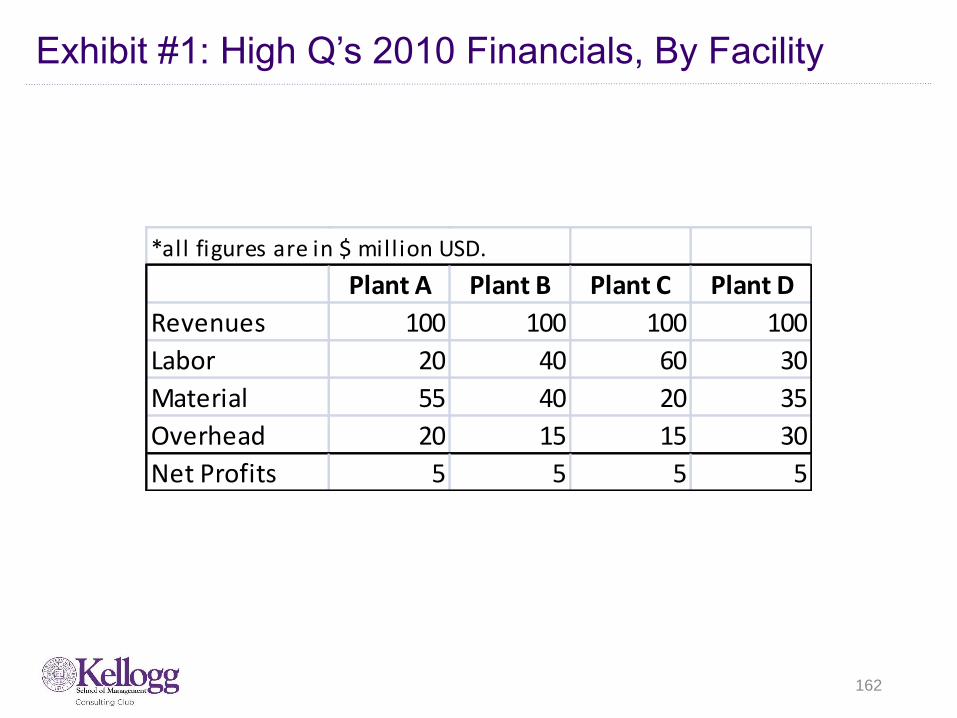
162
Exhibit #1: High Q’s 2010 Financials, By Facility
*all figures are in $ million USD.
Plant A Plant B Plant C Plant D
Revenues 100 100 100 100
Labor 20 40 60 30
Material 55 40 20 35
Overhead 20 15 15 30
Net Profits 5 5 5 5

163
Exhibit #2: 2010 U.S. Automotive Market
38%
42%
20%
2010 U.S. Automotive Sales
Compact cars
Full-size cars
Trucks &SUVs
*Additional Information
2010 U.S. Automotive Sales = 16 Million vehicles

164
Exhibit #3: U.S. Automotive OEM Market
33%31%
19%
10%7%
21% 20%
14%
40%
5%
0%
5%
10%
15%
20%
25%
30%
35%
40%
45%
Ford GM Chrysler Toyota Nissan
OEM Truck / SUV Market Share 2010-2014
2010
2014
*Additional Information
High Q supplies 70% of Toyota's business
Avg. Price of High Q products sold to Toyota = $20

165
Zoo Co.
Case tracker
Industry: Financial Services
Case Format: M&A
Concepts Tested:
- Investments
- Break-even Analysis
- Basic NPV
Case Question
Our client is a zoo that is thinking about acquiring a famous zebra from an African preserve.
It’s a huge investment, but they believe the new zebra would be a great contribution to their animal community. You have been engaged to help decide whether this is a good idea. What would you consider when trying to help your client make this decision?
Guide to interviewer
Even though the client is a Zoo, we're undertaking a similar process to what is done when underwriting an insurance policy. The case evaluates basic concepts, but involves many calculations and use of financial and assessment techniques.
Key case objectives:1. Investment Valuation – Walk through the
valuation process for an asset 2. Breakeven Analysis – Determine the revenue
increase needed for a positive NPV3. Risk Assessment – Should the zoo should use an
insurance contract to hedge downside risk? Rounding numbers is generally okay but should not be
done to the extreme as it will alter the results
By: Aneri Jambusaria (Kellogg Class of ’11), Edited By: Ron Mantel (Kellogg Class of ‘15), Matthew Heintz (Kellogg Class of ‘16)
Quant: 7
Structure: 5
Industry: Fin. Services
Framework: M&A

166
Zoo Co.: Clarifying answers and case guide
Guide to case / Guide to handouts
• The interviewee should think about performing a break-even and a sensitivity analysis. Afterwards, they need to think about performing a risk assessment (only when you reach this point should you deliver exhibit 1)
• They should start by asking about the benefits and costs associated with zebra acquisition (Left)– Share with interviewee after probing questions are received
• Using the data on the left to calculate benefit to zoo from acquisition
- Determine whether or not this zebra purchase makes financial sense for the zoo, using the NPV value
• Using the cost and benefit data provided, the interviewee should calculate the NPV of the acquisition
• Assume that attendance benefits are realized immediately and maintained thereafter
- Annual benefits = (300K)*($15)*(0.08) = $360K
- Upfront costs = $235K + $850K + $110K = $1.195M
- Annual costs = $90K
- NPV = -$1,195K+(($360K - $90K)/0.20) = $155K
• Continue by asking questions in next page
Clarifying answers to provide
• Data to provide when asked
- 300K people visit the zoo annually - Admission is $15 per person- Benefits from zebra acquisition could lead
to increased attendance. Another zoo that acquired a similar zebra had an 8% increase
• Costs from zebra acquisition
- Immediate costs: acquisition fees, transportation costs, and new facilities.
- Food, health costs and additional trainers are part of annual maintenance costs
- Acquisition cost: $235K - New facilities: $850K - Transportation: $110K - Annual maintenance: $90K - Discount rate = 20% Assume that
immediate cost are paid today, and annual costs and benefits are realized beginning next year and sustained into perpetuity, even though the Zebra will not live on to perpetuity

167
Zoo Co.: Key elements to analyze
Break-even analysis
Zoo Co. is concerned about using the other zoo’s attendance benefits as a proxy. They think that attendance could increase by less than 8%. What analysis could you perform to address their concerns? What is the breakeven attendance increase required?
Risk assessment
Since the zoo is very risk-averse, they’re interested in hedging some of their downside risk. An insurance company has offered to provide the Zoo with a constant revenue to increase revenue to $250,000 per year if attendance increases are less than or equal to 5% (if revenue is $135K, the insurance will give the Zoo, $115K). In exchange, the insurance company wants the zoo to pay 1% of the zoo’s total annual revenues as a premium. What might you do to determine if this was a good deal?
Notes to interviewer
The interviewee should determine that a sensitivity / breakeven analysis of the NPV calculation with lower attendance increases will help confirm that the project still makes sense
See calculations page
Notes to interviewer
The interviewee should recognize that additional information is needed, and that a market research study could aid in this process
Hand out Exhibit 1 after the interviewee identifies this notion
The interviewee should use the market research to determine the probable attendance increase

168
Zoo Co.: Calculations
Math questions
1. What is the breakeven attendance increase required?
2. Do you think the insurance company is providing a good deal to the zoo?
Calculations
1. Break-even: = -$1,195,000+((revenue-$90,000)/0.20)
($1,195,000)x .20 = revenue-$90,000
revenue = $239,000 + $90,000 = $329,000 (*required additional revenue to break even)
$329,000 = (300,000) x (15) x (% increase)
% increase = ($329,000 / $4.5M) = 7.3%
After handing over exhibit 1
2. Annual cost to zoo: 1% of total zoo revenues = (0.001)*($4,752,000) = $47,520
Annual expected benefit to zoo = ($250,000 - $225,000)*(0.40) + ($250,000 – 135,000)*(0.20) = $33,000
Costs > Benefits, so this is not a good deal

169
Zoo Co.: Solution and recommendations
Solution & Recommendations
It is unlikely that the zebra acquisition is a good idea for the zoo to undertake given the information provided. At other zoos,attendance has gone up substantially due to a new zebra; however, based upon our market research, it seems less likely that we can breakeven on the investment through increased attendance. We have received an insurance contract to help mitigate some ofthe downside risk; however, it is too expensive to create value.
In order to make the investment more palatable, we may consider negotiating with the insurance company to either increase therevenue benefits provided or decrease the premium cost.
Bonus/Guide to an Excellent Case
Excellent cases will:
Identify that we can use another zoo's attendance increases as a proxy for estimating our own attendance increases
Notice in Exhibit 1 that it is unlikely that attendance will increase sufficiently enough for the zoo to break even
Notice that the insurance company's premiums and benefits are both impacted by attendance increases; so if attendance increases are always greater than 5%, the zoo will be paying even more but getting no benefit
Notice that the insurance company's contract is essentially an option; so a different structure to the contract may be more suitable for the zoo

Exhibit 1: Market Research Findings
170
Exhibit 1: Market research findings
3% Increase $135,000 20%
5% Increase $225,000 40%
7% Increase $315,000 30%
9% Increase $405,000 10%
Expected Additional
Annual Revenue
$252,000
Plus: Current Annual
Revenue
$4,500,000
Expected Total
Annual Revenue
$4,752,000
Possible Attendance
Increases
ProbabilityAnnual Revenue

171
Thompson Healthcare
Case tracker
Case Question
Our client is Thompson Healthcare, a health insurance firm located in the Midwest.
Customers pay Thompson a fixed monthly premium per person covered under the plan. In exchange, Thompson pays for all health services that each member requires (e.g., physician care, prescription medications, hospitalization).
In recent years, Thompson’s financial and competitive position has begun to erode, and the CEO has retained our firm to help them determine what is causing the problem and how to fix it.
Guide to interviewer
By: Aaron Mowery (Kellogg Class of ‘13)
Industry: Healthcare
Case format: Cost reduction
Concepts being tested:
- Cost management
- Sales channel strategy
- Economic value analysis
Read to the Interviewee before beginning:This case is based on a real McKinsey study, and has been formatted as a McKinsey-style structured case.
Before asking you any questions about the case, I will give you the background that you will need.
There are a number of issues that I would like to cover with you today; please do not be surprised if I seem to change topics abruptly.
Quant: 8
Structure: 9
Industry: Healthcare
Framework: Cost
Reduction
Interviewer-Led Case

172
Clarifying answers and case guide
Guide to case / Guide to handoutsClarifying answers to provide
State the information to the left after reading the initial prompt, the interviewee should be able to develop a variant of the following question:
How can Thompson Healthcare reduce its total cost to serve its policy holders?
Ideally, the interviewee should be able to break down the question into two parts:
1. Managing medical costs2. Managing administrative costs
This case is formatted as a McKinsey-style structured case. You should ask the interviewee the questions on pages 3-7 of this case directly and move on to the next page when the interviewee has answered the question sufficiently.
Client Characteristics• Thompson Healthcare is a mutual insurance
company, meaning all of its profits are returned to members in the form of lower premiums the following year. As such, Thompson does not seek to maximize profit – it seeks to minimize cost.
• Thompson’s prices reflect underwriting of risk and the underlying cost to serve a customer
Competitive Dynamics• Market share is steady, despite presence of
major national health insurance company in the market (United Healthcare - UHC).
• UHC has a 30% market share.• UHC typically expects to earn a 5% profit
margin.
Local industry Characteristics/Economics• The national average rate of medical cost
inflation is 10% over the past five years.• Thompson has seen medical cost inflation
of 12% over the past five years.• UHC has seen medical cost inflation of 10%
over the past five years.

173
Key elements to analyze
Problem structure
What factors would you consider in order to understand Thompson’s eroding financial position?
Note to interviewer
The interviewee should lay out a structure for analyzing the case.
The interviewee could have determined that revenue is not relevant to this case based on information given in the initial prompt on page 1 and 2, so the interviewee should focus on cost.
Costs in this case break out into fixed costs and variable costs:
Variable costs (medical costs – claims made by policyholders)
Fixed costs (administrative costs – e.g., marketing & sales, underwriting, finance, HR)
Specifically, we will need to understand how these costs have changed in recent years.
1

174
Key elements to analyze
Initial hypothesis
Medical costs are the largest component of Thompson’s costs. However, Thompson’s medical costs are increasing faster than the national average. What are some potential reasons why this is taking place? What potential opportunities could you explore to reverse this trend?
Note to interviewer
Medical cost = (Number of claims) * (Cost per claim)
Potential answers include:
Deductibles are low, leading members to see doctors for minor medical issues -> increase deductibles to make members more conscious of costs
Thompson pays more for procedures than average -> conduct benchmarking study to determine what competitors charge for various procedures
Thompson insures an older population than average -> increase marketing efforts toward younger customers
Thompson insures a sicker population than average -> enhance wellness programs
2

175
Key elements to analyze
Second hypothesis
In addition to medical costs, administrative costs for Thompson are also higher than average. The biggest driver of this phenomenon is a high cost of sales. Thompson’s policies are sold through independent agents. All independent agents work with a “General Agency” which acts as a sales support organization. How much does Thompson pay in commissions each year? What are some potential approaches Thompson could take to reduce its cost of sales? What potential strategic issues exist with these approaches?
Note to interviewer
Additional information to provide after interviewee explains how they would calculate commission expense
Commission (10% of annual premiums) is paid to the General Agency, which passes a share to the independent agent. Total commission paid is, on average, $25 per agent, per month.
Interviewee should identify the need for # of agents. Give the number 500,000 if asked.
Total commission expense = $25 * 500,000 * 12 = $150,000,000
Potential approaches to reduce cost of sales:
Reduce commission percentage
Cap commission to a certain level per year
Change commissions structure from percent of premium to flat fee (percent of premium increases at the rate of medical cost inflation every year)
Potential risks with these approaches:
Agents could shift business from Thompson to another carrier that pays higher commission
Agents would lose incentive to sell if their commission is capped
3

176
Key elements to analyze
Next level of analysis
The team has decided to pay a flat commission directly to agents, and to pay the General Agencies a separate fee for the support services they provide to agents. If the total commission paid to both parties is set at $20 per member per month, what share should be given to the General Agencies?
(If interviewee is unsure of “what share” means, explain they should find the maximum amount that should be allocated to the General Agencies.)
Note to interviewer
Additional information
General Agencies perform three activities: training, application processing, and performance management.
If Thompson were to perform these activities internally, they would cost:
Training: $6,000,000
Application processing: $9,000,000
Performance management: $15,000,000
Potential approach
The total cost of the activities that General agencies perform is $30,000,000 (=$6,000,000 + $9,000,000 + $15,000,000).
There are 500,000 members and 12 months in a year.
The maximum amount of money Thompson should be willing to pay the General Agencies for the activities performed is the per member, per month cost of these activities ($30,000,000 / (500,000 * 12) = $5
4

177
Wrap-up
Final recommendations
Taking into account what you’ve learned thus far as well as your own additional hypotheses, what initiatives would you recommend to the CEO at this point?
Note to interviewer
Our client should take action to reduce both medical costs and administrative costs.
At this point, the interviewee should synthesize the findings from the interview into several clear initiatives, for example:
Enhance marketing efforts to attract more young customers and bring down the average claims per member.
Conduct a benchmarking study to determine opportunities for reductions in payments for medical services.
Change the commission structure to flat fee per member per month. This achieves the goal of reducing commission expense, while at the same time keeping an agent’s incentive to sell more business.
Strong interviewees will demonstrate the ability to analyze issues using a clear structure and will draw out the implications of their analysis. The quantitative calculations in this case are elementary, but the process to get to them is somewhat more complicated.
5

178
Syzygy Supercomputers
Case tracker
Industry: Tech & Telecom
Case format: Improving profitability
Concepts being tested:
- Competitive analysis
- Operations
Case Question
Syzygy Supercomputers is a large international fully-integrated computers and communications company with annual revenues of approximately $20 billion U.S. In the past several years, the company has seen a steady decline in profits.
The CEO has asked us to look into this problem. How can Syzygy Supercomputers get back on track?
Guide to interviewer
This case is about a tech company undergoing a decline in profitability, despite a strong competitive position. Syzygy has been overinvesting in R&D relative to its returns and performance has suffered as a result.
The interviewee is expected to go through these general steps while presenting a solution:
1. Confirm profitability issues and ask to see historical revenue and cost information.
2. Ask to see market position and related data.3. Realize that this case is going to be decided
based on information regarding the products. 4. Identify the main issue affecting profitability –
the company’s R&D spending
By: Edwin Van Dusen, Brian Fox and David Welch (Kellogg Class of ‘04), Edited By: Uri Kalir (Kellogg Class of ‘12)
Quant: 3
Structure: 7
Industry: Tech
Framework: Profitability

179
Clarifying answers and case guide
Interviewer Guide to Case
A sample case structure would include the following:
1) Examination of historical performance to deep-dive declining profits.
2) Discussion of market dynamics and competitive positioning.
3) Deep-dive into drivers and profitability , ultimately leading to a discussion of SG&A
Necessary Information that should be given only when specifically asked for by interviewee:
Historical costs, revenues and profits – exhibit 1
Note that the interviewee should be asking for historical trends in the company’s profitability. If they are asking only for current profitability, interviewer should point them in the direction of historical trends
Market data – exhibit 2 followed by exhibit 3
Interviewer should give the interviewee a few seconds to understand slide 2 and then handout slide 3. Interviewer should ask interviewee which product in slide 3 is which (on slide 2).
R&D spending data – exhibit 4 and exhibit 5
The candidate will naturally ask about potential drivers of profitability (S&GA expense, COGS, etc.).
These exhibits should only be given once the candidate has identified R&D as a driver of Syzygy’s profitability.
Clarifying answers to provide if Asked
General Information on Syzygy
- Only the information that has already been given. Other information currently unavailable.
Competitive Dynamics
- There are several players in the market, but everything has remained stable from a competitive standpoint.
Profitability drivers
- COGS, SG&A, and other profitability factors are on-par with Syzygy’s competitors (except for R&D, about which the candidate should ask specifically).

180
Key elements to analyze
Interpreting Exhibit 3 Notes on Exhibits 2 & 3 Notes on Exhibits 4 & 5
The X axis represents absolute market share (AMS), which correlates with the height of Syzygy’s rectangles in exhibit 2.
The Y axis represents relative market share (RMS), calculated as Syzygy’s market share divided by the market share of the closest competitor. If Syzygy is the market leader, this number is greater than 1. If Syzygy is not the market leader, its market share divided by the market leader’s share will be lower than 1. This correlates with the the ratio of the height of Syzygy’s rectangles to that of competitors’ rectangles for each product in exhibit 2.
The diameter of the bubbles is driven by Syzygy’s total revenues in that category, comprised of its market share in the category multiplied by the category’s size.
Correctly interpreting slides 2 and 3 will lead the candidate to correctly identify the products on slide 3:
Product #1 is custom applications
Product #2 is supercomputers
Product #3 is telecom equipment
Product #4 is satellites
Product #5 is operating software
The key insight in exhibit 4 is that Syzygy is the only major competitor in this industry whose R&D spending is below the “normative band”
We would expect each company’s degree of technical leadership to go up as it invests in R&D, but Syzygy, with slightly more R&D spending than Cray Research and Sonic Wave, enjoys less of a perception of technical leadership from its customers
Exhibit 5 builds on this point. The key insight is the absolute expense (not percentage) Syzygy is spending on R&D. Correct analysis will show that Syzygy is spending money on features that do not generate customers’ “willingness to pay”. Syzygy is spending money to develop features that consumers are not willing to pay for.

181
Solution and recommendations
Solution & Recommendations
The candidate should be able to produce one of the following insights:
Cut R&D to eliminate spending on unnecessary customer features.
Keep R&D spending the same, but switch the work to developing features that consumers will be willing to pay for at a level that is higher than the R&D expense itself.
A second-order insight from the case is that Syzygy should exit the operating software business (product #5 in this case) since its small market share will continue to erode as a result of economies of scale, network economics and the experience curve all working against it.
Bonus/Guide to an Excellent Case
An excellent interviewee will –
Take a few seconds to fully understand each of the complex graphs he/she is given before giving an answer.
Immediately ask about R&D spending and not go through COGS or SG&A first (this is a hi-tech company, so R&D spending should be looked-at before other drivers of profitability).
Conclude their recommendation by not only stating that Syzygy should exit the operating software business, but also focus on the categories in which it is the market leader in order to get some or all of those economies to work for it and against its competition.

182
Exhibit 1: Syzygy’s Historical Costs, Revenues and Profits

183
Exhibit 2: Worldwide Telecom Computing Market (Today)

184
Exhibit #3: Syzygy’s Absolute vs. Relative Market Share

185
Exhibit #4: Companies’ R&D vs. Degree of Technical Leadership

186
Exhibit #5: Syzygy’s R&D Expenses and Selling Prices for Supercomputers
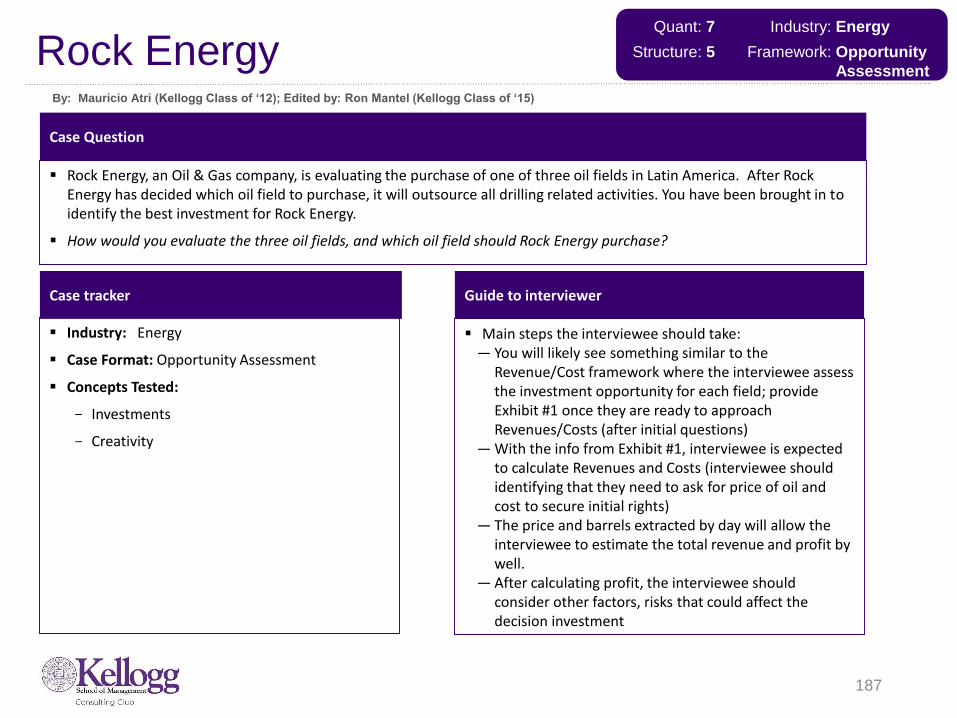
Rock EnergyBy: Mauricio Atri (Kellogg Class of ‘12); Edited by: Ron Mantel (Kellogg Class of ‘15)
Case tracker
Case Question
Rock Energy, an Oil & Gas company, is evaluating the purchase of one of three oil fields in Latin America. After Rock Energy has decided which oil field to purchase, it will outsource all drilling related activities. You have been brought in to identify the best investment for Rock Energy.
How would you evaluate the three oil fields, and which oil field should Rock Energy purchase?
Guide to interviewer
Main steps the interviewee should take:— You will likely see something similar to the
Revenue/Cost framework where the interviewee assess the investment opportunity for each field; provide Exhibit #1 once they are ready to approach Revenues/Costs (after initial questions)
— With the info from Exhibit #1, interviewee is expected to calculate Revenues and Costs (interviewee should identifying that they need to ask for price of oil and cost to secure initial rights)
— The price and barrels extracted by day will allow the interviewee to estimate the total revenue and profit by well.
— After calculating profit, the interviewee should consider other factors, risks that could affect the decision investment
187
Industry: Energy
Case Format: Opportunity Assessment
Concepts Tested:
- Investments
- Creativity
Quant: 7
Structure: 5
Industry: Energy
Framework: Opportunity
Assessment

188
Clarifying answers and case guide
Guide to case / Guide to handouts
Part 1 – Hand out exhibit #1 once the interviewee is at the point in their framework where they will analyze Revenue & Costs
- This handout should lead the interviewee to understand that each region will have different geological characteristics which will affect the drilling time, production, revenues and costs for Rock Energy
Part 2 – Profitability
- Provide the price of oil ($50/bbl) if the interviewee does proactively ask for it when trying to calculate profitability; ask the interviewee to work out the profitability for each field, and not only by well.
- The answer will be a function of the investment, variable costs, and quantity of oil extracted by field. This last variable will depend on the number of wells drilled in one year.
Part3 – Conclusion and other issues
- Rock Energy should choose to buy the rights for Region 2 because it will offer the best profits, but there are other factors that could impact the decision to invest:
- Insurance costs; political stability of the region; labor contracts and unions; volatility of oil prices; oil quality differences
Clarifying answers to provide
Industry Characteristics/Market Economics
- The rights being offered to Rock Energy gives them the right to drill during year 1, and produce oil for 20 years. Assume that no oil is produced until the beginning of year 2.
- Rock Energy can get the drilling operator to deploy a maximum of 10 rigs in each of the regions
- The cost of the rig day includes crew, consumables and services
- Any amount of oil being extracted will be sold at the spot market price of the moment
- For simplicity assume that the oil wells will produce the same amount of oil for the next 20 years with no maintenance costs
- The rights to extract oil cost $40M in each region

189
Math question and solution
Math solution
• Time to complete a well = (Depth/Penetration Rate): Region 1 = 60, Region 2 = 90, Region 3 = 180
• Production per well by region = Daily production * 360 days: Region 1 = 36K, Region 2=72K, Region 3= 108K
• Cost per well = Days to complete well*Cost per rig day. Yearly Revenue per well = Price * # barrels per year. Number of wells per year = 360/(Time to complete a well) * number of rigs. Profit Margin = (Profit per well)/(cost per well). Total Revenue =(Yearly Revenue) *( Number of wells per year). Total Cost = (Cost per well)*(number of wells)+(Rights to extract oil). Profit = Total Rev – Total Cost.
Math question
What are the first profits during the first year of production (i.e. 1st year spent on drilling, and production begins in 2nd year)
Concept Region 1 Region 2 Region 3Investment Cost (Rights to extract oil) $ 40,000,000 $ 40,000,000 $ 40,000,000 Cost per well $ 300,000 $ 900,000 $ 3,600,000 Yearly Revenue per well $ 1,800,000 $ 3,600,000 $ 5,400,000 Profit per well $ 1,500,000 $ 2,700,000 $ 1,800,000 Profit margin per well 500% 300% 50%
Number of wells per year(360/60)=6x10
Rigs=6040 20
Total Revenue $ 108,000,000 $ 144,000,000 $ 108,000,000 Total Cost $ 58,000,000 $ 76,000,000 $ 112,000,000 Profit $ 50,000,000.00 $ 68,000,000.00 $ (4,000,000.00)

190
Solution and recommendations
Solution & Recommendations
Rock Energy should invest in buying the rights for Region 2
It is important to recognize that even though the profit margin for Region 1 is significantly higher on a per well basis, the return of the investment depends on the total number of wells that you can drill in the first year and the upfront cost for the rights to extract oil in that Region
Additionally, the interviewee should be able to identify other qualitative aspects of the investment that might affect the decision to invest in a certain Region
Bonus/Guide to an Excellent Case
An excellent answer would mention and briefly summarize the impact of including an expected value analysis, which would assign different probabilities of extracting the expected barrels per day
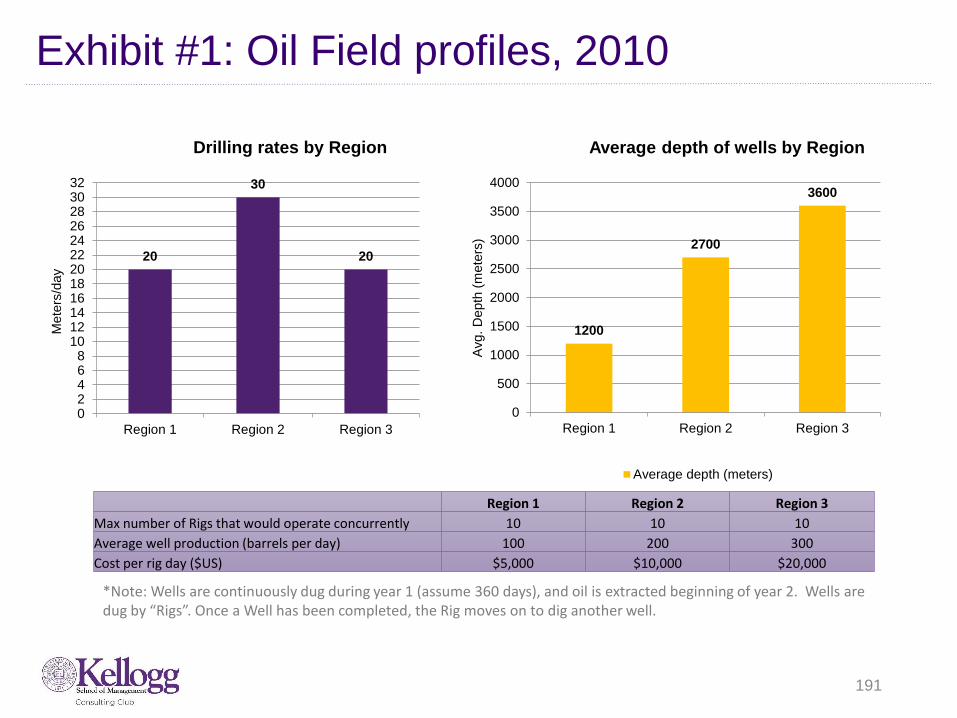
191
Exhibit #1: Oil Field profiles, 2010
20
30
20
02468
101214161820222426283032
Region 1 Region 2 Region 3
Drilling rates by Region
1200
2700
3600
0
500
1000
1500
2000
2500
3000
3500
4000
Region 1 Region 2 Region 3
Average depth of wells by Region
Average depth (meters)
Mete
rs/d
ay
Avg.
Depth
(m
ete
rs)
Region 1 Region 2 Region 3
Max number of Rigs that would operate concurrently 10 10 10
Average well production (barrels per day) 100 200 300
Cost per rig day ($US) $5,000 $10,000 $20,000
*Note: Wells are continuously dug during year 1 (assume 360 days), and oil is extracted beginning of year 2. Wells are dug by “Rigs”. Once a Well has been completed, the Rig moves on to dig another well.

192
Chic Cosmetology University
Case tracker
Case Question
Our client is a for-profit, specialty college named Chic Cosmetology University (CCU). Founded in 2005, CCU is a program for high school graduates seeking their professional cosmetology license. CCU is currently the market leader for cosmetology education with campuses in ten major metropolitan areas in the US.
CCU has capital to invest in a new campus and is considering Chicagoland as a location – should they do it?
(If interviewee asks about OTHER objectives or defining success for opening the new location): The client considers a successful launch as achieving positive operating profit for the new campus two years after opening
Guide to interviewer
This case involves some number crunching but is more structurally focused. It is critical to ensure that the interviewee lands on the figures presented (or is course corrected toward them) in order to proceed with the later parts of the case.
The interviewee should be able to develop a variant of the following question:
Will CCU be able to enroll enough students to offset the initial investment and achieve positive profit?
Key case steps:1. Evaluate CCU revenue and cost structures2. Project CCU’s market share3. Estimate CCU Chicago enrollments4. Identify qualitative issues to consider
Industry: Education
Case Format: Opportunity Assessment
Concepts Tested:
- Break-Even Analysis
- Marketing Strategy
- Market Share
- Investments
By: Peter Manoogian (Kellogg Class of ‘12)
Quant: 7
Structure: 8
Industry: Education
Framework: Opportunity
Assessment

193
Clarifying answers and case guide
Guide to case / Guide to handouts
Share Exhibit 1 with interviewee after probing questions are received about CCUs revenues and costs . Interviewee should be able to compute the following:
- Average revenue per enrollment = $15K (revenue / total enrollments)
- Total annual fixed cost per campus = $4.8M ($48M / 10)
- Total variable cost per student = $8K ($80M / 10K)
- Gross profit per student = $7K ($15K - $8K)
After that, the interviewee should begin to tackle the overall opportunity in the area as well as how many enrollments CCU could reasonably expect to obtain in year 1
Share Exhibit 2 with interviewee after some of the qualitative aspects of CCU’s targeting and marketing strategy are covered. Additionally, the interviewee should have asked about competitor information or made some attempt to assess what share of the market they should expect in Chicago.
- See “Market Share” section in next slide for further information on Exhibit 2
Clarifying answers to provide
Client Characteristics- Enrolled students take classes at a
physical campus for one school year to earn degree (FY begins on 9/1)
- CCU boasts the best campuses in the industry with state of the art equipment
- Strong job placement due to CCU’s relationships with top salons in local areas
- CCU and industry enrollments growing at 5% per year
Competitive Dynamics- 2-3 other large specialty colleges, some of
which are in the same geographies as CCU- Community colleges beginning to offer
cosmetology degrees at lower prices- All ten CCU campuses have been present
for at least three full school years- All competitor campuses have also been
present for similar lengths of timeIndustry Characteristics/Economics- H.S. Diploma and cosmetology degree
required to enter the field- 98% of cosmetologists are women

194
Key elements to analyze
Break-even analysis
How many students will CCU need to break-even in year 1?
Marketing strategy
What types of schools / students do you think CCU targets?
Notes to interviewer
• Interviewee should ask about the investment cost of building a new campus in Chicagoland
• After asking, tell interviewee that the total cost is $4.5M in initial building costs to renovate its chosen site. These costs can be amortized evenly over a three year period.
• Assume fixed costs remain flat per year
Interviewee should calculate • Total fixed costs per year = $6.3M
($4.8M + $1.5M from amortization). • Gross profit per student = $7K• Break-even number of enrollments
per year = 900 ($63M / $7K)
Notes to interviewer
Possible responses (schools):
-Public schools (private HS more likely to have grads go to 4yr univ)
-HS’s in middle-class cities (may be an affordability issue w/lo income)
-Closest to the campus (geography)
Possible responses (students)
-Women HS graduates
-Not attending 4yr college
-Interested in cosmetology
After a few of the above criteria are noted, share:
- CCU has identified 1,000 targeted high schools in the Chicagoland area
- Within these HS, CCU’s market research estimates that on average 6 students per HS have “potential” for CCU enrollment
Market share
What is the highest share we could expect CCU Chicago to capture in Y1?
Notes to interviewer
• Show Exhibit 2 to interviewee• Interviewee should recognize:- Campuses w/competitors present
tend to have a lower share (10%) than those w/out (15%)
- However, presence of >1 competitor does not have an increased negative impact on market share (Boston has 8% share w/only one competitor)
- Interviewee should assume a projected 10% market share for a Chicago campus (one competitor)
• Also share the following : 80% of enrolled students directly from high school, the other 20% of students come from the “Adult” market

195
Calculations
Math questions
1. What is the breakeven number of students required for CCU Chicago?
2. How many students should CCU Chicago expect to enroll in year 1, at the most?
3. (If time permits) = Suppose CCU finds a lot with a one time construction cost of $300K with the same amortization schedule. Should they enter Chicago now?
Calculations
1. Break-even: (Estimated campus fixed cost + Yearly amortization ) / gross profit per student
( $4.8M + $1.5M ) / $7K = 900 students
2. Students: Total potential students x maximum projected market share
Total potential students = Potential (HS) + Potential (Adult) = 7,500 students
Potential (HS) = 6 / HS X 1,000 targeted HS = 6,000 students
Potential (Adult) = 6,000 students * 25% = 1,500 students
Total potential students (year 1) = 7,500 students x 10% share = 750 students
Total potential students (year 2) = 750 students x 1.05 (growth) = 788 students
3. Break-even: (Estimated campus fixed cost + new yearly amortization ) / gross profit per student
( $4.8M + $0.1M ) / $7K = 700 students

196
Solution and recommendations
Solution & Recommendations
Overall, our client should NOT enter the Chicago market under the current cost structure. Even with a 10% market share assumption in year 1, the Chicago campus will enroll only 750 students, this is 150 fewer than the 900 required to break-even.
The client should also consider several qualitative issues:
— Consider offering scholarships to increase the number of potential students and/or conversion rate of potential students
— Consider other cities beyond Chicagoland that currently do not have a CCU presence, or add a second campus to a city such as NYC that has high market share and potentially low capacity
— Perform market research in other cities to understand if there is a greater potential per target high school to increase ROI
— Consider ways to reduce fixed costs (e.g., transporting equipment / materials from campuses that are not at capacity)
Bonus/Guide to an Excellent Case
Excellent interviewees will recognize that the 10% market share is for campuses that have been in place for at least three years , therefore Chicago is unlikely to achieve that share in year 1 or 2; this rules out the feasibility of the follow-up question that suggests the possibility of reducing the one-time investment from $4.5M to $300K.
Additionally, a strong interviewee will identify several of the qualitative issues listed above as ways in which CCU could proceed

197
Exhibit 1: 2010 CCU Financials
CCU Financials as of 8/31/2010 ('000s)
Student enrollments (all campuses) 10Revenue from enrollments $150,000
Total fixed campus costs $48,000Buildings and equipment $32,000
Recruiting, general, and administrative $16,000
Total variable campus costs $80,000Instructors $40,000
Student supplies $40,000
Operating profit $22,000

198
Exhibit 2: CCU and major competitor locations
Campus
2010
share*
San Fran 8%
LA 14%
Minneapolis 15%
Dallas 14%
Houston 10%
Atlanta 16%
Miami 12%
Philly 12%
New York City 16%
Boston 8%
* Measured as share of total “potential” students, as defined by CCU
CCU Campus
Major competitor campus
As of 8/31/2010

199
Tacotle Co.
Case Question
Your client is Tacotle Co., a leading national fast casual restaurant with $420M in revenue in 2014. Over the five years
proceeding 2014, Tacotle has experienced steady revenue growth and industry leading profitability. For the first time in its 15
year history, Tacotle has experienced three straight quarters of EBITDA erosion. Tacotle’s CEO has hired you to explore
what is causing profits to drop and what can be done to reverse the tide.
Clarifying answers to provide A model framework should include the following
Declining
EBITDA
Market
Conditions
Tacotle
Operations
Shrinking
market?
Customer
preferences?
Revenue?
Volume?
Costs?
Fixed
Candidate reflections / initial hypothesis should include
- This case is designed to be interviewee led
- Case Goal: Profitability (no specific milestones, looking
for positive annual profit growth in the short term)
- If asked about market conditions, defer until after the
framework presentation
- Ensure interviewee understands what EBITDA is
After framework review, Candidate should:
- Understand that the problem could originate from
market conditions or company operations
- Discuss the basis profitability framework with some
focus on anticipated fixed and variable cost drivers for
Tacotle
Increased
competition?
Variable
-MKTG,
Labor, PP&E, SG&A
-COGS
-Distribution
Price?
Change in
Product Mix?
By: Ryan Sullivan (Kellogg ’16)
Quant: 6
Structure: 5
Industry: Restaurant
Framework: Profitability
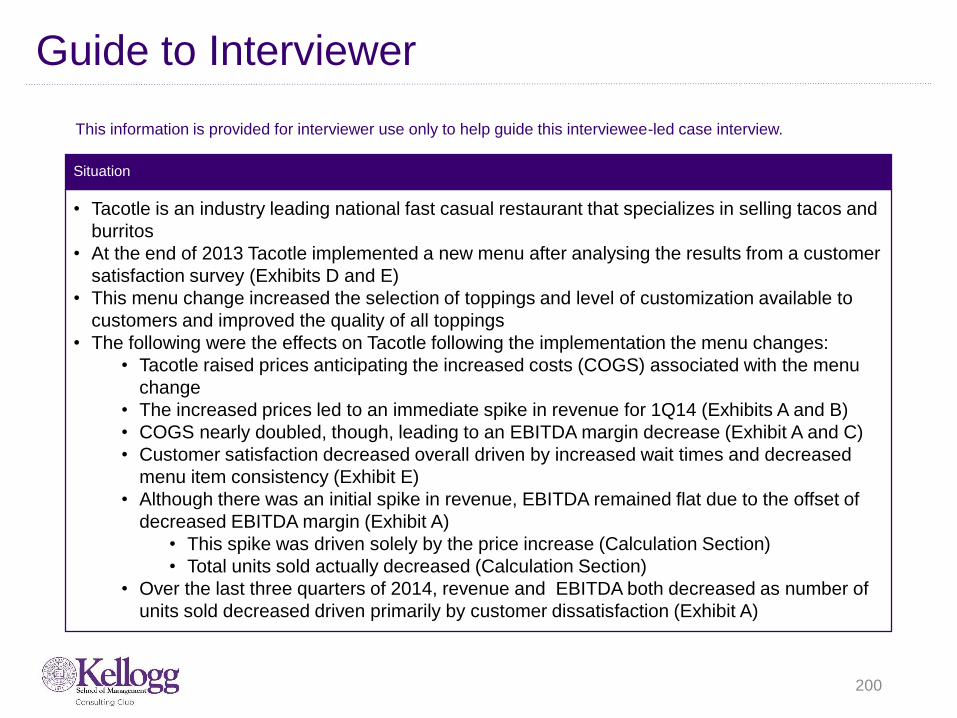
200
Guide to Interviewer
Situation
This information is provided for interviewer use only to help guide this interviewee-led case interview.
• Tacotle is an industry leading national fast casual restaurant that specializes in selling tacos and
burritos
• At the end of 2013 Tacotle implemented a new menu after analysing the results from a customer
satisfaction survey (Exhibits D and E)
• This menu change increased the selection of toppings and level of customization available to
customers and improved the quality of all toppings
• The following were the effects on Tacotle following the implementation the menu changes:
• Tacotle raised prices anticipating the increased costs (COGS) associated with the menu
change
• The increased prices led to an immediate spike in revenue for 1Q14 (Exhibits A and B)
• COGS nearly doubled, though, leading to an EBITDA margin decrease (Exhibit A and C)
• Customer satisfaction decreased overall driven by increased wait times and decreased
menu item consistency (Exhibit E)
• Although there was an initial spike in revenue, EBITDA remained flat due to the offset of
decreased EBITDA margin (Exhibit A)
• This spike was driven solely by the price increase (Calculation Section)
• Total units sold actually decreased (Calculation Section)
• Over the last three quarters of 2014, revenue and EBITDA both decreased as number of
units sold decreased driven primarily by customer dissatisfaction (Exhibit A)

201
Market Conditions
If asked about any changes in the
competitive nature of the market:
• No major competitors have entered or
exited
• No new substitutes introduced
• Tacotle currently has a 30% market
share (by revenue) which it has
maintained
Competition
Candidate insights – Competition
If asked about the market’s growth and
maturity:
• Market is growing at the same rate as
GDP
• Mature market
Market Growth and Maturity
The profitability issue is not one that is
market wide. The problem seems to be
specific to Tacotle
Candidate insights – Growth and Maturity
When asked about customers:
• Customers are beginning to stress the
importance of ingredient quality and
order customization
Customer Preferences
Candidate insights – Customer
The change in customer preferences
doesn’t seem like it is directly driving
decreased profits but it may have
influenced decisions made within Tacotle
There are no major competition related
factors that are driving the decreased
profitability. The issue is most likely
related to a change within Tacotle
Summary - Market Conditions
• The interviewee should at some point want to discuss the market to verify that the decreased profits aren’t due to conditions affecting all
companies in the market. After a quick conversation regarding the market, the interviewee should look at operations within Tacotle.

202
Profitability and Revenue
Profitability
Candidate insights – Profitability
• Once interviewee has hypothesized potential drivers of
increased revenue, provide Exhibit B
• After interviewee has stated that price increased,
interviewee should recognize that a change in price could
lead to a change in quantity. Interviewee should ask “How
did quantity of units sold change in 2014?” – provide
Exhibit C
(See next page for quantitative solution)
Revenue/Quantitative Proof
Exhibit B
• A good interviewee will quickly identify that Tacotle
increased the average price of their orders.
• It should initially be ambiguous whether units sold
increased or decreased. A good interviewee will not rush to
a conclusion
Exhibit C
• Interviewee should evaluate the entire slide then attempt to
answer the question posed regarding units sold in 2014
• Interviewee should refer back to the exhibit and notice that
COGS nearly doubled from 2013 to 2014
Candidate insights – Revenue
• Spike in revenue in Q1 ’14 with relatively flat EBITDA and
large decrease in EBITDA %. Followed by steady revenue
decline
• Good response will hypothesize what could cause this, with
the conclusion that either prices and/or purchases
increased with costs increasing more than the additional
revenue
• A good interviewee will take a deep dive into the profitability
framework looking to determine why:
1) Revenue spiked then declined over the following quarters
2) Profitability (EBITDA) did not follow revenue
• Provide Exhibit A once the interviewee requests
information regarding Tacotle revenue or profitability
• Ensure that the interviewee is clear what EBITDA is
• What are potential drivers of:
• Revenue spike? (Increase in price or units sold)
• EBITDA erosion? (Increase in cost, decrease in rev.)
• EBITDA % decline? (Decrease in margin)

203
Revenue Calculation
How did total number of orders sold change from 2013 to 2014?
Units sold in 2013:
Units sold = Revenue / (Avg. price per unit)
2013 Revenue = $377M (Round to 380M) (From Ex. C)
2013 Avg. price per unit = $4.05 (Round to $4) (From Ex. B)
Units sold = $380M / $4 = 95 M units sold
Units sold in 2014:
Units sold = Revenue / (Avg. price per unit)
2013 Revenue = $420M (From Ex. C)
2013 Avg. price per unit = $5.25 (Don’t round) (From Ex. B)
Units sold = $420M / $5.25 = 80 M units sold
Conclusion:
1) Although revenue increased sharply, the total number of orders decreased.
2) As revenue continued to decline over the last three quarters of 2014, prices remained the same. Therefore, a decrease in the quantity sold is
responsible for the eroding revenues and EBITDA
A good interviewee should have follow up questions to the above conclusions:
• Why did Tacotle increase prices?
• Why did units sold continue to decrease throughout 2014?
***Provide the interviewee with Exhibit D***

204
Costs and Operations
Costs
Candidate insights – Costs
Ensure that before moving into “operations” the interviewee
has analysed Exhibits A,B and C and has received Exhibit
D.
Interviewee should provide hypothesises for all observations
discussed in both exhibits
Operations (Exhibit D)
• Graph illustrates Tacotle’s performance against customer
preferences
• Tacotle lags with regards to quality but is on par or
exceeding expectations for all other categories
• Interviewee should conclude that Tacotle did something
that was aimed to increase quality which most likely caused
COGS and revenue to increase
Candidate insights – Operations (Exhibit D)
• A good interviewee will be creative and will be able to list at
least 5 industry specific cost drivers broken down by fixed
and variable costs
• Interviewee should conclude that COGS (in the fast casual
industry) is mainly comprised of ingredients
Exhibit C
• COGS nearly doubled
• All other costs flat
• COGS increase is the root cause of EBITDA erosion
• Why did COGS increase?
Ask the interviewee to list cost drivers specific to the industry
If the interviewee does not refer back to Exhibit C, guide
him/her to revisit the Income Statement for a breakdown of
costs
After interviewee has speculated on potential operational
changes Tacotle could have implemented, inform them that
Tacotle introduced a new menu focused on allowing the
consumer to customize their orders more and higher quality
and selection of ingredients
*** Provide Exhibit E***
Additional Information

205
Operations
Operations (Exhibit E)
Candidate insights – Operations (Exhibit E)
• Interviewee should recognize that Exhibit E is the same survey as Exhibit D but for the next year (post menu upgrade)
• Interviewee should also recognize that the order of attributes has changed
• “Speed of Service” is now Tacotle’s weakest attribute
• This is due to the new menu which added complexity to food preparation
• “Consistency of Service” has also dropped below customer expectations due to the added complexity of food preparation
• Although Tacotle has met expectations with regard to “Quality”, the decline of ratings in “Speed of Service” and “Consistency of Service” have
more than cancelled it out, resulting in a net decrease in customer satisfaction
• The menu change was not effective
• Once presented with Exhibit E interviewee should review and elaborate on the differences between Exhibits E and D
• If asked for, the average time to serve a customer increased from ~1 minute to ~3.5 minutes.

206
Suggested conclusion
Conclusion
Risks
Next steps
Recommendation: Scale back the menu changes that were implemented during 2014.
Reasons:
1) The menu change led to a significant increase in COGS which decreased EBITDA %
2) The menu change led to overall customer dissatisfaction, degrading brand equity
3) The customer dissatisfaction lead to decreasing unit sales (quarter over quarter) which is driving the EBITDA erosion
• Scaling back the menu too much could lead to decrease in customer satisfaction for “Quality”
• Implementing a scale back could disrupt relationships with suppliers and could require divesting assets that were
purchased for the initial menu change at a loss
• A scale back that does not focus on margin improvement could lead to smaller revenues and profits, effectively
downsizing the company.
• Perform more detailed and focused customer surveys to gage what Tacotle customers expect from the chain
• Perform a scale back on the menu size that focuses on cost cutting balanced with customer needs
• Follow-on menu changes should be implemented on a smaller/trial basis at a small number of individual restaurants

207
Exhibit A
$0
$20
$40
$60
$80
$100
$120
$140
Q1 2012 Q2 2012 Q3 2012 Q4 2012 Q1 2013 Q2 2013 Q3 2013 Q4 2013 Q1 2014 Q2 2014 Q3 2014 Q4 2014
Millio
ns
Revenue EBITDA
Tacotle Co. quarterly revenue and EBITDA
EBITDA
% 44% 45% 44% 46% 45% 45% 44% 46% 39% 40% 39% 40%

208
Exhibit B
$3.00
$3.50
$4.00
$4.50
$5.00
$5.50
Avg. revenue per order
Tacotle Co. avg. revenue per order
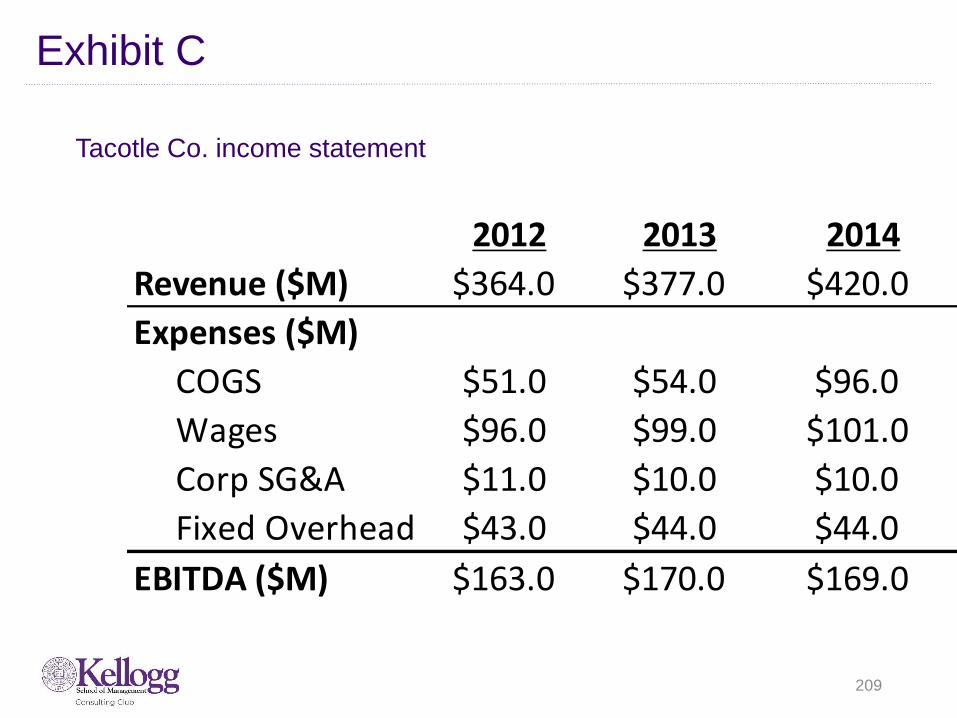
209
Exhibit C
2012 2013 2014
Revenue ($M) $364.0 $377.0 $420.0
Expenses ($M)
COGS $51.0 $54.0 $96.0
Wages $96.0 $99.0 $101.0
Corp SG&A $11.0 $10.0 $10.0
Fixed Overhead $43.0 $44.0 $44.0
EBITDA ($M) $163.0 $170.0 $169.0
Tacotle Co. income statement

Exhibit D
4.84.7
4.5 4.5
3.43.3
3.1
0.0
1.0
2.0
3.0
4.0
5.0
Quality Speed of Service Consistency ofProduct
Has a drivethrough
RestaurantCleanliness
Friendliness ofStaff
Ample Seating
Importance Performance
Results of 2013 Tacotle Co. customer survey
On a scale of 0-5, how important are the following characteristics when dining at fast casual restaurants?
On a scale of 0-5, how well does Tacotle Co. perform against the following characteristics?

Exhibit E
4.8
4.74.6
4.5
3.53.4
3.1
0.0
1.0
2.0
3.0
4.0
5.0
Speed of Service Quality Has a drivethrough
Consistency ofproduct
RestaurantCleanliness
Friendliness ofStaff
Ample Seating
Importance Performance
Results of 2014 Tacotle Co. customer survey
On a scale of 0-5, how important are the following characteristics when dining at fast casual restaurants?
On a scale of 0-5, how well does Tacotle Co. perform against the following characteristics?
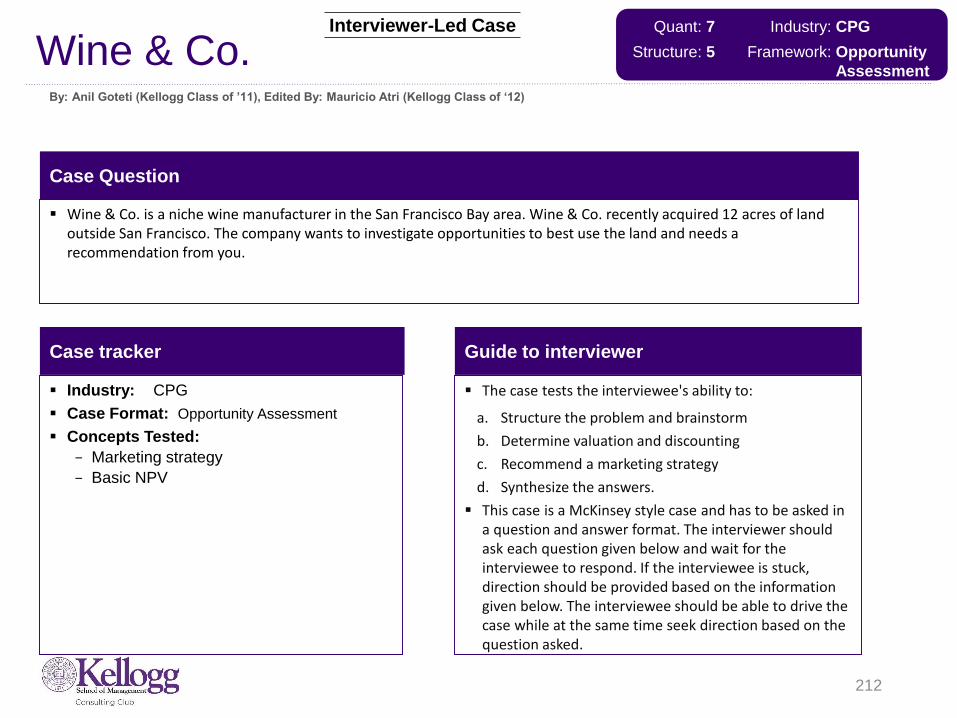
Wine & Co.
Case tracker
Case Question
Wine & Co. is a niche wine manufacturer in the San Francisco Bay area. Wine & Co. recently acquired 12 acres of land outside San Francisco. The company wants to investigate opportunities to best use the land and needs a recommendation from you.
Guide to interviewer
The case tests the interviewee's ability to:
a. Structure the problem and brainstorm
b. Determine valuation and discounting
c. Recommend a marketing strategy
d. Synthesize the answers.
This case is a McKinsey style case and has to be asked in a question and answer format. The interviewer should ask each question given below and wait for the interviewee to respond. If the interviewee is stuck, direction should be provided based on the information given below. The interviewee should be able to drive the case while at the same time seek direction based on the question asked.
212
By: Anil Goteti (Kellogg Class of ’11), Edited By: Mauricio Atri (Kellogg Class of ‘12)
Industry: CPG
Case Format: Opportunity Assessment
Concepts Tested:
- Marketing strategy
- Basic NPV
Quant: 7
Structure: 5
Industry: CPG
Framework: Opportunity
Assessment
Interviewer-Led Case

213
Clarifying answers and case guide
Guide to case / Guide to handouts
Question 1. What are the different ways in which Wine & Co. can use the land?
Question 2. Wine & Co. has decided to use the land to manufacture wine. Each acre of land produces 1000 kg of grapes annually. Wine & Co. has an option to manufacture Merlot or Bordeaux. The two wines use different grapes and the grapes have varying yields. While the Merlot grapes yield 2litres/kg, the Bordeaux grapes yield 1litre/kg. Wine & Co. can charge $20 per liter of Merlot and can charge $40 per liter of Bordeaux. Which wine yields more profits annually?
Question 3. Aging has an effect on the revenues and profitability. Merlot has to be stored for 6 years while Bordeaux has to be stored for 12 years before revenues can be generated. Which wine would you choose for manufacturing?
Question 4. Wine & Co. has decided to manufacture Merlot. How should they market this product in the San Francisco Bay area?
Please summarize your recommendations to the CEO of Wine & Co.
Clarifying answers to provide
• Question 1. Some interviewees ask which geographical regions the company serves, the type of wines they manufacture and if they have other types of products (like other liquors or wine tasting tours in Napa valley). The following information can be provided if asked. a) They only manufacture red wines. b) The company serves only the local market (the San Francisco Bay area). c) The company does not sell any other products. d) The company is currently very healthy and does not face any problems.
• Question 2. Profit Margins on Merlot are 10% while the margins on Bordeaux are 15%.
• Question 3. a) Discount rate is 12% (provide only when asked). Many people forget the time value of money and add profits across years without discounting. b) Assume the costs are only incurred when the revenues are realized after aging (no costs until year 6 for Merlot and no costs until year 12 for Bordeaux). c) If people are struggling with the division or approximations, suggest the "Rule of 72" (If r is the discount rate, 72/r is the number of years it takes to double your money)
• Question 4. Customer segments that are currently served by Wine & Co.- niche wine enthusiasts.

214
Key elements to analyze
Topic 1 being tested
What are the different ways in which Wine & Co.wines can use the land?
Topic 2 being tested
Which wine yields more profits annually?
Notes to interviewer
The interviewee should create a framework and structure the problem. The interviewee should suggest options including manufacturing the wine, creating adjacent products (like wine tasting tours), using the land for other uses (commercial real estate/selling the land for a profit/other opportunity costs). A good candidate would provide a detailed structure (eg. profitability framework for manufacturing feasibility with customization of the framework - yield of grapes, cost per liter of wine, etc.) and outline the risks or considerations involved in some of these options (like usability of land for manufacturing or company competency in pursuing in other opportunities unrelated to wine manufacturing).
Notes to interviewer
A good candidate would ask for the profit margins/costs without being prompted. Look for organization and structure when the candidate evaluates the annual profits for each wine (a good candidate would use a table like structure when doing the math). The revenues would be $480,000 for both wines annually but the margins would be higher for Bordeaux ($72,000 for Bordeaux vs. $48,000 for Merlot). After the candidate arrives at the profits, look for interpretation. A good candidate would recommend using Bordeaux while at the same time consider other factors (competency in manufacturing either of the wines, customer demand in the bay area, sensitivity to product yields, customer reservation price, etc.). A creative candidate might suggest that we compare the age of the two wines (and hence will impact when the profits might actually start)

Math for Topic 2
Value Comments
A Acres of Land 12 Given
B kg of grapes produced/acre 1000 Given
C kg of grapes produced total 12000 =A*B
Merlot Bordeaux Comments
D Yield (Litre/kg) 2 1 Given
E Total Yield (Litre) 24000 12000 =C*D
F Price / Litre $20 $40 Given
G Total Revenue $480,000 $480,000 =E*F
H Profit Margin 10% 15% Given
I Total Profit $48,000 $72,000 =G*H

216
Key elements to analyze
Topic 3 being tested
Which wine would you choose for manufacturing?
Topic 4 being tested
How should they market this product in the San Francisco Bay area?
Notes to interviewer
Candidate should identify that the cash flows for Merlot would be $48,000 annually starting year 6. Cash flows for Bordeaux would start in year 12 ($72,000 annually). A good candidate would then consider the time value of money and discount the two perpetuities to the same year for an apples-to-apples comparison. Merlot: Annual Cash flow starting year 6: $48,000 Perpetuity value of cash flow (value in year 6) = $48,000/0.12 = $400,000 Bordeaux: Annual cash flow starting year 12: $72,000 Perpetuity value of cash flow (value in year 12) = $72,000/0.12 = $600,000 Value of perpetuity in year 6 = $600,000 / (1.12^6) = $300,000 (Rule of 72). Provide help here if the candidate is struggling with the division. Look for the candidate's approach than the exact number. Since value of pursuing Merlot ($400,000) is higher than value of pursuing Bordeaux ($300,000), the company should manufacture Merlot. A good candidate would interpret the result and suggest we take into account other factors like inventory costs, sensitivity to discount rate, etc.
Notes to interviewer
Candidate should ask for the customer segments that the company might sell to and suggest appropriate marketing channels/strategies to consider. Look for a MECE structure here. Suggestions should include retail strategies, direct to consumer strategies (like wine clubs, wine tasting), traditional media and print advertising and online advertising.

Math for Topic 3
Merlot Bordeaux Comments
A Annual Profit $ 48,000 $ 72,000 See Q. 2
B Years to maturity 6 12 Given
C Discount Rate 12% 12% Given
DMerlot NPV once ripe - at year 6 $ 400,000 =A/C
EBordeaux NPV once ripe - at year 12 $ 600,000 =A/C
Method 1 FBordeaux NPV at year 6 (using discount rate) $ 300,000 =E/(1.12)^6
Method 1 G Comparison at year 6 $ 400,000 $ 300,000 =D and F
Method 2 IMerlot NPV at year 12 (using discount rate) $ 800,000 $ 600,000 =D*(1.12)^6
Method 2 J
Comparable comparison at year 12 $ 800,000 $ 600,000 =I and E
Alternative method using "Rule of 72" instead of (1.12)^6 Value Comments
Discount Rate 12% Given
Years to double value = 72/Discount rate 6 =72/12
Bordeaux: changing from year 12 to year 6 = halving the value of year 12
Merlot: changing from year 6 to year 12 = doubling the value of year 6

218
Solution and recommendations
Solution & Recommendations
A good candidate would recommend a solution (manufacturing Merlot) but would detail out the risks/next steps associated with the recommendation. Next steps may involve market research, land usability testing, evaluation of opportunity costs. Risks have been outlined above already.
Bonus/Guide to an Excellent Case
An excellent answer should include:
a) Identification of opportunity costs, particularly of not selling/leasing the land, which might be more profitable considering the current value of land in the Bay Area and/or Napa
b) Considering industry specific issues like aging of wine
c) Considering time value of money/perpetuity of cash flow
d) Considering risks like customer demand, land usability
e) Potential benefits of diversifying the acreage and producing multiple types of grapes (compensate for shifts in consumer demand, broader appeal to local market, etc.)

219
A+ Airline Co.
Case tracker
Industry: Airline
Case format: Opportunity Assessment
Concepts being tested:
- Basic NPV
- Operations
- Market Sizing
- Customer Strategy
Case Question
Our client is A+Airline Co., the third largest airline in the United States by passengers carried. This week, we have been flying on our primary competitor, Gamma airline, and we noticed something interesting; they stopped accepting cash for in-flight food and beverage services and they now only accept major credit cards.
The CEO of A+Airline Co. wants to know, why did Gamma Airline switch from a Cash & Card system to a credit card only system, and should we follow them?
Guide to interviewer
This case will force an interviewee to rely on logic, business acumen, and structure
Commonly, the interviewee will ask a lot of questions about historical costs, revenues, etc. This is not the correct approach to this question.
The savvy interviewer will realize that this is a BEFORE vs. AFTER comparison of switching from a CASH & CARD system to a CARD ONLY system. Therefore, the questions asked should focus on the DELTA, or the cash changes that occur when the switch is made.
By: Adam J. Louras (Kellogg Class of ‘11); Edited by: Deepika Singh (Kellogg Class’16)
Quant: 8
Structure: 8
Industry: Airline
Framework: Opportunity
Assessment

220
Clarifying answers and case guide
Interviewer Guide to case and handouts
Case Structure – Interviewee’s structure should be a BEFORE vs. AFTER comparison of the switch from CASH & CARD to CARD only and should include:
- Revenue Changes: Loss of Cash Only customers vs. Increase in Credit Card customers
- Cost Changes: Benefit of Cash Management Cost Removed vs. Incremental Cost (Fee) of Credit Card
- Cash Flow Changes: Interest and Time Value of Money (TVM), and Working Capital impacts due to an increase in collection speed
Exhibit 1 – After Interviewee walks through structure, they will likely ask questions about consumer purchase behavior on airplanes. Once you feel that they have identified the need to do a market sizing, hand out Exhibit 1.
- Ask the interviewee to determine the Total Market Size in ($) for food and beverage purchases on an average flight
- The interviewee should calculate the CURRENT allocation of purchases (Cash Vs. Card) for an average flight.
- The interviewee should correctly identify that some of the current “Cash” customers will not convert to Card. Tell them we will lose 1/3.
Exhibit 2 – The interviewee should recognize that there might be a cost savings due to the change. Most interviewees know that there is a Credit Card processing fee but do not realize that there are many costs associated with cash management. Ask them about the types of costs A+Airline might face under both processes before handing out the exhibit. When asked, explain that the total, per flight, savings from eliminating overhead due to Cash Management Operations is $35/flight
Clarifying answers to provide if Asked
Industry Characteristics/Market Economics
- Card Use: Roughly 99% of all consumers purchase their airline tickets using a credit card, i.e. all consumers on an airplane have a credit card available to them.
Client Characteristics
- Items Sold: Only food and alcoholic beverage items are sold on A+Airlineflights
- Locations: This is a US Domestic decision only. Ignore international.
Competitive Dynamics
- Gamma is the only airline that has made the switch; however all other airlines are evaluating the switch.
- For the purposes of this case, Gamma and A+Airline should be considered to be exactly the same in all regards.

221
Key elements to analyze
Changes in Revenue
Interviewee will likely begin with the correct assumption that revenue will be lost due to unhappy, cash-only passengers
Once asked about how many are lost, hand out Exhibit 1 to do a market sizing
Changes in Costs
Interviewee should make mention of Cost changes due to the shift to a Card Only strategy.
Ask the interviewee to detail the types of costs that might be involved before handing out Exhibit 2
TVM & Working Capital
Exhibit 2 also shows that there is a 30 day time benefit to collecting payment via Credit Card vs. Cash
Prompt 1: Ask the interviewee to qualitatively explain the impact this time savings will have
Notes on Exhibit 1
Using Exhibit 1, interviewee should calculate:
1. Total Number of Passengers per Plane
2. Total Number that Purchase & Total Spend ($)
3. Cash vs. Card Spend + LOSS
Notes on Exhibit 2
Exhibit 2 shows the current operations for Cash Management and Card Management
The interviewee should notice the following information:
Cash Management & Card Management both have 2% fees associated, so this is a “wash” in terms of savings.
Cash Management requires additional overhead, 7 total employees per airport, that could be eliminated for further savings.
When asked, explain that the total, per flight, savings from eliminating overhead due to Cash Management Operations is $35/flight
Interviewee should notice that the $35 savings offsets the $35 loss in Revenue. A good candidate will notice that savings go straight to the bottom line whereas revenue doesn’t.
Qualitative Assessment
The interviewee should qualitatively mention that there are benefits to eliminating the longer cash management process:
Time Value of Money: A+Airline will receive their money 30 days sooner, and this money could be used to:
Invest in interest earning accounts or growth projects
Pay off suppliers early and take advantage of discounts
Pay down lines of credit faster Working Capital Improvement: $50 per flight in
change can be eliminated, thus freeing up cash flow. Additionally, there will be a reduction in loss of cash due to theft and damage
Happier Customers: The majority of customers will be able to place and receive their order faster on the plane which will also increase sales
Seats Occupants Business Leasure
First Class 50 50 50 0
Economy 150 120 60 60
Total 200 170 110 60
# that Purchase Total Purchase $
Business 45 $450
Leasure 15 $75
Total 60 $525
Cash Card Total
Inflight $ $105 $420 $525
Lose 1/3 of Cash Customers
# $ New Total
Business 3 ($30) $420
Leisure 1 ($5) $70
Total 4 ($35) $490

222
Solution and recommendations
Solution & Recommendations
Overall, our client, A+Airline, should switch to a Credit Card only system for in-flight food & beverage because:
Quantitative Benefits: We calculated that there would be a loss of 3 business customers and 1 economy customer per flight which amounted to a Revenue loss of $35. We also found that we could save $35 in overhead expenses by eliminating the Cash Management process. In sum, the decision to switch is in favor because the savings are to the bottom line and the revenue losses are top line.
Qualitative Benefits: We also found that we will receive payment 30 days sooner by only accepting credit cards. This improves our cash flow and could allow us to earn interest, pay down creditors, or invest in projects. Additionally, by reducing cash losses and eliminating “Change” tied up on airplanes, we can improve our Working Capital and also put this money to work for us. Finally, it appears as though customers, in general, might actually be happier because the speed of transactions on the airplane will improve.
Bonus/Guide to an Excellent Case
An excellent interviewee will note:
Due to the increased transaction speed, probability of purchase for both Business and Economy passengers in the AFTER state should go up due to a reduction in frustration. The people on the back of the airplane often abandon a purchase if it takes too long to place an order. Making change takes a lot of time!
Average purchase amount should also increase. There is a proven psychological phenomenon that shows how consumers who do not carry cash purchase less when a cash option is offered because they feel guilty using their card. A card-only option eliminates this guilt and consumers don’t mind using the card.
Being creative when listing the change of costs as: Wifi cost (connect with banks and verify transaction), Fraud cost (increased chance of fraud to happen after implementing card only payment).

223
Exhibit #1: An Average A+Airline Flight
A+Airline Boeing 737-800 Vers. 2 (738)
Total Seats 200
% of Seats Load Factor % Business % Leisure
First Class 25.0% 100% 100% 0%
Economy 75.0% 80% 50% 50%
% that Purchase Avg. Spend ($)
Business 41.0% $10
Leisure 25.0% $5
*Note: First Class Passengers Receive Free Food & Beverage
% of In-flight Purchases
Cash 20%
Card 80%

224
Exhibit #2: A+Airline Cash & Card Operations
STEP 1:
Cash Handler
Loads Plane with
$50 in Change
AAirline Cash Management Process
STEP 2:
Flight Attendant
collects cash from
passengers and
gives change
AAirline Credit Card Process
31 Days Total Time
On Ground
In Flight
STEP 3:
Flight Attendant
Deposits Cash into
Flight Lockbox
STEP 4:
Cash Handler
collects Flight
Lockbox from
Plane (EOD)
STEP 6:
Armored Car
Service collects
cash
2% Fee on All Cash
Collected
STEP 5:
Flight Lockboxes
deposited to
Onsite Cash
Processing Center
STEP 7:
Armored Car
Service reconciles
cash for
counterfeit.
STEP 8:
Cash (Less Fees)
deposited to
AAirline Bank
Account
KEY
5 Cash Handlers per Airport
2 Employees in Onsite Cash Processing Center per Airport
STEP 1:
Flight Attendant
swipes credit card
in wireless
terminal
24 Hours Total Time
On Ground
In Flight
STEP 3:
Cash (Less Fees)
deposited to
AAirline Bank
Account
STEP 2:
Merchant Service
Receives and
processes Credit
Card
2% Fee on All Cash
Collected

225
Bell Computer Inc.
Case tracker
Industry: Tech/Telecom
Case Format: Improving profitability + Reducing Costs
Concepts Tested:- Marketing Strategy
- Competitive Analysis
- Supply/value chain
Case Question
Our client, Bell Computer Inc., is the second largest PC manufacturer, by unit sales, in the United States. Over the past 5 years, Bell has been gaining market share and growing revenue, but at the same time, their net income is eroding.
The founder of Bell has returned to the company and taken over as CEO. He has hired us to determine:
Why have our profit margins declined?
What can we do to improve our profitability and reach our “Full Potential”?
Guide to interviewer
This case is primarily about product mix changes in the PC industry combined with Average Selling Price (ASP) Declines resulting in lower overall revenues for the industry. Competitors that did not keep up with cost reductions are faced with tighter margins
The interviewee should recognize that this is a “Profit Equation” style question and use a version of the following equation in their “Framework”:
Profit/Unit = Price/Unit – Variable Cost/Unit –Fixed Costs/Unit
Various terms from the PC industry are used throughout the case and it is not expected that the interviewee knows these terms. Help as needed.
By: Adam J. Louras (Kellogg Class of ‘11); Revised by Matthew English ( Kellogg Class of ’16)
Quant: 8
Structure: 10
Industry: Tech
Framework: Profitability
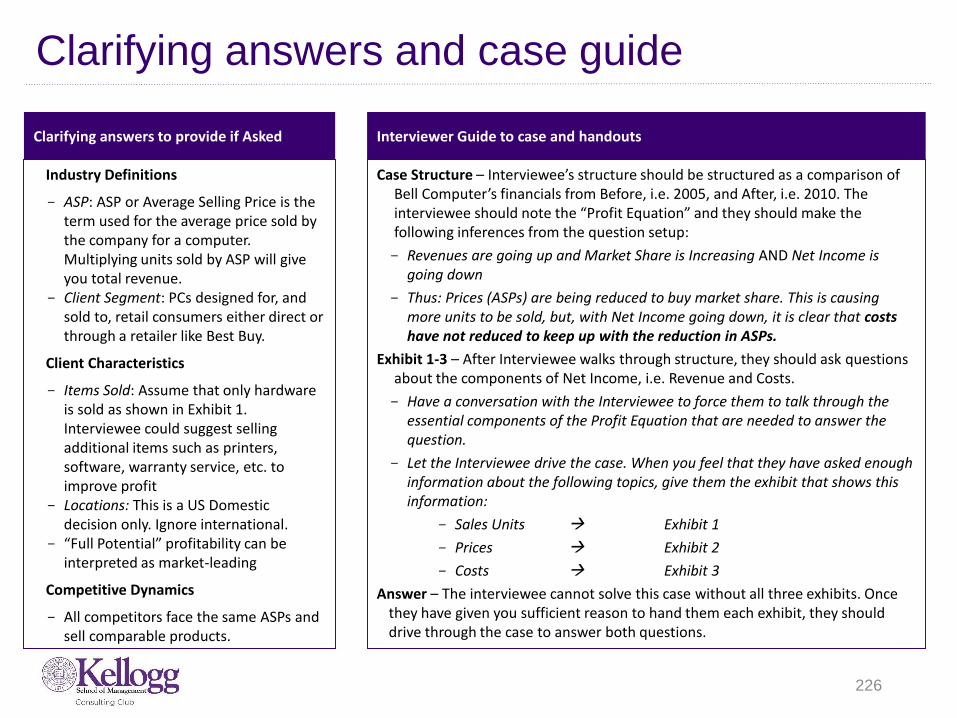
226
Clarifying answers and case guide
Interviewer Guide to case and handouts
Case Structure – Interviewee’s structure should be structured as a comparison of Bell Computer’s financials from Before, i.e. 2005, and After, i.e. 2010. The interviewee should note the “Profit Equation” and they should make the following inferences from the question setup:
- Revenues are going up and Market Share is Increasing AND Net Income is going down
- Thus: Prices (ASPs) are being reduced to buy market share. This is causing more units to be sold, but, with Net Income going down, it is clear that costs have not reduced to keep up with the reduction in ASPs.
Exhibit 1-3 – After Interviewee walks through structure, they should ask questions about the components of Net Income, i.e. Revenue and Costs.
- Have a conversation with the Interviewee to force them to talk through the essential components of the Profit Equation that are needed to answer the question.
- Let the Interviewee drive the case. When you feel that they have asked enough information about the following topics, give them the exhibit that shows this information:
- Sales Units Exhibit 1
- Prices Exhibit 2
- Costs Exhibit 3
Answer – The interviewee cannot solve this case without all three exhibits. Once they have given you sufficient reason to hand them each exhibit, they should drive through the case to answer both questions.
Clarifying answers to provide if Asked
Industry Definitions
- ASP: ASP or Average Selling Price is the term used for the average price sold by the company for a computer. Multiplying units sold by ASP will give you total revenue.
- Client Segment: PCs designed for, and sold to, retail consumers either direct or through a retailer like Best Buy.
Client Characteristics
- Items Sold: Assume that only hardware is sold as shown in Exhibit 1. Interviewee could suggest selling additional items such as printers, software, warranty service, etc. to improve profit
- Locations: This is a US Domestic decision only. Ignore international.
- “Full Potential” profitability can be interpreted as market-leading
Competitive Dynamics
- All competitors face the same ASPs and sell comparable products.

227
Key elements to analyze
Marketing Strategy
Using Exhibits 1-3, the interviewee should be able to determine that margins are falling due to product mix shifting and price declines, focusing on laptops
Competitive Analysis + Supply Chain
Using Exhibit 3, the interviewee should identify a “Full Potential” improvement for Bell to improve its laptop margins by copying the strategy of its direct competitors.
Notes to interviewer
• The Interviewee should be able to answer the question, “Why have our profit margins declined?” with the following rationale:
Exhibit 1: Shift in Consumer preference towards Laptops & Netbooks
Exhibit 2: Declining ASPs for Laptops and Low ASPs for Netbooks
Exhibit 3: Cost position has remained unchanged
• The interviewee could answer the question qualitatively by interpreting Exhibits 1-3. To make this case more quantitatively focused, ask the interviewee to calculate various metrics for 2005 and 2010.
• The interviewee should be able to calculate the negative margin impact of the falling price of laptops – see following page for calculations
Notes to interviewer
The interviewee should be able to answer the question, “What can we do to improve our profitability and reach our “Full Potential”?” with the following COST REDUCTION strategy:
Copy Haysus' strategy for part procurement to reduce the build cost of PCs
Copy Racer's strategy for Direct Labor to reduce the labor cost of producing PCs
Copy HC's strategy for G&A to reduce the total company overhead
The interviewee could answer the question qualitatively by interpreting Exhibit 3. To make this case more quantitatively focused, ask the interviewee to calculate various metrics for “Full Potential”.
The interviewee should be able to calculate Bell’s “Full Potential” margin benefit in the laptops segment – see following page for calculations

228
Math Solutions
Math Part I
BELL FY2005
Laptop PCs
Units Sold (K) 10.0
ASP $2,000.0
Cost per unit 800.0 Contribution/Unit $1,200.0
Revenue ($M) $20.0
Total Cost ($M) 8.0 NI ($M) $12.0
Profit Margin 60.0%
BELL FY2010
Laptop PCs
30.0
$750.0 800.0
($50.0)
$22.5 24.0
($1.5)
(6.7%)
BELL Full Potential
Laptop PCsUnits Sold (K) 30.0
ASP $750.0 Cost per unit 350.0
Contribution/Unit $400.0
Revenue ($M) $22.5 Total Cost ($M) 10.5
NI ($M) $12.0 Profit Margin 53.3%
Math Part II
Results:
Laptop PCs
Profit ($M) Improved $13.5 Cost Per Box Reduced $450.0
Net income from Laptops has
therefore decreased by $13.5M
as a result of the price drop
Lowest possible cost per unit, based on achieving:• Parts in line with
Haysus ($200)• Labour in line with
Racer ($50)• G&A in line with
HC ($50)• Marketing as-is
($50)

229
Solution and recommendations
Solution & Recommendations
Bell Computer Inc. and the PC industry have faced five years of Average Price declines in the Laptop product segment. At the same time, “Client” or retail consumers have shifted their preferences towards Laptops and a new product segment called Netbooks. Because Bell Computer has not reduced its costs over this same timeframe, profit margins and net income have deteriorated despite increases in revenue.
In order for Bell Computer Inc. to return to profitability, they must reduce their cost per unit sold. The best approach we identified was through an analysis of our competitors. Using our competitors line-item costs as a benchmark, we could potentially reduce our cost per box by $450. This amounts to a total Net Income improvement for laptops of roughly $13.5M.
Bonus/Guide to an Excellent Case
An excellent interviewee will note:
Additional ways to improve net income by selling complimentary, high margin products such as:
Printers
Software
Parts upgrades
Warranties
Additional ways to cut costs, such as:
SKU Rationalization (Reducing the number of product models)

230
Exhibit 1: Product Mix breakdown by Business Segment for 2005 and 2010
PC Units(K) Sold in 2005 PC Units(K) Sold in 2010
*Note: Netbook PCs did not exist in 2005; “Other” products include Pocket PCs and Calculators
0 0Consumer CorporateGovernment Consumer CorporateGovernment

231
Exhibit #2: ASPs by Business Segment 2005 and 2010
*Note: Netbook PCs did not exist in 2005

232
Montoya Soup
Case Question
Clarifying answers to provide A model framework should include the following
Profit
Down
Revenue
Down
Costs Up
Mix
Volume
Price
Fixed
Cannibalization
by lower margin
Variable
High margin
product exit
Candidate reflections / initial hypothesis should include
In F14, Montoya Soup Co., a Business Unit of Izzy’s Healthy Foods, grew revenue and increased the contribution margins
on their Traditional and Light Soups. However, a spike in fixed costs caused them to see a dip in profitability. To offset this
effect in F15, they launched a line of premium soups in an attempt to increase volume and generate economies of sale.
Though they felt the new launch was a success, their profitability dropped again in F15. They have hired you to diagnose
the problem and propose a solution for F16.
Traditional, Light, and Premium are the only product lines
in Montoya Soup Co.’s product portfolio.
Montoya sells cases to buyers at grocery retailers who
mark up the units inside to sell to consumers
The prompt hints that revenue is up and fixed costs
haven’t increased in 2015, so the candidate should be
thinking about variable costs right away. That said, this is
a portfolio pricing strategy case disguised as a cost
reduction case and a strong candidate might recognize
that possibility.
By: Nico Montoya (Kellogg ’16)
Quant: 8
Structure: 5
Industry: CPG
Framework: Profitability

233
Deep dive – Why did profitability decline?
Provide Exhibit A
If asked: growth was driven by premium
line. There was some cannibalization of
traditional and light lines (provide Exhibit
B).
Q: What trends do you see with regard to
top line growth?
Revenue
Candidate insights
Provide Exhibit A
If asked: input prices are the same as
F14 for the traditional and light lines .
No additional wastage. No change in
formulation
Q: What happened with fixed costs in
F15? Variable costs?
Q: What could have driven up our
variable costs?
Costs
Fixed costs were flat at $1.3bn in F15
(Gross Margin - Contribution Margin =
Fixed Costs), so profit decline was driven
by an increase in variable costs.
Increase in variable costs could have
come from pricier mix of inputs, same
inputs but increase in input prices, more
waste in manufacturing, or change in
demand mix for more expensive
products. (Provide Exhibit B.)
Candidate insights
Provide Exhibit A
Q: How can profitability be down if
revenue is up, fixed costs are flat, and the
cost of our inputs have not changed?
Q: What information do you need to look
into fixing the product mix to optimize
profitability
Product Mix
Candidate insights
Revenue grew significantly in F15, much
faster than in any other year in recent
history
Revenue outpaced volume, meaning
that not only did revenue grow, but it
grew even though average price
increased
If revenue is up, input costs are flat
(assuming no change in formulation or
wastage), and profitability is down, then
the issue must be with cannibalization of
higher margin products by lower margin
ones.
Candidate should want to look at the
product lines’ prices, COGS, elasticity,
and cannibalization rates.

234
Deep dive – How do we fix profitability?
Provide Exhibit B and C when
appropriate
If asked: Competitors aren’t playing in the
“premium” space, only in “value” and
“super-premium”
Q: How much profit do we make per case
of Premium? Traditional? Light?
Cost Reduction
$10 contribution margin on Traditional
and Light, $6 contribution margin on
Premium (price – sum of variable costs)
Largest opp. for v. cost reduction would
be in packaging, meat, and veg., but
reducing these might erode value
proposition of a premium product
Math on next page
Candidate insights
Provide Exhibit B and C when
appropriate
If we both raise prices and change
packaging, we will lose enormous
distribution
Q: What is the optimum price for
profitability?
Pricing (Cannibalization and Elasticity)
Candidate should infer from Exhibit B that
Premium cannibalized Traditional
substantially.
Math on next page
Candidate insights
Provide Exhibit D
Q: What are the long-run effects on
customers for changing packaging? For
reducing meat/vegetable costs? For
increasing prices?
Q: What about for the end consumer?
Stakeholder Value Proposition
Candidate should see that customer are
willing to pay for a pricier product, but
that reducing variable costs (and thereby
reducing quality) is not a viable long run
strategy and will hurt the brand
Candidate insights

235
Math Solutions
Unit Margin Vol
Profit (Margin*
Vol)
Trad Vol. Cannibaliz
ationTrad
Margin
TradProfit Lost
Light Volume
Cannibalization
Light Margin
Light Profit Lost
Net Profit from
Premium
Last Year $6 40 $240 -20 $10 ($200) -5 $10 ($50) ($10)
If we change packaging $9 32 $288 -24 $10 ($240) -5 $10 ($50) ($2)If we reduce meat and vegetable costs $9 40 $360 -20 $10 ($200) -5 $10 ($50) $110
If we raise price to 33 $9 20 $180 -2 $10 ($20) 0 $10 $0 $160
Below are the calculations the candidate would have to make if they calculated every single scenario. It seems like a lot, but keep in mind
that the margins on Traditional and Light are $10, so candidates can simply add a zero to the cannibalized volume number to get
cannibalized profit.
The candidate should feel free to elect not to even calculate the first two scenarios if they are deemed strategically unwise long-term
decisions.
Net profit from premium will be the profit from Premium (bold) minus and profit lost from cannibalizing Traditional and Light (bold)
Logic behind the math
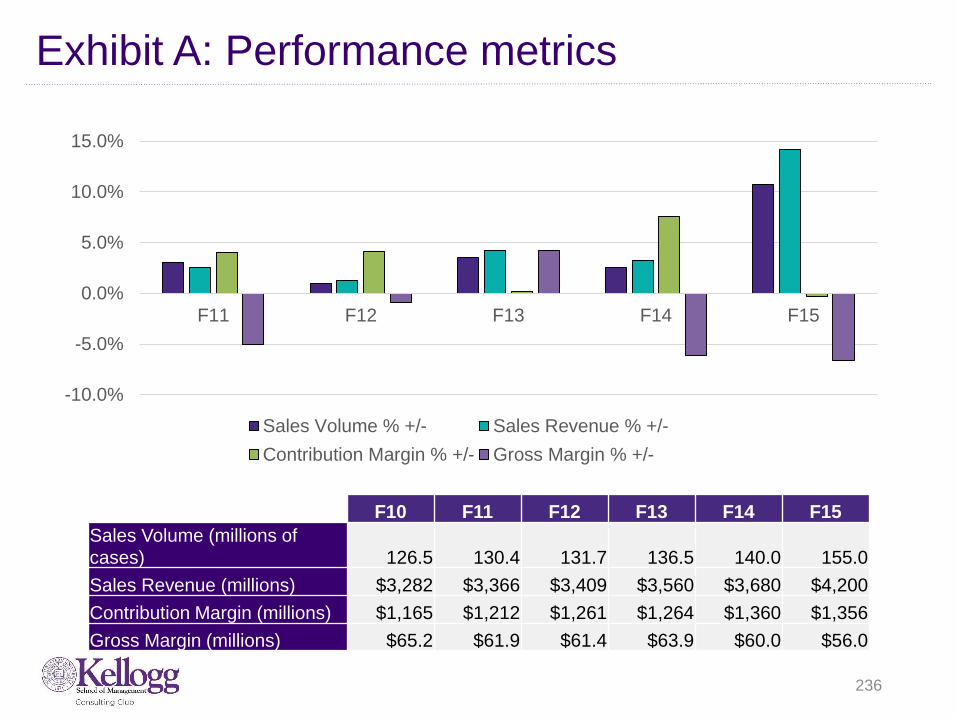
236
Exhibit A: Performance metrics
-10.0%
-5.0%
0.0%
5.0%
10.0%
15.0%
F11 F12 F13 F14 F15
Sales Volume % +/- Sales Revenue % +/-
Contribution Margin % +/- Gross Margin % +/-
F10 F11 F12 F13 F14 F15
Sales Volume (millions of
cases) 126.5 130.4 131.7 136.5 140.0 155.0
Sales Revenue (millions) $3,282 $3,366 $3,409 $3,560 $3,680 $4,200
Contribution Margin (millions) $1,165 $1,212 $1,261 $1,264 $1,360 $1,356
Gross Margin (millions) $65.2 $61.9 $61.4 $63.9 $60.0 $56.0

237
Exhibit B: Product lines
$1 $1 $1
$7
$3
$8
$4
$4
$6 $1
$1
$1 $4
$4
$7
$1
$1
$1
$0
$5
$10
$15
$20
$25
Traditional Light Premium
Variable Input Cost per Case
Broth Meat Vegetables
Spices Packaging Wages
Trad. Light Prem.
Wholesale
Price
$28 $24 $30
F14 Vol. (m
cases)
80 60 -
F15 Vol. (m
cases)
60 55 40
“Our research showed that many of our
consumers were willing to pay more for a
product with more meat and vegetable
bounty in a carton (instead of a can). After
testing several price points, we decided a
lower margin and higher volume would
help us reach the economies of scale we
wanted to see. Consumers loved the
product and thought it was a great
bargain!”

238
Exhibit C: Demand analysis
Cost Reduction Effect on
Demand
Price Elasticity
and
Cannibalization
Last Year
Increase
Price
Premium Price $30 $33
Premium Demand (m cases) 40 20
Traditional cannibalization rate 50% 10%
Light cannibalization rate 12.5% 0%
“We looked into moving premium out of
cartons and into cans. On the plus
side, it would gain us $3 of margin per
case, but on the con side it would
decrease demand by 20% and
cannibalization of our Traditional line
would spike to 75%”
“We could decrease our meat and
vegetable bounty to be on par with
Traditional. That would buy us $3 of
margin points and consumers shouldn’t
know the difference, in the short run at
least.”
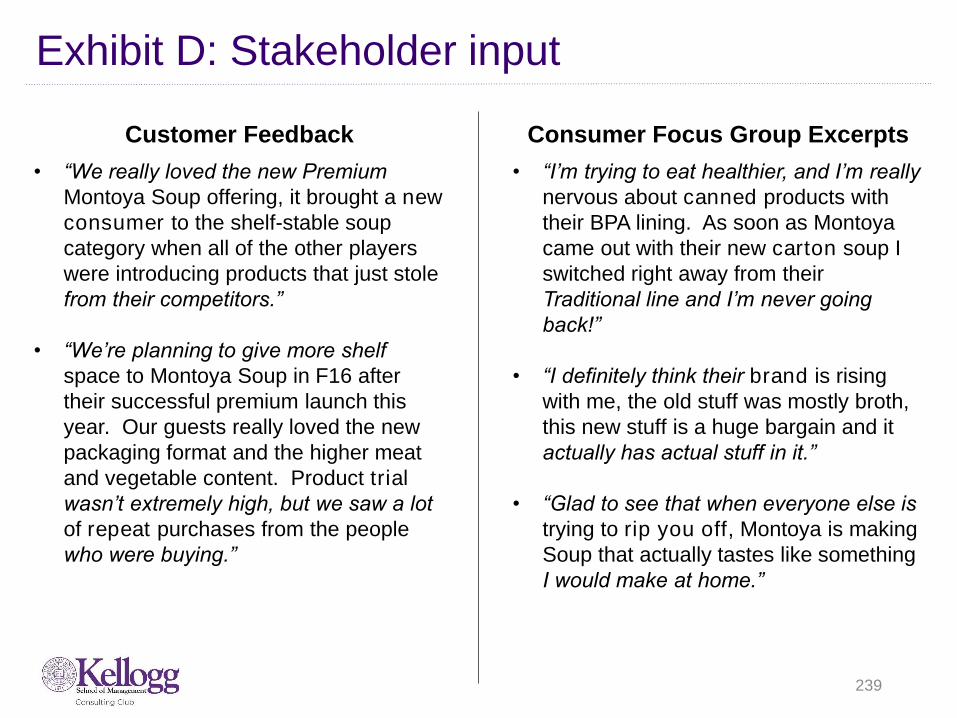
239
Exhibit D: Stakeholder input
Customer Feedback Consumer Focus Group Excerpts
• “We really loved the new Premium
Montoya Soup offering, it brought a new
consumer to the shelf-stable soup
category when all of the other players
were introducing products that just stole
from their competitors.”
• “We’re planning to give more shelf
space to Montoya Soup in F16 after
their successful premium launch this
year. Our guests really loved the new
packaging format and the higher meat
and vegetable content. Product trial
wasn’t extremely high, but we saw a lot
of repeat purchases from the people
who were buying.”
• “I’m trying to eat healthier, and I’m really
nervous about canned products with
their BPA lining. As soon as Montoya
came out with their new carton soup I
switched right away from their
Traditional line and I’m never going
back!”
• “I definitely think their brand is rising
with me, the old stuff was mostly broth,
this new stuff is a huge bargain and it
actually has actual stuff in it.”
• “Glad to see that when everyone else is
trying to rip you off, Montoya is making
Soup that actually tastes like something
I would make at home.”
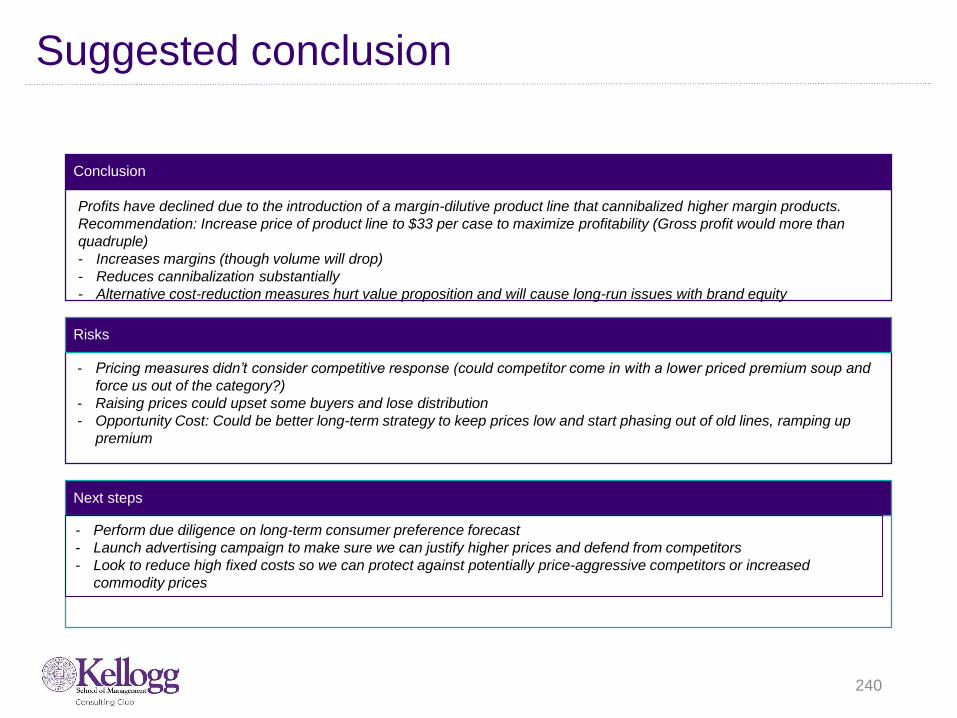
240
Suggested conclusion
Conclusion
Risks
Next steps
Profits have declined due to the introduction of a margin-dilutive product line that cannibalized higher margin products.
Recommendation: Increase price of product line to $33 per case to maximize profitability (Gross profit would more than
quadruple)
- Increases margins (though volume will drop)
- Reduces cannibalization substantially
- Alternative cost-reduction measures hurt value proposition and will cause long-run issues with brand equity
- Pricing measures didn’t consider competitive response (could competitor come in with a lower priced premium soup and
force us out of the category?)
- Raising prices could upset some buyers and lose distribution
- Opportunity Cost: Could be better long-term strategy to keep prices low and start phasing out of old lines, ramping up
premium
- Perform due diligence on long-term consumer preference forecast
- Launch advertising campaign to make sure we can justify higher prices and defend from competitors
- Look to reduce high fixed costs so we can protect against potentially price-aggressive competitors or increased
commodity prices

After School Programming
Case tracker
Case Question
It is 2015, and our client offers after school programming focused on supporting at-risk youth through high school, enabling them to enter and succeed in college.
The client is trying to identify the best approach to meet its growth target. The client’s goals for expansion are to most efficiently serve students at 7 new sites, while raising their national profile. We have been hired to help them vet potential sites to maximize their social and financial impact.
Guide to interviewer
This case should be delivered McKinsey-style, i.e. following presentation of the framework, the interviewer should guide the interviewee from question to question. The secret to this case is thoroughly understanding the client’s business and goals. Interviewers should encourage the interviewee to take time to understand the client’s business model and to be sure they thoroughly understand the questions being asked.
This case focuses on understanding not only the financial objectives but also the other objectives/impact that a client wishes to achieve and these should impact the analysis and recommendations to be delivered.
241
By: David Morse (Kellogg Class of ’11), Edited By: Merih Ocbazghi (Kellogg Class of ’16), Ameed Mallick (Kellogg Class of ‘12)
Industry: Other (Non-Profit)
Case Format: Growth Strategies
Concepts Tested:
- Organizational
- Capacity Expansion
- Customer Strategy
- Marketing Strategy
Quant: ?
Structure: ?
Industry: Non-Profit
Framework: Growth
Interviewer-Led Case

242
Clarifying answers and case guide
Interviewer Guide to case and handouts
Question 1: what are the client’s options for locating and for opening new sites, and what are some considerations the client should consider in selecting among these options?
Question 2: let’s look at the financial considerations, particularly at the effect of additional sites on central costs. The client allocates central office costs to each wholly owned site on a uniform basis, i.e. total central office costs / 8 = allocation per site. The client wants to understand how expanding sites will affect the per wholly owned site allocation of central costs. For this analysis, assume that central costs don’t vary depending on the method selected for expansion. (Show Exhibit 1)
Question 3: from a mission perspective, our client thinks that serving areas with a high density of at-risk youth will best deliver its mission as well as raise its national profile. As such, it would like to determine which geographic areas show the most promise for mission fulfillment. They provided some data from representative school districts for an initial analysis: (Show Exhibit 2)
Question 4: earlier, you listed some additional factors that might help the client screen new locations. What do you think are the pros and cons of these additional factors in each geographic area? How might this influence the client’s choice of target geographies?
Question 5: let’s wrap up with a summary of your findings and a recommendation to the client.
Answer – The interviewee cannot solve this case without understanding the client’s business and goals
Clarifying answers to provide if asked
The following information can be provided if the interviewee asks, but should not be volunteered:
—‘At-risk’ youth are those who, due to behavior or grades, are at risk of dropping out of high school or have already done so—The client operates local centers attached to high schools with full time staff—The client offers tutoring and test prep support to the youth with whom it works, as well as connecting youth to internships and career opportunities—All centers are Massachusetts or southern New Hampshire—The client operates 8 sites with 2,500 youth served—School districts and state agencies reimburse the client for activities—The client has a high national profile and has received calls from high school systems in Florida and California offering to pay for the client to establish centers in their districts; the client has declined these offers to date

243
Key elements to analyze (1)
Question 1: Organizational Changes
Question 1: what are the client’s options for locating and for opening new sites, and what are some considerations the client should consider in selecting among these options?
Notes to interviewer
• The interviewee should quickly focus on geographic options for sites:
• Adjacencies to existing sites (middle schools, neighboring high schools)
• New sites in existing states, separate from existing sites• New states neighboring existing states• New states that have contacted the client
• The three primary methods for opening new sites are:• Partnerships• Branching / licensing• Wholly-owned sites
• The interviewee should go back to their original question, and hopefully their framework, to remember that the client wants to vet potential sites for mission and financial impact. Based on this, they should come up with two sets of criteria, which might include:
• Mission related:• Number of at risk youth• Presence of other youth service organizations• Potential to work with high schools• Knowledge of target market
• Finance / operations related:• Potential to attract funding• Ability to leverage relationships and engage in political
advocacy• Ability to leverage existing infrastructure• Ability to recruit talent

244
Key elements to analyze (2)
Question 2: Capacity Expansion
Question 2: let’s look at the financial considerations, particularly at the effect of additional sites on central costs. (Show Exhibit 1)
Question 3: Customer Strategy
Question 3: our client thinks that serving areas with a high density of at-risk youth will best deliver its mission as well as raise its national profile (Show Exhibit 2)
Notes to interviewer
• A good interviewee will quickly point out that the 74% increase in costs is less than the 88% increase in the number of sites, and that central office cost allocation per site should decrease. Interviewees should quantify the impacts of growth on costs per site.
• Solution on “Math Solution” page
Notes to interviewer
• Note 1: Worcester, MA neighbors an existing site for the client. Nashua, NH does not have a site.
• Note 2: This is a tough problem to solve. Work actively with interviewees to get to the answer. Assume that class sizes, dropout rates and GPA averages are uniform across grades.
• Note 3: Mention that high school is 4 years i.e. There are 4 classes in school at any given time.
• Solution on “Math Solution” page

245
Key elements to analyze (3)
Question 4: Marketing Strategy
Question 4: What do you think are the pros and cons of these additional factors in each geographic area? How might this influence the client’s choice of target geographies?
Notes to interviewer
• Good interviewees will draw a table matching geographic options against the screening criteria they listed in question one, thenwill give a quick summary of the pros and cons of each criteria in each geography. The interviewer can help the interviewee set the chart up but should let the interviewee take the lead on walking through the analysis. This question is highly qualitative and intended to test the interviewees’ judgment and communication skills.
• Here is an illustrative Chart
Neighboring site New site in
existing state
Neighboring state New state
Mission fit Pro: knowledge of local youth; relationships
with policy makers and school admins
Con: might not spread model
Pro: would spread model
Con: need new relationships, regulations
could differ and affect operations
Financial fit Pro: model already approved for funding,
ability to move staff / hire easily
Con: might hit funding limits
Pro: access to new sources of funding,
higher national profile
Con: districts / states might not fund model

246
Math Solutions (1)
ANSWER: Question 2/Exhibit 1
Current Additional costs
Staff $750K $600K
IT $110K $80K
Office expenses $115K No change
Training and
support
$25K $55K
Total central office
costs
$1,000K $735
Cost per site $1,000K / 8 =
$125K
=$1,735K / 15 =
$115.67K
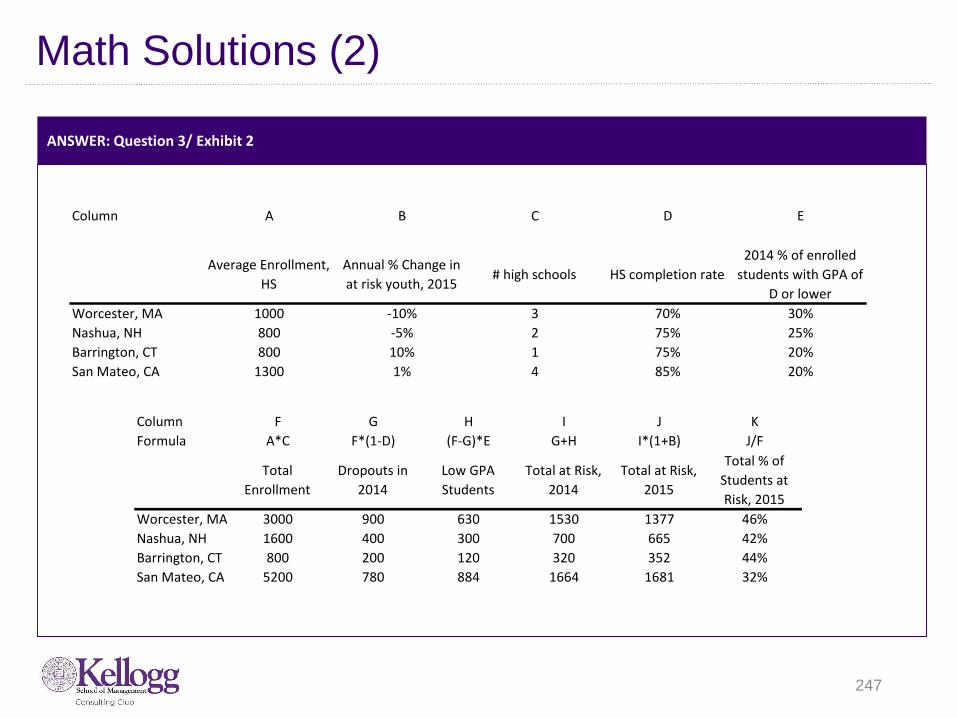
247
Math Solutions (2)
ANSWER: Question 3/ Exhibit 2
Column F G H I J K
Formula A*C F*(1-D) (F-G)*E G+H I*(1+B) J/F
Total
Enrollment
Dropouts in
2014
Low GPA
Students
Total at Risk,
2014
Total at Risk,
2015
Total % of
Students at
Risk, 2015
Worcester, MA 3000 900 630 1530 1377 46%
Nashua, NH 1600 400 300 700 665 42%
Barrington, CT 800 200 120 320 352 44%
San Mateo, CA 5200 780 884 1664 1681 32%
Column A B C D E
Average Enrollment,
HS
Annual % Change in
at risk youth, 2015# high schools HS completion rate
2014 % of enrolled
students with GPA of
D or lower
Worcester, MA 1000 -10% 3 70% 30%
Nashua, NH 800 -5% 2 75% 25%
Barrington, CT 800 10% 1 75% 20%
San Mateo, CA 1300 1% 4 85% 20%

248
Solution and recommendations
Solution & Recommendations
The case is designed to indicate that the client should focus on existing states, and perhaps on neighboring states. The client should not consider expanding outside its existing geographic foot print in New England.
The interviewee should note that the client benefits financially from scale, but that a financial analysis does not indicate a geographic area for expansion. From a mission perspective, existing and neighboring geographies provide the highest density of at-risk youth. New geographies in existing states are also promising from a mission perspective. Thinking further about non-financial benefits from scale, as should be done in question 4, should also indicates that growing within existing states or in neighboring states poses fewer risks for the client.

249
Exhibit 1: Addt’l central costs from expansion
Current Additional costs
Staff $750K $600K
IT $110K $80K
Office expenses $115K No change
Training and support $25K $55K
Total central office costs
Cost per site

250
Exhibit 2: Representative data on at-risk youth
Average Enrollment, HS
Annual % Change in at risk
youth, 2015# high schools
HS completion rate, class of
2014
2014, % of enrolled
students with GPA of D or
lower
Worcester, MA1000 -10% 3 70% 30%
Nashua, NH800 -5% 2 75% 25%
Barrington, CT800 10% 1 75% 20%
San Mateo, CA1300 1% 4 85% 20%

CONTENTS
3
13
22
251
How to use this book
Typical case flow
KCC 2016 cases
Industry primers

252
Industry Research Overview
A tailored approach to industry research can help you prepare
Provides insight into industry-wide trends and revenue/cost drivers o Allows you to make a more nuanced framework or tack on an additional piece of
industry-specific analysis
o May point you toward sources of issues in cases
o Can be helpful in Q&A with your interviewers about their own work
Spend your limited time wello No need for extensive research on industries in which you already have significant prior
experience or knowledge
o Read high-level industry summaries (such as those on the following pages) to gauge
whether anything is completely new to you
o Consider reading in-depth guides for industries that
o Are completely new to you
o You seek to specialize in
o You know will come up in interviews (e.g., due to industry focus of firm)
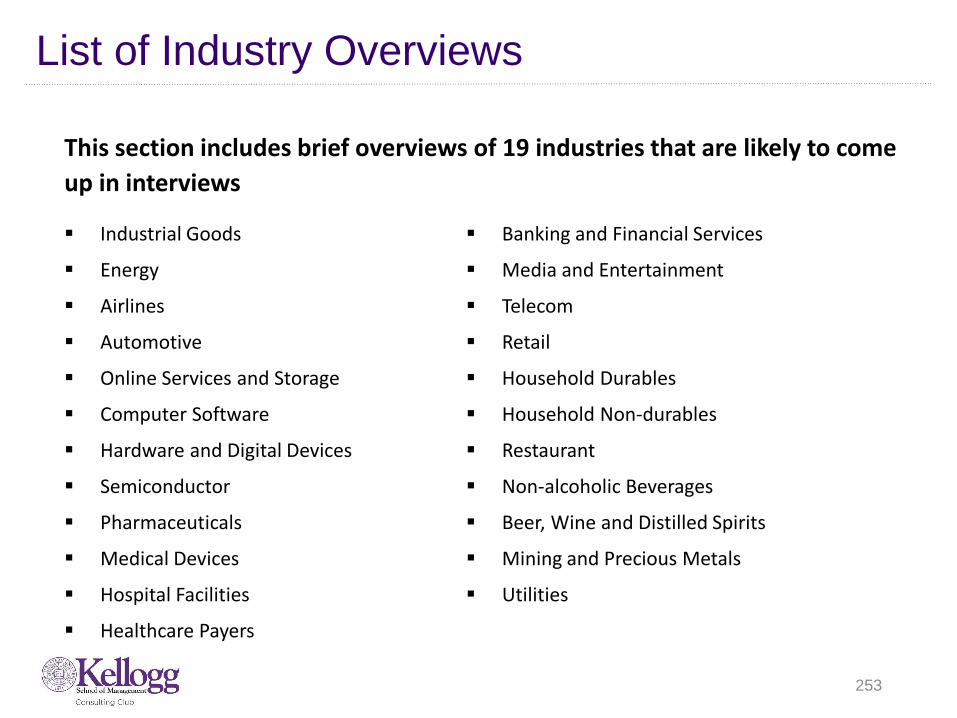
253
List of Industry Overviews
This section includes brief overviews of 19 industries that are likely to come
up in interviews
Banking and Financial Services
Media and Entertainment
Telecom
Retail
Household Durables
Household Non-durables
Restaurant
Non-alcoholic Beverages
Beer, Wine and Distilled Spirits
Mining and Precious Metals
Utilities
Industrial Goods
Energy
Airlines
Automotive
Online Services and Storage
Computer Software
Hardware and Digital Devices
Semiconductor
Pharmaceuticals
Medical Devices
Hospital Facilities
Healthcare Payers

254
Industrial Goods
• Large and diverse industry that provides products/services primarily used to produce other goods
• Main sectors– Electrical Equipment and
Components– Industrial Automation/Heavy
Machinery– Construction and Engineering– Aerospace & Defense
• Key Players include: GE, Siemens, Cummins, Boeing, Lockheed Martin, Northrop Grumman, Eaton, Honeywell, Raytheon, 3M, Caterpillar, Emerson Electric, Fluor, Tyco, Waste Management, Bosch Rexroth
Overview
• Tighter consumer spending has led to reduced production and stagnant growth for the industry
• Industry has seen increasing consolidation over the past few years; Most sub-segments are Oligopoly
• Emerging markets are key for growth as they are quickly developing and increasing production capacity for a variety of goods
• Local assembly is common since components are easier to ship than finished goods
Trends
Revenue• New Product Innovation
• Product quality and reliability including after-sales service
• Specialized products for various customer segments
Cost• Raw materials including oil,
natural gas, metals,
• Human capital costs including engineers, labor/manufacturing force and sales force
• R&D
Drivers

255
Energy
Major E&P players like BP, ExxonMobil, Pertrobras, Aramco are involved in both upstream and downstream.
Upstream Steps: 1. Exploration: Finding oil, including
geological exploration, research, and purchasing/leasing land. Offshore is leased from gov’ts through auctions
2. Drilling. Companies drill exploratory wells to determine size; if satisfactory, add’lwells are developed. Overheating can cause explosions (“blowouts”).
3. Well Completion. Post drilling, engineers put cement in the walls
Steps 1-3 are often contracted out from E&P firms to firms like TransOcean. Delays are very expensive ($500k a day), and may be charged to contractors; but E&P firms make decisions
Downstream Steps: Production Refining Marketing
Liability for spills is extremely costly ($1-4k per barrel spilled, 205M gallons est. spilled)
Overview
New Legislation Post –BP oil spill the industry is likely to experience major changes. • A hodgepodge of oversight agencies
granted exceptions to rules, as government agencies needed to both foster and police the industry
• A mix of companies is in charge of each rig, and their interests are not always in sync (see delays under overview, eg for maintenance)
Foreign countries maintain their own oil standards
State-owned oil companies like Saudi Aramco and Petrobras are sitting on enormous oil reserves, but cannot exploit it as efficiently as public companies
New players in China (supported by government) is entering the OEM and shipping industry
Trends
Revenue DriversOutside Factors: economic environment (GDP growth), supply, consumption and demand level, oil and gas inventories.Prices of oil, gas, and refined products are the most watched factor in energy.Key measures: Supply and demand of oil and natural gas, rig count, rig utilization rates, rig dayrates and daily marginsDrilling companies: provide the rigs and operate them, either on a project or long-term contract basis, with rates charged by the day (popular among offshore drilling), foot drilled, or all-inclusive basis.Wide range of services, including: pressure pumping, wireline, directional drilling and measurement while drilling (MWD), and marine support
Cost DriversUpstream - exploration and production expenditures; Midstream – transportation, and storage costs; Downstream – refining and marketing costs.OPEC: influences global price.
Drivers
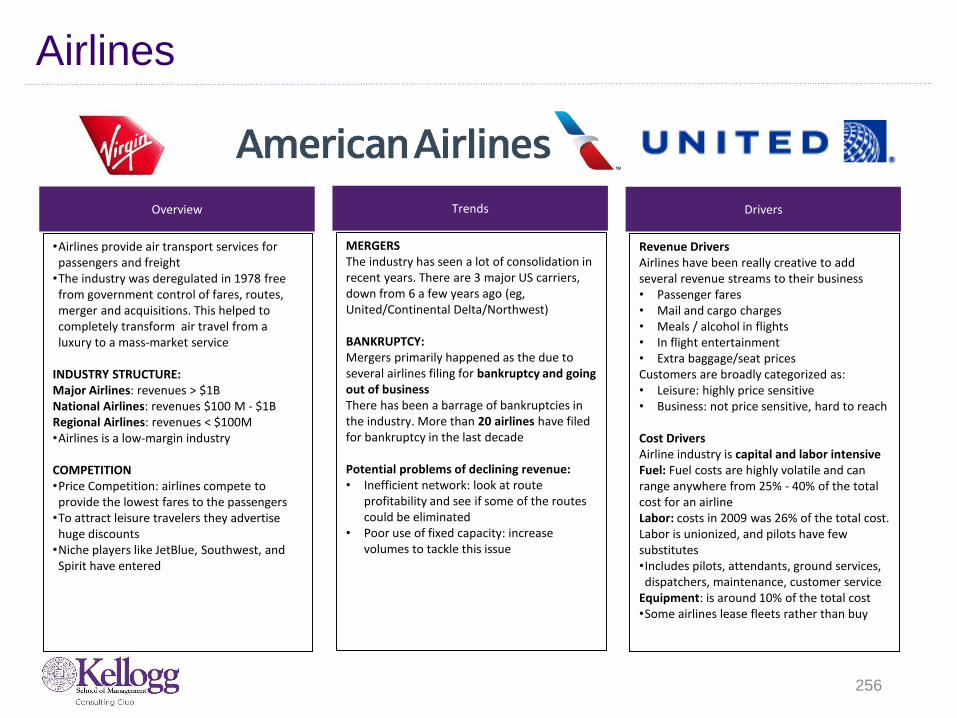
256
Airlines
•Airlines provide air transport services for passengers and freight
•The industry was deregulated in 1978 free from government control of fares, routes, merger and acquisitions. This helped to completely transform air travel from a luxury to a mass-market service
INDUSTRY STRUCTURE:Major Airlines: revenues > $1BNational Airlines: revenues $100 M - $1BRegional Airlines: revenues < $100M•Airlines is a low-margin industry
COMPETITION•Price Competition: airlines compete to provide the lowest fares to the passengers
•To attract leisure travelers they advertise huge discounts
•Niche players like JetBlue, Southwest, and Spirit have entered
Overview
MERGERS The industry has seen a lot of consolidation in recent years. There are 3 major US carriers, down from 6 a few years ago (eg, United/Continental Delta/Northwest)
BANKRUPTCY:Mergers primarily happened as the due to several airlines filing for bankruptcy and going out of businessThere has been a barrage of bankruptcies in the industry. More than 20 airlines have filed for bankruptcy in the last decade
Potential problems of declining revenue:• Inefficient network: look at route
profitability and see if some of the routes could be eliminated
• Poor use of fixed capacity: increase volumes to tackle this issue
Trends
Revenue DriversAirlines have been really creative to add several revenue streams to their business• Passenger fares• Mail and cargo charges• Meals / alcohol in flights• In flight entertainment• Extra baggage/seat prices Customers are broadly categorized as:• Leisure: highly price sensitive• Business: not price sensitive, hard to reach
Cost DriversAirline industry is capital and labor intensiveFuel: Fuel costs are highly volatile and can range anywhere from 25% - 40% of the total cost for an airlineLabor: costs in 2009 was 26% of the total cost. Labor is unionized, and pilots have few substitutes•Includes pilots, attendants, ground services, dispatchers, maintenance, customer service
Equipment: is around 10% of the total cost•Some airlines lease fleets rather than buy
Drivers

257
Automotive
The automotive industry is engaged in the design, production, marketing, sale, and servicing of motor vehicles.
New light vehicle sales in the US expected at 11.7 million for 2010. Volume increase is forecasted in 2011, to 13.5 million.Heavy capital commitments required to keep pace with product development and model changeovers.Demand is naturally affected by economic environment.Auto parts manufacturers highly fragmented: produce original parts and accessories for new vehicles, replacement parts, and accessories for older vehicles, or both
Labor is often unionized and wields power.
CompetitionExtremely competitive. The US is the world’s most competitive auto market.Detroit Three losing market share: GM, Ford, and Chrysler. The top three foreign companies have a combined US market share of 41.5%: Toyota, Honda, and Nissan.
Overview
US share of global market shrinking: In 2009, China overtook the US as the largest market for new vehicles. US accounted for 16.3% of global demand.Demand in developing markets, including the BRIC economies, is projected to outstrip that of the world’s mature markets.US and global sales to advance. Production in NA was up 70% in the first quarter of 2010. Europe may lag.Companies in China, Russia, India to makeacquisitions in the US.Alternative fuel and hybrid vehicles – All automakers are developing the technology: ethanol, methanol, natural gas, and electricity derived from batteries or solar power.Auto parts – online procurement has changed the business, with increased transparency pressuring selling prices for commodity items.Bankruptcy: GM, Chrysler, GMAC (auto lender) and suppliers filed for bankruptcy and some for bailouts in 08/09Distribution: Main channel is – dealership model. Rapid consolidation in recent years.
Trends
Revenue DriversFactors affecting new car sales: changes in style, engineering, safety, quality, cost and availability of gasoline and insurance.Price increases are limited. Rising competition in NA and Europe has restricted manufacturers’ pricing power.Demand, sales rise during sustained economic growth and plentiful employment.Tactics to stimulate demand: discounts and cash rebates, (dealers’ discounts,) financing at lower interest rates, eliminating options on a model to offer a low-priced alternative.
Cost DriversCapital expenditures of 2010: GM $6.0 billion, Ford $4.5-5 billion, Toyota $8.1 billion.Costs breakdown: plants, raw materials, design, production, labor, distribution, marketing, and customer service.Suppliers: number shrinking, due to globalization, reduced volume from US automakers, high material and labor costs.Oil prices and raw material pricesCost cutting tactics: higher unit production volume, savings on parts and labor, improved manufacturing efficiencies.
Drivers

258
Online Services and Storage
The online industry consists of companies that provide virtual-environment services and products, including data search, cloud data storage, social networking, big data analytics, music and video streaming, e-Stores (fashion, media, etc.), news and gaming.
INDUSTRY STRUCTURE:Total Revenues: ~$1.8TrillionIndustry Leader in Revenues: Google ($29.3 Billion)
COMPETITION•Innovation: companies try to differentiate themselves by investing heavily in innovation, or “the next big thing”, such as YouTube, Facebook or eBay, most of which are monopolies in their own specific market.
•In the consumer world, major players include online services companies such as Google or DropBox, e-Retailers such as Amazon and Gilt, entertainment providers such as NetFlix and Hulu, and social networks such as Facebook and Twitter. In the business arena, companies such as IBM, McKinsey, Accenture and other professional services companies are taking the lead.
Overview
CLOUD COMPUTING:A wide variety of service providers are battling over the right to provide consumers with free cloud based services, most notably storage (DropBox, Google Drive, Amazon Cloud Drive), productivity (Google Docs, Microsoft Office Live), CRM (Salesforce) and professional services (Quickbase, Bill.com).
BIG DATA:The huge amount of information out there serves not only as an opportunity for companies to study, analyze and predict market trends, but also as an essential tool for survival.
CYBER SECURITY:Both in the private sector, where many have already entrusted the web with their most intimate information, including bank accounts, emails or work, and in the more global aspect, cyber warfare, spying and intelligence gathering have all increased the need for highly developed cyber security services, to protect both corporate secrets and peoples’ lives.
Trends
Revenue DriversIn the consumer market, most services are given for free, where most revenues come from advertising and data collection. Some services/products are given for a subscription fee, and some (usually e-retailers) usually come from direct sales. In the business sector, the ability to provide expertise to increase value for clients, where many companies are quickly transitioning themselves from conventional services firms into “one-stop-shop” firms, mostly among consulting companies, accounting firms and technology firms, allow such companies to charge service fees.
Customer base is very broad, i.e. not limited solely to ultra-techy consumers, but also to sophisticated business people, organizations and consumers with low-to-intermediate level of technical experience.
Cost DriversThe online industry relies heavily on innovation (a large portion of which comes from M&As of startup companies), customer relations and IT infrastructure. Conventional costs such as physical stores, fragmented inventory space and manpower are very low.
Drivers

259
Computer Software
The software industry includes businesses for development, maintenance and publication of software, including productivity suites, games, mobile apps, hardware-specific software (both firmware and custom made software) and operating systems (including mobile platforms).
INDUSTRY STRUCTURE:Total Revenues: $303Billion (in 2010)Industry Leader in Revenues: Microsoft $69Billion (in 2010)
COMPETITION•Software companies compete not only with other software companies, but also with other technology-based services providers, by focusing on specific clients – whether by creating simple and cheap mobile apps for clients on the go, or niche expertise-based products for sophisticated clients.
•Major players include very large companies such as Microsoft, IBM, Oracle, Symantec and Adobe, which focus on the working environment, and of smaller companies such as Electronic Arts, which focus on gaming across multiple platforms.
Overview
DIGITAL TRANSFORMATION:For the last few years, there is an apparent slowdown in growth in the software industry, where gains are achieved through operational performance rather than technological innovation, and growth is accomplished through mergers rather than organic development. Due to convenience issues, piracy and security risks related to software-based ecosystems, the tech world is moving towards online services and mobility. Other than switching to other, software developers are also either focus on smaller & simpler versions for the consumer market (mobile apps) or on much more sophisticated software for the business market, mostly for CRM, IT systems, database and online services.
MICROSOFT RISE AGAIN(?):Despite overwhelming criticism regarding its lack of innovation and inability to create value in the longer term, Microsoft managed to retain its dominance in the productivity software market with its Office cash-cow, while introducing the much anticipated Windows 8 OS, which draws positive attention.
Trends
Revenue DriversThe industry experienced very few changes in such respect, as revenues are based mostly online and retail sales, service and client support fees, annual subscriptions and licensing fees.
The customer base has changed in the past couple of years: regular consumers are interested more in simple friendly software rather than sophisticated do-it-all software, and businesses are worried that constant innovation will harm their competitiveness if they commit to the wrong software, and are interested more in “renting” a dynamic software rather than buying a product that requires high implementation costs. Therefore, the software industry focuses on the 2 “extremes”: the relatively low-tech customers and ultra-sophisticated ones.
Cost DriversThe biggest cost software companies traditionally faced was related to the development of the products. In the past, the huge allure of the software industry was its relatively low operational costs once the product has been developed, and such costs have shrunk even more in the last few years due to online distribution. However, piracy has plagued most of the software industry and increased the cost of protecting the companies’ intellectual property.
Drivers
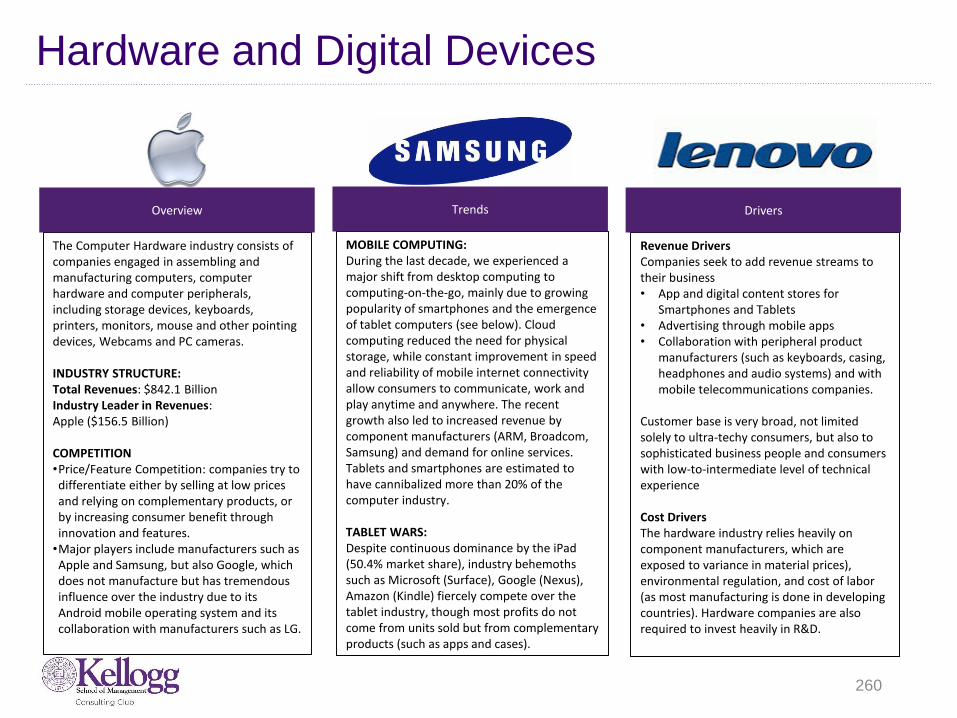
260
Hardware and Digital Devices
The Computer Hardware industry consists of companies engaged in assembling and manufacturing computers, computer hardware and computer peripherals, including storage devices, keyboards, printers, monitors, mouse and other pointing devices, Webcams and PC cameras.
INDUSTRY STRUCTURE:Total Revenues: $842.1 BillionIndustry Leader in Revenues: Apple ($156.5 Billion)
COMPETITION•Price/Feature Competition: companies try to differentiate either by selling at low prices and relying on complementary products, or by increasing consumer benefit through innovation and features.
•Major players include manufacturers such as Apple and Samsung, but also Google, which does not manufacture but has tremendous influence over the industry due to its Android mobile operating system and its collaboration with manufacturers such as LG.
Overview
MOBILE COMPUTING:During the last decade, we experienced a major shift from desktop computing to computing-on-the-go, mainly due to growing popularity of smartphones and the emergence of tablet computers (see below). Cloud computing reduced the need for physical storage, while constant improvement in speed and reliability of mobile internet connectivity allow consumers to communicate, work and play anytime and anywhere. The recent growth also led to increased revenue by component manufacturers (ARM, Broadcom, Samsung) and demand for online services. Tablets and smartphones are estimated to have cannibalized more than 20% of the computer industry.
TABLET WARS:Despite continuous dominance by the iPad(50.4% market share), industry behemoths such as Microsoft (Surface), Google (Nexus), Amazon (Kindle) fiercely compete over the tablet industry, though most profits do not come from units sold but from complementary products (such as apps and cases).
Trends
Revenue DriversCompanies seek to add revenue streams to their business• App and digital content stores for
Smartphones and Tablets• Advertising through mobile apps• Collaboration with peripheral product
manufacturers (such as keyboards, casing, headphones and audio systems) and with mobile telecommunications companies.
Customer base is very broad, not limited solely to ultra-techy consumers, but also to sophisticated business people and consumers with low-to-intermediate level of technical experience
Cost DriversThe hardware industry relies heavily on component manufacturers, which are exposed to variance in material prices), environmental regulation, and cost of labor (as most manufacturing is done in developing countries). Hardware companies are also required to invest heavily in R&D.
Drivers

261
Semiconductor
Overview Trends Drivers
Industry:The research, development, production, and marketing of semi-conductors
Products:Industry is made up of four product categories:1. Memory – Memory chips are temporary
storehouses of data and pass information to and from computer
2. Microprocessors – central processing unit that contain the basic logic to perform tasks
3. Commodity Integrated Circuit – “standard chips” – produced in large batches for routine processing purposes
4. Complex SOC – “System on a Chip” –integrated chip with entire system’s capability on it
Key Ratios/Terms:Moore’s Law – number of transistors on a chip doubling every two years“Fabless” Chip Makers – semi-conductor companies that carry out design and marketing, but outsource the actual manufacturingR&D/Sales – research and development expenses as a percent of sales – want high %Yield – # of operational devices out of all mfg.
Growth:• Semi-conductor industry is highly cyclical
• Companies face constant highs and lows for demand of their product
• Growth trends track closely with demand for personal computers, cell phones, and other electronic equipment
Trends:Traditionally, semi-conductor companies have controlled the entire production process, but in order to be lean, efficient, and effective, they are moving away from that model:• Successful companies must be smaller, faster,
and cheaper• Chip makers are beginning to delegate
manufacturing to foundry companies (whose sole business is manufacturing)
• Noticeable increases in specialized designers and chip testers
Competition:• “Fabless” companies overcome barriers to
entry related to large capital requirements• Foundries gaining supplier power because of
cutting-edge equipment and production skills• Intense rivalries between companies
Revenue:Revenue = Price of chip x quantity sold
• Due to Moore’s law and the competitive nature of the industry, it is not uncommon for the price of a new chip can fall by as much as 50% in a short time period
• By nature of the process, there is a long lead time with product releases, so it may take years before a company sees revenue for certain products
Costs:• Semi-conductor companies live and die by
their ability to be cost efficient• Constant pressure from market and
customers to develop better, cheaper products in a short time frame
• As noted above, each product has a long lead time, so a company will incur costs for a long time before that product generates any revenue
• As noted in “Trends”, historically complete process companies have outsourced some of the production process in order to be more lean and cost efficient
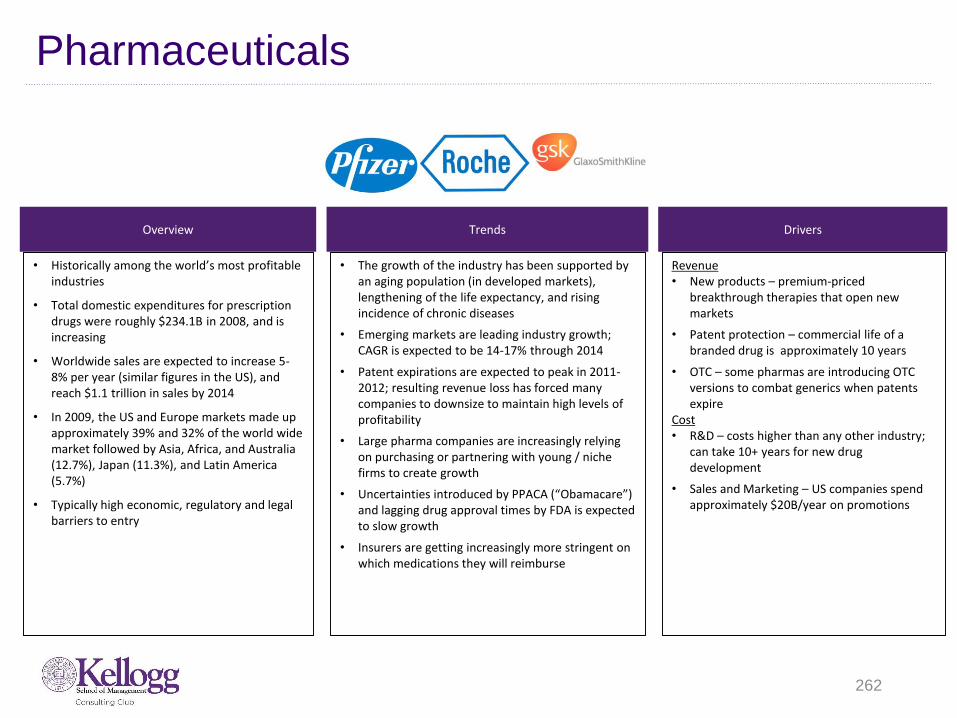
262
Pharmaceuticals
• Historically among the world’s most profitable industries
• Total domestic expenditures for prescription drugs were roughly $234.1B in 2008, and is increasing
• Worldwide sales are expected to increase 5-8% per year (similar figures in the US), and reach $1.1 trillion in sales by 2014
• In 2009, the US and Europe markets made up approximately 39% and 32% of the world wide market followed by Asia, Africa, and Australia (12.7%), Japan (11.3%), and Latin America (5.7%)
• Typically high economic, regulatory and legal barriers to entry
Overview
• The growth of the industry has been supported by an aging population (in developed markets), lengthening of the life expectancy, and rising incidence of chronic diseases
• Emerging markets are leading industry growth; CAGR is expected to be 14-17% through 2014
• Patent expirations are expected to peak in 2011-2012; resulting revenue loss has forced many companies to downsize to maintain high levels of profitability
• Large pharma companies are increasingly relying on purchasing or partnering with young / niche firms to create growth
• Uncertainties introduced by PPACA (“Obamacare”) and lagging drug approval times by FDA is expected to slow growth
• Insurers are getting increasingly more stringent on which medications they will reimburse
Trends
Revenue• New products – premium-priced
breakthrough therapies that open new markets
• Patent protection – commercial life of a branded drug is approximately 10 years
• OTC – some pharmas are introducing OTC versions to combat generics when patents expire
Cost• R&D – costs higher than any other industry;
can take 10+ years for new drug development
• Sales and Marketing – US companies spend approximately $20B/year on promotions
Drivers

263
Medical Devices
Industry Definition: any healthcare product that achieves its intended purpose not throughchemical action or being metabolized
Products: devices range in complexity from tongue depressors to multi-million $ imaging equipment. - Most common are surgical
appliances/supplies, surgical & medical instruments, electro-medical equipment, in-vitro diagnostic substances, irradiation apparatus (typically x-ray), dental & ophthalmic (eye) goods
Key Stats: US industry includes about 11,000 companies with combined annual revenue of over $150 billion. Globally, the industry generates annual revenue over $400 billion. Major markets include the US, Japan, Germany, France, and Italy.- Industry is concentrated: 50 largest
companies account for ~60% of revenue
Major Companies: include Baxter International, Boston Scientific, Johnson & Johnson, Medtronic, GE & St. Jude
Overview
Growth: industry revenue is projected to grow on average 6.6%/yr. from 2012 to 2017Trends:- Uncertainties introduced by PPACA
(“Obamacare”) and lagging device approval times by FDA is expected to slow growth
- PPACA contains med device tax -will cost the industry $20 billion over the next decade
- Increased government regulation around the globe threatening growth
- Recent difficulties in retaining qualified manpower to design and produce devices
- Aging population and increased access to care should help stem some of losses from forces mentioned above
- Growing attention to healthcare in developing markets
Competition: increasingly sophisticated pharmacologic products, growth in preventive medicine
Barriers to entry: high for small players; economies of scale and access to capital are critical to negotiate complex regulatory and approval processes
Trends
Revenue Drivers:- expanding emphasis on healthcare in
developing countries- standardization of regulatory requirements
across countries- Growth in elderly population means increased
demand for devices- Improved patient longevity due to higher
quality healthcare- Innovation in product development due to
strong scientific progress
Cost Drivers- Research and development- Regulatory approval and compliance process- Federal and local taxes- Sales and marketing operations
Drivers

264
Hospital Facilities
Acute care hospitals – 5,815 in 2008. Non profit entities account for 82% of this segment. Total revenues in 2008: $608 billion. Revenue CAGR (04-08) – 5.4%Rehabilitation hospitals (both stand-alone
units & those attached to a larger facility) –203 in 2008Psychiatric hospitals – 447 in 2008; Avg. length of stay has remained stable at 9-10 daysSpecialized hospitals – orthopedics (25); obstetrics & gynecology (13); chronic disease (4); eye, ear, nose, and throat (6); & tuberculosis and other respiratory diseases Nursing homes – 15,531 in 2008, occupancy rate ~84%Assisted-living facilities, and home healthcare services.
Overview
Patient Protection and Affordable Care Act(PPACA) (“ObamaCare”) reforms aspects of the private health insurance industry and public health insurance programs, increases insurance coverage of pre-existing conditions, expands access to insurance to over 30 million Americans, and increases projected national medical spending while lowering projected Medicare spending.
Shortage of Physicians and Nursing staff : As the population ages the shortage of primary care physicians would aggravateHighly regulated by the government which is a key buyer for the hospital industry Gov’t: account for 47% of healthcare spendHealthcare reform will extend healthcare insurance coverage to approximately 32 million of the previously uninsured by 2019
Consolidation: To reduce costs, nonprofit chains or individual nonprofit hospitals being acquired and/or entering into JV arrangements with the for-profit chains
Trends
Sources of Revenue:Inpatient admissions: Has remained flat at ~118 admissions/1000 populationProcedures: Decrease in admissions result of a shift towards procedures performed on an outpatient basis rather than in hospitalReimbursement rates: Controlled by gov’t
Demand Drivers: Increase in unemployment loss of employer-based health coverageDecline in the rate of elective proceduresShift towards procedures performed in outpatient facility or physicians’ offices that don’t require an overnight hospital stayNew medical technologies reduce or eliminate the need for hospitalizationIncreasing influence of third-party payers, Ageing population
Cost DriversLabor Costs (Doctors, Nurses, Admins)Uncompensated Care: high % bills not billed to insurance is written off as bad debtTaxes: non-profits are exempt from some taxes
Drivers

265
Healthcare Payors
WHAT PAYORS DO:• Underwrite (assume risk of, assign premiums
for) health insurance policies • Provide admin services for self-funded plans
(e.g. employers providing benefits with own funds)
• Help manage individuals’ care
KEY INDUSTRY STATISTICS:• Revenues/Profits: $707.4B / 28.3B (4%)• CAGR ‘07-’12 / ’12-’17: 2.8% / 5.1%• Number of businesses: 927
PRIMARY PLAN OFFERINGS:• Fee-for-service: Provider paid on one-off
basis; patient choice not restricted• Health maintenance org: Payer and provider
integrated and pre-paid; cheaper, but patient choice limited
• Preferred provider org: Mix of FFS, HMO • High deductible: Lower premiums but higher
out-of-pocket obligation; patient has incentive to use services efficiently
• Pharmacy benefits
Overview
HEALTHCARE REFORMDirectly pressures payors’ bottom lines by:• Eliminating coverage caps, denials based on
pre-existing conditions, etc.• Increasing medical loss ratios (% premium
dollars payers must spend on healthcare, with remainder going to admin and profit)
• Increasing gov. scrutiny of premium hikes• Forcing payors onto exchanges for
individuals; more price competition, less G&A scale than with employer groups
However, the law will bolster top-line growth by growing the insured population
COMPETITION• The top four payors have ~35% share; the
rest of the market is fairly fragmented• Slow but steady consolidation expected to
continue given profitability issues
MACROECONOMIC ENVIRONMENT• Recession precluding payors from increasing
premiums in line with healthcare cost inflation
Trends
REVENUE DRIVERSPayor revenues are largely dependent on external factors:• Total health-related expenditures• Number of physician visits• Number of employed individuals• Age of population• Regulation and legislationPayors also attempt to steal market share from one another by differentiating on:• Steeper discounts on provider charges • Broader network coverage• Lower administrative fees• Add-on services (e.g. case management)• Attractiveness to individual consumers (once
exchanges go live in 2014)
COST DRIVERS• Purchases of medical and Rx services/
products) comprise ~72% of costs; influenced by utilization and cost inflation.
• Relative to other sectors of healthcare, the health insurance industry is neither capital nor labor intensive.
Drivers

266
Banking and Financial Services
Diversified Financial Services firms: large financial conglomerates (e.g. JP Morgan Chase & Co.) which combine insurance, securities, and lending businesses
Consumer finance firms: primarily lend money to consumers: mostly through small to midsized loans ($1,000 to $75,000). The main products include home equity loans, credit card loans, etc
PE/VC firms: invest in and help manage or guide businesses with hopes of company growth resulting in profits from a later sale
(Additional Types under Drivers)
Interest Rates are at zero, meaning banks will make no money by investing in government bonds. This is the federal reserve encouraging banks to lend money
Customer deposits in banks are FDIC insured up to $250,000, meaning the government will make you whole if the bank loses that money
Overview
As a result of recent financial crisis, regulations have increased (controlled by Treasury Department, The Federal Reserve, House and Senate bills)
The US government intervened in 2007-09 to lend money to banks, insurers, and other key players to keep the financial system afloat.
Consolidation of banksTrend towards large “financial supermarkets” like Citi may be reversing, as many large banks sold off divisions for needed cash during the downturn
Post- financial crisis, many financial institutions have stopped proprietary trading, or placing bets with their own assets.
The Dodd-Frank act, which has not been fully implemented, includes new and consolidated federal regulatory agencies, stricter capital requirements for banks, and regulates the trading of certain derivatives.
Trends
Revenue DriversCommercial Banks earn money by reinvesting customer deposits in higher-yielding funds or lending at higher rates and charging transaction feesInvestment Banks charge fees for advising corporate and governmental clients on mergers, acquisitions, restructuring, and debt and equity issuancesInsurance Companies earn money by taking in monthly premiums from customers, who receive a payout if an event occursCredit Card Companies (Visa / Discover) earn fees from customers and merchants by handling the complex processing necessary. AMEX does the same, but also lends the customer money.
Cost DriversResearch (whether to buy/sell securities, or suggest a specific merger)Salary and benefits, supplies, insurance. Losses on investments like loan defaultsRisks, such as a sudden demand from many customers to redeem their money
Drivers

267
Media and Entertainment
•Media and entertainment companies create, license and / or distribute content (TV shows, movies, music, news, video games, books, magazines, radio shows, advertising, etc.)
•The industry has long been known for conglomeration; developing and acquiring multiple brands and multiple distribution channels for their dissemination
INDUSTRY STRUCTURE:Total: Global revenues of $1.5 TConsumer / End-User Spend: $1 TAdvertising Spend: $500 B•The leading 10 companies in the industry account for one third of revenue
•This includes some cable, telecom, hardware, software and internet spend which is hard to split from “content”
•Other national or regional conglomerates and digital startups comprise remaining revenue
Overview
MACROECONOMICS:Consumer and advertising spending on M&E is tied to economic growth, though some segments (cable, internet access) are resistant to downturns and / or more impacted by secular trends. Annual growth slowed in 2008 and the industry retracted by 2.4% in 2009. Growth has rebounded to ~4.5% since then.
DIGITAL:The biggest long-term issue for industry players is how to put content online. The internet poses a number of challenges:• Lowered barriers to entry for creating /
distributing, increasing competition• Increased piracy due to high-speed
connections and illegal download sites• Consumer expectations of lower priced /
free content, available on-demand• New intermediaries and lack of standards
(Google search, iOS vs. Android app platforms, new ad formats)
• Limitless advertising inventory and less consumer attention, reducing ad prices
• Distribution and standing out harder given huge libraries (Amazon books, iTunes)
Trends
Revenue DriversDepending on the company’s focus, the below revenue mix differs. There has been a lot of experimentation in adapting these business models to digital age:• Consumer / end-user: More of a focus on
subscriptions, multi-device access and free or “freemium” with micro-transactions
• Advertising: More of a focus on direct response and tying ad exposure to purchases or clicks, also use of web usage data to micro-target, raising privacy issues
• Licensing / distribution: More focus on retransmission fees TV networks charge to cable cos. and revenue shares with online marketplaces
Cost DriversThe M&E industry is labor intensive in terms of costs for “creative” talent and sales staffs, which can comprise 40% - 50% of costs for a company or project (one movie). Marketing also represents a large portion of costs, given the competition for consumer attention. Capital investments in digital technologies represent a newer but growing area of cost
Drivers

268
Telecom
Overview Trends Drivers
Industry:Made up of companies that allow people to connect all over the world through a complex networks of phones, mobile phones, and internet-linked PCs.
Products:This is not a comprehensive list, but it does provide examples of products from the Telecom industry:• Telephone• Fiber optics• High-speed internet• Radio• Satellite communications• Cell phone networks
Key Ratios:Churn Rate –rate at which customers leave for a competitor. Telecom industry has highest churn rate of any industry.Average Revenue Per User (ARPU) – understand purchase level for each userBroadband – high-speed internet access techTelecommunications Act – stimulate competition in the industry
Growth:• Growth in this industry comes from services
delivered over mobile networks
Trends:• Deregulation and innovation changed the
competitive landscape of this industry• Telecom companies are beginning to expand
out of telecom and into enter other industry spaces
• An example of this is Comcast entering the media and entertainment industry
• The reverse is also true where outside industry companies are expanding into the telecom industry, e.g. Google Fiber
Competition:• The telecom industry requires large capital
investments upfront, which creates a potential barrier to entry for new entrants
• No significant supplier power due to large quantity of equipment suppliers
• Growing buyer power due to access to substitutes and the telecom becoming a commodity
• Deregulation and receptiveness of the market has made this industry incredibly competitive
Revenue:Revenue = subscription fee x # of subscribers
• Subscription fee structure will vary by service offering and telecom company
• Companies will try to maximize their revenue through the structure of their fee arrangement
• Must be very conscious of industry pressures related to fee structure
• Bundling services is a common practice in the industry in order to maximize revenue
• Another opportunity for telecom companies to make revenue is to provide network connectivity to other telecom companies
Costs:• Fierce competition in an essentially
commodity market has led to cost competition between companies
• Efficient billing systems are a way for companies to decrease cost and improve margins
• Expanding a company’s network and service offering are large cost drivers
• Smaller players may have to pay for connectivity which will increase their costs

269
Retail
• Retail trade makes up $3.8 trillion in sales (second largest US industry)
• Retail industry is comprised of the following sub-industries:
– General merchandise– Apparel– Consumer electronics– Home improvement– Office supplies– Drug retail– Automotive retail– Specialty– Food retail– Hypermarkets/super-centers
Overview
• The industry has generally been negatively impacted by the economy (discount retailers have done best)
• Due to frequent price promotions, lower profit margins are common in the industry
• Retailers are expanding their share of private label brands
• Many specialty retailers are selling services to differentiate themselves from rivals–Best Buy – Geek Squad, Staples – Copy
Centers, Pet Smart – Grooming and Training
• Online sales are increasing faster than traditional retail sales (currently 3-4% of retail industry revenue)
Trends
Revenue• Promotions – retailers drive traffic
through price reductions and in-store displays
• Consumer spending/confidence –retail industry is leading indicator for economic conditions (discount retailers generally do better in bad times than specialty retailers)
Cost• Inventory management – critical to
minimize cost, increase response times and increase profitability
• Real Estate – number of stores and location decisions are important given high fixed costs
Drivers

270
Household Non-Durables
Industry Definition: Manufactured products with useful life < 3 yearsProducts• Household – soap, detergent, cleaning,
paper towels, pet care… (US Revenue ~$100B per year)
• Personal care: hair care, cosmetics, fragrances, skin care, oral care…(US Revenue ~$250B per year)
Major Companies: P&G, Colgate-Palmolive, Ecolab, Henkel KGaA, SC Johnson, Nestle, Georgia Pacific, Kimberly Clark, International Paper, Estee Lauder, J&J, L’Oreal, Unilever Competition: Markets tends to be concentrated• Scale, shelf placement at retail critical and
promotions critical• Small companies compete through product
specialization or targeting local markets
Overview
Growth: Category is expected to grow at a low to moderate pace; most growth from emerging economies
Trends:• Industry concentration• Power of key customers (Wal-Mart)• Focus on export growth to tap into middle
class in emerging economies• Brand rationalization/optimization• Private label gaining share and improving
in quality • Pressure for environmental sustainability,
compliance and product safety• Increase cost and scarcity of raw materials• Growing demand for organic /
environmentally friendly products• R&D– more advanced compounds / multi-
use products
Trends
Revenue• Household products cash flow generally
even throughout the year• Personal care products are seasonal with
loading in first half of year• New product innovation• Marketing/Promotions
• Brand equity / loyalty- insulates against switching & price wars
Costs• Capital intensive significant investment to
improve efficiency • Significant spends on marketing. sales and
R&D• Raw materials costs significant as much as
50% of revenues• Futures contracts to protect cost of inputs• Environmental and other regulatory
compliance in production / waste disposal
Drivers

271
Household Durables
Industry Definition: highly durable goods useful for at least 3 years
Products: industry if often classified into two segments:• Electronics (Brown Goods) – TVs, A/V,
computers, cameras, tools (>$500B globally)
• Appliances (White Goods) –Refrigerators, AC, microwaves (~$160B globally)
• Home furnishings/furniture are also often considered durables (~$400 globally)
Major Companies: GE, Sony, Samsung, LG, Apple, Whirlpool, Panasonic, Xerox, Cannon, Philips, Furniture Bands International, IKEA
Competition: A/V competes with PCs and games for in-home entertainment
Overview
Growth: Despite recession, demand surging as emerging markets (India, China, Mexico…) buy basic goods due to emerging middle class real estate expansion and access to credit
Trends:• Slowing housing market in the US has
directly impacted purchases• Raw material costs for appliances (oil
and precious metals) increasing• US manufacturers losing market share
to foreign producers • Demand for products that work with
smart grid technology• Shift from brick and mortar to internet
purchases• Scrutiny re: “dumping” products in
competitor markets • Recent scandals re: working conditions
in factories
Trends
Revenue• Cash flow partly seasonal (holidays,
real-estate purchases)• Long purchase cycle means goods sold
on higher margin• Demand often tied to fluctuations in
real-estate market • International competition putting
downward pressure on price• Planned obsolescence • Stiff competition and discountingCosts• Often carry large inventories• Capital intensive manufacturing and R&D
processes• Compliance with regulation re:
production and waste disposal • Currency translations and tariffs impact
profit • Supplier network and sourcing• Distribution network and shipping
Drivers

272
Restaurant
• Restaurant industry makes up $604 billion in sales
• Restaurant industry is comprised of the following sub-industries:
– Quick-service restaurants (QSR)– Full-service restaurants
• One of the largest private sector employers (~13M jobs)
• Many QSRs operate as franchises
Overview
• Growth and profits have been hurt by soaring food and energy prices
• Explosive growth overseas, especially in QSR industry, due to strong economic growth and growing middle class in emerging markets
• Health and wellness concerns continue to pose problems for QSRs and have resulted in healthier menu options
• Newer “fast casual” restaurants like Chipotle and Panera threaten to steal market share from both QSR and full-service restaurants
• In general, restaurants have been negatively impacted by the economy and reduce consumer spending
Trends
Revenue• Food and beverages (usually the
higher margin products)
• Merchandise
• Catering
• Franchising fees
• Licensing
Cost• Labor – largest cost for restaurant
operators
• Raw materials – accounts for roughly a third of sales
• Real Estate – number of restaurants and location decisions
• Other – product innovation, consumer research
Drivers

273
Non-Alcoholic Beverages
Non-alcoholic beverages: (NA) industry is highly concentrated: 89% of US retail sales are a few companies: Coca-Cola, PepsiCo, and Cadbury Schweppes PLC (Dr. Pepper & 7UP)
Main NA beverage categories: 1) Carbonated soft-drinks 2) Bottled water (fastest growth) 3) Juice drinks 4) Sports drinks
Overview
Growth in soda is flat. Bottled water’s growth will continue well into the future because of increasing demand for natural, organic products.More manufacturers work with consumers to understand their packaging preferences
Hispanics, followed by Asian-Americans are fastest growing segments.
The low-carbohydrate trend is virtually nonexistent outside of the United States and the United Kingdom Many US consumers believe that the “better-for-you” substitutes do not taste as good as the traditional brands, and a large majority of them remain committed to traditional high-carb, high-sugar foods.
CompetitionEnergy drinks is a growing and competitive segment. These drinks turn into fashion among youngsters.Barriers to entry – not high for small players, however economies of scale and brand are important issues
Trends
Revenue Drivers:Increasing market share:new segments (incl. international, especially emerging markets)new products (incl. acquisitions of niche lines)expanding distribution channels (cooperating with Wal-Mart Stores, etc)Squeeze existing users more (premium labels, complementary products such as Coke and chips)Innovation in product and merchandising strategies, such as the use of mobile internet and online shopping
Cost DriversPackaging – the cost of plastic increases over the yearsTaxes - on inputs (eg sugar) and vice taxes (falls on end users – reduces demand)Wages within the industry are noticeably higher than the national average
Drivers

274
Beer, Wine & Distilled Spirits
Beer/Malt Beverages: major products are malt beverages, primarily beer. Major companies: Anheuser-Busch InBev (Belgium), SABMiller (UK), Heineken (Netherlands), MolsonCoors & Boston Beer (US) - Top sellers: Budweiser, Bud Light, Heineken,
Corona, Skol, Stella Artois
Wine: make wine and brandies from grapes. Major companies: Constellation Brands, E&J Gallo, & Jackson Family (US), Veuve ClicquotPonsard (France), Gruppo Italiano Vini (Italy) ViñaConcha y Toro (Chile)- Red & white containing ≤14% ABV (60% of
market); Brandy, & other wines (15%); Dessert wine, coolers, & effervescents (~10%)
Distilled: distill, blend, or mix liquors. Major companies: Brown-Forman (US), Diageo (UK), Kweichow Moutai (China), & Pernod-Richard (France)- Major products: whiskey & bourbon (10%
industry revenues); cordials &liqueurs (10%); gin (5%). Other products include vodka, specialty liquors & bottled cocktails
Overview
Growth:Beer – forecast to grow at 3% CAGR between 2012-2016Wine – forecast to grow at 2% CAGR between 2012-2016Distilled - forecast to grow at 3% CAGR between 2012-2016Tends:Beer – Consolidation: 8 largest brewers account for ~90% of industry revenue; success of small, independent craft brewers have influenced larger brewers; growing popularity for seasonal brewsWine – reliance on restaurant sales ties performance to food service sector, increasing demand from baby boom generation, agritourism (winery visits)Distilled – mixed fruity drinks increasingly popular, flavored malt beverages evolving, rise in grain pricesCompetition: Beer, Wine, Distilled compete against each other. Energy drinksBarriers to entry: not high for small players, however economies of scale and brand are important issues
Trends
Revenue Drivers:Increasing market share:new segments (incl. international, especially emerging markets)new products (incl. acquisitions of niche lines, increasing variety of products)expanding distribution channels (cooperating with Wal-Mart Stores, increasing importance of convenience stores)Squeeze existing consumers more (premium labels, other occasions for use)Innovation in product development, packaging and merchandising strategies, such as new flavored malt beverage varieties, use of mobile internet, sports and other event promotion
Cost DriversPackaging & Other raw input costs – continue to rise over timeShipping – heavy products and rising gas prices Taxes & Regulation – complex three tier distribution system and heavy federal/state taxation
Drivers

275
Mining and Precious Metals
Industry:Includes the constructing and operating mines as well as building and operating production facilities.
Products:Products include a wide variety of precious metals including gold, silver, copper, diamonds, and lead. Gold is the most popular precious metal for investors.
Industry Structure:• Industry is not vertically integrated
Three types of firms1. Exploration – explore and prove gold exists2. Development – develop mines on sites that
have proven that the precious metal exists3. Production – full-fledged mining companies
Key Ratios/Terms:Mine Production Rates – quantity producedScrap Recovery – supply of metals from sources other than mines, e.g. old jewelryFuture Sales by Producers – indicates producers expectations on future gold pricesBullion – refined metal that is high quality
Overview
Growth:Growth of each precious metal will be unique compared to other precious metals
Gold• Growth for gold is inversely related to the
stock market (i.e. it has a negative beta), so the gold market experienced large growth during the recent recession, but has decreased since the recovery of the market
Trends:• Most gold that is mined today is used for
jewelry as opposed to currency or other possible uses for gold and other precious metals
• Technology has greatly changed the mining industry making it more efficient
Competition:• High capital requirements creates a deterrent
to entry to potential new entrants• Government regulations are main
consideration for supply concerns• Substitutes are other precious metals• Do not compete on price, but do compete for
land with other companies
Trends
Revenue:Revenue = output x the selling price of gold
• Prices are determined by market forces• Output varies by demand and market price• Low operating costs allow a mine to have
higher/more stable outputs at lower market price points and therefore increase revenue
• E.g. if it costs a company $250/ounce to produce, then they will not produce until the price for gold increases over $250/ounce
Costs:Main costs of production:Location – Understand cost in certain areas and risk due to political unrestOre Quality – Oxide ores are better because it is easier to extract the precious metalsMine Type – Most underground mines are more expensive than open pit mines
• Company’s must manage costs in order to maintain good financial health and production levels in the face of volatile gold prices
• Producers usually publish their cost of production in their annual report
Drivers

276
Utilities
Overview Trends Drivers
Industry:Generate, manage, and provide electrical power to the general population
Historically the industry was run by monopolies, but is now disintegrating into the following four supplier segments:
Supplier Segments:Generators – Create electrical powerEnergy Network Operators – Sell access to their networks to retail service providersEnergy Traders and Marketers – buy and sell energy futures and derivatives. Help secure electricity at a stable, predictable priceEnergy Service Providers and Retailers – sells energy to end user
Key Ratios/Terms:Power Purchase Agreements (PPA) – contract between power producer and its customersMegawatt Hour – basic industrial unit for pricing electricityLoad – amount of electricity deliveredFederal Energy Regulatory Commission (FERC) –oversees rates and service standards
Growth:• Consumption of electricity expected grow
rapidly as the world becomes increasingly “electrified”
• Energy Information Administration (EIA) projects that 40% more electric generating capacity will be needed by 2020 to meet growing demand
• Short term direction of the market still remains a risky bet
Trends:Utility companies are undergoing major changes due to:• Regulatory changes• Demand fluctuations• Price volatility• New competition
The once stable industry has become much more unstable and riskyCompetition:• High barriers to entry due to large capital
requirements and significant regulation barriers
• Fierce rivalry between competitors because product is a commodity
Revenue:Revenue = $ per megawatt per hour x utilization
• Wholesale electricity prices are no longer set by regulatory agencies
• This heightens the risk of uncontrollable price increases
• Forwards and future options provide energy buyers (not at the consumer level) the tools to help hedge against large volatility in price
• Utilization will vary by utility company and their market strategy
• See the “Growth” section for more information on short term and long term utilization projections
Costs:• There are high fixed costs upfront in order to
build new generation plants• A lot of capital is required to enter the market• Marginal costs are relatively low, i.e. it is not
costly to offer one more kilowatt-hour to one more person
• Economies of scale are a very effective way to reduce costs in this industry

277
Additional Industry Research Resources
Several sources may help you further research specific industry topics
For a basic overview
Industry overviews provided on consulting firm websites
For more in-depth background on industry context and trends
Vault industry guides (note: these are lengthy!)
Investopedia – http://www.investopedia.com/features/industryhandbook/
For in-depth information on revenue and cost drivers
Standard & Poor’s NetAdvantage guides, which include guidance on how to effectively
analyze and value companies
For up to date information on industry developments
WSJ (can be accessed for free on CMC website’s Factiva link)
All of these resources are public or can be accessed via CMC’s Research
Guide portal

November 21, 2014
KCC Case Book 2014

Kellogg Case Book – 2014 Edition § If you have question or concerns please write to Ryan Mann at: [email protected]
This book is intended for internal use by members of the Kellogg Consulting Club (KCC). Distribution to individuals outside of the KCC is forbidden without express written consent by KCC. Copyright 2014 © by the Kellogg Consulting Club. Copyright Act of 1976, no part of this publication may be reproduced or distributed in any form or by any means, or stored in a database or retrieval system, without the prior written permission of the publisher.
This book was originally written, edited, and designed by: Adam J. Louras (Kellogg Class of ‘11) Ameed Mallick (Kellogg Class of ‘12)
Uri Kalir (Kellogg Class of ‘12) Peter Manoogian (Kellogg Class of ‘12) Craig DePriester (Kellogg Class of ‘12)
Mauricio Atri (Kellogg Class of ‘12) This book was edited in 2014 by KCC
2

CONTENTS
1 2 3 4 5
How to use this book Typical case flow Fit interview tips KCC 2014 cases Industry primers

4
The title page for each case contains details that will inform case selection Using the case book
1 Case tracker: Provides overview on case including industry, format, and concepts tested
2 Status bar: Includes ra=ngs for quant intensity and structure (1 = low, 10 = highest), as well as industry logo, case format, and concepts tested
3 Guide to interviewer: Contains the overview of the case and allows users to determine whether they should give the case based on its aFributes
Overview of case title page
3
2
1
4
4 Fit ques=ons: Contains 3 fit ques=ons to begin the interview. ALer fit, then ask the case ques=on

5
The “Clarifying answers” page contains supplemental information and a suggested guide to the case’s flow
1 Clarifying answers: Contains informa=on that is less crucial to the main solu=on path. This is for supplementary informa=on such as: “we do not know the compe==ve dynamics” or “the market has been growing at GDP.”
2 Guide to case: Lays out the ideal structure for the case and includes hints on how to walk through
the interview/handouts, as well as when to show them to the interviewee.
Overview of clarifying answers and case guide page
1 2
1

6
The “Key elements to analyze” page contains the analysis of the key case concepts
1 Concept box: Includes the key ques=on or objec=ve associated with a main case concept tested. The interviewee should naturally move to asking or addressing the informa=on in this box, but you may need to provide a liFle “push” at =mes.
2 Notes to interviewer: Contains addi=onal informa=on that you may provide to the interviewee during
an inves=ga=on of the par=cular case concept. This informa=on is CRITICAL to the interviewee solving the case both numerically and conceptually.
1
2
Overview of key elements to analyze page

7
Industry logos
CPG
Financial Services
Shipping & Transportati
onRetail Airline Tech &
TelecomMedia &
Entertainment
Other Healthcare
Industrial Goods Energy Consumer
ProductsTravel & Leisure
The following logos will be located underneath the quant/structure scores on the case title page to indicate the industry being covered

8
Tips for effective pre- and post-case activities
• Ask the interviewee if they wish to focus on specific:
– Case formats / concepts – Levels of difficulty – Industries
• Inform interviewee which case you plan to deliver to confirm they have no prior knowledge of the case
• Spend at least 30 minutes to review the case
Interviewer (delivering case) Interviewee (receiving case)• Inform your interviewer if you have
specific areas for improvement • Send the interviewer a list of cases you
have already done • DO NOT read the case ahead of Fme or
discuss the case contents with peers! • Bring plenty of paper to take notes!
Befo
re m
eetin
gAf
ter t
he c
ase
• Provide detailed feedback (both posiFve and construcFve) to interviewee
• Seek feedback from the interviewee on your case delivery
• Seek feedback from the interviewer on your case performance
• Review the case and log your performance in a “case tracker”
• Provide detailed feedback (both posiFve and construcFve) to interviewer

9
Additional tips for giving an effective case
While there is no single “right way” to give a case, here are a few suggesFons: Take the interview seriously; pretend that you are a real interviewer
§ While your interviewee may be your friend, providing a formal atmosphere will be much more valuable and provide a more realisFc interview experience
Learn to be comfortable with silence § While silence may be uncomfortable, resist the urge to jump in with pointers, hints, or
addiFonal informaFon
Solve the case math on your own beforehand § Not only will you gain pracFce with the math required, thinking through the approach
may help you idenFfy traps your interviewee may fall into
If you are not familiar with the industry, spend a few minutes quickly reviewing of the industry summaries (found in the back of this deck) or Vault.com

10
Case prep scoring: Provide tangible points that "can be practiced and improved 1.- General feedback Needs
improvement Good Strong
Quantitative: comfort with complex math; shows math and logically lays out data
Qualitative: conveys understanding of big picture takeaways; realistic thinking
Creative: identifies different approaches to solve the problem
Communication: strong listener, openly shares thought process, good body language
2.- Case specific Feedback Needs improvement
Good Strong
Clearly understands and defines the problem/question; breaks problems into components
Prioritizes analysis; Identifies critical path to the recommendation and most important issues
Provides a structured and thoughtful approach to solve the problem (e.g. draw issue tree with critical pieces of analysis)
Summarizes key findings through the solution of the case and translates them into insights or important takeaways
Pragmatic/ realistic solution that answers the initial question with supporting evidence
Assesses risks and consequences for the recommendation; identifies key next steps to further prove the solution

11
Evaluation criteria (1/2) Case skills and driving the case
Problem definition: Clearly understands and defines the problem/ question; summarizes the essence of the issue
Problem breakdown: Breaks problem into most important components
Structure: Uses a structured and thoughtful approach to solve the problem (e.g. draw issue tree with critical pieces of analysis)
Prioritization: Identifies critical path to the recommendation and most important issues/components
Information: Identifies and addresses key pieces of information and assumptions needed to solve the problem
Solution oriented: Formulates hypothesis when needed and maintains focus on the recommendation
80-20 approach: Deep dives into identified critical issues to develop a recommendation (80% of solution with 20% of analysis)
Recommendation: Ends up with a pragmatic/ realistic solution that answers the initial question; supported with the analysis
Communication skills
Structure: Shares thinking process throughout the case and aligns his communications with the structure of the case
Focus: Highlights key insights, important findings and critical issues
Questions: Ask clear questions related to the case process and solution
Engagement: Engages with the interviewer during the solution of the case
Support: Clearly supports any conclusion or important claim with relevant arguments
Business language: Feels comfortable discussing the case with business terminology
Body language: Communicates naturally and uses body language to support the communication process

12
Evaluation criteria (2/2) Polish and interpersonal skills
Self confidence: Shows confidence when solving and attacking the case without sounding arrogant
Quantitative skills: Feels comfortable handling complex calculations and analytics; shows clear calculations and data framing
Analysis: Deep dives in identified critical issues or components and comes up with a solution for each issue
Interpersonal skills: Drive a conversation and acts naturally
Balance: Good balance of quantitative and qualitative analysis during the solution
Business sense and high level thinking
Creativity: Identifies or uses different approaches to solve the problem. Out of the box thinking; uses creative methods and arrives at creative solutions
Synthesis: Summarizes key findings through the solution of the case and translates them into insights or important take-aways
Concepts: Clearly understands and uses the key business concepts to solve the case
“So what” thinking: Clearly addresses and articulates what each analysis, conclusion or recommendation means to the case, solution or the client
Testing: Frequently tests assumptions and conclusions with reality checks or other quick analysis
Assessment: Assesses risks and consequences for the recommendations; identifies key next steps to further prove the solution
Business sense: Uses common sense and realistic thinking to get to pragmatic recommendations; has the ability to think from different perspectives (e.g. client, competitor, consumer, etc.)

CONTENTS
1 2 3 4 5
How to use this book Typical case flow Fit interview tips KCC 2014 cases Industry primers
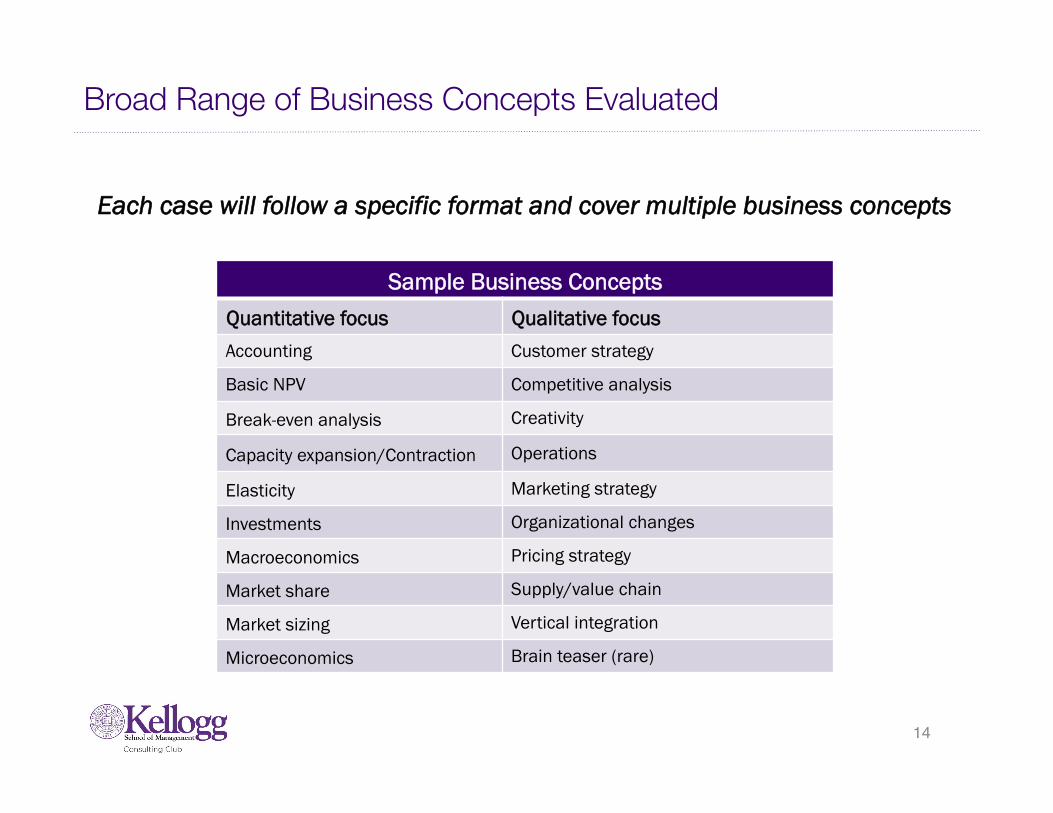
Sample Business Concepts Quantitative focus Qualitative focus Accounting Customer strategy
Basic NPV Competitive analysis
Break-even analysis Creativity
Capacity expansion/Contraction Operations
Elasticity Marketing strategy
Investments Organizational changes
Macroeconomics Pricing strategy
Market share Supply/value chain
Market sizing Vertical integration
Microeconomics Brain teaser (rare)
Each case will follow a specific format and cover multiple business concepts
14
Broad Range of Business Concepts Evaluated

15
Case Topics Vary
The following represent the most common case topics on which a case interview may be based (ranked in descending order of frequency) Format Focus
Profit improvement Analyzing causes for recent drop in profits / ways to increase profits
Market entry Analyzing a firm’s opportunity to expand into a new business or segment
Opportunity assessment Examining the potential purchase / sale of a new or existing business or installation / abandonment of infrastructure
Increasing sales Identifying ways in which a firm can optimally increase sales
Merger / Acquisition Evaluating whether a firm should merge or purchase another company
Market sizing Determining the size, usually in terms of a firm’s revenue potential, of a market
Industry analysis Evaluating an industry’s structure and/or desirability
Starting a new business Similar to entering a new market; then taking an investment point of view
Growth strategies Determining the optimal ways to grow a company
Developing a new product Assessing a new product offering
Reducing costs Identifying internal or external costs that are out of line
Competitive response Evaluating ways to address a competitor’s action (e.g., new product launch)
Turnarounds Gathering info on why company is failing and then suggesting corrective action

16
A Typical Case Flow (Standard Case)
5-10 min
20-30 min 5
min
Intro & Fit Interview Case Interview Wrap Up/
Q&A
Structure the problem
Develop Hypothesis Deep Dive Develop
Solution Synthesize
• Summarize the essence of the problem
• Ask clarifying questions
• Structure thoughts
• Develop a hypothesis
• Prioritize analyses
• Deep dive into priority areas
• Make connections between information given throughout case
• Refer back to the initial problem and your hypothesis
• Be creative• Ask ‘so what?’
• Summarize recommendation for client
• Lay out risks and next steps
5 -10 min 15 min 5 min1 2 3 4 5

17
Structure the Problem
Structure the problem
Develop Hypothe-
sisDeep Dive
Develop Solution
Synthesi-ze
§ Get the facts right – ask clarifying questionso Make 100% sure that you understand the objective: e.g. if the objective is to be the
market leader, clarify what this means (highest market share, revenue, profit?)§ Summarize the essence of the problem
o Do not just repeat all of the facts back to the interviewer§ Draw out your approach to solving the problem (i.e. framework)
o Try to include at least 2 levels of depth in your frameworko Customize your framework to the caseo Be MECE
§ Walk your interviewer through your framework
Remember: since every case is unique, don’t try to force fit standard frameworks!
Key Skills Tested:Structured Thinking, Business
Judgement
1

18
Develop Hypothesis
Structure the problem
Develop Hypothe-
sisDeep Dive
Develop Solution
Synthesi-ze
§ Use the info provided to form an initial hypothesiso For example, if the case asks you to determine whether to enter a new
market, take a position (e.g., enter), and list out the questions you would need to answer in order to validate your hypothesis
§ Use your hypothesis to prioritize your analyseso What is most important to look into first, second, and third?
§ Engage with the interviewer
2
Key Skills Tested:Hypothesis Driven, Prioritization
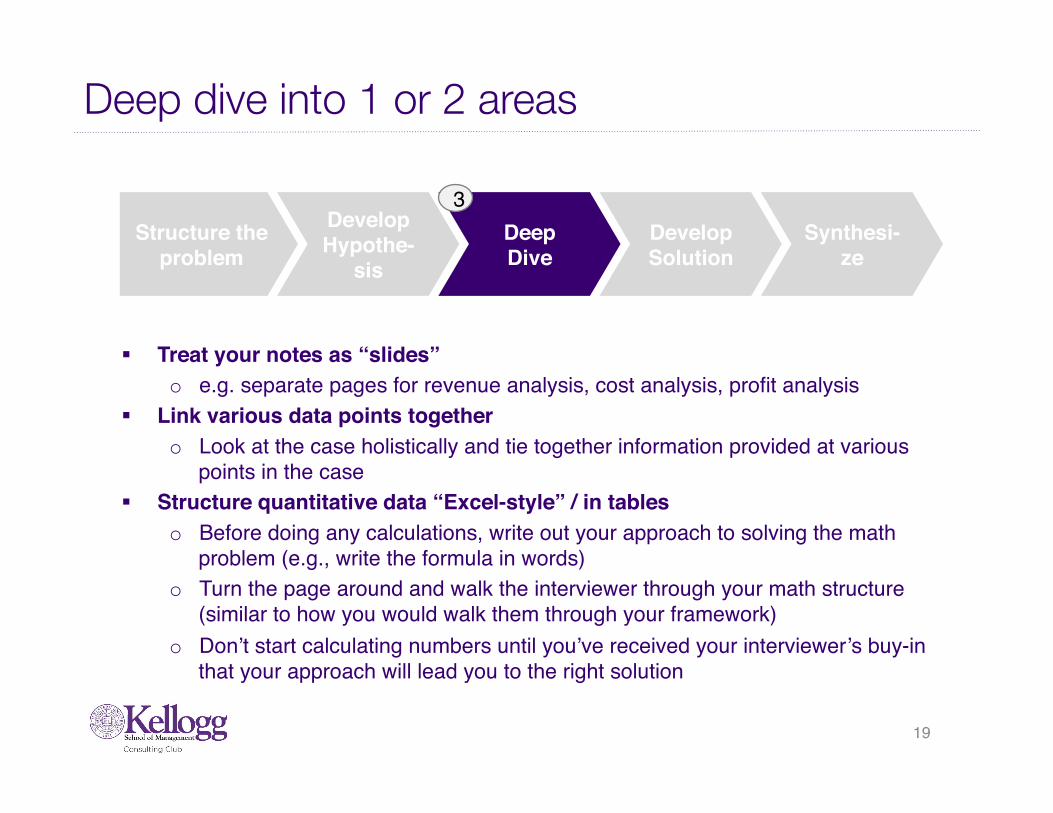
19
Deep dive into 1 or 2 areas
Structure the problem
Develop Hypothe-
sisDeep Dive
Develop Solution
Synthesi-ze
§ Treat your notes as “slides”o e.g. separate pages for revenue analysis, cost analysis, profit analysis
§ Link various data points togethero Look at the case holistically and tie together information provided at various
points in the case§ Structure quantitative data “Excel-style” / in tables
o Before doing any calculations, write out your approach to solving the math problem (e.g., write the formula in words)
o Turn the page around and walk the interviewer through your math structure (similar to how you would walk them through your framework)
o Don’t start calculating numbers until you’ve received your interviewer’s buy-in that your approach will lead you to the right solution
3
Key Skills Tested:Quantitative Skills, Business Judgement
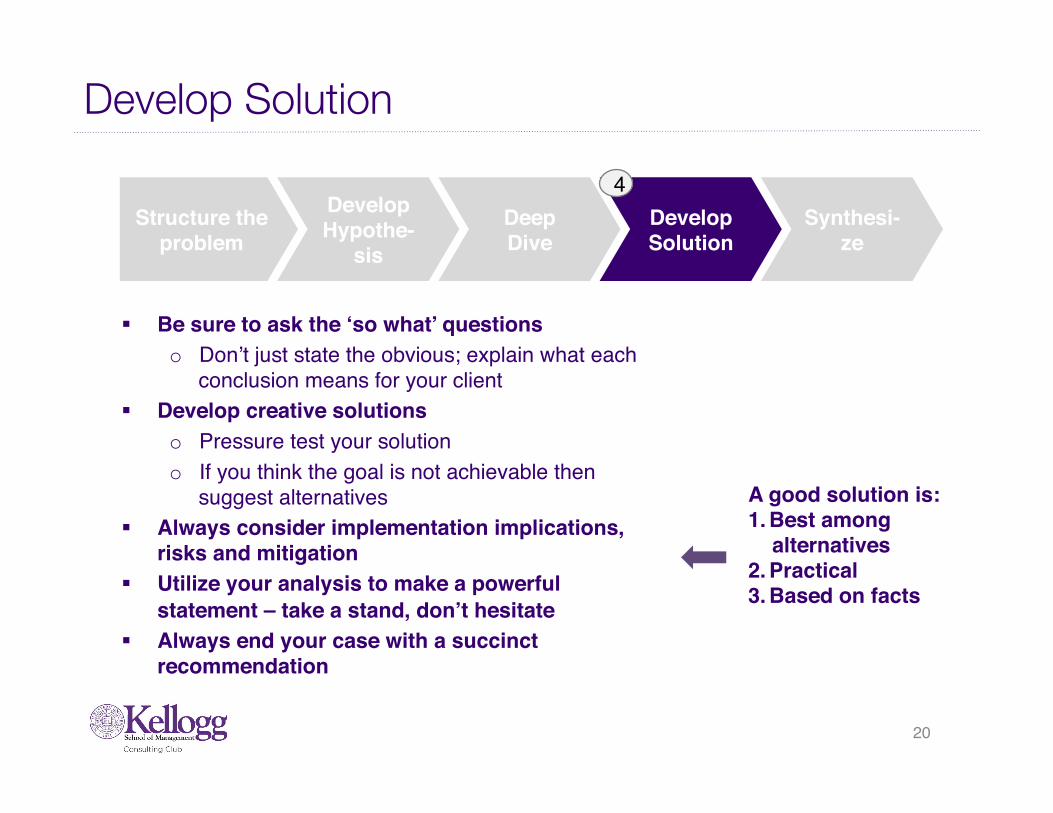
20
Develop Solution
Structure the problem
Develop Hypothe-
sisDeep Dive
Develop Solution
Synthesi-ze
§ Be sure to ask the ‘so what’ questionso Don’t just state the obvious; explain what each
conclusion means for your client§ Develop creative solutions
o Pressure test your solutiono If you think the goal is not achievable then
suggest alternatives§ Always consider implementation implications,
risks and mitigation§ Utilize your analysis to make a powerful
statement – take a stand, don’t hesitate§ Always end your case with a succinct
recommendation
A good solution is:1. Best among
alternatives2. Practical3. Based on facts
4
Key Skills Tested:Creativity, Confidence

21
Synthesize
Structure the problem
Develop Hypothe-
sisDeep Dive
Develop Solution
Synthesi-ze
§ Take a moment to prepare your thoughtso But be prepared for the “elevator test”(interviewer doesn’t allow you time to
prepare your thoughts)§ Provide your recommend approach, backed up by facts § List out risks that the client should consider when evaluating your
recommendation§ Recommend next steps for analysis
Tip: Highlight or circle main points as you go through the analysis to facilitate a concise summary
5
Key Skills Tested:Ability to Synthesize

CONTENTS
1 2 3 4 5
How to use this book Typical case flow Fit interview tips KCC 2014 cases Industry primers

23
What firms are looking for in a fit interview
§ Gravitas/Confidence – Are you poised and professional? Can I trust you in front of a client?
§ Eloquence – Can you speak concisely but accurately about complex issues? Do you communicate with impact?
§ Amicability – Are you friendly and easy to talk to? Are you a good fit for our culture?
§ Engagement – Are you excited to be here? Do you have posiFve energy and presence?
§ Leadership ability – Can you lead a team through obstacles? What kind of impact can you make?
§ Drive – Do you take iniFaFve? Do you persist to achieve your goals? What kind of goals do you have?
§ Genuine Interest – Do you really know what this job entails? Does your story make sense? Do you really know how one firm is different from another?

24
How to prepare for fit interviews
• Know your resume inside and out § Your resume is free game – ALL parts of it § Be prepared to answer detailed quesFons about any item on it § Have a couple of favorites – you may be given free reign to talk about one or
more specific bullets
• Know your personal stories inside and out § Prepare 2 stories for each a_ribute (see next slide) § Memorize broader content, not a word-‐for-‐word story § Use the STAR-‐L (SituaFon, Task, AcFon, Result, Lesson) framework § Emphasize the decisions you made and the impact you personally had § The be_er you tell a story, the more memorable you will be
• Review lists of typical fit ques=ons and prepare answers • Take advantage of video-‐taped CMC mock interviews

25
How to define your stories (illustrative) Attributes STAR-L
Lead
ersh
ip
Team
Pla
yer
Driv
e/
Initi
ativ
e
Inte
llect
ual
Cur
iosi
ty
Ove
rcom
ing
adve
rsity
Situation Task Action Results Learning
Started a non-profit
ü ü
As a retail banker, I noticed that many customers did not understand basic personal finance
I decided to start a non-profit that teaches financial education to underprivileged adults and teens.
1. I created a mission statement and business plan2. I recruited volunteers and staff3. I promoted the non-profit and found a venue for seminars.
We had 81 people in the first event, 200 in the 2nd, and over 500 in the final event. From these students, roughly 30% went on to buy a home
I learned how to successfully raise funds and effectively motivate volunteers/staff. I also got very comfortable presenting in front of large audiences
Built a value-based culture in my company
ü ü
I owned a company where the overly aggressive sales team was making promises we could not keep to customers
Customers were outraged and I had to not only reprimand multiple sales people, but recreate positive momentum
1. I openly discussed the actions with all my employees and sales staff.2. I led an initiative to create customer value code
While we experienced an initial dip in sales, annual sales increased by 20% and customer satisfaction metrics were higher than ever
I learned that I must always develop a value-based culture when building a team
Strong fit stories are clear, show individual impact, and highlight key learnings

26
Your Stories Template Attributes STAR-L
1. 2. 3. 4. 5.
Situation Task Action Results Learning
1. Story
2. Story
3. etc.
Research your target firms’ most emphasized attributes and fill in purple cells. Prepare 2 stories for each attribute. Each story should highlight 1 or 2
attributes
27
General tips for fit interviews
§ Use the pronoun “I”…not “We” § Don’t be modest, now is your Fme to highlight your
accomplishments § Be authenFc § Be energeFc and enthusiasFc § Be specific and emphasize your decisions, not the context § Make good eye contact and watch your posture and body language
(fit interviews are your first impression!) § Know why you really want to do consulFng § PracFce, pracFce, pracFce

28
Most frequently asked fit interview questions
§ Idle chit chat (What’s your favorite class at Kellogg? Why?) § Tell me about yourself… § Why are you interested in consulFng? § Why are you interested in working at this firm? § Why are you interested in this office? § Can you tell me about [any bullet] on your resume? § Tell me about a Fme you exhibited leadership skills/influenced a
team/worked through adversity/failed… § What makes you unique? § Do you have any quesFons for me?

29
Sometimes asked: Goals, Career Questions
§ Where do you see yourself in 5/10/20 years? § Why did you pick your prior job? § What experiences/skills do you feel are transferrable to consulFng? § What kind of work are you best at? § Tell me about your most significant project/experience at your last
job § What is your most significant career accomplishment to date? § What do you think consultants do? § What moFvates you? § What would you change if you could start your career over?

30
Sometimes asked: Team Issue Questions
§ Give me a specific example that shows you are a good team player…
§ How do you manage conflicts in teams? Give me an example… § Tell me about a Fme you influenced a group… § What posiFve and negaFve things would your teammates and
colleagues have to say about you? § What was the best construcFve criFcism you received? How did
you respond? § What types of roles have you played in teams? § How do you deal with a difficult superior? § What was your greatest team accomplishment? What role did you
have on the outcome?

31
Sometimes asked: Other Personal Questions
§ How would you friends, family and colleagues describe you? § Why did you choose Kellogg? § What has been your favorite Kellogg class? Why? § What has been your most significant experience so far at Kellogg? § What are you passionate about outside of work? § What is your GPA? § What is your GMAT? § How are your quanFtaFve skills?

CONTENTS
1 2 3 4 5
How to use this book Typical case flow Fit interview tips KCC 2014 cases Industry primers

33
Table of Contents
1. GoNet2. Maine Apples3. Orrington Office Supplies4. Syzygy Supercomputers5. Winter Olympics Bidding6. Rotisserie Ranch7. Tarrant Fixtures8. Vindaloo Corporation9. Zephyr Beverages10. A+Airline Co.11. Bell Computer12. Shermer Pharma13. Hospitality Co.14. Rock Energy15. Orange Retailer16. Vitality Insurance17. Chic Cosmetology
18. DigiBooks19. After School Programming20. Dark Sky21. Health Coaches22. Wine and Co23. Healthy Foods Co24. High Q Plastics25. Salty Sole Shoe Co26. Plastic World27. Zoo Co28. Money Bank Call Center29. Thompson Healthcare
Kellogg Cases 2004-2010 2011-2012 Case Competition Winners
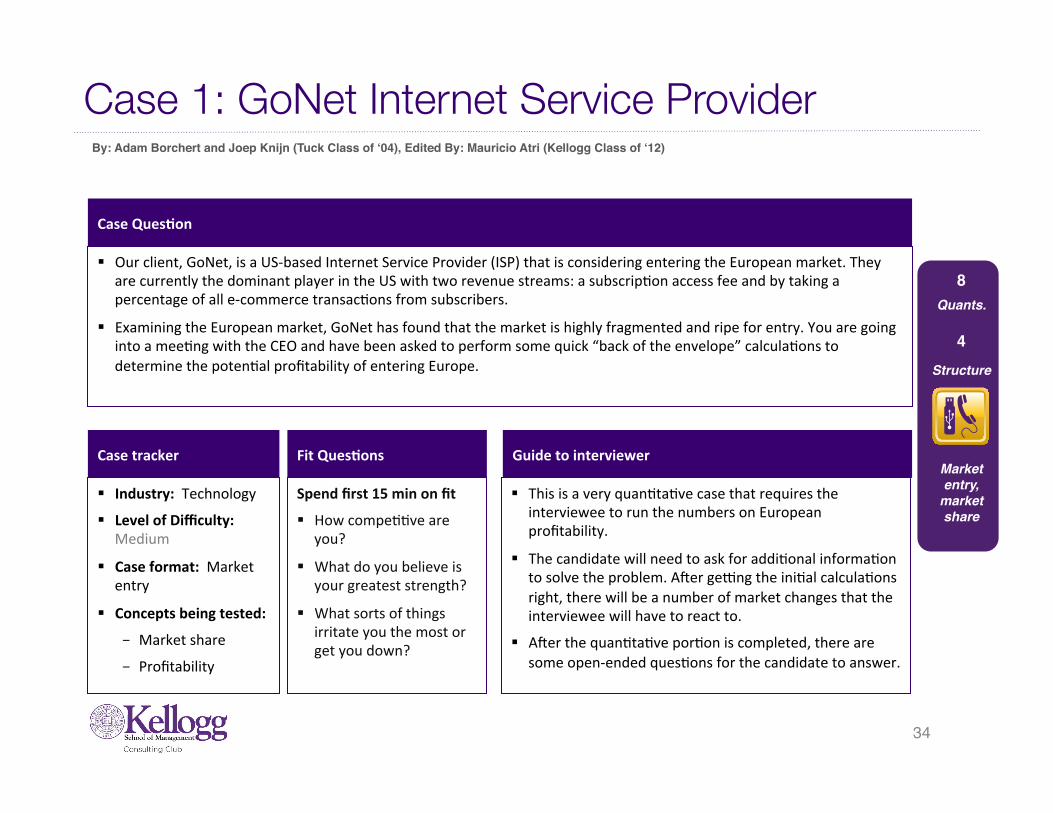
34
Case 1: GoNet Internet Service Provider
Case tracker Fit Ques=ons
§ Industry: Technology § Level of Difficulty:
Medium
§ Case format: Market entry
§ Concepts being tested: - Market share
- Profitability
Case Ques=on
§ Our client, GoNet, is a US-‐based Internet Service Provider (ISP) that is considering entering the European market. They are currently the dominant player in the US with two revenue streams: a subscripFon access fee and by taking a percentage of all e-‐commerce transacFons from subscribers.
§ Examining the European market, GoNet has found that the market is highly fragmented and ripe for entry. You are going into a meeFng with the CEO and have been asked to perform some quick “back of the envelope” calculaFons to determine the potenFal profitability of entering Europe.
Spend first 15 min on fit
§ How compeFFve are you?
§ What do you believe is your greatest strength?
§ What sorts of things irritate you the most or get you down?
Guide to interviewer
§ This is a very quanFtaFve case that requires the interviewee to run the numbers on European profitability.
§ The candidate will need to ask for addiFonal informaFon to solve the problem. Aner geong the iniFal calculaFons right, there will be a number of market changes that the interviewee will have to react to.
§ Aner the quanFtaFve porFon is completed, there are some open-‐ended quesFons for the candidate to answer.
Quants.8
Structure
4
Market entry,
market share
By: Adam Borchert and Joep Knijn (Tuck Class of ‘04), Edited By: Mauricio Atri (Kellogg Class of ‘12)

35
Clarifying answers and case guide
Guide to case
Part 1 – QuanFtaFve discussion - This should be the meat of the case and should be completed before
discussing any general or qualitaFve responses. Part 2 – QualitaFve discussion - Aner navigaFng the math, ask the candidate the following quesFons:
- 1) How could we reduce the fixed costs of investment? - 2) Would there be any reason to conFnue with the investment even if
it looks like it will lose money? - 3) Are there are any other risks/benefits that GoNet should consider? - 4) How would you sum up the situaFon and what is your
recommendaFon?
Clarifying answers to provide
(Provide this informaFon on request)
CompeFFve dynamics
- Highly fragmented industry - No informaFon about market leaders or
trends
European industry overview
- GoNet plans to capture a base of 10 million subscribers
- SubscripFons will cost $20/month - The average GoNet subscriber
purchases $1,800 of goods on the internet annually
- GoNet receives 3% commission - Fixed costs are $1 billion annually - Variable costs are $110/subscriber
annually

36
Math questions (1 of 2)
Math solu=on
1) Revenues each year will be $2.4B for subscripFon (10 million subscribers X $20/month X 12 months) and commissions will be $540M (10 million subscribes X $1,800/year X 3% commission) for a total of $2.94B.
• Fixed costs are $1B and variable costs are $1.1B (10 million subscribers X $110/year) for a total of $2.1B each year. Profits are $840M and the annual profit margin is ~29% ($840M/$2.94B)
2) Annual revenues drop to $1.2B (10 million subscribers X $10/month X 12 months) from subscripFons, while commissions remain constant at $540M. Total revenues are $1.74B. Because total costs remain $2.1B, we lose $0.36B by halving subscripFon charges, making the answer “No.”
• At this point, ask the interviewee what the elasFcity of demand is in this market and the implicaFons for GoNet. The market should be highly elasFc, meaning that GoNet will not win over enough subscribers at $20/month.
Math ques=on
1) Please determine the annual net income (before taxes) in Europe, given the current revenue model and set of assumpFons. What is the annual gross mark-‐up, in percentage?
2) GoNet just found out that a new entrant is charging $10/month and capturing market share. Can we lower our fee to $10/month?
Math informa=on
• 10 million subscribers
• $20 month subscripFon fee
• $1,800/year of online spending @ 3% commission
• Fixed costs: $1 billion • Variable cost: $110/year
per subscriber

37
Math questions (2 of 2)
Math solu=on
3) To keep profits at $840B, we know that costs remain at $2.1B so revenue will need to be $2.94B. SubscripFon revenue will be $1.2B, so commissions need to be $1.74B. There are 10 million subscribers, so each subscriber need to bring in $174/year of commission. At 3%, they will need to buy $5,800/year in goods ($174/3%).
• Ask the candidate if this realisFc. The answer should be “No”. 4) To breakeven, we will need commission to be $900M over 10 million subscribers. That is $90/year per subscriber ($900M/10M), which means $3,000/year in goods purchased online ($90/3%). The candidate should idenFfy that this is also unrealisFc, represenFng more than a 50% increase from last year.
5) To find the answer here, we need to find incremental revenue per subscriber. Each subscriber brings in $174/year ($10/month X 12 months + $1800/year X 3%) at a cost of $110/year for a profit of $64/year. These profits must cover the fixed costs of $1B/year, so we must bring in 15.625 million customers ($1B/$64)
• Note: many people forget the variable costs during the compleFon of this case.
Math ques=on
3) With high market elasFcity, GoNet will not be able to charge more than $10/month. How much would each subscriber have to buy on the Internet to keep profits at the same level as $20/month subscripFon fees?
4) How much would each subscriber have to buy on the Internet to enable us to break even?
5) Given that we cannot charge more or realisFcally increase shopping significantly, how many subscribers would we need in order to maintain the same level of expected profits (at $10/month)?

38
Solution and recommendations
Solu=on & Recommenda=ons
1) Some potenFal ways (not exhausFve) to reduce fixed cost: outsourcing capacity, leasing networks, working in specific geographies, etc.
2) GoNet may sFll be interested in this move as a way to break into Internet retailing and expanding its subscriber base. Based on the math though, this should not be an a_racFve opFon long-‐term either.
3) Very open ended and reliant on candidate’s creaFvity.
4) This is very open-‐ended and should be evaluated based on the candidate’s argument, not answer. Based on iniFal esFmates, this is a very a_racFve market to enter, but with price pressures and high elasFcity the market is far less a_racFve. If we are to undertake this iniFaFve, GoNet needs to find ways to convert a much higher number of customers or differenFate its product, which both require market research. There is also potenFal to reduce costs or establish this foothold as a loss leader, but these require strong arguments from the candidate.
Bonus/Guide to an Excellent Case
§ This case tests two things – the interviewee’s comfort with numbers and ambiguity. An excellent case interview will result in an intuiFve grasp on what is being asked quickly and solid execuFon on the quanFtaFve porFon of the case.
§ UlFmately, the best interviewees will make a very strong argument using the facts provided and support the decision to invest/not invest with a strong business sense about the costs and implicaFons of the project.
§ CreaFve soluFons beyond those listed are possible and encouraged, though should be done within the framework of the informaFon available.

39
Case 2: Maine Apples
Case tracker Fit Ques=ons
§ Industry: Consumer Goods
§ Level of Difficulty: Medium
§ Case format: Developing a new product
§ Concepts being tested: - Market sizing
- Investment
- Pricing Strategy
Case Ques=on
§ Our client is a Korean conglomerate named Danut that has acquired a small Boston-‐based biotechnology firm
§ The biotech firm acquired has developed a chemical that helps control the ripening of produce. Aner tesFng, this chemical appears to work especially well with apples: it allows apple orchards to harvest earlier and it improves the overall quality of the harvest.
§ Danut tradiFonally uses a test market to determine commercializaFon. Given proximity to Boston and average apple yields, Maine has been chosen.
§ Danut would like to know if they should a_empt to commercialize this chemical.
Spend first 15 min on fit
§ Tell me about a recent posiFve team experience
§ How would you describe your learning ability? In what kinds of situaFons are you fast or slow to learn?
§ Describe the last Fme you “put your foot in your mouth.”
Guide to interviewer
§ Aner hearing the prompt, the interviewee should be able to develop a variant of the following quesFon:
Is the market size large enough and the es5mated profitability high enough for Danut to a;empt to commercialize this chemical?
§ Key case steps: 1. Confirm market a_racFveness (size) 2. Evaluate orchard revenue and cost structures 3. Project farmers margins and pricing for Danut 4. IdenFfy qualitaFve issues (Risks) to consider
Quants.8
Structure
6
Mkt. SizePrice Stgy
Invest.
By: Adam Borchert and Joep Knijn (Tuck Class of ‘04), Edited By: Peter Manoogian (Kellogg Class of ‘12)
CPG

40
Clarifying answers and case guide
Guide to case / Guide to handouts
1. Calculate Market Size (determine aFrac=veness) ― Share market size informaFon with interviewee aner probing
quesFons are received ― Is the market large enough to conFnue?
2. Evaluate orchard profitability – Share product benefit details – i.e. 10% increase (from calculaFon page)
― How much incremental profit does our product create for an apple orchard owner?
― Next, the interviewee should determine the profit margins for the farmers given the costs of purchasing the product. AddiFonally the interviewee should determine a reasonable price for the product
3. Risks & Other Considera=ons – Guide the interviewee to consider qualitaFve risks and issues before moving forward with commercializaFon
Clarifying answers to provide
Product Benefits ― Reduced costs through earlier
harvesFng ― Improved apple yields ― Improved juice yields (with higher
quality apples)
Client CharacterisFcs ― Only concerned about a “test-‐
market” in the state of Maine
CompeFFve Dynamics ― No other compeFFve products on
the market currently
Local industry CharacterisFcs/Economics ― Growing at the rate of GDP

41
Key elements to analyze
Market sizing
§ How big is the apple market in Maine? § Does this seem potenFally large
enough to conFnue invesFgaFng this product?
Cost savings
§ What are the cost savings from using the chemical?
§ The chemical allows the farmer to harvest 10 days sooner
Revenue increase
§ How much addiFonal revenue will farmers be able to generate?
§ What is the total profitability increase (including cost savings)?
Note to interviewer
§ When asked, provide the following: - Maine has 200 orchards - Avg. annual orchard revenue is
$30K/acre - Avg. orchard has 100 acres of land - Only one apple harvest per year
§ Interviewee should calculate the
market size based on info provided: ($30K/acre x 200 orchards x 100 acres/orchard = $600M)
§ This is a significant market and warrants further invesFgaFon
Notes to interviewer
§ When asked to quanFfy the improvements, provide the following: - It costs $1.5K/night to maintain
crops for 100 acre orchard - With the chemical, farmers are able
to harvest crop 10 days sooner
§ Interviewee should calculate cost savings per year using this informaFon:
§ ($1.5K/day x 10 days / 100 acres = $150/acre/year)
Qualita=ve Assessment
§ When asked to quanFfy addiFonal revenue, provide the following: - Our client’s product improves the
consistency of red apples and improves the yield by 10%
- The sweetness factor is esFmated to improve the juice yield by 5%
- 25% of revenue comes from whole apple sales, 75% from juice sales
§ Improved yield: ($30K/acre x 25% x 10% = $750/acre/ year)
§ Improved sweetness: ($30K/acre x 75% x 5% = $1,125/acre/year)
§ Total improvement (with cost reducFon) = $2,025/acre/year

42
Key elements to analyze (cont.)
Product Profitability
§ If our product costs $100K per 200 acre farm, what will the farmer’s profit margin be if they buy it at cost?
§ What should our client sell the product for? Is a 50% margin realisFc?
Note to interviewer
§ Farmer’s incremental revenue/cost savings = $2,025/acre § Product costs = $100K/200 acres = $500/acre § Profit margin = ($2025-‐$500)/$2025= 75% § The interviewee should note that this is an extremely high profit margin for the farmer and
realize that there is a significant opportunity for profits with this product. - How much of this benefit can we capture in our pricing? - Interviewee should provide a percentage between 25% and 50%. Anything higher than 50%
should be quesFoned due to the novelty of the product and resulFng lack of social proof. § A 50% profit margin for our client would also realize a 50% profit margin for farmers. This is
absolutely a realisFc price to set, if not a li_le low. - Given the costs provided, will we make a profit? Yes - Interviewee should calculate profit: ($100,000 / 200 acres = $500/acre). Assuming $1,000
price per acre, gross margin will be 50%. [($1,000 -‐ $500) / $1,000]

43
Solution and recommendations Solu=on & Recommenda=ons
§ Overall, our client should commercialize this chemical and price it at approximately $1,000 per acre to make a 50% margin.
§ Ask the interviewee if there are other non-‐financial risks/benefits that our client should consider. § A potenFal answer would note that the client should consider several qualitaFve issues:
— DifferenFaFon: What is our posiFoning?
— Environmental issues: Is there a risk of backlash and/or boyco_ from the general public? Could the U.S. government a_empt to regulate our product?
— OperaFonal reality check: Does the company have the resources to do this?
— PatenFng: Is the product already patented? If yes, then when does it expire? If no, then is it possible to patent? If not, then can we patent the manufacturing process?
— RepresentaFveness of test market: Does it cost less to cover apples in other states?
— Strategic fit: Is this opportunity too small relaFve to the size of the client?
Bonus/Guide to an Excellent Case
§ Excellent interviewees need to address value-‐based pricing: the need to quanFfy added profits that our client’s product will make for its clients and how much of that money our client can capture.
§ AddiFonally, a strong interviewee will share several qualitaFve issues listed above to supplement the recommendaFon to enter the market.

44
Case 3: Orrington Office Supplies (OOS)
Case tracker Fit Ques=ons
§ Industry: Consumer Products
§ Level of Difficulty: Medium/Hard
§ Case format: Improving profitability
§ Concepts being tested: - Capacity
expansion /contracFon
Case Ques=on
§ Our client, OOS is a leading manufacturer of office products in 1992, with sales of $275M in 1991. They have strong brands, invest heavily in markeFng / adverFsing, and have grown through prod. line extensions and four key acquisiFons
§ OOS is organized into 5 autonomous divisions, but shares manufacturing and markeFng funcFons. Shared costs (45% of total) are allocated on a % of sales method. There are three plants running at a current capacity uFlizaFon is 50%
§ Analysts predict OOS is a potenFal acquisiFon target given its strong balance sheet but weakening earnings. They are publicly traded and have li_le long-‐term debt. As a potenFal investor, how would you improve its profitability.
Spend first 15 min on fit
§ Name a Fme when you have caved under pressure. How did you recover?
§ Describe a Fme you have disagreed with your supervisor.
§ How do you keep abreast of current events?
Guide to interviewer
§ This case combines public math with key qualitaFve insights. At its core, this is a case about rapidly declining profitability and finding ways (i.e. plant consolidaFon) as a way to improve its future performance.
§ The interviewee should recognize that this is a performance improvement case and will look for ways to improve profitability. They will have to use the informaFon provided up front to determine that capacity contracFon is the prime means to improve profitability.
§ Because there are many potenFal avenues to explore, the interviewer may need to nudge along the interviewee.
Quants.6
Structure
7
Profit Imp.Cap. Exp.
By: Andy Grieve (Kellogg Class of ‘01), Edited By: Peter Manoogian (Kellogg Class of ‘12)
CPG

45
Clarifying answers and case guide Guide to case / Guide to handouts
A sample case structure would include the following: 1) ExaminaFon of OOS’s recent performance to deep-‐dive declining
profits. 2) Discussion of potenFal for potenFal for plant consolidaFon. 3) A profitability analysis of plant consolidaFon. Exhibit 1– Hand out aner interviewee asks about profitability
Exhibit 2– Hand out aner interviewee concludes that plant consolidaFon
is a worthy area for a “deep-‐dive.” This should be evident from the case introducFon, but provide hints if necessary.
Exhibit 3– Following the discussion of plant closures, the interviewee
should ask about the cost structures about the various plants. - If interviewee asks about revenues, gently suggest to calculate on a
per SKU basis (e.g., total sales / total SKUs = $22K / SKU).
Clarifying answers to provide
Industry trends - U.S. Office supplies market grew at 5%
CAGR historically. In 1990 and 1991, the market declined at 5%/yr.
- Superstore channel is becoming increasingly criFcal
- Gained 10 share pts in past 2 yrs - Typically discount products 30%
to small retailers/dealers - Superstores are aggressively
subsFtuFng private label products for tradiFonal brand names
Client CharacterisFcs - Broader product line than compeFtors
(12.5K SKUs vs. 4-‐5K for compeFtors) - DistribuFon: 75% wholesalers, 15%
superstores, 10% end customers - Most profitable product is a high-‐end
branded stapler - Staples, Inc. is OOS’s largest customer

46
Key elements to analyze
Profitability
§ Using Exhibit 1, have a discussion about why the slopes for sales and profits differ as Fme elapses
Capacity u=liza=on
§ Using Exhibit 2, qualitaFvely discuss the potenFal opFons for plant consolidaFon.
Notes to interviewer
§ Exhibit 1 -‐ interviewee should not only be able to interpret the data on this slide, but also come up with two insights:
1) the fact profits have been declining more steeply than sales reflects the fixed-‐cost nature of this business, and
2) the reason that sales did not grow at a faster clip than profitability during the 1980s likely reflects a strategy to grow through acquisiFons, which prevented OOS from seeing the gains through economies of scale that one would normally expect in a business such as this
Notes to interviewer
§ Interviewee should recognize the Chihuahua plant is close to having capacity to produce OOS’s 12.5K SKUs. Either OOS can close that plant and move all producFon to the US, or it could close the US plants, disconFnue 500 SKUs and move producFon to Chihuahua.
§ Insigh�ul interviewees will note that Chihuahua is the most feasible strategy, but will ask to see fixed and variable cost data; if so, then produce Exhibit 3.
Plant closures
§ Using Exhibit 3, crunch the numbers on the profitability of a possible plant closure?
Notes to interviewer
§ They should have idenFfied that the Chihuahua plant is the most feasible, but there are some key consideraFons.
§ Key ques=ons to ask: How would this change revenues?
(currently $275M / year)
How would this change producFon costs? What are they now?
How would this change pre-‐tax profits (currently $25M /year?)

47
Calculations
Math ques=ons
1. How would consolidaFng to Chihuahua change revenues? (currently $275M / year)
2. How would this change producFon costs? What are they now?
3. How would this change pre-‐tax profits? (currently $25M /year)
Calcula=ons
1. Revenues: Each SKU earns annual revenues of $22K ($275M divided by 12,500 SKUs) therefore, eliminaFng 500 SKUs will decrease annual revenue by $11M, or 4%
2. Prod. costs: Each plant currently has the following annual costs, totaling to $136M
Chihuahua: $20M + ($4K * 4.5K SKUs) = $20M + $18M = $38.0M
Michigan: $15M + ($7.9K * 5K SKUs) = $15M + $39.5M = $54.5M
New Jersey: $18M + ($8.5K * 3K SKUs) = $18M + $25.5M = $43.5M
ConsolidaFng revenues to Chihuahua will reduce annual costs by 50% to:
Chihuahua: $20M + ($4K * 12K SKUs) = $20M + $48M = $68.0M
3. Profits: We have reduced costs by $68M and lowered revenues by $11M, thus increasing profits by $57M, to a total of $82M, which more than triples them.

48
Solution and recommendations Solu=on & Recommenda=ons
§ Overall, our client should eliminate 500 SKUs and consolidate all producFon to the Chihuahua plant to raise annual profits from $25M to $82M.
§ The client should also consider several qualitaFve issues: — ImplementaFon Timeframe: Will not be done tomorrow.
— RelaFonships with Union: If organized labor is part of our producFon employee pool in the two plants that we are going to close, we will need to address that situaFon.
— Changes in DistribuFon and Warehousing: We will need a carefully-‐developed transiFon plan.
— Purchasing: We will need to transiFon to a strong central purchasing department, rather than smaller local ones.
— Culture: CommunicaFng the change properly is key, and we will need to ensure that morale does not take a nosedive.
Bonus/Guide to an Excellent Case
§ Excellent interviewees need to recognize what macroeconomic issues are beyond the scope of the client’s control and then quickly dive into the plant consolidaFon, then analyze the cost structures
§ AddiFonally, common sense and basic familiarity with manufacturing operaFons should guide the successful interviewee to some or all of the qualitaFve issues provided

49
Exhibit 1: OOS Sales / profit trend

50
Exhibit 2: Overview of OOS production plants

51
Exhibit 3: Plant operating costs

52
Case 4: Syzygy Supercomputers
Case tracker Fit Ques=ons
§ Industry: Tech & Telecom
§ Level of Difficulty: Hard
§ Case format: Improving profitability
§ Concepts being tested: - CompeFFve
analysis
- OperaFons
Case Ques=on
§ Syzygy Supercomputers is a large internaFonal fully-‐integrated computers and communicaFons company with annual revenues of approximately $20 billion U.S.. In the past several years, the company has seen a steady decline in profits.
§ The CEO has asked us to look into this problem. How can Syzygy Supercomputers get back on track?
Spend first 15 min on fit
§ What is the single most important detail in your resume?
§ What is the least important detail in your resume?
§ Why is the lifestyle of this job right for you?
Guide to interviewer
§ This case is about a tech company undergoing a decline in profitability, despite a strong compeFFve posiFon. Syzygy has been overinvesFng in R&D relaFve to its returns and performance has suffered as a result.
§ The interviewee is expected to go through these general steps while presenFng a soluFon:
1. Confirm profitability issues and ask to see historical revenue and cost informaFon.
2. Ask to see market posiFon and related data. 3. Realize that this case is going to be decided
based on informaFon regarding the products. 4. IdenFfy the main issue affecFng profitability –
the company’s R&D spending
Quants.3
Structure
7
Profit Imp.Comp. Anl
Ops.
By: Edwin Van Dusen, Brian Fox and David Welch (Kellogg Class of ‘04), Edited By: Uri Kalir (Kellogg Class of ‘12)
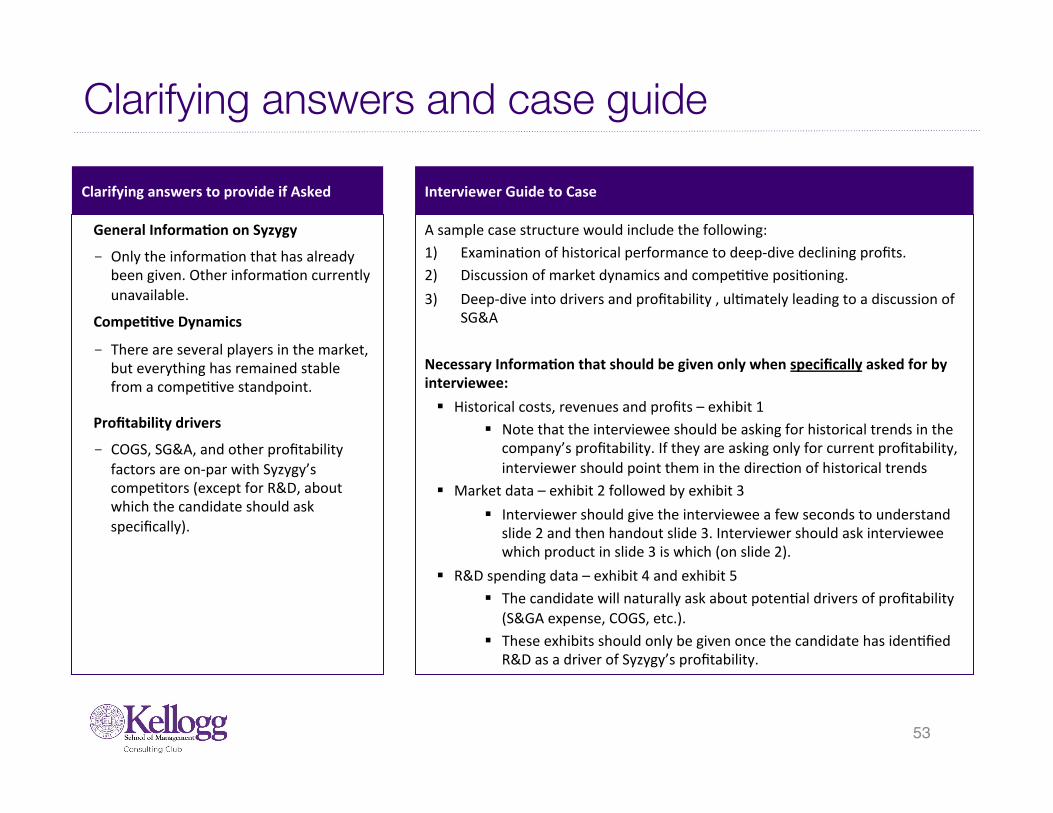
53
Clarifying answers and case guide
Interviewer Guide to Case
A sample case structure would include the following: 1) ExaminaFon of historical performance to deep-‐dive declining profits. 2) Discussion of market dynamics and compeFFve posiFoning. 3) Deep-‐dive into drivers and profitability , ulFmately leading to a discussion of
SG&A
Necessary Informa=on that should be given only when specifically asked for by interviewee: § Historical costs, revenues and profits – exhibit 1
§ Note that the interviewee should be asking for historical trends in the company’s profitability. If they are asking only for current profitability, interviewer should point them in the direcFon of historical trends
§ Market data – exhibit 2 followed by exhibit 3 § Interviewer should give the interviewee a few seconds to understand
slide 2 and then handout slide 3. Interviewer should ask interviewee which product in slide 3 is which (on slide 2).
§ R&D spending data – exhibit 4 and exhibit 5 § The candidate will naturally ask about potenFal drivers of profitability
(S&GA expense, COGS, etc.). § These exhibits should only be given once the candidate has idenFfied
R&D as a driver of Syzygy’s profitability.
Clarifying answers to provide if Asked
General Informa=on on Syzygy
- Only the informaFon that has already been given. Other informaFon currently unavailable.
Compe==ve Dynamics
- There are several players in the market, but everything has remained stable from a compeFFve standpoint.
Profitability drivers
- COGS, SG&A, and other profitability factors are on-‐par with Syzygy’s compeFtors (except for R&D, about which the candidate should ask specifically).

54
Key elements to analyze
Interpre=ng Exhibit 3 Notes on Exhibits 2 & 3 Notes on Exhibits 4 & 5
§ The X axis represents absolute market share (AMS), which correlates with the height of Syzygy’s rectangles in exhibit 2.
§ The Y axis represents relaFve market share (RMS), calculated as Syzygy’s market share divided by the market share of the closest compeFtor. If Syzygy is the market leader, this number is greater than 1. If Syzygy is not the market leader, its market share divided by the market leader’s share will be lower than 1. This correlates with the the raFo of the height of Syzygy’s rectangles to that of compeFtors’ rectangles for each product in exhibit 2.
§ The diameter of the bubbles is driven by Syzygy’s total revenues in that category, comprised of its market share in the category mulFplied by the category’s size.
§ Correctly interpreFng slides 2 and 3 will lead the candidate to correctly idenFfy the products on slide 3:
§ Product #1 is custom applicaFons
§ Product #2 is supercomputers
§ Product #3 is telecom equipment
§ Product #4 is satellites § Product #5 is operaFng
sonware
§ The key insight in exhibit 4 is that Syzygy is the only major compeFtor in this industry whose R&D spending is below the “normaFve band”
§ We would expect each company’s degree of technical leadership to go up as it invests in R&D, but Syzygy, with slightly more R&D spending than Cray Research and Sonic Wave, enjoys less of a percepFon of technical leadership from its customers
§ Exhibit 5 builds on this point. The key insight is the absolute expense (not percentage) Syzygy is spending on R&D. Correct analysis will show that Syzygy is spending money on features that do not generate customers’ “willingness to pay”. Syzygy is spending money to develop features that consumers are not willing to pay for.

55
Solution and recommendations
Solu=on & Recommenda=ons
§ The candidate should be able to produce one of the following insights: § Cut R&D to eliminate spending on unnecessary customer features. § Keep R&D spending the same, but switch the work to developing features that consumers will be willing to
pay for at a level that is higher than the R&D expense itself. § A second-‐order insight from the case is that Syzygy should exit the operaFng sonware business (product #5 in this
case) since it’s small market share will conFnue to erode as a result of economies of scale, network economics and the experience curve all working against it.
Bonus/Guide to an Excellent Case
§ An excellent interviewee will – § Take a few seconds to fully understand each of the complex graphs he/she is given before giving an answer.
§ Immediately ask about R&D spending and not go through COGS or SG&A first (this is a hi-‐tech company, so R&D spending should be looked-‐at before other drivers of profitability).
§ Conclude their recommendaFon by not only staFng that Syzygy should exit the operaFng sonware business, but also focus on the categories in which it is the market leader in order to get some or all of those economies to work for it and against its compeFFon.

56
Exhibit 1: Syzygy’s Historical Costs, Revenues and Profits

57
Exhibit 2: Worldwide Telecom Computing Market (Today)

58
Exhibit #3: Syzygy’s Absolute vs. Relative Market Share

59
Exhibit #4: Companies’ R&D vs. Degree of Technical Leadership

60
Exhibit #5: Syzygy’s R&D Expenses and Selling Prices for Supercomputers

61
Case 5: Winter Olympics Bidding
Case tracker Fit Ques=ons
§ Industry: Media & Entertainment
§ Level of Difficulty: Medium
§ Case format: Opportunity Assessment
§ Concepts being tested: - Basic NPV - Breakeven analysis
Case Ques=on
§ Our client, a major US television network, is trying to figure out how much to bid for the exclusive right to broadcast the 2018 Winter Olympics Games in the U.S.
§ The Winter Olympics are a huge deal and will require a significant amount of capital to secure the rights, so our client has brought us in to help them figure out the right bid amount aner considering all relevant factors.
Spend first 15 min on fit
§ How would you describe your problem solving skills?
§ Do you consider yourself a more visionary or more pragmaFc thinker….and why?
§ What did you like least about your last job?
Guide to interviewer
§ This is a very quanFtaFve case that requires the interviewee to run the numbers on an Olympics bid. The candidate will have to decide potenFal ad revenue/cost informaFon, as well as the NPV, to determine bid size.
§ The candidate will need to ask for addiFonal informaFon that is necessary to solve the problem, rather than relying on the interviewer to dispense it. Aner geong the iniFal calculaFons right, there are a lot of implicaFons that may change the level of the bid.
§ Especially for less finance-‐minded interviewees, you may have to help nudge candidates through the math.
Quants.8
Structure
4
Basic NPV B/E
By: Chris Dupre (Kellogg Class of ‘03), Edited By: Uri Kalir (Kellogg Class of ‘12)

62
Clarifying answers and case guide Guide to case
Part 1 – QuanFtaFve discussion - Candidate should determine that this is a cost-‐benefit / NPV analysis. - Candidate should idenFfy potenFal revenue streams from hosFng the
Olympics, i.e. ad revenue, product placements, etc. - Then, the candidate will have to figure out if this is a good investment. They
should idenFfy 3 costs (producFon costs, opportunity costs, and Fme value of money). By factoring in these costs, the candidate will find out if the Olympics are worth the investment.
- Some of the numbers and assumpFons here are difficult, so nudge the candidate along if necessary.
Exhibit 1 – Provide Winter Olympics schedule if asked - Give to candidate once he/she idenFfies ad revenues
Part 2 – QualitaFve discussion - Aner finding the NPV of $200M, ask the candidate about intangible factors,
benefits, and risks. Some criFcal factors: - Might give network access to new viewers - There is presFge associated with hosFng this event - We can use the air Fme to promote other programming - OpportuniFes for product Fe-‐ins, supplemental revenue
- Aner finishing the discussion, ask the candidate for a recommendaFon.
Clarifying answers to provide
Revenues - No subscripFon revenue, but can keep
100% of adverFsing revenue - Ad rates are $400K/30 second ad for
prime Fme (M-‐F 7-‐11 PM, all weekend) and $200K/ad for non-‐prime Fme
- Market research has shown that you can include no more than 10 minutes of adverFsing per hour.
Costs - $482M of total producFon costs - Opportunity cost: $1M/hour - Time value of money: 4 year lag for
receipt of revenue

63
Math questions
Math solu=on
1) Total revenues should be equal to $928M for the project.
• PrimeFme: Weekdays (M-‐F): 10 weekdays x 4 hrs/day x 10 min/hr x 2 slots/min x $400,000/ad = $320M
• Non-‐prime: Weekdays (M-‐F): 10 weekdays x 6 hrs/day x 10 min/hr x 2 slots/min x $200K/ad = $240M
• Weekend: 4 days x 10 hrs/day x 10 min/hr x 2 slots/min x 400K/ad = $320M
• Opening/Closing: 2 days x 3 hrs/day x 10 min/hr x 2 slots/min x 400K/ad=$48M
2) Total profit should be equal to $300M.
• Profit: Revenues $928M -‐ $482M of total costs -‐ $146M of opportunity cost (2 days x 3 hours x $1M/hr + 14 days x 10 hours x $1M/hr) = $300M
3) NPV should be equal to $200M.
• Discount rate: 1.104 = 1.4641 (ask candidate to round to 1.50) • $300M/1.5 = $200M
Math ques=on
1) Calculate the revenue from broadcasFng the Winter Olympics.
2) Factoring in costs, is this a good investment? Find the NPV.
Math informa=on
Revenues - $400K/ad for prime
Fme (M-‐F 7-‐11 PM, all weekend) and $200K/ad for non-‐prime Fme
- 10 minutes/hour of adverFsements
Costs - $482M of producFon
costs - Opportunity: $1M/hr - WACC: 10%

64
Solution and recommendations
Solu=on & Recommenda=ons
§ While the NPV of the project is $200M, the fact that there are other intangibles (new viewers, plugging our programs, and presFge) the bid should just be $200M.
§ While there is no one correct answer, most answers should be in the range of $200M. If there is significant fluctuaFon from $200M, the candidate will have to provide in-‐depth jusFficaFons and make a concrete argument.
Bonus/Guide to an Excellent Case
§ This case tests the interviewee’s comfort with numbers and understanding of how intangible factors may influence financial value. The bid process requires another level of understanding around game theory and what dynamics will ulFmately determine the value of the bid beyond NPV.
§ UlFmately, the best interviewees will make a very strong argument using the facts provided and support their bid and explain why they moved their bid from the NPV figure.
§ There is also a lot of room for creaFvity for the interviewee to discuss other factors, including supplemental streams of revenue, intangible factors, and things to consider during the bid process.

Exhibit #1
Day 1Opening Ceremonies (Friday)
Day 2-15 Day 16Closing Ceremonies (Saturday)
8-11pm Weekday: 9am-12pm, 2-5pm, 7-11pm
Weekend: 11am-9pm
8-11pm
Winter Olympics Schedule

66
Case 6: Rotisserie Ranch
Case tracker Fit Questions
§ Industry: Consumer Goods
§ Level of Difficulty: Medium
§ Case format: Developing a new product
§ Concepts being tested:- Microeconomics- Elasticity
- Customer strategy
Case Question
§ Our client is Rotisserie Ranch, a poultry farming company that specializes in growing chickens for rotisserie roasting. Its main line customer segment is comprised of large grocery chains, who buy its chickens to fresh roast in the meat departments of their grocery stores. Market research has revealed to Rotisserie Ranch that more and more consumers have begun buying flavored rotisserie chickens recently.
§ Rotisserie Ranch is thinking of pre-flavoring some of its chickens for grocers. Should Rotisserie Ranch begin selling this new product?
Spend first 15 min on fit
§ What are your top 9 weaknesses? (Stress Test – If interviewee gets 9, ask for 9 more until they cannot answer)
§ Ok, what are 9 of your strengths?
§ Imply that interviewee answered the strengths much faster than the weaknesses and ask, why?
Guide to interviewer
§ This case is similar in style to a McKinsey & Company 1st round case in that the Interviewer should drive the case.
§ The case is primarily tests the ideas behind a new product introduction and forces the interviewee to consider market testing, profitability, etc. before rolling out a new product.
§ Because this is a “Market Introduction” case, the interviewee SHOULD ask questions about competition.
§ For the purposes of this case, assume that Rotisserie Ranch will only compete against existing Private Label brands at grocery stores.
Quants.6
Structure
5
MicroPrc. Elas.Cust. Stgy
By: Brian Fox (Kellogg Class of ‘04), Edited By: Adam Louras (Kellogg Class of ‘11)
CPG

67
Clarifying answers and case guide
Interviewer Guide to case and handouts
Case Structure – Interviewee’s structure should include: - Value to customers (grocery chains) – Will they buy it? - Revenue and Cost implica5ons of new venture
- Cost increase to client is offset by price increase to grocers - Compe55on
- None. CompeFFon freezes chicken so can’t be pre-‐seasoned. Prompt 1 & 2 – Aner Interviewee walks through structure, ask them: - Do you think that grocery retailers would be interested in pre-‐seasoned chickens from Ro5sserie Ranch?
- No correct answer; however, should be logically defended - AJer several interviews, it turns out that the grocers are very interested in Ro5sserie Ranch’s proposed new product, but first they want to be sure that the Ro5sserie Ranch chickens will sell well. How would you make sure?
- The correct answer is to run a test market. Prompt 3 – Aner discussing Prompt 2, discuss the results of the market test: - Assumes that the demand funcFon for RoFsserie Ranch chickens is linear.
- Store 1 is comparable to test store A and store 2 to test store B
Clarifying answers to provide if AskedIndustry Characteris=cs/Market Economics
- Perishability: PredicFng demand for cooked chickens is difficult for grocers; any lenover cooked chickens at the end of the day are thrown out; unthawed chickens cannot be re-‐frozen
Client Characteris=cs
- Compe55ve Advantage: Client has patented process for sterilely packaging chicken, so that it will remain fresh for 30 days, making freezing unnecessary
- Client is currently the industry market share leader in roFsserie-‐ready chicken
- Four New “Flavored” Products to be introduced concurrently: Barbecue, lemon herb, tandori and teriyaki
Compe==ve Dynamics
- No compeFFon in new product market due to patented process

68
Key elements to analyze
Value to Grocers
§ Do you think that grocery retailers would be interested in pre-‐seasoned chickens from Ro5sserie Ranch?
Market Testing
§ Aner several interviews, grocers are interested in RoFsserie Ranch’s proposed new product, but first they want to be sure that the chickens will sell well. How would you make sure?
Demand Elasticity
§ A test market launch for the new RoFsserie Ranch BBQ chicken was administered (Hand out Exhibit 1).
§ Should the grocers carry our product?
Prompt 1 Sample Answers
§ Sample “YES” response: § Labor Cost Reduc5on: Meat
department workers; don’t need to spend Fme seasoning the chickens.
§ Economies of Scale: Seasoning centralizaFon; lower cost.
§ Product Consistency: Centrally managed; able to spend more on R&D.
§ Sample “No” response:
§ Loss of Differen5a5on: Grocery chains differenFate by value-‐added .
§ A;une to Local Needs: Likely to be be_er at gauging consumer tastes.
§ Increases Inventory & SKUs.
Prompt 2 Answer
§ The correct answer is to run a test market for the new products. § The candidate may begin going into
detail on how this test would be run. Cut him or her off as soon as you are comfortable that they understand that: § A pilot test should be run. § The pilot needs to have some
control or comparison group.
Notes on Exhibit 1 & 2
§ Using Exhibit 1, interviewee should calculate: § Retail Margin ($):
§ Store A: 25% x $4 = $1 Per Unit § Store B: 25% x $3 = $0.75 Per Unit
§ Gross Profit: § Store A: $1 Per Unit x 400 = $400 § Store B: $0.75 Per Unit x 1000 = $750
§ Cannot answer with Exhibit 1 alone, so they should ask for “Control Group” informaFon: Hand out Exhibit 2 when this is asked
§ Interviewee should calculate (NOTE: Answer is the same for both chicken types):
§ Variable Margin ($) RoFsserie: § Store 1: 30% x $3.33 -‐ $0.20 = $1 /Unit § Store 2: 30% x $2.50 -‐ $0.15 = $0.75 /Unit
§ Gross Profit RoFsserie: § Store 1: $1 Per Unit x 300 = $300 § Store 2: $0.75 Per Unit x 800 = $600

69
Solution and recommendations
Solution & Recommendations
§ Overall, our client should launch the Pre-‐Seasoned BBQ Chicken product and test other products because: § Compe55ve Necessity: Consumers are spending more money on seasoned roFsserie chicken than tradiFonal roFsserie
chicken and the market is shining in this direcFon
§ Benefit to Grocers: Assuming test market was representaFve, Grocers can expect to earn $100 to $150 more gross profit using our client’s product relaFve to their own “Private Label”
§ CannibalizaFon is not an issue because the variable margins and gross profits are the same on standard and seasoned roFsserie chicken, i.e. shining from either of these products to our clients is a net benefit
§ Benefit to Client: Assuming that the increased price to the Grocers offsets the increased cost of producFon, our client will make more money due to increased sales of the new chicken
Bonus/Guide to an Excellent Case
§ An excellent interviewee will note: § The benefit to the Grocers based on a linear interpretaFon of Demand, i.e. At a $3.50 price point, sales are expected
to be 700 units. This give a variable margin of $0.875 /unit and total operaFng profit of $612.50
§ The benefit to the Grocers as percentages, i.e. Store 1 would gain 33.3% and store 2 would gain 25% to their operaFng profit by shining to our client’s product.
§ PotenFal scale benefits to our Client over Fme as more pre-‐seasoned chickens are sold
§ PotenFal labor reducFons by grocers as the workload is “Outsourced” down the value chain to our client

70
Exhibit #1: Market Test of Pre-Seasoned BBQ Chicken
$0.00
$0.50
$1.00
$1.50
$2.00
$2.50
$3.00
$3.50
$4.00
$4.50
400 1000
Rotisserie Ranch Market Test of Pre-Seasoned BBQ Chicken
P
Q
A B Store:
25% 25% Retailer Margin:

71
Exhibit #2: Control Group Stores
Store 1 Store 2 Store 1 Store 2 Chicken Type Standard Standard Chicken Type Store Seasoned Store Seasoned Weekly Sales $1,000 $2,000 Weekly Sales $1,200 $2,400
Retail Price $3.33 $2.50 Retail Price $3.99 $2.99 Seasoning Cost $0.00 $0.00 Seasoning Cost $0.20 $0.15
Retailer Margin 30% 30% Retailer Margin ? ?
Standard Rotisserie Seasoned Rotisserie

72
Case 7: Tarrant Fixtures
Case tracker Fit Ques=ons
§ Industry: Industrial goods
§ Level of Difficulty: Medium
§ Case format: Improving profitability
§ Concepts being tested: - OperaFons - AccounFng
Case Ques=on
§ Our client, Tarrant Fixtures, is a low-‐intensity manufacturing company that produces display fixtures for retail clients. The company’s financial performance has deteriorated in each of the last three years. Specifically, they are concerned with the company’s falling Return on Investment (ROI).
§ The CEO has asked us to look into this problem. How can Tarrant Fixtures get back on track?
Spend first 15 min on fit
§ What do you see as the most challenging aspect of this job?
§ Tell me about your wri_en communicaFon skills.
§ What are a couple of the best and worst decisions you have made in the past year?
Guide to interviewer
§ This case is about improving ROI and requires a real understanding of finance to solve. There has been a massive increase in working capital due to inventory build-‐up from an increase in the number of SKUs.
§ This is a short case, designed to be solved in approximately 15-‐20 minutes. There are no slides.
§ The important steps are: § Establishing a viable structure (Using ROI formula) § Breaking down the problem into component
parts § ConFnuing to examine issues unFl the correct
ones are idenFfied.
Quants.
8
Structure
7
Opps. Acct.
By: David Welch (Kellogg Class of ‘04), Edited By: Adam Louras (Kellogg Class of ‘11)
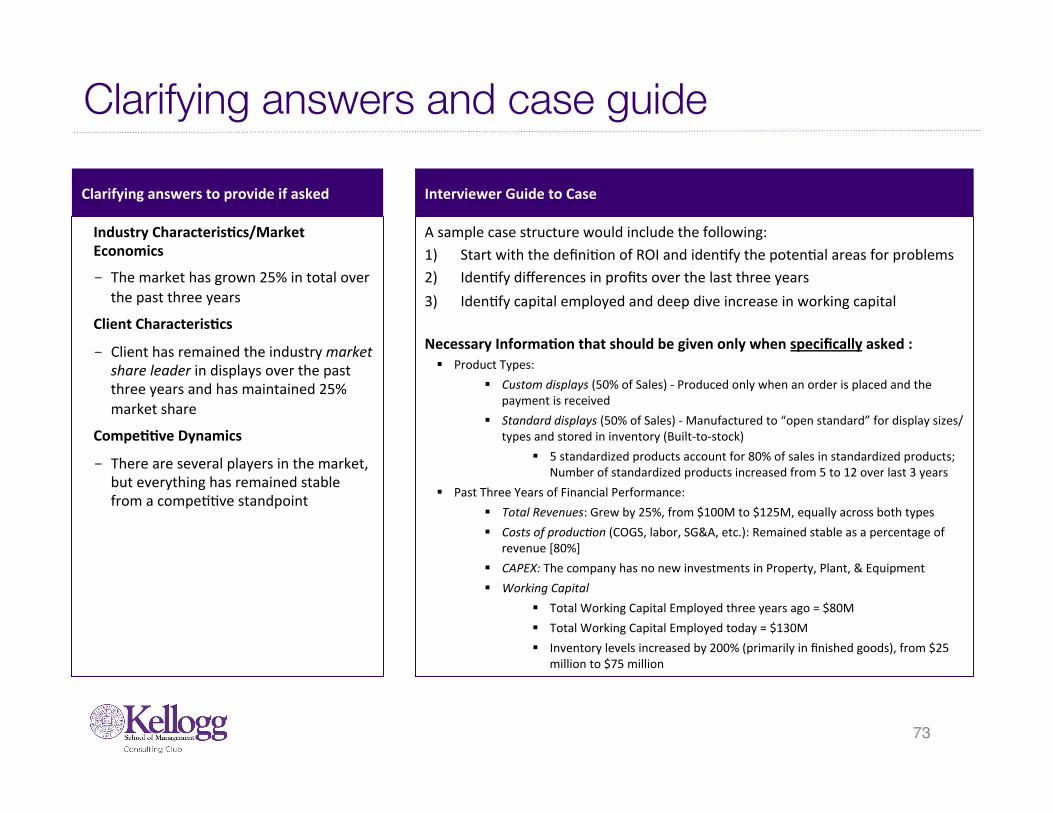
73
Clarifying answers and case guide
Interviewer Guide to Case
A sample case structure would include the following: 1) Start with the definiFon of ROI and idenFfy the potenFal areas for problems 2) IdenFfy differences in profits over the last three years 3) IdenFfy capital employed and deep dive increase in working capital
Necessary Informa=on that should be given only when specifically asked : § Product Types:
§ Custom displays (50% of Sales) -‐ Produced only when an order is placed and the payment is received
§ Standard displays (50% of Sales) -‐ Manufactured to “open standard” for display sizes/types and stored in inventory (Built-‐to-‐stock)
§ 5 standardized products account for 80% of sales in standardized products; Number of standardized products increased from 5 to 12 over last 3 years
§ Past Three Years of Financial Performance: § Total Revenues: Grew by 25%, from $100M to $125M, equally across both types § Costs of produc5on (COGS, labor, SG&A, etc.): Remained stable as a percentage of
revenue [80%] § CAPEX: The company has no new investments in Property, Plant, & Equipment § Working Capital
§ Total Working Capital Employed three years ago = $80M § Total Working Capital Employed today = $130M § Inventory levels increased by 200% (primarily in finished goods), from $25
million to $75 million
Clarifying answers to provide if asked
Industry Characteris=cs/Market Economics
- The market has grown 25% in total over the past three years
Client Characteris=cs
- Client has remained the industry market share leader in displays over the past three years and has maintained 25% market share
Compe==ve Dynamics
- There are several players in the market, but everything has remained stable from a compeFFve standpoint
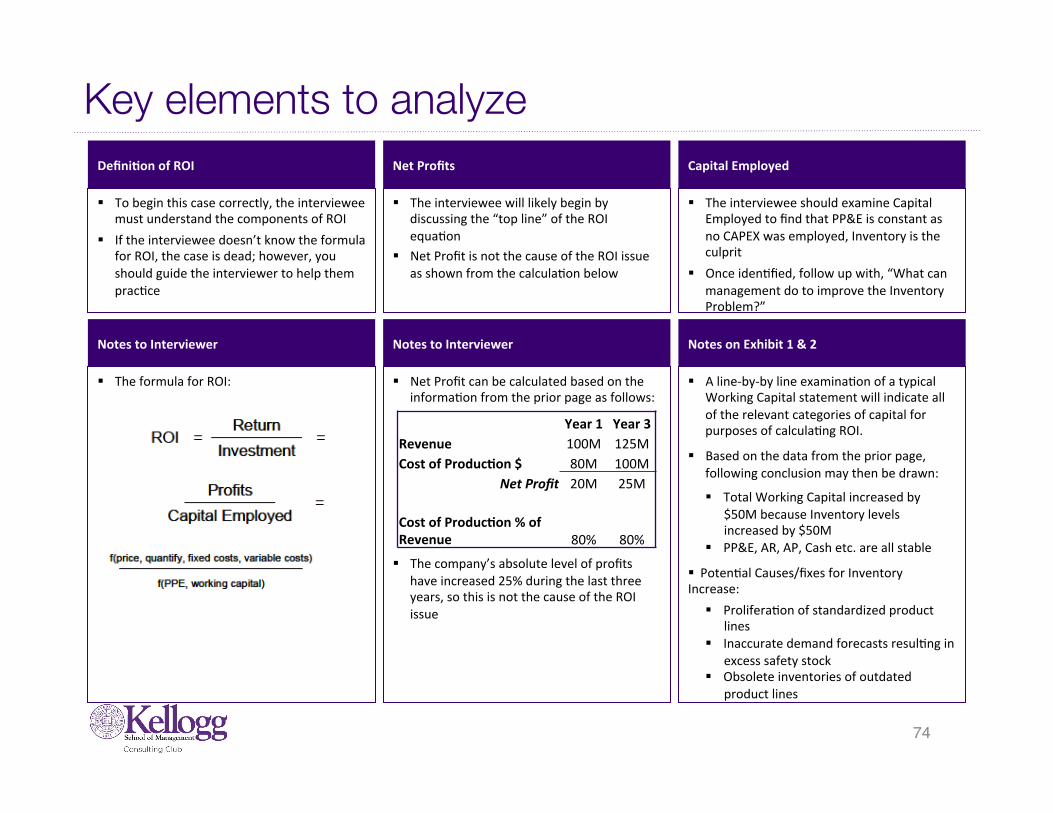
Key elements to analyze Defini=on of ROI
§ To begin this case correctly, the interviewee must understand the components of ROI
§ If the interviewee doesn’t know the formula for ROI, the case is dead; however, you should guide the interviewer to help them pracFce
Net Profits
§ The interviewee will likely begin by discussing the “top line” of the ROI equaFon
§ Net Profit is not the cause of the ROI issue as shown from the calculaFon below
Capital Employed
§ The interviewee should examine Capital Employed to find that PP&E is constant as no CAPEX was employed, Inventory is the culprit
§ Once idenFfied, follow up with, “What can management do to improve the Inventory Problem?”
Notes to Interviewer
§ The formula for ROI:
Notes to Interviewer
§ Net Profit can be calculated based on the informaFon from the prior page as follows:
§ The company’s absolute level of profits have increased 25% during the last three years, so this is not the cause of the ROI issue
Notes on Exhibit 1 & 2
§ A line-‐by-‐by line examinaFon of a typical Working Capital statement will indicate all of the relevant categories of capital for purposes of calculaFng ROI.
§ Based on the data from the prior page, following conclusion may then be drawn:
§ Total Working Capital increased by $50M because Inventory levels increased by $50M
§ PP&E, AR, AP, Cash etc. are all stable
§ PotenFal Causes/fixes for Inventory Increase:
§ ProliferaFon of standardized product lines
§ Inaccurate demand forecasts resulFng in excess safety stock
§ Obsolete inventories of outdated product lines
Year 1 Year 3 Revenue 100M 125M Cost of Produc=on $ 80M 100M
Net Profit 20M 25M
Cost of Produc=on % of Revenue 80% 80%
74

75
Solution and recommendations Solu=on & Recommenda=ons
§ The client’s ROI has fallen over the past three years due to a $50M increase in Working Capital caused by a 200% increase in inventory. Inventory has grown because of:
§ The increase in the Total number of standardized product SKUs from 5 to 12 § Inaccurate demand forecasts resulFng in excess safety stock § Obsolete inventories of outdated products
§ To correct this issue, the client should work to reduce its inventory by: § WriFng off or working down obsolete inventory (a write-‐off will cause an immediate hit on profits, so
management may be reluctant) § Improving demand forecasFng to set more realisFc safety stock levels § Reducing the “Standard” product-‐line down to the top 5 products (80% of current sales)
Bonus/Guide to an Excellent Case
§ An excellent interviewee will: § Provide creaFve, logical reasons for the inventory increase § Provide creaFve, logical soluFons to reduce Inventory § Detail a cohesive demand forecasFng plan that would improve accuracy
§ Provide a plan to limit future product proliferaFon in the “Standard” product lines

76
Case 8: Vindaloo Corporation
Case tracker Fit Ques=ons
§ Industry: Consumer products
§ Level of Difficulty: Medium
§ Case format: Developing a new product
§ Concepts being tested: - Basic NPV - MarkeFng Strategy
- OperaFons
Case Ques=on
§ Our client, Vindaloo CorporaFon, is a small biotechnology company that has developed a new seed for sugar beets, which produces twice as much sugar as the seeds that are currently in use. They now want to sell the company, and wonder how much it is worth.
Spend first 15 min on fit
§ What do you read?
§ What is the most important issue facing the industry of your last job?
§ Describe your methods of diagnosing client’s needs.
Guide to interviewer
§ This is a valuaFon case and, as such, has a lot of number crunching. To calculate the NPV, the interviewee will have to size its impact up and down the value chain and determine its value using assumpFons about market penetraFon and growth rates.
§ There are also several important qualitaFve insights for the candidate to make, the main one of which is that the new technology will halve the land rather than doubling producFon, which would cause an immediate worldwide sugar glut and rapidly falling prices.
Quants.8
Structure
4
Basic NPVMkt. Stgy
Opps.
By: Ben Walter (Kellogg Class of ‘03), Edited By: Ameed Mallick (Kellogg Class of ‘12)
CPG

77
Clarifying answers and case guide Interviewer Guide to Case
A sample case structure would include the following: 1) Start with an understanding of the sugar industry and market economics 2) Analyze the product benefits and potenFal impacts for farmers 3) IdenFfy the channel structure and assess the opportuniFes to minimize costs
within the value chain 4) Calculate NPV of cost savings to value the company
• Beets grown from the new seeds will produce 2x the sugar that tradiFonal seeds yield. For example: Currently 100 beets produce 100 lbs of sugar while the new seeds will produce 200 lbs of sugar, or 2 lbs/beet.
• The elasFcity of demand for sugar is 1. • The value chain can be broken down into four primary processes:
1. Farming (planFng, harvesFng, and selling beets), which is 40% of cost 2. Trucking, which is10% of the cost 3. Refining, which is 30% of the cost 4. DistribuFon, which is 20% of the cost.
• Farmland that is not used for sugar can be repurposed to grow cabbage, which is currently one finh as profitable as sugar.
• Trucking costs for sugar are 5% fixed and 95% variable, with the variable costs directly related to the weight of what is being trucked.
• Refining costs are all variable, and it will cost 25% more per beet to refine the new beets than it cost to refine the old beets.
• There are no cost savings in distribuFon from the reduced volume.
Clarifying answers to provide if Asked
Industry Characteris=cs/Market Economics
- The market has grown at GDP over the last few years which is predicted to grow at 2% annually.
- Sugar is a mature commodity. The wholesale market is $2 billion worldwide per year.
Compe==ve Dynamics
- We can assume a 100% market penetraFon, since there are no compeFng products, and the efficacy of the product is proven.
- There is no imminent threat of compeFFon and a patent would protect the investment for a number of years.

78
Calculations
Math solu=on
• Solu=on -‐ Farming
• The product allows farmers to grow the same amount of sugar on half of the land. So we can assume that farmers will keep half of their land for sugar and repurpose the rest of the land for growing cabbage. Previously, one acre of land produced “X” profits of sugar -‐ now half an acre can produce profits of “X” while the other half produces profits of “.1X” of profits from cabbage. Recall that cabbage is a fiLh (20%) as profitable as sugar currently – accounFng for the 2x yield from the new sugar beets, cabbage would only be 10% as profitable as the “new” sugar. Since profits per acre go from X to 1.1X, there is a 10% increase in profits from farming.
• Common mistakes:
• Candidates who think that farmers will just use the same amount of land and produce twice as much sugar have not thought the quesFon through. Sugar is a mature commodity and if everyone produced twice as much sugar, there would be far more supply than demand, causing global prices to crash. AddiFonally, some candidates will try to calculate the costs savings of the enFre value chain here (make sure to remind them in the debrief to answer the quesFon that is asked.)
Math ques=on
§ What are the cost savings/increase in profits from farming?

79
Calculations (cont.)
Math solu=on
• Solu=on -‐ Trucking • Variable trucking costs, which represent 95% of the total cost structure, will decrease by 50%, leading to an overall
costs savings of 95% x 50% = 47.5%.
• Solu=on -‐ Refining • Refining costs have two components. IniFally the costs will drop by 50% because only half as many sugar beets
need to be refined. However, the variable cost/beat increases by 25% for the new sugar beets. In step the costs go from “X” to “.5X” to “.625X”, an overall cost savings of 37.5%.
• Solu=on – Distribu=on • There are no cost savings in distribuFon.
Math ques=on
§ What are the cost savings from Trucking, Refining, and DistribuFon?

80
Calculations (cont.)
Math solu=on
Math ques=on
§ What are the total cost savings in the value chain?
Step A – Cost Por=on B – Cost Savings Weighted Cost Savings (A x B)
Farming 40% 10% 4%
Trucking 10% 47.5% 4.75%
Refining 30% 37.5% 11.25%
DistribuFon 20% 0% 0%
Total 100% 20%

81
Calculations (cont.)
Math solu=on
• Solu=on – Net present value of cost savings • Our client’s product will save 20% a year in sugar costs -‐ mulFplied by the $2 billion market size, that cost savings comes
out to $400 million per year. The final quesFon then, is how valuable is that? Here, it would be valuable for the candidate to know the perpetuity formula, which is:
• Value = Annual Cash/(r-‐g) • We are given the growth rate, g, as 2%. “r” (the discount rate is not given), so it is fine for the candidate to use the
standard assumpFon of 10%. Therefore the company can be valued at:
• Value = $400M/(10%-‐2%)
= $5B
Math ques=on
§ How valuable is this product?

82
Solution and recommendations
Solu=on & Recommenda=ons
§ This product will only allow our client’s clients (sugar growers) to produce sugar more efficiently. It won’t cause the sugar to taste any be_er or cause consumers to demand more of it. Therefore the product cannot be expected to grow revenue, but it will reduce costs. The value of Vindaloo CorporaFon is directly related to cost savings.
§ Aner running the NPV analysis, Vindaloo CorporaFon should be valued at $5B. § The interviewee should also idenFfy a number of risks and potenFal benefits along the way (i.e. adopFon rates
given the required change to farmland and likely capex for equipment, compeFFve response, other uses for sugar in adjacent or completely separate markets, other uses for newly acquired farmland, potenFal buyers, government intervenFon, etc.) before making their final recommendaFon.
Bonus/Guide to an Excellent Case
§ This is a quanFtaFvely heavy case. A excellent interviewee can quickly idenFfy the important drivers of cost and can crunch the numbers easily and with li_le error. AddiFonally, they will organize the data in a tabular form for ease of calculaFon and presentaFon.
§ AddiFonally, an good interviewee will synthesize each relevant cost savings, the final valuaFon, and next steps/risks as part of their final presentaFon.

83
Case 9: Zephyr Beverages
Case tracker Fit Ques=ons
§ Industry: Consumer Goods
§ Level of Difficulty: Easy
§ Case format: Opportunity assessment
§ Concepts being tested: - CompeFFve
analysis - Capacity
contracFon
Case Ques=on
§ Our client, Zephyr Beverages, is a division of a large consumer products company. The division produces fruit juices in three forms, all under the Zephyr name: chilled, juice boxes, and frozen concentrate. Zephyr had sales of $600 million last year, about 3% of the company’s overall sales of $20 billion.
§ The chilled segment represents $120 million in sales per year. While juice boxes and frozen concentrate have been consistently profitable, chilled juices are only breaking even in good quarters and are losing money in bad quarters. Zephyr has received a proposal from upper management to sell the chilled juices business. We need to help them decide whether or not this is a good idea.
Spend first 15 min on fit
§ What do you do for fun?
§ What did you contribute in your last job that made a difference to the organizaFon?
§ Outside of school and work, what is your greatest personal accomplishment?
Guide to interviewer
§ This is a relaFvely short case that requires the candidate to create a holisFc structure for solving the problem: what does Zephyr do with an underperforming business? It can divest chilled juices, sell its whole juice division, or remain in all its business. Any of the three possible soluFons listed at the end can be argued, but the third soluFon makes the most economic sense.
§ The candidate will need to ask for addiFonal informaFon that is necessary to solve the problem, rather than relying on the interviewer to dispense it all at once.
§ This case is not representaFve of the quanFtaFve rigor of interview cases and therefore we recommend it only be given as a warm-‐up early in the process.
Quants.1
Structure
5
Comp. Als.Capacity
By: Edwin Van Dusen, Brian Fox and David Welch (Kellogg Class of ‘04), Edited By: Ameed Mallick (Kellogg Class of ‘12)
CPG

84
Clarifying answers and case guide
Interviewer Guide to Case
A sample case structure would include the following: 1) IdenFfying the opFons: sell chilled juice, sell all juice businesses, conFnue on
with all businesses 2) QualitaFve discussion of compeFFve dynamics 3) Discussion of product selecFon/components, as well as ways to cut costs
When asked, the interviewer can reveal the following addi=onal informa=on: • Chilled beverages are a $1 billion worldwide industry • The two largest players have market shares of 40% and 25%, respecFvely.
Zephyr’s market share, 12% makes it third in the industry. • The two market leaders are able to do more adverFsing, couponing, promoFon,
and trade than Zephyr is able to do. We do not know about their profitability, but assume it is posiFve.
Clarifying answers to provide if Asked
Industry Characteris=cs/Market Economics
- It has been growing at GDP (~3%) the last few years and is projected to conFnue that growth rate.
- The market for chilled juices is dominated by mothers with young kids.
- Brand name is important in this market, as mothers tend to prefer reliable products. However, the brand premium must be in line with other branded products and all branded juices sell in the same price range.
- This is a highly price sensiFve market that loves coupons, promoFons, etc.
Compe==ve Dynamics
- This is a highly concentrated market. There has not been a lot of change, technological or otherwise, recently and there are no obvious entrants.

85
Key elements to analyze Compe==ve Dynamics
§ Using basic informaFon provided, interviewee should deep dive the compeFFve dynamics in further detail.
Product selec=on
§ Using informaFon about our products vs. our compeFtors, the interviewee should focus on discussion about how to cut costs.
Notes to interviewer
• Relevant info: • Bad market posiFon: 12% vs. 40% and 25% • Assumed profitability differences • Disadvantage on trade promoFons
• Interviewee should be able to see that Zephyr is at a serious disadvantage on all fronts as a smaller company that is both less profitable and less engaged in the kinds of trade promoFons that key customers covet. The overall conclusion should be that this is a weak compeFFve posiFon.
Notes to interviewer
• Relevant info (when asked): • The market leaders produce pure orange juice/blends
based on citrus juices. Zephyr uses more elaborate blends, usually with a base of pear or peach juice (60% of inputs) and flavor with cranberries, bananas, mangoes, etc. (the other 40%). Pear and peach juice are a similarly price to orange juice, but the other flavorings cost about twice as much.
• A plant in California produces all products; chilled, juice boxes and frozen. Each of the three products uses different machinery. It would be difficult to find another use for the plant without a major conversion.
• AddiFonally, there are currently synergies between chilled, frozen and juice boxes – mothers are slightly more likely to buy products from the same brand
• This indicates that, despite a disadvantage, divesFng is not realisFc and there may be room for cost reducFon based on reformulaFon to make Zephyr profitable.

86
Solution and recommendations
Solu=on & Recommenda=ons
There are three possible solu=ons, with no right answer. The recommenda=on should be well-‐reasoned, comprehensive, and include as much relevant informa=on as possible.
§ Sell the chilled juice business. This would, however, affect the juice and frozen concentrate businesses, as there are both adverFsing and manufacturing synergies.
§ Sell all of the juice business. This may be more feasible, as the buyer could capture the synergies, but would not be too likely to turn the business around. The selling price is likely to be low.
§ Keep the chilled juice business and rework the ingredients and costs. This is the most feasible opFon, as evidenced by the success of the compeFtors. We are probably developing extra features in our ingredient mix that the market does not want and is not willing to pay for. EliminaFng or scaling back those features will probably allow us to cut costs without affecFng revenue.
Bonus/Guide to an Excellent Case
§ Prospects who do well on this case will have to be comfortable with ambiguity and with a lack of perfect informaFon. They will quickly grasp the issues and delve into the underlying qualitaFve discussions, coming up with a lot of addiFonal risks/potenFal benefits for each opFon.
§ CreaFve soluFons beyond those listed are possible and encouraged, though should be done within the framework of the informaFon available.

87
Case 10: A+ Airline Co.
Case tracker Fit Ques=ons
§ Industry: Airline § Level of Difficulty: Hard
§ Case format: Opportunity Assessment
§ Concepts being tested: - Basic NPV - OperaFons - Market Sizing
- Customer Strategy
Case Ques=on
§ Our client is A+Airline Co., the third largest airline in the United States by passengers carried. This week, we have been flying on our primary compeFtor, Gamma airline, and we noFced something interesFng; they stopped accepFng cash for in-‐flight food and beverage services and they now only accept major credit cards.
§ The CEO of A+Airline Co. wants to know, why did Gamma Airline switch from a Cash & Card system to a credit card only system, and should we follow them?
Spend first 15 min on fit
§ Tell me about a Fme when you had to adjust a project schedule because you didn’t have all the resources that you needed
§ Describe a situaFon in which you had to change your communicaFon style to influence stakeholders from different groups
Guide to interviewer
§ This case will force an interviewee to rely on logic, business acumen, and structure
§ Commonly, the interviewee will ask a lot of quesFons about historical costs, revenues, etc. This is not the correct approach to this ques=on.
§ The savvy interviewer will realize that this is a BEFORE vs. AFTER comparison of switching from a CASH & CARD system to a CARD ONLY system. Therefore, the quesFons asked should focus on the DELTA, or the cash changes that occur when the switch is made.
Quants.8
Structure
8
Basic NPVOpps.
Mkt. SizeCust Stgy
By: Adam J. Louras (Kellogg Class of ‘11)

88
Clarifying answers and case guide Interviewer Guide to case and handouts
Case Structure – Interviewee’s structure should be a BEFORE vs. AFTER comparison of the switch from CASH & CARD to CARD only and should include: - Revenue Changes: Loss of Cash Only customers vs. Increase in Credit Card
customers - Cost Changes: Benefit of Cash Management Cost Removed vs. Incremental
Cost (Fee) of Credit Card - Cash Flow Changes: Interest and Time Value of Money (TVM), and Working
Capital impacts due to an increase in collecFon speed Exhibit 1 – Aner Interviewee walks through structure, they will likely ask quesFons
about consumer purchase behavior on airplanes. Once you feel that they have idenFfied the need to do a market sizing, hand out Exhibit 1. (DO NOT ALLOW ROUNDING) - Ask the interviewee to determine the Total Market Size in ($) for food and
beverage purchases on an average flight - The interviewee should calculate the CURRENT alloca5on of purchases
(Cash Vs. Card) for an average flight. - The interviewee should correctly iden5fy that some of the current
“Cash” customers will not convert to Card. Tell them we will lose 1/3. Exhibit 2 – The interviewee should recognize that there might be a cost savings
due to the change. Most interviewees know that there is a Credit Card processing fee but do not realize that there are many costs associated with cash management. Ask them about the types of costs A+Airline might face under both processes before handing out the exhibit. When asked, explain that the total, per flight, savings from elimina=ng overhead due to Cash Management Opera=ons is $35/flight
Clarifying answers to provide if Asked
Industry Characteris=cs/Market Economics
- Card Use: Roughly 99% of all consumers purchase their airline Fckets using a credit card, i.e. all consumers on an airplane have a credit card available to them.
Client Characteris=cs
- Items Sold: Only food and alcoholic beverage items are sold on A+Airline flights
- Loca5ons: This is a US DomesFc decision only. Ignore internaFonal.
Compe==ve Dynamics
- Gamma is the only airline that has made the switch; however all other airlines are evaluaFng the switch.
- For the purposes of this case, Gamma and A+Airline should be considered to be exactly the same in all regards.

89
Key elements to analyze
Changes in Revenue
§ Interviewee will likely begin with the correct assumpFon that revenue will be lost due to unhappy, cash-‐only passengers
§ Once asked about how many are lost, hand out Exhibit 1 to do a market sizing
Changes in Costs
§ Interviewee should make menFon of Cost changes due to the shin to a Card Only strategy.
§ Ask the interviewee to detail the types of costs that might be involved before handing out Exhibit 2
TVM & Working Capital
§ Exhibit 2 also shows that there is a 30 day Fme benefit to collecFng payment via Credit Card vs. Cash
§ Prompt 1: Ask the interviewee to qualita5vely explain the impact this 5me savings will have
Notes on Exhibit 1
§ Using Exhibit 1, interviewee should calculate: 1. Total Number of Passengers per Plane
2. Total Number that Purchase & Total Spend ($)
3. Cash vs. Card Spend + LOSS
Notes on Exhibit 2
§ Exhibit 2 shows the current operaFons for Cash Management and Card Management at A+Airline.
§ The interviewee should noFce the following informaFon: § Cash Management & Card Management both
have 2% fees associated, so this is a “wash” in terms of savings.
§ Cash Management requires addiFonal overhead, 7 total employees per airport, that could be eliminated for further savings.
§ When asked, explain that the total, per flight, savings from eliminaFng overhead due to Cash Management OperaFons is $35/flight
§ Interviewee should no=ce that the $35 savings offsets the $35 loss in Revenue (Slightly more because this impacts bo_om line, but ignore margin)
Qualita=ve Assessment
§ The interviewee should qualitaFvely menFon that there are benefits to eliminaFng the longer cash management process: § Time Value of Money: A+Airline will receive
their money 30 days sooner, and this money could be used to: § Invest in interest earning accounts or
growth projects § Pay off suppliers early and take
advantage of discounts § Pay down lines of credit faster
§ Working Capital Improvement: $50 per flight in change can be eliminated, thus freeing up cash flow. AddiFonally, there will be a reducFon in loss of cash due to then and damage
§ Happier Customers: The majority of customers will be able to place and receive their order faster on the plane which will also increase sales
Seats Occupants Business Leasure First Class 50 50 50 0 Economy 150 120 60 60
Total 200 170 110 60
# that Purchase Total Purchase $ Business 45 $450 Leasure 15 $75
Total 60 $525
Cash Card Total Inflight $ $105 $420 $525
Lose 1/3 of Cash Customers # $ New Total
Business 3 ($30) $420 Leisure 1 ($5) $70
Total 4 ($35) $490

90
Solution and recommendations Solu=on & Recommenda=ons
§ Overall, our client, A+Airline, should switch to a Credit Card only system for in-‐flight food & beverage because:
§ Quan5ta5ve Benefits: We calculated that there would be a loss of 3 business customers and 1 economy customer per flight which amounted to a Revenue loss of $35. We also found that we could save $35 in overhead expenses by eliminaFng the Cash Management process. In sum, the decision to switch is in favor because the savings are to the bo_om line and the revenue losses are top line.
§ Qualita5ve Benefits: We also found that we will receive payment 30 days sooner by only accepFng credit cards. This improves our cash flow and could allow us to earn interest, pay down creditors, or invest in projects. AddiFonally, by reducing cash losses and eliminaFng “Change” Fed up on airplanes, we can improve our Working Capital and also put this money to work for us. Finally, it appears as though customers, in general, might actually be happier because the speed of transacFons on the airplane will improve.
Bonus/Guide to an Excellent Case
§ An excellent interviewee will note: § Due to the increased transacFon speed, probability of purchase for both Business and Economy passengers
in the AFTER state should go up due to a reducFon in frustraFon. The people on the back of the airplane onen abandon a purchase if it takes too long to place an order. Making change takes a lot of Fme!
§ Average purchase amount should also increase. There is a proven psychological phenomenon that shows how consumers who do not carry cash purchase less when a cash opFon is offered because they feel guilty using their card. A card-‐only opFon eliminates this guilt and consumers don’t mind using the card.
§ Being creaFve when lisFng the change of costs as: Wifi cost (connect with banks and verify transacFon), Fraud cost (increased chance of fraud to happen aner implemenFng card only payment).
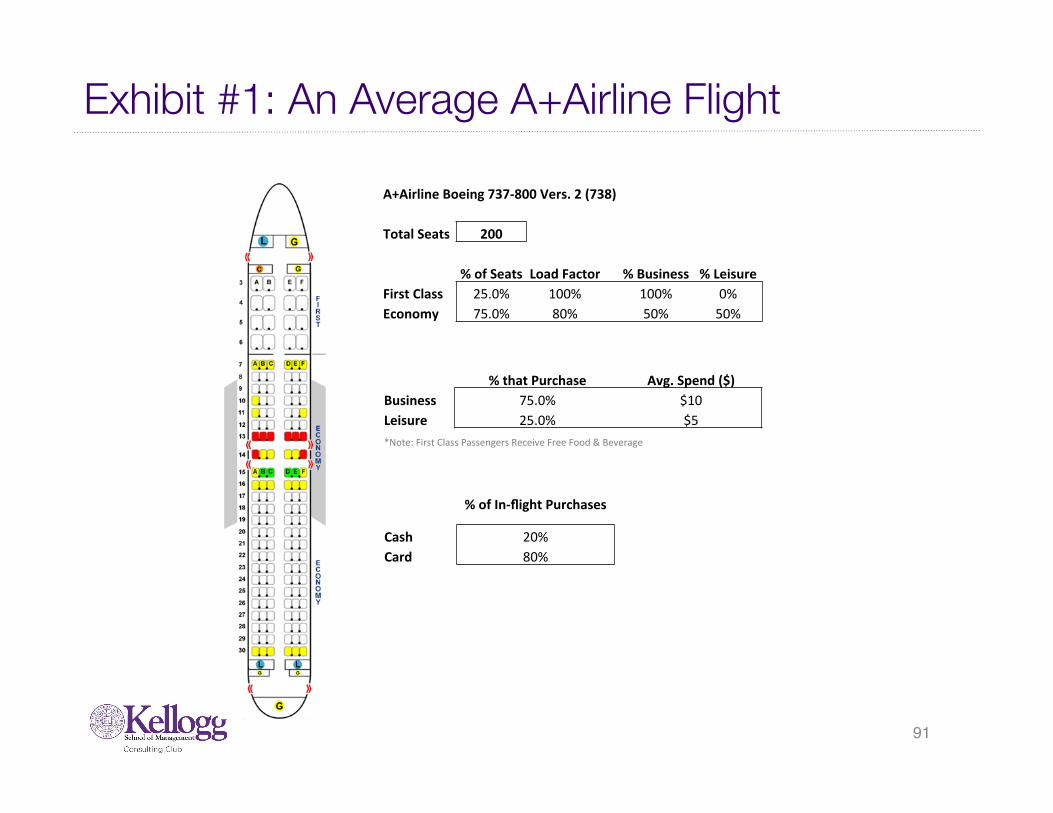
91
Exhibit #1: An Average A+Airline Flight
A+Airline Boeing 737-‐800 Vers. 2 (738)
Total Seats 200
% of Seats Load Factor % Business % Leisure First Class 25.0% 100% 100% 0% Economy 75.0% 80% 50% 50%
% that Purchase Avg. Spend ($) Business 75.0% $10 Leisure 25.0% $5 *Note: First Class Passengers Receive Free Food & Beverage
% of In-‐flight Purchases
Cash 20% Card 80%

92
Exhibit #2: A+Airline Cash & Card Operations
STEP 1: Cash Handler
Loads Plane with $50 in Change
AAirline Cash Management Process
STEP 2:Flight Attendant
collects cash from passengers and
gives change
AAirline Credit Card Process
31 Days Total Time
On Ground
In Flight
STEP 3: Flight Attendant
Deposits Cash into Flight Lockbox
STEP 4: Cash Handler collects Flight Lockbox from Plane (EOD)
STEP 6: Armored Car
Service collects cash
2% Fee on All Cash Collected
STEP 5: Flight Lockboxes
deposited to Onsite Cash
Processing Center
STEP 7: Armored Car
Service reconciles cash for
counterfeit.
STEP 8: Cash (Less Fees)
deposited to AAirline Bank
Account
KEY5 Cash Handlers per Airport2 Employees in Onsite Cash Processing Center per Airport
STEP 1:Flight Attendant
swipes credit card in wireless
terminal
24 Hours Total Time
On Ground
In Flight
STEP 3: Cash (Less Fees)
deposited to AAirline Bank
Account
STEP 2: Merchant Service
Receives and processes Credit
Card
2% Fee on All Cash Collected

93
Case 11: Bell Computer Inc.
Case tracker Fit Ques=ons
§ Industry: Tech/Telecom
§ Level of Difficulty: Hard
§ Case Format: Improving profitability + Reducing Costs
§ Concepts Tested: - MarkeFng Strategy - CompeFFve
Analysis - Supply/value chain
Case Ques=on
§ Our client, Bell Computer Inc., is the second largest PC manufacturer, by unit sales, in the United States. Over the past 5 years, Bell has been gaining market share and growing revenue, but at the same Fme, their net income is eroding.
§ The founder of Bell has returned to the company and taken over as CEO. He has hired us to determine:
§ Why have our profit margins declined?
§ What can we do to improve our profitability and reach our “Full PotenFal”?
Spend first 15 min on fit
§ What skills can you bring to this posiFon?
§ Give me an example of a business problem your company faced and tell me how you solved it.
§ What other types of jobs are you considering? Why and how did you choose the companies? How do they compare to consulFng?
Guide to interviewer
§ This case is primarily about product mix changes in the PC industry combined with Average Selling Price (ASP) Declines resulFng in lower overall revenues for the industry. CompeFtors that did not keep up with cost reducFons are faced with Fghter margins
§ The interviewee should recognize that this is a “Profit EquaFon” style quesFon and use a version of the following equaFon in their “Framework”:
§ Profit/Unit = Price/Unit – Variable Cost/Unit – Fixed Costs/Unit
§ Various terms from the PC industry are used throughout the case and it is not expected that the interviewee knows these terms. Help as needed.
Quants.8
Structure
10
Mkt. StgyComp. AlsSup Chain
By: Adam J. Louras (Kellogg Class of ‘11)

94
Clarifying answers and case guide Interviewer Guide to case and handouts
Case Structure – Interviewee’s structure should be structured as a comparison of Bell Computer’s financials from Before, i.e. 2005, and Aner, i.e. 2010. The interviewee should note the “Profit EquaFon” and they should make the following inferences from the quesFon setup: - Revenues are going up and Market Share is Increasing AND Net Income is
going down - Thus: Prices (ASPs) are being reduced to buy market share. This is causing
more units to be sold, but, with Net Income going down, it is clear that costs have not reduced to keep up with the reducCon in ASPs.
Exhibit 1-‐3 – Aner Interviewee walks through structure, they should ask quesFons about the components of Net Income, i.e. Revenue and Costs. - Have a conversa5on with the Interviewee to force them to talk through the
essen5al components of the Profit Equa5on that are needed to answer the ques5on.
- Let the Interviewee drive the case. When you feel that they have asked enough informa5on about the following topics, give them the exhibit that shows this informa5on:
- Sales Units à Exhibit 1 - Prices à Exhibit 2 - Costs à Exhibit 3
Answer – The interviewee cannot solve this case without all three exhibits. Once they have given you sufficient reason to hand them each exhibit, they should drive through the case to answer both quesFons.
Clarifying answers to provide if Asked
Industry Defini=ons
- ASP: ASP or Average Selling Price is the term used for the average price sold by the company for a computer. MulFplying units sold by ASP will give you total revenue.
- Client Segment: PCs designed for, and sold to, retail consumers either direct or through a retailer like Best Buy.
Client Characteris=cs
- Items Sold: Assume that only hardware is sold as shown in Exhibit 1. Interviewee could suggest selling addiFonal items such as printers, sonware, warranty service, etc. to improve profit
- Loca5ons: This is a US DomesFc decision only. Ignore internaFonal.
Compe==ve Dynamics
- All compeFtors face the same ASPs and sell comparable products.

95
Key elements to analyze Marke=ng Strategy
§ Using Exhibits 1-‐3, the interviewee should be able to determine that margins are falling due to product mix shining and price declines
Compe==ve Analysis + Supply Chain
§ Using Exhibit 3, the interviewee should idenFfy a “Full PotenFal” improvement for Bell to improve its margins by copying the strategy of its direct compeFtors.
Notes to interviewer
• The Interviewee should be able to answer the quesFon, “Why have our profit margins declined?” with the following raFonale:
§ Exhibit 1: Shin in Client preference towards Laptops & Netbooks
§ Exhibit 2: Declining ASPs for Laptops and Low ASPs for Netbooks
§ Exhibit 3: Cost posiFon has remained unchanged
• The interviewee could answer the quesFon qualitaFvely by interpreFng Exhibits 1-‐3. To make this case more quanFtaFvely focused, ask the interviewee to calculate various metrics for 2005 and 2010.
• The interviewee should be able to calculate the following using Exhibits 1-‐3 (Math calculaFons on following page):
• Net Income per Unit by product type
• Revenue by product type and Total Revenue • Cost by product type and Total Cost
• Net Income by product type and Total Net Income
Notes to interviewer
§ The interviewee should be able to answer the quesFon, “What can we do to improve our profitability and reach our “Full PotenFal”?” with the following COST REDUCTION strategy:
§ Copy Haysus' strategy for part procurement to reduce the build cost of PCs
§ Copy Racer's strategy for Direct Labor to reduce the labor cost of producing PCs
§ Copy HC's strategy for G&A to reduce the total company overhead
§ The interviewee could answer the quesFon qualitaFvely by interpreFng Exhibit 3. To make this case more quanFtaFvely focused, ask the interviewee to calculate various metrics for “Full PotenFal”.
§ The interviewee should be able to calculate Bell’s “Full PotenFal” using Exhibits 1-‐3 (Math calculaFons on following page):
§ Net Income per Unit by product type
§ Revenue by product type and Total Revenue § Cost by product type and Total Cost
§ Net Income by product type and Total Net Income

96
Math Solutions Math Part I
BELL FY2005 Desktop PCs
Laptop PCs
Netbook PCs Servers Other TOTAL
Units Sold (K) 20.0 10.0 0.0 5.0 5.0 40.0
ASP $1,000.0 $2,000.0 $0.0 $3,000.0 $250.0 CPU 800.0 800.0 0.0 800.0 200.0
NI/Unit $200.0 $1,200.0 $0.0 $2,200.0 $50.0
Revenue ($M) $20.0 $20.0 $0.0 $15.0 $1.3 $56.3 Total Cost ($M) 16.0 8.0 0.0 4.0 1.0 $29.0
NI ($M) $4.0 $12.0 $0.0 $11.0 $0.3 $27.3 Profit Margin 20.0% 60.0% 73.3% 20.0% 48.4%
BELL FY2010 Desktop
PCs Laptop
PCs Netbook
PCs Servers Other TOTAL Units Sold (K) 30.0 30.0 5.0 10.0 5.0 80.0
ASP $1,000.0 $750.0 $500.0 $3,000.0 $250.0 CPU 800.0 800.0 800.0 800.0 200.0
NI/Unit $200.0 ($50.0) ($300.0) $2,200.0 $50.0
Revenue ($M) $30.0 $22.5 $2.5 $30.0 $1.3 $86.3 Total Cost ($M) 24.0 24.0 4.0 8.0 1.0 $61.0
NI ($M) $6.0 ($1.5) ($1.5) $22.0 $0.3 $25.3 Profit Margin 20.0% (6.7%) (60.0%) 73.3% 20.0% 29.3%
BELL Full Poten=al Desktop PCs
Laptop PCs
Netbook PCs Servers Other TOTAL
Units Sold (K) 30.0 30.0 5.0 10.0 5.0 80.0
ASP $1,000.0 $750.0 $500.0 $3,000.0 $250.0 CPU 350.0 350.0 350.0 350.0 200.0
NI/Unit $650.0 $400.0 $150.0 $2,650.0 $50.0
Revenue ($M) $30.0 $22.5 $2.5 $30.0 $1.3 $86.3 Total Cost ($M) 10.5 10.5 1.8 3.5 1.0 $27.3
NI ($M) $19.5 $12.0 $0.8 $26.5 $0.3 $59.0 Profit Margin 65.0% 53.3% 30.0% 88.3% 20.0% 68.4%
Math Part II
Results: Desktop PCs
Laptop PCs
Netbook PCs Servers Other TOTAL
NI ($M) Improved $13.5 $13.5 $2.3 $4.5 $0.0 $33.8 Cost Per Box Reduced $450.0 $450.0 $450.0 $450.0 $0.0

97
Solution and recommendations Solu=on & Recommenda=ons
§ Bell Computer Inc. and the PC industry have faced five years of Average Price declines in the Laptop product segment. At the same Fme, “Client” or retail consumers have shined their preferences towards Laptops and a new product segment called Netbooks. Because Bell Computer has not reduced its costs over this same Fmeframe, profit margins and net income have deteriorated despite increases in revenue.
§ In order for Bell Computer Inc. to return to profitability, they must reduce their cost per unit sold. The best approach we idenFfied was through an analysis of our compeFtors. Using our compeFtors line-‐item costs as a benchmark, we could potenFally reduce our cost per box by $450. This amounts to a total Net Income improvement of roughly $34M.
Bonus/Guide to an Excellent Case
§ An excellent interviewee will note: § AddiFonal ways to improve net income by selling complimentary, high margin products such as:
§ Printers § Sonware § Parts upgrades § WarranFes
§ AddiFonal ways to cut costs, such as: § SKU RaFonalizaFon (Reducing the number of product models)

98
Exhibit 1: Product Mix breakdown by Business Segment for 2005 and 2010
PC Units(K) Sold in 2005 PC Units(K) Sold in 2010
*Note: Netbook PCs did not exist in 2005; “Other” products include Pocket PCs and Calculators

99
Exhibit #2: ASPs by Business Segment 2005 and 2010
*Note: Netbook PCs did not exist in 2005

100
Exhibit 3: Avg. Per Unit Cost Breakdown of a Desktop PC for Bell (05’,10’) and Top 3 Competitors
*Note: Servers, Laptops, and Netbook Product types have the same costs per unit; however, Net Income will vary based on ASP.“Other” products have a total CPU of $200

Case tracker Fit Ques=ons
§ Industry: Health Care § Level of Difficulty:
Medium
§ Case format: Market entry
§ Concepts Tested: - Break Even analysis - MarkeFng
strategies - OrganizaFonal
changes
Case Ques=on
§ Our client, Shermer Pharma, is a venture backed start-‐up PharmaceuFcal company. Over the past 15 years, Shermer has been developing a molecule that has been approved by the FDA to cure Alzheimer’s with 90% efficacy.
§ Shermer’s owners have hired us to determine:
§ How should we sell our product? § Is our product going to be profitable?
Spend first 15 min on fit
§ Give me an example of a Fme you had to change someone’s mind.
§ What are the most difficult or challenging decisions you have made recently?
§ In what kind of work environment are you most comfortable?
Guide to interviewer
§ This case is focused on 2 quesFons: can you determine what it takes to launch a new product profitably through a cost benefit analysis, and can you think through the implicaFons of starFng a Sales & MarkeFng organizaFon from scratch. The case should be driven by the interviewee.
§ The interviewee should be guided towards 2 primary opFons for the Sales & MarkeFng quesFon
1. Start your own sales force 2. Contract sales
§ Bonus sales force answer is sell Shermer to a larger firm
§ Profitability will center on the interviewees ability to read tables and data on the market and our market share.
101
Case 12: Shermer Pharma By: Ameed Mallick (Kellogg Class of ‘12)
Quants.5
Structure
5
B/EMkt. StgyOrg. Chg.

102
Clarifying answers and case guide Interviewer Guide to case and handouts
Case Structure – Interviewee should focus on the quesFons separately. First we will brainstorm how to sell our product and ask quesFons to get aner the costs of a sales force (Exhibit 1). An opFonal middle step is a brain teaser to determine the size of the Alzheimer’s market. (provide answer of 5MM at the end of the exercise. They then need to ask about the costs and revenues from our new product (Exhibit 2).
Exhibit 1-‐3 – Aner Interviewee walks through structure, they should ask quesFons
about the costs of sales and then ulFmately the profit equaFon. - Let the Interviewee drive the case. When you feel that they have asked
enough informa5on about the following topics, give them the exhibit that shows this informa5on:
- Sales force op5ons à Exhibit 1 - Revenues vs Costs à Exhibit 2
- If the interviewee isn’t gerng to the ques5on on the three Sales Force op5ons, guide them back toward this and provide Exhibit 1.
- Have a conversa5on with the Interviewee to force them to talk through the essen5al components of the profit equa5on that are needed to answer the ques5on.
Answer – The numbers reveal that our product will be profitable. However, a criFcal quesFon will be the sales channel, which is why they need to determine to use contract sales in order to be profitable. It is also correct to state that Shermer should sell the product to a larger firm, but the second half of the case should be under the assumpFon that the owners decide to do contract sales.
Clarifying answers to provide if asked
Industry Defini=ons
- Our product is a pill that cures Alzheimer’s, an illness that currently has no treatment that cures or stops the progress of this disease
- Alzheimer’s is a degeneraFve, terminal disease that causes senility and demenFa. 30 MM people suffer worldwide
- Sales would be focused on Neurologists and Geriatric psychiatrists (not the consumer of the product)
Client Characteris=cs
- We don’t have a Sales or MarkeFng organizaFon, the company has purely been a research firm to this point.
- FDA approval, etc has been granted Compe==ve Dynamics
- We will not focus on compeFFve response during this case as we are the only firm that has a cure for this illness and will be for the next 5 years

103
Key elements to analyze Market Entry
§ Using Exhibits 1 the interviewee should be able to determine that contract sales is the best financial opFon
Profitability
§ Using Exhibit 2, the interviewee should determine that our product will be profitable uFlizing either type of sales force.
Notes to interviewer
• The quesFon boils down to realizing that our client’s competencies are rooted in developing a product, not Sales and MarkeFng. The correct approach is therefore to contract sales or sell the company
• The qualitaFve approach to the answer is appropriate, but once the interviewee has discussed enough of the inputs, exhibit 1 should be shared:
• There is missing data in the chart that should be easy to calculate (soluFons provided)
• A third opFon with no a_ached data would be to sell the company to a larger firm, this is an appropriate discussion to have and if prompted the interviewee should discuss the tradeoffs of this more qualitaFvely
• A contract sales organizaFon is typically less effecFve than internal sales, though most interviewers wont pick up on this and simply giving the financial answer is appropriate
Notes to interviewer
• You should let them try to size the market as a first step, but then provide the actual number of 5MM.
• The firm requires that R&D costs be recovered by Year 5 of the product (a window before which there will be no compeFFve response)
― We can ignore NPV for this quesFon and just assume a straight line amorFzaFon…interviewee should come to this conclusion on their own, but course correcFng is okay if they get stuck
• CriFcal informaFon on the exhibit should be provided as the interviewee asks, though should only be volunteered if the interviewee is stuck
• We can ignore tax, however a good interviewee will ask about it, and doing so would realize we sFll hit our profit targets by year 5
• Manufacturing & Packaging costs are included in the Gross Margin
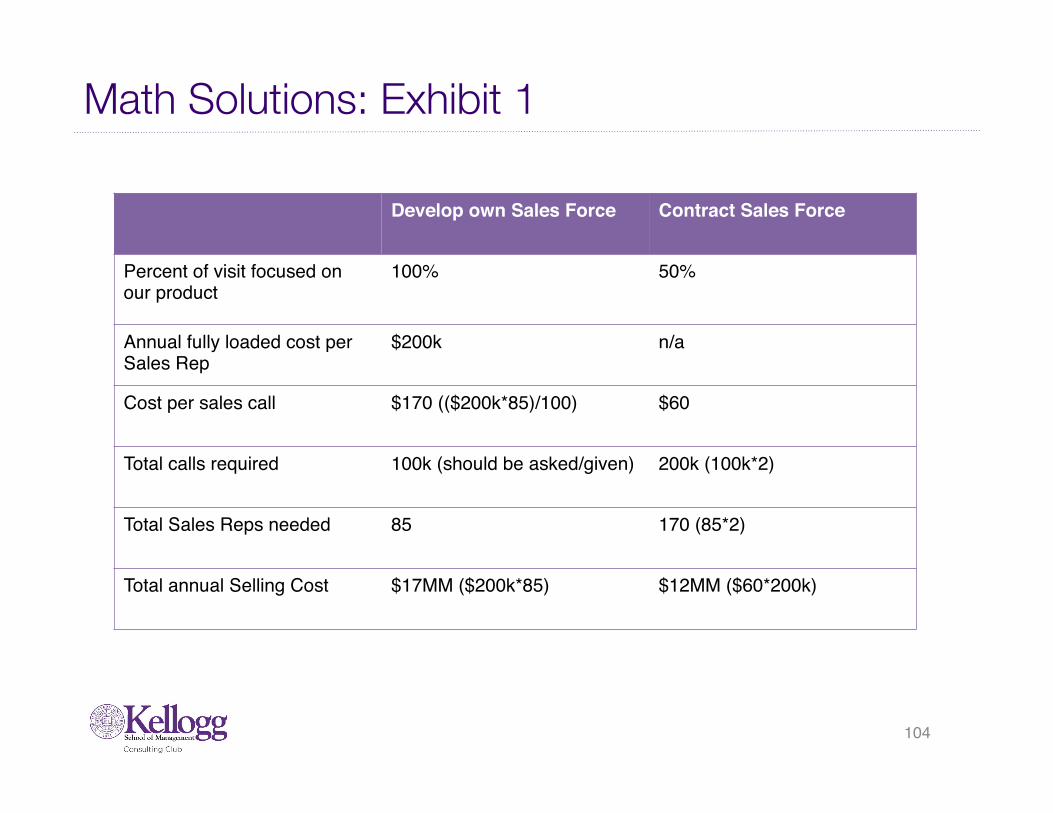
104
Math Solutions: Exhibit 1
Develop own Sales Force Contract Sales Force
Percent of visit focused on our product
100% 50%
Annual fully loaded cost per Sales Rep
$200k n/a
Cost per sales call $170 (($200k*85)/100) $60
Total calls required 100k (should be asked/given) 200k (100k*2)
Total Sales Reps needed 85 170 (85*2)
Total annual Selling Cost $17MM ($200k*85) $12MM ($60*200k)

105
Math Solutions: Exhibit 2 *Data at len to be provided as the quesFons are asked by interviewee
Year 1 Year 2 Year 3 Year 4 Year 5 Projected Market penetration
5% 10% 25% 40% 60%
Total Users 250k (5%*5M)
500k (10%*5M)
1.25MM (25%*5M)
2MM (40%*5M)
3MM (60%*5M)
Total Gross Margin $250MM(250*$1000)
$500MM (500*$1000)
$1.25B (1.25MM*
$1k)
$2B (2MM*$1k)
$3B (3MM*$1k)
Amortized R&D Costs $300MM ($1.5B/5)
$300MM ($1.5B/5)
$300MM ($1.5B/5)
$300MM ($1.5B/5)
$300MM ($1.5B/5)
Selling Costs $12 MM (from ex.1)
$12 MM (from ex.1)
$12 MM (from ex.1)
$12 MM (from ex.1)
$12 MM (from ex.1)
G & A Costs $25 MM $25 MM $25 MM $25 MM $25 MM
Net Income ($87MM) $163MM $913MM $1.663B $2.663B
Total Market 5MM
Annual gross margin per user $1000 R&D Cost $1.5B G&A cost $25MM

106
Solution and recommendations Solu=on & Recommenda=ons
§ Shermer Pharma’s core competency is their research focus. The plausible argument can be made that they should sell the company to a larger firm that has the appropriate capabiliFes that it takes to market and sell a product. Though this might be the right answer, the client isn't always going to do take the opFmal approach, parFcularly when it comes to ownership of the firm. We need to be flexible to account management’s wishes
§ Assuming the owners decide not to sell the company, contract sales is the next best opFon, that gives us the best scenario when determining overall profitability of our product.
§ The la_er half of the case is simple math, determining a P & L for our product and coming up with the correct answer that Shermer can be profitable.
§ Ask for high level analysis at the end of the case, what else should be consider before engaging this plan?
Bonus/Guide to an Excellent Case
§ An excellent interviewee will note: § There is an opFon to sell the company, even though there is no data provided to support this conclusion § Some of the numbers give an obvious answer before needing the exact calculaFons § Challenging the interviewer on the effecFveness of a contract sales organizaFon is a bonus. A qualitaFve
argument can be made that for an addiFonal $5MM a year, we can realize the benefit of a more effecFve sales force, this isn't the financially correct answer but may be the right tradeoff given the relaFvely minimal impact to the bo_om line vs. revenues of $3B
§ $1000 per year for a life saving cure for a currently incurable ailment is definitely under priced!
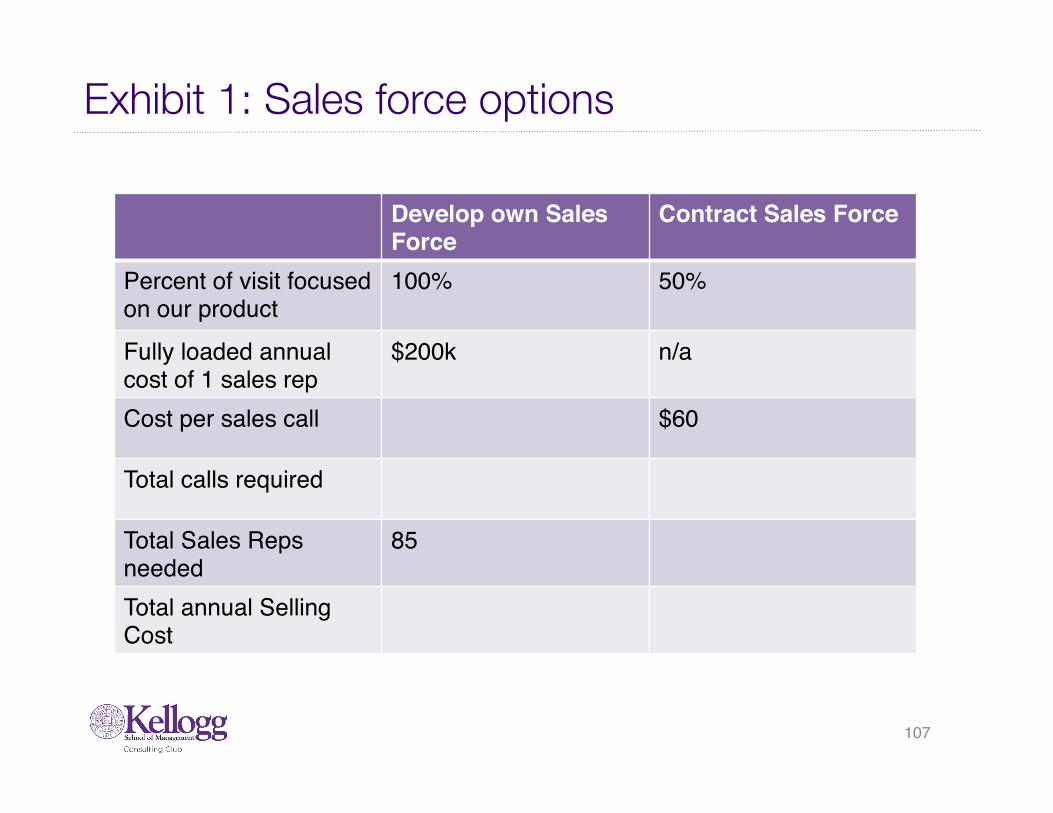
107
Exhibit 1: Sales force options
Develop own Sales Force
Contract Sales Force
Percent of visit focused on our product
100% 50%
Fully loaded annual cost of 1 sales rep
$200k n/a
Cost per sales call $60
Total calls required
Total Sales Reps needed
85
Total annual Selling Cost

108
Exhibit 2: Annual Net Income
Year 1 Year 2 Year 3 Year 4 Year 5
Projected Market penetration
5% 10% 25% 40% 60%
Total Users
Total Gross Margin
Amortized R&D CostsSelling Costs
G & A Costs
Net Income

109
Case 13: Hospitality Co
Case tracker Fit Ques=ons
§ Industry: Leisure § Level of Difficulty:
Medium
§ Case format: Opportunity Assessment
§ Concepts Tested: - Investment
- Breakeven analysis
Case Ques=on
§ Our client owns a large hotel chain and is thinking about invesFng in an add-‐on for a waterpark on one of its properFes. This has been tested in some places and has a lot of potenFal benefits: family friendly, year-‐round availability, and potenFal to bring in new clientele. They have done a lot of work surveying their chain and believe that they have found the right hotel to experiment with a waterpark add-‐on. Currently, this hotel has a lot of business travelers, but our client believes it would also be a_racFve for families.
§ Our client is nervous about the capital required to build the add-‐on and wants to make sure that they are making the right investment. That’s why we brought you on board. What do you think?
Spend first 15 min on fit
§ Tell me about a Fme when you’ve had a conflict with a teammate.
§ How would your friends describe you?
§ How would you compare our industry with others you are interested in?
Guide to interviewer
§ This case forces the interviewee to focus on the right issues and can be tricky. The candidate will need to ignore compeFFve posiFoning and focus on the profitability of the waterpark. The waterpark should recoup its investment and can even charge a premium.
§ They will need to ask the right quesFons about the investment, its buyback period, and make assumpFons about vacancy.
§ There are also lots of potenFal risks and benefits that a great interviewee will recognize that allow them to consider the case on another level of detail.
Quants.
5
Structure
5
Invest.B/E
By: Craig DePriester (Kellogg Class of ‘12)

110
Clarifying answers and case guide
Interview guidelines
This is a simple profitability calculaFon (Profit = Revenue – Costs) for the investment of a water-‐park add on. Many candidates will focus on the revenue side, but we need to back into the minimum amount the hotel has to charge to break-‐even on its investment in the payback period. The math porFon assumes that all guests are incremental (the 50% vacancy rate). This is done to simplify the case, but it may require a li_le explanaFon to the interviewee .
A sample case structure would include the following: 1) Cost structure -‐ IdenFfy the costs (fixed and variable) as well as the relevant
payback period for the investment. 2) Breakeven analysis -‐ Based on the esFmated room rates and payback period,
idenFfy how much the hotel would have to charge (fixed + variable costs) for each room to breakeven over the life of the investment.
3) AddiFonal risks and benefits – QualitaFve assessment of other potenFal benefits/issues that may arise from the investment.
Clarifying answers to provide
(Ignore any discussion of compeFFon or market dynamics)
CompeFFve dynamics
- There are no compeFtors immediately nearby for a waterpark
- We have no informaFon about compeFtors
- There is no possibility for a compeFFve response in the short run
Market informaFon
- We do not have any specifics about the market and are unable to conduct addiFonal survey data
Hotel characterisFcs
- Hotel’s normal clientele is business travelers, but we believe that this waterpark will bring in families as well

111
Math question and solution
Math solu=on
The math is about backing into how much the hotel needs to charge per room over the course of the three years to recover its investment. The interviewee needs to ignore the variable cost and focus on how to spread the fixed cost of the investment over the payback period. $6 million investment / 3 years = $2 million / year in revenues 400 rooms X 50% vacancy X 350 days (don’t use 365) year = 70,000 rooms per year (Many candidates will struggle with this, try to combine costs, and will make the difficult on themselves. Let them struggle for a few minutes before helping). $2 million/year divided by 70,000 rooms/year = 28.6, or about $30/night in fixed cost The candidate should add this with the variable cost for around $70/night total for the three year period. If they do not interpret the number immediately, ask them what they think about the $70/night total.
Math ques=on
§ How much will the hotel need to charge per room to recoup its costs?
Math informa=on
§ Investment:
- $6 million investment
- Payback in 3 years § Hotel:
- 400 rooms
- With waterpark, 50% vacancy on average for the year
§ Cost structure: - Investment is fixed
cost
- Variable cost is $40/night per room

112
Key elements to analyze
Pricing decisions
§ How should we interpret the breakeven point on the hotel costs?
§ How do we think about pricing?
Other revenue streams
§ What other potenFal benefits/revenue streams might this have?
Poten=al risks and issues
§ What are the potenFal risks and issues associated with ?
Notes to interviewer
§ The interviewee should realize $70 is an extremely low number, especially considering that families may be staying at the park.
§ This will also ask the interviewee to gauge this number against the real cost of hotels and their personal experiences.
§ RealisFcally, the hotel will be able to charge significant premium in addiFon to covering its basic costs.
§ There are two opFons: charge an addiFonal fee for waterpark entry or make it all-‐inclusive with hotel fee.
Notes to interviewer
§ There are a lot of potenFal places to go here, but here are some ideas:
§ Charging admission entry
§ Food/restaurants at the park § PromoFonal Fe-‐ins
§ Merchandise/swim suit apparel
§ Expansion to other hotels
Notes to interviewer
§ Similarly, there are a lot of potenFal risks:
§ Management competency (do we have any experience?)
§ Regulatory/insurance risks § Health/liFgaFon risks
associated with theme parks
§ CompeFFve response
§ AlienaFng business customers with family friendly atmosphere

113
Solution and recommendations
Solu=on & Recommenda=ons
§ This project should be undertaken. While there are a number of potenFal risks and consideraFons (including compeFFve dynamics), the economics are extremely a_racFve and the price ($70/room) to earn back our investment is relaFvely low for almost any hotel, much less one with these ameniFes.
§ The interviewee should make a solid case for their recommendaFon, using the other potenFal avenues for profit and the low payback price as key points for its undertaking.
§ While the model answer suggests undertaking the investment, if an interviewee has a compelling, logical story on why the risks outweigh the benefits, it should be judged on its own merits. It would have to be a powerful argument though.
Bonus/Guide to an Excellent Case
§ This case is defies a lot of candidate’s expectaFons, with a lot of them really focusing on compeFFve/market dynamics. An excellent interviewee will get to the math quickly by focusing on the important issues: returning the investment.
§ AddiFonally, an excellent interviewee will interpret the breakeven point as low. Asking them to “interpret” these numbers provides a good check of business judgment. Furthermore, an excellent interviewee will provide a lot of creaFve risks/benefits from this investment as well.
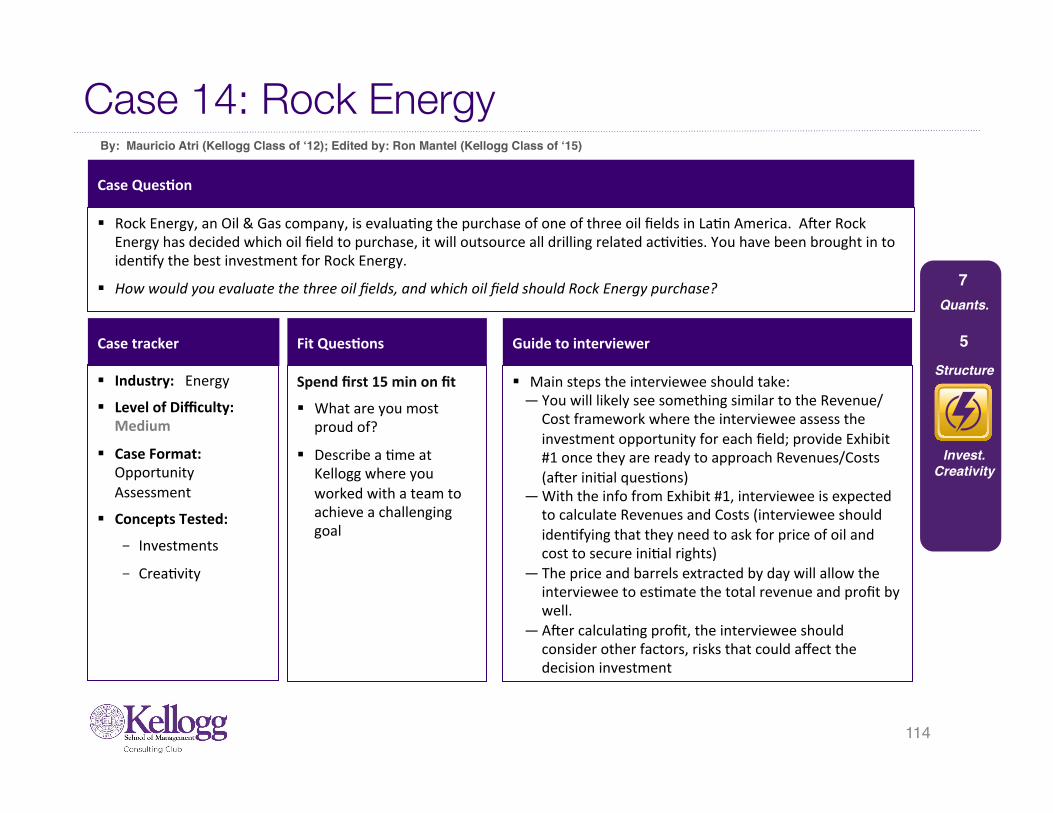
Case 14: Rock Energy By: Mauricio Atri (Kellogg Class of ‘12); Edited by: Ron Mantel (Kellogg Class of ‘15)
Case tracker Fit Ques=ons
Case Ques=on
§ Rock Energy, an Oil & Gas company, is evaluaFng the purchase of one of three oil fields in LaFn America. Aner Rock Energy has decided which oil field to purchase, it will outsource all drilling related acFviFes. You have been brought in to idenFfy the best investment for Rock Energy.
§ How would you evaluate the three oil fields, and which oil field should Rock Energy purchase?
Spend first 15 min on fit
§ What are you most proud of?
§ Describe a Fme at Kellogg where you worked with a team to achieve a challenging goal
Guide to interviewer
§ Main steps the interviewee should take: — You will likely see something similar to the Revenue/
Cost framework where the interviewee assess the investment opportunity for each field; provide Exhibit #1 once they are ready to approach Revenues/Costs (aner iniFal quesFons)
— With the info from Exhibit #1, interviewee is expected to calculate Revenues and Costs (interviewee should idenFfying that they need to ask for price of oil and cost to secure iniFal rights)
— The price and barrels extracted by day will allow the interviewee to esFmate the total revenue and profit by well.
— Aner calculaFng profit, the interviewee should consider other factors, risks that could affect the decision investment
114
Quants.
Structure
5
Invest.Creativity
7
§ Industry: Energy § Level of Difficulty:
Medium
§ Case Format: Opportunity Assessment
§ Concepts Tested: - Investments
- CreaFvity

115
Clarifying answers and case guide
Guide to case / Guide to handouts
Part 1 – Hand out exhibit #1 once the interviewee is at the point in their framework where they will analyze Revenue & Costs - This handout should lead the interviewee to understand that each region will
have different geological characterisFcs which will affect the drilling Fme, producFon, revenues and costs for Rock Energy
Part 2 – Profitability - Provide the price of oil ($50/bbl) if the interviewee does proacFvely ask for it
when trying to calculate profitability; ask the interviewee to work out the profitability for each field, and not only by well.
- The answer will be a funcFon of the investment, variable costs, and quanFty of oil extracted by field. This last variable will depend on the number of wells drilled in one year.
Part3 – Conclusion and other issues - Rock Energy should choose to buy the rights for Region 2 because it will offer
the best profits, but there are other factors that could impact the decision to invest:
- Insurance costs; poliFcal stability of the region; labor contracts and unions; volaFlity of oil prices; oil quality differences
Clarifying answers to provide
Industry CharacterisFcs/Market Economics
- The rights being offered to Rock Energy gives them the right to drill during year 1, and produce oil for 20 years. Assume that no oil is produced unFl the beginning of year 2.
- Rock Energy can get the drilling operator to deploy a maximum of 10 rigs in each of the regions
- The cost of the rig day includes crew, consumables and services
- Any amount of oil being extracted will be sold at the spot market price of the moment
- For simplicity assume that the oil wells will produce the same amount of oil for the next 20 years with no maintenance costs
- The rights to extract oil cost $40M in each region

116
Math question and solution
Math solution
• Time to complete a well = (Depth/PenetraFon Rate): Region 1 = 60, Region 2 = 90, Region 3 = 180
• Produc=on per well by region = Daily producFon * 360 days: Region 1 = 36K, Region 2=72K, Region 3= 108K
• Cost per well = Days to complete well*Cost per rig day. Yearly Revenue per well = Price * # barrels per year. Number of wells per year = 360/(Time to complete a well) * number of rigs. Profit Margin = (Profit per well)/(cost per well). Total Revenue =(Yearly Revenue) *( Number of wells per year). Total Cost = (Cost per well)*(number of wells)+(Rights to extract oil). Profit = Total Rev – Total Cost.
Math question
§ What are the first profits during the first year of producFon (i.e. 1st year spent on drilling, and producFon begins in 2nd year)
Concept Region 1 Region 2 Region 3 Investment Cost (Rights to extract oil) $ 40,000,000 $ 40,000,000 $ 40,000,000 Cost per well $ 300,000 $ 900,000 $ 3,600,000 Yearly Revenue per well $ 1,800,000 $ 3,600,000 $ 5,400,000 Profit per well $ 1,500,000 $ 2,700,000 $ 1,800,000 Profit margin per well 500% 300% 50%
Number of wells per year (360/60)=6x10 Rigs=60 40 20
Total Revenue $ 108,000,000 $ 144,000,000 $ 108,000,000 Total Cost $ 58,000,000 $ 76,000,000 $ 112,000,000 Profit $ 50,000,000.00 $ 68,000,000.00 $ (4,000,000.00)

117
Solution and recommendations
Solu=on & Recommenda=ons
§ Rock Energy should invest in buying the rights for Region 2 § It is important to recognize that even though the profit margin for Region 1 is significantly higher on a per well
basis, the return of the investment depends on the total number of wells that you can drill in the first year and the upfront cost for the rights to extract oil in that Region
§ AddiFonally, the interviewee should be able to idenFfy other qualitaFve aspects of the investment that might affect the decision to invest in a certain Region
Bonus/Guide to an Excellent Case
§ An excellent answer would menFon and briefly summarize the impact of including an expected value analysis, which would assign different probabiliFes of extracFng the expected barrels per day

118
Exhibit #1: Oil Field profiles, 2010
20
30
20
02468
101214161820222426283032
Region 1 Region 2 Region 3
Drilling rates by Region
1200
2700
3600
0
500
1000
1500
2000
2500
3000
3500
4000
Region 1 Region 2 Region 3
Average depth of wells by Region
Average depth (meters)
Met
ers/
day
Avg.
Dep
th (m
eter
s)
Region 1 Region 2 Region 3 Max number of Rigs that would operate concurrently 10 10 10 Average well producFon (barrels per day) 100 200 300 Cost per rig day ($US) $5,000 $10,000 $20,000
*Note: Wells are conFnuously dug during year 1 (assume 360 days), and oil is extracted beginning of year 2. Wells are dug by “Rigs”. Once a Well has been completed, the Rig moves on to dig another well.

Case 15: Orange Retailer Co.
Case tracker Fit Ques=ons
Case Ques=on
§ Orange Retailer Co. (ORC) manufactures, import/exports and distributes high-‐end world known brands and conservaFve/tradiFonal apparel brands in several countries in LaFn America. ORC is considering entering a new country in LaFn America, and you have been hired to determine whether they should enter this new market or not.
§ Don’t men5on this un5l they have determined to enter the market: What would be the best entry strategy?
Spend first 15 min on fit
§ Ask interviewee the name of a firm with which they have an interview, then ask Why this firm?
§ Tell me about a Fme when you led a team through a challenge
Guide to interviewer
§ This case tests the ability to understand business concepts and quanFfy the potenFal benefits and risks of entering a new market.
§ The interviewee should be able to size the potenFal market, disFnguish different type of customer segments, and idenFfy entry strategy for Orange Retailer Co.
§ AddiFonally, the interviewee should idenFfy some associated risks and potenFal ways to miFgate them
§ Hand out exhibit #1 – Size of potenFal market and customer segments
§ Hand out exhibit #2– Current players’ share and margins § Aner quanFfying the size of the opportunity and the ideal
strategy to enter this market, the interviewee should idenFfy qualitaFve aspects of entering this new market
§ Consider doing this case as an interviewer led case for beginners, and interviewee driven case for advanced casers
Quants.5
Structure
5
Mkt Size.Mkt. StgyCreativity
119
§ Industry: Retail § Level of Difficulty:
Medium
§ Case Format: Market Entry
§ Concepts Tested: - Market Sizing
- MarkeFng Strategy
- CreaFvity
By: Mauricio Atri (Kellogg Class of ‘12)

120
Clarifying answers and case guide
Guide to case / Guide to handouts
Part 1 – Hand out aner introducing case - Is there a market opportunity for ORC? What is the size of the relevant market? Interviewee should quanFfy the size of the market for fashion/high end and conservaFve/tradiFonal apparel
- AddiFonally, there should be insight about the most a_racFve customer segments to target
Part 2 – Hand out Exhibit 2 aner solving Exhibit 1 - The data should lead the interviewer to recognize that the high-‐end fashion market is probably driven by brand and/or other factors besides price. The margins are more a_racFve. ORC should be able to leverage the “world known” brands to a_ract customers in this segment. AddiFonally, by targeFng “young adults” and “teen & children” it can serve +80% of the market
- In the conservaFve/tradiFonal market, there seems to be stronger compeFFon, which is probably driven primarily by price. Achieving low costs in this market by imporFng would be unlikely due to tariffs, and local manufacturing would probably require significant fixed (plants, …) and variable (labor, …) costs
Part3 – What other elements should ORC consider in its decision to enter this market?
Clarifying answers to provide
Industry Characteris=cs/Market Economics
- Macroeconomic outlook is posiFve in the new market
- DistribuFon channels are primarily department stores, free standing points of sale, and online sales
Client Characteris=cs - Client is currently the third biggest
apparel retailer and has focused on F/H and T/C brands for over 30 years
- ORC has tradiFonally targeted High-‐End clients, men and women of ages 15-‐40
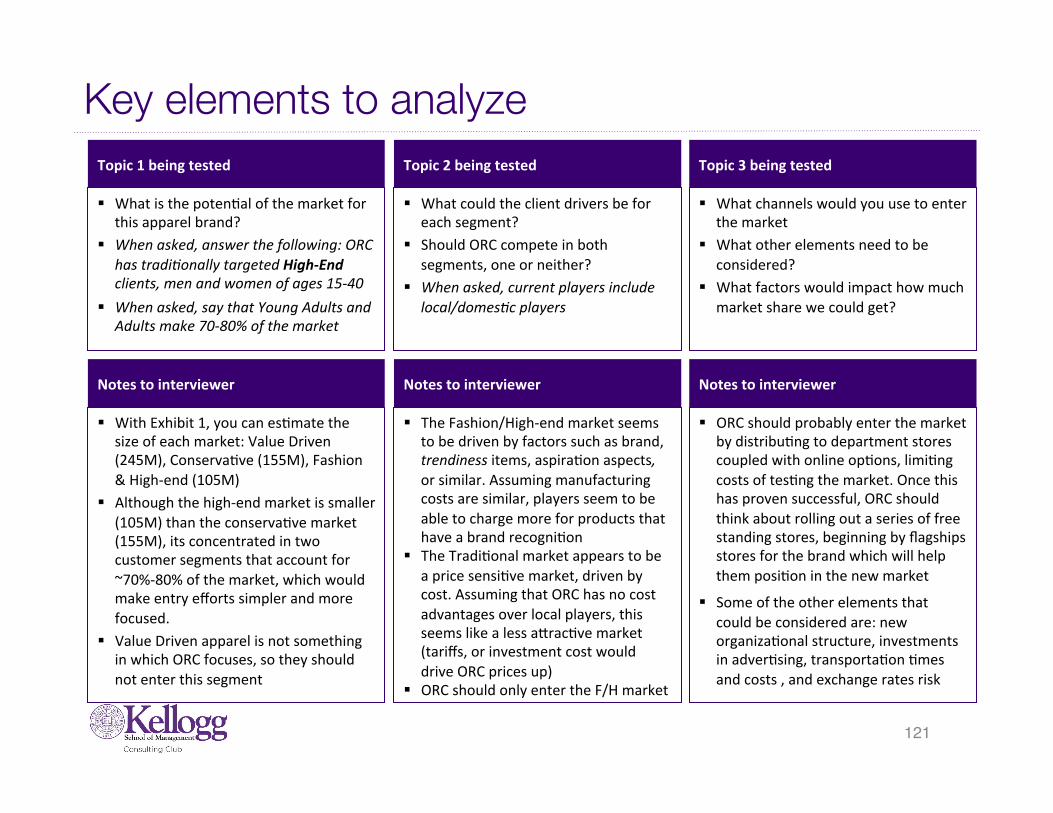
121
Key elements to analyze Topic 1 being tested
§ What is the potenFal of the market for this apparel brand?
§ When asked, answer the following: ORC has tradi5onally targeted High-‐End clients, men and women of ages 15-‐40
§ When asked, say that Young Adults and Adults make 70-‐80% of the market
Topic 2 being tested
§ What could the client drivers be for each segment?
§ Should ORC compete in both segments, one or neither?
§ When asked, current players include local/domes5c players
Topic 3 being tested
§ What channels would you use to enter the market
§ What other elements need to be considered?
§ What factors would impact how much market share we could get?
Notes to interviewer
§ With Exhibit 1, you can esFmate the size of each market: Value Driven (245M), ConservaFve (155M), Fashion & High-‐end (105M)
§ Although the high-‐end market is smaller (105M) than the conservaFve market (155M), its concentrated in two customer segments that account for ~70%-‐80% of the market, which would make entry efforts simpler and more focused.
§ Value Driven apparel is not something in which ORC focuses, so they should not enter this segment
Notes to interviewer
§ The Fashion/High-‐end market seems to be driven by factors such as brand, trendiness items, aspiraFon aspects, or similar. Assuming manufacturing costs are similar, players seem to be able to charge more for products that have a brand recogniFon
§ The TradiFonal market appears to be a price sensiFve market, driven by cost. Assuming that ORC has no cost advantages over local players, this seems like a less a_racFve market (tariffs, or investment cost would drive ORC prices up)
§ ORC should only enter the F/H market
Notes to interviewer
§ ORC should probably enter the market by distribuFng to department stores coupled with online opFons, limiFng costs of tesFng the market. Once this has proven successful, ORC should think about rolling out a series of free standing stores, beginning by flagships stores for the brand which will help them posiFon in the new market
§ Some of the other elements that could be considered are: new organizaFonal structure, investments in adverFsing, transportaFon Fmes and costs , and exchange rates risk

122
Solution and recommendations
Solution & Recommendations
§ ORC should enter the Fashion/High-‐end market. It should be able to leverage the “world known” brands to posiFon itself in this market as an a_racFve opFon for the “adults” and young adults.” Assuming ORC has compeFFve capabiliFes for “teens & children” segments, or can develop these with li_le risk or cost, then it should also consider entering this segment.
§ To enter this market, ORC should focus on department stores first to test the market with low risk. It could enter the department stores and online channels without the need of a local partner. Once the market has been tested, it could be convenient to acquire/form a JV to build an independent store network
Bonus/Guide to an Excellent Case
§ An excellent answer should menFon investments costs, manufacturing costs, transportaFon costs, and exchange rate risks. If costs are expensed outside of the new market, there are opFons to miFgate exchange rate risks by buying currency financial opFons

123
Exhibit #1: Apparel market
49%
31%
21%
0%
10%
20%
30%
40%
50%
60%
70%
80%
90%
100%
Market Share
Fashion/High-‐end
TradiFonal/ConservaFve
Value Driven
Market Share (revenue)
$500M
70%
50% 45% 40%
24%
35% 34%
20%
6% 15% 21%
40%
0%10%20%30%40%50%60%70%80%90%
100%
Seniors Adults Young Adults Teens & Children
Fashion/High-‐end TradiFonal/ConservaFve Value Driven
Market share by customer segment (revenue)

124
Exhibit #2: Current players
Current players in the Fashion/High-‐end market
Conserva=ve/ Tradi=onal Player 1 Player 2 Player 3 Player 4 Player 5 Market share 21% 18% 19% 21% 21% Gross Margin 21% 22% 20% 23% 20% OperaFng Margin 11% 12% 10% 13% 10%
Current players in the ConservaFve/TradiFonal market
Fashion/High-‐end Player 1 Player 2 Player 3 Market share 40% 26% 34% Gross Margin 70% 43% 55% OperaFng Margin 45% 18% 30%

125
Case 16: Vitality Insurance, Inc.
Case tracker Fit Ques=ons
§ Industry: Financial Services
§ Level of Difficulty: Medium
§ Case Format: Improving profitability; Reducing Costs
§ Concepts Tested: - Supply/value chain - MarkeFng strategy
- Customer strategy
Case Ques=on
§ Our client, Vitality Insurance, is a leading provider of supplemental insurance products in the United States.
§ Vitality agents partner with companies to offer their employees opFonal, supplemental insurance for such condiFons as life, long-‐term disability, etc.
§ Vitality has undergone fairly steady growth in the past two years, but profit margin is decreasing. What should they do about it?
Spend first 15 min on fit
§ Give me an example of when you had to moFvate others who did not report to you
§ How would a friend, or a professor who knows you well, describe you?
Guide to interviewer
§ This case is primarily about diagnosing the source of cost increases for an insurance firm and then determining whether those increases are jusFfied by increased profits
§ The case is fairly structured in that the interviewee will need to “peel back” the layers of this case in the following process
§ Recognize that sales costs are rising drasFcally § IdenFfy the shin in sales contest mix for 2010
§ Evaluate the effecFveness of the new contest mix
§ With any cost reducFon case, an interviewee may seek informaFon on other cost drivers. If this occurs, politely tell the interviewee nothing else exists and then refocus
Quants.3
Structure
7
Reducing costs; profit
By: Peter Manoogian (Kellogg Class of ‘12)

126
Clarifying answers and case guide Guide to case / Guide to handouts
Exhibit 1– Provide once interviewee receives clarifying informaFon (len pane) and asks for more detail on costs Interviewee should recognize the following: - All line items except for sales costs growing at 10% per year - Sales costs grow at 10% from 2008 to 2009, but at 45% from 2009 to
2010 (while premium growth remains at 10%) - Stronger interviewees will quickly note that something is strange w/the
2010 sales costs, but will calculate to confirm - Finally, profit margins are declining significantly from 09-‐10, suggesFng
that the increase in sales costs is not paying off Exhibit 2– Provide if interviewee asks about the value chain or selling
process. If the interviewee asks about the new contests focused on premium, provide the following informaFon: - Vitality launched a contest called “Sweeps Week” that aimed to drive
increased premium in weeks that were tradiFonally low volume for the company. Vitality paid an extra 10% bonus on all premium booked in those two weeks.
- Sales agents thought “Sweeps Week” was a great contest - We have no info on the addiFonal two contests on new accounts
Exhibit 3-‐ Provide if interviewee asks for further detail on the effecFveness of “Sweeps Weeks”
Clarifying answers to provide
Client Characteris=cs - Vitality is the leader in its category and
has over 10K field sales agents - Vitality sells all policies through its field
sales agents who are solely compensated on a % commission of total new premium, defined as premium from new customers or addiFonal premium (up-‐sell) from exisFng policyholders
- In addiFon to the commission, short term prioriFes are onen communicated via sales contests that focus on a parFcular customer segment or acFvity and pay a bonus in addiFon to standard commission
- Major costs: sales, G&A, and adverFsing Compe==on - Vitality has a few other compeFtors in
this market who have seen similar growth, but Vitality is a leader in the space and thus compeFFon is not the focus
Industry trends - Mature market - Agent turnover is very high on a yearly
basis (though was lower during the recessionary period)

127
Key elements to analyze
Supply/value chain
§ As seen in Exhibit 2; Vitality’s sales agents are engaged in several acFviFes along the sales process, and that new premium can be generated in many ways.
§ The interviewee should recognize the shin in contest mix from 2008/09 to 2010. Coupled with the addiFonal informaFon provided in the previous slide, the interviewee should realize that Vitality has shined its focus more toward total premium and new accounts in 2010
Marke=ng strategy
§ Exhibit 3 shows weekly premiums for all of Vitality from 2008 – 2010. The chart is shown in a way that compares each year’s actual premium to the average of historical premium for that year, so as to provide for a “benchmark” comparison.
§ The “Sweeps Week” contest launched in 2010 is shown in weeks 4 and 20 in the chart, and clearly yields high premium volume for those parFcular weeks. However, it is done at the expense of the weeks surrounding the sweeps week.
§ This implies that agents may be “gaming” the system by pushing/pulling sales into that week to earn the contest $$
Notes to interviewer
§ Assume the types of contests run in 2008 and 2009 were fairly similar
§ Do not share Exhibit 3 unFl the interviewee recognizes this shin in mix and begins asking quesFons about the new programs
Notes to interviewer
§ If asked, confirm that agents have authority to “book” sales whenever they want by influencing the enrollment Fming by up to one week
§ Strong interviewees will also recognize that, despite not having charts to support it, a shin in customer focus toward acquiring new accounts in 2010 will likely also hinder profit margins, as acquiring a new customer costs considerably more than retaining (or up-‐selling) an exisFng customer
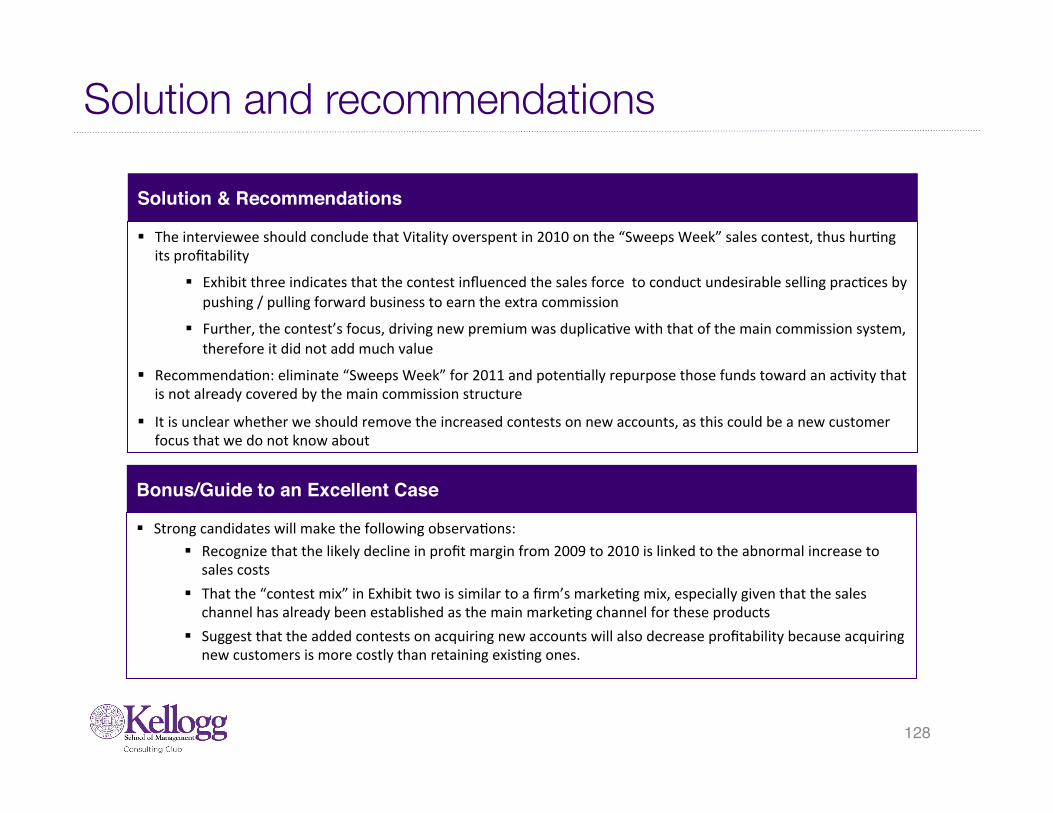
128
Solution and recommendations
Solution & Recommendations
§ The interviewee should conclude that Vitality overspent in 2010 on the “Sweeps Week” sales contest, thus hurFng its profitability
§ Exhibit three indicates that the contest influenced the sales force to conduct undesirable selling pracFces by pushing / pulling forward business to earn the extra commission
§ Further, the contest’s focus, driving new premium was duplicaFve with that of the main commission system, therefore it did not add much value
§ RecommendaFon: eliminate “Sweeps Week” for 2011 and potenFally repurpose those funds toward an acFvity that is not already covered by the main commission structure
§ It is unclear whether we should remove the increased contests on new accounts, as this could be a new customer focus that we do not know about
Bonus/Guide to an Excellent Case
§ Strong candidates will make the following observaFons: § Recognize that the likely decline in profit margin from 2009 to 2010 is linked to the abnormal increase to
sales costs § That the “contest mix” in Exhibit two is similar to a firm’s markeFng mix, especially given that the sales
channel has already been established as the main markeFng channel for these products § Suggest that the added contests on acquiring new accounts will also decrease profitability because acquiring
new customers is more costly than retaining exisFng ones.

129
Exhibit 1: Vitality results and major costs
Vitality insurance key results and costs (Figures in 000s)2008 2009 2010
Accounts converted 500 550 605 Total policyholders enrolled 1,500 1,650 1,815 Total premium from policyholders $2,500,000 $2,750,000 $3,025,000
Total costs General and Administrative $50 $55 $58 Sales $250 $275 $400 Advertising $25 $28 $30
Profit margin 9.50% 9.40% 8.50%

130
Exhibit 2: Vitality insurance sales process
# of sales contests targeted at these leverage points on the selling process
New Agents Acquire new accounts (bonus based on # of accounts)
Keep accounts acFve (bonus based on # of accounts)
Upsell acFve accounts (bonus based on # of accounts)
Produce results (bonus based on total premium $)
2008 N/A 2 4 1 2
2009 N/A 2 4 1 2
2010 N/A 4 0 1 4
Hire new agents
Acquire new accounts
Upsell ac=ve accounts
Keep accounts ac=ve
Produce results (Premium $)
Reac=va=ng dormant account
Year

131
Exhibit 3: Snapshot of “Sweeps Week” contest results
0%
50%
100%
150%
200%
1 2 3 4 5 6 7 8 9 10 11 12 13 14 15 16 17 18 19 20 21 22 23 24 25 26 27
Week during Jan-Jun
Yr 2008 Yr 2009 Yr 2010
2010 “Sweeps Week” (2)
Ratio to Average Weekly Premium (2008-2010)
2010 “Sweeps Week” (1)

132
Case 17: Chic Cosmetology University
Case tracker Fit Ques=ons
Case Ques=on
§ Our client is a for-‐profit, specialty college named Chic Cosmetology University (CCU). Founded in 2005, CCU is a program for high school graduates seeking their professional cosmetology license. CCU is currently the market leader for cosmetology educaFon with campuses in ten major metropolitan areas in the US.
§ CCU has capital to invest in a new campus and is considering Chicagoland as a loca5on – should they do it?
§ (If interviewee asks about OTHER objec5ves or defining success for opening the new loca5on): The client considers a successful launch as achieving posiFve operaFng profit for the new campus two years aner opening
Spend first 15 min on fit
§ Tell me about a difficult or sensiFve situaFon that required careful communicaFon
§ Describe a project or idea that was introduced or implemented because of your efforts
Guide to interviewer
§ This case involves some number crunching but is more structurally focused. It is criFcal to ensure that the interviewee lands on the figures presented (or is course corrected toward them) in order to proceed with the later parts of the case.
§ The interviewee should be able to develop a variant of the following quesFon:
Will CCU be able to enroll enough students to offset the ini5al investment and achieve posi5ve profit?
§ Key case steps: 1. Evaluate CCU revenue and cost structures 2. Project CCU’s market share 3. EsFmate CCU Chicago enrollments 4. IdenFfy qualitaFve issues to consider
Quants.7
Structure
8
B/EMkt. StgyMkt Share
Invest.
§ Industry: EducaFon § Level of Difficulty:
Medium § Case Format:
Opportunity Assessment
§ Concepts Tested: - Break-‐Even Analysis - MarkeFng Strategy - Market Share - Investments
By: Peter Manoogian (Kellogg Class of ‘12)
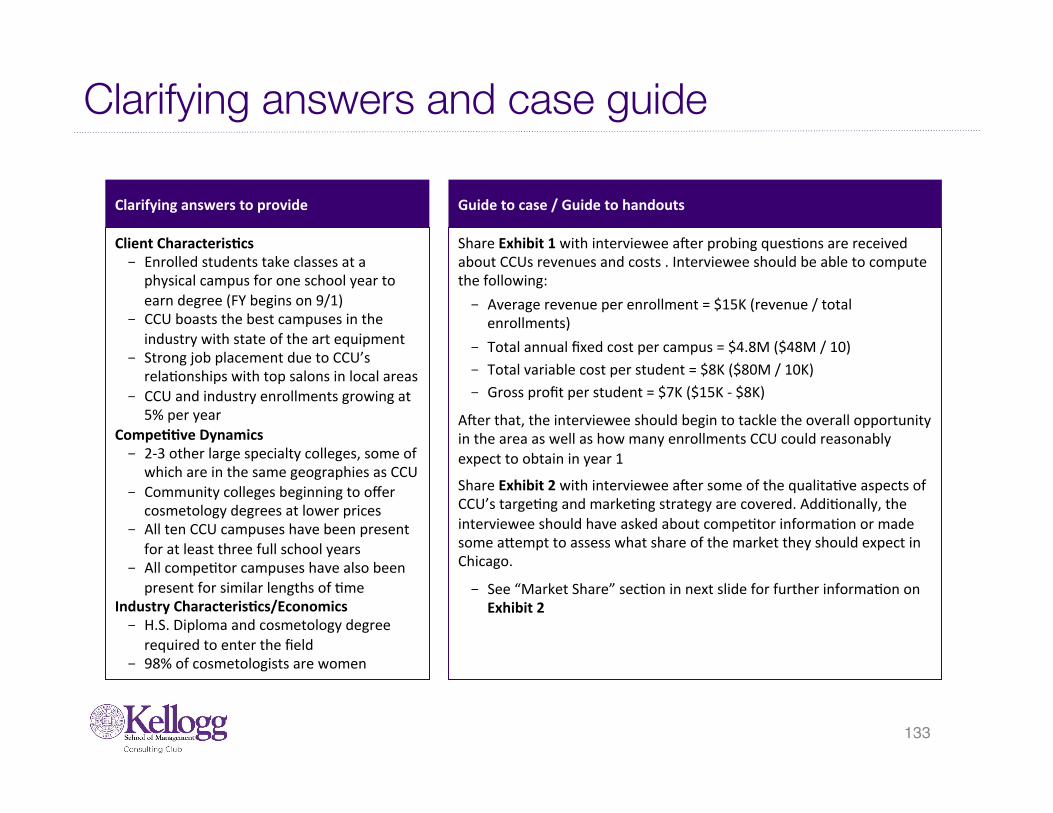
133
Clarifying answers and case guide
Guide to case / Guide to handouts
Share Exhibit 1 with interviewee aner probing quesFons are received about CCUs revenues and costs . Interviewee should be able to compute the following: - Average revenue per enrollment = $15K (revenue / total
enrollments) - Total annual fixed cost per campus = $4.8M ($48M / 10) - Total variable cost per student = $8K ($80M / 10K) - Gross profit per student = $7K ($15K -‐ $8K)
Aner that, the interviewee should begin to tackle the overall opportunity in the area as well as how many enrollments CCU could reasonably expect to obtain in year 1
Share Exhibit 2 with interviewee aner some of the qualitaFve aspects of CCU’s targeFng and markeFng strategy are covered. AddiFonally, the interviewee should have asked about compeFtor informaFon or made some a_empt to assess what share of the market they should expect in Chicago.
- See “Market Share” secFon in next slide for further informaFon on Exhibit 2
Clarifying answers to provide
Client Characteris=cs - Enrolled students take classes at a
physical campus for one school year to earn degree (FY begins on 9/1)
- CCU boasts the best campuses in the industry with state of the art equipment
- Strong job placement due to CCU’s relaFonships with top salons in local areas
- CCU and industry enrollments growing at 5% per year
Compe==ve Dynamics - 2-‐3 other large specialty colleges, some of
which are in the same geographies as CCU - Community colleges beginning to offer
cosmetology degrees at lower prices - All ten CCU campuses have been present
for at least three full school years - All compeFtor campuses have also been
present for similar lengths of Fme Industry Characteris=cs/Economics - H.S. Diploma and cosmetology degree
required to enter the field - 98% of cosmetologists are women

134
Key elements to analyze
Break-‐even analysis
§ How many students will CCU need to break-‐even in year 1?
Marke=ng strategy
§ What types of schools / students do you think CCU targets?
Notes to interviewer
• Interviewee should ask about the investment cost of building a new campus in Chicagoland
• Aner asking, tell interviewee that the total cost is $4.5M in iniFal building costs to renovate its chosen site. These costs can be amorFzed evenly over a three year period.
• Assume fixed costs remain flat per year
Interviewee should calculate • Total fixed costs per year = $6.3M ($4.8M + $1.5M from amorFzaFon).
• Gross profit per student = $7K • Break-‐even number of enrollments per year = 900 ($63M / $7K)
Notes to interviewer
Possible responses (schools): -‐ Public schools (private HS more likely to have grads go to 4yr univ) -‐ HS’s in middle-‐class ciFes (may be an affordability issue w/lo income) -‐ Closest to the campus (geography)
Possible responses (students) -‐ Women HS graduates -‐ Not a_ending 4yr college -‐ Interested in cosmetology
ALer a few of the above criteria are noted, share: - CCU has idenFfied 1,000 targeted high
schools in the Chicagoland area - Within these HS, CCU’s market research
esFmates that on average 6 students per HS have “potenFal” for CCU enrollment
Market share
§ What is the highest share we could expect CCU Chicago to capture in Y1?
Notes to interviewer
• Show Exhibit 2 to interviewee • Interviewee should recognize: - Campuses w/compeFtors present
tend to have a lower share (10%) than those w/out (15%)
- However, presence of >1 compeFtor does not have an increased negaFve impact on market share (Boston has 8% share w/only one compeFtor)
- Interviewee should assume a projected 10% market share for a Chicago campus (one compeFtor)
• Also share the following : 80% of enrolled students directly from high school, the other 20% of students come from the “Adult” market

135
Calculations Math ques=ons
1. What is the breakeven number of students required for CCU Chicago?
2. How many students should CCU Chicago expect to enroll in year 1, at the most?
3. (If Fme permits) = Suppose CCU finds a lot with a one Fme construcFon cost of $300K with the same amorFzaFon schedule. Should they enter Chicago now?
Calcula=ons
1. Break-‐even: (Es=mated campus fixed cost + Yearly amor=za=on ) / gross profit per student
( $4.8M + $1.5M ) / $7K = 900 students
2. Students: Total poten=al students x maximum projected market share
Total potenFal students = PotenFal (HS) + PotenFal (Adult) = 7,500 students
PotenFal (HS) = 6 / HS X 1,000 targeted HS = 6,000 students
PotenFal (Adult) = 6,000 students * 25% = 1,500 students
Total potenFal students (year 1) = 7,500 students x 10% share = 750 students
Total potenFal students (year 2) = 750 students x 1.05 (growth) = 788 students
3. Break-‐even: (Es=mated campus fixed cost + new yearly amor=za=on ) / gross profit per student
( $4.8M + $0.1M ) / $7K = 700 students

136
Solution and recommendations
Solu=on & Recommenda=ons
§ Overall, our client should NOT enter the Chicago market under the current cost structure. Even with a 10% market share assumpFon in year 1, the Chicago campus will enroll only 750 students, this is 150 fewer than the 900 required to break-‐even.
§ The client should also consider several qualitaFve issues: — Consider offering scholarships to increase the number of potenFal students and/or conversion rate of potenFal
students
— Consider other ciFes beyond Chicagoland that currently do not have a CCU presence, or add a second campus to a city such as NYC that has high market share and potenFally low capacity
— Perform market research in other ciFes to understand if there is a greater potenFal per target high school to increase ROI
— Consider ways to reduce fixed costs (e.g., transporFng equipment / materials from campuses that are not at capacity)
Bonus/Guide to an Excellent Case
§ Excellent interviewees will recognize that the 10% market share is for campuses that have been in place for at least three years , therefore Chicago is unlikely to achieve that share in year 1 or 2; this rules out the feasibility of the follow-‐up quesFon that suggests the possibility of reducing the one-‐Fme investment from $4.5M to $300K.
§ AddiFonally, a strong interviewee will idenFfy several of the qualitaFve issues listed above as ways in which CCU could proceed

137
Exhibit 1: 2010 CCU Financials
CCU Financials as of 8/31/2010 ('000s)
Student enrollments (all campuses) 10 Revenue from enrollments $150,000
Total fixed campus costs $48,000 Buildings and equipment $32,000 RecruiFng, general, and administraFve $16,000
Total variable campus costs $80,000 Instructors $40,000 Student supplies $40,000
Opera=ng profit $22,000

138
Exhibit 2: CCU and major competitor locations
Campus2010 share*
San Fran 8%
LA 14%
Minneapolis 15%
Dallas 14%
Houston 10%
Atlanta 16%
Miami 12%
Philly 12%
New York City 16%
Boston 8%
* Measured as share of total “potential” students, as defined by CCU
CCU CampusMajor competitor campus
As of 8/31/2010

139
Case 18: DigiBooks Inc.
Case tracker Fit Ques=ons
§ Industry: Tech/Telecom
§ Level of Difficulty: Easy
§ Case Format: Developing a new product
§ Concepts Tested: - MarkeFng Strategy
- Customer strategy
- CreaFvity
Case Ques=on
§ Our client, DigiBooks, is a manufacturer and seller of electronic book readers (tablets). DigiBooks also distributes e-‐books for the tablets through their website. The tablet is only compaFble with books sold through the DigiBooks site.
§ DigiBooks is planning the launch of its tablets in a country where no electronic book readers are currently sold. Only 1% of the populaFon has ever used an electronic book readers , though 50% is aware of the concept. The Chief MarkeFng Officer of DigiBooks has come to you to help determine:
§ How should DigiBooks launch and market DigiBook tablets in this new country?
Spend first 15 min on fit
§ Tell me about a Fme when you failed.
§ Share me a Fme when you faced a difficult situaFon in a team and how you solved this .
Guide to interviewer
§ The case primarily tests the understanding of markeFng concepts, specifically a new product launch.
§ The case is wri_en in McKinsey style format; the interviewer is expected to guide the interviewer step by step through each quesFon.
§ Begin by laying out the situaFon and case quesFon, allow the interviewee to layout their structure, and then jump immediately to quesFon 1. The interviewer is expected to drive this case rather than the interviewee.
Quants.4
Structure
7
MKT Stgy Cust. Stgy
Creativity
By: Shobhit Chugh (Kellogg Class of ’11), Edited By: Adam Louras (Kellogg Class of ’11)

140
Clarifying answers and case guide Interviewer Guide to case and handouts
Case Structure – Interviewee’s structure should cover the key areas needed to explore in order to determine how DigiBooks should launch and market the tablets in this country.
• The interviewee should take a few minutes to sketch out a framework for analysis of the markeFng plan
• Key elements expected to be included in this framework are:
• Segmenta=on, targe=ng and posi=oning: Are there parFcular segments in the populaFon that will be ideal customers for us?
• Product: What key capabiliFes are people looking for? Can we use our exisFng products or do we need to develop a new one for this country?
• Price: What price should the tablets and books be sold at? What is customers willingness to pay? Should we price the tablet at a low price so as to capture most of the market, and make margin on e-‐books?
• Promo=on: How should the tablets be marketed? What promoFon mechanisms should be used?
• Place/Distribu=on: Should the tablets be sold through retail channels, internet or other alternaFve means?
• Selec=on of e-‐books: Is a wide selecFon of books available for this country?
Prompts 1-‐3 – Aner the interviewee has laid our their structure, begin by asking the quesFon in Prompt 1. Once each prompt has been sufficiently covered, move to the next prompt. Aner all prompts are complete, ask the interviewee to summarize their findings. NOTE: Prompt 2 allows for creaFvity, so use your judgment when evaluaFng.
Clarifying answers to provide if Asked
Industry Defini=ons
- Electronic book readers: Is a sonware, hardware and network pla�orm that uFlizes wireless connecFvity to enable users to shop for, download, browse, and read e-‐books, newspapers, magazines, blogs, and other digital media.
Client Characteris=cs
- DigiBook’s Tablet: Uses an e-‐ink electronic paper display that features 16 shades of grey. This allows for a 12 hour long ba_ery life and easy readability.
- Loca5ons: DigiBook has never sold a product outside of the US.
Compe==ve Dynamics
- No compeFtors in the e-‐book or tablet space plan to enter this country
Market Characteris=cs
- Total populaFon of the country 76MM, high literacy level

§ If unclear, the interviewee should answer this with a 1-‐year Gross Profitability calculaFon for each of the Sales Channels and back out the Upfront Investment. They should ignore all other costs such as SG&A.
§ There is no missing data; however, the Market Size of 20M people in the OR segment is needed from Exhibit 1 and the price per e-‐book of $10.
§ Using Exhibit 2, interviewee should calculate: § Retail Profit = [(10 Books x $10/book x 50%GM)
+ ($100/tablet x 30%GM)] x (10M People x 40% PenetraFon) = $320M -‐ $20M II = $300M
§ Internet Profit = [(10 Books x $10/book x 50%GM) + ($100/tablet x 60%GM)] x (10M People x 10% PenetraFon) = $110M -‐ $10M II = $100M
§ ANSWER: Sales Channel to Use = Retail with a profit of $300M
141
Key elements to analyze Prompt #1: Cust. Strategy
§ Through research, we found several segments. (Hand out Exhibit 1). We are only able to target one segment with our product.
§ Using a 3-‐year projec5on, which segment should DigiBook target?
Prompt #2: MKT Strategy
§ DigiBooks is now considering how it should sell its e-‐book readers: through retail stores or through the internet.
§ How would you go about evalua5ng this decision?
Prompt #3: MKT Strategy
§ Based on revised market esFmates, we decided to price the e-‐reader at $100 and target the Occasional Reader segment.
§ Using this informa5on and Exhibit 2, can you es5mate the profit poten5al of each of these sales channels? Which should we choose?
§ What segment would you recommend to your client?
Notes on Exhibit 1
§ If unclear, the interviewee should answer based on Revenue PotenFal (i.e. Ignore probability of purchase) assuming all tablet sales happen immediately (Ignore TVM).
§ The missing data is that the average price of an e-‐book is $10, for each of the segments, and that e-‐books and tablets have the same margin
§ Using Exhibit 1, interviewee should calculate: § SR Revenue = [(15 books x $10 X 3 Years) +
($200 x 1 tablet)] x 8M People = $5.2B § OR Revenue = [(10 books x $10 x 3 Years) +
($125 x 1 tablet)] x 20M People = $8.5B § RR Revenue = [(5 books x $10 x 3 Years) +
($175 x 1 tablet)] x 10M People = $3.25B § ANSWER: Segment to be targeted =
occasional readers (OR) with a Revenue Poten=al of $8.5B
Notes on Prompt #2
• Retail Channel Sample Responses:
§ CONS: § Lower margin due to value chain
expansion § Will take Fme and money to set up
and adds training costs § PROS:
§ Should encourage Trial of the product § Retailers can help with joint markeFng
campaigns § Retailers can help with customer
service, returns • Internet channel Sample Reponses:
§ PROS: Likely cheaper to establish, will result in higher margins
§ CONS: Hard to encourage trial
Notes on Exhibit 2

142
Solution and recommendations
Solu=on & Recommenda=ons
§ Overall, DigiBooks should launch the e-‐book reader for the Occasional Reader segment through the Retail Sales Channel.
§ Based on our calculaFons, we expect to earn a $300MM return on an iniFal investment of $20MM
§ Other items to consider:
§ What adverFsing mechanisms do we use in this case?
§ Do we setup a manufacturing facility in the country or do we source the products from our current manufacturing faciliFes?
§ Are there any prospects of compeFtors entering the market?
Bonus/Guide to an Excellent Case
§ An be_er interviewee noFces key nuances in the case such as: Time Value of Money impacts on Exhibit 1 and Probability of Purchase or PenetraFon on Exhibit 1
§ An excellent interviewee will detail various elements of markeFng strategy of a new product launch
§ A key element of this case is being able to do relaFvely complex calculaFons at a fast pace. Laying out the tables appropriately for this case is essenFal to success

143
Exhibit #1: Market segments
Segment Size
Super Readers (SR) 8M
Occasional Readers (OR) 20M
Rare readers (RR) 10M
$200
$125
$175

144
Exhibit #2: Channel decisions
Channel Percent of Total potential market
E book Gross Margin %
E-reader Gross Margin %
Penetration Initial investment
Retail 50% 50% 30% 40% $20M
Internet 50% 50% 60% 10% $10M
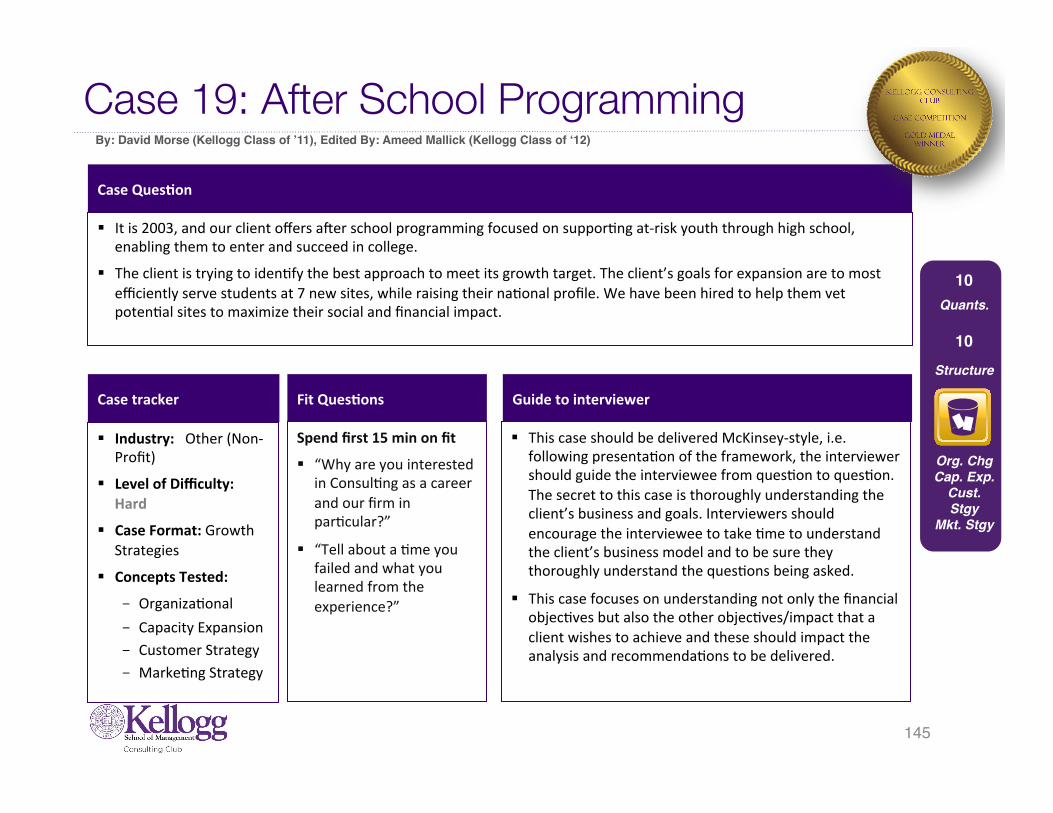
Case 19: After School Programming
Case tracker Fit Ques=ons
Case Ques=on
§ It is 2003, and our client offers aner school programming focused on supporFng at-‐risk youth through high school, enabling them to enter and succeed in college.
§ The client is trying to idenFfy the best approach to meet its growth target. The client’s goals for expansion are to most efficiently serve students at 7 new sites, while raising their naFonal profile. We have been hired to help them vet potenFal sites to maximize their social and financial impact.
Spend first 15 min on fit
§ “Why are you interested in ConsulFng as a career and our firm in parFcular?”
§ “Tell about a Fme you failed and what you learned from the experience?”
Guide to interviewer
§ This case should be delivered McKinsey-‐style, i.e. following presentaFon of the framework, the interviewer should guide the interviewee from quesFon to quesFon. The secret to this case is thoroughly understanding the client’s business and goals. Interviewers should encourage the interviewee to take Fme to understand the client’s business model and to be sure they thoroughly understand the quesFons being asked.
§ This case focuses on understanding not only the financial objecFves but also the other objecFves/impact that a client wishes to achieve and these should impact the analysis and recommendaFons to be delivered.
Quants.10
Structure
10
Org. ChgCap. Exp.
Cust. Stgy
Mkt. Stgy
145
By: David Morse (Kellogg Class of ’11), Edited By: Ameed Mallick (Kellogg Class of ‘12)
§ Industry: Other (Non-‐Profit)
§ Level of Difficulty: Hard
§ Case Format: Growth Strategies
§ Concepts Tested: - OrganizaFonal - Capacity Expansion - Customer Strategy - MarkeFng Strategy

146
Clarifying answers and case guide Interviewer Guide to case and handouts
Ques=on 1: what are the client’s opFons for locaFng and for opening new sites, and what are some consideraFons the client should consider in selecFng among these opFons?
Ques=on 2: let’s look at the financial consideraFons, parFcularly at the effect of addiFonal sites on central costs. The client allocates central office costs to each wholly owned site on a uniform basis, i.e. total central office costs / 8 = allocaFon per site. The client wants to understand how expanding sites will affect the per wholly owned site allocaFon of central costs. For this analysis, assume that central costs don’t vary depending on the method selected for expansion. (Show Exhibit 1)
Ques=on 3: from a mission perspecFve, our client thinks that serving areas with a high density of at-‐risk youth will best deliver its mission as well as raise its naFonal profile. As such, it would like to determine which geographic areas show the most promise for mission fulfillment. They provided some data from representaFve school districts for an iniFal analysis: (Show Exhibit 2)
Ques=on 4: earlier, you listed some addiFonal factors that might help the client screen new locaFons. What do you think are the pros and cons of these addiFonal factors in each geographic area? How might this influence the client’s choice of target geographies?
Ques=on 5: let’s wrap up with a summary of your findings and a recommendaFon to the client.
Answer – The interviewee cannot solve this case without understanding the client’s business and goals
Clarifying answers to provide if Asked
The following informa=on can be provided if the interviewee asks, but should not be volunteered:
— ‘At-‐risk’ youth are those who, due to behavior or grades, are at risk of dropping out of high school or have already done so — The client operates local centers a_ached to high schools with full Fme staff — The client offers tutoring and test prep support to the youth with whom it works, as well as connecFng youth to internships and career opportuniFes — All centers are Massachuse_s or southern New Hampshire — The client operates 8 sites with 2,500 youth served — School districts and state agencies reimburse the client for acFviFes — The client has a high naFonal profile and has received calls from high school systems in Florida and California offering to pay for the client to establish centers in their districts; the client has declined these offers to date

147
Key elements to analyze (1)
Ques=on 1: Organiza=onal Changes
§ Ques=on 1: what are the client’s opFons for locaFng and for opening new sites, and what are some consideraFons the client should consider in selecFng among these opFons?
Notes to interviewer
• The interviewee should quickly focus on geographic opFons for sites:
• Adjacencies to exisFng sites (middle schools, neighboring high schools)
• New sites in exisFng states, separate from exisFng sites • New states neighboring exisFng states • New states that have contacted the client
• The three primary methods for opening new sites are: • Partnerships • Branching / licensing • Wholly-‐owned sites
• The interviewee should go back to their original quesFon, and hopefully their framework, to remember that the client wants to vet potenFal sites for mission and financial impact. Based on this, they should come up with two sets of criteria, which might include:
• Mission related: • Number of at risk youth • Presence of other youth service organizaFons • PotenFal to work with high schools • Knowledge of target market
• Finance / operaFons related: • PotenFal to a_ract funding • Ability to leverage relaFonships and engage in poliFcal advocacy
• Ability to leverage exisFng infrastructure • Ability to recruit talent

148
Key elements to analyze (2)
Ques=on 2: Capacity Expansion
§ Ques=on 2: let’s look at the financial consideraFons, parFcularly at the effect of addiFonal sites on central costs. (Show Exhibit 1)
Ques=on 3: Customer Strategy
§ Ques=on 3: our client thinks that serving areas with a high density of at-‐risk youth will best deliver its mission as well as raise its naFonal profile (Show Exhibit 2)
Notes to interviewer
• A good interviewee will quickly point out that the 74% increase in costs is less than the 88% increase in the number of sites, and that central office cost allocaFon per site should decrease. Interviewees should quanFfy the impacts of growth on costs per site.
Notes to interviewer
• Note 1: Worcester, MA neighbors an exisFng site for the client. Nashua, NH does not have a site.
• Note 2: This is a tough problem to solve. Work acFvely with interviewees to get to the answer. Assume that class sizes, dropout rates and GPA averages are uniform across grades.
• Note 3: MenFon that high school is 4 years i.e. There are 4 classes in school at any given Fme.
• Solu5on on “Math Solu5on”

149
Key elements to analyze (3)
Ques=on 4: Marke=ng Strategy
§ Ques=on 4: What do you think are the pros and cons of these addiFonal factors in each geographic area? How might this influence the client’s choice of target geographies?
Notes to interviewer
• Good interviewees will draw a table matching geographic opFons against the screening criteria they listed in quesFon one, then will give a quick summary of the pros and cons of each criteria in each geography. The interviewer can help the interviewee set the chart up but should let the interviewee take the lead on walking through the analysis. This quesFon is highly qualitaFve and intended to test the interviewees’ judgment and communicaFon skills.
• Here is an illustraFve Chart
Neighboring site New site in exisFng state
Neighboring state New state
Mission fit Pro: knowledge of local youth; relaFonships with policy makers and school admins Con: might not spread model
Pro: would spread model Con: need new relaFonships, regulaFons could differ and affect operaFons
Financial fit Pro: model already approved for funding, ability to move staff / hire easily Con: might hit funding limits
Pro: access to new sources of funding, higher naFonal profile Con: districts / states might not fund model

150
Math Solutions (1)
ANSWER: Ques=on 2/Exhibit 1
Current AddiFonal costs
Staff $750K $600K
IT $110K $80K
Office expenses $115K No change
Training and support
$25K $55K
Total central office costs
$1,000K $735
Cost per site $1,000K / 8 = $125K
=$1,735K / 15 = $115.67K

151
Math Solutions (2)
ANSWER: Ques=on 3/ Exhibit 2
Column A B C D E
Average enrollment, HS
Annual % change in at risk youth, 2003
# high schools
HS completion rate, class of 2002
2002 % of enrolled students with GPA of D or lower
Worcester, MA 1,000 -‐10% 3 70% 30%
Nashua, NH 800 -‐5% 2 75% 25%Barrington, CT 800 10% 1 75% 20%San Mateo, CA 1,300 1% 4 85% 20%
Column F G H I J K L M
FormulaA * C F/4 * (1-‐D) G*3 G + H F -‐ I * E I+J K * (1 + B) L / F
Total Enrollment
Dropouts, class of 2002
Dropouts, other classes
Total Dropouts
Low GPA Students
Total at Risk, 2002
Total at risk, 2003
Total % of students at risk, 2003
Worcester, MA 3000 225 675 900 630 1530 1377 45.9%Nashua, NH 1600 100 300 400 300 700 665 41.6%Barrington, CT 800 50 150 200 120 320 352 44.0%San Mateo, CA 5200 195 585 780 884 1664 1681 32.3%

152
Solution and recommendations
Solu=on & Recommenda=ons
§ The case is designed to indicate that the client should focus on exisFng states, and perhaps on neighboring states. The client should not consider expanding outside its exisFng geographic foot print in New England.
§ The interviewee should note that the client benefits financially from scale, but that a financial analysis does not indicate a geographic area for expansion. From a mission perspecFve, exisFng and neighboring geographies provide the highest density of at-‐risk youth. New geographies in exisFng states are also promising from a mission perspecFve. Thinking further about non-‐financial benefits from scale, as should be done in quesFon 4, should also indicates that growing within exisFng states or in neighboring states poses fewer risks for the client.

153
Exhibit 1: Addt’l central costs from expansion
Current Additional costs Staff $750K $600K IT $110K $80K Office expenses $115K No change Training and support $25K $55K Total central office costs Cost per site

154
Exhibit 2: Representative data on at-risk youth
Average Enrollment, HS
Annual % Change in at risk youth, 2003
# high schools HS comple=on rate, class of
2002
2002, % of enrolled
students with GPA of D or
lower
Worcester, MA 1000 -‐10% 3 70% 30%
Nashua, NH 800 -‐5% 2 75% 25%
Barrington, CT 800 10% 1 75% 20%
San Mateo, CA 1300 1% 4 85% 20%
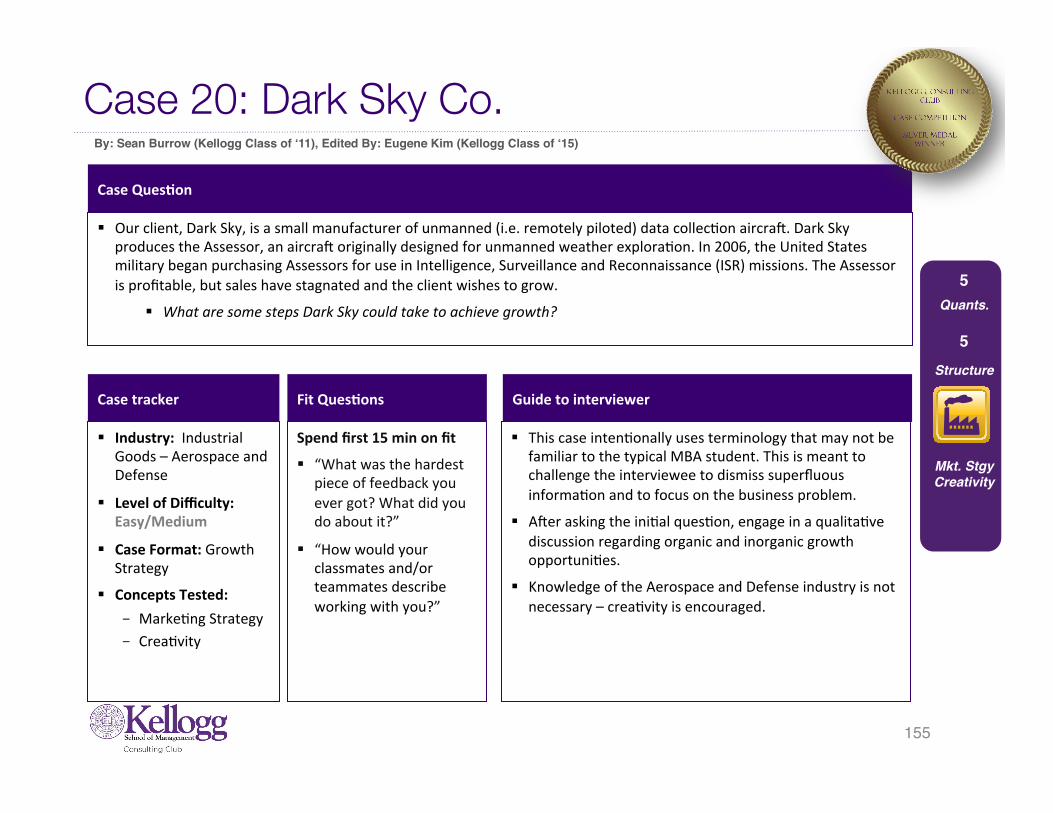
Case 20: Dark Sky Co.
Quants.5
Structure
Mkt. StgyCreativity
5
Case tracker Fit Ques=ons
§ Industry: Industrial Goods – Aerospace and Defense
§ Level of Difficulty: Easy/Medium
§ Case Format: Growth Strategy
§ Concepts Tested: - MarkeFng Strategy - CreaFvity
Case Ques=on
§ Our client, Dark Sky, is a small manufacturer of unmanned (i.e. remotely piloted) data collecFon aircran. Dark Sky produces the Assessor, an aircran originally designed for unmanned weather exploraFon. In 2006, the United States military began purchasing Assessors for use in Intelligence, Surveillance and Reconnaissance (ISR) missions. The Assessor is profitable, but sales have stagnated and the client wishes to grow.
§ What are some steps Dark Sky could take to achieve growth?
Spend first 15 min on fit
§ “What was the hardest piece of feedback you ever got? What did you do about it?”
§ “How would your classmates and/or teammates describe working with you?”
Guide to interviewer
§ This case intenFonally uses terminology that may not be familiar to the typical MBA student. This is meant to challenge the interviewee to dismiss superfluous informaFon and to focus on the business problem.
§ Aner asking the iniFal quesFon, engage in a qualitaFve discussion regarding organic and inorganic growth opportuniFes.
§ Knowledge of the Aerospace and Defense industry is not necessary – creaFvity is encouraged.
155
By: Sean Burrow (Kellogg Class of ‘11), Edited By: Eugene Kim (Kellogg Class of ‘15)

Clarifying answers and case guide Interviewer Guide to case and handouts
This case is meant to s=mulate the growth conversa=on and is designed to funnel the interviewee toward a new product launch. Exhibit 1 – Provide following growth discussion • The military started purchasing the Assessor in 2006. The price of the
aircran has remained constant at $100,000 per unit. Throughout the past decade, The Assessor has been Dark Sky’s only source of revenue.
Exhibit 2 – Provide following Exhibit 1 calcula=ons • Dark Sky has developed several aircran prototypes designed
specifically for military missions. The company has the capability to conFnue producing the Assessor and to introduce one new aircran. • SeaBird is specially designed for mariFme (i.e. Naval) operaFons
and can be sold to the Navy for $220,000 per aircran. • SandBird is specially designed for desolate land-‐based operaFons
and can be sold to the Army for $210,000 per aircran. • JointBird is designed as a compromise for Army and Navy
operaFons and can be sold to either service for $180,000 per aircran.
• The Military has agreed to a 10% Assessor price increase. Exhibit 3 – ONLY PROVIDE IF ASKED • The introducFon of a new aircran will have a negaFve impact on
Assessor sales.
- Con5nue to next page for further detail of the analysis to be performed
Clarifying answers to provide if Asked
Customer / Price: - Dark Sky’s only customer is the U.S. Military. - Dark Sky has a Cost-‐Plus-‐Fixed-‐Fee contract with the U.S.
Military for Assessor sales: - The contract has been extended in the past and is up
for renegoFaFon; the Military has agreed to a marginal fee (i.e. price) increase to account for inflaFon
- Contracts for new aircran will be structured similarly Company: - The firm has addiFonal capacity and is posiFoned to
strengthen any division of the workforce, if required (e.g. sales force, manufacturing, R&D)
Product: - Dark Sky designs a unique aircran that is launched from a
catapult device; the aircran can be launched from ships at sea or from harsh terrain (e.g. desert, mountains).
- Dark Sky only sells the Assessor, but has designed prototypes specifically for military operaFons.
Compe==on: - There are approximately 20 compeFtors that
manufacture unmanned aircran. - Though too small to purchase a compeFtor, Dark Sky has
been considered an acquisiFon target. Dark Sky’s lack of growth in recent years concerns potenFal buyers.
156

Key elements to analyze
Current Revenues & Growth Strategy
§ Exhibit 1: a) How many units were sold in 2014? b) What was the growth rate from 2006 to 2010?
§ What are some steps to achieve growth (original quesFon)
Opportunity Assessment
§ Exhibit 2: To maximize short-‐term growth, which aircran should Dark Sky produce?
Notes to interviewer
• Exhibit 1 should be treated as a math warm up. Price = 100K/Unit • Organic Growth – the interviewee should consider internal opFons to could sFmulate growth. Some potenFal examples include:
• Increase penetra=on – negoFate addiFonal Assessor sales to the military.
• Product development – develop new products that may appeal to the military (e.g. new aircran, training services, aircran accessories / add-‐ons).
• New market entry – sell the Assessor in internaFonal markets or addiFonal domesFc markets (e.g. Border Patrol, police, news channels)
• Diversifica=on – develop a new product to serve a new market. • Increase / Reduce prices (based on elasFcity of demand)
• External growth – the interviewee should consider growth opFons using external resources. Some potenFal examples include:
• Joint Venture – contract with a firm to increase market accessibility or to develop a new product beyond the capability of Dark Sky.
• Merger / AcquisiFon – acquire a new firm to add addiFonal capacity and/or product mix. Because Dark Sky is relaFvely small in the Defense industry, consider becoming an acquisiFon target.
Notes to interviewer
§ Exhibit 2: To maximize growth, Dark Sky should focus on maximizing revenue.
§ To calculate the revenue for each scenario, the interviewee should add Assessor sales to the sales of the new product.
§ Assessor sales are based on: § 50 units sold with no new product launch § CannibalizaFon forecast specific to each new
product launch § $110,000 per aircran
§ New product sales can be easily calculated using shortcuts. For example:
§ SeaBird: $220k * 100 = $22m… then half of this § SandBird: $210k * 100 = $21m… then half of it and
add (10% of $21m) § JointBird: Add to get 90… then $180k*100 = $18m,
subtract (10% of $18m)
157

• To maximize short-‐term growth, which aircran should Dark Sky produce?
• Answer: JointBird • Assessor Sales (Units, Revenue):
• No new product = 50 aircran, $5,500,000 • With SeaBird = 50 + (50 * (-‐40%)) = 50 -‐ 20 =
30 aircran, $3,300,000 • With SandBird = 50 + (50 * (-‐70%)) = 50 -‐ 35 =
15 aircran, $1,650,000 • With JointBird = 50 + (50 * (-‐90%)) = 50 -‐ 45 =
5 aircran, $550,000 • New Product Revenue:
• SeaBird = 50 * $220,000 = $11,000,000 • SandBird = 60 * $210,000 = $12,600,000 • JointBird = (38 + 52) * $180,000 = 90 *
$180,000 = $16,200,000 • Total Revenue:
• Assessor Only = $5,500,000 • Assessor and SeaBird = $3,300,000 +
$11,000,000 = $14,300,000 • Assessor and SandBird = $1,650,000 +
$12,600,000 = $14,250,000 • Assessor and JointBird = $550,000 +
$16,200,000 = $16,750,000
158
Math Solutions
Math Exhibit 1
• How many units were sold in 2014? • Answer: 50 units or $5,000k ÷ $100k/unit = 50 units
• What was the growth rate from 2006 to 2010? • Answer: 900% o ($5,000k -‐ $500k) ÷ ($500k ) x 100 =
900%
Math Exhibit 2

159
Solution and recommendations
Solu=on & Recommenda=ons
§ Based on 2015 forecasted revenue alone, Dark Sky should introduce the JointBird to the U.S. Military in order to boost short-‐term growth. However, there are several connected issues that Dark Sky should consider to include profitability, long-‐term revenue forecasts, compeFFve response, etc.
Bonus/Guide to an Excellent Case
§ An excellent interviewee will note: § How quickly could Dark Sky start manufacturing a third model (i.e. can Dark Sky produce SandBird this year, and
be producing SandBird and SeaBird the following year)? If so, what are the revenue implicaFons? § If Dark Sky produces JointBird, is $550,000 in Assessor revenue worth the associated cost to produce the
aircran? Should resources be allocated to another project? § How profitable are the four aircran models in comparison? Note: Because Dark Sky has a Cost-‐Plus-‐Fixed-‐Fee
contract, profitability for each aircran is likely equivalent. For this reason, Dark Sky should focus on maximizing the number of aircran sold. • How much and how long is the payback period for the investment in manufacturing each type aircran?
§ PotenFal benefits of have two customer bases for new product (Navy and Army).

160
Exhibit #1
Revenue ($, Million)
0
1
2
3
4
5
2004 2006 2008 2010 2012 2014

161
Exhibit #2
New Product Sales (# of aircraLs)
New Product Offering Navy Army Price Per AircraL
SeaBird 50 -‐-‐ $220,000
SandBird -‐-‐ 60 $210,000
JointBird 38 52 $180,000
New Product Sales Forecast, 2015

162
Exhibit #3
Impact of New Product on Assessor Sales
New Product Sales (# of aircraLs)
New Product Offering Navy Army Assessor unit sales lost due to cannibaliza=on
SeaBird 50 -‐-‐ 40%
SandBird -‐-‐ 60 70%
JointBird 38 52 90%

163
Case 21: Health Coaches
Case tracker Fit Ques=ons
Case Ques=on
§ Our client is a large naFonal health care payer (health insurance company, think Aetna) exploring the launch of a new disease management (“DM”) program to be_er serve its 5 million members. The idea is to hire and train a team of “Health Coaches” to specialize in a single disease area (e.g., heart disease, diabetes, etc). Each Coach will manage a por�olio of paFents to reduce the costs of overall health expenditures (e.g., reminders to take drugs, provide limited medical advice, suggested diet, etc). Studies show that once a month contact with each paFent reduces health spending by 5%, on average.
§ Should our client launch the program? If so, what steps should it take?
Spend first 15 min on fit
§ How do you feel about working in a feedback-‐intensive environment?
§ Why is consulFng a be_er career move for you compared to your next best opFon?
Guide to interviewer
§ The case tests the interviewee’s ability to probe and develop a customer segmentaFon, digest a relaFvely complex chart, isolate the most criFcal informaFon and determine profitability
§ The data provided by both exhibits should be requested; try not to show the exhibits unFl need for the data is demonstrated
§ Strong interviewees should use common sense to make reasonable assumpFons before you provide required inputs
Quants.8
Structure
6
Cust. StgyB/E
By: David Wellner (Kellogg Class of ‘11), Edited By: Craig DePriester (Kellogg Class of ‘12)
§ Industry: Healthcare § Level of Difficulty:
Medium § Case Format:
Developing a new product/Service
§ Concepts Tested: - Customer strategy - Break-‐even analysis

164
Clarifying answers and handout guide
Guide to handouts
Before showing exhibits, interviewee should convey the essence of the case: Are the costs associated with the DM program jus=fied by the savings? Sample set-‐up: Exhibit 1 – Hand out when interviewee establishes need for understanding client’s membership segmentaFon and/or exposure to disease areas. If he/she is not headed there alone, you can ask “how would you segment the client’s members?” § “What can we get out of this chart? Please let me know if you have quesFons” § DefiniFons (if needed): Group are employee sponsored plans (e.g. ,if you work
for McKinsey, you are in a group plan), Individual are non-‐groups (e.g., private contractors, unemployed, etc). 65+ (see asterisk below chart).
§ “Which segment is likely to generate the greatest per member costs.? Why?” § “Which disease area should we look at first?”
Exhibit 2 – Hand out when interviewee asks for medical cost data. Try to avoid handing out exhibit 2 unFl exhibit 1 has been discussed (hint: if interviewee leads with profitability, steer him/her to first think about the customer segmenta5on) § “What can we do with this informaFon?”
Clarifying answers to provide
Compe==ve dynamics (not core to case)
§ With spiraling health care costs, the industry is under pressure to innovate new products that will control spending
§ Assume client is first to market
§ Past a_empts to purely automate DM have yielded minimal savings
Health Coaches
§ All acFvity conducted remotely via phone/email
§ Typical profile is registered nurse that wants to work from home
§ It’s difficult to actually reach paFents, so Coaches can contact 8 members per day (assume 25 days per month)
§ Annual costs per Coach: $60K salary +20% other (training, benefits, laptop, etc)
- There are no other program costs
Program Savings - Customer segmentaFon by disease area and cost per member
Program Costs - Salary and other - Por�olio size/capacity (members/coach)
Risks - Do assumpFons hold? - CompeFFve response - Regulatory, liabiliFes
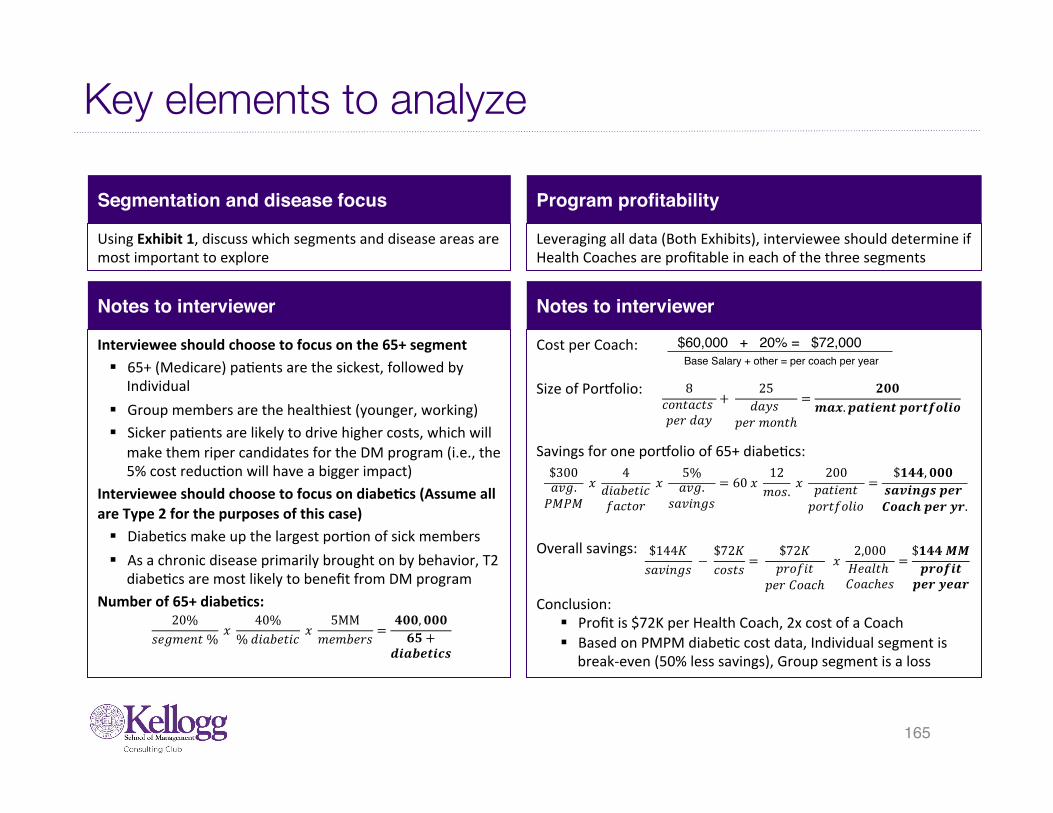
165
Key elements to analyze
Segmentation and disease focus
Using Exhibit 1, discuss which segments and disease areas are most important to explore
Program profitability
Leveraging all data (Both Exhibits), interviewee should determine if Health Coaches are profitable in each of the three segments
Notes to interviewer
Interviewee should choose to focus on the 65+ segment § 65+ (Medicare) paFents are the sickest, followed by
Individual § Group members are the healthiest (younger, working) § Sicker paFents are likely to drive higher costs, which will
make them riper candidates for the DM program (i.e., the 5% cost reducFon will have a bigger impact)
Interviewee should choose to focus on diabe=cs (Assume all are Type 2 for the purposes of this case) § DiabeFcs make up the largest porFon of sick members § As a chronic disease primarily brought on by behavior, T2
diabeFcs are most likely to benefit from DM program Number of 65+ diabe=cs:
Notes to interviewer
Cost per Coach:
Size of Por�olio:
Savings for one por�olio of 65+ diabeFcs:
Overall savings:
Conclusion: § Profit is $72K per Health Coach, 2x cost of a Coach § Based on PMPM diabeFc cost data, Individual segment is
break-‐even (50% less savings), Group segment is a loss
8𝑐𝑜𝑛𝑡𝑎𝑐𝑡𝑠 𝑝𝑒𝑟 𝑑𝑎𝑦
+ 25𝑑𝑎𝑦𝑠
𝑝𝑒𝑟 𝑚𝑜𝑛𝑡ℎ
=𝟐𝟎𝟎
𝒎𝒂𝒙. 𝒑𝒂𝒕𝒊𝒆𝒏𝒕 𝒑𝒐𝒓𝒕𝒇𝒐𝒍𝒊𝒐
$144𝐾𝑠𝑎𝑣𝑖𝑛𝑔𝑠
− $72𝐾𝑐𝑜𝑠𝑡𝑠
= $72𝐾𝑝𝑟𝑜𝑓𝑖𝑡
𝑝𝑒𝑟 𝐶𝑜𝑎𝑐ℎ
𝑥 2,000𝐻𝑒𝑎𝑙𝑡ℎ 𝐶𝑜𝑎𝑐ℎ𝑒𝑠
=$𝟏𝟒𝟒 𝑴𝑴𝒑𝒓𝒐𝒇𝒊𝒕𝒑𝒆𝒓 𝒚𝒆𝒂𝒓
20%𝑠𝑒𝑔𝑚𝑒𝑛𝑡 %
𝑥 40%
% 𝑑𝑖𝑎𝑏𝑒𝑡𝑖𝑐 𝑥
5MM𝑚𝑒𝑚𝑏𝑒𝑟𝑠
=𝟒𝟎𝟎, 𝟎𝟎𝟎𝟔𝟓 +
𝒅𝒊𝒂𝒃𝒆𝒕𝒊𝒄𝒔
$300𝑎𝑣𝑔.𝑃𝑀𝑃𝑀
𝑥 4
𝑑𝑖𝑎𝑏𝑒𝑡𝑖𝑐𝑓𝑎𝑐𝑡𝑜𝑟
𝑥 5%𝑎𝑣𝑔.
𝑠𝑎𝑣𝑖𝑛𝑔𝑠= 60 𝑥
12𝑚𝑜𝑠.
𝑥 200
𝑝𝑎𝑡𝑖𝑒𝑛𝑡𝑝𝑜𝑟𝑡𝑓𝑜𝑙𝑖𝑜
=$𝟏𝟒𝟒, 𝟎𝟎𝟎
𝒔𝒂𝒗𝒊𝒏𝒈𝒔 𝒑𝒆𝒓 𝑪𝒐𝒂𝒄𝒉 𝒑𝒆𝒓 𝒚𝒓.
$60,000 + 20% = $72,000Base Salary + other = per coach per year

166
Solution and recommendations
Solu=on & Recommenda=ons
With 3-‐4 minutes remaining, give interviewee a moment to prepare a recommendaFon. Here is a strong sample:
§ Client should launch the Health Coaching program, and first focus on diabetes for the 65+ Medicare segment
§ The client should take the following steps: - Launch a pilot program to prove out assumpFons (e.g., 5% cost reducFon, Coach por�olio capacity, etc) - First expand to enFre 65+ diabetes segment ($144M per year savings per coach, a 2x return on each
Health Coach) - Consider introducing to Individual diabetes segment despite break-‐even (customer retenFon, moral
raFonale, etc)
Follow-‐up quesFons (if Fme permits) § There are 650K Group diabeFcs len “uncoached.” Is there a way to make the segment profitable? Ideas include:
- More efficient DM program (e.g., Coaching at work, bi-‐monthly contact, automated correspondence, etc) - Seek addiFonal revenue sources (e.g., Employers might be willing to pay a fee, government support) - Since 5% is the average savings, program can target members who will respond with savings well above
5%
§ As first to the market, client plans to expand Health Coach program externally. Who should they target? - It’s tempFng to suggest that the client should market to 65+ Medicare paFents with diabetes, since this is
where the program yields the greatest savings. While it’s good that we have lowered the cost of older diabeFcs, client should keep in mind that more diabeFc members will increase overall health care costs, considerably – (sFll almost 4x aner savings)
- An insFncFve interviewee might suggest an alternaFve: Client should sell its Health Coach service to other payers. But how would you price that? What are the challenges (e.g., regulatory, info sharing, etc)

167
Exhibit #1: Client’s member segmentation by health condition
* Members 65 years of age and above. Known as “Medicare Advantage”, premiums funded by government

168
Exhibit #2: Average cost data (Per Member Per Month)
Segment Average PMPM Average DiabeticIndividual $150
4x(Avg. PMPM)Group $100
65+ $300

Case 22: Wine & Co.
Case tracker Fit Questions
Case Question
§ Wine & Co. is a niche wine manufacturer in the San Francisco Bay area. Wine & Co. recently acquired 12 acres of land outside San Francisco. The company wants to invesFgate opportuniFes to best use the land and needs a recommendaFon from you.
Spend first 15 min on fit
§ Tell me about a Fme when you failed.
§ Share me a Fme when you faced a difficult situaFon in a team and how you solved this .
Guide to interviewer
§ The case tests the interviewee's ability to: a. Structure the problem and brainstorm b. Determine valuaFon and discounFng c. Recommend a markeFng strategy d. Synthesize the answers.
§ This case is a McKinsey style case and has to be asked in a quesFon and answer format. The interviewer should ask each quesFon given below and wait for the interviewee to respond. If the interviewee is stuck, direcFon should be provided based on the informaFon given below. The interviewee should be able to drive the case while at the same Fme seek direcFon based on the quesFon asked.
169
By: Anil Goteti (Kellogg Class of ’11), Edited By: Mauricio Atri (Kellogg Class of ‘12)
§ Industry: CPG§ Level of Difficulty:
Medium§ Case Format:
Opportunity Assessment
§ Concepts Tested:- Marketing
strategy- Basic NPV
Quants.7
Structure
5
Mkt. Stgy
NPV
CPG

170
Clarifying answers and case guide
Guide to case / Guide to handouts
§ QuesFon 1. What are the different ways in which Wine & Co. can use the land?
§ QuesFon 2. Wine & Co. has decided to use the land to manufacture wine. Each acre of land produces 1000 kg of grapes annually. Wine & Co. has an opFon to manufacture Merlot or Bordeaux. The two wines use different grapes and the grapes have varying yields. While the Merlot grapes yield 2litres/kg, the Bordeaux grapes yield 1litre/kg. Wine & Co. can charge $20 per liter of Merlot and can charge $40 per liter of Bordeaux. Which wine yields more profits annually?
§ QuesFon 3. Aging has an effect on the revenues and profitability. Merlot has to be stored for 6 years while Bordeaux has to be stored for 12 years before revenues can be generated. Which wine would you choose for manufacturing?
§ QuesFon 4. Wine & Co. has decided to manufacture Merlot. How should they market this product in the San Francisco Bay area?
§ Please summarize your recommendaFons to the CEO of Wine & Co.
Clarifying answers to provide
• Ques=on 1. Some interviewees ask which geographical regions the company serves, the type of wines they manufacture and if they have other types of products (like other liquors or wine tasFng tours in Napa valley). The following informaFon can be provided if asked. a) They only manufacture red wines. b) The company serves only the local market (the San Francisco Bay area). c) The company does not sell any other products. d) The company is currently very healthy and does not face any problems.
• Ques=on 2. Profit Margins on Merlot are 10% while the margins on Bordeaux are 15%.
• Ques=on 3. a) Discount rate is 12% (provide only when asked). Many people forget the Fme value of money and add profits across years without discounFng. b) Assume the costs are only incurred when the revenues are realized aner aging (no costs unFl year 6 for Merlot and no costs unFl year 12 for Bordeaux). c) If people are struggling with the division or approximaFons, suggest the "Rule of 72" (If r is the discount rate, 72/r is the number of years it takes to double your money)
• Ques=on 4. Customer segments that are currently served by Wine & Co.-‐ niche wine enthusiasts.

171
Key elements to analyze
Topic 1 being tested
§ What are the different ways in which Wine & Co.wines can use the land?
Topic 2 being tested
§ Which wine yields more profits annually?
Notes to interviewer
§ The interviewee should create a framework and structure the problem. The interviewee should suggest opFons including manufacturing the wine, creaFng adjacent products (like wine tasFng tours), using the land for other uses (commercial real estate/selling the land for a profit/other opportunity costs). A good candidate would provide a detailed structure (eg. profitability framework for manufacturing feasibility with customizaFon of the framework -‐ yield of grapes, cost per liter of wine, etc.) and outline the risks or consideraFons involved in some of these opFons (like usability of land for manufacturing or company competency in pursuing in other opportuniFes unrelated to wine manufacturing).
Notes to interviewer
§ A good candidate would ask for the profit margins/costs without being prompted. Look for organizaFon and structure when the candidate evaluates the annual profits for each wine (a good candidate would use a table like structure when doing the math). The revenues would be $480,000 for both wines annually but the margins would be higher for Bordeaux ($72,000 for Bordeaux vs. $48,000 for Merlot). Aner the candidate arrives at the profits, look for interpretaFon. A good candidate would recommend using Bordeaux while at the same Fme consider other factors (competency in manufacturing either of the wines, customer demand in the bay area, sensiFvity to product yields, customer reservaFon price, etc.). A creaFve candidate might suggest that we compare the age of the two wines (and hence will impact when the profits might actually start)

Math for Topic 2
Value Comments
A Acres of Land 12 Given
B kg of grapes produced/acre 1000 Given
C kg of grapes produced total 12000 =A*B
Merlot Bordeaux Comments
D Yield (Litre/kg) 2 1 Given
E Total Yield (Litre) 24000 12000 =C*D
F Price / Litre $20 $40 Given
G Total Revenue $480,000 $480,000 =E*F
H Profit Margin 10% 15% Given
I Total Profit $48,000 $72,000 =G*H

173
Key elements to analyze
Topic 3 being tested
§ Which wine would you choose for manufacturing?
Topic 4 being tested
§ How should they market this product in the San Francisco Bay area?
Notes to interviewer
§ Candidate should idenFfy that the cash flows for Merlot would be $48,000 annually starFng year 6. Cash flows for Bordeaux would start in year 12 ($72,000 annually). A good candidate would then consider the Fme value of money and discount the two perpetuiFes to the same year for an apples-‐to-‐apples comparison. Merlot: Annual Cash flow starFng year 6: $48,000 Perpetuity value of cash flow (value in year 6) = $48,000/0.12 = $400,000 Bordeaux: Annual cash flow starFng year 12: $72,000 Perpetuity value of cash flow (value in year 12) = $72,000/0.12 = $600,000 Value of perpetuity in year 6 = $600,000 / (1.12^6) = $300,000 (Rule of 72). Provide help here if the candidate is struggling with the division. Look for the candidate's approach than the exact number. Since value of pursuing Merlot ($400,000) is higher than value of pursuing Bordeaux ($300,000), the company should manufacture Merlot. A good candidate would interpret the result and suggest we take into account other factors like inventory costs, sensiFvity to discount rate, etc.
Notes to interviewer
§ Candidate should ask for the customer segments that the company might sell to and suggest appropriate markeFng channels/strategies to consider. Look for a MECE structure here. SuggesFons should include retail strategies, direct to consumer strategies (like wine clubs, wine tasFng), tradiFonal media and print adverFsing and online adverFsing.
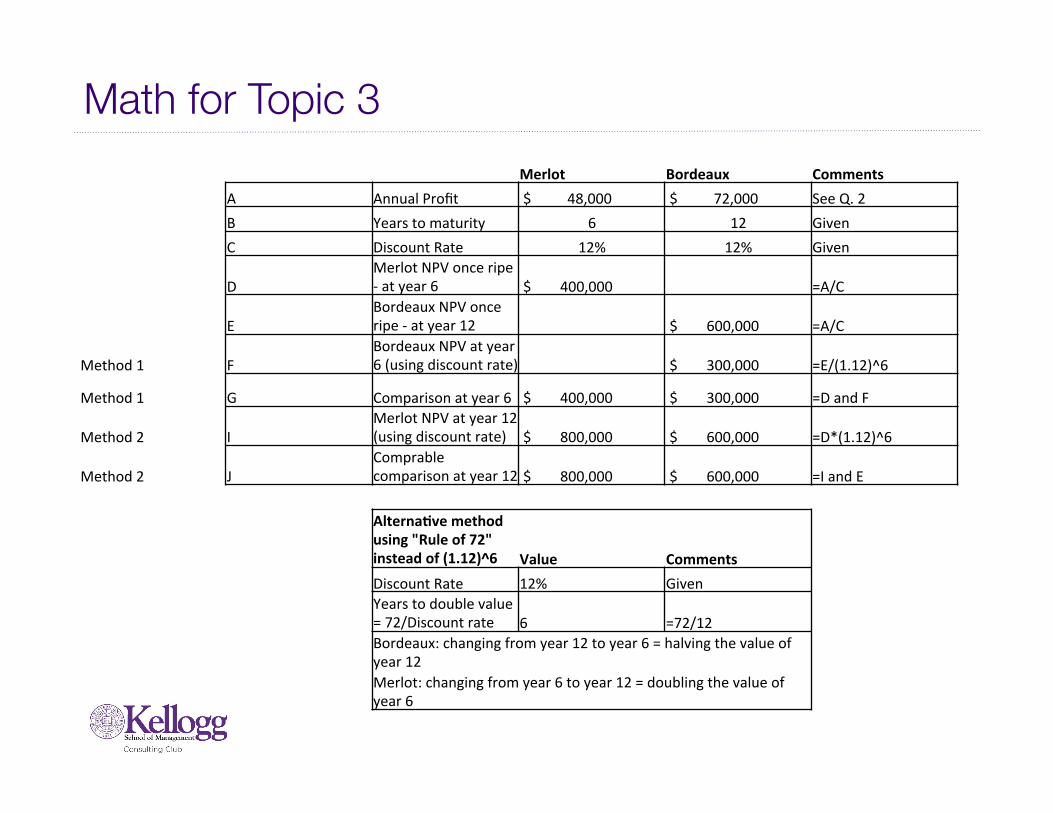
Math for Topic 3 Merlot Bordeaux Comments
A Annual Profit $ 48,000 $ 72,000 See Q. 2 B Years to maturity 6 12 Given C Discount Rate 12% 12% Given
D Merlot NPV once ripe -‐ at year 6 $ 400,000 =A/C
E Bordeaux NPV once ripe -‐ at year 12 $ 600,000 =A/C
Method 1 F Bordeaux NPV at year 6 (using discount rate) $ 300,000 =E/(1.12)^6
Method 1 G Comparison at year 6 $ 400,000 $ 300,000 =D and F
Method 2 I Merlot NPV at year 12 (using discount rate) $ 800,000 $ 600,000 =D*(1.12)^6
Method 2 J Comprable comparison at year 12 $ 800,000 $ 600,000 =I and E
Alterna=ve method using "Rule of 72" instead of (1.12)^6 Value Comments Discount Rate 12% Given Years to double value = 72/Discount rate 6 =72/12 Bordeaux: changing from year 12 to year 6 = halving the value of year 12 Merlot: changing from year 6 to year 12 = doubling the value of year 6

175
Solution and recommendations
Solu=on & Recommenda=ons
§ A good candidate would recommend a soluFon (manufacturing Merlot) but would detail out the risks/next steps associated with the recommendaFon. Next steps may involve market research, land usability tesFng, evaluaFon of opportunity costs. Risks have been outlined above already.
Bonus/Guide to an Excellent Case
§ An excellent answer should include: a) IdenFficaFon of opportunity costs, parFcularly of not selling/leasing the land, which might be more profitable considering the current value of land in the Bay Area and/or Napa
b) Considering industry specific issues like aging of wine
c) Considering Fme value of money/perpetuity of cash flow
d) Considering risks like customer demand, land usability
e) PotenFal benefits of diversifying the acreage and producing mulFple types of grapes (compensate for shins in consumer demand, broader appeal to local market, etc.)

Case tracker Fit Ques=ons
§ Industry: CPG § Level of Difficulty:
Medium
§ Case Format: Growth Strategies
§ Concepts Tested: - CreaFvity - MarkeFng Strategy
- Customer Strategy
Case Ques=on
§ Our client is Healthy Foods Co, a wholesaler serving a variety of clients with Food products. The client is profitable but they want you to help them find revenue growth opportuniFes from their current business.
§ How can we help Healthy Foods Co. drive their revenue growth?
Spend first 15 min on fit
§ Tell me about a Fme when you failed.
§ Share me a Fme when you faced a difficult situaFon in a team and how you solved this .
Guide to interviewer
§ This case tests growth opportuniFes idenFficaFon, and share of wallet analysis.
§ It tests conceptualizaFon skills as the interviewee needs to formulate prioriFzaFon criteria. The case is mainly qualitaFve.
176
Case 23: Healthy Foods Co.
Quants.
Structure
CreativityMkt. StgyCust. Stgy
5
6
By: Milija Medic, Edited By: Mauricio Atri (Kellogg Class of ‘12)
CPG

177
Clarifying answers and case guide
Guide to case / Guide to handouts
§ Exhibit 1: Hand out when interviewee asks about customers or revenue by customer type. Interviewee should noFce that independent restaurants are the largest customer category and revenue source, and that there is a number of other customer types of similar revenue contribuFons comprising the rest.
§ Exhibit 2: Hand out when interviewee idenFfies share of wallet as a relevant parameter, in search of revenue growth from exisFng customer types. Interviewee should generate a key insight that Healthy Foods Co's share of wallet is already large for the customers who bring in the largest revenues. The opportunity for growth therefore is in the smaller revenue-‐generaFng customers.
§ Exhibit 3: Hand out when interviewee recognizes that in order to find the smaller customer types with highest revenue growth potenFal, (s)he needs the plot of the size of the wallet vs. the current client's share of wallet for that customer. The customers with large wallets, where the client has small share of wallet, are at the moment the best candidates to achieve increase in revenue from. Interviewee should idenFfy hospitals and hotels as the customers with largest potenFal for revenue growth.
Clarifying answers to provide
§ Customers
- The client serves various customer categories (shown in Exhibit 1).
- Customer sensiFviFes are (highest to lowest):
- Price - convenient delivery - help with locaFon planning - help with menu
- web site development
- inventory - Help with management opFmizaFon
§ Compe==on
- The client is one of the market leaders and is not loosing the market share

178
Key elements to analyze Topic 1 being tested
§ IdenFfy the main customer types and their current contribuFons to the client's revenues, using Exhibit 1
Topic 2 being tested
§ Share of wallet analysis, using Exhibit 2
Notes to interviewer
§ The interviewee will probably explore opportuniFes for growth in the independent restaurant category. If they inquire about customer saFsfacFon and sensiFviFes, provide informaFon from the "clarifying informaFon" secFon, and emphasize that the needs of this segment are already met.
§ The interviewee should inquire about the share of wallet in the customer categories to get a be_er idea on where the growth opportuniFes lie.
Notes to interviewer
§ The interviewee should recognize that share of wallet in the highest-‐revenue-‐generaFng customer categories is already high, and that the client is already a key provider for a lot of them.
§ Ask the interviewees to list all opFons to increase revenue and the reasons behind.
§ Help interviewee to reach that the growth opportunity in the smaller revenue-‐generaFng customers, where client's share of wallet is smaller. Now the interviewee should formulate the criteria to prioriFze among the smaller revenue-‐generaFng customer types: the bigger their wallet and the smaller client's share of wallet, the be_er.
Topic 3 being tested
§ Wallet size vs. share of wallet
Notes to interviewer
§ The bigger their wallet and the smaller client's share of wallet, the larger the revenue growth opportunity for the client.
§ Using Exhibit 3, the interviewee should idenFfy the hospitals and the hotels as the most promising candidates for revenue growth given their large wallets and small client's share of wallet. The interviewee should idenFfy the strongest sensiFviFes these clients would have and suggest ways to increase client's share of wallet there.
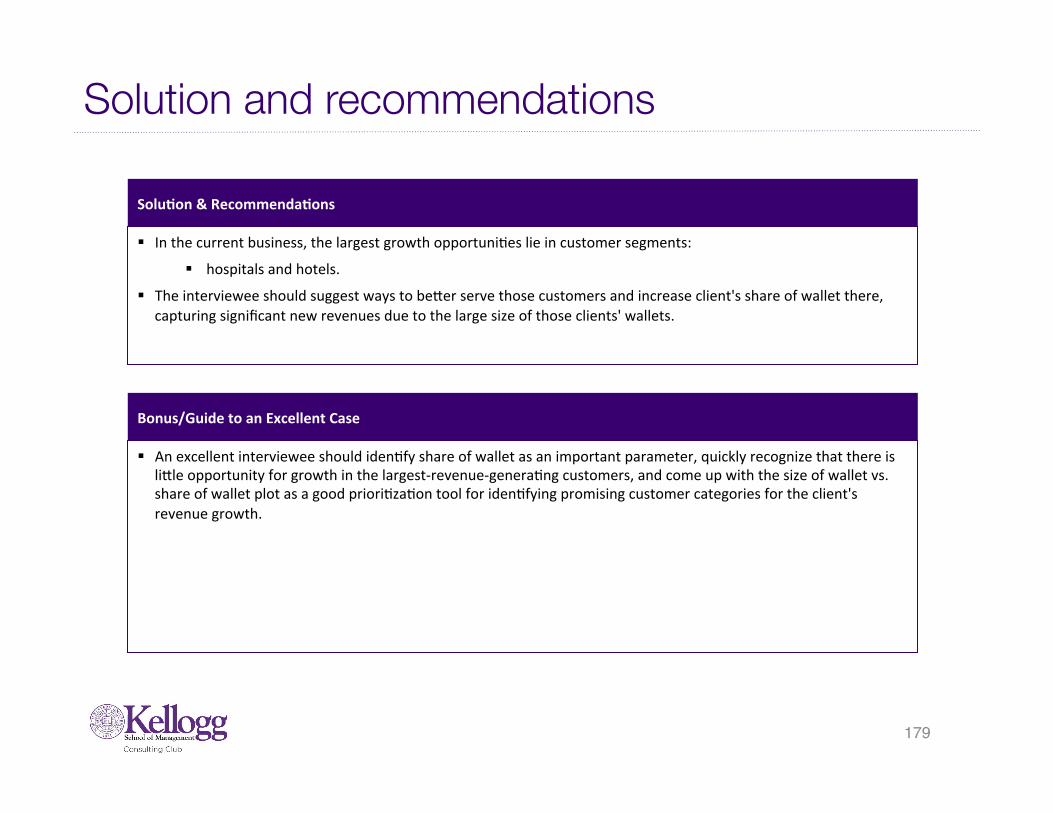
179
Solution and recommendations
Solu=on & Recommenda=ons
§ In the current business, the largest growth opportuniFes lie in customer segments:
§ hospitals and hotels. § The interviewee should suggest ways to be_er serve those customers and increase client's share of wallet there,
capturing significant new revenues due to the large size of those clients' wallets.
Bonus/Guide to an Excellent Case
§ An excellent interviewee should idenFfy share of wallet as an important parameter, quickly recognize that there is li_le opportunity for growth in the largest-‐revenue-‐generaFng customers, and come up with the size of wallet vs. share of wallet plot as a good prioriFzaFon tool for idenFfying promising customer categories for the client's revenue growth.

180
Exhibit #1: Total Market Revenues by Customer Type
Revenues by Customer Type
Independent restaurantsChain restaurantsHospitalsSchool cafeteriasGrocery storesOther

181
Exhibit #2: Client’s Share of Wallet
0% 10% 20% 30% 40% 50% 60% 70%
X
C
B
A Client is Primary food product supplier
Client is one of many food product suppliers
Customer Probability (A: Highest, X: Lowest)

182
Exhibit #3: Wallet Size vs. Share of Wallet
Wallet Size vs. Share of Wallet for the Smaller-Revenue-Generating Customer Categories
0100200300400500600
0 10 20 30 40 50 60
Share of Wallet [%]
Wallet Size [$M]
HospitalsHotelsSchool cafeteriasGrocery storesChain restaurants

Case 24: High Q Plastics
Case Ques=on
§ Our client, High Q PlasFcs, is an automoFve parts supplier in the U.S. They primarily manufacture and sell plasFc injecFon-‐molded parts, such as grills, door handles, decoraFve trim etc., to automoFve customers.
§ The client has two primary revenue sources: large automoFve OEMs, and anermarket. The client has recently seen declining profits, primarily due to increased price compeFFon from new overseas compeFtors in China. Annual profits have declined from $50M to $20M over the past few years.
§ What is the reason behind declining profitability? How can High Q improve profits? Can they reach $100M in profits by 2014?
Quants.
Structure
8
Comp. AlsCreativity
Ops.
5
183
By: Erin Brooks (Kellogg Class of ‘11), Edited By: Uri Kalir (Kellogg Class of ‘12)
Case tracker Fit Ques=ons
§ Industry: Industrial Goods
§ Level of Difficulty: Medium
§ Case Format: Improving Profitability; Cost ReducFon
§ Concepts Tested: - CompeFFve
Analysis - CreaFvity - OperaFons
Spend first 15 min on fit
§ Tell me about your greatest challenge, and how you overcame it.
§ What is the best way to deal with a difficult client who does not agree with your recommendaFons?
Guide to interviewer
§ The interviewee should examine the following MECE quesFons about the compeFFve dynamics of the industry: § Industry: What is the sales volume trend? What is the % of
demand and growth of OEM vs. anermarket segment? Is one of these segments more profitable than the other?
§ Compe5tors: Who are they? What is their relaFve market share? What are their prices vs. our clients’? What is their cost structure vs. our clients’? Do they have a technology or quality compeFFve advantage relaFve to our client?
§ Revenue: How have our clients’ prices changed in recent years? Have they declined across all customers and products?
§ Costs: What trends is our client seeing in their cost structure? Increasing labor or material costs?

184
Clarifying answers and case guide
Clarifying answers to provide
Industry Characteris=cs/Market Economics - AutomoFve sales overall sFll growing
steadily, driven by emerging markets - AutomoFve manufacturing is leaving the
U.S. Client Characteris=cs - Client is currently one of the leaders in this
category - Client has U.S.-‐based manufacturing - Revenues have been slowly declining over
last 5 years - Client’s products are of a higher quality
than most Chinese compeFtors’ products Compe==ve Dynamics - AutomoFve OEM customers are looking to
reduce cost, driving increased price compeFFon among parts suppliers
Ques=ons and Hand-‐out Guide
1. What key quesFons would you ask an industry expert in order to be_er understand the reasons behind High Q’s declining profits?
2. The CEO of High Q wants to know if$100M in annual profits is achievable by 2014. What would you need to know in order to determine this? What data would you ask for?
3. What ways can you think of to increase revenues? What ways can you think of to reduce costs?
4. Our client is planning on implemenFng lean manufacturing across all 4 of its U.S. plants, in order to provide cost savings and increase profits. Hand out exhibit 1.
• The client is expecFng to produce 80% of 2010 volumes in 2014. They are also planning on reducing prices by 10% due to increased compeFFon.
• Lean manufacturing implementaFon across all plants will provide an addiFonal 20% savings in raw material, and 30% savings in labor.
• What is the change in profits the High Q CEO can expect from 2010 to 2014, based on this informaFon?
5. High Q ‘s CEO has also asked us to take a look at compeFFve dynamics among the automoFve OEMs, in order to predict any increase in profits from increased sales. Hand out exhibits 2 and 3.
• Based on the informaFon given, what do you expect High Q will see in addiFonal profits due to Toyota’s predicted 30% increase in market share in truck and SUVs?
6. Please summarize your findings to the CEO, including any other potenFal opportuniFes to increase High Q’s profits over the next few years.

185
Solution and recommendations
Solu=on & Recommenda=ons
1. The interviewee should examine the following MECE quesFons about the compeFFve dynamics of the industry:
a) Industry: What is the sales volume trend? What is the % of demand and growth of OEM vs. anermarket segment? Is one of these segments more profitable than the other?
b) Compe=tors: Who are they? What is their relaFve market share? What are their prices vs. our clients’? What is their cost structure vs. our clients’? Do they have a technology or quality compeFFve advantage relaFve to our client?
c) Revenue: How have our clients’ prices changed in recent years? Have they declined across all customers and products?
d) Costs: What trends is our client seeing in their cost structure? Increasing labor or material costs?
2. In order to understand if $100M in profits by 2014 is achievable, you would need to know the annual qty of units sold, the selling price, and the clients’ fixed and variable costs. Profit = Q*(P-‐VC) – FC
3. The interviewee should come up with 2-‐3 ways each for cost reducFon and increasing revenues:
a) Reduce Cost: find alternaFve material sources, invest in process automaFon to reduce labor, consolidate mulFple manufacturing sites to reduce SG&A costs, relocate close to customers to reduce transportaFon costs.
b) Increase Revenue: segment customers to determine sensiFvity to price, increase markeFng in anermarket segment, negoFate long-‐term contracts with OEM customers.

186
Solution and recommendations (2)
Solu=on & Recommenda=ons
4. The interviewee should use the informaFon provided in Exhibit 1 to calculate the following profitability for each plant in 2014, and walk the interviewer through the calculaFon steps. It is important to first note that revenues, labor, and material will decrease by 20% due to the reduced quanFty output from each plant, plus the addiFonal 20% savings in material and 30% in labor. Revenue will decrease by an addiFonal 10%, in a cost cuong maneuver. Overhead costs will not change.
From this calculaFon, the interviewee should reference back to quesFon 2. Even with the lean manufacturing implementaFon, High Q is sFll a long way from the CEO’s goal of $100M in annual profits, and this is therefore not a realisFc target. A strong interviewee should note the importance of aligning a client’s expectaFons.
*all figures are in $ mill ion USD.Plant A Plant B Plant C Plant D
Revenues 72.0 72.0 72.0 72.0Labor 11.2 22.4 33.6 16.8Material 35.2 25.6 12.8 22.4Overhead 20.0 15.0 15.0 30.0Net Profits 5.6 9.0 10.6 2.8Total 2014 Profits 28.0Additional Profits 8.0

187
Solution and recommendations (3)
Solu=on & Recommenda=ons
5. The interviewee should be able to use the informaFon provided in the Exhibits to calculate the following revenue growth (“Sales” figures below are in units/vehicles). Rounded answers ($13 or $14M) are fine, given that interviewee has already demonstrated math proficiency.
6. The interviewee should concisely summarize the overall goal of the case (to increase High Q’s declining profitability due to new, low-‐cost compeFFon), and main findings from each quesFon, and a recommendaFon (yes, High Q should implement the lean manufacturing iniFaFve, while recognizing that this iniFaFve alone will not hit the CEO’s total profit goal in 2014). The interviewee should also generate a list of addiFonal opportuniFes that were not explored in the case, including:
a) ConsolidaFon of the 4 manufacturing plants (especially Plant D, with its high overhead costs)
b) Pursue growth in the anermarket segment of their business
c) Diversify their business into plasFc injecFon-‐molded parts for other industries (outside of automoFve), with less price compeFFon
2010 2014U.S. Auto Market 16,000,000 U.S. Truck & SUV Sales 3,200,000 Toyota Truck & SUV Sales 320,000 1,280,000 High Q's Toyota Qty. Sold 224,000 896,000 High Q's Toyota Revenues 4,480,000$ 17,920,000$ Additional Revenue 13,440,000$

188
Exhibit #1: High Q’s 2010 Financials, By Facility
*all figures are in $ mill ion USD.Plant A Plant B Plant C Plant D
Revenues 100 100 100 100Labor 20 40 60 30Material 55 40 20 35Overhead 20 15 15 30Net Profits 5 5 5 5

189
Exhibit #2: 2010 U.S. Automotive Market
38%
42%
20%
2010 U.S. Automotive Sales
Compact cars
Full-size cars
Trucks & SUVs
*Addi=onal Informa=on 2010 U.S. AutomoFve Sales = 16 Million vehicles

190
Exhibit #3: U.S. Automotive OEM Market
33% 31%
19%
10%7%
21% 20%
14%
40%
5%
0%5%
10%15%20%25%30%35%40%45%
Ford GM Chrysler Toyota Nissan
OEM Truck / SUV Market Share 2010-2014
20102014
*Addi=onal Informa=on High Q supplies 70% of Toyota's business Avg. Price of High Q products sold to Toyota = $20

191
Case 25: Salty Sole Shoe Co.
Case tracker
§ Industry: Retail Apparel
§ Level of Difficulty: Medium
§ Case Format: Improving profitability
§ Concepts Tested: - CreaFvity - AccounFng - Microeconomics
Case Ques=on
§ Your client is a large retail-‐focused private equity firm that owns Salty Sole, a leading designer of junior women’s footwear, primarily targeFng the 14 – 22 year old age group. Salty Sole was purchased last year by the private equity firm expecFng to realize substanFal profits upon sale in 2012 by increasing the company’s EBITDA. The situaFon, however, is that due to a current recession, annual profit has only grown modestly post the acquisiFon and is not on track to generate the double-‐digit returns that the private equity firm originally anFcipated.
§ How can the company increase profitability and achieve the private equity firm’s return on investment objec5ves?
Fit Ques=ons
Spend first 15 min on fit
§ Tell me about a problem you faced in your professional life, how you resolved it, and what the results were.
§ Tell me about a Fme when you worked in a contenFous or high-‐stress situaFon and how you handled it.
Guide to interviewer
§ The case primarily tests an understanding of profitability and profitability growth strategies
§ Begin by reading the case quesFon and asking the interviewee to take a few moments and then explain how they would like to proceed in the client’s problem
Quants.
Structure
CreativityAcct.Micro.
7
6
By: Meredith Tierney (Kellogg Class of ’11), Edited By: Uri Kalir (Kellogg Class of ‘12)
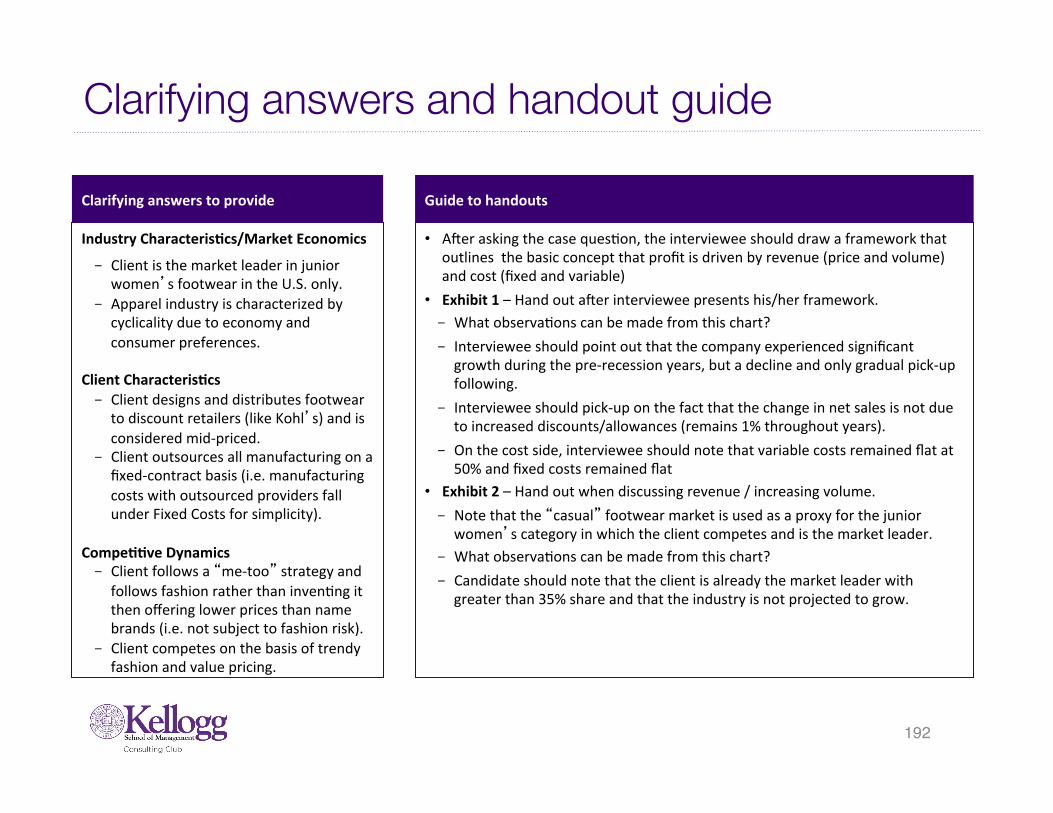
192
Clarifying answers and handout guide
Guide to handouts
• Aner asking the case quesFon, the interviewee should draw a framework that outlines the basic concept that profit is driven by revenue (price and volume) and cost (fixed and variable)
• Exhibit 1 – Hand out aner interviewee presents his/her framework. - What observaFons can be made from this chart? - Interviewee should point out that the company experienced significant
growth during the pre-‐recession years, but a decline and only gradual pick-‐up following.
- Interviewee should pick-‐up on the fact that the change in net sales is not due to increased discounts/allowances (remains 1% throughout years).
- On the cost side, interviewee should note that variable costs remained flat at 50% and fixed costs remained flat
• Exhibit 2 – Hand out when discussing revenue / increasing volume. - Note that the “casual” footwear market is used as a proxy for the junior
women’s category in which the client competes and is the market leader. - What observaFons can be made from this chart? - Candidate should note that the client is already the market leader with
greater than 35% share and that the industry is not projected to grow.
Clarifying answers to provide
Industry Characteris=cs/Market Economics
- Client is the market leader in junior women’s footwear in the U.S. only.
- Apparel industry is characterized by cyclicality due to economy and consumer preferences.
Client Characteris=cs - Client designs and distributes footwear
to discount retailers (like Kohl’s) and is considered mid-‐priced.
- Client outsources all manufacturing on a fixed-‐contract basis (i.e. manufacturing costs with outsourced providers fall under Fixed Costs for simplicity).
Compe==ve Dynamics - Client follows a “me-‐too” strategy and
follows fashion rather than invenFng it then offering lower prices than name brands (i.e. not subject to fashion risk).
- Client competes on the basis of trendy fashion and value pricing.

193
Key elements to analyze
Costs
§ Using Exhibit 1, have a quick discussion about the company’s cost structure.
Revenue
§ Once interviewee determines that cost is not the issue, have a discussion on the components of revenue – price and volume.
Notes to interviewer
• Fixed: Interviewee should note that fixed costs are not extremely high (about 23-‐25%), but could be an area for improvement. Ask how interviewee would reduce fixed costs? Examples include: renegoFate contracts, find cheaper manufacturing partners, etc.
- State that in-‐fact fixed costs cannot be adjusted based on the company’s research.
• Variable: Interviewee should note that variable costs are approximately 50% of sales. Ask how interviewee would think about reducing variable costs? Examples include: reduce labor/sales force, use technology, renegoFate / volume purchase materials
- State that variable costs are currently at the lowest possible rates based on market research.
Notes to interviewer
§ Price: Interviewee should ask if pricing has remained constant over Fme or if the company has adjusted its pricing to reflect lower consumer discreFonary income.
§ Ask what consideraFons the interviewee would have when considering adjusFng price?
§ Answers should be price sensiFvity / elasFcity, cost structure, brand equity (dilute brand through price decrease but compete with more upscale brands if increase).
§ State that pricing has remained constant at an average of $25/unit. The company has determined that it would not be prudent to adjust pricing based on industry research. Interviewee can now determine the number of pairs of shoes sold for later in the case.

194
Key elements to analyze
Revenue (cont’d)
§ Now that the interviewee has hopefully zeroed-‐in on the fact that the issue is volume, ask how many units must be sold by 2012 in order for the private equity firm to achieve a 20% return on the investment in Salty Sole Shoe, which equals approximately $300 million sale value (give this number). Note that interviewee should ignore discounts/allowances for simplicity.
Notes to interviewer
• Interviewee should determine that if the sale value needs to be $300mm in 2012, then EBITDA will need to be $300 / 6.5 = $46.15 (round up to $50 million).
• The formula to determine how many pairs of shoes must be sold to reach that EBITDA level is as follows:
• $50,000,000 = $25*v – (.5 * 25 * v) – 15,000,000 • $65,000,000 = 12.5v • V = 5,200,000 pairs of shoes
• Interviewee should note that this is more than double the 2008 and 2009 volume levels.
• Ask what the interviewee would want to know to determine if this volume is feasible? Answer: market size / share.
Market Size
• Show the candidate Exhibit 2 when he/she notes that market size/share would be helpful.
• Candidate should note that the client is already the market leader with greater than 35% and that the market size is not projected to increase.
• This should lead to the conclusion that the client can increase volume by stealing share and/or new products in other categories.

195
Solution and recommendations
Solu=on & Recommenda=ons
§ The interviewee should zero-‐in on the fact that since cost-‐structure is fixed and price is also fixed, volume is the only real way to increase profitability.
§ However, volume must more than double in order to achieve the growth desired by the private equity firm for a 20% return, which could be difficult given recession and the fact that the industry as a whole isn’t growing.
§ Interviewee should recommend potenFals strategies for achieving that volume growth while outlining the risks of each: 1) Volume: new products / geographies / distribuFon channels (internaFonal?); increase markeFng to steal share; acquire growth (brands); adjust product mix to higher-‐margin products. 2) Price: add value / features. 3) Risks: Capacity, cannibalizaFon if new products.
Bonus/Guide to an Excellent Case
§ An excellent interviewee will quickly idenFfy that volume is the issue by Fcking through the parts of the profitability equaFon.
§ An excellent interviewee will also ask about product mix and quesFon the 50% gross margin. Interviewer should note that it’s assumed that all products have the same margin, but that’s a great quesFon.
§ An excellent interviewee will also note that since the company is not projected to have to adjust discounts / allowances, then it probably has a good product that is highly-‐valued by customers and/or this may be aggressive projecFng.

196
Exhibit #1: Client Financial Estimates
Salty Sole Financial Estimates($ in millions)
2006A 2007A 2008A 2009E 2010E 2011E 2012E
Sales 50.00 65.00 60.00 61.00 62.00 65.00 70.00Less: Discounts/Allowances (0.50) (0.65) (0.60) (0.61) (0.62) (0.65) (0.70)Net Sales $49.50 $64.35 $59.40 $60.39 $61.38 $64.35 $69.30% Increase / Decrease 20.0% 30.0% (7.7%) 1.7% 1.6% 4.8% 7.7%
Cost of Goods Sold 24.75 32.18 29.70 30.20 30.69 32.18 34.65Fixed Costs 15.00 15.00 15.00 15.00 15.00 15.00 15.00Total Costs 39.75 47.18 44.70 45.20 45.69 47.18 49.65
EBITDA $9.75 $17.18 $14.70 $15.20 $15.69 $17.18 $19.65Sale Multiple 6.50x 6.50x 6.50x 6.50x 6.50x 6.50x 6.50xPurchase/Sale Price $111.64 $95.55 $98.77 $101.99 $111.64 $127.73Return on Investment 2.7%
Note: Acquisition occurred on December 31, 2006.

197
Exhibit #2: Market Size and Share
0%
10%
20%
30%
40%
50%
60%
70%
80%
90%
100%
2006 2007 2008 2009
Percen
t Market S
hare
U.S. Casual Footwear Market Size and Share
$56B $58B $57B $58BCompetitor 5
Competitor 4
Competitor 3
Competitor 2
Competitor 1
Salty Sole

198
Case 26: Plastic World
Case tracker Fit Ques=ons
§ Industry: Financial Services
§ Level of Difficulty: Medium
§ Case Format: M&A § Concepts Tested:
- OrganizaFonal changes
- Market share - Customer strategy
Case Ques=on
§ Our client is a private equity firm interested in PlasFcWorld, a plasFc packaging manufacturer.
§ Plas5cWorld’s owners are reques5ng $25M. The offer is final. Should our client buy?
Spend first 15 min on fit
§ Tell me something about yourself that is not listed on your resume.
§ What was the most difficult problem you solved in your previous job, business-‐wise?
Guide to interviewer
§ The case primarily tests the ability to gain insight from quan=ta=ve data , value a company and find poten=al improvements… As such, it is a liFle bit more data-‐driven than the average case.
§ The interviewee should focus on the company value – the recommendaFon regarding the offer depends on it – and on feasibility of idenFfied profit-‐improving changes.
§ The interviewee should be able to come up with the key improvements if (s)he invests some effort in understanding the price drop and its relaFonship to the sales force incenFves. S(he) should also come up with innovaFon-‐related costs from the pressure from the customers and how to push back.
Quants.
Structure
Org. Chg.Mkt. ShareCust. Stgy
3
4
By: Milija Medic, Edited By: Peter Manoogian (Kellogg Class of ‘12)

199
Clarifying answers and case guide
Guide to handouts
Begin by handing out exhibit #1 aner staFng the case quesFon.
Exhibit 1 – Hand out aner introducing case - What observaFons can be made from this P&L statement? - Interviewee should calculate the profit margin (-‐6%), noFce that
sales volume is growing but revenues are dropping, and infer that the cause may be pricing (more detail on next page)
- To check if it’s an industry-‐wide or company-‐specific drop in profitability, they should request compe55on profitability data
Exhibit 2 – Hand out if the candidate requests compeFFon data - Note that it’s a company-‐specific problem - Push the interviewee to postulate what would be a realisFc profit
margin goal for PlasFcWorld based on this industry profitability data (more detail on next page)
Exhibit 3 – Hand out aner discussion of Exhibit 2 - SensiFvity analysis indicates that the company would be worth the
offered $25M if the profit margin was brought from –6% to 0% - Interviewee should invesFgate the profitability drop and the low
prices further and suggest opFons to get PlasFcWorld’s profitability in line with the industry, and their feasibility
Clarifying answers to provide
Plas=cWorld Characteris=cs - Makes plasFc packaging for beverages,
cosmeFcs, household and automoFve chemicals
- Products are top quality, they have 350 sets of molds, with different materials, finish, colors, always innovaFng
- Overall product mix has not changed in recent years
- The sales force is “the best in breed”, they hold market share, and they are compensated on market share
- Two years ago they invested further in equipment for product innovaFon
Customers - PlasFcWorlds’ customers exhibit strong
loyalty
- They are experiencing increasing pressures in their industries to innovate the plasFc packaging
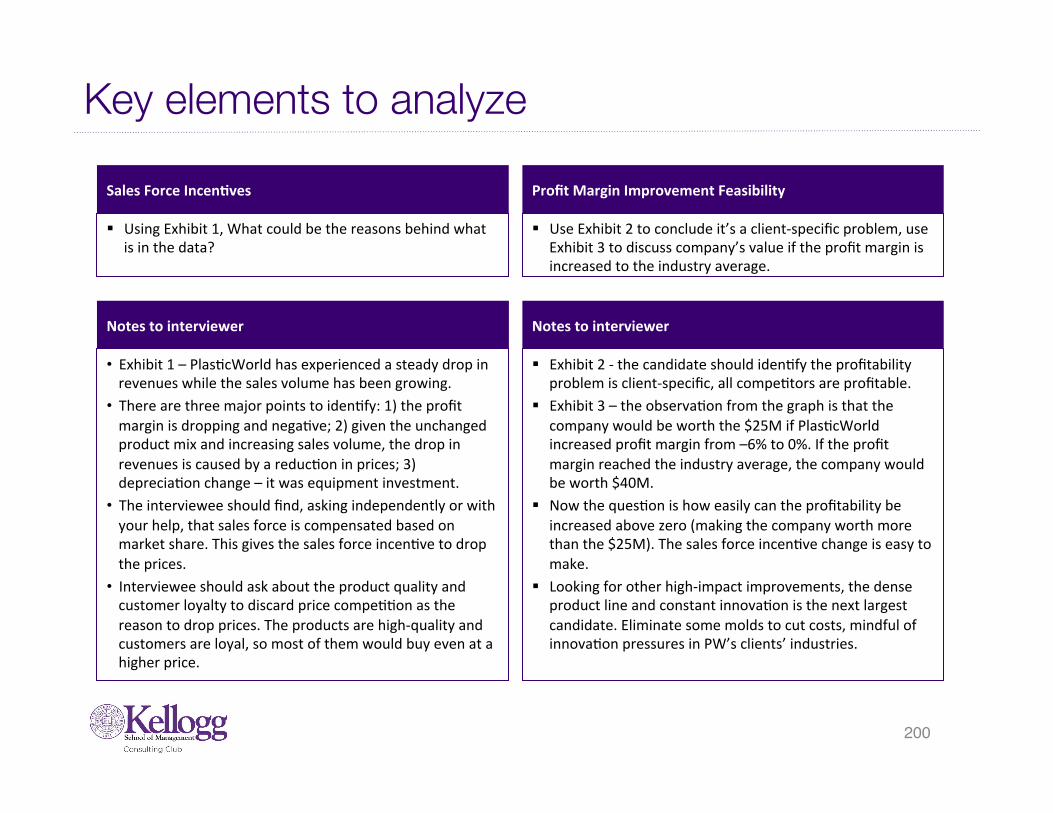
200
Key elements to analyze
Sales Force Incen=ves
§ Using Exhibit 1, What could be the reasons behind what is in the data?
Profit Margin Improvement Feasibility
§ Use Exhibit 2 to conclude it’s a client-‐specific problem, use Exhibit 3 to discuss company’s value if the profit margin is increased to the industry average.
Notes to interviewer
• Exhibit 1 – PlasFcWorld has experienced a steady drop in revenues while the sales volume has been growing.
• There are three major points to idenFfy: 1) the profit margin is dropping and negaFve; 2) given the unchanged product mix and increasing sales volume, the drop in revenues is caused by a reducFon in prices; 3) depreciaFon change – it was equipment investment.
• The interviewee should find, asking independently or with your help, that sales force is compensated based on market share. This gives the sales force incenFve to drop the prices.
• Interviewee should ask about the product quality and customer loyalty to discard price compeFFon as the reason to drop prices. The products are high-‐quality and customers are loyal, so most of them would buy even at a higher price.
Notes to interviewer
§ Exhibit 2 -‐ the candidate should idenFfy the profitability problem is client-‐specific, all compeFtors are profitable.
§ Exhibit 3 – the observaFon from the graph is that the company would be worth the $25M if PlasFcWorld increased profit margin from –6% to 0%. If the profit margin reached the industry average, the company would be worth $40M.
§ Now the quesFon is how easily can the profitability be increased above zero (making the company worth more than the $25M). The sales force incenFve change is easy to make.
§ Looking for other high-‐impact improvements, the dense product line and constant innovaFon is the next largest candidate. Eliminate some molds to cut costs, mindful of innovaFon pressures in PW’s clients’ industries.

201
Solution and recommendations
Solu=on & Recommenda=ons
§ Our client should accept the $25M offer and boost the profitability (and value) of PlasFcWorld.
§ The client should engage in the following easy-‐to-‐implement changes:
§ Compensate sales force based on company earnings instead of market share.
§ Simplify the product line -‐ eliminate some of the 350 molds to cut costs while leveraging the superior sales force to maintain client saFsfacFon.
§ Examine the industry best pracFces to find other areas for improvement.
Bonus/Guide to an Excellent Case
§ An excellent interviewee will quickly idenFfy the pricing as the issue behind the revenue decrease and lay out potenFal causes for the price drop, finding the sales force incenFve.
§ AddiFonally, a strong interviewee will immediately noFce that the company would be worth more than $25M if its profit margin was at the level of industry average.
§ A framework comprehensive enough to find the product line size problem would be a plus.

202
Exhibit 1: PlasticWorld P&L statement in the past three years
2009 2008 2007Sales ($) 18,824,000 19,180,000 19,650,000Volume (units) 36,200,000 34,250,000 32,750,000COGS ($) 9,050,000 8,900,000 8,650,000SG&A ($) 7,500,000 7,200,000 7,300,000Depreciation ($) 3,450,000 3,450,000 2,250,000EBIT ($) -1,176,000 -370,000 1,450,000
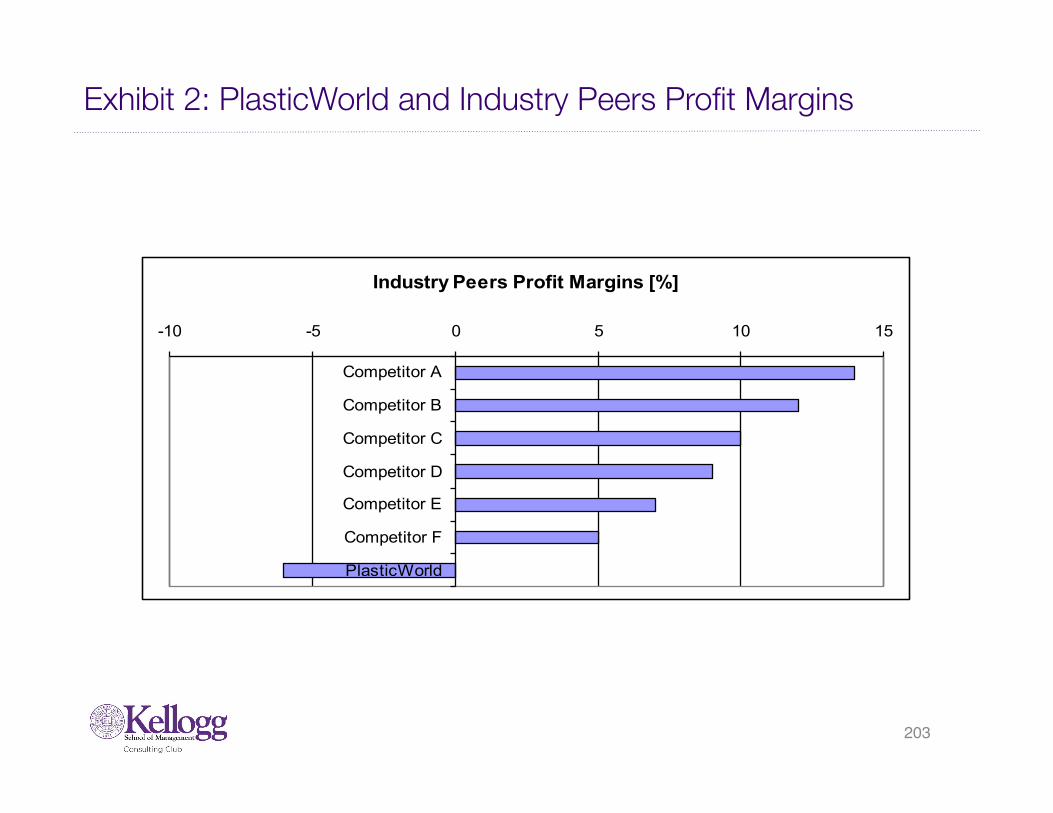
203
Exhibit 2: PlasticWorld and Industry Peers Profit Margins
Industry Peers Profit Margins [%]
-10 -5 0 5 10 15
Competitor A
Competitor B
Competitor C
Competitor D
Competitor E
Competitor F
PlasticWorld

204
Exhibit 3: PlasticWorld Valuation by Profit Margin
PlasticWorld Valuation Sensitivity Analysis
0
5
10
15
20
25
30
35
40
45
50
-10 -5 0 5 10 15
profit margin [%]
com
pany
val
uatio
n [$
M]

205
Case 27: Zoo Co.
Case tracker Fit Questions
§ Industry: Financial Services
§ Level of Difficulty: Medium
§ Case Format: M&A § Concepts Tested:
- Investments
- Break-‐even Analysis - Basic NPV
Case Question
§ Our client is a zoo that is thinking about acquiring a famous zebra from an African preserve.
§ It’s a huge investment, but they believe the new zebra would be a great contribuFon to their animal community. You have been engaged to help decide whether this is a good idea. What would you consider when trying to help your client make this decision?
Spend first 15 min on fit
§ Describe a recent unpopular decision you made. What was the result?
§ Tell me about a successful business relaFonship you built with a client, boss, or peer in your previous job.
Guide to interviewer
§ Even though the client is a Zoo, we're undertaking a similar process to what is done when underwriFng an insurance policy. The case evaluates basic concepts, but involves many calculaFons and use of financial and assessment techniques.
§ Key case objecFves: 1. Investment ValuaFon – Walk through the
valuaFon process for an asset 2. Breakeven Analysis – Determine the revenue
increase needed for a posiFve NPV 3. Risk Assessment – Should the zoo should use an
insurance contract to hedge downside risk? § Rounding numbers is generally okay but should not be
done to the extreme as it will alter the results
Quants.7
Structure
5
Invest.B/E
Basic NPV
By: Aneri Jambusaria (Kellogg Class of ’11), Edited By: Ron Mantel (Kellogg Class of ‘15)

206
Zoo Co: Clarifying answers and case guide Guide to case / Guide to handouts
• The interviewee should think about performing a break even and a sensibility analysis. Anerwards, they need to think about performing a risk assessment (only when you reach this point you should deliver exhibit 1)
• They should start by asking about the benefits and costs associated with zebra acquisiFon (Len)– Share with interviewee aner probing quesFons are received
• Using the data on the len to calculate benefit to zoo from acquisiFon – Determine whether or not this zebra purchase makes financial sense for the zoo, using the NPV value
• Using the cost and benefit data provided, the interviewee should calculate the NPV of the acquisiFon
• Assume that a;endance benefits are realized immediately and maintained thereaJer - Annual benefits = (300K)*($15)*(0.08) = $360K - Upfront costs = $235K + $850K + $110K = $1.195M - Annual costs = $90K - NPV = -‐$1,195K+(($360K -‐ $90K)/0.20) = $155K
• ConFnue by asking quesFons in next page
Clarifying answers to provide
Data to provide when asked - 300K people visit the zoo yearly - Admission is $15 - Benefits from acquisiFon could lead to
increased a_endance. Another zoo that acquired a similar zebra had an 8% increase
Costs from zebra acquisiFon - Immediate costs: acquisiFon fees,
transportaFon costs, and new faciliFes. - Food, health costs and addiFonal trainers
are part of annual maintenance costs - AcquisiFon cost: $235K - New faciliFes: $850K - TransportaFon: $110K - Annual maintenance: $90K - Discount rate = 20% Assume that
immediate cost are paid today, and annual costs and benefits are realized beginning next year and sustained into perpetuity, even thought the Zebra will not live on to perpetuity

207
Zoo Co: Key elements to analyze
Break-‐even analysis
§ Zoo Co. is concerned about using the other zoo’s a_endance benefits as a proxy. They think that a_endance could increase by less than 8%. What analysis could you perform to address their concerns? What is the breakeven a_endance increase required?
Risk assessment
§ Since the zoo is very risk-‐averse, they’re interested in hedging some of their downside risk. An insurance company has offered to provide the Zoo with a constant revenue to increase revenue to $250,000 per year if a_endance increases are less than or equal to 5% (if revenue is $135K, the insurance will give the Zoo, $115K. In exchange, the insurance company wants the zoo to pay 1% of the zoo’s total annual revenues as a premium. What might you do to determine if this was a good deal?
Notes to interviewer
§ The interviewee should determine that a sensiFvity / breakeven analysis of the NPV calculaFon with lower a_endance increases will help confirm that the project sFll makes sense
§ See calculaFons page
Notes to interviewer
§ The interviewee should recognize that addiFonal informaFon is needed, and that a market research study could aid in this process
§ Hand out Exhibit 1 aner the interviewee idenFfies this noFon
§ The interviewee should use the market research to determine the probable a_endance increase
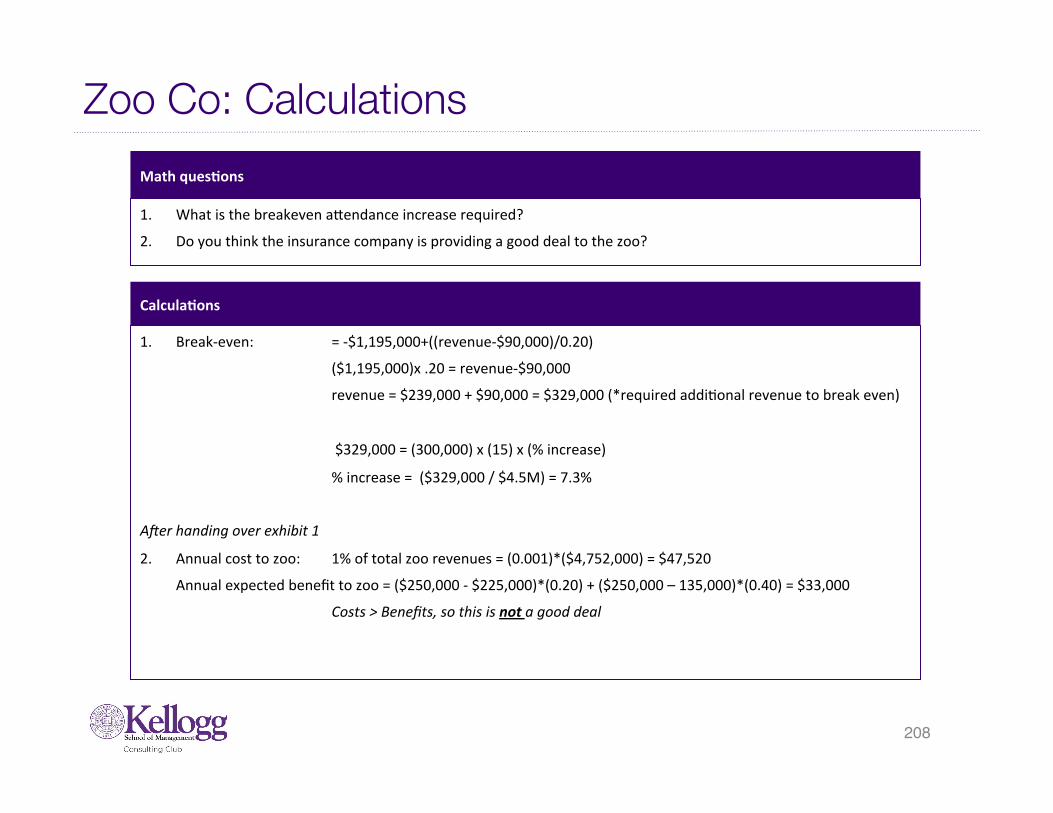
208
Zoo Co: Calculations Math ques=ons
1. What is the breakeven a_endance increase required?
2. Do you think the insurance company is providing a good deal to the zoo?
Calcula=ons
1. Break-‐even: = -‐$1,195,000+((revenue-‐$90,000)/0.20)
($1,195,000)x .20 = revenue-‐$90,000
revenue = $239,000 + $90,000 = $329,000 (*required addiFonal revenue to break even)
$329,000 = (300,000) x (15) x (% increase)
% increase = ($329,000 / $4.5M) = 7.3%
AJer handing over exhibit 1
2. Annual cost to zoo: 1% of total zoo revenues = (0.001)*($4,752,000) = $47,520
Annual expected benefit to zoo = ($250,000 -‐ $225,000)*(0.20) + ($250,000 – 135,000)*(0.40) = $33,000
Costs > Benefits, so this is not a good deal

209
Zoo Co: Solution and recommendations
Solu=on & Recommenda=ons
§ It is unlikely that the zebra acquisiFon is a good idea for the zoo to undertake given the informaFon provided. At other zoos, a_endance has gone up substanFally due to a new zebra; however, based upon our market research, it seems less likely that we can breakeven on the investment through increased a_endance. We have received an insurance contract to help miFgate some of the downside risk; however, it is too expensive to create value.
§ In order to make the investment more palatable, we may consider negoFaFng with the insurance company to either increase the revenue benefits provided or decrease the premium cost.
Bonus/Guide to an Excellent Case
Excellent cases will:
§ IdenFfy that we can use another zoo's a_endance increases as a proxy for esFmaFng our own a_endance increases
§ NoFce in Exhibit 1 that it is unlikely that a_endance will increase sufficiently enough for the zoo to break even
§ NoFce that the insurance company's premiums and benefits are both impacted by a_endance increases; so if a_endance increases are always greater than 5%, the zoo will be paying even more but geong no benefit
§ NoFce that the insurance company's contract is essenFally an opFon; so a different structure to the contract may be more suitable for the zoo

Exhibit 1: Market Research Findings
210
Exhibit 1: Market research findings
3% Increase $135,000 20%
5% Increase $225,000 40%
7% Increase $315,000 30%
9% Increase $405,000 10%
Expected Additional Annual Revenue
$252,000
Plus: Current Annual Revenue
$4,500,000
Expected Total Annual Revenue
$4,752,000
Possible Attendance Increases
ProbabilityAnnual Revenue
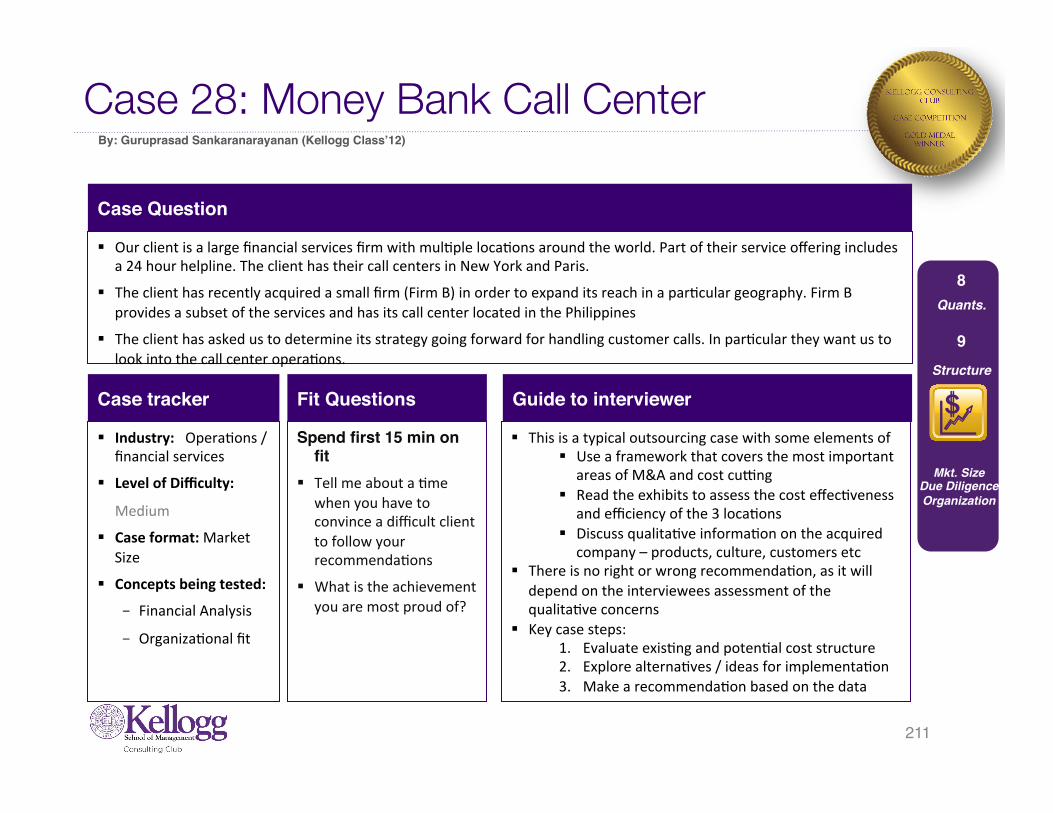
211
Case 28: Money Bank Call Center
Case tracker Fit Questions
§ Industry: OperaFons / financial services
§ Level of Difficulty:
Medium
§ Case format: Market Size
§ Concepts being tested: - Financial Analysis - OrganizaFonal fit
Case Question
§ Our client is a large financial services firm with mulFple locaFons around the world. Part of their service offering includes a 24 hour helpline. The client has their call centers in New York and Paris.
§ The client has recently acquired a small firm (Firm B) in order to expand its reach in a parFcular geography. Firm B provides a subset of the services and has its call center located in the Philippines
§ The client has asked us to determine its strategy going forward for handling customer calls. In parFcular they want us to look into the call center operaFons.
Spend first 15 min on fit
§ Tell me about a Fme when you have to convince a difficult client to follow your recommendaFons
§ What is the achievement you are most proud of?
Guide to interviewer
§ This is a typical outsourcing case with some elements of § Use a framework that covers the most important
areas of M&A and cost cuong § Read the exhibits to assess the cost effecFveness
and efficiency of the 3 locaFons § Discuss qualitaFve informaFon on the acquired
company – products, culture, customers etc § There is no right or wrong recommendaFon, as it will
depend on the interviewees assessment of the qualitaFve concerns
§ Key case steps: 1. Evaluate exisFng and potenFal cost structure 2. Explore alternaFves / ideas for implementaFon 3. Make a recommendaFon based on the data
Quants.8
Structure
9
Mkt. SizeDue DiligenceOrganization
By: Guruprasad Sankaranarayanan (Kellogg Class’12)

212
Clarifying answers and case guide
Guide to case / Guide to handouts
Case structure – The interviewee should dran in a couple of minutes a framework that covers the most important areas in this case. § Op=ons
§ No changes – maintain all 3 call centers § Close Firm B’s call center and route calls to one of the exiFng
locaFons § Consolidate to a single locaFon
§ Company § Comparison of services offered at the 3 call centers / product
mix § Metrics for evaluaFng call center performance (cost / call,
calls / rep etc)
Specifics to outsourcing – The interviewee should include specific concerns to the industry such as employment regulaFons, quality of call, infrastructure capabiliFes etc
Clarifying answers to provide
The following informaFon can be provided to the interviewee if asked: Client Characteris=cs - Provides full range of financial services
for individuals and small organizaFons - Acquired firm was started 5 years ago
and is sFll run by the original founders
Nature of call center - New employees are college graduates
with basic knowledge of financial services and products
- Fluency and English and several European languages required
Regulatory environment - Very difficult to lay off employees in the Paris locaFon – significant costs will be incurred - Philippines government encourages investment in the country – significant tax advantage possible

213
Key elements to analyze
Outsourcing
§ Compare the efficiency of the 3 locaFons – possible explanaFons for variance § IdenFfy the cost effecFve opFon – how is this impacted by integraFon cost
Note to interviewer
§ When asked, the interviewer should provide data from exhibit 1. Key takeaways from the exhibit are: § Total cost incurred by the 2 firms is $9.6M § Philippines can process 20 calls / employee / day (200 days per year) at $6 per call § Currently, we have space, infrastructure necessary to expand. Assume overhead is variable in this
case. To process total call volume Philippines will need 250 employees to handle the traffic – total cost including overheads is $6.0M. Total cost savings from closing centers is $7.8M, net = $1.8M
§ The interviewee should realize that this does not account for all the costs, including hiring and training costs. When prompted inform the interviewee about a 1 Fme cost of $5M (includes severance for NY and Paris, expanding the Philippines facility) implying that the move is not profitable
Calls / employee Cost / call
New York 40 7
Paris 33.3 9
Philippines 20.0 6

214
Key elements to analyze (contd.)
Outsourcing
§ Prompt the interviewee to explore ways to make outsourcing to Philippines feasible § Inform the interviewee that the CEO requires our soluFon to be at least cost neutral by year 2
Note to interviewer
§ The interviewee needs to idenFfy the difference in calls/employee between the New York and Philippines locaFons
§ Ask the interviewee to assume that the best pracFces can be transferred and implemented within 3-‐6 months
§ PotenFal cost savings if Philippines achieves same effecFveness as New York § # employees required = 1.3M calls / 40 (calls / employee ) * 200 (days / year) = 163 § New employee cost is 3.25M § Ask interviewee to assume overheads double which results in total cost of 3.85M
§ Other quesFons interviewee needs to consider § Does Philippines has sufficient space and capacity to handle the expansion § Will the client be able to acquire sufficient talented personnel within the short Fme
frame § Customer saFsfacFon with the new locaFon? § Legal constraints / requirements in NY and Paris – how quickly can we lay off the staff

215
Solution and recommendations
Solu=on & Recommenda=ons
§ This is an open ended case. The interviewee needs to jusFfy the recommendaFon based on the qualitaFve consideraFons.
§ A good recommendaFon would include 3 secFons:
1. RecommendaFons: if the recommendaFon to outsource the interviewee needs to highlight the risks associated with outsourcing and nature of the acquired firm. If the recommendaFon uses any other approach sufficient jusFficaFon needs to be given to overcome the cost savings
2. Risks • Risks associated with increasing capacity ~100% -‐ people, infrastructure, service quality , gaps in
knowledge transfer, organizaFonal changes etc
• ReputaFonal impact -‐ do customers noFce difference in service, can the compeFtor leverage this to steal customers?
3. Next steps: If outsourcing, some of the next steps would be analyzing the infrastructure requirements and capabiliFes, finding the right talent, ensuring smooth transfer and implementaFon of best pracFces etc.
Bonus/Guide to an Excellent Case
§ Excellent interviewees need to address the qualitaFve informaFon provided in the case: nature of merger, nature of markets being served etc.
§ The interviewee should explore the opFon of improving effecFveness of the Philippines locaFon without being prompted to do so.

216
Exhibit 1
Center Call / year Employee cost / year
($)
Overhead cost/year
# Employees
New York 600,000 50,000 450,000 75
Paris 400,000 50,000 600,000 60
Philippines 300,000 20,000 300,000 75
Call center performance – FY2010

217
Case 29: Thompson Healthcare
Case tracker Fit Ques=ons
Case Ques=on
§ Our client is Thompson Healthcare, a health insurance firm located in the Midwest.
§ Customers pay Thompson a fixed monthly premium per person covered under the plan. In exchange, Thompson pays for all health services that each member requires (e.g., physician care, prescripFon medicaFons, hospitalizaFon).
§ In recent years, Thompson’s financial and compeFFve posiFon has begun to erode, and the CEO has retained our firm to help them determine what is causing the problem and how to fix it.
Guide to interviewer
By: Aaron Mowery (Kellogg Class of ‘13)
§ Industry: Healthcare § Level of Difficulty:
Medium
§ Case format: Cost reducFon
§ Concepts being tested: - Cost management
- Sales channel strategy
- Economic value analysis
Spend first 15 min on fit
§ Tell me about a Fme when you failed.
§ Share me a Fme when you faced a difficult situaFon in a team and how you solved this .
Read to the Interviewee before beginning: This case is based on a real McKinsey study, and has been forma_ed as a McKinsey-‐style structured case. Before asking you any quesFons about the case, I will give you the background that you will need. There are a number of issues that I would like to cover with you today; please do not be surprised if I seem to change topics abruptly.
Quants.8
Structure
9
ProfitabilitySales
Channel strategy

218
Clarifying answers and case guide Guide to case / Guide to handouts Clarifying answers to provide
§ State the informaFon to the len aner reading the iniFal prompt, the interviewee should be able to develop a variant of the following quesFon:
How can Thompson Healthcare reduce its total cost to serve its policy holders?
§ Ideally, the interviewee should be able to break down the quesFon into two parts:
1. Managing medical costs 2. Managing administraFve costs
§ This case is forma_ed as a McKinsey-‐style structured case. You should
ask the interviewee the quesFons on pages 3-‐7 of this case directly and move on to the next page when the interviewee has answered the quesFon sufficiently.
Client CharacterisFcs • Thompson Healthcare is a mutual insurance
company, meaning all of its profits are returned to members in the form of lower premiums the following year. As such, Thompson does not seek to maximize profit – it seeks to minimize cost.
• Thompson’s prices reflect underwriFng of risk and the underlying cost to serve a customer
CompeFFve Dynamics • Market share is steady, despite presence of
major naFonal health insurance company in the market (United Healthcare -‐ UHC).
• UHC has a 30% market share. • UHC typically expects to earn a 5% profit
margin.
Local industry CharacterisFcs/Economics • The naFonal average rate of medical cost
inflaFon is 10% over the past five years. • Thompson has seen medical cost inflaFon
of 12% over the past five years. • UHC has seen medical cost inflaFon of 10%
over the past five years.

219
Key elements to analyze
Problem structure
What factors would you consider in order to understand Thompson’s eroding financial posiFon?
Note to interviewer
§ The interviewee should lay out a structure for analyzing the case. § The interviewee could have determined that revenue is not relevant to this case based on
informaFon given in the iniFal prompt on page 1 and 2, so the interviewee should focus on cost.
§ Costs in this case break out into fixed costs and variable costs: § Variable costs (medical costs – claims made by policyholders) § Fixed costs (administraFve costs – e.g., markeFng & sales, underwriFng, finance, HR)
§ Specifically, we will need to understand how these costs have changed in recent years.
1

220
Key elements to analyze
Ini=al hypothesis
Medical costs are the largest component of Thompson’s costs. However, Thompson’s medical costs are increasing faster than the naFonal average. What are some potenFal reasons why this is taking place? What potenFal opportuniFes could you explore to reverse this trend?
Note to interviewer
§ Medical cost = (Number of claims) * (Cost per claim) § PotenFal answers include:
§ DeducFbles are low, leading members to see doctors for minor medical issues -‐> increase deducFbles to make members more conscious of costs
§ Thompson pays more for procedures than average -‐> conduct benchmarking study to determine what compeFtors charge for various procedures
§ Thompson insures an older populaFon than average -‐> increase markeFng efforts toward younger customers
§ Thompson insures a sicker populaFon than average -‐> enhance wellness programs
2

221
Key elements to analyze Second hypothesis
In addiFon to medical costs, administraFve costs for Thompson are also higher than average. The biggest driver of this phenomenon is a high cost of sales. Thompson’s policies are sold through independent agents. All independent agents work with a “General Agency” which acts as a sales support organizaFon. How much does Thompson pay in commissions each year? What are some potenFal approaches Thompson could take to reduce its cost of sales? What potenFal strategic issues exist with these approaches?
Note to interviewer
AddiFonal informaFon to provide aner interviewee explains how they would calculate commission expense § Commission (10% of annual premiums) is paid to the General Agency, which passes a share to the independent
agent. Total commission paid is, on average, $25 per agent, per month. § Interviewee should idenFfy the need for # of agents. Give the number 500,000 if asked. § Total commission expense = $25 * 500,000 * 12 = $150,000,000 § PotenFal approaches to reduce cost of sales:
§ Reduce commission percentage § Cap commission to a certain level per year § Change commissions structure from percent of premium to flat fee (percent of premium increases at the rate
of medical cost inflaFon every year)
§ PotenFal risks with these approaches: § Agents could shin business from Thompson to another carrier that pays higher commission § Agents would lose incenFve to sell if their commission is capped
3

222
Key elements to analyze
Next level of analysis
The team has decided to pay a flat commission directly to agents, and to pay the General Agencies a separate fee for the support services they provide to agents. If the total commission paid to both parFes is set at $20 per member per month, what share should be given to the General Agencies? (If interviewee is unsure of “what share” means, explain they should find the maximum amount that should be allocated to the General Agencies.)
Note to interviewer
Addi=onal informa=on § General Agencies perform three acFviFes: training, applicaFon processing, and performance management. § If Thompson were to perform these acFviFes internally, they would cost:
§ Training: $6,000,000 § ApplicaFon processing: $9,000,000 § Performance management: $15,000,000
Poten=al approach § The total cost of the acFviFes that General agencies perform is $30,000,000 (=$6,000,000 + $9,000,000 +
$15,000,000). § There are 500,000 members and 12 months in a year. § The maximum amount of money Thompson should be willing to pay the General Agencies for the acFviFes
performed is the per member, per month cost of these acFviFes ($30,000,000 / (500,000 * 12) = $5
4

223
Wrap-up
Final recommenda=ons
Taking into account what you’ve learned thus far as well as your own addiFonal hypotheses, what iniFaFves would you recommend to the CEO at this point?
Note to interviewer
§ Our client should take acFon to reduce both medical costs and administraFve costs. § At this point, the interviewee should synthesize the findings from the interview into several
clear iniFaFves, for example: § Enhance markeFng efforts to a_ract more young customers and bring down the average
claims per member. § Conduct a benchmarking study to determine opportuniFes for reducFons in payments
for medical services. § Change the commission structure to flat fee per member per month. This achieves the
goal of reducing commission expense, while at the same Fme keeping an agent’s incenFve to sell more business.
§ Strong interviewees will demonstrate the ability to analyze issues using a clear structure and will draw out the implicaFons of their analysis. The quanFtaFve calculaFons in this case are elementary, but the process to get to them is somewhat more complicated.
5

CONTENTS
1 2 3 4 5
How to use this book Typical case flow Fit interview tips KCC 2014 cases Industry primers

225
Industry Research Overview
A tailored approach to industry research can help you prepare
§ Provides insight into industry-‐wide trends and revenue/cost drivers o Allows you to make a more nuanced framework or tack on an addiFonal piece of
industry-‐specific analysis o May point you toward sources of issues in cases o Can be helpful in Q&A with your interviewers about their own work
§ Spend your limited Fme well o No need for extensive research on industries in which you already have significant prior
experience or knowledge o Read high-‐level industry summaries (such as those on the following pages) to gauge
whether anything is completely new to you o Consider reading in-‐depth guides for industries that
o Are completely new to you o You seek to specialize in o You know will come up in interviews (e.g., due to industry focus of firm)

226
List of Industry Overviews
This sec=on includes brief overviews of 19 industries that are likely to come up in interviews
§ Banking and Financial Services
§ Media and Entertainment
§ Telecom
§ Retail
§ Household Durables
§ Household Non-‐durables
§ Restaurant
§ Non-‐alcoholic Beverages
§ Beer, Wine and DisFlled Spirits
§ Mining and Precious Metals
§ UFliFes
§ Industrial Goods
§ Energy
§ Airlines
§ AutomoFve
§ Online Services and Storage
§ Computer Sonware
§ Hardware and Digital Devices
§ Semiconductor
§ PharmaceuFcals
§ Medical Devices
§ Hospital FaciliFes
§ Healthcare Payers

227
Industrial Goods
• Large and diverse industry that provides products/services primarily used to produce other goods
• Main sectors – Electrical Equipment and
Components – Industrial AutomaFon/Heavy
Machinery – ConstrucFon and Engineering – Aerospace & Defense
• Key Players include: GE, Siemens, Cummins, Boeing, Lockheed MarFn, Northrop Grumman, Eaton, Honeywell, Raytheon, 3M, Caterpillar, Emerson Electric, Fluor, Tyco, Waste Management, Bosch Rexroth
Overview • Tighter consumer spending has led to reduced producFon and stagnant growth for the industry
• Industry has seen increasing consolidaFon over the past few years; Most sub-‐segments are Oligopoly
• Emerging markets are key for growth as they are quickly developing and increasing producFon capacity for a variety of goods
• Local assembly is common since components are easier to ship than finished goods
Trends Revenue • New Product InnovaFon • Product quality and reliability including aner-‐sales service
• Specialized products for various customer segments
Cost • Raw materials including oil, natural gas, metals,
• Human capital costs including engineers, labor/manufacturing force and sales force
• R&D
Drivers

228
Energy
Major E&P players like BP, ExxonMobil, Pertrobras, Aramco are involved in both upstream and downstream. Upstream Steps: 1. ExploraFon: Finding oil, including
geological exploraFon, research, and purchasing/leasing land. Offshore is leased from gov’ts through aucFons
2. Drilling. Companies drill exploratory wells to determine size; if saFsfactory, add’l wells are developed. OverheaFng can cause explosions (“blowouts”).
3. Well CompleFon. Post drilling, engineers put cement in the walls
Steps 1-‐3 are onen contracted out from E&P firms to firms like TransOcean. Delays are very expensive ($500k a day), and may be charged to contractors; but E&P firms make decisions Downstream Steps: ProducFon à Refining à MarkeFng Liability for spills is extremely costly ($1-‐4k per barrel spilled, 205M gallons est. spilled)
Overview
New Legisla=on Post –BP oil spill the industry is likely to experience major changes. • A hodgepodge of oversight agencies
granted excepFons to rules, as government agencies needed to both foster and police the industry
• A mix of companies is in charge of each rig, and their interests are not always in sync (see delays under overview, eg for maintenance)
Foreign countries maintain their own oil standards
State-‐owned oil companies like Saudi Aramco and Petrobras are siong on enormous oil reserves, but cannot exploit it as efficiently as public companies New players in China (supported by government) is entering the OEM and shipping industry
Trends
Revenue Drivers Outside Factors: economic environment (GDP growth), supply, consumpFon and demand level, oil and gas inventories. Prices of oil, gas, and refined products are the most watched factor in energy. Key measures: Supply and demand of oil and natural gas, rig count, rig uFlizaFon rates, rig dayrates and daily margins Drilling companies: provide the rigs and operate them, either on a project or long-‐term contract basis, with rates charged by the day (popular among offshore drilling), foot drilled, or all-‐inclusive basis. Wide range of services, including: pressure pumping, wireline, direcFonal drilling and measurement while drilling (MWD), and marine support Cost Drivers Upstream -‐ exploraFon and producFon expenditures; Midstream – transportaFon, and storage costs; Downstream – refining and markeFng costs. OPEC: influences global price.
Drivers

229
Airlines
• Airlines provide air transport services for passengers and freight
• The industry was deregulated in 1978 free from government control of fares, routes, merger and acquisiFons. This helped to completely transform air travel from a luxury to a mass-‐market service INDUSTRY STRUCTURE: Major Airlines: revenues > $1B Na=onal Airlines: revenues $100 M -‐ $1B Regional Airlines: revenues < $100M • Airlines is a low-‐margin industry COMPETITION • Price CompeFFon: airlines compete to provide the lowest fares to the passengers
• To a_ract leisure travelers they adverFse huge discounts
• Niche players like JetBlue, Southwest, and Spirit have entered
Overview
MERGERS The industry has seen a lot of consolidaFon in recent years. There are 3 major US carriers, down from 6 a few years ago (eg, United/ConFnental Delta/Northwest) BANKRUPTCY: Mergers primarily happened as the due to several airlines filing for bankruptcy and going out of business There has been a barrage of bankruptcies in the industry. More than 20 airlines have filed for bankruptcy in the last decade Poten=al problems of declining revenue: • Inefficient network: look at route
profitability and see if some of the routes could be eliminated
• Poor use of fixed capacity: increase volumes to tackle this issue
Trends
Revenue Drivers Airlines have been really creaFve to add several revenue streams to their business • Passenger fares • Mail and cargo charges • Meals / alcohol in flights • In flight entertainment • Extra baggage/seat prices Customers are broadly categorized as: • Leisure: highly price sensiFve • Business: not price sensiFve, hard to reach Cost Drivers Airline industry is capital and labor intensive Fuel: Fuel costs are highly volaFle and can range anywhere from 25% -‐ 40% of the total cost for an airline Labor: costs in 2009 was 26% of the total cost. Labor is unionized, and pilots have few subsFtutes • Includes pilots, a_endants, ground services, dispatchers, maintenance, customer service Equipment: is around 10% of the total cost • Some airlines lease fleets rather than buy
Drivers

230
Automotive
The automoFve industry is engaged in the design, producFon, markeFng, sale, and servicing of motor vehicles. New light vehicle sales in the US expected at 11.7 million for 2010. Volume increase is forecasted in 2011, to 13.5 million. Heavy capital commitments required to keep pace with product development and model changeovers. Demand is naturally affected by economic environment. Auto parts manufacturers highly fragmented: produce original parts and accessories for new vehicles, replacement parts, and accessories for older vehicles, or both Labor is onen unionized and wields power. Compe==on Extremely compe==ve. The US is the world’s most compeFFve auto market. Detroit Three losing market share: GM, Ford, and Chrysler. The top three foreign companies have a combined US market share of 41.5%: Toyota, Honda, and Nissan.
Overview
US share of global market shrinking: In 2009, China overtook the US as the largest market for new vehicles. US accounted for 16.3% of global demand. Demand in developing markets, including the BRIC economies, is projected to outstrip that of the world’s mature markets. US and global sales to advance. ProducFon in NA was up 70% in the first quarter of 2010. Europe may lag. Companies in China, Russia, India to make acquisi=ons in the US. Alterna=ve fuel and hybrid vehicles – All automakers are developing the technology: ethanol, methanol, natural gas, and electricity derived from ba_eries or solar power. Auto parts – online procurement has changed the business, with increased transparency pressuring selling prices for commodity items. Bankruptcy: GM, Chrysler, GMAC (auto lender) and suppliers filed for bankruptcy and some for bailouts in 08/09 Distribu=on: Main channel is – dealership model. Rapid consolidaFon in recent years.
Trends
Revenue Drivers Factors affec=ng new car sales: changes in style, engineering, safety, quality, cost and availability of gasoline and insurance. Price increases are limited. Rising compeFFon in NA and Europe has restricted manufacturers’ pricing power. Demand, sales rise during sustained economic growth and plenFful employment. Tac=cs to s=mulate demand: discounts and cash rebates, (dealers’ discounts,) financing at lower interest rates, eliminaFng opFons on a model to offer a low-‐priced alternaFve. Cost Drivers Capital expenditures of 2010: GM $6.0 billion, Ford $4.5-‐5 billion, Toyota $8.1 billion. Costs breakdown: plants, raw materials, design, producFon, labor, distribuFon, markeFng, and customer service. Suppliers: number shrinking, due to globalizaFon, reduced volume from US automakers, high material and labor costs. Oil prices and raw material prices Cost cu}ng tac=cs: higher unit producFon volume, savings on parts and labor, improved manufacturing efficiencies.
Drivers

231
Online Services and Storage
The online industry consists of companies that provide virtual-‐environment services and products, including data search, cloud data storage, social networking, big data analyFcs, music and video streaming, e-‐Stores (fashion, media, etc.), news and gaming. INDUSTRY STRUCTURE: Total Revenues: ~$1.8Trillion Industry Leader in Revenues: Google ($29.3 Billion) COMPETITION • InnovaFon: companies try to differenFate themselves by invesFng heavily in innovaFon, or “the next big thing”, such as YouTube, Facebook or eBay, most of which are monopolies in their own specific market.
• In the consumer world, major players include online services companies such as Google or DropBox, e-‐Retailers such as Amazon and Gilt, entertainment providers such as NetFlix and Hulu, and social networks such as Facebook and Twi_er. In the business arena, companies such as IBM, McKinsey, Accenture and other professional services companies are taking the lead.
Overview
CLOUD COMPUTING: A wide variety of service providers are ba_ling over the right to provide consumers with free cloud based services, most notably storage (DropBox, Google Drive, Amazon Cloud Drive), producFvity (Google Docs, Microson Office Live), CRM (Salesforce) and professional services (Quickbase, Bill.com). BIG DATA: The huge amount of informaFon out there serves not only as an opportunity for companies to study, analyze and predict market trends, but also as an essenFal tool for survival. CYBER SECURITY: Both in the private sector, where many have already entrusted the web with their most inFmate informaFon, including bank accounts, emails or work, and in the more global aspect, cyber warfare, spying and intelligence gathering have all increased the need for highly developed cyber security services, to protect both corporate secrets and peoples’ lives.
Trends
Revenue Drivers In the consumer market, most services are given for free, where most revenues come from adverFsing and data collecFon. Some services/products are given for a subscripFon fee, and some (usually e-‐retailers) usually come from direct sales. In the business sector, the ability to provide experFse to increase value for clients, where many companies are quickly transiFoning themselves from convenFonal services firms into “one-‐stop-‐shop” firms, mostly among consulFng companies, accounFng firms and technology firms, allow such companies to charge service fees.
Customer base is very broad, i.e. not limited solely to ultra-‐techy consumers, but also to sophisFcated business people, organizaFons and consumers with low-‐to-‐intermediate level of technical experience.
Cost Drivers The online industry relies heavily on innovaFon (a large porFon of which comes from M&As of startup companies), customer relaFons and IT infrastructure. ConvenFonal costs such as physical stores, fragmented inventory space and manpower are very low.
Drivers
232
Computer Software
The sonware industry includes businesses for development, maintenance and publicaFon of sonware, including producFvity suites, games, mobile apps, hardware-‐specific sonware (both firmware and custom made sonware) and operaFng systems (including mobile pla�orms). INDUSTRY STRUCTURE: Total Revenues: $303Billion (in 2010) Industry Leader in Revenues: Microson $69Billion (in 2010) COMPETITION • Sonware companies compete not only with other sonware companies, but also with other technology-‐based services providers, by focusing on specific clients – whether by creaFng simple and cheap mobile apps for clients on the go, or niche experFse-‐based products for sophisFcated clients.
• Major players include very large companies such as Microson, IBM, Oracle, Symantec and Adobe, which focus on the working environment, and of smaller companies such as Electronic Arts, which focus on gaming across mulFple pla�orms.
Overview DIGITAL TRANSFORMATION: For the last few years, there is an apparent slowdown in growth in the sonware industry, where gains are achieved through operaFonal performance rather than technological innovaFon, and growth is accomplished through mergers rather than organic development. Due to convenience issues, piracy and security risks related to sonware-‐based ecosystems, the tech world is moving towards online services and mobility. Other than switching to other, sonware developers are also either focus on smaller & simpler versions for the consumer market (mobile apps) or on much more sophisFcated sonware for the business market, mostly for CRM, IT systems, database and online services. MICROSOFT RISE AGAIN(?): Despite overwhelming criFcism regarding its lack of innovaFon and inability to create value in the longer term, Microson managed to retain its dominance in the producFvity sonware market with its Office cash-‐cow, while introducing the much anFcipated Windows 8 OS, which draws posiFve a_enFon.
Trends
Revenue Drivers The industry experienced very few changes in such respect, as revenues are based mostly online and retail sales, service and client support fees, annual subscripFons and licensing fees.
The customer base has changed in the past couple of years: regular consumers are interested more in simple friendly sonware rather than sophisFcated do-‐it-‐all sonware, and businesses are worried that constant innovaFon will harm their compeFFveness if they commit to the wrong sonware, and are interested more in “renFng” a dynamic sonware rather than buying a product that requires high implementaFon costs. Therefore, the sonware industry focuses on the 2 “extremes”: the relaFvely low-‐tech customers and ultra-‐sophisFcated ones.
Cost Drivers The biggest cost sonware companies tradiFonally faced was related to the development of the products. In the past, the huge allure of the sonware industry was its relaFvely low operaFonal costs once the product has been developed, and such costs have shrunk even more in the last few years due to online distribuFon. However, piracy has plagued most of the sonware industry and increased the cost of protecFng the companies’ intellectual property.
Drivers

233
Hardware and Digital Devices
The Computer Hardware industry consists of companies engaged in assembling and manufacturing computers, computer hardware and computer peripherals, including storage devices, keyboards, printers, monitors, mouse and other poinFng devices, Webcams and PC cameras. INDUSTRY STRUCTURE: Total Revenues: $842.1 Billion Industry Leader in Revenues: Apple ($156.5 Billion) COMPETITION • Price/Feature CompeFFon: companies try to differenFate either by selling at low prices and relying on complementary products, or by increasing consumer benefit through innovaFon and features.
• Major players include manufacturers such as Apple and Samsung, but also Google, which does not manufacture but has tremendous influence over the industry due to its Android mobile operaFng system and its collaboraFon with manufacturers such as LG.
Overview
MOBILE COMPUTING: During the last decade, we experienced a major shin from desktop compuFng to compuFng-‐on-‐the-‐go, mainly due to growing popularity of smartphones and the emergence of tablet computers (see below). Cloud compuFng reduced the need for physical storage, while constant improvement in speed and reliability of mobile internet connecFvity allow consumers to communicate, work and play anyFme and anywhere. The recent growth also led to increased revenue by component manufacturers (ARM, Broadcom, Samsung) and demand for online services. Tablets and smartphones are esFmated to have cannibalized more than 20% of the computer industry. TABLET WARS: Despite conFnuous dominance by the iPad (50.4% market share), industry behemoths such as Microson (Surface), Google (Nexus), Amazon (Kindle) fiercely compete over the tablet industry, though most profits do not come from units sold but from complementary products (such as apps and cases).
Trends
Revenue Drivers Companies seek to add revenue streams to their business • App and digital content stores for
Smartphones and Tablets • AdverFsing through mobile apps • CollaboraFon with peripheral product
manufacturers (such as keyboards, casing, headphones and audio systems) and with mobile telecommunicaFons companies.
Customer base is very broad, not limited solely to ultra-‐techy consumers, but also to sophisFcated business people and consumers with low-‐to-‐intermediate level of technical experience Cost Drivers The hardware industry relies heavily on component manufacturers, which are exposed to variance in material prices), environmental regulaFon, and cost of labor (as most manufacturing is done in developing countries). Hardware companies are also required to invest heavily in R&D.
Drivers

234
Semiconductor
Overview Trends Drivers
Industry: The research, development, producFon, and markeFng of semi-‐conductors Products: Industry is made up of four product categories: 1. Memory – Memory chips are temporary
storehouses of data and pass informaFon to and from computer
2. Microprocessors – central processing unit that contain the basic logic to perform tasks
3. Commodity Integrated Circuit – “standard chips” – produced in large batches for rouFne processing purposes
4. Complex SOC – “System on a Chip” – integrated chip with enFre system’s capability on it
Key Ra=os/Terms: Moore’s Law – number of transistors on a chip doubling every two years “Fabless” Chip Makers – semi-‐conductor companies that carry out design and markeFng, but outsource the actual manufacturing R&D/Sales – research and development expenses as a percent of sales – want high % Yield – # of operaFonal devices out of all mfg.
Growth: • Semi-‐conductor industry is highly cyclical
• Companies face constant highs and lows for demand of their product
• Growth trends track closely with demand for personal computers, cell phones, and other electronic equipment
Trends: TradiFonally, semi-‐conductor companies have controlled the enFre producFon process, but in order to be lean, efficient, and effecFve, they are moving away from that model: • Successful companies must be smaller, faster,
and cheaper • Chip makers are beginning to delegate
manufacturing to foundry companies (whose sole business is manufacturing)
• NoFceable increases in specialized designers and chip testers
Compe==on: • “Fabless” companies overcome barriers to
entry related to large capital requirements • Foundries gaining supplier power because of
cuong-‐edge equipment and producFon skills • Intense rivalries between companies
Revenue: Revenue = Price of chip x quanFty sold • Due to Moore’s law and the compeFFve
nature of the industry, it is not uncommon for the price of a new chip can fall by as much as 50% in a short Fme period
• By nature of the process, there is a long lead Fme with product releases, so it may take years before a company sees revenue for certain products
Costs: • Semi-‐conductor companies live and die by
their ability to be cost efficient • Constant pressure from market and
customers to develop be_er, cheaper products in a short Fme frame
• As noted above, each product has a long lead Fme, so a company will incur costs for a long Fme before that product generates any revenue
• As noted in “Trends”, historically complete process companies have outsourced some of the producFon process in order to be more lean and cost efficient

235
Pharmaceuticals
• Historically among the world’s most profitable industries
• Total domesFc expenditures for prescripFon drugs were roughly $234.1B in 2008, and is increasing
• Worldwide sales are expected to increase 5-‐8% per year (similar figures in the US), and reach $1.1 trillion in sales by 2014
• In 2009, the US and Europe markets made up approximately 39% and 32% of the world wide market followed by Asia, Africa, and Australia (12.7%), Japan (11.3%), and LaFn America (5.7%)
• Typically high economic, regulatory and legal barriers to entry
Overview
• The growth of the industry has been supported by an aging populaFon (in developed markets), lengthening of the life expectancy, and rising incidence of chronic diseases
• Emerging markets are leading industry growth; CAGR is expected to be 14-‐17% through 2014
• Patent expiraFons are expected to peak in 2011-‐2012; resulFng revenue loss has forced many companies to downsize to maintain high levels of profitability
• Large pharma companies are increasingly relying on purchasing or partnering with young / niche firms to create growth
• UncertainFes introduced by PPACA (“Obamacare”) and lagging drug approval Fmes by FDA is expected to slow growth
• Insurers are geong increasingly more stringent on which medicaFons they will reimburse
Trends
Revenue • New products – premium-‐priced
breakthrough therapies that open new markets
• Patent protecFon – commercial life of a branded drug is approximately 10 years
• OTC – some pharmas are introducing OTC versions to combat generics when patents expire
Cost • R&D – costs higher than any other industry;
can take 10+ years for new drug development
• Sales and MarkeFng – US companies spend approximately $20B/year on promoFons
Drivers
236
Medical Devices
Industry Defini=on: any healthcare product that achieves its intended purpose not through chemical acFon or being metabolized Products: devices range in complexity from tongue depressors to mulF-‐million $ imaging equipment. -‐ Most common are surgical appliances/supplies, surgical & medical instruments, electro-‐medical equipment, in-‐vitro diagnosFc substances, irradiaFon apparatus (typically x-‐ray), dental & ophthalmic (eye) goods
Key Stats: US industry includes about 11,000 companies with combined annual revenue of over $150 billion. Globally, the industry generates annual revenue over $400 billion. Major markets include the US, Japan, Germany, France, and Italy. -‐ Industry is concentrated: 50 largest
companies account for ~60% of revenue Major Companies: include Baxter InternaFonal, Boston ScienFfic, Johnson & Johnson, Medtronic, GE & St. Jude
Overview
Growth: industry revenue is projected to grow on average 6.6%/yr. from 2012 to 2017 Trends: -‐ UncertainFes introduced by PPACA (“Obamacare”) and lagging device approval Fmes by FDA is expected to slow growth
-‐ PPACA contains med device tax -‐will cost the industry $20 billion over the next decade
-‐ Increased government regulaFon around the globe threatening growth
-‐ Recent difficulFes in retaining qualified manpower to design and produce devices
-‐ Aging populaFon and increased access to care should help stem some of losses from forces menFoned above
-‐ Growing a_enFon to healthcare in developing markets
Compe==on: increasingly sophisFcated pharmacologic products, growth in prevenFve medicine Barriers to entry: high for small players; economies of scale and access to capital are criFcal to negoFate complex regulatory and approval processes
Trends
Revenue Drivers: -‐ expanding emphasis on healthcare in developing countries
-‐ standardizaFon of regulatory requirements across countries
-‐ Growth in elderly populaFon means increased demand for devices
-‐ Improved paFent longevity due to higher quality healthcare
-‐ InnovaFon in product development due to strong scienFfic progress
Cost Drivers -‐ Research and development -‐ Regulatory approval and compliance process -‐ Federal and local taxes -‐ Sales and markeFng operaFons
Drivers

237
Hospital Facilities
Acute care hospitals – 5,815 in 2008. Non profit enFFes account for 82% of this segment. Total revenues in 2008: $608 billion. Revenue CAGR (04-‐08) – 5.4% Rehabilita=on hospitals (both stand-‐alone units & those a_ached to a larger facility) – 203 in 2008 Psychiatric hospitals – 447 in 2008; Avg. length of stay has remained stable at 9-‐10 days Specialized hospitals – orthopedics (25); obstetrics & gynecology (13); chronic disease (4); eye, ear, nose, and throat (6); & tuberculosis and other respiratory diseases Nursing homes – 15,531 in 2008, occupancy rate ~84% Assisted-‐living facili=es, and home healthcare services.
Overview
Pa=ent Protec=on and Affordable Care Act (PPACA) (“ObamaCare”) reforms aspects of the private health insurance industry and public health insurance programs, increases insurance coverage of pre-‐exisFng condiFons, expands access to insurance to over 30 million Americans, and increases projected naFonal medical spending while lowering projected Medicare spending. Shortage of Physicians and Nursing staff : As the populaFon ages the shortage of primary care physicians would aggravate Highly regulated by the government which is a key buyer for the hospital industry Gov’t: account for 47% of healthcare spend Healthcare reform will extend healthcare insurance coverage to approximately 32 million of the previously uninsured by 2019 Consolida=on: To reduce costs, nonprofit chains or individual nonprofit hospitals being acquired and/or entering into JV arrangements with the for-‐profit chains
Trends
Sources of Revenue: Inpa=ent admissions: Has remained flat at ~118 admissions/1000 populaFon Procedures: Decrease in admissions result of a shin towards procedures performed on an outpaFent basis rather than in hospital Reimbursement rates: Controlled by gov’t Demand Drivers: Increase in unemployment à loss of employer-‐based health coverage Decline in the rate of elecFve procedures ShiL towards procedures performed in outpaFent facility or physicians’ offices that don’t require an overnight hospital stay New medical technologies reduce or eliminate the need for hospitalizaFon Increasing influence of third-‐party payers, Ageing populaFon Cost Drivers Labor Costs (Doctors, Nurses, Admins) Uncompensated Care: high % bills not billed to insurance is wri_en off as bad debt Taxes: non-‐profits are exempt from some taxes
Drivers

238
Healthcare Payors
WHAT PAYORS DO: • Underwrite (assume risk of, assign premiums for) health insurance policies
• Provide admin services for self-‐funded plans (e.g. employers providing benefits with own funds)
• Help manage individuals’ care
KEY INDUSTRY STATISTICS: • Revenues/Profits: $707.4B / 28.3B (4%) • CAGR ‘07-‐’12 / ’12-‐’17: 2.8% / 5.1% • Number of businesses: 927 PRIMARY PLAN OFFERINGS: • Fee-‐for-‐service: Provider paid on one-‐off basis; paFent choice not restricted
• Health maintenance org: Payer and provider integrated and pre-‐paid; cheaper, but paFent choice limited
• Preferred provider org: Mix of FFS, HMO • High deduc=ble: Lower premiums but higher out-‐of-‐pocket obligaFon; paFent has incenFve to use services efficiently
• Pharmacy benefits
Overview
HEALTHCARE REFORM Directly pressures payors’ bo_om lines by: • EliminaFng coverage caps, denials based on pre-‐exisFng condiFons, etc.
• Increasing medical loss raFos (% premium dollars payers must spend on healthcare, with remainder going to admin and profit)
• Increasing gov. scruFny of premium hikes • Forcing payors onto exchanges for individuals; more price compeFFon, less G&A scale than with employer groups
However, the law will bolster top-‐line growth by growing the insured populaFon COMPETITION • The top four payors have ~35% share; the rest of the market is fairly fragmented
• Slow but steady consolidaFon expected to conFnue given profitability issues
MACROECONOMIC ENVIRONMENT • Recession precluding payors from increasing premiums in line with healthcare cost inflaFon
Trends
REVENUE DRIVERS Payor revenues are largely dependent on external factors: • Total health-‐related expenditures • Number of physician visits • Number of employed individuals • Age of populaFon • RegulaFon and legislaFon Payors also a_empt to steal market share from one another by differenFaFng on: • Steeper discounts on provider charges • Broader network coverage • Lower administraFve fees • Add-‐on services (e.g. case management) • A_racFveness to individual consumers (once exchanges go live in 2014)
COST DRIVERS • Purchases of medical and Rx services/ products) comprise ~72% of costs; influenced by uFlizaFon and cost inflaFon.
• RelaFve to other sectors of healthcare, the health insurance industry is neither capital nor labor intensive.
Drivers

239
Banking and Financial Services
Diversified Financial Services firms: large financial conglomerates (e.g. JP Morgan Chase & Co.) which combine insurance, securiFes, and lending businesses Consumer finance firms: primarily lend money to consumers: mostly through small to midsized loans ($1,000 to $75,000). The main products include home equity loans, credit card loans, etc PE/VC firms: invest in and help manage or guide businesses with hopes of company growth resulFng in profits from a later sale (AddiFonal Types under Drivers) Interest Rates are at zero, meaning banks will make no money by invesFng in government bonds. This is the federal reserve encouraging banks to lend money Customer deposits in banks are FDIC insured up to $250,000, meaning the government will make you whole if the bank loses that money
Overview
As a result of recent financial crisis, regula=ons have increased (controlled by Treasury Department, The Federal Reserve, House and Senate bills) The US government intervened in 2007-‐09 to lend money to banks, insurers, and other key players to keep the financial system afloat. Consolida=on of banks Trend towards large “financial supermarkets” like CiF may be reversing, as many large banks sold off divisions for needed cash during the downturn Post-‐ financial crisis, many financial insFtuFons have stopped proprietary trading, or placing bets with their own assets. The Dodd-‐Frank act, which has not been fully implemented, includes new and consolidated federal regulatory agencies, stricter capital requirements for banks, and regulates the trading of certain deriva=ves.
Trends
Revenue Drivers Commercial Banks earn money by reinvesFng customer deposits in higher-‐yielding funds or lending at higher rates and charging transacFon fees Investment Banks charge fees for advising corporate and governmental clients on mergers, acquisiFons, restructuring, and debt and equity issuances Insurance Companies earn money by taking in monthly premiums from customers, who receive a payout if an event occurs Credit Card Companies (Visa / Discover) earn fees from customers and merchants by handling the complex processing necessary. AMEX does the same, but also lends the customer money. Cost Drivers Research (whether to buy/sell securiFes, or suggest a specific merger) Salary and benefits, supplies, insurance. Losses on investments like loan defaults Risks, such as a sudden demand from many customers to redeem their money
Drivers

240
Media and Entertainment
• Media and entertainment companies create, license and / or distribute content (TV shows, movies, music, news, video games, books, magazines, radio shows, adverFsing, etc.)
• The industry has long been known for conglomeraFon; developing and acquiring mulFple brands and mulFple distribuFon channels for their disseminaFon INDUSTRY STRUCTURE: Total: Global revenues of $1.5 T Consumer / End-‐User Spend: $1 T Adver=sing Spend: $500 B • The leading 10 companies in the industry account for one third of revenue
• This includes some cable, telecom, hardware, sonware and internet spend which is hard to split from “content”
• Other naFonal or regional conglomerates and digital startups comprise remaining revenue
Overview
MACROECONOMICS: Consumer and adverFsing spending on M&E is Fed to economic growth, though some segments (cable, internet access) are resistant to downturns and / or more impacted by secular trends. Annual growth slowed in 2008 and the industry retracted by 2.4% in 2009. Growth has rebounded to ~4.5% since then. DIGITAL: The biggest long-‐term issue for industry players is how to put content online. The internet poses a number of challenges: • Lowered barriers to entry for creaFng /
distribuFng, increasing compeFFon • Increased piracy due to high-‐speed
connecFons and illegal download sites • Consumer expectaFons of lower priced /
free content, available on-‐demand • New intermediaries and lack of standards
(Google search, iOS vs. Android app pla�orms, new ad formats)
• Limitless adverFsing inventory and less consumer a_enFon, reducing ad prices
• DistribuFon and standing out harder given huge libraries (Amazon books, iTunes)
Trends
Revenue Drivers Depending on the company’s focus, the below revenue mix differs. There has been a lot of experimentaFon in adapFng these business models to digital age: • Consumer / end-‐user: More of a focus on
subscripFons, mulF-‐device access and free or “freemium” with micro-‐transacFons
• Adver=sing: More of a focus on direct response and tying ad exposure to purchases or clicks, also use of web usage data to micro-‐target, raising privacy issues
• Licensing / distribu=on: More focus on retransmission fees TV networks charge to cable cos. and revenue shares with online marketplaces
Cost Drivers The M&E industry is labor intensive in terms of costs for “creaFve” talent and sales staffs, which can comprise 40% -‐ 50% of costs for a company or project (one movie). Marke=ng also represents a large porFon of costs, given the compeFFon for consumer a_enFon. Capital investments in digital technologies represent a newer but growing area of cost
Drivers

241
Telecom
Overview Trends Drivers
Industry: Made up of companies that allow people to connect all over the world through a complex networks of phones, mobile phones, and internet-‐linked PCs. Products: This is not a comprehensive list, but it does provide examples of products from the Telecom industry: • Telephone • Fiber opFcs • High-‐speed internet • Radio • Satellite communicaFons • Cell phone networks Key Ra=os: Churn Rate –rate at which customers leave for a compeFtor. Telecom industry has highest churn rate of any industry. Average Revenue Per User (ARPU) – understand purchase level for each user Broadband – high-‐speed internet access tech Telecommunica=ons Act – sFmulate compeFFon in the industry
Growth: • Growth in this industry comes from services
delivered over mobile networks Trends: • DeregulaFon and innovaFon changed the
compeFFve landscape of this industry • Telecom companies are beginning to expand
out of telecom and into enter other industry spaces
• An example of this is Comcast entering the media and entertainment industry
• The reverse is also true where outside industry companies are expanding into the telecom industry, e.g. Google Fiber
Compe==on: • The telecom industry requires large capital
investments upfront, which creates a potenFal barrier to entry for new entrants
• No significant supplier power due to large quanFty of equipment suppliers
• Growing buyer power due to access to subsFtutes and the telecom becoming a commodity
• DeregulaFon and recepFveness of the market has made this industry incredibly compeFFve
Revenue: Revenue = subscripFon fee x # of subscribers • SubscripFon fee structure will vary by service
offering and telecom company • Companies will try to maximize their
revenue through the structure of their fee arrangement
• Must be very conscious of industry pressures related to fee structure
• Bundling services is a common pracFce in the industry in order to maximize revenue
• Another opportunity for telecom companies to make revenue is to provide network connecFvity to other telecom companies
Costs: • Fierce compeFFon in an essenFally
commodity market has led to cost compeFFon between companies
• Efficient billing systems are a way for companies to decrease cost and improve margins
• Expanding a company’s network and service offering are large cost drivers
• Smaller players may have to pay for connecFvity which will increase their costs
242
Retail
• Retail trade makes up $3.8 trillion in sales (second largest US industry)
• Retail industry is comprised of the following sub-‐industries:
– General merchandise – Apparel – Consumer electronics – Home improvement – Office supplies – Drug retail – AutomoFve retail – Specialty – Food retail – Hypermarkets/super-‐centers
Overview
• The industry has generally been negaFvely impacted by the economy (discount retailers have done best)
• Due to frequent price promoFons, lower profit margins are common in the industry
• Retailers are expanding their share of private label brands
• Many specialty retailers are selling services to differenFate themselves from rivals – Best Buy – Geek Squad, Staples – Copy Centers, Pet Smart – Grooming and Training
• Online sales are increasing faster than tradiFonal retail sales (currently 3-‐4% of retail industry revenue)
Trends
Revenue • PromoFons – retailers drive traffic
through price reducFons and in-‐store displays
• Consumer spending/confidence – retail industry is leading indicator for economic condiFons (discount retailers generally do be_er in bad Fmes than specialty retailers)
Cost • Inventory management – criFcal to
minimize cost, increase response Fmes and increase profitability
• Real Estate – number of stores and locaFon decisions are important given high fixed costs
Drivers

243
Household Non-Durables
Industry Defini=on: Manufactured products with useful life < 3 years Products • Household – soap, detergent, cleaning, paper towels, pet care… (US Revenue ~$100B per year)
• Personal care: hair care, cosmeFcs, fragrances, skin care, oral care…(US Revenue ~$250B per year)
Major Companies: P&G, Colgate-‐Palmolive, Ecolab, Henkel KGaA, SC Johnson, Nestle, Georgia Pacific, Kimberly Clark, InternaFonal Paper, Estee Lauder, J&J, L’Oreal, Unilever Compe==on: Markets tends to be concentrated • Scale, shelf placement at retail criFcal and promoFons criFcal
• Small companies compete through product specializaFon or targeFng local markets
Overview
Growth: Category is expected to grow at a low to moderate pace; most growth from emerging economies
Trends: • Industry concentraFon • Power of key customers (Wal-‐Mart) • Focus on export growth to tap into middle
class in emerging economies • Brand raFonalizaFon/opFmizaFon • Private label gaining share and improving
in quality • Pressure for environmental sustainability,
compliance and product safety • Increase cost and scarcity of raw materials • Growing demand for organic /
environmentally friendly products • R&D– more advanced compounds / mulF-‐
use products
Trends
Revenue • Household products cash flow generally even throughout the year
• Personal care products are seasonal with loading in first half of year
• New product innovaFon • MarkeFng/PromoFons • Brand equity / loyalty-‐ insulates against switching & price wars
Costs • Capital intensive significant investment to improve efficiency
• Significant spends on markeFng. sales and R&D
• Raw materials costs significant as much as 50% of revenues
• Futures contracts to protect cost of inputs • Environmental and other regulatory compliance in producFon / waste disposal
Drivers

244
Household Durables
Industry Defini=on: highly durable goods useful for at least 3 years
Products: industry if onen classified into two segments: • Electronics (Brown Goods) – TVs, A/V, computers, cameras, tools (>$500B globally)
• Appliances (White Goods) – Refrigerators, AC, microwaves (~$160B globally)
• Home furnishings/furniture are also onen considered durables (~$400 globally)
Major Companies: GE, Sony, Samsung, LG, Apple, Whirlpool, Panasonic, Xerox, Cannon, Philips, Furniture Bands InternaFonal, IKEA
Compe==on: A/V competes with PCs and games for in-‐home entertainment
Overview
Growth: Despite recession, demand surging as emerging markets (India, China, Mexico…) buy basic goods due to emerging middle class real estate expansion and access to credit
Trends: • Slowing housing market in the US has
directly impacted purchases • Raw material costs for appliances (oil
and precious metals) increasing • US manufacturers losing market share
to foreign producers • Demand for products that work with
smart grid technology • Shin from brick and mortar to internet
purchases • ScruFny re: “dumping” products in
compeFtor markets • Recent scandals re: working condiFons
in factories
Trends
Revenue • Cash flow partly seasonal (holidays, real-‐estate purchases)
• Long purchase cycle means goods sold on higher margin
• Demand onen Fed to fluctuaFons in real-‐estate market
• InternaFonal compeFFon puong downward pressure on price
• Planned obsolescence • SFff compeFFon and discounFng Costs • Onen carry large inventories • Capital intensive manufacturing and R&D processes
• Compliance with regulaFon re: producFon and waste disposal
• Currency translaFons and tariffs impact profit
• Supplier network and sourcing • DistribuFon network and shipping
Drivers
245
Restaurant
• Restaurant industry makes up $604 billion in sales
• Restaurant industry is comprised of the following sub-‐industries:
– Quick-‐service restaurants (QSR) – Full-‐service restaurants
• One of the largest private sector employers (~13M jobs)
• Many QSRs operate as franchises
Overview
• Growth and profits have been hurt by soaring food and energy prices
• Explosive growth overseas, especially in QSR industry, due to strong economic growth and growing middle class in emerging markets
• Health and wellness concerns conFnue to pose problems for QSRs and have resulted in healthier menu opFons
• Newer “fast casual” restaurants like Chipotle and Panera threaten to steal market share from both QSR and full-‐service restaurants
• In general, restaurants have been negaFvely impacted by the economy and reduce consumer spending
Trends
Revenue • Food and beverages (usually the
higher margin products)
• Merchandise • Catering • Franchising fees • Licensing Cost • Labor – largest cost for restaurant
operators • Raw materials – accounts for roughly
a third of sales
• Real Estate – number of restaurants and locaFon decisions
• Other – product innovaFon, consumer research
Drivers

246
Non-Alcoholic Beverages
Non-‐alcoholic beverages: (NA) industry is highly concentrated: 89% of US retail sales are a few companies: Coca-‐Cola, PepsiCo, and Cadbury Schweppes PLC (Dr. Pepper & 7UP) Main NA beverage categories: 1) Carbonated son-‐drinks 2) Bo_led water (fastest growth) 3) Juice drinks 4) Sports drinks
Overview
Growth in soda is flat. Bo_led water’s growth will conFnue well into the future because of increasing demand for natural, organic products. More manufacturers work with consumers to understand their packaging preferences Hispanics, followed by Asian-‐Americans are fastest growing segments. The low-‐carbohydrate trend is virtually nonexistent outside of the United States and the United Kingdom Many US consumers believe that the “be_er-‐for-‐you” subsFtutes do not taste as good as the tradiFonal brands, and a large majority of them remain commi_ed to tradiFonal high-‐carb, high-‐sugar foods. Compe==on Energy drinks is a growing and compe==ve segment. These drinks turn into fashion among youngsters. Barriers to entry – not high for small players, however economies of scale and brand are important issues
Trends
Revenue Drivers: Increasing market share: new segments (incl. internaFonal, especially emerging markets) new products (incl. acquisiFons of niche lines) expanding distribu=on channels (cooperaFng with Wal-‐Mart Stores, etc) Squeeze exis=ng users more (premium labels, complementary products such as Coke and chips) Innova=on in product and merchandising strategies, such as the use of mobile internet and online shopping Cost Drivers Packaging – the cost of plasFc increases over the years Taxes -‐ on inputs (eg sugar) and vice taxes (falls on end users – reduces demand) Wages within the industry are noFceably higher than the naFonal average
Drivers

247
Beer, Wine & Distilled Spirits
Beer/Malt Beverages: major products are malt beverages, primarily beer. Major companies: Anheuser-‐Busch InBev (Belgium), SABMiller (UK), Heineken (Netherlands), MolsonCoors & Boston Beer (US) -‐ Top sellers: Budweiser, Bud Light, Heineken,
Corona, Skol, Stella Artois
Wine: make wine and brandies from grapes. Major companies: ConstellaFon Brands, E&J Gallo, & Jackson Family (US), Veuve Clicquot Ponsard (France), Gruppo Italiano Vini (Italy) Viña Concha y Toro (Chile) -‐ Red & white containing ≤14% ABV (60% of market); Brandy, & other wines (15%); Dessert wine, coolers, & effervescents (~10%)
Dis=lled: disFll, blend, or mix liquors. Major companies: Brown-‐Forman (US), Diageo (UK), Kweichow Moutai (China), & Pernod-‐Richard (France) -‐ Major products: whiskey & bourbon (10% industry revenues); cordials &liqueurs (10%); gin (5%). Other products include vodka, specialty liquors & bo_led cocktails
Overview
Growth: Beer – forecast to grow at 3% CAGR between 2012-‐2016 Wine – forecast to grow at 2% CAGR between 2012-‐2016 Dis=lled -‐ forecast to grow at 3% CAGR between 2012-‐2016 Tends: Beer – ConsolidaFon: 8 largest brewers account for ~90% of industry revenue; success of small, independent cran brewers have influenced larger brewers; growing popularity for seasonal brews Wine – reliance on restaurant sales Fes performance to food service sector, increasing demand from baby boom generaFon, agritourism (winery visits) Dis=lled – mixed fruity drinks increasingly popular, flavored malt beverages evolving, rise in grain prices Compe==on: Beer, Wine, DisFlled compete against each other. Energy drinks Barriers to entry: not high for small players, however economies of scale and brand are important issues
Trends
Revenue Drivers: Increasing market share: new segments (incl. internaFonal, especially emerging markets) new products (incl. acquisiFons of niche lines, increasing variety of products) expanding distribu=on channels (cooperaFng with Wal-‐Mart Stores, increasing importance of convenience stores) Squeeze exis=ng consumers more (premium labels, other occasions for use) Innova=on in product development, packaging and merchandising strategies, such as new flavored malt beverage varieFes, use of mobile internet, sports and other event promoFon Cost Drivers Packaging & Other raw input costs – conFnue to rise over Fme Shipping – heavy products and rising gas prices Taxes & Regula=on – complex three Fer distribuFon system and heavy federal/state taxaFon
Drivers

248
Mining and Precious Metals
Industry: Includes the construcFng and operaFng mines as well as building and operaFng producFon faciliFes. Products: Products include a wide variety of precious metals including gold, silver, copper, diamonds, and lead. Gold is the most popular precious metal for investors. Industry Structure: • Industry is not verFcally integrated Three types of firms 1. ExploraFon – explore and prove gold exists 2. Development – develop mines on sites that
have proven that the precious metal exists 3. ProducFon – full-‐fledged mining companies Key Ra=os/Terms: Mine Produc=on Rates – quanFty produced Scrap Recovery – supply of metals from sources other than mines, e.g. old jewelry Future Sales by Producers – indicates producers expectaFons on future gold prices Bullion – refined metal that is high quality
Overview
Growth: Growth of each precious metal will be unique compared to other precious metals Gold • Growth for gold is inversely related to the
stock market (i.e. it has a negaFve beta), so the gold market experienced large growth during the recent recession, but has decreased since the recovery of the market
Trends: • Most gold that is mined today is used for
jewelry as opposed to currency or other possible uses for gold and other precious metals
• Technology has greatly changed the mining industry making it more efficient
Compe==on: • High capital requirements creates a deterrent
to entry to potenFal new entrants • Government regulaFons are main
consideraFon for supply concerns • SubsFtutes are other precious metals • Do not compete on price, but do compete for
land with other companies
Trends
Revenue: Revenue = output x the selling price of gold • Prices are determined by market forces • Output varies by demand and market price • Low operaFng costs allow a mine to have
higher/more stable outputs at lower market price points and therefore increase revenue
• E.g. if it costs a company $250/ounce to produce, then they will not produce unFl the price for gold increases over $250/ounce
Costs: Main costs of producFon: Loca=on – Understand cost in certain areas and risk due to poliFcal unrest Ore Quality – Oxide ores are be_er because it is easier to extract the precious metals Mine Type – Most underground mines are more expensive than open pit mines • Company’s must manage costs in order to
maintain good financial health and producFon levels in the face of volaFle gold prices
• Producers usually publish their cost of producFon in their annual report
Drivers

249
Utilities
Overview Trends Drivers
Industry: Generate, manage, and provide electrical power to the general populaFon Historically the industry was run by monopolies, but is now disintegraFng into the following four supplier segments: Supplier Segments: Generators – Create electrical power Energy Network Operators – Sell access to their networks to retail service providers Energy Traders and Marketers – buy and sell energy futures and derivaFves. Help secure electricity at a stable, predictable price Energy Service Providers and Retailers – sells energy to end user Key Ra=os/Terms: Power Purchase Agreements (PPA) – contract between power producer and its customers MegawaF Hour – basic industrial unit for pricing electricity Load – amount of electricity delivered Federal Energy Regulatory Commission (FERC) – oversees rates and service standards
Growth: • ConsumpFon of electricity expected grow
rapidly as the world becomes increasingly “electrified”
• Energy InformaFon AdministraFon (EIA) projects that 40% more electric generaFng capacity will be needed by 2020 to meet growing demand
• Short term direcFon of the market sFll remains a risky bet
Trends: UFlity companies are undergoing major changes due to: • Regulatory changes • Demand fluctuaFons • Price volaFlity • New compeFFon The once stable industry has become much more unstable and risky Compe==on: • High barriers to entry due to large capital
requirements and significant regulaFon barriers
• Fierce rivalry between compeFtors because product is a commodity
Revenue: Revenue = $ per megawa_ per hour x uFlizaFon • Wholesale electricity prices are no longer set
by regulatory agencies • This heightens the risk of
uncontrollable price increases • Forwards and future opFons provide energy
buyers (not at the consumer level) the tools to help hedge against large volaFlity in price
• UFlizaFon will vary by uFlity company and
their market strategy • See the “Growth” secFon for more
informaFon on short term and long term uFlizaFon projecFons
Costs: • There are high fixed costs upfront in order to
build new generaFon plants • A lot of capital is required to enter the market • Marginal costs are relaFvely low, i.e. it is not
costly to offer one more kilowa_-‐hour to one more person
• Economies of scale are a very effecFve way to reduce costs in this industry

250
Additional Industry Research Resources
Several sources may help you further research specific industry topics
§ For a basic overview § Industry overviews provided on consulFng firm websites
§ For more in-‐depth background on industry context and trends § Vault industry guides (note: these are lengthy!)
§ Investopedia – h_p://www.investopedia.com/features/industryhandbook/
§ For in-‐depth informaFon on revenue and cost drivers § Standard & Poor’s NetAdvantage guides, which include guidance on how to effecFvely
analyze and value companies
§ For up to date informaFon on industry developments § WSJ (can be accessed for free on CMC website’s FacFva link)
All of these resources are public or can be accessed via CMC’s Research Guide portal