Has Selenium a Chemopreventive Effect on Hepatocellular Carcinoma?
Upload
independentCategory
view
3download
0
This article was originally published in a journal published byElsevier, and the attached copy is provided by Elsevier for the
author’s benefit and for the benefit of the author’s institution, fornon-commercial research and educational use including without
limitation use in instruction at your institution, sending it to specificcolleagues that you know, and providing a copy to your institution’s
administrator.
All other uses, reproduction and distribution, including withoutlimitation commercial reprints, selling or licensing copies or access,
or posting on open internet sites, your personal or institution’swebsite or repository, are prohibited. For exceptions, permission
may be sought for such use through Elsevier’s permissions site at:
http://www.elsevier.com/locate/permissionusematerial

Autho
r's
pers
onal
co
py
Bioavailability of selenium to forage crops in a sandy loam soilamended with Se-rich plant materials
S.K. Dhillon, B.K. Hundal, K.S. Dhillon *
Department of Soils, Punjab Agricultural University, Ludhiana, 141 004 Punjab, India
Received 31 January 2006; received in revised form 30 June 2006; accepted 3 July 2006Available online 21 August 2006
Abstract
Greenhouse experiments were conducted to study the bioavailability of selenium (Se) to sorghum (Sorghum bicolor L.), maize (Zea
mays L.) and berseem (Trifolium alexandrinum L.) fodders in a sandy loam soil amended with different levels of Se-rich wheat (Triticum
aestivum L.) and raya (Brassica juncea L. Czern) straw containing 53.3 and 136.7 lg Se g�1, respectively. Each of the fodder crops wasgrown after incorporation of Se-rich materials either individually or in a sequence – sorghum–maize–berseem by incorporating Se-richstraws only to the first crop. Application of Se-rich straws to each crop, even at the greatest rate of 1%, did not have any detrimentaleffect on dry matter yield of different crops. With increase in the level of wheat straw from 0% to 1%, Se content in sorghum and maizeplants increased to greatest level of 1.3 and 1.5 lg g�1, respectively, at 0.3% of applied straw and thereafter it decreased consistently. Incase of raya straw, the greatest Se content in sorghum (2.3 lg g�1) and maize (3.0 lg g�1) was recorded at 0.3% and 0.4% of the appliedstraw, respectively. Unlike sorghum and maize fodders, Se content in all the four cuts of berseem continued to increase with increase inthe level of applied straws and for different cuts of berseem it varied from 1.6 to 2.3 and 3.4 to 4.3 lg g�1 in case of wheat and raya straw,respectively. Similar variations in Se content of different fodder crops were recorded when these were grown in the sequence – sorghum–maize–berseem; but Se content was 2–4 times lower than when each crop was grown with fresh application of Se-rich straw. None of thefodders absorbed Se in levels toxic for animal consumption (>5 lg g�1) even at the greatest level of applied straw. Of the total Se addedthrough Se-rich straws, utilization of Se was not more than 2% in case of sorghum and maize crops and up to 5% in case of berseem.
At the time of sowing of sorghum, hot water soluble Se (HWS-Se) in soils treated with different levels of Se-rich wheat and raya straw,respectively, varied from 18 to 36 and 18 to 79 lg kg�1. Whereas in case of berseem, it varied from 33 to 101 and 33 to 154 lg kg�1,respectively. HWS-Se present at the sowing time of berseem was significantly correlated with Se content of all the four cuts in the soiltreated with Se-rich straws; the coefficients of correlation ‘r’ varied between 0.79 (p 6 0.05) and 0.99 (p 6 0.001). Selenium-rich materialssupplied significant amounts of S, P and micronutrients to the growing fodder crops. These investigations suggest that Se-rich raya andwheat straw may be disposed off safely in soils used for growing fodders.� 2006 Elsevier Ltd. All rights reserved.
Keywords: Se-rich plants; Incorporation; Fodder crops; Se content; Hot water soluble Se
1. Introduction
Elevated levels of Se in agricultural soils in northeasternparts of Indian Punjab have resulted in severe health prob-lems to animals and humans (Dhillon and Dhillon, 1991,1997). Depositions of seleniferous material transportedthrough floodwater from nearby hills of the Shivalik range
over several decades have resulted in the accumulation ofSe in low-lying areas. Utilization of Se contaminatedunderground water for irrigation purposes is further accen-tuating the problem of Se toxicity in this region. Total Seconcentration in these soils range from 0.32 to 4.55 lg g�1.Parent material of the soils is derived from upper Shivalikrocks comprised mainly of polymictic conglomerates ofvariable composition containing many unstable materialssuch as granite, basalt and limestone (Dhillon and Dhillon,2003). Entry of excessive Se from the soil through plants
0045-6535/$ - see front matter � 2006 Elsevier Ltd. All rights reserved.
doi:10.1016/j.chemosphere.2006.07.006
* Corresponding author. Tel.: +91 161 2560379; fax; +91 161 2400945.E-mail address: [email protected] (K.S. Dhillon).
www.elsevier.com/locate/chemosphere
Chemosphere 66 (2007) 1734–1743
Autho
r's
pers
onal
co
py
into the food chain can be controlled by selecting cropswith low Se absorbing capacity and application of gypsum(Bawa et al., 1992; Dhillon and Dhillon, 2000); but thesemeasures do not allow simultaneous reduction in theamount of soil Se. Regular cultivation of Se accumulatingplants has been suggested (Banuelos, 2001) for lowering Selevels in the contaminated soil. It is economically more fea-sible than physically removing contaminated soil or takingseleniferous soils out of crop production. While evaluatingthe efficacy of phytoremediation technology by growingmustard in rotation with arhar/cotton/sunn hemp underfield conditions, it was possible to remove 0.5–2.1 kg Seha�1 yr�1 compared to 0.3 to 1.0 kg Se ha�1 yr�1 by rice–wheat rotation (Dhillon 2004, unpublished data) depend-ing upon the level of Se in the soil. Plants belonging toBrassica species could reduce total soil Se up to 40% undergreenhouse conditions and up to 20% under field condi-tions after one growing season (Banuelos, 2000). Alongwith plant removal, a small fraction of Se might have lostalso via biological volatilization of Se (Frankenbergerand Karlson, 1994; Terry and Zayed, 1994, 1998). Reduc-ing Se level of agricultural soils via phytoremediation, how-ever, leads to another challenge – the disposal of harvestedplant material rich in Se.
In Se deficient areas, farmers apply Se to the soil forgrowing forage crops to ensure adequate supply of Se totheir livestock (Gissel-Nielsen et al., 1984; Rimmer et al.,1990). Alternatively, Se-rich plant material accumulatedin the process of phytoremediation can be carefullyamended with animal forage and fed to animals (Banuelosand Mayland, 2000). However, this practice may utilizeonly a fraction of Se-rich material generated throughphytoremediation. Amending Se-deficient soils with Seenriched plant material for growing forages constitutesanother important alternative for disposal of phytoremedi-ation materials. Application of Se-enriched plant materialto Se-deficient soils may provide required amount of Seto pasture crops that are repeatedly clipped, with a longerperiod of available Se than Se applied as selenate or selenitesalts. Residual Se would in part depend upon the biologicalcycling of Se, as described by Doran (1982) or in part onthe microbial activity of Se-gas producing microorganisms(Thompson-Eagle and Frankenberger, 1990).
The objective of the present investigation was to studythe bioavailability of Se from incorporation of Se-richwheat and raya straws (generated from field experimentson phytoremediation) into a nonseleniferous soil and todetermine the critical levels of Se-rich straws up to whichthese can be safely incorporated into a nonseleniferous soilso that the crops grown on this soil contain Se in amountssafe (<5 mg kg�1) for animal and human consumption.Possible effect of increased Se concentration in foddersdue to application of Se-rich straw on the balance of othernutrients was also studied. Both direct and residual effectsof different levels of Se-rich straws on dry matter yield andSe content of these fodders were evaluated by growing assingle crop each with fresh application of seleniferous
materials or in a sequence with one time application tothe first crop.
2. Methods and materials
2.1. Collection of research materials
Experimental soil: Bulk soil sample was collected from anonseleniferous site located at Punjab Agricultural Univer-sity Research Farm, air-dried in shade, ground to passthrough 2 mm sieve and stored in a clean and dry place.The soil was characterized by following analytical proce-dures as described by Page et al. (1982). It was sandyloam in texture having pH 7.4, electrical conductivity0.2 dS m�1, organic carbon 0.36%, available P 7.7 kg ha�1,available K 89.6 kg ha�1 and total Se content 182 lg kg�1.
Seleniferous plant materials: Samples of Se-rich wheat(Triticum aestivum L.) shoots at ear initiation and raya(Brassica juncea L. Czern) at peak flowering stage were col-lected from a phytoremediation experiment on naturallyoccurring seleniferous soils in village Jainpur of Nawanshe-har district of Indian Punjab. Plant samples were washedfree of dirt/dust particles and other contaminants, driedin an oven at 50 ± 5 �C, ground to fine powder and storedin plastic containers.
2.2. Greenhouse experiments
Four kg of soil was treated with different levels: 0%,0.1%, 0.2%, 0.3%, 0.4%, 0.5% and 1.0% of raya straw con-taining 136.7 mg Se kg�1 and wheat straw containing53.3 mg Se kg�1 and replicated thrice. Different amountsof powdered Se-rich straws were thoroughly mixed withsoil along with recommended levels of N, P and K fertiliz-ers supplied through urea, potassium dihydrogen ortho-phosphate and potassium chloride, respectively and thetreated soil was placed in polyethylene lined earthen pots.Selenium-rich plant materials were incorporated into thesoil 20 d before sowing sorghum (Sorghum bicolor L., cv.SL-44) and maize (Zea mays L., cv. Parbhat) crops and40 d before sowing berseem (Trifolium alexandrinum L.,cv. BL-10). The three crops were grown either with freshapplication of Se-rich materials before sowing eachcrop or in a sequence (sorghum–maize–berseem) with onetime application of Se-rich straws before planting the firstcrop.
Ten seeds were sown in case of sorghum and maize while20 seeds were sown in case of berseem. As and whenrequired, water was applied to pots to maintain soil mois-ture level near field capacity. After germination, when seed-lings got well established, they were thinned to five per potin case of sorghum and maize and ten in case of berseem.Above ground portion (1 cm above the soil) of maize andsorghum crops were harvested after 50 d of growth whilefour harvests were taken in case of berseem. All the har-vested plant biomass was processed for elemental analysis.The plant samples were washed free of any contamination,
S.K. Dhillon et al. / Chemosphere 66 (2007) 1734–1743 1735

Autho
r's
pers
onal
co
py
air dried and then kept in an oven at 50 ± 5 �C and driedto a constant weight. Dry matter yield was recorded.Thereafter plant samples were ground to a fine powderand stored for chemical analysis.
2.3. Hot water soluble Se (HWS-Se)
Three cores of soil were collected from each pot withstainless steel tube auger (2 cm diameter). The soil sampleswere air dried under shade and mixed thoroughly to makea homogenous sample. In case of sorghum, first samplingwas done 20 d after the incorporation of Se-rich straw (atsowing) followed by second sampling 25 d after sowingand third sampling just after harvesting the crop. Due tolow temperatures in the winter months, relatively greatertime was allowed for decomposition of organic materialsadded to the soil. Thus, in case of berseem, soil sampleswere collected from the pots 40 d after incorporation ofSe-rich materials (before sowing of berseem seeds). Secondsampling was done after 2nd harvest and third after 4thharvest of berseem. In case of maize and berseem that fol-lowed sorghum in the same pots, sampling was done 25 dafter sowing of maize, after harvesting of maize and afterfinal harvest of berseem. Soil samples collected at differenttime intervals were ground to pass through 100 mesh(0.149 mm) sieve. HWS-Se was determined by refluxing10 g soil with 50 ml of glass distilled water for 30 min onwater bath.
2.4. Chemical analysis of soil and plant samples
For analysis of Se and other nutrients, plant sampleswere ground in Willey grinding mill. Soil (0.25 g) and plant(0.5 g) samples were digested in a 10 ml mixture of per-chloric and nitric acids in the ratio of 2:5. The acid digestswere subjected to analysis of Se by following the methoddescribed by Levesque and Vandette (1971). A known vol-ume of the digest was taken in culture tubes to which 2 mlof 1 N HCl was added and the contents were heated at90 �C for 30 min on a thermostatically controlled heater(Kjel-plus) for transforming selenate into selenite. Aftercooling to room temperature, 2 ml of 0.04 M EDTA solu-tion was added. Tubes were then again heated at 60 �C for30 min. After cooling the tubes to room temperature, 1 mlof freshly prepared 0.1% diaminonaphthalene solution wasadded and the tubes were again heated at 60 �C for 30 min.Thereafter, the contents of culture tubes were transferredto 125 ml separatory funnels and 5 ml of cyclohexane wasadded. The samples were shaken vigorously for 1 minand when the two layers got separated, the aqueous phasewas drained off. A blank was also prepared by followingthe above procedure. Fluorescence emitted by the cyclo-hexane layer was measured by fluorometer (Bio-Rad’s Ver-saFluorTM Fluorometer) fitted with excitation filter of364 nm and emission filter of 523 nm wavelength. Standardcurve was prepared by taking one ml of sodium selenitesolution up to 250 lg Se l�1.
Sulphur in the plant digests was analyzed by the turbidi-metric method of Chesnin and Yien (1950) and the turbid-ity produced due to precipitation of sulphate as bariumsulphate was measured on a spectrophotometer (Spectronic20, Bausch and Lomb) at a wave length of 420 nm. Phos-phorus in plant digests was analyzed by ascorbic acid bluecolour method of Watanabe and Olsen (1965). The colouris stable for 24 h and was measured on the spectrophotom-eter at a wavelength of 760 nm. Micronutrients were ana-lyzed using atomic absorption spectrophotometer (AAS20 BQ Varian).
2.5. Statistical analysis
Data pertaining to dry matter yield, Se, S, P and micro-nutrient concentration of plants were analyzed by follow-ing completely randomized design using IRRISTAT.
3. Results and discussion
3.1. Forage crops grown with fresh application of Se-rich
plant materials
3.1.1. Sorghum
Dry matter yield: Dry matter yield of sorghum shootsvaried from 17.5 to 20.3 and 17.5 to 20.9 g pot�1 withthe application of different levels of Se-rich wheat and rayastraw, respectively (Table 1). The differences in dry matteryield obtained with different levels as well as types of Se-rich straws were, however, nonsignificant.
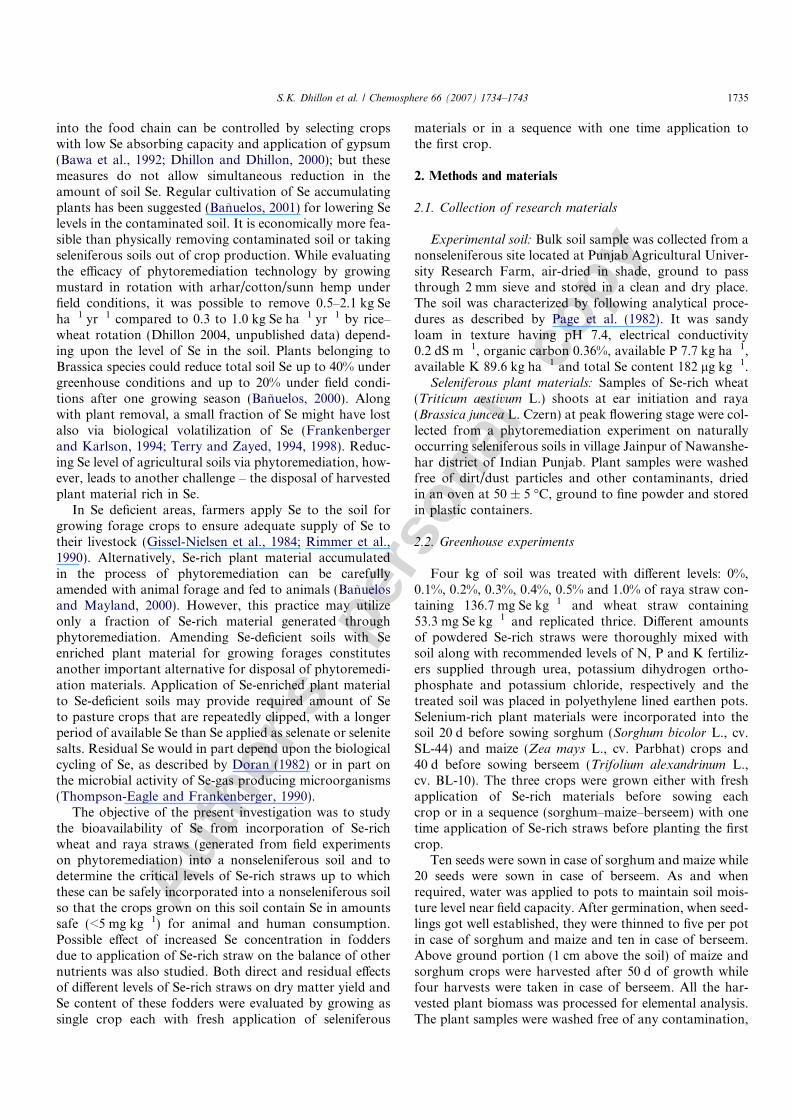
Se content: With increase in the level of Se-rich plantmaterials from 0% to 1%, a consistent increase in Se con-tent of sorghum shoots was observed up to 0.3%; the high-est concentration of Se recorded was 3.3 lg g�1 in case ofraya straw and 1.3 lg g�1 in case of wheat straw. Thereaf-ter, it started decreasing until it reached a concentration of1.0 and 0.5 lg g�1 at 1% level of raya and wheat straw,
Table 1Dry matter yield of sorghum and maize (g pot�1) as affected by differentlevels of Se-rich plant materials
Amount ofSe-richmaterialapplied (%)
Sorghum Maize
Wheatstraw
Rayastraw
Mean Wheatstraw
Rayastraw
Mean
0 17.5 17.5 17.5 15.2 15.2 15.20.1 20.1 17.0 18.5 15.2 18.7 17.00.2 19.9 18.0 19.0 16.0 18.8 17.40.3 20.3 19.8 20.0 16.0 18.3 17.10.4 20.2 19.2 19.7 16.3 18.6 17.40.5 19.0 20.9 20.0 16.3 18.4 17.31.0 18.6 20.5 19.5 17.7 20.1 18.9Mean 19.4 19.0 16.1 18.3LSDa (p 6 0.05)Straws NSb 0.94Levels NS 1.75Straw · level NS NS
a LSD – Least significant difference.b NS – Nonsignificant.
1736 S.K. Dhillon et al. / Chemosphere 66 (2007) 1734–1743
Autho
r's
pers
onal
co
pyrespectively (Fig. 1). Average Se content of sorghum shootsgrown in soil treated with different levels of raya straw(1.5 lg g�1) was significantly greater than that treated withwheat straw (0.9 lg g�1). Obviously it is due to greater Seinput from raya (136.7 lg Se g�1) than from wheat straw(53.3 lg Se g�1). Narrow C: N ratio of raya than wheatstraw may be another reason. The decrease in Se concen-tration of sorghum after a certain level of straw appliedmay be attributed to the increase in organic matter contentof the soil. Reduction in Se accumulation by different plantspecies with the addition of crop residues or animal man-ures to selenate-Se treated soil has been reported by Ajwaet al. (1998). Johnsson (1991) observed that increase inorganic matter content from 1.4% to 39% lead to adecrease in Se uptake by wheat grains up to 88% and byrape up to 69%. Mikkelsen et al. (1989) observed that addi-tion of organic matter resulted in reduced Se tissue concen-trations by 83% to 96% compared with plants grownwithout added organic matter. From a soil treated withSe-rich Brassica straw containing 250 mg Se kg�1 dry mat-ter, tall fescue accumulated only 1.3 and Brassica
50 mg Se kg�1 dry matter (Banuelos et al., 1992). Seleniumwas presumably bound to organo-metallic complexes (Lev-esque, 1974) and is transferred to less accessible forms bythe addition of organic matter. Possibly selenite gets che-lated by proteins, fulvic acid or other organic compoundsthat are continuously produced in soils through the activi-ties of microorganisms (Hamdy and Gissel-Nielsen, 1976).
At all the levels of wheat and raya straw incorporation,Se content of sorghum plants remained well below the
maximum permissible level for animal consumption –5 mg Se kg�1 dry matter. Mayland et al. (1989) observedthat with a few exceptions, plant species grown in soilsamended with seleniferous organic materials accumulatedSe concentration at or below the toxic level for animals.Utilization of Se applied through Se-rich straws variedfrom 0.2% to 1.7% and 0.1% to 1.9% in case of wheatand raya straw, respectively, and it was greatest at 0.3%level of each straw.
Selenium-rich raya straw contributed significantlygreater amounts of S and P towards sorghum nutritionthan wheat straw. Significant increase in P content of sor-ghum was observed with the application of 0.2% andhigher straw levels. However, variation in Se content ofsorghum did not show any relationship with either S or Pcontents of sorghum. Iron content of sorghum in the soiltreated with Se-rich wheat straw varied from 158 to174 mg kg�1. In the soil treated with raya straw it variedfrom 156 to 194 mg kg�1. The differences were howevernot statistically significant. Significant increase in Zn con-tent of sorghum was observed only by applying 0.4% andhigher level of Se-rich straw. Copper content of sorghumin the soil treated with raya straw (Ave 12.3 mg kg�1)was significantly greater than in the soil amended withwheat straw (Ave 11.1 mg kg�1). Opposite was true forMn. Concentration of Mn in sorghum plants progressivelydecreased as the level of applied straw increased from 0%to 1%. Significant decrease in Mn content of sorghumwas, however, observed at 0.4% and higher straw levels.It is not clear whether increased organic matter or Se level
Berseem
0.0
1.0
2.0
3.0
4.0
5.0
0 0.2 0 .4 0 .6 0 .8 1
Se-rich plant material, %
Se
con
ten
t, µ
g g
-1
I cut - Wheat straw II cut - Wheat strawIII cut - Wheat straw IV cut - Wheat strawI cut - Raya straw II cut - Raya strawIII cut - Raya straw IV cut - Raya straw
Maize
0.0
1.0
2.0
3.0
4.0
0 0.2 0.4 0.6 0.8 1
Se
con
ten
t, µ
g g
-1
Sorghum
0.0
1.0
2.0
3.0
0 0.2 0.4 0.6 0.8 1
Raya strawWheat straw
Fig. 1. Se content of different forage crops as affected by fresh application of Se-rich plant materials to each crop.
S.K. Dhillon et al. / Chemosphere 66 (2007) 1734–1743 1737

Autho
r's
pers
onal
co
py
due to straw addition was the reason for decease in Mncontent of sorghum.
3.1.2. Hot water soluble Se (HWS-Se)
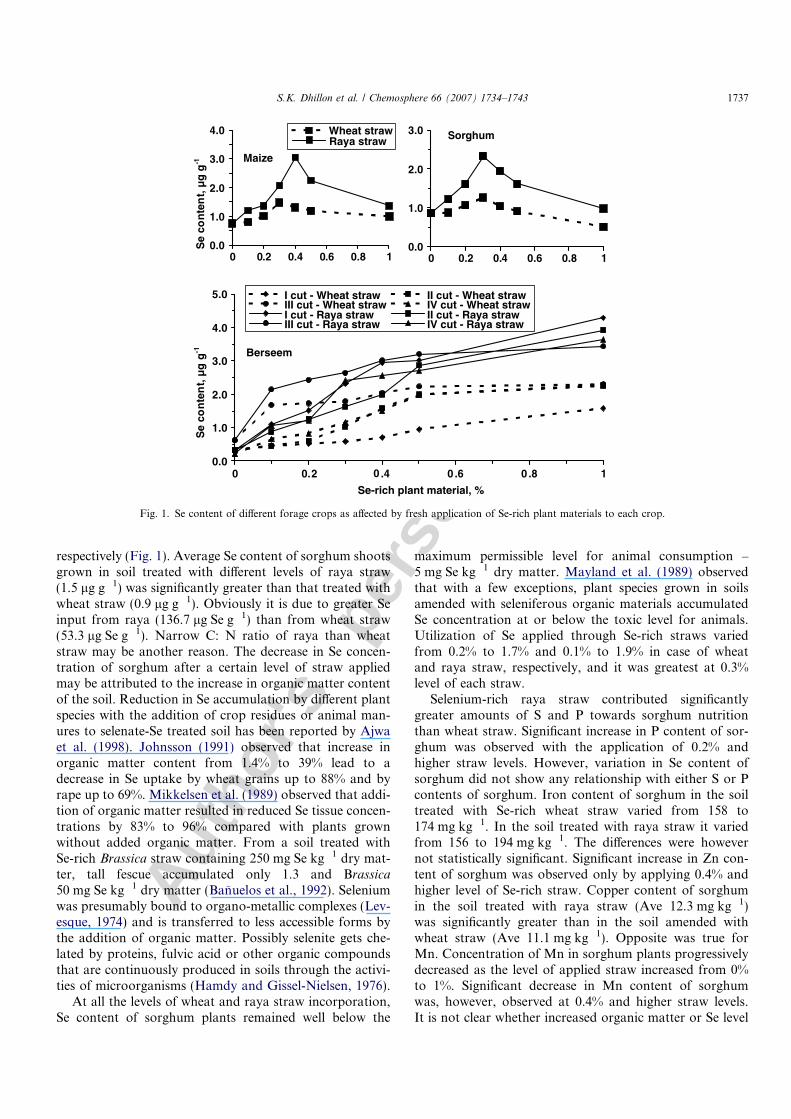
At the time of sowing of sorghum, HWS-Se in soil trea-ted with wheat straw ranged from 18 to 36 lg kg�1 and inthat treated with raya straw it ranged from 18 to79 lg kg�1 soil (Fig. 2). Average value of HWS-Se in thesoil treated with Se-rich raya straw (41 lg Se kg�1 soil)was significantly greater than in that amended with wheatstraw (29 lg kg�1 soil). Comparing the effect of two strawsat different levels, HWS-Se in the soil treated with rayastraw was significantly greater than in that treated withwheat straw at 0.3 to 1% level. Since the amount ofHWS-Se in the soil increased with increase in amount ofstraws applied; the Se content in sorghum plants initiallyincreased up to 0.3% straw level and then decreased upto 1% level. Hence no relationship was observed betweenHWS-Se and Se content of sorghum. In the 2nd sampling(after 25 d of sowing), the pattern of Se released with differ-ent types and levels of plant materials was similar to that of1st sampling; but the amount was considerably less. Theamount of HWS-Se in the soil at the time of harvestingwas greater than that observed after 25 d growth of sor-ghum which could be due to the fact that Se-rich organicmaterials added to the soil are continuously being decom-posed by the microbial activity in the soil and therebyreleasing Se into the soil solution at a rate faster than atwhich it was absorbed by the growing plants.
3.1.3. Maize
Dry matter yield: Dry matter yield of maize varied from15.2 to 17.7 and 15.2 to 20.1 g pot�1 with the application ofdifferent levels of wheat and raya straw, respectively (Table1). Highest dry matter yield was observed at 1% level ofeach straw applied. Accumulation of dry matter by maizeplants was found to be significantly greater with the appli-cation of Se-rich raya straw (Ave 18.3 g pot�1) as comparedto that obtained with wheat straw (Ave 16.1 g pot�1). Com-pared to control, significant increase in dry matter yield wasobtained at 0.1% of straw level; thereafter the yield of maizeremained constant up to 0.5% of straw level. Dry matteryield at 1% straw level was significantly greater than thatobserved at 0.1% level.
Se content: Pattern of Se content in maize as a result ofdifferent levels of plant material applied was found to besimilar to that of sorghum. Selenium content of maizereached the highest values of 1.5 and 3.0 lg g�1 at a levelof 0.3% of wheat straw and at 0.4% of raya straw, respec-tively (Fig. 1). Selenium content of maize with raya straw(Ave 1.7 lg g�1) was significantly greater than that withwheat straw (Ave 1.1 lg g�1). As compared to sorghum(Fig. 1), average Se content of maize plants was relativelygreater both with the wheat and raya straw treatments.Decrease in Se content of maize at higher levels of organicmatter was relatively less than that observed in case of sor-ghum. Thus, maize seems to utilize Se more efficiently ascompared to sorghum. Selenium content of maize plantsremained well below the maximum permissible levels ofSe for animal consumption (5 mg kg�1) at all the levels ofSe-rich wheat as well as raya straw incorporation. Utiliza-tion of Se applied through Se-rich plant materials variedfrom 0.2% to 1.9% and 0.3% to 2.1% in case of wheatand raya straw, respectively. Rest of the Se remained inthe soil and may become available to the following crops.
Type or different levels of Se-rich straws had no effect onS content of maize. Phosphorus content of maize variedform 0.27% to 0.29% and 0.23% to 0.28% when grown inthe soil treated with Se rich wheat and raya straw, respec-tively. Se-rich wheat straw contributed significantly greateramounts of Zn towards maize nutrition (55.7 mg kg�1)than raya straw (50.1 mg kg�1). In the soil treated withwheat straw, Cu and Mn content of maize decreased con-tinuously with increase in the level of straw. Significantdecrease in Cu and Mn content of maize was observed atthe straw level of 0.4% and above.
3.1.4. Berseem
Dry matter yield: During the initial stages of growth ofberseem, the weather remained continuously foggy withvery low temperatures. As a result, dry matter yield duringthe first cut was the lowest, but it increased as the weatherbecame warmer and the greatest dry matter yield wasrecorded for the 3rd cut of berseem (Table 2). No signifi-cant difference in dry matter yield of all the three cutswas observed between the two types of straws applied.But in the 4th cut, average value of dry matter yield with
0
20
40
60
80
HW
S-S
e, µ
gkg
-1
0.0 0.10.2 0.30.4 0.51.0
Raya straw, %
0
20
40
60
7-Jul 27-Jul 16-Aug 5-Sep
Sampling time
HW
S-S
e, µ
gkg
-1
0.0 0.10.2 0.30.4 0.51.0
Wheat straw, %
Fig. 2. Changes in hot water soluble Se (HWS-Se) with the application ofSe-rich plant materials during the growth period of sorghum.
1738 S.K. Dhillon et al. / Chemosphere 66 (2007) 1734–1743

Autho
r's
pers
onal
co
py
raya straw (5.8 g pot�1) was found to be significantlygreater than that with wheat straw (5.2 g pot�1).
Se content: Unlike sorghum and maize plants, Se con-tent of all the cuts of berseem continued to increase asthe level of each straw applied increased from 0% to1.0% and it varied from 0.3 to 4.3 lg Se g�1 (Fig. 1). Com-pared to the control, significant increase in Se content wasobserved at all the levels of both the straws applied exceptfor the 1st cut of berseem grown with wheat straw. Amongthe two types of Se-rich materials, average Se content ofberseem grown in soil treated with raya straw was 1.4–3.0 times greater than that grown in soil treated with wheatstraw.
In case of soil treated with wheat straw, Se content of2nd cut of berseem was greater than that of 1st cut. How-ever, opposite trend was observed for soil treated with rayastraw. It may be due to slow rate of decomposition ofwheat straw, as such, greater amount of Se became avail-able during growth period of 2nd cut of berseem. The aver-age values of Se content of 3rd cut of berseem with both thestraws were greater than those observed for the 1st and 2ndcut. Though the dry matter yield of 3rd cut of berseem wasalso greater than the previous two cuts, greater values ofthe Se content than the previous two cuts indicated theenhanced Se availability in the soil for plant absorption.This could partly be due to increased rate of straw decom-position or better growth performance of berseem as aresult of warmer weather. Uptake of Se by plants is a tem-perature dependent process. In a soil low in Se, plantsabsorbed much higher amount of Se when temperaturewas above 20 �C than during cooler seasons i.e., at temper-atures <15 �C (Kabata-Pendias and Pendias, 2000). Theimmobilized organic Se could have been released fromdead microbial cells (Cooke and Bruland, 1987) that couldbecome readily available for plant uptake for the third cutof berseem.
At different levels of straw applied, the ratio of Seabsorbed by berseem from soil treated with raya straw to
that treated with wheat straw varied from 2.4 to 4.2.Besides the fact that Se content of raya straw was 2.6 timesthat of wheat straw, greater availability of Se from rayathan wheat straw may also be attributed to faster decom-position rate of raya straw. The ratio of average Se contentof plants grown in soil treated with raya and wheat strawwas significantly greater for berseem (3.0) than sorghum/maize (1.6). This significantly greater ratio for berseemmay be attributed to greater efficiency of berseem to absorbSe compared to sorghum and maize. At all the levels ofstraw applied, Se content of berseem did not exceed5 mg kg�1 – the maximum permissible level of Se for ani-mal consumption. In case of wheat straw, utilization ofSe varied from 1.6% to 5.2% and in case of raya straw itranged from 1.4% to 2.8%. Ajwa et al. (1998) observed thatin the soil treated with seleniferous organic materials, morethan 80% of Se remained in soils after two plantings of rapeand all clippings of tall fescue.
Sulphur and P contents of 1st cut of berseem weregreater than those of sorghum as well as maize plants.Probably due to warmer weather and rapid decompositionof Se-rich straws, S and P contents increased progressivelywith each successive cut of berseem. Wheat straw contrib-uted more P to 2nd and 3rd cuts and S to 3rd cut of ber-seem than raya straw. Differences in availability of S andP to berseem in the soil treated with wheat and raya strawmay be due to antagonistic interaction of Se with S and P.As discussed earlier, raya straw contained greater amountof Se (136.7 mg kg�1) than wheat straw (53.3 mg kg�1)and it adversely affected S and P uptake by berseem. Sele-nium-rich wheat straw contributed greater amounts of Feto 1st cut and Zn to 2nd cut of berseem than raya straw.Significant decrease in Mn content of berseem (2nd cut)was observed at 0.2% and higher levels of straw. Se-richstraws contributed significantly greater amounts of Znand Mn to 2nd cut of berseem than 1st cut, but iron con-tent of the 2nd cut was significantly lower than that of1st cut. It may be due to the fact that appreciable amounts
Table 2Dry matter yield of berseem (g pot�1) as affected by different levels of Se-rich plant materials
Amount ofSe-rich materialapplied (%)
1st cut 2nd cut 3rd cut 4th cut
Wheatstraw
Rayastraw
Mean Wheatstraw
Rayastraw
Mean Wheatstraw
Rayastraw
Mean Wheatstraw
Rayastraw
Mean
0 2.6 2.6 2.6 3.0 3.0 3.0 5.4 5.4 5.4 4.5 4.5 4.50.1 3.0 2.5 2.7 3.6 2.6 3.1 6.4 5.4 5.9 5.1 4.8 4.90.2 2.6 2.6 2.6 3.5 3.1 3.3 6.0 6.0 6.0 4.8 6.2 5.50.3 2.6 2.3 2.5 3.7 2.8 3.3 5.9 7.5 6.7 4.8 6.6 5.70.4 2.7 2.4 2.5 3.3 3.3 3.3 5.5 7.8 6.6 6.0 6.7 6.40.5 2.8 3.0 2.9 3.1 3.9 3.5 7.2 7.1 7.1 5.7 5.6 5.71.0 2.8 3.2 3.0 3.2 3.4 3.3 6.9 8.4 7.6 5.8 6.3 6.0Mean 2.7 2.7 3.3 3.2 6.2 6.8 5.2 5.8LSDa (p 6 0.05)Straws NSb NS NS 0.49Levels NS NS 1.21 0.92Straw · levels NS NS NS NS
a LSD – Least significant difference.b NS – Nonsignificant.
S.K. Dhillon et al. / Chemosphere 66 (2007) 1734–1743 1739

Autho
r's
pers
onal
co
py
of iron have been absorbed by 1st cut of berseem and alsothat iron released from Se-rich straws oxidized from fer-rous to ferric forms was partly fixed in the soil. Kabata-Pendias and Pendias (2000) observed that increased Se lev-els in plants suppress concentration of N, P and S as well asseveral amino acids. Also increasing Se levels inhibit theabsorption of heavy metals mainly Zn Cu, Mn, Fe andCd. The relationship is dependent on the ratio betweenthe elements and thus some stimulating effects of high Seconcentration on uptake of heavy metals may also beexpected.
3.1.5. Changes in hot water soluble Se (HWS-Se)
At the time of sowing of berseem, average HWS-Se inthe soil treated with Se-rich raya straw (78 lg kg�1) wassignificantly greater than that treated with wheat straw(62 lg kg�1). While comparing mean values of two strawsat different levels, significant increase in HWS-Se wasobserved at 0.3% and higher straw levels as compared tocontrol. Amount of HWS-Se was found to be greater inall the treatments in the first sampling as compared to2nd and 3rd sampling (Fig. 3). Lower amount of HWS-Se during 2nd and 3rd sampling could be attributed tothe better plant vigour (because of relatively warmerweather from February to April) and hence the faster rateof Se absorption by berseem plants than the rate of strawdecomposition. The pattern of Se released at different levels
and type of Se-rich materials applied was found to be sim-ilar at all the sampling stages (Fig. 3).
HWS-Se at the time of sowing of berseem was signifi-cantly correlated with Se content of all the four cuts inthe soil treated with wheat and raya straw and the coeffi-cients of correlation ‘r’ varied between 0.79 (p 6 0.05)and 0.99 (p 6 0.001). In the soil treated with raya straw,HWS-Se present after 2nd cut of berseem was significantlycorrelated with Se content of 3rd (r = 0.90, p 6 0.01) and4th cut (r = 0.86, p 6 0.05) of berseem. Whereas HWS-Sedetermined after the final harvest of berseem was signifi-cantly correlated with Se content of 4th cut of berseem(r = 0.94, p 6 0.01). Cary and Allaway (1969) observedthat plant uptake of Se was closely related to water solubleSe in soils rich in Se, although such a correlation has notbeen demonstrated for soils low in Se.
3.2. Availability of Se from Se-rich plant materials to forage
crops grown in a sequence
Selenium rich plant materials were incorporated beforegrowing sorghum; maize and berseem in a sequence weresown in the same pots without further application of Se-rich materials. This set up allowed to study the fate of Seapplied through Se-rich straws in terms of its availabilityon a rather long term basis. The results related to sorghumhave already been discussed in the previous section andthose related to maize and berseem are discussed in the fol-lowing sections.
3.2.1. Maize
Dry matter yield: With increase in the level of Se-richstraws applied from 0% to 1%, dry matter yield of maizeslightly decreased in case of wheat straw and increased incase of raya straw, but the differences were statisticallynon significant (Table 3). Dry matter yield of maize grownin the soil treated with raya straw (Ave 32.8 g pot�1) wassignificantly greater than in the soil treated with wheatstraw (Ave 29.1 g pot�1). Dry matter yield of maize grownafter sorghum was 1.8 times the yield of maize growndirectly in soil treated with Se-rich straw. This may bedue to the fact that weather was more favourable for cropgrowth in September than in July.
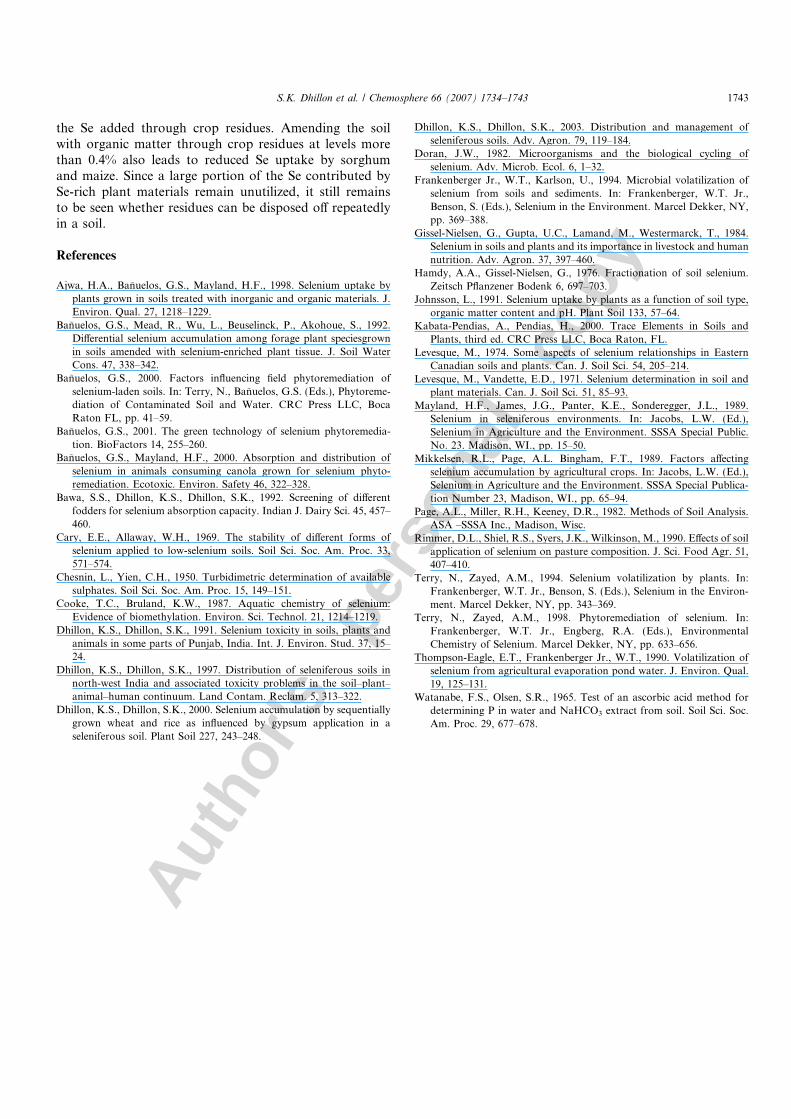
Se content: Selenium content of maize varied from 0.37to 0.54 and 0.37 to 1.33 lg g�1 in the soil treated withwheat and raya straw, respectively (Fig. 4). Selenium con-tent of maize increased to a maximum value at 0.4% andthen it consistently decreased up to 1% of added Se-richwheat straw. But in case of raya straw, Se contentincreased up to 0.5% of added straw and then decreased.Compared to maize grown in a soil freshly amended withSe-rich straws (Fig. 1), Se content in this experiment was2.3 times lower in case of wheat straw and 1.9 times lowerin case of raya straw. It may partly be ascribed to dilutionin Se concentration due to greater yields of maize andpartly to absorption of Se by the previous crop ofsorghum.
0
40
80
120
160
HW
S-S
e, µ
g k
g-1
0.0 0.10.2 0.30.4 0.51.0
Raya straw, %
0
20
40
60
80
100
120
20-Oct
19-Nov
19-Dec
18-Jan
17-Feb
19-Mar
18-Apr
Sampling time
HW
S-S
e, µ
g k
g-1
0.0 0.10.2 0.30.4 0.51.0
Wheat straw, %
Fig. 3. Changes in hot water soluble Se (HWS-Se) with the application ofSe-rich plant materials during the growth period of berseem.
1740 S.K. Dhillon et al. / Chemosphere 66 (2007) 1734–1743

Autho
r's
pers
onal
co
py
3.2.2. BerseemDry matter yield: Dry matter yield of berseem increased
with the application of different levels of Se-rich straw
(Table 3). Significant increase in dry matter yield of differ-ent cuts of berseem was, however, observed above 0.3% ofadded wheat/raya straw. The dry matter yield of berseemprogressively increased with each cut and it was 3–4 timesgreater in case of 3rd cut as compared to 1st/2nd cut. Itmay be ascribed to warmer and favourable weather(March–April). The type of straw added did not haveany significant effect on dry matter yield of berseem.
Se content: Unlike sorghum and maize, Se content of ber-seem continued to increase with increase in amount ofadded straw (Fig. 4). Selenium content of berseem grownwith raya straw remained significantly greater than thatwith wheat straw. In spite of the fact that directly sown ber-seem had greater dry matter yield with the application ofwheat and raya straw, it also had about 3 times greater Secontent than that in case of berseem grown in sorghum–maize–berseem sequence. It shows that a large proportionof the available Se from the incorporated Se-rich strawswas already utilized by sorghum and maize. In case of soiltreated with wheat straw, Se content of 2nd cut of berseemat 0.4% to 1% straw levels was greater than that of first cut,but in case of soil treated with raya straw, the trend was justthe reverse. Comparing the two straws, it was found that Secontent of 2nd cut of berseem in the soil treated with rayastraw was significantly greater than that treated with wheatstraw. Mean values of Se content of 3rd cut both with wheatand raya straw were smaller than the corresponding valuesfor 1st and 2nd cuts of berseem.
Considering all the cuts of berseem together, both withrespect to dry matter yield and Se content, raya straw per-formed better than wheat straw. Selenium content of ber-seem continued to increase until 1% level of appliedstraw. Unlike other crops higher organic matter did notaffect availability of Se to berseem. Availability of Se addedthrough Se-rich straw consistently decreased with thegrowth of successive crops when grown in a sequence. Onthe basis of Se added through straws, utilization of Se
Table 3Effect of incorporation of Se-rich plant materials on dry matter yield (g pot�1) of different crops grown in a sequence
Amount ofSe-rich materialapplied (%)
Sorghum Maize Berseem
1st Cut 2nd Cut 3rd Cut
Wheatstraw
Rayastraw
Mean Wheatstraw
Rayastraw
Mean Wheatstraw
Rayastraw
Mean Wheatstraw
Rayastraw
Mean Wheatstraw
Rayastraw
Mean
0.0 17.5 17.5 17.5 32.8 32.8 32.8 1.6 1.6 1.6 1.7 1.7 1.7 7.0 7.0 7.00.1 20.1 17.0 18.5 31.1 31.7 31.4 1.8 1.7 1.8 1.8 1.7 1.8 7.4 7.7 7.60.2 19.9 18.0 19.0 30.6 31.6 31.1 1.9 1.8 1.9 1.9 1.9 1.9 7.4 7.6 7.50.3 20.3 19.8 20.0 30.3 31.3 30.9 2.1 2.0 2.0 2.2 2.4 2.3 7.8 8.3 8.10.4 20.2 19.2 19.7 26.3 33.0 29.9 2.1 2.4 2.2 2.5 2.7 2.6 7.9 8.9 8.40.5 19.0 20.9 20.0 26.2 34.4 31.3 2.2 2.5 2.4 2.5 3.1 2.8 8.9 9.4 9.11.0 18.6 20.5 19.5 26.3 34.3 30.3 2.2 2.7 2.4 2.8 3.3 3.0 8.5 9.6 9.1Mean 19.4 19.0 29.1 32.8 2.0 2.1 2.2 2.4 7.9 8.4LSDa (p 6 0.05)Straws NSb 2.2 NS NS NSLevels NS NS 0.41 0.69 1.22Straw · levels NS NS NS NS NS
a LSD – Least significant difference.b NS – Nonsignificant.
0.0
0.5
1.0
1.5
2.0
Se
con
ten
t, µ
g g
-1
I cut - Wheat strawII cut - Wheat strawIII cut - Wheat strawI cut - Raya strawII cut - Raya strawIII cut - Raya straw
0.0
0.5
1.0
1.5
Se
con
ten
t, µ
g g
-1
Wheat strawRaya straw
0.0
1.0
2.0
3.0
0 0.2 0.4 0.6 0.8 1
Se-rich material applied, %
Se
con
ten
t, µ
g g
-1
Wheat strawRaya strawSorghum
Maize
Berseem
Fig. 4. Se content of different forage crops grown in a sequence byapplying Se-rich plant materials only to sorghum.
S.K. Dhillon et al. / Chemosphere 66 (2007) 1734–1743 1741

Autho
r's
pers
onal
co
py
(by all crops) was greater from raya than wheat straw andit varied from 0.7% to 2.5% and 0.7% to 3.7% for wheatand raya straw, respectively. Thus more than 90% of Seadded through seleniferous straws still remained in the soilafter growing three crops. The slow release of plant avail-able Se in soils treated with Se-rich organic materials sug-gests that the Se-rich phytoremediation material may besafely incorporated into nonseleniferous soils.
3.2.3. Changes in HWS-Se during the growth period of
sorghum–maize–berseem
The results related to HWS-Se during the growth of sor-ghum have already been discussed in the previous section,but the data have also been included in Fig. 5 so as to pro-vide a complete picture for the whole sequence. HWS-Sepresent at the time of harvest of sorghum was consideredas that present at the sowing time of maize and it variedfrom 15 to 48 and 15 to 60 lg kg�1 soil in case of soil trea-ted with Se-rich wheat and raya straw, respectively. After25 d growth of maize, HWS-Se in the soil did not changemuch, indicating thereby that in 10–11 weeks after incorpo-ration, the Se-rich straws were decomposed to the extentthat HWS-Se was released at the same rate at which itwas absorbed by the growing maize crop. Average valueof HWS-Se (at 25 d growth) with raya straw (39 lg kg�1)was significantly greater than that with wheat straw(28 lg kg�1). Comparing the mean values, significant
increase in HWS-Se over control was observed with addi-tion of straw at a level of 0.2% and above. At the time ofharvest of maize, soils treated with both wheat and rayastraw contained lesser amounts of HWS-Se than that pres-ent at 25 d growth period (Fig. 5). No significant differ-ences were observed between average values of HWS-Sewith the two straws. Except at a level of 1%, soil treatedwith wheat straw contained greater amounts of HWS-Sethan that treated with raya straw.
At the termination of experiment (after growing sor-ghum, maize and three cuts of berseem) HWS-Se in soil trea-ted with wheat straw varied from 17 to 25 and in soil treatedwith raya straw it varied from 17 to 47 lg kg�1. Averagevalue of HWS-Se in soil treated with raya straw (26 lg kg�1)was significantly greater than in soil treated with wheatstraw (19 lg kg�1). No significant differences were observedin HWS-Se with addition of different levels (except 1%) ofSe-rich wheat straw. But in case of soil treated with rayastraw, significant increase in HWS-Se over control wasobserved at 0.3% onwards up to 1% of added straw.
3.2.4. Disposal limits for Se-rich material into the soilIn the present investigation, 53 to 533 and 137 to
1367 lg Se kg�1 were added to the soil through wheat andraya straw, respectively. At all the levels of Se-rich strawsapplied, Se content of different fodder crops remained wellbelow the maximum permissible level of 5 mg Se kg�1. Dif-ferent amounts of Se were absorbed by different foddercrops and in case of directly sown crops the order was: ber-seem > maize > sorghum. When crops were grown in asequence, the order was: sorghum > maize > berseem –the same sequence in which crops were grown. Applicationof straw up to 1.0% level did not show any detrimental effecton dry matter yield and quality (with respect to Se content)of different fodder crops. Rather, when the amount of strawapplied increased from 0.3% to 1%, Se absorption by sor-ghum and maize plants decreased significantly. Thus, Se-rich plant materials like wheat and raya straw can be safelydisposed off into the non-seleniferous soil up to a level of 1%or even more. However, it should not be adopted as a rou-tine disposal procedure, because even the three crops grownin a sequence could remove only a fraction (<4%) of thetotal Se applied through seleniferous materials. Seleniumremaining in soil will become available to the followingcrops. The straw applied will continue to decompose andrelease Se into the soil solution, which can be absorbed bythe following crops. Since plant species differ significantlyin their Se absorption capacity, the amount of Se absorbedwill also depend upon the type of crop selected as fodder foranimal consumption.
4. Conclusions
Selenium-rich wheat and raya straw containing as highas 137 mg Se kg�1 can be safely disposed off into nonsele-niferous soils for growing fodder crops like sorghum, maizeand berseem. Fodder crops do not remove more than 5% of
10
20
30
40
50
HW
S-S
e, µ
g k
g-1
0 0.10.2 0.30.4 0.51.0
Wheat straw, %
0
20
40
60
80
1-Jul 1-Sep 1-Nov 1-Jan 1-Mar 1-May
Sampling time
HW
S-S
e, µ
gkg
-1
0 0.10.2 0.30.4 0.51.0
Raya straw, %
Fig. 5. Changes in hot water soluble Se (HWS-Se) with the application ofSe-rich plant material only to sorghum during the growth period ofsorghum–maize–berseem sequence.
1742 S.K. Dhillon et al. / Chemosphere 66 (2007) 1734–1743
Autho
r's
pers
onal
co
py
the Se added through crop residues. Amending the soilwith organic matter through crop residues at levels morethan 0.4% also leads to reduced Se uptake by sorghumand maize. Since a large portion of the Se contributed bySe-rich plant materials remain unutilized, it still remainsto be seen whether residues can be disposed off repeatedlyin a soil.
References
Ajwa, H.A., Banuelos, G.S., Mayland, H.F., 1998. Selenium uptake byplants grown in soils treated with inorganic and organic materials. J.Environ. Qual. 27, 1218–1229.
Banuelos, G.S., Mead, R., Wu, L., Beuselinck, P., Akohoue, S., 1992.Differential selenium accumulation among forage plant speciesgrownin soils amended with selenium-enriched plant tissue. J. Soil WaterCons. 47, 338–342.
Banuelos, G.S., 2000. Factors influencing field phytoremediation ofselenium-laden soils. In: Terry, N., Banuelos, G.S. (Eds.), Phytoreme-diation of Contaminated Soil and Water. CRC Press LLC, BocaRaton FL, pp. 41–59.
Banuelos, G.S., 2001. The green technology of selenium phytoremedia-tion. BioFactors 14, 255–260.
Banuelos, G.S., Mayland, H.F., 2000. Absorption and distribution ofselenium in animals consuming canola grown for selenium phyto-remediation. Ecotoxic. Environ. Safety 46, 322–328.
Bawa, S.S., Dhillon, K.S., Dhillon, S.K., 1992. Screening of differentfodders for selenium absorption capacity. Indian J. Dairy Sci. 45, 457–460.
Cary, E.E., Allaway, W.H., 1969. The stability of different forms ofselenium applied to low-selenium soils. Soil Sci. Soc. Am. Proc. 33,571–574.
Chesnin, L., Yien, C.H., 1950. Turbidimetric determination of availablesulphates. Soil Sci. Soc. Am. Proc. 15, 149–151.
Cooke, T.C., Bruland, K.W., 1987. Aquatic chemistry of selenium:Evidence of biomethylation. Environ. Sci. Technol. 21, 1214–1219.
Dhillon, K.S., Dhillon, S.K., 1991. Selenium toxicity in soils, plants andanimals in some parts of Punjab, India. Int. J. Environ. Stud. 37, 15–24.
Dhillon, K.S., Dhillon, S.K., 1997. Distribution of seleniferous soils innorth-west India and associated toxicity problems in the soil–plant–animal–human continuum. Land Contam. Reclam. 5, 313–322.
Dhillon, K.S., Dhillon, S.K., 2000. Selenium accumulation by sequentiallygrown wheat and rice as influenced by gypsum application in aseleniferous soil. Plant Soil 227, 243–248.
Dhillon, K.S., Dhillon, S.K., 2003. Distribution and management ofseleniferous soils. Adv. Agron. 79, 119–184.
Doran, J.W., 1982. Microorganisms and the biological cycling ofselenium. Adv. Microb. Ecol. 6, 1–32.
Frankenberger Jr., W.T., Karlson, U., 1994. Microbial volatilization ofselenium from soils and sediments. In: Frankenberger, W.T. Jr.,Benson, S. (Eds.), Selenium in the Environment. Marcel Dekker, NY,pp. 369–388.
Gissel-Nielsen, G., Gupta, U.C., Lamand, M., Westermarck, T., 1984.Selenium in soils and plants and its importance in livestock and humannutrition. Adv. Agron. 37, 397–460.
Hamdy, A.A., Gissel-Nielsen, G., 1976. Fractionation of soil selenium.Zeitsch Pflanzener Bodenk 6, 697–703.
Johnsson, L., 1991. Selenium uptake by plants as a function of soil type,organic matter content and pH. Plant Soil 133, 57–64.
Kabata-Pendias, A., Pendias, H., 2000. Trace Elements in Soils andPlants, third ed. CRC Press LLC, Boca Raton, FL.
Levesque, M., 1974. Some aspects of selenium relationships in EasternCanadian soils and plants. Can. J. Soil Sci. 54, 205–214.
Levesque, M., Vandette, E.D., 1971. Selenium determination in soil andplant materials. Can. J. Soil Sci. 51, 85–93.
Mayland, H.F., James, J.G., Panter, K.E., Sonderegger, J.L., 1989.Selenium in seleniferous environments. In: Jacobs, L.W. (Ed.),Selenium in Agriculture and the Environment. SSSA Special Public.No. 23. Madison, WI., pp. 15–50.
Mikkelsen, R.L., Page, A.L. Bingham, F.T., 1989. Factors affectingselenium accumulation by agricultural crops. In: Jacobs, L.W. (Ed.),Selenium in Agriculture and the Environment. SSSA Special Publica-tion Number 23, Madison, WI., pp. 65–94.
Page, A.L., Miller, R.H., Keeney, D.R., 1982. Methods of Soil Analysis.ASA –SSSA Inc., Madison, Wisc.
Rimmer, D.L., Shiel, R.S., Syers, J.K., Wilkinson, M., 1990. Effects of soilapplication of selenium on pasture composition. J. Sci. Food Agr. 51,407–410.
Terry, N., Zayed, A.M., 1994. Selenium volatilization by plants. In:Frankenberger, W.T. Jr., Benson, S. (Eds.), Selenium in the Environ-ment. Marcel Dekker, NY, pp. 343–369.
Terry, N., Zayed, A.M., 1998. Phytoremediation of selenium. In:Frankenberger, W.T. Jr., Engberg, R.A. (Eds.), EnvironmentalChemistry of Selenium. Marcel Dekker, NY, pp. 633–656.
Thompson-Eagle, E.T., Frankenberger Jr., W.T., 1990. Volatilization ofselenium from agricultural evaporation pond water. J. Environ. Qual.19, 125–131.
Watanabe, F.S., Olsen, S.R., 1965. Test of an ascorbic acid method fordetermining P in water and NaHCO3 extract from soil. Soil Sci. Soc.Am. Proc. 29, 677–678.
S.K. Dhillon et al. / Chemosphere 66 (2007) 1734–1743 1743
Copyright © 2022 FDOKUMEN