Kidd etal 2006 Site characteristics plant communities gravel removal AAAR
Upload
havforskningsinstituttetCategory
view
0download
0
Proc. R. Soc. B (2008) 275, 163–172
doi:10.1098/rspb.2007.1153
Ice-age survival of Atlantic cod: agreementbetween palaeoecology models and genetics
Grant R. Bigg1,*, Clifford W. Cunningham2, Geir Ottersen3,4,
Grant H. Pogson5, Martin R. Wadley6 and Phillip Williamson6,7
1Department of Geography, University of Sheffield, Sheffield S10 2TN, UK2Department of Biology, Duke University, Durham, NC 27708, USA3Institute of Marine Research, Gaustadalleen 21, 0349 Oslo, Norway
4Centre for Ecological and Evolutionary Synthesis, University of Oslo, PO Box 1066 Blindern, 0316 Oslo, Norway5Department of Ecology and Evolutionary Biology, University of California, Santa Cruz, CA 95064, USA
6School of Environmental Sciences, University of East Anglia, Norwich NR4 7TJ, UK7Natural Environment Research Council, North Star Avenue, Swindon SN2 1EU, UK
Published online 14 November 2007
*Autho
ReceivedAccepted
Scant scientific attention has been given to the abundance and distribution of marine biota in the face of
the lower sea level, and steeper latitudinal gradient in climate, during the ice-age conditions that have
dominated the past million years. Here we examine the glacial persistence of Atlantic cod (Gadus morhua)
populations using two ecological-niche-models (ENM) and the first broad synthesis of multi-locus gene
sequence data for this species. One ENM uses a maximum entropy approach (MAXENT); the other is a new
ENM for Atlantic cod, using ecophysiological parameters based on observed reproductive events rather
than adult distribution. Both the ENMs were tested for present-day conditions, then used to hindcast
ranges at the last glacial maximum (LGM) ca 21 kyr ago, employing climate model data. Although the
LGM range of Atlantic cod was much smaller, and fragmented, both the ENMs agreed that populations
should have been able to persist in suitable habitat on both sides of the Atlantic. The genetic results showed
a degree of trans-Atlantic divergence consistent with genealogically continuous populations on both sides
of the North Atlantic since long before the LGM, confirming the ENM results. In contrast, both the
ENMs and the genetic data suggest that the Greenland G. morhua population post-dates the LGM.
Keywords: cod; ecological-niche-modelling; DNA sequence; glacial
1. INTRODUCTION
To predict how species’ ranges may change under global
warming scenarios, we must understand the factors that
limit their distributions today and in the past. Terrestrial
ecologists have correlated information on species occur-
rence with annual rainfall and temperature: remarkably
accurate models of extant ranges can then be developed
(Hugall et al. 2002; Iguchi et al. 2004). In addition,
palaeoclimate records can beused toestimate how terrestrial
species’ ranges might have contracted or expanded during
past climatic cycles (Watson & Peterson 1999; Hugall et al.
2002). Such ecological-niche-modelling has grown in
importance as predictions are made concerning plant and
animal ranges in relation to future climate change and
extinction risks (Thomas et al. 2004; Thuiller et al. 2005).
This study of Atlantic cod addresses major challenges
that complicate extending ecological-niche-modelling to
the three-dimensional environment of marine fishes. Both
Atlantic cod Gadus morhua and Pacific cod Gadus
macrocephalus are descended from an Atlantic lineage
that invaded the Pacific at least 3.5 Myr ago, when the
Bering Strait was open and the Arctic was ice free (Raymo
et al. 1990). The Atlantic cod lineage invaded the Pacific
for a second time ca 2 Myr ago to found the morpho-
logically distinct Alaska pollock Theragra chalcogramma
r for correspondence ([email protected]).
23 August 200719 October 2007
163
(Carr et al. 1999; Coulson et al. 2006). During the last
inter-glacial period ca 100 kyr ago, the Pacific cod lineage
re-invaded the Atlantic to found the Greenland cod Gadus
ogac (Coulson et al. 2006), whose ecophysiological
requirements allow it to extend farther into the Arctic
than either the Atlantic or the Pacific Cod.
The last glacial maximum (LGM) ca 21 kyr ago was
one of the coldest events of the 45–50 major climatic
oscillations in the Late Quaternary (Wolff 2005). Dis-
tributional changes for planktonic organisms, particularly
foraminifera, have provided the basis for most reconstruc-
tions of marine conditions during the LGM (e.g.
CLIMAP 1976). These reconstructions have since been
refined, using additional proxies and palaeoclimate
models (e.g. Mix et al. 2001; Meland et al. 2005). With
few exceptions (Bucklin & Wiebe 1998), such information
has not been used to assess the past distributions of larger
marine fauna and flora; nevertheless, for species occupy-
ing polar or sub-polar shallow water habitats for all or part
of their life cycle, glacial periods were radically different
from the present day, and relatively unfavourable. Thus,
the LGM saw the loss of most shelf sea habitats as global
sea level fell by 120–135 m (Mitrovica 2003), and ice
sheets advanced onto the continental shelf in polar waters
(Peltier 1994). This habitat loss was particularly acute
along the western and northern shores of the North
Atlantic, where the continental shelf is narrow. In
addition, the North Atlantic, and particularly the eastern
This journal is q 2007 The Royal Society

area of distributionspawning areasannual mean temperature 100 m depth
–1
0
2
46
10
8 642
0
–1
12
14
8
16
Figure 1. Present-day distribution of Atlantic cod stocks inrelation to annual mean temperature. Spawning areas shownin black. Adapted with permission from Sundby (2000).
164 G. R. Bigg et al. Ice-age survival of Atlantic cod
coastal region of North America, was subject to repeated
invasion by large increases in iceberg numbers (Bond et al.
1992), causing abrupt climate change and extensive shelf
floor scouring (Piper 2005).
The study of climatically driven range changes for
marine species is greatly complicated by the dynamic,
three-dimensional nature of their environment. Con-
ditions can vary greatly over a few metres in water
depth, and different life-cycle stages may occupy different
habitats. Here we use two ecological-niche-models
(ENMs) for hindcasting LGM ranges of G. morhua: one
based on adult range and the other focusing on the
optimum conditions for reproduction (primarily spawning
that occurs in a subset of the adult range). Both the ranges
are likely to have been significantly compromised by the
harsh and variable environmental conditions described
above in the northern Atlantic during the LGM,
particularly along western and northern margins, with
possible consequences for the genetic diversity of the
species. A limitation of ENMs is the inevitable circularity
introduced by using extant populations to model extant
ranges. Extending the approach of Hugall et al. (2002), we
use mitochondrial and nuclear DNA sequences to test the
predicted patterns of genetic subdivision when our models
are applied to temperature and depth conditions prevail-
ing during the LGM. Thus, through the complementary
analyses of ENMs and genetics we address the question of
whether, and where, LGM environmental conditions were
sufficiently unfavourable to force pre-glacial races of cod
to extinction.
2. MATERIAL AND METHODS(a) Maximum entropy ENM
Most ENMs for fishes are based on observed locations of
adults, with that information used to simulate adult
occurrence by various algorithms. For example, the inter-
active aquamaps system in FISHBASE (www.FishBase.org)
uses a c-squares distribution modelling approach (Rees
2003) while Iguchi et al. (2004) uses the genetic algorithm
for rule-set prediction (GARP). Several parameters used in
the aquamaps system are not easily available from proxies for
palaeo-analyses, such as salinity and accurate measures of
productivity. Here we use a relatively new ENM called
MAXENT (Phillips et al. 2006) to produce a map of the
Proc. R. Soc. B (2008)
probability of cod’s occurrence, using data on known
occurrence and a set of environmental variables considered
important for its habitat. The MAXENT uses a maximum
entropy principle (i.e. the distribution is as uniform as
possible, given a set of constraints conveying our uncertain
knowledge of the species); it has been tested against a wide
range of other ENMs and has been found to be among the
most successful (Elith et al. 2006; Hernandez et al. 2006).
Our training dataset of occurrences combines FISHBASE
records with the collection locations of Pogson et al. (1995)
and Arnason et al. (2000). The test dataset used to check the
performance of the ENM for the present day is from
Jonsdottir et al. (2003). The environmental variables used
to constrain the habitat probability were ocean bathymetry,
sea surface temperature and sea surface salinity. For present-
day validation of MAXENT, the relevant bathymetry was at 5 0
resolution (ETOPO 1986), while the temperature and
salinity were interpolated to this resolution from the 18
Levitus et al. (1994) and Levitus & Boyer (1994) fields,
respectively, or taken from the ocean model (§2c) which does
provide us with palaeosalinity as well as palaeotemperature
data. We acknowledge that temperature effects on adult
distributions may be indirect, e.g. operating through trophic
interactions affecting juvenile survival (Hjermann et al. 2007).
(b) Ecophysiological constraints for spawning
Spawning in cod requires a more restrictive set of environ-
mental conditions than adult existence (figure 1). We
therefore constructed a simple set of ecophysiological
constraints, based on conditions of observed spawning to
enable climate models to predict potentially suitable breeding
habitats. These constraints included: depth; month of
spawning; and ambient temperature for egg development.
Our focus on spawning identifies populations that should be
self-sustaining, excluding ‘sink’ populations where adults are
present but do not spawn. Suitable conditions for cod
spawning were determined from observational syntheses
published by ICES (International Council for the Explora-
tion of the Sea; Brander 1994, 2005).
Figure 2 describes the envelope of criteria for depth of
spawning (that occurs near the sea floor), and field
temperatures in near-surface waters during egg development
(egg buoyancy is increased post-fertilization). Frequency
distributions in figure 2 were determined from ICES data
(table 2.3 of Brander (1994)), allocating each stock equally to
the x -axis categories covered by their range values. These
ranges yielded an envelope of spawning depth from 0 to
400 m, and ambient temperature from 0 to 98C (figure 2).
Because late spring and early summer are key times for egg
development, egg hatch and early juvenile survival, an
additional constraint was that waters should be ice free by
June, defined for modelling purposes as having June
temperatures greater than 08C in the top 20 m. A subsequent
ICES synthesis (Brander 2005) included lower minimum
(K1.58C; East Greenland) and higher maximum spawning
temperatures (up to 12.78C, Georges Bank). To be con-
servative, and to match laboratory data for egg survival
(Pepin et al. 1997), we used the narrower ranges from the
1994 synthesis.
(c) Modelling ocean conditions in the present and at
the last glacial maximum
To produce oceanic environmental parameters at the LGM,
both present-day and LGM ocean simulations were carried

0
2
4
6
8
10
12(a) (b) (c)
200 400 600 800 1000 O N D J F M A M J J A S 0 2 4 6 8 10 12 14 16 18
80
60
40
20
metres deep month of year °C
no. o
f st
ock
popu
latio
ns o
bser
ved
spaw
ning
perc
enta
ge o
f eg
g su
rviv
al in
labo
rato
ry
Figure 2. Environmental factors defining suitable habitat for cod, based on present-day distributions (Brander 1994, 2005).(a) Water depth in which spawning occurs (data for 18 stocks). (b) Seasonality of spawning (nZ23). (c) Ambienttemperature for spawning and eggs (nZ18). For each histogram, arrowed range shows boundaries used for modelling.Multi-stock laboratory egg survival data (Pepin et al. 1997) also given in upper part of (c), as a function of temperature.The curve is fitted with a third-order polynomial.
Ice-age survival of Atlantic cod G. R. Bigg et al. 165
out using an ocean general circulation model (Wadley et al.
2002) based on the Bryan–Semtner–Cox formulation. The
present-day simulation was used to validate the use of the
model hindcasts in the ENMs. The model has an orthogonal
curvilinear grid with its north pole in Greenland. This gives
relatively high resolution in the northern North Atlantic and
Arctic regions, compared with the Southern Hemisphere and
North Pacific. The model can be efficiently integrated by the
use of a variable time-stepping scheme (Wadley & Bigg
1999), which allows the time-step length to be spatially varied
with model resolution. Monthly mean surface forcing was
used for momentum, heat and fresh water fluxes. For the
LGM integration, present-day fluxes were adjusted by the
addition of past (LGM minus present-day) fluxes from
atmospheric model simulations (Dong & Valdes 1998), and
ocean bathymetry took into account changes in absolute sea-
level and ice-loading effects (Peltier 1994). Both present-day
and LGM simulations were run for 4500 years and were
stable for the last 2500 years of integration. Given the ocean
model’s vertical resolution constraints, the criteria for
suitability for method (§2b) were that the seafloor depth is
less than 500 m, water temperatures at 20–100 m depth are in
the range 0–98C sometime between February and June and
the sea surface is ice free during June.
(d) Calibration point for rate of genetic divergence
A temporal component is necessary to test the hypothesis of
population persistence through the last glaciation, requiring
calibration of the rate of molecular evolution. Because cod have
speciated twice since the opening of the Bering Strait ca 3.5 Myr
ago, they are thought to have participated in the first large wave
of invasion (Grant & Stahl 1988; Carr et al. 1999; Pogson &
Mesa 2004). Although one mollusc invaded the Pacific earlier
(Marincovich & Gladenkov 1999), the majority of species with
fossil records crossed the Bering Strait after 3.5 Myr ago
(Vermeij 1991). For this study we used the 3.5 Myr ago date to
calibrate rates of molecular divergence between Atlantic cod
(G. morhua) and Pacific cod (G. macrocephalus). Using an earlier
date for the calibration would have yielded a slower rate of
molecular divergence, making our estimates of trans-Atlantic
population divergence even older than the ages we present.
Proc. R. Soc. B (2008)
Maximum-likelihood trees for the three loci with DNA
sequences were inferred using PAUP� v. 4.0b10 (Swofford
2002) under the HKY model of evolution and among site rate
variation (allowing direct comparison to the age ofdivergence as
simulated by models MDIV and IM, which only implement
the HKY model; see §2g below). Parameters of the model
(estimated nucleotide frequencies, proportion of invariant sites
and the shape of the gamma distribution) were estimated using
maximum likelihood.
(e) Genetic data from the literature and
additional sequencing
The Bering Strait calibration point could only be applied to
data that are directly comparable between Atlantic and
Pacific cod. Such data are available for 10 allozyme loci
(Grant & Stahl 1988), mtDNA (compilation of many
authors’ cytochrome b (CytB), samples recently reviewed
by Arnason (2004)) and two nuclear genes (pantophysin and
S2 ribosomal protein (Pogson & Mesa 2004)). There were no
comparable datasets including both Atlantic and Pacific cod
for either nuclear RFLPs or microsatellites.
Sufficient genetic data were available in the literature and
GenBank from populations across the North Atlantic with
the exception of the nuclear S2 ribosomal protein gene, a
section of which was PCR amplified using Primers F1
CAAGGAGTCAGAGATCATCGAC and R1 TCAAAAG-
CAATTAGGAGGTGGC (Pogson & Mesa 2004) resulting
in 898 aligned base pairs. These new data represented 118
alleles for G. morhua that included 546 bp of coding sequence
and two introns of 267 and 85 bp, respectively. Additional
S2 sequences were obtained from GenBank for one G. morhua
sequence (from Atlantic Canada) and one G. macrocephalus
sequence (from Pacific Canada) from an earlier study of Gadid
phylogeny (Pogson & Mesa 2004). These comparisons strongly
reinforced RFLP studies showing that the S2 gene is not under
positive selection in G. morhua (Pogson et al. 1995): not a single
first or second codon position has fixed in the S2 gene since the
separation of Atlantic and Pacific cod (Pogson & Mesa 2004).
Since selection is not expected to directly affect rates of neutral
substitution (Birky & Walsh 1988), we removed first and second
positions from both nuclear genes (leaving 547 bp for S2, 1473
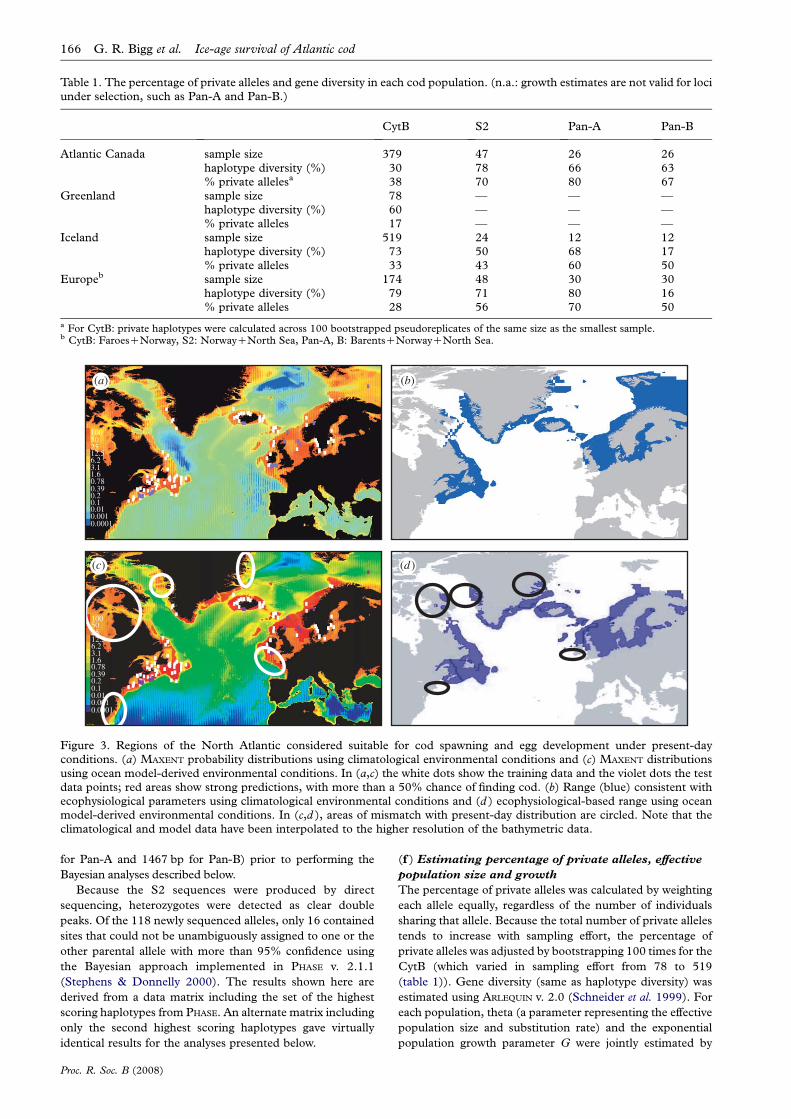
Table 1. The percentage of private alleles and gene diversity in each cod population. (n.a.: growth estimates are not valid for lociunder selection, such as Pan-A and Pan-B.)
CytB S2 Pan-A Pan-B
Atlantic Canada sample size 379 47 26 26haplotype diversity (%) 30 78 66 63% private allelesa 38 70 80 67
Greenland sample size 78 — — —haplotype diversity (%) 60 — — —% private alleles 17 — — —
Iceland sample size 519 24 12 12haplotype diversity (%) 73 50 68 17% private alleles 33 43 60 50
Europeb sample size 174 48 30 30haplotype diversity (%) 79 71 80 16% private alleles 28 56 70 50
a For CytB: private haplotypes were calculated across 100 bootstrapped pseudoreplicates of the same size as the smallest sample.b CytB: FaroesCNorway, S2: NorwayCNorth Sea, Pan-A, B: BarentsCNorwayCNorth Sea.
(a) (b)
(c) (d )
100502512.56.23.11.60.780.390.20.1
0.0010.01
0.0001
100502512.56.23.11.60.780.390.20.10.010.0010.0001
Figure 3. Regions of the North Atlantic considered suitable for cod spawning and egg development under present-dayconditions. (a) MAXENT probability distributions using climatological environmental conditions and (c) MAXENT distributionsusing ocean model-derived environmental conditions. In (a,c) the white dots show the training data and the violet dots the testdata points; red areas show strong predictions, with more than a 50% chance of finding cod. (b) Range (blue) consistent withecophysiological parameters using climatological environmental conditions and (d ) ecophysiological-based range using oceanmodel-derived environmental conditions. In (c,d ), areas of mismatch with present-day distribution are circled. Note that theclimatological and model data have been interpolated to the higher resolution of the bathymetric data.
166 G. R. Bigg et al. Ice-age survival of Atlantic cod
for Pan-A and 1467 bp for Pan-B) prior to performing the
Bayesian analyses described below.
Because the S2 sequences were produced by direct
sequencing, heterozygotes were detected as clear double
peaks. Of the 118 newly sequenced alleles, only 16 contained
sites that could not be unambiguously assigned to one or the
other parental allele with more than 95% confidence using
the Bayesian approach implemented in PHASE v. 2.1.1
(Stephens & Donnelly 2000). The results shown here are
derived from a data matrix including the set of the highest
scoring haplotypes from PHASE. An alternate matrix including
only the second highest scoring haplotypes gave virtually
identical results for the analyses presented below.
Proc. R. Soc. B (2008)
(f ) Estimating percentage of private alleles, effective
population size and growth
The percentage of private alleles was calculated by weighting
each allele equally, regardless of the number of individuals
sharing that allele. Because the total number of private alleles
tends to increase with sampling effort, the percentage of
private alleles was adjusted by bootstrapping 100 times for the
CytB (which varied in sampling effort from 78 to 519
(table 1)). Gene diversity (same as haplotype diversity) was
estimated using ARLEQUIN v. 2.0 (Schneider et al. 1999). For
each population, theta (a parameter representing the effective
population size and substitution rate) and the exponential
population growth parameter G were jointly estimated by

100502512.56.23.11.60.780.390.20.10.010.0010.0001
(a) (b)
Figure 4. Regions of the North Atlantic at the time of the LGM that are suitable for cod population survival, (a) from MAXENT
using ocean model data, as probabilities and (b) from applying the ecophysiological parameters to ocean model data.
Ice-age survival of Atlantic cod G. R. Bigg et al. 167
maximum likelihood with the FLUCTUATE v. 1.4 program
(Kuhner et al. 1998), as described by Wares & Cunningham
(2001). FLUCTUATE was not applied to the pantophysin data
because positive selection will mimic the demographic
consequences of high population growth.
(g) Estimates of migration and timing
of population divergence
It is well established that high levels of migration can
confound estimates of population ages by reducing the degree
of genetic differentiation between populations (Slatkin 1993).
DNA sequence data were analysed by two Bayesian methods
that allow simultaneous estimation of migration (M) and age
of population divergence, MDIV (Nielsen & Wakeley 2001)
and IM (Hey & Nielsen 2004).
The estimates of population divergence between popu-
lations in MDIV depend strongly on age priors (IM results
are much less dependent on priors). Hence all MDIV runs
were standardized so that they had the same maximum prior
of 200 kyr ago (covering about two glacial cycles). To test our
palaeo-ENM hindcasts of cod distributions during the last
glacial period, minimum ages of populations are of interest.
As mentioned above, our calibration of the rate of
substitution is a maximum estimate, so earlier opening of
the Bering Strait would give only older numbers.
Because minimum ages are of interest, we present only the
95% CI for the minimum age of population divergence
calculated as in an earlier study (Riginos et al. 2004). In
subsequent runs, prior values of M were reduced if they
greatly exceeded the curve of values. For MDIV, which
outputs only columns of numbers, the modes for each
parameter were found by fitting a five-order polynomial to
the top one-third of the a posteriori values. MDIV and IM
trials ran for at least 10 million chains, with multiple runs to
ensure stability of results. The options for the IM runs were
set as follows: qu 1 -q1 60 -m1 30 -m2 30 -t 2 -L 6.0 -n 1 -b
100000 -p 234567 -z1000, using the November 2005 version
of IM (the July 2006 version could not handle our large
sample sizes). CIs for the allozyme divergences were
calculated from CONTML (Felsenstein 2005).
3. RESULTS(a) Modelling present-day ocean conditions
and cod distribution
Our modelled present-day ocean circulation (Wadley et al.
2002) is in good agreement with observed circulation, with
approximately 16 Sv (1 SvZ106 m3 sK1) of deep water
Proc. R. Soc. B (2008)
exported from the South Atlantic. Model-derived tempera-
tures and salinities were interpolated onto a 18!18
longitude–latitude grid, masked for the present day by a
5 0!5 0 depth and elevation database (ETOPO 1986).
These fields match well with the ocean climatology of
Levitus et al. (1994).
Environmental conditions from this climatology, as
well as the present-day oceanographic simulation, were
used in the MAXENT ENM (figure 3a,c) and were also used
to define two versions of the expected ranges of present-
day suitable habitat for spawning (figure 3b,d ). In all four
cases, modelled ranges of suitable habitat were congruent
with the distributions of more than 90% of the Atlantic
cod stocks recognized by ICES (Brander 1994, 2005; also
see figure 1); however, the two MAXENT ENM realizations
extend probable near-coastal ranges much further south
than those observed, on both sides of the Atlantic. The
principal environmental predictor for MAXENT is bathyme-
try, followed by sea surface temperature; salinity has only a
minor influence on the probability of G. morhua occurrence.
For both the ENMs, the use of climatological predictors
(figure 3a,b) suggests a more northerly present-day range
than using the ocean model environmental variables
(figure 3c,d ). The discrepancy is the greatest for the NW
Atlantic,but less for the Barents Sea.A probable explanation
is that spring climatological data are poorlyobserved in these
regions, owing to widespread sea ice, leading to loose
constraints except for the bathymetric variable. For the
ecophysiological predictor using ocean model data, there are
two (relatively minor) southerly false negatives, in the
English Channel and Georges Bank off Massachusetts
(figure 3d ), primarily caused by lack of horizontal resolution
of the ocean model providing basic environmental data for
the ENM. There were also some false positives, again driven
by ocean model resolution limitations, in regions off Baffin
Island and Greenland where the species is currently absent.
Note the difference between climatological and model
variable predictions in the northern Barents Sea, where
both MAXENT and our ecophysiological parameters show
blanks when using model data. Although adult cod are
abundant in the Barents Sea as far north as Spitzbergen
(Hjermann et al. 2007), the spawning of this stock is limited
to near the Norwegian coast (figure 1; Brander 1994, 2005).
This result validates the use of ocean model environmental
variables to drive the ENMs (as is necessary for the
LGM simulation, below); in particular, the model-driven
ecophysiological ENM (figure 3d ) provides a relatively

Table 2. Estimated substitution rates for DNA loci, inferredusing PAUP� v. 4.0b10 (Swofford 2002). (See §§2d and 3c formore details. Rates were calibrated assuming a divergencetime of 3.5 Myr (ago) between Atlantic and Pacific cod.)
datano. ofbases
maZ(d/t)/2(!10K9)
CytB: all codon positions 250 8.18S2: intron and third positions only 534 1.88pantophysinb: intron and third
positions only1473 2.48
am units of substitutions per site per year.b Average of substitution rate for G. morhua pantophysin betweenPan-A and B allelic clades to G. macrocephalus.
Table 3. Estimates of theta and the exponential growthparameter G for each cod population. (See Wares &Cunningham (2001) for details of methodology. A large Gimplies swift growth and recent divergence of populations.)
joint estimates fromFLUCTUATE CytB S2
Atlantic Canada theta 0.33 0.045population growth, G 443 2257
Greenland theta 0.03 —population growth, G 1528
Iceland theta 0.20 3.43population growth, G 562 16 579
Europe theta 0.09 0.106population growth, G 414 2628
168 G. R. Bigg et al. Ice-age survival of Atlantic cod
robust predictor of conditions suitable for population
persistence.
(b) Modelling cod range at the LGM
In the LGM simulation most of the 10 Sv of deepwater
formation upwells within the Atlantic basin, with only 4 Sv
leaving the South Atlantic (Wadley et al. 2002). During
the LGM, we estimate sea-surface temperatures decreased
by as much as 128C, with a sharp temperature front at
approximately 508 N separating polar and temperate
surface waters. The LGM land and depth mask was
derived by adding past (LGM minus present-day) depths
and elevations (Peltier 1994) to those for the present day.
Both palaeo-ENMs for the LGM give similar results
(figure 4a,b). They suggest that G. morhua had a
continuous Atlantic range off coastal Europe down to at
least northern Spain. This hindcast simulation also shows
a limited range of potentially suitable habitats off eastern
North America, mostly near Nova Scotia and around
the Grand Banks. This suitable habitat is consistent with
the conclusions of the GLAMAP project that parts of the
Grand Banks were unglaciated at the LGM (Pflaumann
et al. 2003; Meland et al. 2005). Apart from the scattered
small areas off Baffin Island and Greenland, there is a much
larger area in the northeast Mediterranean and the Black Sea
(unlikely to have been occupied owing to geographical
disjunction). Near Iceland the two models show more
disagreement, with only the ecophysiological ENM
suggesting a viable habitat off southern Iceland. From
figure 4b, the total area of suitable LGM habitat in the North
Atlantic is estimated to be approximately 0.7 Mkm2,
compared with 3.5 Mkm2 for present-day conditions (data
from figure 3d ): a fivefold change, with a relatively narrow
and environmentally vulnerable latitudinal range in the
LGM Western Atlantic and off Iceland.
(c) Calibrating rate of genetic divergence
As described above, the 3.5 Myr ago date for the trans-
Arctic interchange was used to calibrate each source of
genetic data. The per-site substitution rate over this time
was estimated using the length of the internal branch on the
maximum-likelihood trees between monophyletic groups
of alleles in G. macrocephalus and the American population
of G. morhua (comparisons with other North Atlantic
populations gave the same result). The estimated per-site
substitution results are shown in table 2. The estimated rate
for CytB is very close to the widely used rate for
mitochondrial protein-coding genes of 2% sequence
Proc. R. Soc. B (2008)
divergence per million years (1.00!10K8 substitutions
per base per year: Brower & DeSalle 1994). There are no
published rate estimates for phantophysin or S2. For
allozymes the procedure was similar, except that the
population tree of Pacific and Atlantic cod species
was constructed using the likelihood program CONTML
(Felsenstein 2005), yielding a CONTML distance of 0.062
for 3.5 Myr ago. The allozyme data for this comparison
came from 12 loci shared in common between a study
of Pacific (Grant & Stahl 1988) and Atlantic cod (Mork
et al. 1985).
(d) Estimating percentage of private alleles,
effective population size and growth
For all four classes of sequenced loci, the percentage of
private alleles and gene diversity (haplotype diversity for
the CytB locus) in each population is reported in table 1.
For the two classes of sequenced loci not experiencing
positive selection—mitochondrial CytB and nuclear
S2—joint estimates of theta (i.e. 4Neu) and the growth
parameter G from the program FLUCTUATE (Kuhner et al.
1998) are reported in table 3. An illustration of the
number of private alleles in the S2 locus in Europe and
America is shown in figure 5.
(e) Estimates of migration and timing
of population divergence
While the age of initial population subdivision is most
crucial to testing genealogical continuity, there is strong
evidence of migration between populations. For each
locus, both MDIV and IM estimated levels of migration to
be about an order of magnitude lower between Canada
and Iceland than between Iceland and Europe (table 4).
IM also estimates the direction of migration: mostly it was
higher from east to west, e.g. for the Pan-B locus; however,
in several cases, this directionality flipped between
analyses (table 4).
Figure 6 summarizes the ages of population divergence
using CONTML for the allozyme data and MDIV (Nielsen &
Wakeley 2001) for the DNA sequence data. The allozymes
and mitochondrial CytB data (which are the only loci
sampled from Greenland) agree that Greenland diverged
from Iceland only since the LGM. In contrast, the
Canadian–Greenland comparison shows divergence since
long before the LGM, consistent with continuous occu-
pation of Atlantic Canada.

American haplotype
European haplotype
S2private,,
Europeanhaplotypes
S2private,,
Americanhaplotypes
,,
,,
Figure 5. S2 allele network (47 American and 72 Iceland/European). The number of private haplotypes in each regionsupports long residency on both sides of the North Atlantic;entire groups of alleles—and their descendants—are uniqueto either America or Europe. Shared alleles reflect somerecent migration. In order to compare relative frequency ofshared haplotypes, sizes of circles and slices are drawn toreflect percentage in each area. This is why singletonAmerican haplotypes are slightly larger to compensate forsmaller total American sample. The black bars are additionalsubstitutions along these branches.
Table 4. Comparing migration estimates (M) from MDIVand IM. (Number presented is average migration across fourruns in each program.)
loci MDIV IM IM multi-locus
Canada–IcelandCytB 1.4 0.3 (W–E) 2.1 (E–W) 1.3 (W–E)
1.3 (E–W)a
S2 1.4 0.02 (W–E) 0.05 (E–W)Pan-A 0.01 0.02 (W–E) 0.03 (E–W)Pan-B 0.03 0.01 (W–E) 7.3 (E–W)
Iceland–EuropeCytB 12.8 5.8 (W–E) 4.3 (E–W)a 12.1 (W–E)
13.8 (E–W)a
S2 11.8 0.03 (W–E) 0.33 (E–W)Pan-A 2.1 0.03 (W–E) 7.100 (E–W)Pan-B 8.7 0.00 (W–E) 13.5 (E–W)
a Directionality of migration flipped depending on analyses.
Ice-age survival of Atlantic cod G. R. Bigg et al. 169
For the comparisons with multiple DNA sequenced
loci (those not including Greenland), we compare the
population divergence estimates for MDIV (Nielsen &
Wakeley 2001) and IM (Hey & Nielsen 2004; table 5).
Both MDIV and IM analyses of individual loci agree that
Atlantic Canada and Icelandic populations diverged long
before the LGM, most likely during a warm inter-glacial
period such as occurred ca 100 kyr ago.
4. DISCUSSIONBoth ENM hindcasts found areas of contiguous suitable
habitat for the Atlantic cod G. morhua in Atlantic Canada
and New England, and significant stretches off mainland
Europe, during the extreme conditions of the LGM ca
21 kyr ago (figure 4). Very little suitable habitat was found
off Greenland, with rather more around Iceland in the
Proc. R. Soc. B (2008)
ecophysiological ENM hindcast but none from MAXENT.
Hence our palaeo-ENMs indicate that we should find
genetic evidence for old populations in Atlantic Canada,
mainland Europe and possibly Iceland, and probably a
post-LGM population in Greenland.
The genetic data are fully consistent with the palaeo-
ENMs. Thus, both the Canadian and the European
populations of Atlantic cod appear to have survived at
least one full glacial cycle (ca 100 kyr ago). For the two
neutral loci (mitochondrial CytB and nuclear S2), cod
populations in Atlantic Canada and Europe show high and
comparable levels of private alleles (table 1), as well as
comparably low levels of the population growth parameter
G (table 3). As also indicated by the palaeo-models, the
Greenland population appears to be newly founded, with
low levels of private alleles (table 1), and a very high
population growth parameter (table 3).
These heuristic measures of population age can be
given a temporal component by estimating the age of
population divergence between Atlantic Canada and the
other North Atlantic populations. As predicted by a long
continuous occupation of Atlantic Canada, all classes of
data (including allozymes) showed estimated divergences
between Atlantic Canada and Iceland significantly older
than the LGM (figure 6), with divergence between
Atlantic Canada and Europe being even older (data not
shown). Estimating the age of initial population diver-
gence gives a minimum age for the continuous genea-
logical continuity for both of the populations being
compared. Note that population divergence does not
preclude migration between the populations once they are
established (e.g. table 4).
The estimated recent divergence between Iceland and
Greenland populations is consistent with colonization
from Iceland and/or Europe since the LGM (figure 6,
table 5). Just as the palaeo-ENMs are equivocal about the
survival of cod off Iceland, the various methods differ
about the ages of divergence between Iceland and Europe
(figure 6, table 5).
Although the extent of glaciation in New England and
Canada’s Maritime Provinces is still controversial, our
conclusions are consistent with the GLAMAP project that
suggests parts of the Canadian Grand Banks were
unglaciated at the LGM (Pflaumann et al. 2003; Meland
et al. 2005). Our conclusions also agree with phylogeo-
graphic analyses of other North Atlantic fishes by
Bernatchez and colleagues who have argued that glacial
refugia existed in Atlantic Canada.These studies include the
anadromous lake whitefish (Bernatchez & Dodson 1991),
rainbow smelt (Bernatchez 1997) and Arctic charr (Brunner
et al. 2001). There is growing evidence that other marine
taxa, such as the hermit crab Pagurus longicarpus (Young
et al. 2002), may have also survived in a glacial refugium.
The nuclear gene pantophysin deserves special atten-
tion. This locus has been shown not only to be under
strong positive selection but also to have two ancient and
distinct allelic lineages, Pan-A and Pan-B (Pogson & Mesa
2004). However, the Pan-A and Pan-B lineages, pruned of
selected mutations, agree with the CytB and S2 data in
showing a long residency in Canadian and European
populations (figure 6) and each exhibits a high degree of
endemism in both regions (table 1). Further evidence for
an old Canadian population comes from RFLP data,
which showed that the A allelic lineage has three

0
20
40
60
80
100
120
140
160
allozymes CytB allozymes CytB S2 Pan-AB
America/Greenland
Greenland/Iceland
America/Iceland
Iceland/Europe
lastglacial
maximum
thou
sand
s of
yea
rsco
ntin
uous
pop
ulat
ion
pers
iste
nce
Figure 6. Columns (with 95% minimum error bars) show estimates of time since population subdivision between major regionsof the North Atlantic determined from maximum-likelihood analyses of 10 allozyme loci (Mork et al. 1985; Grant & Stahl 1988)and coalescent analyses (MDIV) of three DNA sequence loci: mitochondrial CytB (250 bp), nuclear ribosomal protein S2 andnuclear protein pantophysin (Pan-A and Pan-B alleles analysed separately, data shown are from smaller of two estimates). Allcomparisons of estimated times of divergence between America and populations to the east are significantly older than theLGM, suggesting long independent histories. In contrast, our estimated ages for the Greenland/Iceland and Iceland/Europeseparations are generally more recent than the LGM (where ‘Europe’ data are provided by pooled populations from Norway andthe North Sea).
Table 5. Comparing population divergence estimates (inthousands of years) from MDIV and IM.
lociMDIV mode(95% min)
IM mode(95% min)
IM-multi-locusmode (95% min)
Canada–IcelandCytB 103(53) 127(78) 201(110)S2 136(36) 435(115)Pan-A 200(53) 92(32)Pan-B 110(28) 540(16)
Iceland–EuropeCytB 45(25) 35(21) 50(27)S2 9(6) 480(93)Pan-A 54(16) 37(18)Pan-B 52(11) 34(13)
170 G. R. Bigg et al. Ice-age survival of Atlantic cod
recombinant haplotypes endemic to North America
(Pogson 2001). In the same vein, an entire clade of the
B allelic lineage (separated from other B alleles by two
non-replacement substitutions) is entirely unique to
North America (Pogson 2001). This suggests that both
the Pan-A and the Pan-B allelic lineages have histories in
North America at least as long as their histories in Europe.
The ability of cod populations to maintain genealogical
continuity over extreme natural climate variability, as
shown by this study, suggests considerable inherent
resilience. Yet the effects of future climatic conditions
need to be considered in relation to demographic
structures (Andrews et al. 2006), as well as the major
population changes due to human exploitation (Frank
et al. 2005). Further development of integrated physical
and ecological-niche-modelling, combined with phyloge-
netic analyses, of cod and other shelf sea species would
Proc. R. Soc. B (2008)
generate testable predictions about the relative severity of
previous and future bottlenecks and their genetic impacts.
We thank NSF for funding DEB-0130275, which created theCORONA network that brought us together for thiscollaboration. We also thank E. Arnason for providing uswith his compilation of mitochondrial sequences frompublished studies, K. Brander for helpful comments on thiswork and the Leverhulme Trust for funding project F204Qfrom which the modelling work began.
REFERENCESAndrews, J. M., Gurney, W. S. C., Heath, M. R., Gallego, A.,
O’Brien, C. M., Darby, C. & Tyldesley, G. 2006 Modelling
the spatial demography of Atlantic cod (Gadus morhua) on
the European continental shelf. Can. J. Fish. Aquat. Sci. 63,
1027–1048. (doi:10.1139/F06-006)
Arnason, E. 2004 Mitochondrial cytochrome b DNA
variation in the high-fecundity Atlantic cod: trans-Atlantic
clines and shallow gene genealogy. Genetics 166,
1871–1885. (doi:10.1534/genetics.166.4.1871)
Arnason, E., Petersen, P. H., Kristinsson, K., Sigurgıslason,
H. & Palsson, S. 2000 Mitochondrial cytochrome b DNA
sequence variation of Atlantic cod from Iceland and
Greenland. J. Fish Biol. 56, 409–430.
Bernatchez, L. 1997 Mitochondrial DNA analysis confirms
the existence of two glacial races of rainbow smelt Osmerus
mordax and their reproductive isolation in the St Lawrence
River estuary (Quebec, Canada). Mol. Ecol. 6, 73–83.
(doi:10.1046/j.1365-294X.1997.00156.x)
Bernatchez, L. & Dodson, J. J. 1991 Phylogeographic
structure in mitochondrial-DNA of the Lake Whitefish
(Coregonus clupeaformis) and its relation to Pleistocene
glaciations. Evolution 45, 1016–1035. (doi:10.2307/
2409706)
Ice-age survival of Atlantic cod G. R. Bigg et al. 171
Birky, C. W. & Walsh, J. B. 1988 Effects of linkage on rates of
molecular evolution. Proc. Natl Acad. Sci. USA 85,
6414–6418. (doi:10.1073/pnas.85.17.6414)
Bond, G. et al. 1992 Evidence for massive discharges of
icebergs into the North-Atlantic Ocean during the last
glacial period. Nature 360, 245–249. (doi:10.1038/
360245a0)
Brander, K. (ed.) 1994 Spawning and life history information
for North Atlantic Cod stocks. ICES cooperative research
report no. 205, Copenhagen, ICES.
Brander, K. (ed.) 2005 Spawning and life history information
for North Atlantic Cod stocks. ICES cooperative research
report no. 274, Copenhagen, ICES.
Brower, A. V. Z. & DeSalle, R. 1994 Practical and theoretical
considerations for choice of a DNA sequence region in
insect molecular systematics, with a short review of
published studies using nuclear gene regions. Ann.
Entomol. Soc. Am. 87, 702–716.
Brunner, P. C., Douglas, M. R., Osinov, A., Wilson, C. C. &
Bernatchez, L. 2001 Holarctic phylogeography of Arctic
charr (Salvelinus alpinus L.) inferred from mitochondrial
DNA sequences. Evolution 55, 573–586. (doi:10.1554/
0014-3820(2001)055[0573:HPOACS]2.0.CO;2)
Bucklin, A. & Wiebe, P. 1998 Low mitochondrial diversity
and small effective population sizes of the copepods
Calanus finmarchicus and Nannocalanus minor: possible
impact of climatic variation during recent glaciation.
J. Hered. 89, 383–392. (doi:10.1093/jhered/89.5.383)
Carr, S. M., Kivlichan, D. S., Pepin, P. & Crutcher, D. C.
1999 Molecular systematics of gadid fishes: implications
for the biogeographic origins of Pacific species. Can. J. Zool.
Rev. Can. Zool. 77, 19–26. (doi:10.1139/cjz-77-1-19)
CLIMAP 1976 The surface of the ice-age Earth. Science 191,
1131–1137. (doi:10.1126/science.191.4232.1131)
Coulson, M. W., Marshall, H. D., Pepin, P. & Carr, S. M.
2006 Mitochondrial genomics of gadine fishes: impli-
cations for taxonomy and biogeographic origins from
whole-genome data sets. Genome 49, 1115–1130. (doi:10.
1139/G06-083)
Dong, B. & Valdes, P. J. 1998 Simulations of the last glacial
maximum climates using a general circulation model:
prescribed versus computed sea surface temperatures.
Clim. Dyn. 14, 571–591. (doi:10.1007/s003820050242)
Elith, J. et al. 2006 Novel methods improve prediction of
species’ distributions from occurrence data. Ecography 29,
129–151. (doi:10.1111/j.2006.0906-7590.04596.x)
ETOPO 1986 Global 5 0!5 0 depth and elevation. ETOPO
National Geophysical Data Centre. Boulder, CO: NOAA.
Felsenstein, J. 2005 PHYLIP (phylogeny inference package)
Version 3.65. Seattle: Distributed by the author,
University of Washington.
Frank, K. T., Petrie, B., Choi, J. S. & Leggett, W. C. 2005
Trophic cascades in a formerly cod-dominated ecosystem.
Science 308, 1621–1623. (doi:10.1126/science.1113075)
Grant, W. S. & Stahl, G. 1988 Evolution of Atlantic and
Pacific cod: loss of genetic variation and gene expression in
Pacific cod. Evolution 42, 138–146. (doi:10.2307/
2409122)
Hernandez, P. A., Graham, C. H., Master, L. L. & Albert,
D. L. 2006 The effect of sample size and species
characteristics on performance of different species distri-
bution modeling methods. Ecography 29, 773–785.
(doi:10.1111/j.0906-7590.2006.04700.x)
Hey, J. & Nielsen, R. 2004 Multilocus methods for estimating
population sizes, migration rates and divergence time,
with applications to the divergence of Drosophila
pseudoobscura and D. persimilis. Genetics 167, 747–760.
(doi:10.1534/genetics.103.024182)
Proc. R. Soc. B (2008)
Hjermann, D. Ø., Bogstad, B., Eikeset, A. M., Ottersen, G.,Gjøsaeter, H. & Stenseth, N. C. 2007 Food web dynamicsaffect Northeast Arctic cod recruitment. Proc. R. Soc. B274, 661–669. (doi:10.1098/rspb.2006.0069)
Hugall, A., Moritz, C., Moussalli, A. & Stanisic, J. 2002Reconciling paleodistribution models and comparativephylogeography in the wet tropics rainforest land snailGnarosophia bellendenkerensis (Brazier 1875). Proc. NatlAcad. Sci. USA 99, 6112–6117. (doi:10.1073/pnas.092538699)
Iguchi, K., Matsuura, K., McNyset, K., Peterson, A.,Scachetti-Pereira, R., Powers, K., Vieglais, D. & Wiley, E.2004 Predicting invasions of north American basses in Japanusing native range data and a genetic algorithm. Trans. Am.Fish. Soc. 133, 845–854. (doi:10.1577/T03-172.1)
Jonsdottir, O. D. B., Imsland, A. K., Atladottir, O. Y. &Danielsdottir, A. K. 2003 Nuclear DNA RFLP variationof Atlantic cod in the North Atlantic Ocean. Fish. Res. 63,429–436. (doi:10.1016/S0165-7836(03)00098-5)
Kuhner, M. K., Yamato, J. & Felsenstein, J. 1998 Maximumlikelihood estimation of population growth rates based onthe coalescent. Genetics 149, 429–434.
Levitus, S. & Boyer, T. P. 1994 Salinity. World Atlas.Washington, DC: NOAA NESDIS Atlas.
Levitus, S., Burgett, R. & Boyer, T. P. 1994 Temperature.World Atlas. Washington, DC: NOAA NESDIS Atlas.
Marincovich, L. & Gladenkov, A. Y. 1999 Evidence for anearly opening of the Bering Strait. Nature 397, 149–151.(doi:10.1038/16446)
Meland, M. Y., Jansen, E. & Elderfield, H. 2005 Constraintson SST estimates for the northern North Atlantic Nordicseas during the LGM. Quat. Sci. Rev. 24, 835–852.(doi:10.1016/j.quascirev.2004.05.011)
Mitrovica, J. X. 2003 Recent controversies in predicting post-glacial sea-level change. Quat. Sci. Rev. 22, 127–133.(doi:10.1016/S0277-3791(02)00225-1)
Mix, A., Bard, E. & Schneider, R. 2001 Environmentalprocesses of the ice age: land, oceans, glaciers (EPILOG).Quat. Sci. Rev. 20, 627–657. (doi:10.1016/S0277-3791(00)00145-1)
Mork, J., Ryman, N., Stanisic, J., Stahl, G., Utter, F. &Sundnes, G. 1985 Genetic variation in Atlantic cod(Gadus morhua) throughout its range. Can. J. Fish.Aquat. Sci. 42, 1580–1587.
Nielsen, R. & Wakeley, J. 2001 Distinguishing migration fromisolation: a Markov Chain Monte Carlo approach. Genetics158, 885–896.
Peltier, W. 1994 Ice age paleotopography. Science 195,195–201. (doi:10.1126/science.265.5169.195)
Pepin, P., Orr, D. & Anderson, J. 1997 Time to hatch andlarval size in relation to temperature and egg size inAtlantic cod (Gadus morhua). Can. J. Fish. Aquat. Sci.54(Suppl. 1), 2–10. (doi:10.1139/cjfas-54-S1-2)
Pflaumann, U. et al. 2003 Glacial North Atlantic: sea-surfaceconditions reconstructed by GLAMAP 2000. Paleoceano-graphy 18, 1065–1070. (doi:10.1029/2002PA00774)
Phillips, S. J., Anderson, R. P. & Schapire, R. E. 2006Maximum entropy modeling of species geographicdistributions. Ecol. Model. 190, 231–259. (doi:10.1016/j.ecolmodel.2005.03.026)
Piper, D. J. W. 2005 Late Cenozoic evolution of thecontinental margin of eastern Canada, Norweg. J. Geol.85, 305–318.
Pogson, G. H. 2001 Nucleotide polymorphism and naturalselection at the pantophysin (Pan I) locus in the AtlanticCod, Gadus morhua (L.). Genetics 157, 317–330.
Pogson, G. H. & Mesa, K. A. 2004 Positive Darwinianselection at the pantophysin (Pan I) locus in marine gadidfishes. Mol. Biol. Evol. 21, 65–75. (doi:10.1093/molbev/msg237)

172 G. R. Bigg et al. Ice-age survival of Atlantic cod
Pogson, G. H., Mesa, K. A. & Boutilier, R. G. 1995 Genetic
population structure and gene flow in the Atlantic cod
Gadus morhua: a comparison of allozyme and nuclear
RFLP loci. Genetics 139, 375–385.
Raymo, M., Ruddiman, W., Shackleton, N. & Oppo, D. 1990
Evolution of Atlantic–Pacific d13C gradients over the last
2.5 m.y. Earth Plan. Sci. Lett. 97, 353–368. (doi:10.1016/
0012-821X(90)90051-X)
Rees, T. 2003 “C-Squares”, a new spatial indexing system
and its applicability to the description of oceanographic
datasets. Oceanography 16, 11–19.
Riginos, C., Hickerson, M. J., Henzler, C. M. &
Cunningham, C. W. 2004 Differential patterns of male
and female mtDNA exchange across the Atlantic Ocean in
the blue mussel, Mytilus edulis. Evolution 58, 2438–2451.
Schneider, S., Roessli, D. & Excoffier, L. 1999 ARLEQUIN ver.
2.0: a software for population genetic data analysis. Geneva,
Switzerland: Genetics and Biometry Laboratory.
Slatkin, M. 1993 Isolation by distance in equilibrium and
nonequilibrium populations. Evolution 47, 264–279.
(doi:10.2307/2410134)
Stephens, M. & Donnelly, P. 2000 Inference in molecular
population genetics. J. R. Stat. Soc. B 62, 605–635.
(doi:10.1111/1467-9868.00254)
Sundby, S. 2000 Recruitment of Atlantic cod stocks in
relation to temperature and advection of copepod
populations. Sarsia 85, 277–298.
Swofford, D. L. 2002 PAUP�: phylogenetic analysis using
parsimony ( �and other methods), version 4.0 Beta.
CD-ROM. Sunderland, MA: Sinauer Associates, Inc.
Proc. R. Soc. B (2008)
Thomas, C. C. et al. 2004 Extinction risk from climatechange. Nature 427, 145–148. (doi:10.1038/nature02121)
Thuiller, W., Lavorel, S. & Araujo, M. B. 2005 Nicheproperties and geographical extent as predictors of speciessensitivity to climate change. Global Ecol. Biogeogr. 14,347–357. (doi:10.1111/j.1466-822X.2005.00162.x)
Vermeij, G. 1991 Anatomy of an invasion: the trans-Arcticinterchange. Paleobiology 17, 281–307.
Wadley, M. R. & Bigg, G. R. 1999 Implementation ofvariable time stepping in an ocean general circulationmodel. Ocean Model. 1, 71–80. (doi:10.1016/S1463-5003(99)00011-6)
Wadley, M. R., Bigg, G. R., Rohling, E. J. & Payne, A. J. 2002On modelling present-day and last glacial maximumoceanic [delta]18O distributions. Global Planet. Change32, 89–109. (doi:10.1016/S0921-8181(01)00084-4)
Wares, J. P. & Cunningham, C. W. 2001 Phylogeography andhistorical ecology of the North Atlantic intertidal.Evolution 55, 2455–2469.
Watson, D. M. & Peterson, A. T. 1999 Determinants ofdiversity in a naturally fragmented landscape: humidmontane forest avifaunas of Mesoamerica. Ecography 22,582–589. (doi:10.1111/j.1600-0587.1999.tb00547.x)
Wolff, E. W. 2005 Understanding the past - climate historyfrom Antarctica. Antarct. Sci. 17, 487–495. (doi:10.1017/S0954102005002919)
Young, A. M., Torres, C., Mack, J. E. & Cunningham, C. W.2002 Morphological and genetic evidence for vicarianceand refugium in Atlantic and Gulf of Mexico populationsof the hermit crab Pagurus longicarpus. Mar. Biol. 140,1059–1066. (doi:10.1007/s00227-002-0780-2)

NOTICE OF CORRECTION
Figure 1 is now presented in the correct form.
16 November 2007
Copyright © 2022 FDOKUMEN