3 NORTHEAST ARCTIC COD (SUBAREAS I AND II) 3.1 ...
131
3 NORTHEAST ARCTIC COD (SUBAREAS I AND II) 3.1 Status of the fisheries 3.1.1 Historical development of the fisheries (Table 3.1) From a level of about 900,000 t in the mid-1970s, landings declined steadily to around 300,000 t in 1983-1985 (Table 3.1). Landings increased to above 500,000 t in 1987 before dropping to 212,000 t in 1990, the lowest level recorded in the post-war period. The catches increased rapidly from 1991 onwards, stabilised around 750,000 t in 1994-1997 but decreased to about 414,000 t in 2000. The catch in 2002 was 445,000 tonnes. The fishery is conducted both with an international trawler fleet and with coastal vessels using traditional fishing gears. Quotas were introduced in 1978 for the trawler fleets and in 1989 for the coastal fleets. In addition to quotas, the fishery is regulated by a minimum catch size, a minimum mesh size in trawls and Danish seines, a maximum by-catch of undersized fish, closure of areas having high densities of juveniles and by seasonal and area restrictions. 3.1.2 Landings prior to 2003 (Tables 3.1-3.3, Figure 3.1) Total landings of cod in Subarea I and Divisions IIa and IIb: Final reported landings for 2001 amount to 440,745 t. Provisional landings for 2002 are 464,271 t, which is nearly 30,000 t above the agreed quota. Landing figures used for the assessment of Northeast Arctic cod: The historical practise (considering catches between 62 and 67 deg. North for the whole year and catches between 67 and 69 deg. North for the second half of the year to be Norwegian coastal cod) lead to landings of Northeast Arctic cod at 426,471 t in 2001 and 445,060 t in 2002 (Table 3.1). The landings by area, split into trawl and other gears, is given in Table 3.2 and the nominal landings by country is given in Table 3.3. Compared to 2001, the landings in 2002 decreased in Division IIb and increased in Subarea I (Table 3.1). 3.1.3 Expected landings in 2003 The mixed Norwegian-Russian fisheries commission agreed on a TAC of 435,000 t for 2003, including 40,000 t Norwegian coastal cod. Since this quota is equal to the 2002 quota, it is reasonable to assume a similar catch (445,000 t) in 2003 as in 2002. The Working Group has no information on the size of expected unreported landings in 2003 but believes this could continue to be a problem. 3.2 Status of research 3.2.1 Fishing effort and CPUE (Table A1) CPUE series of the Norwegian, Russian and Spanish trawl fisheries are given in Table A1. The data reflect the total trawl effort, both for Norway and Russia. The Norwegian series is given as a total for all areas (Table A1). 3.2.2 Survey results (Tables A2-A5, A10-A11, A14-A15) a) With respect to year class strength, the overall picture seen in the surveys is summarized as follows: the 1999, 2000, and 2002 year classes are close to average and the 2001 year class is weak. Most age groups in the fishable stock, have increased in the last surveys compared to the year before. Joint Barents Sea winter survey (bottom trawl and acoustics(WD 19) The preliminary swept area estimates and acoustic estimates from the Joint winter survey on demersal fish in the Barents Sea in winter 2003 are given in Tables A2 and A3. O:\ACFM\WGREPS\AFWG\REPORTS\2003\3-Northeast Arctic Cod.Doc 42
-
Upload
khangminh22 -
Category
Documents
-
view
1 -
download
0
Transcript of 3 NORTHEAST ARCTIC COD (SUBAREAS I AND II) 3.1 ...

3 NORTHEAST ARCTIC COD (SUBAREAS I AND II)
3.1 Status of the fisheries
3.1.1 Historical development of the fisheries (Table 3.1)
From a level of about 900,000 t in the mid-1970s, landings declined steadily to around 300,000 t in 1983-1985 (Table 3.1). Landings increased to above 500,000 t in 1987 before dropping to 212,000 t in 1990, the lowest level recorded in the post-war period. The catches increased rapidly from 1991 onwards, stabilised around 750,000 t in 1994-1997 but decreased to about 414,000 t in 2000. The catch in 2002 was 445,000 tonnes. The fishery is conducted both with an international trawler fleet and with coastal vessels using traditional fishing gears. Quotas were introduced in 1978 for the trawler fleets and in 1989 for the coastal fleets. In addition to quotas, the fishery is regulated by a minimum catch size, a minimum mesh size in trawls and Danish seines, a maximum by-catch of undersized fish, closure of areas having high densities of juveniles and by seasonal and area restrictions.
3.1.2 Landings prior to 2003 (Tables 3.1-3.3, Figure 3.1)
Total landings of cod in Subarea I and Divisions IIa and IIb:
Final reported landings for 2001 amount to 440,745 t. Provisional landings for 2002 are 464,271 t, which is nearly 30,000 t above the agreed quota.
Landing figures used for the assessment of Northeast Arctic cod:
The historical practise (considering catches between 62 and 67 deg. North for the whole year and catches between 67 and 69 deg. North for the second half of the year to be Norwegian coastal cod) lead to landings of Northeast Arctic cod at 426,471 t in 2001 and 445,060 t in 2002 (Table 3.1). The landings by area, split into trawl and other gears, is given in Table 3.2 and the nominal landings by country is given in Table 3.3. Compared to 2001, the landings in 2002 decreased in Division IIb and increased in Subarea I (Table 3.1).
3.1.3 Expected landings in 2003
The mixed Norwegian-Russian fisheries commission agreed on a TAC of 435,000 t for 2003, including 40,000 t Norwegian coastal cod. Since this quota is equal to the 2002 quota, it is reasonable to assume a similar catch (445,000 t) in 2003 as in 2002.
The Working Group has no information on the size of expected unreported landings in 2003 but believes this could continue to be a problem.
3.2 Status of research
3.2.1 Fishing effort and CPUE (Table A1)
CPUE series of the Norwegian, Russian and Spanish trawl fisheries are given in Table A1. The data reflect the total trawl effort, both for Norway and Russia. The Norwegian series is given as a total for all areas (Table A1).
3.2.2 Survey results (Tables A2-A5, A10-A11, A14-A15)
a) With respect to year class strength, the overall picture seen in the surveys is summarized as follows: the 1999, 2000, and 2002 year classes are close to average and the 2001 year class is weak. Most age groups in the fishable stock, have increased in the last surveys compared to the year before.
Joint Barents Sea winter survey (bottom trawl and acoustics(WD 19)
The preliminary swept area estimates and acoustic estimates from the Joint winter survey on demersal fish in the Barents Sea in winter 2003 are given in Tables A2 and A3.
O:\ACFM\WGREPS\AFWG\REPORTS\2003\3-Northeast Arctic Cod.Doc 42

Before 2000 this survey was made without participation from Russian vessels, while in the three latest surveys Russian vessels have covered important parts of the Russian zone. The indices for 1997 and 1998, when the Russian EEZ was not covered, have been adjusted as reported previously (Mehl, 1999). The number of fish (age group by age group) in the Russian EEZ in 1997 and 1998 was interpolated assuming a linear development in the proportion found in the Russian EEZ from 1996 to 1999. These estimates were then added to the numbers of fish found in the Norwegian EEZ and the Svalbard area in 1997 and 1998.
It should be noted that the survey conducted in 1993 and later years covered a larger area compared to previous years (Jakobsen et al. 1997). In 1991 and 1992, the number of young cod (particularly 1- and 2-year old fish) was probably underestimated, as cod of these ages were distributed at the edge of the old survey area. Other changes in the survey methodology through time are described by Jakobsen et al. (1997). Note that the change from 35 to 22 mm mesh size in the codend in 1994 is not corrected for in the time-series. This mainly affects the age 1 indices.
Lofoten acoustic survey on spawners (WD 21)
The estimated abundance indices from the Norwegian acoustic survey off Lofoten and Vesterålen (the main spawning area for this stock) in March/April are given in Table A4. A description of the survey, sampling effort and details of the estimation procedure can be found in Korsbrekke (1997). There was a high proportion of first time spawners in the survey.
Norwegian summer/autumn survey (WD 23)
Table A5 gives the results of the Norwegian bottom trawl survey in the Svalbard and Barents Sea area in August/September (Høines, WD 23). The results for the Svalbard area (Division IIb) have been used earlier in the XSA tuning but have been left out in the three latest assessments. The series given for the Barents Sea covers ICES Division IIa and IIb and the north-western part of subarea I, and thus includes the Svalbard area estimates.
Russian autumn survey (WD 24)
Abundance estimates from the Russian autumn survey (November-December) are given in Table A10 (acoustic estimates) and Table A11 (bottom trawl estimates). The Russian autumn survey did not cover the Norwegian economical zone in 2002. Indices obtained were adjusted assuming area distribution as 1998-2001 average.
International 0-group survey
Abundance indices of 0-group cod from the International 0-group survey are provided in Tables A14 and A15. It should be noted that in 1985 some gear changes were made, and the earlier part of the time-series is now adjusted to take account of these changes (Nakken and Raknes 1996). The abundance of 0-group cod was low in the years 1999-2001, and average in 2002. The same pattern is observed for age 1 of the same year classes in the groundfish surveys. The 0-group abundance in the years 1992-1997 is rather outstanding in the time-series. Among those year classes only 1994 and 1995 appear to be above average at age 3 in other surveys.
3.2.3 Age reading
The joint Norwegian-Russian work on cod otolith reading has continued, with regular exchanges of otoliths and age readers (Introduction chapter). Within laboratory (IMR) and between laboratories (IMR-PINRO) differences in age reading are presented in WD 11.
3.2.4 Length and Weight-at-age (Tables A6-A9, A12-A13)
Length-at-age is shown in Table A6 for the Norwegian survey in the Barents Sea in winter, in Table A8 for the Lofoten survey and in Table A12 for the Russian survey in October-December. Weight-at-age is shown in Table A7 for the Norwegian survey in the Barents Sea in winter, in Table A9 for the Lofoten survey and in Table A13 for the Russian survey in October-December.
Both the joint winter survey in 2003 and the Russian autumn survey in 2002 show little change in weights for most ages (Table A7 and A13).
O:\ACFM\WGREPS\AFWG\REPORTS\2003\3-Northeast Arctic Cod.Doc 43
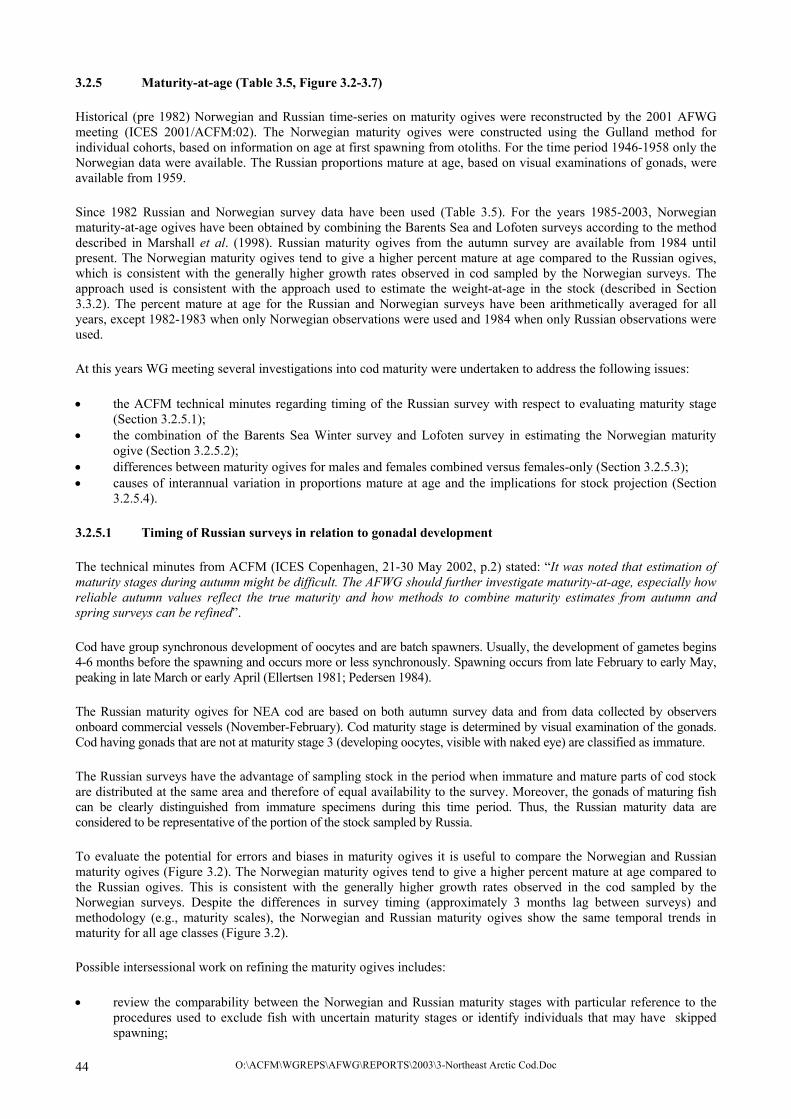
3.2.5 Maturity-at-age (Table 3.5, Figure 3.2-3.7)
Historical (pre 1982) Norwegian and Russian time-series on maturity ogives were reconstructed by the 2001 AFWG meeting (ICES 2001/ACFM:02). The Norwegian maturity ogives were constructed using the Gulland method for individual cohorts, based on information on age at first spawning from otoliths. For the time period 1946-1958 only the Norwegian data were available. The Russian proportions mature at age, based on visual examinations of gonads, were available from 1959.
Since 1982 Russian and Norwegian survey data have been used (Table 3.5). For the years 1985-2003, Norwegian maturity-at-age ogives have been obtained by combining the Barents Sea and Lofoten surveys according to the method described in Marshall et al. (1998). Russian maturity ogives from the autumn survey are available from 1984 until present. The Norwegian maturity ogives tend to give a higher percent mature at age compared to the Russian ogives, which is consistent with the generally higher growth rates observed in cod sampled by the Norwegian surveys. The approach used is consistent with the approach used to estimate the weight-at-age in the stock (described in Section 3.3.2). The percent mature at age for the Russian and Norwegian surveys have been arithmetically averaged for all years, except 1982-1983 when only Norwegian observations were used and 1984 when only Russian observations were used.
At this years WG meeting several investigations into cod maturity were undertaken to address the following issues:
• the ACFM technical minutes regarding timing of the Russian survey with respect to evaluating maturity stage (Section 3.2.5.1);
• the combination of the Barents Sea Winter survey and Lofoten survey in estimating the Norwegian maturity ogive (Section 3.2.5.2);
• differences between maturity ogives for males and females combined versus females-only (Section 3.2.5.3); • causes of interannual variation in proportions mature at age and the implications for stock projection (Section
3.2.5.4).
3.2.5.1 Timing of Russian surveys in relation to gonadal development
The technical minutes from ACFM (ICES Copenhagen, 21-30 May 2002, p.2) stated: “It was noted that estimation of maturity stages during autumn might be difficult. The AFWG should further investigate maturity-at-age, especially how reliable autumn values reflect the true maturity and how methods to combine maturity estimates from autumn and spring surveys can be refined”.
Cod have group synchronous development of oocytes and are batch spawners. Usually, the development of gametes begins 4-6 months before the spawning and occurs more or less synchronously. Spawning occurs from late February to early May, peaking in late March or early April (Ellertsen 1981; Pedersen 1984).
The Russian maturity ogives for NEA cod are based on both autumn survey data and from data collected by observers onboard commercial vessels (November-February). Cod maturity stage is determined by visual examination of the gonads. Cod having gonads that are not at maturity stage 3 (developing oocytes, visible with naked eye) are classified as immature.
The Russian surveys have the advantage of sampling stock in the period when immature and mature parts of cod stock are distributed at the same area and therefore of equal availability to the survey. Moreover, the gonads of maturing fish can be clearly distinguished from immature specimens during this time period. Thus, the Russian maturity data are considered to be representative of the portion of the stock sampled by Russia.
To evaluate the potential for errors and biases in maturity ogives it is useful to compare the Norwegian and Russian maturity ogives (Figure 3.2). The Norwegian maturity ogives tend to give a higher percent mature at age compared to the Russian ogives. This is consistent with the generally higher growth rates observed in the cod sampled by the Norwegian surveys. Despite the differences in survey timing (approximately 3 months lag between surveys) and methodology (e.g., maturity scales), the Norwegian and Russian maturity ogives show the same temporal trends in maturity for all age classes (Figure 3.2).
Possible intersessional work on refining the maturity ogives includes:
• review the comparability between the Norwegian and Russian maturity stages with particular reference to the procedures used to exclude fish with uncertain maturity stages or identify individuals that may have skipped spawning;
O:\ACFM\WGREPS\AFWG\REPORTS\2003\3-Northeast Arctic Cod.Doc 44

• fill in gaps in the data (by regions and months) by smoothing data using appropriate weighting factors (Lepesevich, WD 8, 2002).
3.2.5.2 Combination of Norwegian winter and Lofoten surveys
In winter the mature and immature parts of the NEA cod stock are in a large degree spatially separated from each other. The Norwegian maturity ogives are estimated by combining data from two surveys (Barents Sea Winter survey and Lofoten survey). For each survey the total number of mature and immature cod is determined using the acoustic abundance estimates of total abundance and these values are then combined for the two surveys. It is not known the degree to which the two surveys double count cod or miss counting certain components of the stock due to the migration of the stock at this time of year. This source of error might possibly explain the discrepancy between Norwegian and Russian proportions mature for age 6 cod (Figure 3.2). The difference between Norwegian and Russian values is greatest when the proportions are high. One possible explanation of this tendency is that mature age 6 cod are being over-sampled by the Winter and Lofoten surveys over-represented in the combined survey results.
It may be possible to make improvements to the methods used for combining the Winter and Lofoten surveys. This issue should be reviewed in the coming year. However, the high degree of consistency between the Norwegian and Russian values of maturity-at-age (Figure 3.2) suggests that the magnitude of the error is small.
Possible intersessional work on estimating the Norwegian maturity ogives includes:
• review the procedures used to combine the Barents Sea Winter survey and Lofoten survey.
3.2.5.3 Gender-dependent maturity ogives
Currently, maturity-at-age ogives are estimated for males and females combined. However, female cod grow more slowly and therefore mature later than male cod. As a consequence of this dimorphic growth, both length- and age-based maturity-ogives for females differ from those for males (Ajiad et al. 1999). Changes in the age and size composition of the stock will impact the proportional contribution of females to the spawning stock and contribute to a lack of proportionality between SSB and reproductive potential (Tomkiewicz et al. 1997). For Baltic cod, estimates of female-only SSB give an improved stock/recruit relationship compared to the conventional (males and females combined) estimate of SSB used by management (Köster et al. 2001).
To investigate the degree of bias introduced to estimates of SSB from using combined maturity ogives for NEA cod Norwegian and Russian databases were used to estimate female-only SSB. The proportional contribution of females to the SSB was compared to a reference value of 0.5 that assumes a 1:1 sex ratio in the spawning stock.
3.2.5.3.1 Norwegian female-only maturity
Differences in maturity ogives between combined (males and females) and female-only cod were investigated using data from 1985 to 2001. Observations for individual cod were selected for the 1st quarter with observations for coastal cod being excluded. Cod in maturity stages greater than 1 were classified as being mature. In constructing the ogives it was noted that the database reverses the coding for sex for 1988.
The differences between the combined ogive and the female-only ogive are highest for ages 5 and 6 and decrease to negligible values for older age-classes (Fig. 3.3a). The magnitude of differences for ages 5 and 6 generally falls between 0.05 and 0.15. The female-only maturity ogives for the stock (1985-2001) were then estimated by subtracting these differences from the ogives used in the assessment (Table 3.13). For the youngest age-classes this frequently resulted in negative values. In such cases the proportion mature was set to 0.
3.2.5.3.2 Russian female-only maturity
The Russian data are expressed as the proportion of mature individuals that are female. These values extend back to the beginning of standardized sampling for maturity in 1959. To be comparable to both the Norwegian data and the assessment, the proportions have been shifted forward by one year and age-class. The proportion of mature individuals that are female increases with increasing age (Fig. 3.4). The proportions are negligible for age 3 and quite variable for ages 4-6 and for the older age classes.
O:\ACFM\WGREPS\AFWG\REPORTS\2003\3-Northeast Arctic Cod.Doc 45

3.2.5.3.3 Female-only SSB
As noted above, the Norwegian data is expressed as the proportion of females that are mature, whereas, the Russian data is expressed as the proportion of mature fish that are female. Because of the difference in how the maturity data were formulated the procedures used for estimating female-only SSB differed between the two countries, as is described below.
For the Norwegian data female-only SSB was estimated as:
Female-only SSB = Σ na × sa × ma × wa
where na and wa are number- and weight-at-age, respectively. Both terms are identical to values used in estimating SSB. The sex ratio at age (sa) expresses the proportion of females and was determined from the same Norwegian databases that were used to estimate the maturity ogives. The ma represents the proportion of females that are mature for a given age.
Sex ratios of 1:1 were assumed for cod younger than age 8. For cod age 8 and older modelled values were used (Fig. 3.3b). These show the proportions of females to increase with increasing age. The proportion of females is often lower than 0.5 for age classes younger than 8 (Ajiad and Aglen, unpublished Working Document to SGPA December 2002). However, this tendency is likely an artefact resulting from the differential catchability and availability of males.
The Russian female-only SSB differed in its formulation of female-only SSB because maturity data was expressed as the proportion of mature individuals who were female (pa) rather than the proportion of females who were mature. Consequently, female-only SSB for the Russian data was estimated as:
Female-only SSB = Σ na × ma × pa × wa
where na, ma, and wa are number-, maturity- and weight-at-age, respectively. These terms are identical to values used in estimating SSB.
3.2.5.3.4 Temporal trends in female-only SSB
If both sexes contribute equally to the SSB then contribution of females to the SSB should fluctuate randomly about a value of 0.5. However, both the Norwegian and Russian estimates show a strong tendency for the proportion of female-only SSB to be less than 0.5 (Fig. 3.5). The time trends in the Norwegian and Russian estimates are reasonably synchronous despite differences in their formulation. Females made an especially low (approx. 25%) contribution to SSB in the years1987-1989. Thus, SSB overestimates the reproductive potential of the stock in those years by a considerable margin. Low ratios were also observed in 1994, 1995, 2000 and 2001.
The temporal trends in female-only SSB are driven by the trends in the age composition of the spawning stock (Figure 3.5). Lower mean age of the spawning stock reduces the contribution of females to the spawning stock. This is not accounted for using SSB as an index of reproductive potential. Thus, SSB contains a systematic source of error that is related to the variable size and age composition of the stock. The WG should consider alternative formulations of reproductive potential that include information on sex ratios and gender-specific proportions mature. These alternative formulations should be compared to SSB as well as to recruitment to see if improvements to the stock/recruit relationship are possible, such as has been observed for Baltic cod.
Future work on estimating reproductive potential includes:
• to develop a full time-series of female-only maturity ogives that can be used to estimate female-only SSB.
3.2.5.3.5 Status of research on reproductive potential of NA cod
Research is ongoing into developing alternative indices of reproductive potential for NEA cod (Marshall et al. 1998). This research is benefiting from the improved accessibility of both Norwegian and Russian databases.
Preliminary estimates of total egg production were presented to the WG (Needle and Marshall WD#2). These estimates require further refinements before being considered as final. These refinements include: a) developing female-only maturity ogives for the full time period (1946-2001); b) refinements to the method of hindcasting fecundity and c)
O:\ACFM\WGREPS\AFWG\REPORTS\2003\3-Northeast Arctic Cod.Doc 46

developing a model to incorporate maternal effects on egg viability. Female-only SSB will also be estimated for the full time period. Time-series for female-only SSB and total egg production should be available by next years WG meeting. Additionally, software tools are being developed to estimate alternative indices of reproductive potential from standard assessment output and link this information to both recruitment and medium-term stock projections (Needle and Marshall WD#2).
3.2.5.4 Potential causes of interannual variation in maturity ogives
The maturity ogives used for the medium-term stock projections have a considerable impact on the forecasted SSB values. Average values are used, however, it would be advantageous to identify factors contributing to variation in maturity ogives. Ongoing research into the growth dynamics of Northeast Arctic cod has shown that there is a positive relationship between weight-at-length and maturity-at-length (ICES CM 2003/D:01). Similarly, there is a positive relationship between weight-at-age and maturity-at-age for age-classes 4 to 7 (Fig. 3.6). Liver weight estimates (g) for a 70 cm cod (derived from the Russian liver condition index and age/length keys described in Marshall and Needle WD#3) show a significant, positive relationship with the proportion of mature age 7 cod for the time period 1984 to 2001 (Figure 3.7). During this time period liver weight varies from a historical low in 1988 (108 g) to a historical high in 1991 (260 g). Both Figures 3.6 and 3.7 results are consistent with bioenergetic studies showing that maturation rates of cod reflect their growth history.
The 2003 maturity-at-age values for age classes 6 and 7 are slightly lower than those for 2002. The decreasing trend may continue in the short-term particularly given the high levels of biomass. Short-term projections of maturity-at-age should therefore be consistent with forecasts for weight-at-age, liver condition and potentially capelin stock biomass.
Possible future work on projecting maturity ogives includes:
• model the link between liver weights and maturity using available data resources and establish a method for predicting liver weights in the upcoming year. This research can take advantage of the links between capelin stock biomass and liver condition.
3.3 Data used in the assessment
3.3.1 Catch-at-age (Tables 3.8, 3.9 and 3.10)
For 2001 final total landings for all countries only differed by 31 tons to those used in last year’s assessment. Some Norwegian trawl catches were moved from area IIa to IIb and some Icelandic catches were moved from area I to IIa. This lead to very minor adjustments of the number-at-age in the 2001 landings. For 2002, age compositions for all areas were available from Norway (by gears) Russia and Spain. German catches were sampled for some areas and quarters. For the unsampled areas and quarters German catches were distributed on ages by use of Russian or Norwegian trawl samples. Age compositions of the total landings were calculated separately in Subarea I and Division IIa and IIb by using the age compositions that were available and raising the landings from other countries by Russian trawl (Subarea I and Division IIa), and by Norwegian trawl (Division IIb).
Table 3.8 show available catch-at-age data for all ages 1-15+. The catch numbers shown in Table 3.10 together with cannibalism figures (Tables 3.9) were used in the XSA tuning.
3.3.2 Weight-at-age (Tables 3.4 and 3.11-3.12)
The weights-at-age in stock and catches for the age group 13+ was calculated by the IFAP system when ages 13,14 and 15+ were merged.
Catch weights
For 2001, the mean weight-at-age in the catch (Table 3.11) was calculated as a weighted average of the weight-at-age in the catch for Norway, Russia, Germany and Spain. The weight-at-age in the catch for these countries is given in Table 3.4.
O:\ACFM\WGREPS\AFWG\REPORTS\2003\3-Northeast Arctic Cod.Doc 47

Stock weights
The technical minutes from ACFM May 2001 raise the question about weight-at-age for ages 12 and 13+. Since these ages are scarce in the survey samples, fixed values for ages 12 to 15+ has been used (set equal to typical weights for these ages observed in catches). The IFAP data base has been updated for all ages 1-15+ with these fixed values for ages 12-15+. When the assessment applies 13 as plus group, the 13+ weights is calculated year by year as a weighted mean of the fixed values by older ages.
For ages 1-11 stock weights-at-age a (Wa) at the start of year y for 1983-2002 (Table 3.12) were calculated as follows:
W Wa rus aN W N W
N Nnbar a nbar a lof a lof a
nbar a lof a= +−
+
+0 5 1. ( ( )),
, , , ,
, ,
where
Wrus,a-1 : Weight-at-age a-1 in the Russian survey in year y-1 (Table A13)
Nnbar,a : Abundance at age a in the Norwegian Barents Sea acoustic survey in year y (Table A2)
Wnbar,a : Weight-at-age a in the Norwegian Barents Sea acoustic survey in year y (Table A7)
Nlof,a : Abundance at age a in the Lofoten survey in year y (Table A4)
Wlof,a : Weight-at-age a in the Lofoten survey in year y (Table A9)
3.3.3 Natural mortality
A natural mortality of 0.2 was used. In addition, cannibalism was taken into account as described in Section 3.4.2. The proportion of F and M before spawning was set to zero.
3.3.4 Maturity-at-age (Tables 3.5 and 3.13)
As noted in Section 3.2.5, arithmetic averages of the Russian and Norwegian maturity-at-age values were used for 1985-2002.
3.3.5 Tuning data (Tables 3.14 and 3.15)
The following surveys and commercial CPUE data series was used for initial tuning runs by single fleets:
Name Place Season Age Years Fleet 17 Russian bottom trawl surv. Total area Autumn 3-8 1982-2002 Fleet 09 Russian trawl CPUE Total area All year 9-12 1985-2002 Fleet 15 Joint bottom trawl survey Barents Sea Winter 3-8 1981-2003 Fleet 16 Joint acoustic survey Barents Sea + Lofoten Winter 3-11 1985-2003 (Table A16)
Table 3.15 and Figure 3.8 shows a comparison between the fleets. The table show some differences between fleets, and concerns were raised regarding increased uncertainty in fleet 16 and 17. Table 3.15 show the effect of removing the latest observations in these fleets. It also show the effect of increasing the weight on shrinkage (reducing the minimum SE for shrinkage), and the effect of changing ages for stock size dependent catchabilities. The conclusion was to keep the tuning settings used in previous assessments. Plots of log-catcability residuals are shown in Figures 3.12-3.14.
The output tables from the tuning include ages 1 and 2, just to show the year class abundance at age 1 and 2 created by the cannibalism numbers used in the tuning.
As in earlier assessments the surveys that were conducted during winter were allocated to the end of the previous year. This was done so that data from the surveys in 2003 could be included in the assessment. Some of the survey indices
O:\ACFM\WGREPS\AFWG\REPORTS\2003\3-Northeast Arctic Cod.Doc 48
have been multiplied by a factor 10. This was done to keep the dynamics of the surveys even for very low indices, because XSA adds 1.0 to the indices before the logarithm is taken.
Tuning of the VPA was carried out with XSA using default settings with the following exceptions:
1. Tapered time weighting power 3 over 10 years
2. Catchability dependent of stock size for ages less than 6
3. F of the 2 oldest age groups used in F shrinkage
4. Standard error of the mean to which estimates are shrunk set to 1.0
These settings are identical to those used by last years Working Group.
3.3.6 Recruitment indices (Tables 3.6 and 3.7)
The survey data on ages 0,1 and 2 in the autumn survey and ages 1,2 and 3 in the joint winter survey are not used in the XSA, and are instead used to estimate the year class strength at age 3 by making regressions with VPA estimates of recruitment at age 3 (the RCT3-program in the ICES software). The input is shown in Table 3.6, and the output is shown in Table 3.7.
3.3.7 Cannibalism
The method used for calculation of the consumption is described by Bogstad and Mehl (1997). It should be noted that the temperature is used in these calculations. The estimates were obtained as follows:
The cod stomach content data were taken from the joint PINRO-IMR stomach content database (methods described in Mehl and Yaragina 1992). On average 7,500 cod stomachs from the Barents Sea have been analysed annually. The stomachs are sampled throughout the year, although sampling is less frequent in the second quarter of the year. The consumption calculations have been updated by data for 2002 as well as additional data for 2001. The Barents Sea was divided into three areas (west, east and north) and the consumption by cod was calculated from the average stomach content of each prey group by area, half-year and cod age group.
The number of cod predators at age is taken from the VPA, and thus an iterative procedure has to be applied (Section 3.4.2). It was assumed that the mature part of the cod stock is found outside the Barents Sea for three months during the first half of the year. There were very few samples of the stomach contents of cod in the spawning areas. Thus, consumption by cod in the spawning period was omitted from the calculations. It is believed that the cod generally eats very little during spawning, although some predation by cod on herring has been observed close to the spawning areas. The geographical distribution of the cod stock by season is based on Norwegian survey data. The total number of cod ages 0–6 (million) consumed is given in Table 3.9. Alternative calculations of the number of cod consumed by cod, giving somewhat different results, were presented in WD 6.
3.3.8 Prediction data (Tables 3.23 and 3.28, Figure 3.9)
The input data to the short-term prediction with management option table (2003-2005) are given in Table 3.28. For 2003 stock weights and maturity were taken from surveys as described in Sections 3.3.2 and 3.3.4.
Catch weights in 2003 onwards and Stock weights in 2004 onwards are predicted by the method described by Brander (2002), where the latest observation of weights by cohort are used together with average annual increments to predict the weight of the cohort the following year.
For Catch Weights average annual increments by age were calculated for the period 1994-2001 (based on weights for the period 1994-2002), and for Stock Weights average annual increments by age were calculated for the period 1995-2002 (based on weights for the period 1995-2003).
A preliminary prediction indicated further increase of stock size to levels which in earlier years have been associated with reduced maturation, and the observed maturity in 2003 is slightly lower than in 2002 (see section 3.2.5.4). It was therefore decided to assume a reduced maturation for 2004 and later years. It was decided to use last 20-year average
O:\ACFM\WGREPS\AFWG\REPORTS\2003\3-Northeast Arctic Cod.Doc 49
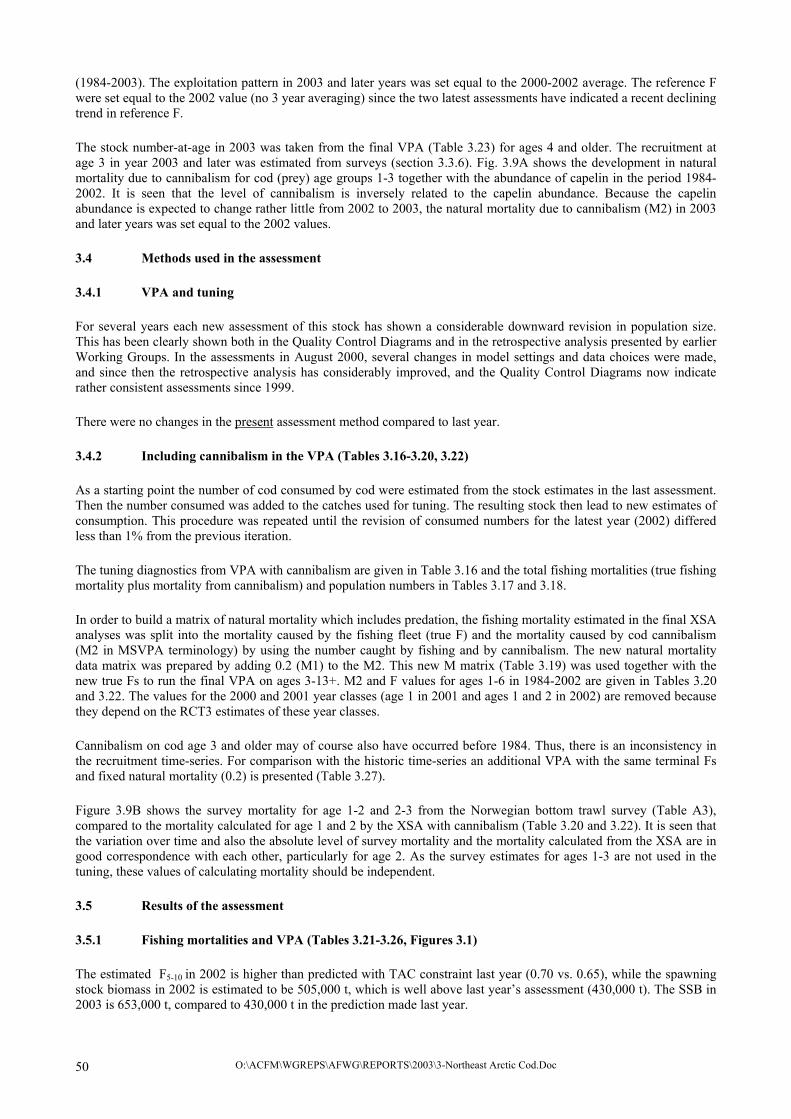
(1984-2003). The exploitation pattern in 2003 and later years was set equal to the 2000-2002 average. The reference F were set equal to the 2002 value (no 3 year averaging) since the two latest assessments have indicated a recent declining trend in reference F.
The stock number-at-age in 2003 was taken from the final VPA (Table 3.23) for ages 4 and older. The recruitment at age 3 in year 2003 and later was estimated from surveys (section 3.3.6). Fig. 3.9A shows the development in natural mortality due to cannibalism for cod (prey) age groups 1-3 together with the abundance of capelin in the period 1984-2002. It is seen that the level of cannibalism is inversely related to the capelin abundance. Because the capelin abundance is expected to change rather little from 2002 to 2003, the natural mortality due to cannibalism (M2) in 2003 and later years was set equal to the 2002 values.
3.4 Methods used in the assessment
3.4.1 VPA and tuning
For several years each new assessment of this stock has shown a considerable downward revision in population size. This has been clearly shown both in the Quality Control Diagrams and in the retrospective analysis presented by earlier Working Groups. In the assessments in August 2000, several changes in model settings and data choices were made, and since then the retrospective analysis has considerably improved, and the Quality Control Diagrams now indicate rather consistent assessments since 1999.
There were no changes in the present assessment method compared to last year.
3.4.2 Including cannibalism in the VPA (Tables 3.16-3.20, 3.22)
As a starting point the number of cod consumed by cod were estimated from the stock estimates in the last assessment. Then the number consumed was added to the catches used for tuning. The resulting stock then lead to new estimates of consumption. This procedure was repeated until the revision of consumed numbers for the latest year (2002) differed less than 1% from the previous iteration.
The tuning diagnostics from VPA with cannibalism are given in Table 3.16 and the total fishing mortalities (true fishing mortality plus mortality from cannibalism) and population numbers in Tables 3.17 and 3.18.
In order to build a matrix of natural mortality which includes predation, the fishing mortality estimated in the final XSA analyses was split into the mortality caused by the fishing fleet (true F) and the mortality caused by cod cannibalism (M2 in MSVPA terminology) by using the number caught by fishing and by cannibalism. The new natural mortality data matrix was prepared by adding 0.2 (M1) to the M2. This new M matrix (Table 3.19) was used together with the new true Fs to run the final VPA on ages 3-13+. M2 and F values for ages 1-6 in 1984-2002 are given in Tables 3.20 and 3.22. The values for the 2000 and 2001 year classes (age 1 in 2001 and ages 1 and 2 in 2002) are removed because they depend on the RCT3 estimates of these year classes.
Cannibalism on cod age 3 and older may of course also have occurred before 1984. Thus, there is an inconsistency in the recruitment time-series. For comparison with the historic time-series an additional VPA with the same terminal Fs and fixed natural mortality (0.2) is presented (Table 3.27).
Figure 3.9B shows the survey mortality for age 1-2 and 2-3 from the Norwegian bottom trawl survey (Table A3), compared to the mortality calculated for age 1 and 2 by the XSA with cannibalism (Table 3.20 and 3.22). It is seen that the variation over time and also the absolute level of survey mortality and the mortality calculated from the XSA are in good correspondence with each other, particularly for age 2. As the survey estimates for ages 1-3 are not used in the tuning, these values of calculating mortality should be independent.
3.5 Results of the assessment
3.5.1 Fishing mortalities and VPA (Tables 3.21-3.26, Figures 3.1)
The estimated F5-10 in 2002 is higher than predicted with TAC constraint last year (0.70 vs. 0.65), while the spawning stock biomass in 2002 is estimated to be 505,000 t, which is well above last year’s assessment (430,000 t). The SSB in 2003 is 653,000 t, compared to 430,000 t in the prediction made last year.
O:\ACFM\WGREPS\AFWG\REPORTS\2003\3-Northeast Arctic Cod.Doc 50

Figure 3.10 shows the results of a retrospective analysis when cannibalism is taken into account. The number of cod consumed by cod was not recalculated year by year in the retrospective analysis, however. The fishing mortalities and stock numbers are given in Tables 3.21 -3.23, while the stock biomass at age and the spawning stock biomass at age are given in Tables 3.24-3.25. A summary of landings, fishing mortality, stock biomass, spawning stock biomass and recruitment since 1946 is given in Table 3.26 and Figures 3.1A and 3.1B.
3.5.2 Recruitment (Table 3.6- 3.7)
From the RCT3 calculations the estimated number (millions) of recruits at age 3 is 681 millions for the 2000 year class, 308 millions for the 2001 year class and 664 millions for the 2002 year class. A comparison of these results with the results of other recruitment models is given in Section 1.4.1.1.
3.6 Reference points
During the 2001 WG considerable revisions of maturity-at-age and weights-at-age were introduced. As a consequence. the PA reference points for Northeast Arctic cod have to be revised. They have been debated for several years and the AFWG 2002 agreed that a special meeting devoted to a full discussion of the PRP for Northeast Arctic cod needed to resolve the matters. In accordance with framework proposed by ICES and developed further at the December 2002 meeting of SGPA the revision of PA reference points for NEA cod was done during the special meeting SGBRP (see Introduction). AFWG proposes these values to be adopted by ACFM
3.6.1 Biomass reference points (Figure 3.1)
The values in current use are Blim =112,000 t (lowest observed in the 1997 assessment) and Bpa = 500,000 t (former MBAL).
The new values are Blim = 220,000t, Bpa = 460,000t. (ICES 2003/ACFM:11).
3.6.2 Fishing mortality reference points
The SGPAFM (ICES 1998/ACFM:10) suggested the limit reference point Flim=Fmed for Northeast Arctic cod, haddock, and saithe. A precautionary fishing mortality (Fpa) is then defined as Fpa= Flime-1.645σ (σ = 0.2-0.3). The 1998 WG, however, found that setting Flim=Fmed did not correspond very well with the exploitation history for cod. The median value for Floss was estimated at 0.70, and the 5th percentile of this value was adopted as a precautionary reference fishing mortality (Fpa=0.42) by the WG in 1998. Since 1998 ACFM has used Flim=Floss=0.70 and Fpa =0.42. This value of Fpa corresponded both to the upper 5 percentile of Floss and to σ = 0.3 in the equation above.
With the revisions of the time-series made at the 2001 WG meeting, the F reference points relating to the stock-recruitment–plot needed to be reconsidered. The new values estimated by SGBRP are Flim = 0.74 and Fpa = 0.40 (ICES 2003/ACFM:11).
3.7 Catch options (Tables 3.29-3.30)
Catch options are presented in Table 3.29. The detailed outputs corresponding to Fsq in 2003 and Fpa in 2004 and 2005 is given in Table 3.30.
In Figure 3.1 the catch level in 2004 and spawning stock biomass level in 2005 are plotted against the fishing mortality in 2004.
3.8 Medium-term forecasts and management scenarios
3.8.1 Input data (Table 3.28)
The simulation period was 2003-2007. The input data were the same as used for the short-term predictions, using the same data for the years after 2005 as for 2005 (Table 3.28). The abundance of the 2003 and 2004 year classes at age 3 was set equal to the long-term average of 600 million individuals.
O:\ACFM\WGREPS\AFWG\REPORTS\2003\3-Northeast Arctic Cod.Doc 51

3.8.2 Methods
It was decided to limit the risk analysis for Northeast Arctic cod to a single-species analysis, where only uncertainty in the initial stock estimate and the recruitment is taken into account. The uncertainty of the stock estimate in 2003 and later years was modeled using a lognormal distribution with a standard error on log scale of 0.3 for all ages. This value is somewhat above the external standard error from the XSA, in recognition of the risk of bias in the assessment, which has been observed in previous years. The errors in numbers-at-age are assumed to be uncorrelated. A modified version of the general-purpose @RISK simulation spreadsheet previously used for studying harvest control rules for Norwegian Spring-spawning herring by the WGNPBW (see e.g. ICES C. M. 1997/Assess:14) was used in the simulations. 2000 simulations were performed for each harvest control rule.
3.8.3 New harvesting strategy adopted
At the 31st session of The Joint Norwegian-Russian Fishery Commission in autumn 2002, the Parties agreed that the new harvesting strategy for Northeast Arctic cod and haddock should incorporate the following considerations:
• to prepare the basis for a long-term high yield of the stocks
• the desirability to obtain a high degree of stability in the TAC from year to year
• full utilization, at all times, of the most recent information available on the stock development
On this basis, the Parties determined the following decision rule for setting the annual fishing quota for Northeast Arctic cod from 2004 onwards:
• estimate the average TAC level for the coming 3 years based on Fpa. TAC for next year will be set to this level as a starting value for the 3 years period
• the year after, the TAC calculation for the next 3 years is repeated based on updated information about the stock development, though such that the TAC should not be changed by more than +/- 10% compared with the previous year’s TAC.
• if the spawning stock falls below Bpa, the Parties should consider a lower TAC than according to the decision rule above.
3.8.4 Comments to the new harvesting strategy
First, a clarification concerning the constraint on the change in quota from one year to the next is needed. It is not entirely clear whether the constraint of a maximum change of 10% from year to year also applies to the setting of the TAC for 2004. In the following, applying this constraint to the 2004 TAC (less than 10% different from the 2003 TAC) is denoted as catch rule 1, while not applying this constraint to the 2004 TAC is denoted as catch rule 2.
The appropriateness of the maximum percentage change will be evaluated by a dedicated working group appointed by the Joint Norwegian-Russian Fisheries Commission before a final decision is made. However, the AFWG notice that the stock fluctuations from year to year may exceed +/- 10%. An attempt to retain catch variations within the 10% may entail both underfishing and overfishing of the stock. It is necessary to test the decision rule with simulation models in order to consider various scenarios of SSB dynamics (both for an increasing and decreasing stock situation). This work needs to be done before the rule is adopted.
A “multi-annual” rule as described above for setting the TAC for Northeast Arctic cod has not previously been considered by ICES Working and Study Groups. Some general points relating to such rules were noted:
According to the ACFM form of Advice any target F should be below Fpa to be in accordance with the Precautionary Approach .The medium-term prognosis shows that the new strategy will not always keep F at below Fpa. The reason is that when F=Fpa is applied for a three-year period, the stock will in many cases increase, so that the catch corresponding to F=Fpa will also increase during the period. When applying the 3-year averaging method to find the TAC in the first year, this will thus be higher than the TAC corresponding to F= Fpa in the first year.
O:\ACFM\WGREPS\AFWG\REPORTS\2003\3-Northeast Arctic Cod.Doc 52

Involving the medium-term prognosis (three years into future) in the setting of quotas for next year also introduces additional uncertainty due to uncertainty in the prognosis of growth, maturation, recruitment and mortality. Thus, the fishing mortality associated with a multi-annual TAC rule may have to be set lower than Fpa in order to ensure the same probability of avoiding limit values. The ICES should provide guidelines on how to evaluate the effect on multi-annual TAC rules on reference points.
The Working Group did not have available software which could perform a risk analysis applying the agreed harvest control rule.
3.8.5 Results (Figure 3.11)
In all runs F status quo was used in 2003, with various options for 2004 and later years. The text table below shows the average catch in the period 2004-2006 and the probability of SSB to be below Bpa = 460 000 tonnes in 2007 for the various catch options. Risk profiles for the total stock biomass, spawning stock biomass and catch are shown in Figs 3.11a-c.
Basis 2003: F status quo=0.70
F Basis, 2004-2006 Average catch 2004-2006 (annual catches in brackets)
P (SSB< Bpa) in 2007
0.00 0 0 <5% 0.25 0.36*Fsq 361 (265-366-452) <5% 0.40 Fpa (=0.57*Fsq) 486(400-498-560) <5% Catch rule1: 10%>03TAC 480 (435-479-527) N/A Catch rule 2 528(486-529-569) N/A 0.70 1.0*Fsq 634(629-646-627) 14%
Short-term catch forecast based on status quo fishing mortality in 2003:
Basis 2003: F=Fsq=0.70, Catch=578000 t, leads to SSB2004=652000 t
F Basis Landings 2004 SSB 2005 P (SSB< Bpa) in 2007 0.00 0 0 1189 <5% 0.25 0.36*Fsq 265 967 <5% 0.40 Fpa (=0.57*Fsq) 400 856 <5% 0.44 Catch rule1 (=0.63*Fsq): 10%>03TAC 435 829 N/A 0.50 Catch rule2 (=0.73*Fsq) 486 788 N/A 0.70 1.0*Fsq 629 677 14%
It should be noted that for catch rule2, the constraint of maximum 10% change from year to year does not affect the catch in 2005 and 2006, while for catch rule 1, the constraint of maximum 10% change from year to year limit the catch both in 2004, 2005 and 2006.
3.8.6 Management considerations
The spawning stock in 2003 is above Bpa , and is predicted to grow further in 2004. The fishing mortality has decreased somewhat, but is still close to Flim.
The forecasts indicate that fishing at Fpa in 2004 (400,000 t) allows for further stock increase in 2005, and the medium-term projections indicate that there is high probability that the stock will remain above Bpa the following two years.
The catch rule in its present form (Section 3.8.3) is not sufficiently specified to be in agreement with the precautionary approach. It does not clearly specify the actions to be taken to ensure that the stock rebuilds in case it falls below Bpa, and the rule could allow the F to be above Fpa for long periods. The rule might be considered to be in agreement with the precautionary approach if sufficient action for a quick rebuilding above Bpa is specified.
O:\ACFM\WGREPS\AFWG\REPORTS\2003\3-Northeast Arctic Cod.Doc 53
The main criteria to be fulfilled for satisfying the precautionary approach is that the probability for SSB>Blim is kept high (90-95%). Comprehensive simulations would give information on the additional specifications needed for the rule to meet this criterion.
It is therefore advised that the F in 2004 should be below Fpa, corresponding to landings less than 400,000 tonnes. If the catch rule is adjusted and proved to be in agreement with the precautionary approach, the landings could be set by the rule.
It should be noted that the current assessment might be over-optimistic (see below). Compared to the prediction above, an assessment based on the Joint bottom trawl survey index alone (Fleet 15 in Table 3.15) gives a prediction with 30% lower spawning stock and 21% lower Fpa-catch in 2004. These values for 2004 are within the 10%-90% percentile range shown in the probabilistic projections shown in Figure 3.11.
3.9 Comments to the assessment (Figures 3.10-3.16, Table 3.31).
There are indications of reduced precision of the latest surveys compared to those in the previous 2-3 years. The Russian autumn survey was not allowed to cover the Norwegian Zone, and at the Joint winter survey, the fish appeared to be more patchy distributed than in recent years. Concerns were raised that at least some of the surveys might have over-estimated the stock.
Previous Working Groups have been concerned about possible discarding and under-reporting (Introduction, and ACFM CM 2001/ACFM:02). The Working Group expresses serious concerns that mis-reporting and discarding of similar magnitude still continues (Sokolov, WD9). This creates uncertainties in the catch statistics and undermines the basis for the assessment and catch predictions. This is a strong reason for additional precaution when setting quotas. It also calls for an evaluation of the current management and catch control systems.
A time-series of discard estimates for cod was presented at the 2002 WG (Dingsør, 2001). Some results are shown in Table 3.31. The later part of this time-series overlaps with the period reported in WD 9. The results in the overlapping years differ considerably. The discrepancies should be analysed before these time-series are used in the assessment.
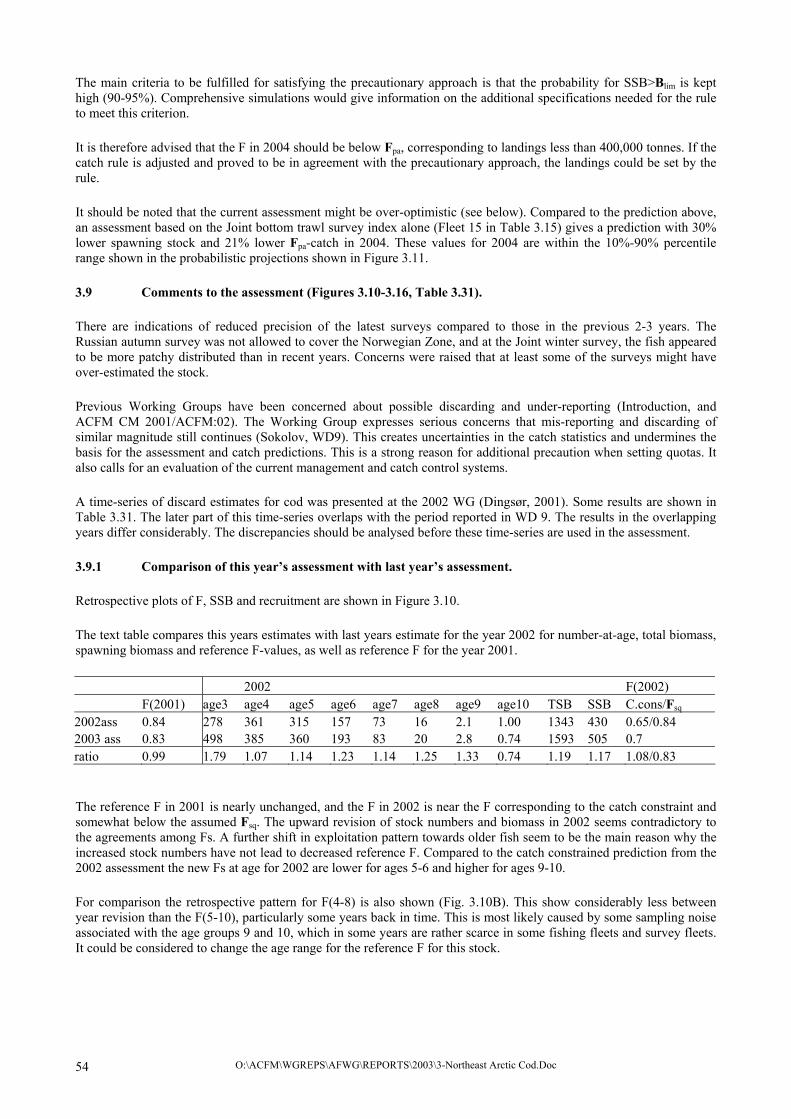
3.9.1 Comparison of this year’s assessment with last year’s assessment.
Retrospective plots of F, SSB and recruitment are shown in Figure 3.10.
The text table compares this years estimates with last years estimate for the year 2002 for number-at-age, total biomass, spawning biomass and reference F-values, as well as reference F for the year 2001.
2002 F(2002) F(2001) age3 age4 age5 age6 age7 age8 age9 age10 TSB SSB C.cons/Fsq 2002ass 0.84 278 361 315 157 73 16 2.1 1.00 1343 430 0.65/0.84 2003 ass 0.83 498 385 360 193 83 20 2.8 0.74 1593 505 0.7 ratio 0.99 1.79 1.07 1.14 1.23 1.14 1.25 1.33 0.74 1.19 1.17 1.08/0.83
The reference F in 2001 is nearly unchanged, and the F in 2002 is near the F corresponding to the catch constraint and somewhat below the assumed Fsq. The upward revision of stock numbers and biomass in 2002 seems contradictory to the agreements among Fs. A further shift in exploitation pattern towards older fish seem to be the main reason why the increased stock numbers have not lead to decreased reference F. Compared to the catch constrained prediction from the 2002 assessment the new Fs at age for 2002 are lower for ages 5-6 and higher for ages 9-10.
For comparison the retrospective pattern for F(4-8) is also shown (Fig. 3.10B). This show considerably less between year revision than the F(5-10), particularly some years back in time. This is most likely caused by some sampling noise associated with the age groups 9 and 10, which in some years are rather scarce in some fishing fleets and survey fleets. It could be considered to change the age range for the reference F for this stock.
O:\ACFM\WGREPS\AFWG\REPORTS\2003\3-Northeast Arctic Cod.Doc 54

3.10 Alternative assessment methods (Fleksibest)
3.10.1 Introduction
A complete description of the mathematical formulations used in Fleksibest is given in Frøysa et al. (2002). Fleksibest is a length-structured extension of the type of age structured assessment models sometimes termed ‘statistical catch-at-age analysis’ (Fournier and Archibald, 1982; Deriso et al., 1985). As last year, a complete assessment including a medium-term prediction is presented for comparison with the XSA assessment. An outline of the plans for future work on Fleksibest is given in the Introduction section.
3.10.2 Stock assessment using Fleksibest
3.10.2.1 Model structure
A quarterly time step is used. The model is run for the period 1.quarter 1985- 1.quarter 2003. The cod stock is divided into an immature (ages 3-10, lengths 15-105 cm) and a mature part (ages 4-12+, lengths 55-135 cm). Maturation takes part in the fourth quarter each year. 1 cm wide length groups are used in the model, and 5 cm wide length groups in the survey and catch data files.
3.10.2.2 Data used
Survey data
The Norwegian summer bottom trawl survey was not included in the Fleksibest assessment this year, in order to be consistent with the XSA assessment. Otherwise, the same surveys as in last year’s assessment were used. Some age and length groups with few or very noisy observations are deleted from some surveys. The table below shows the year, age and length range for the surveys used.
Survey Quarter Year range Age range Length range
Stock covered
Norwegian winter bottom trawl
1 1985-1993 3-9 20-90 cm Immature
Norwegian winter bottom trawl
1 1994-2003 3-9 20-90 cm Immature
Norwegian winter acoustic 1 1985-1993 3-9 20-90 cm Immature Norwegian winter acoustic 1 1994-2003 3-9 20-90 cm Immature Lofoten acoustic 1 1985-1989 5-12+ 55-110 cm Mature Lofoten acoustic 1 1990-2003 5-12+ 55-110 cm Mature Russian bottom trawl 4 1985-1993 and 1995-
2002 3-8 21-106 cm Immature and
mature
The Norwegian winter survey in the Barents Sea (bottom trawl and acoustic indices) was split into two time periods because of the change of gear and increase in area coverage in 1994 (Jakobsen et al., 1997). The Lofoten acoustic survey was split into two periods because of the change of echosounder in 1990 (Korsbrekke, 1997). The 1994 data from the Russian bottom trawl survey gave extremely high residuals and were removed. The XSA also indicates a bad fit for this survey in 1994.
Catch data
As last year, it was decided to treat the gillnet fishery separately from the other fleets, as this fleet is fishing on much larger fish than the other fleets. It was also attempted to treat the Russian trawl fleet separately, but in the final run, this fleet was combined with the non-gillnet Norwegian fleets, just like last year. This is further discussed in Section 3.10.3. Thus, we use catch in numbers-at-age and length by quarter from the following two fleets:
• Combined fleet: All Norwegian fleets except gillnet (Danish seine, handline, longline, Norwegian trawl)+ Russian trawl
• Gillnet
O:\ACFM\WGREPS\AFWG\REPORTS\2003\3-Northeast Arctic Cod.Doc 55

Data for 1985-2002 are used, for length groups 15-135 cm and ages 3-12+.
In addition, two fleets contribute to the fishing mortality in the model, with assumed mortality parameters.
Third countries. The ratio between partial F for this fleet and of the combined fleet is the same as the ratio between the catch in tonnes for these fleets, for each year.
Overfishing. In 1990-1994, the Working Group included estimates of unreported landings (assumed to have the same age distribution as the total reported landings) in the assessment. To account for this we have introduced an ‘overfishing’ fleet which fishes (with the same selection as the combined fleet) in these years. The partial F for this fleet is estimated for each of the years 1990-1994 is estimated.
Consumption data
Data on the consumption (kg/time step) of cod by cod for the period 1985-2002 calculated in the same way as in Bogstad and Mehl (1997). The data are given by predator age group and prey length group.
Differences between data used in XSA and in Fleksibest
It should be noted that there is some difference between the tuning series used is XSA and in Fleksibest. The older part of all the survey time-series are downweighted in XSA. In Fleksibest, all years are given the same weight, but the Norwegian winter bottom trawl survey, the Norwegian winter acoustic survey and the Lofoten survey are split into two time periods. Also, the Norwegian winter acoustic survey and the Lofoten survey are combined in XSA, but not in Fleksibest.
3.10.2.3 Model assumptions
The Pearson function, which is scale dependent, was used as an objective function.
The length selectivity was assumed to be a linear function of length for all surveys except for the Lofoten survey. The slope of this function is close to zero for all the surveys. For the Lofoten survey and for the commercial fleets a logistic length selection curve was assumed.
Linear mean growth in length, variable by year, was assumed. The ratio between the growth rate of mature and immature fish was assumed to be the same for all years.
The maturation parameters were set to values giving slightly lower values for maturity-at-age than in the input to the XSA. However, as the mean weight of mature fish is higher than that of immature fish, the proportion of the biomass, which is mature, is quite similar. A large discrepancy is observed for 1987, when the condition factor was very low. This could possibly be accounted for by also including the condition factor in the maturation function.
The values of the contribution to the objective function from catches were upweighted with a factor of 20 compared to the surveys in order to get approximately the same contribution to the total value of the objective function for both groups of data sources. Also, consumption data were downweighted in the estimations, for the same reasons as given in the 2001 AFWG report. The effect of changing the weighting of the different data sources was investigated during the 2001 AFWG meeting and was not studied this year.
3.10.2.4 Optimization algorithm
A combination of the Simulated Annealing and Hooke & Jeeves algorithms was used. Repeated searches with the combination of these algorithms were performed, starting at the optimum found during the previous search. Sensitivity tests indicate that a minimum was found for the key run.
Changes from last year:
• 1 cm length classes • Beta-binomial distribution used to model distribution of length growth • Different handling of Russian length distributions • Norwegian summer survey excluded
O:\ACFM\WGREPS\AFWG\REPORTS\2003\3-Northeast Arctic Cod.Doc 56

• Catch in tonnes likelihood included
1cm length classes
The model has been altered to use 1cm length classes rather than the previous 2.5cm ones. This allows for a more accurate modelling of the length distribution of modelled fish, in particular it allows for more accurate modelling of the actual distribution of growth in each time step. The previous 2.5cm length classes were too large to capture this distribution accurately (with almost all fish growing by 0, 1 or 2 2.5cm classes each time step). It should be noted that this is a change to the internal model dynamics, and does not directly affect the comparison with the data.
Beta-binomial distribution describing distribution of length growth
The look-up table for determining how many length groups the fish will grow when the mean growth is given, has now been replaced with a fully modelled distribution, controlled by an optimizable parameter. The distribution is controlled using the beta-binomial distribution, with a single optimized parameter, in the same way as described by Björnsson and Sigurdsson (2003). Separate parameters are used for the mature and immature population groups in order to capture the different dynamics of the two stocks.
Handling of Russian length distributions
The Russian catch and survey data have always been given on length classes which are shifted 1cm compared with the Norwegian data (21-25 cm instead of 20-24 cm etc.). Previously, this has been ignored, and the Russian data have been assumed to be given on the same length groups as the Norwegian data. With 1cm wide model length classes, the correct length distribution can be used for the Russian data. This was done for the Russian survey data, but not for the Russian catch data (see below).
Catch in tonnes likelihood
In order to compare the observed and modeled catch in tonnes, a new likelihood function has been included in Fleksibest. This is simply the sum of squares of the difference between the observed (Cy,q,f ) and modeled (Ĉy,q,f ) catch in tonnes, for each year y, quarter q and fleet f:
2,,,, )ˆ( fqyfqy CC −
The observations available for a given fleet are, in addition to the catch in tonnes, length distributions and age distributions for given length. Such proportions at length and age should be used when comparing model results and observations, as done by Björnsson and Sigurdsson (2003). They should be supplemented by the catch in tonnes likelihood described above. This year the catch in tonnes likelihood was only used to determine the fishing mortality for the ‘overfishing’ fleet in the years 1990-1994 by comparing the modeled to the ‘observed’ overfishing in tonnes for these years.
3.10.2.5 Estimates of parameters outside the model
The mean length-at-age and the standard deviation of the mean length-at-age for all age groups of immature and mature fish in the first year and for age 3 in all years were taken from survey data. The SD of mean length of mature in the first year was not available, and was set to values obtained during previous estimations. The number of fish in the first year in age groups with low abundance was fixed. The residual natural mortality was set to 0.2. The maturation function was given values consistent with the work by Ajiad et al., (1999). The weight-length relationship used is the same as for Norwegian commercial catch data. This relationship is variable by quarter and year. The parameters governing size selectivity in cod cannibalism were set to the values given by Bogstad (WD 15, AFWG 2001).
3.10.3 Results from the assessment (Tables 3.32–3.33, Figures 3.17–3.18)
Choice of key run
In order to take into account the 1cm shift between length classes in Norwegian and Russian catch data, the Russian trawl fleet would need to be split from the ‘combined’ fleet. Thus, selectivity parameters need to be estimated also for the Russian trawl fleet. The ratio between the fishing mortality of Russian trawl and the combined fleet is then assumed
O:\ACFM\WGREPS\AFWG\REPORTS\2003\3-Northeast Arctic Cod.Doc 57

to be the same as the ratio between the catch in weight of those two fleets for each quarter. This may cause some error if the selectivity of the two fleets is different.
This approach was attempted, but led to each of the fleets (Norwegian except gillnet and Russian) giving about the same likelihood score as the combined fleet. The reasons for this are unknown. Thus, it was decided to combine the Norwegian non-gillnet fleets and the Russian trawl fleet into one fleet, as in last years’ assessment.
No other changes from last year’s key run than those listed in Section 3.10.2.5 were attempted.
Effect of excluding Russian survey data for 2002.
As for XSA, the effect of excluding the Russian survey for 2002, where the area coverage by this survey was incomplete, was tested. This caused no change in F for 2002, but a slightly lower F in years with high F. SSB in 2002 decreased from 436 to 434 thousand tonnes, while the SSB decreased in years with a high SSB. The effect on the 2002 values is less than seen when the same exercise was done by XSA (Table 3.15).
Parameter sensitivity
Likelihood components, input data and parameter estimates for the key run are given in Table 3.32a-c. The parameter values obtained during the two previous year’s assessments are given for comparison. Also, the effect on the total likelihood score of changing each parameter with +/- 5% is given. Sensitivity tests show that the estimation procedure has found a well-defined optimum, and that the likelihood function is quadratic around the optimum with respect to each parameter.
It is seen that the total likelihood score is most sensitive to L50 (length at 50 % selection) in the commercial fleets. It is also quite sensitive to the growth parameters and the length of a cohort at age 3. Due to the formulation of the catch in tonnes likelihood component and the parameter correlations in the model, the sensitivities for parameters relevant to the stock abundance in the period 1990-1994 were high. Another run was performed where the partial F values for overfishing for these years were fixed, and this run showed sensitivities similar to those presented in last year’s report. This run gave small changes in parameter values and stock development.
Model results
The model values of natural mortality, maturity, stock weight, catch weights and catch in numbers by age group derived from these parameters are given in Table 3.33. This table also presents the fishing mortalities, stock numbers, stock biomass and spawning stock biomass. Results (total stock biomass, SSB, F, catches, recruitment, total stock number) of the key run are shown in Fig. 3.17a-f. The total annual catch in weight as estimated by the model is somewhat higher than the reported catches in almost all years, but in general there is good agreement with the reported catches in tonnes. The maximum discrepancy is about 168 000 tonnes in 1995. In general, the trends given by XSA and Fleksibest are very similar for the recruitment, the stock numbers and stock biomass. Fleksibest shows the same overall trends for F5-10 as XSA, but the curve given by Fleksibest is smoother. One reason for this may be that Fleksibest is less vulnerable to noise in the catch data of the oldest ages due to the fixed selectivity pattern by length. Fleksibest gives high spawning biomass in the years 1992-1995, with significantly higher SSB than in the XSA assessment for the years 1993-1995. Else the SSB trends are very similar.
Compared to the stock weights used in the XSA, the mean weight-at-age in Fleksibest is higher for age 3 and lower for age 7 and older. The discrepancy is higher for weight-at-age in the stock than for weight-at-age in the catch. The maturity-at-age is lower in Fleksibest than in XSA for ages 6 and older, except in the period 1986-1988, when Fleksibest give higher maturity ogives than XSA for all ages.
Figure 3.18a-f shows the fit between modeled and observed survey indices and between modeled and observed catch in number. The plots show the sum over age and length groups year by year.
Compared to last year’s Fleksibest results, the results obtained this year give a more optimistic view of the stock. The fishing mortality (F5-10) in 2001 decreased from 0.68 in last year’s assessment to 0.58 in this year’ assessment, while the SSB in 2002 increased from 376 thousand tonnes to 436 thousand tonnes. This change is partly due to the exclusion of the Norwegian summer survey in this year’s assessment. As mentioned in last year’s report, excluding this survey led to increasing SSB and decreasing F.
O:\ACFM\WGREPS\AFWG\REPORTS\2003\3-Northeast Arctic Cod.Doc 58

3.10.4 Retrospective analysis (Figure 3.19)
Results (total stock biomass, SSB, F, catches, recruitment, total stock number) of a retrospective analysis with the same settings as in the key run are shown in Figure 3.19a-f. The runs stops in first quarter, and are labeled after the year that contains the last time step. The shortest run stops in first quarter in 1998, and is thus labeled 1998. The retrospective pattern seems to be fairly consistent back to 1999.
3.10.5 Use of Fleksibest for predictions (Tables 3.34–3.35, Figure 3.20a-f)
Fleksibest is well suited for prognosis, because the length-dependence of population dynamics processes makes it easy to get consistency between the values of weight, maturity and mortality-at-age. In the prognosis runs with Fleksibest for the period 2003-2007, the same values as in the key run were used for most parameters. For the parameters that are variable by year, the values for 2002 were used for all years in the prognosis, except for recruitment and fishing mortality.
The recruitment at age 3 in 2004 and 2005 is set to the values obtained from the RCT3 analysis. The recruitment at age 3 in 2006 and later is assumed to be equal to the average recruitment (600 million individuals). This is consistent with the assumptions made in the medium-term prognosis based on the XSA run (see Section 3.3.8). Runs were made with F=0.25, Fpa =0.40, Fstatus quo =0.47 and F=0.70 for the period 2003-2007. In all runs Fstatus quo was assumed for 2003. In addition a run with a constant catch of 500 000 tonnes for the period 2003-2007 was made. The values of recruitment, catch weight, stock weight, maturity, natural mortality and fishing mortality-at-age for the Fpa run are given in Table 3.34. This is comparable to the usual prediction input table (Table 3.28). The management option table for the Fleksibest prediction is given in Table 3.35, and results of medium-term projections with these different fishing mortalities are shown in Figure 3.20a-f.
3.10.5.1 Comments to the prognosis
From Figures 3.20a-f it is seen that the four alternatives give large differences in the development of the spawning stock biomass and significant differences in the development of the stock biomass. It should be noted that fishing mortalities of 0.40 and 0.47.throughout the period gives a higher catch in 2007 than fishing at 0.70.
3.10.6 Reference points related to Fleksibest
In order to use Fleksibest for providing management advice for NEA cod, reference points would need to be calculated. It needs to be outlined how reference points could be calculated using Fleksibest. It should be noted that it is somewhat difficult to extend Fleksibest to the time period when survey data are not available (before 1981). Such an extension will require assumptions about the selection pattern of the various fishing fleets backwards in time.
3.11 Comparison of results from XSA and Fleksibest
3.11.1 Comparison of the assessments
The abundance at age in 2002 in the Fleksibest assessment is lower for ages 3-6 and higher for ages 7 and older compared to the XSA assessment (Table 3.15). The reference F in 2002 estimated by Fleksibest is lower (0.47 vs. 0.70), the reason for this is higher fishing mortalities in XSA compared to Fleksibest for age 7 and older fish. The reason for this discrepancy in fishing pattern should be investigated. The spawning stock biomass in 2002 is somewhat lower in Fleksibest than in XSA, 436 vs. 507 thousand tonnes. The declining trend in fishing mortality from 1999 to 2002 is stronger in Fleksibest than in XSA.
3.11.2 Comparison of the predictions (Figure 3.21)
The standard and Fleksibest predictions differ in a fundamental way because all input values to the standard prediction (Table 3.28) are independent and can be determined separately. This may lead to internal inconsistencies in the prediction input to the standard prediction. Also, effects of different exploitation levels on weight, maturity and selection at age cannot be accounted for using standard predictions. This may be important for medium-term predictions.
O:\ACFM\WGREPS\AFWG\REPORTS\2003\3-Northeast Arctic Cod.Doc 59

The population parameters at age in the Fleksibest prediction (Table 3.34) are determined by the values of growth, recruitment and fishing mortality chosen, as mentioned in Section 3.10.5. With this method, the values of weight, maturity and fishing mortality-at-age will be consistent with each other.
Although F status quo is quite different between the XSA run and the Fleksibest run, the catch resulting from applying F status quo in 2003 is not very different (506 thousand tonnes with Fleksibest and 583 thousand tonnes with XSA). The development of fishing mortality, total stock biomass and spawning stock biomass in Fleksibest and XSA for a constant catch of 500 000 tonnes in the period 2003-2007 is compared in Fig. 3.21. The Fleksibest predictions show a less optimistic development of the stock than the XSA predictions.
O:\ACFM\WGREPS\AFWG\REPORTS\2003\3-Northeast Arctic Cod.Doc 60

Table 3.1 North-East Arctic COD. Total catch (t) by fishing areas and unreported catch.(Data provided by Working Group members.)
YearSub-area I Division IIa Division IIb Unreported
catchesTotal catch
1961 409,694 153,019 220,508 783,2211962 548,621 139,848 220,797 909,2661963 547,469 117,100 111,768 776,3371964 206,883 104,698 126,114 437,6951965 241,489 100,011 103,430 444,9831966 292,253 134,805 56,653 483,7111967 322,798 128,747 121,060 572,6051968 642,452 162,472 269,254 1,074,0841969 679,373 255,599 262,254 1,197,2261970 603,855 243,835 85,556 933,2461971 312,505 319,623 56,920 689,0481972 197,015 335,257 32,982 565,2541973 492,716 211,762 88,207 792,6851974 723,489 124,214 254,730 1,102,4331975 561,701 120,276 147,400 829,3771976 526,685 237,245 103,533 867,4631977 538,231 257,073 109,997 905,3011978 418,265 263,157 17,293 698,7151979 195,166 235,449 9,923 440,5381980 168,671 199,313 12,450 380,4341981 137,033 245,167 16,837 399,0371982 96,576 236,125 31,029 363,7301983 64,803 200,279 24,910 289,9921984 54,317 197,573 25,761 277,6511985 112,605 173,559 21,756 307,9201986 157,631 202,688 69,794 430,1131987 146,106 245,387 131,578 523,0711988 166,649 209,930 58,360 434,9391989 164,512 149,360 18,609 332,4811990 62,272 99,465 25,263 25,000 212,0001991 70,970 156,966 41,222 50,000 319,1581992 124,219 172,532 86,483 130,000 513,2341993 195,771 269,383 66,457 50,000 581,6111994 353,425 306,417 86,244 25,000 771,0861995 251,448 317,585 170,966 739,9991996 278,364 297,237 156,627 732,2281997 273,376 326,689 162,338 762,4031998 250,815 257,398 84,411 592,6241999 159,021 216,898 108,991 484,9102000 137,197 204,167 73,506 414,8702001 142,628 185,890 97,953 426,4712002 1 184,795 188,935 71,239 445,060
1 Provisional figures.
O:\ACFM\WGREPS\AFWG\REPORTS\2003\3-Northeast Arctic Cod.Doc 61

Table 3.2 North-East Arctic COD. Total nominal catch ('000 t) by trawl and other gear for each area, data provided by Working Group members.
Sub-area I Division IIa Division IIbYear Trawl Others Trawl Others Trawl Others
1967 238.0 84.8 38.7 90.0 121.1 -1968 588.1 54.4 44.2 118.3 269.2 -1969 633.5 45.9 119.7 135.9 262.3 -1970 524.5 79.4 90.5 153.3 85.6 -1971 253.1 59.4 74.5 245.1 56.9 -1972 158.1 38.9 49.9 285.4 33.0 -1973 459.0 33.7 39.4 172.4 88.2 -1974 677.0 46.5 41.0 83.2 254.7 -1975 526.3 35.4 33.7 86.6 147.4 -1976 466.5 60.2 112.3 124.9 103.5 -1977 471.5 66.7 100.9 156.2 110.0 -1978 360.4 57.9 117.0 146.2 17.3 -1979 161.5 33.7 114.9 120.5 8.1 -1980 133.3 35.4 83.7 115.6 12.5 -1981 91.5 45.1 77.2 167.9 17.2 -1982 44.8 51.8 65.1 171.0 21.0 -1983 36.6 28.2 56.6 143.7 24.9 -1984 24.5 29.8 46.9 150.7 25.6 -1985 72.4 40.2 60.7 112.8 21.5 -1986 109.5 48.1 116.3 86.4 69.8 -1987 126.3 19.8 167.9 77.5 129.9 1.71988 149.1 17.6 122.0 88.0 58.2 0.21989 144.4 19.5 68.9 81.2 19.1 0.11990 51.4 10.9 47.4 52.1 24.5 0.81991 58.9 12.1 73.0 84.0 40.0 1.21992 103.7 20.5 79.7 92.8 85.6 0.91993 165.1 30.7 155.5 113.9 66.3 0.21994 312.1 41.3 165.8 140.6 84.3 1.91995 218.1 33.3 174.3 143.3 160.3 10.71996 248.9 32.7 137.1 159.0 147.7 6.81997 235.6 37.7 150.5 176.2 154.7 7.61998 219.8 31.0 127.0 130.4 82.7 1.71999 133.3 25.7 101.9 115.0 107.2 1.82000 111.7 25.5 105.4 98.8 72.2 1.32001 119.1 23.5 83.1 102.8 95.4 2.52002 1 147.4 37.4 83.4 105.6 70.1 1.3
1 Provisional figures.
O:\ACFM\WGREPS\AFWG\REPORTS\2003\3-Northeast Arctic Cod.Doc 62
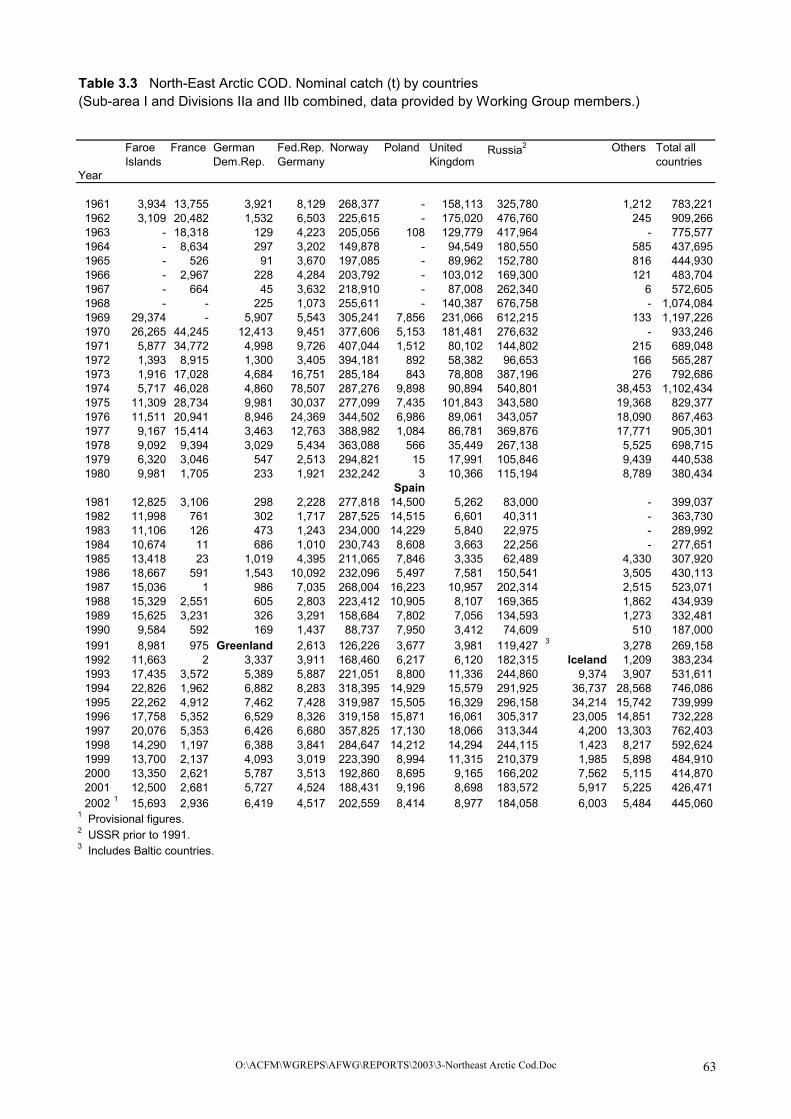
Table 3.3 North-East Arctic COD. Nominal catch (t) by countries (Sub-area I and Divisions IIa and IIb combined, data provided by Working Group members.)
Year
Faroe Islands
France German Dem.Rep.
Fed.Rep.Germany
Norway Poland United Kingdom
Russia2 Others Total all countries
1961 3,934 13,755 3,921 8,129 268,377 - 158,113 325,780 1,212 783,2211962 3,109 20,482 1,532 6,503 225,615 - 175,020 476,760 245 909,2661963 - 18,318 129 4,223 205,056 108 129,779 417,964 - 775,5771964 - 8,634 297 3,202 149,878 - 94,549 180,550 585 437,6951965 - 526 91 3,670 197,085 - 89,962 152,780 816 444,9301966 - 2,967 228 4,284 203,792 - 103,012 169,300 121 483,7041967 - 664 45 3,632 218,910 - 87,008 262,340 6 572,6051968 - - 225 1,073 255,611 - 140,387 676,758 - 1,074,0841969 29,374 - 5,907 5,543 305,241 7,856 231,066 612,215 133 1,197,2261970 26,265 44,245 12,413 9,451 377,606 5,153 181,481 276,632 - 933,2461971 5,877 34,772 4,998 9,726 407,044 1,512 80,102 144,802 215 689,0481972 1,393 8,915 1,300 3,405 394,181 892 58,382 96,653 166 565,2871973 1,916 17,028 4,684 16,751 285,184 843 78,808 387,196 276 792,6861974 5,717 46,028 4,860 78,507 287,276 9,898 90,894 540,801 38,453 1,102,4341975 11,309 28,734 9,981 30,037 277,099 7,435 101,843 343,580 19,368 829,3771976 11,511 20,941 8,946 24,369 344,502 6,986 89,061 343,057 18,090 867,4631977 9,167 15,414 3,463 12,763 388,982 1,084 86,781 369,876 17,771 905,3011978 9,092 9,394 3,029 5,434 363,088 566 35,449 267,138 5,525 698,7151979 6,320 3,046 547 2,513 294,821 15 17,991 105,846 9,439 440,5381980 9,981 1,705 233 1,921 232,242 3 10,366 115,194 8,789 380,434
Spain1981 12,825 3,106 298 2,228 277,818 14,500 5,262 83,000 - 399,0371982 11,998 761 302 1,717 287,525 14,515 6,601 40,311 - 363,7301983 11,106 126 473 1,243 234,000 14,229 5,840 22,975 - 289,9921984 10,674 11 686 1,010 230,743 8,608 3,663 22,256 - 277,6511985 13,418 23 1,019 4,395 211,065 7,846 3,335 62,489 4,330 307,9201986 18,667 591 1,543 10,092 232,096 5,497 7,581 150,541 3,505 430,1131987 15,036 1 986 7,035 268,004 16,223 10,957 202,314 2,515 523,0711988 15,329 2,551 605 2,803 223,412 10,905 8,107 169,365 1,862 434,9391989 15,625 3,231 326 3,291 158,684 7,802 7,056 134,593 1,273 332,4811990 9,584 592 169 1,437 88,737 7,950 3,412 74,609 510 187,0001991 8,981 975 Greenland 2,613 126,226 3,677 3,981 119,427 3 3,278 269,1581992 11,663 2 3,337 3,911 168,460 6,217 6,120 182,315 Iceland 1,209 383,2341993 17,435 3,572 5,389 5,887 221,051 8,800 11,336 244,860 9,374 3,907 531,6111994 22,826 1,962 6,882 8,283 318,395 14,929 15,579 291,925 36,737 28,568 746,0861995 22,262 4,912 7,462 7,428 319,987 15,505 16,329 296,158 34,214 15,742 739,9991996 17,758 5,352 6,529 8,326 319,158 15,871 16,061 305,317 23,005 14,851 732,2281997 20,076 5,353 6,426 6,680 357,825 17,130 18,066 313,344 4,200 13,303 762,4031998 14,290 1,197 6,388 3,841 284,647 14,212 14,294 244,115 1,423 8,217 592,6241999 13,700 2,137 4,093 3,019 223,390 8,994 11,315 210,379 1,985 5,898 484,9102000 13,350 2,621 5,787 3,513 192,860 8,695 9,165 166,202 7,562 5,115 414,8702001 12,500 2,681 5,727 4,524 188,431 9,196 8,698 183,572 5,917 5,225 426,4712002 1 15,693 2,936 6,419 4,517 202,559 8,414 8,977 184,058 6,003 5,484 445,060
1 Provisional figures.2 USSR prior to 1991.3 Includes Baltic countries.
O:\ACFM\WGREPS\AFWG\REPORTS\2003\3-Northeast Arctic Cod.Doc 63

Table 3.4 North-east Arctic COD. Weights at age (kg) in landings from various countriesNorwayYear Age
2 3 4 5 6 7 8 9 10 11 12 13 14 151983 0.41 0.82 1.32 2.05 2.82 3.94 5.53 7.70 9.17 11.46 16.59 16.42 16.96 24.461984 1.16 1.47 1.97 2.53 3.13 3.82 4.81 5.95 7.19 7.86 8.46 7.99 9.78 10.641985 0.34 0.99 1.43 2.14 3.27 4.68 6.05 7.73 9.86 11.87 14.16 14.17 13.52 15.331986 0.30 0.67 1.34 2.04 3.14 4.60 5.78 6.70 7.52 9.74 10.68 12.86 9.59 16.311987 0.24 0.48 0.88 1.66 2.72 4.35 6.21 8.78 9.78 12.50 13.75 15.12 10.43 19.951988 0.36 0.56 0.83 1.31 2.34 3.84 6.50 8.76 9.97 11.06 14.43 19.02 12.89 10.161989 0.53 0.75 0.90 1.17 1.95 3.20 4.88 7.82 9.40 11.52 11.47 19.47 14.681990 0.40 0.81 1.22 1.59 2.14 3.29 4.99 7.83 10.54 14.21 17.63 7.97 14.641991 0.63 1.37 1.77 2.31 3.01 3.68 4.63 6.06 8.98 12.89 17.00 14.17 16.631992 0.41 1.10 1.79 2.45 3.22 4.33 5.27 6.21 8.10 10.51 11.59 15.81 6.521993 0.30 0.83 1.70 2.41 3.35 4.27 5.45 6.28 7.10 7.82 10.10 16.03 19.51 17.681994 0.30 0.82 1.37 2.23 3.35 4.27 5.56 6.86 7.45 7.98 9.53 12.16 11.45 19.791995 0.44 0.78 1.26 1.87 2.80 4.12 5.15 5.96 7.90 8.67 9.20 11.53 17.77 21.111996 0.29 0.90 1.15 1.67 2.58 4.08 6.04 6.62 7.96 9.36 10.55 11.41 9.51 24.241997 0.35 0.78 1.14 1.56 2.25 3.48 5.35 7.38 7.55 8.30 11.15 8.64 12.801998 0.38 0.68 1.03 1.64 2.23 3.24 4.85 6.88 9.18 9.84 15.78 14.37 13.77 15.581999 0.46 0.88 1.16 1.65 2.40 3.12 4.26 6.00 6.52 10.64 14.05 12.67 9.20 17.222000 0.31 0.65 1.23 1.80 2.54 3.58 4.49 5.71 7.54 7.86 12.71 14.71 15.40 20.262001 0.30 0.77 1.18 1.83 2.75 3.64 4.88 5.93 7.43 8.90 10.22 11.11 13.03 18.852001 0.53 0.93 1.36 1.90 2.70 3.80 5.00 6.30 7.50 8.93 8.11 10.12 12.25 11.42
Russia (trawl only)Yea
+
r Age2 3 4 5 6 7 8 9 10 11 12 13 14 15
1983 0.65 1.05 1.58 2.31 3.39 4.87 6.86 8.72 10.40 12.07 14.431984 0.53 0.88 1.45 2.22 3.21 4.73 6.05 8.43 10.34 12.61 14.951985 0.33 0.77 1.31 1.84 2.96 4.17 5.94 6.38 8.58 10.281986 0.29 0.61 1.14 1.75 2.45 4.17 6.18 8.04 9.48 11.33 12.35 14.131987 0.24 0.52 0.88 1.42 2.07 2.96 5.07 7.56 8.93 10.80 13.05 18.161988 0.27 0.49 0.88 1.32 2.06 3.02 4.40 6.91 9.15 11.65 12.53 14.681989 0.50 0.73 1.00 1.39 1.88 2.67 4.06 6.09 7.76 9.881990 0.45 0.83 1.21 1.70 2.27 3.16 4.35 6.25 8.73 10.85 13.521991 0.36 0.64 1.05 2.03 2.85 3.77 4.92 6.13 8.36 10.44 15.84 19.331992 0.55 1.20 1.44 2.07 3.04 4.24 5.14 5.97 7.25 9.28 11.361993 0.48 0.78 1.39 2.06 2.62 4.07 5.72 6.79 7.59 11.26 14.79 17.711994 0.41 0.81 1.24 1.80 2.55 2.88 4.96 6.91 8.12 10.28 12.42 16.931995 0.37 0.77 1.21 1.74 2.37 3.40 4.71 6.73 8.47 9.58 12.03 16.991996 0.30 0.64 1.09 1.60 2.37 3.42 5.30 7.86 8.86 10.87 11.801997 0.30 0.57 1.00 1.52 2.18 3.30 4.94 7.15 10.08 11.87 13.541998 0.33 0.68 1.06 1.60 2.34 3.39 5.03 6.89 10.76 12.39 13.61 14.721999 0.24 0.58 0.98 1.41 2.17 3.26 4.42 5.70 7.27 10.24 14.122000 0.18 0.48 0.85 1.44 2.16 3.12 4.44 5.79 7.49 9.66 10.362001 0.12 0.31 0.62 1.00 1.53 2.30 3.31 4.57 6.55 8.11 9.52 11.992002 0.05 0.20 0.60 1.05 1.46 2.14 3.27 4.47 6.23 8.37 10.06 12.37
Germany (Division IIa and IIb)Yea
+
r Age2 3 4 5 6 7 8 9 10 11 12 13 14 15
1994 0.68 1.04 2.24 3.49 4.51 5.79 6.93 8.16 8.46 8.74 9.48 15.251995 0.44 0.84 1.50 2.72 3.81 4.46 4.81 7.37 7.69 8.25 9.471996 0.84 1.15 1.64 2.53 3.58 4.13 3.90 4.68 6.98 6.43 11.321997 0.43 0.92 1.42 2.01 3.15 4.04 5.16 4.82 3.96 7.04 8.801998 0.23 0.73 1.17 1.89 2.72 3.25 4.13 5.63 6.50 8.57 8.42 11.45 8.791999 1 0.85 1.45 2.00 2.65 3.47 4.16 5.45 6.82 5.90 8.012000 2 0.26 0.73 1.36 2.04 2.87 3.67 4.88 5.78 7.05 8.45 8.67 9.33 6.882001 0.38 0.80 1.21 1.90 2.74 3.90 4.99 5.69 7.15 7.32 11.72 9.11 6.602002 0.06 0.35 1.00 1.31 1.80 2.53 3.64 4.38 5.07 6.82 9.21 7.59 13.18
1 Division IIa only2 IIa and IIb combined
Spain (Division IIb)Yea
+
r Age2 3 4 5 6 7 8 9 10 11 12 13 14 15
1994 0.43 1.08 1.38 2.32 2.47 2.68 3.46 5.20 7.04 6.79 7.20 8.04 10.46 15.351995 0.42 0.51 0.98 1.99 3.41 4.95 5.52 8.62 9.21 11.42 9.78 8.081996 0.66 1.12 1.57 2.43 3.17 3.59 4.44 5.48 6.79 8.101997 1 0.51 0.65 1.22 1.68 2.60 3.39 4.27 6.67 7.88 11.34 13.33 10.03 8.691998 0.47 0.74 1.15 1.82 2.44 3.32 3.71 5.00 7.261999 1 0.21 0.69 1.06 1.69 2.50 3.32 4.72 5.76 6.77 7.24 7.632000 1 0.23 0.61 1.24 1.75 2.47 3.12 4.65 6.06 7.66 10.94 11.40 7.202001 0.23 0.64 1.25 1.95 2.86 3.55 4.95 6.46 8.50 11.07 13.092002 0.16 0.55 1.00 1.48 2.17 3.29 4.47 5.35 8.29 12.23 9.01 12.16 15.2
1 IIa and IIb combinedIceland (Sub-area I)1994 0.42 0.85 1.44 2.77 3.54 4.08 5.84 6.37 7.02 7.48 7.371995 1.17 0.91 1.60 2.28 3.61 4.73 6.27 6.261996 0.36 0.99 1.55 2.83 3.79 4.81 5.34 7.25 7.68 9.08 8.98 10.521997 0.42 0.43 0.76 1.60 2.40 3.45 4.40 5.74 6.15 8.28 10.52 9.89
UK (England & Wales)1995 1 1.47 2.11 3.47 5.57 6.43 7.17 8.12 8.05 10.2 10.11996 2 1.55 1.81 2.42 3.61 6.3 6.47 7.83 7.91 8.93 9.38 10.91997 2 1.93 2.17 3.07 4.17 4.89 6.46 12.3 8.44
1 Division IIa and IIb2 Division IIa
+
O:\ACFM\WGREPS\AFWG\REPORTS\2003\3-Northeast Arctic Cod.Doc 64
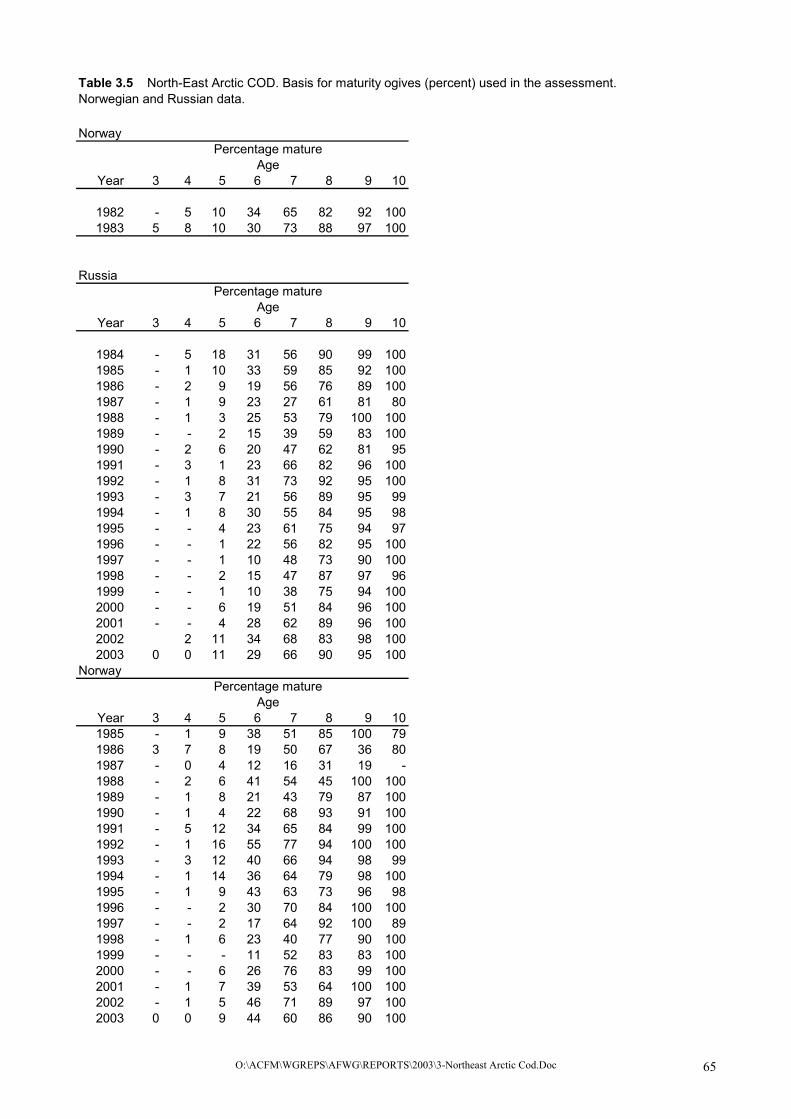
Table 3.5 North-East Arctic COD. Basis for maturity ogives (percent) used in the assessment. Norwegian and Russian data.
NorwayPercentage mature
AgeYear 3 4 5 6 7 8 9 10
1982 - 5 10 34 65 82 92 1001983 5 8 10 30 73 88 97 100
RussiaPercentage mature
AgeYear 3 4 5 6 7 8 9 10
1984 - 5 18 31 56 90 99 1001985 - 1 10 33 59 85 92 1001986 - 2 9 19 56 76 89 1001987 - 1 9 23 27 61 81 801988 - 1 3 25 53 79 100 1001989 - - 2 15 39 59 83 1001990 - 2 6 20 47 62 81 951991 - 3 1 23 66 82 96 1001992 - 1 8 31 73 92 95 1001993 - 3 7 21 56 89 95 991994 - 1 8 30 55 84 95 981995 - - 4 23 61 75 94 971996 - - 1 22 56 82 95 1001997 - - 1 10 48 73 90 1001998 - - 2 15 47 87 97 961999 - - 1 10 38 75 94 1002000 - - 6 19 51 84 96 1002001 - - 4 28 62 89 96 1002002 2 11 34 68 83 98 1002003 0 0 11 29 66 90 95 100
NorwayPercentage mature
AgeYear 3 4 5 6 7 8 9 101985 - 1 9 38 51 85 100 791986 3 7 8 19 50 67 36 801987 - 0 4 12 16 31 19 -1988 - 2 6 41 54 45 100 1001989 - 1 8 21 43 79 87 1001990 - 1 4 22 68 93 91 1001991 - 5 12 34 65 84 99 1001992 - 1 16 55 77 94 100 1001993 - 3 12 40 66 94 98 991994 - 1 14 36 64 79 98 1001995 - 1 9 43 63 73 96 981996 - - 2 30 70 84 100 1001997 - - 2 17 64 92 100 891998 - 1 6 23 40 77 90 1001999 - - - 11 52 83 83 1002000 - - 6 26 76 83 99 1002001 - 1 7 39 53 64 100 1002002 - 1 5 46 71 89 97 1002003 0 0 9 44 60 86 90 100
O:\ACFM\WGREPS\AFWG\REPORTS\2003\3-Northeast Arctic Cod.Doc 65
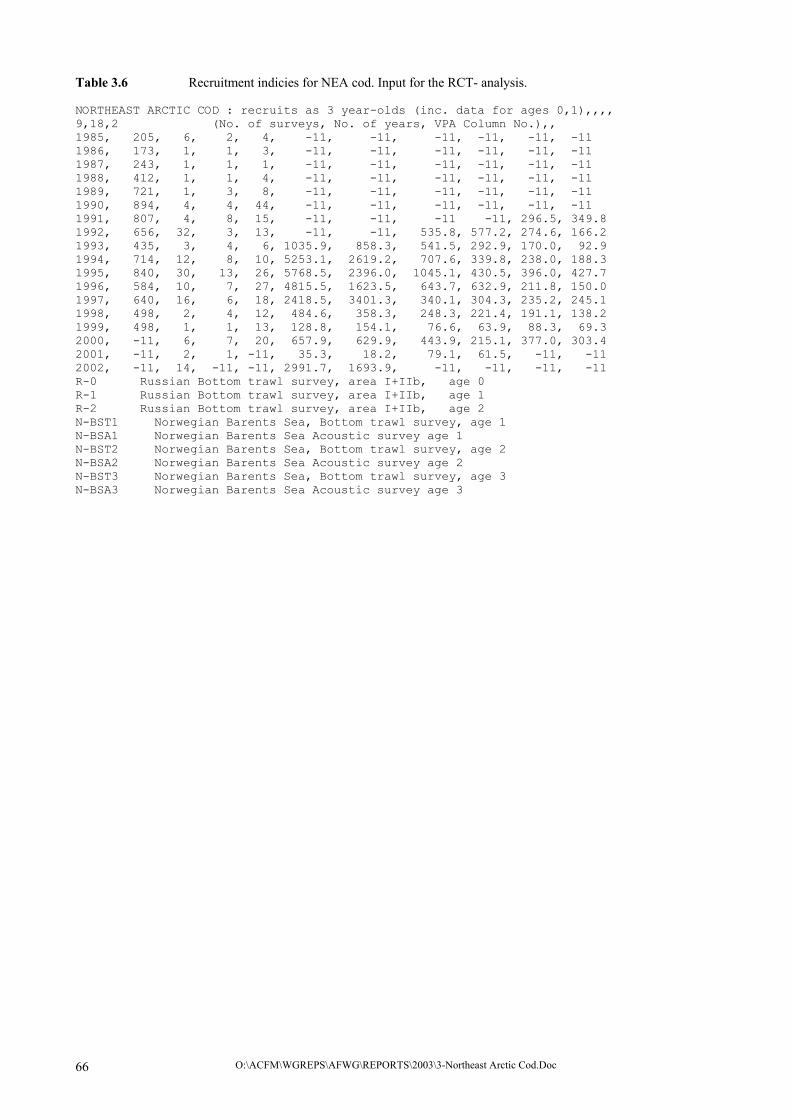
Table 3.6 Recruitment indicies for NEA cod. Input for the RCT- analysis. NORTHEAST ARCTIC COD : recruits as 3 year-olds (inc. data for ages 0,1),,,, 9,18,2 (No. of surveys, No. of years, VPA Column No.),, 1985, 205, 6, 2, 4, -11, -11, -11, -11, -11, -11 1986, 173, 1, 1, 3, -11, -11, -11, -11, -11, -11 1987, 243, 1, 1, 1, -11, -11, -11, -11, -11, -11 1988, 412, 1, 1, 4, -11, -11, -11, -11, -11, -11 1989, 721, 1, 3, 8, -11, -11, -11, -11, -11, -11 1990, 894, 4, 4, 44, -11, -11, -11, -11, -11, -11 1991, 807, 4, 8, 15, -11, -11, -11 -11, 296.5, 349.8 1992, 656, 32, 3, 13, -11, -11, 535.8, 577.2, 274.6, 166.2 1993, 435, 3, 4, 6, 1035.9, 858.3, 541.5, 292.9, 170.0, 92.9 1994, 714, 12, 8, 10, 5253.1, 2619.2, 707.6, 339.8, 238.0, 188.3 1995, 840, 30, 13, 26, 5768.5, 2396.0, 1045.1, 430.5, 396.0, 427.7 1996, 584, 10, 7, 27, 4815.5, 1623.5, 643.7, 632.9, 211.8, 150.0 1997, 640, 16, 6, 18, 2418.5, 3401.3, 340.1, 304.3, 235.2, 245.1 1998, 498, 2, 4, 12, 484.6, 358.3, 248.3, 221.4, 191.1, 138.2 1999, 498, 1, 1, 13, 128.8, 154.1, 76.6, 63.9, 88.3, 69.3 2000, -11, 6, 7, 20, 657.9, 629.9, 443.9, 215.1, 377.0, 303.4 2001, -11, 2, 1, -11, 35.3, 18.2, 79.1, 61.5, -11, -11 2002, -11, 14, -11, -11, 2991.7, 1693.9, -11, -11, -11, -11 R-0 Russian Bottom trawl survey, area I+IIb, age 0 R-1 Russian Bottom trawl survey, area I+IIb, age 1 R-2 Russian Bottom trawl survey, area I+IIb, age 2 N-BST1 Norwegian Barents Sea, Bottom trawl survey, age 1 N-BSA1 Norwegian Barents Sea Acoustic survey age 1 N-BST2 Norwegian Barents Sea, Bottom trawl survey, age 2 N-BSA2 Norwegian Barents Sea Acoustic survey age 2 N-BST3 Norwegian Barents Sea, Bottom trawl survey, age 3 N-BSA3 Norwegian Barents Sea Acoustic survey age 3
O:\ACFM\WGREPS\AFWG\REPORTS\2003\3-Northeast Arctic Cod.Doc 66

Table 3.7. Recruitment predictions based on survey indicies shrunk towards the vpa mean. Analysis by RCT3 ver3.1 of data from file : rec2003.rct NORTHEAST ARCTIC COD : recruits as 3 year-olds (inc. data for ages 0,1),,,, Data for 9 surveys over 18 years : 1985 - 2002 Regression type = C Tapered time weighting applied power = 3 over 20 years Survey weighting not applied Final estimates shrunk towards mean Minimum S.E. for any survey taken as .20 Minimum of 3 points used for regression Forecast/Hindcast variance correction used. Year class = 1995 I-----------Regression----------I I-----------Prediction---------I Survey/ Slope Inter- Std Rsquare No. Index Predicted Std WAP Series cept Error Pts Value Value Error Weights R-0 1.55 3.74 1.45 .157 10 3.43 9.07 2.055 .006 R-1 1.36 4.28 .54 .574 10 2.64 7.86 .792 .042 R-2 .81 4.42 .41 .697 10 3.30 7.10 .536 .091 N-BST1 N-BSA1 N-BST2 2.77 -11.32 .49 .368 3 6.95 7.96 2.399 .005 N-BSA2 1.37 -1.81 .58 .293 3 6.07 6.53 1.185 .019 N-BST3 1.17 .04 .13 .870 4 5.98 7.04 .293 .305 N-BSA3 .53 3.73 .12 .889 4 6.06 6.92 .239 .457 VPA Mean = 6.17 .589 .075 Year class = 1996 I-----------Regression----------I I-----------Prediction---------I Survey/ Slope Inter- Std Rsquare No. Index Predicted Std WAP Series cept Error Pts Value Value Error Weights R-0 1.10 4.29 1.10 .234 11 2.40 6.93 1.319 .006 R-1 1.13 4.51 .52 .580 11 2.08 6.86 .632 .025 R-2 .76 4.50 .38 .725 11 3.33 7.04 .472 .045 N-BST1 .36 3.55 .09 .964 3 8.48 6.61 .194 .252 N-BSA1 .58 2.13 .16 .906 3 7.39 6.42 .313 .103 N-BST2 1.16 -1.08 .28 .596 4 6.47 6.40 .450 .050 N-BSA2 1.79 -4.26 .55 .280 4 6.45 7.31 1.128 .008 N-BST3 .94 1.29 .14 .824 5 5.36 6.30 .210 .229 N-BSA3 .46 4.05 .11 .885 5 5.02 6.35 .161 .252 VPA Mean = 6.24 .576 .030 Year class = 1997 I-----------Regression----------I I-----------Prediction---------I Survey/ Slope Inter- Std Rsquare No. Index Predicted Std WAP Series cept Error Pts Value Value Error Weights R-0 1.05 4.33 1.01 .240 12 2.83 7.30 1.224 .007 R-1 1.10 4.52 .50 .561 12 1.95 6.65 .591 .029 R-2 .73 4.51 .40 .670 12 2.94 6.67 .471 .046 N-BST1 .39 3.27 .17 .800 4 7.79 6.29 .282 .127 N-BSA1 .59 2.06 .12 .900 4 8.13 6.84 .222 .205 N-BST2 1.17 -1.15 .23 .600 5 5.83 5.65 .503 .040 N-BSA2 2.58 -9.20 .94 .084 5 5.72 5.53 1.491 .005 N-BST3 .91 1.44 .12 .832 6 5.46 6.42 .163 .253 N-BSA3 .46 4.07 .09 .891 6 5.51 6.58 .127 .253 VPA Mean = 6.27 .537 .035
O:\ACFM\WGREPS\AFWG\REPORTS\2003\3-Northeast Arctic Cod.Doc 67

Table 3.7 (Cont’d) Year class = 1998 I-----------Regression----------I I-----------Prediction---------I Survey/ Slope Inter- Std Rsquare No. Index Predicted Std WAP Series cept Error Pts Value Value Error Weights R-0 .96 4.41 .92 .248 13 1.10 5.47 1.090 .011 R-1 1.07 4.54 .47 .559 13 1.61 6.26 .540 .045 R-2 .71 4.54 .37 .667 13 2.56 6.37 .430 .071 N-BST1 .39 3.26 .17 .737 5 6.19 5.69 .376 .093 N-BSA1 .57 2.10 .21 .642 5 5.88 5.47 .532 .046 N-BST2 1.21 -1.28 .44 .240 6 5.52 5.39 .821 .019 N-BSA2 2.73 -9.96 .98 .060 6 5.40 4.78 1.642 .005 N-BST3 .90 1.48 .11 .828 7 5.26 6.24 .151 .328 N-BSA3 .46 4.03 .10 .858 7 4.94 6.30 .131 .328 VPA Mean = 6.30 .499 .053 Year class = 1999 I-----------Regression----------I I-----------Prediction---------I Survey/ Slope Inter- Std Rsquare No. Index Predicted Std WAP Series cept Error Pts Value Value Error Weights R-0 .90 4.58 .84 .249 14 .69 5.21 1.023 .013 R-1 1.05 4.56 .44 .549 14 .69 5.28 .560 .043 R-2 .71 4.54 .35 .653 14 2.64 6.40 .405 .082 N-BST1 .29 4.15 .19 .654 6 4.87 5.56 .401 .083 N-BSA1 .38 3.65 .24 .553 6 5.04 5.55 .477 .059 N-BST2 .75 1.69 .32 .371 7 4.35 4.97 .739 .024 N-BSA2 1.35 -1.58 .51 .184 7 4.17 4.05 1.327 .008 N-BST3 .92 1.41 .10 .851 8 4.49 5.53 .214 .291 N-BSA3 .49 3.86 .10 .853 8 4.25 5.95 .157 .334 VPA Mean = 6.32 .459 .064 Year class = 2000 I-----------Regression----------I I-----------Prediction---------I Survey/ Slope Inter- Std Rsquare No. Index Predicted Std WAP Series cept Error Pts Value Value Error Weights R-0 .80 4.84 .76 .248 15 1.95 6.40 .872 .015 R-1 .97 4.75 .47 .469 15 2.08 6.78 .546 .037 R-2 .70 4.52 .34 .630 15 3.04 6.67 .391 .073 N-BST1 .21 4.81 .23 .546 7 6.49 6.20 .299 .124 N-BSA1 .28 4.45 .25 .506 7 6.45 6.23 .321 .108 N-BST2 .44 3.74 .31 .358 8 6.10 6.43 .388 .074 N-BSA2 .61 2.94 .41 .244 8 5.38 6.20 .517 .042 N-BST3 .67 2.83 .18 .633 9 5.93 6.79 .244 .186 N-BSA3 .43 4.21 .12 .816 9 5.72 6.66 .146 .278 VPA Mean = 6.33 .417 .064 Year class = 2001 I-----------Regression----------I I-----------Prediction---------I Survey/ Slope Inter- Std Rsquare No. Index Predicted Std WAP Series cept Error Pts Value Value Error Weights R-0 .73 4.96 .70 .258 15 1.10 5.77 .829 .053 R-1 .93 4.82 .45 .457 15 .69 5.47 .573 .112 R-2 N-BST1 .21 4.83 .23 .548 7 3.59 5.59 .413 .214 N-BSA1 .27 4.47 .25 .509 7 2.95 5.28 .527 .132 N-BST2 .43 3.79 .31 .363 8 4.38 5.69 .476 .161 N-BSA2 .60 2.99 .41 .246 8 4.14 5.46 .649 .087 N-BST3 N-BSA3 VPA Mean = 6.35 .390 .240
O:\ACFM\WGREPS\AFWG\REPORTS\2003\3-Northeast Arctic Cod.Doc 68

Table 3.7 (Cont’d) Year class = 2002 I-----------Regression----------I I-----------Prediction---------I Survey/ Slope Inter- Std Rsquare No. Index Predicted Std WAP Series cept Error Pts Value Value Error Weights R-0 .66 5.11 .62 .272 15 2.71 6.89 .753 .058 R-1 R-2 N-BST1 .21 4.85 .23 .550 7 8.00 6.52 .298 .369 N-BSA1 .27 4.51 .24 .512 7 7.44 6.51 .320 .320 N-BST2 N-BSA2 N-BST3 N-BSA3 VPA Mean = 6.37 .360 .253 Year Weighted Log Int Ext Var VPA Log Class Average WAP Std Std Ratio VPA Prediction Error Error 1995 1058 6.97 .16 .13 .66 840 6.73 1996 644 6.47 .10 .07 .47 585 6.37 1997 673 6.51 .10 .09 .81 640 6.46 1998 470 6.15 .11 .10 .69 498 6.21 1999 315 5.75 .12 .12 1.14 498 6.21 2000 681 6.52 .11 .08 .53 2001 308 5.73 .19 .15 .62 2002 664 6.50 .18 .07 .13
O:\ACFM\WGREPS\AFWG\REPORTS\2003\3-Northeast Arctic Cod.Doc 69

Table 3.8NE Arctic cod. International catch (thousands) at age for ages 1-15+
A G EYear 1 2 3 4 5 6 7 8 9 10 11 12 13 14 11946 1 16 4008 10387 18906 16596 13843 15370 59845 22618 10093 9573 5460 1927 7501947 1 1 710 13192 43890 52017 45501 13075 19718 47678 31392 9348 9330 4622 41031948 1 16 140 3872 31054 55983 77375 21482 15237 9815 30041 7945 4491 3899 42051949 1 7 991 6808 35214 100497 83283 29727 13207 5606 8617 13154 3657 1895 21671950 1 79 1281 10954 29045 45233 62579 30037 19481 9172 6019 4133 6750 1662 14501951 1615 1625 24687 77924 64013 46867 37535 33673 23510 10589 4221 1288 1002 3322 6111952 1 1202 24099 120704 113203 73827 49389 20562 24367 15651 8327 3565 647 467 10441953 1 81 47413 107659 112040 55500 22742 16863 10559 10553 5637 1752 468 173 1561954 1 9 11473 155171 146395 100751 40635 10713 11791 8557 6751 2370 896 268 1231955 1 322 3902 37652 201834 161336 84031 30451 13713 9481 4140 2406 867 355 1281956 81 1498 10614 24172 129803 250472 86784 51091 14987 7465 3952 1655 1292 448 1661957 987 3487 17321 33931 27182 70702 87033 39213 17747 6219 3232 1220 347 299 1731958 1 2600 31219 133576 71051 40737 38380 35786 13338 10475 3289 1070 252 40 1411959 590 2601 32308 77942 148285 53480 18498 17735 23118 9483 3748 997 254 161 981960 465 7147 37882 97865 64222 67425 23117 8429 7240 11675 4504 1843 354 102 2261961 1 1699 45478 132655 123458 51167 38740 17376 5791 6778 5560 1682 910 280 1081962 1 1713 42416 170566 167241 89460 28297 21996 7956 2728 2603 1647 392 280 1031963 1 4 13196 106984 205549 95498 35518 16221 11894 3884 1021 1025 498 129 1571964 103 675 5298 45912 97950 58575 19642 9162 6196 3553 783 172 387 264 1311965 1 2522 15725 25999 78299 68511 25444 8438 3569 1467 1161 131 67 91 1791966 1 869 55937 55644 34676 42539 37169 18500 5077 1495 380 403 77 9 701967 1 151 34467 160048 69235 22061 26295 25139 11323 2329 687 316 225 40 141968 1 1 3709 174585 267961 107051 26701 16399 11597 3657 657 122 124 70 461969 1 275 2307 24545 238511 181239 79363 26989 13463 5092 1913 414 121 23 461970 1 591 7164 10792 25813 137829 96420 31920 8933 3249 1232 260 106 39 351971 38 2210 7754 13739 11831 9527 59290 52003 12093 2434 762 418 149 42 251972 1 4701 35536 45431 26832 12089 7918 34885 22315 4572 1215 353 315 121 401973 1 8277 294262 131493 61000 20569 7248 8328 19130 4499 677 195 81 59 551974 115 21347 91855 437377 203772 47006 12630 4370 2523 5607 2127 322 151 83 621975 1 1184 45282 59798 226646 118567 29522 9353 2617 1555 1928 575 231 15 371976 706 1908 85337 114341 79993 118236 47872 13962 4051 936 558 442 139 26 531977 1 11288 39594 168609 136335 52925 61821 23338 5659 1521 610 271 122 92 541978 3 802 78822 45400 88495 56823 25407 31821 9408 1227 913 446 748 48 511979 0 224 8600 77484 43677 31943 16815 8274 10974 1785 427 103 59 38 451980 31 403 3911 17086 81986 40061 17664 7442 3508 3196 678 79 24 26 81981 1 212 3407 9466 20803 63433 21788 9933 4267 1311 882 109 37 3 11982 2 94 8948 20933 19345 28084 42496 8395 2878 708 271 260 27 5 51983 13 86 3108 19594 20473 17656 17004 18329 2545 646 229 74 58 20 51984 11 999 6942 14240 18807 20086 15145 8287 5988 783 232 153 49 12 81985 92 1805 24634 45769 27806 19418 11369 3747 1557 768 137 36 31 32 81986 41 855 28968 70993 78672 25215 11711 4063 976 726 557 136 28 34 141987 14 390 13648 137106 98210 61407 13707 3866 910 455 187 227 21 59 201988 4 178 9828 22774 135347 54379 21015 3304 1236 519 106 69 43 14 51989 3 237 5085 17313 32165 81756 27854 5501 827 290 41 13 1 11 161990 6 170 1911 7551 12999 17827 30007 6810 828 179 59 15 6 5 21991 24 663 4963 10933 16467 20342 19479 25193 3888 428 48 12 1 1 21992 844 1184 21835 36015 27494 23392 18351 13541 18321 2529 264 82 3 9 11993 42 634 10094 46182 63578 33623 14866 9449 6571 12593 1749 377 63 22 11994 32 312 6531 59444 102548 59766 32504 10019 6163 3671 7528 995 121 19 41995 9 212 4879 42587 115329 98485 32036 7334 3014 1725 1174 1920 222 41 11996 184 895 7655 28782 80711 100509 54590 10545 2023 930 462 230 809 84 11997 79 1228 12827 36491 69633 83017 65768 28392 4651 1151 373 213 144 238 11998 97 1596 31887 88874 48972 40493 34513 26354 6583 965 197 69 42 22 531999 13 313 7501 77714 92816 31139 15778 15851 8828 1837 195 40 34 8 302000 32 215 4701 33094 93044 47210 12671 6677 4787 1647 321 71 11 1 142001 23 237 5044 35019 62139 62456 22794 5266 1773 1163 343 84 6 7 222002 36 104 1907 24824 60622 54709 35572 10053 1593 482 201 113 20 9 5
5+
O:\ACFM\WGREPS\AFWG\REPORTS\2003\3-Northeast Arctic Cod.Doc 70

Table 3.9 Total number (million) of cod consumed by cod, by year and prey age group. A g eYear 0 1 2 3 4 5 6 1984 0 417 21 0 0 0 0 1985 1497 376 67 0 0 0 0 1986 53 413 392 99 0 0 0 1987 681 182 281 14 0 0 0 1988 29 411 22 2 0 0 0 1989 916 144 0 0 0 0 0 1990 0 62 28 0 0 0 0 1991 123 153 215 2 0 0 0 1992 4304 1028 155 4 0 0 0 1993 3802 20264 512 52 1 0 0 1994 8311 6926 645 133 54 8 0 1995 8343 15411 756 251 86 3 0 1996 10010 21902 1499 142 56 20 1 1997 2942 16834 1923 176 17 1 0 1998 79 4925 585 207 25 2 1 1999 579 1848 296 53 4 0 0 2000 1711 2323 171 35 13 4 0 2001 95 2257 111 21 9 1 1 2002 6258 2404 456 34 6 0 0
O:\ACFM\WGREPS\AFWG\REPORTS\2003\3-Northeast Arctic Cod.Doc 71

Table 3.10 Run title : Arctic Cod (run: SVPASA15/V15) At 30/04/2003 23:56 Table 1 Catch numbers-at-age Numbers*10**-3 YEAR, 1946, 1947, 1948, 1949, 1950, 1951, 1952, AGE 3, 4008, 710, 140, 991, 1281, 24687, 24099, 4, 10387, 13192, 3872, 6808, 10954, 77924, 120704, 5, 18906, 43890, 31054, 35214, 29045, 64013, 113203, 6, 16596, 52017, 55983, 100497, 45233, 46867, 73827, 7, 13843, 45501, 77375, 83283, 62579, 37535, 49389, 8, 15370, 13075, 21482, 29727, 30037, 33673, 20562, 9, 59845, 19718, 15237, 13207, 19481, 23510, 24367, 10, 22618, 47678, 9815, 5606, 9172, 10589, 15651, 11, 10093, 31392, 30041, 8617, 6019, 4221, 8327, 12, 9573, 9348, 7945, 13154, 4133, 1288, 3565, +gp, 8137, 18055, 12595, 7719, 9862, 4935, 2158, TOTALNUM, 189376, 294576, 265539, 304823, 227796, 329242, 455852, TONSLAND, 706000, 882017, 774295, 800122, 731982, 827180, 876795, SOPCOF %, 103, 91, 89, 99, 109, 115, 93, Run title : Arctic Cod (run: SVPASA15/V15) At 30/04/2003 23:56 Table 1 Catch numbers-at-age Numbers*10**-3 YEAR, 1953, 1954, 1955, 1956, 1957, 1958, 1959, 1960, 1961, 1962, AGE 3, 47413, 11473, 3902, 10614, 17321, 31219, 32308, 37882, 45478, 42416, 4, 107659, 155171, 37652, 24172, 33931, 133576, 77942, 97865, 132655, 170566, 5, 112040, 146395, 201834, 129803, 27182, 71051, 148285, 64222, 123458, 167241, 6, 55500, 100751, 161336, 250472, 70702, 40737, 53480, 67425, 51167, 89460, 7, 22742, 40635, 84031, 86784, 87033, 38380, 18498, 23117, 38740, 28297, 8, 16863, 10713, 30451, 51091, 39213, 35786, 17735, 8429, 17376, 21996, 9, 10559, 11791, 13713, 14987, 17747, 13338, 23118, 7240, 5791, 7956, 10, 10553, 8557, 9481, 7465, 6219, 10475, 9483, 11675, 6778, 2728, 11, 5637, 6751, 4140, 3952, 3232, 3289, 3748, 4504, 5560, 2603, 12, 1752, 2370, 2406, 1655, 1220, 1070, 997, 1843, 1682, 1647, +gp, 797, 1287, 1350, 1906, 819, 433, 513, 682, 1298, 775, TOTALNUM, 391515, 495894, 550296, 582901, 304619, 379354, 386107, 324884, 429983, 535685, TONSLAND, 695546, 826021, 1147841, 1343068, 792557, 769313, 744607, 622042, 783221, 909266, SOPCOF %, 105, 93, 106, 105, 100, 112, 93, 104, 110, 124, Run title : Arctic Cod (run: SVPASA15/V15) At 30/04/2003 23:56 Table 1 Catch numbers-at-age Numbers*10**-3 YEAR, 1963, 1964, 1965, 1966, 1967, 1968, 1969, 1970, 1971, 1972, AGE 3, 13196, 5298, 15725, 55937, 34467, 3709, 2307, 7164, 7754, 35536, 4, 106984, 45912, 25999, 55644, 160048, 174585, 24545, 10792, 13739, 45431, 5, 205549, 97950, 78299, 34676, 69235, 267961, 238511, 25813, 11831, 26832, 6, 95498, 58575, 68511, 42539, 22061, 107051, 181239, 137829, 9527, 12089, 7, 35518, 19642, 25444, 37169, 26295, 26701, 79363, 96420, 59290, 7918, 8, 16221, 9162, 8438, 18500, 25139, 16399, 26989, 31920, 52003, 34885, 9, 11894, 6196, 3569, 5077, 11323, 11597, 13463, 8933, 12093, 22315, 10, 3884, 3553, 1467, 1495, 2329, 3657, 5092, 3249, 2434, 4572, 11, 1021, 783, 1161, 380, 687, 657, 1913, 1232, 762, 1215, 12, 1025, 172, 131, 403, 316, 122, 414, 260, 418, 353, +gp, 784, 782, 337, 156, 279, 240, 190, 180, 216, 476, TOTALNUM, 491574, 248025, 229081, 251976, 352179, 612679, 574026, 323792, 170067, 191622, TONSLAND, 776337, 437695, 444930, 483711, 572605, 1074084, 1197226, 933246, 689048, 565254, SOPCOF %, 102, 103, 129, 123, 109, 108, 105, 112, 124, 118,
O:\ACFM\WGREPS\AFWG\REPORTS\2003\3-Northeast Arctic Cod.Doc 72

Table 3.10 (continued) Run title : Arctic Cod (run: SVPASA15/V15) At 30/04/2003 23:56 Table 1 Catch numbers-at-age Numbers*10**-3 YEAR, 1973, 1974, 1975, 1976, 1977, 1978, 1979, 1980, 1981, 1982, AGE 3, 294262, 91855, 45282, 85337, 39594, 78822, 8600, 3911, 3407, 8948, 4, 131493, 437377, 59798, 114341, 168609, 45400, 77484, 17086, 9466, 20933, 5, 61000, 203772, 226646, 79993, 136335, 88495, 43677, 81986, 20803, 19345, 6, 20569, 47006, 118567, 118236, 52925, 56823, 31943, 40061, 63433, 28084, 7, 7248, 12630, 29522, 47872, 61821, 25407, 16815, 17664, 21788, 42496, 8, 8328, 4370, 9353, 13962, 23338, 31821, 8274, 7442, 9933, 8395, 9, 19130, 2523, 2617, 4051, 5659, 9408, 10974, 3508, 4267, 2878, 10, 4499, 5607, 1555, 936, 1521, 1227, 1785, 3196, 1311, 708, 11, 677, 2127, 1928, 558, 610, 913, 427, 678, 882, 271, 12, 195, 322, 575, 442, 271, 446, 103, 79, 109, 260, +gp, 195, 296, 283, 218, 268, 847, 142, 58, 41, 37, TOTALNUM, 547596, 807885, 496126, 465946, 490951, 339609, 200224, 175669, 135440, 132355, TONSLAND, 792685, 1102433, 829377, 867463, 905301, 698715, 440538, 380434, 399038, 363730, SOPCOF %, 130, 137, 115, 127, 107, 109, 121, 127, 118, 125, Run title : Arctic Cod (run: SVPASA15/V15) At 30/04/2003 23:56 Table 1 Catch numbers-at-age Numbers*10**-3 YEAR, 1983, 1984, 1985, 1986, 1987, 1988, 1989, 1990, 1991, 1992, AGE 3, 3108, 6942, 24634, 28968, 13648, 9828, 5085, 1911, 4963, 21835, 4, 19594, 14240, 45769, 70993, 137106, 22774, 17313, 7551, 10933, 36015, 5, 20473, 18807, 27806, 78672, 98210, 135347, 32165, 12999, 16467, 27494, 6, 17656, 20086, 19418, 25215, 61407, 54379, 81756, 17827, 20342, 23392, 7, 17004, 15145, 11369, 11711, 13707, 21015, 27854, 30007, 19479, 18351, 8, 18329, 8287, 3747, 4063, 3866, 3304, 5501, 6810, 25193, 13541, 9, 2545, 5988, 1557, 976, 910, 1236, 827, 828, 3888, 18321, 10, 646, 783, 768, 726, 455, 519, 290, 179, 428, 2529, 11, 229, 232, 137, 557, 187, 106, 41, 59, 48, 264, 12, 74, 153, 36, 136, 227, 69, 13, 15, 12, 82, +gp, 83, 69, 71, 76, 100, 62, 28, 13, 4, 13, TOTALNUM, 99741, 90732, 135312, 222093, 329823, 248639, 170873, 78199, 101757, 161837, TONSLAND, 289992, 277651, 307920, 430113, 523071, 434939, 332481, 212000, 319158, 513234, SOPCOF %, 90, 95, 102, 102, 102, 100, 99, 101, 95, 103, Run title : Arctic Cod (run: SVPASA15/V15) At 30/04/2003 23:56 Table 1 Catch numbers-at-age Numbers*10**-3 YEAR, 1993, 1994, 1995, 1996, 1997, 1998, 1999, 2000, 2001, 2002, AGE 3, 10094, 6531, 4879, 7655, 12827, 31887, 7501, 4701, 5044, 1907, 4, 46182, 59444, 42587, 28782, 36491, 88874, 77714, 33094, 35019, 24824, 5, 63578, 102548, 115329, 80711, 69633, 48972, 92816, 93044, 62139, 60622, 6, 33623, 59766, 98485, 100509, 83017, 40493, 31139, 47210, 62456, 54709, 7, 14866, 32504, 32036, 54590, 65768, 34513, 15778, 12671, 22794, 35572, 8, 9449, 10019, 7334, 10545, 28392, 26354, 15851, 6677, 5266, 10053, 9, 6571, 6163, 3014, 2023, 4651, 6583, 8828, 4787, 1773, 1593, 10, 12593, 3671, 1725, 930, 1151, 965, 1837, 1647, 1163, 482, 11, 1749, 7528, 1174, 462, 373, 197, 195, 321, 343, 201, 12, 377, 995, 1920, 230, 213, 69, 40, 71, 85, 113, +gp, 86, 144, 264, 894, 383, 117, 72, 26, 35, 34, TOTALNUM, 199168, 289313, 308747, 287331, 302899, 279024, 251771, 204249, 196117, 190110, TONSLAND, 581611, 771086, 739999, 732228, 762403, 592624, 484910, 414868, 426471, 445060, SOPCOF %, 101, 101, 100, 101, 100, 101, 100, 100, 100, 100,
O:\ACFM\WGREPS\AFWG\REPORTS\2003\3-Northeast Arctic Cod.Doc 73

Table 3.11 Run title : Arctic Cod (run: SVPASA15/V15) At 30/04/2003 23:56 Table 2 Catch weights-at-age (kg) YEAR, 1946, 1947, 1948, 1949, 1950, 1951, 1952, AGE 3, .3500, .3200, .3400, .3700, .3900, .4000, .4400, 4, .5900, .5600, .5300, .6700, .6400, .8300, .8000, 5, 1.1100, .9500, 1.2600, 1.1100, 1.2900, 1.3900, 1.3300, 6, 1.6900, 1.5000, 1.9300, 1.6600, 1.7000, 1.8800, 1.9200, 7, 2.3700, 2.1400, 2.4600, 2.5000, 2.3600, 2.5400, 2.6400, 8, 3.1700, 2.9200, 3.3600, 3.2300, 3.4800, 3.4600, 3.7100, 9, 3.9800, 3.6500, 4.2200, 4.0700, 4.5200, 4.8800, 5.0600, 10, 5.0500, 4.5600, 5.3100, 5.2700, 5.6200, 5.2000, 6.0500, 11, 5.9200, 5.8400, 5.9200, 5.9900, 6.4000, 7.1400, 7.4200, 12, 7.2000, 7.4200, 7.0900, 7.0800, 7.9600, 8.2200, 8.4300, +gp, 8.1460, 8.8480, 8.4300, 8.2180, 8.8910, 9.3890, 10.1850, SOPCOFAC, 1.0300, .9143, .8915, .9920, 1.0880, 1.1483, .9348, Table 2 Catch weights-at-age (kg) YEAR, 1953, 1954, 1955, 1956, 1957, 1958, 1959, 1960, 1961, 1962, AGE 3, .4000, .4400, .3200, .3300, .3300, .3400, .3500, .3400, .3100, .3200, 4, .7600, .7700, .5700, .5800, .5900, .5200, .7200, .5100, .5500, .5500, 5, 1.2800, 1.2600, 1.1300, 1.0700, 1.0200, .9500, 1.4700, 1.0900, 1.0500, .9300, 6, 1.9300, 1.9700, 1.7300, 1.8300, 1.8200, 1.9200, 2.6800, 2.1300, 2.2000, 1.7000, 7, 2.8100, 3.0300, 2.7500, 2.8900, 2.8900, 2.9400, 3.5900, 3.3800, 3.2300, 3.0300, 8, 3.7200, 4.3300, 3.9400, 4.2500, 4.2800, 4.2100, 4.3200, 4.8700, 5.1100, 5.0300, 9, 5.0600, 5.4000, 4.9000, 5.5500, 5.4900, 5.6100, 5.4500, 6.1200, 6.1500, 6.5500, 10, 6.3400, 6.7500, 7.0400, 7.2800, 7.5100, 7.3500, 6.4400, 8.4900, 8.1500, 7.7000, 11, 7.4000, 7.7900, 7.2000, 8.0000, 8.2400, 8.6700, 7.1700, 7.7900, 8.6800, 9.2700, 12, 8.6700, 10.6700, 8.7800, 8.3500, 9.2500, 9.5800, 8.6300, 8.3000, 9.6000, 10.5600, +gp, 10.2380, 9.6800, 10.0770, 9.9440, 10.6050, 11.6310, 11.6210, 11.4220, 11.9520, 12.7170, SOPCOFAC, 1.0485, .9294, 1.0634, 1.0455, 1.0004, 1.1232, .9305, 1.0416, 1.0970, 1.2356, Run title : Arctic Cod (run: SVPASA15/V15) At 30/04/2003 23:56 Table 2 Catch weights-at-age (kg) YEAR, 1963, 1964, 1965, 1966, 1967, 1968, 1969, 1970, 1971, 1972, AGE 3, .3200, .3300, .3800, .4400, .2900, .3300, .4400, .3700, .4500, .3800, 4, .6100, .5500, .6800, .7400, .8100, .7000, .7900, .9100, .8800, .7700, 5, .9600, .9500, 1.0300, 1.1800, 1.3500, 1.4800, 1.2300, 1.3400, 1.3800, 1.4300, 6, 1.7300, 1.8600, 1.4900, 1.7800, 2.0400, 2.1200, 2.0300, 2.0000, 2.1600, 2.1200, 7, 3.0400, 3.2500, 2.4100, 2.4600, 2.8100, 3.1400, 2.9000, 3.0000, 3.0700, 3.2300, 8, 4.9600, 4.9700, 3.5200, 3.8200, 3.4800, 4.2100, 3.8100, 4.1500, 4.2200, 4.3800, 9, 6.4400, 6.4100, 5.7300, 5.3600, 4.8900, 5.2700, 5.0200, 5.5900, 5.8100, 5.8300, 10, 7.9100, 8.0700, 7.5400, 7.2700, 7.1100, 6.6500, 6.4300, 7.6000, 7.1300, 7.6200, 11, 9.6200, 9.3400, 8.4700, 8.6300, 9.0300, 9.0100, 8.3300, 8.9700, 8.6200, 9.5200, 12, 11.3100, 10.1600, 11.1700, 10.6600, 10.5900, 9.6600, 10.7100, 10.9900, 10.8300, 12.0900, +gp, 12.7370, 12.8860, 13.7220, 14.1480, 13.8290, 14.8480, 14.2110, 14.0740, 12.9450, 13.6730, SOPCOFAC, 1.0226, 1.0277, 1.2903, 1.2327, 1.0911, 1.0785, 1.0520, 1.1170, 1.2405, 1.1822,
O:\ACFM\WGREPS\AFWG\REPORTS\2003\3-Northeast Arctic Cod.Doc 74

Table 3.11 (Continued) Table 2 Catch weights-at-age (kg) YEAR, 1973, 1974, 1975, 1976, 1977, 1978, 1979, 1980, 1981, 1982, AGE 3, .3800, .3200, .4100, .3500, .4900, .4900, .3500, .2700, .4900, .3700, 4, .9100, .6600, .6400, .7300, .9000, .8100, .7000, .5600, .9800, .6600, 5, 1.5400, 1.1700, 1.1100, 1.1900, 1.4300, 1.4500, 1.2400, 1.0200, 1.4400, 1.3500, 6, 2.2600, 2.2200, 1.9000, 2.0100, 2.0500, 2.1500, 2.1400, 1.7200, 2.0900, 1.9900, 7, 3.2900, 3.2100, 2.9500, 2.7600, 3.3000, 3.0400, 3.1500, 3.0200, 2.9800, 2.9300, 8, 4.6100, 4.3900, 4.3700, 4.2200, 4.5600, 4.4600, 4.2900, 4.2000, 4.8500, 4.2400, 9, 6.5700, 5.5200, 5.7400, 5.8800, 6.4600, 6.5400, 6.5800, 5.8400, 6.5700, 6.4600, 10, 8.3700, 7.8600, 8.7700, 9.3000, 8.6300, 7.9800, 8.6100, 7.2600, 9.1600, 8.5100, 11, 10.5400, 9.8200, 9.9200, 10.2800, 9.9300, 10.1500, 9.2200, 8.8400, 10.8200, 12.2400, 12, 11.6200, 11.4100, 11.8100, 11.8600, 10.9000, 10.8500, 10.8900, 9.2800, 10.7700, 10.7800, +gp, 13.9040, 13.2420, 13.1070, 13.5440, 13.6680, 13.1770, 14.3440, 14.4480, 13.9320, 14.0410, SOPCOFAC, 1.3003, 1.3660, 1.1520, 1.2688, 1.0683, 1.0890, 1.2139, 1.2723, 1.1809, 1.2521, Table 2 Catch weights-at-age (kg) YEAR, 1983, 1984, 1985, 1986, 1987, 1988, 1989, 1990, 1991, 1992, AGE 3, .8400, 1.4200, .9400, .6400, .4900, .5400, .7400, .8100, 1.0500, 1.1600, 4, 1.3700, 1.9300, 1.3700, 1.2700, .8800, .8500, .9600, 1.2200, 1.4500, 1.5700, 5, 2.0900, 2.4900, 2.0200, 1.8800, 1.5500, 1.3200, 1.3100, 1.6400, 2.1500, 2.2100, 6, 2.8600, 3.1400, 3.2200, 2.7900, 2.3300, 2.2400, 1.9200, 2.2200, 2.8900, 3.1000, 7, 3.9900, 3.9100, 4.6300, 4.4900, 3.4400, 3.5200, 2.9300, 3.2400, 3.7500, 4.2700, 8, 5.5800, 4.9100, 6.0400, 5.8400, 5.9200, 5.3500, 4.6400, 4.6800, 4.7100, 5.1900, 9, 7.7700, 6.0200, 7.6600, 6.8300, 8.6000, 8.0600, 7.5200, 7.3000, 6.0800, 6.1400, 10, 9.2900, 7.4000, 9.8100, 7.6900, 9.6000, 9.5100, 9.1200, 9.8400, 8.8200, 7.7700, 11, 11.5500, 8.1300, 11.8000, 9.8100, 12.1700, 11.3600, 11.0800, 13.2500, 11.8000, 10.1200, 12, 16.2000, 8.5700, 14.1600, 10.7100, 13.7200, 14.0900, 11.4700, 16.8800, 16.5800, 11.5400, +gp, 17.0340, 8.6090, 14.0080, 12.0510, 13.3800, 16.7060, 16.4840, 11.6170, 16.6900, 14.3320, SOPCOFAC, .8953, .9483, 1.0182, 1.0160, 1.0224, 1.0001, .9879, 1.0108, .9521, 1.0270, Table 2 Catch weights-at-age (kg) YEAR, 1993, 1994, 1995, 1996, 1997, 1998, 1999, 2000, 2001, 2002, AGE 3, .8100, .8200, .7700, .7900, .6700, .6800, .6300, .5720, .6600, .7400, 4, 1.5200, 1.3000, 1.2000, 1.1100, 1.0400, 1.0500, 1.0100, 1.0360, 1.0500, 1.1400, 5, 2.1600, 2.0600, 1.7800, 1.6100, 1.5300, 1.6200, 1.5400, 1.6090, 1.6200, 1.5800, 6, 2.7900, 2.8900, 2.5900, 2.4600, 2.2200, 2.3000, 2.3400, 2.3440, 2.5100, 2.3300, 7, 4.0700, 3.2100, 3.8100, 3.8200, 3.4200, 3.3000, 3.2100, 3.3410, 3.5100, 3.5600, 8, 5.5300, 5.2000, 4.9900, 5.7200, 5.2000, 4.8600, 4.2900, 4.4760, 4.7800, 4.8400, 9, 6.4700, 6.8000, 6.2300, 6.7400, 7.1900, 6.8700, 6.0000, 5.7240, 6.0400, 6.2400, 10, 7.1900, 7.5700, 8.0500, 8.0400, 7.7300, 9.3000, 6.7300, 7.5230, 7.5400, 7.6600, 11, 7.9800, 8.0100, 8.7400, 9.2800, 8.6100, 10.3000, 10.0800, 8.0210, 9.0000, 9.1000, 12, 10.1100, 9.4800, 9.2200, 10.4000, 11.0700, 15.0500, 13.8800, 12.4780, 10.4800, 8.1800, +gp, 14.1830, 11.9780, 12.3190, 10.9660, 11.1170, 14.5240, 14.0360, 17.2410, 16.1800, 10.9510, SOPCOFAC, 1.0127, 1.0090, 1.0030, 1.0147, 1.0004, 1.0072, .9967, 1.0039, .9994, 1.0001,
O:\ACFM\WGREPS\AFWG\REPORTS\2003\3-Northeast Arctic Cod.Doc 75

Table 3.12 Run title : Arctic Cod (run: SVPASA15/V15) At 30/04/2003 23:56 Table 3 Stock weights-at-age (kg) YEAR, 1946, 1947, 1948, 1949, 1950, 1951, 1952, AGE 3, .3500, .3200, .3400, .3700, .3900, .4000, .4400, 4, .5900, .5600, .5300, .6700, .6400, .8300, .8000, 5, 1.1100, .9500, 1.2600, 1.1100, 1.2900, 1.3900, 1.3300, 6, 1.6900, 1.5000, 1.9300, 1.6600, 1.7000, 1.8800, 1.9200, 7, 2.3700, 2.1400, 2.4600, 2.5000, 2.3600, 2.5400, 2.6400, 8, 3.1700, 2.9200, 3.3600, 3.2300, 3.4800, 3.4600, 3.7100, 9, 3.9800, 3.6500, 4.2200, 4.0700, 4.5200, 4.8800, 5.0600, 10, 5.0500, 4.5600, 5.3100, 5.2700, 5.6200, 5.2000, 6.0500, 11, 5.9200, 5.8400, 5.9200, 5.9900, 6.4000, 7.1400, 7.4200, 12, 7.2000, 7.4200, 7.0900, 7.0800, 7.9600, 8.2200, 8.4300, +gp, 8.1460, 8.8480, 8.4300, 8.2180, 8.8910, 9.3890, 10.1850, Table 3 Stock weights-at-age (kg) YEAR, 1953, 1954, 1955, 1956, 1957, 1958, 1959, 1960, 1961, 1962, AGE 3, .4000, .4400, .3200, .3300, .3300, .3400, .3500, .3400, .3100, .3200, 4, .7600, .7700, .5700, .5800, .5900, .5200, .7200, .5100, .5500, .5500, 5, 1.2800, 1.2600, 1.1300, 1.0700, 1.0200, .9500, 1.4700, 1.0900, 1.0500, .9300, 6, 1.9300, 1.9700, 1.7300, 1.8300, 1.8200, 1.9200, 2.6800, 2.1300, 2.2000, 1.7000, 7, 2.8100, 3.0300, 2.7500, 2.8900, 2.8900, 2.9400, 3.5900, 3.3800, 3.2300, 3.0300, 8, 3.7200, 4.3300, 3.9400, 4.2500, 4.2800, 4.2100, 4.3200, 4.8700, 5.1100, 5.0300, 9, 5.0600, 5.4000, 4.9000, 5.5500, 5.4900, 5.6100, 5.4500, 6.1200, 6.1500, 6.5500, 10, 6.3400, 6.7500, 7.0400, 7.2800, 7.5100, 7.3500, 6.4400, 8.4900, 8.1500, 7.7000, 11, 7.4000, 7.7900, 7.2000, 8.0000, 8.2400, 8.6700, 7.1700, 7.7900, 8.6800, 9.2700, 12, 8.6700, 10.6700, 8.7800, 8.3500, 9.2500, 9.5800, 8.6300, 8.3000, 9.6000, 10.5600, +gp, 10.2380, 9.6800, 10.0770, 9.9440, 10.6050, 11.6310, 11.6210, 11.4220, 11.9520, 12.7170, Run title : Arctic Cod (run: SVPASA15/V15) At 30/04/2003 23:56 Table 3 Stock weights-at-age (kg) YEAR, 1963, 1964, 1965, 1966, 1967, 1968, 1969, 1970, 1971, 1972, AGE 3, .3200, .3300, .3800, .4400, .2900, .3300, .4400, .3700, .4500, .3800, 4, .6100, .5500, .6800, .7400, .8100, .7000, .7900, .9100, .8800, .7700, 5, .9600, .9500, 1.0300, 1.1800, 1.3500, 1.4800, 1.2300, 1.3400, 1.3800, 1.4300, 6, 1.7300, 1.8600, 1.4900, 1.7800, 2.0400, 2.1200, 2.0300, 2.0000, 2.1600, 2.1200, 7, 3.0400, 3.2500, 2.4100, 2.4600, 2.8100, 3.1400, 2.9000, 3.0000, 3.0700, 3.2300, 8, 4.9600, 4.9700, 3.5200, 3.8200, 3.4800, 4.2100, 3.8100, 4.1500, 4.2200, 4.3800, 9, 6.4400, 6.4100, 5.7300, 5.3600, 4.8900, 5.2700, 5.0200, 5.5900, 5.8100, 5.8300, 10, 7.9100, 8.0700, 7.5400, 7.2700, 7.1100, 6.6500, 6.4300, 7.6000, 7.1300, 7.6200, 11, 9.6200, 9.3400, 8.4700, 8.6300, 9.0300, 9.0100, 8.3300, 8.9700, 8.6200, 9.5200, 12, 11.3100, 10.1600, 11.1700, 10.6600, 10.5900, 9.6600, 10.7100, 10.9900, 10.8300, 12.0900, +gp, 12.7370, 12.8860, 13.7220, 14.1480, 13.8290, 14.8480, 14.2110, 14.0740, 12.9450, 13.6730,
O:\ACFM\WGREPS\AFWG\REPORTS\2003\3-Northeast Arctic Cod.Doc 76

Table 3.12 (continued) Table 3 Stock weights-at-age (kg) YEAR, 1973, 1974, 1975, 1976, 1977, 1978, 1979, 1980, 1981, 1982, AGE 3, .3800, .3200, .4100, .3500, .4900, .4900, .3500, .2700, .4900, .3700, 4, .9100, .6600, .6400, .7300, .9000, .8100, .7000, .5600, .9800, .6600, 5, 1.5400, 1.1700, 1.1100, 1.1900, 1.4300, 1.4500, 1.2400, 1.0200, 1.4400, 1.3500, 6, 2.2600, 2.2200, 1.9000, 2.0100, 2.0500, 2.1500, 2.1400, 1.7200, 2.0900, 1.9900, 7, 3.2900, 3.2100, 2.9500, 2.7600, 3.3000, 3.0400, 3.1500, 3.0200, 2.9800, 2.9300, 8, 4.6100, 4.3900, 4.3700, 4.2200, 4.5600, 4.4600, 4.2900, 4.2000, 4.8500, 4.2400, 9, 6.5700, 5.5200, 5.7400, 5.8800, 6.4600, 6.5400, 6.5800, 5.8400, 6.5700, 6.4600, 10, 8.3700, 7.8600, 8.7700, 9.3000, 8.6300, 7.9800, 8.6100, 7.2600, 9.1600, 8.5100, 11, 10.5400, 9.8200, 9.9200, 10.2800, 9.9300, 10.1500, 9.2200, 8.8400, 10.8200, 12.2400, 12, 11.6200, 11.4100, 11.8100, 11.8600, 10.9000, 10.8500, 10.8900, 9.2800, 10.7700, 10.7800, +gp, 13.9040, 13.2420, 13.1070, 13.5440, 13.6680, 13.1770, 14.3440, 14.4480, 13.9320, 14.0410, Table 3 Stock weights-at-age (kg) YEAR, 1983, 1984, 1985, 1986, 1987, 1988, 1989, 1990, 1991, 1992, AGE 3, .3700, .4200, .4100, .3100, .1900, .2100, .3000, .4000, .5180, .4400, 4, .9200, 1.1600, .8800, .8800, .5100, .4000, .5200, .7100, 1.1360, .9310, 5, 1.6000, 1.8100, 1.6000, 1.4700, 1.2800, .7900, .8700, 1.1800, 1.7430, 1.8120, 6, 2.4400, 2.7900, 2.8100, 2.4700, 1.9400, 1.9000, 1.4800, 1.7200, 2.4280, 2.7160, 7, 3.8200, 3.7800, 4.0600, 3.9200, 3.2800, 2.9800, 2.6900, 2.4600, 3.2140, 3.8950, 8, 4.7600, 4.5700, 5.8300, 5.8100, 5.1700, 4.3900, 4.6300, 3.5700, 4.5380, 5.1760, 9, 6.1700, 6.1700, 7.6900, 6.5800, 6.5200, 7.8100, 7.0500, 4.7100, 6.8800, 6.7740, 10, 7.7000, 7.7000, 10.1200, 6.8300, 9.3000, 12.1100, 9.9800, 7.8000, 10.7190, 9.5980, 11, 9.2500, 9.2500, 14.2900, 11.0000, 13.1500, 13.1100, 9.2500, 8.9600, 9.4450, 12.4270, 12, 10.8500, 10.8500, 10.8500, 10.8500, 10.8500, 10.8500, 10.8500, 10.8500, 10.8500, 10.8500, +gp, 12.9880, 13.0330, 13.4130, 13.5870, 13.8260, 13.0180, 14.4790, 13.4230, 14.1000, 13.6620, Table 3 Stock weights-at-age (kg) YEAR, 1993, 1994, 1995, 1996, 1997, 1998, 1999, 2000, 2001, 2002, AGE 3, .3440, .2350, .2010, .1950, .2020, .2170, .2030, .1940, .2850, .2510, 4, 1.1720, .7530, .4850, .4870, .5210, .5330, .5200, .4650, .5220, .6050, 5, 1.8200, 1.4200, 1.1400, 1.0310, 1.0790, 1.1610, 1.1740, 1.2080, 1.1940, 1.1860, 6, 2.8230, 2.4130, 2.1180, 2.0540, 1.8780, 1.9390, 2.0310, 1.9720, 2.2310, 2.1100, 7, 4.0310, 3.8250, 3.4700, 3.5250, 3.3690, 2.9450, 3.0340, 3.0480, 3.3060, 3.3120, 8, 5.4970, 5.4160, 4.9380, 5.5030, 5.2630, 4.5740, 4.4640, 4.0960, 5.0500, 4.7210, 9, 6.7650, 6.6310, 7.1600, 7.7670, 8.9270, 7.4230, 6.4820, 5.7240, 6.3760, 6.8660, 10, 8.5710, 7.6300, 9.1190, 10.1590, 12.1540, 10.3670, 10.2690, 7.4570, 9.1150, 9.0830, 11, 10.8470, 8.1120, 10.1010, 10.6690, 10.8230, 11.7380, 10.8820, 9.5820, 11.2720, 10.2060, 12, 10.8500, 10.8500, 10.8500, 10.8500, 10.8500, 10.8500, 10.8500, 10.8500, 10.8500, 10.8500, +gp, 12.8870, 12.7540, 12.7270, 12.6340, 13.3770, 13.8960, 13.6970, 13.9000, 14.3510, 12.9950,
O:\ACFM\WGREPS\AFWG\REPORTS\2003\3-Northeast Arctic Cod.Doc 77

Table 3.13 Run title : Arctic Cod (run: SVPASA15/V15) At 30/04/2003 23:56 Table 5 Proportion mature at age YEAR, 1946, 1947, 1948, 1949, 1950, 1951, 1952, AGE 3, .0000, .0000, .0000, .0000, .0000, .0000, .0000, 4, .0000, .0000, .0000, .0000, .0000, .0000, .0000, 5, .0100, .0100, .0100, .0100, .0100, .0100, .0100, 6, .0300, .0300, .0300, .0300, .0300, .0300, .0300, 7, .0600, .0600, .0700, .0900, .0900, .1000, .0800, 8, .1100, .1300, .1300, .1700, .2300, .2400, .2200, 9, .1800, .1600, .2500, .2900, .3500, .4000, .4100, 10, .4400, .4200, .4700, .5400, .5200, .5800, .6300, 11, .6500, .7500, .7300, .7900, .7900, .7200, .8200, 12, .8600, .9100, .9100, .8800, .9500, .8500, .9200, +gp, .9600, .9500, .9700, .9700, .9700, .9600, .9700, Table 5 Proportion mature at age YEAR, 1953, 1954, 1955, 1956, 1957, 1958, 1959, 1960, 1961, 1962, AGE 3, .0000, .0000, .0000, .0000, .0000, .0000, .0000, .0000, .0000, .0000, 4, .0000, .0000, .0000, .0000, .0000, .0000, .0000, .0100, .0000, .0000, 5, .0100, .0100, .0100, .0100, .0100, .0100, .0100, .0300, .0100, .0100, 6, .0300, .0300, .0300, .0300, .0300, .0300, .0400, .0600, .0600, .0500, 7, .0700, .0800, .0700, .0600, .0600, .0600, .1200, .1000, .1200, .1500, 8, .1900, .1600, .1300, .1200, .0900, .1000, .3400, .1900, .3100, .3400, 9, .4000, .3700, .2600, .1400, .1200, .1000, .4900, .4500, .6500, .6100, 10, .6400, .6800, .5300, .4100, .2200, .3000, .6700, .6900, .9100, .8100, 11, .8400, .8700, .8300, .6700, .6000, .5000, .8400, .7700, .9800, .9200, 12, .9400, .9300, .9200, .9100, .8200, .8200, .8700, .8500, .9800, .9700, +gp, .9700, .9600, .9700, .9600, .9700, .9700, 1.0000, .9900, 1.0000, 1.0000, Run title : Arctic Cod (run: SVPASA15/V15) At 30/04/2003 23:56 Table 5 Proportion mature at age YEAR, 1963, 1964, 1965, 1966, 1967, 1968, 1969, 1970, 1971, 1972, AGE 3, .0000, .0000, .0000, .0000, .0000, .0000, .0000, .0000, .0000, .0100, 4, .0100, .0000, .0000, .0000, .0000, .0000, .0000, .0100, .0000, .0200, 5, .0100, .0000, .0000, .0100, .0000, .0300, .0000, .0000, .0100, .0200, 6, .0300, .0300, .0100, .0200, .0300, .0500, .0200, .0100, .0500, .0100, 7, .0700, .1300, .0600, .0600, .0700, .0900, .0400, .0700, .1100, .1000, 8, .2800, .3700, .2000, .2200, .1400, .1900, .1200, .2300, .3000, .3400, 9, .4200, .6600, .5500, .3500, .3800, .3900, .3400, .5800, .5900, .6400, 10, .8100, .8900, .7300, .7400, .6400, .5800, .5500, .8100, .7900, .8100, 11, .9800, .9500, .9900, .9400, .8900, .8200, .7400, .8900, .8600, .9400, 12, .9800, .9900, .9800, .9400, .9000, 1.0000, .9500, .9100, .8800, 1.0000, +gp, 1.0000, 1.0000, 1.0000, 1.0000, 1.0000, 1.0000, 1.0000, 1.0000, 1.0000, 1.0000,
O:\ACFM\WGREPS\AFWG\REPORTS\2003\3-Northeast Arctic Cod.Doc 78

Table 3.13 (continued) Table 5 Proportion mature at age YEAR, 1973, 1974, 1975, 1976, 1977, 1978, 1979, 1980, 1981, 1982, AGE 3, .0000, .0000, .0000, .0000, .0000, .0000, .0000, .0000, .0000, .0000, 4, .0000, .0000, .0000, .0000, .0000, .0000, .0000, .0000, .0000, .0500, 5, .0000, .0000, .0100, .0000, .0200, .0000, .0000, .0000, .0200, .1000, 6, .0200, .0100, .0200, .0500, .0800, .0200, .0300, .0200, .0700, .3400, 7, .1600, .0300, .0900, .1200, .2600, .1300, .1300, .1300, .2000, .6500, 8, .5300, .2100, .2100, .2900, .5400, .4400, .3900, .3500, .5400, .8200, 9, .8100, .5000, .5600, .4500, .7600, .7100, .7700, .6500, .8000, .9200, 10, .9200, .9600, .7800, .8400, .8700, .7700, .8900, .8200, .9700, 1.0000, 11, .9500, 1.0000, .7900, .8300, .9300, .8100, .8300, 1.0000, 1.0000, 1.0000, 12, .9800, .9600, .9500, 1.0000, .9400, .8900, .7800, .9000, 1.0000, 1.0000, +gp, 1.0000, 1.0000, 1.0000, .9000, .9000, .8000, .9000, .9000, 1.0000, 1.0000, Table 5 Proportion mature at age YEAR, 1983, 1984, 1985, 1986, 1987, 1988, 1989, 1990, 1991, 1992, AGE 3, .0100, .0000, .0000, .0000, .0000, .0000, .0000, .0000, .0000, .0100, 4, .0800, .0500, .0100, .0500, .0100, .0200, .0000, .0100, .0400, .0100, 5, .1000, .1800, .0900, .0800, .0700, .0500, .0500, .0500, .0600, .1200, 6, .3000, .3100, .3600, .1900, .1800, .3300, .1800, .2100, .2800, .4300, 7, .7300, .5600, .5500, .5300, .2200, .5300, .4100, .5800, .6500, .7500, 8, .8800, .9000, .8500, .7100, .4600, .6200, .6900, .7700, .8300, .9300, 9, .9700, .9900, .9600, .6200, .5000, 1.0000, .8500, .8600, .9700, .9700, 10, 1.0000, 1.0000, .9000, .9000, .7500, 1.0000, 1.0000, .9800, 1.0000, 1.0000, 11, 1.0000, 1.0000, 1.0000, 1.0000, 1.0000, 1.0000, 1.0000, 1.0000, 1.0000, 1.0000, 12, 1.0000, 1.0000, 1.0000, 1.0000, 1.0000, 1.0000, 1.0000, 1.0000, 1.0000, 1.0000, +gp, 1.0000, 1.0000, 1.0000, 1.0000, 1.0000, 1.0000, 1.0000, 1.0000, 1.0000, 1.0000, Table 5 Proportion mature at age YEAR, 1993, 1994, 1995, 1996, 1997, 1998, 1999, 2000, 2001, 2002, AGE 3, .0000, .0000, .0000, .0000, .0000, .0000, .0000, .0000, .0000, .0000, 4, .0300, .0100, .0000, .0000, .0000, .0100, .0000, .0000, .0100, .0100, 5, .0900, .1100, .0700, .0200, .0200, .0400, .0100, .0600, .0500, .0800, 6, .3000, .3300, .3300, .2600, .1400, .1900, .1000, .2200, .3400, .4000, 7, .6100, .6000, .6200, .6300, .5600, .4400, .4500, .6400, .5800, .7000, 8, .9100, .8100, .7400, .8300, .8200, .8200, .7900, .8300, .7700, .8600, 9, .9700, .9700, .9500, .9800, .9500, .9300, .8800, .9700, .9800, .9800, 10, .9900, .9900, .9800, 1.0000, .9500, .9800, 1.0000, 1.0000, 1.0000, 1.0000, 11, 1.0000, .9900, 1.0000, 1.0000, .9500, 1.0000, 1.0000, 1.0000, .9700, 1.0000, 12, 1.0000, 1.0000, 1.0000, 1.0000, 1.0000, 1.0000, 1.0000, 1.0000, 1.0000, 1.0000, +gp, 1.0000, 1.0000, 1.0000, 1.0000, 1.0000, 1.0000, 1.0000, 1.0000, 1.0000, 1.0000,
O:\ACFM\WGREPS\AFWG\REPORTS\2003\3-Northeast Arctic Cod.Doc 79

Table 3.14 Northeast Arctic cod (Subareas I and II) (run name: XSAASA26) 104 FLT09: Russian trawl catch and effort ages 9 - 14 (Catch: Thousa (Catch: Unknown) (Effort: Unknown) 1985 2002 1 1 0.00 1.00 9 13 0.70 291 77 30 6 0 1.52 87 59 22 3 1 2.10 127 95 37 11 2 2.75 442 215 53 12 3 2.12 140 47 11 0 0 1.11 204 49 14 2 0 1.56 791 71 16 4 1 2.50 3852 689 62 10 0 2.64 2019 1778 68 13 2 2.96 1237 595 167 40 5 3.88 684 345 146 21 1 3.73 364 164 34 10 0 4.92 488 99 34 10 0 6.77 559 88 34 13 1 6.39 882 171 0 0 0 4.25 742 185 25 1 0 3.50 235 95 35 7 0 3.15 336 61 18 1 0 FLT15: NorBarTrSur rev99 (Catch: Unknown) (Effort: Unknown) 1980 2002 1 1 0.99 1.00 3 8 1 233 400 384 48 10 3 1 277 236 155 160 14 2 1 523 433 170 58 32 10 1 283 214 117 41 4 1 1 1260 199 77 33 2 1 1 1439 641 83 19 3 0 1 3911 543 157 20 5 0 1 805 1733 205 36 5 0 1 759 378 902 98 9 1 1 349 346 206 272 16 4 1 337 257 215 122 127 6 1 577 178 128 77 43 27 1 1401 725 158 62 39 22 1 3102 1474 506 93 24 16 1 2414 2559 767 185 24 8 1 1154 1372 1061 240 29 4 1 640 704 527 283 57 9 1 1813 365 259 178 86 10 1 1732 581 134 65 51 12 1 1321 1083 269 43 20 12 1 1828 834 382 89 11 4 1 1350 1096 425 151 24 3 1 1297 911 673 183 49 10
O:\ACFM\WGREPS\AFWG\REPORTS\2003\3-Northeast Arctic Cod.Doc 80

Table 3.14 (continued) FLT16: NorBarLofAcSur rev99 (Catch: Unknown) (Effort: Unknown) 1984 2002 1 1 0.99 1.00 3 11 1 1416 203 150 157 33 12 11 5 0 1 1343 684 116 77 31 2 0 4 1 1 2049 502 174 15 30 7 0 0 0 1 355 578 109 39 2 0 1 0 0 1 344 214 670 166 32 5 1 0 1 1 206 262 269 668 72 6 4 0 0 1 346 293 339 367 500 36 2 2 0 1 658 216 185 284 254 824 44 16 2 1 1911 1131 354 255 252 277 443 49 7 1 4045 2174 894 224 120 94 39 179 27 1 1598 2166 1041 291 43 43 31 26 81 1 705 872 891 446 64 10 4 9 15 1 517 497 422 499 205 22 5 0 8 1 1826 424 338 340 247 49 8 2 0 1 964 454 122 112 187 92 11 2 1 1 1589 1457 493 129 69 52 16 4 1 1 1716 812 554 190 22 8 5 3 1 1 1122 1035 591 297 73 10 4 3 0 1 1144 1320 1492 692 231 41 5 1 1 FLT17: RusSurCatch/hr rev00 (ages 1-8) (Catch: Unknown) ( (Catch: Unknown) (Effort: Unknown) 1982 2002 1 1 0.90 1.00 3 8 1 141 76 94 58 32 11 1 60 73 48 20 7 11 1 156 93 49 30 12 5 1 283 397 181 45 17 6 1 495 286 140 50 14 2 1 61 402 78 34 8 2 1 66 73 193 33 10 2 1 34 91 109 161 131 55 1 9 29 65 78 96 43 1 102 48 58 66 83 71 1 309 90 45 48 26 23 1 491 526 377 117 45 32 1 230 404 383 366 120 42 1 119 235 247 105 23 7 1 77 101 126 86 36 9 1 99 83 62 37 18 5 1 508 334 97 37 16 7 1 284 475 162 31 12 8 1 276 219 169 58 8 3 1 277 372 206 115 22 3 1 180 144 241 252 117 52
O:\ACFM\WGREPS\AFWG\REPORTS\2003\3-Northeast Arctic Cod.Doc 81

Table 3.15. NEAcod. Compared diagnostics and results for xsa tuned by single fleets and combination of fleets.Cannibalism included in catch
FLT 09 FLT 15 FLT 16 FLT 17 Final run Fleksi- Red.surv. 02 deleted 02,03 deletedRus trawl Joint BT Joint+Lof Rus BT ALL best ALL ALL ALL weights in FL 17 in FL16and17
CPUE survey Ac survey survey Fleets Final Fleets Fleets Fleets ALL Fleets ALL fleets ALL fleetsMin. SE for shrinkage 1.0 1.0 1.0 1.0 1.0 1.0 1.0 1.0 0.5 1.0 1.0SS-ind.Q for age> 6 6 6 6 6 2 4 5 7 6 6 6ages with fleet data 9 to 12 3 to 8 3 to 11 3 to 8 3 to 12 3 to 12 3 to 12 3 to 12 3 to 12 3 to 12 3 to 12 3 to 12# of iterations to converg 23 18 21 >30 23 0 25 25 26 21 25 >30
age3 PshrinkW 0.93 0.58 0.58 0.74 0.35 0 0.30 0.33 0.38 0.40 0.43 0.58FshrinkW 0.07 0.04 0.04 0.07 0.03 0 0.02 0.03 0.03 0.11 0.03 0.04
age4 PshrinkW 0.90 0.29 0.31 0.32 0.12 0 * 0.12 0.13 0.15 0.15 0.29FshrinkW 0.10 0.04 0.04 0.05 0.02 0 0.02 0.02 0.02 0.08 0.02 0.04
age5 PshrinkW 0.83 0.16 0.17 0.20 0.06 0 * * 0.06 0.07 0.07 0.14FshrinkW 0.17 0.04 0.04 0.05 0.02 0 0.02 0.02 0.02 0.07 0.02 0.03
age6 FshrinkW 1.00 0.05 0.04 0.08 0.02 0 0.02 0.02 0.05 / 0.02 0.08 0.02 0.04age7 FshrinkW 1.00 0.08 0.10 0.11 0.03 0 0.03 0.03 0.03 0.13 0.04 0.06age8 FshrinkW 1.00 0.10 0.17 0.21 0.05 0 0.05 0.05 0.05 0.20 0.06 0.08age9 FshrinkW 0.37 0.38 0.22 0.71 0.10 0 0.10 0.10 0.10 0.39 0.10 0.19age10 FshrinkW 0.24 0.68 0.22 0.92 0.13 0 0.13 0.13 0.13 0.41 0.13 0.18age11 FshrinkW 0.23 0.90 0.37 0.98 0.17 0 0.17 0.17 0.17 0.50 0.17 0.22age12 FshrinkW 0.45 0.97 0.73 0.99 0.44 0 0.44 0.44 0.44 0.76 0.44 0.40N2002 age3 42870 47193 50338 48587 50165 33980 52047 50760 49193 43687 50690 47695
N*10^-4 age4 28995 34727 39260 33378 38589 30270 41935 38966 37838 33969 40861 35139age5 20833 29771 35213 32601 36201 32884 39336 38440 35303 32630 35273 30670age6 11926 15522 20705 21241 19438 17504 20088 19772 17831 17721 18534 15848age7 7059 7361 7924 12275 8401 10963 8612 8490 8249 7884 8052 7658age8 1677 1861 1892 2696 2046 3042 2049 2056 2039 1887 1974 1908age9 324 234 272 243 284 461 284 284 284 258 286 269age10 88 71 71 71 75 153 75 75 75 73 75 88
F2002 age 4 0.12 0.10 0.09 0.11 0.09 0.10 0.08 0.09 0.09 0.10 0.09 0.10age5 0.39 0.26 0.21 0.23 0.21 0.21 0.19 0.19 0.21 0.23 0.21 0.25age6 0.71 0.49 0.35 0.34 0.37 0.35 0.36 0.37 0.41 0.42 0.39 0.48age7 0.81 0.76 0.69 0.39 0.63 0.46 0.61 0.62 0.65 0.69 0.67 0.72age8 1.09 0.91 0.88 0.53 0.78 0.54 0.78 0.78 0.79 0.89 0.83 0.87age9 0.78 1.39 1.04 1.28 0.97 0.60 0.97 0.97 0.96 1.14 0.96 1.07age10 0.93 1.37 1.38 1.41 1.23 0.66 1.23 1.23 1.23 1.32 1.23 0.93
2002 F(5-10) 0.79 0.86 0.76 0.70 0.70 0.47 0.69 0.69 0.71 0.78 0.71 0.72F(4-8) 0.62 0.50 0.44 0.32 0.42 0.33 0.40 0.41 0.43 0.47 0.44 0.48
TSB2002 incl Age1-2 1245 1489 1726 1844 1730 1595 1815 1771 1672 1574 1700 1527SSB2002 ('000 T) 391 438 504 637 513 436 527 520 494 474 494 454
O:\ACFM\WGREPS\AFWG\REPORTS\2003\3-Northeast Arctic Cod.Doc 82

Table 3.16 Lowestoft VPA Version 3.1 28/04/2003 15:01 Extended Survivors Analysis Arctic Cod (run: XSAASA27/X27) CPUE data from file fleet Catch data for 19 years. 1984 to 2002. Ages 1 to 13. Fleet, First, Last, First, Last, Alpha, Beta , year, year, age , age FLT09: Russian trawl, 1985, 2002, 9, 12, .000, 1.000 FLT15: NorBarTrSur r, 1984, 2002, 3, 8, .990, 1.000 FLT16: NorBarLofAcSu, 1984, 2002, 3, 11, .990, 1.000 FLT17: RusSurCatch/h, 1984, 2002, 3, 8, .900, 1.000 Time-series weights : Tapered time weighting applied Power = 3 over 10 years Catchability analysis : Catchability dependent on stock size for ages < 6 Regression type = C Minimum of 5 points used for regression Survivor estimates shrunk to the population mean for ages < 6 Catchability independent of age for ages >= 10 Terminal population estimation : Survivor estimates shrunk towards the mean F of the final 5 years or the 2 oldest ages. S.E. of the mean to which the estimates are shrunk = 1.000 Minimum standard error for population estimates derived from each fleet = .300 Prior weighting not applied Tuning converged after 25 iterations Regression weights , .020, .116, .284, .482, .670, .820, .921, .976, .997, 1.000 Fishing mortalities Age, 1993, 1994, 1995, 1996, 1997, 1998, 1999, 2000, 2001, 2002 1, 2.567, 1.716, 1.870, 1.983, 2.497, 1.609, 1.129, 1.350, .973, 1.103 2, .450, .631, .939, 1.058, 1.116, .643, .349, .270, .182, .522 3, .079, .208, .554, .472, .341, .373, .120, .070, .059, .083 4, .096, .202, .302, .354, .304, .355, .210, .128, .105, .091 5, .347, .339, .336, .413, .574, .531, .554, .411, .259, .206 6, .460, .646, .576, .543, .726, .791, .747, .616, .518, .373 7, .566, 1.168, .892, .750, .845, .778, .837, .804, .697, .631 8, .598, .986, .943, .864, 1.237, 1.049, 1.080, 1.131, .984, .783 9, .665, 1.056, .962, .752, 1.344, 1.178, 1.423, 1.264, 1.141, .966 10, .668, 1.033, 1.023, .941, 1.510, 1.267, 1.452, 1.265, 1.399, 1.229 11, .683, 1.185, 1.227, .875, 1.448, 1.335, .994, 1.197, 1.042, 1.034 12, .684, 1.143, 1.229, .861, 1.551, 1.328, 1.187, 1.413, 1.375, 1.341
O:\ACFM\WGREPS\AFWG\REPORTS\2003\3-Northeast Arctic Cod.Doc 83

Table 3.16 (continued) XSA population numbers (Thousands) AGE YEAR , 1, 2, 3, 4, 5, 6, 7, 8, 9, 10, 1993, 2.43E+07, 1.56E+06, 9.05E+05, 5.73E+05, 2.42E+05, 1.01E+05, 3.80E+04, 2.32E+04, 1.50E+04, 2.86E+04, 1994, 9.33E+06, 1.53E+06, 8.17E+05, 6.84E+05, 4.26E+05, 1.40E+05, 5.21E+04, 1.77E+04, 1.04E+04, 6.30E+03, 1995, 2.01E+07, 1.37E+06, 6.65E+05, 5.43E+05, 4.58E+05, 2.49E+05, 6.00E+04, 1.33E+04, 5.39E+03, 2.98E+03, 1996, 2.81E+07, 2.54E+06, 4.40E+05, 3.13E+05, 3.29E+05, 2.68E+05, 1.14E+05, 2.01E+04, 4.23E+03, 1.69E+03, 1997, 2.03E+07, 3.16E+06, 7.22E+05, 2.25E+05, 1.80E+05, 1.78E+05, 1.27E+05, 4.42E+04, 6.95E+03, 1.63E+03, 1998, 6.80E+06, 1.37E+06, 8.48E+05, 4.20E+05, 1.36E+05, 8.29E+04, 7.05E+04, 4.48E+04, 1.05E+04, 1.48E+03, 1999, 3.02E+06, 1.11E+06, 5.88E+05, 4.78E+05, 2.41E+05, 6.54E+04, 3.07E+04, 2.65E+04, 1.29E+04, 2.65E+03, 2000, 3.46E+06, 8.00E+05, 6.44E+05, 4.27E+05, 3.17E+05, 1.14E+05, 2.54E+04, 1.09E+04, 7.37E+03, 2.54E+03, 2001, 4.01E+06, 7.35E+05, 5.00E+05, 4.91E+05, 3.08E+05, 1.72E+05, 5.02E+04, 9.29E+03, 2.88E+03, 1.71E+03, 2002, 3.98E+06, 1.24E+06, 5.02E+05, 3.86E+05, 3.62E+05, 1.94E+05, 8.40E+04, 2.05E+04, 2.84E+03, 7.53E+02, Estimated population abundance at 1st Jan 2003 , 0.00E+00, 1.08E+06, 6.02E+05, 3.78E+05, 2.88E+05, 2.41E+05, 1.10E+05, 3.66E+04, 7.66E+03, 8.86E+02, Taper weighted geometric mean of the VPA populations: , 6.10E+06, 1.25E+06, 6.02E+05, 4.06E+05, 2.67E+05, 1.36E+05, 5.65E+04, 2.00E+04, 5.87E+03, 1.76E+03, Standard error of the weighted Log(VPA populations) : , .8353, .5001, .2199, .2726, .3795, .4933, .5944, .6190, .6236, .5249, AGE YEAR , 11, 12, 1993 , 3.90E+03, 8.41E+02, 1994 , 1.20E+04, 1.61E+03, 1995 , 1.84E+03, 3.00E+03, 1996 , 8.75E+02, 4.40E+02, 1997 , 5.39E+02, 2.99E+02, 1998 , 2.95E+02, 1.04E+02, 1999 , 3.42E+02, 6.36E+01, 2000 , 5.08E+02, 1.04E+02, 2001 , 5.86E+02, 1.26E+02, 2002 , 3.45E+02, 1.69E+02, Estimated population abundance at 1st Jan 2003 , 1.80E+02, 1.00E+02, Taper weighted geometric mean of the VPA populations: , 5.10E+02, 1.66E+02, Standard error of the weighted Log(VPA populations) : , .6755, .9766, Log catchability residuals. Fleet : FLT09: Russian trawl Age , 1984, 1985, 1986, 1987, 1988, 1989, 1990, 1991, 1992 3 , No data for this fleet at this age 4 , No data for this fleet at this age 5 , No data for this fleet at this age 6 , No data for this fleet at this age 7 , No data for this fleet at this age 8 , No data for this fleet at this age 9 , 99.99, 99.99, 99.99, 99.99, 99.99, 99.99, 99.99, 99.99, 99.99 10 , 99.99, 99.99, 99.99, 99.99, 99.99, 99.99, 99.99, 99.99, 99.99 11 , 99.99, 99.99, 99.99, 99.99, 99.99, 99.99, 99.99, 99.99, 99.99 12 , 99.99, 99.99, 99.99, 99.99, 99.99, 99.99, 99.99, 99.99, 99.99
O:\ACFM\WGREPS\AFWG\REPORTS\2003\3-Northeast Arctic Cod.Doc 84

Table 3.16 (continued) Age , 1993, 1994, 1995, 1996, 1997, 1998, 1999, 2000, 2001, 2002 3 , No data for this fleet at this age 4 , No data for this fleet at this age 5 , No data for this fleet at this age 6 , No data for this fleet at this age 7 , No data for this fleet at this age 8 , No data for this fleet at this age 9 , .79, .70, .46, .03, -.22, -.88, -.47, .26, .20, .60 10 , .15, .60, .53, .36, -.17, -.60, -.39, .07, .04, .46 11 , -1.12, -1.25, .23, -.58, -.15, .09, 99.99, -.35, -.02, -.06 12 , -1.24, -.70, -2.20, -1.13, -.75, .17, 99.99, -1.90, .04, -2.11 Mean log catchability and standard error of ages with catchability independent of year class strength and constant w.r.t. time Age , 9, 10, 11, 12 Mean Log q, -3.3593, -3.4899, -3.4899, -3.4899, S.E(Log q), .5265, .4035, .3497, 1.5479, Regression statistics : Ages with q independent of year class strength and constant w.r.t. time. Age, Slope , t-value , Intercept, RSquare, No Pts, Reg s.e, Mean Q 9, 2.57, -2.173, -5.01, .31, 10, 1.04, -3.36, 10, 1.21, -.481, 2.65, .55, 10, .53, -3.49, 11, 1.32, -1.271, 2.80, .83, 9, .38, -3.65, 12, 1.41, -.518, 4.22, .32, 9, 1.60, -4.53, Fleet : FLT15: NorBarTrSur r Age , 1984, 1985, 1986, 1987, 1988, 1989, 1990, 1991, 1992 3 , 99.99, 99.99, 99.99, 99.99, 99.99, 99.99, 99.99, 99.99, 99.99 4 , 99.99, 99.99, 99.99, 99.99, 99.99, 99.99, 99.99, 99.99, 99.99 5 , 99.99, 99.99, 99.99, 99.99, 99.99, 99.99, 99.99, 99.99, 99.99 6 , 99.99, 99.99, 99.99, 99.99, 99.99, 99.99, 99.99, 99.99, 99.99 7 , 99.99, 99.99, 99.99, 99.99, 99.99, 99.99, 99.99, 99.99, 99.99 8 , 99.99, 99.99, 99.99, 99.99, 99.99, 99.99, 99.99, 99.99, 99.99 9 , No data for this fleet at this age 10 , No data for this fleet at this age 11 , No data for this fleet at this age 12 , No data for this fleet at this age Age , 1993, 1994, 1995, 1996, 1997, 1998, 1999, 2000, 2001, 2002 3 , .08, .09, .01, -.08, .10, -.07, -.09, .02, .04, .03 4 , .04, .41, .20, .25, .00, -.20, .06, -.11, -.04, .04 5 , .32, .09, .29, .10, .25, -.06, -.03, -.13, -.14, .04 6 , -.07, .47, .09, .14, .27, .09, -.13, -.08, -.07, -.14 7 , -.08, .20, -.03, -.14, .26, .26, .22, -.22, -.23, -.10 8 , .24, .21, -.24, .07, -.24, -.25, .30, .14, -.13, .08 9 , No data for this fleet at this age 10 , No data for this fleet at this age 11 , No data for this fleet at this age 12 , No data for this fleet at this age
O:\ACFM\WGREPS\AFWG\REPORTS\2003\3-Northeast Arctic Cod.Doc 85

Table 3.16 (continued) Mean log catchability and standard error of ages with catchability independent of year class strength and constant w.r.t. time Age , 6, 7, 8 Mean Log q, -6.2573, -6.5231, -6.7288, S.E(Log q), .1627, .2261, .2146, Regression statistics : Ages with q dependent on year class strength Age, Slope , t-value , Intercept, RSquare, No Pts, Reg s.e, Mean Log q 3, .74, 1.668, 7.61, .91, 10, .08, -5.65, 4, .82, .676, 7.04, .78, 10, .16, -5.79, 5, .84, .871, 7.05, .87, 10, .16, -5.99, Ages with q independent of year class strength and constant w.r.t. time. Age, Slope , t-value , Intercept, RSquare, No Pts, Reg s.e, Mean Q 6, .92, .548, 6.69, .92, 10, .16, -6.26, 7, .91, .551, 6.92, .90, 10, .22, -6.52, 8, 1.09, -.523, 6.43, .88, 10, .25, -6.73, 1 Fleet : FLT16: NorBarLofAcSu Age , 1984, 1985, 1986, 1987, 1988, 1989, 1990, 1991, 1992 3 , 99.99, 99.99, 99.99, 99.99, 99.99, 99.99, 99.99, 99.99, 99.99 4 , 99.99, 99.99, 99.99, 99.99, 99.99, 99.99, 99.99, 99.99, 99.99 5 , 99.99, 99.99, 99.99, 99.99, 99.99, 99.99, 99.99, 99.99, 99.99 6 , 99.99, 99.99, 99.99, 99.99, 99.99, 99.99, 99.99, 99.99, 99.99 7 , 99.99, 99.99, 99.99, 99.99, 99.99, 99.99, 99.99, 99.99, 99.99 8 , 99.99, 99.99, 99.99, 99.99, 99.99, 99.99, 99.99, 99.99, 99.99 9 , 99.99, 99.99, 99.99, 99.99, 99.99, 99.99, 99.99, 99.99, 99.99 10 , 99.99, 99.99, 99.99, 99.99, 99.99, 99.99, 99.99, 99.99, 99.99 11 , 99.99, 99.99, 99.99, 99.99, 99.99, 99.99, 99.99, 99.99, 99.99 12 , No data for this fleet at this age Age , 1993, 1994, 1995, 1996, 1997, 1998, 1999, 2000, 2001, 2002 3 , .77, .00, -.31, -.33, .41, -.41, .22, .16, -.06, -.01 4 , .43, .35, -.18, -.10, .04, -.48, .34, -.16, -.10, .36 5 , .44, -.04, -.21, -.32, .24, -.18, .18, -.11, -.14, .28 6 , -.02, .10, -.11, -.11, .10, -.18, .15, -.14, -.21, .37 7 , .38, -.36, -.38, .00, .17, .42, .31, -.67, -.26, .31 8 , .69, .57, -.64, -.35, .03, .46, .45, -.48, -.25, .17 9 , .31, .83, -.65, -.39, .17, -.09, .32, -.44, .15, .22 10 , .79, .74, .42, 99.99, .00, -.15, .15, -.28, .25, -.20 11 , .90, 1.38, 1.61, 1.37, 99.99, .84, .35, .16, 99.99, .39 12 , No data for this fleet at this age Mean log catchability and standard error of ages with catchability independent of year class strength and constant w.r.t. time Age , 6, 7, 8, 9, 10, 11 Mean Log q, -5.4371, -5.3793, -5.4092, -5.3985, -5.0001, -5.0001, S.E(Log q), .2245, .4165, .4140, .3534, .2670, .8720,
O:\ACFM\WGREPS\AFWG\REPORTS\2003\3-Northeast Arctic Cod.Doc 86

Table 3.16 (continued) Regression statistics : Ages with q dependent on year class strength Age, Slope , t-value , Intercept, RSquare, No Pts, Reg s.e, Mean Log q 3, 1.09, -.143, 5.14, .38, 10, .31, -5.80, 4, .93, .132, 6.27, .45, 10, .34, -5.77, 5, .66, 1.175, 7.98, .74, 10, .25, -5.66, Ages with q independent of year class strength and constant w.r.t. time. Age, Slope , t-value , Intercept, RSquare, No Pts, Reg s.e, Mean Q 6, .97, .149, 5.64, .84, 10, .24, -5.44, 7, .74, 1.231, 6.85, .84, 10, .29, -5.38, 8, .67, 2.204, 6.88, .91, 10, .21, -5.41, 9, 1.01, -.027, 5.37, .75, 10, .40, -5.40, 10, .80, 1.137, 5.49, .90, 9, .21, -5.00, 11, .72, 1.253, 4.90, .88, 8, .35, -4.38, Fleet : FLT17: RusSurCatch/h Age , 1984, 1985, 1986, 1987, 1988, 1989, 1990, 1991, 1992 3 , 99.99, 99.99, 99.99, 99.99, 99.99, 99.99, 99.99, 99.99, 99.99 4 , 99.99, 99.99, 99.99, 99.99, 99.99, 99.99, 99.99, 99.99, 99.99 5 , 99.99, 99.99, 99.99, 99.99, 99.99, 99.99, 99.99, 99.99, 99.99 6 , 99.99, 99.99, 99.99, 99.99, 99.99, 99.99, 99.99, 99.99, 99.99 7 , 99.99, 99.99, 99.99, 99.99, 99.99, 99.99, 99.99, 99.99, 99.99 8 , 99.99, 99.99, 99.99, 99.99, 99.99, 99.99, 99.99, 99.99, 99.99 9 , No data for this fleet at this age 10 , No data for this fleet at this age 11 , No data for this fleet at this age 12 , No data for this fleet at this age Age , 1993, 1994, 1995, 1996, 1997, 1998, 1999, 2000, 2001, 2002 3 , .08, -.27, -.29, -.24, -.65, .36, .15, .01, .26, -.04 4 , .05, -.21, -.23, -.11, .09, .25, .24, -.11, .02, -.26 5 , 1.20, .65, -.01, -.47, -.60, .22, .35, -.05, .05, .03 6 , .62, 1.61, -.28, -.58, -.84, -.02, .00, -.05, .13, .65 7 , .89, 2.12, .07, -.26, -.97, -.56, .04, -.21, .02, 1.11 8 , .88, 1.80, .25, .01, -1.01, -.87, -.18, -.22, -.20, 1.67 9 , No data for this fleet at this age 10 , No data for this fleet at this age 11 , No data for this fleet at this age 12 , No data for this fleet at this age Mean log catchability and standard error of ages with catchability independent of year class strength and constant w.r.t. time Age , 6, 7, 8 Mean Log q, -6.7569, -6.8987, -6.7119, S.E(Log q), .5174, .7213, .9348,
O:\ACFM\WGREPS\AFWG\REPORTS\2003\3-Northeast Arctic Cod.Doc 87

Table 3.16 (continued) Regression statistics : Ages with q dependent on year class strength Age, Slope , t-value , Intercept, RSquare, No Pts, Reg s.e, Mean Log q 3, .71, .419, 9.24, .32, 10, .35, -7.54, 4, .54, 1.282, 9.75, .65, 10, .22, -7.10, 5, 1.32, -.762, 5.07, .57, 10, .37, -6.88, Ages with q independent of year class strength and constant w.r.t. time. Age, Slope , t-value , Intercept, RSquare, No Pts, Reg s.e, Mean Q 6, 1.10, -.172, 6.27, .43, 10, .63, -6.76, 7, 1.10, -.152, 6.51, .36, 10, .88, -6.90, 8, 1.78, -.627, 4.23, .13, 10, 1.77, -6.71, Terminal year survivor and F summaries : Age 1 Catchability dependent on age and year class strength Year class = 2001 Fleet, Estimated, Int, Ext, Var, N, Scaled, Estimated , Survivors, s.e, s.e, Ratio, , Weights, F FLT09: Russian trawl, 1., .000, .000, .00, 0, .000, .000 FLT15: NorBarTrSur r, 1., .000, .000, .00, 0, .000, .000 FLT16: NorBarLofAcSu, 1., .000, .000, .00, 0, .000, .000 FLT17: RusSurCatch/h, 1., .000, .000, .00, 0, .000, .000 P shrinkage mean , 1252507., .50,,,, .800, 1.007 F shrinkage mean , 599976., 1.00,,,, .200, 1.532 Weighted prediction : Survivors, Int, Ext, N, Var, F at end of year, s.e, s.e, , Ratio, 1081034., .45, 13.90, 2, 31.071, 1.103 Age 2 Catchability dependent on age and year class strength Year class = 2000 Fleet, Estimated, Int, Ext, Var, N, Scaled, Estimated , Survivors, s.e, s.e, Ratio, , Weights, F FLT09: Russian trawl, 1., .000, .000, .00, 0, .000, .000 FLT15: NorBarTrSur r, 1., .000, .000, .00, 0, .000, .000 FLT16: NorBarLofAcSu, 1., .000, .000, .00, 0, .000, .000 FLT17: RusSurCatch/h, 1., .000, .000, .00, 0, .000, .000 P shrinkage mean , 601980., .22,,,, .954, .523 F shrinkage mean , 611614., 1.00,,,, .046, .516 Weighted prediction : Survivors, Int, Ext, N, Var, F at end of year, s.e, s.e, , Ratio, 602420., .21, 13.31, 2, 61.968, .522
O:\ACFM\WGREPS\AFWG\REPORTS\2003\3-Northeast Arctic Cod.Doc 88

Table 3.16 (continued) Age 3 Catchability dependent on age and year class strength Year class = 1999 Fleet, Estimated, Int, Ext, Var, N, Scaled, Estimated , Survivors, s.e, s.e, Ratio, , Weights, F FLT09: Russian trawl, 1., .000, .000, .00, 0, .000, .000 FLT15: NorBarTrSur r, 388539., .300, .000, .00, 1, .266, .081 FLT16: NorBarLofAcSu, 372630., .345, .000, .00, 1, .202, .084 FLT17: RusSurCatch/h, 364621., .392, .000, .00, 1, .156, .086 P shrinkage mean , 405726., .27,,,, .350, .077 F shrinkage mean , 153097., 1.00,,,, .026, .193 Weighted prediction : Survivors, Int, Ext, N, Var, F at end of year, s.e, s.e, , Ratio, 378034., .16, .08, 5, .487, .083 Age 4 Catchability dependent on age and year class strength Year class = 1998 Fleet, Estimated, Int, Ext, Var, N, Scaled, Estimated , Survivors, s.e, s.e, Ratio, , Weights, F FLT09: Russian trawl, 1., .000, .000, .00, 0, .000, .000 FLT15: NorBarTrSur r, 299874., .212, .004, .02, 2, .345, .088 FLT16: NorBarLofAcSu, 330959., .257, .207, .80, 2, .235, .080 FLT17: RusSurCatch/h, 268696., .236, .248, 1.05, 2, .281, .098 P shrinkage mean , 267272., .38,,,, .122, .098 F shrinkage mean , 111161., 1.00,,,, .018, .222 Weighted prediction : Survivors, Int, Ext, N, Var, F at end of year, s.e, s.e, , Ratio, 288372., .13, .09, 8, .679, .091 Age 5 Catchability dependent on age and year class strength Year class = 1997 Fleet, Estimated, Int, Ext, Var, N, Scaled, Estimated , Survivors, s.e, s.e, Ratio, , Weights, F FLT09: Russian trawl, 1., .000, .000, .00, 0, .000, .000 FLT15: NorBarTrSur r, 243018., .174, .025, .14, 3, .368, .204 FLT16: NorBarLofAcSu, 277853., .196, .111, .56, 3, .294, .181 FLT17: RusSurCatch/h, 246435., .206, .006, .03, 3, .262, .202 P shrinkage mean , 136257., .49,,,, .062, .340 F shrinkage mean , 92047., 1.00,,,, .015, .469 Weighted prediction : Survivors, Int, Ext, N, Var, F at end of year, s.e, s.e, , Ratio, 241302., .11, .07, 11, .663, .206
O:\ACFM\WGREPS\AFWG\REPORTS\2003\3-Northeast Arctic Cod.Doc 89

Table 3.16 (continued) Age 6 Catchability constant w.r.t. time and dependent on age Year class = 1996 Fleet, Estimated, Int, Ext, Var, N, Scaled, Estimated , Survivors, s.e, s.e, Ratio, , Weights, F FLT09: Russian trawl, 1., .000, .000, .00, 0, .000, .000 FLT15: NorBarTrSur r, 96840., .155, .012, .08, 4, .400, .413 FLT16: NorBarLofAcSu, 122188., .167, .139, .83, 4, .353, .340 FLT17: RusSurCatch/h, 122305., .197, .153, .78, 4, .230, .340 F shrinkage mean , 50180., 1.00,,,, .017, .686 Weighted prediction : Survivors, Int, Ext, N, Var, F at end of year, s.e, s.e, , Ratio, 109644., .10, .07, 13, .723, .373 Age 7 Catchability constant w.r.t. time and dependent on age Year class = 1995 Fleet, Estimated, Int, Ext, Var, N, Scaled, Estimated , Survivors, s.e, s.e, Ratio, , Weights, F FLT09: Russian trawl, 1., .000, .000, .00, 0, .000, .000 FLT15: NorBarTrSur r, 33966., .157, .027, .17, 5, .467, .667 FLT16: NorBarLofAcSu, 35898., .177, .130, .74, 5, .329, .640 FLT17: RusSurCatch/h, 49462., .222, .190, .86, 5, .172, .501 F shrinkage mean , 26250., 1.00,,,, .032, .800 Weighted prediction : Survivors, Int, Ext, N, Var, F at end of year, s.e, s.e, , Ratio, 36599., .11, .07, 16, .648, .631 Age 8 Catchability constant w.r.t. time and dependent on age Year class = 1994 Fleet, Estimated, Int, Ext, Var, N, Scaled, Estimated , Survivors, s.e, s.e, Ratio, , Weights, F FLT09: Russian trawl, 1., .000, .000, .00, 0, .000, .000 FLT15: NorBarTrSur r, 7399., .171, .060, .35, 6, .533, .802 FLT16: NorBarLofAcSu, 7634., .211, .098, .46, 6, .303, .785 FLT17: RusSurCatch/h, 11586., .286, .304, 1.06, 6, .113, .579 F shrinkage mean , 4477., 1.00,,,, .051, 1.109 Weighted prediction : Survivors, Int, Ext, N, Var, F at end of year, s.e, s.e, , Ratio, 7656., .13, .08, 19, .622, .783
O:\ACFM\WGREPS\AFWG\REPORTS\2003\3-Northeast Arctic Cod.Doc 90
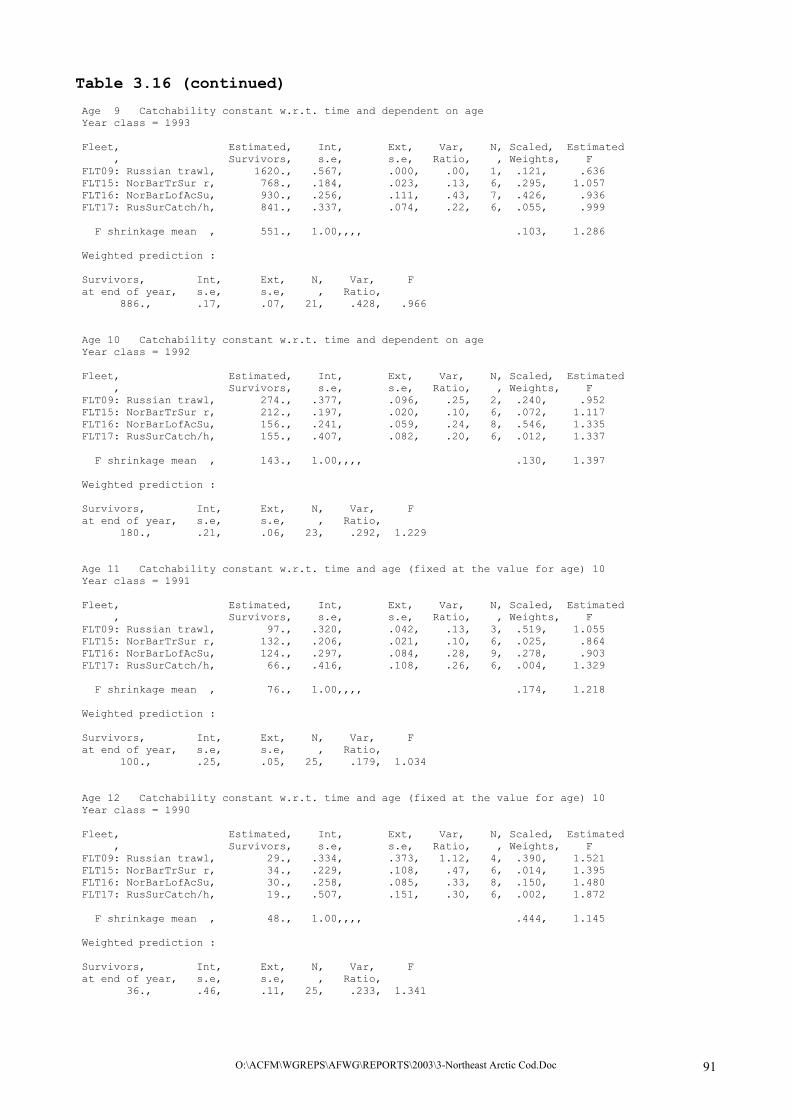
Table 3.16 (continued) Age 9 Catchability constant w.r.t. time and dependent on age Year class = 1993 Fleet, Estimated, Int, Ext, Var, N, Scaled, Estimated , Survivors, s.e, s.e, Ratio, , Weights, F FLT09: Russian trawl, 1620., .567, .000, .00, 1, .121, .636 FLT15: NorBarTrSur r, 768., .184, .023, .13, 6, .295, 1.057 FLT16: NorBarLofAcSu, 930., .256, .111, .43, 7, .426, .936 FLT17: RusSurCatch/h, 841., .337, .074, .22, 6, .055, .999 F shrinkage mean , 551., 1.00,,,, .103, 1.286 Weighted prediction : Survivors, Int, Ext, N, Var, F at end of year, s.e, s.e, , Ratio, 886., .17, .07, 21, .428, .966 Age 10 Catchability constant w.r.t. time and dependent on age Year class = 1992 Fleet, Estimated, Int, Ext, Var, N, Scaled, Estimated , Survivors, s.e, s.e, Ratio, , Weights, F FLT09: Russian trawl, 274., .377, .096, .25, 2, .240, .952 FLT15: NorBarTrSur r, 212., .197, .020, .10, 6, .072, 1.117 FLT16: NorBarLofAcSu, 156., .241, .059, .24, 8, .546, 1.335 FLT17: RusSurCatch/h, 155., .407, .082, .20, 6, .012, 1.337 F shrinkage mean , 143., 1.00,,,, .130, 1.397 Weighted prediction : Survivors, Int, Ext, N, Var, F at end of year, s.e, s.e, , Ratio, 180., .21, .06, 23, .292, 1.229 Age 11 Catchability constant w.r.t. time and age (fixed at the value for age) 10 Year class = 1991 Fleet, Estimated, Int, Ext, Var, N, Scaled, Estimated , Survivors, s.e, s.e, Ratio, , Weights, F FLT09: Russian trawl, 97., .320, .042, .13, 3, .519, 1.055 FLT15: NorBarTrSur r, 132., .206, .021, .10, 6, .025, .864 FLT16: NorBarLofAcSu, 124., .297, .084, .28, 9, .278, .903 FLT17: RusSurCatch/h, 66., .416, .108, .26, 6, .004, 1.329 F shrinkage mean , 76., 1.00,,,, .174, 1.218 Weighted prediction : Survivors, Int, Ext, N, Var, F at end of year, s.e, s.e, , Ratio, 100., .25, .05, 25, .179, 1.034 Age 12 Catchability constant w.r.t. time and age (fixed at the value for age) 10 Year class = 1990 Fleet, Estimated, Int, Ext, Var, N, Scaled, Estimated , Survivors, s.e, s.e, Ratio, , Weights, F FLT09: Russian trawl, 29., .334, .373, 1.12, 4, .390, 1.521 FLT15: NorBarTrSur r, 34., .229, .108, .47, 6, .014, 1.395 FLT16: NorBarLofAcSu, 30., .258, .085, .33, 8, .150, 1.480 FLT17: RusSurCatch/h, 19., .507, .151, .30, 6, .002, 1.872 F shrinkage mean , 48., 1.00,,,, .444, 1.145 Weighted prediction : Survivors, Int, Ext, N, Var, F at end of year, s.e, s.e, , Ratio, 36., .46, .11, 25, .233, 1.341
O:\ACFM\WGREPS\AFWG\REPORTS\2003\3-Northeast Arctic Cod.Doc 91

Table 3.17 Run title : Arctic Cod (run: XSAASA27/X27) At 28/04/2003 15:03 Terminal Fs derived using XSA (With F shrinkage) Table 8 Fishing mortality (F) at age YEAR, 1984, 1985, 1986, 1987, 1988, 1989, 1990, 1991, 1992, AGE 1, .2459, .3590, .5092, .5267, .8044, .2166, .0483, .1029, .4669, 2, .0373, .0578, .8026, .8029, .1102, .0020, .0594, .2371, .1447, 3, .0199, .0533, .1452, .1136, .0629, .0327, .0086, .0183, .0405, 4, .1235, .1702, .2122, .2287, .1269, .1284, .0622, .0624, .1265, 5, .3075, .3763, .4934, .5099, .3708, .2658, .1342, .1875, .2205, 6, .6274, .6052, .7053, .9367, .5976, .4022, .2309, .3211, .4428, 7, 1.1361, .9249, .9481, 1.1402, 1.0456, .7167, .2510, .4255, .5398, 8, 1.2111, 1.0189, 1.0910, 1.0145, .9844, .8914, .3752, .3461, .5984, 9, 1.2623, .7786, .8282, .7786, 1.1598, .7183, .3072, .3819, .4578, 10, .9579, .5057, 1.1121, 1.3243, 1.7194, .9874, .3255, .2575, .4612, 11, 1.0876, .4205, .8746, 1.0272, 1.5382, .5835, .5421, .1347, .2501, 12, 1.0346, .4666, 1.0046, 1.1901, 1.6509, .7934, .4370, .1970, .3579, +gp, 1.0346, .4666, 1.0046, 1.1901, 1.6509, .7934, .4370, .1970, .3579, FBAR 5-10,.9171, .7016, .8630, .9507, .9796, .6636, .2707, .3199, .4534, Table 8 Fishing mortality (F) at age YEAR, 1993, 1994, 1995, 1996, 1997, 1998, 1999, 2000, 2001, 2002, FBAR **-** AGE 1, 2.5667, 1.7162, 1.8704, 1.9831, 2.4968, 1.6093, 1.1286, 1.3502, .9732, 1.1028, 1.1421, 2, .4497, .6305, .9387, 1.0581, 1.1160, .6432, .3485, .2700, .1824, .5222, .3249, 3, .0791, .2084, .5545, .4716, .3411, .3728, .1200, .0705, .0587, .0829, .0707, 4, .0964, .2019, .3021, .3541, .3040, .3548, .2102, .1280, .1054, .0913, .1082, 5, .3467, .3395, .3359, .4126, .5735, .5305, .5538, .4107, .2592, .2056, .2919, 6, .4597, .6459, .5763, .5433, .7265, .7915, .7473, .6162, .5185, .3726, .5024, 7, .5664, 1.1681, .8915, .7500, .8448, .7781, .8374, .8037, .6971, .6310, .7106, 8, .5980, .9865, .9434, .8638, 1.2365, 1.0492, 1.0801, 1.1309, .9844, .7830, .9661, 9, .6647, 1.0557, .9622, .7519, 1.3442, 1.1777, 1.4232, 1.2637, 1.1411, .9657, 1.1235, 10, .6683, 1.0331, 1.0235, .9406, 1.5097, 1.2675, 1.4516, 1.2654, 1.3994, 1.2288, 1.2979, 11, .6833, 1.1850, 1.2272, .8752, 1.4477, 1.3355, .9938, 1.1970, 1.0420, 1.0340, 1.0910, 12, .6842, 1.1431, 1.2289, .8605, 1.5513, 1.3282, 1.1869, 1.4132, 1.3751, 1.3409, 1.3764, +gp, .6842, 1.1431, 1.2289, .8605, 1.5513, 1.3282, 1.1869, 1.4132, 1.3751, 1.3409, FBAR 5-10,.5506, .8715, .7888, .7104, 1.0392, .9324, 1.0156, .9151, .8333, .6978,
O:\ACFM\WGREPS\AFWG\REPORTS\2003\3-Northeast Arctic Cod.Doc 92
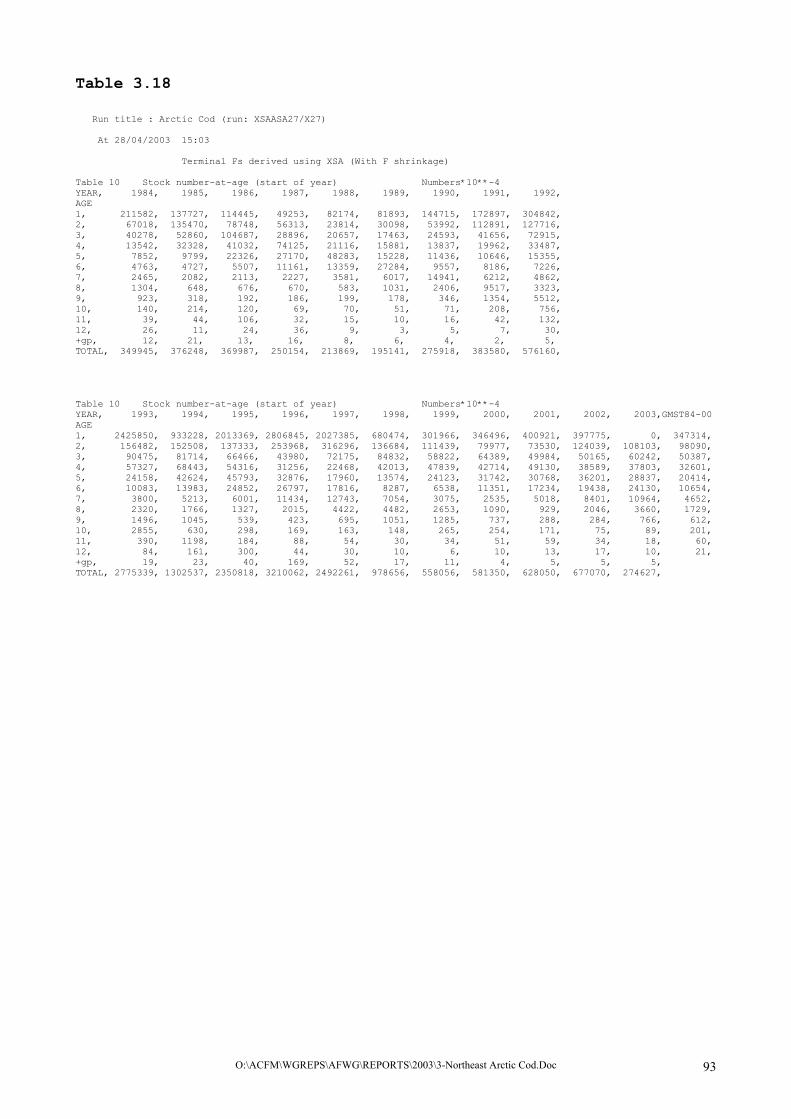
Table 3.18 Run title : Arctic Cod (run: XSAASA27/X27)
At 28/04/2003 15:03 Terminal Fs derived using XSA (With F shrinkage)
Table 10 Stock number-at-age (start of year) Numbers*10**-4 YEAR, 1984, 1985, 1986, 1987, 1988, 1989, 1990, 1991, 1992, AGE 1, 211582, 137727, 114445, 49253, 82174, 81893, 144715, 172897, 304842, 2, 67018, 135470, 78748, 56313, 23814, 30098, 53992, 112891, 127716, 3, 40278, 52860, 104687, 28896, 20657, 17463, 24593, 41656, 72915, 4, 13542, 32328, 41032, 74125, 21116, 15881, 13837, 19962, 33487, 5, 7852, 9799, 22326, 27170, 48283, 15228, 11436, 10646, 15355, 6, 4763, 4727, 5507, 11161, 13359, 27284, 9557, 8186, 7226, 7, 2465, 2082, 2113, 2227, 3581, 6017, 14941, 6212, 4862, 8, 1304, 648, 676, 670, 583, 1031, 2406, 9517, 3323, 9, 923, 318, 192, 186, 199, 178, 346, 1354, 5512, 10, 140, 214, 120, 69, 70, 51, 71, 208, 756, 11, 39, 44, 106, 32, 15, 10, 16, 42, 132, 12, 26, 11, 24, 36, 9, 3, 5, 7, 30, +gp, 12, 21, 13, 16, 8, 6, 4, 2, 5, TOTAL, 349945, 376248, 369987, 250154, 213869, 195141, 275918, 383580, 576160, Table 10 Stock number-at-age (start of year) Numbers*10**-4 YEAR, 1993, 1994, 1995, 1996, 1997, 1998, 1999, 2000, 2001, 2002, 2003,GMST84-00 AGE 1, 2425850, 933228, 2013369, 2806845, 2027385, 680474, 301966, 346496, 400921, 397775, 0, 347314, 2, 156482, 152508, 137333, 253968, 316296, 136684, 111439, 79977, 73530, 124039, 108103, 98090, 3, 90475, 81714, 66466, 43980, 72175, 84832, 58822, 64389, 49984, 50165, 60242, 50387, 4, 57327, 68443, 54316, 31256, 22468, 42013, 47839, 42714, 49130, 38589, 37803, 32601, 5, 24158, 42624, 45793, 32876, 17960, 13574, 24123, 31742, 30768, 36201, 28837, 20414, 6, 10083, 13983, 24852, 26797, 17816, 8287, 6538, 11351, 17234, 19438, 24130, 10654, 7, 3800, 5213, 6001, 11434, 12743, 7054, 3075, 2535, 5018, 8401, 10964, 4652, 8, 2320, 1766, 1327, 2015, 4422, 4482, 2653, 1090, 929, 2046, 3660, 1729, 9, 1496, 1045, 539, 423, 695, 1051, 1285, 737, 288, 284, 766, 612, 10, 2855, 630, 298, 169, 163, 148, 265, 254, 171, 75, 89, 201, 11, 390, 1198, 184, 88, 54, 30, 34, 51, 59, 34, 18, 60, 12, 84, 161, 300, 44, 30, 10, 6, 10, 13, 17, 10, 21, +gp, 19, 23, 40, 169, 52, 17, 11, 4, 5, 5, 5, TOTAL, 2775339, 1302537, 2350818, 3210062, 2492261, 978656, 558056, 581350, 628050, 677070, 274627,
O:\ACFM\WGREPS\AFWG\REPORTS\2003\3-Northeast Arctic Cod.Doc 93

Table 3.19 Run title : Arctic Cod (run: SVPASA15/V15) At 30/04/2003 23:56 Table 4 Natural Mortality (M) at age YEAR, 1946, 1947, 1948, 1949, 1950, 1951, 1952, AGE 3, .2000, .2000, .2000, .2000, .2000, .2000, .2000, 4, .2000, .2000, .2000, .2000, .2000, .2000, .2000, 5, .2000, .2000, .2000, .2000, .2000, .2000, .2000, 6, .2000, .2000, .2000, .2000, .2000, .2000, .2000, 7, .2000, .2000, .2000, .2000, .2000, .2000, .2000, 8, .2000, .2000, .2000, .2000, .2000, .2000, .2000, 9, .2000, .2000, .2000, .2000, .2000, .2000, .2000, 10, .2000, .2000, .2000, .2000, .2000, .2000, .2000, 11, .2000, .2000, .2000, .2000, .2000, .2000, .2000, 12, .2000, .2000, .2000, .2000, .2000, .2000, .2000, +gp, .2000, .2000, .2000, .2000, .2000, .2000, .2000, Table 4 Natural Mortality (M) at age YEAR, 1953, 1954, 1955, 1956, 1957, 1958, 1959, 1960, 1961, 1962, AGE 3, .2000, .2000, .2000, .2000, .2000, .2000, .2000, .2000, .2000, .2000, 4, .2000, .2000, .2000, .2000, .2000, .2000, .2000, .2000, .2000, .2000, 5, .2000, .2000, .2000, .2000, .2000, .2000, .2000, .2000, .2000, .2000, 6, .2000, .2000, .2000, .2000, .2000, .2000, .2000, .2000, .2000, .2000, 7, .2000, .2000, .2000, .2000, .2000, .2000, .2000, .2000, .2000, .2000, 8, .2000, .2000, .2000, .2000, .2000, .2000, .2000, .2000, .2000, .2000, 9, .2000, .2000, .2000, .2000, .2000, .2000, .2000, .2000, .2000, .2000, 10, .2000, .2000, .2000, .2000, .2000, .2000, .2000, .2000, .2000, .2000, 11, .2000, .2000, .2000, .2000, .2000, .2000, .2000, .2000, .2000, .2000, 12, .2000, .2000, .2000, .2000, .2000, .2000, .2000, .2000, .2000, .2000, +gp, .2000, .2000, .2000, .2000, .2000, .2000, .2000, .2000, .2000, .2000, Run title : Arctic Cod (run: SVPASA15/V15) At 30/04/2003 23:56 Table 4 Natural Mortality (M) at age YEAR, 1963, 1964, 1965, 1966, 1967, 1968, 1969, 1970, 1971, 1972, AGE 3, .2000, .2000, .2000, .2000, .2000, .2000, .2000, .2000, .2000, .2000, 4, .2000, .2000, .2000, .2000, .2000, .2000, .2000, .2000, .2000, .2000, 5, .2000, .2000, .2000, .2000, .2000, .2000, .2000, .2000, .2000, .2000, 6, .2000, .2000, .2000, .2000, .2000, .2000, .2000, .2000, .2000, .2000, 7, .2000, .2000, .2000, .2000, .2000, .2000, .2000, .2000, .2000, .2000, 8, .2000, .2000, .2000, .2000, .2000, .2000, .2000, .2000, .2000, .2000, 9, .2000, .2000, .2000, .2000, .2000, .2000, .2000, .2000, .2000, .2000, 10, .2000, .2000, .2000, .2000, .2000, .2000, .2000, .2000, .2000, .2000, 11, .2000, .2000, .2000, .2000, .2000, .2000, .2000, .2000, .2000, .2000, 12, .2000, .2000, .2000, .2000, .2000, .2000, .2000, .2000, .2000, .2000, +gp, .2000, .2000, .2000, .2000, .2000, .2000, .2000, .2000, .2000, .2000,
O:\ACFM\WGREPS\AFWG\REPORTS\2003\3-Northeast Arctic Cod.Doc 94

Table 3.19 (continued) Table 4 Natural Mortality (M) at age YEAR, 1973, 1974, 1975, 1976, 1977, 1978, 1979, 1980, 1981, 1982, AGE 3, .2000, .2000, .2000, .2000, .2000, .2000, .2000, .2000, .2000, .2000, 4, .2000, .2000, .2000, .2000, .2000, .2000, .2000, .2000, .2000, .2000, 5, .2000, .2000, .2000, .2000, .2000, .2000, .2000, .2000, .2000, .2000, 6, .2000, .2000, .2000, .2000, .2000, .2000, .2000, .2000, .2000, .2000, 7, .2000, .2000, .2000, .2000, .2000, .2000, .2000, .2000, .2000, .2000, 8, .2000, .2000, .2000, .2000, .2000, .2000, .2000, .2000, .2000, .2000, 9, .2000, .2000, .2000, .2000, .2000, .2000, .2000, .2000, .2000, .2000, 10, .2000, .2000, .2000, .2000, .2000, .2000, .2000, .2000, .2000, .2000, 11, .2000, .2000, .2000, .2000, .2000, .2000, .2000, .2000, .2000, .2000, 12, .2000, .2000, .2000, .2000, .2000, .2000, .2000, .2000, .2000, .2000, +gp, .2000, .2000, .2000, .2000, .2000, .2000, .2000, .2000, .2000, .2000, Table 4 Natural Mortality (M) at age YEAR, 1983, 1984, 1985, 1986, 1987, 1988, 1989, 1990, 1991, 1992, AGE 3, .2000, .2006, .2004, .3108, .2580, .2087, .2000, .2000, .2050, .2067, 4, .2000, .2000, .2000, .2000, .2000, .2000, .2000, .2000, .2000, .2000, 5, .2000, .2000, .2000, .2000, .2000, .2000, .2000, .2000, .2000, .2000, 6, .2000, .2000, .2000, .2000, .2000, .2000, .2000, .2000, .2000, .2000, 7, .2000, .2000, .2000, .2000, .2000, .2000, .2000, .2000, .2000, .2000, 8, .2000, .2000, .2000, .2000, .2000, .2000, .2000, .2000, .2000, .2000, 9, .2000, .2000, .2000, .2000, .2000, .2000, .2000, .2000, .2000, .2000, 10, .2000, .2000, .2000, .2000, .2000, .2000, .2000, .2000, .2000, .2000, 11, .2000, .2000, .2000, .2000, .2000, .2000, .2000, .2000, .2000, .2000, 12, .2000, .2000, .2000, .2000, .2000, .2000, .2000, .2000, .2000, .2000, +gp, .2000, .2000, .2000, .2000, .2000, .2000, .2000, .2000, .2000, .2000, Table 4 Natural Mortality (M) at age YEAR, 1993, 1994, 1995, 1996, 1997, 1998, 1999, 2000, 2001, 2002, AGE 3, .2662, .3986, .7439, .6475, .5179, .5229, .3050, .2621, .2473, .2786, 4, .2030, .2959, .4017, .4332, .2958, .2770, .2111, .2368, .2224, .2169, 5, .2026, .2259, .2082, .2815, .2105, .2167, .2000, .2157, .2059, .2009, 6, .2000, .2047, .2001, .2060, .2020, .2098, .2000, .2005, .2052, .2000, 7, .2000, .2000, .2000, .2000, .2000, .2000, .2000, .2000, .2000, .2000, 8, .2000, .2000, .2000, .2000, .2000, .2000, .2000, .2000, .2000, .2000, 9, .2000, .2000, .2000, .2000, .2000, .2000, .2000, .2000, .2000, .2000, 10, .2000, .2000, .2000, .2000, .2000, .2000, .2000, .2000, .2000, .2000, 11, .2000, .2000, .2000, .2000, .2000, .2000, .2000, .2000, .2000, .2000, 12, .2000, .2000, .2000, .2000, .2000, .2000, .2000, .2000, .2000, .2000, +gp, .2000, .2000, .2000, .2000, .2000, .2000, .2000, .2000, .2000, .2000,
O:\ACFM\WGREPS\AFWG\REPORTS\2003\3-Northeast Arctic Cod.Doc 95

Table 3.20 Natural mortality of cod (M2) due to cannibalism.
Year M2 age 1 M2 age 2 M2 age 3 M2 age 4 M2 age 5 M2 age 6
1984 0.2435 0.0351 0.0006 0.0000 0.0000 0.0000
1985 0.3583 0.0555 0.0004 0.0000 0.0000 0.0000
1986 0.5068 0.7908 0.1108 0.0000 0.0000 0.0000
1987 0.5205 0.7947 0.0580 0.0000 0.0000 0.0000
1988 0.7998 0.1087 0.0087 0.0000 0.0000 0.0000
1989 0.2148 0.0011 0.0000 0.0000 0.0000 0.0000
1990 0.0480 0.0587 0.0000 0.0000 0.0000 0.0000
1991 0.1023 0.2356 0.0050 0.0000 0.0000 0.0000
1992 0.4666 0.1432 0.0067 0.0000 0.0000 0.0000
1993 2.5667 0.4492 0.0662 0.0030 0.0026 0.0000
1994 1.7162 0.6302 0.1986 0.0959 0.0259 0.0047
1995 1.8704 0.9384 0.5439 0.2017 0.0082 0.0001
1996 1.9831 1.0575 0.4475 0.2332 0.0815 0.0060
1997 2.4968 1.1153 0.3179 0.0958 0.0105 0.0020
1998 1.6093 0.6414 0.3229 0.0770 0.0167 0.0098
1999 1.1286 0.3482 0.1050 0.0111 0.0000 0.0000
2000 1.3502 0.2697 0.0621 0.0368 0.0157 0.0005
2001 0.1820 0.0473 0.0224 0.0059 0.0052
2002 0.0786 0.0169 0.0009 0.0000
O:\ACFM\WGREPS\AFWG\REPORTS\2003\3-Northeast Arctic Cod.Doc 96

Table 3.21 Run title : Arctic Cod (run: SVPASA15/V15) At 30/04/2003 23:56 Traditional vpa using file input for terminal F Table 8 Fishing mortality (F) at age YEAR, 1946, 1947, 1948, 1949, 1950, 1951, 1952, AGE 3, .0061, .0018, .0003, .0023, .0020, .0254, .0225, 4, .0200, .0249, .0124, .0209, .0321, .1612, .1667, 5, .0532, .1101, .0751, .1484, .1167, .2637, .3700, 6, .0973, .2024, .1997, .3662, .2882, .2787, .5501, 7, .1781, .4160, .5201, .5101, .4096, .4122, .5311, 8, .1932, .2545, .3536, .3869, .3480, .4046, .4175, 9, .3125, .4047, .5286, .3832, .4741, .5057, .5790, 10, .2798, .4405, .3617, .3766, .5031, .5149, .7613, 11, .3432, .7827, .5536, .6259, .9031, .4585, 1.0260, 12, .3120, .6182, .4604, .5039, .7111, .4879, .9056, +gp, .3120, .6182, .4604, .5039, .7111, .4879, .9056, FBAR 5-10, .1857, .3047, .3398, .3619, .3566, .3966, .5348, FBAR 4- 8, .1084, .2016, .2322, .2865, .2389, .3041, .4071, Table 8 Fishing mortality (F) at age YEAR, 1953, 1954, 1955, 1956, 1957, 1958, 1959, 1960, 1961, 1962, AGE 3, .0334, .0199, .0159, .0270, .0240, .0718, .0535, .0543, .0562, .0663, 4, .1325, .1457, .0840, .1291, .1128, .2589, .2564, .2266, .2717, .3063, 5, .2299, .2676, .2859, .4568, .2094, .3626, .5093, .3477, .4944, .6498, 6, .3125, .3333, .5297, .6900, .4862, .5517, .5121, .4607, .5168, .8279, 7, .3243, .3969, .5139, .6129, .5494, .5357, .5251, .4363, .5279, .6094, 8, .3469, .2494, .5880, .6880, .6287, .4593, .5111, .4855, .6931, .6564, 9, .3932, .4364, .5805, .6551, .5463, .4535, .6141, .4053, .7389, .8167, 10, .5364, .6441, .7645, .7380, .6333, .7388, .6860, .7381, .8379, .9855, 11, .6980, .8035, .7621, .8756, .8584, .8415, .6511, .8449, 1.0011, .9522, 12, .6217, .7304, .7704, .8152, .7529, .7990, .6734, .7981, .9284, .9756, +gp, .6217, .7304, .7704, .8152, .7529, .7990, .6734, .7981, .9284, .9756, FBAR 5-10, .3572, .3879, .5437, .6401, .5089, .5169, .5596, .4789, .6348, .7576, FBAR 4- 8, .2692, .2786, .4003, .5154, .3973, .4337, .4628, .3914, .5008, .6100, Run title : Arctic Cod (run: SVPASA15/V15) At 30/04/2003 23:56 Traditional vpa using file input for terminal F Table 8 Fishing mortality (F) at age YEAR, 1963, 1964, 1965, 1966, 1967, 1968, 1969, 1970, 1971, 1972, AGE 3, .0313, .0174, .0226, .0398, .0298, .0251, .0230, .0409, .0214, .0394, 4, .2366, .1449, .1110, .1037, .1525, .2064, .2292, .1422, .1028, .1673, 5, .7420, .3537, .3909, .2119, .1814, .4087, .4792, .4004, .2285, .2976, 6, 1.0069, .4854, .4494, .3818, .2026, .4683, .5382, .5680, .2517, .3849, 7, .9764, .5787, .4033, .4713, .4320, .4019, .7725, .6211, .5144, .3427, 8, .8798, .7409, .5303, .5797, .6844, .5291, .9302, .8479, .8330, .6583, 9, .9416, 1.0674, .7389, .7183, .8781, .8041, 1.1783, .9682, .9584, 1.1338, 10, 1.3731, .8476, .8074, .8182, .8850, .8105, 1.0769, 1.0900, .7876, 1.3393, 11, 1.4366, 1.2968, .7617, .5024, 1.2253, .6772, 1.5554, .8533, .8388, 1.2904, 12, 1.4264, 1.0883, .7927, .6634, 1.0696, .7458, 1.3377, .9829, .8179, 1.3377, +gp, 1.4264, 1.0883, .7927, .6634, 1.0696, .7458, 1.3377, .9829, .8179, 1.3377, FBAR 5-10, .9866, .6789, .5533, .5302, .5439, .5704, .8292, .7493, .5956, .6928, FBAR 4- 8, .7683, .4607, .3770, .3497, .3306, .4029, .5899, .5159, .3861, .3702,
O:\ACFM\WGREPS\AFWG\REPORTS\2003\3-Northeast Arctic Cod.Doc 97

Table 3.21 (Continued) Table 8 Fishing mortality (F) at age YEAR, 1973, 1974, 1975, 1976, 1977, 1978, 1979, 1980, 1981, 1982, AGE 3, .1959, .2141, .0837, .1660, .1338, .1460, .0489, .0318, .0252, .0672, 4, .1996, .4959, .2106, .3121, .5671, .2234, .2090, .1296, .1003, .2121, 5, .3536, .5375, .5211, .4800, .7544, .6703, .3475, .3562, .2300, .3045, 6, .3917, .5078, .7021, .5715, .6857, .8497, .5478, .6225, .5163, .5518, 7, .4210, .4451, .7050, .6973, .6763, .8581, .6643, .6766, .8475, .7996, 8, .7375, .4863, .7032, .8908, .9121, .9296, .7789, .7123, 1.0789, .9846, 9, .9698, .5192, .6109, .7746, 1.2298, 1.3057, 1.0352, .9390, 1.2765, 1.1589, 10, .7386, .8842, .7149, .4600, .7689, 1.0301, .9848, 1.0380, 1.2299, .7508, 11, .7222, .9905, .9079, .6132, .6231, 1.8042, 1.4314, 1.4798, .9557, .9516, 12, .7358, .9492, .8218, .5389, .6958, 1.4375, 1.2219, 1.2775, 1.1082, .8607, +gp, .7358, .9492, .8218, .5389, .6958, 1.4375, 1.2219, 1.2775, 1.1082, .8607, FBAR 5-10, .6020, .5633, .6595, .6457, .8379, .9406, .7264, .7241, .8632, .7583, FBAR 4- 8, .4207, .4945, .5684, .5904, .7191, .7062, .5095, .4994, .5546, .5705, Table 8 Fishing mortality (F) at age YEAR, 1983, 1984, 1985, 1986, 1987, 1988, 1989, 1990, 1991, 1992, AGE 3, .0208, .0194, .0533, .0330, .0555, .0546, .0330, .0087, .0134, .0341, 4, .2050, .1247, .1717, .2134, .2295, .1276, .1292, .0627, .0631, .1276, 5, .3308, .3096, .3788, .4961, .5107, .3714, .2669, .1352, .1889, .2226, 6, .5033, .6301, .6078, .7079, .9366, .5979, .4030, .2322, .3228, .4449, 7, .7821, 1.1350, .9264, .9488, 1.1367, 1.0422, .7153, .2524, .4273, .5419, 8, 1.0295, 1.2083, 1.0192, 1.0911, 1.0146, .9798, .8873, .3765, .3481, .6004, 9, .9701, 1.2573, .7818, .8326, .7843, 1.1553, .7151, .3080, .3838, .4606, 10, .9204, .9564, .5088, 1.1134, 1.3248, 1.7042, .9809, .3255, .2587, .4640, 11, .5854, 1.0812, .4237, .8774, 1.0331, 1.5293, .5824, .5398, .1352, .2516, 12, .7590, 1.0346, .4666, 1.0046, 1.1901, 1.6509, .7934, .4370, .1970, .3579, +gp, .7590, 1.0346, .4666, 1.0046, 1.1901, 1.6509, .7934, .4370, .1970, .3579, FBAR 5-10, .7560, .9161, .7038, .8650, .9513, .9751, .6614, .2717, .3216, .4557, FBAR 4- 8, .5701, .6816, .6208, .6914, .7656, .6238, .4804, .2118, .2700, .3875, Table 8 Fishing mortality (F) at age YEAR, 1993, 1994, 1995, 1996, 1997, 1998, 1999, 2000, 2001, 2002,FBAR 00-02, AGE 3, .0129, .0099, .0106, .0242, .0233, .0499, .0150, .0084, .0115, .0044, .0081, 4, .0942, .1068, .1010, .1216, .2094, .2788, .2000, .0915, .0831, .0744, .0830, 5, .3464, .3156, .3298, .3331, .5651, .5156, .5547, .3960, .2538, .2048, .2849, 6, .4635, .6436, .5791, .5402, .7263, .7832, .7484, .6166, .5140, .3726, .5011, 7, .5694, 1.1663, .8930, .7541, .8477, .7812, .8401, .8052, .6978, .6310, .7113, 8, .6013, .9869, .9447, .8679, 1.2366, 1.0524, 1.0820, 1.1313, .9842, .7830, .9661, 9, .6678, 1.0559, .9638, .7577, 1.3429, 1.1800, 1.4210, 1.2641, 1.1420, .9657, 1.1240, 10, .6723, 1.0339, 1.0248, .9450, 1.5072, 1.2662, 1.4493, 1.2642, 1.3952, 1.2288, 1.2961, 11, .6870, 1.1855, 1.2232, .8812, 1.4463, 1.3338, .9978, 1.1989, 1.0450, 1.0340, 1.0926, 12, .6842, 1.1439, 1.2289, .8605, 1.5513, 1.3282, 1.1869, 1.4132, 1.3751, 1.3409, 1.3764, +gp, .6842, 1.1439, 1.2289, .8605, 1.5513, 1.3282, 1.1869, 1.4132, 1.3751, 1.3409, FBAR 5-10, .5534, .8670, .7892, .6996, 1.0376, .9298, 1.0159, .9129, .8312, .6977, FBAR 4- 8, .4150, .6438, .5695, .5233, .7170, .6822, .6851, .6081, .5066, .4132,
O:\ACFM\WGREPS\AFWG\REPORTS\2003\3-Northeast Arctic Cod.Doc 98

Table 3.22 Fishing mortality of age 1-6 cod.
Year F age 1 F age 2 F age 3 F age 4 F age 5 F age 6 1984 0.0000 0.0017 0.0192 0.1235 0.3075 0.6275 1985 0.0001 0.0015 0.0529 0.1702 0.3763 0.6052 1986 0.0001 0.0017 0.0324 0.2123 0.4934 0.7056 1987 0.0000 0.0011 0.0548 0.2287 0.5100 0.9365 1988 0.0000 0.0009 0.0542 0.1270 0.3709 0.5977 1989 0.0000 0.0009 0.0327 0.1284 0.2661 0.4025 1990 0.0000 0.0004 0.0086 0.0622 0.1343 0.2311 1991 0.0000 0.0007 0.0133 0.0623 0.1872 0.3210 1992 0.0004 0.0011 0.0337 0.1265 0.2205 0.4427 1993 0.0000 0.0006 0.0128 0.0934 0.3442 0.4597 1994 0.0000 0.0003 0.0098 0.1060 0.3136 0.6412 1995 0.0000 0.0003 0.0106 0.1004 0.3277 0.5762 1996 0.0000 0.0006 0.0241 0.1208 0.3311 0.5373 1997 0.0000 0.0007 0.0232 0.2081 0.5630 0.7245 1998 0.0000 0.0018 0.0499 0.2778 0.5138 0.7816 1999 0.0000 0.0004 0.0150 0.1991 0.5538 0.7474 2000 0.0000 0.0003 0.0084 0.0912 0.3950 0.6157 2001 0.0004 0.0114 0.0830 0.2534 0.5133 2002 0.0044 0.0744 0.2048 0.3726
O:\ACFM\WGREPS\AFWG\REPORTS\2003\3-Northeast Arctic Cod.Doc 99
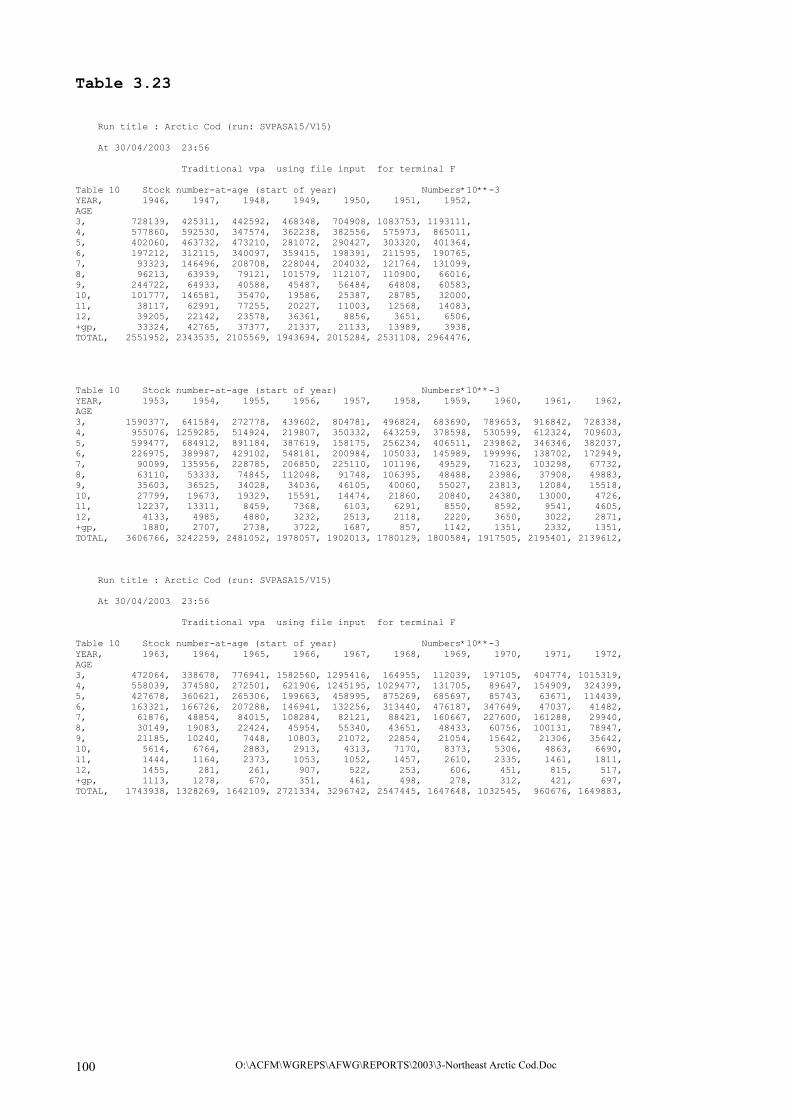
Table 3.23 Run title : Arctic Cod (run: SVPASA15/V15) At 30/04/2003 23:56 Traditional vpa using file input for terminal F Table 10 Stock number-at-age (start of year) Numbers*10**-3 YEAR, 1946, 1947, 1948, 1949, 1950, 1951, 1952, AGE 3, 728139, 425311, 442592, 468348, 704908, 1083753, 1193111, 4, 577860, 592530, 347574, 362238, 382556, 575973, 865011, 5, 402060, 463732, 473210, 281072, 290427, 303320, 401364, 6, 197212, 312115, 340097, 359415, 198391, 211595, 190765, 7, 93323, 146496, 208708, 228044, 204032, 121764, 131099, 8, 96213, 63939, 79121, 101579, 112107, 110900, 66016, 9, 244722, 64933, 40588, 45487, 56484, 64808, 60583, 10, 101777, 146581, 35470, 19586, 25387, 28785, 32000, 11, 38117, 62991, 77255, 20227, 11003, 12568, 14083, 12, 39205, 22142, 23578, 36361, 8856, 3651, 6506, +gp, 33324, 42765, 37377, 21337, 21133, 13989, 3938, TOTAL, 2551952, 2343535, 2105569, 1943694, 2015284, 2531108, 2964476, Table 10 Stock number-at-age (start of year) Numbers*10**-3 YEAR, 1953, 1954, 1955, 1956, 1957, 1958, 1959, 1960, 1961, 1962, AGE 3, 1590377, 641584, 272778, 439602, 804781, 496824, 683690, 789653, 916842, 728338, 4, 955076, 1259285, 514924, 219807, 350332, 643259, 378598, 530599, 612324, 709603, 5, 599477, 684912, 891184, 387619, 158175, 256234, 406511, 239862, 346346, 382037, 6, 226975, 389987, 429102, 548181, 200984, 105033, 145989, 199996, 138702, 172949, 7, 90099, 135956, 228785, 206850, 225110, 101196, 49529, 71623, 103298, 67732, 8, 63110, 53333, 74845, 112048, 91748, 106395, 48488, 23986, 37908, 49883, 9, 35603, 36525, 34028, 34036, 46105, 40060, 55027, 23813, 12084, 15518, 10, 27799, 19673, 19329, 15591, 14474, 21860, 20840, 24380, 13000, 4726, 11, 12237, 13311, 8459, 7368, 6103, 6291, 8550, 8592, 9541, 4605, 12, 4133, 4985, 4880, 3232, 2513, 2118, 2220, 3650, 3022, 2871, +gp, 1880, 2707, 2738, 3722, 1687, 857, 1142, 1351, 2332, 1351, TOTAL, 3606766, 3242259, 2481052, 1978057, 1902013, 1780129, 1800584, 1917505, 2195401, 2139612, Run title : Arctic Cod (run: SVPASA15/V15) At 30/04/2003 23:56 Traditional vpa using file input for terminal F Table 10 Stock number-at-age (start of year) Numbers*10**-3 YEAR, 1963, 1964, 1965, 1966, 1967, 1968, 1969, 1970, 1971, 1972, AGE 3, 472064, 338678, 776941, 1582560, 1295416, 164955, 112039, 197105, 404774, 1015319, 4, 558039, 374580, 272501, 621906, 1245195, 1029477, 131705, 89647, 154909, 324399, 5, 427678, 360621, 265306, 199663, 458995, 875269, 685697, 85743, 63671, 114439, 6, 163321, 166726, 207288, 146941, 132256, 313440, 476187, 347649, 47037, 41482, 7, 61876, 48854, 84015, 108284, 82121, 88421, 160667, 227600, 161288, 29940, 8, 30149, 19083, 22424, 45954, 55340, 43651, 48433, 60756, 100131, 78947, 9, 21185, 10240, 7448, 10803, 21072, 22854, 21054, 15642, 21306, 35642, 10, 5614, 6764, 2883, 2913, 4313, 7170, 8373, 5306, 4863, 6690, 11, 1444, 1164, 2373, 1053, 1052, 1457, 2610, 2335, 1461, 1811, 12, 1455, 281, 261, 907, 522, 253, 606, 451, 815, 517, +gp, 1113, 1278, 670, 351, 461, 498, 278, 312, 421, 697, TOTAL, 1743938, 1328269, 1642109, 2721334, 3296742, 2547445, 1647648, 1032545, 960676, 1649883,
O:\ACFM\WGREPS\AFWG\REPORTS\2003\3-Northeast Arctic Cod.Doc 100

Table 3.23 (continued) Table 10 Stock number-at-age (start of year) Numbers*10**-3 YEAR, 1973, 1974, 1975, 1976, 1977, 1978, 1979, 1980, 1981, 1982, AGE 3, 1818949, 523916, 621616, 613942, 348054, 638490, 198490, 137735, 150867, 151828, 4, 799193, 1224278, 346265, 468089, 425778, 249276, 451722, 154747, 109237, 120443, 5, 224670, 535936, 610486, 229669, 280485, 197708, 163230, 300088, 111295, 80899, 6, 69576, 129164, 256342, 296843, 116349, 108003, 82807, 94414, 172067, 72401, 7, 23112, 38504, 63643, 104000, 137232, 47987, 37806, 39202, 41481, 84063, 8, 17401, 12421, 20199, 25746, 42398, 57130, 16658, 15929, 16316, 14551, 9, 33463, 6815, 6253, 8186, 8650, 13943, 18463, 6259, 6397, 4542, 10, 9391, 10388, 3320, 2779, 3089, 2070, 3093, 5368, 2004, 1461, 11, 1435, 3673, 3513, 1330, 1436, 1172, 605, 946, 1557, 480, 12, 408, 571, 1117, 1160, 590, 631, 158, 118, 176, 490, +gp, 408, 525, 550, 572, 583, 1198, 218, 87, 66, 70, TOTAL, 2998007, 2486189, 1933303, 1752317, 1364643, 1317607, 973250, 754892, 611463, 531227, Table 10 Stock number-at-age (start of year) Numbers*10**-3 YEAR, 1983, 1984, 1985, 1986, 1987, 1988, 1989, 1990, 1991, 1992, AGE 3, 166820, 397785, 523524, 1036538, 286341, 204612, 172775, 242749, 411783, 720690, 4, 116232, 133774, 319216, 406226, 734960, 209277, 157242, 136866, 197020, 330987, 5, 79768, 77523, 96688, 220126, 268686, 478354, 150813, 113133, 105242, 151440, 6, 48847, 46916, 46569, 54201, 109738, 132012, 270130, 94548, 80909, 71337, 7, 34138, 24176, 20455, 20761, 21862, 35217, 59442, 147803, 61368, 47966, 8, 30937, 12785, 6362, 6631, 6582, 5744, 10169, 23800, 94018, 32772, 9, 4451, 9047, 3127, 1880, 1823, 1954, 1765, 3428, 13373, 54349, 10, 1167, 1381, 2107, 1171, 669, 681, 504, 707, 2063, 7459, 11, 565, 381, 435, 1037, 315, 146, 101, 155, 418, 1304, 12, 152, 257, 106, 233, 353, 92, 26, 46, 74, 299, +gp, 170, 116, 208, 130, 156, 82, 56, 40, 25, 47, TOTAL, 483247, 704143, 1018797, 1748935, 1431486, 1068171, 823024, 763275, 966292, 1418649, Table 10 Stock number-at-age (start of year) Numbers*10**-3 YEAR, 1993, 1994, 1995, 1996, 1997, 1998, 1999, 2000, 2001, 2002, 2003,GMST 46-00,AMST 46-00, AGE 3, 894155, 806823, 655968, 434591, 713845, 840213, 584058, 640598, 498208, 497625, 0, 498730, 612877, 4, 566467, 676371, 536273, 308468, 222009, 415507, 473856, 424110, 488787, 384609, 374970, 376569, 461705, 5, 238525, 420808, 452178, 324376, 177124, 133962, 238337, 314123, 305409, 360100, 287415, 258196, 314187, 6, 99244, 137759, 244858, 264038, 175448, 81553, 64408, 112055, 170394, 192858, 240010, 147532, 180770, 7, 37430, 51114, 58982, 112339, 125200, 69342, 30212, 24948, 49494, 83005, 108783, 72911, 92118, 8, 22842, 17342, 13036, 19772, 43270, 43914, 25993, 10678, 9130, 20167, 36158, 33046, 44762, 9, 14720, 10250, 5292, 4150, 6796, 10287, 12552, 7212, 2821, 2794, 7546, 14296, 25038, 10, 28073, 6181, 2919, 1653, 1593, 1453, 2588, 2481, 1668, 737, 871, 5633, 13345, 11, 3840, 11734, 1800, 858, 526, 289, 335, 497, 574, 338, 177, 2129, 6890, 12, 830, 1581, 2936, 434, 291, 101, 62, 101, 123, 165, 99, 782, 3516, +gp, 189, 229, 404, 1685, 523, 172, 112, 37, 51, 50, 46, TOTAL,1906314, 2140190, 1974647, 1472364, 1466626, 1596792, 1432514, 1536842, 1526658, 1542448, 1056075,
O:\ACFM\WGREPS\AFWG\REPORTS\2003\3-Northeast Arctic Cod.Doc 101

Table 3.24 Run title : Arctic Cod (run: SVPASA15/V15) At 30/04/2003 23:56 Traditional vpa using file input for terminal F Table 12 Stock biomass at age (start of year) Tonnes YEAR, 1946, 1947, 1948, 1949, 1950, 1951, 1952, AGE 3, 254849, 136099, 150481, 173289, 274914, 433501, 524969, 4, 340937, 331817, 184214, 242699, 244836, 478058, 692009, 5, 446286, 440545, 596245, 311990, 374651, 421615, 533814, 6, 333289, 468173, 656387, 596629, 337265, 397799, 366270, 7, 221176, 313502, 513421, 570111, 481515, 309280, 346101, 8, 304996, 186702, 265846, 328099, 390132, 383714, 244919, 9, 973994, 237005, 171279, 185131, 255308, 316264, 306548, 10, 513974, 668411, 188345, 103218, 142673, 149682, 193600, 11, 225651, 367868, 457348, 121160, 70420, 89737, 104495, 12, 282275, 164292, 167165, 257435, 70497, 30013, 54844, +gp, 271456, 378386, 315087, 175349, 187892, 131347, 40110, TOTALBIO, 4168882, 3692801, 3665819, 3065111, 2830103, 3141009, 3407679, Table 12 Stock biomass at age (start of year) Tonnes YEAR, 1953, 1954, 1955, 1956, 1957, 1958, 1959, 1960, 1961, 1962, AGE 3, 636151, 282297, 87289, 145069, 265578, 168920, 239291, 268482, 284221, 233068, 4, 725857, 969649, 293507, 127488, 206696, 334495, 272591, 270606, 336778, 390282, 5, 767331, 862989, 1007038, 414753, 161338, 243423, 597571, 261449, 363663, 355294, 6, 438062, 768275, 742347, 1003170, 365792, 201664, 391251, 425991, 305145, 294013, 7, 253178, 411947, 629160, 597796, 650567, 297518, 177809, 242086, 333654, 205229, 8, 234769, 230934, 294890, 476204, 392683, 447924, 209470, 116810, 193710, 250910, 9, 180151, 197233, 166739, 188902, 253117, 224738, 299899, 145737, 74320, 101645, 10, 176245, 132792, 136079, 113501, 108698, 160673, 134210, 206985, 105953, 36390, 11, 90555, 103693, 60902, 58944, 50286, 54540, 61300, 66934, 82819, 42684, 12, 35831, 53190, 42844, 26988, 23247, 20287, 19159, 30297, 29013, 30314, +gp, 19247, 26204, 27591, 37015, 17892, 9967, 13275, 15429, 27875, 17178, TOTALBIO, 3557376, 4039204, 3488383, 3189831, 2495895, 2164149, 2415826, 2050805, 2137149, 1957006, Run title : Arctic Cod (run: SVPASA15/V15) At 30/04/2003 23:56 Traditional vpa using file input for terminal F Table 12 Stock biomass at age (start of year) Tonnes YEAR, 1963, 1964, 1965, 1966, 1967, 1968, 1969, 1970, 1971, 1972, AGE 3, 151061, 111764, 295238, 696327, 375671, 54435, 49297, 72929, 182148, 385821, 4, 340404, 206019, 185301, 460210, 1008608, 720634, 104047, 81578, 136320, 249787, 5, 410571, 342590, 273265, 235602, 619644, 1295399, 843407, 114895, 87866, 163647, 6, 282545, 310111, 308859, 261555, 269803, 664492, 966659, 695298, 101599, 87943, 7, 188104, 158775, 202475, 266378, 230760, 277642, 465934, 682799, 495154, 96707, 8, 149537, 94841, 78931, 175545, 192584, 183771, 184531, 252138, 422555, 345787, 9, 136428, 65640, 42675, 57905, 103040, 120443, 105690, 87437, 123791, 207793, 10, 44408, 54588, 21740, 21174, 30662, 47678, 53839, 40323, 34676, 50977, 11, 13894, 10875, 20098, 9087, 9500, 13129, 21742, 20948, 12590, 17245, 12, 16454, 2856, 2911, 9669, 5524, 2444, 6492, 4958, 8822, 6248, +gp, 14173, 16470, 9201, 4967, 6369, 7389, 3953, 4396, 5449, 9529, TOTALBIO, 1747579, 1374529, 1440693, 2198418, 2852164, 3387455, 2805591, 2057698, 1610969, 1621485,
O:\ACFM\WGREPS\AFWG\REPORTS\2003\3-Northeast Arctic Cod.Doc 102

Table 3.24 (continued) Table 12 Stock biomass at age (start of year) Tonnes YEAR, 1973, 1974, 1975, 1976, 1977, 1978, 1979, 1980, 1981, 1982, AGE 3, 691201, 167653, 254863, 214880, 170547, 312860, 69471, 37188, 73925, 56176, 4, 727266, 808024, 221610, 341705, 383200, 201913, 316205, 86658, 107052, 79493, 5, 345992, 627045, 677639, 273307, 401093, 286676, 202406, 306090, 160265, 109213, 6, 157241, 286743, 487049, 596655, 238515, 232207, 177207, 162392, 359620, 144077, 7, 76038, 123596, 187748, 287041, 452865, 145879, 119088, 118389, 123613, 246303, 8, 80219, 54527, 88269, 108649, 193334, 254800, 71461, 66900, 79133, 61698, 9, 219854, 37616, 35894, 48132, 55876, 91184, 121484, 36552, 42028, 29339, 10, 78601, 81651, 29113, 25849, 26656, 16521, 26635, 38975, 18354, 12436, 11, 15127, 36074, 34848, 13669, 14264, 11898, 5579, 8362, 16843, 5870, 12, 4742, 6512, 13192, 13760, 6427, 6843, 1720, 1099, 1899, 5283, +gp, 5674, 6947, 7206, 7750, 7970, 15783, 3124, 1256, 924, 979, TOTBIO, 2401955, 2236387, 2037430, 1931396, 1950748, 1576565, 1114380, 863861, 983656, 750868, Table 12 Stock biomass at age (start of year) Tonnes YEAR, 1983, 1984, 1985, 1986, 1987, 1988, 1989, 1990, 1991, 1992, AGE 3, 61724, 167070, 214645, 321327, 54405, 42969, 51833, 97099, 213304, 317104, 4, 106934, 155178, 280911, 357479, 374830, 83711, 81766, 97175, 223814, 308149, 5, 127629, 140317, 154701, 323585, 343919, 377899, 131207, 133497, 183437, 274410, 6, 119188, 130895, 130858, 133876, 212891, 250822, 399793, 162622, 196448, 193750, 7, 130406, 91385, 83046, 81385, 71709, 104948, 159899, 363596, 197236, 186826, 8, 147261, 58429, 37091, 38527, 34028, 25215, 47084, 84967, 426654, 169626, 9, 27463, 55823, 24044, 12369, 11889, 15259, 12445, 16148, 92003, 368160, 10, 8986, 10636, 21322, 8001, 6225, 8252, 5028, 5514, 22111, 71588, 11, 5224, 3521, 6210, 11408, 4142, 1910, 939, 1386, 3948, 16203, 12, 1645, 2794, 1147, 2527, 3831, 996, 280, 504, 801, 3243, +gp, 2209, 1513, 2796, 1768, 2151, 1074, 806, 540, 347, 647, TOTBIO, 738666, 817561, 956772, 1292252, 1120019, 913053, 891080, 963046, 1560102, 1909707, Table 12 Stock biomass at age (start of year) Tonnes YEAR, 1993, 1994, 1995, 1996, 1997, 1998, 1999, 2000, 2001, 2002, AGE 3, 307589, 189603, 131850, 84745, 144197, 182326, 118564, 124276, 141989, 124904, 4, 663899, 509307, 260093, 150224, 115667, 221465, 246405, 197211, 255147, 232688, 5, 434115, 597547, 515483, 334432, 191117, 155530, 279807, 379461, 364658, 427078, 6, 280167, 332412, 518609, 542335, 329492, 158130, 130813, 220972, 380149, 406930, 7, 150880, 195511, 204669, 395996, 421798, 204212, 91664, 76042, 163628, 274912, 8, 125560, 93923, 64373, 108803, 227732, 200865, 116034, 43737, 46106, 95209, 9, 99579, 67967, 37892, 32230, 60671, 76357, 81362, 41284, 17984, 19182, 10, 240613, 47159, 26623, 16791, 19356, 15060, 26574, 18504, 15205, 6695, 11, 41648, 95185, 18177, 9152, 5692, 3390, 3649, 4765, 6469, 3454, 12, 9006, 17159, 31854, 4705, 3157, 1100, 676, 1098, 1332, 1793, +gp, 2440, 2919, 5138, 21294, 6998, 2389, 1536, 515, 726, 646, TOTBIO, 2355498, 2148691, 1814760, 1700706, 1525878, 1220825, 1097084, 1107866, 1393393, 1593491,
O:\ACFM\WGREPS\AFWG\REPORTS\2003\3-Northeast Arctic Cod.Doc 103

Table 3.25 Run title : Arctic Cod (run: SVPASA15/V15) At 30/04/2003 23:56 Traditional vpa using file input for terminal F Table 13 Spawning stock biomass at age (spawning time) Tonnes YEAR, 1946, 1947, 1948, 1949, 1950, 1951, 1952, AGE 3, 0, 0, 0, 0, 0, 0, 0, 4, 0, 0, 0, 0, 0, 0, 0, 5, 4463, 4405, 5962, 3120, 3747, 4216, 5338, 6, 9999, 14045, 19692, 17899, 10118, 11934, 10988, 7, 13271, 18810, 35939, 51310, 43336, 30928, 27688, 8, 33550, 24271, 34560, 55777, 89730, 92091, 53882, 9, 175319, 37921, 42820, 53688, 89358, 126506, 125685, 10, 226148, 280733, 88522, 55738, 74190, 86815, 121968, 11, 146673, 275901, 333864, 95716, 55632, 64611, 85686, 12, 242756, 149506, 152120, 226543, 66972, 25511, 50457, +gp, 260598, 359467, 305634, 170088, 182256, 126093, 38907, TOTSPBIO, 1112776, 1165059, 1019114, 729879, 615339, 568705, 520599, Table 13 Spawning stock biomass at age (spawning time) Tonnes YEAR, 1953, 1954, 1955, 1956, 1957, 1958, 1959, 1960, 1961, 1962, AGE 3, 0, 0, 0, 0, 0, 0, 0, 0, 0, 0, 4, 0, 0, 0, 0, 0, 0, 0, 2706, 0, 0, 5, 7673, 8630, 10070, 4148, 1613, 2434, 5976, 7843, 3637, 3553, 6, 13142, 23048, 22270, 30095, 10974, 6050, 15650, 25559, 18309, 14701, 7, 17722, 32956, 44041, 35868, 39034, 17851, 21337, 24209, 40038, 30784, 8, 44606, 36949, 38336, 57144, 35341, 44792, 71220, 22194, 60050, 85309, 9, 72060, 72976, 43352, 26446, 30374, 22474, 146950, 65582, 48308, 62004, 10, 112796, 90299, 72122, 46535, 23914, 48202, 89921, 142819, 96417, 29476, 11, 76066, 90213, 50549, 39492, 30172, 27270, 51492, 51539, 81163, 39269, 12, 33681, 49467, 39416, 24559, 19063, 16635, 16668, 25753, 28433, 29404, +gp, 18670, 25156, 26763, 35534, 17356, 9668, 13275, 15274, 27875, 17178, TOTSPBIO, 396417, 429694, 346919, 299823, 207840, 195377, 432489, 383479, 404228, 311678, Run title : Arctic Cod (run: SVPASA15/V15) At 30/04/2003 23:56 Traditional vpa using file input for terminal F Table 13 Spawning stock biomass at age (spawning time) Tonnes YEAR, 1963, 1964, 1965, 1966, 1967, 1968, 1969, 1970, 1971, 1972, AGE 3, 0, 0, 0, 0, 0, 0, 0, 0, 0, 3858, 4, 3404, 0, 0, 0, 0, 0, 0, 816, 0, 4996, 5, 4106, 0, 0, 2356, 0, 38862, 0, 0, 879, 3273, 6, 8476, 9303, 3089, 5231, 8094, 33225, 19333, 6953, 5080, 879, 7, 13167, 20641, 12149, 15983, 16153, 24988, 18637, 47796, 54467, 9671, 8, 41870, 35091, 15786, 38620, 26962, 34917, 22144, 57992, 126766, 117567, 9, 57300, 43323, 23471, 20267, 39155, 46973, 35935, 50714, 73036, 132988, 10, 35970, 48583, 15870, 15669, 19624, 27653, 29611, 32662, 27394, 41292, 11, 13616, 10332, 19897, 8542, 8455, 10766, 16089, 18644, 10827, 16210, 12, 16125, 2828, 2853, 9089, 4972, 2444, 6167, 4512, 7763, 6248, +gp, 14173, 16470, 9201, 4967, 6369, 7389, 3953, 4396, 5449, 9529, TOTSPBIO, 208207, 186570, 102315, 120722, 129784, 227215, 151870, 224482, 311662, 346511,
O:\ACFM\WGREPS\AFWG\REPORTS\2003\3-Northeast Arctic Cod.Doc 104

Table 3.25 (continued) Table 13 Spawning stock biomass at age (spawning time) Tonnes YEAR, 1973, 1974, 1975, 1976, 1977, 1978, 1979, 1980, 1981, 1982, AGE 3, 0, 0, 0, 0, 0, 0, 0, 0, 0, 0, 4, 0, 0, 0, 0, 0, 0, 0, 0, 0, 3975, 5, 0, 0, 6776, 0, 8022, 0, 0, 0, 3205, 10921, 6, 3145, 2867, 9741, 29833, 19081, 4644, 5316, 3248, 25173, 48986, 7, 12166, 3708, 16897, 34445, 117745, 18964, 15481, 15391, 24723, 160097, 8, 42516, 11451, 18536, 31508, 104400, 112112, 27870, 23415, 42732, 50592, 9, 178082, 18808, 20100, 21659, 42466, 64741, 93543, 23759, 33622, 26992, 10, 72313, 78385, 22708, 21713, 23191, 12721, 23705, 31960, 17804, 12436, 11, 14370, 36074, 27530, 11345, 13266, 9637, 4630, 8362, 16843, 5870, 12, 4647, 6251, 12532, 13760, 6041, 6090, 1342, 989, 1899, 5283, +gp, 5674, 6947, 7206, 6975, 7173, 12626, 2812, 1130, 924, 979, TOTSPBI 332913, 164491, 142028, 171238, 341385, 241536, 174699, 108253, 166925, 326132, Table 13 Spawning stock biomass at age (spawning time) Tonnes YEAR, 1983, 1984, 1985, 1986, 1987, 1988, 1989, 1990, 1991, 1992, AGE 3, 617, 0, 0, 0, 0, 0, 0, 0, 0, 3171, 4, 8555, 7759, 2809, 17874, 3748, 1674, 0, 972, 8953, 3081, 5, 12763, 25257, 13923, 25887, 24074, 18895, 6560, 6675, 11006, 32929, 6, 35756, 40577, 47109, 25437, 38320, 82771, 71963, 34151, 55005, 83312, 7, 95196, 51176, 45675, 43134, 15776, 55622, 65559, 210885, 128203, 140119, 8, 129590, 52586, 31528, 27354, 15653, 15633, 32488, 65424, 354123, 157752, 9, 26639, 55265, 23083, 7669, 5944, 15259, 10578, 13887, 89243, 357115, 10, 8986, 10636, 19190, 7200, 4669, 8252, 5028, 5404, 22111, 71588, 11, 5224, 3521, 6210, 11408, 4142, 1910, 939, 1386, 3948, 16203, 12, 1645, 2794, 1147, 2527, 3831, 996, 280, 504, 801, 3243, +gp, 2209, 1513, 2796, 1768, 2151, 1074, 806, 540, 347, 647, TOTSPBIO, 327179, 251084, 193470, 170258, 118309, 202086, 194201, 339827, 673740, 869164, Table 13 Spawning stock biomass at age (spawning time) Tonnes YEAR, 1993, 1994, 1995, 1996, 1997, 1998, 1999, 2000, 2001, 2002, AGE 3, 0, 0, 0, 0, 0, 0, 0, 0, 0, 0, 4, 19917, 5093, 0, 0, 0, 2215, 0, 0, 2551, 2327, 5, 39070, 65730, 36084, 6689, 3822, 6221, 2798, 22768, 18233, 34166, 6, 84050, 109696, 171141, 141007, 46129, 30045, 13081, 48614, 129251, 162772, 7, 92037, 117307, 126895, 249478, 236207, 89853, 41249, 48667, 94904, 192439, 8, 114260, 76077, 47636, 90306, 186740, 164709, 91667, 36302, 35502, 81880, 9, 96592, 65928, 35998, 31585, 57638, 71012, 71598, 40046, 17624, 18798, 10, 238207, 46687, 26090, 16791, 18388, 14759, 26574, 18504, 15205, 6695, 11, 41648, 94233, 18177, 9152, 5408, 3390, 3649, 4765, 6275, 3454, 12, 9006, 17159, 31854, 4705, 3157, 1100, 676, 1098, 1332, 1793, +gp, 2440, 2919, 5138, 21294, 6998, 2389, 1536, 515, 726, 646, TOTSPBIO, 737227, 600829, 499012, 571006, 564488, 385694, 252829, 221278, 321602, 504969,
O:\ACFM\WGREPS\AFWG\REPORTS\2003\3-Northeast Arctic Cod.Doc 105

Table 3.26 Run title : Arctic Cod (run: SVPASA15/V15) , At 30/04/2003 23:56 Table 16 Summary (without SOP correction) Traditional vpa using file input for terminal F RECRUITS, TOTALBIO, TOTSPBIO, LANDINGS, YIELD/SSB, FBAR 5-10, FBAR 4- 8, Age 3 1946, 728139, 4168882, 1112776, 706000, .6344, .1857, .1084, 1947, 425311, 3692801, 1165059, 882017, .7571, .3047, .2016, 1948, 442592, 3665819, 1019114, 774295, .7598, .3398, .2322, 1949, 468348, 3065111, 729879, 800122, 1.0962, .3619, .2865, 1950, 704908, 2830103, 615339, 731982, 1.1896, .3566, .2389, 1951, 1083753, 3141009, 568705, 827180, 1.4545, .3966, .3041, 1952, 1193111, 3407679, 520599, 876795, 1.6842, .5348, .4071, 1953, 1590377, 3557376, 396417, 695546, 1.7546, .3572, .2692, 1954, 641584, 4039204, 429694, 826021, 1.9223, .3879, .2786, 1955, 272778, 3488383, 346919, 1147841, 3.3087, .5437, .4003, 1956, 439602, 3189831, 299823, 1343068, 4.4795, .6401, .5154, 1957, 804781, 2495895, 207840, 792557, 3.8133, .5089, .3973, 1958, 496824, 2164149, 195377, 769313, 3.9376, .5169, .4337, 1959, 683690, 2415826, 432489, 744607, 1.7217, .5596, .4628, 1960, 789653, 2050805, 383479, 622042, 1.6221, .4789, .3914, 1961, 916842, 2137149, 404228, 783221, 1.9376, .6348, .5008, 1962, 728338, 1957006, 311678, 909266, 2.9173, .7576, .6100, 1963, 472064, 1747579, 208207, 776337, 3.7287, .9866, .7683, 1964, 338678, 1374529, 186570, 437695, 2.3460, .6789, .4607, 1965, 776941, 1440693, 102315, 444930, 4.3486, .5533, .3770, 1966, 1582560, 2198418, 120722, 483711, 4.0068, .5302, .3497, 1967, 1295416, 2852164, 129784, 572605, 4.4120, .5439, .3306, 1968, 164955, 3387455, 227215, 1074084, 4.7272, .5704, .4029, 1969, 112039, 2805591, 151870, 1197226, 7.8832, .8292, .5899, 1970, 197105, 2057698, 224482, 933246, 4.1573, .7493, .5159, 1971, 404774, 1610969, 311662, 689048, 2.2109, .5956, .3861, 1972, 1015319, 1621485, 346511, 565254, 1.6313, .6928, .3702, 1973, 1818949, 2401955, 332913, 792685, 2.3811, .6020, .4207, 1974, 523916, 2236387, 164491, 1102433, 6.7021, .5633, .4945, 1975, 621616, 2037430, 142028, 829377, 5.8395, .6595, .5684, 1976, 613942, 1931396, 171238, 867463, 5.0658, .6457, .5904, 1977, 348054, 1950748, 341385, 905301, 2.6518, .8379, .7191, 1978, 638490, 1576565, 241536, 698715, 2.8928, .9406, .7062, 1979, 198490, 1114380, 174699, 440538, 2.5217, .7264, .5095, 1980, 137735, 863861, 108253, 380434, 3.5143, .7241, .4994, 1981, 150867, 983656, 166925, 399038, 2.3905, .8632, .5546, 1982, 151828, 750868, 326132, 363730, 1.1153, .7583, .5705, 1983, 166820, 738666, 327179, 289992, .8863, .7560, .5701, 1984, 397785, 817561, 251084, 277651, 1.1058, .9161, .6816, 1985, 523524, 956772, 193470, 307920, 1.5916, .7038, .6208, 1986, 1036538, 1292252, 170258, 430113, 2.5262, .8650, .6914, 1987, 286341, 1120019, 118309, 523071, 4.4212, .9513, .7656, 1988, 204612, 913053, 202086, 434939, 2.1522, .9751, .6238, 1989, 172775, 891080, 194201, 332481, 1.7120, .6614, .4804, 1990, 242749, 963046, 339827, 212000, .6238, .2717, .2118, 1991, 411783, 1560102, 673740, 319158, .4737, .3216, .2700, 1992, 720690, 1909707, 869164, 513234, .5905, .4557, .3875, 1993, 894155, 2355498, 737227, 581611, .7889, .5534, .4150, 1994, 806823, 2148691, 600829, 771086, 1.2834, .8670, .6438, 1995, 655968, 1814760, 499012, 739999, 1.4829, .7892, .5695, 1996, 434591, 1700706, 571006, 732228, 1.2823, .6996, .5233, 1997, 713845, 1525878, 564488, 762403, 1.3506, 1.0376, .7170, 1998, 840213, 1220825, 385694, 592624, 1.5365, .9298, .6822, 1999, 584058, 1097084, 252829, 484910, 1.9179, 1.0159, .6851, 2000, 640598, 1107866, 221278, 414868, 1.8749, .9129, .6081, 2001, 498208, 1393393, 321602, 426471, 1.3261, .8312, .5066, 2002, 497625, 1593491, 504969, 445060, .8814, .6977, .4132, Arith. Mean, 608843, 2026865, 373975, 662764, 2.4443, .6514, .4788, Units, (Thousands), (Tonnes), (Tonnes), (Tonnes),
O:\ACFM\WGREPS\AFWG\REPORTS\2003\3-Northeast Arctic Cod.Doc 106

Table 3.27 Summary, no cannibalism included. Table 16 Summary (without SOP correction) Traditional vpa using file input for terminal F RECRUITS TOTALBIO TOTSPBIO LANDINGS YIELD/SSB FBAR 5-10 FBAR 4- 8 Age 3
1946 728139 4168882 1112776 706000 0.6344 0.1857 0.1084 1947 425311 3692801 1165059 882017 0.7571 0.3047 0.2016 1948 442592 3665819 1019114 774295 0.7598 0.3398 0.2322 1949 468348 3065111 729879 800122 1.0962 0.3619 0.2865 1950 704908 2830103 615339 731982 1.1896 0.3566 0.2389 1951 1083753 3141009 568705 827180 1.4545 0.3966 0.3041 1952 1193111 3407679 520599 876795 1.6842 0.5348 0.4071 1953 1590377 3557376 396417 695546 1.7546 0.3572 0.2692 1954 641584 4039204 429694 826021 1.9223 0.3879 0.2786 1955 272778 3488383 346919 1147841 3.3087 0.5437 0.4003 1956 439602 3189831 299823 1343068 4.4795 0.6401 0.5154 1957 804781 2495895 207840 792557 3.8133 0.5089 0.3973 1958 496824 2164149 195377 769313 3.9376 0.5169 0.4337 1959 683690 2415826 432489 744607 1.7217 0.5596 0.4628 1960 789653 2050805 383479 622042 1.6221 0.4789 0.3914 1961 916842 2137149 404228 783221 1.9376 0.6348 0.5008 1962 728338 1957006 311678 909266 2.9173 0.7576 0.61 1963 472064 1747579 208207 776337 3.7287 0.9866 0.7683 1964 338678 1374529 186570 437695 2.346 0.6789 0.4607 1965 776941 1440693 102315 444930 4.3486 0.5533 0.377 1966 1582560 2198418 120722 483711 4.0068 0.5302 0.3497 1967 1295416 2852164 129784 572605 4.412 0.5439 0.3306 1968 164955 3387455 227215 1074084 4.7272 0.5704 0.4029 1969 112039 2805591 151870 1197226 7.8832 0.8292 0.5899 1970 197105 2057698 224482 933246 4.1573 0.7493 0.5159 1971 404774 1610969 311662 689048 2.2109 0.5956 0.3861 1972 1015319 1621485 346511 565254 1.6313 0.6928 0.3702 1973 1818949 2401955 332913 792685 2.3811 0.602 0.4207 1974 523916 2236387 164491 1102433 6.7021 0.5633 0.4945 1975 621616 2037430 142028 829377 5.8395 0.6595 0.5684 1976 613942 1931396 171238 867463 5.0658 0.6457 0.5904 1977 348054 1950748 341385 905301 2.6518 0.8379 0.7191 1978 638490 1576565 241536 698715 2.8928 0.9406 0.7062 1979 198490 1114380 174699 440538 2.5217 0.7264 0.5095 1980 137735 863861 108253 380434 3.5143 0.7241 0.4994 1981 150867 983656 166925 399038 2.3905 0.8632 0.5546 1982 151828 750868 326132 363730 1.1153 0.7583 0.5705 1983 166820 738666 327179 289992 0.8863 0.756 0.5701 1984 397549 817461 251084 277651 1.1058 0.9161 0.6816 1985 523321 956688 193470 307920 1.5916 0.7038 0.6208 1986 929624 1259109 170258 430113 2.5262 0.865 0.6914 1987 270655 1117038 118309 523071 4.4212 0.9513 0.7656 1988 202889 912691 202086 434939 2.1522 0.9751 0.6238 1989 172775 891080 194201 332481 1.712 0.6614 0.4804 1990 242749 963046 339827 212000 0.6238 0.2717 0.2118 1991 408102 1558196 673740 319158 0.4737 0.3216 0.27 1992 700238 1899457 869061 513234 0.5906 0.4557 0.3876 1993 758776 2291839 736594 581611 0.7896 0.5537 0.4157 1994 515805 2017694 598529 771086 1.2883 0.8679 0.6461 1995 305220 1680824 498631 739999 1.4841 0.7896 0.5737 1996 254712 1609946 569908 732228 1.2848 0.7021 0.5296 1997 488820 1467101 564378 762403 1.3509 1.0386 0.7207 1998 600884 1151504 385269 592624 1.5382 0.9309 0.6857 1999 506060 1075642 252828 484910 1.9179 1.016 0.6859 2000 589292 1084258 220908 414868 1.878 0.9136 0.6094 2001 471559 1376865 320932 426471 1.3289 0.8315 0.5072 2002 479211 1586824 504936 445060 0.8814 0.6977 0.4132
Arith. Mean 578236 2015207 373868 662764 2.4446 0.6515 0.4792 0 Units (Thousands) (Tonnes) (Tonnes) (Tonnes)
O:\ACFM\WGREPS\AFWG\REPORTS\2003\3-Northeast Arctic Cod.Doc 107

Table 3.28 Short-term prediction input
MFDP version 1aRun: 84_Time and date: 13:47 01.05.2003Fbar age range: 5-10
2003Age N M Mat PF PM SWt Sel CWt
3 681000 0.279 0 0 0 0.23 0.007 0.6944 374970 0.217 0 0 0 0.537 0.071 1.1215 287415 0.201 0.101 0 0 1.312 0.244 1.6526 240010 0.2 0.365 0 0 2.015 0.43 2.2967 108783 0.2 0.628 0 0 3.255 0.61 3.378 36158 0.2 0.879 0 0 4.974 0.828 5.0029 7546 0.2 0.927 0 0 6.731 0.964 6.28
10 871 0.2 1 0 0 8.696 1.111 7.6811 177 0.2 0.953 0 0 10.403 0.937 9.112 99 0.2 1 0 0 11.785 1.18 10.5413 46 0.2 1 0 0 14.43 1.18 9.62
2004Age N M Mat PF PM SWt Sel CWt
3 308000 0.279 0 0 0 0.232 0.007 0.6944 . 0.217 0.014 0 0 0.535 0.071 1.1215 . 0.201 0.07 0 0 1.188 0.244 1.6526 . 0.2 0.272 0 0 2.194 0.43 2.2967 . 0.2 0.562 0 0 3.197 0.61 3.378 . 0.2 0.791 0 0 4.835 0.828 5.0029 . 0.2 0.91 0 0 6.553 0.964 6.28
10 . 0.2 0.971 0 0 8.31 1.111 7.6811 . 0.2 0.993 0 0 10.275 0.937 9.112 . 0.2 1 0 0 11.982 1.18 10.5413 . 0.2 1 0 0 13.364 1.18 9.62
2005Age N M Mat PF PM SWt Sel CWt
3 664000 0.279 0 0 0 0.232 0.007 0.6944 . 0.217 0.014 0 0 0.535 0.071 1.1215 . 0.201 0.07 0 0 1.188 0.244 1.6526 . 0.2 0.272 0 0 2.194 0.43 2.2967 . 0.2 0.562 0 0 3.197 0.61 3.378 . 0.2 0.791 0 0 4.835 0.828 5.0029 . 0.2 0.91 0 0 6.553 0.964 6.28
10 . 0.2 0.971 0 0 8.31 1.111 7.6811 . 0.2 0.993 0 0 10.275 0.937 9.112 . 0.2 1 0 0 11.982 1.18 10.5413 . 0.2 1 0 0 13.364 1.18 9.62
Input units are thousands and kg - output in tonnes
O:\ACFM\WGREPS\AFWG\REPORTS\2003\3-Northeast Arctic Cod.Doc 108

Table 3.29. Management option table
MFDP version 1aRun: 84_1MFDP Index file 30.04.2003Time and date: 13:47 01.05.2003Fbar age range: 5-10
2003Biomass SSB FMult FBar Landings1814674 653307 1.0000 0.6978 577934
2004 2005Biomass SSB FMult FBar Landings Biomass SSB1833819 651579 0.0000 0.0000 0 2631332 1189133
. 651579 0.0600 0.0419 48200 2572401 1147989
. 651579 0.1200 0.0837 94777 2515533 1108485
. 651579 0.1800 0.1256 139798 2460645 1070551
. 651579 0.2400 0.1675 183324 2407655 1034118
. 651579 0.3000 0.2094 225416 2356488 999121
. 651579 0.3600 0.2512 266130 2307069 965497
. 651579 0.4200 0.2931 305522 2259328 933189
. 651579 0.4800 0.3350 343643 2213199 902138
. 651579 0.5400 0.3768 380544 2168617 872292
. 651579 0.6000 0.4187 416271 2125520 843600
. 651579 0.6600 0.4606 450871 2083851 816011
. 651579 0.7200 0.5024 484388 2043552 789480
. 651579 0.7800 0.5443 516862 2004571 763961
. 651579 0.8400 0.5862 548335 1966856 739412
. 651579 0.9000 0.6281 578844 1930357 715792
. 651579 0.9600 0.6699 608426 1895029 693063
. 651579 1.0200 0.7118 637117 1860825 671187
. 651579 1.0800 0.7537 664949 1827703 650129
. 651579 1.1400 0.7955 691954 1795621 629855
. 651579 1.2000 0.8374 718165 1764541 610332
Input units are thousands and kg - output in tonnes
O:\ACFM\WGREPS\AFWG\REPORTS\2003\3-Northeast Arctic Cod.Doc 109

Table 3.30
Single option prediction: Detailed tables MFDP version 1a Run: 222 Time and date: 12:16 02.05.2003 Fbar age range: 5-10 version 1a Input units are thousands and kg - output in tonnes Year: 2003 F multiplier: 1 Fbar: 0.6978 Age F CatchNos Yield StockNos Biomass SSNos SSB SSNos SSB (JAN) (JAN) (ST) (ST) 3 0.0070 4146 2877 681000 156630 0 0 0 0 4 0.0710 23132 25931 374970 201359 0 0 0 0 5 0.2440 56604 93510 287415 377088 29029 38086 29029 38086 6 0.4300 76569 175803 240010 483620 87604 176521 87604 176521 7 0.6100 45479 153264 108783 354089 68316 222368 68316 222368 8 0.8280 18705 93564 36158 179850 31783 158088 31783 158088 9 0.9640 4298 26992 7546 50792 6995 47084 6995 47084 10 1.1110 539 4141 871 7574 871 7574 871 7574 11 0.9370 99 902 177 1841 169 1755 169 1755 12 1.1800 63 668 99 1167 99 1167 99 1167 13 1.1800 29 283 46 664 46 664 46 664 Total 229664 577934 1737075 1814674 224911 653307 224911 653307 Year: 2004 F multiplier: 0.5732 Fbar: 0.4 Age F CatchNos Yield StockNos Biomass SSNos SSB SSNos SSB (JAN) (JAN) (ST) (ST) 3 0.0040 1076 747 308000 71456 0 0 0 0 4 0.0407 18355 20576 511610 273711 7163 3832 7163 3832 5 0.1399 33320 55044 281138 333992 19680 23379 19680 23379 6 0.2465 36616 84071 184183 404096 50098 109914 50098 109914 7 0.3497 34384 115874 127827 408664 71839 229669 71839 229669 8 0.4746 16705 83556 48393 233980 38279 185078 38279 185078 9 0.5526 5022 31541 12935 84760 11770 77131 11770 77131 10 0.6368 1016 7807 2356 19579 2288 19012 2288 19012 11 0.5371 89 812 235 2412 233 2395 233 2395 12 0.6764 26 270 57 680 57 680 57 680 13 0.6764 16 158 36 488 36 488 36 488 Total 146626 400455 1476769 1833819 201442 651579 201442 651579 Year: 2005 F multiplier: 0.5732 Fbar: 0.4 Age F CatchNos Yield StockNos Biomass SSNos SSB SSNos SSB (JAN) (JAN) (ST) (ST) 3 0.0040 2320 1610 664000 154048 0 0 0 0 4 0.0407 8326 9334 232081 124163 3249 1738 3249 1738 5 0.1399 46860 77413 395387 469720 27677 32880 27677 32880 6 0.2465 39748 91260 199934 438654 54382 119314 54382 119314 7 0.3497 31702 106834 117855 376781 66234 211751 66234 211751 8 0.4746 25466 127382 73776 356705 58357 282154 58357 282154 9 0.5526 9571 60108 24649 161526 22431 146989 22431 146989 10 0.6368 2629 20192 6094 50643 5917 49174 5917 49174 11 0.5371 388 3528 1020 10485 1013 10411 1013 10411 12 0.6764 51 533 112 1346 112 1346 112 1346 13 0.6764 17 168 39 519 39 519 39 519 Total 167078 498363 714947 2144590 239412 856276 239412 856276
O:\ACFM\WGREPS\AFWG\REPORTS\2003\3-Northeast Arctic Cod.Doc 110

Table 3.31 North East arctic cod. Stock numbers-at-age (in thousands) estimated by VPA including discard estimates, and % increase in stock numbers relative to a VPA without discards. From Dingsør (2001).
Estimated stock numbers (thousands) Percent increase
Year Age 3 Age 4 Age 5 Age 3 Age 4 Age 51946 875 346 602 579 407 163 20 % 4 % 1 %1947 531 993 676 806 465 099 27 % 14 % 0 %1948 570 356 392 309 497 476 29 % 14 % 5 %1949 589 367 416 668 285 459 26 % 16 % 3 %1950 799 732 414 016 291 200 13 % 9 % 1 %1951 1 235 322 586 054 302 346 14 % 2 % 0 %1952 1 388 731 889 509 401 768 17 % 3 % 0 %1953 1 801 114 975 004 600 908 13 % 2 % 0 %1954 830 653 1 321 053 684 303 29 % 5 % 0 %1955 381 489 615 696 907 875 40 % 19 % 2 %1956 567 555 274 235 399 344 29 % 25 % 3 %1957 914 850 387 496 161 710 14 % 10 % 2 %1958 552 600 672 221 262 135 11 % 4 % 2 %1959 757 567 391 906 406 694 11 % 3 % 0 %1960 855 470 534 350 240 047 8 % 1 % 0 %1961 1 041 570 620 707 347 043 13 % 1 % 0 %1962 894 728 739 196 382 556 23 % 4 % 0 %1963 551 938 614 025 429 068 17 % 10 % 0 %1964 389 151 396 165 361 790 15 % 5 % 0 %1965 845 469 293 844 266 134 9 % 8 % 0 %1966 1 618 188 647 435 203 168 2 % 4 % 2 %1967 1 404 569 1 249 506 465 035 9 % 0 % 1 %1968 210 875 1 088 071 876 095 24 % 6 % 0 %1969 143 791 155 947 699 033 28 % 15 % 2 %1970 222 635 104 415 92 541 13 % 17 % 4 %1971 462 474 164 397 65 112 14 % 6 % 2 %1972 1 221 559 358 357 115 892 20 % 10 % 1 %1973 1 858 123 947 409 249 400 2 % 19 % 11 %1974 598 555 1 246 499 583 612 14 % 2 % 9 %1975 654 442 382 692 627 793 5 % 10 % 3 %1976 622 230 477 390 233 608 1 % 2 % 1 %1977 397 826 426 386 280 645 14 % 0 % 0 %1978 653 256 277 410 198 204 2 % 11 % 0 %1979 225 935 460 104 164 243 14 % 2 % 1 %1980 152 937 171 954 300 312 11 % 11 % 0 %1981 161 752 116 964 116 337 7 % 7 % 4 %1982 151 642 125 307 81 780 0 % 4 % 1 %1983 166 310 115 423 82 423 0 % -1 % 3 %1984 408 525 133 333 77 728 3 % 0 % 0 %1985 543 828 324 072 96 327 4 % 2 % 0 %1986 1 114 252 412 683 219 993 7 % 2 % 0 %1987 307 425 767 656 268 642 7 % 4 % 0 %1988 222 819 215 720 490 161 9 % 3 % 2 %1989 180 066 166 955 151 576 4 % 6 % 0 %1990 249 968 139 922 114 006 3 % 2 % 1 %1991 418 955 200 700 105 559 2 % 2 % 0 %1992 748 962 333 517 151 973 4 % 1 % 0 %1993 1 002 933 576 112 238 980 10 % 2 % 0 %1994 896 184 744 062 420 039 9 % 8 % 0 %1995 733 664 584 808 476 048 10 % 6 % 3 %1996 467 093 341 918 344 124 3 % 7 % 3 %1997 765 234 238 202 193 102 3 % 0 % 4 %1998 836 301 429 147 144 629 2 % 1 % -1 %
O:\ACFM\WGREPS\AFWG\REPORTS\2003\3-Northeast Arctic Cod.Doc 111

Table 3.32a Likelihood components at end of keyrun.
Likelihood Component Unweighted Likelihood Weight Weighted Likelihood Keyrun 2002 wg Keyrun 2002 wg
overfish.tons 16 16 1 norxgil.catch 374200 373863 20 7484000 7477260gillnet.catch 102700 96616 20 2054000 1932320Wintersur-85-93 1540000 1610232 1 1540000 1610232Wintersur-94-03 925800 794985 1 925800 794985lofotensur-85-89 100900 87933 1 100900 87933lofotensur-90-03 562900 555611 1 562900 555611acousticsur-85-93 1296000 1282978 1 1296000 1282978acousticsur-94-03 1441000 1189236 1 1441000 1189236rustrawlsur-85-02 1428000 1243521 1 1428000 1243521stomach-85-03 2612 1746 100 261200 174600Bounds 0 1 0 Total 17093816 7774128 7236721 16348676
Table 3.32b Parameter values and sensitivity (effect of parameter change on likelihood score) in keyrun, and
2001/2002 values
Parameter Value 2002 wg 2001 wg -5% +5%ba1ac.b 0.104241 0.0783 0.2469 0.01 0.01ba1ac.slope 0.00470287 0.0053 0.0014 0.02 0.02ba1tr.b 0.505311 0.4065 0.4062 0.11 0.10ba1tr.slope -0.00235214 0 -0.0002 0.01 0.00ba2ac.b 0.18179 0.2332 0.3993 0.02 0.02ba2ac.slope 0.0064221 0.0058 0.0016 0.03 0.03ba2tr.b 0.390517 0.3758 0.4276 0.07 0.06ba2tr.slope 0.00172339 0.003 0.0014 0.00 0.00betabinimm 44.0124 0.01 0.01betabinmat 3.39452 0.00 0.00cann_alpha 0.000102867 0.50 0.48cann_delta 0.406176 14.62 9.70gil.f1985 0.788735 0.6769 0.5679 0.03 0.04gil.f1986 0.456546 0.3928 0.3032 0.02 0.02gil.f1987 0.497441 0.4278 0.2589 0.01 0.01gil.f1988 0.647429 0.5144 0.3785 0.00 0.00gil.f1989 1.15757 0.9582 0.6628 0.06 0.05gil.f1990 0.265434 0.2082 0.1485 0.05 0.05gil.f1991 0.213375 0.1842 0.1282 0.20 0.20gil.f1992 0.156414 0.1359 0.0967 0.26 0.26gil.f1993 0.190386 0.1679 0.1287 0.07 0.05gil.f1994 0.246661 0.2222 0.1774 0.02 0.02gil.f1995 0.494976 0.4294 0.3106 0.01 0.01gil.f1996 0.487043 0.4368 0.3323 0.01 0.01gil.f1997 0.591147 0.5145 0.3709 0.01 0.01gil.f1998 0.653523 0.5586 0.4538 0.01 0.01gil.f1999 0.706263 0.6272 0.4633 0.00 0.00gil.f2000 0.725594 0.626 0.4804 0.00 0.00gil.f2001 0.541593 0.5014 0.00 0.00gil.f2002 0.374576 0.00 0.00gil.l50 85.3849 83.3239 80 117.49 70.00gil.slope 0.0359626 0.0367 0.0387 2.88 2.23
O:\ACFM\WGREPS\AFWG\REPORTS\2003\3-Northeast Arctic Cod.Doc 112

Table 3.32b (continued)
growth.1985 8.1602 8.3317 8.7728 1.23 1.22growth.1986 6.54222 6.2809 7.3012 4.14 4.07growth.1987 6.97071 8.3566 6.9926 3.68 3.66growth.1988 7.66196 7.15 7.3956 1.00 1.03growth.1989 12.2885 13.0489 13.1577 12.83 12.68growth.1990 11.5764 10.5856 11.8511 36.06 36.49growth.1991 11.4681 10.5828 9.8304 83.50 86.40growth.1992 8.13503 8.8248 8.0952 18.18 18.67growth.1993 7.72257 6.7464 6.6638 3.72 3.88growth.1994 9.56092 9.561 10.258 0.97 0.96growth.1995 8.53934 8.4603 7.5524 0.22 0.22growth.1996 10.4876 11.1062 10.7937 0.24 0.24growth.1997 10.3318 10.6062 9.6489 0.27 0.27growth.1998 9.40794 8.5245 9.726 0.22 0.22growth.1999 10.8541 11.8582 10.5666 0.25 0.24growth.2000 12.0504 12.0683 11.7 0.27 0.26growth.2001 10.071 10.8442 0.14 0.13growth.2002 9.85303 0.06 0.06growth.ratio 0.740864 0.7792 0.7957 3.49 3.57imm.n_age3 54.1396 55.2526 55.6596 0.34 0.33imm.n_age4 37.7218 37.608 37.1615 0.09 0.08imm.n_age5 7.72005 10.5822 10.7376 0.02 0.02imm.n_age6 3.76807 3.5504 3.4023 0.02 0.02imm.n_age7 1.26253 1.2868 1.0011 0.01 0.01imm.n_age8 0.244392 0.2046 0.1865 0.00 0.00imm.n_age9 0.182001 0.1365 0.1335 0.00 0.00l_minage.1986 34.292 34.3425 34.1084 27.60 42.49l_minage.1987 31.9464 31.6591 32.1017 2.35 2.52l_minage.1988 31.9066 32.1587 32.1236 5.19 3.73l_minage.1989 32.5765 32.303 32.6073 8.20 7.08l_minage.1990 33.4169 33.5965 34.021 34.51 35.51l_minage.1991 37.8729 37.8337 39.7212 99.58 120.12l_minage.1992 39.4278 38.8367 39.7733 70.37 108.70l_minage.1993 35.8976 36.396 36.5644 9.75 12.88l_minage.1994 30.6703 30.6195 30.8819 2.31 1.88l_minage.1995 29.1334 29.6721 30.062 0.90 0.72l_minage.1996 29.7007 29.3409 29.7766 0.92 0.81l_minage.1997 30.8486 30.3504 30.9709 2.01 1.78l_minage.1998 31.15 31.3425 31.0328 2.66 2.53l_minage.1999 28.7398 28.4458 28.9558 1.01 0.91l_minage.2000 29.0021 28.8552 28.7652 1.08 0.96l_minage.2001 32.9234 32.8703 33.2432 0.89 0.83l_minage.2002 30.0252 31.5538 0.64 0.57l_minage.2003 29.838 0.64 0.49
O:\ACFM\WGREPS\AFWG\REPORTS\2003\3-Northeast Arctic Cod.Doc 113

Table 3.32b (Continued)
lof1ac.cbt 0.851288 0.7317 0.6775 0.00 0.00lof1ac.l50 66.5567 51.2518 43.1426 0.01 0.01lof1ac.slope 0.0138748 0.0103 0.0081 0.00 0.00lof2ac.cbt 2.06362 2.01 1.01 0.02 0.02lof2ac.l50 90 87.8967 64.5238 0.12 0.13lof2ac.slope 0.0119362 0.0117 0.0219 0.01 0.01mat.n_age10 0.220849 0.00 0.00mat.n_age5 3.71008 0.00 0.00mat.n_age6 1.64682 0.00 0.00mat.n_age7 1.25175 0.01 0.00mat.n_age8 0.510124 0.00 0.00mat.n_age9 0.166826 0.00 0.00n_minage.1986 117.512 123.5562 125.8591 16.68 16.84n_minage.1987 36.2056 36.8587 38.5834 5.53 5.67n_minage.1988 29.059 28.0084 28.7296 7.30 7.56n_minage.1989 20.4847 19.4994 19.8993 4.84 4.99n_minage.1990 30.4749 30.325 30.0839 5.96 6.13n_minage.1991 49.0125 49.2732 50.121 8.19 8.35n_minage.1992 76.257 79.876 81.562 2.84 2.93n_minage.1993 97.2025 104.5486 106.2583 0.35 0.36n_minage.1994 89.904 88.6541 90.1468 0.10 0.09n_minage.1995 57.8611 56.803 57.1602 0.06 0.06n_minage.1996 35.8281 36.2454 36.1087 0.05 0.05n_minage.1997 59.9047 59.7255 61.0898 0.10 0.08n_minage.1998 73.4807 69.9894 72.7707 0.11 0.10n_minage.1999 51.6259 43.4426 42.7957 0.06 0.06n_minage.2000 58.5576 51.1067 54.4713 0.05 0.04n_minage.2001 38.6685 31.8426 37.4844 0.02 0.02n_minage.2002 33.9831 17.8735 0.01 0.01n_minage.2003 90.6698 0.01 0.01ovr.f1990 0.0288109 8.98 8.99ovr.f1991 0.0405644 35.58 35.46ovr.f1992 0.0852345 231.23 229.48ovr.f1993 0.0333141 35.57 35.68ovr.f1994 0.0180057 9.03 9.00rustr.b 0.0734692 0.0705 0.0836 0.01 0.01rustr.slope 0.000842825 0.0009 0.0008 0.00 0.00
O:\ACFM\WGREPS\AFWG\REPORTS\2003\3-Northeast Arctic Cod.Doc 114
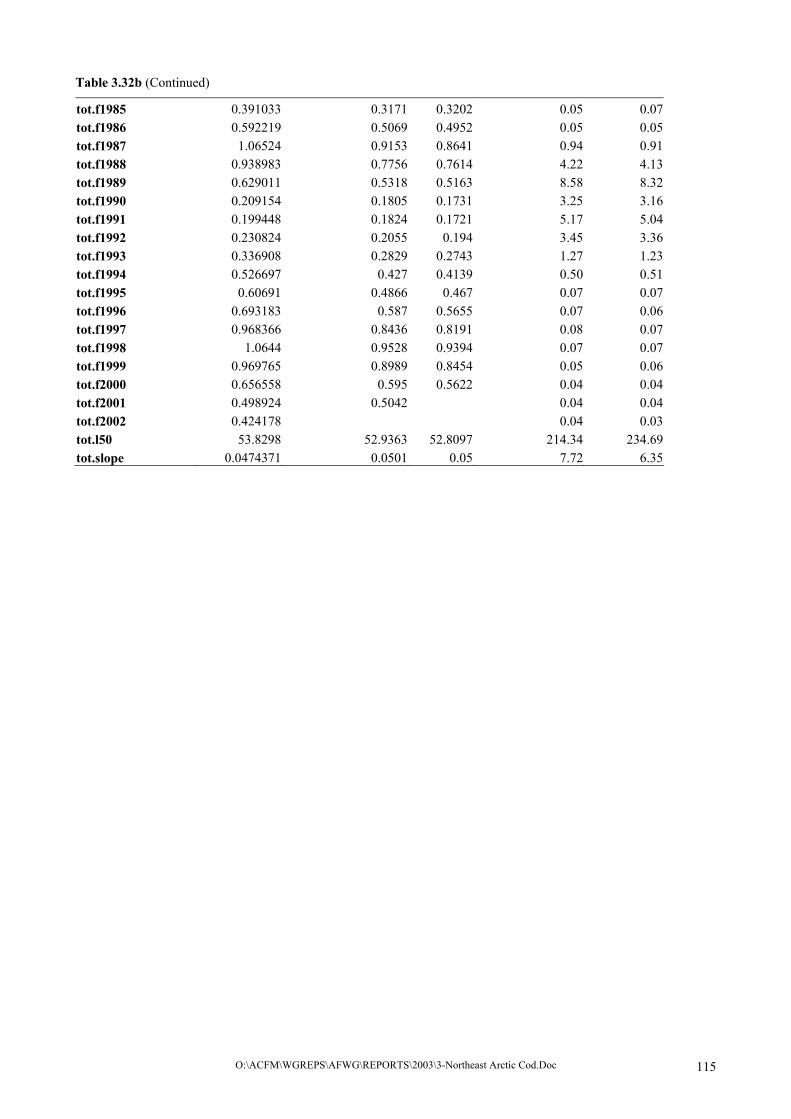
Table 3.32b (Continued)
tot.f1985 0.391033 0.3171 0.3202 0.05 0.07tot.f1986 0.592219 0.5069 0.4952 0.05 0.05tot.f1987 1.06524 0.9153 0.8641 0.94 0.91tot.f1988 0.938983 0.7756 0.7614 4.22 4.13tot.f1989 0.629011 0.5318 0.5163 8.58 8.32tot.f1990 0.209154 0.1805 0.1731 3.25 3.16tot.f1991 0.199448 0.1824 0.1721 5.17 5.04tot.f1992 0.230824 0.2055 0.194 3.45 3.36tot.f1993 0.336908 0.2829 0.2743 1.27 1.23tot.f1994 0.526697 0.427 0.4139 0.50 0.51tot.f1995 0.60691 0.4866 0.467 0.07 0.07tot.f1996 0.693183 0.587 0.5655 0.07 0.06tot.f1997 0.968366 0.8436 0.8191 0.08 0.07tot.f1998 1.0644 0.9528 0.9394 0.07 0.07tot.f1999 0.969765 0.8989 0.8454 0.05 0.06tot.f2000 0.656558 0.595 0.5622 0.04 0.04tot.f2001 0.498924 0.5042 0.04 0.04tot.f2002 0.424178 0.04 0.03tot.l50 53.8298 52.9363 52.8097 214.34 234.69tot.slope 0.0474371 0.0501 0.05 7.72 6.35
O:\ACFM\WGREPS\AFWG\REPORTS\2003\3-Northeast Arctic Cod.Doc 115
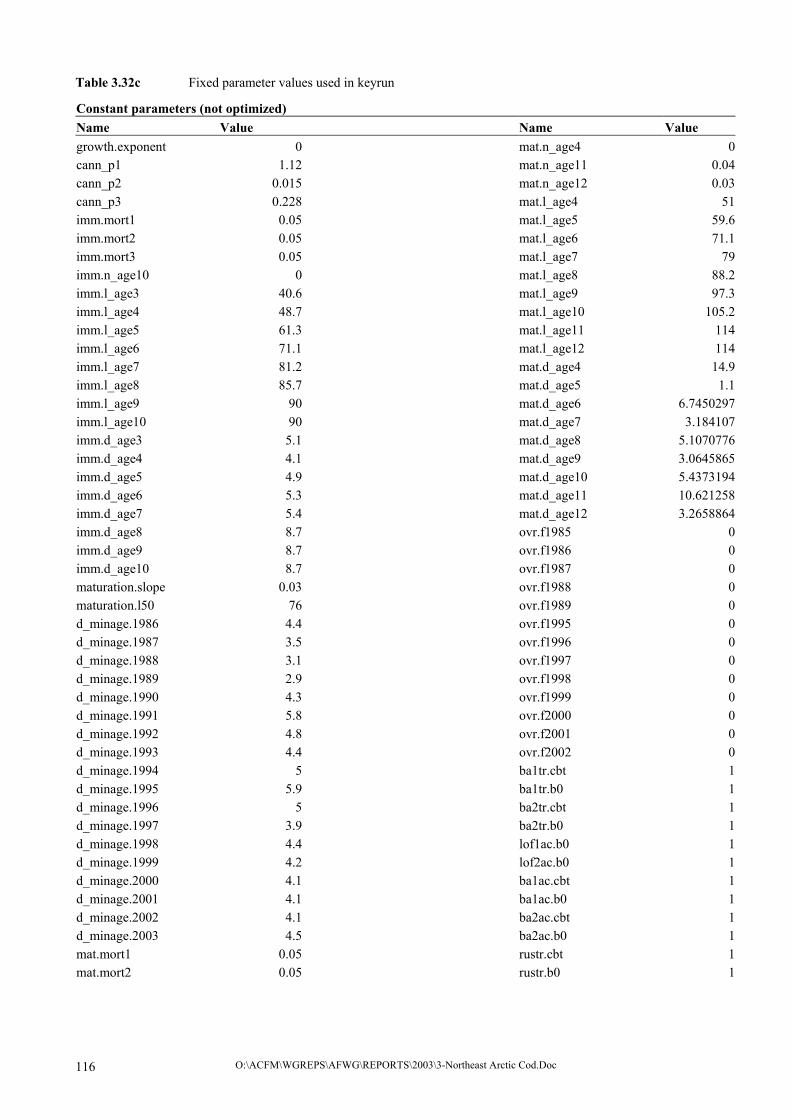
Table 3.32c Fixed parameter values used in keyrun
Constant parameters (not optimized) Name Value Name Value growth.exponent 0 mat.n_age4 0cann_p1 1.12 mat.n_age11 0.04cann_p2 0.015 mat.n_age12 0.03cann_p3 0.228 mat.l_age4 51imm.mort1 0.05 mat.l_age5 59.6imm.mort2 0.05 mat.l_age6 71.1imm.mort3 0.05 mat.l_age7 79imm.n_age10 0
40.6 mat.l_age9 97.3imm.l_age4 48.7 mat.l_age10 105.2imm.l_age5 61.3 mat.l_age11 114imm.l_age6 71.1 mat.l_age12 114imm.l_age7 81.2 mat.d_age4 14.9imm.l_age8 85.7 mat.d_age5 1.1imm.l_age9 90 mat.d_age6 6.7450297imm.l_age10 90 mat.d_age7 3.184107imm.d_age3 5.1 mat.d_age8 5.1070776imm.d_age4 4.1 mat.d_age9 3.0645865imm.d_age5 4.9 mat.d_age10 5.4373194imm.d_age6 5.3 mat.d_age11 10.621258imm.d_age7 5.4 mat.d_age12 3.2658864imm.d_age8 8.7 ovr.f1985 0imm.d_age9 8.7 ovr.f1986 0imm.d_age10 8.7 ovr.f1987 0maturation.slope 0.03 ovr.f1988 0maturation.l50 76 ovr.f1989 0d_minage.1986 4.4 ovr.f1995 0d_minage.1987 3.5 ovr.f1996 0d_minage.1988 3.1 ovr.f1997 0d_minage.1989 2.9 ovr.f1998 0d_minage.1990 4.3 ovr.f1999 0d_minage.1991 5.8 ovr.f2000 0d_minage.1992 4.8 ovr.f2001 0d_minage.1993 4.4 ovr.f2002 0d_minage.1994 5 ba1tr.cbt 1d_minage.1995 5.9 ba1tr.b0 1d_minage.1996 5 ba2tr.cbt 1d_minage.1997 3.9 ba2tr.b0 1d_minage.1998 4.4 lof1ac.b0 1d_minage.1999 4.2 lof2ac.b0 1d_minage.2000 4.1 ba1ac.cbt 1d_minage.2001 4.1 ba1ac.b0 1d_minage.2002 4.1 ba2ac.cbt 1d_minage.2003 4.5 ba2ac.b0 1mat.mort1 0.05 rustr.cbt 1mat.mort2 0.05 rustr.b0 1
mat.l_age8 88.2imm.l_age3
O:\ACFM\WGREPS\AFWG\REPORTS\2003\3-Northeast Arctic Cod.Doc 116

Table 3.33 Results from the keyrun ; Gadget version 2.0.02 running on FLEXIDELL Wed Apr 30 15:25:23 2003 stocks cod.imm cod.mat areas 0 Total fishing mortality-at-age Year 1985 1986 1987 1988 Age 3 0.0669 0.0345 0.0385 0.0334 4 0.1647 0.2301 0.1757 0.1169 5 0.3524 0.4140 0.6202 0.3260 6 0.4941 0.5997 0.9066 0.7139 7 0.6632 0.7264 1.1159 0.9219 8 0.8368 0.8444 1.2670 1.0979 9 0.9566 0.9208 1.3892 1.2686 10 1.1295 0.9748 1.4543 1.4074 11 1.1492 1.0383 1.5014 1.4731 12+ 1.1688 1.0469 1.5515 1.5352 F 5-10 0.7388 0.7467 1.1255 0.9560 Total fishing mortality-at-age Year 1989 1990 1991 1992 1993 1994 1995 Age 3 0.0322 0.0174 0.0363 0.0457 0.0297 0.0257 0.0251 4 0.1021 0.0776 0.0797 0.1403 0.1366 0.1510 0.1274 5 0.2275 0.1360 0.1736 0.2167 0.2583 0.3574 0.3589 6 0.4094 0.1885 0.2174 0.3032 0.3296 0.4888 0.5505 7 0.6646 0.2367 0.2510 0.3347 0.4025 0.5584 0.6667 8 0.8563 0.3021 0.2870 0.3611 0.4355 0.6370 0.7508 9 1.0914 0.3518 0.3397 0.3881 0.4643 0.6747 0.8737 10 1.3524 0.3934 0.3735 0.4196 0.4917 0.7053 0.9318 11 1.5746 0.4403 0.3962 0.4366 0.5212 0.7336 0.9785 12+ 1.6882 0.4813 0.4268 0.4494 0.5372 0.7642 1.0217 F 5-10 0.7669 0.2681 0.2737 0.3372 0.3970 0.5703 0.6887 Total fishing mortality-at-age Year 1996 1997 1998 1999 2000 2001 2002 2000-2002 Age 3 0.0287 0.0407 0.0464 0.0296 0.0211 0.0258 0.0139 0.0203 4 0.1290 0.2025 0.2156 0.1887 0.1145 0.0945 0.1016 0.1035 5 0.3414 0.4738 0.5339 0.4778 0.3379 0.2563 0.2143 0.2695 6 0.5886 0.7788 0.8246 0.7566 0.5385 0.4331 0.3531 0.4416 7 0.7369 1.0059 1.0623 0.9553 0.6819 0.5486 0.4611 0.5639 8 0.8384 1.1560 1.2523 1.1361 0.8118 0.6458 0.5394 0.6657 9 0.9147 1.2617 1.3924 1.3117 0.9635 0.7383 0.6032 0.7683 10 1.0170 1.3375 1.4815 1.4325 1.1066 0.8330 0.6561 0.8652 11 1.0626 1.4309 1.5458 1.5063 1.1963 0.9113 0.7056 0.9377 12+ 1.1149 1.4930 1.6493 1.5898 1.2658 0.9645 0.7486 0.9930 F 5-10 0.7395 1.0023 1.0912 1.0117 0.7400 0.5758 0.4712
O:\ACFM\WGREPS\AFWG\REPORTS\2003\3-Northeast Arctic Cod.Doc 117
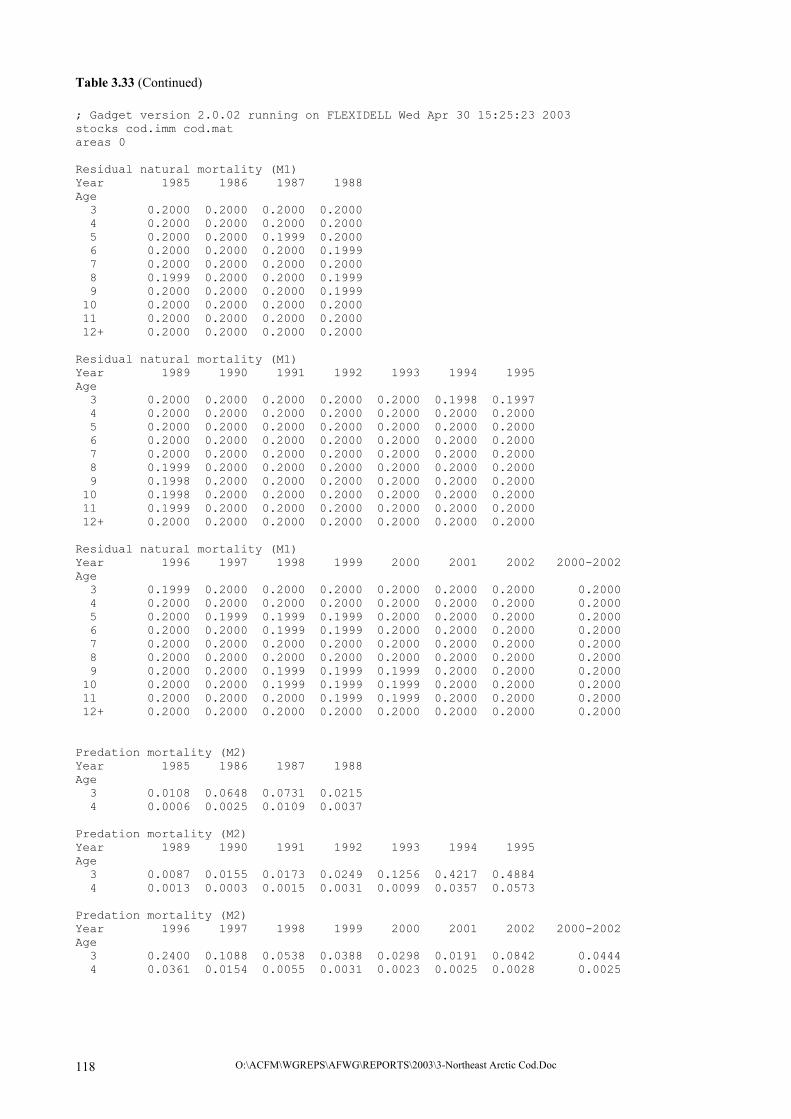
Table 3.33 (Continued) ; Gadget version 2.0.02 running on FLEXIDELL Wed Apr 30 15:25:23 2003 stocks cod.imm cod.mat areas 0 Residual natural mortality (M1) Year 1985 1986 1987 1988 Age 3 0.2000 0.2000 0.2000 0.2000 4 0.2000 0.2000 0.2000 0.2000 5 0.2000 0.2000 0.1999 0.2000 6 0.2000 0.2000 0.2000 0.1999 7 0.2000 0.2000 0.2000 0.2000 8 0.1999 0.2000 0.2000 0.1999 9 0.2000 0.2000 0.2000 0.1999 10 0.2000 0.2000 0.2000 0.2000 11 0.2000 0.2000 0.2000 0.2000 12+ 0.2000 0.2000 0.2000 0.2000 Residual natural mortality (M1) Year 1989 1990 1991 1992 1993 1994 1995 Age 3 0.2000 0.2000 0.2000 0.2000 0.2000 0.1998 0.1997 4 0.2000 0.2000 0.2000 0.2000 0.2000 0.2000 0.2000 5 0.2000 0.2000 0.2000 0.2000 0.2000 0.2000 0.2000 6 0.2000 0.2000 0.2000 0.2000 0.2000 0.2000 0.2000 7 0.2000 0.2000 0.2000 0.2000 0.2000 0.2000 0.2000 8 0.1999 0.2000 0.2000 0.2000 0.2000 0.2000 0.2000 9 0.1998 0.2000 0.2000 0.2000 0.2000 0.2000 0.2000 10 0.1998 0.2000 0.2000 0.2000 0.2000 0.2000 0.2000 11 0.1999 0.2000 0.2000 0.2000 0.2000 0.2000 0.2000 12+ 0.2000 0.2000 0.2000 0.2000 0.2000 0.2000 0.2000 Residual natural mortality (M1) Year 1996 1997 1998 1999 2000 2001 2002 2000-2002 Age 3 0.1999 0.2000 0.2000 0.2000 0.2000 0.2000 0.2000 0.2000 4 0.2000 0.2000 0.2000 0.2000 0.2000 0.2000 0.2000 0.2000 5 0.2000 0.1999 0.1999 0.1999 0.2000 0.2000 0.2000 0.2000 6 0.2000 0.2000 0.1999 0.1999 0.2000 0.2000 0.2000 0.2000 7 0.2000 0.2000 0.2000 0.2000 0.2000 0.2000 0.2000 0.2000 8 0.2000 0.2000 0.2000 0.2000 0.2000 0.2000 0.2000 0.2000 9 0.2000 0.2000 0.1999 0.1999 0.1999 0.2000 0.2000 0.2000 10 0.2000 0.2000 0.1999 0.1999 0.1999 0.2000 0.2000 0.2000 11 0.2000 0.2000 0.2000 0.1999 0.1999 0.2000 0.2000 0.2000 12+ 0.2000 0.2000 0.2000 0.2000 0.2000 0.2000 0.2000 0.2000 Predation mortality (M2) Year 1985 1986 1987 1988 Age 3 0.0108 0.0648 0.0731 0.0215 4 0.0006 0.0025 0.0109 0.0037 Predation mortality (M2) Year 1989 1990 1991 1992 1993 1994 1995 Age 3 0.0087 0.0155 0.0173 0.0249 0.1256 0.4217 0.4884 4 0.0013 0.0003 0.0015 0.0031 0.0099 0.0357 0.0573 Predation mortality (M2) Year 1996 1997 1998 1999 2000 2001 2002 2000-2002 Age 3 0.2400 0.1088 0.0538 0.0388 0.0298 0.0191 0.0842 0.0444 4 0.0361 0.0154 0.0055 0.0031 0.0023 0.0025 0.0028 0.0025
O:\ACFM\WGREPS\AFWG\REPORTS\2003\3-Northeast Arctic Cod.Doc 118

Table 3.33 (Continued) ; Gadget version 2.0.02 running on FLEXIDELL Wed Apr 30 15:25:23 2003 stocks cod.imm cod.mat areas 0 Stock numbers (thousands) at age by Jan. 1 Year 1985 1986 1987 1988 1989 Age 3 541396 1175114 362055 290590 204847 4 377218 410124 871130 265109 225220 5 114301 256487 259607 574613 186971 6 54148 65771 138001 112761 330820 7 25142 27049 29561 45579 45013 8 7545 10603 10710 7929 14839 9 3488 2674 3731 2470 2165 10 2208 1095 875 762 568 11 400 584 334 166 152 12+ 300 180 221 99 48 Total 1126148 1949685 1676230 1300082 1010648 Stock numbers (thousands) at age by Jan. 1 Year 1990 1991 1992 1993 1994 1995 1996 Age 3 304746 490107 762569 972024 898347 574051 357749 4 160996 241430 380323 581726 681355 470287 281346 5 161292 119439 178637 264963 401921 450480 310805 6 119923 114530 82050 117071 166285 228303 254193 7 179108 81215 75424 49597 68859 83395 107668 8 18946 115715 51728 44186 27151 32248 35040 9 5158 11466 71096 29513 23402 11756 12459 10 595 2970 6688 39498 15315 9793 4028 11 120 328 1669 3584 19650 6159 3146 12+ 33 80 223 1000 2221 8572 4422 Total 950921 1177284 1610412 2103166 2304509 1875049 1370860 Stock numbers (thousands) at age by Jan. 1 Year 1997 1998 1999 2000 2001 2002 2003 Age 3 599036 734733 516026 585422 386683 339797 906317 4 223895 422342 544203 394554 455499 302703 252196 5 189812 143251 268869 357263 279434 328842 217185 6 177868 95176 67688 134754 206740 175038 214599 7 115401 66698 34048 25937 64317 109632 100499 8 42179 34545 18868 10718 10733 30417 56590 9 12400 10866 8083 4958 3894 4605 14518 10 4088 2878 2213 1783 1550 1527 2066 11 1190 874 533 431 481 548 644 12+ 2077 615 249 138 138 201 299 Total 1367950 1511983 1460783 1515962 1409472 1293313 1764918
O:\ACFM\WGREPS\AFWG\REPORTS\2003\3-Northeast Arctic Cod.Doc 119
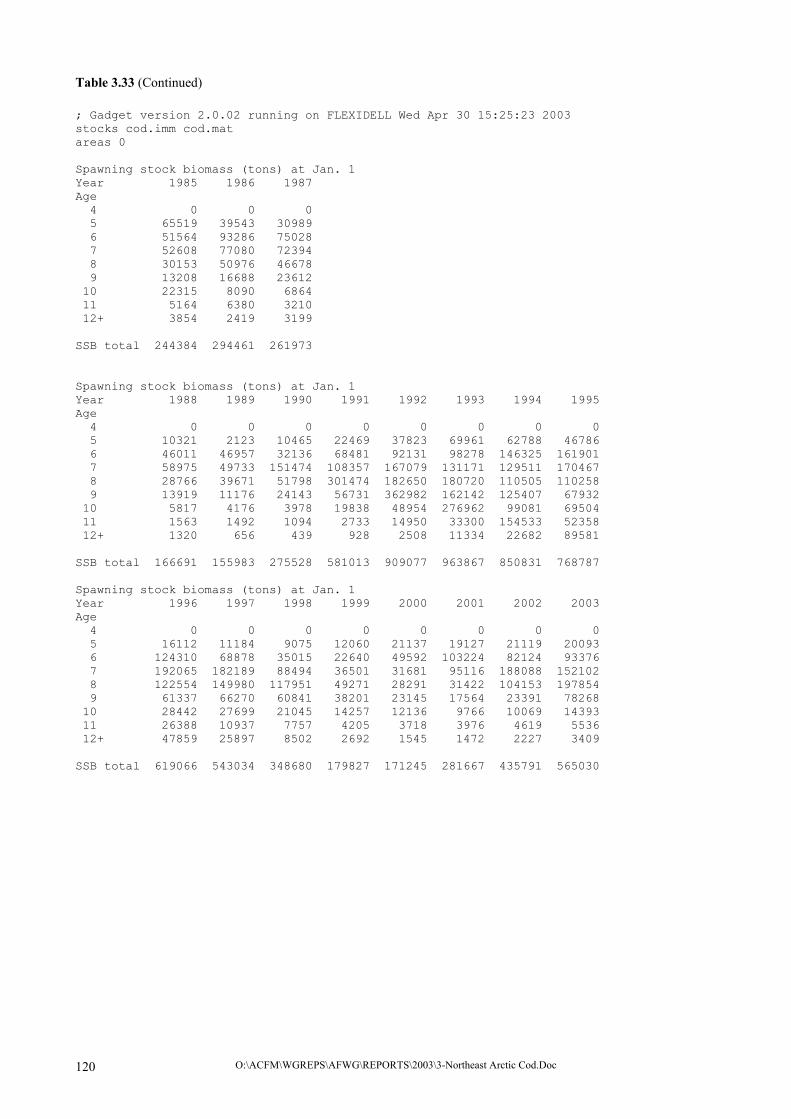
Table 3.33 (Continued) ; Gadget version 2.0.02 running on FLEXIDELL Wed Apr 30 15:25:23 2003 stocks cod.imm cod.mat areas 0 Spawning stock biomass (tons) at Jan. 1 Year 1985 1986 1987 Age 4 0 0 0 5 65519 39543 30989 6 51564 93286 75028 7 52608 77080 72394 8 30153 50976 46678 9 13208 16688 23612 10 22315 8090 6864 11 5164 6380 3210 12+ 3854 2419 3199 SSB total 244384 294461 261973 Spawning stock biomass (tons) at Jan. 1 Year 1988 1989 1990 1991 1992 1993 1994 1995 Age 4 0 0 0 0 0 0 0 0 5 10321 2123 10465 22469 37823 69961 62788 46786 6 46011 46957 32136 68481 92131 98278 146325 161901 7 58975 49733 151474 108357 167079 131171 129511 170467 8 28766 39671 51798 301474 182650 180720 110505 110258 9 13919 11176 24143 56731 362982 162142 125407 67932 10 5817 4176 3978 19838 48954 276962 99081 69504 11 1563 1492 1094 2733 14950 33300 154533 52358 12+ 1320 656 439 928 2508 11334 22682 89581 SSB total 166691 155983 275528 581013 909077 963867 850831 768787 Spawning stock biomass (tons) at Jan. 1 Year 1996 1997 1998 1999 2000 2001 2002 2003 Age 4 0 0 0 0 0 0 0 0 5 16112 11184 9075 12060 21137 19127 21119 20093 6 124310 68878 35015 22640 49592 103224 82124 93376 7 192065 182189 88494 36501 31681 95116 188088 152102 8 122554 149980 117951 49271 28291 31422 104153 197854 9 61337 66270 60841 38201 23145 17564 23391 78268 10 28442 27699 21045 14257 12136 9766 10069 14393 11 26388 10937 7757 4205 3718 3976 4619 5536 12+ 47859 25897 8502 2692 1545 1472 2227 3409 SSB total 619066 543034 348680 179827 171245 281667 435791 565030
O:\ACFM\WGREPS\AFWG\REPORTS\2003\3-Northeast Arctic Cod.Doc 120
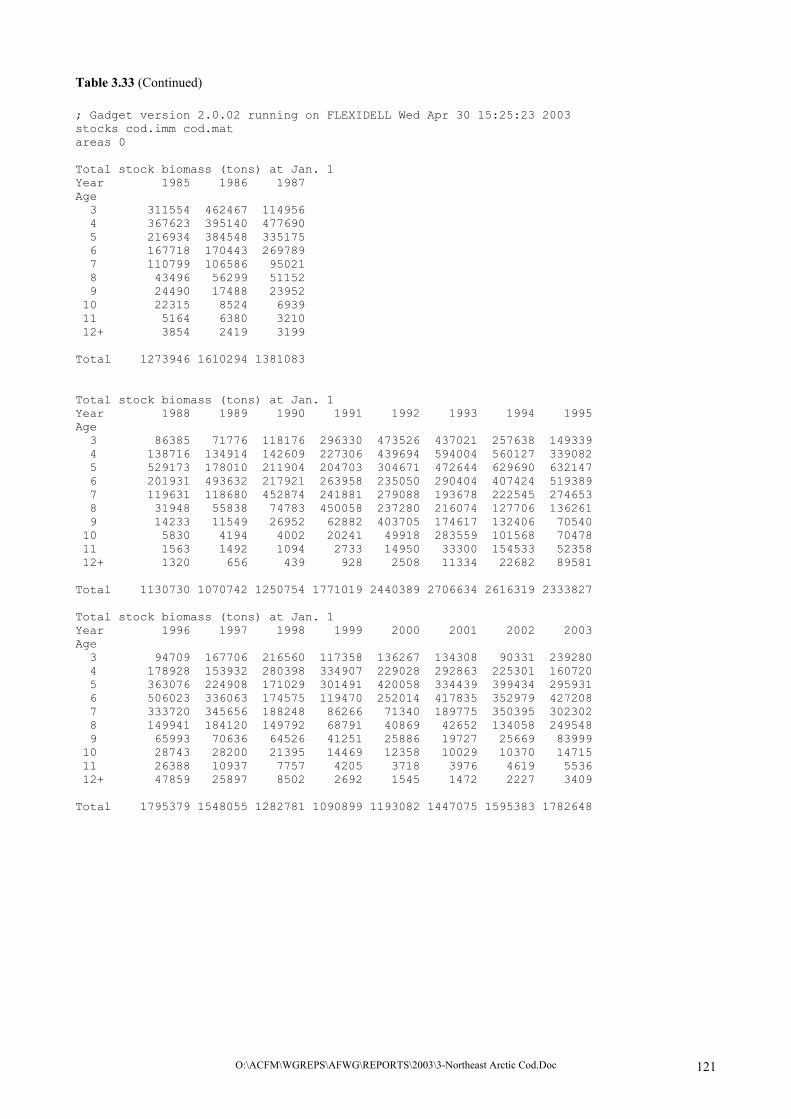
Table 3.33 (Continued) ; Gadget version 2.0.02 running on FLEXIDELL Wed Apr 30 15:25:23 2003 stocks cod.imm cod.mat areas 0 Total stock biomass (tons) at Jan. 1 Year 1985 1986 1987 Age 3 311554 462467 114956 4 367623 395140 477690 5 216934 384548 335175 6 167718 170443 269789 7 110799 106586 95021 8 43496 56299 51152 9 24490 17488 23952 10 22315 8524 6939 11 5164 6380 3210 12+ 3854 2419 3199 Total 1273946 1610294 1381083 Total stock biomass (tons) at Jan. 1 Year 1988 1989 1990 1991 1992 1993 1994 1995 Age 3 86385 71776 118176 296330 473526 437021 257638 149339 4 138716 134914 142609 227306 439694 594004 560127 339082 5 529173 178010 211904 204703 304671 472644 629690 632147 6 201931 493632 217921 263958 235050 290404 407424 519389 7 119631 118680 452874 241881 279088 193678 222545 274653 8 31948 55838 74783 450058 237280 216074 127706 136261 9 14233 11549 26952 62882 403705 174617 132406 70540 10 5830 4194 4002 20241 49918 283559 101568 70478 11 1563 1492 1094 2733 14950 33300 154533 52358 12+ 1320 656 439 928 2508 11334 22682 89581 Total 1130730 1070742 1250754 1771019 2440389 2706634 2616319 2333827 Total stock biomass (tons) at Jan. 1 Year 1996 1997 1998 1999 2000 2001 2002 2003 Age 3 94709 167706 216560 117358 136267 134308 90331 239280 4 178928 153932 280398 334907 229028 292863 225301 160720 5 363076 224908 171029 301491 420058 334439 399434 295931 6 506023 336063 174575 119470 252014 417835 352979 427208 7 333720 345656 188248 86266 71340 189775 350395 302302 8 149941 184120 149792 68791 40869 42652 134058 249548 9 65993 70636 64526 41251 25886 19727 25669 83999 10 28743 28200 21395 14469 12358 10029 10370 14715 11 26388 10937 7757 4205 3718 3976 4619 5536 12+ 47859 25897 8502 2692 1545 1472 2227 3409 Total 1795379 1548055 1282781 1090899 1193082 1447075 1595383 1782648
O:\ACFM\WGREPS\AFWG\REPORTS\2003\3-Northeast Arctic Cod.Doc 121

Table 3.33 (Continued) ; Gadget version 2.0.02 running on FLEXIDELL Wed Apr 30 15:25:23 2003 stocks cod.imm cod.mat areas 0 Weight (kg) in catch (Observed) Year 1985 1986 1987 1988 1989 1990 1991 1992 1993 Age 1 - - - - - - - - - 2 - - - - - - - - - 3 0.91 0.62 0.49 0.53 0.74 0.83 1.03 1.15 0.76 4 1.30 1.25 0.87 0.83 0.92 1.22 1.43 1.56 1.44 5 1.96 1.87 1.53 1.29 1.26 1.61 2.11 2.22 2.07 6 3.19 2.80 2.34 2.22 1.86 2.13 2.80 3.14 2.71 7 4.63 4.46 3.55 3.52 2.86 3.15 3.58 4.31 4.05 8 6.04 5.78 5.97 5.28 4.58 4.57 4.61 5.24 5.44 9 7.67 6.76 8.60 7.92 7.51 7.26 5.99 6.16 6.40 10 9.81 7.60 9.61 9.01 9.09 9.85 8.78 7.89 7.13 11 11.83 9.76 12.26 11.21 11.40 13.54 11.82 10.32 7.99 12+ 14.32 10.63 13.77 13.99 12.00 17.13 16.58 11.81 10.31 Weight (kg) in catch (Observed) Year 1994 1995 1996 1997 1998 1999 2000 2001 2002 2000-2002 Age 1 - - - - - - - - - - 2 - - - - - - - - - - 3 0.83 0.80 0.80 0.67 0.61 0.62 0.55 0.66 0.70 0.64 4 1.27 1.22 1.09 0.99 0.98 1.00 1.00 1.03 1.10 1.04 5 1.97 1.73 1.59 1.45 1.54 1.48 1.56 1.58 1.54 1.56 6 2.89 2.55 2.41 2.13 2.22 2.26 2.29 2.48 2.32 2.36 7 3.41 3.81 3.82 3.34 3.22 3.17 3.29 3.48 3.57 3.45 8 5.33 5.02 5.83 5.26 4.83 4.32 4.45 4.76 4.83 4.68 9 6.91 6.18 6.91 7.28 6.88 6.05 5.71 6.01 6.31 6.01 10 7.67 8.03 8.16 7.83 9.39 6.90 7.52 7.46 7.67 7.55 11 8.07 8.84 9.65 8.57 10.75 11.08 7.71 8.73 9.02 8.49 12+ 9.71 9.24 10.75 11.32 15.73 14.33 12.34 10.95 7.93 10.41
O:\ACFM\WGREPS\AFWG\REPORTS\2003\3-Northeast Arctic Cod.Doc 122

Table 3.33 (Continued) ; Gadget version 2.0.02 running on FLEXIDELL Wed Apr 30 15:25:23 2003 stocks cod.imm cod.mat areas 0 Weight (kg) in catch (Model) Year 1985 1986 1987 1988 1989 1990 1991 1992 1993 Age 1 - - - - - - - - - 2 - - - - - - - - - 3 0.94 0.59 0.46 0.52 0.62 0.83 1.10 0.97 0.73 4 1.31 1.33 0.88 0.88 0.99 1.39 1.46 1.67 1.40 5 2.23 1.80 1.60 1.33 1.36 1.82 2.22 2.17 2.17 6 3.58 2.87 2.18 2.17 1.87 2.31 2.85 3.31 2.79 7 4.93 4.25 3.49 2.96 2.99 3.05 3.59 4.21 4.19 8 6.43 5.59 5.19 4.42 4.07 4.55 4.59 5.17 5.19 9 7.79 6.79 6.98 6.23 5.63 5.81 6.29 6.32 6.22 10 10.96 7.96 8.69 8.18 7.49 7.32 7.64 8.16 7.47 11 14.04 10.96 10.58 10.02 9.59 9.49 9.18 9.65 9.52 12+ 13.91 13.28 16.12 14.18 12.83 13.04 12.26 11.87 11.46 Weight (kg) in catch (Model) Year 1994 1995 1996 1997 1998 1999 2000 2001 2002 2000-2002 Age 1 - - - - - - - - - - 2 - - - - - - - - - - 3 0.63 0.61 0.60 0.56 0.58 0.51 0.53 0.61 0.52 0.55 4 1.20 1.08 1.07 1.08 1.03 1.05 1.02 1.04 1.13 1.06 5 1.89 1.73 1.60 1.59 1.59 1.56 1.63 1.63 1.61 1.62 6 2.77 2.67 2.45 2.29 2.21 2.22 2.32 2.46 2.37 2.38 7 3.56 3.87 3.69 3.45 3.18 3.07 3.25 3.47 3.57 3.43 8 5.19 4.89 5.06 4.91 4.70 4.40 4.39 4.65 4.87 4.64 9 6.29 6.76 6.23 6.32 6.32 6.18 5.91 5.89 6.15 5.98 10 7.42 7.99 8.38 7.57 7.82 7.99 7.77 7.48 7.49 7.58 11 8.86 9.29 9.85 9.92 9.23 9.72 9.65 9.49 9.26 9.47 12+ 11.63 11.19 12.70 13.17 13.91 13.39 12.41 12.12 12.08 12.20
O:\ACFM\WGREPS\AFWG\REPORTS\2003\3-Northeast Arctic Cod.Doc 123

Table 3.33 (Continued) ; Gadget version 2.0.02 running on FLEXIDELL Wed Apr 30 15:25:23 2003 stocks cod.imm cod.mat areas 0 Weight (kg) in stock at Jan. 1 Year 1985 Age 3 0.58 4 0.97 5 1.90 6 3.10 7 4.41 8 5.76 9 7.02 10 10.10 11 12.91 12+ 12.85 Weight (kg) in stock at Jan. 1 Year 1986 1987 1988 1989 1990 1991 1992 1993 1994 Age 3 0.39 0.32 0.30 0.35 0.39 0.60 0.62 0.45 0.29 4 0.96 0.55 0.52 0.60 0.89 0.94 1.16 1.02 0.82 5 1.50 1.29 0.92 0.95 1.31 1.71 1.71 1.78 1.57 6 2.59 1.95 1.79 1.49 1.82 2.30 2.86 2.48 2.45 7 3.94 3.21 2.62 2.64 2.53 2.98 3.70 3.91 3.23 8 5.31 4.78 4.03 3.76 3.95 3.89 4.59 4.89 4.70 9 6.54 6.42 5.76 5.33 5.23 5.48 5.68 5.92 5.66 10 7.78 7.92 7.65 7.38 6.72 6.81 7.46 7.18 6.63 11 10.92 9.59 9.36 9.77 9.10 8.32 8.96 9.29 7.86 12+ 13.43 14.47 13.28 13.45 13.23 11.58 11.20 11.33 10.21 Weight (kg) in stock at Jan. 1 Year 1995 1996 1997 1998 1999 2000 2001 2002 2003 2001-2003 Age 3 0.26 0.26 0.28 0.29 0.23 0.23 0.35 0.27 0.26 0.29 4 0.72 0.64 0.69 0.66 0.62 0.58 0.64 0.74 0.64 0.67 5 1.40 1.17 1.18 1.19 1.12 1.18 1.20 1.21 1.36 1.26 6 2.27 1.99 1.89 1.83 1.76 1.87 2.02 2.02 1.99 2.01 7 3.29 3.10 3.00 2.82 2.53 2.75 2.95 3.20 3.01 3.05 8 4.23 4.28 4.37 4.34 3.65 3.81 3.97 4.41 4.41 4.26 9 6.00 5.30 5.70 5.94 5.10 5.22 5.06 5.57 5.79 5.47 10 7.20 7.13 6.90 7.43 6.54 6.93 6.47 6.79 7.12 6.79 11 8.50 8.39 9.19 8.87 7.89 8.63 8.26 8.42 8.60 8.43 12+ 10.45 10.82 12.46 13.82 10.79 11.16 10.62 11.05 11.37 11.01
O:\ACFM\WGREPS\AFWG\REPORTS\2003\3-Northeast Arctic Cod.Doc 124
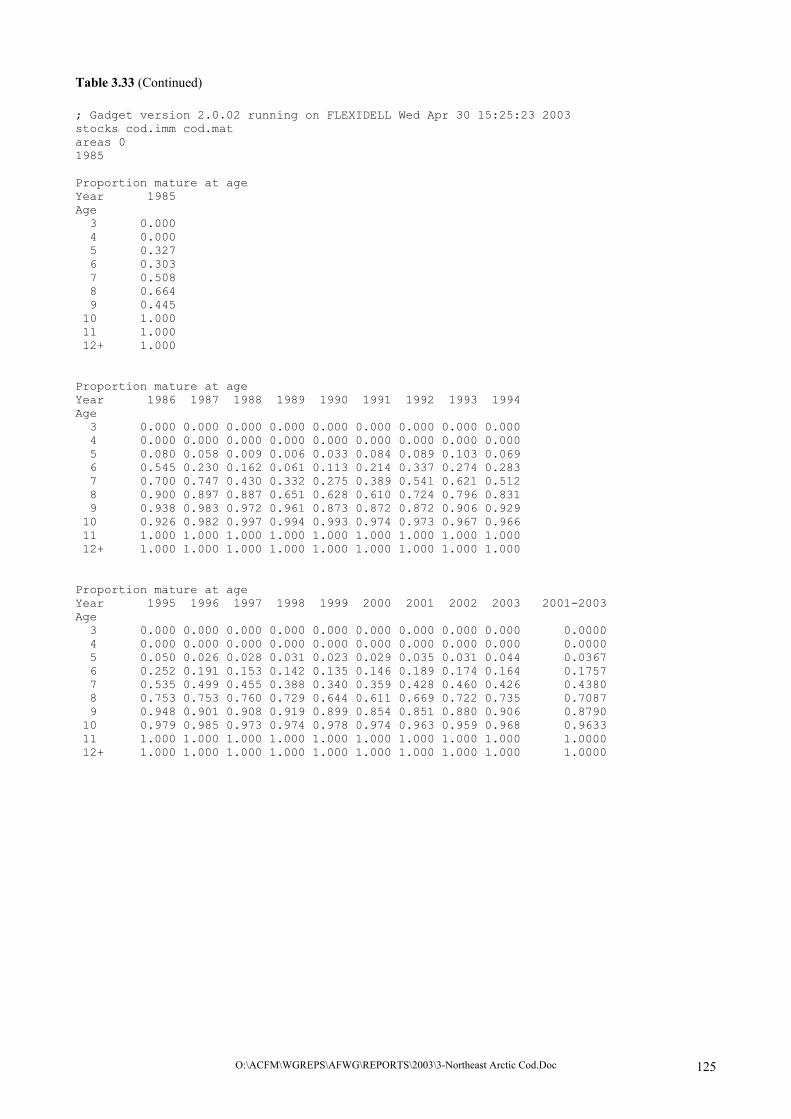
Table 3.33 (Continued) ; Gadget version 2.0.02 running on FLEXIDELL Wed Apr 30 15:25:23 2003 stocks cod.imm cod.mat areas 0 1985 Proportion mature at age Year 1985 Age 3 0.000 4 0.000 5 0.327 6 0.303 7 0.508 8 0.664 9 0.445 10 1.000 11 1.000 12+ 1.000 Proportion mature at age Year 1986 1987 1988 1989 1990 1991 1992 1993 1994 Age 3 0.000 0.000 0.000 0.000 0.000 0.000 0.000 0.000 0.000 4 0.000 0.000 0.000 0.000 0.000 0.000 0.000 0.000 0.000 5 0.080 0.058 0.009 0.006 0.033 0.084 0.089 0.103 0.069 6 0.545 0.230 0.162 0.061 0.113 0.214 0.337 0.274 0.283 7 0.700 0.747 0.430 0.332 0.275 0.389 0.541 0.621 0.512 8 0.900 0.897 0.887 0.651 0.628 0.610 0.724 0.796 0.831 9 0.938 0.983 0.972 0.961 0.873 0.872 0.872 0.906 0.929 10 0.926 0.982 0.997 0.994 0.993 0.974 0.973 0.967 0.966 11 1.000 1.000 1.000 1.000 1.000 1.000 1.000 1.000 1.000 12+ 1.000 1.000 1.000 1.000 1.000 1.000 1.000 1.000 1.000 Proportion mature at age Year 1995 1996 1997 1998 1999 2000 2001 2002 2003 2001-2003 Age 3 0.000 0.000 0.000 0.000 0.000 0.000 0.000 0.000 0.000 0.0000 4 0.000 0.000 0.000 0.000 0.000 0.000 0.000 0.000 0.000 0.0000 5 0.050 0.026 0.028 0.031 0.023 0.029 0.035 0.031 0.044 0.0367 6 0.252 0.191 0.153 0.142 0.135 0.146 0.189 0.174 0.164 0.1757 7 0.535 0.499 0.455 0.388 0.340 0.359 0.428 0.460 0.426 0.4380 8 0.753 0.753 0.760 0.729 0.644 0.611 0.669 0.722 0.735 0.7087 9 0.948 0.901 0.908 0.919 0.899 0.854 0.851 0.880 0.906 0.8790 10 0.979 0.985 0.973 0.974 0.978 0.974 0.963 0.959 0.968 0.9633 11 1.000 1.000 1.000 1.000 1.000 1.000 1.000 1.000 1.000 1.0000 12+ 1.000 1.000 1.000 1.000 1.000 1.000 1.000 1.000 1.000 1.0000
O:\ACFM\WGREPS\AFWG\REPORTS\2003\3-Northeast Arctic Cod.Doc 125

Table 3.33 (Continued) ; Gadget version 2.0.02 running on FLEXIDELL Wed Apr 30 15:25:23 2003 stocks cod.imm cod.mat areas 0 fleets rusnorfleet gillnetfleet Model catch in numbers (thousands) at age Year 1985 1986 Age 1 0 0 2 0 0 3 26480 29926 4 43963 66614 5 26756 69478 6 17364 24157 7 10483 11679 8 3793 5175 9 1934 1396 10 1366 596 11 250 333 12+ 190 103 Total 132578 209455 Model catch in numbers (thousands) at age Year 1987 1988 1989 1990 1991 1992 1993 1994 Age 1 0 0 0 0 0 0 0 0 2 0 0 0 0 0 0 0 0 3 10277 7394 4811 3382 11179 19389 18562 12133 4 110603 23145 16639 7992 12125 29259 52459 65179 5 97165 128946 29737 13926 12902 20767 43603 86120 6 67423 47657 89244 14296 15525 13220 24081 46862 7 16579 23102 18242 26971 12847 13600 12367 21822 8 6545 4551 7343 3726 21316 10250 11958 9753 9 2420 1562 1276 1197 2554 15430 8536 8891 10 584 514 382 155 733 1599 12115 6072 11 228 116 111 35 86 419 1166 8085 12+ 153 70 37 11 23 58 335 949 Total 311975 237057 167821 71691 89290 123989 185181 265865 Model catch in numbers (thousands) at age Year 1995 1996 1997 1998 1999 2000 2001 2002 Age 1 0 0 0 0 0 0 0 0 2 0 0 0 0 0 0 0 0 3 7469 6372 17106 25061 11381 8806 7310 3341 4 39902 25049 31824 64439 73771 32042 31473 22336 5 101506 68832 56882 47460 82208 79693 49800 49551 6 74116 88790 77666 43355 29391 44716 58732 41573 7 31990 45162 60206 35965 17398 10465 22470 33145 8 13716 16373 24277 20788 10856 4987 4327 10624 9 5684 6246 7578 7005 5113 2634 1757 1779 10 4986 2192 2595 1928 1478 1046 769 634 11 3256 1769 788 600 366 266 255 242 12+ 4682 2573 1410 438 177 89 77 93 Total 287307 263357 280330 247039 232139 184742 176970 163318
O:\ACFM\WGREPS\AFWG\REPORTS\2003\3-Northeast Arctic Cod.Doc 126

Table 3.33 (Continued) ; Gadget version 2.0.02 running on FLEXIDELL Wed Apr 30 15:25:23 2003 stocks cod.imm cod.mat areas 0 fleets rusnorfleet gillnetfleet Observed catch in numbers (thousands) at age Year 1985 1986 Age 1 0 0 2 0 0 3 19823 24596 4 41151 59086 5 24948 71516 6 16753 23479 7 10561 10438 8 3508 3797 9 1432 888 10 713 688 11 134 519 12+ 38 134 Total 119061 195140 Observed catch in numbers (thousands) at age Year 1987 1988 1989 1990 1991 1992 1993 1994 Age 1 0 0 0 0 0 0 0 0 2 0 0 0 0 0 0 0 0 3 10450 9317 4902 1315 3493 14276 7680 5558 4 117698 19548 15828 5807 8514 22802 37098 49632 5 84253 117460 28904 9870 12308 18685 54328 79314 6 57239 48949 66506 13786 15174 17113 28245 50230 7 13074 19899 24993 23668 14189 12899 11520 28770 8 3568 3151 5186 5151 18096 9543 7441 7676 9 867 1163 789 605 2701 12820 5183 4523 10 449 381 275 125 264 1761 9806 2498 11 183 107 42 47 37 192 1296 5457 12+ 204 68 14 12 12 46 249 750 Total 287984 220041 147438 60385 74787 110135 162845 234409 Observed catch in numbers (thousands) at age Year 1995 1996 1997 1998 1999 2000 2001 2002 Age 1 0 0 0 0 0 0 0 0 2 0 0 0 0 0 0 0 0 3 4741 7034 10454 28160 8084 4266 4348 1588 4 35100 25574 32828 78268 72593 27993 30719 20863 5 95618 70969 63737 42650 81439 76991 53307 50536 6 79441 87253 75825 35602 27616 40926 53506 45840 7 28290 46081 60395 29462 13875 11508 20104 31170 8 6786 8729 22648 23799 14370 6318 4707 9061 9 2495 1791 3191 6133 7967 4563 1622 1371 10 1433 808 814 883 1812 1517 1063 409 11 808 357 352 174 210 261 275 149 12+ 1664 174 146 58 41 41 49 95 Total 256374 248771 270388 245188 228007 174384 169700 161082
O:\ACFM\WGREPS\AFWG\REPORTS\2003\3-Northeast Arctic Cod.Doc 127

Table 3.33 (Continued) ; Gadget version 2.0.02 running on FLEXIDELL Wed Apr 30 15:25:23 2003 stocks cod.imm cod.mat areas 0 fleets rusnorfleet gillnetfleet Model catch in biomass (tons) at age Year 1985 1986 Age 1 0 0 2 0 0 3 24890 17716 4 57433 88382 5 59750 124718 6 62156 69413 7 51639 49682 8 24380 28907 9 15070 9478 10 14960 4748 11 3509 3645 12+ 2636 1369 Total 316423 398057 Total+ 356218 449765 (+ Also includes: thirdcountries overfishing) Model catch in biomass (tons) at age Year 1987 1988 1989 1990 1991 1992 1993 1994 Age 1 0 0 0 0 0 0 0 0 2 0 0 0 0 0 0 0 0 3 4744 3815 2974 2803 12255 18738 13608 7594 4 97100 20333 16424 11086 17667 48859 73427 77999 5 155422 171539 40580 25306 28692 45023 94502 163166 6 147286 103192 166960 32985 44239 43757 67286 129820 7 57806 68267 54462 82220 46065 57249 51811 77701 8 33960 20104 29917 16968 97894 52942 62059 50600 9 16892 9733 7177 6956 16079 97510 53095 55915 10 5075 4203 2865 1137 5604 13045 90509 45062 11 2406 1157 1066 334 793 4042 11100 71663 12+ 2469 998 472 138 280 689 3840 11038 Total 523160 403340 322896 179932 269567 381854 521236 690558 Total+ 588529 451418 370953 232191 347244 550387 640895 860876 (+ Also includes: thirdcountries overfishing) Model catch in biomass (tons) at age Year 1995 1996 1997 1998 1999 2000 2001 2002 Age 1 0 0 0 0 0 0 0 0 2 0 0 0 0 0 0 0 0 3 4569 3844 9607 14452 5804 4660 4483 1741 4 43219 26755 34457 66612 77190 32695 32780 25145 5 175870 109868 90598 75412 127910 130274 80983 79607 6 198167 217647 177606 95719 65274 103607 144444 98515 7 123762 166574 207620 114405 53476 34012 77990 118428 8 67105 82828 119124 97698 47721 21892 20114 51717 9 38438 38900 47897 44245 31621 15564 10348 10944 10 39821 18372 19637 15069 11809 8131 5750 4748 11 30246 17430 7813 5541 3561 2569 2425 2242 12+ 52410 32687 18577 6090 2366 1100 928 1128 Total 773606 714904 732937 535243 426732 354502 380245 394214 Total+ 910867 825742 823603 597785 478257 412978 436599 453243 (+ Also includes: thirdcountries overfishing)
O:\ACFM\WGREPS\AFWG\REPORTS\2003\3-Northeast Arctic Cod.Doc 128

Table 3.33 (Continued) ; Gadget version 2.0.02 running on FLEXIDELL Wed Apr 30 15:25:23 2003 stocks cod.imm cod.mat areas 0 fleets rusnorfleet gillnetfleet Observed catch in biomass (tons) at age Year 1985 1986 Age 1 0 0 2 0 0 3 17946 15200 4 53607 73787 5 48920 133381 6 53388 65666 7 48902 46521 8 21186 21949 9 10978 5997 10 6995 5232 11 1581 5068 12+ 547 1422 Total 264050 374222 Total+ 301279 424322 (+ Also includes: thirdcountries overfishing) Observed catch in biomass (tons) at age Year 1987 1988 1989 1990 1991 1992 1993 1994 Age 1 0 0 0 0 0 0 0 0 2 0 0 0 0 0 0 0 0 3 5086 4968 3624 1090 3597 16403 5869 4605 4 101978 16313 14598 7070 12153 35478 53248 62856 5 128842 151174 36498 15879 25920 41467 112199 156455 6 133719 108829 123969 29412 42533 53720 76633 144955 7 46379 69956 71372 74450 50742 55633 46655 98004 8 21314 16648 23732 23544 83489 49966 40484 40920 9 7454 9215 5923 4394 16170 78925 33172 31231 10 4318 3431 2496 1229 2314 13899 69911 19171 11 2247 1195 477 632 437 1976 10359 44036 12+ 2810 947 168 199 192 548 2563 7283 Total 454146 382675 282856 157898 237546 348015 451093 609515 Total+ 511736 428270 323683 207083 312608 514345 566914 770657 (+ Also includes: thirdcountries overfishing) Observed catch in biomass (tons) at age Year 1995 1996 1997 1998 1999 2000 2001 2002 Age 1 0 0 0 0 0 0 0 0 2 0 0 0 0 0 0 0 0 3 3802 5644 7034 17085 5037 2354 2870 1105 4 42832 27948 32452 76328 72745 27998 31511 22854 5 165865 112514 92423 65520 120436 120413 84376 77875 6 202254 210237 161292 79064 62387 93671 132569 106462 7 107761 175919 201478 94788 44052 37826 70026 111213 8 34062 50900 119086 114831 62122 28120 22413 43796 9 15421 12384 23228 42175 48170 26052 9745 8650 10 11505 6598 6372 8289 12502 11409 7930 3139 11 7145 3449 3012 1869 2330 2012 2400 1344 12+ 15370 1874 1650 914 592 506 537 754 Total 606017 607465 648026 500863 430373 350362 364376 377190 Total+ 730289 710383 732930 561249 481619 405588 418744 431731 (+ Also includes: thirdcountries overfishing)
O:\ACFM\WGREPS\AFWG\REPORTS\2003\3-Northeast Arctic Cod.Doc 129

Table 3.34 Fleksibest equivalent to standard prediction input table (3.28)
Year: 2003 Age Stock size Natural
Mortality Maturity ogive
Prop.Of F bef.spaw.
Prop.Of M bef.spaw.
Weight in stock
Exploit pattern
Weight in catch
3 906317 0.3275 0.0000 0.0000 0.0000 0.2600 0.0144 0.54004 252196 0.2106 0.0000 0.0000 0.0000 0.6400 0.0722 0.99005 217185 0.2000 0.0440 0.0000 0.0000 1.3600 0.2415 1.70006 214599 0.2000 0.1640 0.0000 0.0000 1.9900 0.3475 2.32007 100499 0.2000 0.4260 0.0000 0.0000 3.0100 0.4486 3.40008 56590 0.2000 0.7340 0.0000 0.0000 4.4100 0.5414 4.93009 14518 0.2000 0.9060 0.0000 0.0000 5.7900 0.6143 6.3700
10 2066 0.2000 0.9680 0.0000 0.0000 7.1200 0.6660 7.740011 644 0.2000 1.0000 0.0000 0.0000 8.6000 0.7062 9.2200
12+ 299 0.2000 1.0000 0.0000 0.0000 11.3700 0.7479 11.9300Unit Thousands - - - - Kilograms - Kilograms
Year: 2004
Age Stock size Natural Mortality
Maturity ogive
Prop.Of F bef.spaw.
Prop.Of M bef.spaw.
Weight in stock
Exploit pattern
Weight in catch
3 307870 0.3485 0.0000 0.0000 0.0000 0.2600 0.0144 0.54004 643869 0.2165 0.0000 0.0000 0.0000 0.6400 0.0736 1.01005 184496 0.2000 0.0240 0.0000 0.0000 1.1800 0.1997 1.54006 138403 0.2000 0.2010 0.0000 0.0000 2.1500 0.3694 2.47007 123884 0.2000 0.4110 0.0000 0.0000 2.9500 0.4444 3.34008 52522 0.2000 0.7010 0.0000 0.0000 4.2100 0.5292 4.71009 26957 0.2000 0.9080 0.0000 0.0000 5.8200 0.6146 6.4100
10 6435 0.2000 0.9780 0.0000 0.0000 7.3600 0.6744 7.980011 864 0.2000 1.0000 0.0000 0.0000 8.8800 0.7129 9.5000
12+ 376 0.2000 1.0000 0.0000 0.0000 11.4500 0.7490 12.0000Unit Thousands - - - - Kilograms - Kilograms
Year: 2005
Age Stock size Natural Mortality
Maturity ogive
Prop.Of F bef.spaw.
Prop.Of M bef.spaw.
Weight in stock
Exploit pattern
Weight in catch
3 663720 0.3567 0.0000 0.0000 0.0000 0.2600 0.0144 0.54004 214179 0.2206 0.0000 0.0000 0.0000 0.6400 0.0741 1.01005 467842 0.2000 0.0250 0.0000 0.0000 1.1800 0.2005 1.55006 121850 0.2000 0.1450 0.0000 0.0000 1.9100 0.3370 2.23007 78235 0.2000 0.4660 0.0000 0.0000 3.1600 0.4609 3.55008 65021 0.2000 0.6890 0.0000 0.0000 4.1400 0.5252 4.64009 25327 0.2000 0.8890 0.0000 0.0000 5.5900 0.6034 6.1800
10 11945 0.2000 0.9770 0.0000 0.0000 7.3900 0.6740 8.010011 2675 0.2000 1.0000 0.0000 0.0000 9.1600 0.7189 9.7700
12+ 492 0.2000 1.0000 0.0000 0.0000 11.6700 0.7523 12.2100Unit Thousands - - - - Kilograms - Kilograms
O:\ACFM\WGREPS\AFWG\REPORTS\2003\3-Northeast Arctic Cod.Doc 130
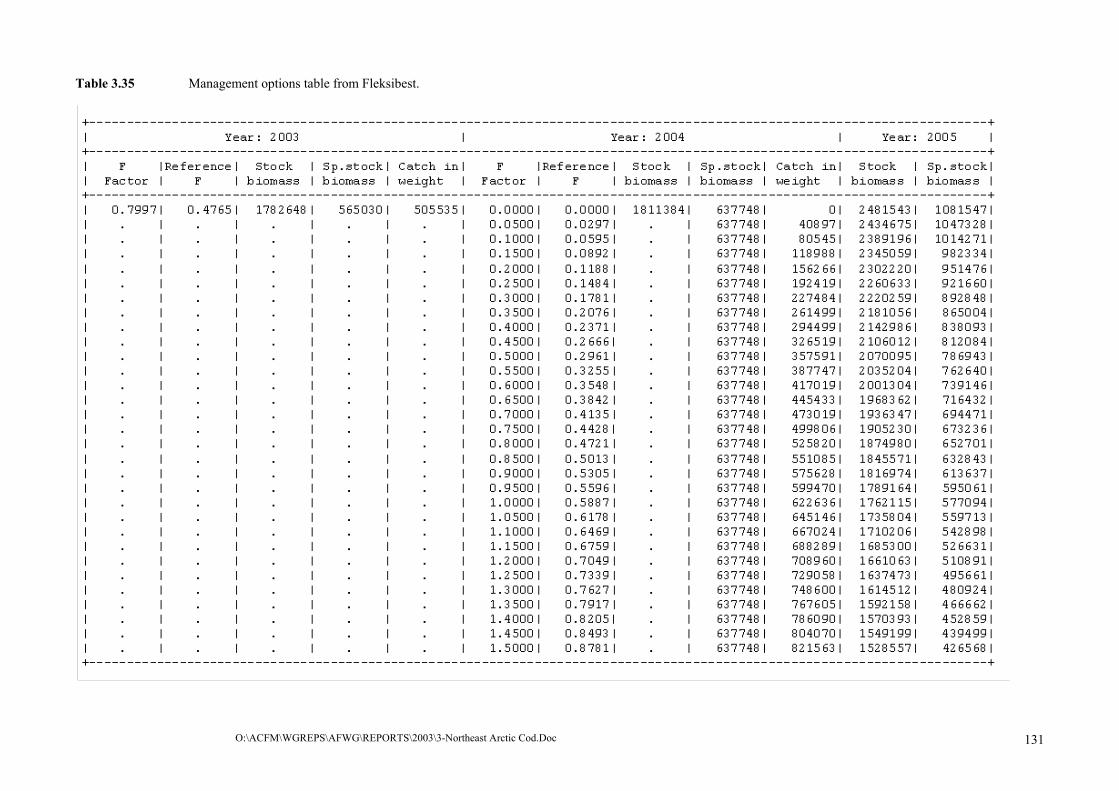
O:\ACFM\WGREPS\AFWG\REPORTS\2003\3-Northeast Arctic Cod.Doc 131
Table 3.35 Management options table from Fleksibest.
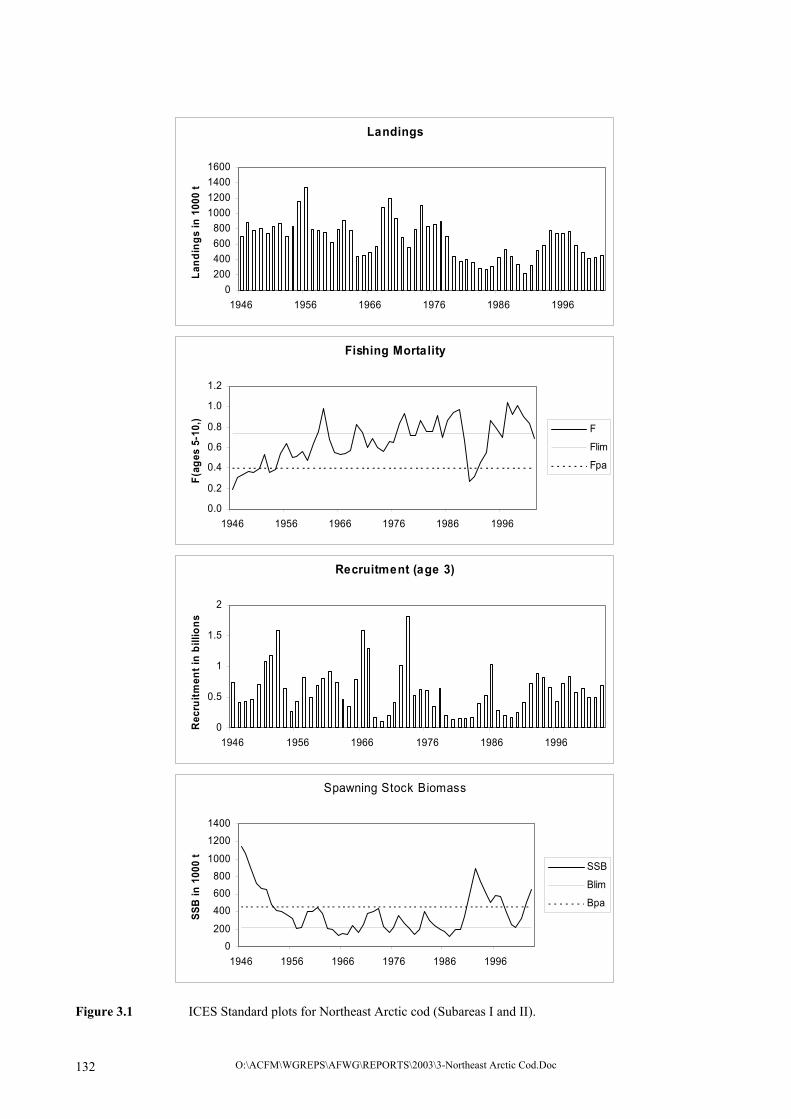
Landings
0200400600800
1000120014001600
1946 1956 1966 1976 1986 1996
Land
ings
in 1
000
t
Fishing Mortality
0.0
0.2
0.4
0.6
0.8
1.0
1.2
1946 1956 1966 1976 1986 1996
F(ag
es 5
-10,
)
F
Flim
Fpa
Recruitment (age 3)
0
0.5
1
1.5
2
1946 1956 1966 1976 1986 1996
Rec
ruitm
ent i
n bi
llion
s
Spawning Stock Biomass
0200
400600800
1000
12001400
1946 1956 1966 1976 1986 1996
SSB
in 1
000
t
SSB
Blim
Bpa
Figure 3.1 ICES Standard plots for Northeast Arctic cod (Subareas I and II).
O:\ACFM\WGREPS\AFWG\REPORTS\2003\3-Northeast Arctic Cod.Doc 132

Stock - Recruitment
00.20.40.60.8
11.21.41.61.8
2
0 200 400 600 800 1000 1200 1400
SSB in 1000 t
Rec
ruitm
ent (
age
3) in
bi
llion
s SSB-Rec.
Blim
Bpa
Yield and Spawning Stock Biomass per Recruit
0
0.2
0.4
0.6
0.8
1
1.2
1.4
0 0.2 0.4 0.6 0.8 1 1.2 1.4 1.6
Fishing Mortality (ages 5-10,)
Yiel
d (d
ashe
d lin
e)
02468101214161820
SSB
(line
)
Precautionary Approach PlotPeriod 1946-2003
0
200
400
600
800
1000
1200
1400
0.0 0.2 0.4 0.6 0.8 1.0 1.2Fishing Mortality (ages 5-10,)
SSB
in 1
000
t F-SSB
2003
Flim
Fpa
Blim
Bpa
Figure 3.1 Continued ICES Standard plots for Northeast Arctic cod (Subareas I and II).
O:\ACFM\WGREPS\AFWG\REPORTS\2003\3-Northeast Arctic Cod.Doc 133
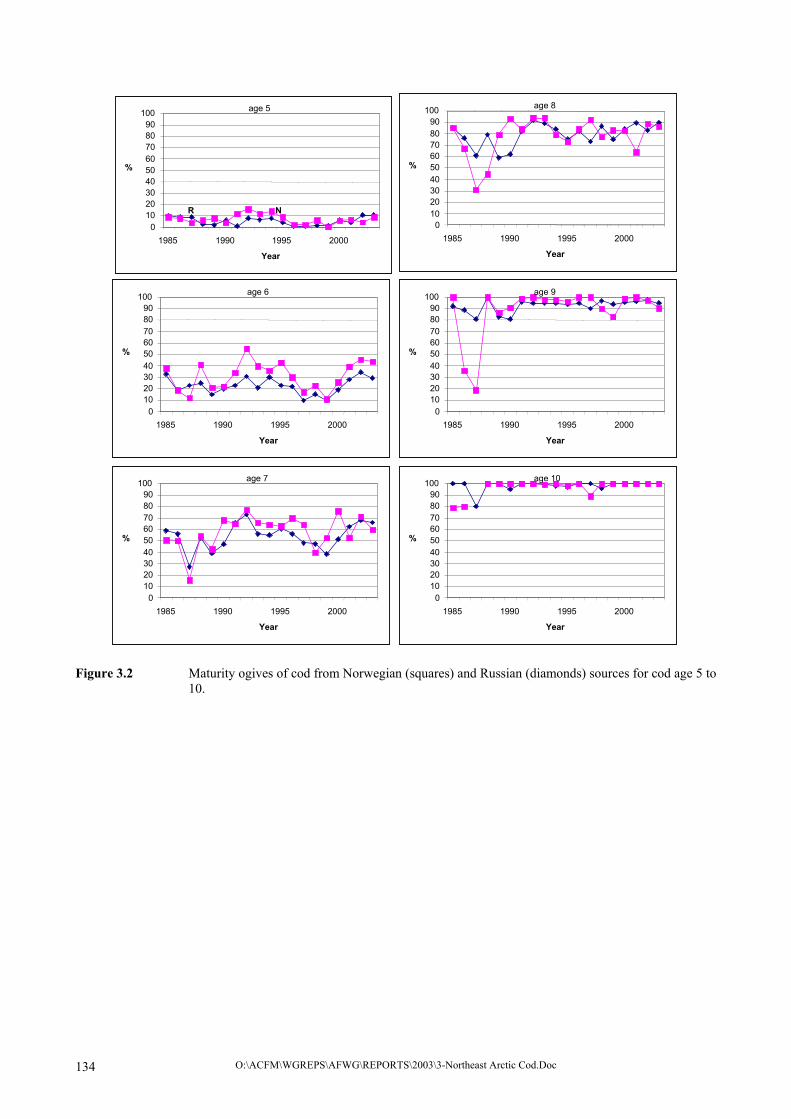
0 10 20 30 40 50 60 70 80 90
100
1985 1990 1995 2000
Year
%
age 5
R
0 10 20 30 40 50 60 70 80 90
100
1985 1990 1995 2000
Year
%
age 6
0 10 20 30 40 50 60 70 80 90
100
1985 1990 1995 2000
Year
%
age 7
0102030405060708090
100
1985 1990 1995 2000 Year
%
age 8
0102030405060708090
100
1985 1990 1995 2000 Year
%
age 9
0102030405060708090
100
1985 1990 1995 2000 Year
%
age 10
N
Figure 3.2 Maturity ogives of cod from Norwegian (squares) and Russian (diamonds) sources for cod age 5 to
10.
O:\ACFM\WGREPS\AFWG\REPORTS\2003\3-Northeast Arctic Cod.Doc 134

-0,020,000,020,040,060,080,100,120,140,160,18
3 4 5 6 7 8 9 10 11 12
Diff
eren
ce b
etw
een
ogiv
es
1985 1986 1987 1988 1989 1990 19911992 1993 1994 1995 1996 1997 19981999 2000 2001
0,4
0,5
0,6
0,7
0,8
0,9
3 4 5 6 7 8 9 10 11 12
Age
Prop
ortio
n fe
mal
e
1985 1986 1987 1988 1989 1990 19911992 1993 1994 1995 1996 1997 19981999 2000 2001
Figure 3.3 The difference between the proportion mature at age estimated for males and females combined
and the proportion mature at age estimated for female only plotted by age for the years 1985 to 2001; and b) the proportion of females by age for years 1985 to 2001.
O:\ACFM\WGREPS\AFWG\REPORTS\2003\3-Northeast Arctic Cod.Doc 135

0
20
40
60
80
100
0 5 10
Age
% o
f mat
ure
that
are
fem
ale
15
1959 1960 1961 1962 1963 1964 1965 1966 1967 1968 1969
1970 1971 1972 1973 1974 1975 1976 1977 1978 1979 1980
1981 1982 1983 1984 1985 1986 1987 1988 1989 1990 1991
1992 1993 1994 1995 1996 1997 1998 1999 2000
Figure 3.4 The percentage of mature cod that are female plotted by age for 1959 to 2000.
0,2
0,3
0,4
0,5
0,6
1985 1987 1989 1991 1993 1995 1997 1999 2001
Year
Fem
ale
SSB
/SSB
5,0
5,5
6,0
6,5
7,0
7,5
8,0
Mean age of SSB
Russian Norwegian Mean age
Figure 3.5 Temporal trends in the proportion of female-only SSB in the SSB as estimated for Russian
(diamonds) and Norwegian (squares) data. The mean age of the mature stock is also shown (line and triangles).
O:\ACFM\WGREPS\AFWG\REPORTS\2003\3-Northeast Arctic Cod.Doc 136

0.0
0.00
40.
008
0.2 0.3 0.4 0.5
0.0
0.02
0.04
0.06
0.08
0.4 0.6 0.8 1.0 1.2
0.0
0.05
0.10
0.15
0.8 1.0 1.2 1.4 1.6 1.8
0.1
0.2
0.3
0.4
1.6 2.0 2.4 2.8
0.2
0.4
0.6
2.5 3.0 3.5 4.0
0.4
0.6
0.8
3.5 4.0 4.5 5.0 5.5
0.5
0.6
0.7
0.8
0.9
1.0
5 6 7 8 9
0.75
0.85
0.95
7 8 9 10 11 12
0.95
0.97
0.99
8 9 10 11 12 13 14
0.90
0.94
0.98
9.5 10.0 10.5
Prop
ortio
n m
atur
e
Weight (kg)
Age 3 Age 4 Age 5 Age 6
Age 7 Age 8 Age 9 Age 10
Age 11 Age 12
Figure 3.6 Scatterplot matrix showing the relationship between weight-at-age and proportion mature-at-age
for years 1980 to 2002 and age-classes 3-12. LOESS smoothers (span=1) are indicated by the solid line.
y = 0,0018x + 0,2399R2 = 0,3936
0,2
0,3
0,4
0,5
0,6
0,7
0,8
100 150 200 250 300
Liver weight at 70 cm
Pro
p m
atur
e at
age
7
Figure 3.7 The bivariate relationship between liver weight(g) of a 70 cm cod and the proportion mature at age
7 for the years 1984 to 2001. Mean length of age 7 cod during this time period varied between a minimum of 66.3 cm in 1990 and a maximum of 78.6 cm in 1993 thus including the 70 cm value used to estimate liver weights (from the Russian liver condition database).
O:\ACFM\WGREPS\AFWG\REPORTS\2003\3-Northeast Arctic Cod.Doc 137

FL17ALLFL16
FL15FL09
0,00
0,10
0,20
0,30
0,40
0,50
0,60
0,70
0,80
0,90
1,00
0 100 200 300 400 500 600 700
SSB ('000 T)
F(5-
10)
FL17
ALLFL16
FL15
FL09
0.00
0.10
0.20
0.30
0.40
0.50
0.60
0.70
0 100 200 300 400 500 600 700
SSB ('000 T)
F(4-
8)
Figure 3.8 Single fleet tuning results.
O:\ACFM\WGREPS\AFWG\REPORTS\2003\3-Northeast Arctic Cod.Doc 138
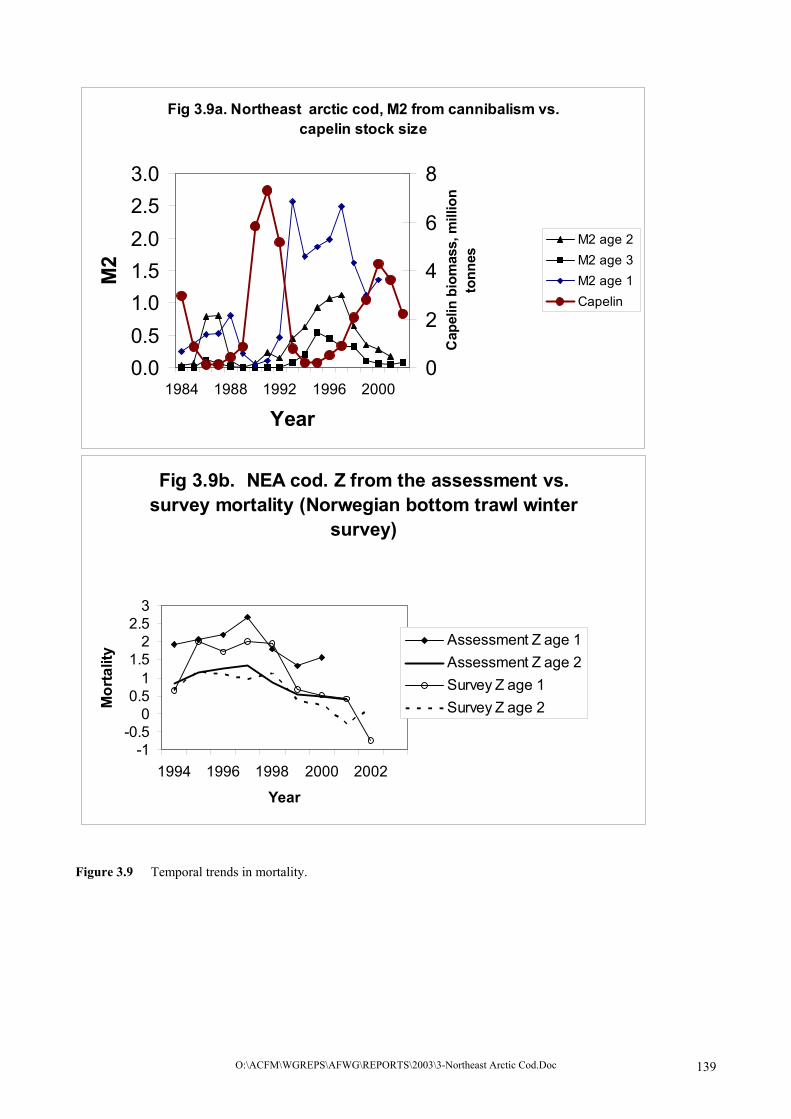
Fig 3.9b. NEA cod. Z from the assessment vs. survey mortality (Norwegian bottom trawl winter
survey)
-1-0.5
00.5
11.5
22.5
3
1994 1996 1998 2000 2002
Year
Mor
talit
y
Assessment Z age 1Assessment Z age 2Survey Z age 1Survey Z age 2
Fig 3.9a. Northeast arctic cod, M2 from cannibalism vs. capelin stock size
0.00.51.01.52.02.53.0
1984 1988 1992 1996 2000
Year
M2
0
2
4
6
8
Cap
elin
bio
mas
s, m
illio
n to
nnes
M2 age 2 M2 age 3 M2 age 1Capelin
O:\ACFM\WGREPS\AFWG\REPORTS\2003\3-Northeast Arctic Cod.Doc 139
Figure 3.9 Temporal trends in mortality.

Figure 3.10a. NEA Cod, retrospective F5-10
0
0,2
0,4
0,6
0,8
1
1,2
1984 1986 1988 1990 1992 1994 1996 1998 2000 2002
1995
1996
1997
1998
1999
2000
2001
2002
2003
Figure 3.10b. NEA Cod, retrospective recruitement age 3
0
200
400
600
800
1000
1200
1400
1984 1986 1988 1990 1992 1994 1996 1998 2000 2002
1995
1996
1997
1998
1999
2000
2001
2002
2003
Figure 3.10c NEA Cod, retrospective SSB
0
200
400
600
800
1000
1200
1984 1986 1988 1990 1992 1994 1996 1998 2000 2002
1995
1996
1997
1998
1999
2000
2001
2002
2003
Figure 3.10d NEA Cod, retrospective F4-8
00,10,20,30,40,50,60,70,80,9
1984 1986 1988 1990 1992 1994 1996 1998 2000 2002
1995
1996
1997
1998
1999
2000
2001
2002
2003
Figure 3.10 Retrospective plots.
O:\ACFM\WGREPS\AFWG\REPORTS\2003\3-Northeast Arctic Cod.Doc 140

Catch percentiles, F=0.25
0
0,2
0,4
0,6
0,8
1
2003 2004 2005 2006 2007
Year
Cat
ch (m
illio
n to
nnes
)10 %25 %50 %75 %90 %
TSB percentiles, F=0.25
00,5
11,5
22,5
33,5
2003 2004 2005 2006 2007
Year
TSB
(mill
ion
tonn
es)
10 %25 %50 %75 %90 %
SSB percentiles, F=0.25
0
0.5
1
1.5
2
2003 2004 2005 2006 2007
Year
SSB
(mill
ion
tonn
es)
10 %25 %50 %75 %90 %Bpa
Figure 3.11a Medium-term projections, assuming F=0.25.
O:\ACFM\WGREPS\AFWG\REPORTS\2003\3-Northeast Arctic Cod.Doc 141
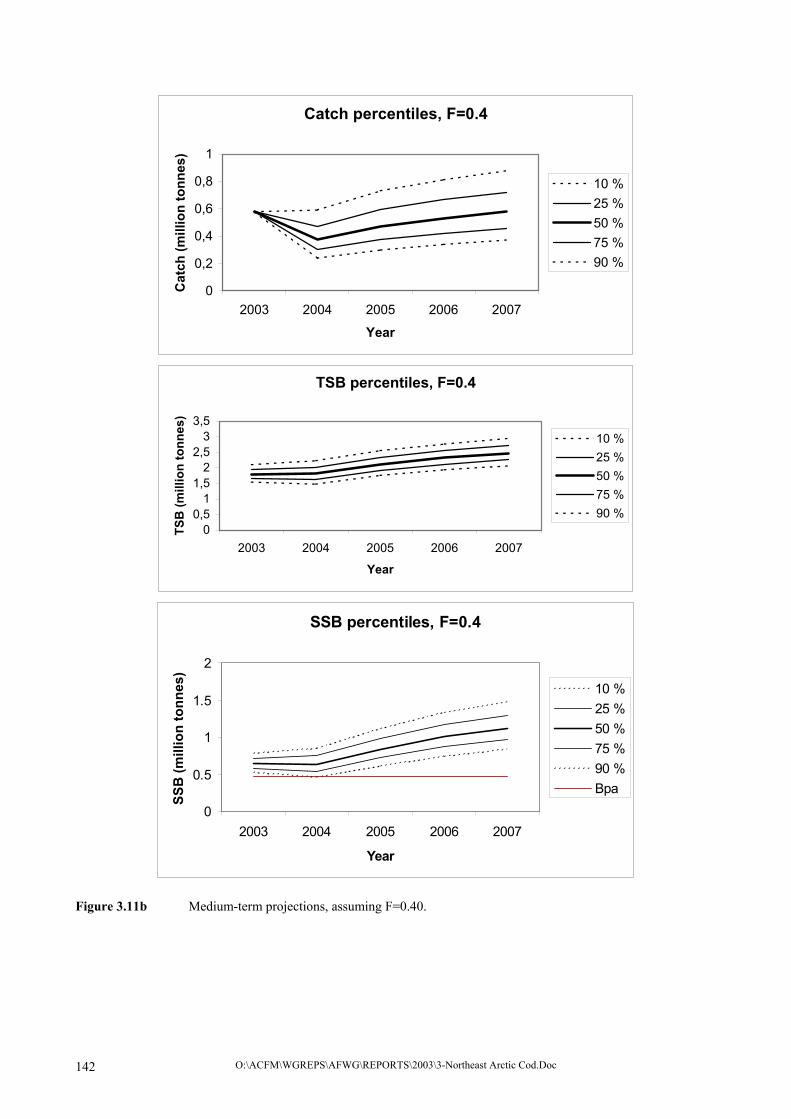
Catch percentiles, F=0.4
0
0,2
0,4
0,6
0,8
1
2003 2004 2005 2006 2007
Year
Cat
ch (m
illio
n to
nnes
)10 %25 %50 %75 %90 %
TSB percentiles, F=0.4
00,5
11,5
22,5
33,5
2003 2004 2005 2006 2007
Year
TSB
(mill
ion
tonn
es)
10 %25 %50 %75 %90 %
SSB percentiles, F=0.4
0
0.5
1
1.5
2
2003 2004 2005 2006 2007
Year
SSB
(mill
ion
tonn
es)
10 %25 %50 %75 %90 %Bpa
Figure 3.11b Medium-term projections, assuming F=0.40.
O:\ACFM\WGREPS\AFWG\REPORTS\2003\3-Northeast Arctic Cod.Doc 142

Catch percentiles, F=0.7
0
0,2
0,4
0,6
0,8
1
2003 2004 2005 2006 2007
Year
Cat
ch (m
illio
n to
nnes
)10 %25 %50 %75 %90 %
TSB percentiles, F=0.7
00,5
11,5
22,5
33,5
2003 2004 2005 2006 2007
Year
TSB
(mill
ion
tonn
es)
10 %25 %50 %75 %90 %
SSB percentiles, F=0.7
0
0.5
1
1.5
2
2003 2004 2005 2006 2007
Year
SSB
(mill
ion
tonn
es)
10 %25 %50 %75 %90 %Bpa
Figure 3.11c Medium-term projections, assuming F=0.70.
O:\ACFM\WGREPS\AFWG\REPORTS\2003\3-Northeast Arctic Cod.Doc 143

Figure 3.12 North-East Arctic cod. Residual log catchability by fleet and age from the XSA output in the 2003 assessment.
FLT15: NorBarTrSur
-1-0.8-0.6-0.4-0.2
00.20.40.60.8
1
1993 1994 1995 1996 1997 1998 1999 2000 2001 2002
Res
idua
l log
Q
Age 3Age 4Age 5
FLT16: NorBarLofAcSur
-1-0.8-0.6-0.4-0.2
00.20.40.60.8
1
1993 1994 1995 1996 1997 1998 1999 2000 2001 2002
Res
idua
l log
Q
Age 3Age 4Age 5
FLT17: RusSurCatch/h
-1-0.8-0.6-0.4-0.2
00.20.40.60.8
1
1993 1994 1995 1996 1997 1998 1999 2000 2001 2002
Res
idua
l log
Q
Age 3Age 4Age 5
O:\ACFM\WGREPS\AFWG\REPORTS\2003\3-Northeast Arctic Cod.Doc 144

Figure 3.13 North-East Arctic cod. Residual log catchability by fleet and age from the XSAoutput in the 2003 assessment.
FLT15: NorBarTrSur
-1-0.8-0.6-0.4-0.2
00.20.40.60.8
1
1993 1994 1995 1996 1997 1998 1999 2000 2001 2002
Res
idua
l log
Q
Age 6Age 7Age 8
FLT16: NorBarLofAcSur
-1-0.8-0.6-0.4-0.2
00.20.40.60.8
1
1993 1994 1995 1996 1997 1998 1999 2000 2001 2002
Res
idua
l log
Q
Age 6Age 7Age 8
FLT17: RusSurCatch/h
-1-0.8-0.6-0.4-0.2
00.20.40.60.8
1
1993 1994 1995 1996 1997 1998 1999 2000 2001 2002
Res
idua
l log
Q
Age 6Age 7Age 8
O:\ACFM\WGREPS\AFWG\REPORTS\2003\3-Northeast Arctic Cod.Doc 145

Figure 3.14 North-East Arctic cod. Residual log catchability by fleet and age from the XSA output in the 2003 assessment.
FLT09: Russian Trawl CPUE
-2
-1.5-1
-0.50
0.5
11.5
2
1993 1994 1995 1996 1997 1998 1999 2000 2001 2002
Res
idua
l log
Q Age 9Age 10Age 11Age 12
FLT16: NorBarLofAcSur
-2
-1.5
-1
-0.5
0
0.5
1
1.5
2
1993 1994 1995 1996 1997 1998 1999 2000 2001 2002
Res
idua
l log
Q
Age 9Age 10Age 11
O:\ACFM\WGREPS\AFWG\REPORTS\2003\3-Northeast Arctic Cod.Doc 146

O:\ACFM\WGREPS\AFWG\REPORTS\2003\3-Northeast Arctic Cod.Doc 147
Figure 3.15 NEA cod. Stock numbers by age relative to the average for the period 1996-2002 for the vpa and the Joint winter bottom trawl survey.
Figure 3.16 NEA cod. Survey mortalities in the Joint winter bottom trawl survey, compared to vpa total
mortalities.
Nor BT survey Z vs XSA Z age 7
0.00
0.50
1.00
1.50
2.00
1994 1995 1996 1997 1998 1999 2000 2001 2002
Year
Mor
talit
y (Z
)
Nor BT survey ZXSA Z
Nor BT survey Z vs XSA Z age 6
0.000.501.001.50
1994 1996 1998 2000 2002
Year
Mor
talit
y (Z
)
Nor BT survey ZXSA Z
Nor BT survey Z vs. XSA Z - age 4
0.00
0.50
1.00
1.50
1994 1996 1998 2000 2002
Year
Mor
talit
y (Z
)
Nor BTsurvey ZXSA Z
Nor BT survey Z vs XSA Z age 5
0.000.501.001.50
1994
1995
1996
1997
1998
1999
2000
2001
2002
Year
Mor
talit
y (Z
)
Nor BT survey ZXSA Z
Age 5
050
100150200250300
1993
1994
1995
1996
1997
1998
1999
2000
2001
2002
2003
% o
f 199
6-20
02 a
vera
ge
vpasurvey
Age 7+
0
50
100
150
200
1993
1994
1995
1996
1997
1998
1999
2000
2001
2002
2003
% o
f 199
6-20
02 a
vera
ge vpasurvey
Age 4
0
50
100
150
200
25019
93
1994
1995
1996
1997
1998
1999
2000
2001
2002
2003
% o
f 199
6-20
02 a
vera
ge vpasurvey
Age 6
050
100150200250300
1993
1994
1995
1996
1997
1998
1999
2000
2001
2002
2003 %
of 1
996-
2002
ave
rage
vpasurvey

Figure 3.17a stock biomass in keyrun, and XSA
Figure 3.17b ssb in keyrun and XSA
O:\ACFM\WGREPS\AFWG\REPORTS\2003\3-Northeast Arctic Cod.Doc 148

Figure 3.17c F5-10 in keyrun and XSA
Figure 3.17d Catch in biomass in keyrun, and observed catches
O:\ACFM\WGREPS\AFWG\REPORTS\2003\3-Northeast Arctic Cod.Doc 149

Figure 3.17e Recruitment (number of 3 year old) in keyrun and XSA
Figure 3.17f Stock numbers in keyrun and XSA
O:\ACFM\WGREPS\AFWG\REPORTS\2003\3-Northeast Arctic Cod.Doc 150

Figure3.18a Observed and modelled survey indices
Figure3.18b Unweighted likelihood contribution from surveys
O:\ACFM\WGREPS\AFWG\REPORTS\2003\3-Northeast Arctic Cod.Doc 151

Figure3.18c Observed and modelled survey indices
Figure3.18d Unweighted likelihood contribution from surveys
O:\ACFM\WGREPS\AFWG\REPORTS\2003\3-Northeast Arctic Cod.Doc 152

Figure3.18e Observed and modelled catches
Figure3.18f Unweighted likelihood contribution from catches
O:\ACFM\WGREPS\AFWG\REPORTS\2003\3-Northeast Arctic Cod.Doc 153

Figure 3.19a Retrospective pattern for stock biomass in keyrun
Figure 3.19b Retrospective pattern for SSB in keyrun
O:\ACFM\WGREPS\AFWG\REPORTS\2003\3-Northeast Arctic Cod.Doc 154

Figure 3.19c Retrospective pattern for F5-10 in keyrun
Figure 3.19d Retrospective pattern for Catch in biomass in key run
O:\ACFM\WGREPS\AFWG\REPORTS\2003\3-Northeast Arctic Cod.Doc 155

Figure 3.19e Retrospective pattern for recruitment in keyrun
Figure 3.19f Retrospective pattern for stock numbers in keyrun
O:\ACFM\WGREPS\AFWG\REPORTS\2003\3-Northeast Arctic Cod.Doc 156

Figure 3.20a Prediction of stock biomass
Figure 3.20b Prediction of SSB
O:\ACFM\WGREPS\AFWG\REPORTS\2003\3-Northeast Arctic Cod.Doc 157
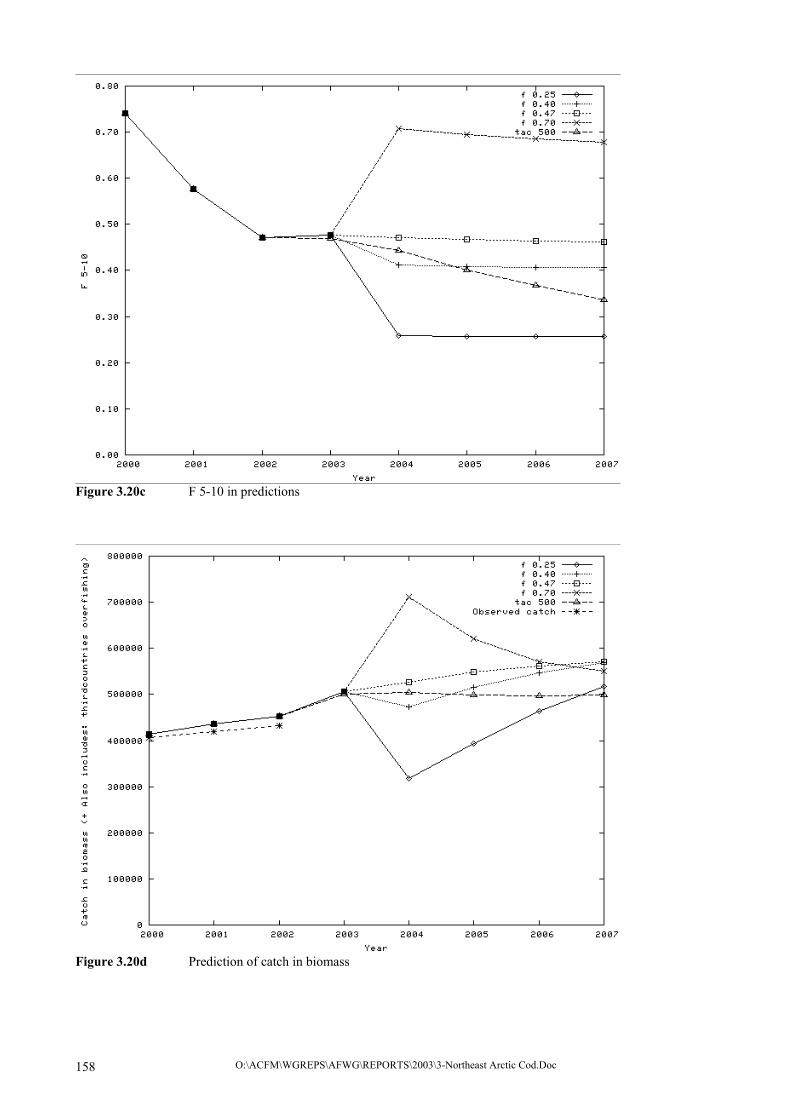
Figure 3.20c F 5-10 in predictions
Figure 3.20d Prediction of catch in biomass
O:\ACFM\WGREPS\AFWG\REPORTS\2003\3-Northeast Arctic Cod.Doc 158

Figure 3.20e Recruitment in prediction
Figure 3.20f Prediction of stock numbers
O:\ACFM\WGREPS\AFWG\REPORTS\2003\3-Northeast Arctic Cod.Doc 159

SSB Predictions for Fleksibest and XSA
0
200000
400000
600000
800000
1000000
1200000
1400000
2003 2004 2005 2006 2007
fbestxsa
TSB Predictions for Fleksibest and XSA
0
500000
1000000
1500000
2000000
2500000
3000000
2003 2004 2005 2006 2007
fbestxsa
F 5-10 Predictions for Fleksibest and XSA
0
0.1
0.2
0.3
0.4
0.5
0.6
0.7
2003 2004 2005 2006 2007
fbestxsa
Figure 3.21 Comparison of F, SSB and TSB for Fleksibest and XSA prediction, both assuming a fixed annual
catch=500,000 t for the period 2003-2007.
O:\ACFM\WGREPS\AFWG\REPORTS\2003\3-Northeast Arctic Cod.Doc 160

O:\ACFM\WGREPS\AFWG\REPORTS\2003\3-Northeast Arctic Cod.Doc 161
PST = stern trawlers, up to 2000 HP.
Table A1 North-East Arctic COD. Catch per unit effort.
Sub-area |I Division IIb Division IIa Total Year Norway2 UK3 Russia4 Norway2 UK3 Russia4 Norway2 UK3 Norway 1960 - 0.075 0.42 - 0.105 0.31 - 0.067 1961 - 0.079 0.38 - 0.129 0.44 - 0.058 1962 - 0.092 0.59 - 0.133 0.74 - 0.066 1963 - 0.085 0.60 - 0.098 0.55 - 0.066 1964 - 0.056 0.37 - 0.092 0.39 - 0.070 1965 - 0.066 0.39 - 0.109 0.49 - 0.066 1966 - 0.074 0.42 - 0.078 0.19 - 0.067 1967 - 0.081 0.53 - 0.106 0.87 - 0.052 1968 - 0.110 1.09 - 0.173 1.21 - 0.056 1969 - 0.113 1.00 - 0.135 1.17 - 0.094 1970 - 0.100 0.80 - 0.100 0.80 - 0.066 1971 - 0.056 0.43 - 0.071 0.16 - 0.062 1972 0.90 0.047 0.34 0.59 0.051 0.18 1.08 0.055 1973 1.05 0.057 0.56 0.43 0.054 0.57 0.71 0.043 1974 1.75 0.079 0.86 1.94 0.106 0.77 0.19 0.028 1975 1.82 0.077 0.94 1.67 0.100 0.43 1.36 0.033 1976 1.69 0.060 0.84 1.20 0.081 0.30 1.69 0.035 1977 1.54 0.052 0.63 0.91 0.056 0.25 1.16 0.044 1.17 1978 1.37 0.062 0.52 0.56 0.044 0.08 1.12 0.037 0.94 1979 0.85 0.046 0.43 0.62 - 0.06 1.06 0.042 0.85 1980 1.47 - 0.49 0.41 - 0.16 1.27 - 1.23 Spain5 Russia4 1981 1.42 - 0.41 (0.96) - 0.07 1.02 0.35 1.21 1982 1.30 - 0.35 - 0.86 0.26 1.01 0.34 1.09 1983 1.58 - 0.31 (1.31) 0.92 0.36 1.05 0.38 1.11 1984 1.40 - 0.45 1.20 0.78 0.35 0.73 0.27 0.96 1985 1.86 - 1.04 1.51 1.37 0.50 0.90 0.39 1.29 1986 1.97 - 1.00 2.39 1.73 0.84 1.36 1.14 1.70 1987 1.77 - 0.97 2.00 1.82 1.05 1.73 0.67 1.77 1988 1.58 - 0.66 1.61 (1.36) 0.54 0.97 0.55 1.03 1989 1.49 - 0.71 0.41 2.70 0.45 0.78 0.43 0.76 1990 1.35 - 0.70 0.39 2.69 0.80 0.38 0.60 0.49 1991 1.38 - 0.67 0.29 4.96 0.76 0.50 0.90 0.44 1992 2.19 - 0.79 3.06 2.47 0.23 0.98 0.65 1.29 1993 2.33 - 0.85 2.98 3.38 1.00 1.74 1.03 1.87 1994 2.50 - 1.01 2.82 1.44 1.14 1.27 0.86 1.59 1995 1.57 - 0.59 2.73 1.65 1.10 1.00 1.01 1.92 1996 0.74 1.11 0.85 0.99 1.81 1997 0.61 0.57 0.74 1.36 1998 0.37 0.29 0.40 0.83 1999 0.29 0.34 0.39 0.74 2000 0.34 0.37 0.53 0.92 2001 0,46 0,46 0,69 1.21 20021 0,58 0,66 0,57 1.34 1Preliminary figures. 2Norwegian data - t per 1,000 tonnage*hrs fishing. 3United Kingdom data - t per 100 tonnage*hrs fishing. 4Russian data - t per hr fishing. 5panish data - t per hr fishing. Period Sub-area I Divisions IIa and IIb 1960–1973 RT RT 1974–1980 PST RT 1981– PST PST Vessel type: RT = side trawlers, 800–1000 HP.

Table A2. North-east Arctic COD. Abundance indices (millions) from the Norwegian acoustic survey in the Barents Sea in January-March. New TS and rock-hopper gear (1981-1988 back-calculated from bobbins gear). Corrected for length-dependent effective spread of trawl.
Year Age1 2 3 4 5 6 7 8 9 10+ Total
1981 8.0 82.0 40.0 63.0 106.0 103.0 16.0 3.0 1.0 1.0 423.01982 4.0 5.0 49.0 43.0 40.0 26.0 28.0 2.0 + 0.0 197.01983 60.5 2.8 5.3 14.3 17.4 11.1 5.6 3.0 0.5 0.1 120.51984 745.4 146.1 39.1 13.6 11.3 7.4 2.8 0.2 0.0 0.0 966.01985 69.1 446.3 153.0 141.6 19.7 7.6 3.3 0.2 0.1 0.0 840.91986 353.6 243.9 499.6 134.3 65.9 8.3 2.2 0.4 0.1 0.0 1308.21987 1.6 34.1 62.8 204.9 41.4 10.4 1.2 0.2 0.7 0.0 357.31988 2.0 26.3 50.4 35.5 56.2 6.5 1.4 0.2 0.0 0.0 178.41989 7.5 8.0 17.0 34.4 21.4 53.8 6.9 1.0 0.1 0.1 150.11990 81.1 24.9 14.8 20.6 26.1 24.3 39.8 2.4 0.1 0.0 234.11991 181.0 219.5 50.2 34.6 29.3 28.9 16.9 17.3 0.9 0.0 578.71992 241.4 562.1 176.5 65.8 18.8 13.2 7.6 4.5 2.8 0.2 1092.91993 1 1074.0 494.7 357.2 191.1 108.2 20.8 8.1 5.0 2.3 2.5 2264.01994 1 858.3 577.2 349.8 404.5 193.7 63.6 12.1 3.7 1.7 0.9 2465.41995 1 2619.2 292.9 166.2 159.8 210.1 68.8 16.7 2.1 0.7 1.0 3537.41996 1 2396.0 339.8 92.9 70.5 85.8 74.7 20.6 2.8 0.3 0.4 3083.81997 1,2 1623.5 430.5 188.3 51.7 49.3 37.2 22.3 4.0 0.7 0.1 2407.51998 1,2 3401.3 632.9 427.7 182.6 42.3 33.5 26.9 13.6 1.7 0.3 4762.81999 358.3 304.3 150.0 96.4 45.1 10.3 6.4 4.1 0.8 0.3 976.12000 154.1 221.4 245.2 158.9 142.1 45.4 9.6 4.7 3.0 1.1 985.52001 629.9 63.9 138.2 171.6 77.3 39.7 11.8 1.4 0.5 0.2 1134.52002 18.2 215.5 69.3 112.2 102.0 47.0 18.0 3.0 0.4 0.3 585.92003 1693.9 61.5 303.4 114.4 129.0 114.9 34.3 7.7 1.9 0.5 2461.5
1 Survey covered a larger area2 Adjusted indices
Table A3. North-East Arctic COD. Abundance indices (millions) from the Norwegian bottom trawlsurvey in the Barents Sea in January-March. Rock-hopper gear (1981-1988 back-calculated from bobbins gear). Corrected for length-dependent effective spread of trawl.
AgeYear 1 2 3 4 5 6 7 8 9 10+ Total
1981 4.6 34.3 16.4 23.3 40 38.4 4.8 1 0.3 0 163.11982 0.8 2.9 28.3 27.7 23.6 15.5 16 1.4 0.2 0 116.41983 152.9 13.4 25.0 52.3 43.3 17.0 5.8 3.2 1.0 0.1 313.91984 2755.0 379.1 97.5 28.3 21.4 11.7 4.1 0.4 0.1 0.1 3297.71985 49.5 660.0 166.8 126.0 19.9 7.7 3.3 0.2 0.1 0.1 1033.61986 665.8 399.6 805.0 143.9 64.1 8.3 1.9 0.3 0.0 0.0 2089.11987 30.7 445.0 240.4 391.1 54.3 15.7 2.0 0.5 0.0 0.0 1179.81988 3.2 72.8 148.0 80.5 173.3 20.5 3.6 0.5 0.0 0.0 502.51989 8.2 15.6 46.4 75.9 37.8 90.2 9.8 0.9 0.1 0.1 285.01990 207.2 56.7 28.4 34.9 34.6 20.6 27.2 1.6 0.4 0.0 411.51991 460.5 220.1 45.9 33.7 25.7 21.5 12.2 12.7 0.6 0.0 832.71992 126.6 570.9 158.3 57.7 17.8 12.8 7.7 4.3 2.7 0.2 959.01993 1 534.5 420.4 273.9 140.1 72.5 15.8 6.2 3.9 2.2 2.4 1471.91994 1 1035.9 535.8 296.5 310.2 147.4 50.6 9.3 2.4 1.6 1.3 2391.01995 1 5253.1 541.5 274.6 241.4 255.9 76.7 18.5 2.4 0.8 1.1 6666.21996 1 5768.5 707.6 170.0 115.4 137.2 106.1 24.0 2.9 0.4 0.5 7032.51997 1,2 4815.5 1045.1 238.0 64.0 70.4 52.7 28.3 5.7 0.9 0.5 6321.11998 1,2 2418.5 643.7 396.0 181.3 36.5 25.9 17.8 8.6 1.0 0.5 3729.81999 1 484.6 340.1 211.8 173.2 58.1 13.4 6.5 5.1 1.2 0.4 1294.42000 128.8 248.3 235.2 132.1 108.3 26.9 4.3 2.0 1.2 0.4 887.52001 657.9 76.6 191.1 182.8 83.4 38.2 8.9 1.1 0.4 0.2 1240.62002 35.3 443.9 88.3 135.0 109.6 42.5 15.1 2.4 0.3 0.2 872.62003 2991.7 79.1 377.0 129.7 91.1 67.3 18.3 4.9 1.0 0.2 3760.3
1 Survey covered a larger area2 Adjusted indices
O:\ACFM\WGREPS\AFWG\REPORTS\2003\3-Northeast Arctic Cod.Doc 162
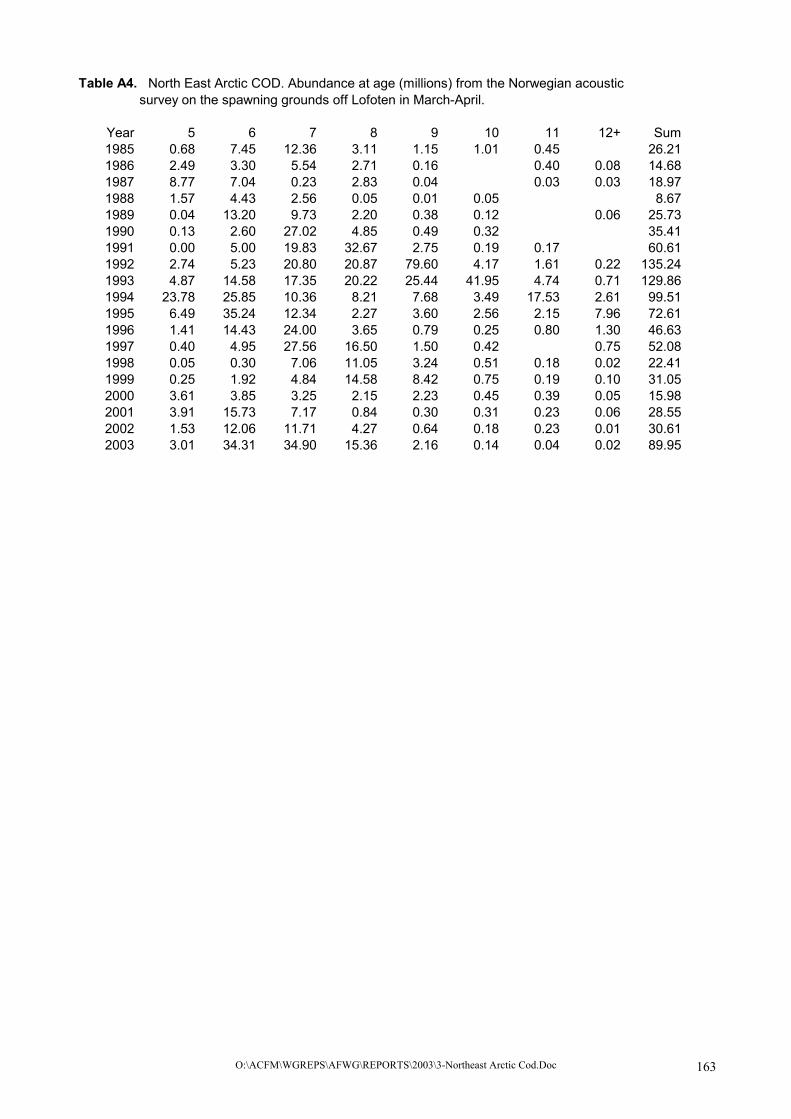
Table A4. North East Arctic COD. Abundance at age (millions) from the Norwegian acoustic survey on the spawning grounds off Lofoten in March-April.
Year 5 6 7 8 9 10 11 12+ S1985 0.68 7.45 12.36 3.11 1.15 1.01 0.45 26.211986 2.49 3.30 5.54 2.71 0.16 0.40 0.08 14.681987 8.77 7.04 0.23 2.83 0.04 0.03 0.03 18.971988 1.57 4.43 2.56 0.05 0.01 0.05 8.671989 0.04 13.20 9.73 2.20 0.38 0.12 0.06 25.731990 0.13 2.60 27.02 4.85 0.49 0.32 35.411991 0.00 5.00 19.83 32.67 2.75 0.19 0.17 60.611992 2.74 5.23 20.80 20.87 79.60 4.17 1.61 0.22 135.241993 4.87 14.58 17.35 20.22 25.44 41.95 4.74 0.71 129.861994 23.78 25.85 10.36 8.21 7.68 3.49 17.53 2.61 99.511995 6.49 35.24 12.34 2.27 3.60 2.56 2.15 7.96 72.611996 1.41 14.43 24.00 3.65 0.79 0.25 0.80 1.30 46.631997 0.40 4.95 27.56 16.50 1.50 0.42 0.75 52.081998 0.05 0.30 7.06 11.05 3.24 0.51 0.18 0.02 22.411999 0.25 1.92 4.84 14.58 8.42 0.75 0.19 0.10 31.052000 3.61 3.85 3.25 2.15 2.23 0.45 0.39 0.05 15.982001 3.91 15.73 7.17 0.84 0.30 0.31 0.23 0.06 28.552002 1.53 12.06 11.71 4.27 0.64 0.18 0.23 0.01 30.612003 3.01 34.31 34.90 15.36 2.16 0.14 0.04 0.02 89.95
um
O:\ACFM\WGREPS\AFWG\REPORTS\2003\3-Northeast Arctic Cod.Doc 163

Table A5. North-east Arctic COD. Abundance indices (millions) from the Norwegian Bottom Trawl survey in the Svalbard area in September-October (1983-1994) and July-August (1995-2002). Swept area estimates of number of fish at each age. Rock-hopper gear. (1983-1988 back-calculated from bobbins gear). Corrected for length-dependent effective spread of trawl.
AgeYear 1 2 3 4 5 6 7 8 9+ T1983 191.2 17.0 4.3 4.4 1.3 1.1 0.5 0.8 0.2 220.81984 598.4 106.8 6.3 3.3 3.4 1.3 0.3 0.3 0.3 720.31985 280.6 447.7 81.1 21.5 9.8 3.9 0.7 0.3 0.2 845.81986 49.8 182.3 260.6 32.5 11.0 1.9 0.7 0.2 0.1 539.11987 48.8 117.7 147.1 137.2 20.2 5.0 0.5 0.3 0.1 476.71988 2.6 26.8 30.8 24.4 37.2 7.1 1.5 0.1 0.1 130.61989 4.0 1.4 12.1 11.3 9.3 14.7 3.0 0.4 0.1 56.31990 95.0 10.3 7.0 10.9 17.0 11.4 17.4 1.6 0.3 170.81991 144.5 88.0 22.4 6.1 9.5 10.2 8.5 13.2 1.5 303.71992 168.0 125.6 81.8 37.9 8.4 3.9 4.4 2.1 4.5 436.61993 157.9 153.1 116.0 44.8 16.8 3.4 2.4 1.5 4.1 499.91994 105.6 149.3 103.1 48.5 39.7 18.6 4.3 1.6 3.0 473.71995 465.2 67.1 101.4 80.8 82.5 43.1 14.6 3.2 1.4 859.21996 553.2 195.6 60.0 38.1 35.1 32.0 17.7 2.3 0.9 934.91997 243.2 209.1 55.0 18.2 10.3 10.2 6.9 2.0 0.4 555.41998 189.9 272.2 168.5 62.8 17.1 8.2 5.6 2.7 0.5 727.41999 105.0 179.2 132.2 106.2 20.8 4.0 3.9 2.1 0.4 553.82000 30.3 121.3 130.9 52.5 43.5 9.6 0.9 1.4 0.3 390.72001 75.8 20.7 39.6 28.4 15.4 18.3 3.8 0.6 0.2 202.82002 6.6 80.5 28.6 18.5 17.2 6.8 3.4 0.5 0.1 162.2
Abundance indices (millions) from the Norwegian Bottom Trawl survey in the Svalbard and Barents Sea area in July-August (1995-2002). Swept area estimates of number of fish at each age. Rock-hopper gear. This survey covers ICES Division IIa and IIb, as well as the north-eastern part of Sub-area I. The figures given above for the Svalbard area are included in these estimates
AgeYear 1 2 3 4 5 6 7 8 9+ T1995 746.1 116.5 176.7 178.3 106.0 47.4 18.1 3.8 2.1 1395.01996 1314.8 440.9 104.9 87.8 73.4 45.6 25.0 4.2 1.5 2098.11997 745.3 551.7 163.8 38.3 27.0 29.5 20.1 7.4 2.0 1585.11998 841.0 466.2 299.3 104.9 27.2 14.6 10.6 5.3 1.6 1770.71999 200.2 274.6 191.2 145.6 35.3 6.7 5.2 3.3 0.9 863.02000 64.5 181.5 220.4 98.5 74.0 21.7 2.7 2.1 1.1 666.52001 319.0 42.3 62.6 49.6 29.1 24.2 6.7 0.7 0.4 534.62002 20.0 147.7 49.2 41.4 38.9 19.4 14.5 2.4 0.7 334.2
otal
otal
O:\ACFM\WGREPS\AFWG\REPORTS\2003\3-Northeast Arctic Cod.Doc 164

Table A6. North-east Arctic COD. Mean length at age(cm) from Norwegian surveys in January-March1983-1999 values re-calculated from raw data.Year 1 2 3 4 5 6 7 8
1978 14.2 23.1 32.1 45.9 54.2 64.6 67.6 76.91979 12.8 22.9 33.1 40.0 52.3 64.4 74.7 83.01980 17.6 24.8 34.2 40.5 52.5 63.5 73.6 83.61981 17.0 26.1 35.5 44.7 52.0 61.3 69.6 77.91982 14.8 25.8 37.6 46.3 54.7 63.1 70.8 82.91983 12.8 27.6 34.8 45.9 54.5 62.7 73.1 78.61984 14.2 28.4 35.8 48.6 56.6 66.2 74.1 79.71985 16.5 23.7 40.3 48.7 61.3 71.1 81.2 85.71986 11.9 21.6 34.4 49.9 59.8 69.4 80.3 93.81987 13.9 21.0 31.8 41.3 56.3 66.3 77.6 87.91988 15.3 23.3 29.7 38.7 47.6 56.8 71.7 79.41989 12.5 25.4 34.7 39.9 46.8 56.2 67.0 83.31990 14.4 27.9 39.4 47.1 53.8 60.6 68.2 79.21991 13.6 27.2 41.6 51.7 59.5 67.1 72.3 77.61992 13.2 23.9 41.3 49.9 60.2 68.4 76.1 82.81993 11.3 20.3 35.9 50.8 59.0 68.2 76.8 85.81994 12.0 18.3 30.5 44.7 55.4 64.3 73.5 82.41995 12.7 18.7 29.9 42.0 54.1 64.1 74.8 80.61996 12.6 19.6 28.1 41.0 49.3 61.4 72.2 85.31997 1 11.4 18.8 28.0 40.4 49.9 59.3 69.1 80.61998 1 10.9 17.4 28.7 40.0 50.5 58.9 67.5 76.31999 12.1 18.8 29.0 40.6 50.6 59.9 70.3 78.02000 13.0 21.0 28.7 39.7 51.5 61.6 70.5 75.72001 12.0 22.5 33.1 41.6 52.2 63.1 71.2 79.22002 12.2 19.9 30.1 43.6 52.2 61.7 71.6 79.12003 12.0 21.2 29.1 39.2 53.3 61.6 70.3 80.7
1 Adjusted lengths
O:\ACFM\WGREPS\AFWG\REPORTS\2003\3-Northeast Arctic Cod.Doc 165

Table A7. North-east Arctic COD. Weight (g) at age from Norwegian surveys in January-MarchYear Age
1 2 3 4 5 6 7 81983 190 372 923 1597 2442 3821 47581984 23 219 421 1155 1806 2793 3777 45661985 171 576 1003 2019 3353 5015 61541986 119 377 997 1623 2926 3838 73851987 2 21 65 230 490 1380 2300 39701988 24 114 241 492 892 1635 3040 43731989 16 158 374 604 947 1535 2582 49061990 26 217 580 1009 1435 1977 2829 44351991 18 196 805 1364 2067 2806 3557 45021992 20 136 619 1118 1912 2792 3933 51271993 9 71 415 1179 1743 2742 3977 57581994 13 55 259 788 1468 2233 3355 49081995 16 54 248 654 1335 2221 3483 47131996 15 62 210 636 1063 1999 3344 55141997 1 12 54 213 606 1112 1790 2851 47611998 1 10 47 231 579 1145 1732 2589 39301999 13 55 219 604 1161 1865 2981 39912000 17 77 210 559 1189 1978 2989 37972001 14 103 338 664 1257 2188 3145 44632002 15 68 256 747 1234 2024 3190 45112003 14 82 228 569 1302 1980 2975 4666
1 Adjusted weights2 Estimated weights
Table A8. Northeast Arctic COD. Length at age in cm in the Lofoten survey
Year/age 5 6 7 8 9 10 11 12+1985 59.6 71.1 79.0 88.2 97.3 105.2 114.01986 62.7 70.0 80.0 89.4 86.6 105.8 115.01987 58.2 64.5 76.7 86.2 88.0 118.5 116.01988 53.1 67.1 71.6 94.0 97.0 119.61989 54.0 59.0 69.8 80.8 96.6 103.0 125.01990 56.9 65.1 69.2 79.5 83.7 100.11991 59.0 67.3 74.4 81.0 91.3 99.8 85.01992 66.3 68.7 78.3 83.9 89.2 92.2 101.9 127.01993 58.3 66.1 72.8 83.6 87.4 92.7 95.4 111.21994 64.3 70.6 82.0 87.3 90.0 95.3 92.4 101.41995 61.5 69.7 77.8 84.4 92.6 96.7 100.3 99.51996 62.2 67.1 75.9 81.0 93.6 100.9 97.4 104.11997 63.7 68.6 74.2 83.8 99.9 108.4 109.01998 55.0 62.6 70.2 80.0 92.0 98.0 96.7 115.01999 52.7 67.0 69.4 78.6 85.8 100.3 102.0 125.02000 58.4 66.5 72.6 77.0 83.9 90.6 93.7 112.42001 59.2 66.8 73.1 86.4 88.9 101.8 98.1 128.22002 57.8 65.8 73.0 80.8 88.2 102.0 91.2 101.42003' 62.3 65.0 73.2 80.9 89.0 86.2 120.0 122.0
' - preliminary
O:\ACFM\WGREPS\AFWG\REPORTS\2003\3-Northeast Arctic Cod.Doc 166

Table A9. Northeast Arctic COD. Mean weight at age (kg) in the Lofoten survey
Year 5 6 7 8 9 10 11 12+1985 2.00 3.42 4.61 6.67 8.89 10.73 14.291986 2.22 3.22 4.74 6.40 5.80 10.84 13.481987 1.44 1.94 3.61 5.40 5.64 13.15 12.551988 1.46 2.82 3.39 6.63 7.27 13.641989 1.30 1.77 2.89 4.74 8.28 9.98 26.001990 1.54 2.32 2.55 3.78 4.77 8.801991 2.21 2.52 3.51 5.18 7.40 11.36 5.351992 2.56 2.85 3.99 5.43 6.35 8.03 9.50 17.801993 1.79 2.58 3.55 5.31 6.21 7.69 9.28 14.711994 2.31 3.27 5.06 6.39 6.64 7.92 7.73 10.101995 2.20 3.24 4.83 5.98 7.80 10.03 10.39 10.681996 2.22 2.75 4.11 5.63 7.92 10.53 10.58 12.081997 2.42 2.92 3.86 5.71 9.65 13.41 12.671998 1.88 2.09 2.98 4.85 7.92 9.91 11.05 18.341999 1.51 2.80 2.96 4.22 5.92 9.33 9.17 16.002000 1.71 2.50 3.16 3.85 5.32 7.07 7.62 12.842001 1.89 2.71 3.48 6.02 6.88 10.69 10.19 28.582002 1.76 2.51 3.49 4.62 6.12 10.59 8.74 10.482003' 2.32 2.35 3.50 4.60 5.90 8.03 24.50 27.70
' - preliminary
Table A10 North-east Arctic COD. Results from the Russian trawl-acoustic surveyin the Barents Sea and adjacent wates in the autumn. Stock number in millions.Year Age
1 2 3 4 5 6 7 8 9 10+ Total1985 1 77 569 400 568 244 51 20 8 1 3 11986 1 25 129 899 612 238 69 20 3 2 1 11987 2 2 58 103 855 198 82 19 4 1 1 11988 2 3 23 96 100 305 54 16 3 1 11989 1 1 3 17 45 57 91 75 25 13 5 3321990 1 36 27 8 27 62 74 91 39 10 31991 1 63 65 96 45 50 54 66 49 5 1 4941992 1 133 399 380 121 56 58 33 29 11 2 12221993 1 20 44 220 234 164 51 19 13 8 10 7831994 1 105 38 147 275 303 314 100 35 10 8 13351995 1 242 42 111 219 229 97 21 6 2 21996 1,3,5 424 275 189 316 449 314 126 27 3 4 21271997 4,5 72 160 263 198 112 57 27 9 1 11998 1 26 86 279 186 57 23 10 4 1 01999 1 19 79 166 260 98 20 8 5 2 12000 1, rev 24 82 191 159 127 48 6 3 1 12001 1 38 59 148 204 120 70 14 2 1 656
1 October-December2 September-October3 Area IIb not covered4 Areas IIa, IIb covered in October-December, part of Area I covered in February-March 19985 Adjusted for incomplete area coverage
941998323602
377
971
900672658642
O:\ACFM\WGREPS\AFWG\REPORTS\2003\3-Northeast Arctic Cod.Doc 167

Table A11. North-East Arctic COD. Results from the Russian bottom trawl survey in the Barents Sea and adjacent waters in November-December (numbers per hour trawling)Year Age
1 2 3 4 5 6 7 8 9 10+ TotalTotal (Sub-area I and Division IIa and IIb)
1982 2.1 2.5 14.1 7.6 9.4 5.8 3.2 1.1 0.4 0.3 46.31983 11.7 5.1 6.0 7.3 4.8 2.0 0.7 1.1 0.2 0.2 39.21984 11.1 11.3 15.6 9.3 4.9 3.0 1.2 0.5 0.3 0.2 57.21985 6.2 39.6 28.3 39.7 18.1 4.5 1.7 0.6 0.1 0.2 139.01986 1.5 8.0 49.5 28.6 14.0 5.0 1.4 0.2 0.1 0.1 108.41987 0.1 2.5 6.1 40.2 7.8 3.4 0.8 0.2 0.1 0.1 61.21988 0.2 1.5 6.6 7.3 19.3 3.3 1.0 0.2 0.1 0.1 39.51989 0.3 0.6 3.4 9.1 10.9 16.1 13.1 5.5 2.9 0.8 62.71990 3.8 2.9 0.9 2.9 6.5 7.8 9.6 4.3 1.1 0.3 40.11991 6.9 7.1 10.2 4.8 5.8 6.6 8.3 7.1 0.7 0.1 57.61992 10.8 30.6 30.9 9.0 4.5 4.8 2.6 2.3 0.9 0.1 96.41993 4.5 10.3 49.1 52.6 37.7 11.7 4.5 3.2 1.9 2.5 178.01994 11.4 5.8 23.0 40.4 38.3 36.6 12.0 4.2 1.3 1.4 174.31995 26.0 4.5 11.9 23.5 24.7 10.5 2.3 0.7 0.2 0.2 104.51996 1 17.8 11.6 7.7 10.1 12.6 8.6 3.6 0.9 0.1 0.1 73.11997 1 7.3 17.3 9.9 8.3 6.2 3.7 1.8 0.5 0.1 0.0 55.11998 4.9 15.9 50.8 33.4 9.7 3.7 1.6 0.7 0.1 0.1 120.91999 3.6 14.3 28.4 47.5 16.2 3.1 1.2 0.8 0.2 0.1 115.42000 3.1 11.7 27.6 21.9 16.9 5.8 0.8 0.3 0.1 0.1 88.32001 6.7 11.0 27.7 37.2 20.6 11.5 2.2 0.3 0.1 0.1 117.42002 2 12.6 0.3 18.0 14.4 24.1 25.2 11.7 5.2 1.2 0.3 113.1
1 Adjusted assuming area distribution as 1982-1995 average.2 Adjusted assuming area distribution as 1998-2001 average.
O:\ACFM\WGREPS\AFWG\REPORTS\2003\3-Northeast Arctic Cod.Doc 168

Table A12 North-East Arctic COD. Length at age (cm) from Russian surveys in November−December
Year Age 0 1 2 3 4 5 6 7 8 9 1984 1985 1986 1987 1988 1989 1990 1991 1992 1993 1994 1995 1996 1997 1998 1999 2000 2001 2002
15.7 15.0 15.2
- 11.3
- 16.0 11.5 11.3 12.1 12.2 11.6 10.2 9.6
11.4 11.7 10.7 10.6 10.7
22.3 21.1 19.7 19.2 21.3 20.8 24.0 22.4 21.3 17.4 20.3 19.8 20.0 18.5 19.0 19.7 20.8 19.4 19.2
30.7 30.6 28.3 27.9 28.7 28.8 30.4 30.6 31.9 29.1 26.3 27.6 28.1 28.8 28.0 27.9 30.1 29.8 29.9
44.3 43.2 39.0 33.4 36.2 34.8 46.5 43.0 50.1 43.4 33.7 33.8 36.7 38.2 36.4 35.3 34.7 37.3 38.2
51.7 53.7 51.8 41.4 43.9 46.0 54.9 55.9 59.8 52.7 47.4 45.2 48.7 50.8 50.5 51.6 49.8 50.4 52.5
63.6 61.2 62.2 59.1 53.3 53.9 62.5 64.6 69.1 64.3 58.7 60.5 58.9 62.0 61.0 60.6 61.1 61.9 60.4
73.4 72.8 70.9 69.2 65.3 61.8 69.7 72.8 78.6 73.9 70.6 71.1 70.5 70.5 70.7 70.6 71.6 71.9 70.6
82.5 83.0 83.0 80.1 79.5 69.8 77.6 78.5 84.0 81.2 80.8 83.5 80.0 80.1 80.3 78.9 82.0 81.4 82.2
88.4 92.8 91.3 95.7 85.0 78.7 87.8 87.9 90.8 89.1 90.1 92.9 93.6 88.9 91.1 86.8 88.3 91.0 91.3
97.0 101.3 104.0 102.6
- 88.6
102.0 101.8 97.5 91.8 96.1 99.1
102.7 103.5 102.5
94.3 85.7 98.7 97.2
Table A13 North-East Arctic COD. Weight (g) at age from Russian surveys in November−December. Year
Age
0 1 2 3 4 5 6 7 8 9 10 1984 1985 1986 1987 1988 1989 1990 1991 1992 1993 1994 1995 1996 1997 1998 1999 2000 2001 2002
26 26 25
- 15
- 28 26 10 11 12 11 7 6
11 10 8 9 8
90 80 63 54 78 73
106 93 76 46 69 61 64 48 55 58 74 58 65
250 245 191 182 223 216 230 260 273 211 153 180 191 203 187 177 232 221 232
746 762 506 316 435 401 908 743
1,165 717 316 337 436 487 435 371 379 459 505
1,1871,2961,117
672789928
1,4181,6291,8951,280
919861
1,0351,1761,1861,2141,1011,1251,299
2,234 1,924 1,940 1,691 1,373 1,427 2,092 2,623 2,971 2,293 1,670 1,987 1,834 2,142 2,050 1,925 2,128 2,078 1,964
3,422 3,346 2,949 2,688 2,609 2,200 2,897 3,816 4,377 3,509 2,884 3,298 3,329 3,220 3,096 3,064 3,341 3,329 3,271
5,027 5,094 4,942 3,959 4,465 3,133 4,131 4,975 5,596 4,902 4,505 5,427 5,001 4,805 4,759 4,378 5,054 4,950 5,325
6,479 7,360 7,406 8,353 5,816 4,649 6,359 7,198 7,319 6,621 6,520 7,614 8,203 6,925 7,044 6,128 6,560 7,270 7,249
9,5036,8339,300
10,583-
6,80110,07811,1659,4527,3398,2079,787
10,89810,82311,2077,8438,4979,5419,195
-11,167
-13,107
-8,956
13,54015,35312,4148,4949,812
10,75711,35812,42612,59311,54312,35311,67211,389
O:\ACFM\WGREPS\AFWG\REPORTS\2003\3-Northeast Arctic Cod.Doc 169

Table A14 Abundance indices of 0-group fish in the Barents Sea and adjacent waters in 1965-2002
Indices for 1965-1985 adjusted according to Nakken and Raknes (1996). Year
Cod
Haddock
Polar cod Redfish
Greenland
halibut
Long rough
Dab West East 1965 1966 1967 1968 1969 1970 1971 1972 1973 1974 1975 1976
11 2
62 45
211 1097 356 225
1101 82
453 57
13 2
76 14
186 208 166 74 87
237 224 148
012916560
208197181140(26)22775
131
1592364421
295247172177385468315447
1 1 8 3
13 21 16
66977317261281656783
11396
1977 1978 1979 1980 1981 1982 1983 1984 1985 1986 1987 1988 1989 1990 1991 1992 1993 1994 1995 1996 1997 1998 1999 2000 2001 2002
279 192 129 61 65
136 459 559 742 434 102 133 202 465
766 1,159
910 899
1,069 1,142 1,077
576 194 870 212
1055
187 110 95 68 30
107 219 293 156 160 72 86
112 227 472 313 240 282 148 196 150 593 184 417 394 412
1571072379
1491448
11560
11117
14420614490
195171506
5912914411676
148179
7014430224773503916
3343661551204148
239118156448
-484453457696387146588
47246098065186169485173279570263184969867020015016241422019507827
1951128
9 35 22 12 38 17 16 40 36 55 41 8 5 2 1 3
11 20 15 5
13 11 13 28 32 34
727669
10895
150807086
755174729235283255
27266104228668186
173
O:\ACFM\WGREPS\AFWG\REPORTS\2003\3-Northeast Arctic Cod.Doc 170

Table A15 Estimated logarithmic indices with 90% confidence limits of year class abundance for 0-
group herring, cod and haddock in the Barents Sea and adjacent waters 1965−2002 Year Herring1 Cod Haddock Index Confidence
limits Index Confidence
limits Index Confidence
limits 1965 1966 1967 1968 1969 1970 1971 1972 1973 1974 1975 1976 1977 1978 1979 1980 1981 1982 1983 1984 1985 1986 1987 1988 1989 1990 1991 1992 1993 1994 1995 1996 1997 1998 1999 2000 2001 2002
0.14 0.00 0.00 0.01 0.00 0.00 0.00 0.05 0.01 0.00 0.00 0.01 0.02 0.09
- 0.00 0.00 1.77 0.34 0.23 0.00 0.00 0.32 0.59 0.31 1.19 1.06 0.75 0.28 0.16 0.65 0.39
0.59 0.41 0.30 0.13
0.53
0.04
- -
0.00 - - -
0.03 0.01
- -
0.00 0.01 0.01
- - -
1.29 0.20 0.18
- 0.00 0.16 0.49 0.16 0.90 0.69 0.45 0.17 0.07 0.47 0.25 0.40 0.25 0.17 0.04 0.36
0.31
- -
0.04 - - -
0.08 0.01
- -
0.03 0.05 0.20
- - -
2.33 0.52 0.28
- 0.03 0.53 0.76 0.50 1.52 1.50 1.14 0.42 0.29 0.85 0.54 0.82 0.59 0.46 0.25 0.73
+ 0.02 0.04 0.02 0.25 2.51 0.77 0.52 1.48 0.29 0.90 0.13 0.49 0.22 0.40 0.13 0.10 0.59 1.69 1.55 2.46 1.37 0.17 0.33 0.38 1.23 2.30 2.94 2.09 2.27 2.40 2.87 1.60 0.68 0.21 1.49 0.23 1.22
0.01 0.02 0.01 0.17 2.02 0.57 0.35 1.18 0.18 0.66 0.06 0.36 0.14 0.25 0.08 0.06 0.43 1.34 1.18 2.22 1.06 0.01 0.22 0.30 1.04 1.97 2.53 1.70 1.83 1.97 2.53 1.35 0.48 0.11 1.21 0.12 0.97
0.04 0.08 0.04 0.34 3.05 1.01 0.72 1.82 0.42 1.17 0.22 0.65 0.32 0.59 0.18 0.18 0.77 2.08 1.98 2.71 1.70 0.40 0.47 0.48 1.34 2.65 3.39 2.51 2.76 2.88 3.24 1.86 0.91 0.34 1.78 0.36 1.50
0.01 0.08 0.00 0.29 0.64 0.26 0.16 0.26 0.51 0.60 0.38 0.33 0.12 0.20 0.15 0.03 0.38 0.62 0.78 0.27 0.39 0.10 0.13 0.14 0.61 1.17 0.87 0.64 0.64 0.25 0.39 0.21 0.59 0.25 0.64 0.67 0.99
0.00 0.03 0.00 0.20 0.42 0.18 0.09 0.15 0.39 0.40 0.24 0.21 0.07 0.12 0.10 0.00 0.30 0.48 0.60 0.23 0.28 0.00 0.05 0.10 0.48 0.98 0.71 0.48 0.49 0.13 0.25 0.12 0.44 0.11 0.46 0.52 0.75
0.03 0.13 0.02 0.41 0.91 0.36 0.27 0.40 0.68 0.85 0.51 0.48 0.19 0.28 0.20 0.05 0.52 0.77 0.99 0.31 0.52 0.25 0.34 0.20 0.75 1.37 1.06 0.82 0.81 0.40 0.56 0.31 0.76 0.44 0.84 0.84 1.25
1Assessment for 1965−1984 made by Toresen (1985).
O:\ACFM\WGREPS\AFWG\REPORTS\2003\3-Northeast Arctic Cod.Doc 171

Table A16. Sum of acoustic abundance estimates (millions) in the Joint winter Barents Sea aurvey (Table A2)and the Norwegian Lofoten acoustic survey (Table A4)
AgeYear 1 2 3 4 5 6 7 8 9 10 11 12+1985 69.1 446.3 153.0 141.6 20.4 15.1 15.7 3.3 1.3 1.0 0.5 0.01986 353.6 243.9 499.6 134.3 68.4 11.6 7.7 3.1 0.3 0.0 0.4 0.11987 1.6 34.1 62.8 204.9 50.2 17.4 1.4 3.0 0.7 0.0 0.0 0.01988 2.0 26.3 50.4 35.5 57.8 10.9 4.0 0.3 0.0 0.1 0.0 0.01989 7.5 8.0 17.0 34.4 21.4 67.0 16.6 3.2 0.5 0.2 0.0 0.11990 81.1 24.9 14.8 20.6 26.2 26.9 66.8 7.3 0.6 0.3 0.0 0.01991 181.0 219.5 50.2 34.6 29.3 33.9 36.7 50.0 3.7 0.2 0.2 0.01992 241.4 562.1 176.5 65.8 21.5 18.4 28.4 25.4 82.4 4.4 1.6 0.21993 1074.0 494.7 357.2 191.1 113.1 35.4 25.5 25.2 27.7 44.5 4.7 0.71994 858.3 577.2 349.8 404.5 217.5 89.5 22.5 11.9 9.4 4.4 17.5 2.61995 2619.2 292.9 166.2 159.8 216.6 104.0 29.0 4.4 4.3 3.6 2.2 8.01996 2396.0 339.8 92.9 70.5 87.2 89.1 44.6 6.5 1.1 0.7 0.8 1.31997 1623.5 430.5 188.3 51.7 49.7 42.2 49.9 20.5 2.2 0.5 0.0 0.81998 3401.3 632.9 427.7 182.6 42.4 33.8 34.0 24.7 4.9 0.8 0.2 0.01999 358.3 304.3 150.0 96.4 45.4 12.2 11.2 18.7 9.2 1.1 0.2 0.12000 154.1 221.4 245.2 158.9 145.7 49.3 12.9 6.9 5.2 1.6 0.4 0.12001 629.9 63.9 138.2 171.6 81.2 55.4 19.0 2.2 0.8 0.5 0.3 0.12002 18.2 215.5 69.3 112.2 103.5 59.1 29.7 7.3 1.0 0.4 0.3 0.02003 1693.9 61.5 303.4 114.4 132.0 149.2 69.2 23.1 4.1 0.5 0.1 0.1
O:\ACFM\WGREPS\AFWG\REPORTS\2003\3-Northeast Arctic Cod.Doc 172