
BER:Vol.3,No.2,December 2013,published
278
-
Upload
macrothink -
Category
Documents
-
view
0 -
download
0
Transcript of BER:Vol.3,No.2,December 2013,published

ISSN: 2162-4860
www.macorthink.org/ber

Business and Economic Research
ISSN 2162-4860
2013, Vol. 3, No. 1
www.macrothink.org/ber
Editorial Team
Editor-in-Chief
Dr. Sahar Bahmani, University of Wisconsin at Parkside, United States
Editorial Assistant
Daisy Young, Macrothink Institute, United States
Associate Editors
Dr Angela Wright, CIT, Ireland
Dr. Manuel Alejandro Cardenete, European Commission (JRC-IPTS), Spain
Dr. Judy Li, Lincoln University, New Zealand
Editorial Board
Ajmer Singh, Kurukshetra University, India
Andrea Morone, University Jaume I, Castellon, Spain & University of Bari "A.Moro", Italy
Angel Espiniella-Menendez, University of Oviedo, Spain
Annamaria Fiore, Regional Innovation and Technology Agency (ARTI), Italy
Antonio Ruiz-Porras, University of Guadalajara, CUCEA, Mexico
Dr. Armin J. Kammel, Danube University Krems, Austria
Bilal Khalaf Sakarneh, Isra University, Jordan
Bratu (Simionescu) Mihaela, Faculty of Cybernetics, Statistics and Economic Informatics,
Romania
Cosimo Magazzino, Roma Tre University/LUSPIO University, Italy
Prof Dr Eddie John Fisher, Universidad de Oriente, Santiago de Cuba, Cuba Univerzita
Palackeho, Olomouc, Czech Republic, United Kingdom
Dr. Ewa J. Kleczyk, TargetRx, Inc, United States
faris nasif ALShubiri, Amman Arab University - College of Business, Jordan
Frantisek Svoboda, Masaryk University, Czech Republic

Business and Economic Research
ISSN 2162-4860
2013, Vol. 3, No. 1
www.macrothink.org/ber
Grigorios L Kyriakopoulos, National Technical University of Athens (NTUA), Greece
Hazem Ali Marashdeh, Alhosn University, Jordan
Associate Professor Hengky Sumisto Halim, Universiti Utara Malaysia, Malaysia
Assoc. Prof Dr Izah Mohd Tahir, University Sultan Zainal Abidin, Malaysia
Kamran Mohamadkhani, Islamic Azad university, Tehran Science and Research branch, Iran,
Islamic Republic of
Dr Mohd Rizal Muwazir, University of Malaya, Malaysia
Dr. Mohammad Nurul Huda Mazumder, Multimedia University, Malaysia
Mohammad Reza Noruzi, Tarbiat Modarres University, Policy Making in Public Sector
Management, Iran
DR Motsomi Marobela, Department of Management, University of Botswana, Botswana
Dr Olubukunola Ranti Uwuigbe, Dept of Accounting, School of Business, Covenant
University, Nigeria
Professor Pacha Malyadri, Government Degree College, Osmania University, India
Dr. Ramil Maano Perez, Eastern Visayas State University, Philippines
Dr. Said Jaouadi, College of business and administration, Jazan University, Saudi Arabia
Dr Santosh Banadahally Manjegowda, Jain University, India
Prof. Shyamkumar D. Kalpande, MET's Institute of Engineering, BKC- Nashik, Pune
University, India
Dr. Socrates Ogalesco Ballais, Eastern Visayas State University, Philippines
Dr Uwalomwa Uwuigbe, Dept of Accounting, Covenant University

Business and Economic Research
ISSN 2162-4860
2013, Vol. 3, No. 1
www.macrothink.org/ber I
Contents
An Investigation of Visual Components of Packaging on Food Consumer Behavior
Golnesa Ahmadi, Hamid Reza Bahrami, Mona Ahani 1-11
Exchange Rate Impacts on Investment of Manufacturing Sectors in Iran
Mohammad Reza Lotfalipour, Maliheh Ashena, Maryam Zabihi 12-22
Private Returns to Education in Urban Cameroon
Christian Zamo Akono, Roger Tsafack Nanfosso 23-37
Success Factors of Entrepreneurs of Small and Medium Sized Enterprises: Evidence from Bangladesh
Mohammed S. Chowdhury, Zahurul Alam, Md. Ifttekhar Arif 38-52
The Impact of Overconfidence on Investors' Decisions
Boubaker Adel, Talbi Mariem 53-75
Determinants of Firm’s Financial Performance: An Empirical Study on Textile Sector of Pakistan
Ali Abbas, Zahid Bashir, Shahid Manzoor, Muhammad Nadeem Akram 76-86
English Language Skills Training: Theory and Practice-A Cuban Perspective
Eddie John Fisher, Jorge Luis Herrera Ochoa, Yoennis Diaz Moreno 87-106
Myths and Realities of Innovative China the Case of Haier Company
Farrukh Nawaz kayani, Saquib Yusaf Janjua, Mumtaz Ahmed, Babar Wasim 107-114
The Relationship between Macroeconomic Variables and Passenger Vehicle Sales in Malaysia
Fidlizan muhammad, Mohd Yahya Mohd Hussin, Azila Abdul Razak, Norimah Rambeli, Gan Pei Tha 115-126
From Cyber Bullying to Cyber Coping: The Misuse of Mobile Technology and Social Media and Their
Effects on People’s Lives
Eddie John Fisher 127-145
New Evidence from Assessing the Tobin Tax Effects on Exchange Stability and Trade
Said Jaouadi 146-155
Is It Possible to Create Goods from Thin Air Using Money and an Expenditure Multiplier?
Gennady Bilych 156-172
Total Reward Concept: A Key Motivational Tool For Corporate Ghana
Olivia Anku Tsede, Ernestina Kutin 173-182
Valuation of IPOs in India-An Empirical study
Sanjay Sehgal, Bhushan Kumar Sinha 183-204
Determinants of Profitability of Indigenous Chickens in Swaziland
Bongani J. Siyaya, Micah Bheki Masuku 205-217
Ownership Structure and Performance of the Listed Tunisian Companies
Habib Affes, Nourchéne Hamza Hakim 218-235

Business and Economic Research
ISSN 2162-4860
2013, Vol. 3, No. 1
www.macrothink.org/ber II
Revisiting the Psychometric Properties of Market Orientation Framework in an
Emerging Economy: a Case-Study of Botswana’S Small Service Firms
Olumide Olasimbo Jaiyeoba 236-245
The Effects of Environmental Munificence and Market Orientation Dimensions
on Performance of Small Business Firms in Botswana
Olumide Olasimbo Jaiyeoba 246-254
Investment Strategies of Different Holding Periods: Evidence from Stock
Markets of Hong Kong, Korea, Shanghai, and Taiwan
Massoud Moslehpour, Munkh Ulzii Batmunkh 255-27

Business and Economic Research
ISSN 2162-4860
2013, Vol. 3, No. 2
www.macrothink.org/ber 1
An Investigation of Visual Components of Packaging
on Food Consumer Behavior
Golnesa Ahmadi
Department of Management, Naragh Branch
Islamic Azad University, Naragh, Iran
E-mail: [email protected]
Hamid Reza Bahrami
Department of Management, Naragh Branch
Islamic Azad University, Naragh, Iran
E-mail: [email protected]
Mona Ahani (Corresponding author)
Department of Management, Young Researchers Club, Naragh Branch
Islamic Azad University, Naragh, Iran
E-mail: [email protected]
Received: June 2, 2013 Accepted: June 16, 2013
doi:10.5296/ber.v3i2.3799 URL: http://dx.doi.org/10.5296/ber.v3i2.3799
Abstract
The present research is aimed to identify the effect of components of packaging on the behavior
of food consumers. In this respect, first a deep examination of literature and the internal and
external studies was performed in order to find out the fundamental basis for drawing out
necessary prerequisites of measuring effects of packaging components. Accordingly, product
package color, package design, and the size of the food package were identified as the
fundamental factors influencing the behavior of food consumers. Thus, the research
assumptions were regulated.

Business and Economic Research
ISSN 2162-4860
2013, Vol. 3, No. 2
www.macrothink.org/ber 2
One sample t-test was used to assess the assumptions. In order to analyze the view of
respondents based on gender, an independent two sample t- test was used, and in order to
analyze their views based on the level of education, income and age, a variation analysis test
was used. The results show that the color of packaging, size of packaging and design of
packaging have an influence (95% confidence) on the behavior of the consumer ranking the
effectiveness of individual aspects shows that the color of packaging has the highest effect on
the behavior of consumers.
Keywords: Consumer behavior, Packaging, Color, Design, Size
1. Introduction
The consumer and his satisfaction are the essential matters which can lead to the promotion of
an organization in the present competitive world. The importance of the consumer and his
satisfaction relate to global competition. Therefore it is important to consider what factors can
be effective more exactly and completely in increasing the satisfaction of the customers.
The role of packaging as a means of communication with the consumer and choosing
trademarks is growing constantly. In order to fulfill the communication goals, it is necessary
for the producers to acquire adequate information regarding the customer's psychology. On the
other hand, the behavior of the consumer has been a major issue of interest for the marketing
researchers during the last decades. Variation of consumer behavior is because of the effect of
different factors influencing the behavior and motivation of the person for purchase. The
existence of different groups of consumers for the markets of a single product indicates wide
differences. The consumer is considered today as the major key to the success or the failure of
a company.
Identification of these relations and examination of the role of different packaging components
in the behavior of the consumer will undoubtedly identify the strengths and the weaknesses of
the companies for entering into competitive markets. Therefore the essential question of the
present research is how the different aspects of product packaging influence the purchasing
behavior of the consumer. In another word, how the individual aspects of product packaging,
i.e color, design and the size of packaging influences the purchasing behavior of the consumer?
2. Literature
2.1 Consumer Behavior
Without knowing how the consumer behaves and without proper understanding of his behavior,
organizations can not take appropriate measures to meet the requirements and needs of the
consumer (Hawkins and Coney, 2010). The behavior of the consumer consists of knowledge
and emotions that people experience and the actions they perform during the process of
consumption. It also includes some elements of the environment that influence the knowledge,
emotions and behavior. Consumers have dynamic behavior since knowledge, thoughts,
emotions and the behavior of the consumer individually, and the target groups of consumers
and the society as a whole are changing constantly. The dynamic nature of the consumer
behavior makes the development of marketing strategies difficult. There are additional

Business and Economic Research
ISSN 2162-4860
2013, Vol. 3, No. 2
www.macrothink.org/ber 3
different definitions of the consumer behavior. For instance, American Marketing Association
defines consumer behavior as follows: "Dynamic interaction of influence, recognition,
behavior, and the environment that people exchange in their lives."
The behavior of a consumer consists of the interaction of thoughts, emotions, behavior, and the
environment. Therefore the marketing agents need to know for instance what products and
trademarks are meaningful for the consumer, how the consumer purchases, and what factors
influence purchase and consumption. In addition, the behavior of consumers includes the
interaction among humans. It means that the people give a valuable thing and take another
thing in return (Peter and C.Olson, 2009: 115).
2.2 Research Views about Consumer
Decision making view: This view suggests that the consumers are rational. When considering
the decision making view of purchase, we find that the consumers first find out a problem and
during some steps they try to solve it rationally. These steps include problem identification,
research, evaluation, choosing, and after -purchase evaluation.
Experimental view: The experimental view of the consumer purchase process suggests that the
consumers sometimes do not purchase based on rational decision making. Rather, they
sometimes purchase goods or services only for enjoyment, imagination, excitement, and
emotions.
Behavioral effect view: The behavioral effect occurs when strong environmental forces drive
the consumer to buy a product without strong pre -shaped emotions or beliefs. At this time, the
purchase results from the direct influence of behavior through environmental forces including
the means of sale promotion, cultural norms, physical environment or economic stresses
(Moon and Minor, 2003).
2.3 The reason for Studying Consumer Behavior
The development of research about consumer behavior results from a shift in marketing
philosophy from the tendency of production and product towards the tendency of sale and then
marketing. Additional factors contributing in the development of research about consumer
behavior includes: the higher rate of introducing new products, the lower product life –cycle,
increasing the movements of consumer support by private groups and public policy makers,
paying attention to environment and growth of service marketing (Golchinfar and Bakhtaee,
2007).
Table 1. Reasons for studying customer behavior; source: Moon & Minor, 2003, 28
Reasons for studying customer behavior
1- The basis for marketing management should be the analysis of consumer behavior.
This helps the managers in the following way:
A) Mixed design marketing
B) Market segmentation
C) Identifying the location and product differentiation
D) Improvement of environmental analysis

Business and Economic Research
ISSN 2162-4860
2013, Vol. 3, No. 2
www.macrothink.org/ber 4
E) Development of market research demands
2- Consumer behavior should play an important role in general policy making.
3- The study of consumer behavior transforms individual to a more efficient consumer.
4- The study of consumer behavior provides information about the consumption
behavior of human being.
The study of consumer behavior provides three types of information:
A) Consumer orientation
B) Realities about human behavior
C) Viewpoints which guide the process of thinking
2.4 Notion of Packaging
Product packaging is any kind of dish or package within which the product is offered for sale in
the market or by which the necessary information about the product is transferred to the
consumer (Roosta et al, 2009: 216). Packaging is described as a harmonic system in order to
prepare goods for transportation, distribution, storage, sale and consumption (Walter, 2005:
17).
2.5 Position of Packaging in Marketing
Packaging is an element mingled with marketing. It means every manager or marketing expert
or a person who wants to study in any way about an institution and its products, needs to study
and examine the different methods and kinds of product packaging of that institution and this
examination should be made in two areas of protection and information. Shape, color, design
and packaging are important elements in the examination of goods and a combination of these
elements constitutes the superficial shape of goods in the eyes of the consumer)Silaloy & Spice,
2004).
3. Research Objectives
The present research aims to investigate the relation between packaging components and
consumer behavior and to obtain the following objectives:
Primary objectives: recognition and determination of the relation between packaging
components and consumer behavior.
Secondary objectives:
1. recognition and determination of the relation between the color of packaging and
consumer behavior
2. recognition and determination of the relation between the design of packaging and
consumer behavior
3. recognition and determination of the relation between the size (volume) of
packaging and consumer behavior
4. Research Assumptions
Primary assumption: There is a meaningful relation between the components of packaging and
consumer behavior.

Business and Economic Research
ISSN 2162-4860
2013, Vol. 3, No. 2
www.macrothink.org/ber 5
Secondary assumptions:
There is a direct and meaningful relation between the color of packaging and
consumer behavior.
There is a direct and meaningful relation between the design of packaging and
consumer behavior.
There is an indirect and meaningful relation between the size (volume) of packaging
and consumer behavior.
5. Research Conceptual Model
Based on research conceptual framework, a research conceptual model can be offered. This
model shows the effect of an individual dimension of product packaging on consumer behavior.
Every dimension of product packaging, i.e color, size and design is considered an independent
variable. The conceptual model of research includes the primary variables and relations among
them shown in figure (1).
Figure 1. Research analytical model
6. Research Method
Since the present research aims primarily to identify the effect of every aspect of product
packaging on food consumer behavior, it can be said that the purpose of present research falls
in the domain of practical research. On the other hand, since the present research has used a
library study method as well as a field study methods like questionnaire, it can be said that the
nature and method of the present research is a descriptive-survey method.
The questionnaire used in this research includes two groups of general and specific questions.
General questions are about gender, age and level of education which constitute personal
specifications of the respondents. Specific questions include 19 items designed based on
assessment and evaluation of individual resumptions of the thesis. Likert scale was used for the
quantitative evaluation and scoring of the specific questions.
A statistical sample of the present research is obtained by the following formula:
Product
packaging
Color of packaging
Consumer
behavior Design of packaging
Size of packaging

Business and Economic Research
ISSN 2162-4860
2013, Vol. 3, No. 2
www.macrothink.org/ber 6
2
22
2
d
SZ
n
In which the major parameter to estimate is S2
which is the variance of the original sample. In
order to measure S2, a number of questionnaires were distributed and the variance of the
original sample was measured.
n = ( Z2
α /2 × S² ) / d2
Z α /2 = 1.96 → Z2
α /2 = 3.8416
d = 0.05
S² = 0.0732
n = (0.0732 × 3.8416)/0.0025 ≈ 112.482
Considering the result obtained, 110 individuals was determined as the sample volume .In
order to determine the validity of the questionnaire, the content needed validation. To do so, the
questionnaire was distributed among a group of experts, and professors of management and
behavior sciences, and then all of the deficiencies and ambiguities were removed. In order to
evaluate the reliability of the questionnaire, 15 questioners were distributed in a primary study
and the confidence correlation was measured based on Cronbach's alpha using SPSS statistical
software and the number 0.724 obtained which shows the reliability of a questionnaire.
6.1 Analysis of Data Relating to the General Specifications of Respondents
This part describes the data relating to general specifications of the respondents, i. e. gender,
age, level of education and income.
Gender: 49 individuals of the total respondents (62.7%) were female and 37.3 % were male.
Age: The respondents were classified into four groups according to their age. 47 respondents
were 30-40 years old. This number has the highest frequency with almost 43% of the total
respondents. 15 % of the sample (16 respondents) was 40-50 years old. 45 respondents were
below 30 years old and 2 respondents were 50 years old.
Education: 49 respondents with a bachelor's degree had the highest frequency. The individuals
with a diploma and below diploma constituted 12.7 % (41 respondents) of the sample. The
individuals with an A.M and higher degree (6 respondents) had the lowest frequency. 14
respondents had a technician degree.
Income: 37 respondents in the present research have a monthly income lower than 300
thousand Tomans1 which constitute almost 32% of the selected sample. 11 respondents (10%)
have an income of 300-400 thousand Tomans. The people with an income higher than 600
thousand Tomans (26 respondents) constituted 26% of the sample volume.
6.2 Research Assumptions Tests
First, research assumptions were tested using one sample t-test.
1. Iranian currency

Business and Economic Research
ISSN 2162-4860
2013, Vol. 3, No. 2
www.macrothink.org/ber 7
Assumption 1 test: The color of packaging influences food consumer behavior.
In order to test this assumption, H0 assumption is regulated in such a way that the color of
packaging has no effect on consumer behavior and H1 is considered the opposite assumption
and test claim. The statistical test assumptions are expressed as follows:
The results of assumption 1 test show that H0 is rejected at an error level of α=%5 and H1 is
accepted. Therefore, the color of packaging influences consumer behavior with 95%
confidence interval.
Table 2. One sample t-test of assumption 1
p Degree of freedom
t Average Assumption 1
0.000 109 17.944 3.956 Color of
packaging
Assumption 2 test: The size of packaging influences food consumer behavior.
In order to test this assumption, H0 is regulated in such a way that the size of packaging has no
effect on consumer behavior and H1 is considered the opposite assumption and test claim. The
statistical test assumptions are expressed as previous:
The results of assumption 2 test (table 3) show that H0 is rejected with 95% confidence and H1
is accepted. In another word, the color of packaging influences consumer behavior with 95%
confidence.
Table 3. One sample t-test of assumption 2
p Degree of
freedom t Average Assumption 2
0.000 109 18.164 3.941 Size of
packaging
Assumption 3 test: The design of packaging influences food consumer behavior.
In order to test this assumption, H0 is regulated in such a way that the design of packaging has
no effect on consumer behavior and H1 is considered the opposite assumption and the test claim.
The statistical test assumptions are expressed as follows:
Here again, based on the results of one sample t-test (table 4), H0 is rejected at an error level of
α= %5 and test claim is accepted. In another word, design of packaging influences consumer
behavior with 95% confidence.
Table 4. One sample t-test of assumption 3
p Degree of freedom
t Average
Assumption 3
0.000 109 6.503 3.487 Size of
packaging

Business and Economic Research
ISSN 2162-4860
2013, Vol. 3, No. 2
www.macrothink.org/ber 8
7. Research Findings
After analysis of research assumptions about gender, age, education, and income of
respondents, data obtained from the research was examined further.
Examination of respondents' views based on gender
In order to measure the meaningfulness of the difference of average scores of respondents,
views based on gender about the effect of packaging components on food consumer behavior,
an independent two-sample test was used. This test is used when the researcher deals with two
independent groups. The output of this test was examined based on variance sameness using
Levine’s test and through SPSS software.
In this test H0 assumption is regulated in such a way that there is no meaningful difference
between the average scores of male and female respondents and that H2 is the opposite
assumption. This is the statistical representation of this assumption, and is therefore based on
the results obtained from assumption tests. It can be said that both men and women believe that
color, design and size of packaging influences purchase behavior. The degree of influence is
also the same in the views of both men and women and no meaningful difference was seen.
Table 5. Data obtained from independent two-sample test based on gender
P F
Average scores
Women's views
Average score Men's views
Assumption
0.375 0.794 3.929 4.000 Color of product
0.232 1.445 3.507 3.455 Size of product
0.512 0.432 3.917 3.982 Design of product
Examination of respondents' views based on age
In order to measure the meaningfulness of the difference of respondents, views based on age,
single-agent variance analysis was used. This test is used for the analysis of more than two
independent groups. Statistical assumptions of the test were regulated in such a way that H0
assumption, that there is no meaningful difference in respondents, views based age, was
rejected when ji for at least one of the average scores and that H1 is the opposite
assumption.
Statistical representation of this assumption is as follows:
Based on findings and the calculated p-value, there is no meaningful difference in average
scores of respondents, views based on age about any research assumptions at P≤%5 among 4
different age groups. Therefore, the people's view in different age groups, about the influence
of packaging components on food consumers' behavior is the same with 95% confidence.

Business and Economic Research
ISSN 2162-4860
2013, Vol. 3, No. 2
www.macrothink.org/ber 9
Table 6. single-agent variance analysis for examination of respondents, view based on age
P F Assumption
0.980 0.062 Color of product
0.532 0.737 Size of product
0.599 0.627 Design of product
Examination of respondents' views based on academic paper
In order to measure the meaningfulness of the difference of respondents, views based on
academic paper, a single-agent variance analysis was used, since here again there are more than
two independent groups. A statistical test is regulated in such a way that in the H0 assumption,
there is no meaningful difference in respondents, views based on academic paper is rejected
when ji for at least one of the average scores and that H1 is the opposite assumption.
Statistical representation of this assumption is as follows:
Based on the findings of the tests and because the calculated P-value is always greater than the
error level, there is no reason to reject H0 about the effect of the color of the product on
purchase behavior. Therefore, there is no meaningful difference in respondents views based on
academic paper about the effect of the color of the product on purchase behavior among four
different groups. However there is a meaningful difference in the mean of respondents, views at
error level of 5% about the effect of size and design of the product on the purchase behavior of
consumers.
Table 7. single-agent variance analysis for examination of respondents,
view based on
academic paper
P F Assumption
0.100 2.136 Color of
product
0.045 2.779 Size of
product
0.035 2.967 Design of
product
Examination of respondents' views based income
In order to measure the meaningfulness of the difference of respondents, views based on
income, a single-agent variance analysis was used. Here again H0 assumption, that there is no
meaningful difference in respondents, views, is rejected when ji for at least one of the
average scores and that H1 is the opposite assumption. Statistical representation of this
assumption is as follows:

Business and Economic Research
ISSN 2162-4860
2013, Vol. 3, No. 2
www.macrothink.org/ber 10
Based on findings shown in table 8 and the calculated P-value, there is no meaningful
difference in the average scores of respondents, views based on income about the effect of color
and size of the product on behavior among 5 different groups. Therefore the views of people
with different incomes about color and size of product on consumer behavior is the same with
90% confidence). However, an error level of 1% and consequently 5% of the views of
respondents with different levels of income about the effect of product design on consumer
behavior is different.
Table 8. single-agent variance analysis for examination of respondents, view based on income
P F Assumption
0.267 1.321 Color of product
0.729 0.509 Size of product
0.000 5.929 Design of product
Ranking of criteria using Freidman test
Based on the output of the Freidman test, the color of packaging is the most important criterion
influencing the purchase decision of customers. The design of packaging and size of
packaging are the next preferences.
Table 9. Freidman test for the ranking of packaging criteria
Normalizes rank Friedman rank Criteria
0.368 2.21 Color of packaging
0.268 1.61 Size of packaging
0.363 2.18 Design of packaging
8. Conclusion and Suggestions
Based on the findings obtained from the theoretic and the field studies in the present research,
the following results and suggestions can be offered:
1- Since the color of packaging influences consumer behavior, food producing companies
should be more careful about the coloring of food packaging. More specifically,
customers in any gender, income and level of education believe that the packaging
color of the product influences the amount of product that will be purchased.
2- Findings of the research show that if the products are offered in smaller packages, the
tendency to buy the products increases. Food producing companies should know that
large and big packages make the process of purchase and transportation of the product
difficult. In addition, because foods have an expiration date, customers do not like
large packages of products.

Business and Economic Research
ISSN 2162-4860
2013, Vol. 3, No. 2
www.macrothink.org/ber 11
3- Design of packaging also influences food consumers, behavior. Food producers should
know that a beautiful package of food increases the appetite and desire to eat food and
persuades the customer to buy it. The packaging design of the product has a positive
effect on the buyer's taste. The design of the package has a direct effect on the prestige
of its contents and even on the confidence of the consumer.
References
Golchinfar, Shadi, Bakhtaei, & Amir. (2005). Internet; an efficient tool at the service of
propaganda, Daneshe Tablighat (knowledge of propaganda), monthly magazine, No 10.
Hawkins, D, Best, R., & Coney, K. (2010). Consumer Behavior: Building Marketing Strategy.
(9th.ed.). New York: McGraw-Hill.
Moon. C. G., & Minor, S. M., (2004). consumer behavior (first volume), Translation Abbas
Saleh Ardestani, Tehran: Asar Press, (Original publication year 1993).
Peter, P. C., & Olson , J. (2009). Consumer Behavior and Marketing Strategy. (7th.ed.). New
York: McGraw-Hill.
Roosta, Ahmad, Venus, Davar & Ebrahimi, Abdolhamid. (2007). Marketing management,
Tehran: Samt Press, Sixth edition.
Serka, Walter. (2005). Principles of packaging technology: recognition: A look at packaging
process, Packaging functions, graphic design, Translation: Hashem Habibi, Tehran: Hirad
Press, First edition.
Silayoi, P., & Speece, M. (2004). Packaging and purchase decisions: An exploratory study on
the impact of involvement level and time pressure, British Food Journal, 106(8), 607-628.
Copyright Disclaimer
Copyright reserved by the author(s).
This article is an open-access article distributed under the terms and conditions of the
Creative Commons Attribution license (http://creativecommons.org/licenses/by/3.0/).

Business and Economic Research
ISSN 2162-4860
2013, Vol. 3, No. 2
www.macrothink.org/ber 12
Exchange Rate Impacts on Investment of
Manufacturing Sectors in Iran
Mohammad Reza Lotfalipour
Professor of Economics, Department of Economics, Ferdowsi University of Mashhad
E-mail: [email protected]
Maliheh Ashena
Ph. D student, Faculty of Economics, Tarbiat Modares University
E-mail: [email protected]
Maryam Zabihi
M.A. in Economics, Ferdowsi University of Mashhad
E-mail:[email protected]
Received: May 23, 2013 Accepted: June 3, 2013
doi:10.5296/ber.v3i2.3716 URL: http://dx.doi.org/10.5296/ber.v3i2.3716
Abstract
As a major factor in the development process and economic policies evaluation, investment
and its growth rate have been considered in many studies. This paper examines the relationship
between changes in exchange rate and the investment of manufacturing sectors in Iran
during1995 to 2009 using the panel data approach. So, the annual data of manufacturing
sectors is used to examine the impact of real exchange rate fluctuations on industrial
investment. It is found a negative and statistically significant impact of real exchange rate
movements on manufacturing investment.
Keywords: Manufacturing sectors, Exchange rate, Panel Data, Iran.
JEL Classification: D51, E22, L52.

Business and Economic Research
ISSN 2162-4860
2013, Vol. 3, No. 2
www.macrothink.org/ber 13
1. Introduction
As a major factor in the development process and economic policies evaluation, investment
and its growth rate have been considered in many studies. Most of the previous studies
introduce increasing investment as the only way to reduce unemployment and increase
productivity. Iran as a developing economy is located in the course of economic growth and has
determined prospects of economic advancement. In order to meet the economic development
needs and to achieve progress of these measures, some necessary and effective tools must be
taken. This is achieved through the study of economic behavior, as well as social and
geography conditions of the society.
Investment in the industry sector is affected by factors such as value added, the amount of
banking facilities, costs of capital, crude oil revenue, exchange rate and economic growth.
Problems such as strong reliance on the oil revenues for buying machinery and raw materials,
the dominant role of government in economic management, shortage of liquidity, lack of
linkage between planning and executing of industrial development needs, exacerbates the
problems of the industry.
The increase of the secondary sector products and shift of resources from the primary to the
secondary sector may be considered as a driver of the development process. The manufactured
export increases income more than the primary products (Hausmann et al., 2005).
Over the past two decades many developed and developing countries have experienced
Changes in exchange rate. Baldwin and Krugman (1989) pointed the durable effects of major
exchange rates changes on international trade.
The economic approaches to exchange rate management have evolved over the past decades.
For adjusting an economy there are some instruments such as exchange rate that it has to be
considered in response to changes in factors affecting a country’s economic equilibrium.
The implications of exchange rate changes for the economy have been focused of empirical
studies in international economics. These studies examined the impact of exchange rate
increase or decrease on macroeconomic key factors.
Although there have been substantial currency fluctuations over the recent years, few studies
have been focused on examining exchange rate movements and manufacturing sector. This
paper investigates the relationship between exchange rate changes and the manufacturing
sector investment in Iran.
The paper is organized in four Sections. Section 2 summarizes theoretical framework and
reviews literature. Section 3 explains the methodology and empirical results. Section 4
represent conclusion.
2. Review of Literature
There are some theoretical arguments underlying the stimulating role of manufacturing sector
for economic development. The increase of the secondary sector products and moving
resources from the primary to the secondary sector may be considered as a driver of the

Business and Economic Research
ISSN 2162-4860
2013, Vol. 3, No. 2
www.macrothink.org/ber 14
development process.
Investment is a determinant factor of output level, productivity and growth. Changes in
exchange rate may cause changes in the profitability of production and investment incentives.
Exchange rate increase may increase the demand of domestic products and the cost of imported
capital and other imported inputs. It will cause investment increase only if the impact on
demand is more than the cost effect.
There are some factors affecting the optimal response of an industry investment policy to
exchange rate changes. It includes the reliance on imported inputs and the share of foreign sales
in total sales. If a firm is more dependent on imported inputs, there will be more variable costs
and less marginal value of capital. So a depreciation of exchange rate causes a reduction in the
level of industrial investment. By contrast, there will be increase in price competitiveness a
firm following an exchange rate appreciation. This is likely leads to an increase in the expected
value of capital and its level of investment.
Those sectors, in which output price is determined in the world markets, are likely to be more
sensitive to exchange rate movements. The manufacturing firms that rely on export and
imported inputs, the effect of currency valuation changes could be either positive or negative.
The choice of control variables is a crucial aspect of any empirical study of investment.
Demand-side explanatory variables (such as sales or output) and cost factors (such as the user
cost of capital or the price of oil) were employed by most studies.
Any changes in exchange rate has set of conflicting changes in foreign and domestic economy
so that its result can be positive or negative. Upcoming opportunities of liberalization of the
exchange rate in the industrial sector can be summarized as follows:
a. An increase in the exchange rate causes moving towards higher value-added products. The
point where is considered as a threat of exchange rate liberalization, may have a key role in the
industrial development of the country.
b. Iran's industry has the ability to produce foreign goods of the same quality. The liberalization
of exchange rates removes the need of high tariff walls for supporting of domestic products.
c. In recent years, many activities have done in order to reduce waste and unnecessary costs.
These removal costs and damages of industries cannot be overlooked. The lliberalization of the
exchange rate will follow decreasing waste and managing costs.
On the other hand, profitability is the most important factor of the private investment in the
industry sector. Increase of industry sector profitability will have the greatest impact on
investment of private sector. Profitability in the non-manufacturing and the speculation sectors
of the economy in some cases is also associated with various rents. Therefore, the owners of
capital will tend to invest in the non-manufacturing sectors that have more profitability, less
risk and more power of transferring the capital. Due to these issues, the exchange policy is one
of the policies affecting investment decisions. The exchange rate changes may affect
investment through increasing exports and increasing prices of imported capital goods and raw
materials. In addition, the feature of irreversibility and the delay of investment make investing
Business and Economic Research
ISSN 2162-4860
2013, Vol. 3, No. 2
www.macrothink.org/ber 15
decisions more sensitive to the real exchange rate fluctuations.
Developing countries, including Iran have experienced large fluctuations in their
macroeconomic variables such as growth, inflation, and exchange rates. The effects of these
fluctuations have discussed in various studies of growth, investment and trade.
The wage has important role in determination of investment while the wage itself is affected by
government expenditure policy. Alesina et al. (2002) presented evidence of a relationship
between investment and government expenditure, and between wages and government
expenditures.
The exchange rate has two opposing effects on manufacturing sales (both to the domestic and
the international markets). Based on the Krugman’s (1979) model and modified model from
Fung (2008), a depreciation of the home currency gives domestic industries a cost advantage
and their sales will rise. Afterward, entry of new firms may reduce the market share. It is more
likely that exports increases following home currency depreciation, but its effect on domestic
sales may be ambiguous, depending on the importance of new firm's entry. If there is
increasing returns to scale of production technology, productivity will move in the same
direction as total sales. Thus, the direction and magnitude of changes in exports and domestic
sales will affect not only total sales but also productivity and investment (Fung and Liu, 2009).
Some studies explored exchange rate and trade relation in terms of export or import (Bernard
and Jensen (2004) and Landon and Smith (2007)). Nouria et al. (2011) showed that during the
period 1991–2005 a number of countries have used undervaluation to foster the price
competitiveness of manufactured exports.
There is considerable emphasis on the study of pricing policies in response to changes in
exchange rate (Goldberg and Knetter, 1997). Some others study the impact of exchange rate
movements on the firm value (Jorion (1990), Bodnar and Gentry (1993), Clarida (1997), and
Bodnar, Dumas and Marston (1998), Harris (2001), Head and Ries (1999)).
The investigation of the exchange rate effects on investment decisions of manufacturing
industries in Colombia has emphasized the negative impact of exchange rate fluctuations on
the industrial sector (Kandilov and Leblebicioğlu, 2011). While studying industries investment
in Canada during 1981-1997 shows that it is not affected by the exchange rate changes
(Harchaoui, et al., 2005).
There are few researches focusing on the sensitivity of firms’ investment to changes in the
currency value (Goldberg (1993), Campa and Goldberg (1995), Campa and Goldberg (1999),
Forbs, 2002 Serven (2003), Fuentes (2006)). As the first contribution, Goldberg (1993)
indicates that currency appreciations led to different consequences on investment in various
periods. Campa and Goldberg (1999) showed that an exchange rate increase leads to
manufacturing investment decline in the US. Similarly, Forbes (2002) found that there is
slower growth in capital investment following exchange rate increase in commodity firms with
higher capital/ labour ratios.
Fung (2008) explored, both theoretically and empirically, the effects of the considerable

Business and Economic Research
ISSN 2162-4860
2013, Vol. 3, No. 2
www.macrothink.org/ber 16
appreciation of the Taiwanese currency, the New Taiwan dollar (the NT dollar), on both firm
turnover and production scale. The results of Fung and Liu (2009) indicated that the real
depreciation of the NT dollar led to an increase in exports, domestic sales, total sales,
value-added, and productivity. In addition, they found that there may be productivity
improvement induced by real currency depreciation a result of firm scale expansion.
Using an error correction methodology, the aggregate and sector-level investment equations for
a panel of 17 OECD countries was estimated by Landon and Smith (2009). It is found that real
currency depreciation may reduce aggregate investment and investment of nine sectors in the
short run. Furthermore, it causes reduction of aggregate investment in the long run. Kandilov
and Leblebicioğlu (2011) found a robust negative impact of exchange rate volatility on plant
investment.
Researches employing the data of the Iranian Manufacturing sectors includes Arman and
Ghorbani (2005), Lotfalipour and Razmara (2006), Khodaparast (2001) and ghetmiri (1996).
While there is some empirical literature on the impact of exchange rate on investment, there are
only a few studies that have considered the manufacturing subsectors. Moreover, most of the
studies are based on the data at the aggregated industry level. In this paper we analyze the
relationship between investment and exchange rate fluctuations using industrial subsectors
panel data.
3. Methodology and Empirical Results
The mentioned theoretical and empirical framework motivates studying investment and
exchange rate relationship, and it also highlights some other important factors of this
relationship. The goal of the paper is to estimate the impact of exchange rate changes on
investment, so we estimate a reduced form investment equation. The following baseline
dynamic specification (1) is estimated, which focuses on the main effect of exchange rate on
investment.
(1)
Where I is investment, EXR is exchange rate, W is real price of the non-tradable domestic input
and VA is value-added.
The model is estimated based on dynamic panel data using the generalized method of moments
estimator developed by Arellano and Bond (1991). In the considered equation, investment
interacts with the relevant industry-specific and time-varying explanatory variables. Therefore,
the estimated effect of the exchange rate on investment is allowed to vary over time for each
industry.
Providing a large number of point data, panel data approach allows for more powerful
statistical tests and normal distribution of test statistics. It can also take heterogeneity of each
cross-sectional unit into account, and give “more variability, less collinearity among variables,
more degrees of freedom, and more efficiency” (Baltagi, 2001).
),,),1(( VAWEXRIFI

Business and Economic Research
ISSN 2162-4860
2013, Vol. 3, No. 2
www.macrothink.org/ber 17
3.1. Panel Data Unit Root Tests
Studies on panel unit root tests include Hadri (2000), Maddala and Wu (1999), Levin et al.
(2002), Im et al. (2003). Among different panel unit root tests developed in the literature,
LLC test (Levin et al., 2002) and IPS test (Im et al., 2003) are the most popular and are based
on the ADF principle. However, the LLC test assumes homogeneity in the dynamics of the
autoregressive coefficients for all panel members. In contrast, the IPS test allows for
heterogeneity in these dynamics. IPS begins by specifying a separate ADF regression for each
cross section. The IPS test is based on the following model:
ip
j
itjtiijtiiiit yyy1
,1, (2)
where yit is the series for country i in the panel over period t, ρi is the number of lags selected
for the ADF regression and εit are independently and normally distributed random variables for
all i and t with zero means and finite heterogeneous variances.
IPS tests the null hypothesis of the unit root for each individual in the panel, that is,
.,0:0 iH i
LLC unit root test considers the coefficients of the autoregressive term as homogeneous across
all individual. So, LLC tests the null hypothesis that each individual in the panel has integrated
time series, that is .,0:0 iH i
Maddalaand Wu’s (1999) and Choi’s (2001) tests were developed to overcome the
shortcomings of the LLC and the IPS tests. They suggest panel unit root tests using a Fisher
statistic. Table 1 presents the test results of the panel level series including a constant term and
time trend.
Table 1. Panel unit root test results
variables LI LEXR LW LVA
Levin, Lin & Chu t. -5.22 (0.00) -6.41(0.00) -6.89 (0.00) -10.27 (0.00)
Im, Pesaran& Shin W-stat -2.19 (0.01) ........ -1.91 (0.02) -3.42 (0.00)
ADF – Fisher Chi-square 72.68 (0.00) 79.84 (0.00) 68.05 (0.02) 87.84 (0.00)
PP – Fisher Chi-square 147.53 (0.00) 150.65 (0.00) 92.75 (0.00) 95.50 (0.00)
Note: (a) Individual intercepts are included as exogenous variables in the test equations. Maximum lags are
selected based on the Schwarz Information Criterion. (b)Figures in brackets denote p-values.
The results of IPS, LLC and Fisher tests indicate that the panel level series are stationary.
Therefore, we have chosen to use the panel level series in the panel VAR analysis.
3.2. Empirical Results
In this section, the exchange rate effect on the investment of manufacturing sector is
investigated empirically. As Iran experienced large currency depreciations in the recent years,
it can be of great importance to policy makers to understand the exchange rate effects on
industry sector performance. In this paper, we employ manufacturing sector panel data of Iran

Business and Economic Research
ISSN 2162-4860
2013, Vol. 3, No. 2
www.macrothink.org/ber 18
to examine the impact on the manufacturing subsectors investment of the substantial real
depreciation of the exchange rate.
The empirical analysis has been conducted using data of 2-digit ISIC industries drawn from
statistical yearbook during 1995-2008. The data include information on exchange rate,
investment, domestic output and compensation of the non-tradable domestic input.
Employing industry-level data from the Iranian Manufacturing sector, we estimate a dynamic
investment equation using the system-GMM estimator developed by Arellano and Bover (1995)
and Blundell and Bond (1998).
The fixed effects in panel data permit us to account for heterogeneity of industries. Moreover,
panel data allows us to study dynamics for the individual industries. Hence, by including both
the individual-specific and the time-specific effects into the specification for panel data, a
larger portion of the omitted-variable bias can be eliminated.
The real exchange rate, EXR, is measured as domestic currency units per unit of foreign
currency. The theoretical investment equation includes real value-added, VA, and the real price
of the non-tradable domestic input, W. Industry-specific fixed effects, µ , are included in the
estimating equation to represent the determinants of investment that differ across industries,
but are constant through time. Incorporating the variables described above in the panel model,
Eq. (3) yields the estimable investment equation:
(3)
m
j
itijti
m
j
jjti
m
j
jjtijjti
m
j
jit LEXRLWLVALILI1
11,
1
4,
1
3,2,
1
11
Where i and t denote, respectively, industry i and time t, j is the lag length, μi is
industry-specific effects and εit is the disturbance terms. If the coefficient βi in equation (3) is
significantly different from zero, then that variable may be said to have impacts on investment.
This specification incorporates lags of investment, and the current value and some lags of all
the explanatory variables. We treat all of the industry specific variables as endogenous, and
use lagged values dated t−2 as the GMM-type instruments.
The optimal lag length in the VAR model based on the Schwarz Information Criterion (SIC) is
chosen two. Table 2 shows the results for estimating the model using GMM. The Sargan test is
a test on whether the instruments are valid (uncorrelated with the error term).
Table 2. Estimation results of the panel regression
Variables LI
LI(-1) -0.393(-4.617)
LI(-2) -0.183(-3.987)
LW 0.691(1.827)
LVA 0.208(0.555)
LEXR -0.568(-2.573)
LVA(-1) 0.313(5.456)
LEXR(-1) 0.474(1.779)
Sargan test (p-level) 9.35
Instrument rank 20
Figures in brackets denote t-statistics.

Business and Economic Research
ISSN 2162-4860
2013, Vol. 3, No. 2
www.macrothink.org/ber 19
Based on these results, we found a strong negative and statistically significant impact of real
exchange rate movements on plant investment. Based on the theoretical expectations, we
would expect exchange rate to have impact on investment and it is valid for selected industrial
subsectors. The test results suggest that the null hypothesis of coefficients insignificance is
rejected. It indicates that exchange rate and investment lags have negative and significant
impact. Since the real exchange rate is indicated as an indicator of competitiveness of domestic
goods relative to foreign goods, therefore fluctuations in the exchange rate reduce desire of
producers to investment.This result demonstrates that real depreciation of the home currency
has unfavorable effects on investment of industry sector. In terms of control variables, we find
an economically and statistically significant impact of value-added first lag on plant-level
investment. Furthermore, the price of non-tradable inputs is found to have no significant effect
on industrial investment.
4. Summary and Conclusion
Investment has important role in the determination of output changes, productivity and growth.
Changes in exchange rate can cause large fluctuations in the profitability of production and
investment incentives. As Iran had experienced large currency depreciations in the recent years,
it can be of great importance to policy makers to understand the exchange rate effects on
industry sector performance. In this paper, we used manufacturing annual data of Iran to
assess the impact of real exchange rate fluctuations on investment of manufacturing sectors.
We used the Iranian data of 2-digits industries from 1995 to 2009 and estimated a dynamic
investment equation using panel data model developed by Arellano and Bover (1995) and
Blundell and Bond (1998).
It is found a strong negative and statistically significant impact of real exchange rate
movements on plant investment. In light of these findings, the analysis incorporates real
value-added and the real price of the non-tradable domestic input as control variables in the
empirical equation. This avoids omitting potentially important variables, and allows for a
comparison of the relative roles of the output, the wage and the exchange rate as determinants
of investment.
Since the real exchange rate is indicated as an indicator of competitiveness of domestic goods
relative to foreign goods, therefore fluctuations in the exchange rate reduce the desire of
producers to invest. The government should try to stabilize the real exchange rate for
motivating investment in industry sector. Any change in price index causes the instability of
the real exchange rate, so government should implement appropriate policies to reduce the
volatility of commodity prices. The foreign exchange reserve is one of the means that the
government can use to control exchange rate supply and demand.
References
Alesina, A., Ardagna, S., Perotti, R., & Schiantarelli, F. (2002). Fiscal policy, profits, and
investment, American Economic Review, 92(3), 571-589.
http://dx.doi.org/10.1257/00028280260136255
Arman, S.A., & Ghorbani, N. (2005). Effect of exchange rate changes on investment in Iran's

Business and Economic Research
ISSN 2162-4860
2013, Vol. 3, No. 2
www.macrothink.org/ber 20
industry subsectors, Journal of Economic Review, 2(4), 5-19.
Arellano, M., & Bond, S. (1991). Some tests of specification for panel data: Monte Carlo
evidence and an application to employment equations, Review of Economic Studies, 58, 277
-297. http://dx.doi.org/10.2307/2297968
Arellano, M., & Bover, O. (1995). Another look at the instrumental variable estimation of
error-components models, Journal of Econometrics, 68, 29-51.
http://dx.doi.org/10.1016/0304-4076(94)01642-D
Baldwin, R., & Krugman, P. (1989). Persistent trade effects of large exchange rate shocks.
Quarterly Journal of Economics, 104, 635-654.
Baltagi, B. H. (2001). Econometric analysis of Panel Data. 2d ed. New York: John Wiley&
Sons. http://dx.doi.org/10.2307/2937860
Bernard, A. B., & Jensen, J. B. (2004). Entry, expansion, and intensity in the U.S. export boom,
1987–1992, Review of International Economics, 12, 662-675.
http://dx.doi.org/10.1111/j.1467-9396.2004.00473.x
Blundell, R., & Bond, S. (1998). Initial conditions and moment restrictions in dynamic panel
data models, Journal of Econometrics, 87, 115-143.
http://dx.doi.org/10.1016/S0304-4076(98)00009-8
Bodnar, G. M., & Gentry, W. M. (1993). Exchange rate exposure and industry characteristics:
evidence from Canada, Japan and the US, Journal of International Money and Finance, 12,
29-45. http://dx.doi.org/10.1016/0261-5606(93)90008-Y
Bodnar, G. M., Dumas, B., & Marston, R. C. (1998). Pass-through and Exposure, paper
presented at the 1998 American Finance Association meetings in Chicago.
Campa, J., & Goldberg, L. S. (1995). Investment in manufacturing, exchange rates and
external exposure, Journal of International Economics, 38, 297-320.
http://dx.doi.org/10.1016/0022-1996(94)01348-V
Campa, J. M., & Goldberg, L. S. (1999). Investment, pass-through, and exchange rates: a
cross-country comparison, International Economic Review, 40(2), 287-314.
http://dx.doi.org/10.1111/1468-2354.00016
Choi, I. (2001). Unit root tests for panel data, Journal of International Money and Finance, 20,
249-272. http://dx.doi.org/10.1016/S0261-5606(00)00048-6
Clarida, R. H. (1997). The Real Exchange Rate and US Manufacturing Profits: A Theoretical
Framework with Some Empirical Support, International Journal of Finance and Economics, 2,
177-187.
http://dx.doi.org/10.1002/(SICI)1099-1158(199707)2:3<177::AID-IJFE50>3.0.CO;2-U
Feenstra, R. C. (1989). Symmetric pass-through of tariffs and exchange rates under imperfect
competition: an empirical test, Journal of International Economics, 27, 25-45.
http://dx.doi.org/10.1016/0022-1996(89)90076-7

Business and Economic Research
ISSN 2162-4860
2013, Vol. 3, No. 2
www.macrothink.org/ber 21
Forbes, K. J. (2002a). Cheap labor meets costly capital: the impact of devaluations on
commodity firms, Journal of Development Economics, 69, 335-365.
http://dx.doi.org/10.1016/S0304-3878(02)00092-5
Forbes, K. J. (2002b). How do large depreciations affect firm performance? IMF Staff Papers,
49, 214-238.
Fuentes, O. (2006). “Exchange Rate Volatility and Investment: Evidence at the Plant-level”,
mimeo.
Fung, L. (2008). Large real exchange rate movements, firm dynamics, and productivity growth,
Canadian Journal of Economics, 41(2), 391-424.
http://dx.doi.org/10.1111/j.1365-2966.2008.00468.x
Fung, L., & Liu, J. T. (2009), The impact of real exchange rate movements on firm
performance: A case study of Taiwanese manufacturing firms, Japan and the World Economy,
21, 85-96. http://dx.doi.org/10.1016/j.japwor.2007.11.002
Ghetmiri, M. A. (1996). Measurement and analysis of factors affecting the productivity of
Iran's industries, The second of National Congress of productivity.
Goldberg, L. S. (1993). Exchange rates and investment in United States Industry, The Review
of Economics and Statistics, 75(4), 575-588. http://dx.doi.org/10.2307/2110011
Hadri, K. (2000). Testing for stationarity inheterogeneous panel data, Econometrics Journal, 3,
148-161. http://dx.doi.org/10.1111/1368-423X.00043
Goldberg P., & Knetter M. (1997). Good Prices and Exchange Rates: What have we learned,
Journal of Economic Literature, 35, 1243-1272.
Harris R. G. (2001). Is There a Case for Exchange Rate Induced Productivity Declines, in L.
Schembri (ed.) Re-Visiting the Case for Flexible Exchange Rates, Ottawa, Bank of Canada,
277-309.
Hausmann, R., Pritchett, L., & Rodrik, D. (2005). Growth Accelerations, Journal of Economic
Growth, 10(4), 303–329. http://dx.doi.org/10.1007/s10887-005-4712-0
Head, K., & Ries, J. (1999). Rationalization effects of tariff reductions, Journal of
International Economics, 47, 295-320. http://dx.doi.org/10.1016/S0022-1996(98)00019-1
Im, K. S., Pesaran, M. H., & Shin, Y. (2003).Testing for unit roots in heterogeneous panels.
Journal of Econometrics, 115, 53-74. http://dx.doi.org/10.1016/S0304-4076(03)00092-7
Jorion, P. (1990). The exchange-rate exposure of US multinationals, Journal of Business, 63,
331-45. http://dx.doi.org/10.1086/296510
Kandilov, T., & Leblebicioğlu, A. (2011). The impact of exchange rate volatility on plant-level
investment: Evidence from Colombia, Journal of Development Economics, 94, 220-230.
http://dx.doi.org/10.1016/j.jdeveco.2010.01.013
Khodaparast, J. (2001). Comparison Investigation of total productivity of production factors in

Business and Economic Research
ISSN 2162-4860
2013, Vol. 3, No. 2
www.macrothink.org/ber 22
large industries, Management and Planning Organization of Fars Province, Coordination and
Planning Department.
Krugman, P. (1979). Increasing returns, monopolistic competition, and international trade,
Journal of International Economics, 9, 469-479.
http://dx.doi.org/10.1016/0022-1996(79)90017-5
Landon, S., & Smith, C. E. (2007). The exchange rate and machinery and equipment imports:
identifying the impact of import source and export destination country currency valuation
changes, North American Journal of Economics and Finance, 18, 3–21.
http://dx.doi.org/10.1016/j.najef.2006.08.001
Levin, A., Lin, C. F., & Chu, C. (2002). Unit root tests in panel data: asymptotic and
finite-sample properties, Journal of Econometrics, 108, 1–24.
http://dx.doi.org/10.1016/j.najef.2006.08.001
Lotfalipour M. R., & Razmara, A. (2006). Evaluation of Technical Efficiency and Productivity
Trend in Iran's Industry(Case Study of Fifty and More Employee Firms), Knowledge and
Development, 18, 55-78.
Maddala, G. S., & Wu, S. (1999). A comparative study of unit root tests with panel data and a
new simple test, Oxford Bulletin of Economics and Statistics, 61, 631-652.
http://dx.doi.org/10.1016/j.najef.2006.08.001
Nouira, R., Plane, P., & Sekkat, K. (2011). Exchange rate undervaluation and manufactured
exports: A deliberate strategy?, Journal of Comparative Economics, 39, 584-601.
http://dx.doi.org/10.1016/j.jce.2011.08.002
Serven, L. (2003). Real exchange rate uncertainty and private investment in developing
countries, Review of Economics and Statistics, 85(1), 212–217.
http://dx.doi.org/10.1162/rest.2003.85.1.212
Stuart Landon, S., & Smith, C. E. (2009). Investment and the exchange rate: Short run and long
run aggregate and sector-level estimates, Journal of International Money and Finance, 28,
813-835. http://dx.doi.org/10.1016/j.jimonfin.2008.07.009
Copyright Disclaimer
Copyright reserved by the author(s).
This article is an open-access article distributed under the terms and conditions of the
Creative Commons Attribution license (http://creativecommons.org/licenses/by/3.0/).

Business and Economic Research
ISSN 2162-4860
2013, Vol. 3, No. 2
www.macrothink.org/ber 23
Private Returns to Education in Urban Cameroon
Christian Zamo-Akono (Corresponding author)
Faculty of Economics and Management
University of Yaoundé II, Cameroon
E-mail: [email protected]
Roger Tsafack Nanfosso
Faculty of Economics and Management
University of Yaoundé II, Cameroon
Received: May 12, 2013 Accepted: May 28, 2013
doi:10.5296/ber.v3i2.3679 URL: http://dx.doi.org/10.5296/ber.v3i2.3679
Abstract
Earlier studies on the impact of education on earnings highlighted a declining pattern of the
private returns in developing countries. However, recent research has argued that failing to
account for the segmented structure of the labour market could be misleading. This study
aims to estimate private returns to education in Cameroon, focusing on how they vary across
the different segments of the Cameroon labour market. The data used in this study are drawn
from the 2005 Employment and Informal Sector Survey, which is nationally representative
and comprehensive survey providing information over 8,540 households and 38,599
individuals around the country. The estimation of wage equations corrected from selectivity
bias reveals that there are convex rates of return to education in all the segments of the labour
market. As far as the private sector is concerned, it is found that those who graduated from
primary school earn no returns compared to those who never attended school. The fact that
only degrees are rewarded on the Cameroon labour market evidences the existence of a
sheepskin effect in Cameroon and may serve as a confirmation of the signalling role of
education in this context.
JEL Classification: I21, J31, J40
Keywords: Returns to education, Labour market sectors, Earnings.

Business and Economic Research
ISSN 2162-4860
2013, Vol. 3, No. 2
www.macrothink.org/ber 24
1. Introduction
1.1. Context
Following independence in 1960, Cameroon recorded tremendous economic growth. The
yearly average growth rate of per capita Gross Domestic Product (GDP) amounted to 4
percent during the period 1965-1976, 13 percent from 1977 to 1981, and 8 percent from 1982
to 1985. By 1985, Cameroon was ranked among the middle-income countries, according to
the World Bank taxonomy (De Monchy and Roubaud, 1991). During this “20-year golden
age”, the Government created many schools (primary and secondary) and instituted a
partially free primary and secondary education in order to ensure access to education. As one
of the crucial problems faced by Cameroon was the need for trained national cadres
(especially for senior positions in the civil service), policy-makers held the view that the
panacea would be for Government to create and run institutions of higher learning and thus
make provision for the acquisition of skills necessary for national development. Cameroon
created a variety of higher education institutions, among which one university and diverse
state-owned professional schoolsi. During this period, unemployment was not a big issue,
thanks to an ambitious development program of employment creation in the public sector,
recruitments in state-owned enterprises, and development projects. Graduates of professional
schools were assured of jobs in the public sector once admitted into the school; a practice that
skewed the Cameroon labour market towards the public sector.
From 1986 to 1994, Cameroon faced a deep-seated crisis which led to a decline of the GDP by
roughly six percent per annum between 1986 and 1993. Reforms engaged in order to comply
with its commitments with the International Monetary Fund and the World Bank consisted in
privatizing and restructuring public firms, dismissing in the public sector, suppressing civil
servant advantages, and almost a 50 percent cut in per capita income during 1992-1993 (World
Bank, 1996). The public sector, previously known as the main caterer in salaried and decent
jobs, witnessed a significant decline in its share of total employment. This shrinking public
sector employment, coupled with the incapacity of the private sector to absorb all the influx of
job searchers in the labour market, induced the rise of unemployment. In 1992, there were over
76,500 job seekers in Cameroon (Aming and Awung, 2005). Along with low paying and poor
working condition in both public and private sectors, many individuals were drained into the
informal sector of the labour market. With 85.9 percent of employed workers in 1996 and 90.4
percent in 2005 (National Institute of Statistics, 1996; 2005), the informal sector emerged as
the leading sector in terms of opportunities for employment. From 1995 onward, Cameroon
regained a steady growth path and an annual GDP growth rate of roughly 4.5 percent (Emini,
Cockburn, and Decaluwe, 2005). But despite the recovery, unemployment remained extremely
pronounced, especially in urban areas. The 2005 Employment and Informal Sector Survey
revealed that highest unemployment levels were observed in the two biggest agglomerations of
Cameroon were the unemployment rates are 14.7% and 12.5%, respectively for Yaoundé and
Douala.
Despite a decline in individuals’ employability due to the reduced capacity of the economy to
absorb all the graduates of the educational system, large amounts of resources are still being

Business and Economic Research
ISSN 2162-4860
2013, Vol. 3, No. 2
www.macrothink.org/ber 25
invested in education by both Cameroon Government and Cameroonians. The landmark
innovations of the 1993 reforms were the institution of a 50,000 CFA francs (CFAF)ii
registration fees for state-owned universities and the liberalization of the higher education
sector. Tuition fees in private-owned institutions involved in the tertiary education range from
CFAF650,000 to almost CFAF1,300,000 depending on the speciality chosen by the student
(Tsafack, 2006). At the same time, the demand for education has kept increasing. While the
Federal University started with a small enrolment of about 600 students, the student enrolment
increased substantially as time went on up to 7 000 in 1970, above 50 000 by 1992
(Tafah-Edokat, 1989). According to the National Institute of Statistics, the student enrolment in
State Universities and at the Catholic University of Central Africa (CUCA) was above 75 000
during the 2001-2002 academic year, 91 000 in 2004-2005, and above 105 000 during the
2005-2006 academic year. It thus becomes interesting to investigate whether Cameroon
educational system yields private returns that justify the resources invested in schooling. The
main objective of this study is to estimate the private returns to education Cameroon. The
outline of the paper is as follows. The next point reviews the literature, section two presents the
methodology and provides a brief description of the data used in the study. Section three
discusses the results and section four concludes.
1.2 Private Returns to Education in the Literature
According to the human capital theory, an individual’s optimal investment in human capital
calls for a consideration of both human and financial capacities, and the prospective utilization
of the capital that is being accumulated (Mincer and Polachek, 1974). Consequently, the
expectations regarding future family and market activities of individuals play an important role
in the determination of the levels and forms of human capital investment. To the extent that
labour market earnings are determined by the stock of human capital accumulated by
individuals, a sequence of positive net investments results in an earning power that grows over
the life cycle (Sackey, 2008). Consequently, educational attainments are thought to be a
plausible cause of earnings differential between individuals. These ideas have given foundation
to a huge number of studies on returns to schooling around the world.
Earlier studies were devoted to the analysis of the impact of length of schooling, labour market
experience, and school quality on earnings. Psacharopoulos (1994) made an extensive survey
of published studies on private returns to investments in education in many sub-Saharan
African countries. He observed a declining pattern of the returns to education over time and
found that the rate of return on primary education was 24 per cent, 18 per cent for secondary
education and 11 per cent for higher education; he concluded that investments in primary
education should be emphasized at the expense of higher education. These results were
challenged by Bennell (1996) who revealed theoretical and empirical shortcomings in studies
of individual rate of return to education in African countries. While undermining the credibility
of Psacharopoulos’ aggregate estimates for the continent as a whole, Bennell’s arguments led to
many other studies of sub-Saharan African countries who did not support Psacharopoulos’
result of consistently higher returns to primary education than either secondary or higher
education. For example, Manda and Bigsten (1998) and Liu (1998) analysed the impact of
educational expansion and returns to schooling in Kenya and found that private return to

Business and Economic Research
ISSN 2162-4860
2013, Vol. 3, No. 2
www.macrothink.org/ber 26
secondary and tertiary education were high, but close to zero for primary education. Examining
private returns to education in same country, Kimenyi et al. (2006) found that the returns to an
additional year of schooling increased from about 8% for primary school to 23% for secondary
school and then to 25% for university level of education. These results were confirmed in a
number of sub-Saharan Africa countries by Appleton et al (1999), Bigsten et al (2000), Schultz
(2004), and Aromolan (2004; 2006).
When it comes to the analysis of returns to schooling in Cameroon, there is relatively little
empirical evidence. Among known studies, only Tafah-Edokat (1998) found that primary
education gives the highest returns followed by secondary and tertiary education. He
concluded like Psacharopoulos (1994) that the investment in primary education should be
emphasized and that individuals willing to pursue further education should be made to bear a
higher proportion of the cost of such education. His results suffer from the fact that his sample
was mostly limited to civil servants. Although other studies find convex returns to education
(Lanot and Muller, 1997; Bigsten et. al., 2000; Aming and Awung, 2005; Ewoudou and
Vencatachellum, 2006), they do suffer from many shortcomings. The first one relates to the fact
that some of the samples were not representative of the urban population diversity. For example,
Bigsten et. al. (2000) worked on a sample of workers from 170 companies in the manufacturing
sector and could not inform about returns in the formal or informal non-manufacturing sectors.
While Lanot and Muller used data from a sample of 200 women in Yaoundé, Aming and
Awung’s results were based on the survey data collected in 1994 from rural and urban areas of
Mfoundi, Moungo, Mezam, Benoue, Nyong and Soo, five subdivisions of only four regions of
Cameroon. Second, results of some of these studies (principally Bigsten et. al., 2000; Aming
and Awung, 2005) may not be reliable as most of them failed to account for the most notable
characteristic of the Cameroon labour market that is, its structure in term of two homogeneous
sectors (public and formal private) and a heterogeneous informal sector. Factors determining
labour market decisions and outcomes are thought to be different from one sector to another
and failing to account for these differences may result in biased estimates of the returns to
education. Thus, this study advocates for an explicit modelling of the economic opportunities
available to job seekers and the correction of selectivity bias in wage equations.
2. Methodology.
2.1. Econometric Method
To ascertain the returns to education, we use the standard and widely applied earnings function
proposed by Mincer (1974). The methodology consists in estimating a semi-logarithmic
equation, where log wages lnW are explained by education and individual economic and
noneconomic characteristics X that is:
ij jijiiii XUnivSecondimW 3210 Prln (1)
with, 0 representing an intercept term, j an unknown parameter associated to variable Xj,

Business and Economic Research
ISSN 2162-4860
2013, Vol. 3, No. 2
www.macrothink.org/ber 27
and the random disturbance term.
Returns to education being dependent of the proportion of qualified individuals that are
applying for a job on the labour market (Angrist, 1995), the increasing production of high
skilled individuals in Cameroon is likely to have induced a filtering down process in which low
paying job attract overqualified individuals. In such a context and for a given labour market
experience, education may loose its explanatory power on the wages. Hypothesizing the
existence of a “parchment effect” on the Cameroon urban labour market, we include dummy
variables representing the highest degree obtained by an individual and obtain the following
second equation.
ij jijk kikiiii XDegreeUnivSecondimW
8
13210 Prln (2)
Due to the fact that wages are unobserved for individuals whose market pay is lower than their
reservation wage, the analysis of earnings is potentially affected by a non-random selection of
individuals into the labour market. In such a setting, earnings are jointly determined with
labour force participation and any analysis that ignores the process of labour force participation
is potentially subject to selection bias. To correct for such a bias, the two-step estimation
method developed by Lee (1983) and Trost and Lee (1984) is adopted. In the first stage, the
selection into the labour market is estimated. As far as the Cameroon labour market is
concerned, individuals face four mutually exclusive labour market outcomes: unemployed (l=0)
the reference group; employed in the public (including parastatal companies) sector (l=1), in
the private formal sector (l=2), and in the informal sector (l=3). The probability that individual
i has outcome l is given by a multinomial logit:
3
0
'' exp/expl ilill ZZp (3)
The choice of or selection into one of these sectors is thought to depend on a vector of
explanatory variables (Z) capturing an individual’s perceived net differentials in wages
between them, tastes and preferences, as well as human capital and other characteristics;
represents a vector of associated unknown parameters to estimate. From these estimates, we
construct the selection term (Mills’ ratio) for the alternative l as ilill ZZ '' / ;
being the normal density function and the normal distribution function. In the second
stage, the estimated l is included among the explanatory variables of the wage equations. The
implied sector wage equation 4 is estimated by OLS for l = 1; 2; 3.
ilj jijk kikiiii XDegreeUnivSecondimW
8
13210 Prln (4)
With this specification, we compute both total and marginal returns to education. Total return
to a given level of education (or degree) is defined as the mean difference between the wage of

Business and Economic Research
ISSN 2162-4860
2013, Vol. 3, No. 2
www.macrothink.org/ber 28
someone who achieved level j (obtained degree k) and the wage of the other one who didn’t go
to school (obtained any degree). It is given by:
exp 1level J jtr and deg exp 1ree K ktr .
Following Kimenyi et al. (2006), the marginal return to education was defined as returns that
accrue to an additional year of schooling. This value is computed by dividing the difference
between the coefficients of adjacent schooling levels (degrees) by their differences in years of
schooling. Letting R represent the rate of return and S the years of schooling, the rate of return
to an additional year of schooling for a given level and for a given degree are measured
respectively for the level of education and the highest degree as follows:
1-
1-
-
1--exp
JlevelJlevel
jj
JlevelSS
mr
and
1-degdeg
1-deg
-
1--exp
KreeKree
kkKree
SSmr
To determine the years of schooling (S), Sackey (2008) used the statutory number of years for
the completion of any given level of schooling, assuming a homogenous educational system.
As far as our study is concerned, there’s a need to point out that Cameroon educational system
is a mixture of the Anglophone and the Francophone systems which differ in some respects
especially on the statutory duration of studies in both the primary and secondary levels. For
instance in the Anglophone system, primary education lasts for seven years and leads to the
First School Leaving Certificate (FSLC). The first level of secondary education lasts for five
years and leads to the General Certificate of Education Ordinary level (GCE-OL) and higher
schools offer two-year courses leading to the GCE Advanced level (GCE-AL). As far as the
Francophone system is concerned, six years in primary education lead to the French version of
the FLSC, five more years in the first cycle of secondary education lead to the French GCE-OL,
and finally three years’ study in the upper secondary lead to the GCE-AL named
BACCALAURÉATiii
.Thus, to get to the tertiary level of education, the Anglophone system
involves a sequence of seven, five and two years, while the Francophone system requires a
sequence of six, four and three years. University level studies depict similar differences
between the facultiesiv
. Consequently, unlike Sackey (2008), our measure of the years of
schooling (S) must allow to account for both heterogeneities inside the system, grade repetition,
examination failures, and school dropout before stage completion. For these reasons, years of
schooling are derived from information on the highest class successfully completed by
attaching the modal number of years to educational levels and degrees.
2.2. Data Source
The data used in this study are drawn from the 2005 Employment and Informal Sector Survey
(EISS) which is a nationally representative and comprehensive survey providing information
over 8,540 households and 38,599 individuals around the country. Information covers
socioeconomic characteristics, employment status and characteristics, and some family
background indicators. Of particular interest is information on variables, which might permit
meaningful separations of the data by type-of-employment and labour market sector. The

Business and Economic Research
ISSN 2162-4860
2013, Vol. 3, No. 2
www.macrothink.org/ber 29
survey also includes information on the industry of employment and occupation and on a
variety of income sources, including weekly earnings and wages analyzed in this study. The
analysis of returns to education concentrates only of salaried workers. The rationale is that,
revenues generated from self-employed individuals’ activities do not simply remunerate labour,
but also capital. Considering the fact that there’s no information on how to dissociate these
components, it is better to exclude these individuals from the analysis. The sample used in this
study included only individuals in the working age group 15 to 65 years, who were full-time
employees, and lived in Cameroon urban areas. It consisted of 13,104 observations covering
individuals both in the public (871), private formal (898), informal (2458) sectors, as well as
unemployed (5420) ones. Sample modal numbers of years are 6, 9 and 16 respectively for those
who have the primary, the secondary and the tertiary levels of educationv. While considering
the highest degree obtained, we have 6 for the Primary school certificate (FLSC), 10 for the
first level secondary school diploma (GCE-OL), 12 for the PROBATION degree, 13 for the
GCE-AL, 15 for the BTS degree, 16 BACHELOR degree, 18 for the MASTER and upper
degrees (Master/PhD).
Table 1 presents means and standard deviations for the main variables of the study. As can be
seen on it, there are differences between those who are considered as having a given level of
education and the proportion of individuals having at least the lowest degree of this level. For
example, 52.9% of civil servants have the secondary level of education but only 46.5% hold at
least a GCE-OL. These differences are due to grade repetition, examination failures, and school
dropout before stage completion. Further, there are important differences in educational
attainment by sector of employment. While 88.6 % of individuals working in the public sector
have at least the secondary level of education, in the formal private and informal sectors the
analogous figures are, respectively, 78.9 % and 53.8 %. As far as degrees are concerned, the
proportions of individuals who hold a university degree are 40.3%, 18.9%, and 2.44%
respectively in the public, formal private and informal sectors. The higher proportion of
university graduates in civil servant jobs than in private sector ones is partly attributable to the
fact that access to many Government jobs require a higher education degree. Observed
differences in education are reflected in wage differences. Actually, sizeable earnings
differentials in favour of public sector employees relative to formal private and informal
sectors workers are found across labour market sectors. The average log(wage) is 11.65 in the
public sector, 11.279 in the formal private sector, and 10.253 in the informal sector. A group
mean comparisons tests reveals that public sector earnings are higher than both formal private
and informal sectors wages. The earnings gap in favour of the public sector may be either due
to higher economic returns to human capital in the public sector, or to differences in personal or
job characteristics (education, experience or occupations) between employees across the
labour market sectors. Consistent with the notion that rewards in the public sector are less
variable, the standard deviation of these variables is lower in the public than in the private
sector.

Business and Economic Research
ISSN 2162-4860
2013, Vol. 3, No. 2
www.macrothink.org/ber 30
Table 1. Sample characteristics for basic variables
Variables
Public sector Formal private sector Informal sector
Mean Standard
deviation
Mean Standard
deviation
Mean Standard
deviation
Education variables
Level of education
Primary school dummy
Secondary school dummy
Tertiary school dummy
Highest degree obtained
Primary school certificate
First Level Secondary school
diploma
Probation degree
High School certificate
BTS degree
Bachelor/Licence degree
Master and upper degrees
Years of schooling
Other variables
Log(wage)
Age
Experience
Monthly hours of work
Migration status
0.106
0.529
0.357
0.190
0.182
0.071
0.212
0.050
0.121
0.111
12.351
11.650
39.640
6.717
156.436
0.437
3.387
0.766
8.823
6.797
31.387
0.191
0.567
0.222
0.285
0.224
0.066
0.146
0.056
0.065
0.060
10.835
11.279
33.726
5.0634
202.841
0.197
4.025
0.863
9.493
5.580
64.462
0.393
0.502
0.036
0.491
0.131
0.042
0.040
0.006
0.013
0.005
6.739
10.253
26.879
3.093
184.019
0.077
3.806
0.774
9.399
4.360
87.006
3. Results and Discussion
Table 2 provides the results from estimating earnings functions for the public, formal private
and informal sectors in Cameroon for the two specifications under consideration. Globally, all
the wage equations are statistically significant with an R-squared which is around 34% in the
public sector, 40% in the formal private sector around 25% the informal sector; these statistics
means that the model is better fitted to explain wages of public and formal private sectors
workers. A first noteworthy result is that a large part of the variance of earnings reflects
unobservable factors that are not captured in the regression equations. Unlike Ewoudou and
Vencatachellum (2006) who got a significant selection term only in the public sector, the
sample selection correction terms are significant and negative for all the labour market sectors,
meaning that it is important in the case of Cameroon to explicitly model selection into
employment when estimating earning functions. If we hypothesize that people choose their
status of employment in a way which maximizes their earnings potential, then we should
observe positive selection. One interpretation of the negative selection into employee status is
therefore that there exist some unobserved factors that increase one’s probability to be
employed but also contribute to the likelihood that a person will earn a below average wage.

Business and Economic Research
ISSN 2162-4860
2013, Vol. 3, No. 2
www.macrothink.org/ber 31
Table 2. Estimated earnings coefficients.
Variables
Public sector Private sector Informal sector
1 2 1 2 1 2
Age
Experience
Experience squared
Monthly hours of
work
Migration status
Level of education
dummies
Primary school
dummy
Secondary school
dummy
Tertiary school
dummy
Highest degree
dummies
FLSC
GCE-OL
PROBATION
degree
GCE-AL
BTS degree
BACHELOR
degree
MASTER and upper
degrees
0.0242***
(6.26)
0.0183*
(1.67)
-0.0009**
(-1.98)
0.0017**
(2.21)
0.1895***
(4.54)
0.5597**
(2.01)
0.8776***
(3.16)
1.2694***
(4.21)
-1.1017**
(-2.13)
10.0179***
(16.32)
49.20
0.0000
0.0239***
(6.42)
0.0180*
(1.67)
-0.0008**
(-1.96)
0.0018**
(2.29)
0.1821***
(4.37)
0.2806
(0.91)
0.3927
(1.21)
0.5499
(1.56)
0.3794***
(2.38)
0.4765***
(2.79)
0.5142***
(2.80)
0.6493***
(3.76)
0.7724***
(3.55)
0.6746***
(3.37)
0.9252***
(4.73)
-0.8818*
(-1.73)
9.8414***
(16.28)
31.81
0.0000
0.0214***
(6.32)
0.0547***
(3.64)
-0.0018**
(-2.46)
0.0004
(1.09)
0.2245***
(3.42)
0.1657
(1.19)
0.4889***
(3.39)
1.1359***
(6.73)
-2.1987***
(-3.04)
11.1954***
(17.21)
53.88
0.0000
0.0195***
(5.99)
0.0547***
(3.59)
-0.0018***
(-2.38)
0.0005
(1.52)
0.1941***
(3.05)
0.0796
(0.53)
0.1769
(1.04)
0.1012
(0.46)
0.1358
(1.51)
0.3082***
(2.77)
0.4353***
(3.22)
0.5758***
(4.58)
1.0822***
(5.61)
0.8702***
(4.51)
1.4887***
(7.23)
-1.9442**
(-2.80)
11.0404***
(17.80)
35.67
0.0000
0.0219***
(9.08)
0.0396***
(4.26)
-0.0013***
(-3.14)
0.0021***
(9.36)
0.1092*
(1.96)
0.1588**
(2.03)
0.5646***
(6.55)
1.2189***
(7.27)
-1.1746***
(-3.75)
9.2179***
(49.39)
44.64
0.0000
0.0199***
(8.55)
0.0407***
(4.56)
-0.0013***
(-3.47)
0.0022***
(9.90)
0.1022*
(1.86)
0.1311
(1. 61)
0.4019***
(4.03)
0.2794
(0.96)
0.0390
(0.80)
0.2390***
(3.40)
0.3332***
(3.29)
0.3960***
(3.83)
0.5426
(1.43)
1.2524***
(4.18)
1.4090***
(4.08)
-1.1588***
(-3.78)
9.2614***
(51.43)
30.35
0.0000

Business and Economic Research
ISSN 2162-4860
2013, Vol. 3, No. 2
www.macrothink.org/ber 32
Selectivity term
Constant term
F( , )
Prob > chi2
R-squared
No. Observation
0.3380
859
0.3620
859
0.3797
874
0.4291
874
0.2325
1616
0.2607
1616
Note: Dependent variable: Log revenue; Dummies No-education, No-diploma, and Non-migrant are base
outcomes for Education level, Diploma and Migration status. Values within parentheses under estimators
represent t-Student. ***(**){*} significant at 1% (5%) {10%}.
Results show that the association between monthly wages and monthly working hours is
positive and significant in the public and informal sectors. There is a non-linear relationship
between earnings and experience is reflected in the coefficient on the experience variable
bearing a positive sign, while the experience squared variable has a negative sign. Following
Mincer’s (1974) and Card’s (1999) idea, one can interpret this result as an indication that
people increase their productivity while working through the learning by doing process an that
earnings increase with an increasing rate at the beginning of the carrier and with a decreasing
rate through the end of the carrier. One more year of experience increases log (wage) by about
1.81% in the public sector, 5.62% in the formal private sector, and 4.15% in the informal
sectorvi
. According to the microeconomic theory of migration, individuals’ migration decisions
are the outcome of human capital investment decisions (Sjaastad, 1962) and are aimed at
securing either jobs or better-paying jobs. This view was confirmed by Tsafack and Zamo
(2009) who gave evidence of significant wage differentials in favor of migrants in urban
Cameroon. This study does dive into that result by explicitly highlighting that returns to
migration are around 19.97% in the public sector, 21.42% in the formal private sector and
10.76% in the informal sector.
In line with findings in the literature, our results show that earnings rise with higher levels of
education. Taking the first specification and irrespective of the labour market sector, returns to
education are convex and the statistical significance becomes stronger with higher levels of
schooling. The profile of the convexity of the returns to education are close in magnitude to
what was estimated for Turkey in the informal sector (Tansel, 1999), for Cameroon private
sector (Ewoudou and Vencatachellum, 2006), and for Ghanaian male workers (Sackey, 2008).
As Benhayoun and Bazen (1995) observed in Morocco, the returns to the level of education are
overestimated when omitting the highest degree obtained by the individual. For instance,
returns to the tertiary level of education are lowered and become non significant in all the
labour market sectors. This result evidences the existence the of a sheepkin effect in the
Cameroon urban labour market, that is the fact that part of the returns to education is due to the
influence of degrees on wages. This may be interpreted as a confirmation of Arrow’s “filter
theory” according to which the main function of education is not to increase people’s
productivity, as postulated in the human capital theory, but to filter candidates with the most

Business and Economic Research
ISSN 2162-4860
2013, Vol. 3, No. 2
www.macrothink.org/ber 33
impressive characteristics.
Table 3 summarizes the private rates of return to education in the different labour market
sectors. It shows that returns to degrees obtained before university are greater in the public
sector. Monthly wages differentials between the omitted class of non-graduated and individual
with a GCE-Ordinary level are around 61.04% in the public sector, 36.09 in the formal private,
and 24.99% in the informal sectors. For those who hold a GCE-AL, the same wage differentials
are around 91.42% in the public sector, 77.85 in the formal private, and 48.58% in the informal
sectors. Thus, the major pattern that emerges from these results is that, it is more beneficial for
those with the secondary level of education to work in the sector formal (public or private) than
in informal sector. As far as university degrees are concerned, returns are greater in the private
sector. For instance, the BACHELOR degree raises wages by approximately 138.73 % in the
formal private sector and only by 96.32% in the public sector. It is worth nothing that university
degrees significantly affect pay in the informal sector. Still, coefficient estimates for different
degrees may not be reliable as there are very few observations in some of the cells. For instance,
there are only 15 observations in the informal sector for the Master and upper degrees.
Therefore, the results concerning informal sector wage equations should be interpreted
cautiously.
Table 3. Estimated return rates to degrees (second specification)
Variables
Public sector Private sector Informal sector
total marginal total marginal total marginal
FLSC
GCE-OL
PROBATION degree
GCE-AL
BTS degree
BACHELOR degree
MASTER and upper degrees
0.4614**
0.6104**
0.6723**
0.9142***
1.1649***
0.9632***
1.5223***
---
0.0254
0.0192
0.1446
0.0654
-0.0931
0.1423
0.1454
0.3609***
0.5454***
0.7785***
1.9511***
1.3873***
3.4313***
---
0.0470
0.0677
0.1508
0.3296
-0.1910
0.4280
0.0397
0.2499***
0.3954***
0.4858***
0.7204
2.4987***
3.0918***
---
0.0553
0.0493
0.0648
0.0789
1.0335
0.0847
Note: ***(**){*} significant at 1% (5%) {10%}.
Source: Author’s calculations based on Table 2.
In the Cameroon economy where the formal sector of the labour market is unable to grow at a
fast enough pace to absorb the ever rising labour force, competition for the limited formal
sector jobs is keen and people tend to invest more in education in order to get degrees that will
enable them to get better paid jobs. As one can observe on table 3, highest marginal rate of

Business and Economic Research
ISSN 2162-4860
2013, Vol. 3, No. 2
www.macrothink.org/ber 34
return to additional certificates are obtained in the formal private sector. Graduating from the
first level of the secondary education entails a marginal return of 2.54% for civil servants,
4.70% for formal private workers, and 5.53% for informal workers. Schooling two additional
years after the GCE-AL increases wages by 6.6.54% in the public sector and by 32.96% in the
formal private sector; the increase is not statistically significant in the informal sector. It is
worth mentioning that in the formal sector (public and private), returns to an additional year of
tertiary education once the BTS certificate is obtained are lower than returns to an additional
year after the GCE-AL. This result comes as an indication that holders of this vocational
certificate are worse-off working with a Bachelor degree. It may also be interpreted as a result
of the quadratic form of returns to additional years of schooling. The return to two additional
years of tertiary education once the Bachelor degree is obtained tends to be relatively high in
the formal private sector (42.80%) followed by the public sector (14.23%).
4. Conclusion
This study analyses the returns to education in Cameroon and uses the 2005 Employment and
Informal Sector Survey. Two sample selection corrected wage equations are estimated for each
labour market sector to check for a “parchment effect” in the urban Cameroon labour market.
In line with findings in the literature on sub-Saharan Africa, results show that earnings rise with
higher certificates in all sectors of employment. Completing a certificate is more beneficial
than completing one year of college without a credential; a GCE-OL degree is more valuable
than four years of college without the credential; the probation degree (Probatoire) increases
earnings by more than two years of college after the GCE-OL without the certificate. This
suggests that completing credentials is the wisest course for most individuals. Overall, returns
to education in the formal private sector are higher than returns to education both in the public
and informal sectors. Thus, it is more beneficial for those with high degrees to work in the
formal private sector.
As a policy prescription from these results, the fact that those who do not graduate from a
certain level of education cannot take advantage of the returns to this level calls for efforts to
reduce classes repeating and school drop outs; there’s a need to improve the internal efficiency
of the Cameroon education system. The decrease in the returns to schooling between the BTS
and the Bachelor degree provides some rationale for greater investment in schooling by private
economic agents, beyond the one year needed to obtain the Bachelor degree. Further, public
policies that enforce private initiative, in order to expand employment opportunities for
underprivileged and socially excluded groups, must be encouraged as they benefit the whole
society via the externalities of education.
References
Amin, A. A., & Awung, W. J. (2005). Economic analysis of private returns to investment in
education in Cameroon. Paper presented at the Regional Conference on Education in West
Africa: Constraints and Opportunities, November 25-26, Dakar, Senegal.
Angrist, J. D. (1995). The economic returns to schooling in the West Bank and Gaza Strip. The
American Economic Review, 85(5). 1065-1087.

Business and Economic Research
ISSN 2162-4860
2013, Vol. 3, No. 2
www.macrothink.org/ber 35
Appleton, S., Bigsten, A., & Manda, D. K. (1999). Educational expansion and economic
decline: Returns to education in Kenya, 1978-1995. Centre for the Study of African Economies
Working Paper 6; Oxford.
Aromolaran, A. B. (2004). Wage returns to schooling in Nigeria. African Development Review,
16(3), 433-55. http://dx.doi.org/10.1111/j.1017-6772.2004.00099.x
Aromolaran, A. B. (2006). Estimates of Mincerian returns to schooling in Nigeria. Oxford
Development Studies, 34(2), 265-89. http://dx.doi.org/10.1080/13600810600707433
Benhayoun, G., & Bazen, S. (1995). Salaire-éducation au Maroc. Région et Développement, 1.
Bennell, P. (1996). Rates of return to education: Does the conventional pattern prevail in
sub-Saharan Africa? World Development, 24(1), 183-99.
http://dx.doi.org/10.1016/0305-750X(95)00115-S
Bigsten A., Collier, P., Dercon, S., Fafchamps, M., Gauthier, B., Gunning, J. W., Isaksson, A.,
Oduro, A., Oostendorp, R., Pattillo, C., Soderbom, M., Teal, F., & Zeufack, A. (2000). Rates
of return on physical and human capital in Africa's manufacturing sector. Economic
Development and Cultural Change, 48, 801-827. http://dx.doi.org/10.1086/452478
De Monchy, G., & Roubaud, F. (1991). Cameroun: Evolution économique rétrospective et
perspectives macroéconomiques à l’horizon de 1995. Etude DIAL, 2/E.
Emini, C. A., Cockburn, J., & Decaluwe, B. (2005). The poverty impacts of the Doha round in
Cameroon: The role of tax policy. MPIA Working Paper 04, Poverty and Economic Policy
(PEP) Research Network, University of Laval, Quebec.
Ewoudou, J., & Vencatachellum D. (2006). An empirical analysis of private rates of returns to
education in Cameroon. Paper presented at the « 7èmes journées scientifiques du réseau
Analyse Economique et Développement de l’Agence Universitaire de la Francophonie » under
the theme, Institutions, développement économique et transition, 7th
to 8th
September 2006,
Paris-France.
National Institute of Statistics (1996). Enquête Camerounaise auprès des ménages. Rapport
Principal». Mimeo
National Institute of Statistics (2005). Enquête sur l’Emploi et le secteur informel au Cameroun
(EESI). Phase 1: Enquête sur l’emploi. Rapport Principal ». Mimeo
Kimenyi, M. S., Mwabu, G., & Manda, D. K. (2006). Human capital externalities and private
returns to education in Kenya. Eastern Economic Journal, 32(3), 493-513.
Lanot, G., & Muller, C. (1997). Dualistic sector choice and female labour supply: Evidence
from formal and informal sectors in Cameroon. Center for the Study of African Economies
Working Paper Series 9, University of Oxford, Oxford.
Lee, L. F. (1983). Generalized econometric models with selectivity. Econometrica, 51,
507-512. http://dx.doi.org/10.2307/1912003

Business and Economic Research
ISSN 2162-4860
2013, Vol. 3, No. 2
www.macrothink.org/ber 36
Liu, Z. (1998). Earnings, education, and economic reforms in urban China. Economic
Development and Cultural Change, 46(4), 697-725. http://dx.doi.org/10.1086/452370
Manda D., & Bigsten, A. (1998). Changes to returns to education overtime in Kenya. Mimeo
CSAE, Oxford University, Oxford.
Mincer, J. (1974). Education, experience and earnings. New York: Columbia University Press.
Mincer, J., & Polacheck, S. (1974). Family investments in human capital: Earnings of women.
Journal of Political Economy, 82(2), S76-S108. http://dx.doi.org/10.1086/260293
Psacharopoulos, G. (1994). Returns to investment in education: A global update. World
Development, 22(9), 1325-1343. http://dx.doi.org/10.1016/0305-750X(94)90007-8
Sackey, H. A. (2008). Private returns to education in Ghana: Implications for investments in
schooling and migration. AERC Research Paper 174, African Economic Research Consortium,
Nairobi, Kenya.
Schultz, T. (2004). Evidence of returns to schooling in Africa from household surveys:
Monitoring and restructuring the market for education. Journal of African Economies, 13
(Supplement), 95-148. http://dx.doi.org/10.1093/jae/ejh044
Tafah-Edokat, E. O. (1998). Rates of return to education: A case of Cameroon. Unpublished
paper, Department of Economics, University of Yaoundé II, Cameroon.
Tansel, A. (1999). Formal versus informal sector choice of wage earners and their wages in
Turkey. Economic Research Forum Working Paper No. 9927, Cairo, Egypt.
Trost, R., & Lee, L. F. (1984). Technical training and earnings: A polytomous model with
selectivity. Review of Economics and Statistics, 66, 151-156.
http://dx.doi.org/10.2307/1924708
Tsafack-Nanfosso, R. (2006). La dynamique de l’enseignement supérieur privé au Cameroun.
Journal of High Education in Africa, 4(2). 99-122.
World Bank (1996). Cameroon: country assistance strategy. Report n° 12275-CM. Washington,
DC.: The World Bank.
Endnotes
i The University of Yaoundé, the sole university at that time, compounded the faculty of Law and Economics,
the faculty of Arts and Social Sciences, and the faculty of Science. The Government also built professional and
technological schools in order to prepare graduates for immediate integration into the public service or
Government corporations. By 1967 other establishments were created and attached to the University of Yaoundé.
The principal ones are the University Centre for Health Sciences (CUSS), the Institut de l’Administration des
Entreprises (IAE), International School of Journalism (ESIJY), the Institute of International Relations (IRIC)

Business and Economic Research
ISSN 2162-4860
2013, Vol. 3, No. 2
www.macrothink.org/ber 37
and the National Advanced School of Engineering (ENSP). With the creation of these training capacities, the
nation was finally poised to tackle the broad strategic problems of development.
ii CFAF represents the monetary unit used in Cameroon and in the countries that are members of the Central
African Economic and Monetary Community. CFAF means Communauté Financière d’Afrique (that is African
Financial Community)
iii During the second year, students sit an exam to get the Probation Degree named “Probatoire” which allow
them sit the final exam of the secondary school, that is the Baccalauréat. Recall, the french name of the FLSC is
Certificat d’Etudes Primaires et Élémentaires (CEPE), while the GCA-OL is named Brevet d’Etudes du
Premier Cycle (BEPC).
iv Post secondary education is mainly provided by universities, specialized institutions and schools. University
level studies are sanctioned by a Diplôme d'Etudes Universitaires Générales (DEUG) after two years, a Bachelor
degree (also called Licence) one year after the DEUG a Maîtrise one year (in faculties of Economics and
Management and in Law) or two years (in faculties of Arts and Sciences) after the Licence, and a doctorate (3 to
5 years after the Diplôme d'Etudes Approfondies (DEA), generally obtained one year after the Maitrise).
v Note, sample mean numbers are very close to these statistics. For instance, we have 5.098, 9.917 and 15.824
respectively for those who have the primary, the secondary and the tertiary levels of education. As far as the
highest degree obtained is concerned, mean number of years of schooling are 7.640 for the FLSC/CEP degree,
10.621 for the GCE-OL/BEPC degree, 12.033 for the Probation degree, 13.364 for the GCE-AL/Bacalaureat
degree, 15.086 for the BTS degree, 16.115 for the Bachelor/Licence degree, 17.996 for the Master and uppers
degrees.
vi To compute these returns to experience, we used coefficients obtained in specification (2) and the formula
used to compute these return is exp 1j .
Copyright Disclaimer
Copyright reserved by the author(s).
This article is an open-access article distributed under the terms and conditions of the
Creative Commons Attribution license (http://creativecommons.org/licenses/by/3.0/).

Business and Economic Research
ISSN 2162-4860
2013, Vol. 3, No. 2
www.macrothink.org/ber 38
Success Factors of Entrepreneurs of Small and Medium
Sized Enterprises: Evidence from Bangladesh
Mohammed S. Chowdhury
Touro College, Department of Business and Accounting, New York
E-mail: [email protected]
Zahurul Alam
Department of Management Studies
University of Chittagong, Bangladesh
E-mail: [email protected]
Md. Ifttekhar Arif
Lecturer, Institute of Education Research and Training
University of Chittagong , Bangladesh
Received: June 13, 2013 Accepted: June 30, 2013
doi:10.5296/ber.v3i2.4127 URL: http://dx.doi.org/10.5296/ber.v3i2.4127
Abstract
In order to assess the factors that affect the success of entrepreneurs of small and medium sized
enterprises of Bangladesh, survey data were collected from eighty entrepreneurs from the
southern region of Bangladesh selected through random sampling technique. Success factors
here refer to demographic characteristics and environmental factors that impede the business
success of entrepreneurs of small and medium-sized enterprises of Bangladesh. The results
indicate that that the success of the entrepreneurs was correlated to all independent variables in
the study and all hypotheses were supported. Lack of infrastructure, sound political
environment, access to market and capital were the major factors that positively hindered the
success of the entrepreneurs. Experience and education were positively correlated while age
was negatively correlated to success. The regression models fit for regression equations were
determined by F statistics. The models indicate positive and statistically significant
relationship. Altogether demographic variables explained 26.9% of the total variance in

Business and Economic Research
ISSN 2162-4860
2013, Vol. 3, No. 2
www.macrothink.org/ber 39
success while environmental variables explained 39.8% of the total variance in success.
Keywords: Entrepreneurship, Infrastructure, Environment, Success, Education, Experience
1. Introduction
There is a broad consensus that a vibrant SMEs (herein referred to as Small and medium-sized
enterprises) sector is one of the principal driving force in the development of a market economy
and vital for a healthy economy (Nafukho and Muya, 2010). The men and women who run
these enterprises are called entrepreneurs. Entrepreneurship is a company that undertakes new
arrangement to produce new products and services ( Schumpeter, 1934). It is a process of
innovation and creation with four dimensional elements –individual, organization,
environmental factors and process, with support from the government, education, and
constitution (Kuratko and Hodgetts, 2004). Historically, it is proven that that with each
economic downturn in both developed and developing countries, it is the entrepreneurial drive
and persistence that brings us back (Kuratko 2006). In this study, we focus on entrepreneurship
as it takes place in SMEs since the two are closely related and cannot be isolated from each
other.
Various types of SMEs such as village handicraft makers (weaving, embroidery etc), potteries,
dying, small machine shops, restaurants, knitting, small dairy process etc, are, therefore,
becoming increasingly important to economic development of developing nations. For
example between 1990 and 1995, an average of 84 out of 100 new jobs in the region were
generated by micro enterprises in Latin American countries. (Orlando & Pollock, 2000). In
Least Developed Countries (LDCs) in Asia small medium enterprises account for 80% of the
firms generating 80% employment and 40-70% of value added and in Bangladesh small
medium enterprises account for the majority of firms (87%) providing 80% of total
employment and contributing 15 percent to Gross Domestic Product (GDP) of the country
(Narain, 2003). It is generally recognized that six million SMEs (firms of less than 100
employees) of Bangladesh have a significant role in generating growth and jobs (ADB, 2004).
The country’s SMEs sector contributed up to 25% of Bangladesh’s gross domestic product,
about 40% of gross manufacturing output, 80% of industrial jobs, and around 25% of the total
labour force in 2003 (ADB, 2004), making the country's SMEs the largest business sector in the
economy of Bangladesh. The garment sector of Bangladesh alone directly employs 2.7
million people, including 1.25 million women and is the source of direct and indirect
employment for 10 million people (Levin, 1998 cited in Chowdhury, 2007).
1.1 Problem Statement
In Bangladesh, most SMEs operate along traditional lines in production and marketing. There
is a growing evidence in literature that the main problem for SMEs in developing countries is
not their small size but their isolation, which hinders access to markets, as well as to
information, finance and institutional support (Mead & Liedholm, 1998; Swierczek & Ha,
2003). A host of factors prevent them from realizing their full potential as entrepreneurs, where
they could make significant contribution to society. These factors relate to the characteristics of
entrepreneurs, psychological traits, finance, capitalization, marketing, technology, social

Business and Economic Research
ISSN 2162-4860
2013, Vol. 3, No. 2
www.macrothink.org/ber 40
network, gender, government policy issues, and management and performance of the firms.
While several of these challenges are in inherent to many countries, some of them are more
severe in South Asia, particularly Bangladesh. It is important that factors be identified that
affect the business success of the entrepreneurs in this country.
Research has shown that success is closely connected to education level (Staw 1991; Meng and
Liang, 1996), experience (Ziemmerer and Scarborough, 1998) and age (Sletten and Hulaas,
1998). Also, numerous studies (Chowdhury, 2007; Larsen and Lewis, 2007; McDowell, 1997;
Prahlad, 2004; Mintoo, 2006) have revealed the relationship of entrepreneurial success to
environmental factors such as political environment, government, infrastructure, technology
etc. Cooper (1985) reported three factors responsible for entrepreneurial development and
success at the grass root level. These are antecedent influences (background factors such as
family influence, skills and knowledge), the incubator organization (the nature of the
organization where the entrepreneurs were employed prior to starting their own business) and
environmental factors (e.g., infrastructure, political environment, access to capital, role of
government etc).
A closer look into such studies reveals that these environmental and demographic factors in
relationship to entrepreneurial success have received scant attention in Bangladesh. Moreover,
though the promotion of SMEs development has been a stated objective of successive
governments of Bangladesh since 1947, they have not been able to unleash entrepreneurial
talents and enhance their success to increase productivity throughout the economy (Chowdhury,
2007).
Built on theories and research on entrepreneurship, this study has attempted to capture the
essence of identification of factors affecting the business success of entrepreneurs of small and
medium sized enterprises. One of the major impacts of this study is that it will constitute an aid
to policy makers, researchers, academia, and the business community as well for improving the
performance of entrepreneurs of small and medium sized enterprises in this country. The
purpose of this study is, therefore, to determine factors affecting business success of small and
medium-scale entrepreneurs in Bangladesh that relate to demographic and environmental
variables (see figure 1) from Bangladesh context.
Research Question
To what extent do demographic factors affect business success of entrepreneurs in SMEs sector
of Bangladesh?
To what extent do environmental factors affect business success of entrepreneurs in SMEs
sector of Bangladesh?
Research Objectives:
To identify demographic factors that affect business success of entrepreneurs in SMEs sector of
Bangladesh
To identify the environmental factors that affect business success of entrepreneurs in SMEs
sector of Bangladesh
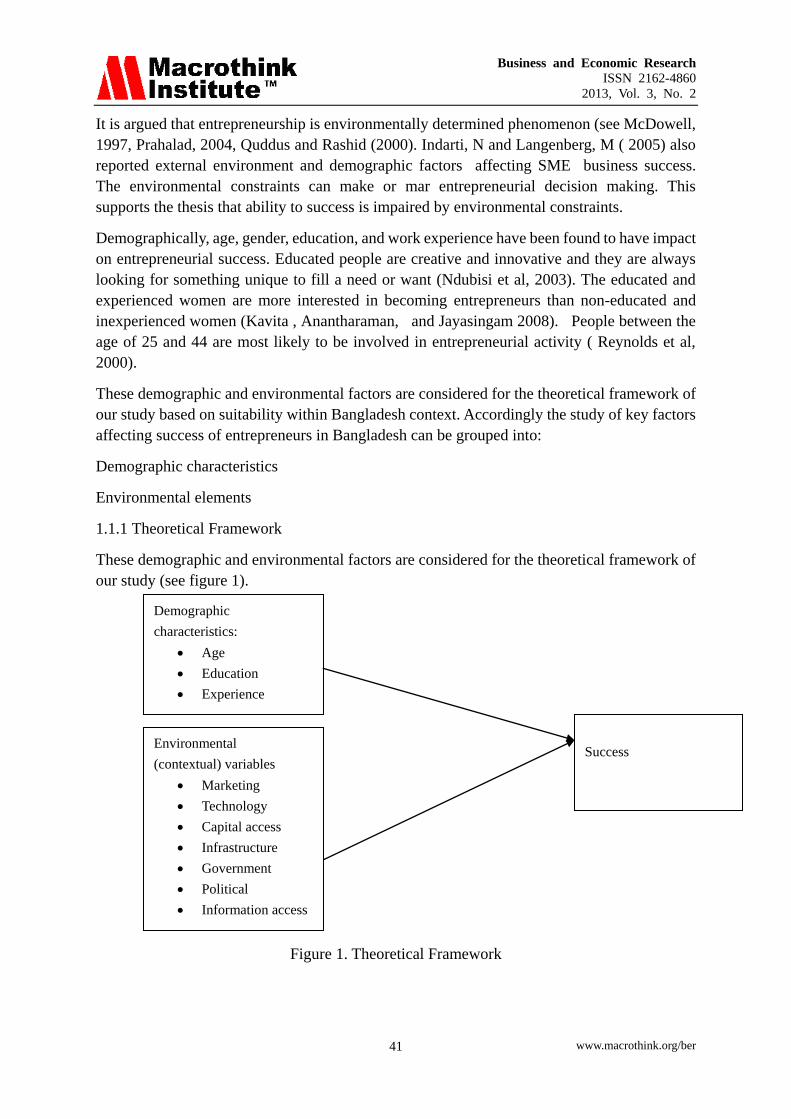
Business and Economic Research
ISSN 2162-4860
2013, Vol. 3, No. 2
www.macrothink.org/ber 41
It is argued that entrepreneurship is environmentally determined phenomenon (see McDowell,
1997, Prahalad, 2004, Quddus and Rashid (2000). Indarti, N and Langenberg, M ( 2005) also
reported external environment and demographic factors affecting SME business success.
The environmental constraints can make or mar entrepreneurial decision making. This
supports the thesis that ability to success is impaired by environmental constraints.
Demographically, age, gender, education, and work experience have been found to have impact
on entrepreneurial success. Educated people are creative and innovative and they are always
looking for something unique to fill a need or want (Ndubisi et al, 2003). The educated and
experienced women are more interested in becoming entrepreneurs than non-educated and
inexperienced women (Kavita , Anantharaman, and Jayasingam 2008). People between the
age of 25 and 44 are most likely to be involved in entrepreneurial activity ( Reynolds et al,
2000).
These demographic and environmental factors are considered for the theoretical framework of
our study based on suitability within Bangladesh context. Accordingly the study of key factors
affecting success of entrepreneurs in Bangladesh can be grouped into:
Demographic characteristics
Environmental elements
1.1.1 Theoretical Framework
These demographic and environmental factors are considered for the theoretical framework of
our study (see figure 1).
Figure 1. Theoretical Framework
Success
Demographic
characteristics:
Age
Education
Experience
Environmental
(contextual) variables
Marketing
Technology
Capital access
Infrastructure
Government
Political
Information access

Business and Economic Research
ISSN 2162-4860
2013, Vol. 3, No. 2
www.macrothink.org/ber 42
2. Literature Review
2.1 Business Success of Entrepreneur
Success refers to the achievement of goals and objectives in any sector of human life. Though,
in business, the concept of success generally refers to a firm’s financial performance, it has
been interpreted in many different ways (Foley and Green, 1989). Some authors defined
success from tangible (objective) points of view such as revenue or a firm’s growth, personal
wealth creation, profitability, turnover (Perren, 2000; Amrit et al 2000). Other studies (Watson
et al 1998; Taormina and Lao, 2007) associated entrepreneurial success with continued
business operations, operating for at least three years. Some other studies have interpreted the
success from intangible points of view where intangible assets (e.g., goodwill of firm) are
linked to key factors of success. Despite the fact that success has been widely studied topic in
the field of entrepreneurship, no consensus on what is understood by the success of the firm can
be found in the literature (Perez and Caninno, 2009). Our contention is that success is largely
determined by subjective perceptions of the entrepreneur regarding their success (Ibrahim and
Goodwin, 1986). This study, therefore, attempts to find out the relationship of success as
perceived by entrepreneurs to demographic and main environmental elements.
2.1.1 Demographic Characteristics
A wide range of studies (Muncuso, 1974; Cooper and Dunkelberg, 1987; Dolinsky et al 1993;
Gratner, 1989 ) profiling the demographic characteristics of entrepreneurs is evidenced in the
literature. A common trend in all of these studies has been the reliance on descriptive profiles of
demographic and personal characteristics, which are then often compared with results derived
from similar studies in different country settings. We propose, in this study, that education, age
and experience are important demographic factors from the context of Bangladesh. The
argument is that education and experience play a fundamental role in the process of economic
development of a developing country (Scott et al 1998). Future entrepreneurs tend to be
younger possessing stronger educational backgrounds and having less previous working
experience (Sletten and Hulaas, 1998). Skills and educational backgrounds of these
entrepreneurs are vital to the development of new businesses. Secondly, more and more men
and women are emerging as entrepreneurs in the economy of Bangladesh with less experience
and education (Chowdhury, 2011). Several other studies (Reynolds et al 2000; Kristiansen et
al 2003; Sinha, 1996) found a significant relationship between the age of entrepreneur and
business success.
Based on the above discussion on demographic characteristics of entrepreneurship proposed in
our theoretical framework, we hypothesize the following:
H1: There is a significant relationship between the age of entrepreneurs and business success.
H2: There is a significant relationship between education of the entrepreneurs and their
success.
H3: There is a significant relationship between work experience of the entrepreneurs and their
success

Business and Economic Research
ISSN 2162-4860
2013, Vol. 3, No. 2
www.macrothink.org/ber 43
2.1.1.1 Environmental Elements
A host of environmental factors (see figure 1) impede the success of small business in
Bangladesh. For example (Begum, 1993) reports lack of government efforts and incentives.
Several studies (Camp and Anderson, 2000; Chowdhury, 2007; McDowell, 1997) report
absence of adequate infrastructure facilities. Some study (Quddus and Rashid, 2000) reports
myriad of bureaucratic obstacles that entrepreneurs face in their quest to start a business. A host
of factors such as lack of long-term capital (Chowdhury and Amin, 2011), limited personal and
family savings (Mintoo, 2006), limited access to market (Keh, Nguyen and Ng, 2007; Mead
and Liedholm, 1998; Swierczek and Ha, 2003), technology (Gundry, Ben-Yoseph and Posig,
2002; Gibbons and O’Connor, 2003) and information (Singh and Krishna, 1994; Duh, 2003;
Kriestiansen, 2002) have been found to be impeding the success of entrepreneurs of small and
medium enterprises of Bangladesh. Personal and political enmity between political rivals,
frequent haratal (strikes), lack of respect for elementary principles of democratic governance
have become the principal characteristics of political system of the country (Chowdhury, 2007).
A series of prolonged haratal and labor unrest at garment factories affect the socio-economic
and political condition of the country. The average cost of haratal during 1990s to Bangladesh
economy was 3 to 4 per cent of GDP of the economy (UNDP, 2005)
The foregoing discussion reveals that the success of entrepreneurs is influenced by
environmental factors. The following hypotheses are, therefore, proposed on the
environmental variables stated in our theoretical framework.
H4: There is a significant relationship between market and the success of entrepreneurs
H5: There is a significant relationship between government support and the
success of entrepreneurs
H6: There is a significant relationship between access to capital and the
success of entrepreneurs.
H7: There is a significant relationship between technology and the success
of entrepreneurs.
H8: There is significant relationship between information access and the
success of entrepreneurs
H9: There is a significant relationship between infrastructures and the
success of entrepreneurs
H10: There is a significant relationship between political environment of the country and
the success of the entrepreneurs
3. Materials and Method
3.1 Sample
To achieve the objectives of this study a sample of eighty seven entrepreneurs was
conveniently chosen from southern region of Bangladesh. Convenience sampling was
employed because of the paucity of statistics on the target group. The questionnaires were
distributed to the entrepreneurs and in distributing the questionnaire “drop and collect”
procedure was chosen. The questionnaires were collected after a period of 30 days. Eighty

Business and Economic Research
ISSN 2162-4860
2013, Vol. 3, No. 2
www.macrothink.org/ber 44
entrepreneurs filled the questionnaire correctly. Therefore, only eighty entrepreneurs were
taken into consideration in the study. Enterprises taken up for the study were food, printing and
publication, wooden & steel furniture, boutiques, beauty parlors, handloom units, and nursing
homes. They were all SMEs with twenty or fewer employees. This is generally accepted
definition of SMEs for this study ( Ibrahim and Goodwin, 1986). Most entrepreneurs were
male (92%) and a vast majority of them (58%) had four years college degrees. Majority of
them fell in the age group of 31-40.
3.1.1 Instruments
The study relied primarily on the survey method. A survey instrument was developed to
capture the information relating to the research objectives. A structured questionnaire was
distributed to entrepreneurs. The resulting questionnaire comprised of demographic and
environmental information of the respondents and a set of items to measure business success.
3.1.1.1 Measurement of Variables
Subjective perceptions of the entrepreneurs regarding their success (dependent variable in this
study) have been used in our study rather than objective measures. This is in parallel with
previous studies (Perez and Canino, 2009; Wang and Ang, 2004). Subjective measures may
also reliably assess the success of business and may become best way to obtain information
that would otherwise be very difficult to gather (Perez and Canino, 2009). Five-point Likert
scale anchored by strongly disagrees and strongly agrees were applied to measure the
perceived success that comprised four items, trapped into one variable.. One typical item was: I
consider my business successful. Another item was: I consider my business growing.
Cronbach’s alpha of the items was .73.
Demographic and Environmental factors are independent variables in this study. As part of
capturing demographic information of the respondents, we have included only three
demographic characteristics: age, education, and experience. The three factors conform to the
suitability of Bangladesh situation. Cronbach’s alpha of the items was .71.
In regard to environmental variables, the respondents were asked to score the importance of
seven environmental factors on a scale anchored by very unimportant to very important. All
these factors relate to external environment that affect success of the entrepreneurs and
conforms to previous research (Indarti and Langenberg, 2005; Huggins, 2000) This part
consisted of 27 items, trapped into seven variables.
4. Results
4.1. Validity and Reliability of the Instrument
Table 1. Reliability test
No Variable No of items Cronbach’s alpha
1 Marketing 5 0.78
2 Technology 4 0.73
3 Information access 3 0.69

Business and Economic Research
ISSN 2162-4860
2013, Vol. 3, No. 2
www.macrothink.org/ber 45
4 Capital access 5 0.81
5 Government support 3 0.67
6 Political environment 4 0.71
7 Infrastructure 3 0.68
As seen in the table 1above each variable consisted of at least 4 items. The values of
Cronbach’s alpha are greater than 0.6 for each variable and hence considered acceptable
( Nunally, 1978). We conclude that the research instrument used in the study is valid and
reliable.
4.1.1 Data Analysis
To analyze data, descriptive statistics, correlation and regression analyses were used. Pearson
r is the most widely used bivariate correlation technique (Gall and Gall, 1996). Pearson’s
correlation measures both direction and extent of association between the variables. The
coefficient of correlation measure was, therefore, used to examine the relationship between the
success and demographic factors and between success and environmental factors. Two
regression equations were used to test our theoretical model. One for analyzing the direct
effects of seven environmental variables on success and another for doing the same for
demographic variables, aimed at determining the highest influence factor (s) of independent
variables on business success of entrepreneurs.
Table 2 presents correlation between success and demographic characteristics. Table 2
indicates that experience and education are positively correlated while age is negatively
correlated to business success.
Table 2. Correlation between success and demographic characteristics
Success Age Education Experience
Success 1 -.241* .255* .249*
Age -.2418 1 .212 -.237
Experience .255* -.212 1 -.322**
Education .249* -.237 -.322** 1
**Correlation is significant at the .01 level (2 –tailed)
*Correlation is significant at the .05 level ( 2 tailed)
Regression analysis results (see table 3) based on independent variables (demographic) depicts
that education and experience directly affect the success of entrepreneurs in Bangladesh, as
evidenced from greater t-value (t>2). Age factor has relatively less and negative influence on
success when compared to these two factors (t= -1.93). Altogether demographic variables
explained 26.9% of the total variance (adjusted r-square is .269).

Business and Economic Research
ISSN 2162-4860
2013, Vol. 3, No. 2
www.macrothink.org/ber 46
Table 3. Coefficient of determination between independent variables (demographic) and
dependent variable
Variable Beta Standard coefficient T-value Significance Mean SD
Success 6.41 000 4.7 .6825
Age -2.00 -1.938 .056 37. 6.301
Experience .293 2.868 .000 2.5 .5031
Education .348 3.329 .000 2.0 .5624
As regards to environmental variables, results (table 4) show that all the independent variables
are correlated to the entrepreneurial success.
Table 4. Inter-correlation between environmental variables and entrepreneurial success
Success Mkt Capital Infra Govt Tech
Polenv
Info
Success 1 .435** .256* .447** .288** .328** .406** .225*
Mkt .435** 1 -.073 .573** . 285* .283* .161 .277*
Capital .256* -.073 1 -,064 .204 .020 .018 .165
Infra .447** .573** -.064 1 .401** .314** .152 .352**
Govt .288** .285* .204 .401** 1 .475** .106 .305**
Tech .328** .283* .020 .314** .475** 1 .146 .396**
Politcal .406** .161 .018 .152 .106 .146 1 -.014
Info .225* .277* .165 .352** .305** .396** -.014 1
**Correaltion is significant at the .01 level ( 2 tailed)
* Correlation is significant at the .05 level ( 2 tailed)
Notes: *p <0.1, ** p <0.05
Mkt= Marketing, Infra= Infrastructure
Govt= Government; Info = Information access
Polenv= Political environment
Regression analysis results based on independent variables (environmental) show that (see
table 5) market, infrastructure, capital access, political environment, affected entrepreneurial
success significantly in positive directions as proved by the higher t (t>2) and beta for each of
them. Altogether, the independent variables (environmental) explained 39.8 % of the total
variance in success (adjusted R-square is .398)
Model summary:
Adjusted R-square .269
F 8.259
Significance 000

Business and Economic Research
ISSN 2162-4860
2013, Vol. 3, No. 2
www.macrothink.org/ber 47
Table 5. Coefficient of determination between independent variables (environmental) and
dependent variables
Variable Beta standard coefficient T-value Significance Mean Standard Deviation
Success -4.19 .000 11.45 3.84
Marketing 2.134** 2.134 .036 12.75 2.37
Capital access .294*** 3.177 .000 13.96 1.22
Infrastructure .263** 2.285 .025 12.56 3.43
Government support -.044 -.406 .686 8.42 4.66
Technology .161 1.514 .134 7.11 4.24
Political environment .304*** 3. 386 .000 4.88 .389
Information access -.027 -.262 .794 11.62 3.64
**p<0.05, *** p<0.001
5. Discussion
The main objective of this study has been to present a general model toward understanding the
dynamics of entrepreneurial success. We have developed the framework that included
demographic and environmental factors (see figure 1). The study supports the contention that
age, education and experience affect the success of entrepreneurs in Bangladesh. Several
studies (Scott, Rosa and Klandt, 1998; Reynolds et al 2000; Kriestiansen et al , 2003; Sinha,
1996) support this contention of our study. The study reveals that supportive environmental
factors may well be linked with the success of the entrepreneurs in Bangladesh. This study
clearly supports that volatile political environment, lack of access to capital, lack of
infrastructure and technology are the major constraints limiting the success of entrepreneurs in
Bangladesh. Entrepreneurs in all parts of the world seem to have a problem accessing capital,
securing financing, convincing bankers and obtaining bank loans or credit from suppliers.
This conforms to several studies around the world that have been carried out to throw light on
the challenges faced by entrepreneurs. For example, in South Asia, lack of access to capital
has been a primary obstacle for entrepreneurs, and recent research suggests it continues to be”
(Gundry, Ben-Yoseph and Posig, 2002). This could also include start-up financing and credit,
cash flow management in the early operations and financial planning. Research suggests that
the primary source of funding has been through family loans, personal savings, credit cards,
and home equity loans (Gundry, Ben-Yoseph and Posig, 2002).
6. Conclusion and Future Research
The challenges towards success of entrepreneurs of small and medium size enterprises have
depicted several key issues, relating to demographic and environmental factors. Despite
many barriers to success, a new entrepreneur class has arisen in the country taking on the
challenge to work in a competitive and complex economic and business environment. Not only
Model summary:
Adjusted R-square
.398: F value 8.448:
Significance 000

Business and Economic Research
ISSN 2162-4860
2013, Vol. 3, No. 2
www.macrothink.org/ber 48
have their entrepreneurship improved their living conditions and earned more respect in the
family and the society, but they are also contributing to business and export growth, supplies,
employment generation, productivity and skills development of the country. Therefore, there is
a need for a continuous and coherent focus on financing, advisory and work life balance for
enhancing entrepreneurship in Bangladesh. The country needs a frame for policy learning in
order to develop a proper policy mix towards promoting entrepreneurship.
A favorable political and economic climate is a pre-condition for the development of any
business in any country in this world. The entrepreneurs of Bangladesh must be recognized as
an important unit contributing to the economic growth of the country since small and medium
business sector is going to attract and create jobs for many more Bangladeshis. They must be
supported by the governmental organizations and their constraints must be recognized and a
structured and organized strategic plan put in place to help them overcome these limiting
factors. Bangladesh Government must come forward to enhance the entrepreneurial
capabilities of entrepreneurs through funding and skill development.
Future Research
The study has been able to explore a number of issues that require further investigation. Future
research should seek to investigate into the factors other than demographic and environmental
factors (e.g., entrepreneurs’ innovative behavior, personality traits) that affect the success and
growth of entrepreneurship in the country. Longitudinal data may reveal a trend in constraints
to entrepreneurship success that this study was not able to uncover. Such study will provide a
clearer picture of the antecedent's influence on entrepreneurial success. A combination of
survey and case study methods should be employed. The findings of such a study should assist
various actors to focus their efforts on the growth and success factors of SME sector of
Bangladesh.
References
Amit, R., MacCrimmon, K., Zietsman, C., & Oesch, J (2000). Does money matter? Wealth
attainment as the motive for initiating growth-oriented technology ventures. Journal of
Business Venturing, 16(2), 119-143. http://dx.doi.org/10.1016/S0883-9026(99)00044-0
Asian Development Bank (2004). ADB to help foster development of SME sector in
Bangladesh. Available at ADB.Org.
Begum, R. (1993). Entrepreneurship in small industries: a case study of engineering units”,
Dhaka University Journal of Business Studies, 14(1), 159-168
Camp and Anderson (2000), Telecommunication Regulation in Bangladesh: A Broad Band
future Through Development Initiative, Electronic proceedings of ISOC. www. ISOC. ORG/
INET
Chowdhury, M, & Amin, M. ( 2011). The effects of human, social and financial capital on
woman entrepreneurship venturing in Bangladesh, International Journal of Business and
Economics Perspectives, 6(1), 138-149.

Business and Economic Research
ISSN 2162-4860
2013, Vol. 3, No. 2
www.macrothink.org/ber 49
Chowdhury, M. (2007). Overcoming entrepreneurship development constraints: the case of
Bangladesh. Journal of Enterprising Communities, 1(3), 240-251, Emerald
Chowdhury, M. (2011). Emerging women entrepreneurs in Bangladesh, The daily Starr, April
Cooper, .C. (1985). The Role of Incubator Organizations in Funding of Growth Oriented Firms.
Journal of Business Venturing, 1(1). http://dx.doi.org/10.1016/0883-9026(85)90008-4
Cooper, A, & Dunkelberg, W (1987). Entrepreneurial research: old questions, new answers,
and methodological issues. American Journal of Small Business, 11(3), 11-23
Dolinsky, L, Caputo, R, Pasumarty, & K Quazi, H. (1993). The effects of education on business
ownership: a longitudinal study of women, Entrepreneurship Theory and Practice, 18(1),
43-53
Duh, M. (2003). Family enterprises as an important factor of the economic Development: the
case of Slovenia. Journal of Enterprising Culture, 11(2), 111-130.
http://dx.doi.org/10.1142/S021849580300007X
Foley, P, & Green, H. (1989). Small Business Success. London, England: Paul Chapman
Publishing
Gall, M, Borg, W, & Gall, J. (1996). Educational research: An introduction, ( 6th ed). White
Plains, NY: Longman Publishers.
Gibbons, T., & O'Connor, T. (2003). Strategic posture, technology strategy and performance
among small firms. Journal of Enterprising Culture, 11(2), 131-146.
http://dx.doi.org/10.1142/S0218495803000081
Gratner, B. (1989). Some suggestions for research on entrepreneurial traits and characteristics.
Entrepreneurship Theory and Practice, 26, 33-49
Gundry. L. K., Ben-Yoseph. M., & Posig. M. (2002). Contemporary Perspectives on
Women’s Entrepreneurship: A Review and Strategic Recommendations. Journal of
Enterprising Culture. 10(1), 67-86. http://dx.doi.org/10.1142/S0218495802000141
Huggins, R. (2000). The success and failure of policy-implanted inter-firm network initiatives:
motivations, process and structure. Entrepreneurship and Regional Development, 12(2),
211-236. http://dx.doi.org/10.1080/089856200283036
Ibrahim, A, & Goodwin, J (1986). Perceived causes of success in small business.
American Journal of Small Business, 11(2), 41-50
Indarti, N., & Langenberg, M (2005). Factors Affecting Business Success Among SMEs:
Empirical Evidences from Indonesia.(available at
ww.utwente.nl/nikos/archief/research/conferences/esu/papers/indartilangenber
Kavitha, R, Anantharaman, R, & Jayasingam, S. (2008). Motivational Factors Affecting
Entrepreneurial Decision: A Comparison between Malaysian Women Entrepreneurs and
Women Non Entrepreneurs, Communications of the IBIMA, Volume 8

Business and Economic Research
ISSN 2162-4860
2013, Vol. 3, No. 2
www.macrothink.org/ber 50
Keh, T., Nguyen, M., & Ng, P. (2007). The effectas of entrepreneurial orientation and
marketing information on the performance of SMEs, Journal of Business Venturing, 22(4) PP
592-611
Kristiansen, S. (2002). Competition and Knowledge in Javanese Rural Business. Singapore
Journal of Tropical Geography, 23(1), 52-70. http://dx.doi.org/10.1111/1467-9493.00118
Kristiansen, S., Furuholt, B., & Wahid, F. (2003). Internet cafe entrepreneurs: pioneers in
information dissemination in Indonesia. The International Journal of Entrepreneurship and
Innovation, 4(4), 251-263. http://dx.doi.org/10.5367/000000003129574315
Kuratko, & Hodgetts. (2004), Entrepreneurship: Theory and Practice. Thomson, Southwestern:
New York
Kuratko, D, (2006). A Tribute to 50 years of Excellence in Entrepreneurship and Small
Business. Journal of Small Business Management, 44(3), 483-492
http://dx.doi.org/10.1111/j.1540-627X.2006.00185.x
Larsen, P and Lewis, A (2007). How award-winning SMEs manage the barriers to innovation.
Creativity and Innovation Management, 16(2), 142-151
http://dx.doi.org/10.1111/j.1540-627X.2006.00185.x
McDowell, S. D. (1997). Globalization, Liberalization and Policy Change: A Political
Economy of India’s Communication Sector. New York: St. Martin Press
http://dx.doi.org/10.1057/9780230374638
Mead, D., & Liedholm, C. (1998). The dynamics of micro and small enterprises in developing
countries. World Development, 26(1), 61-74.
http://dx.doi.org/10.1016/S0305-750X(97)10010-9
Meng, A, & Liang, W. (1996), Entrepreneurs, entrepreneurship and enterprising cultures. Paris:
Addison-Wesley
Mintoo, A. A. (2006), SMEs in Bangladesh, CACCI Journal, 1(1), 2006.
Muncuso, R. (1974). What it takes to be an entrepreneur: A questionnaire approach. Journal of
Small Business management, 12(4), 16-22
Nafukho, M, & Muya, H. (2010) Entrepreneurship and socio-economic development in
Africa: a reality or myth? Journal of European Industrial Training, 34(2), 196-209.
http://dx.doi.org/10.1108/03090591011023961
Narain, S (2003). Institution Capacity Building for Small and Medium –Sized Enterprise
Promotion and Development. Investment Promotion and Enterprise Development Bulletin for
Asia and the Pacific, number #2, U.N. May.
Ndubisi, O, Gupta, K, & Massoud, S. (2003). Organizational Learning and Vendor Support
Quality By The Usage of Application Software Packages: A Study of Asian Entrepreneurs.
Journal of Systems Science and Systems Engineering 12(3), 314-331.
http://dx.doi.org/10.1108/03090591011023961

Business and Economic Research
ISSN 2162-4860
2013, Vol. 3, No. 2
www.macrothink.org/ber 51
Nunally, C (1978) . Psychometric Theory. New York: McGraw Hill
Orlando, M, & Pollock, M. (2000). Micro Enterprises and Poverty: Evidence from Latin
America. Inter-American Development Bank,, Washington D.C.
Perez, E, & Canino, R. (2009). The importance of Entrepreneur’s perception of success.
Review Of International Comparative Management, 10(5), 990-1010
Perren, L (2000). Factors in the growth of micro-enterprises: Exploring the implications.
Journal of Small Business and Enterprise Development, 7(1) 58-68.
http://dx.doi.org/10.1108/EUM0000000006805
Prahald, K. (2004), The fortune at the Bottom of the Pyramid: Eradicating poverty through
profits, Wharton School Publishing, University of Pennsylvania, Philadelphia, P.A.
Quddus, M, & Rashid, S. (2000), Entrepreneurship and Economic Development: The
Remarkable Story of Garment Exports from Bangladesh, The University Press Limited, Dhaka
Reynolds, P. D., Hay, M., Bygrave, W. D., Camp, S. M., & Autio, E. (2000). Global
Entrepreneurship Monitor 2000 Executive Report: Babson College, Kaufm an Center for
Entrepreneurial Leadership, and London Business School.
Schumpeter, J. (1934). The Theory of Economic Development, Harvard University Press,
CCambridge, MA
Scott, M, Rosa, P, & Klandt, H (1998). Educating entrepreneurs for wealth creation.
Brookfield, Vermont: Ashgate Publishing Company.
Singh, A., & Krishna, M. (1994). Agricultural Entrepreneurship: The Concept and Evidence.
Journal of Entrepreneurship, 3(1), 97-111. http://dx.doi.org/10.1177/097135579400300106
Sinha, T. (1996). Human Factors in Entrepreneurship Effectiveness. The Journal of
Entrepreneurship, 5(1), 23-39. http://dx.doi.org/10.1177/097135579600500102
Sletten, J., & Hulaas, H (1998). What and how should entrepreneurs be taught? Implications of
different backgrounds and business goals. In M. Scott, P.Rosa and H. Klandt (Ed), Educating
entrepreneurs for wealth creation (pp. 169-185). Brrokfield, VT; Ashgate Publishing Company.
Staw, M (1991) Psychological dimensions of organization behavior. Sydney,: McMillan
Swierczek, F. W., & Ha, T. T. (2003). Entrepreneurial orientation, uncertainty avoidance and
firm performance: an analysis of Thai and Vietnamese SMEs. International Journal of
Entrepreneurship and Innovation, 4(1), 46-58.
http://dx.doi.org/10.5367/000000003101299393
Taormina, J, & Lao, S. K M. (2007) Measuring Chinese entrepreneurial motivation:
Personality and environmental influences, International Journal of Entrepreneurial Behavior
and Research, 13(4), 200-221. http://dx.doi.org/10.1108/13552550710759997
United Nations Development Report (2005), The Cost of Haratal (Strikes) In Bangladesh, The
New Age, Dhaka, March 11.

Business and Economic Research
ISSN 2162-4860
2013, Vol. 3, No. 2
www.macrothink.org/ber 52
Wang, C, & Ang, L. (2004). Determinants of Venture performance in Singapore. Journal of
Business management, 42(4), 347-363
Watson, K., Hogarth-Scott, S., & Wilson, N. (1998). Small business start-ups: Success factors
and support implication. Journal of Entrepreneurial Behavior and Research, 4(3), 217-238.
http://dx.doi.org/10.1108/13552559810235510
Zimmerer, W, & Scarborough, M. (1998). Essentials of entrepreneurship and business
management ( 2nd ed): New York: Prentice Hall
Copyright Disclaimer
Copyright reserved by the author(s).
This article is an open-access article distributed under the terms and conditions of the
Creative Commons Attribution license (http://creativecommons.org/licenses/by/3.0/).

Business and Economic Research
ISSN 2162-4860
2013, Vol. 3, No. 2
www.macrothink.org/ber 53
The Impact of Overconfidence on Investors' Decisions
Boubaker Adel, Talbi Mariem
International Finance Group Tunisia,
Faculty of Management and Economic Sciences of Tunis
Tunisia, El Manar University, Tunis Cedex, C. P. 2092, Tunisia
Received: June 20, 2013 Accepted: July 4, 2013
doi:10.5296/ber.v3i2.4200 URL: http://dx.doi.org/10.5296/ber.v3i2.4200
Abstract
The purpose of this paper is to study the impact of the bias of overconfidence on the
decisions of investors, specifically to evaluate the relationship between the bias, trading
volume and volatility. The empirical study on a sample of 27 companies listed on the stock
exchange in Tunis, observed over the period, which runs from 2002 until 2010.
The results we have achieved, through the application of tests and VAR modeling
ARMA-EGARCH indicate the importance of confidence bias in the analysis of
characteristics of the Tunisian financial market.
Keywords: Efficiency, Behavioral finance, Overconfidence, Stock returns, Trading volume,
Excess volatility, VAR, EGARCH
1. Introduction
The theory of efficiency is indeed one of the most controversial theories in economics and
finance theories. Despite the amplitude of empirical work to test the hypothesis of efficiency,
no obvious conclusion seems to be clear. This absence of unanimous results is certainly
related to the importance of efficiency in the financial theory.
The efficiency market hypothesis (EMH) requires the validation of a number of conditions:
the rationality of investors, the free flow of information, the market's atomicity and liquidity.
The good performance of financial markets is based on the validation of these five conditions,
but this one proves not easily applicable, due to some shortcomings related to investor
behavior.
According to the literature finding, the investors decisions are not perfectly rational, the EMH
is unable to explain certain anomalies detected on the financial market, This was the origin of
the emergence of a new research program "behavioral finance", this new current treats at the
same time psychology and finances, was able to focus on the behavior of investors in the

Business and Economic Research
ISSN 2162-4860
2013, Vol. 3, No. 2
www.macrothink.org/ber 54
financial market through different psychological biases among these biases, we find through
overconfidence as the choice of this bias seems very important in terms of choice of the
financial decisions.
The purpose of this paper is to analyze the impact of overconfidence bias on investor
decisions, in Tunis stock market through the use of data collected from the stock market of
Tunis (Tunis Stock Exchange).
First, we present the theoretical foundations of EMH by evaluating the size of the efficiency
of financial market based on the literature review, and its contribution in the field of modern
finance, as well as the recently observed anomalies in financial markets. That contributed to
devalue this current, which allowed the entry of a new current “behavioral finance”, in this
context, we recall the notion of overconfidence and its role occupied in the field of behavioral
finance, through a range of studies on this concept, while referring to the existing theoretical
and empirical literature and various reflections.
Second, we present the data collected from the stock market of Tunis and the methodology.
Finally, we present an empirical validation test which will be on the Tunisian context; we
tried to present the main results. The aim of our research is to detect the impact of
overconfidence on investors' decisions, based on different statistical tools.
1. 1 Literature Review
Before presenting the basic assumptions of the EMH, we have tried to present the definition
of the efficiency hypothesis as presented by Fama (1965), “an efficient market is a market
where all agents are rational whose price should reflect fully and instantly all the published
information on the market”, so investors will be able to tap instantly and adequately to the
occurrence of information for inclusion in the asset price, tell that four conditions.
The investor rationality: its rational expectation, that is to say that investors can maximize the
benefit they make for a given level of risk or minimize risk for a given gain level.
The free flow of information: All investors can simultaneously benefit from the same
information, in order to act immediately on the market under identical conditions.
The absence of transaction costs and tax: The investor is when the expected benefits
outweigh the transaction costs and tax as they can influence investor reaction and end
investors and atomicity liquidity.
This efficiency hypothesis was defined according to the first classification of Fama (1965) in
three forms: The weak form; where the information contained in past prices of the market is
fully reflected in asset prices. Therefore, during the titles reflect their historical, it is not
possible to take advantage of the information passed on a financial asset. The semi-strong
form; in which it is impossible to predict the future value of a share price based on historical
data and data publicly accessible, and the high form or any non-public information are
reflected in the course, so it is not possible for an investor to take advantage of inside
information, but this definition has been renewed by Fama (1991 ) and the weak form;

Business and Economic Research
ISSN 2162-4860
2013, Vol. 3, No. 2
www.macrothink.org/ber 55
becomes the test of predictability of returns which aims to analyze the returns rate ,
highlighting the unpredictability of these rates, the semi-strong form tests becomes event
studies with the aim to determine the speed of price adjustment to the announcement of new
information.
This efficiency concept is based upon two key assumptions: rationality: this hypothesis rests
on the notion of fundamental value that equals the present value of future dividends rationally
anticipated by the agents (Allais 1953). It also relies on the notion of homo economics, which
is based on the theory of expected utility, as the market is efficient, if asset prices which are
quoted is only based on rational expectations, as there are three types of rationality.
Procedural rationality or the agent is limited in its ability to collect and pay information
(Simon 1978), and instrumental rationality based on the choice of instrument in which the
individual adopts a utility maximizing behavior and late cognitive rationality which is stewed
for a match between the information received from agents and performances that make them
Walliser (1989). One can conclude that anticipation is called rational if it incorporates
optimally all available information at the level of financial market, the rationality of agents,
consists firstly in that the investor is able to formulate rational expectations and secondly to
maximize their expected utility. The second hypothesis embodies the arbitration, it is a
financial transaction that includes all positive flow with a non zero probability .This operation
is to conduct two simultaneous operations (buying and selling), on two assets with similar
characteristics that is to say substitutable at different prices, to end to make a profit with no
risk and no initial cash outlay. According to Ross (1976), founder of the first principle of
arbitration, this operation is based on the law of unique price, where two identical assets must
be negotiated at the same price, we can conclude that a market has an arbitrage opportunity if
given prices, it is possible to conduct an investment strategy based on a zero capital income
guarantees positive for all states of the world.
This notion of efficiency is still unable to explain certain anomalies detected on the financial
market as the anomaly is defined by Rabin and Thaler (2004), as "an empirical result difficult
to rationalize or require unrealistic assumptions to be explained".
Among these anomalies, we find the effect later this year or January effect, the effect of firm
size, the effect low price-earnings ratio, the weekend effect, the effect of end months, the
value effect, the momentum effect, and the phenomenon "data snooping". These anomalies
are regarded as evidence of market inefficiency, giving birth to a new trend; it is behavioral
finance, which challenges the fundamental assumptions of the theory of efficiency. This new
trend is based on two assumptions further that stand out significantly from the assumptions
that underlie the EMH.
The first is that some investors are not fully rational and their demand for financial assets at
risk is affected by their beliefs or emotions, which obviously are not fully justified by
economic "fundamentals".
These investors are called noises traders. The second assumption is that arbitration, an
activity which will deliver the second category of investors, who are themselves fully rational
activity is not without risk and whose effectiveness is therefore limited. It connects the

Business and Economic Research
ISSN 2162-4860
2013, Vol. 3, No. 2
www.macrothink.org/ber 56
current investor psychology to finance; it combines the results of experiments in cognitive
psychology to the concepts and principles of finance in order to decipher the anomalies at the
end to explain the irrational behavior of investors in the financial market.
One can conclude, therefore, the role occupied by the behavioral finance that is melted on
behavioral psychology and the existence of bias influencing the financial decisions taken, this
current is used to explain observed phenomena in the financial market as arbitrage
opportunities lasting, over or under-reaction courses, self -correlation of returns. It offers a
renewed vision of the issue of agents' behavior in financial markets by psychological biases
that are due to faulty reasoning or emotions that can lead investors to act irrationally in these
decisions especially in situations of uncertainty.
In this case the two psychologists Kahneman and Tversky (1979), conducted researches on
cognition investors it is made in, cognitive biases, feelings and attitudes, their behaviors in
total these biases increase when individuals form their beliefs and preferences, were
considered errors of decision making, such as a behavior adopted to face a situation resulting
from a weakness in the processing of an available information.
So we talk about behavioral biases that constitute a new pattern that complement the
traditional theory of finance, such as the presence of these biases is evidence of the
emergence of the irrationality that is related to the process of decision making. Among these
biases are found optimism bias, the representativeness algorithmic, conservatism or mental
affix, found through overconfidence which is based on our research, according to this aim,
investors tend to overestimate their private signals, that is to say, to have an exaggerated
confidence in their own skills as information is generated by their own thoughts and abilities,
among the consequences of this bias is the excessive transaction.
This bias is defined as behavior that the individual ignores errors or failures and therefore,
contributes to the creation of the illusion of control over events that led him to overestimate
these opportunities and these capabilities.
It always tends to overestimate his ability in different contexts; this bias has been highlighted
by all economic and financial studies which aim to provide a convincing explanation of
abnormal phenomena occurring in the market.
According to De Bondt and Thaler (1995), they found that: “overconfidence the result is the
strongest identified by psychological research that is to say, investors tend to overestimate the
probability of accuracy of their information, their successes and capabilities”.
According to Shiller (1997)," overconfidence is associated with people in their own
judgments, these individuals underestimate the margins of error likely to be committed”,
Odean (1998), which states that investors treat first information leading to biased choices,
they maintain their positions although they do not result in a profit that is to say: losing as to
maintain constant their level of confidence.
As to Barber and Odean (2001), they have identified that investor’s confidence prove their
pride in their beliefs and they ignore any belief from rational investors, it will be a difference

Business and Economic Research
ISSN 2162-4860
2013, Vol. 3, No. 2
www.macrothink.org/ber 57
of opinion and an increase in transaction volume.
Daniel and Al (2002), who showed, from their study that this bias is used to explain certain
anomalies, such as the reaction of stock prices.
According to Lovigne and Legros (2005), this bias is considered the source large volumes of
transaction; this bias can lead to problems and affects the volume of transaction, such
QUELA volatility of assets subject to such transactions and their yields
Stracca (2004), Bénabou and Tirole (2004) who argue that "This bias is the result of
self-attribution as describing individuals tend to attribute successes to their own judgments
while the failures are due to luck and external factors".
As to Broihanne, Merli and Roger (2004), this bias is considered that the search for
information by the private investor and grant him too much.
Chuang and Lee (2006), this bias does play down or weaken the investment risk that is to say,
leads agents to underestimate the level of risk of their investments and so on-hold portfolios
diversified.
Kumer (2006), which linked through to this uncertainty, whichever is higher, more investors
can make mistakes and exhibit increased overconfidence. There are also many new studies
that have been shown to measure this behavioral bias includes a title example.
As to Ronald Huisman, Nico L. Van Der Sar, Remco CJ Zwinkels (2012), they suggested a
new method for measuring investor confidence in using data to end well determined to make
their predictions on the stock market, they applied the estimation of Parkinson's which is
based on extremes around the prediction of action for deduct on investor confidence.
As the aim is to examine directly whether some investors are confident about their
predictions. This measure is based on the evaluation of Parkinson's volatility (Amsterdam
Exchange Index), the results show that some investors display a significant view that
confidence on the prediction of equity volatility is less than the implied volatility.
Other economic actors as Gerlinde Fellner, Sebastian Krügel (2011), who proposed a new
measure of this bias, which is captured as behavioral models, the reliability of signals, the
results and the importance of private information. The latter two have made a distinction
between the overestimation of the accuracy Knowledge of own predictability of a time series
and the overestimation of the predicted signals from three judgment tasks based on three
types of information: forecasts based on information that is not explicitly available , but that
external data is in memory, forecasts of a variable based on previous values of this variable
and the end of the forecast of a variable explicitly on information available on the value of
another variable.
Menkhoffa Lukas, Maik Schmelinga Ulrich Schmidtb, c, (2013), in their study, presented a
line-experience on overconfidence in the context of market funding. As the sample consists of
institutional investors, investment advisors and individual investors.
Each of them being registered users a great platform online data on market sentiment.

Business and Economic Research
ISSN 2162-4860
2013, Vol. 3, No. 2
www.macrothink.org/ber 58
Because of their record, several socio-economic characteristics of participants can be ordered
in their analysis. It turns out that there are stable differences in overconfidence among the
three groups of investors.
In addition, the investment experience has a significant impact on the degree of excess of
confidence that will surprisingly in reverse. Where these results have important implications
for the studies on the impact of the experience on the behavior of markets (financial).
According Dimitris Andriosopoulos has Kostas Andriosopoulos b Hafiz Hoque (2013), a
repurchase shares on the open market is not a commitment, and there is little evidence on
whether firms repurchase shares under. They showed that disclosure information and
overconfident CEOs are important determinants of the rate of completion of redemption
shares. In addition, they found that large companies that perform buyback programs for
further action, and have a reputation of completion, have higher completion rates.
Finally, they assessed whether other features of CEOs affect the completion of redemption
rates and find that companies with executives who hold external mandates can have a
mandate over as CEO are more likely to complete the repurchase programs. In sum, the
results suggest that there is a clear relationship between information disclosure, CEO
overconfidence and the completion of redemption rates.
Sanjay Deshmukh, Anand M. Goel b, Keith M. Howe (2013) developed a model of the
dynamic interaction between CEO overconfidence and dividend policy.
They found that the dividend level is about one sixth in low managed by leaders who are
more likely to be overconfident businesses. They attested that the reduction in dividends
associated with CEO overconfidence is greater in company’s opportunities for growth lower
and lower cash flows.
They also showed that the magnitude of a positive market reaction to the announcement of
increased dividends is higher for firms with greater uncertainty about CEO are confident.
To analyze the overconfidence hypothesis, we presented the relationships between the bias
and information (private-public).
According to Chuang and Lee (2006), the two types of information can generate volumes of
transaction and security prices under-react to the shock of public information and then reach
the equilibrium response. The transaction is generated by informed investors actively sharing
their private information.
The second linkage is the overconfidence and trading volume, as according to Statman, and
Thorly Vorkink (2004), this link is plausible because trading volumes are positively
correlated with over the months proceeding, such as increasing courses during a period,
causes an increase in the confidence of investors who are tempted to negotiate advantage of
the next period.
The third and last relation is defined as the ratio between the bias and volatility as according
Chaung and Lee (2006), the excessive trading in action on investor confidence contributes to
Business and Economic Research
ISSN 2162-4860
2013, Vol. 3, No. 2
www.macrothink.org/ber 59
excessive volatility. They concluded that the high level of market volatility is due to the
presence of excess investors and asymmetric effect of positive and negative signals on asset
returns, while showing that negative innovations on returns assets tend to increase volatility
more than positive.
2. Data and Methodology
2.1 Data
In terms of market capitalization, the Tunis stock market is considered to be close to the small
number of companies listed on them. As can be noted that it is dominated by companies in
the financial sector.
In our empirical study, we investigated the impact of this bias on investments decisions,
which aims to propose an empirical full implications study of the various hypothesis of
overconfidence by focusing on the overall behavior of investors. We had recourse to a
representative sample of the financial market consisting of 27 shares (AMEN BANK, ATB,
ATL, BH, BIAT , BNA, BT, CIL, ELECTROSTAR, GENERAL STORE, SFBT, SIAME,
SIMPAR, SIPHAT, SOTETEL, SOTRAPIL, SOTUVER, STAR STB STEQ, CST LEASING,
UBCI, UIB, AIR LIQUIDE CST, ALKIMIA, GSI, CST LAI) , The choice of the number of
companies is due to the data availability, this brings us back to consider all Tunisian shares
from 1 January 2002 to 31 December2010.
The actions in our sample must have information on stock prices, trading volume (turnover)
and market capitalization. In fact, we use daily data from Tunis Stock Market to build the
daily observations inspired by the famous research paper "investor overconfidence and
trading volume".
Statman Al, (2004) and Wen-Ichaung, Bong-Soo Lee (2006). We use turnover (turnover rate)
as a measure of volume of transactions. In fact the turnover rate may better reflect the reality
that direct employment of shares traded, given the variation of the outstanding securities of
the firm due, for example, to the capital increase.
2.2 Methodology
H1: Investors react over-confident after the shock of private information and under react after
the shock of Public Information: People tend to underestimate their disagreement errors by
making predictions; they give significant weight to their own forecasts relative to those of
other forecasters.
To test this hypothesis, we used the VAR model:
(1)
As: the detrended trading volume (measured by turnover), the stock return. εt private: the
private information shock, public εt: the public information shock. : For i, j = 1, 2 is the
polynomial operator in L such that:

Business and Economic Research
ISSN 2162-4860
2013, Vol. 3, No. 2
www.macrothink.org/ber 60
H2: Market gains prompting investors confident about negotiating aggressively in subsequent
periods:
This idea was highlighted by several studies, for example, Glaser and Weber (2004). This
gave the idea of the causal relationship between the asset returns and trading volume. The
vector auto-regression (VAR) is used to study the interaction of turnover and the time series
of returns for the end market has to prove that VT returns depend delayed:
(2)
: The detrended trading volume that measured by turnover or the turnover rate at time.
: The market return at time.
: The absolute value of broad market return at time t.
: Denotes the deviation of mean absolute cutting performance that is to say transverse
to the standard deviation time t yields. It is weighted by market value of securities, this
variable and the market return, is intended to explain the effect of the volatility time series. To
calculate the market return, we used stock market indices:
(3)
Stock prices generally are used on the closing price. For the average deviation of
cross-market:
(4)
With: (5)
: The (value-weighted) weight of stock i.
: The return on stock i, : the market-wide return.

Business and Economic Research
ISSN 2162-4860
2013, Vol. 3, No. 2
www.macrothink.org/ber 61
N: the total number of all action in the sample.
The trading volume is measured by turnover or the turnover rate is defined as follows:
(6)
H3: the excessive trading of shares on investor confidence contributes to excessive volatility:
The purpose of our third hypothesis is to prove that the transaction in excessive action of
confident investors contributes to excessive volatility. We shall, therefore, by the context
empirically that we can check whether the excessive volatility comes from the excessive
trading on investor confidence.
We begin by dividing the volume of transactions into two components: to model and predict
volatility. We applied the EGARCH model, to estimate this model, there are several steps.
The first part is to estimate the regression that breaks the VT in two parts, the first part
reflects the behavior of investors confident, presented by the delayed returns. The second part
captures the influence of other factors, the present model and the constant residual term.
(7)
= Overconfidence + not Overconfidence = E +NE (8)
: Variable market return.
: Variable trading volume.
Constant
Residual term.
Optimal number of lags to include in the model, determined by the information criteria.
Factors associated with past returns.
The residuals are defined as the component unrelated to over-confident investors and the
difference between transaction volume and the sum of constant terms means overconfidence
due to past asset returns (ECT).
The idea of decomposing the transaction volume in two parts, back to the fact that it can be
affected by several factors other than overconfidence. The number of delay (P) to be included

Business and Economic Research
ISSN 2162-4860
2013, Vol. 3, No. 2
www.macrothink.org/ber 62
will be determined using the criteria of Akaike and Schwartz. The selection procedure of the
order of representation is to estimate all models for an order from 0 to h (h being the
maximum allowable delay in economic theory or available data).
The number of delay p selected, will be one that minimizes the AIC or SC. We also take into
account changes in the value of log-likelihood since a slight improvement of this value shows
a further refinement of the model.
Test the effect of trust on the volatility of market returns: Estimated ARMA (p, q): checking
the stationary of the time series of returns, we allow the calculation of the conditional mean
of this series, for that the calculation requires the stationary of series. We can apply the
Box-Jenkins (1976) without estimating the conditional mean. Models ARMA (p, q)-specific
calculation of the conditional expectation is of a general ARMA (p, q).
(9)
They are therefore representative of a process generated by a combination of the values of
past and past errors. The orders p and q of ARMA model are determined from a series of
correlogram coefficients of auto-correlations (simple and partial), this by considering the
orders corresponding to the auto-correlations significantly different from zero.
After estimating the conditional expectation, it is wise to test the relationship between
overconfidence and the conditional volatility. In this case the EGARCH model is the primary
means used to model and predict this volatility, this model allows both devices to capture
shocks in the estimation of uncertainty and allows the treatment and the distinction of those
negative and positive shocks and that of the asymmetry of the reaction yields to the signs of
shock.
(10)
(11)
(12)
K: volatility parameter to capture the leverage effect, if k significant and negative; the
presence of asymmetry.
: Average conditional on date t on the set of past information.
: Residues from the equation of the conditional mean at time t.
ht: conditional volatility at time t.

Business and Economic Research
ISSN 2162-4860
2013, Vol. 3, No. 2
www.macrothink.org/ber 63
EC: the exchange part motivated by a feeling of confidence and outcome of this model.
NEC: Part exchange unrelated to past market returns and outcome of this model.
f 1: parameter measuring the recurrence relation between the conditional and the
unconditional prior period.
f 2: parameter measuring the recurrence relation between the conditional variance and that
of the previous period.
f 3: parameter measuring the effect of overconfidence on the conditional variance.
f 4: parameter measuring the effect of factors other than reliance on the conditional variance.
3. Results and Interpretations
Before analyzing the assumptions of this bias, we conducted preliminary tests to know the
stationary test as the stationary is a necessary condition in any procedure for estimating a
model to prove that this is representative of the studied phenomenon.
We used the Dickey and Fuller (ADF) that allows highlighting the character or not a
stationary series and taking into account the autocorrelation of a differentiated set via a
correction using the values delayed.
The Phillips Perron test (PP) which takes into account that errors may be heteroscedastic, the
second test is the normality test series where the descriptive analysis is based primarily on
analysis of two coefficients of flattening Kurtosis and asymmetric Skweness as normal for
the law, they are respectively 0 and 3.
Table1: Structure of descriptive statistic:
Following the analysis table of descriptive statistics, these two coefficients are different from
0 and 3; in addition to the Jarque-Berra statistics shows zero probability.
Hence the rejection of null hypothesis of normal distribution of the series. We can conclude
that all series of stock returns ( ); transaction volumes(Vit) per share which is measured by
turnover ( , deviation of the market ) (standard deviation of cross market
return), market return ( ) and total transaction volume (( ), do not follow the normal
distribution, with respect to the stationary test, all series are stationary, because they have
values of ADF and PP below the critical values shown directly by Eviews to seuils1%, 5%
and 10%.
For the variable ( ), we took the rate of stock returns of 27 companies in the form of a
single variable according to panel data, to facilitate and improve the empirical results, the
same approach to variable turnover ( . It is for this reason, the results of two

Business and Economic Research
ISSN 2162-4860
2013, Vol. 3, No. 2
www.macrothink.org/ber 64
Stationary tests (ADF and PP) give us important values for these two variables and Rit are
driven by two types of shocks that are distinguished by an identification restriction imposed
on the VAR model, used to capture the asymmetric effect of two types of information about ,
that is to say that private εt an impact on while εt public has no impact on which is mainly
due to the weight accorded by investors confident of their private information and insufficient
weight attached by public information. The estimation results of the VAR model, after
determining the optimal number of delay, within this framework, we chose the VAR (2),
because it minimizes the information criteria and maximizes the log likelihood.
Table1. Descriptive statistics
Variable
Vit
Mean 0.000225 0.000740 0.006591 0.000643 0.000489
Maximum 0.708972 0.659308 0.124085 0.036794 0.010646
Minimum -1.000 000 0.000 000 0.000644 -0.048805 1.73 E-0.5
Std.dev 0.021502 0.004703 0.004811 0.005220 0.000646
Skewness -15.53119 69.11747 10.69417 -0.167543 6.687332
Kurtosis 719.4974 7834.254 208.5473 13.31909 71.28012
Jarque-bera 1.28 E+09 1.53 E+11 3937957 9851.241 447394.3
Probability 0.000 000 0.000 000 0.000 000 0.000 000 0.000 000
Observation 59882 59882 2213 2213 2213
Table 2. Stationary daily series
Rit Vit Rmt MAD TURN G
calculated value critical value
with constant
(ADF)
-34.09566 -23.11026 -9.357873 -7.287366 -5.878762 1%: -3.430291
5%: -2.861398
10%:-2.566735
With constant
and
trend(ADF)
-34.09564 -23.19727 -9.562849 -7.337168 -8.171259 1%: -3.958187
5%: -3.409877
10%:-3.126647
with constant
(PP)
-252.2731 -302.1727 -38.10739 -46.37997 -47.27678 1%: -3.430290
5%: -2.861398
10%:-2.566734
With constant
and trend
(PP)
-252.2704 -301.3025 -37.99000 -46.15758 -44.74405 1%: -3.958186
5%: -3.409877
10%:-3.126647
H1: Investors reaction over-confident after the shock of private information and under

Business and Economic Research
ISSN 2162-4860
2013, Vol. 3, No. 2
www.macrothink.org/ber 65
reaction after the shock of Public Information:
Table 3. Criteria for choosing the optimal lag order of VAR model
delays Log-likelihood AIC SC
1 386030.3 -12.89412 -12.89322
2 386591.0 -12.91866 -12.91475
3 386273.0 -12.90455 -12.90245
4 386584.3 -12.91611 -12.91340
5 386588.9 -12.91743 -12.91412
6 386193 -12.9072 -12.89922
Following results show that has a positive and significantly different from 0 out
because the t statistic of student at a late and worth (5.11671) is greater than the
critical value which is about 1.96 at 5%, confirming the existence of a positive relationship
between two variables and .
Table 4. Estimation results of the VAR model (2)
Rate of stock returns Turnover
Rit (-1) 0.043134
(0.00409)
[10,5410]**
0.004931
(0.00096)
[5.11671]**
Rit (-2) 0.023819
(0.00378)
[6.29749]**
0.001360
(0.00089)
[1.52643]
Turnover (-1) 0.133293
(0.01735)
[7.68414]**
0.081175
(0.00408)
[19.8717]**
Turnover (-2) 0.126329
(0.01735)
[7.28214]**
0.068893
(0.00409)
[16.8638]**
Confidence level: 1 %(*); 5 %(**); 10 %(***)
These results are improved by impultionel response functions; these functions trace the effect
of a shock, a standard deviation of an innovation current and future value of endogenous
variables.
According to the analysis of pattern of these functions, has a null response during the
first period after following a shock to and then increases during the second and third

Business and Economic Research
ISSN 2162-4860
2013, Vol. 3, No. 2
www.macrothink.org/ber 66
period and then return to balance during the fourth period by a correction process. Same
response to after the shock of , we can conclude that is induced by investors who
actively sharing their private information and heterogeneous interpretations of public
information on investors to conduct trading volumes, that is to say ,it has an impact on
investor confidence and trading activity on the posterior.
Figure 1. Schematic of impulse response functions
H2: market gains prompting investors confident about negotiating aggressively in subsequent
periods:
The results of the VAR model, after determining the optimal number of delay in this case is
chosen, the VAR model of order 3 that minimizes the information criteria and maximizes the
log likelihood.
Table 5. Criteria for choosing the optimal lag order of VAR model
delays Log-likelihood AIC SC
1 30434.43 -27.56903 -27.53804
2 30385.85 -27.59187 -27.53752
3 30465.02 -27.74146 -27.65340
4 30402.02 -27.73122 -27.64006
Estimation results show that in a positive and significantly different from zero as
t-statistic student at a delay of 1 and worth (2.25253) is greater than the critical value which is
about 1.96 at 5% level, where at one level of delay can positively influence the.
Table 6. Estimation results of the VAR model (3)
Turnover amount Market efficiency amount
(-1) 0.005528
(0.00245)
0.190599
(0.02161)

Business and Economic Research
ISSN 2162-4860
2013, Vol. 3, No. 2
www.macrothink.org/ber 67
[2.25253]** [8.81869]**
(-2) 0.002403
(0.00249)
[0.96428]
0.055655
(0.02195)
[2.53544]**
(-3) -0.000956
(0.00245)
[-0.38974]
-0.022543
(0.02161)
[-1.04327]
TURN (-1) 0.162365
(0.02001)
[8.11327]**
0.312264
(0.17624)
[1.77180]
TURN (-2) 0.089578
(0.02016)
[4.44362]**
0.264244
(0.17753)
[1.48844]
TURN (-3) 0.102762
(0.02068)
[4.97027]**
0.398886
(0.18208)
[2.19071]**
Confidence level: 1 %(*); 5 %(**); 10 %(***)
It was applied as the test of Granger causality to test the causal link between the two variables.
Similarly the results of causality prove the existence of dual or causal relationship retroactive
(feedback) between the two variables for the probability that does not cause is
inversely .is very low hence the second hypothesis is verified.
Table 7. Results of Granger Causality test.
Null Hypothesis Observation F-Statistic Prob.
Does not Granger Cause 2213
4.42230 0.0121
Does not Granger Cause. 3.78730 0.0228
H3: the excessive trading of shares on investor confidence contributes to excessive volatility:
Following the estimation of regression which breaks down the transaction volume in two
parts, we have noticed that all the coefficients are significant in terms of t-statistics in terms
of probability; this shows the dependence of of the previous period.
Table8. Decomposition of trading volume
coefficient Std error t-statistics Probability
C 0.000483 1.38 E-05 35.3113 0.0000
Rm (-1) 0.009709 0.002623 3.701321 0.0002
F-Statistics 13.69973 Probability 0.000220

Business and Economic Research
ISSN 2162-4860
2013, Vol. 3, No. 2
www.macrothink.org/ber 68
Significant coefficients in term t-statistic and probability are considered. The lag order chosen
for the estimation of our model is equal to 1. This order is selected, while setting a range of
maximum delay and estimates the model parameters using the method of ordinary least
squares.
The β coefficient has a positive and significant value since the t-statistic is equal to
3.701321> 1.96 for a significance level of 5%, which asserts the dependence of trading
volume market performance in the previous period. The significance of the coefficient C is of
the order (0.000483) may also assert that relationship.
The next step is to estimate the conditional expectation, that is to say, to calculate the
conditional mean return series to select the orders of AR and MA parts from correlograms
coefficients series (for Both kinds of simple and partial autocorrelation).
This step is followed by a validation process using a test on the estimated coefficients (which
must be significantly different from zero), and another on residues that informs us about the
fact that the estimated residuals follow a process white noise (absence of auto-correlation).
The choice of the most appropriate model is based also on the criteria of information that
tends to minimize AIC, SC and HQ criteria and maximize the log-likelihood slight
improvement, since this value reflects a further refinement of the model.
a) Test on the coefficients:
the analysis of these correlograms allows the identification of order p = 1, and an order q = 2,
this result provides three processes (AR ( 1), MA (2) and ARMA (1,2)), the next step is to
perform a test on the coefficients by parameter estimation, due to this estimate, two processes
namely AR (1) and MA (2), are candidates for applying the following test, when the process
ARMA (1,2) is rejected as non has a significance level of one of these coefficients.
The estimation results of three AR (1), MA (2) and ARMA (1, 2).
Table 9. Estimation Results of AR (1)
statistics coefficient t-statistics Probability
C 0.000639 4.620501 0.0000
AR (1) 0.217221 10.47350 0.0000
AIC -7.719279
SC -7.714133
HQ -7.717399
LM 8558.821
Particularly, the constant C is significantly different from zero (4.620501> 1.96) similarly for
the coefficient AR (1) such that (10.47350>1.96). This model is a candidate for the
application of tests on the residue of this process.

Business and Economic Research
ISSN 2162-4860
2013, Vol. 3, No. 2
www.macrothink.org/ber 69
Table 10. Estimation results of MA (2)
statistics coefficient t-statistics Probability
C 0.000643 4.543234 0.0000
MA (1) 0.207374 9.809473 0.0000
MA (2) 0.102048 4.827188 0.0000
AIC -7.722277
SC -7.714561
HQ -7.719459
LM 8567.005
This model is also to keep because of the significance of the coefficients. Specifically the
three coefficients are significantly different from zero and then they check the t-statistics
greater than 1.96, it is candidate for the verification of other tests.
Table 11. Estimation results for ARMA (1, 2)
statistics coefficient t-statistics Probability
C 0.000639 4.426216 0.0000
AR (1) 0.209915 1.057080 0.2906
MA (1) -0.004132 -0.0020812 0.9834
MA (2) 0.058827 1.281476 0.2002
AIC -7.721229
SC -7.710938
HQ -7.717470
LM 8562.983
In contrast to the two processes previously estimated, the ARMA (1, 2) has a non-significance
level of coefficients, this appeared in coefficient of the MA (1) that negative one hand. On the
other hand it gives off a t-statistic less than 1.96 (-0.0020812).
This process is therefore, to reject the point of no significance and the negativity of one of
these coefficients. This leads us to consider only two processes for the following tests, the AR
(1) and MA (2).
b) Tests on the residuals:
*Autocorrelation test:
After removal of the ARMA (1,2) model, we proceed to consider the autocorrelation of errors
of the above process from their simple and partial patterns. For this, we uses has the
Box-Pierce is based on two hypotheses: H0: 1= 2=… k=
H1: there is at least one significantly different from zero i
To perform this test, called the Q statistic is given by:
(13)

Business and Economic Research
ISSN 2162-4860
2013, Vol. 3, No. 2
www.macrothink.org/ber 70
With n: number of observations and k²: coefficient of order k of the estimated residuals.
The verification of the autocorrelation is a comparison of the Q statistic to the value
displayed on the table ² (k). Therefore it retains H0 (no self-correlation) if and only if this
statistic is less than the value of ² a likelihood for fixed risk.
Selected processes will be validated by another test or test on residuals autocorrelation of
errors of two AR (1) and MA (2), following the analysis of correlograms of these two
processes, the AR (1 ) is not a good model because it presents at two types of auto correlation,
not significant (probability less than (0.05)) hence the rejection of the null hypothesis in favor
of the presence autocorrelation, while for MA (2), the above probability (0.05) from which
the acceptance of the null hypothesis (no autocorrelation).
c) Heteroscedasticity test:
The detection of heteroscedasticity of residuals is an essential step in determining the most
appropriate model to study the relationship between the volume of transaction to
overconfidence and excessive volatility.
There are a multitude of tests for heteroscedasticity, such as, Goldfold and Quandt test white
of Haravey and ARCH test, which has been frequently used in the treatment of financial time
series. This test is to perform an autoregressive regression of squared residuals on q delays
0+ (14)
With:
: Refers to residues from the ARMA (p, q), the assumptions of this test are as follows:
H0: homoscedasticity = 1 and q = 0
H1: there is at least one significantly different from zero coefficients.
To conduct this test, the test statistic TR ² is used with T denotes the number of observations
of the residual series and R ² is the coefficient of determination of autoregressive regression.
Under H0 the statistic TR² the law (q). Especially if TR² �² (q), we accept the
homoscedasticity hypothesis (H0).
The last test is a test of heteroscedasticity (test ARCH) which is to study the heteroscedastic
conditional variance observed from the correlogram of squared residuals from the MA (2).
The results show that the probabilities are lower (0.05) where the rejection of the null
hypothesis of homoscedasticity which confirms the existence of ARCH effect.
The ARCH test performed on our series residual gives us the following results:

Business and Economic Research
ISSN 2162-4860
2013, Vol. 3, No. 2
www.macrothink.org/ber 71
Table 12. ARCH –LM test
F-statistic 449.5125 Prob. F(1,2215) 0.0000
Obs*R-squared 374.0156 Prob. Chi-Square(1) 0.0000
We notice from the results found that the probability associated with the statistic TR ² is equal
to 0.0000, which is strictly less than 0.05. Over all t-statistics are greater than 1.96 which
confirms the existence of ARCH effect. There by verifying the heteroscedasticity of residuals
MA (2).
The next step is to estimate the E-GARCH model that presents our third relationship. In this
context, there are more than a candidate model to form the volatility, we chose MA
(2)-EGARCH (3, 3) that minimizes the information criteria and maximizes the log likelihood.
Table 13. Criteria for choosing the optimal lag order (MA-EGARCH) (p, q)
criteria AIC SC HQ LM
MA(2)-EGARCH (1,1) -8.029431 -8.011428 -8.022855 8911.639
MA(2)-EGARCH(1,2) -8.028754 -8.008179 -8.021239 8911.888
MA(2)-EGARCH(1,3) -8.027870 -8.004723 -8.019415 8911.907
MA(2)-EGARCH(2,1) -8.028531 -8.007956 -8.021016 8911.641
MA(2)-EGARCH(2,2) -8.029711 -8.006564 -8.021256 8913.949
MA(2)-EGARCH(2,3) -8.029179 -8.003460 -8. 019785 8914.359
MA(2)-EGARCH(3,1) -8.027731 -8.004585 -8. 019277 8911.754
MA(2)-EGARCH(3,2) -8.028951 -8.003233 -8. 019557 8914.107
MA(2)-EGARCH(3,3) -8.038903 -8.010613 -8.028570 8926.144
The last step is to introduce the two components extracted from the estimated turnover based
Rmt. These two f3 and f4 are components which respectively reflect the effect of the
component related to the excess of confidence and independent of the overconfidence. F3
which is of the order (0.977556) is greater than that F4 is the order (0.089576) where the
positive effect of the bias of overconfidence on the volatility of returns which confirms our
third hypothesis.
Table 14. Results from the introduction of overconfidence:
coefficient Statistics Std-error Z-statistic
W -0.543801 0.293611 -1.852112
F1 0.618981 0.468294 1.321778
F2 0.753497 0.124786 6.037762
F3 0.977556 0.380914 2.015036
F4 0.089576 0.054050 1.657258
K 0.019701 0.053554 0.367868

Business and Economic Research
ISSN 2162-4860
2013, Vol. 3, No. 2
www.macrothink.org/ber 72
4. Conclusions
The purpose of this article was to shed light on the phenomenon of overconfidence observed
in financial markets. Our research work was divided into three sections.
The first section has sought to present the main foundations of the theory of efficient
financial markets as developed by the traditional theory based on the fact that people operate
in the financial markets have rational behavior and prices at all times reflect all available
information.
For this, several limitations have come to question this theory and have concluded that the
inability of the traditional theory to reveal any anomalies in the financial market, we then
oriented to the study of a new approach "finance behavior "that has developed from work in
cognitive psychology that proposes to integrate not perfectly rational behavior in
decision-making by investors.
The main promoters of this current Kahneman and Tversky (1979) who questioned the
rational behavior of agents in favor of a psychological behavior by focusing on the
relationship between psychology and finance, involving the psychology of investor in making
its financial decision.
The idea comes from the presence of several biases that affect the rationality of investors and
produce several anomalies such as excessive trading volume and excess volatility, we find
among these biases through overconfidence, which is considered as an explanation important
for several anomalies in financial markets.
This bias has formed a subject of several studies of economic and financial cost of its
importance in decision-making of investors; this bias is defined as the overstatement of
earnings and consolidated under estimate its error. The second section was devoted to the
presentation of data collected from the stock market of Tunis, and the methodology (models,
variables).
The last section provides our empirical investigation that focused on the study of the impact
of overconfidence on investors' decisions on three assumptions, through the examination of a
part of the relationship between trading volume and performance track to evaluate the
responses asymmetry caused by striking information (private-public), on the other hand, the
relationship between transaction volume and performance of the market through
overconfidence and its role in generating the volatility of the Tunisian financial market.
In the analysis of the hypothesis of overconfidence we are interested in 27 Tunisian
companies over the period January 2002 to December 2010 by a preliminary statistical
analysis of time series of returns, turnover and the deviation of the market.
We proceed by studying the first hypothesis using the vector autoregressive model and
impulse response functions, allowed us to identify that investors over-react on confidence
after the shock of private information and under- react after the shock of Public Information.
In the second case, the Granger causality test, allowed us to identify the performance gains
market lead investors to negotiate over-confident in a more aggressive in previous periods
Business and Economic Research
ISSN 2162-4860
2013, Vol. 3, No. 2
www.macrothink.org/ber 73
this test shows a retroactive reaction in both directions.
The last assumption states that the volume of transactions of intensive investors and the
increased confidence on the conditional volatility of the securities through the use of
MA-EGARCH model seems most appropriate to explain this phenomenon.
Within this framework through overconfidence reflects the excessive volatility of conditional
market return given the significance and importance of the coefficient and component related
to this bias. This result allowed us to verify the third hypothesis. The obtained results indicate
the importance of bias on confidence in the analysis of the specificities of the Tunisian
financial market.
At the end, we believe that this work has some limitations, in effect, using daily data, for
example, carries the effects of day of the week where the importance of considering other
frequencies such as weekly that might give more meaningful results.
References
-Allais.M. (1953), “The behavior of rational man in front of the critical risk assumptions and
axioms of the American school”, Economica, 21, Pages 7-27.
-Barber Brab, and Terrance Odean. (2001), “Boys will be boys: gender, over confidence, and
common stock investment”, Quarterly Journal of Economics, 116, Pages 261-292.
-Bénabou Roland and Tirole Jean (2004), “Will power and Personal Rules” Journal of
Political Economy, 112(4), Pages 848-886.
-Box G. E, and Jenkins G. M (1976), “Times Series Analysis: Forecasting control, Holden
Day”, San Francisco, p575.
-Broihanne.M-H, Merli. M and Roger. P. (2004), “Behavioral portfolio theory: advantages
and limitations”, Pages 297-314.
-Chuang,Wen-I and Lee Bong-Soo (2006), “An empirical evaluation of over confidence
hypothesis”, Journal of Banking et finance, 30(9), Pages 2489-2515.
-Daniel Kahneman and Amos Tversky. (1979), “Prospect Theory: An Analysis of Decision
Making under Risk” Econometrica, 47, Pages 263-294.
-Daniel, Kent, Hirshleifer, David, and Teoh, SiewHong (2002), “Investor psychology in
capital markets: evidence and policy implications”, Journal of Monetary Economics, 49,
Pages 139-209.
-De Bondt. W., and R. H. Thaler, (1995), “Financial decision-making in markets and firms: a
behavioral perspective”, in (R. A. Jarrow, V. Maksimovic and W. T. Ziemba, eds), Finance,
Handbooks in Operations Research and Management Science, Amsterdam: North Holland 9,
Pages 385-410.
-Dimitris Andriosopoulos a, Kostas Andriosopoulos b, and Hafiz Hoque (2013), “Information
disclosure, CEO overconfidence, and share buyback completion rates”, Journal of Banking &

Business and Economic Research
ISSN 2162-4860
2013, Vol. 3, No. 2
www.macrothink.org/ber 74
Finance (2013).
-Fama. E. (1965), “The behavior of stock market prices”, Journal of business, 38(1), Pages
31-105.
-Fama. E. (1991), “efficient capital market: II” Journal of Finance, 46(5), Pages 1575-1617.
-Gerlinde Fellner, and Sebastian Krügel. (2011), “Judgmental overconfidence: Three
measures, one bias?” Journal of Economic Psychology, 33(2012), Pages142–154.
-Herbert Simon. (1978); “Rationality as Process and as Product of throught”, Americain
Economic Review, 68, Pages 1-16.
-Kumar Alok (2006), “When do investors exhibit stronger behavioral biases?” working paper,
university of Notre dame.
-Lovigne and Legros (2005), “behavioral finance and pension funds”, Research Paper No
2005.31, Laboratory of Economics Orléan, octobre2005.
-Lukas Menkhoffa, Maik Schmelinga, and Ulrich Schmidtb,c,(2013), “Overconfidence,
experience, and professionalism: An experimental study”, Journal of Economic Behavior &
Organization, 86(2013), Pages 92-101.
-Markus Glaser and Martin Weber. (2004), “over confidence and trading volume”, working
paper, University of Mannheim.
-Odean Terrance (1998), “Are Investors Reclutant to realize their losses?” Journal of Finance,
53(5), Pages 1775-1798.
-Rabin.Matthow and Richard Thaler (2004), “Anomalies: Risk Aversion”, Journal of
Economic Prespectives, 15(1), Pages 219-232.
-Ronald Huisman, Nico L. van der Sar, and Remco C. J. Zwinkels (2012), “A new
measurement method of investor overconfidence”, Economics Letters, 114(1), 69-71.
-Ross. S. A. (1976), “the arbitrage theory of capital asset pricing”, Journal of Economic
Theory, 13, Pages 341-360.
-Sanjay Deshmukh a, Anand M. Goel b, and Keith M. Howe a, (2013), “CEO overconfidence
and dividend policy” J.Finance. Intermediation, 22(2013), Pages 440-463.
-Shiller, Robert J. (1997), “Human Behavior and the Efficiency of the Financial System”, in
John Taylor and Michael Woodford, eds., Handbook of Macroeconomics, 1C, 1305-40,
Amsterdam: Elsevier, 1999.
-Statman. M, Thorly.S and Vorkink (2004), “Investor over confidence and trading volume”.
Review of Financial Studies, 19(4), Pages 1531-1565.
-Stracca.Livio. (2004), “Behavioral Finance and asset Prices: where dowestand?” Journal of
Economic Psychology, 25, Pages 373-407.
-Walliser.B (1989), “Instrument cognitive Rationality Theory and Decision”, 27(1-2), Pages

Business and Economic Research
ISSN 2162-4860
2013, Vol. 3, No. 2
www.macrothink.org/ber 75
7-36.
Copyright Disclaimer
Copyright reserved by the author(s).
This article is an open-access article distributed under the terms and conditions of the
Creative Commons Attribution license (http://creativecommons.org/licenses/by/3.0/).

Business and Economic Research
ISSN 2162-4860
2013, Vol. 3, No. 2
www.macrothink.org/ber 76
Determinants of Firm’s Financial Performance: An
Empirical Study on Textile Sector of Pakistan
Ali Abbas (Corresponding Author)
Hailey College of Commerce, University of the Punjab Lahore, Pakistan
Tel: 92-333-897-4480 E-mail: [email protected]
Zahid Bashir
Faculty of Finance at School of Business, Economics & Management Sciences
Imperial College of Business Studies Lahore, Pakistan
Tel: 92-323-849-8515 E-mail: [email protected]
Shahid Manzoor
Hailey College of Commerce, University of the Punjab Lahore, Pakistan
Tel: 92-313-413-1676 E-mail: [email protected]
Muhammad Nadeem Akram
Mezan Bank, Quaid-e-Azam Industrial Estate Branch Lahore, Pakistan
Tel: 92-331-402-2421 E-mail: [email protected]
Received: July 5, 2013 Accepted: July 18, 2013
doi:10.5296/ber.v3i2.3958 URL: http://dx.doi.org/10.5296/ber.v3i2.3958
Abstract
The current study aims to find out the determinants significantly affecting the firm’s financial
performance in textile sector of Pakistan for the period 2005-2010. The researcher used
panel/longitudinal data set which are created with the help of State Bank of Pakistan’s annual
publication named as “Financial statement analysis of companies (non-financial) listed in KSE
for the period 2005 to 2010 which is available at www.sbp.org.pk online. The researcher used
one-way fixed effect model due the presence of cross-sectional fixed effect in the regression

Business and Economic Research
ISSN 2162-4860
2013, Vol. 3, No. 2
www.macrothink.org/ber 77
results. The dependent variable was profitability as a measure of firm’s financial performance
while the independent variables were leverage, growth, firm’s size, risk, tax, tangibility,
liquidity and non-debt tax shield. The firm’s performance in textile sector is significantly
affected by Short term leverage, Size, risk, tax and non-debt tax shield while taking long term
leverage as first independent variable, the leverage becomes insignificant along with tax factor.
The textile sector should consider the above said factors because these factors significantly
increasing or decreasing firm’s financial performance. The findings of the current research are
limited and applicable to non-financial sector of Pakistan only. It is not applicable to financial
sector due to their difference of capital structure. In addition, the researcher used ROI as
measure of firm’s financial performance while the future research can have ROA, ROE, EPS
etc as firm’s financial performance.
Keywords: Firm’s performance, Textile sector, Return on Investment
1. Introduction
There are a total number of 411 firms in non-financial sector of Pakistan which is subdivided
into 12 sectors while Textile sector is the largest and the first sector which comprise of a total
number of 164 firms which covers 40% of the overall non-financial sector of Pakistan. The
researcher used the financial data of 139 firms of textile sector because the remaining firms
missed some of the financial records required for analysis. The textile sector represent a large
part of the non-financial sector of Pakistan, the financial performance of this sector may
influence the performance of the other sectors. The basic and fundamental duty of every
financial manager is to maximize the shareholder’s wealth and to increase firm’s value which is
possible when the firm’s financial performance can be increased. The researcher’s aim during
this research is to identify the number of factor that determines the firm’s financial
performance. The previous studies conducted on firm’s performance indicates that a large
number of factors affect significantly the firm’s performance. David Durand (1952) presented
different theories for starting the argument on firm’s value. David Durand (1952) presented
first theory with the name of Net Income (NI) approach, then after wards he presented Net
Operating income approach and finally traditional approach to justify his opinion. He was of
the view that increasing leverage can increase firm’s performance but he could not provide the
operational justification to validate his point of view. Modigliani and Miller (1958) in their
theses revealed it is not mandatory that a firm using leverage or not can have difference in their
value. For the validity of their research they presented an operational justification with the
name of arbitrage process. The arbitrage process states that investor purchases shares or make
investment at low prices and sales their investment or shares at high prices simultaneously in
different markets. Modigliani and Miller (1963) also found that debt provide the tax shield
advantage in the form of interest. A lot of studies afterwards reveal that corporate financial
performance or firm’s performance influenced by a number of factors that should keep in mind
while making financial decision to increase a firm’s performance. The researcher used the
framework of Zeitun and Tian (1997). They used leverage, growth, size, tax, risk and
tangibility to see their effect on corporate performance of Jordan non-financial sector. The
researcher extended the regression model by including liquidity and non-debt tax shield
(depreciation) to make this study more comprehensive.

Business and Economic Research
ISSN 2162-4860
2013, Vol. 3, No. 2
www.macrothink.org/ber 78
1.1 Significance of the Study
Textile sector is the largest industry in Pakistan. It consist of 164 firms which includes 145
firms related to spinning, weaving and finishing while 6 firms consist of made up textiles
articles and the remaining 13 firms are related to other textiles items. From the last many years,
Pakistani textile industry is facing a large number of crises due to continuous load-shedding
from the last many years. A large number of firms in this sector have closed their operations
because without electricity it is not possible to produce any product in textile sector. The
remaining firms are forced to take loan for their survival in order to use generator or private
electricity resources which are much costly. It has increased debt financing trend in this sector
and the firm’s performance is affected largely by this trend. APTMA has requested to
Government of Pakistan to take some serious steps in order to rescue the textile industry for
possible survival by controlling the problem of electricity and restructuring the outstanding
loans. In this way PICIC commercial bank was previously establish to provide loan both short
term and long term according to this sector need and recently NIB bank has been established
for this purpose.
1.2 Objective of the Study
The Textile Sector covers 40% of non-financial industry in Pakistan. It can influence the
performance of other sectors by its financial decision making and actions thereof. The
researcher aims to explore the factors that determine firm’s performance in textile sector of
Pakistan so that the financial performance can be groomed in overall non-financial sector of
Pakistan. The researcher’s objective is to find out the different factors which are significantly
affecting firm’s performance in textile sector of Pakistan for the period 2005-2010.
1.3 Research Questions
The researcher wants to explore the current study with reference to the following research
questions:
What factors are significantly impacting the firm’s performance in textile industry of Pakistan?
Do the observed factors also consistent with the previous researcher’s findings.
2. Literature Review
A large number of previous studies relating to firm’s performance or sometimes corporate
performance has identified a number of factors that empirically and even significantly affecting
the firm’s performance. There are a little number of research findings available in Pakistani
context relating to firm’s performance however the foreign researchers has done a lot in this
context. The researcher used the framework of Zeitun and Tian (2007) with the extension in
their regression model by adding liquidity and non-debt tax shield and applied this regression
model simultaneously on textile and food sectors of Pakistan. The findings of Zeitun and Tian
(2007) indicated that leverage has a significant and negative relationship with firm’s
performance. They used leverage, growth, size, tax, risk and tangibility as independent variable
to see their effect on firm’s performance. They concluded that firm’s size and tax have positive
and significant relationship with firm’s performance while risk and tangibility have negative

Business and Economic Research
ISSN 2162-4860
2013, Vol. 3, No. 2
www.macrothink.org/ber 79
and significant relationship with firm’s performance. Memon, Bhutto and Abbas (2010)
concluded in their study of capital structure and firm’s performance on textile sector that the
companies in this sector are performance below optimum level of capital structure and also fail
to achieve the economies of scale. Nosa and Ose (2010) found that effective funding required
for the growth and development of the corporations in Nigeria. They suggested enhancing the
regulatory framework for increasing the firm’s performance by focusing on risk management
and corporate governance. Onaolapo and Kajola (2010) found a significant and negative
relationship between debt ratio and firm’s financial performance. The study conducted by
Krishnan and Moyer (1997) found a negative and significant relationship between leverage and
firm’s performance while other factors affecting firm’s performance positively includes size,
growth, tax and risk. Jensen and Meckling (1976) found two types of agency cost; agency cost
of equity holders and agency cost of debt holders. They concluded that a conflict of interest
arises between the management and the shareholders when management take decision against
the interest of shareholders and another conflict arises when the shareholder act against the
interest of debt holders. William (1987) found that decision for high leverage by the
management decreases the conflict between management and shareholders. The leverage can
work as disciplinary device that controls the management from wasting their firm’s resources
according to Grossman and Hart (1982). The researcher in the current study used short term as
well as long term debts as proxy for leverage and also the other factors like growth, size, tax,
risk, tangibility, liquidity and non-debt tax shield for measuring their impact on firm’s financial
performance in textile as well as food sector comparatively for the period 2005-2010.
3. Data and Methodology
3.1 Data and Source
The type of data is panel/longitudinal and has been created from the State Bank of Pakistan’s
annual publication “Financial Statement Analysis of companies (non-financial) listed in
Karachi Stock Exchange for the period 2005-2010”. This statement contains the 6 years
financial figures of 12 different sectors relating to non-financial industry having 411 firms in
total and available online at www.sbp.org.pk while the researcher selected the Textile sector
because it covers the greatest part of overall population of non-financial industry in Pakistan.
The sample consists of 139 companies from textile sector of Pakistan. The findings of the
current study is applicable on all sectors of non-financial industry of Pakistan as the sample
selected covers 4.0% approximately of the whole population of non-financial industry.
It is not applicable on financial industry like banks and insurance sector as their capital
structure is entirely different from non-financial sector.
3.2 Econometric Regression Model
For regression analysis of Panel data, there are three methods available for their regression like
fixed effect, Random effect and constant coefficient regression model. The choice between
fixed effect and random effect is finalized by hausman specification test (1978) while the
choice between random effect and constant coefficient model is finalized by Lagrange
multiplier test. As there is a large number of companies in the current study while the time

Business and Economic Research
ISSN 2162-4860
2013, Vol. 3, No. 2
www.macrothink.org/ber 80
period is small so the data type is short panel according to Baltagi (2005). The researcher
expects a cross sectional fixed effect with constant in the current study and developed the
following regression model for the estimation of current study:
Yit = α1+ + β1(LV)it + β2(GR)it + β3(SZ)it + β4(RK)it + β5(TX)it
+β6(TN)it + β7(LQ)it + β8(ND)it + + Uit
Where
Yit = Firm’s Financial Performance over time. This variable is indicated by Return on
Investment (ROI)
α1+ = Constant coefficient including cross sectional fixed effect
β1 – β8 = Regression coefficients for measuring independent variables
LV = Leverage
GR = Growth
SZ = Size
RK = Risk
TX = Tax
TN = Tangibility
LQ = Liquidity
ND = Non-debt Tax shield
+ Uit = Error component showing unobserved factor
3.3 Variables and Hypothesis Development
The previous studies have shown a number of proxies for measuring firm’s financial
performance like ROA, ROE, Tobin’s Q, EPS and ROI. Some of these variable required
current market data like Tobin’s Q. The researcher in the current study used Return on asset
(ROI) as dependent variable for measuring firm’s financial performance while the independent
variables includes short term and long term leverage, growth, firm’s size, risk, tax, tangibility
of fixed assets, liquidity and non-debt tax shield (depreciation).
The description of each variable and their expected signs are given below in the following

Business and Economic Research
ISSN 2162-4860
2013, Vol. 3, No. 2
www.macrothink.org/ber 81
table:
Table 1. Explanation of Dependent and Independent variables and Expected signs
Dependent Variable
ROI EBIT/Total Assets
Independent Variables
Variables Description Expected Signs
Leverage Short term debt/Total assets, Long term debt/Total Assets Negative
Growth Δ Total Assets/ Total Assets Positive
Size Natural Log of Total Sales Positive
Risk EBIT/Earning after interest and Tax Positive
Tax Current year’s Tax/Earnings before Tax Positive
Tangibility Fixed Assets/Total Assets Positive
Liquidity Current Assets/Current Liabilities Positive
NDTS EBIT + Depreciation/Total Assets Positive
On the basis of above table the relationships between dependent and independent variables
have been developed in the following hypothesis:
H1: Leverage (short & long term) should have a negative impact on firm’s performance.
H2: Growth should have a positive impact on firm’s performance.
H3: Firm’s size should have a positive impact on firm’s performance.
H4: There should be a positive relationship between risk and firm’s performance.
H5: There should be a positive relationship between tax and firm’s performance
H6: Tangibility should have a positive relationship with firm’s performance.
H7: Liquidity should have a positive relationship with firm’s performance.
H8: There is a positive relationship between Non-debt tax shield and firm’s performance.
4. Regression Analysis and Discussion on Findings
The researcher used STATA 11 software for the regression analysis of the current study. The
dependent variable is firm’s performance measure ROI while the independent variables
includes Leverage (short, long), Growth, Size, Risk, Tax, Tangibility, Liquidity and Non-debt
tax shield. The descriptive statistics showing mean, standard deviation, minimum and
maximum values of textile sector indicated in table 2 while correlation matrix of textile sector
is indicated in table 3. The regression result using one-way fixed effect model is indicated in
table 4. The presence of fixed cross sectional effect is evidenced by the significant results of
hausman test which validate the name of this model as one way-fixed effect model according to
Baltagi (2005).
Table 2. Descriptive Statistics
Variables Mean SD Min Max
Return on Investment (ROI) .0231793 .1554565 -1.71287 1.736175
Short term Leverage (S-Lev) .5139861 .2567038 .0085605 2.546073
Long term Leverage (L-Lev) .2236888 .2091147 0 1.730722

Business and Economic Research
ISSN 2162-4860
2013, Vol. 3, No. 2
www.macrothink.org/ber 82
Growth (GR) .0337597 .2263425 -2.86857 .9645731
Firm’s Size (SZ) 13.88058 1.417079 7.34601 17.26663
Risk (RK) 1.388222 4.136975 -42.9379 73.95914
Tax (TX) .8204285 13.75174 -58.7819 381.2666
Tangibility (TN) .9245616 .4761682 0 5.93239
Liquidity (LQ) 1.045564 1.070488 .04 10.55
Non-debt Tax shield (ND) .1021373 .5978221 -10.9418 5.070107
The above table 2 indicates the descriptive statistics like Mean, Standard deviation, Min and
Maximum of Firm’s performance (ROI) and other firm’s specific factors like Leverage,
Growth, Size, Risk, Tax, Tangibility, Liquidity and Non-debt tax shield (Depreciation) during
the period 2005-2010 for Textile sector of Pakistan. The above table indicates that short term
leverage has an average (mean) value as 51% in textile sector’s firm’s performance
approximately, while long term leverage showing (mean) value as 22% in Textile sector. The
firm’s Size in Textile sector on average (mean) value showing 139%.
Table 3. Correlation Matrix for Textile Sector
ROI S-LV L-LV GR SZ RK TX TN LQ ND
ROI 1.000
S-LV -0.056 1.000
L-LV -0.132 -0.079 1.000
GR 0.089 -0.109 -0.108 1.000
SZ 0.137 -0.194 -0.129 0.223 1.000
RK 0.057 0.003 -0.030 0.002 0.063 1.000
TX -0.003 0.026 -0.013 -0.003 -0.018 -0.007 1.000
TN -0.106 0.264 0.262 -0.277 -0.413 -0.041 -0.000 1.000
LQ 0.039 -0.204 -0.121 -0.015 0.051 0.029 -0.036 -0.101 1.000
ND 0.705 -0.044 -0.092 0.060 0.053 0.017 -0.609 -0.045 0.045 1.000
The above table 4.2 indicates the correlation matrix of dependent and independent variables
in textile sector of Pakistan for the period 2005-2010. It indicates that short term and long
term leverage including tax and tangibility having negative correlation with firm’s
performance while growth, size, risk, liquidity and non-debt tax shield having positive
correlation with firm’s performance in textile sector of Pakistan. The highest correlation is
indicated between non-debt tax shield and firm’s performance as 0.71 approximately
according to the above table.
Table 4. Regression Results – One way fixed effect regression model Dependent Variable =
Firm’s Performance (ROI)
Independent Variables 1st Model (β1=S-LV) 2nd Model (β1=L-LV)
Coefficients P-values Coefficients P-values
Leverage (S-Lev,
L-Lev)
-.0315
93
**
0.026
.01988
23
0.2
21
Growth (GR) -0.014
184
0.2
39
-.0124
429
0.3
02
Firm’s Size (SZ) .01869
4
*0.
000
.01889
60
*0.000
Risk (RK) .00142
3
**
0.023
.00144
25
**0.021

Business and Economic Research
ISSN 2162-4860
2013, Vol. 3, No. 2
www.macrothink.org/ber 83
Tax (TX) .00775
3
*0.
000
.00779
07
*0.
000
Tangibility (TN) -.0072
14
0.5
11
-.0116
991
0.2
98
Liquidity (LQ) -.0007
47
0.8
43
-.0002
636
0.9
44
Non-debt Tax shield
(ND)
.29488
3
*0.
000
.29660
95
*0.
000
Constant -.2505
96
0.0
01
-.2707
327
0.0
00
Number of
Observations
=834 =834
No of Groups =139 =139
Overall Model
Fitness
F(8,687)=325.51 F(8,687)=323.44
Prob>F = 0.0000 Prob>F=0.0000
R2 (Within) =0.7913 =0.7902
R2 (Between) =0.7833 =0.7926
R2 (Overall) =0.7847 =0.7866
F-test that all u-i=0 F(138,687)=1.57 F(138,687)=1.54
Prob>F=0.0001 Prob>F=0.0003
Hausman test Prob>Chi2=0.000 Prob>Chi2=0.007
Note: The current table is generated by the output STATA 11 regression
result
*significant at 1% level, **significant at 5% level, ***significant at 10%
level
The above table 4.3 indicates results of one-ways fixed effect regression model estimation. The
overall model is statistically fit and significant in both sectors. It indicates that short term
leverage is significant at 5% level in textile sector and showing negative relationship with
firm’s performance and accepts the 1st hypothesis. The negative relation between leverage and
firm’s performance is also consistent with the following researchers like Krisnan and Moyer
(1997), Onaolapo and kajola (2010), Memon, Bhutto and Abbas (2010) and Zeitun and Tian
(2007). It indicates that firm’s performance in textile sector is significantly influenced by short
term debts. Growth is not significant at any level and showing negative relationship which
rejects the 2nd
hypothesis. However the negative relationship between growth and firm’s
performance is consistent with the similar findings of previous researchers Zeitun and Tian
(2007) while the other researchers like Krishnan and Moyer (1997), Onaolapo and Kajola
(2010), Memon, Bhutto and Abbas (2010) found positive relationship between firm’s
performance and growth. Firm’s size is significant @1% level and accepts the 3rd
hypothesis.
This positive relationship is consistent with the following researchers like Onaolapo and
Kajola (2010), Krishnan and Moyer (1997) and Zeitun and Tian (2007). It indicates that firm’s
size increases firm’s performance in textile sector of Pakistan. Risk is significant at 5% level in
textile sector. It is showing positive relationship which accepts 4th
hypothesis. This positive
relationship between risk and firm’s performance is also consistent with the previous
researchers who found the same relationship like Memon, Bhutto and Abbas (2010) and
Krishnan and Moyer (1997). It indicates that more risky firms tend to perform well in textile
sector of Pakistan. Tax is significant at 1% level in textile sector and accepts 5th
hypothesis it is
also consistent with the similar findings by Krishnan and Moyer (1997), Memon, Bhutto and

Business and Economic Research
ISSN 2162-4860
2013, Vol. 3, No. 2
www.macrothink.org/ber 84
Abbas (2010) and Zeitun and Tian (2007). Tangibility is not significant at any level in textile
sector. It means that tangibility does not play a significant role for firm’s performance in textile
sector. Liquidity is not significant at any level in both sectors. It has negative relationship with
firm’s performance in textile sector that rejects the 7th
hypothesis. The non-debt-tax shield
(depreciation) is significant at 1% level with positive relationship and accepts 8th
hypothesis. It
means that non-debt tax shield plays an important and significant role for increasing firm’s
performance in textile sector of Pakistan.
5. Conclusion and Recommendations
The current study concluded that firm’s performance in textile sector of Pakistan is
significantly affected by Short term leverage, size, risk, tax and non-debt tax shield. The
Researchers recommends that the textile sector of Pakistan should make its financial decision
taking into consideration of the above said factors because textile sector is the largest sector in
Pakistan for non-financial industry and it is considered as benchmark for other sectors in
Pakistan. The Findings of the researcher are also consistent with the previous researchers. The
Textile sector should preferably decrease their short term debt financing as it will decrease
firm’s financial performance while all other sector may increase it. The firm should use less
short term debt as it neither provide tax shield advantage and not also cheap as long term debt
financing.
6. Policy Implications
The current research findings empirically implies that the companies in textile sector of
Pakistan has to make their policies by considering short term leverage, firm’s size, financial
risk, tax provision and non-debt tax shield (depreciation) in order to strengthen their
performance. Short term leverage decreases performance significantly so the firms should
avoid short term leverage while all other factors increases firm’s performance in textile sector
of Pakistan.
7. Limitations and Suggestions
The current study is limited and applicable to non-financial industry of Pakistan only. It is not
applicable to financial sector as their capital structure is entirely different from non-financial
sector. The researcher used book value measure for dependent and independent variables. The
future research on firm’s performance may be made through market value measures like
Tobin’s Q etc. The future research may also be conducted on financial sector using the same
models and variables.
References
Baltagi, Badi, H., (2005), “Econometric analysis of Panel data, 3rd
edition”, John wiley and
sons Ltd.
Campbell, A., (2007), “Introduction to Econometrics”, MIT.
Financial statement analysis of Non-financial companies listed in Karachi Stock Exchange for

Business and Economic Research
ISSN 2162-4860
2013, Vol. 3, No. 2
www.macrothink.org/ber 85
the period 2005-2010, Statistic and DWH department, State Bank of Pakistan.
Jensen, Meckling (1986), Agency cost of Free Cash Flows, Corporate Finance and Takeovers,
American Economic Review, Issue 76, PP 323-329.
Krishnan and Moyer (1997), Performance, Capital Structure and Home Country: An analysis
of Asian Countries, Global Finance Journal, Issue 8(1), PP 129-143.
Memon, Bhutto and Abbas, (2010), Capital Structure and firm’s performance: A case of Textile
sector of Pakistan, Asian Journal of Business and Management Sciences, Vol 1, issue 9, PP
9-15.
Modigliani, F., & Miller, M., (1958), The Cost of Capital, Corporation Finance and the theory
of investment, The American Economic Review, Vol 48, Issue 3, 261-297.
Nosa, & Ose, (2010), Capital Structure and Corporate Performance in Nigeria: An empirical
investigation, Journal Of Management Sciences, Vol 1, Issue 1, 43-52.
Onaolapo, & Kajola (2010), “ Capital structure and Firm’s Performance: Evidence from
Nigeria”, European Journal of Economics, Finance and Administration Sciences, Issue 25,
70-82.
Park. (2009), Linear regression models for panel data using SAS, STATA, LIMDEP and SPSS,
Indiana University.
Pratheepkanth, P., (2011), Capital Structure and Financial performance: Evidence from
Selected Business Companies from Colombo Stock Exchange Srilanka, International Referred
Research Journal, Vol 2, Issue 2, 171-183.
San, O. T., & Heng, T. B., (2011), Capital Structure and Corporate Performance in Malaysian
Construction Sector, International Journal of Humanities and Social Sciences, 1(2), 28-36.
Scott, D. E., (1972), Evidence on the Importance of Financial Structure, Journal of Finance
and Management, Issue 1, 45-50.
Shah, S.M., & Amir (2007), The Determinants of Corporate Debt Policy, Pre and Post
Financial Market Reforms: A case from Textile Industry of Pakistan, The Pakistan
Development Review, 46(4), 465-478.
Smith, C.W., & Watts, R. L., (1992), The Investment opportunity set and corporate financing
dividend and compensation policies, Journal of Financial Economics, 32, 263-292.
Williamson, O., (1988), Corporate Finance and Corporate Governance, Journal of Finance,
Issue 43, 567-591.
Wooldridge, J.M., Introductory Econometrics: A modern Approach, 2nd
Edition.
Zeitun, R., & Tian, G. G., (2007), “Capital Structure and Corporate performance: Evidence
from Jordan”, Australasian Accounting, Business and Finance Journal, Vol 1, Issue 4, article 3.
Zeitun, R., (2009), Ownership Structure, Corporate Performance and Failure: Evidence of

Business and Economic Research
ISSN 2162-4860
2013, Vol. 3, No. 2
www.macrothink.org/ber 86
Panel Data of emerging market, a case of Jordan, Corporate Ownership and Control, Vol 6,
Issue 4, 96-114.
Copyright Disclaimer
Copyright reserved by the author(s).
This article is an open-access article distributed under the terms and conditions of the
Creative Commons Attribution license (http://creativecommons.org/licenses/by/3.0/).

Business and Economic Research
ISSN 2162-4860
2013, Vol. 3, No. 2
www.macrothink.org/ber 87
English Language Skills Training: Theory and
Practice-A Cuban Perspective
Eddie Fisher
Faculty of Social Sciences, Universidad de Oriente, Santiago de Cuba, Cuba
Tel: 44-179-349-0423 E-mail: [email protected]
Jorge Luis Herrera Ochoa, Yoennis Diaz Moreno
Faculty of Humanities, Universidad de Oriente, Santiago de Cuba
Received: August 8, 2013 Accepted: August 26, 2013
doi:10.5296/ber.v3i2.7097 URL: http://dx.doi.org/10.5296/ber.v3i2.4097
Abstract
The ability to teach foreign languages effectively has become an increasingly important skill
to develop and improve the language proficiency of students. Teachers need to develop and
apply proactive and positive attitudes to foster new levels of foreign language learning within
their students. Teaching, on its own, is not a panacea for success. This paper investigates how
teachers at the Universidad de Oriente (UO) in Santiago de Cuba search for and apply
innovative ways of teaching foreign languages to their students within current boundaries.
The results from this research show that there is a positive relationship between the level of
proficiency in a foreign language and the methods and approaches teachers apply to keep
students motivated and interested in the subject matter. The literature review from this study
provided supportive evidence which was strengthened with insights from face to face
interviews and a focus group meeting. The outcomes confirmed that students, who are
exposed regularly to practical and diverse teaching methods, are more likely to exceed the
expected foreign language proficiency levels set by the UO‟s quality standards.
Keywords: English language teaching, Content and Language Integrated Learning (CLIL),
Communications, Psychology, Language Teachers
1. Introduction
1.1 Introduction
Being able to communicate in a language other than one‟s own native language has become
paramount not only in business but also in people‟s private lives. Many businesses operate in

Business and Economic Research
ISSN 2162-4860
2013, Vol. 3, No. 2
www.macrothink.org/ber 88
more than one country and people travel across the world to experience the different cultures
of other people. Being able to communicate in another language brings people much closer
together and much faster. Language teaching plays a vital role in developing and fostering
people with the necessary attitude, motivation and driving force to become proficient in
another language. This is not an easy task. Every person is different and responds in a
different way to language teaching approaches and methods. Language teachers need to keep
themselves informed of new technological advances, for example, to improve the effective
and efficient means of teaching a foreign language to students. Some countries have been
more exposed to the need to learn other languages depending on their geographical position
and their economic situation, such as tourism being a major income provider. Europe, for
example, has a long tradition of language teaching and language learning. Most European
nations are close to each other or they are bi-or multi-lingual themselves such as Belgium or
Switzerland. The need to communicate with one another across languages is therefore an old
and obvious one.
Much of today‟s business discussions and negotiations are conducted primarily in English
and many tourists use English as a common means to communicate with others in countries
such as Cuba, Spain and Italy. The learning and teaching of foreign languages such as English,
Spanish and German is of enormous importance across the world. It appears that publications
on language teaching have often been seen as the lowest step of a staircase according to
Appel (1995). At the top there is theory and as one walks down, the lower steps become more
and more practical until class room interaction is reached. Practical applications in many and
varied forms are what makes successful language teaching today. As knowledge methods of
how to teach languages increase, so does the effectiveness of the end results. It appears that
an emphasis on how languages are taught does not necessarily combine with changes in
practice. Some teachers have shown a strong resistance to educational change. This has often
been the subject of complaint. Some scholars such as Appel and Celik suggest that language
teaching practice has been going on as if advances in research had never happened. The
attitudes and associated behaviors of language teachers and Heads of Language Schools are
of paramount importance. It is here where fundamental positive steps forward can be
achieved.
One such forward-thinking institution is the Faculty of Humanities at the Universidad de
Oriente (UO) in Santiago de Cuba. Language teachers of foreign languages such as English
and German regularly review contemporary literature to keep up to date with the latest
thinking in foreign language teaching methods. In addition, they conduct research via the
Internet and by contacting language teaching institutions outside of Cuba to gather
knowledge to make informed decisions to improve their own language teaching approaches.
The UO currently teaches topics such as British and American History and Literature so that
students learn about a new topic whilst at the same time improving their practical language
skills, including linguistics and semantics.
Students have workshops and exams that provide opportunities to recycle the newly-gained
knowledge. Early indications show that students perform better when the passing on of
knowledge is approached in such a way that the level of motivation within students is

Business and Economic Research
ISSN 2162-4860
2013, Vol. 3, No. 2
www.macrothink.org/ber 89
increased noticeably and significantly. There is clear evidence that students enjoy and benefit
from visits by foreign scholars who share their knowledge and experience in the appropriate
language. These encounters are landmark points for the students as part of their training and
development plan within the UO and their later professional/working life. For example,
recent encounters at the UO included presentations and interactive class room discussions
about topical business issues such as Conflict Management, Team Building and Effective
Communications. These sessions are very intense and provide superior levels of learning over
a much shorter period of time compared to regular classroom teaching. The use of equipment
is limited to available resources but this does in no way limit the positive and proactive spirit
of the teachers and the learners of new languages.
This research presents the outcomes of a study that investigated the close relationships
between attitudes, behaviors and teaching competencies of foreign language teachers at the
UO in Santiago de Cuba, how the students benefit from their proactive and forward-thinking
teaching approaches and what the benefits are to the students in terms of increased levels of
language proficiencies (Fig. 1).
Language Teachers Language Students Language Proficiency
Figure 1 The Relationship between Language Teachers, Language Students and Language
Proficiency
1.2 Literature Review
According to Doernyei (2009), it will not come as a surprise to hear that language is a part of
psychology. The reason for this is that language is not just a communications code or a
cognitive linguistic system. Language is at the centre of everything human beings do, from the
most prosaic to the most profound. It is the basic ingredient of virtually every social situation.
Lightbown and Spada (2006) suggest that the acquisition of language is one of the most
impressive and fascinating aspects of human development. It appears that the two fields of
psychology and linguistics had the potential during the 1960s to work much closer together.
In contrast, Segalowitz (2001) considers that this opportunity never materialized. Segalowitz
takes the grim view that “The sad truth is that many psychologists interested in language have
not kept up with recent developments in linguistics and it would also seem that many linguists
are not aware of what is happening in psychology, especially in cognitive psychology and
Positive Attitude Positive/Proactive Thinking Topics of Interest Motivates/Directs Brings together Theory, Practice and Context
Benefit from new ways of teaching/learning Become comfortable in unfamiliar territories Their needs are met Well prepared for the „real world‟
In Depth Highly Confident Any Time, any Place Professional Recognized High Demand

Business and Economic Research
ISSN 2162-4860
2013, Vol. 3, No. 2
www.macrothink.org/ber 90
cognitive neuropsychology” (p.4). According to Doernyei linguists and psychologists have
looked at the same phenomenon from different perspectives. Accordingly, for example,
teachers of languages tend to concentrate more on the descriptive rules and patterns of the
language system such as grammar. Doernyei suggests that psychologists, on the other hand,
focus more on the mental processes and structures whereby people understand, produce,
remember, store and acquire the actual language.
Belyayev (1965) considers that students who learn a foreign language must by force of
necessity learn to think in that language. Consequently, the whole process of language teaching
is to be envisaged as the switching of the student‟s thinking from one language to another.
Belyayev asserts, based on some research, that once students have mastered a foreign language,
the learner does not need to revert back to his native language to use the resources of that
tongue. The learner has acquired the ability to think directly in the new foreign language he/she
has learned. According to Belyayev (1969), based on some further research, language teachers
have an important role to play in the effective teaching of foreign languages. Belyayev
considers that thinking in a foreign language reveals specific characteristics and presents
certain distinctive features in relation to thinking in the native language. This is why language
teachers need to master the art and means of communication in a foreign language so that the
language student evolves a different way of thinking. Belyayev did not elaborate on what he
meant by “thinking”. Littlewood (1981) considered earlier that communicative activities are
paramount to the successful learning of another language. He defines communicative learning
as an activity whereby the student engages in activities with the main purpose of
communicating meanings effectively to another student or the teacher. Littlewood suggests a
number of contributions that communicative activities can make to language learning. For
example, whole task practice is a structured approach in order to suit the learner‟s level of
ability. This integrates all of what has been learned so far. Littlewood asserts that learners want
to participate more in communications with others and are therefore more motivated to learn
much faster. The actual use of the new language is also an important part of the total learning
process. Natural learning is a result of applying, for example, in conversations what has been
learned. Communicative activities create environments that support the individual in their
efforts to learn.
Lynch (1996) suggests that it is important that teachers observe how foreign language students
succeed or fail in their efforts to communicate in the classroom or language laboratory. It can
help them to intervene to make learners‟ use of the foreign language more effective. Teachers
should never be afraid to search for new teaching techniques and approaches to improve the
effectiveness of language teaching. Some methods may well work better in some settings such
as rural schools or Universities but of paramount importance is to have the right attitude to at
least try some new way of teaching.
Teachers should always try out something themselves so they can use this practical experience
to argue in favor of any desired approach changes. Lynch points out that students should be
encouraged to interact through classroom tasks such as presentations and group exercises by
using the traditional language skills of listening, reading, speaking and writing.
Comprehension plays an important role in the development of the foreign language learners‟

Business and Economic Research
ISSN 2162-4860
2013, Vol. 3, No. 2
www.macrothink.org/ber 91
competence in that language. As part of the teaching process, teachers of foreign languages
must develop the active listening skills of students. To become competent in another language
involves much more than just recognizing what is being said. Comprehension is multi-layered
and requires or allows interpretation at different levels. When people, for example, listen to
their own language, they often go beyond the input in many ways. This is where language
schools can provide learners with appropriate help. Research has shown that low-level learners
tend not to use the effective listening strategies that they would apply in their first language.
Lynch quotes Krashen (1985) who argues that under suitable affective conditions such as
positive feelings and motivation, language learners will use some parts of this input not only to
comprehend the current message but also to pick up new items of grammar and vocabulary and
to improve their fluency in speaking. Interactive negotiations are an effective route to improve
language proficiency. Lynch considers that language teachers play a vital role in the effective
teaching of foreign languages to students. Teachers, based on years of practical class room
experience, recognize the important link between comprehension and progress in a foreign
language and then design classroom teaching appropriately. This includes the effective
utilization of tools such as the language laboratory and inviting native English speakers to
interact with students. Krashen reports that it is the teacher‟s personal style that makes a
fundamental difference how students pick up language skills, for example, by how they ask
questions. This has a major impact on how students learn. Krashen asserts that those teachers‟
abilities to close the gap between the students‟ perception what the teachers are trying to focus
on and what they actually are focusing their attention on is of paramount importance to the
effective teaching of a foreign language. The authors, based on years of practical classroom
teaching in foreign languages, suggest that regular interactions with native speakers of
languages provide students with opportunities to acquire and use, for example, new vocabulary,
grammar and contemporary expressions and phrases in the relatively safe environment of the
classroom. Native speakers of languages must modify their speech content to ensure that the
messages sent are received as intended.
According to House (2008), language is the most important means of communicating, of
transmitting information and providing human bonding. It is a person‟s prime means of
acquiring knowledge of the world, of transmitting mental representations and making them
public and inter-subjectively accessible. House considers that language per se has an influence
on its speakers‟ thinking, their world view and behavior. This is in contrast of the view that
language “reflects” the culture of a social group. House suggests that some people have
acquired language proficiency in more than one language.
This is the kind of person who has been exposed to, for example, the language intricacies of his
own native tongue and those of another language. Such a person has the potential to develop
“his or her own third way, based on the combined knowledge and experience of more than one
native language” (p.19). This puts students into a precarious position but ultimately one of
enrichment. Such experiences offer the intercultural speakers deeper insights and
understanding in both cultures (own and learned). It appears that English is the preferred option
for linguistic unity, allowing people from different first language backgrounds to communicate
(Soler, 2008). As a consequence, nearly all Europeans, irrespective of social class, are provided

Business and Economic Research
ISSN 2162-4860
2013, Vol. 3, No. 2
www.macrothink.org/ber 92
with instructions in English. The language is also accepted as an international or global
language. It should be noted that the following statements are not questioned and some are
perhaps the fundamental reason why so many students across the world study English at
University level:
-English is the language spoken by more non-native speakers than native speakers
-English is the language to have access to journals and conferences
-English is the dominant language in publishing
-English is used when the content of courses, manuals and software have a bilingual or
trilingual pattern
-Multinationals are set up in Europe and irrespective of their location, English is the working
language
-English language education is compulsory in most schools
House suggests that when English is used in mutually occurring contexts, then the outcome
will be much stronger and more relevant for its intended use. Frydryclova Klimova (2012)
reports that the European Union (EU) emphasizes that Content and Integrated Language
Learning (CLIL) in which pupils learn a subject through the medium of a foreign language, has
a major contribution to make to the Union‟s language learning goals. It can provide effective
opportunities for pupils to use their new language skills now rather than learn them now for use
later. It opens doors on languages for a broader range of learners, nurturing self-confidence in
young learners and those who have not responded well to formal language instruction in
general education. It provides exposure to the language without requiring extra time in the
curriculum which can be of particular interest in vocational settings. The introduction of CLIL
approaches into an institution can be facilitated by the presence of trained teachers who are
native speakers of the vehicular language. The authors consider in this context that the example
of the EU is relevant to this research as many languages are spoken within the current member
states of the EU. The combined learning knowledge and experiences from Europe are relevant
and should be taken into consideration as it is suggested that these can be applied universally,
subject to local prevailing cultural differences.
Hismanoglu and Hismanoglu (2011) consider that, based on the constructivist theory of
learning and communicative language teaching methodology, the task-based viewpoint of
language teaching has emerged in response to some constraints of the traditional Presentation,
Practice and Performance (PPP) approach (Ellis, 2003; Long and Crookes, 1991).
It has the significant meaning that language learning is a developmental process enhancing
communication and social interaction rather than a product internalized by practicing language
items, and that learners master the target language more powerfully when being exposed to
meaningful task-based activities in a natural way. It was in the 1980s that this viewpoint of
language learning gave rise to the popularity of various task-based approaches (Breen, 1987;
Candlin and Murphy, 1987; Nunan, 1989; Prabhu, 1987). Moreover, during the 1990s, it
developed into a comprehensive structure for the communicative classroom where learners did

Business and Economic Research
ISSN 2162-4860
2013, Vol. 3, No. 2
www.macrothink.org/ber 93
task-based activities via cycles of pre-task preparation, task performance, and post-task
feedback via language focus (Skehan, 1996). According to Ellis (2003) task-based language
teaching has been re-investigated recently from a variety of perspectives covering oral
performance, writing performance and performance assessment.
Celik (2013) holds the view that course instructors across a wide range of disciplines such as
language teaching, have implemented computer-based learning resources such as online
discussion boards. Celik suggests that the benefits of implementing an online discussion board
in teaching have been well-documented and that an investigation into the social aspects of
online learning environments is still needed in order to develop a deeper understanding of how
group dynamics affect the overall learning experience. Celik conducted a related action
research project that explored the perceptions of graduate students concerning the use of an
online discussion board that revealed that positive group dynamics appeared to be prevalent in
the discussion. In contrast, the perception of the individual class members did not always agree
with this view. The authors consider that that outcomes of Celik‟s discussion board project
could be of value to students with disparate levels of knowledge of a foreign language as the
cumulative learning effect would be of benefit to students, irrespective of their levels of
proficiency.
The literature review from this research suggests that there is a gap between contemporary
language teaching approaches and methods and what language teachers could achieve if they
adopted new and different approaches to develop the language proficiencies of their students.
Established subject matter experts consider that it is the appropriate application of different
language teaching approaches and methods that can make it possible for language teachers to
improve the foreign language proficiency levels of their students significantly.
1.3 Main Research Questions/Hypotheses
The following research questions were constructed:
1. What is the value of presenting topics of interest by visiting native English language
practitioners who use contemporary English that is used in business and academic
environments?
2. What is the value to English language teachers of conducting regular research in order to
keep abreast of the latest thinking in language teaching approaches and methods?
3. Does the power distance between English language teachers and their students affect the
quality and proficiency levels of the learning?
The following hypotheses were constructed:
H1: English language students improve their English language proficiency substantially if they
interact regularly with business people and academics whose native language is English
H2: English language teachers improve the quality of their teaching in the classroom for the
benefits of students if they develop a positive and proactive attitude towards contemporary
foreign language teaching methods and tools

Business and Economic Research
ISSN 2162-4860
2013, Vol. 3, No. 2
www.macrothink.org/ber 94
H3: English language teachers who give students the freedom to learn and practice using their
own chosen topics are increasing students‟ self-confidence and speaking abilities of speaking
in the foreign language substantially
2. Research Methodology
2.1 Method
The authors applied a constructivist interpretivist research approach within a
phenomenological research paradigm. They considered that this was most appropriate in order
to make a valid and reliable contribution to knowledge. The outcome of this research is
applicable to both academics and practitioners. The aim and purpose of this research, in line
with the research questions and hypotheses from Section 1.3, are to suggest what makes an
effective and efficient language teacher based on the work that has already been done at the UO
in Santiago de Cuba and what is planned in future. It is important that foreign language
teachers can experience new approaches and methods themselves to confirm that these are
valid and reliable. The authors consider that the change in expectations to develop new tools
and techniques for teaching foreign languages (Section 1.1) is the likely reason why foreign
language teachers are under increasing pressures to respond to these new demands in a
proactive and positive manner. Thirteen final year undergraduate students from the Faculty of
Humanities and thirty-three undergraduate students from the Faculty of Social Sciences of the
Universidad de Oriente (UO) in Santiago de Cuba were interviewed by the authors during face
to face and focus group meetings. The authors who have over 50 years of theoretical and
practical work experience were acting as participatory observers to facilitate this research. The
interviews were conducted in early 2013 in Santiago and recorded verbatim to ensure that all
responses were captured correctly, including meaning as intended. Interviews were
semi-structured. Participants‟ ages ranged from 19 years to 24 years and they had between
three and four years of practical work experience of applying foreign language skills acting as
translators and interpreters. The participants were asked for their insights to answer the main
research questions from Section 1.3, using their own theoretical and practical experiences from
the past and the present.
Table 1 is a summary of the questions that were asked during the face to face and focus group
meetings. The first objective of the face to face interviews was to review the outcome of the
literature review and confirm whether the research data from the literature review was relevant
and admissible as evidence for this research. The second objective was to consider how
language teachers need to apply these kills in a practical way in classroom situations and to
confirm what makes an effective foreign language teacher. The purpose of the focus group was
to review the contributions the individuals made during the face to face meetings, in a group
environment, to check whether these findings, together with the outcome from the literature
review, could be verified and improved. The focus group reviewed and checked the findings
from the literature review and the face to face interviews and made final recommendations that
would be of practical value to suggest what makes an effective foreign language teacher and
what the associated teaching approaches and methods are.
Table 1. Research Questionnaire: Practical Language Skills Teaching

Business and Economic Research
ISSN 2162-4860
2013, Vol. 3, No. 2
www.macrothink.org/ber 95
1. What is your definition of Language Skills Teaching?
2. What are the aspects you associate with effective language skills teaching?
3. What is your view on the claim that the concept of practical language skills teaching is a desirable and
effective methodology?
4. What potential problems do you associate with practical language skills teaching?
5. What are your personal practical experiences with practical Language Skills Teaching -give some real
life/practical examples/feedback on the course
Why did it work for you?
Why did it not work for you?
2.2 Data Collection, Interpretation and Triangulation
The authors applied three methods to collect relevant research data to answer the main research
questions and hypotheses from Section 1.3: a review of the literature (Section 1.2), face to face
interviews (Section 3.1) and a focus group meeting (Section 3.2), within the context of a
phenomenological research paradigm and an associated constructivist interpretivist research
approach. The authors were thus able to get closer to the subject matter under investigation.
They have added their own interpretations of what makes an effective foreign language teacher
and associated teaching approaches and methods, in their role as participant observers. This
research approach allowed for the collection of different perceptions of the phenomena under
investigation. All research data was collected over a period of three months. The authors
applied triangulation as a means to use a combination of different methods in order to reduce
reliance on a single research method and to ensure that the use of all data was consistent and
coherent.
3. Results
3.1 Face to Face Interviews
Thirteen final year undergraduate English language students and their teachers from the
Faculty of Humanities placed a high importance on the attitude and abilities of foreign
language teachers to make language teaching in the classroom and laboratory interesting and
exciting. They considered that it is not the syllabus in itself that will lead to the successful
teaching of foreign languages but how teachers interpret the syllabus and how they consider
and develop new methods of effective teaching. To have detailed knowledge of a subject matter
such as English language is no panacea for success. It is the teachers‟ personal ability to engage
with language students in an interesting, motivational and exciting way that will make all the
difference. The authors, based on many years of practical language teaching in classrooms,
consider that students learn much better if different teaching approaches are applied as this
allows different levels of immersion in the language. The students considered that the four
linguistic skills of reading, writing, listening and speaking are still valid but that it is the
practical application of these that will make a substantial contribution how quickly and how
effectively students learn foreign languages. All participants insisted that real names should be
used to give this research authenticity. Individual interviews were conducted with the students

Business and Economic Research
ISSN 2162-4860
2013, Vol. 3, No. 2
www.macrothink.org/ber 96
who considered what they associate with effective language skills teaching and what effective
teaching methods should be applied to improve the long-term proficiency in a foreign language
such as English:
1. What is your definition of Language Skills Teaching? “It means teaching the language by
dividing the teaching process into the different skills of the language: reading, writing,
listening and speaking” (Yeynier; Anelis). “The teaching of language skills is the implicit
teaching of separate language skills in order to help the student achieve the proper competence
in the language” (Maikel). “Language skills teaching is the teaching of a foreign language
dividing the content into the four linguistic skills and at the same time combining it into one
major skill or competence” (Clara). “It is about the teaching of a foreign language in respect of
the language‟s idiosyncrasies through the methods of reading, writing, speaking, listening and
other sub skills” (Manuel).
2. What are the aspects you associate with effective language skills teaching? “Teaching
language skills in an effective way requires teaching the content the students actually need at
the time and thus motivate them to study the language in an accurate way” (Lianne).” To teach
language skills effectively the teacher must be well prepared in the proper methodology to
teach each of the skills separately and all in tandem. Besides, a key factor is the inclusion of
real life situations in the teaching learning process2 (Alberto).” A skilled language teacher
should combine all the content of the four skills so that the students learn the four skills in
tandem and thus develop the required language competence” (Roberquis).” An efficient and
proficient teacher would integrate the content of the four skills in his/her lectures and would
also raise students‟ awareness of the importance of the four linguistic skills as well as provide a
positive feedback”(Fernando).
3. What is your view on the claim that the concept of practical language skills teaching is a
desirable and effective methodology? “The concept of practical language skills teaching is
quite relevant in the training of language students. Students will get the language and the
culture of the source language as well” (Fernando). “It is so because it enables teachers to
prioritize the elements of language skills they would like to concentrate on” (Lisbet). “It is
effective for people above a basic level and a faster way to learn the language for immigrants or
academic applicants” (Manuel).
4. What potential problems do you associate with practical language skills teaching? “The
potential problem would be for beginner learners; this approach is more suitable for
intermediate and advanced students who have more background to acquire vocabulary and
grammar rules in this way” (Yeynier).
“Using the practical language skills teaching approach would probably be a problem for it
alone would not cover all the aspects that the students need to properly learn a language
“ (Lianne). “Practical language-skills teaching should not present problems but with the
grading of the content to be taught which should be suited to the student‟s needs “(Maikel).
“Practical language skills teaching should not be used on its own. It should be combined with

Business and Economic Research
ISSN 2162-4860
2013, Vol. 3, No. 2
www.macrothink.org/ber 97
other methods to achieve the required level of competence “(Fernando).
5. What are your personal practical experiences with practical Language Skills Teaching -give
some real life/practical examples/feedback on courses you attended. Why did it work for you?
Why did it not work for you? “Personally, I have noticed that it is much easier to learn this way,
for instance, when I was a student, I spent two years studying English language and then during
the third year we had lectures about British history where I learned new historical facts but at
the same time you unconsciously learn new grammar rules and vocabulary along with the
pronunciation and contextual usage of the words; that is what makes it work, it is easier to
remember grammar rules and vocabulary in this way than it would be learning random words
and rules “ (Yeynier). “In my experience practical language skills teaching is quite useful. It is
easier to practice what you have learned when you practice it in that way. This kind of
knowledge is easier to remember and closer to real life situations “(Lianne). “Practical
language skills teaching has proved relevant to me because my students seem to enjoy it more
and at the same time they remember the things learned more easily, which makes it a win-win
situation for both students and teachers “ (Daniel). “The concept of practical language skills
teaching has always been useful to me but combining it with other methods. I have always used
to support the rest of the classes and it has had excellent results for me when I take other
subjects, somehow related to the content of the semester, and use them in practical language
skills lessons” (Fernando). “I have worked with videos and I have integrated the other skills
with them. The course helped a lot. I was great to realize that what I have been doing for a few
years was not crazy at all “(Lisbet).
The authors assert that the contributions from the community of practice have been invaluable
to the drive to answer the main research questions and hypotheses from Section 1.4. All
students have been engaged in applying their acquired English language skills during
simultaneous translation sessions during academic and business presentations held at the UO
over a period of time. This provided them with valuable opportunities to apply in real life what
they learned in the classroom and language laboratory environments and to validate and review
the English language teaching approaches currently employed at the UO. These insights have
strengthened the presentation of the qualitative data from this research and provided important
inputs to the presentation of the analysis and interpretation to emphasize the qualitative nature
and to the constructivist interpretivist research approach of this current research. The inputs
from the community of practice and the authors‟ own extensive experiences have provided
important insights and contributions to develop and suggest what the effective approaches and
effective English language teaching skills are within a proactive thinking and acting language
department at the UO in Santiago de Cuba.
3.2 Focus Group Meeting
This focus group was made up of the same thirteen final year undergraduate students from the
Faculty of Social Sciences at the UO that were interviewed individually during the face to face
interviews. Attendees were familiar with best practice in English language teaching. This was
reinforced by the authors through a series of short presentations prior to the start of the formal
discussions to set the scene for the focus group meeting. The focus group checked and

Business and Economic Research
ISSN 2162-4860
2013, Vol. 3, No. 2
www.macrothink.org/ber 98
validated the reliability of the research data from the literature review and the face to face
interviews. The focus group confirmed that the research data from the literature review was
consistent and admissible. The focus group associated the infusion of presentations from a
native English speaker with improving language skills in a number of areas. They felt that a
regular exposure to native English speakers, for example, enhances their vocabulary in topical
areas such as Project Management, Intercultural Communications and Negotiation and
Persuasion. This learning is reinforced by drawing on the practical knowledge and experience
of guest speakers. They suggest that topical presentations by external native English speakers
should be incorporated into English language degree program syllabuses. It should be noted
that this applies equally to all other language programs at the UO. The same research questions
from the face to face interviews were used in the focus group meeting:
1. What is your definition of Language Skills Teaching? “The teaching of language skills
means teaching a foreign language in an organized way by dividing the content into the four
linguistic skills of listening, speaking, reading and writing” (Jorge, Yoennis). “Language skills
teaching is the teaching of a foreign language dividing the content into the four linguistic skills,
and at the same time combining it into one major skill or competence” (Clara).
2. What are the aspects you associate with effective language skills teaching? “An effective
language skills teaching would include all the skills not only in a theoretical way but also in a
practical and contextual way” (Yeynier). “In order to teach language skills effectively the
teacher must reach a synergy between the four skills making the content as close to real life as
possible, so that the boundary between each skill is nearly imperceptible” (Jorge, Yoennis). “To
teach the four skills in a proper way the teacher must grade the data according to the level and
needs of the students, keep the students‟ attention focused on the subject matter and encourage
the students to further their studies by means of positive feedback” (Daniel).
3. What is your view on the claim that the concept of practical language skills teaching is a
desirable and effective methodology? “In my opinion practical language skills teaching is
indeed a desirable and viable way to teach a language because the learners acquire knowledge
in a more ample and contextual way- for example, they learn new vocabulary and grammar in a
given context which makes it easier to remember and put into practice later” (Yeynier).
“Practical language teaching is a good approach both for the student and the teacher because it
implies teaching vocabulary and grammar rules without directly focusing on them” (Jorge,
Yoennis). “The practical teaching of a language is a very effective method for it involves being
more interactive and at the same time teaching more than just language” (Alberto). “The
teaching of practical language skills is very useful. It combines all the skills into one and
soothes the teaching learning process. It is also a powerful source of motivation” (Maikel).
“Teaching language skills in a practical way is a good approach because it actually combines
the language skills with other areas of expertise and thus enhances the professional profile of
the student” (Roberquis). “It is very good for ESL students because it shows them that they can
learn from any topic involving real life situations including the language” (Clara).
4. What potential problems do you associate with practical language skills teaching? “The
problem of practical language teaching is that it should always be addressed to intermediate

Business and Economic Research
ISSN 2162-4860
2013, Vol. 3, No. 2
www.macrothink.org/ber 99
and advanced students. It should also include topics of interests to them. Otherwise it turns
difficult to create the proper learning environment. It should also be mixed with traditional
teaching styles because alone it does not meet all the students‟ needs” (Jorge, Yoennis). “A
potential problem would be adjusting the content to be taught to students‟ proficiency levels
of the foreign language, for example, giving a lecture about advanced mechanics to beginner
students would not be accurate and would probably de-motivate the students” (Alberto). “A
potential problem with practical language skills teaching would be the topic. The topic should
fit the students‟ needs and interests as interesting topics would add value to the effective
teaching of foreign languages” (Daniel). “A poor attention to language structure which is the
key for the complete assimilation of linguistic competence” (Manuel).
5. What are your personal practical experiences with practical Language Skills Teaching
-give some real life/practical examples/feedback on the course. Why did it work for you?
Why did it not work for you? “Practical language teaching really works. For me the clearest
example occurred when I was a student. I spend a year studying English at the university and
then went to Canada for a training course of a month. The way I see it, I learned more language
in that month than I did in one year studying at the university. In one month I experienced
the context and the motivation to learn more very strongly.” (Anelis). “Practical language
teaching has always worked for me. I have been a teacher for more than 20 years and I have
always included this approach on my courses, not alone though. Students tend to learn easily
with this approach for it motivates them more than the traditional approaches, and also they get
to learn a language but also a new topic of interest that serves their professional profile” (Jorge,
Yoennis).
6. “Practical/contextual language skills teaching for me is the best from the students‟ point of
view. My students always ask for this kind of class because it is more motivational for them and
also it is easier for them to remember what they have learned as it is more easily associated to
real life situations than, say, a purely grammar lesson” (Alberto). “In my experience practical
language skills teaching is a powerful tool to support the teaching-learning process. A good
example is the course we have just attended. We have learned a lot about new subject matters,
for example, management, and at the same time we have learned a lot about the language such
as vocabulary, use in context, pronunciation and the general culture of the language” (Maikel).
“This course we have just received is the proof of the relevance of practical language skills
teaching. We have learned many new things about the English language in context and at the
same time we have learned about topics that are new to us and are useful” (Roberquis).
The focus group members identified that effective language teaching skills and the methods of
teaching language teachers apply will lead to improved language proficiency levels of students,
particularly at intermediate and advanced levels. They consider that knowledge of the words
and vocabulary of a language on its own does not increase the proficiency levels of language
students in that particular language. They suggest that the attitude of the teacher how they wish
to pass on their extensive knowledge and practical experiences of a particular language are of
paramount importance. For example, a good and competent car driver is more likely to teach
someone else how to drive with competence if they have the right positive attitude towards
teaching others how to become a good driver. In addition, language teachers need to consider

Business and Economic Research
ISSN 2162-4860
2013, Vol. 3, No. 2
www.macrothink.org/ber 100
new ways of passing on their knowledge and experience to others in such a way that students
feel compelled to learn more and to drive themselves for higher levels of language
proficiencies that they thought they could never achieve. Table 2 is a summary of the
application and rankings of the examined language teaching skills set. Results from this
research suggest that language teachers who adopt and apply these skills are more likely to
increase the language proficiency levels of their students.
Table 2: Application and Ranking of the examined Language Teaching Skills Set
Skills Set Application Ranking
Practical
Language
Teaching
It is imperative that the right content is taught in
language classes and the language laboratory
There is a relationship between the attitude,
behavior and the competence of the foreign
language teacher and the effectiveness of the
teaching itself
Real life situations should be included in the foreign
language teaching syllabus to prepare students for
real life situations.
Some skills such as reading or listening to a foreign
language need to be taught on their own and at
other times all four skills (reading, writing, listening
and speaking) need to be taught simultaneously.
Positive reinforcements and regular feedback are
the trademarks of an effective foreign language
teacher
It is important to keep informed of the latest
thinking in foreign language teaching including new
approaches and methods.
It is important to understand that theory, practice
and context are important to the effective teaching
of foreign languages
It is important that foreign language teachers create
synergy in the classroom or laboratory by sharing
knowledge and experience consistently
Identified by all parties as being
important *
Considered by all parties to be highly
important. Members of the focus group
suggest that this is an integral part of
being an effective foreign language
teacher *
Considered important by the literature
review.
Identified by all parties to be highly
important *
Considered important by all parties *
Identified by all parties as being highly
important.*
Considered important by the face to face
interviews and the focus group meeting
Considered important by the literature

Business and Economic Research
ISSN 2162-4860
2013, Vol. 3, No. 2
www.macrothink.org/ber 101
review and face to face interviews.
*Literature review, face to face interviews and focus group meeting
It appears, based on the strength of evidence from the results of this research, that the language
teaching skills of language teachers can be improved in a number of ways:
Develop „Can Do‟ attitudes within students and drive them to higher language proficiency
levels
Turn any negative attitudes towards more in depth learning into positive ones by selling the
students the benefits for doing so
Convince students to try new ways of learning in both familiar and unfamiliar territories by
changing their mind sets to put efforts where the greatest achievements can be made (*see
below for an explanation of this 80/20 rule by Pareto, adopted by Koch, 1988)
Search for new established or untried methods of teaching language skills, adopt/ adapt these
and then make them fit for purpose for the UO
Invite more native language speakers from Universities and the Business World to improve the
language proficiency levels of students in order to get them ready for the world that exists
outside of the safe environment of the UO
Visit language teaching facilities in other countries and prepare proposals how to introduce
new language teaching methods into the UO within current guidelines and budget limitations
*Koch (1998) suggests that the approach developed by the Italian economist and sociologist
Vilifredo Pareto should be applied to become more effective and efficient in whatever people
undertake to do. Koch questions the need to spend equal time on all work activities. To achieve,
for example, higher levels of language proficiency, one should put one‟s efforts where the
greatest achievements can be delivered. Koch suggests that 80% of what is important can be
achieved with only 20% of effort (Fig.2).
Input
Inputs Outputs
Causes Consequences
Effort Results
20 %
% 80%

Business and Economic Research
ISSN 2162-4860
2013, Vol. 3, No. 2
www.macrothink.org/ber 102
Figure 2. The 80/20 Principle adapted from Koch (1998)
4. Discussion
The outcome of the literature review confirms that the ability to teach foreign languages on its
own is not sufficient to increase the language proficiency levels of students and to maintain
high levels of interest within students to immerse themselves more in foreign languages. It
appears that students learn more effectively when a good learning climate has been created by
their teachers in the classroom or language laboratory. The provision of “safe” working
environments is vital as this enables students to practice and perfect their language skills. The
most effective environments are those where making mistakes is considered to be a learning
experience. The outcome from the face to face interviews and the focus group meeting
provides new insights into what good language teaching looks like. Students at the UO benefit
from being given some level of autonomy by their teachers to express themselves freely and
being able to critically review the language teaching processes. Based on the strength of
evidence from interviews, participants in the research consider that it is this level of personal
involvement that increases motivation levels within students significantly.
Students and teachers would benefit from regular interactions with, for example, native English
speakers who come from a variety of backgrounds such as business, education and non-profit
organizations. This provides opportunities to learn new words and phrases but also to engage
interactively, in another language, with subject matter experts who can share current best
business practice across a number of industries. Students would be able to increase their
knowledge how a business functions and operates. This will help them in their later life or
career by being able to understand the perspectives of others better and gaining a deeper
understanding of “where others are coming from or what is of value to others”. In this respect,
practice makes not only perfect but also helps to become a better translator or interpreter.
Knowing the words of another language such as English is considered not sufficient. Attaching
more meaning to words and expressions is far more effective and allows language students to
become more proficient in new languages much faster and with better results. The UO is
including translation and interpretation in its language teaching syllabus. Both are related to
and dependent on psychological aspects. The UO is endeavoring to excel in these areas with a
view to raise the language proficiency levels of its students whilst at the same time aiming to
close the gap between linguists and psychologists (Section 1.2) for the benefit of foreign
language teachers and students. This is encouraging.
The three hypotheses of this research are supported by strength of evidence from the literature
review, face to face interviews and the focus group meeting (see Table 3 for a summary of the
results), namely:
H1: English language students improve their English language proficiency substantially if they

Business and Economic Research
ISSN 2162-4860
2013, Vol. 3, No. 2
www.macrothink.org/ber 103
interact regularly with business people and academics whose native language is English. This
hypothesis holds true. High levels of exposure to native English or other language speakers will
increase foreign language proficiency levels in accordance with the levels of exposure to the
foreign language. Language schools should consider adopting this approach.
H2: English language teachers improve the quality of their teaching in the classroom for the
benefits of students if they develop a positive and proactive attitude towards contemporary
foreign language teaching methods and tools. This is a valid premise. The latest thinking in
language teaching is based on years of research and feedback from practitioners in the field.
Language teachers and language schools need to keep themselves abreast of new developments
in this area and consider these for use in the classroom or language laboratory.
H3: English language teachers who give students the freedom to learn and practice using their
own chosen topics are increasing students‟ self-confidence and speaking abilities of speaking
in the foreign language substantially. This is a true hypothesis. Teachers who give students
freedom to choose their own topics increase their motivation levels significantly which leads to
higher levels of language proficiency.
Table 3. Hypotheses and Research Questions: Summary of Results
Hypothesis Related Research Question(s) Results
H1: English language students
improve their English language
proficiency substantially if they
interact regularly with business
people and academics whose
native language is English.
1. What is the value of presenting
topics of interest by visiting
native English language
practitioners who use
contemporary English that is used
in business and academic
environments?
3. Does the power distance
between English language
teachers and their students affect
the quality and proficiency levels
of the learning?
The evaluation of the literature made
positive contributions to determine
whether exposure, for example, to
native English speakers would
enhance language proficiency to the
desired level. The face to face
interviews and focus group meeting
concluded that students who interact
regularly with business and
academics are more likely to develop
stronger language proficiency levels.
They will also increase their
understanding how businesses across
a number of industries function and
operate.
H2: English language teachers
improve the quality of their
teaching in the classroom for the
benefits of students if they
develop a positive and proactive
attitude towards contemporary
foreign language teaching
methods and tools.
2. What is the value to English
language teachers of conducting
regular research in order to keep
abreast of the latest thinking in
language teaching approaches and
methods?
3. Does the power distance
between English language
teachers and their students affect
the quality and proficiency levels
of the learning?
The literature provided some valid
and reliable evidence that suggests
that English language teachers who
are striving to keep abreast of the
latest thinking in foreign language
teaching, are improving the language
efficiency of their students. The
outputs from the face to face
interviews and the focus group
meeting strengthened the findings
from the literature review.

Business and Economic Research
ISSN 2162-4860
2013, Vol. 3, No. 2
www.macrothink.org/ber 104
H3: English language teachers
who give students the freedom to
learn and practice using their own
chosen topics are increasing
students‟ self-confidence and
speaking abilities of speaking in
the foreign language substantially.
3. Do proactive and interactive
presentations in native English
improve the language skills of
students or do these divert from
the syllabus?
5. What is the value of regular
research to keep abreast of the
latest thinking in language
teaching approaches and
methods?
The literature is positively
conclusive that students would
benefit from being given the
freedom to choose their own topics,
for example, for discussion in the
classroom, as this increases their
motivation level significantly.
5. Conclusions
The Faculty of Humanities at the UO has created an inclusive and participatory language
learning environment in which students can apply, try, bring together and evaluate their
knowledge of foreign languages in a safe and realistic real life setting. Academic staff and
foreign language teachers are continuously striving to improve ways of teaching their students
languages such as contemporary English. It is highly commendable, given the financial and
resource constraints, that new research is planned in order to enhance the effectiveness of
language teaching. The positive, proactive and “can do” attitudes of language teachers are of
paramount importance. These are the driving forces behind motivating and keeping students
interested in trying out new approaches to learning a foreign language. Tools and techniques
are important, too, and latest technological developments should be considered for use in the
classroom and language laboratory, depending on prevailing local circumstances. Teachers will
engage more in trying to close the gap between the perspectives of linguists and psychologists
for the benefit of those who are going to learn languages. It is anticipated that teachers will
become more actively engaged by conducting more teacher-initiated research into teaching
methods and practices by, for example, spending more time in language learning facilities in
other countries such as Belgium. The UO has recently engaged in some collaborative work
with Flemish Universities in Belgium. Language teachers will attend workshops on current
innovative teaching techniques including e-learning and other computer-based teaching
methodologies.
A language laboratory will be created (language self access resource centre) for students to use
current proactive and interactive techniques. Native English speakers are interacting with
teachers and students in areas such as teaching and researching. There is conclusive evidence
from the literature review, face to face interviews and the focus group meeting that language
teaching skills and methods, when applied appropriately, can improve the people skills of
language students as well as improve their self confidence levels, as shown by this study. One
of the planned objectives is to teach English to all academic staff at the UO thus enhancing the
professional profiles of all UO personnel. Insights and subject matter knowledge from a larger
sample of students and practitioners of other Universities, including those in other countries,
would have provided richer and diverse research data to address the research scope in more
depth and universally. It is confirmed that the research scope from Section 1.3 has been

Business and Economic Research
ISSN 2162-4860
2013, Vol. 3, No. 2
www.macrothink.org/ber 105
answered and that all three hypotheses hold true and are valid in the context of this research.
The authors suggest that more research and practical work needs to be conducted to close the
perspective gap between linguists and psychologists in order to bring the two parties much
closer together. New research should be considered in the area of developing multi-lingual and
intercultural competence and their relationship.
References
Appel, J. (1995). Diary of a Language Teacher, Heinemann
Belyayev, B. V. (1969). Recent work on the psychology of language learning in The
Psychological and Psycholinguistic Problems of Acquiring and Mastering a New Language,
Moscow State University Press, pp. 145, 151, 152, 153
Belyayev, B. V. (1965). Brief Notes on the Psychology of Language Teaching, Moscow
Breen, M. (1987). Learner contribution to task design. In C. Candlin and D. Murphy (eds.),
Language Learning Tasks (pp.23-46). EnglewoodCliffs, N.J.: Prentice Hall
Candlin, C., & Murphy, D. F. (1987). Language learning tasks. Englewood Cliffs, NJ: Prentice
Hall.
Celik, S. (2013). Unspoken social dynamics in an online discussion group: the disconnect
between attitudes and overt behaviour of English language teaching graduate students,
Educational Technology Research and Development, 61, 665-683,
http://dx.doi.org/10.1007/s11423-013-9288-3
Doernyei, Z. (2009). The Psychology of Second Language Acquisition, Oxford University
Press.
Ellis, R. (2003). Task-based language learning and teaching. Oxford: Oxford University Press.
Frydryclova Klimova, B. (2012). CLIL and the teaching of foreign languages, Social and
Behavioral Sciences, 47, 572-576, Elsevier
Hismanoglu, M., & Hismanoglu, S. (2011). Task-based language teaching: What every EFL
teacher should do, Social and Behavioral Sciences, 15, 46-52, Elsevier
House, J. (2008). What is an Intercultural Speaker, in E. A. Soler‟s and M. P. S.
Jorda‟sIntercultural Language Use and Language Learning, Springer
Koch, R. (1998). The 80/20 Principle: The Secret of Achieving More with Less, New York
Currency
Krashen, S. (1985). The Input Hypothesis: Issues and Implications, London: Longman
Lightbown, P. M., & Spada, N. (2006). How Languages Are Learnt, Third Edition, Oxford
University Press

Business and Economic Research
ISSN 2162-4860
2013, Vol. 3, No. 2
www.macrothink.org/ber 106
Littlewood, W. (1981). Communicative Language Teaching-An Introduction, Twelfth Printing
1990, Press Syndicate of the University of Cambridge
Long, M, & Crookes, G. (1991). Three approaches to task-based syllabus design, TESOL
Quarterly, 26(1), 27-56, http://dx.doi.org/10.2307/3587368
Lynch, T. (1996). Communication in the Language Classroom, Oxford University Press
Nunan, D. (1989). Designing tasks for the communicative classroom, Cambridge: Cambridge
University Press.
Prabhu, N. (1987). Second language pedagogy, Oxford: Oxford University Press
Segalowitz, N. (2001). On the evolving connections between psychology and linguistics,
Annual Review of Applied Linguistics, 21, 3-22, Cambridge University Press
Skehan, P. (1996). Task-based instruction, Annual Review of Applied Linguistics, 18, 268-286,
http://dx.doi.org/10.1017/S0267190500003585
Soler, E. A. (2008). Linguistic Unity and Cultural Diversity in Europe: Implications for
Research on English Language and Learning, in E.A. Soler‟s and M.P.S. Jorda‟s Intercultural
Language Use and Language Learning, Springer
Copyright Disclaimer
Copyright reserved by the author(s).
This article is an open-access article distributed under the terms and conditions of the
Creative Commons Attribution license (http://creativecommons.org/licenses/by/3.0/).

Business and Economic Research
ISSN 2162-4860
2013, Vol. 3, No. 2
www.macrothink.org/ber 107
Myths and Realities of Innovative China the Case of
Haier Company
Farrukh Nawaz Kayani (Corresponding author)
Assistant Professor, Department of Management Sciences
COMSATS Institute of Information Technology, Islamabad
E-mail: [email protected]
Saquib Yusaf Janjua
Assistant Professor, Department of Management Sciences
COMSATS Institute of Information Technology, Islamabad
E-mail: [email protected]
Babar Wasim
Assistant Professor, Department of Management Sciences
COMSATS Institute of Information Technology, Wah
E-mail: [email protected]
Received: July 6, 2013 Accepted: July 19, 2013
doi:10.5296/ber.v3i2.3961 URL: http://dx.doi.org/10.5296/ber.v3i2.3961
Abstract
It is well recognized phenomenon that innovations are a strategic weapon for economic growth
and have played an important role in industrialization process of developing countries. Because
of the conventional thought that China produces sub-standard goods; the term innovative
China sounds like a myth. In reality China has made tremendous progress in producing
innovated goods. To support this view, in this paper, we have thoroughly discussed the case of
Haier Company. Haier is one of the very successful stories of Chinese companies which
absorbed the foreign technology and climbed up the technological ladder. This case of Haier

Business and Economic Research
ISSN 2162-4860
2013, Vol. 3, No. 2
www.macrothink.org/ber 108
supports our notion of innovation philosophy behind success of world renown Chinese
companies.
Keywords: China, Innovation, Case Study, Developing Countries, Haier
1. Introduction
The enormous growth of Chines economy in last of couple of decades have grasped
attention of academicians and practitioners. They are curious to understand the reasons and
factors behind this formidable growth and progress of Chinese companies. In 1978, the
Chinese government decided to move away from Soviet-style economic policies in order to
gradually reform the economy towards free market principles. In this regard, Chinese
government encouraged import substitution strategies to export promotion policies. They
established Social Economic Zones (SEZs) to attract foreign direct investments and
facilitated domestic firms. Social Economic Zones are geographically separate small areas of
a country where governments provide special fiscal and financial incentives to foreign and
domestic firms for boosting the exports.
Developing countries offer various kinds of incentive packages to attract Multinational
Corporations (MNCs) from developed countries. These incentives are usually divided into
“soft” and “hard” ones (Kusago and Tzannatos, 1998). Wong (1987) mentioned that countries
establish SEZs for employment creation, technology up-grading and foreign exchange
earnings. SEZs as a means of attracting foreign investment and technology along with
promoting Chinese exports. By granting special investment incentives to foreign investors, it
was hoped that an export-oriented industrial base might be created in the SEZs via foreign
capital and technology. Many of these privileges were also extended to domestic firms to
encourage their participation in the SEZs and thereby increase their contact with foreign
technology and managerial skills.
Aggarwal (2007) has discussed three aspects of SEZs i.e. employment generation, human
capital development and technology up gradation. Each aspect exerts two types of effects i.e.
direct and indirect. For instance, the employment would be directly generated when the SEZs
would hire labor. The indirect employment would be generated through the demand for
complementary goods. Similarly, the skill formation effect operates directly when they
acquire the skills by working in the SEZs. The spillover effects would take place through the
movement of workers to domestic firms. The SEZs would also result into technology transfer
to domestic firms.
Johanson and Vahlne (2003, 2001, 1977) stated that with the increasing internationalization,
lots of businesses are emerging on the globe. For firms, to survive and to earn a leading role in
the fierce global competitive landscape, unremitting innovations are of immense importance. A
number of studies in international business field show that the internationalization of a firm is
an incremental process, that is, a firm should gradually increase its international involvement.
There are several theories that focus on internationalization process of a firm on “its gradual
acquisition, integration and uses of knowledge about foreign markets and operations and on its
successively increasing commitment to foreign markets”.

Business and Economic Research
ISSN 2162-4860
2013, Vol. 3, No. 2
www.macrothink.org/ber 109
Haier is the single most extensive producer of exhaustive family machines in China. It has
developed from minor undertaking to being one of the advancing family apparatuses of China.
The philosophy of expansion and internalization of Haier is based on innovation. The paper
deliberates on success story of Haier i.e. one the leading Chinese company presence all over the
globe. The rest of the paper critically analyzes and discusses the developments and strategy of
Haier that make him successful in global competitive environment.
2. Haier’s Historical Development
Haier group started to work in 1992 by renaming the Qingdao Refrigerator plant which was
shaped in 1984. In 1984 an organization together with Liebherr was created following a
watchful assessment of 32 potential agreeable confederates. Haier transported in Liebherr's
four-star fridge processing innovation and gear to China. Liebherr had 70 years of interaction
in generating brilliant fridges. The Chinese features were a few star advances and
obsolete-formed with a solidifying ability of – 12 degree Celsius. The solidifying ability of
Liebherr's four-star innovation was – 18 degree Celsius. Haier ended up being the just Chinese
ensemble to give four-star refrigerator mechanics following the partnership with Liebherr.
Following collusion, Haier sent above and beyond 40 of its beat engineers and managers to
Liebherr. Liebherr authenticated to be a truly fruitful teaching establishment for Haier's beat
R&D talents. They concentrated on the growth of four-star refrigerator, and possibly aced the
crux innovative aptitudes needed for improving progressed fridges. In 1985, a year following it
permitted Liebherr's engineering, Haier was fit to present its first four-star icebox in the
Chinese business. This feature immediately secured Haier as the advancing refrigerator maker
in China. The figure 1, shows tremendous growth of Haier from 2008-2012 in terms of revenue
and net income.
Source: http://markets.ft.com/
Figure 1. Revenue over the time and Net Income over the time (2008-2012)
The overall sale pattern of Haier Electronics Company, for the years 2008 to 2012 is provided
along with forecasted sale in the same year as well as for the years 2013 and 2014, is provided
in Figure 2. There is upward trend which shows an increase in sales. The forecast till year
2012 is very close to the actual sale, which shows the accuracy of the forecast sales. For the
subsequent years after the year 2012, we can expect the same pattern of the Haier’s sales.

Business and Economic Research
ISSN 2162-4860
2013, Vol. 3, No. 2
www.macrothink.org/ber 110
Source: http://www.4-traders.com/
Figure 2. Actual vs Forecasted Annual Sales (2007-2015)
Haier, today makes about 15,100 feature mixed bags in 96 item lines. Over the period of time,
Haier has not just upgraded the value but added objective and innovative proficiencies as well.
In 1993, nine years following its establishment, Haier was certain enough to start a worldwide
operations. The role of present CEO of Haier in upgrading the quality of products is obvious.
His order of destruction of 76 defective refrigerators was a symbolic step of moving towards
quality production.
In 2003, the Haier brand topped all Chinese trademarks in a nationwide survey. The Chinese
Fortune Magazine (issue 8/2004) appraised Haier the second in their catalogue of most
obviously appreciated ensembles in China. In this rating Haier was observed as number one in
the fields of administration display, development capacity and social obligation. In 2004, Haier
was distinguished as one of the World's 100 Most Recognizable Brands in a worldwide name
mark post altered by the World Brand Laboratory 10.
As per 2006 Euro-monitor statistics on outfit bargains, Haier has the most extensive planet
business sector mark impart for fridges, and it is the fourth right around the worldwide white
merchandise makers. Among 2003 and 2006, Haier ranked first in terms of the most part
initiative right around terrain Chinese ensembles in the Wall Street Journal Asia's anniversary
study of Asia's 200 Most Admired Companies. In 2008, Haier ranked 13th on Forbes'
Reputation Institute Global 200 record. In addition in the same year, Haier ranked first around
Chinese endeavors on the Financial Times record of the most exceptionally regarded
worldwide teams (Duysters et al., 2010). This short article thoroughly discusses the historical
development, diversification process and globalization strategies of Haier Company in China.
3. The Process of Haier’s Diversification
In 1991, Haier started to diversify. Haier also started to produce air-conditioners and freezers
besides refrigerators. Haier took three years to establish repute in these two industries. In 1991,
the sales and profits of Haier were RMB 724 million and RMB 31.2 million respectively.
Whereas in 1994, Haier’s sales and profits had grown to RMB 2.56 billion and to RMB 200
million respectively. Subsequently, Haier developed washing machines, microwave ovens and

Business and Economic Research
ISSN 2162-4860
2013, Vol. 3, No. 2
www.macrothink.org/ber 111
water heaters. In 1997, Haier entered into the production of black household appliances. Table
1 summarizes the processes of Haier’s diversification over the time.
Table 1. The Stages of Haier’s Diversification
Stage Period Diversification
Area Procedure
1 1984-Dec 1991 Refrigerators Imported refrigerator technology from Liebherr
Company of Germany.
2 Dec. 1991- Jul.1995 Freezers
Air-conditioners
Acquired Qingdao Freezer General Plant and Qingdao
Air-conditioner Plant.
3 July.1995-Aug.1995
Washing machines
Microwave ovens
Water Heaters
Acquired Red Star Electric Appliance Factory and
established a joint venture with Laiyang of Shandong
Household Appliance General Plant.
4 Sept. 1997 Black household
Appliances
Established a joint venture with West Lake of Hangzhou
Electric Group.
5 1998 Knowledge sectors Formed technology cooperation with many external
organizations
Source: Sun (2002) Yan and Hu (2001) and Duysters et al.(2010)
With the idea of “customers as the foundation of growth”, Haier furnishes a one-stop star aid to
its clients. In a joint review directed by the China Consumer Association and the China
Enterprise Research Centre of Tsinghua University on China's domesticated sturdy items for
2003 and 2004, eight of Haier's feature classifications were ranked No. 1 for client fulfillment
and for the most part fulfillment. Notwithstanding excellent home apparatuses, Haier is
additionally centered on offering greatest-of-breed aid answers to its clients. Haier's aid
framework runs all through the preparation method from item plan, preparation, assembling, to
pre-deal, under deals and following deals fix. Inasmuch as 2002, Haier has efficaciously
secured an arrangement of over 5,000 household pro aid suppliers to transport auspicious redid
utility.
4. Internationalization Strategies
Haier is the first Chinese firm to buy a fridge production line in the European Household
apparatus segment. It made the first European acquisition in 2001 by getting refrigerator
manufacturing plant in Italy. The reason for this acquisition is to enhance range and production
capacity. Haier has several abroad modern points of production and sales in the United States,
Pakistan and Jordan. In particular, it has 30 abroad plants and 58,800 deals executors
worldwide. It sends out its items to more than 130 nations in Europe, Asia, Middle East and
North America. The predominant production plant of Haier was in Yugoslavia under a joint
venture with a neighborhood community. Haier is transforming coolers, freezers, clothes
washers, dishwashers, microwave broilers and modest machines for the European business. In

Business and Economic Research
ISSN 2162-4860
2013, Vol. 3, No. 2
www.macrothink.org/ber 112
Asia, it has engaged in the business sectors of Indonesia, Philippine, Malaysia, United Arab
Emirates, Algeria, Bangladesh and Iran through joint ventures. Table 2 below shows the
foreign operations of Haier internationally.
Table 2. Foreign Operations of Haier
North America Europe South Asia ASEAN Middle East Africa
USA Germany India Thailand Jordan Tunisia
Italy Pakistan Indonesia Nigeria
Holland Bangladesh Philippines Egypt
Denmark Sri Lanka Malaysia Algeria
Romania South Africa
Ukraine
Haier has devised a few guidelines for its globalization policy. Under this guideline, one-third
of its features are both handled and sold in its home nation and the other on one-third of the
items are handled in home nation but sold abroad, and rest of the items are both handled and
sold abroad. In worldwide extension procedure, Haier's method is to move from challenge to
simplicity i.e. dropping in additional propelled business sectors first. It is vital to drop in the
more progressed businesses first with a specific end goal, which is to increase more brand
recognition.
In the European Union, Haier entered in the German business sector first. Germany is
recognized as a troublesome business sector to enter in. Scrutinize systems possess a foremost
place in the development and innovative advancements of any immovable. In this respect Haier
has engaged in accommodating scrutinize systems with acclaimed unfamiliar firms. The
proposed helpful systems furnish Haier qualified information about global slants in innovation
improvement. Haier's worldwide mechanics cooperation compass Tokyo, Los Angeles,
Montreal, Lyons, Seoul, Sydney and Amsterdam. The accommodating associates of Haier
incorporate Toshiba, Mitsubishi, ESS, Philips, Metz and Lucent.
5. Discussion
Haier’s success lies in the careful positioning of the products rather than only selling its
products at the lowest possible prices. The products that accommodate the local specificities
were made along with the identification of the niche markets. They are a lot of examples where
Haier’s products accommodated the local requirements. In Indonesia, Haier presented power
saving adaptable-voltage apparatuses due to nation's capacity deficiencies and voltage
variances. Haier presented a fridge with fold-out table in United States so as to target the
scholars who are residing in dorms. Similarly in Pakistan, they modify their cooling machines
to make them adaptable and efficient to extreme weather and electricity load shedding.
In China, Haier advanced a clothes washer that washes both the garments and vegetables. This
model is offered to target the people of country territories. In France and Italy, Haier first sold
out the iceboxes in light of strategic explanation. As the ventilation system business sector
being comparatively a brand new mark was not imperative. The different item lines for

Business and Economic Research
ISSN 2162-4860
2013, Vol. 3, No. 2
www.macrothink.org/ber 113
example iceboxes and clothes washers were presented later following making its mark. Haier
additionally presented brand new classes of products similarly as wine cellar room for
American market. Initially, Haier confronted great challenge in influencing the clients
regarding the handiness of this feature but later on this item has a tremendous demand in the
American businesses. In nutshell, the secret of great success of Chines company lies in its
innovation philosophy and localization strategy of product features and branding compaign.
6. Conclusion
The products of Haier are sold in over 100 nations. The sales of Haier's production are about
RMB 118 billion and it employees more than 50,000 workers across the world. Haier with its
innovation spirit is a pioneer of Chinese enterprises globalization and brand building. It has
emerged into a hefty multinational corporation, and it keeps on expanding its business in China
as well as in abroad, such as North America, Europe, and Asia. Over the passage of time, Haier
has advanced a noteworthy international R&D system. The ambitiousness of Haier’s plan is
reflected in its innovation target: two successful intellectual patent applications every work
day that dispel the image of substandard products and reverse re engineering approach of
Chinese business counterparts.
References
Aggarwal, A. (2007). Impact of Social Economic Zones on Employment, Poverty and Human
Development Indian Council for Research on International Economic Relations,Working
Paper No 194.
Duysters, G., Jo, J., Charmianne, L., & Yu, J. (2010). “Internationalization and Technological
Catching up of Emerging Multinationals: A Comparative Case Study of China’s Haier Group”,
Industrial and Corporate Change, 18(2), 325-349. http://dx.doi.org/10.1093/icc/dtp006
Johanson, J., & Vahlne, J. E. (1977). The Internationalization Process of the Firm: A Model of
Knowledge Development and Increasing Foreign Market Commitments, Journal Of
International Business Studies, 8(1), 32-44. http://dx.doi.org/10.1057/palgrave.jibs.8490676
Johanson, J., & Vahlne, J. E. (2001). “The Mechanism of Internationalization”, International
Market Review, 7(4), 11-24.
Johanson, J., & Vahlne, J. E. (2003). “Business Relationship Learning and Commitment in the
Internationalization Process”, Journal of International Entrepreneurship, 1, 83-101.
http://dx.doi.org/10.1023/A:1023219207042
Kusago, T, & Tzannatos Z. (1998). Export Processing Zones: A Review in need of Update,
Social Protection Discussion Paper No 9802.
Sun, J. (2002). The Company Strategy of Haier, The Enterprise Management Press, China:
Beijing.
Yan, J., & Hu, H. (2001), China’s Haier. Hainan of China Press: Haikou.

Business and Economic Research
ISSN 2162-4860
2013, Vol. 3, No. 2
www.macrothink.org/ber 114
Copyright Disclaimer
Copyright reserved by the author(s).
This article is an open-access article distributed under the terms and conditions of the
Creative Commons Attribution license (http://creativecommons.org/licenses/by/3.0/).
Business and Economic Research
ISSN 2162-4860
2013, Vol. 3, No. 2
www.macrothink.org/ber 115
The Relationship between Macroeconomic Variables
and Passenger Vehicle Sales in Malaysia
Fidlizan Muhammad (corresponding author)
Department of Economics, Faculty of Management and Economics
Universiti Pendidikan Sultan Idris, Perak, Malaysia
E-mail: [email protected]
Mohd Yahya Mohd Hussin
Department of Economics, Faculty of Management and Economics
Universiti Pendidikan Sultan Idris, Perak, Malaysia
E-mail: [email protected]
Azila Abdul Razak
Department of Economics, Faculty of Management and Economics
Universiti Pendidikan Sultan Idris, Perak, Malaysia
E-mail: [email protected]
Norimah Rambeli
Department of Economics, Faculty of Management and Economics
Universiti Pendidikan Sultan Idris, Perak, Malaysia
E-mail: [email protected]
Gan Pei Tha
Department of Economics, Faculty of Management and Economics
Universiti Pendidikan Sultan Idris, Perak, Malaysia
E-mail: [email protected]

Business and Economic Research
ISSN 2162-4860
2013, Vol. 3, No. 2
www.macrothink.org/ber 116
Received: January 10, 2013 Accepted: February 2, 2013
doi:10.5296/ber.v3i2.3881 URL: http://dx.doi.org/10.5296/ber.v3i2.3881
Abstract
This study aims to analyze the long-term relationship and causal relationship between
macroeconomic variables and passenger vehicle sales in Malaysia. In this study, the monthly
time series data from April; 2004 to December; 2010 is used. To achieve the objectives, the
Vector Autoregressive (VAR) estimation method is applied. Results show that there is no
significant long-term equilibrium relationship between sales of passenger vehicles with
macroeconomic variables. For the short term, only significant IPI variable affects the growth of
passenger vehicle sales in Malaysia.
Keywords: Passenger Vehicle Sales, Macroeconomic, VAR
1. Introduction
Passenger vehicle is a part of the important transportation to the world now. It serves in smooth
mobility of people and goods from one destination to another destination. Through efficient
transportation infrastructure, economic activities involving local and foreign business can be
conducted quickly and minimize the financial cost. According to Abu-Eisheh and Mannering
(2002), the demand for vehicles will determine the pattern of travel, tourism, road design and
housing. Therefore, transportation is an important factor for economic development of a
country today.
In addition, according to Sean et al. (2003), the hierarchical position of the demand for vehicles
comes second after the property demand among the people in the United States. This scenario
occurs in many countries of the world including Malaysia. This can be proven by two
circumstances. Firstly, the ratio of bank loans especially for car loan until 2010 which
represents 13.3% of the total loan amount, demonstrates a double increase as compared to 6.7%
in 1996 (BNM, 2010). Secondly, the total number of vehicles sold in the market in Malaysia
has shown an increase of 262% or an average of 12% per annum for the period from 1990 to
2011. The increase in car sales is as shown in Figure 1.
Figure 1: Passenger Vehicle Sales in Malaysia (1990-2011).

Business and Economic Research
ISSN 2162-4860
2013, Vol. 3, No. 2
www.macrothink.org/ber 117
Source: Malaysian Automotive Association (MAA)
Figure 1 shows the total vehicle sales in 1990 amounted to 165,861 units, later it increased to
343,173 units in 2000. Total sales continually increased from year to year. In 2011, the number
of vehicles sold amounted to 600,123 units. Although the figure of vehicle sales indicated an
increase as a whole, it was also affected by the current economic situation. The economic crisis
in Asia in 1997/98 for instance, also gave negative implications on Malaysia's vehicle sales
which had decreased by 60% than the previous year.
Due to the fluctuations that occur in the economy, it also has implications for the economic
growth. This is because, the automotive sector in Malaysia is the sector that has contributed
significantly to the economic policy changes in Malaysia, particularly in achieving the
economic status of high-income by 2020. The sector has accounted for 11% to 13% of
economic value added to the manufacturing industry. In addition, the number of employment in
the automotive sector has also nearly doubled in a decade from 2000 to 2009. (NPC, 2009; Wad
and Govindaraju, 2011). During the economic crisis in the United States in 2008, the Malaysian
government has established the Automotive Development Fund totaling to RM200 million to
consolidate and rationalize the PROTON vendor system for the purpose of promoting exports
and financing the easy loan scheme to vendors. Besides that, the scrapping scheme for vehicle
over the age of 10 years was also implemented to promote car sales (Annual Report of the
Malaysian Economy 2009/2010,p.14).
Over the factor of vehicle importance in daily business facilities for the community and also the
country's economic growth, the study focuses on the macro analysis of relevant variables that
affect the total passenger vehicles sales in the long term and short term.
The writing of this study is arranged as follows. The second section describes the literature
review related to the topic of study, followed by a description of the data and research
methodology in the third and the fourth. In the fifth part, the findings will be discussed and the
conclusion of the study is discussed in the sixth.
2. Literature Review
Studies on the relationship between macroeconomic variables vehicle sales are very limited.
However, there are few studies that have examined the impact of oil prices on car sales.
According to Hamilton (1988) and Pindyck and Rotemberg (1984), the increase in the oil
prices has increased the cost of operation for some durable goods. This will directly affect the
demand for goods and investment, particularly for the automotive sector.
This study is supported by Lee and Ni (2002) research, that involves 14 industrial countries.
They have seen the impact of oil prices through two aspects of supply and demand. On the
supply side, it appears that the oil based manufacturing industry have been affected by the
rising of oil prices as compared to other industries. Among the identified industries affected by
these changes is the automotive industry. On the demand side, rising oil prices and their impact
on production has resulted in inflation. This situation indirectly causes reduced consumer real
income which will eventually reduce the demand for vehicle.

Business and Economic Research
ISSN 2162-4860
2013, Vol. 3, No. 2
www.macrothink.org/ber 118
The study by Barber et al. (1999) also examined the relationship between oil prices and foreign
exchange rates on the sale of vehicles manufactured by the United States and Japan. The study
found that both variables are significant to the sale of vehicles produced. However, it was
found that the rise in oil prices gave more negative implications to the U.S. car production than
the Japanese production. Justification to this situation is based on the focus of the automotive
manufacturing market. The target of manufacturers in the United States is to produce vehicles
in the luxury category as opposed to Japanese manufacturers. This situation has given market
advantage (market gains) to Japanese manufacturers. Despite of the rising oil prices and
affecting the demand, the impact suffered by the Japanese manufacturers is smaller.
The finding of this study is in line with Duncan (1980) who found that the increase in oil prices
results in an increasing demand for small-sized vehicles that use less fuel. A study by
Shahabudin (2009) through regression analysis using macroeconomic variables and monetary
aggregates found that all the variables are significantly influenced by either vehicle sales of
locally produced vehicles and imported. However, the findings of this analysis have serial
correlation problems that stir the model consistency.
A study by Ludvigson (1998) is more focused on the impact of monetary policy on the sale of
vehicles proxied by bank loan supply for automobile loans. The increase in interest rates was
found to have negative implications. This is because the ability of banks to provide more loan
offers was reduced due to the change in monetary policy.
A study by Dargay and Gately (1999) on the impact of income on car ownership in 26 countries
for the period 1960 to 1992 found that, estimation of vehicle ownership for the past two
decades through 2015 is high for low-income countries. Whereas, for the countries of China,
India and Pakistan, the ownership of the vehicle doubled in line with the growth in per capita
income.
In Dargay’s study (2001) in the UK using data from the Family Expenditure Surveys 1970 and
1995, found that the ownership of the vehicle increases if income is also increased. However,
this situation is not consistent in the event of a decline in income. This condition is associated
with a person's behavior and the difficulty to change as the vehicle is now becomes a necessity
in life.
In Malaysia, studies analyzing the relationship between vehicle sales with macroeconomic
variables using econometric approach are also very limited. Many previous studies conducted
were more focused on qualitative discussion regarding the development of the automotive
sector in Malaysia. As an example in Ward and Govindaraju (2011) and Mohd Rosli (2006).
Therefore, this study can be considered as a preliminary study aimed to explore the extent of
these macroeconomic variables relating to the sales of passenger vehicles, particularly in
Malaysia. Given no specific studies done to examine this relationship, the objective of this
study is looking at the long-term equilibrium relationship and the Granger causal relationship
between sales of passenger vehicles with macroeconomic variables in Malaysia.
3. Description of Data
In this study, five variables are used for the analysis section. Definitions for each of the

Business and Economic Research
ISSN 2162-4860
2013, Vol. 3, No. 2
www.macrothink.org/ber 119
variables used are outlined in Table 1
Table 1. Definition of research variables
No Variable Description Source
1 Sales of passenger
vehicles (CAR)
CAR is the number of passenger vehicles sold in
Malaysia
MAA, UPE
2 Consumer Price
Index (CPI)
CPI is used as a proxy to the inflation BNM
3 Index of Industrial
Production (IPP)
IPP is used as a proxy to the Gross domestic product
(GDP)
BNM
4 Oil Price
(OIL)
OIL is used as a proxy to the oil price sold at gas stations
in Malaysia. the price is based on car oil of RON92
(currently RON95)
Ministry of Commerce
and Consumer Affairs
5 Monetary Policy
Rate (ONR) ONR is used as a proxy for the country's monetary
policy. This rate determines the interest rate of loans
offered by banking institutions.
BNM
In this study, the time series of monthly data from April 2004 to December of 2010 is used. The
choice of this period is based on the availability of the monthly vehicle sales data reported by
the Economic Planning Unit, Malaysia. For the purpose of analysis, the CAR, CPI and IPI
variables are transformed in log form. Regression model for this study is based on the model of
aggregate demand vehicles. This model has been applied in the study of Duncan (1980),
Shahabudin (2009) and Lee and Ni (2002). Regression models to examine the relationship can
be summarized as follows:
CAR =f {CPI, IPP, OIL, ONR} (1)
Model in equation (1) is regressed in log-linear form which is written as follows:
tttttt LNONRLNOILLNIPPLNCPILNCAR 4321 (2)
Based on the standard VAR estimation method, the model of the above equation containing
these five variables can be rewritten as follows:
5
4
3
2
1
1
1
1
1
1
5
4
3
2
1
)(
et
et
et
et
et
ONR
OIL
IPP
CPI
CAR
LR
A
A
A
A
A
ONR
OIL
IPP
tCPI
t
t
t
t
t
t
t
t
tCAR
(3)
Where R is a 5 x 5 matrix polynomial estimator parameters, (L) is the lag operator, A is the
intercept and et is the Gaussian error vector with zero mean and variance matrix Ω.
4. Research Methodology

Business and Economic Research
ISSN 2162-4860
2013, Vol. 3, No. 2
www.macrothink.org/ber 120
For the purpose of analyzing the long term and short term causal relationship between the
passenger vehicle sales variable and the macroeconomic variables, the method of vector
autocorrelation (VAR) was applied. To get the good results of the analysis, the standard
procedure of time series data analysis was conducted.
Stationarity test of variables series using the Augmented Dickey-Fuller (ADF) and
Phillips-Perron (PP) was conducted as the first step to find out whether all study variables have
the same degree of integration or different. Degree of integration is essential to enable further
analysis to be undertaken. In addition, the same level of integration also shows the possibility
of long-term causal relationship, known as cointegration.
The next step is to determine the appropriate lag before applying model-based cointegration
method of Johansen (1988) and Johansen and Juselius (1990) or to simplify the J & J. To ensure
that the selected lag is appropriate, the test of the VAR unit stability was implemented. The
next step is the cointegration analysis based on the J & J method called Multivariate Johansen
Test. This method aims to ensure that the relationship of the series of variables studied exist in
the long term. The determination of the existence of this relationship is seen on the significant
value for the two types of statistical value which is the Trace statistical value and Eigen
maximum value.
To obtain the mutual relationship between the variables that is known as the causal short-term
relationship, the method of vector error correction model-VECM was applied. This method can
describe the variables analyzed whether it is exogenous or otherwise.
5. Result of Empirical Analysis
Discussion on the data analysis results obtained based on the VAR testing procedures initiated
by the unit root test analysis results, followed by cointegration test and ended with a vector
error correction model.
5.1 Stationarity Test
Stationarity analysis or also known as integration test was done to investigate the stationarity
degree of each variable. It should be done in advance to avoid the occurrence of spurious
regression problem. This study requires the same degree of immobilization for each time series
as it is a prerequisite in cointegration analysis and Granger causal VECM version.
Table 2 shows the results of the analysis of stationarity tests using ADF and PP. Based on Table
2, it appears that all variables in the study had the same integration or stationarity level of I (1).
Table 2. Unit Root Test
Variable ADF (level)
ADF (First differentiation)
PP (level)
PP (First differentiation)
CAR 0.3103 -9.6479* 0.3815 -17.1546* CPI 2.3495 -5.4047* 3.0213 -5.3991* IPP 1.0726 -2.0174* 0.4660 -20.8352* OIL 0.2423 -7.8217* 0.2423 -7.8259* ONR -0.3147 -4.5939* -0.2537 -4.5760*

Business and Economic Research
ISSN 2162-4860
2013, Vol. 3, No. 2
www.macrothink.org/ber 121
* Significant at 1% significance level.
5.2 Lags Selection
Based on the method of estimation of vector autoregressive (VAR), the selection of the
correct lag is important to ensure that the findings reflect the real economic situation and in
line with economic theory and econometrics (Ibrahim, 2007)
Table 2. Lags Test
Lags Final Prediction Error
(FPE)
Akaike Information Criterion
(AIC)
Schwarz Information Criterion
(SIC)
0 2.59e-10 -7.8858 -7.7336
1 1.50e-14 -17.6453 -16.7322*
2 7.05e-15* -18.4063* -16.7321
3 8.50e-15 -18.2040 -15.8052
* show the lags selected by the criteria are based on the minimum value
Based on Table 3, criteria of Final Prediction Error (FPE) and the Akaike Information Criterion
(AIC) suggest that the selected lags are lags 2, while the Schwarz Information Criterion (SIC)
was chosen based on the lags of 1 to the smallest value for each criterion. However, this study
will only be using the Akaike Information Criterion (AIC) in selecting the lag of lags 2. The
selection of lags that uses these criteria in previous studies is the same as the study by Adam
and George (2008) and Yusoff et al. (2006). Therefore, the lag two (2) will be used to test the
cointegration and vector error correction model (VECM).
5.3 The VAR Stability Test
Among the important features in VAR analysis is the VAR (p) – variable that can produce a
stable process. Stable VAR process is important because it produces an efficient model in terms
of analysis of variance, covariance and also the beginning of the analysis period. VAR stability
is achieved if the value of the modulus obtained is less than one. If VAR is not stable, the
solution can be done is to reduce the time lags (Charemza and Deadman 1997, Gujarati 2003).
Results of this analysis are shown in Table 4.
Table 4. VAR Unit Polynomial Stability Test
Unit Modulus
0.995051 0.995051
0.845294 - 0.091717i 0.850256
0.845294 + 0.091717i 0.850256
0.540139 - 0.407871i 0.676837
0.540139 + 0.407871i 0.676837
0.670566 0.670566
-0.494558 - 0.203829i 0.534915
-0.494558 + 0.203829i 0.534915
-0.339778 0.339778
0.184408 0.184408
Based on Table 4, it was found that the modulus obtained is smaller than one. This shows that

Business and Economic Research
ISSN 2162-4860
2013, Vol. 3, No. 2
www.macrothink.org/ber 122
the analysis is stable. Therefore, the selected lag two (2) is sufficient.
5.4 Cointegration Analysis
Based on the findings of the analysis shown in Table 2 showing that the series of variables have
the same degree of integration, the cointegration test was implemented. This test result analysis
is shown in Table 5.
Table 5. Cointegration Test
Model Null Hypothesis Trace Statistics
Critical Value
(5%)
Maximum Eigen
Statistics
Critical Value
(5%)
Lag : 2# r ≤ 0 96.0375* 69.8188 40.5145* 33.8768
r ≤ 1 55.5230* 47.8651 32.9616* 27.5843
r ≤ 2 22.5614 29.7907 16.3253 21.1316
r ≤ 3 6.2360 15.4947 6.0497 14.2646
* Significant at 5% significance level.
critical value is obtained from Osterwald-Lenum (1992)
# Lags is based on AIC value
Based on Table 5, it is found that there are at least two cointegration relationship obtained. This
shows that there are two equations that may be developed in the long term. Based on the results
of this cointegration, long-term relationship that has been transformed in the form of the
normal equations for passenger vehicle sales in Malaysia with macroeconomic variables can be
written as shown in Table 6.
Table 6. Cointegration Relationship
Dependent variable (LNCAR) Independent Variable
LNCPI LNIPP OIL ONR C
Coefficient - 0.0452 0.7089 -0.1065 -0.1266 -7.8915
s.e value (0.8207) (0.5747) (0.1563) (0.0640)
* Significant at 1% significance level.
Based on Table 6, it appears that CPI, OIL and ONR variables are negatively related, while the
IPPs are not. Although, these variables are in line with the theory and also with the findings of
previous studies, but it is not significant. The question now is, does the passenger vehicle sales
variable is the independent variable (exogenous) or dependent (endogenous)? To answer this
question, the method of vector error correction model (VECM) is applied.
5.5 Analysis of Vector Error Correction Models (VECM)
Based on the cointegration test shown in Table 6, it is proven that the existence of a long-term
relationship between the variables-variables in the study is of the same degree of integration.
Hence, the term of error correction (ECT) should be included in the model before testing the
Granger causal relationship can be carried out. Engle and Granger (1987) and Toda and Phillips
(1993) argue that the failure to take into account the error correction term (ECT) will result in
the test conducted produces specification error model (model misspecification). Therefore, the
Granger causality test should be expected in the vector error correction model (VECM) version
and the results are shown in Table 7.

Business and Economic Research
ISSN 2162-4860
2013, Vol. 3, No. 2
www.macrothink.org/ber 123
Table 7. Vector Error Correction Model (VECM) test
Dependent Variables Independent Variable
Chi-Square Value (Wald test)
t- statistics value
LNCPI LNIPP OIL ONR
LNCAR Ect-1
LNCPI 0.0541 3.6518 0.7249 0.7299 0.0046(0.0067)
LNIPP 6.5342** 12.7820* 0.0658 2.8863 -0.0959*(0.0511)
OIL 4.0849 0.8742 0.9681 3.4444 -0.0730(0.0408)
ONR 10.6819* 0.8019 3.9030 1.1005 -0.1859(0.1463)
LNCAR
2.5426 8.8054** 1.3943 0.1230 -0.5659*(0.1413)
*,**,*** Signficant at significance level of 1, 5 and 10 %
( ) s.e value
Based on Table 7, long-term Granger causal relationship can be seen on the ECT-1 for each
variable. Based on the VECM test results, it is found that the ECT-1 CAR and IPI variables are
significant. This variable indicates that the CPI, the IPI, OIL and ONR are long-term Granger
causal to CAR, while the CPI, ONR, CAR OIL are for the IPP variable.
The result from the ECT value on the CAR variable in particular clearly shows that the CAR
variable in the equation carries the error correction burden of scattered short-term balance to
strike a balance in the long term. This suggests that the CAR variable is endogenous variables
in the study model. Coefficient ECT-1 also reflects the speed of adjustment to achieve a
balance in the long-term in which the value is -0.5659 that means as much as 56.59 percent of
the adjustment is done during the lags two to achieve long-term equilibrium.
From Table 8 also, a short-term causal relationship is obtained based on the Wald test. Test
results reveal that the CPI is a short-term causes of the IPP, and OPR, while the OIL is the
short-term cause to IPPs. For CAR variables, only the IPI is found to have a short-term
relationship.
Overall, the direction design of Granger causal short-term relationship can be summarized as
shown in Figure 2 below.
Figure 2. Causal Relationship
OIL
ONR
CPI
IPP CAR
Indicator:
One way relationship two way relationship

Business and Economic Research
ISSN 2162-4860
2013, Vol. 3, No. 2
www.macrothink.org/ber 124
Based on Figure 2, it can be concluded that there are two pathways that affect auto sales in
Malaysia in the short term. The first route is OIL-IPP-CAR, while the second path is the
CPI-IPI-CAR. From the first line, it is in line with the findings of previous studies that found
that changes in oil prices will affect the demand for cars. This can be attributed to the net
income of users will be affected in the event of rising oil prices. Apart from the oil price factor,
the increase in overall inflation will also affect the consumer income. Thus, the main factor
affecting the automotive sales in Malaysia is the income. For that reason, factors that can affect
this income will directly affect the automotive sales.
6. Conclusion
This paper analyzes the relationship between macroeconomic variables with auto sales in
Malaysia for the period of 2004: M4 to 2010 : M12 by using the VAR method. From the
analysis results obtained, it appears that there are two pathways that influence the sales of
passenger vehicles in Malaysia, which are the CPI variables to the IPP and secondly the OIL
variables to the IPP. Shocks that occurr on IPP variables are found to affect the sales of
passenger vehicles in Malaysia. This indicates that the sale is dependent on the economic level
which is a proxy for the measurement of consumer income. Good income position will affect
positively to the increasing demand for passenger vehicle sales in Malaysia. Therefore, to
improve the automotive sector in Malaysia, the government should ensure that the level of
income of the users in Malaysia to remain strong and not be adversely affected by factors such
as rising prices, oil and so on.
7. Acknowledgements
The research is financed by Internal Short-Term Grant by RMIC-UPSI, Perak, Malaysia.
For ASEAN automotive relationship already published in IOSR Journal of Business and
Management (IOSRJBM), Vol. 2, Issue 1 (July-Aug 2012).
Reference
Abu-Eisheh, S. A., & Mannering, F. L. (2002). Forecasting automobile demand for
economics in transition: a dynamic simultaneous equation system approach, Transportation
Planning and Technology, 25(4), 311-31. http://dx.doi.org/10.1080/0308106022000019026
Adam, A. M, & George T. (2008). Do macroeconomic variables play any role in the stock
market movement in Ghana?. Munich Personal RePEc Archive (MRPA). No. 9357, 1-21.
http://dx.doi.org/10.2139/ssrn.1152970
Brad M. Barber, Reid W. Click, & Masako N. Darrough. (1999). The impact of shocks to
exchange rates and oil prices on U.S sales of American and Japanese automakers, Japan and
the World Economy, 11, 57-93. http://dx.doi.org/10.1016/S0922-1425(98)00041-3
Charemza, W., & Deadman, D. (1997). New Directions in Econometric Practice : General to
Specific Modelling, Cointegration, and Vector Autoregression, Edward Elgar Pub., Lyme,
N.H.

Business and Economic Research
ISSN 2162-4860
2013, Vol. 3, No. 2
www.macrothink.org/ber 125
Cheung, Y-W., & Lai, K. (1993). A fractional cointegration analysis of purchasing power
parity, Journal of Business & Economic Statistics, 11, 103-112.
http://dx.doi.org/10.2307/1391310, http://dx.doi.org/10.1080/07350015.1993.10509936
Engle, R. F., & C. W. J. Granger. (1987). Cointegration and error correction: representation,
estimation and testing, Econometrica, 55, 251-276. http://dx.doi.org/10.2307/1913236
Gujarati, D. N. (2003). Basic Econometrics, McGraw Hill, Boston.
Hamilton, J. D. (1988). A neoclassical model of unemployment and the business cycle.
Journal of Political Economy, 96, 593-617. http://dx.doi.org/10.1086/261553
Ibrahim, M. (2007). The Role of Financial Sector in Economic Development: The Malaysian
Case, International Review of Economics, 5(4), 463-483.
http://dx.doi.org/10.1007/s12232-007-0023-4
Johansen, S, & K. Juselius. (1990). Maximum Likelihood Estimation and Inferences on
Cointegration With Application to The Demand For Money, Oxford Bulletin of Economics and
Statistics, 52, 169-210. http://dx.doi.org/10.1111/j.1468-0084.1990.mp52002003.x
Johansen, S. (1988). Statistical Analysis of Co-Integration Vectors, Journal of Economic
Dynamics and Control, 12, 231-254.
Joyce, M. D. (2001). The effect of income on car ownership: evidence of asymmetry,
Transportation Research Part A, 35, 807-821.
http://dx.doi.org/10.1016/S0965-8564(98)00026-3
Joyce, M. D., & Detmot, G. (1999). Income’s effect on car and vehicle ownership, worldwide:
1960-2015, Transportation Research Part A, 33,101-138.
Kiseok, L., & Shawn, N. (2002). On the dynamic effects of oil shocks: a study using industry
level data, Journal of Monetary economics, 49, 823-852.
Mohd Rosli, (2006). The Automobile industry and Performance of Malaysian Auto Production,
Journal of Economic Cooperation, 27(1), 89-114.
Pindyck, R. S. & Rotemberg, J. J. (1983). Dynamic factor demands and the effects of
energy price shocks, American Economic Review, 73, 1066–1079.
Roger, S. D. (1980). The Effect of Gasoline Prices on Automobile Sales, The American
Economist, 24(1-Spring), 62-66.
Sean, P. McAlinden, Kim Hill & Bernand Swiecki (2003). Economic Contribution of the
Automotive Industry to the U.S Economy-An Update, A report for the Alliance of Automobile
Manufacturers, Center for Automotive Research (CAR), 1-47.
Sydney, L. (1998). The Channel of Monetary Transmission to Demand: Evidence from the
Market for Automobile Credit, Journal of Money, Credit and Banking, 30(3), 365-383.
http://dx.doi.org/10.2307/2601106

Business and Economic Research
ISSN 2162-4860
2013, Vol. 3, No. 2
www.macrothink.org/ber 126
Syed Shahabudin, (2009). Forecasting automobile sales, Management Research News, 32(7),
670-682. http://dx.doi.org/10.1108/01409170910965260
Toda, H. Y., & Phillips, C. B. (1993). Vector Autoregressions and Causality, Econometrica, 61,
1367-1393. http://dx.doi.org/10.2307/2951647
Wad, P., & Govindaraju, V. G. R. C. (2011). Automotive industry in Malaysia: an assessment
of its development, Int. J. Automotive Technology and Management, 11(2), 152–171.
http://dx.doi.org/10.1504/IJATM.2011.039542
Yusoff, R. M, Majid, M. S. A, & Razali, A. N. (2006). Macroeconomic Variables and Stock
Returns in the Post 1997 Financial Crisis: An Application of the ARDL Model, Paper presented
in 6th
Global Conference on Business & Economics, Gutman Conference Center, USA, 15-17
October 2006.
Copyright Disclaimer
Copyright reserved by the author(s).
This article is an open-access article distributed under the terms and conditions of the
Creative Commons Attribution license (http://creativecommons.org/licenses/by/3.0/).

Business and Economic Research
ISSN 2162-4860
2013, Vol. 3, No. 2
www.macrothink.org/ber 127
From Cyber Bullying to Cyber Coping: The Misuse of
Mobile Technology and Social Media and Their Effects
on People‟s Lives
Eddie Fisher (Corresponding author)
Faculty of Social Sciences, Universidad de Oriente, Santiago de Cuba, Cuba
Univerzita Palackeho, Olomouc, Czech Republic, 8 Kendal, Swindon,
Wiltshire, SN5 8HW, United Kingdom
Tel: 44-179-349-0423 E-mail: [email protected]
Received: August 27, 2013 Accepted: September 17, 2013
doi:10.5296/ber.v3i2.4176 URL: http://dx.doi.org/10.5296/ber.v3i2.4176
Abstract
The ability to deal and cope with cyber bullying attacks is becoming increasingly important to
children and young people in the United Kingdom although this phenomenon appears to be
acute in many other countries, too. This paper investigates and provides a deeper understanding
of what the effects of cyber bullying have on people‟s lives. The results show that there is a
relationship between an increase in access to digital technology and the methods cyber bullies
apply to threaten, harass, humiliate and embarrass people. Results suggest that parents,
teachers, employers and owners of social media sites are not educating and coaching young
people sufficiently so that these can stay safe in a world of texting, twittering and social
networking. The research suggests a number of practical solutions such as incentivized
schemes and engaging young people in cyber bullying awareness focus groups. It is anticipated
that this will help young people to develop their own levels of responsibilities to make
informed decisions what is safe for them to access, view and act upon.
Keywords: Cyber bullying, Mobile phone technology, E-Safety, Social networks, Attitude and
behavior
1. Introduction
1.1 Introduction
It appears that the misuse of mobile technology and social media networks is becoming

Business and Economic Research
ISSN 2162-4860
2013, Vol. 3, No. 2
www.macrothink.org/ber 128
epidemic not just in the United Kingdom but also in other countries such as the United States. A
few years ago words such as “cyber bullying” or “e-safety” would not have meant much to
most people. Today these words appear to have become part of people‟s everyday vocabulary.
The meaning of these words is clear to most people but not everyone understands what the
consequences are to people‟s lives who are, for example, cyber bullied. According to Giant
(2013) the explosion of twentieth-century technology has been unprecedented and most people
cannot remember a time when this technology did not exist. Mobile technology allows people
to communicate with each other at any time anywhere in the world. It is possible to send
pictures and video clips to friends and family at the click of a button. This revolution has
changed people‟s lives irreversibly. The vast majority of children and young people own a
computer and mobile phone which gives them unlimited access to information and allows them
to share this information with others across the globe (Rogers, 2010). Older people perhaps
have developed a sense of caution not to trust technology blindly. In contrast, younger people
do not have this balanced view. They were born and are brought up in a world that is full of
technology that forms a substantial part of their everyday lives. It appears that the technology
has become a right to most young people. This explains why the technology is used extensively
throughout their daily lives, exceeding the uses of most adults by a substantial margin. With the
right to have and use this technology also come responsibilities such as how to use the
technology responsibly and in such a way that no direct or indirect harm is caused to other
people. This is the theory but reality looks different. Access to the new technology has led to an
increase in misuse or abuse of this technology leading to many incidents of threatening,
harassing, embarrassing and humiliating behaviors and actions. Cases of so-called cyber
bullying have become proportionately sophisticated as access to the new technology has grown.
Predators can target their selected audience quite easily and with hardly any effort and at very
low cost if any. The misuse of mobile technology and social media has become a concern of
parents, social psychologists and authorities including schools, colleges and universities. The
aim and objectives of this research are to investigate the current status of the misuse of mobile
technology and social media in the UK and some other countries. The research will suggest
practical mitigations to try and help young people to move from cyber bullying to cyber coping
(Figure1). The article further aims to promote the responsibilities of safe and acceptable use of
these and to mitigate the risks of misuse whether at work, in schools or at home, and the role
social psychology needs to play to achieve the desired outcomes.
Cyber Bullying Social Psychology Cyber Coping
Figure 1 From Cyber Bullying to Cyber Coping
Threaten
Harass
Humiliate/Denigrate
Embarrass
Blackmail
Flaming/Exclusion
Educate
Self-Confidence
Attitude/Behavior
Real/Cyber Worlds
Online Protocols
Influencing/Persuasion
Being in Control
Shrug off Attacks
ICT Astute
Respect for Others
Face to Face Comms
Know who to Trust

Business and Economic Research
ISSN 2162-4860
2013, Vol. 3, No. 2
www.macrothink.org/ber 129
1.2 Literature Review
1.2.1 Misuse of Mobile Technology and Cyber Bullying
According to some recent research by Giant (2013), it is difficult for people to conceptualize
what the Internet and related technologies actually represent. It is therefore more difficult for
people to rely on their intuitions and common sense to navigate through the maze of technology.
Common sense usually develops a degree of maturity and a sense of individual responsibility.
A moral appreciation of right and wrong also falls into this category. These qualities are
generally linked to age and children/young people are not expected to hold the same degree of
maturity, responsibility and moral values as the adults around them. Experience does matter in
this context. With so many people having access to the Internet and associated mobile
technologies, it is perhaps too late to pretend that this technology does not exist. The time has
come to make explicit not just the benefits of the new technology but also the risks associated
with it. This should also include the related responsibilities to keep everyone safe and ensure
people‟s well-being in both the real and the “virtual” world. Giant suggests that the issue of
cyber bullying is only as old as the technologies used to hurt and denigrate others. The research
and study of cyber bullying is still growing but perhaps not as fast as the phenomenon itself.
Giant quotes Belsey (2004, p.1) who defines cyber bullying as a phenomenon that
“…..involves the use of information and communication technologies to support deliberate,
repeated and hostile behavior by an individual or group that is intended to harm others”. Giant
points out further that any technology can be used for both positive and negative effects but the
extremes to which mobile phones, online platforms and other forms of technology are abused
to bully others, often leaves,for example, parents, youths and teachers astounded.
Giant suggests that there are seven forms of cyber bullying:
1. Flaming: sending angry, rude, vulgar messages directed at a person or persons
privately or to an online group
2. Harassment: repeatedly sending a person offensive messages
3. Denigration: sending/posting rumors, harmful, untrue information about a person to
others
4. Cyber stalking: harassment that includes threats of harm or is highly intimidating
5. Impersonation or masquerading: to be another person and posting/sending material
online to make them look bad
6. Outing or trickery: tricking a person into sending information (secrets, embarrassing
information) that can be used to send to others online
7. Exclusion: excluding someone purposefully from an online group, for example, an IM
or BBM list
Source: Willard (2007)

Business and Economic Research
ISSN 2162-4860
2013, Vol. 3, No. 2
www.macrothink.org/ber 130
Giant (p.23) considers that “It is widely understood that face to face communication is
conducted not only through the spoken word but through tone, intonation, body language and
other non-verbal cues that alert participants to potential discrepancies, incongruencies or
dangers. Virtual communication often asks participants to make a judgment about the content
by relying solely upon the words with which they are presented. This can be particularly
difficult for children and young people with less maturity, awareness of risk and connection
with their intuition or an inner sense of right and wrong”. Different types of technology such as
text and instant messaging, E-mail and online chat rooms are often used as a method of
harassment, discrimination and bullying of others. Giant considers that some form of
harassment or cyber bullying maybe deemed to be a criminal offence as far as adults are
concerned. This consideration is particularly relevant in the context of this research as many
cyber bullying offences are committed by those who are over 18 years of age. Giant suggests
that there is a difference in opinion among researchers whether cyber bullying is a phenomenon
that is perpetrated by and affects more girls than boys. Both sexes are using the technology and
can, therefore, also experience cyber bullying, and both could be just as likely to commit it. It
appears that girls are more likely to be involved in cyber bullying.
According to Lenhart (2007) and Smith et al (2008), this is perhaps due to the increased
likelihood of girls utilizing relationally aggressive tactics which can be suitably employed
online. This includes isolation, rumor and gossip spreading and otherwise damaging and
manipulating relationships to gain power and control. Hinduja and Patchin (2009) found that
girls engaged in cyber bullying for longer than boys, and employed different tactics, including
taking pictures of victims and posting them online.
The Kaiser Foundation in the United States (2010) reports that young people 8-18 years old
spend more than seven and a half hours each day using some form of media or technology,
including TV, games consoles or a computer. This does not include the 90 minutes or so each
day that young people spend texting or talking on the phone. Except time spent sleeping or at
school, this means that young people spend every possible moment using some form of
technology. This raises the possibilities and potential for bullying, access to inappropriate
content, unsafe conduct and general health and social risks related to technological over-use.
The Pew Research Centre (2010) in the United States found that ¾ of teens now have a mobile
phone, with as many as 58% of 12-year olds owning a phone, up from just 18% of such teens as
recent as 2004. Researchers found that 93% of both teens and adults aged 12-29 years of age go
online, compared to only 74% of all adults. A study conducted by the international consumer
research specialist Intersperience (2012) declared that 65% of the approximate 32 million
Smartphone users in the United Kingdom would declare themselves to be “lost” without their
phone. An Ofcom (2011) report that specifically studied the use of technology, suggests that
81% of Smartphone users have their phones switched on all of the time, even when they are in
bed, with 40% of teens admitting to using their Smartphone after it woke them. An earlier study
conducted by Ofcom (2010) found that young people between 5-15 years of age:
1. Only 1% of 12-15 year olds in the United Kingdom do not have access to the Internet
at home

Business and Economic Research
ISSN 2162-4860
2013, Vol. 3, No. 2
www.macrothink.org/ber 131
2. Half of 5-7 year olds (49%), 2/3 of 8-11year olds (67%) and ¾ of 12-15 year olds
(77%) have a TV in their bedroom
3. 85% of parents trust their children to use the Internet safely
4. Only 34% of parents whose children are aged 12-15, are likely to be concerned about
Internet content
A study conducted by Carnegie Mellon University concluded that Internet use leads to small
but statistically significant increases in misery and loneliness and a decline in overall
psychological well-being (De Angelis, 2000). With this increasing use of the Internet and
related technologies in children as young as two years old, there is a debate among
psychologists as to the prevalence of a psychological disorder associated with online use.
Labeled by some as Internet Addiction Disorder (Goldberg, 1996), studies suggest that the
growth of addictive behavior is typical among heavy Internet users (Greenfield, 1999; Young,
1998).
“The web filtering standard set by Becta (2012, p.1) should be considered as the technical
minimum threshold for safe Internet access for children and staff in education as no other
implementable standard currently exists”. Becta sets an accreditation standard for filtering
products or services, including a need for the product or service to block 100% of illegal
material identified by the Internet Watch Foundation (CAIC) List. The software should be able
to block approximately 90% of inappropriate Internet content in categories such as violence,
race hate material, illegal drug taking and criminal skill/activity.
From June 2012, Ofsted (2012), the UK school inspection authority, will feature e-safety and
cyber bullying as part of school inspection criteria. The aim is to ensure that students not only
feel safe at school but also understand how to keep themselves and others safe.
Rogers (2010) suggests that mobile technology and access to social networks gives young
people almost unlimited access to information. This positive side is overshadowed by a darker
side. The misuse of technology to threaten, harass, humiliate and embarrass victims is defined
as “cyber bullying”. Particularly young people are affected by this approach of psychological
attacks.
Rogers considers that cyber bullying is just as unacceptable as physical bullying, leaving
emotional rather than physical scars. The emotional damage is not tangible so victims are often
left with a feeling that there is no safe place to escape to and that they cannot trust anyone
anymore. Young people need to be encouraged and made feel comfortable to talk about how
they use the Internet and their mobile phones. Victims need the language to be able to express
what has happened to them, to know that it is wrong and to be able to tell someone they can
trust. This is now of widespread concern how children and young people can stay safe in a
texting, twittering and social networking world. Rogers considers that cyber bullying is
different from ordinary bullying in a number of ways. The bullies can keep a safe distance
between themselves and their victims. They maintain anonymity. There are no feelings of guilt
or empathy. Cyber bullying can take place 24 hours a day, seven days a week. Table 1 is a
summary of the most common used cyber bullying methods. Rogers suggests that it is also

Business and Economic Research
ISSN 2162-4860
2013, Vol. 3, No. 2
www.macrothink.org/ber 132
important for parents to encourage young people to keep detailed records of any offending
material or communication, as this could be used later on in court or by some service providers
to make their sites/services safer. It is important to guide young people to deal with “real
world” issues in the “real world” and not to get side-tracked into cyber land. Young people
should accept only friends from the real world as friends on social networks such as My Space
and Twitter. Rogers suggests that parents should be particularly aware of changes in attitudes
and behaviors of young people such as being upset after using the Internet or making adverse
comments about friends or observing changes in their relationships with friends.
Fisher and Gonzalez (2013) suggest that contextual performance such as parents helping their
children, teachers helping their students and employers helping their employees, is increasing
in importance in today‟s social environments. Parents, teachers and employers not only have to
deliver their social responsibilities but should also work together as a team to create social
opportunities that foster responsible individual and group attitudes and behaviors that
strengthen the cyber coping capabilities of young people. An essential tool to achieve these
goals is the ability to influence and persuade others.
Bhat et al (2011) suggest that cyber bullying or bullying using information and
communications technology becomes more and more widespread. The Asian region accounts
for one of the highest regions in the world as far as mobile phone and Internet users are
concerned. It appears that students in particular experience cyber bullying which in turn leads
to several detrimental psychosocial effects that detract from their ability to be successful in
school. In some instances, student suicides have been linked to cyber bullying goals. The
outcome of their research suggests a number of ways of reducing cyber bullying and other
harmful uses. This includes the sharing of knowledge about media literacy elements such as the
definition of cyber bullying and behavioral examples of types of actions that constitute cyber
bullying, knowledge and understanding of the types of ICT used to cyber bully, the roles in
cyber bullying including that of active cyber bully, secondary cyber bully, observer and target,
what actions each one can take to prevent cyber bullying and the specific actions students
should take if they are cyber bullied. Some of these actions could be taking screen shots,
printing evidence, speaking to trusted adults, not retaliating as this often escalates the cyber
bullying and what the clear consequences are for those who engage in cyber bullying.
These initiatives are targeted at teachers and students as Bhat et al consider that students cannot
achieve improvements on their own. Parents are a key element of media literacy initiatives.
Parents provide and pay for computers, Internet connections, and cell phones and should
acknowledge that it is a parental responsibility to teach children how to use these powerful
forms of communication in an ethical and safe manner. Parents need to know and understand
that with children who are minors, they can be held accountable for the actions of their
children.
In contrast, Klick et al (2012) suggest, based on some research they conducted in the United
States, that mobile technology has made a significant positive contribution to people‟s lives
and they link mobile phone use to a historic drop in the crime rate and urges
policymakers to encourage individuals to carry their cell phones with them as a way to

Business and Economic Research
ISSN 2162-4860
2013, Vol. 3, No. 2
www.macrothink.org/ber 133
further deter crime. Klick et al report a novel contributing factor to help explain the
remarkable crime decline of the 1990s, when crime rates dropped by about a third
across all crime categories. Mobile phones allow for quicker reporting of crimes and
in some cases real time communication of details about the crime and the criminal.
The perceived risk of apprehension could increase among motivated offenders when
they notice potential targets are carrying a mobile phone. As technology has improved
to allow the transmission of photographic images, identification, apprehension,
prosecution and conviction all presumably become even more likely.
Jones and Mayo (2013) consider whether electronic media such as smart phones,
iPods, computers and tablets are contributing to society’s growing physical
estrangement. Jones and Mayo argue that the reverse is true. People who use social
media sites such as Facebook are also the most sociable people in real life. Social
media actually creates more opportunities for meeting up. It allows people to be more
spontaneous and creates more face to face socialization, not less. People prefer to
belong to communities irrespective of whether these are online or physical such as the
village shop or local Post Office. If people find value in social relationships, then being
a member of a social media community such as Facebook ranks much higher
provided that it reflects people’s values and beliefs appropriately.
Table 1. Summary of Common Cyber bullying Methods (Source: Rogers, 2010)
Cyber bullying Method Details
Text Messages Takes the form of messages that are threatening, offensive or persistent
Picture/Video clip via
Mobile Phone Cameras
Clear images are captured to make the victim feel threatened or embarrassed.
Random physical assaults are filmed and shared.
Mobile Phone Calls Bullies bombard victims with silent or persistent calls and abusive messages or
steal the phone and harass others, causing the victim to appear responsible for the
call
E-mails Multiple E-mail accounts make it easy to send threatening or bullying E-mails
using a pseudonym or somebody else‟s name
Chat rooms Can be a good and safe way to communicate for young provided security measures
are in place. Can easily become a forum for menacing and targeting people
Instant Messaging (IM) Once messages are posted, they are in “cyber land”. Things can get out of hand
and can include groups of people ganging up on one target
Social Networking Sites Can be misused without appropriate security settings. Easy to spread rumor and
gossip. Children often accept strangers as “friends” and give access to personal
information. It is possible to cyber target by posing as someone else. Bullies can
retain anonymity and stalk their victims
Websites Bullies can set up defamatory blogs or create personal websites featuring their
victim. They can set up online polling sites asking an unlimited number of
questions about the victim

Business and Economic Research
ISSN 2162-4860
2013, Vol. 3, No. 2
www.macrothink.org/ber 134
1.2.2 Media Reports/Studies and Court Room Cases
Media Reports/Studies:
Daniel Perry (17 years old): Sky News reports on 18 August 2013 that police are investigating
claims that a teenage boy killed himself after being targeted by online blackmailers. He is
thought to have fallen victim of to a scam where Internet users are lured into online chats and
then blackmailed. It is believed that he thought he was talking to a girl of similar age in the US
state of Illinois for several months through Skype and other websites. It appears that he killed
himself on 15 July 2013 when he was told by the blackmailers that the conversations he had
with the girl would be shared with his family and friends unless he paid up.
The Huffington Post reports on 18 August 2013 that Sergeant Jeremy Scott, a serving police
officer who posted an offensive message online following Baroness Thatcher‟s death, has
resigned. He is understood to have written on social networking website Twitter that he hoped
that Baroness Thatcher‟s death was “painful and degrading”. His resignation was accepted by
Scotland Yard with immediate effect.
His resignation comes after figures from Scotland Yard revealed that three police officers have
been sacked for misusing social media over the past five years. Allegations linked to the use of
sites including Facebook and Twitter have been recorded against 75 Metropolitan police
officers since 2009, with 38 of the claims substantiated.
BBC West reported in July 2013 that Ben Townsend, 25 years old, received a fine of £1000 by
a local court and a life time ban by Cheltenham Football Club for racially abusing two
footballers on Twitter. The offence took place in May 2013 after a football match between
Northampton Town FC and Cheltenham Town FC. Responses from other Twitter users alerted
the police who tracked him down and arrested him.
Another offender, Swansea student Liam Stacey, was jailed in 2012 for making racist remarks
about another footballer on a social media site. These examples should be tough lessons for the
users of social media that the law still applies online. On 16 June 2013 Sky News reported that
the first juror to be prosecuted for contempt of court using the Internet has been jailed after her
online activities led to a retrial in a multi-million pound drugs case. Joanne Fraill was
sentenced to 8 months prison.
Court Room Cases:
The researcher engaged in practical field research, by attending public hearings at a Swindon
Magistrates Court over a prolonged period of time (October 2012 to August 2013), capturing
extensive relevant research data to act as supportive evidence. The court cases listed below
involved incidents of theft, fraud, domestic violence, drug dealing and grievous bodily harm
(GBH). The statistical analysis of the research sample suggests that more than 70% of court
cases involve the misuse of mobile phones or social media networks. Of the actual cases where
the misuse of mobile or social media technology was evident, approximately 55% of cases
ended up in domestic violence or physical assaults. 45% of cases resulted in drug
dealings/abuse and mental/physical threats (Table 2).

Business and Economic Research
ISSN 2162-4860
2013, Vol. 3, No. 2
www.macrothink.org/ber 135
Table 2. Statistical Analysis of Observed Court Cases/Trials October 2012 to August 2013
Type of Case/Trial Number of Cases/Trials Percentage of Total Number
Irrelevant:
Traffic Violations 15 10
Theft 15 10
Fraud 10 7
Total: Relevant: 40 27%
Domestic Violence 30 20
GBH 30 20
Drug Abuse/Dealing 20 13
Threats 30 20
Total: 110 73%
1. Young man aged 24 years of age splits up with his girl friend. She continues to hassle
him by sending text messages to his mobile. He cannot cope and decides to sleep in
his car in a public car park. Consumed food and alcohol in the car and turned on the
engine during the night to keep warm. A routine police patrol leads to his arrest for
being drunk in charge of a motor vehicle. He loses his driving license for 12 months.
2. A young couple splits up. He meets her sometime later and takes her mobile phone to
check text messages and detailed call records as he suspects that this all happened
because of her new boy friend. He then sends threatening messages/makes threatening
calls to her new boy friend. He was issued with a community order for 80 hours of
community work.
3. A well-known drug dealer uses the Blackberry Messaging (BBM) facility on his
mobile phone to discuss with his friends the details of a new drug delivery. He gets
arrested during a routine check of his car (some drugs found) and the Police
confiscate and analyze call and text details from his mobile phone which includes
details of his „conference calls‟ with his friends. The case in currently pending and
will almost certainly lead to a custodial sentence for this drug dealer.
4. Young man relaxes at home and has some alcoholic drinks. Receives compromising
text messages from his girl friend who thinks he is cheating on her. He wants to sort
this out immediately and drives his car to see her but is stopped by Police for erratic
driving and is convicted of drunk driving. He loses his license for 12 months.
5. Young man receives threatening text messages on his mobile. Replies go backwards
and forwards, ultimately leading to a visit to the other person‟s home where the young
man commits aggravated bodily harm. He is found guilty and a suspended custodial
sentence is awarded plus 60 hours of unpaid community work.

Business and Economic Research
ISSN 2162-4860
2013, Vol. 3, No. 2
www.macrothink.org/ber 136
1.3 Knowledge Gap
The literature review from this current research has confirmed that there is a need to develop
and train young people much more and using a different approach in the safe and appropriate
use of mobile technology, such as texting and picture/video sending, and associated social
media sites such as Facebook and Twitter. Established subject matter experts suggest that
increasing awareness levels and providing guidelines for young people in how to use mobile
technology and media sites are adequate activities to help young people stay safe in today‟s
texting, twittering and social networking world. Reality appears to differ. Recent incidents
(Section 1.2) suggest that the existing training and guidance that is provided to young people is
not working effectively and that perhaps a different approach needs to be developed and
implemented that closes this gap.
Young people who are emotionally disturbed and affected by, for example, adverse comments
made about their appearance on a social media site, are unlikely to make good use of any social
media site‟s help and support tool or ask parents or trusted friends for help and advice. They
appear not to be in control of themselves anymore and this leads to irrational and uncontrolled
responses to these cyber bullying attacks. The practical insights from solicitors and district
judges from face to face meetings together with the suggested views of the researcher will help
to close the knowledge gap.
1.4 Main Research Questions/Hypotheses
The main research questions for this research are:
1. How widespread is cyber bullying really? Are the effects as serious as is reported by the
media?
2. What practical and workable solutions can be developed to improve and increase the e-safety
of young people?
3. Does a potential shortcoming exist between the existing e-safety training and guidance that
is provided by education authorities, parents and employers?
4. How can the contributions to knowledge from this research be practically applied to help
young and mature people to cope better with incidents of cyber bullying or mobile technology
abuse?
The following hypotheses were constructed:
H1: The increased use of mobile phones and its technology leads to higher/lower levels of
criminal activities. There is a proportionate relationship between the use of mobile technology
and social media and an increase in domestic violence/aggravated bodily harm (GBH)
H2: Mobile phone operators and providers of social media sites are discharging their social
responsibilities of educating young people more in the safe use of the technologies and
associated applications
H3: People are using mobile technology and social media as a substitute for face to face

Business and Economic Research
ISSN 2162-4860
2013, Vol. 3, No. 2
www.macrothink.org/ber 137
communications. This affects the ability to socialize and develop interpersonal relationships
adversely
H4: Parents, teachers and employers are failing in their duty of care to take ownership of
providing young people with practical advice that is fit for purpose for the intended audience.
Incentive schemes could improve this situation
2. Research Methodology
2.1 Method
The researcher considered that a qualitative research approach was most appropriate for this
research and therefore applied a constructivist interpretivist research approach within a
phenomenological research paradigm. He considered that this was most appropriate and
defendable in order to make a valid and reliable contribution to knowledge. In addition, some
quantitative research approach was used to capture relevant statistical information from the
court cases and to strengthen the resulting conclusions drawn from this evidence. The outcome
of this research is applicable to both academics and practitioners. The aim and purpose of this
research is to suggest new practical approaches to combat cyber bullying and misuse of mobile
technology amongst primarily young people and how these should be applied to make them
work effectively. As such, it is important that, for example, parents and teachers experience the
new approaches themselves to confirm that these are valid and reliable. The researcher
suggests that an increase in the use and abuse of mobile technology and associated social media
sites (Section 1.1) has necessitated the need for this research and to propose more effective
solutions to develop e-safety in young people. Two solicitors from a local law firm in Swindon
and twelve district judges and other solicitors from the Swindon Magistrates Court were
interviewed by the researcher during face to face and ad hoc interviews. The interviews were
conducted between October 2012 and August 2013 and recorded verbatim to ensure that all
responses were captured correctly, including meaning as intended. Interviews were
semi-structured. Participants‟ ages ranged from 35 years to 55 years and they had between ten
and thirty years of practical work experience. The participants were asked what their
experiences were with cyber bullying and misuse of mobile technology in court cases and to
provide appropriate details to support their statements subject to data protection limitations.
The researcher then focused his attention on capturing what the participants considered to be
the main applications of cyber bullying and misuse of mobile technology and what the
participants considered to be practical approaches to mitigate or eliminate the effects of these
phenomena on young people.
2.2 Data Collection, Interpretation and Triangulation
The researcher considered three methods to collect relevant research data to answer the main
research questions and hypotheses from Section 1.4: a review of the literature, relevant media
reports/studies, court room cases (Section 1.2) and face to face interviews (Section 3.1), within
the context of a phenomenological research paradigm and an associated constructivist
interpretivist research approach. The researcher, in his role as participant observer, added his
contributions of what he considers are practical and effective means to reduce or eliminate the

Business and Economic Research
ISSN 2162-4860
2013, Vol. 3, No. 2
www.macrothink.org/ber 138
effects cyber bullying attacks have on young people in order to obtain different perceptions of
the phenomena under investigation. Data was collected over different time frames and from
different sources.
The researcher applied triangulation as a means to use a combination of different methods in
order to reduce reliance on a single method.
3. Results
3.1 Face to Face Interviews
Two local solicitors from a local law firm were interviewed by the researcher to collect further
evidence and to capture the insights of the solicitors based on their practical experiences as law
practitioners. In addition, twelve ad hoc and planned interviews took place before and after
actual court hearings with district judges and other solicitors at Swindon Magistrates Court.
These short interviews typically lasted 30 minutes. The purpose of these interviews was to
gather additional relevant and reliable information from law practitioners. The research
materials used were a semi-structured questionnaire with open-ended questions for the face to
face interviews. Further open-ended questions were used during these semi-structured
meetings to elicit further data from the participants, for use in the triangulation of the collected
data. The participants in the research were given details of the purpose of the research. The
researcher asked all participants to give open and honest answers that were based on, for
example, what the participants had actually done and how they had done it. Where participants
strayed from this path, the researcher quickly pulled interviewees back onto the right track. The
planned interview lasted around three hours. All interviews took place in appropriate meeting
room surroundings to put the participants at ease and to create a relaxed atmosphere that aided
a genuine participation. The law practice solicitors (Rob and Chris) considered that mobile
technology is increasingly being misused by drug dealers to target their existing and potential
new audiences via applications such as texting, Blackberry Messaging (BBM) and social
media such as Twitter and Facebook. The number of court cases where defendants are
convicted of crimes due to the misuse of mobile technology and social media is on the increase.
People‟s phone numbers, their names and other personal details such as home address are often
quoted in these types of communications which are then easy to obtain by the Police and the
Courts. Police now have access to much improved technology that allows for faster and more
accurate retrieval of appropriate data that can then be used in the Court Room, for example, to
convict the guilty party or parties very effectively. Forensic Telecommunications Services
(FTS) in the UK can retrieve data and images from any mobile device up to 12 months since the
data and images have been deleted and provide the Police with detailed accounts which are
admissible as evidence in court. Rob and Chris reported that iphones are increasingly used to
show inappropriate material to very young children. Predators encourage young girls on Skype
to commit to do inappropriate sexual activities. The number of offenders in this respect is on
the increase and Rob and Chris have recently been engaged in a larger number of cases than,
for example, compared to 5 years ago. It is suggested that most young people between the ages
of 14 and 24 live their lives through the use of mobile technology and social media. Mobile
technology and social media have been seen to be the catalyst of new crimes. Rob and Chris

Business and Economic Research
ISSN 2162-4860
2013, Vol. 3, No. 2
www.macrothink.org/ber 139
suggest that young people need to be educated much earlier (Age 8 onwards) in the appropriate
use of mobile technology and social media.
The interviewed district judges and other solicitors suggest that there has been a substantial
increase in court cases in the United Kingdom where incidents of aggravated and grievous
bodily harm are directly attributable to the incorrect/misuse of mobile technology or social
media sites.
This includes text messaging, phone calls and sites such as Facebook and Twitter. The police
are providing increasing levels of evidence such as details of SMSs and MMSs. They consider
that this situation is becoming epidemic, judging by the number of cases involved. They
suggest that this could be as high as 2/3 of all court cases. As technology improves further, new
opportunities will open up for criminals and cyber bullies to look for new ways of making this
work for their intended purposes. Cyberspace and Satellite services will enhance the
availability of what has been communicated and when, by whom and how. This issue is live
and it is necessary to take proactive action to provide much stronger and relevant help and
support to young people (Table 3). They suggest that young people aged 8 years of age and
over need to be educated in a number of ways such as age dependant training films, posters in
schools, colleges and Universities and regular class room sessions with practical exercises that
address both the bullied and the bully so that young people can see both perspectives. They
consider that mobile phone operators and owners of social media sites also need to take more
proactive social responsibilities by developing positive attitudes and solutions to reduce cyber
bullying and mobile phone misuse substantially.
Table 3. How to Improve E-Safety-Application and Ranking of the Considered Solutions
Skills Application Ranking
Building
Self-Confidence
and becoming
“Cyber Coping”
Developing an ability to say “No” and ignoring acts
of cyber bullying will develop higher levels of
self-confidence in emotionally unstable youngsters
There is a relationship between the attitude people
hold towards what others stand for and how they
respect them. People must not be used as a means to
an end. All communications must be genuine and
authentic. Showing empathy and sincerity are the
building blocks of authentic interpersonal
relationships
Young people need to learn not to copy others who do
engage in undesirable activities such as cyber
bullying by following their own values and beliefs of
what is right and wrong and what is acceptable and
unacceptable behavior towards others
Considered important by the
literature review and face to face
interviews
Considered by all parties to be
highly important. Young people
who develop the right attitude
will be less likely to engage in
cyber bullying and mobile
misuse activities *
Considered important by the
literature review and the face to
face interviews. Young people
should not follow the “herd
instinct” but decide for
themselves by considering, for

Business and Economic Research
ISSN 2162-4860
2013, Vol. 3, No. 2
www.macrothink.org/ber 140
Young people need to acquire more in depth
knowledge of the concepts of influencing and
persuading as these are the skills of effective cyber
bullies. Appearing to be trustworthy, self-confident
and secure are the traits of effective
influencers/persuaders who then misuse these skills
to their advantage by cyber bullying others
successfully.
Developing a better understanding of the impacts the
misuse of mobile technology and social media sites
have on society will help young people to see the
much wider picture of the negative effects these
concepts have on business in general and the
economy
example, the consequences of
their actions and the effects these
could have on others
Identified by all parties to be
highly important *
Considered important by the
literature review and face to face
interviews
*Literature review, face to face interviews and media reports/studies
4. Discussion
The evidence from the literature review, face to face meetings with law professionals, media
reports and actual court room cases suggests that there is a link between the increasing use of
mobile technology and social media websites and increased levels of associated crimes. This is
not limited to committing crimes that affect the other person(s). Recent suicide cases such as
Hannah Smith (2013, aged 14) and Daniel Perry (2013, aged 17) suggest that young people are
not sufficiently informed and trained how to deal and cope with the social pressures they are
placed under by cyber bullies such as threatening behaviors and malicious rumors. They may
not be aware of and appreciate the consequences the various forms of cyber bullying can have
on the lives of other people, irrespective of the victim‟s age. Older people can be emotionally
unstable or uninformed and fall victim to cyber bullying, too. There is no panacea for all-round
success to stop cyber bullying and the misuse of mobile technology and social media sites but it
is important to take more proactive actions to alleviate the problem as much as is practically
and realistically possible. Actions speak louder than words and it is the responsibility of parents,
teachers, employers and mobile services operators/owners of social media sites to increase the
e-safety of young people. E-safety needs to start at home. Parents need to spend more quality
time with their children to explain the various forms of cyber bullying in detail. They should
then use real life examples to show their children what it feels like to be cyber bullied by
another person and what the consequences are. Young people need to experience what it “feels
like” to be cyber bullied.

Business and Economic Research
ISSN 2162-4860
2013, Vol. 3, No. 2
www.macrothink.org/ber 141
Parents need to encourage their children (aged 8 and above) to report and talk about cases of
cyber bullying and incentivize them to do so willingly. They need to change their children‟s
attitude to feel good about the reporting of incidents and reward this behavior with gifts
appropriate to the age of the young person. Young people should adopt that asking for help is
considered to be a strength and not a weakness. This whole approach could achieve desired
repeat behaviors and have a knock-on effect on other parents and their children. Teachers need
to work closely with parents to ensure that there is a consistent and co-operative approach
between them (one version of the truth) and that young people are getting the message that
cyber bullying is unacceptable. Teachers could set up focus groups that address cyber bullying
and the misuse of mobile technology and then share the work of these groups during school
assembly, on specifically designed posters that appeal to young people and by sending out
regular “Cyber Coping” bulletins. Mobile phone operators and owners of social media sites
need to provide more practical advice to users such as what forms of misuse exist, what the
effects are on the victims and what the legal implications are for those who cyber bully others.
Cyber bullying can affect how people perform at work and directly affect a company‟s
reputation which in turn can lead to loss of business, customers and profit. Employers should
make it clear to employees that cyber bullying is not an acceptable behavior and that proven
cases will lead to dismissal and/or prosecution. Help should be offered to employees who are
victims of cyber bullying through professional coaching services. Human Resources (HR)
need to ensure that this is reflected in company HR policies. The four hypotheses of this
research are supported by strength of evidence from the literature review, face to face
interviews, media reports/studies and court room cases (see Table 4 for a summary of the
results), namely:
H1: The increased use of mobile phones and its technology leads to higher/lower levels of
criminal activities. There is a proportionate relationship between the use of mobile technology
and social media and an increase in domestic violence/aggravated bodily harm (GBH). This
premise holds true. Although some evidence suggests that the wider availability of mobile
phones has made some contribution towards reducing potential crimes, mobile phone misuse
and social media abuse crime rates in the United Kingdom have increased in recent years. This
includes cases of domestic violence and GBH
H2: Mobile phone operators and providers of social media sites are discharging their social
responsibilities of educating young people more in the safe use of the technologies and
associated applications. This hypothesis is valid. There is sufficient evidence from the
outcomes of this research that suggests that mobile phone operators and owners of social media
sites are not committed to engage in devising and implementing e-safety improvement
programs for young people
H3: People are using mobile technology and social media as a substitute for face to face
communications. This affects the ability to socialize and develop interpersonal relationships
adversely. This is a valid hypothesis. Young people are spending more of their time on the
phone and using social media sites to communicate with each other.
It appears that face to face communications are no longer the preferred method of

Business and Economic Research
ISSN 2162-4860
2013, Vol. 3, No. 2
www.macrothink.org/ber 142
communicating with each other
H4: Parents, teachers and employers are failing in their duty of care to take ownership of
providing young people with practical advice that is fit for purpose for the intended audience.
Incentive schemes could improve this situation. This premise holds true.
These groups are not sufficiently engaged in proving young people with appropriate practical
advice and support to cope with incidents of cyber bullying and mobile technology better and
more effectively. Awards and incentivized schemes to achieve good repeat behaviors would
make a major contribution to improve the identified shortfall
Table 4. Hypotheses and Research Questions: Summary of Results
Hypothesis Related Research Question(s) Results
H1: The increased use of mobile
phones and its technology leads to
higher/lower levels of criminal
activities. There is a proportionate
relationship between the use of
mobile technology and social
media and an increase in domestic
violence/aggravated bodily harm
(GBH)
1. How widespread is cyber
bullying really? Are the effects as
serious as is reported by the
media?
2. What practical and workable
solutions can be developed to
improve and increase the e-safety
of young people?
The evaluation of the literature was
positive but not conclusive to
determine what needs to be done
practically. The face to face
interviews and media reports
concluded that parents, teachers and
employers need to focus their efforts
more on those identified as being
vulnerable whilst at the same time
provide in depth coaching for the
wider community
H2: Mobile phone operators and
providers of social media sites are
discharging their social
responsibilities of educating
young people more in the safe use
of the technologies and associated
applications
3. Does a potential short coming
exist between the existing
e-safety training and guidance
that is provided by education
authorities, parents and
employers?
4. How can the contributions to
knowledge from this research be
practically applied to help young
and mature people to cope better
with incidents of cyber bullying
or mobile technology abuse?
The literature was not positively
conclusive and did not provide
sufficient valid and reliable evidence
that suggests that this is the case.
Inputs from the face to face
interviews and court cases suggest
that the providers of such services
are not seen to be engaging in
activities that lead to a reduction in
cyber bullying and mobile phone
misuse
H3: People are using mobile
technology and social media as a
substitute for face to face
communications. This affects the
ability to socialize and develop
interpersonal relationships
adversely
2. What practical and workable
solutions can be developed to
improve and increase the e-safety
of young people?
4. How can the contributions to
knowledge from this research be
practically applied to help young
The literature is positively
conclusive that young people in
particular are not communicating
directly with each other anymore.
This has been supported by evidence
from the court room cases and
reports/studies by the media.

Business and Economic Research
ISSN 2162-4860
2013, Vol. 3, No. 2
www.macrothink.org/ber 143
and mature people to cope better
with incidents of cyber bullying
or mobile technology abuse?
H4: Parents, teachers and
employers are failing in their duty
of care to take ownership of
providing young people with
practical advice that is fit for
purpose for the intended audience.
Incentive schemes could improve
this situation
2. What practical and workable
solutions can be developed to
improve and increase the e-safety
of young people?
3. Does a potential shortcoming
exist between the existing
e-safety training and guidance
that is provided by education
authorities, parents and
employers?
The evaluation of the literature was
positive but not conclusive. The face
to face interviews and inputs from
the media studies/reports and court
room cases suggest that these groups
do not focus their attention and are
not sufficiently engaged and
committed to reduce or eliminate
cyber bullying and mobile phone
abuse amongst people of all ages
(but particularly the young and
inexperienced)
5. Conclusions
The technological revolution has changed people‟s lives forever and irreversibly. With the
considered right to have access to and being able to use this technology when and where people
want, come social responsibilities. Digital communication has grown much faster than people
of all ages have been able to catch up with. Technology is increasingly misused to threaten,
harass and embarrass victims and methods known as cyber bullying have become more
sophisticated and widespread. By working in partnership and driving each other to succeed,
parents, teachers, employers and mobile phone operators/owners of social media sites can
reduce and alleviate risks of misuse, promote responsibilities and foster positive attitudes and
behaviors in younger and more mature people. Young people have a very short attention span
so it will be important to concentrate efforts where the greatest achievements can be realized in
the shortest period of time. It is encouraging that the Office for Standards and Education and
Children‟s Services and Skills (Ofsted) in the United Kingdom has included e-safety and cyber
bullying as part of school inspection criteria since June 2012. No empirical data is available yet
that could provide evidence of how successful this initiative has been at the end of its first year.
Combating the misuse of mobile technology and social media sites is a long journey and many
steps need to be taken to complete it. The research was limited to a relatively small number of
district judges and solicitors from the Magistrates Court in Swindon. Insights and subject
matter knowledge from a larger sample of law professionals would have provided richer and
diverse research data to address the research scope in more depth and universally. Further
research should be conducted to assess and confirm the actual cost to the economy of the
effects of cyber bullying such as loss of income to employers, employing more counselors in
educational establishments and the need for additional law professionals. It is confirmed that
the research scope from Section 1.4 has been answered and that all four hypotheses hold true
and are valid in the context of this research.

Business and Economic Research
ISSN 2162-4860
2013, Vol. 3, No. 2
www.macrothink.org/ber 144
References
Becta. (2012). About the Department, London: Becta,
www.education.gov.uk/aboutdfe/armslengthbodies/900192537becta
Belsey, B. (2004). Cyberbullying Definitions, Canada: Cyberbullying Canada,
www.cyberbullying.ca
Center, www.pewInternet.org/Reports/2010/Social-Media-and-Young-Adults.aspx
De Angelis, T. (2000). Is Internet addiction real?, Monitor on Psychology, 31(4), 24-26
Fisher, E. J. P., & Santana Gonzalez, Y. (2013, b). The Art of Influencing: How Managers Can
Put ‘Squar Pegs’ into ‘Round Holes’, Journal of Management Research, 5(4), 1-19,
Macrothink Institute, http://dx.doi.org/10.5296/jmr.v5i4.3971,
Giant, N. (2013). E-Safety For The i-Generation-Combating The Misuse and Abuse Of
Technology In Schools, Jessica Kingsley Publishers
Goldberg, I. (1996). Internet Addiction Disorder, New Jersey: Rider University,
http://users.rider.edu/~ruler/psycyber/supportgp.html
Greenfield, D. (1999). Virtual Addiction: Help for Netheads, Cyber Freaks and Those Who
Love Them, Oakland, CA: New Harbinger Publications
Hinduja, S., & Patchin, J. W. (2009). Bullying Beyond the Schoolyard: Preventing and
Responding to Cyberbullying, Thousand Oaks, CA: Sage Publications
Intersperience Research Limited (2012). I am My Smartphone, Cumbria, UK: Intersperience,
Jones, G., & Mayo, E.(2013). What future community?, benhealth magazine, Issue 24, pp.6-7,
Autumn Edition, Benenden Healthcare Society
Klick, J.; MacDonald, J., & Stratmann,T. (2012). Mobile Phones and Crime Deterrence: An
Underappreciated Link, Research Handbook on the Economies of Criminal Law, Alon Harel
and Keith N Hylton, eds.,IJ of Penn, Inst. Ofr Law and Econ Research Paper No 12-33
Lenhart, A. (2007). A Timeline of Teens and Technology, Washington, D.C.: Pew Internet and
American Life,
http://www.pewInternet.org/Presentations/2007/A-Timeline-of-Teens-and-Technology.aspx
Ofcom. (2010). UK Children’s Media Literacy, London, Ofcom,
http://stakeholders.ofcom.org.UK/binaries/research/media-literacy/ukchildrensm11.pdf
Ofcom. (2011). A Nation Addicted to Smartphones, London: Ofcom,
http://media.ofcom.org.uk/2011/08/04/a-nation-addicted-to-smartphones
Ofsted. (2012). Handbook for Inspecting Schools in England under Section 5 of the Education
Act 2005 (as amended) from September 2012, London: Ofsted
Pew Research Center. (2010). Social Media and Young Adults, Washington, D.C: Pew
Research
Business and Economic Research
ISSN 2162-4860
2013, Vol. 3, No. 2
www.macrothink.org/ber 145
Rogers,V. (2010). Cyber Bullying- Activities To Help Children And Teens To Stay Safe In A
Texting, Twittering, Social Networking World, Jessica Kingsley Publishers
Smith, P., Mahdawi, J., Carvalho, M., Fischer, S., Russell, S., & Tippett, N. (2008).
Cyberbullying: Its nature and impact in secondary school pupils, Journal of Child Psychology
and Psychiatry, 49, 4, 376-385, http://dx.doi.org/10.1111/j.1469-7610.2007.01846.x
Willard, N. (2007). Cybersafe Kids, Cyber-savvy Kids: Helping Young People Learn to Use
the Internet Safely and Responsibly, San Francisco: CA: Jossey-Bass.
www.intersperience.com/article_more.asp?art_id=43
Young, K. S. (1998). Caught in the Net: How to Recognize the Signs of Internet Addiction-and
a Winning Strategy, New York: John Wiley and Sons.
Copyright Disclaimer
Copyright reserved by the author(s).
This article is an open-access article distributed under the terms and conditions of the
Creative Commons Attribution license (http://creativecommons.org/licenses/by/3.0/).

Business and Economic Research
ISSN 2162-4860
2013, Vol. 3, No. 2
www.macrothink.org/ber 146
New Evidence from Assessing the Tobin Tax Effects on
Exchange Stability and Trade
Dr. Said Jaouadi
Dept. of Finance and Banking, Jazan University
PO Box 114, Jazan, KSA
Tel: 966-7321-4436 E-mail: [email protected]
Received: June 28, 2013 Accepted: July 17, 2013
doi:10.5296/ber.v3i2.3929 URL: http://dx.doi.org/10.5296/ber.v3i2.3929
Abstract
The paper attempted to find out the economic effects of setting up a tax on currency
transactions. Professor James Tobin was the first to propose the particular taxation to reduce
the exchange volatility. Many authors interested by the Tobin tax topic, raised many statements
against implementing such tax, they argued that it should tend to raise the fluctuations of
exchanges rates, and in return, finish by harming the international trade.
In the empirical investigation of the paper, we carried out an econometric modeling focused on
data about exchange rate volatility, international trade. To explore the effects of the Tobin tax
on exchange volatility and international trade, we calculated the currency transactions costs
according to a new methodology, covering the period 1990 – 2011, and finding out the effects
of the taxation on the exchange market of these countries: United Kingdom, Japan and
Germany.
The empirical investigation underlines two major findings, which allow us to reinforce
establishing the tax on currency transactions, proposed by Professor James Tobin. The model
puts emphasis on the decreasing effect of the Tobin tax on exchange volatility, it enabled us to
infer that the currency taxation is contributing to improve the exchange rates stability.
According to the estimation findings, the currency tax has positive impact on foreign trade, this
evidence authorized us to denote that the Tobin tax tends to promote international trade
transactions.
Keywords: Tobin tax, Speculation, Trade volume, Volatility, Transactions costs, Foreign
currency tax, Exchange market, Foreign exchange.

Business and Economic Research
ISSN 2162-4860
2013, Vol. 3, No. 2
www.macrothink.org/ber 147
1. Introduction
In 1972, Professor James Tobin suggested in conference at Princeton to set up a tax equal to 1%
on every currency transaction. For the author, applying tax on exchange market will have the
same impact of throwing sand in the wheels of international finance, to reduce the speculation
and in return the exchange market volatility.
In recent years, the Tobin tax topics were widely broached as critical question in international
debates, imposing a tax on currency transactions should generate several benefits. The
proposal of James Tobin was primarily targeting to reinforce the exchange markets stability.
Although, during the last few years, many NGO contributed to diffuse the Tobin tax principle
in the media and hereby, they facilitated the advertisement for the topic and created widespread
for the tax proposal in international meetings. The prime interesting output of the Tobin tax
project relies on the huge revenues generated from the taxation, which should help poor
countries in eradicating poverty, according to theses NGO.
The Tobin tax becomes the prime issue of the bulk of debates in economic reviews and
academic journals, because of its positive economic effects cited above. The focus of the
international comunityon the Tobin tax issue made the Tobin proposal a pivotal question to
fight poverty in developing countries, like promoted by several NGO.
2. Literature review
In economic theory, carrying out a tax on currency transactions seems a difficult task without
agreement of the bulk of the developed countries. Therefore, many authors elaborated other
variants of the Tobin tax. The preliminary assessment of their theoretical development were
encouraging to establish such tax.
2.1 The new Variants of Tobin Tax
In fact, to apply a tax on currency transactions, we pointed out several difficulties that thwart
implementation such taxation. Many authors contributed to develop flexible forms of the Tobin
tax and to find solutions to some obstacles that could make the overwhelming Tobin tax project
impossible to set up.
2.1.1 The Variant of Spahn
According to Spahn (1995), carrying out a tax on currency transactions could face several
problems to come through, the author argued that: “analysis has shown that the Tobin tax as
originally proposed is not viable and should be laid aside for good.”
For Spahn, the major obstacle thwarting the Tobin tax project, remains in the distinction
between normal liquidity and speculative trading in exchange market, the author stresses1: “It
is virtually impossible to distinguish between normal liquidity trading and speculative noise
trading.” In the sum, the author puts emphasis on carrying out a tax on currency transactions
could be harmful with high rate and ineffective with low rate.
1Spahn, P. B. 1995. “International financial flows and transactions taxes: Survey and options.” IMF working paper
WP/95/60.

Business and Economic Research
ISSN 2162-4860
2013, Vol. 3, No. 2
www.macrothink.org/ber 148
To avoid this problem, Spahn proposed to impose a tax on currency transactions with double
items: low fix rate for normal currency transactions, and high variable rate solely applied in
period of speculative noise trading.
2.1.2 The proposal of Eichengreen et al
According to Eichengreen et al2, exchange volatility is the direct result of speculative
transactions in currency market, the authors attributed crucial role for banks to reduce the
speculative trading volume. They suggested that banks should make special deposits without
interest returns on the monetary authorities, the amount of deposit will depend on the volume
of exchange transactions of short run.
With the new financial rule advanced by Eichengreen et al, it should virtually eliminate the
speculative transactions on the currency market.
2.1.3 The variant of Schmidt
According to Schmidt, the Tobin taxation is a partial solution to avoid international financial
crises, through limiting speculative transactions on currency markets.
The author argued that currency markets are decentralized, unregulated and moving, so any
country attempting to apply the Tobin tax, will push the transactions of its currency to be made
on offshore markets.
To thwart this weakness, the author suggested the importance of establishing the taxation on
major developed countries, to avoid concurrence among countries and the tax revenues should
be retrieved on the place of the currency transaction.
2.2 The Tobin Tax and its Effect on Currency Volatility
In economic literature, there are many theoretical essays founded to explore the relationship
between taxing the currency transactions and the exchange volatility.
Introducing these theoretical developments remains quite important to illustrate the importance
of this taxation in the international finance, we can sum up the effects of implementing the
Tobin tax into two major statements:
2.2.1 Stabilizing the Speculators Expectations
It seems crucial to describe the stabilizer effect provided by implementing the Tobin tax,
because, it should eliminate the opportunities to generate profits from speculative trading,
through the deviations registered in the exchange rates market.
The stabilizer effect becomes more effective when the tax value is high, so we can argue that
affecting the speculators expectations has major role to alter the decisions of noise trading on
the currency market.
Reducing the speculator activities on currency markets should decrease the possibility of
2Eichengreen B., Wyplosz C. and Tobin J. 1993. “Two cases of sand in the wheels of international finance”, Economic
journal, volume 13.

Business and Economic Research
ISSN 2162-4860
2013, Vol. 3, No. 2
www.macrothink.org/ber 149
currency crisis creation, and avoid the crisis contagion effects among countries. The
speculators plaid guilty in many papers for the advent of several crises. According to Taketa
(2003): “it is quite important to investigate how such speculators can affect the market during
contagious currency crisis.”
2.2.2 The Negative Impact on the Currency Market Liquidity:
Fixing the amount of the tax on currency transactions should reduce the liquidity in the
currency market and in return, it could harm the market efficiency. The lack of liquidity due to
the Tobin taxation could arise preliminary fluctuations, and finish by increasing the currency
volatility.
In several surveys, some authors stressed that there is no link between liquidity of currency
market and the stability of exchange rates. Because of the simple reason that the rise of
liquidity in the currency market in recent years, did not reduced the number of financial crises.
According to (Bernardos, 2009)3: “the creation of the first real estate bubble was mainly driven
by great liquidity at global scale between 2001 and 2005.”
2.2.3 Assumptions
Setting up a tax on currency transactions should arise directly the currency transactions costs.
So, finding out the effect of these costs on exchange volatility and international trade, allows us
to examine the effect of Tobin tax on volatility and foreign trade.
3. Empirical Evidence
3.1 The Aliber Model
The examination of the effects of the Tobin taxation on currency market was primarily
concerned through many papers and surveys, many authors attempted to explore the real
impact of the taxation on exchange volatility and international trade.
3.1.1 The Model Presentation
In 2001, Aliber et al4 carried out an empirical model to analyze the effect of a tax on currency
transactions on the exchange volatility and the international trade. The authors put forward
their model according to the following introduction:
(1)
(2)
Where and are error terms. Volatility represents the difference of exchange rate between
two years.
3Bernardos G. 2009. “The rise and fall of the first global real estate bubble”, paradigmes issue n°2, June 2009, p99 – p106. 4Aliber R. Z., Bhagwan C. and Yan S. 2001. “Some evidence that a Tobin tax on foreign exchange transactions may increase
volatility”, European Finance Review, 7, pp. 481-510, 2003.

Business and Economic Research
ISSN 2162-4860
2013, Vol. 3, No. 2
www.macrothink.org/ber 150
The variable “Cost” makes up the cost of currency transactions in the exchange market, the
examination of its impact, thoroughly points up the effect of Tobin tax, due to the relevant
positive relationship between the taxation and the transactions costs.
For the variable “Trade”, it makes up the volume of transactions of futures, the variable
indicates the number of long term transactions in the currency market, and in return, it reflects
the volume of transactions of international trade. The sample of the empirical investigation
conducted by Aliber et al (2001) includes 4 developing countries: USA, Japan, Germany and
UK.
3.1.2 The Methodology
In economic literature, we assume that costs depend on the difference between the two terms of
equilibrium in the market. Therefore, there is margin between supply and demand, which
makes up the transaction costs of the market.
For Aliber et al, the currency market is considered in equilibrium if we reach the equality of the
terms of the arbitration operation, following the presentation below:
(3)
Where: i and i* are the domestic and the international interest rate.
F is the exchange rate future and S is the exchange rate spot.
Making the logarithm of (3), it provides
(4)
Making the difference between two periods T1 and T2, it gives
(5)
We can sum up the relation in
(6)
We finish by finding
(7)
For the authors, the difference between the two terms of the equation, represents the cost of
currency transactions on the market.
Therefore, the authors make the covariance of the difference between the two terms of the
equality (7), using the following formula:

Business and Economic Research
ISSN 2162-4860
2013, Vol. 3, No. 2
www.macrothink.org/ber 151
(8)
3.2 The New Approach
In this paper, we used another approach to calculate the costs of currency transactions. We
considered another equilibrium condition, particularly distinct than the relationship adopted by
Aliber et al (2001) focused on the arbitration operation, between the future rate and spot rate.
3.2.1 The Methodology
In the current paper, we conducted our empirical investigation focusing on the equality of
Fisher. The latter resumed the equilibrium relationship between the real interest rates between
the country and international interest rate. According to Fisher, countries using their production
factors intensively, have the same development, in return we should finish by getting equality
of their real interest rates.
The Fisher equality of real interest rates among countries is made up as following
iD = i* (9)
Where iD the domestic real interest rate and i* the international real interest rate. The nominal
returns of interest rates are roughly equal to the real interest rate minus the price level, which
give
ID - PD = I* - P* (10)
Where: PD the domestic price index, P* the international price index, ID the domestic nominal
interest rate, and I* the international nominal interest rate.
We Finished by founding:
ID - I* = PD - P* (11)
We can sum up the Fisher relationship, as compensating the variation of nominal interest rate
by variation in the price index.
From equation (11), we can calculate the costs of currency transactions from the value of the
difference between the two terms of this equality, as done by Aliber et al (2001).
(12)
From the equation 12, we can determine the cost of currency transactions by calculating the
covariance:
(13)

Business and Economic Research
ISSN 2162-4860
2013, Vol. 3, No. 2
www.macrothink.org/ber 152
3.2.2 The Data
In the current paper, we used data about the exchange rate to calculate volatility, and the real
and nominal interest rates and the exports and imports as shares of GDP, as variable reflecting
the international trade. We collected the data from the database of the World Bank, World
Development Indicators 2013. The sample of the elaborated survey is covering the period 1990
– 2011. We estimated our model using the method of ordinal least squares (OLS), for panel of
three developed countries: Japan, Germany and Great Britain.
3.3 Comparing the Results of the Two Approaches
The model estimation authorized us to explore the effect of Tobin tax on volatility and
international trade. We put forward the results in table 1 and table 2, to compare between the
two approaches of costs calculations.
Table 1. The effect of the Tobin tax on the exchange rates volatility.
The results of Aliber et al The results of the new approach
countries Great Britain Germany Japan Great Britain Germany Japan
Constant -- -- -- -0.004
(-0.54)
0.5
(2.63)
-9.03
(-0.84)
Transactions costs 12.1**
(2.24)
2.76
(0.53)
16.8***
(3.25)
0.09**
(2.5)
-0.36**
(-2.53)
6.77
(0.68)
Exchange volatility t-1 0.55***
(10.94)
0.46***
(8.4)
0.36***
(6.24)
0.2
(1)
-0.14
(-0.65)
0.23
(0.87)
R2 31% 21.3% 18.5% 30.4% 27.4% 12.8%
For the results of the effect of setting up Tobin tax on the international trade, they are
summarized in the Table 2.
Table 2. The effect of the Tobin tax on international trade.
The results of Aliber et al The result of the new approach
countries United Kingdom Germany Japan United Kingdom Germany Japan
Constant -- -- -- -0.14
(-0.1)
39.5**
(2.53)
-3.97
(-1.39)
Transactions costs -1.27***
(-3.56)
-1.86*
(-1.82)
-2.44***
(-3.66)
1.3
(0.97)
-27.4**
(-2.41)
4.83*
(1.79)
Exchange volatility 0.11***
(3.55)
0.49***
(4.54)
0.371***
(5.19)
17.3
(1.17)
-12.2
(-0.79)
0.06
(0.93)
International trade t-1 0.78***
(23.31)
0.85***
(30.01)
0.78***
(22.46)
-0.25
(-1.13)
-0.27
(-1.09)
-0.29
(-1.25)
R2 73.3% 80.8% 72.2% 18.2% 28.1% 24.8%

Business and Economic Research
ISSN 2162-4860
2013, Vol. 3, No. 2
www.macrothink.org/ber 153
According to Aliber et al, it seems that establishing a tax on currency transactions tends to raise
the exchange volatility and to reduce the international trade for countries applying this tax.
These effects remain statistically significant at 5% at the most cases for the sample of the
estimation. Therefore, the authors argued that applying the Tobin tax on currency markets has
destabilizing effect by rising the exchange volatility for countries, and finish by harming the
international trade value.
In table 1, all the R2 of the models are weak, including the results of Aliber et al, therefore, the
models elaborated did not explain the reality because of the sensitivity of the volatility concept.
For which many econometric models and methods are developed, we can cite the examples of:
ARCH, GARCH, EGARCH, FIGARCH…
Although, according to the new approach adopted to calculate the currency costs, we found that
establishing tax on currency transactions tends to reduce the exchange rates volatility. So
imposing the Tobin tax could potentially stabilize the fluctuations of the exchange rates in the
market. The statement is consolidated by (Erturk, 2013)5, the author emphasizes: “the core
issue remains the contention that a small transactions tax would stabilize international currency
markets by reducing volatility.”
According to the tables, with the new approach of cost calculation, we found that for Germany,
the cost transactions tend to reduce the volatility of the exchange rate. This result allows us to
infer that establishing the Tobin tax could contribute to reduce the fluctuations of the exchange
rate, according to (Palley, 2003)6: “the tax would reduce volatility, in turn reducing the
volatility risk…”
For Japan, it seems that setting up a tax on currency transactions tends to raise the international
trade. We could explain the result by focusing on the effect of the Tobin tax on the expectations
of speculators, the tax contribute to reduce the opportunities to generate profits from
fluctuations of the exchange rate among countries. The benefic effect of Tobin tax when
targeting the international trade depends on the level of the tax compared to the costs supported
by traders. (Dodd, 2003)7 highlights: “the Tobin tax is small relative to the lower cost
advantages of trading in the US over countries and this small tax would not there overwhelm
these cost advantages.”
4. Conclusion
This paper finished by providing new evidences in favor of fixing the Tobin tax in the financial
world economy. Through the empirical investigation, the survey call into question the
evidences found by many authors about the rise of volatility of exchange rates related to
applying tax on currency transactions and about harming the international trade.
The Tobin tax remains promoting project and its harmful effects identified in the paper of
Aliber et al, remain limited after altering the methodology of currency costs calculations,
5Erturk K. A. 2013. “On the Tobin tax”, Department of economics, University of Utah. 6Palley T. I. 2003. « the economic case of the Tobin tax », debating the Tobin tax, new rules for Global finance, Washington
DC. 7Dodd R. 2003. « Lessons for Tobin tax advocates: the politics of policy and the economics market micro-structure »,
Derivatives study center.

Business and Economic Research
ISSN 2162-4860
2013, Vol. 3, No. 2
www.macrothink.org/ber 154
which represent the major empirical effort exerted in this paper.
The current paper attempted to sum up the effects of posing a Tobin tax in economic literature
and provided new findings. The last should consolidate adopting such tax, because it could
reduce volatility of exchange and improve the transactions of international trade. Primarily,
many countries like Chili and Malaysia begun establishing variant to this tax in their exchange
market and they reached significant economic effects, in favor of reinforcing the financial
market stability and the international trade.
The results provided by this paper lead to infer that the Tobin tax could be an effective tool to
reduce the exchange rates volatility and to promote the international trade. Given the threats of
exchange instability, it seems reasonable to reinforce taxation on currency transactions, to
promote exchange operations of international trade and to avoid the consequences of financial
crises.
Eventually, the current paper is contributing to rehabilitate the Tobin tax proposal and to
reinforce the hope to establish it. Recently, many NGO are encouraging the currency taxation.
The economic effects of the tax argued by Professor James Tobin are not the major motivation
of many international organizations. But, the huge volume of tax revenues has seduced many
authors and NGO, it could serve to eradicate poverty in developing countries.
References
Aliber R. Z., Bhagwan C. and Yan S. (2001). Some evidence that a Tobin tax on foreign
exchange transactions may increase volatility, European Finance Review, 7, 481-510, 2003.
Bernardos G. (2009). The rise and fall of the first global real estate bubble, paradigmes issue
n°2, June 2009, 99-106.
Eichengreen B., Wyplosz C., & Tobin J. (1993). Two cases of sand in the wheels of
international finance, Economic journal, volume 13.
Erturk K. A. (2013). On the Tobin tax, Department of economics, University of Utah.
Frenkel J. (1977). Transactions costs and interest arbitrage: tranquil versus turbulent periods,
journal of political economy, vol 85.
Palley T. I. (2003). The economic case of the Tobin tax », debating the Tobin tax, new rules for
Global finance, Washington DC.
Riggs A. R., & Velk T. (1999). The Tobin tax: a bad idea whose time has passed, Policy
options.
Rodney S. (1999). A feasible foreign exchange transactions tax, Research Associate The North
South Institute.
Rodney S. (2000). Is the Tobin tax practicable?, international development research center
government of Canada, June 2000.
Shi K. (2008). Entry cost, Tobin tax, and noise trading in the foreign exchange market, Hong

Business and Economic Research
ISSN 2162-4860
2013, Vol. 3, No. 2
www.macrothink.org/ber 155
Kong University of science and technology, Simon Fraser University.
Singh J., & Yadav P. (2011). Tobin tax and its applicability in India, international journal of
multidisciplinary research, vol.1 issue 7.
Spahn P. B. (1996). La taxe Tobin et la stabilité des taux des changes, FMI, Finance et
Développement.
Spahn, P. B. (1995). International financial flows and transactions taxes: Survey and options.
IMF workingpaper WP/95/60.
Stotsky J. (1996). Pourquoi une taxe Tobin double est vouée à l’échec ? Finance &
Développement, Juin 1996.
Taketa K. (2003). A large speculator in contagious currency crises: a single « George Soros »
makes countries more vulnerable to crises, but mitigates contagion, Department of Economics,
University of Wisconsin-Madison.
Copyright Disclaimer
Copyright reserved by the author(s).
This article is an open-access article distributed under the terms and conditions of the Creative
Commons Attribution license (http://creativecommons.org/licenses/by/3.0/).
Business and Economic Research
ISSN 2162-4860
2013, Vol. 3, No. 2
www.macrothink.org/ber 156
Is It Possible to Create Goods from Thin Air Using
Money and an Expenditure Multiplier?
Gennady Bilych
Dept. of Management, UPEC Corporation, Belgorod
20 Popova str., 308000, Belgorod, Russia
Tel: 7-472-220-2033 E-mail: [email protected]
Received: September 29, 2013 Accepted: October 15, 2013
doi:10.5296/ber.v3i2.4341 URL: http://dx.doi.org/10.5296/ber.v3i2.4341
Abstract
Most sensible people will not think to dispute the fact that any active government monetary
policy that has no solid theoretical or empirical grounding should be thought of as an
irresponsible experiment with completely unpredictable consequences for the economy.
However, as surprising as it may be, this is exactly the policy in use today in many countries all
over the world in the hope of overcoming the crisis and reviving national economies. The
results of empirical studies on the effects of a certain amount of money on economic growth are
rather contradictory and do not allow us to definitively evaluate the effectiveness of
government intervention. The Keynes Theory, which for a long time served as scientific proof
of the entry of the government to a market, has been the object of fierce criticism for the last 40
years. Little is left of the proud status it once enjoyed. Many economists are still only willing to
support Keynes when he states that under certain circumstances, an unexpected increase in the
money supply may have a positive effect on the function of the economy. Author argues that
such attempts to refute the neutrality of money are theoretically unfounded and contradict
empirical data and additional money in a crisis is more likely to be a poison rather than a cure.
Keywords: Money, Monetary Policy, Multiplier, Keynes Theory, Economic Growth
1. Introduction. Scientists and Engineers
Mankiw (2006) rightly noted that there are two types of economists: engineers and scientists.
The engineers address the important practical issues. Their efforts are primarily aimed at
improving the function of the economy. They are in a constant struggle against unemployment,
crises, inflation and other market imperfections. Most macroeconomists are, of course,
engineers, or in any case strive to be. Engineers often become advisers to politicians and

Business and Economic Research
ISSN 2162-4860
2013, Vol. 3, No. 2
www.macrothink.org/ber 157
sometimes become politicians themselves; they occupy positions in commissions, committees
and working groups. They write speeches and develop programmes for current and future
presidents and prime ministers. They have a high level of authority and they are in demand. In
my opinion, however, the close link between engineers and politicians has now become a major
problem for society. The problem lies in the fact that engineers have now come to depend on
politicians to the same extent that politicians depend on them. Today, the level of prestige of
macroeconomics as a profession largely depends on the level of interest of politicians towards
engineers. This dependency is, of course, rather dangerous; the danger has to do with the fact
that very many politicians and state officials have a vested interest in expanding their influence
over the economic life of society. The prestige of their profession is, to a significant extent,
determined by the size of the budget they manage. This is why politicians usually have a highly
sympathetic attitude towards any theories that justify government intervention. I am by no
means judging certain individuals, but it cannot be denied that a situation such as this is far
from ideal.
Mankiw believes that scientists have a different objective – to understand how the world is
built, how the market system works. Scientists are mainly focused on microeconomic issues.
Their choice is easily explained. Economic scientists believe that in order to understand
macroeconomic issues we have to thoroughly study the mechanism of interaction of individual
economic agents and only then can we move on to discussing the function of the economy as a
whole. The relationship between these two types of economists has never been simple.
Engineers criticise scientists for ignoring the interest towards real markets and for attempting
to create their own theories on very dubious grounds. Engineers believe that there are no ideal
markets, no perfect competition and no balance in real life, and if there are they are very rare,
an exception. We live in a world of imbalance and imperfect competition, therefore all
microeconomic theories are invalid. What is proposed instead? Even less realistic grounds for
forming theories: money illusion, liquidity preference and animal spirits (Keynes, 1973;
Krugman, 2008; Skidelsky, 2009; Akerlof and Shiller, 2009). For some reason it is also thought
that some people are not subject to all these preferences and illusions, therefore only they are
able to think sensibly and advise the rest. Naturally engineers believe that they are the only
ones who are capable of doing this, which I personally doubt, given the confusion that prevails
in the macroeconomic environment every time there is a crisis. These strange grounds are not
only used to develop theories, but also serve as a basis for practical steps taken towards
improving the function of the economic markets. The results of these practical steps usually
seem less than convincing. Most macroeconomic theories do not even stand up to basic
empirical tests. Furthermore, many theories contradict not only microeconomic foundations of
science, but also plain common sense. For some reason, however, this does not concern
engineers in the least and does not prevent them from bringing their dubious ideas to life. There
is no need to recall what came out of the realisation of the ideas of one of the first economic
engineers in history. Fortunately Marx was not a practising engineer, but unfortunately he did
have many practising followers. Thanks to their efforts and advice, economies in many
countries were put back hundreds of years, to the Middle Ages. Marx’s preaching on the
immorality of the free market became so deeply ingrained in people that even today certain
rather well-respected economists attempt to use them as scientific arguments (Akerlof and

Business and Economic Research
ISSN 2162-4860
2013, Vol. 3, No. 2
www.macrothink.org/ber 158
Shiller, 2009; Sandel, 2012; Skidelsky, 2009). All of their moral limitations of the free market
that they tirelessly state are in fact absolutely immoral from the point of view of those who are
affected by such limitations. It is not only economic engineers who are responsible for this
situation; microeconomic scientists, too, are responsible. Today much depends on the
viewpoint of scientists, their voice is important in discussions of practical issues associated
with attempts to regulate the economy. How actively and successfully they defend their views
will have a great impact not only on the future of our science and the authority of economists,
but also on the level of people’s wellbeing. In order to win over people’s minds and
demonstrate that they, the scientists, are right, they do not need to create complicated, obscure
theories, filling them with endless mathematical equations. Very often, using only common
sense and the simplest truths, success can be achieved and dubious economic experiments can
be avoided. Today the circumstances are such that scientists have now become the only force
that is able to and must stand up against the dangerous tandem of engineers and politicians.
This paper does not set out to do much. I would simply like to try to analyse the influence of an
increase in the money supply on inflation, employment and economic growth and also discuss
the function of the multiplier mechanism. For this purpose I will critically examine currently
existing microeconomic grounds for the lack of neutrality of money. The influence of an
amount of money on business activity and the function of the multiplier are used by many
economists in order to justify intervention in the economy with the aim of correcting what they
believe to be imperfections in the function of the free market. I will primarily be interested in
the response and actions of economic agents and which macroeconomic effects these actions
bring about. The analysis will be based solely on simple ideas and arguments that nobody can
refute and also common sense.
2. Literature Survey. Inflation, Employment and Economic Growth
As stated by Lucas (2009), the matter of the effect of an amount of money on economic activity
has been given so much attention and so much has been written about it that one could assume
that the issue had long since been resolved. However, this is not the case. The issue was not
resolved during the times of Keynes, nor in the 1970s, nor the 1990s and today there is still no
satisfactory answer to the question. Now almost all economists, with few exceptions (for
example Akerlof and Shiller, 2009), are only willing to unconditionally support the claim that
money is neutral in the long term. In this case there is a rare unanimity. There have never been
any serious theoretical and empirical objections to this claim. It is enough to recall the
respected and credible work of McCandless and Weber (1995), which gives a correlation
between the increase in the monetary base and inflation and also between the increase in the
monetary base and the actual production output during different time intervals in a large sample
of 116 countries. The result, especially for large time intervals, is consistent with the
quantitative theory of money. Inflation rises in the same proportion as the amount of money
and the actual production output does not depend at all on the increase of the money supply.
The short-term effect of the increase in an amount of money is far from obvious. According to
data from McCandless and Weber (1995), in the short term, with a moderate increase in the
money supply, there is a rather large range of values for inflation and production. This fact

Business and Economic Research
ISSN 2162-4860
2013, Vol. 3, No. 2
www.macrothink.org/ber 159
alone does not say much. When looking at the influence of money on the economy, it is
important to remember that money can only have an effect on certain economic parameters
when it is really involved in the process of market exchange. When additional money appears
in an economy, economic agents need time to make a decision on how to use it. This means that
money does not start to actively participate in market exchange processes right away. Briefly
speaking, this can be expressed as follows: money cannot instantly be absorbed into an
economy as there are transaction costs of exchange. Therefore there is nothing surprising about
the uncertainty of the results of the short-term effects of money. Furthermore, in the late 1960s,
thanks to the efforts of Friedman (1968) and Phelps (1968), insight was given into the causes of
the uncertainty associated with the consequences of the short-term effects of money and
reasonable doubts were expressed regarding the effectiveness of the countercyclical monetary
policy carried out by the authorities. It became clear that the short-term effect of money on real
economic indicators depends on the predictability of the actions of the authorities. A rational
and informed economic agent would not immediately increase output in response to an
increase in prices of their own products. Only people with limited information who are
suffering from monetary illusion would act in accordance with the wishes of regulatory bodies.
This approach seriously undermined the theoretical foundations of economic regulation, which
is why many economic engineers rushed to defend their ideas. The struggle continues to this
day with mixed success.
It must be recognised that the empirical studies available today do not allow us to give a
definitive answer to the question of the short-term effect of money on economic activity. In a
sample of 100 countries from 1960 to 1990, Barro (1995) discovered a weak negative
relationship between inflation and economic growth. Barro and Sala-I-Martin (2004) confirm
this conclusion also noting a significant inhibitory effect of high inflation on output growth.
Fischer (1993) suggests that high inflation lowers labour productivity growth rates. Some
authors (Rindyck and Solimano, 1993) believe that high inflation has a negative effect,
especially on making investment decisions. It also inevitably raises a question: what level of
inflation should be considered high and what happens in the event of a moderate increase in an
amount of money? Ghosh (1997) defined the threshold value of inflation having a positive
impact on growth as 10% per year. Fischer (1996) believes that the threshold is in the region of
15% and Sarel (1996) is certain that inflation of less than 8% is harmless and has no significant
effect on the economy. Many economists believe that the threshold value of inflation depends
on the particular economic features of a country. Khan, Senhadji and Smith (2001) suggest that
the threshold value of inflation for developed countries is in the region of 1% and for
developing countries – in the region of 11%, and with lower values of inflation they were not
able to define the relationship between growth and inflation. The empirical results of studies
for 42 economies conducted by Lopez and Mignon (2011) give threshold values of 2.7% and
17.5% respectively; with inflation below the threshold values, a very weak relationship is
observed between the increase in the monetary base and the growth in the economy.
The issue of the influence of inflation on employment also lacks clarity. Lucas (2009), using
the results of Stockman (1996), rightly notes that just because there is a Phillips Curve in
certain short periods of time, we should not draw hasty conclusions on the positive effects of

Business and Economic Research
ISSN 2162-4860
2013, Vol. 3, No. 2
www.macrothink.org/ber 160
inflation on employment. If we look at long periods of time, we can easily be clear that periods
of a positive slope in the Phillips Curve are inevitably followed by periods of a negative slope
and vice versa. This is confirmed by the results of numerous studies. Some of them indicate a
positive link between inflation and employment (for example: Caporale and Skare, 2011),
others do not agree (for example: Hooker, 2002).
What conclusion can be drawn from all this? At present there are no arguments in favour of the
positive influence of moderate and high inflation in the long term. Furthermore, all researchers
note the unambiguously harmful effects of high inflation. In the short term the situation is not
entirely clear, some researchers confirm the positive effect of money, others reject this effect. It
is surprising that this has no effect on the activity of regulatory authorities and monetary
authorities who persist in trying to influence market processes, despite the very dubious end
results of their activity. This is just like trying to embark on a round-the-world trip with a
newly-built ship full of passengers that nobody has checked is seaworthy against the advice of
the ship’s engineers.
The mechanism of the expenditure multiplier has received extremely widespread coverage in
economic literature (Blaug, 1993; Benassy, 2007; Corsetti, Meier and Muller, 2012; Giles,
2012; Romer, 2012), and practically in every macroeconomic textbook there is a whole section
on the wonderful way in which it works (for example: Mankiw, 2007). A great deal of scientific
work is currently devoted to discussing the values of the multiplier for different economies and
markets and also explaining the reasons for its volatile character. The reality of the multiplier
effect is not really disputed by anyone, although there are certain doubts regarding its fantastic
capabilities (Moore, 1994; Hazlitt, 1959; Stoddard, 2010; Barro, 2009). This is strange and
surprising if you consider the improbable and unrealistic consequences that it could potentially
have. For example, you could very well have a situation where the increase in output and profit
of a certain company could be many times greater than initial investments. This unusual
situation should be the rule for large vertically-integrated companies. Indeed, if a certain
subdivision of a company decides to invest a certain amount of funds into expanding
production and increasing profit, this should automatically increase profits and production in
all other subdivisions. Consequently, regardless of the desires, abilities and efforts, the
productivity of labour in all subdivisions will increase by itself. A fantastic result! What more
does one need to be happy! Another example, any dictator can easily create conditions in a
country whereby the multiplier will be infinite, or in any case will reach a very high value. The
prosperity and success of the country will be guaranteed. Of course such assumptions have no
common sense; neither do they have any sense of history of how a certain family dispute could
provoke a real business crisis in a small town or how the broken windows of a shop and the
window of your neighbour are able to cause an economic boom. These light-hearted tales are
clearly only included in textbooks to cheer up students studying the multiplier effect
(McConnell and Brue, 2005). At the same time, these stories should sow seeds of doubt and
encourage microeconomists comprehensively analyse such strange inventions of
macroeconomists as the multiplier or the effect of money on economic activity. I will try to
follow this advice and analyse the behaviour of rational and irrational people in response to the
appearance of additional money in an economy.

Business and Economic Research
ISSN 2162-4860
2013, Vol. 3, No. 2
www.macrothink.org/ber 161
3. The Models of Production of Goods from Thin Air
3.1 Money and Economic Growth
It may seem surprising, but today, in order to theoretically justify the lack of neutrality of
money in the short term, economists usually use the same arguments used by David Hume
([1752], 1970) in his time. His explanations sound so common, natural and convincing that
they have long since been taken as self-evident and banal truths. However, nothing is as simple
as it seems at first glance. A more detailed analysis inevitably points to a number of errors,
inaccuracies and contradictions that Hume overlooks in justifying the short-term effect of
money.
Hume states that the main cause of the short-term effect of an additional amount of money on
output is its unequal distribution among the population. If one night by some miracle five
pounds lands in the pocket of every person in the United Kingdom, this will have no effect on
the wellbeing of the population. All goods will increase in price in accordance with the quantity
theory of money. Speaking in modern terms, these people in the United Kingdom should have
no monetary illusion; they have enough information in order to respond rationally to such an
event. However, Hume believes that everything changes if not all people in the United
Kingdom, but only a certain group of producers receive a certain amount of additional money.
They will be able to hire additional workers who will not even think of asking for a higher wage.
These workers will produce an additional amount of goods. Even at this stage of reasoning a
number of questions arise. Firstly, why is Hume so certain that there is always involuntary
unemployment? On what grounds? Secondly, if producers seek to expand production, this
means that their activity is bringing profit and has done so in the past. Therefore it is entirely
unclear why they did not try to hire additional workers before. An expansion of production
would enable them to increase their profits. What prevented them from doing this? In this case
a lack of funds cannot be a comprehensive explanation for the passivity of entrepreneurs.
Producers could take out a loan and pay it off using the profit they have. If the rates are too high
for them they are still able to fund the gradual expansion of production using existing profits.
What fundamental change did money have? It is not clear. Thirdly, Hume’s model assumes that
there is not only involuntary unemployment, but also unlimited economic opportunities to
produce any capital goods. This is how it must be because in order to expand production an
additional amount of material resources and raw materials are always needed. If the additional
demand increases the prices for a certain raw material, this has a negative effect on the activity
of all enterprises that use the raw material. Enterprises that have not received any benefit from
the expansion of the money supply will be forced to reduce output, which is further evidence
against the positive effects of an increase in an amount of money.
As it goes on there are more and more questions and less and less clear answers. According to
Hume, after a certain period of time, people going to the market discover that goods are sold at
the same price as before, but they return with more goods of a better quality for their family.
The farmer and the gardener, convinced that all their goods are being sold, try to increase
production. Very strange conclusions. As mentioned before, salaries remain the same, prices
for goods have not changed, but for some unknown reason people are able to buy more
Business and Economic Research
ISSN 2162-4860
2013, Vol. 3, No. 2
www.macrothink.org/ber 162
products of a better quality. How can this be? An increase in production caused by an increase
in employment, if this happens at all, will be compensated by an increase in demand from new
workers. Their incomes will be exactly equal to the value of the additionally produced goods.
The production of goods and services per UK resident will not change, therefore nobody will
come back from the market with more goods of a better quality. This is not possible, and
neither is the increase in demand for the goods of the farmers and gardeners. It may well be so
that new workers want to buy their goods, but goods produced by new workers will also have to
be purchased by somebody. Therefore the demand for the goods of the farmers and gardeners
will remain the same. There will be no economic boom. There may be a slight increase in
employment, but even this conclusion seems doubtful. Why did none of the producers or
traders see the opportunity for earning profit before the additional money arrived? What could
have prevented them from doing so? It is a well-known fact that an amount of money is in no
way connected to intelligence and the acuity of human vision, therefore there was nothing
preventing entrepreneurs from seeing an opportunity to increase their profits and expand
production before the money appeared. Following all of these arguments, we were only able to
conclude that an increase in an amount of money could have the same result as with no increase
in an amount of money. This is all that can be concluded from Hume’s explanations.
The starting point for Hume’s argument was the effect of money on the supply of goods and
services. The Keynes Theory is based on other conditions and focuses on demand. Let us
examine what this approach may change. Let us suppose that residents of the UK receive
additional money and they go off to the market. At that moment in time the amount of goods
and their price are the same. What then happens? There are two alternatives. If the prices
remain unchanged, a portion of the buyers will not have any goods because the amount of
money is greater than the total value of the goods. The buyers will have all the additional
money. In this case nothing in the economy will change because the previous amount of money
is involved in the process of exchange. This result is of no interest to us. What is more
interesting is the second version of the events whereby the increase in demand leads to an
increase in price. As a result, the residents who have suddenly become wealthier will purchase
more goods than before and the rest will be forced to reduce their consumption. However, what
is most important is that the earnings of producers will be higher than their costs and they will
receive profit. This means that Keynes’ dreams start to come true. Following his logic,
producers should immediately start investing their profit in the production of goods that are
becoming more expensive. This may happen, but I hope to demonstrate that this route will lead
to nothing but disappointment. Let us not forget that for consumers the increase in prices has
already become a reality, therefore it is most likely that in the future when making decisions
they will take this fact into consideration. If they demand an increase in wages they will put
possible investments under threat. Producers will not have funds left for investment and all
profit will go towards payment of compensation. This version of events will have no effect on
the growth of economic activity, therefore we will go on slightly different assumptions and we
will accept that most people suffer from a full range of all the possible Keynes diseases,
including monetary illusion. We will suppose that nobody will demand an increase in wages
and producers will continue to hire additional workers who will produce additional goods. We
are, of course, again forced to admit the existence of infinite economic opportunities for the

Business and Economic Research
ISSN 2162-4860
2013, Vol. 3, No. 2
www.macrothink.org/ber 163
production of any amount of resources and raw materials. Otherwise the additional demand for
resources and raw materials must inevitably increase the prices for them, which will have a
negative effect on the output of end goods and services in a country. However, even under these
imaginary conditions producers will be faced with very unfavourable events – prices of the
goods will start to go down. This will be inevitable because the amount of money will remain
unchanged, but the amount of goods will increase. Nobody will receive any additional profit; at
best producers will be able to only reimburse their expenses. The most optimistic outcome of
all this will be the production of a certain additional amount of consumer goods with a value
equal to the cost of the additionally hired workers. The income per resident of the country will
remain the same, employment may rise slightly. However, employment will only rise if a
number of not very plausible conditions are fulfilled: irrational behaviour, a lack of information,
involuntary unemployment, disregard of past experience, limitless production of capital goods
and many more. And even if all of these conditions are fulfilled, a rise in employment still
seems very doubtful. After an increase in production followed by a reduction in prices,
entrepreneurs will most likely try to somehow retain their profits. In order to do so they must
either lower wages, which Keynes believes is impossible, or dismiss some workers. This will
result in levels of output and employment returning to previous values.
Very often, followers of Keynes argue that real markets are different to markets invented by
microeconomists as some of the firms have unsold residual stock. In this case the appearance of
additional money will not lead to inflation, therefore the growth of the economy will not
depend on how rationally or irrationally consumers or producers behave. An increase in
demand will enable all residual stock to be sold and producers will respond to this by
increasing the number of staff and expanding production output. At first glance this is
wonderful; the markets receive a powerful positive impulse and there are no negative
consequences for the economy. Is this really the case? In my opinion it is not. Firstly, an
increase in goods reserves means that nobody needs the product at the offered price. The price
for the product is too high and it will only be purchased if its real value decreases. After the
appearance of additional money and an increase in demand, prices increase for all products
except for those that are available in abundance. Its relative value will decrease and only in this
case will it be sold. Secondly, there will be no increase in output. Producers of higher-priced
goods will not increase output for the reasons discussed above. If a producer who has sold all of
their goods reserves decides to increase their output, they will end up in the same situation that
they were in before. The demand for their products will remain the same, but the supply will
increase. The producer will again be faced with unsold residual stock or will have to reduce the
price of the products. They will not be able to lower the prices; on the contrary they will be
forced to increase prices because raw materials, machinery and labour costs will have become
more expensive due to the rise in prices, which happened because of an increase in the money
supply. In either case there will again be unsold residual stock and everything will revert back
to as before with just one difference: there will be higher prices on the market. One thing is
clear – an increase in the money supply under all of the possible scenarios of the development
of events cannot cause an increase in production output. Money can have no effect on the
existing level of GDP in a country.

Business and Economic Research
ISSN 2162-4860
2013, Vol. 3, No. 2
www.macrothink.org/ber 164
All of today’s misunderstandings regarding the possibility of the real effect of money on the
economy are to do with common misconceptions on the nature of economic growth. Modern
economic science considers investment to be a key factor of growth and nobody denies this.
However it is very important to understand and take on board when conducting any economic
policy that not all investments increase the production of goods and services. As can be seen
from the above examples, additional investments always require an additional amount of
capital resources and raw materials, which puts certain limitations on investment processes.
Investments enter into a competitive battle with one another for resources and economic
growth becomes dependent upon which methods of investment win the battle. Only the most
effective investments, which allow producers to receive the maximum amount of goods from
one resource unit, are conducted in a free market. These producers may offer the highest price
for the resources. The market sets the price for the resource and this price will be equal to the
average marginal product. The marginal product of the most efficient producers will be greater
than the average market marginal product and these companies will earn profit. In order to
further increase their income, successful companies will put their profit towards acquiring
additional resources and expanding output. The value of the additional product will equal the
profit obtained. This is why profit always turns into economic growth. This is why real market
signals, rather than artificially created signals are important for an economy to function
properly. This is why rational and informed producers and consumers, rather than individuals
with complicated illusions and preferences are needed for growth. By intervening, the
government creates false signals for market participants and profit may not go to the most
efficient producer, which takes resources away from this producer. Illusions always give rise to
illusions and artificial profit always gives rise to nominal economic growth rather than real
economic growth, or, in other words, inflation. Therefore artificial stimulation of the economy,
which is seen as a cure and which modern interpreters of Keynes (Krugman, 2008; Skidelsky,
2009) insist upon, more often than not leads to recession rather than recovery. This may be the
reason why economies sometimes have a very hard time during a crisis and take a long time to
recover.
At first glance, nothing is preventing producers from increasing the production of any capital
goods or raw materials if necessary. However, this is not the case; the production of capital
goods and end products may, at any given moment in time, come to an end because the
economy has one very important resource, the production of which cannot be increased –
people. A person’s productivity, not an amount of money, determines the level of output of
goods and services in any country and is a key driver of economic growth. The reluctance of
many economists to note this variable and include it in their models is entirely understandable
and is most likely due to the fact that labour productivity is in no way connected to the amount
of money in an economy. No governments or central banks are in a position to influence this
indicator, even with large sums of money. Money is entirely useless in a situation when more
goods have to be produced from a resource unit than were produced before. This requires
innovation implemented by entrepreneurs in order to increase their profit. Innovation does not
depend on money; therefore all attempts to stimulate an increase in production by injecting
cash into an economy are doomed to fail. A magical multiplier, which we will discuss later on,
cannot cause a rise in business activity because it is not able to alter the existing level of labour

Business and Economic Research
ISSN 2162-4860
2013, Vol. 3, No. 2
www.macrothink.org/ber 165
productivity. Productivity depends not on the efforts of the monetary authorities and theories of
macroeconomists, but on the level of development of science, technology, education and the
quality of control.
3.2 The Multiplier
The time has now come to discuss one of the most important inventions of economic engineers.
We are, of course, going to talk about the multiplier, which enables goods to miraculously be
produced from thin air. For this magic to take place, all you have to do is invest a certain sum of
money and a mysterious mechanism will be activated that will allow you to obtain much more
goods than any sensible person would expect. Prior to this invention, nobody would have
dreamed that there could be a situation where the value of additionally produced goods could
be many times greater than the amount of initial investment. In other words, the value of the
additionally produced goods can be many times higher than the costs. How is that for a miracle!
What an incredible return! And the higher the so-called propensity to consume, the greater
amount of products will be produced. It remains a mystery why this discovery was not taken
advantage of by many non-free countries. In these countries they know perfectly well how to
deal with various human propensities, including the propensity to consume, and guide them in
the right direction. Consequently, any dictator will easily be able to increase the expenses
multiplier to the highest values possible and turn the country into a paradise. However,
something invariably prevents dictators from turning Keynes’ dream into reality. Perhaps they
simply did not read textbooks on macroeconomics or missed the chapter on the multiplier. Let
us remind ourselves and them how the multiplier effect is described in modern textbooks (for
example: Mankiw, 2007). At the beginning of the chapter, authors usually put readers at ease,
stating that elementary mathematical knowledge that even a senior student at secondary school
would know is enough to understand the function of the multiplier. This is perfect because as
Coase (1988) once stated, if nonsense is too obvious people often try to express it using
complicated mathematical equations. This is followed by an example of the government
deciding to purchase new fighter planes worth $20 billion from Boeing, which causes a rise in
employment and profit for the contractor of the government order. Even a senior student at
secondary school may think to ask the reasonable question: where did the government get such
a large sum of money from? Did it reduce funding for education? Did it raise taxes? If it did,
then did employment and profits decrease in other industries of the economy? Usually
textbooks do not mention anything about this therefore we will assume that the government
simply printed the money. Let us continue. The increase in income of workers at Boeing raises
the demand for the goods and services of other companies. If the marginal propensity to
consume is ¾, the demand will increase by $15 billion. The increased incomes of workers of
these companies will raise the demand for production of other companies. A shrinking wave of
additional demand will appear in the economy, which will in the end lead to an increase in
combined demand of $80 billion. This is all very fascinating, but a very attentive secondary
school student may have certain doubts. How can it be so that the appearance of $20 billion in
an economy allows workers to acquire goods for $80 billion? This contradicts the rules of
elementary mathematics. Economic engineers will, of course, condescendingly explain to the
student that the expansion of production and the rise in employment happen gradually and the

Business and Economic Research
ISSN 2162-4860
2013, Vol. 3, No. 2
www.macrothink.org/ber 166
demand is transferred from one industry to the other not in an instant, but over a period of time.
However, the meticulous student may object: this means that growth in demand will inevitably
be followed by a decrease in demand and a rise in employment in one industry will lead to
redundancies in another. Consequently there can be no growth in demand of $80 billion. Indeed,
after workers at Boeing announce an additional demand of $15 billion for the goods of other
industries, the prices of these goods will increase and the additional profit will enable the
company’s management to hire additional staff who will produce additional products. But who
will buy them? Boeing’s workers will not be able to; they already spent the $15 billion. If the
government fails to quickly allocate $20 billion for the purchase of the fighter planes, nobody
will purchase the products of other industries. This will cause demand for goods to return to
previous values and all hired workers will lose their jobs. In order to sell additionally produced
goods, companies will be forced to lower goods output for a certain period of time. The GDP in
the country will remain the same. The economy will be hit by waves of employment followed
by redundancies and periods of profit will alternate with periods of losses. It may well be the
case this activity will bring more harm than good. One thing is clear, the prices for goods and
services will increase because the manufacturers of additional fighter planes need to eat, clothe
themselves and have a place to live.
In this dispute I am on the side of the secondary school student; I believe their arguments are
more consistent and logical. If we continue to believe in the wonderful capabilities of money,
we still have to explain how the appearance of $20 billion made it possible to purchase goods
for $80 billion. It is possible if $20 billion are spent over a certain period of time more than
once. However, it would be completely erroneous to argue that GDP had increased by $80
billion. Real or, more likely nominal GDP will only increase $20 billion. Textbook authors use
strange calculations; they add together the growth in GDP at different periods of time,
forgetting that growth in one industry is always followed by decline in another.
If the reader goes back to the very beginning of the aforementioned textbooks on
macroeconomics, he or she will certainly find a section on circular flow, which is directly
linked to the topic being discussed. The whole section together with the circular flow diagram
easily fits onto 1-2 pages and its contents rarely rouses much interest. It is important however
because it demonstrates that any income of individuals and firms is always at the expense of
other people and firms. If the income of certain companies increases, this means that the
expenses of other companies increase. An increase in income equals an increase in expenses.
Therefore, when prices for cars increase, at the same time the costs of transport companies
increases, which has a negative effect on the activity of companies that require transport
services, including the car manufacturers themselves. For the economy as a whole, the increase
in price does not change anything. An increase in production in one industry is compensated by
a decrease in another. Economic growth is not an increase in the value of goods and services;
on the contrary, it is a reduction. Only when prices for goods and services are lower than the
level of salaries will people be in a condition to obtain more of them. The ratio between product
prices and the cost of labour determines the level of economic well-being, therefore monetary
stimulation or burying bank notes in pits, as once recommended by Keynes, will not restore
growth. Growth can only be restored by increasing labour productivity which, fortunately or

Business and Economic Research
ISSN 2162-4860
2013, Vol. 3, No. 2
www.macrothink.org/ber 167
not, does not at all depend on the efforts of macroeconomic engineers and politicians.
4. Empirical Results
Fig.1 shows the changes in economic growth, inflation and unemployment in the US from
1965 to 2012.
0%
5%
10%
0%
5%
10%
0%
10%
5%
1970 1980 1990 2000 2010
Unemployment
Inflation
Economic Growth
Source: Bureau of Economic Analysis, U.S. Departament of Commerce.
Figure 1. Economic Growth, Inflation and Unemployment in the US (1965-2012).
Even a quick glance at the shape of the curves will reveal a very interesting feature: at certain
periods in time inflation and unemployment behave exactly as predicted by the classic Phillips
Curve. However, an unexpected fact is that this happens when economic growth is in decline.
At this time, when growth is slowing down and the economy is approaching another crisis,
inflation rises and unemployment decreases. This result seems strange because for most people
an increase in employment is always associated with a rise in economic activity. In order to
explain this phenomenon I will try to express certain concerns regarding the causes of cyclical
changes of GDP having refused to use Keynes’ numerous and dubious inventions. Surprisingly
this is not so difficult if we remain within the boundaries of classic theory rather than endlessly
searching for market imperfections. The only reasonable explanation for an increase in
production and consumption is an increase in labour productivity. In order to increase
production we have to somehow increase the production process or improve the management
of a company. These improvements are usually called innovation. A company that introduces
innovation has the capability of producing more products from one resource unit than other
companies. Consequently the difference between earnings and costs will be higher at that
company and this means that it will have higher profits. This company will become a
temporary monopoly continually increasing production and its market share. Naturally the
company will rapidly acquire followers, which will enable a greater amount of economic

Business and Economic Research
ISSN 2162-4860
2013, Vol. 3, No. 2
www.macrothink.org/ber 168
resources to be used in the most productive manner. During such periods, indicators for
economic growth in a country rise at a steady rate. In the US, for example, such periods were
observed in 1971-1973, 1975-1976, 1982-1984, 1992-1993, 1996-1999 and 2002-2004. Many
companies unable to introduce innovation into production are forced to reduce output or
terminate their activity. Unemployment may rise during these periods if the number of
redundancies at companies experiencing problems is not compensated by a rise in employment
at more successful companies. There are no objective reasons for a rise in inflation during
periods of heightened economic growth. Furthermore, the introduction of innovation creates
real conditions for lowering prices, which is also confirmed by the data presented in Fig. 1. At
the time when half of the country’s resources begin to be used in the most productive manner or,
in other words, half the companies introduce innovation, growth reaches its maximum values.
After this, economic growth in the country begins to decrease and the battle for resources
intensifies. Fewer resources are used non-productively, therefore companies have less and less
opportunities to obtain profit and expand output. The fierce competition for material and
human resources pushes prices up, therefore unemployment declines steadily and inflation
begins to rise. During periods of declining economic growth, which in the US economy took
place in 1965-1971, 1973-1975, 1978-1980, 1988-1991, 1999-2001, 2005-2008 we see a
classic Phillips Curve. During these years the profits of companies gradually go down and this
means that there is a great difference between the profits of companies when they receive loans
and when they return them. If in such a situation the managers of companies reassess their
capabilities, this may cause serious financial difficulties both for the companies themselves and
for the banks that are providing loans to them. During this period, active government
intervention in the form of a relaxation of the monetary policy is most likely to only make the
situation worse. A rise in inflation and a reduction in interest rates caused by an expansion of
the money supply will, of course, make repaying loans simpler, but at the same time this will
encourage less efficient production companies to use borrowed funds, which may cause serious
difficulties for the whole economy in the short term. During this period the future is rather
predictable. Companies have less and less opportunities to increase labour productivity and the
economy inevitably approaches the limit of its production capacity. Profits and economic
growth tend towards zero, which signifies the advent of an economic crisis. People will soon
rush to blame financial institutes and their managers of greed and dishonesty, producers of
being too presumptuous and consumers of behaving irrationally. Keynes’ followers will perk
up and with renewed energy begin to criticise the market system, demanding that control be
tightened and freedom limited. The governments will make new laws, introduce additional
taxes and begin to pour money into the economy. All of these actions will not give any positive
results because the economy has reached the limits of its production capacity and overcoming
these limits does not require heightened government control, but creative efforts of
entrepreneurs. Innovation is needed to get out of a crisis and this will certainly happen. It will
happen not through the efforts of economic engineers and politicians, but through people’s
natural pursuit of profit. Only the implementation of innovation, which increases labour
productivity, will enable entrepreneurs to earn profit again and bring the economy back on
course for the next business expansion. This is how it always has been and how it always will
be. This is how it was in the times when people hunted with wooden arrows and stone axes.

Business and Economic Research
ISSN 2162-4860
2013, Vol. 3, No. 2
www.macrothink.org/ber 169
This is how it was when the pharaohs and feudal lords ruled. This is how it was when the first
merchants and free peasants appeared. Of course, features of capitalism and the free market
system do not actually cause crises. Crises have always been as inevitable as the onset of winter
or summer. What can an active government monetary policy or fantastic inventions of
economic engineers do to change the situation? In the best case nothing and in the worst case
they may create additional problems. We can, of course, proudly argue and ramble on about the
highly important role of money in the economy. But show me on Fig. 1 the year when the work
of the monetary authorities gave a positive result and changed the function of the economic
markets for the better. In which year did adding money to the economy and rising inflation
overcome recession and encourage growth? I searched for a long time, but could not find the
answer.
5. Conclusion
A monetary policy conducted by the authorities must have solid theoretical and empirical
grounding; in any case it must be supported by the majority of actively working economists. If
these conditions are not fulfilled, any monetary policy should be regarded as dubious and an
irresponsible economic experiment. I may be mistaken in regard to the extent to which a
government’s monetary policy is supported by economists, but I am convinced that at present
there are not enough theoretical and empirical grounds for attempts to stimulate business
activity by expanding the money supply. Most empirical studies carried out over the last 40
years either reveal an inverse relationship between the increase of the money supply and the
value of economic growth, or they support the idea of the neutrality of money. Only a few
studies leave hope for a successful stimulating monetary policy.
Today there is little left of the former glory of the Keynes Theory, which for a long time served
as scientific evidence of the entry of a country to the free market. A significant number of
economists are still prepared to only support Keynes in as far as that only a poorly informed
individual suffering from monetary illusion could behave as the monetary authorities hope for.
As they see it, in response to the appearance of additional money in an economy, such an
individual will immediately attempt to increase production output. However, I believe that
these assumptions are completely unfounded and contain a serious logical error. In arguments
on the possibility of the positive influence of the expansion of the money supply, the fact is not
taken into consideration that any increase in income of certain economic agents is the same
increase in expenses for other economic agents. The income of people selling certain goods or
services is exactly equal to the expenses of the people who obtain these goods or services. The
expansion of demand of certain goods causes their price to rise, which increases the costs of the
people or firms consuming these goods. The possible increase in output of goods that have
risen in price is compensated by a reduction in the output of other goods. The economy does
not produce anything new; the loss of certain individuals is exactly equal to the losses of others.
This clearly demonstrates the circular flow diagram studied by all novice economists. Adding a
certain amount of money to the economy does not make it possible to change the existing level
of labour productivity, upon which the real output of goods and services in a country are
dependent. Naturally, for this very reason in the real world there is no multiplier effect allowing
us to magically increase GDP in a country to a value many times higher than an initial

Business and Economic Research
ISSN 2162-4860
2013, Vol. 3, No. 2
www.macrothink.org/ber 170
government investment. It is nice to dream that having spent $20 billion, we could produce
goods and services for $80 billion, but this is not possible. It is nice to imagine yourself being a
wonderful magician creating a wide range of goods from thin air, but even the most
distinguished politicians and economic engineers are not able to do this.
Today, the disappearance of money from models used by economists, which greatly surprised
and upset King (2002), in actual fact reflects the constantly rising doubts of economists of the
chances of successfully implementing an active monetary policy. Increasing numbers of
macroeconomists are coming to the conclusion that increasing the money supply only leads to
price increases and does not bring about any economic changes. It is not easy to give up the role
of ruler of destinies and go from being an irreplaceable engineer, fearlessly hurling hundreds of
billions of dollars into the fire of a crisis, to an ordinary scientist. It is even more difficult, but
sooner or later it will have to be admitted that over the last 70 years, not ordinary citizens, but
many former and currently active politicians and economic engineers have suffered from
monetary illusion and other Keynes diseases. This is not surprising. The sooner we admit this,
the more chances we will have to maintain economic freedoms and prevent the market from
turning into a lifeless desert with ‘no-entry’ signs dotted here and there and kilometre after
kilometre of barbed wire fences.
References
Ahiakpor, J. W. (2003). Classical Macroeconomics. Some Modern Variations and Distortions.
London. Routledge.
Akerlof, G. A., & Shiller, R. J. (2009). Animal Spirits. How Human Psychology Drives the
Economy, and Why it Matters for Global Capitalism. Princeton University Press.
Barro, R. J. (1995). Inflation and Economic Growth. Bank of England Quarterly Bulletin: May
1995.
Barro, R. J. (2009). Government Spending is No Free Lunch. Wall Street Journal. Jenuary 22,
2009.
Barro, R. J., & Sala-I-Martin, X. (2004). Economic Growth. Second Edition. The MIT Press.
Benassy, J-P. (2007). Ricardian Equivalence and Intertemporal Keynesian Multiplier.
Economic Letters. 94(1), 118-123. http://dx.doi.org/10.1016/j.econlet.2006.08.010
Blaug, M. (1993). Second Thoughts on the Keynesian Revolution. In The Philosophy and
Methodology of Economics III. Ed. by B.J. Caldwell. Edward Elgar.
Caporale, M. G., & Skare M. (2011). Short- and Long-Run Linkages Between Employment
Growth, Inflation and Output Growth: Evidence From a Large Panel. Economics and Finance
Working Paper Series. No. 11-17. October 2011. http://www.brunel.ac.uk/economics
Coase, R. (1988). The Firm, the Market and the Law. The University of Chicago Press.
Corsetti, G., Meier, A., & Muller, G. (2012). What Determines Government Spending
Multipliers? Economic Policy. October. P. 521-565.

Business and Economic Research
ISSN 2162-4860
2013, Vol. 3, No. 2
www.macrothink.org/ber 171
http://dx.doi.org/10.1016/j.econlet.2006.08.010
Fischer, S. (1993). Macroeconomic Factors in Growth. Journal of Monetary Economics. 32. P.
485-512. http://dx.doi.org/10.1016/0304-3932(93)90027-D
Fischer, S. (1996). Why Are Central Banks Pursuing Long-Run Price Stability? Achieving
Price Stability, a Symposium Sponsored by the Federal Reserve Bank of Kansas City. Jackson
Hall. Wyoming. P. 7-34.
Friedman, M. (1968). The Role of Monetary Policy. American Economic Review. 58 (1). P.
1-17.
Ghosh, A. (1997). Inflation in Transition Economies: How Much? And Why? IMF Working
Paper. P. 117-122.
Giles, C. (2012). Has the IMF Proved Multipliers Are Really Large? Financial Times. 12,
October.
Hazlitt, H. (1959). The Failure of the “New Economics”. Princeton. NJ.
Hooker, M. A. (2002). Are Oil Shocks Inflationary? Asymmetric and Nonlinear Specifications
Versus Changes in Regime. Journal of Money, Credit and Banking. 34, 540-561.
http://dx.doi.org/10.1353/mcb.2002.0041
Hume, D. (1970). Writings on Economics. Eugene Rotwein, ed. Madison: University of
Wisconsin Press.
Keynes, J. M. (1973). The General Theory of Employment, Interest and Money. New York:
Macmillan.
Khan, M. S., Senhadji, A., & Smith, B. (2001). Inflation and Financial Depth. IMF Working
Paper 01/44. Washington DC.
King, M. (2002). No Money, No Inflation – The Role of Money in the Economy. Bank of
England Quarterly Bulletin. 3. P. 162-175.
Krugman, P. (2008). Let’s Get Fiscal. New York Times. 17 October 2008.
Lopez-Villavicencio, A., & Mignon, V. (2011). On the Impact of Inflation on Output Growth:
Does the Level of Inflation Matter? Journal of Macroeconomics. 33. P. 455-464.
http://dx.doi.org/10.1016/j.jmacro.2011.02.003
Lucas, R. E. (2009). Nobel Memorial Lecture. In: Nobel Laureates in Economics. Vol.2. The
Nobel Foundation.
Lucas, R. E., & Sargent, T. J. (1979). After Keynesian Macroeconomics. Federal Reserve
Bank of Minneapolis Quarterly Review. 3(2). Spring. P. 1-16.
Mankiw, N. G. (2006). The Macroeconomist as Scientist and Engineer. NBER Working Papers.
June.
Mankiw, N. G. (2007). Principles of Macroeconomics. Fourth Edition. Thompson South

Business and Economic Research
ISSN 2162-4860
2013, Vol. 3, No. 2
www.macrothink.org/ber 172
Western.
McCandless, G. T., & Weber, W. E. (1995). Some Monetary Facts. Federal Reserve Bank of
Minneapolis Quarterly Review, 19(3), 2-11.
McConnell, C. R., & Brue, S. L. (2005). Economics. Principles, Problems, and Policies.
Sixteenth Edition. McGraw-Hill.
Moore, B. J. (1994). The Demise of the Keynesian Multiplier: Reply to Cottrell. Journal of
Post Keynesian Economics. 17(1), 121-133.
Phelps, E. S. (1968). Money-Wage Dynamics and Labor-Market Equilibrium. Journal of
Political Economy. 76(4), 678-711. http://dx.doi.org/10.1086/259438
Rindyck, R., & Solimano, A. (1993). Economic Instability and Aggregate Investment. NBER
Macroeconomics Annual. P. 259-303.
Romer, C. (2012). Fiscal Policy in the Crisis: Lessons and Policy Implications. IMF Fiscal
Forum.
Sandel, M. J. (2012). What Money Can’t Buy. The Moral Limits of Markets. Farrar, Straus and
Giroux.
Sarel, M. (1996). Non-linear Effects of Inflation on Economic Growth. IMF Staff Papers. 43(1),
199-215. http://dx.doi.org/10.2307/3867357
Skidelsky, R. (2009). Keynes. The Return of the Master. Robert Skidelsky. New York.
Stoddard, W. H. (2010). The Algebra of John Maynard Keynes.
http://www.troynovant.com/Stoddard/Essays/Keynesian-Algebra.html
Copyright Disclaimer
Copyright reserved by the author(s).
This article is an open-access article distributed under the terms and conditions of the Creative
Commons Attribution license (http://creativecommons.org/licenses/by/3.0/).

Business and Economic Research
ISSN 2162-4860
2013, Vol. 3, No. 2
www.macrothink.org/ber 173
Total Reward Concept: A Key Motivational Tool For
Corporate Ghana
Dr. Olivia Anku-Tsede
Organizational and Human Resource Department
University of Ghana Business School. P. O. Box LG 78, Legon-Accra, Ghana
Tel: 054-105-5346 E-mail: [email protected]
Ernestina Kutin (Corresponding author)
P. O. Box CT 550, Cantonment- Accra, Ghana
Tel: 024-423-9267 E-mail: [email protected]
Received: September 19, 2013 Accepted: October 2, 2013
doi:10.5296/ber.v3i2.4291 URL: http://dx.doi.org/10.5296/ber.v3i2.4291
Abstract
This paper examines the concept of total reward and its application in motivating employees in
Ghana. Total reward as an integral element of reward management is the combination of
financial and non-financial rewards given to employees in exchange for their efforts. The aim
of total reward is to maximize the combined impact of a wide range of reward elements on
motivation, commitment and job engagement. Hence, total reward embraces everything that
employees’ value in the employment relationship. In spite of the growing need to pay attention
to the concept of total reward, it appears most Ghanaian organisations place more emphasis on
traditional rewards that are typically extrinsic and financial in nature. Thus, most Ghanaian
organisations pay too much attention to financial rewards at the expense of non-financial
rewards. This paper thus examines existing literature on the concept of total reward to
determine whether the adoption of total reward strategy could be the answer to corporate
Ghana in its bid to obtain maximum efforts from employees.
Keywords: Total reward, Financial and non-financial rewards, Employee motivation, Ghana

Business and Economic Research
ISSN 2162-4860
2013, Vol. 3, No. 2
www.macrothink.org/ber 174
1. Introduction
The complexity of today’s business environment has imposed continually changing settings in
which organisations compete for survival. As a result, special emphasis is placed on acquiring
and retaining quality employees as this is seen as a key factor underpinning organisational
success. Although it takes a great deal of other resources to run a business, employees have
been identified as the most valued resource which determines the success of every business. As
Milkovich and Bondreau (1988) put it, ‘plant, equipment and financial assets are resources
required by firms but employees are particularly important’. Take away their creative minds
and organisations are just pile of papers, blocks and metals. Thus, the ability of organisations to
create a sustainable competitive advantage in today’s dynamic business environment depends
greatly on employees’ ideas and innovations, making them the most valuable assets in
organisational success. As rightly stated by Deeprose (1994), effective reward system
improves employee motivation and increases employee productivity which contributes to
better enhanced organisational performance. Hence, total reward which is a combination of
both financial and non-financial rewards to gain employee commitment cannot be
over-emphasised. The implementation of total reward strategy improves not only employees’
motivation, efficiency and performance but also their psychological contract and overall
organisational behaviours. Moreover, as organisational success is tied to people innovations,
rewards have become strategic which confirms why organisations whatever their size and
business orientation are looking for better ways to reward their employees for a sustainable
competitive advantage.
In view of these challenges, this paper seeks to examine how total reward management could
be used as a key motivational tool in Ghana.
2. Total Reward Concept
The concept of total reward has emerged quite recently and is exerting considerable influence
on reward management. Total reward as an integral element of reward management is the
combination of financial and non-financial rewards given to employees in exchange for their
efforts. Worldat Work (2006) defines total reward as all of the tools available to the employer
that is used to attract, motivate and retain employees and includes everything the employee
perceives to be of value resulting from the employment relationship. Thompson (2002) also
defines total reward to typically encompass not only traditional, quantifiable elements like pay
and benefits, but also more intangible elements such as scope to achieve and exercise
responsibility, career opportunities, learning and development, the intrinsic motivation
provided by the work itself and the quality of working life provided by the organisation. As
expressed by Lawler (2003), the greatest amount of motivation is present when employees
perform tasks that are both intrinsically and extrinsically rewarding. Total reward strategies are
vertically integrated with business strategies, but they are also horizontally integrated with
other HR strategies to achieve internal consistency. This view has been shared by Kaplan
(2007), who said that total reward is a holistic approach aligning with business strategy and
people strategy. This reward strategy brings about maximum return and builds up employment
brand, all of which create sustainable competitive advantage for organisations. The conceptual

Business and Economic Research
ISSN 2162-4860
2013, Vol. 3, No. 2
www.macrothink.org/ber 175
basis of total reward is that of bundling, so that different reward processes are interrelated,
complementary and mutually reinforcing (Armstrong, 2006).
The aim of total reward is to maximize the combined impact of a wide range of reward
elements on motivation, commitment and job engagement. Hence, total reward embraces
everything that employees value in the employment relationship. According to O’Neal (1998),
a total reward strategy is critical to addressing the issues created by recruitment and retention as
it creates a work experience that meets the needs of employees and encourages them to expend
more effort. The significance of total reward is creating a challenging work environment in
which individuals are able to use their abilities to do meaningful jobs for which they are shown
appreciation is likely to be a more certain way to enhance motivation (Pfeffer, 1998).
According to Armstrong (2006), the benefits of a total reward approach include a combined
effect of different types of rewards makes a deeper and long-lasting impact on the motivation
and commitment of employees. Also, the employment relationship created by a total reward
approach makes the maximum use of relational as well as transactional rewards and therefore
appeal more to employees. Besides, a system of total rewards allows flexibility to meet
individual needs as relational rewards binds employees more strongly to the organisation
because they answer those special individual needs. Relational rewards also deliver a positive
psychological contract and this can serve as a differentiator in the recruitment market which is
much more difficult to replicate than individual pay practices.
Hutcheson (2007) also stated that organisations that practices total reward strategy are able to
establish a distinctive set of rewards to support the institution’s employment brand and enables
the institution to attract and retain qualified workforce. According to him, it provides a
roadmap for the HR function to review and enrich the total rewards offerings and also provides
a clear and consistent communication device to remind employees of the full array of rewards.
Developing and implementing total reward strategy is a critical organisational intervention that
requires top management support. It is important for top management to develop strong
relationship between the organisation and employees to fulfil the continuous changing needs of
both parties as the employees are seen as principal source of the organisation’s competitive
advantage. Management should acknowledge the increasingly important role of reward
programmes in achieving business goal; thus ensuring that organisations deliver the right
amount and mix of rewards to the right people, at the right time, and for the right reasons.
Managers are also required to provide rewards that are valued, clearly linked to the desired
behaviours and perceived as fair and equitable ( Mullins, 2010). Top managers should not only
verbally advocate the strategy or merely mimic the reward systems of other organisations but
they should strive to get the right mix of financial and non-financial rewards to motivate their
workforce towards achieving their strategic goals. As Morris (2006) puts it, management must
deliberately create a customised total reward strategy to holistically create a program that best
fits their unique human capital and business strategies as this differentiates the organisation
from competitors. Management must also recognise the fact that involving employees in the
design of the total reward strategy increase their acceptance and commitment towards effective
implementation. It is also very critical for managers to consider their external environment and

Business and Economic Research
ISSN 2162-4860
2013, Vol. 3, No. 2
www.macrothink.org/ber 176
organisational culture when developing total reward strategy as well as equity in the
implementation of the strategy (Worldat Work, 2006).
A total reward strategy articulates in simple but powerful terms how organisations should
invest their resources, reinforce their core principles and values, and create competitive
advantage. According to Lawler (2003), an effective reward strategy should be designed to
motivate employees to perform and give them the power to influence their performance.
Wilson (1994) on the other hand, states that an effective reward strategy would impact
positively on behaviour when they are meaningful and valuable to employees based on the
organization’s objectives and attainable goals, open and well-communicated to all and not
based on competitive struggles within the workplace and balanced between extrinsic and
intrinsic rewards. The UK Cabinet Office (2007) outlines that in developing a total reward
strategy, organizations must build a good understanding of the organisation's strategy, goals,
capability to deliver and sustain changes in total reward practice and key measures of success.
They further posited that there must be an understanding of what motivates people, how they
contribute to organisational success, the competences and capabilities required, the values and
culture needed to secure high performance, the current HR strategy, the way key HR programs
are focused and how current total rewards are perceived by employees. After these, a set of
total reward programs, policies and practices could be developed for planned implementation.
In deciding which of the many rewards to incorporate in the total reward strategy, managers
must weigh the strengths and weaknesses of each reward as well as considering the kind of
synergies that can be generated by combining these rewards. Understanding the rewards
preferences and the value of rewards as perceived by the workforce helps organisations adjust
the reward elements to attract and retain the necessary skill mix (Morris, 2006).
Since the 1990s, various total reward models have been developed to motivate employees to
give thier best. While each approach presents a unique point of view, all the models seem to
recognise the importance of leveraging multiple rewards, HR practices and cultural dynamics
to satisfy and engage the best employees to contribute and improve business performance and
results. Some of these models include the World at Work Total Reward Model (World at Work,
2006; The UK Cabinet Office’s Pay and Workforce Reform Team (2007); and Armstrong’
Total Reward Model (2006).
The World at Work total reward model integrates five key elements, each of which includes
programmes and practices that collectively define an organisation's strategy to motivate and
retain talents required to achieve desired business results. These five key rewards elements are
compensation; benefits; work-life; performance and recognition; and development and career
opportunities. These components are not mutually exclusive and are not intended to represent
the ways that companies deploy programs and elements within them. This model recognizes
that total rewards operate in the context of overall business strategy, organizational culture, HR
strategy and external influences such as competition. Indeed, a company's exceptional culture
or external brand value may be considered a critical component of the total employment value
proposition. The backdrop of the World at Work model represents the external influences on a
business, such as regulatory issues; cultural influences and competition. An important
dimension of the model is the exchange relationship between the employer and employee

Business and Economic Research
ISSN 2162-4860
2013, Vol. 3, No. 2
www.macrothink.org/ber 177
where successful companies realise that productive employees create value for their
organizations in return for tangible and intangible value that enriches their lives.
The UK Cabinet Office’s Pay and Workforce Reform Team (2007), developed a Total Reward
Model that organisations especially public institutions can adopt to be able to attract, motivate
and retain the most sufficient and effective workforce.
The Armstrong Total Reward Model on the other hand combines the impact of two major
categories of reward: transactional rewards and relational rewards. The transactional rewards
are tangible rewards arising from transactions between the employer and employees
concerning pay and benefits. The relational rewards on the other hand, are intangible rewards
concerned with learning and development and work experience. According to Armstrong
(2006), pay and benefits; represent transactional rewards which are financial and extrinsic in
nature and are essential to recruit and retain staff but can easily be copied by competitors.
Conversely, relational rewards are non-financial and enhances the value of transactional
rewards.
According to Thompson (2002), an analysis of the various total reward models shows that
almost all these models have certain common characteristics. For instance, they all appear to be
holistic in nature. That is, they seem to address the entire employment value proposition using
an array of financial and non-financial rewards. These total reward models are often
programmed in such a way that they are tailored to suit an organisation's own culture, structure,
work process and business objectives. Simply put, these models are best fit.
They also seem to be strategic and integrative. This is because these total reward models align
all aspect of rewards to business strategy and are integrated with other HR policies and
practices. More importantly, the various components appear to complement each other.
Whilst the total reward models proposed by Thompson (2002), seem more people-centered,
thus recognise that employees are the key source of sustainable competitive advantage and
focus on what they value in the employment relationship, they also appear customised and
distinctive. They therefore identify flexible mix of rewards that offers choice and are better
designed to meet employees' needs. These models use diverse rewards to create a powerful and
competitive employer brand that serves to differentiate the organisation from its rivals.
Following from the above literature review, it appears financial rewards are just one part of a
reward package and may not be sufficient in motivating employees for best results. It also
suggests that for an effective and beneficial exchange between employer and employee to
occur, the organisation's reward system must be all embracing, taking into consideration both
financial and non-financial rewards. A total reward concept with an underlying holistic
approach, must thus be adopted to gain a sustainable competitive advantage.
3. The Ghanaian Situation
Many reasons have been attributed to the failure of some Ghanaian organisations in their bid to
achieve their goals. Common among them is low employee motivation due to poor reward
strategies that mostly concentrate on financial rewards (Gneezy, Meier & Rey-Biel, 2011).

Business and Economic Research
ISSN 2162-4860
2013, Vol. 3, No. 2
www.macrothink.org/ber 178
Most organisations in Ghana typically place more emphasis on traditional rewards that are
typically extrinsic and financial in nature in the bid to motivate the employees to achieve
competitive advantage. These managers often pay too much attention to financial rewards at
the expense of non-financial rewards such as work/life balance, employee recognition, job
enrichment, career development, job security, and sense of affiliation, which all bear relational
and personal orientation to the work itself. More often than not, these financial rewards are not
equitably distributed and consequently employees are discontented and dissatisfied (Fehr &
Fischbacher, 2004).
Also, pay increment initiated by most organisations do not produce corresponding rise in
productivity which makes managers frustrated and disillusioned. One other worrying trend
among most Ghanaian organisations is that employees do not seem to have a say in the
composition of their respective benefit packages. Thus, one-fits-all approach to reward
management mostly does not have the desired effect because of the uniqueness of employees’
needs and wants (Bahaudin & Shandana., 2010). Still more troublesome, is the realization
that the reward that effectively motivate some workers do not succeed with others. These result
in low productivity, high turnover, poor customer service, and labour unrest which all impact
unfavourably on organisational success (Armstrong, 2006). It is therefore important for
organisations to understand what motivates their employees and reward them appropriately.
Existing literature, suggests that the African worker is more interested in the financial reward
and may not be affected by the absence of non-financial reward. Perhaps, this may be attributed
to the biblical saying that money answers all things (Ecclesiastes 10:19), as well as the high
rate of poverty associated with African communities. According to Kanungo and Jaeger (1990),
the African worker is often portrayed as being content with just having employment of any
kind rather than facing the threat of hunger from unemployment. It is however suggested that
as much as the Ghanaian worker may be interested in getting a job in exchange for financial
gains for survival, it should be noted that financial rewards alone do not necessarily motivate
the worker in employment to give up his best. It is thus argued that even though financial
reward may entice a poverty stricken person to accept a job offer, it might not guarantee good
or adequate value from the worker. The worker may irrespective of the financial reward not
give his best. It is thus crucial for managers to note that employees can be well motivated to
work without being perceived as driven purely by financial rewards.
All these challenges call for an understanding of the strategies that will truly motivate
Ghanaian workers to expend more towards the achievement of organisational goals. A study
conducted by Neghandhi (1985), in six African countries with similar work ethics and
environment as Ghana revealed that, workers in Africa and those of other countries in Europe
and America, want not only financial rewards but also non-financial rewards such as
opportunities for advancement, fair treatment, better working conditions, challenging and
interesting jobs, autonomy on the job and responsibility.
Consequently, it is suggested that Ghanaian organisations do more to make the work
environment more challenging and interesting. Cognizant of this, managers in collaboration
with human resource departments could formulate and implement total reward strategies to

Business and Economic Research
ISSN 2162-4860
2013, Vol. 3, No. 2
www.macrothink.org/ber 179
ensure that both extrinsic and intrinsic motivational needs of their employees are well met.
Ghanaian organisations could also improve their reward strategies by configuring modern
rewards that embraces everything that employees’ value. This balanced approach is more likely
to drive employee commitment towards performance and effectively engage and retain vibrant
workforce. It appears this approach, if used in reward management, could create a win-win
exchange relationship between organisations and their employees as well as advance the
overall HR and business strategies. This is because, total reward concept seems to take into
account the needs of both the organisation and its employees as it integrates compensation with
work content/context and employee growth opportunities (Armstrong, 2006).
It is further suggested that Ghanaian managers could adopt the cafeteria approach in order to
obtain maximum efforts from workers. This is because the cafeteria approach allows
employees to choose what really matters to them. Employees are thus allowed a great deal of
choice as to how exactly their benefit package should be (Griffin, 1999). The overall value is
set by the employer, but it is for employees to choose for themselves what balance they wish to
strike between the different kinds of benefits (Torrington et al, 2005). Armstrong (2006) and
Griffin (1999) shared the same view when they stated that flexible benefit schemes allow
employees to decide within certain limits on the make-up of their benefit package according to
their needs.
There are a number of reasons for considering this cafeteria approach instead of the employee
benefit schemes which limits employees to certain limited benefits without any room for
choice. Griffin (1999) for example, mentions that the flexible schemes encourage employees to
stay in the organisation longer and even help attract new employees. One way of doing this,
could be in the form of creating forums where benefits offered by the organisation could be
discussed with employees taking into consideration the uniqueness of individual needs. Even
though the success of this approach may depend on the organisation’s ability to afford, it is
suggested that organisations ensure that the various reward components are internally equitable
and externally competitive. Corporate Ghana encourage or adopt open communication system
to ensure free information flow. Corporate intranet, HR circulars, unit meetings, and shared
folders could also be used for this purpose. Most importantly, reward policy could be
effectively communicated to all employees to inform them about the various reward packages
available to them and the basis for rewarding. Also, any changes to the policy should be
communicated to forestall any negative perceptions that may arise. This is likely to promote
equity, trust, and commitment (Armstrong, 2006).
Following from the above, it seems employee involvement is one key form of recognition and
as such should be encouraged and practiced. Managers should therefore create opportunities
for employees to participate in decision-making through meetings, workshops, and retreats. It
appears reward strategies are more likely to be accepted and therefore more effective if
employees who are affected by these decisions are allowed to make inputs to their design and
implementation. Recognition of employees’ efforts should thus be a deliberate strategic
exercise for managers. As part of their key performance areas, departmental heads and unit
supervisors who have direct contact with employees could continuously look for opportunities
to recognise and appreciate employees for good ideas and work well done (Wilson (1994).

Business and Economic Research
ISSN 2162-4860
2013, Vol. 3, No. 2
www.macrothink.org/ber 180
Having regard to the literature reviewed, it is suggested that the following could be adopted
as a means of appreciating employees for good work done and motivating them to do their
maximum best for the growth and development of the organisation:
i) Besides the normal best worker or long service awards, managers could introduce
employee of the month award partly nominated by fellow employees and management. One
simple but effective way of doing this is to publish the employee’s photo in the
organisation's newsletter or on notice boards.
ii) Cultivating a culture of caring by introducing personally signed birthday cards for
employees celebrating their birthdays and wedding anniversaries.
iii) Work well done or great ideas should be immediately acknowledged by way of
praise or a simple thank you or a visible hand shake preferably in the presence of others.
iv) Consistently giving positive feedback about their work and sharing positive
feedback from customers with employees. A constructive criticism is critical to the
employee’s continuance or improvement of work but managers and supervisors should not
dwell too much on negatives as this may kill creativity and innovativeness.
v) Corporate souvenirs such as T-shirts, diaries and calendars could be given to
employees once a year. The giving of these items could serve as a means of recognising
employees as part of the organisation, as well as advocates of the organisation’s identity and
reputation, which further creates a sense of belonging.
4. Conclusion
Following from the literature review and discussion above, it appears total reward strategy is a
powerful and useful tool for motivating employees to achieve higher performance. Ghanaian
organiations could utilise total reward strategy to stay ahead of competition as it establishes
distinctive set of rewards that serve as a differentiator in the recruitment market and may be
difficult for competitors to replicate. Further, it seems the combined effect of both financial and
non-financial rewards creates a deeper and long-lasting impact on employees’ performance and
commitment towards sustainable organisational success. Non-financial rewards therefore
appears to bind employees more strongly to the organisation as they deliver positive
psychological contract that meet those special individual needs.
Acknowledgement
The authors wish to thank the University of Ghana Business School for its assistance. The
authors accept full responsibility for this article.
References
Armstrong, M. (2006), A Handbook of Human Resource Management Practice. (10th
ed.),
Kogan Page Limited, London.
Bahaudin G. M. & Shandana S. (2010), An Equitable Total Rewards Approach to Pay for
Performance Management, Journal of Management Policy and Practice, 11(4), 111.

Business and Economic Research
ISSN 2162-4860
2013, Vol. 3, No. 2
www.macrothink.org/ber 181
Deeprose, D. (1994), How to Recognize and Reward Employees. AMACOM: New York, USA.
Ecclesiastes (1996), The Holy Bible, Ecclesiastes Chapter 10, Verse 19, King James Version,
Broadman & Holman Publishers.
Fehr, E., & Fischbacher, U. (2004), Social norms and human cooperation, Trends in
Cognitive Sciences, 8, 185-190.
Griffin, R. W. (1999). Management, 6th
ed., Houghton Mifflin Company, Boston, USA.
Hutcheson, K. (2007), The Complete Package, HR Horizons, 2(1), 1-5.
Kaplan, S. L. (2007), Business Strategy and Total Rewards, Benefit and Compensation Digest,
44(9), 12-19.
Kanungo, R. N. & Jaeger, A. M. (1990), Introduction: The Need for Indigenous Management
in Developing Countries. Routledge: London.
Lawler, E. E. (2003), Treat People Right. Jossey-Bass Inc: San Francisco, USA.
Milkovich, G. T., & Boudreau, J. W. (1988), Human Resource Management, (5th
Ed.). Business
Publications Inc.: Texas, USA.
Morris, I. (2006), The Future of Work: Total Reward Strategies and Canadian’s Aging
Workforce. Rogers Media Inc.: Toronto, Canada.
Mullins, L. J. (2010), Management and Organizational Behaviour, (9th
Ed.). Pearson
Education Limited: England.
Negandhi, A. R. (1985), Management in the third world, In P.Joynt & M.Warner (eds.),”
Managing in Different Cultures, Oslo, Universeitforlaget, (69-97).
O’Neil, S. (1998), The Phenomenon of Total Rewards, ACA Journal, 7(3), 8–12.
Pfeffer, J. (1998), The Human Equation: Building Profits By Putting People First. Harvard
Business School Press: Boston, USA.
Thompson, P. (2002), Total Reward. Chartered Institute of Personnel Development (CIPD):
London.
Torrington, D., et al (2005). Human Resource Management, 6th
ed., Pearson Education Limited,
England.
UK Cabinet Office (2007), Total Reward Strategy. Available at:
www.cabinetoffice.gov.uk/workforcematters
Gneezy, U., Meier, S., and Rey-Biel, P. (2011), When and Why Incentives (Don’t) Work to
Modify Behavior, Journal of Economic Perspectives, 25(4), 191–210.
Wilson, T. B. (1994), Innovative Reward Systems for the Changing Workplace. R. R.
Donnelley and Sons Company: USA.

Business and Economic Research
ISSN 2162-4860
2013, Vol. 3, No. 2
www.macrothink.org/ber 182
WorldatWork (2006), Total Rewards Concept and Model. Available at www.worldatwork.org.
Copyright Disclaimer
Copyright reserved by the author(s).
This article is an open-access article distributed under the terms and conditions of the Creative
Commons Attribution license (http://creativecommons.org/licenses/by/3.0/).

Business and Economic Research
ISSN 2162-4860
2013, Vol. 3, No. 2
www.macrothink.org/ber 183
Valuation of IPOs in India-An Empirical study
Sanjay Sehgal
Professor, Department of Financial Studies, Faculty of Commerce & Business
University of Delhi, New Delhi, India
Bhushan Kumar Sinha (Corresponding author)
Department of Economic Affairs, Ministry of Finance
Government of India, New Delhi, India
E-mail: [email protected]
Received: July21, 2013 Accepted: August 9, 2013
doi:10.5296/ber.v3i2.4585 URL: http://dx.doi.org/10.5296/ber.v3i2.4585
Abstract
In this paper, we examine two main propositions for Indian Equity Market: (i) important
factors that determine short-run underpricing of initial public offerings (IPOs) (ii) impact of
IPOs‟ mispricing on investment banks‟ reputation. Data is employed for 432 new IPO issues
for India from April, 2001 to December, 2011. We find that 5 variables i.e. number of times an
IPO issue subscribed, number of uses of IPOs‟ proceeds, Listing Delay, Industry PE ratio and
dummy for companies representing new economies are positively related to the short run initial
return on IPOs, while 4 variables, i.e. company size , investors‟ sentiment , investment banks‟
reputation defined in terms of share in IPO proceeds and dummy for private companies‟ IPOs
bear a negative relationship with initial return. The IPOs seems to be overpriced and the Indian
market takes about 6 months to fully incorporate information for discovering the fair value of
IPOs. Mispricing of IPOs seems to negatively impact the investment banks‟ reputation in the
next period. Our results are in conformity with the previous findings of developed market. The
findings of this research have strong implications for the policy makers, market intermediaries
as well as investors. The present study contributes to the capital market literature, especially for
emerging economies.
Keywords: IPO, Underpricing, Investment Banks, Investor‟s sentiment, Short-run initial
return

Business and Economic Research
ISSN 2162-4860
2013, Vol. 3, No. 2
www.macrothink.org/ber 184
1. Introduction
In 1980s and 1990s, there was an increasing realisation on the part of the policy planners that
an efficient and well developed capital market is essential for sustained growth in an emerging
market economy like India. The capital market fosters economic growth by promoting
channelisation of real savings for capital formation and raises productivity of investment by
improving allocation of investible funds. However, it is quality of the market which determines
effectiveness of this mechanism for capital flows. Accordingly, with the view to improve the
quality of the market in terms of its efficiency, transparency and price discovery process and
bringing the Indian capital market up to the international standards, a package of reforms
comprising of measures to liberalise, regulate and develop the Indian capital market have been
implemented since early 1990s. The reforms mainly covered areas like legislative framework,
trading mechanisms, institutional support, etc.
As a result of the reforms initiated by the Government of India, primary market (including
IPOs) started emerging as one of the major source of funds for Indian companies as well as an
important avenue for retail investors to channelise their savings for higher return. A perusal of
the trend in the Indian capital market shows that as a proportion of the total resources mobilised
through primary market, the share of IPOs went up from 15.9 per cent in FY 2001-02 to 48.7
per cent in 2004-05 and then declined marginally to 39.9 per cent before reaching the peak of
85.1per cent in 2006-07. Thereafter, it exhibited a sharp decline in the next two years before it
started rising again in 2009-10 and reached the level of 50.3% in 2010-11. No doubt, on
account of temporary phases of cyclical downturn due to domestic and international factors,
there may be fluctuating trends in the IPO market. However, keeping in view the requirements
of Indian corporates and the available sources of funding, IPOs segment will continue to
remain an important component of Indian capital market in the medium to long-term horizon.
As far as IPO market is concerned, the available IPO literature indicates that there are
significant underpricing of IPOs expressed in terms of positive abnormal returns measured
from either the opening or the closing price on the first day of trading versus the offer price of
IPOs in US and other international markets. In other words, there is a significant underpricing
of IPOs. A review of the existing literature on IPOs shows that a number of studies have
already been undertaken on underpricing of IPOs for developed capital markets as discussed in
section 2 of this study. It will be interesting to examine whether the underlying factors
identified in these studies also influence pricing behavior for IPOs in an emerging market like
India. Past studies have also shown that pricing of IPOs is always an issue and one needs to
analyse factors that determine the level of underpricing especially for an emerging market like
India. A review of studies on the subject reveals that no significant attempt has been made so
far in the direction of developing a model that explains the underpricing of Indian IPOs as
discussed in Section 2 of this study. Most of the studies on Indian IPOs have mainly focused on
testing various theoretical explanations/hypotheses explaining underpricing, identifying
determinants of IPO underpricing both in the short-run and long-term performance of IPOs,
comparative studies of underpricing under fixed price and book building method of allocation
of IPOs etc. Since IPOs are now a major source for investment especially by the Indian retail
investors, and have gradually emerged as one of the important source for raising fund in the

Business and Economic Research
ISSN 2162-4860
2013, Vol. 3, No. 2
www.macrothink.org/ber 185
Indian primary market, it is important that the pricing of IPOs truly reflects the intrinsic value
of the company. With strong market fundamentals and good prospect for growth, a sound
capital market with a transparent mechanism for price discovery process for IPOs will go a
long way in leveraging India‟s potential as a preferred destination for investment by both
domestic as well as international investors. Hence from the policy perspective, an attempt has
been made in this paper to develop a model for explaining the possible level of short run
underpricing in India.
Past studies also show that investment banks with high reputation tend to underprice IPOs to a
lesser degree as due diligence by highly reputed investment banks reflect less riskiness of an
issue among the investor community. By subscribing to an IPO, investors are taking a bet on
the reputation of investment banks that have managed/co-managed the issue and hence willing
to subscribe to the issue at a lesser discount. A logical corollary to this argument is that if the
pricing of the issue is not done accurately by an investment bank, the market may penalize
them in subsequent period, which could then be reflected in terms of decline in the market
share of investment banks for the period under reference. Accordingly, it is always in the
interest of investment banks to enforce underpricing equilibrium to the extent possible. Hence,
the hypothesis relating to IPO mispricing and its impact on investment banks‟ market share
needs to be tested in case of India so that policy changes with respect to the role of investment
banks, if any, could be suggested. An attempt has accordingly been also been made in this study
to examine the relationship between mispricing by an investment bank during a given period
and change in its market share in the subsequent period.
The study comprises of 7 sections, including the present one. Section 2 of this study provides
theoretical explanation and a brief review of studies undertaken on underpricing of IPOs, both
in the international as well as Indian context. While section 3 describes the details of the data
and their sources for the study, section 4 covers performance of the Indian IPOs market over the
study period. A detailed analysis of the factors influencing short term initial return on IPOs for
developing an underpricing model is covered in section 5 of this report. In section 6, of this
study examines the relationship between investment banks‟ reputation and underpricing of
Indian IPOs. Summary and concluding remarks are provided in section 7 of this study.
2. Review of Literature
Past international studies on short-run underpricing of IPOs show that these research mainly
focused on variables/parameters which could broadly be classified under 4 categories, i.e.,
company/issue specific parameters, industry specific parameters, market specific information
and country specific macro parameters. Beatty & Ritter (1985) in their study, inter alia,
postulated the hypothesis that greater is the ex-ante uncertainty, the higher was the expected
underpricing. The authors have used (i) the log (1+no. of uses of proceeds) listed in the
prospectus and (ii) inverse of gross proceeds as proxies for ex-ante uncertainties. Both these
variables are found to be positively related to the degree of underpricing. According to Karlis
(2000), IT and other new economy industries IPOs tend to be underpriced leading to higher
initial return. This is based on the argument that industry with shorter & less informative
history will be more underpriced because there is more uncertainty about the issuing firm.

Business and Economic Research
ISSN 2162-4860
2013, Vol. 3, No. 2
www.macrothink.org/ber 186
Kooli & Suret (2001) examined ex-ante uncertainty hypothesis, underwriter reputation
hypothesis and market climate hypothesis in the context of the Canadian IPO market for the
period 1991-1998. According to this study, a negative relationship existed between the level of
underpricing vis-à-vis ex-ante uncertainty (issue proceeds used as a proxy for ex-ante
uncertainty) and the reputation of the underwriter. The results are consistent with the findings
of Beatty and Ritter as former used gross proceeds instead of inverse of gross proceeds as in the
case of latter study. Kooli & Suret have further observed that the IPOs issued during an
upswing in the stock market experienced a higher underpricing than IPOs issued during a
falling market. Guner, Onder & Rhoades (2004) examined the relationship between reputation
of an underwriter and the initial-day IPO return in the emerging market of Turkey from January,
1993 to June, 1999. The authors used two reputation measures: the first measure assumed that
two underwriters with the highest number of IPOs managed or co-managed were the
prestigious underwriter and the rest are not. This variable measured the visibility of
underwriters in the IPO market. The second reputation variable was a proxy for the volumes of
IPO business (either in dollar amount or in number) lead or co-lead by an underwriter.
According to their model, a negative relationship between the initial day IPO returns and the
visibility measures was found. This indicated that since these underwriters were well known by
the investors, they underpriced IPOs to a lesser degree. On the other hand, initial day IPO
returns was found to be positively related to the volume of IPOs indicating that the more IPOs
an underwriter handled, the harder would be to sell the shares. Therefore, these underwriters
had to underprice the issues to a higher degree.
Procianoy and Cigerza (2007) in their comparative study of IPOs in emerging markets of
Brazil, India and China used multivariate linear regression model with a mix of variables
covering IPO specific information, market related factors and macro-parameters. The variables
used are offer size, Investment bank reputation, final offer price, market performance, dummy
for goods produced using high-tech content, interest rate, FDI, GDP, inflation, etc. In this study,
the authors found market performance (before and after the issue) and the high-tech dummy
were the only variables influencing short run initial return with acceptable statistical
significance at 10% or below. The independent variables used in the multivariate analysis of
the first day trading performance of the IPOs in the Brazilian Market between January, 2004 to
April, 2007 by Faria (2007) included age of the firm, ratio of primary offer size to the total offer
size and nine key ratios: sales, growth in sales, solvency, liquidity, fixed asset turnover, total
asset turnover, return on equity, return on assets and operation profit margin. The author
observed that out of all the above independent variables, only return on equity was statistically
significant with negative correlation with underpricing. While examining the determinants of
initial IPO performance in Hong Kong and Taiwan, Lin & Hsu (2008), inter alia, found that
„allotment ratio‟ of the subscribed shares (total IPO shares issued over the number of shares
subscribed by the participants applicants) was the most consistent determinant for IPO
underpricing in both the Hong Kong as well as Taiwanese market, thereby supporting Rock‟s
(1986) adverse selection theory of underpricing .
In the Indian context, Krishnamurti & Kumar (2002) in their study analysed 386 IPOs issued
between 1992 and 1994 on the Bombay Stock Exchange and documented time-lag between

Business and Economic Research
ISSN 2162-4860
2013, Vol. 3, No. 2
www.macrothink.org/ber 187
final allotment and listing as one of the important reasons for underpricing of IPOs in India as it
increased the perceived risk of the investors and hence they demanded more return. They also
suggested but not tested that there is higher IPOs underpricing in India because of the presence
of individual and small investors, who are less informed than the large investors. Presence of a
large number of uninformed investors would require the issuers to underprice their IPOs to a
large extent to induce these investors to invest in IPOs (Rock 1986). Ghosh (2002) in his study
examined the uncertainty and signalling models of underpricing in the Indian context over the
last decade. The empirical findings showed that there existed positive relationship between
IPO underpricing and ex-ante measures of risk proxies. The relationship between underpricing
and age of the company in a simple OLS framework showed that the age of the company could
not explain the variations in the initial returns. This could possibly due to the fact that since
most of the companies that tapped the capital market were young in terms of their age, it
seemed that the Indian investors did not frame their opinion about the viability of a corporate
from its age profile. Kumar (2007) analysed the short run and long run performance of Book
built IPOs in India by performing a cross sectional regression with the short run initial returns
as dependent variable and size (the natural log of the issue size), dummy for before market
conditions and quotient of offered price to the upper price as independent variables. From the
regression results it was observed that only offer price quotient was found to be significant and
the remaining variables were not statistically significant. Pandey & Vaidyanathan (December
2008) studied the underpricing of IPOs listed on National Stock Exchange during 2004 to 2006.
The multivariate regression analysis was based on factors like dummy for demand for the IPOs,
listing delay, issue size and marketing expenditure (in millions of rupees). The results of this
study showed that the coefficient of demand is positive and significant indicating more
underpricing if the issue is finally priced towards the higher end of the price band. Similarly,
the coefficient of listing delay had a significant positive relation with underpricing. Bansal &
Khanna (2012) inter-alia analysed the factors which affected the degree of underpricing after
the global economic crisis during 2008-11. The study found a negative relationship between
variables like number of shares offered, issue size and private IPOs vis-à-vis the level of
underpricing.
Prior studies in India have focused on a limited no of variables to explain IPO underpricing and
generally cover a time horizon of 4-5 years. In the present study, we employ a comprehensive
set of macro-economic, industry, market and company related factors that may influence the
level of underpricing in India. The study also covers a longer study period from April 2001 to
December, 2011. This study period has witnessed market upswings as well as downswings due
to domestic as well as international factors and therefore covers all phases of market cycle. In
addition, the study also examines the relationship between IPO pricing error and the
Investment bank reputation, an issue which has not been addressed so far in prior literature for
India. Hence the paper fills an important research gap in equity market literature.
3. Data and Their Sources
Data for companies issuing IPOs from March, 2000 to December, 2011, have been obtained
from Prime Database, an organisation dedicated to the primary capital market covering fund
raising by the Indian corporate sector and the Government through equity, debt or

Business and Economic Research
ISSN 2162-4860
2013, Vol. 3, No. 2
www.macrothink.org/ber 188
securitisation, in India or abroad. Information obtained from the Prime Database covers
opening and closing date of issue, price band, offer price, employees share, date of listing,
closing price at the end of 1st day, 7th day, 1 month, 3 months, 6 months, details of the lead
manager/co-manager, industry/sector, uses, etc. The details of income of the company, industry
P/E ratio, date of certificate of incorporation, etc. are taken from the draft prospectus filed by
each of these issuing companies with Securities and Exchange Board of India (SEBI), the
market regulator in India. However, since there are a lot of missing data in respect of the IPOs
issued between April, 2000 to March, 2001 especially in regard to the listing and closing price
details for different moments, the reference period for this study that has subsequently been
used is April, 2002 to December, 2011 thereby covering 432 IPO issues.
The details of GDP, Wholesale Price Index (WPI) and Index of Industrial Production (IIP) for
the reference period have been obtained from the Central Statistical Organisation (CSO),
Ministry of Statistics and Programme Implementation (www.mospi.nic.in) and the Department
of Industrial Policy and Promotion (DIP&P), Ministry of Commerce and Industry website
(www.dipp.nic.in). While WPI time series data has been used to calculate the time series data
on inflation, IIP series have been used to estimate the rate of growth of industry. The implicit
yield at cut-off price for the 91 days Treasury Bills in the last week of the month immediately
preceding the month in which offers for IPOs have been closed is obtained from RBI monthly
bulletin as provided on the central bank website (www.rbi.org.in). The T-Bill yield has been
used as proxy for opportunity cost of capital. The Put-Call ratio of NIFTY index option as a
proxy for investors‟ sentiment is sourced from National Stock Exchange (NSE).
4. Review and Performance of Indian IPOs Market over the Study Period
In this study, we estimate the short term initial return for the sample IPOs as the difference
between the first day closing price and offer price. The average short run initial return for all
the 432 IPOs from April, 2002 to December, 2011 is 24.93 per cent. The short-run initial return
has come down significantly over time as shown in prior research (see Table 1). According to
Kumar (2007), this decline is probably due to the introduction of book-building process, an
important change that the public issue process has witnessed from the early nineties to the
present day. According to Pandey & Vaidyanathan (2008), the reduction in underpricing could
also be attributed in part to the change in regulation whereby the allocation to informed
institutional investors was allowed.
Table 1. Short-run performance of Indian IPOs – A comparison with prior studies
Studies Period First Day Return (after Listing)
Kakati (1999) 1993-96 34.9% (un-annualised)
Krishnamurti and Kumar (2002) 1992-94 72.34% (un-annualised)
Jaitly and Sharma (2004) 1993-94 72% (un-annualised)
S S S Kumar (2007) 1999-2006 26.35% (un-annualised)
Present studies 2002-2012 ( up to Dec. 2011) 24.93% (un-annualised)

Business and Economic Research
ISSN 2162-4860
2013, Vol. 3, No. 2
www.macrothink.org/ber 189
The year-wise pattern of short-run Initial Return on Indian IPOs over the study period is
provided in Table 2. While the first day return is with respect to the offer price, return for
subsequent periods have been estimated with respect to the first day closing price of the IPO.
An analysis of the trend in initial return across short term and medium-term time horizon (up to
6 months period) indicates that the first day initial return which is highly positive at about
24.93 per cent for the first day becomes negative and is -1.21 per cent for the 6 month period
from the issue date, excluding the first day return. The trend is also in conformity with the
international findings that as time passes and more information becomes available, divergence
of opinion between optimistic and pessimistic investors will narrow down and consequently
price will drop in the market.
Table 2. Short-run & Medium-term return on IPOs
Year IRD1 IR 7D/
day 1 closing
IR 1 month/
day 1 closing
IR 3 months/
day1 closing
IR 6 months/
day 1 closing
2002-03 0.127 0.023 0.177 0.470 1.448
2003-04 0.527 0.045 0.016 -0.004 0.057
2004-05 0.458 0.008 0.029 0.172 0.420
2005-06 0.356 0.021 0.060 0.020 -0.005
2006-07 0.170 0.012 -0.016 0.081 0.138
2007-08 0.390 -0.029 -0.055 -0.097 -0.124
2008-09 0.122 -0.072 -0.192 -0.348 -0.357
2009-10 0.054 -0.017 -0.022 -0.09 -0.010
2010-11 0.157 -0.039 -0.094 -0.082 -0.148
2011-12
(up to Dec. 11) 0.013 -0.093 -0.173 -0.204 -0.215
Overall Return 0.249 -0.014 -0.033 -0.037 -0.012
IRD1-First day initial return (calculated w.r.t. offer price), IR7D-Seventh day return (calculated
w.r.t. first day closing price), IR1 month- return at the end of 1 month (calculated w.r.t. first day
closing price), IR3 months- return at the end of 3 months (calculated w.r.t. first day closing
price), IR 6months- return at the end of 6 months (calculated w.r.t. first day closing price)
A snapshot of the IPO activities during the reference period i.e. April 2002 to December 2011
in India is provided in the Table 3 of this study. It can be observed that the Indian market saw a
steady rise in terms of IPO issues up to 2007-08. Thereafter, the market started declining on
account of global economic crises. The effect of global economic slowdown was reflected in
terms of decline in the number of IPO issues which came to the market during 2008-09 and
2009-10. Then, there was a recovery period of one year when the number of IPO issues went up
to 52 in 2010-11. The subdued IPO market of 2011-12 thereafter could be regarded as the
fall-out of impact of Euro Zone crises on India growth story as reflected in terms of decline in

Business and Economic Research
ISSN 2162-4860
2013, Vol. 3, No. 2
www.macrothink.org/ber 190
IPO issues as shown in the table. It has also been observed that the Indian companies took
advantage of the bullish phase of the Indian capital market as the period of market upturn is
followed by high issue volumes in the market. In other words, when investors are
overoptimistic, firms respond by issuing equity in a window of opportunities. The average
issue size of Indian IPOs during the reference period increased from USD 35.77 million in
2002-03 to USD 145.22 million in 2004-05. It subsequently declined to USD 33.10 million in
2005-06 and exhibited a mixed trend thereafter before reaching a peak of USD 139.67 million
in 2010-11.
Table 3. IPO activities in India –An overview
Year Avg. Issue Size
(in USD mn#)
Mean Median Maximum Minimum Std. Dev. Skewness Kurtosis Obs.
2002-03 35.77 0.128 0.022 0.404 -0.058 0.196 0.535 1.633 6
2003-04 37.86 0.528 0.312 1.791 -0.023 0.574 1.082 3.058 18
2004-05 145.22 0.458 0.322 2.097 -0.206 0.542 1.426 4.941 22
2005-06 33.10 0.356 0.258 2.582 -0.881 0.537 1.886 8.588 82
2006-07 72.24 0.170 0.013 2.303 -0.422 0.468 1.955 8.216 78
2007-08 122.10 0.390 0.237 2.863 -0.240 0.596 1.978 7.371 84
2008-09 20.70 0.122 -0.018 1.596 -0.672 0.557 1.276 4.025 22
2009-10 131.70 0.055 0.019 0.636 -0.372 0.247 0.515 3.015 39
2010-11 139.67 0.157 0.091 1.144 -0.529 0.344 0.824 3.483 52
20011-12
(up to Dec. 2011) 36.39 0.013 -0.137 1.535 -0.731 0.573 0.723 2.927 29
# Based on average annual exchange rates
5. Determinants of Short Run Underpricing of IPOs
Linear regression model (OLS framework) has been used in this study to identify variables that
may explain the level of underpricing. To start with, initial return (dependent variable) has been
regressed vis-à-vis 20 independent variables identified on the basis of the past research. Based
on the results of bivariate regression analysis, 13 variables are identified in the first stage as
variables significantly influencing short run initial return on Indian IPOs at 20 per cent level of
significance or below. Since there are prior results hypothesising and explaining the
relationship of the shortlisted variables vis-à-vis short run underpricing of IPOs including the
direction of relationship, one tail test has been applied to check the level of significance of the
short listed variables. The internal returns are then regressed on 13 variables identified at the
first stage within the framework of multivariate regression analysis. Pair-wise cross correlation
are estimated for sample independent variables to verify whether there is an overlap among the
13 factors identified at the first stage of regression analysis. Four variables, namely CDROI
(proxy for opportunity cost of capital), D1 (dummy for offer price), IGP (inverse of gross
proceeds), INF (inflation) have been dropped due to multicollinearity problem and 9 variables
are finally selected for underpricing model as discussed below. White test has been performed
on the residuals to check the presence of Heteroscedasticity in the cross-sectional model
suggested for predicting the possible level of underpricing. It is observed that no significant
Heteroscedasticity is present and hence the OLS estimation for the proposed model is
satisfactory.

Business and Economic Research
ISSN 2162-4860
2013, Vol. 3, No. 2
www.macrothink.org/ber 191
Based on past studies, it is observed that the variables affecting IPOs underpricing could
broadly be classified into the following four categories and the variables for the present study
have accordingly been selected as shown in Exhibit A:
Exhibit A. Sample Variables used for explaining IPO underpricing
A. Company/issue related variables
IGP Inverse of the Gross Proceeds -Gross Proceeds being defined as the total number of
shares issued multiplied by the final offer price.
Uses Log (1+no. of uses uses). No. of uses as indicated in the draft prospectus.
CS Proxy for Company size /IPO Deal Size – defined in terms of the log value of the
proceeds raised through the IPO route.
IRR Insider Retention – The proportion of issued stock retained by the original owners
and/or reserved for the employees of the company as indicated in the draft prospectus.
TS Times Subscribed-no of times an issue subscribed by all class of investors.
LD Listing Delay – Defined in terms of time lag between the closing date of the offer and
listing of the issue at the Stock Exchange.
Age Age of the Company-Log value of number of years calculated from the date of
certificate of incorporation of the company to the offer date of the issue.
Offer Price Dummy for Offer Price
D1 If the final offer price is nearer to the lower end of the price band of the IPO, the
dummy will take a value of 1 otherwise 0.
D2 If the final offer price is nearer to the upper end of the price band of the IPO, the
dummy will take a value of 1 otherwise 0.
Pvt. companies
IPO
D5 - for private companies IPO. It takes a value of 1 for the private company issuing IPO,
otherwise 0.
Income Total Income of the company – Log value of the total income of the company as
reported in the prospectus for the year immediately preceding the year in which IPO
was issued.
B. Industry specific information
Industry PE ratio Industry‟s Price to Earning (P/E) Ratio – Taken as the proxy for the overall growth
potential of the industry.
C. Market related information
Investor
sentiment
Proxy for Market Investment Sentiment –The put-call ratio of NIFTY index option
taken as proxy for investor‟s sentiment in the markets.
Market Climate D3 -Dummy for market performance: If the market return (return on NIFTY index)
during the month immediately preceding the date of issue of IPO is issued is greater than
the average of the last three months (including the immediate preceding month), then the
dummy variable takes a value of 1 otherwise 0.

Business and Economic Research
ISSN 2162-4860
2013, Vol. 3, No. 2
www.macrothink.org/ber 192
Cos representing
new economies
D4- Dummy for the companies representing new economy: Biotech, pharma, telecom
media, entertainment, IT/ ITES) takes a value of 1 otherwise 0.
IBRP
IBRI
Proxy for the Investment Bank Reputation – The proxy being defined in terms of share
of an underwriter in the value of IPO business (in rupee amount) during the reference
period.
Proxy for the Investment Bank Reputation – The proxy being defined in terms of share
in IPO business defined in terms of no. of issues
D. Country Specific Macro Variables
GDP Growth GDP annual growth
Net FII Net Foreign Institutional Investment (FIIs) Inflow – Net FIIs flows during the month
immediately preceding the month in which the IPOs are issued
Inflation Inflation – Change in Wholesale Price Index during the month immediately preceding the
month in which the IPOs are issued.
IIP Industrial Growth – Represented by the IIP figures released by the Ministry of
Statistics & Programme Implementation/ Department of Industrial Production and
Policy (DIP&P), Govt. of India during the month immediately preceding the month in
which the IPOs are issued
CDROI Proxy for opportunity cost of capital - The yearly effective rate in percentage points for
the 91 days Treasury Bills issued by the RBI on behalf of the Government of India in
the last week of the month immediately preceding the month in which the IPOs are
issue
The details methodology is described as follows. As a first step the short-run initial return (IR)
is regressed vis-à-vis each of the 20 variables one at a time (bivariate regression) to analyse
their significance in explaining the level of underpricing in Indian IPO market. The results of
the bivariate regression analysis are reported in Table 4 of this study.
Table 4. Results of Bivariate Regression Analysis
The Table below shows the result of the bivariate regression analysis with IR as the
dependent variables.
Variables Co-efficient (t statistics)
CDROI -0.029323(-1.515098*)
CS -0.130401(-3.567408*)
I_Sentiment -0.382349(-2.508626*)
IBRP -0.005595(-1.332057*)
IBRI 0.005123(0.734003)
IGP 0.063896
(3.585411*)
IIP 0.003436 (0.522147)
IPE 0.003618 (2.231194*)
Income -0.096729 (-0.417389)
Age 0.039093 (0.423853)

Business and Economic Research
ISSN 2162-4860
2013, Vol. 3, No. 2
www.macrothink.org/ber 193
Variables Co-efficient (t statistics)
TS 0.011147 (11.84548*)
USES 0.193183 (1.475995*)
LD 0.019239 (3.749942*)
Net _FII 8.98E-06 (0.642232)
INF -0.026800 (-2.793067*)
IIP 0.003436 (0.522147)
IRR 0.005035 (0.698123)
GDP_Growth -0.003452 (-0.178378)
D1 -0.295059 (-3.564244*)
D2 0.046116 (0.851441)
D3 0.005035 (0.698123)
D4 0.209422 (3.663342*)
D5 -0.190367 (-1.534628*)
IR- Initial Return; CDROI – interest rate expressed in terms of 91 days GoI T – bill, CS – Proxy
for company size defined in terms of log value of proceeds raised, I_Sentiment – investors
sentiment expressed in terms of put/call ratio, IBRP – proxy for investment bank reputation in
terms of proceeds raised ; IBRI - proxy for investment bank reputation in terms of no. of issues
managed/co-managed ; IGP – log value of inverse of gross proceeds, IPE – industry PE ratio,
Income – log value of total income of the company, Age – log value of the age of company
expressed in terms of no. of years, TS - time subscribed, Uses - Log (of 1 + no. of uses), LD –
Listing Delay, Net _FII - net foreign institutional inflows, INF – inflation, IIP- industrial
growth, IRR – insider retention by employees/ original owner, GDP_growth – annual growth
rate of GDP, D1 – dummy for final offer price in the lower end of the price band, D2 - dummy
for final offer price in the upper end of the price band, D3 – dummy for market performance,
D4 – dummy for companies representing new economy, D5 - dummy for private companies
IPO.
*Variables significant at 20% level and below (One tail test).
Based on the result of the bivariate regression analysis, all independent variables significant at
20% and below level are initially shortlisted in the first stage for multivariate regression
analysis. As mentioned above, since there are prior results hypothesising and explaining the
relationship of the shortlisted variables vis-à-vis short run underpricing alongwith the direction
of relationship, one tail test has been applied to test the level of significance. Based on these
criteria, the independent parameters which qualify for multivariate modelling exercise includes
Times Subscribed (TS), Company Size (CS), Listing Delay (LD), Interest Rate (CDROI), log
value of inverse of gross proceeds (IGP), USES, Put- Call ratio taken as proxy for I_Sentiment,
Inflation (INF), Industry PE ratio (IPE), Proxy for an Investment bank reputation in terms of
value of IPO business (IBRP), Dummies for (i) Offer Price (D1) (ii) companies representing
new economy (D4) and private companies IPOs (D5). The 13 variables identified at the first
stage as detailed above are then regressed vis-à-vis initial return within the framework of
multivariate regression analysis. It is then observed that factors like CDROI, D1, IGP, and INF,
become insignificant even at 20% level because of their multicollinearity with some of the
identified variables.

Business and Economic Research
ISSN 2162-4860
2013, Vol. 3, No. 2
www.macrothink.org/ber 194
Table 5. Pairwise correlation between pricing factors
CDROI CS D1 D4
I_SENTI
MENT IBRP IGP INF IPE D5 TS USES LD
CDROI 1 -0.07619 0.035123 -0.03149 0.191211 -0.05489 0.105696 0.286417 0.010925 0.092337 -0.05938 0.057765 -0.11019
CS -0.07619 1 0.071122 -0.11796 0.061239 0.001335 -0.9031 -0.0452 0.011149 -0.15396 0.143529 -0.16479 -0.22238
D1 0.035123 0.071122 1 -0.01247 0.044616 -0.00897 -0.11439 0.124261 0.08794 0.061748 -0.16094 0.027418 -0.20962
D4 -0.03149 -0.11796 -0.01247 1 -0.06675 0.060296 0.154566 -0.06811 0.033867 0.109231 0.16059 0.094776 0.045226
I_SENTIMENT 0.191211 0.061239 0.044616 -0.06675 1 -0.2312 -0.04551 0.045454 0.147312 0.211686 0.093207 0.219737 -0.03132
IBRP -0.05489 0.001335 -0.00897 0.060296 -0.2312 1 0.00071 -0.07864 -0.07873 -0.17035 -0.02393 -0.01026 0.071672
IGP 0.105696 -0.9031 -0.11439 0.154566 -0.04551 0.00071 1 0.062248 -0.02345 0.213153 -0.17522 0.184565 0.251051
INF 0.286417 -0.0452 0.124261 -0.06811 0.045454 -0.07864 0.062248 1 -0.04505 0.090511 -0.18164 -0.14042 -0.35234
IPE 0.010925 0.011149 0.08794 0.033867 0.147312 -0.07873 -0.02345 -0.04505 1 0.014994 0.101511 0.021046 0.108089
PVTIPO 0.092337 -0.15396 0.061748 0.109231 0.211686 -0.17035 0.213153 0.090511 0.014994 1 -0.0881 0.269157 -0.07596
TS -0.05938 0.143529 -0.16094 0.16059 0.093207 -0.02393 -0.17522 -0.18164 0.101511 -0.0881 1 -0.02164 0.024527
USES 0.057765 -0.16479 0.027418 0.094776 0.219737 -0.01026 0.184565 -0.14042 0.021046 0.269157 -0.02164 1 0.111024
LD -0.11019 -0.22238 -0.20962 0.045226 -0.03132 0.071672 0.251051 -0.35234 0.108089 -0.07596 0.024527 0.111024 1

Business and Economic Research
ISSN 2162-4860
2013, Vol. 3, No. 2
www.macrothink.org/ber 195
CDROI – interest rate expressed in terms of 91 days GoI T – bill, CS – Proxy for company size
defined in terms of log value of proceeds raised, D1 – dummy for final offer price in the lower
end of the price band D4 – dummy for companies representing new economy, I_Sentiment –
investors sentiment expressed in terms of put/call ratio, IBRP – proxy for investment bank
reputation in terms of proceeds, IGP-log value of inverse of gross proceeds, INF – inflation,
IPE – industry PE ratio, D5 - dummy for private companies IPO. TS - Times subscribed, Uses
- Log (of 1 + no. of uses), LD - Listing Delay.
After taking into consideration the pair-wise correlation as provided in Table 5 of this study and
further filtering of variables, the model becomes more robust with TS, CS, I_Sentiment,
Industry PE ratio, uses, D4 and D5 at 20 per cent level of significance and below. Thereafter,
variables relating to CDROI, D1, IBRP, IGP, INF, LD are added one at a time to see their likely
impact on the overall goodness of fit of the model. It is observed that after incorporating
CDROI, D1, IGP, INF, one at a time, there is no change in the statistical parameters of the
significant variables already present in the model as well as on the overall performance of the
model. As the significance of variables have been tested at 20% level and below (one tail test),
it is observed that when IBRP and LD with „t‟ value of -1.12 and 1.15 respectively are added to
the multivariate regression model, both the variables also exhibit significant relationship
vis-à-vis short run underpricing at 20% and below (one tail test). Further, overall of
performance of the model also improves in terms of explanatory power of the model. Apart
from these 9 significant factors, additional factor(s) do not contribute to augment the
explanatory power of the model. The final result of the multivariate regression analysis is
summarised in Table 6 of this study. The sign of the co-efficients of variables of this model are
also found to be in conformity with the findings of international/ Indian studies on underpricing
of IPOs. The detailed economic explanation of the relationship between the dependent and
independent variables of the model is as under:
Times Subscribed: It is observed that TS is the most important factor affecting short run
underpricing of IPOs. This variable is positively related with short run underpricing of IPOs
with a„t‟ value of 11.691. The TS ratio is regarded as one of the important indicator of
uncertainty in the literature on IPOs. Higher the extent to which an issue is subscribed higher is
the uncertainty about getting shares allotted in oversubscribed issues. Hence, a representative
investor will submit purchase order if more money is “left on the table” in the form of higher
discount resulting into higher underpricing.
Company Size: The variable CS representing company size is found to be negatively related to
short run underpricing with„t‟ value of -4.79. The negative relationship is explained by the facts
that large IPO offers in India are expected to have less initial underpricing because they tend to
be fairly priced and a less risky.
Investor Sentiment: The investor sentiment represented by the put-call ratio is negatively
related to the short run underpricing with a„t‟ value of -2.63. This relationship is explained by
the fact that a bearish trend in the stock market represented by high put call ratio results into
lower demand for IPOs and hence higher underpricing of IPOs.

Business and Economic Research
ISSN 2162-4860
2013, Vol. 3, No. 2
www.macrothink.org/ber 196
Uses: The log value of (1+ number of uses of IPO proceeds) listed in the prospectus have been
taken as one of the important proxy for ex-ante uncertainty for an IPO issue. The greater the
number of uses listed in the prospectus of a company, greater is the uncertainty about the end
utilization of the IPO proceeds. The investor view investment opportunities in such issues risky
and therefore demands a higher level of underpricing. Accordingly, the finding of this study is
in conformity with international findings with a„t‟ value of 1.81.
Listing Delay: The LD is positively related with short run underpricing with a„t‟ value of 1.74.
As there is a delay in listing of the issue, the market starts revising its expectation about the
company resulting into higher uncertainty and the investors accordingly demanding a higher
degree of underpricing.
Industry PE Ratio: The Industry PE ratio is considered to be one of the most important
indicators of the growth potential of an industry. The positive relationship between industry PE
ratio and short run underpricing with a„t‟ value of 1.63 could be explained in terms of the fact
that the investors are not very sure whether a company accessing the IPO market with a new
issue will be able to catch up with the pace of the growth of the industry/sector expressed in
terms of high PE ratio. To compensate for this uncertainty, the investors demand a higher
degree of underpricing of IPOs.
Investment Bank Reputation: The investment bank‟s reputation defined in terms of share in
the total value of IPO business managed or co-managed by an underwriter during a given
reference period is found to be negatively related with the degree of underpricing with a „t‟
value of -1.18. When IPOs are managed/underwritten by reputed investment banks, it gives
signal to the market that there has been a proper due diligence of these issues and hence their
pricing truly reflects the fundamentals of the companies. Investors are accordingly willing to
subscribe to these issues at lower discount. Hence, an investment banks with high reputation
will tend to underprice IPOs to a lesser degree. However, the impact of investment bank‟s
reputation on underpricing of IPOs seems to be weak in our case.
Dummy D4: The dummy D4 representing the new economy companies such as IT and ITeS,
media and entertainment, telecom, biotech, Pharma etc. is found to be positively related with
the short run underpricing with a „t‟ value of 1.40. This indicates that industries with shorter
and less information history will be more under-priced as there is more uncertainty about the
issuing companies. Further, owing to the intangible nature of their assets, these companies are
difficult to value and thus expose investors to greater uncertainty.
Dummy D5: The negative relationship between the dummy D5 (representing private
companies IPOs) and short run underpricing (with „t‟ value of -2.60) indicates that there will be
less underpricing for private companies‟ IPOs vis-à-vis the public sector IPOs as the former are
perceived to be better managed with good growth potential. The majority shareholdings of the
Government in the public sector IPOs gives the impression that there will be more interference
by them in the day to day operation of such companies, and as such, the management will have
less financial and operational autonomy. This may adversely affect operational efficiency and
future growth potential of such public sector companies. The stated policy of the disinvestment
of public sector undertakings gives further impression that Government is not able to meet its

Business and Economic Research
ISSN 2162-4860
2013, Vol. 3, No. 2
www.macrothink.org/ber 197
expenditure out of its own revenue resources and hence resorting to divestment of their share in
these companies to meet the shortfall. All these factors give rise to uncertainty and hence
demand for a higher degree of underpricing by investors in case of public sector enterprises.
Table 6. Empirical Results for Multivariate Regression Model
The Table below shows the result of the multivariate regression analysis with IR as the
dependent variable. Variables Co-efficient (t statistics)
Intercept 1.942443 (4.540695)
CS -0.176552 (-4.788974)
D4 0.079010 (1.396525)
I_Sentiment -0.415502 (-2.632723)
IPE 0.002170 (1.630414)
D5 -0.289732 (-2.603667)
TS 0.010435 (11.68961)
USES 0.236813 (1.806345)
LD 0.008974 (1.737816)
IBRP -0.001041 (-1.182188)
R Squared 0.380261
Adj. R-Squared 0.362993
IR- Initial Return; CS – Proxy for company size defined in terms of log value of proceeds
raised through IPOs, D4 – dummy for companies representing new economy, I_Sentiment –
proxy for investor sentiment expressed in terms of put-call ratio, IPE – industry PE ratio, D5 -
dummy for private companies IPO, TS - time subscribed, Uses - Log (of 1 + no. of uses), LD –
Listing Delay, IBRP – proxy for investment bank reputation in terms of proceeds;
*Variables significant at 20% level and below (One tail test).
Based on the multivariate regression model developed for determining the possible level of
short run underpricing, the average predicted short-run initial returns is 26.11 % which is
higher than average actual short-run underpricing of 24.93%. This shows that the market for
Indian IPOs is overpriced and the difference of (-) 1.18 % is recovered through price correction
over 6 months period when the average return on IPOs becomes (-) 1.21%. It is further
observed that R square and adjusted R square in this model are low at 38.02% and 36.30%
respectively which are in conformity with ex-ante uncertainty hypothesis of underpricing. In
the other words if the R square was high, it would imply that the actual initial return on an
offering is predictable. The theory states that there is a positive relation between ex-ante
uncertainty and expected initial return. The reason for this positive relation is that it is difficult
for investors to predict the actual initial return for an issue coming to the market, giving rise to
the winner‟s curse problem , even though the average initial return in a large sample can be
predicted with reasonable accuracy. Accordingly, R square and Adjusted-R square ratio arrived
at in the final model of this study is consistent with the positive relationship between ex-ante
uncertainty and level of underpricing.
6. Investment Banks’ Reputation and Underpricing of IPOs

Business and Economic Research
ISSN 2162-4860
2013, Vol. 3, No. 2
www.macrothink.org/ber 198
A perusal of past research shows that proxy for an investment bank reputation has been used in
number of studies in various countries as a variable influencing the initial returns, but none of
the studies have attempted to look into the relationship between investment banks reputation
and underpricing of IPOs. However, it was Beatty and Ritter (1985) who attempted to analyse
the relationship between investment bank reputation and underpricing. Beatty and Ritter, inter
alia, have documented that investment banks will not be able to attract investors if there is
insufficient underpricing and not be able to satisfy issuers if the discount offered is too large.
Investment banks who commit new issue pricing errors experience adverse impact on their
businesses.
To test the proposition, Beatty and Ritter have split the sample of common stock issued during
1977-82 in US market into two approximately equal time period for testing the hypothesis. The
first sub-period included the 483 firms that went public between 1977 and the first quarter of
1981. The second sub-period included the 545 firms that went public between second quarter
of 1981 and 1982. They divided the sample into two periods because the proposition predicts
changing market shares, so dividing the samples into sub-period is required to test this
proposition. They have further analysed whether there is a relation between mispricing by an
investment bank and subsequent change in its market share.
To analyse the relation, they defined the “absolute standardized average residual” as a measure
of “mispricing”. For this purpose, they have first computed the predicted initial return based on
the regression coefficient arrived at while testing their first proposition in the same paper, i.e.
higher the ex-ante uncertainty higher the level of expected underpricing. Using the absolute
standardised average residuals as the measure of mispricing, they regressed the percentage
change in the market share of the investment banks in sub-period II as the dependent variable
on absolute standardized average residual for the 49 underwriters (who had 4 or more initial
offerings in the sub-period I) within the OLS framework. As observed by Beatty & Ritter, the
slope co-efficient of -10.83 per cent in their OLS regression implies that as the value of the
explanatory variable changes from 1 Standard Deviation(SD) below the mean to 1 SD above
the mean, the expected market share of investment banks drops by 27.3 per cent. With a„t‟
statistics of 1.94 on the slope co-efficient, the one tailed t value is significant at 3 per cent.
For testing the mispricing hypothesis, the model developed for predicting the possible level of
underpricing in this study is used to calculate the predicted short run initial returns, which are
then subtracted from the actual initial returns to arrive at the residuals that are termed as pricing
errors. Thereafter, based on the study of Beatty and Ritter, absolute standardised average
residual are calculated for each of the 432 IPO issues for taking them as a measure of
mispricing.
To begin with, the data is divided into 7 overlapping sub-periods of 3 years each, generated by
taking 1 year moving average. Standardised pricing error is then individually estimated for all
Investment Banks for each of the sub-periods as under:
• For each underwriter the average of absolute residual is computed after taking into account
the total number of offerings taken public by an underwriter during a given sub-period.

Business and Economic Research
ISSN 2162-4860
2013, Vol. 3, No. 2
www.macrothink.org/ber 199
• The average of absolute residual is further divided by the ratio of standard deviation of the
pricing errors of an underwriter in a given sub-period and the square root of the total number of
offerings taken public by it in the same sub-period so as to arrive at the “standardized pricing
error”.
1
| |n
peipe
pe
Sn n
……………………………………….(1)
Where, and denote standard pricing error and pricing error for each issue for a given merchant
bank observed in the three year sub-period. exhibits standard deviation of pricing errors for
each underwriter in a given sub-period. indicates the number of issues managed/co-managed
by an underwriter in a given sub-period.
As a measure of Investment Bank‟s reputation, the annual market share (defined in terms of
share in the total proceeds raised) for each Investment Bank is then estimated in a particular
year. The change in the market share is then computed by taking the difference of the market
share in the year t+1 and the average market share in 3 previous years (t, t-1, t-2) which were
also used for estimating the pricing error variables. The change in the market share is then
regressed on pricing error using the regression equation as under:
1 0 1 ,t pe t tMS S …………………………… (2)
Where, denotes change in market share in the year t+1. is the standard pricing error at time
period t. and are the co-efficient. I is the stochastic or error.
The relationship between Investment Banks‟ reputation and pricing error shall be evaluated by
examining the sign and magnitude of . Since our data is both cross-sectional (across Investment
Banks) as well as time period (across 7 sub-periods), we employ panel regression methodology
by selecting the appropriate panel data model based on Hausman Specification Test. Table 7
reports the results.
Table 7. Results for panel estimation involving regression between mispricing of IPOs and
Investment Banks‟ reputation*
Correlated Random Effects - Hausman Test
Equation: Untitled
Test cross-section random effects
Test Summary Chi-Sq. Statistic Chi-Sq. d.f. Prob.
Cross-section random 0.408191 1 0.5229
Cross-section random effects test comparisons:
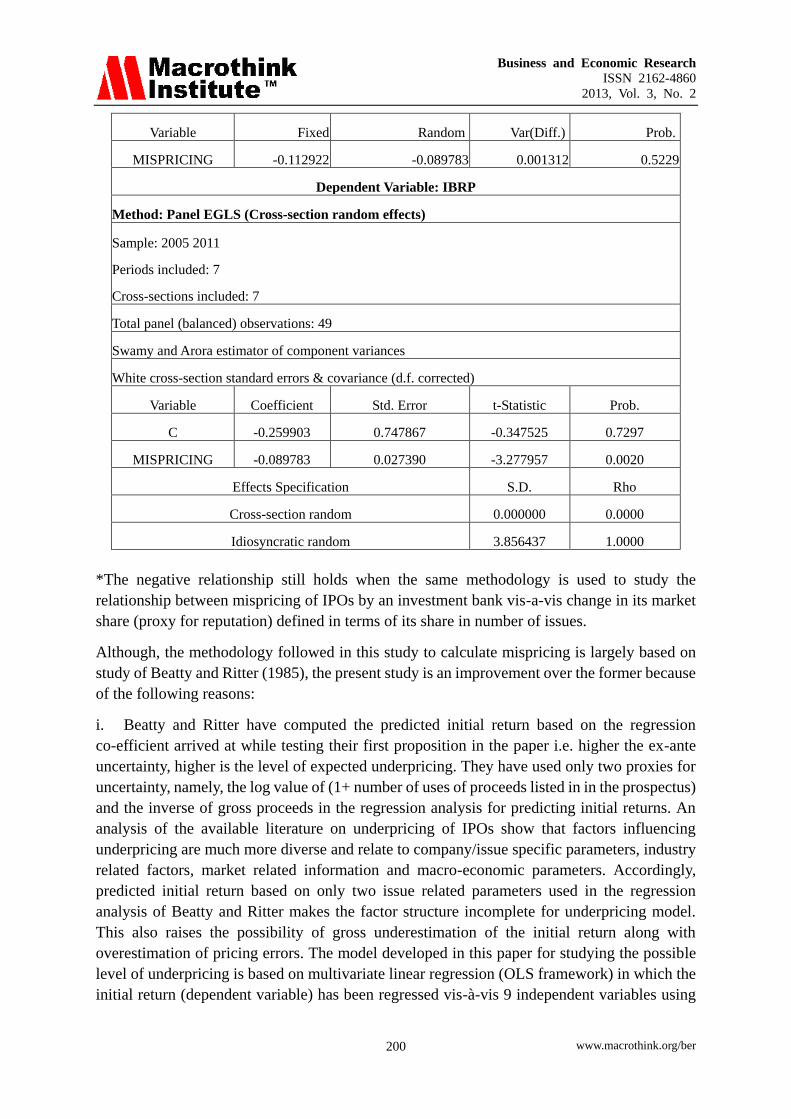
Business and Economic Research
ISSN 2162-4860
2013, Vol. 3, No. 2
www.macrothink.org/ber 200
Variable Fixed Random Var(Diff.) Prob.
MISPRICING -0.112922 -0.089783 0.001312 0.5229
Dependent Variable: IBRP
Method: Panel EGLS (Cross-section random effects)
Sample: 2005 2011
Periods included: 7
Cross-sections included: 7
Total panel (balanced) observations: 49
Swamy and Arora estimator of component variances
White cross-section standard errors & covariance (d.f. corrected)
Variable Coefficient Std. Error t-Statistic Prob.
C -0.259903 0.747867 -0.347525 0.7297
MISPRICING -0.089783 0.027390 -3.277957 0.0020
Effects Specification S.D. Rho
Cross-section random 0.000000 0.0000
Idiosyncratic random 3.856437 1.0000
*The negative relationship still holds when the same methodology is used to study the
relationship between mispricing of IPOs by an investment bank vis-a-vis change in its market
share (proxy for reputation) defined in terms of its share in number of issues.
Although, the methodology followed in this study to calculate mispricing is largely based on
study of Beatty and Ritter (1985), the present study is an improvement over the former because
of the following reasons:
i. Beatty and Ritter have computed the predicted initial return based on the regression
co-efficient arrived at while testing their first proposition in the paper i.e. higher the ex-ante
uncertainty, higher is the level of expected underpricing. They have used only two proxies for
uncertainty, namely, the log value of (1+ number of uses of proceeds listed in in the prospectus)
and the inverse of gross proceeds in the regression analysis for predicting initial returns. An
analysis of the available literature on underpricing of IPOs show that factors influencing
underpricing are much more diverse and relate to company/issue specific parameters, industry
related factors, market related information and macro-economic parameters. Accordingly,
predicted initial return based on only two issue related parameters used in the regression
analysis of Beatty and Ritter makes the factor structure incomplete for underpricing model.
This also raises the possibility of gross underestimation of the initial return along with
overestimation of pricing errors. The model developed in this paper for studying the possible
level of underpricing is based on multivariate linear regression (OLS framework) in which the
initial return (dependent variable) has been regressed vis-à-vis 9 independent variables using

Business and Economic Research
ISSN 2162-4860
2013, Vol. 3, No. 2
www.macrothink.org/ber 201
multivariate regression framework. The use of multi-factor model for underpricing shall
provide better prediction of initial returns and more precise estimates of pricing errors.
ii. To test the proposition, Beatty and Ritter have split the sample of common stock issued
during 1977-82 in US market into two approximately equal length periods for testing the
hypothesis as mentioned above. The two period methods assumes that these variables are
stationary and regression results may, therefore, give static estimates of investment bank
reputation and mispricing. As these parameters are dynamic in concept, the result of the
regression analysis may be biased because the independent variable in the model may have
measurement error problem. To address this issue, the reference period for the present study
has been divided into 7 sub-periods of 3 years each for calculating the mispricing of IPOs by
investment banks on a rolling average basis. Similarly the change in the market share during a
given year has been calculated vis-à-vis the average of 3 consecutive preceding years. This is
based on the presumption that investors, on an average, have a 3 years‟ past memory of average
mispricing of IPOs by investment banks. It is further presumed that investors take into
consideration this period into consideration while deciding to subscribe to a particular issue
managed/ co-managed by investment banks in the subsequent period. As mentioned above, the
change in the market share is then computed by taking the difference of the market share in the
year t+1 and the average market share in 3 previous year (t, t-1, t-2) which were also used for
estimating the pricing error variables.
iii. While Beatty and Ritter estimate the relationship between pricing errors and investment
bank‟s reputation using OLS regression, our estimation procedure involves use of panel
regressions which is more desirable. Panel regressions involve data pooling across
cross-section as well as time-series and hence model coefficients are estimated at a higher
degree of freedom.
As mentioned above, the change in the market share is regressed on pricing error using the
regression equation (2) above. The Correlated Random Effects-Hausman Test conducted to
check the applicability of the fixed or random effect indicates the „p‟ value as 0.5229 (> 0.05).
This shows that the null hypothesis holds in the case and the random effect method is to be
applied for the regression analysis. Accordingly, panel EGLS (Cross Section Random Effects)
method is used to regress change in the market share (proxy for investment bank reputation
IBRP in terms of share in IPO proceeds) on mispricing as the independent variable and a
negative relationship is confirmed with a coefficient and t value of mispricing being -0.089 and
-3.28 (p value of 0.002) respectively. In other words, if an investment bank misprices an issue
by 1 % during a particular period, it will lose its market share by around 9 % in the subsequent
period. The summary of the regression analysis is reported in Table 6 of this study.
7. Summary & Conclusion
In this paper, we covered 432 IPO issues from April, 2001 to December, 2011 for India. Two
propositions were specifically examined:
i. Fundamental determinants of short run initial returns;
ii. Impact of IPOs‟ mispricing on investment banks‟ reputation.
We find that 5 variables i.e. times subscribed (TS), no of uses of IPO proceeds (USES),

Business and Economic Research
ISSN 2162-4860
2013, Vol. 3, No. 2
www.macrothink.org/ber 202
Listing Delay (LD), Industry PE ratio (IPE) and dummy for companies representing new
economies (D4) have a positive relationship with short run initial return, while 4 variables, i.e.
company size (CS), investors‟ sentiment (I_Sentiment), investment bank reputation defined in
terms of share in IPO proceeds (IBRP) and dummy for private companies‟ IPOs (D5) are
negatively related to initial return on IPOs. The results are in conformity with prior literature
on the subject. Our multi-factor model projects an average initial return of 26.11% for the
sample IPOs while the actual average initial return was 24.93%. The Indian IPOs seemed to
be overvalued initially and as more information flows into the system reducing the degree of
uncertainty, the pricing moves back to the equilibrium value resulting in a negative return
between the second trading days to the end of 6th month. Thus the Indian market takes about
6 months to fully incorporate information relating to IPOs. From the policy perspective, with
a view to control excess speculation in the short run, the Government may consider a
lock-in-period of 6 months for IPOs, till the time they are able to achieve their equilibrium
value. In other words, public trading of newly listed IPOs may begin six months from the
listing date. In addition, the capital market regulator may recommend a comprehensive model
as a benchmark for determining the fair pricing of IPOs. It is further observed that IPOs
mispricing significantly impacts Investment Banks‟ reputation and hence pricing of IPOs has
long term implications for policy makers, market intermediaries, as well as investors.
The present study contributes to the capital market literature, especially for emerging
economies.
References
Bajpai, G. N. (2004). A Historical Perspective of the Securities Market Reforms in India. SEBI
Bulletin, 2(4). SEBI.
Bansal, R., & Khanna, A. (2012). Determinants of IPO Underpricing: An Empirical Evidence
from Bombay Stock Exchange after Stock Market Crisis. Retrieved from
http://ssrn.com/abstract=2041158 .
Beatty, R. P., & Ritter, Jay R. (1986). Investment banking, reputation, and the underpricing of
initial public offerings. Journal of Financial Economics,15(1-2), 213-232.
http://dx.doi.org/10.1016/0304-405X(86)90055-3
Vos, E., & Cheung, J. (1992). New Zealand IPOs Underpricing: the Reputation Factor. Small
Enterprise Research, 1(1). 13-22. http://dx.doi.org/10.5172/ser.1.1.13
Faria, E. (2007). Underpring of Brazilian Initial Public Offerings. Master Thesis, Umea School
of Business and Economics.
Ghosh,S.(2002). Underpricing of IPOs: The Indian Experience over the Last Decade.
Retrieved from http://ssrn.com/abstract=336041.
Gunar, N., Onder, Z., & Rhoades, S.D. (1999).Underwriter Reputation and Short Run IPO
Return: A Revaluation Factor for an Emerging Market. Retrieved from
http://ssrn.com/abstract=495742 or http://dx.doi.org/10.2139/ssrn.495742
Karlis, P. (2000). IPO Underpricing. The Park Place Economist, 8. Retrieved from

Business and Economic Research
ISSN 2162-4860
2013, Vol. 3, No. 2
www.macrothink.org/ber 203
http://digitalcommons.iwu.edu/parkplace/vol8/iss1/17.
Kumar, S. S. S. (2007). Short and Long-run Performance of Book built IPOs in India.
International Journal of Management Practices & Contemporary Thoughts, 2(2). 20-29
Kooli, M., & Suret, J. M. (2001). The Aftermarket Performance of Initial Public Offerings in
Canada. Journal of Multinational Financial Management, 14(1), 47-66.
http://dx.doi.org/10.1016/S1042-444X(03)00038-0
Lin, Chien Ting, & Hsu, Shou-Ming. (2008). Determinants of Initial IPO performance:
Evidence from Hong Kong and Taiwan. Applied Financial Economics, 18. 955-963.
http://dx.doi.org/10.1080/09603100701367393
Ljungqvist, A., & B. Espen Eckbo (2006). IPO Underpricing: A Survey. Handbook of
Corporate Finance: Empirical Corporate Finance, A.
Murthy, K. V. B. & Singh, A. K. (2008). IPO Pricing: Informational Inefficiency and
Misallocation in Capital Market. Retrieved from http://ssrn.com/abstract=1303409
Pandey, A., & Vaidyanathan, R. (2008). Determinants of IPO Underpricing in the National
Stock Exchange of India. Retrieved from http://ssrn.com/abstract=1081272
Procianoy, J. L. & Cigerza, G. C. (2007). IPOs in Emerging Market: A Comparison of Brazil,
India and China. Retrieved from http://ssrn.com/abstract=968300.
Ritter, J. R. (1998). Initial Public Offerings. Contemporary Finance Digest, 2(1). 5-30.
Ritter, J. R. (2002). A Review of IPO Activities, Pricing and Allocation. National Bureau of
Economic Research, (NBER) Working Paper Series No. 8805. Retrieved from
http://www.nber.org/papers/w8805.
Reports/Surveys
SEBI Annual Reports
Economic Surveys
Websites
www.sebi.gov.in
www.rbi.org.in
www.mospi.nic.in
www.dipp.nic.in
www.moneycontrol.com
www.chittorgarh.com
Copyright Disclaimer
Copyright reserved by the author(s).

Business and Economic Research
ISSN 2162-4860
2013, Vol. 3, No. 2
www.macrothink.org/ber 204
This article is an open-access article distributed under the terms and conditions of the
Creative Commons Attribution license (http://creativecommons.org/licenses/by/3.0/).

Business and Economic Research
ISSN 2162-4860
2013, Vol. 3, No. 2
www.macrothink.org/ber 205
Determinants of Profitability of Indigenous Chickens in
Swaziland
Bongani J. Siyaya
P.O. Box 4305, Manzini, M200, Swaziland
Micah B. Masuku (Corresponding Author)
Department of Agricultural Economics and Management
P. O. Luyengo, Luyengo. M205. University of Swaziland, Swaziland
Tel: 268-7602-6557 E-mail: [email protected]
Received: September 29, 2013 Accepted: October 15, 2013
doi:10.5296/ber.v3i2.4346 URL: http://dx.doi.org/10.5296/ber.v3i2.4346
Abstract
As a move towards ensuring food security and income generation, the Ministry of Agriculture
advocates for the commercialisation of indigenous chickens. In 2008, the ministry embarked
on a commercialisation training programme. The main purpose of the study was to conduct an
economic analysis of the indigenous chickens’ production in Swaziland, as well as factors
affecting profitability of indigenous chickens’ production. Using a stratified random sampling
technique, the study used primary data from a sample of 147 smallholder poultry farmers who
have been trained by poultry officers on indigenous poultry production in the four regions of
Swaziland. A cost - benefit analysis was used to determine profitability and the Cobb Douglas
production function was used to identify factors affecting profitability of indigenous chickens.
The results revealed an adjusted R2 of 0.85, hence the variables in the model explained 85% of
the variation in profitability. The results further showed that profitability of indigenous
chickens was E0.40 per E1.00 of feed costs. Feed cost, market price, stock size, number of
birds sold and number of birds consumed significantly (p< 0.10) affected profitability.. It is
recommended that farmers organize themselves to take advantage of discounts when
purchasing feed. The Swaziland Government need to construct a hatchery, mini - abattoir and
storage facilities per region to improve the production of indigenous chickens. The hatcheries
can allow farmers to use incubators to improve hatchability. Farmers can also use the abattoirs
to slaughter and dress their chickens and then store them in cold storage for sale. Research on
market size and spread should be undertaken to determine the demand patterns of indigenous

Business and Economic Research
ISSN 2162-4860
2013, Vol. 3, No. 2
www.macrothink.org/ber 206
chickens.
Keywords: Commercialisation, Indigenous chickens, Profitability, Poultry production.
1. Introduction
1.1 Agricultural Production in Swaziland
Agriculture is traditionally the backbone of Swaziland’s economy and a major source of
employment for rural households with over 70% of the population relying on this sector for
their incomes. The diverse agricultural activities that take place in the country include the
production of sugarcane, citrus fruits, and maize, cotton, forestry and livestock. Swaziland’s
agricultural sector is divided into two sub-sectors namely; formal and informal or subsistence.
Subsistence farming is mainly practiced on Swazi Nation Land (SNL), which is about 60
percent of land on Swaziland (MOA, 2012). It is acquired in terms of Swazi law and custom.
While agricultural activities in these areas may be carried out for subsistence purposes, efforts
are made to encourage SNL farmers to practice commercial farming (Thompson, 2012).
According to Thompson (2012) the formal agriculture embraces the large sugarcane and citrus
estates, forestry and other undertakings on individual tenure farms (ITFs), which generate
foreign exchange earnings. It covers about 40 percent of the land in Swaziland.
1.2 Indigenous Poultry Production
The Ministry of Agriculture (MOA) promotes poultry production and emphasises on broiler
production, egg production and the production of indigenous chickens. The MOA (2012)
reported that indigenous poultry production is a fast growing industry in the country. The
indigenous poultry farmers have been encouraged to commercialise in order to improve their
livelihoods in terms of food security, poverty alleviation, income generation and as a drive
towards self-sufficiency in poultry and poultry products. According to Thompson (2012) the
livestock development policy emphasises the commercialisation of cattle, poultry and pigs in
particular, as well as goats in order to create employment and attain food security in the rural
areas.
The most common type of poultry kept in rural households is chicken (Gallus domesticus)
species (Masuku, 2011). Many farmers keep chickens for meat consumption purposes. In the
past chickens were exposed to scavenging systems for feed and had minimal supplementary
feed. There was no provision for housing, thus they were characterized by low input and low
output. Masimula (2004) noted that surveys indicated that 91% of families in rural areas of
Swaziland raise chickens. In Swaziland, indigenous chickens are kept through subsistence
farming practices by almost all the households, with a minimum of at least five birds per family
(Thwala, 2012). Like in other developing countries, Swazi farmers use family labour and
occasionally use commercially available feeds. The chickens are kept under scavenging
production systems with limited application of management interventions to improve
productivity. Thwala (2012) argued that indigenous poultry production is of great importance
to smallholder farmers, but they face the challenge of improving productivity of their flock
which could have financial benefit and promote food security as well as achieve market
potential.

Business and Economic Research
ISSN 2162-4860
2013, Vol. 3, No. 2
www.macrothink.org/ber 207
Currently, consumers opt for organically produced meat from indigenous chickens (Ondwasy
et al., 2006) than meat from broiler chickens. The demand for exotic chickens is declining
worldwide due to a majority of the consumers opting of meat for indigenous chickens.
According to Ondwasy et al. (2006), commercialisation of indigenous poultry production is
therefore timely in terms of meeting the unmet market demand. Commercial indigenous
poultry production is a fast supplementary income-generating enterprise for rural farmers.
Though, there are opportunities for exports of indigenous poultry products, the traditional
poultry marketing channels need to be clearly defined (Thwala, 2012). Indigenous chickens are
ready for marketing at six to eight months and they do not require high financial and technical
inputs. There is no formal or organized market for indigenous chickens and as a result, farmers
of indigenous chickens compete unfairly with broiler chicken farmers, thus forcing indigenous
chicken farmers to lower their prices. However, the demand for indigenous chickens is still
high. Many restaurants and food outlets now serve indigenous chicken meat though, only in
limited amounts (MOA, 2012).
1.3 Profitability of Agricultural Produce
The Agricultural Marketing Resource Centre (AMRC) (2013), on its analysis of agriculture
and rural development defined profit as the excess of income over costs. Profitability was
described as the measure of the returns a business creates after deducting operating costs and
other expenses from income divided by inputs. Though determining profitability may be the
most challenging task, it is also a very rewarding part of a new agricultural enterprise. The use
of the income statement and sensitivity analysis helps to determine profitability of an enterprise.
An income statement measures profitability by recording the costs of production and the value
of production for a set period of time, usually a year (AMRC, 2013).
Chase (2008) noted that producers often try to maximize their income by selling produce
directly to consumers through various marketing outlets where the highest price of the product
can be received. Even though this strategy may allow producers to achieve the highest gross
revenue, it may not yield the highest profit because of the differences in transaction costs.
According to Chase (2008), products are generally priced based on customers demand
competition and costs. Most farmers use the cost based strategy, which is the strategy that
determines profit based on cost. This also requires a budget to be developed for each product
that contributes to the overall profitability of the business. The budget needs to include all costs
of production and transaction costs from the farm or business. Secondly, the profit margin or
percentage should be added to help cover family living and other overhead costs.
1.4 Factors Affecting Profitability of Indigenous Chickens
Natukunda, Kugonza and Kyarisiima (2011) in their study to determine factors affecting
marketing and profitability of indigenous chickens in Uganda used a two stage sampling
involving purposive random sampling technique to select 100 chicken farmer households. In
the study, they found that indigenous chickens were profitable and profit was found to be 5000
Ugandan shillings (UShs) per bird sold. The factors that affected profitability were: total
average costs; distance to the nearest market; access to extension services; education level and
experience of the farmer (Natakunda et al., 2011).

Business and Economic Research
ISSN 2162-4860
2013, Vol. 3, No. 2
www.macrothink.org/ber 208
Hossen (2010) conducted a study on the effect of management interventions on the
productivity and profitability of indigenous chickens in Bangladesh. It was found that
households earn a minimum profit of US$ 47.3 per annum. It was also noted that with the
management interventions such as chick separation and creep feeding of chicks, egg
production was increased and mortality of local chickens was reduced. This resulted in the
increase of the family or household income from US$ 47.3 to US$ 342 per annum. Hossen
(2010) further concluded that weaning of chicks, feed supplementation of broody hens during
incubation and the creep feeding system of management may have formed a basis of the
increasing egg production and survival of the indigenous chickens, which eventually leads to
enhanced productivity and profitability of family poultry in Bangladesh.
Dutta, Islam and Kabir (2013) investigated the production performance of indigenous chickens
in selected areas of Rajshali, in Bangladesh, using a stratified random sampling technique from
six districts. In their study, profitability was calculated using a cost-benefit ratio and it was
estimated at US$ 0.24 and US$ 0.19 per family and per bird respectively (Dutta et al., 2013). It
was concluded that raising indigenous chickens was a feasible and efficient enterprise, which
required better understanding of the socio-economic aspects of the small scale poultry farmers
in urban, semi-urban and rural areas of Bangladesh.
Debbie Cutting, Technoserve Director (Swazi Observer, 31 July 2012) in a study of the key
market dynamics and profit drivers of the indigenous chickens industry in Swaziland, noted
that profitability was affected by four key drivers, namely: vaccination costs, transportation
costs, costs of supplementary feed and the selling price per unit of an indigenous chicken. She
also pointed out that these key drivers vary from one farmer to the other. She emphasised that
overspending on supplementary feed eroded more than 50% of the revenue generated by the
producers and more than 25% of the revenue were spent on transport costs (Swazi Observer, 31
July 2012).
1.5 Statement of the Problem
Sohngwe (2009) reported that farmers who are producing village chickens commercially in
Swaziland were happy with the profit margins they get when selling their chickens. The
demand for organic food and village chickens produced organically was reportedly high. Due
to the limited supply of village chickens in the market, consumers would pay a premium for
them. Whenever available, the catering industry and supermarkets were failing to get suppliers
of village chickens in Swaziland and were unable to satisfy customer demand. Indigenous
chicken production in Swaziland offers prospective and current chicken producers and
entrepreneurs good business opportunities. Indigenous chicken production also offers the
small-scale chicken producers an escape route from the congested and highly competitive
broiler production business in Swaziland. Furthermore, Dlamini (2012), the Minister of
Agriculture, as quoted by the Swazi Observer (June 8, 2012), noted that most small-holder
indigenous poultry farmers were commercialising the industry. He further noted that this was
one endeavor to mitigate food insecurity in the country and to create wealth for the farmers
themselves as indigenous chickens tend to generate more revenue. However, what is still
uncertain is the profitability of indigenous chickens and the factors affecting their profitability.

Business and Economic Research
ISSN 2162-4860
2013, Vol. 3, No. 2
www.macrothink.org/ber 209
1.6 Objectives of the study
The purpose of the study was to assess the economic performance of indigenous chickens
reared by smallholder farmers in Swaziland. The specific objectives of the study were to: (1)
Characterise indigenous poultry farmers; (2) Determine the profitability of indigenous
chickens; and (3) Identify factors affecting profitability of indigenous chickens.
2. Research Methodology
2.1 Research Design
The study involved a descriptive research using quantitative approaches. It sought to determine
the profitability of indigenous chickens and further identify factors affecting their profitability.
2.2 Sampling and Data Collection
The target population for the study was active smallholder farmers of indigenous chickens in
Swaziland that had been trained by poultry officers on the commercialisation programme
between 2009 and 2011. From the population of 729 farmers obtained from a list of farmers
trained on the commercialisation programme in the four regions of Swaziland, 147 farmers
were sampled using stratified random sampling technique. Data were collected using personal
interviews by an aid of structured questionnaire.
2.3 Data Analysis
Data were analysed using STATA version 10 software. The profitability of indigenous chickens
was analysed using descriptive statistics (means, standard deviation, minimum and maximum
values). The Cobb Douglas regression was used to analyse the factors affecting profitability of
indigenous chickens.
2.4 Analytical Framework
Profitability of the indigenous chickens industry was determined as a ratio of profit to total feed
costs. This is because feed costs are major operational costs in the production of poultry,
amounting to about 60%. Thus:
Profitability = Output
Input
Hence:
Profitability of Input X = Profit – Input X
Input X
Therefore:
Profitability of Feed cost = Profit per year - Total feed costs per year
Total feed costs per year

Business and Economic Research
ISSN 2162-4860
2013, Vol. 3, No. 2
www.macrothink.org/ber 210
The empirical analysis of profitability of indigenous chickens was based on the estimation of a
Cobb-Douglas production function in which both the output and inputs were expressed in
logarithmic form. The Cobb-Douglas functional form is widely used to represent the
relationship of an output to inputs (Bravo-Ureta & Pinheiro, 1997). According to Khai and
Yabe (2011) there are many functional forms for estimating the physical relationship between
inputs and output, but the Cobb-Douglas functional form is preferred to other forms, especially
if there are three or more independent variables in the model. The Cobb-Douglas production
function was used to explain the relationship between the dependent variable (profitability of
indigenous chickens) and explanatory variables (factors affecting profitability) and was stated
as follows:
q = f (k, l) = A k α
l β,
Where A, α , β are constants.
The Cobb-Douglas production function for the profitability of indigenous chickens is defined
by the general model, Y, to a given set of resources, X, and other conditional factors are given as
follows:
Y = β0X1β1
X2 β2
X3β3
X4 β4
… X6 β6
µV-U
This function is linearised in order to be able to use the least squares estimations, hence the
following regression specification:
lnYi = α + β1 lnX1 + β2 lnX2 + β3 lnX3 + β4 lnX4 + ……. β6 lnX6 + µ;
Where: Yi = Profitability (profit per feed cost) in Emalangeni;
X1 = Total number of chickens produced per year by the farmer (stock size);
X2 = Total number of chickens sold by the farmer per year;
X3 = Total number of chickens consumed by the household per year;
X4 = Market price per unit of chicken;
X5 = Total vaccination costs per year;
X6 = Total costs of feed per farmer in Emalangeni;
µ = Random error term;
βi = coefficients of the independent variables Xi.
2.5 Explanation of Variables and A Priori Expectations
Profitability (Y): This is the dependent variable and it is measured by profit per feed cost. The
assumption made is that profitability is determined by the variables on the regression model.
Table 1 presents the a priori expectations of the independent variables.
Stock size (X1): Total number of chicken units produced in a year. It is expected to have a
significant and positive effect on profitability because the higher the stock size, the higher the

Business and Economic Research
ISSN 2162-4860
2013, Vol. 3, No. 2
www.macrothink.org/ber 211
probability to sell.
Total number of chickens sold (X2): A positive and significant relationship is expected between
profitability and number of chickens sold.
Total number of chickens consumed (X3): A negative but significant effect is expected between
consumption and profitability.
Market price per bird (X4): This is the average market price of indigenous chicken. Demand for
food commodities is inelastic, so a positive relationship between price and profitability is
expected.
Vaccination costs (X5): These are costs incurred due to diseases or parasites. They increase
total costs and reduce profitability. A negative relationship between vaccination costs and
profitability is expected.
Feed costs (X6)): This refers to total feed costs of producing indigenous chickens and major
costs of production. A significantly negative relationship between feed costs and profitability is
expected.
Table 1. Variables and Expected signs
Variable Expected Sign
Stock size +
Total number of chickens sold +
Total number of chickens consumed -
Market price per bird +
Vaccination costs -
Feed costs -
3. Results and Discussion
3.1 Characteristics of Respondents
Table 2 shows the characteristics of respondents according to age, gender, level of formal
education and marital status. Of the 147 respondents that were interviewed, 66% were females
and 34% were males. This is because in most homesteads, males are always at work and not at
home and most of the farming activities are done by women. Therefore, the majority of
indigenous chickens’ farmers were women. Most of the men were those that had retired from
work, thus keeping indigenous chickens in order to earn income. The results in Table 2 also
show that 26% of the respondents were farmers who were above 60 years old. This includes the
group of farmers who were pensioners, and have retired from employment. Twenty one percent
of the respondents were 50 to 59 years old and above, while 27% had a range of 40 to 49 years
old. Twenty four percent of the farmers were aged 30 to 39 years old and only 2% of the
respondents were aged less than 30 years.

Business and Economic Research
ISSN 2162-4860
2013, Vol. 3, No. 2
www.macrothink.org/ber 212
Table 2. Characteristics of Respondents
Variable Frequency Percentages
Gender
Males 97 66
Females 50 34
Age
20 – 29 years 3 2
30 – 39 years 36 24
40 – 49 years 39 27
50 – 59 years 31 21
Above 60 years 38 26
Marital Status
Single 16 11
Married 110 75
Divorced 0 0
Widowed 21 14
Educational Level
Primary 45 31
Secondary 52 35
High School 35 24
Tertiary 5 3
None 10 7
According to the results in Table 2, only 11% of the respondents were single, while 75% were
married and 14% were widows. The results show that only 7% of the respondents did not have
formal education, while 31% of them attended up to primary level of formal education and
35% reached secondary level. Twenty four percent of the respondents completed high school
and 3% had tertiary education. Table 3 further indicates that the average age of the farmers of
indigenous chickens was 49 years. This is because the industry is dominated to a greater extent
by adults who are the home owners and most of them are pensioners or retired. The youngest
farmer was 28 years old and the oldest was 74 years old. The farming experience of the farmers
was 12 years on average, ranging from zero years to 50 years of farming experience.
3.2 Description of the Variables
As shown in Table 3, the average household size was 5 persons with a range of 1 person to 11
persons per household. All farmers of indigenous chickens were found on Swazi Nation Land
(communal land tenure). The average land size allocated per farmer was 3 hectares (ranging
from 0.5 ha to 10 ha). Stock size the previous year (2012) varied from 6 chickens to over 300
chickens with a mean of 71 chickens. The current year stock size showed an overall significant
decline to a mean of 41 chickens per farmer due to prevalent challenges, especially the high
cost of feed. Losses of chickens due to theft stood at about 4 chickens per farmer and chickens
that died due to diseases, predators and weather averaged at 28 chickens per farmer per year.

Business and Economic Research
ISSN 2162-4860
2013, Vol. 3, No. 2
www.macrothink.org/ber 213
Vaccination costs per farmer averaged at E87.16 per year; ranging from zero for subsistence
farmers who used locally available medicines to control diseases, and was E505.00 for more
commercialised farmers. Almost all of the farmers interviewed provided their chickens with
supplementary feed and the average feed cost was at E2459.14 per year. Subsistence farmers
spent at least E200 on feed, while commercialised farmers spent E9000.00 on feed per year.
The cost of breeding stock (hen and cock) costed E66.00 on average, while the most expensive
cock was bought at E200.00. The maximum price for a hen of E120.00 was reported. The
average price of a cock was at E78.00, while the average price of a hen was E54.00. The
average chicken price at the market was E60.00, with a range of E35.00 to E150 maximum per
bird. Flea markets to which farmers sell their chickens were located 22 km away from the
farmers, with a minimum of 1km to 95 km away. Farmers far away from flea markets
complained of high transport costs that reduced their returns as they had to hire cars to the flea
market.
Table 3. Description of the Variables used in the Study
Variable Mean Std. Dev. Min Max
Farmer’s age (years) 49.453 12.394 28 74
Farming experience (years) 12.672 10.835 1 50
Commercial farming exp. (years) 2.9297 2.498 0 21
Household size (persons) 5.472 2.214 1 11
Vaccination costs (E) 87.164 98.345 0 505
Total land size (ha/farmer) 2.949 1.656 .5 10
Land size used by chickens (ha) 2.073 1.129 .4 6
Land tenure (1for SNL; 2 for TDL) 1 0 1 2
Supplementary feed (1= yes; 2 = no) 1.102 .303 1 2
Current stock size (number) 41.898 25.634 10 115
Previous years’ stock size (number) 71.266 53.154 6 316
Previous year feed cost (E) 2459.141 1796.683 200 9000
Off-farm income (1= yes; 2 = no) 1.125 .332 1 2
Breeding stock price (E) 65.992 30.523 0 200
Market price (E) 59.922 19.042 35 150
Extension service (1 = yes; 2 = no) 1.484 .502 1 2
Cooperative membership (1= yes; 2= no) 1.3125 .465 1 2
Production training (1 = yes or 0 = no) 1 .178 0 1
Flea market distance (Km) 22.27344 15.41485 1 95
Stolen chickens (Number) 4.425197 6.533819 0 36
Mortality of chicken (Number) 27.89063 31.87901 0 198
Sales rate (percentage proportion) .3412578 .2704177 0 1

Business and Economic Research
ISSN 2162-4860
2013, Vol. 3, No. 2
www.macrothink.org/ber 214
Even though most farmers were not working, they had off-farm income from children’s support
and husbands support as most farmers were found to be women who had no formal
employment, but housekeepers. All the farmers agreed that they had received training on
indigenous chickens through poultry officers from the regional agricultural offices and from
some parastatal organizations such as SWADE. About 50% of the farmers reported to be
receiving extension service in their areas, while the others claimed they never received
assistance from extension officers. Most of the respondents were either members of
cooperatives or were organised in some way to easily access production training and market
information.
3.4 Profitability of Indigenous Chickens
The profitability of indigenous poultry production was analysed using descriptive statistics
(means, standard deviation, minimum and maximum). These were used to determine viability
of the indigenous chickens as a business. Profitability is described as a ratio of returns or
income to feed costs. Table 4 presents the results of profitability of indigenous chickens.
The mean total returns were estimated at E3539.96 per year and the mean total costs per year
were E2546.31. This shows positive returns from the indigenous chickens industry. The
minimum profit figures were negative because most farmers had no or very low sales per year
(subsistence farmers). The profit figure shows a positive mean of E993.66 and profitability of
E0.40 per bird. This means that for every E1.00 spent on feed which is the primary cost, there is
E0.40 return earned by the farmers, which indicates that indigenous chicken farming is a viable
and profitable enterprise.
Table 4. Profitability of Indigenous Chickens
Variables Mean Std. Dev. Min Max
Total returns (E) 3539.96 4314.45 0 29200
Total costs (E) 2546.31 1848.46 200 9120
Profit (E) 993.66 3867.45 -3976 25022
Profitability (E) 0.40 4.69 -2.05 38.92
US$ 1 = E9.80 (July, 2013)
3.5 Factors Affecting Profitability of Indigenous Chickens
The Cobb-Douglas production function was used to identify the factors that affect profitability
of indigenous poultry production. The results in Table 5 show that the model was able to
explain 85% of the variation in profitability as a result of the independent variables (Adjusted
R- squared = 0.847). This indicates that the model represents a fair goodness of fit between the
profitability of indigenous chickens and the explanatory variables. The tabulated F value is
26.75 at (6, 22) degrees of freedom and the calculated F – value is 26.75 and it also explains a
significant relationship between profitability and the explanatory variables.

Business and Economic Research
ISSN 2162-4860
2013, Vol. 3, No. 2
www.macrothink.org/ber 215
Table 5. Factors Affecting Profitability of Indigenous Chickens.
Variable Coefficient Std. Err. t-value P – Value
Vaccination costs -0.39 0.242 -1.59 0.126
Feed costs -2.18*** 0.205 -10.59 0.000
Stock size 1.64** 0.581 2.82 0.010
Market price 3.37*** 0.485 6.95 0.000
Number of chickens consumed 0.01* 0.003 2.14 0.044
Number of chickens sold 0.50* 0.261 1.91 0.069
Constant -2.80 0.921 -3.04 0.006
F (6, 22) = 26.75; Prob > F = 0.000; R – Squared = 0.880; Adjusted R – squared = 0.846;
*** = significant at 1%; **= significant at 5%; *=significant at 10%.
The costs of feed and market price were found to be significant (p< 0.01) factors of profitability,
whilst costs of vaccination were found to be insignificant. Total feed costs over the year were
significantly (p< 0.01) related to profitability. The results show that when feed costs are
increased by one percent, profitability declines by 2.18%. This result corresponds to the a
priori expectation in relation to feed cost. The results further suggest that there is a significant
(p< 0.01) and positive relationship between profitability and market price of chickens as
expected. This implies that a one percent increase in price of indigenous chickens amounts to
3.37% increase in profitability. Food commodities demand is inelastic, so increase in market
price does not reduce consumption. The higher the number of chickens sold by the farmer, the
greater the returns and the greater the profit earned per farmer given total feed costs. The
previous year stock size was found to have a significant (p< 0.05) relationship with profitability.
An increase in stock size by 1% would increase profitability by 1.64%. The higher the number
of chickens kept, the more chickens available to sell. When the total number of chickens
consumed per year increases by one percent, profitability increases by 0.01%. Though the
results show that there is a significant (p< 0.1) relationship between consumption and
profitability, profitability does not increase when consumption increases. The number of
chickens sold was significantly (p< 0.1) related to profitability. A percentage increase in the
number of chickens sold results to 0.5 percent increases in profitability. The result was not
expected. The possible reason for such a result could be that chicken consumed are regarded as
returns and not as costs.
4. Conclusions and Recommendations
4.1 Conclusions
The study has shown that indigenous chickens are profitable. Therefore, the null hypothesis
that indigenous chickens are not profitable is rejected. The profitability of indigenous chickens
was affected by feed cost, previous year stock size, market prize, the number of chickens
consumed and number of chickens sold.

Business and Economic Research
ISSN 2162-4860
2013, Vol. 3, No. 2
www.macrothink.org/ber 216
4.2 Recommendations
There is a lack of an organized market for indigenous chickens. Further studies should be
conducted to determine the market size and potential for indigenous chickens. Demand and
consumption patterns also need to be verified statistically to improve profitability of
indigenous chickens. In order for farmers to improve profitability, they need to form
associations, produce their own feed or buy feed in bulk so that they benefit from discounts
associated with buying in bulk. Further studies should also be conducted to identify alternative
markets for indigenous chickens.
References
AMRC. (2013). Agriculture and Rural Development Profitability: Will it Make Profit.
Agricultural Marketing and Resource Centre. Alberta, CA. USA. www.agmrc.org/ operating a
business/finance/profitability, 16/01/13.
Ary, D., Jacobs, L.C., & Razavieh, A. (2002). Introduction to Research in Education. Belmont,
CA: Wadsworth/Thomson Learning.
Bravo-Ureta, B., & Pinheiro, A. E. (1997). Technical, economic, and allocative efficiency in
peasant farming: evidence from the Dominican Republic. The Developing Economies 35,
48-67. http://dx.doi.org/10.1111/j.1746-1049.1997.tb01186.x
Chase, C. (2008). Pricing for Profit. Agricultural Marketing and Resource Centre. USA.
[email protected]. 18/01/13.
Dornbusch, R., Fischer, S., & Startz, R. (2008). Macroeconomics. Tenth Edition. McGraw Hill
International Edition.
Fowler, F.J. (2002). Survey Research Methods. Thousand Oaks, CA: Sage Publications.
Khai, H. V., & Yabe, M. (2011). Technical efficiency analysis of rice production in Vietnam.
Journal of ISSAAS , 17(1), 135-146.
Hossen, M. J. (2010). Effect of Management Interventions on the Productivity and Profitability
of Indigenous Chickens Under Rural Conditions in Bangladesh. www.Irrd.org, 18/01/2013.
Dutta, R. K., Islam, M. S., & Kabir M. A. (2013). Production Performance of Indigenous
Chickens (Gallus domesticus L.) in Selected Areas of Rajshali, Bangladesh. American Journal
of Experimental Agriculture 3(2), 308-323.
Magagula, C. (2012). Shaping Swaziland’s Response to Food Insecurity: Indigenous Chickens.
Techno-serve. Mbabane. Swaziland.
Martey, E., Ramatu, M., & Kuwornu, J. (2012). Commercialisation of smallholder agriculture
in Ghana: A Tobit regression analysis. African Journal of Agricultural Research.7(14),
2131-2141. http://www.academicjournals.org/AJARDOI:10.5897/AJAR11.1743, 15/10/2012.
Masimula, J. M. (2004). Poultry Enterprise Budget and Farmers Perceptions towards the
National Agricultural Marketing Board (NAMBOARD). Unpublished Research Project,

Business and Economic Research
ISSN 2162-4860
2013, Vol. 3, No. 2
www.macrothink.org/ber 217
University of Swaziland.
Masuku, M. B. (2011). An Analysis of the Broiler Supply Chain in Swaziland: A Case Study of
the Manzini Region. Asian Journal of Agricultural Sciences, 3(6), 492-499.
MOA (2012). Ministry of Agriculture Annual Report. Introduction to Indigenous Poultry
Keeping – The Case of the Swazi Chicken. Mbabane, Swaziland.
Natukunda, K, Kugonza D. R., & Kyarisiima C. C. (2011). Indigenous chickens of the Kamuli
Plains in Uganda: II Factors affecting their marketing and profitability. Livestock Research for
Rural Development. 23, Article #221, http://www.lrrd.org/lrrd23/10/natu23221.htm,
17/10/2013
Ondwasy, H., Wesong, H., & Okitoi, L. (2006). Indigenous Chicken Production Manual.
Technical Note Series Number 18. Kenya Agricultural Research Institute. www.kari.org,
21/09/2012,.
Snyder, C., & Nicholson, W. (2008). Microeconomic Theory: Basic Principles and Extensions.
Tenth Ed. International Student Edition, South-Western Cengage Learning, Mason.
Thompson, C. F. (2012) Swaziland Business Year Book. Government of Swaziland. Mbabane.
Swaziland. www.swazibusiness.com, 03/10/2012.
Shongwe, S. (2009). High Demand for Village Chickens.. Livestock and Technical Services.
Ministry of Agriculture. Mbabane. Swaziland., Times of Swaziland, 24 June, 2009. Accessed
from www.times.co.sz, 21/09/2012.
Thwala, M. (2012). Analysing the value chain of the Family Poultry Subsector in the Lower
Usuthu Project Area in Swaziland. SWADE. Siphofaneni. Swaziland.
Von Braun, J., Bouis, H., & Kennedy, E. (1994). Conceptual Framework, In: Agricultural
Commercialisation, Economic Development and Nutrition. In Von Braun and Kennedy (eds).
The Johns Hopkins University Press, London. England.
Copyright Disclaimer
Copyright reserved by the author(s).
This article is an open-access article distributed under the terms and conditions of the
Creative Commons Attribution license (http://creativecommons.org/licenses/by/3.0/).

Business and Economic Research
ISSN 2162-4860
2013, Vol. 3, No. 2
www.macrothink.org/ber 218
Ownership Structure and Performance of the
Listed Tunisian Companies
Dr. Habib AFFES
Associate professor at the Faculty of Economics and Management
University of Sfax-Tunisia, Research Unit at Sfax University: LARTIGE
E-mail: [email protected]
Mrs. Nourchéne Hamza Hakim
Contractual Assistant at the Faculty of Sciences of Sfax
PhD student at the Faculty of Economics and management, Sfax
Research Unit at sfax university: LARTIGE
E-mail: [email protected]
Received: September 27, 2013 Accepted: November 1, 2013
doi:10.5296/ber.v3i2.4332 URL: http://dx.doi.org/10.5296/ber.v3i2.4332
Abstract
Across this study, we propose to study the role of the ownership structure in the discipline of
executives and test if the managerial shareholdings, the concentration of property and the
property of the institutional investors improve the performance of companies. Based on a
sample of 17 Tunisian firms listed on the TSE between 2001 and 2005, we performed the
variables regressions of ownership structure on the various measures of accounting and stock
market performance.
Our results show that the concentration of ownership acts positively only on the accounting
performance measured by ROE and the ownership of the institutional investors has a positive
and significant effect on the accounting and stock market performance, while the managers
shareholding has a negative and significant effect on the market performance measured by the
Marris ratio.
Keywords: Ownership structure, Ownership of institutional investors, Concentration of
ownership, Managerial shareholding, Performance.

Business and Economic Research
ISSN 2162-4860
2013, Vol. 3, No. 2
www.macrothink.org/ber 219
1. Introduction
The issue of governance has been the subject of a vast literature and continuous to draw the
attention of the general public by economists, jurists but also by sociologists and management
scientists.
The issue of governance appeared with Berle and Means (1932) and the separation of
ownership and decision-making in the major listed companies with widespread shareholding.
This separation causes the deterioration in the companies’ performance. Charreaux (1997)
defines corporate governance as "the set of the organizational mechanisms whose effect is to
determine the powers and influence the management decisions that govern their behavior and
define their discretionary space." Corporate governance is "the set of organizational
mechanisms which define the leaders’ discretionary space" [Charreaux, 1997].
This definition, which focuses on the dominant leadership role, enables to override the analysis
of the relationship between the shareholders and directors and put back corporate governance
in all the relations that a firm has with the shareholders as well as with bankers, employees,
customers or the public authorities. Corporate governance is considered as the set of
mechanisms for controlling the executive and defending the interests of all the stakeholders of
the company. These mechanisms can be either of an external nature, such as the market of
goods and services, the financial market and the leaders’ labor market, or of a domestic nature,
such as the mutual monitoring and the board of directors. The latter is considered as an
important internal control mechanism of the leaders.
The internal mechanisms of corporate governance are defined as the way to control the firm
using its structures and internal processes, for instance, the board of directors, the incentive and
compensation systems, and ownership structure. These mechanisms of internal control, in their
turn, benefited from a direct access to information and have an internal and direct view about
leaders’ behavior, which theoretically helps them monitor the managers better. The external
mechanisms are represented by the market of goods and services, the financial market, the
executives’ labor market, the legal and regulatory environment as well as the lending financial
institutions. The function of these mechanisms is to ensure a disciplinary sanction if there a
non-compliance with the legal and contractual rules as well as with the competition rules.
Several empirical studies attempted to identify the relationship between the control variables,
particularly the variables of corporate governance internal mechanisms that are related to the
ownership structure (majority, institutional, financial shareholders...) and to the features of the
board of directors (composition, size and nature of the directors) and the firm performance.
The results are varied, which implies the absence of optimal characteristics that could increase
the performance of any business. The effectiveness of the internal control mechanisms of the
leaders or their impact on performance depends on the theoretical framework and the context
of the study.
2. Literature Review
The theory of corporate governance has remarkably developed thanks to the agency theory
which is broadly based on the managerial theory of Berle and Means (1932). The agency

Business and Economic Research
ISSN 2162-4860
2013, Vol. 3, No. 2
www.macrothink.org/ber 220
theory analyzes the consequences of the separation of management and property which creates
conflicts. The agency theory deals with the way to resolve these conflicts by seeking the
optimal type of contract.
This theory first appeared mainly in the work of Alchian and Demsetz (1972), Fama (1980) and
Fama and Jensen (1983). However the article of Jensen and Meckling (1976) is the main
reference on the issue of the agency relationships within the firm. Jensen and Meckling (1976)
define an agency relationship as "a contract by which one or more persons (principal) engages
another person (agent) to execute in his name any task that involves a assigning a power
decision to the agent”. The agency relationship between the shareholders and the managers can
result in conflicts called agency conflicts due to the divergent interests of these people. The
agency theory has analyzed only the relationship between the shareholders and the managers.
This classical analysis is the shareholder-based vision of the corporate governance theory. The
field of corporate governance goes beyond the relationship between the shareholders and the
managers and must be defined much more broadly.
The new vision of corporate governance, more precisely the partnership vision helps overcome
this analysis and put the issue of corporate governance throughout the firm's relations with the
various partners including the banks, the customers, the employees, the government , etc...
Over the past two decades, the poor performance, the scandals and bankruptcies of large
companies have led the media, the investors, the governments, the regulators and the
researchers to select a good governance system to discipline the managers and therefore
improve the companies’ performance (Charreaux, 1998).
Several theoretical studies found a link between ownership structure and performance. First,
many researches tried to highlight the link between the management ownership and the firms’
performance. The obtained results are contradictory. Some found a linear relationship, while
others showed a nonlinear one (Demsetz and Lehn, 1985; Morck et al, 1988. McConnell and
Servaes, 1990, and Hermalin and Weisbach, 1991). Secondly, ownership concentration plays a
crucial role in the discipline of the leaders (Shleifer and Vishny 1986). An examination of its
impact on performance leads to mixed results. Actually, some studies found a positive effect of
the presence of the majority shareholders on performance (Berles and Means (1932), Shleifer
and Vishny (1986)), while other studies concluded that there is no relationship between
ownership concentration and performance (Holderness and Sheehan (1988)).
Investors play an important role in corporate governance. They are great monitoring staff for
the company. Some authors found a positive relationship between the presence of institutional
investors in the capital and the company’s performance (McConnell and Servaes (1990) and
Mohamed Omri). Since the work of Berle and Means (1932) and the identification of the
problems caused by the separation of ownership and decision-making, many studies have
focused on the study of the relationship between ownership structure and business performance.
These studies emphasized that the managers can pursue objectives different from those of the
shareholders, which are therefore contrary to the maximization of the market value of the
shareholders’ wealth. They add that the managers would submit to internal or external
constraints that compel them to manage in accordance with this traditional objective. However,

Business and Economic Research
ISSN 2162-4860
2013, Vol. 3, No. 2
www.macrothink.org/ber 221
Demsetz (1983) argues that ownership / decision separation led to a decline in of the leaders’
debits and there is no reason to think that a firm where its capital is wholly owned by its leader
should be more efficient than a company having a diffuse capital. Currently, there are three
main theories on this subject: "convergence of interests", "neutrality "and" persistence ".
2.1 Thesis of the Alignment of Interests
According to the theory of the alignment of interests initially supported by Berle and Means
and reused by Jensen and Meckling (1976), the more percentage of the capital held by the
managers is significant, the greater the deviation from the objective of the value
maximization is low.
2.2 The Neutrality Thesis
In this thesis, Demsetz (1983) argues that capital ownership structure is an endogenous
response to the process of profit maximization and depends on the firm's operating features and
the pressure exerted by environmental, in other words, all the structures are equivalent.
The neutrality thesis advocated by Demsetz (1983) was taken up by Demsetz and Lehn (1985).
Both authors reject any link between performance and ownership structure by studying the
relationship between the accounting rate of return on equity and the concentration rate of the
capital held by the major shareholders.
This test and this conclusion have been criticized by Morck, Shleifer and Vishny (1988). These
authors identify a nonlinear relationship between the performance measured by Tobin's Q and
the percentage of capital held by the board of directors, the body which is supposed to represent
the capital held by the managers. Depending on the area the capital percentage considered, the
effect of entrenchment or convergence of interests is dominant.
2.3 The entrenchment thesis
The entrenchment thesis set up by Morck, Shleifer and Vishny (1989) states that, contrary to
the theory of the alignment of interests, the managers who have a solid majority of the capital
escape any kind of control and then can manage a way opposite to the value maximization.
Therefore, they will have a lower performance. However, these same authors (1988) using the
Tobin's Q, as a performance indicator, identified a non-linear relationship between
performance and the percentage of capital held by the managers. They concluded that in the
area where the percentage exists, the effect of interest convergence outweighs the effect of
rootedness or vice versa.
2.4 Other Theses
However, there are also nuanced positions. In particular, that of Fama and Jensen (1983)
described as "mitigated neutrality ", based on the argument of natural selection. They
concluded that the organizational forms that survive on time are effective and therefore leave
the possibility of the existence of unsuitable ownership structures in the short term. Their
analysis incorporates the elements of the leaders’ control system. Morck, Shleifer and Vishny
(1988) empirically concluded that the effect of the interest convergence outweighs the effect of

Business and Economic Research
ISSN 2162-4860
2013, Vol. 3, No. 2
www.macrothink.org/ber 222
the rootedness or vice versa depending on the area where the percentage of the capital held by
the Board of Directors exists. To further understand the relationship between ownership
structure and performance, we will be studying the effect of the leaders’ shareholdings on the
performance of the firm.
2.4.1 The Effect of the managers’ Shareholding
The managers can be shareholders in the company. They have a percentage stake in the firm.
The managers’ shareholding is not a very recent phenomenon; it appeared with the agency
theory. This theory assumes that the increase in the share capital held by the managers is a
means of limiting the conflicts of interest between the managers and the shareholders.
An enormous amount of research tried to highlight the link that exists between the managers ’
shareholding and the firms’ performance. The obtained results are contradictory. Some found a
linear relationship, while others showed a nonlinear one. The recent studies that sought the
relationship between the firm’s performance and the capital share held by the leaders came up
with different viewpoints (Demsetz and Lehn, 1985; Morck et all, 1988. McConnell and
Servaes, 1990 and Hermalin and Weisbach, 1991).
Most of the empirical studies dealing with the impact of the managers’ shareholding on
performance are based on five assumptions.
As Milton Friedman (1953) suggests that each event can be associated with an infinite number
of explanations. The first hypothesis considers that the firm’s performance increases with the
managerial participation. The corresponding argument is that of the interest alignment. In other
words, the greater the managers ’ share is, the higher performance is, which means that there is
a good protection of the managers and other owners’ interests (Jensen and Meckling [1976]).
The second states that company’s performance decreases with the capital share held by the
managers and the managers’ entrenchment and the capital cost explain this inverse relationship.
A significant proportion of the capital held by the managers can reduce financial performance
because these managers when having huge shares in the capital of the firm will have so much
power that they will neglect the interests of the other stakeholders. The second argument is that
the capital cost, which is, in fact, the growth of the capital share held by the managers, can
result in the drop of financial performance since it increases the capital cost of the firm due to
the decrease in the market liquidity or to the decline of the diversification opportunities on the
part of the investors (Fama and Jensen [1983 page329]).
The third assumes that the firm’s performance is a non-monotonic function with the
participation of the managers in the capital. The fourth hypothesis suggests that the
managers ’ participation increases with the company’s performance. The last one stipulates that
the managerial participation has no effect on the company’s performance and vice versa
because of the natural selection and the mitigated neutrality.
On the one hand, ownership aligns the executives’ interests with the shareholders’ ones and
increases performance, and on the other hand, it makes the rooting and easier and thus
negatively affects performance which shows the complexity of the role of managers’

Business and Economic Research
ISSN 2162-4860
2013, Vol. 3, No. 2
www.macrothink.org/ber 223
stockholdings.
Several empirical studies contradicted the results concerning the existence of a linear
relationship between the managers ’ shareholding and the firm’s performance and consider the
possible existence of a nonlinear relationship. Non-linearity may be the result of the leaders’
rooting. The study sample of McConnell and Servaes consists of two sub-samples. The first is
composed of 1,173 firms with the analysis relating to the year 1976. The second sample
includes 1,093 firms and refers to the year 1986. Both authors choose the capital share held by
the managers as a proxy for ownership structure and the Tobin's Q as a measure of performance.
They included other variables known as of control such as spending on research and
development, debt, spending on advertising and the asset replacement value. The results of
McConnell and Servaes (1990) confirm the hypothesis that the ownership structure has a
significant impact on the firm’s value. They showed that the value of Tobin's Q increases and
then decreases gradually as the property becomes concentrated in the hands of the managers.
Hermalin and Weisbach (1991) examine the managerial participation effect on Tobin's Q.
Managerial participation is measured by the percentage of the shares held by the new and
former CEOs of the Board of Directors. Using five-year panel data, the authors found a
non-monotonic relationship between managerial participation and performance (positive
between 0 and 1%, decreasing between 1 and 5%, increasing between 5 and 20% and
decreasing beyond 20%). Cho (1998) found the same non-monotonic relationship between
Tobin's Q and management shareholding. However, he believes there are three equations in
which the share capital held by the leaders depends on Q, on investment and on a set of control
variables.
Holderness et al. (1999) reproduce, for the years 1935 and 1995, the central aspects of the study
carried out by Morck et al. and that of Demsetz and Lehn. Morck et al. found a significant
positive relationship between performance and the managerial participation with a level of
managerial ownership between 0 and 5%, by contrast, Morck et al. found no statistically
significant relationship beyond 5%.
Some authors confirm the lack of a relationship between the structure of the managerial
ownership and the firm performance (Demsetz and Lehn, Himmelberg et al (1999), and
Paquerot Alexander (2000)). The study of Demsetz and Lehn focuses on 511 U.S. firms
belonging to different sectors. The analysis is spread over five years from 1976 to 1980. To
assess the impact of the separation between property and decision on performance, the authors
used a regression rate of return on equity measured for accounting purposes (ROA) on a
broadcast indicator of capital. The empirical results showed no relationship between ownership
structure and the rate of return on equity. This result confirms the neutrality thesis supported by
Demsetz (1983). Himmelberg, Hubbard and Palia (1999) reviewed the relationship between
property and performance using panel data of the Compustat large and small companies and
found no relationship between the managers’ shareholding and performance. Himmelberg et al.
(1999) extended the study of Demsetz and Lehn by adding new variables so as to explain the
variation in the ownership structure. Ownership structure is measured by the managers’
shareholding; however, the Tobin's Q is the appropriate measure of performance although the
Business and Economic Research
ISSN 2162-4860
2013, Vol. 3, No. 2
www.macrothink.org/ber 224
authors confirm producing similar results if the ROA is the measure of performance.
Hypothesis 1: The positive relationship between the managers’ shareholding and the
company’s financial performance.
2.4.2 The Impact of Ownership Concentration
Ownership concentration plays an important role in the managers’ discipline (Shleifer and
Vishny 1986). An examination of its impact on performance leads to mixed results. Indeed,
some studies found a positive effect of the presence of the majority shareholders on
performance while in others there is no relationship between ownership concentration and
performance.
Berles and Means (1932) suggest the existence of a positive linear relationship between the
capital concentration and the firm’s value. In the same context, Shleifer and Vishny (1986)
show the positive influence of capital concentration on the performance and therefore the
importance of the role played by large shareholders. Agrawal and Mandelker (1996) suggest
that the existence of large shareholders leads to a better monitoring of management and better
performance especially when ownership is concentrated in the hands of institutional investors.
In Japan, Kaplan and Minton, (1994), Morck, Nakamura and Shivdasani (2000), show that it is
the major shareholders who control the leaders.
The German corporate governance system is also characterized by the presence of large
shareholders. Gorton and Schmid, (2000), show that the value of the German firms improves
when ownership concentration increases. Chen (2001) examines the relationship between
ownership structure and the firm’s value in China. The results show a positive relationship
between a concentrated ownership and the company’s value measured by Tobin's Q.
Holderness and Sheehan (1988) suggest that there is no significant performance difference
between firms with diffused capital and those of which capital is owned by a majority
shareholder.
Similarly, Mulari and Welch, (1989), claim that the performance of closed organizations (with
a small circulation of securities) is not different from that of the open ones (with a high
diffusion of securities). Indeed, the performance of organizations with a high concentration of
capital is similar to that of the organizations with a low concentration of capital. The presence
of majority shareholders in the firms’ capital positively affects their performance. Hence our
hypothesis:
Hypothesis 2: The positive relationship between the percentage of the share capital held by the
majority shareholders and performance.
2.4.3 The Effect of the Institutional Investors’ Ownership:
The emergence of institutional investors, as major holders of financial assets with an increasing
participation in capital markets, is one of the peculiarities of the current financial world, a
feature likely to become more prominent in the coming years. Investors play an important role
in corporate governance. They are great monitors for the company. The presence of
institutional investors alters the relationship between ownership structure and corporate

Business and Economic Research
ISSN 2162-4860
2013, Vol. 3, No. 2
www.macrothink.org/ber 225
performance. The impact of monitoring by institutional investors on corporate performance is
studied by more than one researcher. This impact is ambiguous (Dahia, Lonie and Power, 1998;
Denis, Denis and Sarin, 1997).
McConnell and Servaes (1990) found a positive relationship between institutional investors’
shareholding and the firm’s performance measured by Tobin's Q. This is due to the fact that
institutional investors buy stocks of the companies that have performed well. However, Pound
(1988), Barclay and Holderness (1991); Loderer and Martin (1993) claim that institutional
investors have impact on the firm’s performance only when they are actively involved in
corporate governance. These authors integrate the behavioral dimension of the institutional
investors in the study of the previous relationship.
Among the various institutional investors, the pension funds were carefully considered. British
companies are controlled and managed by pension funds. These are the institutional
shareholders of these companies. Holding a large share of capital is considered as one of the
mechanisms in solving the agency problems that arise when the leaders act against the
shareholders’ interests. Faccio and Lasfer (2000), by comparing the companies in which the
pension funds are shareholders with a group of publicly traded companies in the UK, tested the
hypothesis according to which control increases with ownership concentration and found that
the pension funds reduce the conflicts of interest and improve the business performance. Due to
the size of their shareholding, the UK pension funds are not known by their control and their
voting in the annual general meeting is difficult
Smith (1996) found that the companies controlled by pension funds, such as CalPERS, have a
much higher performance. The observation of the Tunisian economy, even if it is not developed
enough to be compared to the American and French economies, shows that financial
institutions (banks, insurance and investment companies ...) are the institutional investors of
the Tunisian companies. They are involved in the control and management of companies
through their financial contribution. An empirical study conducted by Mohamed Omri (2002)
on this subject shows that the presence of institutional investors has a positive effect on the
performance of the Tunisian firm.
The control functions of the managers may be assigned to specialized agents. In addition to the
main shareholders, banks can be excellent monitors in supervising the managers’ behavior.
Management control by banks is very common in the Japanese companies. Moreover, the
importance of the disciplinary role exerted by banks is considered as one of the determinant
factors of the Japanese firms’ effectiveness.
Financial institutions within the business groups in Japan called keiretsu are both creditors and
shareholders. In other words, the Japanese firms belonging to a keiretsu are controlled by major
banks that are both shareholders and creditors. Firm control through banks is rather a special
form of governance in Japan. In fact, the involvement of the bank in the capital enables it to
control the management of companies.
Contemporary literature was unable to deal with the fact that ownership structure of the
financial institutions could affect their performance. Banks use their position as shareholders to

Business and Economic Research
ISSN 2162-4860
2013, Vol. 3, No. 2
www.macrothink.org/ber 226
increase the profitability of the Japanese company or increase the debt on behalf of these
companies.
In this study, the author used panel data to show that if the bank is at the same time a
shareholder and a creditor, this does not mean profit maximization. Paquerot and Alexander
(2000) studied the effect of ownership structure on the firm’s performance measured by the
Sharpe ratio for the years 1991, 1992 and 1993. On the one hand, they found that the
percentage of the capital held by institutional investors has a negative impact on the firm’s
performance. The institutional shareholders have no power to control the executives, the thing
which confirms the entrenchment thesis.
On the other hand, they concluded that the capital concentration has no impact on the firm’s
performance. Moreover, they found that the percentage of the capital held by the managers has
no effect on the firm’s performance. Finally, we can conclude that the presence of institutional
investors in the companies’ capital significantly influences their performance.
Hence our hypothesis:
Hypothesis 3: There is a positive relationship between the percentage of the capital held by the
institutional investors and performance.
2.4.4 The Effect of Indebtedness:
Economists and management researchers have not always found a consensus on the effect of
indebtedness on the firm’s performance.
The relationship between indebtedness and the firm’s value is studied by more than one
researcher (Modigliani and Miller, 1958, Ross, 1977, Jensen, 1986 and Opler and Titman,
1994).
Modigliani and Miller (1958) showed that indebtedness acts positively on the firm’s value only
in the presence of taxation.
Ross (1977) considers indebtedness as a signal of the firm’s quality and its future profits.
Indeed, indebtedness solves the conflicts that arise from the asymmetric information, hence its
positive role. Under the assumption of free cash flow, Jensen (1986) assumes that indebtedness
is a means of the managers’ discipline which is value-generator and therefore acts positively
on performance.
All these authors discuss the positive role of indebtedness on the firm’s performance. However,
indebtedness can act negatively on performance. Therefore, the relationship between
performance and indebtedness is no longer linear, since it is sometimes positive and sometimes
negative. Opler and Titman (1994) show that excess indebtedness can cause bankruptcy and
direct and indirect costs which lead to the loss of confidence reflected in the loss of customers
even before the period of receivership
For some people, the effect of indebtedness on performance is determined by a number of
factors such as the ownership structure (Charreaux, 1997), the economic environment (Platt
and Platt, 1994) and the field of activity (Titman and Opler, 1994). A study conducted by R J

Business and Economic Research
ISSN 2162-4860
2013, Vol. 3, No. 2
www.macrothink.org/ber 227
Davies et al (2005) on the effect of the indebtedness ratio on performance is built on the work
of Morck et al (1988), McConnell and Servaes (1990), Modigliani and Miller (1963) , Ross
(1977) and Demsetz and Villalonga (2001).
Morck et al (1988) found the result where indebtedness has a negative and insignificant impact
on the firm’s value and hence its performance. This explains that the leaders of highly
leveraged firms hold a large share of the capital. This idea is similar to that of G. Charreaux
(1997). Demsetz and Villalonga, (2001), show that the negative relationship between
indebtedness and performance may be due to inflation.
The indebtedness impact hypothesis
Hypothesis8: indebtedness has a negative impact on performance
2.4.5 The Impact of the Firm’S Size
The firm’s size is an important determinant of companies’ performance.
Management researchers often establish a relationship between firm’s size and its performance.
Actually, this influence is not new. The conducted researches in finance, and more specifically
in corporate governance, consider this variable as a control variable which can be included in
models related to the structure of ownership and the characteristics of the board of directors.
All the researches on the type of this relationship say that the larger the firms get, the higher
their performance is. The researches conducted in financial management show that large size
can cause the emergence of coordination problems of the management teams as well as
conflicts of interest which makes these big companies no longer efficient and then have low
levels of performance.
The results of the researches on the type of performance-size relationship show the
non-linearity of the latter, as it is sometimes positive and sometimes negative. G.Charreaux
distinguishes three types of companies: family-owned, controlled and managerial companies.
There is a performance difference between these three types of companies. According
Charreaux, the firm’s performance does not depend on its size, but rather on the type of the
company. Another study conducted by G.Charreaux on the holdings, the very large companies,
shows that their performance is not different from that of other companies. The hypothesis on
the impact of the firm’s size
Hypothesis 9: The firm’s size is positively associated with performance
Summary of the assumptions
ASSUMPTIONS SIGN PROVIDED
H1: The relationship between the managers’ shareholding and performance is positive +
H2: The relationship between the majority shareholder and performance is positive +
H3: The relationship between the institutional investors’ shareholding and performance is
positive +

Business and Economic Research
ISSN 2162-4860
2013, Vol. 3, No. 2
www.macrothink.org/ber 228
Control variables: H8: The relationship between indebtedness and performance is negative
H9: The relationship between the firm’s size and performance is positive
3. Methodology
3.1 Presentation of the Sample
As far as the characteristics of our sample are concerned, the study focuses on 17 Tunisian
companies listed on the TSE over a five-year period going from 2001 to 2005, which would
mean 85 observations after excluding the banks, the insurance and financial companies and the
property and real estate companies from our sample.
3.2 Model, Variables and Measurements
The aim of our research is to analyze the impact of the variables of ownership structure, namely
the participation of the leaders in the capital, the concentration of ownership, the participation
of the institutional investors in the capital, on the performance of the listed Tunisian
companies.
The Model
PER = c+ α1MAJ+α2MANA+α3INS+α4END+α5TAIL+εt
PERF: is calculated by the accounting measures (ROA, ROE) and the stock market measures
(Tobin's Q and Marris)
MAJ: The percentage of the capital held by the majority shareholders
MANA: The percentage of the capital held by the manager
INS: The percentage of the capital held by the institutional shareholders
END: the company’s indebtedness
TAIL: the firm’s size.
Table 1. Variables and measurements.
Variables of Ownership
Structure
Variables Measures
SP Variables
proppdg % of the capital held by the managers.
propmaj The part of the capital held by the majority shareholders.
propinstit The part of the capital held by the institutional investors.
Variables de performance
ROA Net profit /Total Assets
ROE Net profit/Equity
TOBIN Market value of assets/Asset accounting value
MARRIS Equity market value /Equity accounting value
Variables de contrôle
Lev Indebtedness ratio
LnTA The company’s size measured by Neperian logarithm/total
assets

Business and Economic Research
ISSN 2162-4860
2013, Vol. 3, No. 2
www.macrothink.org/ber 229
Table 2. Descriptive statistics
Variables Minimum Maximum Mean Standard deviation
Propmaj 0,16 0,96 0,5940 0,21079
Proppdg 0,00 0,17 0,0220 0,04703
Propinstit 0,00 0,56 0,1874 0,17131
ROA -18,10 73,78 6,5032 10,02117
ROE -90,10 67,40 11,7066 18,12562
Q TOBIN 0,31 3,99 1,3168 0,65665
Marris 0,57 15,90 3,2174 2,47146
LEV 5,27 98,50 47,2275 18,97193
LNTA 9,58 14,06 11,0304 0,91524
Table 2 shows that the Tunisian companies show: a high concentration of capital, (on average
59.40%), a high debt ratio of about 48%, a poor accounting performance and a better stock
market one.
4. Results and Interpretations
Table 4. Results of the regression variables of ownership structure on the performance
measures
Accounting Measures STOCK MEASURES
ROA ROE TOBIN MARRIS
Constant -3,598 19,287*** 0,154 -1,583
% of capital held by the majority shareholders 20,09**
Managerial ownership -10,223*
% of capital held by the institutional shareholders 15,648** 24,874** 1,125** 4,353**
OverallLiabilities/Total Assets -0,350*** -0,512*** -0,0185*** -0,0749***
LN Total Assets 2,147* 0,165* 0,703**
*** Significant at 1% ; ** Significant at 5% ; * Significant at 10%
4.1. The impact of Equity on Performance
4.1.1 The Participation of the Majority Shareholders
The Tunisian listed companies are characterized by a concentrated ownership structure. Indeed,
the average holding of the majority shareholders is around 60% (see Appendix 1).
The regression result of this variable over the various performance measures shows that the
majority shareholders hae only a positive and significant impact on the return on equity (ROE),
which confirms hypothesis H 2 (see Annex 2).
4.1.2 Managerial Participation
The managers’ ownership of the Tunisian firms is, on average, around 2.2% (see Appendix 1).
This low weak rate below 5% does not mean that the managers’ interests of the listed Tunisian
firms converge towards those of the shareholders.

Business and Economic Research
ISSN 2162-4860
2013, Vol. 3, No. 2
www.macrothink.org/ber 230
This is confirmed by the regression results of this variable on the various measures of the
accounting (ROA, ROE) and the stock market (Tobin's Q, Marris) performance, since the part
of the capital held by the managers has negative and significant effects on all the performance
measures mentioned before. This does not confirm hypothesis H1 (see above).
4.1.3 Participation of the Institutional Shareholders
The institutional shareholders’ participation in the equity of the listed Tunisian firms is, on
average, 18.74% (Appendix 1).
On the basis of the regression variables of ownership structure on the accounting measures and
the stock market performance, we find that institutional investors’ shareholding has a positive
and significant impact on all the performance measures. The effect on the accounting measures
is greater than it is on the stock market ones. This confirms hypothesis H3.
4.2 The impact of the Control Variables on Performance
4.2.1 Indebtedness
The indebtedness rate is measured by the ratio of the total debt to the total assets. The average
indebtedness rate of the listed Tunisian firms is, on average, around 47.22%, but it is highly
dispersed (see Appendix 1). According to the first regression category, we notice that the
leverage has slightly significant negative effects on all the performance measures which
confirms hypothesis H8.
Indebtedness for the Tunisian companies cannot help solve the problems of the
shareholder-managers’ interests after maximizing the firm’s value.
4.2.2 The Company’s Size
The average size of the Tunisian companies measured by the natural logarithm of the total
assets has positive and significant effects on most of the accounting and stock market
performance measures. This confirms hypothesis H9 which states that the larger the firm is, the
better its performance will be. Performance is positively associated with the company’s size.
Table 4. Results of the study and hypotheses checking
Accounting Performance Stock Market Performance
(ROA) (ROE) (Q Tobin) (MARRIS)
Hypotheses on the variables relationship of ownership structure and performance
% Majority + HV
% Managerial - HNV
% Institutional + HV + HV + HV + HV
Hypotheses on the relationships of the control variables and performance
Indebtedness - HV - HV - HV - HV
Size + HV + HV + HV + HV
(+) the relationship is positive and significant.

Business and Economic Research
ISSN 2162-4860
2013, Vol. 3, No. 2
www.macrothink.org/ber 231
(-) the relationship is negative and significant.
HV: Tested hypothesis, HNV: untested hypothesis
5. Conclusion
We tried to distinguish between the variables effects of the internal governance mechanisms,
namely the ownership structure and control variables such as indebtedness and the firm’s size,
on the one hand, the impact on the accounting performance and , on the other hand, on the
market performance.The regression results showed that the hypotheses on the governance
variables are sometimes confirmed and sometimes not in the case of the Tunisian companies in
our sample, but only for some measures.
Indeed, the impact of the ownership structure and indebtedness variables is not the same for all
the performance measures.
The majority shareholding in the listed Tunisian firms has only a positive impact on the
accounting performance measured by the ROE ratio, which confirms our hypothesis.
The managers’ shareholding (managerial ownership) shows a negative and significant effect on
the performance of the market as measured by Marris ratio, which does not validate our
hypothesis.
The participation of the institutional shareholders in the capital of the Tunisian listed
companies gave the expected signs, since the interests of these shareholders have positive
effects on all the performance measures whether accounting or stock. This may reflect the
quality of the institutional shareholders, which are in most cases banks, in controlling and the
pursuing the firm’s objectives.
Concerning the control variables in our model, we realized that: the indebtedness of the
Tunisian listed companies has negative effects on most of the accounting and stock market
performance measures, which does not validate the hypothesis on the disciplinary role of
indebtedness for the managers.
The size of the listed Tunisian firms has positive effects on measures of the accounting and
stock market performance, which confirms the hypothesis and the expected sign.
To better understand the link between the internal control mechanisms and the firm’s
performance, we are interested, in this research, in studying one single system of internal
control namely the ownership structure and its influence on the performance of the firm.
Thus, for ownership structure, we first dealt with the effect of the managers’ ownership on
performance. This served as the basis for several theories the most important of which are the
convergence of interests, rootedness and neutrality. The most common conclusion was that the
first two theories coexist and, depending on the level of the managers’ ownership, either of
them dominates.
Secondly, we discussed the concentration effect and the type of ownership and opted for the
supremacy of the ownership benefits of the majority and institutional shareholders. In fact, the

Business and Economic Research
ISSN 2162-4860
2013, Vol. 3, No. 2
www.macrothink.org/ber 232
effect of this on the firms' performance is generally positive.
We tried to test the hypotheses about the effect of ownership structure on the firm’s
performance. This research used a sample of 17 Tunisian companies listed on the stock
exchange in Tunis between 2001 and 2005. We found that the managers’ ownership has a
negative effect on performance as it is measured by Tobin whereas for the other measures it has
no effect or it is not significant. We also found that the ownership of
the institutional and the majority shareholders has a positive effect.
Our study could have been more extensive if we had had data on the external control
mechanisms which, beside the internal mechanisms, can have a very important role in the
management discipline. These external mechanisms include mainly the legal and regulatory
environment, the market for goods and services, the financial market and the managers’ labor
market.
References
Agrawal, A., & Knoeber, C. R., (1996), Firm performance and mechanisms to control agency
problems between managers and shareholders”, Journal of Financial and Quantitative
Analysis, 31,377-397.
Alexander H. et Paquerot M., (2000). Efficacité des structures de contrôle et enracinement des
dirigeants”, Finance, Contrôle, Stratégie, 3(2), 5-29.
Bhagat S. and Black B., (1999). The uncertain relationship between board composition and
performance”, Business Lawyer, vol.54, pp.921-963.
Bhagat S and Black B., (2001). Board independence and long-term firm performance”,
working paper, University of Colorado.
Barclay M.and Holderness C. (1991). Negociated blocktrades and corporate control”, Journal
of Finance, 46, 861-878.
Baysinger B., & Butler H., (1985). Corporate governance and the board of directors:
performance effects of changes in board composition, Journal of Law, Economics, and
Organisations, 1, 101-124.
Borokhovich K., Parrino R., & Trapani T., (1996). Outside directors and CEO selection,
Journal of Financial and Quantitative Analysis, 31, 337-355.
http://dx.doi.org/10.2307/2331395
Boyd B., (1994). Board control and CEO compensation, Strategic Management Journal, 15,
335-344. http://dx.doi.org/10.1002/smj.4250150502
Boyd B. K. (1995). CEO Duality and firm performance: a contingency Model, Strategic
Management Journal, 16, 301-312. http://dx.doi.org/10.1002/smj.4250160404
Charreaux G. et Pitol-Belin J-P., (1990). Le conseil d administration, Vuibert Gestion
Charreaux, G., (2000). Le conseil d administration dans les théories de la gouvernance, Revue

Business and Economic Research
ISSN 2162-4860
2013, Vol. 3, No. 2
www.macrothink.org/ber 233
du financier, N 31, Décembre, 6-17.
Core J., Holtausen R., & Larcker D., (1999). Corporate governance, Chief executive officer
compensation, and firm performance, Journal of Financial Economics, 51,371-406.
http://dx.doi.org/10.1016/S0304-405X(98)00058-0
Denis, D., & Sarin A., (1999). Ownership and board structures in publicly traded corporations.
Journal of Financial Economics, 52, 187-224.
http://dx.doi.org/10.1016/S0304-405X(99)00008-2
Eisenberg T., S. Sundgren, & M. T. Wells, (1998). Larger board Size and decreasing value in
small firms. Journal of Financial Economics, vol. 48(1), 35-54.
http://dx.doi.org/10.1016/S0304-405X(98)00003-8
Fama, E. (1980). Agency problems and the theory of the firm, Journal of Political Economy,
88, 288-307. http://dx.doi.org/10.1086/260866
Godard, L. (2002). La taille du conseil d administration : déterminants et impact sur la
performance, Revue sciences de gestion, 33, 125-148.
Godard, L. (1998). Les déterminants de choix entre un conseil d administration et un conseil de
surveillance, Finance Contrôle Stratégie, 1(4), 39-61.
Gorton, G., & Schmid, F. A., (2000). Universal banking and the performance of German firms,
Journal of Financial Economics, 58, 29-80.
http://dx.doi.org/10.1016/S0304-405X(00)00066-0
Hermalin, B. E., & Weisbach M. S., (1988). The determinants of board composition, Rand
Journal of Economics, 19, 589-606. http://dx.doi.org/10.2307/2555459
Hermalin, B., Weisbach, M., (1991). The effects of board composition and direct incentives on
firm performance,Financial Management, 20,101-112. http://dx.doi.org/10.2307/3665716
Hermalin, B. E., & Weisbach M. S., (2001). Board of directors as an endogenously determined
institution: a survey of the economic literature «, Rand Journal of Economics, March, 589-606.
Jensen M. C. (1993). The modern industrial revolution, exit, and the failure of internal control
systems, The Journal of Finance, vol.XLVIII, n3, 831-880.
http://dx.doi.org/10.1111/j.1540-6261.1993.tb04022.x
Jensen, M., & W. Meckling (1976). Theory of the firm: Management behavior, agency costs
and ownership structure, Journal of Financial Economics, 3, 305-360.
http://dx.doi.org/10.1016/0304-405X(76)90026-X
Kaplan, S., & Minton, B., (1994). Appointments of outsiders to Japanese boards-determinants
and implications for managers, Journal of Financial Economics, 36, 225-258.
http://dx.doi.org/10.1016/0304-405X(94)90025-6
Klein, A, (1998). Firm performance and board committee structure. Journal of Law and
Economics, 41, 275-303. http://dx.doi.org/10.1086/467391

Business and Economic Research
ISSN 2162-4860
2013, Vol. 3, No. 2
www.macrothink.org/ber 234
Lipton, Martin, & Jay Lorsch (1992). A Modest Proposal for Improved corporate governance,
Business Lawyer, 48(1), 59-77.
MacAvoy, Paul W., S. Cantor, J.Dana, & S. Peck, (1983). Ali proposals for increased control of
the corporation by the board of directors: An economic analysis. In Statement of the Business
Roundtable on the American Law Institute’s Proposed. Principles of corporate governance and
Structure: Restatement and Recommendations, Exhibit C-1.
Mace, L., (1986). Directors, myth and reality. Boston. Harvard Business School Press.
Omri A., & Mehri B, (2003), African Administrative Studies, 60, 1-17
Pearce J. A., & S. A. Zahra, (1992). Board composition from a strategic contingency
perspective, Journal of Management Studies, 29(4), 411-438.
http://dx.doi.org/10.1111/j.1467-6486.1992.tb00672.x
Perry, T. (2000). Incentive compensation for outside directors and CEO Turnover, Working
paper, Arizona State University.
Prevost A. K, Rao R. P et Hussain M, (2002). Determinants of board composition in New
Zealand: a simultaneous equations approach,Journal of Empirical Finance, 9, 373-397.
http://dx.doi.org/10.1016/S0927-5398(02)00002-6
Pichard-Stamford J.-P., (1998). La légitimation du dirigeant par le réseau des administrateurs,
Actes des XIV èmes journées nationales des I.A.E., tome2, Nantes, 389-407
Rapport Bouton, pour un meilleur gouvernement des entreprises cotées,
AFEP/AGREF-MEDEF, septembre, 2002.
Rapport Vienot, Le conseil d administration des sociétés cotées, AFEP-CNFP, juillet, 1995.
Rapport Vienot, Rapport du comité sur le gouvernement d entreprise, AFEP-MEDEF, juillet,
1999.
Rosenstein S., & Wyatt G., (1990). Outside directors, board independence, and shareholder
wealth, Journal of Financial Economics, August, 175-192.
http://dx.doi.org/10.1016/0304-405X(90)90002-H
Rosenstein S., & Wyatt G., (1997). Inside directors, board effectiveness, and shareholder
wealth, Journal of Financial Economics, 44, 229-248.
http://dx.doi.org/10.1016/S0304-405X(97)00004-4
Shleifer, A., & Vishny, R., (1997). A survey of corporate governance, Journal of Finance, 52,
737-784. http://dx.doi.org/10.1111/j.1540-6261.1997.tb04820.x
Vaananen J., (2005). Corporate governance: Mechanisms to align interests of owners and
managers, Business Strategy and International Business, 1-36
Vance, Stanley C., (1964). Board of directors: Structure and performance. Harvard Business
School Press, Boston, MA.

Business and Economic Research
ISSN 2162-4860
2013, Vol. 3, No. 2
www.macrothink.org/ber 235
Weisbach M., (1988). Outside Directors and CEO Turnover, Journal of Financial Economics,
20, 431-460. http://dx.doi.org/10.1016/0304-405X(88)90053-0
Williamson O. E. The Economic Institutions of Capitalism, The Free Press: New York, 1985
Yermack D., (1996). Higher market valuation of companies with a small board of directors,
Journal of Financial Economics, 40(2), 185-211.
http://dx.doi.org/10.1016/0304-405X(95)00844-5
Copyright Disclaimer
Copyright reserved by the author(s).
This article is an open-access article distributed under the terms and conditions of the
CreativeCommons Attribution license (http://creativecommons.org/licenses/by/3.0/).

Business and Economic Research
ISSN 2162-4860
2013, Vol. 3, No. 2
www.macrothink.org/ber 236
Revisiting the Psychometric Properties of Market
Orientation Framework in an Emerging Economy: a
Case-Study of Botswana’S Small Service Firms
Olumide Olasimbo Jaiyeoba,
Department of Marketing, Faculty of Business
University of Botswana
Received: July 18, 2013 Accepted: August 9, 2013
doi:10.5296/ber.v3i2.4686 URL: http://dx.doi.org/10.5296/ber.v3i2.4686
Abstract
While much empirical work has centered on market orientation, an investigation of the
psychometric properties of Market Orientation (MO) scale items as adapted from Kholi and
Jaworski,(1993), in the Botswana context has been under researched. A reliable scale with
demonstrated content and convergent validity is developed in this empirical study and the
impact of market orientation efficiency on economic and noneconomic performance of service
firms is evaluated based on key informant data drawn from sampled service firms in Botswana.
Top management emphasis, centralization, market turbulence, intelligence generation,
dissemination and responsiveness, business performance, customer satisfaction, technological
turbulence, market based reward system, and overall market orientation were found to be
reliable and valid antecedents and consequences of market orientation. The study results using
factor analysis approach, therefore offer one more robustness in the applicability of MO scale
items among Botswana’s small service firms by ensuring that managers use psychometrically
valid scale items to generate, disseminate and respond to information with a view to improving
performance of small service firms.
Keywords: Psychometric Properties of Market orientation, Factor Analysis Approach, Small
Service Firms, Business Performance and Botswana.
1. Introduction
The development of coherent, robust and generalizable theory requires a base of well defined
constructs (Summers, 2001). While much empirical work has centered on market orientation,
an investigation of the psychometric properties of MO scale items as adopted from Kholi and

Business and Economic Research
ISSN 2162-4860
2013, Vol. 3, No. 2
www.macrothink.org/ber 237
Jaworski, (1993), in the Botswana context has been under researched. This study therefore
intends to investigate the reliability and validity of market orientation framework in Botswana.
A reliable scale with demonstrated content and convergent validity is developed and the impact
of market orientation efficiency on economic and noneconomic performance of service firms is
evaluated based on key informant data drawn from sampled service firms in Botswana. Gilliam
and Voss, (2013) postulated that if researchers expend the necessary resources to properly
define constructs during early stages of research projects, this foundation will be strong and
able to support expansive theories. Gilliam and Voss,(2013) concluded that construct
definitions prevent scientific discussion from devolving into babel Thus, the process of
construct definition is a critically important and complex task facing marketing researchers not
only in developed world, but also in the developing economy.
2. Objective of the Study
To investigate the psychometric properties of prominent market orientation factors influencing
the economic and non economic performance of small service firms in Botswana using Factor
analysis Approach.
3. Literature Review
A scale is said to have content validity, if the scale items form a representative sample of the
theoretical domain of the construct (Churchill, 1979; Bagozzi and Foxall, 1995). Babin and
Svensson, (2012), thus identified the year 1979, as the year of breakthrough from the paradigm
of single item structures and metric measures, as well as the lack of reliability estimates of used
constructs in marketing research to a change towards the use of multi items structures and
metric measures and reliability theory in marketing research of human perception, behaviour or
phenomenon. After this time, the reliability concept became a routine part of the results
sections of marketing research articles. Infact, Churchill,(1979), wrote about an emerging
paradigm for developing measures of marketing constructs, while Peter,(1979),cited in Babin
and Svensson (2012), presented a reliability review of psychometric basics and marketing
practices. Indeed, many otherwise well executed projects fail to have the impact they should
due to poor construct definitions (Churchill,1979).Bearden and Netemeyer, (1999),thus
provided extensive reviews of numerous multi item structures and metric measures in extant
marketing research literature that have considered the estimates of validity and reliability.
Therefore, the goal of measurement development is to produce instruments that carry meaning
and are useful for describing and explaining phenomena. This empirical study thus lend
credence to the need for measurement development. Psychometricians consider three criteria in
their assessment of the quality of measures. The first is the unidimensionality of the scale. This
is concerned with the degree to which the items in the scale load on a single factor Gerbing and
Anderson,(1988). This aspect of a measurement is important because, theory development and
testing requires that a single idea be represented by the measure to allow for subsequent testing
for correlations with other constructs or differences between groups. A second aspect of good
measures is that they are reliable. This characteristic deals with the stability of the measures
over time and the internal consistency of answers on measures containing multiple items, Rust
and Cooil, (1994). This empirical study, thus examine the content validity, dimensionality,

Business and Economic Research
ISSN 2162-4860
2013, Vol. 3, No. 2
www.macrothink.org/ber 238
coefficient alpha, with a focus on the coherence or interrelatedness of the psychometric
properties of small service firms in Botswana. The third indicator of strong measures is validity.
This is concerned with the degree to which the measure in fact represents the construct domain
(Churchill, 1979). Thus, at the heart of repeatability and standardization are the measurement
properties of reliability and validity, which this study intends to explicate.
Mowen & Voss, (2008); Rossiter, (2002), analogously postulated that some authors have
suggested that researcher concentration on operationalisation and statistical analysis have
distracted attention from construct definition. This assertion created the need for this empirical
study among Botswana’s small service firms. Gilliam and Voss, (2010), therefore posited that a
contributing factor is the lack of understanding of an implementable construct definition
process within the extant psychometric literature. Mackenzie, (2003), thus suggested that poor
construct conceptualization and definition plagues many manuscripts submitted for review.
Mackenzie, (2003), noted the impossibility of accurately specifying theoretical relations
between two constructs that lack precise meanings. Summers,(2001),concluded that the
development of coherent ,robust and generalizable theory requires a base of well defined
constructs. Hunt (1991) and Teas and Palan (1997) thus suggested the use of formalized
language in definitions to reduce ambiguity and vagueness in psychometric competence.
Contrastingly, Williamson, (1994), postulated that while the use of formalized language may
facilitate some aspects of the construct definition effort, it introduces a number of problems
that have prevented its widespread adoption. Rejecting this psychometric paradigm, Rossiter,
(2002), suggested that being far more specific in regard to the time and place where the
construct is applicable will aid in construct definition.
4. Research Methodology
The study employed a snowball sample of managers and business owners in the small service
firm domain within Gaborone and its environs. The reason for opting for non-probability rather
than probability sampling was that the sampling frame of the key informants was not available.
In addition, the study was confirmatory in nature in order to improve the understanding of
organizational market orientation behaviour in Botswana context. The final pool of small
service firms to whom questionnaires was sent totaled 400. Eventually, only 249 (constituting
over 60% response rate) usable questionnaires were returned by the respondents. The
questionnaire was pretested prior to collecting data and respondents were asked to identify
items they found unclear, ambiguous or confusing. As a result of the pretest, minor adjustments
were made to the questionnaire. Data was collected between mid July 2012 to Mid October
2012.The service firms sampled included tourism firms (5.6%); transport firms (10.7%);
financial services subsector (9.4%); consulting services (19.2%) and other services subsector
accounting for (55.1%). The majority of the respondent personnel were managers, accounting
for about 50% of the total. This suggests that most respondents were sufficiently experienced to
be able to provide meaningful response to broader policy issues relating to market orientation.
After comparing the responses of the early and late respondents, on a number of characteristics,
no significant difference was found suggesting that the sample is free from response bias. The
sample size and the response rate are consistent with related studies.

Business and Economic Research
ISSN 2162-4860
2013, Vol. 3, No. 2
www.macrothink.org/ber 239
The questionnaire and scale measures (MARKOR Scale) were adapted from Kholi & Jaworski,
(1993) constructs. The items in the questionnaire were measured with the aid of a Five point
Likert type Scale. The internal antecedents were measured by items adapted from Jaworski &
Kholi, (1993). External antecedents were adopted from Jaworski & Kholi, (1993) and Gray et
al,(1998) respectively. Reliability analysis was conducted on all the multi items scales to check
the internal consistency of the scales. This study adopted a cut off of 0.5 for Cronbach’s
Coefficient following Nunally (1978).Using 0.5 as the cut off is not without precedent. It has
been adopted in related studies (Blankson & Stoke, 2002; Blankson & Cheng, 2005).
5. Results and Discussion
In order to ascertain whether the measures retained construct validity (i.e. measure what they
are supposed to), an exploratory factor analysis using principal components and varimax
rotation technique was conducted to examine the underlying dimension of MO construct. In
determining the factors, common decision rules employed in empirical research was applied:
minimum Eigen value of 1; KMO measure of sampling adequacy greater than 0.5 and Bartlett’s
test of sphericity are significant, which indicate that the items are appropriate for factor
analysis. This analysis thus test for the distinctiveness of internal and external antecedents,
overall market orientation, as well as economic and non economic performance constructs and
validate the measurement models (See Tables 1-6 below). This empirical study thus exhibit
psychometric equivalence by providing acceptable levels of reliability, variance extracted, and
both discriminant and nomological validity.
All factor loadings included in this study were statistically significant at the 0.01 level and
exceed the arbitrary 0.5 standard. Thus, these measures demonstrate adequate convergent
validity. All of the cross-construct correlations were significantly different from 1.0, which
suggests that discriminant validity was present. In general, these results provide support for
construct validity for the measures included in this study. As displayed in the Tables 1-6 below,
the estimated standard loadings ranged from 0.50- 0.92. These are above the accepted cut-off
value of 0.50 (Teo & King 1996). Finally, all items loaded higher on their respective constructs
than on others, thus providing strong support for discriminant validity. The validity of the scale
therefore explicates the unidimensionality of the components of each scale (Gerbing &
Anderson, 1998) with a principal component factor analysis. These findings thus reduce the
plausibility of threat to validity in this study, by presenting a description of MO construct and
explicative MO model, grounded on the marketing concept.
Table 1. Psychometric properties of market orientation awareness, intelligence generation and
dissemination:
Factor
Loading
Eigen
Value
%
Variance KMO
Bartlett’s
test df
Factor 1: Market orientation awareness α =
0.71, F-test = 51.029 p<0.01 2.174 54.349 70.6 % 198.495 6 p<0.01
We encourage customer comments and
complaints because they help us to do better job 0.760
We have a strong commitment to our customer’s
need 0.809
We are always looking at ways to create 0.787

Business and Economic Research
ISSN 2162-4860
2013, Vol. 3, No. 2
www.macrothink.org/ber 240
customer value in our services
We measures customer’s satisfaction on a regular
basis 0.568
Factor 2: Intelligence generation α = 0.630,
F-test = 141.351 p<0.01 2.948 59.948 66.9 % 469.771 45 p<0.01
In this business, we meet with customers at least
once a year to find out their future needs 0.609
Individuals/Employees from our business
interact directly with customers to learn how to
serve them better
0.468
We often talk with or survey those who can
influence our end users ‘purchases
(e.g.,retailers,distributors)
0.653
In our business unit, information on our
competitors is generated independently by our
business
0.589
We collect industry information by informal
means (e.g., lunch with industry friends, talks
with trade partners).
0.632
In this business, we do a lot of in house market
research 0.594
We survey our end users at least once a year to
assess how they perceive the quality of our
products
0.705
We periodically review the likely effect of
changes in our business environment (e.g.,
regulation) on customer
0.515
Factor 3: Intelligence dissemination α = 0.60,
F-test = 89.409 p<0.01 2.641 44.016 72.4 % 317.927 15 p<0.01
In our business, we have business meetings at
least once a quarter to discuss market trends and
developments
0.703
Marketing personnel in our business spend time
discussing customers future needs with other
employees
0.748
Data on customer satisfaction are disseminated at
all levels in this business on a regular basis 0.783
If anything important happens to a major
customer or market, the whole business knows
about it in a short period
0.716
A lot of informal talk in this business unit
concerns our competitors’ tactics or strategies 0.567
Table 2. Psychometric properties of intelligence responsiveness and top management emphasis
Factor
Loading
Eigen
Value
%
Variance KMO
Bartlett’s
test
df
Factor 4 :Intelligence responsiveness α = 0.55, F-test =
116.689 p<0.01
3.616 55.83 75.00% 688.427 91
p<0.01
We periodically review our product development efforts to
ensure that they are in line with what customers want
0.602
When we find that customers would like us to modify a
product, the business involved make concerted efforts to do
so
0.503
The different activities in this business are well coordinated 0.671

Business and Economic Research
ISSN 2162-4860
2013, Vol. 3, No. 2
www.macrothink.org/ber 241
Principles of market segmentation(market or products we are
dealing with) drive new product development efforts in this
business unit
0.556
When we find that customers are unhappy with the quality of
our service, we take corrective action immediately
0.545
Factor 5 :Top management emphasis α = 0.730, F-test =
22.147 p<0.01
2.238 55.953 69.20% 238.845 6 p<0.01
In this business, manager/owner repeatedly tell employees
that this business survival depends on its adapting to market
trends
0.809
Managers/owners often tell employees to be sensitive to the
activities of our competitors
0.790
Managers keep telling people around here that they must gear
up now to meet customers future needs
0.841
According to managers/owners here, serving customers is the
most important thing our business does
0.501
Table 3. Psychometric properties of risk aversion, centralization, and formalization
Factor
Loading
Eigen
Value
%
Variance KMO
Bartlett’s
test
df
Factor 6 :Risk aversion α = 0.53, F-test = 3.439 p<0.05 1.736 53.403 60.0 % 99.413 6 p<0.01
Managers/owners in this business believe that higher financial
risks are worth taking for higher rewards
0.554
Managers/owners in this business like to take big financial
risks
0.827
Managers here encourage the development of innovating
business strategies, knowing well that some will fail
0.784
Formal business education is the key requirement of the
owner/ manager in our business
0.753
Factor 7: Centralization α = 0. 880, F-test = 12.328 p<0.01 2.947 73.669 78.2 % 602.255 6 p<0.01
There can be little action taken here until a supervisor
approves a decision
0.743
Even small matters have to be referred to someone higher for
a final decision
0.911
I have to ask my boss before I do almost anything 0.922
Any decision I make has to be my boss approval 0.845
Factor 8: Formalization α = 0. 512, F-test = 18.396 p<0.01 1.293 43.106 50.3 % 20.932 3 p<0.01
For most of the things in our business, it is within the authority
of those(owner/manager), who are responsible for them to
decide how they will be done
0.731
The employees in this business are constantly monitored for
rules violation
0.802
Table 4. Psychometric properties of Market based reward system, interpersonal
connectedness ,interpersonal conflict and competition
Factor
Loading
Eigen
Value
%
Variance KMO
Bartlett
‘test
df
Factor 9 : Market based reward system α = 0.782, F-test =
7.135 p<0.01
2.420 60.492 76.8 % 265.436 6 p<0.01
Employees in this business get recognized for being sensitive
to competitive moves
0.740

Business and Economic Research
ISSN 2162-4860
2013, Vol. 3, No. 2
www.macrothink.org/ber 242
Customer satisfaction assessments influence owner/managers
pay in this business
0.847
Formal rewards (e.g., pay rise, promotion) are forthcoming to
anyone who consistently provides good market
intelligence/information
0.789
Salespeople’s performance in this business is measured by the
strength of relationships they build with customers
0.729
Factor 10 : Interpersonal conflict α = 0.62, F-test = 176.980
p<0.01
1.878 37.564 59.0 % 122.742 10 p<0.01
Most employees in this business get along well with each other 0.727
Employees from this business feel that the goals of their
respective business are in harmony with each other
0.669
There is little or no interpersonal conflict in this company 0.515
Factor 11 : Interpersonal connectedness α = 0.81, F-test =
4.373 p<0.01
2.532 63.304 76.0% 316.486 6 p<0.01
In this business, regardless of their rank or position, it is easy
to talk to anyone needed
0.752
There is ample opportunity for informal hall talk among
individuals in this business
0.771
In this business, employees feel comfortable calling each other
when the need arises
0.845
People in this business are quite accessible to one another 0.812
Factor 12 : Competition α = 0.77, F-test = 45.422 p<0.01 3.092 44.171 78.3 % 511.320 21 p<0.01
We regularly monitor our competitors marketing efforts 0.763
We frequently collect marketing data/information on our
competitors to help direct our marketing plans
0.789
Our salespeople are instructed to monitor and report on
competitor activity
0.815
We respond rapidly to competitors actions 0.744
There are many promotion wars in our business. 0.588
Price competition is a hallmark of our business. 0.592
Our competitors are relatively weak 0.584
Table 5. Psychometric properties of market turbulence, general economy, organizational
commitment, esprit de corps and business performance.
Factor
Loading
Eigen
Value
%
Variance KMO
Bartlett’s
test
df
Factor 13 : Market Turbulence α = 0.529, F-test = 9.188
p<0.01
1.894 47.347 67.8 % 110.611 6 p<0.01
In our kind of business, customer’s product preferences
change quite a bit over time
0.717
Our customers tend to look for new product all the time 0.767
We are witnessing demand for our products and services from
customers who never bought them before
0.616
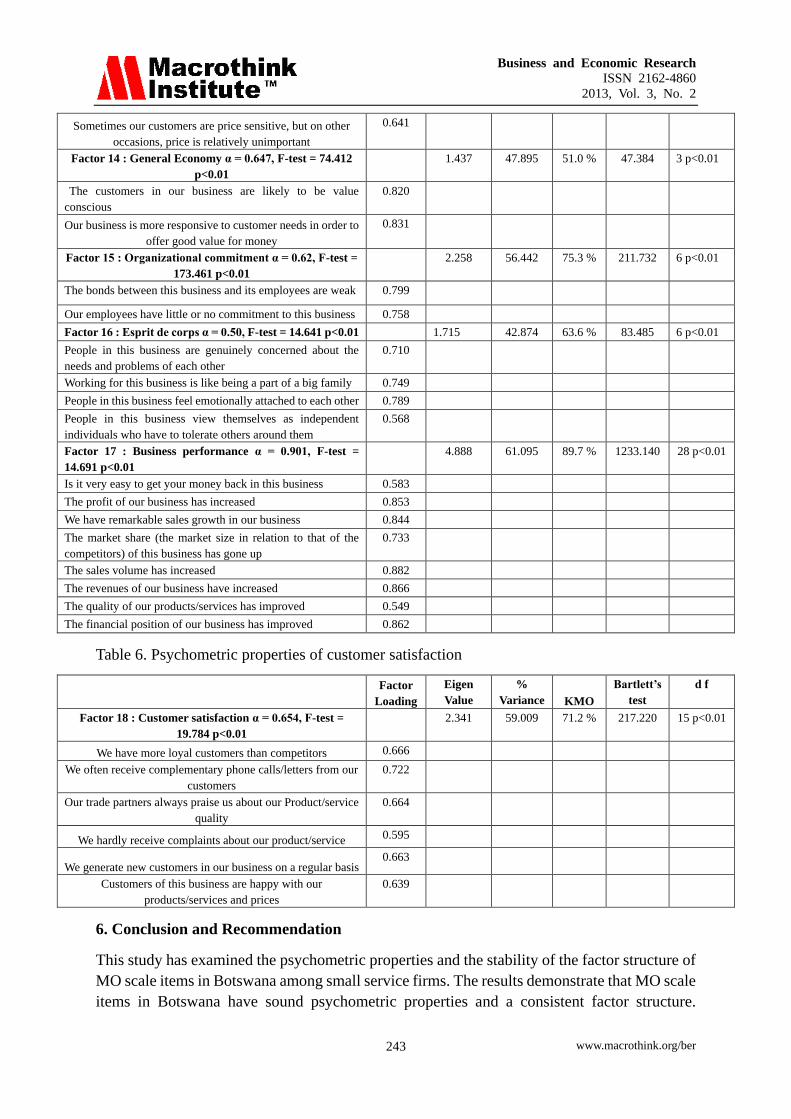
Business and Economic Research
ISSN 2162-4860
2013, Vol. 3, No. 2
www.macrothink.org/ber 243
Sometimes our customers are price sensitive, but on other
occasions, price is relatively unimportant
0.641
Factor 14 : General Economy α = 0.647, F-test = 74.412
p<0.01
1.437 47.895 51.0 % 47.384 3 p<0.01
The customers in our business are likely to be value
conscious
0.820
Our business is more responsive to customer needs in order to
offer good value for money
0.831
Factor 15 : Organizational commitment α = 0.62, F-test =
173.461 p<0.01
2.258 56.442 75.3 % 211.732 6 p<0.01
The bonds between this business and its employees are weak 0.799
Our employees have little or no commitment to this business 0.758
Factor 16 : Esprit de corps α = 0.50, F-test = 14.641 p<0.01 1.715 42.874 63.6 % 83.485 6 p<0.01
People in this business are genuinely concerned about the
needs and problems of each other
0.710
Working for this business is like being a part of a big family 0.749
People in this business feel emotionally attached to each other 0.789
People in this business view themselves as independent
individuals who have to tolerate others around them
0.568
Factor 17 : Business performance α = 0.901, F-test =
14.691 p<0.01
4.888 61.095 89.7 % 1233.140 28 p<0.01
Is it very easy to get your money back in this business 0.583
The profit of our business has increased 0.853
We have remarkable sales growth in our business 0.844
The market share (the market size in relation to that of the
competitors) of this business has gone up
0.733
The sales volume has increased 0.882
The revenues of our business have increased 0.866
The quality of our products/services has improved 0.549
The financial position of our business has improved 0.862
Table 6. Psychometric properties of customer satisfaction
Factor
Loading
Eigen
Value
%
Variance KMO
Bartlett’s
test
d f
Factor 18 : Customer satisfaction α = 0.654, F-test =
19.784 p<0.01
2.341 59.009 71.2 % 217.220 15 p<0.01
We have more loyal customers than competitors 0.666
We often receive complementary phone calls/letters from our
customers
0.722
Our trade partners always praise us about our Product/service
quality
0.664
We hardly receive complaints about our product/service 0.595
We generate new customers in our business on a regular basis 0.663
Customers of this business are happy with our
products/services and prices
0.639
6. Conclusion and Recommendation
This study has examined the psychometric properties and the stability of the factor structure of
MO scale items in Botswana among small service firms. The results demonstrate that MO scale
items in Botswana have sound psychometric properties and a consistent factor structure.

Business and Economic Research
ISSN 2162-4860
2013, Vol. 3, No. 2
www.macrothink.org/ber 244
Although further research is necessary to replicate present findings and provide additional
evidence of the psychometric competence. The Botswana version of MO scale items is thus
posited to be an excellent instrument for the assessment of performance of small service
firms .The instrument therefore exhibits both conceptual and psychometric equivalence by
providing acceptable levels of reliability, variance extracted and both discriminant and
nomological validity. The instrument in this empirical study will thus contribute to theory
development and business performance among small service firms in Botswana. From a
managerial perspective, the MO scale can be used to evaluate small service firms level of MO
efficiency as a baseline measure.
References
Babin, J. B., & Svensson,G, (2012). Structural equation modeling in social science research
process, European Business Review, 24(4), 320-330.
http://dx.doi.org/10.1108/09555341211242132
Bagozzi ,R. P., & Foxall, G. R (1995). Construct validity and generalizability of the kirton
adaption-innovation inventory. European Journal of Personality, 9(3), 185-206.
http://dx.doi.org/10.1002/per.2410090303
Bearden,W. O., & Netemeyer, R. G (1999).Handbook of Marketing scales:Multi item
measures for marketing and Consumer Behaviour research, Sage,Newsbury Park,CA.
Blankson, C., & Stokes, D, (2002). Marketing practices in the UK small businesses sector.
Marketing Intelligence and Planning, 20(1), 49-61.
http://dx.doi.org/10.1108/02634500210414774
Blankson, C., & Cheng, J. M. S, (2005). Have small business adopted Market orientation
concept? The case of small business in Michigan. Journal of Business and Industrial
Marketing, 20(60), 317-330. http://dx.doi.org/10.1108/08858620510618156
Churchill, G. A .Jr, (1979) A paradigm for developing better measures of marketing constructs.
Journal of Marketing Research, 16, 64-73. http://dx.doi.org/10.2307/3150876
Gerbing, D. W., & Anderson, J. C, (1988). An updated paradigm for scale development
incorporating unidimensionality and its assessment, Journal of Marketing Research, 25,
186-192. http://dx.doi.org/10.2307/3172650
Gilliam, D. A., & Voss, K (2013). A proposed procedure for construct definition in marketing,
European Journal of Marketing, Vol.47 No.1/2, 5-26.
http://dx.doi.org/10.1108/03090561311285439
Gray, B., Matear,S., Boshoff ,C., & Matheson ,P. (1998). Developing a better measure of
market orientation. European Journal of Marketing, 32(9-10), 884-903.
http://dx.doi.org/10.1108/03090569810232327
Hunt, S. D, (1991). Modern marketing theory, Critical Issues in the Philosophy of Marketing
Science, South Western Publishing Company, Cincinnati ,Ohio.

Business and Economic Research
ISSN 2162-4860
2013, Vol. 3, No. 2
www.macrothink.org/ber 245
Jaworski, B. J., & Kholi, A. K, (1993). Market orientation antecedents and consequences.
Journal of Marketing. 57(30), 53-70. http://dx.doi.org/10.2307/1251854
Mackenzie, S. B. (2003). The dangers of poor constructs conceptualization, Journal of the
Academy of Marketing Science, 31(3), 323-326.
http://dx.doi.org/10.1177/0092070303031003011
Mowen, J. C., & Voss, K. E. (2008). On building better construct measures: Implications of a
general hierarchical model: Psychology and Marketing, 25(6), 485-505.
http://dx.doi.org/10.1002/mar.20221
Nunnally, J. C. (1978). Psychometric Theory ,Mc Graw-Hill, Publishing, New York.
Rossiter, J. R. (2002). The C-OAR-SE procedure for scale development in marketing,
International Journal of Research in Marketing, 19(4), 305-335.
http://dx.doi.org/10.1016/S0167-8116(02)00097-6
Rust, R. T., & Cooil, B. (1994). Reliability measures for qualitative data: theory and
implications. Journal of Marketing Research. 31, 1-15. http://dx.doi.org/10.2307/3151942
Summers, J. O., (2001). Guide lines for conducting research and publishing in marketing: from
conceptualization through the review process. Journal of the Academy of Marketing Science,
29(4), 405-415. http://dx.doi.org/10.1177/03079450094243
Teas, R. K., & Palan, K. M (1997). The realms of scientific meaning framework for
constructing theoretically meaningful nominal definitions of marketing concepts. Journal of
Marketing. 61(2), 52-67.
Teo, TSH., & King W. R., (1996). Key dimensions of facilitators and inhibitors for the strategic
use of information technology. Journal of Management information systems, 12(4) 35-53.
http://dx.doi.org/10.2307/1251830
Williamson, T. (1994). Vagueness,Routledge,London.
Copyright Disclaimer
Copyright reserved by the author(s).
This article is an open-access article distributed under the terms and conditions of the
Creative Commons Attribution license (http://creativecommons.org/licenses/by/3.0/).

Business and Economic Research
ISSN 2162-4860
2013, Vol. 3, No. 2
www.macrothink.org/ber 246
The Effects of Environmental Munificence and Market
Orientation Dimensions on Performance of Small
Business Firms in Botswana
Olumide Olasimbo Jaiyeoba (Corresponding author)
Department of Marketing, Faculty of Business
University of Botswana, Gaborone
Received: July 13, 2013 Accepted: August 2, 2013
doi:10. 5296/ber.v3i2.4687 URL: http://dx.doi.org/10. 5296/ber.v3i2.4687
Abstract
The significance and importance of the relationship between market orientation and
environmental munificence is clearly embedded in the extant literature. There is however the
acute paucity or conceptual ambiguity of such investigation in developing economies.Thus,this
study aims to investigate the effects of environmental munificence and market orientation
dimensions on performance of small business firms in Botswana. While there is a rich body of
research on market orientation抯 effect on business performance, much little attention has been
given to the combined effects of environmental munificence and market orientation on small
businesses in developing economies. To provide insights into the above inconsistencies, this
study hope to generate empirical results on the combined effects of market orientation and
environmental munificence on small business performance in Botswana
Keywords: Environmental Munificence, Market Orientation, Small Business Firms,
Botswana.
1 Introduction
Botswana has long realized the importance of Small firms in fostering economic growth and in
creating jobs. This led to the introduction, over the last two decades, of targeted financial
support as well as advisory programmes to help Batswana establish their own enterprises.
These programmes, however, were set up more in reaction to specific problems encountered
rather than as the basis of a comprehensive and more focused government policy on Small
businesses. Over the last decade, considerable changes have taken place in the world economic
order, brought about by a number of factors. The most important new factor is the growing
intensity of international competition, spurred by the advent of globalization. The other factor

Business and Economic Research
ISSN 2162-4860
2013, Vol. 3, No. 2
www.macrothink.org/ber 247
that is increasing competitiveness is the rapid introduction of more productive technology and
improved operating procedures in business enterprises throughout the world. The significance
and importance of the relationship between market orientation and environmental munificence
is clearly embedded in the existent literature. There is however the acute paucity or conceptual
ambiguity of such investigation in developing economies.Thus,this study aims to investigate
the effects of environmental munificence and market orientation dimensions on performance
of small business firms in Botswana. The research community largely shares the view that
growing Small firms have a special importance in the economy (Storey,1994). Although there
has been much interest in understanding small firm growth during the last twenty years (Dobbs
and Hamilton,2007;O扲egan et al.,2006;Wiklund,1998;Delmar et al,2003),there is still not
much of a common body or nexus of relationship of well founded knowledge about the causes,
effects or processes of growth (Davidsson and Wiklund,2000).While there is a rich body of
research on market orientation抯 effect on business performance, much little attention has been
given to the combined effects of environmental munificence and market orientation on small
businesses in developing economies. Also a rich body of research in marketing has examined
the relationship between market orientation-firms?focus on the identification and satisfaction
of customer needs and business performance (Ellis 2006;Kirca et al,2005).Still, our
understanding of the relationship between market orientation and environmental munificence,
which is also central for firms?growth and competitive advantage, is much more limited, most
especially in Africa. To provide insights into the above inconsistencies, this study hope to
generate empirical results on the combined effects of market orientation and environmental
munificence on small business performance in Botswana. Environmental munificence is the
scarcity or abundance of critical resources needed by firms operating within an environment
(Randolph& Dess,1984).The resources available within an environment influence the survival
and growth of firms sharing that environment, they also affect the abilities of new firms to enter
this environment (Randolph& Dess,1984).Research has indicated that environmental
munificence is positively associated with the range of strategy and organization options
available to firms, including market orientation dynamics.(Tushman &Anderson,1986).When
resources are abundant, it is relatively easy for firms to survive, and pursue goals other than
survival.However,when resources are scarce, competition intensifies (Dess &
Beard,1984),adversely affecting firm profitability and organizational slack and causing
changes in interorganisational characteristics and tangible and intangible behaviors of
organizational members .Together, these findings suggest that munificence is an important
theoretical dimension.
2 Literature Review
The environment creates opportunities and threats for an organization. It affects organizational
structure, processes, and managerial decision making (Duncan,1972;Keats and Hitt,1988).The
environment creates uncertainty for an organization抯 managers which in turn influences the
information processing needs within the top management team most especially in small
business firms in developing economies. Zahra et al., (1999) thus call for comparative
entrepreneurship studies across multiple countries and cultures, with the underlying premise
that different cultural and economic contexts may lead to differential intensities of

Business and Economic Research
ISSN 2162-4860
2013, Vol. 3, No. 2
www.macrothink.org/ber 248
entrepreneurial orientation and its antecedents and consequences. Managers must cope with
uncertainty by identifying opportunities, recognizing problems or threats, and by implementing
strategic adaptations (Hambrick,1980;Jemison,1984).Therefore, the study of different regions,
cultures, economies and environments becomes a research priority if we want a full
understanding of the nature and the role of entrepreneurship and market orientation.
Environmental munificence refers to environmental capacity which permits organizational
growth and stability. Munificence can also facilitate the generation of slack resources (Cyert
and March, 1963) which the organization can use during periods of scarcity or which can be
used for organizational innovation. Hostile market environments characterized by intense
competition and lack of exploitable opportunities, and dynamic market environments
characterized by rapid technological advancements and rapidly changing consumer
preferences, are considered to have a significant influence on business performance (Covin and
Slevin,1989;Gray et al.,1998;Jaworski and Kholi,1993;Low,2000;Kumar and
Srivastava,2004;Slater and Narver,1994).Clearly, the desire to be competitive in such
environmental conditions may provide the impetus for organizations to implement marketing
audits to ensure the marketing executives to have adequate environmental information for
market conduct, most especially amongst small business firms in developing economies. In the
literature, environment has been defined as a multidimensional concepts (Egeren and onnor,
1998).Following Egeren and onnor (1998) approach, this study will define environment in
terms of marketing manager perceptions of munificence and dynamic attributes.
3 Conceptual Models and Hypotheses Development
Group cohesiveness has been shown to be related to the quantity of interaction (Lott and Lott,
1961) and quality of interaction (Shaw, 1964) between group members, most especially
amongst small business firms. Connectedness between departments facilitates interaction and
the exchange of information (Ruekert & Walker, 1987). Kirca et al.,(2005),analogously
concluded that managers can improve market orientation by emphasizing market-oriented
attitudes, behaviors, and reward systems; tolerating acceptable risk; communicating effectively;
embracing change; and providing opportunities for staff development or advancement while
avoiding formalization, centralization, and interdepartmental conflict. The perception of an
organization as being comprised of different but interdependent departments and functions,
together with the availability of conflict resolution mechanisms, facilitates the open flow of
resources, work and assistance across all organizational departments (Ruekert & Walker
1987).Based on this reasoning, Jaworski and Kholi (1993) postulate that interdepartmental
connectedness fosters an interdependency within the organization and encourages employees
to act in a concerted manner in the processes of knowledge generation and knowledge
utilization. Thus, the following hypothesized relationship could be established:
H1: The higher the level of top management cohesiveness, the higher the Small Business
Firm抯 level of market orientation.
Communication affects strategic decision making by influencing the breadth of the field of
vision during the intelligence generation and dissemination activities of market orientation,
and the processing of information during the intelligence response activities. Kholi and

Business and Economic Research
ISSN 2162-4860
2013, Vol. 3, No. 2
www.macrothink.org/ber 249
Jaworski,(1993),therefore concluded that the role of senior management is critical in shaping
organizational values to promote and reinforce behaviors necessary to serve the current and
future needs of customers, better than their key competitors. Burgess and
Nyajeka,(2007),posited that besides top management reinforcement, their commitment of
continuous communication of specific guidelines to be market-oriented was considered
mandatory to encourage organizational employees, in order to create, disseminate and
effectively respond to market intelligence. Two types of intergroup conflict affect
organizations: relationship conflict and task conflict (Polzer, Milton, & Swann,2002).Burgess
and Nyajeka, (2007), thus postulate that relationship conflict emerges from interpersonal
incompatibility, produces frustration, annoyance and tension; thus reducing information
sharing and causes employees to disengage psychologically and physically from a firm.
Atuahene-Gima & Murray,(2004),concluded that high task conflict adversely affect marketing
strategy development by stifling cross-functional cooperation. The following hypothesized
relationship could be established:
H2: The higher the level of communication exhibited by top management, the higher the
organization level of market orientation.
The literature in business policy and strategic management has long stressed the need to scan
and assess the organization抯 environment and to align environmental characteristics with
organizational capabilities and goals (Miles and Snow,1978). Khandwalla (1976), found that
when managers perceived their environments as being dynamic and uncertain, their strategies
were more likely to be extenstive, more comprehensive and more multifaceted. Environmental
munificence means a great availability of resources in the environment and great opportunity in
access and acquirement of resources needed. This is in line with the position of Covin and
Slevin (1991); and Brown and Kirchhoff,(1997).Environmental munificence, thus refers to
environmental capacity which permits organizational growth and stability. Kholi and Jaworski,
(1990), thus concluded that in those environments high in munificence, an organization may be
able to get away with a minimal amount of market orientation. Dess and Beard, 1984, postulate
that in environments low in munificence, competition increases. In some cases, the intensity of
the relationship between entrepreneurship and market orientation depends on the context in
which firms operate. Covin and Slevin, (1989), posited that the relationship between
entrepreneurship and performance is higher when environmental hostility increases. Dess et al.,
(1997), also argue that entrepreneurial orientation may be especially useful in uncertain or
turbulent environments. Knight (2000), concluded that entrepreneurship may be useful for
small business firms affected by globalization. This reasoning suggests that organizations will
respond to low munificence by using a higher degree of market orientation. The following
hypothesized relationship is posited in this study:
H3: Small Business Firms in environments low in munificence will exhibit a higher degree of
market orientation than Small Business Firms in environments high in munificence.
Market instability or dynamism can come from changes in consumers and in consumers
preferences. In environments marked by stable preferences, there is little need for an
organization to adjust its marketing mix. In contrast, in an environment marked by rapidly

Business and Economic Research
ISSN 2162-4860
2013, Vol. 3, No. 2
www.macrothink.org/ber 250
changing sets of consumers and consumers taste and preferences, there is greater likelihood
that the organization抯 offerings will be mismatched with consumer needs. Technological
turbulence, competitive intensity, and the state of the economy can also bring about
environmental dynamism, which could create diverse opportunities leading to creating value
for consumers, thus making strong market orientation more desirable. Dynamism is the degree
of change or market or market stability.Overall,the reason why market environment
characteristics may influence marketing audits is because marketing audits provide the
marketing management with programmed appraisals and critical evaluations of the
environmental analysis and help ensure the marketing management to identify opportunities
and threats from markets. Dynamic environment is likely to generate opportunities, which the
growth-oriented businesses can take advantage of (Covin & Slevin,1991;Zahra,1993).In their
study of independent Swedish small businesses, Wiklund and Shepherd,(2003), found that
environmental dynamism magnifies the effect the managers rowth aspirations have on the
realization of growth. Based on the discussion earlier, the following exploratory propositions
are presented:
H4: Small Business Firms in environments high in dynamism will exhibit a higher degree of
market orientation than Small Business Firms in environments low in dynamism.
Several empirical studies have found a strong positive relationship between Market orientation
and performance, whether one looks at consumer products, new products, innovation or
services. There is however, a small body of evidence that does not support a strong positive
relationship between MO and business performance. A market orientation provides a unifying
framework and focus for people and departments, thereby creating superior value for
consumers and superior performance for organizations. In a meta-analysis of more than 200
effect sizes, Kirca et al., (2005) find that the effects of market orientation on performance are
strongly positive, although somewhat weaker in emerging markets and service industries. The
meta analysis of Cano et al., (2004) found that the effects of market orientation on performance
are not moderated by national culture, GDP per capita, or human development and are stronger
in service firms than in manufacturing firms. However, only three of the 53 studies they
examined were located in developing economies and they theorized that developing economies
cultural priorities would increase the positive impact of market orientation on performance.
This is consistent with a priori findings of Deshpande and Farley (2004), which states that the
effects of market orientation on performance should be highest in developing economies.
Based on the discussion earlier, the following exploratory propositions are presented:
H5: Small Business Firms with a high degree of market orientation will have higher
performance than Small Business Firms with a low degree of market orientation in Botswana.
Figure 1. Proposed model of Environmental munificence and market orientation dimensions
effect on Small Business Firms In Botswana.
4. Research Methodology
The research design to be adopted in this study is cross-sectional. The target population in this
study would be made up of top management teams of Small business firms in service and

Business and Economic Research
ISSN 2162-4860
2013, Vol. 3, No. 2
www.macrothink.org/ber 251
manufacturing firms as key informants for the firms. The CEOs of 150 small business firms
would be interviewed. Group cohesiveness and communication amongst the small business
firms would be measured by using a series of items to which key informants would respond
using a five point Likert scale. This research intends to use a modification of Slater and Narver
(1992) and Khandwalla (1976) measures to measure munificence, dynamism and
organizational performance. Snowball sampling technique will be utilized due to lack of access
to adequate sampling frame. LISREL (statistical technique of linear structural relations), would
be utilized because it has the potential to address structural relationships among theoretical
(latent) constructs that cannot be directly observed and its ability to incorporate measurement
error in the model. All the scales used would be tested for unidimensionality and reliability in
order to investigate the psychometric competence of scale items.
5. Conclusions
As to environmental ramifications for services marketing management, this study adds support
to the intuitive claims of academicians, that environments high in dynamism and low in
munificence engender higher degrees of market orientation. It could thus be concluded that
those organizations which are in tune with their environments and recognize themselves as
being in high dynamic or low munificence environments will be well advised to invest in
becoming more market oriented.
This study will hopefully contribute to empirical evidence about the relationship among
entrepreneurship, market orientation and performance. Because the adoption of
entrepreneurship and market orientation as part of a firms organizational culture requires
greater effort, it is crucial to understand the relationship of these orientations in terms of their
implementations and implications for performance of small sized firms in Botswana. Therefore,
policies aimed at enhancing entrepreneurial orientation and exploiting its complementarities
with MO constitute an appropriate way to promote economic growth and welfare of small sized
firms in Botswana.
References
Atuahene-Gima, K, & Murray, J. Y. (2004). Antecedents and outcomes of marketing strategy
competitiveness. Journal of Marketing, 68(4), 33-46.
http://dx.doi.org/10.1509/jmkg.68.4.33.42732
Brown, T. E., & Kirchhoff B. A. (1997). The Effects of Resource Availability and
Entrepreneurial orientation on firm Growth. Frontiers of Entrepreneurship Research. Babson
College.
Burgress, S. M & Nyajeka, (2007). Market orientation and performance in low-income
countries: The case of Zimbabwean retailers. Advances in International Management, 20,
215-257. http://dx.doi.org/10.1016/S1571-5027(07)20010-5
Covin., J. G., & Slevin., D. P. (1989),Strategic Management of Small Firms in Hostile and
Beningn Environments. Strategic Management Journal, 10(1), 75-87.
http://dx.doi.org/10.1002/smj.4250100107

Business and Economic Research
ISSN 2162-4860
2013, Vol. 3, No. 2
www.macrothink.org/ber 252
Cyert, R. M., & March, J. G. (1963). A behavioural Theory of the Firm,Prentice-Hall,
Englewood Cliffs, NJ.
Delmar., Davison., & Gartner, W. B. (2003). Arriving at the high growth firm. Journal of
Business Venturing, 18(2), 189-216. http://dx.doi.org/10.1016/S0883-9026(02)00080-0
Deshpande R., Farley, J. U, & Webster, J. F. E (1993). Corporate culture, customer orientation
and innovativeness in Japanese Firms: a quadrad analysis, Journal of Marketing, 57(1), 23-27.
http://dx.doi.org/10.2307/1252055
Dess, G. C., & Beard, D. W. (1984). Dimensions of organizational task environments.
Administrative Science Quarterly, (29), 52-73. http://dx.doi.org/10.2307/2393080
Dobbs, M., & Hamilton, R, (2007). Small business growth: recent evidence and new directions.
International Journal of Entrepreneurial behaviour and Research, 13(5), 296-322.
http://dx.doi.org/10.1108/13552550710780885
Duncan, R. B. (1972). Characeristics of organizational environments and perceived
environmental uncertainty, Administrative Science Quarterly, 20, 613-629.
Egeren, M. V., & O onnor, S. (1998). Drivers of Market orientation and performance in service
firms? Journal of Services Marketing, 12(1), 39-58.
http://dx.doi.org/10.1108/08876049810202357
Ellis, P. D, (2006). Market Orientation and performance : A meta analysis and cross national
comparisons. Journal of Management Studies, 43(5), 1089-1107.
http://dx.doi.org/10.1111/j.1467-6486.2006.00630.x
Gray, B. J., Matear, S., Boshoff, C., & Matheson, P. K. (1998). Developing a Better Measure of
Market Orientation. European Journal of Marketing. 32(9/10), 884-903.
http://dx.doi.org/10.1108/03090569810232327
Hambrick, D. C., & Mason, P. A. (1984). Upper echelons :the organization as a reflection of its
top managers. Academy of Management Review, 9(2), 193-206.
Jemison, D. (1984). The importance of boundary spanning roles in strategic decision making.
Journal of Management Studies, 21(2), 131-152.
http://dx.doi.org/10.1111/j.1467-6486.1984.tb00228.x
Keats, B. W., & Hitt, M. A. (1988), A causal model of linkages among environmental
dimensions macro organizational characteristics and performance. Academy of Management
Journal, 31, 57-98. http://dx.doi.org/10.1111/j.1467-6486.1984.tb00228.x
Khandwalla, P. (1976). The Design of Organisations, Harcourt, Brace, Jovanovich, New York,
NY.
Kholi, A. K., Jaworski, B. J., & Kumar, A. (1993) MARKOR:A measure of MO, Journal of
Marketing Research, 30 (Nov), 467-477. http://dx.doi.org/10.2307/3172691
Kirca, A. H, Jayachandran, S, & Bearden, W. O (2005). Market Orientation: A meta-analytic

Business and Economic Research
ISSN 2162-4860
2013, Vol. 3, No. 2
www.macrothink.org/ber 253
review and assessment of its antecedents and impact on performance. Journal of Marketing.
69(2), 24-41. http://dx.doi.org/10.1509/jmkg.69.2.24.60761
Knight, G. (2000). Entrepreneurship and marketing strategy: the SME under globalization.
Journal of International Marketing, 8(2), 12-32. http://dx.doi.org/10.1509/jimk.8.2.12.19620
Kumar, V., & Srivastava, R. K. (2004). Measuring Marketing Productivity: Current
Knowledge and Future Directions. Journal of Marketing, 68 (October), 76-89.
Lott and Lott (1961). Group cohesiveness, communication level and conformity, Journal of
Abnormal and Social Psychology, 62, 408-412. http://dx.doi.org/10.1509/jimk.8.2.12.19620
Low, G. S. (2000) Correlates of Integrated Marketing Communications. Journal of Advertising
Research, 40(3), 27-39.
Oegan , N., & Ghobadian, A. (2006). Perceptions of generic strategies of small and medium
sized engineering and electronics manufacturers in the UK: the applicability of the miles and
Snow typology, Journal of Manufacturing Technology Management, 5(17), 603-620.
http://dx.doi.org/10.1016/j.technovation.2005.01.003
Polzer, J. T., Milton, L. P., & Swann., W. B. (2002). Capitalizing on diversity: Interpersonal
congruence in small work groups. Administrative Science Quarterly, 47(2). 296-324.
http://dx.doi.org/10.2307/3094807
Randolph. & Dess (1984).The congruence perspective of organization design: a conceptual
model and multivariate research approach, Academy of Management Review, 9(1), 114-127.
Rodriguez, Cano, C, Carrilat, F. A, & Jaramillo, F, (2004). A meta-analysis of the relationship
between Market orientation and Business Performance: Evidence from five continents.
International Journal of Research in Marketing, 21(2), 179-200.
http://dx.doi.org/10.1016/j.ijresmar.2003.07.001
Ruekert, R, & Walker, O. C Jr. (1987). Marketing抯 interaction with other functional units:A
conceptual framework and empirical evidence. Journal of Marketing. 51(1), 1-19.
Shaw, M. E. (1964). Group effectiveness as a function of group members compatibility and
cooperation requirements of the task. Group Dynamics, 3rd edition, McGraw-Hill, New York,
NY.
Slater, S. F. & Narver, J. C. (1994) Does Competitive Environment Moderate the
MO-Performance Relationship? Journal of Marketing. 58, 46-55.
http://dx.doi.org/10.2307/1252250
Tushman, M. L., & Anderson, P. (1986). Technological discontinuities and organizational
environments. Administrative Science Quarterly. 31, 439-465.
http://dx.doi.org/10.2307/1252250
Wiklund, J. (1998). Entrepreneurial orientation as predictor of performance and
entrepreneurial behaviour in small firms:Longitudinal evidence In Frontiers of Entrepreneurial
Research. Wellesey, MA:Babson College. http:www. babson. edu/entrep/papers. htm.

Business and Economic Research
ISSN 2162-4860
2013, Vol. 3, No. 2
www.macrothink.org/ber 254
Zahra, S. A., & Covin, J. G. (1995). Contextual influences on the corporate
entrepreneurial-performance relationship: A longitudinal analysis. Journal of Business
Venturing, 10, 43-58. http://dx.doi.org/10.1016/0883-9026(94)00004-E
Copyright Disclaimer
Copyright reserved by the author(s).
This article is an open-access article distributed under the terms and conditions of the
Creative Commons Attribution license (http://creativecommons.org/licenses/by/3.0/).

Business and Economic Research
ISSN 2162-4860
2013, Vol. 3, No. 2
www.macrothink.org/ber 255
Investment Strategies of Different Holding Periods:
Evidence from Stock Markets of Hong Kong, Korea,
Shanghai, and Taiwan
Massoud Moslehpour
Dept. of Business Administration, Asia University
500, Lioufeng Rd., Wufeng, Taichung 41354, Taiwan
Tel: +886-423-323-456 (Ext.1962) E-mail: [email protected]
Munkh-Ulzii Batmunkh (Corresponding author)
Dept. of Business Administration, Asia University
500, Lioufeng Rd., Wufeng, Taichung 41354, Taiwan
Tel: +886-423-323-456 E-mail: [email protected]
Received: November 1, 2013 Accepted: November 15, 2013
doi:10.5296/ber.v3i2.4491 URL: http://dx.doi.org/10.5296/ber.v3i2.4491
Abstract
Although there is abundant research focusing on estimating the level of returns on stock market,
there is a lack of studies examining the comparison of stock return movements for short-term
and long-term investment in the Asian stock market. The present study examines return on
investment of different holding periods among selected stock markets in Asia. Based on the
trading performance of key indices and market capitalization value, Korean Stock Exchange
(KRE), Shanghai Stock Exchange (SSE), Hong Kong Stock Exchange (HKSE), and Taiwan
Stock Exchange (TWSE) were selected for this study. In assessing the comparative output of
the case stock markets, this study used ANOVA and post-hoc analysis to process time series
data of daily, monthly, quarterly, semiannually and annually return of investments of indices of
the case stock markets. The results of this study showed that there are significant differences in
return on investment among the case stock markets in the given holding periods. While a
country might have a higher return in short-term investment, it may not necessarily be suitable
for long-term investment as evidenced by their performance from 2001 to 2012.

Business and Economic Research
ISSN 2162-4860
2013, Vol. 3, No. 2
www.macrothink.org/ber 256
Keywords: Return on Investment, Holding Periods, Short-Term and Long-Term Investment,
HSI, KOSPI, SSECI, TAIEX
1. Introduction
Investment in stock markets has gained unprecedented popularity in financial markets around
the world. Recently the increasing diversity of financial instruments has broadened the
dimension of global investment opportunity to both individual and institutional investors.
Overall competitive pressure has been increased on many stock exchanges due to a range of
significant changes in the industrial environment. The intensive globalization activity brings
stock markets from home-based state to the international arena, where severe competition for
surviving in the financial markets held among investors (Michael, 2009; Sulloway, 2009).
Amid this harsh competition, it is not so easy to make profit from an investment. There are
many economic and social barriers awaiting the investment to be crashed. When
macroeconomic indicators, such as inflation rate and interest rate, move up or down they will
simultaneously trigger uncertainty among the investment decision. Once uncertainty happens,
investors start to sell stocks in order to protect their asset value from devaluation. In the grand
scale, this movement induces volatility into stock markets, which finally cause the value of
shares sink down (Koshnazarov, 2010).
In contrast, during the periods of macroeconomic stability the value of shares keep growing
positively which sends a message to the investors to keep their assets, and even invest more
in buying new shares. Once a positive sign of value of shares appears among investors,
demand for new shares spikes in stock markets, which pulls the price of the shares up. But,
this suitable period of time does not last forever and difficult times for equity values could be
the next movement of the stock market (Araujo, 2009; Chow, Kim, & Sun, 2007).
Therefore, studies in finance overwhelmingly agree that the volatility in stock markets is the
direct reaction to the investment behavior of fund managers. Sometimes financial markets
crash without potential swing in economic fundamentals. Studies conclude that this scenario
appears to be as a common case of investment misbehaving or irrational investment behavior,
which is driven by emotion-greed in the bubbles and fear in the crashes (Climent & Meneu,
2003; Chiang & Zheng, 2010).
Although investment behavior is the key factor in driving stock prices, however, the stock
market performance (measured by market capitalization), trading volume and market return
on investment are also crucial factors for investors. In order to make profit, investors analyze
stock market performance, plan their strategy, and finally put their strategy into action. This
process in whole is called investment behavior (Abdulkadir & Green, 2002; Indrawati, 2002).
Thus, the main purpose of this paper is to compare return on investments among different
stock markets, in Asia in terms of different timing periods.
The capital markets in US and other largest economies might have already been matured.
Therefore, investors now tend to invest into the emerging capital markets of Asia, preferably
South Korea, Taiwan, Hong Kong, and Shanghai, to raise value of their assets. Since 1970s,

Business and Economic Research
ISSN 2162-4860
2013, Vol. 3, No. 2
www.macrothink.org/ber 257
these countries started to exhibit a notable economic growth, and shortly were named as the
tiger economies in the world. The upcoming body of this study focuses more on the stock
markets of mentioned countries, and their performances (Pontines & Siregar, 2009; Singh,
Kumar, & Pandey, 2010).
1.1 Research Problem
The main problem of investors of all times has been the issue of how to do an investment with
low risk and high margin. Even experienced investors do betting blindly as if they were
gambling. According to the previous studies, investment returns may vary in
holding-periods, such as short-term and long-term investment. Thus, studies denote that the
differences in holding periods in investment appear to be as one of the essential factors for
investment strategy (Rigobon, 2003; Zhou, Wu, & Yang, 2011; Singh et al., 2010).
Global equity markets and regional markets are often correlated with one another, especially in
times of economic recession with a prominent contagion and spillover effects. Even in
relatively stable periods, co-moving trending behavior might be presented across equity
markets. Studies on interrelations of equity markets could provide a useful insight for the
international investors who look forward for diversified opportunities. Since co-movements
are common among stock markets, the cross-market gains and losses are prevalent.
Nevertheless, emerging markets with explosive growth rates, such as those in Asia and Pacific
region, have recently attracted market players who seek to diversify their portfolio (Tan,
Chiang, Mason, & Nelling, 2008).
Emerging economies as well as tiger economies are nations with social and economic activity
in the process of rapid growth and industrialization. This process is usually accompanied by an
increase in foreign and domestic investments and life quality. Thus, stock markets of South
Korea, Taiwan, Hong Kong, and Shanghai exhibit characteristics both of emerging and tiger
markets that predominantly attract investors` interest. However, studies state that one of the
key features of emerging markets is that they frequently tend to display upward and downward
movements in stock prices in either of short-term and long term periods. These characteristics
of stock market boost momentum and market swings which in turn add to the market volatility
(Liu, Pan, & Shieh, 1998; Pontines & Siregar, 2009).
Individual investors speculate in short-term and mid-term strategies. However, institutional
investors head for wealth maximization in primary and secondary markets by implementing
long-term investment and other strategies, such as merging and acquisition, as well as IPOs.
Institutional investors rely mostly on long-term value from an investment rather than
speculating in short-term. The key point of long-term investment strategy is not only increasing
the value of capital asset, but also investors can receive income from shares, which is known as
a dividend (In, Kim, & Yoon, 2002; Pontines & Siregar, 2009).
With the foregoing discussion we tried to construct a firm perception of how holding periods
are essential for the decision making pattern of investors, which have recently appeared as one
of the front line issues of latter studies. Do different holding periods impact the investment
returns in emerging stock markets? This is the main question of this study that needs to be

Business and Economic Research
ISSN 2162-4860
2013, Vol. 3, No. 2
www.macrothink.org/ber 258
answered. Thus, present study implements a comparison among investment returns of
emerging stock markets for different holding periods. As for the case stock markets, we select
Shanghai Stock Exchange (hereinafter referred to as SSE), Hong Kong Stock Exchange
(hereinafter referred to as HKSE), Taiwan Stock Exchange (hereinafter referred to as TWSE),
and Korean Stock Exchange (hereinafter referred to as KRE).
2. Related Research and Hypothesis Development
The main purpose of this paper is to give a reasonable answer to the research question: Are
there any significant differences among investment time periods for investment returns in
TWSE, KRE, SSE, and HKSE? If yes, to what extent are these differences exhibited among the
markets? In order to translate the question into theoretical framework we review the following
body of literature.
Recently investors are increasingly seeking for opportunities to minimize the portfolio risk for
an investment return in a given period of time. It is a well established fact that the lower the
correlations among international equity markets the lesser the investment risk. However, the
recent trend of development of emerging stock markets increased the correlation among equity
markets. Therefore, high volatility in returns still exists among developed and emerging equity
markets in terms of holding periods (Dimson, Marsh, & Staunton, 2002; Li, Sarkar, & Wang,
2003; Goetzmann, Li, & Rouwenhorst, 2005).
Numbers of studies reveal differences in returns among the Asian stock markets impacted by
western markets, in both short-term and long-term intervals (Cha & Cheung, 1998; De Roon,
Nijman, & Werker, 2001; Syriopoulos, 2004). However, so far, there is no study to investigate
relationships among the case stock markets of this study.
Mukherjee and Bose (2008) found that recent returns on Indian stock market were severely
influenced by US and other Asian markets including Japan. More importantly, outcomes of
their study suggest that Indian stock market returns impact on the stock returns of major
markets of Asia. Moreover, studies demonstrate that US capital market often exhibit a
significant impact on Asian equity markets in long-term. As well, a notable correlation among
markets of the same region is explained by the degree of restrictions on foreign investment or
certain market characteristics, such as market returns in different holding periods and market
liquidity (Elyasiani, Perera, & Puri, 1998; Lin, 2008).
Hsiao, Hsiao, and Yamashita (2003) found a significant unidirectional causality from the US
market towards stock market returns of Japan and Korea, but not to China and Taiwan. They
also found that the Chinese stock market, based on the data of Shanghai Composite price index,
is not significantly correlated with rest of the Asian markets.
Janakiramanan and Lamba (1998) found that the stock markets of US impact the majority of
Asian markets except for the relatively segmented market of Indonesia. They also revealed that
markets that are located geographically close, such as Australia-New Zealand and
Singapore-Malaysia affect to each other.
Singh, Kumar and Pandey (2010) examine the stock returns volatility spillover effects across
Business and Economic Research
ISSN 2162-4860
2013, Vol. 3, No. 2
www.macrothink.org/ber 259
fifteen stock markets of North America, Europe and Asia. Their research sample for the Asian
stock markets includes China and Indonesia; and the composite stock indices data are used for
both markets. In assessing the investment returns spillover effects, they employed vector
autoregression model, which is used to capture the linear interdependencies among multiple
time series data. Results of their study suggest that information flow within stock markets plays
main role in investment returns. For example, a market that opens earlier generally tends to
have a greater effect on those that open later. Especially, this phenomenon is often displayed
between the equity markets of Japan, Singapore and Hong Kong.
Climent and Meneu (2003) assessed the impacts of the Asian capital market crisis in 1997, on
implication of Southeast Asian markets that include Indonesia, Philippines and Thailand, and
US. Results of their study state that the US equity market affects all the Asian stock markets
except Korea. Moreover, findings of this study also suggest that Asian stock markets with the
close geographical and economical zone demonstrate significant correlations in their
investment returns in short-term and long-term time horizons.
Furthermore, In et al. (2001) examined causality between HKSE, Thailand stock market, and
KRE. They found that Thailand stock market exhibits greater market interdependence, while
HKSE appears as the potential generator of volatility through other Asian stock markets.
Pontines and Siregar (2009) examined correlation of market returns in different holding
periods among eight east Asian stock markets, around the time of the Asian financial recession.
They found significant evidence of increased correlations among market returns on both of
short-term and long-term investment in the post-crisis period, starting especially with declining
in HKSE.
Lee (2009) measured return volatility spillover effects in short-term and long-term investments
among six east Asian stock markets including India. Results found significant spillover effects
among five countries that are geographically close, and as markets as close to each other the
effects were greater. Chuang, Lu, and Tswei (2007) did same study among six Asian stock
markets including Thailand. They found high interdependencies on investment returns in
various time horizons, and the Japanese stock market appears to be a potential volatility
transmitter to other east Asian markets. For the same purpose Singh et al. (2010) used a
GARCH model. They found that the volatility of a particular market return is mostly affected
by one that opens earlier. According to their results the correlation among the Asian markets
was strong.
2.1 Hypothesis Development
Reviewing the theoretical background, we noticed several important aspects for developing
theoretical framework. First, it is obvious that examining correlation of investment returns
within same holding period, or among the same market, as well as the markets that are not
considered to be related to each other, is not good idea. The reason is that correlations between
market returns are more profound among markets that belong to the same geographical and
economical zone. Moreover, returns of equity markets vary according to the holding periods.
Second, previous studies tested the impacts and relationships among stock markets of Asia and
US, but did not target solely on the Asian markets. Therefore, in order to generate rather new

Business and Economic Research
ISSN 2162-4860
2013, Vol. 3, No. 2
www.macrothink.org/ber 260
outcomes, as shown in the Figure 1, we develop the following theoretical framework and
hypothesis.
Figure 1. Research framework
Basing on theoretical foundation, the present study develops the following hypotheses:
H1: There are significant differences among TWSE, HKSE, SSE, and KRE in their daily
investment returns for the period of 2001-2011.
H2: There are significant differences among TWSE, HKSE, SSE, and KRE in their monthly
investment returns for the period of 2001-2011.
H3: There are significant differences among TWSE, HKSE, SSE, and KRE in their quarterly
investment returns for the period of 2001-2011.
H4: There are significant differences among TWSE, HKSE, SSE, and KRE in their
semiannually investment returns for the period of 2001-2011.
H5: There are significant differences among TWSE, HKSE, SSE, and KRE in their annually
investment returns for the period of 2001-2011.
3. Research Methodology
3.1 Data
This study uses time series data of index prices of HSI, KOSPI, SSECI, and TAIEX; covering
periods from January 2001 to April 2012. The time period of chosen data constitutes the
availability and limitation of data source. In order to capture returns in different time horizons
we divided data into time scales of day, month, quarter, semiannual and annual base. The data
for this study was collected from the data source Thomson Reuters Datastream (2013).
Business and Economic Research
ISSN 2162-4860
2013, Vol. 3, No. 2
www.macrothink.org/ber 261
3.2 Methodology
To test the hypotheses of this study we employed analysis of variance (ANOVA). ANOVA is
used to test significance of differences among the means. Furthermore, in order to find the
detailed differences among the subgroups, that could be otherwise undetected; we adopted
post-hoc analysis. Post hoc test is designed for situations in which the researcher has already
obtained a significant omnibus F-test with a factor that consists of three or more means and
additional exploration of the differences among means is needed to provide specific
information on which means are significantly different from each other (Hung, Lu, & Lee,
2010).
Also the descriptive statistics display the characteristics, functions, relationship and patterns of
the research phenomena. It also explains and validates findings. For this study, the p-value is
less than or equal to 5% to indicate statistical significance and to control for type I and type II
error. (Rigobon, 2003).
3.3 Case Stock Markets
3.3.1 Twse
The TWSE is operated by the Taiwan Stock Exchange Corporation (TWSEC), which is a
financial institution that located in Taipei 101, in Taipei, Taiwan. The TWSEC was established
in 1961 and began operating as a stock exchange on 9 February 1962. It is regulated by the
Financial Supervisory Commission of Taiwan. As of 31 December 2010, the TWSE had 758
listed companies with a combined market capitalization of USD821,083 million.
Taiwan Capitalization Weighted Stock Index (TAIEX) is a stock market index for companies
traded on the TWSE. TAIEX covers all of the listed stocks excluding preferred stocks,
full-delivery stocks and newly listed stocks, which are listed for less than one calendar month.
It was first published in 1967 by TWSE with 1966 being the base year with a value of 100
(Taiwan Stock Exchange, 2013).
3.3.2 KRE
KRE is the sole securities exchange operator in South Korea. It is headquartered in Busan, and
has an office for cash markets and market oversight in Seoul. The KRE was created through the
integration of Korea Stock Exchange, Korea Futures Exchange and KOSDAQ Stock Market
under the Korea Stock & Futures Exchange Act. The securities and derivatives markets of
former exchanges are now business divisions of KRE: the Stock Market Division, KOSDAQ
Market Division and Derivatives Market Division. As of October 2012, KE had 1,796 listed
companies with a combined market capitalization of USD1.1 trillion. The Korea Composite
Stock Price Index (KOSPI) is the index of all common stocks traded on the KRE. It's the
representative stock market index of South Korea. KOSPI was introduced in 1983 with the
base value of 100 as of January 4, 1980. It's calculated based on market capitalization (Korean
Stock Exchange, 2013).

Business and Economic Research
ISSN 2162-4860
2013, Vol. 3, No. 2
www.macrothink.org/ber 262
3.3.3 SSE
The SSE is a stock exchange that is based in the city of Shanghai, China. It is one of the two
stock exchanges operating independently in the People's Republic of China, the other is the
Shenzhen Stock Exchange. SSE is the one of the six largest stock exchanges in the world by
market capitalization at USD2.3 trillion as of Dec 2011. Unlike the HKSE, the SSE is still not
entirely open to foreign investors due to tight capital account controls exercised by the Chinese
mainland authorities. The current exchange was re-established on November 26, 1990 and was
in operation on December 19 of the same year. It is a non-profit organization directly
administered by the China Securities Regulatory Commission.
The SSE Composite Index (SSECI) is the most commonly used indicator to reflect SSE's
market performance. Constituents for the SSECI are all listed stocks including at the SSE. The
base day for the SSECI is December 19, 1990. The base period is the total market capitalization
of all stocks of that day. The base value is 100. The index was launched on July 15, 1991
(Shanghai Stock Exchange, 2013).
3.3.4 HKSE
The HKSE is a stock exchange located in Hong Kong. It is Asia's second largest stock
exchange in terms of market capitalization behind the Tokyo Stock Exchange, and the fifth
largest in the world. As of 30 November 2011, the HKSE had 1,477 listed companies with a
combined market capitalization of USD2191.6 trillion.
The Hang Seng Index (HSI) is a free float-adjusted market capitalization-weighted stock
market index of HKSE. It is used to record and monitor daily changes of the largest companies
of the HKSE and is the main indicator of the overall market performance in Hong Kong. These
48 constituent companies represent about 60% of capitalization of the HKSE. HSI was started
on November 24, 1969, and is currently compiled and maintained by Hang Seng Indices
Company Limited (Hong Kong Stock Exchange, 2013).
4. Empirical Findings
Under the assumption of five hypotheses in this study, we analyze the time series data of
indices HSI, KOSPI, SSECI, and TAIEX to find out degree of correlation in different holding
periods. The data is divided into five timing scales such as daily, monthly, quarterly,
semiannually, and annually, and analyzed by ANOVA modeling techniques and post-hoc test.
4.1 Descriptive Statistics
Descriptive statistics is the discipline of quantitatively describing the main features of data.
Descriptive statistics are distinguished from inferential statistics, in that it aims to summarize a
data, rather than use the data to learn about the population. This generally means that
descriptive statistics, unlike inferential statistics, is not developed on the basis of probability
theory. Even when a data analysis draws its main conclusions using inferential statistics,
descriptive statistics are generally also presented.

Business and Economic Research
ISSN 2162-4860
2013, Vol. 3, No. 2
www.macrothink.org/ber 263
Table 1. Descriptive statistics of the four case stock markets
Periods
Code
N Mean
Std.
Deviation
Std.
Error
95% Confidence Interval for
Mean
Minimum Maximum Lower Bound Upper Bound
Daily
KRE 2482 .00052 .015984 .000321 -.00011 .00115 -.106 .119
SSE 2482 .00571 .083138 .001669 .00244 .00899 -.250 .350
HKSE 2482 .02073 .121428 .002437 .01595 .02551 -.515 .637
TWSE 2482 .04694 .201066 .004036 .03902 .05485 -.525 .788
Total 9928 .01847 .126116 .001266 .01599 .02095 -.525 .788
Monthly
KRE 2482 .00028 .017037 .000342 -.00039 .00095 -.088 .095
SSE 2482 .00612 .066711 .001339 .00349 .00874 -.410 .322
HKSe 2482 .02081 .134813 .002706 .01550 .02611 -.413 .612
TWSE 2482 .15736 .248274 .004983 .14759 .16713 -.535 .828
Total 9928 .04614 .159098 .001597 .04301 .04927 -.535 .828
Quarterly
KRE 2482 .00052 .015984 .000321 -.00011 .00115 -.106 .119
SSE 2482 .00456 .066194 .001329 .00196 .00717 -.264 .261
HKSE 2482 .07817 .198077 .003976 .07038 .08597 -.488 .909
TWSE 2482 -.33306 .280194 .005624 -.34409 -.32203 -.838 .392
Total 9928 -.06245 .236545 .002374 -.06710 -.05780 -.838 .909
Semi
annually
KRE 2482 .00022 .014446 .000290 -.00035 .00079 -.088 .067
SSE 2482 .03563 .124644 .002502 .03073 .04054 -.401 .493
HKSE 2482 .05435 .298261 .005987 .04261 .06609 -.533 1.125
TWSE 2482 -.85676 .052857 .001061 -.85884 -.85468 -.942 -.664
Total 9928 -.19164 .417995 .004195 -.19986 -.18342 -.942 1.125
Annually
KRE 2482 .01059 .066847 .001342 .00796 .01322 -.375 .240
SSE 2482 .02193 .169393 .003400 .01526 .02860 -.394 .646
HKSE 2482 .04513 .186937 .003752 .03777 .05248 -.580 .803
TWSE 2482 1.67257 .714040 .014332 1.64447 1.70068 .183 4.406
Total 9928 .43755 .808131 .008111 .42166 .45345 -.580 4.406
4.2 ANOVA Analysis
In statistics, ANOVA is a statistical model, in which the observed variance in a particular
variable is partitioned into components attributable to different sources of variation. In its
simplest form, ANOVA provides a statistical test of whether or not the means of several groups
are all equal. For this reason, ANOVA is useful in comparison of more than two means.
According to the results generated from ANOVA analysis shown in the Table 2, all the
proposed hypotheses of this study are supported.
Table 2. ANOVA testing of the four stock markets
Sum of Squares df Mean Square F Sig.
Daily
Between Groups 3.228 3 1.076 69.033 .000
Within Groups 154.664 9924 .016
Total 157.892 9927

Business and Economic Research
ISSN 2162-4860
2013, Vol. 3, No. 2
www.macrothink.org/ber 264
Monthly
Between Groups 41.491 3 13.830 654.269 .000
Within Groups 209.781 9924 .021
Total 251.273 9927
Quarterly
Between Groups 251.824 3 83.941 2.744E3 .000
Within Groups 303.625 9924 .031
Total 555.449 9927
Semi
annually
Between Groups 1467.736 3 489.245 1.820E4 .000
Within Groups 266.704 9924 .027
Total 1734.440 9927
Annually
Between Groups 5049.166 3 1683.055 1.165E4 .000
Within Groups 1433.922 9924 .144
Total 6483.088 9927
4.3 Post-hoc Analysis
In the design and analysis of experiments, post-hoc analysis consists of looking at the data-after
the experiment has concluded-for patterns that were not specified a priori. It is sometimes
called by critics data dredging to evoke the sense that the more one looks the more likely
something will be found. More subtly, each time a pattern in the data is considered, a statistical
test is effectively performed. This greatly inflates the total number of statistical tests and
necessitates the use of multiple testing procedures to compensate.
However, this is difficult to do precisely and in fact most results of post-hoc analyses are
reported as they are with unadjusted p-values. These p-values must be interpreted in light of the
fact that they are a small and selected subset of a potentially large group of p-values. Results of
post-hoc analysis should be explicitly labeled in studies to avoid misleading of audience.
Table 3. Post hoc analysis for daily stock index
Dependent Variable (I) country (J) country
Mean Difference
(I-J) Std. Error Sig.
95% Confidence Interval
Lower Bound Upper Bound
Daily
KRE
SSE -.005196 .003544 .542 -.01510 .00471
HKSE -.020209* .003544 .000 -.03012 -.01030
TWSE -.046418* .003544 .000 -.05633 -.03651
SSE
KRE .005196 .003544 .542 -.00471 .01510
HKSE -.015013* .003544 .000 -.02492 -.00511
TWSE -.041222* .003544 .000 -.05113 -.03131
HKSE
KRE .020209* .003544 .000 .01030 .03012
SSE .015013* .003544 .000 .00511 .02492
TWSE -.026209* .003544 .000 -.03612 -.01630
TWSE KRE .046418* .003544 .000 .03651 .05633
SSE .041222* .003544 .000 .03131 .05113
HKSE .026209* .003544 .000 .01630 .03612
Based on post-hoc daily test results, as shown in the Table 4, the following 6 conclusions can be drawn:
1) there is no significant difference between KRE and SSE (p > .05);

Business and Economic Research
ISSN 2162-4860
2013, Vol. 3, No. 2
www.macrothink.org/ber 265
2) there is significant difference between KRE and HKSE (p < .001);
3) there is significant difference between KRE and TWSE (p < .001);
4) there is significant difference between SSE and HKSE (p < .001),
5) there is significant difference between SSE and TWSE (p < .001);
6) there is significant difference between HKSE and TWSE (p < .001);
Table 4. Post hoc analysis for monthly stock index
Monthly
KRE
SSE -.005839 .004127 .572 -.01738 .00570
HKSE -.020532* .004127 .000 -.03207 -.00899
TWSE -.157083* .004127 .000 -.16862 -.14554
SSE
KRE .005839 .004127 .572 -.00570 .01738
HKSE -.014692* .004127 .005 -.02623 -.00315
TWSE -.151244* .004127 .000 -.16278 -.13970
HKSE
KRE .020532* .004127 .000 .00899 .03207
SSE .014692* .004127 .005 .00315 .02623
TWSE -.136552* .004127 .000 -.14809 -.12501
TWSE
KRE .157083* .004127 .000 .14554 .16862
SSE .151244* .004127 .000 .13970 .16278
HKSE .136552* .004127 .000 .12501 .14809
Based on post-hoc monthly test results, as shown in the Table 5, the following 6 conclusions can be drawn:
1) there is no significant difference between KRE and SSE (p > .05);
2) there is significant difference between KRE and HKSE (p < .001);
3) there is significant difference between KRE and TWSE (p < .001);
4) there is significant difference between SSE and HKSE (p < .001),
5) there is significant difference between SSE and TWSE (p < .001);
6) there is significant difference between HKSE and TWSE (p < .001);
Table 5. Post hoc analysis for quarterly stock index
KRE
SSE -.004046 .004965 .882 -.01793 .00984
HKSE -.077657* .004965 .000 -.09154 -.06377
TWSE .333577* .004965 .000 .31969 .34746
SSE
KRE .004046 .004965 .882 -.00984 .01793
HKSE -.073611* .004965 .000 -.08749 -.05973

Business and Economic Research
ISSN 2162-4860
2013, Vol. 3, No. 2
www.macrothink.org/ber 266
Quarterly
TWSE .337623* .004965 .000 .32374 .35151
HKSE
KRE .077657* .004965 .000 .06377 .09154
SSE .073611* .004965 .000 .05973 .08749
TWSE .411234* .004965 .000 .39735 .42512
TWSE
KRE -.333577* .004965 .000 -.34746 -.31969
SSE -.337623* .004965 .000 -.35151 -.32374
HKSE -.411234* .004965 .000 -.42512 -.39735
Based on post-hoc quarterly test results, as shown in the Table 6, the following 6 conclusions can be drawn:
1) there is significant difference between KRE and SSE (p < .001);
2) there is significant difference between KRE and HKSE (p < .001);
3) there is significant difference between KRE and TWSE (p < .001);
4) there is significant difference between SSE and HKSE (p < .001),
5) there is significant difference between SSE and TWSE (p < .001);
6) there is significant difference between HKSE and TWSE (p < .001);
Table 6. Post hoc analysis for semiannually stock index
Semi
annually
KRE
SSE -.035418* .004654 .000 -.04843 -.02241
HKSE -.054131* .004654 .000 -.06714 -.04112
TWSE .856973* .004654 .000 .84396 .86998
SSE
KRE .035418* .004654 .000 .02241 .04843
HKSE -.018713* .004654 .001 -.03172 -.00570
TWSE .892391* .004654 .000 .87938 .90540
HKSE KRE .054131* .004654 .000 .04112 .06714
SSE .018713* .004654 .001 .00570 .03172
TWSE .911104* .004654 .000 .89809 .92412
TWSE
KRE -.856973* .004654 .000 -.86998 -.84396
SSE -.892391* .004654 .000 -.90540 -.87938
HKSE -.911104* .004654 .000 -.92412 -.89809
Based on post-hoc semiannually test results, as shown in the Table 7, the following 6 conclusions can be drawn:
1) there is significant difference between KRE and SSE (p < .001);
2) there is significant difference between KRE and HKSE (p < .001);
3) there is significant difference between KRE and TWSE (p < .001);
4) there is significant difference between SSE and HKSE (p < .001),
5) there is significant difference between SSE and TWSE (p < .001);
6) there is significant difference between HKSE and TWSE (p < .001);

Business and Economic Research
ISSN 2162-4860
2013, Vol. 3, No. 2
www.macrothink.org/ber 267
Table 7. Post hoc analysis for annually stock index
Annually
KRE
SSE -.011339 .010790 .776 -.04151 .01883
HKSE -.034535 .010790 .017 -.06470 -.00437
TWSE -1.661983* .010790 .000 -1.69215 -1.63181
SSE
KRE .011339 .010790 .776 -.01883 .04151
HKSE -.023196 .010790 .202 -.05336 .00697
TWSE -1.650643* .010790 .000 -1.68081 -1.62047
HKSE
KRE .034535 .010790 .017 .00437 .06470
SSE .023196 .010790 .202 -.00697 .05336
TWSE -1.627448* .010790 .000 -1.65762 -1.59728
TWSE
KRE 1.661983* .010790 .000 1.63181 1.69215
SSE 1.650643* .010790 .000 1.62047 1.68081
HKSE 1.627448* .010790 .000 1.59728 1.65762
Based on post-hoc annually test results, as shown in the Table 8, the following 6 conclusions can be drawn:
1) there is no significant difference between KRE and SSE (p > .05);
2) there is no significant difference between KRE and HKSE (p > .05);
3) there is significant difference between KRE and TWSE (p < .001);
4) there is no significant difference between SSE and HKSE (p > .05),
5) there is significant difference between SSE and TWSE (p < .001);
6) there is significant difference between HKSE and TWSE (p < .001);
5. Empirical Contributions
According to the results, it is evident that the market returns are highly diversified among the
case stock markets through the investment time horizon. Thus, in order to make the results
more visible and applicable, we re-categorise each holding periods into three groups. First is
short-term investment period, which includes daily and monthly trading intervals. Second is
mid-term investment period, which includes quarterly and semi-annually trading intervals.
Third is long-term investment period, which includes annually trading interval (Martin, Maria,
Tommy, & Anders, 2012).
5.1 Short-Term Investment Period
According to the results, TWSE appears to be the most profitable market, and the second most
profitable market is HKSE. For SSE, returns are mediocre. Investment returns of SSE are
better than KRE, however are not as high as HKSE and TWSE. Thus, investors are suggested
to be cautious in doing short-term (daily and monthly) investment in KRE.
5.2 Mid-Term Investment Period
The best choice for investment in this period appears to be HKSE and then SSE. The middle
point market here is KRE. The low return investment market for mid-term investing period

Business and Economic Research
ISSN 2162-4860
2013, Vol. 3, No. 2
www.macrothink.org/ber 268
seems to be TWSE. Thus, investors should be careful with mid-term (quarterly and
semi-annually) investment decisions related to TWSE.
5.3 Long-Term Investment Period
Based on the findings of this study, investors can expect better long-term investment return
from TWSE. There are no significant difference between long-term investment returns of the
SSE, HKSE, and KRE. However, fund managers may keep in mind that KRE might be riskier
than the HKSE and SSE because of the lowest investment return for the long-term investment
period.
6. Conclusions and Limitations
6.1 Conclusions
This study investigates the differences for diverse holding periods of investments in the case of
four Asian stock markets. Thus, the primary objective of this research is to demonstrate that
returns of the case stock markets are diversified in different holding periods. To test the
proposed hypotheses this study used ANOVA and time series data, with time interval from
January 01, 2001 to April 26, 2012. The results of ANOVA indicate that all the presumed
hypotheses are supported. Results of post-hoc analysis summarized below.
6.1.1 Daily (short-term) Trading
In daily trading, as shown in the Table 3, returns of HKSE, SSE and TWSE are greater than
returns KRE. In daily trading, the equity market of Taiwan seems to be the most suitable and
the most profitable place than the rest of the markets in this study. Based on the mean values for
daily returns of investment the following ranking from best to worst is exhibited: 1) TWSE, 2)
HKSE, 3) SSE, and 4) KRE. That is, when considering the average return of all stocks in daily
trading the best market seems to be TWSE and the worst market seems to be KRE.
6.1.2 Monthly (short-term) trading
In monthly trading, as shown in the Table 4, returns of HKSE, SSE and TWSE are greater than
returns KRE. Literally, TWSE seem to be the most suitable and the most profitable place again.
Based on the mean values of monthly returns of investment the following ranking from best to
worst is displayed: 1) TWSE, 2) HKSE, 3) SSE, and 4) KRE. Considering the average returns
of all stocks for the monthly holding period, the TWSE obviously appears outperforming the
other three markets while KRE stands at last.
6.1.3 Quarterly (mid-term) Trading
In quarterly trading, as shown in the Table 5, returns of HKSE, SSE and KRE are greater than
returns TWSE. Interesting turn of events when we move from short-term trading to mid-term
trading we can see significant shift in market returns. When it comes to mid-term trading, the
TWSE seems to be the least suitable and least profitable place. In fact TWSE shows a loss of
capital for quarterly holding period. Based on the mean values for quarterly trading the
following rankings from best to worst is presented: 1) HKSE, 2) SSE, 3) KRE, and 4) TWSE.
That is, when considering the average return of all stock in quarterly holding period, HKSE

Business and Economic Research
ISSN 2162-4860
2013, Vol. 3, No. 2
www.macrothink.org/ber 269
significantly surpasses all three other markets, while TWSE significantly does the worst.
6.1.4 Semi-annually (mid-term) Trading
In semi-annual trading, as shown in the Table 6, likewise quarterly, returns of HKSE, SSE and
KRE are greater than returns TWSE. The two mid-term holding periods seem to behave exactly
identical with similar significant differences. Thus, the TWSE Taiwan appears to be the least
suitable and least profitable place again. Based on the mean values for semi-annual trading the
following rankings from best to worst can be assigned: 1) HKSE, 2) SSE, 3) KRE, and 4)
TWSE. Therefore, considering the average return of all stock in quarterly holding period,
HKSE significantly surpasses all three other markets, while TWSE took the last spot.
6.1.5 Annual (long-term) Trading
In annual trading, as shown in the Table 7, returns of HKSE, SSE and TWSE are greater than
returns KRE. When it come yearly returns of investment in stock trading, the TWSE seems to
come back on top once again to be the most suitable and the most profitable place. Based on the
mean values for day trading the following rankings from best to worst can be assigned: 1)
TWSE, 2) HKSE, 3) SSE, and 4) KRE. This finding is very similar to that of the short-term
trading strategy. That is, when considering the average return of all stocks in yearly holding
trading period the best market seems to be the TWSE and the worst market seems to be KRE.
Therefore, we can make a quick and simple conclusion that when it comes to holding stock
periods, considering the four markets chosen for this study, long-term and short-term holding
periods seem to act similarly. The international traders might think of diversification in the four
mentioned markets in order to lower investments risks. Due to the variation of returns between
long-term, mid-term and short-term holding periods, investors should shape the best fit
strategy to meet the goal of low risk and high profit.
6.2 Limitations
This study has several limitations that further studies needed to pay attention. First, due to the
availability of data, the present study employs data that covers time period from 2001 to 2012,
which is not enough to present the whole period of investment returns of the case stock markets.
Although this is the limitation of this study, it should be noted that the economies of the Asian
countries have grown much rapidly during the past decade. Therefore studying of the historic
data before 2001 may not be helpful to the investors to make future predictions.
Second, this study does not consider specific stocks or specific sectors of stock market. Finally,
this study uses ANOVA and post-hoc analysis. Thus, further studies are advised to employ
different approaches and use different sources for data than the present study does, to ensure
and improve the outcomes.
References
Abdulkadir, A., & Green, D. J. (2002). Provincial growth and equality in Indonesia. Paper
prepared for 8th Convention of the East Asian Economic Association (4-5 November). Kuala
Lumpur.

Business and Economic Research
ISSN 2162-4860
2013, Vol. 3, No. 2
www.macrothink.org/ber 270
Araujo, E. (2009). Macroeconomics shocks and the co-movement of stock returns in Latin
America. Emerging Markets Review, 10, 331-344.
http://dx.doi.org/10.1016/j.ememar.2009.08.003
Cha, B., & Cheung, Y. (1998). The impact of the US and the Japanese equity markets on the
emerging Asia-Pacific equity markets. Asia-Pacific Financial Markets, 5, 191-209.
http://dx.doi.org/10.1023/A:1010038229774
Chiang, T. C., & Zheng, D. (In Press). An empirical analysis of herd behavior in global stock
markets. Journal of Banking & Finance.
Chow, H. K., Kim, Y., & Sun, W. (2007). Characterizing exchange rate policy in East Asia: a
reconsideration. Journal of Asian Economics, 18, 448-465.
http://dx.doi.org/10.1016/j.asieco.2007.02.011
Chuang, I., Lu, J., & Tswei, K. (2007). Interdependence of international equity variances:
evidence from East Asian markets. Emerging Markets Review, 8, 311-327.
http://dx.doi.org/10.1016/j.ememar.2007.08.001
Climent, F., & Meneu, V. (2003). Has 1997 Asian crisis increased information flows between
international markets? International Review of Economics and Finance, 12, 111-143.
http://dx.doi.org/10.1016/S1059-0560(02)00140-5
De Roon, F. A., Nijman, T. E., & Werker, B. (2001). Testing for mean-variance spanning with
short sales constraints and transaction costs: the case of emerging markets. Journal of Finance,
56, 721-742. http://dx.doi.org/10.1111/0022-1082.00343
Dimson, E., Marsh, P., & Staunton, M. (2002). Triumph of the Optimists: 101 Years of Global
Investment Return. Princeton University Press, Princeton, New Jersey.
Elyasiani, E., Perera, P., & Puri, T. N. (1998). Interdependence and dynamic linkages between
stock markets of Sri Lanka and its trading partners. Journal of Multinational Financial
Management, 8, 89-101. http://dx.doi.org/10.1016/S1042-444X(98)00020-6
Goetzmann, W., Li, L., & Rouwenhorst, K. (2005). Long term global market correlations.
Journal of Business, 78, 1-38. http://dx.doi.org/10.1086/426518
Hong Kong Stock Exchange. [Online] Available: http://www.hkex.com.hk/eng/index.htm
(February 01, 2013)
Hsiao, F., Hsiao, M., & Yamashita, A. (2003). The impact of the US economy on the
Asia-Pacific region: does it matter? Journal of Asian Economics, 14, 219-241.
http://dx.doi.org/10.1016/S1049-0078(03)00018-6
Hung, W., Lu, C., & Lee, C. F. (2010). Mutual fund herding its impact on stock returns:
Evidence from the Taiwan stock market . Pacific-Basin Finance Journal , 18, 477-493.
http://dx.doi.org/10.1016/j.pacfin.2010.06.001
In, F., Kim, S., & Yoon, J. H. (2002). International stock market linkages: evidence from the
Asian financial crisis. Journal of Emerging Market Finance, 1, 1-29.

Business and Economic Research
ISSN 2162-4860
2013, Vol. 3, No. 2
www.macrothink.org/ber 271
http://dx.doi.org/10.1016/S1042-4431(98)00029-8
Indrawati, S. (2002). Indonesian economic recovery process and the role of government.
Journal of Asian Economics, 13, 577-596. http://dx.doi.org/10.1016/S1049-0078(02)00176-8
Janakiramanan, S., & Lamba, A. S. (1998). An empirical Examination of Linkages between
Pacific Basin Stock Markets. Journal of International Financial Markets, Institutions and
Money, 8, 155-173. http://dx.doi.org/10.1016/S1042-4431(98)00029-8
Korean Stock Exchange. [Online] Available: Retrieved from http://eng.krx.co.kr/ (February 01,
2013)
Koshnazarov, S. (2010). LSE Partners with Mongolian Stock Exchange. In E. CAPITAL (Ed.).
Lee, S. (2009). Volatility spillover effects among six Asian countries. Applied Economics
Letters, 16, 501-508. http://dx.doi.org/10.1016/S0927-5398(02)00027-0
Li, K., Sarkar, A., & Wang, Z. (2003). Diversification benefits of emerging markets subject to
portfolio constraints. Journal of Empirical Finance, 10, 57-80.
http://dx.doi.org/10.1016/S0927-5398(02)00027-0
Lin, J. (2008). Are stock returns on the US used as an exogenous predictor to the Asian
emerging equity markets? Applied Economics Letters, 15, 235-237.
http://dx.doi.org/10.1080/13504850600706289
Liu, Y., Pan, M., & Shieh, J. (1998). International transmission of stock price movements:
evidence from the U.S. and five Asian- Pacific markets. Journal of Economics and Finance, 22,
59-69. http://dx.doi.org/10.1016/j.socec.2011.12.010
Martin H., Maria A., Tommy G., & Anders B. (2012). Stock investors’ preference for
short-term vs. long-term bonuses. The Journal of Socio-Economics , 41, 137-142.
http://dx.doi.org/10.1016/j.socec.2011.12.010
Michael, R. (2009). Charles Darwin on human evolution. Journal of Economic Behavior &
Organization, 71, 10-19. http://dx.doi.org/10.1016/j.jebo.2006.09.005
Mukherjee, P., & Bose, S. (2008). Does the stock market in India move with Asia? A
multivariate cointegration-vector autoregression approach. Emerging Markets Finance and
Trade, 44, 5-22. http://dx.doi.org/10.2753/REE1540-496X440501
Pontines, V., & Siregar, R. (2009). Tranquil and crisis windows, heteroscedasticity, and
contagion measurement: MS-VAR application of the DCC procedure. Applied Financial
Economics, 19, 745-752. http://dx.doi.org/10.1080/09603100802167239
Return on investment. [Online] Available: Retrieved from
http://en.wikipedia.org/wiki/Return_on_investment (February 01, 2013)
Rigobon, R. (2003). On the measurement of the international propagation of shocks: Is the
transmission stable? Journal of International Economics, 61, 261-283.
http://dx.doi.org/10.1016/S0022-1996(03)00007-2

Business and Economic Research
ISSN 2162-4860
2013, Vol. 3, No. 2
www.macrothink.org/ber 272
Shanghai Stock Exchange. [Online] Available: Retrieved from
http://en.wikipedia.org/wiki/Shanghai_Stock_Exchange (February 01, 2013)
Singh, P., Kumar, B., & Pandey, A. (2010). Price and volatility spillovers across North
American, European and Asian stock markets. International Review of Financial Analysis, 19,
55-64.
Sulloway, F. (2009). Why Darwin rejected intelligent design. Journal of Biosciences, 34,
173-183. http://dx.doi.org/10.1007/s12038-009-0020-8
Syriopoulos, T. (2004). International portfolio diversification to Central European stock
markets. Applied Financial Economics, 14, 1253-1268.
http://dx.doi.org/10.1080/0960310042000280465
Taiwan Stock Exchange. [Online] Available: http://www.twse.com.tw/en/ (February 03, 2013)
Tan, L., Chiang, T., Mason, J., & Nelling, E. (2008). Herding behavior in Chinese
stockmarkets: an examination of A and B shares. Pacific-Basin Finance Journal , 16, 61-77.
http://dx.doi.org/10.1016/j.pacfin.2007.04.004
Thomson Reuters Datastream. (2013) Retrieved from:
https://forms.thomsonreuters.com/datastream
Zhou, C., Wu, C., & Yang, L. (2011). The informational role of stock and warrant trades:
empirical evidence from China. Emerging Markets Finance and Trade, 47, 78-93.
http://dx.doi.org/10.2753/REE1540-496X4701S107

CrossRefEBSCOhostGale's Academic DatabasesGenamics JournalSeekGoogle ScholarLOCKSSMediaFinder®-Standard Periodical DirectoryMediaFinder®-Standard Periodical DirectoryPKP Open Archives HarvesterProQuestUlrich'sWorldCat
Business and Economic ResearchSemiannual
PublisherAddressTelephone
FaxE-mailWebsite
Macrothink Institute5348 Vegas Dr.#825, Las Vegas, Nevada 89108, United States1-702-953-1852 [email protected]/ber