Behavioral Risk Factors and Latino Body Mass Index: A Cross-Sectional Study in Missouri
19
Access Provided by Washington University @ St. Louis at 11/06/12 11:00PM GMT
Transcript of Behavioral Risk Factors and Latino Body Mass Index: A Cross-Sectional Study in Missouri

Access Provided by Washington University @ St. Louis at 11/06/12 11:00PM GMT
Part 5: Original PaPer
© Meharry Medical College Journal of Health Care for the Poor and Underserved 23 (2012): 1750–1767.
Behavioral risk Factors and latino Body Mass index: a Cross-Sectional Study in Missouri
J.S. Onésimo Sandoval, PhDJenine K. Harris, PhDJoel P. Jennings, PhD
Leslie Hinyard, PhD, MSWGina Banks, MPH
Abstract: Obesity is the fastest-growing cause of disease and death in the United States, with minority populations suffering some of the most severe consequences. Latinos constitute 16% of the U.S. population as of 2010, and have a higher proportion of the population that is overweight and obese compared with their non-Hispanic Black and White counterparts. Although there are over 15.8 million Latino residents living in non-gateway states (outside California, Texas, Arizona, Illinois, and New York), there is little research exploring obe-sity factors among Latinos outside of gateway states. The aim of this paper was to study socio-economic characteristics, mental health, insurance status, physical activity, and fruit and vegetable consumption, in relation to body mass index (BMI) among Latinos living in a non-gateway state. The results showed that income, employment status, marital status, insurance status, physical activity, fruit and vegetable consumption, and mental health were all associated with BMI.
Key words: Latino, obesity, BMI, overweight, Midwest.
In 2003, Surgeon General Richard Carmona described obesity as the fastest-growing cause of disease and death in the United States, with minority populations suffering
some of the biggest increases and deadliest consequences.1 Latino adults in the U.S. have a higher proportion of the population that is overweight and obese (76.9%) than non-Hispanic Whites (67.5%) and non-Hispanic Blacks (73.7%).2 The largest increase
J.s. OnÉsimO sandOval is an Assistant Professor teaching courses on urban sociology, research methods, and spatial statistics in the Department of Sociology and Criminal Justice at Saint Louis University (SLU). Jenine Harris is an Assistant Professor teaching biostatistics courses in the public health graduate program in the George Warren Brown School of Social Work at Washington University in St. Louis. JOel Jennings is an Assistant Professor teaching courses on immigration, citizenship, and Latinos in the United States in the Department of Sociology and Criminal Justice at SLU. leslie Hinyard is an Assistant Professor teaching graduate courses on research methods in health and medicine, foundations of outcomes research, and survey of epidemiology for health services research in SLUCOR. gina Banks holds a Master’s in Public Health from SLU and is currently a graduate student at the St. Louis College of Pharmacy. Please address all correspondence to J.S. Onésimo Sandoval; Department of Sociology and Criminal Justice; 3750 Lindell Blvd., McGannon Hall, Room 246; Saint Louis University; Saint Louis, MO 63108-3342; (314) 977-2613; [email protected].
1751Sandoval, Harris, Jennings, Hinyard, and Banks
in obesity in the U.S. in recent years has been among Latinos, whose obesity rates increased by nearly 80% between 1991 and 1998.3 Research has shown that obesity is associated with heart attacks, strokes, and type 2 diabetes.4 Obesity-related diseases account for nearly 60% of deaths in obese and overweight individuals.1,5
Latinos are the largest minority group, constituting about 16% of the population as of 2010,6 with projections of 25% by 2050.7 The latest numbers from the U.S. Census showed that there were 50,477,594 Latinos in the country in 2010. About two out of three Latinos were of Mexican descent (63%), 9% of Puerto Rican descent, 4% of Cuban descent, 3% of Dominican descent, 8% from Central America, and 5% from South America, while 8% were classified as other Hispanic.8 The Latino demographic transitions taking place across the U.S. have started to affect new communities. Accord-ing to the 2010 census, 15.8 million Latinos were living in non-gateway states (outside California, Texas, Arizona, Illinois, and New York), representing about 31% of the U.S. Latino population.6 This compares with 9.5 million Latinos living in non-gateway states in 2000, representing 27% of the U.S. Latino population.9
Scholars have turned their attention to understanding the emergence of the Latino population in non-gateway communities.10–13 Non-gateway states that have experienced an increase in Latino immigrant populations include Georgia, North Carolina, and Missouri. Despite this increase in scholarship, there is little research exploring obesity risk factors among Latinos in non-gateway communities. Exploring the obesity risk factors among Latinos in these new destinations is important because these communi-ties do not have an established history of Latino settlement patterns. Latinos arriving in communities across the Midwest and so-called Nuevo New South14,15 often encounter impeded access to medical care.* Access to culturally and linguistically competent health care services may be more limited for Latino residents in non-gateway states, influencing their overall health, including overweight and obesity. Changes in diet due to the availability of different foods (and sometimes the lack of traditional foods) may also influence Latino health.16,17 Emergent Latino communities may have health clinics that serve the local population, but generally these services remain far less developed than comparable services in urban areas that have long served Latino populations.10
Research has shown that many risk factors (including tobacco use, alcohol intake, consumption of fruits and vegetables, and physical activity) are associated with obesity in the Latino population.18,19 Socioeconomic status (SES) is also a major risk factor for obesity.20–23 Although most studies use only income to demonstrate SES,22 other schol-ars note that employment and marital status may also be important in understanding obesity.21 Urban vs. rural residence has also been related to obesity status in previous studies.24,25
Physical activity is a key factor in understanding obesity among Latinos, as Latinos are less likely than other ethnic groups to engage in physical exercise.20,25 Specifically, national data indicate that 28% of Latinos, compared with 23% of Whites, did not par-ticipate in physical activities in the month before completing the Behavioral Risk Factor Surveillance Survey.26 Likewise a study of Latinas in the Midwest found only 36% met
*The term Nuevo New South refers to the opening of the South to a new era of economic revitalization driven by low-wage Latino immigrant labor14 and the Latino population growth from the laborers.15
1752 Behavioral risk factors and Latino BMI in Missouri
the current physical activity recommendation of 30 minutes of moderate activity five or more days per week or 30 minutes of vigorous activity three or more days per week.25
Poor nutrition also contributes to obesity among Latinos.27–29 Some research sug-gests that up to 80% of Latinos do not eat the daily recommended number of fruits and vegetables.30 Additionally, the diets of Latino children are higher in fat, sweetened beverages, and lower in fruits and vegetables than the diets of children in other ethnic groups.31–33 However, studies have shown that that Latinos who maintain a traditional native diet (i.e., high in vegetables and fruits) have a lower risk for obesity.27,34,35
Mental health and obesity are associated with each other, with higher BMI associated with diagnoses of mental health disorders,36–38 although the nature of this relationship is unclear39 and study populations are often not representative of emerging minority populations.36,40
The aim of this paper was to study the relationship between socio-economic char-acteristics, mental health, insurance status, physical activity, and fruit and vegetable consumption with obesity levels among Latinos living in a non-gateway state. It seeks to shed light on the risk factors associated with obesity for Latinos living in Missouri. The findings will contribute to the paucity of knowledge about obesity among Latinos in Missouri, and to a more informed public health discourse for Latinos living in the Midwest. To our knowledge this study will be the first to investigate the relationship between socioeconomic characteristics, physical activities, nutrition, and obesity for Latinos in Missouri, and by extension this paper offers an opportunity to compare findings from the Latino population with the substantial amount of research conducted in more established Latino communities.
Methods
Data source. The data were collected as part of the 2007 Missouri County-level Study (CLS), which was designed to determine county-level prevalence of behavioral risk factors, chronic diseases, and preventive practices among Missouri adults. The survey was administered according to the U.S. Centers for Disease Control and Prevention (CDC) Behavioral Risk Factor Surveillance System (BRFSS) methods and consisted of items from the BRFSS and CDC Adult Tobacco Survey. Data were collected between February 2007 and April 2008 by the University of Missouri’s Health and Behavioral Risk Research Center through random-digit-dial telephone interviews conducted in English. The study response rate was 60.3%, resulting in 49,513 completed interviews. The weighted sample used in this study consisted of 974 (2%) residents who completed the CLS and identified themselves as Latino when asked during the survey administra-tion. This percentage reflected the population of Missouri in 2000 (2.1% according to the U.S. Census).* Respondents were allowed to self-identify their ethnicity. The survey did not include questions about national origin status or immigration status. More information about the County Level Study can be found on the Missouri Department of Health and Senior Services website (http://health.mo.gov/).
*For more information about the CLS, see the Missouri Department of Health and Human Services website: http://www.dhss.mo.gov/CLS/index.html.
1753Sandoval, Harris, Jennings, Hinyard, and Banks
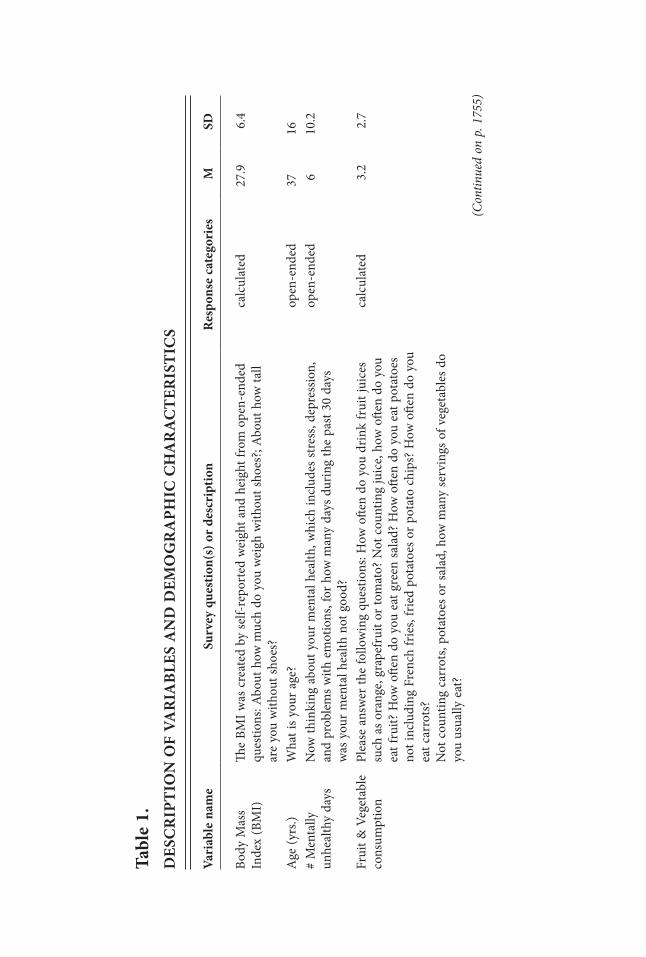
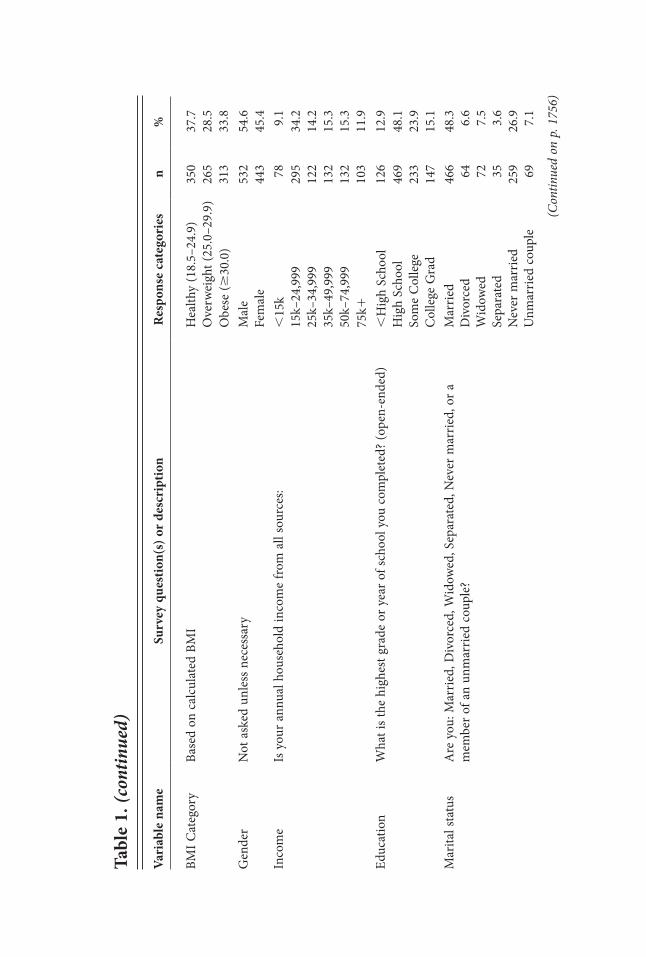
Measures. Dependent variable. Body mass index (BMI) is often used to classify individuals into categories representing healthy weight, overweight, and obese, with BMI being calculated as weight by height squared (weight/height²). Survey participants were asked to report their weight and height, and responses were coded in terms of BMI. The average BMI was 27.9 with a standard deviation of 6.4. For the descriptive statistics in Table 1, BMI was classified into three categories: (1) healthy (18.5–24.9), (2) overweight (25.0–29.9), and (3) obese ($30).
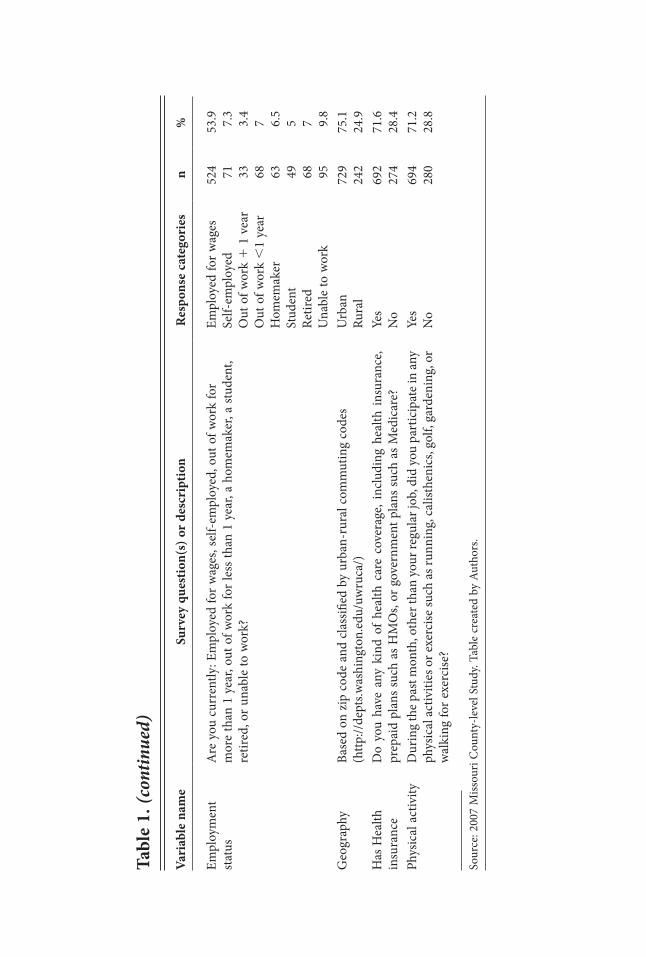
Independent variables. This study identified several categories of variables that were examined in the statistical model. The categories included: (1) SES, (2) mental health, (3) health insurance, (4) physical activity, and (5) nutrition. All of the independent variables, with the exception of fruit and vegetable consumption variable, were used in the original measurement scale from the survey. We created a fruit and vegetable consumption variable based on the answers to six questions shown in Table 1. The definition and measurement of all of the variables used for the analyses can be found in Table 1.
analyses. A general univariate linear equation was used to estimate two models for BMI: (1) a demographic baseline model (age, gender, income, education, marital status, employment, and geography), and a full model that includes the baseline model, mental health, health insurance, physical activity, and nutrition. We used measures of model significance (F) and model fit (adjusted-R2) to compare the two models. Prior to model development we examined variables to determine if any were missing 10% of responses (or more) to determine possible patterns of missing values that might influ-ence model results. The income variable was found to be the only one missing more than 10% of values. An independent samples t-test comparing mean BMI between those missing income information and those not missing income information found no significant difference (t51.65; p5.27). Therefore, we did not include the missing category for income in the models.
results
Demographic characteristics of latinos. The average age of Latino Missourians was 37.0 years old, the sample was almost 55% male and nearly half were married (48.3%). The majority of the sample had at least a high school education (87.1%), was employed for wages (53.9%), and had health insurance (71.6%). Most of the sample resided in urban areas (75.1%) and 43.3% reported an income of less than $25,000 per year. On average, Latinos reported six unhealthy days per month and 28.8% of the sample stated that they did not participate in physical activity. Finally, Latinos consumed about 3.2 servings of fruits and vegetables per day. (See Table 1.)
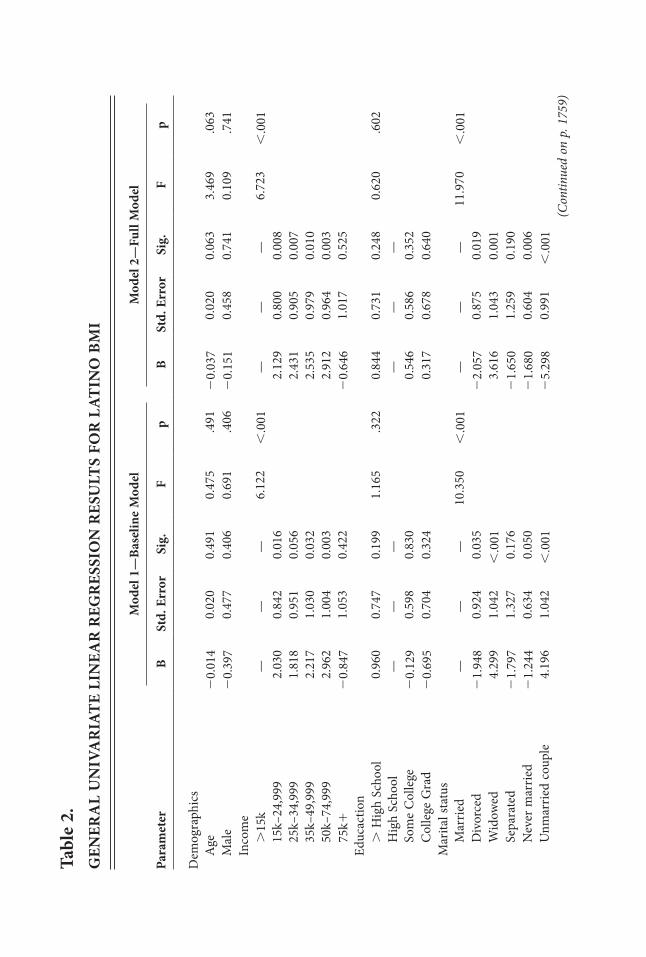
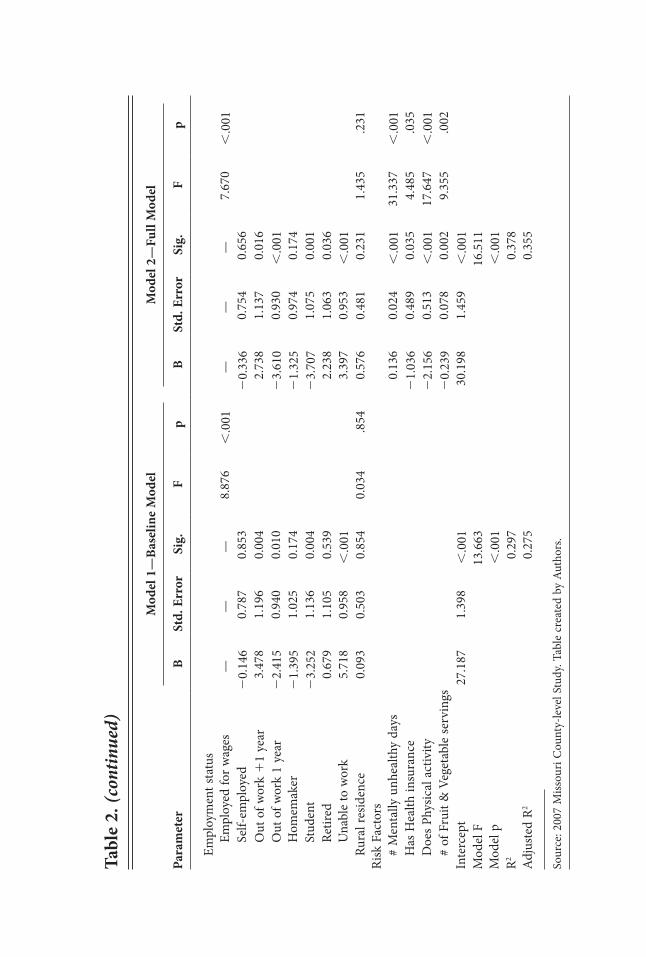
Predictors of BMi. Table 2 presents results from the two models. Overall, Model 2 proved to be the best fit (Adjusted R250.355) compared with Model 1 (Adjusted R250.275). Tests of model assumptions revealed no problems with multicollinearity or heteroscedasticity.
Income was significantly associated with BMI (F56.723, p,.001). Compared with those with an annual household income less than $15k, BMI was higher (p,.001) for all income groups except the highest income group. Latinos with annual incomes
tabl
e 1.
D
eSC
riP
tiO
n O
F Va
ria
BleS
an
D D
eMO
gr
aPh
iC C
ha
ra
Cte
riS
tiC
S
Vari
able
nam
eSu
rvey
que
stio
n(s)
or
desc
ript
ion
res
pons
e ca
tego
ries
M
SD
Body
Mas
s In
dex
(BM
I)Th
e BM
I was
cre
ated
by
self-
repo
rted
wei
ght a
nd h
eigh
t fro
m o
pen-
ende
d qu
estio
ns: A
bout
how
muc
h do
you
wei
gh w
ithou
t sho
es?;
Abo
ut h
ow ta
ll ar
e yo
u w
ithou
t sho
es?
calc
ulat
ed
27.9
6.
4
Age
(yrs
.)W
hat i
s you
r age
? op
en-e
nded
37
16
# M
enta
lly
unhe
alth
y da
ys
Now
thin
king
abo
ut y
our m
enta
l hea
lth, w
hich
incl
udes
stre
ss, d
epre
ssio
n,
and
prob
lem
s with
em
otio
ns, f
or h
ow m
any
days
dur
ing
the
past
30
days
w
as y
our m
enta
l hea
lth n
ot g
ood?
open
-end
ed6
10.2
Frui
t & V
eget
able
co
nsum
ptio
n Pl
ease
ans
wer
the
follo
win
g qu
estio
ns: H
ow o
ften
do y
ou d
rink
frui
t jui
ces
such
as o
rang
e, gr
apef
ruit
or to
mat
o? N
ot c
ount
ing
juic
e, ho
w o
ften
do y
ou
eat f
ruit?
How
ofte
n do
you
eat
gre
en sa
lad?
How
ofte
n do
you
eat
pot
atoe
s no
t inc
ludi
ng F
renc
h fr
ies,
frie
d po
tato
es o
r pot
ato
chip
s? H
ow o
ften
do y
ou
eat c
arro
ts?
Not
cou
ntin
g ca
rrot
s, po
tato
es o
r sal
ad, h
ow m
any
serv
ings
of v
eget
able
s do
you
usua
lly e
at?
calc
ulat
ed3.
2 2.
7
(Con
tinue
d on
p. 1
755)
(Con
tinue
d on
p. 1
756)
BMI C
ateg
ory
Base
d on
cal
cula
ted
BMI
Hea
lthy
(18.
5–24
.9)
350
37.7
O
verw
eigh
t (25
.0–2
9.9)
26
5 28
.5
Obe
se ($
30.0
) 31
3 33
.8
Gen
der
Not
ask
ed u
nles
s nec
essa
ry
Mal
e 53
2 54
.6
Fem
ale
443
45.4
In
com
eIs
you
r ann
ual h
ouse
hold
inco
me
from
all
sour
ces:
,15
k 78
9.
1 15
k–24
,999
29
5 34
.2
25k–
34,9
99
122
14.2
35
k–49
,999
13
2 15
.3
50k–
74,9
99
132
15.3
75
k110
3 11
.9
Educ
atio
nW
hat i
s the
hig
hest
gra
de o
r yea
r of s
choo
l you
com
plet
ed? (
open
-end
ed)
,H
igh
Scho
ol
126
12.9
H
igh
Scho
ol
469
48.1
So
me
Col
lege
23
3 23
.9
Col
lege
Gra
d 14
7 15
.1
Mar
ital s
tatu
s A
re y
ou: M
arrie
d, D
ivor
ced,
Wid
owed
, Sep
arat
ed, N
ever
mar
ried,
or a
m
embe
r of a
n un
mar
ried
coup
le?
Mar
ried
Div
orce
d W
idow
ed
Sepa
rate
d N
ever
mar
ried
Unm
arrie
d co
uple
466 64 72 35 259 69
48.3 6.6
7.5
3.6
26.9 7.1
Vari
able
nam
eSu
rvey
que
stio
n(s)
or
desc
ript
ion
res
pons
e ca
tego
ries
n
%
tabl
e 1.
(con
tinue
d)
Vari
able
nam
eSu
rvey
que
stio
n(s)
or
desc
ript
ion
res
pons
e ca
tego
ries
n
%
tabl
e 1.
(con
tinue
d)
Empl
oym
ent
stat
us
Are
you
cur
rent
ly: E
mpl
oyed
for w
ages
, sel
f-em
ploy
ed, o
ut o
f wor
k fo
r m
ore
than
1 y
ear,
out o
f wor
k fo
r les
s tha
n 1
year
, a h
omem
aker
, a st
uden
t, re
tired
, or u
nabl
e to
wor
k?
Empl
oyed
for w
ages
Se
lf-em
ploy
ed
Out
of w
ork
1 1
vea
r O
ut o
f wor
k ,
1 ye
ar
Hom
emak
er
Stud
ent
Retir
ed
Una
ble
to w
ork
524 71 33 68 63 49 68 95
53.9 7.3
3.4
7 6.5
5 7 9.8
Geo
grap
hyBa
sed
on z
ip c
ode
and
clas
sified
by
urba
n-ru
ral c
omm
utin
g co
des
(http
://de
pts.w
ashi
ngto
n.ed
u/uw
ruca
/)U
rban
Ru
ral
729
242
75.1
24.9
Has
Hea
lth
insu
ranc
eD
o yo
u ha
ve a
ny k
ind
of h
ealth
car
e co
vera
ge, i
nclu
ding
hea
lth in
sura
nce,
prep
aid
plan
s suc
h as
HM
Os,
or g
over
nmen
t pla
ns su
ch a
s Med
icar
e?Ye
s N
o 69
2 27
4 71
.628
.4
Phys
ical
act
ivity
Dur
ing
the p
ast m
onth
, oth
er th
an y
our r
egul
ar jo
b, d
id y
ou p
artic
ipat
e in
any
phys
ical
act
iviti
es o
r exe
rcise
such
as r
unni
ng, c
alist
heni
cs, g
olf,
gard
enin
g, o
r w
alki
ng fo
r exe
rcise
?
Yes
No
694
280
71.2
28.8
Sour
ce: 2
007
Miss
ouri
Cou
nty-
leve
l Stu
dy. T
able
cre
ated
by
Auth
ors.
1757Sandoval, Harris, Jennings, Hinyard, and Banks
greater than or equal to $75,000 did not have statistically significantly different BMIs from those with incomes less than $15,000 (b520.646, p5.525). Marital status (F511.970, p,.001) was also associated with BMI. Compared with people who were married, people who were divorced, never married, or part of an unmarried couple demonstrated a lower BMI (b522.057, p5.019; b51.680, p5.006; b525.298, p,.001, respectively). Latinos who were widowed demonstrated a higher BMI than those who were married (b53.616, p,.001) and there was no statistically significant difference in BMI between those who were married and those who were separated (b521.650, p5.190). Employment status (F57.670, p,.001) was also associated with BMI. Com-pared with those who were employed for wages, those who were out of work for less than a year and those who were students demonstrated a lower BMI (b523.610, p,.001; b523.707, p5.001, respectively). Latinos out of work for more than one year, who were retired, or who were unable to work had BMIs greater than those who were employed for wages (b52.738, p5.016; b52.238, p5.036; b53.397, p,.001, respec-tively). Latinos who were self-employed or who were homemakers demonstrated no statistically significant difference in BMI compared with those who were employed for wages (b52.336, p5.656; b521.325, p5.174, respectively).
Mental health (F531.337, p,.001) demonstrated a small, but statistically significant, effect on BMI (b50.136, p,.001). Physical activity (F517.647, p,.001) was associ-ated with a lower BMI (b522.156, p,.001). The consumption of fruits or vegetables (F59.355; p5.002) was predictive of a lower BMI (b52.239; p5.002). Finally, Latinos with health insurance (F54.485; p5.035) had lower BMI levels (b521.036; p5.035).
Discussion
This article offers insight into BMI levels for the Latino population in a non-gateway state, and it provides a baseline to begin to study health changes, as the Latino population continues to grow. At the outset of this paper, we made the distinction between Latinos living in a gateway and a non-gateway state and the need to determine empirically if the health outcomes were similar or different. Our results are mixed. We find that some risk factors (i.e., physical activity, nutrition) associated with BMI for Latinos in Missouri were consistent with other research findings for the Latino population at the national level or in gateway destination states.41,42 However, we also discovered some divergence in our findings (specifically, concerning the relationships between insurance status and income with BMI).
The results suggest that income, employment status, marital status, insurance status, physical activity, fruit and vegetable consumption, and mental health were associated with BMI. We found BMI to have a positive relationship with income, which is not unusual in Latino populations.43,44 Overweight status among Latino children may be indicative of a higher parental socio-economic status in some Latin American coun-tries,20 and higher national incomes are associated with higher obesity rates in Latin American countries.45,46 In addition, Latino youth in the U.S. who have a lower level of cultural adaptation are less likely to become obese, even if they are at a lower SES.20,47
Employment status was significantly associated with BMI. Compared with being currently employed, recently unemployed Latinos had a significantly lower BMI, and
tabl
e 2.
gen
era
l U
niV
ar
iate
lin
ear
reg
reS
SiO
n r
eSU
ltS
FOr
lat
inO
BM
i
Mod
el 1
—Ba
selin
e M
odel
M
odel
2—
Full
Mod
el
Para
met
er
B St
d. e
rror
Si
g.
F p
B St
d. e
rror
Si
g.
F p
Dem
ogra
phic
s
Age
2
0.01
4 0.
020
0.49
1 0.
475
.491
2
0.03
7 0.
020
0.06
3 3.
469
.063
Mal
e 2
0.39
7 0.
477
0.40
6 0.
691
.406
2
0.15
1 0.
458
0.74
1 0.
109
.741
Inco
me
.15
k —
——
6.12
2 ,
.001
—
——
6.72
3 ,
.001
15
k–24
,999
2.
030
0.84
2 0.
016
2.12
9 0.
800
0.00
8
25
k–34
,999
1.
818
0.95
1 0.
056
2.43
1 0.
905
0.00
7
35
k–49
,999
2.
217
1.03
0 0.
032
2.53
5 0.
979
0.01
0
50
k–74
,999
2.
962
1.00
4 0.
003
2.91
2 0.
964
0.00
3
75
k1
20.
847
1.05
3 0.
422
20.
646
1.01
7 0.
525
Ed
ucac
tion
. H
igh
Scho
ol
0.96
0 0.
747
0.19
9 1.
165
.322
0.
844
0.73
1 0.
248
0.62
0 .6
02
Hig
h Sc
hool
—
——
——
—
So
me
Col
lege
2
0.12
9 0.
598
0.83
0 0.
546
0.58
6 0.
352
Col
lege
Gra
d 2
0.69
5 0.
704
0.32
4 0.
317
0.67
8 0.
640
M
arita
l sta
tus
Mar
ried
——
—10
.350
,
.001
—
——
11.9
70
,.0
01
Div
orce
d 2
1.94
8 0.
924
0.03
5 2
2.05
7 0.
875
0.01
9
W
idow
ed
4.29
9 1.
042
,.0
01
3.61
6 1.
043
0.00
1
Se
para
ted
21.
797
1.32
7 0.
176
21.
650
1.25
9 0.
190
Nev
er m
arrie
d 2
1.24
4 0.
634
0.05
0 2
1.68
0 0.
604
0.00
6
U
nmar
ried
coup
le
4.19
6 1.
042
,.0
01
25.
298
0.99
1 ,
.001
(C
ontin
ued
on p
. 175
9)
Em
ploy
men
t sta
tus
Empl
oyed
for w
ages
—
——
8.87
6 ,
.001
—
——
7.67
0 ,
.001
Se
lf-em
ploy
ed
20.
146
0.78
7 0.
853
20.
336
0.75
4 0.
656
Out
of w
ork
11
year
3.
478
1.19
6 0.
004
2.73
8 1.
137
0.01
6
O
ut o
f wor
k 1
year
2
2.41
5 0.
940
0.01
0 2
3.61
0 0.
930
,.0
01
Hom
emak
er
21.
395
1.02
5 0.
174
21.
325
0.97
4 0.
174
Stud
ent
23.
252
1.13
6 0.
004
23.
707
1.07
5 0.
001
Retir
ed
0.67
9 1.
105
0.53
9 2.
238
1.06
3 0.
036
Una
ble
to w
ork
5.71
8 0.
958
,.0
01
3.39
7 0.
953
,.0
01
Ru
ral r
esid
ence
0.
093
0.50
3 0.
854
0.03
4 .8
54
0.57
6 0.
481
0.23
1 1.
435
.231
Ri
sk F
acto
rs
#
Men
tally
unh
ealth
y da
ys
0.13
6 0.
024
,.0
01
31.3
37
,.0
01
H
as H
ealth
insu
ranc
e 2
1.03
6 0.
489
0.03
5 4.
485
.035
Doe
s Phy
sical
act
ivity
2
2.15
6 0.
513
,.0
01
17.6
47
,.0
01
# of
Fru
it &
Veg
etab
le se
rvin
gs
20.
239
0.07
8 0.
002
9.35
5 .0
02
Inte
rcep
t 27
.187
1.
398
,.0
01
30.1
98
1.45
9 ,
.001
M
odel
F
13.6
63
16.5
11
Mod
el p
,
.001
,
.001
R2
0.29
7 0.
378
Adj
uste
d R2
0.27
5 0.
355
Sour
ce: 2
007
Miss
ouri
Cou
nty-
leve
l Stu
dy. T
able
cre
ated
by
Auth
ors.
Mod
el 1
—Ba
selin
e M
odel
M
odel
2—
Full
Mod
el
Para
met
er
B St
d. e
rror
Si
g.
F p
B St
d. e
rror
Si
g.
F p
tabl
e 2.
(con
tinue
d)
1760 Behavioral risk factors and Latino BMI in Missouri
those unemployed for a longer term had a significantly higher BMI. Several stud-ies have identified associations between unemployment and BMI.21,48–50 In general, unemployment is associated with higher BMI for women and lower BMI for men.21,49,50 In international studies, evidence related to BMI and duration of unemployment is mixed.49,51 The relationship between gender, unemployment, and BMI is unclear in the U.S. Latino population and may be worth further exploration.
Prior research from several studies of different groups (Latino and non-Latino) in America has found that individuals who were married had higher BMI than most other marital status categories.52,53 The and Gordon-Larsen suggest that a shared household environment increases the risk of obesity because the married household is at a higher risk of producing environments that are conducive to physical inactivity and sedentary behavior.52 However, research also shows a ripple effect, where a spouse’s weight loss has a positive impact on his or her spouse’s weight loss.53 The net result is that indi-viduals who adopt a healthier lifestyle spreads this lifestyle change to their spouses, which could be an alternative solution to the weight-gain-after-marriage thesis posited in previous studies.54,55
Health insurance status was also associated with BMI, with insured individuals hav-ing lower BMI levels. This finding was not consistent with the previous studies utilizing large nationally representative datasets that found that individuals with health insurance had higher levels of BMI.56 However, our findings were in accord with studies that focus on Latino health status.42,57,58 Latinos with no health insurance may not have access to the appropriate medical personnel or treatment facilities that can offer assistance or medication for weight management issues.57 Furthermore, Latinos immigrants who have had limited opportunity for cultural adaptation for medical treatment offered in the U.S may not be able to access information about health care insurance because of cultural and linguistic barriers.42,57
Physical inactivity was a significant predictor of BMI for Latinos. Research dem-onstrates that Latinos do not participate in adequate physical activity.59,60 Studies also show that Latino immigrants are more physically active compared with native born Latinos.61,62 However, as immigrants become more acculturated to a U.S. sedentary lifestyle and adopt unhealthy behaviors, their risk for obesity increases.63 Finally, lack of physical activity may be related to the high number of hours worked by Latinos in the U.S., and inadequate sleep due to overscheduled workdays.64–66 With fewer hours available because of multiple jobs, demanding household tasks, and long commutes, individuals simply do not have the extra time for physical activity.66
Research shows that the U.S. Latino diet is deficient in fruits and vegetables,16 and suggests that cultural adaptation is one of the most important factors that may explain the low-level of consumption of fruits and vegetables.17,19 There are two important dimensions of cultural adaptation that affect diets: (1) fast-food consumption,67 and (2) dietary changes.68,69 The evidence is mixed regarding fast-food consumption and cultural adaption. However, one study did find that second generation Mexican Americans were more likely to consume fast food and snacks high in fat compared with their parents.69 Dietary changes require access to affordable fruits and vegetables. Latino families that struggle to make ends meet or live in neighborhoods where access to fruits and vege-tables is limited may find it challenging to buy fruits and vegetables.68,70–72
1761Sandoval, Harris, Jennings, Hinyard, and Banks
The findings also reveal that Latinos who reported mentally unhealthy days in the last month were more likely to have high BMI scores. This finding is consistent with studies that found a robust relationship with depressive disorders and obesity.36–39,73–77 Although this relationship is well documented, it is complex and not fully understood.36,39,74,78–81
Latinos residing in Missouri live and work in a different socio-ecological environ-ment from Latinos in gateway destination states, which may have a differential effect on quality of life, stress, and health outcomes. The relationship between physical activity, fruit and vegetable consumption, and BMI was consistent with research finding for Latinos in California and are consistent with findings for the general population.5,42 However, there were some noticeable differences. For example, the Latino population in Missouri was slightly more likely to report that they had health insurance compared with a study for the Latino population in California.42 Our results showed that health insurance had a significant effect on BMI, whereas a study conducted among Latinos in California, showed a similar effect only with Central American males.42 Moreover, some of the findings regarding socio-demographic characteristics produced differences. In our study, income was a significant predictor of BMI, but this relationship was not significant in research findings that focused on Latino obesity at the national level.82
limitations. This study has two primary limitations. First, the analysis presented in this paper is based on cross-sectional data. Longitudinal data would allow for a more sophisticated analysis that would augment the findings in this study. Second, there were no variables on language fluency, immigration status, generational status, or cultural adaptation. This limitation is commonly found in studies on Latinos. Latinos are a heterogeneous group in terms of their ethnicity, race, citizenship status, and language fluency. Variables that measure immigration status, generational status, or cultural adaptation improve our understanding of Latino health characteristics in the U.S.19,62 For example, different attitudes towards weight by Latino citizens versus Latino non-citizens about body size may contribute to obesity.83 Moreover, other factors (such as nation-of-origin, length of time in the U.S., language fluency) may help explain the variation in obesity levels among Latinos.18
Diversity within the Latino ethnic category generates three implications for public health policy and practice. First, the analysis of aggregate data for the diverse and distinctive Latino population should be performed with caution. Researchers and policymakers must acknowledge that findings from an aggregate ethnic category (i.e., Latino or Hispanic)—although helpful—conceal differences within the category. With the increase diversity of the Latino population it will be even more important that policymakers, practitioners, and researchers design interventions and treatments that are appropriate for the sub-populations that constituted the Latino ethnic category. Second, there is an urgent need to consider new models of measurement that accurately measure the diversity of the Latino population.84 Researchers must incorporate more questions into the health surveillance surveys designed to parse the Latino populations into more accurate units of analysis for etiological analysis.85 The etiological factors for health outcomes for a fourth generation Mexican American male may differ from those for health outcomes for a first generation Mexican American male. Giving researchers and policymakers the ability to make such distinctions may improve medical treat-ment and overall quality of life. Third, training medical professionals to have a greater
1762 Behavioral risk factors and Latino BMI in Missouri
awareness of the diversity within the U.S. Latino ethnic category will increase their cultural competency to treat risk factors for diseases and to develop interventions that are conducive to the cultural beliefs of the patients.84,86
Conclusions. Latinos, the fastest-growing large U.S. ethnic group, are increasingly living in states that historically have not had significant Latino populations, present-ing a new public health challenge in non-gateway states. Although the prevalence of obesity among Latino adults has been on the rise in recent years,2 few studies have examined the risk factors associated with the prevalence of obesity in emergent Latino populations in the Midwest. As the first study to focus on Latino BMI in the state of Missouri and as it is among one of the very few studies to examine Latino obesity outside a Latino gateway state, this study fills important gaps in the existing literature on Latino obesity in the Midwest. First, it shows that socioeconomic characteristics measured by income, marital status, and employment status were associated with BMI. Second, this study also showed that risk factors measured by insurance status, fruit and vegetable consumption, mental health, and physical activity were also associated with BMI. Further longitudinal obesity research in non-gateway states must explore the effects of immigration status, country of origin, generational status, and cohort status. The addition of these variables would provide information that would help health practitioners develop culturally sensitive interventions to reduce obesity among Latinos living in Missouri.
Funding Source
Data for this publication were obtained in whole from the 2007 Missouri County-level Study. Funding for the Missouri County-level Study was provided by the Missouri Foundation for Health. The Missouri Foundation for Health is a philanthropic orga-nization whose vision is to improve the health of people in the communities it serves. The interpretations and conclusions of the data are the sole responsibility of the authors and not that of the Missouri Foundation for Health.
notes 1. Carmona R. The obesity crisis in America: testimony before the Subcommittee
on Education Reform Committee on Education and the Workforce, United States House of Representatives. Washington, DC: U.S. Public Health Service, Office of the Surgeon General, 2003. Available at: http://www.surgeongeneral.gov/news/testimony /obesity07162003.html.
2. Flegal KM, Carroll MD, Ogden CL, et al. Prevalence and trends in obesity among U.S. adults, 1999–2008. JAMA. 2010 Jan 20;303(3):235–41.
3. Mokdad AH, Serdula MK, Dietz WH, et al. The spread of the obesity epidemic in the United States, 1991–1998. JAMA. 1999 Oct 27;282(16):1519–22.
4. Kepka D, Ayala GX, Cherrington A. Do Latino immigrants link self-rated health with BMI and health behaviors? Am J Health Behav. 2007 Sep–Oct;31(5):535–44.
5. Woodward-Lopez G, Flores GR. Obesity in Latino communities. Sacramento, CA: Latino Coalition for a Healthy California, 2006. Available at: http://www.lchc.org /documents/ObesityLatinosLCHC.pdf.
1763Sandoval, Harris, Jennings, Hinyard, and Banks
6. United States Census Bureau. 2010 Census national summary file of redistricting data. Washington, DC: U.S. Census Bureau, 2011. Available at: http://www.census.gov /prod/cen2010/doc/nsfrd.pdf.
7. United States Census Bureau. Population projections of the United States by age, sex, race, Hispanic origin, and nativity: 1999 to 2100. Washington, DC: U.S. Census Bureau, 2000. Available at: http://www.census.gov/population/projections/nation/detail /np-d5-a.txt.
8. United States Census Bureau. 2010 Census summary file 1, table PCT 11. Washington DC: U.S. Census Bureau, 2012. Available at: http://www.census.gov/prod/cen2010 /doc/sf1.pdf.
9. Bump MN, Lowell BL, et al. The growth and population characteristics of immigrants and minorities in America’s new settlement states. In: Gozdziak E, Martin SF, eds. Beyond the gateway: immigrants in a changing America. Lanham, MD: Lexington Books, 2005; 19–56.
10. Gozdziak E, Martin SF, eds. Beyond the gateway: immigrants in a changing America. Lanham, MD: Lexington Books, 2005.
11. Schwartz LR, Sable MR, Dannerberk A, et al. Using Photovoice to improve family planning services for immigrant Hispanics. J Health Care Poor Underserved. 2007 Nov;18(4):757–66.
12. Segal UA. Mexican migration to the United States: a focus on Missouri. J Immigr Refug Stud. 2008;6(3):451–62.
13. Walker SE. Population characteristics and health service use by Latino immigrants to Southwest Missouri. Great Plains Research. 2007;17(Spring 2007):87–100.
14. Mohl RA. Globalization, Latinization, and the Nuevo New South. J Am Ethn Hist. 2003;22(4):31–66.
15. Weeks GB, Weeks JR. Irresistible forces: Latin American migration to the United States and its effects on the south. Albuquerque, NM: University of New Mexico Press, 2011.
16. Ayala GX, Baquero B, Klinger S. A systematic review of the relationship between acculturation and diet among Latinos in the United States: implications for future research. J Am Diet Assoc. 2008 Aug;108(8):1330–44.
17. Dixon LB, Sundquist J, Winkleby M. Differences in energy, nutrient, and food intakes in a U.S. sample of Mexican-American women and men: findings from the Third National Health and Nutrition Examination Survey, 1988–1994. Am J Epidemiol. 2000 Sep 15;152(6):548–57.
18. Delva J, O’Malley PM, Johnston LD. Health-related behaviors and overweight: a study of Latino adolescents in the United States of America. Rev Panam Salud Publica. 2007 Jan;21(1):11–20.
19. Gordon-Larsen P, Harris KM, Ward DS, et al. Acculturation and overweight-related behaviors among Hispanic immigrants to the U.S.: the National Longitudinal Study of Adolescent Health. Soc Sci Med. 2003 Dec;57(11):2023–34.
20. Harrington S. Overweight in Latino/Hispanic adolescents: scope of the problem and nursing implications. Pediatr Nurs. 2008 Sep–Oct;34(5):389–94.
21. Ball K, Mishra G, Crawford D. Which aspects of socioeconomic status are related to obesity among men and women? Int J Obes Relat Metab Disord. 2002 Apr;26(4):559–65.
22. Sobal J, Stunkard AJ. Socioeconomic status and obesity: a review of the literature. Psychol Bull. 1989 Mar;105(2):260–75.
23. Haas JS, Lee LB, Kaplan CP, et al. The association of race, socioeconomic status,
1764 Behavioral risk factors and Latino BMI in Missouri
and health insurance status with the prevalence of overweight among children and adolescents. Am J Public Health. 2003 Dec;93(12):2105–10.
24. Ramsey PW, Glenn LL. Obesity and health status in rural, urban and suburban southern women. South Med J. 2002 Jul;95(7):666–71.
25. Wilbur J, Chandler PJ, Dancy B, et al. Correlates of physical activity in urban Mid-western Latinas. Am J Prev Med. 2003 Oct;25(3 Suppl 1):69–76.
26. Centers for Disease Control and Prevention (CDC). Behavioral Risk Factor Surveillance System, prevalence and trends data. Atlanta, GA: U.S. Department of Health and Human Services, Centers for Disease Control and Prevention, 2010. Available at: http://apps.nccd.cdc.gov/brfss/race.asp?cat5EX&yr52010&qkey54347&state5UB.
27. Neuhouser ML, Thompson B, Coronado GD, et al. Higher fat intake and lower fruit and vegetables intakes are associated with greater acculturation among Mexicans living in Washington State. J Am Diet Assoc. 2004 Jan;104(1):51–7.
28. Vergnaud AC, Norat T, Romaguera D, et al. Fruit and vegetable consumption and prospective weight change in participants of the European Prospective Investigation into Cancer and Nutrition-Physical Activity, Nutrition, Alcohol, Cessation of Smok-ing, Eating Out of Home, and Obesity Study. Am J Clin Nutr. 2012 Jan;95(1):184–93.
29. He K, Hu FB, Colditz GA, et al. Changes in intake of fruits and vegetables in relation to risk of obesity and weight gain among middle-aged women. Int J Obes Relat Metab Disord. 2004 Dec;28(12):1569–74.
30. James KS, Connelly CD, Rutkowski E, et al. Family-based weight management with Latino mothers and children. J Spec Pediatr Nurs. 2008 Oct;13(4):249–62.
31. Troiano RP, Briefel RR, Carroll MD, et al. Energy and fat intakes of children and ado-lescents in the united states: data from the national health and nutrition examination surveys. Am J Clin Nutr. 2000 Nov;72(5 Suppl):1343S–1353S.
32. Giammattei J, Blix G, Marshak HH, et al. Television watching and soft drink con-sumption: associations with obesity in 11- to 13-year-old schoolchildren. Arch Pediatr Adolesc Med. 2003 Sep;157(9):882–6.
33. Neumark-Sztainer D, Story M, Resnick MD, et al. Correlates of inadequate fruit and vegetable consumption among adolescents. Prev Med. 1996 Sep–Oct;25(5):497–505.
34. Murtaugh MA, Herrick JS, Sweeney C, et al. Diet composition and risk of overweight and obesity in women living in the southwestern United States. J Am Diet Assoc. 2007 Aug;107(8):1311–21.
35. Bermúdez OI, Falcón LM, Tucker KL. Intake and food sources of macronutrients among older Hispanic adults: association with ethnicity acculturation, and length of residence in the United States. J Am Diet Assoc. 2000 Jun;100(6):665–73.
36. Simon GE, Von Korff M, Saunders K, et al. Association between obesity and psychiatric disorders in the U.S. adult population. Arch Gen Psychiatry. 2006 Jul;63(7):824–30.
37. Elmslie JL, Silverstone JT, Mann JI, et al. Prevalence of overweight and obesity in bipolar patients. J Clin Psychiatry. 2000 Mar;61(3):179–84.
38. Johnson E, Johnson S, McLeod P, et al. The relation of body mass index to depressive symptoms. Can J Public Health. 2004 May–Jun;95(3):179–83.
39. Forman-Hoffman VL, Yankey JW, Hillis SL, et al. Weight and depressive symp-toms in older adults: direction of influence? J Gerontol B Psychol Sci Soc Sci. 2007 Jan;62(1):S43–51.
40. Li ZB, Ho SY, Chan WM, et al. Obesity and depressive symptoms in Chinese elderly. Int J Geriatr Psychiatry. 2004 Jan;19(1):68–74.
41. Hubert HB, Snider J, Winkleby MA. Health status, health behaviors, and accultura-
1765Sandoval, Harris, Jennings, Hinyard, and Banks
tion factors associated with overweight and obesity in Latinos from a community and agricultural labor camp survey. Prev Med. 2005 Jun;40(6):642–51.
42. Bowie JV, Juon H-S, Cho J, et al. Factors associated with overweight and obesity among Mexican Americans and Central Americans: results from the 2001 California Health Interview Survey. Prev Chronic Dis. 2007 Jan;4(1):A10.
43. Zhang Q, Wang Y. Socioeconomic inequality of obesity in the United States: do gender, age and ethnicity matter? Soc Sci Med. 2004 Mar;58(6):1171–80.
44. Wang YF, Beydoun MA. The obesity epidemic in the United States—gender, age, socioeconomic, racial/ethnic, and geographic characteristics: a systematic review and meta-regression analysis. Epidemiol Rev. 2007;29:6–28.
45. Martorell R, Khan LK, Hughes ML, et al. Obesity in Latin American women and children. J Nutr. 1998 Sep;128(9):1464–73.
46. Uauy R, Albala C, Kain J. Obesity trends in Latin America: transiting from under- to-overweight. J Nutr. 2001 Mar;131(3):893s–899s.
47. Mazur RE, Marquis GS, Jensen HH. Diet and food insufficiency among Hispanic youths: acculturation and socioeconomic factors in the third National Health and Nutrition Examination Survey. Am J Clin Nutr. 2003 Dec;78(6):1120–7.
48. Henriksson KM, Lindblad U, Argen B, et al. Associations between unemployment and cardiovascular risk factors varies with the unemployment rate: the Cardiovascular Risk Factor Study in Southern Sweden (CRISS). Scand J Public Health. 2003;31(4):305–11.
49. Sarlio-Lahteenkorva S, Lahelma E. The association of body mass index with social and economic disadvantage in women and men. Int J Epidemiol. 1999 Jun;28(3):445–9.
50. Montgomery SM, Cook DG, Bartley MJ, et al. Unemployment, cigarrete smoking, alcohol consumption and body weight in young British men. Eur J Public Health. 1998;8(1):21–7.
51. Freidl W, Fazekas C, Raml R, et al. Perceived social justice, long-term unemployment and health. A survey among marginalised groups in Austria. Soc Psychiatry Psychiatr Epidemiol. 2007 Jul;42(7):547–53.
52. The NS, Gordon-Larsen P. Entry into romantic partnership is associated with obesity. Obesity (Silver Spring). 2009 Jul;17(7):1441–7.
53. Gorin AA, Wing RR, Fava JL, et al. Weight loss treatment influences untreated spouses and the home environment: evidence of a ripple effect. Int J Obes (Lond). 2008 Nov;32(11):1678–84.
54. Jeffery RW, Rick AM. Cross-sectional and longitudinal associations between body mass index and marriage related factors. Obes Res. 2002 Aug;10(8):809–15.
55. Kahn HS, Williamson DF. The contributions of income, education and changing marital status to weight change among U.S. men. Int J Obes. 1990 Dec;14(12):1057–68.
56. Finkelstein EA, Fiebelkorn IC, Wang G. National medical spending attributable to overweight and obesity: how much, and who’s paying? Health Aff (Millwood). 2003 Jan–Jun;Suppl Web Exclusives:W3-219–26.
57. Marshall KJ, Urrutia-Rojas X, Mas FS, et al. Health status and access to health care of documented and undocumented immigrant Latino women. Health Care Women Int. 2005 Nov–Dec;26(10):916–36.
58. Leybas-Amedia V, Nuno T, Garcia F. Effect of acculturation and income on Hispanic women’s health. J Health Care Poor Underserved. 2005 Nov;16(4 Suppl A):128–41.
59. Gordon-Larsen P, McMurray RG, Popkin BM. Determinants of adolescent physical activity and inactivity patterns. Pediatrics. 2000 Jun;105(6):E83.
60. Gordon-Larsen P, McMurray RG, Popkin BM. Adolescent physical activity and
1766 Behavioral risk factors and Latino BMI in Missouri
inactivity vary by ethnicity: the National Longitudinal Study of Adolescent Health. J Pediatr. 1999 Sep;135(3):301–6.
61. Ravussin E, Valencia ME, Esparza J, et al. Effects of a traditional lifestyle on obesity in Pima Indians. Diabetes Care. 1994 Sep;17(9):1067–74.
62. Unger JB, Reynolds K, Shakib S, et al. Acculturation, physical activity, and fast-food consumption among Asian-American and Hispanic adolescents. J Community Health. 2004 Dec;29(6):467–81.
63. Gowen KL, Chris H, Killen JD, et al. Acculturation and eating disorder symptoms in adolescent girls. J Res Adolesc. 1999;91(1):67–83.
64. Ko GT, Chan JC, Chan AW, et al. Association between sleeping hours, working hours and obesity in Hong Kong Chinese: the ‘better health for better Hong Kong’ health promotion campaign. Int J Obes (Lond). 2007 Feb;31(2):254–60.
65. Gangwisch JE, Malapina D, Boden-Albala B, et al. Inadequate sleep as a factor for obesity: analysis of the NHANES I. Sleep. 2005 Oct;28(10):1289–96.
66. Courtemanche CJ. Longer hours and large waistlines? The relationship between work hours and obesity. Forum for Health Economics & Policy. 2009;12(2):2.
67. Maddock J. The relationship between obesity and the prevalence of fast food restau-rants: state-level analysis. Am J Health Promot. 2004 Nov–Dec;19(2):137–43.
68. Chamorro R, Flores-Ortiz Y. Acculturation and disordered eating patterns among Mexican American women. Int J Eat Disord. 2000 Jul;28(1):125–9.
69. Guendelman S, Abrams B. Dietary intake among Mexican-American women: genera-tional differences and a comparison with White non-Hispanic women. Am J Public Health. 1995 Jan;85(1):20–5.
70. Sallis JF, Glanz K. Physical activity and food enviornments: solutions to the obesity epidemic. Milbank Q. 2009 Mar;87(1):123–54.
71. Fitzgibbon ML, Stolley MR. Environmental changes may be needed for prevention of overweight in minority children. Pediatric Ann. 2004 Jan;33(1):45–9.
72. White M. Food access and obesity. Obes Rev. 2007;8(Suppl 1):99–107.73. Friedman MA, Brownell KD. Psychological correlates of obesity: moving to the next
research generation. Psychol Bull. 1995 Jan;117(1):3–20.74. McElroy SL, Kotwal R, Malhotra S, et al. Are mood disorders and obesity related? A
review for the mental health professional. J Clin Psychiatry. 2004 May;65(5):634–51, quiz 730.
75. Jorm AF, Korte AE, Christensen H, et al. Association of obesity and anxiety, depres-sion, and emotional well-being: a community survey. Aust N J Public Health. 2003; 27(4):434–40.
76. Roberts RE, Deleger S, Strawbridge WJ, et al. Prospective association between obesity and depression: evidence from the Alameda County study. Int J Obes Relat Metab Disord. 2003 Apr;27(4):514–21.
77. Räikkönen K, Matthews KA, Kuller LH. The relationship between psychological risk attributes and the metabolic syndome in healthy women: antecedent or consequence? Metabolism. 2002 Dec;51(12):1573–7.
78. Frank LD, Anderson MA, Schmid TL. Obesity relationship with community design, physical activity, and time spent in cars. Am J Prev Med. 2004 Aug;27(2):87–96.
79. Roberts RE, Kaplan GA, Shema SJ, et al. Are the obese at greater risk for depression? Am J Epidemiol. 2000 Jul 15;152(2):163–70.
80. Carpenter KM, Hasin DS, Allison DB, et al. Relationship between obesity and DSM-IV major depressive disorder, suicide ideation, and suicide attempts: results from a general population study. Am J Public Health. 2000 Feb;90(2):251–7.
1767Sandoval, Harris, Jennings, Hinyard, and Banks
81. Ross CE, Hayes D. Exercise and psycholic well-being in the community. Am J Epi-demiol. 1988 Apr;127(4):762–71.
82. Khan LK, Sobal J, Martorell R. Acculuration, socioeconomic status, and obesity in Mexican Americans, Cuban Americans, and Puerto Ricans. Int J Obes Relat Metab Disord. 1997 Feb;21(2):91–6.
83. Diaz VA, Mainous AG 3rd, Pope C. Cultural conflicts in the weight loss experience of overweight Latinos. Int J Obes (Lond). 2007 Feb;31(2):328–33.
84. Mays VM, Ponce NA, Washington DL, et al. Classification of race and ethnicity: implications for public health. Annu Rev Public Health. 2003;24:83–110.
85. Hahn RA, Stroup DF. Race and ethnicity in public health surveillance: criteria for the scientific use of social categories. Public Health Rep. 1994 Jan–Feb;109(1):7–15.
86. Betancourt JR, Green AR, Carrillo JE, et al. Defining cultural competence: a practical framework for addressing racial/ethnic disparities in health and health care. Public Health Rep. 2003 Jul–Aug;118(4):293–302.