Connecticut Department of Transportation 2019 Estimating ...
Upload
khangminh22Category
view
0download
0

(This page is intentionally left blank for duplexing purposes)

Pete K. Rahn, DirectorMissouri Department of Transportation
Greetings from MoDOT
Our mission is to provide a world-class transportation experience that delights our customers and promotes a prosperous Missouri.
Mission
The Missouri Department of Transportation is committed to being open and transparent. We want you to know what we do well, what we don’t do so well and what we are doing to get better. That is why we created the Tracker.
This document is your window into MoDOT – warts and all. It invites you to hold us account-able for exceeding your expectations. You expect MoDOT to get the best value out of every dollar spent. You expect us to make highways smoother and safer, soon. You expect us to fix bad bridges, be responsive and to proactively give you the information you need. You expect us to provide a world-class transportation experience.
We share your expectations and have built 18 tangible results around them. These results guide us everyday as we go about the business of delighting our customers. In the Tracker, you will see that we have established measures to gauge our progress and we are comparing ourselves to the best organizations in the country.
You can use the Tracker to see how we are mea-suring up. We make it available in a printed format and on our website at www.modot.org. Missouri’s transportation system will not improve unless we all work together. The Tracker is one of the many ways you can help. Please look it over and let us know how we are doing.
Sincerely,
• Uninterrupted Traffic Flow • Smooth and Unrestricted Roads and Bridges • Safe Transportation System • Roadway Visibility • Personal, Fast, Courteous and Understandable Response to Customer Requests (Inbound) • Partner With Others to Deliver Transportation Services • Leverage Transportation to Advance Economic Development • Innovative Transportation Solutions • Fast Projects That Are of Great Value • Environmentally Responsible • Efficient Movement of Goods • Easily Accessible Modal Choices • Customer Involvement in Transportation Decision-Making• Convenient, Clean and Safe Roadside Accommodations • Best Value for Every Dollar Spent • Attractive Roadsides • Advocate for Transportation Issues • Accurate, Timely, Understandable and Proactive Transportation Information (Outbound)
Tangible Results
Value StatementsMoDOT will -
• support and develop employees because we believe they are the key to our success.• be flexible because we believe one size does not fit all.• honor our commitments because we believe in integrity. • encourage risk and accept failure because we believe in getting better.• be responsive and courteous because we believe in delighting our customers.• empower employees because we trust them to make timely and innovative decisions. • not compromise safety because we believe in the well-being of employees and customers.• provide the best value for every dollar spent because we’re taxpayers too. • value diversity because we believe in the power of our differences. • be one team because we all share the same mission. • use teamwork because it produces the best results.• foster an enjoyable workplace because we care about each other and our mission. • be open and honest because we must be trustworthy.• listen and seek to understand because we value everyone’s opinion. • treat everyone with respect because we value their dignity.• seek out and welcome any idea that increases our options because we don’t have all the answers.• always strive to do our job better, faster, and cheaper because we want to meet more of Missouri’s needs.

Uninterrupted Traffic Flow – Don Hillis (Page 1)
Average speeds on selected roadway sections Troy Pinkerton 1a Average rate of travel on selected signalized routes Julie Stotlemeyer 1b Average time to clear traffic incident Rick Bennett 1c Average time to clear traffic backup from incident Rick Bennett 1d Number of customers assisted by the Motorist Assist program Rick Bennett 1e Percent of Motorist Assist customers who are satisfied with the service Rick Bennett 1f Percent of work zones meeting expectations for traffic flow Scott Stotlemeyer 1g Time to meet winter storm event performance objectives on major and minor highways Tim Jackson 1h
Smooth and Unrestricted Roads and Bridges – Kevin Keith (Page 2) Percent of major highways that are in good condition Jay Bledsoe 2a Percent of minor highways that are in good condition Jay Bledsoe 2b Percent of deficient bridges on major highways Jay Bledsoe 2c Percent of deficient bridges on minor highways Jay Bledsoe 2d Number of deficient bridges on the state system (major & minor highways) Jay Bledsoe 2e
Safe Transportation System – Don Hillis (Page 3) Number of fatalities and disabling injuries Leanna Depue 3a Number of impaired driver-related fatalities and disabling injuries Leanna Depue 3b Rate of annual fatalities and disabling injuries Leanna Depue 3c Percent of safety belt/passenger vehicle restraint use Leanna Depue 3d Number of bicycle and pedestrian fatalities and disabling injuries Leanna Depue 3e Number of motorcycle fatalities and disabling injuries Leanna Depue 3f Number of commercial motor vehicle crashes resulting in fatalities Charles Gohring 3g Number of commercial motor vehicle crashes resulting in injuries Charles Gohring 3h Number of fatalities and injuries in work zones Scott Stotlemeyer 3i Number of highway-rail crossing fatalities and collisions Rod Massman 3j
Roadway Visibility – Don Hillis (Page 4) Rate of nighttime crashes Mike Curtit 4a Percent of signs that meet customers’ expectations Mike Curtit 4b Percent of stripes that meet customers’ expectations Jim Brocksmith 4c Percent of work zones meeting expectations for visibility Scott Stotlemeyer 4d
Personal, Fast, Courteous and Understandable Response to Customer Requests (Inbound) – Shane Peck (Page 5)
Percent of overall customer satisfaction Sally Oxenhandler 5a Percent of customers who contacted MoDOT that felt they were responded to quickly and courteously with an understandable response
Jeff Briggs 5b
Percent of documented customer requests responded to within 24 hours Jeff Briggs 5c Average completion time on requests requiring follow up Jeff Briggs 5d
Partner With Others to Deliver Transportation Services – Kevin Keith (Page 6) Number of dollars of discretionary funds allocated to Missouri Todd Grosvenor 6a Percent of earmarked dollars that represent MoDOT’s high priority highway projects Todd Grosvenor 6b Number of dollars generated through cost-sharing and other partnering agreements Jay Moore 6c
Leverage Transportation to Advance Economic Development – Roberta Broeker (Page 7) Number of miles of new 4-lane corridors completed Jay Bledsoe 7a Percent utilization of SIB & STAR loan programs Jay Moore 7b Rate of economic return from transportation investment Jay Moore 7c
Innovative Transportation Solutions – Mara Campbell (Page 8) Percent of innovative transportation solutions implemented Ernie Perry 8a Number of external awards received Ernie Perry 8b
TRACKER Table of Contents

Fast Projects That Are of Great Value – Dave Nichols (Page 9) Percent of estimated project cost as compared to final project cost Renate Wilkinson 9a Average number of years it takes to go from the programmed commitment in the Statewide Transportation Improvement Program to construction completion
Machelle Watkins 9b
Percent of projects completed within programmed amount Dave Ahlvers 9c Percent of projects completed on time Dave Ahlvers 9d Percent of change for finalized contracts Dave Ahlvers 9e Average construction cost per day by contract type Dave Ahlvers 9f Unit cost of construction expenditures Travis Koestner 9g Annual dollar amount saved by implementing value engineering Kathy Harvey 9h Dollar amount saved by implementing practical design Kathy Harvey 9i Percent of customers who feel completed projects are the right transportation solutions Kathy Harvey 9j
Environmentally Responsible – Dave Nichols (Page 10) Percent of projects completed without environmental violation Kathy Harvey 10a Number of projects MoDOT protects sensitive species or restores habitat Gayle Unruh 10b Ratio of acres of wetlands created compared to the number of acres of wetlands impacted Gayle Unruh 10c Percent of air quality days that meet Environmental Protection Agency standards by metropolitan area
Eric Curtit 10d
Percent of alternative fuel consumed Dave DeWitt 10e Number of historic resources avoided or protected as compared to those mitigated Bob Reeder 10f Number of tons of recycled/waste materials used in construction projects Joe Schroer 10g
Efficient Movement of Goods – Dave DeWitt (Page 11) Freight tonnage by mode Brian Weiler 11a Average travel speeds for trucks on selected roadway sections Michelle Teel 11b Percent of trucks using advanced technology at Missouri weigh stations Barbara Hague 11c Interstate motor carrier mileage Joy Prenger 11d Percent of satisfied motor carriers Mary Jo Pointer 11e Customer satisfaction with timeliness of Motor Carrier Services response Mary Jo Pointer 11f
Easily Accessible Modal Choices – Brian Weiler (Page 12) Number of airline passengers Joe Pestka 12a Number of rail passengers Rod Massman 12b Number of transit passengers Steve Billings 12c Number of passengers and vehicles transported by ferryboat Sherrie Martin 12d Number of days the Missouri River is navigable Sherrie Martin 12e Number of business-capable airports Joe Pestka 12f Number of daily scheduled airline flights Joe Pestka 12g Average number of days per week rural transit service is available Steve Billings 12h Number of intercity bus stops Steve Billings 12i Percent of customers satisfied with transportation options Matt Cowell 12j
Customer Involvement in Transportation Decision-Making – Dave Nichols (Page 13) Number of customers who attend transportation-related meetings Bob Brendel 13a Percent of customers who are satisfied with feedback they receive from MoDOT after offering comments
Bob Brendel 13b
Percent of customers who feel MoDOT includes them in transportation decision-making process Sue Cox 13c Percent of positive feedback responses received from planning partners regarding involvement in transportation decision-making
Sue Cox 13d
Convenient, Clean & Safe Roadside Accommodations – Don Hillis (Page 14) Percent of customers satisfied with rest areas’ convenience, cleanliness and safety Jim Carney 14a Percent of customers satisfied with commuter lots’ convenience, cleanliness and safety Tim Chojnacki 14b Number of users of commuter parking lots Tim Chojnacki 14c Number of users of rest areas Stacy Armstrong 14d Number of truck customers that utilize rest areas Tim Jackson 14e
TRACKER Table of Contents (cont.)

TRACKER Table of Contents (cont.)
Best Value for Every Dollar Spent – Roberta Broeker (Page 15) Number of MoDOT employees (converted to full-time equivalency) Micki Knudsen 15a Percent of work capacity based on average hours worked Micki Knudsen 15b Rate of employee turnover Micki Knudsen 15c Percent of satisfied employees Micki Knudsen 15d Number of lost workdays per year Beth Ring 15e Rate and total of OSHA recordable incidents Beth Ring 15f Number of claims and total claims expense for general liability Beth Ring 15g Unit cost per square foot of buildings Chris DeVore 15h Fleet expenses compared to fleet value Jeannie Wilson 15i Dollars expended on consultants other than program consultants Debbie Rickard 15j Percent of vendor invoices paid on time Debbie Rickard 15k Average cost of outsourced design and bridge engineer vs. full costed full-time employee Debbie Rickard 15l Distribution of expenditures Debbie Rickard 15m Percent variance of state revenue projections Ben Reeser 15n MoDOT national ranking in revenue per mile Ben Reeser 15o
Attractive Roadsides – Don Hillis (Page 16) Percent of roadsides that meet customers’ expectations Jim Carney 16a Number of miles in Adopt-A-Highway program Stacy Armstrong 16b
Advocate for Transportation Issues – Pete Rahn (Page 17)
Percent of minorities and females employed Brenda Treadwell-
Martin 17a
Percent of transportation-related pieces of legislation directly impacted by MoDOT Pam Harlan 17b Percent of federal earmarked highway projects on the state highway system Kent Van Landuyt 17c Percent of customers who view MoDOT as Missouri’s transportation expert Jay Wunderlich 17d
Accurate, Timely, Understandable and Proactive Transportation Information (Outbound) – Shane Peck (Page 18)
Number of public appearances Sally Oxenhandler 18a Percent of customers who feel MoDOT provides timely, accurate and understandable information Sally Oxenhandler 18b Number of contacts initiated by MoDOT to media Jeff Briggs 18c Percent of MoDOT information that meets the media’s expectations Jeff Briggs 18d Percent of positive newspaper editorials Jeff Briggs 18e Number of repeat visitors to MoDOT’s web site Matt Hiebert 18f
Please Note: Tangible Results are listed in reverse alphabetical order, not by importance.

(This page is intentionally left blank for duplexing purposes)

Uninterrupted Traffic FlowTangible Result Driver – Don Hillis, Director of System Management
Missouri drivers expect to get to their destinations on time, without delays. Traffic, changes in weather, work zones and highway incidents can all impact their travel. MoDOT works to ensure that motorists travel as efficiently as possible on the state system by better managing work zones, snow removal and highway incidents, and by using the latest technology to inform motorists of possible delays and available options. Better traffic flow means fewer crashes.
1

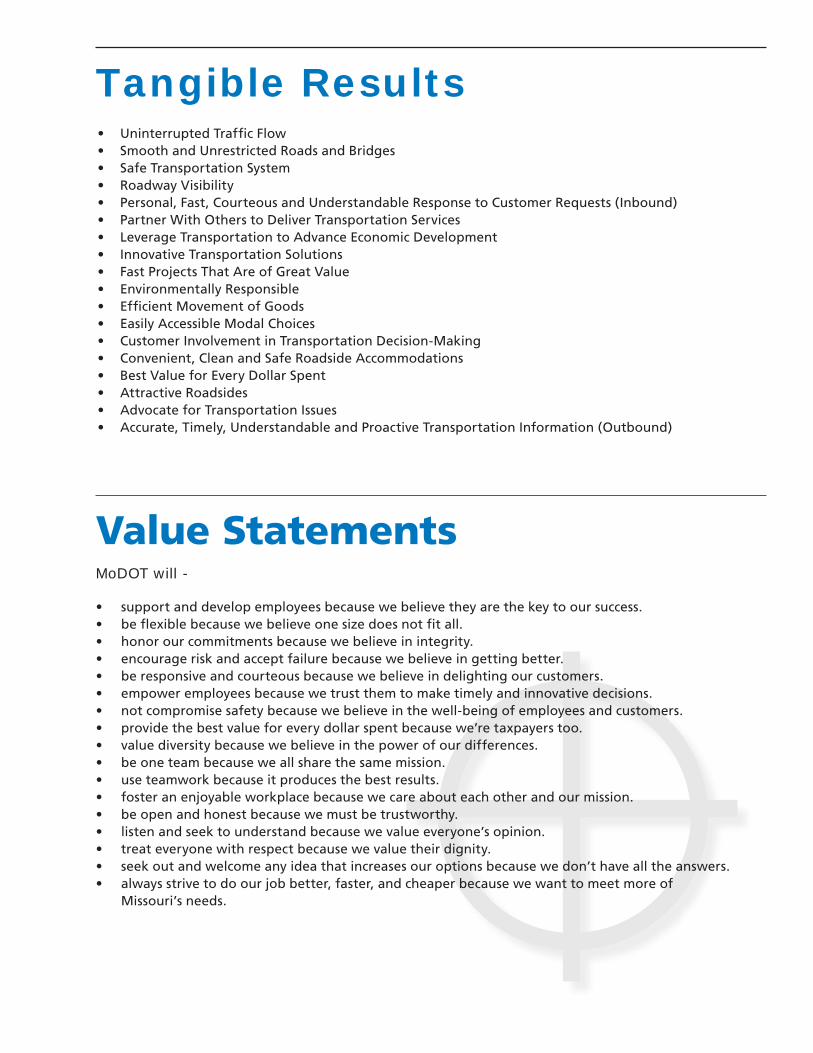
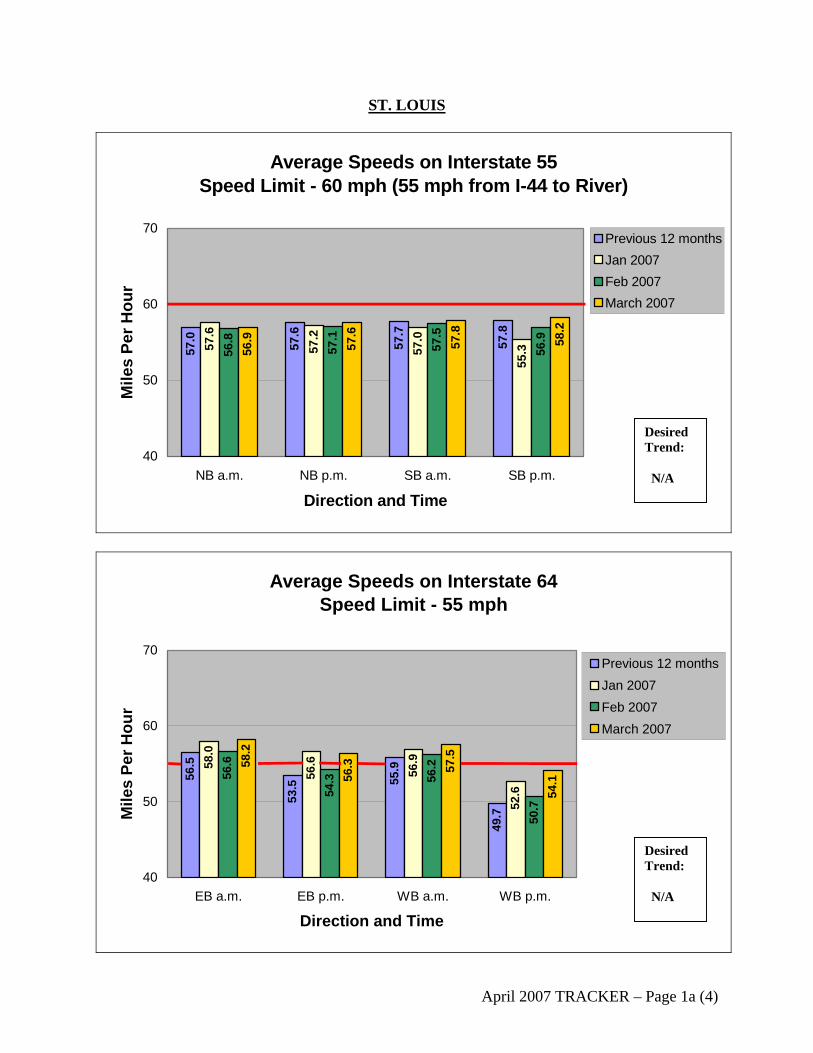
Uninterrupted Traffic Flow Average speeds on selected roadway sections Result Driver: Don Hillis, Director of System Management Measurement Driver: Troy Pinkerton, Traffic Liaison Engineer Purpose of the Measure: This measure tracks average speeds on various roadway sections. The desired trend is for the average speed to approach the posted speed limit. Measurement and Data Collection: Data from the St. Louis and Kansas City regions are provided by MoDOT’s traffic management centers. Information about the St. Louis traffic management center, Gateway Guide can be found at http://www.gatewayguide.com and information about the traffic management center in Kansas City, KC Scout can be found at http://www.kcscout.net/. Data for the St. Louis region is also provided through a partnership with Traffic.com. All data is reported for weekdays only, to better represent peak traffic conditions. The data from St. Louis is representative of large sections of roadway, while Kansas City and statewide data are shown at specific sensor locations. Data for each location is updated quarterly. Improvement Status: Statewide: Average speed data this quarter is within one to two mph of the posted speed limit for each month at every location with one exception. Average speeds are running about 10 percent less than the posted speed limit on Interstate 35 in Daviess County. As indicated last quarter, many locations reported equipment calibration issues following the aggressive construction season. All locations are being evaluated and calibrated as necessary in order to ensure accurate average speed reporting. St. Louis: The average speeds in the St. Louis region are consistent as compared to the previous twelve-month averages. Interstates 64 and 170 continue to experience some volatility associated with the peak volumes. The St. Louis region has recently been focused on preparing for the construction associated with the new I-64 project. As a result of these efforts, travel times are now being posted on dynamic message signs along the I-70 corridor. Kansas City: Average speeds in the Kansas City region are also consistent with that of the previous averages and typically due to the large volumes of merging traffic. The general trend in the January to March data shows average speeds on the rise, possibly in part due to the posting of travel times on dynamic message signs throughout the region. Average speeds for January showed a slight drop but rebounded quickly as travelers became accustomed to the travel time messages being displayed.
April 2007 TRACKER – Page 1a

STATEWIDE
Average Speeds on Rural Routes StatewideSpeed Limit - 70 mph
64.3
69.4
69.9
68.0
62.0
69.0 71
.0
62.0
69.0 71
.0
70.0
63.0
70.0 72
.0
68.3
68.0
45
55
65
75
I-29 Holt I-35 Daviess I-435 Clay I-70 Cooper
Route and County
Mile
s Pe
r Hou
r
Previous 12 monthsJan 2007Feb 2007March 2007
Desired Trend: N/A
April 2007 TRACKER – Page 1a (2)
Average Speeds on Rural Routes Statewide Speed Limit - 70 mph
69.0
69.3
69.6
69.0
68.0
71.0
69.0
69.0
72.0
70.0 72
.0
72.0
45
55
65
75
I-55 Ste Genevieve US 71 Jasper I-44 Newton
Route and County
Mile
s Pe
r Hou
r
Previous 12 monthsJan 2007Feb 2007March 2007
Desired Trend: N/A

ST. LOUIS
Average Speeds on Interstate 170 Speed Limit - 60 mph
57.9
53.6
57.4
57.9
57.6
52.1
57.6 58
.9
56.3
51.3
56.2 58
.3
56.8
53.3
57.5 59
.8
40
50
60
70
NB a.m. NB p.m. SB a.m. SB p.m.
Direction and Time
Mile
s Pe
r Hou
r
Previous 12 monthsJan 2007Feb 2007March 2007
Desired Trend: N/A
Average Speeds on Interstate 44 Speed Limit - 60 mph (55 mph from Grand to I-55)
59.3
59.4
59.2
55.7
60.7
59.7
59.8
57.0
59.7
59.7
59.5
55.6
60.5
60.5
59.7
58.0
40
50
60
70
EB a.m. EB p.m. WB a.m. WB p.m.
Direction and Time
Mile
s Pe
r Hou
r
Previous 12 monthsJan 2007Feb 2007March 2007
Desired Trend: N/A
April 2007 TRACKER – Page 1a (3)
ST. LOUIS
Average Speeds on Interstate 55 Speed Limit - 60 mph (55 mph from I-44 to River)
57.0
57.6
57.7
57.8
57.6
57.2
57.0
55.357
.1
57.5
56.9
56.9 57.6
57.8
58.2
56.8
40
50
60
70
NB a.m. NB p.m. SB a.m. SB p.m.
Direction and Time
Mile
s Pe
r Hou
r
Previous 12 monthsJan 2007Feb 2007March 2007
Desired Trend: N/A
Average Speeds on Interstate 64 Speed Limit - 55 mph
56.5
53.5 55
.9
49.7
56.6
56.9
52.6
56.6
54.3 56
.2
50.7
58.2
56.3 57
.5
54.1
58.0
40
50
60
70
EB a.m. EB p.m. WB a.m. WB p.m.
Direction and Time
Mile
s Pe
r Hou
r
Previous 12 monthsJan 2007Feb 2007March 2007
Desired Trend: N/A
April 2007 TRACKER – Page 1a (4)
ST. LOUIS
Average Speeds on State Route 370 Speed Limit - 60 mph
63.4
63.1 63.9
64.1
63.4
62.5 64
.9
64.2
62.6
62.2 64
.2
64.2
63.2
62.8 64
.6
65.0
40
50
60
70
EB a.m. EB p.m. WB a.m. WB p.m.
Direction and Time
Mile
s Pe
r Hou
r
Previous 12 monthsJan 2007Feb 2007March 2007
Desired Trend: N/A
KANSAS CITY
Average Speeds on Interstate 35 at 27th Street Speed Limit - 55 mph
45.7
43.2
55.9
53.7
46.2
47.2
54.1
49.3
48.4 49.7
55.9
54.2
48.2
47.7
56.1
54.5
25
35
45
55
65
NB a.m. NB p.m. SB a.m. SB p.m.
Direction and Time
Mile
s Pe
r Hou
r
Previous 12 monthsJan 2007Feb 2007March 2007
Desired Trend: N/A
April 2007 TRACKER – Page 1a (5)

KANSAS CITY
Average Speeds on Interstate 35 at Armour Road Speed Limit - 55 mph
57.1
53.6
29.5
57.9
56.6
52.6
25.2
56.7
57.7
55.2
31.5
58.9
58.7
55.7
30.7
59.1
20
30
40
50
60
NB a.m. NB p.m. SB a.m. SB p.m.
Direction and Time
Mile
s Pe
r Hou
r
Previous 12 monthsJan 2007Feb 2007March 2007
Desired Trend: N/A
April 2007 TRACKER – Page 1a (6)
Desired Trend: N/A
Average Speeds on Interstate 70 at Blue Ridge Cutoff Speed Limit - 65 mph
66.7
48.7 50
.1
59.8
66.0
45.7 47
.1
56.8
66.8
52.2
48.7
59.8
67.3
47.2 50
.1
59.7
25
35
45
55
65
EB a.m. EB p.m. WB a.m. WB p.m.
Direction and Time
Mile
s Pe
r Hou
r
Previous 12 monthsJan 2007Feb 2007March 2007

KANSAS CITY
April 2007 TRACKER – Page 1a (7)
Desired Trend: N/A
Average Speeds on Interstate 435 at 104th Street Speed Limit - 65 mph
68.2
44.0
58.2
67.5
66.0
45.1
58.8
66.868.5
49.3
57.2
66.768
.9
45.1
56.9
66.8
25
35
45
55
65
EB a.m. EB p.m. WB a.m. WB p.m.
Direction and Time
Mile
s Pe
r Hou
r
Previous 12 months
Jan 2007
Feb 2007
March 2007

Uninterrupted Traffic Flow Average rate of travel on selected signalized routes Result Driver: Don Hillis, Director of System Management Measurement Driver: Julie Stotlemeyer, Traffic Liaison Engineer Purpose of the Measure: The purpose of this measure is to show how well selected arterials across the state are operating during peak traffic times. As improvements are made to these arterials, such as signal timing or access management, this measure will show the effects of those efforts and decisions on the arterials. Measurement and Data Collection: This measure tracks travel times on various arterials. Data is collected from driving each route twice during AM and PM peak times and timing how long it takes to traverse the route. The travel time is compared to the speed limit and the travel time factor determined. The travel time factor for each route should approach 1.0. This indicates traffic is moving at the speed limit. This is a quarterly measure. Improvement Status: Of the 68 travel time factors for the 17 selected routes, the average statewide is 0.65. Further analysis shows there is no difference for direction of travel but AM peaks are above the average and PM peaks are below. Route 54 in the Central District is operating above 0.9. Nine travel time factors are below 0.5, of which four are AM peaks and five are PM peaks. The largest changes from previous quarter data occur in the Kansas City Area District for the northbound directions of Routes 291 and 13 during the AM and PM peaks respectively. There were increases in 37 travel time factors and 31 decreases. Of those 37, 19 were AM peaks and 18 were PM peaks. Timing adjustments, for one or all signals along the route, were made to eight of the 17 selected routes.
Average Rate of Travel on Selected Signalized RoutesNorthwest, North Central and Northeast Districts
0.76
8
0.68
0 0.75
9
0.63
8
0.44
9 0.59
7
0.79
0
0.84
6
0.75
2
0.69
1
0.55
2 0.66
70.83
2*
0.76
6*
0.72
8*
0.68
9*
0.50
8*
0.57
6*
0.77
3*
0.73
9* 0.88
2*
0.67
9*
0.56
9* 0.68
4*
0.00.10.20.30.40.50.60.70.80.91.0
LP 29/US 169 St. Joseph US 63 Kirksville US 61 Hannibal
Selected Routes
Trav
el T
ime
Fact
or
NB/EB AM
NB/EB PM
SB/WB AM
SB/WB PM
Desired Trend: 1.0
*Previous quarter data
April 2007 TRACKER – Page 1b

Average Rate of Travel on Selected Signalized RoutesKansas City Area District
0.75
1
0.32
3
0.72
7
0.65
9
0.41
1
0.70
5
0.67
3
0.34
4
0.70
4
0.71
3
0.40
5
0.70
4
0.80
2*
0.56
8*
0.76
9*
0.62
3*
0.43
8*
0.41
7*
0.73
2*
0.49
9*
0.79
4*
0.70
9*
0.43
1* 0.57
5*
0.00.10.20.30.40.50.60.70.80.91.0
MO 7 Lee's Summit MO 291 Blue Springs MO 13 Warrensburg
Selected Routes
Trav
el T
ime
Fact
or
NB/EB AM
NB/EB PM
SB/WB AM
SB/WB PM
*Previous quarter data
Desired Trend: 1.0
Average Rate of Travel on Selected Signalized RoutesCentral and Springfield Area Districts
0.96
4
0.72
8 0.86
4
0.71
9
0.98
0
0.55
0 0.66
9
0.53
5
0.97
6
0.54
0
0.74
2
0.74
0
0.92
5
0.55
0
0.55
1
0.57
20.74
5*
0.69
7*
0.63
7*
0.94
7*
0.61
8*
0.58
7*
0.46
8*
0.89
8*
0.69
9*
0.62
5*
0.68
3*
0.95
7*
0.52
0*
0.57
9*
0.46
4*
0.78
4*
0.00.10.20.30.40.50.60.70.80.91.0
US 54 OsageBeach
MO 740 Columbia MO 5 Lebanon MO 13 Springfield
Selected Routes
Trav
el T
ime
Fact
or
NB/EB AM
NB/EB PM
SB/WB AM
SB/WB PM
*Previous quarter data
Desired Trend: 1.0
April 2007 TRACKER – Page 1b (2)

Average Rate of Travel on Selected Signalized RoutesSt. Louis Area District
0.58
1
0.31
6
0.54
90.65
3
0.54
2
0.60
7 0.69
0
0.62
0
0.63
5
0.40
8
0.81
8
0.64
4
0.45
0
0.68
8
0.63
6
0.52
1*
0.27
9*
0.55
3*0.68
7*0.
693
0.68
9*
0.65
3*
0.66
8*
0.65
1*
0.63
6*
0.61
0*
0.39
1*
0.66
5*
0.68
5*
0.64
2*
0.47
0*
0.65
3*
0.00.10.20.30.40.50.60.70.80.91.0
MO 30 I-270 to I-55 MO 94 US 40 to I-70
US 67 Mo 367 to I-270
MO 141 US 40 to I-55
Selected Routes
Trav
el T
ime
Fact
or
NB/EB AM
NB/EB PM
SB/WB AM
SB/WB PM
*Previous quarter data
Desired Trend: 1.0
Average Rate of Travel on Selected Signalized RoutesSouthwest, South Central and Southeast Districts
0.82
9
0.65
4
0.54
7
0.76
3
0.64
6
0.48
6
0.84
6
0.62
9
0.61
50.77
3
0.57
8
0.60
3
0.58
6*0.66
4*0.79
6*
0.55
2*
0.58
8*
0.75
9*
0.59
8*
0.75
8*
0.78
5*
0.51
8*
0.69
6*0.78
4*
0.00.10.20.30.40.50.60.70.80.91.0
LP71 Joplin US 63 Rolla RT K Cape Girardeau
Selected Routes
Trav
el T
ime
Fact
or
NB/EB AM
NB/EB PM
SB/WB AM
SB/WB PM
*Previous quarter data
Desired Trend: 1.0
April 2007 TRACKER – Page 1b (3)

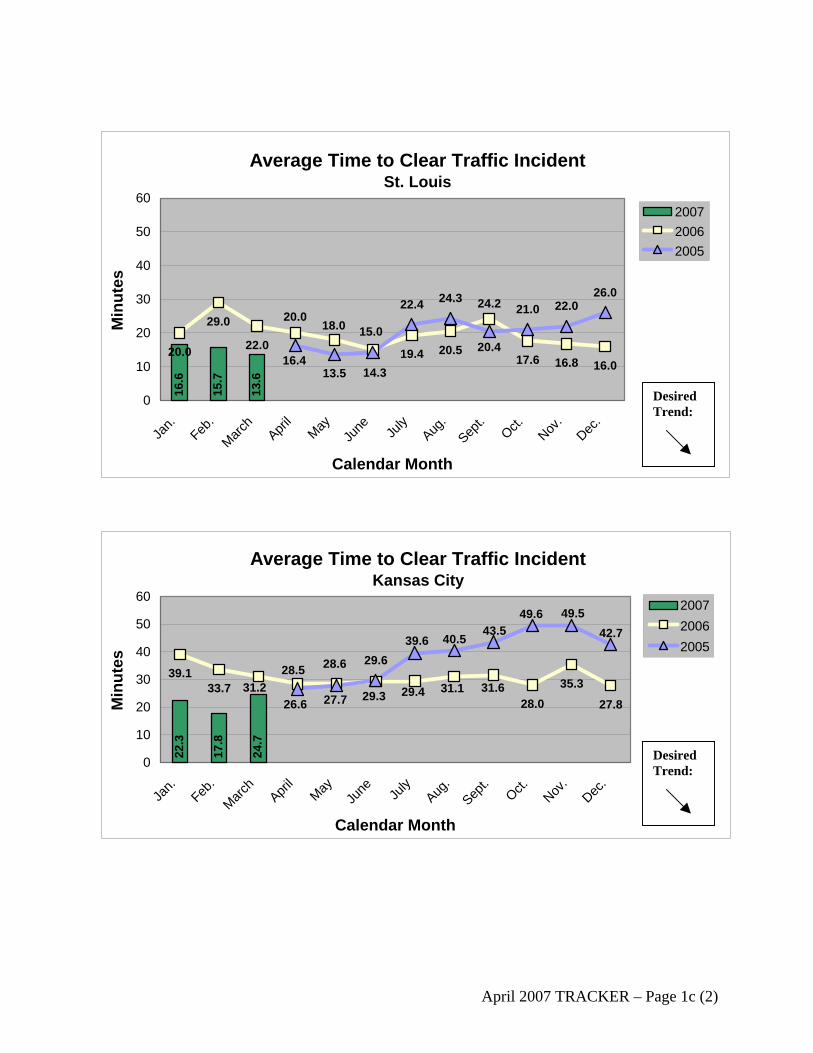
Uninterrupted Traffic Flow Average time to clear traffic incident Result Driver: Don Hillis, Director of System Management Measurement Driver: Rick Bennett, Traffic Liaison Engineer Purpose of the Measure: This measure is used to determine the trends in incident clearance on the state highway system. A traffic incident is an unplanned event that creates a temporary reduction in the number of vehicles that can travel on the road. The sooner an incident is removed, the sooner the highway system returns to normal capacity. Therefore, responding to and quickly addressing the incidents (crashes, flat tires and stalled vehicles) improves system performance. Measurement and Data Collection: Collection of data began March 1, 2005. Motorist Assist operators and Traffic Management Center staff record “time of arrival” and the time for “all lanes cleared.” Average time to clear traffic incidents is calculated from these times. The data includes only those incidents handled by Motorist Assist and urban emergency response crews in the Kansas and St. Louis areas. Improvement Status: Overall, data shows that both St. Louis and Kansas City areas continued to reduce incident clearance times. Increased efforts in incident management, Motorists Assist and police coordination in both the St. Louis and Kansas City regions continue to support MoDOT’s objective of quick clearance and open roadways with the ultimate goal of improving clearance times. January and March data in Kansas City show a consistent decline for this measure, but February’s quicker average time to clear can be attributed to the 114 low-impact incidents. Thirty-five, approximately 25 percent of these incidents, had back-ups that cleared within seven minutes causing a lower "average time to clear" for the month. January and March had 82 and 87 low-impact incidents respectively.
April 2007 TRACKER – Page 1c
Average Time to Clear Traffic IncidentSt. Louis
13.6
15.7
16.6
17.6 16.016.8
15.018.020.029.0
20.0 22.019.4
24.2
20.5
14.313.516.4
22.4
20.4
21.0 22.026.024.3
0
10
20
30
40
50
60
Jan.
Feb.
March
April
MayJu
ne July
Aug.
Sept.
Oct.Nov
.Dec
.
Calendar Month
Min
utes
200720062005
Desired Trend:
Average Time to Clear Traffic IncidentKansas City
22.3
17.8
24.7
29.6
28.0 27.8
35.329.3
28.628.533.7
39.131.2 29.4 31.631.1
26.6 27.7
39.643.5
49.6 49.542.740.5
0
10
20
30
40
50
60
Jan.
Feb.
March
April
MayJu
ne July
Aug.
Sept.
Oct.Nov
.Dec
.
Calendar Month
Min
utes
200720062005
Desired Trend:
April 2007 TRACKER – Page 1c (2)

Uninterrupted Traffic Flow Average time to clear traffic backup from incident Result Driver: Don Hillis, Director of System Management Measurement Driver: Rick Bennett, Traffic Liaison Engineer Purpose of the Measure: This measure tracks the amount of time it takes to return traffic flow back to normal after a traffic incident. A traffic incident is any unplanned event that creates a temporary reduction in the number of vehicles that can travel on the road. Measurement and Data Collection: “Lanes cleared” and “clear backup” times are being recorded by MoDOT’s traffic management centers in Kansas City and St. Louis. Average times to clear traffic backups are calculated from these recorded times. In 2005, the Kansas City operators just terminated the incident when they perceived it to be back to "normal" conditions. To standardize that data, Kansas City set up benchmarks of what normal is across the system and automated it to the reports. Starting in January 2006, Kansas City reports were modified to capture when a backup was relieved as an automated process. The Kansas City area has devices to collect data along portions of interstates 435 and 70. St. Louis collects data manually using video equipment and verification from Motorist Assist operators. St. Louis continues to record “clear backup” times when they perceived traffic to be back to "normal" conditions. They will use advanced transportation management system devices and software when they become available. Improvement Status: This data shows clearance times in Kansas City average around 11 minutes, while the St. Louis metro area clearance times are higher. The Kansas City data includes all detected incidents on the KC Scout, the Kansas City emergency response unit, instrumented routes. The St. Louis data is skewed because it only includes a portion of major incidents on the St. Louis freeway network that can be monitored by operators in the traffic management center or by Motorist Assist and Emergency Response personnel on the scene. The St. Louis data does not necessarily capture short-term incidents that clear before a Motorist Assist operator can get to the scene. St. Louis area routes also have larger traffic volumes that create more significant congestion problems than in Kansas City. The continual decline in the time to clear backups in the Kansas City area can be attributed to the launch of the travel-time system and drivers having real-time information to make informed decisions about detouring away from extended backups. The unusual spike in St. Louis time to clear backup for the month of January is a result of only having six incidents that the operators were able to monitor on camera to determine when the traffic flow returned to normal. Most of the incidents in January were severe and occurred during peak traffic hours. Clearance times on these six incidents range from 16 minutes to 44 minutes. In February and March the operators tracked the time to clear backup on eight and 15 incidents respectively. Typically there are more than 700 incidents a month on the St. Louis system.
April 2007 TRACKER – Page 1d

Average Time to Clear Traffic Backup From IncidentSt. Louis
30.0
23.6
20.5
17.0
12.0
17.020.2
17.012.1
27.0
19.020.0
13.0
29.0
20.0
17.0
19.022.0
0
5
10
15
20
25
30
35
Jan.
Feb.
March
April
MayJu
ne July
Aug.
Sept.
Oct.Nov
.Dec
.
Calendar Month
Min
utes
200720062005
Desired Trend:
Desired Trend:
Average Time to Clear Traffic Backup From IncidentKansas City
11.3
10.8
10.7
11.012.7
11.112.9
11.111.511.310.4 10.4 9.6 9.8 9.8
9.48.49.09.4
7.06.75.87.9 8.3
6.30
5
10
15
20
25
30
35
Jan.
Feb.
March
April
MayJu
ne July
Aug.
Sept.
Oct.Nov
.Dec
.
Calendar Month
Min
utes
200720062005
April 2007 TRACKER – Page 1d (2)

Uninterrupted Traffic Flow Number of customers assisted by the Motorist Assist program Result Driver: Don Hillis, Director of System Management Measurement Driver: Rick Bennett, Traffic Liaison Engineer Purpose of the Measure: This measure is used to gauge the use of the Motorist Assist programs. Incidents impact Missouri’s transportation system capacity. An incident is any unplanned event that creates a temporary reduction in roadway capacity that impedes normal traffic flow. The sooner an incident is removed, the sooner the highway system returns to normal capacity. Therefore, responding to and quickly addressing the incidents (crashes, flat tires and stalled vehicles) improves system performance. Our Motorist Assist operators are able to respond to nearly every incident, major or minor, in the areas they cover. Measurement and Data Collection: The Motorist Assist operators record each assist and then prepare a monthly summary. St. Louis operators patrol approximately 160 freeway miles, while Kansas City operators patrol approximately 60 freeway miles. Improvement Status: This data demonstrates that the Motorist Assist program in both St. Louis and Kansas City experienced a routine increase in assists due to increased roadway volumes. Typical patterns show increased assists during peak travel season and winter weather and decreased services in late summer and early fall. The increased number of assists in January correspond to the increased number of stranded motorists and accidents associated with the weather and snow events.
April 2007 TRACKER – Page 1e

Number of Customers Assisted bythe Motorist Assist Program
St. Louis4,
180
3,77
7
4,22
02,852
2,420
3,708 3,809 3,881
3,1703,533
4,1644,0483,171
2,953
3,432
0
1,000
2,000
3,000
4,000
5,000
Jan.
Feb.
March
April
MayJu
ne July
Aug.
Sept.
Oct.Nov
.Dec
.
Calendar Month
Num
ber
20072006
Desired Trend: N/A
Number of Customers Assisted bythe Motorist Assist Program
Kansas City
1,40
5
1,19
1
1,27
2
1,0611,229 1,219
1,030 1,005
1,2231,0061,048
788839
1,015982
0
400
800
1,200
1,600
Jan.
Feb.
March
April
MayJu
ne July
Aug.
Sept.
Oct.Nov
.Dec
.
Calendar Month
Num
ber
20072006
Desired Trend: N/A
April 2007 TRACKER – Page 1e (2)

Uninterrupted Traffic Flow Percent of Motorist Assist customers who are satisfied with the service Result Driver: Don Hillis, Director of System Management Measurement Driver: Rick Bennett, Traffic Liaison Engineer Purpose of the Measure: This measure helps evaluate services provided through MoDOT’s Motorist Assist Program, specifically whether the customers who use the program are satisfied with the service. Information received provides direction on how to better serve our customers and keep traffic moving safely and efficiently. Measurement and Data Collection: Motorist Assist operators distributed survey cards to customers starting June 1, 2005. Data from the cards is compiled and tabulated by the Missouri Transportation Institute. Surveys with selections identifying that the service was “probably” or “definitely” valuable were tabulated as “satisfied” for this measure. Improvement Status: This data agrees with information provided by customers on prior comment forms - almost all customers are satisfied.
• First Quarter 2006, 380 surveys received • Second Quarter 2006, 447 surveys received • Third Quarter 2006, 704 surveys received • Fourth Quarter 2006, 575 surveys received • First Quarter 2007, 540 surveys received
Percent of Motorist Assist Customers Who Are Satisfied With the Service
100.0100.0 100.0 99.4 99.8
0
20
40
60
80
100
1st Qtr. 2006 2nd Qtr. 2006 3rd Qtr. 2006 4th Qtr. 2006 1st Qtr. 2007
Calendar Year
Perc
ent
Desired Trend:
April 2007 TRACKER – Page 1f

Uninterrupted Traffic Flow Percent of work zones meeting expectations for traffic flow Result Driver: Don Hillis, Director of System Management Measurement Driver: Scott Stotlemeyer, Traffic Liaison Engineer Purpose of the Measure: An important factor in evaluating the department’s performance in temporary traffic control design, deployment, operation, and maintenance is the measurement of work zones’ affect on the mobility of highway users. This measure tracks how well the department meets customer expectations of traffic flow in, around, and through work zones on state highways. Measurement and Data Collection: Using a formal inspection worksheet, Construction and Materials, Maintenance, Traffic, and district employees evaluate mobility in work zones across the state. Each evaluation consists of a subjective assessment of engineered and operational factors affecting traffic flow. The evaluator assigns a pass, fail, or n/a rating to each of these individual factors and a pass or fail rating for their overall perception of traffic flow in, around, and through the work zone. The overall perception ratings are compiled quarterly and reported via this measurement. Note: This inspection program began in June 2005. Improvement Status: Compilation of the 357 evaluations performed by MoDOT staff between January and March of this calendar year resulted in a 96 percent satisfaction rating for work zone traffic flow (i.e., a negative perception of traffic flow was recorded in 3.6 percent of the evaluations). This rating is within one-half a percentage point of last calendar year’s first quarter and year-end ratings – a year the department showed an 8.4 percent improvement in work zone traffic flow when compared to the previous year’s inspection results. Such progress is attributable to MoDOT’s emphasis on creating exemplary work zones by minimizing work zone congestion and delays despite increased traffic demand and volume of work zones in Missouri.
Percent of Work Zones Meeting Expectations for Traffic Flow
8897 96
0
20
40
60
80
100
2005 2006 1st Qtr. 2007
Calendar Year
Perc
ent
Desired Trend:
April 2007 TRACKER – Page 1g

Uninterrupted Traffic Flow Time to meet winter storm event performance objectives on major and minor highways Result Driver: Don Hillis, Director of System Management Measurement Driver: Tim Jackson, Technical Support Engineer Purpose of the Measure: This measure tracks the amount of time needed to perform MoDOT’s snow and ice removal efforts. Measurement and Data Collection: This data is collected in the winter event database. This measurement tracks the actual time involved in this process so improvements can be made. After each winter event, such as a snow or ice storm, area maintenance personnel submit a report indicating how much time it took to clear snow from the major and minor highways. Data collection for this measure runs from November through March of each winter season. After a storm ends, the objectives are to restore the major highways to a wet or dry condition as soon as possible, restore the higher-volume minor highways to a wet or dry condition as soon as possible, and have the lower-volume minor highways open to two-way traffic and treated with salt and/or abrasives at all critical areas such as intersections, hills and curves as soon as possible. The end of the storm is defined as when freezing precipitation stops accumulating on the roadways, either from falling or drifting conditions. This data is updated in the January and April Tracker reports. The time in hours is the statewide average for each month. Improvement Status: January and February had several large snowstorms that covered most of the state of Missouri. A major ice storm hit southwest, central and south central Missouri in January. The average time to meet the winter event performance objectives has declined over the three months of this quarter. These times will vary based on the amount of snow received, the duration and the intensity of the storm. Strategies to improve these numbers include pursuing equipment enhancements, testing new materials and continued training of snow removal employees.
Time to Meet Winter Storm Event Performance Objectives on Major and Minor Highways
13.7
5.6 5.0
20.1
4.47.5 6.2
2.12.9 2.70
5
10
15
20
25
November December January February March
Winter 2006-2007
Hou
rs
MajorHighways
MinorHighways
Desired Trend:
April 2007 TRACKER – Page 1h
Smooth and Unrestricted Roads and BridgesTangible Result Driver – Kevin Keith, Chief Engineer
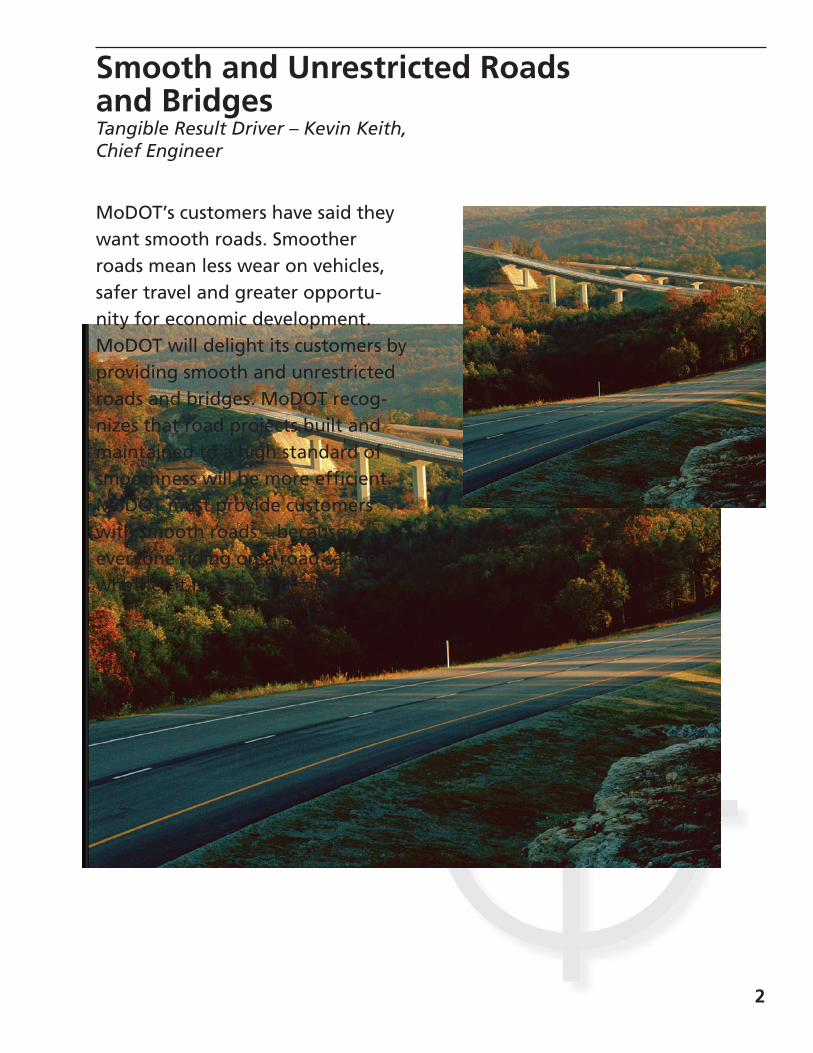
MoDOT’s customers have said they want smooth roads. Smoother roads mean less wear on vehicles, safer travel and greater opportu-nity for economic development. MoDOT will delight its customers by providing smooth and unrestricted roads and bridges. MoDOT recog-nizes that road projects built and maintained to a high standard of smoothness will be more efficient. MoDOT must provide customers with smooth roads – because everyone riding on a road can feel whether it is smooth or not!
2

Smooth and Unrestricted Roads and Bridges Percent of major highways that are in good condition Result Driver: Kevin Keith, Chief Engineer Measurement Driver: Jay Bledsoe, Transportation System Analysis Engineer Purpose of the Measure: This measure tracks the condition of Missouri’s major highway road surfaces. The public has indicated the condition of Missouri’s existing state roadway system should be one of the state’s highest priorities. MoDOT places a high priority on improving the condition of state highways. Measurement and Data Collection: The major highway system is defined as all routes functionally classified as principal arterials. By definition, the principal arterial system provides for statewide or interstate movement of traffic. Examples include the Interstate System and most U.S. routes such as 63, 54 or 36. In urban areas, principal arterials carry traffic entering or leaving the urban area and serve movement of vehicles between central business districts and suburban residential areas. Examples include Business 50 (Missouri Blvd.) in Jefferson City, MO 740 (Stadium Blvd.) in Columbia and Route D (Page Ave.) in St. Louis. The major roads in Missouri total approximately 5,573 centerline miles. This revised figure reflects additional mileage based on statewide review of the highway system. Good condition is defined using a combination of criteria. On high-speed routes (speed limits greater than 50 mph) the International Roughness Index (IRI) is used. For lower-speed routes (mostly urban areas) where smoothness is less critical, a Present Serviceability Rating (PSR) is used. While smoothness is a factor in PSR, physical condition is also a factor. Direct comparison to other states is difficult because of differences in measurement methodologies. However, a general order-of-magnitude comparison is possible given certain assumptions. For example, there are five states that report mileage for major highways within 10 percent of that maintained by MoDOT. Of these five, Georgia, with 5,875 miles, currently has the highest percentage of these highways classified in good condition based on smoothness only. The Missouri definition of good uses smoothness as one factor; however, it also includes other condition factors such as physical distress to determine quality. While the comparison is not exact, it does indicate the level of performance possible on a system of Missouri’s size. This is an annual measure. Missouri data is updated in January to reflect prior calendar-year ratings. Improvement Status: More than $430 million per year is dedicated to taking care of the existing highway system. An additional $359 million available from Amendment 3 (approved by Missouri voters in November 2004) was added to this sum as part of MoDOT’s Smooth Roads Initiative (SRI). Completion of the SRI has resulted in a significant improvement in pavement condition. Currently, 74 percent of the major highways are in good condition, up from 46 percent at the beginning of the SRI. Under the Better Roads Brighter Future program MoDOT will emphasize maintenance of the miles improved under the SRI while making major improvements to the remainder of the 5,573 major highway system. By the end of 2011, a total of 85 percent of the major highways will have improved surfaces along with new or improved shoulders and rumble stripes. However, all 5,573 miles will benefit from safety features such as wider striping and brighter signing. Funding for the Better Roads, Brighter Future program will come from existing Taking Care Of System (TCOS) funds in accordance with the current commission approved funding allocation method.
April 2007 TRACKER – Page 2a

Percent of Major Highways That Are in Good Condition
44.8 44.5 47.4
60.8
74.0
89.9 87.591.7 93.1
0
20
40
60
80
100
2002 2003 2004 2005 2006
Calendar Year
Perc
ent
MissouriGeorgia *
Desired Trend:
* Source data for Georgia is “Highway Statistics ” published by FHWA. Data for 2006 not available at time of publication. Georgia data is based only on pavement smoothness (IRI) submitted as part of the Highway Performance Monitoring System.
April 2007 TRACKER – Page 2a (2)

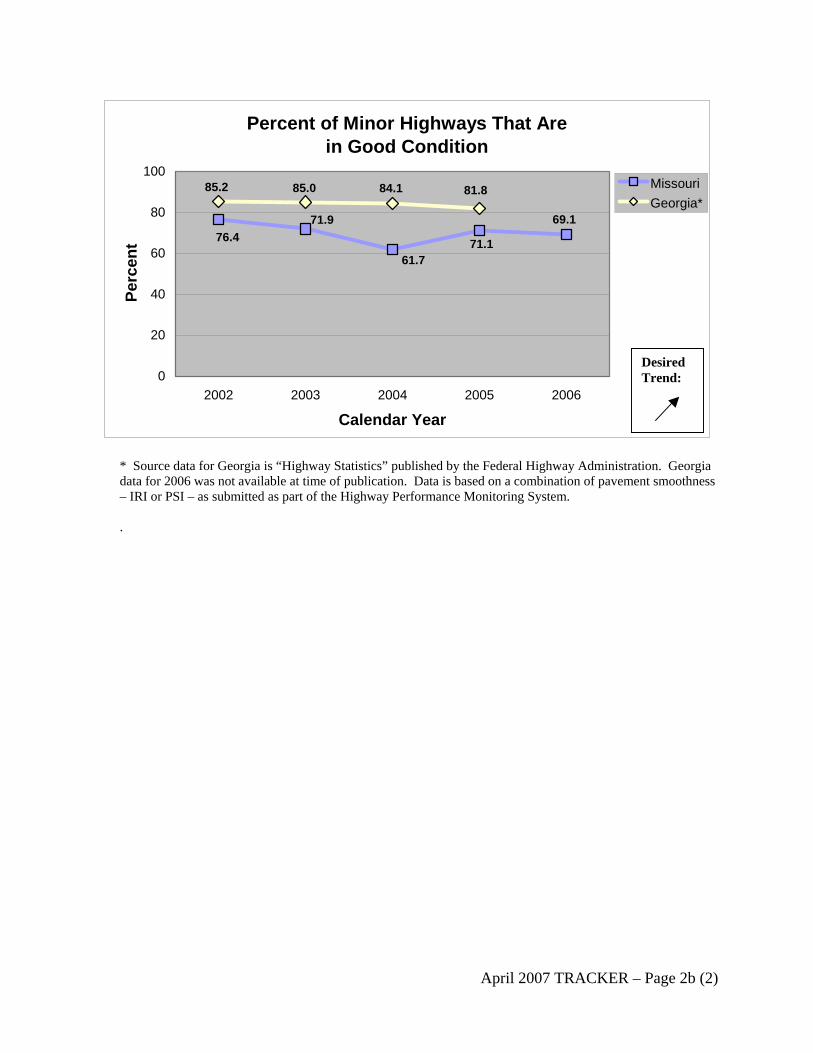
Smooth and Unrestricted Roads and Bridges Percent of minor highways that are in good condition Result Driver: Kevin Keith, Chief Engineer Measurement Driver: Jay Bledsoe, Transportation System Analysis Engineer Purpose of the Measure: This measure tracks the condition of Missouri’s minor highway road surfaces. The public has indicated the condition of Missouri’s existing state roadway system should be one of the state’s highest priorities. MoDOT places a high priority on improving the condition of highways in the state system. Measurement and Data Collection: The minor highway system consists of all routes functionally classified as minor arterials or collectors. These routes mainly serve local transportation needs and include highways commonly referred to as lettered routes, such as Route A, Route C and Route DD. The public sometimes refers to these routes as farm-to-market roads. The minor roads in Missouri total approximately 27,000 centerline miles. Good condition is defined using a combination of criteria. Where available, on high-speed routes (speed limits greater than 50 mph) the International Roughness Index (IRI) is used. For lower-speed routes where smoothness is less critical, a Present Serviceability Rating (PSR) or IRI is used. While smoothness is a factor in PSR, physical condition is also a factor. Direct comparison to other states is difficult because of differences in measurement methodologies. However, a general order-of-magnitude comparison is possible given certain assumptions. For example, there are six states that report mileage for minor highways within 10 percent of that maintained by MoDOT. Of these six, Georgia, with 24,707 miles, currently has the highest percentage of these highways classified in good condition. The ratings reported by states as part of the Highway Performance Monitoring System for roads classified as minor more closely relate to Missouri’s rating system. Federal Highway Administration allows conditions on minor highways to be reported on either IRI or Present Serviceability Index (PSI). PSI includes an assessment of physical distress similar to Missouri’s definition. The Missouri definition of good uses smoothness as one factor. However, it also includes other condition factors such as physical distress to determine quality. Improvement Status: Prior to 2005, pavement conditions on minor highways had shown a steady decrease. The increase in 2005 is due primarily to modification of the rating method. Prior to 2005, ratings used a combination of automated methods and MoDOT district manual ratings. More than 60 percent of minor roads were surveyed using automated methods by MoDOT Transportation Planning staff in 2006. The acquisition of additional equipment in 2007 should allow virtually all state system routes to be rated annually. Through the Better Roads, Brighter Future program, MoDOT has identified the major highway system as a priority in the next five years. Efforts on the minor highways will emphasize maintenance of this system at or near the current levels. Work on minor highways will emphasize the use of MoDOT maintenance forces and will consist of treatments that include routine patching, crack sealing and chip seals.
April 2007 TRACKER – Page 2b
Percent of Minor Highways That Are in Good Condition
69.1
71.161.7
71.976.4
85.2 85.0 84.1 81.8
0
20
40
60
80
100
2002 2003 2004 2005 2006
Calendar Year
Perc
ent
MissouriGeorgia*
Desired Trend:
* Source data for Georgia is “Highway Statistics” published by the Federal Highway Administration. Georgia data for 2006 was not available at time of publication. Data is based on a combination of pavement smoothness – IRI or PSI – as submitted as part of the Highway Performance Monitoring System.
.
April 2007 TRACKER – Page 2b (2)

Smooth and Unrestricted Roads and Bridges Percent of deficient bridges on major highways Result Driver: Kevin Keith, Chief Engineer Measurement Driver: Jay Bledsoe, Transportation System Analysis Engineer Purpose of the Measure: This measure tracks progress toward improving the condition of Missouri’s bridges on major highways. The public has indicated the condition of Missouri’s existing roadway system should be one of the state’s highest priorities. MoDOT places a high priority on increasing the quality of bridges on the state system. Measurement and Data Collection: The major highway system is defined as all routes functionally classified as principal arterials. By definition, the principal arterial system provides for statewide or interstate movement of traffic. Examples include the Interstate System or most U.S. routes such as 63, 54 or 36. In urban areas, principal arterials carry traffic entering or leaving the urban area and serve movement of vehicles between central business districts and suburban residential areas. Examples include Business 50 (Missouri Blvd.) in Jefferson City, MO 740 (Stadium Blvd.) in Columbia and Route D (Page Ave.) in St. Louis. A bridge is considered deficient if it is either structurally deficient (SD) or functionally obsolete (FO) as defined using Federal Highway Administration criteria. A SD bridge is in poor condition or has insufficient load capacity when compared to modern design standards. A FO bridge has poor roadway alignment or has clearance or width restrictions that no longer meet the usual criteria for the system it serves. MoDOT staff inspects all state-owned bridges. There are currently 3,317 bridges on major highways. This is an annual measure. Data is updated each April based on the prior year’s inspections. Improvement Status: Bridge conditions on major highways have shown a moderate improvement. The percent of deficient bridges has been reduced to 17.7 percent over the last five years as a result of increasing funds directed to care for the existing highway system. A minimum of $10 million per year is dedicated to preventive maintenance activities on major river crossings and other structures more than 1,000 feet in length. The Safe & Sound bridge improvement program will address more than 800 of the state’s most critical structures. This program will repair or replace these bridges over a five-year period and emphasize their maintenance at an acceptable level for an additional 25 years. While most of these bridges are located on the minor highway system, a benefit to bridges on major highways is also anticipated.
18.8 19.0 18.4 18.0 17.7
020406080
100
2002 2003 2004 2005 2006
Calendar Year
Perc
ent
Percent of Deficient Bridges on Major Highways
Desired Trend:
April 2007 TRACKER – Page 2c

Smooth and Unrestricted Roads and Bridges Percent of deficient bridges on minor highways Result Driver: Kevin Keith, Chief Engineer Measurement Driver: Jay Bledsoe, Transportation System Analysis Engineer Purpose of the Measure: This measure tracks progress toward improving the condition of Missouri’s minor highway bridges. The public has indicated the condition of Missouri’s existing roadway system should be one of the state’s highest priorities. MoDOT places a high priority on increasing the quality of bridges on the state system. Measurement and Data Collection: The minor highway system consists of all routes functionally classified as minor arterials or collectors. These routes serve more local transportation needs and include highways commonly referred to as lettered routes, such as Route A, Route C and Route DD. The public sometimes refers to these routes as farm-to-market roads. A bridge is considered deficient if it is either structurally deficient (SD) or functionally obsolete (FO) as defined using Federal Highway Administration criteria. A SD bridge is in poor condition or has insufficient load capacity when compared to modern design standards. A FO bridge has poor roadway alignment or has clearance or width restrictions that no longer meet the usual criteria for the system it serves. MoDOT staff inspects all state-owned bridges. There are currently 6,923 bridges on minor highways. This is an annual measure. Data is updated each April based on the prior year’s inspections. Improvement Status: Bridge conditions on minor highways have shown a moderate improvement. The percent of deficient bridges has been reduced to 32.5 percent over the last five years as a result of increasing funds directed to care for the existing highway system. A minimum of $10 million per year is dedicated to preventive maintenance activities on major river crossings and other structures more than 1,000 feet in length. The Safe & Sound bridge improvement program will address more than 800 of the state’s most critical structures. This program will repair or replace these bridges over a five-year period and emphasize their maintenance at an acceptable level for an additional 25 years. Most of these bridges are located on the minor highway system. A substantial decrease in the number of deficient bridges is expected to occur with the completion of this program.
32.533.233.433.934.5
0
20
40
60
80
100
2002 2003 2004 2005 2006
Calendar Year
Perc
ent
Percent of Deficient Bridges on Minor Highways
Desired Trend:
April 2007 TRACKER – Page 2d

Smooth and Unrestricted Roads and Bridges Number of deficient bridges on the state system (major and minor highways) Result Driver: Kevin Keith, Chief Engineer Measurement Driver: Jay Bledsoe, Transportation System Analysis Engineer Purpose of the Measure: This measure tracks progress toward improving the condition of Missouri’s bridges. The public has indicated the condition of Missouri’s existing roadway system should be one of the state’s highest priorities. MoDOT places a high priority on increasing the quality of bridges on the state system. Measurement and Data Collection: A bridge is considered deficient if it is either structurally deficient (SD) or functionally obsolete (FO) as defined using Federal Highway Administration criteria. A SD bridge is in poor condition or has insufficient load capacity when compared to modern design standards. A FO bridge has poor roadway alignment or has clearance or width restrictions that no longer meet the usual criteria for the system it serves. MoDOT staff inspects all state-owned bridges. There are currently a total of 10,240 bridges on the state highway system. This is an annual measure. Data is taken from the National Bridge Inventory. Missouri data is available in April of each calendar year and is updated at that time. However, the data for other states is not published until the following year. Improvement Status: Bridge conditions on Missouri highways have shown a moderate improvement in the last five years as a result of increasing funds directed to care for the existing highway system. Currently, 2,836 bridges are considered deficient on the state highway system. A minimum of $10 million per year is dedicated to preventive maintenance activities on major river crossings and other structures more than 1,000 feet in length. The Safe & Sound bridge improvement program will address more than 800 of the state’s most critical structures. This program will repair or replace these bridges over a five-year period and emphasize their maintenance at an acceptable level for an additional 25 years. A marked improvement in the number of deficient bridges will occur with the completion of this program.
Number of Deficient Bridges on the State System(Major and Minor Highways)
2,9593,0292,8362,8922,907
2,3842,3742,5362,536
2,000
2,500
3,000
3,500
2002 2003 2004 2005 2006
Calendar Year
Num
ber
MissouriOhio
Desired Trend:
* Source for Ohio, “Better Bridges” November 2006, for data collected in calendar year 2005.
April 2007 TRACKER – Page 2e

Safe Transportation SystemTangible Result Driver – Don Hillis, Director of System Management
MoDOT works closely with other safety advocates to make our roads and work zones safer. The department supports educational programs which encourage safe driving practices and enforcement efforts which increase adherence to traffic laws. MoDOT will not compromise safety because it believes in the well-being of its employees and customers.
3

Safe Transportation System Number of fatalities and disabling injuries Result Driver: Don Hillis, Director of System Management Measurement Driver: Leanna Depue, Highway Safety Director Purpose of the Measure: This measure tracks annual trends in fatal and disabling injuries resulting from traffic crashes on all Missouri roadways. This data drives the development and focus of the Missouri Highway Safety Plan. This plan is required annually by the National Highway Traffic Safety Administration and outlines key strategies to reduce these losses. In addition, this data supports the Missouri Blueprint for Safer Roadways. This document identifies the statewide initiatives with a goal of reducing fatalities to 1,000 or fewer by 2008. Measurement and Data Collection: Crash data is collected by the Missouri State Highway Patrol and entered into a traffic accident record system. The record system automatically updates MoDOT’s traffic management system. Crash data reports are available to law enforcement and traffic safety advocates for crash analysis through both databases. Data is collected on an annual basis and is updated in July of the following year. Improvement Status: Fatalities increased by 11 percent in 2005 after experiencing a significant decrease from 2003 to 2004. Disabling injuries continue to show a decreasing trend. Missouri has decreased its national ranking in the total number of fatalities from 37th in 2004 to 40th in 2005. Fatalities and disabling injuries are higher due to non-use of safety belts, speeding, and impaired driving. Exposure rates increase each year due to more registered vehicles, licensed drivers and the number of miles traveled. Rural crashes on state numbered roadways continue to be a concern. Focusing public information, education and sustained enforcement efforts on specific behavior demonstrated by specific age groups is the best practice.
Number of Fatalities
1,2571,1301,2321,2081,098
0300600900
1,2001,500
2001 2002 2003 2004 2005Calendar Year
Num
ber
Desired Trend:
Number of Disabling Injuries
9,156 8,730 8,857 8,6218,620
02,0004,0006,0008,000
10,000
2001 2002 2003 2004 2005Calendar Year
Num
ber
Desired Trend:
April 2007 TRACKER – Page 3a

01,0002,0003,0004,0005,000
CA FL TX GA PA
NC NY IL OH TN MO AZ AL MI
SC KY LA VA IN MS WI
OK NJ
AR
WA
MD
CO
MN
NM
OR IA MA
KS
NV
WV UT
NE ID CT
MT
SD
WY
ME
NH HI
DE
ND RI
VT
AK
State
Num
ber
Missouri 's National Ranking by Total Number of Fatalities2005
40th
0
1,000
2,000
3,000
4,000
5,000
CA TX FL GA
NC NY PA IL TN OH MI
AL
AZ
MO SC KY IN VA LA MS WI
OK NJ
AR
CO
MD
MN
WA
NM MA
KS
OR
WV NV IA UT
CT ID NE
MT
SD
ME
NH
WY HI
DE AK
ND VT RI
State
Num
ber
Missouri's National Ranking by Total Number of Fatalities2004
37th
0
1,000
2,000
3,000
4,000
5,000
CA TX FL GA PA
NC NY IL MI
OH
MO TN AZ AL
SC VA LA KY
MS WI IN NJ
OK
MN
MD
CO AR
WA
OR KS
MA IA NM
WV NV
UT
CT ID NE
MT
ME
SD
WY DE HI
NH
ND RI
AK VT
State
Num
ber
Missouri's National Ranking by Total Number of Fatalities2003
40th
April 2007 TRACKER – Page 3a (2)

Safe Transportation System Number of impaired driver-related fatalities and disabling injuries Result Driver: Don Hillis, Director of System Management Measurement Driver: Leanna Depue, Highway Safety Director Purpose of the Measure: This measure tracks annual trends in fatalities and injuries resulting from traffic crashes on all Missouri roadways involving drivers who are impaired by alcohol and/or drugs. This data drives the development and focus of the Missouri Highway Safety Plan. This plan is required annually by the National Highway Traffic Safety Administration and outlines key strategies to reduce these losses. In addition, this data supports the Missouri Blueprint for Safer Roadways. This document identifies the statewide initiatives with a goal of reducing fatalities to 1,000 or fewer by 2008. Measurement and Data Collection: Crash data is collected by the Missouri State Highway Patrol and entered into a traffic accident record system. The record system automatically updates MoDOT’s traffic management system. Crash data reports are available to law enforcement and traffic safety advocates for crash analysis through both databases. Data is collected on an annual basis and is updated in July of the following year. Improvement Status: Alcohol- and drug-related fatalities and disabling injuries decreased annually from 2002 through 2004. In the national ranking, Missouri is moving away from the desired downward trend in percent of persons killed in alcohol-related crashes. In addition to Missouri participating in the national “You Drink and Drive, You Lose” campaign, the Missouri Law Enforcement Traffic Safety Advisory Council selected four specific days to increase law enforcement activity through December 2007. Public information and education has been directed at high-risk drivers ages 21 to 35. Law enforcement efforts have been concentrated on high-crash corridors. Although these efforts have helped reduce impaired driving crashes overall, impaired driving fatalities increased slightly from 2004 to 2005.
Number of Impaired Driver-Related Fatalities Alcohol & Drug Involved
289262289307275
0100200300400
2001 2002 2003 2004 2005Calendar Year
Num
ber
Desired Trend:
Number of Impaired Driver-Related Disabling Injuries Alcohol & Drug Involved
1,4071,434 1,536 1,376 1,366
0400800
1,2001,600
2001 2002 2003 2004 2005Calendar Year
Num
ber
Desired Trend:
April 2007 TRACKER – Page 3b

Missouri's National Ranking by Percent Killed in Alcohol-Related Crashes
2005
0
20
40
60
80
100
HI
RI
DE
MT
AK
ND TX WA WI
CT IL SD AZ FL SC LA MO CA
CO
MS VT
MA
NM PA
MD
OH
WY AL MI
NV
NY
TN VA
AR
MN
NH
NC
OR KS
ME NJ
OK IN WV NE
GA ID KY IA UT
State
Perc
ent
34th
Missouri's National Ranking by Percent Killed inAlcohol-Related Crashes
2004
0
20
40
60
80
100
RI
HI
LA MT
TX ILM
D WI
CT
OR SC
SD
WA
MA
PA
CA
MO
NM TN AR
CO NV
NY
ND VA AL
AZ
DE FL MS
OH MI
NJ ID ME
NE
OK
WY
NH
NC
WV
GA IN KS
KY
MN VT
AK IA UT
State
Perc
ent
34th
Missouri's National Ranking by Percent Killed inAlcohol-Related Crashes
2003
0
20
40
60
80
100
RI
HI
SC
ND
MT
NV
SD
MA
NM CT TX WI IL LA M
DD
EW
A AZ
KS VT AL FL MN
NE
MO
NH
OR AR
CA
CO OK PA
VA
AK MI
NJ
WV
WY
MS
OH TN ID ME
NY
NC IA IN GA KY
UT
State
Perc
ent
26th
April 2007 TRACKER – Page 3b (2)

Safe Transportation System Rate of annual fatalities and disabling injuries Result Driver: Don Hillis, Director of System Management Measurement Driver: Leanna Depue, Highway Safety Director Purpose of the Measure: This measure tracks annual trends in fatal and disabling injury rates per 100 million vehicle miles traveled (HMVM) in Missouri. This data drives the development and focus of the Missouri Highway Safety Plan. This plan is required annually by the National Highway Traffic Safety Administration and outlines key strategies to reduce these losses. In addition, this data supports the Missouri Blueprint for Safer Roadways. This document identifies the statewide initiatives with a goal of reducing fatalities to 1,000 or fewer by 2008. Measurement and Data Collection: Crash data is collected by the Missouri State Highway Patrol and entered into a traffic accident record system. The record system automatically updates MoDOT’s traffic management system. Crash data reports are available to law enforcement and traffic safety advocates for crash analysis through both databases. Data is collected on an annual basis and is updated in July of the following year. Improvement Status: The fatality rate increased from 1.70 in 2004 to 1.83 in 2005. Based on the national trend, however, Missouri is moving in the desired downward trend from 37th in 2003 to 32nd in 2004. Focused law enforcement efforts, engineering safety enhancements and increased public awareness all contribute to the decrease.
Rate of Annual Fatalities
1.621.79 1.81 1.70 1.83
0
1
2
2001 2002 2003 2004 2005Calendar Year
Rat
e
Desired Trend:
Rate of Annual Disabling Injuries
12.85 12.9713.42 12.5412.75
0
4
8
12
16
2001 2002 2003 2004 2005Calendar Year
Rat
e
Desired Trend:
April 2007 TRACKER – Page 3c

Missouri's National Ranking in State Fatality Rates2004
0
1
2
3M
SS
DA
RN
M SC KY
MT
NV LA AK
WV AZ AL
TN ID WY
OK FL MO
NC KS TX HI
CO GA
DE PA
NE
ND WI
IN ME
NH
OR
CA VT IL IA UT
VA
MD
OH MI
NY
WA
MN NJ RI
CT
MA
State
Rat
e
32nd
Missouri's National Ranking in State Fatality Rates2003
0
1
2
3
MT
SD
MS LA AR AZ ID SC KY
AK
WV
NM NV
MO
WY TN AL FL TX NC KS
DE
NE
CO PA
GA
OK
OR HI IA WI
ND
ME IL CA UT MI
RI
VA
MD
MN
OH IN NY
WA NJ
NH CT
MA VT
State
Rat
e
37th
Missouri's National Ranking in State Fatality Rates2002
0
1
2
3
MT
MS
SC
WV AZ
AR
NV
SD LA NM KY
WY ID AK AL
KS
MO FL TN TX CO
NC NE
OK PA
ME
GA
DE WI IL HI
UT IA OH MI
CA
OR
MD
MN
WA VA
NY NJ IN CT
NH RI
VT
MA
ND
State
Rat
e
34th
April 2007 TRACKER – Page 3c (2)

Safe Transportation System Percent of safety belt/passenger vehicle restraint use Result Driver: Don Hillis, Director of System Management Measurement Driver: Leanna Depue, Highway Safety Director Purpose of the Measure: This measure tracks annual trends in safety belt usage by persons in passenger vehicles. This data drives the development and focus of the Missouri Highway Safety Plan. This plan is required annually by the National Highway Traffic Safety Administration and outlines key strategies to reduce these losses. In addition, this data supports the Missouri Blueprint for Safer Roadways. This document identifies the statewide initiatives with a goal of reducing fatalities to 1,000 or fewer by 2008. Measurement and Data Collection: Each June, a statewide survey is conducted at 460 pre-selected locations in 20 counties. The data collected at these sites is calculated into a safety belt usage rate by using a formula approved by the National Highway Traffic Safety Administration. The safety belt usage survey enables data collection from locations representative of 85 percent of the state’s population. The data collection plan is the same each year for consistency and compliance with the National Highway Traffic Safety Administration guidelines. Data is collected on an annual basis and is updated in August of the following year. Annual information for the national rankings is not available from all 50 states. Improvement Status: Safety belt use in Missouri increased 8 percent from 2002 through 2005 but decreased by 2 percent in 2006. In the 2006 national comparison, Missouri ranked 40th in safety belt usage. Missouri’s 8 percent increase from 2002 to 2005 is largely due to increased public awareness and law enforcement participation in the national “Click it or Ticket” campaign. A program beginning in 2005, focused on teen safety belt usage, also proved to be successful in increasing use among teenagers. MoDOT continues to promote the need for a primary safety belt law in Missouri.
7577767369
0
20
40
60
80
100
2002 2003 2004 2005 2006
Perc
ent
Percent of Safety Belt/Passenger Vehicle Restraint Use
Calendar Year
Desired Trend:
April 2007 TRACKER – Page 3d

020406080
100W
YM
AK
YA
RS
DS
C KS
MS RI
LA MO WI
NE
ME
TN VA ID AZ
MT
ND
CO FL OH VT AL
NY AK
MN
CA
CT
NH
OK IN DE PA IL NC
WV UT IA NM GA NJ
TX MD
NV HI
OR MI
WA
State
Perc
ent
Missouri's National Ranking in Percent of Safety Belt Use2006
020406080
100
MS
MA
KY
AR
SD KS
SC WI
FL TN RI
ME ID ND
MO LA AK
OH
CO NE
MT
VA IN CT
GA AL
MN
OK PA
DE VT
WV
NY IA IL NJ
NC UT
NM TX MD
CA MI
OR AZ
NV
WA HI
State
Perc
ent
April 2007 TRACKER – Page 3d (2)
020406080
100
MA
MS
AR KS
ND KY
TN WI
SD ID FL SC
MO
WV LA RI
VA
OH DE
NE
OK AL
CO CT
NV AK
PA
MN
MT IL NJ IN VT
TX GA
NY MI
UT
NC AZ IA NM
MD
OR CA HI
WA
State
Perc
ent
Missouri's National Ranking in Percent of Safety Belt Use2003
020406080
100
MS
MA
AR
SC KY
ND KS
SD
WY TN ME WI ID O
H LA WV
MO RI
FL AK
NE
CO VA VT AL
OK
MT
PA NJ
MN
DE
CT IL TX IN NY
UT
NC IA NV
GA
MD
NM CA MI
OR
WA HI
AZ
State
Perc
ent
Missouri's National Ranking in Percent of Safety Belt Use2004
Missouri's National Ranking in Percent of Safety Belt Use2005
34th
40th
33rd
35th

Safe Transportation System Number of bicycle and pedestrian fatalities and disabling injuries Result Driver: Don Hillis, Director of System Management Measurement Driver: Leanna Depue, Highway Safety Director Purpose of the Measure: This measure tracks annual trends in fatalities and disabling injuries resulting from traffic crashes with bicycles and pedestrians on Missouri roadways. This data drives the development and focus of the Missouri Highway Safety Plan. This plan is required annually by the National Highway Traffic Safety Administration and outlines key strategies to reduce these losses. In addition, this data supports the Missouri Blueprint for Safer Roadways. This document identifies the statewide initiatives with a goal of reducing fatalities to 1,000 or fewer by 2008. Measurement and Data Collection: Crash data is collected by the Missouri State Highway Patrol and entered into a traffic accident record system. The record system automatically updates MoDOT’s traffic management system. Crash data reports are available to law enforcement and traffic safety advocates for crash analysis through both databases. Data is collected on an annual basis and updated in July of the following year. Improvement Status: This data reflects the number of fatalities and disabling injuries occurring when a motor vehicle is involved in a crash with a bicycle or pedestrian. Pedestrian fatalities and disabling injuries are on a downward trend due to improved crosswalks and signaling. Funds have been dedicated to the St. Louis and Kansas City regions in support of pedestrian safety.
Number of Bicycle Fatalities
16
926
8
0
5
10
15
20
2001 2002 2003 2004 2005Calendar Year
Num
ber
Desired Trend:
Number of Bicycle Disabling Injuries
83919810390
020406080
100120
2001 2002 2003 2004 2005
Calendar Year
Num
ber
Desired Trend:
April 2007 TRACKER – Page 3e

Number of Pedestrian Fatalities
9288 9281 81
0
20
40
60
80
100
2001 2002 2003 2004 2005
Calendar Year
Num
ber
Desired Trend:
Number of Pedestrian Disabling Injuries
328345329369 375
0
100
200
300
400
2001 2002 2003 2004 2005
Calendar Year
Num
ber
Desired Trend:
April 2007 TRACKER – Page 3e (2)

Safe Transportation System Number of motorcycle fatalities and disabling injuries Result Driver: Don Hillis, Director of System Management Measurement Driver: Leanna Depue, Highway Safety Director Purpose of the Measure: This measure tracks annual trends in fatal and disabling injuries resulting from motorcycle traffic crashes on all Missouri roadways. This data drives the development and focus of the Missouri Highway Safety Plan. This plan is required annually by the National Highway Traffic Safety Administration and outlines key strategies to reduce these losses. In addition, this data supports the Missouri Blueprint for Safer Roadways. This document identifies the statewide initiatives with a goal of reducing fatalities to 1,000 or fewer by 2008. Measurement and Data Collection: Crash data is collected by the Missouri State Highway Patrol and entered into a traffic accident record system. The record system automatically updates MoDOT’s traffic management system. Crash data reports are available to law enforcement and traffic safety advocates for crash analysis through both databases. Data is collected on an annual basis and updated in July of the following year. Improvement Status: Fatalities and disabling injuries have shown an upward trend over the past four years. Missouri’s national ranking in the total number of motorcycle fatalities has worsened from 23rd in 2004 to 35th in 2005. A significant increase in the number of licensed motorcycles and riders has increased the exposure rate. Rider education classes are offered within one hour’s driving time throughout Missouri. More than 4,000 riders at 28 sites are trained each year. Twenty-four new instructors are also trained each year. In 2006, a Motorcycle Safety Task Force was organized and charged with developing a strategic plan. The task force has completed the plan and is currently moving forward with implementation.
Number of Motorcycle Fatalities
88
55
89
5852
020406080
100
2001 2002 2003 2004 2005Calendar Year
Num
ber
Number of Motorcycle Disabling Injuries
586467475
395561
0
200
400
600
800
2001 2002 2003 2004 2005
Calendar Year
Num
ber
Desired Trend:
Desired Trend:
April 2007 TRACKER – Page 3f

0
100
200
300
400
500C
A FL TX PA
OH NY IL NC
GA
TN AZ MI
IN SC WI
MO KY
CO
MD
OK LA WA VA
AR AL
NJ
MN
NV
MA
OR IA NH CT
MS
NM KS
WV HI
MT ID UT
SD
DE
WY NE
ME RI
VT
ND AK
State
Num
ber
Missouri's National Ranking in Number of Motorcycle Fatalities2005
35th
0
100
200
300
400
500
CA FL TX PA IL NY
NC
OH AZ
GA IN TN SC MI
CO WI
OK AL
NJ
LA WA
MD KY
MA
AR CT
VA
MO
MN
NV
MS
NM IA OR UT
KS
NH
WV SD ID ME HI
MT
NE
WY VT RI
ND AK
DE
State
Num
ber
Missouri's National Ranking in Number of Motorcycle Fatalities2004
23rd
0
100
200
300
400
500
CA FL TX PA
NY IL OH AZ
NC
GA WI
MO TN SC IN MI
LA CO
MN
WA KY
AR
MD VA AL IA OR
OK
MS
NM MA NJ
KS
WV CT
NV
UT
ME
WY HI
ID SD
NE RI
AK
MT
DE
NH
ND VT
State
Num
ber
Missouri's National Ranking in Number of Motorcycle Fatalities2003
39th
April 2007 TRACKER – Page 3f (2)

Safe Transportation System Number of commercial motor vehicle crashes resulting in fatalities Result Driver: Don Hillis, Director of Systems Management Measurement Driver: Charles Gohring, Motor Carrier Services Program Manager Purpose of the Measure: This measure tracks the number of commercial motor vehicles involved in fatal crashes each year. MoDOT uses the nformation to target educational and enforcement efforts. i
Measurement and Data Collection: The Missouri State Highway Patrol collects and records the crash statistics used in this measure. The data used in this measure reports the number of commercial motor vehicles involved in a crash where one or more people die within 30 days as a result of the crash. This is an annual measure and will be updated each April for the previous
ear. y Improvement Status: Between 2002 and 2004, the number of Missouri commercial motor vehicle fatal crashes slowly dropped from 161 to 153. The number of fatal crashes notably decreased by 17 percent in 2006 to 133. It should be noted that the 2006 crash statistics are not finalized and are subject to future updates. MoDOT coordinates its efforts with those of the Missouri State Highway Patrol, the Federal Motor Carrier Safety Administration Missouri Division and the Kansas City and St. Louis police departments. MoDOT efforts include the installation of larger highway signs, highly reflective pavement markings, cable guardrails, roundabout intersections, incident management alert signs, roadside rumble strips, and intelligent transportation systems at scales. MoDOT conducts carrier safety training, regulation compliance reviews, safety audits of new motor carrier firms and truck inspections at terminals and destinations. The Missouri State Highway Patrol, St. Louis and Kansas City Police Departments conduct commercial vehicle roadside inspections in order to remove unsafe drivers and vehicles from the road. Missouri ranked 42nd in the number of fatality crashes nationwide in 2005.
Number of Commercial Motor Vehicle Crashes Resulting in Fatalities
133161153157161
0
50
100
150
200
2002 2003 2004 2005 2006
Calendar Year
Num
ber
Desired Trend:
April 2007 TRACKER – Page 3g

Missouri's National Ranking in Number of Fatal Commercial Vehicle Crashes
2005
0100200300400500600
TX FL CA
GA IL NC PA
OH
MO TN NY IN AR LA SC AL
KY
OK VA NJ MI
AZ
MS WI
KS IA CO
OR
MN
WA
NM
MD
WV NV
NE ID UT
WY
MA
MT
ME
CT
SD
NH VT
ND DE HI
AK RI
State
Num
ber
42nd
Missouri's National Ranking in Number of Fatal Commercial Vehicle Crashes
2004
0100200300400500600
TX CA FL GA
NC PA
OH AL IL TN NY IN MO AR KY MI
OK AZ
WI
SC VA LA MS
KS
MD NJ
MN IA CO
NM
WV
WA
OR
WY UT
NV
NE ID CT
ME
MA
DE
SD
NH
MT
VT
AK
ND RI
HI
State
Num
ber
38th
Missouri's National Ranking in Number of Fatal Commercial Vehicle Crashes
2003
0100200300400500600
TX CA FL GA PA IL NY
NC
OH IN MO AL
LA KY AZ MI
TN VA
AR
OK WI
SC
CO NJ IA KS
MN
MS
MD
OR NE
WV
NM
WA ID ME
NV
WY
MT
CT
DE
UT
ND SD
MA
NH VT RI
AK HI
State
Num
ber
40th
April 2007 TRACKER – Page 3g (2)

Safe Transportation System Number of commercial motor vehicle crashes resulting in injuries Result Driver: Don Hillis, Director of Systems Management Measurement Driver: Charles Gohring, Motor Carrier Services Program Manager Purpose of the Measure: This measure tracks number of commercial motor vehicles involved in injury crashes each year. MoDOT uses the information to target educational and enforcement efforts. Measurement and Data Collection: The Missouri State Highway Patrol collects and records crash statistics. The data for this measure reflects the number of commercial motor vehicles involved in crashes where one or more people are injured. This is an annual measure. Improvement Status: Between 2001 and 2004, the number of commercial motor vehicle crashes resulting in injuries decreased. The number of injury crashes notably decreased by 12 percent in 2006 to 2,362. It should be noted that the 2006 statistics are not finalized and are subject to future updates. The overall downward trend is due to the coordinated safety efforts of MoDOT, the Missouri State Highway Patrol, the Federal Motor Carrier Safety Administration Missouri Division, and the Kansas City and St. Louis police departments. MoDOT efforts include the installation of larger highway signs, highly reflective pavement markings, cable guardrails, roundabout intersections, incident management alert signs, rumble stripes, and intelligent transportation systems at scales. MoDOT conducts carrier safety training, regulation compliance reviews, safety audits of new motor carrier firms and truck inspections at terminals and destinations. The Missouri State Highway Patrol, St. Louis and Kansas City police departments conduct commercial vehicle roadside inspections in order to remove unsafe drivers and vehicles from the road. Missouri ranked 43rd in the number of injury crashes nationwide in 2005.
Number of Commercial Motor Vehicle Crashes Resulting in Injuries
2,3622,6932,6842,7552,865
0500
1,0001,5002,0002,5003,0003,500
2002 2003 2004 2005 2006
Calendar Year
Num
ber
Desired Trend:
April 2007 TRACKER – Page 3h

Missouri's National Ranking in Number of Injury Commercial Vehicle Crashes
2005
0
2,000
4,000
6,000TX C
AG
A PA FL NJ
OH
MO IL IN TN NC NY AZ
SC AL
OK VA
KY LA MI
WI IA M
NA
RC
O UT
MD KS
WV ID NE
OR CT
ME
MS
NV
MA
WY
MT RI
DE
WA
ND
NM HI
VT
SD
NH AK
State
Num
ber
43rd
Missouri's National Ranking in Number of Injury Commercial Vehicle Crashes
2004
0
2,000
4,000
6,000
TX CA FL GA NJ
PA
OH IL
MO
NC IN NY LA TN AL
SC VA AZ MI
OK WI
KY
MD
MN
AR IA UT
CO KS
MS ID NE
OR
MA
CT
ME
NV
WY
WV
MT
NM RI
WA
NH
ND DE
SD HI
VT
AK
State
Num
ber
42nd
Missouri's National Ranking in Number of Injury Commercial Vehicle Crashes
2003
0
2,000
4,000
6,000
TX CA NJ
PA GA FL OH IL NC
MO IN NY TN MI
LA AZ AL VA OK
MS
SC MD IA KY WI
MN AR UT
KS MA
NE ID ME
OR CT
CO NV
WY
MT
WV
NH
ND RI
WA
DE
NM SD H
IVT AK
State
Num
ber
41st
April 2007 TRACKER – Page 3h (2)

Safe Transportation System Number of fatalities and injuries in work zones Result Driver: Don Hillis, Director of System Management Measurement Driver: Scott Stotlemeyer, Traffic Liaison Engineer Purpose of the Measure: An important factor in evaluating the safety of Missouri’s transportation system is determining the safety of work zones on the state’s roads. This measure tracks the number of traffic-related fatalities, disabling injuries, injuries, and crashes occurring in a work zone on any Missouri public road. Measurement and Data Collection: Missouri law enforcement agencies are required to report crashes by submitting a standardized vehicle accident report form to the Missouri State Highway Patrol. MSHP personnel enter these reports into a statewide traffic crash database. MoDOT staff queries this data to identify work zone-related crash statistics quarterly and report the results via this measurement. Improvement Status: Crash statistics for January through March 2007, while not yet final, indicate no change in the number of fatalities, a 25 percent increase in the number of disabling injuries, a 36 percent reduction in the number of injuries and a 55 percent reduction in the number of crashes occurring in Missouri’s work zones when compared to the final numbers for the same time period of calendar year 2006. Note: Large variances such as these are expected when comparing quarter-to-quarter crash statistics, particularly the first quarter, due to the time frame in which crash data is entered and captured for query. Despite an increase in work zone-related fatalities, injuries, and crashes during calendar year 2006, Missouri generally has experienced a downward trend in these statistics, including work zone-related disabling injuries since 2002. Such improvement in work zone safety is attributable partially to the department’s proactive approach to raising work zone safety awareness and minimizing impacts on the traveling public.
Number of Fatalities in Work Zones
28
23
28
1519
10
10
20
30
2002 2003 2004 2005 2006 1st Qtr.2007Calendar Year
Num
ber
Desired Trend:
April 2007 TRACKER – Page 3i

Number of Disabling Injuries in Work Zones
178 168142
108 104
150
50
100
150
200
2002 2003 2004 2005 2006 1st Qtr.2007Calendar Year
Num
ber
Desired Trend:
Number of Injuries in Work Zones
1,652 1,560
1,1711,005
1,194
910
500
1,000
1,500
2,000
2002 2003 2004 2005 2006 1st Qtr.2007Calendar Year
Num
ber
Desired Trend:
Number of Crashes in Work Zones4,881
4,492
3,4843,162 3,436
2340
1,000
2,000
3,000
4,000
5,000
2002 2003 2004 2005 2006 1st Qtr.2007Calendar Year
Num
ber
Desired Trend:
April 2007 TRACKER – Page 3i (2)

Safe Transportation System Number of highway-rail crossing fatalities and collisions Results Driver: Don Hillis, Director of System Management Measurement Driver: Rod Massman, Administrator of Railroads Purpose of the Measure: This measure tracks annual trends in fatalities and collisions resulting from train-vehicle crashes at public railroad crossings in Missouri. This data drives the development and focus of the Missouri Highway Safety Plan. This plan is required annually by the National Highway Traffic Safety Administration and outlines key strategies to reduce these losses. In addition, this data supports the Missouri Blueprint for Safer Roadways. This document identifies the statewide initiatives with a goal of reducing fatalities to 1,000 or fewer by 2008. Measurement and Data Collection: MoDOT collects crash data and enters it into a railroad safety information system used to update MoDOT’s traffic management system. This does not include fatalities or collisions from those on railroad property at areas other than at public railroad crossings, which are tabulated separately. Missouri is then ranked with all other states using data from the Federal Railroad Administration that consists of the numbers of collisions and fatalities in each state. Data is updated quarterly. Improvement Status: MoDOT continues to coordinate its railroad crossing projects in the areas of greatest need using a safety exposure index, in addition to focusing on crossings with a history of accidents or limited sight distance. By agreeing with the railroads to look at a defined area, called a corridor, and sharing financial responsibilities for improvements, limited funds can be spread over a wider area. This increases the number of overall projects completed in specific areas of the state. Other improvements include an increased emphasis on and MoDOT employee participation in public outreach opportunities on rail safety in conjunction with Operation Lifesaver, Inc. Another improvement is the exploration of partnerships with other government agencies, cities and school districts to upgrade flasher-only crossings to crossings with both lights and gates, to install gates and lights at crossings and to replace outdated lighting with LED systems. There is also a renewed emphasis on closing redundant or unnecessary crossings. Although fatalities and collisions in calendar year 2006 were decreased markedly from 2005, so far in 2007 there have been four fatalities, which nearly matches the total for 2006. In order to combat this, in addition to the above engineering factors, MODOT has increased and implemented more public outreach efforts. This has included distributing an emergency responder manual for train accidents, a specific light-rail safety brochure for Metrolink in St. Louis, and a special in-cab card detailing specific crossing safety tips for truckers in large semis. Most importantly MoDOT is co-sponsoring Rail Safety Week April 22-28, 2007, with the Missouri Highway Patrol and Missouri Operation Lifesaver. This event is designed to increase public awareness and discussion of the need for increased safety and heightened awareness at railroad crossings.
April 2007 TRACKER – Page 3j

Number of Highway-Rail Crossing Fatalities in Missouri
46
17
81010
0
5
10
15
20
2002 2003 2004 2005 2006 YTD 2007Calendar Year
Num
ber
Desired Trend:
April 2007 TRACKER – Page 3j (2)
Missouri's National Ranking in Number ofHighway-Rail Crossing Fatalities
January-December 2006
0
10
20
30
40
TX CA IL OK KS
MS
MN
OH SC AL IN CO FL MI
NJ
AR
GA LA KY
TN AZ IA
MO NC WI
NE
PA ID
WV
MA
NY
SD
WA
MD
ME
NM
OR AK
CT
DE HI
MT
ND
NH
NV RI
UT
VA VT
WY
State
Num
ber
Desired Trend: 28th
Missouri's National Ranking in Number of
Highway-Rail Crossing Fatalities January-December 2005
05
101520253035
IL CA IN LA MO FL AL
TX WI
GA
NE
NY
MS
SC
MN
AR
OH
ND
OK
CO IA KS
KY
NC TN WA MI
CT
UT
MT NJ
NM PA
SD AZ
MA
DE ID NV
OR
WV
NH
MD VA VT
WY AK RI
ME HI
State
Num
ber
46th
Desired
Trend:

Number of Highway-Rail Crossing Collisions in Missouri
5344
6254
11
55
0
20
40
60
80
2002 2003 2004 2005 2006 YTD 2007Calendar Year
Num
ber
Desired Trend:
Missouri's National Ranking in Number ofHighway-Rail Crossing Collisions
January-December 2006
0
50
100
150
200
250
TX IL CA IN LA GA AL FL OH
MS
AR MI
OK IA NC TN KY
MN KS
PA WI
MO AZ
SC NJ
WA
CO NE
VA
NY
OR ID
WV
MD
SD
MT
ND UT
MA
NM CT
ME
DE
WY NV VT
AK HI
NH RI
State
Num
ber
29th Desired Trend:
Missouri's National Ranking in Number ofHighway-Rail Crossing Collisions
January-December 2005
050
100150200250300
TX IN IL CA
OH LA GA AL FL MI
WI
MS
SC IA PA
TN KY
MO
OK
AR
MN
NC KS
NE
WA NJ
NY AZ
CO VA
WV ID OR
NM SD UT
ND
MT
MD
MA
DE
CT
NV
ME VT
NH AK
WY RI
HI
State
Num
ber
33rdDesired Trend:
April 2007 TRACKER – Page 3j (3)

Roadway VisibilityTangible Result Driver – Don Hillis, Director of System Management
Good roadway visibility in all weather and light conditions is critical to safe and efficient travel. MoDOT will delight its cus-tomers by using top-quality and highly visible stripes and signs.
4

Roadway Visibility Rate of nighttime crashes Result Driver: Don Hillis, Director of System Management Measurement Driver: Mike Curtit, Assistant State Traffic Engineer Purpose of the Measure: This measure tracks the types of crashes where visibility of stripes and signs may be a contributing factor. Measurement and Data Collection: To measure the rate of nighttime crashes, data is collected from the statewide crash database and crashes that occur during night conditions are identified. Further filtering of the data divides these night crashes by major and minor roadways. Major roadways are generally used for statewide or interstate travel and minor roadways are generally used for local traffic needs. Crash rates are calculated using the average annual daily traffic counts and are expressed in the unit, per 100 million vehicle miles (HMVM), which is the national standard for expressing crash rates. This is an annual measure with the data updated each April. Improvement Status: The rate of nighttime crashes on major and minor roads has decreased for each measure except for head on and sideswipe crashes on major roads. The rate of head-on and sideswipe crashes on major roads has remained virtually flat from 2002 to 2006. The previous years’ rates were also updated with current crash data. As part of the recently completed Smooth Roads Initiative (SRI), over 188,000 new signs, over 12,000 new emergency reference markers on interstates, over 150,000 delineators on guardrail and guardcable, and approximately 3 million feet of highly reflective pavement tape were installed. In addition, edgeline rumble stripes are being installed on SRI routes. The guidelines for the Better Roads, Brighter Future program include upgrading the signing, continuing to implement the new pavement marking system, adding edgeline rumble stripes, and including centerline rumble stripes on two lane roadways. The pavement tape that will be used as a part of Better Roads, Brighter Future program will be a “wet reflective” tape that has improved visibility during wet pavement conditions.
Rate of Nighttime Crashes Run off Road
12.1 12.2 12.4 12.3 11.1
34.530.2 29.6 27.7
31.3
05
10152025303540
2002 2003 2004 2005 2006
Calendar Year
Rat
e
Major Road
Minor Road
Desired Trend:
April 2007 TRACKER – Page 4a

Rate of Nighttime Crashes Cross Median on Major Roads
0.730.80 0.630.72 0.740
1
2
3
2002 2003 2004 2005 2006Calendar Year
Rat
e
Desired Trend:
Rate of Nighttime Crashes Head On and Sideswipe
3.73.0 2.70.80.70.91.01.1
3.13.7
0
2
4
6
8
10
2002 2003 2004 2005 2006
Calendar Year
Rat
e
Major Road
Minor Road
Desired Trend:
Rate of Nighttime Crashes Wet Pavement Crashes
8.8 9.6 10.69.4
8.1
12.2 11.310.1
12.8 13.2
0
5
10
15
20
2002 2003 2004 2005 2006Calendar Year
Rat
e
Major Road
Minor Road
Desired Trend:
April 2007 TRACKER – Page 4a (2)

Roadway Visibility Percent of signs that meet customers’ expectations Result Driver: Don Hillis, Director of System Management Measurement Driver: Mike Curtit, Assistant State Traffic Engineer Purpose of the Measure: This measure will track whether the department’s sign policy and the design standards, and sign replacement policy are resulting in visible signs that meet customers’ expectations. Measurement and Data Collection: Sign-quality attributes that define user expectations have been developed based on an industry-wide literature review. The attributes selected for this measure are those that can be captured during a night sign log. A night sign log is conducted by MoDOT employees driving a road at night, recording the location and condition of the signs, particularly how visible the signs are with headlights. Data for this measure is collected by doing night sign logs on randomly generated road segments. MoDOT employees collect the data annually in the fall, and update it each October. Improvement Status: The data shows a 14 percent increase in the percent of signs on the major highways that are meeting customer expectations. Through the Smooth Roads Initiative, MoDOT replaced many of the signs on the major roads. Results should continue to improve with the continued emphasis on improving the major roads within the next five years and the proposed 10-year replacement program for signs on major roads. The data also shows an 8 percent increase for signs on minor highways meeting customer expectations. MoDOT has implemented a program to upgrade curve signing. This program has improved and will continue to improve a significant portion of the signs on minor roads. In addition, the proposed 12-year replacement program for signs on minor roads should continue to improve the results.
Percent of Signs that Meet Customers' Expectations
69.9 65.2
83.973.1
0
20
40
60
80
100
Major Highways Minor Highways
Road Class
Perc
ent
2005
2006
Desired Trend:
April 2007 TRACKER – Page 4b
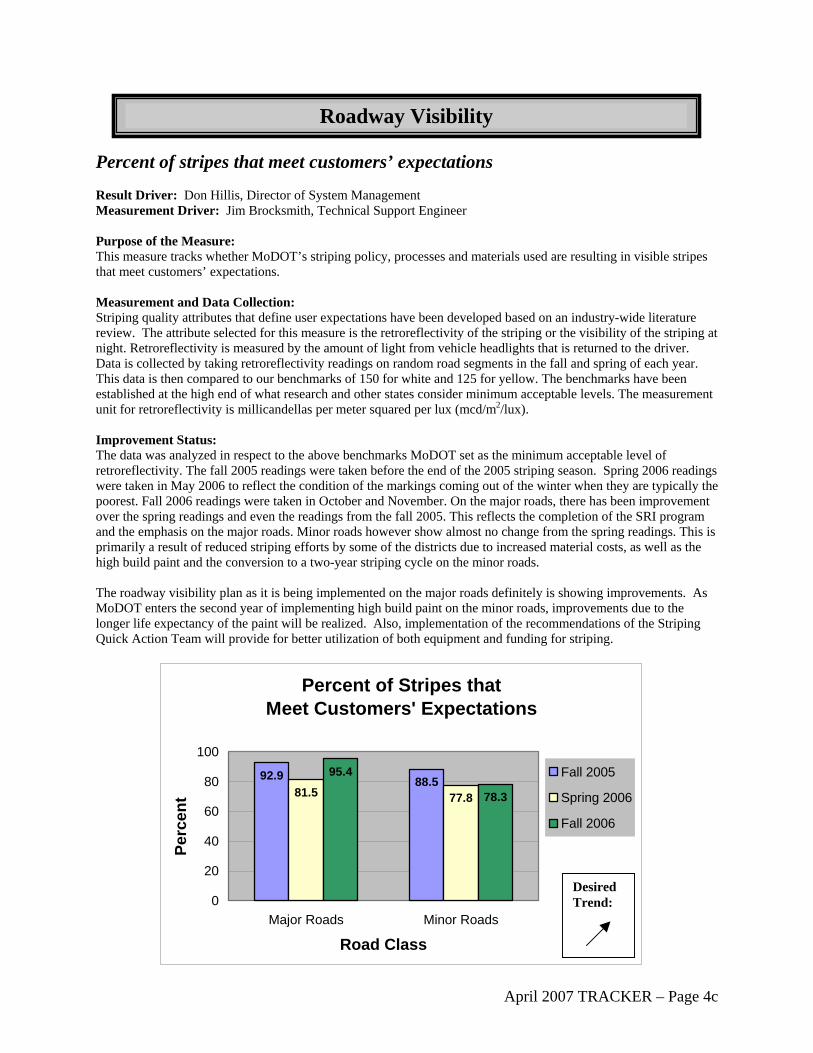
Roadway Visibility Percent of stripes that meet customers’ expectations Result Driver: Don Hillis, Director of System Management Measurement Driver: Jim Brocksmith, Technical Support Engineer Purpose of the Measure: This measure tracks whether MoDOT’s striping policy, processes and materials used are resulting in visible stripes that meet customers’ expectations. Measurement and Data Collection: Striping quality attributes that define user expectations have been developed based on an industry-wide literature review. The attribute selected for this measure is the retroreflectivity of the striping or the visibility of the striping at night. Retroreflectivity is measured by the amount of light from vehicle headlights that is returned to the driver. Data is collected by taking retroreflectivity readings on random road segments in the fall and spring of each year. This data is then compared to our benchmarks of 150 for white and 125 for yellow. The benchmarks have been established at the high end of what research and other states consider minimum acceptable levels. The measurement unit for retroreflectivity is millicandellas per meter squared per lux (mcd/m2/lux). Improvement Status: The data was analyzed in respect to the above benchmarks MoDOT set as the minimum acceptable level of retroreflectivity. The fall 2005 readings were taken before the end of the 2005 striping season. Spring 2006 readings were taken in May 2006 to reflect the condition of the markings coming out of the winter when they are typically the poorest. Fall 2006 readings were taken in October and November. On the major roads, there has been improvement over the spring readings and even the readings from the fall 2005. This reflects the completion of the SRI program and the emphasis on the major roads. Minor roads however show almost no change from the spring readings. This is primarily a result of reduced striping efforts by some of the districts due to increased material costs, as well as the high build paint and the conversion to a two-year striping cycle on the minor roads. The roadway visibility plan as it is being implemented on the major roads definitely is showing improvements. As MoDOT enters the second year of implementing high build paint on the minor roads, improvements due to the longer life expectancy of the paint will be realized. Also, implementation of the recommendations of the Striping Quick Action Team will provide for better utilization of both equipment and funding for striping.
Desired Trend:
Percent of Stripes thatMeet Customers' Expectations
92.9 88.581.5 77.8
95.4
78.3
0
20
40
60
80
100
Major Roads Minor Roads
Road Class
Perc
ent
Fall 2005
Spring 2006
Fall 2006
Desired Trend:
April 2007 TRACKER – Page 4c
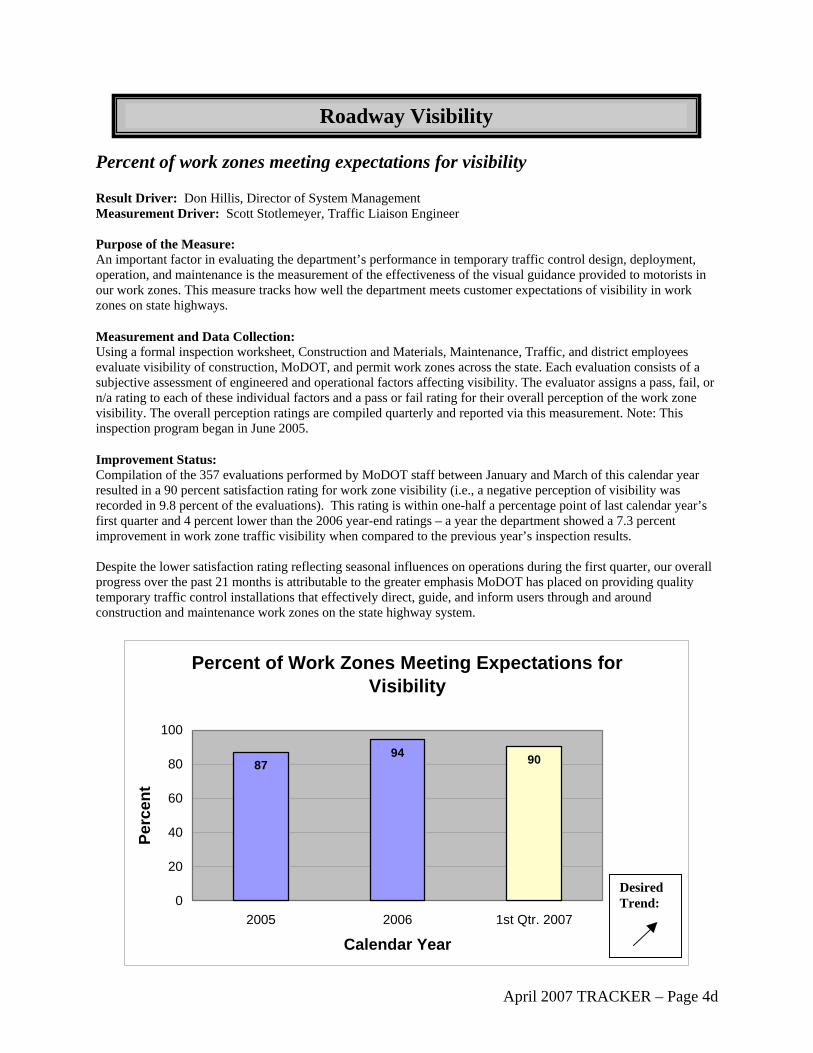
Roadway Visibility Percent of work zones meeting expectations for visibility Result Driver: Don Hillis, Director of System Management Measurement Driver: Scott Stotlemeyer, Traffic Liaison Engineer Purpose of the Measure: An important factor in evaluating the department’s performance in temporary traffic control design, deployment, operation, and maintenance is the measurement of the effectiveness of the visual guidance provided to motorists in our work zones. This measure tracks how well the department meets customer expectations of visibility in work zones on state highways. Measurement and Data Collection: Using a formal inspection worksheet, Construction and Materials, Maintenance, Traffic, and district employees evaluate visibility of construction, MoDOT, and permit work zones across the state. Each evaluation consists of a subjective assessment of engineered and operational factors affecting visibility. The evaluator assigns a pass, fail, or n/a rating to each of these individual factors and a pass or fail rating for their overall perception of the work zone visibility. The overall perception ratings are compiled quarterly and reported via this measurement. Note: This inspection program began in June 2005. Improvement Status: Compilation of the 357 evaluations performed by MoDOT staff between January and March of this calendar year resulted in a 90 percent satisfaction rating for work zone visibility (i.e., a negative perception of visibility was recorded in 9.8 percent of the evaluations). This rating is within one-half a percentage point of last calendar year’s first quarter and 4 percent lower than the 2006 year-end ratings – a year the department showed a 7.3 percent improvement in work zone traffic visibility when compared to the previous year’s inspection results. Despite the lower satisfaction rating reflecting seasonal influences on operations during the first quarter, our overall progress over the past 21 months is attributable to the greater emphasis MoDOT has placed on providing quality temporary traffic control installations that effectively direct, guide, and inform users through and around construction and maintenance work zones on the state highway system.
Percent of Work Zones Meeting Expectations for Visibility
8794 90
0
20
40
60
80
100
2005 2006 1st Qtr. 2007
Calendar Year
Perc
ent
Desired Trend:
April 2007 TRACKER – Page 4d

Personal, Fast, Courteous and Understandable Response to Customer Requests (Inbound)Tangible Result Driver – Shane Peck, Community Relations Director
Responding to customers in a courteous, personal and un-derstandable way is important. MoDOT listens and seeks to understand, because it values everyone’s opinion. MoDOT’s goal is to delight them with its customer service.
5

Personal, Fast, Courteous and Understandable Response to Customer Requests (Inbound)
Percent of overall customer satisfaction Result Driver: Shane Peck, Community Relations Director Measurement Driver: Sally Oxenhandler, Community Relations Coordinator Purpose of the Measure: This measure tracks MoDOT’s progress toward the mission of delighting its customers. Measurement and Data Collection: This is an annual measure. New data will be available in July 2007. Data is collected as part of a study commissioned by the Missouri Transportation Institute each May. The study interviews 3,500 randomly selected adult Missourians. Community Relations targeted Federal Express as the benchmark for this measure. Based on information compiled by the American Customer Satisfaction Index, Federal Express has the highest customer satisfaction rate – 86 percent – out of the 200 companies and government agencies that the ACSI scores. Community Relations continues to research customer satisfaction rates for other state departments of transportation. Some of the findings: Alaska had an 80.3 percent customer satisfaction score in 2005; Virginia had an 82 percent satisfaction rate in 2001. Improvement Status: MoDOT has had a lot of good news to share with Missourians in the year since the last study was taken: completing the Smooth Roads Initiative a year ahead of schedule; the largest construction season ever; the Safe & Sound Bridge Improvement Plan; and the Better Roads, Brighter Future program to name just a few items. However, traffic backups that occurred due to the severe ice and snowstorm across most of the state in December and activities associated with the New I-64 project could negatively affect customer feedback on this measure.
Percent of Overall Customer Satisfaction(Annual Survey)
55 54 63
54
15 10 13 5
86 83 82 84
0
20
40
60
80
100
1999 2003 2005 2006
Calendar Year
Perc
ent
Very Satisfied
Satisfied
FederalExpress
70 64 68 67
Desired Trend:
April 2007 TRACKER – Page 5a

Personal, Fast, Courteous and Understandable Response to Customer Requests (Inbound)
Percent of customers who contacted MoDOT that felt they were responded to quickly and courteously with an understandable response Result Driver: Shane Peck, Community Relations Director Measurement Driver: Jeff Briggs, Community Relations Manager Purpose of the Measure: This measure indicates whether customers are comfortable with the speed, courtesy and clarity of MoDOT customer service. Measurement and Data Collection: Customers who contact MoDOT Customer Service Centers are asked to complete a short telephone survey when their business with the customer service representative is complete. Callers who agree are forwarded to an automated survey that asks three “yes or no” questions on the timeliness, accuracy and courtesy of the call. Improvement Status: Results continue to be extremely high across the board. This data comes from 6,030 surveys taken in the past quarter. Ongoing “secret shopper” efforts encourage continued improvement.
Percent of Customers Who Contacted MoDOT That Felt They Were Responded to Quickly
98.297.697.297.4
0
20
40
60
80
100
2nd Qtr 2006 3rd Qtr 2006 4th Qtr 2006 1st Qtr 2007
Calendar Year
Perc
ent
Desired Trend:
April 2007 TRACKER – Page 5b

Percent of Customers Who Contacted MoDOT That Felt They Were Responded To In a Personal and
Courteous Manner
99.499.499.599.3
0
20
40
60
80
100
2nd Qtr 2006 3rd Qtr 2006 4th Qtr 2006 1st Qtr 2007
Calendar Year
Perc
ent
Desired Trend:
Percent of Customers Who Contacted MoDOT That Understood
the Response Given
98.898.998.398.2
0
20
40
60
80
100
2nd Qtr 2006 3rd Qtr 2006 4th Qtr 2006 1st Qtr 2007
Calendar Year
Perc
ent
Desired Trend:
April 2007 TRACKER – Page 5b (2)

Personal, Fast, Courteous and Understandable Response to Customer Requests (Inbound)
Percent of documented customer requests responded to within 24 hours Result Driver: Shane Peck, Community Relations Director Measurement Driver: Jeff Briggs, Community Relations Manager Purpose of the Measure: This measure tracks how quickly MoDOT responds to customer requests through the customer service centers. Measurement and Data Collection: This information comes from the customer service database, where customer requests requiring follow-up are documented from the time the call comes in until the request is responded to. This may include requests for signs, traffic signal review, pothole patching or work zone congestion. More than 90 percent of our total customer requests are responded to immediately, including basic phone call transfers, questions, or requests for general information. These routine contacts are not documented here. Improvement Status: Numbers are extremely high in this area and continue to improve. Database improvements to document response times, including e-mail reminders for delayed responses, will help these numbers improve further.
Percent of Documented Customer Requests Responded to Within 24 Hours
96.5 98.597.897.2
0
20
40
60
80
100
2nd Qtr.2006
3rd Qtr. 2006 4th Qtr. 2006 1st Otr. 2007
Calendar Year
Perc
ent
Desired Trend:
April 2007 TRACKER – Page 5c

Personal, Fast, Courteous and Understandable Response to Customer Requests (Inbound)
Average completion time on requests requiring follow up Result Driver: Shane Peck, Community Relations Director Measurement Driver: Jeff Briggs, Community Relations Manager Purpose of the Measure: This measure tracks MoDOT’s responsiveness to customer inquiries that are received through the customer service centers and documented in the database. Measurement and Data Collection: Customer requests in the customer service database requiring a completion time of more than 24 hours are tracked for average completion time. Longer-term requests that require more than 30 days to complete are removed from the results, because a few of these longer-term requests would skew the overall results. Time is measured in working days; weekends and holidays are excluded. Improvement Status: Completion times are expected to average less than five days, so much improvement is still needed. Districts with slower completion times have been reminded to address customer requests as quickly as practical and report completion to customer service centers to enter in the database. Beginning March 12, districts are now receiving daily, automated e-mail reminders for all requests taking longer than four days. Management visits with all district engineers and community relations managers will emphasize the need to further improve this measure.
Average Completion Time on RequestsRequiring Follow-up
(Excludes Long-Term Issues)
7.88.08.07.4 7.2 7.3
0
2
4
6
8
10
4th Qtr.2005
1st Qtr.2006
2nd Qtr.2006
3rd Qtr.2006
4th Otr.2006
1st Otr.2007
Calendar Year
Day
s
Desired Trend:
April 2007 TRACKER – Page 5d

Partner with Others to Deliver Transportation ServicesTangible Result Driver – Kevin Keith, Chief Engineer
To be an effective leader in transportation, MoDOT must work with agencies and branches of government, including state, county, private industry and municipalities to deliver a quality transportation system that meets the needs of everyone. A coor-dinated transportation system requires partnerships to ensure compatible decisions are made. Partnering builds trust and ensures quality results.
6

Partner With Others to Deliver Transportation Services Number of dollars of discretionary funds allocated to Missouri Result Driver: Kevin Keith, Chief Engineer Measurement Driver: Todd Grosvenor, Finance Manager Purpose of the Measure: This measure shows the number of dollars of discretionary funds allocated to Missouri. Measurement and Data Collection: This is an annual measure updated each January. The federal government allocates discretionary funds to states for specific highway and multimodal projects. Multimodal projects include waterway, aviation and transit activities. These funds are distributed administratively for programs that do not have statutory distribution formulas. States compete for these funds, which are above the formula apportionments. Resource Management collects this information from the Federal Highway Administration, Federal Transit Administration and Federal Aviation Administration. Missouri’s share of the total highway funds allocated nationwide over the last five years is 3.6 percent, which ranks seventh. The state of California received the largest share with 8.4 percent. Missouri’s share of the total multimodal funds allocated nationwide over the last five years is 2.0 percent, which ranks 16th. The state of New York received the largest share with 11.8 percent. Improvement Status: The number of dollars of discretionary funds allocated to Missouri for highway projects increased significantly in 2006. This was mainly attributable to an increase in the funds made available from the annual appropriations bill and an increase in the annual allocation percentages for the projects identified in the current highway act, SAFETEA-LU. The funds allocated to Missouri increased 54 percent from 2005 to 2006, while the funds allocated nationwide decreased by 10 percent. Missouri’s Congressional delegates were successful in securing discretionary funds for highway projects in Missouri. The number of dollars of discretionary funds allocated to Missouri for multimodal projects increased slightly in 2006. This was mainly attributable to an increase in transit funds. The funds allocated to Missouri increased 6 percent, which is the same increase as nationwide. MoDOT continues to work closely with Missouri’s Congressional delegates to identify specific transportation projects that are good candidates for discretionary funds.
April 2007 TRACKER – Page 6a

Number of Dollars of Discretionary FundsAllocated to Missouri - Highways
(in millions)
10568334454
3.6
2.2 2.9
5.04.4
0
20
40
60
80
100
120
2002 2003 2004 2005 2006
Federal Fiscal Year
Dol
lars
0
1
2
3
4
5
6
Perc
ent
Amount ofHighway Funds
Percent Share ofTotal Nationwide
5-Year Average for Missouri:$61 million, 3.6%
5-Year Average for California:$141 million, 8.4%
Desired Trend:
Number of Dollars of Discretionary FundsAllocated to Missouri - Multimodal
(in millions)
9085114106111
2.2 2.31.6 1.6
2.4
0
20
40
60
80
100
120
2002 2003 2004 2005 2006
Federal Fiscal Year
Dol
lars
0
1
2
3
4
5
6
Perc
ent
Amount ofMultimodal Funds
Percent Share ofTotal Nationwide
5-Year Average for Missouri:$101 million, 2.0%
5-Year Average for New York:$597 million, 11.8%
Desired Trend:
April 2007 TRACKER – Page 6a (2)

Partner With Others to Deliver Transportation Services Percent of earmarked dollars that represent MoDOT’s high priority highway projects Result Driver: Kevin Keith, Chief Engineer Measurement Driver: Todd Grosvenor, Finance Manager Purpose of the Measure: This measure shows the percent of earmarked dollars that represent MoDOT’s high priority highway projects. Measurement and Data Collection: This is an annual measure updated each January. Earmarked dollars are federal funds allocated to states for specific highway projects. These funds are distributed administratively for programs that do not have statutory distribution formulas. States compete for these funds, which are above the formula apportionments. Resource Management collects this information from the Federal Highway Administration. MoDOT’s high priority highway projects are identified in the Federal Priorities list that is prepared by Governmental Relations. This list is provided to Missouri’s Congressional delegates. Improvement Status: Missouri’s earmarked dollars for specific highway projects increased significantly in 2006. This was mainly attributable to an increase in the funds made available from the annual appropriations bill and an increase in the annual allocation percentages for the projects identified in the current highway act, SAFETEA-LU. Missouri’s Congressional delegates were successful in securing earmarked dollars for highway projects in Missouri. However, the percent of earmarked dollars that represent MoDOT’s high priority highway projects decreased considerably. Many of the earmarked dollars were for projects not identified in our Federal Priorities list. Over the last five years, MoDOT’s high priority highway projects received 72 percent of the earmarked dollars. MoDOT continues to work closely with Missouri’s Congressional delegates to identify MoDOT’s high priority highway projects that are good candidates for earmarked dollars.
April 2007 TRACKER – Page 6b
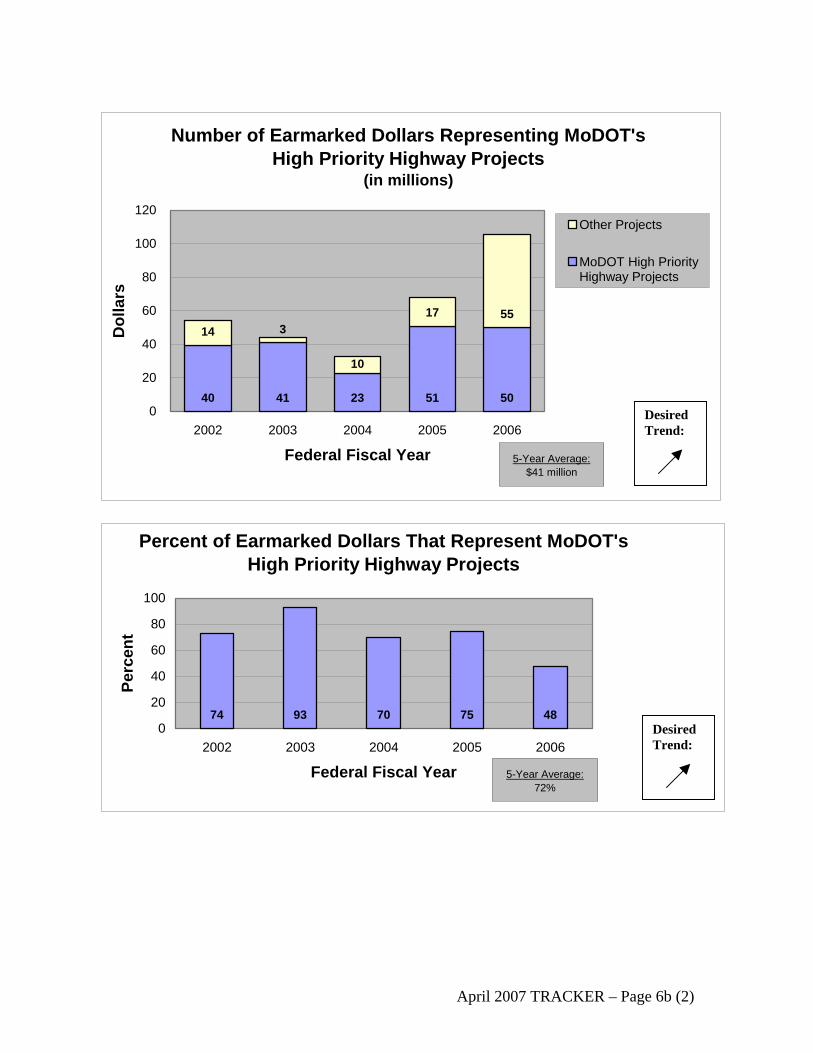
Number of Earmarked Dollars Representing MoDOT's High Priority Highway Projects
(in millions)
40 41 23 51 50
1417 55
10
3
0
20
40
60
80
100
120
2002 2003 2004 2005 2006
Federal Fiscal Year
Dol
lars
Other Projects
MoDOT High PriorityHighway Projects
5-Year Average:$41 million
Desired Trend:
Percent of Earmarked Dollars That Represent MoDOT's High Priority Highway Projects
74 93 70 75 480
20
40
60
80
100
2002 2003 2004 2005 2006
Federal Fiscal Year
Perc
ent
5-Year Average:72%
Desired Trend:
April 2007 TRACKER – Page 6b (2)
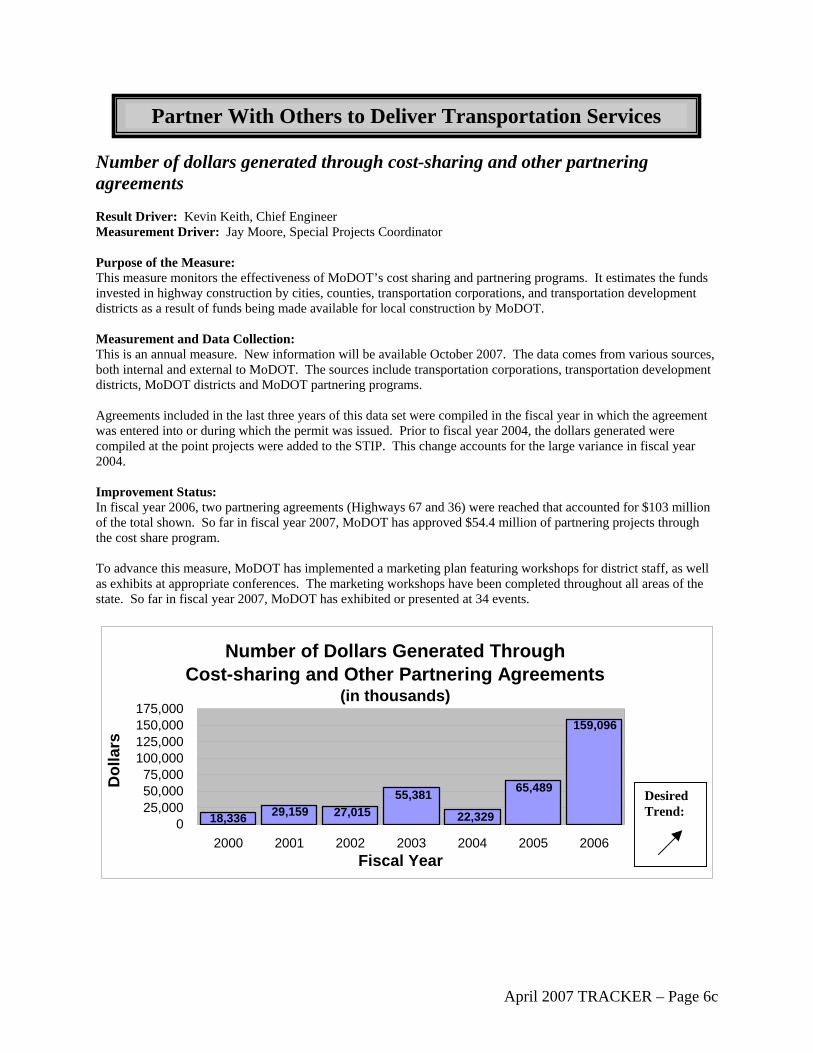
Partner With Others to Deliver Transportation Services Number of dollars generated through cost-sharing and other partnering agreements Result Driver: Kevin Keith, Chief Engineer Measurement Driver: Jay Moore, Special Projects Coordinator Purpose of the Measure: This measure monitors the effectiveness of MoDOT’s cost sharing and partnering programs. It estimates the funds invested in highway construction by cities, counties, transportation corporations, and transportation development districts as a result of funds being made available for local construction by MoDOT. Measurement and Data Collection: This is an annual measure. New information will be available October 2007. The data comes from various sources, both internal and external to MoDOT. The sources include transportation corporations, transportation development districts, MoDOT districts and MoDOT partnering programs. Agreements included in the last three years of this data set were compiled in the fiscal year in which the agreement was entered into or during which the permit was issued. Prior to fiscal year 2004, the dollars generated were compiled at the point projects were added to the STIP. This change accounts for the large variance in fiscal year 2004. Improvement Status: In fiscal year 2006, two partnering agreements (Highways 67 and 36) were reached that accounted for $103 million of the total shown. So far in fiscal year 2007, MoDOT has approved $54.4 million of partnering projects through the cost share program. To advance this measure, MoDOT has implemented a marketing plan featuring workshops for district staff, as well as exhibits at appropriate conferences. The marketing workshops have been completed throughout all areas of the state. So far in fiscal year 2007, MoDOT has exhibited or presented at 34 events.
Number of Dollars Generated ThroughCost-sharing and Other Partnering Agreements
(in thousands)
159,096
18,336 29,159 27,01555,381
22,329
65,489
025,00050,00075,000
100,000125,000150,000175,000
2000 2001 2002 2003 2004 2005 2006Fiscal Year
Dol
lars
Desired Trend:
April 2007 TRACKER – Page 6c
Leverage Transportation to Advance Economic Development
Transportation is essential to Missouri’s economic well-being. It plays a critical role in creat-ing jobs and stimulating lasting growth for Missouri. In addition, focusing on ways to advance economic development helps MoDOT achieve its mission of promoting a prosperous Missouri.
Tangible Result Driver – Roberta Broeker, Chief Financial Officer
7

Leverage Transportation to Advance Economic Development Number of miles of new four-lane corridors completed Result Driver: Roberta Broeker, Chief Financial Officer Measurement Driver: Jay Bledsoe, Transportation System Analysis Engineer Purpose of the Measure: This measure tracks the miles of additional divided highways available to the public. Access to a divided highway system supports economic development in Missouri. One of MoDOT’s recent priorities has been completion of four-lane corridors in order to connect segments of highway where gaps exist. Measurement and Data Collection: Projects that create or complete sections of dual-divided highways will be identified and tracked. Completion will be defined as the date the project is opened to traffic. This is an annual measure updated each January. Improvement Status: Approximately 15 miles of new four-lane corridors were completed during calendar year 2006, primarily on U.S. Route 63. Because of the department’s emphasis on Smooth Roads Initiative projects, progress in 2006 was significantly lower. However, the number of miles of new four-lane corridors constructed will begin to increase in 2007 due to Amendment 3 bond funds approved by Missouri voters in November 2004. As part of a partnership with the Missouri Department of Economic Development, MoDOT is initiating a study to track the creation and location of businesses along newly established four-lane corridors. This information, along with data on business size and employment, will help determine the economic value of four-lane corridors.
Number of Miles of New Four-Lane Corridors Completed
45.3
15.0
56.963.472.7
0
20
40
60
80
100
120
2002 2003 2004 2005 2006
Calendar Year
Num
ber
Desired Trend: N/A
April 2007 TRACKER – Page 7a

Leverage Transportation To Advance Economic Development Percent utilization of SIB & STAR loan programs Result Driver: Roberta Broeker, Chief Financial Officer Measurement Driver: Jay Moore, Special Projects Coordinator Purpose of Measure: This measure shows the percent utilization of MoDOT’s revolving loan programs, the Missouri State Infrastructure Bank (SIB) and the State Transportation Assistance Revolving (STAR) program. It demonstrates how well-utilized these funds are by showing a ratio of how much of the funds are currently on loan versus the amount available to be loaned. The Missouri Transportation Finance Corporation (MTFC), a not-for-profit corporation, is Missouri's SIB. The SIB program was created by federal law in 1995 to finance both highway and non-highway projects. The STAR program finances non-highway projects such as air, water, rail, or mass transit facility construction, mass transit vehicles, and vehicles for elderly or handicapped persons. STAR funding is appropriated by the General Assembly. Measurement and Data Collection: This is an annual measure. New information will be available in October 2007. The data used to calculate the amounts of funds currently on loan is collected through a database used to track the SIB and STAR loans. Amounts available to be loaned are obtained from financial reports. Improvement Status: A SIB loan for $60,000 was disbursed during fiscal year 2006. A large amount of loans was repaid to the SIB in fiscal year 2006, but only a small loan was disbursed. This resulted in a lower percentage of SIB funds being utilized. The SIB currently has three formal loan applications pending, seven loans totaling $67.5 million approved but not disbursed, and six loans in the discussion stage. On March 31, 2007, the SIB funds available for loan were approximately $58 million. To advance this measure and improve SIB utilization, the MTFC Board ratified a marketing plan prepared by the partnership development staff. Part of the plan adopted by the board featured marketing workshops for district staff and exhibiting at appropriate conferences. The marketing workshops have been completed throughout all areas of the state. So far in fiscal year 2007, MoDOT has exhibited or presented at 34 events.
Percent Utilization of SIB & STAR Loan Programs(Loans Receivable / Current Assets)
67
82828190
2946454543
020406080
100
2002 2003 2004 2005 2006
Fiscal Year
Perc
ent
STARSIB
Desired Trend:
April 2007 TRACKER – Page 7b

Leverage Transportation to Advance Economic Development Rate of economic return from transportation investment Result Driver: Roberta Broeker, Chief Financial Officer Measurement Driver: Jay Moore, Special Projects Coordinator Purpose of the Measure: This measure monitors the economic return from the state’s roadway transportation investment through the number of jobs created, changes in personal income, and value-added GSP (Gross State Product). Measurement and Data Collection: This is an annual measure. New information will be available in October 2007. MoDOT partners with the Department of Economic Development to complete economic modeling of the state's transportation investments. The Regional Economic Models, Inc. (REMI) is used for this analysis. Through these efforts, the department is able to provide state and regional estimates to demonstrate employment, income and state benefits related to specific projects, corridors and program expenditures. Improvement Status: The information generated through the use of the REMI model demonstrates that there is a strong link between transportation investments and economic development. A year-by-year analysis of the Statewide Transportation Improvement Program is used to provide a summary of economic benefits related to transportation investments on a program basis. As a summary measure of transportation’s contributions, the fiscal year 2007 through 2011 Statewide Transportation Improvement Plan (STIP) will invest over $5.7 billion in 900 transportation projects across the state. In the average year, the STIP investments create approximately 10,605 new jobs paying an average wage of $28,207 per job. There is an expected increase in annual average personal income of $399.2 million and an expected increase in economic activity of $1 billion. In terms of Gross State Product – value added, the fiscal year 2007 through 2011 STIP projects contribute over $594.7 million per year and $20.6 billion over the next 20 years. This equates to a 3.61:1 return on the transportation investment. MoDOT will continue to work to understand and maximize the benefits to the state and its citizens from transportation investments.
Rate of Economic Return from Transportation Investment
(Annual Employment Benefit)
10,605
0
2,500
5,000
7,500
10,000
Statewide Transportation Improvement Plan
Num
ber o
f Job
s C
reat
ed
(Fiscal Year 2007 - 2011)
April 2007 TRACKER – Page 7c

Rate of Economic Return from Transportation
Investment in Millions of Dollars (Annual Personal Income Benefit)
399.2
0
100
200
300
400
500
Statewide Transportation Improvement Plan (Fiscal Year 2007 - 2011)
Dol
lars
Rate of Economic Return from Transportation Investment in Billions of Dollars
(Cumulative Value-Added Gross State Product Through Next 20 Years)
20.6
0
5
10
15
20
25
Statewide Transportation Improvement Plan (Fiscal Year 2007 - 2011)
Dol
lars
April 2007 TRACKER – Page 7c (2)

(This page is intentionally left blank for duplexing purposes)

Innovative Transportation Solutions
MoDOT values innovation. The department empowers employ-ees and seeks input from stakeholders to generate inno-vative ideas. Collaboration with staff, academia and industry make unique concepts come to life so MoDOT can serve its customers better, faster and at less expense to the taxpayer.
Tangible Result Driver – Mara Campbell, Organizational Results Director
8

Innovative Transportation Solutions Percent of innovative transportation solutions implemented Result Driver: Mara Campbell, Organizational Results Director Measurement Driver: Ernie Perry, Organizational Performance Administrator Purpose of the Measure: This measure tracks the percentage of new and innovative ideas, methods, or tools MoDOT implements as a result of research and innovation efforts. MoDOT realizes the importance of supporting innovation and research and is driven to provide the department with the latest ideas, technologies, and solutions needed to deliver the most efficient, safe, and economical transportation system. Measurement and Data Collection: Innovative transportation solutions include any new ideas, methods, policies, processes, standards, equipment or tools introduced for the purpose of improving the department’s operation, services, or products. Such solutions are likely introduced as a result of a research project, study, or initiative managed through MoDOT’s research program. “Solutions implemented” refers to MoDOT’s application of a new idea, method, policy, process, standard, equipment or tool for the purpose of improvement. The definition of implemented, for purposes of this measure, includes all solutions that have been or are being applied. “Percent of solutions implemented” is determined by dividing the number of research projects producing implementable results by the total number of research projects completed during the prior six-month period. While many ideas and technologies are pursued through research and related efforts, not all solutions can be implemented by MoDOT. However, MoDOT’s elevated emphasis on strategically focused research and its implementation should result in better and more economical transportation products and services delivered. Data for this measure is collected and analyzed every six months with updates in the January and July Tracker editions. Improvement Status: During the first and second quarters of fiscal year 2007, MoDOT’s research program completed 11 projects, eight of which produced implemented results. This level of implementation represents a nearly 73 percent rate of solutions implemented. Currently MoDOT’s implementation rate exceeds the New York DOT implementation comparison of 65 percent. MoDOT’s Organizational Results continues to aggressively pursue research and innovations focused on addressing pertinent department needs that are closely tied to the 18 Tangible Results. This focus will lead to more usable solutions and better value. While not all research results or solutions can be implemented, MoDOT recognizes the importance and value of conducting a research program driven to make a difference and working to
ure implementation. ens
73717465
0102030405060708090
100
2006 Total 1st and 2nd Qtrs.2006
1st and 2nd Qtrs.2007
Fiscal Year
Perc
ent
MoDOTNYDOT
Percent of Innovative Transportation Solutions Implemented
Desired Trend:
April 2007 TRACKER – Page 8a

Innovative Transportation Solutions Number of external awards received Result Driver: Mara Campbell, Organizational Results Director Measurement Driver: Ernie Perry, Organizational Performance Administrator Purpose of the Measure: This measure tracks the number of external awards received by the department. These awards display the department’s dedication and efforts towards efficiency, innovation and quality throughout the organization. This information enables the department to measure progress and encourage further participation in award programs. It also provides opportunities for the department to increase public awareness of department activities.
Measurement and Data Collection: Each district and division office tracks the awards presented to the department by external organizations, to include all awards presented to individuals, teams, districts, divisions and MoDOT as a whole. Data collection began for this measure on Jan. 1, 2005 and is updated quarterly. Improvement Status: So far in fiscal year 2007, MoDOT has received 28 awards. This compares to 38 for the same time period in fiscal year 2006. In the third quarter of fiscal year 2007, MoDOT received 15 awards, which was three more than the number received in the same quarter last year. MoDOT districts and divisions continue to enter various competitions to compare MoDOT’s work against the efforts of other organizations and use this information to make improvements.
Number of External Awards Received
49
38
28
0
10
20
30
40
50
60
2006 YTD 2006 YTD 2007
Fiscal Year
Num
ber
Desired Trend:
April 2007 TRACKER – Page 8b

(This page is intentionally left blank for duplexing purposes)

Fast Projects That Are of Great Value
MoDOT customers expect that transportation projects be completed quickly and provide major improvements for travel-ers. MoDOT will honor project commitments because it believes in integrity.
Tangible Result Driver – Dave Nichols, Director of Program Delivery
9
Fast Projects That Are of Great Value Percent of estimated project cost as compared to final project cost Result Driver: Dave Nichols, Director of Program Delivery Measurement Driver: Renate Wilkinson, Planning and Programming Engineer Purpose of the Measure: This measure determines how close MoDOT’s total program completion costs are to the estimated costs. Measurement and Data Collection: MoDOT determines the completed project costs and compares them to the estimated costs. The completed project costs are reported during the state fiscal year in which the project is completed. Project costs include design, right of way purchases, utilities, construction, inspection and other miscellaneous costs. The estimated cost is based on the amount included in the most recently approved Statewide Transportation Improvement Program. Completed costs include actual expenditures. The costs do not include those that might result from any legal claims, which are rare occurrences, regarding the projects after they are completed. Positive numbers indicate the final (completed) cost was higher than the estimated cost. This is an annual measure updated each quarter. In November of each year this data is provided to the Legislature through the Report to the Joint Committee on Transportation Oversight. Improvement Status: To date a total of 352 jobs have been completed at a cost of $918 million. This represents a deviation of -1.52 percent or $14 million less than the estimated cost of $932 million. District construction budgets are adjusted based on variations from estimated costs. Therefore, districts have an incentive to develop accurate estimates and complete the projects within estimate. The increased cost trend through fiscal year 2004 reflects the increased number of projects in fiscal years 2002 and 2003. The increased work volume resulted in higher awards and overall costs. The decrease in 2005 can be attributed to the lower work volume and increased competition among contractors. The increase in 2006 can be primarily attributed to inflationary pressures. The ideal status is no deviation in the estimated vs. final project cost, or 0 percent. While a number of states track construction costs, very few provide data for total project costs. Fewer still compare estimated total project costs to final total project cost. The graph below shows how MoDOT performance compares with neighboring Nebraska*. In 2002 and 2004, the performance of both states was nearly the same. In other years, it varied substantially.
April 2007 TRACKER – Page 9a
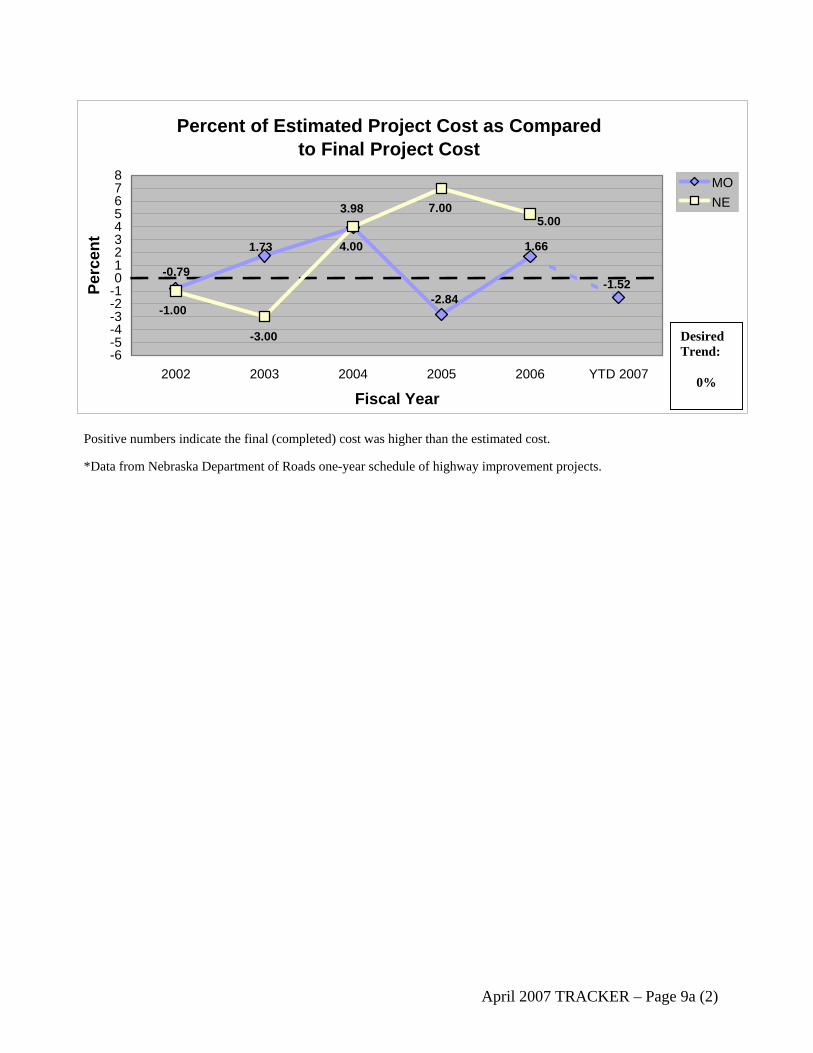
Percent of Estimated Project Cost as Compared to Final Project Cost
-2.84
-0.79
3.98
1.661.73
-1.52
4.00
7.00
-3.00
-1.00
5.00
-6-5-4-3-2-1012345678
2002 2003 2004 2005 2006 YTD 2007
Fiscal Year
Perc
ent
MONE
Desired Trend:
0%
Positive numbers indicate the final (completed) cost was higher than the estimated cost. *Data from Nebraska Department of Roads one-year schedule of highway improvement projects.
April 2007 TRACKER – Page 9a (2)

Fast Projects That Are of Great Value
Average number of years it takes to go from the programmed commitment in the Statewide Transportation Improvement Program to construction completion Result Driver: Dave Nichols, Director of Program Delivery Measurement Driver: Machelle Watkins, Transportation Planning Director Purpose of the Measure: This measure monitors how quickly projects go from the programmed commitment to construction completion. Measurement and Data Collection: MoDOT compares how long it takes from when the project is added to the Statewide Transportation Improvement Program to when the project is completed. Data is categorized by the type of work, and distinguishes between design and construction stages. This is an annual measure and data will be updated in October. Improvement Status: In general, resurfacing and safety projects take the least amount of time to develop and complete, around two years. New or improved bridge projects take more time, around four years. New or expanded highways take yet more time, from five to eight years. Major bridge projects take the most time, from seven to 11 years to develop and complete. The apparent increase in construction time from 2004 to 2005 is due to different data used to denote project completion. The 2004 data represents completion of the contractor's construction activities. The 2005 data represents project finalization, which includes final payment and contract completion. The change in data was made because there is more data available for project finalization, making the measurement more representative. MoDOT and industry officials met on Feb. 1, 2007, as part of the Partnering for Innovative Efficiencies program to discuss the acceleration of project finalization.
April 2007 TRACKER – Page 9b

Average Number of Years it Takes to Go from the Programmed Commitment in the STIP to Construction
CompletionResurfacing Projects
0.8
3.1
1.1 0.8
1.4
0.8
0
1
2
3
4
5
2003 2004 2005Calendar Year
Num
ber o
f Ye
ars
Award Date toConstruction CompletionProgrammedCommitment to Award
Average Number of Years it Takes to Go from the Programmed Commitment in the STIP to Construction
CompletionSafety Projects
0.8
1.11.42.0
1.41.5
0
1
2
3
4
5
2003 2004 2005Calendar Year
Num
ber
of
Year
s
Award Date toConstructionCompletionProgrammedCommitment to Award
Average Number of Years it Takes to Go from the Programmed Commitment in the STIP to Construction
CompletionNew/Improved Bridge Projects
1.1
1.9
2.92.3
1.32.2
0
1
2
3
4
5
2003 2004 2005Calendar Year
Num
ber o
f Ye
ars
Award Date toConstructionCompletionProgrammedCommitment to Award
3.9
2.2 1.9
Desired Trend: N/A
3.4 2.6
2.2
Desired Trend: N/A
3.6 4.14.0
Desired Trend: N/A
April 2007 TRACKER – Page 9b (2)

Average Number of Years it Takes to Go from the Programmed Commitment in the STIP to Construction
CompletionNew/Expanded Highway Projects
4.93.2
5.2 2.02.4 3.1
02468
101214
2003 2004 2005Calendar Year
Num
ber o
f Ye
ars
Award Date toConstructionCompletionProgrammedCommitment to Award
Average Number of Years it Takes to Go from the Programmed Commitment in the STIP to Construction
CompletionMajor Bridge Projects
3.50.0
9.4
2.0
3.3
02468
101214
2003 2004 2005Calendar Year
Num
ber o
f Ye
ars
Award Date toConstruction Completion
ProgrammedCommitment to Award
8.0 7.6 5.2
Desired Trend:
N/A
11.4
6.8
Desired Trend:
N/A
April 2007 TRACKER – Page 9b (3)

Fast Projects That Are of Great Value Percent of projects completed within programmed amount Results Driver: Dave Nichols, Director of Program Delivery Measurement Driver: Dave Ahlvers, State Construction & Materials Engineer Purpose of the Measure: The measure tracks the percentage of projects completed within the programmed amount. The cost includes such items as engineering, right-of-way and contract payments. MoDOT would like to see all projects completed at or near the programmed amount. The goal to deliver projects at or near the programmed amount will allow the greatest number of projects to be built with the funding available. Measurement and Data Collection: The completed project cost is compared to the estimated cost for each project. The percentage of projects completed within the estimated cost is gathered from across the state. Project costs include design, right-of-way purchases, utilities, construction payments, inspection and other miscellaneous costs. Improvement Status: MoDOT’s data indicates that there is a great deal of deviation among individual projects with half over and half under budget. Emphasis has been placed on scoping projects and developing estimates that represent the true cost of delivering the projects. MoDOT is striving to deliver quality projects cheaper by using practical design and by encouraging the use of value engineering.
46
584850
0
20
40
60
80
100
2004 2005 2006 YTD 2007
Fiscal Year
Perc
ent
Percent of Projects Completed within Programmed Amount
Desired Trend:
April 2007 TRACKER – Page 9c

Fast Projects That Are of Great Value Percent of projects completed on time Results Driver: Dave Nichols, Director of Program Delivery Measurement Driver: Dave Ahlvers, State Construction & Materials Engineer Purpose of the Measure: This measure tracks the percentage of projects completed by the commitment date established in the contract. Adjustments to the completion date are made when additional work is required or for unusual weather occurrences. It indicates MoDOT’s ability to complete projects by the agreed upon date. Measurement and Data Collection: The project manager will establish project completion dates for each project. They are documented in MoDOT’s SiteManager and STIP databases. It will be part of the Plans, Specifications & Estimates submittal. The actual completion date will be documented by the resident engineer and placed in MoDOT’s project management system. Improvement Status: The results indicate a significant increase from previous years in the percent of projects completed on time. MoDOT has focused on reducing the number of days available for construction in order to reduce congestion and inconvenience to the traveling public, while stressing the importance of completing projects on time. An emphasis has been placed on reviewing construction schedules and assessing liquidated damages, which should lead to improvements in timely completion.
8372 73 76
0
20
40
60
80
100
2004 2005 2006 YTD 2007
Fiscal Year
Perc
ent
Percent of Projects Completed on Time
Desired Trend:
April 2007 TRACKER – Page 9d

Fast Projects That Are of Great Value Percent of change for finalized contracts Results Driver: Dave Nichols, Director of Program Delivery Measurement Driver: Dave Ahlvers, State Construction & Materials Engineer Purpose of the Measure: The measure tracks the percentage difference of total construction payouts to the original contract award amounts. This indicates how many changes are made on projects after they are awarded to the contractor. Measurement and Data Collection: Contractor payments are generated through MoDOT’s SiteManager database and processed in the financial management system for payment. Change orders document the underrun/overrun of the original contract. Improvements Status: MoDOT’s performance through the fist three quarters of 2007 is well below the target of 2 percent. The overall improvement is a result of a strong emphasis placed on constructing projects within budget, the use of practical design and value engineering. By limiting overruns on contracts, MoDOT can deliver more projects, leading to an overall improvement of the entire highway system. Recently, the Performance Plus employee incentive program is placing additional emphasis on completion of projects within budget.
Percent of Change for Finalized ContractsTotal Contractor Payment vs. Award Amount
1.2
4.1
2.1
3.1
0
2
4
6
2004 2005 2006 YTD 2007
Fiscal Year
Perc
ent
Desired Trend: N/A
April 2007 TRACKER – Page 9e

Fast Projects That Are of Great Value Average construction cost per day by contract type Results Driver: Dave Nichols, Director of Program Delivery Measurement Driver: Dave Ahlvers, State Construction & Materials Engineer Purpose of the Measure: This measure tracks the cost per day for project completion to determine the impact to the traveling public, enabling MoDOT to better manage project completion needs. Measurement and Data Collection: This information is gathered by extracting the actual time used for construction from the summary of working days in the SiteManager database and dividing it by the total costs of the project. The measurement groups construction contracts into three categories:
WD working day contracts CD calendar day contracts and; A + B or innovative contracts that provide incentive/disincentives to the contractor for early completion.
Improvement Status: The greater use of A+B and calendar-day contracts resulted in a larger amount paid per calendar day. MoDOT’s strategy of utilizing innovative contracting techniques has resulted in faster contract completion and fewer delays to the traveling public. Contract types are reviewed to make a determination of the most effective use of resources for timely completion of projects. Traditionally, there is a greater amount of work performed in the first quarter of the fiscal year due to optimal weather conditions.
7,30
5
14,4
19
9,69
1
10,9
46
10,1
00 14,8
44
13,4
85
11,8
78
13,0
86
14,6
13
36,1
58
32,5
23
24,5
44
34,1
07
36,2
30
0
10,000
20,000
30,000
40,000
2003 2004 2005 2006 YTD 2007
Fiscal Year
Dol
lars
Working DayCalendar DayA+B
Average Construction Cost Per Day by Contract Type
Desired Trend:
April 2007 TRACKER – Page 9f

Average Construction Cost Per Day by Contract TypeAll Contract Types
12,667 12,685
11,268
14,050 14,631
0
4,000
8,000
12,000
16,000
2003 2004 2005 2006 YTD 2007
Fiscal Year
Dol
lars
Desired Trend:
Average Construction Cost Per Day by Contract TypeNumber of Active Contracts
428
72
121
191233257
570
443413417
182419117
0
100
200
300
400
500
600
2003 2004 2005 2006 YTD 2007
Fiscal Year
Num
ber
Working Day
Calendar Day
A+B
Desired Trend: N/A
April 2007 TRACKER – Page 9f (2)

Fast Projects That Are of Great Value Unit cost of construction expenditures Result Driver: Dave Nichols, Director of Program Delivery Measurement Driver: Travis Koestner, Bid & Contract Services Engineer Purpose of the Measure: This measure tracks how MoDOT projects provide great value by comparing the cost of major items of work for MoDOT projects to other state DOTs. MoDOT customers should be able to gain an understanding of what it costs for a DOT to install an item of work. While value should not be defined as MoDOT prices per unit being the lowest as compared to other DOTs, prices can be compared keeping in mind that labor rates, material availability and general project conditions such as urban vs. rural will vary from state to state. Measurement and Data Collection: Value in this measure has simply been related back to dollars per unit of measure. MoDOT staff categorizes raw data from an outside vendor for the unit cost from other states. Identifying the “lowest in the country” is from data produced by FHWA as well as the FHWA national average price. Bridge price data is also from FHWA. The most recent data from FHWA is used for Tracker. This is an annual measure updated each January. The FHWA comparative data may lag as much as one year. Improvement Status: MoDOT prices have remained in the same relative position vs. states surrounding Missouri in the areas of concrete pavement and soil excavation while the average asphalt price for 2006 compares more favorably than in 2005. The percentage increase in price for MoDOT for the items of work in all categories is approximately one-half that of the straight average increase of the states compared. This can be attributed to the increase in competition that MoDOT has seen in the past six to eight months. Examples of strategies to keep the level of competition as high as possible include continued use of alternate and optional pavement, working with the districts when scheduling major projects and the implementation of electronic bidding in January 2007.
Unit Cost of Construction ExpendituresConcrete Pavement
9" Equivalent Square Yard
41.9
1
34.1
5
34.0
9
33.7
8
30.9
0
30.7
0
26.0
9
25.8
5 34.2
8
57.1
5
0
10
20
30
40
50
60
Illin
ois
Tenn
esse
e
Okl
ahom
a
Ken
tuck
y
Mis
sour
i
Kan
sas
Ark
ansa
s
Iow
a
Neb
rask
a*
Nat
iona
lA
vera
ge
State
Dol
lars
*Lowest in US
Desired Trend:
April 2007 TRACKER – Page 9g

Unit Cost of Construction ExpendituresAsphalt Price per Ton
45.5
5
42.4
7
39.1
9 45.9
9
65.7
8
63.6
2
56.2
8
54.5
8
54.4
3
54.3
2
52.2
9
10
20
30
40
50
60
70A
rkan
sas
Illin
ois
Kan
sas
Mis
sour
i
Okl
ahom
a
Ken
tuck
y
Tenn
esse
e
Neb
rask
a
Iow
a
Min
neso
ta*
Nat
iona
lA
vera
ge
State
Dol
lars
Desired Trend:
*Lowest in US
Unit Cost of Construction ExpendituresSoil Excavation per Cubic Yard
4.13
10.0
7
6.36
4.73
4.28
3.81
3.50
3.34
2.29
1.89
1.66
0
2
4
6
8
10
12
Illin
ois
Ark
ansa
s
Ok l
ahom
a
Mis
sour
i
Tenn
esse
e
Ken
tuck
y
Kan
s as
Iow
a
Neb
rask
a
Sou
th D
akot
a*
Nat
iona
l Av e
rage
State
Dol
lars
*Lowest in US
Desired Trend:
Footnote for the charts above: Source Data for states other than Missouri from Oman Systems Bid Tabs Professional latest data available as of Jan. 1, 2006. Items include common excavation items paid for by the cubic yard. FHWA Data from FHWA “Price Trends for Federal-Aid Highway Construction” First Quarter 2006. Missouri Data from MoDOT bid history.
April 2007 TRACKER – Page 9g (2)

Unit Cost of Construction ExpendituresFHWA Bridge Cost per Square Foot
Calendar Year 2004
92 89
73 71 70 66 66 61
47
0102030405060708090
100Ill
inoi
s
Ken
tuck
y
Kan
sas
Neb
rask
a
Mis
sour
i
Ark
ansa
s
Iow
a
Tenn
esse
e
Okl
ahom
a*
State
Dol
lars
Desired Trend:
*Lowest in US Source data from FHWA memo “Bridge Construction Unit Cost” dated Dec. 7, 2005. FHWA does not publish an average U.S. cost per square foot for bridges.
Unit Cost of Construction ExpendituresFHWA Cost Index Calendar Year 2005
256229
214194 187 186 185
155184
0
50
100
150
200
250
300
Illin
ois
Neb
rask
a
Okl
ahom
a
Ken
tuck
y
Mis
sour
i
Kan
sas
Ark
ansa
s
Iow
a
US
State
Inde
x
Desired Trend:
Source: FHWA “Price Trends for Federal-Aid Highway Construction” Fourth Quarter 2005.
April 2007 TRACKER – Page 9g (3)

Fast Projects That Are of Great Value Annual dollar amount saved by implementing value engineering Result Driver: Dave Nichols, Director of Program Delivery Measurement Driver: Kathy Harvey, State Design Engineer Purpose of the Measure: This measure tracks the amount of money MoDOT saves by implementing value engineering proposals. Measurement and Data Collection: Value engineering (VE) has saved MoDOT over $277 million since 1988. VE achieves savings at the design phase and at the construction phase of a project. VE utilizes a team approach to refine the purpose and need and then develop innovative and creative ideas, which result in project savings while optimizing project performance. The VE team is usually independent from the project core team and includes participants from various disciplines both from within and outside of MoDOT. VE studies are done on projects at all stages of development, from the concept stage to final design and during construction. VE savings are reported annually to the Federal Highway Administration by each state and the results are available for Federal Fiscal Year 2005. For design phase savings, Washington is the best in the nation showing $1.112 billion implemented. For construction phase savings, Georgia is the best in the nation showing $5.6 million implemented. When compared to states similar to Missouri in program size, Illinois reported $14.5 million saved during design and Michigan reported $1.6 million saved during construction. Direct comparison to other states is challenging because of differences in construction program size and project development processes. This is an annual measure using a federal fiscal year, running from November 1 to October 31. New updates are reported in the December Tracker edition, however the year-to-date total for the current fiscal year is included. Improvement Status: Traditionally, VE studies during the design phase of a project were a five-day formal event that required a tremendous amount of organization and facilitation. As a result, VE studies were only done on the significant few projects where large savings could be realized. In an effort to increase the number of VE studies being done and thus increase the potential for cost savings, the format of the study has been revised to be more flexible. VE studies now match the size and needs of the project, ranging from four hours to five days. Any trained staff can conduct studies, but the documentation goes through the VE administrator. This change has already increased the number of VE studies being done during the design phase of the project (25 in 2006 vs. eight in 2005), and almost $40 million was saved in 2006. That was down from 2005, when practical design began influencing VE studies; it was significantly higher than 2003 and 2004. So far, 2007 looks like it will be a great year for VE savings. On the construction side, the implementation of the Performance Plus pilot program has increased the interest in VE studies by contractors and MoDOT staff. In addition, there has been a large effort to educate resident engineers on what VE studies are and their importance. Better reporting associated with the change order process has been encouraged. In 2006, construction savings from VE studies were $3.27 million; more than the last four years combined.
April 2007 TRACKER – Page 9h

Design Phase (in millions)
47.139.3
60
8.1 13.9
Illinois21.90
Illinois14.5
0
20
40
60
80
100
2003 2004 2005 2006 2007 YTD
Federal Fiscal Year
Dol
lars
Missouri
Best In TheNation
Best ofSurroundingStates
Ca
Annual Dollar Amount Saved by Implementing Value Engineering
lifornia362
Washington1,112
Desired Trend:
Construction Phase(in millions)
0.740.17 0.79
3.27
2.00
Florida5.0
Georgia5.6
Minnesota2.8
Michigian1.6
0
1
2
3
4
5
6
2003 2004 2005 2006 2007 YTD
Federal Fiscal Year
Dol
lars
Missouri
Best In TheNation
Best ofSurroundingStates
Annual Dollar Amount Saved by Implementing Value Engineering
Desired Trend:
April 2007 TRACKER – Page 9h (2)

Fast Projects That Are of Great Value Dollar amount saved by implementing practical design Result Driver: Dave Nichols, Director of Program Delivery Measurement Driver: Kathy Harvey, State Design Engineer Purpose of the Measure: This measure tracks the amount of money MoDOT saves by implementing practical design concepts. Measurement and Data Collection: At the project level, significant innovations that result in cost savings can be realized through design modifications. These are variations from traditional standards to fit the individual characteristics and needs of a specific project. In MoDOT’s new design environment practical design is the umbrella for a more widespread application of this process. Practical design savings were previously reported as an annual lump sum for our 2005-09 STIP. During that initial implementation of practical design, $400 million was saved and put back into the construction program. Since that initial effort, practical design has been incorporated into all projects from the conceptual stages, and it has become our way of doing business. As such, it would be impossible to continue to report on total program savings. Therefore, this measure has changed and is focusing on average savings by type of work. Projects were selected in four categories: Minor System Bridge Replacement, Minor System Resurfacing, Major System Resurfacing and Two-lane to Four-lane Upgrade. A comparison was made between project costs during fiscal year 2006 (post practical design) and projects awarded during fiscal years 2002-2004 (pre-practical design) in each of the categories with costs inflated to 2006 as appropriate. This is an annual fiscal year measure updated each July. Improvement Status: Percentage of savings varies by the work type with the largest reduction, 64 percent, seen for the two-lane to four-lane upgrade work. The following points summarize the practical design elements that were significant contributors to the savings for each work type: • Minor System Bridge Replacement – Incentives such as closing a road for bridge replacement in the same
location instead of bridge relocation; using a narrower width that matches the approach roadway width. • Minor System Resurfacing – Using alternative methods such as chip seal or scrub seal instead of one-inch
surface level course or 1¼ -inch bituminous pavement. • Major System Resurfacing – Reducing overlay thicknesses from 5¾ inches to 3¾ inches; using less cold mill
before overlay; reducing shoulder thickness and width; using mill and fill instead of unbonded concrete overlay. • Two-lane to Four-lane Upgrade: Cutting slopes and using existing right-of-way; using alternative methods of
erosion control such as rock blanket instead of concrete slope protection. New this year is a practical design competition. This competition was open to all ten districts, Central Office Bridge and all consultants. Eight awards were presented at the TEAM meeting in March for projects that attributed $83 million in savings to practical design. In all, there were 30 entries that had an aggregate savings of $361 million. This competition is one way to share best practices and great ideas with designers all over the state.
April 2007 TRACKER – Page 9i

2,979,100
744,60038,500
1,041,500689,800
292,00012,600
1,073,300
0
500,000
1,000,000
1,500,000
2,000,000
2,500,000
3,000,000
3,500,000
Minor SystemBridge
Replacement(Average Cost
per bridge)
Minor SystemResurfacing
(Work type per centerline mile)
Major SystemResurfacing
(Work type per centerline mile)
2-Lane to 4-LaneUpgrade
(Work type per centerline mile)
Work Type
Dol
lars
FiscalYear2002-2004
FiscalYear2006
Dollar Amount Saved by Implementing Practical Design(Practical Design Comparison)
Desired Trend: N/A
April 2007 TRACKER – Page 9i (2)

Fast Projects That Are of Great Value Percent of customers who feel completed projects are the right transportation solutions Result Driver: Dave Nichols, Director of Program Delivery Measurement Driver: Kathy Harvey, State Design Engineer Purpose of the Measure: This measure provides information regarding the public’s perception of MoDOT’s performance in providing the right transportation solutions. Measurement and Data Collection: MoDOT districts identified 30 projects – three per district – in three different categories (large – major route listed as or funded through major project dollars; medium – district-wide importance; and small – only local significance). These projects were completed within the previous year and are open to traffic. The Truman School of Public Affairs at the University of Missouri, in collaboration with MoDOT, developed a survey that was directed to the users of each specific facility. A sample of residents was drawn from zip code areas adjoining the roadway where the project was recently completed. The sample included 400 addresses per project area for a total of 12,000 surveys sent. Nearly 2,900 surveys were returned. This measure will be reported annually. Districts will continue to identify one project in each of the three categories to be surveyed, although it is recognized that in the future it might not be possible for every district to have three projects that meet the criteria each year. Projects for the 2007 survey are now being identified. Improvement Status: Project-specific questions were asked of MoDOT customers and each showed a high level of satisfaction with important goals such as safety, convenience, less congestion, handles traffic efficiently, easy to navigate, easy to understand, and well marked. The lowest percent on the favorable side of any question was less congestion, and yet about 70 percent either agreed or strongly agreed that the road now has less congestion. However, an important component of MoDOT’s Tangible Result is the concept of “great value.” Clearly, customers may enjoy the fine features of an expensive luxury vehicle, but not consider it a great value. Likewise, it is important to assess whether the Missourians, who appear to see many great features of the projects, also see them as the right transportation solution. Therefore, the questionnaire asked the respondent whether it was the right transportation solution, and it offered a set of responses from “not at all worth it” to “very much worth it.” The overall perception of the projects in this survey is extremely positive. More than two-thirds of Missourians said the local project was “very much worth it,” and an additional 17 percent said it was “somewhat worth it.” The two positive responses combined for a value of about 85 percent of respondents who felt that the project in their area was the right transportation solution. About 11 percent were not sure, but less than five percent felt that the project was “not really worth it” or “not at all worth it.” Overall, 79 percent of the respondents said they were satisfied with the quality of the system, but only 13 percent said they were extremely satisfied. This was virtually the reverse of the opinions expressed about their local projects, although the overall percentage was about the same. This strongly supports the long-held notion that people are most interested in the projects that benefit them directly.
April 2007 TRACKER – Page 9j
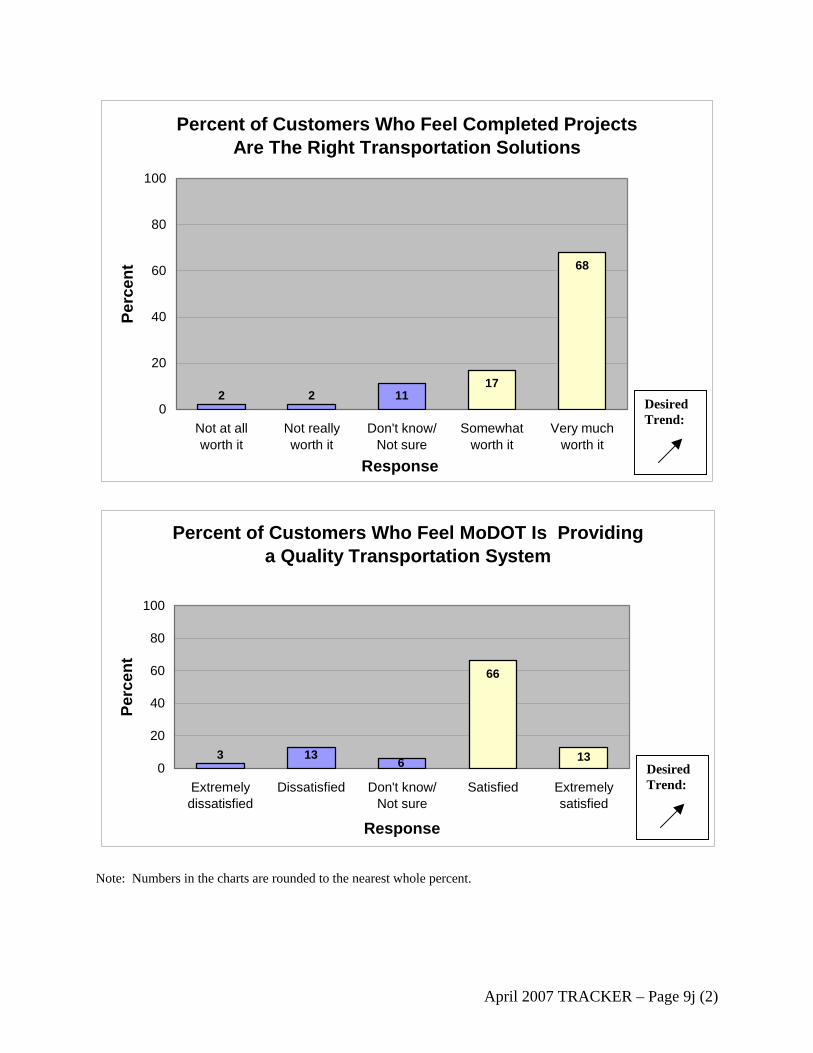
Percent of Customers Who Feel Completed Projects Are The Right Transportation Solutions
2 217
68
110
20
40
60
80
100
Not at allworth it
Not reallyworth it
Don't know/Not sure
Somewhatworth it
Very muchworth it
Response
Perc
ent
Desired Trend:
Percent of Customers Who Feel MoDOT Is Providing a Quality Transportation System
13
66
13630
20
40
60
80
100
Extremelydissatisfied
Dissatisfied Don't know/Not sure
Satisfied Extremelysatisfied
Response
Perc
ent
Desired Trend:
Note: Numbers in the charts are rounded to the nearest whole percent.
April 2007 TRACKER – Page 9j (2)
Environmentally Responsible
MoDOT takes great pride in being a good steward of the environment, both in the construction and operation of Missouri’s transportation system and in the manner in which its employees complete their daily work. The department strives to protect, conserve, restore and enhance the environment while it plans, designs, builds, main-tains and operates a complex transportation infrastructure.
Tangible Result Driver – Dave Nichols, Director of Program Delivery
10

Environmentally Responsible Percent of projects completed without environmental violation Result Driver: Dave Nichols, Director of Program Delivery Measurement Driver: Kathy Harvey, State Design Engineer Purpose of the Measure: This measure tracks environmental violations. MoDOT projects must comply with several environmental laws and regulations. To be in compliance, MoDOT makes commitments throughout the project development process that must be carried forward during construction and maintenance. In addition, the various permits obtained for projects also contain specific requirements for compliance. MoDOT must also comply with the environmental laws and regulations as it conducts its daily work in all areas of the organization. If a violation is noted, it can result in either a Letter of Warning (LOW) or a Notice of Violation (NOV) to MoDOT. Letters of Warning can also be received as simply that, a warning to MoDOT of a special circumstance to be aware of, or for a situation that needs to be monitored so that a violation does not occur. For that reason, LOWs will never be eliminated, but should be kept to a minimum. However, it is unacceptable to the department to have an NOV. Measurement and Data Collection: Both LOWs and NOVs are written correspondence to MoDOT from regulatory agencies, which are tracked in a MoDOT database by location or project number, as appropriate. Where tracked by project, the violations received may span several years. The first chart is based on a calendar year of construction projects reported to be completed during that year and the number of violations received on those projects over the life of the project. The second chart is a report by calendar year of the LOWs and NOVs received by the department for any activity and the data is updated quarterly. Improvement Status: The first graph shows a relatively level trend line for the past five years, while the second graph shows an increase in the total number of NOVs received and a decrease in the total number of LOWs received in calendar year 2006. In the first quarter of 2007, MoDOT received one NOV. The NOV was for failure to submit a manifest summary report in a timely manner. In the first quarter of 2007, MoDOT received two LOWs. One LOW was for erosion control measures on a construction job, the other LOW was for a potential illicit discharge into a ditch. In order to reduce the number of warnings and violations associated with maintenance lots, the department conducted an inspection of each maintenance lot in the spring of 2006. The results of these inspections were summarized in a report presented to leadership of the various impacted divisions and districts. Each district is reviewing the information and if appropriate, developing action plans to address any concerns that were noted. In the fall of 2006, the environmental and historic preservation staff held training sessions at all ten districts. They trained over 900 employees from construction, design, maintenance and planning. In November, MoDOT received a letter of commendation from the Solid Waste Management Program at DNR for the recycling efforts of the Dove Maintenance Shed in the Springfield Area District. Following receipt of the second NOV on the same project, both due to the actions of one contractor, MoDOT terminated that contract. In 2007, MoDOT will conduct detailed inspections of all rest areas, similar to the maintenance lots, and prepare detailed reports for each site with recommendations to address any concerns that are noted, if any.
April 2007 TRACKER – Page 10a

Percent of Projects Completedwithout Environmental Violation
99.1
98.7
97.9
99.8
98.2
98.1
97.6
98.7
99.1
97.7
99.6
97.4
95.8
97.1
98.5
0
20
40
60
80
100
2002 2003 2004 2005 2006
Perc
ent
w/o NOVw/o LOWTotal
Calendar Year
Desired Trend:
Number of LOWs & NOVs
2
5
6
87
1
8
6
4
10123456789
2003 2004 2005 2006 YTD 2007
Calendar Year
Num
ber
LOWNOV
Desired Trend:
Note: There is no benchmark data presented with this measure. MoDOT has a zero-tolerance policy towards NOVs, but recognizes LOWs will never be eliminated due to their nature. Therefore, regardless of what other states are doing, MoDOTs desired results are zero NOVs.
April 2007 TRACKER – Page 10a (2)

Environmentally Responsible Number of projects MoDOT protects sensitive species or restores habitat Result Driver: Dave Nichols, Director of Program Delivery Measurement Driver: Gayle Unruh, Environmental & Historic Preservation Manager Purpose of the Measure: Missouri is home to many rare species of plants and animals, some of which are on the federal endangered species list. The Endangered Species Act of 1973 prohibits harm or harassment of these species. Avoiding or minimizing harm to these species and protecting or restoring their habitat is a fundamental obligation of this organization. Avoidance and/or protection are the first goals of MoDOT’s efforts, but under circumstances where avoidance cannot be achieved, restoration of habitat is a minimum acceptable result. Measurement and Data Collection: On all MoDOT projects, the department investigates and informs the U.S. Fish and Wildlife Service (FWS) of any activity in the vicinity of a known threatened or endangered species or critical habitat. Through consultation with FWS MoDOT has the data to report on this measure. Because this measure focuses on projects that protect or restore sensitive habitats that could not initially be avoided, most MoDOT projects are not included in this data. This measure is tracked by calendar year with quarterly updates. Annual data are finalized and shown in the January Tracker. There is no desired trend with this measure. The number reported will fluctuate depending on the size of MoDOT’s construction program each year, type of projects being constructed, location and the ability to make adjustments to avoid impacts on sensitive species or their habitat. Improvement Status: During the first quarter of 2007, MoDOT protected sensitive species or restored their habitat on six construction projects and one emergency winter storm clean up project. These species included the Indiana bat (seven projects), Niangua darter (one project), Virginia sneezeweed (one project). New discoveries of Indiana bats increase the number of projects for which MoDOT does consultation with the FWS and habitat protection. The environmental section continues educating the districts concerning fieldwork and the lifecycles of species that could affect project timing.
Number of Projects MoDOT Protects Sensitive Species or Restores Habitat
7
18
11
810
0
5
10
15
20
2003 2004 2005 2006 YTD 2007
Calendar Year
Num
ber
Desired Trend: N/A
April 2007 TRACKER – Page 10b

Ratio of acres of wetlands created compared to the number of acres of wetlands impacted Result Driver: Dave Nichols, Director of Program Delivery Measurement Driver: Gayle Unruh, Environmental & Historic Preservation Manager Purpose of the Measure: Wetlands are a valuable resource in Missouri, having beneficial functions such as wildlife habitat, flood storage and water quality improvement. In addition to these benefits, it is required in the Clean Water Act that impacts to wetlands are avoided, minimized or that wetlands are recreated when a wetland is destroyed during a transportation project. Measurement and Data Collection: Data for this measure is calculated by comparing acres of project impacts taken from Clean Water Act permits to acres of wetland constructed, as shown in roadway design plans or by calculating the actual wetland areas recreated by MoDOT, or wetland mitigation purchased from a commercial wetland bank. Impacts may occur in a different year from the mitigation, so for the purposes of this measure, the timeframe for the reporting is when the mitigation construction is complete based on a calendar year. The national goal set by the FHWA for recreating wetland is to construct 1.5 acres of wetland for every 1.0 acre of wetland impacted. Recreating wetlands at this ratio helps to offset the lost beneficial functions during the time it takes for a wetland to develop. This measure helps ensure that MoDOT is doing its part to maintain wetlands in Missouri. Since this measure is also tracked by FHWA for the nation, MoDOT contacted state DOTs that are successful at meeting the 1.5 to 1 ratio. Most of the states queried said that the biggest factor in meeting the ratio is in the use of wetland mitigation banks. They had greater control over achieving their target ratios and more ecologically successful wetland mitigation. MoDOT has a statewide umbrella wetland mitigation banking agreement. This is an annual measure and the data is updated quarterly. Improvement Status: MoDOT did not build or use any wetland mitigation in the first quarter of 2007. The wetland staff is in the final negotiation stages of a wetland/stream mitigation bank agreement at Blue Springs. MoDOT is also negotiating with the Corps of Engineers to put one person in place at the Corps office to manage and process Section 404 permits statewide. The expected benefits for MoDOT include more consistent and timely permits and mitigation requirements.
Environmentally Responsible
Ratio of Acres of Wetlands Created Compared to the Number of Acres of Wetlands Impacted
3.02.7
8.5
2.8
0.00123456789
10
2003 2004 2005 2006 YTD 2007
Calendar Year
Rat
io
DesiredTrend: 1.5:1
April 2007 TRACKER – Page 10c

Environmentally Responsible Percent of air quality days that meet Environmental Protection Agency standards by metropolitan area Result Driver: Dave Nichols, Director of Program Delivery Measurement Driver: Eric Curtit, Long-Range Transportation Planning Coordinator Purpose of the Measure: This measure tracks MoDOT’s role in improving the air quality of Missouri’s metro areas. The Environmental Protection Agency approves state plans to improve air quality. MoDOT makes every effort to design and build roads that improve air quality in affected areas. Measurement and Data Collection: EPA establishes air quality standards including ozone for the United States. The ground-level ozone standard affects Missouri. Ozone readings are collected in Kansas City and St. Louis during the ozone season – April through October – and then reported annually with updates presented in January. The data contained in the table below reflects the available percentage of days, by metro area, that met the EPA’s ground-level ozone standard. The data for Missouri’s 2006 ozone season is now included. Beginning in 2006, MoDOT began comparing ozone exceedances to the Dallas, Texas, metropolitan area. Dallas is being compared to Missouri cities because of its similar distance to other cities that affect its air quality. Dallas also has similar pollutants. Improvement Status: MoDOT’s efforts, coupled with milder than normal weather in 2004, contributed to 100 percent positive air quality days as measured by EPA standards. Changes to more strict EPA standards and warmer than normal weather during the 2006 ozone season contributed to a reduction in the percentage of positive air quality days. MoDOT continues to serve on the Air Quality Forum Committee in Kansas City and the Air Quality Advisory Committee in St. Louis. MoDOT staff attends monthly meetings to review these committees’ programs and ensure that both regions continually work to improve the air quality for Missouri citizens. MoDOT is committed to improving the region's air quality through modifying daily work-related operations, modifying employees’ actions, education, providing information to the public, being a leader in air quality improvements, managing congestion to reduce emissions, providing alternative choices for commuters, and promoting the use of environmentally friendly fuels and vehicles.
Percent of Air Quality Days that Meet EPA Standards by Metropolitan Area
83
98 96
89
93
100
9394
100100
100
70
75
80
85
90
95
100
2002 2003 2004 2005 2006Calendar Year
Perc
ent
St. LouisKansas CityDallas
Desired Trend:
April 2007 TRACKER – Page 10d

Environmentally Responsible Percent of alternative fuel consumed Result Driver: Dave Nichols, Director of Program Delivery Measurement Driver: Dave DeWitt, Deputy Administrative Officer Purpose of the Measure: This measure tracks the use of alternative fuels. It shows MoDOT’s contribution toward environmental responsibility and conservation of resources. Measurement and Data Collection: Alternative fuel is E-85 and biodiesel. When a user pumps fuel into a MoDOT vehicle or piece of equipment, that usage by gallon and by fuel type is captured in the statewide financial accounting system. Reports are generated to extract the number of gallons used from that system. Improvement Status: The use of alternative fuel consumed is slightly behind the same period last year. The percent of alternative fuel consumed was 28.8 percent through the third quarter of fiscal year 2007 compared to 31.0 percent through the third quarter of fiscal year 2006. Through the third quarter the usage of biodiesel and E-85 increased compared to the same period last year; however, the increase in the alternative fuel used was not enough to overcome the large increase in winter blend diesel fuel purchased in the third quarter of 2007. MoDOT purchased 600,000 gallons more diesel than in the same time period of fiscal year 2006. The use of biodiesel is seasonal and resumed in April 2007. The department currently operates an E-85 bulk fuel station in each of the following areas: Central Office, Northwest District, Kansas City Area, St. Louis Area, and Southwest District.
Percent of Alternative Fuel Consumed
28.8
4.8 7.2 9.3
30.0
11.0
31.0
0
20
40
60
80
100
2002 2003 2004 2005 2006 Through3rd Qtr.
2006
Through3rd Qtr.
2007Fiscal Year
Perc
ent
Desired Trend:
April 2007 TRACKER – Page 10e

Environmentally Responsible Number of historic resources avoided or protected as compared to those mitigated Result Driver: Dave Nichols, Director of Program Delivery Measurement Driver: Bob Reeder, Historic Preservation Coordinator Purpose of the Measure: Federal historic preservation laws relating to federally funded projects, gaining public and agency support for particular projects, and general environmental stewardship require MoDOT to avoid, minimize or mitigate project impacts to historic buildings and bridges whenever feasible. Compiling information about project impacts to important cultural resources provides a measure of MoDOT’s success at avoiding, protecting or mitigating project impacts to important cultural resources. Measurement and Data Collection: Data collection begins at the approved conceptual plans stage for projects. As project design plans and right of way plans are prepared by the district, department staff track the number of historic resources in project footprints and the number of resources that can be avoided or protected by revising the design of a project versus the number of resources MoDOT can not avoid and must be mitigated. The data includes only historic resources identified as potentially affected by projects after the conceptual plan stage. The data does not include historic resources avoided during early project planning or those avoided during consideration of different alignments during National Environmental Policy Act (NEPA) studies. This measure has no overall desired trend. For any year, data for the measure will vary due to the number of projects in the MoDOT program and the specific nature of those projects. This is an annual measure with quarterly updates. Improvement Status: Through early project design, MoDOT was able to avoid impacts to all but four historic resources in the first quarter 2007. Of the four historic properties identified at the conceptual plan stage as being impacted by projects, MoDOT was able to modify the project in the final stages of design to avoid impacts to three historic architectural resources. The only significant historic resource that could not be avoided was a historic bridge that had project impacts mitigated through the preparation of detailed photographic and historical documentation. While there is no desired trend, the overall effectiveness of MoDOT’s historic preservation efforts is reflected by all of MoDOT’s activities during the first quarter of 2007 resulting in the required mitigation of project impacts to only one historic resource.
Number of Historic Resources Avoided or Protected as Compared to Those Mitigated
3
14
12
14
8
010 1 0 1
4
8
6
10
24
68
10
1214
16
2003 2004 2005 2006 2007Calendar Year
Num
ber
AvoidedProtectedMitigated
Desired Trend:
N/A
April 2007 TRACKER – Page 10f

Environmentally Responsible Number of tons of recycled/waste materials used in construction projects Result Driver: Dave Nichols, Director of Program Delivery Measurement Driver: Joe Schroer, Field Materials Engineer Purpose of the Measure: This measure tracks MoDOT’s efforts to be environmentally conscious while being fiscally responsible through the use of recycled/waste material when applicable. Measurement and Data Collection: The number of tons of recycled/waste material used in construction projects is measured through MoDOT’s construction management database, which tracks material incorporated into projects. Data is collected on an annual basis due to the seasonal nature of the construction. Improvement Status: Due to cooler and wetter weather conditions during the first quarter of 2007, fewer tons of recycled materials were used than in the same period of 2006. Although MoDOT will perform less concrete and asphalt paving this year, indicators are that the percentage of recycled materials used will increase – keeping the total tonnage of these materials near last year’s total. Higher availability and a change in philosophy have enhanced MoDOT’s use of recycled/waste materials. For example, four contractors are currently using mix designs with asphalt shingles, some of which were damaged by excessive heat while stored in a roofing supply warehouse last summer that rendered them unusable for their intended purpose. In the past, MoDOT used recycled/waste materials in its construction projects after being approached by suppliers/contractors. Starting in 2007, MoDOT has changed its philosophy and is now seeking out waste or recyclable materials that can be incorporated into construction projects. As a result, several potential new recycled/waste materials have been identified such as bottom ash from coal-fired power plants.
Number of Tons of Recycled/Waste MaterialsUsed in Construction Projects
27,000
466,000
201,000
895,000
2,00039,000 48,00061,000
0
100,000
200,000
300,000
400,000
500,000
600,000
700,000
800,000
900,000
1,000,000
2004 2005 2006 YTD 2007Calendar Year
Num
ber
Hot MixAsphalt
Concrete
Desired Trend:
April 2007 TRACKER – Page 10g

(This page is intentionally left blank for duplexing purposes)

Efficient Movement of Goods
Missouri’s location in the nation’s center makes it a major cross-roads in the movement of goods. Transportation infrastructure must be up to the task so that as the flow of freight becomes more efficient, businesses and communities share the economic benefits.
Tangible Result Driver – Dave DeWitt, Deputy Administrative Officer
11

Efficient Movement of Goods Freight tonnage by mode Result Driver: Dave DeWitt, Deputy Administrative Officer Measurement Driver: Brian Weiler, Multimodal Operations Director Purpose of the Measure: This measure tracks trends and indicates diversification of freight movement on Missouri’s transportation system. Measurement and Data Collection: This is an annual measure. Port tonnage is reported to MoDOT from public ports. Air cargo data is collected via mail survey to commercial airports with known cargo activity. Rail tonnage is obtained from the Association of American Railroads. MoDOT calculates motor carrier freight movement using commercial vehicle miles traveled, trip length per shipment and average truck cargo weight. Improvement Status: Total freight tonnage for all modes exceeds 1.2 billion tons. Port tonnage has remained relatively steady since 2002 despite low flows on the Missouri River. The amounts for 2006 show a slight decrease due to continued industry impacts from Hurricane Katrina and a shortened navigation season on the Missouri River (see measure 12e). Long-term growth of river transportation is hampered by an inadequate lock and dam system on the Upper-Mississippi River above St. Louis. MoDOT supports a federal proposal to update and expand this system. Motor carrier data indicates a 10 percent increase in tonnage amounts for 2006, but this spike could be partially impacted by changing variables used in MoDOT’s data calculation. It may not directly reflect exact industry tonnage amounts and should only be used to indicate general industry trends. Aviation tonnage continues to be impacted by a downturn in the aviation industry from 9/11 and the resulting financial impacts to airlines, which carry a significant portion of air cargo. Commercial airports are under the jurisdiction of the Federal Aviation Administration. However, MoDOT’s Aviation Advisory Committee helps identify ways to better support the commercial aviation industry. Rail freight tonnage declined 1 percent in 2005 despite strong demand. Railroads continue to struggle with system capacity and labor shortage issues. MoDOT is funding a capacity analysis through the University of Missouri to identify specific rail infrastructure projects that will improve both freight flow and passenger rail reliability on Union Pacific’s mainline between St. Louis and Kansas City. 2006 data for rail tonnage is not expected until late 2007.
Total Freight Tonnage(in millions)
1,187 1,207 1,232 1,202
0250500750
1,0001,2501,500
2002 2003 2004 2005Calendar Year
Tonn
age
Desired Trend:
April 2007 TRACKER – Page 11a

Port Freight Tonnage(in millions)
2.4 2.4 2.4 2.32.2
0
1
2
3
2002 2003 2004 2005 2006Calendar Year
Tonn
age
Desired Trend:
Motor Carrier Freight Tonnage (in millions)
819804 824 799 882
0
300
600
900
2002 2003 2004 2005 2006Calendar Year
Tonn
age
Desired Trend:
+
Desired Trend:
Aviation Freight Tonnage(in thousands)
299 290 282 278 267
0
100
200
300
2002 2003 2004 2005 2006Calendar Year
Tonn
age
Desired Trend:
April 2007 TRACKER – Page 11a (2)
Desired Trend:
Rail Freight Tonnage(in millions)
376 380405 400385
511501480488 514
0100200300400500600
2001 2002 2003 2004 2005Calendar Year
Tonn
age MO
IL
Desired Trend:

Efficient Movement of Goods Average travel speeds for trucks on selected roadway sections Result Driver: Dave DeWitt, Deputy Administrative Officer Measurement Driver: Michelle Teel, Assistant Motor Carrier Services Director Purpose of the Measure: This measure tracks average truck travel speeds on selected roadway sections. MoDOT recognizes the efficient movement of trucks is critical to the economy. Timely, reliable goods movement allows businesses to reduce manufacturing and inventory costs and improve responsiveness to rapidly changing markets. The desired trend is for the average truck speeds to approach the posted speed limit (the average speed limit on I-70 in Missouri is 67 mph). Measurement and Data Collection: The Federal Highway Administration launched the Freight Performance Measure initiative to monitor truck travel speeds in freight-significant corridors, including Interstate 70. In 2002, the FHWA established a partnership with the American Transportation Research Institute to determine whether and how information from communication technologies used by the freight industry could provide data to support freight performance measures. ATRI worked with technology vendors and commercial carriers to demonstrate that after removing all information except time and location data, communication technologies can be used to derive travel speeds measures. Preliminary research data, including truck travel speeds on I-70 nationwide, is available from FHWA. This data allows MoDOT to measure Missouri’s truck performance on I-70 compared to I-70 nationwide. Additional Missouri routes may be added in the future, including Interstates 55, 57, and 35. MoDOT was recently selected as a case study state to further improve and enhance the FHWA Freight Performance Measurement initiative. This measure is updated each month that new data is available from FHWA. Improvement Status: Live traffic data for three Missouri metro areas is available on MoDOT’s Web site. Motorists use Kansas City Scout, St. Louis’ Gateway Guide and Springfield’s Ozarks Traffic Web pages to check conditions on their planned and alternate routes. Motorists also base decisions on information found on work zone and road condition maps found on MoDOT’s Web site. Dynamic message signs are used to relay information to those already on the road. In addition, MoDOT’s increased emphasis on work zone and incident management and the efforts of the I-70 and I-44 corridor teams resulted in many traffic flow improvements. July through December 2006 truck travel speeds on I-70 nationwide was unavailable at time of publication.
April 2007 TRACKER – Page 11b

54.9 54.0 54.7 51.6 53.4 53.1 54.2 54.1 54.9 54.9 54.9 53.8
53.353.552.1
54.854.954.6
5051525354555657
Jan Feb Mar Apr May June July Aug Sep Oct Nov Dec
Month
Mile
s Pe
r Hou
r
Missouri
I-70 Nationwide
Average Travel Speeds for Trucks on Selected Roadway Sections2006 Calendar Year Comparison for Interstate 70
Desired Trend: N/A
54.8 54.8 54.8 55.2 55.3 53.8 53.7 54.4 54.6 55.6 54.7 54.8
54.4 54.4 54.5 54.054.854.554.4
53.953.9
54.654.553.9
50
51
52
53
54
55
56
57
Jan Feb Mar Apr May Jun Jul Aug Sept Oct Nov Dec
Month
Mile
s Pe
r Hou
r Missouri
I-70 Nationwide
Average Travel Speeds for Trucks on Selected Roadway Sections 2005 Calendar Year Comparison for Interstate 70
Desired Trend: N/A
April 2007 TRACKER – Page 11b (2)
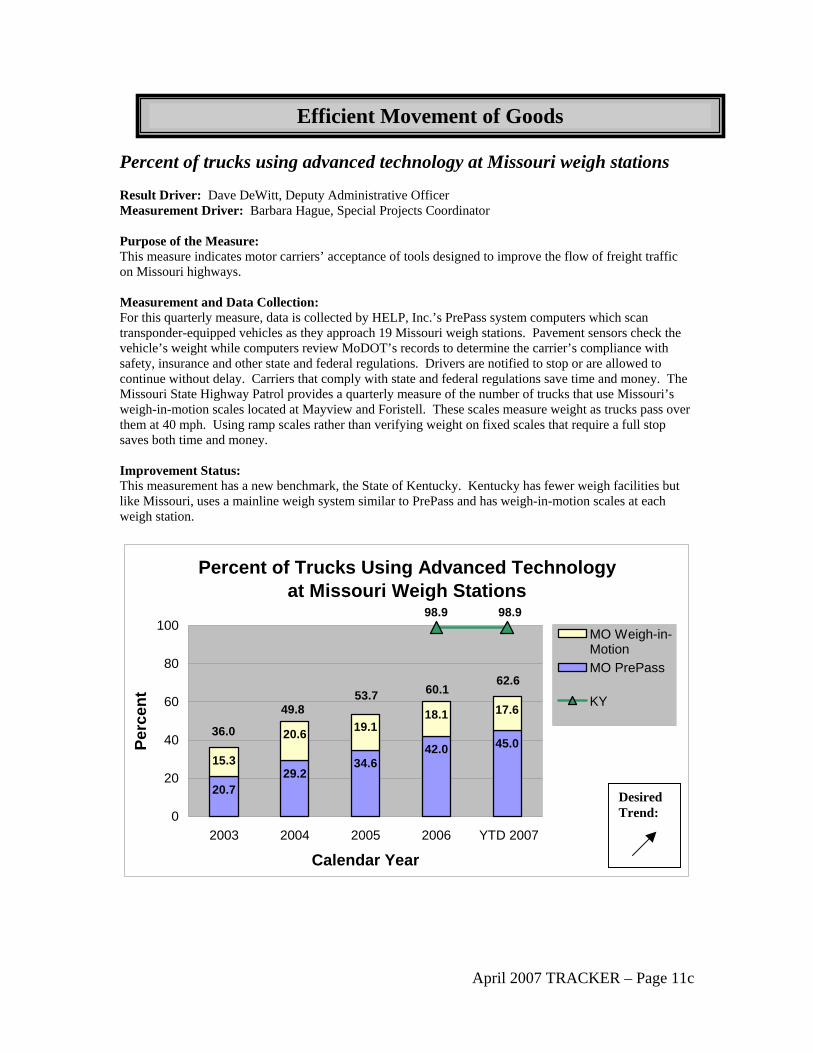
Efficient Movement of Goods Percent of trucks using advanced technology at Missouri weigh stations Result Driver: Dave DeWitt, Deputy Administrative Officer Measurement Driver: Barbara Hague, Special Projects Coordinator Purpose of the Measure: This measure indicates motor carriers’ acceptance of tools designed to improve the flow of freight traffic on Missouri highways. Measurement and Data Collection: For this quarterly measure, data is collected by HELP, Inc.’s PrePass system computers which scan transponder-equipped vehicles as they approach 19 Missouri weigh stations. Pavement sensors check the vehicle’s weight while computers review MoDOT’s records to determine the carrier’s compliance with safety, insurance and other state and federal regulations. Drivers are notified to stop or are allowed to continue without delay. Carriers that comply with state and federal regulations save time and money. The Missouri State Highway Patrol provides a quarterly measure of the number of trucks that use Missouri’s weigh-in-motion scales located at Mayview and Foristell. These scales measure weight as trucks pass over them at 40 mph. Using ramp scales rather than verifying weight on fixed scales that require a full stop saves both time and money. Improvement Status: This measurement has a new benchmark, the State of Kentucky. Kentucky has fewer weigh facilities but like Missouri, uses a mainline weigh system similar to PrePass and has weigh-in-motion scales at each weigh station.
Percent of Trucks Using Advanced Technologyat Missouri Weigh Stations
20.7
45.0
17.6
29.234.6
42.015.3
18.119.120.6
98.998.9
0
20
40
60
80
100
2003 2004 2005 2006 YTD 2007
Calendar Year
Perc
ent
MO Weigh-in-MotionMO PrePass
KY
36.0
49.853.7 60.1
62.6
Desired Trend:
April 2007 TRACKER – Page 11c

April 2007 TRACKER – Page 11d
Efficient Movement of Goods
Interstate motor carrier mileage Result Driver: Dave DeWitt, Deputy Administrative Officer Measurement Driver: Joy Prenger, Accounting Services Supervisor Purpose of the Measure: This measure reports the fluctuations of motor carrier freight movement in Missouri. MoDOT uses the information to monitor freight movement trends. Measurement and Data Collection: Data is collected quarterly. International Fuel Tax Agreement tax returns filed by member state and provinces and monthly reports of mileage data by the members are used to monitor the number of taxable miles traveled in Missouri by all motor carriers. Improvement Status: During the first quarter of 2007, motor carriers traveled 3.2 percent more miles in Missouri than in the previous quarter. This is the first gain in the four quarters for which reliable data exists. Out-of-state carriers are responsible for the increase. Missouri-based companies reported that they drove fewer miles in their home state. Trucking industry news outlets indicated that the national truck tonnage index rose 1.6 percent in February after falling 3.1 percent in January. They are not optimistic that the deep 25 percent drop in tonnage experienced in 2006 will rebound during 2007.
Interstate Motor Carrier Mileage(in millions)
1,720
957812 741 765
0
500
1,000
1,500
2,000
1st Qtr.2006
2nd Qtr.2006
3rd Qtr.2006
4th Qtr.2006
1st Qtr.2007
Calendar Year
Num
ber
Desired Trend:

Efficient Movement of Goods Percent of satisfied motor carriers Results Driver: Dave DeWitt, Deputy Administrative Officer Measurement Driver: Mary Jo Pointer, Motor Carrier Manager Purpose of the Measure: This measure tracks MoDOT’s progress toward the goal of expeditiously meeting the needs of the motor carrier industry and facilitating freight movement. MoDOT’s Motor Carrier Services team uses the data to identify opportunities to improve customer satisfaction. Measurement and Data Collection: MCS personnel, working with the Missouri Transportation Institute, developed a survey to collect customer satisfaction data. A single survey addressed all four MCS program divisions, International Registration Plan/International Fuel Tax Agreement, Overdimension/Overweight Permitting, Safety and Compliance and Operating Authority. Survey respondents identified the service(s) they use when doing business with MCS, then indicated their level of satisfaction with 12 customer service factors such as “timely response”, “friendly”, “respectful”, and “outcome”. They also gave an “overall satisfaction” score. Customers used a four-point scale: 4 = Very Satisfied, 3 = Satisfied, 2 = Dissatisfied and 1 = Very Dissatisfied. Federal Express is the benchmark for this measure that also mirrors measure 5a, Percent of Overall Customer Satisfaction. The American Customer Satisfaction Index reports that Federal Express has the highest customer satisfaction rate – 86 percent – out of 200 companies and government agencies it scores. Improvement Status: Compared to the 3rd quarter of 2006, overall MCS customer satisfaction levels decreased 4 percent to 85 percent in the fourth quarter. On an annual basis, customer satisfaction increased by 4 percent compared to the fourth quarter of 2005. A year-to-year comparison takes into account the seasonal nature of overdimension/overweight permit volumes and the fact that all fuel tax license renewals and more than half of Missouri’s carrier registration renewals are processed in the fourth quarter. On an annual basis, satisfaction with three of the four teams within MCS rose. Satisfaction with the safety and compliance section, employees who enforce motor carrier safety regulations, remained steady from the third quarter, but dropped when compared to the same time last year. To improve its service, MCS:
• Made reminder calls to customers who were in danger of missing deadlines; • Assigned senior agents to act as account managers for the largest volume carrier companies; • Continued to explore and implement process and technology improvements suggested by MCS’ Technical
User Group; and • Instigated the revival of the Mississippi Valley Conference OD/OW team to improve communication and
uniformity among member states.
April 2007 TRACKER – Page 11e

Percent of Satisfied Motor Carriers
46.044.643.043.036.0
45.1
39.047.0 38.0 38.0 39.4 43.5
86.084.0 84.0 86.0 86.0 86.0
0
20
40
60
80
100
3rdQtr.2005
4th Qtr.2005
1st Qtr.2006
2nd Qtr.2006
3rd Qtr.2006
4th Qtr.2006
Calendar Year
Perc
ent
VerySatisfied
Satisfied
FederalExpress
88.6 85.2 81.0 84.0
81.0 83.0
Desired Trend:
April 2007 TRACKER – Page 11e (2)

Efficient Movement of Goods Customer satisfaction with timeliness of Motor Carrier Services’ response Result Driver: Dave DeWitt, Deputy Administrative Officer Measurement Driver: Mary Jo Pointer, Motor Carrier Manager Purpose of the Measure: This measure tracks motor carriers’ satisfaction with MoDOT Motor Carrier Services’ speed of response. Measurement and Data Collection: Each quarter, the Missouri Transportation Institute surveys a pool of motor carriers who contacted MCS in the previous three months. These customers are asked to evaluate their satisfaction with 12 customer service factors across the four MCS program divisions, International Registration Plan/International Fuel Tax Agreement, Safety and Compliance, Over-dimension/Overweight Permitting and Operating Authority. “Timely Response” is one factor carriers evaluate with a four-point scale: 4 = Very Satisfied, 3 = Satisfied, 2 = Dissatisfied and 1 = Very Dissatisfied. Improvement Status: The customer satisfaction score for MCS’ timely response in the fourth quarter of 2006 is .34 higher than the same quarter of 2005. The satisfaction score dropped slightly from the third quarter of 2006. During the fourth quarter of each year, MCS processes all fuel tax license renewals and more than half of Missouri’s carrier registration renewals for the upcoming year. While the latest renewal season was the smoothest in recent memory, there were problems with temporary vehicle registration documents and in billing penalty fees for late payments. Working solutions are in place. Permanent fixes are scheduled to be completed by mid-2007. To improve response time, MCS:
• Paired each of the largest volume accounts with a single, senior agent. The agent acts as an account manager, handling all the carriers’ transactions and inquiries;
• Petitioned and received authorization from the Missouri Highways and Transportation Commission to allow carrier companies to deliver cab cards (registration receipts) to drivers by fax and e-mail; and
• Continued to provide training on the MoDOT Carrier Express system at customers’ request.
Customer Satisfaction with Timeliness of Motor Carrier Services' Response
3.142.982.842.733.07
0
1
2
3
4
4th Qtr.2005
1st Qtr.2006
2nd Qtr.2006
3rd Qtr.2006
4th Qtr.2006
Calendar Year
Scal
e
Desired Trend:
April 2007 TRACKER – Page 11f

Easily Accessible Modal Choices
MoDOT has an active role in all modes of transportation, including rail, air, water, and transit. Transportation is more than highways and bridges. Every day millions of tons of goods move through the state by rail. Thousands of passengers use Missouri’s airport facilities. And hundreds of barges navigate state waterways. All of these modes combine to keep Mis-souri’s economy robust and vital.
Tangible Result Driver – Brian Weiler, Multimodal Operations Director
12
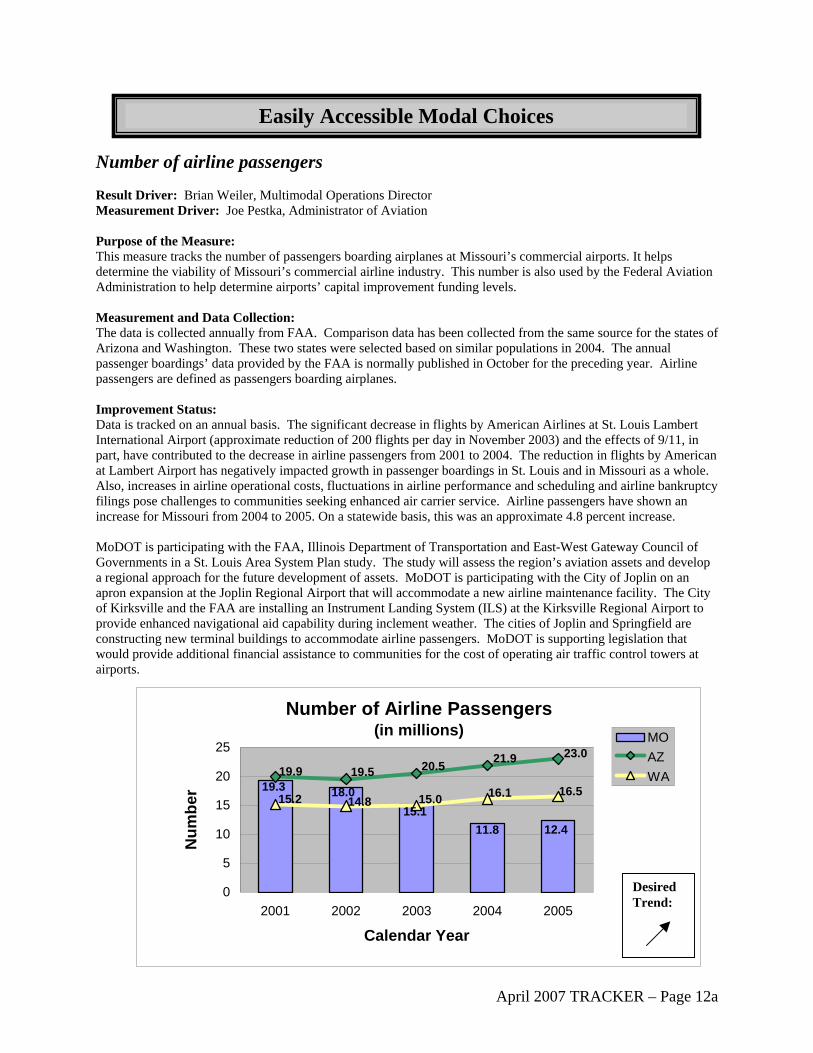
Easily Accessible Modal Choices Number of airline passengers Result Driver: Brian Weiler, Multimodal Operations Director Measurement Driver: Joe Pestka, Administrator of Aviation Purpose of the Measure: This measure tracks the number of passengers boarding airplanes at Missouri’s commercial airports. It helps determine the viability of Missouri’s commercial airline industry. This number is also used by the Federal Aviation Administration to help determine airports’ capital improvement funding levels. Measurement and Data Collection: The data is collected annually from FAA. Comparison data has been collected from the same source for the states of Arizona and Washington. These two states were selected based on similar populations in 2004. The annual passenger boardings’ data provided by the FAA is normally published in October for the preceding year. Airline passengers are defined as passengers boarding airplanes. Improvement Status: Data is tracked on an annual basis. The significant decrease in flights by American Airlines at St. Louis Lambert International Airport (approximate reduction of 200 flights per day in November 2003) and the effects of 9/11, in part, have contributed to the decrease in airline passengers from 2001 to 2004. The reduction in flights by American at Lambert Airport has negatively impacted growth in passenger boardings in St. Louis and in Missouri as a whole. Also, increases in airline operational costs, fluctuations in airline performance and scheduling and airline bankruptcy filings pose challenges to communities seeking enhanced air carrier service. Airline passengers have shown an increase for Missouri from 2004 to 2005. On a statewide basis, this was an approximate 4.8 percent increase. MoDOT is participating with the FAA, Illinois Department of Transportation and East-West Gateway Council of Governments in a St. Louis Area System Plan study. The study will assess the region’s aviation assets and develop a regional approach for the future development of assets. MoDOT is participating with the City of Joplin on an apron expansion at the Joplin Regional Airport that will accommodate a new airline maintenance facility. The City of Kirksville and the FAA are installing an Instrument Landing System (ILS) at the Kirksville Regional Airport to provide enhanced navigational aid capability during inclement weather. The cities of Joplin and Springfield are constructing new terminal buildings to accommodate airline passengers. MoDOT is supporting legislation that would provide additional financial assistance to communities for the cost of operating air traffic control towers at airports.
Number of Airline Passengers(in millions)
18.015.1
11.8 12.4
19.3
23.021.919.9 19.5 20.5
16.115.014.815.2 16.5
0
5
10
15
20
25
2001 2002 2003 2004 2005
Calendar Year
Num
ber
MOAZWA
Desired Trend:
April 2007 TRACKER – Page 12a

Easily Accessible Modal Choices Number of rail passengers Result Driver: Brian Weiler, Multimodal Operations Director Measurement Driver: Rod Massman, Administrator of Railroads Purpose of the Measure: This measure tracks the number of people using the Amtrak train service in Missouri. This includes those taking a train trip in Missouri at any point within the state, which counts those riding on the state-supported passenger rail trains between Kansas City and St. Louis; the national trains that run through the state; and the St. Louis-to-Chicago trains, which are partly supported by the state of Illinois. For comparison purposes, the state of Washington’s train data is shown based on the state’s similar size, population and the fact that Washington has both national- and state-supported trains. Washington’s “Cascades” train service is a model for the nation because the state invests millions of dollars in both infrastructure and operations every year. Measurement and Data Collection: Amtrak provides the number of passengers per train in Missouri on a monthly basis. MoDOT’s Multimodal Operations Division’s Railroad Section then tabulates the numbers. Data is updated quarterly. Improvement Status: State fiscal year 2006 showed an increase of about 2 percent over the previous year and is also the second consecutive year total ridership numbers on the St. Louis-to-Kansas City route have increased. The rising price of gas and increased congestion may explain the increase from an external viewpoint. Internally, stepped-up publicity efforts by MoDOT – such as new roadside signs, news releases, a wide-ranging distribution of train schedules, a focus on college students and a variety of other new publicity efforts, including combining appearances at rail safety fairs with Amtrak information and ticket giveaways – may account for some increases. In terms of numbers for the current fiscal year, passenger counts on the state-supported route are down 13 percent during the same time period of July through March a year ago. Challenges include a major track work program undertaken by Union Pacific during the summer of 2006 and another that began in April 2007 and will end in November 2007 on the St. Louis-to-Kansas City route which affected on-time performance. In 2006, the solution was to completely substitute buses for many trains. To avoid problems created by using buses instead of trains, the train schedules for spring 2007 were drastically altered in order to avoid the construction during its most active period during the day. These altered schedules will remain in effect from April to June 2007, and then again from August to November 2007. The addition of two more daily trains from St. Louis to Chicago and an additional train from Quincy, IL, to Chicago that both began in late 2006, along with MoDOT’s exploration of expanding Amtrak service to Springfield, have increased public discussion of Amtrak.
Number of Rail Passengers(in thousands)
427 402 422 433
313390
117174171162167189
482608609598581573
371 381 391 409402 329
0100200300400500600700
2002 2003 2004 2005 2006 YTD 2007Fiscal Year
Num
ber
All Missouri Trains
Missouri StateSponsored TrainsAll WashingtonTrainsWashington StateSponsored Trains
Desired Trend:
April 2007 TRACKER – Page 12b

Easily Accessible Modal Choices Number of transit passengers Result Driver: Brian Weiler, Multimodal Operations Director Measurement Driver: Steve Billings, Administrator of Transit Purpose of the Measure: This measure gauges the use of public transit mobility services in Missouri. It also provides a historical perspective and trend of public transit service use in Missouri. Measurement and Data Collection: The total number of transit passengers is measured by the annual total of one-way unlinked transit trips taken by passengers on public transit vehicles. Data is obtained from urban and rural providers of general public transit services. The 2004-2006 measures are benchmarked to Wisconsin, which has a comparable total statewide population. This is an annual measure with Missouri data updated in October. Wisconsin’s 2006 fiscal year data is by the calendar year. Improvement Status: Metro ridership statewide in 2006 increased by 4.6 million trips compared to 2005 with more annual transit trips taken by riders in all of Missouri’s metro transit systems, except St. Joseph. Kansas City began its MAX bus rapid transit service during this period while higher gasoline prices convinced some people to make more of their trips by transit. Non-metro (rural) ridership decreased by 6 percent from 3.3 million trips in 2005 to 3.1 million trips in 2006. Most of the loss in rural transit use is associated with cuts in funding and schedules for social service transportation programs that were coordinated, in part, with rural public transit service schedules. Missouri compared favorably to Wisconsin’s rural transit ridership in 2004-2006. Wisconsin’s transit ridership statewide increased in 2005, largely due to greater transit use in Milwaukee. For 2007, the Missouri Legislature appropriated an additional $250,000 for non-metro transit, as well as an additional $250,000 to Springfield to partially offset a decrease of federal transit operating assistance. MoDOT continues working with transit providers in developing a second Missouri Rural Transit Marketing Campaign. Marketing meetings began in December 2006.
April 2007 TRACKER – Page 12c

Number of Transit Passengers(in millions of annual one-way unlinked
metro transit passenger trips)
67.362.761.462.064.6
68.6 70.470.4
0
15
30
45
60
75
2002 2003 2004 2005 2006Fiscal Year
Num
ber
MissouriMetro
WisconsinMetro
Desired Trend:
Number of Transit Passengers(in millions of annual one-way unlinked
non-metro transit passenger trips)
3.1 3.1 3.2 3.13.3
2.4 2.62.5
0
1
2
3
4
2002 2003 2004 2005 2006Fiscal Year
Num
ber
MissouriNon-Metro
WisconsinNon-Metro
Desired Trend:
April 2007 TRACKER – Page 12c (2)

Easily Accessible Modal Choices
Number of passengers and vehicles transported by ferryboat Result Driver: Brian Weiler, Multimodal Operations Director Measurement Driver: Sherrie Martin, Waterways Program Manager Purpose of the Measure: This measure tracks information regarding use of ferryboat services in Missouri. Measurement and Data Collection: Missouri’s two ferry services submit a monthly report that includes information on the number of passengers and vehicles, the cost for providing the service and reasons for any service disruption. This measure is updated on a quarterly basis. Improvement Status: In the first three quarters of fiscal year 2007, the New Bourbon ferryboat carried a total of 7,779 vehicles with 23,956 passengers compared to 11,780 vehicles with 27,054 passengers in the first three quarters of fiscal year 2006. While this is a 34 percent decrease in vehicle traffic from one year ago, it still has improved from a 55 percent decrease in the first quarter and a 40 percent decrease in the second quarter. The service was closed for 15 days in February due to low water. The Mississippi County ferryboat sustained transmission damage on Dec. 15, 2006, and was out of service until Jan. 12, 2007. Repairs were complete with the boat back in service on Jan. 11, 2007. With the loss of 11 days of service, vehicle and passenger counts were down for the month of January. However, February and March counts exceeded the previous year. In fiscal year 2006 year-to-date the ferry had carried 12,186 vehicles and 26,826 passengers, in the same period in fiscal year 2007 the ferry carried 11,686 vehicles with 24,895 passengers. That is a 4 percent decrease in vehicles and a 7 percent decrease in passengers. The ferry operated 266 days in fiscal year 2006 compared to 247 days in fiscal year 2007. This 7 percent decrease is a direct result of the service interruption. MoDOT will submit applications to the Federal Highway Administration for the Federal Ferry Boat Discretionary Program to increase the capacity of both services. The application for the Mississippi County ferry service will be for $1 million for a larger barge. The application for the New Bourbon ferry service will be for $200,000 in federal funds to be matched with $50,000 in state Port Capital Improvement Program funds. These funds will be used to purchase the barge that is currently in service at Mississippi County and will be contingent upon Mississippi County being funded for new equipment.
April 2007 TRACKER – Page 12d

Number of Passengers and VehiclesTransported by Ferryboat
New Bourbon Regional(in thousands)
11.816.6
7.817.816.615.8
52.258.858.2
36.7
27.1 24.0
010203040506070
2003 2004 2005 2006 Through3rd Qtr.
2006
Through3rd Qtr.
2007Fiscal Year
Num
ber
VehiclesPassengers
Desired Trend:
Desired Trend:
Number of Passengers and VehiclesTransported by Ferryboat
Mississippi County(in thousands)
12.217.9
13.7 16.4 17.711.7
31.337.3 39.9 39.1
26.8 24.9
0
10
20
30
40
50
2003 2004 2005 2006 Through3rd Qtr.
2006
Through3rd Qtr.
2007
Fiscal Year
Num
ber
VehiclesPassengers
April 2007 TRACKER – Page 12d (2)

Easily Accessible Modal Choices Number of days the Missouri River is navigable Result Driver: Brian Weiler, Multimodal Operations Director Measurement Driver: Sherrie Martin, Waterways Program Manager Purpose of the Measure: This measure provides historical data regarding the use of the inland waterways navigation system. The Mississippi River typically is open to navigation year round with interruptions to navigation only for extreme high/low water events and winter conditions on the Upper Mississippi. The Missouri River has a controlled navigation season. Measurement and Data Collection: The U.S. Army Corps of Engineers publishes an Annual Operating Plan for the Missouri River and bases the end of navigation season on pool storage levels as of July 1 each year. Improvement Status: The 2007 navigation season began April 1 and will maintain flows and trigger dates as outlined in the Master Water Control Manual. Releases will support minimum navigation through the season, and the storage level as of July 1 will determine the end of the season. The full navigation season would end Dec. 1, 2007. The Corps of Engineers estimates, based on current storage levels, that the navigation season will be shortened between 33 and 61 days. This is an annual measure that will be updated in July 2007.
Number of Days the Missouri River is Navigable
(Navigation Season)
221238
197 200196
244
050
100150200250300350
2002 2003 2004 2005 2006
Calendar Year
Num
ber
ActualNavigationSeasonFullNavigationSeason
Desired Trend:
April 2007 TRACKER – Page 12e

Easily Accessible Modal Choices Number of business-capable airports Result Driver: Brian Weiler, Multimodal Operations Director Measurement Driver: Joe Pestka, Administrator of Aviation Purpose of the Measure: This measure tracks the number of airports capable of handling business aircraft. Local communities and economic development agencies can use airports to assist in increasing a community’s economic viability for business retention and development. Measurement and Data Collection: The graph shows the number of business-capable airports. A business-capable airport is defined as accommodating business- or corporate-type aircraft with a runway length of 5,000 feet or more. Since 2002, three additional airports in Missouri have either extended or constructed runways of 5,000 feet or greater. This increase allows additional communities and an increased population area greater exposure to business-capable airports. Comparison data for 2005 and 2006 has been collected from the states of Washington and Arizona. These states have similar population totals as Missouri. Washington is similar in geographic area with Arizona being approximately 65 percent larger than Missouri. Data is collected annually by monitoring airport developments and Federal Aviation Administration records. Improvement Status: The State Airport System Plan Update and the annual development of MoDOT’s Statewide Transportation Improvement Plan identify airports that meet the demand criteria and would support the development of a 5,000-foot runway. A new business-capable airport is under construction in Branson West, and the City of Dexter is extending the runway at the Dexter Municipal Airport to 5,000 feet. The State Aviation Trust Fund, which is used for maintenance and capital improvement projects at airports, increased from approximately $3 million in calendar year 2004 to $6 million in calendar year 2006. An airport survey and information campaign conducted by MoDOT, and the Missouri Department of Revenue’s review of the trust fund, led to obtaining these additional funds. MoDOT is supporting legislation that would increase the annual cap on the State Aviation Trust Fund from $6 million to $8.5 million.
Number of Business-Capable Airports
2929292726
51 52
2625
0102030405060
2002 2003 2004 2005 2006
Calendar Year
Num
ber MO
AZWA
Desired Trend:
April 2007 TRACKER – Page 12f

Easily Accessible Modal Choices Number of daily scheduled airline flights Result Driver: Brian Weiler, Multimodal Operations Director Measurement Driver: Joe Pestka, Administrator of Aviation Purpose of the Measure: This measure tracks the number of airline flights. The data assists in determining options available to the traveling public. It provides an indication of the airline industry’s economic stability in Missouri. Measurement and Data Collection: A direct scheduled airline flight is a take-off by a scheduled commercial air carrier. A direct flight has the same flight number and is flying to one or more destinations. Data is being collected from seven airports in the state that presently accommodate scheduled airline flights. These airports are: St. Louis Lambert International, Kansas City International, Springfield-Branson, Joplin, Columbia, Waynesville and Cape Girardeau. Comparison data has been collected for the commercial airports in Arizona and Washington. These two states were selected based on similar populations in 2004. The data is collected from the Official Airline Guide. The flights are tracked on a monthly basis with a daily snapshot collected for each month and are then averaged on a quarterly basis. Improvement Status: The number of daily scheduled airline flights in Missouri peaked in the third quarter of 2006 at 1,042. This quarter includes the summer travel months of July, August and September. Daily scheduled airline flights in Missouri have increased from the fourth quarter of 2005 compared to the fourth quarter of 2006 and from the first quarter of 2006 compared to the first quarter of 2007, while there has been a reduction in flights experienced for the same time period in Washington and Arizona. MoDOT is participating with the Federal Aviation Administration, Illinois Department of Transportation and East-West Gateway Council of Governments in a St. Louis Area Aviation System Plan study. The study will assess the region’s aviation assets and develop a regional approach for the future development of assets.
Number of Daily Scheduled Airline Flights(Direct)
9449441,042
944938924
1,1641,1611,342
1,2411,1731,223
1,5611,418 1,444
1,6721,419
1,261
0200400600800
1,0001,2001,4001,6001,800
4th Qtr.2005
1st Qtr.2006
2nd Qtr.2006
3rd Qtr.2006
4th Qtr.2006
1st Qtr.2007
Calendar Year
Num
ber MO
WAAZ
Desire Trend:
April 2007 TRACKER – Page 12g

Easily Accessible Modal Choices Average number of days per week rural transit service is available Result Driver: Brian Weiler, Multimodal Operations Director Measurement Driver: Steve Billings, Administrator of Transit Purpose of the Measure: This measure identifies the average existing public transit service in rural Missouri by indicating the availability of rural mobility services for employment, medical appointments and necessary shopping. Measurement and Data Collection: Reviewing published transit service schedules for each rural Missouri county and averaging these daily frequencies within a week’s schedule for available countywide transit service calculates the statewide average number of days per week rural transit service is available. Rural transit agencies operate on an annual budget and customarily make transit service changes with the start of a new budget year. This is an annual measure with updates occurring in April. The measure is benchmarked to Tennessee, which has a comparable statewide population and some amount of transit service in every rural county as does Missouri. Improvement Status: Rural transit service at a statewide average of two days per week is not sufficient for its riders to support full-time employment. The outlook for 2008 suggests an opportunity for growth in rural transit service based on an increase of federal rural transit funds authorized to Missouri through SAFETEA-LU, which is the federal transportation funding legislation. For 2006, Tennessee deployed more days of rural transit service with five-day-a-week service, subject to available seating. Tennessee directs more state funding to rural public transportation ($7.0 million vs. $1.1 million in Missouri). Tennessee’s transit providers also use pure demand-response dispatching compared to designated daily routes as used by OATS and other Missouri providers. However in 2005, Missouri’s rural transit providers together delivered 3.3 million trips compared to 1.4 million rural transit trips provided in Tennessee. MoDOT recently worked with local transit systems to produce a speaker’s video to help transit managers make a persuasive case for more local funding for rural transit service. MoDOT also procured rural transit intelligent transportation system design services to help bring technology improvements to rural public transit to increase service through scheduling efficiencies. The kick-off meeting for the rural transit ITS design project was held in December 2006 with subsequent rural transit assessment visits occurring in January and February of 2007.
Average Number of Days Per Week Rural Transit Service is Available
2.12.0 2.0
5.05.0
01234567
2005 2006 2007Fiscal Year
Num
ber
MissouriTennessee
Desired Trend:
April 2007 TRACKER – Page 12h

Easily Accessible Modal Choices Number of intercity bus stops Result Driver: Brian Weiler, Multimodal Operations Director Measurement Driver: Steve Billings, Administrator of Transit Purpose of the Measure: This measure tracks the number of intercity bus stops. Intercity bus stops represent access points to intercity bus services provided by Greyhound, Jefferson Lines and Trailways, and most recently, Megabus. More stops among Missouri’s 114 counties means greater access. Fewer stops create a barrier by requiring greater traveling distances in order to board an intercity bus. Measurement and Data Collection: Data on the number and location of intercity bus stops is obtained annually from the national and regional intercity bus carriers. This is an annual measure with quarterly year-to-date updates of the most recent calendar year. The 2006 and 2007 measures are benchmarked to Wisconsin, which has a comparable total statewide population. Improvement Status: The number of Missouri’s intercity bus stops has stabilized after a decline due to changes in Greyhound service. New stops were added in Kansas City and St. Louis in April with the start of Megabus service. However those Megabus stop locations do not allow for direct transfers to other intercity bus carriers. Also, this Megabus route makes no intermediate stops between Kansas City and St. Louis. Megabus offers Internet based discounted bus fares and continuing service to Chicago from St. Louis. Wisconsin has seen no net change in total statewide intercity bus stops from 2006 to 2007. However, five stops were abandoned and five intercity bus stops were added this past year in Wisconsin. MoDOT delivered a presentation of a report on Missouri’s intercity bus services to the Transportation Research Board’s Rural and Intercity Bus Conference in Stevenson, WA in October 2006. That report contained several recommendations including improved marketing of intercity bus services in Missouri. MoDOT recently worked with Jefferson Lines to procure two buses that were delivered in December 2006 to operate service in Missouri. Jefferson Lines in May 2006 added a route with five stops to serve the abandoned Greyhound routes on the Missouri 13/U.S. Route 65 corridor that restored intercity bus service to Clinton, Osceola, Humansville, Bolivar and Branson.
Number of Intercity Bus Stops
50 4739 37 39
7575
0
20
40
60
80
100
2003 2004 2005 2006 YTD 2007
Calendar Year
Num
ber
MissouriWisconsin
Desired Trend:
April 2007 TRACKER – Page 12i

Easily Accessible Modal Choices Percent of customers satisfied with transportation options Result Driver: Brian Weiler, Multimodal Operations Director Measurement Driver: Matt Cowell, Railroad Operations Manager Purpose of the Measure: This measure provides information about the public’s perception of MoDOT’s performance in providing transportation options. Measurement and Data Collection: Data was collected through an annual statewide customer satisfaction telephone survey, which is reported in July of each year. The survey included interviews with 3,500 Missouri adults with an overall margin of error of +/- 3 percent. Improvement Status: For the 2006 survey, over 69 percent of the survey participants sampled stated they are strongly satisfied or somewhat satisfied with transportation options in Missouri. Conversely, 24 percent of the sample is somewhat dissatisfied or strongly dissatisfied with the transportation options available. The remaining seven percent sampled were unsure about transportation options. When compared to the 2005 data provided from the statewide customer survey, 67 percent of the sample was somewhat satisfied or was strongly satisfied with transportation options, while 28 percent responded as somewhat dissatisfied or strongly dissatisfied, and 5 percent were unsure with the options available to those who do not or cannot drive. The desired trend has increased by 2 percent from the 2005 survey. MoDOT is currently working with Missouri's regional planning commissions and metropolitan planning organizations to determine Missouri's highest transportation investment priorities. Investment scenarios are being created that will represent both highway and bridge priorities, as well as alternative mode priorities. This collaborative process will be shared with Missouri legislators and other pertinent parties as discussions about increased investment in transportation take place.
Percent of Customers Satisfied with Transportation Options
5054
34
19
18
13
0
20
40
60
80
100
2000 2005 2006
Calendar Year
Perc
ent
StronglySatisfied
SomewhatSatisfied
6967
52
Desired Trend:
April 2007 TRACKER – Page 12j

(This page is intentionally left blank for duplexing purposes)

Customer Involvement in Transportation Decision-Making
MoDOT seeks out and welcomes any idea that increases its op-tions, because the department doesn’t have all the answers. The department creates and preserves a transportation de-cision-making process that is collaborative and transparent, involving its customers in the determination of needs right through to the development, design and delivery of projects.
Tangible Result Driver – Dave Nichols, Director of Program Delivery
13

Customer Involvement in Transportation Decision-Making Number of customers who attend transportation-related meetings Result Driver: Dave Nichols, Director of Program Delivery Measurement Driver: Bob Brendel, Outreach Coordinator Purpose of the Measure: This measure gauges MoDOT’s public involvement success – both in terms of public meetings and hearings that are held to make collaborative decisions with the general public, communities, elected officials, stakeholders, and in terms of public informational events scheduled by MoDOT to keep its customers advised of project status and potential impacts that could be experienced. Measurement and Data Collection: Attendance is determined by analyzing sign-in sheets used at public meetings or by head counts conducted by MoDOT staff. This is an annual measure updated quarterly. Improvement Status: Attendance at public meetings/hearings hosted by MoDOT during the first quarter of 2007 was up five percent over the same quarter in 2006. More than 2,000 persons attended first-quarter meetings in the Kansas City Area District alone, and nearly 800 attended a series of meetings in St. Louis to share construction plans for The New I-64 project.
Number of Customers Who AttendTransportation-Related Meetings
5,2455,995
4,308
7,356
5,501
01,0002,0003,0004,0005,0006,0007,0008,000
1st Qtr.2006
2nd Qtr.2006
3rd Qtr.2006
4th Qtr.2006
1st Qtr.2007
Calendar Year
Num
ber
Desired Trend:
April 2007 TRACKER – Page 13a

Customer Involvement in Transportation Decision-Making Percent of customers who are satisfied with feedback they receive from MoDOT after offering comments Result Driver: Dave Nichols, Director of Program Delivery Measurement Driver: Bob Brendel, Outreach Coordinator Purpose of the Measure: This measure tracks MoDOT’s responses to its customers. MoDOT routinely asks people who attend public meetings/hearings to submit comments that will be examined by the project team and will become part of the project’s official record. It is important that people who avail themselves of this opportunity know that their comments are taken seriously. Measurement and Data Collection: MoDOT Design, Community Relations and Organizational Results developed a survey in cooperation with the Missouri Transportation Institute for persons who attend project-specific meetings and hearings. The initial survey was sent to more than 4,500 persons who attended meetings in a five-year period. A survey process continues, with contacts made each time a project reaches the official public hearing milestone. This is an annual measure based upon a fiscal year, and data is analyzed twice each year. Improvement Status: There is no new data for this measure. Its next update will be in July 2007. In the first six months of fiscal year 2007, people who attended public hearings for 14 projects in four MoDOT districts were surveyed, and their overall satisfaction with MoDOT continues to rise. An all-time high of 77.5 percent said they were satisfied with how their questions and comments were handled by MoDOT. A record-high response was also realized in the number of people who said they clearly understood the information and explanations given by MoDOT (90.3 percent) and in the number of people who said the decision-making process was open, transparent and fair (75.2 percent). Quarterly discussions and reviews of Tracker measures with CR managers across the state continue to help enhance performance in the area of public involvement and proactive communication with MoDOT customers. MoDOT’s satisfaction rate compares favorably with that of utility companies whose customer satisfaction is evaluated by the American Customer Satisfaction Index, coordinated by the University of Michigan.
55.2 54.1 57.111.5 19.4 20.4
62.372.2
0
20
40
60
80
100
1999 - 2005 2006 YTD 2007Fiscal Year
Perc
ent
VerySatisfied
Satisfied
UtilityCompanies*
Percent of Customers Who Are Satisfied with Feedback They Receive from MoDOT after Offering Comments
77.5
66.7 73.5
Desired Trend:
*As measured by the American Customer Satisfaction Index.
April 2007 TRACKER – Page 13b

Customer Involvement in Transportation Decision-Making Percent of customers who feel MoDOT includes them in transportation decision-making process Result Driver: Dave Nichols, Director of Program Delivery Measurement Driver: Sue Cox, Transportation Planning Outreach Coordinator Purpose of the Measure: This data assists in determining the effectiveness of MoDOT’s project planning outreach efforts. Measurement and Data Collection: Data for this measure is collected annually. The most recent data, gathered from a statewide random telephone survey of 3,500 Missourians, was collected in May 2006. Survey data originally collected for MoDOT’s long-range planning initiative called Missouri Advance Planning in May 2005 provided a baseline for comparison of the 2006 survey data. One focus of the MAP initiative was to improve the public’s involvement in transportation decision-making. To accomplish this, six citizen groups, called Regional Working Groups, were created, representing economic development leaders, educators, farmers, bankers, community leaders and local elected officials. RWG members helped MoDOT analyze transportation policies and develop new ideas in an effort to plan for Missouri’s transportation future. Improvement Status: A May 2006 customer telephone survey showed that 52 percent of the survey sample feels MoDOT takes into consideration their concerns and needs when developing transportation decisions, up from 46 percent in 2005. Dissatisfaction with MoDOT has dropped from 44 percent in 2005 to 37 percent in 2006. MoDOT anticipates that continuously improving community outreach and external communication efforts will result in greater public involvement in transportation decision-making.
Percent of Customers Who Feel MoDOT Includes Them in Transportation
Decision-Making Process
36 39
1310
0
20
40
60
80
100
2005 2006Calendar Year
Perc
ent
Strongly AgreeSomewhat Agree
4652
Desired Trend:
April 2007 TRACKER – Page 13c

Customer Involvement in Transportation Decision-Making Percent of positive feedback responses received from planning partners regarding involvement in transportation decision-making Result Driver: Dave Nichols, Director of Program Delivery Measurement Driver: Sue Cox, Transportation Planning Outreach Coordinator Purpose of the Measure: This measures MoDOT’s efforts of including planning partners (members of metropolitan planning organizations and regional planning commissions) in transportation-related decision-making. The percent of positive feedback through the surveys demonstrates planning partners’ involvement. Measurement and Data Collection: MoDOT Transportation Planning works with Missouri Transportation Institute to administer a survey measuring planning partners’ involvement in the transportation decision-making process. The survey answers are based on the following scale: strongly disagree, disagree, agree and strongly agree. This measure is changing to an annual measure. The next survey will be late spring/early summer 2007. Previously, survey data was collected from planning partners following each quarter of MoDOT’s planning meetings or work sessions. Improvement Status: Beginning in fiscal year 2007, the quarterly survey will become an annual survey focusing more on feedback regarding overall involvement of planning partners in the planning process rather than on individual MoDOT meetings. Planning partners have indicated a survey following each quarters’ public outreach activities is excessive, and thus the survey participation and feedback have declined. The following results indicate positive experiences and involvement in the outreach efforts.
• 20 of 22 completed surveys in the 4th quarter of state fiscal year 2005 • 37 of 44 completed surveys in the 1st quarter of state fiscal year 2006 • 9 of 14 completed surveys in the 2nd quarter of state fiscal year 2006 • 8 of 11 completed surveys in the 3rd quarter of state fiscal year 2006 • 15 of 21 completed surveys in the 4th quarter of state fiscal year 2006
Percent of Positive Feedback Responses Received from Planning Partners Regarding Involvement in
Transportation Decision-Making
84
6473 71
0
20
40
60
80
100
4th Qtr.FY 2005
1st Qtr.FY 2006
2nd Qtr.FY 2006
3rd Qtr.FY 2006
4th Qtr.FY 2006
Fiscal Year
Perc
ent
Desired Trend:
91
Note: The percent for each quarter reflects agree and strongly agree answers from the survey.
April 2007 TRACKER – Page 13d
(This page is intentionally left blank for duplexing purposes)
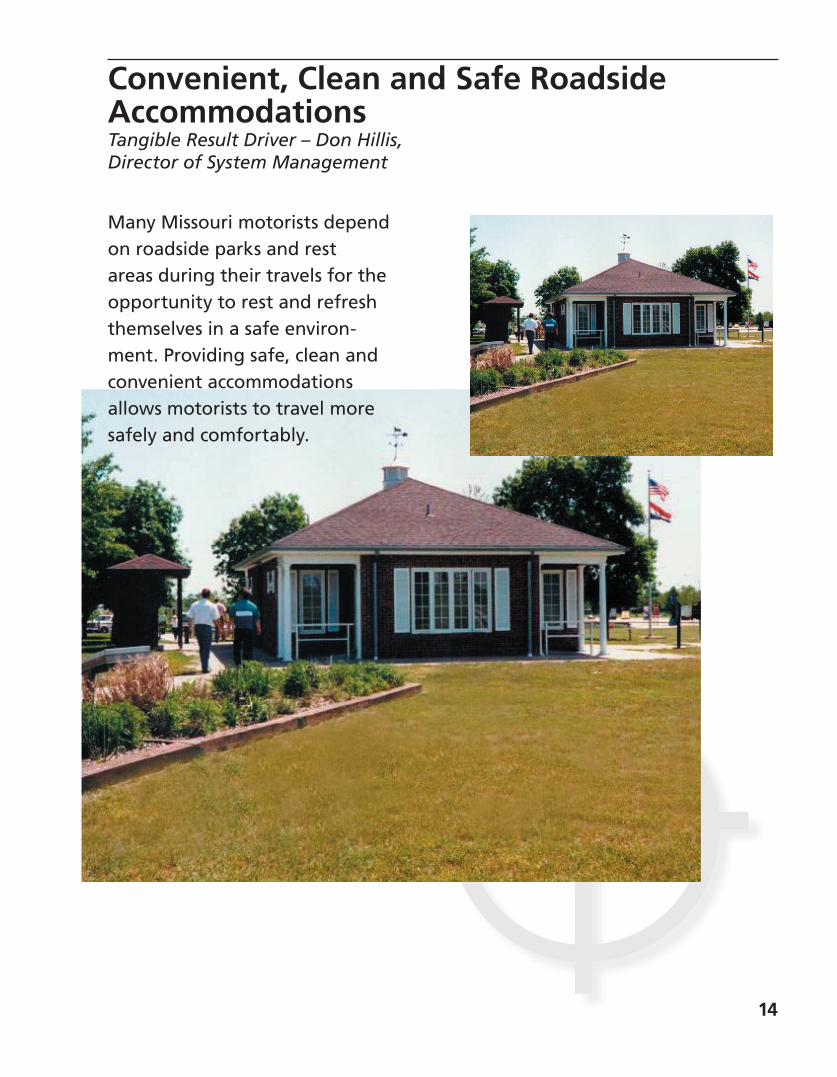
Convenient, Clean and Safe Roadside Accommodations
Many Missouri motorists depend on roadside parks and rest areas during their travels for the opportunity to rest and refresh themselves in a safe environ-ment. Providing safe, clean and convenient accommodations allows motorists to travel more safely and comfortably.
Tangible Result Driver – Don Hillis, Director of System Management
14

Convenient, Clean and Safe Roadside Accommodations Percent of customers satisfied with rest areas’ convenience, cleanliness and safety Result Driver: Don Hillis, Director of System Management Measurement Driver: Jim Carney, State Maintenance Engineer Purpose of the Measure: This measure helps MoDOT understand customer expectations concerning the convenience, cleanliness and safety of its rest areas. This information will provide insight to rest area location, lighting, and security as well as the overall cleanliness expectations. Measurement and Data Collection: MoDOT measures this attribute with both internal and external data collection. MoDOT receives information from a survey card offered at all rest areas. The survey cards ask a variety of questions with three of the questions specifically asking if the rest area is convenient, clean and safe. This provides direct input from our customers and is considered our external source. All comments from the cards are sent to the districts and sheltered workshop contractor on a quarterly basis to ensure concerns are addressed in a timely manner. To ensure the customer satisfaction, all rest areas are inspected using an attribute list developed and based on an industry-wide literature review. The attribute list includes characteristics rest-area users identified as what they consider convenient, clean and safe. MoDOT maintenance employees inspect all rest areas and the work of the sheltered workshop contractor at least two times per month using this list and are considered our internal source. MoDOT works with Extended Employment Sheltered Workshops to provide the cleaning at all 19 rest areas in the system. The sheltered workshop employees provide this service 365 days a year, many from early morning (6 a.m.) to late in the evening (10 p.m.). This measure is updated quarterly. Improvement Status: The rest area survey cards were made available in May 2005. The increase in the number of returned cards corresponds with the seasonal increase in visitors to the rest areas. A total of 8,054 cards were returned in fiscal year 2006. The 3,125 cards returned in the first quarter of fiscal year 2007 then dropped to 1,489 cards in the second quarter and 788 cards for the current quarter. Customer satisfaction for all three attributes is slightly lower than the previous quarter. One site had over 44 percent (26 of 59) of the “not clean” responses. The lower rating at this site may be due to new water and sewer line installation that resulted in fixtures being out of order. MoDOT implements actions to improve the cleanliness at rest areas with lower satisfaction ratings by direct contact with the contractor. Based on the cards returned from 48 different states, Canada, Ireland, the United Kingdom and Switzerland, MoDOT is meeting the needs of its customers. The internal rest area inspections started in May 2005. MoDOT is doing extremely well at meeting the customers’ expectations for convenient, clean and safe facilities, largely in part to these inspections conducted a minimum of two times per month. The inspection scores have increased over the past few quarters but dropped slightly to 94.3 percent for the third quarter of 2007. This is still slightly higher than the same time period of 2006. MoDOT takes care of maintenance concerns in a timely manner to keep the rest areas open for use.
April 2007 TRACKER – Page 14a
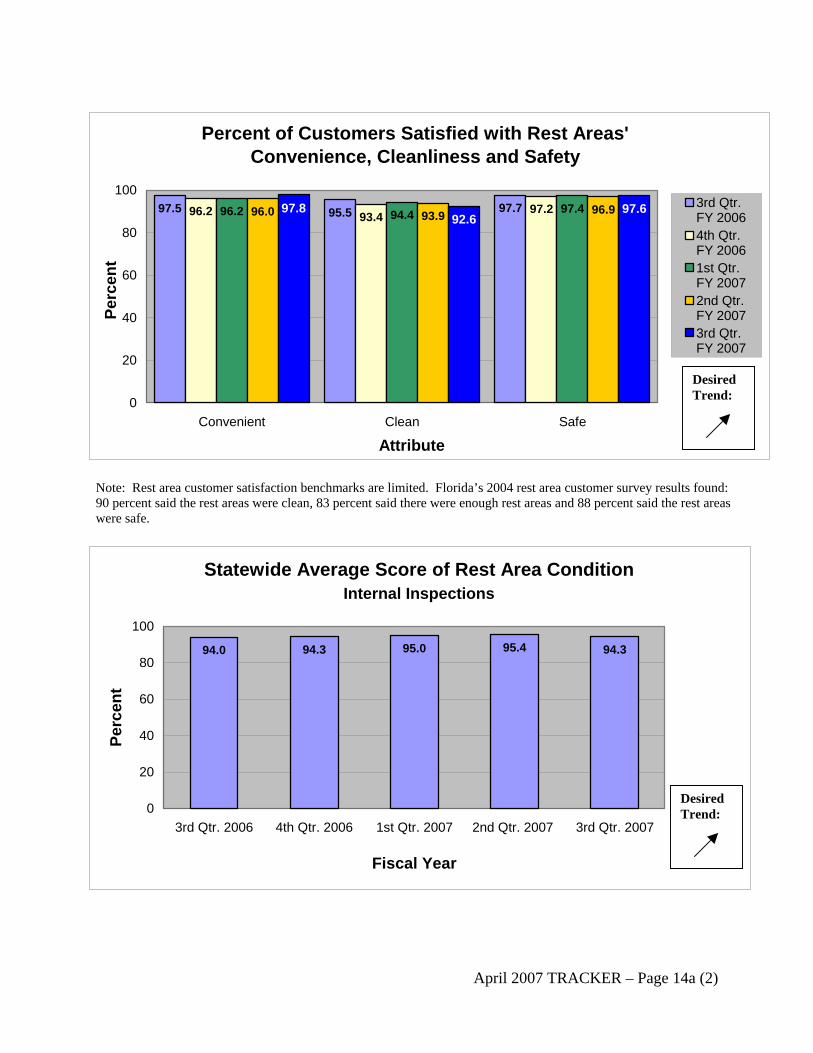
Percent of Customers Satisfied with Rest Areas' Convenience, Cleanliness and Safety
95.597.5 97.796.2 97.293.496.2 94.4 97.493.9 96.996.0 97.692.6
97.8
0
20
40
60
80
100
Convenient Clean Safe
Attribute
Perc
ent
3rd Qtr.FY 2006 4th Qtr.FY 20061st Qtr.FY 2007 2nd Qtr.FY 2007 3rd Qtr.FY 2007
Desired Trend:
Note: Rest area customer satisfaction benchmarks are limited. Florida’s 2004 rest area customer survey results found: 90 percent said the rest areas were clean, 83 percent said there were enough rest areas and 88 percent said the rest areas were safe.
94.395.495.094.394.0
0
20
40
60
80
100
3rd Qtr. 2006 4th Qtr. 2006 1st Qtr. 2007 2nd Qtr. 2007 3rd Qtr. 2007
Fiscal Year
Perc
ent
Statewide Average Score of Rest Area ConditionInternal Inspections
Desired Trend:
April 2007 TRACKER – Page 14a (2)

Convenient, Clean and Safe Roadside Accommodations Percent of customers satisfied with commuter lots’ convenience, cleanliness and safety Result Driver: Don Hillis, Director of System Management Measurement Driver: Tim Chojnacki, Technical Support Engineer Purpose of the Measure: This measure will help the department understand customer expectations concerning commuter lot convenience, cleanliness and safety. This information will provide insight to location, lighting and security at commuter lots as well as their overall cleanliness. Measurement and Data Collection: MoDOT receives information in the form of survey cards distributed by MoDOT employees at 20 commuter lots. The survey contains a variety of questions, three of which specifically ask if the commuter lot is convenient, clean and safe. This is a baseline measure that provides direct input from the department’s customers and is considered an external source. This is an annual measure updated each January. To further assess condition and ensure customer satisfaction with the commuter lots, all lots are inspected based on attributes identified in an industry-wide literature review as to what commuter lot customers’ consider convenient, clean and safe. MoDOT maintenance employees inspect all commuter lots each quarter. This measure is updated quarterly. Improvement Status: Commuter lot survey cards were distributed to 1,134 customers in December 2006 and the department received 446 replies. Ninety-seven percent of the customers thought the lots were convenient with 66 percent using them five days per week. Sixty-eight percent cited saving fuel costs as the most important reason to use the lot. Eighty-three percent of the customers were satisfied with cleanliness. MoDOT received many comments about litter and the need for trash cans. Eighty-two percent of customers were satisfied with safety at the lots with several customers expressing the need for additional lighting and almost 9 percent reporting theft and property damage concerns. Other frequent comments included the need for better surface maintenance on the gravel and asphalt lots and in a few lots expansion to provide more parking spaces. MoDOT established a quarterly internal inspection process in May 2006 to be performed at all commuter lots to identify maintenance needs. The quarterly inspections provide input to district maintenance supervisors on work needed at the commuter lot for condition of signs, parking lot surface, litter, and vegetation management. The May 2006 inspection indicated a statewide average condition score of 75 percent. The August 2006 condition score was 78 percent and the November 2006 condition score was 80 percent. The February 2007 condition score remained flat at 80 percent. MoDOT staff continues to improve their efforts working with law enforcement agencies to more closely monitor the lots that have reported concerns with theft and property damage complaints to improve safety.
April 2007 TRACKER – Page 14b
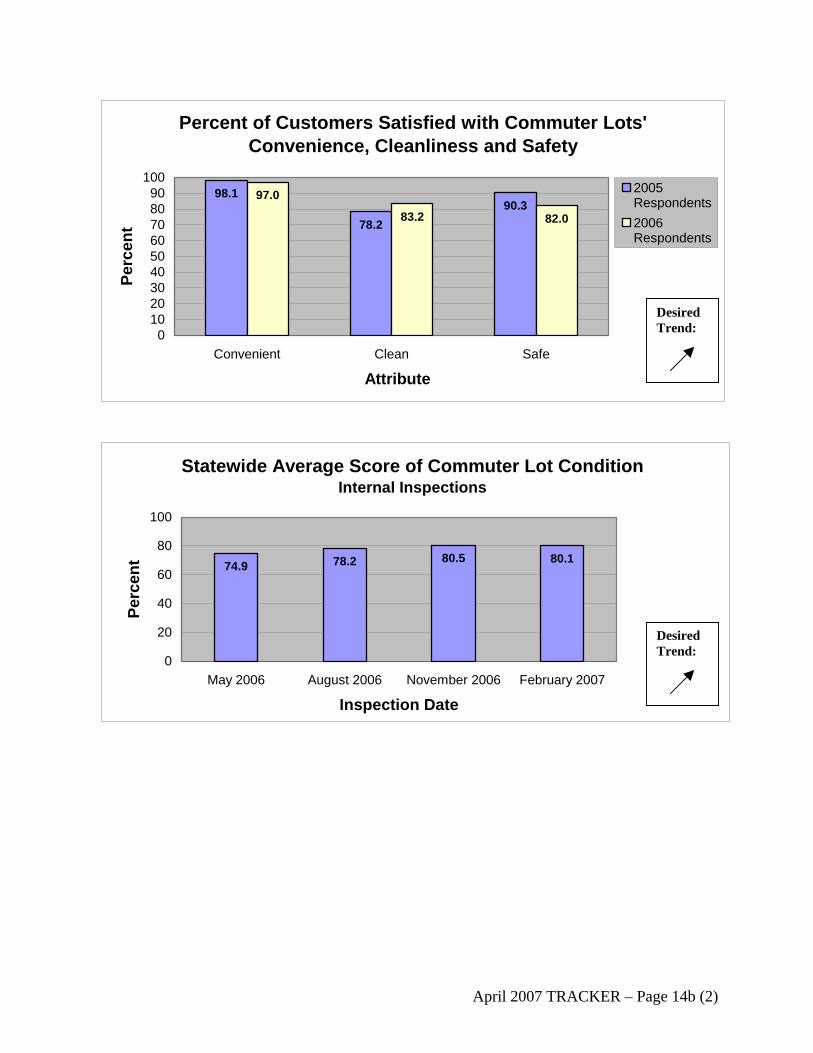
Percent of Customers Satisfied with Commuter Lots' Convenience, Cleanliness and Safety
90.378.2
98.1
82.083.2
97.0
0102030405060708090
100
Convenient Clean Safe
Attribute
Perc
ent
2005Respondents2006Respondents
Desired Trend:
80.180.578.274.9
0
20
40
60
80
100
May 2006 August 2006 November 2006 February 2007
Inspection Date
Perc
ent
Statewide Average Score of Commuter Lot ConditionInternal Inspections
Desired Trend:
April 2007 TRACKER – Page 14b (2)

Convenient, Clean and Safe Roadside Accommodations Number of users of commuter parking lots Result Driver: Don Hillis, Director of System Management Measurement Driver: Tim Chojnacki, Technical Support Engineer Purpose of the Measure: This measure tracks the number of commuter parking lot users. It will help the department determine whether its commuter parking lots are adequate at current locations and whether lots are fulfilling the needs of the traveling public. Measurement and Data Collection: District maintenance personnel count the number of vehicles parked in each commuter lot in conjunction with the quarterly condition inspections. Data is collected from every district to create a statewide report. This measure is updated quarterly. Improvement Status: There was a decrease in the number of vehicles parked in the commuter lots from the previous quarter, however the overall trend since beginning this measure has been an increase in users. Comparing this quarter’s count, 2,676, to the same time period last year, 2,511, shows a 6.5 percent increase over last year. A continuing emphasis on maintaining the appearance of these lots is a contributing factor in the increase of commuter parking lot users. It should also be noted that a strong correlation exists between gasoline prices and number of users of the commuter lots. Three commuter lots have been closed which result in the number of spaces available decreasing to 6,205. MoDOT will continue to encourage motorists to use these lots through news releases and the recently developed commuter parking lot brochure.
Number of Users of Commuter Parking Lots
2,580 2,764
6,2056,276 6,291 6,304 6,304
2,6762,511 2,742
0
1,000
2,000
3,000
4,000
5,000
6,000
7,000
3rd Qtr.2006
4th Qtr.2006
1st Qtr.2007
2nd Qtr.2007
3rd Qtr.2007
Fiscal Year
Num
ber
Number ofAvailableSpaces
Number ofParkedVehicles
Desired Trend:
April 2007 TRACKER – Page 14c
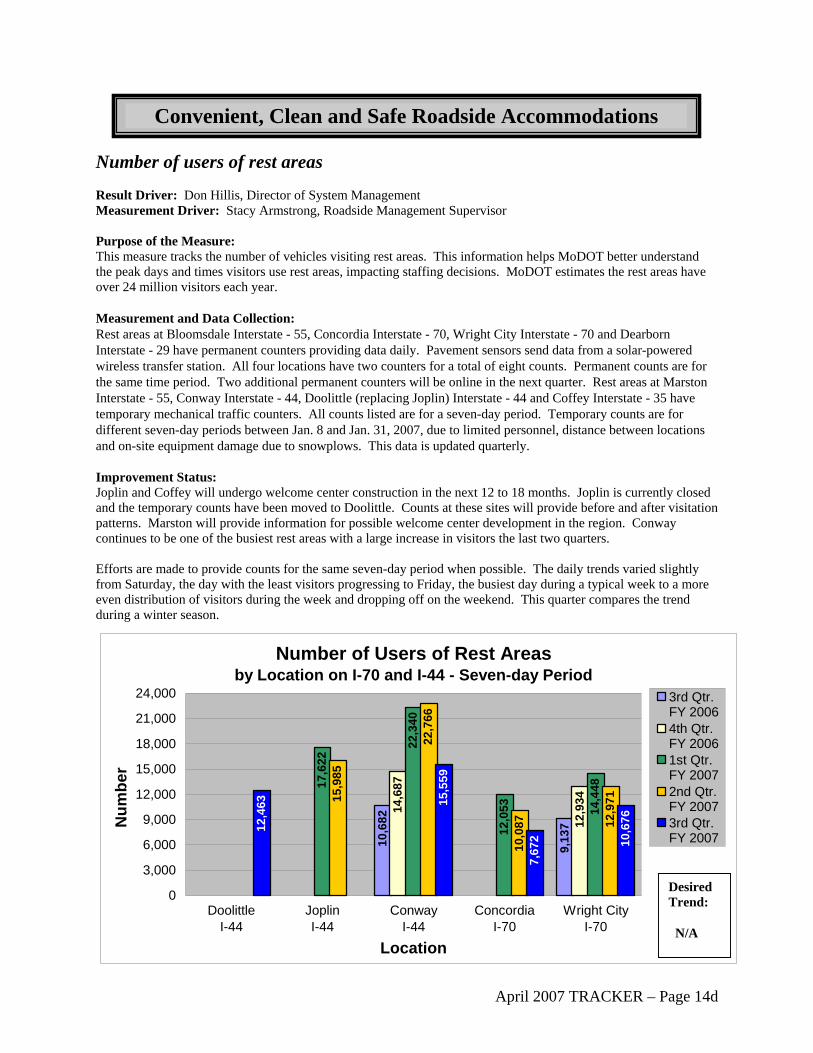
Convenient, Clean and Safe Roadside Accommodations Number of users of rest areas Result Driver: Don Hillis, Director of System Management Measurement Driver: Stacy Armstrong, Roadside Management Supervisor Purpose of the Measure: This measure tracks the number of vehicles visiting rest areas. This information helps MoDOT better understand the peak days and times visitors use rest areas, impacting staffing decisions. MoDOT estimates the rest areas have over 24 million visitors each year. Measurement and Data Collection: Rest areas at Bloomsdale Interstate - 55, Concordia Interstate - 70, Wright City Interstate - 70 and Dearborn Interstate - 29 have permanent counters providing data daily. Pavement sensors send data from a solar-powered wireless transfer station. All four locations have two counters for a total of eight counts. Permanent counts are for the same time period. Two additional permanent counters will be online in the next quarter. Rest areas at Marston Interstate - 55, Conway Interstate - 44, Doolittle (replacing Joplin) Interstate - 44 and Coffey Interstate - 35 have temporary mechanical traffic counters. All counts listed are for a seven-day period. Temporary counts are for different seven-day periods between Jan. 8 and Jan. 31, 2007, due to limited personnel, distance between locations and on-site equipment damage due to snowplows. This data is updated quarterly. Improvement Status: Joplin and Coffey will undergo welcome center construction in the next 12 to 18 months. Joplin is currently closed and the temporary counts have been moved to Doolittle. Counts at these sites will provide before and after visitation patterns. Marston will provide information for possible welcome center development in the region. Conway continues to be one of the busiest rest areas with a large increase in visitors the last two quarters. Efforts are made to provide counts for the same seven-day period when possible. The daily trends varied slightly from Saturday, the day with the least visitors progressing to Friday, the busiest day during a typical week to a more even distribution of visitors during the week and dropping off on the weekend. This quarter compares the trend during a winter season.
Number of Users of Rest Areasby Location on I-70 and I-44 - Seven-day Period
9,13
7 12,9
3414
,448
12,9
7115,5
59
7,67
2 10,6
76
10,6
8214
,687
12,0
53
22,3
40
17,6
2215,000
22,7
66
15,9
85
10,0
8712,4
63
0
3,000
6,000
9,000
12,000
18,000
21,000
24,000
DoolittleI-44
JoplinI-44
ConwayI-44
ConcordiaI-70
Wright CityI-70
Location
Num
ber
3rd Qtr.FY 20064th Qtr.FY 20061st Qtr.FY 20072nd Qtr.FY 20073rd Qtr.FY 2007
Desired Trend: N/A
April 2007 TRACKER – Page 14d
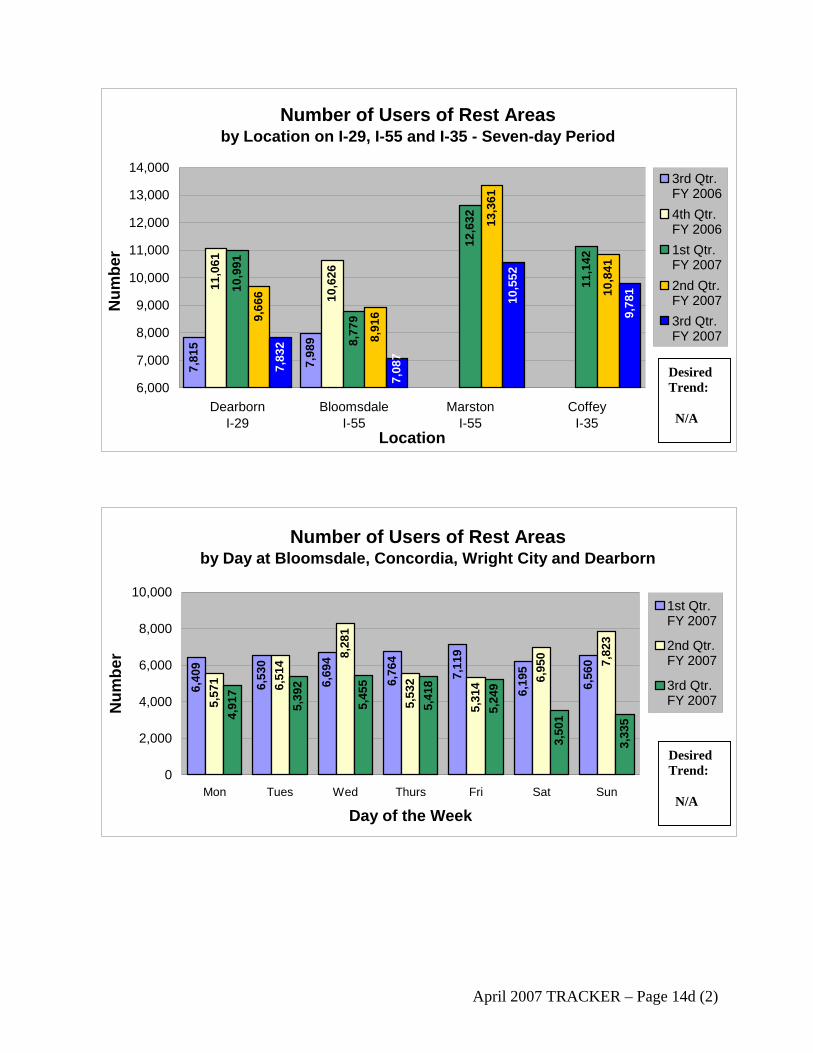
Number of Users of Rest Areasby Location on I-29, I-55 and I-35 - Seven-day Period
7,81
5
7,98
9
11,0
61
10,6
26
10,9
91
8,77
9
12,6
32
11,1
42
9,66
6
8,91
6
13,3
61
10,8
41
7,83
2
7,08
7
10,5
52
9,78
1
6,000
7,000
8,000
9,000
10,000
11,000
12,000
13,000
14,000
DearbornI-29
BloomsdaleI-55
MarstonI-55
CoffeyI-35
Location
Num
ber
3rd Qtr.FY 20064th Qtr.FY 20061st Qtr.FY 20072nd Qtr.FY 20073rd Qtr.FY 2007
Desired Trend: N/A
Number of Users of Rest Areas by Day at Bloomsdale, Concordia, Wright City and Dearborn
5,57
1 6,51
4
8,28
1
5,53
2
5,31
4 6,95
0 7,82
3
4,91
7
5,39
2
5,45
5
5,41
8
5,24
9
3,50
1
3,33
5
6,40
9
6,76
4
7,11
9
6,19
5
6,56
0
6,69
4
6,53
0
0
2,000
4,000
6,000
8,000
10,000
Mon Tues Wed Thurs Fri Sat Sun
Day of the Week
Num
ber
1st Qtr.FY 2007
2nd Qtr.FY 2007
3rd Qtr.FY 2007
Desired Trend: N/A
April 2007 TRACKER – Page 14d (2)

Convenient, Clean and Safe Roadside Accommodations Number of truck customers that utilize rest areas Result Driver: Don Hillis, Director of System Management Measurement Driver: Tim Jackson, Technical Support Engineer Purpose of the Measure: This measure tracks the number of trucks at rest areas. The numbers of trucks using the rest areas and the nearby ramps could be used to help determine how many spaces are needed to provide convenient parking facilities at each rest area. Measurement and Data Collection: On a monthly basis, district maintenance personnel count the number of trucks parked at rest areas, on nearby ramps within 15 miles of the rest areas and at abandoned weigh stations that have been converted to truck parking facilities. The count is done between 4 and 6 a.m., which is typically the busiest time. Data is collected from every rest area and truck parking facility to create a statewide report and updated quarterly. Improvement Status: The first quarter of calendar year 2007 showed a decrease of 47 in the average number of trucks using the rest areas and other truck parking facilities from the previous quarter. This decrease is due to an incomplete count of all the rest areas in the first quarter of 2007. Had all the rest areas been counted this quarter, the upward trend over the previous four quarters would have continued. Converting additional abandoned weigh stations into truck parking facilities continues to be a way to add truck parking spaces across the state to accommodate the increasing need for additional truck parking spaces.
744791756724692
303 317 332 323271
647637597587587
0
250
500
750
1,000
1,250
1st Qtr.2006
2nd Qtr.2006
3rd Qtr.2006
4th Qtr.2006
1st Qtr.2007
Calendar Year
Num
ber
Average Number ofTrucks on Ramps
Average Number ofTrucks in RestAreas
Total AvailableTruck ParkingSpaces
Number of Truck Customers That Utilize Rest Areas
Desired Trend:
N/A
April 2007 TRACKER – Page 14e

(This page is intentionally left blank for duplexing purposes)

Best Value For Every Dollar Spent
Providing the best value for every dollar spent means MoDOT is running its business as efficiently and effectively as possible. A tightly managed budget means more roads and bridges can be fixed. That keeps Missouri moving. This is one of MoDOT’s values because every employee is a taxpayer too!
Tangible Result Driver – Roberta Broeker, Chief Financial Officer
15

Best Value for Every Dollar Spent Number of MoDOT employees (converted to full-time equivalency) Result Driver: Roberta Broeker, Chief Financial Officer Measurement Driver: Micki Knudsen, Human Resources Director Purpose of the Measure: This measure tracks the growth in the number of employees within the department. This measure converts salary dollars paid to temporary and salaried employees, as well as the amount paid for overtime worked, to full-time equivalency (FTE). In order to convert these numbers to FTEs, the total number of hours worked is divided by 2080. Overtime includes both salaried and wage employees. Measurement and Data Collection: The data is collected and reported each quarter of each fiscal year. The data is a high-level view of overall staffing at MoDOT in relation to authorized positions that could be filled. Improvement Status: The number of authorized salaried positions increased over last fiscal year due to a group of Motor Carrier auditors that transferred from the Missouri Department of Revenue to MoDOT and the addition of one position to coordinate the Safe and Sound Bridge program. As of March 31, 2007, the actual number of salaried employees was 6,342 with an additional 144 seasonal employees working for the department compared to 382 at the same time in 2006. The reduced number of seasonal employees is a result of the considerable amount of overtime worked during the winter due to snow and ice removal and post-storm cleanup. Beginning with the upcoming fiscal year, districts and divisions have been empowered to manage staffing levels to an overall FTE count and budget amount, rather than an authorized number of salaried employees. Therefore, some districts may choose to increase the number of full-time employees and reduce the number of seasonal employees hired.
Number of MoDOT Employees(converted to full-time equivalencies)
337326
247225 205
6,3086,2886,2846,2216,107
338561 543
453
2196,4936,4766,4836,4986,493
4,000
4,500
5,000
5,500
6,000
6,500
7,000
7,500
2003 2004 2005 2006 2007*Fiscal Year
Num
ber
Overtime
TemporaryEmployeesSalariedEmployeesAuthorizedSalaried Positions
*For FY 2007, the Salaried Employees data has had the FTE for salaried employees used to date converted to an annual number for ease in comparison to previous years. This could not be reasonably accomplished for wage employees or for overtime.
Desired Trend: N/A
April 2007 TRACKER – Page 15a

Best Value for Every Dollar Spent Percent of work capacity based on average hours worked Result Driver: Roberta Broeker, Chief Financial Officer Measurement Driver: Micki Knudsen, Human Resources Director Purpose of the Measure: The purpose of this measure is to track how many hours the average employee works on an annual basis. It can assist management in determining staffing and productivity levels. Measurement and Data Collection: MoDOT measures organizational work capacity based on average regular hours worked and average overtime hours worked by employees. This measure also displays the percentage of regular hours available that are worked. The average regular hours worked does not include seasonal or wage employees. The average overtime hours worked does not include exempt, seasonal, or wage employees. Benchmark data is from Saratoga Institute report, “Key Trends in Human Capital – Global Perspective,” indicating average hours worked per person in the United States. Improvement Status: The regular hours worked by employees for the most recent quarter was higher than the annual average at 89.7 percent; however, this is consistent with the same period last year. The amount of overtime worked during the quarter was considerably higher than the same period one year ago. This increased overtime is attributed to significant snow events that occurred during the quarter. One event in January and one in February occurred over holiday weekends, which increased the amount of overtime work required. In the most recent quarter, the average number of hours worked at MoDOT locations ranged between 458 and 473. Continued focus on sharing leave management strategies with supervisors has resulted in reduction in sick leave usage for eight of the 11 locations compared to the same period in 2006.
Percent of Work Capacity
466
1,7961,804 1,805 1,813
70
38
61 60 78
0
300
600
900
1,200
1,500
1,800
2,100
2003 2004 2005 2006 YTD 2007Calendar Year*
hou
rs
AverageOvertimeHours WorkedAverageRegular HoursWorkedSaratogaInstitute
(2,080 hours total)87% 87% 86% 87% 90%
1819
Desired Trend: N/A
* Percentage does not include overtime hours.
April 2007 TRACKER – Page 15b

Best Value for Every Dollar Spent Rate of employee turnover Result Driver: Roberta Broeker, Chief Financial Officer Measurement Driver: Micki Knudsen, Human Resources Director Purpose of the Measure: This measure tracks the percentage of employees who leave MoDOT annually and compares the department’s turnover rate to benchmarked data. Voluntary turnover includes resignations and retirements. Involuntary turnover includes dismissals only. Turnover rates include voluntary separations, involuntary separations, and deceased employees. Measurement and Data Collection: The data is collected statewide to assess employee overall turnover. Comparison data is collected from various sources annually. For benchmarked data, Saratoga Institute surveyed 288 organizations representing a wide variety of industries. In addition, the Watson Wyatt study determined the optimum turnover rate by analyzing turnover rate compared to organizational financial performance. Improvement Status: During the first quarter of the calendar year there were 121 separations, compared to 105 during the same period in 2006. Sixty-five percent of the voluntary separations were due to retirements. MoDOT has seen a decrease in resignations compared to the same period in 2006, falling to 37 from 55. In this most recent quarter, seven employees in civil engineering positions resigned from MoDOT, six of these resignations were in the urban districts. Retirements hit MoDOT hard this quarter with a total of 69. There were 12 employees dismissed during the quarter. Seven employees were dismissed for conduct issues, four employees were dismissed due to unsatisfactory performance, and one employee was unable to return to work after one year of extended sick leave without pay.
Rate of Employee Turnover
1.76.255.94.7
5.9 1.0 0.20.6 0.7 1.0
5.0 4.3
9.38.8
15 15 15 15
0
5
10
15
20
2003 2004 2005 2006 YTD 2007
Calendar Year
Rat
e
MoDOT VoluntaryMoDOT (Involuntary)Saratoga (Voluntary)Saratoga (Involuntary)Watson Wyatt
Desired Trend: N/A
April 2007 TRACKER – Page 15c
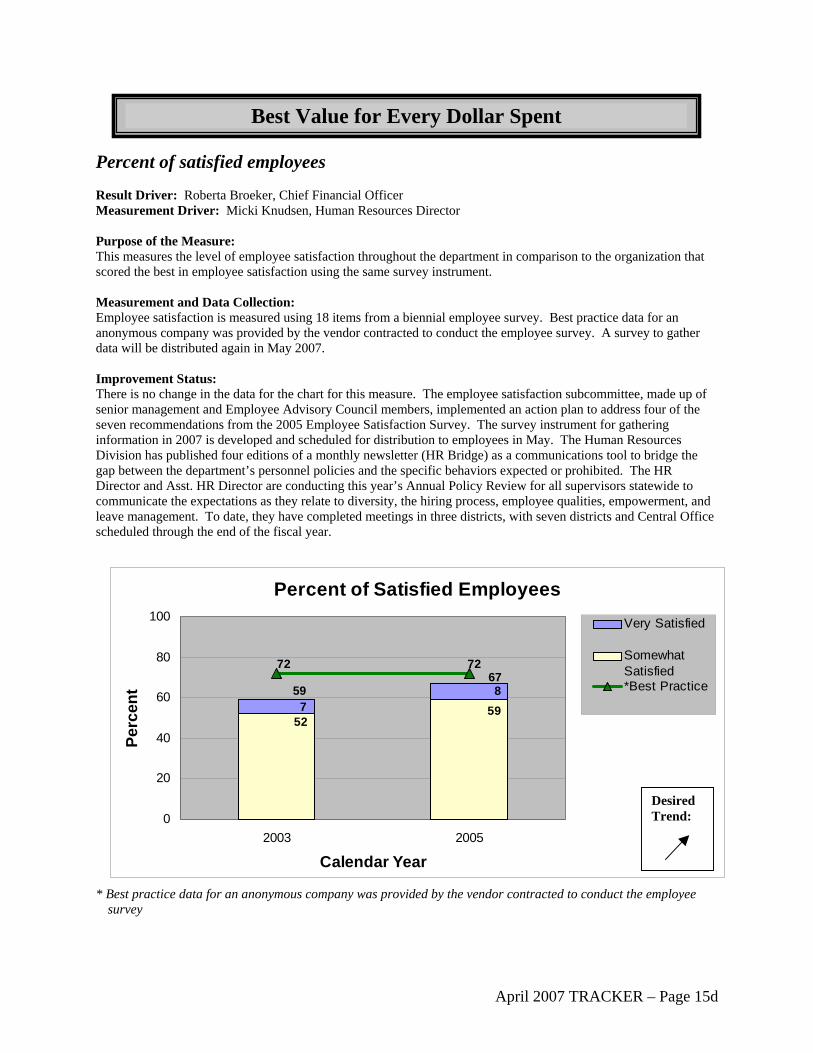
Best Value for Every Dollar Spent Percent of satisfied employees Result Driver: Roberta Broeker, Chief Financial Officer Measurement Driver: Micki Knudsen, Human Resources Director Purpose of the Measure: This measures the level of employee satisfaction throughout the department in comparison to the organization that scored the best in employee satisfaction using the same survey instrument. Measurement and Data Collection: Employee satisfaction is measured using 18 items from a biennial employee survey. Best practice data for an anonymous company was provided by the vendor contracted to conduct the employee survey. A survey to gather data will be distributed again in May 2007. Improvement Status: There is no change in the data for the chart for this measure. The employee satisfaction subcommittee, made up of senior management and Employee Advisory Council members, implemented an action plan to address four of the seven recommendations from the 2005 Employee Satisfaction Survey. The survey instrument for gathering information in 2007 is developed and scheduled for distribution to employees in May. The Human Resources Division has published four editions of a monthly newsletter (HR Bridge) as a communications tool to bridge the gap between the department’s personnel policies and the specific behaviors expected or prohibited. The HR Director and Asst. HR Director are conducting this year’s Annual Policy Review for all supervisors statewide to communicate the expectations as they relate to diversity, the hiring process, employee qualities, empowerment, and leave management. To date, they have completed meetings in three districts, with seven districts and Central Office scheduled through the end of the fiscal year.
Desired Trend:
Percent of Satisfied Employees
52597
8
72 72
0
20
40
60
80
100
2003 2005
Calendar Year
Perc
ent
Very Satisfied
SomewhatSatisfied*Best Practice
6759
* Best practice data for an anonymous company was provided by the vendor contracted to conduct the employee survey
April 2007 TRACKER – Page 15d
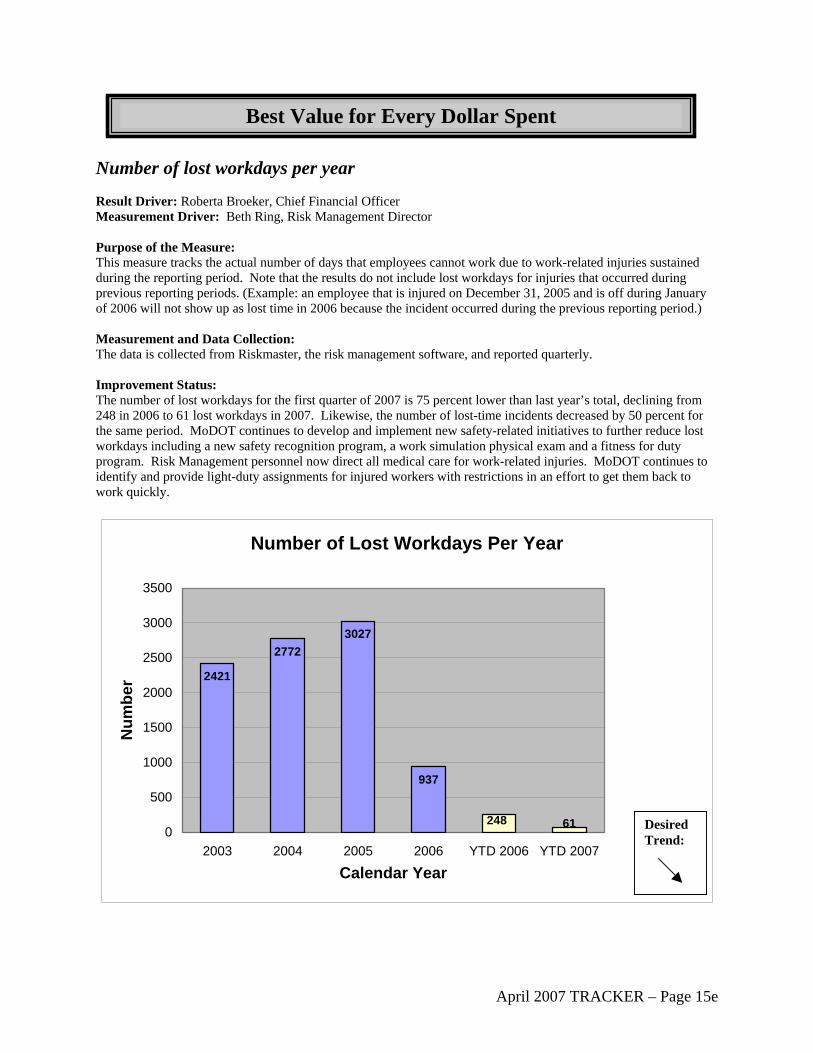
Best Value for Every Dollar Spent
Number of lost workdays per year Result Driver: Roberta Broeker, Chief Financial Officer Measurement Driver: Beth Ring, Risk Management Director Purpose of the Measure: This measure tracks the actual number of days that employees cannot work due to work-related injuries sustained during the reporting period. Note that the results do not include lost workdays for injuries that occurred during previous reporting periods. (Example: an employee that is injured on December 31, 2005 and is off during January of 2006 will not show up as lost time in 2006 because the incident occurred during the previous reporting period.) Measurement and Data Collection: The data is collected from Riskmaster, the risk management software, and reported quarterly. Improvement Status: The number of lost workdays for the first quarter of 2007 is 75 percent lower than last year’s total, declining from 248 in 2006 to 61 lost workdays in 2007. Likewise, the number of lost-time incidents decreased by 50 percent for the same period. MoDOT continues to develop and implement new safety-related initiatives to further reduce lost workdays including a new safety recognition program, a work simulation physical exam and a fitness for duty program. Risk Management personnel now direct all medical care for work-related injuries. MoDOT continues to identify and provide light-duty assignments for injured workers with restrictions in an effort to get them back to work quickly.
Number of Lost Workdays Per Year
2421
27723027
937
248 610
500
1000
1500
2000
2500
3000
3500
2003 2004 2005 2006 YTD 2006 YTD 2007
Calendar Year
Num
ber
Desired Trend:
April 2007 TRACKER – Page 15e

Best Value for Every Dollar Spent Rate and total of OSHA recordable incidents Result Driver: Roberta Broeker, Chief Financial Officer Measurement Driver: Beth Ring, Risk Management Director Purpose of the Measure: This measure tracks the number of recordable injuries, as defined by OSHA, in total and as a rate of injuries per 100 workers. The calculation for incidence rate is the number of recordables times 200,000 divided by the number of hours worked. The 200,000 used in the calculation is the base for 100 full-time workers (working 40 hours per week, 50 weeks per year). OSHA defines a recordable incident as a work-related injury or illness that results in death, days away from work, restricted work or transfer to another job, medical treatment beyond first aid, or loss of consciousness. MoDOT defines medical treatment beyond first aid as work-related injuries requiring two or more doctor visits. Measurement and Data Collection: Risk Management reports on the measure quarterly, one quarter in arrears, and collects the injury data from Riskmaster, the Risk Management claims administration software. The Controller’s Division gathers the number of hours worked from the HR Payroll Datamart. Improvement Status: The number of OSHA recordables and the incidence rate has declined over the reporting periods noted. The incidence rate has declined by 23 percent over 2005, dropping from 7.6 to 6.3. The number of recordables has declined by 25 percent over the same period, demonstrating a reduction from 502 to 379 OSHA recordables. The department has reduced its injury rate as a result of successfully implementing numerous safety-related initiatives.
April 2007 TRACKER – Page 15f

Rate of OSHA Recordable Incidents
8.44
7.60
5.846.30
7.007.00
4.39
6.205.40
6.40 6.30
0
1
2
3
4
5
6
7
8
9
2004 2005 2006Calendar Year
Rat
e
MoDOT
Maryland DOT
New MexicoDOTPrivate IndustryConstruction
Desired Trend:
(Information from Private Industry Construction was not available for 2006.)
Total of OSHA Recordable Incidents
379
502543
0
100
200
300
400
500
600
2004 2005 2006
Calendar Year
Num
ber
Desired Trend:
April 2007 TRACKER – Page 15f (2)

Best Value for Every Dollar Spent Number of claims and total claims expense for general liability Result Driver: Roberta Broeker, Chief Financial Officer Measurement Driver: Beth Ring, Risk Management Director Purpose of the Measure: General liability claims arise from allegations of injuries/damages caused by the dangerous condition of MoDOT property and the injury/damage directly resulting from the dangerous condition. In addition, an employee must be negligent and create the dangerous condition or MoDOT must have actual or constructive notice of the dangerous condition in sufficient time prior to the injury/damage to have taken measures to protect the public against the dangerous condition. This measure tracks the number general liability claims filed and claims expense incurred during the reporting period. The claims expense includes cash paid and adjustments to claim reserves. Measurement and Data Collection: Risk Management Division reports on the measure quarterly and collects the claims data from Riskmaster, the risk management claims administration software. The Controller’s Division provides the claims expense in the self-insurance plan financial statements. Improvement Status: The decrease in number of claims filed between 2004 and 2005 is largely attributable to a substantial reduction in pothole claims in the urban areas as SRI began. The number of claims filed in 2006 increased over 2005 because of a chip seal job in the Springfield area, which resulted in over 400 claims. The increase in the number of claims filed during the first quarter of 2007 was largely the result of a southeast region maintenance operation on Route 53 in Butler County. The claims expenses increased substantially in 2005 as MoDOT received approximately 70 additional lawsuits immediately prior to the effective date of tort reform legislation. The expense represents the best estimate of the future liability attached to each claim and has been and will continue to be adjusted over the life of the claims.
April 2007 TRACKER – Page 15g

Number of Claims for General Liability
348205
12561099
1332
0
300
600
900
1200
1500
2004 2005 2006 1st Qtr.2006
1st Qtr.2007
Calendar Year
Num
ber
Desired Trend:
Total Claims Expense for General Liability(in millions)
20
25
1.41.4
6.2
19.4
3.40
5
10
15
2004 2005 2006 1st Qtr.2006
1st Qtr.2007
Calendar Year
Dol
lars
Desired Trend:
April 2007 TRACKER – Page 15g (2)

Best Value for Every Dollar Spent Unit cost per square foot of buildings Result Driver: Roberta Broeker, Chief Financial Officer Measurement Driver: Chris Devore, General Services Manager - Facilities Purpose of the Measure: This measure tracks the cost of operating department buildings, building capital improvements and capital asset preservation projects. Measurement and Data Collection: The data is collected based on expenditures recorded in the statewide financial accounting system. The following expenditures are included in the analysis: the cost of labor, benefits, and materials for central office facilities management and facilities maintenance. It does not include the employer’s share of Social Security/Medicare taxes and the department’s match for deferred compensation. Operating expenditures, including repair supplies, custodial supplies, janitorial and other services, maintenance and repair services, building and storage leases, and utilities have been included. Capital expenditures include new construction and asset preservation projects. Improvement Status: This is an annual measure. New data will be available July 2007. Between 2005 and 2006, capital costs per square foot have decreased approximately 20 percent. Operating costs per square foot have remained relatively steady even with increases in energy costs. As operational needs developed, extra consideration and funding were expended to repair/replace with energy efficient options. These improvements have included, but are not limited to, installing energy efficient windows, overhead doors, and new HVAC system and insulating maintenance bays. A team of MoDOT and DNR employees has been established to seek out opportunities for MoDOT to become more energy efficient. The Director will be presented with goals to achieve and ideas for saving energy. The benchmark is from the Washington State DOT (WSDOT). Based on its budget the approximate capital expenditures for 2005 were $3.44 per square foot and the approximate operating expenditures were $6.12 per square foot.
Unit Cost per Square Foot of Buildings
2.982.963.35 2.76 2.88
2.102.632.842.25
2.55
9.56
0
2
4
6
8
10
2002 2003 2004 2005 2006Fiscal Year
Dol
lars
CapitalExpendituresOperatingExpendituresWashingtonTotal
5.90 5.72 5.59 5.01 5.08
Desired Trend: N/A
April 2007 TRACKER – Page 15h

Best Value for Every Dollar Spent Fleet expenses compared to fleet value Result Driver: Roberta Broeker, Chief Financial Officer Measurement Driver: Jeannie Wilson, General Services Manager - Fleet Purpose of the Measure: This measure tracks costs for MoDOT's fleet, as well as its condition. The first chart compares repair cost, acquisition expenditures, and total fleet value. The second chart provides an overall fleet condition status based on actual fleet age and meter compared to maximum life-cycle thresholds. Measurement and Data Collection: The expenditures are collected from the statewide financial accounting system. All costs associated with repairs, supplies and maintenance for all fleet items are included in the analysis. Fleet value is established based on current replacement cost for all active units. Age and meter thresholds were established based on maximum life usefulness. Units are identified as either exceeding their primary life cycle for either its age or meter, reaching maximum primary life in the next three years; and not exceeding the threshold within the next three years. Improvement Status: This is an annual measure. New data will be available July 2007. The repair costs to MoDOT’s fleet increased from $9 million to $10 million from fiscal year 2005 to fiscal year 2006, while MoDOT’s salary and benefit costs for its fleet employees remained the same at $14 million in both fiscal years. Acquisition costs for new fleet increased from $23 million to $27 million from fiscal year 2005 to fiscal year 2006. The total value of MoDOT’s fleet in 2006 was $380 million. District offices have been working to assess individual fleets. Once the critical equipment has been identified, the district offices can begin reducing their fleet. Some districts have made significant progress with right-sizing efforts. This has resulted in a fleet size that can be supported financially. The other added benefit of right sizing the fleet is the increase MoDOT has seen in disposal returns. Disposal returns increased approximately $1.9 million from calendar year 2005 to calendar year 2006.
April 2007 TRACKER – Page 15i

Fleet Expenses Compared to Fleet Value(in millions)
9 1014 14 2723
380
050
100150200250300350400
2005 2006
Fiscal Year
Dol
lars
Repair CostEmp. Salary and BenefitsAcquisitionFleet Value
Desired Trend: N/A
Statewide Fleet Status(in units)
3,025 (50%)
1,393 (23%)
1,601 (27%)
0
1,000
2,000
3,000
4,000
5,000
6,000
7,000
2006
Fiscal Year
Num
ber
Exceeds Threshold
Exceeding Threshold inNext 3 YearsUnder Threshold
.
6,019
Desired Trend: N/A
April 2007 TRACKER – Page 15i (2)

Best Value for Every Dollar Spent Dollars expended on consultants other than program consultants Result Driver: Roberta Broeker, Chief Financial Officer Measurement Driver: Debbie Rickard, Controller Purpose of the Measure: The measure tracks the department’s use of consultants for other than right of way and construction. The department uses consultants to complement employee resources and expertise. Reporting heightens awareness and provides a tool to measure the utilization of consultants. Measurement and Data Collection: The data is collected and reported quarterly based on expenditures recorded in the statewide financial accounting system. The data includes expenditures for professional services and computer information services. Improvement Status: Expenditures for consultants in a fiscal year are dependent on the department’s needs. Fluctuations between fiscal years are normal. The department will continue to use non-design consultants for specialized services and to supplement available employee resources. Fiscal year 2007 information systems' projects using consultants include the completion of the Motor Carrier Services and Medical and Life Insurance Projects, along with the start and completion of the Crystal Software Upgrade and the Broadband Wireless Projects. Estimated consultant costs related to these four projects total $2.3 million. Completion of the Motor Carrier Services project was anticipated in fiscal year 2006, however, it continued into fiscal year 2007. Other anticipated consultant costs in fiscal year 2007 include the Missouri Statewide Traffic Data and Traveler Information system and completion of the MoDOT Emergency Communication Services system.
Dollars Expended on Consultants Other Than Program Consultants
(in thousands)
326,979308,425
412,478399,990
352,446373,264
7,6649,424 12,656 12,26722,585 8,8480
100,000
200,000
300,000
400,000
500,000
2003 2004 2005 2006 Through3rd Qtr.
2006
Through3rd Qtr.
2007
Fiscal Year
Dol
lars
Personalservices &benefits for allMoDOTemployees Consultants
Desired Trend: N/A
April 2007 TRACKER – Page 15j

Best Value for Every Dollar Spent Percent of vendor invoices paid on time Result Driver: Roberta Broeker, Chief Financial Officer Measurement Driver: Debbie Rickard, Controller Purpose of the Measure: This measure tracks the department’s timeliness in processing vendor payments. Measurement and Data Collection: The check date determines if invoice payment is timely. Timely is defined as a check issued less than 31 days from the date of the invoice. Improvement Status: Vendors age their receivables based on the date of invoice. This measure indicates there has been consistent improvement. However, there are still opportunities for improvements to ensure vendors consider the department a good customer. The steps to further improve are: (1) identify specific vendors experiencing delayed payment and work with those vendors to obtain timely, accurate invoices, (2) determine if delayed payments are common to a particular division within the Central Office or a district, and (3) identify processes contributing to the delayed payment. District and divisional analysis tools have been developed to assist in identifying areas where improvements can be made.
Percent Of Vendor Invoices Paid On Time
88.990.186.988.188.087.084.583.778.385.182.181.4
0
20
40
60
80
100
April2006
May2006
June2006
July2006
Aug.2006
Sept.2006
Oct.2006
Nov.2006
Dec.2006
Jan.2007
Feb.2007
Mar.2007
Fiscal Year
Perc
ent
Desired Trend:
April 2007 TRACKER – Page 15k

Best Value for Every Dollar Spent Average cost of outsourced design and bridge engineer vs. full costed full-time employee Result Driver: Roberta Broeker, Chief Financial Officer Measurement Driver: Debbie Rickard, Controller Purpose of the Measure: The purpose of the measure is to demonstrate a responsible use of taxpayers’ money, with the emphasis of spending for design and bridge engineering efforts. Measurement and Data Collection: The data collection is based on outsourced contracts and employee expenditures. This is an annual measure. The process is to measure external design consultant costs and compare to MoDOT staff design engineer costs. Both categories are fully costed and comparable. Improvement Status: Consultant rates increased 7.1 percent from 2004 to 2005 while MoDOT design and bridge engineer costs increased 2.6 percent for the same period. The desired trend is to narrow the profit factor gap between the two rates. The fiscal year 2006 rates will be included in the July 2007 Tracker.
Average Cost of Outsourced Design and Bridge Engineer vs. Full Costed Full-time Employee
(per hour)
85.6779.5776.6073.9668.81
54.25 53.97 58.5056.9856.34
0102030405060708090
100
2001 2002 2003 2004 2005
Fiscal Year
Dol
lars
ConsultantMoDOT Engineers
Desired Trend: N/A
April 2007 TRACKER – Page 15l

Best Value for Every Dollar Spent Distribution of expenditures Result Driver: Roberta Broeker, Chief Financial Officer Measurement Driver: Debbie Rickard, Controller Purpose of the Measure: The purpose of the measure is to demonstrate a responsible use of taxpayers’ money, with the emphasis of spending on the construction and maintenance of our transportation system. Measurement and Data Collection: The data collection is based on cash expenditures by appropriation on a quarterly basis. Construction and maintenance expenditures are defined as expenditures from the construction and maintenance appropriations. Other expenditures include: administration, multimodal, fleet, facilities, information systems, and other services (FFIS & Other) appropriations. Improvement Status: The department’s emphasis is on expenditures for routine maintenance of the system (maintenance appropriation) and renovation and construction of the system (construction appropriation). Construction expenditures have increased from the same period for fiscal year 2006, percentage and dollars, as construction projects have accelerated as a result of bond proceeds. Expenditures from appropriations other than construction and maintenance remain constant, which is consistent with the desired trend.
Distribution of ExpendituresConstruction and Maintenance
16.0 19.622.918.6 21.0 17.6
71.167.268.564.069.672.3
0
20
40
60
80
100
2003 2004 2005 2006 Through3rd Qtr.
2006
Through3rd Qtr.
2007Fiscal Year
Perc
ent
ConstructionMaintenance
Thousands of Dollars 2003 2004 2005 2006 YTD 2007 Construction $1,302,824 $ 1,247,541 $ 1,085,840 $1,373,699 $ 1,192,911Maintenance $ 286,509 $ 333,361 $ 386,399 $ 391,817 $ 295,420
88.1 88.2 88.788.2 88.3 86.9
Desired Trend:
April 2007 TRACKER – Page 15m
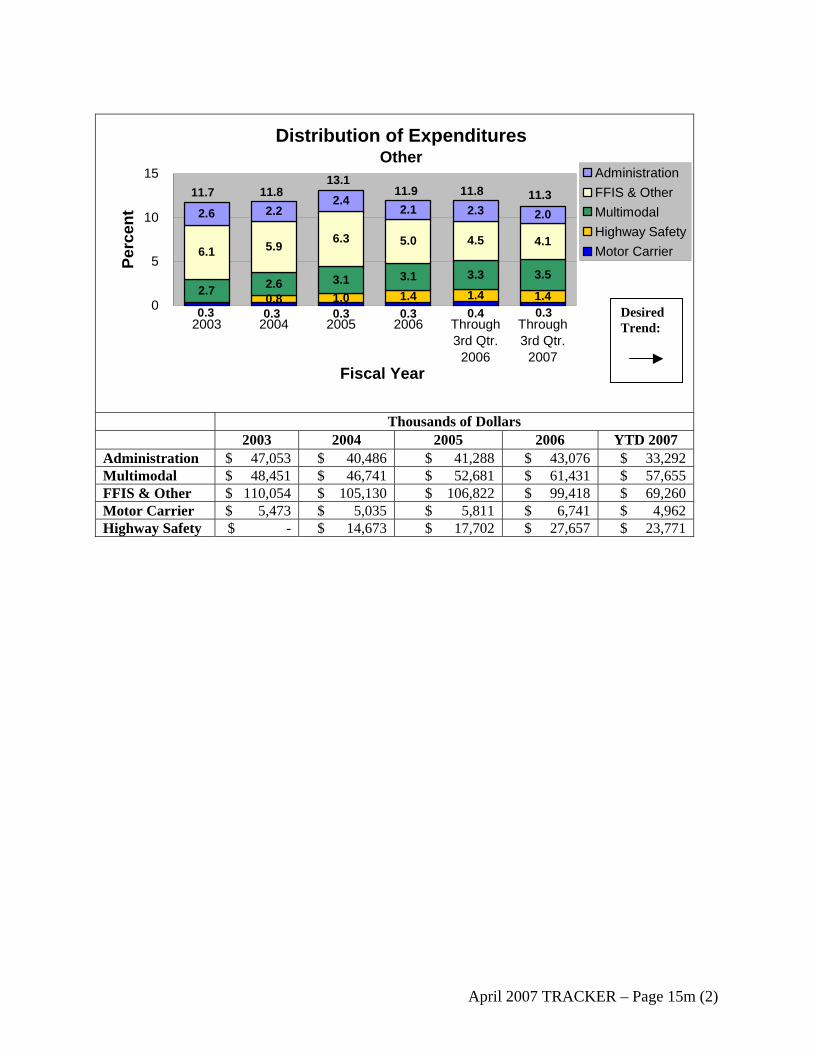
Distribution of ExpendituresOther
0.8 1.0 1.4 1.4 1.42.7 2.6 3.1 3.1 3.3 3.5
6.1 5.9 6.3 5.0 4.5 4.1
2.6 2.22.4
2.1 2.3 2.0
0.3 0.4 0.30.30.30.30
5
10
15
2003 2004 2005 2006 Through3rd Qtr.
2006
Through3rd Qtr.
2007Fiscal Year
Perc
ent
AdministrationFFIS & OtherMultimodalHighway SafetyMotor Carrier
Thousands of Dollars 2003 2004 2005 2006 YTD 2007 Administration $ 47,053 $ 40,486 $ 41,288 $ 43,076 $ 33,292 Multimodal $ 48,451 $ 46,741 $ 52,681 $ 61,431 $ 57,655 FFIS & Other $ 110,054 $ 105,130 $ 106,822 $ 99,418 $ 69,260 Motor Carrier $ 5,473 $ 5,035 $ 5,811 $ 6,741 $ 4,962 Highway Safety $ - $ 14,673 $ 17,702 $ 27,657 $ 23,771
13.111.9 11.811.8 11.7 11.3
Desired Trend:
April 2007 TRACKER – Page 15m (2)

Best Value for Every Dollar Spent Percent variance of state revenue projections Result Driver: Roberta Broeker, Chief Financial Officer Measurement Driver: Ben Reeser, Finance Manager Purpose of the Measure: The measure shows the precision of state revenue projections. Projections are used to adjust the budget that funds MoDOT’s operations and capital program. Measurement and Data Collection: State revenue includes three major components of taxes and fees paid by highway users: motor fuel taxes, motor vehicle and driver licensing fees, and motor vehicle sales and use taxes. This measure does not include interest earnings and miscellaneous revenue, which are also considered state revenues. The measure provides the cumulative, year-to-date percent variance of actual state revenue versus projected state revenue. Projections are based on the current financial forecast. The Controller’s Division provides the actual data monthly to Resource Management. The forecast is updated at the beginning of each fiscal year. This measure is updated quarterly. Improvement Status: The actual state revenue was greater than projected through the third quarter of fiscal year 2007. The projected revenue was $742.9 million. However, the actual receipts were $757.3 million, a difference of $14.4 million and a positive variance of 1.94 percent. The desired trend is for the actual revenue to match projections with a variance of 0 percent. MoDOT staff adjusts future operating and capital budgets to account for these variances.
Percent Variance of State Revenue Projections
-2.72-0.47
-6.00-4.00-2.000.002.004.006.00
2005 2006Fiscal Year
Perc
ent
Percent Variance of State Revenue Projections
0.734.68
-2.72-2.58-4.78
1.94
-6.00-4.00-2.000.002.004.006.00
2nd Qtr.2006
3rd Qtr.2006
4th Qtr.2006
1st Qtr.2007
2nd Qtr.2007
3rd Qtr.2007
Fiscal Year
Perc
ent
Desired Trend:
0%
Desired Trend:
0%
April 2007 TRACKER – Page 15n

Best Value for Every Dollar Spent MoDOT national ranking in revenue per mile Result Driver: Roberta Broeker, Chief Financial Officer Measurement Driver: Ben Reeser, Finance Manager Purpose of the Measure: This measure shows Missouri’s national ranking in the amount of revenue per mile that is available to spend on the state highway system. Measurement and Data Collection: Revenue is the total receipts less bonds as reported in the Federal Highway Administration’s annual highway statistics report entitled “Revenues Used By States For State-Administered Highways.” The mileage is the state highway agency miles as reported in the Federal Highway Administration’s annual highway statistics report entitled “Public Road Length – Miles By Ownership.” Resource Management collects this information from the Federal Highway Administration. This annual measure is updated each January. Improvement Status: Missouri’s revenue per mile of $50,099 currently ranks 44th in the nation. Missouri has a very large state highway system, consisting of 32,464 miles, which is the seventh largest system in the nation. New Jersey’s revenue per mile of $872,389 ranks first. However, its state highway system contains only 2,321 miles. MoDOT staff continues to communicate with the public the need for additional transportation funding. Missouri’s transportation needs greatly exceed current available funding.
MoDOT National Ranking in Revenue Per Mile
0
100,000
200,000
300,000
400,000
500,000
600,000
700,000
800,000
900,000
1,000,000
WV SC MT NC ND VA MO SD AR NM MA KY NE WY MS OK LA KS TX ID GA VT IA OR NH AK MN TN AL PA WI
NV IN UT OH DE CO IL WA MI AZ MA CT NY RI HA CA FL MA NJ
State
Dol
lars
44th
April 2007 TRACKER – Page 15o

Attractive Roadsides
An enjoyable transportation experience includes more than a smooth surface – motorists expect to see roadsides free of litter and debris, well-managed and maintained grass and other vegetation and other attractive enhancements. MoDOT works to meet and exceed expectations for roadsides. Beautiful roadsides are visible proof that MoDOT takes pride in everything it does.
Tangible Result Driver – Don Hillis, Director of System Management
16

Attractive Roadsides Percent of roadsides that meet customers’ expectations Result Driver: Don Hillis, Director of System Management Measurement Driver: Jim Carney, State Maintenance Engineer Purpose of the Measure: This measure tracks the percent of MoDOT’s roadway system that meet customers’ expectations for attractiveness. Measurement and Data Collection: A list of roadside quality indicators were developed and approved based on an industry-wide literature review. The activities selected for this measure were used to develop a quality assurance checklist for roadside attractiveness. Data collection for this measure is based on a yearly inspection of a number of randomly selected sample sites located throughout the state. The random sites are inspected yearly for each activity. This is an annual measure updated each January. Improvement Status: Over the past five reporting years, the five roadside activities referenced below have shown varying trend lines. By sharing these results with district personnel, they are able to shift resources to improve in all categories. Over the last year, only a minor improvement in litter/debris has been shown. MoDOT staff continues to shift more resources to improve their efforts in litter/debris pickup and weed control.
Percent of Roadsides That Meet Customers' Expectations
59
8880
66
82
50
848270
92
61
8578
70
93
53
9188
59
93
53
9289
66
92
0
20
40
60
80
100
Mowing Litter/Debris Brush/Trees Slope Erosion Weed Control
Roadside Activities
Perc
ent
20022003200420052006
Desired Trend:
April 2007 TRACKER – Page 16a

Attractive Roadsides Number of miles in Adopt-A-Highway program Result Driver: Don Hillis, Director of System Management Measurement Driver: Stacy Armstrong, Roadside Management Supervisor Purpose of the Measure: This measure tracks public involvement in taking care of Missouri’s roadsides through the Adopt-A-Highway program. Missouri has one of the largest and oldest Adopt-A-Highway programs in the nation. The volunteers learn about litter awareness and some of the challenges MoDOT faces, while allowing maintenance crews to do more critical activities. Measurement and Data Collection: Adopters agree to pick up litter on a designated roadway section for a minimum of four times a year and report their results. Adopters commit to a three-year agreement when they join the program. Urban adoptions are for a minimum of one-half mile and rural adoptions are for at least two miles. Miles are measured by the centerline, however, volunteers are responsible for both sides of the roadway. Adopter-related information is maintained in an Adopt-A-Highway database using the Transportation Management System. This is an annual measure updated quarterly. Improvement Status: In recent years, the number of miles adopted has increased. Recent growth may be due to increased public awareness through No MOre Trash!, a litter–prevention campaign coordinated by MoDOT and the Department of Conservation. Total miles increased in 2007 with 72 new adoptions. Simplified Adopt-A-Highway rules and regulations became effective Aug. 30, 2006. The program will continue to be promoted at Earth Day, state and county fairs, and other events.
5,142 5,243 5,251 5,263 5,276
0
1,000
2,000
3,000
4,000
5,000
6,000
2003 2004 2005 2006 YTD 2007
Calendar Year
Mile
s
Number of Miles in Adopt-A-Highway Program
Desired Trend:
April 2007 TRACKER – Page 16b

(This page is intentionally left blank for duplexing purposes)

Advocate for Transportation Issues
Transportation issues can be ex-tremely diverse and complex. An efficient transportation system requires leadership and, most im-portantly, a champion to ensure the resources support projects that will help the department fulfill its responsibilities to the taxpayers. MoDOT will be an ad-vocate for transportation.
Tangible Result Driver – Pete Rahn, Director of MoDOT
17

Advocate for Transportation Issues Percent of minorities and females employed Result Driver: Pete Rahn, Director of MoDOT Measurement Driver: Brenda Treadwell-Martin, Equal Opportunity Director Purpose of the Measure: This measure tracks minority and female employment in MoDOT’s workforce and availability data from the Missouri 2000 Census report. Efficient use of people resources provides opportunities for the department to leverage transportation resources to available human capital. By placing the right people in the right place, the department can better serve its customers and help fulfill its responsibilities to taxpayers. Measurement and Data Collection: MoDOT’s Affirmative Action software database and Missouri 2000 Census Report are used to collect data. Private sector, departments of transportation, Missouri state agencies, and Missouri 2000 Census Data were researched to determine a benchmark for this measurement. Due to the significant variations for some of these entities (such as pay incentives, number of employees, geographic locations), it was determined Missouri 2000 Census Data, based on jobs used by the department, would be the benchmark for this measurement. Improvement Status: During this reporting period, employment decreased by 0.52 percent (6,382 to 6,349). Concurrently, minority employment decreased by 1.38 percent (507 to 500) and female employment decreased by 0.58 percent (1,375 to 1,367). Steps taken to improve this measurement: hiring a co-op student into a full-time position to increase female and minority employments, expanding minority and female contacts to increase applicant pools, and developing senior management expectations for job vacancy selection process to make greater progress toward MoDOT’s diversity efforts.
April 2007 TRACKER – Page 17a

Percent of Minorities Employed
7.887.947.837.617.597.26
12.13 12.16 12.16 12.32
0
5
10
15
20
25
2004 2005 2006 1st Qtr.2007
2nd Qtr.2007
3rd Qtr.2007
Fiscal Year
Perc
ent
MissouriAvailability
Desired Trend:
Percent of Females Employed
21.5321.5421.6321.3221.2020.9719.92 19.9419.92 19.92
0
5
10
15
20
25
2004 2005 2006 1st Qtr.2007
2nd Qtr.2007
3rd Qtr.2007
Fiscal Year
Perc
ent
MissouriAvailability
Desired Trend:
April 2007 TRACKER – Page 17a (2)

Advocate for Transportation Issues Percent of transportation-related pieces of legislation directly impacted by MoDOT Result Driver: Pete Rahn, Director of MoDOT Measurement Driver: Pam Harlan, Senior Governmental Relations Specialist Purpose of the Measure: This measure tracks the department’s impact on the total number of transportation-related bills filed by the General Assembly as well as the department’s progress on its own legislative agenda. Measurement and Data Collection: In the summer, data is obtained by reviewing both the Senate and House Web sites for legislation in the transportation subject categories. Each bill is reviewed for department impact. A percentage is determined from the total number of bills the department impacted in each category divided by the total number of bills in each category. This percentage of impact is noted on the first chart. Each fall, potential legislative proposals are submitted to the Missouri Highways and Transportation Commission for review and approval. The second chart tracks each approved legislative proposal through the legislative process. Improvement Status: The MHTC priority proposals have been filed and most are currently moving through the process. Some of the MHTC priority proposals have become transportation-related omnibus proposals, or are included along with other omnibus bills that are not priority legislation for the department.
Percent of Transportation-Related Pieces ofLegislation Directly Impacted by MoDOT
71.364.0
38.0
25.0
54.1 59.0
0
20
40
60
80
100
2004 2005 2006Fiscal Year
Perc
ent
SenateHouse
Desired Trend:
April 2007 TRACKER – Page 17b

Progress on MoDOT Legislative Initiatives
HB 295 Multimodal
SB 104 Highway Safety
HB 744 Outdoor Advertising
SB 130 Outdoor Advertising
HB 596 Annual Bid Bond
SB 52 Annual Bid Bond
HB 744 Unified Carrier Registration
SB 200 Unified Carrier Registration
HB 90 Safety Belt
2007
- 94
th G
ener
al A
ssem
bly
Progress
1st ChamberCmte HearingCmte VotePass 1st Chamber2nd ChamberCmte HearingCmte VotePass 2nd ChamberConferenceTAFPGovernor Signed
Desired Trend: N/A
April 2007 TRACKER – Page 17b (2)

Advocate for Transportation Issues Percent of federal earmarked highway projects on the state highway system Result Driver: Pete Rahn, Director of MoDOT Measurement Driver: Kent Van Landuyt, Assistant to the Director Purpose of the Measure: Missouri’s support for transportation on the national level is demonstrated by the impact of federal legislation on Missouri’s ability to address transportation needs. The percent of federal earmarks on the state highway system, that are also identified as Missouri needs, is representative of the department’s success as an advocate of the state’s transportation needs. Measurement and Data Collection: This is an annual measure. The data represents the percent of federal earmarked highway projects on the state highway system and the percent of federal earmarked state highway system projects that are identified as needs. The percent of federal earmarked individual projects on the state highway system represents the department’s success in working with Missouri’s Congressional delegation and the percent of state system earmarks the department has identified as needs demonstrates MoDOT has provided adequate information to the Missouri Congressional members that these needs are the same needs recognized by their constituents. The identified needs for this measure are projects on the state highway system that are included in the STIP or projects ready to be added to the STIP as soon as funding becomes available. Improvement Status: The charts show Missouri did not receive any earmarked funds for highway projects in FY 2007, as Congress did not approve funds for specific earmarks in the FY 2007 appropriations legislation. Missouri believes Congress will restore earmarked funds for projects in the FY 2008 appropriations legislation. Therefore, MoDOT continues to meet with the staff of each member of Missouri’s U. S. Congressional delegation on a regular basis and we continue to provide information on transportation issues, urging them to support programs, and projects that address Missouri’s transportation needs. In the first quarter of CY 2008, MoDOT met with all of our Congressional offices and provided them with details on 201 highway, transit and aviation projects for their consideration in FY 2008 appropriations. The department is striving for more than 75 percent of the earmarked projects to be on the state highway system and more than 85 percent of the state highway system earmarked projects to be identified needs. The department continues to communicate directly with Congressional staff members to increase the number of earmarked projects that are identified needs on the state transportation system.
April 2007 TRACKER – Page 17c

Percent of Federal Earmarked Highway Projectson the State Highway System
0
76
26
6272
020406080
100
2004 2005 SAFETEA-LU
2006 2007
Fiscal Year
Perc
ent
Desired Trend:
Percent of Federal Earmarked Highway Projects on the State Highway System Identified as Needs
0
100 100
63
89
020406080
100
2004 2005 SAFETEA-LU
2006 2007
Fiscal Year
Perc
ent
Desired Trend:
April 2007 TRACKER – Page 17c (2)
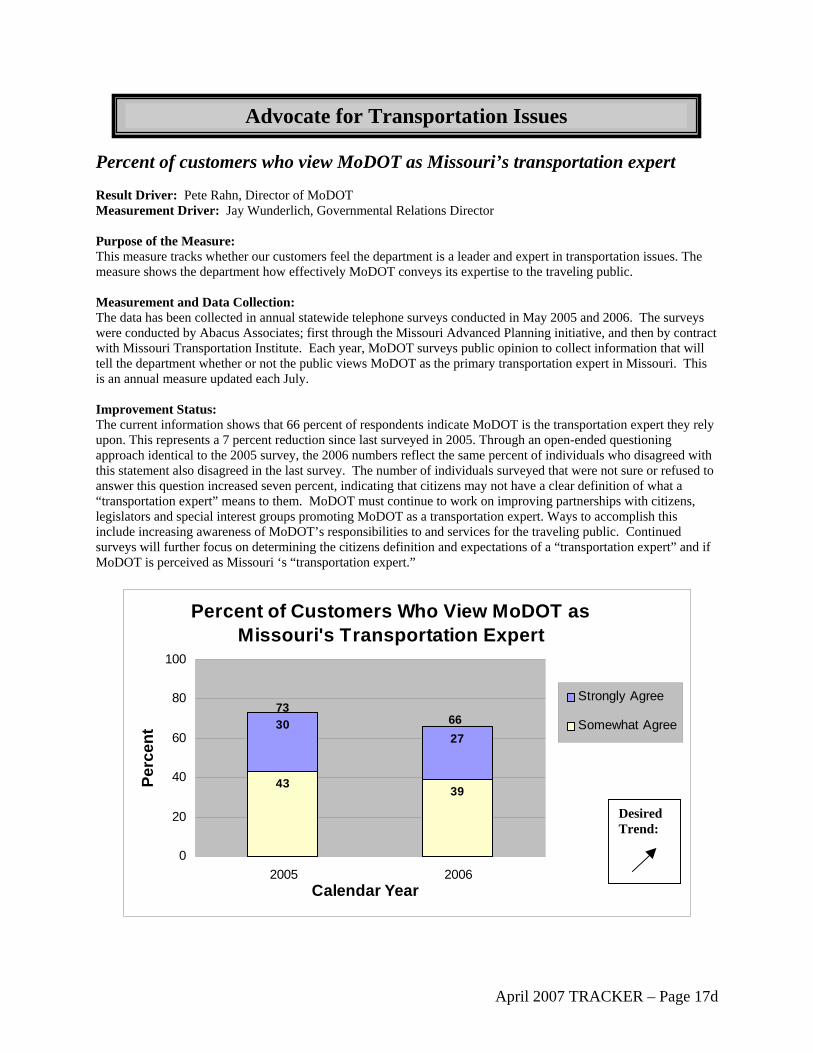
Advocate for Transportation Issues Percent of customers who view MoDOT as Missouri’s transportation expert Result Driver: Pete Rahn, Director of MoDOT Measurement Driver: Jay Wunderlich, Governmental Relations Director Purpose of the Measure: This measure tracks whether our customers feel the department is a leader and expert in transportation issues. The measure shows the department how effectively MoDOT conveys its expertise to the traveling public. Measurement and Data Collection: The data has been collected in annual statewide telephone surveys conducted in May 2005 and 2006. The surveys were conducted by Abacus Associates; first through the Missouri Advanced Planning initiative, and then by contract with Missouri Transportation Institute. Each year, MoDOT surveys public opinion to collect information that will tell the department whether or not the public views MoDOT as the primary transportation expert in Missouri. This is an annual measure updated each July. Improvement Status: The current information shows that 66 percent of respondents indicate MoDOT is the transportation expert they rely upon. This represents a 7 percent reduction since last surveyed in 2005. Through an open-ended questioning approach identical to the 2005 survey, the 2006 numbers reflect the same percent of individuals who disagreed with this statement also disagreed in the last survey. The number of individuals surveyed that were not sure or refused to answer this question increased seven percent, indicating that citizens may not have a clear definition of what a “transportation expert” means to them. MoDOT must continue to work on improving partnerships with citizens, legislators and special interest groups promoting MoDOT as a transportation expert. Ways to accomplish this include increasing awareness of MoDOT’s responsibilities to and services for the traveling public. Continued surveys will further focus on determining the citizens definition and expectations of a “transportation expert” and if MoDOT is perceived as Missouri ‘s “transportation expert.”
Percent of Customers Who View MoDOT as Missouri's Transportation Expert
43 39
3027
0
20
40
60
80
100
2005 2006Calendar Year
Perc
ent
Strongly Agree
Somewhat Agree
73 66
Desired Trend:
April 2007 TRACKER – Page 17d

Accurate, Timely, Understandable and Proactive Transportation Information(Outbound)
Accurate, consistent and timely information is critical to accom-plishing MoDOT’s mission. By providing this information to its customers, MoDOT becomes the first and best source for transpor-tation information in Missouri. Openness and honesty build trust with our customers.
Tangible Result Driver – Shane Peck, Community Relations Director
18
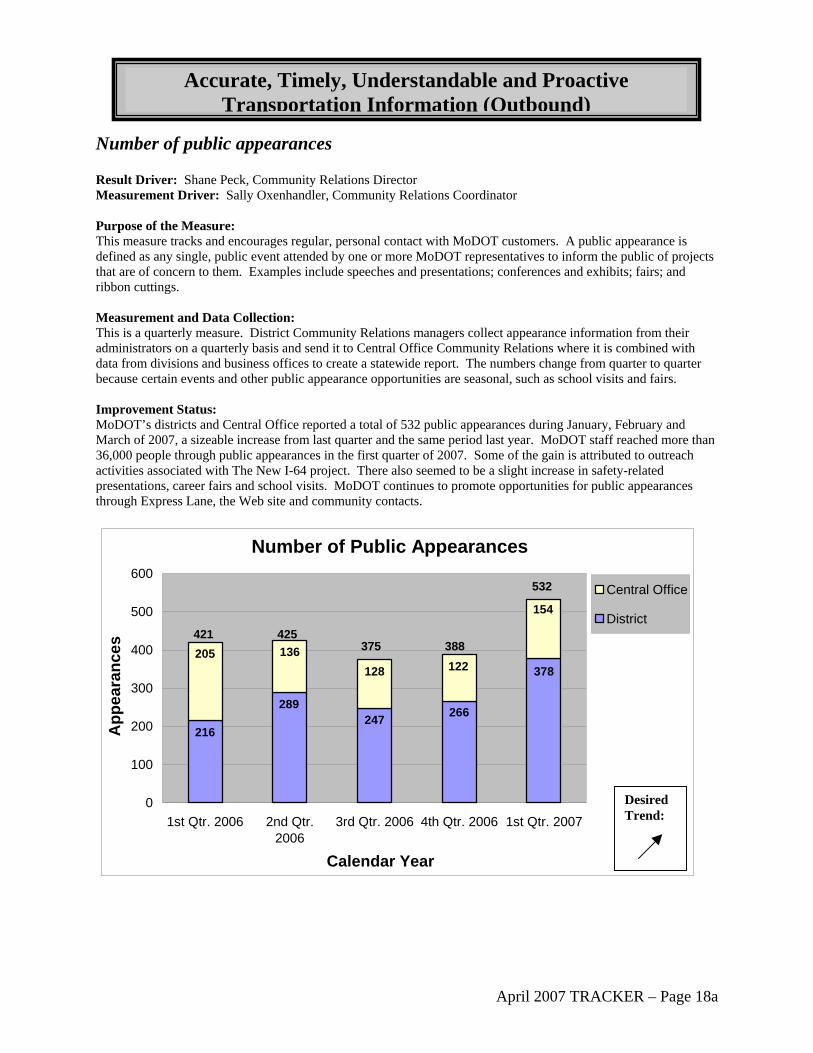
Accurate, Timely, Understandable and Proactive Transportation Information (Outbound)
Number of public appearances Result Driver: Shane Peck, Community Relations Director Measurement Driver: Sally Oxenhandler, Community Relations Coordinator Purpose of the Measure: This measure tracks and encourages regular, personal contact with MoDOT customers. A public appearance is defined as any single, public event attended by one or more MoDOT representatives to inform the public of projects that are of concern to them. Examples include speeches and presentations; conferences and exhibits; fairs; and ribbon cuttings. Measurement and Data Collection: This is a quarterly measure. District Community Relations managers collect appearance information from their administrators on a quarterly basis and send it to Central Office Community Relations where it is combined with data from divisions and business offices to create a statewide report. The numbers change from quarter to quarter because certain events and other public appearance opportunities are seasonal, such as school visits and fairs. Improvement Status: MoDOT’s districts and Central Office reported a total of 532 public appearances during January, February and March of 2007, a sizeable increase from last quarter and the same period last year. MoDOT staff reached more than 36,000 people through public appearances in the first quarter of 2007. Some of the gain is attributed to outreach activities associated with The New I-64 project. There also seemed to be a slight increase in safety-related presentations, career fairs and school visits. MoDOT continues to promote opportunities for public appearances through Express Lane, the Web site and community contacts.
Number of Public Appearances
378
266247289
216
154
128136205
122
0
100
200
300
400
500
600
1st Qtr. 2006 2nd Qtr.2006
3rd Qtr. 2006 4th Qtr. 2006 1st Qtr. 2007
Calendar Year
App
eara
nces
Central Office
District
532
421 425 375 388
Desired Trend:
April 2007 TRACKER – Page 18a

Accurate, Timely, Understandable and Proactive Transportation Information (Outbound)
Percent of customers who feel MoDOT provides timely, accurate and understandable information Result Driver: Shane Peck, Community Relations Director Measurement Driver: Sally Oxenhandler, Community Relations Coordinator Purpose of the Measure: This measure tracks whether customers are comfortable with MoDOT’s proactive efforts to provide accurate and understandable information they need and use. Measurement and Data Collection: This is an annual measure. New data will be available in May 2007. Data is collected as part of a study commissioned by the Missouri Transportation Institute each May. The study interviews 3,500 randomly selected adult Missourians. Improvement Status: Changeable message boards, incident management teams, public meetings, paid advertising, news releases, ExpressLane and the Web site are just a few of the ways MoDOT works to provide accurate, timely, understandable and proactive information to customers. Public outreach activities such as news conferences to introduce the new state map and the Safe & Sound Bridge Improvement Plan and lighting state landmarks orange during Work Zone Awareness Week also help get important transportation information to Missouri citizens.
Percent of Customers Who Feel MoDOT Provides Timely Information
(Annual Survey)
52 54
21 17
0
20
40
60
80
100
2005 2006Calendar Year
Perc
ent
Strongly Agree
Agree
73 71
Desired Trend:
April 2007 TRACKER – Page 18b

Percent of Customers Who Feel MoDOT Provides Accurate Information
(Annual Survey)
49 52
22 20
0
20
40
60
80
100
2005 2006Calendar Year
Perc
ent
Strongly Agree
Agree
72 71
Desired Trend:
Percent of Customers Who Feel MoDOT Provides Understandable Information
(Annual Survey)
49 50
22 20
0
20
40
60
80
100
2005 2006Calendar Year
Perc
ent
Strongly Agree
Agree
7170
Desired Trend:
April 2007 TRACKER – Page 18b (2)

Accurate, Timely, Understandable and Proactive Transportation Information (Outbound)
Number of contacts initiated by MoDOT to media Result Driver: Shane Peck, Community Relations Director Measurement Driver: Jeff Briggs, Community Relations Manager Purpose of the Measure: This measure tracks how well MoDOT staff is “reaching out” to reporters to tell them about the good work MoDOT does. Measurement and Data Collection: All contacts (news releases, e-mail, phone and correspondence) initiated by MoDOT staff are included. Central Office Community Relations collects quarterly results, including submissions from districts. Improvement Status: Contacts increased 51 percent over this time last year. Although contacts are typically less frequent during the winter months, several heavy snowstorms required frequent media updates. The rollout of the Better Roads, Brighter Future Program also helped, as did continued expansion of non-traditional media contacts such as e-mail databases and Express Lane subscriptions.
Number of Contacts Initiated by MoDOT to Media
47,88347,82044,185
34,364
51,847
0
10,000
20,000
30,000
40,000
50,000
60,000
1st Qtr. 2006 2nd Qtr. 2006 3rd Qtr. 2006 4th Qtr. 2006 1st Qtr. 2007
Calendar Year
Num
ber
Desired Trend:
April 2007 TRACKER – Page 18c

Accurate, Timely, Understandable and Proactive Transportation Information (Outbound)
Percent of MoDOT information that meets the media’s expectations Result Driver: Shane Peck, Community Relations Director Measurement Driver: Jeff Briggs, Community Relations Manager Purpose of the Measure: This measure tracks how MoDOT is meeting the media’s needs by providing appropriate information. Measurement and Data Collection: MoDOT sends out surveys asking statewide media if MoDOT’s outreach efforts meet their expectations. They are asked to rate their level of satisfaction in the areas of press releases, public meetings and events. Each area is further rated in newsworthiness, timeliness, and how understandable it is. Improvement Status: There is no new data for this annual measure. The 2006 annual survey was completed in June and July of that year, and showed continuing high numbers along with growth in some areas. Continued emphasis on electronic distribution to improve timeliness as well as newsworthy events such as the Safe & Sound and Better Roads, Brighter Future programs will help next year’s results.
Percent of MoDOT Information That Meets the Media's Expectations
(Press Releases)
91.4 82.5 77.8
91.3 85.4
77.9
0
20
40
60
80
100
Newsworthy Timely UnderstandableAttributes
Perc
ent
2005
2006
Desired Trend:
April 2007 TRACKER – Page 18d

Percent of MoDOT Information That Meets the Media's Expectations
(Public Meetings)
79.4 83.8 87.4 81.4
87.0 87.0
0
20
40
60
80
100
Newsworthy Timely Understandable
Attributes
Perc
ent
2005
2006
Desired Trend:
Percent of MoDOT Information That Meets the Media's Expectations
(Events)
82.9 85.1 86.9 83.8 86.5 89.4
0
20
40
60
80
100
Newsworthy Timely Understandable
Attributes
Perc
ent
2005
2006
Desired Trend:
April 2007 TRACKER – Page 18d (2)

Accurate, Timely, Understandable and Proactive Transportation Information (Outbound)
Percent of positive newspaper editorials Result Driver: Shane Peck, Community Relations Director Measurement Driver: Jeff Briggs, Community Relations Manager Purpose of the Measure: This measure tracks how MoDOT is perceived by the media, and by extension the public. Measurement and Data Collection: Using a newspaper clips database, MoDOT staff reviews statewide newspaper editorials and determines whether they’re positive or negative toward MoDOT and/or the issues it advocates. Only editorials written by newspaper staff are included; guest editorials and letters to the editor are not. Results are charted quarterly. Improvement Status: Editorial activity was very high this quarter, with 35 of 46 editorials positive. MoDOT’s push for a primary seat belt law generated 16 editorials, which were all positive. Numerous editorials discussed additional funding for transportation, including toll road possibilities, with nine of 12 funding editorials positive. Snow removal and work zone efforts also received positive coverage. The proposed Mississippi River crossing and I-64 work in St. Louis received some negative editorials.
Percent of Positive Newspaper Editorials
7676 70
77 83 79
0
20
40
60
80
100
4th Qtr. 2005 1st Qtr. 2006 2nd Qtr.2006
3rd Qtr.2006
4th Qtr. 2006 1st Qtr. 2007
Calendar Year
Perc
ent
Desired Trend:
April 2007 TRACKER – Page 18e

April 2007 TRACKER – Page 18f
Number of repeat visitors to MoDOT’s web site Result Driver: Shane Peck, Community Relations Director Measurement Driver: Matt Hiebert, Community Relations Coordinator Purpose of the Measure: This measure tracks the number of customers who have used MoDOT’s Web site on a repeat basis. The data helps demonstrate whether the public views the site as a valuable information resource. If they are returning to the site for multiple visits, they probably view it as a worthwhile use of their time online. Measurement and Data Collection: Data is gathered using Web Trends software. Web Trends measures site activity and produces reports in graphic and tabular formats. Improvement Status: The extremely high repeat visitor numbers for January and February are largely due to the traffic to the Road Conditions map and text reports. Also this is the first report that includes figures from Gateway Guide. Repeat visitors from that site ranged from 5,752 in March to 10,471 in February. Although there was some repeat traffic to the Road Conditions map due to the snowstorm in Iowa, most of the repeat visitors for March were looking at other pages of the site, particularly in the Careers and Business areas. MoDOT recently added a direct link to the project bidding information page on the homepage and have added images that cycle upon refresh to give more “real estate” to other MoDOT divisions and projects.
Number of Repeat Visitors to MoDOT's Web Site by Month
18,705 21,89119,989
63,586
36,574
51,534
010,00020,00030,00040,00050,00060,00070,000
Jan. 2006 Jan. 2007 Feb. 2006 Feb. 2007 Mar. 2006 Mar. 2007Calendar Year
Num
ber
Accurate, Timely, Understandable and Proactive Transportation Information (Outbound)
Desired Trend:
Number of Repeat Visitors to MoDOT's Web Site by Quarter
151,694
90,72369,39663,977
0
40,000
80,000
120,000
160,000
Calendar Year
Num
ber
Desired Trend:
2nd Qtr. 2006 3rd Qtr. 2006 4th Qtr. 2006 1st Qtr. 2007
Copyright © 2022 FDOKUMEN