Behavioral Finance in Brazil: applying the prospect theory to potential investors
22
594 Rev. bus. manag., São Paulo, Vol. 16, No. 53, pp. 594-615, Oct./Dec. 2014 REVISTA BRASILEIRA DE GESTÃO DE NEGÓCIOS ISSN 1806-4892 REVIEW OF BUSINESS MANAGEMENT © FECAP DOI: 10.7819/rbgn.v16i52.1865 Subject Area: Finance and Economics RBGN Behavioral Finance in Brazil: applying the prospect theory to potential investors Finanças Comportamentais no Brasil: uma aplicação da teoria da perspectiva em potenciais investidores Finanzas comportamentales en Brasil: aplicación de la teoría de la perspectiva a los inversores potenciales Claudia Emiko Yoshinaga 1 iago Borges Ramalho 2 Received on January 14, 2014 / Approved on November 11, 2014 Responsible editor: João Maurício Gama Boaventura, Dr. Evaluation process: Double Blind Review 1. Doctor in Management with focus on Finances from University of São Paulo (USP) [[email protected]] 2. Master in Management with focus on Finances from FECAP [[email protected]] Authors’ address: FECAP University Center Avenida da Liberdade, 532 – CEP: 01502-001 – São Paulo – SP – Brazil ABSTRACT e premise of unbounded rationality defended by the Efficient Market Hypothesis is challenged by the theoretical framework that involves Behavioral Finance, whose basis, Kahneman and Tversky’s Prospect eory (1979), questions the Expected Utility eory, an important element of Neoclassical Economics, as basis for decision- making. This research aims to replicate the empirical research of Kahneman and Tversky’s seminal article (1979) to evaluate the decision- making process of employees (potential investors) from a major national financial institution. e results of this study were compared to those obtained in the original article and to other similar studies. The questionnaire employed was an adaptation of the one originally used, so that we could test, in the studied sample, the applicability of the Prospect eory, more specifically with regard to Certainty, Reflection and Isolation Effects. We also analyzed differences in the decision-making process considering respondents’ attributes (gender, age and income). The results confirmed that behavioral effects do exist, and proved that a large portion of the sample presented significant inconsistency in their choices according to Expected Utility eory principles, highlighting that their decisions were not made according to strictly rational behavior. Furthermore, we analyzed the relationship between violations and investor characteristics by estimating a linear model. Results indicate
Transcript of Behavioral Finance in Brazil: applying the prospect theory to potential investors

594
Rev. bus. manag., São Paulo, Vol. 16, No. 53, pp. 594-615, Oct./Dec. 2014
REVISTA BRASILEIRA DE GESTÃO DE NEGÓCIOS ISSN 1806-4892REVIEw Of BuSINESS MANAGEMENT
© FECAP
DOI: 10.7819/rbgn.v16i52.1865
Subject Area: Finance and Economics
RBGN
Behavioral Finance in Brazil: applying the prospect theory to potential investors
Finanças Comportamentais no Brasil: uma aplicação da teoria da perspectiva em potenciais investidores
Finanzas comportamentales en Brasil: aplicación de la teoría de la perspectiva a los inversores potenciales
Claudia Emiko Yoshinaga1 Thiago Borges Ramalho2
Received on January 14, 2014 / Approved on November 11, 2014Responsible editor: João Maurício Gama Boaventura, Dr.Evaluation process: Double Blind Review
1. Doctor in Management with focus on Finances from University of São Paulo (USP) [[email protected]]2. Master in Management with focus on Finances from FECAP [[email protected]] Authors’ address: FECAP University Center Avenida da Liberdade, 532 – CEP: 01502-001 – São Paulo – SP – Brazil
ABSTRACTThe premise of unbounded rationality defended by the Efficient Market Hypothesis is challenged by the theoretical framework that involves Behavioral Finance, whose basis, Kahneman and Tversky’s Prospect Theory (1979), questions the Expected Utility Theory, an important element of Neoclassical Economics, as basis for decision-making. This research aims to replicate the empirical research of Kahneman and Tversky’s seminal article (1979) to evaluate the decision-making process of employees (potential investors) from a major national financial institution. The results of this study were compared to those obtained in the original article and to other similar studies. The questionnaire employed
was an adaptation of the one originally used, so that we could test, in the studied sample, the applicability of the Prospect Theory, more specifically with regard to Certainty, Reflection and Isolation Effects. We also analyzed differences in the decision-making process considering respondents’ attributes (gender, age and income). The results confirmed that behavioral effects do exist, and proved that a large portion of the sample presented significant inconsistency in their choices according to Expected Utility Theory principles, highlighting that their decisions were not made according to strictly rational behavior. Furthermore, we analyzed the relationship between violations and investor characteristics by estimating a linear model. Results indicate

595
Rev. bus. manag., São Paulo, Vol. 16, No. 53, pp. 594-615, Oct./Dec. 2014
Behavioral Finance in Brazil: applying the prospect theory to potential investors
that both age and level of income were negatively related to total violations.
Keywords: Prospect theory. Heuristics. Cognitive biases. Decision-making process. Investor characteristics.
RESUMOA premissa de racionalidade ilimitada preconizada pela Hipótese dos Mercados Eficientes é contestada como ferramenta para tomada de decisões pelo arcabouço teórico que envolve as Finanças Comportamentais, cuja base, a Teoria da Perspectiva de Kahneman e Tversky (1979), questiona o que prediz a Teoria da Utilidade Esperada, importante elemento da Economia Neoclássica. A presente pesquisa objetiva replicar a investigação empírica do artigo seminal de Kahneman e Tversky (1979) para avaliar o processo decisório de funcionários (potenciais investidores) de uma importante instituição financeira nacional. Os resultados deste estudo foram comparados aos obtidos no trabalho original e em pesquisas similares. O questionário adotado foi uma adaptação do originalmente utilizado, para que se pudesse testar, na amostra estudada, a aplicabilidade da Teoria da Perspectiva, mais especificamente no que diz respeito aos Efeitos Certeza, Reflexão e Isolamento. Foram analisadas, ainda, as diferenças no comportamento frente à tomada de decisões considerando os perfis demográficos dos respondentes (gênero, idade e renda). Os resultados obtidos confirmaram a presença dos efeitos e comprovaram que uma grande parcela do público amostral apresentou efetiva inconsistência em suas escolhas segundo os fundamentos da Teoria da Utilidade Esperada, o que indica que suas decisões não foram tomadas de forma estritamente racional. Como contribuição, foi analisado se as violações estão relacionadas a características dos investidores, por meio de um modelo de regressão linear. Os resultados indicam que, em relação aos perfis, idade e renda apresentaram relação negativa com o total de violações.
Palavras-chave: Teoria do prospecto.Heurís-ticas. Vieses cognitivos. Processo decisório. Características dos investidores.
RESUMENLa premisa de la racionalidad ilimitada defendida por la hipótesis del mercado eficiente se contempla como una herramienta para la toma de decisiones en el marco teórico que implica el comportamiento financiero, cuya base, la teoría de la perspectiva de Kahneman y Tversky (1979), cuestiona la teoría que predice la utilidad esperada, un elemento importante de la economía neoclásica. Esta investigación tiene como objetivo replicar la investigación empírica del artículo seminal para evaluar el proceso de toma de decisiones de los trabajadores (potenciales inversionistas) de una institución financiera nacional importante. Los resultados de este estudio se compararon con los obtenidos en la obra original y los estudios similares. El cuestionario utilizado fue una adaptación del utilizado originalmente, para que se pudiera probar, en nuestra muestra, la aplicabilidad de la teoría de la perspectiva, más específicamente en lo que respecta a los efectos certeza, reflexión y aislamiento. Se analizaron también las diferencias de comportamiento en la toma de decisiones teniendo en cuenta los perfiles demográficos de los entrevistados. Los resultados confirmaron la presencia de los efectos y demostraron que una gran parte de la muestra pública mostró inconsistencia efectiva en sus decisiones, de acuerdo a los principios de la teoría de utilidad esperada, lo que indica que sus decisiones no fueron tomadas de manera estrictamente racional. Como contribución, analizamos si los incumplimientos están relacionados con las características de los inversores a través de un modelo de regresión lineal. Los resultados indican que, en relación con el perfil, la edad y los ingresos mostraron una relación negativa con los incumplimientos totales.
Palabras clave: Teoría de la perspectiva. Heurística. Sesgos cognitivos. Proceso de toma de decisiones. Características de los inversores.
1 INTRODUCTION
The Modern Theory of Finance’s theoretical framework, based on the precepts
596
Rev. bus. manag., São Paulo, Vol. 16, No. 53, pp. 594-615, Oct./Dec. 2014
Claudia Emiko Yoshinaga / Thiago Borges Ramalho
of Neoclassical Economic Theory, assumes that economic subjects make decisions with unlimited rationality, present risk aversion and aim to maximize expected utility at every decision made. However, Simon (1955) was already critical of the current paradigm, claiming that people’s decision-making processes are based on limits to rationality, paving the way for the emergence of a new and promising field of study in finance, later known as Behavioral Finance.
Behavioral Finance challenged the Efficient Market Hypothesis (EMH), based on the belief that economic subjects do not make strictly rational decisions and that there are limits to the role of so-called rational arbitrageurs. Two of its main theorists, Daniel Kahneman and Amos Tversky, concluded – in research carried
out in the 1970s – that decisions are made with the use of heuristics (simplified decision-making processes) that are subject to systematic errors (cognitive biases).
Considering, then, that the EMH has not been sufficient to explain people’s decision-making behavior, the theoretical scope involving Behavioral Finance, based on the development of Kahneman and Tversky’s Prospect Theory (1979), signals that it is able to fill the gap left by Modern Finance Theory with regard to understanding phenomena that clash with the rational model.
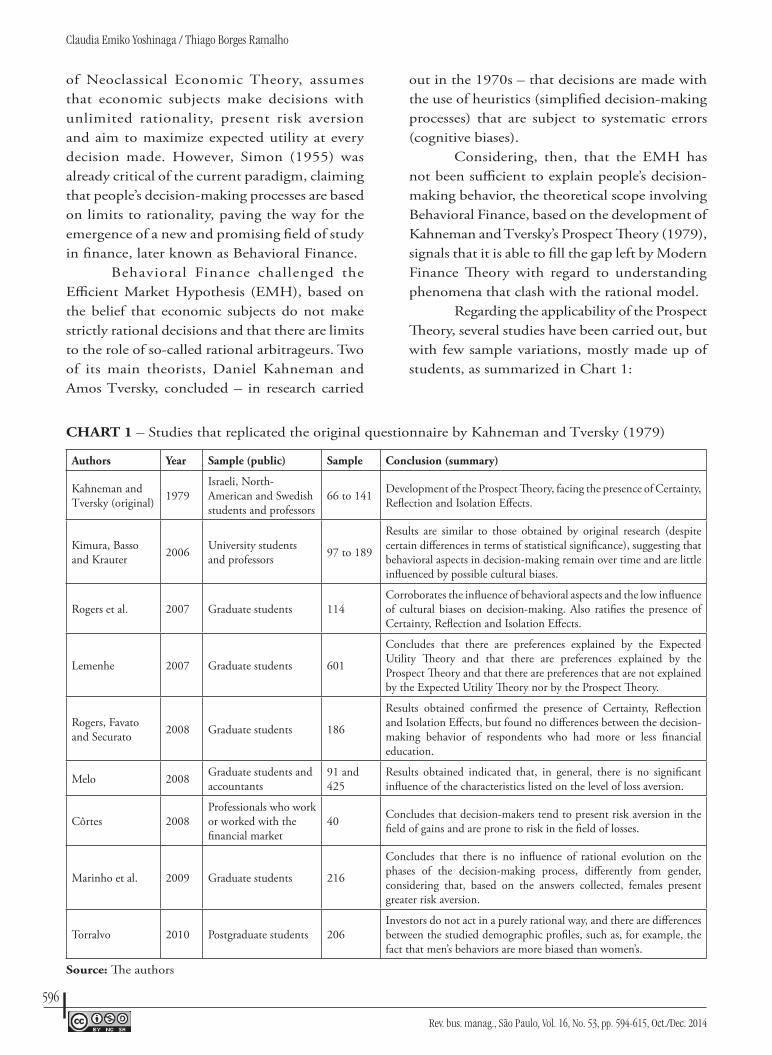
Regarding the applicability of the Prospect Theory, several studies have been carried out, but with few sample variations, mostly made up of students, as summarized in Chart 1:
CHART 1 – Studies that replicated the original questionnaire by Kahneman and Tversky (1979)
Authors Year Sample (public) Sample Conclusion (summary)
Kahneman and Tversky (original) 1979
Israeli, North-American and Swedish students and professors
66 to 141 Development of the Prospect Theory, facing the presence of Certainty, Reflection and Isolation Effects.
Kimura, Basso and Krauter 2006 University students
and professors 97 to 189
Results are similar to those obtained by original research (despite certain differences in terms of statistical significance), suggesting that behavioral aspects in decision-making remain over time and are little influenced by possible cultural biases.
Rogers et al. 2007 Graduate students 114Corroborates the influence of behavioral aspects and the low influence of cultural biases on decision-making. Also ratifies the presence of Certainty, Reflection and Isolation Effects.
Lemenhe 2007 Graduate students 601
Concludes that there are preferences explained by the Expected Utility Theory and that there are preferences explained by the Prospect Theory and that there are preferences that are not explained by the Expected Utility Theory nor by the Prospect Theory.
Rogers, Favato and Securato 2008 Graduate students 186
Results obtained confirmed the presence of Certainty, Reflection and Isolation Effects, but found no differences between the decision-making behavior of respondents who had more or less financial education.
Melo 2008 Graduate students and accountants
91 and 425
Results obtained indicated that, in general, there is no significant influence of the characteristics listed on the level of loss aversion.
Côrtes 2008Professionals who work or worked with thefinancial market
40 Concludes that decision-makers tend to present risk aversion in the field of gains and are prone to risk in the field of losses.
Marinho et al. 2009 Graduate students 216
Concludes that there is no influence of rational evolution on the phases of the decision-making process, differently from gender, considering that, based on the answers collected, females present greater risk aversion.
Torralvo 2010 Postgraduate students 206Investors do not act in a purely rational way, and there are differences between the studied demographic profiles, such as, for example, the fact that men’s behaviors are more biased than women’s.
Source: The authors

597
Rev. bus. manag., São Paulo, Vol. 16, No. 53, pp. 594-615, Oct./Dec. 2014
Behavioral Finance in Brazil: applying the prospect theory to potential investors
Marconi and Lakatos (2010, p. 63) indicate that the function of science is “improvement, through the growing body of knowledge, of man’s relationship with his world”. They also considered “invention of new ideas (hypotheses, theories or techniques) or production of new empirical data that promise to solve the problem” (MARCONI; LAKATOS, 2010, p. 66) as one of the steps of the scientific method. This research, in an unprecedented way, in order to produce new empirical data, has used employees from a major national financial institution as sample. We must mention that these employees are also customers of the said bank and, hence, are potential investors.
Also differently, and to quantify the groups’ majority preferences for alternatives that reveal or do not reveal v iolat ions of the rational decision-making model, this research measured the percentage of respondents who actually made inconsistent choices, considering the precepts of the Theory of Expected Utility; as an additional contribution, we used econometric models to analyze differences between the studied demographic profiles.
We must also mention that this work’s sample in made up of 2,590 respondents, a much larger number than earlier research carried out on the subject and summarized in Chart 1.
The results confirmed the presence of the effects and proved that a large portion of the sample presented effective inconsistency in their choices, according to the principles of the Theory of Expected Utility, which indicates that decisions were not made in a strictly rational way. As to the analysis of behavioral differences between demographic profiles analyzed, the proposed econometric models indicated a negative relationship between age and income and total violations, according to the rational model.
2 THEORETICAL FRAMEWORK
2.1 Origins of behavioral finance
According to classical economic theory, prices of goods are defined based on their respective production costs. Neoclassical economic theory included, in analysis of the formation of price, the importance of demand, defined – based on subjective assessment – by the satisfaction or utility provided to consumers, whose choices are made respecting the postulate of rationality.
The Theory of Expected Utility, according to Cusinato (2003), assumes that the value of things cannot be based on their prices, but on the utility they provide, so that each level of income is associated with a degree of ultimate benefit, defined as a utility, which can take positive weights (in the field of gains) and negative weights (in the field of losses), with symmetric weights. Thus, based on the premise that people are fully rational, that all information is effectively processed by decision-making subjects and that markets are efficient, each decision is made to maximize its expected utility.
Under the precepts of neoclassical economics, especially with regard to the rationality of economic subjects and the pursuit of maximizing expected utility at every decision made, the Modern Theory of Finance was founded.
With origins in the 1950s, it is based on the studies of Markowitz (1952), Modigliani and Miller (1958, 1961, 1963), Sharpe (1964) and Fama (1970), who developed the Efficient Market Hypothesis, a theory that considers that asset prices reflect all available information. Therefore, the EMH – the most empirically solid economics proposition, according to Jensen (1979) – is based on the premise that asset prices reflect their correct values and that any deviations can be corrected by arbitration. Moreover, Fama (1970) lists certain premises that are required for a market

598
Rev. bus. manag., São Paulo, Vol. 16, No. 53, pp. 594-615, Oct./Dec. 2014
Claudia Emiko Yoshinaga / Thiago Borges Ramalho
to be efficient, such as the lack of transaction costs, equal access to available information, and homogeneity of investors’ expectations as to asset return probabilities.
According to Shleifer (2000, p. 5), the Efficient Market Hypothesis assumes that “when people are rational, markets are efficient by definition”. Based on the studies of Fama (1970), he also lists three arguments that support this hypothesis: rational evaluation of assets by investors, randomness of transactions by irrational investors (which cancel out without affecting prices) and correction – by rational arbitrageurs – of any possible price deviations caused by irrational investors.
Based on the assumption that people present risk aversion and are fully rational, that all information is effectively processed by decision-making subjects and that markets are efficient, decisions are made in order to maximize expected utility. However, criticism of the current paradigm by several studies led to the emergence of a new financial theory: Behavioral Finance, based on the premise, therefore, that decision-makers do not behave in a strictly rational way, but make judgments and choices under the influence of emotional aspects, using mental shortcuts or simplifying rules that are called heuristics and can lead to systematic errors and deviations, considered cognitive biases.
According to Tversky and Kahneman (1974), beliefs concerning uncertainty are eventually expressed as probabilities, and often subjectively evaluated based on heuristics and not on statistical calculations. In the same study, they are segmented into heuristics of representativeness, availability and adjustment and anchorage, explaining their cognitive biases.
The heuristics of representativeness bases evaluation of the probability that certain events will be created by certain processes on the similarity between them and stereotypes. The heuristics of availability explains cases in which
probabilities or frequencies are based on how easily occurrences are remembered. The heuristics of adjustment and anchorage bases judgments on a reference (anchor) that may or may not refer to the events involved in the decision.
Irrational decisions in financial markets may cause so-called anomalies. To Macedo Jr, Kolinsky and Morais (2011, p. 265), “an anomaly is statistical evidence of the incorrect establishment of asset prices by the market”. According to the Modern Finance Theory, anomalies occur randomly and can be solved by arbitration. According to what Behavioral Finance advocates, this isn’t always possible, due to certain limits. Thus, we can state, as observed by Shleifer (2000), that Behavioral Finance is based on two pillars: on the limits of arbitration and on the limits of economic subjects’ rationality, as well as on the respective cognitive process leading to decision-making, also known as investor sentiment.
Regarding limited rationality, according to Halfeld and Torres (2001, p. 65), “the man of Behavioral Finance is not totally rational; he is simply a normal man”. In the same line of reasoning, psychology, particularly research on decision-making, such as the study carried out by Richard Thaler, Daniel Kahneman and Amos Tversky, became enormously important to new research in the fields of economics and finance. Thaler (1999) relates understanding the market to understanding people, and states that, in a not too distant future, the term “Behavioral Finance” will be redundant – after all, he asks, does any type of finance not include behavioral aspects?
According to Bazerman and Moore (2010, p. 6), “the term rationality refers to the decision-making process that will hopefully lead to an ideal result, given accurate evaluation of the decision-maker’s risk values and preferences”. Simon (1955) argues that people’s decision-making process is built upon limits to rationality. The rational model, the prescriptive one, recommends

599
Rev. bus. manag., São Paulo, Vol. 16, No. 53, pp. 594-615, Oct./Dec. 2014
Behavioral Finance in Brazil: applying the prospect theory to potential investors
how decisions should ideally be made. The model that considers the limits of rationality, the descriptive one, deals with how decisions are actually made, given the constraints to resources such as information and time.
The EMH advocates that, while they randomly occur, eventual “irrational” movements by so-called noise traders are corrected by rational subjects in a timely way, correcting any possible deviations in asset prices caused by arbitration. According to Rabelo Jr. and Ikeda (2004, p. 5), arbitration is the “simultaneous buying and selling of the same title, or of an essentially similar one, in two different markets, at different prices, in order to obtain an advantage in the operation”.
However, according to theoretical supporters of Behavioral Finance, the actions of arbitrageurs are limited; this can be corroborated by observing, over the years, the presence of financial bubbles and other anomalies in the market (phenomena considered random by EMH advocates). Arbitration can be expensive and risky and, in some cases, unfeasible, because of its limitations. Baker and Wurgler (2011) conclude that, based on literature concerning limited arbitration, price deviations (mispricing) in the market often do not present real opportunities for arbitration. These limits refer to the fundamental risks of assets (absence of substitute titles), to risks inherent to actions of so-called noise traders and to the risks of implementation costs involved. According to Shleifer (2000), arbitration can be risky and limited because asset prices do not instantly converge to their core values. Moreover, there are also the inherent implementation costs that refer to arbitration strategies that can make them less attractive or viable.
2.2The prospect theory
Kahneman and Tversky (1979) created the Prospect Theory, a critique of the Theory of
Expected Utility as a tool for decision-making in situations involving uncertainty and risk, adopting as premises the presence of irrationality and the corresponding use of heuristics in people’s decision-making processes, leading to systematic errors due to biased cognitive processes.
Two steps can be observed in the decision-making process, according to Kahneman and Tversky (1979): editing (preliminary analysis and simplification of perspectives) and evaluation (evaluation and choice of the highest value perspective).
The Prospect Theory, even assuming that people tend to attach greater weight to possibilities as their respective probabilities increase, challenges this principle by stating that the change from 0% to 5% creates a nonexistent possibility and, therefore, although highly unlikely, causes decision-makers to overweight the value attributed to this condition, characterized as the Possibility Effect (amounts paid in lotteries confirm this bias). On the other hand, the change from 95% to 100% results in another bias, the so-called Certainty Effect, in which highly probable possibilities are underweighted and greater weight is attributed to events that are certain than to events that are possible.
The Prospect Theory also advocates that different weight are assigned to gains (results above the reference point) and to losses (results below the reference point), indicating loss aversion (and not generally to risk, in itself, according to the Expected Utility concept). Asymmetry between weight attributed to gains and losses can be seen in GRAPH 1, which represents the Prospect Theory’s hypothetical value function. We can observe that the curve is concave in the field of gains, as occurs with the Expected Utility Theory’s value function, but convex in the field of losses.

600
Rev. bus. manag., São Paulo, Vol. 16, No. 53, pp. 594-615, Oct./Dec. 2014
Claudia Emiko Yoshinaga / Thiago Borges Ramalho
GRAPH 1 – The prospect theory’s hypothetical value function the prospect theory
Source: Kahneman and Tversky (1979, p. 279)
This bias was named the Reflection Effect, a trend towards risk aversion in the field of gains and towards risk seeking in the field of losses, with greater recovery of losses when compared to gains.
Loss aversion and the use of a reference point when making choices refer us to another phenomenon known as the Endowment Effect, developed by Thaler, in which, in a way that is inconsistent with rational analysis, we tend to overweight certain property that we possess if it is intended to be used, resulting in discrepancies between values attributed at the time of buying and of selling (KAHNEMAN, 2012). “When it is more painful to give up a good than it is pleasurable to obtain it, buying prices will be significantly lower than selling prices.” (KAHNEMAN; TVERSKY; 1984, p. 348)
When we are in situations that involve more than one problem and, therefore, more than one decision, we tend to make case by case evaluation, whilst each problem presents itself, characterizing a narrow framework and highlighting the bias Isolation Effect. Concerning this bias in the context of the Prospect Theory, Macedo Jr, Kolinsky and Morais (2011, p. 276) point out that “people generally discard components that are shared by all considered probabilities” and Rogers et al. (2007, p. 52)
point out that “to simplify the decision-making process, subjects generally disregard many of the characteristics of the available choices and focus analysis on the components that differentiate these options”.
Based on the Isolation Effect, considering the non-linearity of the Prospect Theory’s hypothetical value function and the fact that decisions are based on a reference point, the Framing Effect arises, in which the choices for the same problem may be different according to the way in which the latter is framed (KAHNEMAN; TVERSKY, 1984).
3 METHODOLOGICAL PROCEDURES
We defined employees who work in the sales and high net worth (except Private Banking) segments of a major national financial institution in the state of São Paulo as the sample of this paper.
For this research, we adapted the questionnaire first used by Kahneman and Tversky (1979) in their seminal article, explained in the discussion of results, changing the currency to the Brazilian real and including qualitative questions to analyze respondents’ demographics. The numbers of the questions presented in this article refer to those used in the questionnaire that was applied.
Between October 26, 2012 and November 25, 2012, at random, to avoid selection bias, 21,267 questionnaires were sent electronically to respondents, and data was collected by the SurveyMonkey tool. Questionnaire could only be completed if all answers were filled in; of the 3,143 respondents who started to answer the questionnaire, 2,590 concluded it, representing a 12.2% success rate as to the total sent, and an 82.4% success rate as to the total of those who began to answer.
Answers were analyzed question by question, in order to verify statistical significance,

601
Rev. bus. manag., São Paulo, Vol. 16, No. 53, pp. 594-615, Oct./Dec. 2014
Behavioral Finance in Brazil: applying the prospect theory to potential investors
using the chi-square test, with significance levels of 1% and 5% of the ratio of choices for each alternative – and if there was a majority preference for any of them. To this end, the following assumptions were considered:
H0: there is no majority preference for an alternative. In this case, the ratio of choices for alternative A is equal to the ratio of choices for alternative B, that is, the observed ratio is equal to the expected ratio (50% for both).
H1: there is a majority preference for an alternative. In this case, the ratio of choices for alternative A is different from the ratio of choices for alternative B, that is, the observed ratio is different from the expected ratio (50% for both).
Next, the answers were analyzed in pairs and, if inconsistent, were considered violations. According to Kimura, Basso and Krauter (2006, p. 44), “inconsistency depends on identifying incoherence between attitudes”. Importantly, the presence of inconsistency does not mean error on the part of the respondents, but implies only that their preferences are inconsistent with what the Expected Utility Theory predicts. If there were inconsistent majority preferences among the questions that make up each pair, this proves that there are deviations from behavior predicted by expected utility in respondents’ decision-making as to Certainty, Reflection and Isolation Effects. Thus, the following hypotheses were considered:
H0: there is no evidence of deviation from behavior predicted by expected utility in respondents’ decision-making. In this case, there are no majority inconsistent preferences among the questions that involve each pair.
H1: there is evidence of deviation from behavior predicted by expected utility in respondents’ decision-making. In this case,
there are majority inconsistent preferences among the questions that involve each pair.
As well as analyzing the majority preferences for alternatives that demonstrate deviations to rationality, we also analyzed, pair by pair, if there was a majority preference for effectively inconsistent alternatives, that is, respondents who chose alternative A and B (or B and A) in each pair, respectively. In this case, the following hypotheses were considered:
H0: there is no majority preference for effectively inconsistent alternatives. In this case, the ratio of choices for alternatives A and A or B and B is equal to the ratio of choices for alternatives A and B or B and A, that is, the observed ratio is equal to the expected ratio (50% for both).
H1: there is a majority preference for effectively inconsistent alternatives. In this case, the ratio of choices for alternatives A and A or B and B is different from the ratio of choices for alternatives A and B or B and A, that is, the observed ratio is different from the expected ratio (50% for both).
So as to test and measure differences in respondents’ decision-making behavior, taking analyzed demographic profiles into account, we developed econometric models that are detailed in section 4.2.
4 RESULTS OBTAINED
4.1 Questions – discussion of results
Analysis of issues 8-15 intends to test for the existence of the Certainty Effect, in which highly likely alternatives have their weight undervalued and higher weights are assigned to certain events when compared to weights assigned to possible events.

602
Rev. bus. manag., São Paulo, Vol. 16, No. 53, pp. 594-615, Oct./Dec. 2014
Claudia Emiko Yoshinaga / Thiago Borges Ramalho
CHART 2 – Question 8
Which of the two alternatives do you prefer? Utility
Alternative A: a 33% chance of winning R$ 2,500.00, a 66% chance of winning R$ 2.400,00 and a 1% chance of winning R$ 0.00
0.33 × U(2,500) + 0.66 × U(2,400)
Alternative B: a 100% chance of winning R$ 2,400.00 U(2,400)
Source: Adapted from Kahneman and Tversky (1979)
According to the Certainty Effect, we expect most respondents to have chosen alternative B, preferring the certainty of gains.
Thus: 0.33 × U(2,500) + 0.66 × U(2,400) < U(2,400). Simplifying the inequation, thus: 0.33 × U(2,500) < 0.34 × U(2,400).
CHART 3 – Question 9
Which of the two alternatives do you prefer? Utility
Alternative A: a 33% chance of winning R$ 2,500.00 and a 67% chances of winning R$ 0.00 0.33 × U(2,500)
Alternative B: a 34% chance of winning R$ 2,400.00 and a 66% chance of winning R$ 0.00 0.34 × U(2,400)
Source: Adapted from Kahneman and Tversky (1979)
There will be evidence of deviation as to the behavior predicted by the Expected Utility Theory in decision-making by respondents as to the Certainty Effect if the majority chose alternative A, indicating a preference for the largest gain (since there is no alternative with a gain that is certain) even facing a one percentage point smaller chance of it occurring. The result of this preference is described by 0.33 × U(2,500) > 0.34 × U(2,400). These deviations can be proven by comparing inequations 0.33 × U(2,500) < 0.34 × U(2,400) and 0.33 × U(2,500) > 0.34 × U(2,400).
With regard to question 8, the choice for alternative B (75.4%) prevailed, confirming preference for the alternative that offers a gain that is certain. However, with regard to question 9, we cannot state that there was a majority choice among alternatives, thus not revealing inconsistency in respondents’ decision-making process.
When we analyzed the percentage of effectively inconsistent responses, we observed that most respondents were consistent in their choices (54.1%).
CHART 4 – Question 10
Which of the two alternatives do you prefer? Utility
Alternative A: an 80% chance of winning R$ 4,000.00 and a 20% chance of winning R$ 0.00 0.80 × U(4,000)
Alternative B: an 100% chance of winning R$ 3,000.00 1.00 × U(3,000)
Source: Adapted from Kahneman and Tversky (1979)
According to the Certainty Effect, we expect the majority of respondents to have chosen alternative B, preferring the certainty of
gain. Thus: 0.80 × U(4.000) < 1.00 × U(3,000). Dividing both sides of the inequation by 4, we find: 0.20 × U(4,000) < 0.25 × U(3,000).
CHART 5 – Question 11
Which of the two alternatives do you prefer? Utility
Alternative A: a 20% chance of winning R$ 4,000.00 and an 80% chance of winning R$ 0.00 0.20 x U(4,000)
Alternative B: a 25% chance of winning R$ 3,000.00 and a 75% chance of winning R$ 0.00 0.25 x U(3,000)
Source: Adapted from Kahneman and Tversky (1979)

603
Rev. bus. manag., São Paulo, Vol. 16, No. 53, pp. 594-615, Oct./Dec. 2014
Behavioral Finance in Brazil: applying the prospect theory to potential investors
There will be evidence of deviation as to the behavior predicted by the Expected Utility Theory in decision-making by respondents as to the Certainty Effect if the majority chose alternative A, indicating a preference for the largest gain (since there is no alternative with a gain that is certain) even facing a five percentage point smaller chance of it occurring. The result of this preference is described by: 0.20 × U(4,000) > 0.25 × U(3,000). These deviations can be proven by comparing inequations 0.20 × U(4,000) < 0.25 × U(3,000) and 0.20 × U(4,000) > 0.25 × U(3,000).
With regard to question 10, the same as in question 8, the choice for alternative B (87.3%) prevailed, confirming preference for the alternative that offers a gain that is certain. However, with regard to question 11, considering the preference for alternative B in the total of answers, we can observe consistency in respondents’ decision-making process.
When we analyzed the percentage of effectively inconsistent responses, we observed an expressive ratio of biased choices (41.2%), although the majority presented effective consistency in their choices (58.8%).
CHART 6 – Question 12
Which of the two alternatives do you prefer? Utility
Alternative A: a 50% chance of winning a 3-week trip to England, France and Italy and a 50% chance of not winning anything 0.50 × U (3-week trip)
Alternative B: an 100% chance of winning a 1-week trip to England 1.00 × U (1-week trip)
Source: Adapted from Kahneman and Tversky (1979)
According to the Certainty Effect, we expect the majority of respondents to have chosen alternative B, preferring the certainty of
gain. Thus: 0.50 × U(3-week trip) < 1.00 × U (1-week trip).
CHART 7 – Question 13
Which of the two alternatives do you prefer? Utility
Alternative A: a 5% chance of winning a 3-week trip to England, France and Italy and a 95% chance of not winning anything
0.05 × U (3-week trip)
Alternative B: a 10% chance of winning a 1-week trip to England, and a 90% chance of not winning anything
0,10 × U (1-week trip)
Source: Adapted from Kahneman and Tversky (1979)
There will be evidence of deviation as to the behavior predicted by the Expected Utility Theory in decision-making by respondents as to the Certainty Effect if the majority chose alternative A, indicating a preference for the largest gain (since there is no alternative with a gain that is certain) even facing a five percentage point smaller chance of it occurring. The result of this preference is described by: 0.05 × U (3-week trip) > 0.10 × U (1-week trip). These deviations can be proven by comparing inequations 0.50 × U(3-week trip) < 1.00 × U(1-week trip) and 0.50 × U(3-week trip) > 1.00 × U(1-week trip).
With regard to question 12, the same as in questions 8 and 10, the choice for alternative B (87.6%) prevailed, confirming preference for the alternative that offers a gain that is certain. With regard to question 13, considering the preference for alternative B in the total of answers (56.8%), we can observe consistency in respondents’ decision-making process. Even considering an expressive ratio of biased choices (35.5%), there was a majority preference for alternatives that revealed consistency in their choices (58.8%).

604
Rev. bus. manag., São Paulo, Vol. 16, No. 53, pp. 594-615, Oct./Dec. 2014
Claudia Emiko Yoshinaga / Thiago Borges Ramalho
CHART 8 – Question 14
Which of the two alternatives do you prefer? Utility
Alternative A: a 45% chance of winning R$ 6,000.00 and a 55% chance of winning R$ 0,00 0.45 × U(6,000)
Alternative B: a 90% chance of winning R$ 3,000.00 and a 10% chance of winning R$ 0.00 0.90 × U(3,000)
Source: Adapted from Kahneman and Tversky (1979)
According to the Certainty Effect, we expect the majority of respondents to have chosen alternative B, preferring the certainty of gain,
even if it smaller. Thus: 0.45 × U(6,000) < 0.90 × U(3,000).
CHART 9 – Question 15
Which of the two alternatives do you prefer? Utility
Alternative A: a 0.1% chance of winning R$ 6,000.00 and a 99.9% chance of winning R$ 0.00 0.001 × U(6,000)Alternative B: a 0.2% chance of winning R$ 3,000.00 and a 99.8% chance of winning R$ 0.00 0.002 × U(3,000)
Source: Adapted from Kahneman and Tversky (1979)
There will be evidence of deviation as to the behavior predicted by the Expected Utility Theory in decision-making by respondents as to the Certainty Effect if the majority chose alternative A, indicating a preference for the largest gain (since there is no alternative with a gain that is certain) even facing a one-tenth of a percentage point smaller chance of it occurring, in perspectives that involve extremely small probabilities. The result of this preference is described by: 0.001 × U(6,000) > 0.002 × U(3,000). Multiplying both sides of the inequation by 450, we find: 0.45 × U(6,000) > 0.90 × U(3,000). These deviations can be proven by comparing inequations 0.45 × U(6,000) < 0.90 × U(3,000) and 0.45 × U(6,000) > 0.90 × U(3,000).
With regard to question 14, the choice for alternative B (85.7%) prevailed, confirming preference for the alternative that offers greater probability of gain, even though it is smaller. With regard to question 15, considering the preference for alternative A in the total of answers (59.9%), we can observe inconsistency in respondents’ decision-making process. This is confirmed by analyzing the ratio of effectively inconsistent choices, majority preference of the total of respondents (52.8%).
Analysis of questions 10, 11, 14, 15, 16, 17, 18 and 19 aims at testing for the Reflection Effect, people’s tendency to be risk averse in the field of gains and prone to risk in the field of losses.
CHART 10 – Question 16
Which of the two alternatives do you prefer? Utility
Alternative A: an 80% chance of losing R$ 4,000.00 and a 20% chance of losing R$ 0.00 0.80 × U(-4,000)
Alternative B: an 100% chance of losing R$ 3,000.00 1.00 × U(-3,000)
Source: Adapted from Kahneman and Tversky (1979)
There will be evidence of deviation as to the behavior predicted by the Expected Utility Theory in decision-making by respondents as to the Reflection Effect if the majority chose alternative A, indicating aversion to the alternative
that offers certain loss (B), even when the latter presents a smaller value that the probable loss than the former. The result of this preference is described by: 0.80 × U(-4,000) > 1.00 × U(-3,000). These deviations can be proven by

605
Rev. bus. manag., São Paulo, Vol. 16, No. 53, pp. 594-615, Oct./Dec. 2014
Behavioral Finance in Brazil: applying the prospect theory to potential investors
comparing inequations 0.80 × U(4,000) < 1.00 × U(3,000) and 0.80 × U(-4,000) > 1.00 × U(-3,000).
Just as what was analyzed previously, with regard to question 10, the choice for alternative B prevailed, confirming preference for the alternative that offers a gain that is certain. With
regard to question 16, considering the preference for alternative A in the total of answers (84.6%), we can observe inconsistency in respondents’ decision-making process, confirmed by analyzing the ratio of effectively inconsistent choices (74.9%).
CHART 11 – Question 17
Which of the two alternatives do you prefer? Utility
Alternative A: a 20% chance of losing R$ 4,000.00 and a 80% chance of losing R$ 0.00 0.20 x U(-4,000)
Alternative B: a 25% chance of losing $ 3,000.00 and a 75% chance of losing R$ 0.00 0.25 x U(-3,000)
Source: Adapted from Kahneman and Tversky (1979)
There will be evidence of deviation as to the behavior predicted by the Expected Utility Theory in decision-making by respondents as to the Reflection Effect if the majority chose alternative B, indicating aversion to the alternative that offers larger loss (A), even with a 5 percentage point smaller probability of occurring. The result of this preference is described by: 0.20 × U(-4,000) < 0.25 × U(-3,000). These deviations can be proven by comparing inequations 0.20 × U(4,000) > 0.25 × U(3,000) and 0.20 × U(-4,000) < 0.25 × U(3,000).
Differently from what is expected according to the Reflection Effect, we observe that, with regard to question 11, there was
majority preference for alternative B for the total respondents. With regard to question 17, also differently from what is expected according to the Reflection Effect, there was a majority preference for alternative A for the total respondents (53.1%). Even so, even facing majority preference for alternatives that were not expected according to the Reflection Effect, most of the respondents were inconsistent in their choices.
This is confirmed by analyzing the ratio of effectively inconsistent answers (49.3%). We cannot state that there was majority preference for alternatives that revealed effective inconsistency in their choices. It is important to note the expressive ratio of biased choices (49.3%).
CHART 12 – Question 18
Which of the two alternatives do you prefer? Utility
Alternative A: a 45% chance of losing R$ 6,000.00 and a 55% chance of losing R$ 0,00 0.45 × U(-6,000)
Alternative B: a 90% chance of losing R$ 3,000.00 and a 10% chance of losing R$ 0.00 0.90 x U(-3,000)
Source: Adapted from Kahneman and Tversky (1979)
There will be evidence of deviation as to the behavior predicted by the Expected Utility Theory in decision-making by respondents as to the Reflection Effect if the majority chose alternative A, indicating aversion to the alternative that offers greater probability of loss (B), even if the latter presents a smaller value. The result of this preference is described by: 0.45 × U(-6,000)
> 0.90 × U(-3,000). These deviations can be proven by comparing inequations 0.45 × U(6,000) < 0.90 × U(3,000) and 0.45 × U(-6,000) > 0.90 × U(-3,000).
With regard to question 14, facing the lack of perspectives involving certain gain, the choice for alternative B prevailed, confirming preference for the alternative that offers greater

606
Rev. bus. manag., São Paulo, Vol. 16, No. 53, pp. 594-615, Oct./Dec. 2014
Claudia Emiko Yoshinaga / Thiago Borges Ramalho
probability of gain, even though it is smaller. With regard to question 18, considering the preference for alternative A (72.4%), we can observe inconsistency in respondents’
decision-making process, confirmed by analyzing the ratio of effectively inconsistent choices (64.8%). We can state that most respondents chose effectively inconsistent alternatives (52.8%).
CHART 13 – Question 19
Which of the two alternatives do you prefer? Utility
Alternative A: a 0.1% chance of losing R$ 6,000.00 and a 99.9% chance of losing R$ 0.00 0.001 × U(-6,000)
Alternative B: a 0.2% chance of losing R$ 3,000.00 and a 99.8% chance of losing R$ 0.00 0.002 × U(-3,000)
Source: Adapted from Kahneman and Tversky (1979)
There will be evidence of deviation as to the behavior predicted by the Expected Utility Theory in decision-making by respondents as to the Reflection Effect if the majority chose alternative B, indicating aversion to the alternative that offers greater loss (B), even with a one-tenth of a percentage point smaller probability of occurring, in perspectives that involve extremely low probabilities. The result of this preference is described by: 0.001 × U(-6,000) < 0.002 × U(-3,000). These deviations can be proven by comparing inequations 0.001 × U(6,000) > 0.002 × U(3,000) and 0.001 × U(-6,000) < 0.002 × U(-3,000).
With regard to question 15, we observe preference for alternative A. With regard to question 19, as is expected according to the
Reflection Effect, we can observe inconsistency in respondents’ decision-making process, since there was a preference for alternative B (56.5%). This is confirmed by analyzing the ratio of effectively inconsistent choices (64.8%). We can state that most respondents chose effectively inconsistent alternatives. Although we cannot state that the majority of respondents chose effectively inconsistent alternatives, we highlight, however, the expressive ratio of biased choices (51.5%).
Analysis of questions 11 and 21 aims at testing for the Isolation Effect, a bias observed when, facing situations that include more than one problem and, thus, involve more than one decision, people tend to make case-by-case evaluations, while issues are presented, instead of being analyzing them together.
CHART 14 – QUESTION 21
Consider a game with two phases. In the first phase, there is a 75% probability that the game ends without you winning anything and a 25% probability that you move to the second phase. If you reach the second phase, you can choose between the following alternatives. Please note that the choice must be made before the game starts.
Utility
Alternative A: an 80% chance of winning R$ 4,000.00 and a 20% chance of winning R$ 0.00 0.20 × U(4,000)
Alternative B: an 100% chance of winning R$ 3,000.00 0.25 × U(3,000)
Source: Adapted from Kahneman and Tversky (1979)
There will be evidence of deviation as to the behavior predicted by the Expected Utility Theory in decision-making by respondents as to the Isolation Effect if the majority chose alternative B, indicating that the first phase of the question was discarded and that, at the second
stage, there was preference for alternative that offers certain gain. The result of this preference is described by: 0.20 × U(4,000) < 0.25 × U(3,000). These deviations can be proven by comparing inequations 0,20 × U(4,000) > 0.25 × U(3,000) and 0.20 × U(4,000) < 0.25 × U(3,000).

607
Rev. bus. manag., São Paulo, Vol. 16, No. 53, pp. 594-615, Oct./Dec. 2014
Behavioral Finance in Brazil: applying the prospect theory to potential investors
Differently from what is expected according to the Certainty Effect, we observe that, with regard to question 11, there was majority preference for alternative B. With regard to question 21, there was a majority preference for alternative B (83.6%), confirming what is expected according to the Isolation Effect. Most of the respondents, however, were consistent in their choices.
This is confirmed by analyzing the ratio of effectively inconsistent answers (41.9%). We can state that there was majority preference for alternatives that revealed effective inconsistency in their choices.
The results of this research, for the total respondents, are compared with those obtained by Kahneman and Tversky (1979) and other similar work carried out, such as the study by Kimura, Basso and Krauter (2006), which has been reference for the preparation of other studies. The numbering of questions adopted was the one used in this work.
Table 1 presents the results for pairs involving the analysis of the Certainty Effect. Preferences observed in questions 8, 10 and 12, involving alternatives that offer certain gains, and issues 14 and 15, that signal different decision weights assigned to different levels of probability, are common to all papers, which strongly indicates presence of the Effect, regardless of the different
sample, geographic and time characteristics of each study.
In question 9, whose alternatives do not offer certain gain and that present minor differences between probabilities and gains, in this study, as observed in Kimura, Basso and Krauter (2006), but unlike other studies, there is no statistically significant preference.
In questions 11 and 13, also with no perspectives that offer certain gain, this study was the only one to present reverse preference to that observed in the original work of Kahneman and Tversky (1979), with statistical significance, which influenced the assessment of inconsistency in respondents’ decision-making from the point of view of the Expected Utility Theory. In that seminal work, the four pairs referring to the Certainty Effect revealed inconsistent choices, whereas, in this study, we observed this only for the fourth pair (questions 14 and 15), which deal with non-linearity between decision weights and probabilities, following the results of Kimura, Basso and Krauter (2006). Rogers, Favato and Securato (2008) and Cortes (2008) also found inconsistency in one pair only, but in the first (questions 8 and 9). Rogers et al (2007) and Torralvo (2010), on the other hand, found inconsistencies in three of the four pairs, excluding the third pair (questions 12 and 13) for the sake of statistical significance.

608
Rev. bus. manag., São Paulo, Vol. 16, No. 53, pp. 594-615, Oct./Dec. 2014
Claudia Emiko Yoshinaga / Thiago Borges Ramalho
TABLE 1 – Comparison of results – certainty effect
Pair 1 Alternative Present Study KT (79) KBK (06) R et al (07) RFS (08) C (08) T (10) A 24.6% 18.0% 30.0% 31.0% 24.7% 42.0% 35.9% B 75.4%** 82.0%** 70.0%** 69.0%** 75.3%** 58.0%** 64.1%** A 50.8% 83.0%** 52.0% 94.0%** 81.2%** 65.0%** 70.8%** B 49.2% 17.0% 48.0% 6.0% 18.8% 35.0% 29.2%
Pair 2 Alternative A 12.7% 20.0% 29.0% 30.0% 24.7% 37.0% 25.7% B 87.3%** 80.0%** 71.0%** 70.0%** 75.3%** 63.0%** 74.3%** A 44.8% 65.0%** 57.0% 61.0%** 57.0% 73.0% 64%** B 55.2%** 35.0% 43.0% 39.0% 43.0% 27.0% 36.0%
Pair 3 Alternative A 11.3% 22.0% 20.0% 25.0% 25.3% 10.0% 17.6% B 88.7%** 78.0%** 80.0%** 75.0%** 74.7%** 90.0% 82.4%** A 39.2% 67.0%** 49.0% 54.0% 45.7% 63.0%** 53.9% B 60.8%** 33.0% 51.0% 46.0% 54.3% 37.0% 46.1%
Pair 4 Alternative A 14.3% 14.0% 23.0% 19.0% 19.4% 12.0% 27.7% B 85.7%** 86.0%** 77.0%** 81.0%** 80.6%** 88.0% 72.3%** A 59.9%** 73.0%** 72.0%** 66.0%** 54.3% 80.0% 77.2%** B 40.1% 27.0% 28.0% 34.0% 45.7% 20.0% 22.8%
Certainty Effect
Question 8
Question 9
Question 10
Question 11
Question 12
Question 13
Question 14
Question 15
Percentages in bold are statistically significant at levels 1% (**) and 5% (*).
KT (79): Kahneman and Tversky (1979); KBK (06): Kimura, Basso and Krauter (2006); R et al (07): Rogers et al (2007); RFS (08): Rogers, Favato and Securato (2008); C (08): Côrtes (2008); T (10): Torralvo (2010)
Source: The authors
Table 2 presents the results for pairs that involve an analysis of the Reflection Effect. Questions 10, 11, 14 and 15 have already been discussed in analysis of the Certainty Effect. Preferences observed in questions 16 and 18, involving alternatives that offer certain loss and a high probability of loss, respectively, are common to all papers, strongly indicating the presence of the Reflection Effect, especially with regard to loss aversion.
In question 19, similarly to the question 15, but formulated in terms of losses, whose alternatives involve very low probabilities, this study and the one carried out by Côrtes (2008) followed the results of Kahneman and Tversky (1979).
In question 17, which is analogous to question 11, also formulated in terms of losses, without any perspective that offers certainty of loss, this study was the only one with a reverse
preference to that observed in the original work of Kahneman and Tversky (1979), with statistical significance, repeating what occurred in questions 11 and 13.
With regard to inconsistency in respondents’ decision-making process from the point of view of the Expected Utility Theory, in this study, the four pairs referring to the Reflection Effect revealed inconsistent choices, whereas, in the original paper, this occurred in three of the four pairs, meaning that, empirically, this work presented more elements that support the theory that involves the Reflection Effect, notably loss aversion, than the actual seminal article. Please note that Kimura, Basso and Krauter (2006), Rogers et al (2007), Rogers, Favato and Securato (2008) and Torralvo (2010) found inconsistencies in the same two of the four pairs (Pairs 5 and 7), while Côrtes (2008) did so in only one (Pair 5).

609
Rev. bus. manag., São Paulo, Vol. 16, No. 53, pp. 594-615, Oct./Dec. 2014
Behavioral Finance in Brazil: applying the prospect theory to potential investors
TABLE 2 – Comparison of results – reflection effect
Pair 5 Alternative Present Study
KT (79) KBK (06 R et al (07) RFS (08) C (08) T (10) A 12.7% 20.0% 29.0% 30.0% 24.7% 37.0% 25.7% B 87.3%** 80.0%** 71.0%** 70.0%** 75.3%** 63.0%** 74.3%** A 84.6%** 92.0%** 82.0%** 81.0%** 75.3%** 68.0%** 81.6%** B 15.4% 8.0% 18.0% 19.0% 24.7% 32.0% 18.4%
Pair 6 Alternative A 44.8% 65.0%** 57.0% 61.0%** 57.0% 73.0% 64.0%** B 55.2%** 35.0% 43.0% 39.0% 43.0% 27.0% 36.0% A 53.1%** 42.0% 37.0% 57.0% 51.6% 47.0% 55.2% B 46.9% 58.0% 63.0% 43.0% 48.4% 53.0%** 44.8%
Pair 7 Alternative
A 14.3% 14.0% 23.0% 19.0% 19.4% 12.0% 27.7% B 85.7%** 86.0%** 77.0%** 81.0%** 80.6%** 88.0% 72.3%** A 72.4%** 92.0%** 75.0%** 88,0%** 76.3%** 70.0% 70.6%** B 27.6% 8.0% 25.0% 12.0% 23.7% 30.0% 29.4%
Pair 8 A 59.9%** 73.0%** 72.0%** 66.0%** 54.3% 80.0% 77.2%** B 40.1% 27.0% 28.0% 34.0% 45.7% 20.0% 22.8% A 43.5% 30.0% 50.0% 54.0% 54.8% 35.0% 45.4% B 56.5%** 70%* 50.0% 46.0% 45.2% 65.0%** 54.6%
Reflection Effect
Question 14
Question 18
Question 15
Question 19
Question 10
Question 16
Question 11
Question 17
Percentages in bold are statistically significant at levels 1% (**) and 5% (*).
KT (79): Kahneman and Tversky (1979); KBK (06): Kimura, Basso and Krauter (2006); R et al (07): Rogers et al (2007); RFS (08): Rogers, Favato and Securato (2008); C (08): Côrtes (2008); T (10): Torralvo (2010)
Source: The authors
Table 3 presents the results for the pair that involves analyzing the Isolation Effect. Preferences observed in question 21, formulated in two phases and that, at the second phase, offer certain gain, are common to all papers, strongly indicating the presence of the Effect, as to contempt for the first phase of the problem and total focus on the second, analyzing perspectives separately, rather than together.
Regarding inconsistency in respondents’ decision-making from the point of view of
the Expected Utility Theory, to reflect what is observed in question 11, as in the descriptive analysis of the Certainty Effect, this study was the only one which found consistent choices with statistical significance. In the original research, authors, followed by Rogers et al. (2007) and Torralvo (2010), found inconsistent choices, while other studies could not say whether or not there were statistically significant inconsistencies.

610
Rev. bus. manag., São Paulo, Vol. 16, No. 53, pp. 594-615, Oct./Dec. 2014
Claudia Emiko Yoshinaga / Thiago Borges Ramalho
TABLE 3 – Comparison of results – isolation effect
Pair 9 Alternative Present Study KT (79) KBK (06) R et al (07) RFS (08) C (08) T (10) A 44.8% 65%** 57.0% 61.0%** 57.0% 73.0% 64%** B 55.2%** 35.0% 43.0% 39.0% 43.0% 27.0% 36.0% A 16.4% 22.0% 22.0% 29.0% 28.0% 30.0% 18.4% B 83.6%** 78.0%** 78.0%** 71.0%** 72.0%** 70.0% 81.6%**
Isolation Effect
Question 11
Question 21
Percentages in bold are statistically significant at levels 1% (**) and 5% (*).
KT (79): Kahneman and Tversky (1979); KBK (06): Kimura, Basso and Krauter (2006); R et al (07): Rogers et al (2007); RFS (08): Rogers, Favato and Securato (2008); C (08): Côrtes (2008); T (10): Torralvo (2010)
Source: The authors
4.2Econometric model – demographic profiles
Several studies have been carried out in order to research, for various demographic profiles, differences with regard to people’s decision-making behavior in situations involving uncertainty and risk, identifying the presence of bias in their choices.
Barsky et al. (1997) concluded, among other characteristics, that, separately, people with higher levels of education and those who are very rich are more prone to risk. On the other hand, people with an average income level and education and aged between 55 and 70 are more risk averse.
Torralvo (2010), too, among other characteristics, identified more biased behavior, separately, in men, in respondents who were graduated in courses associated with Management, with a greater volume of financial instruments, with no financial experience and in managing third party funds. On the other hand, he did not identify any differences between individuals with or without financial dependents. Bhandari and Deaves (2006) found that men with a high educational level are more prone to overconfidence.
According to Bajtelsmit and Bernasek (1996), many studies have found that women invest more conservatively and with greater risk aversion, which is corroborated by Marinho et al. (2009). Santos and Barros (2011) also attributed to men a greater propensity to risk. On this track,
according to Barber and Odean (2005), men are more overconfident than women; they cite other studies that confirm this conclusion.
Décourt (2004) noted the presence of behavioral biases in financial executives, doctors, MBA and university students. Similarly, Ribeiro (2010) concluded that financial experts are more likely to take risks than non-specialists, and Rogers, Favato and Securato (2008, p. 1) state that “bias in the cognitive process and limits to learning remain even in individuals with a higher level of education and more structured financial education”.
Hallahan, Faff and McKenzie (2004) concluded that gender, age, number of dependents, marital status, education, income and wealth are related to risk tolerance. They also studied variations in the results when analysis is segmented: number of dependents, for example, has an inverse relationship with risk tolerance when the entire base is analyzed, but becomes not significant when only respondents aged over 60 were analyzed, just as occurred with married and unmarried respondents, when analyzed separately. According to the authors, the results for gender, education and income are consistent with the previous literature. However, the relationship between wealth and risk tolerance contrasts with previous research, emphasizing the presence of conflicting results observed in different studies.
In this study, to test and measure the differences in the decision-making behavior of

611
Rev. bus. manag., São Paulo, Vol. 16, No. 53, pp. 594-615, Oct./Dec. 2014
Behavioral Finance in Brazil: applying the prospect theory to potential investors
respondents, taking into account the demographic profile analysis, econometric models were developed (multiple regressions with parameters estimated by OLS and TOBIT, the latter considering 0 and 9 as lower and higher). To this end, initially, we verified, considering the nine pairs referring to Certainty, Reflection and Isolation Effects, how many violations (inconsistent choices with the rational model)
each respondent committed in making his decision. The total violations, expressed as a percentage scale, was defined as the dependent variable model, as summarized in Chart 15:
Regarding consumers’ boycott, Cruz, Pires Jr and Ross (2013, p. 504) concluded, from the study sample, that “women feel more guilty than men with regard to the motivations for boycott”.
CHART 15 – Dependent variable model
Dependent Variable Effect Interval
Ytotal Total Violations All 0 to 100% (OLS)0 to 9 (TOBIT)
Source: The authors
Next, we defined the independent variables presented in Chart 16:
CHART 16 – Independent variable models
Independent Variable Nature Interval Dummy = 1
X1 age Quantitative 18 to 72 DNA
X2 Income 4 Dummy 0 to 1 Income below R$ 4 thousand
X3 Income4to6 Dummy 0 to 1 Income between R$ 4 thousand and R$ 6 thousand
X4 Man Dummy 0 to 1 Man
Source: The authors
The resulting models are expressed by the following equation:Total Violations (% for OLS and quantity for TOBIT) = β0 + β1age + β2income4 + β3income4to6
+ β4man + uTable 4 presents the results of the econometric models estimated by OLS and TOBIT:
TABLE 4 – Results of regressions
Variable OLS TOBIT
Method Coefficient Robust standard deviation p-value Coefficient Robust standard
deviation p-value
age -.1225918 ** .0480865 0.011 -.0118213 *** .0045255 0.009 income4 -2.466916 ** 1.132108 0.029 -.2395307 ** .10425 0.022 Income4to6 -1.425233 1.223503 0.244 -.1440494 .1124809 0.200 man 1.385536 .8627834 0.108 .1207144 .0800183 0.132 Constant 56.3603 *** 2.346062 0.000 5.115782 *** .2188416 0.000 F 3.42 *** 0.0085R2 0.0049 0.012LR 13.08 ** 0.0109#Obs 2590 2590
* , ** and *** denote significance at 10%, 5% and 1% levels, respectively.
Source: The authors

612
Rev. bus. manag., São Paulo, Vol. 16, No. 53, pp. 594-615, Oct./Dec. 2014
Claudia Emiko Yoshinaga / Thiago Borges Ramalho
We observed, in both estimations, that the age and income below R$ 4,000 coefficients are significant at 5% and have a negative relationship with the total violations. Considering, then, as a basis, respondents who are women, aged 0 and with an income over R$ 6,000, we can conclude that, as age increases, violations decrease, and, as income decreases, violations increase. As to gender, the male dummy variable was a positive coefficient, although not significant, indicating that total violations tend to increase if the investor is man. These results are potentially significant, although the degree of explanation of the parameters and correlation coefficients of the models are low.
5 CONCLUSIONS
For the effects studied, this study allowed us to:
a) quantify majority preferences for alterna-tives that do or do not reveal violations of the rational model for decision-making, compared to the results obtained in the original article and similar research;
b) quantify proportions of respondents who were effectively inconsistent in their choices according to what the Theory of Expected Utility predicts;
c) propose and test an econometric model to investigate the differences between the profiles of the respondents.Regarding the Certainty Effect, the results
confirmed the preference for options that offered certain gain and presented effective inconsistency in decision-making by most respondents only when the choice involved perspectives with extremely low probabilities, and, in this situation, decision weights were higher than their respective probabilities. We should mention, however, the significant proportion of effectively inconsistent choices for all respondents: 45.9%, 41.2%, 35.5% and 52.8%, referring to pairs 1, 2, 3 and 4, respectively.
With regard to the Reflection effect, the results indicated the presence of asymmetry of weights assigned to gains and losses, with risk aversion trend in perspectives formulated in terms of gain and risk propensity formulated in terms of loss, indicating loss aversion. Only in the case of the second pair of questions (Pair 6) did the results not confirm what is expected by the Reflection Effect. Still, there was inconsistency in the choice of respondents, which occurred in all pairs, and effective inconsistency in pairs 5, presenting perspectives that involve certain gains and losses, and 7, which involves high probabilities of gains and losses. We should mention, also, to this effect, the significant proportion of effectively inconsistent choices for all respondents: 74.9%, 49.3%, 64.8% and 51.5%, referring to pairs 5, 6, 7 and 8, respectively.
Regarding the Isolation Effect, results confirm the expected considering the majority preference for the alternative that indicated realization, by the respondents, of disjunctive analysis and isolation of phases at the time of their decision-making. However, there was a majority preference for effective alternatives that revealed effective consistency in their choices, when the pair concerning the effect was examined. Nevertheless, it is important to note, as has been done for Certainty and Reflection effects, a significant proportion of biased choices for all respondents: 41.9%.
When the results of this research are compared to those obtained by other studies, one can see that there are similarities that indicate that the presence of Certainty, Reflection and Isolation Effects are not very sensitive to the sample period and socio-demographic profile of respondents. However, we also observe differences, especially with regard to the study of violations of the rational model. The fact that there were significant proportions of choices inconsistent with the precepts of the Expected Utility Theory indicates that the paradigm of strict rationality that guided research corresponding to the Modern Theory

613
Rev. bus. manag., São Paulo, Vol. 16, No. 53, pp. 594-615, Oct./Dec. 2014
Behavioral Finance in Brazil: applying the prospect theory to potential investors
of Finance seems to have been overcome. On the other hand, an also significant proportion of consistent choices show that there is also an absolute and incontestable truth about the matter, which refers to the need to carry out further research. We suggest, therefore, that this research continues, preferably with the goal of trying to understand the reasons why part of the decisions are made rationally, and part are not.
The proposed econometric models indicated a negative relationship between age and income and the total violations according to the rational model, with low levels of explanation and determination coefficients, which refers to the need to carry out further research to investigate the differences in behavior between different decision-making demographic profiles. We suggest, also, that new studies be carried out by means of laboratory situations or actual investment transactions by individuals, to capture more safely the “real” behavior of decision-makers.
REFERENCES
BAJTELSMIT, V. L.; BERNASEK, A. Why do woman invest differently than men? Financial Counseling and Planning, 1996. Available at: <http://ssrn.com/abstract=2238>. Accessed on: 26 May 2013.
BAKER, M.; WURGLER, J. Behavioral corporate finance: an updated survey. NBER Working Paper, 17333, Aug. 2011. Available at: < http://www.nber.org/papers/w17333>. Accessed on: 20 May 2012.
BARBER, B. M.; ODEAN, T. Individual investors. In: THALER, R. (Org.). Advances in behavioral finance. New York: Russell Sage Foundation, 2005. v. 2, p. 543-569.
BARSKY, R. B. et al. Preference parameters and behavioral heterogeneity: an experimental approach in the health and retirement study. The
Quarterly Journal of Economics, Cambridge, v. 112, n. 2, p. 537-579, 1997.
BAZERMAN, M. H.; MOORE, D. Processo decisório.7. ed. Rio de Janeiro: Elsevier, 2010.
BHANDARI, G.; DEAVES, R. The demographics of overconfidence. The Journal of Behavioral Finance, Philadelphia, v. 7, n. 1, p. 5-11, 2006.
CÔRTES, F. M. Finanças comportamentais: uma aplicação da teoria do prospecto na tomada de decisão de investidores no Brasil.2008. 71 f. Dissertação (Mestrado em Administração de Empresas) – Pontifícia Universidade Católica do Rio de Janeiro, Rio de Janeiro, 2008.
CRUZ, B. P. A.; PIRES JR, R. J. M; ROSS, S. D. Diferença de gênero na percepção de culpa no boicote de consumidores. Revista Brasileira de Gestão de Negócios, São Paulo, v. 15, n. 49, p. 504-523, Oct/Dec. 2013.
CUSINATO, R. T. Teoria da decisão sob incerteza e a hipótese da utilidade esperada: conceitos analíticos e paradoxos. 2003. 181 f. Dissertação (Mestrado em Economia) – Universidade Federal do Rio Grande do Sul, Porto Alegre, 2003.
DÉCOURT, R. F. As finanças comportamentais e o processo de decisão no mercado financeiro brasileiro. 2004. 122 f. Dissertação (Mestrado em Administração de Empresas) – Centro Universitário Álvares Penteado – Unifecap, São Paulo, 2004.
FAMA, E. Efficient capital markets: a review of theory and empirical work. Journal of Finance, Malden, v. 25, n. 2, p. 383-417, 1970.
HALFELD, M.; TORRES, F. F. L. Finanças comportamentais: aplicações no contexto brasileiro. RAE – Revista de Administração de Empresas, São Paulo, v. 41, n. 2, p. 64-71 Apr./Jun. 2001.

614
Rev. bus. manag., São Paulo, Vol. 16, No. 53, pp. 594-615, Oct./Dec. 2014
Claudia Emiko Yoshinaga / Thiago Borges Ramalho
HALLAHAN, T. A.; FAFF, R. W.; MCKENZIE, M. D. An empirical investigation of personal financial risk tolerance. Financial Services Review-Greenwich, [S.l.], v. 13, n. 1, p. 57-78, 2004.
JENSEN, M.C. Some anomalous evidence regarding market efficiency. Journal of Financial Economics, Amsterdan, v. 47, n. 2, p. 263-291, 1979.
KAHNEMAN, D. Rápido e devagar: duas formas de pensar. Rio de Janeiro: Objetiva, 2012.
______; TVERSKY, A. Prospect theory: ananalysis of decision under risk. Econometrica, Chicago, v. 47, n. 2, p. 263-291, Mar. 1979.
______; ______. Choices, values, and frames. American Psychologist, Washington, D.C, v. 34, n. 4, p. 341-350, 1984.
KIMURA, H.; BASSO, L. F. C; KRAUTER, E. Paradoxos em finanças: teoria moderna versus finanças comportamentais. Revista de Administração de Empresas – RAE, São Paulo, v. 46, n. 1, p. 41-58, 2006.
MACEDO JUNIOR, J. S.; KOLINSKY, R.; MORAIS, J. C. J. Finanças comportamentais: como o desejo, o poder, o dinheiro e as pessoas influenciam nossas decisões. São Paulo: Atlas, 2011.
MARCONI, M. A.; LAKATOS, E. M. Fundamentos de metodologia científica. 7. ed. São Paulo: Atlas, 2010.
MARKOWITZ, H. Portfolio selection. The Journal of Finance, Malden, v. 7, n. 1, p. 77-91, Mar. 1952. Available at: <http://www.math.ust.hk/~maykwok/courses/ma362/07F/markowitz_JF.pdf>. Accessed on: 09 Jun. 2012.
MODIGLIANI, F.; MILLER, M. H. The cost of capital, corporation finance, and the theory
of investiment. American Economic Review, Nashville, v. 48, n. 3, p. 261-297, June 1958.
______; ______. Dividend policy, growth and the valuation of shares. Journal of Business, Chicago, v. 34, n. 4, p. 411-433, 1961.
______; ______. Corporate income taxes and the cost of capital: a correction. The American Economic Review, Nashville, v. 53, n. 3, p. 433-443, 1963.
RABELO JUNIOR, T. S.; IKEDA, R. H. Mercados eficientes e arbitragem: um estudo sob o enfoque das finanças comportamentais. Revista Contabilidade & Finanças, São Paulo, v. 15, n. 34, p. 97-107, Jan./Apr. 2004.
RIBEIRO, D. P. C. Prospect theory, diversificação ingênua e propensão a risco de especialistas em mercado: evidência empírica no Brasil. 2010. 55 f. Dissertação (Mestrado em Finanças e Economia Empresarial) - Escola de Pós-Graduação em Economia, Fundação Getúlio Vargas, Rio de Janeiro, 2010.
ROGERS, P. et al. Finanças comportamentais no Brasil: um estudo comparativo. Revista de Economia e Administração, São Paulo, v. 6, n.1, p. 49-68, 2007.
______; FAVATO, V.; SECURATO, J. R. Efeito educação financeira no processo de tomada de decisões em investimentos: um estudo a luz das finanças comportamentais. In: CONGRESSO ASSOCIAÇÃO NACIONAL DE PROGRAMAS DE PÓS-GRADUAÇÃO EM CIÊNCIAS CONTÁBEIS, 2, 2008, Salvador. Anais eletrônicos... Salvador: ANPCONT, 2008. p. 1-17. Available at: <http://www.pablo.prof.ufu.br/artigos/anpcont2.pdf>. Accessed on: 23 Jun. 2012.
SHARPE, W. F. Capital and prices: a theory of market equilibrium under conditions of risk. Journal of Finance, Malden, v. 19, n. 3, p. 425-442, Sept. 1964.

615
Rev. bus. manag., São Paulo, Vol. 16, No. 53, pp. 594-615, Oct./Dec. 2014
Behavioral Finance in Brazil: applying the prospect theory to potential investors
SHLEIFER, A. Inefficient markets: an introduction to behavioral finance. New York: Oxford University Press, 2000.
SIMON, H. A. A behavioral model of rationality choice. Quarterly Journal of Economics, Cambridge, v. 69, n.1, p. 99-118, 1955.
THALER, R. The end of behavioral finance. Financial Analysts Journal, Charlottesville, v. 55, n. 6, p. 12-17, 1999.
TORRALVO, C. F. Finanças comportamentais: uma aplicação da teoria do prospecto em alunos brasileiros de pós-graduação. 2010. 124 f. Dissertação (Mestrado em Administração) – Universidade de São Paulo, São Paulo, 2010.
TVERSKY, A.; KAHNEMAN, D. A judgment under uncertainty: heuristics and biases. Science, [S.l], v. 185, n. 4157, p. 1124-1131, Sept. 1974.