BeanWatcher: A Tool to Generate Multimedia Monitoring Applications for Wireless Sensor Networks
14
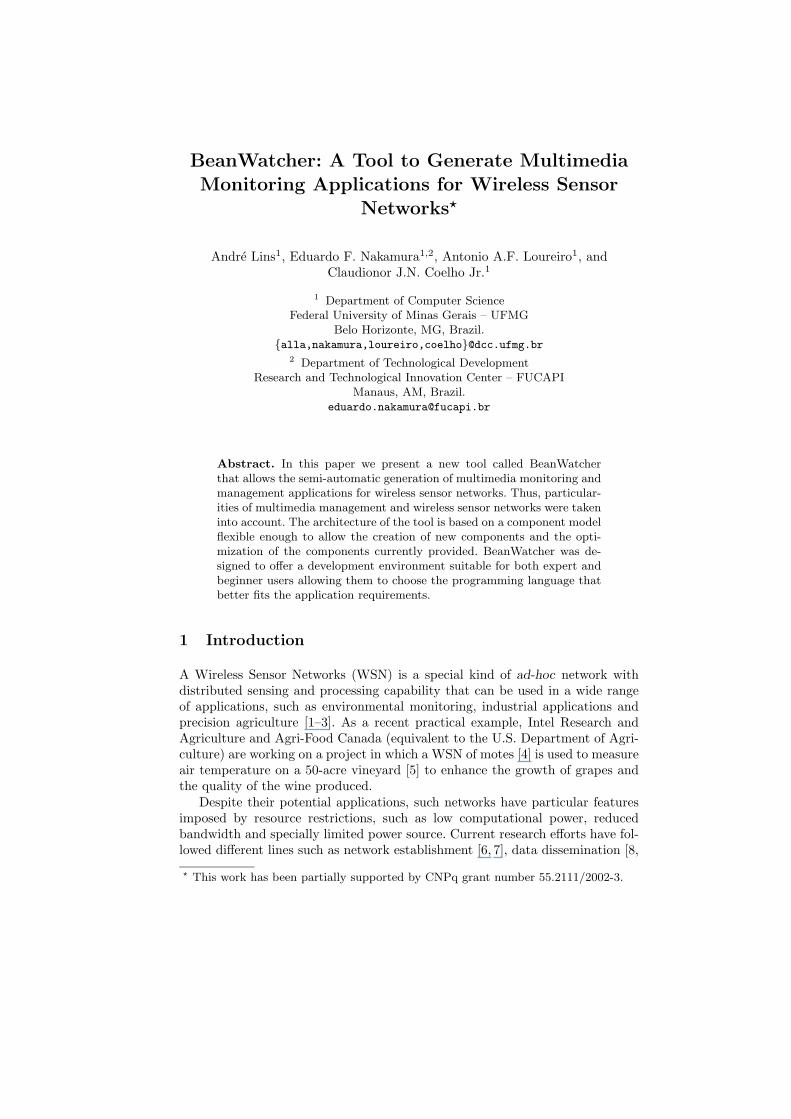
BeanWatcher: A Tool to Generate Multimedia Monitoring Applications for Wireless Sensor Networks ? Andr´ e Lins 1 , Eduardo F. Nakamura 1,2 , Antonio A.F. Loureiro 1 , and Claudionor J.N. Coelho Jr. 1 1 Department of Computer Science Federal University of Minas Gerais – UFMG Belo Horizonte, MG, Brazil. {alla,nakamura,loureiro,coelho}@dcc.ufmg.br 2 Department of Technological Development Research and Technological Innovation Center – FUCAPI Manaus, AM, Brazil. [email protected] Abstract. In this paper we present a new tool called BeanWatcher that allows the semi-automatic generation of multimedia monitoring and management applications for wireless sensor networks. Thus, particular- ities of multimedia management and wireless sensor networks were taken into account. The architecture of the tool is based on a component model flexible enough to allow the creation of new components and the opti- mization of the components currently provided. BeanWatcher was de- signed to offer a development environment suitable for both expert and beginner users allowing them to choose the programming language that better fits the application requirements. 1 Introduction A Wireless Sensor Networks (WSN) is a special kind of ad-hoc network with distributed sensing and processing capability that can be used in a wide range of applications, such as environmental monitoring, industrial applications and precision agriculture [1–3]. As a recent practical example, Intel Research and Agriculture and Agri-Food Canada (equivalent to the U.S. Department of Agri- culture) are working on a project in which a WSN of motes [4] is used to measure air temperature on a 50-acre vineyard [5] to enhance the growth of grapes and the quality of the wine produced. Despite their potential applications, such networks have particular features imposed by resource restrictions, such as low computational power, reduced bandwidth and specially limited power source. Current research efforts have fol- lowed different lines such as network establishment [6,7], data dissemination [8, ? This work has been partially supported by CNPq grant number 55.2111/2002-3.
Transcript of BeanWatcher: A Tool to Generate Multimedia Monitoring Applications for Wireless Sensor Networks
BeanWatcher: A Tool to Generate Multimedia
Monitoring Applications for Wireless Sensor
Networks?
Andre Lins1, Eduardo F. Nakamura1,2, Antonio A.F. Loureiro1, andClaudionor J.N. Coelho Jr.1
1 Department of Computer ScienceFederal University of Minas Gerais – UFMG
Belo Horizonte, MG, Brazil.{alla,nakamura,loureiro,coelho}@dcc.ufmg.br
2 Department of Technological DevelopmentResearch and Technological Innovation Center – FUCAPI
Manaus, AM, [email protected]
Abstract. In this paper we present a new tool called BeanWatcherthat allows the semi-automatic generation of multimedia monitoring andmanagement applications for wireless sensor networks. Thus, particular-ities of multimedia management and wireless sensor networks were takeninto account. The architecture of the tool is based on a component modelflexible enough to allow the creation of new components and the opti-mization of the components currently provided. BeanWatcher was de-signed to offer a development environment suitable for both expert andbeginner users allowing them to choose the programming language thatbetter fits the application requirements.
1 Introduction
A Wireless Sensor Networks (WSN) is a special kind of ad-hoc network withdistributed sensing and processing capability that can be used in a wide rangeof applications, such as environmental monitoring, industrial applications andprecision agriculture [1–3]. As a recent practical example, Intel Research andAgriculture and Agri-Food Canada (equivalent to the U.S. Department of Agri-culture) are working on a project in which a WSN of motes [4] is used to measureair temperature on a 50-acre vineyard [5] to enhance the growth of grapes andthe quality of the wine produced.
Despite their potential applications, such networks have particular featuresimposed by resource restrictions, such as low computational power, reducedbandwidth and specially limited power source. Current research efforts have fol-lowed different lines such as network establishment [6, 7], data dissemination [8,
? This work has been partially supported by CNPq grant number 55.2111/2002-3.
9], network and resource management [10–13]. Therefore, tools to assist design-ers with the development of management applications in such networks are veryuseful.
Usually, WSNs are composed of source and sink nodes [8, 9]. Sources aredata generators that detect events and provide observations or measurementsof a physical phenomena. Sinks are designed to receive data sent by sources.Therefore, such nodes can monitor and act in the network performing somemanagement function. Besides, sinks can act as gateways between the WSN anda infrastructured network. Thus, sinks may also provide an interface to the userallowing a manager to decide and act based on the data provided. This interfacecan be textual or multimedia becoming a useful tool to network managers.
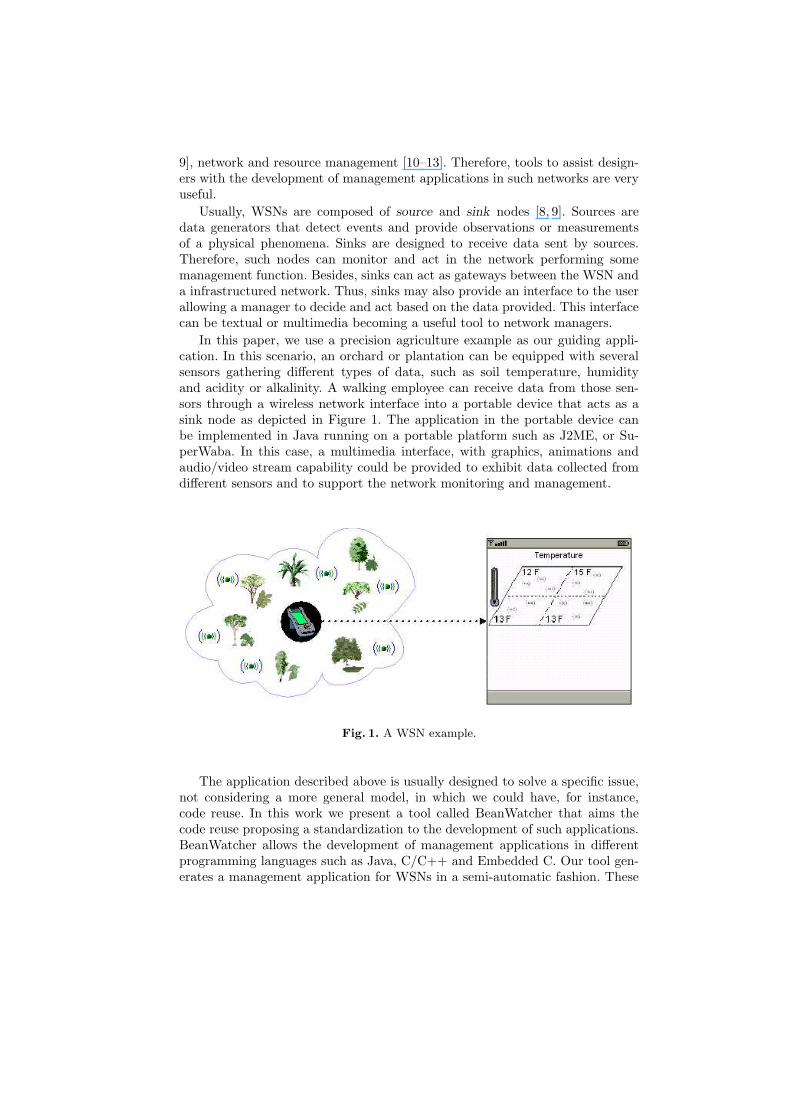
In this paper, we use a precision agriculture example as our guiding appli-cation. In this scenario, an orchard or plantation can be equipped with severalsensors gathering different types of data, such as soil temperature, humidityand acidity or alkalinity. A walking employee can receive data from those sen-sors through a wireless network interface into a portable device that acts as asink node as depicted in Figure 1. The application in the portable device canbe implemented in Java running on a portable platform such as J2ME, or Su-perWaba. In this case, a multimedia interface, with graphics, animations andaudio/video stream capability could be provided to exhibit data collected fromdifferent sensors and to support the network monitoring and management.
Fig. 1. A WSN example.
The application described above is usually designed to solve a specific issue,not considering a more general model, in which we could have, for instance,code reuse. In this work we present a tool called BeanWatcher that aims thecode reuse proposing a standardization to the development of such applications.BeanWatcher allows the development of management applications in differentprogramming languages such as Java, C/C++ and Embedded C. Our tool gen-erates a management application for WSNs in a semi-automatic fashion. These
applications are intended to be run on portable and mobile devices acting as asink node monitoring raw sensory data and multimedia data streams.
Some commercial tools like LabView3 and HP VEE4 were designed to developapplications to monitor and act on instruments. However, those tools are propri-etary solutions hardly integrated with other tools and languages. Furthermore,those tools do not allow the development of applications to portables devices nei-ther monitoring applications for WSNs. Other related tool is the PECOS Com-ponent Environment5 that allows the development of monitoring and actuationapplications. In this paper, we show how it can be used to develop applicationsrunning in portable devices.
This paper is organized as follows. Section 2 presents some challenges inthe design of multimedia management applications for WSNs. In Section 3 wepresent the component model used in BeanWatcher. Section 4 presents the Bean-Watcher architecture and Section 5 shows how we can use BeanWatcher to de-velop a simple monitoring application. Finally, Section 6 presents our conclusionsand future work.
2 BeanWatcher Challenges
In the following, we discuss the challenges that we must address when developinga multimedia management application for WSNs.
2.1 Multimedia Management for WSNs
Multimedia management faces new challenges in WSNs concerned with provi-sion of scalable quality of service (QoS) through the management of metrics,such as coverage [14–16], exposure [17, 18], energy consumption [12, 13], andapplication specific metrics (e.g., for target detection, miss detection and falsedetection ratios). Due to the ad-hoc nature of WSNs, which might be deployedin hostile environments with fairly unpredictable conditions, management mustbe scalable, self-configurable and adaptive to handle such challenges. A classicapproach is the data-centric design of WSNs [8, 9], which aims the integrationof application-level and network-level operations to provide power-efficient solu-tions.
In addition, WSNs can be composed of unrelated sensors that measure dif-ferent physical properties (e.g., temperature, pressure, image, video and audiostreams) that are semantically and/or structurally distinct. In such networks, in-commensurate data can be understood as different types of media. In this case,multimedia management encompasses resources, theories, tools and techniquesto manipulate data provided by different sources (multiple medias) with the goalto extract relevant information.
3 National Instruments – Labview 6.1. http://www.ni.com/4 Agilent – VEE Onelab 6.1. http://www.agilent.com/5 PECOS Composition Environment. http://www.pecosproject.org/software.html
From this perspective, data fusion [19–21] should be used by multimediamanagement to combine different medias (e.g., video streams and temperature)to obtain relevant information (e.g., fire detection) or to improve the qualityof the data provided (e.g., noise reduction). Therefore, fusion of multimediadata is equivalent to cooperative fusion proposed by Durrant-Whyte [22] wheredifferent nodes contribute with different data (e.g., video and audio streams) toaccomplish a common task (e.g., intrusion detection). In addition, simple dataaggregation schemes [11, 23, 8] can be used to summarize, organize and retrievedata in a power-efficient manner.
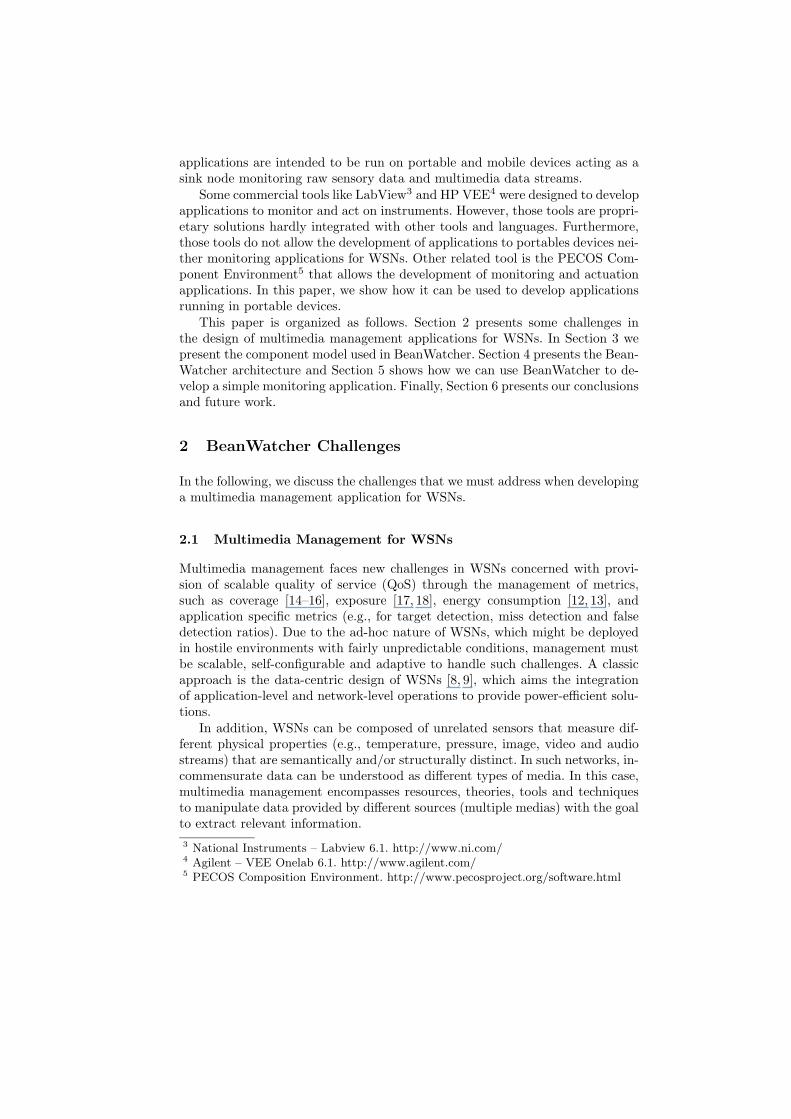
Figure 2 depicts some possible components in a multimedia managementapplication for WSNs. The Stream Organizer receives multiple data streamsthrough the same communication channel, then it organizes and directs themto the appropriate processing module. Three levels of processing are identified.The first level is the Stream Processing, which can perform low level data fusion.The second level is represented by the Feature Extractor which fuses severaldata streams to obtain relevant features from the environment. The last levelis represented by the Decision Making where action plans are formulated inresponse to a identified situation. According to the application requirementsor computational restrictions, the application can encompass only the desiredprocessing levels (stream processing, feature extraction or decision making). Thisis also depicted in Figure 2 where the user interface is connected to all processinglevels. In addition, the user can set properties and parameter related to thecomponents responsible for each level of processing.
Stream Processing
Stream Organizer
Stream 1 Processing
Stream 2 Processing
Stream N Processing
.
.
.
data streams
data stream 1
data stream 2
data stream N
Feature Extractor
feature 1
feature 2
feature m
Decision Maker
.
.
.
User Interface
Fig. 2. Possible application involving multimedia management.
Considering our precision agriculture example with different data streams(soil temperature, acidity and humidity), which can be received in any orderthrough the same communication channel. Thus, we need a component to or-ganize the data streams properly. Further processing can be executed on these
streams, such as data fusion algorithms like Kalman Filter [24], Particle Fil-ter [25] or the Marzullo function [26] to obtain more accurate values. If desired,these data can be fused again to extract characteristics, like the soil conditions
that are favorable to cultivation of “X” or whether the soil is dry. Yet furtherdata fusion can be applied to obtain decisions, such as “X” should be harvested
in one week or irrigation required or freezing threat is eminent. Multimedia fu-sion (concerned with feature extraction and decision making) is strongly coupledto the application and the type of data provided by sensors. Thus, the reusabil-ity of a multimedia fusion component might be limited to a specific domain ofapplication and sensors. In addition, the development of such applications, anda tool to generate them, is still subject to the particularities of WSNs.
2.2 Attending WSN Requirements
Traditionally, system design can be organized in a Logical Layer Architecture(LLA) were the system is divided in different abstraction levels ranging from aphysical layer, that deals with computing devices, to an application layer, thatdeals with business requirements. Usually, the LLA model is used in a bottom-up approach. However, WSNs are application-driven, and as discussed in [10], atop-down approach is preferable since once the business issues are understood,the requirements of lower levels become clearer.
Clearly, different applications tend to present distinct features and restric-tions. Thus, it is not feasible to provide a unique Application Programming In-terface (API) that is self-contained. Instead, we should think of providing smallsoftware components that represent elementary functionalities useful for variousapplications.
Regarding the applications illustrated in Figure 2 and using the top-downapproach, we consider first the elements of the user interface that are related tomultimedia management applications for WSNs. As we consider physical mea-surements acquired by sensors, it is reasonable to provide visual componentsappropriate to display common measurements, such as, temperature, pressure,acidity and humidity. Thus, BeanWatcher provides some visual components (e.g.,thermometer, speedometer, gauge, and valued maps) to cover different types ofsensory data.
The next steps should try to identify features in data streams. As mentionedbefore, this task depends on the application objectives, and, thus, the tool doesnot provide special components for them, since its reusability is restricted. Forstream processing, there are some popular fusion algorithms that can be appliedsuch as Kalman Filter, Particle Filter or Marzullo function. The current versionof the tool provides two components that implement the Kalman Filter and theMarzullo function.
At the lower levels we need a component to receive data streams and toproperly organize them. To get data from sensors we implement a communi-cation component that receives and sends data without worrying about theirsemantics. Again, as we might have different types of sensors, we cannot pro-
vide a unique stream organizer. Besides, same sensors (data streams) can besemantically distinct in two different applications.
In summary, our API comprises elements for visual display, low level datafusion algorithms and communication operations. We chose to use a componentmodel to implement this API and to generate the applications using our tool. Theadoption of a component model allows us to take advantage of code reusability.
3 Component Model
BeanWatcher adopts the PECOS component model proposed by Genssler etal. [27], and provides a communication component to allow the monitoring ofremote applications. In this section, we briefly describe PECOS and how it isused in BeanWatcher.
3.1 PECOS Component Model
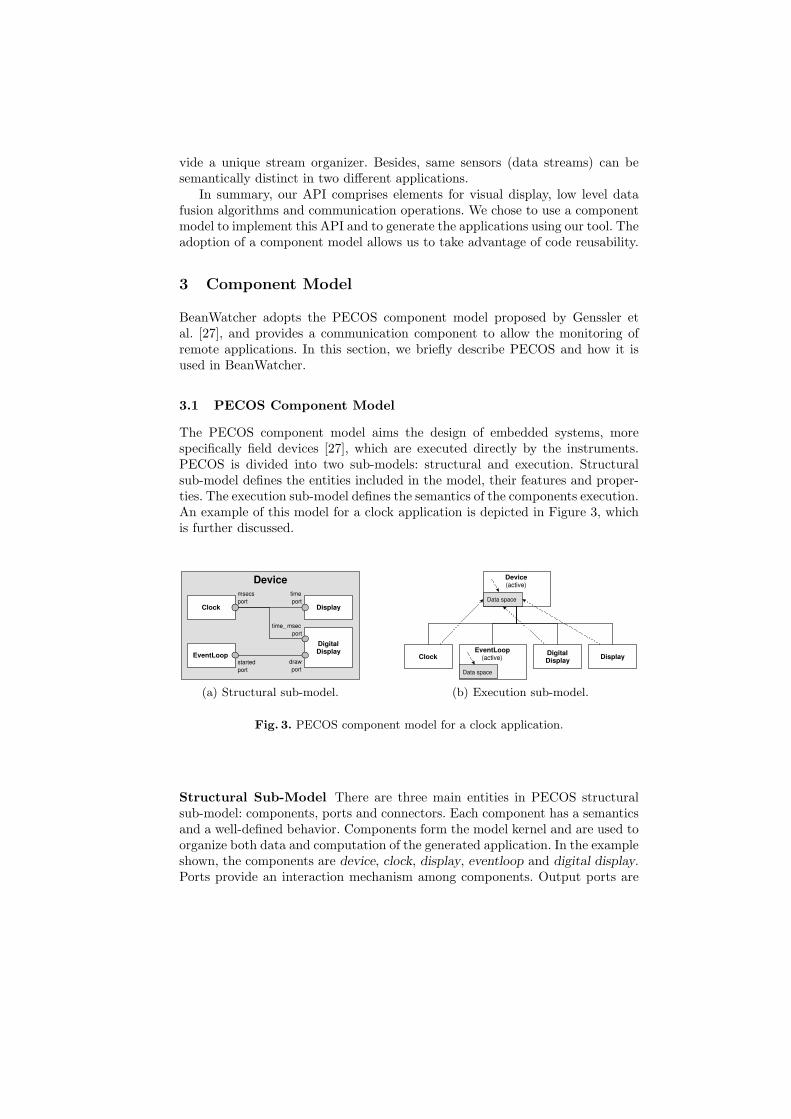
The PECOS component model aims the design of embedded systems, morespecifically field devices [27], which are executed directly by the instruments.PECOS is divided into two sub-models: structural and execution. Structuralsub-model defines the entities included in the model, their features and proper-ties. The execution sub-model defines the semantics of the components execution.An example of this model for a clock application is depicted in Figure 3, whichis further discussed.
Device
Clock Display
EventLoop
Digital Display
msecs port
time port
time_ msec port
draw port
started port
(a) Structural sub-model.
Clock Digital Display Display
EventLoop (active)
Data space
Device (active)
Data space
(b) Execution sub-model.
Fig. 3. PECOS component model for a clock application.
Structural Sub-Model There are three main entities in PECOS structuralsub-model: components, ports and connectors. Each component has a semanticsand a well-defined behavior. Components form the model kernel and are used toorganize both data and computation of the generated application. In the exampleshown, the components are device, clock, display, eventloop and digital display.Ports provide an interaction mechanism among components. Output ports are

connected to input ports through connectors as illustrated in Figure 3a, thatshows the output ports msecs and started, and input ports time, time milsecs,and draw. Connectors describe a data sharing a relationship between two portsand are represented by lines connecting them.
Components in PECOS can be primitive and composed. A primitive com-ponent can be passive, active or an event. Passive components cannot controltheir execution, and are used as part of the behavior of another component beingexecuted synchronously. In Figure 3a, the passive components are clock, display
and digital display. Active components control their execution, which is trig-gered by a system request. In Figure 3a, the active components are device andeventloop. Event components are similar to active components, but their execu-tions are triggered by an event. A composite component is built using connectedsub-components, but their internal sub-components are not visible to the user.In addition, a composite component must define a scheduling with the exactexecution order of its sub-components. In Figure 3a, the composite componentis the device.
Ports can be input, output or input/output ports. Input ports just receivedata from other components. Output ports just send data to other components.Input/Output ports are bi-directional receiving and sending data from and toother components.
PECOS also defines properties and a parent component. Properties are com-ponent’s meta-data such as memory usage or execution time. The structure ofa component generated by the model is always hierarchical where the top com-ponent is always a composite component (parent).
Execution Sub-Model PECOS provides a sub-model for the execution ofapplications, that shows how data are synchronized among components runningin different threads and describes their semantics.
Problems of data synchronism may happen in PECOS. For instance, supposethere are two active components connected to each other through a port. Bothcan read and write data simultaneously by different operations. To solve thisproblem, active and event components have a private data space where they canupdate unconditionally and periodically a private data that can be synchronizedwith a parent component. In Figure 3b we can see the private data space in thedevice and eventloop components.
Due to this need for synchronization, active and event components have twopossible behaviors: execution and synchronization. The execution behavior de-fines the actions performed when the component is executed. The synchroniza-tion behavior specifies how the private data space is synchronized with the parentcomponent (arrows in Figure 3b). The execution semantics obeys the followingsimple rules:
– Execution behavior of a passive component is executed by a thread of itsparent component;
– Synchronization behavior is executed by a thread of its parent component;

– Active and event components execute their sub-components using a controlthread;
– Each component has a scheduler for its children.
3.2 PECOS in BeanWatcher
BeanWatcher adopts PECOS as its component model adding a communicationcomponent to support remote monitoring applications for wireless sensor net-works. As an example, consider a WSN and a temperature application with threecomponents: one to present the temperature, one to perform data fusion and onefor communication, as depicted in Figure 4a.
ApplComponent (active)
Thermometer Data Fusion
Communicator
temp port
data port
receiver port
sensing port
(a) Structural sub-model.
(active)
Thermometer Data Fusion Communicator
(b) Execution sub-model.
Fig. 4. Using PECOS in BeanWatcher.
In the structural sub-model of BeanWatcher, every component that monitorsdata provided by the WSN (e.g., a thermometer) is an active component sinceit just receives data that is presented to the user. Also the ApplComponent isalways an active component. Components used as alarm indicators are eventcomponents. Internal components (used by a parent component) are passive. InFigure 4a, the Data Fusion and Communicator components are passive. In ad-dition, we added a show functionality to the components because the generatedremote applications show raw or pre-processed data from the WSN.
The execution sub-model of BeanWatcher adopted a pipeline execution, i.e.,only one component can be executed at a time. This is illustrated in Figure 4bwhere ApplComponent executes sequentially its sub-components.
BeanWatcher gives at least two benefits to the user by adopting PECOS.First, the component model allows the code reuse. Second, PECOS specifies thatthe interaction of two components must be done through input and output ports;this interaction simplifies the understating of the application that is constructedby connecting input ports to output ports.
4 BeanWatcher Architecture
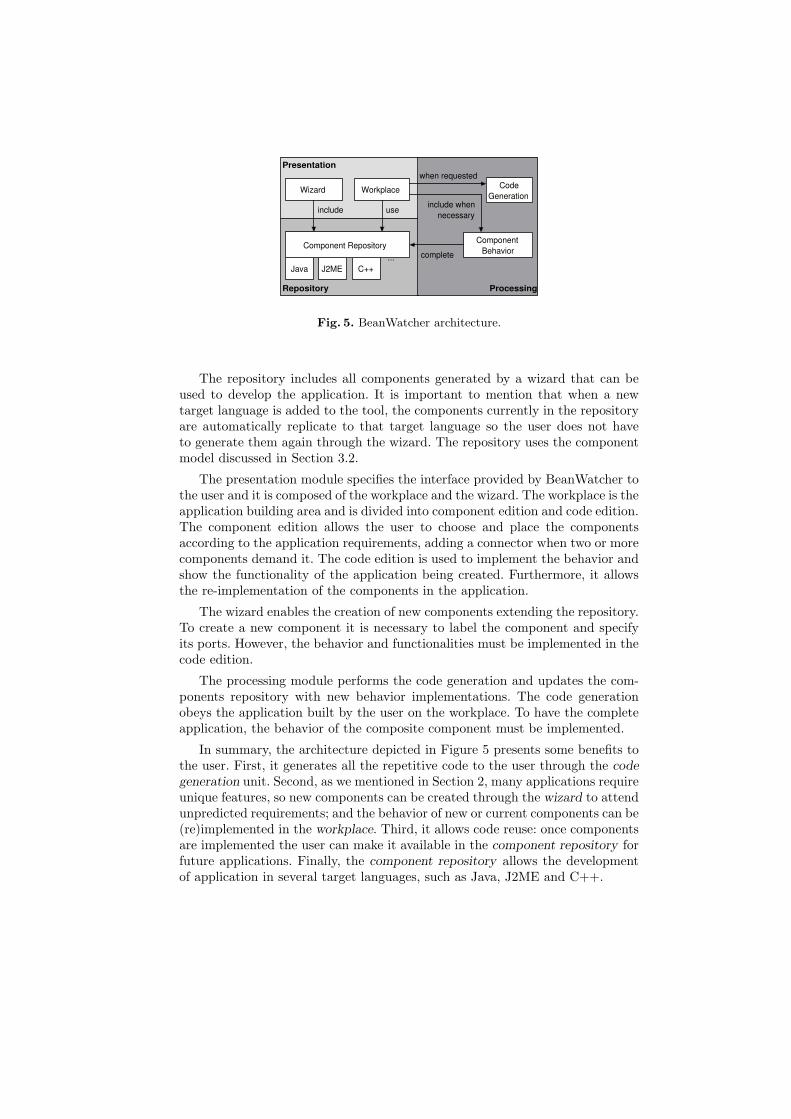
Figure 5 shows the BeanWatcher architecture that has three different modules:repository, processing and presentation.
Repository
Presentation
Processing
Wizard Workplace Code Generation
Component Behavior
Java J2ME C ++ ... complete
include use include when
necessary
when requested
Component Repository
Fig. 5. BeanWatcher architecture.
The repository includes all components generated by a wizard that can beused to develop the application. It is important to mention that when a newtarget language is added to the tool, the components currently in the repositoryare automatically replicate to that target language so the user does not haveto generate them again through the wizard. The repository uses the componentmodel discussed in Section 3.2.
The presentation module specifies the interface provided by BeanWatcher tothe user and it is composed of the workplace and the wizard. The workplace is theapplication building area and is divided into component edition and code edition.The component edition allows the user to choose and place the componentsaccording to the application requirements, adding a connector when two or morecomponents demand it. The code edition is used to implement the behavior andshow the functionality of the application being created. Furthermore, it allowsthe re-implementation of the components in the application.
The wizard enables the creation of new components extending the repository.To create a new component it is necessary to label the component and specifyits ports. However, the behavior and functionalities must be implemented in thecode edition.
The processing module performs the code generation and updates the com-ponents repository with new behavior implementations. The code generationobeys the application built by the user on the workplace. To have the completeapplication, the behavior of the composite component must be implemented.
In summary, the architecture depicted in Figure 5 presents some benefits tothe user. First, it generates all the repetitive code to the user through the code
generation unit. Second, as we mentioned in Section 2, many applications requireunique features, so new components can be created through the wizard to attendunpredicted requirements; and the behavior of new or current components can be(re)implemented in the workplace. Third, it allows code reuse: once componentsare implemented the user can make it available in the component repository forfuture applications. Finally, the component repository allows the developmentof application in several target languages, such as Java, J2ME and C++.
5 Application Development Using BeanWatcher
In this section, we present an example using BeanWatcher.
5.1 The Three-Step Generation Process
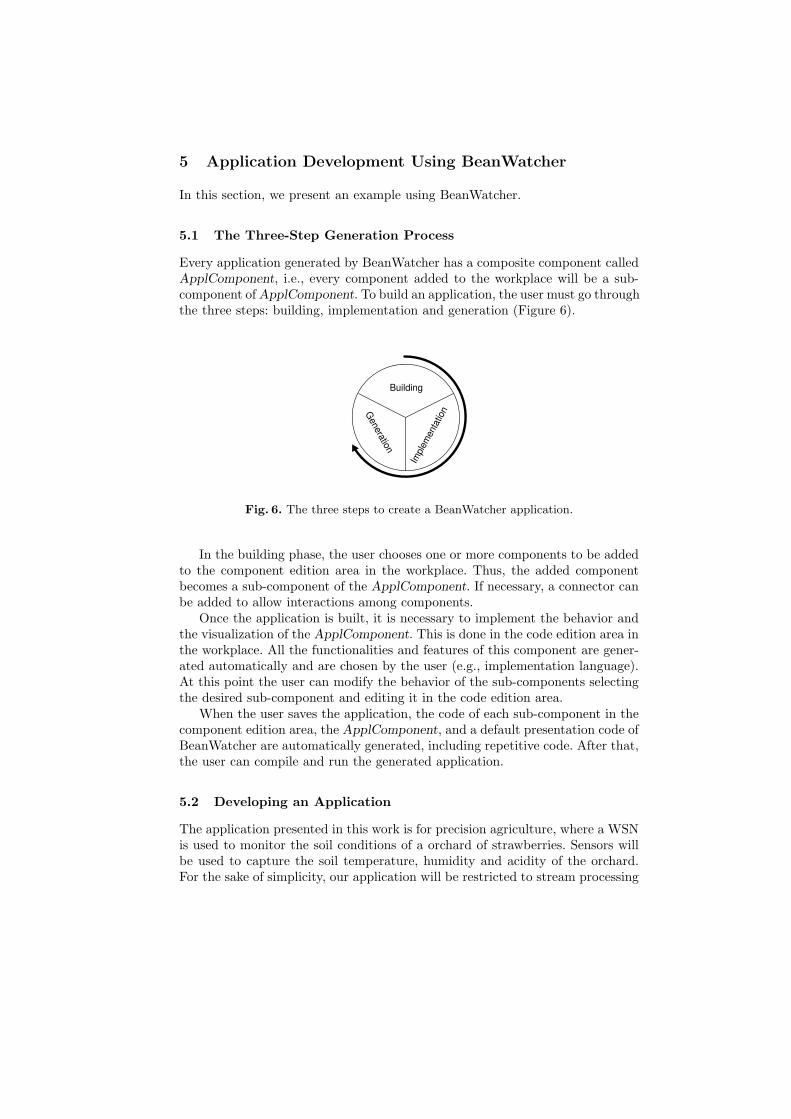
Every application generated by BeanWatcher has a composite component calledApplComponent, i.e., every component added to the workplace will be a sub-component of ApplComponent. To build an application, the user must go throughthe three steps: building, implementation and generation (Figure 6).
Building
Impl
emen
tatio
n Generation
Fig. 6. The three steps to create a BeanWatcher application.
In the building phase, the user chooses one or more components to be addedto the component edition area in the workplace. Thus, the added componentbecomes a sub-component of the ApplComponent. If necessary, a connector canbe added to allow interactions among components.
Once the application is built, it is necessary to implement the behavior andthe visualization of the ApplComponent. This is done in the code edition area inthe workplace. All the functionalities and features of this component are gener-ated automatically and are chosen by the user (e.g., implementation language).At this point the user can modify the behavior of the sub-components selectingthe desired sub-component and editing it in the code edition area.
When the user saves the application, the code of each sub-component in thecomponent edition area, the ApplComponent, and a default presentation code ofBeanWatcher are automatically generated, including repetitive code. After that,the user can compile and run the generated application.
5.2 Developing an Application
The application presented in this work is for precision agriculture, where a WSNis used to monitor the soil conditions of a orchard of strawberries. Sensors willbe used to capture the soil temperature, humidity and acidity of the orchard.For the sake of simplicity, our application will be restricted to stream processing
using the Kalman Filter, and no feature extraction nor decision making will beperformed by the application (see Figure 2).
Initially, we chose the components from the menu (temperature map, datafusion and communicator). The temperature map is an active component thatshows the temperature provided by the sensors and represents the area delimitedby the sensors and is divided into four quadrants that show the respective fusedvalues; if the user wants the quadrants can be zoomed in. The data fusion is apassive component based in the Kalman Filter.
The same procedure is repeated using the humidity and acidity maps thatwill show the other fused measures.
The communicator must be added to get the data streams and it is a passivecomponent that allows the communication between sink and sources. Finally, afilter component is added to organize the received streams (this component isimplemented by the designer).
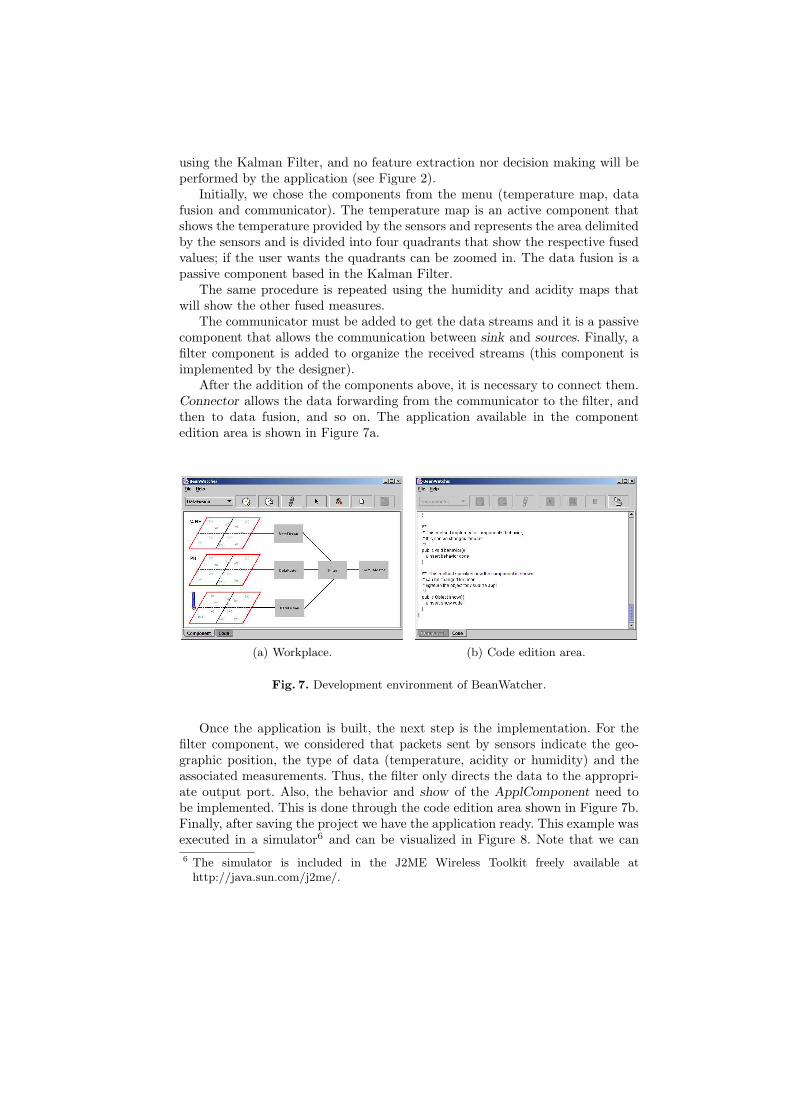
After the addition of the components above, it is necessary to connect them.Connector allows the data forwarding from the communicator to the filter, andthen to data fusion, and so on. The application available in the componentedition area is shown in Figure 7a.
(a) Workplace. (b) Code edition area.
Fig. 7. Development environment of BeanWatcher.
Once the application is built, the next step is the implementation. For thefilter component, we considered that packets sent by sensors indicate the geo-graphic position, the type of data (temperature, acidity or humidity) and theassociated measurements. Thus, the filter only directs the data to the appropri-ate output port. Also, the behavior and show of the ApplComponent need tobe implemented. This is done through the code edition area shown in Figure 7b.Finally, after saving the project we have the application ready. This example wasexecuted in a simulator6 and can be visualized in Figure 8. Note that we can
6 The simulator is included in the J2ME Wireless Toolkit freely available athttp://java.sun.com/j2me/.
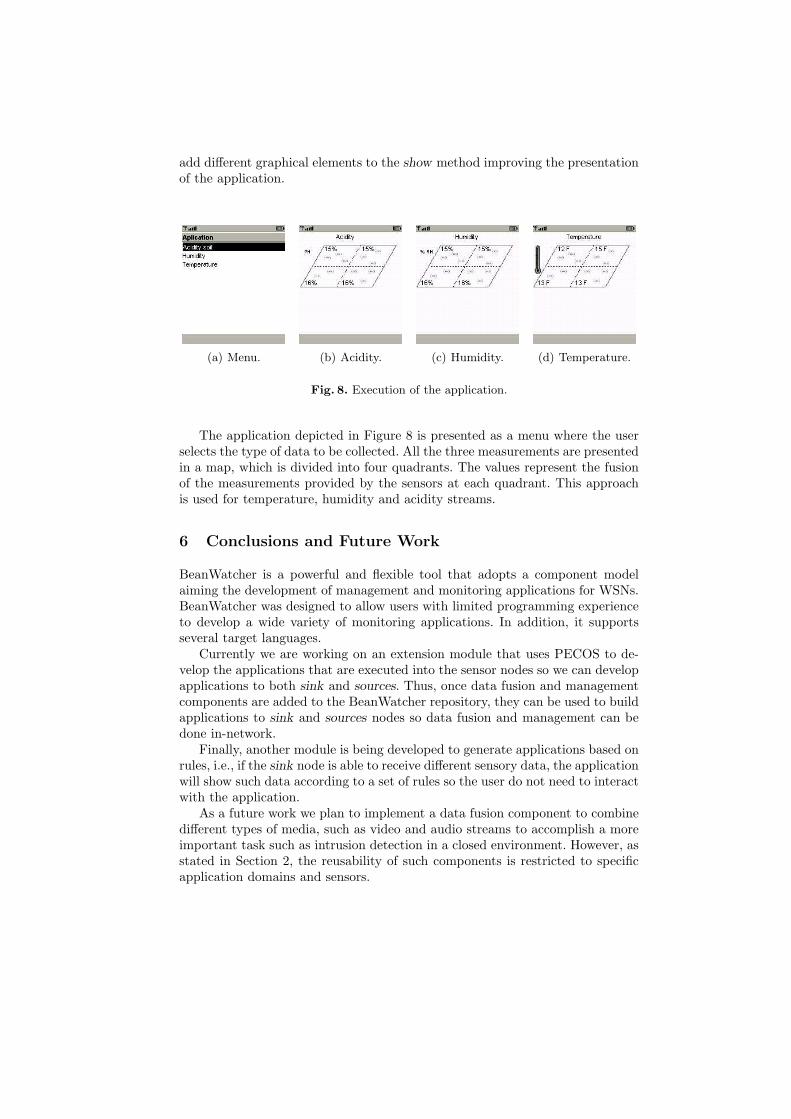
add different graphical elements to the show method improving the presentationof the application.
(a) Menu. (b) Acidity. (c) Humidity. (d) Temperature.
Fig. 8. Execution of the application.
The application depicted in Figure 8 is presented as a menu where the userselects the type of data to be collected. All the three measurements are presentedin a map, which is divided into four quadrants. The values represent the fusionof the measurements provided by the sensors at each quadrant. This approachis used for temperature, humidity and acidity streams.
6 Conclusions and Future Work
BeanWatcher is a powerful and flexible tool that adopts a component modelaiming the development of management and monitoring applications for WSNs.BeanWatcher was designed to allow users with limited programming experienceto develop a wide variety of monitoring applications. In addition, it supportsseveral target languages.
Currently we are working on an extension module that uses PECOS to de-velop the applications that are executed into the sensor nodes so we can developapplications to both sink and sources. Thus, once data fusion and managementcomponents are added to the BeanWatcher repository, they can be used to buildapplications to sink and sources nodes so data fusion and management can bedone in-network.
Finally, another module is being developed to generate applications based onrules, i.e., if the sink node is able to receive different sensory data, the applicationwill show such data according to a set of rules so the user do not need to interactwith the application.
As a future work we plan to implement a data fusion component to combinedifferent types of media, such as video and audio streams to accomplish a moreimportant task such as intrusion detection in a closed environment. However, asstated in Section 2, the reusability of such components is restricted to specificapplication domains and sensors.
References
1. Estrin, D., Girod, L., Pottie, G., Srivastava, M.: Instrumenting the world withwireless sensor networks. In: International Conference on Acoustics, Speech, andSignal Processing, Salt Lake City, USA (2001)
2. Pottie, G.J., Kaiser, W.J.: Wireless integrated network sensors. Communicationsof the ACM 43 (2000) 51–58
3. Estrin, D., Govindan, R., Heidemann, J., Kumar, S.: Next century challenges: Scal-able coordination in sensor networks. In: Proceedings of the Fifth Annual Inter-national Conference on Mobile Computing and Networks (MobiCom’99), Seattle,Washington, USA, ACM Press (1999)
4. Hill, J., Culler, D.: Mica: A wireless platform for deeply embedded networks. IEEEMicro (2002) 12–24
5. Baard, M.: Wired news: Making wines finer with wireless. [online] available:http://www.wired.com/news/wireless/0,1382,58312,00.html, access: March 2003(2003)
6. Schurgers, C., Tsiatsis, V., Ganeriwal, S., Srivastava, M.B.: Topology managementfor sensor networks: Exploiting latency and density. In: 2002 ACM Symposium onMobile Ad Hoc Networking & Computing (MobiHoc’02), Lausanne, Switzerland(2002)
7. Chen, B., Jamieson, K., Balakrishnan, H., Morris, R.: Span: An energy-efficient co-ordination algorithm for topology maintenance in ad hoc wireless networks. Wire-less Networks 8 (2002) 481–494
8. Krishanamachari, B., Estrin, D., Wicker, S.: The impact of data aggregation inwireless sensor networks. In: Proceedings of the International Workshop of Dis-tributed Event Based Systems (DEBS), Vienna, Austria (2002)
9. Intanagonwiwat, C., Govindan, R., Estrin, D.: Directed diffusion: A scalableand robust communication paradigm for sensor networks. In: Proceedings of the6th ACM International Conference on Mobile Computing and Networking (Mobi-Com’00), Boston, MA, USA, ACM Press (2000) 56–67
10. Ruiz, L.B., Nogueira, J.M., Loureiro, A.A.F.: Manna: A management architecturefor wireless sensor networks. IEEE Commmunications Magazine 41 (2003) 116–125
11. Zhao, Y.J., Govindan, R., Estrin, D.: Computing aggregates for monitoring wirelesssensor networks. In: Proceedings of the 1st IEEE International Workshop on SensorNetwork Protocols and Applications (SNPA’03), Anchorage, AK, USA (2003)
12. Zhao, J., Govindan, R., Estrin, D.: Residual energy scans for monitoring wirelesssensor networks. In: IEEE Wireless Communications and Networking Conference(WCNC’02), Orlando, FL, USA (2002)
13. Mini, R.A.F., Nath, B., Loureiro, A.A.F.: A probabilistic approach to predict theenergy consumption in wireless sensor networks. In: IV Workshop de Comunicacaosem Fio e Computacao Movel, Sao Paulo, SP, Brazil (2002)
14. Tian, D., Georganas, N.D.: A coverage-preserving node scheduling scheme for largewireless sensor networks. In: Proceedings of the 1st ACM International Workshopon Wireless Sensor Networks and Applications, Atlanta, Georgia, USA, ACM Press(2002) 32–41
15. Chakrabarty, K., Iyengar, S.S., Qi, H., Cho, E.: Grid coverage for surveillance andtarget location in distributed sensor networks. IEEE Transactions on Computers51 (2002) 1448–1453
16. Meguerdichian, S., Koushanfar, F., Potkonjak, M., Srivastava, M.: Coverage prob-lems in wireless ad-hoc sensor networks. In: Proceedings of IEEE Infocom 2001.Volume 3., Anchorage, AK, USA (2001) 1380–1387
17. Megerian, S., Koushanfar, F., Qu, G., Veltri, G., Potkonjak, M.: Exposure inwireless sensor networks: Theory and practical solutions. Wireless Networks 8
(2002) 443–45418. Meguerdichian, S., Slijepcevic, S., Karayan, V., Potkonjak, M.: Localized al-
gorithms in wireless ad-hoc networks: Location discovery and sensor exposure.In: Proceedings of the 2001 ACM International Symposium on Mobile Ad HocNetworking & Computing, Long Beach, CA, USA, ACM Press (2001) 106–116
19. Luo, R.C., Yih, C.C., Su, K.L.: Multisensor fusion and integration: Approaches,applications, and future research directions. IEEE Sensors Journal 2 (2002) 107–119
20. Brooks, R.R., Iyengar, S.S.: Multi-Sensor Fusion: Fundamentals and Applications.Prentice Hall, New Jersey, USA (1998)
21. Hall, D.L.: Mathematical Techniques in Multisensor Data Fusion. Artech House,Norwood, Massachusetts, USA (1992)
22. Durrant-Whyte, H.F.: Sensor models and multisensor integration. InternationalJournal of Robotics Research 7 (1988) 97–113
23. Dasgupta, K., Kalpakis, K., Namjoshi, P.: Improving the lifetime of sensor networksvia intelligent selection of data aggregation trees. In: Proceedings of the Commu-nication Networks and Distributed Systems Modeling and Simulation Conference,Orlando, FL, USA (2003)
24. Brown, R.G., Hwang, P.Y.: Introduction to Random Signals and Applied KalmanFiltering. 2nd edn. John Wiley & Sons, New York, NY, USA (1992)
25. Arulampalam, S., Maskell, S., Gordon, N., Clapp, T.: A tutorial on particle filtersfor on-line non-linear/non-gaussian bayesian tracking. IEEE Transactions on SignalProcessing 50 (2002) 174–188
26. Marzullo, K.: Tolerating failures of continuous-valued sensors. ACM Transactionson Computer Systems (TOCS) 8 (1990) 284–304
27. Genssler, T., Christoph, A., Schulz, B., Winter, M., Stich, C.M.., Zeidler, C., Mller,P., Stelter, A., Nierstrasz, O., Ducasse, S., Arevalo, G., Wuyts, R., Liang, P.,Schonhage, B., van den Born, R.: Pecos in a nutshell. Technical report, The PecosConsortium (2002)