
TOR โครงการจัดซื้อรถพยาบาลฉุกเฉิน(รถกระบะ) - องค์การบริหารส่วน ...
Upload
independentCategory
view
6download
0
BATHTUB DYNAMICS AT THE
“TOR VERGATA” UNIVERSITY IN ROME, ITALY.
Stefano Armenia, Riccardo Onori PhD Student
DISP - Faculty of Engineering - “Tor Vergata” University, Rome [email protected] – [email protected]
Adriano Bertini
B.Eng. Faculty of Engineering - “Tor Vergata” University, Rome
ABSTRACT In a content of changes in education systems and in a situation of turmoil in Research (both issues especially according to our country, Italy), Systems Thinking appears to be as a valid alternative in order to help students in speeding up their learning processes. Trying to validate such belief, Professor John Sterman has accepted this challenge and tested on his MIT students both their understanding of basic systemic concepts without any prior knowledge of System Dynamics as well as their ability to improve learning skills by means of a System Dynamics education. Other Universities, like WPI, or High Schools (Portland, Wilson High) have afterwards taken up the challenge, fitting it to their own educational environments, thus providing very useful and interesting data, if compared to MIT’s experience. Statistical analysis has been carried out on different groups of students and has provided valuable information their behaviour, as well as an interesting collection of all the most frequent and typical mistakes or misunderstandings that may drive us in clustering the reasonings and rationales beyond them. However, up to now, very few has been done according to inquiring about such reasonings and rationales or even difficulties that students have found in confronting themselves with the tests. May System Dynamics at least partially help students in devising correct solutions? Does a particular academic background or do some particular courses help or improve one’s ability to think sistemically? We have then directly asked them such questions in the tests, trying to inquire which logic processes they followed in text comprehension and graph understanding and if SD constituted an effective aid in doing it or instead was only a confusing tool which didn’t add much to their counterintuitive and non-linear system analysis skills. Simple statistical results on the four tests (BT1, CF2, DS and MC) are provided and some of the most interesting solutions (both correct and wrong ones) as well as answers to the added questions are also presented in this paper.

INTRODUCTION In February/March 2004, we tested our students’abilty to understand the dynamics underlying counterintuitive system behaviours in two different moments: before and after a SD module of 5 lessons, as a part of the Production Systems Modelling course at the faculty of Business Engineerings, Tor Vergata University, Rome. We decided to explore this research topic in order to survey the actual situation of the educational system in our University (whether it is effective or not in developing even only basic systemic skills in the students) as well as to draw some more general considerations on the actual italian educational context, which especially at the moment is living a period of general turmoil in the research of new teaching methodologies. In fact, the upcoming of the new italian universitary reform (which roughly speaking has splitted former academic courses in two “half-courses”, then as a matter of fact increasing the overall time, i.e.: Mathematical Analysis has been splitted in Math 1 and Math2) has forced the teaching institutions to cope with emerging educational issues, thus facing them with the need to respond with substantial innovations to a general speed up in learning and to a drop in the amount of teaching hours per each course. Our comparison to other foreigner academic institutions hasn’t anyway been carried all through because of the lack of sufficient and independent samples. That is, we carried out our analysis just on the basis of one class: it would have been interesting to submit the same tests, under the same conditions, to at least another different class, so as to allow us to perform some statistical independence tests (chi-squared or t-student). Moreover, the tasks in the tests were assembled in a slightly different way from those submitted to students at MIT or other institutions, and we believe that this may have caused also some further deviation from average results. However, we did so mostly because we wanted to have the most possible data in order to focus more on difficulties reported by the students than on the correctness of the solutions. This has thus constituted a very interesting first experience which allowed us to better understand which are those mental obstacles that students find while trying to solve mathematical and/or physical problems, as well as designing their own mental models of the reality under examination. Though it may then seem a rather empirical approach, this work has given us a deeper insight on the testing process as well as on the way of thinking of our students. We plan in the future to submit the tests to at least three or four different groups of students, some with prior SD knowledge and some not, extending the issue also to high-school students. This will also allow us to perform statistical robustness and independence tests, and in the end, hopefully return us better results and show us whether System Dynamics will have contributed or will contribute to a better learning system.

TASKS ADMINISTERED In March 2004, we tested our students’ability to understand the dynamics underlying system behaviours in two different moments: before and after a SD module of 5 lessons, as a part of the Production Systems Modelling course. We administered the following “bathtub dynamics” tasks (as reported in Sterman, Sweeney 2000):
• Bathtub Task 1 (BT 1) • Cash Flow Task 2 (CF 2) • The Department Store Task • Manufacturing case Task
We administered the tasks to our students in regular classes at the “Tor Vergata” University in order to explore the difficulties or cultural gaps (in mathematical or pattern deduction terms) that students have in understanding the dynamics of systems. In particular, we wanted to understand if, and to what extent, SD skills improve this ability. Group 1 (test 1) was administered a test including first BathTub task 1 (BT1) and then CashFlow task 2 (CF2). Group 2 (test 2) was instead administered quite a different and more difficult test, that is the one including both the Department Store case (DS) and the Manifacturing Case (MC). It is necessary to point out again that we administered the tasks to two groups of students, that is before and after the SD module was carried out. However, as a difference with previous research on this topic, we asked them to explain what kind of problems they found in the tests by asking them three more questions, as we will see in the following sections.

TESTS Students of the same class went through two kind of tests, the first at the beginning of SD course and the last at the end of it. The overall composition of the class was made out of 120 undergraduate students at their last year of a Bachelor Engineering Degree (B.Eng.). Most of them had mainly undergone the following courses: Control Theory, Microeconomics, various Calculus courses (mathematical analysis, Algebra, Geometry, Physics, etc…) On the first day of the SD module, only 66 students (group 1) were present and did the test, while on the second test-day, which was the last lesson of the SD-module, 81 students (group 2) were given the test. The increase in test attendance was probably due, as many of the students later told us, to a growing interest in the SD subject, which is not so widespread in Italian Universities, yet. The first test was a sort of mixture taken from Sweeney and Sterman (2000): it was BT1 and CF2 and every student in the class was given the same test sheet. The students had nearly 30 minutes in order to complete the test. We allowed them almost double time if compared to the “traditional” tests administered in US Universities (MIT, WPI and so on), mostly because we wanted to gain, by means of three more questions, some further insight concerning the problems they had in text comprehension, problem solving, graphical integration, diagram reading and the like. Here are the questions which we included in the first test:
1) Give you interpretation of the diagrams representing inflow and outflow both in the BT1 and in the CF2 tasks
2) Explain what is the rationale behind your solutions 3) Report any difficulties encountered and if there was any particular exam you
drew from which helped you in finding a solution. The second test consisted of the Ossimitz’s Department Store task (Gunther Ossimitz 2002) and of Sterman/Sweeney's Manufacturing Case (Sweeney, Sterman, 2000). Of course, the main target of this second test mostly consisted in checking whether the number of correct answers would improve or not and, by means of three more questions (as in the case of the first test), understanding whether the wrong answers derived from a wrong comprehension of the text or still from a lack of either mathematical, graphical or systemic skills. We also included, at the end of this second test, some additional questions to the students, which are reported here in the following:
1) Explain what is the rational behind your solutions: a. Describe in detail the reasoning in answering to the 4 questions of the DS
task and how the diagram was interpreted in order to give a solution b. Describe in detail the reasoning in finding out the solution to the MC
task and how the 2 diagrams have been interpreted
2) Report any difficulties encountered and if there was any particular exam you drew from which helped you in finding a solution.
3) Do you think that studying basic System Dynamics concepts like S&F dynamics, feedback structure, etc…, may have contributed to your systemic skills towards the analysis of complex and/or counterintuitive systems?
INFORMATION ON THE STUDENT SAMPLE As already said, all of the students were undergraduates at the “Tor Vergata” University in Rome - Italy -, and attending the faculty of Business and Management Engineering. We have been able to infer some simple statistical data on the students sample by asking them to fill out, before the test, a form in which we asked their age, gender, specialization and typology of passed exams, especially those typical ones of the Italian traditional engineering degree (Laurea). As undergraduates at their last year, their age ranges from 20 to 23 (71% were 21 years old). The population was fairly distributed on genders, with a little predominance in males (52% males, 48% females). All were Italian students but we didn’t ask the country they were coming from as well as their region of birth. Moreover, most of the students came from the Management Engineering Specialization (88%) but there were also students from other specializations, mostly Logistics Engineering (6%) and Production Engineering (6%). We also asked the students to tell us of their mathematical background, that is any passed Calculus exams or similar. Collected data allowed us to establish that the three more followed courses until then had been Mathematical Analysis, Operations Research, Probability and Statistics. Also, none of the students had any prior experience with system dynamics, nor had they played the Beer Game, both before and after the first test. Moreover, since the SD module was placed right in the middle of the “Production Systems Modelling” course, the students had already acquired a basic knowledge, even if partial, on production models and production systems issues. In the end, the “Tor Vergata” University student sample showed to be a fairly homogeneous group.
RESULTS TEST 1 In the first test, corresponding to group 1, that is the composition of our class at the beginning of the SD module, we wanted to test the starting systemic skills/cultural level of our students. We found interesting results both on the BT1 task and on the CF2 one and it was also interesting to relate such findings with data relative to other universities or educational institutions. This has also allowed us to infer some considerations on our university’s educational system, as well as to generalize such considerations to the overall italian educational situation.
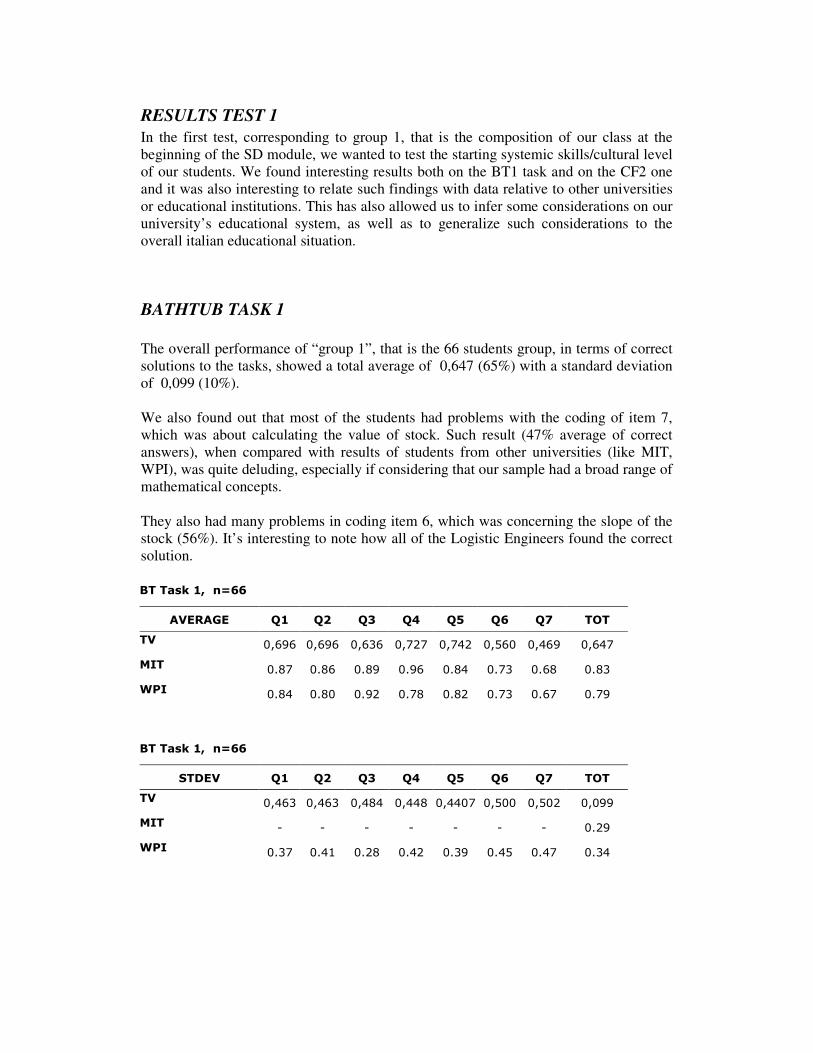
BATHTUB TASK 1 The overall performance of “group 1”, that is the 66 students group, in terms of correct solutions to the tasks, showed a total average of 0,647 (65%) with a standard deviation of 0,099 (10%). We also found out that most of the students had problems with the coding of item 7, which was about calculating the value of stock. Such result (47% average of correct answers), when compared with results of students from other universities (like MIT, WPI), was quite deluding, especially if considering that our sample had a broad range of mathematical concepts. They also had many problems in coding item 6, which was concerning the slope of the stock (56%). It’s interesting to note how all of the Logistic Engineers found the correct solution. ��������������� � � � � � � � �
� ������ ��� ��� ��� ��� ��� ��� ��� ����
� � ������ ������ ������ ������ ����� ����� ����� �����
���� ����� ����� ����� ����� ���� ����� ����� �����
���� ���� ����� ����� ����� ����� ����� ����� �����
��������������� � � � � � � � �
���� � ��� ��� ��� ��� ��� ��� ��� ����
� � ����� ����� ���� ���� ����� ����� ����� ������
���� � � � � � � � �����
���� ����� ���� ����� ���� ����� ��� ���� ����
�
����� ������������ ��� ������ ���� �������� �!� �"�� �� ������ ��� �"��
������������ ��������
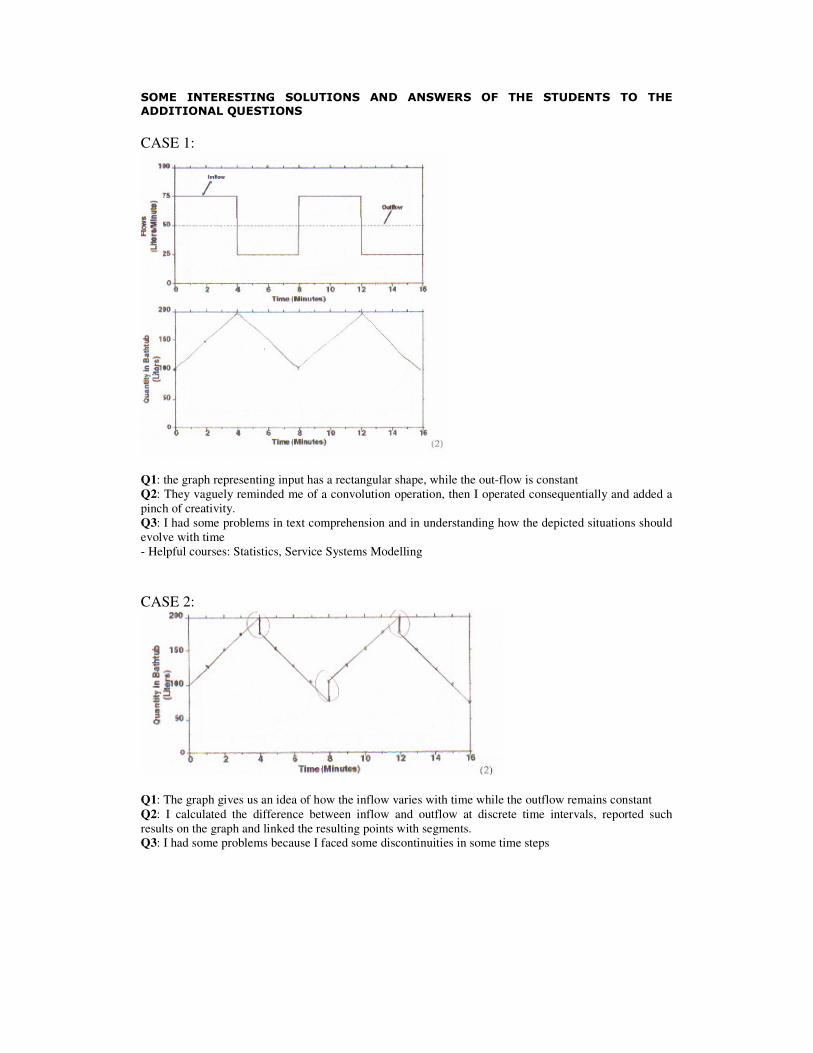
CASE 1:
Q1: the graph representing input has a rectangular shape, while the out-flow is constant Q2: They vaguely reminded me of a convolution operation, then I operated consequentially and added a pinch of creativity. Q3: I had some problems in text comprehension and in understanding how the depicted situations should evolve with time - Helpful courses: Statistics, Service Systems Modelling CASE 2:
Q1: The graph gives us an idea of how the inflow varies with time while the outflow remains constant Q2: I calculated the difference between inflow and outflow at discrete time intervals, reported such results on the graph and linked the resulting points with segments. Q3: I had some problems because I faced some discontinuities in some time steps

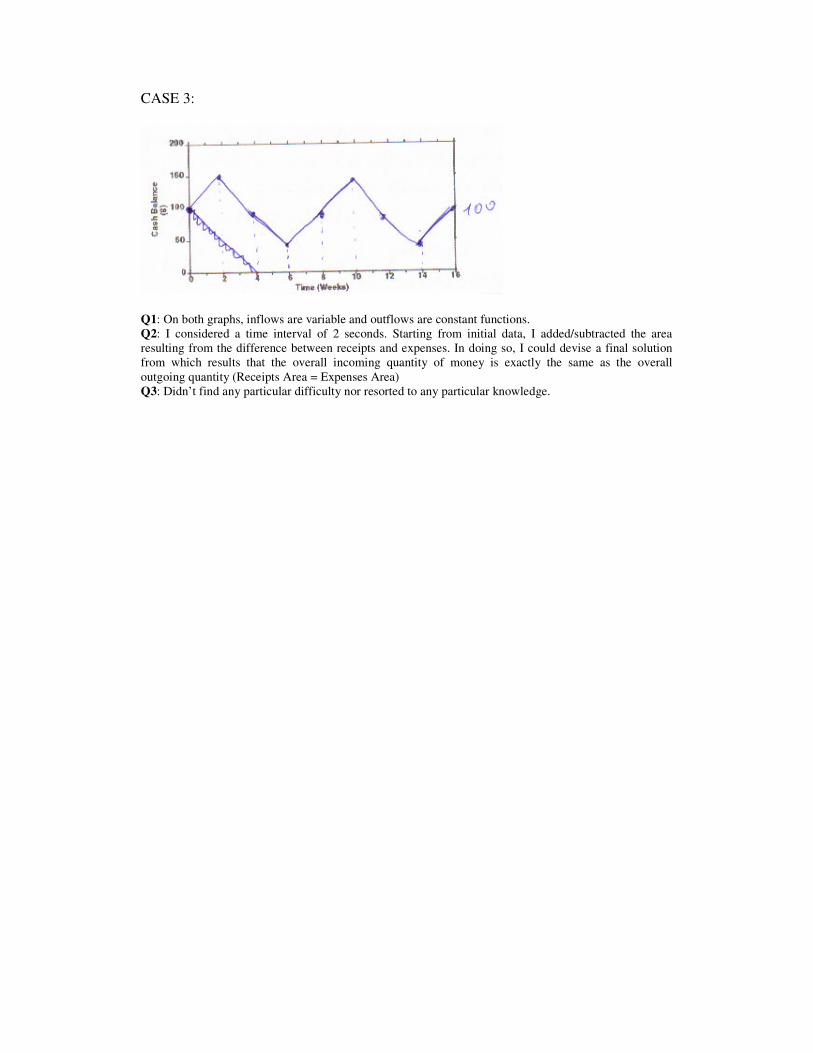
CASE 3:
Q1: Outflow is constant while inflow is a piecewise constant function. In the first 4 seconds, there’s a total inflow of 75 lts., while afterwards, and for other 4 seconds, there’s an inflow of 25 lts. The signal is periodic in this way. Q2: The rationale behind my solution comes from what I deduced from the text. Q3: Signal Theory and Signal Transmission have helped me. I studied such topics when I was at my High School. Here at University, I still haven’t found any course or module which could help me in such a kind of problems. I do really hope that this course and the SD module will help me understand such aspects because I don’t think that I have a proper cultural background on a topic which I deem as very important.

CASH FLOW TASK 2 The “sawtooth wave” task caused even more problems than the “square wave” one. The same “group 1” averaged 0,412 (41%) of correct answers with a standard deviation of 0,26 (26%). By comparing BT1 and CF2 tasks, we noted quite a big worsening in correct answers for almost each of the coding criteria, except for Q4, that is about the discontinuities, for which 95% of students answered correctly. The most frequent wrong solution was including the so called “pattern matching” problem between inflow and outflow. The worst result was concerning the Q7 coding criterion, where only 20% of the students performed correctly, but this is in line with a decrease in performance on this criterion between the BT1 and CF2 tasks. #!������������� � � � � � � � � �
� ������ ��� ��� ��� ��� ��� ��� ��� �$� ����
� � ����� ����� ���� ���� ����� ������ ������ ������ �����
�%&'(�)��*+!���� ���� ���� ����� ���� ��� ���� ���� ���� ����
���� ���� ���� ����� ����� ����� ���� ���� ���� ����
#!������������� � � � � � � � � �
���� � ��� ��� ��� ��� ��� ��� ��� �$� ����
� � ����� ���� ���� ������ ����� ����� ����� ����� �����
�%&'(�)��*+!���� � � � � � � � � �����
���� � � � � � � � � ����
�

����� ������������ ��� ������ ���� �������� �!� �"�� �� ������ ��� �"��
������������ ��������
CASE 1:
Q1: In CF2, the input function is linear, then the difference between input and output is also a linear function. Consequently, the representation of the integral of the differential flow function is the one depicted on the second graph. Q2: Mathematical Analysis 1 Q3: Bachelor and Math 1 CASE 2:
Q1: - Q2: In order to devise a solution, I took into account, on every time instant, the difference between inflow and outflow. Q3: I mainly had problems in tracing the resulting diagrams of the solutions. Didn’t resort to any particular course.
CASE 3:
Q1: On both graphs, inflows are variable and outflows are constant functions. Q2: I considered a time interval of 2 seconds. Starting from initial data, I added/subtracted the area resulting from the difference between receipts and expenses. In doing so, I could devise a final solution from which results that the overall incoming quantity of money is exactly the same as the overall outgoing quantity (Receipts Area = Expenses Area) Q3: Didn’t find any particular difficulty nor resorted to any particular knowledge.

RESULTS TEST 2 (group 2) In the second test, corresponding to group 2, that is the composition of our class at the end of the SD module, we wanted to test what had been, and to what extent, the acquired systemic skills of our students. Also here we found interesting results both on the DS task and on the MC one. Also here, it was also interesting to relate such findings with data relative to other universities and educational institutions.
DEPARTMENT STORE TASK Group1, with the addition of some more students, became as a matter of fact what we refer to as Group2, even if most of the students were exactly the same as in the previous test. But as we pointed in previous sections, our main target was to discover whether just a 4 lessons SD module would have caused an improvement in our students’ systemic skills and thinking. Before this test, all of students had had a small SD module and had improved their systemic skills as well as developed the concept of stock & flow dynamics, feedback loops, counterintuitive thinking and nonlinearities underlying dynamic behaviours of systems; in fact general performance was much better than the BT/CF one. Performance on the first two questions (Q1 and Q2) was far better than on the last two ones. Only one student went wrong on Q1 and 8 on Q2. his is mostly due to the fact that Q3 and Q4 are probably more elaborate questions, thus raising the difficulty level. The average performance was respectively 0,33 (33%) on Q3 and 0,23 (23%) on Q4, far lower than the performance of students at MIT or WPI. It is interesting to note that, as in the MIT case, most of the students either answered correctly to all of the 4 questions or missed both of the last two. The average on all 4 questions for the whole group 2 was 0,61 (61%) with a standard deviation of 0,38 (38%). ����������$�� � � � � �
� ������ ��� ��� ��� ��� ����
� � ����� ������ ������ ����� ������
���� ���� ���� ���� ����� ����
����,���-'&%�
.%/&�01������ ����� ���� ����� �����
����������$�� � � � � �
���� � ��� ��� ��� ��� ����
� � ����� ������ ���� ����� ������
���� � � � � ������
����,���-'&%�
.%/&�01��� �� ���� ���� ����

In this second test, it was very interesting to ask the students some additional questions, which we report here below once again for clarity:
1. Explain what is the rational behind your solutions: a. Describe in detail the reasoning in answering to the 4 questions of the DS
task and how the diagram was interpreted in order to give a solution b. Describe in detail the reasoning in finding out the solution to the MC
task and how the 2 diagrams have been interpreted
2. Report any difficulties encountered and if there was any particular exam you drew from which helped you in finding a solution.
3. Do you think that studying basic System Dynamics concepts like S&F dynamics, feedback structure, etc…, may have contributed to your systemic skills towards the analysis of complex and/or counterintuitive systems?
��
����� ������������ ��� ������ ���� �������� �!� �"�� �� ������ ��� �"�������������� ��������
CASE 1: correctly answered all four items.
Q1: By resorting to concepts coming from Physics, I considered the curves in the diagram as a velocity. I then divided the graph in two areas, the one on the left (a>0, or arrivals velocity > departures velocity), for which people in the store increase, the one on the right (a<0) for which people in the store decrease. Equilibrium point: a=0, thai represents the instant for which there’s the maximum number of persons in the store. Peaks (local max) are those instants which registered the highest/lowest velocities (number of people) Q2: Physics and intuition have helped me. Q3: I believe that SD is a truly valid analysis tool, which should be dedicated, because of its relevant interest, a proper universitary course here at Tor Vergata. CASE 2: Q1: In order to trace the maximum and minimum number of people in the store, I calculated the difference between the people entering and those leaving in every instant, while in order to find out in which moment there had been more leavings or enterings, it sufficed to check for the maximum peaks of the two curves. Q2: - Q3: I didn’t find SD concepts very useful since I was not able to link theory with practical isues or problems. Maybe a deeper insight would have done better or helped more

CASE 3: Q1: 1- max entering peak, 2- max leaving peak , 3 – until entering is greater than leaving, 4 – when leaving is greater than entering Q2: - Q3: Didn’t find any particular difficulty but believe that SD teaching is very important and found it very interesting
MANUFACTURING CASE TASK Even though this task presented more difficulties than the previous one, here the students performed much better than MIT. Performance was quite good. Average performance was 57% against 41% of MIT. It probably improved because students had relevant experience with such kind of systems (basic knowledge of manufacturing systems already acquired), but we do not have a particular evidence on that, so that we like to think that by improving their SD skills (by means of the knowledge acquired during the SD module) students have been more capable of providing correct answers. This is confirmed by the presence, on almost each student’s sheet, of some SD schemes (Causal Loop diagrams and Stock and Flow diagrams, see in the following) and by the additional question on “how much SD has improved the ability to solve this kind of problems”. The table below shows performance by individual coding criteria. Most of the students (62% ~ 74%) were able to understand that the system was starting in equilibrium and how to draw a lag/delay between the change in orders and the response of the production area. Anyway, only 46% showed the correct answer: that is production overshooting orders. �#��������$�� � � � � � � � �
� ������ ��� ��� ��� ��� ��� ��� ��� ����
� � ����� ������ ���� ������ ������ ����� ����� �����
���� ���� ��� ��� ����� ����� ���� ����� ����
�%&'(�)��*+!���� ���� ���� ����� ��� ����� ����� ���� �����
�#��������$�� � � � � � � � �
���� � ��� ��� ��� ��� ��� ��� ��� ����
� � ���� ����� ����� ����� ��� ���� ����� ������
���� � � � � � � � �����
�%&'(�)��*+!���� � � � � � � � �����
�
�

����� ������������ ��� ������ ���� �������� �!� �"�� �� ������ ��� �"��
������������ ��������
CASE 1:
Q1: - Q2: - Q3: I believe that the SD course was definitely important in understanding and solving the exercise. CASE 2:
Q1: Since production can be increased only after 4 weeks, I keep producing 10.000 units/week until week 9, increase up to 12.000 from week 9 to week 13 and then reduce to the new production rate of 11.000 units/week. Q2: - Q3: SD has offered a great contribution

CASE 3:
Q1: - Q2: In the first diagram I depicted production as a linear function raising in the 4 weeks during which the inventory should be adjusted to the new level, and then it becomes constant once equilibrium has been reached. In diagram 2, the inventory level falls as the order rate gets its increase of 5.000 units/week, but then, after production reaches equilibrium, returns to a new value of 55.000 units on stock. Q3: I believe that SD didn’t help me in absolutely any way in understanding this kind of problems.
DISCUSSION, IMPLICATIONS AND FUTURE WORK The results presented in Sweeney/Sterman (2000), suggest that even subjects with previous training and/or background in mathematics and science have a poor understanding of the basic concepts presented in the tests, which seems to be in contrast with for example reported in our CF2/case1. The subject, here presenting typical mathematical argumentations, has effectively found the correct solution. We believe that such a discrepancy may be mostly due to the fact that the effective students level of education (i.e.: mathematical skills, etc…) was not taken into proper consideration. We mean that probably an inference test concerning statistics on the average performance of students on related exams would help in confirming good results. This issue appears to be confirmed by the fact that a student with a good educational level correctly handling the first task, was then also able to correctly manage the second one. Moreover, we noticed that students who said to have studied SD in an accurate way, were effectively able to positively manage both tests and reported SD disciplines as being very important. According to BT1 results, our students showed an overall poor performance, reaching a rate which was 20% worse than MIT students and 16% worse than those at WPI. However, also taking into consideration such an overall bad performance, there were some correct solutions either to the BT1 and to the CF2 tasks. In BT1/case1, the selected student has provided the correct solution. Question Q1 also reports how the student said to have managed to analyse the problem. His analysis is mainly Statistics driven and this is confirmed from what he says in Q3. It is interesting to note that in Q2 the student recalls the convolution concept even if this helps him only partially, since the problem analysis is also instinct driven. In BT1/case2, the selected student has some problems because of the introduction of discontinuity points in the level diagram (seconds: 4,8,12), probably due to a pattern matching thinking only in correspondence to discontinuities in the inflow step function. Nevertheless, the students shows to have the concept of graphical integration. In BT1/case3, the student has serious problems in understanding both the diagrams and the text. He shows a lack of SD skills and of the most fundamental concepts of mathematics, as also shown in Q1 in his wrong explanation of the graph drawn, as well as through his words in Q3. According to CF2 results, overall performance is still poor, and the results are 10% worse than those obtained at MIT and 16% worse than those obtained at Portland Symfest. In CF2/case1, the student gives the correct solution, and in Q1 he explains that this is due to the fact that he resorted to the mathematical concept of "differential equations". This is confirmed by the calculations shown in the lower part of the figure and from his words in Q3. So, in this case, the selected student shows to have a solid mathematical background that helps him in solving the problem without the use of any SD notions. In CF2/case2, the student is not able to effectively match what he thinks about the problem solution with its graphical representation, as also himself says in Q3. In CF2/case3, the student understands the dynamics of the system and this allows him to suppose a well developed systemic vision, even if the mathematical concept of derivation is missing, as shown by checking the wrong slope of the function.
The second test (DS/MC group 2) presents some improvements on overall performance. In fact, the students performance in the DS task is only 4% worse than MIT and 10% worse than WPI. We believe then the SD module to have had at least some effect in developing our students systemic skills. In DS/case1, the student finds SD as an interesting analysis method and, together with some Physics notions, he uses it to give the correct answers. In DS/case2, the student is not able to solve the exercise and his lack of comprehension probably drives his bad opinion about SD. On the MC task, Tor Vergata (TV) students reach good results, 16% better than MIT and only 6% worse than those at the Portland SYMfest. This is probably due to the SD topics learned in the SD module which, according to the main topic of the overall course, were mainly focused on production systems models. Those students presenting a good performance, also show quite a deep interest in SD topics, as shown from answers to Q3. In MC/case 1, the student draws a correct feedback loop concerning the production area, identifying the gap and a stock and flow in the inventory. We saw that, on the contrary, as the SD models are not taken into proper consideration, problems in understanding the system's behaviour were rising. This was confirmed by the fact that those students applying SD concepts (as well as saying that SD had been useful to them) were on average performing better than those who either didn't apply it or just said that SD had not been useful to their understanding of production systems. Finally, it's interesting to notice how the joined use of the SD discipline with ones from other scientific areas often underlines the ability to reach excellent results and improved solutions. As a future research direction on this topic, we mainly want to confront our results and findings with researchers in the same area. According to other possible statistics, it would also be interesting to extend the test even to other classes of students, as well as also filter data according to students’ age, educational background, and so on. An other interesting issue will be the analysis of the correlation between the tests' results and the performance at the attended exams. Moreover, based on the results obtained in each of those exams, by each student, a study will be carried out, by focusing on the relation between the attitude of every student towards studying and his ability in problem solving. We were not able to implement any “Chi-Squared” and “t-Student” tests because of very nature of the way we administered the two tests (BT1 associated with CF2 to the first group, and DS associated with MC to the second one – we recall also here that group 1 was a subset of group 2). In order to implement such statistic inference tests as well as to analyze new results by comparing them with those ones obtained this year, we are planning for the next year to repeat the experiment by correctly administering the tasks to different groups of student (Sweeney, Sterman, 2000).

REFERENCES Bianchi C., Modelli contabili e modelli dinamici per il controllo di gestione in un’ottica strategica (1996),
Giuffré Editore SpA, Milano ________, Bivona E., Landriscina F., Promoting entrepreneurship through open-distance learning
management flight simulators: ecoroll educational package. (2000) International System Dynamics Conference Proceedings, System Dynamics Society, Bergen
Busacca B., Valdani E., Customer Based View (1999), Finanza, Marketing e Produzione, Anno XVII Cavaleri S, Sterman J. 1997. Towards evaluation of systems thinking interventions: a case study. System
Dynamics Review 13(2): 171–186. Dangerfield BC, Roberts CA. 1995. Projecting dynamic behavior in the absence of a model: an
experiment. System Dynamics Review 11(2): 157–172. Doerner D. 1996. The Logic of Failure. Metropolitan Books/Henry Holt: New York. Forrester JW. 1961. Industrial Dynamics. MIT Press: Cambridge: Currently available from Pegasus
Communications: Waltham, MA. ___________ , Principles of Systems (1968), Productivity Press. ___________ , Urban Dynamics (1969), Productivity Press. Grotzer T. 1993. Children’s Understanding of Complex Causal Relationships in Natural Systems.
Harvard Graduate School of Education: Cambridge, MA. Grotzer TA, Bell B. 1999. Negotiating the funnel: Guiding students toward understanding elusive
generative concepts. In The Project Zero Classroom: Views on Understanding. Hetland L, Veenema S (eds). Fellows and Trustees of Harvard College: Cambridge, MA. Lyneis J.,Lyneis D. Bathtub Dynamics at WPI,Conference Proceedings of the International System
Dynamics 2003, NewYork Ossimitz G. 1996. Development of Systems Thinking. Institute of Educational Research: Bonn, Germany. Richmond B. 1993. Systems thinking: critical thinking skills for the 1990s and beyond. System Dynamics
Review 9(2): 113–134. Roberts, E. B. (ed.), Managerial Applications of System Dynamics. (1978) Productivity Press. Roberts N., Andersen D.F., Deal R.M., Garet M.S., Shaffer W.A., Introduction to Computer Simulation:
The System Dynamics Approach. (1983) Addison-Wesley. Ruth, M. Y Hannon, B. Modeling Dynamic Economic Systems. (1997) Springer Verlag. Senge, Peter M. The Fifth Discipline: The Art and Practice of the Learning Organization. (1990)
Doubleday/Currency. Sterman J.D., 1989a. Misperceptions of feedback in dynamic decision making. Organizational Behavior
and Human Decision Processes 43(3): 301–335. __________, 1989b. Modeling managerial behavior: misperceptions of feedback in a dynamic decision
making experiment. Management Science 35(3): 321–339. __________,1994. Learning in and about complex systems. System Dynamics Review10(2–3): 291–330. _________,, Business Dynamics. Systems Thinking and Modeling for a Complex World. (2000) Mc
Graw Hill. _________, Repenning N., Kofman F., Unanticipated side effects of successful quality programs:
exploring the paradox of organization improving. (1997) Management Science 43(4), 503-521 Sweeney L.B., Sterman J. - Bathtub Dynamics : Initial Results of a Systems Thinking Inventory System
Dynamics Review, 9 (2): 249-286 TLC Team Learning Lab Brochure. 1998. The Learning Circle, Sudbury, MA. Van Ackere A., Smith P.C., Towards a macro model of National Health Service waiting lists. (1999)
System Dynamics Review 15(3), 225-252 Vennix J. A. M., Group Model Building. Facilitating team Learning Using System Dynamics. (1996)
John Willey & Sons.
Copyright © 2022 FDOKUMEN