Basin 8-1 Alternative 2022 Update - Orange County Water ...
246
Basin 8-1 Alternative 2022 Update Submitted by: Orange County Water District City of La Habra Irvine Ranch Water District Submitted to: California Department of Water Resources January 1, 2022
-
Upload
khangminh22 -
Category
Documents
-
view
1 -
download
0
Transcript of Basin 8-1 Alternative 2022 Update - Orange County Water ...

Basin 8-1 Alternative
2022 Update
Submitted by: Orange County Water District
City of La Habra
Irvine Ranch Water District
Submitted to: California Department of Water Resources
January 1, 2022

Table of Contents
BASIN 8-1 ALTERNATIVE: 2022 UPDATE Table of Contents i
I. Overview
II. La Habra-Brea Management Area
III. OCWD Management Area
IV. South East Management Area
V. Santa Ana Canyon Management Area
Attachment One: DWR Comments on 2017 Alternative and Responses

Overview
BASIN 8-1 ALTERNATIVE: 2022 UPDATE Overview
BASIN 8-1 ALTERNATIVE
OVERVIEW
The Sustainable Groundwater Management Act (SGMA) requires all high- and medium-priority
basins, as designated by the California Department of Water Resources (DWR), be sustainably
managed. DWR designated the Coastal Plain of Orange County Groundwater Basin (“Basin 8-
1” or “Basin”) as a medium-priority basin, primarily due to heavy reliance on the Basin’s
groundwater as a source of water supply.
The agencies within Basin 8-1 collaborated to prepare and submit an Alternative to a
Groundwater Sustainability Plan (GSP) on December 22, 2016. Within this document, this
Alternative to a GSP will be referred to herein as the “Basin 8-1 Alternative” or “Alternative”. In
accordance with Water Code §10733.6(b)(3), the Alternative presented an analysis of basin
conditions that demonstrated that Basin8-1 had operated within its sustainable yield over a
period of at least 10 years. On July 17, 2019, DWR determined that the Alternative satisfied
SGMA objectives and was therefore approved.
Approved alternatives are required to submit annual reports to DWR on April 1 of each year,
and to resubmit the alternative by January 1 every five years. Annual reports were submitted to
DWR as follows:
• Water Year 2016-17 – March 29, 2018
• Water Year 2017-18 – March 29, 2019
• Water Year 2018-19 – March 30, 2020
• Water Year 2019-20 – March 30, 2021
This document represents the first five-year update, which is due January 1, 2022.
This update has been jointly prepared by the Orange County Water District (OCWD), Irvine
Ranch Water District (IRWD); and the City of La Habra Groundwater Sustainability Agency
(collectively the “Submitting Agencies”); pursuant to this Alternative, the Submitting Agencies
will ensure the entire Basin 8-1 continues to be sustainably managed and data reported as
required by SGMA. Pursuant to Water Code §10733.6(b)(3), the Basin 8-1 Alternative has been
prepared by or under the direction of a professional geologist or professional engineer.
For purposes of this report, the Basin 8-1 Alternative approved by DWR on July 17, 2019 is
referred to as the 2017 Alternative. The first five-year update will be referred to as the 2022
Update. The 2017 Alternative was a comprehensive document showing that Basin 8-1 had
been managed sustainably for more than 10 years. For the 2022 Update, the focus is on
documenting that the basin has continued to be operated sustainably during the five years since
the 2017 Alternative was submitted and to present any new information. As such, background
information, such as Basin Hydrogeology, and other sections with no new information is not
repeated in the 2022 Update.

Overview
BASIN 8-1 ALTERNATIVE: 2022 UPDATE Overview
As described in the 2017 Alternative, Basin 8-1 was sub-divided into four management areas:
La Habra-Brea, OCWD, South East, and Santa Ana Canyon Management Areas (Figure 1-1).
The 2022 Update contains four chapters, one for each management area.
Figure 1-1: Basin 8-1 Management Area Boundaries
In its evaluation of the Basin 8-1 Alternative, DWR provided four recommendations that they
encouraged “be given due consideration and suggest incorporating any resulting changes to the
Alternative in future updates.” The recommendations and responses to these recommendations
are in Attachment 1 and incorporated into the 2022 Update where appropriate.

Abbreviations and Acronyms
BASIN 8-1 ALTERNATIVE: 2022 UPDATE Abbreviations and Acronyms
ABBREVIATIONS AND ACRONYMS afy acre-feet per year
AWPF Advanced Water Purification Facility
basin Orange County groundwater basin
Basin Model OCWD groundwater model
BEA Basin Equity Assessment
BPP Basin Production Percentage
CDPH California Department of Public Health
cfs cubic feet per second
DATS Deep Aquifer Treatment System
DOC dissolved organic compound
DWR Department of Water Resources
DWSAP Drinking Water Source Assessment and Protection
EDCs Endocrine Disrupting Compounds
EIR Environmental Impact Report
EPA U.S. Environmental Protection Agency
FY fiscal year
GAC granular activated carbon
GIS geographic information system
GWRS Groundwater Replenishment System
IAP Independent Advisory Panel
IRWD Irvine Ranch Water District
LACPW Los Angeles County Public Works
maf million acre feet
MCAS Marine Corps Air Station
MCL maximum contaminant level
MF microfiltration
MODFLOW Computer modeling program developed by USGS
mgd million gallons per day
mg/L milligrams per liter
MTBE methyl tertiary-butyl ether
MWD Metropolitan Water District of Southern California
MWDOC Municipal Water District of Orange County
NDMA n-Nitrosodimethylamine
NF nanofiltration
ng/L nanograms per liter
NBGPP North Basin Groundwater Protection Program
NO2 nitrite
NO3- nitrate
NPDES National Pollution Discharge Elimination System
NWRI National Water Research Institute

Abbreviations and Acronyms
BASIN 8-1 ALTERNATIVE: 2022 UPDATE Abbreviations and Acronyms
ABBREVIATIONS AND ACRONYMS O&M operations and maintenance
OCHCA Orange County Health Care Agency
OCSD Orange County Sanitation District
OC Survey Orange County Survey
OCWD Orange County Water District
PCE perchloroethylene
PFAS Per- and polyfluoroalkyl substances
PPCPs pharmaceuticals and personal care products
Producers Orange County groundwater producers
RA replenishment assessment
RO reverse osmosis
Regional Water Board Regional Water Quality Control Board
SARI Santa Ana River Interceptor
SARMON Santa Ana River Monitoring Program
SARWQH Santa Ana River Water Quality and Health
SAWPA Santa Ana Watershed Project Authority
SBGPP South Basin Groundwater Protection Program
SDWA Safe Drinking Water Act
SOCs synthetic organic chemicals
SWP State Water Project
SWRCB State Water Resources Control Board
TCE trichloroethylene
TDS total dissolved solids
TIN total inorganic nitrogen
µg/L micrograms per liter
USFWS U.S. Fish & Wildlife Service
USGS U.S. Geological Survey
UV ultraviolet light
VOCs volatile organic compounds
WACO Water Advisory Committee of Orange County
WEI Wildermuth Environmental Inc.
WF-21 Water Factory 21
WLAM Waste Load Allocation Model
WRD Water Replenishment District of Southern California
WRMS Water Resources Management System

La Habra Management Area
This section is under construction and will be added as soon as
it is ready.

Basin 8-1 Alternative
OCWD Management Area
2022 UPDATE
Prepared by: Orange County Water District
January 1, 2022

Basin 8-1 Alternative
OCWD Management Area
2022 UPDATE
Roy Herndon, P.G., C.Hg.
Chief Hydrogeologist
Orange County Water District
18700 Ward Street
Fountain Valley, CA 92708
Prepared for the Department of Water Resources, pursuant to Water Code
§10733.6(b)(3), (c) and §10733.6
January 1, 2022

Table of Contents
BASIN 8-1 ALTERNATIVE 2022 UPDATE Table of Contents i
Section Page
SECTION 1 EXECUTIVE SUMMARY ................................................................................... 1-1
1.1 GROUNDWATER BASIN CONDITIONS ..................................................................... 1-2
1.2 WATER BUDGET ....................................................................................................... 1-6
1.3 WATER RESOURCE MONITORING PROGRAMS ..................................................... 1-7
1.4 GROUNDWATER MANAGEMENT PROGRAMS........................................................ 1-7
1.5 NOTICE AND COMMUNICATION .............................................................................. 1-9
1.6 SUSTAINABLE BASIN MANAGEMENT ...................................................................... 1-9
1.6.1 Sustainable Management: Water Levels ................................................. 1-10
1.6.2 Sustainable Management: Basin Storage ............................................... 1-10
1.6.3 Sustainable Management: Water Quality ................................................ 1-12
1.6.4 Sustainable Management: Seawater Intrusion ........................................ 1-12
1.6.5 Sustainable Management: Land Subsidence .......................................... 1-13
1.6.6 Sustainable Management: Depletion of Interconnected Surface Waters 1-13
1.7 PROTOCOLS FOR MODIFYING MONITORING PROGRAMS ................................. 1-13
1.8 EVALUATION OF POTENTIAL PROJECTS ............................................................. 1-13
1.9 CONCLUSION .......................................................................................................... 1-14
SECTION 2 AGENCY INFORMATION ................................................................................. 2-1
2.1 HISTORY OF OCWD .................................................................................................. 2-1
2.2 GOVERNANCE AND MANAGEMENT STRUCTURE ................................................. 2-2
2.3 LEGAL AUTHORITY ................................................................................................... 2-2
2.4 BUDGET ..................................................................................................................... 2-3
SECTION 3 MANAGEMENT AREA DESCRIPTION ............................................................. 3-4
3.1 OCWD MANAGEMENT AREA .................................................................................... 3-4
3.2 GROUNDWATER CONDITIONS ................................................................................ 3-7

Table of Contents
BASIN 8-1 ALTERNATIVE 2022 UPDATE Table of Contents ii
3.2.1 Groundwater Elevation Contours .............................................................. 3-7
3.2.2 Regional Pumping Patterns..................................................................... 3-10
3.2.3 Long-Term Groundwater Elevation Hydrographs .................................... 3-11
3.2.4 Groundwater Storage Data ..................................................................... 3-18
3.3 BASIN MODEL .......................................................................................................... 3-18
3.3.1 Groundwater Quality Conditions .......................................................... 3-19
3.3.2 Coastal Gaps .......................................................................................... 3-26
3.3.3 Land Subsidence .................................................................................... 3-27
3.3.4 Groundwater/Surface Water Interactions and Groundwater Dependent
Ecosystems ......................................................................................... 3-28
SECTION 4 WATER BUDGET ............................................................................................. 4-1
4.1 WATER BUDGET COMPONENTS ............................................................................. 4-1
4.1.1 Measured Recharge .................................................................................. 4-1
4.1.2 Unmeasured Recharge ............................................................................. 4-1
4.1.3 Groundwater Production ........................................................................... 4-2
4.1.4 Subsurface Outflow ................................................................................... 4-3
4.1.5 Evaporation ............................................................................................... 4-3
4.2 WATER YEAR TYPE .................................................................................................. 4-3
4.3 ESTIMATE OF SUSTAINABLE YIELD ........................................................................ 4-4
4.4 WATER BUDGETS ..................................................................................................... 4-4
SECTION 5 WATER RESOURCE MONITORING PROGRAMS ........................................... 5-1
5.1 OVERVIEW ................................................................................................................. 5-1
5.2 GROUNDWATER MONITORING PROGRAMS .......................................................... 5-1
5.2.1 Groundwater Production Monitoring .......................................................... 5-4
5.2.2 Groundwater Elevation Monitoring ............................................................ 5-5
5.2.3 Groundwater Quality Monitoring ................................................................ 5-8

Table of Contents
BASIN 8-1 ALTERNATIVE 2022 UPDATE Table of Contents iii
5.2.4 Coastal Area Monitoring ............................................................................ 5-2
5.3 SURFACE WATER AND RECYCLED WATER MONITORING ................................... 5-4
5.3.1 Surface Water Monitoring Programs ......................................................... 5-5
5.3.2 Recycled Water Monitoring ....................................................................... 5-6
SECTION 6 WATER RESOURCE MANAGEMENT PROGRAMS ........................................ 6-1
6.1 LAND USE ELEMENTS RELATED TO BASIN MANAGEMENT ................................. 6-1
6.1.1 Summary of Plans Related to Basin Management .................................... 6-1
6.1.2 Land Use Development and Water Demands and Supply ........................ 6-2
6.1.3 Well Construction, Management, and Closure .......................................... 6-2
6.2 GROUNDWATER QUALITY PROTECTION AND MANAGEMENT ............................ 6-3
6.2.1 Regulation and Management of Contaminants ......................................... 6-4
6.3 RECYCLED WATER PRODUCTION .......................................................................... 6-5
6.3.1 Overview ................................................................................................... 6-5
6.4 FINAL EXPANSION .................................................................................................... 6-5
6.5 CONJUNCTIVE USE PROGRAMS ............................................................................. 6-7
6.5.1 Sources of Recharge Water Supplies ....................................................... 6-8
6.5.2 Surface Water Recharge Facilities ............................................................ 6-4
6.6 MANAGEMENT OF SEAWATER INTRUSION ........................................................... 6-5
6.6.1 Talbert Seawater Intrusion Barrier ............................................................ 6-6
6.6.2 Alamitos Seawater Intrusion Barrier .......................................................... 6-6
SECTION 7 NOTICE AND COMMUNICATION ..................................................................... 7-1
7.1 DESCRIPTION OF GROUNDWATER USERS ........................................................... 7-1
7.2 PUBLIC PARTICIPATION ........................................................................................... 7-2
7.3 COMMUNICATION PLAN ........................................................................................... 7-2
SECTION 8 SUSTAINABLE BASIN MANAGEMENT ............................................................ 8-1
8.1 SUSTAINABILITY GOAL ............................................................................................. 8-1

Table of Contents
BASIN 8-1 ALTERNATIVE 2022 UPDATE Table of Contents iv
SECTION 9 SUSTAINABLE MANAGEMENT RELATED TO GROUNDWATER LEVELS .... 9-1
9.1 HISTORY/SUMMARY ................................................................................................. 9-1
9.2 MONITORING OF GROUNDWATER LEVELS FOR SUSTAINABILITY ..................... 9-1
9.3 MANAGEMENT OF GROUNDWATER LEVELS FOR SUSTAINABILITY ................... 9-2
9.4 DEFINITION OF SIGNIFICANT AND UNREASONABLE LOWERING OF
GROUNDWATER LEVELS .................................................................................... 9-5
9.5 DETERMINATION OF MINIMUM THRESHOLD ......................................................... 9-6
SECTION 10 SUSTAINABLE MANAGEMENT RELATED TO BASIN STORAGE .............. 10-1
10.1 HISTORY ................................................................................................................ 10-1
10.2 CALCULATION OF GROUNDWATER STORAGE LEVELS ................................... 10-2
10.3 SUSTAINABLE MANAGEMENT PROGRAMS ........................................................ 10-3
10.3.1 Basin Operating Range ......................................................................... 10-3
10.3.2 Balancing Production and Recharge ..................................................... 10-3
10.3.3 Managing Basin Pumping ..................................................................... 10-3
10.3.4 Supply Management Strategies ............................................................ 10-5
10.4 DEVELOPING NEW LOCAL WATER RESOURCES POLICY ................................ 10-5
10.4.1 Water Demands .................................................................................... 10-6
10.5 DEFINITION OF SIGNIFICANT AND UNREASONABLE REDUCTION OF
GROUNDWATER STORAGE .............................................................................. 10-7
10.6 DETERMINATION OF MINIMUM THRESHOLDS ................................................... 10-1
SECTION 11 SUSTAINABLE MANAGEMENT RELATED TO WATER QUALITY .............. 11-1
11.1 SALINITY MANAGEMENT ...................................................................................... 11-1
11.2 GROUNDWATER QUALITY IMPROVEMENT PROJECTS .................................... 11-1
DEFINITION OF SIGNIFICANT AND UNREASONABLE DEGRADATION OF WATER
QUALITY .............................................................................................................. 11-8
11.4 DETERMINATION OF MINIMUM THRESHOLDS ................................................... 11-9
SECTION 12 SUSTAINABLE MANAGEMENT RELATED TO SEAWATER INTRUSION ... 12-1
Table of Contents
BASIN 8-1 ALTERNATIVE 2022 UPDATE Table of Contents v
12.1 TALBERT GAP ....................................................................................................... 12-1
12.1.1 Talbert Barrier Groundwater Model ....................................................... 12-2
12.2 ALAMITOS GAP ..................................................................................................... 12-3
12.2.1 Alamitos Barrier Groundwater Model .................................................... 12-5
12.3 SUNSET GAP ......................................................................................................... 12-5
12.3.1 Evaluation of Sunset Gap Alternatives .................................................. 12-7
12.4 BOLSA GAP .......................................................................................................... 12-10
12.5 NEWPORT MESA ................................................................................................. 12-11
12.6 IMPLEMENTATION OF SEAWATER INTRUSION PREVENTION POLICY .......... 12-12
12.6.1 Effective Barrier Operations ................................................................ 12-12
12.6.2 Barrier Performance Monitoring and Evaluation .................................. 12-13
12.6.3 Susceptible Coastal Area Monitoring and Evaluation .......................... 12-13
12.6.4 Coastal Groundwater Management .................................................... 12-14
12.7 DEFINITION OF SIGNIFICANT AND UNREASONABLE SEAWATER INTRUSION12-14
12.8 DETERMINATION OF MINIMUM THRESHOLDS ................................................. 12-14
SECTION 13 SUSTAINABLE MANAGEMENT RELATED TO LAND SUBSIDENCE .......... 13-1
13.1 DEFINITION OF SIGNIFICANT AND UNREASONABLE LAND SUBSIDENCE THAT
SUBSTANTIALLY INTERFERES WITH SURFACE USES ................................... 13-3
13.2 DETERMINATION OF MINIMUM THRESHOLDS ................................................... 13-4
SECTION 14 SUSTAINABLE MANAGEMENT RELATED TO GROUNDWATER DEPLETIONS
IMPACTING SURFACE WATER ................................................................ 14-1
SECTION 15 PROTOCOLS FOR MODIFYING MONITORING PROGRAMS ..................... 15-1
SECTION 16 EVALUATION OF POTENTIAL PROJECTS ................................................. 16-1
SECTION 17 REFERENCES .............................................................................................. 17-1
Figure
Figure 1-1: Basin 8-1, OCWD Service Area and OCWD Management Area ............... 1-3

Table of Contents
BASIN 8-1 ALTERNATIVE 2022 UPDATE Table of Contents vi
Figure 1-2: Groundwater Elevation Contours for the Principal Aquifer, June 2021 ...... 1-4
Figure 1-3: Available Basin Storage WY1957-58 to 2020-21 ....................................... 1-5
Figure 1-4: Basin Production and Recharge Sources, WY1999-20 to 2020-21 ........... 1-7
Figure 1-5: Total Water Demands within OCWD, WY1997-98 to 2020-21 ................... 1-8
Figure 1-6: Example Hydrographs ............................................................................ 1-11
Figure 3-1: Basin 8-1, OCWD Service Area and OCWD Management Area ............... 3-4
Figure 3-2: Federal and State Lands ............................................................................ 3-5
Figure 3-3: Retail Water Supply Agencies .................................................................... 3-6
Figure 3-4: Land Uses .................................................................................................. 3-7
Figure 3-5: Groundwater Elevation Contours for the Shallow Aquifer, June 2021 ....... 3-8
Figure 3-6: Groundwater Elevation Contours for the Principal Aquifer, June 2021 ...... 3-9
Figure 3-7: Groundwater Elevation Contours for the Deep Aquifer, June 2021 ......... 3-10
Figure 3-8: Groundwater Production, WY2018-19 ..................................................... 3-11
Figure 3-9: Location of Long-Term Groundwater Elevation Hydrographs .................. 3-13
Figure 3-10: Water Level Hydrographs of Wells SA-21 and GG-16 in Pressure Area 3-14
Figure 3-11: Water Level Hydrograph of Well A-27/AMD-9 in Forebay Area ............. 3-15
Figure 3-12: Water Level Hydrographs of Wells SAR-1 and OCWD-CTG1 ............... 3-16
Figure 3-13: Water Level Hydrographs of Wells HBM-1 and IDM-1 ........................... 3-17
Figure 3-14: Groundwater Storage Change, June 2020 to June 2021 ....................... 3-18
Figure 3-15: OCWD Groundwater Basin Model Boundaries ...................................... 3-19
Figure 3-16: Regional Water Board Groundwater Management Zones ..................... 3-20
Figure 3-17: TDS in Groundwater Production Wells, ................................................. 3-22
Figure 3-18: Nitrate (as N) Levels in Groundwater Production Wells, ........................ 3-23
Figure 3-19: Groundwater Contamination Plume Locations ....................................... 3-26
Figure 3-20: Orange County Coastal Gaps ................................................................ 3-27
Figure 4-1: Estimated Subsurface Inflow ...................................................................... 4-2
Figure 5-1: OCWD Monitoring Wells ............................................................................ 5-2
Figure 5-2: Large and Small System Drinking Water Wells .......................................... 5-3
Figure 5-3: Private Domestic, Irrigation and Industrial Wells ........................................ 5-4
Figure 5-4: SGMA Shallow Aquifer System Monitoring Well Network .......................... 5-6
Figure 5-5: SGMA Principal Aquifer System Monitoring Well Network ......................... 5-7
Figure 5-6: SGMA Deep Aquifer System Monitoring Well Network .............................. 5-8
Figure 5-7: North Basin Groundwater Protection Program Monitoring Wells ............... 5-1
Figure 5-8: South Basin Groundwater Protection Program Monitoring Wells ............... 5-2
Figure 5-9: Seawater Intrusion Monitoring Wells ......................................................... 5-3
Figure 5-10: Surface Water Monitoring Locations ........................................................ 5-5
Figure 5-11: Recycled Water Monitoring Wells ............................................................ 5-7
Figure 6-1: Groundwater Replenishment System ........................................................ 6-5
Figure 6-2: GWRS Final Expansion Overview ............................................................. 6-7
Figure 6-3: Historical Recharge in Surface Water Recharge System ........................... 6-2

Table of Contents
BASIN 8-1 ALTERNATIVE 2022 UPDATE Table of Contents vii
Figure 6-4: Locations of Imported Water Deliveries ..................................................... 6-3
Figure 6-5: OCWD Surface Water Recharge Facilities ................................................ 6-4
Figure 9-1: Shallow Aquifer Water Level Change, June 2020 to June 2021 ................ 9-3
Figure 9-2: Principal Aquifer Water Level Change, June 2020 to June 2021 ............... 9-4
Figure 9-3: Deep Aquifer Water Level Change, June 2020 to June 2021 .................... 9-5
Figure 11-1: Estimated TDS Concentration in Base Case for 30-year Period ............ 11-2
Figure 11-2: Water Quality Improvement Projects and Programs .............................. 11-2
Figure 11-3: North Basin Groundwater VOC Plume ................................................... 11-3
Figure 11-4: South Basin Groundwater Contaminant Plume ..................................... 11-4
Figure 11-5: Production Wells to be Treated to Remove PFAS ................................ 11-7
Figure 12-1: Talbert Gap – Seawater Intrusion Barrier.............................................. 12-2
Figure 12-2: Key Well OCWD-M26 Groundwater Levels, .......................................... 12-1
Figure 12-3: Talbert Gap 250 mg/L Chloride Concentration Contours ....................... 12-2
Figure 12-4: Alamitos Gap – Seawater Intrusion Barrier ............................................ 12-3
Figure 12-5: Alamitos Gap I Zone Chloride Concentration Contours, 2021 ............... 12-4
Figure 12-6: Schematic Geologic Cross-Section from Huntington Harbor ................. 12-5
Figure 12-7: Sunset Gap Chloride Concentrations, 2020 ........................................... 12-7
Figure 12-8: Alamitos-Sunset Gap Groundwater Model Boundaries .......................... 12-8
Figure 12-9: Potential Sunset Gap Barrier Project Facilities .................................... 12-10
Figure 12-10: Newport Mesa Chloride Contours, 2020 ............................................ 12-12
Figure 13-1: Total Vertical Ground Surface Displacement from June 2015 to July 2020
................................................................................................................................... 13-3
Table
Table 3-1: TDS Water Quality Objectives for Lower Santa Ana River
Basin Management Zones ......................................................................................... 3-21
Table 3-2: Nitrate (as N) Water Quality Objective for ................................................. 3-23
Table 4-1 Water Budget, WY2016-17 to 2020-21 ........................................................ 4-1
Table 6-1: Sources of Recharge Water Supplies ......................................................... 6-1
Table 7-1: Major Groundwater Producers .................................................................... 7-1
Table 10-1: Management Actions based on Change in Groundwater Storage .......... 10-5
Table 10-2: Approaches to Refilling the Basin ........................................................... 10-1
Table 11-1: Baseline Projected Future Salt Inflows .................................................... 11-1
Table 11-2: Baseline Future Nitrate (as N) Inflows ..................................................... 11-1
Table 11-3: Summary of BEA Exemption Projects ..................................................... 11-8

OCWD Management Area
BASIN 8-1 ALTERNATIVE 2022 UPDATE Executive Summary 1-1
SECTION 1 EXECUTIVE SUMMARY
The Orange County Water District (OCWD) is a special district formed in 1933 by an act of the
California Legislature, the “OCWD Act”. OCWD manages the groundwater basin that underlies
north and central Orange County pursuant to the OCWD Act. Water produced from the basin is
the primary water supply for approximately 2.5 million residents living within the service area
boundaries. The mission of OCWD includes sustainably managing the Orange County
Groundwater Basin, Basin 8-1, over the long-term. Additionally, as a special act district listed in
Water Code § 10723 (c)(1), OCWD is the exclusive local agency within its jurisdictional
boundaries with powers to comply with the Sustainable Groundwater management Act (SGMA)
via a groundwater sustainability plan (“GSP”) or via an Alternative prepared in accordance with
Water Code § 10733.6.
The OCWD Management Area includes 89 percent of the area designated by the Department of
Water Resources (DWR) as Basin 8-1, the “Coastal Plain of Orange County Groundwater
Basin” in Bulletin 118 (DWR, 2003). The OCWD Management Area includes the same land
area as the OCWD service area within Basin 8-1 except for a small 6.7-square mile area in the
northeast corner of the basin that is part of the Santa Ana Canyon Management Area. The
boundaries of Basin 8-1, the OCWD service area and the OCWD Management Area are shown
in Figure 1-1.
The agencies within Basin 8-1 collaborated to prepare and submit an Alternative to a
Groundwater Sustainability Plan (GSP). In accordance with Water Code §10733.6(b)(3)(c), the
Basin 8-1 Alternative presented an analysis of basin conditions that demonstrated that Basin 8-
1 had operated within its sustainable yield over a period of at least 10 years. The Alternative
was submitted to DWR on December 22, 2016. On July 17, 2019, DWR determined that the
Alternative satisfied SGMA objectives and was therefore approved.
Approved alternatives are required to submit annual reports to DWR on April 1 of each year.
Annual reports for Basin 8-1 were submitted to DWR as follows:
• Water Year 2016-17, submitted on March 29, 2018
• Water Year 2017-18, submitted on March 29, 2019
• Water Year 2018-19, submitted on March 30, 2020
• Water Year 2019-20, submitted on March 30, 2021 *Note, the DWR Water Year extends from Oct. 1 to Sept. 30.
According to Water Code §10733.8, “At least every five years after initial submission of a plan
pursuant to Section 10733.4, the department shall review any available groundwater
sustainability plan or alternative submitted in accordance with Section 10733.6, and the
implementation of the corresponding groundwater sustainability program for consistency with
this part, including achieving the sustainability goal. The department shall issue an assessment
for each basin for which a plan or alternative has been submitted in accordance with this
chapter, with an emphasis on assessing progress in achieving the sustainability goal within the

OCWD Management Area
BASIN 8-1 ALTERNATIVE 2022 UPDATE Executive Summary 1-2
basin. The assessment may include recommended corrective actions to address any
deficiencies identified by the department.”
This document, called the 2022 Update, represents the first five-year update, which is due
January 1, 2022.
For purposes of this report, the Basin 8-1 Alternative submitted on December 22, 2016,
will be referred to as the 2017 Alternative. The first five-year update will be referred to as
the 2022 Update for ease of reference. The 2017 Alternative was a comprehensive
document showing that Basin 8-1 had been managed sustainably for more than 10 years.
For the 2022 Update, the focus is on documenting that the basin has been sustainably
managed during the five years since the 2017 Alternative was submitted and to present
relevant new information from the last five years. As such, the 2017 Alternative is
considered a key reference document with background information that is not duplicated
in the 2022 Update.
1.1 GROUNDWATER BASIN CONDITIONS
GROUNDWATER ELEVATIONS
OCWD prepares groundwater elevation contour maps for each of the three major aquifer
systems (Shallow, Principal, and Deep) annually. In addition to illustrating regional groundwater
gradients, the maps are used to prepare water level change maps and to calculate the amount
of groundwater in storage and the annual storage change. OCWD’s basin-wide network of
monitoring wells is used to monitor groundwater levels and quality, assess effects of pumping
and recharge, estimate groundwater storage, characterize basin hydrogeology, and develop
and calibrate a numerical flow model of the basin. Groundwater elevation contours for the
Principal Aquifer as of June 2021 are shown in Figure 1-2.

OCWD Management Area
BASIN 8-1 ALTERNATIVE 2022 UPDATE Executive Summary 1-3
Figure 1-1: Basin 8-1, OCWD Service Area and OCWD Management Area

OCWD Management Area
BASIN 8-1 ALTERNATIVE 2022 UPDATE Executive Summary 1-4
Figure 1-2: Groundwater Elevation Contours for the Principal Aquifer, June 2021
GROUNDWATER STORAGE
The groundwater basin contains an estimated 66 million acre-feet when full. However, OCWD
manages the basin within an established operating range of up to 500,000 acre-feet below full
condition. This operating range was established to designate the levels of groundwater storage
within which the basin that can be maintained without causing adverse impacts. In order to
manage the basin within this operating range, OCWD calculates the amount of groundwater in
storage on an annual basis. Long-term groundwater storage levels based on OCWD’s water
year (July 1 to June 30) are shown in Figure 1-3.

OCWD Management Area
BASIN 8-1 ALTERNATIVE 2022 UPDATE Executive Summary 1-5
Acre-feet
Below Full
(x1000)
Figure 1-3: Available Basin Storage WY1957-58 to 2020-21
WATER QUALITY
The California Regional Water Quality Control Board, Santa Ana Region (Regional Water
Board) is responsible for protection and enhancement of the quality of waters in the watershed,
which includes surface water and groundwater in the OCWD Management Area. The
watershed’s salinity management program, overseen by the Regional Water Board, is managed
by the Basin Monitoring Program Task Force. Water quality objectives for total dissolved solids
(TDS) and nitrate-nitrogen in groundwater management zones were adopted by the Regional
Water Board based on historical water quality data. Every three years the Task Force
calculates the current ambient water quality for each groundwater management zone. The most
recent recalculation for the groundwater basin was completed in 2020 (OCWD, 2020).
There are several regional groundwater contamination plumes within the OCWD Management
Area, all of which are under active remediation, and some are being evaluated for additional
remediation. The U.S. Environmental Protection Agency (EPA) is the lead agency in
overseeing a remedial investigation/feasibility study (RI/FS) to develop an interim remedy for the
VOC plume in the North Basin area. OCWD is conducting an RI/FS to develop an interim
remedy for the plume in the South Basin area. Investigations and remediation for individual
contaminant source sites within the North Basin and South Basin areas are within the
jurisdiction of either the California Department of Toxic Substances Control or the Regional
Water Board. The U.S. Navy is taking the lead in remediation of plumes from the former El Toro
and Tustin Marine Corps Air Stations and the Naval Weapons Station Seal Beach.
0
100
200
300
400
500
600
1957-58 1962-63 1967-68 1972-73 1977-78 1982-83 1987-88 1992-93 1997-98 2002-03 2007-08 2012-13 2017-18
Full Basin Condition

OCWD Management Area
BASIN 8-1 ALTERNATIVE 2022 UPDATE Executive Summary 1-6
Per- and Polyfluoroalkyl Substances (PFAS)
Per- and polyfluoroalkyl substances (PFAS) are a group of thousands of manmade chemicals
that includes perfluorooctanoic acid (PFOA) and perfluorooctane sulfonate (PFOS). PFAS
compounds have been commonly used in many products including, among many others, stain-
and water-repellent fabrics, nonstick products (e.g., Teflon), polishes, waxes, paints, cleaning
products, and fire-fighting foams. Beginning in the summer of 2019, the California Division of
Drinking Water (DDW) began requiring testing for PFAS compounds in some groundwater
production wells in the OCWD area.
As a result of required testing, as of September 2021, approximately 60 wells in the OCWD
service area have been temporarily turned off until treatment systems can be constructed. As
additional wells are tested, this figure may increase.
In April 2020, OCWD as the groundwater basin manager, executed a multi-party agreement
with the impacted groundwater producers to fund and construct the necessary treatment
systems for production wells impacted by PFAS compounds. OCWD expects the treatment
systems to be constructed for the approximately 60 impacted wells within the next 2 to 3 years.
LAND SUBSIDENCE
Ground surface elevations rise and fall due to groundwater conditions in the OCWD
Management Area and do not show a pattern of widespread, permanent lowering of the ground
surface. There is no evidence of permanent, inelastic land subsidence within the OCWD
Management Area.
1.2 WATER BUDGET
OCWD developed a hydrologic budget for the purpose of constructing a basin-wide numerical
groundwater flow model and for evaluating basin production capacity and recharge
requirements. The key components of the budget include measured and unmeasured
(estimated) recharge, groundwater production and subsurface outflows.
The groundwater basin is not operated on an annual safe-yield basis. The net change in
storage in any given year may be positive or negative; however, over a period of several years,
the basin is maintained in an approximate balance. Amounts of total basin production and total
water recharged from OCWD water years (WY)1999-2000 to 2020-21 are shown in Figure 1-4.
The OCWD water year extends from July 1 to June 30.

OCWD Management Area
BASIN 8-1 ALTERNATIVE 2022 UPDATE Executive Summary 1-7
Figure 1-4: Basin Production and Recharge Sources, WY1999-20 to 2020-21
1.3 WATER RESOURCE MONITORING PROGRAMS
Water resource monitoring programs for groundwater, surface water, recycled water, and
imported water remain unchanged (see 2017 Alternative for list). The only slight modification is
the replacement of the CA Statewide Groundwater Elevation Monitoring (CASGEM) Program
with annual data reports required for SGMA compliance.
1.4 GROUNDWATER MANAGEMENT PROGRAMS
LAND USE
The OCWD Management Area is highly urbanized. As such, OCWD monitors, reviews and
comments on local land use plans, environmental documents, and proposed regulatory agency
permits to provide input to land use planning agencies regarding proposed projects and
programs that could cause short- or long-term water quality impacts to the groundwater basin.
DEMAND MANAGEMENT
The average annual water demand within the OCWD Management Area for the most recent five
water years, WY2016-17 to 2020-21 is approximately 400,000 acre-feet. Total water demands
0
50
100
150
200
250
300
350
400
450
500
550
1999-00 2002-03 2005-06 2008-09 2011-12 2014-15 2017-18 2020-21
Santa Ana River Base Flow Santa Ana River Storm Flow Recycled Water
Imported Water Incidental Recharge Groundwater ProductionAcre-feet
(x1000)

OCWD Management Area
BASIN 8-1 ALTERNATIVE 2022 UPDATE Executive Summary 1-8
in the management area are met by a combination of groundwater, imported water, and
recycled water. From WY1996-97 to present, water demands have ranged between 367,000
and 526,000 acre-feet per year but have generally decreased, as shown in Figure 1-5. It is
noted that water demands in WY2015-16 reflect mandatory demand reductions imposed by the
State Water Board in response to an extended drought. OCWD strives to sustainably maximize
both production from the basin and recharge of the groundwater basin.
Figure 1-5: Total Water Demands within OCWD, WY1997-98 to 2020-21
GROUNDWATER QUALITY PROTECTION AND MANAGEMENT
OCWD adopted a Groundwater Quality Protection Policy in 1987 and updated it in 2014. This
policy guides the actions of OCWD to maintain groundwater quality suitable for all existing and
potential beneficial uses; prevent degradation of groundwater quality and protect groundwater
from contamination; maintain surface water and groundwater quality monitoring programs, a
monitoring well network and data management system; and assist regulatory agencies in
remediating contaminated sites.
In January 2020, in preparation for the impacts of PFAS to groundwater supply, OCWD adopted
a Per- and Polyfluoroalkyl Substances (PFAS) Policy. Central to this policy is OCWD’s desire to
maintain a groundwater supply of suitable quality for all existing and potential beneficial uses.
Among other items, the policy states that OCWD will fund the lowest reasonable and efficient
treatment system design and construction costs to remove PFAS compounds for groundwater
producers. Additionally, the policy states that OCWD will fund 50 percent of operation and
maintenance expenses up to $75 per acre-foot plus potential adjustments.
As of September 2021, approximately 60 production wells operated by 11 groundwater
producers have been temporary shut down until treatment systems can be constructed. OCWD
expects these treatment systems to be constructed within the next 2 to 3 years.
0
100
200
300
400
500
600
1996-97 1999-00 2002-03 2005-06 2008-09 2011-12 2014-15 2017-18 2020-21
Water Year
Acre-feet
(x1000)

OCWD Management Area
BASIN 8-1 ALTERNATIVE 2022 UPDATE Executive Summary 1-9
RECYCLED WATER PRODUCTION
OCWD’s Groundwater Replenishment System (GWRS) produces up to 100 million gallons per
day (mgd) of highly treated recycled water. The GWRS Final Expansion is under construction
and will be on-line in early 2023. The final expansion will increase plant capacity to 130 mgd.
GWRS water is recharged into the groundwater basin and is the primary source of water for the
Talbert Seawater Barrier. OCWD also operates the Green Acres Project, a non-potable
recycled water supply for irrigation and industrial water users.
CONJUNCTIVE USE PROGRAMS
Recharge water sources include the Santa Ana River and tributaries, imported water, and
recycled water supplied by the GWRS as well as incidental recharge from precipitation and
subsurface inflow. OCWD’s conjunctive use program includes over 1,500 acres of land on
which there are 1,067 wetted acres of recharge facilities.
MANAGEMENT OF SEAWATER INTRUSION
The Alamitos and Talbert Seawater Intrusion Barriers control seawater intrusion through the
Alamitos and Talbert Gaps by injecting fresh water into susceptible aquifers through a series of
injection wells to create a hydraulic barrier.
Work is underway to characterize intrusion in the Sunset Gap, including installation of
monitoring wells, development of a groundwater flow model, and feasibility studies. This
information is needed to guide design of a potential new seawater barrier in the Sunset Gap.
1.5 NOTICE AND COMMUNICATION
The local agencies that produce the majority of the groundwater from the basin include 19 cities,
water districts, and a private water company. OCWD staff holds monthly meetings with this
group to provide information and seek input on issues related to groundwater management.
OCWD has a proactive community outreach program that includes conducting an annual
Children’s Water Education Festival attended by over 7,000 elementary school students and a
monthly electronic newsletter with approximately 5,700 subscribers.
1.6 SUSTAINABLE BASIN MANAGEMENT
The sustainability goal for the OCWD Management Area is to:
Continue to manage the groundwater basin to prevent basin conditions that would
lead to significant and unreasonable (1) lowering of groundwater levels, (2)
reduction in storage, (3) water quality degradation, (4) seawater intrusion, (5) land
subsidence and (6) depletions of interconnected surface water that have significant
and unreasonable adverse impacts on beneficial uses of the surface water.

OCWD Management Area
BASIN 8-1 ALTERNATIVE 2022 UPDATE Executive Summary 1-10
Existing monitoring and management programs in place today enable OCWD to sustainably
manage the groundwater basin. Since its founding in 1933, OCWD has developed a managed
aquifer recharge program, constructed hundreds of monitoring wells, developed an extensive
water quality monitoring program, installed seawater intrusion barriers, and doubled the volume
of groundwater production while protecting the long-term sustainability of the groundwater
resource. OCWD’s management of the OCWD Management Area will continue to provide long-
term sustainable basin management that is able to adapt to changing conditions affecting the
groundwater basin.
1.6.1 Sustainable Management: Water Levels
OCWD manages the basin for long-term sustainability by maximizing groundwater recharge and
managing basin production within sustainable levels. Long-term groundwater level trends
demonstrate the undesirable result of “chronic lowering of groundwater levels indicating a
significant and unreasonable depletion of supply” is not present. Hydrographs representative of
long-term water levels in the basin are shown in Figure 1-6. These hydrographs demonstrate
that groundwater levels in the OCWD Management Area are being managed at long-term
sustainable levels. Chronic lowering of groundwater levels is not anticipated to occur in the
future in the OCWD Management Area due to OCWD’s management programs.
1.6.2 Sustainable Management: Basin Storage
OCWD manages basin storage within an established operating range of up to 500,000 acre-feet
below full condition. Maintaining basin storage within this range protects the basin from
detrimental impacts such as land subsidence, chronic lowering of groundwater levels and
chronic reduction in storage. OCWD manages groundwater pumping such that it is sustainable
over the long-term; however, in any given year pumping may exceed recharge or vice versa.
Thus, the amount of groundwater stored in or withdrawn from the basin varies from year to year
and often goes through multi-year cycles of emptying and filling, which typically correlates with
state-wide and/or local precipitation patterns and other factors.

OCWD Management Area
BASIN 8-1 ALTERNATIVE 2022 UPDATE Executive Summary 1-11
Figure 1-6: Example Hydrographs
Each year OCWD calculates the volume of groundwater storage change from a theoretical “full”
benchmark condition based on a calculation using changes in groundwater elevations in each of
the three major aquifer systems and aquifer storage properties. This calculation is checked
against an annual water budget that accounts for all production, measured recharge and
estimated unmeasured recharge (also referred to as “incidental recharge”). The amount of
available or unfilled storage from the theoretical full condition is shown on Figure 1-3.
Maintaining the basin storage condition on a long-term basis within the established operating
range allows for long-term sustainable management of the basin without experiencing
undesirable effects. Therefore, the undesirable result of “significant and unreasonable reduction
of groundwater storage” is not present and is not anticipated to occur in the OCWD
Management Area in the future due to OCWD’s management programs.

OCWD Management Area
BASIN 8-1 ALTERNATIVE 2022 UPDATE Executive Summary 1-12
1.6.3 Sustainable Management: Water Quality
OCWD has extensive monitoring and management programs in place to monitor and protect
groundwater quality. OCWD’s network of approximately 400 monitoring wells is distributed
throughout the basin. Water quality in these wells is tested on a regular basis for a large
number of parameters. OCWD also conducts groundwater quality sampling of approximately
200 production wells on behalf of the groundwater producers to comply with Title 22
requirements. An additional approximately 120 private, domestic, and irrigation production wells
area also sampled periodically.
OCWD has a sampling protocol in place that includes standards for increased monitoring of
individual wells. In cases where there is a detection of an organic compound for the first time,
for example, OCWD will resample that well and if the detection is confirmed will increase the
sampling frequency of that well. Another example is an increased frequency for monitoring
when there is a detection of nitrate at 50% of the Maximum Contaminant Level (MCL). These
sampling protocols are designed to detect water quality problems at the earliest possible stage.
The recent detections of per- and polyfluoroalkyl substances (PFAS) in groundwater have
affected the use of groundwater by 11 groundwater producers. As described in detail later in
this report, OCWD is taking steps to restore the beneficial uses of impacted groundwater by
installing treatment systems to remove PFAS.
The undesirable result of “significant and unreasonable degradation of water quality that impair
water supplies” is not present and is not anticipated to occur in the future in the OCWD
Management Area due to OCWD’s management programs.
1.6.4 Sustainable Management: Seawater Intrusion
OCWD’s management of seawater intrusion is implemented through a comprehensive program
that includes operating two seawater intrusion barriers, monitoring and evaluating barrier
performance, monitoring and evaluating susceptible coastal areas, and coastal groundwater
management.
The Alamitos Seawater Intrusion Barrier manages seawater intrusion in the Alamitos Gap. The
Talbert Seawater Intrusion Barrier manages seawater intrusion in the Talbert Gap. Work is
underway to further characterize intrusion in the Sunset Gap, including construction of additional
monitoring wells, further development of the Alamitos Barrier groundwater model to evaluate
seawater intrusion in the area of the Sunset Gap, and feasibility studies to evaluate potential
future barrier design.
Monitoring and evaluating barrier performance and potential seawater intrusion consists of
sampling monitoring wells semi-annually, measuring water levels at least quarterly, installing
monitoring wells when needed to fill data gaps, and conducting other management activities to
reduce potential for seawater intrusion, such as construction of additional injection wells and the
Coastal Pumping Transfer Program.

OCWD Management Area
BASIN 8-1 ALTERNATIVE 2022 UPDATE Executive Summary 1-13
The undesirable result of “significant and unreasonable seawater intrusion” is not present and is
not anticipated to occur in the future in the OCWD Management Area due to OCWD’s
management programs.
1.6.5 Sustainable Management: Land Subsidence
Management of the groundwater basin by maintaining storage levels within the established
operating range has prevented the undesirable result of significant and unreasonable land
subsidence that substantially interferes with surface uses. Within the OCWD Management Area
ground surface movements rise and fall as basin storage levels rise and fall. There is no
evidence of long-term inelastic land subsidence, nor any land subsidence that has interfered
with surface uses. Therefore, the undesirable result of “significant and unreasonable land
subsidence that substantially interferes with surface uses” is not present and is not anticipated
to occur in the OCWD Management Area in the future due to OCWD’s management programs.
1.6.6 Sustainable Management: Depletion of Interconnected Surface
Waters
There are no surface water bodies within the OCWD Management Area that are interconnected
with groundwater in which the groundwater connection to the surface water provides surface
water flow to sustain beneficial uses in a surface water body. Therefore, the undesirable result
of “depletions of interconnected surface water that have significant and unreasonable adverse
impacts on beneficial uses of the surface water due to groundwater conditions occurring
throughout the basin” is not present and is not anticipated to occur in the OCWD Management
Area due to OCWD’s management programs.
1.7 PROTOCOLS FOR MODIFYING MONITORING PROGRAMS
Protocols that trigger a change in a monitoring program include a change in regulations, a first-
time detection of a constituent in a water sample, an increase in a constituent in a water sample
that approaches or exceeds a regulatory limit or MCL, an indication of an adverse water quality
trend or water level, a special study, or a recommendation from OCWD’s Independent Expert
Panel.
1.8 EVALUATION OF POTENTIAL PROJECTS
OCWD regularly evaluates potential projects and conducts studies to improve existing
operations. This may include:
• Increasing the capacity of existing recharge basins
• Constructing new recharge facilities
• Constructing new production wells
• Improving seawater intrusion barriers

OCWD Management Area
BASIN 8-1 ALTERNATIVE 2022 UPDATE Executive Summary 1-14
• Constructing a new seawater barrier in the Sunset Gap
• Constructing water quality improvement projects
1.9 CONCLUSION
OCWD has been managing the OCWD Management Area since its formation by the State
Legislature in 1933. Monitoring and management programs described in the 2017 Alternative,
submitted in compliance with CA Code of Regulations (Title 23, Division 2, Chapter 1.5,
Subchapter 2) demonstrated that the groundwater basin has been and will continue to be
sustainably managed. The Alternative submitted in 2017 and approved by DWR in 2019
demonstrated that the OCWD Management Area operated within its sustainable yield over a
period of at least 10 years, as required by CCR Title 23, Division 2, Chapter 1.5, Subchapter 2,
Article 9, Section 358.2 (c)(3). The 2022 Update, prepared to satisfy Water Code §10733.8,
shows that the OCWD Management area continues to be managed sustainably.
Please note that for consistency, the same chapter headings used in the 2017 Alternative
are used in the 2022 Update. The goal of the update is to present new relevant
information that has become available over the last five years. Where there is no new
relevant information, the reader is directed to the 2017 Alternative by reference.

OCWD Management Area
BASIN 8-1 ALTERNATIVE 2022 UPDATE Agency Information 2-1
SECTION 2 AGENCY INFORMATION
2.1 HISTORY OF OCWD
The Orange County Water District (OCWD) is a special district formed in 1933 by an act of the
California Legislature, the OCWD Act. Additionally, as a special act district listed in Water Code
§ 10723 (c)(1), OCWD is the exclusive local agency within its jurisdictional boundaries with
powers to comply with the Sustainable Groundwater Management Act (SGMA) via a
groundwater sustainability plan (“GSP”) or via an Alternative prepared in accordance with Water
Code § 10733.6.
OCWD manages the groundwater basin that underlies north and central Orange County. Water
produced from the basin is the primary water supply for approximately 2.5 million residents
living within OCWD’s boundaries. With passage of SGMA (Water Code §10723(c)) in 2014,
OCWD was designated the exclusive local agency within its jurisdictional boundaries with
powers to comply with SGMA.
Nineteen major groundwater producers, including cities, water districts, and a private water
company, pump groundwater from approximately 200 large-capacity wells for retail water use.
There are also approximately 120 small-capacity wells that pump water from the basin. OCWD
protects and manages the groundwater resource for long-term sustainability, while meeting
approximately 75 percent of the water demand within its service area.
Since its founding, OCWD has grown in area from 162,676 to 243,968 acres and has
experienced an increase in population from approximately 120,000 to 2.5 million people.
OCWD has employed groundwater management techniques to increase the annual yield from
the basin including operating over 1,500 acres of recharge basins in the cities of Anaheim,
Orange, and unincorporated areas of Orange County. Annual groundwater production
increased from approximately 150,000 acre-feet per year in the mid-1950s to a high of over
366,000 acre-feet per year in WY2007-08.
OCWD has managed the basin to provide a reliable supply of relatively low-cost water,
accommodating rapid population growth while at the same time avoiding the costly and time-
consuming adjudication of water rights experienced in many other major groundwater basins in
Southern California. Facing the challenge of increasing demand for water has fostered a history
of innovation and creativity that has enabled OCWD to increase available groundwater supply
while ensuring the long-term sustainability of the groundwater basin.
A brief history of OCWD from 1933 to 2015 is provided in the 2017 Alternative. Significant
events that have occurred during the last five years are as follows:
2018: GWRS sets the Guinness World Record for most wastewater recycled in 24 hours. The
official amount was 100,008,000 gallons.
2019: OCWD’s Philip L. Anthony Water Quality Laboratory was the first public agency
laboratory in California to achieve state certification to analyze for PFAS in drinking
water. OCWD launched the nation’s largest pilot program to test various treatment
options for PFAS.

OCWD Management Area
BASIN 8-1 ALTERNATIVE 2022 UPDATE Agency Information 2-2
2019: Construction of the GWRS Final Expansion began. Construction is anticipated to be
completed in early 2023. Once complete the plant will produce up to 130 mgd and
recycle 100 percent of reclaimable sources from the Orange County Sanitation District.
2021: U.S. Army Corps of Engineers approves Prado Conservation Pool increase up to
elevation 505 feet mean sea level (approx. 20,000 acre-feet of storage) based on the
Prado Basin Ecosystem Restoration and Water Conservation Feasibility Study.
2021: The first PFAS treatment system, at Fullerton’s KIM-1A production well, is completed
and the well returned to service.
2.2 GOVERNANCE AND MANAGEMENT STRUCTURE
The Orange County Water District was created by the OCWD Act for the purpose of:
“providing for the importation of water into said district and preventing waste of
water in or exportation of water from said district and providing for reclamation of
drainage, storm, flood and other water for beneficial use in said district and for
the conservation and control of storm and flood water flowing into said district;
providing for the organization and management of said district and establishing
the boundaries and divisions thereof and defining the powers of the district,
including the right of the district to sue and be sued, and the powers and duties of
the officers thereof; providing for the construction of works and acquisition of
property by the district to carry out the purposes of this act; authorizing the
incurring of indebtedness and the voting, issuing and selling of bonds and the
levying and collecting of assessments by said district; and providing for the
inclusion of additional lands therein and exclusion of lands therefrom.”
(Stats.1933, c. 924, p. 2400)
Further details on OCWD governance and management are described in the 2017 Alternative.
The nineteen major groundwater producers meet on a monthly basis with OCWD staff to consult
with and provide advice on basin management issues. This group is described in more detail in
Section 7.1.
2.3 LEGAL AUTHORITY
A description of OCWD’s legal authority is described in the 2017 Alternative.
A copy of the OCWD Act, which has been the basis for OCWD’s sustainable management of its
portion of Basin 8-1 over many years, can be found at:
http://www.ocwd.com/media/2681/ocwddistrictact_201501.pdf

OCWD Management Area
BASIN 8-1 ALTERNATIVE 2022 UPDATE Agency Information 2-3
2.4 BUDGET
The mission of OCWD is to provide a reliable, high quality water supply in a cost-effective and
environmentally responsible manner and to manage the Orange County groundwater basin in a
sustainable manner over the long-term.
For a summary description of OCWD’s budget structure, see the 2017 Alternative. For more
recent information, see OCWD’s website at www.ocwd.com where detailed budget reports are
published annually.

OCWD Management Area
BASIN 8-1 ALTERNATIVE 2022 UPDATE Management Area Description 3-4
SECTION 3 MANAGEMENT AREA DESCRIPTION
3.1 OCWD MANAGEMENT AREA
OCWD’s service area covers approximately 430 square miles and is co-extensive with the
OCWD Management Area for purposes of the Alternative, except as identified below. The
OCWD service area includes 90 percent of the area designated by the Department of Water
Resources (DWR) as Basin 8-1, the “Coastal Plain of Orange County Groundwater Basin” in
Bulletin 118 (DWR, 2003). For the purposes of this Alternative, the OCWD Management Area
contains the same geographical area as the portion of the OCWD service area within Basin 8-1
except for a small 6.7-square mile area in the northeast corner of the basin that is part of the
Santa Ana Canyon Management Area. The boundaries of Basin 8-1, the OCWD service area
and the OCWD Management Area are shown in Figure 3-1.
Figure 3-1: Basin 8-1, OCWD Service Area and OCWD Management Area

OCWD Management Area
BASIN 8-1 ALTERNATIVE 2022 UPDATE Management Area Description 3-5
Jurisdictional Areas within OCWD Management Area
Federal and state lands within the OCWD Management Area as well as city boundaries are
shown in Figure 3-2 and have not changed since the 2017 Alternative. Retail water providers
within OCWD’s service area are shown in Figure 3-3. The OCWD Management Area with a
population of approximately 2.5 million is highly urbanized, as shown in Figure 3-4. Each of the
22 cities within OCWD’s jurisdiction has an adopted general plan. There are no federally
recognized tribes with land and there are no adjudicated groundwater areas within the OCWD
Management Area. The unincorporated areas are managed by the County of Orange.
Groundwater supplies are managed as a single, shared resource with no separate water use
sectors.
Figure 3-2: Federal and State Lands

OCWD Management Area
BASIN 8-1 ALTERNATIVE 2022 UPDATE Management Area Description 3-6
Figure 3-3: Retail Water Supply Agencies

OCWD Management Area
BASIN 8-1 ALTERNATIVE 2022 UPDATE Management Area Description 3-7
Figure 3-4: Land Uses
3.2 GROUNDWATER CONDITIONS
This section describes the groundwater conditions within the OCWD Management Area. The
focus is on data from the last five years. For some historical data, please see the 2017
Alternative. The description includes groundwater elevation, pumping patterns, storage levels,
groundwater quality, information concerning land subsidence, seawater intrusion, and
interactions between surface water and groundwater. All elevations in this report are in units of
feet above mean sea level referenced to vertical datum NGVD29, which can be converted to
NAVD88. Geographic locations are reported in GPS State Plane coordinates referenced to
NAD83.
3.2.1 Groundwater Elevation Contours
Figures 3-5, 3-6 and 3-7 show the contoured water levels for the Shallow, Principal and Deep
Aquifers in June 2021. The contour maps for each of the three aquifer systems are prepared
annually. The contour maps are used to prepare water level change maps for the three major

OCWD Management Area
BASIN 8-1 ALTERNATIVE 2022 UPDATE Management Area Description 3-8
aquifer systems and to calculate the amount of groundwater in storage and the annual storage
change.
Figure 3-5: Groundwater Elevation Contours for the Shallow Aquifer, June 2021

OCWD Management Area
BASIN 8-1 ALTERNATIVE 2022 UPDATE Management Area Description 3-9
Figure 3-6: Groundwater Elevation Contours for the Principal Aquifer, June 2021

OCWD Management Area
BASIN 8-1 ALTERNATIVE 2022 UPDATE Management Area Description 3-10
Figure 3-7: Groundwater Elevation Contours for the Deep Aquifer, June 2021
3.2.2 Regional Pumping Patterns
Active wells pumping water from the basin are shown in Figure 3-8. The approximately 200large-
system wells account for an estimated 97 percent of the total basin production. The remaining
three percent of total basin production includes agricultural and industrial producers, small mutual
water companies, domestic well producers, and production from privately-owned wells. As can be
seen in Figure 3-8, groundwater production is distributed throughout the basin. Please note that
due to the recent impacts of COVID and PFAS, data from WY2018-19 is presented to show the
typical average distribution of pumping in the basin.

OCWD Management Area
BASIN 8-1 ALTERNATIVE 2022 UPDATE Management Area Description 3-11
* Due to impacts from COVID-19 FY 2018-19 groundwater production was chosen to be representative of typical pumping
patterns.
Figure 3-8: Groundwater Production, WY2018-19
3.2.3 Long-Term Groundwater Elevation Hydrographs
Groundwater elevation trends exhibit both short-term (seasonal) and long-term fluctuations.
Seasonal elevation changes reflect short-term variations in pumping and recharge, while multi-
year trends reflect the effects of extended periods of above- or below-average precipitation
and/or availability of imported water.
OCWD measures elevations in three principal aquifer systems. In general, groundwater
elevations in the Shallow Aquifer system show less amplitude than those in the underlying
Principal and Deep Aquifer systems due to the higher degree of pumping and confinement of
the Principal and Deep Aquifer systems. Because approximately 95 percent of all production
occurs from wells screened within the Principal Aquifer system, groundwater elevations within
this system are typically lower than those in the overlying Shallow Aquifer system and, in some
areas, the underlying Deep Aquifer system. As a result, vertical gradients created by pumping

OCWD Management Area
BASIN 8-1 ALTERNATIVE 2022 UPDATE Management Area Description 3-12
and recharge drive groundwater into the Principal Aquifer system from the overlying Shallow
Aquifer system and, to a lesser extent, from the Deep Aquifer system.
Groundwater elevation trends can be examined using seven wells with long-term groundwater
level data, the locations of which are shown in Figure 3-9. Figures 3-10 and 3-11 show water
level hydrographs for wells SA-21 and GG-16 representing historical conditions in the Pressure
Area and well A-27 representing historical conditions in the Forebay. Water level data for well
A-27 near Anaheim Lake dates back to 1932 and indicate that the historic low water level in this
area occurred in 1951-52. The subsequent replenishment of Colorado River water essentially
refilled the basin by 1965. Water levels in this well reached a historic high in 1994 and have
generally remained high as recharge has been nearly continuous at Anaheim Lake since the
late 1950s. Well A-27 was destroyed in May 2012. To continue this hydrograph, water levels
from nearby OCWD monitoring well, AMD-9/1 is used. A comparison of water levels when the
two wells were in operation show they are nearly identical.
The hydrograph for well SA-21 indicates that water levels in this area have decreased since
1970. Also noteworthy is the large range of water level fluctuations from the early 1990s to
early 2000s. The increased water level fluctuations during this period were due to a
combination seasonal water demand-driven pumping and participation in the Metropolitan Water
District of Southern California’s (MWD) Short-Term Seasonal Storage Program by local
groundwater producers (Boyle Engineering and OCWD, 1997), which encouraged increased
pumping from the groundwater basin during summer months when MWD was experiencing high
demand for imported water. Although this program did not increase the amount of pumping
from the basin on an annual basis, it did result in greater water level declines during the summer
during the period of 1989 to 2002 when the program was active.
Figure 3-12 presents water level hydrographs of two OCWD multi-depth monitoring wells, SAR-
1 and OCWD-CTG1, showing the relationship between water level elevations in aquifer zones
at different depths. The hydrograph of well SAR-1 in the Forebay exhibits a similarity in water
levels between shallow and deep aquifers, which indicates the high degree of hydraulic
interconnection between aquifers characteristic of much of the Forebay.
The hydrograph of well OCWD-CTG1 is typical of the Pressure Area in that there are large
differences in water levels in different aquifers, indicating a reduced level of hydraulic
interconnectivity between shallow and deep aquifers caused by fine-grained layers that restrict
vertical groundwater flow. Water levels in the deepest aquifer zone at well OCWD-CTG1 are
higher than overlying aquifers, in part, because few wells directly produce water from these
zones. The lack of production from the deepest aquifers is due to the presences of amber-
colored water, the cost to construct very deep wells, and the fact that sufficient high-quality
groundwater is readily available within the overlying Principal aquifer.
Two additional hydrographs for wells HBM-1 and IDM-1 show multi-depth water levels
representative of the coastal area and the southwestern portion of the management area. The
downward trend in water levels at well IDM-1 shows the effects of a water quality improvement
project known as the Irvine Desalter Project. This joint project between OCWD and IRWD, in
collaboration with the U.S. Department of Navy, went on line in 2006 and consists of production

OCWD Management Area
BASIN 8-1 ALTERNATIVE 2022 UPDATE Management Area Description 3-13
wells, pipelines, and treatment facilities to remove, treat, and put to beneficial use groundwater
that contains elevated TDS, nitrate, and/or trichloroethylene. To provide the intended hydraulic
containment of this impacted groundwater, lowered groundwater levels in the Irvine area were
necessary and expected based on model projections.
For additional information and background information on groundwater level measurements,
see the 2017 Alternative.
Figure 3-9: Location of Long-Term Groundwater Elevation Hydrographs

OCWD Management Area
BASIN 8-1 ALTERNATIVE 2022 UPDATE Management Area Description 3-14
Figure 3-10: Water Level Hydrographs of Wells SA-21 and GG-16 in Pressure Area

OCWD Management Area
BASIN 8-1 ALTERNATIVE 2022 UPDATE Management Area Description 3-15
Figure 3-11: Water Level Hydrograph of Well A-27/AMD-9 in Forebay Area

OCWD Management Area
BASIN 8-1 ALTERNATIVE 2022 UPDATE Management Area Description 3-16
Figure 3-12: Water Level Hydrographs of Wells SAR-1 and OCWD-CTG1

OCWD Management Area
BASIN 8-1 ALTERNATIVE 2022 UPDATE Management Area Description 3-17
Figure 3-13: Water Level Hydrographs of Wells HBM-1 and IDM-1

OCWD Management Area
BASIN 8-1 ALTERNATIVE 2022 UPDATE Management Area Description 3-18
3.2.4 Groundwater Storage Data
OCWD operates the basin within an operating range from a full condition to approximately
500,000 acre-feet below full to protect against seawater intrusion, inelastic land subsidence, and
other potential undesirable results. Figure 1-3 shows how storage has fluctuated from 1958 to
2021. On a short-term basis, the basin can be operated at an even lower storage level in an
emergency.
In order to manage the basin within this operating range, OCWD calculates the change in
storage relative to a full basin condition on an annual basis for the three aquifer layers, an
example of which is shown in Figure 3-14.
Figure 3-14: Groundwater Storage Change, June 2020 to June 2021
3.3 BASIN MODEL
OCWD’s basin model encompasses most of Basin 8-1 and extends approximately three miles
into the Central Basin in Los Angeles County to provide for more accurate model results than if
the model boundary stopped at the county line (see Figure 3-15). The county line is not a
hydrogeologic boundary, and groundwater freely flows through aquifers that have been
correlated across the county line. The model provides a tool to supplement the storage change
calculations that are done each year with actual groundwater elevation data. The model also
provides a tool to conduct evaluations of proposed projects and operating scenarios.
For more detailed information about the model, please refer to the 2017 Alternative.

OCWD Management Area
BASIN 8-1 ALTERNATIVE 2022 UPDATE Management Area Description 3-19
Figure 3-15: OCWD Groundwater Basin Model Boundaries
OCWD staff update the basin groundwater model approximately every three to five years.
Major changes and improvements since the 2017 Alternative was submitted include:
1. Extension of the model transient calibration through WY2016-17. The new calibration
period is November 1990 to June 2017 which includes a wide range of basin storage
conditions as well as a wide range of hydrologic conditions.
2. Addition of new recharge basin, La Palma Basin.
3. Updating aquifer parameters, i.e., hydraulic conductivity and storage parameters,
changes during calibration (still in progress).
4. Model layer revision in Irvine Sub Basin area.
3.3.1 Groundwater Quality Conditions
Salinity

OCWD Management Area
BASIN 8-1 ALTERNATIVE 2022 UPDATE Management Area Description 3-20
At the state level, the State Water Resources Control Board (SWRCB) and Regional Water
Quality Control Boards have authority to manage TDS concentrations in water supplies. The
salinity management program for the Santa Ana River Watershed is implemented by the Basin
Monitoring Program Task Force (Task Force), a group comprised of water districts, wastewater
treatment agencies and the Regional Water Board. OCWD is a member of the Task Force.
Historical ambient or baseline conditions were calculated for levels of TDS and nitrate (as N) in
each of the 39 groundwater management zones in the watershed. Management Zones
established by the Regional Water Board within the OCWD Management Area are shown in
Figure 3-16. The TDS water quality objectives and ambient water quality levels for the two
zones within the OCWD Management Area are shown in Table 3-1.
Figure 3-16: Regional Water Board Groundwater Management Zones

OCWD Management Area
BASIN 8-1 ALTERNATIVE 2022 UPDATE Management Area Description 3-21
Table 3-1: TDS Water Quality Objectives for Lower Santa Ana River
Basin Management Zones
Groundwater
Management Zone Water Quality Objective 2018 Ambient Quality*
Orange 580 mg/L 603 mg/L
Irvine 910 mg/L 877 mg/L
*Water Systems Consulting, 2020.
Figure 3-17 shows the average TDS at production wells in the basin for WY2016-17 to 2020-21.
In general, the TDS concentrations in the Principal Aquifer in the Orange Groundwater
Management Zone generally range from 300 to 400 mg/L in the Pressure Area and from 500 to
700 mg/L in the Forebay Area. In the Irvine Groundwater Management Zone, TDS
concentrations range from approximately 400 mg/L west of Culver Drive to 1,000 mg/L in the
area northeast of Interstate 5.

OCWD Management Area
BASIN 8-1 ALTERNATIVE 2022 UPDATE Management Area Description 3-22
Figure 3-17: TDS in Groundwater Production Wells,
5-year average, WY2016-17 to 2020-21
Nitrate
Management of nitrate is a component of the salinity management program in the Santa Ana
River Watershed. Along with TDS objectives, water quality objectives for nitrate (as N) are
established for each of the 39 groundwater management zones in the watershed. Water quality
objectives and ambient quality levels for the zones within the OCWD Management Area are
shown in Table 3-2.
Figure 3-18 shows the 5-year average nitrate (as N) levels in production wells for WY2016-17 to
2020-21. In general, nitrate (as N) concentrations in the Orange Groundwater Management
Zone are generally less than 5 mg/L. There are some localized areas with concentrations
greater than 10 mg/L. In cases where pumped groundwater exceeds the MCL, the groundwater
producer treats the water to reduce nitrate (as N) levels prior to being served to customers.

OCWD Management Area
BASIN 8-1 ALTERNATIVE 2022 UPDATE Management Area Description 3-23
Table 3-2: Nitrate (as N) Water Quality Objective for
Lower Santa Ana River Basin Management Zones
Groundwater
Management Zone Water Quality Objective
2018 Ambient
Quality*
Orange 3.4 mg/L 3.0 mg/L
Irvine 5.9 mg/L 6.37 mg/L
*Water Systems Consulting, 2020.
Figure 3-18: Nitrate (as N) Levels in Groundwater Production Wells,
5-year average, WY2016-17 to 2020-21
Per- and polyfluoroalkyl substances (PFAS)
Per- and polyfluoroalkyl substances (PFAS) are a group of thousands of manmade chemicals
that includes perfluorooctanoic acid (PFOA) and perfluorooctane sulfonate (PFOS). PFAS
compounds have been commonly used in many products including, among many others, stain-
and water-repellent fabrics, nonstick products (e.g., Teflon), polishes, waxes, paints, cleaning

OCWD Management Area
BASIN 8-1 ALTERNATIVE 2022 UPDATE Management Area Description 3-24
products, and fire-fighting foams. Beginning in the summer of 2019, the California Division of
Drinking Water (DDW) began requiring testing for PFAS compounds in some groundwater
production wells in the OCWD area.
In February 2020, the DDW lowered its Response Levels (RL) for PFOA and PFOS to 10 and
40 parts per trillion (ppt or nanogram/L, ng/L), respectively. In March 2021, DDW established a
third PFAS RL for perfluorobutane sulfonate (PFBS) at 5,000 ppt. The DDW recommends the
public water systems not serve any water exceeding the RL – effectively making the RL a de
facto interim MCL while the state undertakes the formal process to set an enforceable MCL. In
response to DDW’s issuance of the revised RL, as of September 2021, approximately 60 wells
in the OCWD service area have been temporarily turned off until treatment systems can be
constructed. As additional wells are tested, this figure may increase. The state has begun the
process of establishing MCLs for PFOA and PFOS; in July 2021, the state Office of
Environmental Health Hazard Assessment (OEHHA) released draft Public Health Goals (PHGs)
for PFOA and PFOS or 0.007 ng/L and 1 ng/L, respectively, for public comment. After the
PHGs are finalized, DDW will formally begin developing corresponding MCLs and currently
anticipates issuing a final MCL by 2023 or 2024. OCWD anticipates the MCLs will be set at or
below the RLs.
In April 2020, OCWD as the groundwater basin manager, executed a multi-party agreement
with the impacted groundwater producers to fund and construct the necessary treatment
systems for production wells impacted by PFAS compounds. The PFAS treatment projects
include the design, permitting, construction, and operation of PFAS treatment systems for
impacted production wells. Each well treatment system will be evaluated for use with either
granular activated carbon (GAC), ion exchange (IX), or an alternative novel sorbent for the
removal of PFAS compounds. These treatment systems utilize vessels in a lead-lag
configuration to remove PFOA and PFOS to less than 2 ppt, the current laboratory detection
limit. These PFAS treatment systems are designed to ensure the groundwater supplied by
producer wells can be served in compliance with current and future PFAS regulations. The
groundwater producers will own the treatment systems once they are completed. With financial
assistance from OCWD, the groundwater producers will operate and maintain the new
treatment systems once they are constructed.
To minimize alternative water supply expenses and provide maximum protection to the public
water supply, OCWD initiated design, permitting, and construction of the PFAS treatment
projects on a schedule that allows rapid deployment of treatment systems. As of September
2021, construction contracts have been awarded for treatment systems for production wells
owned by the cities of Orange (Phase 1), and Garden Grove, Serrano Water District, and Yorba
Linda Water District. The City of Anaheim has also awarded a design-build contact (phase A)
for 8 impacted wells, that will be reimbursed by OCWD. The City of Fullerton’s well KIM-1A
treatment system has been completed and is in operation. Additional construction contracts are
anticipated to be awarded for impacted wells operated by the cities of Fullerton (Main Plant),
Orange (Phase 2), Santa Ana, Tustin, Irvine Ranch Water District and East Orange County
Water District by early 2022. OCWD expects the treatment systems to be constructed for the
approximately 60 impacted wells within the next 2 to 3 years.

OCWD Management Area
BASIN 8-1 ALTERNATIVE 2022 UPDATE Management Area Description 3-25
As monitoring continues and additional wells are taken off-line due to PFAS detections reported
at or near the current RL (or future MCL), OCWD will continue to partner with the affected
groundwater producers and take action to design and construct necessary treatment systems to
bring the impacted wells back online as quickly as possible.
Groundwater production in WY2020-21 was expected to be approximately 325,000 acre-feet but
declined to 282,000 acre-feet primarily due to PFAS impacted wells being turned off around
February 2020. OCWD expects groundwater production to be in the area of 250,000 acre-feet
in WY2021-22 due to the currently idled wells and additional wells being impacted by PFAS and
turned off. As PFAS treatment systems are constructed, OCWD expects total annual
groundwater production to slowly increase back to levels similar to years prior to PFAS impacts.
Contamination Plumes
Major groundwater contamination sites within the OCWD Management Area include areas
where contamination has migrated significantly beyond the contamination sources and threaten
to further impact the groundwater quality. These plumes, shown in Figure 3-19, are in the
process of being remediated, and some are being evaluated for additional remediation.
The North Basin Volatile Organic Compound (VOC) plume area contains contaminated
groundwater primarily in the Shallow Aquifer, which is generally less than 200 feet deep with
migration downward into the Principal Aquifer. OCWD is performing a remedial
investigation/feasibility study (RI/FS) under the oversight of the U.S. EPA and working with state
regulatory agencies and stakeholders to evaluate and develop effective remedies to address the
contamination under the National Contingency Plan process. The U.S. EPA is the lead agency
for this North Basin RI/FS.
The South Basin plume area contains VOCs and perchlorate. OCWD has collected extensive
data to delineate the comingled plumes. OCWD is performing an RI/FS in consultation with the
Regional Water Board, Department of Toxic Substances Control, and stakeholders to evaluate
and develop effective remedies to address the contamination under the National Contingency
Plan process, designated as the South Basin Groundwater Protection Project (SBGPP).
The U.S. Navy is taking the lead in remediation of three groundwater contamination plumes of
VOCs in the vicinity of the former El Toro Marine Corps Air Station (MCAS), former Tustin
MCAS, and the Naval Weapons Station Seal Beach.

OCWD Management Area
BASIN 8-1 ALTERNATIVE 2022 UPDATE Management Area Description 3-26
Figure 3-19: Groundwater Contamination Plume Locations
3.3.2 Coastal Gaps
In the coastal area of Orange County, the primary source of saline groundwater is seawater
intrusion into the basin through permeable aquifer sediments underlying topographic lowlands
or gaps between the erosional remnants or mesas of the Newport-Inglewood Uplift. The
susceptible locations from north to south are the Alamitos, Sunset, Bolsa, and Talbert gaps as
shown in Figure 3-20. Note that new wells added within the last five years are shown in Figure
3-20.
Background information on these gaps is contained in the 2017 Alternative. Ongoing activities
related to seawater intrusion protection is described in subsequent sections of this report.

OCWD Management Area
BASIN 8-1 ALTERNATIVE 2022 UPDATE Management Area Description 3-27
Figure 3-20: Orange County Coastal Gaps
3.3.3 Land Subsidence
In Orange County, subsidence in swampy low-lying coastal areas underlain by shallow organic
peat deposits started as early as 1898 when development of these areas for agriculture resulted
in excavation of unlined drainage ditches. The ditches drained the swamps and intercepted the
shallow water table which was lowered to allow the land to drain adequately for irrigated
agriculture. When the shallow water table was lowered, it exposed the formerly saturated peat
deposits to oxygen that caused depletion and shrinkage of the peat due to oxidation (Fairchild
and Wiebe, 1976).
Subsidence related to shallow peat deposits was associated with land development practices
that occurred in Orange County in the late 1800s and early 1900s and, as such, is not
something associated with or controlled by groundwater withdrawals in the basin. Another
documented cause of subsidence in Orange County unrelated to groundwater basin utilization is
oil extraction along the coast, particularly in Huntington Beach (Morton et al., 1976).

OCWD Management Area
BASIN 8-1 ALTERNATIVE 2022 UPDATE Management Area Description 3-28
Ground surface elevations rise and fall due to groundwater conditions in the OCWD
Management Area, and there is no indication of widespread irreversible lowering of the ground
surface. Storage conditions in the groundwater basin were at historical lows in the mid-1950s,
but since this time OCWD has operated the groundwater basin within a storage range above
this historical low. There are reports that some subsidence may have occurred before OCWD
began refilling the groundwater basin in the late 1950s (Morton, et al., 1976); however, the
magnitude and scope of this subsidence is uncertain, and it is not clear if this subsidence was
permanent. As such, there is no evidence of permanent, inelastic land subsidence in the
OCWD Management Area (see Section 13), and future subsidence is not expected as long as
OCWD continues to manage basin storage above the historic low observed in the late 1950s.
3.3.4 Groundwater/Surface Water Interactions and Groundwater
Dependent Ecosystems
Frequent and destructive flooding of the Santa Ana River in Orange County was the impetus for
construction of Prado Dam in 1941. Prior to the construction of flood control facilities, the banks
of the Santa Ana River naturally overflowed periodically and flooded broad areas of Orange
County. Coastal marshes were inundated during winter storms, and the mouth of the river
moved both northward and southward of its present location. In the days before flood control,
surface water naturally percolated into the groundwater basin, replenishing groundwater
supplies.
Subsequent flood protection efforts included construction of levees along the river and concrete-
lined bottoms along portions of the river. Flood risk was reduced, increased pumping of
groundwater lowered water levels, and low-lying areas were filled in and/or equipped with
drains, pumps and other flood control measures to allow for urban development. Since at least
the 1950s, groundwater levels throughout the OCWD Management Area have been low enough
that the rising and lowering of groundwater levels do not impact surface water flows or
ecosystems.
Although it is outside the OCWD Management Area (within the Santa Ana Canyon Management
Area described later), it is noted that from Prado Dam to Imperial Highway, the wide soft-
bottomed Santa Ana River channel supports riparian habitat. Riparian habitat is dependent on
river water released through Prado Dam, which is predominantly treated wastewater discharged
in the upper watershed when storm flow is not present. In aggregate, this stretch is generally
considered to be in equilibrium between surface water and groundwater based on available
stream gage and groundwater level data, although some infiltration may occur due to minor
groundwater pumping in the Santa Ana Canyon Management Area.
As the Santa Ana River enters the OCWD Management Area, from Imperial Highway to 17th
Street in Santa Ana, there is minimal riparian habitat, and the river is a losing reach with
engineered facilities to infiltrate surface water into the groundwater basin. OCWD conducts
recharge operations within the soft-bottomed river channel except for a portion of the river
where the Riverview Golf Course occupies the river channel. The river levees are constructed
of either rip-rap or concrete.

OCWD Management Area
BASIN 8-1 ALTERNATIVE 2022 UPDATE Management Area Description 3-29
From 17th Street to near Adams Avenue in Costa Mesa, the river channel is concrete-lined for
flood control with vertical to sloping concrete side walls and a concrete bottom. From Adams
Avenue to the coast, the channel has vertical concrete side walls or rip-rap for flood control and
a soft bottom. Estuary conditions within the concrete channel exist at the mouth of the river
where the ocean encroaches at high tide. The tidal prism extends from the ocean
approximately three miles inland to the Adams Avenue Bridge.
There are no surface water bodies within the boundaries of the OCWD Management Area that
are dependent on groundwater. Therefore, there are no groundwater-dependent ecosystems in
the OCWD Management Area.
Some areas in the basin experience relatively high groundwater levels due to perched
groundwater where shallow groundwater is impeded from flowing into deeper groundwater by a
layer of low-permeable clay or silt, known as an aquitard. Except in very low-lying areas near
sea level, the high groundwater is not close enough to the surface to support hydrophilic
vegetation. OCWD carefully monitors water levels in the vicinity of the Talbert Seawater Barrier
in order to maintain injection well rates to assure that groundwater levels do not rise to levels
that could threaten urban infrastructure.

OCWD Management Area
BASIN 8-1 ALTERNATIVE 2022 UPDATE Water Budget 4-1
SECTION 4 WATER BUDGET
OCWD developed a hydrologic budget (inflows and outflows) for the purpose of constructing a
basin-wide groundwater flow model, (Basin Model) and for evaluating basin production capacity
and recharge requirements. The key components of the budget include measured and
unmeasured (estimated) recharge, groundwater production, and subsurface flows along the
coast and across the Orange County/Los Angeles County line. Because the basin is not
operated on an annual safe-yield basis, the net change in storage in any given year may be
positive or negative; however, over the long-term, the basin is operated within the established
operating range. The components of the water budget are described below. OCWD’s water
year (WY) begins on July 1 and ends on June 30.
4.1 WATER BUDGET COMPONENTS
4.1.1 Measured Recharge
Measured recharge consists of all water artificially recharged at OCWD’s surface water
recharge facilities, water injected in the Talbert and Alamitos Barriers, and water injected in the
Mid-Basin Injection wells. The majority of measured recharge occurs in the District’s surface
water system, which receives Santa Ana River baseflow and storm flow, GWRS water, and
imported water.
4.1.2 Unmeasured Recharge
Unmeasured recharge also referred to as “incidental recharge” accounts for a significant
amount of the basin’s recharge, particularly in wet periods. This includes recharge from
precipitation, irrigation return flows, urban runoff, seawater inflow through the gaps as well as
subsurface inflow at the basin margins along the Chino, Coyote, and San Joaquin hills and the
Santa Ana Mountains, and beneath the Santa Ana River and Santiago Creek. Subsurface
inflow beneath the Santa Ana River and Santiago Creek refers to groundwater that enters the
basin at the mouth of Santa Ana Canyon and in the Santiago Creek drainage below Villa Park
Dam. Estimated average subsurface inflow to the basin is shown in Figure 4-1.
OCWD has estimated total unmeasured recharge, sometimes referred to as “incidental
recharge,” between 20,000 and 160,000 acre-feet per year. Net unmeasured recharge is the
amount of unmeasured recharge remaining in the basin after accounting for underflow losses to
Los Angeles County and relatively minor groundwater inflows/outflows at the coastal gaps.
Under average hydrologic conditions, net incidental recharge averages 66,000 acre-feet per
year. This average was substantiated during calibration of the Basin Model and is also
consistent with the estimate of 58,000 acre-feet per year reported by Hardt and Cordes (1971)
as part of a USGS modeling study of the basin. Because unmeasured recharge is one of the
least understood components of the basin’s water budget, the error margin for any given year is
likely in the range of 10,000 to 20,000 acre-feet. Since unmeasured recharge is well distributed

OCWD Management Area
BASIN 8-1 ALTERNATIVE 2022 UPDATE Water Budget 4-2
throughout the basin, the physical significance (e.g., water level drawdown or mounding in any
given area) of overestimating or underestimating the total recharge volume within this error
margin is considered to be minor.
Figure 4-1: Estimated Subsurface Inflow
4.1.3 Groundwater Production
Entities that produce groundwater within the OCWD Management Area include major
groundwater producers and small groundwater producers. Ninety-eight percent of groundwater
production within Basin 8-1 occurs within the OCWD Management Area. The major groundwater
producers include cities, water districts and a private water company that account for
approximately 97 percent of the total basin production. These 19 major producers operate
approximately 200 large-system wells. Small groundwater producers include entities that typically

OCWD Management Area
BASIN 8-1 ALTERNATIVE 2022 UPDATE Water Budget 4-3
produce less than 500 acre-feet per year. These include small mutual water companies,
agricultural companies, golf courses, cemeteries (irrigation wells), and private-well owners.
Groundwater pumping for agricultural irrigation use accounts for less than one percent of total
basin production.
4.1.4 Subsurface Outflow
Groundwater outflow from the basin across the Los Angeles County/Orange County line has
been estimated to range from approximately 1,000 to 14,000 acre-feet per year based on
groundwater elevation gradients and aquifer transmissivity (DWR, 1967; McGillicuddy, 1989).
The Water Replenishment District of Southern California (WRD) also has estimated underflow
from Orange County to Los Angeles County within the aforementioned range. Groundwater
outflow cannot be directly measured and is accounted for in the basin water budget within the
net unmeasured recharge described above. Modeling by OCWD indicates that underflow to Los
Angeles County increases by approximately 7,500 acre-feet per year for every 100,000 acre-
feet of increased groundwater in storage in Orange County, given the assumption that
groundwater elevations in Los Angeles County remain constant.
Recent updates to the OCWD groundwater model show that subsurface outflow averaged
approximately 13,000 acre-feet per year during the period 1991 to 2017 with a range of 5,000 to
25,000 acre-feet per year. Due to differences in model-estimated inter-basin groundwater flows,
OCWD and WRD are jointly conducting a study to evaluate OCWD’s Basin Model and WRD’s
groundwater model of Central Basin in Los Angeles County constructed by the USGS. The goal
is to improve each model’s ability to more closely represent local groundwater conditions and
thereby more accurately estimate inter-basin groundwater flows.
With the exception of unknown amounts of semi-perched (near-surface) groundwater being
intercepted and drained by submerged sewer trunk lines and unlined flood control channels
along coastal portions of the basin, no other significant basin outflows are known to occur.
4.1.5 Evaporation
The total wetted area of the District’s recharge system is over 1,000 acres. OCWD estimates
the evaporation from this system on a monthly basis. Generally, total evaporation is on the
order of 2,000 acre-feet per year which is approximately one percent of the total volume
recharged annually. The relatively minor impact of evaporation reflects moderate temperatures
in the region and high percolation rates (1 to 10 feet per day).
4.2 WATER YEAR TYPE
As explained previously, OCWD manages groundwater pumping and basin storage over the
long-term, which includes wet and dry years. Basin storage levels from WY1957-58 to 2020-21
are shown in Figure 1-3. Typically, basin storage levels increase during wet periods and
decrease during dry periods. Operating the basin within the operating range provides for
maximum basin production while preventing significant and unreasonable undesirable results.

OCWD Management Area
BASIN 8-1 ALTERNATIVE 2022 UPDATE Water Budget 4-4
4.3 ESTIMATE OF SUSTAINABLE YIELD
Even though the groundwater basin contains an estimated 66 million acre-feet when full, OCWD
operates the basin within an operating range of up to 500,000 acre-feet below full condition to
protect against seawater intrusion, inelastic land subsidence, and other potential undesirable
results. On a short-term basis, the basin can be operated at an even lower storage level in an
emergency.
OCWD manages groundwater production and recharge to maintain groundwater storage levels
within the established operating range. In this sense, the basin’s sustainable yield can be
defined as the volume of groundwater production that can be sustained while maintaining
groundwater in storage within the operating range. Basin storage is determined on an annual
basis by calculating the difference between groundwater production and recharge based on
OCWD’s July 1 to June 30 water year.
The sustainable yield of the basin is a function of the amount of groundwater recharge from
OCWD’s managed aquifer recharge program and natural recharge as a result of precipitation
and percolation of irrigation flows. The process that determines a sustainable level of pumping
on an annual basis considers the basin’s operating range, basin storage conditions and the
amount of available recharge water supplies.
As mentioned in Section 1.2, the groundwater basin is not operated on an annual safe-yield
basis. The net change in storage in any given year may be positive or negative; however, over
a period of several years, the basin is maintained in an approximate balance. Amounts of total
basin production and total water recharged from WY1999-2000 to 2020-21 are shown in Figure
1-4.
4.4 WATER BUDGETS
The OCWD Management Area water budget for WY2016-17 to 2020-21 is presented in Table 4-
1. Estimated water budgets for dry years, average years and wet years as well as a future
projected budget are presented in the 2017 Alternative.

OCWD Management Area
BASIN 8-1 ALTERNATIVE 2022 UPDATE Water Budget 4-1
Table 4-1 Water Budget, WY2016-17 to 2020-21
FLOW COMPONENT 2016-17 2017-18 2018-19 2019-20 2020-21
INFLOW
Santa Ana River baseflow 70,000 65,400 98,000 74,500 76,400
Santa Ana River stormflow 65,400 24,100 63,700 79,500 36,600
Recycled Water (GWRS/Alamitos Barrier) 98,000 106,400 97,200 99,700 101,700
Imported Water 50,400 66,100 40,300 18,100 0
Net Estimated Unmeasured or Incidental Recharge*
67,900 26,200 45,600 41,400 19,100
TOTAL INFLOW: 351,700 288,200 344,800 313,200 233,800
OUTFLOW
Groundwater Production 300,700 237,200 303,800 277,200 281,800
TOTAL OUTFLOW: 300,700 237,200 303,800 277,200 281,800
CHANGE IN STORAGE: 51,000 51,000 41,000 36,000 (48,000)

OCWD Management Area
BASIN 8-1 ALTERNATIVE 2022 UPDATE Water Resource Monitoring Programs 5-1
SECTION 5 WATER RESOURCE MONITORING
PROGRAMS
5.1 OVERVIEW
Water resource monitoring programs can be categorized into groundwater, surface water, and
recycled and imported water programs. These programs are summarized in Table 5-1 in the
2017 Alternative. The only change is related to the termination of CASGEM, which is being
replaced by annual reporting required by SGMA.
5.2 GROUNDWATER MONITORING PROGRAMS
OCWD collects samples and analyzes water elevation and water quality data from
approximately 400 District-owned monitoring wells (shown in Figure 5-1) and at over 250
privately-owned and publicly-owned large and small system drinking water wells that are part of
OCWD’s Title 22 program, shown in Figure 5-2. OCWD also has access agreements to sample
a number of non-District-owned monitoring wells and privately-owned irrigation, domestic and
industrial wells, shown in Figure 5-3. New wells constructed in the last five years are
highlighted in these figures. Inactive wells are included in District monitoring programs when
feasible. An inactive well is defined as a well that is not currently being routinely operated. The
number and location of wells that are sampled change regularly as new wells come online and
old ones are abandoned and destroyed.
The District collects, stores, and uses data from wells owned and sampled by other agencies.
For example, data collected by the WRD from wells in Los Angeles County along the Orange
County boundary are part of the network of wells evaluated to determine annual groundwater
elevations and are used for basin modeling. Also included in OCWD’s monitoring network are
wells that are owned and operated by the U.S. Navy for remediation of contamination plumes in
the cities of Irvine, Seal Beach and Tustin, and wells that are related to operation of the
Alamitos Barrier that are located in Los Angeles County. Los Angeles County wells are also
used to model the Orange County groundwater basin as groundwater flow is unrestricted across
the county line.
Wells sampled under various monitoring programs change in response to fluctuations in the
number of available wells, basin conditions, observed water quality, and regulatory and non-
regulatory requirements. Appendix A of the 2017 Alternative presented a comprehensive list of
all wells in OCWD’s database. This list included well name, owner, type of well, casing
sequence number, depth, screened interval, and aquifer zone monitored, when known.
In some cases, well depth and screened intervals are listed in the database as unknown.
OCWD maintains data on these wells when water quality or elevation data continues to be
collected by the owner or operator. OCWD uses data from these wells in monitoring programs,
for groundwater modeling, or for other basin programs. Wells on the list also include inactive

OCWD Management Area
BASIN 8-1 ALTERNATIVE 2022 UPDATE Water Resource Monitoring Programs 5-2
wells when water quality or water elevation data continues to be collected or the data is utilized
in one or more current basin programs. Groundwater elevation and monthly production data are
used to quantify total basin pumping, evaluate seasonal groundwater level fluctuations and
assess basin storage conditions.
Figure 5-1: OCWD Monitoring Wells

OCWD Management Area
BASIN 8-1 ALTERNATIVE 2022 UPDATE Water Resource Monitoring Programs 5-3
Figure 5-2: Large and Small System Drinking Water Wells
in Title 22 Monitoring Program

OCWD Management Area
BASIN 8-1 ALTERNATIVE 2022 UPDATE Water Resource Monitoring Programs 5-4
Figure 5-3: Private Domestic, Irrigation and Industrial Wells
in OCWD Monitoring Program
5.2.1 Groundwater Production Monitoring
All entities that pump groundwater from the basin are required by the OCWD District Act to
report production every six months and pay a Replenishment Assessment. Owners or
operators of wells with discharge outlets of two inches in diameter or less and supply an area of
no more than one acre pay an annual flat fee as the Replenishment Assessment and do not
have to report their production.
Approximately 200 large-capacity production wells owned by 19 major water retail agencies
account for ninety-seven percent of production. Large-capacity well owners voluntarily report
monthly groundwater production for each of their wells. The production volumes are verified by
OCWD field staff. Production data are used to evaluate basin conditions, calculate and manage
basin storage, run groundwater model scenarios, and collect revenues.

OCWD Management Area
BASIN 8-1 ALTERNATIVE 2022 UPDATE Water Resource Monitoring Programs 5-5
5.2.2 Groundwater Elevation Monitoring
Production and monitoring wells in the basin are measured for groundwater elevation at varying
intervals, as explained below:
• Water elevation measurements are collected for every OCWD monitoring well at least
once a year with most wells measured at least monthly;
• Monitoring of production wells is typically monthly but may vary depending on
operational status, well maintenance, abandonment, new well construction, and related
factors;
• Over 1,000 individual measuring points are monitored for water levels on a monthly or
bi-monthly basis to evaluate short-term effects of pumping, recharge or injection
operations; and
• Additional monitoring is done as needed in the vicinity of OCWD’s recharge facilities,
seawater barriers, and areas of special investigation where drawdown, water quality
impacts or contamination are of concern.
Beginning in 2011, OCWD began reporting seasonal groundwater elevation measurements to
DWR as part of the CASGEM program. The monitoring well network developed for the
CASGEM program provide a detailed and representative data set, both spatially and temporally.
The initial network established in 2011 consisted of a total of 77 monitoring stations distributed
laterally and vertically throughout the groundwater basin. Most of the wells are owned by
OCWD and have detailed borehole geologic logs and downhole geophysical logs.
In 2021, DWR instructed agencies that submitted an Alternative to begin submitting data to the
SGMA portal. As a result, CASGEM data was incorporated into annual data submittals required
for SGMA compliance. For the 2022 Update, OCWD reviewed the CASGEM network and
updated it, primarily in removing wells that were no longer accessible, and changed the name to
the SGMA Monitoring Well Network.
Figures 5-4 to 5-6 present the monitoring well locations for each of the three aquifer systems.
The SGMA network includes wells within the OCWD, La Habra-Brea, Santa Ana Canyon, and
Southeast Management Areas. The City of La Habra Groundwater Sustainability Agency will be
reporting water levels from the La Habra Management Area separately. Two wells monitored by
the Irvine Ranch Water District (IRWD) that are located in the Southeast Management area,
IRWD-LA1 and IRWD-LA4 (Figure 5-5) are included in the SGMA reports that OCWD will
submit to DWR.

OCWD Management Area
BASIN 8-1 ALTERNATIVE 2022 UPDATE Water Resource Monitoring Programs 5-6
Figure 5-4: SGMA Shallow Aquifer System Monitoring Well Network

OCWD Management Area
BASIN 8-1 ALTERNATIVE 2022 UPDATE Water Resource Monitoring Programs 5-7
Figure 5-5: SGMA Principal Aquifer System Monitoring Well Network

OCWD Management Area
BASIN 8-1 ALTERNATIVE 2022 UPDATE Water Resource Monitoring Programs 5-8
Figure 5-6: SGMA Deep Aquifer System Monitoring Well Network
5.2.3 Groundwater Quality Monitoring
OCWD monitors water quality in production wells on behalf of the groundwater producers for
compliance with state and federal drinking water regulations. Samples are analyzed for more
than 100 regulated and unregulated chemicals at frequencies established by regulations from
the DDW and EPA. Over 425 monitoring and production wells are sampled semi-annually to
assess water quality conditions during periods of lowest (winter) and peak production (summer).
The total number of water samples analyzed varies year-to-year due to regulatory requirements,
conditions in the basin and applied research and/or special study demands. In 2020, OCWD
water quality staff collected 15,496 samples, 4,139 of which were collected from drinking water
wells.
OCWD developed specific programs to monitor the North Basin and South Basin plumes \\as
described in the 2017 Alternative. Several new monitoring wells were constructed within the
last five years for the North Basin and South Basin plume areas as shown on Figures 5-7 and 5-
8.

OCWD Management Area
BASIN 8-1 ALTERNATIVE 2022 UPDATE Water Resource Monitoring Programs 5-9
Continual monitoring of groundwater near the coast is done to assess the effectiveness of the
Alamitos and Talbert Barriers and track salinity levels in the Bolsa and Sunset Gaps. Key
groundwater monitoring parameters used to determine the effectiveness of the barriers include
water level elevations, chloride, TDS, electrical conductivity, and bromide. Groundwater
elevation contour maps for the aquifers most susceptible to seawater intrusion are prepared to
evaluate whether the freshwater mound developed by the barrier injection wells is sufficient to
prevent the inland movement of saline water.
OCWD’s extensive network of monitoring wells within the groundwater basin includes
concentrated monitoring along the seawater barrier and near the recharge basins. GWRS-
related monitoring wells in the vicinity of Kraemer, Miller, La Palma and Miraloma basins are
used to measure water levels and to collect water quality samples. In addition to ensuring the
protection of water quality, these wells have been used to determine travel times from recharge
basins to production wells.
Permits regulating operation of GWRS require adherence to rigorous product water quality
specifications, extensive groundwater monitoring, buffer zones near recharge operations,
reporting requirements, and a detailed treatment plant operation, maintenance and monitoring
program. GWRS product water is monitored daily, weekly, and quarterly for general minerals,
metals, organics, and microbiological constituents. Focused research-type testing has been
conducted on organic contaminants and selected microbial species.

OCWD Management Area
BASIN 8-1 ALTERNATIVE 2022 UPDATE Water Resource Monitoring Programs 5-1
Figure 5-7: North Basin Groundwater Protection Program Monitoring Wells

OCWD Management Area
BASIN 8-1 ALTERNATIVE 2022 UPDATE Water Resource Monitoring Programs 5-2
Figure 5-8: South Basin Groundwater Protection Program Monitoring Wells
5.2.4 Coastal Area Monitoring
OCWD operates and maintains a network of coastal area monitoring wells that provide water
level and water quality data that allow staff to evaluate the performance of seawater intrusion
barriers and to identify potential intrusion in coastal areas. The monitoring well network has
been expanded and improved over time based on new information and a greater understanding
of the basin hydrogeology.
Approximately 200 monitoring and production well sites are monitored for groundwater levels
and quality within a 4- to 5- mile area from the coast, generally seaward or south of the 405
freeway, as shown in Figure 5-9. The monitoring wells are largely located in the coastal gaps
as well as on the coastal mesas. The mesas are not impermeable features; rather, the marine
deposition Pleistocene aquifers extend beneath the mesas to the basin production wells and
provide potential avenues for seawater intrusion.
OCWD conducts the groundwater monitoring for the majority of the monitoring wells with the
exception of the Alamitos Barrier monitoring wells. The Alamitos Seawater Intrusion Barrier is

OCWD Management Area
BASIN 8-1 ALTERNATIVE 2022 UPDATE Water Resource Monitoring Programs 5-3
located along the border of Los Angeles and Orange counties and is jointly owned by OCWD
and Los Angeles County Public Works (LACPW). LACPW operates, maintains, and samples
Alamitos Barrier monitoring and injection wells, including those owned by OCWD located within
Orange County. Through an interagency cooperative agreement dating to 1964, operational
costs and data are shared between the two agencies with a joint report on the status of the
barrier prepared on an annual basis.
Most of the monitoring wells shown in Figure 5-9 are owned by OCWD and are either single-
point or nested. Single-point monitoring wells have one screened interval in one targeted
aquifer zone, while nested wells have multiple (2 to 6) casings within the same borehole, with
each casing screened in a separate aquifer zone at a discrete depth. A handful of OCWD
monitoring wells in the coastal area are Westbay multi-port type, having only one well casing but
with multiple monitoring ports each separated by inflatable packers. Therefore, although there
are approximately 200 monitoring and production well sites in the coastal groundwater
monitoring program, there are over 430 individual sampling points.
Figure 5-9: Seawater Intrusion Monitoring Wells

OCWD Management Area
BASIN 8-1 ALTERNATIVE 2022 UPDATE Water Resource Monitoring Programs 5-4
In addition to OCWD monitoring wells, there are a few privately owned monitoring wells and
active municipal production wells included in OCWD’s coastal monitoring program. For
example, in Sunset Gap there are a few monitoring wells owned by The Boeing Company
(Boeing) related to a shallow VOC plume in the area; Boeing monitors these wells twice a year
(groundwater levels and VOCs), and OCWD obtains split samples with Boeing for seawater
intrusion monitoring. The retail water agency production wells in the coastal monitoring program
include three wells inland of the Alamitos Barrier (City of Seal Beach and Golden State Water
Company) and three wells just inland of Sunset Gap (City of Huntington Beach). A complete list
of all wells in the coastal groundwater monitoring program, along with their screened interval
depths, was presented in Appendix A of the 2017 Alternative.
Groundwater levels are measured bi-monthly (every 2 months) at the majority of coastal
monitoring wells and nearly all of the coastal monitoring wells are sampled semi-annually
(March and September) for key groundwater quality parameters to assess seawater intrusion
and barrier operations. Key groundwater quality parameters analyzed for the coastal monitoring
program include chloride, bromide, and electrical conductivity (EC), which is a surrogate for
TDS. The EC is typically measured both in the field at the time of sampling and in the
laboratory.
Dissolved chloride concentrations and EC are used both to track seawater intrusion and to trace
the injection of purified recycled water at the barriers, especially the Talbert Barrier in which the
injection supply consists of 100 percent recycled water having a much lower salinity signal than
native fresh groundwater. Chloride is considered to be a good conservative intrinsic tracer
since it is relatively unaffected by sorption- and chemical-, or biological reactions in the
subsurface. Bromide concentrations in brackish groundwater samples are valuable to help
determine the origin or source of intrusion by evaluating the chloride to bromide ratio. Chloride
to bromide ratios in the range of 280-300 in brackish coastal samples suggest relatively young
active intrusion from the ocean or water body connected to the ocean, whereas lower ratios may
indicate intrusion from past oil brine disposal or an influence of very old connate water from the
original marine depositional process when these coastal aquifers were first formed.
5.3 SURFACE WATER AND RECYCLED WATER MONITORING
Surface water from the Santa Ana River is a major source of recharge supply for the
groundwater basin. As a result, the quality of the surface water has a significant influence on
groundwater quality. Therefore, characterizing the quality of the river and its effect on the basin
is necessary to verify the sustainability of continued use of river water for recharge and to
safeguard a high-quality drinking water supply for Orange County. Several on-going programs
monitor the condition of Santa Ana River water. OCWD monitoring sites along the river and its
tributaries are shown in Figure 5-10.

OCWD Management Area
BASIN 8-1 ALTERNATIVE 2022 UPDATE Water Resource Monitoring Programs 5-5
Figure 5-10: Surface Water Monitoring Locations
5.3.1 Surface Water Monitoring Programs
The surface water monitoring programs include:
• Santa Ana River Monitoring (SARMON) Program
• The Basin Monitoring Program Task Force (Task Force)
• Santa Ana River Watermaster
• Emerging constituents
• Imported water from MWD
Detailed descriptions of each program are contained in the 2017 Alternative.
Within the last five years, additional work has been done by the watershed-wide Emerging
Constituents Monitoring Task Force administered by the Santa Ana Watershed Project Authority
(SAWPA). This group was formed in 2010 to characterize emerging constituents in 1) municipal
wastewater effluents, 2) the Santa Ana River at various locations, and 3) imported water. Three
years of testing (2011-2013) were completed as directed by the Regional Water Board (R8-

OCWD Management Area
BASIN 8-1 ALTERNATIVE 2022 UPDATE Water Resource Monitoring Programs 5-6
2009-0071). OCWD monitored two sites twice a year on the Santa Ana River for this program.
The SAWPA testing program was resumed voluntarily 2019, with the addition of PFAS
monitoring; the program was not continued in 2020 and has been functionally replaced by the
statewide PFAS Investigation Orders issued to upper watershed wastewater dischargers.
OCWD monitors for Constituents of Emerging Concern (CECs), including PFAS, at two surface
water sites quarterly on the Santa Ana River and at various locations within District recharge
facilities below Prado Dam. Samples are analyzed for pharmaceuticals, endocrine disruptors
and other emerging constituents such as personal care products, food additives, and pesticides.
5.3.2 Recycled Water Monitoring
Use and monitoring of GWRS water is regulated by the Regional Water Board and DDW.
Performance of the GWRS is monitored on a routine basis. Monitoring wells to monitor and
track GWRS water are located adjacent to surface recharge basins located in Anaheim,
downgradient of Mid-Basin Injection wells, and near the injection wells of the Talbert Seawater
Barrier as shown on Figure 5-11. Additional details on recycled water monitoring and reporting
are presented in the 2017 Alternative. Similar monitoring is performed at the WRD-owned Leo
J. Vander Lans Advanced Water Treatment Facility that supplies recycled water to the Alamitos
Seawater Barrier for injection.
In March 2020, OCWD’s Mid-Basin Injection (MBI) Project went on-line. This project started in
April 2015 with the operation of a demonstration well (MBI-1). The MBI Project is located in the
city of Santa Ana, primarily at Centennial Park and injects up to 10 million gallons of GWRS
water a day into the Principal Aquifer and includes four new injection wells, MBI-2, 3, 4, and 5.
Additionally, a total of four nested monitoring wells were installed as part of the MBI Project to
track the quality and movement of injection water prior to reaching down gradient production
wells. Nested wells SAR-10 and -11 were installed downgradient of MBI-1. To track the
movement of GWRS water from the four new injection wells, SAR -12 and -13 were constructed
(see Figure 5-11).

OCWD Management Area
BASIN 8-1 ALTERNATIVE 2022 UPDATE Water Resource Monitoring Programs 5-7
Figure 5-11: Recycled Water Monitoring Wells

OCWD Management Area
BASIN 8-1 ALTERNATIVE 2022 UPDATE Water Resource Management Programs 6-1
SECTION 6 WATER RESOURCE MANAGEMENT
PROGRAMS
6.1 LAND USE ELEMENTS RELATED TO BASIN
MANAGEMENT
The OCWD Management Area is highly urbanized as shown on Figure 3-4. Monitoring potential
impacts from proposed new land uses and planning for future development are key
management activities essential for sustainable management of the groundwater basin.
OCWD monitors, reviews and comments on local land use plans and environmental documents
such as environmental impact reports, notices of preparation, amendments to local general
plans and specific plans, proposed zoning changes, draft water quality management plans, and
other land development plans. District staff also review draft National Pollution Discharge
Elimination System and waste discharge permits issued by the Regional Water Board. The
proposed projects and programs may have elements that could cause short- or long-term water
quality impacts to source water used for groundwater replenishment or have the potential to
degrade groundwater resources. Monitoring and reviewing waste discharge permits provides
OCWD with insight on activities in the watershed that could affect water quality.
The majority of the basin’s land area is located in a highly urbanized setting and requires
tailored water supply protection strategies. Reviewing and commenting on stormwater permits
and waste discharge permits adopted by the Regional Water Board for the portions of Orange,
Riverside and San Bernardino counties that are within the Santa Ana River watershed are
conducted by OCWD on a routine basis. These permits can affect the quality of water in the
Santa Ana River and other water bodies, thereby impacting groundwater quality in the basin.
OCWD works with local agencies having oversight responsibilities on the handling, use and
storage of hazardous materials; underground tank permitting; well abandonment programs;
septic tank upgrades; and drainage issues. Participating in basin planning activities of the
Regional Water Board and serving on technical advisory committees and task forces related to
water quality are also valuable activities to protect water quality.
6.1.1 Summary of Plans Related to Basin Management
The 2017 Alternative presented a comprehensive list of plans related to basin management,
including:
• Municipal Stormwater Permit
• The OC Plan which is the combined North Orange County Integrated Regional Water
Management Plan (IRWM), Central Orange County IRWM, and Coastal Watershed
Management Plan
• OWOW 2.0 Plan which is the IRWM Plan for the Santa Ana Watershed

OCWD Management Area
BASIN 8-1 ALTERNATIVE 2022 UPDATE Water Resource Management Programs 6-2
• Municipal Water District of Orange County (MWDOC) 2020 Regional Urban Water
Management Plan
• Municipal Water District of Orange County (MWDOC) 2016 Orange County Reliability
Study
6.1.2 Land Use Development and Water Demands and Supply
Water demands within the OCWD Management Area between WY1989-90 and 2020-21 have
fluctuated between approximately 367,000 and 526,000 acre-feet per year but have leveled off
in the past few years to approximately 400,000 acre-feet per year as shown in Figure 1-5.
Since its founding, OCWD has grown in area from 162,676 to 243,968 acres and has
experienced an increase in population from approximately 120,000 to 2.5 million people.
OCWD has employed groundwater management techniques to increase the annual yield from
the basin including operating over 1,000 wetted acres of infiltration basins. Annual groundwater
production increased from approximately 150,000 acre-feet in the mid-1950s to a high of over
366,000 acre-feet in WY2007-08. OCWD strives to maximize production from the basin through
maximizing recharge of the groundwater basin. The basin is managed within the established
groundwater storage operating range independently of total regional water demands as total
water demands are met by a combination of groundwater and imported water.
6.1.3 Well Construction, Management, and Closure
Well construction, management and closure are regulated by various state agencies. To
comply with federal Safe Drinking Water Act requirements regarding the protection of drinking
water sources, the DDW created the Drinking Water Source Assessment and Protection
(DWSAP) program. Water suppliers must submit a DWSAP report as part of the drinking water
well permitting process and have it approved before providing a new source of water from a new
well. OCWD provides technical support to groundwater producers in the preparation of these
reports.
Well construction ordinances adopted and implemented by the Orange County Health Care
Agency (OCHCA) and certain municipalities follow state well construction standards established
to protect water quality under California Water Code Section 231. Cities within OCWD
boundaries that have local well construction ordinances and manage well construction within
their local jurisdictions include the cities of Anaheim, Fountain Valley, Buena Park, and Orange.
To provide guidance and policy recommendations on these ordinances, the County of Orange
established the Well Standards Advisory Board in the early 1970s. The five-member appointed
Board includes OCWD’s Chief Hydrogeologist. Recommendations of the Board are used by the
OCHCA and municipalities to enforce well construction ordinances within their jurisdictions.
A well is considered abandoned when the owner has permanently discontinued its use, or it is in
such a condition that it can no longer be used for its intended purpose. This often occurs when
wells have been forgotten by the owner, were not disclosed to a new property owner, or when
the owner is unknown.

OCWD Management Area
BASIN 8-1 ALTERNATIVE 2022 UPDATE Water Resource Management Programs 6-3
A properly destroyed and sealed well has been filled so that it cannot produce water or act as a
vertical conduit for the movement of groundwater. In cases where a well is paved over or under
a structure and can no longer be accessed it is considered destroyed but not properly sealed.
Many of these wells may not be able to be properly closed due to overlying structures,
landscaping or pavement. Some of them may pose a threat to water quality because they can
be conduits for contaminant movement as well as physical hazards to humans and/or animals.
OCWD supports and encourages efforts to properly destroy abandoned wells. As part of
routine monitoring of the groundwater basin, OCWD will investigate on a case-by-case basis
any location where data suggests that an abandoned well may be present and may be
threatening water quality. When an abandoned well is found to be a significant threat to the
quality of groundwater, OCWD will work with OCHCA and the well owner, when appropriate, to
properly destroy the well.
The City of Anaheim has a well destruction policy and has an annual budget to destroy one or
two wells per year. The funds are used when an abandoned well is determined to be a public
nuisance or needs to be destroyed to allow development of the site. The city’s well permit
program requires all well owners to destroy their wells when they are no longer needed. When
grant funding becomes available, the city uses the funds to destroy wells where a responsible
party has not been determined and where the well was previously owned by a defunct water
consortium.
Information on the status of wells is kept within OCWD’s Water Resource Management System
data base. Since the 2017 Alternative was submitted, a total of 15 production wells were
properly destroyed and sealed. During this same period, a total of 9 new production wells were
constructed.
6.2 GROUNDWATER QUALITY PROTECTION AND
MANAGEMENT
OCWD has a number of policies and programs to project groundwater quality. The list of
programs below is described in detail in the 2017 Alternative.
• OCWD Groundwater Protection Policy (2014)
• Various Salinity Management Programs
o Seawater Intrusion Barriers
o Coastal Pumping Transfer Program
o Groundwater Replenishment System
o Septic Systems
o Nitrogen and Selenium Management Program
o Groundwater Desalters and Inland Empire Brine Line and Non-Reclaimable
Waste Line
o Basin Monitoring Program Task Force
o Salinity Management and imported Water Workgroup
o Nitrate Management Program

OCWD Management Area
BASIN 8-1 ALTERNATIVE 2022 UPDATE Water Resource Management Programs 6-4
6.2.1 Regulation and Management of Contaminants
A variety of federal, state, county and local agencies have jurisdiction over the regulation and
management of hazardous substances and the remediation of contaminated groundwater
supplies. OCWD does not have regulatory authority to require responsible parties to clean up
pollutants that have contaminated groundwater. In some cases, OCWD has pursued legal
action against entities that are responsible for contaminating the groundwater basin to recover
OCWD’s remediation costs or to compel those entities to implement remedies. OCWD also
coordinates and cooperates with regulatory oversight agencies that investigate sources of
contamination. OCWD efforts to assess the potential threat to public health and the
environment from contamination in the Santa Ana River Watershed and within the County of
Orange include:
• Reviewing ongoing groundwater cleanup site investigations and commenting on the
findings, conclusions, and technical merits of progress reports
• Providing knowledge and expertise to assess contaminated sites and evaluating the
merits of proposed remedial activities
• Conducting third-party groundwater split samples at contaminated sites to assist
regulatory agencies in evaluating progress of groundwater cleanup and/or providing
confirmation data of the areal extent of contamination
The following is a list of potential contaminants of greatest concern for basin water quality
management. More details on these are presented in the 2017 Alternative.
• Per- and polyfluorinated Alkyl Substances (PFAS)
• Methyl Tertiary Butyl Ether (MTBE)
• Volatile Organic Compounds (VOCs)
• N-Nitrosodimethylamine (NDMA)
• 1,4-Dioxane
• Constituents of Emerging Concern (CECs)
As new chemicals become of scientific interest or are regulated, the OCWD laboratory develops
the analytical capability and becomes certified in the approved method to process compliance
samples. In 2019, the District’s lab became the first public agency laboratory in the state of
California to achieve state certification to analyze PFAS in drinking water. The District has
invested over $1 million in monitoring equipment to test for PFAS and other CECs.
OCWD is committed to (1) track new compounds of concern; (2) research chemical occurrence
and treatment; (3) communicate closely with the DDW on prioritizing investigation and guidance;
(4) coordinate with OC San, upper watershed wastewater dischargers and regulatory agencies
to identify sources and reduce contaminant releases; and (5) inform the groundwater producers
on emerging issues.

OCWD Management Area
BASIN 8-1 ALTERNATIVE 2022 UPDATE Water Resource Management Programs 6-5
6.3 RECYCLED WATER PRODUCTION
6.3.1 Overview
The Groundwater Replenishment System (GWRS) is a joint project built by OCWD and OC San
that began operating in 2008. Secondary treated wastewater that otherwise would be
discharged to the Pacific Ocean is purified using a three-step process to produce high-quality
water used to control seawater intrusion and recharge the basin. As shown on Figure 6-1, the
system includes four major components (1) the Advanced Water Purification Facility (AWPF),
(2) the Talbert Seawater Intrusion Barrier, (3) Mid-Basin Injection wells, and (4) four dedicated
recharge basins.
Figure 6-1: Groundwater Replenishment System
6.4 FINAL EXPANSION
The GWRS Final Expansion (GWRSFE) Project began in 2019 with a budget of $310 million. It
is the third and final phase of the project to build-out capacity of the GWRS facility that treats

OCWD Management Area
BASIN 8-1 ALTERNATIVE 2022 UPDATE Water Resource Management Programs 6-6
secondary effluent from OC San to drinking water standards for groundwater replenishment. As
discussed above, the GWRS first began operating in 2008 producing 70 mgd and in 2015, it
underwent a 30 mgd expansion. When the Final Expansion is completed in 2023, the plant will
have the capacity to produce 130 mgd.
In order to produce 130 mgd, additional treated wastewater from the OC San is required. This
additional water will come from OC San’s Treatment Plant 2, which is located in the city of
Huntington Beach approximately 3.5 miles south of the GWRS. Since the current GWRS facility
only receives influent from OC San’s Plant No. 1, new secondary effluent conveyance facilities
are required at OC San’ Plant No. 2 to convey the secondary effluent to GWRS. These
conveyance facilities include an effluent pump station, two flow equalization tanks and
rehabilitation of an existing pipeline.
In order for secondary effluent from OC San’s Plant No. 2 to be recycled by GWRS, Santa Ana
Regional Interceptor (SARI) flows must be segregated. Currently, SARI flows are not permitted
to be recycled through GWRS due to the industrial and treatment facility discharges that
currently flow in the SARI pipeline. Therefore, in addition to the conveyance facilities,
modifications will be made to OC San Plant No. 2 headworks facilities to segregate the SARI
flows and treat these flows separately for discharge to the ocean outfall. This project is referred
to as the Plant No. 2 Headworks Modification Project. In addition to the Plant No. 2 Headworks
Modification Project, an upgrade to OC San’s Plant No. 2 water pump station is required to feed
the headworks with reclaimable water. This Plant Water Pump Station Project is also
considered part of the complete GWRSFE Project. An overview of the sites and the project
locations of the GWRSFE are shown in Figure 6-2.

OCWD Management Area
BASIN 8-1 ALTERNATIVE 2022 UPDATE Water Resource Management Programs 6-7
Figure 6-2: GWRS Final Expansion Overview
The GWRSFE is anticipated to be completed and operational in 2023. Once completed, the
GWRS will recycle 100 percent of OC San’s reclaimable sources and produce enough water to
meet the needs of over one million people.
6.5 CONJUNCTIVE USE PROGRAMS
The conjunctive use of surface and groundwater has been the foundation of OCWD’s basin
management strategy since it was formed in 1933. OCWD Managed Aquifer Recharge (MAR)
program began in 1936 when it began purchasing portions of the Santa Ana River channel,
eventually acquiring six miles of the channel in Orange County, in order to maximize the
recharge of river water to the basin.
Recharge of imported water began in 1949 when OCWD began purchasing Colorado River
water from MWD. In 1958, OCWD purchased and excavated a 64-acre site one mile north of
the Santa Ana River to create Anaheim Lake, OCWD’s first recharge basin. Today OCWD
operates a network of 25 facilities that recharge an average of over 230,000 acre-feet per year.

OCWD Management Area
BASIN 8-1 ALTERNATIVE 2022 UPDATE Water Resource Management Programs 6-8
OCWD has developed a diverse recharge portfolio including water from the Santa Ana River
and tributaries, imported water, and recycled water supplied by the GWRS. The basin also
receives natural recharge (also called incidental recharge) from precipitation and subsurface
inflow.
6.5.1 Sources of Recharge Water Supplies
Water supplies used to recharge the groundwater basin are listed in Table 6-1. Figure 6-3
shows the historical recharge by source from 1936 to 2021. Table 4-1 presents the annual
recharge by source for WY2016-17 to 2020-21.
Santa Ana River
Water from the Santa Ana River is a primary source of water used to recharge the groundwater
basin. OCWD diverts river water into recharge facilities where the water percolates into the
groundwater basin. Recharge facilities are capable of recharging all of the base flow. Both the
Santa Ana River base flow and storm flow vary from year to year. The volume of storm water
that can be recharged into the basin is highlight dependent on the amount and timing of
precipitation in the upper watershed, which is highly variable. OCWD has water rights to all
storm flows and base flows that reach Prado Dam. When storm flows exceed the capacity of
the diversion facilities, river water reaches the ocean, and this portion is lost as a water supply.
Santiago Creek
Santiago Creek is the primary drainage for the northwest portion of the Santa Ana Mountains
and ultimately drains into the Santa Ana River. OCWD captures and recharges water in
Santiago Creek that flows into the Santiago Recharge Basins. During dry periods, the Santiago
basins are used to recharge Santa Ana River flows which are pumped to the basins.

OCWD Management Area
BASIN 8-1 ALTERNATIVE 2022 UPDATE Water Resource Management Programs 6-1
Table 6-1: Sources of Recharge Water Supplies
SUPPLY SOURCES AND DESCRIPTION RECHARGE LOCATION
Santa Ana River
Base Flow Perennial flows from the upper watershed in Santa Ana River; predominately treated wastewater discharges
Santa Ana River, recharge basins, and Santiago Creek
Storm Flow Precipitation from upper watershed flowing in Santa Ana River through Prado Dam
Santa Ana River, recharge basins, and Santiago Creek
Santiago Creek
Storm Flow / Santa Ana River
Storm flows in Santiago Creek and Santa Ana River water pumped from Burris Basin via Santiago Pipeline
Santiago Creek, Santa Ana River, recharge basins
Incidental Recharge
Precipitation and subsurface inflow
Precipitation and runoff from Orange County foothills, subsurface inflow from basin boundaries
Basin-wide
Recycled Water
Groundwater Replenishment System
Advanced treated wastewater produced at GWRS plant in Fountain Valley
Injected into Talbert Barrier and Mid-Basin Injection Wells, recharged in Kraemer, Miller, La Palma and Miraloma basins
Water Replenishment District of Southern CA
Water purified at the Leo J. Vander Lans Treatment Facility in Long Beach
Injected into Alamitos Barrier
Imported Water
Untreated State Water Project and Colorado River Aqueduct
Various recharge basins
Treated State Water Project and Colorado River Aqueduct treated at MWD Diemer Water Treatment Plant
Injected into Alamitos Barrier
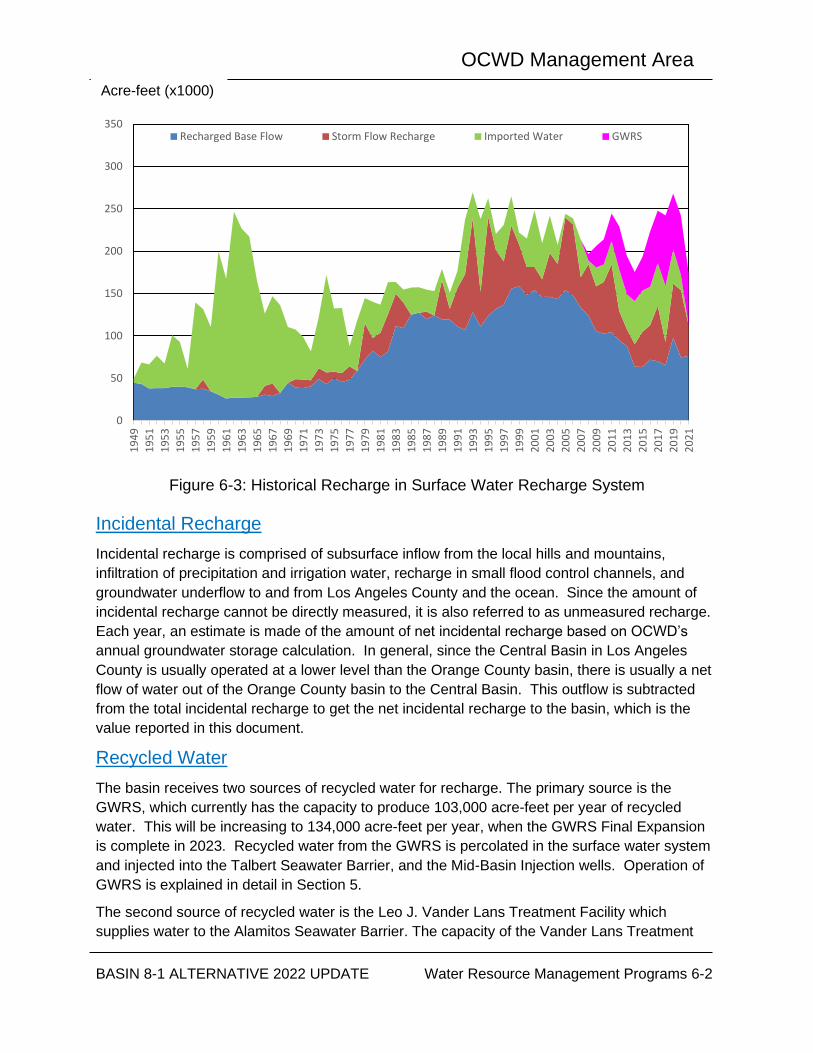
OCWD Management Area
BASIN 8-1 ALTERNATIVE 2022 UPDATE Water Resource Management Programs 6-2
Figure 6-3: Historical Recharge in Surface Water Recharge System
Incidental Recharge
Incidental recharge is comprised of subsurface inflow from the local hills and mountains,
infiltration of precipitation and irrigation water, recharge in small flood control channels, and
groundwater underflow to and from Los Angeles County and the ocean. Since the amount of
incidental recharge cannot be directly measured, it is also referred to as unmeasured recharge.
Each year, an estimate is made of the amount of net incidental recharge based on OCWD’s
annual groundwater storage calculation. In general, since the Central Basin in Los Angeles
County is usually operated at a lower level than the Orange County basin, there is usually a net
flow of water out of the Orange County basin to the Central Basin. This outflow is subtracted
from the total incidental recharge to get the net incidental recharge to the basin, which is the
value reported in this document.
Recycled Water
The basin receives two sources of recycled water for recharge. The primary source is the
GWRS, which currently has the capacity to produce 103,000 acre-feet per year of recycled
water. This will be increasing to 134,000 acre-feet per year, when the GWRS Final Expansion
is complete in 2023. Recycled water from the GWRS is percolated in the surface water system
and injected into the Talbert Seawater Barrier, and the Mid-Basin Injection wells. Operation of
GWRS is explained in detail in Section 5.
The second source of recycled water is the Leo J. Vander Lans Treatment Facility which
supplies water to the Alamitos Seawater Barrier. The capacity of the Vander Lans Treatment
0
50
100
150
200
250
300
3501
94
9
19
51
19
53
19
55
19
57
19
59
19
61
19
63
19
65
19
67
19
69
19
71
19
73
19
75
19
77
19
79
19
81
19
83
19
85
19
87
19
89
19
91
19
93
19
95
19
97
19
99
20
01
20
03
20
05
20
07
20
09
20
11
20
13
20
15
20
17
20
19
20
21
Recharged Base Flow Storm Flow Recharge Imported Water GWRS
Acre-feet (x1000)

OCWD Management Area
BASIN 8-1 ALTERNATIVE 2022 UPDATE Water Resource Management Programs 6-3
Facility was expanded from 3 mgd to 8 mgd but has generally not operated above 4 mgd for
extended periods of time for various reasons. WRD is working on increasing this facility’s online
performance. A portion of the water recharged in the Alamitos Barrier recharges the Orange
County Groundwater Basin with the remainder recharging the Central Basin in Los Angeles
County.
Imported Water
OCWD purchases imported water for recharge from the Municipal Water District of Orange
County (MWDOC), which is a member agency of MWD. Untreated imported water can be
delivered to the surface water recharge system in multiple locations, including Anaheim Lake
(OC-28/28A), Santa Ana River (OC-11), Irvine Lake (OC-13A), and San Antonio Creek near the
City of Upland (OC-59). These locations are shown in Figure 6-4. Connections OC-28, OC-11
and OC-13A supply OCWD with Colorado River Aqueduct water. Connection OC-59 supplies
OCWD with State Water Project water, and OC-28A (co-located with OC-28) supplies OCWD
with a variable blend of water from these two sources.
Figure 6-4: Locations of Imported Water Deliveries

OCWD Management Area
BASIN 8-1 ALTERNATIVE 2022 UPDATE Water Resource Management Programs 6-4
6.5.2 Surface Water Recharge Facilities
OCWD operates a network of 25 surface water facilities located adjacent to the Santa Ana River
in the City of Anaheim and Santiago Creek in the City of Orange as shown in Figure 6-5. The
system has a total storage capacity of over 25,000 acre-feet. OCWD carefully tracks the
amount of water being recharged in each facility on a daily basis.
Figure 6-5: OCWD Surface Water Recharge Facilities
Three full-time hydrographers control and monitor the recharge system. These hydrographers
and other OCWD staff prepare a monthly Water Resources Summary Report, which lists the
source and volume for each recharge water supply, provides an estimate of the amount of water
percolated in each recharge basin, documents total groundwater production from the basin, and
estimates the change in groundwater storage. The report also estimates the amount of
incidental recharge, evaporation and losses to the ocean – essentially a monthly water budget

OCWD Management Area
BASIN 8-1 ALTERNATIVE 2022 UPDATE Water Resource Management Programs 6-5
accounting. The monthly figures are compiled to determine yearly recharge and production
totals and used in the year-end determination of groundwater storage change.
6.6 MANAGEMENT OF SEAWATER INTRUSION
In the coastal area of Orange County, the primary source of saline groundwater is seawater
intrusion into the groundwater basin through permeable sediments underlying topographic
lowlands or gaps between the erosional remnants or mesas of the Newport-Inglewood Uplift.
Areas susceptible to intrusion are the Talbert, Bolsa, Sunset, and Alamitos gaps as shown in
Figure 3-26.
Seawater intrusion in the Talbert Gap area began as early as the 1920s as the previously
flowing artesian conditions within the shallow Talbert aquifer were gradually lowered until
groundwater levels declined below sea level due to unrestricted agricultural pumping. By the
1930s and 1940s, seawater had advanced more than one mile inland within the Talbert Gap,
forcing the closure of municipal supply wells owned and operated by the cities of Newport
Beach and Laguna Beach due to elevated salinity.
Seawater intrusion became a critical problem in the 1950s. Overdraft of the basin caused water
levels to drop as much as 40 feet below sea level. By the mid-1960s seawater had intruded
nearly four miles inland within the Talbert Gap. Intrusion was also observed in the Alamitos
Gap area along the Orange County/Los Angeles County border. During the 1950s and 1960s
seawater intrusion investigations in coastal Orange County were conducted by the USGS, DWR
and OCWD to define the nature and extent of the problem. During this time, OCWD slowed
seawater intrusion by filling the basin with imported Colorado River water in the Anaheim
Forebay area, thus reducing the overdraft throughout the basin and raising coastal groundwater
levels (DWR, 1966).
Largely based on the 1966 DWR study, OCWD constructed the initial Talbert Seawater
Intrusion Barrier in 1975 with 23 injection well sites. In 1965, a line of injection wells was
constructed across the Alamitos Gap to form a subsurface freshwater hydraulic barrier. The
Alamitos and Talbert barriers control seawater intrusion in their respective gaps by injecting
fresh water into a series of multi-depth wells targeting each individual aquifer zone that is
susceptible to seawater intrusion. The pressure mound resulting from this injection minimizes
seawater intrusion through these gaps into the basin.
Both the Alamitos and Talbert barriers have been expanded and improved periodically and have
allowed the basin to be operated more flexibly as a storage reservoir with an operating range of
500,000 acre-feet below full condition.
In July 2014, the OCWD Board of Directors adopted a Seawater Intrusion Prevention Policy that
contained the following tenets:
• Prevent degradation of the quality of the groundwater basin from seawater intrusion
• Effectively operate and evaluate the performance of the seawater barrier facilities

OCWD Management Area
BASIN 8-1 ALTERNATIVE 2022 UPDATE Water Resource Management Programs 6-6
• Adequately identify and track trends in seawater intrusion in susceptible coastal areas
and evaluate and act upon this information, as needed, to protect the groundwater basin
6.6.1 Talbert Seawater Intrusion Barrier
The Talbert Barrier consists of 36 injection well sites, shown in Figure 3-26, with the primary
alignment along Ellis Avenue approximately four miles inland from the ocean. Barrier injection
raises groundwater levels in the immediate vicinity and thus creates a groundwater mound that
acts as a hydraulic barrier to seawater that would otherwise migrate inland toward areas of
groundwater production.
From 1975 until 2008, a blend of deep well water, imported water and recycled water from the
former Water Factory 21 was injected into the barrier. In 2008, GWRS recycled water became
the primary supply used for the injection wells, with a small and intermittent portion of the supply
from potable imported water delivered via the City of Huntington Beach at the OC-44 turnout
and potable water delivered by the City of Fountain Valley (a blend of groundwater and imported
water). Since approval by the Regional Water Board in 2009, OCWD uses recycled water for all
of the injection well supply at the Talbert Barrier.
Prior to GWRS, barrier capacity averaged approximately 15 mgd but now averages
approximately 30 mgd with a typical seasonal range of 20 to nearly 40 mgd. Doubling the
injection capacity was necessary to prevent seawater intrusion as groundwater production
increased and was made possible by construction of additional injection wells and pipelines,
superior water quality (GWRS water), and improved barrier operations, such as more frequent
backwashing and rehabilitation. Barrier injection rates are adjusted based on overall basin
storage conditions and seasonally varying coastal water levels. Therefore, injection is typically
lower in the winter months and higher in the summer when increased coastal production causes
lower coastal groundwater levels. Approximately 85 to 90 percent of barrier injection is typically
targeted into the shallow and intermediate aquifer zones for seawater intrusion control on an
annual basis, while the other 10 to 15 percent goes into the deeper Main aquifer zone primarily
for basin replenishment. Based on the much steeper hydraulic gradient inland toward pumping
depressions (relative to that toward the coast), OCWD estimates that approximately 95 percent
of the water injected at the Talbert Barrier flows inland to replenish the basin, with the remainder
ultimately flowing to the ocean as subsurface outflow.
6.6.2 Alamitos Seawater Intrusion Barrier
The Alamitos Barrier Project was initially constructed in 1964 and went into operation in 1965 to
create a freshwater pressure ridge to prevent seawater intrusion from migrating through the
Alamitos Gap into the Central Basin of Los Angeles County and the Orange County
groundwater basin. The barrier alignment straddles the Los Angeles-Orange County line and
spans approximately 1.8 miles across the Alamitos Gap from Bixby Ranch Hill in the City of
Long Beach to the vicinity of Landing Hill in the City of Seal Beach.

OCWD Management Area
BASIN 8-1 ALTERNATIVE 2022 UPDATE Water Resource Management Programs 6-7
Under the terms of the 1964 Agreement for Cooperative Implementation of the Alamitos Barrier
Project (1964 Agreement), the barrier facilities are co-owned by OCWD and the Los Angeles
County Flood Control District (LACFCD, a division of LACPW) and currently include 58 injection
wells and 238 active monitoring wells as shown in Figure 3-26. The barrier is operated and
maintained by LACPW under the direction of the Alamitos Barrier Joint Management Committee
(JMC), whose membership includes OCWD, LACPW, WRD, City of Long Beach, and Golden
State Water Company.
The barrier has been incrementally expanded over time to include the construction of additional
injection and monitoring wells. Since the initial 14 injection wells were constructed in 1964, an
additional 44 injection wells have been installed over eight phases of well construction. Most
recently in 2018, with the addition of 17 new injection wells at 8 locations to control breaches
through the barrier where well spacing was too large and injection capacity too small.
Similar to the Talbert Barrier, the Alamitos Barrier consists of both nested and cluster-type
injection wells screened discretely in each aquifer zone in order to control the injection rate and
injection pressure into each targeted aquifer zone independently since each aquifer zone has
different physical characteristics and groundwater levels. In addition, there are a couple “dual-
point” injection wells that consist of only one well casing, but two different screened interval
depths separated inside the well by an inflatable packer and two separate injection drop pipes.

OCWD Management Area
Basin 8-1 ALTERNATIVE 2022 UPDATE Notice and Communication 7-1
SECTION 7 NOTICE AND COMMUNICATION
7.1 DESCRIPTION OF GROUNDWATER USERS
The local agencies that produce the majority of the groundwater from the basin are listed in
Table 7-1 with geographic boundaries shown in Figure 3-3. OCWD meets monthly with 19
major water retail agencies, referred to as the groundwater producers, to discuss and evaluate
basin management issues and proposed projects and work cooperatively among the agencies
in the OCWD Management Area.
Table 7-1: Major Groundwater Producers
CITIES
Anaheim Huntington Beach Santa Ana
Buena Park La Palma Seal Beach
Fountain Valley Newport Beach Tustin
Fullerton Orange Westminster
Garden Grove
WATER DISTRICTS AND WATER COMPANIES
East Orange County Water District Mesa Water District
Golden State Water Company Serrano Water District
Irvine Ranch Water District Yorba Linda Water District
The monthly meeting with OCWD staff and the groundwater producers provides a forum for the
groundwater producers to provide their input to OCWD on important issues such as:
• Setting the Basin Production Percentage (BPP) each year
• Reviewing the merits of proposed capital improvement projects
• Purchasing imported water to recharge the groundwater basin
• Reviewing water quality data and regulations
• Maintaining and monitoring basin water quality
• Budgeting, replenishment assessment and considering other important policy
decisions

OCWD Management Area
Basin 8-1 ALTERNATIVE 2022 UPDATE Notice and Communication 7-2
7.2 PUBLIC PARTICIPATION
On September 30, 2021, OCWD sent a letter via email to all of the Basin 8-1 agencies to inform
them that the 2017 Alternative was being updated and would be available for review and
comment. No comments were received by any of the agencies contacted.
A draft of the 2022 Update was presented to the OCWD Board and posted on the OCWD
website on November 18, 2021, to allow for public review and comment. The final 2022 Update
was presented to the OCWD Board on December 15, 2021. At this board meeting, a resolution
was adopted to support the submission of the 2022 Update to DWR.
7.3 COMMUNICATION PLAN
Proactive community outreach and public education are central to OCWD. The 2017 Alternative
provides detailed information on OCWD’s communication plan.

OCWD Management Area
BASIN 8-1 ALTERNATIVE 2022 UPDATE Sustainable Basin Management 8-1
SECTION 8 SUSTAINABLE BASIN MANAGEMENT
8.1 SUSTAINABILITY GOAL
The sustainability goal for the OCWD Management Area is as follows:
Continue to manage the groundwater basin to prevent basin conditions that would lead
to significant and unreasonable undesirable results as defined by California Water Code
Section 10721(x).
Existing monitoring and management programs in place today enable OCWD to sustainably
manage the groundwater basin. Since its formation in 1933, OCWD has developed a managed
aquifer recharge program, constructed hundreds of monitoring wells, developed water quality
monitoring programs, constructed a large surface water recharge system, installed seawater
intrusion barriers, and managed the volume of groundwater production through a scientifically
based understanding of the basin’s sustainable yield and the use of financial incentives.
Continued successful protection of the groundwater basin requires that OCWD’s management
of the basin be able to adapt to changing conditions affecting the groundwater basin. The
following sections describe the sustainable basin management for each of the undesirable
results as defined in the California Water Code, Section 10721(x).

OCWD Management Area
2017 BASIN 8-1 ALTERNATIVE Sustainable Management: Groundwater Levels 9-1
SECTION 9 SUSTAINABLE MANAGEMENT RELATED
TO GROUNDWATER LEVELS
9.1 HISTORY/SUMMARY
OCWD manages the basin for long-term sustainability by maximizing recharge of the basin and
managing basin production within sustainable levels. This section will discuss the relationship
between groundwater elevations and sustainable groundwater management.
Groundwater elevations over the last twenty years exhibit short-term changes and long-term
(multi-year) trends see Figures 3-10 through 3-13). Short-term elevation changes typically
reflect seasonal variations in pumping and recharge, while multi-year trends reflect the effects of
extended periods of above- or below-average precipitation and/or availability of imported water.
Groundwater elevation is monitored at over 1,000 individual measuring points, including key
wells formerly designated under the CASGEM program which has been superseded by annual
reporting required under SGMA. OCWD will be reporting water level data for the basin except
for the La Habra-Brea Management Area.
In general, groundwater elevations in the Shallow Aquifer system show less amplitude than
those in the underlying Principal and Deep Aquifer systems due to the higher degree of
pumping and confinement of the Principal and Deep Aquifer systems. Because approximately
95 percent of all production occurs from wells screened within the Principal Aquifer system,
groundwater elevations within this system are typically lower than those in the overlying Shallow
Aquifer system and, in some areas, the underlying Deep Aquifer system. Vertical hydraulic
gradients created by pumping and recharge drive groundwater into the Principal Aquifer system
from the overlying Shallow Aquifer system and, to a lesser extent, from the Deep Aquifer
system.
Long-term data demonstrates that groundwater elevations in the basin have exhibited multi-year
cyclical patterns and have not experienced chronic lowering due to OCWD’s management
approach of maintaining basin storage within the established operating range. As a result, the
undesirable effect of “chronic lowering of groundwater levels indicating a significant and
unreasonable depletion of supply” is not occurring in the OCWD Management Area and is not
expected to occur in the future as OCWD continues to manage the basin as described in this
report.
9.2 MONITORING OF GROUNDWATER LEVELS FOR
SUSTAINABILITY
As explained in Section 3.2, OCWD monitors water levels at over 1,000 individual measuring
points on a monthly or bi-monthly basis to evaluate the effects of pumping, recharge or injection
operations. Additional monitoring is conducted as needed in the vicinity of OCWD’s recharge

OCWD Management Area
2017 BASIN 8-1 ALTERNATIVE Sustainable Management: Groundwater Levels 9-2
facilities, seawater barriers and areas of special investigation where drawdown, water quality
impacts or contaminants are of concern.
Groundwater elevation contour maps for the Shallow, Principal and Deep Aquifers are prepared
annually and are scanned and digitized into OCWD’s GIS database. Figures 3-5, 3-6, and 3-7
show the groundwater elevation contours for June 2021 for all three basin aquifers. The
changes in groundwater elevations for the three aquifers are also calculated on an annual basis.
The water level changes for each of the three aquifers for June 2020 to June 2021 are shown in
Figures 9-1, 9-2 and 9-3.
9.3 MANAGEMENT OF GROUNDWATER LEVELS FOR
SUSTAINABILITY
For each of the three major aquifer systems, GIS mapping is used to multiply the water level
changes by a grid of aquifer storage properties from OCWD’s calibrated groundwater flow
model. This results in a storage change volume for each of the three aquifer layers which are
totaled to provide a net annual storage change for the basin. Thus, measurements of
groundwater elevations are ultimately used to calculate total basin storage levels each year.

OCWD Management Area
2017 BASIN 8-1 ALTERNATIVE Sustainable Management: Groundwater Levels 9-3
Figure 9-1: Shallow Aquifer Water Level Change, June 2020 to June 2021
In determining the operating range for groundwater storage levels, OCWD considered the
potential negative impacts that could occur due to unreasonable and chronic lowering of
groundwater elevations. These potential negative impacts include increased costs for
groundwater producers to pump groundwater, decreased yield in production wells, increased
risk of land subsidence, and increased risk of seawater intrusion.
Monitoring and management of groundwater elevations in the OCWD Management Area is
most important in the coastal areas in order to protect groundwater basin water quality from
seawater intrusion. Management programs that enable long-term sustainable basin
management related to groundwater elevations in the coastal areas include the operation of the
Alamitos and Talbert Seawater Intrusion Barriers and the Coastal Pumping Transfer Program.

OCWD Management Area
2017 BASIN 8-1 ALTERNATIVE Sustainable Management: Groundwater Levels 9-4
Figure 9-2: Principal Aquifer Water Level Change, June 2020 to June 2021

OCWD Management Area
2017 BASIN 8-1 ALTERNATIVE Sustainable Management: Groundwater Levels 9-5
Figure 9-3: Deep Aquifer Water Level Change, June 2020 to June 2021
9.4 DEFINITION OF SIGNIFICANT AND UNREASONABLE
LOWERING OF GROUNDWATER LEVELS
OCWD closely monitors groundwater levels in the three major aquifer systems (Shallow,
Principal and Deep) for a number of purposes including determination of groundwater storage
within the basin. OCWD uses groundwater storage conditions to manage the basin sustainably
by keeping storage levels within an operating range up to 500,000 acre-feet below full condition.
Significant and unreasonable reduction of groundwater in storage could occur in the event that
the volume of groundwater in storage fell below the 500,000 acre-feet below full condition for an
extended period of time. If OCWD were to consider an operating range below 500,000 acre-
feet from full condition, additional analysis and monitoring would be needed.

OCWD Management Area
2017 BASIN 8-1 ALTERNATIVE Sustainable Management: Groundwater Levels 9-6
9.5 DETERMINATION OF MINIMUM THRESHOLD
The minimum threshold for significant and unreasonable reduction in groundwater levels is
reached when the storage volume of the groundwater basin falls below the operating range of
up to 500,000 acre-feet below full condition for an extended period of time.
OCWD Management Area
BASIN 8-1 ALTERNATIVE 2022 UPDATE Sustainable Management: Basin Storage 10-1
SECTION 10 SUSTAINABLE MANAGEMENT RELATED
TO BASIN STORAGE
10.1 HISTORY
Within the Orange County Groundwater Basin, there is an estimated 66 million acre-feet of
water in storage (OCWD, 2007). In spite of the large amount of stored water, there is a
comparatively narrow operating range within which the basin can be safely operated.
The operating range of the basin is considered to be the maximum allowable storage range over
the long-term without incurring detrimental impacts. The upper limit of the operating range is
defined by the full basin condition. Although it may be physically possible to fill the basin higher
than this full condition, it could lead to detrimental impacts such as percolation reductions in
recharge facilities and increased risk of shallow groundwater seepage in low-lying coastal
areas.
The lower limit of the operating range is considered to be 500,000 acre-feet below full condition.
Although it may be considered to be acceptable to allow the basin to decline below 500,000
acre-feet below full condition for brief periods due to severe drought conditions and lack of
imported water for basin recharge, it is not considered to be an acceptable management
practice to intentionally manage the basin for sustained periods at this lower limit for the
following reasons:
• Increased risk of seawater intrusion
• Increased risk of land subsidence
• Depletion of water in storage available for future drought conditions
• Some wells potentially becoming inoperable due to lower groundwater levels
• Increased costs to pump groundwater for groundwater users
• Increased potential for upwelling of amber-colored groundwater from the Deep Aquifer
It is important to note that detrimental impacts do not suddenly happen when storage levels fall
to 500,000 or more acre-feet below full condition; rather, they occur incrementally, or the
potential for their occurrence grows as the basin declines to lower levels. OCWD has used the
basin model computer simulations to evaluate the potential for detrimental impacts if storage
were to fall to 700,000 acre-feet from full. Basin model runs at 700,000 acre-feet below full
condition indicates the potential for increased seawater intrusion and considerably more
production wells being impacted by low pumping levels. Thus, a reduction of up to 700,000
acre-feet of groundwater in storage is only considered acceptable during an extreme
emergency, such as a disruption in imported water supplies due to an earthquake. Negative or
adverse impacts that are considered when establishing the operating range include chronic
lowering of groundwater levels indicating a significant and unreasonable depletion of supply if

OCWD Management Area
BASIN 8-1 ALTERNATIVE 2022 UPDATE Sustainable Management: Basin Storage 10-2
continued over the long-term, increased seawater intrusion, significant and unreasonable land
subsidence that substantially interferes with surface land uses, and increased pumping costs.
The current policy of maintaining a groundwater storage level of up to 500,000 acre-feet below
full was established based on completion of a comprehensive hydrogeological study of the
basin in 2007 (OCWD, 2007).
The basin’s storage level is quantified based on a benchmark defined as the full basin condition.
Although the groundwater basin rarely reaches the full basin condition, basin storage has
fluctuated within the operating range for many decades. OCWD manages groundwater
pumping such that it is sustainable over the long term; however, in any given year pumping may
exceed recharge or vice versa. Thus, the amount of groundwater stored in or withdrawn from
the basin varies from year to year and often goes through multi-year cycles of emptying and
filling, which generally correlates with state-wide and/or local precipitation patterns.
Each year OCWD calculates the volume of groundwater storage change from a theoretical “full”
benchmark condition based on a calculation using changes in groundwater elevations in each of
the three major aquifer systems and aquifer storage coefficients. This calculation is checked
against an annual water budget that accounts for all production, measured recharge, and
estimated unmeasured recharge. The amount of available or unfilled storage from the
theoretical full condition from WY1958-59 to 2020-21 is shown in Figure 1-3.
Maintaining the basin storage condition on a long-term basis within this operating range allows
for long-term sustainable management of the basin without experiencing undesirable effects.
Short-term excursions from the operating range due to extreme drought or other factors are not
expected to cause adverse impacts but would need to be monitored closely and be of limited
duration. In the California Water Plan Update 2013 (DWR, 2014) this manner of groundwater
basin management is described as follows:
“Change in groundwater storage is the difference in stored groundwater volume
between two time periods…However, declining storage over a period
characterized by average hydrologic conditions does not necessarily mean that
the basin is being managed unsustainably or is subject to conditions of
overdraft. Utilization of groundwater in storage during years of diminishing
surface water supply, followed by active recharge of the aquifer when surface
water or other alternative supplies become available, is a recognized and
acceptable approach to conjunctive water management.” (p. SC-77)
10.2 CALCULATION OF GROUNDWATER STORAGE LEVELS
The estimated historical minimum storage level of 500,000 to 700,000 acre-feet below full
condition occurred in 1956-57 (DWR, 1967; OCWD, 2003). Since this time, the basin storage
fluctuated within the operating range reaching a full condition in 1969 and 1983.
OCWD uses two methods to calculate the storage condition of the basin: (1) water budget
method and (2) three-layer storage change method. The water budget method is simply an
accounting of the inflows to the basin and outflows. This data is collected and compiled on a

OCWD Management Area
BASIN 8-1 ALTERNATIVE 2022 UPDATE Sustainable Management: Basin Storage 10-3
monthly basis. Estimates of unmeasured or incidental recharge are used based on a statistical
relationship between historical local precipitation and calculated unmeasured recharge.
Unmeasured recharge is trued up at the end of the year with the final reports of inflows and
outflows and basin storage change (based on groundwater level changes). This method
produces a monthly estimate of the change in groundwater storage and allows for real-time
decision making with respect to managing the basin.
In 2007, OCWD instituted a new three-layer change in storage method for calculating the
amount of groundwater in storage (OCWD, 2007). The three-layer method involves creating
groundwater elevation contour maps for each of the three aquifer layers (Shallow, Principal and
Deep aquifers) for conditions at the end of June of each year. Prior to this time, groundwater
storage was determined based on a single groundwater elevation map that was essentially a
composite of the Shallow and Principal aquifers.
10.3 SUSTAINABLE MANAGEMENT PROGRAMS
10.3.1 Basin Operating Range
Each year OCWD assesses current basin storage and projected water supply availability as
factors in establishing how much groundwater can be pumped from the basin for the following
year. If basin storage approaches or falls within the lower end of the established operating
range, issues that are evaluated when considering the management of the basin include the
current status of seawater intrusion protective measures, monitoring of ground surface
elevations to assess the risk of land subsidence, inflow of amber-colored water or poor quality
groundwater into the Principal Aquifer from underlying or overlying aquifers, and the number of
shallow production wells that would become affected by lower groundwater levels. On the other
hand, when operating the basin near the higher end of the storage range, considerations
include the potential to increase groundwater pumping, purchase less imported replenishment
water, and the potential for more groundwater outflow to Los Angeles County.
10.3.2 Balancing Production and Recharge
Over the long-term, the basin must be maintained in an approximate balance to ensure the
long-term viability of basin water supplies. In a given year, water withdrawals may exceed water
recharged as long as over the course of a number of years this is balanced by years where
water recharged exceeds withdrawals. Levels of total basin production and total water
recharged since WY1999-00 are shown in Figure 1-4.
10.3.3 Managing Basin Pumping
The primary mechanisms used by OCWD to manage pumping are the Basin Production
Percentage (BPP) and the Basin Equity Assessment (BEA). The ability to assess the BPP and
the BEA were provided to OCWD through an amendment to the OCWD Act in 1969. Section
31.5 of the OCWD Act empowers the Board to annually establish the BPP, defined as:

OCWD Management Area
BASIN 8-1 ALTERNATIVE 2022 UPDATE Sustainable Management: Basin Storage 10-4
“…the ratio that all water to be produced from groundwater supplies with the
district bears to all water to be produced by persons and operators within the
District from supplemental sources and from groundwater within the District
during the ensuing water year.”
In other words, the BPP is a percentage of each Producer’s water supply (supplemental and
groundwater sources) that comes from groundwater pumped from the basin. The BPP is set
uniformly for all groundwater producers. Groundwater production at or below the BPP is
assessed the Replenishment Assessment (RA). Production above the BPP is charged the RA
plus the Basin Equity Assessment (BEA). The BEA is set by the Board and is presently
calculated so that the cost of groundwater production above the BPP is equivalent to the cost of
purchasing imported potable supplies. This approach serves to discourage, but not eliminate,
production above the BPP. In practice, groundwater producers rarely pump in excess of the
BPP as doing so triggers a requirement to pay the BEA, thereby eliminating any cost savings
that a pumper might obtain by pumping an amount in excess of the BPP. Collection of the BEA
provides funds for OCWD to purchase additional replenishment water (where determined
appropriate by OCWD). If necessary, the BEA can be increased to further discourage
production above the BPP.
The BPP is set after evaluating groundwater storage conditions, availability of recharge water
supplies and basin management objectives. OCWD’s goal is to set the BPP as high as possible
to allow groundwater producers to sustainably maximize pumping and reduce their overall water
supply cost.
To change the BPP, the Board of Directors must hold a public hearing. Raising or lowering the
BPP allows OCWD to manage the amount of pumping from the basin. The BPP is lowered
when basin conditions necessitate a decrease in pumping. A lower BPP results in the need for
groundwater producers to purchase additional, more expensive imported water.
The methodology for setting the BPP and OCWD polices related to the BPP are described
further in the 2017 Alternative.
Table 10-1 shows the management actions to be used to guide OCWD in setting the BPP. As
the BPP is annually set in April for the following fiscal year (but may be changed throughout the
year), the projected change in basin storage would be estimated for the end of that fiscal year
(as of June 30), given various assumptions of basin pumping, inflows and outflows.
Maintaining some available storage space in the basin allows for maximizing surface water
recharge when such supplies are available, especially in relatively wet years. By keeping the
basin relatively full during wet years and for as long as possible in years with near-normal
recharge, the maximum amount of groundwater could be maintained in storage for future
drought conditions. During dry hydrologic years when less water would be available for
recharge, the BPP could be lowered to maintain groundwater storage levels.
At the beginning of 2015, OCWD committed to purchase 650,000 acre-feet of imported water to
recharge the basin over a ten-year time period. This amount of imported water for recharge into
the basin will help maintain the BPP and assist in managing the basin storage level within the
operating range. OCWD works to maintain a Water Reserve Fund to purchase imported water

OCWD Management Area
BASIN 8-1 ALTERNATIVE 2022 UPDATE Sustainable Management: Basin Storage 10-5
from MWD. Each year, a specific amount of money is budgeted to purchase imported water
and, if water is not available from MWD, the funds are carried over to the next year in the Water
Reserve Fund.
Table 10-1: Management Actions based on Change in Groundwater Storage
Available Storage Space
(amount below full basin condition) Basin Management Actions to Consider
Less than 100,000 acre-feet Raise BPP
100,000 to 300,000 acre-feet Maintain and/or raise BPP towards 75% goal
300,000 to 350,000 acre-feet Seek additional supplies to refill basin and/or
lower the BPP
Greater than 350,000 acre-feet Seek additional supplies to refill basin & lower the
BPP
Basin Production Limitation
Another management tool that enables OCWD to sustainably manage the basin is the Basin
Production Limitation. Section 31.5(g)(7) of the OCWD Act authorizes limitations on production
and the setting of surcharges when those limits are exceeded. This provision can be used
when it is necessary to shift pumping from one area of the basin to another. An example of this
is the Coastal Pumping Transfer Program, which shifts pumping from the coastal area to inland
to minimize seawater intrusion, when necessary.
10.3.4 Supply Management Strategies
One of OCWD’s basin management objectives is to maximize groundwater recharge. This is
achieved through increasing the efficiency of and expanding OCWD’s recharge facilities and the
supply of recharge water. Construction and operation of the GWRS has provided a substantial
increase in supply of water available to recharge the basin. Additional OCWD supply
management programs include developing increased stormwater capture programs behind
Prado Dam in cooperation with the U.S. Army Corps of Engineers, encouraging and
participating in water conservation efforts, and working with MWD and the Municipal Water
District of Orange County in developing and conducting other supply augmentation projects and
strategies.
10.4 DEVELOPING NEW LOCAL WATER RESOURCES
POLICY
In July 2020, the District adopted a policy called the Developing New Local Water Resources
Policy to acknowledge that the local multi-billion-dollar economy and 2.5 million citizens that rely
on groundwater as their primary water supply require a reliable, sustainable and economical

OCWD Management Area
BASIN 8-1 ALTERNATIVE 2022 UPDATE Sustainable Management: Basin Storage 10-6
water source to remain healthy and strong. It further acknowledges that the imported water that
is purchased annually to meet the needs of the groundwater producers is becoming uncertain
as environmental, agricultural, and urban interests maneuver to obtain a greater share and is
susceptible to impacts from climate change. The Policy contains the following tenets:
• The District recognizes the impacts of climate change and their ability to disrupt
predictions of future local water supplies for the District’s service territory
• The District will evaluate and undertake economical and environmentally sensitive
projects and programs to work towards the goal of ensuring adequate water supplies are
always available to its service territory
• The types of projects that will be evaluated include: (1) Maximizing Santa Ana River
base and storm flow capture, (2) Increasing water conservation, (3) Increasing water
recycling, (4) Improving the reliability of imported water supplies, (5) Brackish water
desalination, (6) weather modification/cloud seeding; and (7) Seawater desalination
Conjunctive Use and Water Transfers
By agreement with OCWD, MWD established a Conjunctive Use Project (CUP) in the OCWD
Management Area by purchasing the right to store up to 66,000 acre-feet of water in the
groundwater basin until 2028. OCWD used the funds provided by MWD to improve basin
management facilities including the construction of eight new production wells for water retail
agencies and new injection wells for the Talbert Barrier. Under the agreement, MWD may
request that stored water be extracted up to a maximum of 22,000 acre-feet each year.
OCWD reviews opportunities for additional conjunctive use projects that would store water in
the basin and potentially in other groundwater basins. Additionally, OCWD reviews
opportunities for water transfers that could provide additional sources of recharge water. Such
projects are evaluated carefully with respect to their impact on available storage, reliability and
cost effectiveness.
10.4.1 Water Demands
Water demands within the OCWD Management Area for WY2016-17 to 2020-21 averaged
400,000 acre-feet per year (Figure 6-1). Total demand includes the use of groundwater, surface
water from Santiago Creek and Irvine Lake, recycled water, and imported water.
Projected Water Demands
OCWD estimated future total water demands (including recycled water) within the OCWD
Management Area to be approximately 431,000 acre-feet per year in 2050. This is based on a
water demand study jointly funded by OCWD and MWDOC. This study was undertaken to
assist the 19 major groundwater producers in the development of their 2020 Urban Water
Management Plans. Water Demands within the OCWD Management Area was determined by
summing the 19 producer future estimates and water produced by private, mutual water
company, and irrigation wells.

OCWD Management Area
BASIN 8-1 ALTERNATIVE 2022 UPDATE Sustainable Management: Basin Storage 10-7
Drought Management
During a drought, flexibility to manage pumping from the basin becomes increasingly important.
The OCWD Management Area may experience a decline in the supply of recharge water (local
supply of Santa Ana River water and net incidental recharge) of 55,000 acre-feet per year or
more during drought.
Provided that the basin has available water in storage within the established operating range,
this stored water provides a valuable water supply asset during drought conditions. Ensuring
that the basin can provide a buffer against drought conditions requires:
• Maintaining sufficient water in storage that can be pumped out in time of need; and
• Possessing a plan to recover basin storage following the drought, including having a
reserve account with sufficient funds to purchase replenishment water.
A sufficient supply of stored groundwater provides a safe and reliable buffer to manage for
drought periods. If the basin, for example, has an available storage level of 150,000 acre-feet
and can be drawn down to 500,000 acre-feet without irreparable seawater intrusion, a supply of
350,000 acre-feet is available for increased production. In a hypothetical five-year drought, an
additional 70,000 acre-feet per year may be produced from the basin for five years without
jeopardizing the long-term health of the basin. In addition to reducing pumping when the basin
is at lower storage levels, planning for refilling the basin is important. Approaches for refilling
the basin are described in Table 10-2.
10.5 DEFINITION OF SIGNIFICANT AND UNREASONABLE
REDUCTION OF GROUNDWATER STORAGE
OCWD manages the groundwater basin to maintain groundwater storage levels within an
operating range of up to 500,000 acre-feet below the full condition. Significant and
unreasonable reduction of groundwater in storage would occur when the volume of groundwater
in storage fell below the 500,000 acre-feet below full condition for an extended period of time. If
OCWD were to consider an operating range below 500,000 acre-feet additional analysis and
monitoring would be needed.

OCWD Management Area
BASIN 8-1 ALTERNATIVE 2022 UPDATE Sustainable Management: Basin Storage 10-1
Table 10-2: Approaches to Refilling the Basin
APPROACH DISCUSSION
Decrease Total
Water Demands • Increase water conservation and water-use efficiency measures
Decrease BPP • Allows groundwater levels to recover rapidly
• Decreases revenue to the OCWD
• Increases water cost for groundwater producers
• Does not require additional recharge facilities
• Dependent upon other sources of water (e.g., imported water) being
available to substitute for reduced groundwater pumping
Increase Recharge • Dependent on increased supply of recharge water
• Replenishment could be in the form of in-lieu water (additional
imported water delivered to groundwater producers instead of
groundwater pumping)
• Water transfers and exchanges could be utilized to provide the
increased supply of recharge water
• May be dependent on building and maintaining excess recharge
capacity (which may be underutilized in non-drought years)
Combination of the
Above • A combination of the approaches provides flexibility and a range of
options for refilling the basin
10.6 DETERMINATION OF MINIMUM THRESHOLDS
The minimum threshold for significant and unreasonable reduction in groundwater in storage is
reached when the storage volume of the groundwater basin falls below the operating range of
up to 500,000 acre-feet below full condition for an extended period of time.

OCWD Management Area
BASIN 8-1 ALTERNATIVE 2022 UPDATE Sustainable Management: Water Quality 11-1
SECTION 11 SUSTAINABLE MANAGEMENT RELATED
TO WATER QUALITY
OCWD has extensive monitoring and management programs in place to protect the
groundwater basin from significant and unreasonable degradation of water quality including
migration of contaminant plumes that impair water supplies. These programs include
monitoring, remediation of contaminated groundwater, and recharging high-quality recycled
water. This section describes sustainable basin management related to the water quality
programs and projects instituted to prevent degradation of water quality and to remediate water
quality problems in the OCWD Management Area.
11.1 SALINITY MANAGEMENT
Management of salt and nitrate concentrations in groundwater is important to maintaining the
long-term sustainable use of groundwater supplies. OCWD also operates the Prado Wetlands
to remove nitrate from Santa Ana River (SAR) water that is recharged into the groundwater
basin. These efforts help provide high-quality groundwater to water users in Orange County.
In 2020, OCWD completed an evaluation of future TDS and nitrate concentrations in the Orange
and Irvine Management Zones (OCWD, 2020). Figure 3-16 shows the areal extent of these
zones, which are not to be confused with the OCWD Management Area that is the subject of
this report. The 2020 update is similar to an analysis conducted in 2016 (OCWD, 2016) and
involved using a model to evaluate the effects of different basin management scenarios on TDS
and nitrate concentrations over the next 30 years. One of the key outputs of the model is the
calculated ambient TDS and nitrate concentrations for groundwater in the Orange and Irvine
Management Zones. The model-calculated ambient concentration represents a volume-
weighted average value for the Shallow and Principal Aquifers. The report was prepared to
meet regulatory requirements of the Regional Water Board as part of the watershed-wide salt
and nutrient management plan.
Data and information used for this analysis included:
• Quantity and quality of water recharged through surface recharge facilities and injection
wells
• Quantity and quality of unmeasured recharge, such as percolation of irrigation water into
the groundwater basin
• Measurements of groundwater pumping
• Estimates of groundwater outflow from the Orange Management Zone
The most significant change from the prior analysis is the impact of the GWRS Final Expansion,
which increases the volume of low-TDS recycled water recharged by 30,000 acre-feet per year.
Because OCWD is obtaining the additional water from OC San Plant No. 2, the overall TDS of
the recycled water generated increases slightly from 60 mg/L to 86 mg/L.

OCWD Management Area
BASIN 8-1 ALTERNATIVE 2022 UPDATE Sustainable Management: Water Quality 11-2
The quantity and quality of water recharged in the model for the Baseline Scenario are shown in
Table 11-1.

OCWD Management Area
BASIN 8-1 ALTERNATIVE 2022 UPDATE Sustainable Management: Water Quality 11-1
Table 11-1: Baseline Projected Future Salt Inflows
Source of Water Recharge
Volume
(acre-feet/yr)
TDS Conc.
(mg/L)
Mass
(tons/yr)
Deep percolation of precipitation* 6,500 100 900
Percolation of applied water* 9,000 1,900 23,200
Subsurface inflow* 44,500 1,290 78,200
SAR base flow 52,000 700 49,500
SAR storm flow 50,000 200 13,600
Recycled water (GWRS) 133,000 86 15,600
Alamitos Barrier 2,500 350 950
MWD imported water 0 0 0
Total 297,000 449 181,200
*Component of unmeasured recharge
The Baseline Scenario assumes that no imported water is used for recharge for the 30-year
period and is utilized to compare with other model runs and determine how changing model
inputs affect the predicted concentration. The projected trend for TDS for the Baseline declines
from the current ambient groundwater concentration of 603 mg/L to 569 mg/L in 30 years as
shown in Figure 11-1. Seven additional scenarios were run to model different quantities of
recharge source water. The projected 30-year TDS for these scenarios range from 559 mg/L to
580 mg/L. This shows the tremendous impact of low-TDS GWRS water in lowering the overall
salinity in the basin over time regardless of how much water is obtained from other recharge
sources, such as higher TDS imported water.

OCWD Management Area
BASIN 8-1 ALTERNATIVE 2022 UPDATE Sustainable Management: Water Quality 11-2
Figure 11-1: Estimated TDS Concentration in Base Case for 30-year Period
With regards to nitrate, the approach used to estimate future nitrate concentrations was similar
to the approached used for TDS projections. The nitrate (as nitrogen, N) concentration for each
inflow component was estimated using available data. Table 11-2 summarizes the inflow terms
and their nitrate-N concentrations for the Baseline Scenario.
The flow-weighted average nitrate (as N) concentration for all inflows to the management zone
is 2.3 mg/L. The initial concentration was set at 2.95 mg/L (based on the current ambient
concentration for the most recent 20-year period).
Since the inflow concentration is less than the initial concentration, the estimated future nitrate
(as N) concentration gradually decreases. For the Baseline Scenario, the ambient nitrate (as N)
concentration is projected to decrease from 2.95 mg/L to 2.8 mg/L over the course of 30 years.
Again, as with TDS, the impact of recharging large volumes of high quality GWRS water lowers
nitrate concentrations in basin groundwater over time.
550
560
570
580
590
600
610
620
2018 2023 2028 2033 2038 2043 2048
TDS(mg/L)
Year
2018 Ambient Water Quality
Water Quality Objective
Projected Ambient Water Quality

OCWD Management Area
BASIN 8-1 ALTERNATIVE 2022 UPDATE Sustainable Management: Water Quality 11-1
Table 11-2: Baseline Future Nitrate (as N) Inflows
Inflow Volume
(Acre-Feet/yr)
Nitrate-N
Conc.(mg/L)
Mass
(tons/yr)
Deep percolation of precipitation* 6,500 1 9
Percolation of applied water* 9,000 10 122
SAR base flow 52,000 3.6 255
SAR storm flow 50,000 1.3 88
Imported water recharge 0 0 0
Recycled water recharge (GWRS) 133,000 1.0 181
Subsurface inflow* 44,500 4.2 253
Alamitos Barrier 2,000 1.4 4
Total 297,000 2.3 657
*component of unmeasured recharge
11.2 GROUNDWATER QUALITY IMPROVEMENT PROJECTS
This section describes specific projects that improve groundwater quality by removing TDS,
nitrate, VOCs and other constituents, including PFAS. The locations of these projects, except
for PFAS, are shown in Figure 11-2. PFAS projects are located at specific groundwater
producer wells.

OCWD Management Area
BASIN 8-1 ALTERNATIVE 2022 UPDATE Sustainable Management: Water Quality 11-2
Figure 11-2: Water Quality Improvement Projects and Programs
North Basin Groundwater Protection Program
The U.S. Environmental Protection Agency (USEPA) is taking the lead to remediate a VOC
plume in the North Basin area of the groundwater basin as shown in Figure 11-3. Groundwater
contamination is primarily found in the Shallow Aquifer, which is generally less than 200 feet
deep; however, VOC-impacted groundwater has migrated downward into the Principal Aquifer
tapped by production wells. The contamination continues to migrate both laterally and vertically
threatening downgradient production wells operated by the cities of Fullerton and Anaheim and
other agencies. OCWD is conducting a remedial investigation/feasibility study under USEPA
oversight to evaluate and develop effective remedies to address the contamination under the
National Contingency Plan (NCP) process. In September 2020 the USEPA included the North
Basin site on the National Priorities (Superfund) List.

OCWD Management Area
BASIN 8-1 ALTERNATIVE 2022 UPDATE Sustainable Management: Water Quality 11-3
Figure 11-3: North Basin Groundwater VOC Plume
South Basin Groundwater Protection Program
Groundwater contaminated with VOCs and perchlorate in the South Basin area of the
groundwater basin is shown in Figure 11-4. Elevated concentrations of perchloroethylene
(PCE), trichloroethylene (TCE), and perchlorate were detected in Irvine Ranch Water District’s
Well No. 3, located in Santa Ana. OCWD’s remedial investigation has resulted in the
delineation of an approximately 2-mile long comingled contaminant plume. With the remedial
investigation complete, OCWD is proceeding with a feasibility study to evaluate and develop
remedial measures in cooperation with regulatory agencies and stakeholders following the NCP
process. In tandem with OCWD’s remediation program to address off-site contamination, the
Regional Water Board and DTSC are overseeing investigation and remediation activities at the
contaminant source sites.
MTBE Remediation
In 2003, OCWD filed suit against numerous oil and petroleum-related companies that produce,
refine, distribute, market, and sell MTBE and other oxygenates. The suit seeks funding from

OCWD Management Area
BASIN 8-1 ALTERNATIVE 2022 UPDATE Sustainable Management: Water Quality 11-4
these responsible parties to pay for the investigation, monitoring and removal of oxygenates
from the basin. Most of the major defendants have settled the litigation with OCWD, and funds
from these settlements have been set aside for use at such time as treatment is required at
drinking water wells.
Treatment technologies used to remove MTBE from groundwater include granular activated
carbon or advanced oxidation. Depending upon site-specific requirements, a treatment train of
two or more technologies in series may be appropriate (i.e., use one technology to remove the
bulk of MTBE and a follow-up technology to polish the effluent water stream).
Figure 11-4: South Basin Groundwater Contaminant Plume
Irvine Desalter
The Irvine Desalter was built in response to elevated TDS and nitrate and the discovery in 1985
of VOCs beneath the former El Toro Marine Air Corps Station and the central area of Irvine. A
plume of TCE migrated off base and impacted the groundwater basin. In 1990 the USEPA
placed the site on the National Priorities List. Irvine Ranch Water District and OCWD
cooperated with the U.S. Department of Navy in building production wells, pipelines and two
Santa Ana
Irvine

OCWD Management Area
BASIN 8-1 ALTERNATIVE 2022 UPDATE Sustainable Management: Water Quality 11-5
treatment plants, both of which are now owned and managed by IRWD. Operating since 2007,
the two plants remove VOCs by air-stripping and vapor-phase carbon adsorption with the
treated water used for irrigation and recycled water purposes. A third plant treats groundwater
outside the plume to remove excess nitrate and TDS concentrations using reverse osmosis
(RO) membranes for drinking water purposes. Combined production of the Irvine Desalter wells
is approximately 8,000 acre-feet per year. OCWD provides a financial subsidy to IRWD in the
form of a BEA exemption to help offset the treatment costs.
Tustin Desalters
Tustin’s Main Street Treatment Plant has operated since 1989 to reduce nitrate levels from the
groundwater produced by Tustin’s Main Street Wells Nos. 3 and 4. The groundwater undergoes
either RO or ion exchange treatment. The RO membranes and ion exchange units operate in a
parallel treatment train. Approximately 1 mgd is bypassed and blended with the treatment plant
product water to produce up to 2 mgd or 2,000 acre-feet per year.
The Tustin Seventeenth Street Desalter began operation in 1996 to reduce high nitrate and TDS
concentrations from the groundwater pumped by Tustin’s Seventeenth Street Wells Nos. 2 and
4 and Tustin’s Newport Well. The desalter utilizes two RO membrane trains to treat the
groundwater. The treatment capacity of each RO train is 1 mgd. Approximately 1 mgd is
bypassed and blended with the RO product water to produce up to 3 mgd or 3,000 acre-feet per
year. OCWD provides a financial subsidy to the City of Tustin in the form of a BEA exemption to
help offset the treatment costs.
Irvine Ranch Water District Wells 21 and 22
Water produced by IRWD Wells 21 and 22 contain nitrate (as N) at levels exceeding the primary
MCL of 10 mg/L. TDS concentrations range from 650-740 mg/L, which is above the secondary
MCL of 500 mg/L. Because of the elevated nitrate, TDS, and hardness concentrations, IRWD
constructed a RO treatment facility to reduce concentrations in the water before conveying to
the potable supply distribution system. Operation of the treatment facility provides 6,300 acre-
feet per year of drinking water and benefits the groundwater basin by reducing the spread of
impaired groundwater to other portions of the basin. OCWD provides a financial subsidy to
IRWD in the form of a BEA exemption to help offset the treatment costs.
Amber-Colored Groundwater
Amber-colored water is found in the Deep Aquifer (600 to 2,000 feet below ground surface).
Natural organic material from ancient, buried plant and wood material gives the water an amber
tint and a sulfur odor. Although this water is of high quality, its color and odor produce negative
aesthetic qualities that require treatment before use as drinking water.
Two facilities currently treat colored groundwater in Orange County for potable supply. In 2001,
Mesa Water District opened its Colored Water Treatment Facility capable of treating 5.8 mgd.
This facility was replaced in 2012 by the 8.6-mgd Mesa Water Reliability Facility that uses nano-
filtration membranes to remove color. OCWD provides a financial subsidy to Mesa Water
District in the form of a BEA exemption to help offset the treatment costs. The second facility is

OCWD Management Area
BASIN 8-1 ALTERNATIVE 2022 UPDATE Sustainable Management: Water Quality 11-6
the Deep Aquifer Treatment System (DATS), a treatment facility owned and operated by the
IRWD since 2002 that uses nano-filtration membranes. This facility purifies 7.4 mgd of amber-
colored water.
PFAS Treatment Systems
In 2020 OCWD as the groundwater basin manager, executed a multi-party agreement with the
impacted groundwater producers to fund and construct the necessary treatment systems for
production wells impacted by PFAS compounds. The PFAS treatment projects include the
design, permitting, construction, and operation of PFAS treatment systems for impacted
production wells. Each well treatment system will be evaluated for use with granular activated
carbon (GAC), ion exchange (IX), or an alternative novel sorbent for the removal of PFAS
compounds. These treatment systems utilize vessels in a lead-lag configuration to remove
PFOA and PFOS to less than 2 ppt, the current laboratory detection limit. These PFAS
treatment systems are designed to ensure the groundwater supplied by producer wells can be
served in compliance with current and future PFAS regulations. The groundwater producers will
own the treatment systems once they are completed; with financial assistance from OCWD, the
groundwater producers will operate and maintain the new treatment systems once they are
constructed.
To minimize alternative water supply expenses and provide maximum protection to the public
water supply, OCWD initiated design, permitting, and construction of the PFAS treatment
projects on a schedule that allows rapid deployment of treatment systems. As of September
2021, construction contracts have been awarded for treatment systems for production wells
owned by the cities of Orange (Phase 1) and Garden Grove, Serrano Water District, and Yorba
Linda Water District. The City of Anaheim has also awarded a design-build contact (Phase A)
for 8 impacted wells, that will be reimbursed by OCWD. The City of Fullerton’s well KIM-1A
treatment system has been completed and is in operation. Additional construction contracts are
anticipated to be awarded for impacted wells operated by the cities of Fullerton (Main Plant),
Orange (Phase 2), Santa Ana, and Tustin; Irvine Ranch Water District; and East Orange County
Water District by early 2022. OCWD expects the treatment systems to be constructed for the
approximately 60 impacted wells within the next 2 to 3 years. Figure 11-5 shows locations of
wells affected by and to be treated for PFAS.
As monitoring continues and additional wells are anticipated to be taken off-line due to PFAS
detections reported at or near the current RL (or future MCL), OCWD will continue to partner
with the affected groundwater producers and take action to design and construct necessary
treatment systems to bring the impacted wells back online as quickly as possible.
Groundwater production in WY2020-21 was expected to be approximately 325,000 acre-feet but
declined to 282,000 acre-feet primarily due to PFAS-impacted wells being turned off around
February 2020. OCWD projects groundwater production to be approximately 250,000 acre-feet
in WY2021-22 due to the currently idled wells and additional wells being impacted by PFAS and
turned off. As PFAS treatment systems are constructed, OCWD expects total annual
groundwater production to increase back to levels similar to years prior to PFAS impacts.

OCWD Management Area
BASIN 8-1 ALTERNATIVE 2022 UPDATE Sustainable Management: Water Quality 11-7
Figure 11-5: Production Wells to be Treated to Remove PFAS
BEA Exemption for Water Quality Improvement Projects
In some cases, OCWD encourages the pumping of groundwater that does not meet drinking
water standards in order to protect water quality. This is achieved by using a financial incentive
called the Basin Equity Assessment (BEA) Exemption. The benefits to the basin include
promoting beneficial uses of poor-quality groundwater and reducing or preventing the spread of
poor-quality groundwater into non-degraded aquifer zones.
OCWD uses a partial or total exemption of the BEA to compensate a qualified participating
groundwater producer for the costs of treating poor-quality groundwater. These costs typically
include capital, interest and operations and maintenance (O&M) costs for the treatment
facilities.
Using this approach, OCWD has exempted all or a portion of the BEA for pumping and treating
groundwater for removal of nitrates, TDS, VOCs, and other contaminants. Water quality
improvement projects that currently are receiving BEA exemptions are listed in Table 11-3.

OCWD Management Area
BASIN 8-1 ALTERNATIVE 2022 UPDATE Sustainable Management: Water Quality 11-8
Table 11-3: Summary of BEA Exemption Projects
Project
Name
Project
Description
BEA
Exemption
Approved
Average 5-Year
Pumping
(afy)
Max
Production
Above BPP
(afy)
OCWD
BEA
Subsidy
Irvine
Desalter
Remove
nitrates, TDS,
and VOCs
2001 6,990 10,000 Exemption
Tustin
Desalter
Remove nitrates
and TDS 1998 2,240 3,500 Exemption
Tustin
Nitrate
Removal
Remove nitrates 1998 170 1,000 Exemption
Mesa Water
Colored
Water
Removal
Remove color 2011 4,605 8,700 Exemption
IRWD Wells
No. 21 and
22
Remove nitrates 2012 2,420 7,000 Exemption
Huntington
Beach Well
No. 9
Remove odor 2018 1,680 (3 yrs) 3,000 Partial
exemption
DEFINITION OF SIGNIFICANT AND UNREASONABLE
DEGRADATION OF WATER QUALITY
Three elements must be considered when evaluating the impact of groundwater quality
degradation with regard to SGMA undesirable results.
The first element is considering the causal nexus between groundwater management activities
and groundwater quality. For example, groundwater contamination due to improper handling of
toxic materials impacts groundwater quality; however, this water quality degradation is not
caused by groundwater management activities.
The second element is the beneficial uses of the groundwater and water quality regulations,
such as MCLs and other potable water quality requirements.
The third element that must be considered is the volume of groundwater impacted by quality
degradation. If small volumes are negatively affected that do not materially affect the overall
use of the aquifer or basin for its existing beneficial uses, then this would not represent a

OCWD Management Area
BASIN 8-1 ALTERNATIVE 2022 UPDATE Sustainable Management: Water Quality 11-9
significant and unreasonable degradation of water quality. However, if the impacted volume
grows, then it could reach a level that it becomes significant and unreasonable.
When considering all three elements, “significant and unreasonable degradation of water
quality” is defined as degradation of groundwater quality attributable to groundwater production
or recharge practices in the OCWD Management Area and to the extent that a significant
volume of groundwater becomes unusable for its designated beneficial uses.
11.4 DETERMINATION OF MINIMUM THRESHOLDS
The minimum thresholds for groundwater quality are exceedances of MCLs or other applicable
regulatory limits that are directly attributable to groundwater management actions in the OCWD
Management Area that prevent the use of groundwater for its designated beneficial uses.

OCWD Management Area
BASIN 8-1 ALTERNATIVE 2022 UPDATE Sustainable Management: Seawater Intrusion 12-1
SECTION 12 SUSTAINABLE MANAGEMENT RELATED
TO SEAWATER INTRUSION
In the coastal area of the Orange County groundwater basin, the primary source of saline
groundwater is seawater intrusion through permeable aquifer sediments underlying topographic
lowlands or gaps between the erosional remnants or mesas of the Newport-Inglewood Uplift.
The susceptible locations from north to south are the Alamitos, Sunset, Bolsa, and Talbert gaps
as shown in Figure 3-20.
OCWD’s policy regarding control of seawater intrusion is implemented through a
comprehensive program that includes operating seawater intrusion barriers, monitoring and
evaluating barrier performance, monitoring and evaluating susceptible coastal areas, and
coastal groundwater management. These programs enable OCWD to sustainably manage
groundwater conditions in the basin in order to prevent significant and unreasonable seawater
intrusion.
12.1 TALBERT GAP
The Talbert Gap, also referred to as the Santa Ana Gap, is shown in Figure 12-1. The furthest
seaward mergence zone between the Talbert and Lambda aquifers in the vicinity of Adams
Avenue is a primary pathway by which seawater can potentially migrate inland and downward
within the Talbert Gap.
OCWD monitoring well M26 is a key monitoring well for evaluating barrier injection requirements
versus seawater intrusion potential and is used to assess whether protective groundwater
elevations are being achieved in the Talbert Gap. The well is strategically located seaward of
the barrier in the middle of the Talbert Gap and is screened within the merged Talbert and
Lambda aquifers (see Figure 12-2). At the location of well M26, the protective groundwater
elevation is approximately 3.5 feet above mean sea level (msl), as explained below.
The protective groundwater elevation is based on the Ghyben-Herzberg relation (Ghyben, 1888;
Herzberg, 1901; Freeze and Cherry, 1979, pp. 375-376), which takes into account the depth of
the Talbert aquifer at a given location along with the density difference between saline and fresh
groundwater. Using this relation, for every 40 feet that the bottom of the aquifer is below sea
level, there should be about one foot of head of fresh water above sea level to overcome the
density effect of seawater. In the case of well M26, the bottom of the merged Talbert-Lambda
aquifer is approximately 140 feet below sea level. Therefore, the freshwater head (protective
elevation) should be approximately 140 feet divided by 40 which equals 3.5 feet above sea
level. Achieving this protective elevation at well M26 is OCWD’s goal to prevent brackish water
in the Talbert aquifer from migrating down into the Lambda aquifer that is tapped by inland
production wells.
Figure 12-2 shows the historical interrelationship between coastal groundwater production,
Talbert Barrier injection, and groundwater elevations at well M26 from 2008 to 2021. This figure

OCWD Management Area
BASIN 8-1 ALTERNATIVE 2022 UPDATE Sustainable Management: Seawater Intrusion 12-2
shows that groundwater elevations at well M26 have consistently been maintained at or above
protective elevations since 2010 with the exception of brief periods related to GWRS
shutdowns.
Figure 12-1: Talbert Gap – Seawater Intrusion Barrier
Figure 12-3 shows the 250 mg/L chloride concentration contour in the Talbert and Bolsa gaps
and adjacent mesas for 1993, 1998, 2008, and 2020. The 250 mg/L chloride contour is used to
delineate the inland extent of intrusion because this is above ambient (non-intruded)
groundwater quality and is equal to the secondary drinking water standard. Native fresh
groundwater in this area typically has a chloride concentration well below 100 mg/L, while the
GWRS injection supply has a chloride concentration of approximately 10 mg/L. This figure
shows that the 250 mg/L chloride contour has remained relatively unchanged from 2008 to
2020, indicating that the barrier and other basin management programs are keeping seawater
intrusion from taking place.

OCWD Management Area
BASIN 8-1 ALTERNATIVE 2022 UPDATE Sustainable Management: Seawater Intrusion 12-1
Figure 12-2: Key Well OCWD-M26 Groundwater Levels,
Talbert Barrier Injection, and Coastal Pumping
Protective elevation to prevent seawater intrusion

OCWD Management Area
BASIN 8-1 ALTERNATIVE 2022 UPDATE Sustainable Management: Seawater Intrusion 12-2
Figure 12-3: Talbert Gap 250 mg/L Chloride Concentration Contours
for Selected Years
12.1.1 Talbert Barrier Groundwater Model
OCWD has developed a calibrated MODFLOW groundwater model of the Talbert Barrier and
surrounding area (Talbert Model). In addition to helping to guide the planning, location, and
hydraulic effectiveness of the supplemental injection wells for the Talbert Barrier during pre-
GWRS planning activities, the Talbert Model was also used to estimate the general groundwater
flow paths and subsurface residence time of barrier injection water by using the USGS particle
tracking code MODPATH (Pollack, 1994). This modeling work provided the basis for
delineating a recycled water retention buffer area surrounding the Talbert Barrier at a distance
of 2,000 feet and one-year travel distance. No new drinking water production wells are allowed
within this buffer area, as required by the California Department of Public Health requirements
contained within the original permit to operate GWRS (RWQCB, 2004; OCWD, 2005). For more
information on the Talbert Model, see the 2017 Alternative.

OCWD Management Area
BASIN 8-1 ALTERNATIVE 2022 UPDATE Sustainable Management: Seawater Intrusion 12-3
12.2 ALAMITOS GAP
The Alamitos Barrier Project was initially constructed in 1964 and became operational in 1965 to
manage seawater intrusion in the Alamitos Gap. The barrier has been expanded over time to
include the construction of additional injection and monitoring wells (Figure 12-4).
Similar to the Talbert Barrier, the Alamitos Barrier consists of both nested and cluster-type
injection wells screened discretely in each aquifer in order to control the injection rate and
injection pressure into each targeted aquifer independently since each aquifer has different
physical characteristics and groundwater levels.
Figure 12-4: Alamitos Gap – Seawater Intrusion Barrier
The pathways for intrusion in Alamitos Gap are similar to the Talbert Gap with the uppermost
Recent aquifer connected to the Pacific Ocean. Once seawater migrates inland within the
Recent aquifer past the Seal Beach Fault, the brackish water can then migrate downward into
the C, B, A, and I aquifers via areas of hydraulic mergence with the Recent aquifer where the
intervening low-permeability aquitards are absent. These susceptible Pleistocene aquifers were

OCWD Management Area
BASIN 8-1 ALTERNATIVE 2022 UPDATE Sustainable Management: Seawater Intrusion 12-4
warped upward by the Newport-Inglewood Fault Zone and then during Recent geologic time
were eroded away and subsequently overlain by the Recent aquifer river deposits. The aquifers
susceptible to intrusion are generally thinner and finer-grained than their counterparts in Talbert
Gap. Therefore, per-well injection capacity in the Alamitos Barrier is about half that of the
Talbert Barrier and thus requires more injection wells and denser spacing to achieve sufficient
injection for creating a continuous pressure ridge that achieves protective elevations.
Figure 12-5: Alamitos Gap I Zone Chloride Concentration Contours, 2021
Additional injection wells were constructed as part of the Alamitos Barrier Improvement Project
to control the identified breaches through the barrier and to address barrier deficiencies along
the north-south reach where injection well spacing was too large and injection well capacity too
small. In addition, four monitoring wells and two piezometer were installed to improve
monitoring near the barrier. Figure 12-5 shows the extent of chlorine intrusion in the I zone in
2021.
Since the completion of the Alamitos Barrier Improvement Project in 2018, freshwater injection
capacity along the north-south barrier alignment has improved with the even distribution of
injection flow through the added new wells and water levels along this barrier reach have

OCWD Management Area
BASIN 8-1 ALTERNATIVE 2022 UPDATE Sustainable Management: Seawater Intrusion 12-5
achieved and maintained protective elevations, a first since the barrier was constructed over 50
years ago.
LACPW continues to operate and maintain the existing and new barrier facilities as OCWD will
continue to work alongside LACPW to monitor the water levels and the barrier performance
along the stretch affecting Orange County.
12.2.1 Alamitos Barrier Groundwater Model
A transient groundwater flow and solute transport model of the Alamitos Barrier area was
developed and calibrated in 2010 by Intera, Inc. with oversight and cost sharing from OCWD,
LACPW, and WRD. The model was developed to provide a useful tool to evaluate the existing
barrier’s effectiveness, determine barrier expansion requirements, evaluate migration of saline
intrusion as well as migration of recycled injection water towards production wells for regulatory
purposes, and optimize existing barrier operations. For more information on this model, see the
2017 Alternative.
12.3 SUNSET GAP
Sunset Gap was historically considered to be a much lesser seawater intrusion threat compared
to the Talbert and Alamitos Gaps. Recent monitoring data, however, indicate that seawater
intrusion is occurring in Sunset Gap, as shown schematically in a cross-section in Figure 12-6.
Figure 12-7 shows the location of this cross-section.
Figure 12-6: Schematic Geologic Cross-Section from Huntington Harbor
through Sunset Gap (Fall 2020 Chloride Concentrations, mg/L)

OCWD Management Area
BASIN 8-1 ALTERNATIVE 2022 UPDATE Sustainable Management: Seawater Intrusion 12-6
Three potential seawater intrusion source areas appear likely:
• Intrusion from Alamitos Gap south of Alamitos Barrier moving in an easterly direction
• Intrusion moving north-northeasterly from the Huntington Harbor Marina where dredged
canals may have breached through the shallow aquitard overlying the shallow-most
potable aquifer
• Lateral leakage across the Newport/Inglewood Fault Zone (Seal Beach Fault) in the
Landing Hill area in one or more of the Upper Pleistocene aquifers
In the southeast portion of Sunset Gap, dredging associated with construction of the boat canals
in Huntington Harbor during the 1960s was the subject of several studies at that time regarding
the potential for causing saline intrusion. Conclusions of these studies were inconsistent and
inconclusive. Studies done by the USGS (1967) and DWR (1968) found that seawater intrusion
into the semi-perched aquifer (generally the uppermost 50 feet) associated with the harbor
development was occurring, but this was considered to be of little to no significance due to the
lack of beneficial use of this near-surface water-bearing zone.
Approximately 10 years after construction of Huntington Harbor, chloride concentrations began
to rise during the mid-1970s at OCWD monitoring well HH2 screened in the shallow-most
Pleistocene Alpha aquifer at a depth of 85-95 ft bgs and located just inland of the Bolsa-
Fairview Fault in the Huntington Harbor area. The Bolsa-Fairview Fault is the farthest inland
branch of the Newport-Inglewood Fault Zone in the area. Chloride concentrations at this well
rose steadily over time to very brackish levels today, suggesting an inland gradient and active
pathway for inland intrusion.
In 2004, elevated chloride concentrations ranging from 300 to 800 mg/L were discovered at two
monitoring wells owned by the Boeing Company (BOE-MW16 and BOE-MW17) screened in the
Beta aquifer. OCWD commissioned a geophysical survey in 2010 at the Seal Beach Naval
Weapons Station to investigate the extent and depth of intrusion and to help guide the number
and location of proposed monitoring wells necessary to sufficiently define the extent of intrusion.
One large system production well (HB-12) was shut down and destroyed due to impacts from
advancing intrusion in Sunset Gap. From 2012 to 2016, OCWD constructed seven multi-depth
monitoring wells to depths up to 1,000 feet in Sunset Gap to better define the source areas,
pathways, and overall inland extent of seawater intrusion as the first step towards identifying
feasible remedies.
In 2021, OCWD began a project to install 11 monitoring wells clustered at five locations: one
site in Seal Beach (BS25) and four in Huntington Beach (BS23, BS26, BS27 and BS28). Figure
12-7 shows the location of new wells installed in the last five years and the wells being installed
in 2021. The multiple wells at each site will allow for the measurement of groundwater levels
and collection of groundwater samples for water quality analyses in specific aquifers at different
depths. The information from these monitoring wells may be used to determine if the
groundwater flow model needs refinement before finalizing recommendations regarding a
potential new seawater barrier in Sunset Gap (e.g., locations and number of injection wells and
their injection rates).

OCWD Management Area
BASIN 8-1 ALTERNATIVE 2022 UPDATE Sustainable Management: Seawater Intrusion 12-7
Figure 12-7: Sunset Gap Chloride Concentrations, 2020
12.3.1 Evaluation of Sunset Gap Alternatives
The Alamitos Barrier groundwater flow and transport model was recently updated and expanded
to include the Sunset Gap area and thereby utilize data from newer OCWD monitoring wells on
the Naval Weapons Station Seal Beach (NWSSB). The Alamitos-Sunset Gap model
boundaries are shown in Figure 12-8.

OCWD Management Area
BASIN 8-1 ALTERNATIVE 2022 UPDATE Sustainable Management: Seawater Intrusion 12-8
Figure 12-8: Alamitos-Sunset Gap Groundwater Model Boundaries
To date, the calibrated Alamitos-Sunset Gap model has been used to evaluate the effectiveness
of five alternatives for a potential seawater intrusion barrier. These and other alternatives will be
evaluated with the goal of halting the inland movement of seawater intrusion without significantly
raising or lowering groundwater levels in the environmentally sensitive tidal marsh on the
NWSSB. The effects, if any, of the simulated alternatives on nearby contaminant plumes will
also be evaluated. Other factors to evaluate once the additional predictive scenarios are
modeled will include feasibility, constructability, injection water supply, brackish extraction
disposal/reuse, and cost.
The number of injection and extraction wells, well spacing, and injection volumes were varied
from scenario to scenario to determine the preferred barrier scenario that prevents seawater
intrusion by maintaining a seaward gradient without significantly raising or lowering groundwater
levels in the environmentally sensitive tidal marsh on the NWSSB. Additionally, the model will
run a series of no-barrier predictive scenarios to evaluate the potential maximum future inland
extent of seawater intrusion and associated impacts and measures that would likely occur as a
result, e.g., groundwater production well loss and/or inland groundwater desalters.

OCWD Management Area
BASIN 8-1 ALTERNATIVE 2022 UPDATE Sustainable Management: Seawater Intrusion 12-9
Preliminarily and subject to further analysis, the most favorable approach based on the five
predictive scenarios completed so far includes a dual injection/extraction barrier, with an L-
shaped injection well alignment around the perimeter of the NWSSB (Figure 12-9). A potential
Sunset Gap Barrier Project (SGBP) would be designed to prevent the inland advancement of
seawater intrusion near the NWSSB and the Huntington Harbor areas, thus protecting
production wells in the cities of Huntington Beach, Seal Beach, and Westminster.
The preliminary favorable injection alignment would include approximately 20 injection well sites
spaced approximately 1,500 to 2,000 feet apart (subject to further analysis). Total modeled
injection was 13 mgd, with the majority being injected into the Beta and Lambda aquifers.
The preliminary favorable extraction alignment would include three single-point extraction wells
screened across the Beta and Lambda aquifers. Total modeled extraction was 3 mgd, or 1 mgd
per well. The three potential extraction wells were strategically located just outside (inland) of
the Seal Beach National Wildlife Refuge perimeter to provide ample distance from the injection
wells while also remaining outside of the NWSSB ordnance areas. Initially, the extracted
brackish groundwater would be expected to have a chloride concentration ranging from 5,000 to
15,000 mg/L.
Depending on extracted water disposal/use feasibility and cost, a groundwater treatment plant
may be appropriate to remove the high salinity from the groundwater produced by the barrier
extraction wells. Reverse osmosis would be the likely treatment process. The technical and
economic viability of this supply option would need to be evaluated as part of the future
technical work described below.
To provide the injection wells with high-quality fresh water, the several water supply alternatives
will be considered, including: (1) Groundwater treatment plant (brackish extraction wells and/or
Deep aquifer amber-colored water wells); (2) Satellite wastewater treatment plant; (3) GWRS
water via new pipeline; and (4) Imported water.
Future technical analysis that would need to be conducted as part of the feasibility study
includes the following:
• Evaluate injection water supply alternatives
• Perform siting study for pipelines and wells
• Evaluate extraction well discharge alternatives
• Identify hydrogeologic data necessary to design, construct, and monitor the performance
of barrier facilities
• Develop preliminary project design to support CEQA evaluation
• Estimate staffing needs for barrier operation and maintenance (O&M)
• Provide capital and O&M cost estimate

OCWD Management Area
BASIN 8-1 ALTERNATIVE 2022 UPDATE Sustainable Management: Seawater Intrusion 12-10
Figure 12-9: Potential Sunset Gap Barrier Project Facilities
12.4 BOLSA GAP
In the Bolsa Gap, seawater intrusion extends approximately 1.3 miles inland from the Pacific
Ocean. Groundwater monitoring data show that the highest chloride concentrations in Bolsa
Gap have remained seaward of the Bolsa-Fairview Fault, which is the farthest inland branch of
the Newport-Inglewood Fault Zone in that area. Therefore, the saline groundwater appears to
be largely restricted from migrating inland across the Bolsa-Fairview Fault within the Bolsa
aquifer under normal basin conditions, as the Bolsa aquifer zones of mergence with the
underlying Pleistocene aquifers are all inland of the Bolsa-Fairview Fault. An area of slightly
elevated salinity has existed beneath the Huntington Beach Mesa for many years and is thought
to be due to past disposal practices of oil field brines in the early 1900s rather than active
seawater intrusion from the ocean. This area of saline groundwater is being pushed westerly
into Bolsa Gap due to increased injection at the west end of the Talbert Barrier but is not
expected to be a threat to active production wells or groundwater resources.

OCWD Management Area
BASIN 8-1 ALTERNATIVE 2022 UPDATE Sustainable Management: Seawater Intrusion 12-11
12.5 NEWPORT MESA
Chloride concentrations in the Beta/Lambda aquifers beneath the Newport Mesa east of the
Talbert Gap have either remained stable or decreased over the last 10 years even though
groundwater elevations have typically been below sea level in these aquifers in this area.
Chloride concentrations in the underlying Main aquifer in this area have either decreased or
have remained relatively stable for the last 10 years. A proposed extension of the Talbert
Barrier eastward along Adams Avenue onto the Newport Mesa has been preliminarily evaluated
and modeled by OCWD staff using the Talbert Model. Such a project would serve to provide
insurance against future intrusion in the Beta/Lambda and Main aquifers under lower basin
conditions and would thus protect production wells owned by Mesa Water District in addition to
replenishing the basin. Based on the stability of chloride concentrations in the Newport Mesa,
there is no need to advance this project at this time.
In 2014, OCWD constructed four new multi-depth monitoring wells (M51, M52, M53, MRSH)
farther east on the Newport Mesa, as shown on Figure 12-10. These four well sites are now a
part of OCWD’s coastal monitoring program for both groundwater levels and seawater intrusion
sampling. The East Newport Mesa area is at the southern margin of the groundwater basin,
which geologic formations (including the aquifers with them) have been faulted, uplifted, and
eroded. It has been a data gap in which the aquifer stratigraphy and groundwater flow patterns
were not well understood. To further characterize this complex portion of the basin, OCWD
plans to install a multi-depth cluster of monitoring wells east of John Wayne Airport in early
2022.

OCWD Management Area
BASIN 8-1 ALTERNATIVE 2022 UPDATE Sustainable Management: Seawater Intrusion 12-12
Figure 12-10: Newport Mesa Chloride Contours, 2020
12.6 IMPLEMENTATION OF SEAWATER INTRUSION
PREVENTION POLICY
Implementation of OCWD’s seawater intrusion prevention policy is summarized below. These
programs enable OCWD to continue sustainably managing the groundwater basin to prevent
significant and unreasonable seawater intrusion.
12.6.1 Effective Barrier Operations
The effective operation of the Talbert and Alamitos barriers is critical to the protection of the
basin aquifers from seawater intrusion. This program includes, but is not limited to, the
following activities:

OCWD Management Area
BASIN 8-1 ALTERNATIVE 2022 UPDATE Sustainable Management: Seawater Intrusion 12-13
1. Injection of sufficient water quantities combined with other basin management programs,
such that protective groundwater elevations are established and maintained, where
applicable, based on local hydrogeologic characteristics.
2. Regular maintenance of injection facilities to provide sufficient injection quantities. Such
maintenance includes backwashing, redevelopment, and replacement (if necessary) of
injection wells and operational fitness checks/repairs of flow meters, pressure reducing
valves, and telemetry equipment.
3. Regular communications and coordination between operations, hydrogeology, and
engineering staff on barrier operations and activities.
4. Annual reporting on barrier facilities status and operations. The reports include
recommendations, as necessary, for barrier improvements to achieve policy objectives.
12.6.2 Barrier Performance Monitoring and Evaluation
Monitoring and evaluating barrier performance provides the basis on which to determine if the
barriers are preventing seawater intrusion from occurring. This program consists of the
following activities:
1. Semi-annual sampling and testing of designated monitoring wells in the vicinity of the
seawater barriers. Testing includes parameters such as TDS, chloride, and electrical
conductivity as indicators of seawater intrusion. Wells have been designated to provide
adequate spatial coverage, particularly near likely seawater pathways and near the interface
between seawater and freshwater.
2. Quarterly water level measurements at designated monitoring wells in the vicinity of the
seawater barriers. More frequent measurements will be collected as needed at key
locations.
3. Installation of monitoring wells in areas where it is determined that data gaps exist near the
seawater barriers that may allow seawater intrusion to go undetected or would otherwise
significantly impede the ability to assess barrier performance.
4. Annual evaluation and reporting of barrier performance based on surrounding groundwater
level and quality data.
12.6.3 Susceptible Coastal Area Monitoring and Evaluation
This program addresses the assessment and ongoing monitoring of the coastal gaps and other
areas that are not currently protected from seawater intrusion by the Talbert and Alamitos
barriers. These areas include the Bolsa and Sunset gaps and adjacent mesas. This program
includes the following activities:
1. Semi-annual sampling and testing of designated monitoring wells. Testing includes
parameters such as TDS, chloride, and electrical conductivity as indicators of seawater

OCWD Management Area
BASIN 8-1 ALTERNATIVE 2022 UPDATE Sustainable Management: Seawater Intrusion 12-14
intrusion. Wells have been designated to provide adequate spatial coverage, particularly
near likely seawater pathways.
2. Quarterly water level measurements at designated monitoring wells. More frequent
measurements will be collected as needed at key locations.
3. Installation of monitoring wells in areas where it is determined that data gaps exist that may
allow seawater intrusion to go undetected or would significantly impede the ability to
understand the location of and trends in seawater intrusion.
4. Annual evaluation and reporting of the coastal area monitoring program, including
recommendations, as needed, for further investigation or other potential actions to address
seawater intrusion.
12.6.4 Coastal Groundwater Management
In addition to operating the seawater barriers, OCWD has implemented other basin
management activities to lessen the potential for seawater intrusion. These activities have
included the Coastal Pumping Transfer Program, Coastal In-Lieu Program, and maintaining
basin storage levels within the operating range. Each of these activities shall continue to be
considered and implemented as deemed necessary along with other potential actions to
complement and enhance the OCWD seawater prevention program.
12.7 DEFINITION OF SIGNIFICANT AND UNREASONABLE
SEAWATER INTRUSION
As explained above, OCWD conducts comprehensive programs to protect the groundwater
basin from the undesirable effect of significant and unreasonable seawater intrusion. Seawater
intrusion in the OCWD Management Area would be considered significant and unreasonable if a
significant and continuing reduction in usable storage volume in the groundwater basin occurs
as a result of increased salinity due to seawater intrusion.
12.8 DETERMINATION OF MINIMUM THRESHOLDS
The minimum threshold for seawater intrusion that defines an undesirable result is (1) the
shutdown of active large system production wells due to seawater-derived salinity, and (2)
continuing loss of a significant amount of basin storage due to seawater-derived salinity.

OCWD Management Area
BASIN 8-1 ALTERNATIVE 2022 UPDATE Sustainable Management: Land Subsidence 13-1
SECTION 13 SUSTAINABLE MANAGEMENT RELATED
TO LAND SUBSIDENCE
Management of the groundwater basin by maintaining storage levels within OCWD’s
established operating range has prevented significant and unreasonable land subsidence that
substantially interferes with surface uses. Within the OCWD Management Area there is no
evidence of continuing irreversible land subsidence, nor is there evidence that land subsidence
has interfered with surface uses. Therefore, the undesirable result of “significant and
unreasonable land subsidence that substantially interferes with surface uses” is not present and
is not anticipated to occur in the OCWD Management Area in the future.
Subsidence due to changes in groundwater conditions in the Orange County groundwater basin
is variable and does not show a pattern of irreversible permanent lowering of the ground
surface. Some subsidence may have occurred before OCWD began refilling the groundwater
basin in the late 1950s after storage conditions reached a historic low (Morton, et al., 1976);
however, the magnitude and scope of this subsidence is uncertain, and it is not clear if this
subsidence was permanent. Since this time OCWD has operated the groundwater basin within
the established operating range.
More recent data show a consistent pattern of the ground surface rising and falling in tandem
with groundwater levels and overall changes in basin groundwater storage. This is referred to
as elastic subsidence. Interferometric Synthetic Aperture Radar (InSAR) data collected from
satellites and data collected by the Orange County Surveyor (Surveyor) show that ground
surface elevations in Orange County both rise and fall in response to groundwater recharge and
withdrawals. InSAR data during the period 1993-1999 shows temporary seasonal land surface
changes of up to 4.3 inches (total seasonal amplitude from high to low) in the Los Angeles-
Orange County area and a net decline of approximately 0.5 inch/year near Santa Ana over the
period 1993 to 1999, which happened to coincide with a period of a net decrease in
groundwater storage in the basin (Bawden, 2001; 2003).
The 2017 Alternative presented GPS data collected by the Orange County Surveyor’s office.
These data showed that ground surface elevation changes at selected sites from 2002 to 2014
correlate well with changes in groundwater storage.
Recently, as part of DWR's SGMA technical assistance to provide important SGMA-relevant
data to Groundwater Sustainability Agency’s (GSAs) for Groundwater Sustainability Plan (GSP)
development and implementation, DWR contracted with TRE ALTAMIRA, Inc. to provide vertical
displacement estimates derived from InSAR data that are collected by the European Space
Agency (ESA) Sentinel-1A satellite.
The DWR-commissioned dataset represents measurements of vertical ground surface
displacement in more than 200 of the high-use and populated groundwater basins across the
California between January 2015 and October 2020. InSAR data coverage began in late 2014
for parts of California, and coverage for the entire study area began on June 13, 2015. Included

OCWD Management Area
BASIN 8-1 ALTERNATIVE 2022 UPDATE Sustainable Management: Land Subsidence 13-2
in this dataset are point data that represent average vertical displacement values for 100 square
meter areas, as well as GIS rasters that were interpolated from the point data; rasters for total
vertical displacement relative to June 13, 2015, and rasters for annual vertical displacement
rates with earlier coverage for some areas, both in monthly time steps. The level of accuracy is
approximately 0.05 feet.
To show subsidence in Basin 8-1, OCWD used the used a layer showing the total land
subsidence since the start of the InSAR data on 6/13/2015 and ending on 7/1/2020, which
corresponds to the end of the OCWD water year. The GIS layer used was:
https://gis.water.ca.gov/arcgisimg/rest/services/SAR/Vertical_Displacement_TRE_ALTAMIRA_v
2020_Total_Since_20150613_20200701/ImageServer
Figure 13-1 shows the total land displacement in Basin 8-1 from June 2015 to July 2020.
During this time period as shown on Figure 1-3, basin storage increased from 381,000 acre-feet
below full conditions to 200,000 acre-feet below full conditions; that is, basin storage increased
by 181,000 acre-feet. In addition to increasing groundwater levels, this rise in groundwater
storage manifests itself as a rise in ground surface elevation over much of the basin, particularly
in the center of the basin where there was as much as 0.15 feet of rise.
A localized area of downward (negative) displacement was observed in Tustin centered around
production well T-ED. This is a relatively new well that came on-line in October 2016. Due to
pumping of this well, water levels in the Principal Aquifer in the vicinity of the well declined by
approximately 60 feet from June 2015 to July 2020. The small decline in ground surface in the
vicinity of this well is not surprising given that it is a new well and the relatively fine-grained
nature of the aquifer sediments in the area. As with other locations in the basin, we expect the
impact of this well to stabilize with future displacements expected to be small.
Finally, there is little potential for future widespread permanent, irreversible subsidence given
OCWD’s commitment to sustainable groundwater management and policy of maintaining
groundwater storage levels within a specified operating range. Nevertheless, OCWD will
continue to review InSAR data and other data sources to evaluate ground surface fluctuations
within OCWD’s service area. If irreversible subsidence was found to occur in a localized area in
relation to groundwater pumping patterns or groundwater storage conditions, OCWD would
coordinate with local officials to investigate and develop an approach to address the
subsidence. This could include OCWD managing the basin at higher groundwater storage
levels.

OCWD Management Area
BASIN 8-1 ALTERNATIVE 2022 UPDATE Sustainable Management: Land Subsidence 13-3
Figure 13-1: Total Vertical Ground Surface Displacement from June 2015 to July 2020
13.1 DEFINITION OF SIGNIFICANT AND UNREASONABLE
LAND SUBSIDENCE THAT SUBSTANTIALLY INTERFERES
WITH SURFACE USES
As stated above, data indicates that there is no inelastic land subsidence within the OCWD
Management Area due to changes in groundwater elevation or groundwater storage levels.
Land subsidence would be considered to be significant and unreasonable if ground surface
elevation changes are determined to be inelastic over a significant period of time, these
elevation changes are attributed to declines in groundwater storage, and these changes are
likely to significantly interfere with surface uses.

OCWD Management Area
BASIN 8-1 ALTERNATIVE 2022 UPDATE Sustainable Management: Land Subsidence 13-4
13.2 DETERMINATION OF MINIMUM THRESHOLDS
The minimum threshold for land subsidence that defines an undesirable result is a sustained
lowering of ground surface elevation that is attributable to lowering of groundwater storage in
the basin and is likely to significantly interfere with surface uses.

OCWD Management Area
BASIN 8-1 ALTERNATIVE 2022 UPDATE Sustainable Management Groundwater Depletions 14-1
SECTION 14 SUSTAINABLE MANAGEMENT RELATED
TO GROUNDWATER DEPLETIONS IMPACTING
SURFACE WATER
There are no surface water bodies within the OCWD Management Area that are interconnected
and dependent on groundwater basin conditions. Therefore, the undesirable result of
“depletions of interconnected surface water that have significant and unreasonable adverse
impacts on beneficial uses of the surface water due to groundwater conditions occurring
throughout the basin” is not present and in the future is not anticipated to occur in the OCWD
Management Area due to OCWD’s management programs.
The two main surface water sources in Orange County are the Santa Ana River and Santiago
Creek. The Santa Ana River in Orange County flows through a highly urbanized environment.
Flood protection infrastructure has constrained the flow of the river with engineered levees
along most of its course. Santiago Creek, a major tributary of the Santa Ana River, is the
primary drainage for the northwest portion of the Santa Ana Mountains. Under natural
conditions, the creek is ephemeral, with dry conditions predominant during most of the year.
Additional information on these sources can be found in the 2017 Alternative.

OCWD Management Area
BASIN 8-1 ALTERNATIVE 2022 UPDATE Protocols for Monitoring Programs 15-1
SECTION 15 PROTOCOLS FOR MODIFYING
MONITORING PROGRAMS
Protocols that trigger a change in a monitoring program include:
• a recommendation by the GWRS Independent Advisory Panel for resampling or
increased monitoring of a particular constituent of concern;
• a recommendation by the Independent Advisory Panel that reviews OCWD use of
Santa Ana River water for groundwater recharge and related water quality;
• a change in regulation or anticipation of a change in regulation;
• a constituent in a sample approaches or exceeds a regulatory water quality limit or
Maximum Contaminant Level, notification level, or first-time detection of a
constituent;
• the computer program built by OCWD to validate water quality data prior to transfer
to the WRMS data base flags a variation in historical data that may indicate a
statistically significant change in water quality;
• analysis of water quality trends conducted by water quality, hydrogeology, or
recycled water production staff indicate a need to change monitoring; or
• OCWD initiates a special study, such as quantifying the removal of contaminants
using treatment wetlands or testing the infiltration rate of a proposed new recharge
basins.

OCWD Management Area
BASIN 8-1 ALTERNATIVE 2022 UPDATE Evaluation of Potential Projects 16-1
SECTION 16 EVALUATION OF POTENTIAL PROJECTS
As described in the 2017 Alternative, OCWD regularly evaluates potential projects, conducts
studies and prepares reports and plans (e.g., Long Term Facilities Plan) to continue to
sustainably manage the groundwater basin and advance the mission of OCWD. Described
below are a few of the key projects and activities OCWD has undertaken over the last five
years.
Key activities/projects that were completed in the last five years include:
• Four deep mid-basin injection wells were constructed in Santa Ana (MBI wells). The
wells are injecting approximately 8-10 mgd of GWRS water into the center of the
basin where groundwater levels tend to be the lowest.
• Alamitos Barrier Improvement Project: 17 new injection wells were constructed at the
Alamitos Seawater Barrier to reduce the spacing between wells to improve barrier
performance. The additional 1.4-mgd of injection capacity has raised water levels
near or at protective elevations.
• Shallow geophysical exploration of the Lower Off-River Channel to characterize the
shallow subsurface sediments. This data will be useful in assessing whether or not it
is feasible to remove areas of fine-grained sediments to increase facility recharge
rates.
• Continued testing of the Riverbed Filtration System (RFS), which is a shallow
underdrain system designed to filter SAR water prior to delivery to a recharge basin.
Testing conducted thus far shows it has the potential to double the capacity of a
receiving basin. Work is also ongoing on how to potentially expand the RFS to the
main SAR channel.
• Geophysical evaluation of deeper sediments in the lower SAR to assess the potential
of installing a horizonal collector well (e.g., Ranney well) that would be used for
recharge of GWRS water. Modeling was also conducted to assess the potential
recharge capacity of a “Ranney” type well.
Key activities/projects that are underway include:
• Final expansion of the GWRS to 130 mgd capacity. This is scheduled to be
complete in 2023. This project will provide OCWD 30 mgd of new water supply.
• Construction of water treatment facilities at production wells currently impacted by
PFAS is ongoing. This is scheduled to be complete by 2024.
• Continued assessment of potential seawater intrusion in the Sunset Gap, including
installation of additional monitoring wells, modeling, and feasibility studies.
• Completion of the Integrated Santa Ana River Watershed Model (ISARM), which is
the integration of several surface and groundwater models in the upper SAR
watershed above Prado Dam. This model will assist OCWD and other upper SAR

OCWD Management Area
BASIN 8-1 ALTERNATIVE 2022 UPDATE Evaluation of Potential Projects 16-2
watershed stakeholders in determining potential future SAR flows arriving at Prado
Dam and the potential impact of future projects on these flows.
• A study to examine the use of Forecast Informed Reservoir Operations (FIRO) at
Prado Dam. A Preliminary Viability Assessment (PVA) was completed in July 2021,
which showed that FIRO is viable at Prado Dam and able to provide an average of
up to 7,000 acre-feet of water depending on how much water can be temporarily
impounded (Ralph et al., 2021). Work on the Final Viability Assessment (FVA) is
underway and scheduled for completion in mid-2023. In parallel to the FVA is work
with the US Army Corps of Engineers to test FIRO at Prado Dam (through a minor
deviation from the approved Water Control Plan) for a five-year period, starting in fall
2023.
Future anticipated activities and projects:
• Additional treatment systems may need to be constructed on production wells based
on water quality results or changes in regulations.
• Projects may need to be constructed to improve water quality during recharge, such
as sorbents to remove contaminants during recharge.
• Projects may needed to facilitate implementation of FIRO at Prado Dam or at
Santiago Basins.
▪ Additional groundwater monitoring wells may need to be constructed to fill data gaps,
including the Sunset Gap, and other areas in the basin.
▪ Design and construction of a potential seawater barrier at the Sunset Gap.
▪ Implementation of a groundwater contamination remedy in the South Basin area.

OCWD Management Area
BASIN 8-1 ALTERNATIVE 2022 UPDATE References 17-1
SECTION 17 REFERENCES
Bawden, Gerald W., Wayne Thatcher, Ross S. Stein, Ken W. Hudnut, and Gilles Peltzer, 2001.
Tectonic Contraction Across Los Angeles After Removal of Groundwater Pumping
Effects, Nature, Vol. 412, pp. 812-815.
Bawden, G.W., 2003. Separating groundwater and hydrocarbon-induced surface deformation
from geodetic tectonic contraction measurements across metropolitan Los Angeles,
California. In K.R. Prince and Galloway, D.L., eds., U.S. Geological Survey subsidence
interest group conference, proceedings of the technical meeting, Galveston, Texas,
November 27-29, 2001. U.S. Geological Survey Open-File Report 03-308.
http://pubs.usgs.gov/of/2003/ofr03-308/.
Boyle Engineering Corporation and Orange County Water District, 1997. Coastal Groundwater
Management Investigation.
California Department of Water Resources, 1966. Ground Water Basin Protection Project: Santa Ana Gap Salinity Barrier, Orange County, Bulletin No. 147-1.
***** 1967. Progress Report on the Ground Water Geology of the Coastal Plain of Orange County.
***** 1968. Sea-Water Intrusion: Bolsa-Sunset Area, Orange County, Bulletin No. 63-2.
***** 2014. California Water Plan Update. October 2014.
California Regional Water Quality Control Board, Santa Ana Region (RWQCB), 2004. Order
No. R8-2004-0002, Producer/User Water Recycling Requirements and Monitoring and
Reporting Program for the Orange County Water District Interim Water Factory 21 and
Groundwater Replenishment System Groundwater Recharge and Reuse at Talbert Gap
Seawater Intrusion Barrier and Kraemer/Miller Basins. March 12, 2004.
***** 2008. Order No. R8-2008-0058
Fairchild, F.B. and Wiebe, K.H., 1976. Subsidence of organic soils and salinity barrier design in
coastal Orange County, California. In A.I. Johnson, ed., Proceedings of the Second
International Symposium on Land Subsidence, Anaheim, California, December 13–
17,1976, International Association of Hydrological Sciences Publication 121, 334-346.
Freeze, R. Allan and John A. Cherry. 1979. Groundwater. Prentice-Hall, Inc., 604 pp.
Ghyben, W.B. 1888. Nota in verband met de voorgenomen putboring nabij Amsterdam.
Tijdschrift van Let Koninklijk Inst. Van Ing.
Hardt, William F. and E. H. Cordes, 1971. Analysis of Ground-Water System in Orange County,
California by Use of an Electrical Analog Model, USGS Open-File Report.
Herzberg, A. 1901. Die Wasserversorgung einiger Nordseebader. J.
Gasbeleucht. Wasserversorg., 44, pp. 815-819.
Intera, Inc., 2010. Alamitos Barrier Model Final Report, prepared for OCWD.

OCWD Management Area
BASIN 8-1 ALTERNATIVE 2022 UPDATE References 17-2
McGillicuddy, Kevin B., 1989. Ground Water Underflow Beneath Los Angeles-Orange County
Line, unpubl. M.S. thesis, Univ. of Southern California Dept. of Geological Sciences.
Morton, Paul K., et al., 1976. Environmental Geology of Orange County, California, California
Division of Mines and Geology Open-File Report No. 79-8 LA.
Municipal Water District of Orange County, 2016. Technical Memorandum on Orange County
Reliability Study, Water Demand Forecast and Supply Gap Analysis, prepared by CDM
Smith for MWDOC, April 20, 2016.
Orange County Water District, 1997. Issues Paper – Development of the Colored Water Zone.
June 1997.
***** 2003. Orange County Water District Recharge Study.
***** 2005. Board of Directors Resolution No. 05-4-40: Establishing a GWR System Buffer
Area around the GWR System injection operation at the Talbert Gap Seawater Intrusion
Barrier, April 20, 2005, Fountain Valley, California.
***** 2007. Report on Evaluation of Orange County Groundwater Basin Storage and
Operational Strategy.
***** 2016. Salt and Nitrate Projections for Orange County Management Zone, Final
Technical Memorandum by Greg Woodside, July 18, 2016.
***** 2020. Salt and Nitrate Projections for Orange County Management Zone, Technical
Memorandum by Adam Hutchinson and Kevin O’Toole, December 28, 2020.
Pollack, D.W., 1994. User’s Guide for MODPATH/MODPATH-PLOT, Version 3: A particle
tracking post-processing package for MODFLOW, the U. S. Geological Survey finite-
difference ground-water flow model, USGS Open File Report 94-464.
Ralph, F. M., Woodside, G., Anderson, M., Cleary-Rose, K., Haynes, A., Jasperse, J.,
Sweeten,J., Talbot, C.,Tyler, J.,Vermeeren, R., 2021. Prado Dam Forecast Informed
Reservoir Operations Preliminary Viability Assessment. UC San Diego. Retrieved from
https://escholarship.org/uc/item/13091539.
U.S. Geological Survey, 1967. An Investigation of Potential Salt-Water Intrusion from Inland
Waterways in the Shallow Alluvial and Coastal Deposits of Sunset and Bolsa Gaps,
Orange County, California, USGS Water Resources Division, Open-File Report, July 17,
1967.
Water Systems Consulting, Inc., 2020. Technical Memorandum: Recomputation of Ambient
Water Quality in the Santa Ana Watershed for the Period 1999 to 2018.


South East Management Area
BASIN 8-1 ALTERNATIVE 2022 UPDATE 1-0
Section Page
CONTENTS
2.1 HISTORY OF AGENCIES IN SOUTH EAST BASIN MANAGEMENT AREA .............. 2-1
2.2 GOVERNANCE AND MANAGEMENT STRUCTURE ................................................. 2-1
2.3 LEGAL AUTHORITY ................................................................................................... 2-1
2.4 BUDGET ..................................................................................................................... 2-1
3.1 SOUTH EAST SERVICE AREA .................................................................................. 3-1
JURISDICTIONAL BOUNDARIES ........................................................................ 3-1 LAND USE DESIGNATIONS ................................................................................ 3-1
3.2 GROUNDWATER CONDITIONS ................................................................................ 3-1
3.2.1 GROUNDWATER LEVELS .................................................................................. 3-3 3.2.2 REGIONAL PUMPING PATTERNS ..................................................................... 3-5 3.2.3 GROUNDWATER STORAGE DATA .................................................................... 3-7 3.2.4 GROUNDWATER QUALITY CONDITIONS ......................................................... 3-7 3.2.5 LAND SUBSIDENCE ............................................................................................ 3-8 3.2.6 GROUNDWATER AND SURFACE WATER INTERACTIONS AND GROUNDWATER DEPENDENT ECOSYSTEMS ....................................................... 3-10
4.1 BUDGET COMPONENTS ........................................................................................... 4-1
4.1.1 RECHARGE ......................................................................................................... 4-1 4.1.2 GROUNDWATER PRODUCTION ........................................................................ 4-1 4.1.3 SUBSURFACE OUTFLOW .................................................................................. 4-2
4.2 CHANGES IN GROUNDWATER STORAGE .............................................................. 4-2
4.3 WATER YEAR TYPE .................................................................................................. 4-2
4.4 ESTIMATE OF SUSTAINABLE YIELD ........................................................................ 4-2
4.5 CURRENT, HISTORICAL, AND PROJECTED WATER BUDGET .............................. 4-2
5.1 OVERVIEW ................................................................................................................. 5-1
5.2 GROUNDWATER MONITORING PROGRAMS .......................................................... 5-1
5.3 OTHER MONITORING PROGRAMS .......................................................................... 5-1
9.1 HISTORY .................................................................................................................... 9-1
9.2 MONITORING OF GROUNDWATER LEVELS ........................................................... 9-1
i
....1-1

South East Management Area
BASIN 8-1 ALTERNATIVE 2022 UPDATE 1-1
9.3 DEFINITION OF SIGNIFICANT AND UNREASONABLE LOWERING OF
GROUNDWATER LEVELS .................................................................................... 9-1
9.4 DETERMINATION OF MINIMUM THRESHOLDS ....................................................... 9-1
10.1 DEFINITION OF SIGNIFICANT AND UNREASONABLE REDUCTION IN
STORAGE ............................................................................................................ 10-1
10.2 DETERMINATION OF MINIMUM THRESHOLDS ................................................... 10-1
11.1 DEFINITION OF SIGNIFICANT AND UNREASONABLE DEGREDATION OF
WATER QUALITY ................................................................................................ 11-111.2 DETERMINATION OF MINIMUM THRESHOLDS ................................................... 11-1
15.1 ESTABLISHMENT OF PROTOCOLS FOR WATER QUALITY ................................ 15-1
Figures
Figure 1-1: Agencies in the South East Management Area ............................................ 1-1 Figure 3-1: Groundwater Production Wells (Active and Inactive) ................................... 3-2 Figure 3-2:Historic Groundwater Levels in South East Management Area, 1991-2021 3-4Figure 3-3: Current Groundwater Levels in South East Management Area, 2020-21 .... 3-4Figure 3-4: Monthly Groundwater Pumping Pattern in Well LF-2, 2016-2021 ............... 3-6Figure 3-5: Total Annual Pumping for Well LF-2, Water Year 2016-2021 ...................... 3-7Figure 3-6: Total Vertial Ground Surface Displacement ................................................ 3-10
Tables
Table 1-1: Agencies in South East Management Area and Area Covered ..................... 1-3 Table 3-1: Wells and Flow Data ..................................................................................... 3-5
Table 3-2: Annual Pumping Average 2016-2021 ........................................................... 3-6 Table 3-3: Ground Water Quality in Selected Wells ....................................................... 3-8
Table 4-1: Average Annual Groundwater Budget ........................................................... 4-1
ii
...11-1
..12-1..13-1
....14-1
....15-1
....16-1....17-1
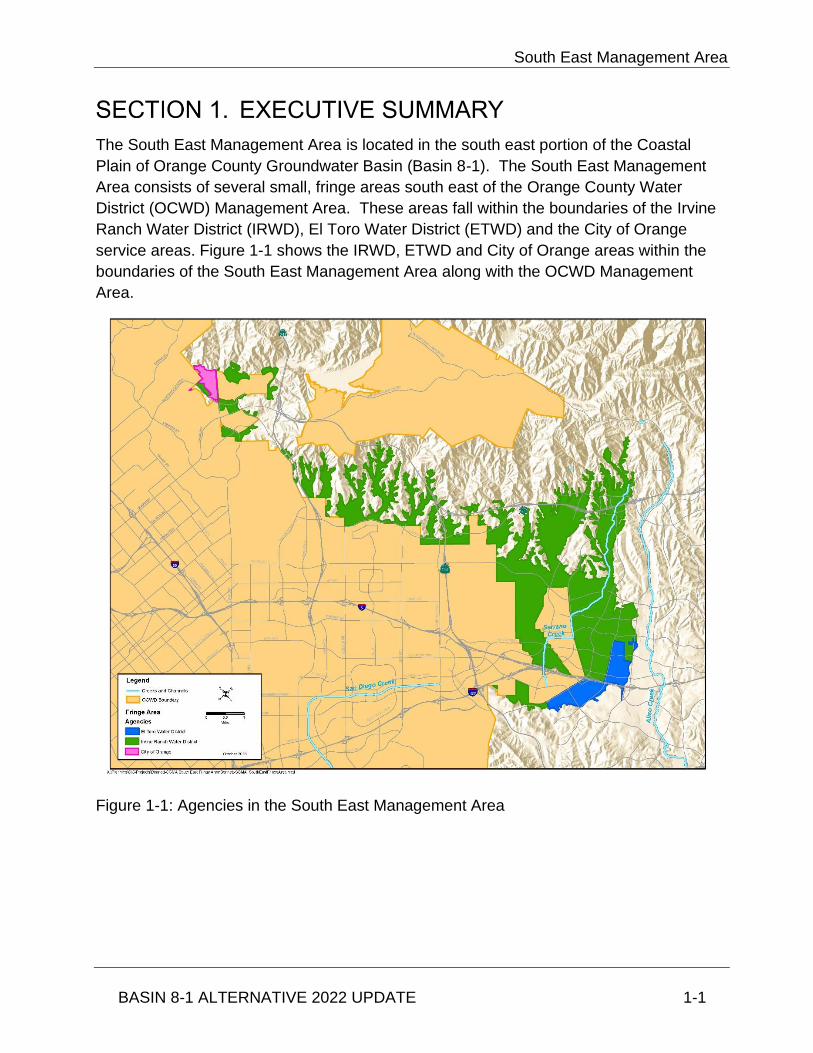
South East Management Area
BASIN 8-1 ALTERNATIVE 2022 UPDATE 1-2
EXECUTIVE SUMMARY
The South East Management Area is located in the south east portion of the Coastal
Plain of Orange County Groundwater Basin (Basin 8-1). The South East Management
Area consists of several small, fringe areas south east of the Orange County Water
District (OCWD) Management Area. These areas fall within the boundaries of the Irvine
Ranch Water District (IRWD), El Toro Water District (ETWD) and the City of Orange
service areas. Figure 1-1 shows the IRWD, ETWD and City of Orange areas within the
boundaries of the South East Management Area along with the OCWD Management
Area.
Figure 1-1: Agencies in the South East Management Area
1-1

South East Management Area
BASIN 8-1 ALTERNATIVE 2022 UPDATE 1-3
Table 1-1 shows the area (in acres) associated with each agency within the South East
Management Area. The South East Management Area covers approximately 4.4 percent
of Basin 8-1, which has a total area of 223,600 acres.
Table 1-1: Agencies in South East Management Area and Area Covered
Agency Area (acres)
Irvine Ranch Water District 8,870
El Toro Water District 762
City of Orange 134
Total Area 9,766
Update to 2017 Alternative
This document provides any updates to the 2017 Alternative for the South East
Management Area plan, submitted by OCWD on December 2, 2016. The 2017
Alternative, including the South East Management Area was reviewed by the State of
California Department of Water Resources (DWR) in July 2019. Based on DWR’s
assessment, the 2017 Alternative was found to meet the requirements under SGMA and
was approved.
Approved alternatives are required to submit annual reports to DWR on April 1 of each
year. Annual reports for Basin 8-1 were submitted to DWR as follows:
• Water Year 2016-17, Submitted on March 29, 2018
• Water Year 2017-18, Submitted on March 29, 2019
• Water Year 2018-19, Submitted on March 30, 2020
• Water Year 2019-20, Submitted on March 30, 2021
According to Water Code §10733.8, “At least every five years after initial submission of a
plan pursuant to Section 10733.4, the department shall review any available groundwater
sustainability plan or alternative submitted in accordance with Section 10733.6, and the
implementation of the corresponding groundwater sustainability program for consistency
with this part, including achieving the sustainability goal. The department shall issue an
assessment for each basin for which a plan or alternative has been submitted in
accordance with this chapter, with an emphasis on assessing progress in achieving the
sustainability goal within the basin. The assessment may include recommended
corrective actions to address any deficiencies identified by the department.”
This document represents the first five-year update, which is due January 1, 2022.
1-2

South East Management Area
BASIN 8-1 ALTERNATIVE 2022 UPDATE 1-4
For purposes of this report, the Basin 8-1 Alternative submitted on December 22, 2016, will be referred to as the 2017 Alternative. The first five-year update will be referred to as the 2022 Update for ease of reference. The 2017 Alternative was a comprehensive document showing that Basin 8-1 had been managed sustainably for more than 10 years. For the 2022 Update, the focus is on documenting that the basin has been continued to be sustainably managed during the five years since the 2017 Alternative was submitted and to present any new information from the last five years. As such, the 2017 Alternative is considered a key reference document with background information that is not duplicated in the 2022 Update.
The water resources in the South East Management Area include surface water from Serrano Creek and numerous smaller tributaries, groundwater and imported water. Serrano Creek provides surface waters that flow into and/or out of the IRWD’s Lake Forest portion of the South East Management Area (Boyle, 2002). Historically, groundwater production has been a minor source of water supply for the South East Management Area and there has been no groundwater production since February 2018. Imported water received through the Metropolitan Water District of Southern California is the primary water supply source to meet the water demands within the South East Management Area.
Historically, IRWD has produced groundwater from six wells located in the city of Lake
Forest. Groundwater production within the South East Management Area has historically
represented less than 2 percent of the potable water supply for IRWD’s Lake Forest area
and less than 0.2 percent of IRWD’s overall potable water supply. Due to the relatively
low yield of the Aquifer in the South East Management Area, groundwater production is
expected to remain a relatively insignificant water supply source for the area.
None of IRWD’s six wells have been active since February 2018. At the time of the
preparation of the Basin-8 Alternative, IRWD was pumping groundwater from only one
active well (Well LF-2) in the South East Management Area. In early 2018, due to poor
water quality of the well water, IRWD ceased well pumping and the well has been
inactive since. IRWD has plans to rehabilitate Well LF-2 and resume groundwater
production in the future. In addition, in February 2020, well LF-5 was destroyed due to
low water production and high salinity and to also make way for a new pump station on
the site where the well was located. While no plans are currently in place, placement for a
potential new well was included with the pump station siting.
The five remaining wells within IRWD’s Lake Forest portion of the Management Area are
currently monitored for groundwater levels on a monthly basis. There are no other
programs in the South East Management Area responsible for managing or monitoring
groundwater resources at this time. As of the beginning of 2018, the monthly water
quality monitoring of the operational well was halted temporarily due to lack of production.
Sampling and water quality monitoring will resume at this well when the planned well
rehabilitation project is completed. In addition, two wells are to be designated as
Important Note:
1-3

South East Management Area
BASIN 8-1 ALTERNATIVE 2022 UPDATE 1-5
groundwater level monitoring wells (LF-1 and LF-4) and added to the Basin 8-1 SGMA
monitoring program. The groundwater levels at these wells will be monitored on a
monthly basis with the results transmitted to DWR as part of the Basin 8-1 monitoring
program.
The approach to sustainably managing the South East Management Area is to continue
to monitor groundwater levels and production to ensure that groundwater pumping does
not lead to significant and unreasonable conditions such as (1) chronic lowering of
groundwater levels, (2) chronic reduction in storage, (3) groundwater quality degradation,
(4) inelastic land subsidence or (5) unreasonable adverse effect on surface water
resources. Descriptions of these undesirable results can be found in Sections 8 through
14.
1-4

South East Management Area
BASIN 8-1 ALTERNATIVE 2022 UPDATE 2-6
AGENCY INFORMATION
2.1 HISTORY OF AGENCIES IN SOUTH EAST BASIN
MANAGEMENT AREA
No update since the 2017 Alternative – See 2017 Alternative.
2.2 GOVERNANCE AND MANAGEMENT STRUCTURE
No update since the 2017 Alternative – See 2017 Alternative.
2.3 LEGAL AUTHORITY
No update since the 2017 Alternative – See 2017 Alternative.
2.4 BUDGET
The budget required to monitor and report groundwater information for the South East
Management Area has not been defined. As part of its standard operations, IRWD
regularly collects and maintains information on its groundwater production, groundwater
levels and water quality testing. Funding for well monitoring, operation, and rehabilitation
where applicable is defined in the IRWD’s operating or capital budgets. Since the
preparation of the 2017 Alternative, there continues to be no groundwater production
within ETWD or City of Orange areas of the South East Management Area, therefore
these agencies are not be responsible for monitoring and reporting groundwater
information.
For this 2022 update, it should be noted that two monitoring wells (LF-1 and LF-4) will be
designated to report on monthly water levels which will be transmitted to DWR as part of
the Basin 8-1 SGMA monitoring program.
2-1

South East Management Area
BASIN 8-1 ALTERNATIVE 2022 UPDATE 3-7
MANAGEMENT AREA DESCRIPTION
3.1 SOUTH EAST SERVICE AREA
No update since the 2017 Alternative – See 2017 Alternative.
Jurisdictional Boundaries
No update since the 2017 Alternative – See 2017 Alternative.
Land Use Designations
No update since the 2017 Alternative – See 2017 Alternative.
3.2 GROUNDWATER CONDITIONS
Groundwater level trends in the South East Management Area are relatively stable, or
rising, consistent with the limited recent groundwater production in the area. Of the six
groundwater production wells IRWD has in the area, only one is active and that well is
currently not pumping due to groundwater quality issues and required maintenance (see
Figure 3-1). As there is no current groundwater pumping and only limited planned future
groundwater development, the stable or rising groundwater level trends are expected to
continue.
3 -1

South East Management Area
BASIN 8-1 ALTERNATIVE 2022 UPDATE 3-8
Figure 2 Figure 3-1: Groundwater Production Wells (Active and Inactive)
A study completed in 2002 assessed the potential of the development of future wells in
the IRWD Lake Forest area, which is located in the eastern portion of the South East
Management Area. It was noted that based on available well driller’s logs there was
considerable clay in the alluvium and that the specific capacity of these wells is very low.
Based on the very low specific capacity results, it appears that the alluvium is
characterized by low permeability. This seems to be reflected in the low production
capacity of the wells (Boyle 2002).
Since the preparation of the 2017 Alternative, only well LF-2 was operational up through
January 2018. Due to water quality issues related to iron and manganese, well LF-2 was
taken offline in early 2018 and IRWD plans to rehabilitate the well and construct
treatment for the removal of iron and manganese. The rehabilitation project is planned to
be performed in late 2022 and depending on the performance and water quality testing
results from the well, IRWD may construct a treatment facility to remove iron and
manganese. While well LF-2 has not been active in the last few years, it is shown as
3 -2
South East Management Area
BASIN 8-1 ALTERNATIVE 2022 UPDATE 3-9
“active” on Figure 3-1 because IRWD plans to put well LF-2 back into production once it
is rehabilitated and treatment facilities are constructed.
In 2020, well LF-5 was destroyed to make way for a new planned pump station on the
site. Well LF-5 was previously used to supplement water in IRWD’s recycled water
system. However, due to continual poor water production and high salinity, IRWD
ceased the operation of well LF-5, and in February 2020, IRWD destroyed the well. At the
site, IRWD plans to construct a new recycled water pump station. Although construction
and operation of a new well is not a currently planned project, space is being allocated on
the existing site adjacent to the pump station to accommodate a potential new well in the
future.
3.2.1 Groundwater Levels
The range of observed groundwater levels in the South East Management Area from
2016 to 2021 are summarized in Figure 3-2. It is noted that no groundwater level data
exists in the ETWD and City of Orange portions of the South East Management Area.
Historic and estimated groundwater levels from 1991 to 2021 for IRWD’s Lake Forest
wells are shown in Figure 3-2. Historic groundwater level data is available from 1991
through 2001, after which there is no data available until 2015. More recent groundwater
level data is available from 2015 to present. Monthly groundwater levels from IRWD’s
Lake Forest wells for 2020 to 2021 are shown in Figure 3-3.
In all IRWD wells, groundwater levels are the same or higher in 2021 than they were in
2017. With the exception of LF-1, groundwater levels show a rising trend, indicating that
recharge to the area exceeds the discharge. Well LF-1 shows a stable groundwater level
trend.
3 -3

South East Management Area
BASIN 8-1 ALTERNATIVE 2022 UPDATE 3-10
Figure 3Figure 3-2:Historic Groundwater Levels in South East Management Area, 1991-2021
Figure 4Figure 3-3: Current Groundwater Levels in South East Management Area, 2020-21
3 -4

South East Management Area
BASIN 8-1 ALTERNATIVE 2022 UPDATE 3-11
3.2.2 Regional Pumping Patterns
Table 3-1 summarizes information on all of the wells that are known to exist within the
South East Management Area by agency. As presented, well design flows range from
125 to 350 gallons per minute (gpm) and well depths range from 675 to 1,000 feet below
ground surface (ft-bgs).
Table 2Table 3-1: Wells and Flow Data
Agency Well State
Well No. System Status
Design
Flow
(gpm)
Drilled
Depth
(ft-
bgs)
Perforated
Intervals
(ft)
IRWD LF-1 06S/08W-
15A00 Nonpotable Inactive 300 1989 800 200-790
IRWD LF-2 06S/08W-
12Q02 Potable Inactive 300
1957,
redrilled
2010
675 200-675
IRWD LF-3 06S/08W-
12J01 Potable Inactive 350 1950 800
270-395;
400-785
IRWD LF-4 06S/08W-
12L02 Nonpotable Inactive 200 1993 810
350-470
510-790
IRWD LF-5 06S/08W-
12A01 Nonpotable N/A 140 1997 800 350-780
IRWD LF-7 06S/08W-
12E00 Potable Inactive 125 1994 1000 430-980
ETWD N/A N/A N/A N/A N/A N/A N/A N/A
City of
Orange N/A N/A N/A N/A N/A N/A N/A N/A
For the 2022 Update, Table 3-2 summarizes average annual pumping from 2016-2021
within the South East Management Area by agency. As shown, ETWD and City of
Orange did not pump any groundwater from the South East Management Area during
this time period. In IRWD’s portion of the South East Management Area none of the
existing wells are currently active. Over the last 5 years, well LF-2 annual pumping
ranged from 0 acre-feet to 389 acre-feet and averaged approximately 90 acre-feet.
3 -5

South East Management Area
BASIN 8-1 ALTERNATIVE 2022 UPDATE 3-12
Table 3 Table 3-2: Annual Pumping Average 2016-2021
Agency Average Annual Production
(acre-feet/yr.)
IRWD 90
ETWD 0
City of Orange 0
Total 90
In the last five years, pumping from LF-2 occurred in 2016 and 2018, after which LF-2
was taken offline. Figure 3-4 shows monthly pumping patterns for LF-2 from 2016 to
2021. Figure 3-5 shows annual pumping by water year (October-September) for 2017
through 2021.
Figure
5Figure 3-4: Monthly Groundwater Pumping Pattern in Well LF-2, 2016-2021
3 -6

South East Management Area
BASIN 8-1 ALTERNATIVE 2022 UPDATE 3-13
Figure 6Figure 3-5: Total Annual Pumping for Well LF-2, (Water Year 2016-2021)1
1 All data shown for 2017 on this chart occurs between October and December 2016 of the water year.
3.2.3 Groundwater Storage Data
No update since the 2017 Alternative – See 2017 Alternative.
3.2.4 Groundwater Quality Conditions
Historically, only three of the six IRWD Lake Forest wells were permitted for potable use
as the other three Lake Forest wells have had elevated levels of iron(Pb), manganese
(Mn), electrical conductivity (EC) and total dissolved solids (TDS). Recent groundwater
quality data for the South East Management Area which includes arsenic (As) is
presented in Table 3-3. As presented, no other water quality data exists for the ETWD
and City of Orange areas within the South East Management Area.
3 -7

South East Management Area
BASIN 8-1 ALTERNATIVE 2022 UPDATE 3-814
Table 4 Table 3-3: Ground Water Quality in Selected Wells
Agency Well
Name Well Use
Date
Range
Avg
TDS
(#)1
(mg/L)
Avg
As
(ug/L)
Avg
Pb
(ug/L)
Avg
Mn
(mg/L)
IRWD LF-2 Production 2016-2018* 602 0.42 0.51 22.3
IRWD LF-1 Production 1961-2000 >500 (21)
IRWD LF-4 Production 1993-2000 >500 (12)
IRWD LF-5 Production 1997-2001 >500 (5)
IRWD LF-3 Production 1991-1998 >500 (12)
IRWD LF-7 Production 1994-2001 <500 (12)
City of
Orange N/A N/A N/A N/A N/A N/A N/A
ETWD N/A N/A N/A N/A N/A N/A N/A
1 # = Number of Samples
* LF-2 Turned Offline in February 2018
3.2.5 Land Subsidence
Non-recoverable land subsidence has not been observed since 2015 in the South East
Management Area (see Figure 3-6). The area is not susceptible to land subsidence given
the following:
1. Minimal groundwater development exists in the South East Management Area.
2. Groundwater levels are stable or rising and have been for at least the last 10
years.
3. Low risk of future groundwater level declines due to limited planned
groundwater production.
As shown in Figure 3-6, the South East Management Area experienced between -0.05
and 0.05 feet of vertical displacement across years 2015 to 2020 with an accuracy of
approximately 0.05 feet in data readings.
Recently, as part of DWR's SGMA technical assistance to provide important SGMA-
relevant data to Groundwater Sustainability Agency’s (GSAs) for Groundwater
Sustainability Plan (GSP) development and implementation, DWR contracted with TRE
ALTAMIRA, Inc. to provide vertical displacement estimates are derived from InSAR data
that are collected by the European Space Agency (ESA) Sentinel-1A satellite.

South East Management Area
BASIN 8-1 ALTERNATIVE 2022 UPDATE 3-3-95
This dataset represents measurements of vertical ground surface displacement in more
than 200 of the high-use and populated groundwater basins across the State of California
between January of 2015 and October of 2020. InSAR data coverage began in late 2014
for parts of California, and coverage for the entire study area began in June 13, 2015.
Included in this dataset are point data that represent average vertical displacement
values for 100 meter by 100 meter areas, as well as GIS rasters that were interpolated
from the point data; rasters for total vertical displacement relative to June 13, 2015, and
rasters for annual vertical displacement rates with earlier coverage for some areas, both
in monthly time steps. The level of accuracy is approximately 0.05 feet.
To show subsidence in Basin 8-1, the layer showing total land subsidence since the start
of the InSAR data on 6/13/2015 and ending on 7/1/2020, which corresponds to the end of
the water year was used. (GIS layer used:
https://gis.water.ca.gov/arcgisimg/rest/services/SAR/Vertical_Displacement_TRE_ALTA
MIRA_v2020_Total_Since_20150613_20200701/ImageServer.)

South East Management Area
BASIN 8-1 ALTERNATIVE 2022 UPDATE -3-1016
3.2.6 Groundwater and Surface Water Interactions and Groundwater Dependent Ecosystems
The primary surface water drainage in the South East Management Area is Serrano
Creek. Serrano Creek is an intermittent stream that only flows during the rainy season
following storm events. The predominant interaction between the surface flow in the
creek and groundwater is percolation from the creek and recharge of the groundwater
(see Boyle 2002 Groundwater Supply Evaluation study). Groundwater does not typically
discharge at the land surface near the creek. Data from the California Department of
Figure 7. Figure 3-6: Total Vertial Ground Surface Displacement from June 2015 to July 2020

South East Management Area
BASIN 8-1 ALTERNATIVE 2022 UPDATE
Water Resources (CDWR) NC dataset viewer indicates that there are some areas along
Serrano Creek that are designated as groundwater dependent ecosystems
(https://gis.water.ca.gov/app/NCDatasetViewer/).
Planned future groundwater pumping in IRWD’s Lake Forest portion of the South East
Management Area from Well LF-2 will not occur in areas of groundwater dependent
ecosystems (GDEs). Some of IRWD’s inactive wells are located near the Serrano Creek
drainage, but outside the GDE areas. With the exception of Well LF-5, there are no plans
to pump groundwater from any of these wells in the future. Well LF-2, which may be
pumped in the future, is located outside the Serrano Creek drainage and is not expected
to have an impact on GDEs within the Serrano Creek drainage. In the event that a
replacement well is constructed near the existing Well LF-5, groundwater monitoring will
be implemented to ensure the production from that well does not have an undesirable
result on the GDE along Serrano Creek.
33 ---11

South East Management Area
BASIN 8-1 ALTERNATIVE 2022 UPDATE 4-18
WATER BUDGET
An average annual groundwater budget for the South East Management Area for the last
5 years is presented in Table 4-1. The simple water budget for the IRWD portion of the
South East Management Area is based on measured groundwater production and the
subsurface flow calculated by the numerical model for the OCWD Management Area
(Basin 8-1 Alternative 2017). The development of individual components in the average
annual groundwater budget are described in the following subsections.
4.1 BUDGET COMPONENTS
For IRWD’s Lake Forest portion of the South East Management Area, the components of
the groundwater budget are presented in Table 4-1 and described below. Groundwater
Production includes an average from 2016-2021. As of 2018, the groundwater
production is zero until the LF-2 well can be rehabilitated and placed back in service.
Table 5 Table 4-1: Average Annual Groundwater Budget
South East Management Area Groundwater Budget 2016-2021 (acre-feet)
Item Total
(acre-feet)
Recharge 2,900
Total Inflow 2,900
Groundwater Production 90
Subsurface Outflow 2,810
Total Outflow 2,900
Change in Storage 0
4.1.1 Recharge
Recharge includes infiltration from ephemeral creeks, precipitation and return flow recharge from irrigation. It was estimated to equal the total outflow as summarized in Table 4-1.
4.1.2 Groundwater Production
Groundwater production was taken from measured records by IRWD as summarized in Table 4-1. In the base period 2016 to 2021, groundwater production was only conducted by IRWD’s Well LF-2. Groundwater production in this well ranged from 0 to 389 acre-ft/yr. from 2016 to 2021 with an average of approximately 90 acre-ft/yr.
4 -1

South East Management Area
BASIN 8-1 ALTERNATIVE 2022 UPDATE 4-19
4.1.3 Subsurface Outflow
Subsurface outflow from the South East Management Area into the OCWD Management
Area was estimated using the OCWD groundwater flow model (Basin 8-1 Alternative
2017).
4.2 CHANGES IN GROUNDWATER STORAGE
Changes in groundwater storage within the South East Management Area since 2015 have been positive reflecting the rising groundwater levels measured in the wells. As indicated in Section 3.2.1, groundwater levels are the same or higher in 2021 than they were in 2017. With the exception of LF-1, groundwater levels show a rising trend, indicating that recharge to the area exceeds the discharge. Well LF-1 shows a stable groundwater level trend. These trends have persisted despite multiple years of below normal precipitation. As presented in Section 4.1, groundwater pumping in the South East Management Area is relatively minor and averages only 125 acre-feet per year over the previous 10 years (2006-2015), and 90 acre-feet in the last six years (2016-2021). The groundwater level and pumping data indicate groundwater production is below the sustainable yield of the basin.
4.3 WATER YEAR TYPE
No update since the 2017 Alternative – See 2017 Alternative.
4.4 ESTIMATE OF SUSTAINABLE YIELD
The sustainable yield of the South East Management Area is approximated by the
volume of average annual recharge that is estimated to enter the basin (approximately
2,900 acre-ft), as shown in Table 4-1. Average annual groundwater production over the
last 5 years, ranging from 0 acre-feet to 389 acre-feet and averaging approximately 90
acre-feet, is significantly below the sustainable yield, which is supported by rising
groundwater levels in the area over the same time period. Due to production rate
limitations and groundwater quality issues, it is unlikely groundwater production in the
South East Management Area will ever increase to the sustainable yield.
4.5 CURRENT, HISTORICAL, AND PROJECTED
GROUNDWATER BUDGET
IRWD does not plan any significant changes to groundwater use in the South East
Management Area that would change the water budget. The historical water budget is
4 -2

South East Management Area
BASIN 8-1 ALTERNATIVE 2022 UPDATE 4-20
discussed in Section 4.1 and summarized in Table 4-1. Currently, there is no
groundwater production in the South East Management Area. Future groundwater
production could include bringing Well LF-2 online, replacing Well LF-5, and developing
two new wells (see Section 16). No projected groundwater production is currently
anticipated within the ETWD and city of Orange portions of the South East Management
Area. Any future groundwater production will be managed within the sustainable yield of
the aquifer system.
4 -3

South East Management Area
BASIN 8-1 ALTERNATIVE 2022 UPDATE 5-21
WATER RESOURCE MONITORING
PROGRAMS
5.1 OVERVIEW
This section describes surface and groundwater monitoring programs in the South East
Management Area
5.2 GROUNDWATER MONITORING PROGRAMS
No groundwater development exists in the ETWD and City of Orange portions of the
South East Management Area. In IRWD’s Lake Forest portion of the South East
Management Area the existing five wells (whether active or inactive) have been, and will
continue to be, used to monitor the groundwater levels on a monthly basis. Section 3.2.1
provides information on the South East Management Area groundwater levels, and
Figure 3-1 shows the locations of the Lake Forest wells within the South East
Management Area.
5.3 OTHER MONITORING PROGRAMS
IRWD monitors groundwater quality in LF-2, when operating, as required by the
California Code of Regulation (Title 22) and California Division of Drinking Water, Santa
Ana District. In addition, as of 2021 two monitoring wells will be designated (LF-1 and LF-
4) for the monitoring and reporting groundwater elevations in the South East
Management Area which will be transmitted to the DWR under the SGMA monitoring
program for Basin 8-1. DWR currently requires bi-annual reporting for well monitoring
data.
5 -1

South East Management Area
BASIN 8-1 ALTERNATIVE 2022 UPDATE 6-22
WATER RESOURCE MANAGEMENT
PROGRAMS
IRWD works with ETWD and City of Orange on plans for groundwater development
within the South East Management Area and updates demand projections and the water
budget accordingly.
IRWD: The compilation of land use data is the basis for IRWD’s water resource planning
including its portion of the South East Management Area. Per IRWD’s 2020 Urban Water
Management Plan (UWMP), the land use data obtained from multiple jurisdictions in
IRWD’s service area is used in conjunction with IRWD’s applied water use factors in
order to estimate water requirements.
ETWD: ETWD’s water resource planning is based on the 2020 UWMP demand
projections. Regional demands are forecasted by the Municipal Water District of Orange
County and are then tailored to ETWD’s service area using available data for land use,
population, and economic growth, intermixed with a trajectory of conservation, which
includes both additional future passive measures and active measures.
City of Orange: The City of Orange’s current UWMP (2020) provides the basis for water
resource planning in Orange’s water service area. The UWMP, in conjunction with
applicable water use factors, form the basis for any potential water use estimates
required for potential planning use in the service area.
6 -1

South East Management Area
BASIN 8-1 ALTERNATIVE 2022 UPDATE 7-23
NOTICE AND COMMUNICATION
There are three agencies within the South East Management Area, as follows:
• IRWD
• ETWD
• City of Orange
On September 30, 2021, OCWD sent a letter via email to all of the Basin 8-1 agencies,
including each of the agencies listed above to let them know that the 2017 Alternative
was being updated and would be available for review and comment. No comments were
received by any of the agencies contacted. The three South East Management Area
agencies coordinated with OCWD and the other management areas to prepare the 2022
Update, in accordance with SGMA requirements.
A draft 2022 Update was presented to OCWD staff and posted on the OCWD website on
November 17, 2021 to allow for public review and comment. The final 2022 Update was
received and filed by the OCWD board in December 2021.
7 -1

South East Management Area
BASIN 8-1 ALTERNATIVE 2022 UPDATE 8-24
SUSTAINABLE MANAGEMENT APPROACH
The Sustainable Management Approach for the South East Management Area is to
continue monitoring sustainable conditions and monitor to ensure that conditions do not
lead to significant and unreasonable (1) lowering of groundwater levels, (2) reduction in
storage, (3) water quality degradation, or (4) inelastic land subsidence or (5)
unreasonable adverse effect on surface water resources.
8 -1

South East Management Area
BASIN 8-1 ALTERNATIVE 2022 UPDATE 9-25
SUSTAINABLE MANAGEMENT RELATED
TO GROUNDWATER LEVELS
9.1 HISTORY
As shown on Figure 3-2 historical groundwater levels in the IRWD’s Lake Forest portion
of the South East Management Area have shown stable or rising trends and are, in all
cases, at the same level or higher than they were in 2017. Because future groundwater
pumping in the South East Management Area is expected to be limited, groundwater
levels are expected to remain relatively steady in the future.
9.2 MONITORING OF GROUNDWATER LEVELS
Groundwater levels are currently monitored in the five wells located in IRWD’s Lake
Forest portion of the South East Management Area on a monthly basis. This monitoring
will continue into the future.
9.3 DEFINITION OF SIGNIFICANT AND UNREASONABLE
LOWERING OF GROUNDWATER LEVELS
Significant and unreasonable lowering of groundwater levels is defined as a long-term
chronic lowering of groundwater levels, despite changes in precipitation patterns. No
long-term reduction in groundwater levels in the South East Management Area is
expected to occur.
9.4 DETERMINATION OF MINIMUM THRESHOLDS
It is not possible to determine a minimum threshold at this time since no undesirable
effects due to groundwater levels have occurred in the past and are not foreseen in the
future. Nevertheless, the South East Management Area well monitoring program is
expected to continue to monitor water levels and groundwater quality in the future. If
water levels start to show a consistent, long-term decline and undesirable results are
observed, action would be taken and minimum thresholds would be evaluated and
established as appropriate.
9 -1

South East Management Area
BASIN 8-1 ALTERNATIVE 2022 UPDATE 10-26
SUSTAINABLE MANAGEMENT
RELATED TO BASIN STORAGE
No groundwater development exists in the ETWD and City of Orange portions of the
South East Management Area. The total volume of groundwater storage in IRWD’s
portion of the South East Management Area has been estimated to be approximately
360,000 acre-feet (see Section 3.2.3).
10.1 DEFINITION OF SIGNIFICANT AND UNREASONABLE
REDUCTION IN STORAGE
No significant long-term reduction in groundwater storage is expected to occur in the
South East Management Area because of the limited groundwater use. However, a
decline in groundwater storage may be determined unreasonable if one more of the
following occurred:
1. Significant loss of well production capacity.
2. Degradation of water quality that significantly impacts the use of
groundwater.
10.2 DETERMINATION OF MINIMUM THRESHOLDS
A minimum threshold for the reduction of groundwater storage in the South East
Management Area is not anticipated since no undesirable effects have occurred in the
past and are not foreseen in the future. Nevertheless, IRWD’s Lake Forest monitoring
program continuously tracks water levels and groundwater quality. If water levels show a
consistent decline, IRWD’s Lake Forest monitoring program would be expanded to
examine any potential impacts and action would be taken to identify minimum thresholds
as appropriate.
10 -1

South East Management Area
BASIN 8-1 ALTERNATIVE 2022 UPDATE 11-27
SUSTAINABLE MANAGEMENT
RELATED TO WATER QUALITY
No groundwater development exists in the ETWD and City of Orange portions of the
South East Management Area. Groundwater quality in IRWD’s portion of the South East
Management Area is affected by the quality of recharge from Serrano Creek and
precipitation and incidental recharge from irrigation. Groundwater from subsurface inflow
could contain naturally elevated concentrations of TDS and manganese. IRWD has the
ability to utilize water produced from non-potable wells to supplement its extensive
recycled water system which serves irrigation demands.
11.1 DEFINITION OF SIGNIFICANT AND UNREASONABLE
DEGREDATION OF WATER QUALITY
There are three elements that must be considered when evaluating the impact of
groundwater quality degradation.
The first element is considering the causal nexus between groundwater management
activities and groundwater quality. For example, groundwater contamination due to
improper handling of toxic materials impacts groundwater quality; however, this water
quality degradation is not caused by groundwater management activities.
The second element is the beneficial uses of the groundwater and water quality
regulations, such as Maximum Contaminant Levels (MCLs) and other potable water
quality requirements.
The third element that must be considered is the volume of groundwater impacted by
groundwater quality degradation. If small volumes are negatively affected that don’t
materially affect the use of the aquifer or basin for its existing beneficial uses, then this
would not represent a significant and unreasonable degradation of water quality.
However, if the impacted volume grows, then it could reach a level that it becomes
significant and unreasonable.
When considering all three elements, the definition of significant and unreasonable
degradation of water quality is defined as degradation of groundwater quality in the South
East Management Area to the extent that a significant volume of groundwater becomes
unusable for its designated beneficial uses.
11.2 DETERMINATION OF MINIMUM THRESHOLDS
The minimum thresholds for groundwater quality are exceedances of Maximum
Contaminant Levels (MCLs) or other applicable regulatory limits that are directly
attributable to groundwater management actions in the South East Management Area
that prevents the use of groundwater for its designated beneficial uses
11 -1

South East Management Area
BASIN 8-1 ALTERNATIVE 2022 UPDATE 12-28
SUSTAINABLE MANAGEMENT
RELATED TO SEAWATER INTRUSION
The South East Management Area is located far from the ocean and thus there is no
reason to consider the potential impact of seawater intrusion in this management area.
12-1

South East Management Area
BASIN 8-1 ALTERNATIVE 2022 UPDATE 9
SUSTAINABLE MANAGEMENT
RELATED TO LAND SUBSIDENCE
Subsidence is not an issue for the South East Management Area given the following:
• Minimal groundwater development exists in the South East Management Area.
• Groundwater levels are stable or rising and have been for at least 10 years.
• Low risk of future groundwater level declines due to limited planned
groundwater production.
As discussed previously in Section 3, the Basin 8-1 area will continue to be monitored for changes in InSAR data (via OCWD and consultants) to evaluate ground surface fluctuations within the service area. If irreversible subsidence was found to occur in a localized area in relation to groundwater pumping patterns or groundwater storage conditions, the South East Management Area managers would coordinate with local officials to investigate and develop an approach to address the subsidence.
113-1

South East Management Area
BASIN 8-1 ALTERNATIVE 2022 UPDATE 14-30
MANAGING GROUNDWATER
DEPLETIONS IMPACTING SURFACE WATER
Although IRWD does not have immediate plans for groundwater pumping in areas of
GDEs, in the event that replacement or new wells are constructed near sensitive areas,
groundwater monitoring will be implemented to ensure the groundwater production does
not have an undesirable result on the GDE along Serrano Creek.
14 -1

South East Management Area
BASIN 8-1 ALTERNATIVE 2022 UPDATE 15-31
PROTOCOLS FOR MODIFYING
MONITORING PROGRAMS
Protocols for modifying monitoring programs are based on changes from historical
conditions or changes in water quality that begin to approach or exceed regulatory limits.
15.1 ESTABLISHMENT OF PROTOCOLS FOR WATER QUALITY
Protocols for modifying monitoring programs are described in the 2017 Alternative.
15 -1

South East Management Area
BASIN 8-1 ALTERNATIVE 2022 UPDATE 16-12
PROCESS TO EVALUATE NEW
PROJECTS
When new projects are proposed within the South East Management Area, the agency
proposing the project will be responsible for preparing a CEQA document to ensure
alternatives have been evaluated and any significant and unreasonable results are
mitigated. Plans to rehabilitate the well are currently going out for construction bid with
potential construction expected to start in fall of 2022. The project may include facilities
to remove high levels of iron and manganese as needed to meet potable water quality
requirements.
There are a number of potential well projects currently in development in the South East
Management Area. These include:
• LF-1 and LF-4 designated monitoring well operations.
• LF-2 rehabilitation and water quality treatment planned construction in 2022.
• LF-5 (replacement) future projects may include the possible development of a
new production well on or near the existing decommissioned site.
• General well rehabilitation and monitoring projects across the South East
Management Area, with approved funding allocated in the capital budgets
approved for 2021-2023.
In IRWD’s Lake Forest portion of the South East Management Area, a 2002 study by
Boyle Engineering Corporation and 2015 study by Dudek were performed in order to
assess the potential for development of two future wells, LF-6 and LF-8, as well as
the re-drilling of existing inactive wells. Although IRWD has no near-term plans to
drill wells LF-6 and LF-8, it has included a capital project for the design, construction
and equipping of LF-1.
A capital project for the design, construction and equipping of LF-1 has been
included in IRWD’s most recent capital budget, however, there are no plans to
begin this specific project. IRWD also has no near-term plans to drill wells LF-6 and
LF-8. In 2000, its last active year, LF-1 pumped approximately 230 acre-feet. Over
the last 5 years well LF-2 annual pumping has ranged from 0 acre-feet to 389 acre-
feet and averaged approximately 90 acre-feet including years of non-operation. It is
expected that when LF-1 is redrilled, groundwater production from IRWD’s southern
portion of the South East Management Area could increase.
Water produced from LF-1 could be used to provide supply to the nearby lake which
currently is supplied by untreated imported water. Water produced could also
potentially be pumped and conveyed to the Baker Water Treatment Plant for

South East Management Area
BASIN 8-1 ALTERNATIVE 2022 UPDATE 3
treatment if needed (Dudek, 2015). Due to the consistently lower yields from the
aquifer in this area, it is expected that additional production from LF-1 will continue
to be considered supplemental, and therefore insignificant in terms of IRWD’s overall
water supply for its Lake Forest area. As of 2021, LF-1 is still currently off line
although there are future plans to potentially re-drill and rehabilitate the well in the
future.
1616 -- 2

South East Management Area
BASIN 8-1 ALTERNATIVE 2022 UPDATE 17-34
REFERENCES
Following are references and technical studies for the South East Management Area.
• Basin 8-1 Alternative, 2017
• Communication with OCWD. Email dated November 28, 2016.
• Communication with OCWD. Email dated October 21, 2021.
• Communication with OCWD. Email dated November 17, 2021.
• Geohydrology and Acritical-Recharge Potential of the Irvine Area Orange
County, California. J. A. Singer, January 8,1973.
• Groundwater Supply Evaluation for the Los Alisos System Phase 1. Boyle
Engineering Corporation, July 2002.
• Ground Water Management, Irvine Area, Orange County, California. Harvey O.
Banks, Consulting Engineer, Inc.
• Lake Forest Groundwater Conveyance Analysis Results. Dudek, November 5,
2015.
• 2015 Urban Water Management Plan, Irvine Ranch Water District, 2016
• 2020 Urban Water Management Plan, Irvine Ranch Water District, 2021
17 -1

Basin 8-1 Alternative
Santa Ana Canyon
Management Area
2022 Update
Prepared by: Orange County Water District
January 1, 2021

Basin 8-1 Alternative
2022 Update
Santa Ana Canyon Management Area
Adam Hutchinson, P.G., C.Hg.
Recharge Planning Manager Orange County Water District
18700 Ward Street Fountain Valley, CA 92708
Prepared for the Department of Water Resources, pursuant to Water Code §10733.6(b)(3),(c) and §10733.8
January 1, 2022

Table of Contents
BASIN 8-1 ALTERNATIVE 2022 UPDATE i
Section Page
2.1 HISTORY OF AGENCIES IN SANTA ANA CANYON MANAGEMENT AREA ........ 2-1
2.2 GOVERNANCE AND MANAGEMENT STRUCTURE ............................................. 2-1
2.3 LEGAL AUTHORITY ............................................................................................... 2-1
2.4 BUDGET ................................................................................................................. 2-2
3.1 SANTA ANA CANYON MANAGEMENT AREA ...................................................... 3-1
3.1.1 Jurisdictional Boundaries ................................................................................. 3-3
3.1.2 Existing Land Use Designations ...................................................................... 3-3
3.2 GROUNDWATER CONDITIONS ............................................................................ 3-4
3.2.1 Groundwater Elevation .................................................................................... 3-4
3.2.2 Groundwater Beneficial Uses and Regional Pumping Patterns ........................ 3-5
3.2.3 Groundwater Storage Data .............................................................................. 3-7
3.2.4 Groundwater Quality Conditions ...................................................................... 3-7
3.2.5 Land Subsidence ............................................................................................. 3-7
3.2.6 Groundwater and Surface Water Interactions and Groundwater Dependent
Ecosystems ..................................................................................................... 3-7
4.1 BUDGET COMPONENTS ...................................................................................... 4-1
4.1.1 Subsurface Inflow/Outflow ............................................................................... 4-2
4.1.2 Infiltrated Santa Ana River Base Flow .............................................................. 4-2
4.1.3 Evapotranspiration ........................................................................................... 4-2
4.1.4 Groundwater Production .................................................................................. 4-2
4.2 CHANGES IN GROUNDWATER STORAGE .......................................................... 4-2
4.3 WATER YEAR TYPE .............................................................................................. 4-3
4.4 ESTIMATE OF SUSTAINABLE YIELD ................................................................... 4-3
4.5 CURRENT, HISTORICAL, AND PROJECTED WATER BUDGET .......................... 4-3
5.1 OVERVIEW ............................................................................................................ 5-1

Table of Contents
BASIN 8-1 ALTERNATIVE 2022 UPDATE ii
5.2 GROUNDWATER MONITORING PROGRAMS ..................................................... 5-1
5.3 OTHER MONITORING PROGRAMS...................................................................... 5-3
9.1 HISTORY ................................................................................................................ 9-1
9.2 MONITORING OF GROUNDWATER LEVELS ....................................................... 9-1
9.3 DEFINITION OF SIGNIFICANT AND UNREASONABLE LOWERING OF
GROUNDWATER LEVELS .................................................................................... 9-1
9.4 DETERMINATION OF MINIMUM THRESHOLDS .................................................. 9-1
10.1 DEFINITION OF SIGNIFICANT AND UNREASONABLE REDUCTION IN STORAGE
............................................................................................................................. 10-1
10.2 DETERMINATION OF MINIMUM THRESHOLDS ................................................ 10-1
11.1 DEFINITION OF SIGNIFICANT AND UNREASONABLE DEGRADATION OF WATER
QUALITY .............................................................................................................. 11-1
11.2 DETERMINATION OF MINIMUM THRESHOLDS ................................................ 11-1

Table of Contents
BASIN 8-1 ALTERNATIVE 2022 UPDATE iii
Figure Figure 1-1: Agencies in the Santa Ana Canyon Management Area ......................................... 1-1
Figure 3-1: Boundary of Santa Ana Canyon Management Area .............................................. 3-2 Figure 3-2: Groundwater Production Wells (Active and Inactive) ............................................. 3-3 Figure 3-3: Water Level Hydrographs of Selected Wells ......................................................... 3-5 Figure 5-1: Wells Used to Monitor Groundwater Levels .......................................................... 5-2 Figure 13-1: Total Vertical Ground Surface Displacement from June 2015 to July 2020 ....... 13-2
Table
Table 1-1: Agencies in Santa Ana Canyon Management Area .................................... 1-3 Table 1-2: Water Budget, 5-Year Average (2016-21) ................................................... 1-3 Table 3-1: Production Wells, Flow-Meter Status, and 5 Year Average Production ...... 3-6
Table 5-1: Wells Monitored for Water Quality ............................................................... 5-3

Executive Summary
BASIN 8-1 ALTERNATIVE 2022 UPDATE 1-1
SECTION 1. EXECUTIVE SUMMARY
The Santa Ana Canyon Management Area covers the easternmost extent of the Department of
Water Resources (DWR) Basin 8-1, Coastal Plain of Orange County Groundwater Basin
(Basin). This Management Area was created for this Alternative (under 23 CCR 354.20)
because of the unique characteristics of the Santa Ana Canyon and the appropriateness of
developing different management objectives and strategies for this portion of the Basin. These
different objectives and management approaches, as described in this Section, account for the
significant differences in groundwater use, geology, aquifer characteristics, and other factors
which distinguish Santa Ana Canyon from other portions of the Basin. Figure 1-1 shows the
extent of the Santa Ana Canyon Management Area and the agencies with jurisdiction in the
Santa Ana Canyon Management Area. Table 1-1 lists the agencies shown on Figure 1-1.
Figure 1-1: Agencies in the Santa Ana Canyon Management Area

Executive Summary
BASIN 8-1 ALTERNATIVE 2022 UPDATE 1-2
The agencies within Basin 8-1 collaborated to prepare and submit an Alternative to a
Groundwater Sustainability Plan (GSP). In accordance with Water Code §10733.6(b)(3), the
Alternative presented an analysis of basin conditions that demonstrated that the Basin had
operated within its sustainable yield over a period of at least 10 years. The Alternative was
submitted to DWR on December 22, 2016. On July 17, 2019, DWR determined that the
Alternative satisfied SGMA objectives and was therefore approved.
Agencies with approved alternatives are required to submit annual reports to DWR by April 1 of
each year. Annual reports for Basin 8-1 were submitted to DWR as follows:
• Water Year 2016-17, submitted on March 29, 2018
• Water Year 2017-18, submitted on March 29, 2019
• Water Year 2018-19, submitted on March 30, 2020
• Water Year 2019-20, submitted on March 30, 2021
According to Water Code §10733.8, “At least every five years after initial submission of a plan
pursuant to Section 10733.4, the department shall review any available groundwater
sustainability plan or alternative submitted in accordance with Section 10733.6, and the
implementation of the corresponding groundwater sustainability program for consistency with
this part, including achieving the sustainability goal. The department shall issue an assessment
for each basin for which a plan or alternative has been submitted in accordance with this
chapter, with an emphasis on assessing progress in achieving the sustainability goal within the
basin. The assessment may include recommended corrective actions to address any
deficiencies identified by the department.”
This document, called the 2022 Update, represents the first five-year update, which is due
January 1, 2022.
For purposes of this report, the Basin 8-1 Alternative submitted on December 22, 2016,
will be referred to as the 2017 Alternative. The first five-year update will be referred to as
the 2022 Update for ease of reference. The 2017 Alternative was a comprehensive
document showing that Basin 8-1 had been managed sustainably for more than 10 years.
For the 2022 Update, the focus is on documenting that the basin has been sustainably
managed during the five years since the 2017 Alternative was submitted and to present
relevant new information from the last five years. As such, the 2017 Alternative is
considered a key reference document with background information that is not duplicated
in the 2022 Update.
The water resources in the Santa Ana Canyon Management Area include the Santa Ana River
and limited groundwater. Groundwater is primarily located in a thin alluvial aquifer that is 90 to
100 feet thick and is a combination of infiltrated Santa Ana River water and subsurface inflow
from the adjacent foothills. Groundwater produced from the alluvial aquifer is primarily used for
irrigation, but some is also used for potable purposes. The volume of produced groundwater
represents less than one percent of the total available water supply to the Santa Ana Canyon
Management Area due to the significantly larger flow of the Santa Ana River as shown on Table
1-2. Even under projected dry conditions, groundwater production is expected to be less than

Executive Summary
BASIN 8-1 ALTERNATIVE 2022 UPDATE 1-3
four percent of the total available water supply (see 2017 Alternative, Santa Ana Canyon
Management Area).
Table 1-1: Agencies in Santa Ana Canyon Management Area
Agency
City of Anaheim
City of Chino Hills
City of Yorba Linda
City of Corona
Orange County Water District
County of Orange
Riverside County
Yorba Linda Water District
Table 1-2: Water Budget, 5-Year Average (2016-21)
Flow Component 5-Yr Avg: 2016-21 (afy)
INFLOW
Santa Ana River Base Flow 76,860
Santa Ana River Storm Flow 78,750
Subsurface Inflow 6,000
TOTAL INFLOW 161,610
OUTFLOW
Santa Ana River Base Flow 76,120
Santa Ana River Storm Flow 78,750
Evapotranspiration 740
Groundwater Production 1,000
Subsurface Outflow 5,000
TOTAL OUTFLOW 161,610
Per the monitoring discussed in Section 5, groundwater levels in the Santa Ana Canyon
Management Area are relatively stable, having been consistently 20 to 30 feet below ground
surface since 1991, indicating that the supply of subsurface inflow and surface water from the
Santa Ana River is more than sufficient to sustain local groundwater production. Groundwater
quality is suitable for irrigation and potable uses. Native groundwater from the surrounding
foothills tends to have naturally elevated total dissolved solids (TDS) and manganese
concentrations. Most wells in the canyon appear to produce a blend of infiltrated Santa Ana
River water and native groundwater, with some wells producing more infiltrated Santa Ana River
water than others.

Executive Summary
BASIN 8-1 ALTERNATIVE 2022 UPDATE 1-4
The Orange County Water District (OCWD) monitors Santa Ana River flow and quality as well
as groundwater levels, quality, and production in the Santa Ana Canyon Management Area (see
Section 5). Moreover, OCWD has a wide variety of water resource management programs that
cover the OCWD Management Area as well as programs in the upper Santa Ana River
watershed to address Santa Ana River flow and quality (see Section 6). These programs are
important in protecting the quality of the Santa Ana River, which has a significant influence on
the groundwater quality in the Santa Ana Canyon Management Area.
The approach to managing the Santa Ana Canyon Management Area is for OCWD, in
cooperation with the County of Orange, to continue monitoring groundwater levels and quality to
ensure that no significant and unreasonable undesirable results occur in the future, both in the
Santa Ana Canyon portion of the Basin and in the other hydrologically connected portions of the
Basin.
Due to the conditions documented within the Santa Ana Canyon Management Area, it will not
be difficult to prevent conditions that could lead to significant and unreasonable undesirable
results due to the low risk of increased groundwater production, little available developable land,
and continued high flows of the Santa Ana River relative to the amount of groundwater
production. A summary of the applicable undesirable results that must be prevented under
SGMA is presented below. A more detailed description of these can be found in Sections 8 to
13.
1. Water Levels: Long-term reduction in groundwater levels in the Santa Ana Canyon
Management Area are not expected given the high volume of Santa Ana River flow
relative to the amount of groundwater production and the ability of the shallow alluvial
aquifer to be recharged as a result of continuous and abundant surface flow in the Santa
Ana Canyon; however, if an unforeseen long-term reduction in groundwater levels were
to occur, water levels could reach a significant and unreasonable level if one or more of
the following occurred as a result of reduced groundwater levels:
a. Significant loss of riparian habitat along the Santa Ana River.
b. Significant loss of well production capacity (in the Santa Ana Canyon
Management Area).
c. Degradation of water quality that significantly impacts the beneficial uses of
groundwater.
2. Storage: As with groundwater levels, long-term reduction in groundwater storage in the
Santa Ana Canyon Management Area is not projected to occur; however, an unforeseen
decline in groundwater storage could reach a significant and unreasonable level if such
a decline caused one or more of the following:
a. Loss of significant riparian habitat along the Santa Ana River.
b. Significant loss of well production capacity.
c. Degradation of water quality that significantly impacts the beneficial uses of
groundwater.
3. Water Quality: The significant and unreasonable degradation of water quality is defined
as the degradation of groundwater quality in the Santa Ana Canyon Management Area
that is attributable to groundwater production or recharge practices within the Santa Ana

Executive Summary
BASIN 8-1 ALTERNATIVE 2022 UPDATE 1-5
Canyon Management Area that cause a significant volume of groundwater to become
unusable for its designated beneficial uses.
4. Seawater Intrusion: This does not apply to the Santa Ana Canyon Management Area
because this area if far removed from the coastline.
5. Subsidence: No vertical changes have been noted using DWR-supplied InSAR data.
It is unlikely that this will occur in the Santa Ana Canyon Management Area due to:
a. The presence of shale and sandstone bedrock underlying the alluvial aquifer.
b. The alluvial aquifer is thin, generally less than 100 feet, and comprised mainly of
sand and gravel with little clay.
c. Groundwater levels and groundwater storage are stable.
d. Very low risk of substantial groundwater level declines due to a de minimis
amount of groundwater production relative to the overall inflow of water to the
Santa Ana Canyon Management Area.
6. Groundwater Depletions Impacting Surface Water: Due to hydrogeologic conditions
and land use limitations, groundwater production in the Santa Ana Canyon Management
area has had and is projected to have a de minimis effect on groundwater conditions
and flows of surface water through the canyon. Therefore, this factor does not apply to
the Santa Ana Canyon Management Area.

Agency Information
BASIN 8-1 ALTERNATIVE 2022 UPDATE 2-1
SECTION 2. AGENCY INFORMATION
2.1 HISTORY OF AGENCIES IN SANTA ANA CANYON MANAGEMENT AREA
As shown on Figure 1-1, eight agencies have jurisdiction within the Santa Ana Canyon
Management Area. The footprint of the various agencies within the Santa Ana Canyon
Management Area has not changed since the 2017 Alternative. Table 1-1 lists the agencies
and the approximate area covered by each.
The Santa Ana Canyon Management Area covers 2.6 percent of Basin 8-1, which has a total
area of 223,600 acres or 350 mi2.
2.2 GOVERNANCE AND MANAGEMENT STRUCTURE
There are currently no groundwater withdrawals or plans for withdrawals within the portions of
the Santa Ana Canyon Management Area that are within the City of Anaheim, City of Chino
Hills, City of Yorba Linda, Riverside County, and the Yorba Linda Water District. Key reasons
for the lack of significant groundwater production are the lack of demands in these areas, the
relatively high mineral content of groundwater in the Santa Ana Canyon Management Area, and
lack of developable land due to land use limitations. In addition, there are no groundwater
withdrawals or plans for withdrawals by the City of Corona. Although there are existing
groundwater withdrawals within the Corona service area, the wells are owned and operated by
the County of Orange for golf course irrigation. As mentioned above, Corona delivers water
from sources outside of the Santa Ana Canyon Management Area.
Accordingly, no additional groundwater governance and management structure is needed for
the areas in the Santa Ana Canyon Management Area beyond the existing monitoring program
that OCWD already carries out in accordance with its authorities under the OCWD Act, in
cooperation with the other jurisdictional agencies. The governance and management structure
of OCWD is described in the OCWD Management Area part of this report. As will be shown
later in this section, groundwater withdrawals by the County of Orange and private well owner
within the Santa Ana Canyon Management Area are de minimis compared to the overall flow of
water through the Santa Ana Canyon Management Area, and they are expected to remain at
current sustainable levels. As a result, there is no need for other agencies to establish
groundwater governance or management in the Santa Ana Canyon Management Area beyond
the existing groundwater production, level and quality data collection and reporting to DWR by
OCWD per SGMA requirements.
2.3 LEGAL AUTHORITY
The legal authority of OCWD is described in the OCWD Management Area part of this report.
As described in the OCWD Management Area part of the report, OCWD has obtained water
rights from the State Water Resources Control Board (SWRCB) to all of the flows in the Santa
Ana River arriving at Prado Dam. As a result, any future groundwater production within the

Agency Information
BASIN 8-1 ALTERNATIVE 2022 UPDATE 2-2
Santa Ana Canyon Management Area would be reviewed by OCWD and the SWRCB to ensure
it does not interfere with OCWD’s existing water rights. Moreover, though outside of OCWD’s
boundaries, OCWD currently monitors portions of Santa Ana Canyon pursuant to its authority
under Section 2, subparagraphs 5, 6, 7 and 14, of the OCWD Act.
The Orange County Well Ordinance (County Ordinance No. 2607) requires that a permit be
obtained from Orange County prior to the construction or destruction of any well. In
unincorporated areas and in 29 of 34 Orange County cities, the Orange County Health Officer is
responsible for enforcement of the well ordinance. In the remaining five cities (Anaheim, Buena
Park, Fountain Valley, Orange and San Clemente), well ordinances are enforced by city
personnel. Any plans for wells in areas covered by Riverside and San Bernardino Counties
would be reviewed by OCWD to ensure they did not interfere with OCWD’s rights to Santa Ana
River flows.
2.4 BUDGET
OCWD’s costs for data collection within the Santa Ana Canyon Management Area are
contained within OCWD’s budget for data collection in the OCWD Management Area, which is
presented in the OCWD Management Area portion of this report. The County of Orange is
responsible for costs associated with collecting production data from wells used to irrigate the
County-owned Green River Golf Course. The other agencies within the Santa Ana Canyon
Management Area do not incur any additional data collection costs since no further monitoring
other that already undertaken by OCWD, and Orange County is believed needed in order to
prevent undesirable results from occurring. As a result, an estimated budget for other agencies
has not been prepared for the Santa Ana Canyon Management Area due to the minimal nature
of the effort to collect and report groundwater production, level and water quality data.

Management Area Description
BASIN 8-1 ALTERNATIVE 2022 UPDATE 3-1
SECTION 3. MANAGEMENT AREA DESCRIPTION
3.1 SANTA ANA CANYON MANAGEMENT AREA
The Santa Ana Canyon is a narrow east-west trending canyon between the Santa Ana
Mountains to the south and the Chino Hills to the north near the intersection of Orange, San
Bernardino and Riverside Counties. As shown on Figure 3-1, a key feature is the Santa Ana
River. Just upstream of the Santa Ana Canyon is Prado Dam, which was constructed by the US
Army Corps of Engineers in 1941 to reduce flood risks to Orange County.
Detailed geologic information, including cross sections, is presented in the 2017 Alternative.
The Santa Ana Canyon Management Area covers the area of alluvial deposits in the Santa Ana
Canyon east of Imperial Highway (Hwy 90), as shown on Figure 3-1. Imperial Highway was
selected as the western boundary of the Santa Ana Canyon Management Area because this is
where the groundwater basin transitions from a relatively thin alluvial aquifer to a deep multi-
layered alluvial basin. Moreover, Imperial Highway is the approximate boundary of OCWD’s
groundwater flow model, allowing subsurface outflows from the entire Santa Ana Canyon
Management Area to be readily quantified for purposes of the water budget and monitoring
groundwater in storage.
Previously published reports indicated that the alluvial deposits in Santa Ana Canyon ranged
from 90 to 100 feet thick (USGS, 1964). Cross-sections presented in the 2017 Alternative using
more recent data showed that the thickness of the alluvial deposits in the Santa Ana Canyon
are consistent with those reported by the USGS (1964).

Management Area Description
BASIN 8-1 ALTERNATIVE 2022 UPDATE 3-2
Figure 3-1: Boundary of Santa Ana Canyon Management Area

Management Area Description
BASIN 8-1 ALTERNATIVE 2022 UPDATE 3-3
Figure 3-2: Groundwater Production Wells (Active and Inactive)
3.1.1 Jurisdictional Boundaries
As described in Section 2, there are eight agencies with jurisdiction in the Santa Ana Canyon
Management Area as shown on Figure 2-1. The western boundary of the Santa Ana Canyon
Management Area coincides with Imperial Highway and is within OCWD’s jurisdiction.
3.1.2 Existing Land Use Designations
As described in the OCWD Management Area part of this report, much of the land use in
Orange County is urban. The Santa Ana Canyon Management Area has some dedicated open-
space due to the presence of the Santa Ana River and adjacent floodplain and the Chino Hills
State Park, located in the far northeastern portion of the Santa Ana Canyon Management Area.
The Green River Golf Club owned by the County of Orange covers approximately 220 acres
along the river near the intersections of Orange, Riverside, and San Bernardino counties. Land
use has remained essentially unchanged in the last five years.

Management Area Description
BASIN 8-1 ALTERNATIVE 2022 UPDATE 3-4
3.2 GROUNDWATER CONDITIONS
Groundwater within the Santa Ana Canyon Management Area occurs in a narrow canyon within
a relatively thin alluvial aquifer that is less than 100 feet thick in most places.
3.2.1 Groundwater Elevation
Groundwater elevations in the Santa Ana Canyon Management Area tend to be stable.
Hydrographs from four wells show that water levels vary over a narrow range as shown on
Figure 3-3. Well locations are shown on Figure 3-2 and cover the eastern (GRV-RSIR), south-
central (FPRK-YLE/SILV-YL), and western (SCE-YLCS, EMA-AH5) areas of the Santa Ana
Canyon Management Area.
Maximum water level elevations in many wells were recorded in 2004, which was a record-
breaking wet year with very high sustained flows in the Santa Ana River. Low water levels
appear to be primarily related to short-term local pumping. In the vicinity of all the wells,
groundwater is approximately 20 to 30 feet below ground surface. Since the Santa Ana River
channel is incised in some areas by 10 to 15 feet below the surrounding area, the depth to
groundwater is even shallower directly beneath the river channel where it is not covered by the
river itself.
The consistent, stable nature of groundwater elevations in the Santa Ana Canyon Management
Area shows that the aquifer is generally full and at equilibrium, which is consistent with the
finding that here are no measurable losses of flows between Prado Dam upstream and OCWD’s
diversion to its recharge system just below Imperial Highway.
Within the last five years, OCWD, in cooperation with the County of Orange, began collecting
groundwater elevation data at selected wells at the Green River Golf Course to complement
existing groundwater elevation monitoring data. Note that wells SILV-YL and SCE-YLCS were
formerly monitored for the CASGEM program. Well SCE-YLCS was destroyed and replaced by
well EMA-AH5. As a result, water level data from SILV-YL and EMA-AH5 will be included in
annual reports required to comply with SGMA.

Management Area Description
BASIN 8-1 ALTERNATIVE 2022 UPDATE 3-5
Figure 3-3: Water Level Hydrographs of Selected Wells
3.2.2 Groundwater Beneficial Uses and Regional Pumping Patterns
The Santa Ana Canyon Management Area is within the Santa Ana Region of the California
Water Boards and is subject to the Santa Ana Region Basin Plan (January 24, 2014; updated
July 2014). The Basin Plan designates zones related to groundwater management. The Santa
Ana Canyon Management Area is included in the Orange County Management Zone. Within
this Zone, groundwater has been designated for municipal, agricultural, and industrial (service
supply and process) beneficial uses. Currently, local groundwater provides primarily irrigation
supply with some residential drinking water (RV Park) and domestic uses.
There are 18 wells that can withdraw groundwater within the Santa Ana Canyon Management
Area as shown on Figure 3-2; however, some of the wells shown are not currently being used
(e.g., inactive). At the time the 2017 Alternative was prepared, some wells, namely those
owned by the County of Orange to supply irrigation water to the Green River Golf Course, were
not metered. OCWD worked with the County of Orange to have all their wells metered and
production reported to OCWD. Prior estimates of pumping before meters were installed was on
the order of 1,000 acre-feet per year (Personal Communication, Merrie Weinstock, County of
Orange). Data collected in recent years shows that total production is less, averaging just over
600 acre-feet per year.
As shown on Table 3-1, total groundwater production within the Santa Ana Canyon
Management Area over the last 5 years has averaged just over 1,000 acre-feet per year. Table
290
310
330
350
370
390
410
430
Jan-92 Jan-02 Jan-12 Jan-22
Wat
er L
evel
Ele
vati
on
(fe
et m
sl)
GRV-RSIR (RP Elev: 430 ft msl)FPRK-YLE (RP Elev: 382.59 ft msl)SILV-YL (RP Elev: 381.84 ft msl)SCE-YLCS (RP Elev: 340.67 ft msl)EMA-AH5 (RP Elev: 309.66 ft ms)

Management Area Description
BASIN 8-1 ALTERNATIVE 2022 UPDATE 3-6
3-1 lists the production wells, meter status, and 5-year average production for wells located
within the Santa Ana Canyon Management Area.
Table 3-1: Production Wells, Flow-Meter Status, and 5-Year Average Production
Well Name Well Use
Owner Metered Production
5-Yr Avg 2016-21 (afy)*
Notes
BYNT-YLSE IR Neff Ranch, Ltd Yes 69.8
EMA-AH5 IR County Of
Orange Yes 118.2 SGMA monitoring well.
FPRK-YLE DW/IR Canyon RV Park Yes 79.5
FPRK-YLW DW/IR Canyon RV Park Yes 36.9
GARD-A IR Kindred Outreach
Ministries Yes 1
GRGC-CO1 IR OCFCD Yes 82.2 Monthly metering started Jan. 2019. Avg based on
Jan. 2019-June 2021.
GRGC-COR1
IR OCFCD Yes 295.0 Monthly metering started Jan. 2019. Avg based on
Jan. 2019-June 2021
GRGC-YL14
IR OCFCD Yes Inactive
GRGC-YL15
IR OCFCD No Inactive, only used for
emergencies.
GRGC-YL16
IR OCFCD Yes 161.0 Monthly metering started Jan. 2019. Avg based on
Jan. 2019-June 2021
GRGC-YL4 IR OCFCD Yes 75.5 Monthly metering started Jan. 2019. Avg based on
Jan. 2019-June 2021
GRGC-YL9 IR OCFCD Yes Inactive
GRGC-YLA1
IR OCFCD Yes Inactive
GRV-RSIR IR Green River
Village Yes 6.2
LKVG-YL IR Eastlake Village
HOA Yes 70.8
ROBSN-PD2
IR Robertson Ready
Mix Yes 5.4
Monthly metering started Jan. 2018. Avg based on
Jan. 2018-June 2021
ROBSN-YL1
IR Robertson Ready
Mix Yes Inactive
WALL-A DOM Kindred Outreach Ministries
No Inactive
Total 1,007 *Five-year average except where noted.
IR= Irrigation; DW=Drinking Water; DOM=Domestic
OCFCD = Orange County Flood Control District
Management Area Description
BASIN 8-1 ALTERNATIVE 2022 UPDATE 3-7
3.2.3 Groundwater Storage Data
Groundwater storage in Basin 8-1 is estimated at 66 million acre-feet (OCWD, 2007), which
does not include the Santa Ana Canyon Management Area. To estimate the amount of storage
in the alluvial aquifer within Santa Ana Canyon Management Area, all well data were used and
depths to bedrock estimated. The thickness of the alluvial deposits is assumed to be zero at the
basin margin. Using a Topo to Raster Interpolation function in ArcGIS, the total volume of
alluvial deposits was estimated at 174,000 acre-feet. Assuming a porosity of 25 percent gives a
total potential groundwater storage volume of 43,500 acre-feet. The actual volume of
groundwater in storage is smaller given that this estimate does not take into account that the
depth to groundwater is typically 20 to 30 feet below ground surface.
3.2.4 Groundwater Quality Conditions
Groundwater quality in the Santa Ana Canyon Management Area is generally good and suitable
to meet beneficial uses. Groundwater in the Santa Ana Canyon Management Area is a mixture
of infiltrated Santa Ana River water and subsurface inflow. Detailed water quality information is
presented in the 2017 Alternative. No substantive changes in groundwater quality have
occurred within the last five years.
3.2.5 Land Subsidence
Land subsidence measurements derived from InSAR data provided by DWR show that land
displacement in the Santa Ana Canyon Management Area from June 2015 to July 2020 is within
the accuracy of the method (0 to 0.05 ft). This is not surprising given the following:
1. The presence of shale and sandstone bedrock underlying the alluvial aquifer is not
thought to be sufficiently compressible to cause inelastic subsidence.
2. The alluvial aquifer is thin, generally less than 100 feet, and composed mainly of
sand and gravel with only minor amounts of clay.
3. Groundwater levels and storage volumes have not changed significantly over the last
five years.
3.2.6 Groundwater and Surface Water Interactions and Groundwater Dependent Ecosystems
Groundwater within the Santa Ana Canyon alluvial aquifer is consistently 20 to 30 feet below
ground surface and even shallower in the incised portions of the Santa Ana River channel. As
described in Section 4, Water Budget, the flow of surface water through the canyon dwarfs the
documented groundwater production. As a result, groundwater production has a de minimis
impact on groundwater conditions and flows of surface water through the canyon. This in turn
demonstrates that groundwater production in the Santa Ana Canyon has little to no impact on
local groundwater dependent ecosystems in the Santa Ana Canyon Management Area.

Water Budget
BASIN 8-1 ALTERNATIVE 2022 UPDATE 4-1
SECTION 4. WATER BUDGET
The water budget of the Santa Ana Canyon Management Area is dominated by surface flows of
the Santa Ana River with a minor contribution of subsurface inflow, return flows from irrigation,
and a small amount of groundwater production. Table 1-2 presents the water budget for the
Santa Ana Canyon Management Area for the last five years. Additional water budget
information was presented in the 2017 Alternative. The water budget contains both surface
water and groundwater components and is not used to analyze change in groundwater storage.
The purpose of presenting this water budget is to show the relative contributions of different
sources in the Santa Ana Canyon Management Area.
Groundwater level data suggest that groundwater conditions in the Santa Ana Canyon
Management Area are essentially at steady state conditions with inflow equaling outflow and no
change in groundwater storage. Inflow to the shallow alluvial aquifer includes subsurface inflow
and infiltrated Santa Ana River water. Outflow includes evapotranspiration, groundwater
production and subsurface outflow. Table 4-1 presents the groundwater budget for the Santa
Ana Canyon Management Area.
Table 4-1: Groundwater Budget, 5-Year Average (2016-21)
Flow Component 5-Yr Avg: 2016-21
(afy)
INFLOW
Subsurface Inflow (1) 6,000
Infiltrated Santa Ana River Flow (2) 740
TOTAL INFLOW 6,740
OUTFLOW
Evapotranspiration (3) 740
Groundwater Production 1,000
Subsurface Outflow to OCWD Management Area (4) 5,000
TOTAL OUTFLOW 6,740
NET CHANGE 0
(1) Subsurface inflow is estimated and includes irrigation return flow and areal recharge from precipitation. (2) Estimated infiltration of Santa Ana River flow to balance outflow. (3) Evapotranspiration is based on 370 acres of riparian habitat and a usage rate of 2 afy/acre of habitat per Santa
Ana River Watermaster Reports. (4) Subsurface outflow is based on OCWD’s calibrated groundwater flow model.
4.1 BUDGET COMPONENTS
The components of the groundwater budget are described below.

Water Budget
BASIN 8-1 ALTERNATIVE 2022 UPDATE 4-2
4.1.1 Subsurface Inflow/Outflow
In the 2017 Alternative, the estimated subsurface outflow was 4,000 acre-feet per year based
on the steady state groundwater flow model. More recent transient groundwater flow modeling
using the period 1999 to 2017, showed that average outflow from the Santa Ana Canyon to the
main basin to be approximately 5,000 acre-feet per year. As a result, the water budget tables
have been updated accordingly.
Subsurface inflow is a combination of subsurface mountain front recharge, areal recharge from
precipitation, and irrigation return flow. It is estimated to be approximately 6,000 acre-feet per
year.
4.1.2 Infiltrated Santa Ana River Flow
Water quality data suggests that some of the groundwater produced from wells in the Santa Ana
Canyon Management Area is a blend of subsurface inflow and infiltrated Santa Ana River water;
however, there is not enough data to determine the relative contribution of each source. For
purposes of the groundwater budget, the amount of infiltrated Santa Ana River flow is the
amount necessary to balance the water budget assuming subsurface inflow is 6,000 acre-feet
per year. If the assumed amount of subsurface inflow were to change, the amount of infiltrated
Santa Ana River water needed to balance the water budget would change accordingly.
Evapotranspiration
Evapotranspiration is assumed to be due to riparian vegetation adjacent to the Santa Ana River.
The County of Orange, as part of developing a Habitat Management Plan (HMP), established a
baseline of 370 acres of riparian vegetation within the Santa Ana Canyon Management Area
(County of Orange, 2016).
The Santa Ana River Watermaster reports that riparian vegetation consumes approximately 2
acre-feet per year per acre of vegetated area. Using this approach, the estimated
evapotranspiration within the Santa Ana Canyon Management area is estimated to be 740 acre-
feet per year.
4.1.3 Groundwater Production
As described in Section 3.2.2, there are 18 wells that can withdraw groundwater within the
Santa Ana Canyon Management Area (Figure 3-2); however, some of the wells shown are not
currently being used (e.g., inactive). Groundwater production from these wells is summarized in
Table 3-1.
4.2 CHANGES IN GROUNDWATER STORAGE
As shown in Figure 3-3, groundwater levels in the Santa Ana Canyon Management Area are
stable, indicating that the thin, alluvial aquifer is generally always in a near-full equilibrium
condition. Therefore, any changes in groundwater storage are small and insignificant.

Water Budget
BASIN 8-1 ALTERNATIVE 2022 UPDATE 4-3
4.3 WATER YEAR TYPE
The water year type has little impact on the water budget in the Santa Ana Canyon
Management Area given the minimal changes in groundwater level observed through time due
to the ever-present Santa Ana River flow and subsurface inflow. Water budgets for wet and dry
year water types are presented in the 2017 Alternative.
4.4 ESTIMATE OF SUSTAINABLE YIELD
As described in Table 4-1, average groundwater production over the last five years is less than
one percent of the total inflow to the Santa Ana Canyon Management Area. This condition is
the same as what was presented in the 2017 Alternative. It is clear the sustainable yield of the
Santa Ana Canyon Management Area is much greater than current production levels.
Nevertheless, there are no plans for additional wells or groundwater production in the Santa
Ana Canyon Management Area, and it is highly unlikely that groundwater demands would rise
to the level of changing the water budget of this area significantly. In terms of sustainable yield,
it is more appropriate to look at Basin 8-1 as a whole.
4.5 CURRENT, HISTORICAL, AND PROJECTED WATER BUDGET
Current water budgets are presented in presented in Tables 4-1 and 4-2. Historical and
projected water budgets, including Dry and Wet Year Water Budgets, are presented in the 2017
Alternative.

Water Resource Monitoring Programs
BASIN 8-1 ALTERNATIVE 2022 UPDATE 5-1
SECTION 5. WATER RESOURCE MONITORING
PROGRAMS
5.1 OVERVIEW
This section describes OCWD’s surface water and groundwater monitoring programs in the
Santa Ana Canyon Management Area.
5.2 GROUNDWATER MONITORING PROGRAMS
OCWD monitors groundwater levels, quality and production in the Santa Ana Canyon
Management Area. As shown on Figure 5-1, groundwater levels are monitored at six wells.
Within the last five years, well SCE-YLCS was destroyed and replaced in the monitoring
network by well EMA-AH5. Water level data from wells SILV-YL and EMA-AH5 will be reported
annually to DWR in compliance with SGMA. In addition, OCWD worked with the County of
Orange to install meters on wells used to supply Green River Golf Course and to begin
collecting and reporting production data. Data provided in this report utilizes metered data for
all wells that pump groundwater in the Santa Ana Canyon Management area.

Water Resource Monitoring Programs
BASIN 8-1 ALTERNATIVE 2022 UPDATE 5-2
Figure 5-1: Wells Used to Monitor Groundwater Levels
For wells within OCWD’s boundaries, groundwater production must be reported at a minimum
frequency of every 6 months. Groundwater production volumes from the County of Orange’s
wells that supply the Green River Golf Course are now being collected monthly.
OCWD also monitors groundwater quality in selected wells in the Santa Ana Canyon
Management Area. Table 5-1 lists the wells monitored and the groundwater quality monitoring
program each well is part of, which is based on its use (e.g., irrigation, potable). Wells used for
irrigation are sampled every year for volatile organic compounds (VOCs) and every three years
for general minerals (major cations and anions), 1,4-dioxane, and perchlorate (ClO4). The two
wells in Featherly Park used for potable supplies are monitored in accordance with drinking
water regulations.

Water Resource Monitoring Programs
BASIN 8-1 ALTERNATIVE 2022 UPDATE 5-3
Table 5-1: Wells Monitored for Water Quality
Well Name Water Quality Monitoring Program
IRRIGATION WELLS BYNT-YLSE
Annual: Volatile Organic Compounds (VOCs) Every 3 yrs: General Minerals, 1,4-Dioxane, and ClO4
EMA-AH5
GARD-A
GRGC-CO1
GRGC-COR1
GRGC-YL15
GRGC-YL16
GRGC-YL4
GRV-RSIR
LKVG-YL ROBSN-PD2
POTABLE USE WELLS FPRK-YLE FPRK-YLW
Annual: NO3, ClO4, 1,4-Dioxane, Mn, TDS, EC Atrazine/Simazine: every 3 yrs Title 22 Inorganics: every 3 yrs CN: every 9 yrs CrIV: every 3 yrs Radioactivity: every 6 yrs (Gross Alpha, Uranium) Radioactivity: every 9 yrs (Radium 226 & Radium 228)
5.3 OTHER MONITORING PROGRAMS
OCWD monitors the quantity and quality of water in the Santa Ana River just below Prado Dam.
The flow of the Santa Ana River below Prado Dam is measured by the United States Geological
Survey (USGS) at station No. 11074000
(http://waterdata.usgs.gov/ca/nwis/dv/?site_no=11074000). In addition to flow, the USGS
measures the electrical conductivity (EC) of the water as well as sampling the water two times
per month for TDS. One use of these data is to calculate the flow-weighted average TDS of
base and storm flow discharged from Prado Dam. The flow and quality data are collected for
the Santa Ana River Watermaster, which was formed to implement the Stipulated Judgement in
the case of Orange County Water District v. City of Chino, et al., Case No. 1172628-County of
Orange, entered by the court on April 17, 1969. Copies of the watermaster reports can be
found on OCWD’s website at http://www.ocwd.com. In addition to OCWD, the Santa Ana River
Watermaster is comprised of representatives from the Inland Empire Utilities Agency, San
Bernardino Valley Municipal Water District, and Western Municipal Water District.
The significance of the 1969 Judgment is that it guarantees a minimum base flow at Prado Dam
of 42,000 acre-feet per year; however, per the terms of the Judgment, the upstream agencies
have received (and will continue to receive) credits when base flows exceed of 42,000 acre-feet
at Prado. With these cumulative credits, the required minimum base flow is 34,000 acre-feet.
As a point of reference, the base flow in Water Year 2020-21 was estimated to be 76,000 acre-
feet (Note that this is an OCWD estimate to be finalized in a future SAR Watermaster Report).
OCWD also closely monitors the quality of water in the Santa Ana River before it is diverted into
OCWD’s recharge system below Imperial Highway. More information about this program can
be found in Section 5 of the OCWD Management Area section of this report.

Water Resource Management Programs
BASIN 8-1 ALTERNATIVE 2022 UPDATE 6-1
SECTION 6. WATER RESOURCE MANAGEMENT
PROGRAMS
OCWD has a wide variety of water resource management programs that cover the main
groundwater basin as well as the upper Santa Ana River watershed to address Santa Ana River
flow and quality. These programs are important in protecting the quality of the Santa Ana River,
which affects groundwater quality in the Santa Ana Canyon Management Area. These
programs are described in detail in Section 6 of the OCWD Management Area part of the 2017
Alternative.

Notice and Communication
BASIN 8-1 ALTERNATIVE 2022 UPDATE 7-1
SECTION 7. NOTICE AND COMMUNICATION
There are eight stakeholder agencies within the Santa Ana Canyon Management Area,
including the following:
• City of Anaheim
• City of Chino Hills
• City of Yorba Linda
• City of Corona
• Orange County Water District
• County of Orange
• Riverside County
• Yorba Linda Water District
On September 30, 2021, OCWD sent a letter via email to all of the Basin 8-1 agencies,
including each of the agencies listed above to let them know that the 2017 Alternative was being
updated and would be available for review and comment. No comments were received by any
of the agencies contacted.
A draft of the 2022 Update was presented to the OCWD Board and posted on the OCWD
website on November 18, 2021, to allow for public review and comment. The final 2022 Update
was presented to the OCWD Board on December 15, 2021. At this board meeting, a resolution
was adopted to support the submission of the 2022 Update to DWR.

Sustainable Management Approach
BASIN 8-1 ALTERNATIVE 2022 UPDATE 8-1
SECTION 8. SUSTAINABLE MANAGEMENT
APPROACH
The approach to sustainably managing the Santa Ana Canyon Management Area is to continue
monitoring conditions to ensure that no significant and unreasonable results occur in the future.

Sustainable Management Related to Groundwater Levels
BASIN 8-1 ALTERNATIVE 2022 UPDATE 9-1
SECTION 9. SUSTAINABLE MANAGEMENT RELATED
TO GROUNDWATER LEVELS
9.1 HISTORY
As shown on Figure 3-3, groundwater levels in the Santa Ana Canyon Management Area have
been steady over the last 20 years. Given the large amount of surface inflow to the Santa Ana
Canyon Management Area relative to the amount of groundwater production, groundwater
levels are expected to remain steady in the future.
9.2 MONITORING OF GROUNDWATER LEVELS
OCWD monitors groundwater levels at multiple wells in the Santa Ana Canyon Management
Area and will continue to do so in the future.
Within the last five years, several wells at the Green River Golf Course were added to the
OCWD monitoring network and destroyed well SCE-YLCS was replaced in the network by well
EMA-AH5.
9.3 DEFINITION OF SIGNIFICANT AND UNREASONABLE LOWERING OF
GROUNDWATER LEVELS
No long-term reduction in groundwater levels is foreseen in the Santa Ana Canyon
Management Area; however, if that were to occur, a decline in groundwater levels could reach a
significant and unreasonable level if one more of the following occurred as a result of reduced
groundwater levels:
1. Significant and unreasonable loss of riparian habitat along the Santa Ana River.
2. Significant and unreasonable loss of well production capacity.
3. Degradation of water quality that significantly impacts the beneficial uses of
groundwater.
9.4 DETERMINATION OF MINIMUM THRESHOLDS
It is not possible to determine a minimum threshold at this time since no undesirable effects due
to water levels have occurred in the past and are not foreseen. Nevertheless, OCWD’s
monitoring program continuously tracks water levels and groundwater quality in the
Management Area. If water levels started to show a consistent long-term decline, OCWD’s
monitoring program would be expanded to examine potential impacts to riparian habitat, well
yields, and groundwater quality. If impacts were observed, action would be taken, and minimum
thresholds would be evaluated and established as appropriate.
Sustainable Management Related to Basin Storage
BASIN 8-1 ALTERNATIVE 2022 UPDATE 10-1
SECTION 10. SUSTAINABLE MANAGEMENT
RELATED TO BASIN STORAGE
The total volume of groundwater storage in the OCWD Basin is estimated to be 66 million acre-
feet (OCWD, 2007). The total potential storage volume in the Santa Ana Canyon Management
Area is estimated to be 43,500 acre-feet, as described in Section 3.2.3.
10.1 DEFINITION OF SIGNIFICANT AND UNREASONABLE REDUCTION IN
STORAGE
As with groundwater levels, no long-term reduction in groundwater storage is foreseen in the
Santa Ana Canyon Management Area; however, if that were to occur, a decline in groundwater
storage could reach a significant and unreasonable level if one more of the following occurred
due to a reduction in storage:
1. Significant and unreasonable loss of riparian habitat along the Santa Ana River.
2. Significant and unreasonable loss of well production capacity.
3. Degradation of water quality that significantly impacts the beneficial uses of
groundwater.
10.2 DETERMINATION OF MINIMUM THRESHOLDS
It is not possible to determine a minimum threshold at this time since no undesirable effects due
to a change in groundwater storage levels have occurred in the past and are not foreseen in the
future. Nevertheless, OCWD’s monitoring program continuously tracks water levels, which is a
proxy for groundwater storage, and groundwater quality in the Management Area. If water
levels showed a consistent long-term decline, OCWD’s monitoring program would be expanded
to examine potential impacts to riparian habitat, well yields and groundwater quality. If impacts
were observed, action would be taken, and minimum thresholds would be evaluated and
established as appropriate.
Sustainable Management Related to Basin Water Quality
BASIN 8-1 ALTERNATIVE 2022 UPDATE 11-1
SECTION 11. SUSTAINABLE MANAGEMENT
RELATED TO BASIN WATER QUALITY
Groundwater quality in the Santa Ana Canyon Management Area is affected by the quality of
Santa Ana River water and subsurface inflow from the surrounding foothills. As mentioned in
Section 6, Water Resource Programs, OCWD is involved in multiple programs to protect and
improve the quality of water in the Santa Ana River. Groundwater from subsurface inflow
contains naturally elevated concentrations of TDS and manganese.
OCWD has an extensive groundwater monitoring program in the Santa Ana Canyon
Management Area as described in Section 5, Water Resource Monitoring Programs.
11.1 DEFINITION OF SIGNIFICANT AND UNREASONABLE DEGRADATION OF
WATER QUALITY
There are three elements that must be considered when evaluating the impact of groundwater
quality degradation.
The first element is considering the causal nexus between local groundwater management
activities and groundwater quality. For example, if subsurface inflow from the surrounding
foothills increases during a wet period, TDS and manganese levels could increase; however,
this increase is not caused by groundwater management activities, but by natural events. A
similar situation applies to the quality of Santa Ana River water. Although OCWD is involved in
many programs to protect and improve the quality of Santa Ana River water, there could be
changes in water quality that are outside of the control of Santa Ana Canyon Management Area
stakeholders.
The second element to consider is if the beneficial uses of the groundwater have been
negatively affected and/or if water quality regulations, such as Maximum Contaminant Levels
(MCLs) and other potable water quality requirements have been exceeded.
The third element that must be considered is the volume of groundwater impacted by
groundwater quality degradation. If small volumes are negatively affected yet do not materially
affect the use of the aquifer for its existing beneficial uses, then this would not represent a
significant and unreasonable degradation of water quality. However, if the impacted volume
grows, then it could reach a level that it becomes significant and unreasonable.
When considering all three elements, “significant and unreasonable degradation of water
quality” is defined as degradation of groundwater quality in the Santa Ana Canyon Management
Area that is attributable to groundwater production or recharge practices within the Santa Ana
Canyon Management Area and to the extent that a significant volume of groundwater becomes
unusable for its designated beneficial uses.
11.2 DETERMINATION OF MINIMUM THRESHOLDS
The minimum thresholds for groundwater quality are exceedances of Maximum Contaminant
Levels (MCLs) or other applicable regulatory limits that are directly attributable to groundwater

Sustainable Management Related to Basin Water Quality
BASIN 8-1 ALTERNATIVE 2022 UPDATE 11-2
production and recharge practices in the Santa Ana Canyon Management Area that prevents
the use of groundwater for its designated beneficial uses.

Sustainable Management Related to Seawater Intrusion
BASIN 8-1 ALTERNATIVE 2022 UPDATE 12-1
SECTION 12. SUSTAINABLE MANAGEMENT
RELATED TO SEAWATER INTRUSION
The Santa Ana Canyon Management Area is located far from the ocean and thus there is no
reason to consider the potential impact of seawater intrusion in this management area.

Sustainable Management Related to Land Subsidence
BASIN 8-1 ALTERNATIVE 2022 UPDATE 13-1
SECTION 13. SUSTAINABLE MANAGEMENT
RELATED TO LAND SUBSIDENCE
Recently, as part of DWR's SGMA technical assistance to provide important SGMA-relevant
data to Groundwater Sustainability Agency’s (GSAs) for Groundwater Sustainability Plan (GSP)
development and implementation, DWR contracted with TRE ALTAMIRA, Inc. to provide vertical
displacement estimates are derived from InSAR data that are collected by the European Space
Agency (ESA) Sentinel-1A satellite.
This dataset represents measurements of vertical ground surface displacement in more than
200 of the high-use and populated groundwater basins across the State of California between
January of 2015 and October of 2020. InSAR data coverage began in late 2014 for parts of
California, and coverage for the entire study area began on June 13, 2015. Included in this
dataset are point data that represent average vertical displacement values for 100 square meter
areas, as well as GIS rasters that were interpolated from the point data; rasters for total vertical
displacement relative to June 13, 2015, and rasters for annual vertical displacement rates with
earlier coverage for some areas, both in monthly time steps. The level of accuracy is
approximately 0.05 feet.
To show subsidence in Basin 8-1, OCWD used the used a layer showing the total land
subsidence since the start of the InSAR data on 6/13/2015 and ending on 7/1/2020, which
corresponds to the end of the OCWD water year. The GIS layer used was:
https://gis.water.ca.gov/arcgisimg/rest/services/SAR/Vertical_Displacement_TRE_ALTAMIRA_v
2020_Total_Since_20150613_20200701/ImageServer
Figure 13-1 shows the total land displacement in Basin 8-1 from June 2015 to July 2020. In the
Santa Ana Canyon Management Area, vertical displacement is essentially unchanged and
within the accuracy of the method (0 to 0.05 ft). This is not surprising given the following:
• The presence of shale and sandstone bedrock underlying the alluvial aquifer is not
thought to be sufficiently compressible to cause inelastic subsidence.
• The alluvial aquifer is thin, generally less than 100 feet, and composed mainly of
sand and gravel with only minor amounts of clay.
• Groundwater levels and storage volumes are stable.
• Substantial groundwater level declines are highly unlikely due to the de minimis
amount of groundwater production relative to the overall inflow of water to the Santa
Ana Canyon Management Area.

Sustainable Management Related to Land Subsidence
BASIN 8-1 ALTERNATIVE 2022 UPDATE 13-2
Figure 13-1: Total Vertical Ground Surface Displacement from June 2015 to July 2020

Managing Groundwater Depletions Impacting Surface Water
BASIN 8-1 ALTERNATIVE 2022 UPDATE 14-1
SECTION 14. MANAGING GROUNDWATER
DEPLETIONS IMPACTING SURFACE WATER
The primary surface water feature in the Santa Ana Canyon Management Area is the Santa Ana
River. In the Santa Ana Canyon Management Area, the Santa Ana River is a soft-bottomed
channel that supports riparian habitat. Riparian habitat is dependent on river water released
through Prado Dam, which is predominantly treated wastewater discharged in the upper
watershed when storm flow is not present.
Groundwater within the Santa Ana Canyon alluvial aquifer is consistently 20 to 30 feet below
ground surface and even shallower in the incised portions of the Santa Ana River channel. As
described in Section 4, Water Budget, the flow of surface water through the canyon is two
orders of magnitude larger than groundwater production. As a result, groundwater production
has a de minimis impact on groundwater conditions and the flows of surface water through the
canyon. This, in turn, means that groundwater production in the Santa Ana Canyon has a de
minimis impact on the groundwater dependent ecosystems in the Santa Ana Canyon
Management Area. Therefore, the undesirable result of “depletions of interconnected surface
water that have significant and unreasonable adverse impacts on beneficial uses of the surface
water due to groundwater conditions occurring throughout the basin” does not apply.

Protocols for Modifying Monitoring Programs
BASIN 8-1 ALTERNATIVE 2022 UPDATE 15-1
SECTION 15. PROTOCOLS FOR MODIFYING
MONITORING PROGRAMS
Protocols for modifying monitoring programs are described in the 2017 Alternative.

Process to Elevate New Projects
BASIN 8-1 ALTERNATIVE 2022 UPDATE 16-1
SECTION 16. PROCESS TO EVALUATE NEW
PROJECTS
For projects within OCWD, the process described in the OCWD Management Area part of this
report applies. If new projects are proposed by others outside of OCWD’s boundaries, OCWD
would collaborate with the agency proposing the project to ensure that any proposed project
would not cause significant and unreasonable results. Moreover, OCWD would review
proposed projects through the CEQA process (i.e., reviewing and commenting on draft CEQA
documents).

References
BASIN 8-1 ALTERNATIVE 2022 UPDATE 17-1
SECTION 17. REFERENCES
County of Orange, 2016. County of Orange, Santa Ana River Canyon and Brush Canyon Habitat Management Areas, 2016 Annual Monitoring Report, June 2016.
OCWD, 2007. Report on Evaluation of Orange County Groundwater Basin Storage and Operational Strategy, February 2007.
USGS, 1964. Geology and Oil Resources of the Eastern Puente Hills Area, Southern California. By D.L. Durham and R.F. Yerkes. USGS Professional Paper 420-B.

Attachment 1
Department of Water Resources (DWR) Comments on 2017 Alternative and
Responses
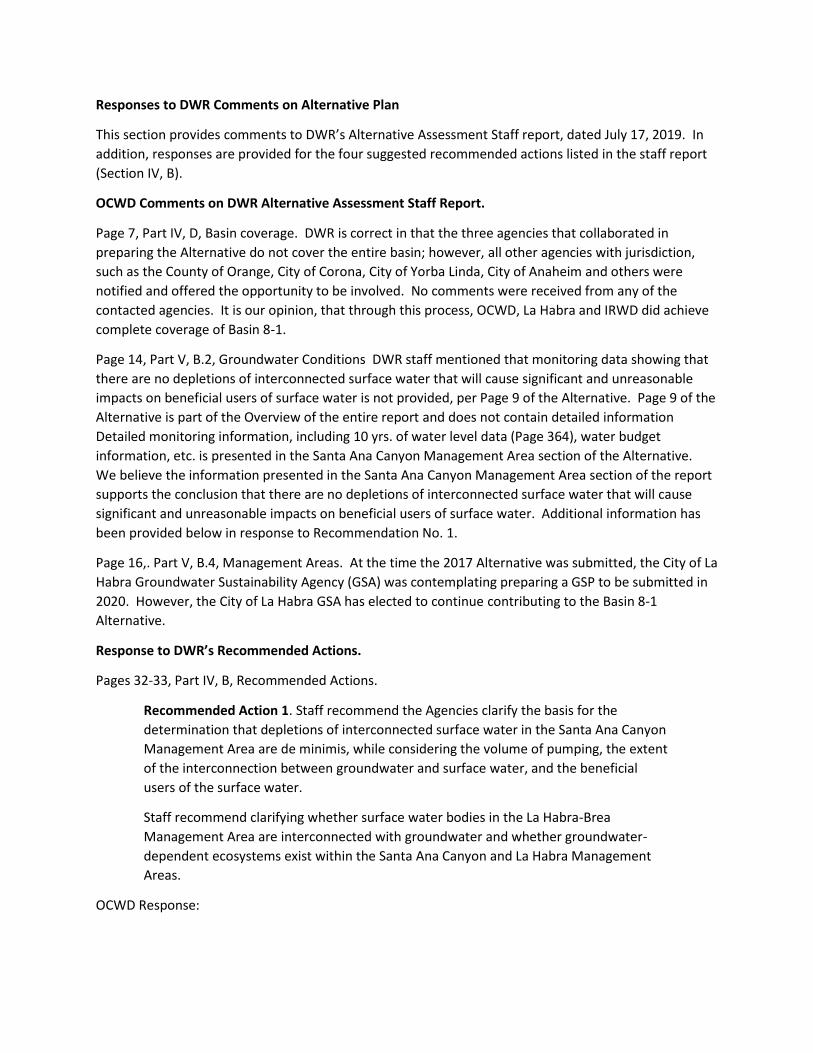
Responses to DWR Comments on Alternative Plan
This section provides comments to DWR’s Alternative Assessment Staff report, dated July 17, 2019. In
addition, responses are provided for the four suggested recommended actions listed in the staff report
(Section IV, B).
OCWD Comments on DWR Alternative Assessment Staff Report.
Page 7, Part IV, D, Basin coverage. DWR is correct in that the three agencies that collaborated in
preparing the Alternative do not cover the entire basin; however, all other agencies with jurisdiction,
such as the County of Orange, City of Corona, City of Yorba Linda, City of Anaheim and others were
notified and offered the opportunity to be involved. No comments were received from any of the
contacted agencies. It is our opinion, that through this process, OCWD, La Habra and IRWD did achieve
complete coverage of Basin 8-1.
Page 14, Part V, B.2, Groundwater Conditions DWR staff mentioned that monitoring data showing that
there are no depletions of interconnected surface water that will cause significant and unreasonable
impacts on beneficial users of surface water is not provided, per Page 9 of the Alternative. Page 9 of the
Alternative is part of the Overview of the entire report and does not contain detailed information
Detailed monitoring information, including 10 yrs. of water level data (Page 364), water budget
information, etc. is presented in the Santa Ana Canyon Management Area section of the Alternative.
We believe the information presented in the Santa Ana Canyon Management Area section of the report
supports the conclusion that there are no depletions of interconnected surface water that will cause
significant and unreasonable impacts on beneficial users of surface water. Additional information has
been provided below in response to Recommendation No. 1.
Page 16,. Part V, B.4, Management Areas. At the time the 2017 Alternative was submitted, the City of La
Habra Groundwater Sustainability Agency (GSA) was contemplating preparing a GSP to be submitted in
2020. However, the City of La Habra GSA has elected to continue contributing to the Basin 8-1
Alternative.
Response to DWR’s Recommended Actions.
Pages 32-33, Part IV, B, Recommended Actions.
Recommended Action 1. Staff recommend the Agencies clarify the basis for the
determination that depletions of interconnected surface water in the Santa Ana Canyon
Management Area are de minimis, while considering the volume of pumping, the extent
of the interconnection between groundwater and surface water, and the beneficial
users of the surface water.
Staff recommend clarifying whether surface water bodies in the La Habra-Brea
Management Area are interconnected with groundwater and whether groundwater-
dependent ecosystems exist within the Santa Ana Canyon and La Habra Management
Areas.
OCWD Response:

OCWD provided several lines of evidence for the determination that depletions of interconnected
surface water in the Santa Ana Canyon area are insignificant (i.e., de minimis).
1. The large disparity in the supply of surface water to the Santa Ana Canyon area compared to the amount of pumping. When the 2017 Alternative was prepared, some production wells in the Santa Ana Canyon were estimated, namely production wells supplying irrigation water to the Green River Golf Course. OCWD and Orange County Department of Public Works have worked together to install meters on wells supplying the Green River Golf Course. Now all production wells in the Santa Ana Canyon are metered. This effort resulted in a reduction in pumping as prior estimates were too high. For the 2022 Update, the 5-year water budget is presented in Table 1-2 in the Santa Ana Canyon section. A copy of Table 1-2 is shown below. As shown on this table, groundwater production over this five-year period is approximately 0.6 percent of the total inflow to the canyon area.
Table 1-2: Water Budget, 5-Year Average (2016-21)
Flow Component 5-Yr Avg: 2016-21 (afy)
INFLOW
Santa Ana River Base Flow 76,860
Santa Ana River Storm Flow 78,750
Subsurface Inflow 6,000
TOTAL INFLOW 161,610
OUTFLOW
Santa Ana River Base Flow 76,120
Santa Ana River Storm Flow 78,750
Evapotranspiration 740
Groundwater Production 1,000
Subsurface Outflow 5,000
TOTAL OUTFLOW 161,610
2. The second line of evidence is the stability of groundwater levels as shown in Figure 3-3 in the Santa Ana Canyon section of the report. This figure is reproduced below. The consistent, stable nature of groundwater elevations in the Santa Ana Canyon Management Area shows that the aquifer is generally full and at equilibrium, which is consistent with the finding that here are no measurable losses of flows between Prado Dam upstream and OCWD’s diversion to its recharge system just below Imperial Highway.
3. The third line of evidence, mentioned above, is the finding that there are no measurable losses of flows between Prado Dam and OCWD’s diversion at the Imperial Rubber Dam. The location of these two measuring locations are shown in the figure below. The measuring location below Prado Dam is operated by the United States Geological Survey (USGS) and is identified as US11074000, Santa Ana R BL Prado Dam, CA. The USGS carefully reviews data from this location and publishes it annually as it is of interest to multiple stakeholders, including OCWD, the US Army Corps of Engineers, and a number of agencies upstream of Prado Dam.

Figure 3-3: Water Level Hydrographs of Selected Wells
290
310
330
350
370
390
410
430
Jan-92 Jan-02 Jan-12 Jan-22
Wat
er L
evel
Ele
vati
on
(fe
et m
sl)
GRV-RSIR (RP Elev: 430 ft msl)FPRK-YLE (RP Elev: 382.59 ft msl)SILV-YL (RP Elev: 381.84 ft msl)SCE-YLCS (RP Elev: 340.67 ft msl)EMA-AH5 (RP Elev: 309.66 ft ms)
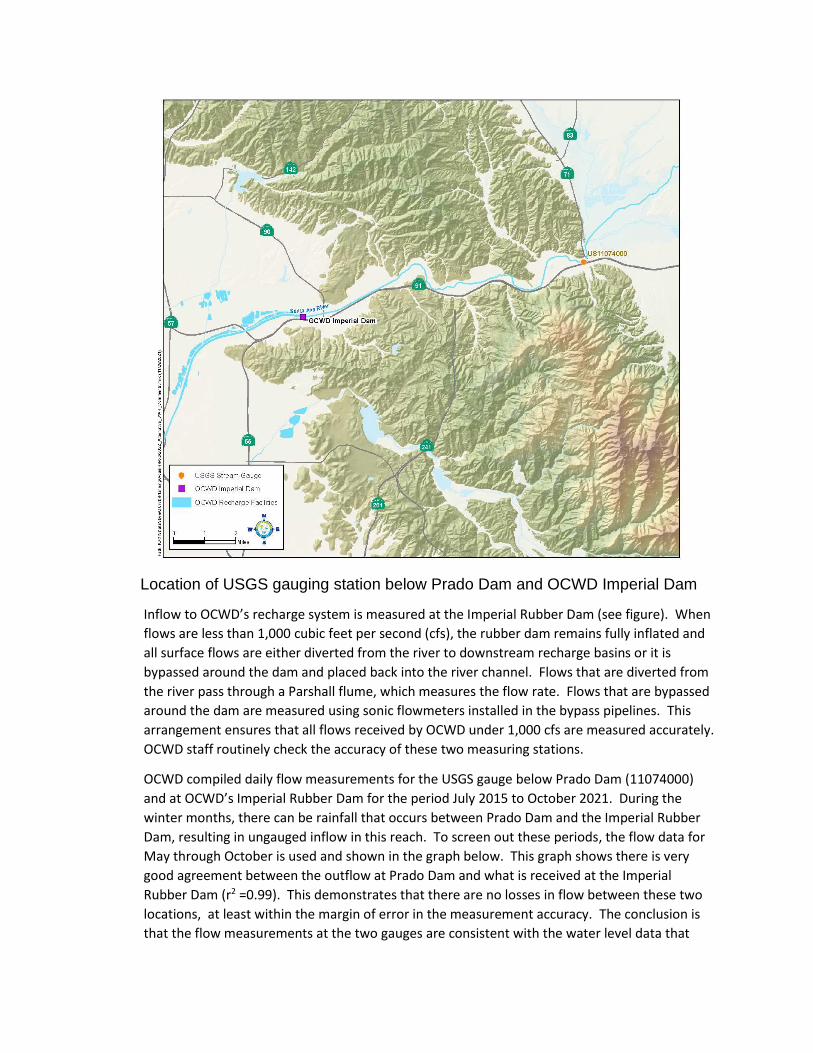
Location of USGS gauging station below Prado Dam and OCWD Imperial Dam
Inflow to OCWD’s recharge system is measured at the Imperial Rubber Dam (see figure). When
flows are less than 1,000 cubic feet per second (cfs), the rubber dam remains fully inflated and
all surface flows are either diverted from the river to downstream recharge basins or it is
bypassed around the dam and placed back into the river channel. Flows that are diverted from
the river pass through a Parshall flume, which measures the flow rate. Flows that are bypassed
around the dam are measured using sonic flowmeters installed in the bypass pipelines. This
arrangement ensures that all flows received by OCWD under 1,000 cfs are measured accurately.
OCWD staff routinely check the accuracy of these two measuring stations.
OCWD compiled daily flow measurements for the USGS gauge below Prado Dam (11074000)
and at OCWD’s Imperial Rubber Dam for the period July 2015 to October 2021. During the
winter months, there can be rainfall that occurs between Prado Dam and the Imperial Rubber
Dam, resulting in ungauged inflow in this reach. To screen out these periods, the flow data for
May through October is used and shown in the graph below. This graph shows there is very
good agreement between the outflow at Prado Dam and what is received at the Imperial
Rubber Dam (r2 =0.99). This demonstrates that there are no losses in flow between these two
locations, at least within the margin of error in the measurement accuracy. The conclusion is
that the flow measurements at the two gauges are consistent with the water level data that

show that the Santa Ana Canyon Management Area is in hydrologic equilibrium, and also that
the volume of groundwater pumping is relatively small so as to not measurably reduce surface
water volumes through the canyon.
DWR has made a dataset, called “Natural Communities Commonly Associated with Groundwater (NCCAG) Dataset” available at NC Dataset Viewer (ca.gov). This dataset shows that there is riparian habitat located in the Santa Ana Management Area along the SAR channel.
La Habra GSA Response:
Requested information on whether surface water bodies in the La Habra-Brea Management Area are
interconnected with groundwater and whether groundwater-dependent ecosystems exist within the La
Habra Management Area is included in the 2022 Update.
Recommended Action 2. Staff recommend a basin-wide water budget utilizing inflow
and outflow information from each management area or a water budget for each
management area be provided in accordance with the GSP regulations (CCR 23 Section
354.18).
y = 1.02xR² = 0.9895
0
50
100
150
200
250
300
350
400
450
500
0 50 100 150 200 250 300 350 400 450 500
Imp
eria
l Dam
Infl
ow
(cf
s)
Prado Dam Outflow (cfs)
Comparison of Prado Outflow vs Imperial Dam Inflow (May-October, 2015-2021)

Response:
Over the years, OCWD has developed a comprehensive data collection system to characterize basin
inflows and outflows. In an average year, approximately 80 percent of the inflow to the basin is
measured and all of the groundwater production is measured and accounted for. In addition, every
year, the change in groundwater storage is estimated based on water level changes in the three basin
aquifers. This process defines the current storage condition in the basin and refines the net incidental
(unmeasured) recharge portion of the water budget. Section 4 of the OCWD Management Area section
of the Alternative describes the various elements of the water budget. The five-year water budget
presented in the OCWD Management Area of the report is reproduced below.
Table 4-1 Water Budget, WY2016-17 to 2020-21
FLOW COMPONENT 2016-17 2017-18 2018-19 2019-20 2020-21
INFLOW
Santa Ana River baseflow 70,000 65,400 98,000 74,500 76,400
Santa Ana River stormflow 65,400 24,100 63,700 79,500 36,600
Recycled Water (GWRS/Alamitos Barrier) 98,000 106,400 97,200 99,700 101,700
Imported Water 50,400 66,100 40,300 18,100 0
Net Estimated Unmeasured or Incidental Recharge*
67,900 26,200 45,600 41,400 19,100
TOTAL INFLOW: 351,700 288,200 344,800 313,200 233,800
OUTFLOW
Groundwater Production 300,700 237,200 303,800 277,200 281,800
TOTAL OUTFLOW: 300,700 237,200 303,800 277,200 281,800
CHANGE IN STORAGE: 51,000 51,000 41,000 36,000 (48,000)
The water budget presented in Table 4-1 is essentially the water budget for Basin 8-1, except for the La
Habra Management Area. The water budget for the Santa Ana Canyon Management Area shows that
this area provides a net source of water to the OCWD Management area that is captured in the surface
water recharge component and net estimated unmeasured recharge (via subsurface inflow). The water
budget for the South East Management area is captured in the net unmeasured recharge (via subsurface
inflow) minus any groundwater production in this area. Groundwater production in the South East
Management area is so small, it is inconsequential.

Starting in April 2022, OCWD and other agencies within Basin 8-1 will be presenting the various water
budget components as defined in CCR 23 Section 354.18 as part of the annual reporting process.
Recommended Action 3. Staff recommend that the Agencies provide the agreements
among the different jurisdictions which commit the Agencies to conduct monitoring and
implement the Alternative within their management areas. If no GSP is developed for
the La Habra-Brea Management Area, the next Alternative update should provide
additional explanation and quantification of the management approaches, sustainable
management criteria, and evidence for the presence or absence of undesirable results
for the La Habra-Brea Management Area.
Response:
The response to this recommended action comes in two parts. The first addresses the commitment of
the Agencies to conduct monitoring and implement the Alternative within their management areas. The
second addresses additional information requested for the La Habra-Brea Management Area.
Part 1: Commitment to Conduct Monitoring and Implement Alternative:
As part of the process of developing the Basin 8-1 Alternative, OCWD collaborated with the City of La
Habra Groundwater Sustainability Agency and the Irvine Ranch Water District (IRWD). Both of these
agencies committed resources to prepare their respective sections of the Alternative and submitted
letters of support for the Alternative. The letters of support and OCWD’s resolution of support were
submitted to DWR along with the Alternative in December 2016. These same agencies have committed
resources to updating the Alternative and OCWD has again adopted a resolution of support to submit
the updated Alternative to DWR. This process demonstrates the continued commitment of the agencies
to comply with SGMA and take necessary actions to continue sustainably managing Basin 8-1.
In terms of groundwater monitoring, OCWD has an extensive monitoring well network. A subset of
these wells were part of the CASGEM program. As described in the 2022 Update, this well network was
updated and is now part of the Monitoring Well Network (MWN), which has replaced CASGEM.
Included in the MWN are two wells owned by IRWD that are located in the South East Management
Area. As a result, water level data submitted twice a year by OCWD covers all of Basin 8-1 except for the
La Habra-Brea Management Area. The City of La Habra GSA will be submitting water level data for their
area separately.
In addition to groundwater level monitoring, the agencies are committed to continuing to conduct
monitoring of water quality, groundwater production, subsidence, and any other monitoring that may
be required to satisfy sustainable management criteria.
Part 2: Additional Information for La Habra-Brea Management Area
The City of La Habra GSA incorporated additional information into the La Habra-Brea Management Area
section, including additional explanation and quantification of the management approaches, sustainable
management criteria, and evidence for the presence or absence of undesirable results for the La Habra-
Brea Management Area.
Recommended Action 4. Staff recommend the Agencies explain the timeframe that the
Basin can safely operate, without experiencing undesirable results, after exceeding

500,000 AF below full conditions (23 CCR Section 354.26(b)(2)) and clarify the wells used
to calculate the change in groundwater in storage and the overall groundwater in
storage.
Response:
It is important to reiterate that exceeding 500,000 acre-feet from full is a hypothetical situation and is
not an intended action under normal basin management circumstances. Such a hypothetical situation is
considered an extraordinary circumstance; for example, an extended drought that is exacerbated by a
lengthy shutdown of imported water into southern California due to a catastrophic event such as a
major earthquake. This hypothetical situation would not be expected to last more than one year;
however, other worse hypothetical cases can be conceived. Because the cause(s) and magnitude of a
hypothetical temporary storage exceedance beyond 500,000 acre-feet below full are unknown, it is
difficult to quantify a precise timeframe that the Basin can operate without experiencing undesirable
results. That said, a cumulative exceedance of no more than 200,000 acre-feet beyond 500,000 acre-
feet below full conditions over five consecutive years is suggested as a general guideline. This means
that the average exceedance would be no more than 40,000 acre-feet during a maximum five-year
period. If the period of exceedance was two years, then the average exceedance would be 100,000
acre-feet. As a general guideline, limiting the magnitude and duration of the exceedance will lessen the
potential for undesirable results, as described below:
1. The rate of inland movement of seawater intrusion with seawater barriers continuing to operate is expected to be on the order of 1-2 feet per day. Over a 5-year period, this could represent a brackish water encroachment of roughly ½ mile into some of the coastal gaps. While this encroachment could cause localized water quality degradation, it is unlikely to reach production wells which are farther inland. Once the storage exceedance ends, and the basin storage is within the established operating range, the seawater barriers’ performance would be expected to recover to their design conditions and subsequently halt and reverse the brackish groundwater inland encroachment.
2. Reduction of pore pressures in and drainage of water from thick, compressible confining layers is a slow process due to the low permeability of the confining layers. Therefore, a maximum five-year period of basin storage exceeding 500,000 acre-feet from full would not be expected to cause significant inelastic land subsidence.
3. Lowering of groundwater levels could temporarily reduce or halt the production potential of an unknown number of water supply wells; however, assuming the distribution of lower groundwater levels is distributed across the Basin, the magnitude of reduced groundwater levels would be lessened, and the number of temporarily-impacted wells would likely be manageable.
Note that this discussion applies to the OCWD portion of the groundwater basin. Storage conditions in
the La Habra-Brea Management Area are separate.
OCWD uses a large network of wells to obtain water levels in June every year, including:
1. OCWD owned wells (including multi-port monitoring wells) 2. Groundwater producer wells (must be turned off for 24 hours in advance) 3. Selected wells in Geotracker

The wells/monitoring points used for the June 2021 contour maps of the Shallow, Principal and Deep
Aquifers are attached. For 2021, 350 wells/monitoring points were used for the Shallow Aquifer, 421
wells/monitoring points for the Principal Aquifer, and 61 wells/monitoring points for the Deep Aquifer.
There may be small changes in this well/monitoring point list on an annual basis.

List of Wells/Monitoring Points Used for June 2021 Water Level Contour Map of
Orange County Groundwater Basin (OCWD Management Area)

Wells Used to Develop 2021 Groundwater Contour Maps in Orange County Groundwater BasinShallow Aquifer Wells (Model Layer 1)STAID1 WELLNM STAID STANAME OWNERNM NAD83_X NAD83_Y GIS_SYMNM PERF_ZONE SHORTDATE WLELEV_2021
19013 CSF-1 19127 CSF-1/1/WB1/MP1 CA. STATE UNIV., FULLERTON 6064343.084 2270822.497 Multiport Monitoring Well MP1 (132) <Null> <Null>
1092 FPRK-YLE 1093 FPRK-YLE/1 CANYON RV PARK 6119133.638 2263083.811 Active Small-System Production Well 60-84 6/29/2021 360.79
1090 FPRK-YLW 1091 FPRK-YLW/1 CANYON RV PARK 6119044.248 2263049.927 Active Small-System Production Well 48-80 6/29/2021 359.55
1136 SULY-OA4 1137 SULY-OA4/1 CHANDLER'S SAND & GRAVEL 6094796.046 2243793.122 Inactive Production Well - <Null> <Null>
23723 CHEV-MW15B 23724 CHEV-MW15B/1 CHEVRON MANAGEMENT COMPANY 6072572.119 2277343.802 Monitoring Well 90-130 <Null> <Null>
15561 CNXT-NBES2 15562 CNXT-NBES2/1 CONEXANT SYSTEMS, INC. 6071916.005 2188840.827 Monitoring Well 21-41 5/27/2021 21.63
15734 CNXT-NBES3A 15735 CNXT-NBES3A/1 CONEXANT SYSTEMS, INC. 6071601.336 2188635.986 Monitoring Well 23.9-44.3 5/27/2021 21.43
15571 CNXT-NBES4B 15572 CNXT-NBES4B/1 CONEXANT SYSTEMS, INC. 6071542.899 2188493.017 Monitoring Well 23-43 <Null> <Null>
15569 CNXT-NBES6 15570 CNXT-NBES6/1 CONEXANT SYSTEMS, INC. 6071620.501 2188443.488 Monitoring Well 25-40 <Null> <Null>
8610 CNXT-NBMW29 8611 CNXT-NBMW29/1 CONEXANT SYSTEMS, INC. 6071755.155 2189235.843 Monitoring Well 21-40 <Null> <Null>
8608 CNXT-NBMW30 8609 CNXT-NBMW30/1 CONEXANT SYSTEMS, INC. 6071902.892 2189098.302 Monitoring Well 21-42 <Null> <Null>
14611 SILV-YL 14612 SILV-YL/1 COUNTY OF ORANGE 6117870.025 2262814.346 Other Active Production Well 40-66 6/30/2021 359.99
15932 DAVI-O 15933 DAVI-O/1 DAVIDSON, TOM & CINDY 6090897.443 2241414.862 Other Active Production Well - <Null> <Null>
23713 DLA-GTMW04 23714 DLA-GTMW04/1 DEFENSE LOGISTICS AGENCY 6087208.914 2219923.944 Monitoring Well 90-110 7/7/2021 48.06
4156 OCWD-BS103 5213 OCWD-BS103/1 DEPARTMENT OF WATER RESOURCES 6027754.184 2208435.987 Monitoring Well 43-78 6/29/2021 -4.68
5218 OCWD-BS105 5219 OCWD-BS105/1 DEPARTMENT OF WATER RESOURCES 6022947.616 2207365.785 Monitoring Well 69-85 7/7/2021 -8.97
3071 OCWD-BS106 5222 OCWD-BS106/1 DEPARTMENT OF WATER RESOURCES 6024891.085 2211245.522 Monitoring Well 50-92 6/30/2021 -6.17
5133 OCWD-SA10 5134 OCWD-SA10/1 DEPARTMENT OF WATER RESOURCES 6039247.362 2190515.118 Monitoring Well 90-120 6/28/2021 3.249
5139 OCWD-SA12 5140 OCWD-SA12/1 DEPARTMENT OF WATER RESOURCES 6040581.662 2205805.671 Monitoring Well 86-126 6/30/2021 8.88
5115 OCWD-SA3 5116 OCWD-SA3/1 DEPARTMENT OF WATER RESOURCES 6034107.028 2196075.864 Monitoring Well 100-160 6/28/2021 2.631
1620 CMIL-A 3108 CMIL-A/1 FIRST INTERSTATE BANK 6101671.628 2260355.691 Destroyed and Sealed Well 21-101 <Null> <Null>
39 GG-28 2687 GG-28/1 GARDEN GROVE 6049374.528 2232905.514 Inactive Production Well 130-240 6/30/2021 59
1407 WWGC-SAK3 1408 WWGC-SAK3/1 GARDEN GROVE 6056974.671 2220835.054 Other Active Production Well 149-170 6/28/2021 50.85
9522 SCWC-YLCO2 9523 SCWC-YLCO2/1 GOLDEN STATE WATER COMPANY 6091725.912 2261952.552 Inactive Production Well 100-480 5/25/2021 254
506 ETCH-AL2 507 ETCH-AL2/1 GOODWIN MUTUAL WATER COMPANY 6086723.02 2261993.771 Inactive Production Well 85-185 6/29/2021 236.58
23034 HEUL-A 23035 HEUL-A/1 HEULER, BARTON 6060159.382 2256110.939 Other Active Production Well 125-145 <Null> <Null>
2830 OCWD-HH2 2832 OCWD-HH2/2 HUNTINGTON HARBOUR CORPORATION 6012383.001 2212193.192 Monitoring Well 85-95 6/29/2021 -8.893
2845 OCWD-HH3 2847 OCWD-HH3/2 HUNTINGTON HARBOUR CORPORATION 6012242.137 2210674.48 Monitoring Well 75-85 6/29/2021 -7.988
4242 OCWD-HH5 4245 OCWD-HH5/3 HUNTINGTON HARBOUR CORPORATION 6013929.084 2207761.949 Monitoring Well 63-73 6/29/2021 -5.877
20312 OCWD-HH6B 20313 OCWD-HH6B/1 HUNTINGTON HARBOUR CORPORATION 6011785.354 2213862.346 Monitoring Well 90-100 7/1/2021 -10.411
1200 HYNS-S2 1201 HYNS-S2/1 HYNES ESTATES, INC. 6032783.88 2236398.43 Destroyed and Sealed Well 162-182 <Null> <Null>
23616 IRWD-MICH11 23617 IRWD-MICH11/1 IRVINE RANCH WATER DISTRICT 6078141.044 2188888.245 Other Active Production Well 21-69 <Null> <Null>
23618 IRWD-MICH12 23622 IRWD-MICH12/1 IRVINE RANCH WATER DISTRICT 6078209.142 2188963.633 Other Active Production Well 19-63 <Null> <Null>
23623 IRWD-MICH13 23624 IRWD-MICH13/1 IRVINE RANCH WATER DISTRICT 6078263.018 2188904.583 Other Active Production Well 21-67 <Null> <Null>
23625 IRWD-MICH14 23626 IRWD-MICH14/1 IRVINE RANCH WATER DISTRICT 6078303.831 2188587.342 Other Active Production Well - <Null> <Null>
23627 IRWD-MICH15 23628 IRWD-MICH15/1 IRVINE RANCH WATER DISTRICT 6078219.918 2188672.325 Other Active Production Well - <Null> <Null>
23495 CREA-YL 23496 CREA-YL/1 JOHN CREANGA 6078734.136 2277902.352 Other Active Production Well 135-175 6/30/2021 302.223
1211 ITO-LA 1212 ITO-LA/1 JOINT FORCES TRAINING BASE LOS ALAMITOS 6014444.094 2233893.201 Other Active Production Well 70-710 6/29/2021 14.26
432 W-432 433 W-432/1 KATHY BONANNO 6080325.38 2272580.463 Inactive Production Well 117-137 6/30/2021 286.993
1759 MKAW-FV 3235 MKAW-FV/1 KAWAGUCHI ENTERPRISES, LP 6051164.175 2210349.133 Other Active Production Well 185-225 <Null> <Null>
11544 LAC-33Y10 11545 LAC-33Y10/1 LOS ANGELES COUNTY 6000026.997 2231221.991 Monitoring Well 75-115 <Null> <Null>
1160 GHAV-GG 1161 GHAV-GG/1 MAGILL, STANLEY R. 6059608.702 2232220.109 Other Active Production Well 168-188 6/28/2021 61.3
22691 HMW-01 22692 HMW-01/1 MANHEIM CALIFORNIA (COX ENTERPRISES) 6078590.494 2262972.301 Monitoring Well 55-75 <Null> <Null>
19926 USMC-16MW11 19927 USMC-16MW11/1 MARINE CORPS AIR STATION 6110625.131 2193056.413 Monitoring Well 160-180 <Null> <Null>
18840 USMC-16MW2 18841 USMC-16MW2/1 MARINE CORPS AIR STATION 6110221.201 2193322.5 Monitoring Well 153-178 <Null> <Null>
19957 USMC-24EX11 19958 USMC-24EX11/1 MARINE CORPS AIR STATION 6104523.31 2191224.413 Monitoring Well 135-180 <Null> <Null>
19959 USMC-24EX12A 19960 USMC-24EX12A/1 MARINE CORPS AIR STATION 6105720.54 2190982.863 Monitoring Well 115-160 <Null> <Null>
19965 USMC-24EX13A 19966 USMC-24EX13A/1 MARINE CORPS AIR STATION 6107553.141 2190629.843 Monitoring Well 110-160 <Null> <Null>
19971 USMC-24EX14 19972 USMC-24EX14/1 MARINE CORPS AIR STATION 6104912.99 2191678.953 Monitoring Well 115-185 <Null> <Null>
19953 USMC-24EX9 19954 USMC-24EX9/1 MARINE CORPS AIR STATION 6108691.53 2189395.353 Monitoring Well 120-200 <Null> <Null>
20253 USMC-24MW10AB 20255 USMC-24MW10AB/2 MARINE CORPS AIR STATION 6107253.063 2191367.404 Monitoring Well 130-140 <Null> <Null>
20269 USMC-24MW9AB 20271 USMC-24MW9AB/2 MARINE CORPS AIR STATION 6106891.198 2190845.415 Monitoring Well 140-150 <Null> <Null>
18621 USMC-24NEW7 18622 USMC-24NEW7/1 MARINE CORPS AIR STATION 6108983.5 2190576.7 Monitoring Well 118-158 <Null> <Null>
18619 USMC-24NEW8 18620 USMC-24NEW8/1 MARINE CORPS AIR STATION 6109711.5 2190269.7 Monitoring Well 122-162 <Null> <Null>
13875 USMC-MW03E 13876 USMC-MW03E/1 MARINE CORPS AIR STATION 6109510.523 2188847.525 Monitoring Well 124-164 <Null> <Null>
13833 USMC-MW19E 13834 USMC-MW19E/1 MARINE CORPS AIR STATION 6104580.874 2194499.736 Monitoring Well 98-138 <Null> <Null>
14336 USMC-MW23 14337 USMC-MW23/1 MARINE CORPS AIR STATION 6105584.809 2185916.035 Monitoring Well 64-104 <Null> <Null>
18586 USMC-MW29A 18587 USMC-MW29A/1 MARINE CORPS AIR STATION 6110133.9 2187312.33 Monitoring Well 75-100 <Null> <Null>
22910 USMC-MW2D2 22911 USMC-MW2D2/1 MARINE CORPS AIR STATION 6081840.685 2206480.568 Monitoring Well 76-86 <Null> <Null>
13861 USMC-MW31 13862 USMC-MW31/1 MARINE CORPS AIR STATION 6107617.015 2189648.229 Monitoring Well 105-145 <Null> <Null>
13859 USMC-MW37 13860 USMC-MW37/1 MARINE CORPS AIR STATION 6108153.508 2188707.479 Monitoring Well 89-130 <Null> <Null>
22617 USMC-MW43B 22618 USMC-MW43B/1 MARINE CORPS AIR STATION 6110701.167 2188814.201 Monitoring Well 100.41-140.91 <Null> <Null>
13817 USMC-MW51 13818 USMC-MW51/1 MARINE CORPS AIR STATION 6107153.052 2192582.528 Monitoring Well 125-165 <Null> <Null>
13877 USMC-MW70 13878 USMC-MW70/1 MARINE CORPS AIR STATION 6110644.542 2189446.258 Monitoring Well 125-165 <Null> <Null>
13903 USMC-MW73 13904 USMC-MW73/1 MARINE CORPS AIR STATION 6109324.506 2187794.721 Monitoring Well 90-130 <Null> <Null>
13889 USMC-MW91 13890 USMC-MW91/1 MARINE CORPS AIR STATION 6108291.003 2188258.73 Monitoring Well 110-150 <Null> <Null>
7256 USMC-PS1 7257 USMC-PS1/1 MARINE CORPS AIR STATION 6106591.503 2189442.242 Monitoring Well 102-122 <Null> <Null>
7258 USMC-PS2 7259 USMC-PS2/1 MARINE CORPS AIR STATION 6105657.052 2193519.226 Monitoring Well 103-133 <Null> <Null>
18564 USMC-PS3A 18565 USMC-PS3A/1 MARINE CORPS AIR STATION 6109290.87 2187093.49 Monitoring Well 70-105 <Null> <Null>
13849 USMC-MP06 14437 USMC-MP06/1/WB1/MP1 MARINE CORPS AIR STATION 6100689.85 2194415.05 Multiport Monitoring Well MP1 (110) <Null> <Null>
13851 USMC-MP08 14457 USMC-MP08/1/WB1/MP1 MARINE CORPS AIR STATION 6105310.575 2187889.19 Multiport Monitoring Well MP1 (70) <Null> <Null>
13853 USMC-MP10 14501 USMC-MP10/1/WB1/MP1 MARINE CORPS AIR STATION 6089272.939 2200492.977 Multiport Monitoring Well MP1 (222) <Null> <Null>
20296 USMC-24EX20B 20297 USMC-24EX20B/1 MARINE CORPS AIR STATION 6106098.39 2192979.513 Other Active Production Well 106.8-204.8 <Null> <Null>
20015 USMC-SGU1 20016 USMC-SGU1/1 MARINE CORPS AIR STATION 6109366.294 2188607.434 Other Active Production Well 96-206 3/9/2021 153.37
20090 USMC-SGU16 20091 USMC-SGU16/1 MARINE CORPS AIR STATION 6108500.694 2189851.338 Other Active Production Well 105-185 3/9/2021 128.4
21967 USMC-SGU39 21968 USMC-SGU39/1 MARINE CORPS AIR STATION 6105829.364 2192700.994 Other Active Production Well 90-190 3/8/2021 108.56
15117 MCGN-BP1 15118 MCGN-BP1/1 MC GINNESS, BILL 6030378.839 2253137.368 Other Active Production Well 50-255 6/30/2021 39.29
14284 MSG-BP10L 14285 MSG-BP10L/1 MCCOLL SITE GROUP 6037931.453 2272258.752 Monitoring Well 247-257 6/30/2021 103.92
1134 SULY-OA1 1135 SULY-OA1/1 MILAN REI, LLC 6095028.945 2243462.53 Other Active Production Well - 6/29/2021 <Null>
428 W-428 429 W-428/1 MONBRI, LLC 6074730.957 2271716.012 Inactive Production Well - <Null> <Null>
3976 OCWD-P10 3977 OCWD-P10/1 ORANGE COUNTY WATER DISTRICT 6044117.886 2186405.599 Destroyed and Sealed Well 90-130 <Null> <Null>
19007 OCWD-BIO1 19008 OCWD-BIO1/1 ORANGE COUNTY WATER DISTRICT 6082730.975 2257183.878 Inactive Production Well 25-115 7/7/2021 229.84
20858 OCWD-EW2 20859 OCWD-EW2/1 ORANGE COUNTY WATER DISTRICT 6053332.928 2263207.928 Inactive Production Well 130-196 <Null> <Null>
20851 OCWD-EW2A 20852 OCWD-EW2A/1 ORANGE COUNTY WATER DISTRICT 6049376.318 2263317.874 Inactive Production Well 122-188 <Null> <Null>
22619 OCWD-EW3A 22620 OCWD-EW3A/1 ORANGE COUNTY WATER DISTRICT 6050896.1 2260365.9 Inactive Production Well 235-290 <Null> <Null>
21041 OCWD-EW4 21042 OCWD-EW4/1 ORANGE COUNTY WATER DISTRICT 6053819.546 2259558.892 Inactive Production Well 130-255 <Null> <Null>
18056 OCWD-I26A 18057 OCWD-I26A/1 ORANGE COUNTY WATER DISTRICT 6048813.793 2200416.667 Injection Well 60-195 7/6/2021 5.49
19465 OCWD-I27A 19466 OCWD-I27A/1 ORANGE COUNTY WATER DISTRICT 6036244.383 2199722.281 Injection Well 78-148 <Null> <Null>
19469 OCWD-I28A 19470 OCWD-I28A/1 ORANGE COUNTY WATER DISTRICT 6036238.41 2199048.656 Injection Well 80-140 7/6/2021 3
19697 OCWD-I29A 19698 OCWD-I29A/1 ORANGE COUNTY WATER DISTRICT 6034766.9 2200360.103 Injection Well 90-120 <Null> <Null>
19701 OCWD-I30A 19702 OCWD-I30A/1 ORANGE COUNTY WATER DISTRICT 6034047.2 2200278.003 Injection Well 95-160 6/28/2021 2.53
19711 OCWD-I31A 19712 OCWD-I31A/1 ORANGE COUNTY WATER DISTRICT 6033586.7 2201013.903 Injection Well 90-165 7/6/2021 1.67
19707 OCWD-I32A 19708 OCWD-I32A/1 ORANGE COUNTY WATER DISTRICT 6033114.8 2200599.403 Injection Well 90-155 <Null> <Null>
19654 OCWD-I33A 19655 OCWD-I33A/1 ORANGE COUNTY WATER DISTRICT 6045921.5 2194432.303 Injection Well 61-156 6/30/2021 5.16
19656 OCWD-I34A 19657 OCWD-I34A/1 ORANGE COUNTY WATER DISTRICT 6045756.9 2193917.303 Injection Well 60-135 <Null> <Null>
19658 OCWD-I35A 19659 OCWD-I35A/1 ORANGE COUNTY WATER DISTRICT 6045558.2 2193150.603 Injection Well 60-115 6/30/2021 7.89
19678 OCWD-I36A 19679 OCWD-I36A/1 ORANGE COUNTY WATER DISTRICT 6045421.1 2192575.403 Injection Well 60-110 <Null> <Null>
1018 AM-1 1019 AM-1/1 ORANGE COUNTY WATER DISTRICT 6090472.39 2264185.952 Monitoring Well 97-115 6/30/2021 245.03
1 of 4

Wells Used to Develop 2021 Groundwater Contour Maps in Orange County Groundwater BasinShallow Aquifer Wells (Model Layer 1)STAID1 WELLNM STAID STANAME OWNERNM NAD83_X NAD83_Y GIS_SYMNM PERF_ZONE SHORTDATE WLELEV_2021
545 AM-10 546 AM-10/1 ORANGE COUNTY WATER DISTRICT 6071304.771 2257813.261 Monitoring Well 217-235 7/7/2021 121.51
557 AM-11 558 AM-11/1 ORANGE COUNTY WATER DISTRICT 6072499.755 2255656.617 Monitoring Well 218-240 6/30/2021 121.98
555 AM-12 556 AM-12/1 ORANGE COUNTY WATER DISTRICT 6070962.221 2255565.488 Monitoring Well 210-225 7/7/2021 113.56
553 AM-13 554 AM-13/1 ORANGE COUNTY WATER DISTRICT 6072701.528 2256964.39 Monitoring Well 252-270 6/30/2021 128.38
2744 AM-15A 2745 AM-15A/1 ORANGE COUNTY WATER DISTRICT 6062585.788 2256914.422 Monitoring Well 214-220 6/25/2021 89.81
2895 AM-19A 2896 AM-19A/1 ORANGE COUNTY WATER DISTRICT 6065134.464 2236977.559 Monitoring Well 115-123 6/25/2021 77.56
1022 AM-2 1023 AM-2/1 ORANGE COUNTY WATER DISTRICT 6091404.587 2263383.522 Monitoring Well 87-100 6/30/2021 246.46
6515 AM-21A 6516 AM-21A/1 ORANGE COUNTY WATER DISTRICT 6067232.542 2241283.088 Monitoring Well 157-165 6/25/2021 90.52
7011 AM-25A 7012 AM-25A/1 ORANGE COUNTY WATER DISTRICT 6060775.248 2252483.682 Monitoring Well 188-195 6/25/2021 84.41
1020 AM-3 1021 AM-3/1 ORANGE COUNTY WATER DISTRICT 6090425.411 2261850.384 Monitoring Well 91-107 6/30/2021 245.62
7543 AM-30A 7544 AM-30A/1 ORANGE COUNTY WATER DISTRICT 6046015.103 2255909.924 Monitoring Well 152-159 6/25/2021 55.16
22901 AM-31AR 22902 AM-31AR/1 ORANGE COUNTY WATER DISTRICT 6052258.095 2257683 Monitoring Well 150-170 7/8/2021 69.05
8904 AM-39A 8905 AM-39A/1 ORANGE COUNTY WATER DISTRICT 6057788.178 2260561.644 Monitoring Well 115-135 6/29/2021 82.15
549 AM-4 550 AM-4/1 ORANGE COUNTY WATER DISTRICT 6078257.417 2258629.141 Monitoring Well 187-205 7/7/2021 166.388
8908 AM-40A 8909 AM-40A/1 ORANGE COUNTY WATER DISTRICT 6057765.028 2259083.041 Monitoring Well 145-165 6/25/2021 83.08
10147 AM-41A 10148 AM-41A/1 ORANGE COUNTY WATER DISTRICT 6055818.758 2261031.665 Monitoring Well 156-166 6/30/2021 77.7
8232 AM-42A 8233 AM-42A/1 ORANGE COUNTY WATER DISTRICT 6057305.512 2258837.864 Monitoring Well 115-130 <Null> <Null>
14615 AM-44 14616 AM-44/1 ORANGE COUNTY WATER DISTRICT 6075009.801 2261947.637 Monitoring Well 140-160 6/30/2021 168.75
15331 AM-45 15332 AM-45/1 ORANGE COUNTY WATER DISTRICT 6071037.809 2252432.19 Monitoring Well 102-132 7/7/2021 104.04
15329 AM-46 15330 AM-46/1 ORANGE COUNTY WATER DISTRICT 6073338.847 2254329.24 Monitoring Well 94-124 7/7/2021 124.15
20711 AM-47A 20712 AM-47A/1 ORANGE COUNTY WATER DISTRICT 6054345.1 2258323.2 Monitoring Well 160-170 6/25/2021 73.68
20703 AM-48A 20704 AM-48A/1 ORANGE COUNTY WATER DISTRICT 6069389.1 2259146.8 Monitoring Well 116-146 7/8/2021 114.1
20760 AM-49 20761 AM-49/1 ORANGE COUNTY WATER DISTRICT 6068833 2259389.2 Monitoring Well 120-150 6/30/2021 112.28
22372 AM-50 22373 AM-50/1 ORANGE COUNTY WATER DISTRICT 6075090.3 2260329.2 Monitoring Well 140-150 7/1/2021 158.68
22714 AM-51 22715 AM-51/1 ORANGE COUNTY WATER DISTRICT 6078407.7 2256724.2 Monitoring Well 105-125 7/1/2021 176.413
23001 AM-52 23002 AM-52/1 ORANGE COUNTY WATER DISTRICT 6074643.8 2257784.5 Monitoring Well 140-150 7/1/2021 145.33
22939 AM-53 22940 AM-53/1 ORANGE COUNTY WATER DISTRICT 6076000.9 2255632.4 Monitoring Well 35-50 6/30/2021 199.08
23209 AM-54A 23210 AM-54A/1 ORANGE COUNTY WATER DISTRICT 6055949.4 2259518.7 Monitoring Well 102-117 6/25/2021 77.92
2732 AM-5A 2733 AM-5A/1 ORANGE COUNTY WATER DISTRICT 6078678.675 2259935.902 Monitoring Well 168-175 7/7/2021 166.45
551 AM-6 552 AM-6/1 ORANGE COUNTY WATER DISTRICT 6075037.515 2257301.421 Monitoring Well 232-250 7/7/2021 143.29
2734 AM-7 2735 AM-7/1 ORANGE COUNTY WATER DISTRICT 6071731.515 2260900.336 Monitoring Well 210-225 7/7/2021 131.58
2736 AM-8 2737 AM-8/1 ORANGE COUNTY WATER DISTRICT 6069027.597 2259867.528 Monitoring Well 268-285 7/7/2021 112.8
2738 AM-9 2739 AM-9/1 ORANGE COUNTY WATER DISTRICT 6068551.962 2256957.039 Monitoring Well 285-303 6/30/2021 106.16
14585 AMD-9 14586 AMD-9/1 ORANGE COUNTY WATER DISTRICT 6075825.081 2261784.701 Monitoring Well 200-220 7/1/2021 158.94
18333 FM-10A 18334 FM-10A/1 ORANGE COUNTY WATER DISTRICT 6057594.391 2262015.979 Monitoring Well 151-171 6/29/2021 80.97
18337 FM-11A 18338 FM-11A/1 ORANGE COUNTY WATER DISTRICT 6054079.666 2261018.177 Monitoring Well 134-154 6/30/2021 73.93
18341 FM-12A 18342 FM-12A/1 ORANGE COUNTY WATER DISTRICT 6058082.287 2263020.488 Monitoring Well 135-155 6/29/2021 82.13
18345 FM-13A 18346 FM-13A/1 ORANGE COUNTY WATER DISTRICT 6064721.254 2262602.268 Monitoring Well 140-160 7/1/2021 93.9
18349 FM-14A 18350 FM-14A/1 ORANGE COUNTY WATER DISTRICT 6064616.249 2263074.072 Monitoring Well 147-167 7/2/2021 93.36
18353 FM-15A 18354 FM-15A/1 ORANGE COUNTY WATER DISTRICT 6054101.553 2262617.193 Monitoring Well 120-140 6/29/2021 71.92
18414 FM-16A 18415 FM-16A/1 ORANGE COUNTY WATER DISTRICT 6063638.746 2262326.768 Monitoring Well 125-145 7/3/2021 91.85
19614 FM-18A 19615 FM-18A/1 ORANGE COUNTY WATER DISTRICT 6049386.482 2263643.669 Monitoring Well 120.5-150.5 6/29/2021 63.93
19618 FM-19A 19619 FM-19A/1 ORANGE COUNTY WATER DISTRICT 6051553.311 2262443.484 Monitoring Well 115-135 6/29/2021 68.63
7019 FM-1A 7020 FM-1A/1 ORANGE COUNTY WATER DISTRICT 6053145.617 2258731.83 Monitoring Well 164-172 6/25/2021 71.88
20764 FM-20A 20765 FM-20A/1 ORANGE COUNTY WATER DISTRICT 6053785.7 2263876.3 Monitoring Well 130-150 6/29/2021 72.54
20768 FM-21A 20769 FM-21A/1 ORANGE COUNTY WATER DISTRICT 6047768.5 2262675.5 Monitoring Well 140-160 6/29/2021 60.141
20753 FM-22A 20754 FM-22A/1 ORANGE COUNTY WATER DISTRICT 6051124.3 2260372.1 Monitoring Well 150-170 6/25/2021 67.28
20884 FM-23A 20885 FM-23A/1 ORANGE COUNTY WATER DISTRICT 6054153.6 2260625.1 Monitoring Well 128-143 6/29/2021 74.3
20701 FM-24A 20702 FM-24A/1 ORANGE COUNTY WATER DISTRICT 6051431.3 2258787.9 Monitoring Well 154-174 6/25/2021 67.61
20316 FM-25 20317 FM-25/1 ORANGE COUNTY WATER DISTRICT 6068593.3 2262774.2 Monitoring Well 132-152 6/30/2021 110.53
20878 FM-26 20879 FM-26/1 ORANGE COUNTY WATER DISTRICT 6053369.5 2263220 Monitoring Well 145-155 <Null> <Null>
20894 FM-27 20895 FM-27/1 ORANGE COUNTY WATER DISTRICT 6054575.1 2263550.9 Monitoring Well 105-125 6/29/2021 74.86
23221 FM-29A 23222 FM-29A/1 ORANGE COUNTY WATER DISTRICT 6048986.6 2262406 Monitoring Well 150-170 6/29/2021 62.36
23571 FM-30A 23572 FM-30A/1 ORANGE COUNTY WATER DISTRICT 6061066.47 2263552.561 Monitoring Well 106-126 6/29/2021 86.65
23227 FM-31A 23228 FM-31A/1 ORANGE COUNTY WATER DISTRICT 6054066.6 2261852.6 Monitoring Well 122-137 6/29/2021 73.97
23231 FM-32A 23232 FM-32A/1 ORANGE COUNTY WATER DISTRICT 6045296.9 2263968.8 Monitoring Well 135-155 6/29/2021 56.56
23483 FM-33A 23484 FM-33A/1 ORANGE COUNTY WATER DISTRICT 6052364.7 2264780 Monitoring Well 135-155 6/29/2021 69.67
23575 FM-34A 23576 FM-34A/1 ORANGE COUNTY WATER DISTRICT 6057208.2 2265369.9 Monitoring Well 114-124 7/8/2021 81.62
23894 FM-35A 23895 FM-35A/1 ORANGE COUNTY WATER DISTRICT 6062993.381 2262539.528 Monitoring Well 180.1-195.1 7/6/2021 89.8
7521 FM-4A 7522 FM-4A/1 ORANGE COUNTY WATER DISTRICT 6048400.799 2258801.821 Monitoring Well 142-160 6/25/2021 60.89
7932 FM-5 7933 FM-5/1 ORANGE COUNTY WATER DISTRICT 6059389.1 2261084.6 Monitoring Well 121-141 6/29/2021 85
9947 FM-6 9948 FM-6/1 ORANGE COUNTY WATER DISTRICT 6053264.065 2274113.568 Monitoring Well 150-310 6/30/2021 175.28
10145 FM-7A 10146 FM-7A/1 ORANGE COUNTY WATER DISTRICT 6054314.136 2259267.565 Monitoring Well 160-170 6/25/2021 74.11
18325 FM-8 18326 FM-8/1 ORANGE COUNTY WATER DISTRICT 6059585.097 2263564.489 Monitoring Well 114-134 6/29/2021 84.74
18329 FM-9A 18330 FM-9A/1 ORANGE COUNTY WATER DISTRICT 6063388.839 2262959.974 Monitoring Well 166-186 6/30/2021 89
19009 IDM-3 19010 IDM-3/1 ORANGE COUNTY WATER DISTRICT 6099726.882 2201438.084 Monitoring Well 174-194 6/28/2021 94.682
19404 IDM-4 19405 IDM-4/1 ORANGE COUNTY WATER DISTRICT 6103585.541 2200230.218 Monitoring Well 136-156 6/28/2021 107.205
19478 IDP-2R 19479 IDP-2R/1 ORANGE COUNTY WATER DISTRICT 6106015.21 2193086.752 Monitoring Well 155-195 6/28/2021 115.845
721 KBS-1 998 KBS-1/1 ORANGE COUNTY WATER DISTRICT 6074374.124 2260345.831 Monitoring Well 209-219 7/1/2021 154.21
14600 KBS-4 14601 KBS-4/1 ORANGE COUNTY WATER DISTRICT 6073595.666 2262004.207 Monitoring Well 138-158 7/7/2021 154.88
1360 MCAS-4 1361 MCAS-4/1 ORANGE COUNTY WATER DISTRICT 6098189.884 2189446.916 Monitoring Well 181-238 6/28/2021 95.46
10217 MCAS-5A 10218 MCAS-5A/1 ORANGE COUNTY WATER DISTRICT 6101340.027 2187474.726 Monitoring Well 120-130 6/28/2021 118.26
21062 OCWD-34X40 21063 OCWD-34X40/1 ORANGE COUNTY WATER DISTRICT 6005285 2228276.5 Monitoring Well 88-113 <Null> <Null>
23057 OCWD-34Y01 23058 OCWD-34Y01/1 ORANGE COUNTY WATER DISTRICT 6001790.9 2226024.1 Monitoring Well 60-80 7/6/2021 2.734
5410 OCWD-35H11 5413 OCWD-35H11/1 ORANGE COUNTY WATER DISTRICT 6002891.562 2224892.037 Monitoring Well 44-77 7/6/2021 -1.064
5414 OCWD-35N01 5416 OCWD-35N01/1 ORANGE COUNTY WATER DISTRICT 6001915.345 2223579.533 Monitoring Well 39-79 <Null> <Null>
2859 OCWD-AIR1 2860 OCWD-AIR1/1 ORANGE COUNTY WATER DISTRICT 6037614.933 2265072.135 Monitoring Well 200-250 6/29/2021 39.807
3327 OCWD-AN2 3328 OCWD-AN2/1 ORANGE COUNTY WATER DISTRICT 6078166.807 2262263.165 Monitoring Well 35-115 6/28/2021 174.34
3317 OCWD-BP3 3318 OCWD-BP3/1 ORANGE COUNTY WATER DISTRICT 6069054.595 2245231.281 Monitoring Well 185-205 7/7/2021 97.415
3311 OCWD-BP4 3312 OCWD-BP4/1 ORANGE COUNTY WATER DISTRICT 6070719.841 2250468.164 Monitoring Well 140-180 7/7/2021 91.57
20224 OCWD-BP5 20226 OCWD-BP5/2 ORANGE COUNTY WATER DISTRICT 6069894.721 2249887.593 Monitoring Well 146.5-166.5 7/7/2021 125.41
20227 OCWD-BP6 20228 OCWD-BP6/1 ORANGE COUNTY WATER DISTRICT 6069328.8 2249065.103 Monitoring Well 148-168 7/7/2021 102.79
20229 OCWD-BP7 20231 OCWD-BP7/2 ORANGE COUNTY WATER DISTRICT 6069218.53 2247697.383 Monitoring Well 148-168 7/7/2021 101.76
22323 OCWD-BS10 22324 OCWD-BS10/1 ORANGE COUNTY WATER DISTRICT 6013179.752 2219396.307 Monitoring Well 100-110 7/1/2021 -13.06
22330 OCWD-BS11 22331 OCWD-BS11/1 ORANGE COUNTY WATER DISTRICT 6008506.1 2221300 Monitoring Well 95-115 7/1/2021 -9.453
22774 OCWD-BS12 22968 OCWD-BS12/1 ORANGE COUNTY WATER DISTRICT 6015660.3 2214181.8 Monitoring Well 115-125 7/1/2021 -12.659
23682 OCWD-BS13A 23683 OCWD-BS13A/1 ORANGE COUNTY WATER DISTRICT 6009763.8 2214240.5 Monitoring Well 127-132 7/1/2021 -10.876
22776 OCWD-BS14 22912 OCWD-BS14/1 ORANGE COUNTY WATER DISTRICT 6003965.9 2221842.9 Monitoring Well 75-85 7/1/2021 -4.65
19673 OCWD-BS16 19674 OCWD-BS16/1 ORANGE COUNTY WATER DISTRICT 6021997.663 2201854.703 Monitoring Well 60-80 7/1/2021 -9.627
19675 OCWD-BS18 19676 OCWD-BS18/1 ORANGE COUNTY WATER DISTRICT 6018119.189 2205526.66 Monitoring Well 72-82 7/1/2021 -11.001
22899 OCWD-BS18B 22900 OCWD-BS18B/1 ORANGE COUNTY WATER DISTRICT 6018114.308 2205521.438 Monitoring Well 52-62 7/1/2021 -11.192
19854 OCWD-BS19 19855 OCWD-BS19/1 ORANGE COUNTY WATER DISTRICT 6019002.9 2203605.503 Monitoring Well 62.5-82.5 7/1/2021 -9.346
20140 OCWD-BS20B 20141 OCWD-BS20B/1 ORANGE COUNTY WATER DISTRICT 6018514.448 2207922.493 Monitoring Well 70.8-80.8 6/24/2021 -9.28
22778 OCWD-BS21 22895 OCWD-BS21/1 ORANGE COUNTY WATER DISTRICT 6004262.7 2223732.4 Monitoring Well 65-85 6/29/2021 -2.96
23498 OCWD-BS24A 23500 OCWD-BS24A/1 ORANGE COUNTY WATER DISTRICT 6005236.2 2219558.6 Monitoring Well 87.5-92.5 7/1/2021 -8.055
2867 OCWD-CTG1 2868 OCWD-CTG1/1 ORANGE COUNTY WATER DISTRICT 6061970.346 2206073.478 Monitoring Well 160-260 6/30/2021 32.73
3309 OCWD-FC2 3310 OCWD-FC2/1 ORANGE COUNTY WATER DISTRICT 6072303.404 2252609.097 Monitoring Well 95-115 7/7/2021 105.49
3305 OCWD-FH1 3306 OCWD-FH1/1 ORANGE COUNTY WATER DISTRICT 6081695.772 2257027.264 Monitoring Well 120-140 7/7/2021 213.83
2 of 4

Wells Used to Develop 2021 Groundwater Contour Maps in Orange County Groundwater BasinShallow Aquifer Wells (Model Layer 1)STAID1 WELLNM STAID STANAME OWNERNM NAD83_X NAD83_Y GIS_SYMNM PERF_ZONE SHORTDATE WLELEV_2021
7056 OCWD-GA2 7057 OCWD-GA2/1 ORANGE COUNTY WATER DISTRICT 6024924.606 2202223.668 Monitoring Well 30-40 6/24/2021 -4.615
23477 OCWD-HG2 23478 OCWD-HG2/1 ORANGE COUNTY WATER DISTRICT 6090811.6 2258833 Monitoring Well 43-48 7/7/2021 258.38
543 OCWD-KB1 544 OCWD-KB1/1 ORANGE COUNTY WATER DISTRICT 6073294.322 2259903.951 Monitoring Well 180-200 7/7/2021 141.77
20232 OCWD-LB1 20234 OCWD-LB1/2 ORANGE COUNTY WATER DISTRICT 6070964.86 2251336.473 Monitoring Well 148-168 7/7/2021 97.07
20237 OCWD-LB3 20239 OCWD-LB3/2 ORANGE COUNTY WATER DISTRICT 6071277.961 2250678.833 Monitoring Well 145-165 7/7/2021 93.26
21196 OCWD-LB4 21198 OCWD-LB4/2 ORANGE COUNTY WATER DISTRICT 6070798.52 2250812.078 Monitoring Well 78-88 7/7/2021 121.19
3303 OCWD-LV1 3304 OCWD-LV1/1 ORANGE COUNTY WATER DISTRICT 6085675.722 2259327.385 Monitoring Well 135-155 7/7/2021 237.5
3020 OCWD-M1 3021 OCWD-M1/1 ORANGE COUNTY WATER DISTRICT 6042016.978 2187264.062 Monitoring Well 75-110 6/30/2021 2.55
2906 OCWD-M10 2907 OCWD-M10/1 ORANGE COUNTY WATER DISTRICT 6038138.474 2201788.445 Monitoring Well 80-160 6/29/2021 2.175
2911 OCWD-M11 2912 OCWD-M11/1 ORANGE COUNTY WATER DISTRICT 6040661.307 2201457.181 Monitoring Well 70-105 6/30/2021 3.83
2924 OCWD-M12 2925 OCWD-M12/1 ORANGE COUNTY WATER DISTRICT 6043375.718 2201517.376 Monitoring Well 70-110 6/30/2021 5.775
2929 OCWD-M13 2930 OCWD-M13/1 ORANGE COUNTY WATER DISTRICT 6045991.781 2201410.369 Monitoring Well 65-95 6/30/2021 10.798
2947 OCWD-M14A 2948 OCWD-M14A/1 ORANGE COUNTY WATER DISTRICT 6046612.239 2200062.034 Monitoring Well 60-90 6/28/2021 7.94
2954 OCWD-M15A 2955 OCWD-M15A/1 ORANGE COUNTY WATER DISTRICT 6046620.011 2199773.098 Monitoring Well 60-85 6/28/2021 6.96
2961 OCWD-M16 2962 OCWD-M16/1 ORANGE COUNTY WATER DISTRICT 6046615.518 2199268.584 Monitoring Well 65-90 6/28/2021 4.264
2966 OCWD-M17A 2967 OCWD-M17A/1 ORANGE COUNTY WATER DISTRICT 6046331.102 2200365.515 Monitoring Well 60-95 6/28/2021 7.867
2934 OCWD-M19 2935 OCWD-M19/1 ORANGE COUNTY WATER DISTRICT 6046001.209 2200836.043 Monitoring Well 60-110 6/30/2021 8.575
3022 OCWD-M2 3023 OCWD-M2/1 ORANGE COUNTY WATER DISTRICT 6039248.099 2187144.76 Monitoring Well 85-150 6/28/2021 4.202
2938 OCWD-M20 2939 OCWD-M20/1 ORANGE COUNTY WATER DISTRICT 6045975.835 2200531.536 Monitoring Well 60-105 6/30/2021 8.088
4395 OCWD-M21 4398 OCWD-M21/1 ORANGE COUNTY WATER DISTRICT 6046004.999 2200239.171 Monitoring Well 65-100 6/30/2021 7.39
2976 OCWD-M22 2977 OCWD-M22/1 ORANGE COUNTY WATER DISTRICT 6046004.496 2199936.42 Monitoring Well 70-105 6/30/2021 7.525
2987 OCWD-M24 2988 OCWD-M24/1 ORANGE COUNTY WATER DISTRICT 6045442.857 2199803.456 Monitoring Well 70-95 6/24/2021 6.605
3026 OCWD-M25 3027 OCWD-M25/1 ORANGE COUNTY WATER DISTRICT 6033478.884 2192672.122 Monitoring Well 65-185 6/30/2021 4.323
3014 OCWD-M26 3015 OCWD-M26/1 ORANGE COUNTY WATER DISTRICT 6040602.649 2193477.553 Monitoring Well 70-135 7/1/2021 3.386
3016 OCWD-M27 3017 OCWD-M27/1 ORANGE COUNTY WATER DISTRICT 6043039.524 2189845.444 Monitoring Well 60-110 6/30/2021 3.357
3030 OCWD-M28 3031 OCWD-M28/1 ORANGE COUNTY WATER DISTRICT 6040384.981 2184652.638 Monitoring Well 80-145 6/30/2021 3.808
3018 OCWD-M30 3019 OCWD-M30/1 ORANGE COUNTY WATER DISTRICT 6043301.989 2183249.013 Monitoring Well 90-110 6/28/2021 3.325
3024 OCWD-M31 3025 OCWD-M31/1 ORANGE COUNTY WATER DISTRICT 6040492.197 2179496.985 Monitoring Well 82-162 6/28/2021 4.918
11859 OCWD-M36 11860 OCWD-M36/1 ORANGE COUNTY WATER DISTRICT 6035356.833 2200840.246 Monitoring Well 80-90 6/28/2021 2.46
14515 OCWD-M37 14516 OCWD-M37/1 ORANGE COUNTY WATER DISTRICT 6035034.164 2201302.677 Monitoring Well 120-130 6/28/2021 1.78
15127 OCWD-M38 15128 OCWD-M38/1 ORANGE COUNTY WATER DISTRICT 6030736.262 2198146.213 Monitoring Well 94-104 6/30/2021 0.234
2992 OCWD-M4 2993 OCWD-M4/1 ORANGE COUNTY WATER DISTRICT 6049340.682 2199524.535 Monitoring Well 80-120 6/28/2021 3.04
16654 OCWD-M40 16655 OCWD-M40/1 ORANGE COUNTY WATER DISTRICT 6051222.286 2195005.215 Monitoring Well 85-105 6/28/2021 0.72
18425 OCWD-M41 18427 OCWD-M41/2 ORANGE COUNTY WATER DISTRICT 6031312.152 2196141.497 Monitoring Well 95-105 6/30/2021 1.256
18418 OCWD-M42 18419 OCWD-M42/1 ORANGE COUNTY WATER DISTRICT 6030956.495 2201880.558 Monitoring Well 100-120 6/24/2021 -1.085
23769 OCWD-M43R 23770 OCWD-M43R/1 ORANGE COUNTY WATER DISTRICT 6056258.4 2193225.9 Monitoring Well 75-95 6/28/2021 -10.84
20371 OCWD-M44 20372 OCWD-M44/1 ORANGE COUNTY WATER DISTRICT 6048200.8 2193011.3 Monitoring Well 50-60 6/28/2021 5.089
19640 OCWD-M45 19641 OCWD-M45/1 ORANGE COUNTY WATER DISTRICT 6040339.8 2203350.603 Monitoring Well 195-205 6/30/2021 1.11
18766 OCWD-M48 18767 OCWD-M48/1 ORANGE COUNTY WATER DISTRICT 6059972.844 2188953.882 Monitoring Well 80-100 6/28/2021 -25.796
2942 OCWD-M5 2943 OCWD-M5/1 ORANGE COUNTY WATER DISTRICT 6046006.801 2199404.116 Monitoring Well 65-95 6/30/2021 6.035
22780 OCWD-M51A 22847 OCWD-M51A/1 ORANGE COUNTY WATER DISTRICT 6065086.6 2189052.9 Monitoring Well 28-38 6/24/2021 6.643
22782 OCWD-M52A 22845 OCWD-M52A/1 ORANGE COUNTY WATER DISTRICT 6067063.8 2192832.5 Monitoring Well 46-56 6/24/2021 14.66
22783 OCWD-M53A 22849 OCWD-M53A/1 ORANGE COUNTY WATER DISTRICT 6070492.9 2196785 Monitoring Well 21.5-31.5 7/27/2021 21.502
22785 OCWD-M54A 22852 OCWD-M54A/1 ORANGE COUNTY WATER DISTRICT 6074213.9 2188681.7 Monitoring Well 38-43 6/24/2021 -18.326
23136 OCWD-M55B 23137 OCWD-M55B/1 ORANGE COUNTY WATER DISTRICT 6073271.8 2195029.2 Monitoring Well 57-67 6/24/2021 24.195
23138 OCWD-M56 23139 OCWD-M56/1 ORANGE COUNTY WATER DISTRICT 6076007.2 2194374.4 Monitoring Well 106-116 6/24/2021 12.115
23819 OCWD-M57 23820 OCWD-M57/1 ORANGE COUNTY WATER DISTRICT 6043815.8 2186794.1 Monitoring Well 80-130 6/28/2021 3.257
23888 OCWD-M58A 23889 OCWD-M58A/1 ORANGE COUNTY WATER DISTRICT 6038939.075 2198039.987 Monitoring Well 80-90 6/28/2021 2.69
2997 OCWD-M6A 2998 OCWD-M6A/1 ORANGE COUNTY WATER DISTRICT 6043358.318 2199431.427 Monitoring Well 65-125 6/30/2021 5.345
2916 OCWD-M7A 2917 OCWD-M7A/1 ORANGE COUNTY WATER DISTRICT 6040722.972 2199455.757 Monitoring Well 70-135 7/1/2021 4.75
3004 OCWD-M8 3005 OCWD-M8/1 ORANGE COUNTY WATER DISTRICT 6036253.121 2199205.112 Monitoring Well 50-150 6/24/2021 4.403
3009 OCWD-M9 3011 OCWD-M9/2 ORANGE COUNTY WATER DISTRICT 6033874.971 2200507.549 Monitoring Well 135-155 6/30/2021 2.905
22659 OCWD-SA22R 22661 OCWD-SA22R/2 ORANGE COUNTY WATER DISTRICT 6036740.5 2194795.1 Monitoring Well 100-130 6/30/2021 2.618
3978 OCWD-T2 3980 OCWD-T2/2 ORANGE COUNTY WATER DISTRICT 6035679.306 2192640.337 Monitoring Well 70-170 6/24/2021 3.624
4804 OCWD-T3 4805 OCWD-T3/1 ORANGE COUNTY WATER DISTRICT 6035928.37 2192634.905 Monitoring Well 65-85 6/30/2021 2.581
3985 OCWD-T4 4846 OCWD-T4/1 ORANGE COUNTY WATER DISTRICT 6036181.511 2192629.058 Monitoring Well 68-168 6/30/2021 3.314
3982 OCWD-T5 3983 OCWD-T5/1 ORANGE COUNTY WATER DISTRICT 6035375.819 2190450.423 Monitoring Well 110-190 6/30/2021 4.479
20892 OCWD-YLR3 20893 OCWD-YLR3/1 ORANGE COUNTY WATER DISTRICT 6087613.912 2264061.986 Monitoring Well 31-36 6/30/2021 237.2
1052 OM-2A 1053 OM-2A/1 ORANGE COUNTY WATER DISTRICT 6064189.6 2231238.364 Monitoring Well 118-125 6/25/2021 63.638
1039 OM-4A 1040 OM-4A/1 ORANGE COUNTY WATER DISTRICT 6066713.864 2235618.971 Monitoring Well 112-117 6/23/2021 76.25
6519 OM-8A 6520 OM-8A/1 ORANGE COUNTY WATER DISTRICT 6068864.508 2240692.482 Monitoring Well 156-164 6/25/2021 89.55
20962 SAM-1 20964 SAM-1/2 ORANGE COUNTY WATER DISTRICT 6074659.6 2209328.2 Monitoring Well 132-147 6/30/2021 40.67
23285 SAM-10C 23286 SAM-10C/1 ORANGE COUNTY WATER DISTRICT 6075362.1 2201059 Monitoring Well 77.5-82.5 7/1/2021 31.8
23291 SAM-11D 23292 SAM-11D/1 ORANGE COUNTY WATER DISTRICT 6076595.5 2202810.9 Monitoring Well 90-100 6/30/2021 34.47
23297 SAM-13D 23298 SAM-13D/1 ORANGE COUNTY WATER DISTRICT 6073031.3 2202354.5 Monitoring Well 91.5-101.5 6/30/2021 32.14
20984 SAM-2 20986 SAM-2/2 ORANGE COUNTY WATER DISTRICT 6072812.2 2208121.4 Monitoring Well 121-131 6/30/2021 39.83
20958 SAM-3 20960 SAM-3/2 ORANGE COUNTY WATER DISTRICT 6074219.9 2207608.9 Monitoring Well 122-142 6/30/2021 39.53
20970 SAM-4 20972 SAM-4/2 ORANGE COUNTY WATER DISTRICT 6072905.5 2206698.6 Monitoring Well 120-135 6/30/2021 38.16
20966 SAM-5 20968 SAM-5/2 ORANGE COUNTY WATER DISTRICT 6072894 2205886.2 Monitoring Well 115-130 6/30/2021 37.31
20948 SAM-6 20950 SAM-6/2 ORANGE COUNTY WATER DISTRICT 6075457.3 2205983.5 Monitoring Well 114-134 <Null> <Null>
23263 SAM-7C 23264 SAM-7C/1 ORANGE COUNTY WATER DISTRICT 6070824 2202542.5 Monitoring Well 106-111 7/1/2021 31.32
23301 SAM-8C 23302 SAM-8C/1 ORANGE COUNTY WATER DISTRICT 6072805.6 2199933 Monitoring Well 65.5-75.5 6/30/2021 28.61
23275 SAM-9C 23276 SAM-9C/1 ORANGE COUNTY WATER DISTRICT 6074482.7 2198350.3 Monitoring Well 58.5-63.5 6/30/2021 26.56
23824 SAR-14B 23825 SAR-14B/1 ORANGE COUNTY WATER DISTRICT 6099053.012 2261319.993 Monitoring Well 37-42 <Null> <Null>
20926 SCS-11 20927 SCS-11/1 ORANGE COUNTY WATER DISTRICT 6070448.4 2228003 Monitoring Well 156-166 7/8/2021 48.71
20929 SCS-12 20930 SCS-12/1 ORANGE COUNTY WATER DISTRICT 6067610.6 2228198.9 Monitoring Well 170-180 7/8/2021 60.2
15392 SCS-6 15394 SCS-6/2 ORANGE COUNTY WATER DISTRICT 6081489.879 2232585.107 Monitoring Well 147-152.5 7/8/2021 85.86
15395 SCS-7 15397 SCS-7/2 ORANGE COUNTY WATER DISTRICT 6080943.41 2232168.833 Monitoring Well 125-140.5 7/8/2021 93.62
15398 SCS-8 15399 SCS-8/1 ORANGE COUNTY WATER DISTRICT 6081887.799 2233776.982 Monitoring Well 108-128.5 7/8/2021 120.23
18179 SCS-9 18180 SCS-9/1 ORANGE COUNTY WATER DISTRICT 6082464.896 2233574.788 Monitoring Well 153-173 7/8/2021 76
997 ABS-1 22665 ABS-1/1/WB2/MP3 ORANGE COUNTY WATER DISTRICT 6076226.851 2262977.612 Multiport Monitoring Well MP3 (257) 7/7/2021 158.375
547 AMD-1 21135 AMD-1/1/WB2/MP3 ORANGE COUNTY WATER DISTRICT 6073916.932 2258572.091 Multiport Monitoring Well MP3 (182) 6/30/2021 144.17
565 AMD-2 22202 AMD-2/1/WB2/MP1 ORANGE COUNTY WATER DISTRICT 6066705.21 2254540.618 Multiport Monitoring Well MP1 (157) 6/29/2021 99.56
6410 AMD-3 6433 AMD-3/1/WB1/MP2 ORANGE COUNTY WATER DISTRICT 6057347.584 2256481.116 Multiport Monitoring Well MP2 (135) <Null> <Null>
7295 AMD-5 7315 AMD-5/1/WB1/MP2 ORANGE COUNTY WATER DISTRICT 6060070.244 2248962.576 Multiport Monitoring Well MP2 (201) 6/28/2021 81.17
7293 AMD-6 7477 AMD-6/1/WB1/MP2 ORANGE COUNTY WATER DISTRICT 6057374.729 2241092.645 Multiport Monitoring Well MP2 (152) 6/28/2021 69.17
8596 AMD-7 8748 AMD-7/1/WB1/MP1 ORANGE COUNTY WATER DISTRICT 6049188.026 2247218.215 Multiport Monitoring Well MP1 (121) 6/28/2021 59.63
9682 AMD-8 9903 AMD-8/1/WB1/MP2 ORANGE COUNTY WATER DISTRICT 6033488.697 2249624.328 Multiport Monitoring Well MP2 (180) 7/12/2021 44.575
9831 BPM-1 9980 BPM-1/1/WB1/MP1 ORANGE COUNTY WATER DISTRICT 6022348.508 2259541.566 Multiport Monitoring Well MP1 (129) 7/12/2021 26.87
9832 BPM-2 10174 BPM-2/1/WB1/MP1 ORANGE COUNTY WATER DISTRICT 6025195.413 2246739.597 Multiport Monitoring Well MP1 (181) 7/12/2021 35.65
685 CB-1 8787 CB-1/1/WB2/MP2 ORANGE COUNTY WATER DISTRICT 6044695.232 2253837.186 Multiport Monitoring Well MP2 (143) 7/6/2021 53.15
5155 COSM-1 7143 COSM-1/1/WB1/MP1 ORANGE COUNTY WATER DISTRICT 6055253.401 2197825.036 Multiport Monitoring Well MP1 (92) 6/30/2021 2.01
18846 COSM-2 18860 COSM-2/1/WB1/MP2 ORANGE COUNTY WATER DISTRICT 6052266.414 2199776.431 Multiport Monitoring Well MP2 (115) 6/30/2021 8.62
719 FFS-1 14241 FFS-1/1/WB2/MP1 ORANGE COUNTY WATER DISTRICT 6061436.461 2262022.62 Multiport Monitoring Well MP1 (181) 7/6/2021 88.13
1291 FVM-1 15685 FVM-1/1/WB2/MP2 ORANGE COUNTY WATER DISTRICT 6047178.815 2210990.613 Multiport Monitoring Well MP2 (173) 6/22/2021 28.21
7297 GGM-1 10021 GGM-1/1/WB1/MP1 ORANGE COUNTY WATER DISTRICT 6045688.299 2230864.24 Multiport Monitoring Well MP1 (150) 7/8/2021 51.65
8923 GGM-2 9045 GGM-2/1/WB1/MP1 ORANGE COUNTY WATER DISTRICT 6026525.607 2230233.156 Multiport Monitoring Well MP1 (213) 6/22/2021 26.83
8592 GGM-3 8661 GGM-3/1/WB1/MP1 ORANGE COUNTY WATER DISTRICT 6037298.069 2237458.988 Multiport Monitoring Well MP1 (197) 7/8/2021 43.98
3 of 4

Wells Used to Develop 2021 Groundwater Contour Maps in Orange County Groundwater BasinShallow Aquifer Wells (Model Layer 1)STAID1 WELLNM STAID STANAME OWNERNM NAD83_X NAD83_Y GIS_SYMNM PERF_ZONE SHORTDATE WLELEV_2021
7178 HBM-1 8433 HBM-1/1/WB1/MP1 ORANGE COUNTY WATER DISTRICT 6031700.722 2216385.252 Multiport Monitoring Well MP1 (91) 7/2/2021 24.52
7086 HBM-2 7218 HBM-2/1/WB1/MP1 ORANGE COUNTY WATER DISTRICT 6036228.737 2196532.383 Multiport Monitoring Well MP1 (112) 7/2/2021 3.49
9200 HBM-4 9219 HBM-4/1/WB1/MP2 ORANGE COUNTY WATER DISTRICT 6034095.825 2197123.319 Multiport Monitoring Well MP2 (120) 7/2/2021 2.99
9688 HBM-5 9873 HBM-5/1/WB1/MP2 ORANGE COUNTY WATER DISTRICT 6045744.869 2193971.856 Multiport Monitoring Well MP2 (76) 7/2/2021 9.36
15088 HBM-6 15239 HBM-6/1/WB1/MP1 ORANGE COUNTY WATER DISTRICT 6025106.578 2204548.969 Multiport Monitoring Well MP1 (53) 7/2/2021 -6.84
720 IDM-1 18976 IDM-1/1/WB2/MP1 ORANGE COUNTY WATER DISTRICT 6099572.243 2207081.537 Multiport Monitoring Well MP1 (86) 7/7/2021 92.85
9830 IDM-2 10059 IDM-2/1/WB1/MP1 ORANGE COUNTY WATER DISTRICT 6080705.598 2209836.046 Multiport Monitoring Well MP1 (129) 7/7/2021 48.9
541 KBS-2 10226 KBS-2/1/WB1/MP2 ORANGE COUNTY WATER DISTRICT 6073053.762 2260992.439 Multiport Monitoring Well MP2 (214) 6/21/2021 144.53
11949 LAM-1 12020 LAM-1/1/WB1/MP1 ORANGE COUNTY WATER DISTRICT 6009581.587 2238043.705 Multiport Monitoring Well MP1 (72) 6/15/2021 13.07
1345 MCAS-1 5841 MCAS-1/1/WB2/MP2 ORANGE COUNTY WATER DISTRICT 6098255.481 2192973.357 Multiport Monitoring Well MP2 (155) 7/6/2021 97.79
759 MCAS-2 5926 MCAS-2/1/WB2/MP2 ORANGE COUNTY WATER DISTRICT 6100360.442 2191167.958 Multiport Monitoring Well MP2 (135) 7/6/2021 106.75
1339 MCAS-3 5882 MCAS-3/1/WB2/MP2 ORANGE COUNTY WATER DISTRICT 6104434.428 2191276.758 Multiport Monitoring Well MP2 (166) 7/6/2021 114.92
758 MCAS-7 11826 MCAS-7/1/WB3/MP1 ORANGE COUNTY WATER DISTRICT 6093900.827 2194418.586 Multiport Monitoring Well MP1 (92) 7/7/2021 83.2
756 SAR-1 9257 SAR-1/1/WB2/MP1 ORANGE COUNTY WATER DISTRICT 6070684.206 2250425.314 Multiport Monitoring Well MP1 (162) 6/29/2021 92.52
761 SAR-2 11984 SAR-2/1/WB2/MP1 ORANGE COUNTY WATER DISTRICT 6069096.008 2245410.807 Multiport Monitoring Well MP1 (141) 6/29/2021 99.88
762 SAR-3 9461 SAR-3/1/WB2/MP1 ORANGE COUNTY WATER DISTRICT 6066892.02 2238409.284 Multiport Monitoring Well MP1 (164) 6/24/2021 81.47
763 SAR-4 14628 SAR-4/1/WB2/MP1 ORANGE COUNTY WATER DISTRICT 6065370.966 2233375.154 Multiport Monitoring Well MP1 (123) 6/29/2021 70.47
1289 SAR-5 21217 SAR-5/1/WB3/MP2 ORANGE COUNTY WATER DISTRICT 6062597.607 2227874.211 Multiport Monitoring Well MP2 (172) 6/30/2021 58.48
996 SAR-7 19998 SAR-7/1/WB2/MP2 ORANGE COUNTY WATER DISTRICT 6078049.17 2256383.048 Multiport Monitoring Well MP2 (171) 6/21/2021 183.21
559 SAR-8 22591 SAR-8/1/WB2/MP3 ORANGE COUNTY WATER DISTRICT 6076100.201 2255671.218 Multiport Monitoring Well MP3 (161) 6/21/2021 204.32
7181 SAR-9 9796 SAR-9/1/WB1/MP1 ORANGE COUNTY WATER DISTRICT 6058380.802 2221450.982 Multiport Monitoring Well MP1 (150) 6/30/2021 49.087
9686 SBM-1 9723 SBM-1/1/WB1/MP1 ORANGE COUNTY WATER DISTRICT 6016566.11 2224523.54 Multiport Monitoring Well MP1 (79) 6/15/2021 8.535
1000 SC-1 21651 SC-1/1/WB2/MP1 ORANGE COUNTY WATER DISTRICT 6089555.444 2242038.806 Multiport Monitoring Well MP1 (47) <Null> <Null>
1001 SC-2 18744 SC-2/1/WB2/MP3 ORANGE COUNTY WATER DISTRICT 6086489.295 2237887.557 Multiport Monitoring Well MP3 (148) <Null> <Null>
2888 SC-4 6293 SC-4/1/WB1/MP1 ORANGE COUNTY WATER DISTRICT 6082605.785 2235080.546 Multiport Monitoring Well MP1 (102) 3/10/2021 164.02
2854 SC-5 6327 SC-5/1/WB1/MP1 ORANGE COUNTY WATER DISTRICT 6077454.866 2225543.458 Multiport Monitoring Well MP1 (124) 7/1/2021 59.96
9684 SC-6 9754 SC-6/1/WB1/MP2 ORANGE COUNTY WATER DISTRICT 6066813.288 2216032.113 Multiport Monitoring Well MP2 (202) 7/7/2021 47.93
1016 SCS-1 8863 SCS-1/1/WB1/MP2 ORANGE COUNTY WATER DISTRICT 6088950.708 2237855.374 Multiport Monitoring Well MP2 (94) <Null> <Null>
1014 SCS-2 22649 SCS-2/1/WB2/MP1 ORANGE COUNTY WATER DISTRICT 6088207.123 2239962.183 Multiport Monitoring Well MP1 (139) <Null> <Null>
1008 WBS-2A 10234 WBS-2A/1/WB1/MP2 ORANGE COUNTY WATER DISTRICT 6082321.431 2259606.923 Multiport Monitoring Well MP2 (94) 6/21/2021 208.44
1011 WBS-4 19982 WBS-4/1/WB2/MP2 ORANGE COUNTY WATER DISTRICT 6080099.39 2256910.089 Multiport Monitoring Well MP2 (122) 6/21/2021 193.21
1293 WMM-1 19877 WMM-1/1/WB2/MP1 ORANGE COUNTY WATER DISTRICT 6038251.554 2221751.195 Multiport Monitoring Well MP1 (111) 7/8/2021 35.73
1124 OCWD-BESS 1152 OCWD-BESS/1 ORANGE COUNTY WATER DISTRICT 6080158.417 2258062.783 Other Active Production Well 172-189 7/7/2021 171.45
1399 OWOD-GG 1400 OWOD-GG/1 ORANGEWOOD ACADEMY 6057015.043 2226104.239 Other Active Production Well 159-179 6/28/2021 57.78
2268 W-2268 2270 W-2268/1 PRIVATE 6055379.538 2239905.999 Inactive Production Well 140-190 6/28/2021 65.1
2447 W-2447 2448 W-2447/1 PRIVATE 6039781.004 2230376.471 Inactive Production Well 157-178 6/30/2021 45.52
7046 W-7046 7047 W-7046/1 PRIVATE 6078609.174 2244437.793 Inactive Production Well - 7/8/2021 83.04
23777 PRUD-MW49 23778 PRUD-MW49/1 PRUDENTIAL REALTY CORPORATION 6075571.865 2190248.213 Monitoring Well 22-32 <Null> <Null>
23783 PRUD-TP07 23784 PRUD-TP07/1 PRUDENTIAL REALTY CORPORATION 6075439.364 2190268.695 Monitoring Well 22-32 <Null> <Null>
23785 PRUD-TP10 23786 PRUD-TP10/1 PRUDENTIAL REALTY CORPORATION 6075138.851 2190153.723 Monitoring Well 35-45 <Null> <Null>
22761 RAY-P07 22762 RAY-P07/1 RAYTHEON TECHNOLOGIES CORPORATION 6042051.6 2268371.59 Monitoring Well 107.7-129.6 6/30/2021 56.01
22763 RAY-P09 22764 RAY-P09/1 RAYTHEON TECHNOLOGIES CORPORATION 6042223.4 2268769.56 Monitoring Well 109.6-129.6 6/30/2021 68.63
1194 SANZ-C 1195 SANZ-C/1 SANCHEZ, AMELIA 6023494.753 2248016.248 Other Active Production Well 76-83 6/28/2021 42.58
1164 RODE-A 1165 RODE-A/1 SILICON SALVAGE 6035121.635 2259930.623 Other Active Production Well 178-208 6/28/2021 40.77
3743 TIC-127 3744 TIC-127/1 SOUTHERN CALIFORNIA EDISON 6098420.447 2188499.752 Monitoring Well - <Null> <Null>
19683 BOE-MW31S 19684 BOE-MW31S/1 THE BOEING COMPANY 6017036.97 2217640.872 Monitoring Well 78-88 6/7/2021 -3.481
20244 BOE-EW102 20245 BOE-EW102/1 THE BOEING COMPANY 6017705 2219232.003 Other Active Production Well 62-81.7 <Null> <Null>
1128 TMIX-O 1129 TMIX-O/1 TRANSIT MIXED CONCRETE COMPANY 6069953.158 2244552.046 Abandoned Well 76-288 6/29/2021 107.06
1370 T-NEWP 1371 T-NEWP/1 TUSTIN 6087882.616 2220782.263 Active Large-System Production Well 234-267 7/1/2021 31.06
21187 WRD-SEALBEACH-1 21188 WRD-SEALBEACH-1/1 WATER REPLENISHMENT DISTRICT 6002807.228 2229796.158 Monitoring Well 60-70 6/7/2021 -0.287
23796 XER-MW3 23797 XER-MW3/1 XEROX CORPORATION 6074925.4 2191231.3 Destroyed and Sealed Well 29-34 <Null> <Null>
23801 XER-MW5 23802 XER-MW5/1 XEROX CORPORATION 6076231.9 2191234.6 Monitoring Well 34.5-39.5 <Null> <Null>
23803 XER-OW50 23804 XER-OW50/1 XEROX CORPORATION 6074926.467 2191241.45 Monitoring Well 35-47 <Null> <Null>
7027 YLWD-16 7028 YLWD-16/1 YORBA LINDA WATER DISTRICT 6123141.996 2265497.536 Destroyed and Sealed Well 40-60 <Null> <Null>
7529 YLWD-17 7530 YLWD-17/1 YORBA LINDA WATER DISTRICT 6123146.156 2265420.578 Destroyed and Sealed Well 42-82 <Null> <Null>
1520 YLWD-15 1521 YLWD-15/1 YORBA LINDA WATER DISTRICT 6085437.359 2260363.815 Standby Large-System Production Well 133-198 <Null> <Null>
4 of 4

Wells Used to Develop 2021 Groundwater Contour Maps in Orange County Groundwater BasinPrincipal Aquifer Wells (Model Layer 2)STAID1 WELLNM STAID STANAME OWNERNM GIS_SYMNM NAD83_X NAD83_Y PERF_ZONE SHORTDATE WLELEV_2021 NOTES
15484 AVCC-P2 15485 AVCC-P2/1 ALTA VISTA COUNTRY CLUB Other Active Production Well 6075388.705 2267012.656 210-770 6/29/2021 83.575 <Null>
903 A-39 904 A-39/1 ANAHEIM Active Large-System Production Well 6029597.629 2248076.493 540-1280 6/24/2021 0.95 <Null>
8 A-40 109 A-40/1 ANAHEIM Active Large-System Production Well 6042665.936 2241510.291 505-1220 6/25/2021 0.99 <Null>
2 A-42 102 A-42/1 ANAHEIM Active Large-System Production Well 6076410.19 2260884.14 430-1180 6/24/2021 158.27 <Null>
3 A-44 106 A-44/1 ANAHEIM Active Large-System Production Well 6075745.03 2262067.192 450-1130 6/24/2021 149.51 <Null>
18323 A-45 18324 A-45/1 ANAHEIM Active Large-System Production Well 6064928.908 2240047.749 455-1410 6/24/2021 70.25 <Null>
9029 A-46 9030 A-46/1 ANAHEIM Active Large-System Production Well 6063620.6 2247980.932 599-1529 6/24/2021 78.27 <Null>
3296 A-47 3297 A-47/1 ANAHEIM Active Large-System Production Well 6043274.016 2253508.899 482-1375 6/25/2021 6.94 <Null>
20128 A-48 20129 A-48/1 ANAHEIM Active Large-System Production Well 6039676.184 2252635.146 932-1344 6/25/2021 -8 <Null>
7175 A-49 7176 A-49/1 ANAHEIM Active Large-System Production Well 6051692.012 2255804.997 580-1450 6/24/2021 42.3 <Null>
18380 A-51 18381 A-51/1 ANAHEIM Active Large-System Production Well 6033547.226 2249423.825 525-965 6/25/2021 -13.82 <Null>
19546 A-52 19547 A-52/1 ANAHEIM Active Large-System Production Well 6077704.821 2261093.873 570-1066 6/24/2021 169.8 <Null>
19371 A-53 19372 A-53/1 ANAHEIM Active Large-System Production Well 6037376.558 2245173.272 945-1270 6/25/2021 -15 <Null>
20130 A-54 20131 A-54/1 ANAHEIM Active Large-System Production Well 6057250.4 2249808.49 680-1480 6/24/2021 37.5 <Null>
15155 A-55 15156 A-55/1 ANAHEIM Active Large-System Production Well 6057199.693 2240917.141 370-1300 6/24/2021 24.82 <Null>
20814 A-56 20815 A-56/1 ANAHEIM Active Large-System Production Well 6049068.109 2246784.849 725-1300 6/24/2021 11 <Null>
22689 A-58 22690 A-58/1 ANAHEIM Active Large-System Production Well 6076957.97 2260975.182 400-930 6/24/2021 157 <Null>
23093 A-59 23094 A-59/1 ANAHEIM Active Large-System Production Well 6050447.318 2241983.774 740-1270 6/24/2021 18 <Null>
9 A-41 112 A-41/1 ANAHEIM Inactive Production Well 6053236.333 2238146.843 437-1450 6/29/2021 17.41 <Null>
1 A-43 101 A-43/1 ANAHEIM Inactive Production Well 6075927.929 2261453.161 530-1210 6/24/2021 155.86 <Null>
882 A-DMGC 883 A-DMGC/1 ANAHEIM Other Active Production Well 6039662.685 2252561.822 430-482 6/25/2021 3 <Null>
11918 BP-BALL 11919 BP-BALL/1 BUENA PARK Active Large-System Production Well 6022213.798 2245381.375 260-870 6/28/2021 -8.9 <Null>
11890 BP-BOIS 11891 BP-BOIS/1 BUENA PARK Active Large-System Production Well 6035674.646 2258374.859 475-1355 6/30/2021 14.03 <Null>
6 BP-CABA 110 BP-CABA/1 BUENA PARK Active Large-System Production Well 6024286.125 2262965.786 250-1010 6/28/2021 -24.6 <Null>
394 BP-FREE 901 BP-FREE/1 BUENA PARK Active Large-System Production Well 6026742.413 2259834.394 260-1000 6/28/2021 -24.5 <Null>
13 BP-HOLD 103 BP-HOLD/1 BUENA PARK Active Large-System Production Well 6024539.646 2250081.536 250-1000 7/1/2021 -6.4 <Null>
205 BP-KNOT 206 BP-KNOT/1 BUENA PARK Active Large-System Production Well 6026889.096 2263326.166 260-1000 6/28/2021 -22.7 <Null>
19624 BP-LIND 19625 BP-LIND/1 BUENA PARK Active Large-System Production Well 6033483.531 2254059.483 470-1221 7/1/2021 -11.5 <Null>
4 BP-SM 107 BP-SM/1 BUENA PARK Active Large-System Production Well 6033035.282 2270048.001 308-1038 6/29/2021 60.3 <Null>
19013 CSF-1 19130 CSF-1/1/WB1/MP4 CA. STATE UNIV., FULLERTON Multiport Monitoring Well 6064343.084 2270822.497 MP4 (454) 7/6/2021 95.19 <Null>
5133 OCWD-SA10 5136 OCWD-SA10/3 DEPARTMENT OF WATER RESOURCES Monitoring Well 6039247.362 2190515.118 300-330 6/28/2021 -27.73 <Null>
75 EOCW-E 2624 EOCW-E/1 EAST ORANGE COUNTY WATER DISTRICT Active Large-System Production Well 6084070.661 2234506.703 324-450 6/9/2021 40.6 <Null>
74 EOCW-W 2623 EOCW-W/1 EAST ORANGE COUNTY WATER DISTRICT Active Large-System Production Well 6084006.305 2234482.779 315-450 6/9/2021 42.5 <Null>
1636 ANDR-A 3116 ANDR-A/1 ELTISTE, JAMIE Other Active Production Well 6089089.85 2256920.388 - 6/29/2021 266.7 <Null>
2151 FV-10 2152 FV-10/1 FOUNTAIN VALLEY Active Large-System Production Well 6050675.518 2207799.966 460-980 3/28/2021 -32.08 <Null>
2218 FV-11 2219 FV-11/1 FOUNTAIN VALLEY Active Large-System Production Well 6043548.905 2210280.198 440-950 6/28/2021 -13.22 <Null>
15548 FV-12 15549 FV-12/1 FOUNTAIN VALLEY Active Large-System Production Well 6048362.825 2212580.442 340-1070 6/28/2021 -19.8 <Null>
643 FV-6 1228 FV-6/1 FOUNTAIN VALLEY Active Large-System Production Well 6052471.003 2208423.32 370-1110 6/27/2021 -57.6 <Null>
989 FV-8 990 FV-8/1 FOUNTAIN VALLEY Active Large-System Production Well 6052244.232 2213617.679 312-844 6/23/2021 -22.77 <Null>
21043 FV-9 21044 FV-9/1 FOUNTAIN VALLEY Active Large-System Production Well 6039667.163 2210310.989 415-1070 7/3/2021 -39.2 <Null>
6999 F-10 7000 F-10/1 FULLERTON Active Large-System Production Well 6062173.417 2262322.138 460-1290 6/30/2021 78.92 <Null>
62 F-4 1066 F-4/1 FULLERTON Active Large-System Production Well 6053113.41 2256243.518 315-405 <Null> <Null> No static water level
60 F-5 1064 F-5/1 FULLERTON Active Large-System Production Well 6052548.597 2256107.709 350-400 6/30/2021 73.32 <Null>
61 F-6 1065 F-6/1 FULLERTON Active Large-System Production Well 6052747.388 2256082.222 340-401 <Null> <Null> No static water level
58 F-8 1062 F-8/1 FULLERTON Active Large-System Production Well 6052703.232 2256195.873 324-402 6/30/2021 53.02 <Null>
7 F-AIRP 111 F-AIRP/1 FULLERTON Active Large-System Production Well 6036730.867 2265796.644 435-1080 6/30/2021 -0.98 <Null>
8250 F-CHRI2 8251 F-CHRI2/1 FULLERTON Active Large-System Production Well 6043423.817 2259590.954 520-1330 6/30/2021 11 <Null>
18605 F-KIM1A 18606 F-KIM1A/1 FULLERTON Active Large-System Production Well 6059437.543 2261596.705 500-1225 <Null> <Null> No static water level
2614 F-KIM2 2615 F-KIM2/1 FULLERTON Active Large-System Production Well 6062988.653 2261590.596 320-626 6/30/2021 83.02 <Null>
14527 F-3A 14528 F-3A/1 FULLERTON Inactive Production Well 6052567.9 2256330.735 580-1280 6/30/2021 43.62 <Null>
8556 F-COYO2 8557 F-COYO2/1 FULLERTON Inactive Production Well 6040365.852 2271034.694 309-919 6/30/2021 85.12 <Null>
16 GG-16 120 GG-16/1 GARDEN GROVE Active Large-System Production Well 6018579.01 2232461.498 304-864 6/30/2021 -17.92 <Null>
24 GG-20 126 GG-20/1 GARDEN GROVE Active Large-System Production Well 6038073.339 2227032.571 360-912 7/2/2021 -3 <Null>
395 GG-22 929 GG-22/1 GARDEN GROVE Active Large-System Production Well 6026676.395 2235110.939 416-1020 6/28/2021 -8 <Null>
970 GG-25 971 GG-25/1 GARDEN GROVE Active Large-System Production Well 6047504.135 2225582.455 442-850 7/4/2021 -4 <Null>
968 GG-26 969 GG-26/1 GARDEN GROVE Active Large-System Production Well 6055989.26 2226872.674 470-1060 6/27/2021 -7.5 <Null>
899 GG-27 900 GG-27/1 GARDEN GROVE Active Large-System Production Well 6037663.073 2237687.515 520-1160 7/6/2021 -2 <Null>
21518 GG-31 21519 GG-31/1 GARDEN GROVE Active Large-System Production Well 6049303.952 2233106.343 739-1373 7/7/2021 -12 <Null>
43 GG-19 2673 GG-19/1 GARDEN GROVE Inactive Production Well 6046486.765 2237386.406 818-892 6/30/2021 12.66 <Null>
10 GG-21 113 GG-21/1 GARDEN GROVE Inactive Production Well 6053483.401 2233322.843 428-1080 6/28/2021 10 <Null>
40 GG-23 2683 GG-23/1 GARDEN GROVE Inactive Production Well 6049380.377 2233107.081 474-835 6/30/2021 21 <Null>
11910 GG-29 11911 GG-29/1 GARDEN GROVE Standby Large-System Production Well 6058221.696 2231433.99 465-1110 6/28/2021 -8 <Null>
19548 GG-30 19549 GG-30/1 GARDEN GROVE Standby Large-System Production Well 6058357.807 2234214.139 390-1146 6/28/2021 19.2 <Null>
23833 GSWC-CHF3 23834 GSWC-CHF3/1 GOLDEN STATE WATER COMPANY Active Large-System Production Well 6080817.993 2228562.283 415-825 6/1/2021 2.66 <Null>
20695 GSWC-POR1 20696 GSWC-POR1/1 GOLDEN STATE WATER COMPANY Active Large-System Production Well 6079506.635 2263540.675 350-895 <Null> <Null> No static water level
21249 GSWC-SCL5 21250 GSWC-SCL5/1 GOLDEN STATE WATER COMPANY Active Large-System Production Well 6033365.183 2242754.29 915-1280 6/26/2021 -14 <Null>
913 SCWC-CBAL 914 SCWC-CBAL/1 GOLDEN STATE WATER COMPANY Active Large-System Production Well 6020255.615 2245432.308 200-770 6/26/2021 -16.3 <Null>
905 SCWC-CSC 906 SCWC-CSC/1 GOLDEN STATE WATER COMPANY Active Large-System Production Well 6019058.295 2249273.52 526-556 6/29/2021 -16 <Null>
15059 SCWC-LABL2 15060 SCWC-LABL2/1 GOLDEN STATE WATER COMPANY Active Large-System Production Well 6010813.626 2245084.513 460-690 6/25/2021 -45 <Null>
909 SCWC-LAC3 910 SCWC-LAC3/1 GOLDEN STATE WATER COMPANY Active Large-System Production Well 6009351.523 2240861.379 346-593 6/2/2021 -39.28 <Null>
2890 SCWC-LAFL 2891 SCWC-LAFL/1 GOLDEN STATE WATER COMPANY Active Large-System Production Well 6009761.621 2241392.543 300-680 6/2/2021 -44.7 <Null>
932 SCWC-LAHO 933 SCWC-LAHO/1 GOLDEN STATE WATER COMPANY Active Large-System Production Well 6013044.186 2239882.249 386-486 6/26/2021 -22.15 <Null>
938 SCWC-LAYT 939 SCWC-LAYT/1 GOLDEN STATE WATER COMPANY Active Large-System Production Well 6006632.572 2231013.121 250-800 6/29/2021 -47.42 <Null>
83 SCWC-PBF4 1075 SCWC-PBF4/1 GOLDEN STATE WATER COMPANY Active Large-System Production Well 6069384.796 2263342.45 275-520 5/25/2021 119 <Null>
66 SCWC-PLJ2 1070 SCWC-PLJ2/1 GOLDEN STATE WATER COMPANY Active Large-System Production Well 6067609.83 2260053.948 402-492 6/25/2021 106 <Null>
15488 SCWC-PRU 15489 SCWC-PRU/1 GOLDEN STATE WATER COMPANY Active Large-System Production Well 6069096.18 2266983.102 430-790 6/30/2021 98 <Null>
940 SCWC-SBCH 941 SCWC-SBCH/1 GOLDEN STATE WATER COMPANY Active Large-System Production Well 6031904.764 2233300.581 200-570 <Null> <Null> Well in exclusion list
925 SCWC-SDAL 926 SCWC-SDAL/1 GOLDEN STATE WATER COMPANY Active Large-System Production Well 6034900.671 2235490.72 500-542 6/28/2021 -1 <Null>
1530 SCWC-SLON 1531 SCWC-SLON/1 GOLDEN STATE WATER COMPANY Active Large-System Production Well 6028180.861 2242547.915 - 6/26/2021 1 <Null>
927 SCWC-SORG 928 SCWC-SORG/1 GOLDEN STATE WATER COMPANY Active Large-System Production Well 6031153.704 2237527.217 242-286 <Null> <Null> Well in exclusion list
919 SCWC-SSHR 920 SCWC-SSHR/1 GOLDEN STATE WATER COMPANY Active Large-System Production Well 6036356.964 2241844.025 520-580 6/29/2021 14 <Null>
942 SCWC-SSYC 943 SCWC-SSYC/1 GOLDEN STATE WATER COMPANY Active Large-System Production Well 6033362.684 2230788.849 500-546 6/16/2021 -5 <Null>
18790 RHWC-W2 18791 RHWC-W2/1 GOLDEN STATE WATER COMPANY Inactive Production Well 6080901.573 2228585.131 474-753 6/1/2021 -4.2 <Null>
19579 SCWC-CVV2 19580 SCWC-CVV2/1 GOLDEN STATE WATER COMPANY Inactive Production Well 6021484.347 2249526.359 480-981 6/29/2021 -16 <Null>
2616 SCWC-PBF3 2617 SCWC-PBF3/1 GOLDEN STATE WATER COMPANY Inactive Production Well 6069378.014 2263398.289 220-475 5/25/2021 117 <Null>
9522 SCWC-YLCO2 9523 SCWC-YLCO2/1 GOLDEN STATE WATER COMPANY Inactive Production Well 6091725.912 2261952.552 100-480 5/25/2021 254 <Null>
1147 HOLY-A 1148 HOLY-A/1 HOLY SEPULCHER CEMETERY Other Active Production Well 6047567.386 2247438.547 334-364 6/28/2021 23.43 <Null>
1244 HB-10 1245 HB-10/1 HUNTINGTON BEACH Active Large-System Production Well 6031343.851 2212699.814 232-942 6/30/2021 -39.55 <Null>
18384 HB-13 18385 HB-13/1 HUNTINGTON BEACH Active Large-System Production Well 6021661.742 2221160.513 280-810 6/14/2021 -44.54 <Null>
23201 HB-1A 23202 HB-1A/1 HUNTINGTON BEACH Active Large-System Production Well 6023131.185 2218817.882 410-805 4/29/2021 -42.324 <Null>
10208 HB-3A 10209 HB-3A/1 HUNTINGTON BEACH Active Large-System Production Well 6031590.226 2208300.41 370-640 6/28/2021 -41.53 <Null>
27 HB-4 130 HB-4/1 HUNTINGTON BEACH Active Large-System Production Well 6021540.371 2221406.93 252-804 6/28/2021 -30.04 <Null>
1252 HB-5 1253 HB-5/1 HUNTINGTON BEACH Active Large-System Production Well 6036338.835 2208549.742 223-800 6/29/2021 -39.24 <Null>
1246 HB-6 1247 HB-6/1 HUNTINGTON BEACH Active Large-System Production Well 6029305.314 2212450.473 246-810 6/15/2021 -44.55 <Null>
1261 HB-7 1262 HB-7/1 HUNTINGTON BEACH Active Large-System Production Well 6022149.127 2221238.007 263-879 6/21/2021 -37.74 <Null>
28 HB-9 129 HB-9/1 HUNTINGTON BEACH Active Large-System Production Well 6037364.908 2208498.213 556-996 6/30/2021 -55.58 <Null>
1248 HB-8 1249 HB-8/1 HUNTINGTON BEACH Inactive Production Well 6027670.035 2209264.856 256-704 6/15/2021 -45.53 <Null>
1457 HB-MEA2 1458 HB-MEA2/1 HUNTINGTON BEACH Other Active Production Well 6020702.13 2209754.143 480-510 6/29/2021 -44.67 <Null>
1643 TAOR-A 3123 TAOR-A/1 HUYNH, TUAN Inactive Production Well 6067751.89 2255475.782 - 6/28/2021 90.52 <Null>
22 IRWD-1 124 IRWD-1/1 IRVINE RANCH WATER DISTRICT Active Large-System Production Well 6061580.041 2205422.106 410-860 6/23/2021 -85.8 <Null>
11476 IRWD-10 11477 IRWD-10/1 IRVINE RANCH WATER DISTRICT Active Large-System Production Well 6055993.429 2207529.468 419.07-939.6 <Null> <Null> No static water level
22342 IRWD-107R 22343 IRWD-107R/1 IRVINE RANCH WATER DISTRICT Active Large-System Production Well 6095711.53 2205898.451 275-1000 <Null> <Null> No static water level
393 IRWD-11 1224 IRWD-11/1 IRVINE RANCH WATER DISTRICT Active Large-System Production Well 6059766.912 2205005.285 410-870 6/23/2021 -98.3 <Null>
19366 IRWD-110 19367 IRWD-110/1 IRVINE RANCH WATER DISTRICT Active Large-System Production Well 6100371.561 2196315.961 555-1015 <Null> <Null> No static water level
22856 IRWD-115R 22857 IRWD-115R/1 IRVINE RANCH WATER DISTRICT Active Large-System Production Well 6093475.865 2207945.022 290-1080 <Null> <Null> No static water level
397 IRWD-12 991 IRWD-12/1 IRVINE RANCH WATER DISTRICT Active Large-System Production Well 6057023.616 2209371.259 580-1040 5/26/2021 -67.4 <Null>
1 of 4

Wells Used to Develop 2021 Groundwater Contour Maps in Orange County Groundwater BasinPrincipal Aquifer Wells (Model Layer 2)STAID1 WELLNM STAID STANAME OWNERNM GIS_SYMNM NAD83_X NAD83_Y PERF_ZONE SHORTDATE WLELEV_2021 NOTES
392 IRWD-13 1227 IRWD-13/1 IRVINE RANCH WATER DISTRICT Active Large-System Production Well 6056862.056 2205734.981 410-980 6/30/2021 -76 <Null>
1225 IRWD-14 1226 IRWD-14/1 IRVINE RANCH WATER DISTRICT Active Large-System Production Well 6057193.114 2207516.401 470-970 6/30/2021 -90.2 <Null>
7082 IRWD-15 7083 IRWD-15/1 IRVINE RANCH WATER DISTRICT Active Large-System Production Well 6058994.6 2207797.409 470-990 4/21/2021 -62.1 <Null>
14827 IRWD-16 14828 IRWD-16/1 IRVINE RANCH WATER DISTRICT Active Large-System Production Well 6055756.572 2207045.785 406.03-806.73 6/30/2021 -75.3 <Null>
11478 IRWD-17 11479 IRWD-17/1 IRVINE RANCH WATER DISTRICT Active Large-System Production Well 6056285.662 2208810.875 504.06-959.62 4/21/2021 -52.2 <Null>
21 IRWD-18 115 IRWD-18/1 IRVINE RANCH WATER DISTRICT Active Large-System Production Well 6060643.784 2208050.14 390-1080 <Null> <Null> No static water level
994 IRWD-2 995 IRWD-2/1 IRVINE RANCH WATER DISTRICT Active Large-System Production Well 6067589.167 2204114.565 385-855 4/21/2021 -75.9 <Null>
8372 IRWD-21 8373 IRWD-21/1 IRVINE RANCH WATER DISTRICT Active Large-System Production Well 6083385.042 2214485.399 290-970 6/29/2021 2.41 <Null>
8370 IRWD-22 8371 IRWD-22/1 IRVINE RANCH WATER DISTRICT Active Large-System Production Well 6083876.226 2214049.348 300-970 <Null> <Null> No static water level
11474 IRWD-3 11475 IRWD-3/1 IRVINE RANCH WATER DISTRICT Active Large-System Production Well 6072630.329 2206528.469 483.53-1249.9 6/23/2021 -64.9 <Null>
672 IRWD-4 993 IRWD-4/1 IRVINE RANCH WATER DISTRICT Active Large-System Production Well 6065784.295 2205666.545 440-910 <Null> <Null> No static water level
15490 IRWD-5 15491 IRWD-5/1 IRVINE RANCH WATER DISTRICT Active Large-System Production Well 6070026.423 2205985.727 554.42-1028.47 <Null> <Null> No static water level
8558 IRWD-6 8559 IRWD-6/1 IRVINE RANCH WATER DISTRICT Active Large-System Production Well 6067126.622 2207312.356 499-1124 3/23/2021 -51.4 <Null>
8560 IRWD-7 8561 IRWD-7/1 IRVINE RANCH WATER DISTRICT Active Large-System Production Well 6057958.676 2203766.228 359-660 6/23/2021 -86.8 <Null>
19412 IRWD-76 19413 IRWD-76/1 IRVINE RANCH WATER DISTRICT Active Large-System Production Well 6097532.587 2201980.705 450-900 <Null> <Null> No static water level
19414 IRWD-77 19415 IRWD-77/1 IRVINE RANCH WATER DISTRICT Active Large-System Production Well 6095951.099 2203527.216 330-980 <Null> <Null> No static water level
18510 IRWD-C8 18511 IRWD-C8/1 IRVINE RANCH WATER DISTRICT Active Large-System Production Well 6062825.396 2204153.762 1080-1982 <Null> <Null> Well in exclusion list
18512 IRWD-C9 18513 IRWD-C9/1 IRVINE RANCH WATER DISTRICT Active Large-System Production Well 6062422.93 2205055.852 1055-1930 <Null> <Null> Well in exclusion list
8929 IRWD-51 8930 IRWD-51/1 IRVINE RANCH WATER DISTRICT Inactive Production Well 6072287.787 2201236.375 310-880 6/29/2021 -51.7 <Null>
22065 IRWD-52 22066 IRWD-52/1 IRVINE RANCH WATER DISTRICT Inactive Production Well 6073545.847 2203710.984 635-1290 6/29/2021 -62.3 <Null>
1503 IRWD-98 1504 IRWD-98/1 IRVINE RANCH WATER DISTRICT Inactive Production Well 6080266.015 2190031.269 115-343 6/29/2021 -54.42 <Null>
22710 IRWD-OPA1 22711 IRWD-OPA1/1 IRVINE RANCH WATER DISTRICT Inactive Production Well 6086291.17 2237727.918 390-750 6/28/2021 41.5 <Null>
1379 TIC-109 1380 TIC-109/1 IRVINE RANCH WATER DISTRICT Inactive Production Well 6093513 2212849.72 240-1120 6/29/2021 16.9 <Null>
1381 TIC-112 1382 TIC-112/1 IRVINE RANCH WATER DISTRICT Inactive Production Well 6092052.48 2212026.724 240-1100 6/29/2021 15.23 <Null>
1377 TIC-114 1378 TIC-114/1 IRVINE RANCH WATER DISTRICT Inactive Production Well 6094747.508 2212848.22 300-960 6/29/2021 19.88 <Null>
1941 TIC-82 1942 TIC-82/1 IRVINE RANCH WATER DISTRICT Monitoring Well 6090541.059 2199639.983 410-1002 6/29/2021 -8.83 <Null>
1343 IRWD-72 1344 IRWD-72/1 IRVINE RANCH WATER DISTRICT Other Active Production Well 6090498.014 2215406.267 254-1151 6/29/2021 9.9 <Null>
1389 TIC-106 1390 TIC-106/1 IRVINE RANCH WATER DISTRICT Other Active Production Well 6084967 2197177.989 405-715 3/23/2021 -45.1 <Null>
432 W-432 433 W-432/1 KATHY BONANNO Inactive Production Well 6080325.38 2272580.463 117-137 6/30/2021 286.97 <Null>
1176 KNOT-BPBS 1515 KNOT-BPBS/1 KNOTT'S BERRY FARM Active Small-System Production Well 6029633.814 2254234.979 430-630 6/29/2021 8.14 <Null>
12 LP-CITY 105 LP-CITY/1 LA PALMA Active Large-System Production Well 6015567.916 2254199.963 290-1415 6/29/2021 -72.67 <Null>
5 LP-WALK 108 LP-WALK/1 LA PALMA Active Large-System Production Well 6019189.082 2262316.73 489-919 6/25/2021 -25.45 <Null>
14284 MSG-BP10L 14285 MSG-BP10L/1 MCCOLL SITE GROUP Monitoring Well 6037931.453 2272258.752 247-257 6/30/2021 103.92 <Null>
1505 MVCC-COSD2 1506 MVCC-COSD2/1 MESA VERDE COUNTRY CLUB Other Active Production Well 6049566.742 2197240.664 200-450 6/30/2021 -65.825 <Null>
15780 MCWD-11 15781 MCWD-11/1 MESA WATER DISTRICT Active Large-System Production Well 6055237.67 2197733.913 330-1000 7/7/2021 -86.57 <Null>
10138 MCWD-1B 10139 MCWD-1B/1 MESA WATER DISTRICT Active Large-System Production Well 6058120.94 2200970.067 305-580 <Null> <Null> No static water level
31 MCWD-3B 2892 MCWD-3B/1 MESA WATER DISTRICT Active Large-System Production Well 6053761.218 2202557.912 242-572 <Null> <Null> Well in exclusion list
1231 MCWD-5 1232 MCWD-5/1 MESA WATER DISTRICT Active Large-System Production Well 6051212.891 2202686.998 400-940 <Null> <Null> No static water level
2135 MCWD-6 2136 MCWD-6/1 MESA WATER DISTRICT Active Large-System Production Well 6055652.152 2197722.22 310-1025 <Null> <Null> No static water level
1233 MCWD-7 1234 MCWD-7/1 MESA WATER DISTRICT Active Large-System Production Well 6053044.669 2200013.913 363-753 <Null> <Null> No static water level
23121 MESA-9B 23122 MESA-9B/1 MESA WATER DISTRICT Active Large-System Production Well 6055224.568 2200729.295 350-580 <Null> <Null> No static water level
23 MCWD-2 125 MCWD-2/1 MESA WATER DISTRICT Monitoring Well 6060220.541 2200931.5 300-650 7/7/2021 -88.14 <Null>
7747 MCWD-3BM 7748 MCWD-3BM/1 MESA WATER DISTRICT Monitoring Well 6053810.232 2202578.466 530-570 7/7/2021 -67.5 <Null>
14833 NB-DOLD 14834 NB-DOLD/1 NEWPORT BEACH Active Large-System Production Well 6041557.515 2205737.495 399-729 6/30/2021 -41.75 <Null>
14835 NB-DOLS 14836 NB-DOLS/1 NEWPORT BEACH Active Large-System Production Well 6041637.348 2205746.699 201-356 <Null> <Null> Well in exclusion list
14837 NB-TAMD 14838 NB-TAMD/1 NEWPORT BEACH Active Large-System Production Well 6037391.886 2206329.916 395-690 6/29/2021 -42.79 <Null>
14839 NB-TAMS 14840 NB-TAMS/1 NEWPORT BEACH Active Large-System Production Well 6037391.924 2206247.365 170-360 <Null> <Null> Well in exclusion list
71 O-18 2625 O-18/1 ORANGE Active Large-System Production Well 6073004.258 2233669.343 372-574 6/28/2021 44.64 <Null>
79 O-19 2618 O-19/1 ORANGE Active Large-System Production Well 6072211.218 2241094.476 444-1014 6/28/2021 105.35 <Null>
2694 O-20 2696 O-20/1 ORANGE Active Large-System Production Well 6065992.895 2234093.189 400-1130 6/28/2021 13.83 <Null>
81 O-21 1073 O-21/1 ORANGE Active Large-System Production Well 6075241.088 2245598.993 482-1252 6/28/2021 90.16 <Null>
2921 O-22 3295 O-22/1 ORANGE Active Large-System Production Well 6077271.09 2239348.179 342-802 6/28/2021 53.77 <Null>
7173 O-23 7174 O-23/1 ORANGE Active Large-System Production Well 6084469.321 2236564.181 370-640 6/28/2021 23.32 <Null>
10140 O-24 10141 O-24/1 ORANGE Active Large-System Production Well 6084080.037 2238925.34 420-800 6/28/2021 42.65 <Null>
15474 O-25 15475 O-25/1 ORANGE Active Large-System Production Well 6078385.795 2233068.736 430-885 6/28/2021 -9.78 <Null>
18435 O-26 18436 O-26/1 ORANGE Active Large-System Production Well 6061791.146 2233358.136 460-1170 6/28/2021 -2.58 <Null>
22860 O-27 22861 O-27/1 ORANGE Active Large-System Production Well 6078303.303 2233680.531 425-890 6/28/2021 -45 <Null>
47 O-8 2652 O-8/1 ORANGE Active Large-System Production Well 6069397.223 2240803.328 570-850 4/5/2021 53.07 <Null>
46 O-9 2656 O-9/1 ORANGE Active Large-System Production Well 6069440.354 2241135.949 546-888 <Null> <Null> No static water level
22370 MBI-1 22371 MBI-1/1 ORANGE COUNTY WATER DISTRICT Injection Well 6055132.435 2212498.453 530-1190 7/1/2021 -38.54 <Null>
23015 MBI-2 23016 MBI-2/1 ORANGE COUNTY WATER DISTRICT Injection Well 6056141.1 2211006.5 646-1085 6/29/2021 -55.78 <Null>
23017 MBI-3 23018 MBI-3/1 ORANGE COUNTY WATER DISTRICT Injection Well 6056123.8 2212200.9 654-1114 6/29/2021 -42.47 <Null>
23019 MBI-4 23020 MBI-4/1 ORANGE COUNTY WATER DISTRICT Injection Well 6057084.9 2212185.2 650-1089 6/29/2021 -47.65 <Null>
23021 MBI-5 23022 MBI-5/1 ORANGE COUNTY WATER DISTRICT Injection Well 6057622.7 2211477.6 609-1059 6/29/2021 -53.62 <Null>
15492 OCWD-I24 15494 OCWD-I24/2 ORANGE COUNTY WATER DISTRICT Injection Well 6046615.244 2199848.75 420-605 7/6/2021 -59.31 <Null>
18060 OCWD-I26C 18061 OCWD-I26C/1 ORANGE COUNTY WATER DISTRICT Injection Well 6048796.348 2200397.494 476-660 7/6/2021 -65.21 <Null>
19463 OCWD-I28C 19464 OCWD-I28C/1 ORANGE COUNTY WATER DISTRICT Injection Well 6036240.299 2199039.947 360-460 7/6/2021 -22.14 <Null>
19648 OCWD-I30C 19649 OCWD-I30C/1 ORANGE COUNTY WATER DISTRICT Injection Well 6034047 2200300.103 425-650 6/28/2021 -18.35 <Null>
19650 OCWD-I31C 19651 OCWD-I31C/1 ORANGE COUNTY WATER DISTRICT Injection Well 6033606.9 2201013.303 440-590 7/6/2021 -22.46 <Null>
1018 AM-1 1019 AM-1/1 ORANGE COUNTY WATER DISTRICT Monitoring Well 6090472.39 2264185.952 97-115 6/30/2021 245.03 <Null>
545 AM-10 546 AM-10/1 ORANGE COUNTY WATER DISTRICT Monitoring Well 6071304.771 2257813.261 217-235 7/7/2021 121.51 <Null>
557 AM-11 558 AM-11/1 ORANGE COUNTY WATER DISTRICT Monitoring Well 6072499.755 2255656.617 218-240 6/30/2021 121.98 <Null>
555 AM-12 556 AM-12/1 ORANGE COUNTY WATER DISTRICT Monitoring Well 6070962.221 2255565.488 210-225 7/7/2021 113.56 <Null>
553 AM-13 554 AM-13/1 ORANGE COUNTY WATER DISTRICT Monitoring Well 6072701.528 2256964.39 252-270 6/30/2021 128.38 <Null>
2740 AM-14 2741 AM-14/1 ORANGE COUNTY WATER DISTRICT Monitoring Well 6065935.798 2256505.388 297-315 6/30/2021 96.56 <Null>
2742 AM-15 2743 AM-15/1 ORANGE COUNTY WATER DISTRICT Monitoring Well 6062582.08 2256912.924 300-317 6/25/2021 86.54 <Null>
2746 AM-16 2747 AM-16/1 ORANGE COUNTY WATER DISTRICT Monitoring Well 6057468.185 2255986.324 300-315 7/1/2021 70.09 <Null>
2750 AM-17 2751 AM-17/1 ORANGE COUNTY WATER DISTRICT Monitoring Well 6056078.923 2256637.855 290-308 6/25/2021 67.03 <Null>
2752 AM-18 2753 AM-18/1 ORANGE COUNTY WATER DISTRICT Monitoring Well 6054337.392 2256704.097 291-309 7/1/2021 60.89 <Null>
1022 AM-2 1023 AM-2/1 ORANGE COUNTY WATER DISTRICT Monitoring Well 6091404.587 2263383.522 87-100 6/30/2021 246.46 <Null>
7535 AM-20 7536 AM-20/1 ORANGE COUNTY WATER DISTRICT Monitoring Well 6054209.307 2247063.369 361-379 6/25/2021 34.97 <Null>
7001 AM-22 7002 AM-22/1 ORANGE COUNTY WATER DISTRICT Monitoring Well 6059519.306 2254484.798 339-353 6/25/2021 72.1 <Null>
7003 AM-23 7004 AM-23/1 ORANGE COUNTY WATER DISTRICT Monitoring Well 6062009.413 2254628.535 330-347 6/25/2021 83.21 <Null>
7005 AM-24 7006 AM-24/1 ORANGE COUNTY WATER DISTRICT Monitoring Well 6058556.647 2251960.234 335-350 6/25/2021 69.28 <Null>
7009 AM-25 7010 AM-25/1 ORANGE COUNTY WATER DISTRICT Monitoring Well 6060774.466 2252487.982 340-358 6/25/2021 74.37 <Null>
7533 AM-26 7534 AM-26/1 ORANGE COUNTY WATER DISTRICT Monitoring Well 6051909.723 2244283.122 377-383 7/1/2021 29.21 <Null>
7013 AM-27 7014 AM-27/1 ORANGE COUNTY WATER DISTRICT Monitoring Well 6064651.178 2249603.126 287-305 6/25/2021 82.55 <Null>
7015 AM-29 7016 AM-29/1 ORANGE COUNTY WATER DISTRICT Monitoring Well 6062902.901 2259184.123 340-358 6/30/2021 88.5 <Null>
1020 AM-3 1021 AM-3/1 ORANGE COUNTY WATER DISTRICT Monitoring Well 6090425.411 2261850.384 91-107 6/30/2021 245.62 <Null>
7541 AM-30 7542 AM-30/1 ORANGE COUNTY WATER DISTRICT Monitoring Well 6046016.856 2255914.15 349-367 6/25/2021 41.38 <Null>
8919 AM-31 8920 AM-31/1 ORANGE COUNTY WATER DISTRICT Monitoring Well 6052262.726 2257664.465 335-353 6/25/2021 57.41 <Null>
7753 AM-32 7754 AM-32/1 ORANGE COUNTY WATER DISTRICT Monitoring Well 6052527.256 2252384.43 335-353 6/25/2021 50.68 <Null>
7523 AM-33 7524 AM-33/1 ORANGE COUNTY WATER DISTRICT Monitoring Well 6055430.54 2253987.665 354-372 6/25/2021 61.86 <Null>
7527 AM-34 7528 AM-34/1 ORANGE COUNTY WATER DISTRICT Monitoring Well 6049928.243 2250310.571 317-335 6/25/2021 39.01 <Null>
7755 AM-35 7756 AM-35/1 ORANGE COUNTY WATER DISTRICT Monitoring Well 6044316.748 2249355.364 332-350 6/25/2021 28.86 <Null>
7759 AM-37 7760 AM-37/1 ORANGE COUNTY WATER DISTRICT Monitoring Well 6054347.18 2250152.867 349-367 6/25/2021 46.31 <Null>
7761 AM-38 7762 AM-38/1 ORANGE COUNTY WATER DISTRICT Monitoring Well 6058042.463 2246387.411 316-334 6/25/2021 35.25 <Null>
549 AM-4 550 AM-4/1 ORANGE COUNTY WATER DISTRICT Monitoring Well 6078257.417 2258629.141 187-205 7/7/2021 166.16 <Null>
20709 AM-47 20710 AM-47/1 ORANGE COUNTY WATER DISTRICT Monitoring Well 6054333.5 2258316.7 227-242 6/25/2021 64.05 <Null>
20705 AM-48 20706 AM-48/1 ORANGE COUNTY WATER DISTRICT Monitoring Well 6069379.3 2259143.9 270-300 7/8/2021 113.68 <Null>
1024 AM-5 1025 AM-5/1 ORANGE COUNTY WATER DISTRICT Monitoring Well 6078674.697 2259936.321 230-245 7/7/2021 156.58 <Null>
23213 AM-54C 23214 AM-54C/1 ORANGE COUNTY WATER DISTRICT Monitoring Well 6055965.303 2259518 280-295 6/25/2021 69.46 <Null>
23563 AM-55B 23564 AM-55B/1 ORANGE COUNTY WATER DISTRICT Monitoring Well 6054292.1 2256036.6 375-395 7/8/2021 59.8 <Null>
23567 AM-56B 23569 AM-56B/1 ORANGE COUNTY WATER DISTRICT Monitoring Well 6053578.9 2256950.9 380-400 7/8/2021 58.82 <Null>
551 AM-6 552 AM-6/1 ORANGE COUNTY WATER DISTRICT Monitoring Well 6075037.515 2257301.421 232-250 7/7/2021 143.29 <Null>
2734 AM-7 2735 AM-7/1 ORANGE COUNTY WATER DISTRICT Monitoring Well 6071731.515 2260900.336 210-225 7/7/2021 131.58 <Null>
2 of 4

Wells Used to Develop 2021 Groundwater Contour Maps in Orange County Groundwater BasinPrincipal Aquifer Wells (Model Layer 2)STAID1 WELLNM STAID STANAME OWNERNM GIS_SYMNM NAD83_X NAD83_Y PERF_ZONE SHORTDATE WLELEV_2021 NOTES
2736 AM-8 2737 AM-8/1 ORANGE COUNTY WATER DISTRICT Monitoring Well 6069027.597 2259867.528 268-285 7/7/2021 112.8 <Null>
15043 AMD-10 15045 AMD-10/2 ORANGE COUNTY WATER DISTRICT Monitoring Well 6072825.077 2260900.884 440-460 7/7/2021 135.71 <Null>
15053 AMD-11 15056 AMD-11/3 ORANGE COUNTY WATER DISTRICT Monitoring Well 6070695.395 2257252.242 600-620 6/30/2021 117.07 <Null>
19507 AMD-12 19510 AMD-12/3 ORANGE COUNTY WATER DISTRICT Monitoring Well 6071323.1 2260657.003 595-615 6/30/2021 126.14 <Null>
14585 AMD-9 14587 AMD-9/2 ORANGE COUNTY WATER DISTRICT Monitoring Well 6075825.081 2261784.701 450-470 7/7/2021 151.35 <Null>
7017 FM-1 7018 FM-1/1 ORANGE COUNTY WATER DISTRICT Monitoring Well 6053154.441 2258736.246 348-356 6/25/2021 60.62 <Null>
18331 FM-10 18332 FM-10/1 ORANGE COUNTY WATER DISTRICT Monitoring Well 6057584.791 2262009.679 215-235 6/29/2021 79.5 <Null>
18335 FM-11 18336 FM-11/1 ORANGE COUNTY WATER DISTRICT Monitoring Well 6054079.466 2261009.777 236-256 6/30/2021 69.03 <Null>
18339 FM-12 18340 FM-12/1 ORANGE COUNTY WATER DISTRICT Monitoring Well 6058076.487 2263025.088 206-226 6/29/2021 82.04 <Null>
18343 FM-13 18344 FM-13/1 ORANGE COUNTY WATER DISTRICT Monitoring Well 6064730.854 2262602.368 210-230 6/30/2021 93.15 <Null>
18347 FM-14 18348 FM-14/1 ORANGE COUNTY WATER DISTRICT Monitoring Well 6064606.249 2263073.772 234-254 7/1/2021 93.13 <Null>
18351 FM-15 18352 FM-15/1 ORANGE COUNTY WATER DISTRICT Monitoring Well 6054099.553 2262606.493 218-238 6/29/2021 73.72 <Null>
18412 FM-16 18413 FM-16/1 ORANGE COUNTY WATER DISTRICT Monitoring Well 6063630.746 2262324.068 248-268 6/30/2021 88.76 <Null>
19626 FM-17 19627 FM-17/1 ORANGE COUNTY WATER DISTRICT Monitoring Well 6061492.436 2262019.765 250-270 6/30/2021 84.02 <Null>
19612 FM-18 19613 FM-18/1 ORANGE COUNTY WATER DISTRICT Monitoring Well 6049362.557 2263643.539 224-244 6/29/2021 62.44 <Null>
19622 FM-19C 19623 FM-19C/1 ORANGE COUNTY WATER DISTRICT Monitoring Well 6051551.893 2262403.786 365-385 6/29/2021 57.84 <Null>
23462 FM-19D 23463 FM-19D/1 ORANGE COUNTY WATER DISTRICT Monitoring Well 6051660.8 2262458.6 435-455 6/29/2021 59.85 <Null>
7021 FM-2 7022 FM-2/1 ORANGE COUNTY WATER DISTRICT Monitoring Well 6058816.966 2258623.398 320-338 6/25/2021 76.61 <Null>
20762 FM-20 20763 FM-20/1 ORANGE COUNTY WATER DISTRICT Monitoring Well 6053785.7 2263886.1 221-241 6/29/2021 72.51 <Null>
20766 FM-21 20767 FM-21/1 ORANGE COUNTY WATER DISTRICT Monitoring Well 6047750.6 2262684.3 260-270 6/29/2021 58.02 <Null>
20751 FM-22 20752 FM-22/1 ORANGE COUNTY WATER DISTRICT Monitoring Well 6051135 2260372.1 242-262 7/8/2021 60.23 <Null>
23217 FM-22B 23218 FM-22B/1 ORANGE COUNTY WATER DISTRICT Monitoring Well 6051128.1 2260379.8 326-346 6/25/2021 56.32 <Null>
20882 FM-23 20883 FM-23/1 ORANGE COUNTY WATER DISTRICT Monitoring Well 6054166.9 2260625 234-249 6/29/2021 69.17 <Null>
20699 FM-24 20700 FM-24/1 ORANGE COUNTY WATER DISTRICT Monitoring Well 6051441.4 2258786 271-291 6/25/2021 57 <Null>
23219 FM-24B 23220 FM-24B/1 ORANGE COUNTY WATER DISTRICT Monitoring Well 6051418.9 2258788.7 338-358 6/25/2021 55.89 <Null>
23225 FM-29C 23226 FM-29C/1 ORANGE COUNTY WATER DISTRICT Monitoring Well 6049003.993 2262397.371 340-360 6/29/2021 49.19 <Null>
7025 FM-3 7026 FM-3/1 ORANGE COUNTY WATER DISTRICT Monitoring Well 6061451.851 2259514.599 257-263 6/30/2021 84.27 <Null>
23573 FM-30B 23574 FM-30B/1 ORANGE COUNTY WATER DISTRICT Monitoring Well 6061056.8 2263552.8 370-390 6/29/2021 83.12 <Null>
23229 FM-31B 23230 FM-31B/1 ORANGE COUNTY WATER DISTRICT Monitoring Well 6054065.947 2261842.665 230-250 6/29/2021 70.23 <Null>
23449 FM-32B 23452 FM-32B/1 ORANGE COUNTY WATER DISTRICT Monitoring Well 6045316.1 2263964.1 220-230 6/29/2021 56.28 <Null>
23577 FM-34B 23578 FM-34B/1 ORANGE COUNTY WATER DISTRICT Monitoring Well 6057207.6 2265354.1 377-397 7/8/2021 66.54 <Null>
23898 FM-35C 23899 FM-35C/1 ORANGE COUNTY WATER DISTRICT Monitoring Well 6062992.887 2262505.466 460.5-480.5 7/6/2021 85.12 <Null>
7519 FM-4 7520 FM-4/1 ORANGE COUNTY WATER DISTRICT Monitoring Well 6048406.619 2258792.993 327-345 6/25/2021 49.86 <Null>
9947 FM-6 9948 FM-6/1 ORANGE COUNTY WATER DISTRICT Monitoring Well 6053264.065 2274113.568 150-310 6/30/2021 175.2 <Null>
23215 FM-7B 23216 FM-7B/1 ORANGE COUNTY WATER DISTRICT Monitoring Well 6054304.1 2259270.6 329.5-344.5 6/25/2021 64.28 <Null>
18327 FM-9 18328 FM-9/1 ORANGE COUNTY WATER DISTRICT Monitoring Well 6063377.138 2262960.474 220-240 6/30/2021 88.97 <Null>
19009 IDM-3 19012 IDM-3/3 ORANGE COUNTY WATER DISTRICT Monitoring Well 6099726.882 2201438.084 652-672 6/28/2021 8.37 <Null>
19404 IDM-4 19407 IDM-4/3 ORANGE COUNTY WATER DISTRICT Monitoring Well 6103585.541 2200230.218 654-674 6/28/2021 51.87 <Null>
19478 IDP-2R 19480 IDP-2R/2 ORANGE COUNTY WATER DISTRICT Monitoring Well 6106015.21 2193086.752 300-340 6/28/2021 108.257 <Null>
721 KBS-1 998 KBS-1/1 ORANGE COUNTY WATER DISTRICT Monitoring Well 6074374.124 2260345.831 209-219 7/1/2021 154.21 <Null>
1285 MCAS-10 1286 MCAS-10/1 ORANGE COUNTY WATER DISTRICT Monitoring Well 6096082.894 2198174.236 347-377 6/28/2021 9.88 <Null>
1360 MCAS-4 1361 MCAS-4/1 ORANGE COUNTY WATER DISTRICT Monitoring Well 6098189.884 2189446.916 181-238 6/28/2021 95.46 <Null>
10217 MCAS-5A 10218 MCAS-5A/1 ORANGE COUNTY WATER DISTRICT Monitoring Well 6101340.027 2187474.726 120-130 6/28/2021 118.26 <Null>
1355 MCAS-8 1356 MCAS-8/1 ORANGE COUNTY WATER DISTRICT Monitoring Well 6088737.288 2194284.922 392-410 6/28/2021 -63.35 <Null>
1287 MCAS-9 1288 MCAS-9/1 ORANGE COUNTY WATER DISTRICT Monitoring Well 6092651.761 2198312.255 372-445 6/28/2021 2.18 <Null>
23057 OCWD-34Y01 23061 OCWD-34Y01/4 ORANGE COUNTY WATER DISTRICT Monitoring Well 6001790.9 2226024.1 400-420 7/6/2021 -43.1 <Null>
11700 OCWD-36FP1Z 11701 OCWD-36FP1Z/1 ORANGE COUNTY WATER DISTRICT Monitoring Well 6001815.979 2221372.331 504-514 7/1/2021 -42.84 <Null>
2859 OCWD-AIR1 2861 OCWD-AIR1/2 ORANGE COUNTY WATER DISTRICT Monitoring Well 6037614.933 2265072.135 410-510 6/29/2021 -7.44 <Null>
22323 OCWD-BS10 22329 OCWD-BS10/6 ORANGE COUNTY WATER DISTRICT Monitoring Well 6013179.752 2219396.307 595-605 7/1/2021 -46.87 <Null>
22330 OCWD-BS11 22336 OCWD-BS11/6 ORANGE COUNTY WATER DISTRICT Monitoring Well 6008506.1 2221300 580-590 7/1/2021 -47.03 <Null>
22774 OCWD-BS12 22973 OCWD-BS12/6 ORANGE COUNTY WATER DISTRICT Monitoring Well 6015660.3 2214181.8 585-605 7/1/2021 -49.9 <Null>
23692 OCWD-BS13F 23693 OCWD-BS13F/1 ORANGE COUNTY WATER DISTRICT Monitoring Well 6009690 2214241.6 575-595 7/1/2021 -44.86 <Null>
22776 OCWD-BS14 22916 OCWD-BS14/5 ORANGE COUNTY WATER DISTRICT Monitoring Well 6003965.9 2221842.9 490-510 7/1/2021 -43.9 <Null>
23550 OCWD-BS24F 23554 OCWD-BS24F/1 ORANGE COUNTY WATER DISTRICT Monitoring Well 6005185.3 2219560 500-520 7/1/2021 -41.91 <Null>
2867 OCWD-CTG1 2869 OCWD-CTG1/2 ORANGE COUNTY WATER DISTRICT Monitoring Well 6061970.346 2206073.478 420-720 6/30/2021 -85.71 <Null>
2872 OCWD-CTG5 2873 OCWD-CTG5/1 ORANGE COUNTY WATER DISTRICT Monitoring Well 6062530.714 2206394.591 420-620 8/4/2021 -81.04 <Null>
2876 OCWD-CTK1 2878 OCWD-CTK1/2 ORANGE COUNTY WATER DISTRICT Monitoring Well 6062486.259 2205158.852 780-1015 6/30/2021 -81.99 <Null>
3307 OCWD-FC1 3308 OCWD-FC1/1 ORANGE COUNTY WATER DISTRICT Monitoring Well 6072297.077 2252615.883 165-185 7/7/2021 104.96 <Null>
3305 OCWD-FH1 3306 OCWD-FH1/1 ORANGE COUNTY WATER DISTRICT Monitoring Well 6081695.772 2257027.264 120-140 7/7/2021 213.83 <Null>
3303 OCWD-LV1 3304 OCWD-LV1/1 ORANGE COUNTY WATER DISTRICT Monitoring Well 6085675.722 2259327.385 135-155 7/7/2021 237.5 <Null>
15127 OCWD-M38 15131 OCWD-M38/4 ORANGE COUNTY WATER DISTRICT Monitoring Well 6030736.262 2198146.213 336-346 6/30/2021 -27.7 <Null>
16021 OCWD-M39 16026 OCWD-M39/5 ORANGE COUNTY WATER DISTRICT Monitoring Well 6048139.112 2190636.716 250-270 6/28/2021 -16.46 <Null>
16654 OCWD-M40 16658 OCWD-M40/4 ORANGE COUNTY WATER DISTRICT Monitoring Well 6051222.286 2195005.215 330-520 6/28/2021 -81.04 <Null>
18425 OCWD-M41 18430 OCWD-M41/5 ORANGE COUNTY WATER DISTRICT Monitoring Well 6031312.152 2196141.497 370-390 6/30/2021 -27.74 <Null>
18418 OCWD-M42 18423 OCWD-M42/5 ORANGE COUNTY WATER DISTRICT Monitoring Well 6030956.495 2201880.558 500-520 6/24/2021 -30.94 <Null>
23769 OCWD-M43R 23774 OCWD-M43R/5 ORANGE COUNTY WATER DISTRICT Monitoring Well 6056258.4 2193225.9 530-550 6/28/2021 -82.54 <Null>
20371 OCWD-M44 20376 OCWD-M44/5 ORANGE COUNTY WATER DISTRICT Monitoring Well 6048200.8 2193011.3 295-305 6/28/2021 -58.37 <Null>
19640 OCWD-M45 19645 OCWD-M45/5 ORANGE COUNTY WATER DISTRICT Monitoring Well 6040339.8 2203350.603 780-790 6/30/2021 -56.92 <Null>
19482 OCWD-M46 19487 OCWD-M46/5 ORANGE COUNTY WATER DISTRICT Monitoring Well 6049299 2201186.803 890-910 6/28/2021 -61.24 <Null>
19634 OCWD-M47 19639 OCWD-M47/5 ORANGE COUNTY WATER DISTRICT Monitoring Well 6049915.7 2202379.503 940-960 6/28/2021 -61.7 <Null>
18766 OCWD-M48 18768 OCWD-M48/2 ORANGE COUNTY WATER DISTRICT Monitoring Well 6059972.844 2188953.882 175-195 6/28/2021 -73.7 <Null>
22842 OCWD-M52C 22843 OCWD-M52C/1 ORANGE COUNTY WATER DISTRICT Monitoring Well 6067045.9 2192841.2 210-230 6/24/2021 -69.15 <Null>
22786 OCWD-MRSH 22854 OCWD-MRSH/1 ORANGE COUNTY WATER DISTRICT Monitoring Well 6074220 2188672.3 199-219 6/29/2021 -28.15 <Null>
22659 OCWD-SA22R 22663 OCWD-SA22R/4 ORANGE COUNTY WATER DISTRICT Monitoring Well 6036740.5 2194795.1 310-330 6/30/2021 -28.24 <Null>
3978 OCWD-T2 3981 OCWD-T2/3 ORANGE COUNTY WATER DISTRICT Monitoring Well 6035679.306 2192640.337 300-360 6/24/2021 -27.11 <Null>
315 OCWD-W1 316 OCWD-W1/1 ORANGE COUNTY WATER DISTRICT Monitoring Well 6081387.171 2258988.611 - 7/7/2021 174.34 <Null>
22347 SAR-10 22351 SAR-10/4 ORANGE COUNTY WATER DISTRICT Monitoring Well 6055179.3 2212421.7 1100-1115 7/1/2021 -51.98 <Null>
22061 SAR-11 22064 SAR-11/3 ORANGE COUNTY WATER DISTRICT Monitoring Well 6055349.4 2211898 1100-1110 7/1/2021 -54.34 <Null>
23010 SAR-12 23014 SAR-12/4 ORANGE COUNTY WATER DISTRICT Monitoring Well 6056736.8 2210170.5 1045-1055 6/30/2021 -67.896 <Null>
23203 SAR-13 23207 SAR-13/4 ORANGE COUNTY WATER DISTRICT Monitoring Well 6057504.8 2210763.1 1045-1055 6/30/2021 -63.83 <Null>
1851 TIC-67 1852 TIC-67/1 ORANGE COUNTY WATER DISTRICT Monitoring Well 6100937.109 2211418.256 245-900 6/29/2021 73.58 <Null>
997 ABS-1 22665 ABS-1/1/WB2/MP3 ORANGE COUNTY WATER DISTRICT Multiport Monitoring Well 6076226.851 2262977.612 MP3 (257) 7/7/2021 158.375 <Null>
547 AMD-1 21137 AMD-1/1/WB2/MP5 ORANGE COUNTY WATER DISTRICT Multiport Monitoring Well 6073916.932 2258572.091 MP5 (331) 6/21/2021 143.45 <Null>
565 AMD-2 22205 AMD-2/1/WB2/MP4 ORANGE COUNTY WATER DISTRICT Multiport Monitoring Well 6066705.21 2254540.618 MP4 (512) 6/29/2021 99.11 <Null>
7031 AMD-4 7104 AMD-4/1/WB1/MP4 ORANGE COUNTY WATER DISTRICT Multiport Monitoring Well 6050716.117 2255097.562 MP4 (561) 6/28/2021 43.82 <Null>
7295 AMD-5 7320 AMD-5/1/WB1/MP7 ORANGE COUNTY WATER DISTRICT Multiport Monitoring Well 6060070.244 2248962.576 MP7 (754) 6/28/2021 69.39 <Null>
7293 AMD-6 7482 AMD-6/1/WB1/MP7 ORANGE COUNTY WATER DISTRICT Multiport Monitoring Well 6057374.729 2241092.645 MP7 (622) 6/28/2021 15.03 <Null>
8596 AMD-7 8754 AMD-7/1/WB1/MP7 ORANGE COUNTY WATER DISTRICT Multiport Monitoring Well 6049188.026 2247218.215 MP7 (580) 6/28/2021 15.36 <Null>
9682 AMD-8 9906 AMD-8/1/WB1/MP5 ORANGE COUNTY WATER DISTRICT Multiport Monitoring Well 6033488.697 2249624.328 MP5 (662) 7/12/2021 -8.705 <Null>
9831 BPM-1 9985 BPM-1/1/WB1/MP6 ORANGE COUNTY WATER DISTRICT Multiport Monitoring Well 6022348.508 2259541.566 MP6 (890) 7/12/2021 -42.1 <Null>
9832 BPM-2 10178 BPM-2/1/WB1/MP5 ORANGE COUNTY WATER DISTRICT Multiport Monitoring Well 6025195.413 2246739.597 MP5 (778) 7/12/2021 -11.49 <Null>
685 CB-1 8788 CB-1/1/WB2/MP3 ORANGE COUNTY WATER DISTRICT Multiport Monitoring Well 6044695.232 2253837.186 MP3 (443) 7/6/2021 30.09 <Null>
5155 COSM-1 7147 COSM-1/1/WB1/MP5 ORANGE COUNTY WATER DISTRICT Multiport Monitoring Well 6055253.401 2197825.036 MP5 (451) 6/30/2021 -87.65 <Null>
18846 COSM-2 18866 COSM-2/1/WB1/MP8 ORANGE COUNTY WATER DISTRICT Multiport Monitoring Well 6052266.414 2199776.431 MP8 (763) 6/30/2021 -80.87 <Null>
719 FFS-1 14243 FFS-1/1/WB2/MP3 ORANGE COUNTY WATER DISTRICT Multiport Monitoring Well 6061436.461 2262022.62 MP3 (530) 7/6/2021 81.44 <Null>
1291 FVM-1 15692 FVM-1/1/WB2/MP9 ORANGE COUNTY WATER DISTRICT Multiport Monitoring Well 6047178.815 2210990.613 MP9 (814) 6/22/2021 -47.21 <Null>
7297 GGM-1 10028 GGM-1/1/WB1/MP8 ORANGE COUNTY WATER DISTRICT Multiport Monitoring Well 6045688.299 2230864.24 MP8 (1074) 7/8/2021 -22.44 <Null>
8923 GGM-2 9049 GGM-2/1/WB1/MP5 ORANGE COUNTY WATER DISTRICT Multiport Monitoring Well 6026525.607 2230233.156 MP5 (954) 6/22/2021 -30.46 <Null>
8592 GGM-3 8666 GGM-3/1/WB1/MP6 ORANGE COUNTY WATER DISTRICT Multiport Monitoring Well 6037298.069 2237458.988 MP6 (1007) 7/8/2021 -17.34 <Null>
7178 HBM-1 8439 HBM-1/1/WB1/MP7 ORANGE COUNTY WATER DISTRICT Multiport Monitoring Well 6031700.722 2216385.252 MP7 (924) 7/2/2021 -43.89 <Null>
7086 HBM-2 7223 HBM-2/1/WB1/MP6 ORANGE COUNTY WATER DISTRICT Multiport Monitoring Well 6036228.737 2196532.383 MP6 (447) 7/2/2021 -25.01 <Null>
9200 HBM-4 9225 HBM-4/1/WB1/MP8 ORANGE COUNTY WATER DISTRICT Multiport Monitoring Well 6034095.825 2197123.319 MP8 (551) 7/2/2021 -20.86 <Null>
9688 HBM-5 9879 HBM-5/1/WB1/MP8 ORANGE COUNTY WATER DISTRICT Multiport Monitoring Well 6045744.869 2193971.856 MP8 (273) 7/2/2021 -52.65 <Null>
15088 HBM-6 15245 HBM-6/1/WB1/MP7 ORANGE COUNTY WATER DISTRICT Multiport Monitoring Well 6025106.578 2204548.969 MP7 (508) 7/2/2021 -37.1 <Null>
720 IDM-1 18979 IDM-1/1/WB2/MP4 ORANGE COUNTY WATER DISTRICT Multiport Monitoring Well 6099572.243 2207081.537 MP4 (436) 7/7/2021 28.49 <Null>
9830 IDM-2 10064 IDM-2/1/WB1/MP6 ORANGE COUNTY WATER DISTRICT Multiport Monitoring Well 6080705.598 2209836.046 MP6 (613) 7/7/2021 -71.94 <Null>
3 of 4

Wells Used to Develop 2021 Groundwater Contour Maps in Orange County Groundwater BasinPrincipal Aquifer Wells (Model Layer 2)STAID1 WELLNM STAID STANAME OWNERNM GIS_SYMNM NAD83_X NAD83_Y PERF_ZONE SHORTDATE WLELEV_2021 NOTES
541 KBS-2 10226 KBS-2/1/WB1/MP2 ORANGE COUNTY WATER DISTRICT Multiport Monitoring Well 6073053.762 2260992.439 MP2 (214) 6/21/2021 144.53 <Null>
11949 LAM-1 12028 LAM-1/1/WB1/MP9 ORANGE COUNTY WATER DISTRICT Multiport Monitoring Well 6009581.587 2238043.705 MP9 (1153) 6/15/2021 -56.23 <Null>
1345 MCAS-1 5853 MCAS-1/1/WB2/MP6 ORANGE COUNTY WATER DISTRICT Multiport Monitoring Well 6098255.481 2192973.357 MP6 (455) 7/6/2021 36.17 <Null>
759 MCAS-2 5935 MCAS-2/1/WB2/MP5 ORANGE COUNTY WATER DISTRICT Multiport Monitoring Well 6100360.442 2191167.958 MP5 (425) 7/6/2021 62.46 <Null>
1339 MCAS-3 5891 MCAS-3/1/WB2/MP5 ORANGE COUNTY WATER DISTRICT Multiport Monitoring Well 6104434.428 2191276.758 MP5 (426) 7/6/2021 89.45 <Null>
758 MCAS-7 11829 MCAS-7/1/WB3/MP4 ORANGE COUNTY WATER DISTRICT Multiport Monitoring Well 6093900.827 2194418.586 MP4 (442) 7/7/2021 -23.9 <Null>
756 SAR-1 9261 SAR-1/1/WB2/MP5 ORANGE COUNTY WATER DISTRICT Multiport Monitoring Well 6070684.206 2250425.314 MP5 (519) 6/29/2021 88.12 <Null>
761 SAR-2 11989 SAR-2/1/WB2/MP6 ORANGE COUNTY WATER DISTRICT Multiport Monitoring Well 6069096.008 2245410.807 MP6 (741) 6/29/2021 71.42 <Null>
762 SAR-3 9466 SAR-3/1/WB2/MP6 ORANGE COUNTY WATER DISTRICT Multiport Monitoring Well 6066892.02 2238409.284 MP6 (774) 6/24/2021 54.27 <Null>
763 SAR-4 14633 SAR-4/1/WB2/MP6 ORANGE COUNTY WATER DISTRICT Multiport Monitoring Well 6065370.966 2233375.154 MP6 (868) 6/29/2021 31.58 <Null>
1289 SAR-5 21220 SAR-5/1/WB3/MP5 ORANGE COUNTY WATER DISTRICT Multiport Monitoring Well 6062597.607 2227874.211 MP5 (766) 6/30/2021 -16.37 <Null>
561 SAR-6 10113 SAR-6/1/WB2/MP4 ORANGE COUNTY WATER DISTRICT Multiport Monitoring Well 6073313.538 2254365.369 MP4 (581) 6/21/2021 142.26 <Null>
996 SAR-7 20000 SAR-7/1/WB2/MP4 ORANGE COUNTY WATER DISTRICT Multiport Monitoring Well 6078049.17 2256383.048 MP4 (440) 6/21/2021 192.2 <Null>
7181 SAR-9 9802 SAR-9/1/WB1/MP7 ORANGE COUNTY WATER DISTRICT Multiport Monitoring Well 6058380.802 2221450.982 MP7 (877) 6/30/2021 -40.723 <Null>
9686 SBM-1 9729 SBM-1/1/WB1/MP7 ORANGE COUNTY WATER DISTRICT Multiport Monitoring Well 6016566.11 2224523.54 MP7 (916) 6/15/2021 -47.295 <Null>
1000 SC-1 21654 SC-1/1/WB2/MP4 ORANGE COUNTY WATER DISTRICT Multiport Monitoring Well 6089555.444 2242038.806 MP4 (197) 7/1/2021 213.44 <Null>
1001 SC-2 18747 SC-2/1/WB2/MP6 ORANGE COUNTY WATER DISTRICT Multiport Monitoring Well 6086489.295 2237887.557 MP6 (303) 7/1/2021 112.45 <Null>
1005 SC-3 8839 SC-3/1/WB2/MP3 ORANGE COUNTY WATER DISTRICT Multiport Monitoring Well 6081074.85 2229940.413 MP3 (577) 7/1/2021 29.49 <Null>
2888 SC-4 6296 SC-4/1/WB1/MP4 ORANGE COUNTY WATER DISTRICT Multiport Monitoring Well 6082605.785 2235080.546 MP4 (393) 7/1/2021 46.59 <Null>
2854 SC-5 6331 SC-5/1/WB1/MP5 ORANGE COUNTY WATER DISTRICT Multiport Monitoring Well 6077454.866 2225543.458 MP5 (670) 7/1/2021 4.73 <Null>
9684 SC-6 9758 SC-6/1/WB1/MP6 ORANGE COUNTY WATER DISTRICT Multiport Monitoring Well 6066813.288 2216032.113 MP6 (964) 7/7/2021 -60.78 <Null>
1016 SCS-1 8867 SCS-1/1/WB1/MP6 ORANGE COUNTY WATER DISTRICT Multiport Monitoring Well 6088950.708 2237855.374 MP6 (298) 7/1/2021 89.68 <Null>
1014 SCS-2 22653 SCS-2/1/WB2/MP5 ORANGE COUNTY WATER DISTRICT Multiport Monitoring Well 6088207.123 2239962.183 MP5 (329) 7/1/2021 72.99 <Null>
1011 WBS-4 19983 WBS-4/1/WB2/MP3 ORANGE COUNTY WATER DISTRICT Multiport Monitoring Well 6080099.39 2256910.089 MP3 (212) 6/21/2021 206.6 <Null>
1293 WMM-1 19884 WMM-1/1/WB2/MP8 ORANGE COUNTY WATER DISTRICT Multiport Monitoring Well 6038251.554 2221751.195 MP8 (985) 7/8/2021 -24.03 <Null>
1423 OCWD-D1 1424 OCWD-D1/1 ORANGE COUNTY WATER DISTRICT Other Active Production Well 6046612.36 2200327.641 780-880 6/23/2021 -60.642 <Null>
1412 OCWD-D3 1413 OCWD-D3/1 ORANGE COUNTY WATER DISTRICT Other Active Production Well 6046034.602 2201849.851 560-1000 6/23/2021 -58.66 <Null>
3797 OCWD-D4 3798 OCWD-D4/1 ORANGE COUNTY WATER DISTRICT Other Active Production Well 6047147.793 2201759.429 531-979 6/23/2021 -61.08 <Null>
1798 NVLW-SB3 3275 NVLW-SB3/1 PURSCHE, ROY Other Active Production Well 6011353.936 2219409.749 - 6/29/2021 -51.1 <Null>
1126 NOBL-O 1127 NOBL-O/1 R.J. NOBLE COMPANY Other Active Production Well 6072535.517 2251285.626 290-474 6/29/2021 91.85 <Null>
22874 RAY-MW06 22875 RAY-MW06/1 RAYTHEON TECHNOLOGIES CORPORATION Monitoring Well 6042228.1 2268828.8 149.6-189.6 6/30/2021 33.58 <Null>
22408 RAY-MW32 22410 RAY-MW32/2 RAYTHEON TECHNOLOGIES CORPORATION Monitoring Well 6039287.583 2267257.657 969-999 6/30/2021 17.47 <Null>
22416 RAY-MW34B 22417 RAY-MW34B/1 RAYTHEON TECHNOLOGIES CORPORATION Monitoring Well 6039046.07 2268346.15 486-536 6/30/2021 18.29 <Null>
22420 RAY-MW35 22423 RAY-MW35/3 RAYTHEON TECHNOLOGIES CORPORATION Monitoring Well 6039878.34 2265861.26 990-1040 6/30/2021 12.69 <Null>
22757 RAY-MW39 22758 RAY-MW39/1 RAYTHEON TECHNOLOGIES CORPORATION Monitoring Well 6034604.76 2267260.25 982-1012 6/30/2021 14.6 <Null>
22759 RAY-MW40 22760 RAY-MW40/1 RAYTHEON TECHNOLOGIES CORPORATION Monitoring Well 6042465.71 2267070.62 930-970 6/30/2021 20.33 <Null>
975 SA-16 976 SA-16/1 SANTA ANA Active Large-System Production Well 6066775.852 2220474.597 305-950 <Null> <Null> Well in exclusion list
964 SA-18 965 SA-18/1 SANTA ANA Active Large-System Production Well 6065423.295 2227343.923 245-623 6/30/2021 6.21 <Null>
983 SA-20 984 SA-20/1 SANTA ANA Active Large-System Production Well 6051943.524 2218208.729 390-940 6/29/2021 -18.5 <Null>
981 SA-21 982 SA-21/1 SANTA ANA Active Large-System Production Well 6051992.474 2218775.287 400-960 6/29/2021 -17.7 <Null>
966 SA-24 967 SA-24/1 SANTA ANA Active Large-System Production Well 6062495.013 2226820.521 352-654 6/30/2021 -4.27 <Null>
19 SA-29 117 SA-29/1 SANTA ANA Active Large-System Production Well 6067350.619 2218664.363 450-1050 7/1/2021 -48.19 <Null>
985 SA-30 986 SA-30/1 SANTA ANA Active Large-System Production Well 6051988.27 2217594.374 440-900 6/29/2021 -22.8 <Null>
979 SA-33 980 SA-33/1 SANTA ANA Active Large-System Production Well 6067018.394 2218472.227 425-935 7/1/2021 -47.2 <Null>
3322 SA-34 3323 SA-34/1 SANTA ANA Active Large-System Production Well 6062544.736 2203955.867 370-520 7/2/2021 -83 <Null>
8823 SA-35 8824 SA-35/1 SANTA ANA Active Large-System Production Well 6058367.7 2224408.129 429.2-1480 5/24/2021 -29 <Null>
1993 SA-36 1994 SA-36/1 SANTA ANA Active Large-System Production Well 6064973.942 2227415.821 570-1290 6/30/2021 -21.75 <Null>
8825 SA-37 8826 SA-37/1 SANTA ANA Active Large-System Production Well 6061211.41 2214947.524 348-1480 5/24/2021 -48 <Null>
18391 SA-39 18393 SA-39/1 SANTA ANA Active Large-System Production Well 6064925.485 2227035.79 590-1290 6/30/2021 -26.3 <Null>
19552 SA-41 19553 SA-41/1 SANTA ANA Active Large-System Production Well 6067142.505 2220423.372 525-978 5/25/2021 -40.58 <Null>
956 SA-26 957 SA-26/1 SANTA ANA Standby Large-System Production Well 6073873.971 2210851.779 330-1140 7/2/2021 -58.82 <Null>
532 SA-27 533 SA-27/1 SANTA ANA Standby Large-System Production Well 6072868.882 2229547.215 396-1140 6/30/2021 -6.9 <Null>
70 SA-28 2629 SA-28/1 SANTA ANA Standby Large-System Production Well 6073394.893 2229877.64 250-980 6/30/2021 11.5 <Null>
18 SA-31 118 SA-31/1 SANTA ANA Standby Large-System Production Well 6078121.42 2217676.874 465-1240 6/22/2021 -11.32 <Null>
8817 SA-38 8818 SA-38/1 SANTA ANA Standby Large-System Production Well 6077082.488 2229427.758 400-1270 6/30/2021 27 <Null>
19550 SA-40 19551 SA-40/1 SANTA ANA Standby Large-System Production Well 6077600.85 2221373.519 550-1305 6/30/2021 -50.75 <Null>
1513 SACC-SA 1514 SACC-SA/1 SANTA ANA COUNTRY CLUB Other Active Production Well 6062143.936 2190413.821 205-406 6/30/2021 -80.85 <Null>
26 SB-BC 123 SB-BC/1 SEAL BEACH Active Large-System Production Well 6016910.323 2228579.652 370-1020 6/29/2021 -62 <Null>
1282 SB-BEV 1283 SB-BEV/1 SEAL BEACH Active Large-System Production Well 6006691.531 2229990.738 400-800 5/26/2021 -58.14 <Null>
21089 SB-LAM 21090 SB-LAM/1 SEAL BEACH Active Large-System Production Well 6012636.62 2232616.404 360-1170 6/29/2021 -50 <Null>
78 SID-3 2619 SID-3/1 SERRANO WATER DISTRICT Active Large-System Production Well 6085523.367 2241664.186 296-584 6/30/2021 49 <Null>
7036 SID-4 7037 SID-4/1 SERRANO WATER DISTRICT Active Large-System Production Well 6088277.371 2242027.33 290-520 <Null> <Null> No static water level
15486 SWD-5 15487 SWD-5/1 SERRANO WATER DISTRICT Active Large-System Production Well 6085860.482 2241857.866 310-720 6/30/2021 53 <Null>
3801 W-3801 3802 W-3801/1 STATE OF CALIFORNIA Inactive Production Well 6061820.651 2190918.886 254-407 6/30/2021 -80.36 <Null>
1927 TIC-194 1931 TIC-194/1 THE IRVINE COMPANY Monitoring Well 6085062.044 2200644.721 562-726 6/29/2021 -62.48 <Null>
3524 TIC-25 3525 TIC-25/1 THE IRVINE COMPANY Monitoring Well 6082128.447 2194002.252 666-760 6/29/2021 -62.21 <Null>
1829 TIC-50 1830 TIC-50/1 THE IRVINE COMPANY Monitoring Well 6089719.969 2212322.221 475-1070 6/29/2021 19.34 <Null>
1331 TIC-99 1332 TIC-99/1 THE IRVINE COMPANY Monitoring Well 6094081.516 2213753.527 346-650 6/29/2021 10.69 <Null>
18770 T-17S4 18771 T-17S4/1 TUSTIN Active Large-System Production Well 6087962.147 2223505.698 200-480 7/1/2021 22 <Null>
950 T-COLU 951 T-COLU/1 TUSTIN Active Large-System Production Well 6083806.737 2220457.042 560-1160 6/30/2021 -16 <Null>
22699 T-ED 22700 T-ED/1 TUSTIN Active Large-System Production Well 6079918.435 2211393.25 500-840 7/1/2021 -58 <Null>
954 T-MS3 955 T-MS3/1 TUSTIN Active Large-System Production Well 6083758.623 2217438.721 300-630 6/30/2021 32 <Null>
15470 T-MS4 15471 T-MS4/1 TUSTIN Active Large-System Production Well 6084025.072 2217344.269 330-880 6/30/2021 9 <Null>
1370 T-NEWP 1371 T-NEWP/1 TUSTIN Active Large-System Production Well 6087882.616 2220782.263 234-267 7/1/2021 31 <Null>
20304 T-PAS 20305 T-PAS/1 TUSTIN Active Large-System Production Well 6080513.128 2217850.37 440-1225 6/30/2021 -11 <Null>
9204 T-VNBG 9205 T-VNBG/1 TUSTIN Active Large-System Production Well 6083087.233 2223256.938 480-900 <Null> <Null> No static water level
958 T-WALN 959 T-WALN/1 TUSTIN Active Large-System Production Well 6084028.458 2212002.398 397-995 7/2/2021 -40 <Null>
948 T-LIVI 949 T-LIVI/1 TUSTIN Inactive Production Well 6085117.397 2221039.77 300-617 6/30/2021 21 <Null>
960 T-PANK 961 T-PANK/1 TUSTIN Inactive Production Well 6087674.762 2213340.094 323-614 6/30/2021 10.88 <Null>
946 T-TUST 947 T-TUST/1 TUSTIN Inactive Production Well 6079841.655 2224465.712 306-776 5/10/2021 0 <Null>
33 T-YORB 2898 T-YORB/1 TUSTIN Inactive Production Well 6082254.093 2227714.437 385-850 6/30/2021 12 <Null>
2139 COS-PLAZ 3551 COS-PLAZ/1 UNKNOWN Monitoring Well 6062779.265 2200089.756 - 6/30/2021 -82.38 <Null>
21187 WRD-SEALBEACH-1 21191 WRD-SEALBEACH-1/4 WATER REPLENISHMENT DISTRICT Monitoring Well 6002807.228 2229796.158 775-795 6/7/2021 -61.51 <Null>
20132 WM-107A 20133 WM-107A/1 WESTMINSTER Active Large-System Production Well 6036756.169 2221201.688 350-980 6/23/2021 -3.71 <Null>
18462 WM-11 18463 WM-11/1 WESTMINSTER Active Large-System Production Well 6030376.492 2221521.749 325-790 6/28/2021 -16 <Null>
15462 WM-125 15463 WM-125/1 WESTMINSTER Active Large-System Production Well 6019490.522 2226357.926 374-860 6/29/2021 -35 <Null>
1250 WM-3 1251 WM-3/1 WESTMINSTER Active Large-System Production Well 6035334.153 2212273.162 285-365 <Null> <Null> Well in exclusion list
987 WM-4 988 WM-4/1 WESTMINSTER Active Large-System Production Well 6041811.441 2216473.787 345-1125 6/30/2021 -10 <Null>
973 WM-6 974 WM-6/1 WESTMINSTER Active Large-System Production Well 6040452.837 2221186.654 176-660 <Null> <Null> Well in exclusion list
19581 WM-75A 19582 WM-75A/1 WESTMINSTER Active Large-System Production Well 6027529.048 2227543.038 410-996 7/1/2021 -18.75 <Null>
2351 WM-RES1 2352 WM-RES1/1 WESTMINSTER Active Large-System Production Well 6034195.466 2226587.136 390-880 6/29/2021 -13.33 <Null>
25 WM-RES2 127 WM-RES2/1 WESTMINSTER Active Large-System Production Well 6022510.924 2225649.817 340-937 6/28/2021 -36 <Null>
1549 WM-SC4 1550 WM-SC4/1 WESTMINSTER Active Large-System Production Well 6024891.234 2228376.544 425-454 6/28/2021 -13 <Null>
1501 WOOD-INLK 1502 WOOD-INLK/1 WOODBRIDGE VILL HOMEOWNER ASSN Inactive Production Well 6090903.001 2195025.511 370-890 6/28/2021 -33.24 <Null>
2602 YLWD-1 2603 YLWD-1/1 YORBA LINDA WATER DISTRICT Standby Large-System Production Well 6083180.423 2261475.297 90-340 6/24/2021 201.25 <Null>
2600 YLWD-10 2601 YLWD-10/1 YORBA LINDA WATER DISTRICT Standby Large-System Production Well 6082573.916 2261063.226 90-406 6/24/2021 199.95 <Null>
2598 YLWD-12 2599 YLWD-12/1 YORBA LINDA WATER DISTRICT Standby Large-System Production Well 6082579.233 2261460.266 80-498 6/24/2021 194.75 <Null>
18764 YLWD-18 18765 YLWD-18/1 YORBA LINDA WATER DISTRICT Standby Large-System Production Well 6082572.851 2261290.355 250-570 6/24/2021 202 <Null>
19554 YLWD-19 19555 YLWD-19/1 YORBA LINDA WATER DISTRICT Standby Large-System Production Well 6082841.553 2261300.166 280-581 6/24/2021 200.7 <Null>
21243 YLWD-20 21244 YLWD-20/1 YORBA LINDA WATER DISTRICT Standby Large-System Production Well 6083164.301 2258232.562 225-570 6/24/2021 227.32 <Null>
22794 YLWD-21 22795 YLWD-21/1 YORBA LINDA WATER DISTRICT Standby Large-System Production Well 6082500.179 2259535.434 210-510 6/24/2021 211.25 <Null>
2592 YLWD-5 2593 YLWD-5/1 YORBA LINDA WATER DISTRICT Standby Large-System Production Well 6083146.35 2261304.493 90-340 6/24/2021 200.5 <Null>
2596 YLWD-7 2597 YLWD-7/1 YORBA LINDA WATER DISTRICT Standby Large-System Production Well 6082874.48 2261508.045 137-259 6/24/2021 197.25 <Null>
4 of 4

Wells Used to Develop 2021 Groundwater Contour Maps in Orange County Groundwater BasinDeep Aquifer Wells (Model Layer 3)STAID1 WELLNM STAID STANAME OWNERNM GIS_SYMNM NAD83_X NAD83_Y PERF_ZONE SHORTDATE WLELEV NAD83_X NAD83_Y
19013 CSF-1 19132 CSF-1/1/WB1/MP6 CA. STATE UNIV., FULLERTON Multiport Monitoring Well 6064343.084 2270822.497 MP6 (718) 7/6/2021 108.52 6064343.084 2270822.497
8556 F-COYO2 8557 F-COYO2/1 FULLERTON Inactive Production Well 6040365.852 2271034.694 309-919 6/30/2021 85.12 6040365.852 2271034.694
1387 SNDR-SA 1388 SNDR-SA/1 I & G 4 HUTTON LLC-ASSOC. Other Active Production Well 6070727.949 2200897.503 930-990 6/30/2021 -71.45 6070727.949 2200897.503
19366 IRWD-110 19367 IRWD-110/1 IRVINE RANCH WATER DISTRICT Active Large-System Production Well 6100371.561 2196315.961 555-1015 <Null> <Null> 6100371.561 2196315.961
11474 IRWD-3 11475 IRWD-3/1 IRVINE RANCH WATER DISTRICT Active Large-System Production Well 6072630.329 2206528.469 483.53-1249.9 6/23/2021 -64.9 6072630.329 2206528.469
18510 IRWD-C8 18511 IRWD-C8/1 IRVINE RANCH WATER DISTRICT Active Large-System Production Well 6062825.396 2204153.762 1080-1982 <Null> <Null> 6062825.396 2204153.762
18512 IRWD-C9 18513 IRWD-C9/1 IRVINE RANCH WATER DISTRICT Active Large-System Production Well 6062422.93 2205055.852 1055-1930 <Null> <Null> 6062422.93 2205055.852
22065 IRWD-52 22066 IRWD-52/1 IRVINE RANCH WATER DISTRICT Inactive Production Well 6073545.847 2203710.984 635-1290 6/29/2021 -62.3 6073545.847 2203710.984
1941 TIC-82 1942 TIC-82/1 IRVINE RANCH WATER DISTRICT Monitoring Well 6090541.059 2199639.983 410-1002 6/29/2021 -8.83 6090541.059 2199639.983
1391 ET-2 1392 ET-2/1 IRVINE RANCH WATER DISTRICT Other Active Production Well 6090684.562 2199800.983 280-1080 <Null> <Null> 6090684.562 2199800.983
1389 TIC-106 1390 TIC-106/1 IRVINE RANCH WATER DISTRICT Other Active Production Well 6084967 2197177.989 405-715 <Null> <Null> 6084967 2197177.989
15780 MCWD-11 15781 MCWD-11/1 MESA WATER DISTRICT Active Large-System Production Well 6055237.67 2197733.913 330-1000 7/7/2021 -86.57 6055237.67 2197733.913
2135 MCWD-6 2136 MCWD-6/1 MESA WATER DISTRICT Active Large-System Production Well 6055652.152 2197722.22 310-1025 <Null> <Null> 6055652.152 2197722.22
1357 MCAS-6 1358 MCAS-6/1 ORANGE COUNTY WATER DISTRICT Monitoring Well 6094225.41 2191657.016 167-222 6/28/2021 76.17 6094225.41 2191657.016
2867 OCWD-CTG1 2871 OCWD-CTG1/4 ORANGE COUNTY WATER DISTRICT Monitoring Well 6061970.346 2206073.478 1060-1220 6/30/2021 -81.88 6061970.346 2206073.478
2872 OCWD-CTG5 2875 OCWD-CTG5/3 ORANGE COUNTY WATER DISTRICT Monitoring Well 6062530.714 2206394.591 1040-1120 8/4/2021 -87.56 6062530.714 2206394.591
2876 OCWD-CTK1 2879 OCWD-CTK1/3 ORANGE COUNTY WATER DISTRICT Monitoring Well 6062486.259 2205158.852 1260-1315 6/30/2021 -83.03 6062486.259 2205158.852
22786 OCWD-MRSH 22854 OCWD-MRSH/1 ORANGE COUNTY WATER DISTRICT Monitoring Well 6074220 2188672.3 199-219 6/29/2021 -28.15 6074220 2188672.3
547 AMD-1 21142 AMD-1/1/WB2/MP10 ORANGE COUNTY WATER DISTRICT Multiport Monitoring Well 6073916.932 2258572.091 MP10 (1394) 6/21/2021 139.96 6073916.932 2258572.091
565 AMD-2 22211 AMD-2/1/WB2/MP10 ORANGE COUNTY WATER DISTRICT Multiport Monitoring Well 6066705.21 2254540.618 MP10 (1444) 6/29/2021 104.23 6066705.21 2254540.618
7031 AMD-4 7111 AMD-4/1/WB1/MP11 ORANGE COUNTY WATER DISTRICT Multiport Monitoring Well 6050716.117 2255097.562 MP11 (1409) 6/28/2021 60.28 6050716.117 2255097.562
7295 AMD-5 7324 AMD-5/1/WB1/MP11 ORANGE COUNTY WATER DISTRICT Multiport Monitoring Well 6060070.244 2248962.576 MP11 (1324) 6/28/2021 82.65 6060070.244 2248962.576
8596 AMD-7 8761 AMD-7/1/WB1/MP14 ORANGE COUNTY WATER DISTRICT Multiport Monitoring Well 6049188.026 2247218.215 MP14 (1424) 6/28/2021 30.68 6049188.026 2247218.215
9682 AMD-8 9916 AMD-8/1/WB1/MP15 ORANGE COUNTY WATER DISTRICT Multiport Monitoring Well 6033488.697 2249624.328 MP15 (2014) 7/12/2021 -13.155 6033488.697 2249624.328
9831 BPM-1 9993 BPM-1/1/WB1/MP14 ORANGE COUNTY WATER DISTRICT Multiport Monitoring Well 6022348.508 2259541.566 MP14 (2109) 7/12/2021 -25.24 6022348.508 2259541.566
9832 BPM-2 10188 BPM-2/1/WB1/MP15 ORANGE COUNTY WATER DISTRICT Multiport Monitoring Well 6025195.413 2246739.597 MP15 (2173) 7/12/2021 -23.16 6025195.413 2246739.597
685 CB-1 8794 CB-1/1/WB2/MP9 ORANGE COUNTY WATER DISTRICT Multiport Monitoring Well 6044695.232 2253837.186 MP9 (1463) 7/6/2021 29.14 6044695.232 2253837.186
5155 COSM-1 7156 COSM-1/1/WB1/MP14 ORANGE COUNTY WATER DISTRICT Multiport Monitoring Well 6055253.401 2197825.036 MP14 (1599) 6/30/2021 -77.7 6055253.401 2197825.036
719 FFS-1 14248 FFS-1/1/WB2/MP8 ORANGE COUNTY WATER DISTRICT Multiport Monitoring Well 6061436.461 2262022.62 MP8 (1420) 7/6/2021 88.03 6061436.461 2262022.62
1291 FVM-1 15700 FVM-1/1/WB2/MP17 ORANGE COUNTY WATER DISTRICT Multiport Monitoring Well 6047178.815 2210990.613 MP17 (1587) 6/22/2021 -29.3 6047178.815 2210990.613
7297 GGM-1 10033 GGM-1/1/WB1/MP13 ORANGE COUNTY WATER DISTRICT Multiport Monitoring Well 6045688.299 2230864.24 MP13 (2011) 7/8/2021 -13.6 6045688.299 2230864.24
8923 GGM-2 9057 GGM-2/1/WB1/MP13 ORANGE COUNTY WATER DISTRICT Multiport Monitoring Well 6026525.607 2230233.156 MP13 (1994) 6/22/2021 -15.01 6026525.607 2230233.156
7178 HBM-1 8443 HBM-1/1/WB1/MP11 ORANGE COUNTY WATER DISTRICT Multiport Monitoring Well 6031700.722 2216385.252 MP11 (1464) 7/2/2021 -25.08 6031700.722 2216385.252
720 IDM-1 18984 IDM-1/1/WB2/MP9 ORANGE COUNTY WATER DISTRICT Multiport Monitoring Well 6099572.243 2207081.537 MP9 (993) 7/7/2021 -10.34 6099572.243 2207081.537
9830 IDM-2 10066 IDM-2/1/WB1/MP8 ORANGE COUNTY WATER DISTRICT Multiport Monitoring Well 6080705.598 2209836.046 MP8 (890) 7/7/2021 -53.81 6080705.598 2209836.046
11949 LAM-1 12031 LAM-1/1/WB1/MP12 ORANGE COUNTY WATER DISTRICT Multiport Monitoring Well 6009581.587 2238043.705 MP12 (1613) 6/15/2021 -36.83 6009581.587 2238043.705
758 MCAS-7 11831 MCAS-7/1/WB3/MP6 ORANGE COUNTY WATER DISTRICT Multiport Monitoring Well 6093900.827 2194418.586 MP6 (802) 7/7/2021 21.5 6093900.827 2194418.586
756 SAR-1 9269 SAR-1/1/WB2/MP13 ORANGE COUNTY WATER DISTRICT Multiport Monitoring Well 6070684.206 2250425.314 MP13 (1374) 6/29/2021 85.58 6070684.206 2250425.314
761 SAR-2 11995 SAR-2/1/WB2/MP12 ORANGE COUNTY WATER DISTRICT Multiport Monitoring Well 6069096.008 2245410.807 MP12 (1351) 6/29/2021 74.07 6069096.008 2245410.807
762 SAR-3 9471 SAR-3/1/WB2/MP11 ORANGE COUNTY WATER DISTRICT Multiport Monitoring Well 6066892.02 2238409.284 MP11 (1393) 6/24/2021 58.87 6066892.02 2238409.284
763 SAR-4 14637 SAR-4/1/WB2/MP10 ORANGE COUNTY WATER DISTRICT Multiport Monitoring Well 6065370.966 2233375.154 MP10 (1398) 6/29/2021 -9.56 6065370.966 2233375.154
1289 SAR-5 21226 SAR-5/1/WB3/MP11 ORANGE COUNTY WATER DISTRICT Multiport Monitoring Well 6062597.607 2227874.211 MP11 (1735) 6/30/2021 -15.3 6062597.607 2227874.211
7181 SAR-9 9807 SAR-9/1/WB1/MP12 ORANGE COUNTY WATER DISTRICT Multiport Monitoring Well 6058380.802 2221450.982 MP12 (1724) 6/30/2021 -28.443 6058380.802 2221450.982
9686 SBM-1 9730 SBM-1/1/WB1/MP8 ORANGE COUNTY WATER DISTRICT Multiport Monitoring Well 6016566.11 2224523.54 MP8 (1256) 6/15/2021 -28.045 6016566.11 2224523.54
1001 SC-2 6242 SC-2/1/WB2/MP10 ORANGE COUNTY WATER DISTRICT Multiport Monitoring Well 6086489.295 2237887.557 MP10 (664) <Null> <Null> 6086489.295 2237887.557
1005 SC-3 8841 SC-3/1/WB2/MP5 ORANGE COUNTY WATER DISTRICT Multiport Monitoring Well 6081074.85 2229940.413 MP5 (1022) 7/1/2021 48.56 6081074.85 2229940.413
2888 SC-4 6300 SC-4/1/WB1/MP8 ORANGE COUNTY WATER DISTRICT Multiport Monitoring Well 6082605.785 2235080.546 MP8 (830) 7/1/2021 44.34 6082605.785 2235080.546
2854 SC-5 6336 SC-5/1/WB1/MP10 ORANGE COUNTY WATER DISTRICT Multiport Monitoring Well 6077454.866 2225543.458 MP10 (1430) 7/1/2021 -27.75 6077454.866 2225543.458
9684 SC-6 9763 SC-6/1/WB1/MP11 ORANGE COUNTY WATER DISTRICT Multiport Monitoring Well 6066813.288 2216032.113 MP11 (1684) 7/7/2021 -50.96 6066813.288 2216032.113
1293 WMM-1 19892 WMM-1/1/WB2/MP16 ORANGE COUNTY WATER DISTRICT Multiport Monitoring Well 6038251.554 2221751.195 MP16 (1745) 7/8/2021 -23.94 6038251.554 2221751.195
1883 TIC-91 1884 TIC-91/1 PRIVATE Destroyed and Sealed Well 6075952.042 2204613.252 403-1208 <Null> <Null> 6075952.042 2204613.252
22391 RAY-MW25 22392 RAY-MW25/1 RAYTHEON TECHNOLOGIES CORPORATION Monitoring Well 6042037.4 2268206.9 449.4-479.8 6/30/2021 30.11 6042037.4 2268206.9
22408 RAY-MW32 22411 RAY-MW32/3 RAYTHEON TECHNOLOGIES CORPORATION Monitoring Well 6039287.583 2267257.657 1070-1100 6/30/2021 26.62 6039287.583 2267257.657
8817 SA-38 8818 SA-38/1 SANTA ANA Standby Large-System Production Well 6077082.488 2229427.758 400-1270 6/30/2021 27 6077082.488 2229427.758
1873 TIC-93 1874 TIC-93/1 THE IRVINE COMPANY Destroyed and Sealed Well 6080030.447 2205228.503 400-1120 <Null> <Null> 6080030.447 2205228.503
1927 TIC-194 1931 TIC-194/1 THE IRVINE COMPANY Monitoring Well 6085062.044 2200644.721 562-726 6/29/2021 -62.48 6085062.044 2200644.721
3524 TIC-25 3525 TIC-25/1 THE IRVINE COMPANY Monitoring Well 6082128.447 2194002.252 666-760 6/29/2021 -62.21 6082128.447 2194002.252
1829 TIC-50 1830 TIC-50/1 THE IRVINE COMPANY Monitoring Well 6089719.969 2212322.221 475-1070 6/29/2021 19.34 6089719.969 2212322.221
958 T-WALN 959 T-WALN/1 TUSTIN Active Large-System Production Well 6084028.458 2212002.398 397-995 7/2/2021 -40 6084028.458 2212002.398
21187 WRD-SEALBEACH-1 21192 WRD-SEALBEACH-1/5 WATER REPLENISHMENT DISTRICT Monitoring Well 6002807.228 2229796.158 1020-1040 6/7/2021 -39.7 6002807.228 2229796.158
3518 WOOD-ISLK 3519 WOOD-ISLK/1 WOODBRIDGE VILL HOMEOWNER ASSN Inactive Production Well 6089676.955 2191898.777 210-800 6/28/2021 26.83 6089676.955 2191898.777
1 of 1