Orange Line - CapMetro
18
Your Plan, Your Orange Line Summary Report April 2020
-
Upload
khangminh22 -
Category
Documents
-
view
0 -
download
0
Transcript of Orange Line - CapMetro
Your Plan, Your Orange Line
Summary Report April 2020
CONTENTSWHY PLAN THE ORANGE LINE
CORRIDOR PLANNING & ROUTE EVOLUTION
EXPLORING OUR OPTIONS FOR A TUNNEL
HOW IT ALL COMES TOGETHER
HOW WE GOT HERE
WHO IS INVOLVED
WHAT WE HEARD
HOW IT COULD BE IMPLEMENTED
ORANGE LINE AT A GLANCE
WHAT ’S IN IT FOR YOU
WHAT ’S NEXT
1
2
4
5
6
7
9
10
11
12
14
The Project Connect Vision Plan identified two HCT corridors - the Blue Line Corridor and the Orange Line Corridor - as the backbone of the future system. Capital Metro initiated the Orange Line Corridor Study in 2019 to better define Orange Line HCT, and to explore how it could advance as an individual investment (to attract federal funds) and as a part of the Capital Metro system (as part of the local and regional planning process). The Project Connect System Plan will be significantly advanced following the adoption of the Orange Line Locally Preferred Alternative (LPA).
This document provides an overview of the process used to evaluate HCT in Austin and the path to develop a proposed LPA, including how public and agency input was used to craft the proposed LPA. Key features and benefits of the LPA are illustrated, and future actions on the path toward implementation are outlined.
WHY PLAN THE ORANGE LINE
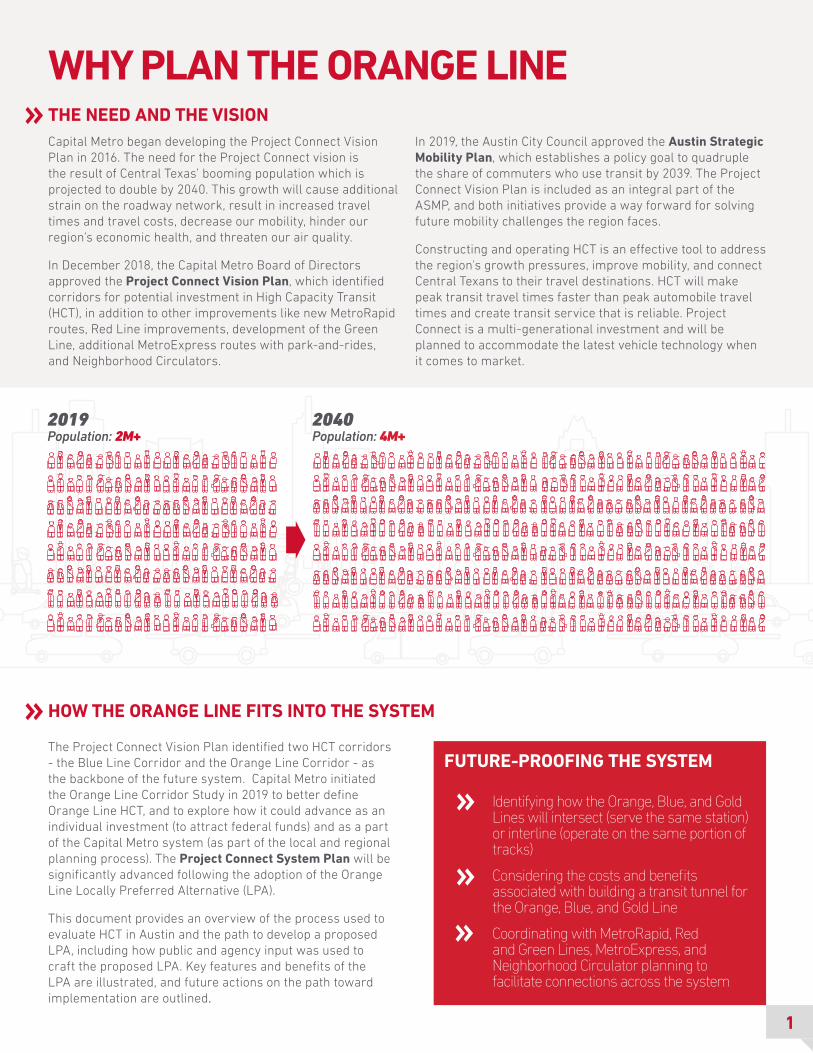
2019Population: 2M+
2040Population: 4M+
Coordinating with MetroRapid, Red and Green Lines, MetroExpress, and Neighborhood Circulator planning to facilitate connections across the system
Identifying how the Orange, Blue, and Gold Lines will intersect (serve the same station) or interline (operate on the same portion of tracks)
Considering the costs and benefits associated with building a transit tunnel for the Orange, Blue, and Gold Line
HOW THE ORANGE LINE FITS INTO THE SYSTEM
THE NEED AND THE VISION
FUTURE-PROOFING THE SYSTEM
Capital Metro began developing the Project Connect Vision Plan in 2016. The need for the Project Connect vision is the result of Central Texas’ booming population which is projected to double by 2040. This growth will cause additional strain on the roadway network, result in increased travel times and travel costs, decrease our mobility, hinder our region’s economic health, and threaten our air quality.
In December 2018, the Capital Metro Board of Directors approved the Project Connect Vision Plan, which identified corridors for potential investment in High Capacity Transit (HCT), in addition to other improvements like new MetroRapid routes, Red Line improvements, development of the Green Line, additional MetroExpress routes with park-and-rides, and Neighborhood Circulators.
In 2019, the Austin City Council approved the Austin Strategic Mobility Plan, which establishes a policy goal to quadruple the share of commuters who use transit by 2039. The Project Connect Vision Plan is included as an integral part of the ASMP, and both initiatives provide a way forward for solving future mobility challenges the region faces.
Constructing and operating HCT is an effective tool to address the region's growth pressures, improve mobility, and connect Central Texans to their travel destinations. HCT will make peak transit travel times faster than peak automobile travel times and create transit service that is reliable. Project Connect is a multi-generational investment and will be planned to accommodate the latest vehicle technology when it comes to market.
1
SoCo
Oltorf
St. Edward’s University
Stassney
William Cannon
Slaughter
South Congress Transit Center
UT Mall (24th)UT Mall (24th)
Rundberg
Braker
Parmer
Triangle
Hyde Park (38th)
Hemphill Park (29th)
Capitol West
Wooldridge Square
Koenig
Tech Ridge
North Lamar Transit Center
Crestview
AUS
AirportFa
ro
Montopolis
Rivers
ide
Waterfront
7th/Trinity
Capitol East
Hancock
St. David’s
Clarkson
Medical School
Downtown
MACC/Rainey
Travis HeightsLakeshore
Republic Square
UT East
ACC Highland
Metro C
enter
Auditorium ShoresAuditorium Shores
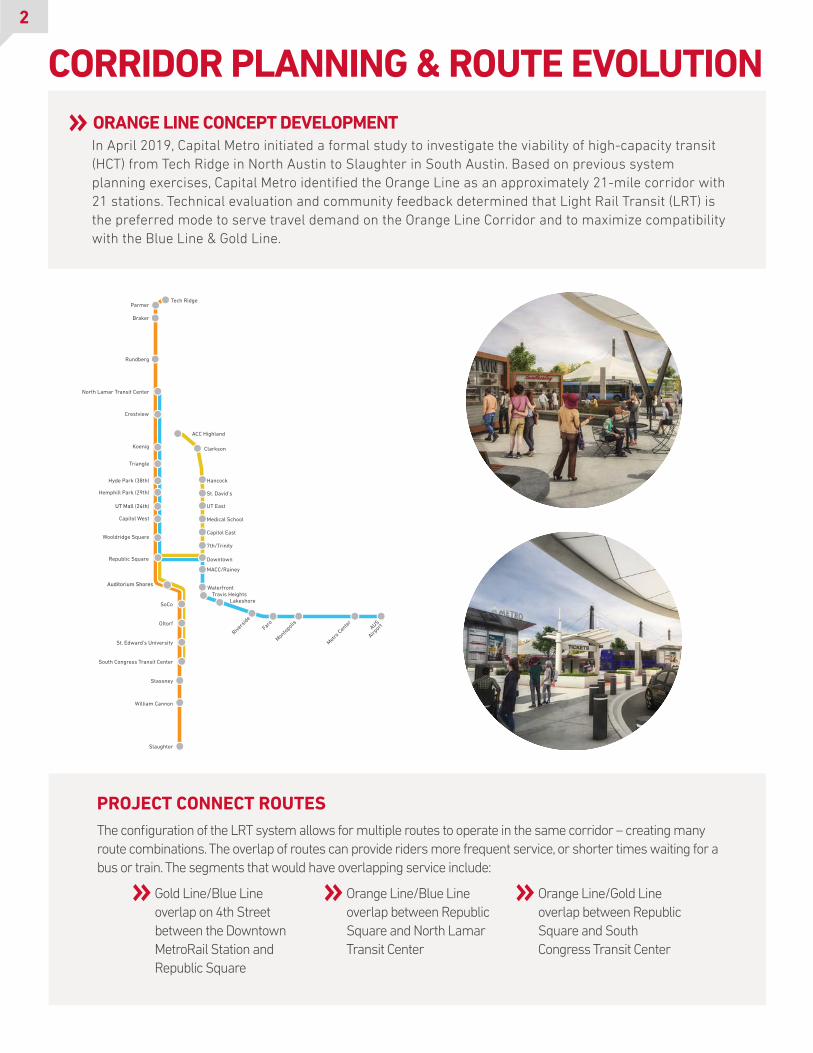
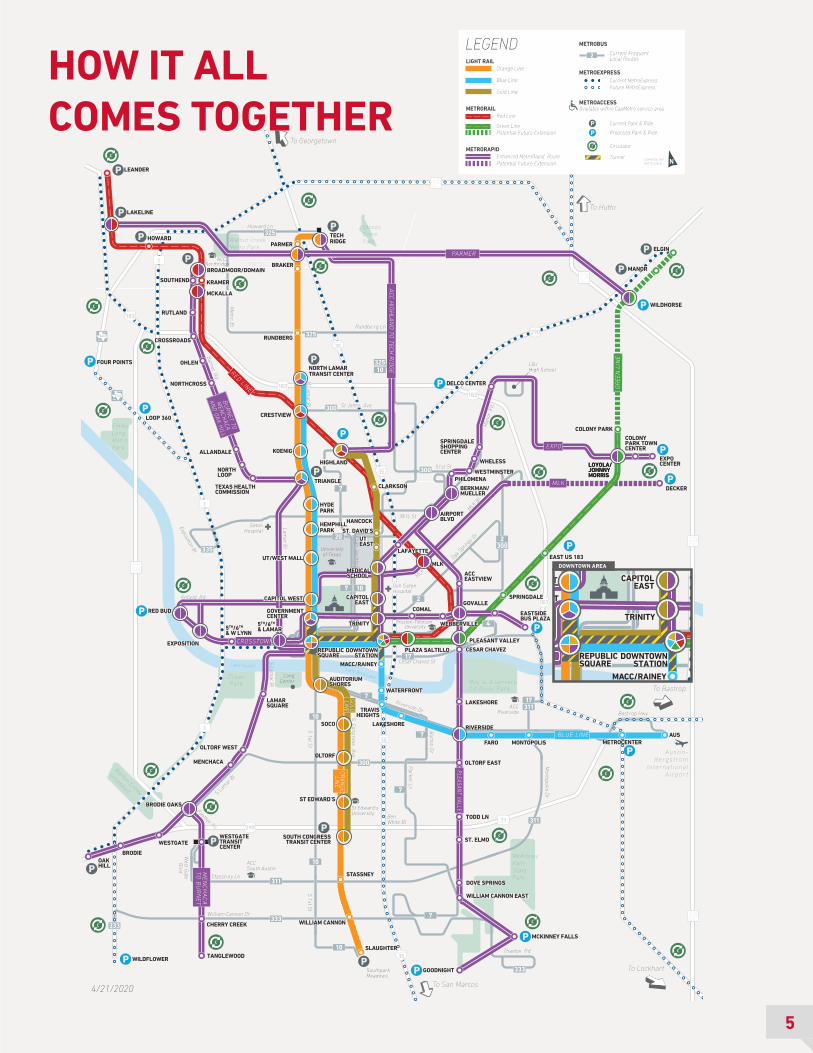
CORRIDOR PLANNING & ROUTE EVOLUTIONORANGE LINE CONCEPT DEVELOPMENTIn April 2019, Capital Metro initiated a formal study to investigate the viability of high-capacity transit (HCT) from Tech Ridge in North Austin to Slaughter in South Austin. Based on previous system planning exercises, Capital Metro identified the Orange Line as an approximately 21-mile corridor with 21 stations. Technical evaluation and community feedback determined that Light Rail Transit (LRT) is the preferred mode to serve travel demand on the Orange Line Corridor and to maximize compatibility with the Blue Line & Gold Line.
PROJECT CONNECT ROUTES
Gold Line/Blue Line overlap on 4th Street between the Downtown MetroRail Station and Republic Square
Orange Line/Blue Line overlap between Republic Square and North Lamar Transit Center
Orange Line/Gold Line overlap between Republic Square and South Congress Transit Center
The configuration of the LRT system allows for multiple routes to operate in the same corridor – creating many route combinations. The overlap of routes can provide riders more frequent service, or shorter times waiting for a bus or train. The segments that would have overlapping service include:
2
BETTER TRANSFERS AT KEY POINTS
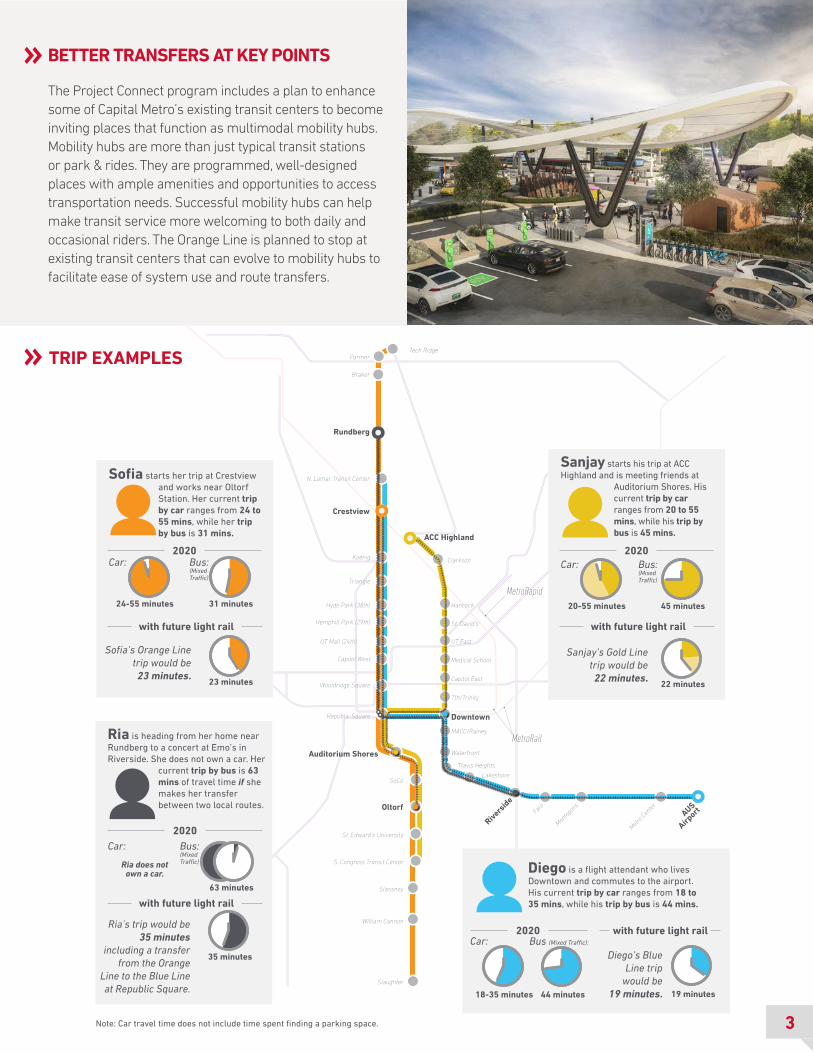
The Project Connect program includes a plan to enhance some of Capital Metro’s existing transit centers to become inviting places that function as multimodal mobility hubs. Mobility hubs are more than just typical transit stations or park & rides. They are programmed, well-designed places with ample amenities and opportunities to access transportation needs. Successful mobility hubs can help make transit service more welcoming to both daily and occasional riders. The Orange Line is planned to stop at existing transit centers that can evolve to mobility hubs to facilitate ease of system use and route transfers.
Note: Car travel time does not include time spent finding a parking space.
Sofia starts her trip at Crestview and works near Oltorf Station. Her current trip by car ranges from 24 to 55 mins, while her trip by bus is 31 mins.
Sofia’s Orange Line trip would be23 minutes.
Car: Bus:(MixedTra�c)
23 minutes
31 minutes24-55 minutes
Sanjay starts his trip at ACCHighland and is meeting friends at
Auditorium Shores. His current trip by car ranges from 20 to 55 mins, while his trip by bus is 45 mins.
Sanjay’s Gold Line trip would be22 minutes.
Car: Bus:(MixedTra�c)
22 minutes
45 minutes20-55 minutes
Ria is heading from her home near Rundberg to a concert at Emo’s in Riverside. She does not own a car. Her
current trip by bus is 63 mins of travel time if she makes her transferbetween two local routes.
Ria’s trip would be35 minutes
including a transfer from the Orange
Line to the Blue Line at Republic Square.
Car: Bus:(MixedTra�c)
2020
with future light rail
35 minutes
63 minutes
Ria does not own a car. Diego is a flight attendant who lives
Downtown and commutes to the airport.His current trip by car ranges from 18 to35 mins, while his trip by bus is 44 mins.
Diego’s Blue Line trip
would be19 minutes.
Car: Bus (Mixed Tra�c):
19 minutes44 minutes18-35 minutes
Oltorf
Crestview
Rundberg
AUS
Airport
Rivers
ide
MACC/Rainey
Auditorium Shores
ACC Highland
SoCo
St. Edward’s University
William Cannon
Slaughter
S. Congress Transit Center
Stassney
UT Mall (24th)
Braker
Parmer
Triangle
Hyde Park (38th)
Hemphill Park (29th)
Capitol West
Wooldridge Square
Koenig
Tech Ridge
N. Lamar Transit Center
Faro
Montop
olis
Waterfront
7th/Trinity
Capitol East
Hancock
St. David’s
Clarkson
Medical School
Downtown
Travis Heights
Lakeshore
Republic Square
UT East
Metro C
enter
2020
with future light rail
2020
with future light rail
2020 with future light rail
MetroRapid
MetroRail
TRIP EXAMPLES
3
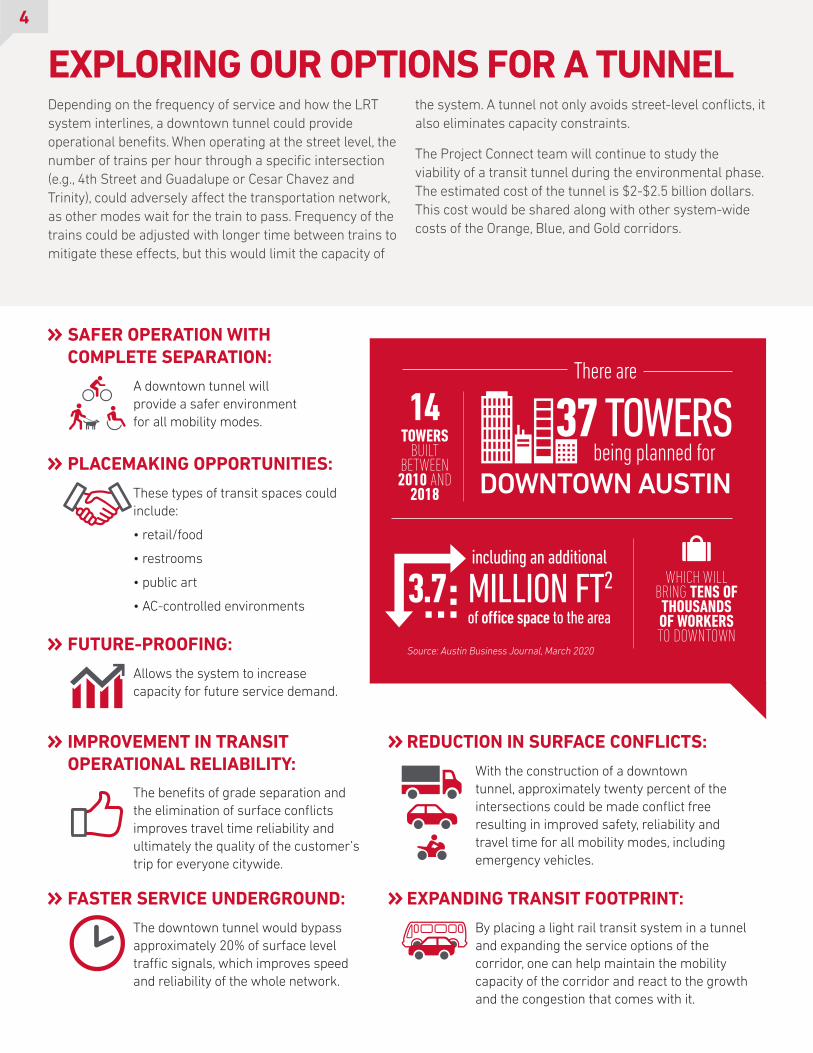
Depending on the frequency of service and how the LRT system interlines, a downtown tunnel could provide operational benefits. When operating at the street level, the number of trains per hour through a specific intersection (e.g., 4th Street and Guadalupe or Cesar Chavez and Trinity), could adversely affect the transportation network, as other modes wait for the train to pass. Frequency of the trains could be adjusted with longer time between trains to mitigate these effects, but this would limit the capacity of
the system. A tunnel not only avoids street-level conflicts, it also eliminates capacity constraints.
The Project Connect team will continue to study the viability of a transit tunnel during the environmental phase. The estimated cost of the tunnel is $2-$2.5 billion dollars. This cost would be shared along with other system-wide costs of the Orange, Blue, and Gold corridors.
EXPLORING OUR OPTIONS FOR A TUNNEL
Source: Austin Business Journal, March 2020
3.7 MILLION FT2including an additional
of office space to the area
WHICH WILL BRING TENS OF THOUSANDS OF WORKERS TO DOWNTOWN
Allows the system to increase capacity for future service demand.
FUTURE-PROOFING:
A downtown tunnel will provide a safer environment for all mobility modes.
SAFER OPERATION WITH COMPLETE SEPARATION:
There are
being planned for37 TOWERS
DOWNTOWN AUSTIN
14TOWERS
BUILT BETWEEN 2010 AND
2018These types of transit spaces could include:
• retail/food
• restrooms
• public art
• AC-controlled environments
PLACEMAKING OPPORTUNITIES:
The downtown tunnel would bypass approximately 20% of surface level traffic signals, which improves speed and reliability of the whole network.
FASTER SERVICE UNDERGROUND:
With the construction of a downtown tunnel, approximately twenty percent of the intersections could be made conflict free resulting in improved safety, reliability and travel time for all mobility modes, including emergency vehicles.
REDUCTION IN SURFACE CONFLICTS:
The benefits of grade separation and the elimination of surface conflicts improves travel time reliability and ultimately the quality of the customer’s trip for everyone citywide.
IMPROVEMENT IN TRANSIT OPERATIONAL RELIABILITY:
By placing a light rail transit system in a tunnel and expanding the service options of the corridor, one can help maintain the mobility capacity of the corridor and react to the growth and the congestion that comes with it.
EXPANDING TRANSIT FOOTPRINT:
4
Barton Creek
Greenbelt
Walnut Creek Metro Park
Emma Long Metro Park
McKinney Falls State Park
Stoney CreekPark
Huston-TillotsonUniversity
Howard Ln
Rundbe rg Ln
51st St
MLK B
l
St Johns Ave
Enfield Rd
Exposition Bl
38½ St
San Jacinto B
l
N Lam
ar Bl
Burnet Rd
Riverside Dr
Montopolis D
r
Bast rop Hwy
BenWhite Bl
West G
ate B
lvd
Burton D
r
S Cong
ress Ave
Parker Ln
Thaxton Rd
S Lam
ar Bl
S Lam
ar B
l
Panther Trl
Metric B
l
BRAKER LN
Stassn ey Ln
S 1st S
tS
1st St
Cesar Chavez St
ACCSouth Austin
SetonHospital
ACCRiverside
ACCNorthridge
Universityof Texas
St Edward’sUniversity
LBJ High School
LongCenter
Zi lkerPar k Roy G. G uer rero
CO River Par k
Lady Bird Lake
Austin-Bergstrom
InternationalA irpor t
TECHRIDGE
SouthparkMeadows
Man
or R
d
Oak S
prings
Dr
Lamar B
l
William Cannon Dr
Lake Austin
MLK
45TOLL
130TOLL
130TOLL
130TOLL
360LOOP
Dell S etonHospital
DECKERMLKMLK
UT EAST
HANCOCK
CLARKSON
ST. DAVID’S
MEDICAL SCHOOL
CAPITOLEAST
TRINITY
GOLD
LINE
GOLD
LINE
DOWNTOWNSTATION
PLAZA SALTILLO
CRESTVIEW
MCKALLA
KRAMER
BROADMOOR/DOMAIN
HOWARD
LEANDER
MLK
RED LINE
RED LINE
HIGHLAND
EG
DIR
HCET
OT
D
NAL
HGI
H CC
AE
GDI
R HC
ET
OT
DN
ALH
GIH
CCA
AUSMETROCENTERMONTOPOLISFARO
LAKESHORE
TRAVISHEIGHTS
WATERFRONT
MACC/RAINEY
BLUE LINEBLUE LINE
WILDHORSE
MANOR
ELGIN
COLONY PARK
EAST US 183
PLAZA SALTILLO
PLEASANT VALLEY
SPRINGDALE
ENIL
NEER
GE
NIL NEE
RG
LOYOLA/JOHNNYMORRIS
BERKMAN/MUELLER
AIRPORTBLVD
ACCEASTVIEW
CESAR CHAVEZ
LAKESHORE
RIVERSIDE
OLTORF EAST
TODD LN
ST. ELMO
DOVE SPRINGS
WILLIAM CANNON EAST
MCKINNEY FALLS
GOODNIGHT
PLEASANT VALLEYPLEASANT VALLEY
GOVALLE
DELCO CENTER
WHELESS
SPRINGDALESHOPPING CENTER
WESTMINSTERPHILOMENA
LAFAYETTE
EXPO CENTER
COLONY PARK TOWN CENTER
LOYOLA/JOHNNYMORRIS
EXPOEXPO
SOUTHEND
RUTLAND
CROSSROADS
OHLEN
NORTHCROSS
ALLANDALE
NORTHLOOP
TEXAS HEALTHCOMMISSION
LAMARSQUARE
OLTORF WEST
MENCHACA
BRODIE OAKS
WESTGATE
BRODIE
CHERRY CREEK
TANGLEWOODWILDFLOWER
OAKHILL
WESTGATETRANSIT CENTER
ME
NC
HA
CA
T
O B
UR
NE
TM
EN
CH
AC
A
TO
BU
RN
ET
BU
RN
ET TO
MEN
CHACA
AND
OAK HILL
BU
RN
ET TO
MEN
CHACA
AND
OAK HILL
SLAUGHTER
HEMPHILL PARK
HYDEPARK
KOENIG
NORTH LAMARTRANSIT CENTER
RUNDBERG
BRAKER
CAPITOL WEST
SOCO
OLTORF
ST EDWARD’S
SOUTH CONGRESSTRANSIT CENTER
STASSNEY
WILLIAM CANNON
PARMER
AUDITORIUM SHORES
TRIANGLE
UT/WEST MALL
REPUBLICSQUARE
ORAN
GE LIN
EOR
ANGE
LINE
RED BUD
EXPOSITION
5TH/6TH
& LAMAR
GOVERNMENTCENTER
COMAL
WEBBERVILLE
GOVALLE
EASTSIDE BUS PLAZA
5TH/6TH
& W LYNNCROSSTOWNCROSSTOWN
PARMERPARMER
LAKELINE
333
300
333
333
300
300
300
335
7
7
7
20
10
10
10
10
7
7
4
2
2
17
17
7
10325
325
325
311
311
311
LOOP 360
FOUR POINTS
To San Marcos
To Lockhart
To Bastrop
To Hutto
To Georgetown
SCHEMATIC MAPNOT TO SCALE
Orange Line
Blue Line
Gold Line
Current Frequent Local Routes2
LEGEND
Red Line
Green Line
Enhanced MetroRapid RoutePotential Future Extension
Proposed Park & Ride
Current Park & Ride
Circulator
Current MetroExpressFuture MetroExpress
METROBUS
LIGHT RAIL
METRORAIL
METRORAPID
METROEXPRESS
METROACCESSAvailable within CapMetro service area
Tunnel
Potential Future Extension
4/21/2020
Barton Creek
Greenbelt
Walnut Creek Metro Park
Emma Long Metro Park
Stoney CreekPark
Huston-TillotsonUniversity
Howard Ln
Rundbe rg Ln
St Johns Ave
Enfield Rd
Exposition Bl
38½ St
San Jacinto B
l
N Lam
ar Bl
Burnet Rd
Riverside Dr
BenWhite Bl
West G
ate B
lvd
S Cong
ress Ave
Parker Ln
S Lam
ar Bl
S Lam
ar B
l
Panther Trl
Metric B
l
BRAKER LN
Stassn ey Ln
S 1st S
tS
1st St
Cesar Chavez St
ACCSouth Austin
SetonHospital
ACCNorthridge
Universityof Texas
St Edward’sUniversity
LongCenter
Zi lkerPar k
Lady Bird Lake
TECHRIDGE
Lamar B
l
Lake Austin
360LOOP
Dell S etoHospital
UT EAST
HANCOCK
CLARKSON
ST. DAVID’S
MEDICAL SCHOOL
CAPITOLEAST
TRINITY
GOLD
LINE
GOLD
LINE
DOWNTOWNSTATION
PLAZA SALTILLO
CRESTVIEW
MCKALLA
KRAMER
BROADMOOR/DOMAIN
HOWARD
RED LINE
RED LINE
HIGHLAND
EG
DIR
HCET
OT
D
NAL
HGI
H CC
AE
GDI
R HC
ET
OT
DN
ALH
GIH
CCA
LAKESHORE
TRAVISHEIGHTS
WATERFRONT
MACC/RAINEY
PLAZA SALTILLO
LAFAYETTE
SOUTHEND
RUTLAND
CROSSROADS
OHLEN
NORTHCROSS
ALLANDALE
NORTHLOOP
TEXAS HEALTHCOMMISSION
LAMARSQUARE
OLTORF WEST
MENCHACA
BRODIE OAKS
WESTGATE
BRODIEOAKHILL
WESTGATETRANSIT CENTER
ME
NC
HA
CA
T
O B
UR
NE
TM
EN
CH
AC
A
TO
BU
RN
ET
BU
RN
ET TO
MEN
CHACA
AND
OAK HILL
BU
RN
ET TO
MEN
CHACA
AND
OAK HILL
HEMPHILL PARK
HYDEPARK
KOENIG
NORTH LAMARTRANSIT CENTER
RUNDBERG
BRAKER
CAPITOL WEST
SOCO
OLTORF
ST EDWARD’S
SOUTH CONGRESSTRANSIT CENTER
STASSNEY
PARMER
AUDITORIUM SHORES
TRIANGLE
UT/WEST MALL
REPUBLICSQUARE
ORAN
GE LIN
EOR
ANGE
LINE
RED BUD
EXPOSITION
5TH/6TH
& LAMAR
GOVERNMENTCENTER
COMAL
5TH/6TH
& W LYNNCROSSTOWNCROSSTOWN
LAKELINE
300
300
335
7
7
20
10
10
107
17
7
10325
325
325
311
LOOP 360
FOUR POINTS
DOWNTOWN AREA
HOW IT ALL COMES TOGETHER
5
STEP 2:Detailed
Definition + Evaluation
NEPAEnvironmental
Process
LPA SELECTION
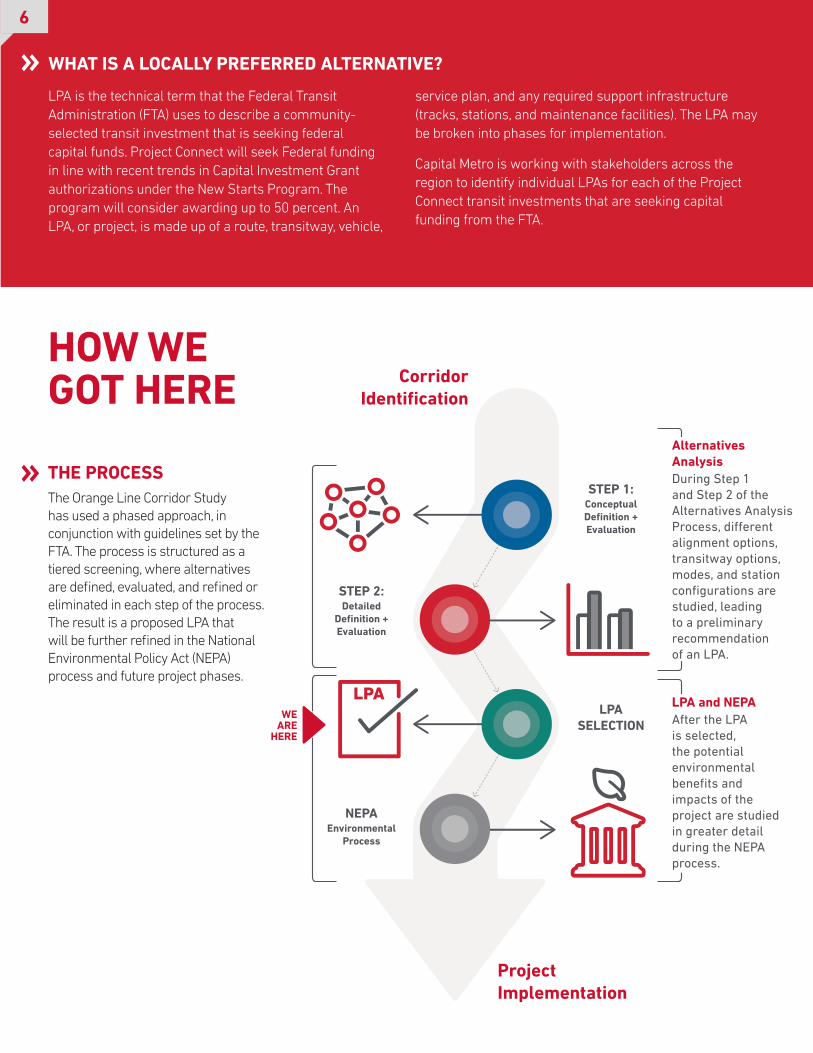
Alternatives AnalysisDuring Step 1 and Step 2 of the Alternatives Analysis Process, different alignment options, transitway options, modes, and station configurations are studied, leading to a preliminary recommendation of an LPA.
LPA is the technical term that the Federal Transit Administration (FTA) uses to describe a community-selected transit investment that is seeking federal capital funds. Project Connect will seek Federal funding in line with recent trends in Capital Investment Grant authorizations under the New Starts Program. The program will consider awarding up to 50 percent. An LPA, or project, is made up of a route, transitway, vehicle,
service plan, and any required support infrastructure (tracks, stations, and maintenance facilities). The LPA may be broken into phases for implementation.
Capital Metro is working with stakeholders across the region to identify individual LPAs for each of the Project Connect transit investments that are seeking capital funding from the FTA.
THE PROCESSThe Orange Line Corridor Study has used a phased approach, in conjunction with guidelines set by the FTA. The process is structured as a tiered screening, where alternatives are defined, evaluated, and refined or eliminated in each step of the process. The result is a proposed LPA that will be further refined in the National Environmental Policy Act (NEPA) process and future project phases.
STEP 1:Conceptual Definition + Evaluation
Project Implementation
Corridor Identification
LPA and NEPAAfter the LPA is selected, the potential environmental benefits and impacts of the project are studied in greater detail during the NEPA process.
WE ARE
HERE
HOW WE GOT HERE
WHAT IS A LOCALLY PREFERRED ALTERNATIVE?
6
STAKEHOLDERS
PARTNER AGENCIES
YOU, THE PUBLICCOMMUNITY LEADERS
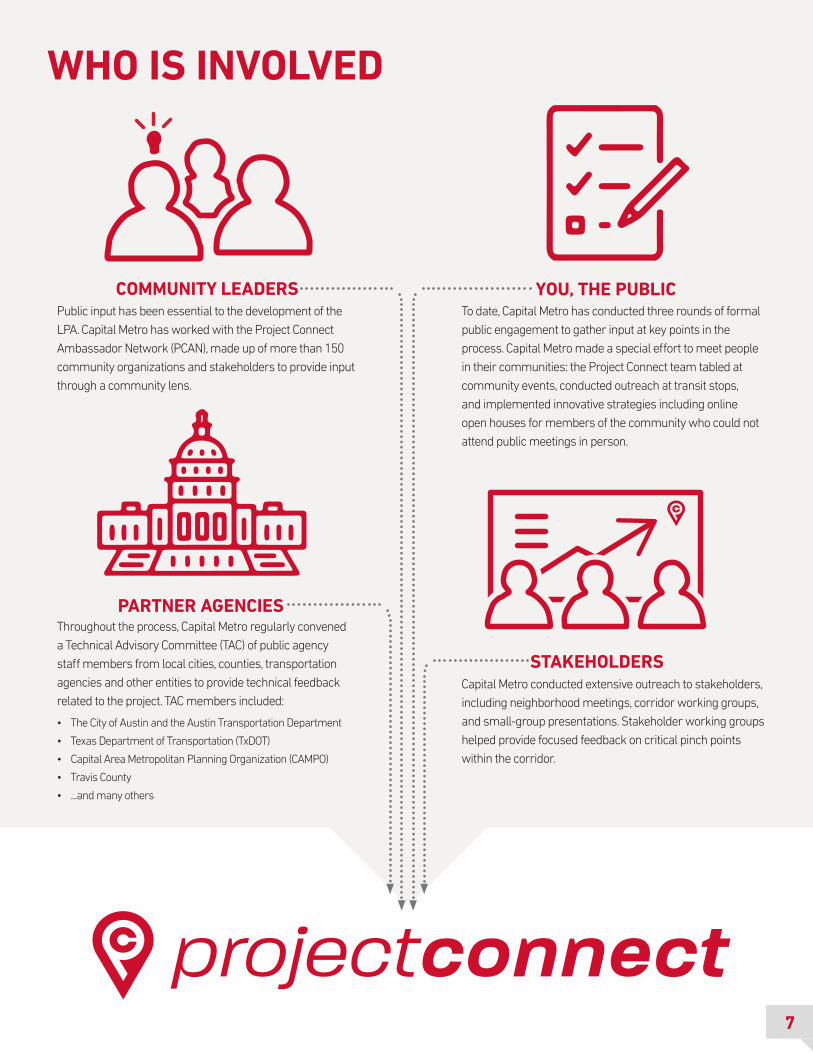
Capital Metro conducted extensive outreach to stakeholders, including neighborhood meetings, corridor working groups, and small-group presentations. Stakeholder working groups helped provide focused feedback on critical pinch points within the corridor.
Public input has been essential to the development of the LPA. Capital Metro has worked with the Project Connect Ambassador Network (PCAN), made up of more than 150 community organizations and stakeholders to provide input through a community lens.
To date, Capital Metro has conducted three rounds of formal public engagement to gather input at key points in the process. Capital Metro made a special effort to meet people in their communities: the Project Connect team tabled at community events, conducted outreach at transit stops, and implemented innovative strategies including online open houses for members of the community who could not attend public meetings in person.
Throughout the process, Capital Metro regularly convened a Technical Advisory Committee (TAC) of public agency staff members from local cities, counties, transportation agencies and other entities to provide technical feedback related to the project. TAC members included:
• The City of Austin and the Austin Transportation Department
• Texas Department of Transportation (TxDOT)
• Capital Area Metropolitan Planning Organization (CAMPO)
• Travis County
• ...and many others
WHO IS INVOLVED
7
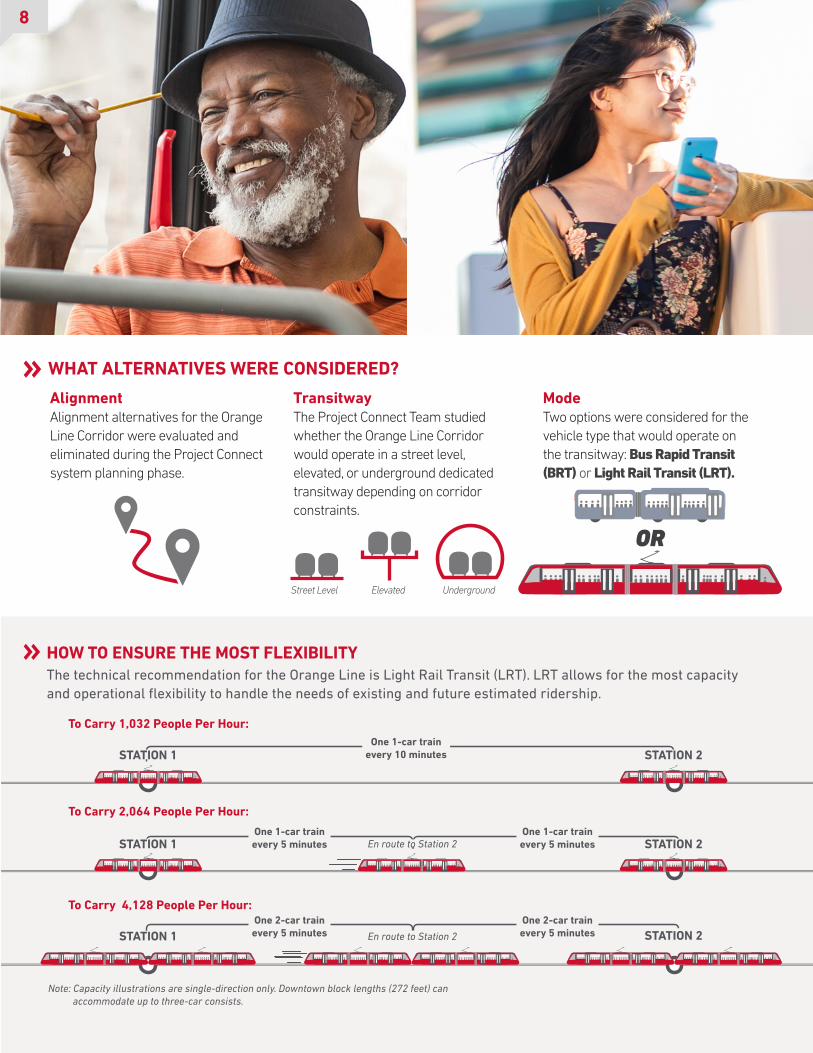
The technical recommendation for the Orange Line is Light Rail Transit (LRT). LRT allows for the most capacity and operational flexibility to handle the needs of existing and future estimated ridership.
HOW TO ENSURE THE MOST FLEXIBILITY
WHAT ALTERNATIVES WERE CONSIDERED?
Note: Capacity illustrations are single-direction only. Downtown block lengths (272 feet) can accommodate up to three-car consists.
To Carry 1,032 People Per Hour:
To Carry 2,064 People Per Hour:
To Carry 4,128 People Per Hour:One 2-car train every 5 minutes
One 1-car train every 5 minutes
One 2-car train every 5 minutes
One 1-car train every 5 minutes
One 1-car train every 10 minutes
STATION 1
STATION 1
En route to Station 2
En route to Station 2
STATION 1
STATION 2
STATION 2
STATION 2
Mode Two options were considered for the vehicle type that would operate on the transitway: Bus Rapid Transit (BRT) or Light Rail Transit (LRT).
OROR
Transitway The Project Connect Team studied whether the Orange Line Corridor would operate in a street level, elevated, or underground dedicated transitway depending on corridor constraints.
Alignment Alignment alternatives for the Orange Line Corridor were evaluated and eliminated during the Project Connect system planning phase.
Street Level Elevated Underground
8
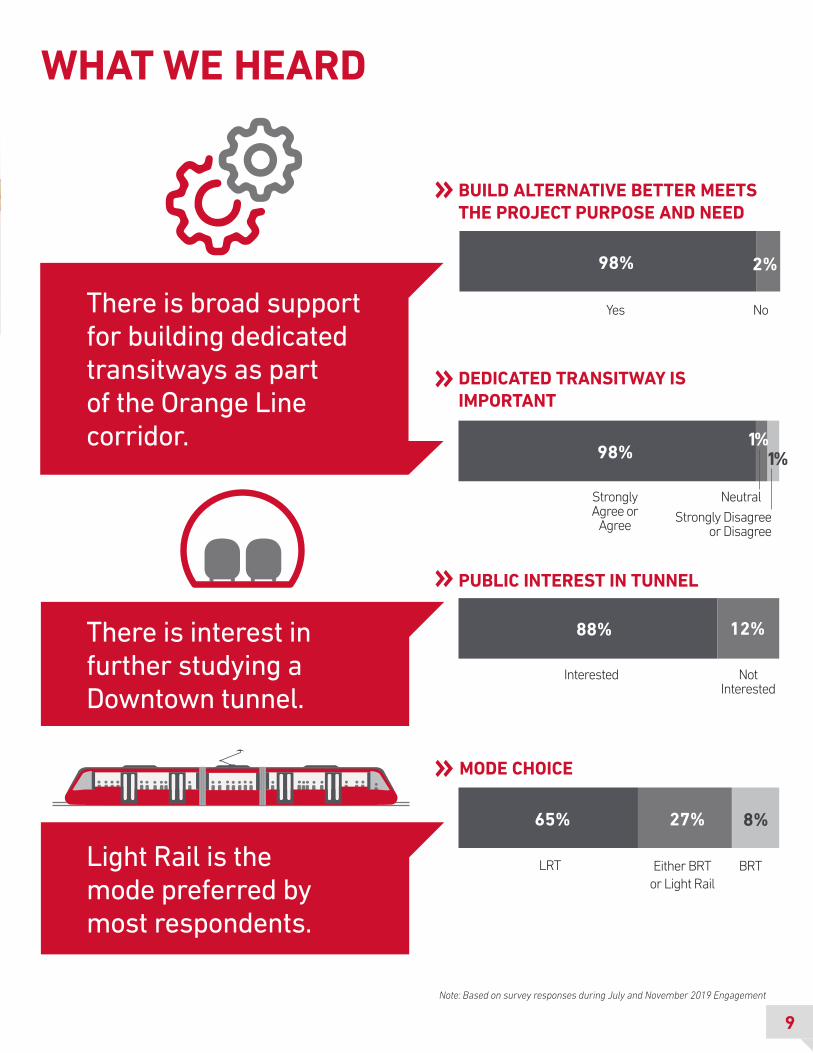
WHAT WE HEARD
65%
88%
98%
98%
There is broad support for building dedicated transitways as part of the Orange Line corridor.
There is interest in further studying a Downtown tunnel.
Light Rail is the mode preferred by most respondents.
BUILD ALTERNATIVE BETTER MEETS THE PROJECT PURPOSE AND NEED
PUBLIC INTEREST IN TUNNEL
MODE CHOICE
DEDICATED TRANSITWAY IS IMPORTANT
BRT
No
Strongly Agree or
AgreeStrongly Disagree
or Disagree
Neutral
Yes
Not Interested
Interested
Either BRT or Light Rail
LRT
2%
12%
8%27%
1% 1%
Note: Based on survey responses during July and November 2019 Engagement
9
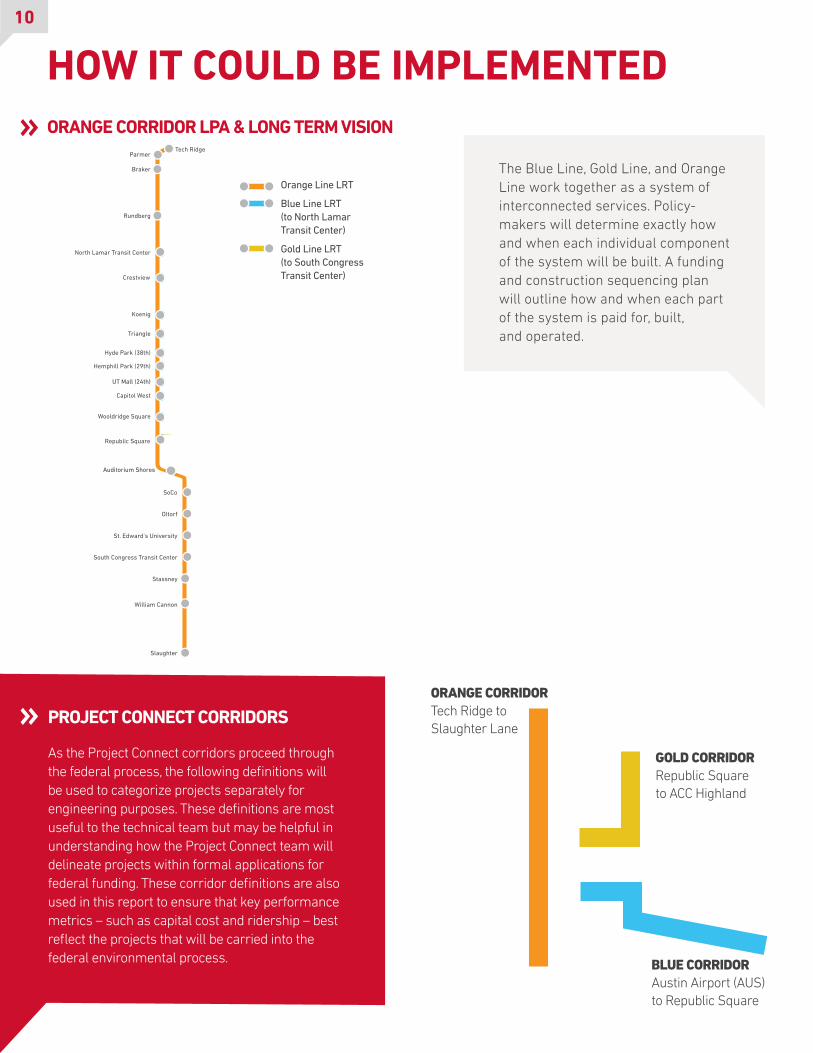
HOW IT COULD BE IMPLEMENTEDORANGE CORRIDOR LPA & LONG TERM VISION
PROJECT CONNECT CORRIDORS
As the Project Connect corridors proceed through the federal process, the following definitions will be used to categorize projects separately for engineering purposes. These definitions are most useful to the technical team but may be helpful in understanding how the Project Connect team will delineate projects within formal applications for federal funding. These corridor definitions are also used in this report to ensure that key performance metrics – such as capital cost and ridership – best reflect the projects that will be carried into the federal environmental process. BLUE CORRIDOR
Austin Airport (AUS) to Republic Square
GOLD CORRIDOR Republic Square to ACC Highland
ORANGE CORRIDOR Tech Ridge to Slaughter Lane
SoCo
Oltorf
St. Edward’s University
Stassney
William Cannon
Slaughter
South Congress Transit Center
UT Mall (24th)UT Mall (24th)
Rundberg
Braker
Parmer
Triangle
Hyde Park (38th)
Hemphill Park (29th)
Capitol West
Wooldridge Square
Koenig
Tech Ridge
North Lamar Transit Center
Crestview
AUS
AirportFa
ro
Montopolis
Rivers
ide
Waterfront
7th/Trinity
Capitol East
Hancock
St. David’s
Clarkson
Medical School
Downtown
MACC/Rainey
Travis HeightsLakeshore
Republic Square
UT East
ACC Highland
Metro C
enter
Auditorium ShoresAuditorium Shores
Blue Line LRT
Orange Line LRT
MetroRapid
Gold Line
MetroRapid
Blue Line LRT
Orange Line LRT
MetroRapid
Gold Line
MetroRapid
Blue Line LRT
Orange Line LRT
MetroRapid
Gold Line
MetroRapid
Blue Line LRT (to North Lamar Transit Center)
Orange Line LRT
Gold Line LRT (to South Congress Transit Center)
The Blue Line, Gold Line, and Orange Line work together as a system of interconnected services. Policy-makers will determine exactly how and when each individual component of the system will be built. A funding and construction sequencing plan will outline how and when each part of the system is paid for, built, and operated.
10
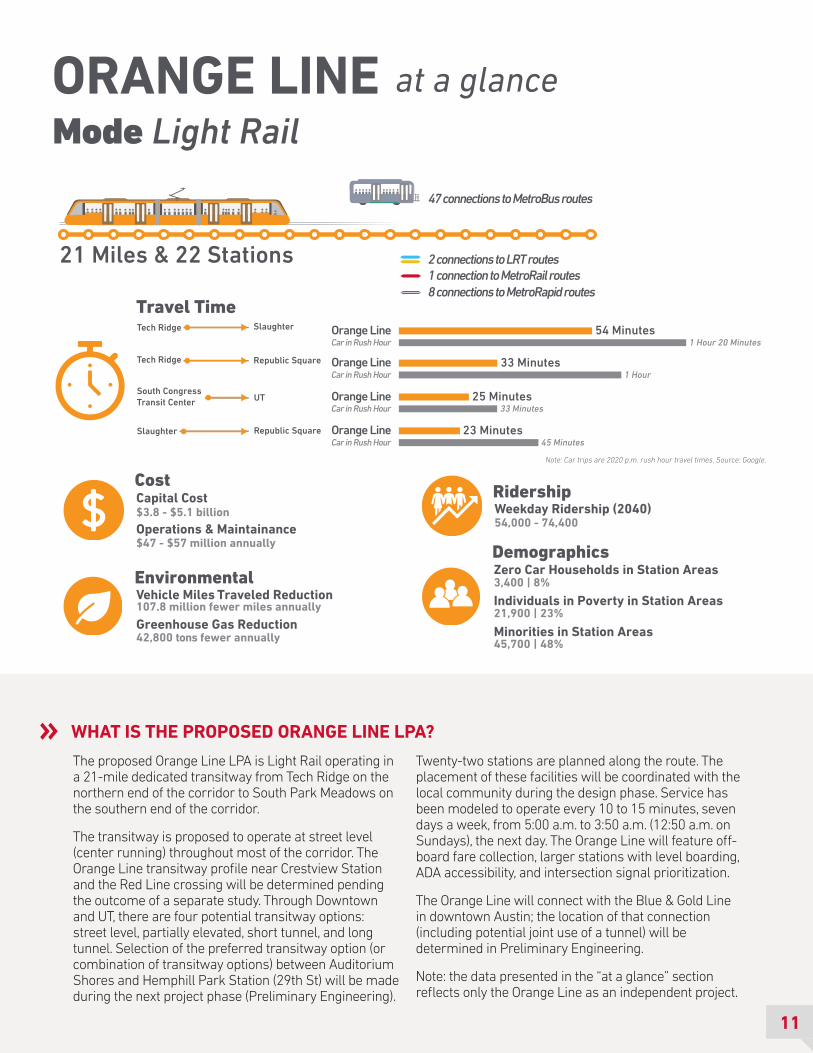
WHAT IS THE PROPOSED ORANGE LINE LPA?
The proposed Orange Line LPA is Light Rail operating in a 21-mile dedicated transitway from Tech Ridge on the northern end of the corridor to South Park Meadows on the southern end of the corridor.
The transitway is proposed to operate at street level (center running) throughout most of the corridor. The Orange Line transitway profile near Crestview Station and the Red Line crossing will be determined pending the outcome of a separate study. Through Downtown and UT, there are four potential transitway options: street level, partially elevated, short tunnel, and long tunnel. Selection of the preferred transitway option (or combination of transitway options) between Auditorium Shores and Hemphill Park Station (29th St) will be made during the next project phase (Preliminary Engineering).
Twenty-two stations are planned along the route. The placement of these facilities will be coordinated with the local community during the design phase. Service has been modeled to operate every 10 to 15 minutes, seven days a week, from 5:00 a.m. to 3:50 a.m. (12:50 a.m. on Sundays), the next day. The Orange Line will feature off-board fare collection, larger stations with level boarding, ADA accessibility, and intersection signal prioritization.
The Orange Line will connect with the Blue & Gold Line in downtown Austin; the location of that connection (including potential joint use of a tunnel) will be determined in Preliminary Engineering.
Note: the data presented in the “at a glance” section reflects only the Orange Line as an independent project.
21 Miles & 22 Stations
at a glanceTech Ridge Slaughter
Travel Time
Tech Ridge Republic Square
Slaughter Republic Square
South Congress Transit Center UT
54,000 - 74,400Weekday Ridership (2040)Ridership
54 Minutes
33 Minutes
25 Minutes
23 Minutes
1 Hour 20 Minutes
1 Hour
33 Minutes
45 Minutes
ORANGE LINE
3,400 | 8%Zero Car Households in Station Areas
21,900 | 23%Individuals in Poverty in Station Areas
45,700 | 48%Minorities in Station Areas
Demographics
107.8 million fewer miles annuallyVehicle Miles Traveled Reduction
42,800 tons fewer annuallyGreenhouse Gas Reduction
Environmental
$3.8 - $5.1 billionCapital CostCost
$47 - $57 million annuallyOperations & Maintainance
Orange Line
Orange Line
Orange Line
Orange LineCar in Rush Hour
Car in Rush Hour
Car in Rush Hour
Car in Rush Hour
47 connections to MetroBus routes
2 connections to LRT routes1 connection to MetroRail routes8 connections to MetroRapid routes
Mode Light Rail
Note: Car trips are 2020 p.m. rush hour travel times. Source: Google.
11
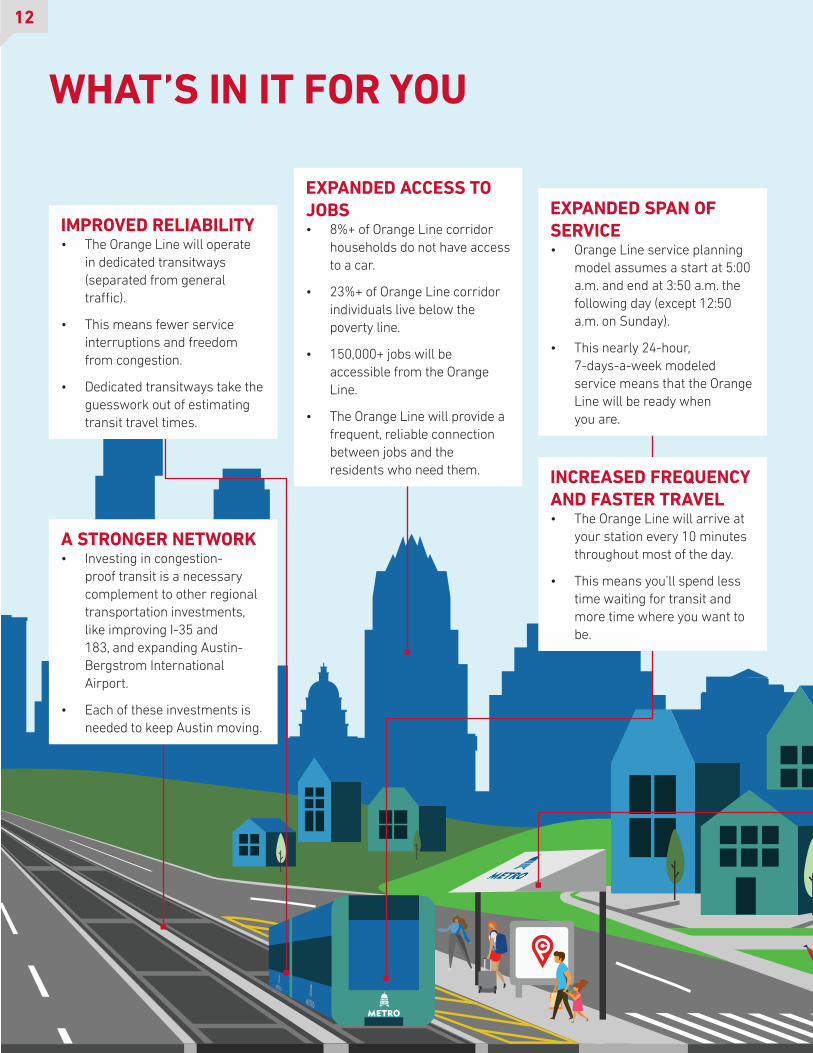
WHAT’S IN IT FOR YOU
12
IMPROVED RELIABILITY• The Orange Line will operate
in dedicated transitways (separated from general traffic).
• This means fewer service interruptions and freedom from congestion.
• Dedicated transitways take the guesswork out of estimating transit travel times.
INCREASED FREQUENCY AND FASTER TRAVEL• The Orange Line will arrive at
your station every 10 minutes throughout most of the day.
• This means you’ll spend less time waiting for transit and more time where you want to be.
EXPANDED SPAN OF SERVICE• Orange Line service planning
model assumes a start at 5:00 a.m. and end at 3:50 a.m. the following day (except 12:50 a.m. on Sunday).
• This nearly 24-hour, 7-days-a-week modeled service means that the Orange Line will be ready when you are.
EXPANDED ACCESS TO JOBS• 8%+ of Orange Line corridor
households do not have access to a car.
• 23%+ of Orange Line corridor individuals live below the poverty line.
• 150,000+ jobs will be accessible from the Orange Line.
• The Orange Line will provide a frequent, reliable connection between jobs and the residents who need them.
A STRONGER NETWORK• Investing in congestion-
proof transit is a necessary complement to other regional transportation investments, like improving I-35 and 183, and expanding Austin-Bergstrom International Airport.
• Each of these investments is needed to keep Austin moving.
13
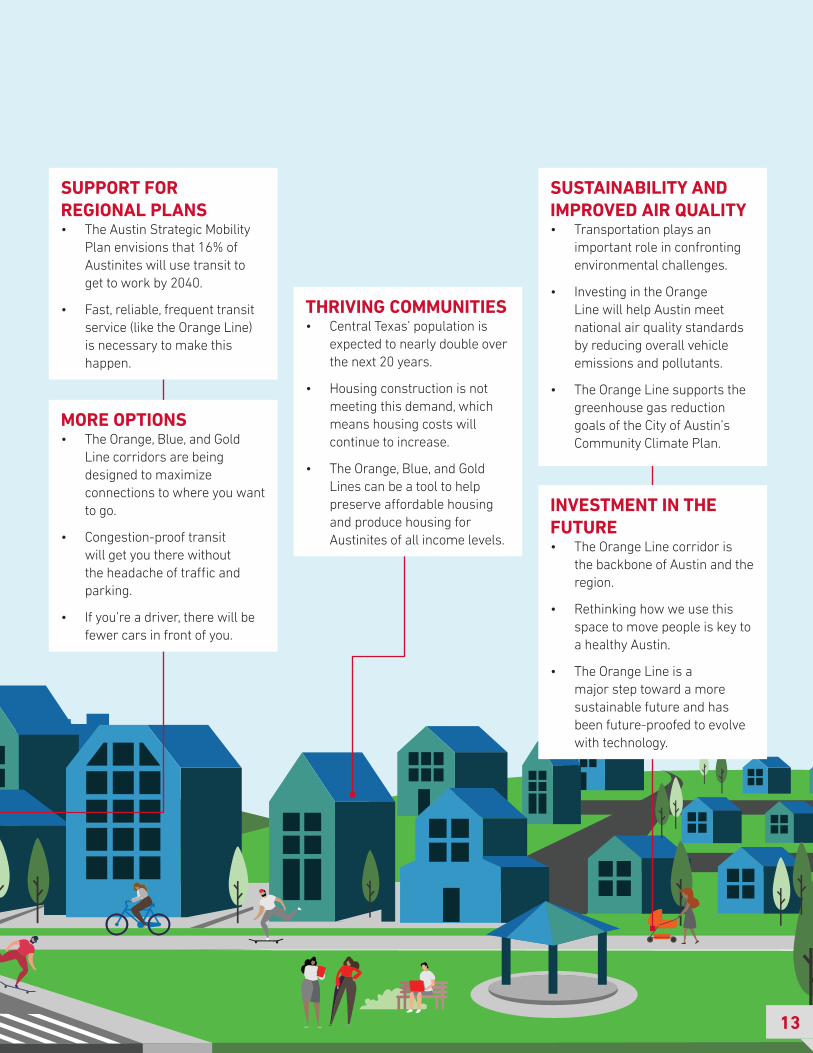
SUPPORT FOR REGIONAL PLANS• The Austin Strategic Mobility
Plan envisions that 16% of Austinites will use transit to get to work by 2040.
• Fast, reliable, frequent transit service (like the Orange Line) is necessary to make this happen.
THRIVING COMMUNITIES• Central Texas’ population is
expected to nearly double over the next 20 years.
• Housing construction is not meeting this demand, which means housing costs will continue to increase.
• The Orange, Blue, and Gold Lines can be a tool to help preserve affordable housing and produce housing for Austinites of all income levels.
SUSTAINABILITY AND IMPROVED AIR QUALITY• Transportation plays an
important role in confronting environmental challenges.
• Investing in the Orange Line will help Austin meet national air quality standards by reducing overall vehicle emissions and pollutants.
• The Orange Line supports the greenhouse gas reduction goals of the City of Austin’s Community Climate Plan.
INVESTMENT IN THE FUTURE• The Orange Line corridor is
the backbone of Austin and the region.
• Rethinking how we use this space to move people is key to a healthy Austin.
• The Orange Line is a major step toward a more sustainable future and has been future-proofed to evolve with technology.
MORE OPTIONS• The Orange, Blue, and Gold
Line corridors are being designed to maximize connections to where you want to go.
• Congestion-proof transit will get you there without the headache of traffic and parking.
• If you’re a driver, there will be fewer cars in front of you.
WHAT’S NEXT
FEDERAL
OTHER
OTHER
UP TO 50%
ORANGE LINE
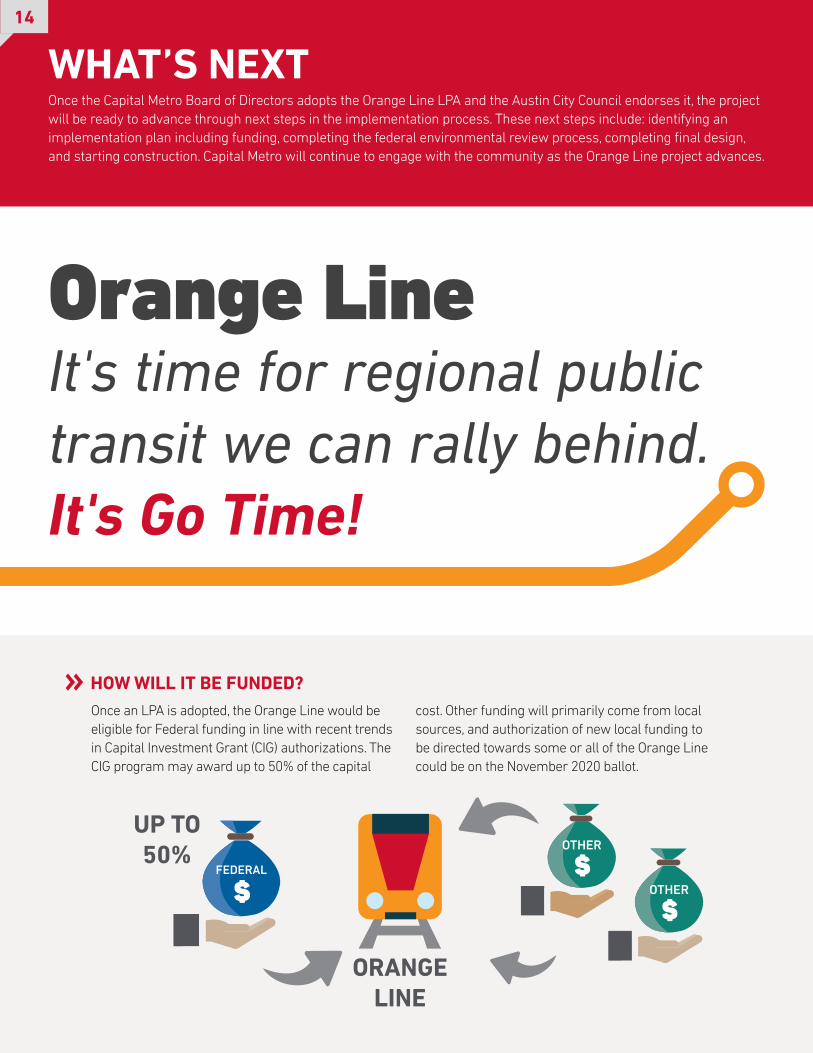
HOW WILL IT BE FUNDED?Once an LPA is adopted, the Orange Line would be eligible for Federal funding in line with recent trends in Capital Investment Grant (CIG) authorizations. The CIG program may award up to 50% of the capital
cost. Other funding will primarily come from local sources, and authorization of new local funding to be directed towards some or all of the Orange Line could be on the November 2020 ballot.
Once the Capital Metro Board of Directors adopts the Orange Line LPA and the Austin City Council endorses it, the project will be ready to advance through next steps in the implementation process. These next steps include: identifying an implementation plan including funding, completing the federal environmental review process, completing final design, and starting construction. Capital Metro will continue to engage with the community as the Orange Line project advances.
WHAT’S NEXT
Orange Line It's time for regional public transit we can rally behind. It's Go Time!
14
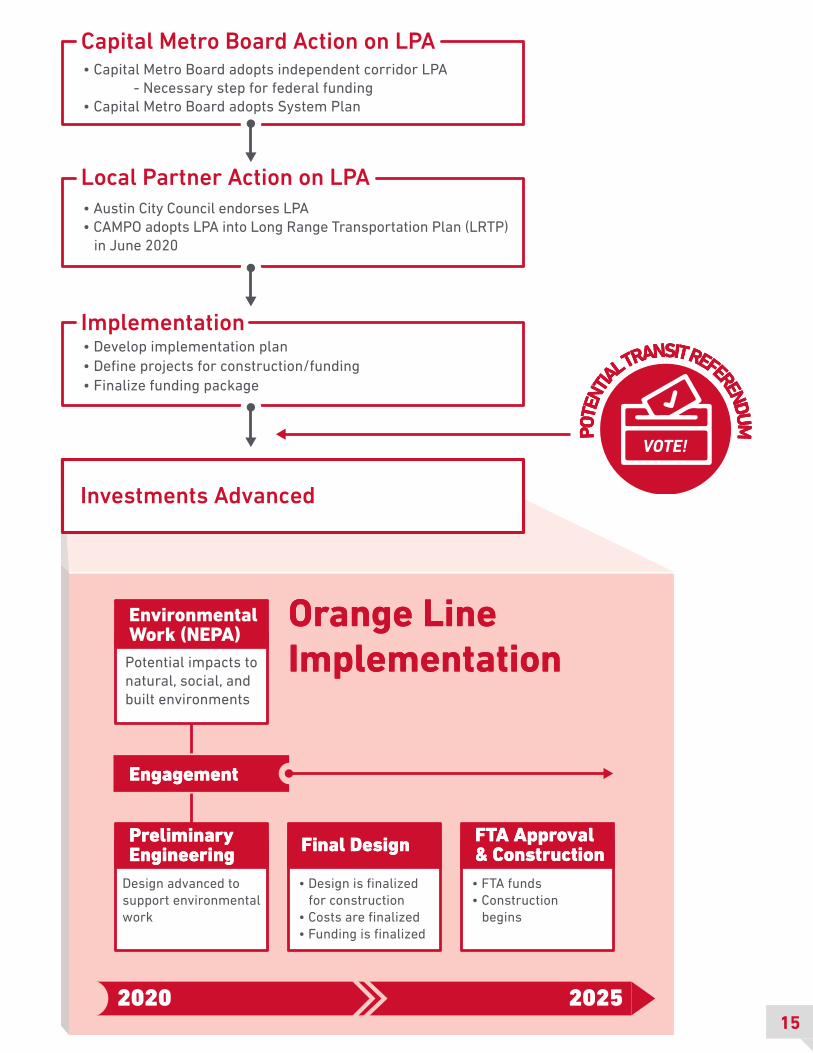
Orange LineOrange LineImplementationImplementation
2020 2025
Potential impacts to natural, social, and built environments
Preliminary EngineeringPreliminary Engineering Final DesignFinal Design FTA Approval
& ConstructionFTA Approval & Construction
Design advanced to support environmental work
• Design is finalized for construction
• Costs are finalized • Funding is finalized
• FTA funds• Construction
begins
Environmental Work (NEPA)
EngagementEngagement
Investments Advanced
Implementation• Develop implementation plan• Define projects for construction/funding• Finalize funding package
VOTE! POT
ENTIA
L TRANSIT REFERENDUM
POT
ENTIA
L TRANSIT REFERENDUM
POT
ENTIA
L TRANSIT REFERENDUMCapital Metro Board Action on LPA• Capital Metro Board adopts independent corridor LPA - Necessary step for federal funding• Capital Metro Board adopts System Plan
Local Partner Action on LPA• Austin City Council endorses LPA• CAMPO adopts LPA into Long Range Transportation Plan (LRTP) in June 2020
15
Led by Capital Metro with support from the City of Austin
Visit the Project Connect Community Office located at 607 Congress Ave.
Talk with project staff, ask questions and provide feedback between 9 a.m. and 4 p.m.
QUESTIONS?
Visit ProjectConnect.com
We value your input! Sign up to receive updates or learn about upcoming meetings.
Join us on Facebook.com/CapitalMetro!
Follow us on Twitter @CapMetroATX!