Synthesis of polyhydroxyalkanoates using orange juicing ...
158
Synthesis of polyhydroxyalkanoates using orange juicing waste as feedstock A thesis submitted to The University of Manchester for the degree of Doctor of Philosophy in the Faculty of Science and Engineering 2019 Fernando Guzman Lagunes Faculty of Science & Engineering School of Chemical Engineering and Analytical Science
-
Upload
khangminh22 -
Category
Documents
-
view
3 -
download
0
Transcript of Synthesis of polyhydroxyalkanoates using orange juicing ...

Synthesis of polyhydroxyalkanoates using orange juicing waste as feedstock
A thesis submitted to The University of Manchester for the degree of Doctor of
Philosophy in the Faculty of Science and Engineering
2019
Fernando Guzman Lagunes
Faculty of Science & Engineering
School of Chemical Engineering and Analytical Science

2
Contents List of figures ...................................................................................................................................... 4
List of tables ....................................................................................................................................... 6
List of abbreviations and acronyms ................................................................................................... 7
Abstract .............................................................................................................................................. 9
Copyright Statement ........................................................................................................................ 11
Aknowledgments.............................................................................................................................. 12
Associated publication ..................................................................................................................... 13
1 INTRODUCTION ........................................................................................................................ 14
2 LITERATURE REVIEW ................................................................................................................ 19
2.1 Petroleum-based plastics ................................................................................................. 19
2.2 Bioplastics ......................................................................................................................... 20
2.3 Polyhydroxyalkanoates .................................................................................................... 22
2.3.1 PHA properties ......................................................................................................... 25
2.3.2 Industrial production and commercialisation .......................................................... 27
2.3.3 Fermentation modes of operation for PHA production ........................................... 33
2.4 Alternative raw materials as carbon sources to PHA production .................................... 39
2.5 Orange Juicing waste (OJW) ............................................................................................. 41
2.5.1 Mexican orange production ..................................................................................... 43
2.6 Valorisation strategies for the OJW ................................................................................. 43
2.7 Cupriavidus necator .......................................................................................................... 45
2.7.1 Polyhydroxybutyrate synthesis in C. necator ........................................................... 47
3 SCOPE OF THE THESIS ............................................................................................................... 49
3.1 Structure of the thesis ...................................................................................................... 50
4 MATERIALS AND METHODS ..................................................................................................... 53
4.1 Microbial strain storage and maintenance ...................................................................... 53
4.2 Preliminary experiments .................................................................................................. 54
4.2.1 OJW medium ............................................................................................................ 55
4.2.2 Orange peel medium fermentation ......................................................................... 56
4.2.3 Limonene inhibition effect medium ......................................................................... 57
4.3 Biomass measurements ................................................................................................... 58
4.3.1 Optical density .......................................................................................................... 58
4.3.2 Dry matter analysis................................................................................................... 59
4.3.3 Viable cell count ....................................................................................................... 59
4.3.4 Microscopy ............................................................................................................... 60

3
4.3.5 Electron microscopy ................................................................................................. 60
4.4 Analytical methods ........................................................................................................... 61
4.4.1 PHB determination ................................................................................................... 61
4.4.2 Carbohydrates measuring ........................................................................................ 62
4.4.3 Total nitrogen quantification ................................................................................... 63
4.4.4 Determination of ash ............................................................................................... 63
4.4.5 Determination of crude fibres .................................................................................. 63
4.4.6 Quantification of total sugars ................................................................................... 64
4.4.7 Determination of protein ......................................................................................... 64
4.4.8 Extraction of orange essential oil ............................................................................. 65
5 PRODUCTION OF A NUTRIENT RICH MEDIUM FROM ORANGE JUICING WASTE ..................... 67
5.1 Introduction ..................................................................................................................... 67
5.2 Cupriavidus necator growth in different carbon sources................................................. 68
5.2.1 Testing different carbon sources.............................................................................. 68
5.2.2 Dry cell weight .......................................................................................................... 71
5.2.3 Polyhydroxybutyrate production ............................................................................. 73
5.2.4 Optical density relation with dry matter .................................................................. 76
5.2.5 Viability of microbial strain ...................................................................................... 77
5.2.6 Microscopy ............................................................................................................... 78
5.3 Orange juice as feedstock for PHA production ................................................................ 79
5.3.1 Characterisation of the OJW .................................................................................... 80
5.3.2 Orange essential oil extraction by steam distillation ............................................... 81
5.4 Production of a fructose rich medium ............................................................................. 82
5.4.1 Fermentation broth Characterisation ...................................................................... 83
5.5 OJW as starting material for PHA production .................................................................. 84
5.6 Summary .......................................................................................................................... 87
6 ORANGE JUICING WASTE AS RAW MATERIAL FOR FEEDSTOCK PRODUCTION ....................... 88
6.1 Introduction ..................................................................................................................... 88
6.1.1 Extracting carbohydrates from fresh orange peel ................................................... 88
6.1.2 Dried orange peel as carbon source......................................................................... 92
6.1.3 Limonene effect on Cupriavidus necator cell growth .............................................. 97
7 PHB PRODUCTION FROM ORANGE JUICING WASTE IN BIOREACTORS ................................. 102
7.1 Introduction ................................................................................................................... 102
7.2 Bioreactor experiment under batch fermentation mode. ............................................. 104
7.3 OJW as starting material for PHB production by C. necator in a bioreactor scale ......... 106
7.4 Fed-batch fermentation of OJW medium ...................................................................... 110

4
7.5 Discussion ....................................................................................................................... 112
8 Conclusion and future work ................................................................................................... 116
8.1 Conclusion ...................................................................................................................... 116
8.2 Recommendations for future work ................................................................................ 119
9 References .............................................................................................................................. 121
APPENDICES ................................................................................................................................... 157
List of figures
Figure 2.1 Four quadrant of plastic material types: PE, polyethylene; PET, Poly(ethylene-terephthalate); PA,
polyamide; PTT, Poly(trimethylene-terephthalate); PLA, polylactic acid; PHA, polyhydroxyalkanoate; PGA,
polyglycolic acid; PP, polypropylene; PS, polystyrene; PBAT, poly(butylene adipate-co-terephthalate); PCL,
poly(e-caprolactone); PBS poly(butylene succinate). The prefix bio- refers to the biological base of the
intermediates used. Modified from Ross et al., 2017. ___________________________________________ 21 Figure 2.2 Structure of the different types of PHA repeat units. Modified from Sudesh et al., 2000. _______ 23 Figure 2.3 Bioplastics global production capacities. (European Bioplastics and Nova-Institute, 2018) _____ 28 Figure 2.4 Waste streams and metabolic pathways used for PHA production Modified from (Koller et al.,
2010a) ________________________________________________________________________________ 40 Figure 2.5 D-Limonene, the main compound present in orange essential oil. _________________________ 42 Figure 2.6 STEM image showing the acumulation of PHB in Cupriavidus necator at 72 h of incubation, using
a synthetic medium described in section 4.2 with fructose as sole carbon source _____________________ 46 Figure 2.7 The pathway for the biosynthesis of PHB from acetyl-CoA in C. necator and most other bacteria
(adapted from Steinbüchel and Füchtenbusch (1998) and Suriyamongkol et al.,(2007). ________________ 48 Figure 4.1 Diagram showing the different OJW media production processes tested. OJW can enter the
process either at the drying, grinding or hydrolysis stages;two different hydrolysis media were used, distilled
water and a solution H2SO4 3% (v/v) (Rivas et al., 2008). ________________________________________ 56 Figure 4.2 Typical gas chromatogram obtained for A: a standard of pure PHB and B: a sample from mineral
media, using fructose as carbon source at an initial concentration of 25 g/L, 72 h after inoculation. ______ 62 Figure 4.3 Steam distillation apparatus used for OEO extraction __________________________________ 66 Figure 5.1 Growth of C. necator H16 in mineral media using fructose (blue) and rapeseed oil (red) at 5 () ,
10 (), 25 () and 50 () g /L as initial concentration. _________________________________________ 69 Figure 5.2 Growth of C. necator H16 in mineral media using glycerol at 5 () , 10 (), 25 () and 50 () g
/L as initial concentration. _________________________________________________________________ 69 Figure 5.3 Specific growth rate calculation for C. necator H16 grown in mineral media, using fructose (black)
and rapeseed oil (red) at 5 () , 10 (), 25 () and 50 () g /L as initial concentration. ______________ 70 Figure 5.4 Cell growth of C. necator H16 in mineral media using fructose (orange, hollow) and rapeseed oil
(blue solid) at 5 () , 10 (), 25 () and 50 () g /L as initial concentration. _______________________ 72 Figure 5.5 Calibration curve for the determination of PHB concentration given the area under the peak. __ 74 Figure 5.6 PHB accumulation kinetics for C. necator cultures using fructose (red) and rapeseed oil (blue
hollow) as sole carbon sources at 5 () , 10 (), 25 () and 50 () g /L as inicial concentration. _______ 74 Figure 5.7 Biomas (red), PHB (blue) and residual biomass (hollow symbols) accumulation kinetics for C.
necator cultures using fructose () and Rapeseed oil ( )as sole carbon sources at 10 and 25 g/L,
respectively. ____________________________________________________________________________ 75 Figure 5.8 Biomass to optical density correlation calculated for C. necator cultures using 10 g/L of fructose
initial concentration as sole carbon source. ___________________________________________________ 77 Figure 5.9 Optical density and viability count results for a C. necator culture using fructose as sole carbon
source, with an initial concentration of 10 g/L. ________________________________________________ 78

5
Figure 5.10 Optical micrographs from C. necator cultures, 36 and 96h after inoculation. Initial concentration
of carbon source was set to 25 g/L, for the mineral medium described above. Nutrient broth was used as
indicated as specified by the manufacturer, no carbon source was added. __________________________ 79 Figure 5.11 Sugar extraction stage for different OJW. From left to right: OJW ground and dried; whole OJW
dried; fresh OJW ground; whole OJW fresh. ___________________________________________________ 85 Figure 5.12 Diagram for the final production process a of an OJW based medium. ____________________ 86 Figure 6.1 Biomass growth (▲: optical density; : Dry matter concentration [X]) and fructose
concentration (●,[Fru]) measured for C. necator H16 cultures grown in orange peel medium coming for the
fresh manually peeled and fresh OJW (blue and red respectively). At initial solids ratio of 1:8 (w/v) for
medium production. fermentation conditions were 30° C, 250 rpm and initial pH was set at 6.8. ________ 89 Figure 6.2 Effect of the initial carbon source concentration on the specific growth rate, µ. (,fructose;
,glycerol; ▲, rapeseed oil; --,nutrient broth). ________________________________________________ 91 Figure 6.3 Chromatograms for OPM produced with an initial solid load of 1:12. Left: starting the
fermentation; Right: after 76 h. ____________________________________________________________ 92 Figure 6.4 Fructose concentration for the different treatments. : ground orange peel and : whole orange
peel ratio 1:8 (w:v) ; : ground orange peel diluted 1:12 (w:v). ___________________________________ 93 Figure 6.5 Cell growth curve obtained for the 1:8 (w:w) initial ratio if OP treatment. __________________ 94 Figure 6.6- Cell growth curve obtained for the 1:12 (w:w) initial ratio if OP treatment. ________________ 94 Figure 6.7- Dry matter (), PHB() and residual biomass concentration(▲) for the treatments with initial
solids ratio 1:8 (solid symbols) and 1:12(hollow symbols). _______________________________________ 95 Figure 6.8 STEM micrographs showing the PHB accumulation in C. necator H16, when growing in an OJW
medium prepared with an initial solids load ratio 1:8 (w:v). Left, 48 h into the fermentation; right, 72 h after
inoculation._____________________________________________________________________________ 96 Figure 6.9- Cell growth, PHB production and fructose uptake for different levels of limonene. A 0%; B 0.5%; C
1%; D 1.5%; E 2%. Fructose(); dry matter(); PHB (▲); residual biomass[X] ()(Guzman Lagunes and
Winterburn, 2016)._______________________________________________________________________ 98 Figure 6.10- Variation of specific growth rate (), dry matter () and PHB(▲) yields over substrate and
intracellular percentage of polymer () with concentration of limonene. ___________________________ 99 Figure 6.11- Normalised percentages of specific growth rate (), dry matter () and intracellular PHB()
at different concentrations of limonene._____________________________________________________ 100 Figure 7.1 Fermentation of synthetic medium by C. necator, using fructose as sole carbon source. No pH
Control implemented. Temperature was set to 30° C and airflow maintained to 1 vvm. ______________ 104 Figure 7.2 Fermentation of synthetic medium by C. necator, using fructose as sole carbon source and with a
pH value of 6.8. Temperature was maintained at 30° C. ________________________________________ 105 Figure 7.3 Fermentation of OJW medium by C. necator, using fructose as sole carbon source. No pH Control
implemented. Temperature was set to 30° C and airflow maintained to 1 vvm. _____________________ 106 Figure 7.4 Fermentation of OJW medium by C. necator, using fructose as sole carbon source and with a pH
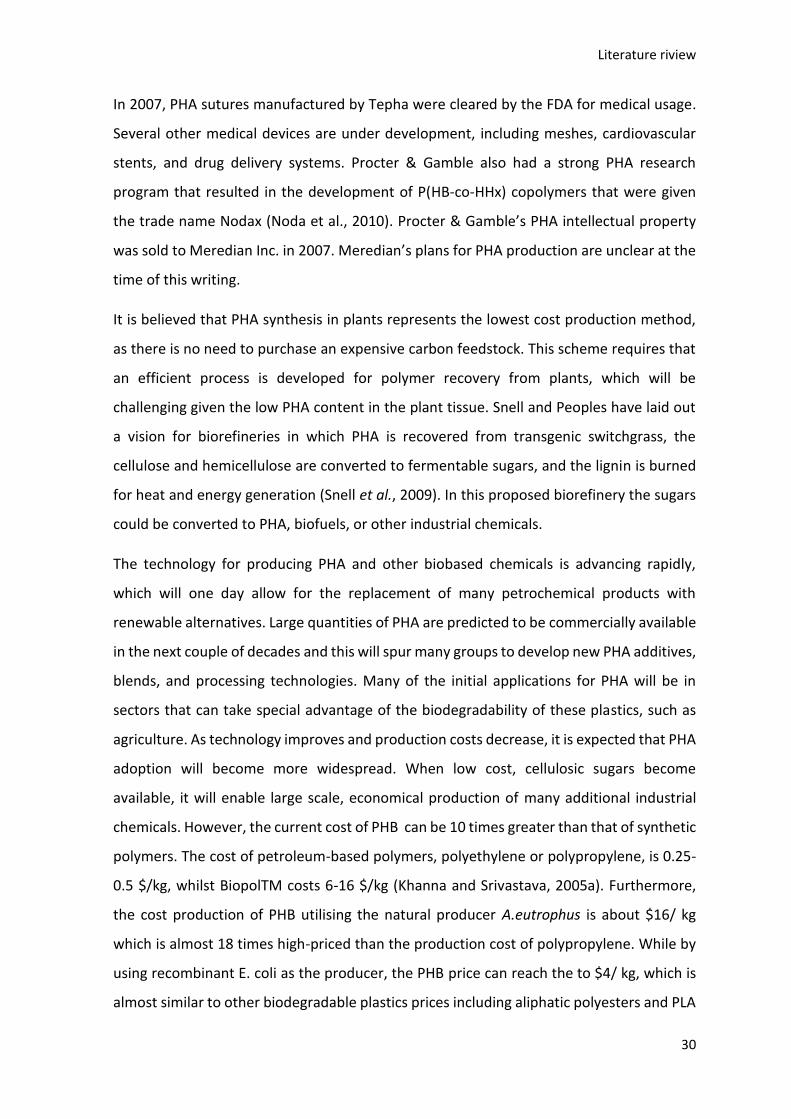
value of 6.8. ___________________________________________________________________________ 107 Figure 7.5 Fermentation of OJW medium using a younger inoculum. A pH value of 6.8 was maintained
through the experiment. Temperature was maintained at 30 °C and DO level set to 30%. _____________ 108 Figure 7.6 Fed Bach strategy for PHB production by C. necator using OJW medium. __________________ 110

6
List of tables
Table 2-1 PHA main advantages ..................................................................................................................... 24 Table 2-2 Physical properties of different PHA ................................................................................................ 26 Table 2-3 Worldwide PHA producing companies from 1980s to date. Modified from (Bugnicourt et al., 2014;
Chanprateep, 2010; Chen, 2009; Jacquel et al., 2008) .................................................................................... 32 Table 2-4 Fermentation modes and waste streams studies for the production of PHA. ................................. 36 Table 2-6 Orange juicing waste composition .................................................................................................. 41 Table 2-7 Enzymes and encoding genes for the synthesis of PHA in C. necator .............................................. 47 Table 4-1 Usual composition of nutrient broth no. 2 ....................................................................................... 53 Table 4-2 Mineral media composition ............................................................................................................. 54 Table 4-3 Mineral media composition ............................................................................................................. 57 Table 4-4 Trace elements solution ................................................................................................................... 57 Table 5-1 Specific cell growth rate for the different carbon sources tested. ................................................... 71 Table 5-2 Maximum biomass yield obtained for the different concentrations tested..................................... 73 Table 5-3 Maximum PHB concentration and percentage over biomass achieved for the different carbon
sources. ............................................................................................................................................................ 76 Table 5-4 Partial characterisation of the OJW (dry basis) ............................................................................... 81 Table 5-5 Carbohydrate concentrations measured fir the different extractives produced. ............................. 83 Table 5-6 Acidic hydrolysis of OJW, effect over sugar and ethanol concentrations. ....................................... 84 Table 6-1- Effect of the media on the kinetic parameters and PHB production. ............................................. 90 Table 6-2- Summary of the results obtained for the different autohydrolysis experiments studied for dried
OJW. ................................................................................................................................................................ 96 Table 7-1 Comparison of different fermentation conditions ......................................................................... 111

7
List of abbreviations and acronyms
ARF Artificial rumen fluid CCS Condensed corn solubles CFU Colony forming units CSTR Continuous stirred tank reactor DCW Dry cell weight DOT Dissolved oxygen tension h Hour(s) HMF Hydroxymethylfurfural HPLC High performance liquid chromatography FI Fresh Inoculum g Gram(s) GC Gas chromatography kg Kilogram(s) L Litre (s) mcl-PHAs Medium-chain-length polyhydroxyalkanoates ml Millilitre(s) mm Millimetre(s) MM mineral medium MSM Mineral salt medium MW Molecular weight Nm Nanometre(s) NMR Nuclear magnetic resonance OD600 Optical density at 600 nanometres OEO Orange essential oil OJW Orange juicing waste OPM Orange peels manually obtained PA Polyamide PBAT Polybutylene adipate-co-terephthalate PBS Polybutylene succinate PGA Polyglycolic acid PHA Polyhydroxyalkanoates PHB Polyhydroxybutyrate PHD Polyhydroxydecanoato PHDD Polyhydroxydodecanoato PHHx Polyhydroxyhexanoate PHO Polyhydroxyoctanoate PHV Polyhydroxyvalerate PE Petroleum ether PET Polyethylene terephthalate PLA Polylactic acid PS Polystyrene PP Polypropylene PTT Polytrimethylene terephthalate rpm Round per minute P Product S Substrate SM Synthetic medium scl-PHAs Short-chain-length polyhydroxyalkanoates sec Second(s)

8
SO sodium octanoate STEM Scanning transmission electron microscopy STR Stirred tank reactor TDM Total dry matter Tg Glass transition temperature TN Total nitrogen Tm Melting temperature Yx/s Yield of biomass Yp/s Yield of product μm Micrometer (s) X Biomass Yx/s Yield of biomass

9
Synthesis of polyhydroxyalkanoates using orange juicing waste as feedstock Fernando Guzman-Lagunes. The University of Manchester. 25th May 2018.
Submitted for the degree of Doctor of Philosophy
Abstract The cost of polyhydroxyalkanoates (PHA) production currently hinders the wider use of these biopolymers when compare to those of their petroleum-based plastics. Polyhydroxybutyrate (PHB) was the first discovered PHA and is being widely studied over the last four decades as a potential biodegradable replacement for commonly used petroleum-based plastics. This polyester is naturally synthesised by a number of microbial strains, when grown under unbalanced nutritional conditions, such as nitrogen limitation when plenty of carbon source is available. The use of inexpensive, renewable, raw materials is proposed as a feasible strategy to make PHB economically competitive.
On the other hand, the orange juicing process discards approximately 50 % (w/w) of the raw material input as waste, becoming a disposal problem for the industries involved. This thesis presents an investigation into the feasibility of a valorisation strategy for orange juicing waste (OJW), via its utilisation as feedstock for PHB production by the microbial strain Cupriavidus necator H16. This constitutes a novel valorisation strategy for OJW, aiming to add value to this material, ensuring a better exploitation of the different fractions that conform it, while at the same time attempting to alleviate the elevate PHB production costs.
The characterisation of the OJW demonstrates the potential of its implementation as nutrient source for biotechnology processes, and the naturally low concentration of protein in the material, and consequent low nitrogen concentration in the medium, make it a promising raw material for PHB production. The effects of different extraction ratios and pH conditions on sugar recovery were investigated. A preliminary study showed, for the first time, that C. necator H16 reached similar growth rates using OJW-based medium with a fructose concentration of 3 g/L and a synthetic medium added with 10 g/L of the sugar, 0.15 and 0.1 h-1 respectively. Further research of the sugar extraction process led to an increase in fructose concentrations to levels above 24 g/L.
The technical suitability of the OJW based medium for the production of PHB was investigated at two different scales, for the first time. Flask experiments led to a maximum biomass accumulation of 9.5 g/L with a PHB content of 76 % (w/w), corresponding to a PHB concentration of 7.3 g/L. A parallel study on the effect of the inhibitory effect of limonene, the main constituent of orange essential oil, showed that concentrations above 1% (v/v) of the terpene lead to a decrease of the growth rate of 60%, suggesting the necessity of the addition of a limonene extraction stage to the medium production process. Bioreactor experiments were performed in order to gain control over the process parameters; results under batch strategy led to similar results to those found in flask scale. A maximum biomass concentration of 9.4 g/L with a corresponding PHB concentration of 6.62 g/L, 70 % (w/w) of PHB, were achieved when pH and dissolved oxygen control were enabled. The use of a fed batch strategy led to the best results found by this study, reaching biomass and PHB concentrations of 13.3 and 9.8 g/L respectively.
Overall, the feasibility of implementation of OJW as a raw material for PHB production has been demonstrated. The results obtained lead to a wider outlook that OJW has the potential to be use as feedstock of a holistic orange biorefinery, taking advantage of the different fractions of the material. Further development of the fermentation process to improve production yields and subsequent integration to the orange juice production process could well be a contribution to the development of a more sustainable industry.
Keywords: Bioplastics, polyhydroxybutyrate, fermentation, orange waste, biorefinery.

10
Declaration
I declare, no portion of the work referred to in the thesis has been submitted in support of
an application for another degree or qualification of this or any other university or other
institute of learning.
Fernando Guzman-Lagunes

11
Copyright Statement
i. The author of this thesis (including any appendices and/or schedules to this thesis)
owns certain copyright or related rights in it (the “Copyright”) and she has given
The University of Manchester certain rights to use such Copyright, including for
administrative purposes.
ii. Copies of this thesis, either in full or in extracts and whether in hard or electronic
copy, may be made only in accordance with the Copyright, Designs and Patents Act
1988 (as amended) and regulations issued under it or, where appropriate, in
accordance with licensing agreements which the University has from time to time.
This page must form part of any such copies made.
iii. The ownership of certain Copyright, patents, designs, trademarks and other
intellectual property (the “Intellectual Property”) and any reproductions of
copyright works in the thesis, for example graphs and tables (“Reproductions”),
which may be described in this thesis, may not be owned by the author and may be
owned by third parties. Such Intellectual Property and Reproductions cannot and
must not be made available for use without the prior written permission of the
owner(s) of the relevant Intellectual Property and/or Reproductions.
iv. Further information on the conditions under which disclosure, publication and
commercialisation of this thesis, the Copyright and any Intellectual Property and/or
Reproductions described in it may take place is available in the University IP Policy
(see http://documents.manchester.ac.uk/DocuInfo.aspx?DocID=24420), in any
relevant Thesis restriction declarations deposited in the University Library, The
University Library’s regulations and in The University’s policy on Presentation of
Theses (see http://www.library.manchester.ac.uk/about/regulations/).

12
Aknowledgments
I am especially thankful to Dr James Winterburn, Doc, for his supervision and advice
throughout the development of this project. I will always be grateful for the eternal
patience he granted me and for his prompt help whenever it was needed. I know great
things will come for our research family.
I would also like to acknowledge my parents and brother, for their support and
encouragement throughout this adventure, for without them I would not be.
I would like to express my gratitude to Thomas Szpitter, Liz Davenport and Aleksandr
Mironov, for his technical assistance.
To the countless wonderful people I met in SCEAS and the incredible, beautiful, people I
encountered in Manchester from every corner of the world. Thank you, you make this
floating rock, one worth to witness. I will always remain a sincere admirer of the brightness
you bring to this world.
Last, but not least I wish to thank the Mexican Council of Science and Technology
(CONACyT) for their financial support.

13
Associated publication
Guzman Lagunes, F., Winterburn, J.B.B., 2016. Effect of limonene on the heterotrophic growth
and polyhydroxybutyrate production by Cupriavidus necator H16. Bioresour. Technol. 221, 336–
343. doi:10.1016/j.biortech.2016.09.045

Introduction
14
1 INTRODUCTION
Modern world and quality of life have been moulded by plastics over the last century. From
clothing and packaging to health care and aeronautics, there is no human activity where
plastics do not play a key role.
Plastics are materials, formed by macromolecules, that can be made fluids by heating and
pressuring. The use of these materials has become ubiquitous over the last 70 years due
to their durability and barrier properties. Additionally, plastics thermoplasticity provides
processing advantages over other materials, allowing to shape them into products with any
useful shape. Plastics can be processed, in a very wide range of temperatures, are
chemically resistant. The physical strength, lightweight and low cost of plastics have
granted them industrial success for the last 70 years (Andrady and Neal, 2009). The global
annual plastic production is currently about 300 million tons with an annual increase of 5%
(Siracusa et al., 2008). These materials are, typically, derived from petroleum, polymerised
and modified to give the desired material properties. Similar to other polymers, the
properties of plastics vary with molecular weight and their characteristics can be
customised by chemical modification (Andrady and Neal, 2009). The use of mixtures of
starting monomers and additives is common to increase a plastic’s strength, reduce its
processing temperature or change its appearance. However, it is precisely the resilient
nature of plastics that has turned their post-use management into a large societal problem.
Given the high production volume of plastics, the accumulation of plastic waste in the
environment is a pressing issue since some petroleum-derived plastics can take more than
a hundred years to degrade (Jambeck et al., 2015).
A variety of polymers, such as nucleic acids, proteins, and other polyamides,
polysaccharides, polyesters, polythioesters, polyanhydrides, polyisoprenoids, and lignin
are synthesised by living organisms. A growing industrial and research interest in these
biologically produced polymers exists due to their unique physical, chemical and material
properties. Proteins and enzymes are among the highest value molecules in industry, with
specialty applications as catalysts, food additives and therapeutic compounds;
polysaccharides have found applications in the paper and food industries; and nucleic acids
are the base of the genetic science (Chaabouni et al., 2014). Over the last five decades,

Introduction
15
research into these biopolymers has shown that some of them possess similar mechanical
and permeability properties to those of the oil-based plastics; thus, starch and bio-
synthesised polyesters are now considered as potential alternatives to traditional plastics.
In addition to their useful processing properties inherent to petrochemical plastics,
biopolymers are, typically, susceptible to biodegradation and can be produced under
milder reaction conditions through processes, such as fermentation, which are potentially
more environmentally friendly than petrochemical routes to plastics (Sudesh et al., 2000).
The term bioplastics is used for macromolecules that are either produced from,
synthesised or degraded by living organisms or are a combination of these characteristics,
which show physical, mechanical or chemical properties similar to common plastics.
Polylactides (PLA) are bioplastics synthesised by the polymerisation of lactide, a cyclic
dimer of bio-technologically produced lactic acid (Kricheldorf, 2001). Polylactones are a
family biodegradable polyesters that are synthesised from petroleum derivatives. Both,
PLA and polylactones, have found application as biomaterials in the pharmaceutical
industry due to their biodegradability and biocompatibility (Kricheldorf et al., 1988).
Polymer science efforts, focussed on the production of classically oil-based plastics, have
now attained the synthesis of bio-based polystyrene (bio-PS) and polyethylene
terephthalate (bio-PET) from renewable raw materials, thus increasing their sustainability
and reducing their environmental impact of these plastics (Voevodina and Kržan, 2013).
Bioplastics produced from renewable sources can help in reducing the dependence on oil
reserves. At the same time, if this bioplastics are susceptible to biodegradation, they could
alleviate the current issues with accumulation of plastic waste in the environment,
granting easier disposal strategies (Khanna and Srivastava, 2009). However, less than 1%
of the plastics used nowadays are derived from renewable resources, due to the inherent
lower yields of biotechnological processes, when compared to chemical polymerisation,
and the higher production costs (Gironi and Piemonte, 2011). In order to make bioplastics
industrially appealing they have to possess properties, such as thermoplasticity,
mechanical, and barrier properties, similar to the standard plastics currently in use, while
at the same time being economically competitive (Gironi and Piemonte, 2011; Jain and
Tiwari, 2015).

Introduction
16
Polyhydroxyalkanoates (PHA) are a family of aliphatic polyesters that can be produced
through biological processes and possess similar mechanical properties to commonly used
plastics. PHA have been extensively studied due to the fact they can be used effectively as
a biodegradable and biocompatible alternative to petroleum based plastics, such as
polypropylene (PP) and polystyrene (PS) (Verlinden et al., 2011). Moreover, the mechanical
properties of these biopolymers can be manipulated by several methods, such as co-
polymerization of different monomers; by the addition of a core molecule to obtain a
branched polymers instead of a linear chains; or by the use of blends of different
bioplastics, resulting in a wide range of possible materials with new properties (Lackner et
al., 2015; Park et al., 2012; Somleva et al., 2013).
Although PHA production has been studied for decades, industrial PHA bio-production
costs are in disadvantage against their petroleum counterpart. PHA production costs
significantly surpass those of their petrochemically produced counterparts. By 2011, PHA
reached a value in the market within the range of 3.6-4.2 £/kg, more than twice the price
of common plastics; the price of a kilogram of PS was within £ 1.5-1.6 for the same year
(Bolck et al., 2012). A low cost and environmentally friendly method of PHA production
depends on the restructuring of traditional fermentation and recovery technologies. As for
the majority of biotechnological processes, PHA production costs are a function of a good
microbial strain, the growth medium selection and composition, and the optimisation of
the process conditions (Dietrich et al., 2017; Lee and Choi, 1998). A reduction in the costs
of microbially produced PHA can be achieved utilising cheap renewable raw materials,
agricultural feedstock and co-products of previously stablished processes, as media
nutrients; such as cheese whey, lignocellulosic residues from the paper industry and
agricultural industries, oil mill waste streams, and glycerol by-product; aiming to substitute
the use of purified carbon sources, that can account for about 40% of the total production
costs (Riedel et al., 2015; Wiles et al., 2005).
Cupriavidus necator is the model bacterial strain used for the production of PHAs, it has
been extensively studied due to its capacity to accumulate more than 90% of its weight as
polyhydroxybutyrate (PHB), the first discovered PHA (Riedel et al., 2012). C. necator
synthetic pathway towards PHA is triggered when grown under stress conditions and the
presence of large amounts of carbon source and such as limitation of other nutrients.

Introduction
17
However, the wild strain has a very narrow carbon source range of use (Sichwart et al.,
2011). Along with the efforts that have been made to find the optimal carbon source to
produce PHB through a fermentation process, using C. necator (Castilho et al., 2009),
different operational modes have also been tried to enhance the profitability of the process
(Gumel et al., 2013). However, there is still a lot of work to do before the production of
PHAs be economically competitive to the petrochemical common use plastics, reducing
costs of production using cheaper raw materials and enhancing productivity of the
fermentation process are among the different strategies proposed to face this challenge.
On the other hand, the production of orange fruit reaches about the 50 million tons every
year, with approximately 30% of this production destined to the juicing industry. The
orange juicing process is considered very inefficient, with almost 50 % of the used raw
material being discarded as waste. Several valorisation strategies have been studied aiming
to successfully exploit this material, from anaerobic digestion to animal feed; nevertheless,
the complex composition of the orange juicing waste (OJW) has hindered its wider
implementation (Ruiz and Flotats, 2016; Shan, 2016). Mexico is the fifth biggest orange
producer in the world, with a predicted production of 4 million tons by 2017, and nearly
1.5 million tons destined to be processed by the juicing industry (FDA, 2017). For the
developing economy of the country, the proper use of all valuable resources is essential to
secure economic stability. Thus, Mexico has focused several research groups towards a
more efficient use of their natural resources (Aleman-Nava et al., 2015).
This project aims to establish a methodology to produce PHAs through a fermentation
process using the bacteria Cupriavidus necator H16, using an alternative media based in
the orange juicing industry waste, in order to reduce the costs of the process used
nowadays. Identifying possible new added-value chemicals present in this complex
material, with a view to improving the economics of PHA production and minimise the
environmental impact.
This thesis document consists of eight chapters. Chapter one introduces the basic concepts
related to this research and the structure of the content as a way to give context for the
main objective for this project. The following section, chapter two, explores and discusses
the different efforts that have been made related to the production of PHAs. The main
advantages, drawbacks and results found by these studies are critically analysed, in order

Introduction
18
to serve as a contrast to the findings of this project. Figures of the production of bioplastics
and their current market is briefly discussed. The production of orange fruit and OJW is
presented, both, globally and for the Mexican market. Finally, the diverse valorisation
strategies studied for the OJW implementation are discussed including the main obstacles
observed by the researchers.
The scope of the project is presented in the third chapter of the thesis, including a broader
description of the content. The main objective is presented and divided in smaller and
more specific studies. Chapter four details the materials and methods needed for the
completion of the different specific objectives, describing the procedures followed and
discussing the theory related to each technique.
The following three chapters, present and discuss the obtained results, for the different
studies made. Chapter five focusses on the characterisation of the raw material; the
determination of the best saccharification conditions for the selected process are also
presented. Chapter six evaluated the effect of the initial media composition on the
production of PHA by C.necator H16 and discusses the inhibitory effect of limonene on
bioplastic production and microbial growth. Finally, chapter eight presents the results of
the scale-up study performed in bench-scale bioreactors, evaluating the effect of different
culture conditions, control strategies and the inclusion of a feeding step over the
fermentation process productivities.
The final chapter discusses the implication of the experimental findings in the broader
context, how they compare to other studies, and what route of action is recommended for
future studies. The concept of an orange biorefinery is proposed as an alternative
sustainable strategy to add value the OJW.

Literature riview
19
2 LITERATURE REVIEW
A summary and discussion of the different concepts, and studies, relevant to this project
are presented in this chapter. The current situation of plastics market, their properties and
applications are introduced, as well as a comparison to those properties inherent to
bioplastics. The classification and structure of PHA are discussed and the strategies that
have been studied aiming their production. The diverse raw materials used for PHA
synthesis are enlisted and the results obtained discussed. Finally, an introduction to the
use of orange waste as feedstock for PHA production, market figures and availability of the
material are presented along with the valorisation strategies proposed for the material.
2.1 Petroleum-based plastics
Petroleum-based plastics possess many desirable properties over conventional substances,
including strength, durability, resistance to degradation and low density (Khanna and
Srivastava, 2005a). These properties have widen the use of plastics, from their application
as packaging materials to very specialised uses in biomedical therapies, reaching a
worldwide production of about 300 million tonnes by 2016 (European Bioplastics, 2016).
However, these desired properties are precisely the ones causing their accumulation in the
environment, generating a disposal problem for the nowadays society. Adding to this, the
concern about reducing the oil dependency, and the interest of reducing the
environmental impact of the industrial activity, has motivated many efforts into the
research of alternative materials to plastics and processes that can use renewable raw
materials as feedstock (Gironi and Piemonte, 2011).
The use of fossil resources needed for the production of the commonly used plastic, has
contribute to worldwide problems, such as the greenhouse effect and global warming.
Plastic materials are typically used for a short period before disposal due to their inherent
low cost, aggravating the problem of waste processing. The lack of proper strategies for
the plastic waste management often leads to incineration; thus, increasing the
concentration of carbon dioxide in the atmosphere and, thus, contributing to the
mentioned effects. Decontamination and a proper categorisation of plastic materials are
requirements to achieve an efficient recycling process, increasing the costs of collection
and handling of the plastic residues. Nevertheless, it has been proven that the recycling

Literature riview
20
process has a negative impact on the mechanical properties of the materials, narrowing
their window of applications and reducing the number of cycles the material can be used
(Braunegg et al., 2004; Koller et al., 2010b).
Finally, even with the recently discovered oil reservoirs, and taking in account the
development of new recovery technologies and advanced tracking methods, mineral oils
fossil feedstock will eventually be depleted (Gironi and Piemonte, 2011). This has brought
an awareness for the necessity for developing novel production techniques that, avoiding
altering the environmental closed cycles, and based on the exploitation of renewable
resources.
2.2 Bioplastics
Biopolymers are generally defined as polymers produced by living organisms under
controlled conditions. These natural polymers are formed during the growth cycles of all
organisms and they are usually biodegradable. Polysaccharides, as starch and cellulose,
represent the most abundant family of these natural polymers with the second largest
natural group of polymers being formed by proteins. Both materials are involved in many
of the vital processes of organisms, playing key functions from bringing structural support,
to their use as catalysts in complex chemical reactions. . One of the first materials that
could be considered a bioplastic was rayon, a highly processed form of cellulose used to
make fibres and fabrics. Starch can be modified so that it behaves like a thermoplastic,
starch‐based materials have a narrow window of application due to their poor resistance
however to water. (Endres, 2011).
These biodegradable polymers can be obtained from renewable resources and have
attracted much attention in recent years due to their many potential applications. With
the use of biotechnology, these polymers can be synthetized from different monomers,
through the fermentation of sugars, or the bioprocessing of a range of different carbon
sources, such as lipid rich streams or even carbon dioxide using autotrophic bioprocesses
(Raza et al., 2018).
On the other hand, the production of different polymers and the possibility of customising
their inherent properties, has been reported for a great number of prokaryotic organisms,
when grown under the right conditions. Among these materials, there are several that have

Literature riview
21
attracted the industry interest because their potential use as substitutes for plastic
materials such as starch-based materials, polylactides (PLA) and polyhydroxyalkanoates
(PHA).
The term ‘bioplastics’ is used, nowadays, to describe plastic like materials that are either,
or both, biodegradable or produced from bio-based materials. Figure 2.1 shows a
schematic representation of the classification of plastics proposed by Ross et al., based on
their biodegradability and the nature of the raw material used for the production process
(Ross et al., 2017). Quadrants I, II and IV (highlighted in green) correspond to materials
described as bioplastics; while the conventional plastics are enclosed in the quadrant III
(highlighted in red). Examples of some polymers
Figure 2.1 Four quadrant of plastic material types: PE, polyethylene; PET, Poly(ethylene-terephthalate); PA,
polyamide; PTT, Poly(trimethylene-terephthalate); PLA, polylactic acid; PHA, polyhydroxyalkanoate; PGA,
polyglycolic acid; PP, polypropylene; PS, polystyrene; PBAT, poly(butylene adipate-co-terephthalate); PCL,
poly(e-caprolactone); PBS poly(butylene succinate). The prefix bio- refers to the biological base of the
intermediates used. Modified from Ross et al., 2017.
Moreover, one of the most exploited property of polymers is how their properties can be
tailored to a desired level, with the use of additives, their mixture with other materials, or

Literature riview
22
by simple chemical modifications, as the functionalisation of head end or the crosslinking
of polymer chains. This characteristic is can be exploited in biopolymers as well, and
different mixtures of biopolymers have been used in order to develop materials with
certain desired characteristics, either closer to oil based polymers for packaging and
industrial aplications, or increasing its biocompatibility for tissue scaffolding applications
(Amass et al., 1998; Botta et al., 2015).
2.3 Polyhydroxyalkanoates
An increasing interest in the biotechnological production of polyhydroxylkanoates (PHA)
from renewable resources, natural occurring polyesters that can act as alternatives for
fossil-based plastics, has been showed by the industry nowadays. This family of
biopolymers have been extensively studied on the last four decades, as they have similar
mechanical properties to the commonly used plastics. PHA are thermoplastic and
elastomeric materials which, in addition, are biodegradable, biocompatible and
environmentally friendly, which makes them attractive for biomedical applications
(Keshavarz and Roy, 2010).
PHA are synthetized by a wide group of living organisms, to be used as energy and carbon
storage, as a response to stressful growth condition when a high concentration of carbon
source is available. These family polyesters are synthetized by several prokaryotic strains
when they grow under unfavourable conditions. PHA can be produced from different
renewable resources such as carbohydrates, lipids, alcohols and organic acids. Generally,
PHA accumulation is triggered when, in the abundant presence of a suitable carbon source,
there is a limiting concentration of a macrocomponent such as nitrogen, phosphate or
dissolved oxygen or microcomponents as magnesium, sulphate, iron, manganese, copper,
sodium, cobalt, tin or calcium (Helm et al., 2008; Park et al., 2012). This has been harnessed
by different research groups, allowing control over the metabolic-switch from favouring
microbial growth to PHA accumulation, triggering it usually by either phosphate or nitrogen
limitation. Helm et al., in 2008, studied the influence of microelements in the media,
reporting the production of ultrahigh molecular masses of PHA under potassium limitation.
Prior this, high molecular weight PHA were only achieved using recombinant strains of
Escherichia coli lacking PHA depolymerase enzymes (Kahar et al., 2004).

Literature riview
23
Bacteria can synthesise PHA when they are under the presence of a limiting concentration
of a nutrient different to carbon, or in the presence of a growth inhibitors, such as ethanol
or methanol. The production of PHA occurs by the condensation of acyl CoA units, from
the central metabolism this has been found for most of the PHA producers. Cupriavidus
necator, Haloferax mediterranei, Azotobacter vinelandii, Hydrogenophaga pseudoflava
and Pseudomonas hydrogenovora are known to produce the polyesters when microbial
growth is compromised. Alcaligenes latus, Methylobacterium sp. ZP24 (Nath et al., 2008),
Bacillus mycoides RLJ B-017 (Borah et al., 2002) and recombinant E. coli, manifest parallel
growth and accumulation. Braunegg and Korneti demonstrated that after a period of
carbon starvation the hyperproduction of PHA is triggered in Pseudomonas 2F (Braunegg
and Korneti, 1984).
PHA are a family of aliphatic polyesters with a hydrocarbon chain residue in the middle of
the repeat unit structure. Depending on the length of the substituent group they can be
sub-categorised into two different groups. Short chain length (scl-PHA) refers to PHA with
residue chains from three to five carbon atoms and medium chain length (mcl-PHA) to six
carbon atoms and greater residues (Iwata, 2005). The substituent group has an impact over
the bioplastic mechanical properties, with scl-PHA being stiff and brittle, while mcl-PHA
have shown enhanced elastomeric behaviour, molecular structures of different PHA repeat
units are presented in figure 2.2.
Figure 2.2 Structure of the different types of PHA repeat units. Modified from Sudesh et al., 2000.

Literature riview
24
Depending on the monomer composition of the polymer structure PHA can also be
classified as homopolymers, when formed by one repeat unit, or heteropolymers, when
more than one repeat unit is presented. The molecular weight of these polymers depends
on the microorganism and grow conditions used, with average values between 2x10⁵ and
3x10⁶ Da (Keshavarz and Roy, 2010).
When composted, PHA products can be completely degraded to water and carbon dioxide
which, in turn, are the raw materials required for the photosynthetic reactions by
autotrophic organisms for carbohydrates production. Thus, PHA are inserted in the
naturally occurring carbon cycle contrary to oil-based materials. Furthermore, PHA can be
degraded by our metabolic system by the enzymatic hydrolysis of the ester bond. Thus,
their applications are not restricted to packaging materials, the elaboration of commodity
items and industrial materials, but PHA are candidates for biomedical applications. The
occurrence of (R)-3-hydroxybutyric acid (3HB) and its polymers in human blood makes
them ideal for these applications. The main advantages of PHA are summarized in the
Table2.1.
Table 2-1 PHA main advantages
Lower fossil dependency
PHA synthesis can be attained using renewable resources as process feedstock
Biodegradability Being compostable, PHA do not contribute to increase the
landfill crisis
Biocompatibility PHA are candidates to biomedical applications as tissue
scaffolds and drug delivery systems
Balanced carbon flux The final compost products of PHA degradation can are
recycled to the natural carbon cycle of earth
(Amache et al., 2013; Iwata, 2005; Raza et al., 2018)
Nevertheless, in spite of the intensive research carried out on bacterial PHA, their
production cost is still far above the price of conventional plastics mainly due to the high
cost of raw materials and relatively low conversion rates (Castilho et al., 2009).

Literature riview
25
2.3.1 PHA properties
A polymer chemical and physical properties determine the best suited application and
processing method for the material. The properties of PHA are greatly influenced by the
physical state of the material. PHA are usually stored in an amorphous state forming
intracellular granules. However, when the bioplastics are isolated or when cells are dried,
PHA crystallise. This crystallinity is a consequence to their isotacticity, all lateral residues
being aligned to the same direction along the polymeric chain, as the biological pathway
favours the inclusion of repeat units of the same stereochemical configuration in their
polymer chains.
The crystallisation of PHB, an homopolymer, has been studied in great detail. Bulk PHB
crystallizes rapidly when it is quenched from the melt or cast from solution, and reaches
an equilibrium crystallinity within the range of 60 – 70% (Bloembergen et al., 1986). X‐ray
diffraction data and molecular modelling revealed that PHB chains take on a 21-helical
conformation in which the methyl and carbonyl groups point away from the axis of the
helix. The unit cell is orthorhombic and contains two antiparallel helices. The dimensions
of the unit cell are a = 5.76 Å, b = 13.20 Å, and c = 5.96 Å, in which c is the direction of the
helical axis.
The high degree of crystallinity of PHB leads to a plastic that is strong, but very stiff due to
the high Young’s modulus and brittle because of its low Izod impact strength and
elongation to break. This brittleness hinders the commercial implementation of PHB. The
procedecomposition temperature of the polymer (Uchino et al., 2007). This has shown
prejudicial as reductions in PHB molecular weight are observed when the polymer is
incubated at temperatures above 170°C and evolution of monomers occurs at
temperatures higher than 200°C (Carrasco et al., 2006). PHB polymers can be used to
replace petrochemical plastics in numerous applications such as performance additives,
foils and moulded goods. Also disposable items such as hygiene products, razors, diapers,
utensils, as well as disposable containers including cups and shampoo bottles (Reddy et al.,
2003).
Different studies have focussed in the synthesis of several PHA copolymers as they have
shown more favourable properties than PHB. The first of these PHA that was studied in

Literature riview
26
detail was polyhydroxy butyrate-co-valerate P(HB‐co‐HV). Addition of HV units to the
polymer chain resulted a lower Young’s modulus and a correspondent increase of the
elongation to break; however, the changes induced by incorporation of this monomer were
only moderate (Uchino et al., 2007). It was found that the P(HB‐co‐HV) system is
isodimorphic, meaning that the HV monomers are able to insert into the PHB crystal
structure. P(HB‐co‐HV) crystallizes more slowly than PHB, but both polymers eventually
reach the same degree of crystallinity at equilibrium (Bloembergen et al., 1986). 3‐
hydroxyalkanoate monomers longer than HV, monomers that are C6 and longer, have a
more pronounced effect on polymer properties. The crystallinity equilibrium degree and
Tm of P(HB‐co‐mcl) decrease linearly as functions of the mol% of mcl in the polymer, and
the length of the mcl side chains does not influence the behaviour of these properties. The
glass transition temperature (Tg) of these copolymers also decreases when mcl units are
added to the polymer, with the longer monomers lead to greater decreases in Tg (Loureiro
et al., 2014). P(HB‐co‐mcl), mcl-PHA repeat units, copolymers are weaker than PHB, but
also tougher and more flexible. The effect of the monomer composition on the mechanical
properties of some of these co-polymers are summarized in table 2.2. PHA that consists
only of mcl monomer units is a soft, flexible thermoplastic (Ashby et al., 2001). Another
PHA copolymer that has received considerable attention is P(3HB‐co‐4HB). The 4HB units
have four carbons in the polymer backbone and no side chain. Inclusion of 4HB in the
copolymer decreases crystallinity and changes the mechanical properties of the plastic.
Table 2-2 Physical properties of different PHA
Polymer
Tm
(°C)
Tg
(°C)
Young’s
modulus
(GPa)
Tensile
strength
(MPa)
Elongation
to break
(%)
PHB 180 4 3.5 40 5
P(HB‐co‐20mol% HV) 145 ‐1 0.8 20 50
P(HB‐co‐10mol% HHx) 127 ‐1 0.52 21 400
P(HB‐co‐17mol% HHx) 120 ‐2 N.D. 20 850
P(3HB‐co‐16mol% 4HB) 152 ‐8 N.D. 26 444
P(4HB) 60 ‐50 0.15 104 1,000
mcl‐PHA* 43 ‐44 0.001 4.7 335
Polypropylene 176 ‐10 1.7 38 400

Literature riview
27
* Monomers ranging in size from C6 to C14 (Ashby et al., 2001)
A number of technologies have been developed for modifying the properties of PHA,
including chemical treatments, processing techniques, and polymer additives. Graft block
copolymers can be constructed by linking PHA chains to other polymers, although the
biodegradability of the final product will be compromised if all other blocks are not
biodegradable. Cross‐linked polymers are of interest due to their rubber‐like properties.
Studies of PHA cross‐linking have been conducted using PHA that include either all
saturated side chains, or a combination of saturated and unsaturated moieties. Cross‐
linking can be achieved using peroxides and cross-linking agents, or through sulphur
vulcanization (Gagnon et al., 1994). In both studies, gels could be formed with the cross‐
linked PHA, indicating that successful cross‐linking had taken place. Cross‐linking led to low
crystallinity material with poor tensile strength, but the vulcanized PHA did show reduced
tensile set. The molecular weight of the polymer in these studies was very low (<100,000
g/mol), so results could be improved if starting material with higher molecular weight is
used. Branched P(HB‐co‐HV) was produced by extruding the polymer in the presence of
dicumyl-peroxide, and the resulting branched PHA showed improved elasticity (Pol
D’Haene et al., 1999).
2.3.2 Industrial production and commercialisation
Today the vast majority of commercial plastics are made from fossil resources. It is
inevitable that these resources will eventually be depleted; therefore, many companies
and research groups are focused in developing strategies for producing plastics from
renewable feedstocks. Some of the typically petroleum-based plastics can now be made
from agricultural resources and they are referred to as biobased-plastics, but, as the
chemical properties are the same than their counterparts, this does not necessarily mean
that the plastic is biodegradable (Ross et al., 2017). However, global bioplastics production
represents roughly 1% of the 300 million tonnes of plastic produced annually.
Nevertheless, the growing demand and the development of more sophisticated materials,
application and products has kept the bioplastics market is continuously growing.
According to the latest market data, the global bioplastics production capacities is set to
increase around 24% from 2018 to 2023. (European Bioplastics and Nova-Institute, 2018).
Figure 2.3 shows the global annual forecast for the bioplastics production capacities. Solid

Literature riview
28
coloured bars represent the marked data acquired for years 2017 and 2018; while
transparency was used for the estimated forecasts. A significant increase of the percentage
of biodegradable polymers is also predicted, going from 43 %, in 2017 to 49 % in 2023.
Figure 2.3 Bioplastics global production capacities. (European Bioplastics and Nova-Institute, 2018)
Genetic engineering advances have allowed the companies to types of renewable
monomers. DuPont, Genencor, and Tate & Lyle have developed a process for making 1,3‐
propanediol from sugar using an engineered strain of E. coli (Slater et al., 1988). The 1,3‐
propanediol is polymerized with terephthalic acid to create a new polyester with the trade
name Sorona®. New processes are also being explored for synthesis of traditional plastics
from renewable materials. Dow and the Brazilian ethanol producer Crystalsev formed a
business partnership in 2007 to produce polyethylene from sugar cane. Cane sucrose will
be fermented to ethanol and then is dehydrated to make ethylene, which can be
polymerized by normal routes to make polyethylene. The new process is expected to
generate less carbon dioxide than traditional polyethylene manufacturing processes
enhancing the sustainability and reducing environmental impact.
One of the plastics most often compared to PHA is polylactic acid (PLA). NatureWorks, a
subsidiary of Cargill, produces PLA from corn sugar at the industrial scale. Corn sugar is
fermented to lactic acid, which is then converted to cyclic lactide. The lactide is
polymerized to form PLA via a ring opening polymerization reaction. PLA properties can be
88
5
91
2 99
4
10
26
10
26
11
13 12
88
11
75
12
00
12
00
11
90
11
79
12
44
13
28
20
60
21
12
21
94
22
16
22
05 23
57 2
61
6
0
500
1000
1500
2000
2500
3000
2017 2018 2019 2020 2021 2022 2023
10
00
to
nn
es
Biodegradable Biobased/non biodegradable Total capacity

Literature riview
29
adjusted by controlling the proportions of (R) and (S) lactic repeat units contained in the
main chain of the polymer (Ahmed and Varshney, 2011). This is important, because it
makes it possible to control the crystallinity of the PLA produced, and thus the
transparency, enabling the plastic to be used in applications that require clear material.
Transparency in semicrystalline polymers is directly related to the crystallinity. Polymer
structures are much larger than the wavelength of visible light (0.4–0.7 μm), and the
refractive index of crystalline regions is higher than that of amorphous regions. Due to this
decrease in crystallinity in a semi-crystalline polymer enhances the clarity (Maier et al.,
1998).This transparency represents gives PLA an advantage over common PHA, which can
only be made semi‐transparent at this time. However PHA biodegrades faster than PLA,
expanding the possible applications for the former, as biodegradability is perceived as a
desirable characteristic, (Hottle et al., 2013), PLA also shows more dramatic decreases in
molecular weight than PHA when processed. Blends of PHA and PLA have been shown to
have attractive properties, and it may be possible to use these alloys for applications in
which neither pure PHA nor PLA is suitable (Noda et al., 2004). Groups have recognized the
commercial potential of PHA for many years. Researchers at W.R. Grace and Company, a
specialty chemicals firm, produced small quantities of PHB for commercial evaluation in
the 1960s, and were granted patents for methods to produce and recover the polymer
(Baptis 1962, patent). Their process suffered from low productivity and the material was
contaminated with residual bacterial biomass, causing the company to abandon its
commercialization efforts. In the 1980s Imperial Chemical Industries began working with
PHA and developed a process for production of P(HB‐co‐HV) in which C. necator was grown
on sugar and propionate (Luong et al., 1988)(Holmes, 1985). The availability of large
quantities of this plastic, given the trade name Biopol, allowed many new studies of PHA
properties to be conducted. The Biopol process was ultimately determined to be too
expensive for commercial viability, so production was halted. The business was sold to
Monsanto, who hoped to produce PHA in plants. Much progress was made by Monsanto,
including the synthesis of P(HB‐co‐HV) by Arabidopsis thaliana and Brassica napus, typically
known as rapeseed (Slater et al., 1999). Monsanto eventually decided that PHA were not
part of their long-term strategy and sold their intellectual property assets to Metabolix.
Literature riview
30
In 2007, PHA sutures manufactured by Tepha were cleared by the FDA for medical usage.
Several other medical devices are under development, including meshes, cardiovascular
stents, and drug delivery systems. Procter & Gamble also had a strong PHA research
program that resulted in the development of P(HB‐co‐HHx) copolymers that were given
the trade name Nodax (Noda et al., 2010). Procter & Gamble’s PHA intellectual property
was sold to Meredian Inc. in 2007. Meredian’s plans for PHA production are unclear at the
time of this writing.
It is believed that PHA synthesis in plants represents the lowest cost production method,
as there is no need to purchase an expensive carbon feedstock. This scheme requires that
an efficient process is developed for polymer recovery from plants, which will be
challenging given the low PHA content in the plant tissue. Snell and Peoples have laid out
a vision for biorefineries in which PHA is recovered from transgenic switchgrass, the
cellulose and hemicellulose are converted to fermentable sugars, and the lignin is burned
for heat and energy generation (Snell et al., 2009). In this proposed biorefinery the sugars
could be converted to PHA, biofuels, or other industrial chemicals.
The technology for producing PHA and other biobased chemicals is advancing rapidly,
which will one day allow for the replacement of many petrochemical products with
renewable alternatives. Large quantities of PHA are predicted to be commercially available
in the next couple of decades and this will spur many groups to develop new PHA additives,
blends, and processing technologies. Many of the initial applications for PHA will be in
sectors that can take special advantage of the biodegradability of these plastics, such as
agriculture. As technology improves and production costs decrease, it is expected that PHA
adoption will become more widespread. When low cost, cellulosic sugars become
available, it will enable large scale, economical production of many additional industrial
chemicals. However, the current cost of PHB can be 10 times greater than that of synthetic
polymers. The cost of petroleum-based polymers, polyethylene or polypropylene, is 0.25-
0.5 $/kg, whilst BiopolTM costs 6-16 $/kg (Khanna and Srivastava, 2005a). Furthermore,
the cost production of PHB utilising the natural producer A.eutrophus is about $16/ kg
which is almost 18 times high-priced than the production cost of polypropylene. While by
using recombinant E. coli as the producer, the PHB price can reach the to $4/ kg, which is
almost similar to other biodegradable plastics prices including aliphatic polyesters and PLA

Literature riview
31
This biobased chemical industry will reduce our dependence on foreign oil and decrease
greenhouse gas emissions. Principal PHA derived products; their origin and manufacturer
company, are summarized in Table 2.3.
The PHA downstream processing becomes inherently complex due to its intracellular
nature, energy intense stages are required to isolate the PHA granules. Generally, the
recovery process consists of a biomass isolation step followed by the recovery of the PHA
granules, a final purification step is needed for most cases. The biomass recovery from the
media, typically involves a centrifugation or filtration step. PHA is then isolated and purified
from the biomass. Most commonly chemical methods are used in this stage as it generates
high purity PHA; solvent extraction using acetone or chlorinated compounds. However, the
large amount of solvent required is not environmentally sustainable. Enzymatic treatment,
chemical digestion with sodium hypochlorite or surfactants, and mechanical disruption are
other commonly used techniques (Chanprateep, 2010b; Gumel et al., 2013; Verlinden et
al., 2007).

Literature riview
32
Table 2-3 Worldwide PHA producing companies from 1980s to date. Modified from (Bugnicourt et al., 2014; Chanprateep, 2010a; Chen, 2009; Jacquel et al., 2008)
Commercial name
Producer Country Material Organism Substrate Production
per year (tonnes)
Price (€/kg)
Applications
Biomer Biomer Germany PHB A. latus --- 50 3-5 Packaging Minerv-PHA Bio-on Italy PHA --- Starch 10,000 --- Raw material
Biogreen Mitshubishi
Gas Japan PHB --- Methanol 30-60,000 2.5-3 Packaging
Biocycle PHB Industrial Brazil PHB, PHBV Alcaligenes sp. Sugar cane 10,000 Raw material
Ecogen Zhejiang Tian
An China PHBV
Recombinant E. coli
Potato starch 2,000 3.26 Raw material
BiopolTM Metabolix USA Several PHA C. necator Glucose --- 2-2.5 Packaging
--- Monsanto USA PHB,PHV --- Transgenic
plants --- --- Raw material
Nodax P&G
Chemicals USA/Japan
PHA copolymers
Aeromonas caviae and C.
necator --- 20-50,000 2.5 Packaging
Jiangsu Nantian
Jiangsu Nantian Group
China PHB --- --- Pilot scale --- Raw material
Goodfellow Goodfellow
Cambridge Ltd UK
PHBV 12% –Biopolymer
--- --- --- --- ---
Tepha Tepha Inc USA P(4HB) --- --- --- --- Medical Implants
--- Chemie Linz Austria PHB --- --- 20-100 --- Packaging,
drug delivery
--- Tianjin Green
BioScience China P3HB4HB --- --- 10,000 --- Raw material

Literature riview
33
2.3.3 Fermentation modes of operation for PHA production
The choice of operation strategy for production of bacterial PHA depends on various
factors including carbon source, strain, bioreactor type and operation mode of the system.
Batch fermentation for PHA production is a popular process due to its flexibility and low
operation costs. However, it is associated with low PHA productivity since after utilization
of the carbon source; bacterial cells degrade the accumulated PHA resulting in reduced
PHA content (Zinn et al., 2001). Kulpreecha et al. (2009) reported a higher PHA productivity
of 1.27 g/L h compared to 0.45 g/L h by Bacillus megaterium using sugarcane molasses
under fed-batch compared to batch mode of fermentation. However, even though fed-
batch fermentation, yielded higher PHA productivity, the overall PHA production is still
considered low in cases where nitrogen limitation was implemented (Zinn et al., 2001).
The combined process of batch and fed-batch processes is the most common fermentation
strategy used for PHA production. Under this strategy, the process is divided into two
stages: in the first stage, the microorganism is grown under batch mode until the desired
biomass is achieved and PHA accumulation has started. In the second stage, the
fermentation is shifted to fed-batch, where usually one or more essential nutrients (most
common is nitrogen) are maintained in limited concentration and carbon source is
continuously fed into the reactor to further produce and accumulate PHA in the cells (Zinn
et al., 2001). Verlinden et al. (2007) summarized several studies that employ a combination
of batch and fed-batch systems in a two-stage process to encourage biomass production
initially, followed by PHA accumulation and production. Likewise, Ibrahim and Steinbüchel
(2009) reported a fed-batch fermentation of Zebella denitrificans at a pilot scale (42 L) using
a stirred tank reactor (STR) for PHA production under improved aeration conditions.
Typically, pH and the percentage Dissolved Oxygen Tension (% DOT) levels in bioreactors
are maintained around 7 and 20% respectively; however, the levels are adjusted based on
the culture and the specific product. An example is the high cell density cultivation of
Pseudomonas oleovorans, using n-octane as a carbon source in fed-batch culture. In this
study Preusting et al. (2004) reported simultaneous cell growth and PHA accumulation by
keeping pH at 7 and maintaining % DOT level between 30-40% by lowering the temperature
of the culture broth to 18°C and the addition of nitrogen source at limited levels to the

Literature riview
34
bioreactor. Consequently, final cell and PHA concentrations of 37.1 and 12.1 g/L
respectively.
Continuous culture, chemostat, is another option adopted as the third operation strategy
for PHA production. In this method, the culture broth is continuously replaced by sterile
medium. In Chemostat culture, the carbon source is continuously fed in excess, keeping
one or more nutrients (e.g. phosphorous or nitrogen) in limitation. Chemostat is highly
controllable as the specific growth-rate can be maintained by adjusting the dilution-rate.
Therefore, under appropriate growth conditions, continuous fermentation might have the
potential to give highest PHA productivity levels. Nonetheless chemostat culture exhibits a
higher risk of contamination (Zinn et al., 2001).
In terms of bacterial cultures used, majority of the reports emphasize the use of a single
bacterial strain employing different operation systems and reactor types, and a variety of
cheap substrates (sugarcane molasses, waste potato starch, hydrolysed corn oil) or other
organic compounds such as glycerol or glucose for PHA production. Studies of this type
were mainly carried out at bench-scale utilising a CSTR to either maintain the culture at log
phase by constant introduction of the feeding medium and removal of the culture solution
(continuous fermentation) or batch fermentation of an organic matter under anaerobic
condition followed by utilization of an air-lift reactor for PHA production. The choice of
strain also appears to influence the operation mode used for PHA production, depending
on the synthesis route occurrence, either coupled or independent to cell growth. A coupled
production typically favours a continuous operation mode. Secondary metabolites are
generally produced on the last stages of cell growth, or completely independent to it; thus,
the optimal conditions for biomass production are different to those required for the
synthesis of the metabolite (Verlinden et al., 2007). Ishizaki et al. (2001) reported a
significantly higher PHA production in a fed-batch culture of Cupriavidus necator compared
to its cultivation in continuous mode. Considering this, they suggested the use of
Alcaligenes eutrophus instead, when continues mode was employed. This was based on
the finding that the latter organism was able to accumulate P(3HB) during the exponential
phase (Ishizaki et al., 2001).
The use of mixed cultures for biopolymer production with reduced overall process cost was
reviewed by Salehizadeh and Van Loosdrecht (2004). The process involves several steps

Literature riview
35
targeting to enrich the culture with PHA producer strains and utilization of substrate
followed by batch fermentation for PHA production. They suggested a Sequencing batch
reactor (SBR) for the industrial production of PHA in batch/fed batch mode, or a plug flow
reactor (PFR) followed by a continuous stirred tank reactor (CSTR) if a continuous system
is to be employed (Salehizadeh and Van Loosdrecht, 2004). Other reports were also
published subsequently emphasising the use of mixed cultures in order to enhance the PHA
productivity. Levels of PHA accumulation of up to 75% (w/w) are reported, employing a
three-step process. At bench scale the SBR commenced with anaerobic fermentation
followed by enrichment of the culture using a fed batch system in a CSTR and then a batch
PHA accumulation step in a STR (Grousseau et al., 2013). Other reports are also available
on using other fermenter types such as bubble-column reactor for PHA accumulation using
both batch and fed-batch processes (Preusting et al., 2004). Finally, Table 2-4 presents a
comprehensive summary of the information related to the different fermentation modes
and waste streams tested for the production of PHAs; as well as the producer strains that
have been studied.

36
Table 2-4 Fermentation modes and waste streams studies for the production of PHA.
Organism Carbon source Operation
mode
Biomass Concentration
(g/L)
PHA Concentration
(g/L)
PHB productivity
(g/L h) Product References
Pseudomonas aeruginosa
Sugarcane molasses
Batch 7.32 7.3 0.11 PHB (Tripathi et al.,
2011)
Bacillus sacchari Bagasse
hydrolysate Batch 4.4 2.73* 0.11 PHA
(Silva et al., 2004a)
Halomonas boliviensis
Wheat Bran hydrolysate
Batch 8 4 0.2 PHB (Van-Thuoc et al.,
2007)
Saccharophogus degradaus
Cellulose in tequila bagasse
Batch 8.8 1.5 --- PHA (Alva Munoz and
Riley, 2008)(
Cupriavidus necator wild and
recombinant Soybean oil Batch --- 2.5-6 ---
P(3HB-co- 3HHx-co-3HO)
(Tsuge et al., 2009)
Cupriavidus necator H16
Waste frying oil (from rapeseed)
Batch 2 1.2 0.016 P(3HB) Poly-(3HB-
co-3HV)
(Verlinden et al., 2011)
Azotobacter vinelandii UWD
Sugar beet molasses
Batch 47 36 1.05 PHB (Chen and Page,
1997)
Azotobacter chroococcum H23
Alhechin (olive oil mill wastewater)
Batch 6 5.2 0.21 PHA (Ceyhan
Guvensen and Ozdemir, 2011)
Recombinant Escherichia coli
Whey Batch 22 21.0 --- PHA (Mothe et al.,
2009)

37
Organism Carbon source Operation
mode
Biomass Concentration
(g/L)
PHA Concentration
(g/L)
PHB productivity
(g/L h) Product References
Pseudomonas putida
Hydrolysed corn oil
Fed-Batch 103 28 0.61 mcl-PHA (Shang et al.,
2008)
Pseudomonas putida
Oleic acid Fed-Batch 30.22 13.2 0.1878 C6, C8, C10, C12
PHA (Marsudi et al.,
2009)
Bacillus megaterium
Sugarcane molasses
Fed-Batch 72.6 29 1.27 PHB (Kulpreecha et al.,
2009)
Cupriavidus. necator
Glycerol Fed-Batch 75 53 0.92 PHB (Tanadchangsaeng and Yu, 2012)
Cupriavidus necator
Waste potato starch
Fed-Batch 179 94 1.47 PHB (Haas et al., 2008)
Cupriavidus necator DSM 545
Waste Glycerol Fed-bach 68.8 26.14 0.6-1.5 PHB
(Cavalheiro et al.,
2009)
Alcaligenes eutrophus
Glucose Fed-Batch 164 121 2.42 PHB (Kim et al., 1994)
Haloferaz mediterranei
Whey Fed-batch 10.9 7.2 --- PHB (Koller, 2015)
Recombinant Escherichia coli
Sugar cane molasses
Fed-batch 39.5 30.5
1 PHB (Liu et al., 1998)
Recombinant Escherichia coli
Whey Fed-batch 119.5 96.2 2.57 PHB (Ahn et al., 2000)

38
Organism Carbon source Operation
mode
Biomass Concentration
(g/L)
PHA Concentration
(g/L)
PHB productivity
(g/L h) Product References
Pseudomonas putida
MM continuously fed with SO
Continuous 3.75 --- --- --- (Troeger and Harvey, 2009)
Ralstonia eutropha
Fructose Continuous 30 8.7 0.55 PHB (Khanna and
Srivastava, 2010)
Cupriavidus necator
Stage 1: CCS Stage 2: ARF
Batch/Fed-Batch 21.13 8.4 0.0697 PHB (Chakraborty et
al., 2012)
Ralstonia Eutropha
Canola oil Batch/Fed-bach 20.4 18.2 0.075 PHB (López-Cuellar et
al., 2011)
Cupriavidus necator
Glucose Growth phase:
Batch; Production phase: continuous
81 63 1.85 PHB (Atlić et al., 2011)
Bacterial consortium
Sugarcane molasses
Stage 1: Continuous; Stage
2: Feast & Famine; Stage 3:
Batch
2.0- 3.0 0.6-1 0.43 PHBV (Albuquerque et
al., 2007)
CCS= Condensed corn solubles, ARF= Artificial rumen fluid, MSM= mineral salt medium, MM= mineral medium, SO: sodium octanoate.

Literature review
39
2.4 Alternative raw materials as carbon sources to PHA production
Biotechnological processes for industrial production can be considered as promising for
sustainable development, although several cases of biotechnological production processes
have not yet passed the test of economic viability. This occurs caused for the cost of the raw
materials. A strategy that can be used to solve this problem is the utilization of a broad range
of waste and surplus materials that can be modified for its use as feedstocks for
biotechnological process. Agriculture and angroindustrial industries are usually producing this
kind of materials as waste streams or by-products (Braunegg et al., 2004; Khanna and
Srivastava, 2005b)
Cost of raw materials, mainly carbon sources, is one of the most important factors affecting
the overall economics of PHA production, up to 50% of the entire production costs, specifically
for large-scale process (Castilho et al., 2009). This is caused by the fact that PHA accumulation
occurs under aerobic conditions, resulting in high losses of the carbon substrate by
intracellular respiration.
Therefore, the economic feasibility of bulk PHA production is dependant of developing
efficient fermentation processes from inexpensive carbon sources. Utilization of waste
products as carbon sources presents the advantage of concomitant decrease in disposal costs
and production of value-added products (Du et al., 2012).
The selection of the appropriate waste stream as a feedstock for biotechnological purposes
mainly depends on the global region where a production plant will be constructed. In Europe
huge amounts of surplus whey are available in the dairy industry, providing lactose for the
production of lactic acid, PLA, PHA and bioethanol. The increasing production of biodiesel here
generates enormous amounts of its major side stream, namely glycerol, a starting material to
produce PHA and lactic acid. On the other hand, in other areas of the world, waste from the
sugar industry, starch, waste lipids, alcohols such as methanol (Bourque et al., 1995) and
especially lignocellulosic feedstocks are available in quantities that are appropriate for
industrial process demands.
Waste lipids are available from a variety of sources: waste cooking oil, different plant oils,
lipids of MBM or waste water from olive oil and palm oil production. In all cases, the

Literature review
40
triacylglycerides can be directly utilized as a carbon source, or after hydrolysation to glycerol
and fatty acids, or after transesterification towards biodiesel and glycerol.
Lignocellulosic material, consisting of lignin, cellulosic and hemicellulosic fibres, provide the
feedstocks of highest quantity. Industrial branches generating the major shares of this waste
are the wood-processing, paper and agriculture industries. Nowadays, plenty of effort is
dedicated worldwide to develop biorefinery plants for the conversion of lignocellulose and
cellulose waste to starting materials for biotechnological production of bioethanol,
biopolymers and a range of fine chemicals. The optimization of methods for digestion of
lignocellulose and the development of effective biocatalysts for the breakdown of cellulose
and hemicellulose into microbially convertible sugars (hexoses and pentoses) are the
prerequisite for an efficient biotechnological conversion of these promising raw materials into
desired end products. Figure 2.4 presents the different waste streams used to the production
to PHA and the pathways that cells use to assimilate them.
Figure 2.4 Waste streams and metabolic pathways used for PHA production Modified from (Koller et al., 2010a)
Whey
Glycerol
liquid phase
Waste
lipids
Starch- based
residues
Glyceraldehyde-3-Phosphate
Glycerol
Triacylglycerides
Fatty acids
Acetyl-CoA
Acetoacetyl-CoA
Acetoacetate
3-Hydroxybutyryl-CoA
3-Hydroxybutyrate
Pyruvate
mcl-PHAs
Starch
Galactose
MaltoseGlucose
Lactose
Xylose
Arabinose
Fructose
Lactic acid
Molasses Sucrose
Lignocellulose
Cellulose
Hemicellulose
PHB

Literature review
41
2.5 Orange Juicing waste (OJW)
One of the main lignocellulosic materials worldwide is produced by the citrus processing
industry, with orange juice as the main product (Angel Siles López et al., 2010; Boukroufa et
al., 2014). The world production of citrus fruits has showed continuous growth in the last
decades. Being the forecast for the global production of oranges around 50 million tonnes for
2017 (USDA and FDA, 2017). A large portion of this production is destined for the extraction
of citrus juice; USA and Brazil use the 69% and 73% of their total productions respectively.
Orange juicing generates a huge amount of residues, around 50-60% of weight (Balu et al.
2012) , including peels and segment membranes, with the disposal of these representing a
problem for the industries involved. Citrus residues contain soluble and other insoluble
carbohydrates, making this material interesting as potential feedstock for value added
products, prior a chemical or enzymatic hydrolysis and a subsequent biological conversion of
them (Balu et al., 2012; Choi et al., 2013; Mohammad Pourbafrani, 2007). Fructose represents
more than 15% of the soluble sugars found in orange peels. Table 2.5 presents the typical
composition of orange peel founded by Rivas et al., (2008).
Table 2-5 Orange juicing waste composition
Compound %*
Soluble sugars 16.9
Starch 3.75
Fiber
Cellulose 9.21
Hemicellulose 10.5
Lignin 0.84
Pectin 42.5
Ash 3.50
Fat 1.95
Protein 6.50
Other compounds 4.35
* Percent on Dry basis

Literature review
42
Different strategies for the valorisation of orange peel waste (OJW) have been tested, from
burning it as heat and power source to the use as hard metals sieve in water treatment (Balu
et al., 2012; Bampidis and Robinson, 2006; Santos et al., 2015). The use of OJW as starting
material for different biotechnological processes is currently being assessed, however the due
to the complexity of the composition, and the presence of toxic substances, the process has
not been successfully stablished(Mohammad Pourbafrani, 2007; Pourbafrani et al., 2010).
Figure 2.5 D-Limonene, the main compound present in orange essential oil.
OJW can contain up to 1.6 % (w/w) of orange essential oil (OEO), with important applications
in several industries, including food, cosmetics and pharmaceutical. This essential oil
accumulates in small oil sacs of 0.4 to 0.6 mm in diameter and is located at irregular depths in
the flavedo at the outer peel of the fruit (Angel Siles López et al., 2010) and in addition to its
characteristic smell it also has shown inhibitory effects on the growth of several pathogenic
strains (Muthaiyan et al., 2012; Subramenium et al., 2015; Zahi et al., 2015). Approximately
90% of the OEO consists of limonene, structure showed in Figure 2.5, a naturally occurring
monoterpene; consequently, studies on the antimicrobial effect of orange essential oil have
focused on the limonene titration. According to literature, concentrations as low as 0.05% can
inhibit cell growth for bioethanol production (Choi et al., 2013; Joshi et al., 2015).
Furthermore, different approaches focused in the holistic implementation of citrus wastes
have highlighted the importance of recovery of the OEO prior its biotechnological processing,
enhancing the productivities of the microbiological stage, and adding value to the starting
material (Lohrasbi et al., 2010; Ruiz and Flotats, 2016).

Literature review
43
2.5.1 Mexican orange production
For the developing economy of the country, the efficient use of the natural resources has
become a priority. Different governmental agencies and the national research council
(CONACyT) has implemented programs and incentivise projects that tackle the
biotechnological implementation of agroindustral waste and by-products (Lopez M., 2017).
Mexico is currently the fifth orange producer in the world, with an estimate production of 4
million tonnes. Nearly 1.5 million tonnes will be destined to be processed, with orange juice
being the main product. This leads to the production of about 750,000 tonnes of OJW in the
country which are mainly disposed as waste, used as animal feed or as a heat source (Lerma
et al.,2015). However, there is a growing interest in the development of processes that allow
a better usage of the different fractions of the OJW.
2.6 Valorisation strategies for the OJW
OJW is formed by a complex matrix of different substances that are, generally, not being
exploited in an efficient manner. Once the juice has been separated, around 50-60% of
processed fruit waste is discarded as a by-product. This material includes seeds, peels and
segment membranes, is rich in carbohydrates, organic acids and volatile compounds. Different
fractions of the material have been proven to have a market value. Several studies have
agreed that the best approach to successfully add value to OJW requires an integrated process
that uses the by-products of subsequent process lines targeting specific compounds (Angel
Siles López et al., 2010; Boluda-Aguilar et al., 2010; Lohrasbi et al., 2010).
Biorefineries has been defined as “the sustainable processing of biomass into a spectrum of
marketable products and energy”(De Jong and Jungmeier, 2015.). The concept was originally
developed to biofuel production factories, after realising the importance of the valorisation of
the different streams coming from the process. The concept was rapidly expanded to other
biotechnological processes.
Several approaches have been studied towards the valorisation of OJW. The simplest attempts
involve its use as either animal feed or combustible for heat generation. Both involve lowest
processing demand, as usually the whole material is dried and used as obtained. However, the
main disadvantage found for these strategies is the underuse of some of the material

Literature review
44
components. The low protein content of OJW makes necessary the addition of supplements,
rising the overall costs of implementation. Finally, different on-site reports claim certain
degree of rejection to the OJW-based feed from animals, making necessary the mixing with
different products. Overall, even when these strategies represent the simplest alternative only
a fraction of the OJW produced can be directed, depending on the feeding stage of animals or
heat demand of the process.
The use of OJW for wastewater treatment has gain interest in the last decade as the material
can act as absorbent for several heavy metal ions. When batch absorption experiments were
carried out using OJW dried powder, the removal of Cu (II) was found highly dependent with
pH, reaching a peak absorption of 90% removal when a value of pH 7 was maintained (Habib
et al., 2007). Other studies focused on the removal of Zn2+, Ni2+, Co2+ and Pb2+. In 2003,
Annadural et al. demonstrated that OJW absorbs each of these metals, with Pb2+ as the
preferred ion. Reaching a Pb absorption of 8 mg per gram of OJW used (Annadural et al.,
2003). As for the previous alternatives described, this strategy does underuse the OJW
derivatisation potential nor reduce the final material volume, as is still needed to direct the
waste after its use.
Pectin represents about 40% (w/w) of OJW weight, on a dry basis, and is currently the main
fraction exploited. As a hydrocolloid, Pectin is capable to trap water and form gels at low
concentrations. This has increased the use of pectin in several industrial sectors as gelling and
thickening agent (Ciriminna et al., 2016). However, due to pectin low market value, around 12
USD per kilogram, and the high volume of acid wastewater produced by the extraction
process, have deferred the proliferation of the pectin industry (Casas-Orozco et al., 2015).
The biotechnological use of OJW through fermentation has been attempted by several
research groups. As the material is rich in polysaccharides the main objective of these studies
is the implementation of the OJW as carbon source. An upstream step is needed for the
hydrolysis of the polymers present in the OJW. Talebnia et al. studied the saccharification of
citrus wastes by dilute-acid hydrolysis; they found that pectin was not susceptible to
hydrolysis at temperatures below 210°C; while the optimum results for the hydrolysis of the
sugar polymers was obtained at 116°C using a solution 0.5 % (v/v) of sulphuric acid. With low

Literature review
45
degradiaton sugars to hydroxymethylfurfural (HMF). Thus, enabling the extraction of pectin
and the production of a sugar-rich medium for the further implementation in fermentation
processes (Talebnia et al., 2007). Gomaa in 2013, studied the bioconversion of orange peels
for production of ethanol using B. suptilis and P. aeruginosa. Maximum ethanol
concentrations reached the 92.5 and 82.7 g/L for B. suptilis and P aeruginosa respectively,
when media was enriched with nitrogen sources. In 2008. Rivas et al. researched the use if an
orange peel autohydrolysate for the citric acid fermentation using Aspergillus niger CECT
2090; a free sugars rich medium was produced with a maximal concentration of 38.2 g/L
through an autohydrolysis process that involved the addition of only water. The maximum
citric acid concentration reached was 9.9 g/L for a yield on consumed sugars of 0.53 g/g (Rivas
et al., 2008; Zakaria Gomaa, 2013).
The present thesis work was carried out to examine the feasibility of using citrus waste as a
raw material to produce a complex fermentation media rich in fructose that can provide the
necessary nutrients for the synthesis of PHA by Cupriavidus necator H16. Simultaneously
adding value to this lignocellulosic material usually regarded as waste. Additionally, study on
the inhibitory effect was carried out to understand the mechanism of limonene inhibition over
this bacterium, discussion is made on the importance of a holistic approach to the valorisation
of the OJW aiming to use the majority of its components.
2.7 Cupriavidus necator
Cupriavidus necator is a versatile PHB-producing bacterium and the most extensively studied;
it has been commonly used due to its ability to accumulate up to 90% of its dry weight as PHB
(Arun et al., 2006; Chee et al., 2010). Figure 2.6 shows a scanning transmission microscopy
that allow to appreciate the formation of inclusion bodies at different times inside cells of C.
necator. C. necator is a gram-negative, coccoid rod-shaped bacterium measuring 0.7-0.9×0.9-
1.3 µm. It is motile with 2-10 peritrichous flagella. It reproduces by binary fission and in older
cultures, the rods decrease in size and become rounded. The colony diameter is 2-4 mm
(Makkar and Casida, 1987).

Literature review
46
Figure 2.6 STEM image showing the acumulation of PHB in Cupriavidus necator at 72 h of incubation, using a
synthetic medium described in section 4.2 with fructose as sole carbon source
It was formerly classified as Ralstonia eutropha and Alcaligenes eutrophus (German Collection
of Microorganisms and Cell Culture, DSMZ) (Fukui et al.,2009). Wautersia eutropha is another
synonym of C. necator. However, according to the rules of the International Code of
Nomenclature of Bacteria, the genus name Cupriavidus has priority over the genus name
Wautersia. Due to this all members of the genus Wautersia have been reclassified into
Cupriavidus (Vandamme and Coenye, 2004; German Collection of Microorganisms and Cell
Culture (DSMZ) 2009). The terms Cupriavidus necator derive from Latin words “cuprum”
(copper) and “avidus” (eager for, loving) while “necator” means “slayer”(Balkwill, 2015;
Makkar and Casida, 1987).
C. necator is aerobic and mesophilic with optimal temperature of 27°C but good growth is also
obtained at 37°C. It can grow in the pH range 5.5 to 9.2, though optimal pH is between 7.0 and
8.0. Several chemicals including hydroxybutyrate, acetate, fructose, lactate, succinate and
amino acids except for L-lysine or L-methionine can be used as carbon/nitrogen sources.
Makkar and Casida (1987) reported that, for C. necator strain N-1, carbon sources that are not
utilised include glucose, glycerol, lactose, mannitol mannose, xylose and rhamnose (Makkar
and Casida, 1987). However, several strains have been reported to be capable of utilising
glucose and glycerol as carbon source, for example C. necator strain DSM545 and DSM4058
(Fiorese et al., 2009).

Literature review
47
Media containing 1% NaCl have been found to support the growth, but it is inhibited at 3%
NaCl. C. necator is a non-obligate predator of various other gram-positive and gram-negative
bacteria in soil. It is resistant to copper and growth initiation is stimulated by copper (Balkwill,
2005). Under unbalanced growth conditions for instance limitation of essential nutrients such
as nitrogen, phosphorus, magnesium, potassium, oxygen or sulphur and excess carbon, C.
necator synthesises and accumulates PHB inside its cell as a carbon and energy reserve
(Posada et al., 2011).
2.7.1 Polyhydroxybutyrate synthesis in C. necator
As mentioned earlier, C. necator is the most extensively studied micro-organism for PHB
production due to its high productivity (Ashby et al., 2001). A glucose-utilising mutant of this
bacterium had been reported accumulating up to 80% (w/w) PHB (Holmes, 1985). Whereas
on glycerol, PHB content of 70% of dry cell mass is achievable (Mothes et al., 2007). The
synthesis of PHB is considered the simplest biosynthesis pathway, which involves three
enzymes and their encoding genes. (Suriyamongkol et al., 2007), Table 2.6.
Table 2-6 Enzymes and encoding genes for the synthesis of PHA in C. necator
Gene Enzyme Function
phaA β-ketothiolase Condense two acetyl-CoA molecules to form
acetoacetyl-CoA
phaB Acetoacetyl-CoA
reductase
Catalyse the reduction of acetoacetyl-CoA to (R)-3-
hydroxybutyryl-CoA, this enzyme is NADPH-
dependent
phaC PHA synthase Catalyse the polymerisation of (R)-3-hydroxybutyryl-
CoA monomers
The process of PHB synthesis, as shown in figure 2.7, starts with the condensation of two
acetyl-CoA molecules to form acetoacetyl-CoA by ȕ-ketothiolase. The second reaction is the
reduction of acetoacetyl-CoA to (R)-3-hydroxybutyryl-CoA by the NADPH-dependent
acetoacetyl- CoA reductase. Lastly, (R)-3-hydroxybutyryl-CoA monomers are polymerised by
PHA synthase, yielding PHB (Doi et al., 1990; Steinbüchel and Füchtenbusch, 1998;
Suriyamongkol et al., 2007). PHA synthase, the main enzyme for PHB biosynthesis, in C.

Literature review
48
necator reacts with substrates containing three to five carbon atoms, with C4- substrate as its
preference. As a consequence, PHA polymers obtained from this pathway contain short-chain-
length monomers (Suriyamongkol et al., 2007).
Figure 2.7 The pathway for the biosynthesis of PHB from acetyl-CoA in C. necator and most other bacteria (adapted
from Steinbüchel and Füchtenbusch (1998) and Suriyamongkol et al.,(2007).
Apart from PHB monopolymer, C. necator can also synthesise PHB copolymers including
poly(3-hydroxybutyrate-co-3-hydroxyhexanoate), poly(3-hydroxybutytate-co-4-
hydroxybutyrate) and poly(3-hydroxybutyrate-co-3-hydroxyvalerate) (Chanprateep et al.,
2008; Obruca et al., 2010). As mentioned, this inclusion of different repeat units leads to
polymers with a wide range of mechanical and physical characteristics, with a wide range of
applications.
β-ketothiolase
Acetoacetyl-CoA reductase
PHA synthase
CoASH
NADPH + H+
2 molecules Acetyl-CoA Acetoacetyl-CoA
(R)-3-hydroxybutyryl-CoA
PHB
CoASH
NADP+

Scope of the thesis
49
3 SCOPE OF THE THESIS
The use of plastics is ubiquitous to various applications across our society due to their
versatility, although the disposal of plastic waste is a growing global environmental issue.
Nevertheless, the growing interest in the development of more environmentally friendly
products and processes has set in motion different efforts to find alternatives to currently
used crude oil-based products. This need for alternative materials is driving research into
biopolymers, such as polyhydroxyalkanoates, as biodegradable substitutes to fossil-based
plastics. Different processes and biotechnological systems have been studied to produce
biopolymers, some of which have seen implementation at large scale over the last few
decades. Starch based plastics were the first to be commercialised as a potential additive to
oil-based plastics, in order to make them susceptible to biodegradation. Companies such as
NatureWorks, produce PLA, and historically Imperial Chemical Industries (ICI), manufactured
PHB in the UK. The current bioplastics production represents about one per cent of the global
plastic production at over 2.1 million tons every year. However, the elevated production cost
of bioplastics when compared to fossil- based plastics has hindered their broader utilisation.
The use of renewable and cheap raw materials is one of the alternatives being studied as a
strategy to reduce the overall cost of PHA production. Lignocellulosic materials, such as sugar
cane bagasse, grape pomace and orange peels coming from juice extraction, are usually
regarded as by-products from many different agro-industrial processes. These materials are
habitually formed of complex chemical matrixes that can be used as feedstocks in higher
added value processes. However, due to elevated pre-treatment processing costs and a lack
of suitable technology these agro-industrial wastes are typically employed as a whole, as
energy sources (via combustion) or as animal feed, or just directly discarded as waste.
This research project was conceived from the concept of reducing the cost of PHA production
by the utilisation of an agro-industrial waste as a carbon source, thus, adding value to this
underexploited material. For the flourishing agroindustry in Mexico, adding value to
underused materials is essential to reach optimum economic and environmental efficiency.
The citrus processing industry is one of the biggest in the country processing over 1.5 million
tons of orange per year, which represents approximately 750,000 tons of fresh orange juicing

Scope of the thesis
50
waste a year. The development of a process that allows the use of the orange juicing industry
waste as a starting material for the synthesis of the bioplastic polyhydroxybutyrate and the
extraction of D-limonene gives novelty to the research. The main target of this work is to
demonstrate the technical feasibility of the implementation of orange juicing waste as a raw
material to produce polyhydroxyalkanoates, making PHB as a target molecule using a wild
type strain of Cupriavidus necator.
In order to develop a technically feasible route to add value to orange juicing waste through
biopolymer production three main experimental studies were necessary to achieve
biopolymer production via a biotechnological route. First, the characterisation of the orange
juicing waste to determine its composition and the presence of target molecules necessary
for strain growth, followed by the selection of the process to generate a nutrient rich medium.
The second study focused on the conversion of the extracted nutrients into biopolymer, PHB,
focusing on the kinetic characterisation of the bioconversion by determining the conditions
that lead to the highest biopolymer yields and concentration. Finally, the characterisation of
the PHB obtained was necessary to determine potential applications. Smaller specific
objectives were set as milestones in order to facilitate the achievement of the project aims:
• Characterisation of the composition of the orange juicing waste.
• Optimisation of the extraction process, focusing on maximising fructose concentration as
a target.
• Evaluation of the feasibility of using an orange juicing waste medium for PHB production.
• Study of the effect of growth inhibitors in the medium, specifically limonene.
• Effect of the orange essential oil extraction prior the bioconversion stage over the
biopolymer production.
• Scale up the process to bench scale bioreactors to gain control of the process parameters
and evaluate the effect of control and feeding strategies over the PHB production.
3.1 Structure of the thesis
To date, the high production costs of biopolymers combined with low oil prices have hindered
the wider use of biopolymers. The main target of the work presented here is to engineer a
process to make use of orange juicing waste for PHB production, aiming for technical

Scope of the thesis
51
feasibility and economic competitivity. The content of this thesis is presented in eight
chapters.
Chapter one introduced the basic concepts necessary for the understanding of this research
project. General, PHA and OJW definitions, the global production figures and the potential
applications. The introduction to the project aims and structure of this report are also
presented in this chapter.
In Chapter two analyse critically in detail the different studies and reports involving PHB
production, with special focus on those processes driven by bacterial microbial strains. The
challenges related to the implementation of agro-industrial by-products and wastes.
Presenting the state of the art related to this approach to PHA production. A discussion of the
different valorisation strategies studied for the case of the OJW as raw material is included to
give context to the project. The advantages and drawbacks of the different strategies that
have been studied aiming to reduce the cost of production are discussed. The concept of
orange and citrus biorefineries is also discussed as an essential approach to achieve a
sustainable process.
Chapter three presents the scope of the research and the main objectives that lead the
experimental development and theoretical programme will be discussed.
A detailed description of the theoretical principles and applications of each analytical method,
their set-up procedure and performance indicators, will be included in Chapter four, as well
as the description of the experimental strategy.
In chapter five the results for the characterization of the raw material are presented, protein,
fibre and carbohydrates content are discussed and compared with similar by-products form
other processes. A discussion of the different saccharification methods is included as an
introduction to this study comparative summary that helped the selection of the process
technology. The effect of temperature, solids load and time length of the hydrolysis stage was
studied, determining the best conditions that allow the highest concentration of fructose
inside the hydrolysate. Finally, the feasibility of the implementation of an additional limonene
extraction stage is presented by means of steam distillation is presented.

Scope of the thesis
52
Chapter six will evaluate the effects of the initial media composition on the synthesis of PHAs
and the cellular growth. A kinetic analysis of the different variables involved gives insight of
the different stages of the growth of the bacterial strain; as well as the synthesis triggering
cause for the microbial strain. Effect of the media production process and polymer synthesis
is discussed, using the media obtained from the experiments in chapter five. Results are
compared to those obtained for a synthetic medium using different carbon sources. The effect
of the limonene titre on the bioprocess parameters is assessed using a mineral medium which
emulates the conditions provided by the OJW medium
The knowledge of the kinetics of the system, gained through the studies described above,
served to investigate the scale-up to bench scale bioreactors; the results of this investigation
are presented through chapter seven. Different culture conditions, control strategies and a
different feeding strategy were studied in order to improve the process yields and
productivities. An alternative inoculation strategy was tested to increase the initial biomass
viability in the bioreactors. Results found for OJW medium are compared to those reported in
the literature for media derived from similar agroindustrial materials.
A general discussion on the possible implications of the experimental findings presented in
this thesis and the conclusions derived from the results are be presented in the last chapter,
including a summary of the key outcomes, as well as recommendations for further research
related to the implementation of OJW as raw material for biorefining.

Materials and methods
53
4 MATERIALS AND METHODS
This chapter enlists the materials used and describes all the experimental work performed in
order to achieve the research objectives, including medium and sample preparations. A
thorough description of the experimental procedures and some insight on the theoretical
principles of the analytical techniques are given where appropriate. Results from the
experimental work are presented in later chapters.
4.1 Microbial strain storage and maintenance
Freeze dried Cupriavidus necator H16, from the DSMZ-German Collection of Microorganisms
and Cell Cultures, was purchased and cultivated according to the supplier instructions. A
master and working stock were created using MicroBankTM cryovial system (Pro-Lab
Diagnostics, UK) and keep at the -80 °C. Short term storage plates, consisting of nutrient agar,
were prepared from a single ceramic bead every time a batch of experiments was started, to
keep the variability of the strain as low as possible.
The lyophilized cells were directly inoculated into a rich medium. Nutrient broth no. 2 (Sigma,
Germany) was used for this purpose, with its usual composition displayed in Table 4.1. After
24h of incubation at 30°C and 200 rpm, when the culture showed high cell density, cryovial
systems that contains chemically treated ceramic beads suspended in a medium consisting of
a phosphate buffered saline supplemented with sucrose, glycerol, and peptone (MicroBankTM,
Pro-Lab Diagnostics) were inoculated with 100 µL of the cell culture to be storage at -80° C.
Table 4-1 Usual composition of nutrient broth no. 2
Component *Concentration (g/L)
Casein peptone 4.3
Meat peptone 4.3
NaCl 6.4
*as reported by supplier
Petri dishes containing Nutrient Agar media (Merck, Germany) were inoculated using a single
bead from the working stock, and used as short-term storage stock kept at 5°C. Composition,
as reported by the provider: peptone, 5g/l; meat extract, 3 g/l; and, agar-agar, 12 g/L. The

Materials and methods
54
streak plate method was used to obtain isolated colonies to be used as inoculum for the
experiments. If required, new plates were prepared after two weeks to keep a good viability
level of the cells.
4.2 Preliminary experiments
In order to gain knowledge on the microorganism growth kinetics and the technical ability
necessary, preliminary experiments were performed using different concentrations of several
carbon sources. Nutrient broth no. 2 was used to re-activate the strain from the short-term
stock agar plates. For these experiments, the mineral medium described by Salakkam and
Webb (2012), when studying the growth of C. necator with glycerol as sole carbon source, was
used. Composition showed in Table 4.2.
Table 4-2 Mineral media composition
Reactive Manufacturer g/L
KH2PO4 Sigma, Germany 1.52
Na2HPO4 Fisher, UK 2.44
(NH4)2SO4 Sigma, Germany 0.5
Mg2SO4 •7 H2O Sigma, Germany 0.2
CaCl2 •2 H2O Sigma, Germany 0.05
*Tap water was used instead of distilled water on order to compensate
the lack of some trace elements.
Chemical reagents were used as supplied. Pure glycerol, fructose (Merck, Germany) and
common sunflower oil (Spar Ltd, UK) were tested as sole carbon sources at concentrations of
5, 10, 25 and 50 g/L. Reagents were weighed and dissolved as needed and sterilized by
autoclave. Fructose was autoclaved separately to avoid caramelisation of sugars. Before
autoclaving, the pH of the media solutions was adjusted to 6.8 by the addition of 1 M solution
of NaOH or HCl, as required.
Inoculation, was done by adding 10% (v/v) of the overnight culture to the shake-flask
containing the medium required for the experiment. From an agar plate a single colony was
inoculated into 10 ml of nutrient broth No. 2 to ensure the cell growth. After 24 h, the entire
volume was used to inoculate 100 ml of the mineral medium, added with 10 g/L of the

Materials and methods
55
corresponding carbon source, to be used as the seed culture for the experiment. Once the
seed culture reached exponential phase, 24 h after inoculation, 500 ml shake-flasks containing
100 ml of the corresponding medium were inoculated using 10 ml of the seed culture, for a
total working volume of 110 ml. Growth conditions for all the experiments were 30°C and 200
rpm. Samples were taken at different times and measurements of biomass, carbon source and
PHB concentrations production were performed. All experiments were run in triplicate.
4.2.1 OJW medium
Two different raw materials were originally tested. Orange peel manually (OPM) produced
from the consumption of a group of volunteers was collected for a period of two weeks; and
the waste produced at a juice bar business as a consequence of orange juice production during
a working day (OJW). Both materials were stored froze as received, at −20°C in order to avoid
rotting. Alternatively, a drying stage was performed if required by the study, samples of the
material were placed in a drying oven at temperature 70° C, and left there until constant
weight was reached, approximately 72 h.
A milling stage was performed on the raw materials using a typical food processor to improve
the mass transfer from the lignocellulosic matrix to the solution. The products of grinding
stage were then submerged in distilled water maintaining a ratio of 1:8 (w:v) (Rivas et al.,
2008) ground peel to water and boiled using an common autoclave sterilization process 121°C
during 15 min, reaching a pressure of 15 psi. The resulting solutions were then filtered using
a Buchner system and filter paper No 2 for separation of the solids. Measurement of the pH
was carried out and a 1M NaOH solution was used to adjust the initial pH of the media to a
value of 7. Finally, a second sterilization stage was performed using 0.2 µm filters to avoid
contamination during the experiments. Figure 4.1 shows different stages of fructose
extraction for the production of the medium.

Materials and methods
56
Figure 4.1 Diagram showing the different OJW media production processes tested. OJW can enter the process
either at the drying, grinding or hydrolysis stages;two different hydrolysis media were used, distilled water and a
solution H2SO4 3% (v/v) (Rivas et al., 2008).
4.2.2 Orange peel medium fermentation
From an agar plate a single colony was inoculated into 10 ml of nutrient broth to ensure the
cell growth; after 24 hours cells were harvested by centrifugation, 5 min 10,000 rpm, using a
MiniSpin centrifuge (Fisher Scientific, UK) and then suspended in to a volume of 10 ml of
orange peel based media and a 24 h adaptation stage for the cells was run. Finally, 500 ml
shake flasks containing 100 ml of orange peel-based media were inoculated using 5 ml of the
inoculum culture; growth conditions for shaker were 30°C and 200 rpm. Samples were taken
at different times and measurements of biomass, fructose concentration and PHB production
were performed. All experiments were run in triplicate.

Materials and methods
57
4.2.3 Limonene inhibition effect medium
The effect of limonene over the cell growth of Cupriavidus necator H16 was studied adding
different concentrations to the mineral media developed by Aramvash et al. (2015) for the
production of PHB. The medium composition is presented in the Tables 4.3 and 4.4, pH was
adjusted to 7 using solutions of NaOH and HCl at 1M concentration. The carbon source used
for this study was fructose at concentrations similar to those reached for the OJW medium
prepared, 25 g/L.
Table 4-3 Mineral media composition
Component Concentration
(g/L)
KH2PO4 1.75
MgSO4•7H2O 1.2
Citric acid 1.7
NH4CL/NH4 2
Trace elements solution 10 ml/L
Table 4-4 Trace elements solution
Component Concentration
(mg/L)
ZnSO4•7H2O 2.25
FeSO4•7H2O 10
CaCl•2H2O 2
Na2B4O7•7H2O 0.23
(NH4)6Mo7O24 0.1
CuSO4•5H2O 1
MnSO4•5H2O 0.6
HCl (35%) 10 ml/L

Materials and methods
58
0, 0.5, 1, 1.5 and 2 % (v/v) of limonene (Thermo Fisher Scientific, UK) were added after
sterilisation to avoid evaporation. For every experiment a single colony from the agar plates
was taken with a loop under aseptic conditions and inoculated into 10 ml of nutrient broth
No. 2. Contained in 50ml falcon tubes. Cultivation conditions were 30° C and 200 RPM. After
24 h of cultivation, the entire volume was used to inoculate 100 ml of mineral media added
with fructose and limonene at different concentrations, depending on the case. And were
cultivated in identical conditions for 24 h. Finally, 10 ml of culture broth were used to inoculate
100 ml of the mineral media contained into 500 ml shake flasks. All experiments were run in
triplicate.
4.3 Biomass measurements
Cell growth measurements were carried out to evaluate microorganism performance and the
effect of the carbon source on the growth of the strain. Several methods were tested for
monitoring the biomass growth.
4.3.1 Optical density
The optical density (OD) or turbidity is an indirect method as the light absorbed through a cell
culture is proportional to the cell concentration of cells. Standard curve of OD against cell
concentration can be constructed and used as a quick method to read the cell concentration
of samples.
The cell density was estimated by optical density measurements at a wave length () of 600
nm (OD600), using a spectrophotometer UVmini-1240 (Shimadzu,USA); to keep the values of
the absorbance readings between 0.05 and 0.9 and ensure the accuracy of the study, dilutions
of the samples were prepared when necessary. Cell density of the diluted samples was
estimated by multiplying the value of the reading times the dilution factor defined as follow:
(1)
𝐷𝑖𝑙𝑢𝑡𝑖𝑜𝑛 𝑓𝑎𝑐𝑡𝑜𝑟 = 𝑣𝑜𝑙𝑢𝑚𝑒 𝑜𝑓 𝑡ℎ𝑒 𝑑𝑖𝑙𝑢𝑡𝑒𝑑 𝑠𝑎𝑚𝑝𝑙𝑒
𝑣𝑜𝑙𝑢𝑚𝑒 𝑜𝑓 𝑡ℎ𝑒 𝑎𝑙𝑖𝑐𝑢𝑜𝑡 (1)

Materials and methods
59
4.3.2 Dry matter analysis
Total dry matter (TDM) quantification was performed to characterize cell growth and PHA
production. The dry matter content of fermentation broth was measured by transferring 2 ml
of sample cell containing broth into a pre-weighed 2 ml micro test tube (Eppendorf, DE), cells
were then spun down by centrifuged at 13,000 rpm for 10 minutes using an Eppendorf
MiniSpin centrifuge (Fisher Scientific, UK). The resulting supernatant was decanted and used
in subsequent analyses to determine residual nutrient concentrations. The remaining cell
pellet was washed twice using distilled water and dried at 60C until constant weight was
reached, which took approximately 48 hours. The dry matter was calculated from the change
in mass of the sample.
Dry matter (g ∙ kg−1) = 𝑊3−𝑊1
𝑊2−𝑊1× 1000 (2)
where W1 is the weight (g) of the tube, W2 the weight of the tube containing the sample,
before removing the supernatant, and W3 the weight after drying. Concentration of could also
be calculated using:
Dry matter (g ∙ L−1) = 𝑊2−𝑊1
𝑉1× 1000 (3)
where W2 is the weight after drying (g), W1 the weight of the tube (g), and V1 the volume of
the sample in mL.
Residual dry cell weight (RDCW) can be calculated as the TDM minus the mass of PHA.
4.3.3 Viable cell count
The method created by the American Public Health Association for the examination of water
microbiological quality (Rand et al., 1976) was used to determinate the number of Colony
Forming Units (CFU). Ten-fold serial dilutions of the sample were prepared using sterile saline
water; 100 µL of 10-6 to 10-8 dilutions were spread onto the surface of Nutrient Agar plates
and incubated 24 hours at 30°C. Plates exhibit between 30 and 300 CFU were used to calculate
the bacterial concentration according to the following equation.
[𝑥]𝑏𝑟𝑜𝑡ℎ =∑ 𝐷𝑓×𝑛
𝑟×𝑉𝑖 (4)

Materials and methods
60
Were, [x]Broth: Bacterial concentration in CFU /ml; Df: Dilution factor of the plate; n: number of
CFU counted on the plate; Vi: volume spread on the plate in mL; r: number of plates counted.
4.3.4 Microscopy
A Leica CME microscope (Leica microsystems GmbH, Germany) with an EC3 camera was used
to take 1000x pictures of the samples. Cells were fixed to the slide by heating over a flame and
then covered during 30 seconds with Fuchsine, a contrast dye, to stain the bacterial bodies.
Finally, the slides were rinsed with distilled water prior visualization in the microscope.
4.3.5 Electron microscopy
Scanning transmission electron microscopy (STEM) combines the principles of transmission
electron microscopy and scanning electron microscopy and can be performed on either type
of instrument. Transmission Electron Microscopy (TEM) is a technique which high energy
electrons are transmitted through electron transparent samples (~100nm thick). These thin
samples interact with the electrons as it passes through it. An image is formed while electron
transmitted through the sample. STEM is distinguished from TEM by focusing the electron
beam into a narrow spot which is scanned over the sample in a raster. By using TEM or STEM,
a high-quality image could be generated at atomic scale resolution which is around 1-2Å. The
images are applied in cancer research, virology, material science and other basic research.
STEM have better spatial resolution than Scanning electron microscope (SEM). However, it
usually requires more complex sample preparation and takes more time than normal
analytical tools. In order to provide high resolution information and details on the structure
and function, all samples should be kept in native state with ~100nm thickness (Vadlja et al.,
2016; Yücelen et al., 2018). The pictures constitute TEM pictures but were generated in SEM
mode at lower acceleration voltage.
In order to be able to appreciate the formation of PHB inclusion bodies by Crupiavidus necator
H16, samples of different cell cultures were analysed by STEM. The analysis was performed by
Dr Aleksandr Mironov at the EM Core Facility, in the Faculty of Life Sciences, University of
Manchester. A FEI Tecnai12 Twin transmission electron microscope with STEM module was
used for this study. Cryo-preparation, entrapment in synthetic resin and sectioning by
ultramicrotomes of the samples was performed by the lab technician.

Materials and methods
61
4.4 Analytical methods
4.4.1 PHB determination
Gas chromatography (GC) was employed for PHB quantification according to the method
developed by Riis and Mai (1988). A reagent solution was prepared by adding 50% (v/v) 1, 2-
dichloroethane (DCE), 40% (v/v) 1-propanol and 10% (v/v) hydrochloric acid 37% purity (Fisher
Scientific, UK), to perform both the hydrolysis and extraction of the PHB. From the samples
taken during dry weight analysis (section 4.3.2), 40 mg of dried cells were weighed and
dissolved in 4 mL of the reagent solution inside a sealed container and then placed in a boiling
water bath for 2 h. After cooling to room temperature, 4 mL of distilled water was added and
the samples were mixed using a vortex mixer for 20-30 seconds. The organic part of the
dispersion formed was separated and filtered using nylon syringe filters 0.45 μm of pore size
and lately the concentration of propyl esters was correlated to the PHB concentration.
A gas chromatography system model 7820A (Agilnet Technologies,USA) coupled with an
autosampler Combi/Pal from Varian was used for this study. The injection volume and
temperature were 1 μL and 230°C respectively. The initial temperature was 120°C and it was
gradually increased to 230°C after 3 min and remained at 230°C until the end. Detection
temperature was 200°C. Helium was used as the carrier gas. A flame ionization detection
system and a Poraplot Q-HT 10×32 mm column were used for the analysis; the area of the
peak obtained was compared to that obtain from standards of known concentration to
determine PHB concentration.
A calibration curve was prepared using purified PHB as a standard (Sigma-Aldrich, UK). A stock
solution was prepared dissolving 10 mg of PHB in 10 mL reagent solution and heating until
completely dissolved. Different known concentration solutions were prepared mixing of the
stock solution with the reagent solution at different proportions to get a final volume of 4 mL.
The sample preparation method described above was then followed. Figure 4.2 shows the
characteristic chromatograms for a standard (A) and a sample (B). The peaks showed obtained
at times 5.29 and 6.705 (min) correspond to the solvents. Peak for PHB was identified as the
one occurring at 16 minutes after the injection.

Materials and methods
62
Figure 4.2 Typical gas chromatogram obtained for A: a standard of pure PHB and B: a sample from
mineral media, using fructose as carbon source at an initial concentration of 25 g/L, 72 h after
inoculation.
4.4.2 Carbohydrates measuring
The concentration of fructose in the supernatant, collected during the dry matter analysis
(section 4.3.2) samples preparation, was determined by a Dionex Ultimate 3000 HPLC
equipment. The refractive index intensity of the samples was measured using a RefractoMax
521 (ThermoFisher Scientific, UK) detector, set at 50 C, peak area and concentration were
correlated using a calibration curve constructed by running standards of known concentration.
An Aminex HPX-87C Column was used to achieve the separation at a temperature of 50 C.
The mobile phase used was 5 mM sulphuric acid at a flow rate of 0.4 mL /min. Samples were
A
B

Materials and methods
63
diluted to assure a good column performance using HPLC grade water and filtered using nylon
syringe filters 0.45 μm pore size prior analysis.
4.4.3 Total nitrogen quantification
Total nitrogen concentration was determined using a total nitrogen analyser unit (TNM-1, TOC
control V). Standards of five different concentrations (1-50 mg/L) using KNO3 as a source of
nitrogen, were prepared to cover the range of nitrogen concentrations in the media. For
analysis 15 ml of each sample was transferred to a universal tube after being filtered using 0.2
µm syringe filter.
4.4.4 Determination of ash
Ash is an inorganic material remaining in the residue after burning the material. The ash
content was calculated, according to (AOAC, 1990) by measuring the difference in the weight
before and after burning. A cubic container contains 10 g OJW was put in a furnace (Muffle
furnace) overnight at 550 °C to burn off all impurities; then the container left in the desiccator
to cool for 2 h. Ash percentage on a dry weight base is calculated from equation 5:
𝐴𝑠ℎ (%) =𝑤𝑒𝑖𝑔ℎ𝑡 𝑜𝑓 𝑎𝑠ℎ
𝑤𝑒𝑖𝑔ℎ𝑡 𝑜𝑓 𝑂𝐽𝑊 𝑠𝑎𝑚𝑝𝑙𝑒× 100 (5)
4.4.5 Determination of crude fibres
A variant of the method 962.09 described in the Official Methods of Analysis for the AOAC
(AOAC, 1990) for the determination of fibre was developed by by Borchani et al. in 2002, and
followed by this work. The principle of this method is based an acidic and subsequent alkali
treatment of the sample. The oxidative hydrolytic reactions will degrade the cellulose and
lignin in the sample (Borchani et al., 2002). After a filtration stage, a weighting procedure is
carried out, then the sample is ignited with an electronic muffle furnace, and weighted again;
the weight difference is considered the crude fibre content then.
A 2 g of a dried sample of dried OJW was placed into tube contain 200 ml of a solution 0.25 N
of H2SO4, a boiling in water bath at 95°C was used for heating the solution for 30 min, then
the samples were centrifuged at 7000 rpm for 15 min. The supernatant was discarded, and
the residual was washed with the boiling water for seven times until neutral pH is reached.

Materials and methods
64
Subsequently, the residual then boiled with 200 ml sodium hydroxide solution (0.3 N) for 30
min, centrifuged at 7000 rpm for 15 min, washed with 25 ml of 1.25 % (v/v) boiling sulphuric
acid, then centrifuged and placed the residual into pre-weighed ceramic plate, heated at 130
°C for a period of 2 h. Finally, the sample was let to reach room temperature inside the
desiccator and weighted again. The residual was ignited at 600°C for 30 min and let to reach
constant weight in a desiccator. Crude fibre was calculated by the next relation.
% 𝑐𝑟𝑢𝑑𝑒 𝑓𝑖𝑏𝑟𝑒 =𝑙𝑜𝑜𝑠𝑒 𝑜𝑓 𝑤𝑒𝑖𝑔ℎ𝑡 𝑑𝑢𝑟𝑖𝑛𝑔 𝑖𝑔𝑛𝑖𝑡𝑖𝑜𝑛
𝑊𝑒𝑖𝑔ℎ𝑡 𝑜𝑓 𝑡ℎ𝑒 𝑠𝑎𝑚𝑝𝑙𝑒× 100 (6)
4.4.6 Quantification of total sugars
Total sugar concentration was determined using the phenol-sulphuric acid method described
by (Nielsen, 2010). Eight standard curves of fructose were prepared at concentrations from
0.02 to 1 g/L. Duplicate samples of 1 g of dried OJW were placed into universal tubes
containing 10 ml of 80 % (v/v) ethanol, samples were kept in a water bath for 10 min at 95°C.
Immediately the mixture was centrifuged, and the supernatant filtered through a 25 μm
syringe filter. 1 ml of filtrate samples and standards were mixed with 1 ml of a 5% (w/v) phenol
solution and 5 ml of sulphuric acid 98 % were then added and the samples were homogenised
by vortex. After letting the samples cool down for 30 mins, the mixtures were vortexed again,
and the absorbance was measured at 490 nm using a UV-visible spectrophotometer (UV min-
1240, UV-VIS spectrophotometer, Shimadzu). The amount of soluble sugars was calculated as
a percentage of the sample on a dry basis.
4.4.7 Determination of protein
Standard procedure 954.01, described in the Official Methods of Analysis for the AOAC
(AOAC, 1990) was modified for the determination of crude protein and fibre. The analysis is
divided in two main stages, the digestion of the sample to transform the nitrogen groups in
the protein molecules to mineral to ammonium sulphates, followed to their conversion to
ammonia by distilling the solution with addition of NaOH; ammonia is finally captured by a
solution of boric acid. A second stage, involved the determination of total nitrogen of the
solution, by the method described in section 4.5.3.

Materials and methods
65
Two grams of OJW sample were placed into a Kjeldahl flask, containing 25 ml of H2SO4 and 4
g of Na2SO4. The mixture was boiled briskly until solution clarified and then held boiling for 2
h. The solution from the hydrolysis was cooled down by adding 200 mL of H2O. Finally, 37.5 g
of NaOH were added to the flask. 1 ml of this solution was then taken to perform the total
nitrogen analysis. A protein factor of 6.25 was used, to calculate the protein percentage of the
original material (AOAC, 1990).
A gravimetric procedure was tested for the determination of OJW. Proteins consist of a large,
complex molecule called amino acid which is connected to each another by a bond (peptide
bond) in the long chain and play different roles in the body. The OJW is extracted by
solubilising dried OJW in the water at 60 °C, 10:1 ratio (water: powder) and pH 8.5 using (2N)
NaOH for 45 min. The mixture was centrifuged to remove the insoluble fibre. Then, the protein
was precipitated by adjusting the pH to 4.5 (2N HCl), the protein crude was removed from the
soluble sugars by centrifuging. The protein crude was washed with water and centrifuged
again. This washed protein was neutralised to pH 6.8 using 2N NaOH, the product was
centrifuged, and the supernatant was removed and the precipitation was dried until the
constant weight was achieved (Wang et al., 2004).
4.4.8 Extraction of orange essential oil
A preliminary experiment on the extraction of the orange essential oil (OEO) was performed
by the means of steam distillation. Samples of OJW of 10 g were taken, after the grinding
stage of the medium production process; before both, the flask and bioreactor experiments
started. Steam distillation was performed adding 100 ml of distilled water into a 200 ml round
flask were the samples were previously added. The suspension was then heated until 50 ml of
condensate were collected, the apparatus used is shown in Figure 4.3. The remaining biomass
was then dried at 60 °C, until constant weight was reached, then the content of essential oil
was calculated by the difference of mass between the original sample and the sample after
the extraction.

Materials and methods
66
Figure 4.3 Steam distillation apparatus used for OEO extraction

Results and discussion
67
5 PRODUCTION OF A NUTRIENT RICH MEDIUM FROM ORANGE JUICING WASTE
5.1 Introduction
One of the main factors which must be addressed in order to develop a successful
biotechnological process is the composition of the fermentation medium. The right
combination of microbial strain and nutrient medium has significant impact on the process
efficiency and productivity. In this Chapter, the results of several preliminary studies
performed in order to understand the growth of the microbial strain in different carbon
sources are presented. Subsequently, the chapter focuses on obtaining a fructose rich medium
that can be fermentated by C. necator into PHB, using OJW as the raw material. The
characterisation of the OJW feedstock and development of the process to produce such a
medium is described and compared to different valorisation processes reported in literature.
Section 5.2 presents the results obtained when studying the growth of C. necator H16 in the
presence of different carbon sources. Several initial concentrations of the same carbon source
were used, aiming to understand the effect of carbon source concentration and type on the
kinetic parameters of the fermentation process. With this purpose, biomass and product
measurements were taken and kinetic parameters were calculated for each condition.
Correlations were created in order to characterise the production system in terms of dry cell
weight and optical density. Specific microbial growth is then analysed as a function of the
carbon source nature and concentration.
Results of the characterisation of the OJW raw material are shown in section 5.3. Soluble
carbohydrates, fibre content, protein and ash percentage were measured, and findings are
compared to literature reports for similar materials and correlated to their most common
applications. Pectin and limonene extractions were then performed as these two components
have market value and their recovery serves two purposes; adding value to the process and
eliminating growth inhibition that could lead to lower efficiencies in the bioprocess.
The development of the process to obtain a fructose rich nutrient broth is presented in section
5.4. An autohydrolysis procedure proposed by Rivas et al. (2008), when, studying the
valorisation of orange peels as feedstock material for biodiesels production was used as a
starting point. To adapt this process different hydrolysis conditions, reaction time and

Results and discussion
68
temperature, were tested for several initial solid to water ratios (w:w). The supernatant of
each experimental trial was separated and the content of fructose measured, as the target
compound. The media preparation process was developed aiming for the simplest possible
that reached an optimal fructose concentration. The total nitrogen and limonene contents of
supernatants were measured for the conditions that gave the higher concentrations of
fructose.
Section 5.5 presents a summary of all the results presented in this Chapter. The fructose rich
media produced is later used as nourishment for the subsequent PHB production experiments,
presented in Chapter 6. The process developed for media production is discussed later, taken
as a production line of a holistic orange biorefinery.
5.2 Cupriavidus necator growth in different carbon sources.
Biomass concentration was monitored during the experiments in order to characterise the
kinetics of the process. A standard Cell growth curve was elaborated and a correlation
between cell concentration and dry cell weight was determined.
5.2.1 Testing different carbon sources
The growth of Cupriavidus necator H16 was studied using the mineral media described by
Salakkam in 2012. The effect of the carbon source type was tested using fructose, glycerol and
rapeseed oil as sole carbon sources at concentrations of 5, 10, 25 and 50 g/L, respectively. An
overnight culture, using the same carbon source and concentration that the tested flasks, was
prepared and used as inoculum for each experiment. The results obtained for the OD600 of the
cultures are shown in the Figure 5.1, for the fructose and rapeseed oil, and 5.2, for glycerol.
The carbon source that gave the greatest cell growth and OD value was fructose. However,
increasing the concentration seemed to have an inhibitory effect on the growth, leading to a
longer lag stage for higher initial fructose concentrations. It is interesting that the inverse
effect was observed for the same concentrations when rapeseed oil was used as the sole
carbon source. Higher concentrations of glycerol, used as sole carbon source, showed the
same behaviour as observed for rapeseed oil. This can be associated with the cell uptake

Results and discussion
69
mechanisms, being more difficult for the Cupriavidus necator to transport carbohydrates into
the cell in the case of fructose (Sichwart et al., 2011), .
Figure 5.1 Growth of C. necator H16 in mineral media using fructose (blue) and rapeseed oil (red) at 5 () , 10
(), 25 () and 50 () g /L as initial concentration.
Figure 5.2 Growth of C. necator H16 in mineral media using glycerol at 5 () , 10 (), 25 () and 50 () g /L as
initial concentration.
The cell growth rate is classically defined by the equation:
𝑑𝑋
𝑑𝑡= µ𝑋 (7)
where X is the cell concentration, t is the time and µ is a kinetic parameter known as specific
growth rate. Higher specific growth rates are indicative that the cells are reproducing faster.
0
5
10
15
20
25
30
35
0 20 40 60 80 100 120 140
OD
60
0
Time (h)
0
0.05
0.1
0.15
0.2
0.25
0 20 40 60 80 100 120 140
OD
60
0
Time (h)

Results and discussion
70
The specific growth rate can be estimated by plotting the ln(X/X0) during the exponential
growth phase against time, the slope of a linear regression curve is by definition µ, X and X0
represent the cell concentration in g/L at a time t and at the beginning of the exponential
phase respectively, t0. Figure 5.3 shows how the specific growth rates were estimated for the
different concentrations of rapeseed oil (RO) and fructose.
Figure 5.3 Specific growth rate calculation for C. necator H16 grown in mineral media, using fructose (black) and
rapeseed oil (red) at 5 () , 10 (), 25 () and 50 () g /L as initial concentration.
Table 5.1 shows a summary of the µ results obtained for the different experiments and the
values for the correlation index for each linear regression. It is possible to observe that even
when C. necator H16 shows a faster growth in at lower concentrations of fructose, exists an
inhibitory effect when fructose concentration was elevated generated a loss of 90% of the µ
for the higher concentrations evaluated for this study. On the other hand, rapeseed oil highest
concentration tested exhibit similar results than to the maximum µ obtained for fructose,
0.0949 and 0.1057 h−1 respectively.
0
0.5
1
1.5
2
2.5
0 10 20 30 40 50 60 70
Ln(X
/X0)
Time (h)

Results and discussion
71
Table 5-1 Specific cell growth rate for the different carbon sources tested.
Carbon source Concentration
(g/L)
µ
(h−1)
R2
Fructose 5 0.0852 0.990
10 0.1057 0.992
25 0.0408 0.957
50 0.0176 0.916
Rapeseed oil 5 0.0375 0.936
10 0.0558 0.932
25 0.0818 0.983
50 0.0949 0.974
Glycerol 5 0.0209 0.932
10 0.0293 0.933
25 0.0393 0.950
50 0.0556 0.947
Nutrient broth N/A 0.1112 0.955
5.2.2 Dry cell weight
Samples of the culture broth were taken at different times to determinate the content of dry
matter. This analysis had the objective of measure the biomass concentration by a direct
method; samples taken for this study were also treated for PHA determination. Results of this
study are displayed in figure 5.4. The higher biomass concentrations were achieved when
rapeseed oil was used as sole carbon source being 7.72 g/L after 72 hours using 25 g/L as initial
concentration.

Results and discussion
72
Figure 5.4 Cell growth of C. necator H16 in mineral media using fructose (orange, hollow) and rapeseed oil (blue
solid) at 5 () , 10 (), 25 () and 50 () g /L as initial concentration.
However, the maximum yield in biomass (Yx/s), defined according to equation showed below,
was attained using 5 g/L if fructose as sole carbon source, around 90% (w/w) after 60 h. A
summary of the Yx/s, biomass concentrations and the time that took to achieve them is
presented in Table 5.2
𝑌𝑥𝑠⁄ =
𝑋−𝑋0
𝑆0 (8)
Were Yx/s is the biomass yield, and X0 and S0 are initial concentrations in g/L of biomass and
the carbon source.
Biomass concentration measured by dry cell weight and OD measurements exhibit the same
behaviour during the exponential stage of the growth which allows confirming the relation
between both parameters. It is also important to mention the fact that this relation decreases
at longer times.
0
1
2
3
4
5
6
7
8
9
0 20 40 60 80 100
[X]
(g L
-1)
Time (h)

Results and discussion
73
Table 5-2 Maximum biomass yield obtained for the different concentrations tested
Carbon source
Initial concentration of
carbon source
(g/L)
Max Yx/s
% (w/w)
Fructose
5 90
10 65
25 19
50 1.5
Rapeseed oil
5 64
10 54
25 29
50 12
Glycerol
5 5
10 52
25 3.1
50 0.6
5.2.3 Polyhydroxybutyrate production
The concentration of PHB was measured using the method described by Riis and Mai (1988).
Samples were processed by a hydrolysis and an extraction stage and then filtered using nylon
syringe filters 0.45 μm. A standard curve needed to be constructed in order to relate the area
under the peak to the concentration. Figure 5.5 shows the calibration curve obtained with a
correlation index of 0.99.

Results and discussion
74
Figure 5.5 Calibration curve for the determination of PHB concentration given the area under the peak.
Figure 5.6 Shows the PHB concentration against time for the experiments using rapeseed oil
and fructose as sole carbon sources. As expected, the PHB concentration was showed similar
behaviour that the dry matter curves, never the less, a mass balance was made to know the
fraction of the dry matter corresponding to the residual biomass, figure 5.7.
Figure 5.6 PHB accumulation kinetics for C. necator cultures using fructose (red) and rapeseed oil (blue hollow)
as sole carbon sources at 5 () , 10 (), 25 () and 50 () g /L as inicial concentration.
y = 386.53x + 94.704
0.E+00
5.E+02
1.E+03
2.E+03
2.E+03
3.E+03
3.E+03
4.E+03
4.E+03
0.0 1.0 2.0 3.0 4.0 5.0 6.0 7.0 8.0 9.0
Are
a u
nd
er
the
pe
ak (
pA
*s)
PHB concentration (g/L)
-0.5
0
0.5
1
1.5
2
2.5
3
0 20 40 60 80 100
[PH
B]
(g/L
)
Time (h)

Results and discussion
75
Figure 5.7 Biomas (red), PHB (blue) and residual biomass (hollow symbols) accumulation kinetics for C. necator
cultures using fructose () and Rapeseed oil ( )as sole carbon sources at 10 and 25 g/L, respectively.
An initial concentration of rapeseed oil 25 g/L attained 2.49 g/L of PHB after 72 hours of
culture, being this the higher concentration achieved; fructose initial concentration of 10 g/L
led to similar concentrations at 48 h.
Most of glycerol samples were lost due to a human failure while the hydrolysis was being
carried out, however it was possible to measure the ones corresponding to the time 96 h. A
summary with the maximum values for PHB concentrations, polymer percentage and the time
the maximum concentration was reached, is presented in the Table 5.3.
0
1
2
3
4
5
6
7
8
9
0 10 20 30 40 50 60 70 80 90 100
Co
cem
trat
ion
(g/
L)
Time (h)

Results and discussion
76
Table 5-3 Maximum PHB concentration and percentage over biomass achieved for the different carbon sources.
Carbon source
Initial
concentration of
carbon source
(g/L)
[PHB]
(g/L)
%
[PHB:X]
Time
(h)
Fructose 5 0.646 *15.9 48
10 2.410 36.2 48
25 1.236 32.9 96
50 0.160 11.4 96
Rapeseed oil 5 0.355 10.3 72
10 0.695 12.2 72
25 2.489 32.2 72
50 2.309 36.6 96
Glycerol 5 0.018 4.4 **96
10 0.341 6.3 ---
25 0.053 11.4 ---
50 0.012 5.7 ---
*Percentage measured at 72 hours ** only samples at 96 h were measured for glycerol.
5.2.4 Optical density relation with dry matter
Typically, the biomass of a fermentation broth is measured directly by weighing the suspended
solids of a known volume. However, the drying stage necessary for each sample means that
having an accurate measurement can take days after each sample is taken. In order to being
capable of monitoring the biomass change in a short time, optical density measurements were
carried out as an indirect method. The correlation curve obtained between the OD and DCW
for different concentrations of fructose is presented in figure 5.8. The curve obtained achieved
a high accuracy with an R square of 0.998. The total biomass of the samples, in grams per litre,
was calculated using the following relation:
[𝑋] = 0.5022 × 𝑂𝐷600 (9)

Results and discussion
77
Where [X] represents the biomass concentration of the sample and OD600 the optical density
of the samples read at 600 nm. The curve was constructed with cells on the exponential
growth and washed with distilled water to avoid media interference.
Figure 5.8 Biomass to optical density correlation calculated for C. necator cultures using 10 g/L of fructose initial
concentration as sole carbon source.
5.2.5 Viability of microbial strain
The viability of the population was monitored using plate count. This study was carried out
using nutrient broth as medium; the results for this study are presented in figure 5.9. No
correlation was found when contrasted to the optical density study, this is explained as the
biomass that is no longer viable will still show absorbance. Due to the large amount of time
required to obtain the results, it was decided that for the next experiments only
measurements of the dried matter and optical density will be carried out until the best
conditions for PHA production were determined.
y = 0.5022xR² = 0.9982
0
2
4
6
8
10
12
14
0 5 10 15 20 25
[X]
(g/L
)
OD600

Results and discussion
78
Figure 5.9 Optical density and viability count results for a C. necator culture using fructose as sole carbon source,
with an initial concentration of 10 g/L.
5.2.6 Microscopy
Microscopy was carried out to have an idea of the cell population and to know the morphology
of the strain under the different conditions tested. Even when the optical microscope
resolution only could provide a 1000x zoom, the objective of the study was achieved to be
familiar with the strain morphology and behaviour during the culture experiments; it was also
used as a tool to determine possible contamination, agar plates were inoculated with samples
of the cell broth to ensure strain purity at the end of every experiment. It was also possible to
notice some inclusion bodies inside the cells at the late stages of some of the experiments,
which could give an indication that the accumulation of PHA was triggered. Several pictures
for different culture conditions are shown in the figure 5.10.
8.1
8.2
8.3
8.4
8.5
8.6
8.7
8.8
8.9
9
9.1
0
0.5
1
1.5
2
2.5
0 2 4 6 8 10 12 14
Log(
CFU
)
OD
60
0
Time (h)
OD600
Log (CFU)

Results and discussion
79
Figure 5.10 Optical micrographs from C. necator cultures, 36 and 96h after inoculation. Initial concentration of
carbon source was set to 25 g/L, for the mineral medium described above. Nutrient broth was used as indicated as
specified by the manufacturer, no carbon source was added.
5.3 Orange juice as feedstock for PHA production
The orange juicing process is an inefficient one, with about 50 % (w/w) of the input raw
material processed being discarded as waste. The vast availability of OJW has generated a
great interest in finding strategies for valorisation of this waste material. However, due to the
complex composition of OJW the implementation of a single valorisation route has been
hindered. OJW is known for its high content of polysaccharides and soluble sugars, including
fructose.
To be able to select best strategy to extract and add value to the different components of a
complex matrix, the first step is the characterisation of said material. Agro-industrial by-
products are in general complex matrixes composed of a wide range of fractions with different
chemical and physical properties. Different extraction and derivatising methods have been
established as efforts to add value to the various fractions OJW, which is otherwise a generally
under exploited resource when used in a single application, such as animal feed, where the
high value fractions and components are not exploited.
10 µm
Nutrient broth No. 2, 36h
10 µm
Nutrient broth No. 2, 96h
10 µm
Fructose, 36h
10 µm
Fructose, 96h
10 µm
Rapeseed oil, 36h
10 µm
Rapeseed oil, 36h

Results and discussion
80
5.3.1 Characterisation of the OJW
In to ascertain the suitability of OJW as a source of nutrients for added value fermentation
processes the total carbohydrates, crude protein, crude fibre and water content
measurements were carried out to the OJW in order to characterise the material. Phenol-
sulphuric acid method described by Nielsen was used for total carbohydrate determination
(Nielsen, 2010). Standard procedures 954.01, 962.09 described in the Official Methods of
Analysis for the AOAC (AOAC, 1990) were followed for the determination of crude protein and
fibre. A protein factor of 6.25 was used to calculate the protein content. Water content was
determined by measuring the weight difference between fresh material and the material after
dried. Samples of fresh OJW were located into a drying oven at 60°C during a period of 48 h.
OJW protein, soluble sugars and fibre contents were measured in order to partially
characterise the starting material. Water content was determined by measuring the weight
difference between fresh material and the material after dried. Samples of fresh OJW were
located into a drying oven at 60°C during a period of 48 h. Results showed a solids content
around 20 ± 0.6 % (w/w) for the OJW tested, this is similar to what Pourbafrani et al. obtained,
20 ± 0.8 % of solids content, when working with citrus waste coming from a juice factory
(Pourbafrani et al., 2010). The difference in the water content extracted from the ground OJW
and the whole material was around only 6.5 % (w/w) after 48 h of drying leading to the
decision of grinding the material after the drying stage. Table 5.4 compares the results
obtained in this study with the ones obtained by and Rivas et al. when working with orange
juicing based waste (Rivas et al., 2008).
Composition of agro-industrial materials is usually a function of the product origin source,
maturity of the crop and the handling process. However, as seen from the table, the
composition of the OJW used in this study showed a slightly higher content of soluble sugars
than that reported by Marin et al. (2007) this can be explained due to the fact that this
methodology is only sensitive to the reducing sugars inside the samples from the liquors
obtained.

Results and discussion
81
Table 5-4 Partial characterisation of the OJW (dry basis)
(Rivas et al., 2008) This study (Marín et al., 2007)
Compound % (w/w)
Soluble sugars 16.9 18.4 9.57*
Starch 3.75 ND ND
Total fiber 63.05 66. 31 78.6
Ash 3.50 3.05 2.56
Protein 6.50 7.22 9.06
Other compounds 4.35 ND ND
*Reducing sugars
The levels of protein inside the materials are considered to be low for use as a feedstock for
ruminants (Bampidis and Robinson, 2006) making the enrichment of the materials necessary
and, thus, elevating the cost of such valorisation strategy. On the other hand, the activation
of the PHA synthesis pathway requires the microorganisms to be cultivated under the
availability of excess carbon source when growth is limited owing to starvation of other
nutrient, usually nitrogen and phosphorus (Rehm, 2010). Total fibre includes the ligno and
hemi-cellulosic fractions as well as the pectin contents in the material, while these are not the
focus of this project, they represent important fractions with potential for exploitation.
Around 85% of the total pectin production is industrially extracted from citrus materials
(Ciriminna et al., 2016) with around 13% of it coming from orange peels. Cellulosic materials
can be used as carbon sources for different fermentation processes, prior and hydrolysis stage
(Kawaguchi et al., 2016; Rivas et al., 2008; Santi et al., 2015); or as feedstock for the production
of enzymes by fungal strains (Mantzouridou et al., 2015).
5.3.2 Orange essential oil extraction by steam distillation
One of the most studied components of the OJW is its essential oil content. Orange essential
oil (OEO) is composed by a mixture of secondary metabolites, typically located in the flavedo
or the exocarp of the citrus fruit. The oil typically holds a mixture of between the 20-60
compounds. Volatile compounds form about 90-95 % of the OEO; while the resting 5-10 % is
composed by oxygenated compounds, such as aldehydes, alcohols and esters, responsible for

Results and discussion
82
the organoleptic properties to the fruit. The vast majority of the components of the OEO
formed by volatile molecules, is mainly constituted by monoterpenes and sesquiterpenes.
Limonene can account up to 98 % (w/w) of the orange essential oil. This monoterpene is a
valuable ingredient for food and pharmaceutical industries. A preliminary study on the
development of a limonene extraction stage was performed using the stem distillation
extraction. Results showed a limonene content of 2.3 ± 0.5 % (w/w) for a group of samples of
dried material, taken at two different periods of this project of OJW. This goes in agreement
with the values found by Lopresto et al. (2014), when testing a no conventional microwave-
based extraction method, they conclude that the yield in OEO is significantly influenced by
decreasing the size particle from 5-6 mm to 0.125 mm, furthermore, a two-fold increase was
found when an additional drying stage was added to the process (Lopresto et al., 2014). Steam
distillation is considered an energy intensive and low efficient process; however, this study
showed the possible inclusion of a solvent free extraction process for limonene.
5.4 Production of a fructose rich medium
The production of a fructose rich medium based in this material was then the main objective
of this section of the project. Previous studies have found the optimal fructose concentration
for the growth of C. necator in the range of 20-30 g/L, thus, that was the concentration
targeted by this study. In order to achieve this the methodology described by Rivas et al.
(2008), when researching the use of orange waste as starting material for the production of
biofuels. They proposed the use of an autohydrolysis system that only required water to
extract the free sugars content inside the material. Different concentration and hydrolysis
duration were tested aiming to improve soluble sugars concentration in the media (Rivas et
al., 2008).
This project made its focus the concentration of fructose in the media obtained, different
material preparations were tested, particle size, humidity content, and initial solids to liquid
ration were varied aiming to reach the concentration range mentioned. Extra runs using a 3 %
(v/v) solution of H2SO4 were carried out for two different material sources aiming to increase
the sugar concentration. The different media produced was neutralised and inoculated with
C. necator and the growth of the strain was measured after 72 h.

Results and discussion
83
5.4.1 Fermentation broth Characterisation
Several extraction conditions were studied in order to evaluate the effect of the initial solids
to liquid ratio and pH of the solution have over the concentration of carbohydrate in the final
medium. The change on mass of the OJW throughout the drying stage was as well recorded
in order to determine the optimum length of the drying process. Particle size was another
variable studied, it was observed that besides the technical advantages for the mass transfer
conferred by the reduction in size, the handling of the material improved greatly by the
inclusion of this stage, as the volume occupied by it reduced. Finally, Table 5.5, includes the
total nitrogen measurements for the extractives that showed the higher concentrations of
fructose to give perspective on the unbalanced levels of protein in the material. OJW was used
as received at first (fresh) and then after a drying stage. This drying step showed to be a crucial
stage during the medium preparation process, for the media prepared from fresh OJW
resulted in a maximum fructose concentration of 6.96 g/L, below to the reported as optimum
found for the bacterium used by this project of 20-30 g/L (Khanna and Srivastava, 2005a).
Table 5-5 Carbohydrate concentrations measured fir the different extractives produced.
% H2O
(w/w)
Initial
solids
ratio
[Initial
fructose]
(g/L)
[Initial
glucose]
(g/L)
[Initial
sucrose]
(g/L)
Total
Nitrogen
(g/L)
Ground OJW 80 1:12 11.91 10.58 --- 0.35
1:8 24.74 13.62 9.90 0.64
Whole OJW 73.5 1:12 12.09 10.97 --- 0.46
1:8 22.08 14.65 5.92 0.59
Manual peeling
(OPM) 60 1:12 14.13 10.74 --- 0.38
Fresh OJW whole N/D 1:8
4.51 4.78 3.06 N/D
Fresh OJW ground 6.96 6.13 3.34 N/D
*All condition tested include a drying step, except stated as fresh

Results and discussion
84
The use of diluted solutions of H2SO4 is considered an effective strategy for the saccharification
of lignocellulosic materials (Mezule et al., 2015; Yu and Stahl, 2008). A solution of H2SO4 3 %
(v/v) was used, aiming to increase the solubilisation of sugars from the OJW. The results are
shown in table 5-6. The two materials tested, manually peeled (OPM) and the juicing industry
waste (OJW), showed similar behaviour for the addition of the 3% (v/v) solution of H2SO4,
lower concentrations of sugars were obtained compared to those obtained for the
autohydrolysis process, indicating that degradation conditions may be favoured under the
conditions tested. The initial solids ratio selected for both materials studied in this experiment
was 1:8 (w/v), as this was the ratio that yielded the higher concentration of fructose.
Table 5-6 Acidic hydrolysis of OJW, effect over sugar and ethanol concentrations.
Sucrose
(g/L)
Glucose
(g/L)
Fructose
(g/L)
OJW 3% (v/v) H2SO4 0.52 4.83 4.47
OPM 3% (v/v) H2SO4 1.31 7.85 6.06
OJW ground 9.90 13.62 24.74
5.5 OJW as starting material for PHA production
In order to determine the effect of the grinding stage over the sugar concentrations in the
medium, both options, grounded OJW and whole OJW were tested during the extraction step.
A run of the hydrolysis stage was performed using fresh material in two particle sizes, ground
and used as received, to measure the effect of grinding over the drying stage. Figure 5.11
shows the extraction essays for fresh and dried OJW; each material was tested as obtained
and after a reduction of size process.

Results and discussion
85
Figure 5.11 Sugar extraction stage for different OJW. From left to right: OJW ground and dried; whole OJW dried;
fresh OJW ground; whole OJW fresh.
The pH of all the extracts needs to be adjusted after the treatment using NaOH pearls before
any biological test was started; the pH value for the treatments without acid was around 3.2
± 0.2. The fructose concentrations on the aqueous extracts was improved by almost 15 %
comparing the whole material to the ground OJW, after the drying step. The maximum
concentration of fructose obtained was 24.74 g/L when the ground OJW was used. The drying
strategy improves the handling of OJW, reducing the risk of microbial growth and
concentrating the target compounds in the solids fraction. On the other hand, grinding stage
enhance the carbohydrates recovery by increasing the surface area with the aqueous fraction.
Results confirms what previous reports that have studied the effect of the particle size for
hydrolysis and extractions processes for citrus by products (Agbor et al., 2011; Choi et al.,
2013; Lopresto et al., 2014) concluded. The process proposed by this contribution only
focused in the effect of the grinding stage, not taking in count the resulting particle size.
Nevertheless, previous studies focused on lignocellulosic materials shown that reduction of
particle size below 0.400 mm has little impact on the rates and yields of hydrolysis process
(Agbor et al., 2011).
Initial solids load during media preparation lead to a correspondent difference on the fructose
extracted from the peels. The treatment probed effective fructose recovery, where Rivas et
al. (2008) (Rivas et al., 2008) reported maximum concentrations of 16 g/L of fructose, this

Results and discussion
86
study obtained 24.74 g/L for the best condition tested. Treatment with an initial ratio of
orange peel of 1:12 (w/v) lead to an initial concentration of 14.1 g/L. The drying stage
implemented during the development of the medium production process; proved to be crucial
to easier the handling of the material and preparation of the experiments; improve the
concentrations obtained and enable the obtention of a sugar rich medium with potential
applications for biotechnology process (Marín et al., 2007; Rivas-Cantu et al., 2013; Rivas et
al., 2008). A diagram of the final process developed to obtain the OJW medium that rendered
the highest fructose concentrations is shown in figure 5.12.
Figure 5.12 Diagram for the final production process a of an OJW based medium.
Autohydrolysis
121°C; 15 minDistilled
water
Filtration Filter paper No. 2
pH adjustment pH= 6.9
Sterilisation0.2 µm
OJW Grinding
Particle size ≤ 5 mm
8:1 (v:w)
OJW based medium
Drying
60° C; 48 h

Results and discussion
87
5.6 Summary
Different concentration of several carbon sources were tested for the growth of C. necator
H16 with fructose giving the highest specific growth rate of 0.11 h−1 when using a mineral
medium supplemented with 10 g/L. However, the accumulation of PHB only reached 36 %
(w:w), lower to the maximum reported for the strain, above 80 % (w:w).
Concentrations of fructose within the range of 20 to 30 g/L are reported as the best when a
mineral medium was optimised for PHB production by C. necator H16 (Khanna and Srivastava,
2005a). The process for obtaining a media based on OJW as starting material was studied for
a final concentration of fructose within the range just mentioned. The process steps and
conditions for the carbohydrates extraction that resulted in the maximum fructose
concentration, 24.74 g/L, were used for subsequent experiments. The liqueurs from the
different conditions studied were then used as nutrient medium for the fermentation
experiments presented in Chapter 6.
The characterisation of the OJW material confirm its potential as a source of carbon source
for further biotechnological applications. The high concentration of fructose in the OJW,
confirmed its potential application for the production of PHB by C. necator H16. Other
fractions of the material have shown to be of the interest of several industrial areas, thus the
further development of specific extractive steps is crucial to attain a holistic valorisation.

Results and discussion
88
6 ORANGE JUICING WASTE AS RAW MATERIAL FOR FEEDSTOCK PRODUCTION
6.1 Introduction
In order to evaluate the feasibility of using OJW as raw material, it is key to have a basic
knowledge of what the contents of this complex matrix are. The growing awareness in current
society about the impact different processes have on the environment has led a whole wave
of studies focussed on finding better and more sustainable ways to use our natural resources.
One strategy such studies have taken is to aim for the utilisation of waste or by-product
streams coming from established processes that are made of complex matrixes rich in
promising chemicals.
The orange processing industry produces approximately 46 Mton of waste every year (USDA
and FDA, 2017). This waste is formed of peels, seeds and unwanted fruit. These fractions of
different nature whom confer the material its complexity and potential exploitation. Industrial
efforts have been established in order to exploit different fractions of the material, however,
such efforts typically focus in the extraction of only one of its components. Pectin extraction
from citrus waste is a well-established process, accounting for around 85 % of the pectin
produced in the world (Ciriminna et al., 2016). Limonene extraction is another strategy used
at industrial scale for the utilisation of citrus waste. Both processes dismiss the rest of the
material as waste streams, taking advantage of less than 50% of the input material, neglecting
the high sugar content of the material, as well as the lignocellulosic fraction. This project
studies the possible exploitation of the high sugar content inherent to the OJW to create a
nutrient rich substrate for the production of biopolymer via fermentation.
6.1.1 Extracting carbohydrates from fresh orange peel
Initial concentration of fructose was higher for the media obtained from the manual peeling
of the fruit, 4.3 and 2.7 g/L respectively; this can be related with the production process of the
media. Both residues were frozen as received and, as a fist attempt, no drying stage was
performed leading to have a larger content of H2O in the orange peel produced at the juice
bar and therefore generating a more diluted media. Further experiments will include a drying
stage to avoid this factor and standardise the experimental approach. It was also observed
fructose depletion occurred earlier for the media from the juice bar where more than 90% of

Results and discussion
89
the fructose was consumed during the first 24h, while only 70% was consumed for the
manually peeled based media. Figure 6.1 shows the results obtained for the biomass
measurements and residual fructose.
Figure 6.1 Biomass growth (▲: optical density; : Dry matter concentration [X]) and fructose concentration
(●,[Fru]) measured for C. necator H16 cultures grown in orange peel medium coming for the fresh manually
peeled and fresh OJW (blue and red respectively). At initial solids ratio of 1:8 (w/v) for medium production.
fermentation conditions were 30° C, 250 rpm and initial pH was set at 6.8.
The cell growth rate is defined by equation (7) as:
𝑑𝑋
𝑑𝑡= µ𝑋 (7)
Were X is the cell concentration, t is the time and µ is a kinetic parameter known as specific
growth rate. Higher specific growth rates are indicative that the cells are reproducing faster.
The specific growth rate can be estimated by plotting the ln(X/X0) during the exponential
growth phase against time, the slope of a linear regression curve is by definition µ, X and X0
represent the cell concentration in g/L at a time t and at the beginning of the exponential
phase respectively, t0.
For both media, the maximum biomass yield obtained was reached after 48 h, were the
biomass concentration has the maximum for both cases; Yx/s for the orange peel from the
manual (OPO) peeling reached 0.67 gr of biomass per gr of initial fructose, Yx/s for the juice

Results and discussion
90
bar peels (OPB) achieved a 0.90 gr of biomass per gr of initial fructose at that time (Table 6.1).
However is important to mention that the only carbon source taken as reference is fructose
while it is possible, due to the complexity of the media that some other substrates can be
used, further characterization of the media should be performed for a better understanding
of this phenomena.
Table 6-1- Effect of the media on the kinetic parameters and PHB production.
Media
[Initial
fructose]
(g/L)
Yx/S*
%PHB ** µ
(h-1)
Nutrient broth N/A N/A --- 0.12
Mineral mediaa 10 0.70 36 0.10
Fresh OPM 4.3 0.67 55 0.12
Fresh OPB 2.7 0.90 58 0.15
a Based in Salakkam & Webb, 2015
*Yield calculated as: g biomass/g Initial fructose.
**After 76 h of growth.
µ, for the first 24h of cell growth was calculated; result showed that the cells grew faster
during the first day cultivation for the juice bar peels were the µ obtained was 0.15 h-1. Manual
peeling lead to a µ of 0.12 h-1. A previous study testing different concentrations of several
carbon sources in a mineral media gave a maximum value for µ of 0.12 h-1 when nutrient broth
was used as fermentation media, as shown in figure 6.2. This means that the orange peel
medium provides better conditions for both the propagation of the cells while the biopolymer
accumulation reached around 90% of the dry matter weight.

Results and discussion
91
Figure 6.2 Effect of the initial carbon source concentration on the specific growth rate, µ. (,fructose; ,glycerol;
▲, rapeseed oil; --,nutrient broth).
According to literature the process freeing sugars from the peel matrix can also realize some
sugar degradation products like furfural and hydroxyl-methyl-furfural (HMF) as well as some
phenolic compounds from lignin degradation, all of them considered as inhibitors for cell
growth; similar to what could happen for the fructose case, these products can be more
diluted in the OJW media (Locatelli et al., 2012; Talebnia et al., 2007).
The PHB measurements revealed that even when the cell growth was better for the OJW
media the synthesis performance for PHB was slightly better for the OPM media. While cells
growing in OJW reached only 31% of PHB accumulation for the first 24 hours the cells growing
in OPM based media already had reached 42%. On the other hand, after 72 h both cultures
exhibit similar accumulation percentages, being 55% for OPB and 58% for OPO based media.
The synthesis of PHA is usually triggered in a culture by submitting the culture to stress
conditions; this is achieved by lowering the concentration of a selected nutriment, mostly
nitrogen, while having a vast concentration of carbon source. Other approaches include the
addition of some cell growth inhibitors like ethanol (Gomaa 2014). This supports the
hypothesis that OPM provides both more carbon source and stress conditions to the cells to
trigger the synthesis pathway.

Results and discussion
92
6.1.2 Dried orange peel as carbon source
After a filtration performed using 0.2 µm filters, for assure a sterile broth, 100 ml of the
concentrated media were collocated into 500 ml shaker flasks and an individual inoculum was
prepared for every condition tested following the methodology described above (see section
4.2.2), starting from the short-term storage plate. Acid treated media failed to show cell
growth after 72 h of cultivation and the analysis of the fructose concentration revealed that
no consumption of fructose happened during all the fermentation process. This can be related
due to the low fructose concentration, 4.82 g/L, and the inhibitors present in the broth as
result of the extraction process conditions (Talebnia et al. 2007; Mohan et al. 2015; Locatelli
et al. 2011).
Dried orange peel medias extracted with only water showed better cell growth. A HPLC results
indicated that fructose was preferably consumed by the strain, this behaviour has been
previously reported by Sichwart et al. when trying to increase the uptake of glucose and
mannose by C. necator H16 (Sichwart et al., 2011). Three carbohydrate peaks were identified,
glucose, fructose and sucrose; consumption over time was estimated by the difference on the
peak areas, figure 6.3 illustrates this behaviour.
Figure 6.3 Chromatograms for OPM produced with an initial solid load of 1:12. Left: starting the fermentation;
Right: after 76 h.
Initial solid load during media preparation lead to a correspondent difference on the fructose
extracted from the peels; figure 6.4 shows the fructose consumption for the different media
preparations. The treatment probed effective fructose recovery, where Rivas et al. (2008)
reported maximum concentrations of 16 g/L of fructose, this study obtained 24.7 g/L.

Results and discussion
93
Treatment with an initial ratio of orange peel of 1:12 (w) lead to an initial concentration of
14.1 g/L and complete depletion was achieved after 72 h of fermentation. The depletion of
fructose for treatments with ratio 1:8 was not achieved for the period of the study.
Figure 6.4 Fructose concentration for the different treatments. : ground orange peel and : whole orange peel
ratio 1:8 (w:v) ; : ground orange peel diluted 1:12 (w:v).
Figures 6.5 and 6.6 showed the cell growth curves as well as the PHB concentration at different
times for the treatments analysed. The specific growth rate value estimated for the media
with initial solid proportion 1:12 (w:v) reached the highest value for the different treatments
studied, 0.179 h-1, with an intracellular PHB percentage above 80%. These values are similar
to those obtained for C. necator H16 when grown in a phosphate buffer medium and using
organic acids as carbon source reaching a maximum of 83.7 % of PHA content (Yang et al.,
2010). This is comparable to the result obtained by different efforts targeting to implement
glycerol as carbon source for PHA production by C. necator strains, as this by-product of the
biodiesel process is available in great quantities; in 2012 Tanadchangsaeng & Yu growing C.
necator H16 in a mineral media added with 20 g/L of glycerol achieving a μmax of 0.11h-1 and
70% of PHB accumulation. A recent study showed that methanol contained in the crude
glycerol can inhibit the cell growth of C. necator DSM4058, however a μmax of 0.47 h-1 was
obtained when 50 g/L of glycerol were used as carbon source in inhibition free conditions
(Salakkam and Webb, 2015), doubling the results found for OJW.
0 10 20 30 40 50 60 70
0
5
10
15
20
25
Co
ncen
tra
tion
(g
L-1)
Time (h)

Results and discussion
94
Figure 6.5 Cell growth curve obtained for the 1:8 (w:w) initial ratio if OP treatment.
Figure 6.6- Cell growth curve obtained for the 1:12 (w:w) initial ratio if OP treatment.
A maximum dry matter concentration of 9.58 g/L with a percentage of PHB of 76% was
achieved when the medium prepared from not ground orange peel, however a better PHB,
80%, intracellular content was reached for the same concentration of initial solids but adding
0 10 20 30 40 50 60 70 80 90 100
0
5
10
15
20
25
Fru
cto
se
(g
L-1)
Time (h)
0
1
2
3
4
5
6
7
8
9
10
Dry
ma
tte
r (g
L-1)
0
1
2
3
4
5
6
7
8
9
10
PH
B (
gL
-1)
0
1
2
3
4
5
6
7
8
9
10B
iom
ass (
gL
-1)
0.0
0.1
0.2
0.3
0.4
0.5
0.6
0.7
0.8
Nitro
ge
n (
gL
-1)
0 10 20 30 40 50 60 70 80 90 100
0
5
10
15
20
25
Fru
cto
se (
gL
-1)
Time (h)
0
1
2
3
4
5
6
7
8
9
10
Dry
matter
(gL
-1)
0
1
2
3
4
5
6
7
8
9
10
PH
B (
gL
-1)
0
1
2
3
4
5
6
7
8
9
10
Bio
mass (
gL
-1)
0.0
0.1
0.2
0.3
0.4
0.5
0.6
0.7
0.8
Nitro
gen g
L-1

Results and discussion
95
the grinding stage. With yields on consumed fructose (YX/S) of 0.41 and 0.39 respectively. This
results are comparable to the ones attained by Aramvash et al. (2015), using a mineral media
with an initial fructose concentration of 35 g/L, reaching 7.48 g/L of PHB with a maximum of
90% of PHB accumulation. Other strains have been tested on different wastes, Halomonas
campisialis was capable of using 84% of the sugars in an orange peel based medium with a
content of 42% (w) in PHB, and probed similar results for banana peels and bagasse extracts
(Kulkarni et al., 2010).
Figure 6.7- Dry matter (), PHB() and residual biomass concentration(▲) for the treatments with initial solids
ratio 1:8 (solid symbols) and 1:12(hollow symbols).
Aiming to know when the cell growth stopped and production was triggered, residual biomass
was calculated as the difference of total dry matter minus PHB concentration. Results for this
analysis (figure 6.7) showed that after the first 30 hours the cell growth reaches a plateau
stage and stay constant for a period of 40 h when it starts to increase again. This growth
coincides with a loss on intracellular PHB. This stop in growth is usually related to the nitrogen
source reaching the limiting concentration and triggering PHA accumulation at the same time
(Koller et al., 2010b; Rodríguez-Contreras et al., 2015). Table 6.2 presents a summary of the
results obtained.
0 10 20 30 40 50 60 70 80 90 100
0
1
2
3
4
5
6
7
8
9
10
11
12
Conce
ntr
atio
n (
gL
-1)
Time (h)

Results and discussion
96
Table 6-2- Summary of the results obtained for the different autohydrolysis experiments studied for dried OJW.
[Fru]0
(g/L)
[DM]f
(g/L)
[PHB]f
(g/L)
YDM/s Yp/s μmax
(h-1)
% PHB
(w)
OJW ground 1:12 (w:v) 14.94 6.21 5.03 0.40 0.43 0.179 80.9
OJW ground 1:8 (w:v) 23.14 9.01 7.34 0.46 0.39 0.122 81.4
OJW whole 1:8 (w:v) 22.22 9.58 7.31 0.52 0.41 0.118 76.3
Glycerol (García et al., 2013) 25 15 6 0.66 0.26 --- 40
Cassaba hydrolysate
(Poomipuk et al., 2014) 20 * 5.97 2.43 0.31 0.20** 61.7**
*total sugar; ** maximum reported
Scanning transmission electron microscopy images were taken, from different cultures of C.
necator grown using OJW media, in order to appreciate the bacterial growth and polymer
accumulation within the cells. Figure 6.8 shows the STEM micrographs obtained from samples
taken from the shake flask at 48 and 72, when the OJM derived medium with an initial solid
load ratio of 1:8 was used. PHB accumulation can be appreciated as the white inclusion bodies
within the cells. Although a slight increase in cell count is visible for the area shown in the
images, is necessary to clarify that the criteria for the picture taking was to show as many cells
per picture as possible.
Figure 6.8 STEM micrographs showing the PHB accumulation in C. necator H16, when growing in an OJW medium
prepared with an initial solids load ratio 1:8 (w:v). Left, 48 h into the fermentation; right, 72 h after inoculation.

Results and discussion
97
The pictures helped to corroborate that polymer accumulation is already triggered 48 h into
the fermentation run. Some cell debris can be seen in the images, being more accentuated for
the 72h picture, this can be explained by the cellular lysis happening as result of some cells
reaching death stage and the sampling preparation method.
6.1.3 Limonene effect on Cupriavidus necator cell growth
The biomass concentrations were followed for all conditions tested, along the concentrations
of PHB and fructose. The different limonene concentrations exhibit different kinetic
behaviours. As the limonene concentration rises, stronger inhibition effect can be observed
as reported for other strains (Metoui et al., 2015; Zahi et al., 2015). The lag phase exhibit
during the first hours of fermentation increased considerably with concentration of limonene.
The final concentration of biomass, as reported for other strains (Marques et al., 2014;
Mohammad Pourbafrani, 2007), and PHB was strongly affected by the presence of the
terpene.
Studies on antimicrobial effect of orange essential oil have focus on the limonene titration;
orange peel waste can contain up to 1.6 % on essential oil and limonene represents about 90%
of this oil. According to literature concentrations as low as 0.05% can inhibit cell growth for
bioethanol production (Choi et al., 2013; Joshi et al., 2015). As well pathogenic bacterial strain
showed strong inhibitory response to the presence of limonene.
Final concentration of dry matter as well as PHB titre were affected by the presence of
limonene. Experiments run in absence of the essential compound reached a maximum dry
matter concentration of 10.18 g/L after 60 hours of fermentation while adding 0.5% (v/v) of
limonene caused a drop in the concentration to 8.28 g/L after 72 h. Figure 6.9 shows the
different cell growth curves, substrate uptake and polymer production for the different
limonene concentrations tested. It is interesting to notice that the trigger point for the
synthesis of the polymer increased for the lower concentration of limonene, while it was
possible to detect a slight amount earlier for the next concentrations.

98
Figure 6.9- Cell growth, PHB production and fructose uptake for different levels of limonene. A 0%; B 0.5%; C 1%; D 1.5%; E 2%. Fructose(); dry matter(); PHB (▲); residual
biomass[X] ()(Guzman Lagunes and Winterburn, 2016).
0 10 20 30 40 50 60 70 80
0
1
2
3
4
5
6
7
8
9
10
11
12
[Fru
] (g
L-1)
[D
M] (g
L-1)
Time (h)
0
2
4
6
8
10
12
14
16
18
20
22
24
26
0
1
2
3
4
5
6
7
8
9
10
11
12
[P
HB
] (g
L-1)
0
2
4
6
8
10
12
[X
] (g
L-1)
0 10 20 30 40 50 60 70 80
0
1
2
3
4
5
6
7
8
9
10
11
12
[Fru
] (g
L-1)
[D
M] (g
L-1)
Time (h)
0
2
4
6
8
10
12
14
16
18
20
22
24
26
0
1
2
3
4
5
6
7
8
9
10
11
12
[P
HB
] (g
L-1)
0
2
4
6
8
10
12
[X
] (g
L-1)
0 10 20 30 40 50 60 70 80
0
1
2
3
4
5
6
7
8
9
10
11
12
[Fru
] (g
L-1)
[D
M] (g
L-1)
Time (h)
0
2
4
6
8
10
12
14
16
18
20
22
24
26
0
2
4
6
8
10
12
[P
HB
](g L
-1)
0
2
4
6
8
10
12
[X
] (g
L-1)
0 10 20 30 40 50 60 70 80 90 100 110 120
0
2
4
6
8
10
12
[Fru
] (g
L-1)
[D
M] (g
L-1)
Time (h)
0
2
4
6
8
10
12
14
16
18
20
22
24
26
0
2
4
6
8
10
12
[P
HB
] (g
L-1)
0
2
4
6
8
10
12
[X
] (g
L-1)
0 10 20 30 40 50 60 70 80 90 100 110
0
2
4
6
8
10
12
[Fru
] (g
L-1)
[D
M] (g
L-1)
Time (h)
0
2
4
6
8
10
12
14
16
18
20
22
24
26
0
2
4
6
8
10
12
[P
HB
] (g
L-1)
0
2
4
6
8
10
12
[X
] (g
L-1)
A B
C D E

Results and discussion
99
It is also possible to notice for all the limonene concentrations a decrease on the residual
biomass the during the second half of the fermentation. This can be related to the mechanism
of action of limonene, some reports showed that limonene break the osmotic equilibrium at
the cytoplasmic membrane of microorganisms leading them to break, realising intracellular
content (Mohammad Pourbafrani, 2007; Zahi et al., 2015).
PHB content inside the cells dropped from 68% to 59% (w/w) for the same conditions.
However, C. necator reported was able to still show some growth in the presence of 2 % (v/v)
terpene reaching 2.6 g/L of dry mass with a content of 22% of PHB after 98h of fermentation,
this differs to what Pourbafrani (2007) reported for the ethanol producer yeast
Saccharomyces cerevisiae where no cell growth was observed under the presence of 0.5 % of
limonene and cell viability reached 0 after 3 hours of cultivation. Tao et al. (2014) described
moderated antifungal effect of limonene over a pathogenic strain that infects citrus plants,
Penicillum digitatum, at concentrations around 0.24 %, reporting a mycelial growth inhibition
of 43 %. C. necator showed stronger resistance when compared with above mentioned strains
losing 25% of its growth with concentrations up to 1% (v/v) of limonene.
Figure 6.10- Variation of specific growth rate (), dry matter () and PHB(▲) yields over substrate and
intracellular percentage of polymer () with concentration of limonene.
0.0 0.5 1.0 1.5 2.0
0.00
0.02
0.04
0.06
0.08
0.10
0.12
0.14
0.16
0.18
0.20
(
h-1)
Limonene (%)
0.00
0.05
0.10
0.15
0.20
0.25
0.30
0.35
0.40
0.45
0.50
0.55
0.60
YX
/S (
g/g
)
0.00
0.05
0.10
0.15
0.20
0.25
0.30
0.35
0.40
0.45
0.50
0.55
0.60
YP
/S (g/g
)
0
10
20
30
40
50
60
70
80
90
100
PH
B (%
)

Results and discussion
100
Biomass and product yields, as well as specific growth rate and maximum PHB content were
calculated for different limonene concentrations tested, figure 6.10 shows these results. The
trend for specific growth rate and PHB content showed an increase in the inhibitory effect for
every increasing concentration of limonene, with a major drop for both parameters between
the point that correspond to 1 and 1.5 %(v/v) of limonene. The effect was less marked for the
consumed substrate yields on dry matter and product, however total consumptions was
considerably slower for concentrations of limonene above 1%, as previous data showed.
Previous studies testing inhibitory effect of orange oil and limonene against several organisms
showed that the minimal inhibitory concentration were on the range of 1-4% for Gram
negative strains, while for the Gram positive Staphylococcus aureus and Brochotrix
thermospacta a maximum sublethal concentration of 1.68 mg/L was determined (Ruiz and
Flotats, 2014).
Figure 6.11- Normalised percentages of specific growth rate (), dry matter () and intracellular PHB() at
different concentrations of limonene.
The values of μ, as shown in figure 6.11 obtained for showed a decrease of more than 50%
when the concentration of limonene was 2% (v/v); however, compared with the reports for
some pathogenic bacterial strains, C. necator was able to still grow in such conditions. These
0.0 0.5 1.0 1.5 2.0
0
10
20
30
40
50
60
70
80
90
100
%
Limonene % (v/v)

Results and discussion
101
results indicate that C. necator should be able to grow in medias prepared from orange peel
media if the concentration if limonene is as low as 1%. Furthermore, as limonene is an
important additive for several industries many groups have tried to implement an extraction
stage in order to recover limonene from orange peels during the medium preparation adding
value to the process (Lohrasbi et al., 2010; Lopresto et al., 2014; Pourbafrani et al., 2010).

Results and discussion
102
7 PHB PRODUCTION FROM ORANGE JUICING WASTE IN BIOREACTORS
7.1 Introduction
In order to gain a better understanding of the effect that the different process parameters of
the experiment have on the fermentation process, experiments were carried out in 2 L
bioreactors. Moving to bioreactors allows for better control over the process compared to the
flask experiments as variables such as pH, dissolved oxygen can be monitored and directly
controlled. Additionally, in terms of scale up bench top bioreactors are a closer to the
equipment used for industrial scale production than shake flasks are. This chapter contains
the results of bioreactor experiments with varying control setups, first using synthetic media
as a baseline and then using OJW derived medium for PHB production. Both batch and fed
batch fermentation strategies were tested in 2 L bioreactors. Dry cell weight, fructose, residual
biomass and PHB concentrations were observed over the course of the fermentation. The
synthetic medium was prepared with a fructose concentration representative of that obtained
in the OJW derived media. Six different bioreactor runs were performed under several
different control conditions in order to evaluate the effect of pH control, and inoculum activity
on PHB production.
To develop a biotechnological process from laboratory to an industrial scale requires the
acquisition of an extensive quantity of data regarding the behaviour of the bioprocess at
different scales and understanding of growth and production kinetics as well as the relevant
yields and overall productivity. Flask scale experiments provide essential information for
determining the optimal nutrient and physical requirements for the microbial strain. The small
scale and ease of handling gives the opportunity to try several conditions in a simultaneously.
Thus, becoming a key stage in the development of any biotechnological process. It is
important, however, to consider the limitations flask experiments confer to the data obtained;
such limitations are related to the lack of control over transport phenomena, such as oxygen
mass transfer and mixing, in the system. Failing to understand and address these areas leads
to difficulties in industrial scale implementation.
Small-scale bioreactors allow for some of these limitations to be overcome by enabling a
thorough monitoring of the process variables, temperature, pH, agitation, aeration, dissolved

Results and discussion
103
oxygen, and effective control of them. Furthermore, a flexible and adaptive design could grant
the homogenisation of the culture broth, enable calculations for power requirements, mass
and energy balances; and, even more, the implementation of operation modes, such as fed
batch or continuous, not available when working in shake flasks. According to the nature of
the bioprocess of interest, different bioreactor classifications can be used. Depending on their
oxygen demand they can be either aerobic or anaerobic. The aerobic classification can be
subdivided according to the agitation and aeration system used. Operation modes are usually
divided into batch, fed-batch and continuous operation. A batch operation implies the load of
the reactor with all the nutrients necessary for growth and production from the start of the
process. Temperature, aeriation and agitation are monitored and control through the
experiment length. The pH level can either be controlled thorough the experiment or just set
to an initial value let it vary. The process finishes when nutrient depletion is completed; or
inhibitory conditions have been reached, such that the production stops.
In this chapter the results of six bioreactor experiments are presented and compared to results
obtained from previous shake flask work. This aimed to gain understanding of how the system
behaves under different control regimes and the effect of the inoculum strategy on the
bioreactor cultivations. Firstly, five batch experiments were performed. The synthetic medium
(SM), defined in section 4.2.3, was used to evaluate the effect that controlling pH will have on
the process production yields. To replicate shake flask conditions, a fermentation using SM
was performed with an initial pH value of 6.8, temperature, aeration and agitation were
maintained constant during the experiment, with no control of DO or pH values. A second
fermentation was performed in SM controlling the pH and DO values, to highlight the effect
automated control has on the strain and PHB production. The suitability that OJW medium
has on the microorganism production was tested by means of two fermentation experiments
replicating the conditions described for synthetic medium with automated control and in
complete absence of it. Finally, a fed-batch fermentation was carried out with three feeding
stages; the first, aiming to increase biomass production, while the second and third aimed to
prolong the PHA production stage.

Results and discussion
104
7.2 Bioreactor experiment under batch fermentation mode.
Figure 7.1 Fermentation of synthetic medium by C. necator, using fructose as sole carbon source. No pH Control
implemented. Temperature was set to 30° C and airflow maintained to 1 vvm.
The first batch fermentation was carried out using minieral medium added with fructose as
the only available carbon source. The experiment was designed to emulate the uncontrolled
conditions found in shake flask experiments at 2 L bioreactor scale. Temperature was set to
30° C and airflow maintained to 1 vvm. The initial pH value was adjusted to 6.8 using a NaOH
solution with a concentration 2M and a 1M solution of HCl. Figure 7.1 shows the variation of
fructose, biomass and PHB throughout the whole of fermentation 1. The experiment lasted
for 120 h, reaching a final biomass concentration of around 4.6 g/L
Total biomass (cells and PHB) values showed a steady increase during the first 40 h, when a
stationary phase was reached. Production of PHB was detected from the twelfth hour of
fermentation, lasting for the next 84 h when the polymer concentration reached its maximum
concentration of 2.9 g/L, corresponding to a percentage of accumulation of 61 % (w/w). A

Results and discussion
105
continuous, slow, increase of the pH value was recorded for the experiment reaching a
maximum of 7.79 after 30 h of fermentation, and maintaining this value for the next 30 h when it
starts to decrease to reach the value of 7.39 by the end of the experiment.
Figure 7.2 Fermentation of synthetic medium by C. necator, using fructose as sole carbon source and with a pH
value of 6.8. Temperature was maintained at 30° C.
A second batch fermentation run was performed using the same synthetic medium, aeration
rate and working volume and with pH control, results for fructose, nitrogen, biomass and PHB
concentration are shown in figure 7.2. Temperature was maintained throughout the
experiment to a value of 30° C. The pH value was controlled, and set to 6.8, with the help of
a NaOH solution with a concentration 1M and a 1M solution of HCl. Solutions were pumped
into the bioreactor using the corresponding peristaltic pumps of the control unit. The
concentration behaviour with time followed the same profile than the ones for fermentation
1, throughout the 120 h of the experiment duration. The overall fructose consumption
recorded was around 17 g/L. The biomass generated reached a final concentration of 7 g/L. A

Results and discussion
106
longer growth stage can be appreciated, taking around 72 h to reach the stationary stage. PHB
accumulation reached similar values to the ones obtained with pH control absent, 60%
accumulation. However, the polymer concentration reached a maximum 4.4 g/L; 1.5 times the
maximum recorded with no control. Thus, highlighting the impact that an adequate process
control can have on the process productivity.
7.3 OJW as starting material for PHB production by C. necator in a bioreactor
scale
Figure 7.3 Fermentation of OJW medium by C. necator, using fructose as sole carbon source. No pH Control
implemented. Temperature was set to 30° C and airflow maintained to 1 vvm.
Figure 7.3 shows the change in biomass, fructose and PHB conentrations over the course of
128 h that Fermentation 3 lasted. Conditions were set equal to those used for fermentation
1, this time using an OJW based medium with an initial pH value of 6.8. No pH control was
programed and the aireation and temperature conditions were identical to the ones used with
synthetic medium. Biomass growth occured for the first 36 h, after which a second period of
PHB
(g
/L)
% P
HB

Results and discussion
107
biomass growth seem to proced at a slower rate. A maximum of 3.1 g/L of biomass was
reached by the end of the experiment. Biopolymer accumulation reached similar levels as in
previous experiments, with a maximum of 59% for the 72h mark. The final concentration of
fructose was 12.3 g/L, from an initial concentration of 25.4 g/L, only around50% of the carbon
source was consumed under these conditions. Residual biomass stop increasing, after 36 h;
thus, all further change in the total biomass reading was effected by the acumulation of PHB.
However, due to the small amount of cells available PHB production was lower than in
previous runs.
Figure 7.4 Fermentation of OJW medium by C. necator, using fructose as sole carbon source and with a pH value of
6.8.
A second fermentation using OJW was performed with pH control, setting the pH value to
remain 6.8 during the experiment. The profiles of the biomass, fructose and PHB
concentrations are shown in Figure 7.4. Similar to previous experiments, it is possible to notice
period of cell growth during the first 30 h of the fermentation, shown by the residual biomass
data set. Polymer accumulation was detected from eight hours of fermentation; a constant
PH
B (
g/L
)
% P
HB
Results and discussion
108
PHA synthesis rate was apparent during the complete duration of the experiment. A final
concentration of PHB of 2.3 g/L was reached, representing a polymer accumulation of 63 %
(w/w; dry basis). The fructose assimilation by cells was slower, when compared to previous
experiments, leading to slower growth rates and final concentrations of biomass and PHB.
However, OJW medium gave the highest values of the four runs with regards to effective
production of PHB reaching an overall YP/S of 0.22 gram of PHB produced per gram of fructose
consumed. Therefore, OJW medium can provide good conditions for the accumulation of PHB.
In order to increase the concentration a higher biomass production needs to be reached.
Finally, a failure with the pH probe in the equipment caused a poor pH control after 60 h of
run, letting the pH drop to reach a value of 6.1 by the end of the experiment.
.
Figure 7.5 Fermentation of OJW medium using a younger inoculum. A pH value of 6.8 was maintained through
the experiment. Temperature was maintained at 30 °C and DO level set to 30%.
In order to increase the biomass growth, a different inoculum strategy was adapted from
Mozumder et al., 2014. Temperature and pH values were maintained all over the duration of
the experiment to 30° C and 6.8, respectively. The fermentation was let to reach the 140 h.

Results and discussion
109
Figure 7.5 presents the records of the concentrations for biomass, fructose and polymer
against time. A higher initial biomass concentration is evident, when compared to previous
experiments, a value of 1.12 g/L for compared to 0.6 g/L for fermentation 4. Two different
stages of biomass growth can be observed from the total biomass curve. However, analysing
the data obtained for the PHB and residual biomass, it can be stated that the cell growth
reached a stationary state at about the 30th hour, after which a pronunciated synthesis rate
of polymer dominates the increment in total biomass. Final concentration of total biomass
reached a maximum of 9.4 g/L, tripling previous results obtained with the OJW medium in
bioreactors. Biopolymer accumulation reached its highest 90 h into the experiment reaching
63 % (w/w). Synthesis of PHB occurred from the early stages of the experiment, 14 % (w/w)
PHB was detected after 12 h of fermentation, remaining active until the end of the
experiment. Fructose concentration went from 23.5 g/L, at time zero, to 10.1 g/L towards the
end of the experiment. In this experiment the biopolymer production is higher than in
previous experiments even though 43 % of the fructose was not consumed by the
microorganism, the overall YP/S calculated reached a value of 0.49, the highest obtained during
this study

Results and discussion
110
7.4 Fed-batch fermentation of OJW medium
Figure 7.6 Fed Bach strategy for PHB production by C. necator using OJW medium. A pH value of 6.8 was
maintained through the experiment. Temperature was maintained at 30 °C and DO level set to 30%
A fed-batch strategy was used in order to gain control over fructose consumption and to
increase the final biomass and PHB concentrations. The initial working volume was one litre,
with three feeding stages of 500 ml each. The feeding points were selected to maximise cell
growth initially and then to enhance PHB accumulation. Figure 6 shows the results obtained
for biomass and PHB production as well as fructose consumption. Fructose concentration was
25.7 g/L at the start of the experiment, dropping to 5.3 g/L by the end of the experiment;
surpassing all previous fructose consumptions registered for batch fermentation experiments
in the bioreactor using OJW medium. Biomass growth was enhanced with the first feeding
stage, after 24 h of fermentation, going from total biomass concentrations of 1.4 g/L to 9.1
g/L by 48 h. A second feeding stage took place at 48 h, cell growth was continued during this
second stage, though at a slower rate than in the previous stage. Biopolymer accumulation
reached a peak of 67 % at 90 h before starting the last feeding stage. The last feeding stage

Results and discussion
111
was performed after 120 h of fermentation. Cell growth was reactivated during the first 24 h
of this last stage, as the residual biomass concentration went from 1.2 g/L to 3.4 g/L. Once C.
necator growth ceased a stage of PHB accumulation was triggered and cells continued to
synthesise biopolymer until the end of the experiment. A final PHB concentration of 8.9 g/L
was reached by the end of fermentation 6, with the maximum accumulation of 74 % (w/w)
recorded at 192 h. Yields were found to be similar to the ones obtained when working under
batch regimen, with Yx/s and Yp/s values of 0.6 and 0.48, respectively. A summary of the main
results for each fermentation are presented in Table 7.1, additionally the best results found
for synthetic and OJW medium are included for comparison.
Table 7-1 Comparison of different fermentation conditions
Scale Conditions Medium [Fructose]0
(g/L )
[Dry matter]
f
(g/L )
[PHB]f
(g/L ) Y
x/s Y
p/s % PHB
Flask 200 rpm
30° C pH
0 6.8 NC
SM 25.00 9.56 6.52 0.53 0.34 68.2
OJW 23.14 9.01 7.34 0.46 0.39 81.5
Bioreactor
250 rpm 30 °C
pH0 6.8 NC
SM 25.00 4.55 2.83 0.37 0.22 62.3
OJW 25.40 3.08 1.69 0.23 0.13 54.7
DO 30% 30 °C
pH 6.8
SM 25.00 7.05 4.30 0.41 0.25 61.0 OJW FI 23.58 9.42 6.62 0.62 0.49 70.3
OJW 22.39 3.58 2.29 0.35 0.26 63.9
OJW fed batch 25.74 13.32 9.83 0.60 0.48 73.8
SM: Synthetic medium; FI, Fresh inoculum.
Synthetic medium showed better results working inside flasks, 9.5 g/L total biomass with a
correspondent 6.52 g/L of PHB, while the best results, for synthetic medium using the
bioreactor were a biomass concentration of 7.05 g/L with 4.3 g/L were produced by the end
of the experiment. However, results for OJW medium indicate that the complexity of this
alternative medium, favours the accumulation of polymer within the cells.

Results and discussion
112
Batch fermentations led, under all the conditions tested, to the same biopolymer
accumulation levels, demonstrating one constant element of the system. Thus, if biomass
levels are significant enough production of PHB should increase.
7.5 Discussion
The inoculum preparation strategy developed by (Mozumder et al., 2014), showed to have a
great impact on the fermentation parameters, such as, when OJW derived medium was used.
A significant increase in biomass and PHB production was observed, compared to the previous
bioreactor experiments performed. Results obtained were superior to those reached with the
synthetic medium used in any scale in this project. However, shake flask scale experiments
seemed to provide slightly better conditions for specific (per cell) PHB production, reaching
around 10 % (w/w) more accumulation for similar levels of total biomass concentration, 9.42
and 9.01 g/L for fermenter and flask respectively. Batch experiments in bioreactor reached
the best results when combining the improved inoculum strategy with control sof key
fermentation parameters, with PHB concentration reaching a maximum of 6.62 g/L,
representing an accumulation of 70 % (w/w) of the total biomass. Similar to values obtained
in flask experiments using an optimised synthetic medium, 6.5 g/L and 68 % (w/w).
An important remark to be made is the fact that for all the batch experiments performed, at
bioreactor and shake flask scale, the accumulation fell within a constant range of 60-70 %
(w/w). With the maximum accumulation occurring for OJW cultures in shake flask
experiments, 81 %. This gives indication of the suitability of OJW as feedstock for the
production of PHA. Dissolved oxygen and pH control had impact over strain growth and kinetic
parameters, leading to increment in Yx/s and Yp/s.Fed-batch operation made possible the
highest total biomass and PHB concentrations obtained in this study by prolonging the stages
duration and hence the final concentrations attained. Successful industrial scale production
of PHA is coupled with the sustainable use of cheap raw materials as alternatives to the use
of pure carbon sources. Different agro-industrial wastes have been examined as potential raw
materials for PHA production, aiming to replace the use of pure carbon sources. Molasses;
starch-based materials; hemicellulosic materials and sugars; whey culture media; and culture

Results and discussion
113
media based in oil, fatty acids and glycerol, are the main groups of materials studied for PHA
production.
Molasses are a by-product of sugar production commonly used as cheap culture media raw
material. Fang et al.(1998), working with a beet molasses and mineral medium, reached
concentrations of 31.6 g/L of PHB with a polymer accumulation of 80 % (w/w), working with
a recombinant E. coli strain under fed-batch mode, tripling the results obtained in flasks;
Indicating the importance of the pH and DO control to the process. Sugar cane liquor is rich
in inexpensive sucrose that can be used as feedstock for PHA production, Jiang et al. (2008)
reached 22 g/L of PHB working in batch conditions using a Pseudomonas fluorescens strain.
Utilisation of sucrose by Cupriavidus necator is restricted to the naturally occurred mutants of
recombinant strains, in 2011 Sichwart et al. used E. coli and Zymomonas mobilis genes to add
mannose and glucose pathways to C. necator H16 metabolism, reaching polymer
accumulations of 67 % (w/w). This study used the wild type strain of C. necator reaching
accumulations up to 70 % (w/w), working a batch operation of the bioreactor and with no
nutrient enrichment or addition to the OJW medium. The medium is rich in other sugars,
glucose and sucrose 13. 9 and 9.9 g/L respectively, that could be used, by modifying the strain
or by a co-culture (Obruca et al., 2015), enhancing the final concentrations attained.
Hemicellulosic hydrolysates are often used as cultivation media for valorisation strategies to
agro-industrial wastes. Burkholderia sacchari and Burkholderia cepacia can achieve PHB
contents of 62 and 53 % (w/w) grown in bagasse hydrolysate medium (Silva et al., 2004b).
Batch operation lead to biomass concentrations around 4 g/L for both strains, however the
fed-batch system enhanced the biomass concentration to levels of 60 g/L with similar polymer
accumulation. Yu and Stahl (2008) implemented an adaptation stage for C. necator cells to
hydrolysed bagasse and, with the use of a concentrated inoculum, reached biomass
concentrations of 6 g/L with a polymer content of 65 % (w/w). Results obtained using the OJW
based medium were comparable to those obtained by C. necator working with similar agro-
industrial waste based medium when those were enriched with growth nutrients. Cruz et
al.(2014) obtained 6 g/L of PHA concentration working in batch conditions after 22 h, using
spend coffee grounds oil as the sole carbon source. Using Bacilllus ssp. Kumar et al. (2015)
used several biologically hydrolysed agro-industrial wastes; pea shells, potato peels, apple

Results and discussion
114
pomace and onion peels; achieving for the first time customised PHA co-polymers with
biomass concentration around 3 g/L.
Different efforts have been made in order to scale up the production of PHAs from shake flask
experiments. These include the use of many combinations of microbial strain and carbon
sources, to the implementation of by products and waste streams from other industrial
processes. The use of microbial consortia and feast-famine cycles is commonly studied as an
alternative to add value to standard water treatments; selectively growing PHA producer
strains over others(Anterrieu et al., 2014; Valentino et al., 2015). Cupriavidus, Burkholderia,
Ralstonia and Pseudomonas are the genus most commonly cited in literature, with many
studies focused in the isolation and identification of wild strains from different carbon rich
natural materials (Bugnicourt et al., 2014; Chanprateep, 2010a; Leong et al., 2014). The
advance in genetic technology has allowed the modification of non-producer microorganisms
to express the PHA synthesis pathway, giving access to the use of different carbon sources
than those used by wild type strains, i.e. recombinant E. coli (Slater et al., 1988). Genetic
modification also allows the triggering of the PHA synthesis before reaching nutrient
limitation; thus, coupling production of the biopolymers with cellular growth. Results obtained
with the OJW medium showed its suitability for the production of PHB by C. necator, in spite
of the inability of the microorganism to metabolise other carbon sources present in the
medium. Enhancement of the process is then possible, by genetically modifying the used
strain to include the utilisation of the other carbon sources present in the medium (Sichwart
et al., 2011).
C. necator H16 is regarded as the model strain for PHA production, due to its capacity to
accumulate PHB. It is important to emphasise that the results obtained by this study are
comparable to those achieved by the strain, working with similar raw materials This was
achieved avoiding any extra nutrient supplementation, which are typically used in industrial
scale increasing the overall cost of production. The OJW medium created the environmental
conditions necessary for C. necator H16 to produce the biopolymer, reaching 6.6 g/L working
under batch operation and 9.9 g/L working a fed-batch fermentation. These results fall short
when compared with concentrations reached for similar feeding strategies (Table 2-4);
nevertheless, the PHB accumulation reached values of the range of 60% (w/w), demostranting

Results and discussion
115
the hyperaccumulation related to the strain, and at the same time suggesting that biomass
accumulation in the bioreactor is the limiting stage. The use of feeding strategies, and the use
of nitrogen rich medium, aiming to maximise cell growth in a first stage of the process in order
to enhance biomass production, have been demonstrated to be a successful strategy to
increase PHA productivities that could lead to higher concentrations for the system here
studied (Ahn et al., 2015).
C. necator produces PHAs to use it as a carbon and energy storage, the pathway is triggered
when the microorganism, in in the presence of a vast amount of carbon source, detects no
growth favourable conditions. The stress conditions that can trigger PHA production in C.
necator are several, with the most common being a limiting concentration of a macronutrient,
different from carbon. The difference in these conditions creates a conundrum, as the
conditions that favour microbial growth diminish PHA production and vice versa. To overcome
this problem, PHAs production process involves two stages; the first one prioritising cell
growth using a nutrient rich medium; the second then triggers PHA production by limiting one
particular nutrient, typically nitrogen. Low protein content in OJW is considered a
disadvantage for its utilisation as nutrient source. However, results suggested that an OJW
based medium favours PHA accumulation, due to the misbalanced nutrient conditions
required. The OJM based medium prompt similar cell growth and PHB accumulations, to
enriched media obtained from agro-industrial waste streams.

Conclusion and future work
116
8 Conclusion and future work
8.1 Conclusion
The use of polyhydroxalkanoates (PHA) as a biodegradable alternative to petroleum-based
plastics, has been proposed as a potential strategy to alleviate the environmental impact that
the disposal of the enormous quantities of plastics has become. The use of cheap raw
materials has been pointed to be a key factor to achieve technical and economic efficiency to
the process. The research findings presented throughout this thesis centre on a series of flask
and bioreactor scale experiments focussed on assessing the technical feasibility of the use of
orange juicing waste (OJW) as feedstock for the production of polyhydroxybutyrate (PHB). The
knowledge gained from the characterisation of the material and fructose extraction
experiments was used to propose a bioprocess for the production of an OJW-based nutrient
rich medium for PHB production.
The results from the different studies presented demonstrate the technical feasibility of the
implementation of OJW as feedstock for PHB production. Representing a novel valorisation
strategy for the valorisation of a plenty available material, typically discarded as waste, while
simultaneously aiming to achieve economic feasibility for PHB production. The findings of this
project lead to the conclusion that OJW is a material rich in valuable organic compounds that
could be extracted to be used as chemicals or feedstock for different processes. This work has
enabled the development of an OJW based bioprocess for the production of a sugar rich
medium; 40 g/L, including fructose, glucose and sucrose; that can be used for PHB production
through fermentation using C. necator. Biomass concentrations within the range of 3-13 g/L
were attained with a characteristic internal accumulation of PHB of 70±8 % (w/w). A maximum
biomass concentration of 9.42 g/L with a corresponding PHB concentration of 6.6 g/L was
attained for batch conditions maintaining a constant value of pH of 6.8 and DO cascade control
in 30% saturation. When a fed-batch strategy was implemented the maximum biomass,
concentration achieved by this study was reached, 13.3 g/L, with a polymer accumulation level
of 73% (w/w).
The initial characterisation of OJW material, presented in chapter 5, indicated its potential as
raw material for biotechnological processes due to its rich content in nutrients for cell growth.

Conclusion and future work
117
The high fructose concentration within the material, along with the low protein content,
generate the unbalanced growth conditions necessary for the production of PHB by C.
nectator H16. Different conditions for the fructose extraction demonstrated that it was
possible to achieve fructose concentrations of 24 g/L. Utilisation of an H2SO4 3% (v/v)
hydrolysis aiming to increase the concentration of fermentable sugars in the medium, led to
degradation of the fructose. This led to the proposal of an autohydrolysis process for the
fructose extraction.
Once the process for medium production was established, the growth of C. necator and
synthesis of PHB for the OJW-based medium produced was tested, and the results presented
in chapter 6. It was possible to demonstrate for the first time that a complex medium
produced using orange peel waste as a raw material can provide the nutrients required for
cell growth of C. necator H16 and PHB production, without the need to supplement the
medium with extra components. PHB production was achieved, reaching values similar to
those reported for different mineral media in the literature. The maximum dry matter
concentration attained was 9.58 g/L, corresponding to a YDM/s of 0.52 and with a intracellular
PHB content of 76% (w); this coincides with García et al. (2013) for batch fermentations using
the same strain when grown in glycerol; another study used cassava starch hydrolysate lead
to a PHA accumulation of 61.6 % with moderate biomass concentrations (Poomipuk et al.,
2014). However, improvement on productivities and yields need to be achieved to enhance
competence, different feed strategies can be studied in order to increase the substrate uptake
by the strain.
The inhibitory effect of limonene was assessed, in a parallel study, and it was possible
demonstrate that C. necator loses 10 % of cell growth when concentrations of the terpene
were up to 1%. A drop of the cell growth of 50% was observed for a limonene concentration
of 1.5%. However, this titre of limonene is higher than those reported for the complete
inhibition other microbial strains pathogens to the fruit and those used in anaerobic digestion
(Marei et al., 2012; Ruiz and Flotats, 2016) . Thus, two important remarks can be made; in
order to the process be efficient, the initial concentration of limonene in the medium needs
to be under 1 % (v/v) to avoid important drops on the yields; C. necator showed potential as

Conclusion and future work
118
a limonene tolerant bacterium when compared to other bacterial strains studied as possible
limonene metabolisers (Duetz et al., 2003).
With the aim of gaining a better control of the parameters, fermentation experiments were
carried out in 3 L bioreactors, Results for the bioreactor experiments highlighted the
importance of pH control to the synthesis process of PHB. Uncontrolled experiments reached
a maximum biomass concentration of 3 g/L when OJW medium was used, while changing
conditions for maintaining a constant value of pH of 6.8 and DO cascade control in 30%
saturation led to 3.5 g/L; with PHB accumulation increase of 9 % (w/w) going from 55 % to
64%. A much more marked difference was noticed when a fresher inoculum preparation was
used. Results obtained triple the biomass concentrations obtained for previous experiment
using OJW based medium, and surpassed the biomass content reached with the synthetic
medium of 7g/L, reaching the 9.4 g/L. Accumulation levels for PHB were higher with the OJW,
70 % (w/w) than those achieved using an optimised synthetic medium optimised for the
process (Aramvash et al., 2015). Thus, concluding that OJW medium provides the conditions
necessary to trigger the synthesis of PHB by C. necator. However, shake flask scale
experiments seemed to provide slightly better conditions for specific (per cell) PHB
production, reaching around 10 % (w/w) more accumulation for similar levels of total biomass
concentration, 9.42 and 9.01 g/L for fermenter and flask respectively.
Batch experiments in bioreactor reached the maximum of PHB concentration of 6.62 g/L,
representing an accumulation of 70 % (w/w) of the total biomass. Finally, the effect that the
feeding strategy has over PHB production was tested using by means of a fed-batch operation
mode. This feeding strategy enabled the maximum concentrations reached by this project of
13 and 9 g/L for biomass and PHB respectively. The importance of separating the growth of
the strain and the accumulation of the polymer is marked by this experiment, suggesting that
detaching both processes could lead to better results. The convenience of this strategies is
highly strain dependant as each microorganism shows different behaviour depending of the
nature of their metabolism (Chen et al., 2015; Lai et al., 2013).
In this work the need for a feasible PHB production route, based in low cost raw materials, has
been identified and the suitability of OJW as feedstock for the preparation of a sugar rich

Conclusion and future work
119
medium, to be implemented as fermentation medium, was demonstrated in response. A
process for the preparation of the medium was developed for the production of PHB by C.
necator H16, avoiding the addition of any hydrolysis agent. Simultaneously, nutrient
supplementation to the medium obtained was avoided. This minimises the material costs
aiming to enhance the economic viability of PHB production. Results presented here
demonstrated that the medium produced provides the conditions necessary for PHB
production to competitive levels other similar raw materials studied by literature. Thus, the
feasibility of PHB production from OJW has been demonstrated, adding value to the synthesis
of this biopolymer by the utilisation of a plenty available renewable material. The results
obtained in this work lay the ground to the potential further exploitation of different fractions
of this complex material. The process developed in this thesis could enable the
commercialisation of 14,000 Tonnes of PHB per year, using the entire OJW production in
Mexico; thus, assuming a cost of 4 GBP per kilogram, creating a 56 million market. However,
the capital investment required for the implementation of this type of valorisation processes
demands the exploitation of other fractions of the complex material (Angel Siles López et al.,
2010; Boukroufa et al., 2014; FitzPatrick et al., 2010).
Although the use of OJW as feedstock for the production of PHB by C. necator is a feasible
valorisation strategy for this agro-indrustrial waste surplus, the successful adoption of this
alternative would require a holistic approach for the exploitation of the different fractions of
this complex material. Further development of the process proposed, with focus on the
improvement of nutrient recovery, separation of different fractions and biopolymer
production yields, could well be a significant contribution to the achievement of a sustainable
biopolymer industry, and the establishment of a holistic citrus biorefinery. A flow diagram for
a theoretical orange biorefinery with PHB, methane, pectin and limonene as target molecules,
is presented in the appendix A.
8.2 Recommendations for future work
There are several portions of the research presented in this thesis which are interesting to
explore further if time permitted. Although the feasibility of OJW as feedstock for
biotechnological conversion to PHB has been demonstrated, higher final product

Conclusion and future work
120
concentration is desirable as a starting point for the downstream processing. An investigation
aiming to optimize the extraction process targeting higher fructose concentration while
lowering inhibitory compounds. A deep characterization of the media composition and
starting material, is also necessary to fully understand interactions among the compounds
present in the media; nitrogen is an important factor triggering the PHAs synthesis pathway,
a study on the concentration on the media would explain when the limiting concentration is
reached as well as allow further studies on fermentations feeding strategies. The addition of
a limonene extraction stage to the process could add value to the material, while the use of
green chemicals will ensure sustainability of the process (Ozturk et al., 2018). This, combined
with other processing lines as the pectin recovery and anaerobic digestion, can be used to
implement the concept of biorefinery to orange the processing industry , that could exploit all
fractions of the OJW (Angel Siles López et al., 2010; Liguori and Faraco, 2016). Residual
carbohydrates in the media are available for implementation on further processes to convert
them in added value products, different microbial strains can be studied as alternatives to C.
necator in order to take advantage of this nutrients could lead to the synthesis of different
polymers with broader range of applications (Ferre-Guell and Winterburn, 2017). Proper
measurement of them needs to be performed in order to develop a strategy to optimise their
extraction as usable carbon sources. Modelling of the fermentation process will allow the
prediction of the behaviour on an industrial scale as well as economic evaluation of the
process, thus facilitating the scaling up of the process ensuring technical feasibility and more
accurate outcome prediction (Yousuf and Winterburn, 2016). The best route to approach
scaling up experiments would be with an industrial partner that could provide the material
and some facilities for the required for the upstream process. Large scale trials would provide
robust data on the effectiveness of the process design to ensure the commercially viable PHB
production.

References
121
9 References
Acid Hydrolysis of Pectin for Cell Growth of <I>Cupriavidus necator</I> [WWW Document], n.d. URL
http://www.scialert.net/fulltext/?doi=biotech.2012.29.36&org=11 (accessed 4.15.15).
Agbor, V.B., Cicek, N., Sparling, R., Berlin, A., Levin, D.B., 2011. Biomass pretreatment: fundamentals
toward application. Biotechnol. Adv. 29, 675–85. doi:10.1016/j.biotechadv.2011.05.005
Ahmed, J., Varshney, S.K., 2011. POLYLACTIDES—CHEMISTRY, PROPERTIES AND GREEN PACKAGING
TECHNOLOGY: A REVIEW. Int. J. Food Prop. 14, 37–58. doi:10.1080/10942910903125284
Ahn, J., Jho, E.H., Nam, K., 2015. Effect of C/N ratio on polyhydroxyalkanoates (PHA) accumulation by
Cupriavidus necator and its implication on the use of rice straw hydrolysates. Environ. Eng. Res.
20, 246–253. doi:10.4491/eer.2015.055
Ahn, W.S., Park, S.J., Lee, S.Y., 2000. Production of Poly(3-hydroxybutyrate) by fed-batch culture of
recombinant Escherichia coli with a highly concentrated whey solution. Appl. Environ.
Microbiol. 66, 3624–7.
Albuquerque, M.G.E., Eiroa, M., Torres, C., Nunes, B.R., Reis, M.A.M., 2007. Strategies for the
development of a side stream process for polyhydroxyalkanoate (PHA) production from sugar
cane molasses. J. Biotechnol. 130, 411–421. doi:10.1016/j.jbiotec.2007.05.011
Aleman-Nava, G.S., Meneses-Jacome, A., C?rdenas-Ch?vez, D.L., D?az-Chavez, R., Scarlat, N.,
Dallemand, J.-F., Ornelas-Soto, N., Garc?a-Arrazola, R., Parra, R., 2015. Bioenergy in Mexico:
Status and perspective. Biofuels, Bioprod. Biorefining 9, 8–20. doi:10.1002/bbb.1523
Alva Munoz, L.E., Riley, M.R., 2008. Utilization of cellulosic waste from tequila bagasse and
production of polyhydroxyalkanoate (PHA) bioplastics bySaccharophagus degradans.
Biotechnol. Bioeng. 100, 882–888. doi:10.1002/bit.21854
Amache, R., Sukan, A., Safari, M., Roy, I., Keshavarz, T., 2013. Advances in PHAs production. Chem.
Eng. Trans. 32. doi:10.3303/CET1332156
Amass, W., Amass, A., Tighe, B., 1998. A review of biodegradable polymers: uses, current
developments in the synthesis and characterization of biodegradable polyesters, blends of
biodegradable polymers and recent advances in biodegradation studies. Polym. Int. 47, 89–144.
doi:10.1002/(SICI)1097-0126(1998100)47:2<89::AID-PI86>3.0.CO;2-F
Andrady, A.L., Neal, M.A., 2009. Applications and societal benefits of plastics. Philos. Trans. R. Soc.

References
122
Lond. B. Biol. Sci. 364, 1977–84. doi:10.1098/rstb.2008.0304
Angel Siles López, J., Li, Q., Thompson, I.P., 2010. Biorefinery of waste orange peel. Crit. Rev.
Biotechnol. 30, 63–9. doi:10.3109/07388550903425201
Annadural, G., Juang, R.S., Lee, D.J., 2003. Adsorption of heavy metals from water using banana and
orange peels. Water Sci. Technol. 47, 185–90.
Anterrieu, S., Quadri, L., Geurkink, B., Dinkla, I., Bengtsson, S., Arcos-Hernandez, M., Alexandersson,
T., Morgan-Sagastume, F., Karlsson, A., Hjort, M., Karabegovic, L., Magnusson, P., Johansson, P.,
Christensson, M., Werker, A., 2014. Integration of biopolymer production with process water
treatment at a sugar factory. N. Biotechnol. 31, 308–323. doi:10.1016/j.nbt.2013.11.008
AOAC, I., 1990. AOAC: Official Methods of Analysis (Volume 1) 1.
Aramvash, A., Akbari Shahabi, Z., Dashti Aghjeh, S., Ghafari, M.D., 2015. Statistical physical and
nutrient optimization of bioplastic polyhydroxybutyrate production by Cupriavidus necator. Int.
J. Environ. Sci. Technol. 12, 2307–2316. doi:10.1007/s13762-015-0768-3
Arun, A., Murrugappan, R., D. David Ravindran, A., Veeramani, V., Balaji, S., 2006. Utilization of
various industrial wastes for the production of poly-β-hydroxy butyrate (PHB) by Alcaligenes
eutrophus, African Journal of Biotechnology (ISSN: 1684-5315) Vol 5 Num 17.
doi:10.4314/ajb.v5i17.43150
Ashby, R.D., Solaiman, D.K.Y., Foglia, T.A., Liu, C.-K., 2001. Glucose/Lipid Mixed Substrates as a Means
of Controlling the Properties of Medium Chain Length Poly(hydroxyalkanoates) †.
Biomacromolecules 2, 211–216. doi:10.1021/bm000098+
Atlić, A., Koller, M., Scherzer, D., Kutschera, C., Grillo-Fernandes, E., Horvat, P., Chiellini, E., Braunegg,
G., 2011. Continuous production of poly([R]-3-hydroxybutyrate) by Cupriavidus necator in a
multistage bioreactor cascade. Appl. Microbiol. Biotechnol. 91, 295–304. doi:10.1007/s00253-
011-3260-0
Balkwill, D.L., 2015. Cupriavidus, in: Bergey’s Manual of Systematics of Archaea and Bacteria. John
Wiley & Sons, Ltd, Chichester, UK, pp. 1–7. doi:10.1002/9781118960608.gbm00936
Balu, A.M., Budarin, V., Shuttleworth, P.S., Pfaltzgraff, L.A., Waldron, K., Luque, R., Clark, J.H., 2012.
Valorisation of orange peel residues: waste to biochemicals and nanoporous materials.
ChemSusChem 5, 1694–7. doi:10.1002/cssc.201200381

References
123
Bampidis, V.A., Robinson, P.H., 2006. Citrus by-products as ruminant feeds: A review. Anim. Feed Sci.
Technol. 128, 175–217. doi:10.1016/j.anifeedsci.2005.12.002
Bloembergen, S., Holden, D.A., Hamer, G.K., Bluhm, T.L., Marchessault, R.H., 1986. Studies of
composition and crystallinity of bacterial poly(β-hydroxybutyrate-co-β-hydroxyvalerate).
Macromolecules 19, 2865–2871. doi:10.1021/ma00165a034
Bolck, C., En, J.R., Molenveld, K., Harmsen, P., n.d. Biobased Plastics 2012.
Boluda-Aguilar, M., García-Vidal, L., González-Castañeda, F.D.P., López-Gómez, A., 2010. Mandarin
peel wastes pretreatment with steam explosion for bioethanol production. Bioresour. Technol.
101, 3506–13. doi:10.1016/j.biortech.2009.12.063
Borah, B., Thakur, P.S., Nigam, J.N., 2002. The influence of nutritional and environmental conditions
on the accumulation of poly-beta-hydroxybutyrate in Bacillus mycoides RLJ B-017. J. Appl.
Microbiol. 92, 776–83.
Borchani, C., Besbes, S., Blecker, C., Masmoudi, M., Baati, R., Attia, H., 2002. African journal of
biotechnology., African Journal of Biotechnology. Academic Journals.
Botta, L., Mistretta, M.C., Palermo, S., Fragalà, M., Pappalardo, F., 2015. Characterization and
Processability of Blends of Polylactide Acid with a New Biodegradable Medium-Chain-Length
Polyhydroxyalkanoate. J. Polym. Environ. doi:10.1007/s10924-015-0729-4
Boukroufa, M., Boutekedjiret, C., Petigny, L., Rakotomanomana, N., Chemat, F., 2014. Bio-refinery of
orange peels waste: A new concept based on integrated green and solvent free extraction
processes using ultrasound and microwave techniques to obtain essential oil, polyphenols and
pectin. Ultrason. Sonochem. 24, 72–79. doi:10.1016/j.ultsonch.2014.11.015
Braunegg, G., Bona, R., Koller, M., 2004. Sustainable Polymer Production. Polym. Plast. Technol. Eng.
43, 1779–1793. doi:10.1081/PPT-200040130
Braunegg, G., Korneti, L., 1984. Pseudomonas 2 F: Kinetics of growth and accumulation of poly - D(-)-
3-hydroxybutyric acid (poly - HB). Biotechnol. Lett. 6, 825–829. doi:10.1007/BF00134727
Bugnicourt, E., Cinelli, P., Lazzeri, A., Alvarez, V., 2014. Polyhydroxyalkanoate (PHA): Review of
synthesis, characteristics, processing and potential applications in packaging. Express Polym.
Lett. 8. doi:10.3144/expresspolymlett.2014.82
Carrasco, F., Dionisi, D., Martinelli, A., Majone, M., 2006. Thermal stability of polyhydroxyalkanoates.

References
124
J. Appl. Polym. Sci. 100, 2111–2121. doi:10.1002/app.23586
Casas-Orozco, D., Villa, A.L., Bustamante, F., González, L.-M., 2015. Process development and
simulation of pectin extraction from orange peels. Food Bioprod. Process. 96, 86–98.
doi:10.1016/j.fbp.2015.06.006
Castilho, L.R., Mitchell, D.A., Freire, D.M.G.G., 2009. Production of polyhydroxyalkanoates (PHAs)
from waste materials and by-products by submerged and solid-state fermentation. Bioresour.
Technol. 100, 5996–6009. doi:10.1016/j.biortech.2009.03.088
Cavalheiro, J.M.B.T., de Almeida, M.C.M.D., Grandfils, C., da Fonseca, M.M.R., 2009. Poly(3-
hydroxybutyrate) production by Cupriavidus necator using waste glycerol. Process Biochem. 44,
509–515. doi:10.1016/J.PROCBIO.2009.01.008
Ceyhan Guvensen, N., Ozdemir, G., 2011. Poly-β-hydroxybutyrate (PHB) production from domestic
wastewater using Enterobacter aerogenes 12Bi strain, African Journal of Microbiology
Research.
Chaabouni, E., Gassara, F., Brar, S.K., 2014. Biopolymers Synthesis and Application, in:
Biotransformation of Waste Biomass into High Value Biochemicals. Springer New York, New
York, NY, pp. 415–443. doi:10.1007/978-1-4614-8005-1_17
Chakraborty, P., Muthukumarappan, K., Gibbons, W.R., 2012. PHA Productivity and Yield of Ralstonia
eutropha When Intermittently or Continuously Fed a Mixture of Short Chain Fatty Acids. J.
Biomed. Biotechnol. 2012, 1–8. doi:10.1155/2012/506153
Chanprateep, S., 2010a. Current trends in biodegradable polyhydroxyalkanoates. J. Biosci. Bioeng.
110, 621–32. doi:10.1016/j.jbiosc.2010.07.014
Chanprateep, S., 2010b. Current trends in biodegradable polyhydroxyalkanoates. J. Biosci. Bioeng.
110, 621–632. doi:10.1016/J.JBIOSC.2010.07.014
Chanprateep, S., Katakura, Y., Visetkoop, S., Shimizu, H., Kulpreecha, S., Shioya, S., 2008.
Characterization of new isolated Ralstonia eutropha strain A-04 and kinetic study of
biodegradable copolyester poly(3-hydroxybutyrate-co-4-hydroxybutyrate) production. J. Ind.
Microbiol. Biotechnol. 35, 1205–1215. doi:10.1007/s10295-008-0427-5
Chee, J.Y., S. Yoga, S., Lau, N.-S., C. Ling, S., Abed, R., Sudesh, K., 2010. Bacterially produced
polyhydroxyalkanoate (PHA): Converting renewable resources into bioplastic, in: Current

References
125
Research, Technology and Education Topics in Applied Microbiology and Microbial
Biotechnology. pp. 1395–1404.
Chen, G.-Q., 2009. A microbial polyhydroxyalkanoates (PHA) based bio- and materials industry.
Chem. Soc. Rev. 38, 2434. doi:10.1039/b812677c
Chen, G.-Q., Page, W.J., 1997. Production of poly-b-hydroxybutyrate by Azotobacter vinelandii in a
two-stage fermentation process. Biotechnol. Tech. 11, 347–350. doi:10.1023/A:1018435815864
Chen, Z., Huang, L., Wen, Q., Guo, Z., 2015. Efficient polyhydroxyalkanoate (PHA) accumulation by a
new continuous feeding mode in three-stage mixed microbial culture (MMC) PHA production
process. J. Biotechnol. 209, 68–75. doi:10.1016/j.jbiotec.2015.06.382
Choi, I.S., Kim, J.-H., Wi, S.G., Kim, K.H., Bae, H.-J., 2013. Bioethanol production from mandarin (Citrus
unshiu) peel waste using popping pretreatment. Appl. Energy 102, 204–210.
doi:10.1016/j.apenergy.2012.03.066
Ciriminna, R., Fidalgo, A., Delisi, R., 2016. Pectin production and global market. Food Ind. Hi ….
Cruz, M. V, Paiva, A., Lisboa, P., Freitas, F., Alves, V.D., Simões, P., Barreiros, S., Reis, M.A.M., 2014.
Production of polyhydroxyalkanoates from spent coffee grounds oil obtained by supercritical
fluid extraction technology. Bioresour. Technol. 157, 360–3. doi:10.1016/j.biortech.2014.02.013
de Jong, E., Jungmeier, G., 2015. Biorefinery Concepts in Comparison to Petrochemical Refineries.
Ind. Biorefineries White Biotechnol. 3–33. doi:10.1016/B978-0-444-63453-5.00001-X
Dietrich, K., Dumont, M.-J., Del Rio, L.F., Orsat, V., 2017. Producing PHAs in the bioeconomy —
Towards a sustainable bioplastic. Sustain. Prod. Consum. 9, 58–70.
doi:10.1016/j.spc.2016.09.001
Doi, Y., Segawa, A., Kunioka, M., 1990. Biosynthesis and characterization of poly(3-hydroxybutyrate-
co-4-hydroxybutyrate) in Alcaligenes eutrophus. Int. J. Biol. Macromol. 12, 106–111.
doi:10.1016/0141-8130(90)90061-E
Du, C., Sabirova, J., Soetaert, W., Ki Carol Lin, S., 2012. Polyhydroxyalkanoates Production From Low-
cost Sustainable Raw Materials. Curr. Chem. Biol. 6, 14–25. doi:10.2174/2212796811206010014
Duetz, W.A., Bouwmeester, H., van Beilen, J.B., Witholt, B., 2003. Biotransformation of limonene by
bacteria, fungi, yeasts, and plants. Appl. Microbiol. Biotechnol. 61, 269–77.
doi:10.1007/s00253-003-1221-y

References
126
Endres, H.J., 2011. Biopolymers as a sustainable alternative? Kunststoffe Int. 101, 15–20.
European Bioplastics, 2016. Market – European Bioplastics e.V. [WWW Document]. URL
http://www.european-bioplastics.org/market/ (accessed 7.11.17).
European Bioplastics, Nova-Institute, 2018. Bioplastics market data 2018. Global production
capacities of bioplastics 2018-2023. doi:10.1017/S0022226700007799
Fang, L., WenQing, L., Ridgway, D., TingYue, G., Shen ZhongYao (Department of Chemical Engineering
Athens, OH 45701 (USA)), O.U., 1998. Production of poly-beta-hydroxybutyrate on molasses by
recombinant Escherichia coli. Biotechnol. Lett. (United Kingdom).
Ferre-Guell, A., Winterburn, J., 2017. Production of the copolymer poly(3-hydroxybutyrate-co-3-
hydroxyvalerate) with varied composition using different nitrogen sources with Haloferax
mediterranei. Extremophiles.
Fiorese, M.L., Freitas, F., Pais, J., Ramos, A.M., de Aragão, G.M.F., Reis, M.A.M., 2009. Recovery of
polyhydroxybutyrate (PHB) from Cupriavidus necator biomass by solvent extraction with 1,2-
propylene carbonate. Eng. Life Sci. 9, 454–461. doi:10.1002/elsc.200900034
FitzPatrick, M., Champagne, P., Cunningham, M.F., Whitney, R.A., 2010. A biorefinery processing
perspective: Treatment of lignocellulosic materials for the production of value-added products.
Bioresour. Technol. 101, 8915–8922. doi:10.1016/j.biortech.2010.06.125
Gagnon, K.., Lenz, R.., Farris, R.., Fuller, R.., 1994. Chemical modification of bacterial elastomers: 2.
Sulfur vulcanization. Polymer (Guildf). 35, 4368–4375. doi:10.1016/0032-3861(94)90094-9
García, I.L., López, J.A., Dorado, M.P., Kopsahelis, N., Alexandri, M., Papanikolaou, S., Villar, M.A.,
Koutinas, A.A., 2013. Evaluation of by-products from the biodiesel industry as fermentation
feedstock for poly(3-hydroxybutyrate-co-3-hydroxyvalerate) production by Cupriavidus necator.
Bioresour. Technol. 130, 16–22. doi:10.1016/j.biortech.2012.11.088
Gironi, F., Piemonte, V., 2011. Bioplastics and Petroleum-based Plastics: Strengths and Weaknesses.
Energy Sources, Part A Recover. Util. Environ. Eff. 33, 1949–1959.
doi:10.1080/15567030903436830
Gomaa, E.Z., n.d. Production of polyhydroxyalkanoates (PHAs) by Bacillus subtilis and Escherichia coli
grown on cane molasses fortified with ethanol. Brazilian Arch. Biol. Technol. 57, 145–154.
doi:10.1590/S1516-89132014000100020

References
127
Grousseau, E., Blanchet, E., Déléris, S., Albuquerque, M.G.E., Paul, E., Uribelarrea, J.-L., 2013. Impact
of sustaining a controlled residual growth on polyhydroxybutyrate yield and production kinetics
in Cupriavidus necator. Bioresour. Technol. 148, 30–8. doi:10.1016/j.biortech.2013.08.120
Gumel, A.M., Annuar, M.S.M., Chisti, Y., 2013. Recent Advances in the Production, Recovery and
Applications of Polyhydroxyalkanoates. J. Polym. Environ. doi:10.1007/s10924-012-0527-1
Guzman Lagunes, F., Winterburn, J.B.B., 2016. Effect of limonene on the heterotrophic growth and
polyhydroxybutyrate production by Cupriavidus necator H16. Bioresour. Technol. 221, 336–343.
doi:10.1016/j.biortech.2016.09.045
HAAS, R., JIN, B., ZEPF, F.T., 2008. Production of Poly(3-hydroxybutyrate) from Waste Potato Starch.
Biosci. Biotechnol. Biochem. 72, 253–256. doi:10.1271/bbb.70503
Habib, A., Islam, N., Islam, A., Alam, A.M.S., 2007. Removal of Copper from Aqueous Solution Using
Orange Peel, Sawdust and Bagasse. J. Anal. Environ. Chem 8, 21–25.
Helm, J., Wendlandt, K.-D., Jechorek, M., Stottmeister, U., 2008. Potassium deficiency results in
accumulation of ultra-high molecular weight poly-β-hydroxybutyrate in a methane-utilizing
mixed culture. J. Appl. Microbiol. 105, 1054–1061. doi:10.1111/j.1365-2672.2008.03831.x
Holmes, P.A., 1985. Applications of PHB - a microbially produced biodegradable thermoplastic. Phys.
Technol. 16, 32–36. doi:10.1088/0305-4624/16/1/305
Hottle, T.A., Bilec, M.M., Landis, A.E., 2013. Sustainability assessments of bio-based polymers. Polym.
Degrad. Stab. doi:10.1016/j.polymdegradstab.2013.06.016
Impact of phosphate limitation on PHA production in a feast-famine process, 2017. . Water Res. 126,
472–480. doi:10.1016/J.WATRES.2017.09.031
Ishizaki, A., Tanaka, K., Taga, N., 2001. Microbial production of poly-D-3-hydroxybutyrate from CO2.
Appl. Microbiol. Biotechnol. 57, 6–12.
Iwata, T., 2005. Strong Fibers and Films of Microbial Polyesters. Macromol. Biosci. 5, 689–701.
doi:10.1002/mabi.200500066
Jacquel, N., Lo, C.-W., Wei, Y.-H., Wu, H.-S., Wang, S.S., 2008. Isolation and purification of bacterial
poly(3-hydroxyalkanoates). Biochem. Eng. J. 39, 15–27. doi:10.1016/j.bej.2007.11.029
Jain, R., Tiwari, A., 2015. Biosynthesis of planet friendly bioplastics using renewable carbon source. J.

References
128
Environ. Heal. Sci. Eng. 13, 11. doi:10.1186/s40201-015-0165-3
Jambeck, J.R., Geyer, R., Wilcox, C., Siegler, T.R., Perryman, M., Andrady, A., Narayan, R., Law, K.L.,
2015. Plastic waste inputs from land into the ocean. Science (80-. ). 347.
doi:10.1126/science.1260352
JESÚS LERMA CARBAJAL Director General ING ALONSO IBARRA TAMEZ Director Agrícola MVZ
VICENTE GALVÁN GONZÁLEZ Director Pecuario DR JESÚS MARTÍNEZ DE LA CERDA Director de
Desarrollo Rural DR GUILLERMO ARTURO RODRÍGUEZ Y RODRÍGUEZ, I.R., JUAN PATRICIO
GALICIA CAVAZOS Coordinador Administrativo, I., Jesús Lerma Carbajal, I., n.d. CORPORACIÓN
PARA EL DESARROLLO AGROPECUARIO DE NUEVO LEÓN DIRECTORIO.
Jiang, Y., Song, X., Gong, L., Li, P., Dai, C., Shao, W., 2008. High poly(β-hydroxybutyrate) production by
Pseudomonas fluorescens A2a5 from inexpensive substrates. Enzyme Microb. Technol. 42, 167–
172. doi:10.1016/J.ENZMICTEC.2007.09.003
Joshi, S.M., Waghmare, J.S., Sonawane, K.D., Waghmare, S.R., 2015. Bio-ethanol and bio-butanol
production from orange peel waste. Biofuels 6, 55–61. doi:10.1080/17597269.2015.1045276
Kahar, P., Tsuge, T., Taguchi, K., Doi, Y., 2004. High yield production of polyhydroxyalkanoates from
soybean oil by Ralstonia eutropha and its recombinant strain. Polym. Degrad. Stab. 83, 79–86.
doi:10.1016/S0141-3910(03)00227-1
Kawaguchi, H., Hasunuma, T., Ogino, C., Kondo, A., 2016. Bioprocessing of bio-based chemicals
produced from lignocellulosic feedstocks. Curr. Opin. Biotechnol. 42, 30–39.
doi:10.1016/j.copbio.2016.02.031
Keshavarz, T., Roy, I., 2010. Polyhydroxyalkanoates: bioplastics with a green agenda. Curr. Opin.
Microbiol. 13, 321–6. doi:10.1016/j.mib.2010.02.006
Khanna, S., Srivastava, A.K., 2010. Continuous Cultivation of Wautersia eutropha for the Production
of A Biodegradable Polymer Poly-(B-Hydroxybutyrate), AsPac J. Mol. Biol. Biotechnol.
Khanna, S., Srivastava, A.K., 2009. On-line characterization of physiological state in poly(beta-
hydroxybutyrate) production by Wautersia eutropha. Appl. Biochem. Biotechnol. 157, 237–43.
doi:10.1007/s12010-008-8395-9
Khanna, S., Srivastava, A.K., 2005a. Statistical media optimization studies for growth and PHB
production by Ralstonia eutropha. Process Biochem. 40, 2173–2182.

References
129
doi:10.1016/j.procbio.2004.08.011
Khanna, S., Srivastava, A.K., 2005b. Recent advances in microbial polyhydroxyalkanoates. Process
Biochem. 40, 607–619. doi:10.1016/J.PROCBIO.2004.01.053
Kim, B.S., Lee, S.C., Lee, S.Y., Chang, H.N., Chang, Y.K., Woo, S.I., 1994. Production of poly(3-
hydroxybutyric acid) by fed-batch culture ofAlcaligenes eutrophus with glucose concentration
control. Biotechnol. Bioeng. 43, 892–898. doi:10.1002/bit.260430908
Koller, M., 2015. Recycling of Waste Streams of the Biotechnological Poly(hydroxyalkanoate)
Production by Haloferax mediterranei on Whey. Int. J. Polym. Sci. 2015, 1–8.
doi:10.1155/2015/370164
Koller, M., Atlić, A., Dias, M., Reiterer, A., Braunegg, G., 2010a. Microbial PHA Production from Waste
Raw Materials. pp. 85–119. doi:10.1007/978-3-642-03287-5_5
Koller, M., Salerno, A., Dias, M., Reiterer, A., Braunegg, G., 2010b. Modern biotechnological polymer
synthesis: A review. Food Technol. Biotechnol. 48, 255–269.
Kricheldorf, H.R., 2001. Syntheses and application of polylactides. Chemosphere 43, 49–54.
doi:10.1016/S0045-6535(00)00323-4
Kricheldorf, H.R., Berl, M., Scharnagl, N., 1988. Poly(lactones). 9. Polymerization mechanism of metal
alkoxide initiated polymerizations of lactide and various lactones. Macromolecules 21, 286–293.
doi:10.1021/ma00180a002
Kulkarni, S.O., Kanekar, P.P., Nilegaonkar, S.S., Sarnaik, S.S., Jog, J.P., 2010. Production and
characterization of a biodegradable poly (hydroxybutyrate-co-hydroxyvalerate) (PHB-co-PHV)
copolymer by moderately haloalkalitolerant Halomonas campisalis MCM B-1027 isolated from
Lonar Lake, India. Bioresour. Technol. 101, 9765–71. doi:10.1016/j.biortech.2010.07.089
Kulpreecha, S., Boonruangthavorn, A., Meksiriporn, B., Thongchul, N., 2009. Inexpensive fed-batch
cultivation for high poly(3-hydroxybutyrate) production by a new isolate of Bacillus
megaterium. J. Biosci. Bioeng. 107, 240–245. doi:10.1016/j.jbiosc.2008.10.006
Kumar, P., Ray, S., Kalia, V.C., 2015. Production of co-polymers of polyhydroxyalkanoates by
regulating the hydrolysis of biowastes. Bioresour. Technol. 200, 413–419.
doi:10.1016/j.biortech.2015.10.045
Lackner, M., Lackner, Maximilian, 2015. Bioplastics, in: Kirk-Othmer Encyclopedia of Chemical

References
130
Technology. John Wiley & Sons, Inc., Hoboken, NJ, USA, pp. 1–41.
doi:10.1002/0471238961.koe00006
Lai, S.-Y., Kuo, P.-C., Wu, W., Jang, M.-F., Chou, Y.-S., 2013. Biopolymer production in a fed-batch
reactor using optimal feeding strategies. J. Chem. Technol. Biotechnol. 88, n/a-n/a.
doi:10.1002/jctb.4067
Lee, S.Y., Choi, J., 1998. Effect of fermentation performance on the economics of poly(3-
hydroxybutyrate) production byAlcaligenes latus. Polym. Degrad. Stab. 59, 387–393.
doi:10.1016/S0141-3910(97)00176-6
Leong, Y.K., Show, P.L., Ooi, C.W., Ling, T.C., Lan, J.C.W., 2014. Current trends in
polyhydroxyalkanoates (PHAs) biosynthesis: Insights from the recombinant Escherichia coli. J.
Biotechnol. 180, 52–65.
Liguori, R., Faraco, V., 2016. Biological processes for advancing lignocellulosic waste biorefinery by
advocating circular economy. Bioresour. Technol. doi:10.1016/j.biortech.2016.04.054
Liu, F., Li, W., Ridgway, D., Gu, T., Shen, Z., 1998. Production of poly-b-hydroxybutyrateon molasses
by recombinantEscherichia coli.
Locatelli, G., da Silva, G.D., Finkler, L., Finkler, C.L.L., 2012. Acid Hydrolysis of Pectin for Cell Growth of
Cupriavidus necator. Biotechnology(Faisalabad) 11, 29–36. doi:10.3923/biotech.2012.29.36
Lohrasbi, M., Pourbafrani, M., Niklasson, C., Taherzadeh, M.J., 2010. Process design and economic
analysis of a citrus waste biorefinery with biofuels and limonene as products. Bioresour.
Technol. 101, 7382–8. doi:10.1016/j.biortech.2010.04.078
López-Cuellar, M.R., Alba-Flores, J., Rodríguez, J.N.G., Pérez-Guevara, F., 2011. Production of
polyhydroxyalkanoates (PHAs) with canola oil as carbon source. Int. J. Biol. Macromol. 48, 74–
80. doi:10.1016/j.ijbiomac.2010.09.016
Lopez M., 2017, 2017. Sagarpa y Conacyt lanzan convocatoria para la investigación agrícola, pecuaria,
acuacultura, agrobiotecnología y recursos fitogenéticos [WWW Document]. CONACyTprensa.
URL http://www.conacytprensa.mx/index.php/sociedad/convocatorias/14809-sagarpa-conacyt-
convocatoria-investigacion-agricola-pecuaria-acuacultura-agrobiotecnologia-recursos-
fitogeneticos (accessed 7.11.17).
Lopresto, C.G., Petrillo, F., Casazza, A.A., Aliakbarian, B., Perego, P., Calabrò, V., 2014. A non-

References
131
conventional method to extract D-limonene from waste lemon peels and comparison with
traditional Soxhlet extraction. Sep. Purif. Technol. 137, 13–20.
doi:10.1016/j.seppur.2014.09.015
Loureiro, N.C., Ghosh, S., Viana, J.C., Esteves, J.L., 2014. Thermal Characterization of
Polyhydroxyalkanoates and Poly(lactic acid) Blends Obtained by Injection Molding. Polym. Plast.
Technol. Eng. 54, 350–356. doi:10.1080/03602559.2014.935422
Luong, J.H.T., Mulchandani, A., Leduy, A., 1988. Kinetics of biopolymer synthesis: A revisit. Enzyme
Microb. Technol. 10, 326–332. doi:10.1016/0141-0229(88)90010-5
Maier, C., Calafut, T., Maier, C., Calafut, T., 1998. Morphology and Commercial Forms. Polypropylene
11–25. doi:10.1016/B978-188420758-7.50007-2
Makkar, N.S., Casida, L.E., 1987. Cupriavidus necator gen. nov., sp. nov.; a Nonobligate Bacterial
Predator of Bacteria in Soil. Int. J. Syst. Bacteriol. 37, 323–326. doi:10.1099/00207713-37-4-323
Mantzouridou, F.T., Paraskevopoulou, A., Lalou, S., 2015. Yeast flavour production by solid state
fermentation of orange peel waste. Biochem. Eng. J. 101, 1–8. doi:10.1016/j.bej.2015.04.013
Marei, G.I.K., Abdel Rasoul, M.A., Abdelgaleil, S.A.M., 2012. Comparative antifungal activities and
biochemical effects of monoterpenes on plant pathogenic fungi. Pestic. Biochem. Physiol. 103,
56–61. doi:10.1016/j.pestbp.2012.03.004
Marín, F.R., Soler-Rivas, C., Benavente-García, O., Castillo, J., Pérez-Alvarez, J.A., 2007. By-products
from different citrus processes as a source of customized functional fibres. Food Chem. 100,
736–741. doi:10.1016/j.foodchem.2005.04.040
Marques, J.P.R., Amorim, L., Silva-Junior, G.J., Spósito, M.B., Appezzato-da Gloria, B., 2014. Structural
and biochemical characteristics of citrus flowers associated with defence against a fungal
pathogen. AoB Plants 7, plu090-. doi:10.1093/aobpla/plu090
Marsudi, S., Tan, I., Gan, S., 2009. Prodution of medium chain lenght Polyhydroyalkanoates from oleic
acid using Pseudomonas putida pga1 by fed batch culture. Makara Teknol. 11, 1–4.
Metoui, N., Gargouri, S., Amri, I., Fezzani, T., Jamoussi, B., Hamrouni, L., 2015. Activity antifungal of
the essential oils; aqueous and ethanol extracts from Citrus aurantium L. Nat. Prod. Res. 29,
2238–41. doi:10.1080/14786419.2015.1007136
Mezule, L., Dalecka, B., Juhna, T., 2015. Fermentable Sugar Production from Lignocellulosic Waste 43.

References
132
doi:10.3303/CET1543104
Mohammad Pourbafrani, F.T.C.N.M.J.T., 2007. Protective Effect of Encapsulation in Fermentation of
Limonene-contained Media and Orange Peel Hydrolyzate. Int. J. Mol. Sci.
Mohan, M., Banerjee, T., Goud, V. V, 2015. Hydrolysis of bamboo biomass by subcritical water
treatment. Bioresour. Technol. 191, 244–252. doi:10.1016/j.biortech.2015.05.010
Mothe, T., Sultanpuram, V., Mahmood, S.K., 2009. Production of Poly-3-hydroxybutyrate from
inexpensive substrates, Journal of Pure and Applied Microbiology.
Mothes, G., Schnorpfeil, C., Ackermann, J.-U., 2007. Production of PHB from Crude Glycerol. Eng. Life
Sci. 7, 475–479. doi:10.1002/elsc.200620210
Mozumder, M.S.I., De Wever, H., Volcke, E.I.P., Garcia-Gonzalez, L., 2014. A robust fed-batch feeding
strategy independent of the carbon source for optimal polyhydroxybutyrate production.
Process Biochem. 49, 365–373. doi:10.1016/j.procbio.2013.12.004
Muthaiyan, A., Martin, E.M., Natesan, S., Crandall, P.G., Wilkinson, B.J., Ricke, S.C., 2012.
Antimicrobial effect and mode of action of terpeneless cold-pressed Valencia orange essential
oil on methicillin-resistant Staphylococcus aureus. J. Appl. Microbiol. 112, 1020–33.
doi:10.1111/j.1365-2672.2012.05270.x
Nath, A., Dixit, M., Bandiya, A., Chavda, S., Desai, A.J., 2008. Enhanced PHB production and scale up
studies using cheese whey in fed batch culture of Methylobacterium sp. ZP24. Bioresour.
Technol. 99, 5749–5755. doi:10.1016/j.biortech.2007.10.017
Nielsen, S.S., 2010. Food Analysis Laboratory Manual, Food Science Texts Series. Springer US, Boston,
MA. doi:10.1007/978-1-4419-1463-7
Noda, I., Lindsey, S.B., Caraway, D., 2010. NodaxTM Class PHA Copolymers: Their Properties and
Applications. Springer, Berlin, Heidelberg, pp. 237–255. doi:10.1007/978-3-642-03287-5_10
Obruca, S., Benesova, P., Kucera, D., Petrik, S., Marova, I., 2015. Biotechnological conversion of spent
coffee grounds into polyhydroxyalkanoates and carotenoids. N. Biotechnol.
doi:10.1016/j.nbt.2015.02.008
Obruca, S., Marova, I., Snajdar, O., Mravcova, L., Svoboda, Z., 2010. Production of poly(3-
hydroxybutyrate-co-3-hydroxyvalerate) by Cupriavidus necator from waste rapeseed oil using
propanol as a precursor of 3-hydroxyvalerate. Biotechnol. Lett. 32, 1925–1932.

References
133
doi:10.1007/s10529-010-0376-8
Ozturk, B., Esteban, J., Gonzalez-Miquel, M., 2018. Deterpenation of Citrus Essential Oils Using
Glycerol-Based Deep Eutectic Solvents. J. Chem. Eng. Data acs.jced.7b00944.
doi:10.1021/acs.jced.7b00944
Park, S.J., Kim, T.W., Kim, M.K., Lee, S.Y., Lim, S.-C., 2012. Advanced bacterial polyhydroxyalkanoates:
towards a versatile and sustainable platform for unnatural tailor-made polyesters. Biotechnol.
Adv. 30, 1196–206. doi:10.1016/j.biotechadv.2011.11.007
Pol D’Haene, †, Edward E. Remsen, and, Asrar*, J., 1999. Preparation and Characterization of a
Branched Bacterial Polyester. doi:10.1021/MA981911K
Poomipuk, N., Reungsang, A., Plangklang, P., 2014. Poly-β-hydroxyalkanoates production from
cassava starch hydrolysate by Cupriavidus sp. KKU38. Int. J. Biol. Macromol. 65, 51–64.
doi:10.1016/j.ijbiomac.2014.01.002
Posada, J.A., Naranjo, J.M., López, J.A., Higuita, J.C., Cardona, C.A., 2011. Design and analysis of poly-
3-hydroxybutyrate production processes from crude glycerol. Process Biochem. 46, 310–317.
doi:10.1016/J.PROCBIO.2010.09.003
Pourbafrani, M., Forgács, G., Horváth, I.S., Niklasson, C., Taherzadeh, M.J., 2010. Production of
biofuels, limonene and pectin from citrus wastes. Bioresour. Technol. 101, 4246–50.
doi:10.1016/j.biortech.2010.01.077
Raza, Z.A., Abid, S., Banat, I.M., 2018. Polyhydroxyalkanoates: Characteristics, production, recent
developments and applications. Elsevier.
Reddy, C.S.., Ghai, R., Kalia, V.., 2003. Polyhydroxyalkanoates: an overview. Bioresour. Technol. 87,
137–146. doi:10.1016/S0960-8524(02)00212-2
Rehm, B.H.A., 2010. Bacterial polymers: biosynthesis, modifications and applications. Nat. Rev.
Microbiol. 8, 578–592. doi:10.1038/nrmicro2354
Riedel, S.L., Bader, J., Brigham, C.J., Budde, C.F., Yusof, Z.A.M., Rha, C., Sinskey, A.J., 2012. Production
of poly(3-hydroxybutyrate-co-3-hydroxyhexanoate) by Ralstonia eutropha in high cell density
palm oil fermentations. Biotechnol. Bioeng. 109, 74–83. doi:10.1002/bit.23283
Riedel, S.L., Jahns, S., Koenig, S., Bock, M.C.E., Brigham, C.J., Bader, J., Stahl, U., 2015.
Polyhydroxyalkanoates production with Ralstonia eutropha from low quality waste animal fats.

References
134
J. Biotechnol. 214, 119–127. doi:10.1016/j.jbiotec.2015.09.002
Rivas-Cantu, R.C., Jones, K.D., Mills, P.L., 2013. A citrus waste-based biorefinery as a source of
renewable energy: technical advances and analysis of engineering challenges. Waste Manag.
Res. 31, 413–420. doi:10.1177/0734242X13479432
Rivas, B., Torrado, A., Torre, P., Converti, A., Domínguez, J.M., 2008. Submerged citric acid
fermentation on orange peel autohydrolysate. J. Agric. Food Chem. 56, 2380–7.
doi:10.1021/jf073388r
Rodríguez-Contreras, A., Koller, M., Miranda-de Sousa Dias, M., Calafell-Monfort, M., Braunegg, G.,
Marqués-Calvo, M.S., 2015. Influence of glycerol on poly(3-hydroxybutyrate) production by
Cupriavidus necator and Burkholderia sacchari. Biochem. Eng. J. 94, 50–57.
doi:10.1016/j.bej.2014.11.007
Ross, G., Ross, S., Tighe, B.J., 2017. Bioplastics, in: Brydson’s Plastics Materials. Elsevier, pp. 631–652.
doi:10.1016/B978-0-323-35824-8.00023-2
Ruiz, B., Flotats, X., 2016. Effect of limonene on batch anaerobic digestion of citrus peel waste.
Biochem. Eng. J. 109, 9–18. doi:10.1016/j.bej.2015.12.011
Ruiz, B., Flotats, X., 2014. Citrus essential oils and their influence on the anaerobic digestion process:
an overview. Waste Manag. 34, 2063–79. doi:10.1016/j.wasman.2014.06.026
Salakkam, A., Webb, C., 2015. The inhibition effect of methanol, as a component of crude glycerol, on
the growth rate of Cupriavidus necator and other micro-organisms. Biochem. Eng. J. 98, 84–90.
doi:10.1016/j.bej.2015.02.024
Salehizadeh, H., Van Loosdrecht, M.C.M., 2004. Production of polyhydroxyalkanoates by mixed
culture: recent trends and biotechnological importance. Biotechnol. Adv. 22, 261–279.
doi:10.1016/J.BIOTECHADV.2003.09.003
Santi, G., Jasiulewicz, J., Crognale, S., D’Annibale, A., Petruccioli, M., Moresi, M., 2015. High Solid
Loading in Dilute Acid Hydrolysis of Orange Peel Waste Improves Ethanol Production. BioEnergy
Res. doi:10.1007/s12155-015-9591-4
Santos, C.M., Dweck, J., Viotto, R.S., Rosa, A.H., de Morais, L.C., 2015. Application of orange peel
waste in the production of solid biofuels and biosorbents. Bioresour. Technol. 196, 469–79.
doi:10.1016/j.biortech.2015.07.114

References
135
Shan, Y., 2016. Comprehensive Utilization of Citrus By-Products, Comprehensive Utilization of Citrus
By-Products. Elsevier. doi:10.1016/B978-0-12-809785-4.00001-0
Shang, L., Jiang, M., Yun, Z., Yan, H.-Q., Chang, H.-N., 2008. Mass production of medium-chain-length
poly(3-hydroxyalkanoates) from hydrolyzed corn oil by fed-batch culture of Pseudomonas
putida. World J. Microbiol. Biotechnol. 24, 2783–2787. doi:10.1007/s11274-008-9808-1
Sichwart, S., Hetzler, S., Bröker, D., Steinbüchel, A., 2011. Extension of the substrate utilization range
of Ralstonia eutropha strain H16 by metabolic engineering to include mannose and glucose.
Appl. Environ. Microbiol. 77, 1325–34. doi:10.1128/AEM.01977-10
Silva, L.F., Taciro, M.K., Michelin Ramos, M.E., Carter, J.M., Pradella, J.G.C., Gomez, J.G.C., 2004a.
Poly-3-hydroxybutyrate (P3HB) production by bacteria from xylose, glucose and sugarcane
bagasse hydrolysate. J. Ind. Microbiol. Biotechnol. 31, 245–254. doi:10.1007/s10295-004-0136-
7
Silva, L.F., Taciro, M.K., Michelin Ramos, M.E., Carter, J.M., Pradella, J.G.C., Gomez, J.G.C., 2004b.
Poly-3-hydroxybutyrate (P3HB) production by bacteria from xylose, glucose and sugarcane
bagasse hydrolysate. J. Ind. Microbiol. Biotechnol. 31, 245–254. doi:10.1007/s10295-004-0136-
7
Siracusa, V., Rocculi, P., Romani, S., Rosa, M.D., 2008. Biodegradable polymers for food packaging: a
review. Trends Food Sci. Technol. 19, 634–643. doi:10.1016/J.TIFS.2008.07.003
Slater, S., Mitsky, T.A., Houmiel, K.L., Hao, M., Reiser, S.E., Taylor, N.B., Tran, M., Valentin, H.E.,
Rodriguez, D.J., Stone, D.A., Padgette, S.R., Kishore, G., Gruys, K.J., 1999. Metabolic engineering
of Arabidopsis and Brassica for poly(3-hydroxybutyrate- co-3-hydroxyvalerate) copolymer
production. Nat. Biotechnol. 17, 1011–1016. doi:10.1038/13711
Slater, S.C., Voige, W.H., Dennis, D.E., 1988. Cloning and expression in Escherichia coli of the
Alcaligenes eutrophus H16 poly-beta-hydroxybutyrate biosynthetic pathway. J. Bacteriol. 170,
4431–6. doi:10.1128/JB.170.10.4431-4436.1988
Somleva, M.N., Peoples, O.P., Snell, K.D., 2013. PHA Bioplastics, Biochemicals, and Energy from
Crops. Plant Biotechnol. J. 11, 233–252. doi:10.1111/pbi.12039
Steinbüchel, A., Füchtenbusch, B., 1998. Bacterial and other biological systems for polyester
production. Trends Biotechnol. 16, 419–27.

References
136
Subramenium, G.A., Vijayakumar, K., Pandian, S.K., 2015. Limonene inhibits streptococcal biofilm
formation by targeting surface-associated virulence factors. J. Med. Microbiol. 64, 879–90.
doi:10.1099/jmm.0.000105
Sudesh, K., Abe, H., Doi, Y., 2000. Synthesis, structure and properties of polyhydroxyalkanoates:
biological polyesters. Prog. Polym. Sci. 25, 1503–1555. doi:10.1016/S0079-6700(00)00035-6
Suriyamongkol, P., Weselake, R., Narine, S., Moloney, M., Shah, S., 2007. Biotechnological
approaches for the production of polyhydroxyalkanoates in microorganisms and plants - a
review. Biotechnol. Adv. 25, 148–75. doi:10.1016/j.biotechadv.2006.11.007
Talebnia, F., Bafrani, M.P., Lundin, M., Taherzadeh, M., 2007. OPTIMIZATION STUDY OF CITRUS
WASTES SACCHARIFICATION BY DILUTE ACID HYDROLYSIS. BioResources.
doi:10.15376/biores.3.1.108-122
Tanadchangsaeng, N., Yu, J., 2012. Microbial synthesis of polyhydroxybutyrate from glycerol:
gluconeogenesis, molecular weight and material properties of biopolyester. Biotechnol. Bioeng.
109, 2808–18. doi:10.1002/bit.24546
Tao, N., Jia, L., Zhou, H., 2014. Anti-fungal activity of Citrus reticulata Blanco essential oil against
Penicillium italicum and Penicillium digitatum. Food Chem. 153, 265–71.
doi:10.1016/j.foodchem.2013.12.070
Tripathi, A.D., Yadav, A., Jha, A., Srivastava, S.K., 2011. Utilizing of Sugar Refinery Waste (Cane
Molasses) for Production of Bio-Plastic Under Submerged Fermentation Process. J. Polym.
Environ. 20, 446–453. doi:10.1007/s10924-011-0394-1
Troeger, C.N., Harvey, A.P., 2009. The Production of Polyhydroxyalkanoates Using an Oscillatory
Baffled Bioreactor. Chem. Prod. Process Model. 4. doi:10.2202/1934-2659.1381
Tsuge, T., Yamamoto, T., Yano, K., Abe, H., Doi, Y., Taguchi, S., 2009. Evaluating the Ability of
Polyhydroxyalkanoate Synthase Mutants to Produce P(3HB -co- 3HA) from Soybean Oil.
Macromol. Biosci. 9, 71–78. doi:10.1002/mabi.200800118
Uchino, K., Saito, T., Gebauer, B., Jendrossek, D., 2007. Isolated poly(3-hydroxybutyrate) (PHB)
granules are complex bacterial organelles catalyzing formation of PHB from acetyl coenzyme A
(CoA) and degradation of PHB to acetyl-CoA. J. Bacteriol. 189, 8250–6. doi:10.1128/JB.00752-07
USDA, FDA, 2017. Citrus: World Markets and Trade (2015) [WWW Document]. URL

References
137
http://www.sitrus.eu/sites/default/files/files/citrus world markets and trade.pdf (accessed
4.22.15).
Vadlja, D., Koller, M., Novak, M., Braunegg, G., Horvat, P., 2016. Footprint area analysis of binary
imaged Cupriavidus necator cells to study PHB production at balanced, transient, and limited
growth conditions in a cascade process. Appl. Microbiol. Biotechnol. 100, 10065–10080.
doi:10.1007/s00253-016-7844-6
Valentino, F., Karabegovic, L., Majone, M., Morgan-Sagastume, F., Werker, A., 2015.
Polyhydroxyalkanoate (PHA) storage within a mixed-culture biomass with simultaneous growth
as a function of accumulation substrate nitrogen and phosphorus levels. Water Res. 77, 49–63.
doi:10.1016/j.watres.2015.03.016
Van-Thuoc, D., Quillaguamán, J., Mamo, G., Mattiasson, B., 2007. Utilization of agricultural residues
for poly(3-hydroxybutyrate) production by Halomonas boliviensis LC1. J. Appl. Microbiol. 0,
071003000434003–??? doi:10.1111/j.1365-2672.2007.03553.x
Vandamme, P., Coenye, T., 2004. Taxonomy of the genus Cupriavidus: a tale of lost and found. Int. J.
Syst. Evol. Microbiol. 54, 2285–2289. doi:10.1099/ijs.0.63247-0
Verlinden, R.A., Hill, D.J., Kenward, M.A., Williams, C.D., Piotrowska-Seget, Z., Radecka, I.K., 2011.
Production of polyhydroxyalkanoates from waste frying oil by Cupriavidus necator. AMB
Express 1, 11. doi:10.1186/2191-0855-1-11
Verlinden, R.A.J.A.J., Hill, D.J.J., Kenward, M.A.A., Williams, C.D.D., Radecka, I., 2007. Bacterial
synthesis of biodegradable polyhydroxyalkanoates. J. Appl. Microbiol. 102, 1437–49.
doi:10.1111/j.1365-2672.2007.03335.x
Voevodina, I., Kržan, A., 2013. Bio-based polymers.
Wang, H., Johnson, L.A., Wang, T., 2004. Preparation of soy protein concentrate and isolate from
extruded-expelled soybean meals. J. Am. Oil Chem. Soc. 81, 713–717. doi:10.1007/s11746-004-
966-8
Wiles, D.M., Yu, L., Dean, K., Xu, Q., Scott, G., Dean, K., Yu, L., Chen, G..-Q., Halley, P.J., Guilbert, S.,
Feuilloley, P., Bewa, H., Bellon-maurel, V., Clarinval, A.-M., Halleux, J., Zhang, J.-F., Sun, X.,
Madras, G., Kenan, T.M., Tannbaum, S.W., Nakas, J.P., Bhattacharya, M., Reis, R.L., Correlo, V.,
Boesel, L., Varma, A.J., Plackett, D., Lips, P.A.M., Dijkstra, P.J., Jérôme, R., Lecomte, P., Wiles,
D.M., Matsumura, S., Scott, G., 2005. Biodegradable Polymers for Industrial Applications,

References
138
Biodegradable Polymers for Industrial Applications. Elsevier. doi:10.1533/9781845690762.3.357
Yang, Y.-H., Brigham, C.J., Budde, C.F., Boccazzi, P., Willis, L.B., Hassan, M.A., Yusof, Z.A.M., Rha, C.,
Sinskey, A.J., 2010. Optimization of growth media components for polyhydroxyalkanoate (PHA)
production from organic acids by Ralstonia eutropha. Appl. Microbiol. Biotechnol. 87, 2037–45.
doi:10.1007/s00253-010-2699-8
Yousuf, R.G., Winterburn, J.B., 2016. Date seed characterisation, substrate extraction and process
modelling for the production of polyhydroxybutyrate by Cupriavidus necator. Bioresour.
Technol. 222, 242–251. doi:10.1016/j.biortech.2016.09.107
Yu, J., Stahl, H., 2008. Microbial utilization and biopolyester synthesis of bagasse hydrolysates.
Bioresour. Technol. 99, 8042–8048. doi:10.1016/J.BIORTECH.2008.03.071
Yücelen, E., Lazić, I., Bosch, E.G.T., 2018. Phase contrast scanning transmission electron microscopy
imaging of light and heavy atoms at the limit of contrast and resolution. Sci. Rep. 8, 1–10.
doi:10.1038/s41598-018-20377-2
Zahi, M.R., Liang, H., Yuan, Q., 2015. Improving the antimicrobial activity of d-limonene using a novel
organogel-based nanoemulsion. Food Control 50, 554–559. doi:10.1016/j.foodcont.2014.10.001
Zakaria Gomaa, E., 2013. African Journal of Microbiology Research Bioconversion of orange peels for
ethanol production using Bacillus subtilis and Pseudomonas aeruginosa 7, 1266–1277.
doi:10.5897/AJMR12.2160
Acid Hydrolysis of Pectin for Cell Growth of <I>Cupriavidus necator</I> [WWW Document], n.d. URL
http://www.scialert.net/fulltext/?doi=biotech.2012.29.36&org=11 (accessed 4.15.15).
Agbor, V.B., Cicek, N., Sparling, R., Berlin, A., Levin, D.B., 2011. Biomass pretreatment: fundamentals
toward application. Biotechnol. Adv. 29, 675–85. doi:10.1016/j.biotechadv.2011.05.005
Ahmed, J., Varshney, S.K., 2011. POLYLACTIDES—CHEMISTRY, PROPERTIES AND GREEN PACKAGING
TECHNOLOGY: A REVIEW. Int. J. Food Prop. 14, 37–58. doi:10.1080/10942910903125284
Ahn, J., Jho, E.H., Nam, K., 2015. Effect of C/N ratio on polyhydroxyalkanoates (PHA) accumulation by
Cupriavidus necator and its implication on the use of rice straw hydrolysates. Environ. Eng. Res.
20, 246–253. doi:10.4491/eer.2015.055
Ahn, W.S., Park, S.J., Lee, S.Y., 2000. Production of Poly(3-hydroxybutyrate) by fed-batch culture of
recombinant Escherichia coli with a highly concentrated whey solution. Appl. Environ.

References
139
Microbiol. 66, 3624–7.
Albuquerque, M.G.E., Eiroa, M., Torres, C., Nunes, B.R., Reis, M.A.M., 2007. Strategies for the
development of a side stream process for polyhydroxyalkanoate (PHA) production from sugar
cane molasses. J. Biotechnol. 130, 411–421. doi:10.1016/j.jbiotec.2007.05.011
Aleman-Nava, G.S., Meneses-Jacome, A., C?rdenas-Ch?vez, D.L., D?az-Chavez, R., Scarlat, N.,
Dallemand, J.-F., Ornelas-Soto, N., Garc?a-Arrazola, R., Parra, R., 2015. Bioenergy in Mexico:
Status and perspective. Biofuels, Bioprod. Biorefining 9, 8–20. doi:10.1002/bbb.1523
Alva Munoz, L.E., Riley, M.R., 2008. Utilization of cellulosic waste from tequila bagasse and
production of polyhydroxyalkanoate (PHA) bioplastics bySaccharophagus degradans.
Biotechnol. Bioeng. 100, 882–888. doi:10.1002/bit.21854
Amache, R., Sukan, A., Safari, M., Roy, I., Keshavarz, T., 2013. Advances in PHAs production. Chem.
Eng. Trans. 32. doi:10.3303/CET1332156
Amass, W., Amass, A., Tighe, B., 1998. A review of biodegradable polymers: uses, current
developments in the synthesis and characterization of biodegradable polyesters, blends of
biodegradable polymers and recent advances in biodegradation studies. Polym. Int. 47, 89–144.
doi:10.1002/(SICI)1097-0126(1998100)47:2<89::AID-PI86>3.0.CO;2-F
Andrady, A.L., Neal, M.A., 2009. Applications and societal benefits of plastics. Philos. Trans. R. Soc.
Lond. B. Biol. Sci. 364, 1977–84. doi:10.1098/rstb.2008.0304
Angel Siles López, J., Li, Q., Thompson, I.P., 2010. Biorefinery of waste orange peel. Crit. Rev.
Biotechnol. 30, 63–9. doi:10.3109/07388550903425201
Annadural, G., Juang, R.S., Lee, D.J., 2003. Adsorption of heavy metals from water using banana and
orange peels. Water Sci. Technol. 47, 185–90.
Anterrieu, S., Quadri, L., Geurkink, B., Dinkla, I., Bengtsson, S., Arcos-Hernandez, M., Alexandersson,
T., Morgan-Sagastume, F., Karlsson, A., Hjort, M., Karabegovic, L., Magnusson, P., Johansson, P.,
Christensson, M., Werker, A., 2014. Integration of biopolymer production with process water
treatment at a sugar factory. N. Biotechnol. 31, 308–323. doi:10.1016/j.nbt.2013.11.008
AOAC, I., 1990. AOAC: Official Methods of Analysis (Volume 1) 1.
Aramvash, A., Akbari Shahabi, Z., Dashti Aghjeh, S., Ghafari, M.D., 2015. Statistical physical and
nutrient optimization of bioplastic polyhydroxybutyrate production by Cupriavidus necator. Int.

References
140
J. Environ. Sci. Technol. 12, 2307–2316. doi:10.1007/s13762-015-0768-3
Arun, A., Murrugappan, R., D. David Ravindran, A., Veeramani, V., Balaji, S., 2006. Utilization of
various industrial wastes for the production of poly-β-hydroxy butyrate (PHB) by Alcaligenes
eutrophus, African Journal of Biotechnology (ISSN: 1684-5315) Vol 5 Num 17.
doi:10.4314/ajb.v5i17.43150
Ashby, R.D., Solaiman, D.K.Y., Foglia, T.A., Liu, C.-K., 2001. Glucose/Lipid Mixed Substrates as a Means
of Controlling the Properties of Medium Chain Length Poly(hydroxyalkanoates) †.
Biomacromolecules 2, 211–216. doi:10.1021/bm000098+
Atlić, A., Koller, M., Scherzer, D., Kutschera, C., Grillo-Fernandes, E., Horvat, P., Chiellini, E., Braunegg,
G., 2011. Continuous production of poly([R]-3-hydroxybutyrate) by Cupriavidus necator in a
multistage bioreactor cascade. Appl. Microbiol. Biotechnol. 91, 295–304. doi:10.1007/s00253-
011-3260-0
Balkwill, D.L., 2015. Cupriavidus, in: Bergey’s Manual of Systematics of Archaea and Bacteria. John
Wiley & Sons, Ltd, Chichester, UK, pp. 1–7. doi:10.1002/9781118960608.gbm00936
Balu, A.M., Budarin, V., Shuttleworth, P.S., Pfaltzgraff, L.A., Waldron, K., Luque, R., Clark, J.H., 2012.
Valorisation of orange peel residues: waste to biochemicals and nanoporous materials.
ChemSusChem 5, 1694–7. doi:10.1002/cssc.201200381
Bampidis, V.A., Robinson, P.H., 2006. Citrus by-products as ruminant feeds: A review. Anim. Feed Sci.
Technol. 128, 175–217. doi:10.1016/j.anifeedsci.2005.12.002
Bloembergen, S., Holden, D.A., Hamer, G.K., Bluhm, T.L., Marchessault, R.H., 1986. Studies of
composition and crystallinity of bacterial poly(β-hydroxybutyrate-co-β-hydroxyvalerate).
Macromolecules 19, 2865–2871. doi:10.1021/ma00165a034
Bolck, C., En, J.R., Molenveld, K., Harmsen, P., n.d. Biobased Plastics 2012.
Boluda-Aguilar, M., García-Vidal, L., González-Castañeda, F.D.P., López-Gómez, A., 2010. Mandarin
peel wastes pretreatment with steam explosion for bioethanol production. Bioresour. Technol.
101, 3506–13. doi:10.1016/j.biortech.2009.12.063
Borah, B., Thakur, P.S., Nigam, J.N., 2002. The influence of nutritional and environmental conditions
on the accumulation of poly-beta-hydroxybutyrate in Bacillus mycoides RLJ B-017. J. Appl.
Microbiol. 92, 776–83.

References
141
Borchani, C., Besbes, S., Blecker, C., Masmoudi, M., Baati, R., Attia, H., 2002. African journal of
biotechnology., African Journal of Biotechnology. Academic Journals.
Botta, L., Mistretta, M.C., Palermo, S., Fragalà, M., Pappalardo, F., 2015. Characterization and
Processability of Blends of Polylactide Acid with a New Biodegradable Medium-Chain-Length
Polyhydroxyalkanoate. J. Polym. Environ. doi:10.1007/s10924-015-0729-4
Boukroufa, M., Boutekedjiret, C., Petigny, L., Rakotomanomana, N., Chemat, F., 2014. Bio-refinery of
orange peels waste: A new concept based on integrated green and solvent free extraction
processes using ultrasound and microwave techniques to obtain essential oil, polyphenols and
pectin. Ultrason. Sonochem. 24, 72–79. doi:10.1016/j.ultsonch.2014.11.015
Braunegg, G., Bona, R., Koller, M., 2004. Sustainable Polymer Production. Polym. Plast. Technol. Eng.
43, 1779–1793. doi:10.1081/PPT-200040130
Braunegg, G., Korneti, L., 1984. Pseudomonas 2 F: Kinetics of growth and accumulation of poly - D(-)-
3-hydroxybutyric acid (poly - HB). Biotechnol. Lett. 6, 825–829. doi:10.1007/BF00134727
Bugnicourt, E., Cinelli, P., Lazzeri, A., Alvarez, V., 2014. Polyhydroxyalkanoate (PHA): Review of
synthesis, characteristics, processing and potential applications in packaging. Express Polym.
Lett. 8. doi:10.3144/expresspolymlett.2014.82
Carrasco, F., Dionisi, D., Martinelli, A., Majone, M., 2006. Thermal stability of polyhydroxyalkanoates.
J. Appl. Polym. Sci. 100, 2111–2121. doi:10.1002/app.23586
Casas-Orozco, D., Villa, A.L., Bustamante, F., González, L.-M., 2015. Process development and
simulation of pectin extraction from orange peels. Food Bioprod. Process. 96, 86–98.
doi:10.1016/j.fbp.2015.06.006
Castilho, L.R., Mitchell, D.A., Freire, D.M.G.G., 2009. Production of polyhydroxyalkanoates (PHAs)
from waste materials and by-products by submerged and solid-state fermentation. Bioresour.
Technol. 100, 5996–6009. doi:10.1016/j.biortech.2009.03.088
Cavalheiro, J.M.B.T., de Almeida, M.C.M.D., Grandfils, C., da Fonseca, M.M.R., 2009. Poly(3-
hydroxybutyrate) production by Cupriavidus necator using waste glycerol. Process Biochem. 44,
509–515. doi:10.1016/J.PROCBIO.2009.01.008
Ceyhan Guvensen, N., Ozdemir, G., 2011. Poly-β-hydroxybutyrate (PHB) production from domestic
wastewater using Enterobacter aerogenes 12Bi strain, African Journal of Microbiology

References
142
Research.
Chaabouni, E., Gassara, F., Brar, S.K., 2014. Biopolymers Synthesis and Application, in:
Biotransformation of Waste Biomass into High Value Biochemicals. Springer New York, New
York, NY, pp. 415–443. doi:10.1007/978-1-4614-8005-1_17
Chakraborty, P., Muthukumarappan, K., Gibbons, W.R., 2012. PHA Productivity and Yield of Ralstonia
eutropha When Intermittently or Continuously Fed a Mixture of Short Chain Fatty Acids. J.
Biomed. Biotechnol. 2012, 1–8. doi:10.1155/2012/506153
Chanprateep, S., 2010a. Current trends in biodegradable polyhydroxyalkanoates. J. Biosci. Bioeng.
110, 621–32. doi:10.1016/j.jbiosc.2010.07.014
Chanprateep, S., 2010b. Current trends in biodegradable polyhydroxyalkanoates. J. Biosci. Bioeng.
110, 621–632. doi:10.1016/J.JBIOSC.2010.07.014
Chanprateep, S., Katakura, Y., Visetkoop, S., Shimizu, H., Kulpreecha, S., Shioya, S., 2008.
Characterization of new isolated Ralstonia eutropha strain A-04 and kinetic study of
biodegradable copolyester poly(3-hydroxybutyrate-co-4-hydroxybutyrate) production. J. Ind.
Microbiol. Biotechnol. 35, 1205–1215. doi:10.1007/s10295-008-0427-5
Chee, J.Y., S. Yoga, S., Lau, N.-S., C. Ling, S., Abed, R., Sudesh, K., 2010. Bacterially produced
polyhydroxyalkanoate (PHA): Converting renewable resources into bioplastic, in: Current
Research, Technology and Education Topics in Applied Microbiology and Microbial
Biotechnology. pp. 1395–1404.
Chen, G.-Q., 2009. A microbial polyhydroxyalkanoates (PHA) based bio- and materials industry.
Chem. Soc. Rev. 38, 2434. doi:10.1039/b812677c
Chen, G.-Q., Page, W.J., 1997. Production of poly-b-hydroxybutyrate by Azotobacter vinelandii in a
two-stage fermentation process. Biotechnol. Tech. 11, 347–350. doi:10.1023/A:1018435815864
Chen, Z., Huang, L., Wen, Q., Guo, Z., 2015. Efficient polyhydroxyalkanoate (PHA) accumulation by a
new continuous feeding mode in three-stage mixed microbial culture (MMC) PHA production
process. J. Biotechnol. 209, 68–75. doi:10.1016/j.jbiotec.2015.06.382
Choi, I.S., Kim, J.-H., Wi, S.G., Kim, K.H., Bae, H.-J., 2013. Bioethanol production from mandarin (Citrus
unshiu) peel waste using popping pretreatment. Appl. Energy 102, 204–210.
doi:10.1016/j.apenergy.2012.03.066

References
143
Ciriminna, R., Fidalgo, A., Delisi, R., 2016. Pectin production and global market. Food Ind. Hi ….
Cruz, M. V, Paiva, A., Lisboa, P., Freitas, F., Alves, V.D., Simões, P., Barreiros, S., Reis, M.A.M., 2014.
Production of polyhydroxyalkanoates from spent coffee grounds oil obtained by supercritical
fluid extraction technology. Bioresour. Technol. 157, 360–3. doi:10.1016/j.biortech.2014.02.013
de Jong, E., Jungmeier, G., 2015. Biorefinery Concepts in Comparison to Petrochemical Refineries.
Ind. Biorefineries White Biotechnol. 3–33. doi:10.1016/B978-0-444-63453-5.00001-X
Dietrich, K., Dumont, M.-J., Del Rio, L.F., Orsat, V., 2017. Producing PHAs in the bioeconomy —
Towards a sustainable bioplastic. Sustain. Prod. Consum. 9, 58–70.
doi:10.1016/j.spc.2016.09.001
Doi, Y., Segawa, A., Kunioka, M., 1990. Biosynthesis and characterization of poly(3-hydroxybutyrate-
co-4-hydroxybutyrate) in Alcaligenes eutrophus. Int. J. Biol. Macromol. 12, 106–111.
doi:10.1016/0141-8130(90)90061-E
Du, C., Sabirova, J., Soetaert, W., Ki Carol Lin, S., 2012. Polyhydroxyalkanoates Production From Low-
cost Sustainable Raw Materials. Curr. Chem. Biol. 6, 14–25. doi:10.2174/2212796811206010014
Duetz, W.A., Bouwmeester, H., van Beilen, J.B., Witholt, B., 2003. Biotransformation of limonene by
bacteria, fungi, yeasts, and plants. Appl. Microbiol. Biotechnol. 61, 269–77.
doi:10.1007/s00253-003-1221-y
Endres, H.J., 2011. Biopolymers as a sustainable alternative? Kunststoffe Int. 101, 15–20.
European Bioplastics, 2016. Market – European Bioplastics e.V. [WWW Document]. URL
http://www.european-bioplastics.org/market/ (accessed 7.11.17).
European Bioplastics, Nova-Institute, 2018. Bioplastics market data 2018. Global production
capacities of bioplastics 2018-2023. doi:10.1017/S0022226700007799
Fang, L., WenQing, L., Ridgway, D., TingYue, G., Shen ZhongYao (Department of Chemical Engineering
Athens, OH 45701 (USA)), O.U., 1998. Production of poly-beta-hydroxybutyrate on molasses by
recombinant Escherichia coli. Biotechnol. Lett. (United Kingdom).
Ferre-Guell, A., Winterburn, J., 2017. Production of the copolymer poly(3-hydroxybutyrate-co-3-
hydroxyvalerate) with varied composition using different nitrogen sources with Haloferax
mediterranei. Extremophiles.

References
144
Fiorese, M.L., Freitas, F., Pais, J., Ramos, A.M., de Aragão, G.M.F., Reis, M.A.M., 2009. Recovery of
polyhydroxybutyrate (PHB) from Cupriavidus necator biomass by solvent extraction with 1,2-
propylene carbonate. Eng. Life Sci. 9, 454–461. doi:10.1002/elsc.200900034
FitzPatrick, M., Champagne, P., Cunningham, M.F., Whitney, R.A., 2010. A biorefinery processing
perspective: Treatment of lignocellulosic materials for the production of value-added products.
Bioresour. Technol. 101, 8915–8922. doi:10.1016/j.biortech.2010.06.125
Gagnon, K.., Lenz, R.., Farris, R.., Fuller, R.., 1994. Chemical modification of bacterial elastomers: 2.
Sulfur vulcanization. Polymer (Guildf). 35, 4368–4375. doi:10.1016/0032-3861(94)90094-9
García, I.L., López, J.A., Dorado, M.P., Kopsahelis, N., Alexandri, M., Papanikolaou, S., Villar, M.A.,
Koutinas, A.A., 2013. Evaluation of by-products from the biodiesel industry as fermentation
feedstock for poly(3-hydroxybutyrate-co-3-hydroxyvalerate) production by Cupriavidus necator.
Bioresour. Technol. 130, 16–22. doi:10.1016/j.biortech.2012.11.088
Gironi, F., Piemonte, V., 2011. Bioplastics and Petroleum-based Plastics: Strengths and Weaknesses.
Energy Sources, Part A Recover. Util. Environ. Eff. 33, 1949–1959.
doi:10.1080/15567030903436830
Gomaa, E.Z., n.d. Production of polyhydroxyalkanoates (PHAs) by Bacillus subtilis and Escherichia coli
grown on cane molasses fortified with ethanol. Brazilian Arch. Biol. Technol. 57, 145–154.
doi:10.1590/S1516-89132014000100020
Grousseau, E., Blanchet, E., Déléris, S., Albuquerque, M.G.E., Paul, E., Uribelarrea, J.-L., 2013. Impact
of sustaining a controlled residual growth on polyhydroxybutyrate yield and production kinetics
in Cupriavidus necator. Bioresour. Technol. 148, 30–8. doi:10.1016/j.biortech.2013.08.120
Gumel, A.M., Annuar, M.S.M., Chisti, Y., 2013. Recent Advances in the Production, Recovery and
Applications of Polyhydroxyalkanoates. J. Polym. Environ. doi:10.1007/s10924-012-0527-1
Guzman Lagunes, F., Winterburn, J.B.B., 2016. Effect of limonene on the heterotrophic growth and
polyhydroxybutyrate production by Cupriavidus necator H16. Bioresour. Technol. 221, 336–343.
doi:10.1016/j.biortech.2016.09.045
HAAS, R., JIN, B., ZEPF, F.T., 2008. Production of Poly(3-hydroxybutyrate) from Waste Potato Starch.
Biosci. Biotechnol. Biochem. 72, 253–256. doi:10.1271/bbb.70503
Habib, A., Islam, N., Islam, A., Alam, A.M.S., 2007. Removal of Copper from Aqueous Solution Using

References
145
Orange Peel, Sawdust and Bagasse. J. Anal. Environ. Chem 8, 21–25.
Helm, J., Wendlandt, K.-D., Jechorek, M., Stottmeister, U., 2008. Potassium deficiency results in
accumulation of ultra-high molecular weight poly-β-hydroxybutyrate in a methane-utilizing
mixed culture. J. Appl. Microbiol. 105, 1054–1061. doi:10.1111/j.1365-2672.2008.03831.x
Holmes, P.A., 1985. Applications of PHB - a microbially produced biodegradable thermoplastic. Phys.
Technol. 16, 32–36. doi:10.1088/0305-4624/16/1/305
Hottle, T.A., Bilec, M.M., Landis, A.E., 2013. Sustainability assessments of bio-based polymers. Polym.
Degrad. Stab. doi:10.1016/j.polymdegradstab.2013.06.016
Impact of phosphate limitation on PHA production in a feast-famine process, 2017. . Water Res. 126,
472–480. doi:10.1016/J.WATRES.2017.09.031
Ishizaki, A., Tanaka, K., Taga, N., 2001. Microbial production of poly-D-3-hydroxybutyrate from CO2.
Appl. Microbiol. Biotechnol. 57, 6–12.
Iwata, T., 2005. Strong Fibers and Films of Microbial Polyesters. Macromol. Biosci. 5, 689–701.
doi:10.1002/mabi.200500066
Jacquel, N., Lo, C.-W., Wei, Y.-H., Wu, H.-S., Wang, S.S., 2008. Isolation and purification of bacterial
poly(3-hydroxyalkanoates). Biochem. Eng. J. 39, 15–27. doi:10.1016/j.bej.2007.11.029
Jain, R., Tiwari, A., 2015. Biosynthesis of planet friendly bioplastics using renewable carbon source. J.
Environ. Heal. Sci. Eng. 13, 11. doi:10.1186/s40201-015-0165-3
Jambeck, J.R., Geyer, R., Wilcox, C., Siegler, T.R., Perryman, M., Andrady, A., Narayan, R., Law, K.L.,
2015. Plastic waste inputs from land into the ocean. Science (80-. ). 347.
doi:10.1126/science.1260352
JESÚS LERMA CARBAJAL Director General ING ALONSO IBARRA TAMEZ Director Agrícola MVZ
VICENTE GALVÁN GONZÁLEZ Director Pecuario DR JESÚS MARTÍNEZ DE LA CERDA Director de
Desarrollo Rural DR GUILLERMO ARTURO RODRÍGUEZ Y RODRÍGUEZ, I.R., JUAN PATRICIO
GALICIA CAVAZOS Coordinador Administrativo, I., Jesús Lerma Carbajal, I., n.d. CORPORACIÓN
PARA EL DESARROLLO AGROPECUARIO DE NUEVO LEÓN DIRECTORIO.
Jiang, Y., Song, X., Gong, L., Li, P., Dai, C., Shao, W., 2008. High poly(β-hydroxybutyrate) production by
Pseudomonas fluorescens A2a5 from inexpensive substrates. Enzyme Microb. Technol. 42, 167–
172. doi:10.1016/J.ENZMICTEC.2007.09.003

References
146
Joshi, S.M., Waghmare, J.S., Sonawane, K.D., Waghmare, S.R., 2015. Bio-ethanol and bio-butanol
production from orange peel waste. Biofuels 6, 55–61. doi:10.1080/17597269.2015.1045276
Kahar, P., Tsuge, T., Taguchi, K., Doi, Y., 2004. High yield production of polyhydroxyalkanoates from
soybean oil by Ralstonia eutropha and its recombinant strain. Polym. Degrad. Stab. 83, 79–86.
doi:10.1016/S0141-3910(03)00227-1
Kawaguchi, H., Hasunuma, T., Ogino, C., Kondo, A., 2016. Bioprocessing of bio-based chemicals
produced from lignocellulosic feedstocks. Curr. Opin. Biotechnol. 42, 30–39.
doi:10.1016/j.copbio.2016.02.031
Keshavarz, T., Roy, I., 2010. Polyhydroxyalkanoates: bioplastics with a green agenda. Curr. Opin.
Microbiol. 13, 321–6. doi:10.1016/j.mib.2010.02.006
Khanna, S., Srivastava, A.K., 2010. Continuous Cultivation of Wautersia eutropha for the Production
of A Biodegradable Polymer Poly-(B-Hydroxybutyrate), AsPac J. Mol. Biol. Biotechnol.
Khanna, S., Srivastava, A.K., 2009. On-line characterization of physiological state in poly(beta-
hydroxybutyrate) production by Wautersia eutropha. Appl. Biochem. Biotechnol. 157, 237–43.
doi:10.1007/s12010-008-8395-9
Khanna, S., Srivastava, A.K., 2005a. Statistical media optimization studies for growth and PHB
production by Ralstonia eutropha. Process Biochem. 40, 2173–2182.
doi:10.1016/j.procbio.2004.08.011
Khanna, S., Srivastava, A.K., 2005b. Recent advances in microbial polyhydroxyalkanoates. Process
Biochem. 40, 607–619. doi:10.1016/J.PROCBIO.2004.01.053
Kim, B.S., Lee, S.C., Lee, S.Y., Chang, H.N., Chang, Y.K., Woo, S.I., 1994. Production of poly(3-
hydroxybutyric acid) by fed-batch culture ofAlcaligenes eutrophus with glucose concentration
control. Biotechnol. Bioeng. 43, 892–898. doi:10.1002/bit.260430908
Koller, M., 2015. Recycling of Waste Streams of the Biotechnological Poly(hydroxyalkanoate)
Production by Haloferax mediterranei on Whey. Int. J. Polym. Sci. 2015, 1–8.
doi:10.1155/2015/370164
Koller, M., Atlić, A., Dias, M., Reiterer, A., Braunegg, G., 2010a. Microbial PHA Production from Waste
Raw Materials. pp. 85–119. doi:10.1007/978-3-642-03287-5_5
Koller, M., Salerno, A., Dias, M., Reiterer, A., Braunegg, G., 2010b. Modern biotechnological polymer

References
147
synthesis: A review. Food Technol. Biotechnol. 48, 255–269.
Kricheldorf, H.R., 2001. Syntheses and application of polylactides. Chemosphere 43, 49–54.
doi:10.1016/S0045-6535(00)00323-4
Kricheldorf, H.R., Berl, M., Scharnagl, N., 1988. Poly(lactones). 9. Polymerization mechanism of metal
alkoxide initiated polymerizations of lactide and various lactones. Macromolecules 21, 286–293.
doi:10.1021/ma00180a002
Kulkarni, S.O., Kanekar, P.P., Nilegaonkar, S.S., Sarnaik, S.S., Jog, J.P., 2010. Production and
characterization of a biodegradable poly (hydroxybutyrate-co-hydroxyvalerate) (PHB-co-PHV)
copolymer by moderately haloalkalitolerant Halomonas campisalis MCM B-1027 isolated from
Lonar Lake, India. Bioresour. Technol. 101, 9765–71. doi:10.1016/j.biortech.2010.07.089
Kulpreecha, S., Boonruangthavorn, A., Meksiriporn, B., Thongchul, N., 2009. Inexpensive fed-batch
cultivation for high poly(3-hydroxybutyrate) production by a new isolate of Bacillus
megaterium. J. Biosci. Bioeng. 107, 240–245. doi:10.1016/j.jbiosc.2008.10.006
Kumar, P., Ray, S., Kalia, V.C., 2015. Production of co-polymers of polyhydroxyalkanoates by
regulating the hydrolysis of biowastes. Bioresour. Technol. 200, 413–419.
doi:10.1016/j.biortech.2015.10.045
Lackner, M., Lackner, Maximilian, 2015. Bioplastics, in: Kirk-Othmer Encyclopedia of Chemical
Technology. John Wiley & Sons, Inc., Hoboken, NJ, USA, pp. 1–41.
doi:10.1002/0471238961.koe00006
Lai, S.-Y., Kuo, P.-C., Wu, W., Jang, M.-F., Chou, Y.-S., 2013. Biopolymer production in a fed-batch
reactor using optimal feeding strategies. J. Chem. Technol. Biotechnol. 88, n/a-n/a.
doi:10.1002/jctb.4067
Lee, S.Y., Choi, J., 1998. Effect of fermentation performance on the economics of poly(3-
hydroxybutyrate) production byAlcaligenes latus. Polym. Degrad. Stab. 59, 387–393.
doi:10.1016/S0141-3910(97)00176-6
Leong, Y.K., Show, P.L., Ooi, C.W., Ling, T.C., Lan, J.C.W., 2014. Current trends in
polyhydroxyalkanoates (PHAs) biosynthesis: Insights from the recombinant Escherichia coli. J.
Biotechnol. 180, 52–65.
Liguori, R., Faraco, V., 2016. Biological processes for advancing lignocellulosic waste biorefinery by

References
148
advocating circular economy. Bioresour. Technol. doi:10.1016/j.biortech.2016.04.054
Liu, F., Li, W., Ridgway, D., Gu, T., Shen, Z., 1998. Production of poly-b-hydroxybutyrateon molasses
by recombinantEscherichia coli.
Locatelli, G., da Silva, G.D., Finkler, L., Finkler, C.L.L., 2012. Acid Hydrolysis of Pectin for Cell Growth of
Cupriavidus necator. Biotechnology(Faisalabad) 11, 29–36. doi:10.3923/biotech.2012.29.36
Lohrasbi, M., Pourbafrani, M., Niklasson, C., Taherzadeh, M.J., 2010. Process design and economic
analysis of a citrus waste biorefinery with biofuels and limonene as products. Bioresour.
Technol. 101, 7382–8. doi:10.1016/j.biortech.2010.04.078
López-Cuellar, M.R., Alba-Flores, J., Rodríguez, J.N.G., Pérez-Guevara, F., 2011. Production of
polyhydroxyalkanoates (PHAs) with canola oil as carbon source. Int. J. Biol. Macromol. 48, 74–
80. doi:10.1016/j.ijbiomac.2010.09.016
Lopez M., 2017, 2017. Sagarpa y Conacyt lanzan convocatoria para la investigación agrícola, pecuaria,
acuacultura, agrobiotecnología y recursos fitogenéticos [WWW Document]. CONACyTprensa.
URL http://www.conacytprensa.mx/index.php/sociedad/convocatorias/14809-sagarpa-conacyt-
convocatoria-investigacion-agricola-pecuaria-acuacultura-agrobiotecnologia-recursos-
fitogeneticos (accessed 7.11.17).
Lopresto, C.G., Petrillo, F., Casazza, A.A., Aliakbarian, B., Perego, P., Calabrò, V., 2014. A non-
conventional method to extract D-limonene from waste lemon peels and comparison with
traditional Soxhlet extraction. Sep. Purif. Technol. 137, 13–20.
doi:10.1016/j.seppur.2014.09.015
Loureiro, N.C., Ghosh, S., Viana, J.C., Esteves, J.L., 2014. Thermal Characterization of
Polyhydroxyalkanoates and Poly(lactic acid) Blends Obtained by Injection Molding. Polym. Plast.
Technol. Eng. 54, 350–356. doi:10.1080/03602559.2014.935422
Luong, J.H.T., Mulchandani, A., Leduy, A., 1988. Kinetics of biopolymer synthesis: A revisit. Enzyme
Microb. Technol. 10, 326–332. doi:10.1016/0141-0229(88)90010-5
Maier, C., Calafut, T., Maier, C., Calafut, T., 1998. Morphology and Commercial Forms. Polypropylene
11–25. doi:10.1016/B978-188420758-7.50007-2
Makkar, N.S., Casida, L.E., 1987. Cupriavidus necator gen. nov., sp. nov.; a Nonobligate Bacterial
Predator of Bacteria in Soil. Int. J. Syst. Bacteriol. 37, 323–326. doi:10.1099/00207713-37-4-323

References
149
Mantzouridou, F.T., Paraskevopoulou, A., Lalou, S., 2015. Yeast flavour production by solid state
fermentation of orange peel waste. Biochem. Eng. J. 101, 1–8. doi:10.1016/j.bej.2015.04.013
Marei, G.I.K., Abdel Rasoul, M.A., Abdelgaleil, S.A.M., 2012. Comparative antifungal activities and
biochemical effects of monoterpenes on plant pathogenic fungi. Pestic. Biochem. Physiol. 103,
56–61. doi:10.1016/j.pestbp.2012.03.004
Marín, F.R., Soler-Rivas, C., Benavente-García, O., Castillo, J., Pérez-Alvarez, J.A., 2007. By-products
from different citrus processes as a source of customized functional fibres. Food Chem. 100,
736–741. doi:10.1016/j.foodchem.2005.04.040
Marques, J.P.R., Amorim, L., Silva-Junior, G.J., Spósito, M.B., Appezzato-da Gloria, B., 2014. Structural
and biochemical characteristics of citrus flowers associated with defence against a fungal
pathogen. AoB Plants 7, plu090-. doi:10.1093/aobpla/plu090
Marsudi, S., Tan, I., Gan, S., 2009. Prodution of medium chain lenght Polyhydroyalkanoates from oleic
acid using Pseudomonas putida pga1 by fed batch culture. Makara Teknol. 11, 1–4.
Metoui, N., Gargouri, S., Amri, I., Fezzani, T., Jamoussi, B., Hamrouni, L., 2015. Activity antifungal of
the essential oils; aqueous and ethanol extracts from Citrus aurantium L. Nat. Prod. Res. 29,
2238–41. doi:10.1080/14786419.2015.1007136
Mezule, L., Dalecka, B., Juhna, T., 2015. Fermentable Sugar Production from Lignocellulosic Waste 43.
doi:10.3303/CET1543104
Mohammad Pourbafrani, F.T.C.N.M.J.T., 2007. Protective Effect of Encapsulation in Fermentation of
Limonene-contained Media and Orange Peel Hydrolyzate. Int. J. Mol. Sci.
Mohan, M., Banerjee, T., Goud, V. V, 2015. Hydrolysis of bamboo biomass by subcritical water
treatment. Bioresour. Technol. 191, 244–252. doi:10.1016/j.biortech.2015.05.010
Mothe, T., Sultanpuram, V., Mahmood, S.K., 2009. Production of Poly-3-hydroxybutyrate from
inexpensive substrates, Journal of Pure and Applied Microbiology.
Mothes, G., Schnorpfeil, C., Ackermann, J.-U., 2007. Production of PHB from Crude Glycerol. Eng. Life
Sci. 7, 475–479. doi:10.1002/elsc.200620210
Mozumder, M.S.I., De Wever, H., Volcke, E.I.P., Garcia-Gonzalez, L., 2014. A robust fed-batch feeding
strategy independent of the carbon source for optimal polyhydroxybutyrate production.
Process Biochem. 49, 365–373. doi:10.1016/j.procbio.2013.12.004

References
150
Muthaiyan, A., Martin, E.M., Natesan, S., Crandall, P.G., Wilkinson, B.J., Ricke, S.C., 2012.
Antimicrobial effect and mode of action of terpeneless cold-pressed Valencia orange essential
oil on methicillin-resistant Staphylococcus aureus. J. Appl. Microbiol. 112, 1020–33.
doi:10.1111/j.1365-2672.2012.05270.x
Nath, A., Dixit, M., Bandiya, A., Chavda, S., Desai, A.J., 2008. Enhanced PHB production and scale up
studies using cheese whey in fed batch culture of Methylobacterium sp. ZP24. Bioresour.
Technol. 99, 5749–5755. doi:10.1016/j.biortech.2007.10.017
Nielsen, S.S., 2010. Food Analysis Laboratory Manual, Food Science Texts Series. Springer US, Boston,
MA. doi:10.1007/978-1-4419-1463-7
Noda, I., Lindsey, S.B., Caraway, D., 2010. NodaxTM Class PHA Copolymers: Their Properties and
Applications. Springer, Berlin, Heidelberg, pp. 237–255. doi:10.1007/978-3-642-03287-5_10
Obruca, S., Benesova, P., Kucera, D., Petrik, S., Marova, I., 2015. Biotechnological conversion of spent
coffee grounds into polyhydroxyalkanoates and carotenoids. N. Biotechnol.
doi:10.1016/j.nbt.2015.02.008
Obruca, S., Marova, I., Snajdar, O., Mravcova, L., Svoboda, Z., 2010. Production of poly(3-
hydroxybutyrate-co-3-hydroxyvalerate) by Cupriavidus necator from waste rapeseed oil using
propanol as a precursor of 3-hydroxyvalerate. Biotechnol. Lett. 32, 1925–1932.
doi:10.1007/s10529-010-0376-8
Ozturk, B., Esteban, J., Gonzalez-Miquel, M., 2018. Deterpenation of Citrus Essential Oils Using
Glycerol-Based Deep Eutectic Solvents. J. Chem. Eng. Data acs.jced.7b00944.
doi:10.1021/acs.jced.7b00944
Park, S.J., Kim, T.W., Kim, M.K., Lee, S.Y., Lim, S.-C., 2012. Advanced bacterial polyhydroxyalkanoates:
towards a versatile and sustainable platform for unnatural tailor-made polyesters. Biotechnol.
Adv. 30, 1196–206. doi:10.1016/j.biotechadv.2011.11.007
Pol D’Haene, †, Edward E. Remsen, and, Asrar*, J., 1999. Preparation and Characterization of a
Branched Bacterial Polyester. doi:10.1021/MA981911K
Poomipuk, N., Reungsang, A., Plangklang, P., 2014. Poly-β-hydroxyalkanoates production from
cassava starch hydrolysate by Cupriavidus sp. KKU38. Int. J. Biol. Macromol. 65, 51–64.
doi:10.1016/j.ijbiomac.2014.01.002

References
151
Posada, J.A., Naranjo, J.M., López, J.A., Higuita, J.C., Cardona, C.A., 2011. Design and analysis of poly-
3-hydroxybutyrate production processes from crude glycerol. Process Biochem. 46, 310–317.
doi:10.1016/J.PROCBIO.2010.09.003
Pourbafrani, M., Forgács, G., Horváth, I.S., Niklasson, C., Taherzadeh, M.J., 2010. Production of
biofuels, limonene and pectin from citrus wastes. Bioresour. Technol. 101, 4246–50.
doi:10.1016/j.biortech.2010.01.077
Raza, Z.A., Abid, S., Banat, I.M., 2018. Polyhydroxyalkanoates: Characteristics, production, recent
developments and applications. Elsevier.
Reddy, C.S.., Ghai, R., Kalia, V.., 2003. Polyhydroxyalkanoates: an overview. Bioresour. Technol. 87,
137–146. doi:10.1016/S0960-8524(02)00212-2
Rehm, B.H.A., 2010. Bacterial polymers: biosynthesis, modifications and applications. Nat. Rev.
Microbiol. 8, 578–592. doi:10.1038/nrmicro2354
Riedel, S.L., Bader, J., Brigham, C.J., Budde, C.F., Yusof, Z.A.M., Rha, C., Sinskey, A.J., 2012. Production
of poly(3-hydroxybutyrate-co-3-hydroxyhexanoate) by Ralstonia eutropha in high cell density
palm oil fermentations. Biotechnol. Bioeng. 109, 74–83. doi:10.1002/bit.23283
Riedel, S.L., Jahns, S., Koenig, S., Bock, M.C.E., Brigham, C.J., Bader, J., Stahl, U., 2015.
Polyhydroxyalkanoates production with Ralstonia eutropha from low quality waste animal fats.
J. Biotechnol. 214, 119–127. doi:10.1016/j.jbiotec.2015.09.002
Rivas-Cantu, R.C., Jones, K.D., Mills, P.L., 2013. A citrus waste-based biorefinery as a source of
renewable energy: technical advances and analysis of engineering challenges. Waste Manag.
Res. 31, 413–420. doi:10.1177/0734242X13479432
Rivas, B., Torrado, A., Torre, P., Converti, A., Domínguez, J.M., 2008. Submerged citric acid
fermentation on orange peel autohydrolysate. J. Agric. Food Chem. 56, 2380–7.
doi:10.1021/jf073388r
Rodríguez-Contreras, A., Koller, M., Miranda-de Sousa Dias, M., Calafell-Monfort, M., Braunegg, G.,
Marqués-Calvo, M.S., 2015. Influence of glycerol on poly(3-hydroxybutyrate) production by
Cupriavidus necator and Burkholderia sacchari. Biochem. Eng. J. 94, 50–57.
doi:10.1016/j.bej.2014.11.007
Ross, G., Ross, S., Tighe, B.J., 2017. Bioplastics, in: Brydson’s Plastics Materials. Elsevier, pp. 631–652.
References
152
doi:10.1016/B978-0-323-35824-8.00023-2
Ruiz, B., Flotats, X., 2016. Effect of limonene on batch anaerobic digestion of citrus peel waste.
Biochem. Eng. J. 109, 9–18. doi:10.1016/j.bej.2015.12.011
Ruiz, B., Flotats, X., 2014. Citrus essential oils and their influence on the anaerobic digestion process:
an overview. Waste Manag. 34, 2063–79. doi:10.1016/j.wasman.2014.06.026
Salakkam, A., Webb, C., 2015. The inhibition effect of methanol, as a component of crude glycerol, on
the growth rate of Cupriavidus necator and other micro-organisms. Biochem. Eng. J. 98, 84–90.
doi:10.1016/j.bej.2015.02.024
Salehizadeh, H., Van Loosdrecht, M.C.M., 2004. Production of polyhydroxyalkanoates by mixed
culture: recent trends and biotechnological importance. Biotechnol. Adv. 22, 261–279.
doi:10.1016/J.BIOTECHADV.2003.09.003
Santi, G., Jasiulewicz, J., Crognale, S., D’Annibale, A., Petruccioli, M., Moresi, M., 2015. High Solid
Loading in Dilute Acid Hydrolysis of Orange Peel Waste Improves Ethanol Production. BioEnergy
Res. doi:10.1007/s12155-015-9591-4
Santos, C.M., Dweck, J., Viotto, R.S., Rosa, A.H., de Morais, L.C., 2015. Application of orange peel
waste in the production of solid biofuels and biosorbents. Bioresour. Technol. 196, 469–79.
doi:10.1016/j.biortech.2015.07.114
Shan, Y., 2016. Comprehensive Utilization of Citrus By-Products, Comprehensive Utilization of Citrus
By-Products. Elsevier. doi:10.1016/B978-0-12-809785-4.00001-0
Shang, L., Jiang, M., Yun, Z., Yan, H.-Q., Chang, H.-N., 2008. Mass production of medium-chain-length
poly(3-hydroxyalkanoates) from hydrolyzed corn oil by fed-batch culture of Pseudomonas
putida. World J. Microbiol. Biotechnol. 24, 2783–2787. doi:10.1007/s11274-008-9808-1
Sichwart, S., Hetzler, S., Bröker, D., Steinbüchel, A., 2011. Extension of the substrate utilization range
of Ralstonia eutropha strain H16 by metabolic engineering to include mannose and glucose.
Appl. Environ. Microbiol. 77, 1325–34. doi:10.1128/AEM.01977-10
Silva, L.F., Taciro, M.K., Michelin Ramos, M.E., Carter, J.M., Pradella, J.G.C., Gomez, J.G.C., 2004a.
Poly-3-hydroxybutyrate (P3HB) production by bacteria from xylose, glucose and sugarcane
bagasse hydrolysate. J. Ind. Microbiol. Biotechnol. 31, 245–254. doi:10.1007/s10295-004-0136-
7

References
153
Silva, L.F., Taciro, M.K., Michelin Ramos, M.E., Carter, J.M., Pradella, J.G.C., Gomez, J.G.C., 2004b.
Poly-3-hydroxybutyrate (P3HB) production by bacteria from xylose, glucose and sugarcane
bagasse hydrolysate. J. Ind. Microbiol. Biotechnol. 31, 245–254. doi:10.1007/s10295-004-0136-
7
Siracusa, V., Rocculi, P., Romani, S., Rosa, M.D., 2008. Biodegradable polymers for food packaging: a
review. Trends Food Sci. Technol. 19, 634–643. doi:10.1016/J.TIFS.2008.07.003
Slater, S., Mitsky, T.A., Houmiel, K.L., Hao, M., Reiser, S.E., Taylor, N.B., Tran, M., Valentin, H.E.,
Rodriguez, D.J., Stone, D.A., Padgette, S.R., Kishore, G., Gruys, K.J., 1999. Metabolic engineering
of Arabidopsis and Brassica for poly(3-hydroxybutyrate- co-3-hydroxyvalerate) copolymer
production. Nat. Biotechnol. 17, 1011–1016. doi:10.1038/13711
Slater, S.C., Voige, W.H., Dennis, D.E., 1988. Cloning and expression in Escherichia coli of the
Alcaligenes eutrophus H16 poly-beta-hydroxybutyrate biosynthetic pathway. J. Bacteriol. 170,
4431–6. doi:10.1128/JB.170.10.4431-4436.1988
Somleva, M.N., Peoples, O.P., Snell, K.D., 2013. PHA Bioplastics, Biochemicals, and Energy from
Crops. Plant Biotechnol. J. 11, 233–252. doi:10.1111/pbi.12039
Steinbüchel, A., Füchtenbusch, B., 1998. Bacterial and other biological systems for polyester
production. Trends Biotechnol. 16, 419–27.
Subramenium, G.A., Vijayakumar, K., Pandian, S.K., 2015. Limonene inhibits streptococcal biofilm
formation by targeting surface-associated virulence factors. J. Med. Microbiol. 64, 879–90.
doi:10.1099/jmm.0.000105
Sudesh, K., Abe, H., Doi, Y., 2000. Synthesis, structure and properties of polyhydroxyalkanoates:
biological polyesters. Prog. Polym. Sci. 25, 1503–1555. doi:10.1016/S0079-6700(00)00035-6
Suriyamongkol, P., Weselake, R., Narine, S., Moloney, M., Shah, S., 2007. Biotechnological
approaches for the production of polyhydroxyalkanoates in microorganisms and plants - a
review. Biotechnol. Adv. 25, 148–75. doi:10.1016/j.biotechadv.2006.11.007
Talebnia, F., Bafrani, M.P., Lundin, M., Taherzadeh, M., 2007. OPTIMIZATION STUDY OF CITRUS
WASTES SACCHARIFICATION BY DILUTE ACID HYDROLYSIS. BioResources.
doi:10.15376/biores.3.1.108-122
Tanadchangsaeng, N., Yu, J., 2012. Microbial synthesis of polyhydroxybutyrate from glycerol:

References
154
gluconeogenesis, molecular weight and material properties of biopolyester. Biotechnol. Bioeng.
109, 2808–18. doi:10.1002/bit.24546
Tao, N., Jia, L., Zhou, H., 2014. Anti-fungal activity of Citrus reticulata Blanco essential oil against
Penicillium italicum and Penicillium digitatum. Food Chem. 153, 265–71.
doi:10.1016/j.foodchem.2013.12.070
Tripathi, A.D., Yadav, A., Jha, A., Srivastava, S.K., 2011. Utilizing of Sugar Refinery Waste (Cane
Molasses) for Production of Bio-Plastic Under Submerged Fermentation Process. J. Polym.
Environ. 20, 446–453. doi:10.1007/s10924-011-0394-1
Troeger, C.N., Harvey, A.P., 2009. The Production of Polyhydroxyalkanoates Using an Oscillatory
Baffled Bioreactor. Chem. Prod. Process Model. 4. doi:10.2202/1934-2659.1381
Tsuge, T., Yamamoto, T., Yano, K., Abe, H., Doi, Y., Taguchi, S., 2009. Evaluating the Ability of
Polyhydroxyalkanoate Synthase Mutants to Produce P(3HB -co- 3HA) from Soybean Oil.
Macromol. Biosci. 9, 71–78. doi:10.1002/mabi.200800118
Uchino, K., Saito, T., Gebauer, B., Jendrossek, D., 2007. Isolated poly(3-hydroxybutyrate) (PHB)
granules are complex bacterial organelles catalyzing formation of PHB from acetyl coenzyme A
(CoA) and degradation of PHB to acetyl-CoA. J. Bacteriol. 189, 8250–6. doi:10.1128/JB.00752-07
USDA, FDA, 2017. Citrus: World Markets and Trade (2015) [WWW Document]. URL
http://www.sitrus.eu/sites/default/files/files/citrus world markets and trade.pdf (accessed
4.22.15).
Vadlja, D., Koller, M., Novak, M., Braunegg, G., Horvat, P., 2016. Footprint area analysis of binary
imaged Cupriavidus necator cells to study PHB production at balanced, transient, and limited
growth conditions in a cascade process. Appl. Microbiol. Biotechnol. 100, 10065–10080.
doi:10.1007/s00253-016-7844-6
Valentino, F., Karabegovic, L., Majone, M., Morgan-Sagastume, F., Werker, A., 2015.
Polyhydroxyalkanoate (PHA) storage within a mixed-culture biomass with simultaneous growth
as a function of accumulation substrate nitrogen and phosphorus levels. Water Res. 77, 49–63.
doi:10.1016/j.watres.2015.03.016
Van-Thuoc, D., Quillaguamán, J., Mamo, G., Mattiasson, B., 2007. Utilization of agricultural residues
for poly(3-hydroxybutyrate) production by Halomonas boliviensis LC1. J. Appl. Microbiol. 0,
071003000434003–??? doi:10.1111/j.1365-2672.2007.03553.x

References
155
Vandamme, P., Coenye, T., 2004. Taxonomy of the genus Cupriavidus: a tale of lost and found. Int. J.
Syst. Evol. Microbiol. 54, 2285–2289. doi:10.1099/ijs.0.63247-0
Verlinden, R.A., Hill, D.J., Kenward, M.A., Williams, C.D., Piotrowska-Seget, Z., Radecka, I.K., 2011.
Production of polyhydroxyalkanoates from waste frying oil by Cupriavidus necator. AMB
Express 1, 11. doi:10.1186/2191-0855-1-11
Verlinden, R.A.J.A.J., Hill, D.J.J., Kenward, M.A.A., Williams, C.D.D., Radecka, I., 2007. Bacterial
synthesis of biodegradable polyhydroxyalkanoates. J. Appl. Microbiol. 102, 1437–49.
doi:10.1111/j.1365-2672.2007.03335.x
Voevodina, I., Kržan, A., 2013. Bio-based polymers.
Wang, H., Johnson, L.A., Wang, T., 2004. Preparation of soy protein concentrate and isolate from
extruded-expelled soybean meals. J. Am. Oil Chem. Soc. 81, 713–717. doi:10.1007/s11746-004-
966-8
Wiles, D.M., Yu, L., Dean, K., Xu, Q., Scott, G., Dean, K., Yu, L., Chen, G..-Q., Halley, P.J., Guilbert, S.,
Feuilloley, P., Bewa, H., Bellon-maurel, V., Clarinval, A.-M., Halleux, J., Zhang, J.-F., Sun, X.,
Madras, G., Kenan, T.M., Tannbaum, S.W., Nakas, J.P., Bhattacharya, M., Reis, R.L., Correlo, V.,
Boesel, L., Varma, A.J., Plackett, D., Lips, P.A.M., Dijkstra, P.J., Jérôme, R., Lecomte, P., Wiles,
D.M., Matsumura, S., Scott, G., 2005. Biodegradable Polymers for Industrial Applications,
Biodegradable Polymers for Industrial Applications. Elsevier. doi:10.1533/9781845690762.3.357
Yang, Y.-H., Brigham, C.J., Budde, C.F., Boccazzi, P., Willis, L.B., Hassan, M.A., Yusof, Z.A.M., Rha, C.,
Sinskey, A.J., 2010. Optimization of growth media components for polyhydroxyalkanoate (PHA)
production from organic acids by Ralstonia eutropha. Appl. Microbiol. Biotechnol. 87, 2037–45.
doi:10.1007/s00253-010-2699-8
Yousuf, R.G., Winterburn, J.B., 2016. Date seed characterisation, substrate extraction and process
modelling for the production of polyhydroxybutyrate by Cupriavidus necator. Bioresour.
Technol. 222, 242–251. doi:10.1016/j.biortech.2016.09.107
Yu, J., Stahl, H., 2008. Microbial utilization and biopolyester synthesis of bagasse hydrolysates.
Bioresour. Technol. 99, 8042–8048. doi:10.1016/J.BIORTECH.2008.03.071
Yücelen, E., Lazić, I., Bosch, E.G.T., 2018. Phase contrast scanning transmission electron microscopy
imaging of light and heavy atoms at the limit of contrast and resolution. Sci. Rep. 8, 1–10.
doi:10.1038/s41598-018-20377-2

References
156
Zahi, M.R., Liang, H., Yuan, Q., 2015. Improving the antimicrobial activity of d-limonene using a novel
organogel-based nanoemulsion. Food Control 50, 554–559. doi:10.1016/j.foodcont.2014.10.001
Zakaria Gomaa, E., 2013. African Journal of Microbiology Research Bioconversion of orange peels for
ethanol production using Bacillus subtilis and Pseudomonas aeruginosa 7, 1266–1277.
doi:10.5897/AJMR12.2160

Appendices
157
APPENDICES
A: Theoretical OJW biorefinery flow diagram, with PHB, limonene, pectin and methane as target molecules.

Appendices
158
B: Publication
The cover page of the publication derived from the research contained in this thesis is below. A paper
derived from the study of the inhibitory effect of limonene on the strain growth, presented in
Chapter 6, entitled “Effect of limonene on the heterotrophic growth and polyhydroxybutyrate
production by Cupriavidus necator H16” was published in Bioresource Technology.