Basic calculation proficiency and mathematics achievement in elementary school children
59
Running head: BASIC CALCULATION 1 Basic Calculation Proficiency and Mathematics Achievement in Elementary School Children Richard Cowan, Institute of Education University of London Chris Donlan University College London Donna-Lynn Shepherd, Rachel Cole-Fletcher, Matthew Saxton, Jane Hurry Institute of Education University of London Author Note Richard Cowan, Psychology and Human Development, Institute of Education University of London, England; Chris Donlan, Division of Psychology and Language Sciences, University College London, England; Donna-Lynn Shepherd, Psychology and Human Development, Institute of Education University of London, England; Rachel Cole-Fletcher, Psychology and Human Development, Institute of Education University of London, England; Matthew Saxton, Psychology and Human Development, Institute of Education University of London, England; Jane Hurry, Psychology and Human Development, Institute of Education University of London, England. Rachel Cole-Fletcher is now at the Department of Psychology, University of Newcastle. This research was supported by an Economic and Social Research Council grant. We also gratefully acknowledge the assistance of Jane Gabb and Robert French with various parts of the study and the staff and children of participating schools in the Royal Borough of Windsor and Maidenhead.
Transcript of Basic calculation proficiency and mathematics achievement in elementary school children

Running head: BASIC CALCULATION 1
Basic Calculation Proficiency and Mathematics Achievement
in Elementary School Children
Richard Cowan,
Institute of Education University of London
Chris Donlan
University College London
Donna-Lynn Shepherd, Rachel Cole-Fletcher, Matthew Saxton, Jane Hurry
Institute of Education University of London
Author Note
Richard Cowan, Psychology and Human Development, Institute of Education University of
London, England; Chris Donlan, Division of Psychology and Language Sciences, University
College London, England; Donna-Lynn Shepherd, Psychology and Human Development,
Institute of Education University of London, England; Rachel Cole-Fletcher, Psychology and
Human Development, Institute of Education University of London, England; Matthew
Saxton, Psychology and Human Development, Institute of Education University of London,
England; Jane Hurry, Psychology and Human Development, Institute of Education University
of London, England.
Rachel Cole-Fletcher is now at the Department of Psychology, University of
Newcastle.
This research was supported by an Economic and Social Research Council grant. We
also gratefully acknowledge the assistance of Jane Gabb and Robert French with various
parts of the study and the staff and children of participating schools in the Royal Borough of
Windsor and Maidenhead.

Running head: BASIC CALCULATION 2
Correspondence concerning this article should be addressed to Richard Cowan,
Psychology and Human Development, Institute of Education University of London, 20
Bedford Way, London WC1H 0AL, England. E-mail: [email protected]

Running head: BASIC CALCULATION 3
Abstract
The relation between skill in simple addition and subtraction and more general math
achievement in elementary school is well established but not understood. Both the intrinsic
importance of skill in simple calculation for math and the influence of conceptual knowledge
and cognitive factors (working memory, processing speed, oral language) on simple
calculation and math are plausible. The authors investigated the development of basic
calculation fluency and its relations to math achievement and other factors by tracking a
group of 259 UK English children from 2nd to 3rd grade. In both grades the group did not
retrieve the solutions to most problems but their math achievement was typical. Improvement
in basic calculation proficiency was partially predicted by conceptual knowledge and
cognitive factors. These factors only partially mediated the relation between basic calculation
and math achievement. The relation between reading and math was wholly mediated by
number measures and cognitive factors.
Keywords: mathematical achievement; simple addition; working memory; reading;
young children

Running head: BASIC CALCULATION 4
Basic Calculation Proficiency and Mathematics Achievement in Elementary School Children
Basic calculation is the addition or subtraction of numbers with sums less than 20
(e.g. 8 + 7, 15 – 7). Although research consistently finds that basic calculation skills covary
with maths achievement (e.g. Durand, Hulme, Larkin, & Snowling, 2005; Geary & Brown,
1991; Hecht, Torgesen, Wagner, & Rashotte, 2001; Jordan, Hanich, & Kaplan, 2003a, 2003b;
Russell & Ginsburg, 1984; Siegler, 1988) the explanation for this relationship remains
uncertain.
The importance of basic calculation is emphasized in elementary education but
opinions vary concerning both what constitutes proficiency in this skill and how to develop it
(Baroody, 2003, 2006; Cowan, 2003). These views are likely to affect what children learn at
school and home.
Educational views of basic calculation proficiency
The traditional view equates proficiency with having the solutions to basic
calculations stored in long term memory so that they can be readily retrieved. Proponents of
this view consider proficiency develops through rote memorization and practice. Developing
proficiency is important for mental and written arithmetic involving larger numbers, the
application of arithmetic to everyday life, and progress in mathematics.
Many elementary mathematics educators in the US and UK still emphasize
memorized solutions as the basis for computational fluency, but regard conceptual knowledge
as playing an important part in their development (Askew, 1998; Reys, Suydam, Lindquist, &
Smith, 1998). Baroody (2006) describes this view as ‘conventional wisdom’ (p.22) and
observes that it is based on three separate phases of development. First, children solve basic
calculation problems by counting and using their fingers. In the second phase, they use
arithmetical principles and knowledge of other combinations, for example solving 12 – 6 by
using both their understanding that subtraction is the inverse of addition and their knowledge

Running head: BASIC CALCULATION 5
of the relevant addition fact, 6 + 6 = 12. Solving problems by using principles, related facts,
or decomposing numbers into parts constitutes the family of strategies known as
decomposition. Finally, the child will simply retrieve the solutions (Reys et al., 1998).
The English National Curriculum (Department for Education and Employment, 1999)
follows conventional wisdom. It prescribes that by the end of their third year of schooling,
children should know principles such as the inverse relation between addition and subtraction
and the commutativity of addition, and be able to decompose single digit numbers above 5,
such as 8, into parts consisting of 5 and another number, such as 5 and 3. They should use
this knowledge to solve addition and subtraction problems when they cannot retrieve the
solution. By the end of their fourth year (equivalent to US 2nd Grade), English children
should solve all the basic calculations by retrieval. To achieve fluency in calculation, pupils
receive a daily numeracy lesson with a focus on mental and oral calculation. Since the
introduction of the National Curriculum, England has made the greatest advance in math
achievement by 4th grade pupils of any country sampled by the Trends in International
Mathematics and Science Study (TIMSS, Mullis, Martin, & Foy, 2009).
An alternative to conventional wisdom is the number sense view, advocated by
Baroody (2006). On this view, proficiency in basic calculation means accurate solution by
any efficient strategy not just retrieval. Proficiency is believed to result from understanding
number operations, patterns and principles (Baroody, 1999; Canobi, Reeve, & Pattison,
1998). Both traditional and conventional wisdom views imply that satisfactory mathematical
progress depends on knowing the solutions to every basic calculation problem. The number
sense view does not. We now consider these views in relation to research on basic calculation
skill and diversity in math achievement.
Basic calculation skill and diversity in math achievement

Running head: BASIC CALCULATION 6
Researchers have primarily used two paradigms to assess basic calculation
proficiency: strategy assessment tasks (e.g. Geary, Hoard, Byrd-Craven, & DeSoto, 2004);
and forced-retrieval tasks (e.g. Russell & Ginsburg, 1984). In strategy assessment tasks,
children are told they can use any method to solve problems. Knowledge of basic calculation
solutions is equated with accurate retrieval. Children are credited with retrieving the answer
on the basis of a mixture of observation and self-report. In forced- retrieval tasks, retrieval is
inferred from correct answers given within 3s.
Studies from both paradigms have reported inaccurate retrieval is associated with
poor math achievement as both traditional and conventional wisdom views would expect.
Less compatible with either view is the infrequency of retrieval by normal children: Geary et
al. (2004) found retrieval was used to solve fewer than 40% of single digit addition problems
in Grade 3 and fewer than 50% in Grade 5. One explanation for the discrepancy is that
children’s retrieval use yields underestimates of their knowledge of solutions. Siegler (1988)
identified a group of children as perfectionists. Perfectionists used retrieval on fewer than
50% of problems, considerably less often than good students and not-so-good students, but
when they did retrieve they were extremely accurate, above 95% correct. Despite their low
levels of retrieval, perfectionists matched good students in math achievement. The Siegler
and Shrager (1984) model of strategy development could account for perfectionists as setting
a higher confidence threshold for reliance on retrieved answers. Like Siegler’s perfectionists,
the Grade 3 and 5 typically developing pupils in Geary et al. (2004) were extremely accurate
when they did use retrieval, so perhaps they too had higher confidence thresholds.
There is some doubt as to whether retrieval is the only basis for success on forced-
retrieval tasks (Jordan, Hanich, & Kaplan, 2003a). Decomposition in particular is a strategy
associated with fast response times (Siegler, 1987a). The use of decomposition increases
Running head: BASIC CALCULATION 7
substantially with grade (Geary et al., 2004; Siegler, 1987a). So success on forced-retrieval
tasks may reflect a mixture of retrieval and decomposition solutions.
Research on children’s strategies provides a further challenge for the traditional view.
Young children often use their fingers when solving arithmetical problems, either to support
counting strategies or to represent the numbers (Siegler, 1987b; Siegler & Shrager, 1984).
Advocates of the traditional view would discourage finger use as it indicates reliance on
back-up strategies rather than retrieval. But this may be misguided, since children can be
more accurate when using their fingers (e.g. Siegler, 1987b) and accurate solutions increase
the likelihood of subsequent retrieval (Siegler, 2003). Enhanced accuracy with finger use may
be limited to younger children and problems with smaller numbers (Jordan, Kaplan,
Ramineni, & Locuniak, 2008). In the present study we examine the frequency of finger use in
2nd and 3rd grade and its relation to strategy and accuracy.
A simple interpretation of the three-phase depiction of strategies in the conventional
wisdom view is that children progress in strategy use from counting to decomposition to
retrieval. However, research indicates that children use multiple strategies across problems
and even on the same problem they do not follow a fixed sequence of development (Siegler,
1987a, 1996; Siegler & Shipley, 1995). Decomposition is the back-up strategy with the
highest associated accuracy (Siegler, 1987a) but models of strategy use allow for shifts to
retrieval following accurate execution of any strategy, not just decomposition. In this study
we examine the relation between correct strategy use in 2nd and 3rd grade to determine
whether retrieval in 3rd grade is particularly or exclusively associated with correct
decomposition or retrieval use in 2nd grade.
The number sense view implies that conceptual knowledge explains the relationship
between basic calculation proficiency and math achievement. Two aspects of conceptual
knowledge might be relevant. One is knowledge of the natural number system (Case et al.,

Running head: BASIC CALCULATION 8
1996; Cowan, Donlan, Newton, & Lloyd, 2005; Donlan, Cowan, Newton, & Lloyd, 2007;
Griffin, 1997, 2005). The other is knowledge of calculation principles (Hanich, Jordan,
Kaplan, & Dick, 2001; Russell & Ginsburg, 1984). Previous research suggests that
knowledge of the natural number system is particularly important in predicting variation in
math achievement (Gersten, Jordan, & Flojo, 2005; Donlan et al., 2007; Jordan, Kaplan,
Locuniak, & Ramineni, 2007). In contrast, the influence exerted by knowledge of calculation
principles is less clear cut. It discriminates typically developing children from those with
math difficulties in 2nd grade (Hanich et al., 2001) but not in 4th grade (Russell & Ginsburg,
1984). In this study, we explore whether either aspect of conceptual knowledge mediates the
relation between basic calculation proficiency and math achievement.
There are other factors that might influence both basic calculation proficiency and
math achievement. These are more general features of cognitive functioning, such as working
memory, processing speed, oral language, and literacy. Controlling for these factors makes
for a stronger test of the relations between basic calculation proficiency, conceptual
knowledge, and math achievement. In what follows, we examine the potential role played by
these factors in explaining diversity in child performance on basic calculation problems.
Working Memory
In recent years, substantial research effort has been devoted to working memory as a
possible cause of variation in a wide range of domains, including language, reading and
mathematics (e.g., Geary, 2004; Montgomery, Magimairaj & Finney, 2010; Savage, Lavers,
& Pillay, 2007). Much of this research is based on Baddeley and Hitch’s (1974) model of
working memory. In this model, there are two slave systems, the phonological loop (PL) and
the visuo- spatial sketchpad (VSSP), together with a central executive (CE). Tests of PL and
VSSP functioning include simple span tasks such as digit recall and Corsi blocks. In contrast,
central executive functioning is assessed by complex span tasks involving both storage and

Running head: BASIC CALCULATION 9
processing, for example backward digit recall. Working memory functioning correlates with
basic calculation proficiency (Andersson & Lyxell, 2007; Cowan et al., 2005; Geary, Hoard,
Byrd-Craven, Nugent, & Numtee, 2007). By including separate assessments of the PL, VSSP,
and CE components of working memory we seek to assess their contribution to explaining
variation in basic calculation proficiency and math achievement.
Processing Speed
Slower performance of basic calculations is characteristic of children with
mathematics difficulties (Geary & Brown, 1991; Jordan & Montani, 1997) but the extent to
which this reflects general processing speed characteristics is uncertain. Some studies have
found processing speed to be an independent predictor of calculation (e.g., Bull & Johnston,
1997), while others have found that groups who differ in calculation proficiency do not differ
on measures of speed (e.g., Andersson & Lyxell, 2007; Jordan et al., 2003a).
Performance on complex span tasks is correlated with processing speed (Hitch,
Towse, & Hutton, 2001). There are plausible explanations of both how working memory
characteristics may affect performance on processing speed tasks and how speed of
processing may affect performance on working memory tasks. We follow Geary et al. (2007)
in including measures of processing speed as well as working memory to determine whether
each make independent contributions to explaining variation in basic calculation and math
achievement and whether they mediate the relation between them.
Oral Language
Oral language is the principal medium of instruction for children in elementary
school. It follows that the child’s linguistic abilities will, to some extent at least, determine
their development of mathematical skills and knowledge. And, in fact, there are some
indications that particular aspects of linguistic skill are related to math performance.
Following Geary (1993), a number of studies demonstrate that both phonological processing

Running head: BASIC CALCULATION 10
skills and vocabulary level are related to basic calculation proficiency (Durand et al., 2005;
Hecht et al., 2001; though see Jordan et al., 2003a for a contrasting view). A critical aspect of
language which has, so far, received little attention is grammatical ability: Cowan et al.
(2005) found it accounted for more variation in basic calculation proficiency than did
working memory. Accordingly, we include both vocabulary level and grammatical ability in
a composite measure of oral language used to help explain variation in basic calculation
performance and math attainment.
Literacy
Although mathematical difficulties can exist independently of reading difficulties,
math achievement correlates substantially with reading (Durand et al., 2005). Also children
who show low achievement in both domains have greater impairments in number than those
with just low math (Jordan et al., 2003b). The association between reading and math may be
due to both being associated with the same cognitive factors, such as working memory
(Swanson, 1992; Gathercole & Pickering, 2000), processing speed (Kail & Hall, 1999), and
oral language skills (Durand et al., 2005). An alternative hypothesis is that reading skill is
specifically connected with numerical skills and knowledge. Accordingly we assess which
factors mediate the relation between reading proficiency and math achievement.
Summary of Aims
Research on the correlates of diversity in math achievement has often identified basic
calculation skills as significant but whether this is due to the role basic calculation plays in
math achievement or because both basic calculation and mathematical development are
affected by the same factors is uncertain. The main aim of this study is to contribute to these
debates by examining (a) how basic calculation proficiency develops from 2nd grade to 3rd
grade, (b) the association of individual differences in basic calculation proficiency with
conceptual knowledge and general cognitive factors and (c) the extent to which the relation

Running head: BASIC CALCULATION 11
between basic calculation proficiency and math achievement is mediated by these other
characteristics.
Our study of basic calculation development includes an examination of the role of
finger use in basic calculation, comparison of strategy assessment and forced- retrieval tasks,
and exploration of the relation between correct strategy use in 2nd and 3rd grade.
Method
Participants
All 2nd grade (UK English Year 3) children from nine classes in seven state schools
in the same English administrative district were invited to participate in a longitudinal maths
project. Parental permission and child assent were obtained for 269 (88%) of eligible
children. The following year, 96% (134 male, 125 female) continued to participate. The only
children who did not continue had changed schools. Participating schools served socially
mixed catchment areas. The retained children’s ages when assessed in 2nd grade ranged from
7 years 0 months to 9 years 5 months (mean 7 years 11 months, SD = 5 months). The large
variation in age results from assessments taking place throughout the school year and an
exception: only one child was older than 8 years 9 months.
Demographic characteristics for the sample were estimated from the proportion of
families claiming free school meals and the neighbourhood quality associated with each
child’s postal address, obtained for 250 children. Both measures indicated that the sample
was less deprived than England as a whole. The proportion claiming free school meals was
5.4%, which is average for the source administrative district, but lower than the average for
England as a whole (13.1%, Department for Children Schools and Families, 2007).
Neighbourhood quality was assessed using the English 2007 Index of Multiple Deprivation
(IMD, Noble et al., 2008) for Lower Level Super Output Areas (LSOA). England is divided
into 32,482 LSOAs. IMD is an ordinal measure where 1 corresponds to the most deprived
Running head: BASIC CALCULATION 12
neighbourhood and 32,482 to the least. Converting the English LSOA ranks into stanines
showed that the mean stanine for the sample was 6.8 (SD = 1.7). This is considerably higher
than the population mean of 5: t (249) = 16.14, p < .001. Inspection of the distributions
showed that few children (6.8%) lived in the lowest 40% of English neighbourhoods.
English schools identify children failing to make satisfactory progress as having one
of three levels of special educational needs. The levels are in order of increasing severity
School Action, School Action Plus, and Statement of Special Educational Needs. In the
sample, there were 19 children (7 girls, 12 boys) on School Action, 19 on School Action Plus
(5 girls, 14 boys) and 9 (2 girls, 7 boys) with Statements of Special Educational Needs. The
incidence of School Action and School Action Plus pupils in the sample (38/259: 14.7%) is
lower than the national average for state-funded elementary schools (18.2%, Department for
Education, 2010b). The incidence of children with statements (9/259: 3.5%) is higher (1.4%,
Department for Education, 2010a). Both of these variations from national figures are
consistent with patterns in the administrative district (Reddick, 2010).
Quality of education provided in English elementary schools is assessed by
inspection. In the most recent inspections of the schools in the sample, pupil achievement was
considered to be outstanding in two schools (32% of sample), good in four (63%), and
average in the other (5%). For the five schools that taught pupils until they became 11 years
old, achievement in National Curriculum tests at 11, and the comparison with schools
matched in the pupil intake characteristics of gender, ethnicity, and neighbourhood
deprivation, provide additional indications. Achievement was much above the national
average in three schools, at the national average in one school, and below the national
average in the fifth. The ordering of schools in achievement was consistent with the
inspection data. The school whose achievement was below the national average was attended
Running head: BASIC CALCULATION 13
by only 5% of the sample. It was also, in common with two others in the sample, judged to be
more effective than average when intake characteristics were taken into account.
Materials and Procedure
Number tasks.
Basic calculation proficiency: Forced retrieval. Knowledge of addition and
subtraction combinations was assessed using a forced-retrieval procedure (Jordan et al.,
2003a). For the first practice item, the experimenter displayed 4 – 2 on a laptop computer and
asked the child to read it out loud. Adopting the child’s preference, be it ‘4 take away 2’ or ‘4
minus 2’, the experimenter then said most people knew the answer to this problem without
having to work it out. She explained she was going to show some more sums and that, if the
child knew the answer, they should tell her as fast as possible. If they would need to work it
out, then they should just say ‘work out’. The second practice item was ‘3 – 2’. Then
followed 18 subtraction items in the same order for all children: 10 – 5, 3 – 3, 10 – 9, 6 – 4,
15 – 10, 8 – 4, 13 – 5, 12 – 11, 7 – 7, 14 – 10, 8 – 0, 12 – 6, 13 – 9, 16 – 7, 15 – 8, 11 – 8. As
each item was displayed, the experimenter read it out. Addition items were then introduced
via two practice items: 2 + 2, and 3 + 2. Ten test items were then presented: 4 + 2, 10 + 8, 9 +
3, 6 + 6, 3 + 4, 6 + 10, 9 + 4, 3 + 8, 7 + 5, 6 + 7, 9 + 9, 7 + 9. Responses were audio recorded
and timings were derived from the audio recordings. Children were given one point for each
problem correctly answered within 3 seconds from when the experimenter finished reading
out the problem. The maximum possible score is 28.
Basic calculation proficiency: Strategies. Following the forced-retrieval task,
children’s strategies were assessed with a set of 16 addition and subtraction problems. In two
practice items (2 + 5, 5 – 3) the child was invited to solve some problems, both adding and
take-away. They were told that they could use any way they knew to work out the answers
and that the experimenter would ask afterwards how they had solved each problem. The

Running head: BASIC CALCULATION 14
problems were presented on computer and read out by the experimenter. They were given in
the following fixed order: 4 + 6, 17 – 9, 11 + 5, 10 – 4, 3 + 14, 7 – 6, 8 + 9, 7 – 7, 7 + 8, 12 –
7, 4 + 9, 16 – 8, 12 – 6, 15 + 3, 6 + 9, 15 – 8. Audio recordings were made of each child’s
performance. For each problem where the child offered a solution, the child’s use of fingers
to support calculation and strategy were coded. Finger use was coded as present or absent. If
the child had hidden their fingers they were asked if they had used them and their answer
accepted.
Strategies were coded as retrieval, decomposition, counting, or unidentified. Strategy
coding was based primarily on children’s responses to questions informed by the
experimenter’s observations. In general the questioning began with ‘How did you do that
one?’ but if the child answered very quickly the experimenter might ask ‘Did you just know
that one?’. Strategies were coded as retrieval if the answer was claimed to be already known,
as decomposition if the answer was claimed to be derived from either conceptual knowledge
or knowledge of a different combination or a mixture of both, and counting if the child
reported counting out one or both the numbers in the problem. When children said they
counted, they were asked what number they started counting from. For addition problems this
was to distinguish min, counting on from the larger number, from sum, counting out both
numbers from one, and max, counting on from the smaller number. For subtraction problems,
it was to discriminate count up from count down. Where children spontaneously self-
corrected their response or changed their strategy, the strategy for their final response was
coded.
Strategies were coded as unidentified when children offered no response or if their
strategy could not be identified as retrieval, decomposition or counting. These included
reports of guessing and incomprehensible or inconsistent strategy descriptions, such as
assertions of retrieval on trials where they had audibly counted. In Grade 2 there were 407

Running head: BASIC CALCULATION 15
instances of unidentified strategies: 148 occasions when a child offered no solution, 142
reports of guessing, 110 incomprehensible descriptions, and 7 trials when the child’s reported
strategy conflicted with observation. In Grade3 there were 197 instances of unidentified
strategies (87 when no solution was offered, 103 reported guesses, and 7 incomprehensible
descriptions).
Each experimenter coded the strategies of the children they tested. Reliability of
strategy coding was assessed on 9% of trials by a different coder working independently.
Sampling was random within the constraints that children initially coded by each
experimenter were sampled, and that each school and times of testing were sampled, with
more than twice as many from the first time of testing as the second. Agreement between
coders was high: strategy assignments were identical on 98% of trials. This suggests the
experimenters’ codings were very reliable, an impression further reinforced by a third coder’s
analysis of discrepant trials: on most (74%) of the small number of discrepant trials the third
coder agreed with the initial coding by the experimenter.
For the regression and mediation analyses the measure of strategy assessment
performance was the sum of correct retrieval and correct decomposition trials. This is the
memory accuracy measure used by Geary et al. (2007). The maximum possible score is 16.
Calculation principles: Derived facts. Based on procedures by Dowker (2005) and
Jordan et al. (2003b), this task assessed children’s ability to apply patterns and principles of
calculation in addition and subtraction. Children were presented with pairs of problems in
which the answer to the first problem was given, and which could then be used to solve the
second, i.e., the answer could be derived from the given fact. The first practice pair was ‘32 +
19 = 51: 32 + 19 = ?’. The second practice pair was ‘20 – 5 = 15: 21 – 5 = ?’. In each case,
the experimenter explained that the child would see a problem with the answer and another
problem which she wanted them to solve as fast as possible. The child was also told that the

Running head: BASIC CALCULATION 16
first problem might help them with the second. Each pair of problems was presented on
computer and read to the child.
Twelve test items were presented, two for each of six different types of principle and
pattern: commutativity of addition ( 47 + 86 = 133, 86 + 47 = ?; 94 + 68 = 162, 68 + 94 = ?);
subtrahend minus one ( 46 – 28 = 18, 46 – 27 = ?; 273 – 245 = 28, 273 – 244 = ?); subtraction
complement principle (153 – 19 = 134, 153 – 134 = ?; 84 – 27 = 57, 84 – 57 = ?); doubles
plus one pattern (37 + 37 = 74, 37 + 38 = ?; 64 + 64 = 128, 65 + 64 = ?); inverse relation
between addition and subtraction ( 27 + 69 = 96, 96 – 69 = ?; 36 + 98 = 134, 134 – 36 = ? );
and subtrahend plus one (64 – 36 = 28, 64 – 37 = ?; 157 – 92 = 165, 157 – 93 = ?). The
presentation order of problem pairs was fixed so that the first six and the second six featured
an item of each type.
Audio recordings were made of each child’s performance and timings derived from
the audio recordings. Children were given one point for each problem answered correctly
within 5s of the experimenter finishing reading out the second problem. The maximum
possible score is 12.
Calculation principles: Explaining patterns. The aim of this task was to assess
children’s knowledge of numerical rules, patterns and principles and their beliefs in the
generality of them. The experimenter introduced it as follows. ‘There are some patterns and
rules for adding and subtracting. Some you might know about already and some you might be
learning about later. I’m going to show you sets of problems that have a pattern or rule in
common.’ The warm up item involved showing three n + 1 problems (4 + 1, 37 + 1, 125 + 1).
The experimenter asked what they had in common. If necessary, she explained the number
after rule, such that when one is added to a number the answer is the next number when you
count. She asked if they knew that already. She then pointed out that it was true for all
numbers when you add one to them.

Running head: BASIC CALCULATION 17
The six main items followed a similar pattern. First a set of three problems was shown
on the computer and the child was asked to articulate the connection between them
(spontaneous naming). Subsequently the experimenter described the connection and the child
was asked if they recognized it (recognition). Finally the experimenter asked if the
connection held for all problems (generalization). The six patterns used were n – n, n + 10, n
– 0, n - (n -1), n + 0, and 1 + n.
Audio recordings were made of each child’s performance. Children were given one
point for each spontaneous naming question answered correctly, for each connection they
claimed to recognize, and for each generalization question they answered affirmatively. The
maximum possible score is 18.
Number system knowledge: Number knowledge. Items were derived from the
Number Knowledge test in Griffin (1997). Four subtasks were presented in the same fixed
order for all children: number sequence knowledge; relative magnitude; numerical distance;
and finally, differences. Each subtask consisted of practice items and six test items. Numbers
were shown on computer as well as being named by the experimenter.
Number sequence items required children to name the number in given positions in
the number sequence. The three practice items were ‘What number comes right after 7?’,
‘What number comes before 5?’, and ‘What number comes two numbers after 3?’. Correct
answers were explained if necessary. The test items were ‘two numbers after 7’, ‘right after
9’, ‘five numbers after 49’, ‘four numbers before 60’, ‘ten numbers after 99’, and ‘nine
numbers after 999’.
Relative magnitude items required children to identify the bigger of two numbers.
Practice items asked children ‘Which is bigger: 5 or 4?’ and ‘Which is bigger: 6 or 7?’. The
pairs of numbers in the test items were: (9 & 7); (13 & 14); (69 & 71); (32 & 28); (51 & 39);
and (199 & 203). In half of the test items, the first number in each pair was the larger of the

Running head: BASIC CALCULATION 18
two. By presenting the first item in each pair on the left of the screen and the second on the
right, children could not respond correctly simply by choosing the same position each time.
Numerical distance items required children to identify which of two numbers was
closer to a target number. Practice items were ‘Which number is closer to 3: 2 or 6?’ and
‘Which number is closer to 4: 6 or 1?’. The triads of numbers in the test items were: ‘7: 4 or
9?’; ‘13: 14 or 11?’; ’21: 25 or 18?’; ’49: 51 or 45?’; ‘28: 31 or 24?’; ‘102: 98 or 109?’.
Target items were presented in the upper middle of the screen and the other numbers were
presented in the lower left and right positions. The location of the correct answer was
balanced across items.
Differences items asked children to identify which of two pairs of numbers had the
greater difference. In introducing the practice item, the experimenter ensured that the child
understood what was meant by difference. The practice item asked ‘Which difference is
bigger: the difference between 4 and 2 or the difference between 6 and 3?’. The test items
featured the following contrasting pairs of numbers: (10 & 5) vs. (10 & 7); (9 & 6) vs. (8 &
3); (6 & 2) vs. (8 & 5); (20 & 17) vs. (25 & 20); (25 & 11) vs. (99 & 92); (48 & 36) vs. (84 &
73). Pairs of numbers were presented in opposing quadrants of the screen: upper left versus
lower right. The position of the pair with the larger difference was balanced across items.
Testing within a subtask was discontinued after the child had made three errors. Only
children who had not been discontinued on previous subtasks were invited to try the
Differences subtask as the items were derived from Level 3 of the Number Knowledge test
which is designed for average 10-year-olds. Children were told it was for older children and
that they need not attempt it. The maximum possible score is 24.
Number system knowledge: Count sequences. Knowledge of the natural number
sequence was assessed orally and then with numerals. Both versions involved ascending and
descending sequences. A practice item was given in which the child was asked to count up

Running head: BASIC CALCULATION 19
from 5 to 16. Children were give support if necessary to enable them to recite the numbers by
themselves. Following this, they attempted a set of ascending sequences (25 to 32, 194 to
210, 2,995 to 3,004, 9,996 to10,003) and then a set of descending sequences (46 to 38, 325 to
317, 1,006 to 997, 20,005 to 19, 998).
Numeral sequences were presented in column grids with the first few items filled in.
The experimenter read out the numbers up to the continuation point and the child was asked
to continue by writing what came next in the cells below. The digits of each number appeared
in separate cells of the grid. Support was given with the first item if required to ensure that
the child only wrote one digit in each cell. The first item required the child to continue from
13 to 16 and the numbers from 5 to 12 were printed above 13. Subsequent ascending
sequences were: 28 to 31; 899 to 901; 7,999 to 8,001; and 59,999 to 60, 001. The set of
descending sequences were: 11 to 9, 41 to 38; 601 to 599; 6,001 to 5,998; and 70,001 to 69,
999. Testing within a set was discontinued once a child had made errors on two sequences in
a set, or when they did not wish to attempt an item.
Children were given one point for each sequence correctly completed. The maximum
possible score is 18.
Cognitive tasks.
Working memory. Children were assessed using subtests of the Working Memory
Test Battery for Children (WMTB-C, Pickering & Gathercole, 2001), namely, two
phonological loop (PL) subtests (Digit Recall, Word List Recall), two visuo-spatial sketchpad
(VSSP) subtests (Block Recall, Mazes Memory), and two central executive (CE) subtests
(Backwards Digit Recall, Listening Recall). Tests were administered and scored in
accordance with the manual, with each child receiving the subtests in the same fixed order
(Digit Recall, Word List Recall, Block Recall, Listening Recall, Mazes Memory, Backward
Digit Recall). The number of correct trials yields the score for each subtest. Maximum

Running head: BASIC CALCULATION 20
possible scores are 36 (Listening Recall, Backwards Digit Recall), 42 (Word List Recall,
Mazes Memory) and 54 (Digit Recall, Block Recall).
Processing speed. Two measures of processing speed were used: the Symbol
Matching subtest of WISC III UK (Wechsler, 1992); and the Pair Cancellation subtest of
Woodcock-Johnson III (Woodcock, McGrew, & Mather, 2001). Symbol Matching presents
the child with 45 rows of abstract geometric designs. For each row, two symbols are
identified as targets and the child has to decide whether it is also present in the row. The child
has two minutes to complete the task. The score is the number of correct decisions less the
number of incorrect decisions (maximum 45). In the Pair Cancellation subtest, the child is
shown an array consisting of pictures of dogs, balls, and cups of coffee. The child is allowed
three minutes to circle instances where a dog is adjacent and to the right of a ball. The score
is the number of correct identifications (maximum 69).
Language. The two language measures used were the electronic version of the Test
for Reception of Grammar Version 2 (TROG-E, Bishop, 2005) and the British Picture
Vocabulary Scale (BPVS II, Dunn, Dunn, Whetton, & Burley, 1997). TROG-E is a
computer-presented test of grammar comprehension. The child’s task is to choose the one
picture out of four which matches an orally presented sentence (e.g., ‘the pencil is above the
flower’). Items are presented in blocks of four, with testing being discontinued if the child
fails one or more items in five consecutive blocks. A child's score is the number of blocks,
out of 20, for which every item is answered correctly. The BPVS II is a vocabulary test
which, like TROG-E, requires the child to pick an appropriate picture corresponding to the
name of one item from a set of four. Trials are administered in blocks of 12 and testing is
discontinued if the child fails 10 items within a block. The maximum possible score is 168.
The BPVS II manual provides tables for converting raw scores to standard scores for
each three month age band from 3 years to 15 years 8 months (mean = 100, SD = 15).

Running head: BASIC CALCULATION 21
Achievement tests.
Reading. Reading was assessed with the Form B Sight Word Efficiency and
Phonemic Decoding Efficiency subtests from the Test of Word Reading Efficiency (TOWRE,
Torgesen, Wagner, & Rashotte, 1999). Both measures require the child to read as quickly as
possible and scores comprise both the number of words and nonwords correctly read in 45
seconds. The maximum possible scores are 104 for words and 63 for nonwords.
Mathematics. Mathematics was assessed with both the Numerical Operations and
Mathematical Reasoning subtests from the Wechsler Individual Achievement Test (WIAT II
– UK, Wechsler, 2005). The Numerical Operations subtest is a paper-and-pencil test with
items that progress in complexity. The first 7 items assess numeral identification, counting
and numeral writing. Simple addition and subtraction is assessed in the next 5 items. The
following 12 items assess integer arithmetic: multidigit addition and subtraction; and single
digit multiplication and division. Later items involve fractions, decimals, and percentages as
well as integers.
The Mathematical Reasoning subtest is an orally-presented verbal problem solving
test with pictures. The first 16 items assess counting, comparison, simple addition and
subtraction word problems, mathematical language, and interpretation of charts. The next 16
problems involve completion of patterns, knowledge of measures, graphs, and money. The
next 16 items feature fractions, decimals, probability, and mental rotation.
Maximum scores for Numerical Operations and Mathematical Reasoning are 54 and
67. The manual provides tables for converting raw scores to standard scores for each subtest
and are given for each four month age band from 5 years to 17 years with a table for
converting combined standard scores to composite standard scores (mean = 100, SD = 15).
Procedure

Running head: BASIC CALCULATION 22
Each child was tested individually in a quiet room at their school during the school
day by a female researcher. Testing in 2nd and 3rd grade involved up to five sessions, each
no longer than 40 minutes, in the same half term: the English school year is divided into six
half terms of up to five weeks. All except one child was tested in 3rd grade in the same half
term as they had been tested in 2nd grade. The interval between 2nd and 3rd grade
assessments was between 11 and 13 months, with 12 months being the most common interval
(73%). One child had an interval of 14 months.
In 2nd grade, the order of assessments was Count sequences, Number knowledge,
Forced retrieval, Strategies, Derived facts, Explaining patterns, BPVS II, WMTB-C, Symbol
Matching, Pair Cancellation, TROG-E.
In 3rd grade, the order of task administration was Count sequences, Number
knowledge, Forced retrieval, Strategies, Derived facts, Explaining patterns, WIAT II
Numerical Operations and Mathematical Reasoning, TOWRE Sight Word Efficiency and
Phonemic Decoding Efficiency.
The tasks given in both grades (basic calculation proficiency, calculation principles,
and number system knowledge) were identical with respect to administration and items
included.
Results
Overview
The aims of the study are addressed in three sets of analyses. The first set concerns
the characteristics and development of basic calculation proficiency by examining the data
from the strategy assessment and the forced-retrieval tasks administered in 2nd and 3rd grade.
In this set of analyses all identified strategies are considered.
The second set of analyses concern the contribution of cognitive factors and
conceptual knowledge to explaining variation in basic calculation proficiency and the

Running head: BASIC CALCULATION 23
relations between 2nd and 3rd grade basic calculation, calculation principles, and number
system knowledge after controlling for cognitive characteristics. The third set of analyses
assess the role of mediating variables in the relationships between basic calculation
proficiency and math achievement and between reading and math achievement. The second
and third sets of analyses use composite measures for every factor. In these sets of analyses
the composite of basic calculation proficiency is formed from the number of correct rapid
solutions on the forced-retrieval task and the accuracy of retrieval and decomposition
solutions on the strategy assessment task, as in Geary et al. (2007).
The composite measures were formed by averaging the standardized scores of the
constituents. Several composites deviated substantially from normality and included outliers.
Analyses involving them could be misleading. So all composites were further transformed
into scores from 1 to 9 using the following procedure to create normal frequency
distributions: 1 for the lowest 4.0%, 2 for the next lowest 6.6%, 3 to the next 12.1%, 4 to the
next 17.5%, 5 to the next 19.8%, 6 to the next 17.5%, 7 to the next 12.1%, 8 to the next 6.6%,
and 9 to the highest 4.0%. In the case of ties, all tied scores were assigned the same
transformed score even if this meant departure from the assignment procedure. Deviations
from the target frequency distribution were minimized. The transformation procedure yielded
sets of scores that were reasonably normally distributed with no outliers and no statistically
significant skewness or kurtosis (all absolute z scores < 1.96). The transformation procedure
ensures each predictor is on a common scale and avoids the problems of abnormal
distributions. As the procedure reduces variability we repeat the analyses using
untransformed composites.
Table 1 shows the descriptives for each composite and its components with internal
reliabilities where appropriate. The internal reliabilities as assessed by Cronbach alphas
ranged between .78 and .96 with most above .80. Alpha values above .7 are commonly

Running head: BASIC CALCULATION 24
asserted to be acceptable for research purposes and alpha values above .8 to be evidence of
good reliability (de Vaus, 2002; Field, 2009; Kline, 1999).
Basic Calculation Proficiency
Table 2 shows the frequencies of strategies, finger use, and associated error rates. In
neither grade was retrieval the most commonly used strategy: counting strategies were the
modal strategy type in 2nd grade and decomposition in 3rd grade. Finger use was uncommon
on retrieval or decomposition trials but children used their fingers on most trials when they
counted. Overall accuracy was lower with finger use but inspection of Table 2 indicates that
this reflects the higher accuracies associated with retrieval and decomposition. For counting
strategies finger use was adaptive: comparing the error rates for each problem solved by
counting showed that these were lower when accompanied by finger use for most problems in
both grades (Grade 2, 12/16; Grade 3, 10/16). Wilcoxon tests indicated the difference was
statistically significant in 2nd grade: 2nd grade, T = 18, N = 16, p < .01; 3rd grade, T = 39, N
= 16, ns.
The relation between accurate strategy execution in 2nd and 3rd grade is shown in
Table 3. For most strategies there is a high degree of consistency: children used the same
strategy in 3rd grade to solve a particular problem as they had used to solve that problem in
2nd grade: for example 62% of problems correctly solved by decomposition in 2nd grade
were also correctly solved by decomposition in 3rd grade. Sum and max show a different
pattern as they were more likely to be replaced by min, the more efficient counting strategy.
Table 3 also shows progression from counting to decomposition and from
decomposition to retrieval, as expected by conventional wisdom and models of strategy
development: the next phase strategy was the most common when strategies differed between
grades. Consistent with psychological accounts of strategy development (Siegler, 1996), but
less expected by conventional wisdom in mathematics education, is the variability shown in

Running head: BASIC CALCULATION 25
strategies. In particular almost a third of problems correctly solved by retrieval in 2nd grade
were not solved by retrieval in 3rd grade. Possible explanations for this will be considered in
the discussion.
Examination of individual children’s strategy use showed that in both grades very few
children used the same type of strategy (counting, decomposition, or retrieval) to solve all
problems (Grade 2, 9; Grade 3, 25). Most used all three types (Grade 2, 160; Grade 3, 142).
The variety of strategies used by the same child is consistent with Siegler’s account of
strategy development but contrary to phase models such as the conventional wisdom view.
Knowledge of solutions has been estimated from accurate retrieval in strategy
assessment tasks and correct answers within 3s to questions in forced-retrieval tasks. In this
study the estimates from the two procedures differ markedly. The strategy assessment task
estimates are 17% in Grade 2 and 25% in Grade 3: the estimates are derived from the ratio of
correct retrieval solutions (Grade 2, 686; Grade 3, 1028) to the product of problems and
children (16 * 259 = 4144). In contrast, the forced-retrieval estimates are 45% in Grade 2 and
58% in Grade 3: the estimates are derived by dividing the means in Table 1 for the forced-
retrieval task by the number of items (28). Several factors might contribute to this
discrepancy.
The strategy assessment task may be a more accurate and valid way to assess
knowledge of solutions. In the forced-retrieval task, solutions which are correct and rapid
(within 3s) may be obtained by other strategies (Jordan et al., 2003a, 2003b; Siegler & Stern,
1998). The data from this study can be used to assess this explanation in two ways: by
comparing problems common to both tasks; and by examining the distribution of strategies
associated with rapid correct responses on the strategy assessment task.
The two problems that featured in both the strategy assessment and forced-retrieval
tasks were 12-6 and 15-8. Correct retrieval solutions in the strategy assessment task were

Running head: BASIC CALCULATION 26
much less common than rapid correct answers in the forced-retrieval task: Grade 2, 63 vs
144; Grade 3, 110 vs 206. In contrast, the frequencies of rapid correct solutions to these
problems in the strategy assessment task are almost identical to the frequencies in the forced-
retrieval task: Grade 2, 142 vs 144; Grade 3, 209 vs 206. This suggests that some of the
discrepancy between estimates of combination knowledge from the two tasks arose because
rapid solutions on the forced-retrieval task do not just result from retrieval.
Analyses of the correct rapid solutions for all strategy assessment problems provided
further support for the idea that rapid solutions on the forced-retrieval task were not just due
to retrieval of combination knowledge. The associations of correct rapid solutions with
strategies were very consistent in both assessments. Retrieval accounted for the largest
proportion of rapid solutions (Grade 2, 54%; Grade 3, 52%), but many resulted from
decomposition (Grade 2, 37%; Grade 3, 40%), and even counting yielded some rapid
solutions (Grade 2, 8%; Grade 3, 8%). Examination of the relation between rapid solution
and strategy also showed that retrieval solutions were usually but not always rapid: in Grade
2, 84% of retrieval solutions were given in 3s or less, and in Grade 3 this had risen to 90%. In
comparison the frequencies of rapid solutions for decomposition were 37% in Grade 2 and
48% in Grade 3.
The overall percentages of correct rapid solutions on the strategy assessment task
(Grade 2, 26%; Grade 3, 43%) are substantially higher than the percentages of correct
retrieval (Grade 2, 17%; Grade 3, 25%), but still less than success on the forced-retrieval task
(Grade 2, 45%; Grade 3, 58%). This indicates that the discrepancy between the overall results
from the two tasks is only partially due to rapid solutions by strategies other than retrieval.
Differences in difficulty of the non-overlapping problems in the two sets may play a role.
Such differences have long been acknowledged and rankings of basic combinations have

Running head: BASIC CALCULATION 27
been produced. There is, however, little consistency between different rankings (Cowan,
2003).
In summary both the forced-retrieval task and the strategy assessment task indicated
low frequencies of retrieval in Grade 2 and 3. Despite the aspiration of the English National
Curriculum for children to know all the solutions to basic calculations by the end of Grade 2,
retrieval was not the most common strategy in either Grade 2 or 3 and only one child
answered all forced-retrieval problems correctly in 3s. Indeed, no child in either grade
correctly retrieved the answers to more than 14 of the 16 basic calculation problems. The
forced-retrieval task yielded higher estimates of knowledge than the strategy assessment task
but this does not seem to be because the latter made children rely less on retrieval. Instead
comparison of problems common to both tasks suggested that the forced-retrieval task
overestimates knowledge, as rapid solutions were frequently obtained by the use of back up
strategies, particularly decomposition.
Basic calculation proficiency, calculation principles and number system knowledge
The number sense view emphasizes the contribution of conceptual knowledge to basic
calculation proficiency. In this set of analyses we first assess these views by analysing how
variation in basic calculation proficiency is explained by conceptual knowledge (calculation
principles and number system knowledge) and general factors. Then we examine how basic
calculation proficiency and conceptual knowledge in 2nd grade contribute to explaining
individual differences in these variables a year later.
Although the interval between testing in 2nd and 3rd grade was a year, individual
children were tested at different points in the school year with some being tested in
September, the first month of the English school year, and others being tested in July, the last
month. Preliminary analyses indicated that some measures were more strongly related to
month of testing than to the child’s chronological age at time of testing (cf., Cahan & Cohen,

Running head: BASIC CALCULATION 28
1989; Cahan, Greenbaum, Artman, Deluy & Gappel-Gilon, 2008). Both measures correlated
substantially, r = .75, p < .001, so a composite was included in the analyses.
Table 4 shows the zero-order correlations for all composites and the partial
correlations between Grades 2 and 3 number composites after controlling for the general
cognitive factors (composites of working memory, processing speed, and oral language) and
age. All were statistically significant. The correlations between basic calculation proficiency
and the measures of conceptual knowledge are higher than the correlations with general
factors.
With basic calculation proficiency as the dependent variable, three- step multiple
regressions were conducted with forced entry of the age composite in step 1, the two
measures of conceptual knowledge in step 2 and the cognitive factors in step 3. Table 5
summarizes the results. The results were consistent in both grades: the two conceptual
knowledge measures accounted for substantial amounts of variance in basic calculation
proficiency, and processing speed accounted for additional variance. Functioning of the
phonological loop component of working memory also made a statistically significant
contribution in Grade 2. The substantial similarity between step 2 and step 3 coefficients for
conceptual knowledge measures indicates that their relationship with basic calculation
proficiency is only slightly mediated by cognitive factors. Repeating the analyses with
untransformed composites yielded almost identical results. The only difference was that the
contribution of the phonological component was not statistically significant in Grade 2.
Another way of assessing the relationship between basic calculation proficiency and
conceptual knowledge is by assessing how Grade 2 composite measures account for Grade 3
composites, after controlling for factors that may affect both. This approach is taken rather
than analyses of gain scores which are problematic (Campbell & Kenny, 1999). For example,
one problem with gain scores is that gain is constrained for individuals who score at or near

Running head: BASIC CALCULATION 29
the maximum in 2nd grade. Inspection of the ranges of 2nd grade scores on constituent
measures in Table 1 indicates this is a relevant concern for this sample.
Separate hierarchical regression analyses were conducted for the Grade 3 number
composites with control factors (age, the three components of working memory, processing
speed, and oral language) entered in Step 1 and Grade 2 number composites entered in Step
2. The results are summarized in Table 6. Grade 2 number measures made unique
contributions to explaining variance in Grade 3 number measures, even after controlling for
general factors. There was one exception: calculation principles did not contribute to
explaining variance in later number system knowledge.
Repeating the analyses with untransformed composites yielded almost identical
results. The only differences were that Grade 2 basic calculation proficiency made a smaller
contribution to Grade 3 calculation principles and number knowledge.
Basic calculation proficiency, math achievement, and reading
The sample as whole showed math achievement in Grade 3 that was slightly superior
to age-based norms: the mean standard score for the WIAT Math Composite in Table 1 is
more than 100. Table 1 also shows that the average standard score for the BPVS II is also
slightly higher than age-based expectation. This suggests that overall the sample was slightly
above average in cognitive ability. The sample was diverse, particularly in math, as the
ranges and SDs in Table 1 show.
As Table 4 shows, Grade 3 math achievement was highly correlated with all
cognitive factors and number skills. Multiple regressions of math achievement in which all
factors are entered simultaneously show which factors uniquely account for variance. This
tells us which factors have effects that cannot be explained by mediation through other
factors. Table 7 summarizes two such regressions one using Grade 2 measures of basic
calculation proficiency and conceptual knowledge, the other using Grade 3 measures. Both

Running head: BASIC CALCULATION 30
regressions showed that basic calculation proficiency uniquely accounted for variance, but
the amount of variance it accounted for was relatively low (6 -7%) in comparison with both
the zero-order correlations between basic calculation proficiency and math achievement and
the overall R2 values which showed 81% of the variance was accounted for by the full set of
variables. Repeating the analyses with untransformed composites yielded almost identical
results: the only differences were that age made a statistically significant contribution in both
grades and WM CE’s contribution was reduced.
To assess which factors partially mediated the relationship between basic calculation
proficiency and math achievement we ran the Preacher and Hayes (2008) SPSS Macro for
Multiple Mediation with the set of control, cognitive and Grade 2 number variables as
potential mediators. This macro uses bootstrapping to estimate confidence intervals for the
paths involving each mediating variable. Table 8 summarizes the results. Both conceptual
knowledge variables were statistically significant mediating variables. So too were WM
VSSP, WM CE, and oral language. A separate analysis of children with no identified special
educational need yielded similar results: the direct path between basic calculation proficiency
and math achievement was still significant despite mediation effects involving number
system knowledge, oral language and WM VSSP. The analysis with untransformed
composites also found the direct path between proficiency and math achievement remained
significant despite mediation effects. The variables identified as mediators were both
measures of conceptual knowledge, oral language, and WM VSSP.
Table 7 shows that reading did not uniquely explain variance. Therefore any
relationship between reading and math is wholly mediated by other variables included. To
assess what variables mediated the relationship between reading and math, we ran the
Preacher and Hayes (2008) macro with reading as the independent variable, math
achievement as the dependent variable, and the set of control, cognitive and Grade 3 number

Running head: BASIC CALCULATION 31
variables as potential mediators. Table 9 summarizes the results. Several significant paths
were identified including all number variables as well as oral language and WM CE. Also,
although age and WM VSSP were not identified as being statistically significant by normal
theory tests, none of the three bootstrap CIs for these paths included zero. A separate analysis
of children with no identified special educational need yielded similar results: the direct path
between reading and math achievement was not significant, all paths involving number
variables were significant as were the oral language and WM CE paths. Bootstrap and normal
theory tests agreed in finding a statistically significant effect of Age but not WM VSSP. The
mediation analysis with untransformed composites also found no significant direct path
between reading and math achievement, and identified the number variables and oral
language as statistically significant mediators.
Discussion
This study contributes to knowledge about basic calculation proficiency and
elementary school mathematics achievement in several ways. First, it shows how basic
calculation skill develops from 2nd to 3rd grade. In many respects, the observed changes fit
Siegler’s (1996) overlapping waves characterisation of development. Second, we have
established that conceptual knowledge and basic calculation skill are linked, even after
controlling for cognitive abilities that covary with both. We have evidence, therefore, that
skills and knowledge support each other in development. Third, our results indicate that
variation in basic calculation skill is related to math achievement independently of mediation
by conceptual knowledge and cognitive abilities. Fourth, we find that, math achievement is
not compromised by imperfect knowledge of basic calculation solutions. Finally, in our
sample the relationship between achievement in math and reading is wholly mediated by the
set of mediating factors we used.
The development of basic calculation proficiency
Running head: BASIC CALCULATION 32
The current results agree with other studies (e.g. Geary et al., 2004; Siegler, 1987a) in
finding variability in strategy use within the same grade, in the same individuals on different
problems, and even on the same problems on different occasions. Siegler (1996) argues that
variability is a fundamental characteristic of computational strategy development, just as it is
for other areas of cognitive development, and that variability is what facilitates development.
Another fundamental characteristic of children’s strategy choices is adaptiveness
(Siegler, 1996). In the present study, children’s use of their fingers to support computation
was adaptive: children used their fingers most often to support counting strategies, and, this
made counting strategies more accurate. So although we, like Jordan et al. (2008), found
overall greater accuracy when children did not use their fingers, the explanation lies in the
superior accuracy of strategies such as retrieval and decomposition that are rarely
accompanied by finger use. Jordan et al. (2008) concluded that children might be “better
served by calculating in their heads than on their hands” (p.667). However, our analyses of
the relation between strategy use and accuracy do not support a recommendation that finger
use should be discouraged.
From Grade 2 to Grade 3, children’s strategies changed, consistent with Siegler’s
(1996) characterization of strategy choice. Overall strategy choices migrated in the direction
of greater efficiency and accuracy. Execution of all strategies improved in accuracy. Contrary
to the conventional wisdom view, we did observe regression to less advanced strategies. In
particular, a substantial number (30%) of problems that were correctly solved by retrieval in
Grade 2 were not solved by retrieval in Grade 3. This might simply reflect the variability of
strategy choice or it may reflect features of the children’s experience. Such features include
fewer opportunities to practise retrieval of addition and subtraction combinations, challenges
resulting from learning multiplication and division combinations, or classroom environments
where children receive greater approval from teachers for using decomposition strategies.

Running head: BASIC CALCULATION 33
The incidence of retrieval is extremely low in relation to curriculum expectations.
According to the English National Curriculum, children should have known all the solutions
to basic calculation problems by the end of Grade 2 and so used retrieval to solve most
problems. They did not. Other researchers (e.g. Siegler, 1996) have noted that frequency of
retrieval is below educational expectations and that change in use of retrieval is surprisingly
slow. Retrieval use was lower in the present study compared to others. For example, Geary et
al. (2004) found that retrieval was used on 38% of problems by typically developing Grade 3
pupils compared with 26% in our study. The order of administration of tasks in the present
study may have affected retrieval use. The strategy assessment task followed the forced
retrieval task where children were supposed to only use retrieval. Children’s strategy choices
may have reflected adaptation to the difference in task instructions: decomposition use was
more common (39%) in the present study than Geary’s (29%). Incidentally, excluding
children with identified special educational needs made little difference to the frequencies in
our study: retrieval in Grade 3 increased only to 27% and decomposition to 40%.
The forced-retrieval task yielded higher estimates of combination knowledge than the
use of retrieval in the strategy assessment task. This seems partly due to the inclusion of rapid
decomposition solutions as evidence of combination knowledge, as suggested by other
researchers (e.g. Jordan et al., 2003a). This applies to other measures where researchers infer
combination knowledge from numbers of problems solved in a given time (e.g. Durand et al.,
2005; Hitch, 1978; Fuchs et al., 2006). The amount of time taken to answer each item is
unknown, though the means indicate average response times well in excess of 3s.
Although the strategy assessment task can discriminate solutions based on direct
application of combination knowledge from other strategies, there are grounds for combining
accurate solutions based on retrieval and decomposition as a measure of basic calculation
proficiency. First, decomposition commonly involves the application of a combination so it

Running head: BASIC CALCULATION 34
reflects both combination knowledge and conceptual knowledge. Second, measures
combining accurate retrieval and decomposition are related to math achievement (Geary &
Burlingham-Dubree, 1989; Geary et al., 2007). Finally, combining accurate decomposition
and retrieval is consistent with the number sense view of proficiency.
Basic calculation and conceptual knowledge
Our measure of basic calculation proficiency combined success on the forced-retrieval
task with accurate retrieval and decomposition use on the strategy assessment task. In both
grades, scores were highly correlated with scores on the two composite measures of
conceptual knowledge. Consistent with the number sense view, both measures of conceptual
knowledge in Grade 2 accounted for variation in Grade 3 basic calculation proficiency, even
in a model that included Grade 2 basic calculation proficiency and controlled for associated
cognitive factors. We also found that variation in basic calculation proficiency was predictive
of later conceptual knowledge with similar controls. Our data show that the development of
conceptual knowledge and basic calculation proficiency are linked. Future research should
address the nature of this relationship (Rittle-Johnson & Siegler, 1998).
Number skills, math achievement, general cognitive factors, and reading
The correlation between basic calculation proficiency and math achievement in our
sample was very substantial, consistent with all three views of education considered here. But
contrary to the traditional perspective, the math achievement of our sample was normal
despite imperfect combination knowledge. We used multiple regression and mediation
analyses to assess the contributions of conceptual knowledge and cognitive factors to
explaining the relationship between basic calculation proficiency and math achievement.
These indicated that both calculation principles and number system knowledge partially
mediated the relationship. We also have independent evidence of mediation by working
memory factors and oral language skills. The amount of variance in math achievement

Running head: BASIC CALCULATION 35
uniquely accounted for by basic calculation proficiency was the largest of all the predictors.
A separate analysis of the relationship between reading and math achievement
indicated that it was wholly mediated by basic calculation proficiency, conceptual knowledge
and cognitive factors, principally oral language skills and central executive functioning.
In considering the interpretation of these results we must caution readers that this is
essentially a correlational study and therefore equivocal about causality. Another
consideration is that although we have included factors which previous research has
identified as relevant, a different pattern of results might emerge from the inclusion of
different factors. Put another way, the dependence of our results on the particular measures
used is unknown. Finally, while the overall variance accounted for by our set of factors in
each analysis is substantial, no single factor uniquely accounts for much variance. This is
because much variance is shared.
Both measures of conceptual knowledge, number system knowledge and calculation
principles, accounted for variance in math achievement as well as basic calculation skill. The
importance of number system knowledge extends previous research that has found
kindergarten number knowledge predicts attainment in first grade (Gersten et al., 2005;
Jordan et al., 2007) and the ability to generate count sequences to be critical in accounting for
differences between 3rd grade language–impaired children and their peers on number tasks,
(Donlan et al., 2007). The importance of knowledge of calculation principles bears out the
emphasis placed on these in developing meaningful arithmetic (Baroody & Ginsburg, 1986).
Every cognitive factor assessed made unique contributions to explaining variance in
at least one analysis. Functioning of one or more components of working memory was found
to play a part in explaining diversity in math (Table 7). Working memory also mediated the
relationships between math achievement and both basic calculation (Table 8) and reading
(Table 9). In contrast, processing speed only contributed to explaining variation in basic

Running head: BASIC CALCULATION 36
calculation (Table 5). This pattern of results suggests that associations between working
memory and math are not just due to covariation with processing speed. The limited
contribution of processing speed replicates the finding by Fuchs et al. (2006). They found a
substantial link between processing speed and basic calculation in 3rd grade, but no
significant paths which related processing speed to algorithmic arithmetic and story
problems. The measure of math achievement we used mainly comprises algorithmic
arithmetic and story problems.
Amongst the working memory components we found that both visuo-spatial
sketchpad (VSSP) and central executive (CE) measures contribute more than phonological
loop measures to explaining variation in math. This is consistent with previous research
(Meyer, Salimpoor, Wu, Geary, & Menon, 2010). We found both VSSP and CE accounted
for variation in math independently of number skills and other cognitive factors (Table 5) and
both partially mediated the relationship between basic calculation and math (Table 8). CE
was also involved in mediating the relationship between reading and math (Table 9), a
finding which is predictable from theoretical views of its involvement in a broad range of
cognitive tasks (Baddeley, 1996).
Our composite measure of oral language skills made an independent contribution to
explaining variation in math in both analyses (Table 7) and it was a significant mediator both
between basic calculation proficiency and math (Table 8) and between reading and math
(Table 9). This more clearly establishes the importance of oral language skills for math than
previous research. Durand et al. (2005) found verbal ability to be a major predictor of
variation in math, but the only number skill they assessed was simple number comparison. As
oral language skills correlate substantially with basic calculation and number system
knowledge (Cowan et al., 2005), their contribution to explaining diversity in math could have
been due to their association with these number skills. But the results of the present study

Running head: BASIC CALCULATION 37
show that this is not the case. Controlling for these factors did not eliminate the contribution
of oral language.
Cowan et al. (2005) reported that language comprehension frequently accounted for
more variation in number skills than working memory variables. However reading level was
not included in their study, making it uncertain whether the relationships observed were due
to covariation of both language and working memory with reading skills. The present study
helps disentangle these variables. It shows that oral language and working memory are each
important in their own right.
The analysis of factors mediating the relationship between reading and math was
successful in that the set of mediating factors completely accounted for the relationship
between reading and math. Unexpectedly, better readers are superior at maths not just
because of their superior language and memory skills. If this finding can be replicated, then
future research may usefully distinguish between the following explanations. The relationship
between reading and number skills might reflect the influence of reading or reading-related
processes, such as phonological processing, on number skills, the effect of environmental
variables such as parental support for educational achievement, or aspects of oral language
and working memory functioning not captured in the measures used.
It should be borne in mind that the relative importance of oral language skills and
reading may change with age. As children shift from learning to read to reading to learn,
mathematical learning may depend more on literacy.
How math is assessed may also determine the relative importance of reading and oral
language skills. In conventional classroom settings, reading skill is almost bound to impact
on mathematical ability, given standard methods of assessment of math. Group-administered
math tests, such as English National Curriculum Tests, make considerable demands on
children with respect to independent reading skills. In contrast, we used the WIAT

Running head: BASIC CALCULATION 38
Mathematics subtests which are individually administered. The only independent reading
demands made on the child are reading numerals and basic mathematical symbols in the
Numerical Operations subtest. The Mathematical Reasoning subtest we used does present the
child with text, but the tester reads it out.
In summary, the present study found that variation in math in 3rd grade was largely
predictable from 2nd grade assessments of both general cognitive abilities and specifically
math-related skills and knowledge. Although most variance was shared, language and two
components of working memory uniquely accounted for variance. Specific number skills
accounted for more. None of the three views of education considered here is fully supported.
Ignorance of basic number combinations is not the barrier to achievement in math that both
the traditional and conventional wisdom views predict. And contrary to the number sense
view, conceptual knowledge does not completely mediate the relationship between basic
calculation skill and math achievement.
With this study we have tried to throw some light on the connection between
proficiency in basic calculation and general attainment in math in elementary school children.
Our findings indicate that this connection is strong and cannot be explained by relations with
other factors identified as relevant to both. It is important to emphasise that our results do not
prove that the route to higher attainment in math is through developing basic calculation
proficiency. The opposite relation may well obtain. Improving children’s grasp of math may
bring about improvements in their basic calculation proficiency, either directly or through
leading them to engage in more calculations outside school, for example in playing games.
Just as better readers read more and so enhance their basic reading skills (Stanovich, 1986),
children who understand math better may use math more in everyday activities and so
enhance their basic calculation competence. This may also explain the results obtained in
studies of adults which indicate that even amongst college students, superior achievement in

Running head: BASIC CALCULATION 39
math is associated with greater basic calculation skill (Hecht, 2006; LeFevre, Sadesky, &
Bisanz, 1996). In attaining mathematical competence, children must draw on a wide range of
skills and knowledge. We show here that aspects of working memory (visuo-spatial
sketchpad and central executive functioning), linguistic competence and specific aspects of
numeracy all make unique contributions in development.

Running head: BASIC CALCULATION 40
References
Andersson, U., & Lyxell, B. (2007). Working memory deficit in children with mathematical
difficulties: A general or specific deficit. Journal of Experimental Child Psychology,
96, 197-228.
Askew, M. (1998). Teaching primary mathematics: A guide for newly qualified and student
teachers. London: Hodder & Stoughton.
Baddeley, A. (1996). Exploring the central executive. Quarterly Journal of Experimental
Psychology, 49A, 5-28.
Baddeley, A. D., & Hitch, G. J. (1974). Working memory. In G. A. Bower (Ed.), Recent
advances in learning and motivation (Vol. 8, pp. 47-90). New York: Academic Press.
Baroody, A. J. (1999). Children's relational knowledge of addition and subtraction. Cognition
and Instruction, 17, 137-175.
Baroody, A. J. (2003). The development of adaptive expertise and flexibility: The integration
of conceptual and procedural knowledge. In A. J. Baroody & A. Dowker (Eds.), The
development of arithmetic concepts and skills: Constructing adaptive expertise (pp. 1
- 33). Mahwah, NJ: Lawrence Erlbaum Associates.
Baroody, A. J. (2006, August). Why children have difficulty mastering the basic number
combinations and how to help them. Teaching Children Mathematics, 13, 22-31.
Baroody, A. J., & Ginsburg, H. P. (1986). The relationship between initial meaningful and
mechanical knowledge of arithmetic. In J. Hiebert (Ed.), Conceptual and procedural
knowledge: The case of mathematics (pp. 75-112). Hillsdale, NJ: Erlbaum.
Bishop, D. V. M. (2005). TROG-E: Test for Reception of Grammar -Version 2 (electronic).
Oxford: Harcourt Assessment.

Running head: BASIC CALCULATION 41
Bull, R., & Johnston, R. S. (1997). Children's arithmetical difficulties: Contributions from
processing speed, item identification, and short-term memory. Journal of
Experimental Child Psychology, 65, 1-24.
Cahan, S. & Cohen, N. (1989). Age versus schooling effects on intelligence development.
Child Development, 60, 1239-1249.
Cahan, S., Greenbaum, C., Artman, L., Deluy, N., & Gappel-Gilon, Y. (2008). The
differential effects of age and first grade schooling on the development of infralogical
and logico-mathematical concrete operations. Cognitive Development, 23, 258-277.
Campbell, D. T., & Kenny, D. A. (1999). A primer on regression artifacts. New York: The
Guilford Press.
Canobi, K. H., Reeve, R. A., & Pattison, P. E. (1998). The role of conceptual understanding
in children's addition problem solving. Developmental Psychology, 34, 882-891.
Case, R., Okamoto, Y., Griffin, S., McKeough, A., Bleiker, C., Henderson, B., & Stephenson,
K.M. (1996). The role of central conceptual structures in the development of
children's thought. Monographs of the Society for Research in Child Development, 61,
1-297.
Cowan, R. (2003). Does it all add up? Changes in children's knowledge of addition facts,
strategies, and principles. In A. J. Baroody & A. Dowker (Eds.), The development of
arithmetic concepts and skills: Constructing adaptive expertise (pp. 35-74). Mahwah,
NJ: Lawrence Erlbaum Associates.
Cowan, R., Donlan, C., Newton, E. J., & Lloyd, D. (2005). Number skills and knowledge in
children with specific language impairment. Journal of Educational Psychology, 97,
732-744.
De Vaus, D. (2002). Surveys in social research (5th ed.). London: Routledge.

Running head: BASIC CALCULATION 42
Department for Children Schools and Families (2007). Table 19. Maintained nursery and
primary schools (1): School meal arrangements (2) January 2007 by Local Authority
area and Government Office region in England. Retrieved from
http://www.dcsf.gov.uk/rsgateway/DB/SFR/s000744/index.shtml
Department for Education (2010a). Table 7a. Pupils with statements of special educational
needs (SEN) by type of school. Retrieved from
http://www.education.gov.uk/rsgateway/DB/SFR/s000925/index.shtml
Department for Education (2010b). Table 7b. Pupils with special educational needs (SEN)
without statements by type of school. Retrieved from
http://www.education.gov.uk/rsgateway/DB/SFR/s000925/index.shtml
Department for Education and Employment (1999). The National Numeracy Strategy.
Framework for teaching mathematics from Reception to Year 6. Cambridge:
Cambridge University Press.
Donlan, C., Cowan, R., Newton, E. J., & Lloyd, D. (2007). The role of language in
mathematical development: Evidence from children with Specific Language
Impairments. Cognition, 103, 23-33.
Dowker, A. (2005). Individual differences in arithmetic. Hove: Psychology Press.
Dunn, L. M., Dunn, L. M., Whetton, C., & Burley, J. (1997). The British Picture Vocabulary
Scale (2nd ed.). London: NFER-Nelson.
Durand, M., Hulme, C., Larkin, R., & Snowling, M. (2005). The cognitive foundations of
reading and arithmetic skills in 7-to 10-year-olds. Journal of Experimental Child
Psychology, 91, 113-136.
Field, A. (2009). Discovering statistics using SPSS (3rd ed.). London: Sage.
Fuchs, L. S., Fuchs, D., Compton, D. L., Powell, S. R., Seethaler, P. M., Capizzi, A. M.,
...Fletcher, J. M. (2006). The cognitive correlates of third-grade skill in arithmetic,

Running head: BASIC CALCULATION 43
algorithmic computation, and arithmetic word problems. Journal of Educational
Psychology, 98, 29-43.
Gathercole, S. E., & Pickering, S. J. (2000). Assessment of working memory in six- and
seven-year-old children. Journal of Educational Psychology, 92, 377-390.
Geary, D. C. (1993). Mathematical disabilities: Cognitive, neuropsychological and genetic
components. Psychological Bulletin, 114, 345-362.
Geary, D. C. (1994). Children's mathematical development: Research and practical
applications. Washington, DC: American Psychological Association.
Geary, D. C. (2004). Mathematics and learning disabilities. Journal of Learning Disabilities,
37, 4-15.
Geary, D. C., & Brown, S. C. (1991). Cognitive addition: Strategy choice, and speed-of-
processing differences in gifted, normal, and mathematically disabled children.
Developmental Psychology, 27, 398-406.
Geary, D. C., & Burlingham-Dubree, M. (1989). External validation of the strategy choice
model of addition. Journal of Experimental Child Psychology, 47, 175-192.
Geary, D. C., Hoard, M. K., Byrd-Craven, J., & DeSoto, M. C. (2004). Strategy choices in
simple and complex addition: Contributions of working memory and counting
knowledge for children with mathematical disability. Journal of Experimental Child
Psychology, 88, 121-151.
Geary, D. C., Hoard, M. K., Byrd-Craven, J., Nugent, L., & Numtee, C. (2007). Cognitive
mechanisms underlying achievement deficits in children with mathematical learning
disability. Child Development, 78, 1343-1359.
Gersten, R., Jordan, N. C., & Flojo, J. R. (2005). Early identification and interventions for
students with mathematics difficulties. Journal of Learning Disabilities, 38, 293-304.

Running head: BASIC CALCULATION 44
Griffin, S. (1997). Building conceptual bridges: Creating more powerful models to improve
mathematics learning and teaching. Year 2 report submitted to the James S.
McDonnell Foundation. Unpublished manuscript. Number Knowledge test available
from http://www.clarku.edu/numberworlds/nw_TestItems.htm.
Griffin, S. (2005). Fostering the development of whole-number sense: Teaching mathematics
in the primary grades. In M. S. Donovan & J. D. Bransford (Eds.), How students
learn: History, mathematics, and science in the classroom (pp. 257-308).
Washington, DC: The National Academies Press.
Groen, G. J., & Parkman, J. M. (1972). A chronometric analysis of simple addition.
Psychological Review, 79, 329-343.
Hanich, L. B., Jordan, N. C., Kaplan, D., & Dick, J. (2001). Performance across different
areas of mathematical cognition in children with learning difficulties. Journal of
Educational Psychology, 93, 615-626.
Hecht, S. A. (2006). Group differences in adult simple arithmetic: Good retrievers, not-so-
good retrievers, and perfectionists. Memory & Cognition, 34, 207-216.
Hecht, S. A., Torgesen, J. K., Wagner, R. K., & Rashotte, C. A. (2001). The relations
between phonological processing abilities and emerging individual differences in
mathematical computation skills: a longitudinal study from second to fifth grades.
Journal of Experimental Child Psychology, 79, 192-227.
Hitch, G. J. (1978). The numerical abilities of industrial trainee apprentices. Journal of
Occupational Psychology, 51, 163-176.
Hitch, G. J., Towse, J. N., & Hutton, U. (2001). What limits children's working memory
span? Theoretical accounts and applications for scholastic development. Journal of
Experimental Psychology: General, 130, 184-198.

Running head: BASIC CALCULATION 45
Jordan, N. C., Hanich, L. B., & Kaplan, D. (2003a). Arithmetic fact mastery in young
children: A longitudinal investigation. Journal of Experimental Child Psychology, 85,
103-119.
Jordan, N. C., Hanich, L. B., & Kaplan, D. (2003b). A longitudinal study of mathematical
competencies in children with specific mathematics difficulties versus children with
comorbid mathematics and reading difficulties. Child Development, 74, 834-850.
Jordan, N. C., Kaplan, D., Locuniak, M. N., & Ramineni, C. (2007). Predicting first-grade
math achievement from developmental number sense trajectories. Learning
Disabilities Research & Practice, 22, 36-46.
Jordan, N. C., Kaplan, D., Ramineni, C., & Locuniak, M. N. (2008). Development of number
combination skill in the early school years: when do fingers help? Developmental
Science, 11, 662-668.
Jordan, N. C., & Montani, T. O. (1997). Cognitive arithmetic and problem solving: A
comparison of children with specific and general mathematics difficulties. Journal of
Learning Disabilities, 30, 624-634.
Kail, R., & Hall, L. K. (1999). Sources of developmental change in children's word-problem
performance. Journal of Educational Psychology, 91, 660-668.
Kline, P. (1999). The handbook of psychological testing (2nd ed.). London: Routledge.
LeFevre, J., Sadesky, G. S., & Bisanz, J. (1996). Selection of procedures in mental addition:
Reassessing the problem-size effect in adults. Journal of Experimental Psychology:
Learning, Memory, and Cognition, 22, 216-230.
Meyer, M. L., Salimpoor, V. N., Wyu, S. S., Geary, D. C., & Menon, V. (2010). Differential
contribution of specific working memory components to mathematics achievement in
2nd and 3rd graders. Learning & Individual Differences, 20, 101-109.

Running head: BASIC CALCULATION 46
Montgomery, J. W., Magimairaj, B. M., & Finney, M. C. (2010). Working memory and
specific language impairment: an update on the relation and perspectives on assessment
and treatment. American Journal of Speech-Language Pathology, 19, 78-94.
Mullis, I. V. S., Martin, M. O., & Foy, P. (2009). TIMSS 2007 International Mathematics
Report: Findings from IEA's Trends in International Mathematics and Science Study
at the fourth and eighth grades (Revised ed.). Chestnut Hill, MA: TIMSS & PIRLS
International Study Center, Boston College.
Noble, M., McLennan, D., Wilkinson, K., Whitworth, A., Barnes, H., & Dibben, C. (2008).
The English indices of deprivation 2007. London: Communities and Local
Government Publications.
Pickering, S. J., & Gathercole, S. E. (2001). Working Memory Test Battery for Children
(WMTB-C). London: The Psychological Corporation.
Preacher, K. J., & Hayes, A. F. (2008). Asymptotic and resampling strategies for assessing
and comparing indirect effects in multiple mediator models. Behavior Research
Methods, 40, 879-891.
Reddick, M. (2010). Behaviour and alternative education review. Executive summary and
recommendations. Retrieved from
http://www.rbwm.gov.uk/public/meetings_100705_cslosp_behaviour_review_append
ix.pdf.
Reys, R. E., Suydam, M. N., Lindquist, M. M., & Smith, N. L. (1998). Helping children
learn mathematics (5th ed.). Boston: Allyn & Bacon.
Rittle-Johnson, B., & Siegler, R. S. (1998). The relation between conceptual and procedural
knowledge in learning mathematics: A review. In C. Donlan (Ed.), The development
of mathematical skills (pp. 75-110). Hove: Psychology Press.

Running head: BASIC CALCULATION 47
Russell, R. L., & Ginsburg, H. P. (1984). Cognitive analysis of children's mathematical
difficulties. Cognition and Instruction, 1, 217-244.
Savage, R., Lavers, N., & Pillay, V. (2007). Working memory and reading difficulties: What
we know and what we don't know about the relationship. Educational Psychology
Review, 19, 185-221.
Siegler, R. S. (1987a). The perils of averaging data over strategies: An example from
children's addition. Journal of Experimental Psychology General, 116, 250-264.
Siegler, R. S. (1987b). Strategy choices in subtraction. In J. A. Sloboda & D. Rogers (Eds.),
Cognitive processes in mathematics (pp. 81-106). Oxford: Clarendon.
Siegler, R. S. (1988). Individual differences in strategy choices: Good students, not-so-good
students, and perfectionists. Child Development, 59, 833-851.
Siegler, R. S. (1996). Emerging minds: The process of change in children's thinking. Oxford:
Oxford University Press.
Siegler, R. S. (2003). Implications of cognitive science research for mathematics education.
In J. Kilpatrick, W. B. Martin & D. E. Schifter (Eds.), A research companion to skills
and standards for school mathematics. Reston, VA: NCTM.
Siegler, R. S., & Shipley, C. (1995). Variation, selection, and cognitive change. In T. Simon
& G. Halford (Eds.), Developing cognitive competence: New approaches to process
modelling (pp. 31-76). Hillsdale, NJ: Erlbaum.
Siegler, R. S., & Shrager, J. (1984). Strategy choices in addition and subtraction: How do
children know what to do? In C. Sophian (Ed.), Origins of cognitive skills (pp. 229-
293). Hillsdale, NJ: Lawrence Erlbaum Associates.
Siegler, R. S., & Stern, E. (1998). Conscious and unconscious strategy discoveries: A
microgenetic analysis. Journal of Experimental Psychology: General, 127, 377-397.

Running head: BASIC CALCULATION 48
Stanovich, K. E. (1986). Matthew effects in reading: Some consequences of individual
differences in the acquisition of literacy. Reading Research Quarterly, 21, 360-407.
Swanson, H. L. (1992). Generality and modifiability of working memory among skilled and
less skilled readers. Journal of Educational Psychology, 84, 473-488.
Torgesen, J. K., Wagner, R. K., & Rashotte, C. A. (1999). Test of Word Reading Efficiency.
Austin, TX: Pro-Ed.
Wechsler, D. (1992). Wechsler Intelligence Scale for Children- Third UK edition. London:
The Psychological Corporation.
Wechsler, D. (2005). Wechsler Individual Achievement Test - Second UK Edition (WIAT-
IIUK
). Oxford: Harcourt Assessment.
Woodcock, R. W., McGrew, K. S., & Mather, N. (2001). Woodcock-Johnson III Tests of
Cognitive Abilities. Itasca, IL: Riverside Publishing.

Running head: BASIC CALCULATION 49
Table 1
Descriptive Statistics for Number, Cognitive, and Achievement Composites and Constituent
Measures
Domain, Composite, Constituents Constituent
Ranges
M SD Reliability
Number
Grade 2 basic calculation proficiency 5.00 1.95
Forced retrieval 0 - 27 12.64 6.85 .92
Strategies 0 - 16 6.91 5.31 -
Grade 3 basic calculation proficiency 5.00 1.93
Forced retrieval 0 – 28 16.30 6.49 .92
Strategies 0 - 16 9.64 5.15 -
Grade 2 calculation principles 5.00 1.93
Derived facts 0 - 12 4.32 3.00 .79
Explaining patterns 0 - 18 15.39 3.07 .83
Grade 3 calculation principles 5.06 1.94
Derived facts 0 - 12 6.53 2.89 .78
Explaining patterns 0 - 18 16.83 2.25 .84
Grade 2 number system knowledge 4.99 1.95
Number knowledge 5 – 24 17.44 4.11 .82
Count sequences 0 - 18 10.05 4.51 .89
Grade 3 number system knowledge 4.98 1.92
Number knowledge 4 - 24 19.75 3.43 .81
Count sequences 1 - 18 13.44 4.05 .88
Cognitive
WM PL 5.00 1.95
Digit Recall 12 - 40 27.17 3.93 .85
Word List Recall 9 - 30 19.50 3.40 .82
WM VSSP 5.00 1.93
Block Recall 1 - 35 23.07 4.20 .85
Mazes Memory 0 - 29 12.57 6.65 .92
WM CE 4.99 1.94
Backwards Digit Recall 0 - 23 11.26 3.70 .84
Listening Recall 0 - 19 10.34 3.31 .82
Processing Speed 5.00 1.95
Symbol Matching 0 - 29 17.58 4.49 -
Pair Cancellation 14 - 68 37.79 9.82 -
Oral Language 5.00 1.95
TROG-E 0 - 19 13.42 3.48 .78
BPVS II 9 - 124 86.20 13.43 .93
BPVS II Standard Score 63 - 140 105.51 11.84
Achievement
Reading 5.00 1.95
Sight Word Efficiency 2 - 86 62.08 13.00 .96
Phonemic Decoding Efficiency 0 - 55 29.17 12.21 .95

Running head: BASIC CALCULATION 50
Mathematics 5.00 1.96
WIAT Numerical Operations 7 - 35 19.12 4.83 .87
WIAT Mathematical Reasoning 10 - 57 38.63 7.64 .91
WIAT Math Composite Standard
Score
42 - 154 102.07 18.15
Note. N = 259 for all measures. Ranges for all composites are 1 – 9. Measure of reliability is
Cronbach’s alpha.
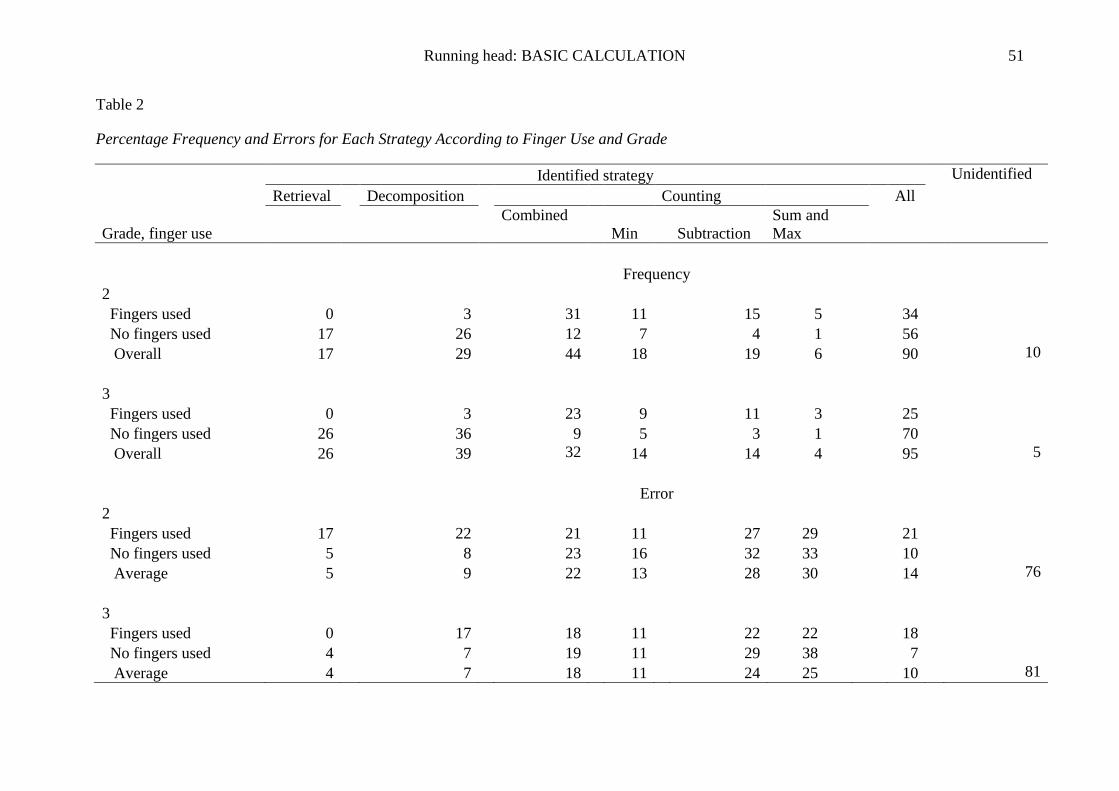
Running head: BASIC CALCULATION 51
Table 2
Percentage Frequency and Errors for Each Strategy According to Finger Use and Grade
Identified strategy Unidentified
Retrieval
Decomposition
Counting All
Grade, finger use
Combined
Min
Subtraction
Sum and
Max
Frequency
2
Fingers used 0
3 31
11
15 5 34
No fingers used 17
26 12
7
4 1 56
Overall 17
29 44
18
19 6 90 10
3
Fingers used 0
3 23
9
11 3 25
No fingers used 26
36 9
5
3 1 70
Overall 26
39 32
14
14 4 95 5
Error
2
Fingers used 17
22 21
11
27 29 21
No fingers used 5
8 23
16
32 33 10
Average 5
9 22
13
28 30 14 76
3
Fingers used 0
17 18
11
22 22 18
No fingers used 4
7 19
11
29 38 7
Average 4
7 18
11
24 25 10 81

Running head: BASIC CALCULATION 52
Note. Frequencies and error rates are rounded to the nearest whole number percentage. There were a very small number of trials when fingers
were used in conjunction with retrieval (Grade 2, 12; Grade 3, 2). Frequencies sum to 100 within a grade. Combined counting frequencies are
the sum of individual counting strategy frequencies. Subtraction combines both counting up and counting down: counting up was identified in
less than 1% of trials in both grades. All is the aggregate of all identified strategies. Average error rates for individual strategies and aggregates
are weighted according to frequencies of finger use and nonuse.

Running head: BASIC CALCULATION 53
Table 3
Overall Relations between Correct Strategy Execution in Grade 2 and Grade 3
Grade 2
Correct strategy use
Incorrect
Grade 3 Retrieval Decomposition Min Subtraction Sum and Max
Correct
Retrieval 68 25 13 15 9 8
Decomposition 24 62 30 27 15 25
Min 4 4 43 40 10
Subtraction 2 3 41 17
Sum and Max 0 1 5 14 3
Unidentified 0 0 0 1 3 2
Incorrect 2 5 9 16 19 35
Note. Figures in columns are percentages of Grade 2 categories.

Running head: BASIC CALCULATION 54
Table 4
Correlations between Variables and Partial Correlations between Grade 2 and 3 Number Variables
1 2 3 4 5 6 7 8 9 10 11 12 13
Age .09 .12**
.16**
.26**
.20**
.24**
.19**
.25**
.20**
.19**
.23**
.15**
.29**
1. WM PL
.30**
.46**
.36**
.48**
.42**
.37**
.30**
.36**
.40**
.24**
.34**
.44**
2. WM VSSP
.42**
.46**
.32**
.36**
.40**
.36**
.39**
.38**
.38**
.18**
.47**
3. WM CE
.47**
.45**
.54**
.49**
.50**
.50**
.48**
.45**
.36**
.60**
4. Processing speed
.44**
.59**
.54**
.44**
.57**
.56**
.40**
.42**
.59**
5. Oral language
.46**
.46**
.40**
.45**
.49**
.43**
.26**
.57**
6. Grade 2 basic calculation
.73**
.74**
.88**
.70**
.67**
.41**
.84**
7. Grade 2 calculation principles
.52**
.60**
.71**
.69**
.56**
.44**
.72**
8. Grade 2 number system knowledge
.60**
.37**
.70**
.65**
.80**
.29**
.75**
9. Grade 3 basic calculation
.79**
.51**
.54**
.71**
.69**
.41**
.83**
10. Grade 3 calculation principles
.46**
.47**
.46**
.49**
.61**
.47**
.73**
11. Grade 3 number system knowledge
.53**
.34**
.71**
.55**
.43**
.30**
.73**
12. Grade 3 Reading
.42**
13. Grade 3 Mathematics
Note. N = 259. All variables are composites. Age is composite of chronological age and school month at time of testing. Zero-order correlations
are above the diagonal. Below the diagonal are the partial correlations (251 df ) which control for age and general cognitive factors (WM PL,
WMVSSP, WM CE, processing speed, and oral language).
* p < .05. ** p < .01.

Running head: BASIC CALCULATION 55
Table 5
Summary of Multiple Regressions of Basic Calculation Proficiency in Grade 2 and 3 onto
Conceptual Knowledge and Cognitive Factors
Grade
2 3
Predictor ΔR2
β ΔR2
β
Step 1 .06*** 04**
Age -.24** -.20**
Step 2 .62*** .56***
Age -.03 -.02
Calculation principles -.44*** -.45***
Number system knowledge -.47*** -.41***
Step 3 .04*** .04***
Age -.01 -.01
Calculation principles -.33*** -.31***
Number system knowledge -.42*** -.39***
WM PL -.09* -.04
WM VSSP -.06 -.01
WM CE -.05 -.06
Processing speed -.19*** -.21***
Oral language -.01 -.00
Total R2 .71*** .65***
Note. Predictors and dependent variables are composites. Calculation principles and number
system knowledge predictors are from same grade as dependent.
* p < .05. ** p < .01. *** p < .001.

Running head: BASIC CALCULATION 56
Table 6
Summary of Multiple Regressions of Grade 3 Basic Calculation Proficiency and Conceptual
Knowledge onto Grade 2 Control and Number Variables
Basic
calculation
proficiency
Calculation
principles
Number system
knowledge
Predictor ΔR2
β ΔR2
β ΔR2
β
Step 1 .42*** .43*** .32***
Control factorsa
Step 2 .37*** .19*** .36***
Basic calculation
proficiency
.69*** .16* .17*
Calculation principles .12** .29*** .04
Number system
knowledge
.09* .24*** .62***
Total R2 .79*** .62*** .68***
Note. Predictors and dependent variables are composites.
a Control factors included age, WM PL, WM VSSP, WM CE, processing speed, and oral
language.
* p < .05. ** p < .01. *** p < .001.

Running head: BASIC CALCULATION 57
Table 7
Summary of Simultaneous Multiple Regressions of Grade 3 Mathematics Achievement onto
Age, Cognitive Factors, Reading and Number Variables from Grade 2 and Grade 3
Number variables grade
2
3
Variable B 95% C1 sr2
B 95% C1 sr2
Age -.06 [-0.00, 0.12]
.08* [0.02, 0.13] .01
Cognitive
WM PL -.00 [-0.07, 0.07]
.03 [-0.04, 0.10]
WM VSSP -.11** [0.04, 0.18] .01 .07* [0.01, 0.14] .00
WM CE -.08* [0.01, 0.15] .00 .12** [0.05, 0.19] .01
Processing speed .00 [-0.08, 0.08]
.02 [-0.06, 0.09]
Oral language -.15*** [0.08, 0.22] .01 .12** [0.05, 0.19] .01
Reading -.04 [-0.03, 0.10]
.01 [-0.05, 0.08]
Number
Basic calculation proficiency -.45*** [0.35, 0.56] .06 .45*** [0.36, 0.54] .07
Calculation principles -.10* [0.02, 0.19] .00 .14** [0.05, 0.22] .01
Number system knowledge -.19*** [0.11, 0.28] .02 .18*** [0.10, 0.26] .01
R2
.81
.81
F 106.18***
107.95***
Note. N = 259. Predictors and dependent variables are composites.
* p < .05. ** p < .01. *** p < .001.

Running head: BASIC CALCULATION 58
Table 8
Mediation of the Relation between Grade 2 Basic Calculation Proficiency and Grade 3
Mathematics Achievement through Age, Cognitive Factors, Reading and Grade 2 Conceptual
Knowledge
Product of Coefficients
95% CI
Variable
Point
Estimate SE
Z
LL UL
Age 0.01 0.01
-1.65
-0.00 0.03
WM PL -0.00 0.01
-0.09
-0.03 0.03
WM VSSP 0.04 0.01
-2.86**
0.02 0.07
WM CE 0.04 0.02
-2.09*
0.01 0.08
Processing speed 0.00 0.02
-0.04
-0.05 0.05
Oral language 0.07 0.02
-3.83***
0.04 0.11
Reading 0.02 0.01
-1.15
-0.01 0.05
Calculation principles 0.07 0.03
-2.30*
0.00 0.14
Number system knowledge 0.14 0.03
-4.31***
0.08 0.22
Total indirect effects 0.40 0.05
-7.99***
0.30 0.50
Note. Predictors and dependent variables are composites. Confidence intervals are bias
corrected and accelerated. They were generated using Preacher and Hayes’s (2008) SPSS
Macro for Multiple Mediation with 5000 bootstrap samples. Percentile and bias corrected
confidence intervals were also generated and were essentially identical.
* p < .05. ** p < .01. *** p < .001.

Running head: BASIC CALCULATION 59
Table 9
Mediation of the Relation between Grade 3 Reading and Mathematics Achievement through
Age, Cognitive Factors, and Grade 3 Number Measures
Product of coefficients 95% CI
Variable
Point
Estimate SE
Z
LL UL
Age 0.01 0.01 1.72 0.00 0.03
WM PL 0.01 0.01 0.90 -0.01 0.04
WM VSSP 0.01 0.01 1.71 0.00 0.03
WM CE 0.04 0.02 2.84** 0.02 0.08
Processing speed 0.01 0.02 0.38 -0.03 0.04
Oral language 0.03 0.01 2.64** 0.01 0.06
Basic calculation proficiency 0.18 0.03 5.67*** 0.12 0.25
Calculation principles 0.06 0.02 2.91** 0.02 0.11
Number system knowledge 0.05 0.02 3.21** 0.03 0.09
Total indirect effects 0.41 0.05 8.01*** 0.31 0.51
Note. Predictors and dependent variables are composites. Confidence intervals are bias
corrected and accelerated. They were generated using Preacher and Hayes’s (2008) SPSS
Macro for Multiple Mediation with 5000 bootstrap samples. Percentile and bias corrected
confidence intervals were also generated and were essentially identical.
* p < .05. ** p < .01. *** p < .001.