Report No Waters Proficiency Te Round
42
SD 9.17. W - Tot PTA wis Dr M B Proficie and dist .11 Waters tal Kje shes to gra Buckley-Smi ency Ltd (Ne tribution of t P R s Pro R eldah D atefully ackn ith, Global ew Zealand the samples © Copyrig PO Box 750 Repor oficien Roun hl Nitro Decem Ack nowledge th Proficiency d) and to G s. ght Profici 07 SILVER rt No. ncy T nd No ogen, mber knowledgm he technica y Ltd (New Global Profi iency Tes RWATER N . 1006 Testin o. 203 , Tota r 2016 ments al assistance Zealand). iciency Pty sting Austr NSW 212 6 ng Pr 3 al Pho 6 e provided Also our th Ltd (Austra ralia, 2016 28, Austral rogra osphor for this pro hanks go to alia) for the 6 alia am rus - ogram by o Global e supply
-
Upload
khangminh22 -
Category
Documents
-
view
0 -
download
0
Transcript of Report No Waters Proficiency Te Round

SD 9.17.11
Waters Proficiency Testing
- Total Kjeldahl
PTA wishes to gratefully acknowledge the technical assistance provided for this program by Dr M BuckleyProficiency Ltd (New Zealand) and to Global Proficiency Pty Ltd (Australia) for the supply and distribution of the samples.
SD 9.17.11
Waters Proficiency Testing
Total Kjeldahl
PTA wishes to gratefully acknowledge the technical assistance provided for this program by Dr M Buckley-Smith, GlobaProficiency Ltd (New Zealand) and to Global Proficiency Pty Ltd (Australia) for the supply and distribution of the samples.
PO Box 7507
Report No
Waters Proficiency Testing
Round
Total Kjeldahl
December 2016
PTA wishes to gratefully acknowledge the technical assistance provided for this program by Smith, Global Proficiency Ltd (New Zealand)
Proficiency Ltd (New Zealand) and to Global Proficiency Pty Ltd (Australia) for the supply and distribution of the samples.
© Copyright
PO Box 7507
Report No
Waters Proficiency Testing
Round
Total Kjeldahl Nitrogen, Total Phosphorus
December 2016
Acknowledgments
PTA wishes to gratefully acknowledge the technical assistance provided for this program by l Proficiency Ltd (New Zealand)
Proficiency Ltd (New Zealand) and to Global Proficiency Pty Ltd (Australia) for the supply and distribution of the samples.
© Copyright Proficiency Testing Australia
PO Box 7507 SILVERWATER
Report No .
Waters Proficiency Testing
Round No.
Nitrogen, Total Phosphorus
December 2016
Acknowledgments
PTA wishes to gratefully acknowledge the technical assistance provided for this program by l Proficiency Ltd (New Zealand)
Proficiency Ltd (New Zealand) and to Global Proficiency Pty Ltd (Australia) for the supply
Proficiency Testing Australia
ILVERWATER NSW
. 1006
Waters Proficiency Testing
o. 203
Nitrogen, Total Phosphorus
December 2016
Acknowledgments
PTA wishes to gratefully acknowledge the technical assistance provided for this program by l Proficiency Ltd (New Zealand).
Proficiency Ltd (New Zealand) and to Global Proficiency Pty Ltd (Australia) for the supply
Proficiency Testing Australia
NSW 2128
1006
Waters Proficiency Testing Program
203
Nitrogen, Total Phosphorus
December 2016
PTA wishes to gratefully acknowledge the technical assistance provided for this program by . Also our thanks go to Global
Proficiency Ltd (New Zealand) and to Global Proficiency Pty Ltd (Australia) for the supply
Proficiency Testing Australia , 2016
2128, Australia
Program
Nitrogen, Total Phosphorus
PTA wishes to gratefully acknowledge the technical assistance provided for this program by Also our thanks go to Global
Proficiency Ltd (New Zealand) and to Global Proficiency Pty Ltd (Australia) for the supply
2016
, Australia
Program
Nitrogen, Total Phosphorus -
PTA wishes to gratefully acknowledge the technical assistance provided for this program by Also our thanks go to Global
Proficiency Ltd (New Zealand) and to Global Proficiency Pty Ltd (Australia) for the supply
SD 9.17.11
CONTENTS
1. Foreword ............................................................................................................................ 1
2. Program Features and Design ........................................................................................... 1
3. Statistical Format ............................................................................................................... 2
4. PTA and Technical Adviser’s Comments .......................................................................... 4
5. Outlier Results ................................................................................................................. 14
6. References ...................................................................................................................... 14
APPENDIX A – Results and Data Analysis
Total Kjeldahl Nitrogen (TKN) ............................................................................................... A1
Total Phosphorus (TP) .......................................................................................................... A7
APPENDIX B – Sample Homogeneity and Stability
Homogeneity and Stability Testing ........................................................................................ B1
APPENDIX C – Documentation
Instructions to Participants .................................................................................................... C1
Method Codes ....................................................................................................................... C3
Results Sheet ........................................................................................................................ C6

1
SD 9.17.11
1. Foreword
This report summarises the results of a proficiency testing program on the determination of Total Kjeldahl Nitrogen and Total Phosphorus in waters. This is round 203 in a planned series of programs involving the analysis of chemical and physical parameters of waters. The exercise was conducted in October 2016 by Proficiency Testing Australia (PTA). The main aim of the program was to assess laboratories’ abilities to competently perform the prescribed analyses. The Program Coordinator was Mrs D Mihaila and the Technical Adviser was Dr M Buckley-Smith, Global Proficiency Ltd (New Zealand). This report was authorised by Mrs K Cividin, PTA Quality Coordinator / Senior Scientific Officer.
2. Program Features and Design 2.1 Each laboratory was randomly allocated a unique code number for the program to
ensure confidentiality of results. Reference to each laboratory in this report is by code number only.
2.2 Laboratories were provided with the "Instructions to Participants" and "Results Sheet"
(see Appendix C). Laboratories were requested to perform the tests according to their routine methods.
2.3 Participants were provided with three plastic vials (labelled PTA 1, PTA 2 and PTA 3)
containing artificial potable water concentrates for testing of Total Kjeldahl Nitrogen and Total Phosphorus.
2.4 A total of 27 laboratories received samples, comprising:
- 22 Australian participants; and
- 5 overseas participants, including:
- Indonesia (2), Malaysia (1), Singapore (1), Vietnam (1). Of these 27 laboratories, one was unable to submit results by the due date. 2.5 Results (as reported by participants) with corresponding summary statistics (i.e.
number of results, median, normalised interquartile range, uncertainty of the median, robust coefficient of variation, minimum, maximum and range) are presented in Appendix A (for each sample and for each of the analyses performed).
2.6 A robust statistical approach, using z-scores, was utilised to assess laboratories’
testing performance (see Section 3). Robust z-scores and ordered z-score charts relevant to each test are presented in Appendix A. The document entitled Guide to Proficiency Testing Australia, 2016 (reference [1]) defines the statistical terms and details the statistical procedures referred to in this report.
2
SD 9.17.11
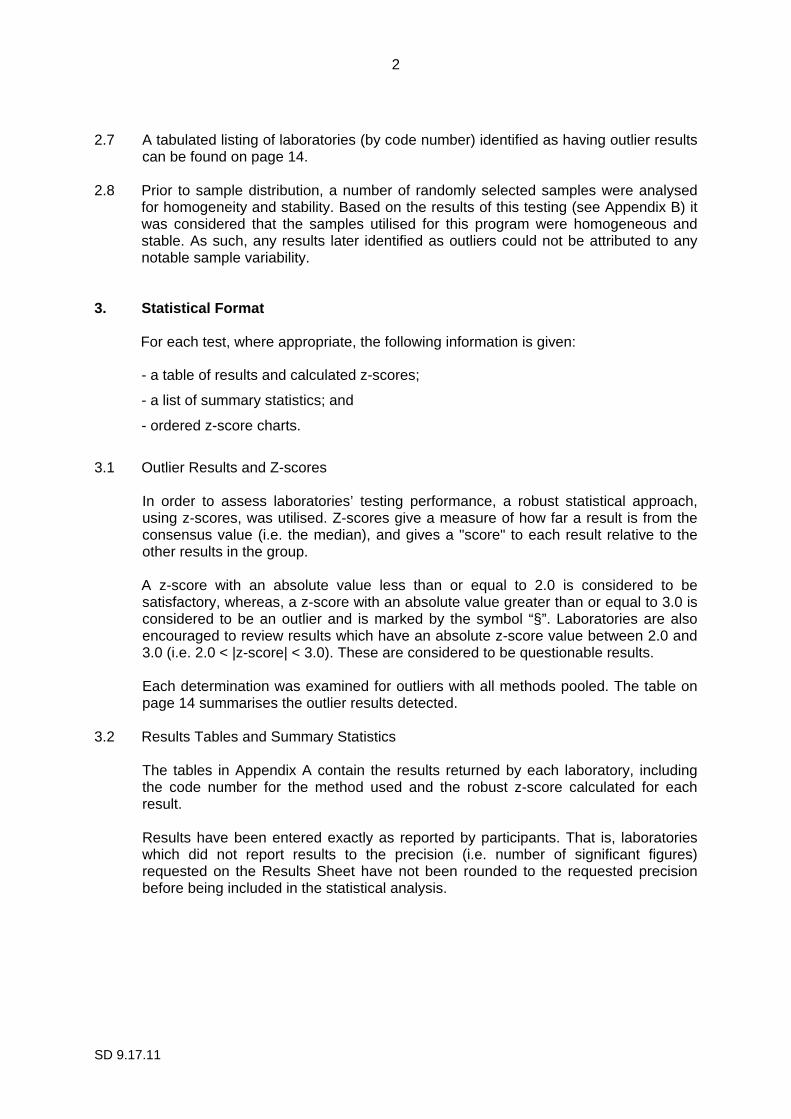
2.7 A tabulated listing of laboratories (by code number) identified as having outlier results can be found on page 14.
2.8 Prior to sample distribution, a number of randomly selected samples were analysed
for homogeneity and stability. Based on the results of this testing (see Appendix B) it was considered that the samples utilised for this program were homogeneous and stable. As such, any results later identified as outliers could not be attributed to any notable sample variability.
3. Statistical Format
For each test, where appropriate, the following information is given:
- a table of results and calculated z-scores;
- a list of summary statistics; and
- ordered z-score charts.
3.1 Outlier Results and Z-scores In order to assess laboratories’ testing performance, a robust statistical approach,
using z-scores, was utilised. Z-scores give a measure of how far a result is from the consensus value (i.e. the median), and gives a "score" to each result relative to the other results in the group.
A z-score with an absolute value less than or equal to 2.0 is considered to be satisfactory, whereas, a z-score with an absolute value greater than or equal to 3.0 is considered to be an outlier and is marked by the symbol “§”. Laboratories are also encouraged to review results which have an absolute z-score value between 2.0 and 3.0 (i.e. 2.0 < |z-score| < 3.0). These are considered to be questionable results.
Each determination was examined for outliers with all methods pooled. The table on
page 14 summarises the outlier results detected. 3.2 Results Tables and Summary Statistics The tables in Appendix A contain the results returned by each laboratory, including
the code number for the method used and the robust z-score calculated for each result.
Results have been entered exactly as reported by participants. That is, laboratories
which did not report results to the precision (i.e. number of significant figures) requested on the Results Sheet have not been rounded to the requested precision before being included in the statistical analysis.

3
SD 9.17.11
A list of summary statistics appears at the bottom of each of the results tables and consists of:
- No. of Results: the total number of results for that test/sample;
- Median: the middle value of the results;
- Normalised IQR: the normalised interquartile range of the results;
- Uncertainty of the Median: a robust estimate of the standard deviation of the Median;
- Robust CV: the robust coefficient of variation expressed as a percentage, i.e. 100 x Normalised IQR / Median;
- Minimum: the lowest laboratory result;
- Maximum: the highest laboratory result; and
- Range: the difference between the Maximum and Minimum.
The median is a measure of the centre of the data. The normalised IQR is a measure of the spread of the results. It is calculated by multiplying the interquartile range (IQR) by a correction factor, which converts the IQR to an estimate of the standard deviation. The IQR is the difference between the upper and lower quartiles (i.e. the values above and below which a quarter of the results lie, respectively). For normally distributed data, the uncertainty of the median is approximated by:
��2 ������
√�
� = number of results. Please see reference [1] for further details on these robust summary statistics.
3.3 Ordered Z-score Charts The charts in Appendix A indicate each laboratory's robust z-score, in order of
magnitude, marked with its laboratory code number. From these charts, each laboratory can readily compare its performance relative to the other laboratories.
These charts contain solid lines at +3.0 and -3.0, so that outliers are clearly
identifiable as those laboratories whose "bar" extends beyond these "cut-off" lines. The y-axis of these charts has been limited, so very large z-scores appear to extend beyond the chart boundary.

4
SD 9.17.11
4. PTA and Technical Adviser’s Comments 4.1 Metrological Traceability and Uncertainty of Assigned Values
Consensus values (median) derived from participants’ results are used in this program. These values are not metrologically traceable to an external reference. Sample preparation was undertaken according to Global Proficiency Ltd’s Standard Operating Procedures to ensure samples were fit-for-purpose, homogeneous and stable. Solutions were stable and homogeneous, and medians obtained from this proficiency round were in consistent agreement with the expected levels (dope concentration), as shown in Table 1. Average recoveries were similar to those published in APHA 4500-Norg B (Macro-Kjeldahl) and APHA 4500-Norg D (Block Digestion – Flow Injection Analysis, FIA). Samples PTA 1 and PTA 2 were prepared from Ammonium Chloride, Sulphanilamide and Potassium Dihydrogen Orthophosphate in distilled water. Sample PTA 3 was prepared from Nicotinic Acid and Tetra Potassium Pyrophosphate in distilled water. All samples were preserved with Sulphuric Acid. The sample format was designed so that two samples had unbound target analyte, with a more challenging third sample which had organically bound analyte, requiring rigorous digestion prior to being analysed. This was intended to provide more realistic and demanding samples for analysis while maintaining homogeneity and stability, continuity with previous rounds, and challenging the ability to troubleshoot any problems. As the assigned value for each analyte in this program is the median of the results submitted by the participants, the uncertainty of the median for each analyte has been calculated and is presented in Table 1 below, together with the average analyte recovery data. Table 1. Comparison of expected levels (dope concentration) and proficiency medians. The values of the calculated uncertainty of the median are also presented.
Analyte Sample Dope
Concentration (mg/L)
Median (mg/L)
Analyte Recovery
(%)
Uncertainty of the median
(mg/L)
Total Kjeldahl Nitrogen
PTA 1 9.5 9.320 98.1% 0.167 [1.8%]
PTA 2 45 43.10 95.8% 0.42 [1.0%]
PTA 3 20 19.00 95.0% 1.10 [5.8%]
Total Phosphorus
PTA 1 8 8.000 100.0% 0.062 [0.8%]
PTA 2 1.5 1.460 97.3% 0.011 [0.8%]
PTA 3 4 4.210 105.3% 0.065 [1.5%]

5
SD 9.17.11
4.2 Analysis of Round 203 Results 4.2.1 Total Kjeldahl Nitrogen (TKN) Table 2 compares the TKN medians and robust CVs from this round to those obtained in previous PTA rounds. These CV were higher than those published in APHA 4500 – Norg B (Macro-Kjeldahl), where repeatability relative standard deviations (RSD) were between 0.84%-3.46% for concentration ranges of 5-20 mg/L. APHA 4500 – Norg D (Block Digestion-FIA) published RSD of between 3.3%-7.3%, which were closer to CVs observed in this round. Table 2. Comparison of current round variability and proficiency medians of TKN testing with the results of the previous two rounds.
Round Sample Median (mg/L) Robust CV (%) No. of Res ults
This study
PTA 1 9.320 7.2 25
PTA 2 43.10 3.9 25
PTA 3 19.00 22.2 23
Report 938
PTA 1 7.070 6.2 22
PTA 2 33.90 5.6 24
PTA 3 14.30 8.3 23
Report 815
PTA 1 8.235 5.2 28
PTA 2 25.50 7.8 28
PTA 3 11.40 13.9 27
A considerable increase in CV was observed for the more challenging sample PTA 3 (22.2%) when compared to the more easily digestible samples PTA 1 and PTA 2 (7.2% and 3.9%, respectively). If the grossly under recovered results (<50% recovery) were removed from statistical analysis of TKN results for sample PTA 3, the CV would reduce to a more realistic value of 10.5%. Bias / Accuracy
TKN testing was successfully performed, with satisfactory results (|z-scores| ≤ 2.0) ranging between 8.43 – 10.2 mg/L for sample PTA 1, 41.7 – 44.7 mg/L for sample PTA 2 and 13.9 – 26.6 mg/L for sample PTA 3. Out of 25 participants for sample PTA 1, two questionable results (2.0 < |z-scores| < 3.0) were obtained (laboratories 473 and 526). For sample PTA 2, out of 25 participants, one questionable result was obtained (laboratory 445) and for sample PTA 3, out of 23 participants, two questionable results were obtained (laboratories 213 and 603). Five outlier results (|z-scores| ≥ 3.0) were obtained for sample PTA 1 requiring follow-up action by laboratories 233, 345, 407, 498 and 603. Six outlier results were obtained for sample PTA 2, requiring follow-up action by laboratories 181, 233, 345, 473, 579 and 603. Four outlier results were obtained for sample PTA 3, requiring follow-up action by laboratories 129, 181, 400 and 467.

6
SD 9.17.11
Figure 1. Spread of results for TKN testing of sample PTA 1, with a median concentration of 9.320 mg/L.
Figure 2. Spread of results for TKN testing of sample PTA 2, with a median concentration of 43.10 mg/L.
0
2
4
6
8
10
12
3 4 5 6 7 8 9 10 11 12 13 14 15 16
Fre
quen
cy
Results (mg/L)
Total Kjeldahl Nitrogen - Sample PTA 1
APHA 4500 – Norg B.
APHA 4500 – Norg C.
APHA 4500 – Norg D.
US EPA 351.1 - 351.4
ISO 11905–1:1997
Calculation
Other
APHA 4500 – NH₃ H.
Modified StandardMethod
0
2
4
6
8
10
12
24 26 28 30 32 34 36 38 40 42 44 46 48 50
Fre
quen
cy
Results (mg/L)
Total Kjeldahl Nitrogen - Sample PTA 2
APHA 4500 – Norg B.
APHA 4500 – Norg C.
APHA 4500 – Norg D.
US EPA 351.1 - 351.4
ISO 11905–1:1997
Calculation
Other
APHA 4500 – NH₃ H.
Modified StandardMethod
<

7
SD 9.17.11
Figure 3. Spread of results for TKN testing of sample PTA 3, with a median concentration of 19.00 mg/L. The TKN datasets formed a normal distribution with no significant bias attributable to any digestion / analysis method (Figures 1 to 3). The most frequently used method to determine TKN was APHA 4500 – Norg B (Macro-Kjeldahl), which was used by approximately 30-32% of participants. Calculation methods (TN – NOx = TKN) were used by approximately 24-26% of participants. It is recommended that laboratories who recovered less than 50% of the 20 mg/L nicotinic acid doped into sample PTA 3 (Laboratories 129, 181, 213 and 603), follow up on the Quality Control (QC) procedures recommended in APHA 4020 B and Table 4020:I, including mandatory Method blanks, Laboratory Fortified Blanks, Laboratory Fortified Matrix and Duplicates every 20th sample, or batch of samples tested. For troubleshooting and ongoing QC, section APHA 4500-Norg A 4 recommends the use of known additions of nicotinic acid to determine nitrogen recovery and the completeness of digestion, and known additions of ammonium chloride to test for loss of nitrogen. Laboratory 400 reported satisfactory results for samples PTA 1 and PTA 2, and outlier results for sample PTA 3 (for both TKN and TP). After investigation, it was found that TKN in samples PTA 1 and PTA 2 was analysed using Block Digestion – FIA, whereas the results reported for sample PTA 3 were obtained by Macro-Kjeldahl technique. A dilution error in preparation of sample PTA 3 was found to be the cause of these outlier results. Published precision information in APHA 4500-Norg D (Block Digestion – FIA) indicated that recoveries of between 81% - 119% for influent and effluent type matrices are achievable for the FIA method. APHA 4500-Norg B (Macro-Kjeldahl) indicated recoveries of between 84.3% - 112% were achievable for nicotinic acid.
0
1
2
3
4
5
6
7
8
3 5.5 8 10.5 13 15.5 18 20.5 23 25.5 28 30.5 33 35.5
Fre
quen
cy
Results (mg/L)
Total Kjeldahl Nitrogen - Sample PTA 3
APHA 4500 – Norg B.
APHA 4500 – Norg C.
APHA 4500 – Norg D.
US EPA 351.1 - 351.4
ISO 11905–1:1997
Calculation
Other
APHA 4500 – NH₃ C.
Modified StandardMethod
/ >

8
SD 9.17.11
Catalyst
The move away from use of Mercury as a catalyst for Kjeldahl digestion, because of its toxicity and legal disposal issues, has been widely implemented. A large number of participants in this round (approximately 40-44%) used the Copper catalyst in the digestion of TKN, with a small number of laboratories reporting Persulphate, Selenium, Sodium Nitroferricyanide or other catalysts. APHA 4500-Norg A 4 indicates that effective digestion results can be obtained using a salt/acid ratio of 1 g/mL with copper; and if a change is made in the reagent formula, it is important to report the change and indicate the percentage recovery relative to the results for similar samples analysed using the previous formula. Carrying out the demonstration of capability indicated in APHA 4020 B 1a or method validation in APHA 1040 B, are also recommended for any modifications to standard methods. Final Ammonia Method
The most frequently used final Ammonia method in this round was the titrimetric method (APHA 4500 – NH3 C), which was used by approximately 16-22% of participants. A relatively large number of laboratories (approximately 38%) did not report the final Ammonia method. This could be at least in part attributed to the sample analysis procedures being included with the digestion procedures in some methods. APHA recommends the use of titration, ammonia selective electrode, manual phenate or automated phenate methods (APHA 4500-NH3. C, D, F, and G, respectively), however a number of laboratories used the colorimetric methods recommended by US EPA, and FIA for total N and NOx.

9
SD 9.17.11
4.2.2 Total Phosphorus (TP) Table 3 compares the TP medians and robust CVs from this round to those obtained in previous PTA rounds. These CV were better than those published in APHA 4500-P:I for TP at levels similar (10 mg/L) to those used in the current study, and ranged between 6.5% - 11.7% for various Persulphate, Sulphuric/Nitric acids or Perchloric acid digestion procedures. As seen previously in Table 1, the average recoveries of participants were very good compared to the doping concentrations, with the relative errors similar to those published in APHA 4500-P:I which ranged between 0.3% - 4.3% for TP. Table 3. Comparison of current round variability and proficiency medians of TP testing with the results of the previous two rounds.
Round Sample Median (mg/L) Robust CV (%) No. of Res ults
This study
PTA 1 8.000 3.1 25
PTA 2 1.460 3.0 25
PTA 3 4.210 6.2 25
Report 938
PTA 1 4.990 3.5 32
PTA 2 1.240 6.9 34
PTA 3 7.510 4.4 32
Report 815
PTA 1 4.250 5.4 33
PTA 2 1.110 6.3 34
PTA 3 2.305 9.5 34 Bias / Accuracy Total Phosphorus testing was successfully performed, with satisfactory results (|z-scores| ≤ 2.0) ranging between 7.70 – 8.40 mg/L for sample PTA 1, 1.38 – 1.5 mg/L for sample PTA 2 and 3.83 – 4.62 for sample PTA 3. Out of 25 participants, four questionable results (2.0 < |z-scores| < 3.0) were obtained for each of the samples PTA 1 and PTA 2 (PTA 1: laboratories 205, 345, 575 and 579; PTA 2: laboratories 205, 432, 473 and 498). No questionable results were obtained for sample PTA 3. Two outlier results (|z-scores| ≥ 3.0) were obtained for sample PTA 1 requiring follow-up action by laboratories 364 and 603. Five outlier results were obtained for sample PTA 2, requiring follow-up action by laboratories 364, 579, 590, 603 and 646. Two outlier results were obtained for sample PTA 3, requiring follow-up action by laboratories 400 and 603. In general, participants performed remarkably well, analysing samples containing Monopotassium phosphate in samples PTA 1 and PTA 2; and Tetra Potassium Pyro Phosphate (TPPP) in sample PTA 3. The TP datasets formed a normal distribution with no significant bias attributable to any one analysis method (Figures 4 to 6). There was a large variety of methods used for TP analysis in this round, including: Vanado-

10
SD 9.17.11
molybdophosphoric Acid Colorimetric, Ascorbic Acid, FIA, Persulfate, Ammonium Molybdate, Discrete Analyser, In-house ICP - MS/OES, etc.
Figure 4. Spread of results for TP testing of sample PTA 1, with a median concentration of 8.000 mg/L.
Figure 5. Spread of results for TP testing of sample PTA 2, with a median concentration of 1.460 mg/L.
0
1
2
3
4
5
6
7
8
6.7 6.9 7.1 7.3 7.5 7.7 7.9 8.1 8.3 8.5 8.7 8.9 9.1 9.3
Fre
quen
cy
Results (mg/L)
Total Phosphorus - Sample PTA 1
APHA 4500 – P C.
APHA 4500 – P E.
APHA 4500 – P F.
APHA 4500 – P H.
APHA 4500 – P I.
APHA 4500 – P J.
US EPA 365.1 - 365.4
Discrete Analyser
AA/FIA
In-house ICP - MS/OES
Other
0
2
4
6
8
10
12
14
16
1 1.1 1.2 1.3 1.4 1.5 1.6 1.7 1.8 1.9 2 2.1 2.2 2.3
Fre
quen
cy
Results (mg/L)
Total Phosphorus - Sample PTA 2
APHA 4500 – P C.
APHA 4500 – P E.
APHA 4500 – P F.
APHA 4500 – P H.
APHA 4500 – P I.
APHA 4500 – P J.
US EPA 365.1 - 365.4
Discrete Analyser
AA/FIA
In-house ICP - MS/OES
Other
/>

11
SD 9.17.11
Figure 6. Spread of results for TP testing of sample PTA 3, with a median concentration of 4.210 mg/L. Digestion Method
The most frequently used digestion method to determine TP was the APHA 4500 – P B5 (Persulfate Method), which was used by 44% of participants. Other methods used included US EPA methods, Sulphuric-Nitric acid digestion, modified standard methods, and In-house methods. No laboratory indicated they were using the more drastic and time-consuming perchloric acid method, as it is primarily recommended only for particularly difficult samples, such as sediments. The nitric acid/sulfuric acid method is recommended for most samples, however persulfate oxidation method has proven popular as it is by far the simplest method. It is recommended that persulfate oxidation methods be checked against one or more of the more drastic digestion techniques, and only be adopted if identical recoveries are obtained on your natural matrices. QC procedures recommended in APHA 4020 B and Table 4020:I continued, included mandatory Method blanks, Laboratory Fortified Blanks, Laboratory Fortified Matrix and Duplicates every 20th sample, or batch of samples tested.
0
2
4
6
8
10
12
14
16
18
2.5 3 3.5 4 4.5 5 5.5 6 6.5 7 7.5 8 8.5 9
Fre
quen
cy
Results (mg/L)
Total Phosphorus - Sample PTA 3
APHA 4500 – P C.
APHA 4500 – P E.
APHA 4500 – P F.
APHA 4500 – P H.
APHA 4500 – P I.
APHA 4500 – P J.
US EPA 365.1 - 365.4
Discrete Analyser
AA/FIA
In-house ICP - MS/OES
Other
12
SD 9.17.11
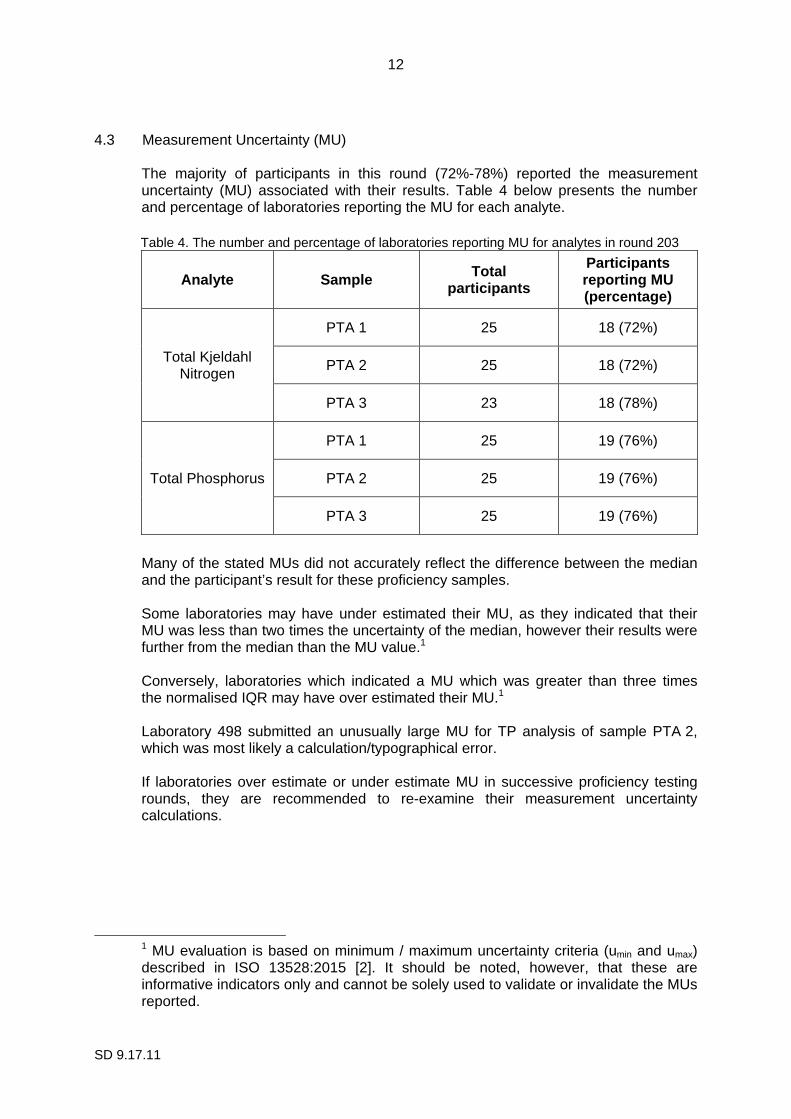
4.3 Measurement Uncertainty (MU)
The majority of participants in this round (72%-78%) reported the measurement uncertainty (MU) associated with their results. Table 4 below presents the number and percentage of laboratories reporting the MU for each analyte. Table 4. The number and percentage of laboratories reporting MU for analytes in round 203
Analyte Sample Total participants
Participants reporting MU (percentage)
Total Kjeldahl Nitrogen
PTA 1 25 18 (72%)
PTA 2 25 18 (72%)
PTA 3 23 18 (78%)
Total Phosphorus
PTA 1 25 19 (76%)
PTA 2 25 19 (76%)
PTA 3 25 19 (76%)
Many of the stated MUs did not accurately reflect the difference between the median and the participant’s result for these proficiency samples. Some laboratories may have under estimated their MU, as they indicated that their MU was less than two times the uncertainty of the median, however their results were further from the median than the MU value.1
Conversely, laboratories which indicated a MU which was greater than three times the normalised IQR may have over estimated their MU.1 Laboratory 498 submitted an unusually large MU for TP analysis of sample PTA 2, which was most likely a calculation/typographical error. If laboratories over estimate or under estimate MU in successive proficiency testing rounds, they are recommended to re-examine their measurement uncertainty calculations.
1 MU evaluation is based on minimum / maximum uncertainty criteria (umin and umax) described in ISO 13528:2015 [2]. It should be noted, however, that these are informative indicators only and cannot be solely used to validate or invalidate the MUs reported.

13
SD 9.17.11
4.4 Analysis of Results by Method Groups In order for methods to be grouped for analysis, PTA requires at least 11 sets of results from the same method group. As there were less than 11 results submitted for each method, reliable conclusions cannot be drawn from analysing grouped methods on this occasion. Therefore, results from all method groups have been pooled for analysis.
14
SD 9.17.11
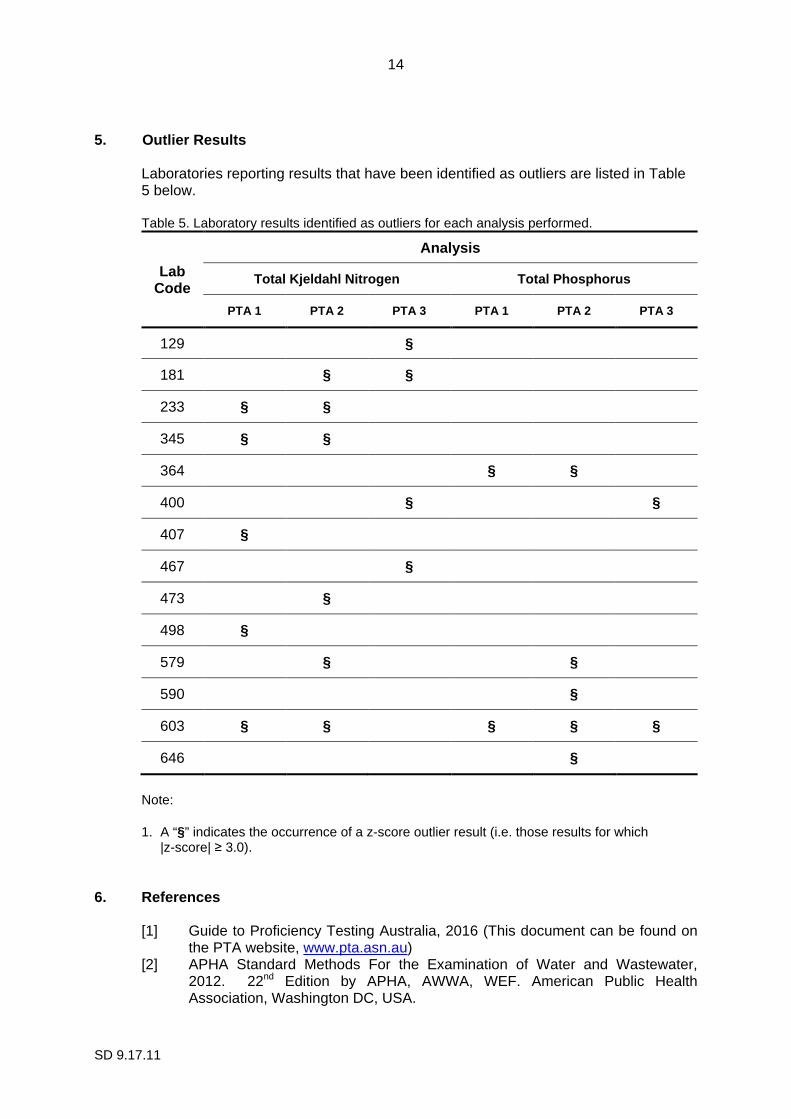
5. Outlier Results Laboratories reporting results that have been identified as outliers are listed in Table 5 below.
Table 5. Laboratory results identified as outliers for each analysis performed.
Lab Code
Analysis
Total Kjeldahl Nitrogen Total Phosphorus
PTA 1 PTA 2 PTA 3 PTA 1 PTA 2 PTA 3
129 §
181 § §
233 § §
345 § §
364 § §
400 § §
407 §
467 §
473 §
498 §
579 § §
590 §
603 § § § § §
646 §
Note: 1. A “§” indicates the occurrence of a z-score outlier result (i.e. those results for which
|z-score| ≥ 3.0).
6. References
[1] Guide to Proficiency Testing Australia, 2016 (This document can be found on the PTA website, www.pta.asn.au)
[2] APHA Standard Methods For the Examination of Water and Wastewater, 2012. 22nd Edition by APHA, AWWA, WEF. American Public Health Association, Washington DC, USA.

SD 9.17.11
APPENDIX A
Results and Data Analysis Total Kjeldahl Nitrogen (TKN) ............................................................................................... A1
Total Phosphorus (TP) .......................................................................................................... A7

SD 9.17.11
Total Kjeldahl Nitrogen (TKN) Results
Samples PTA 1, PTA 2 and PTA 3

A1
SD 9.17.11
Total Kjeldahl Nitrogen (TKN) Results by Laboratory Code
Sample PTA 1
Lab Code Result ± MU1
(mg/L) Robust z-score2
Method Code3
Catalyst Code3
Final Ammonia Method Code3
103 9.46 ± 0.540 0.21 25 41 57 129 8.90 ± 0.62 -0.63 26 45 # 181 9.66 # 0.51 25 41 46 205 9.15 ± 0.65 -0.25 25 45 # 213 9.26 ± 1.26 -0.09 25 41 46 233 11.5 # 3.27 § 25 41 47 317 9.32 ± 0.93 0.00 32 20 # 345 13.3 ± 1.33 5.97 § 28 45 52 364 8.43 ± 0.8 -1.33 53 25, 41 53 400 8.80 # -0.78 51 41 51 407 12.2 ± 0.5 4.32 § 38 # # 445 9.7 ± 0.7 0.57 27 41 50 467 8.774 # -0.82 28 43 52 473 10.7 ± 3.2 2.07 27 41 51 485 8.58 ± 0.98 -1.11 38 # # 498 6.74 ± 1.48 -3.87 § 38 # # 526 7.66 ± 0.73 -2.49 38 45 57 575 9.36 ± 1.87 0.06 38 45 57 579 8.60 # -1.08 26 41 49 590 8.95 # -0.55 25 42 46 597 9.45 ± 1.0 0.19 38 45 57 603 15.0 # 8.51 § 25 # # 607 9.06 ± 1 -0.39 27 # # 646 10.2 ± 0.4 1.32 25 41 46 690 9.52 ± 0.952 0.30 39 41, 42 57 No of Results: 25
Median: 9.320
Normalised IQR: 0.667
Uncertainty of the Median:
0.167
Robust CV: 7.2%
Minimum: 6.74
Maximum: 15.0
Range: 8.26
1 Where reported, results are shown with their corresponding measurement uncertainty (MU). 2 "§" denotes an outlier (i.e. those results for which |z-score| ≥ 3.0). Robust z-scores are
calculated as: z = (A - median) ÷ normalised IQR, where A is the participant laboratory's result.
3 Please refer to Appendix C (pages C3-C5) for method, catalyst and final Ammonia method code descriptions.

SD 9.17.11
Total Kjeldahl Nitrogen (TKN)- Sample PTA 1 - Robus t Z-Scores
Ordered R
obust Z-S
core Charts
Total K
jeldahl Nitrogen (T
KN
)- Sam
ple PT
A 1
A2
Robust Z-Scores
498
526
364
485
579
467
400
129
590
607
205
213
-5
-4
-3
-2
-1
0
1
2
3
4
5
z-sc
ore
lab code
-5
-4
-3
-2
-1
0
1
2
3
4
5
z-sc
ore
lab code
A3
SD 9.17.11
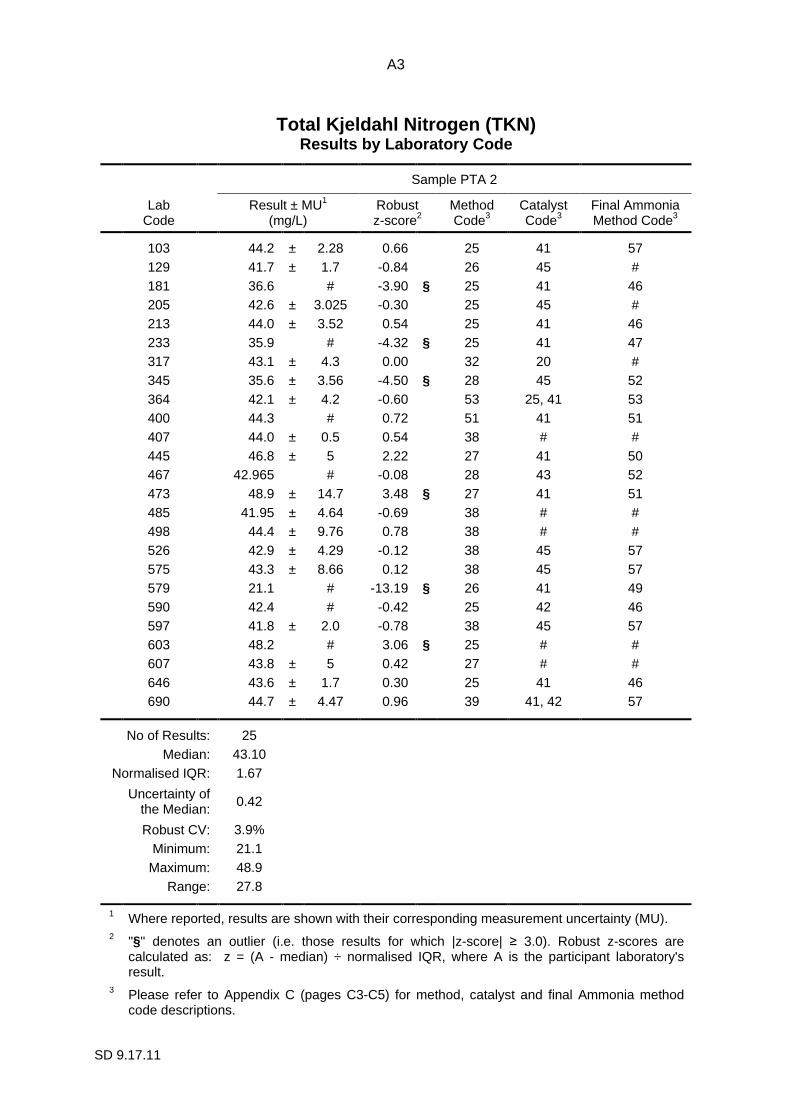
Total Kjeldahl Nitrogen (TKN) Results by Laboratory Code
Sample PTA 2
Lab Code Result ± MU1
(mg/L) Robust z-score2
Method Code3
Catalyst Code3
Final Ammonia Method Code3
103 44.2 ± 2.28 0.66 25 41 57 129 41.7 ± 1.7 -0.84 26 45 # 181 36.6 # -3.90 § 25 41 46 205 42.6 ± 3.025 -0.30 25 45 # 213 44.0 ± 3.52 0.54 25 41 46 233 35.9 # -4.32 § 25 41 47 317 43.1 ± 4.3 0.00 32 20 # 345 35.6 ± 3.56 -4.50 § 28 45 52 364 42.1 ± 4.2 -0.60 53 25, 41 53 400 44.3 # 0.72 51 41 51 407 44.0 ± 0.5 0.54 38 # # 445 46.8 ± 5 2.22 27 41 50 467 42.965 # -0.08 28 43 52 473 48.9 ± 14.7 3.48 § 27 41 51 485 41.95 ± 4.64 -0.69 38 # # 498 44.4 ± 9.76 0.78 38 # # 526 42.9 ± 4.29 -0.12 38 45 57 575 43.3 ± 8.66 0.12 38 45 57 579 21.1 # -13.19 § 26 41 49 590 42.4 # -0.42 25 42 46 597 41.8 ± 2.0 -0.78 38 45 57 603 48.2 # 3.06 § 25 # # 607 43.8 ± 5 0.42 27 # # 646 43.6 ± 1.7 0.30 25 41 46 690 44.7 ± 4.47 0.96 39 41, 42 57 No of Results: 25
Median: 43.10
Normalised IQR: 1.67
Uncertainty of the Median:
0.42
Robust CV: 3.9%
Minimum: 21.1
Maximum: 48.9
Range: 27.8
1 Where reported, results are shown with their corresponding measurement uncertainty (MU). 2 "§" denotes an outlier (i.e. those results for which |z-score| ≥ 3.0). Robust z-scores are
calculated as: z = (A - median) ÷ normalised IQR, where A is the participant laboratory's result.
3 Please refer to Appendix C (pages C3-C5) for method, catalyst and final Ammonia method code descriptions.

SD 9.17.11
Total Kjeldahl Nitrogen (TKN)- Sample PTA 2 - Robus t Z-Scores
Ordered R
obust Z-S
core Charts
Total K
jeldahl Nitrogen (T
KN
)- Sam
ple PT
A 2
A4
Robust Z-Scores
579 34
5
233 18
1
129
597
485
364
590
205
526
467
-5
-4
-3
-2
-1
0
1
2
3
4
5
z-sc
ore
lab code
-5
-4
-3
-2
-1
0
1
2
3
4
5
z-sc
ore
lab code

A5
SD 9.17.11
Total Kjeldahl Nitrogen (TKN) Results by Laboratory Code
Sample PTA 3
Lab Code Result ± MU1
(mg/L) Robust z-score2
Method Code3
Catalyst Code3
Final Ammonia Method Code3
103 18.7 ± 1.01 -0.07 25 41 57 129 6.32 ± 0.54 -3.00 § 26 45 # 181 3.64 # -3.64 § 25 41 46 205 23.6 ± 1.676 1.09 25 45 # 213 8.13 ± 1.06 -2.57 25 41 46 317 20.5 ± 2.1 0.35 32 20 # 345 26.6 ± 2.66 1.80 28 45 52 364 16.3 ± 1.6 -0.64 53 25, 41 53 400 37.3 # 4.33 § 46 41 46 407 21.0 ± 0.5 0.47 38 # # 445 24.1 ± 2 1.21 27 41 50 467 6.121 # -3.05 § 28 43 52 473 17.4 ± 5.3 -0.38 27 41 51 485 20.39 ± 2.27 0.33 38 # # 498 20.0 ± 4.40 0.24 38 # # 526 19.0 ± 1.90 0.00 38 45 57 575 19.3 ± 3.86 0.07 38 45 57 590 16.0 # -0.71 25 42 46 597 20.8 ± 1.0 0.43 38 45 57 603 6.58 # -2.94 25 # # 607 20.3 ± 2.5 0.31 27 # # 646 17.9 ± 0.7 -0.26 25 41 46 690 13.9 ± 1.39 -1.21 39 41, 42 57 No of Results: 23
Median: 19.00
Normalised IQR: 4.23
Uncertainty of the Median:
1.10
Robust CV: 22.2%
Minimum: 3.64
Maximum: 37.3
Range: 33.66
1 Where reported, results are shown with their corresponding measurement uncertainty (MU). 2 "§" denotes an outlier (i.e. those results for which |z-score| ≥ 3.0). Robust z-scores are
calculated as: z = (A - median) ÷ normalised IQR, where A is the participant laboratory's result.
3 Please refer to Appendix C (pages C3-C5) for method, catalyst and final Ammonia method code descriptions.

SD 9.17.11
Total Kjeldahl Nitrogen (TKN)- Sample PTA 3 - Robus t Z-Scores
Ordered R
obust Z-S
core Charts
Total K
jeldahl Nitrogen (T
KN
)- Sam
ple PT
A 3
A6
Robust Z-Scores
181 46
7
129
603 21
3
690 59
0
364
473
646
103
526
-5
-4
-3
-2
-1
0
1
2
3
4
5
z-sc
ore
lab code
-5
-4
-3
-2
-1
0
1
2
3
4
5
z-sc
ore
lab code

SD 9.17.11
Total Phosphorus (TP) Results
Samples PTA 1, PTA 2 and PTA 3

A7
SD 9.17.11
Total Phosphorus (TP) Results by Laboratory Code
Sample PTA 1
Lab Code Result ± MU1
(mg/L) Robust z-score2
Method Code3
Digestion Code3
103 8.12 ± 0.248 0.48 4 22 181 7.70 # -1.21 3 20 205 7.50 ± 0.623 -2.01 13 20 213 8.40 ± 1.26 1.61 13 20 233 7.73 ± 0.250 -1.09 16 # 317 8.10 ± 0.81 0.40 8 20 345 7.5 ± 0.324 -2.01 16 22 364 6.73 ± 0.7 -5.11 § 4 20 400 7.90 # -0.40 6 20 407 7.71 ± 0.05 -1.17 16 23 432 8.11 ± 0.05 0.44 16 24 445 8.0 ± 0.7 0.00 6 20 467 7.785 # -0.87 9 9 473 8.01 ± 1.60 0.04 7 20 485 8.33 ± 1.70 1.33 14 22 498 8.38 ± 1.56 1.53 8 20 526 7.95 ± 0.80 -0.20 8 24 575 8.58 ± 1.72 2.34 4 20 579 8.72 # 2.90 1 19 590 7.85 # -0.60 4 19 597 8.04 ± 0.2 0.16 6 20 603 8.91 # 3.66 § 16 24 607 8.00 ± 1 0.00 8 # 646 7.85 ± 0.74 -0.60 3 19 690 7.92 ± 0.792 -0.32 17 24 No of Results: 25
Median: 8.000
Normalised IQR: 0.248
Uncertainty of the Median:
0.062
Robust CV: 3.1%
Minimum: 6.73
Maximum: 8.91
Range: 2.18
1 Where reported, results are shown with their corresponding measurement
uncertainty (MU). 2 "§" denotes an outlier (i.e. those results for which |z-score| ≥ 3.0). Robust z-
scores are calculated as: z = (A - median) ÷ normalised IQR, where A is the participant laboratory's result.
3 Please refer to Appendix C (pages C3-C5) for method and digestion code descriptions.

SD 9.17.11
Total Phosphorus (TP)- Sample PTA 1 - Robust Z-Scor es
Ordered R
obust Z-S
core Charts
Total P
hosphorus (TP
) - Sam
ple PT
A 1
A8
Robust Z-Scores
364
205
345 18
1
407
233
467
590
646
400
690
526
-5
-4
-3
-2
-1
0
1
2
3
4
5z-
scor
e
lab code
-5
-4
-3
-2
-1
0
1
2
3
4
5
z-sc
ore
lab code

A9
SD 9.17.11
Total Phosphorus (TP) Results by Laboratory Code
Sample PTA 2
Lab Code Result ± MU1
(mg/L) Robust z-score2
Method Code3
Digestion Code3
103 1.50 ± 0.049 0.90 4 22 181 1.40 # -1.35 3 20 205 1.34 ± 0.111 -2.70 13 20 213 1.47 ± 0.22 0.22 13 20 233 1.44 ± 0.250 -0.45 16 # 317 1.47 ± 0.15 0.22 8 20 345 1.38 ± 0.06 -1.80 16 22 364 1.27 ± 0.2 -4.27 § 4 20 400 1.41 # -1.12 6 20 407 1.44 ± 0.05 -0.45 16 23 432 1.57 ± 0.02 2.47 16 24 445 1.5 ± 0.5 0.90 6 20 467 1.450 # -0.22 9 9 473 1.55 ± 0.31 2.02 7 20 485 1.46 ± 0.30 0.00 14 22 498 1.56 ± 2.91 2.25 8 20 526 1.47 ± 0.15 0.22 8 24 575 1.44 ± 0.29 -0.45 4 20 579 4.27 # 63.18 § 1 19 590 1.28 # -4.05 § 4 19 597 1.46 ± 0.05 0.00 6 20 603 1.77 # 6.97 § 16 24 607 1.47 ± 0.2 0.22 8 # 646 1.80 ± 0.17 7.64 § 3 19 690 1.45 ± 0.145 -0.22 17 24 No of Results: 25
Median: 1.460
Normalised IQR: 0.044
Uncertainty of the Median:
0.011
Robust CV: 3.0%
Minimum: 1.27
Maximum: 4.27
Range: 3.00
1 Where reported, results are shown with their corresponding measurement
uncertainty (MU). 2 "§" denotes an outlier (i.e. those results for which |z-score| ≥ 3.0). Robust z-
scores are calculated as: z = (A - median) ÷ normalised IQR, where A is the participant laboratory's result.
3 Please refer to Appendix C (pages C3-C5) for method and digestion code descriptions.

SD 9.17.11
Total Phosphorus (TP)- Sample PTA 2 - Robust Z-Scor es
Ordered R
obust Z-S
core Charts
Total P
hosphorus (TP
) - Sam
ple PT
A 2
A10
Robust Z-Scores
364
590
205
345 18
1
400 23
3
407
575
467
690
485
-5
-4
-3
-2
-1
0
1
2
3
4
5z-
scor
e
lab code
-5
-4
-3
-2
-1
0
1
2
3
4
5
z-sc
ore
lab code

A11
SD 9.17.11
Total Phosphorus (TP) Results by Laboratory Code
Sample PTA 3
Lab Code Result ± MU1
(mg/L) Robust z-score2
Method Code3
Digestion Code3
103 4.43 ± 0.137 0.85 4 22 181 3.92 # -1.12 3 20 205 3.83 ± 0.318 -1.46 13 20 213 4.36 ± 0.66 0.58 13 20 233 4.17 ± 0.250 -0.15 16 # 317 4.37 ± 0.44 0.62 8 20 345 4.08 ± 0.176 -0.50 16 22 364 3.87 ± 0.4 -1.31 4 20 400 8.65 # 17.11 § 6 20 407 4.21 ± 0.05 0.00 16 23 432 4.62 ± 0.04 1.58 16 24 445 4.3 ± 0.5 0.35 6 20 467 4.076 # -0.52 9 9 473 3.91 ± 0.78 -1.16 7 20 485 4.49 ± 0.92 1.08 14 22 498 4.19 ± 0.78 -0.08 8 20 526 4.22 ± 0.42 0.04 8 24 575 4.12 ± 0.82 -0.35 4 20 579 4.61 # 1.54 1 19 590 4.30 # 0.35 4 19 597 4.21 ± 0.1 0.00 6 20 603 5.48 # 4.89 § 16 24 607 4.10 ± 0.5 -0.42 8 # 646 4.57 ± 0.43 1.39 3 19 690 4.08 ± 0.408 -0.50 17 24 No of Results: 25
Median: 4.210
Normalised IQR: 0.259
Uncertainty of the Median:
0.065
Robust CV: 6.2%
Minimum: 3.83
Maximum: 8.65
Range: 4.82
1 Where reported, results are shown with their corresponding measurement
uncertainty (MU). 2 "§" denotes an outlier (i.e. those results for which |z-score| ≥ 3.0). Robust z-
scores are calculated as: z = (A - median) ÷ normalised IQR, where A is the participant laboratory's result.
3 Please refer to Appendix C (pages C3-C5) for method and digestion code descriptions.

SD 9.17.11
Total Phosphorus (TP) - Sample PTA 3 - Robust Z-Sco res
Ordered R
obust Z-S
core Charts
Total P
hosphorus (TP
) - Sam
ple PT
A 3
A12
Robust Z-Scores
205
364
473
181 46
7
345
690
607
575
233
498
407
-5
-4
-3
-2
-1
0
1
2
3
4
5z-
scor
e
lab code
-5
-4
-3
-2
-1
0
1
2
3
4
5
z-sc
ore
lab code

SD 9.17.11
APPENDIX B
Sample Homogeneity and Stability
Homogeneity and Stability Testing ........................................................................................ B1

B1
SD 9.17.11
Homogeneity and Stability Testing Samples for this program were obtained from Global Proficiency Ltd, New Zealand. As such, all samples are subjected to rigorous quality control and homogeneity / stability testing. A random selection of ten samples was chosen from sample sets PTA 1 and PTA 3 for homogeneity and stability testing. Seven of each set were stored frozen, the remaining three were subjected to 35ºC for three days for an accelerated ageing stability trial. The samples were then analysed in duplicate by Hill Laboratories, New Zealand. The TKN method used by Hill Laboratories was a Sulphuric acid digestion with copper sulphate catalyst then phenol/hypochlorite colorimetry using a Discrete Analyser [APHA 4500-Norg D. (modified) 4500 NH3 F (modified) 22nd ed. 2012]. Samples PTA 1 and PTA 2 were analysed for Dissolved Reactive Phosphorus using Molybdenum blue colorimetry using a Discrete Analyser [APHA 4500-P E (modified from manual analysis) 22nd ed. 2012]; and sample PTA 3 analysed for Total Phosphorus using Acid persulphate digestion and ascorbic acid colorimetry by Discrete Analyser [APHA 4500-P B and E (modified from manual analysis) 22nd ed. 2012]. For sample set PTA 2, two samples were randomly selected, stored frozen in the same conditions as the homogeneity samples and subjected to a verification testing (one replicate per sample) by Hill Laboratories. Homogeneity and stability characteristics were assumed to be similar to samples PTA 1 and PTA 3, based on identical manufacturing procedure and sample handling. All stability samples showed no notable differences when compared to homogeneity samples. Based on the assumption that the rate of ageing doubles with every 10ºC elevated temperature, these samples were assumed stable for more than 118 days (3 days*2(53/10)) from the date of manufacture, for all analytes. From statistical analyses based on the results of this testing and rigorous quality control, it was considered that all samples were sufficiently homogeneous and stable, so that any results later identified as outliers should not be attributed to any notable sample variability. The results of homogeneity and stability testing are presented in Tables B1 to B3 below. Please note that the mean results for these tests are not intended to be used as reference values. Table B1. Homogeneity and stability testing of PTA 1 samples.
Round PTA 203
Samples PTA 1
Sample ID Total Kjeldahl Nitrogen
(mg/L) Dissolved Reactive Phosphorus (mg/L)
Duplicate 1 Duplicate 2 Duplicate 1 Duplicate 2 Homogeneity H1 8.221 8.391 7.952 7.849
H2 7.836 8.081 7.708 7.809 H3 8.451 8.251 7.687 7.629 H4 8.426 8.561 7.881 7.853 H5 9.326 9.051 7.828 7.742 H6 9.026 9.001 7.783 7.945 H7 9.531 9.641 7.753 7.795
Stability S1 8.636 8.611 7.886 7.677 S2 8.766 9.036 7.742 7.935 S3 9.356 9.896 7.787 7.897
RSD 6.26% 6.65% 1.09% 1.35%

B2
SD 9.17.11
Table B2. Homogeneity testing of PTA 2 samples.
Round PTA 203
Samples PTA 2
Sample ID Total Kjeldahl Nitrogen
(mg/L) Dissolved Reactive Phosphorus (mg/L)
Duplicate 1 Duplicate 1 Homogeneity H1 41.78 1.48
H2 45.74 1.48 RSD 6.40% 0.24%
Table B3. Homogeneity and stability testing of PTA 3 samples.
Round PTA 203
Samples PTA 3
Sample ID Total Kjeldahl Nitrogen
(mg/L) Dissolved Reactive Phosphorus (mg/L)
Duplicate 1 Duplicate 2 Duplicate 1 Duplicate 2 Homogeneity H1 19.366 18.426 4.367 4.304
H2 17.076 19.526 4.447 4.272 H3 17.0891 17.931 4.458 4.045 H4 19.231 17.771 4.125 4.146 H5 19.174 18.369 4.227 4.055 H6 19.314 18.614 4.024 4.164 H7 19.889 18.939 4.171 4.059
Stability S1 19.099 18.609 4.125 4.188 S2 19.834 20.134 4.304 4.111 S3 20.599 20.824 4.293 4.122
RSD 5.97% 5.14% 3.41% 2.14%

SD 9.17.11
APPENDIX C
Documentation
Instructions to Participants .................................................................................................... C1
Method Codes ....................................................................................................................... C3
Results Sheet ........................................................................................................................ C6

SD 9.17.11
CHEMICAL ANALYSIS Total Kjeldahl Nitrogen, Total Phosphorus
Please note the following before commencing the analysis 1. Samples
i)
ii)
iii)
Please Note:laboratory sample.
2. Sample Preparation
Caution:
i)
ii)
iii)
iv)
v)
vi)
vii)
viii)
Please report results for the diluted sample.
SD 9.17.11
CHEMICAL ANALYSIS
Total Kjeldahl Nitrogen, Total Phosphorus
**Please record (on the Results Sheet) the approximate tempe rature
Please note the following before commencing the analysis
Samples
Three plastic bottles labelled PTA 1, PTA 2 and PTA 3The bottles contain approximately 22 mL of artificial potable water concentrate for analysis of Total KjeldahlH2SO4, samples PTA 1 and PTA 2 to pH ~2, and sample PTA 3 to pH ~3.
The samples must be thoroughly mixed prior to analysis.
The samples will require dilution in reagent grade waterPreparation
Please Note: laboratory sample.
Sample Preparation
Caution: Analysis must begin immediately after bottle is opened.
Adjust bottle temperature to 20ºC and mix thoroughly to ensure any precipitate has fully redissolved prior to dilution step. If any precipitate remains, microwave for 20and swirl to dissolve, returning sample to 20ºC before dilution.
Add approximately
Record bottle ID number. Open bottle.
Using a volumetric pipette transfer 10.00 mL from the bottle into the flask.
Bring to volume with reagent grade water.
Close with stopper and mix by inversio
Test according to your normal procedures.
viii) Repeat steps
Please report results for the diluted sample.
PROFICIENCY TESTING AUSTRALIA
WATERS PROFICIENCY TESTING PROGRAM
CHEMICAL ANALYSIS ROUND 203
Total Kjeldahl Nitrogen, Total Phosphorus
INSTRUCTIONS TO PARTICIPANTS
**Please record (on the Results Sheet) the approximate tempe rature
Please note the following before commencing the analysis
Three plastic bottles labelled PTA 1, PTA 2 and PTA 3The bottles contain approximately 22 mL of artificial potable water concentrate for analysis of Total Kjeldahl Nitrogen and Total Phosphorus. The concentrate samples are stabilised with
, samples PTA 1 and PTA 2 to pH ~2, and sample PTA 3 to pH ~3.
The samples must be thoroughly mixed prior to analysis.
The samples will require dilution in reagent grade waterPreparation steps below)
Where possible, proficiency testing samples should be treated as a routine laboratory sample.
Sample Preparation
Analysis must begin immediately after bottle is opened.
bottle temperature to 20ºC and mix thoroughly to ensure any precipitate has fully redissolved prior to dilution step. If any precipitate remains, microwave for 20and swirl to dissolve, returning sample to 20ºC before dilution.
Add approximately 900 mL reagent grade water to a one
Record bottle ID number. Open bottle.
Using a volumetric pipette transfer 10.00 mL from the bottle into the flask.
Bring to volume with reagent grade water.
Close with stopper and mix by inversio
Test according to your normal procedures.
Repeat steps i) to vii) for the second and third sample.
Please report results for the diluted sample.
PROFICIENCY TESTING AUSTRALIA
WATERS PROFICIENCY TESTING PROGRAM
ROUND 203
Total Kjeldahl Nitrogen, Total Phosphorus
INSTRUCTIONS TO PARTICIPANTS
**Please record (on the Results Sheet) the approximate tempe rature of the samples upon receipt**
Please note the following before commencing the analysis
Three plastic bottles labelled PTA 1, PTA 2 and PTA 3The bottles contain approximately 22 mL of artificial potable water concentrate for analysis of
Nitrogen and Total Phosphorus. The concentrate samples are stabilised with , samples PTA 1 and PTA 2 to pH ~2, and sample PTA 3 to pH ~3.
The samples must be thoroughly mixed prior to analysis.
The samples will require dilution in reagent grade waterbelow).
Where possible, proficiency testing samples should be treated as a routine
Analysis must begin immediately after bottle is opened.
bottle temperature to 20ºC and mix thoroughly to ensure any precipitate has fully redissolved prior to dilution step. If any precipitate remains, microwave for 20and swirl to dissolve, returning sample to 20ºC before dilution.
900 mL reagent grade water to a one
Record bottle ID number. Open bottle.
Using a volumetric pipette transfer 10.00 mL from the bottle into the flask.
Bring to volume with reagent grade water.
Close with stopper and mix by inversio
Test according to your normal procedures.
for the second and third sample.
Please report results for the diluted sample.
C1
PROFICIENCY TESTING AUSTRALIA
WATERS PROFICIENCY TESTING PROGRAM
Total Kjeldahl Nitrogen, Total Phosphorus
INSTRUCTIONS TO PARTICIPANTS
**Please record (on the Results Sheet) the approximate tempe rature of the samples upon receipt**
Please note the following before commencing the analysis
Three plastic bottles labelled PTA 1, PTA 2 and PTA 3The bottles contain approximately 22 mL of artificial potable water concentrate for analysis of
Nitrogen and Total Phosphorus. The concentrate samples are stabilised with , samples PTA 1 and PTA 2 to pH ~2, and sample PTA 3 to pH ~3.
The samples must be thoroughly mixed prior to analysis.
The samples will require dilution in reagent grade water
Where possible, proficiency testing samples should be treated as a routine
Analysis must begin immediately after bottle is opened.
bottle temperature to 20ºC and mix thoroughly to ensure any precipitate has fully redissolved prior to dilution step. If any precipitate remains, microwave for 20and swirl to dissolve, returning sample to 20ºC before dilution.
900 mL reagent grade water to a one
Record bottle ID number. Open bottle.
Using a volumetric pipette transfer 10.00 mL from the bottle into the flask.
Bring to volume with reagent grade water.
Close with stopper and mix by inversion.
Test according to your normal procedures.
for the second and third sample.
Please report results for the diluted sample.
PROFICIENCY TESTING AUSTRALIA
WATERS PROFICIENCY TESTING PROGRAM
INSTRUCTIONS TO PARTICIPANTS
**Please record (on the Results Sheet) the approximate tempe rature of the samples upon receipt**
Please note the following before commencing the analysis of the samples.
Three plastic bottles labelled PTA 1, PTA 2 and PTA 3, supplied by Global Proficiency Ltd. The bottles contain approximately 22 mL of artificial potable water concentrate for analysis of
Nitrogen and Total Phosphorus. The concentrate samples are stabilised with , samples PTA 1 and PTA 2 to pH ~2, and sample PTA 3 to pH ~3.
The samples must be thoroughly mixed prior to analysis.
The samples will require dilution in reagent grade water
Where possible, proficiency testing samples should be treated as a routine
Analysis must begin immediately after bottle is opened.
bottle temperature to 20ºC and mix thoroughly to ensure any precipitate has fully redissolved prior to dilution step. If any precipitate remains, microwave for 20and swirl to dissolve, returning sample to 20ºC before dilution.
900 mL reagent grade water to a one-litre volumetric flask.
Using a volumetric pipette transfer 10.00 mL from the bottle into the flask.
for the second and third sample.
PROFICIENCY TESTING AUSTRALIA
WATERS PROFICIENCY TESTING PROGRAM
INSTRUCTIONS TO PARTICIPANTS
**Please record (on the Results Sheet) the approximate tempe rature
of the samples.
, supplied by Global Proficiency Ltd. The bottles contain approximately 22 mL of artificial potable water concentrate for analysis of
Nitrogen and Total Phosphorus. The concentrate samples are stabilised with , samples PTA 1 and PTA 2 to pH ~2, and sample PTA 3 to pH ~3.
The samples will require dilution in reagent grade water (please follow the
Where possible, proficiency testing samples should be treated as a routine
Analysis must begin immediately after bottle is opened.
bottle temperature to 20ºC and mix thoroughly to ensure any precipitate has fully redissolved prior to dilution step. If any precipitate remains, microwave for 20and swirl to dissolve, returning sample to 20ºC before dilution.
litre volumetric flask.
Using a volumetric pipette transfer 10.00 mL from the bottle into the flask.
OCTOBER, 2016
**Please record (on the Results Sheet) the approximate tempe rature
, supplied by Global Proficiency Ltd. The bottles contain approximately 22 mL of artificial potable water concentrate for analysis of
Nitrogen and Total Phosphorus. The concentrate samples are stabilised with , samples PTA 1 and PTA 2 to pH ~2, and sample PTA 3 to pH ~3.
(please follow the
Where possible, proficiency testing samples should be treated as a routine
bottle temperature to 20ºC and mix thoroughly to ensure any precipitate has fully redissolved prior to dilution step. If any precipitate remains, microwave for 20-30 seconds
litre volumetric flask.
Using a volumetric pipette transfer 10.00 mL from the bottle into the flask.
OCTOBER, 2016
, supplied by Global Proficiency Ltd. The bottles contain approximately 22 mL of artificial potable water concentrate for analysis of
Nitrogen and Total Phosphorus. The concentrate samples are stabilised with
(please follow the Sample
Where possible, proficiency testing samples should be treated as a routine
bottle temperature to 20ºC and mix thoroughly to ensure any precipitate has fully 30 seconds

C2
SD 9.17.11
3. Tests Requested
For each of the samples prepared from the three bottles:
i) Total Kjeldahl Nitrogen (TKN)
ii) Total Phosphorus (TP)
(It is recommended that a reagent water blank is analysed by the same method used to analyse the samples.)
If unable to perform the above please note this on your Results Sheet.
4. Safety
i) Samples are for laboratory use only.
ii) Participants should have sufficient experience and training to take the necessary precautions when handling the samples and reagent chemicals and during disposal.
iii) Use of personal protective equipment such as safety glasses, gloves, laboratory coats and fume hoods, where appropriate during the determinations, is recommended.
5. Reporting
i) Report results using three significant figures (e.g.: 0.0123, 0.123, 1.23, 12.3).
ii) Report results in milligrams per litre (mg/L).
iii) Do not correct results for recovery.
iv) Select the appropriate method code for each test from the Method Code Table and record it on the Results Sheet.
v) Calculate the measurement uncertainty (MU) for each reported result. All estimates of MU must be given as a 95% confidence interval (coverage factor k ≈ 2) and reported in mg/L. Report MU using the same number of decimal places as for the result.
6. Testing should commence as soon as possible after receiving the samples and results reported
NO LATER THAN 21 OCTOBER 2016 to:
Delfina Mihaila Proficiency Testing Australia PO Box 7507 SILVERWATER NSW 2128 AUSTRALIA Phone: +612 9736 8397 Fax: +612 9743 6664 Email: [email protected]
7. For this program your laboratory has been allocated the code number shown on the attached
Results Sheet. All reference to your laboratory in reports associated with the program will be through this code number, thus ensuring the confidentiality of your results.
8. As a guide, ranges for the samples can be expected to be:
Analyte Range (mg/L) Total Kjeldahl Nitrogen (TKN) 5 - 50 Total Phosphorus (TP) 0.5 - 10

C3
SD 9.17.11
Method Codes to be used for the Results Sheet
ANALYSIS METHOD REFERENCE METHOD DESCRIPTION CODE
Total Phosphorus (TP)
APHA APHA 4500 – P C. Vanadomolybdophosphoric Acid Colorimetric Method
1
APHA 4500 – P D. Stannous Chloride Method
2
APHA 4500 – P E. Ascorbic Acid Method
3
APHA 4500 – P F. Automated Ascorbic Acid Reduction Method
4
APHA 4500 – P G. Flow Injection Analysis for Orthophosphate
5
APHA 4500 – P H. Manual Digestion and Flow Injection Analysis for Total Phosphorus
6
APHA 4500 – P I. In-line UV/Persulfate Digestion and Flow Injection Analysis for Total Phosphorus
7
APHA 4500 – P J. Persulfate Method for Simultaneous Determination of Total Nitrogen and Total Phosphorus
8
USEPA US EPA 0365.1 – 0.365.4 0365.1 Orthophosphate (as P) - Automated Colorimetry 0365.1 Phosphorus, All Forms - Colorimetric/Automated 0365.2 Phosphorus - manual colorimetric/1 reagent 0365.3 Phosphorus - colorimetric/ 2 reagents 0365.4 Phosphorus, Total -Colorimetric/Automated
9
ESS Method 230.1: Total Phosphorus and Total Kjeldahl Nitrogen, Semi-Automated Method
10
ISO / CEN EN ISO 6878:2004 Water Quality - Determination Of Phosphorus - Ammonium Molybdate Spectrometric Method
11
Other Modified Standard Method 12
Discrete Analyser 13
AA / FIA 14
Test Kit, Colorimeter (HACH, Fluka… specify). 15
In-house ICP – MS/ OES 16
Other (please specify) 17
Digestion Procedure for TP
APHA APHA 4500 – P B3. Perchloric Acid 18
APHA 4500 – P B4. Sulfuric-Nitric 19
APHA 4500 – P B5. Persulfate 20
USEPA US EPA 0200.2 Phosphorus - Sample Preparation 21
Other In-house method 22
Modified Standard Method 23
Other (please specify) 24

C4
SD 9.17.11
Method Codes to be used for the Results Sheet (cont .)
ANALYSIS METHOD REFERENCE METHOD DESCRIPTION CODE
Total Kjeldahl Nitrogen (TKN)
APHA APHA Part 4500 - Norg B. Macro-Kjeldahl Method 25
APHA Part 4500 - Norg C. Semi-Micro Kjeldahl Method 26
APHA Part 4500 - Norg D. Block Digestion and Flow Injection Analysis 27
USEPA USEPA 0351.1 – 0351.4 0351.1 Colorimetric/ Automated 0351.2 Colorimetric 0351.2 Semi-Automated Colorimetric 0351.3 Colorimetric/ Titrimetric 0351.4 Potentiometric
28
ESS Method 230.1: Total Phosphorus and Total Kjeldahl Nitrogen, Semi-Automated Method
29
ASTM ASTM D3590 - 11 Standard Test Methods for Total Kjeldahl Nitrogen in Water 30
ISO / CEN ISO 5663:1984 (EN 25663:1993) Water quality - Determination of Kjeldahl nitrogen - Method after mineralization with selenium
31
ISO 11905-1:1997 Water quality - Determination of nitrogen - Part 1: Method using oxidative digestion with peroxodisulfate
32
EN 12260:2003 Water quality - Determination of nitrogen -Determination of bound nitrogen (TNb), following oxidation to nitrogen oxides
33
Other Modified Standard Method 34
Discrete Analyser 35
AA / FIA 36
Test Kit, Colorimeter (HACH… specify). 37
Calculation (TN-NOx =TKN) 38
Other (please specify) 39
TKN Catalyst Mercury 40
Copper 41
Selenium 42
Sodium nitroferricyanide 43
Titanium 44
Other (please specify) 45
Continued on next page for Ammonia analysis methods…

C5
SD 9.17.11
Method Codes to be used for the Results Sheet (cont .)
ANALYSIS METHOD REFERENCE METHOD DESCRIPTION CODE
Ammonia Measurement for TKN
APHA APHA 4500 – NH3 C. Titrimetric Method 46
APHA 4500 – NH3 D. Ammonia-Selective Electrode Method 47
APHA 4500 – NH3 E. Ammonia-Selective Electrode Method Using Known Addition 48
APHA 4500 – NH3 F. Phenate Method 49
APHA 4500 – NH3 G. Automated Phenate Method 50
APHA 4500 – NH3 H. Flow Injection Analysis 51
USEPA US EPA 0351.1 – 0351.4 0351.1 Colorimetric/ Automated 0351.2 Colorimetric 0351.2 Semi-Automated Colorimetric 0351.3 Colorimetric/ Titrimetric 0351.4 Potentiometric
52
Other Modified Standard Method 53
Discrete Analyser 54
AA / FIA 55
Test Kit, Colorimeter (e.g. HACH… specify). 56
Other (please specify) 57
Method Reference Key i) APHA SM APHA “Standard Methods for the Examination of Water and Wastewater” (18, 19 20,
21, 22 Edition). (http://www.standardmethods.org/) ii) ASTM Annual Book of ASTM Standards, Vol. 11.01(2004). (http://www.astm.org) iii) CEN European Committee for Standardization. (http://www.cen.eu/cen) iv) ISO International Organization for Standardization. (http://www.iso.org) v) US EPA U.S Environmental Protection Agency.
(http://www.epa.gov/osa/fem/methcollectns.htm)

SD 9.17.11
Please note:Where possible, proficiency testing samples should be treated as a routine laboratory
*Approximate temperature of samples upon receipt:
ANALYSIS
Sample PTA 1 Total KjeldahlNitrogen (TKN)Total Phosphorus (TP)
Sample PTA 2 Total Kjeldahl Nitrogen (TKN)Total Phosphorus (TP)
Sample PTA 3 Total Kjeldahl Nitrogen (TKN)Total Phosphorus (TP)
i) For ii) Report results for the diluted sample.
iii) Report results using three significant figures.
iv) Report results in v) Do not correct results for recovery.
vi) MU* Laboratories Measurement Uncertainty (MU) if known for the result. Please report in mg/L
DATE:
INSTRUCT WATERS PROF TEST PROG 203
SD 9.17.11
Please note: Where possible, proficiency testing samples should be treated as a routine laboratory
*Approximate temperature of samples upon receipt:
ANALYSIS
Sample PTA 1 (Bottle diluted x100)
Total Kjeldahl Nitrogen (TKN)
Phosphorus (TP)
Sample PTA 2 (Bottle diluted x100)
Total Kjeldahl Nitrogen (TKN)
Phosphorus (TP)
Sample PTA 3 (Bottle diluted x100)
Total Kjeldahl Nitrogen (TKN)
Phosphorus (TP)
For each prepared sample only a single result is requested.Report results for the diluted sample.
Report results using three significant figures.
Report results in Do not correct results for recovery.
MU* Laboratories Measurement Uncertainty (MU) if known for the result. Please report in mg/L, using the same number of decimal places as for the result.
DATE: ______________________
Return results Delfina MihailaProficiency Testing AustraliaPO Box 7507 SILVERWATER NSW 2128 AUSTRALIA
INSTRUCT WATERS PROF TEST PROG 203
PROFICIENCY TESTING
WATERS PROFICIENCY TESTING PROGRAM
Total Kjeldahl Nitrogen, Total Phosphorus
Where possible, proficiency testing samples should be treated as a routine laboratory
*Approximate temperature of samples upon receipt:
Result (mg/L)
(Bottle diluted x100)
(Bottle diluted x100)
(Bottle diluted x100)
prepared sample only a single result is requested.Report results for the diluted sample.
Report results using three significant figures.
Report results in milligrams per litre (mg/L).Do not correct results for recovery.
MU* Laboratories Measurement Uncertainty (MU) if known for the result. Please report in , using the same number of decimal places as for the result.
______________________
Return results NO LATER THAN 21 OCTOBER 2016 Delfina Mihaila Proficiency Testing AustraliaPO Box 7507 SILVERWATER NSW 2128 AUSTRALIA
INSTRUCT WATERS PROF TEST PROG 203
PROFICIENCY TESTING
WATERS PROFICIENCY TESTING PROGRAM
CHEMICAL ANALYSIS ROUND 203
Total Kjeldahl Nitrogen, Total PhosphorusOCTOBER, 2016
RESULTS SHEET
Where possible, proficiency testing samples should be treated as a routine laboratory
*Approximate temperature of samples upon receipt:
Result
±MU*(mg/L)
(Bottle diluted x100)
(Bottle diluted x100)
(Bottle diluted x100)
prepared sample only a single result is requested.Report results for the diluted sample.
Report results using three significant figures.
milligrams per litre (mg/L).Do not correct results for recovery.
MU* Laboratories Measurement Uncertainty (MU) if known for the result. Please report in , using the same number of decimal places as for the result.
______________________
NO LATER THAN 21 OCTOBER 2016
Proficiency Testing Australia PO Box 7507 SILVERWATER NSW 2128
INSTRUCT WATERS PROF TEST PROG 203
C6
PROFICIENCY TESTING
WATERS PROFICIENCY TESTING PROGRAM
CHEMICAL ANALYSIS ROUND 203
Total Kjeldahl Nitrogen, Total PhosphorusOCTOBER, 2016
RESULTS SHEET(mg/L)
Where possible, proficiency testing samples should be treated as a routine laboratory
*Approximate temperature of samples upon receipt:
±MU* (mg/L)
METHOD
prepared sample only a single result is requested.Report results for the diluted sample.
Report results using three significant figures.
milligrams per litre (mg/L).
MU* Laboratories Measurement Uncertainty (MU) if known for the result. Please report in , using the same number of decimal places as for the result.
SIGNATURE:
NO LATER THAN 21 OCTOBER 2016
PO Box 7507 Phone:SILVERWATER NSW 2128 Fax:
Email:
PROFICIENCY TESTING AUSTRALIA
WATERS PROFICIENCY TESTING PROGRAM
CHEMICAL ANALYSIS ROUND 203
Total Kjeldahl Nitrogen, Total PhosphorusOCTOBER, 2016
RESULTS SHEET
Where possible, proficiency testing samples should be treated as a routine laboratory
METHOD CODE
prepared sample only a single result is requested.
MU* Laboratories Measurement Uncertainty (MU) if known for the result. Please report in , using the same number of decimal places as for the result.
SIGNATURE: _______________________________
NO LATER THAN 21 OCTOBER 2016 to:
Phone: +61 2 9736 8397 +61 2 9743 6664
Email: [email protected]
AUSTRALIA
WATERS PROFICIENCY TESTING PROGRAM
CHEMICAL ANALYSIS ROUND 203
Total Kjeldahl Nitrogen, Total Phosphorus
Where possible, proficiency testing samples should be treated as a routine laboratory
Laboratory Code
DIGESTION
or CATALYST
CODE
MU* Laboratories Measurement Uncertainty (MU) if known for the result. Please report in , using the same number of decimal places as for the result.
_______________________________
+61 2 9736 8397 +61 2 9743 6664 [email protected]
Where possible, proficiency testing samples should be treated as a routine laboratory sample.
Laboratory Code
DIGESTION
CATALYST CODE
FINAL AMMONIA METHOD
CODE
MU* Laboratories Measurement Uncertainty (MU) if known for the result. Please report in
_______________________________
sample.
FINAL AMMONIA METHOD
CODE
MU* Laboratories Measurement Uncertainty (MU) if known for the result. Please report in
_______________________________

SD 9.17.11
- End of Report -