Balanced Mix Design for Surface Asphalt Mixtures: Phase I
68
Balanced Mix Design for Surface Asphalt Mixtures: Phase I: Initial Roadmap Development and Specification Verification http://www.virginiadot.org/vtrc/main/online_reports/pdf/21-r15.pdf STACEY D. DIEFENDERFER, Ph.D., P.E. Senior Research Scientist ILKER BOZ, Ph.D. Research Scientist JHONY HABBOUCHE, Ph.D., P.E. Research Scientist Final Report VTRC 21-R15
-
Upload
khangminh22 -
Category
Documents
-
view
0 -
download
0
Transcript of Balanced Mix Design for Surface Asphalt Mixtures: Phase I

Balanced Mix Design for Surface Asphalt Mixtures: Phase I: Initial Roadmap Development and Specification Verification
http://www.virginiadot.org/vtrc/main/online_reports/pdf/21-r15.pdf
STACEY D. DIEFENDERFER, Ph.D., P.E. Senior Research Scientist ILKER BOZ, Ph.D. Research Scientist JHONY HABBOUCHE, Ph.D., P.E. Research Scientist
Final Report VTRC 21-R15

Standard Title Page - Report on Federally Funded Project
1. Report No.: 2. Government Accession No.: 3. Recipient’s Catalog No.:
FHWA/VTRC 21-R15
4. Title and Subtitle: 5. Report Date:
Balanced Mix Design for Surface Asphalt Mixtures: Phase I: Initial Roadmap
Development and Specification Verification
May 2021
6. Performing Organization Code:
7. Author(s):
Stacey D. Diefenderfer, Ph.D., P.E., Ilker Boz, Ph.D., and Jhony Habbouche, Ph.D.,
P.E.
8. Performing Organization Report No.:
VTRC 21-R15
9. Performing Organization and Address:
Virginia Transportation Research Council
530 Edgemont Road
Charlottesville, VA 22903
10. Work Unit No. (TRAIS):
11. Contract or Grant No.:
112037
12. Sponsoring Agencies’ Name and Address: 13. Type of Report and Period Covered:
Virginia Department of Transportation
1401 E. Broad Street
Richmond, VA 23219
Federal Highway Administration
400 North 8th Street, Room 750
Richmond, VA 23219-4825
Final
14. Sponsoring Agency Code:
15. Supplementary Notes:
This is an SPR-B report.
16. Abstract:
The Virginia Department of Transportation (VDOT), as with many owner agencies, is interested in ways to facilitate the
increased durability of asphalt mixtures in an effort to make its roadway network more sustainable, longer lasting, and more
economical. The balanced mix design (BMD) method addresses this through the incorporation of performance criteria into mix
design and acceptance. VDOT has committed to the implementation of the BMD method in an effort to improve asphalt mixture
performance.
The purpose of this study was to continue advancing efforts toward VDOT’s implementation of BMD by developing a
performance-based mix design roadmap for application in Virginia. The proposed roadmap was developed to provide guidance
on the specific needs and activities necessary for VDOT to adopt the BMD concept. A specific need outlined in the roadmap was
to validate and/or refine the selected initial performance tests and associated test threshold criteria. To accomplish this, 13 asphalt
mixtures were evaluated using performance-measuring laboratory tests. The results of these tests were used to assess the initial
performance tests and test threshold criteria selected for BMD use.
The proposed roadmap is intended to be an evolving resource for outlining the agenda of activities necessary for
implementation of BMD. The roadmap identified specific needs addressed in this study. Based on the results for the mixtures
evaluated as part of those needs, the Asphalt Pavement Analyzer (APA) rut test (hereinafter “APA test”); indirect tensile cracking
test (IDT-CT) (hereinafter “IDT-CT test”); and Cantabro mass loss test (hereinafter “Cantabro test”) are suitable for continued
use in BMD. The current threshold criteria for all three tests were reasonable, based on additional testing and analysis.
The study recommends that the roadmap for BMD continue to be refined to provide a clear direction of the activities
necessary for implementation and serve as a resource to evaluate progress. VDOT should continue to use the APA, IDT-CT, and
Cantabro tests for BMD. The APA and IDT-CT test results should be compared and correlated with those of fundamental rutting
and cracking tests, respectively, and with performance predictions obtained from mechanistic-empirical pavement design
simulations and field performance for full assurance that test threshold values are appropriate. In addition, the differences in test
results attributable to mixture reheating and different specimen types, such as laboratory-compacted specimens and field cores,
should be addressed. The study further recommends evaluating the Cantabro, IDT-CT, and APA test results to determine
acceptable variability and establish precision statements.
17 Key Words: 18. Distribution Statement:
Balanced Mix Design, rutting, cracking, durability, performance
testing, APA rut test, indirect tensile cracking test, I-FIT test,
IDT Nflex test, dynamic modulus, Cantabro test, cracking index
No restrictions. This document is available to the public
through NTIS, Springfield, VA 22161.
19. Security Classif. (of this report): 20. Security Classif. (of this page): 21. No. of Pages: 22. Price:
Unclassified Unclassified 66
Form DOT F 1700.7 (8-72) Reproduction of completed page authorized
FINAL REPORT
BALANCED MIX DESIGN FOR SURFACE ASPHALT MIXTURES:
PHASE I: INITIAL ROADMAP DEVELOPMENT AND SPECIFICATION
VERIFICATION
Stacey D. Diefenderfer, Ph.D., P.E.
Senior Research Scientist
Ilker Boz, Ph.D.
Research Scientist
Jhony Habbouche, Ph.D., P.E.
Research Scientist
In Cooperation with the U.S. Department of Transportation
Federal Highway Administration
Virginia Transportation Research Council
(A partnership of the Virginia Department of Transportation
and the University of Virginia since 1948)
Charlottesville, Virginia
May 2021
VTRC 21-R15

ii
DISCLAIMER
The contents of this report reflect the views of the authors, who are responsible for the
facts and the accuracy of the data presented herein. The contents do not necessarily reflect the
official views or policies of the Virginia Department of Transportation, the Commonwealth
Transportation Board, or the Federal Highway Administration. This report does not constitute a
standard, specification, or regulation. Any inclusion of manufacturer names, trade names, or
trademarks is for identification purposes only and is not to be considered an endorsement.
Copyright 2021 by the Commonwealth of Virginia.
All rights reserved.

iii
ABSTRACT
The Virginia Department of Transportation (VDOT), as with many owner agencies, is
interested in ways to facilitate the increased durability of asphalt mixtures in an effort to make its
roadway network more sustainable, longer lasting, and more economical. The balanced mix
design (BMD) method addresses this through the incorporation of performance criteria into mix
design and acceptance. VDOT has committed to the implementation of the BMD method in an
effort to improve asphalt mixture performance.
The purpose of this study was to continue advancing efforts toward VDOT’s
implementation of BMD by developing a performance-based mix design roadmap for application
in Virginia. The proposed roadmap was developed to provide guidance on the specific needs and
activities necessary for VDOT to adopt the BMD concept. A specific need outlined in the
roadmap was to validate and/or refine the selected initial performance tests and associated test
threshold criteria. To accomplish this, 13 asphalt mixtures were evaluated using performance-
measuring laboratory tests. The results of these tests were used to assess the initial performance
tests and test threshold criteria selected for BMD use.
The proposed roadmap is intended to be an evolving resource for outlining the agenda of
activities necessary for implementation of BMD. The roadmap identified specific needs
addressed in this study. Based on the results for the mixtures evaluated as part of those needs,
the Asphalt Pavement Analyzer (APA) rut test (hereinafter “APA test”); indirect tensile cracking
test (IDT-CT) (hereinafter “IDT-CT test”); and Cantabro mass loss test (hereinafter “Cantabro
test”) are suitable for continued use in BMD. The current threshold criteria for all three tests
were reasonable, based on additional testing and analysis.
The study recommends that the roadmap for BMD continue to be refined to provide a
clear direction of the activities necessary for implementation and serve as a resource to evaluate
progress. VDOT should continue to use the APA, IDT-CT, and Cantabro tests for BMD. The
APA and IDT-CT test results should be compared and correlated with those of fundamental
rutting and cracking tests, respectively, and with performance predictions obtained from
mechanistic-empirical pavement design simulations and field performance for full assurance that
test threshold values are appropriate. In addition, the differences in test results attributable to
mixture reheating and different specimen types, such as laboratory-compacted specimens and
field cores, should be addressed. The study further recommends evaluating the Cantabro, IDT-
CT, and APA test results to determine acceptable variability and establish precision statements.

1
FINAL REPORT
BALANCED MIX DESIGN FOR SURFACE ASPHALT MIXTURES:
PHASE I: INITIAL ROADMAP DEVELOPMENT AND SPECIFICATION
VERIFICATION
Stacey D. Diefenderfer, Ph.D., P.E.
Senior Research Scientist
Ilker Boz, Ph.D.
Research Scientist
Jhony Habbouche, Ph.D., P.E.
Research Scientist
INTRODUCTION
Historically, the design of asphalt mixtures has been largely based on the volumetric
properties of the mixture. The move to the Superpave mix design process in the mid-1990s
continued to rely on these principles, which are used in both mix design and acceptance during
production. Part of the initial Superpave mix design procedure included various degrees of
asphalt mixture performance testing, especially for roads designed for moderate to high volumes.
However, because of a number of factors, these performance tests were implemented on a
limited basis. For many years, there has been a desire for owner agencies and the asphalt
industry to have performance tests that can be used in the design process both to screen mixtures
that may pass volumetric criteria but perform poorly in the field because of mixture deficiencies
and to facilitate the responsible use of innovative materials in the mix design process.
The balanced mix design (BMD) approach has been rapidly gaining attention on the
national level. This method replaces some aspects of traditional volumetric design with
performance testing criteria for the most common distresses such as rutting and cracking. The
approach requires that a mix design pass performance criteria for approval. The approval
process can take place at the mixture acceptance and/or construction acceptance level. The
BMD is a significant step forward in the pursuit of better performing asphalt mixtures; however,
these mixtures cannot compensate for an unsound underlying pavement structure or the selection
of inappropriate maintenance treatments.
The Virginia Department of Transportation (VDOT), as with many owner agencies, is
interested in ways to facilitate the increased durability of asphalt mixtures in an effort to make its
roadway network more sustainable, longer lasting, and more economical. The BMD method
addresses this through the incorporation of performance criteria into mix design and acceptance.
Instead of providing only recipe-type specifications for design and acceptance, the BMD method
uses additional performance test criteria to assess and accept mixtures. There are differing levels
of application of the BMD method that allow implementation to occur in stages, as agencies and
industry become more familiar with the process.

2
BMD is not yet a widely established method of design, and as such, there are not existing
specifications readily available for widespread adoption. There is a need to develop a framework
to address how VDOT can adopt this method and a need for specification language and
requirements. In addition, a validation of proposed specification requirements is necessary,
along with training activities to ensure agency and industry consistency in applying the new
method and specifications.
In January 2018, an initial effort was undertaken by researchers at the Virginia
Transportation Research Council (VTRC) to provide benchmark indications of performance for a
number of asphalt mixtures produced and sampled in 2015 (Bowers and Diefenderfer, 2018).
These mixtures were characterized in the laboratory using numerous performance tests. Based
on the study, a suite of performance tests addressing different modes of pavement distress (i.e.,
durability, cracking, and rutting) was selected for use in the BMD method. This selection was
based on several factors such as the degree of correlation of the tests to fundamental performance
test methods or in-service performance; simplicity and repeatability of the tests; cost-
effectiveness of the test methods associated with the procurement of test equipment; and time
needed to perform each test. The selected tests were the Cantabro mass loss test (hereinafter
“Cantabro test”); the indirect tensile cracking test (IDT-CT) (hereinafter “IDT-CT test”) at
intermediate temperatures; and the Asphalt Pavement Analyzer (APA) rut test (hereinafter “APA
test”) for assessing durability, cracking potential, and rutting potential, respectively, of asphalt
mixtures. In addition, initial performance threshold criteria were developed for the selected tests.
PURPOSE AND SCOPE
The purpose of this study was to build on previous efforts toward implementation of
BMD by developing a draft roadmap to guide adoption of the BMD concept in Virginia. In
addition, the study addressed specific needs for test and threshold criterion validation and
refinement identified in the draft roadmap. This required the continued evaluation of current
mixtures using performance-measuring laboratory tests and analysis of the resulting data to
validate and refine the initial performance tests and test threshold criteria selected for BMD use.
METHODS
The following tasks were performed to achieve the study objectives:
1. A literature review was conducted, including a summary of Virginia’s BMD efforts to
date.
2. A roadmap for BMD implementation was developed.
3. Plant-produced mixtures were sampled, and select paving projects were documented.
4. Laboratory testing was conducted and analyses were performed to validate and/or
refine initial performance test selection and performance threshold criteria.
3
Literature Review
Literature related to BMD was identified by a search of various databases related to
transportation engineering such as the Transport Research International Documentation (TRID)
database. The identified literature was then reviewed in order to summarize findings from
relevant work.
VDOT and VTRC began to investigate the application of BMD in 2018. A summary of
relevant activities leading to specification development and the current effort is provided.
Roadmap Development
Based on the results of the literature review, project experiences, and initial VDOT
activities, a draft roadmap was developed to outline necessary steps and activities for continued
progress toward implementation of the BMD method.
Sampling and Documentation
Loose Mixtures
Thirteen plant-produced mixtures were collected from various plants in Virginia in 2018.
The sampled mixtures were dense-graded surface mixtures (SMs) having a nominal maximum
aggregate size (NMAS) of 9.5 mm and 12.5 mm that were being used in maintenance paving
contracts. The mixtures were designated A through M.
Field Cores
Cores were collected from six paving sites during construction. These sites corresponded
to plant-produced Mixtures A through F. Cores were taken approximately every 100 ft along the
center of the lane. Air-void contents were determined in accordance with AASHTO T 269,
Standard Method of Test for Percent Air Voids in Compacted Dense and Open Asphalt
Mixtures.
Paving Project Location
Project locations were documented for six of the Mixtures (A through F) in order to
support monitoring of long-term performance in service. The locations and basic information for
the projects paved with these mixtures are summarized in Table 1.

4
Table 1. Paving Project Information
Mix Type RAP Content Paving Date District Location
A SM-9.5A 30% 6/28/2018 Hampton Roads Settlers Landing Road, City of Hampton
B SM-12.5A 30% 8/22/2018 Fredericksburg US 3, Spotsylvania County
C SM-12.5D 26% 9/12/2018 Lynchburg SR 623, Nelson County
D SM-9.5D 26% 10/2/2018 Salem SR 100, Giles County
E SM-9.5D 26% 10/31/2018 Salem SR 122, Bedford County
F SM-12.5A 30% 11/14/2018 Fredericksburg SR 684, Essex County
RAP = reclaimed asphalt pavement.
Laboratory Testing and Evaluation
Laboratory testing was conducted on the sampled mixtures to achieve two objectives: (1)
validate and/or refine the selection of suitable BMD performance tests, and (2) validate and/or
refine the selected performance-based threshold criteria. All of the evaluated mixtures were
typical production mixtures, designed under VDOT specifications for Superpave mixtures.
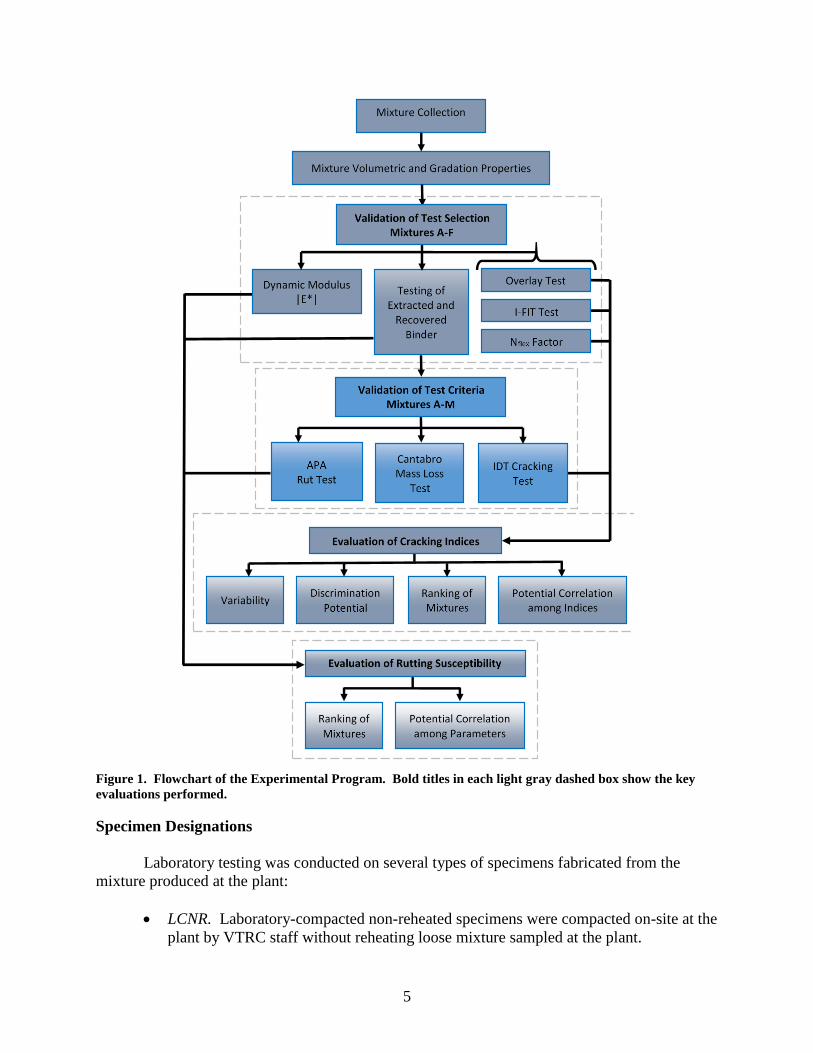
Figure 1 summarizes the laboratory experimental plan.
Validation and refinement of the initially selected BMD performance tests were
accomplished by evaluating six of the collected mixtures (A through F). Volumetric properties
and gradations of the mixtures and the performance grade (PG) and rheological properties of the
extracted and recovered asphalt binders were determined. The tests initially determined for use
with BMD in Virginia were performed on reheated, laboratory-compacted specimens: the
Cantabro test for durability, the APA test for rutting susceptibility, and the IDT-CT test for
cracking susceptibility. For validation purposes, additional cracking tests were performed: the
overlay test (OT), Illinois Flexibility Index test (I-FIT), and indirect tensile Nflex factor test. The
cracking indices of the tests were further evaluated in terms of variability; discrimination
potential and ranking among the selected asphalt mixtures; and correlation among each other.
Finally, the mechanical properties in terms of dynamic modulus (E*) and phase angle (δ) were
determined for the six mixtures using reheated, laboratory-compacted specimens. Parameters
such as the Glover-Rowe (G-Rm) at intermediate temperature were determined and employed to
evaluate and compare the cracking resistance of the mixtures. Further, because rutting distress
has been proven to have a direct correlation with the structural responses of the mixtures to
loading, the |E*| master curves were also used to estimate the rutting susceptibility of the
mixtures.
Validation and refinement of the selected performance-based threshold criteria were
accomplished by evaluating Mixtures A through F and seven additional plant-produced mixtures,
Mixtures G through M. Volumetric properties and gradations were determined for all mixtures.
The Cantabro, APA, and IDT-CT tests were conducted on reheated laboratory-compacted
specimens for all mixtures. For some of the mixtures, the Cantabro, APA, and IDT-CT tests
were conducted on non-reheated specimens compacted on-site in the contractor’s laboratory by
VTRC staff and/or the producer’s staff. The APA and IDT-CT tests were also conducted on
field-compacted specimens (i.e., cores) collected from the paving site. The resulting data were
compared to the preliminary threshold criteria. In addition, the various specimen types (e.g.,
reheated vs. non-reheated) were used to evaluate the effect of reheating on the test variability and
magnitude of the resulting indices.
5
Figure 1. Flowchart of the Experimental Program. Bold titles in each light gray dashed box show the key
evaluations performed.
Specimen Designations
Laboratory testing was conducted on several types of specimens fabricated from the
mixture produced at the plant:
LCNR. Laboratory-compacted non-reheated specimens were compacted on-site at the
plant by VTRC staff without reheating loose mixture sampled at the plant.

6
LCNR-P. Laboratory-compacted non-reheated specimens were compacted on-site at
the plant by producer staff without reheating the loose mixture sampled at the plant.
LCR. Laboratory-compacted reheated specimens were compacted in the VTRC
laboratory by VTRC staff after reheating loose mixture sampled at the plant.
FC. Field-compacted specimens were cored from the mat at the job site.
Specimens were designated “X-Y,” where “X” is the mixture designation (A-M) and “Y”
is the specimen type (LCNR, LCNR-P, LCR, or FC).
Reheated specimens were fabricated by reheating the loose mixture in boxes until
workable, splitting the material into specimen quantities, and then heating to the appropriate
compaction temperature and compacting.
Mixture Volumetric Properties and Gradations
Volumetric and gradation analyses were performed to determine fundamental mixture
properties. The data collected included asphalt content and gradation; bulk and Rice mixture
specific gravities (Gmb and Gmm); air voids (voids in total mix [VTM]); voids in mineral
aggregate (VMA); voids filled with asphalt (VFA); bulk and effective aggregate specific
gravities (Gsb and Gse); dust/asphalt ratio; percent binder absorbed (Pba); and effective binder
content (Pbe).
Asphalt Binder Extraction and Recovery
Extraction of asphalt binder from collected mixtures was performed in accordance with
AASHTO T 164, Quantitative Extraction of Asphalt Binder from Hot Mix Asphalt (HMA),
Method A, using n-propyl bromide as the solvent. The asphalt binder was then recovered from
the solvent using the Rotavap recovery procedure specified in AASHTO T 319, Quantitative
Extraction and Recovery of Asphalt Binder from Asphalt Mixtures.
Asphalt Binder Testing
Asphalt binder grading was performed on extracted and recovered binder in accordance
with AASHTO M 320, Standard Specification for Performance-Graded Asphalt Binder, and
AASHTO M 332, Standard Specification for Performance-Graded Asphalt Binder Using
Multiple Stress Creep Recovery (MSCR) Test.
Cantabro Mass Loss Test
The Cantabro test was performed on mixtures to evaluate durability in accordance with
AASHTO TP 108, Standard Method of Test for Abrasion Loss of Asphalt Mixture Specimens.
Test specimens were compacted to Ndesign and tested in triplicate at a temperature of 25 ± 1°C.

7
APA Test
Testing was performed in accordance with AASHTO T 340, Determining Rutting
Susceptibility of Hot Mix Asphalt (HMA) Using the Asphalt Pavement Analyzer (APA), using a
test temperature of 64 ± 0.5°C. An APA Jr. tester was used such that two replicate tests
consisting of two specimens each were conducted for each mixture.
IDT-CT Test
Testing was conducted at 25 ± 0.5°C in accordance with ASTM D8225, Standard Test
Method for Determination of Cracking Tolerance Index of Asphalt Mixture Using the Indirect
Tensile Cracking Test at Intermediate Temperature, using an Instrotek Auto-SCB load frame
with a 15 kN load cell. A minimum of three replicate specimens were tested.
Overlay Test
The OT was performed on mixtures to evaluate cracking in general and reflective
cracking in particular generally in accordance with TX-248-F, Test Procedure for Overlay Test
(Texas Department of Transportation [DOT], 2014). Test specimens were cut in pairs from the
center of gyratory specimens that were 150 mm in diameter and 170 mm in height; care was
taken to minimize any influence of an air-void differential between the top and bottom of the
specimen. Testing was performed using a universal testing machine with a 25 to 100 kN loading
capacity. A temperature of 25 ± 0.5°C was used for testing; loading was applied for 1,200 cycles
or until a 93% reduction of the initial load was reached. Four replicate specimens were tested.
The OT was performed; however, the data quality checks indicated that the test results
were flawed for four of the six mixtures tested. The test data for these mixtures showed a sudden
drop in the load magnitude after two or three loading cycles followed by a very low (less than 1
kN) steady load magnitude until the test reached its termination point at 1,200 loading cycles.
The adhesive agent used to glue test specimens to the test plates was the source of the flawed
tests. The visual inspection of the test specimens indicated that adhesive failure occurred
between the adhesive agent and the specimens during the tests because of the defective adhesive
agent. The tests could not be repeated because sufficient materials were not available to
fabricate additional test specimens. Thus, no data were reported.
Illinois Flexibility Index Test
The Semi-Circular Bend (SCB) I-FIT for cracking resistance was conducted in
accordance with AASHTO TP 124-16, Standard Method of Test for Determining the Fracture
Potential of Asphalt Mixtures Using Semicircular Bend Geometry (SCB) at Intermediate
Temperature. Tests were conducted at a temperature of 25 ± 0.5°C using an Instrotek Auto-SCB
load frame with a 15 kN load cell. The analysis of the results was conducted using the I-FIT (IL-
SCB) Analysis Tool developed by the Illinois Center for Transportation and the University of
Illinois Urbana-Champaign. Four replicate specimens were tested.
8
Nflex Factor Test
The Nflex factor test was conducted in accordance with the method proposed by Yin et al.
(2018). A gyratory Ndesign pill was cut to a 50-mm thickness and then loaded in the indirect
tensile mode at 25 ± 0.5°C using an Instrotek Auto-SCB load frame with a 15 kN load cell. The
load-displacement curve was converted to a stress-strain curve, and a series of mathematical
equations were applied to calculate the Nflex factor. Four replicate specimens were tested for
each mixture.
Dynamic Modulus Test
Dynamic modulus tests were performed using an Asphalt Mixture Performance Tester
with a 25 to 100 kN loading capacity in accordance with AASHTO T 342, Standard Method of
Test for Determining Dynamic Modulus of Hot-Mix Asphalt Concrete Mixtures. Tests were
performed on 100-mm-diameter by 150-mm-high specimens compacted to 7.0 ± 0.5% air voids.
Four test temperatures (4.4, 21.1, 37.8, and 54.4°C) and six test frequencies ranging from 0.1 to
25 Hz were used. All tests were conducted in the uniaxial mode without confinement. Stress vs.
strain values were captured continuously and used to calculate dynamic modulus. Dynamic
modulus was computed automatically using IPC |E*| software. Three replicate specimens were
tested for each mixture, and results at each temperature-frequency combination were reported.
RESULTS AND DISCUSSION
Literature Review
The National Center for Asphalt Technology recently concluded a National Cooperative
Highway Research Program (NCHRP) study on developing a framework for the BMD concept.
The study included a survey to obtain information from state DOTs and asphalt contractors
regarding the current practice on mix design, mixture performance testing, quality assurance
through performance tests, and implementation of BMD. Three BMD approaches were
identified and summarized (West et al., 2018):
Approach I: volumetric design with performance verification. This approach
involves performing a conventional volumetric mix design method and then applying
performance tests to the volumetrically designed mixture. If the design does not meet
the required performance criteria, the process is repeated.
Approach II: performance-modified volumetric design. This approach uses
volumetric design guidelines to establish the initial aggregate blend and asphalt
content. The results of performance testing are then used to adjust the mixture
proportions such that the resulting mix design meets performance criteria. In this
case, the final design may not be required to meet traditional volumetric criteria.

9
Approach III: performance design. This approach relies on establishing aggregate
blends and asphalt contents that meet the performance testing criteria regardless of
the volumetric properties and/or design guidelines.
At the core of the BMD approach is the identification of common pavement distress
modes encountered and the identification of associated test methods to address these distresses.
According to the survey conducted by West et al. (2018) at the National Center for Asphalt
Technology, fatigue cracking, rutting, and thermal cracking were identified as the three main
distresses to be addressed with mixture performance testing. Responses to the survey addressed
testing requirements (West et al., 2018). A rutting test was required in the current mix design
specifications for 24 state DOTs. Only 8 state DOTs mandated the use of a cracking test in
design. Some of these DOTs intended to address one specific type of cracking, whereas the
others focused on assessing the overall cracking resistance of asphalt mixtures. In terms of
quality assurance, 14 state DOTs required performance testing on plant-produced mixtures. The
survey noted that multiple concerns were identified by state DOTs and asphalt contractors
regarding the implementation of BMD. These concerns included the validity of mixture
performance tests, specimen preparation and testing time, and lack of acceptance testing
protocols. Overall, 68% of state DOTs (34 of 50) showed interest in constructing BMD field
trials. The intent of these demonstration sections was to compare the performance of asphalt
mixtures designed following conventional methods (i.e., Superpave volumetric approach) vs. any
of the BMD approaches.
A number of states including California, Illinois, Iowa, Louisiana, New Jersey, and Texas
have already been experimenting with or implementing the BMD at the mixture acceptance
and/or construction acceptance level. All of these states have followed BMD Approach I with
the exception of California, which has followed BMD Approach II. No state reported following
BMD Approach III.
State BMD Efforts
California has adopted a framework for BMD mixtures that includes performance-based
specifications and its mechanistic empirical design program, CalME. These mixtures are
typically designed and placed on very-high-volume roads, and the BMD specifications are
applied to plant-produced mixtures. The performance testing protocol includes the repeated
simple shear test, bending beam fatigue (BBF) test, and Hamburg wheel-track test (HWTT). The
specification criteria were selected based on repetitions to 5% permanent deformation shear
strain for the repeated simple shear test and 50% loss of stiffness and flexural stiffness at 20°C
and a test frequency of 10 Hz for the BBF test (Harvey et al., 2014).
The Illinois DOT is in the process of implementing BMD Approach I. The DOT requires
performing the HWTT, I-FIT, and a modified version of the tensile strength ratio test to evaluate
rutting, fatigue, and moisture susceptibility, respectively. A long-term aging protocol for
implementation of the I-FIT was recently published (Al-Qadi et al., 2019). This effort
recommended using aging compacted specimens in forced-draft ovens. Three days of oven
aging at 95°C was chosen as the key component of the long-term aging protocol. For
acceptance, laboratory-produced laboratory-compacted specimens must have a mean flexibility

10
index (FI) for unaged and oven-aged specimens greater than 8.0 and 5.0, respectively. In
addition, plant-produced laboratory-compacted specimens must have a mean FI for unaged and
oven-aged specimens greater than 8.0 and 4.0, respectively. Contractors were also provided an
optional approach to use oven aging for 1 day at 95°C to screen for problematic mixtures; a
minimum FI of 6 should be met for this approach (Al-Qadi et al., 2019).
The Iowa DOT designs the majority of its asphalt mixtures following the conventional
Superpave volumetric approach. However, mixtures designed for very-high-volume traffic
and/or produced using a particular aggregate mineralogy must be evaluated for rutting resistance
using the HWTT by the contractor or a third-party mix design laboratory. The HWTT testing
temperature is a function of the asphalt binder PG high temperature. The current specifications
require a minimum stripping inflection point of 10,000 cycles and 14,000 cycles for plant-
produced mixtures with traffic designation Standard (S), and High (H) or Very High (V),
respectively. Additional performance testing and acceptance criteria might be required for
special types of asphalt mixtures. Moreover, the Iowa DOT is currently considering the addition
of the disc-shaped compact tension test as part of their BMD effort to evaluate mixture resistance
to thermal cracking (West et al., 2018).
The Louisiana DOT has implemented BMD Approach I using conventional volumetric
criteria along with loaded wheel tracking (LWT) and SCB tests to evaluate rutting and
intermediate temperature cracking, respectively, as part of their simplified performance-based
specifications. The roadway acceptance test sampling consists of collecting 25 random cores
from five sublots, with five random cores per sublot. Some of these cores undergo density
measurement and verifications, and others are subjected to LWT and SCB testing (Mohammad et
al., 2016). For rutting, the current specifications require an LWT test at 50°C and 20,000 cycles
to be lower than 6 mm for mixtures containing polymer and crumb rubber modified asphalt
binders and lower than 10 mm for mixtures containing unmodified binders. For cracking, the
current specifications require the SCB fracture energy (SCB-Jc) at 25°C to be greater than 0.5
kJ/m2 and 0.6 kJ/m2 for unmodified and modified asphalt mixtures, respectively (Cooper et al.,
2016). Efforts related to evaluating the changes in test parameters from different specimen types
(mix design vs. plant produced vs. field cores), developing an accelerated aging protocol, and
implementing the SCB test into quality control are ongoing.
The New Jersey DOT currently uses BMD Approach I on several types of asphalt
mixtures including high reclaimed asphalt pavement (RAP), high-performance thin overlay,
binder-rich intermediate course, bottom-rich base course, and bridge deck waterproofing surface
course mixtures. The performance-testing matrix at both the mix design and plant-production
stages includes APA testing at 64°C, tensile strength ratio and OT testing at 25°C, and BBF
testing at 15°C. The maximum APA rut depths after 8,000 cycles at 64°C for high RAP
mixtures are 4.0 mm and 7.0 mm for modified and unmodified asphalt binders, respectively. In
addition, the minimum number of cycles to failure using the OT for high RAP SMs is 275 cycles
for modified mixtures and 200 cycles for unmodified mixtures. For high RAP intermediate and
base mixtures, the required number of overlay cycles is reduced to 150 for modified mixtures
and 100 for unmodified mixtures. Binder-rich intermediate course and high-performance thin
overlay mixtures must have APA rut depths not exceeding 6.0 mm and 4.0 mm and minimum
numbers of 700 and 600 overlay cycles, respectively. With the shift to using quicker and simpler

11
tests such as the IDT at intermediate and high temperature to evaluate cracking and rutting,
tentative thresholds for IDT strength at high temperature and the cracking tolerance index
(CTindex) at intermediate temperature have been determined and are undergoing further
evaluation for possible implementation (Bennert et al., 2020).
The Texas DOT currently uses BMD Approach I for premium asphalt mixtures such as
porous friction courses, stone matrix asphalt, thin overlay mixtures, and hot in-place recycling of
asphalt concrete surfaces. They require the use of the HWTT and OT to evaluate mixture
resistance to rutting/moisture damage and reflection/bottom-up cracking, respectively. The
Superpave volumetric mix design criteria are used to determine an optimum binder content
(OBC). The HWTT and OT are then used to evaluate specimens at three binder contents (OBC,
OBC + 0.5%, and OBC + 1.0%). The final optimum OBC is selected to satisfy the requirements
of both tests. The minimum number of HWTT passes to 12.5 mm rut depth at a test temperature
of 50°C are 10,000 cycles, 15,000 cycles, and 20,000 cycles for mixtures produced with high-
temperature binder PG of 64°C and lower, 70°C, and 76°C and higher, respectively. The
requirements for the OT include a minimum critical fracture energy of 1 in-lb/in2 and a
maximum crack propagation rate of 0.45 (Texas DOT, 2019). Zhou et al. (2020) recommended
a quality control/quality assurance (QC/QA) acceptance protocol using practical performance-
related tests suitable for production QC such as the IDT at intermediate and high temperatures.
This includes sampling and conditioning produced loose mixtures at 135°C for 2 hours and then
compacting performance test specimens to an air-void level of 7 ± 0.5%. A minimum CTindex at
25°C of 105 and a minimum IDT shear strength of 1.02 MPa at 50°C were recommended as QC
production acceptance criteria (Zhou et al., 2020).
A growing number of states including Florida, Georgia, Indiana, Minnesota, Nebraska,
New Hampshire, New Mexico, Ohio, Oklahoma, Oregon, South Dakota, Utah, and Wisconsin,
among others, have ongoing efforts related to BMD. Table 2 summarizes some of the recently
completed and current ongoing efforts.
Virginia BMD Efforts
VDOT has continuously supported efforts to improve mixture durability. In an effort to
address rutting in Marshall mixtures, the Superpave system began to be adopted in 1997 with the
use of PG binders. Adoption continued as VDOT began using Superpave to design mixtures in
2000, and full implementation occurred in 2002. However, it was quickly noted that many of the
early Superpave-designed mixtures were coarse and dry, resulting in lives that were shorter than
desired. This began an effort to improve service life. Maupin (2003) found that as much as
0.5% binder could be added to nine studied mixtures to obtain beneficial results. To increase
binder contents, VDOT changed the gyratory compaction effort from the AASHTO-specified
traffic-dependent level to 65 gyrations. Additional work by Maupin (2011) found that binder
contents determined during the Superpave design had not significantly changed from those of the
previous Marshall mixtures, although differences in mixture gradations may have influenced the
results. Following this, VDOT made additional changes to mix design requirements, including
further reducing the design gyrations to 50 along with making gradation and volumetric
adjustments (Diefenderfer et al., 2018).

12
Table 2. States With Efforts to Address BMD and/or Performance Testing
State Description of Efforts
Florida
(West et al., 2018) Use FN, HWTT, and APA rut tests to evaluate rutting
Use IDT energy ratio and OT to evaluate cracking
Georgia
(West et al., 2018) Use APA and moisture susceptibility test as part of the mix design approval and field verification of
all asphalt mixtures
Use different APA test temperatures depending on mix location in pavement structure
Currently looking into CTindex and FI parameters
Minnesota
(Newcomb and Zhou,
2018)
Use the DCT fracture energy, Gf, to evaluate cracking performance
Require DCT testing on both mix design and production mix samples
Considering applying the DCT as a mix design test and the IDT as a QC/QA test
Need further work to define failure criteria for all cracking tests
New Mexico
(West et al., 2018) Constructed test sections on existing projects by using asphalt mixtures designed following a BMD
procedure
Use HWTT to evaluate rutting and stripping potentials of asphalt mixtures
Ohio
(Rodezno et al., 2018) Use APA testing for mixtures with more than 15% fine aggregates and that do not meet the fine
aggregate angularity criteria
Use BBF tests for bridge deck waterproofing mixtures
Selected the I-FIT to assess the cracking resistance and durability of mixtures with recycled
materials; however, with the emergence of the IDT, are evaluating the suitability of both tests for
implementation in mix design approval and QC/QA. Will recommend specification limits and test
standards.
Oklahoma
(Cross and Li, 2019) Are considering potential implementation of BMD Approach II
Constructed several BMD trial projects in spring 2018
Use the HWTT, I-FIT, IDT, and Cantabro test to evaluate mix design and production samples
Recommended the IDT if Oklahoma DOT decides to move forward with BMD
Recommended a minimum CTindex of 80 as the criterion for short-term aged specimens;
recommended consideration of dropping the binder grade in case failure to meet this criterion
occurs
Oregon
(Coleri et al., 2020) Previous research efforts established a performance-based BMD framework that suggested the use
of the I-FIT with typical FI values ranging from 9-14 for production mixtures
Recently completed efforts developed a long-term aging protocol to be implemented consisting of
aging mixtures at 95°C for 24 hours to simulate not more than 3-5 years of aging in the field; FI
threshold was refined to a minimum of 6 for Level 3 mixtures (1-10 million ESALs on rural
highways and 1-3 million ESALs on urban highways) and 8 for Level 4 mixtures (>10 million
ESALs on rural highways and >3 million ESALs on urban highways). A rut depth threshold of 3
mm for Level 3 mixtures and 2.5 mm for Level 4 mixtures was recommended.
South Dakota
(West et al., 2018) Currently follows the conventional Superpave volumetric mix design
Uses APA and TSR tests to evaluate rutting and moisture damage of asphalt mixtures, respectively
Utah
(West et al., 2018) Uses Superpave volumetric approach to design asphalt mixtures
Uses HWTT to evaluate resistance to rutting
Is exploring the use of the BBR sliver test and I-FIT to evaluate the mixture resistance to low-
temperature and intermediate-temperature cracking, respectively
Wisconsin
(West et al., 2018) Lowered the mixture design air-void target from 4.0% to 3.5%
Increased the minimum TSR requirement from 0.70 to 0.75
Uses HWTT to evaluate moisture susceptibility and rutting
Uses DCT test to evaluate low temperature cracking
Uses SCB test for fatigue cracking
Evaluates the PG grading of the recovered asphalt binder
Is exploring and evaluating the feasibility of using the HWTT, confined FN, and SCB tests at
intermediate and low temperatures
Identified potential for increase of asphalt contents by regressed air voids using the HWTT, DCT,
and I-FIT tests
APA = Asphalt Pavement Analyzer; BBF = bending beam fatigue; BBR = bending beam rheometer; BMD = balanced mix
design; DCT = disk-shaped compact tension; ESALs = equivalent single axle loads; FI = flexibility index; FN = flow number;
HWTT = Hamburg wheel-tracking test; IDT = indirect tensile test; OT = overlay test; PG = performance grade; QC/QA = quality
control/quality assurance; SCB = semi-circular bend; TSR = tensile strength ratio.
13
In addition to the efforts to improve durability, VDOT has been responding to increased
interest in the use of RAP. Beginning in 2007, VDOT allowed the use of up to 30% RAP (by
weight of mixture) in certain dense-graded SMs (Maupin et al., 2008). By 2017, interest from
industry in pursuing even higher SM RAP contents, up to 40% and above, had grown, and the
need to address this topic and the ongoing desire to achieve longer service lives prompted VDOT
and VTRC to begin investigating the BMD concept.
Asphalt Mixture Benchmarking
As previously discussed, the BMD method replaces some aspects of traditional
volumetric design with performance testing criteria for most common distresses such as rutting
and cracking. The approach requires that a mix design pass performance criteria for approval.
However, since no data were available to determine what performance tests should be used or
what the threshold criteria should be in order to provide the appropriate lifespan, the effort began
by performing benchmarking testing on asphalt mixtures meeting current specifications using
potential performance tests. An extensive suite of laboratory tests was performed on specimens
fabricated from asphalt mixtures collected during a 2015 study (Diefenderfer et al., 2018)
published by VTRC. Loose plant-produced mixtures were collected and evaluated in terms of
mixture volumetrics, aggregate gradation, and binder grade. The loose mixture was reheated and
compacted to fabricate test specimens for performance testing including the Cantabro test, the
APA test, the I-FIT, the OT, the NFlex factor, and the IDT-CT test (Bowers and Diefenderfer,
2018).
After the benchmarking data were evaluated and several approaches were applied to the
test selection, Diefenderfer and Bowers (2019) recommended the Cantabro, APA, and IDT-CT
tests for consideration in the BMD specification for Virginia. Further analysis was undertaken to
determine threshold values for each selected performance test (Bowers and Diefenderfer, 2018).
A maximum value of 7.5% was recommended for the Cantabro mass loss threshold to assess
general durability. All of the evaluated mixtures had mass loss values within a reasonable range
based on the literature (Cox et al., 2017). A maximum rutting threshold of 8.0 mm for APA rut
testing was recommended. This limit was near the maximum rut depth exhibited and was
selected because Virginia has not experienced any consistent rutting issues in its modern asphalt
mixtures. A minimum CTindex of 70 was recommended to evaluate the cracking susceptibility.
This recommendation was based on the study benchmarking results and the results presented by
Zhou et al. (2017). Zhou et al. (2017) included CTindex values for mixtures used on the Federal
Highway Administration Accelerated Loading and subsequent full-scale test cracking results. It
was noted that the worst performing asphalt mixtures had CTindex values below 70 whereas the
best performing asphalt mixtures had CTindex values greater than 100. More information and
analysis details can be found elsewhere (Bowers and Diefenderfer, 2018).
Specification Development
The adoption of BMD will not only have VDOT-wide impacts, it will also affect the
asphalt construction industry. As part of VDOT’s effort to address BMD, two committees were
created to coordinate efforts within VDOT and with industry in late 2018. A BMD advisory
group was initiated to address BMD at the executive level, manage VDOT-wide communication,

14
determine final policies, and make other relevant decisions. Committee members include VDOT
and industry representatives. In addition, a technical committee was established to address the
technical aspects of BMD collaboratively among VDOT, VTRC, and industry representatives.
The initial products of the technical committee were the 2019 versions of two special
provisions for BMD SFs: (1) Special Provision for Balanced Mix Design (BMD) Surface
Mixtures Designed Using Performance Criteria, and (2) Special Provision for High RAP Content
Surface Mixtures Designed Using Performance Criteria. These are presented in the Appendix.
The contents are the same for both special provisions with the exception that RAP contents are
limited to 30% or less for BMD SMs; in addition, “high RAP content surface mixtures” are
defined as having a minimum RAP content of 40%. The provisions cover requirements for
materials, job-mix formula (JMF), production testing, acceptance, and initial production. The
requirements for performance, recommended from the benchmarking effort, are summarized in
the JMF requirements, which also define the two types of BMD approaches that VDOT is
evaluating.
In the BMD special provisions, SMs with an A or D designation (SM-9.5A, SM-9.5D,
SM-12.5A, and SM-12.5D) may be designed to meet either Performance + Volumetric (P+V)
criteria or Performance Only (P) criteria. The JMF must meet the NMAS of the designated
mixture type. For both mixtures, performance test results must be reported in the design
submission:
Cantabro testing: mass loss at design binder content and 0.5% below design binder
contents.
IDT-CT testing: CTindex at design binder content, at 0.5% above design binder content,
and 0.5% below design binder contents.
APA rut testing: rut depth at design binder content and at 0.5% above design binder
contents.
The varying binder content required for each test is intended to provide an indication of
how sensitive the mix design is to changes in the binder content. If a mixture is too sensitive, it
is likely the mixture could fail the performance criteria during production because of the inherent
variability during production. In addition, the performance qualities (as defined in Table 3) for
the P and/or P+V JMF must show improvement over the original JMF specifically through a
higher CTIndex, a lower rutting depth, and less Cantabro mass loss. This is intended to support
the goal of improved mixture performance.
P+V mixtures are designed to meet the volumetric requirements in Section 211.03 of the
VDOT specifications (VDOT, 2016) and the criteria summarized in Table 3 at the design binder
content.

15
Table 3. Performance Testing Requirements
Test Procedure Specimens Criteria
AASHTO TP 108:
Standard Method of Test
for Determining the
Abrasion Loss of Asphalt
Mixture Specimens
(Cantabro)
300 rotations
30-33 rotations/min
3 replicates
Gyratory pill: 150 mm
diameter, 115 ± 5 mm
height
Compact to Ndesign, report
air voids
Lab-produced mix:
condition loose mix for 2
hr at design compaction
temperature prior to
compacting
Mass loss ≤ 7.5%
AASHTO T 340:
Method of Test for
Determining Rutting
Susceptibility of HMA
Using the Asphalt
Pavement Analyzer
(APA)
8,000 passes at 64°C 2 replicates of 2 pills (APA
Jr.)
Gyratory pill: 150 mm
diameter, 75 ± 2 mm height
Compact to 7 ± 0.5% air
voids
Lab-produced mix:
condition loose mixture for
2 hr at design compaction
temperature prior to
compacting
Plant-produced mix:
Minimize any cooling,
bring specimens to
compaction temperature,
and compact immediately
Rutting ≤ 8.0 mm
ASTM D 8225:
Determination of
Cracking Tolerance Index
of Asphalt Mixture Using
the Indirect Tensile
Cracking Test at
Intermediate Temperature
(CTindex)
Condition specimens at 25
± 1°C for 2 hr ± 10 min;
specimens must remain
dry; if conditioning in a
water bath, specimens must
be sealed in plastic bags
Apply load using load-line
displacement control at rate
of 50 mm/min, record load
to peak and through failure,
and analyze
5 replicates
Gyratory pill: 150 mm
diameter, 62 ± 2 mm height
Compact to 7 ± 0.5% air
voids
Lab-produced mix:
condition loose mix for 4
hr at the design compaction
temperature prior to
compacting
CTindex ≥ 70
P mixtures are designed to meet the requirements of Section 211.03 of the VDOT
specifications (VDOT, 2016) except that volumetric requirements are waived. The JMF for P
mixtures must establish a single percentage of aggregate passing each required sieve, a single
percentage of liquid asphalt material to be added to the mixture, the ranges for which the
Superpave volumetric properties will be held to during production, and the mixture production
temperature.
Based on the literature and experience gained through Virginia’s BMD efforts, the need
for further development of a roadmap was identified. The purpose of this roadmap was to
provide a detailed plan to address all aspects of VDOT’s initial implementation of BMD. This
roadmap needed be a dynamic document and be able to accommodate changes as the effort
16
continued and new developments occurred. The intent behind the roadmap presented herein was
to identify the broad categories under which specific efforts are required to implement BMD. An
initial example is presented showing detailed tasks and questions or knowledge gaps to address.
Further details are presented to show how several of these tasks were addressed in this study.
Roadmap for BMD Implementation
BMD was defined as “asphalt mix design using performance tests on appropriately
conditioned specimens that address multiple modes of distress taking into consideration mix
aging, traffic, climate, and location within the pavement structure” by the BMD task force,
formed in September 2015 by the Federal Highway Administration Expert Task Group on
Mixtures and Construction. Since then, interest in the BMD concept has continued to grow. To
provide guidance and resources for state agencies, NCHRP 20-07/Task 406 was initiated to
develop a framework addressing approaches to develop and implement BMD procedures (West
et al., 2018). The products included draft AASHTO practices and specifications that were fully
adopted as AASHTO PP 105, Standard Practice for Balanced Design of Asphalt Mixtures, and
AASHTO MP 46, Standard Specification for Balanced Mix Design.
AASHTO PP 105 presents a general framework for BMD that introduces the available
approaches to BMD and details the processes followed for each. AASHTO MP 46 presents a
selection of tests available to address and assess mixture susceptibility to rutting, cracking, and
moisture damage. Where available, the method of practice reports test criteria being used by
various entities; however, no criteria are recommended in AASHTO MP 46 at this time.
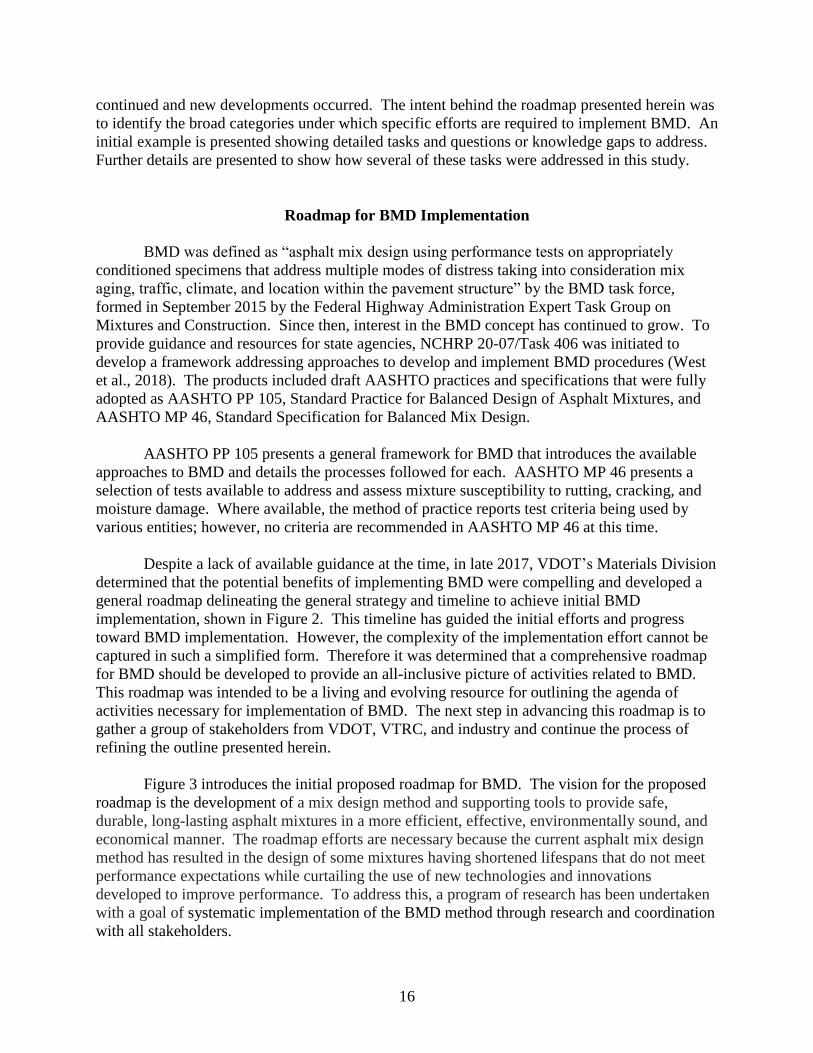
Despite a lack of available guidance at the time, in late 2017, VDOT’s Materials Division
determined that the potential benefits of implementing BMD were compelling and developed a
general roadmap delineating the general strategy and timeline to achieve initial BMD
implementation, shown in Figure 2. This timeline has guided the initial efforts and progress
toward BMD implementation. However, the complexity of the implementation effort cannot be
captured in such a simplified form. Therefore it was determined that a comprehensive roadmap
for BMD should be developed to provide an all-inclusive picture of activities related to BMD.
This roadmap was intended to be a living and evolving resource for outlining the agenda of
activities necessary for implementation of BMD. The next step in advancing this roadmap is to
gather a group of stakeholders from VDOT, VTRC, and industry and continue the process of
refining the outline presented herein.
Figure 3 introduces the initial proposed roadmap for BMD. The vision for the proposed
roadmap is the development of a mix design method and supporting tools to provide safe,
durable, long-lasting asphalt mixtures in a more efficient, effective, environmentally sound, and
economical manner. The roadmap efforts are necessary because the current asphalt mix design
method has resulted in the design of some mixtures having shortened lifespans that do not meet
performance expectations while curtailing the use of new technologies and innovations
developed to improve performance. To address this, a program of research has been undertaken
with a goal of systematic implementation of the BMD method through research and coordination
with all stakeholders.
17
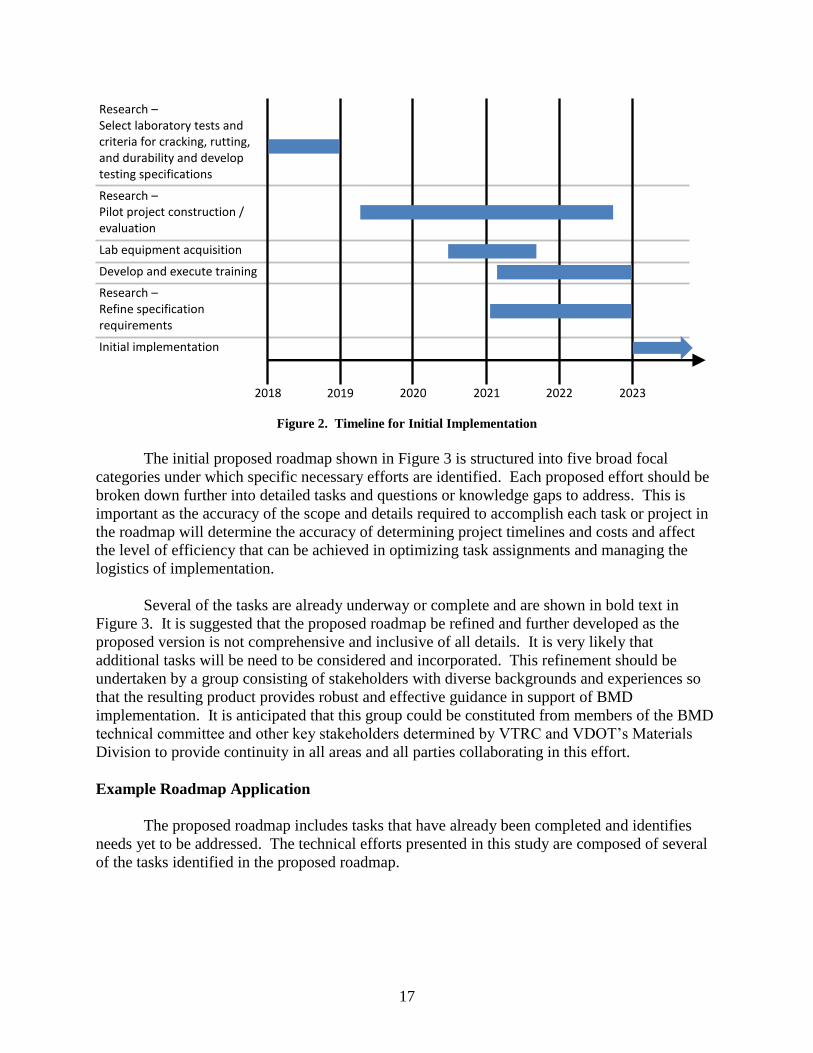
Figure 2. Timeline for Initial Implementation
The initial proposed roadmap shown in Figure 3 is structured into five broad focal
categories under which specific necessary efforts are identified. Each proposed effort should be
broken down further into detailed tasks and questions or knowledge gaps to address. This is
important as the accuracy of the scope and details required to accomplish each task or project in
the roadmap will determine the accuracy of determining project timelines and costs and affect
the level of efficiency that can be achieved in optimizing task assignments and managing the
logistics of implementation.
Several of the tasks are already underway or complete and are shown in bold text in
Figure 3. It is suggested that the proposed roadmap be refined and further developed as the
proposed version is not comprehensive and inclusive of all details. It is very likely that
additional tasks will be need to be considered and incorporated. This refinement should be
undertaken by a group consisting of stakeholders with diverse backgrounds and experiences so
that the resulting product provides robust and effective guidance in support of BMD
implementation. It is anticipated that this group could be constituted from members of the BMD
technical committee and other key stakeholders determined by VTRC and VDOT’s Materials
Division to provide continuity in all areas and all parties collaborating in this effort.
Example Roadmap Application
The proposed roadmap includes tasks that have already been completed and identifies
needs yet to be addressed. The technical efforts presented in this study are composed of several
of the tasks identified in the proposed roadmap.
2018 2019 2020 2023 2022 2021
Research – Select laboratory tests and criteria for cracking, rutting, and durability and develop testing specifications
Research – Pilot project construction / evaluation
Lab equipment acquisition
Develop and execute training
Research – Refine specification requirements
Initial implementation

18
Figure 3. Initial Proposed Roadmap for Balanced Mix Design. Tasks in bold text are underway or complete.
Establish Communications and Transparency with All Stakeholders
• Identify champion(s) and key stakeholders
• Establish joint committees – VDOT/VTRC/Industry
Identify and Address Knowledge Gaps
• Confirm the current performance cycle length for dense-graded mixtures using PMS data
• Install and monitor mixtures on structurally sound pavements to assess mixture performance cycle
• Develop performance metrics to assess and measure improvements in service life
• Identify/develop tests suitable for laboratory evaluation and performance testing
• Consider potential for integration with pavement design and maintenance
Initiate Research Efforts
• Select and evaluate potential performance tests
• Conduct benchmarking or shadow evaluation of current mixtures
• Select recommended tests for performance assessment
• Determine preliminary test acceptance criteria
• Develop sampling and testing plan
• Conduct precision/variability studies
• Conduct production data analysis
• Verify and/or refine test acceptance criteria
• Refine sampling and testing plan
• Develop process to address mixture QC/QA, acceptance, and payment
Initiate Operational Efforts
• Acquire equipment
• Conduct trial/demonstration projects (no cost)
• Update training program and laboratory accreditation process
• Conduct pilot projects (bid)
• Perform final analysis and specification revisions
Implementation
• Use a phased approach
• Revisit processes, review metrics, and assess improvement
• Implement further refinements and advancements
Initial Roadmap for Balanced Mix Design
Develop a mix design method and supporting tools to provide safe, durable, long-lasting asphalt mixtures in a more efficient, effective, environmentally sound, and economical manner.
Vision
The current asphalt mix design method has resulted in the design of some mixtures having shortened lifespans that do not meet performance expectations while curtailing the use of new technologies and innovations developed to improve performance.
Problem Statement
Achieve systematic implementation of the balanced mix design method through research and coordination with all stakeholders. Goal

19
An example of using the proposed roadmap to identify needs for research can be shown
for the first item listed under “Initiate Research Efforts”: Select and evaluate potential
performance tests. This objective can be broken down into a number of more specific tasks, as
shown in Figure 4. Although this list may not be comprehensive at this time, further refinement
of the roadmap will remedy that as stakeholder input is incorporated.
Several of the tasks shown in Figure 4 are addressed in this study and are shown in bold
font in the figure. Additional production mixtures were sampled and evaluated to provide
additional benchmark data. Various specimen types including non-reheated specimens, reheated
specimens, and field cores were evaluated to assess the impact of the different fabrication
methods. The performance tests selected by Diefenderfer and Bowers (2019) were validated by
considering relationships to fundamental properties and comparing test quality factors. The test
criteria determined in the previous benchmarking study (Bowers and Diefenderfer, 2018) were
also validated and the differences in specimen fabrication methods were assessed. These are
discussed in detail in the following sections.
Validation and Refinement of BMD Performance Test Selection
Mixtures A through F were used to validate and/or refine the selection of suitable BMD
performance tests. This was accomplished by first comparing the ranking and expected
performance of the mixtures determined by the selected BMD tests (IDT-CT and APA) with
fundamental mechanical responses and parameters measured from binder and mixture
rheological testing. The choice of cracking test was further evaluated by assessing the IDT-CT,
OT, I-FIT, and Nflex factor tests in terms of variability, discrimination potential and ranking
among the selected asphalt mixtures, and correlation among each other. The volumetric
properties and gradations of Mixtures A through F are shown in Table 5, along with those of
Mixtures G through M, which will be addressed later.
The PG and rheological properties of the extracted and recovered asphalt binders from
Mixtures A through F are presented in Table 6. Binder grading was performed in accordance
with AASHTO M 332, which incorporates the non-recoverable creep compliance at 3.2 kPa
(Jnr,3.2kPa) from the MSCR test. MSCR testing was conducted at 64°C, the average 7-day
maximum pavement design temperature for Virginia. AASHTO M 332 specifies a maximum
Jnr,3.2kPa requirement for standard (S), heavy (H), very heavy (V), and extremely heavy (E) traffic
of 4.0, 2.0, 1.0, and 0.5 kPa-1, respectively. VDOT specifications call for a minimum of PG 64S-
16 and PG 64H-16 asphalt binders for SMs with the A and D designation, respectively. Table 6
shows that Mixture B and Mixture E binders were in the extremely high traffic (E) category;
Mixture C, D, and F binders fell under the very heavy traffic (V) category; and the Mixture A
binder was adequate for heavy traffic (H) loading. This indicates that all of the mixtures used in
this study met or exceeded VDOT specification criteria from the standpoint of binder properties.
The percentage recovery at the 3.2 kPa stress level for all binders was very low, an expected
outcome for unmodified binders.

20
Figure 4. Example Tasks and Activities Necessary to Select and Evaluate Potential Performance Tests.
Activities in bold were conducted as part of this study.
Table 6 also presents the critical low temperature difference (ΔTc) values for the binders
after 20 hours of aging in a pressure-aging vessel (PAV). The ΔTc is calculated as the difference
in continuous PG temperature for stiffness (TS) and relaxation (Tm) properties in the BBR. It
provides insight into the relaxation properties of a binder that can be used to indicate
susceptibility to non-load related cracking or other age-related embrittlement distresses in an
asphalt pavement, especially for unmodified binders (Asphalt Institute, 2019; Martin et al.,
2019). Generally, for ΔTc, a minimum threshold of -2.5°C is recommended for the cracking
warning limit and -5.0°C is recommended for the cracking limit, both after 20-hour PAV aging
(Anderson et al., 2011; Asphalt Institute, 2019). In a draft AASHTO specification prepared
under the NCHRP 9-58 study, the ΔTc value of -5 after 20-hour PAV aging is proposed as a
requirement to evaluate the low-temperature performance of binder blends (Martin et al., 2019).
•Rutting. cracking, durability
Identify target failure mechanisms to be addressed by performance testing
•Rutting - APA rut test, Hamburg wheel track test, dynamic modulus, binder properties
•Cracking - IDT-CT, Overlay test, I-FIT, Nflex test, Bending Beam Fatigue test, dynamic modulus, binder properties
•Durability - Cantabro test
Identify the potential pool of tests relevant to each failure mechanism
•Preliminary benchmarking
•Determine if relationships exist between tests and mix performance
•Are the tests practical to perform in terms of cost, effort, and time
Initial screening to identify the most promising test candidates
•Collect test data for analysis and further evaluation and screening of tests
•Establish a reference baseline of performance test results for known mixtures
•Assess impact of specimen type - reheated, non-reheated, core
Benchmark typical production mixtures
•Variability of results
•Discrimination potential
•Ranking capability
•Correlation or relationship with fundamental tests
•Correlation to field performance
Evaluate and compare test quality factors
•Consider applications - mix design, QC, QA, acceptance, pay
•Eliminating impractical tests
Eliminate poorly ranked tests from consideration
•Do criteria compare well with current mixtures
•Do criteria relate to field performance
Verify and/or refine performance test criteria
Select and evaluate potential performance tests

Tab
le 5
. V
olu
met
ric
Prop
erti
es a
nd
Grad
ati
on
s fo
r A
ll M
ixtu
res
Mix
ture
A
B
C
D
E
F
G
H
I
J
K
L
M
Mix
ture
Ty
pe
SM
-
9.5
A
SM
-
12
.5A
SM
-
12
.5D
SM
-
12
.5D
SM
-
9.5
A
SM
-
12
.5A
SM
-
9.5
A
SM
-
12
.5A
SM
-
9.5
A
SM
-
12
.5A
SM
-
9.5
A
SM
-
9.5
A
SM
-
9.5
A
RA
P C
on
ten
t, %
3
0
30
26
26
26
30
30
30
30
30
30
30
30
Pro
per
ty
NM
AS
, m
m
9.5
1
2.5
1
2.5
9
.5
9.5
1
2.5
9
.5
12
.5
9.5
1
2.5
9
.5
9.5
9
.5
Asp
hal
t C
on
ten
t, %
5
.64
5.0
4
5.3
9
6.1
9
5.4
7
5.9
5
5.7
4
5.7
0
5.1
4
5.3
1
5.6
2
5.5
0
5.5
1
Ric
e S
G (
Gm
m)
2.4
35
2.6
70
2.6
34
2.4
47
2.5
87
2.4
91
2.4
31
2.5
07
2.7
20
2.5
87
2.6
56
2.6
29
2.6
32
VT
M,
%
3.3
3
.1
3.0
2
.2
4.5
1
.9
4.4
2
.5
4.3
3
.1
3.4
4
.0
4.7
VM
A,
%
16
.1
15
.3
15
.8
16
.3
17
.5
14
.9
17
.1
16
.0
17
.1
15
.9
17
.3
17
.4
17
.9
VF
A,
%
79
.5
79
.6
81
.3
86
.2
74
.2
87
.5
74
.5
84
.4
74
.6
80
.3
80
.3
76
.7
74
.0
FA
Rat
io
0.8
7
1.2
8
1.3
6
1.0
3
1.2
5
1.0
6
1.1
5
1.1
2
2.0
8
1.1
4
0.9
7
1.2
2
1.1
8
Mix
ture
Bu
lk S
G (
Gm
b)
2.3
55
2.5
86
2.5
56
2.3
92
2.4
70
2.4
44
2.3
25
2.4
44
2.6
02
2.5
06
2.5
65
2.5
23
2.5
09
Aggre
gat
e E
ffec
tive
SG
(G
se)
2.6
51
2.9
16
2.8
90
2.6
91
2.8
34
2.7
36
2.6
50
2.7
45
2.9
86
2.8
27
2.9
32
2.8
90
2.8
94
Aggre
gat
e B
ulk
SG
(G
sb)
2.6
48
2.9
01
2.8
72
2.6
80
2.8
30
2.7
02
2.6
42
2.7
45
2.9
78
2.8
23
2.9
29
2.8
85
2.8
89
Ab
sorb
ed A
sph
alt
Co
nte
nt
(Pba)
, %
0.0
4
0.1
8
0.2
2
0.1
6
0.0
5
0.4
7
0.1
2
0.0
0
0.0
9
0.0
5
0.0
4
0.0
6
0.0
6
Eff
ecti
ve
Asp
hal
t C
on
ten
t (P
be)
, %
5.5
9
4.8
7
5.1
8
6.0
4
5.4
2
5.5
0
5.6
3
5.7
0
5.0
5
5.2
6
5.5
9
5.4
4
5.4
5
Eff
ecti
ve
Fil
m T
hic
kn
ess
(Fbe)
, µ
m
9.7
7
.8
8.4
1
0.4
8
.4
9.8
8
.2
9.4
6
.3
8.5
1
0.5
9
.3
9.4
Gra
dati
on
, p
ercen
t p
ass
ing
¾ i
n (
19
.0 m
m)
10
0.0
1
00.0
1
00.0
1
00.0
1
00.0
1
00.0
1
00.0
1
00.0
1
00.0
1
00.0
1
00.0
1
00.0
1
00.0
½ i
n (
12
.5 m
m)
98
.9
97
.3
99
.3
10
0.0
9
9.4
9
6.0
9
8.9
9
8.0
9
9.6
9
8.2
9
9.9
9
9.5
9
9.7
3/8
in
(9
.5 m
m)
93
.3
86
.6
92
.0
91
.9
94
.7
85
.7
95
.0
87
.0
90
.7
90
.8
94
.9
91
.1
94
.0
No
. 4 (
4.7
5 m
m)
60
.7
55
.6
58
.5
56
.7
65
.9
58
.1
71
.2
58
.1
57
.4
59
.4
56
.9
58
.3
60
.9
No
. 8 (
2.3
6 m
m)
43
.9
39
.2
39
.6
40
.6
47
.1
40
.9
52
.3
40
.0
38
.0
41
.8
37
.0
40
.5
41
.4
No
. 16
(1
.18
mm
) 3
5.0
3
0.3
2
8.4
3
3.3
3
4.9
2
9.9
3
9.8
2
9.6
2
5.8
3
1.2
2
6.2
2
9.4
3
0.2
No
. 30
(6
00
µm
) 2
5.8
2
3.5
2
0.1
2
5.0
2
4.5
2
1.2
2
8.6
2
1.9
1
8.1
2
3.5
1
8.8
2
0.7
2
0.9
No
. 50
(3
00
µm
) 1
7.0
1
6.8
1
3.7
1
3.1
1
5.4
1
3.4
1
9.0
1
5.2
1
2.4
1
6.4
1
3.0
1
2.5
1
2.5
No
. 10
0 (
15
0 µ
m)
8.4
1
0.3
9
.8
8.0
9
.5
8.3
1
0.3
9
.7
8.0
1
0.1
8
.5
8.6
8
.5
No
. 20
0 (
75
µm
) 4
.9
6.2
7
.1
6.2
6
.8
5.8
6
.5
6.4
5
.3
6.0
5
.4
6.7
6
.4
Ex
tract
ed a
nd
Reco
ver
ed A
sph
alt
Bin
der
Per
form
ance
Gra
de
(PG
) 6
4H
-22
64
E-1
6
64V
-16
64
H-1
6
64
E-1
6
64V
-16
- -
- -
- -
-
RA
P =
rec
ycl
ed a
sph
alt
pav
emen
t; N
MA
S =
no
min
al m
axim
um
ag
gre
gat
e si
ze;
SG
= s
pec
ific
gra
vit
y;
VT
M =
vo
ids
in t
ota
l m
ixtu
re;
VM
A =
vo
ids
in m
iner
al a
ggre
gat
e; V
FA
=
vo
ids
fill
ed w
ith
asp
hal
t; F
A =
fin
es t
o a
ggre
gat
e; -
= e
xtr
acti
on
no
t p
erfo
rmed
.

22
Table 6. Performance Grading Results of Extracted and Recovered Asphalt Binders
Property
Mixture
A B C D E F
Dynamic Shear, 10 rad/sec, specification: |G*|/sin δ >2.20 kPa
RTFO |G*|/sin δ 70°C 2.24 7.12 6.41 3.97 9.44 6.01
76°C 1.08 3.40 3.06 1.90 4.57 2.81
82°C - 1.68 1.51 - 2.26 1.36
88°C - - - - 1.17 -
RTFO Failure Temperature, °C 70.1 79.7 78.8 74.8 82.4 78.1
Dynamic Shear, 10 rad/sec, specification: |G*|∙sin δ < 5000 kPa
PAV |G*|∙sin δ 22°C 5418 - - 5989 - -
25°C 3861 6109 5166 4337 - 6082
28°C - 4500 3894 - 5035 4354
31°C - - - - 3832 3051
PAV Failure Temperature, °C 22.7 27.0 25.4 23.7 28.1 26.7
Creep Stiffness, 60 sec, specification: Stiffness < 300 MPa and m-value > 0.300
Stiffness, S -6ºC - 126 106 101 126 131
-12ºC 157 206 214 189 226 249
-18ºC 340 - - - - -
M-value, m -6ºC - 0.318 0.325 0.338 0.301 0.33
-12ºC 0.313 0.275 0.29 0.297 0.273 0.286
-18ºC 0.265 - - - - -
ΔTc, ºC -3.4 -8.1 -4.6 -4.9 -8.7 -3.6
Performance Grade (AASHTO M 320) 70-22 76-16 76-16 70-16 82-16 76-16
Multiple Stress and Creep Recovery (MSCR) Test at 64°C
Jnr, kPa-1 0.1 kPa 1.652 0.395 0.465 0.908 0.261 0.546
3.2 kPa 1.851 0.429 0.504 1.000 0.283 0.589
Avg. % Recovery, % 0.1 kPa 8.1 21.9 19.8 12.1 2.9 14.6
3.2 kPa 2.7 15.8 14.2 6.3 2.3 9.6
Performance Grade (AASHTO M322) 64H-22 64E-16 64V-16 64H-16 64E-16 64V-16
RTFO = rolling thin film oven; PAV = pressure aging vessel; - = no data collected.
From Table 6, Mixtures A, C, D, and F had ΔTc values ranging from -3.6 to -4.9°C, all
exceeding the cracking warning limit. For Mixtures B and E, the corresponding ΔTc values
exceeded the cracking limit of -5.0°C indicating a high susceptibility to non-load related
cracking.
Dynamic Modulus Test
The dynamic modulus (|E*|) and phase angle (δ) of Mixtures A through F were measured
on three replicate specimens, and the average results at each temperature-frequency combination
were reported. An overall average coefficient of variation (COV) of 11.2% for the |E*|
measurements and a COV of 3.3% for the δ measurements were observed across all temperature-
frequency test combinations.
The dynamic modulus (|E*|) and phase angle (δ) of the six mixtures are presented in
Figure 5 and Figure 6, respectively. These curves were constructed at a reference temperature
(Tr) of 21°C using the generalized logistic models (for both |E*| and δ data) along with the
polynomial shift factor, which provide a better fit to the measured data compared to a
conventional sigmoid function implemented in the current mechanistic-empirical pavement

23
design software (Boz and Solaimanian, 2019; Boz et al., 2017a, b; Oshone et al., 2017; Rowe et
al., 2016; Tavassoti-Kheiry et al., 2017). In general, a higher |E*| value at higher temperatures
(and lower frequencies) is often attributed to a higher rutting resistance potential of asphalt
mixtures. Conversely, a higher |E*| value and lower δ at lower temperatures (and higher
frequencies) is often associated with a higher cracking susceptibility potential of asphalt
mixtures. A visual inspection of Figure 5 shows that Mixtures A and D have lower |E*| values
(lower stiffness) and Mixture E has higher |E*| values (higher stiffness) across the loading
spectrum. As seen in Figure 6, Mixture D has higher δ values and Mixture E has lower δ values
(lower relaxation capability), indicating a higher cracking potential for Mixture E among the six
mixtures.
Figure 5. Dynamic Modulus |E*| Master Curves
Figure 6. Phase Angle (δ) Master Curves
1
10
100
1000
10000
100000
1.E-06 1.E-04 1.E-02 1.E+00 1.E+02 1.E+04 1.E+06
Dynam
ic M
odulu
s,
MP
a
Reduced Frequency, Hz
A B C
D E F
0
5
10
15
20
25
30
35
40
1.E-07 1.E-05 1.E-03 1.E-01 1.E+01 1.E+03 1.E+05 1.E+07
Phase A
ngle
, D
egre
es
Reduced Frequency, Hz
A B C
D E F
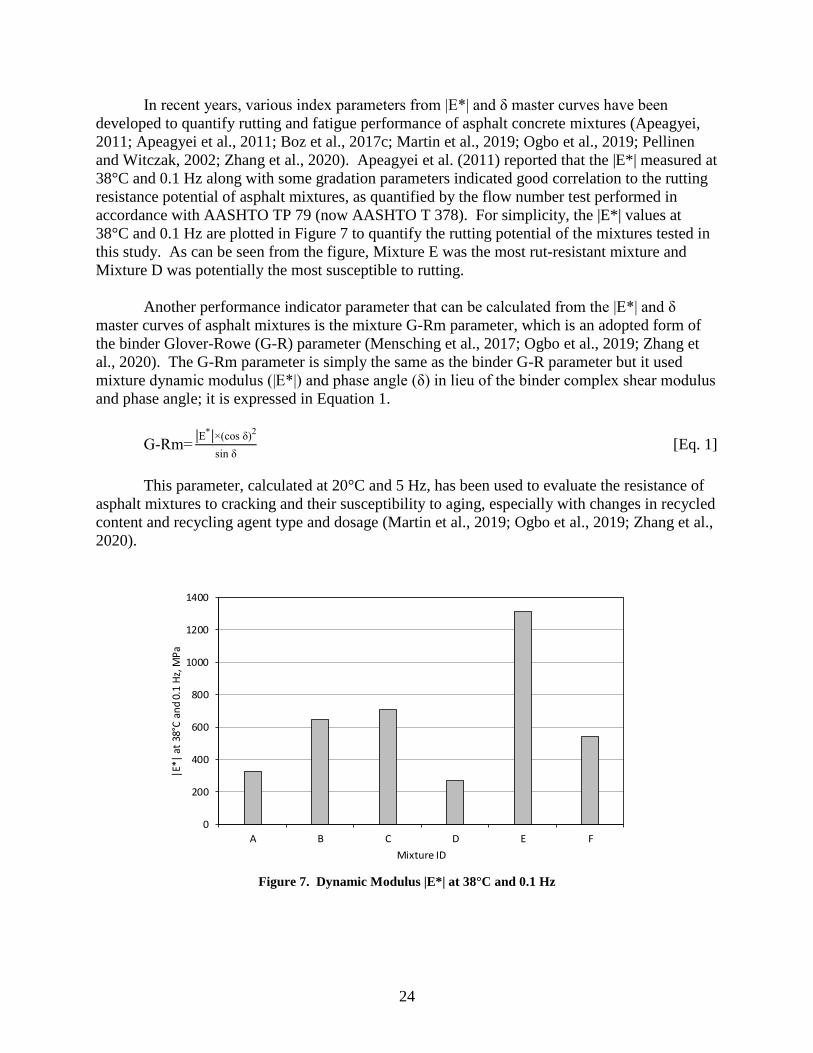
24
In recent years, various index parameters from |E*| and δ master curves have been
developed to quantify rutting and fatigue performance of asphalt concrete mixtures (Apeagyei,
2011; Apeagyei et al., 2011; Boz et al., 2017c; Martin et al., 2019; Ogbo et al., 2019; Pellinen
and Witczak, 2002; Zhang et al., 2020). Apeagyei et al. (2011) reported that the |E*| measured at
38°C and 0.1 Hz along with some gradation parameters indicated good correlation to the rutting
resistance potential of asphalt mixtures, as quantified by the flow number test performed in
accordance with AASHTO TP 79 (now AASHTO T 378). For simplicity, the |E*| values at
38°C and 0.1 Hz are plotted in Figure 7 to quantify the rutting potential of the mixtures tested in
this study. As can be seen from the figure, Mixture E was the most rut-resistant mixture and
Mixture D was potentially the most susceptible to rutting.
Another performance indicator parameter that can be calculated from the |E*| and δ
master curves of asphalt mixtures is the mixture G-Rm parameter, which is an adopted form of
the binder Glover-Rowe (G-R) parameter (Mensching et al., 2017; Ogbo et al., 2019; Zhang et
al., 2020). The G-Rm parameter is simply the same as the binder G-R parameter but it used
mixture dynamic modulus (|E*|) and phase angle (δ) in lieu of the binder complex shear modulus
and phase angle; it is expressed in Equation 1.
G-Rm=|E*|×(cos δ)
2
sin δ [Eq. 1]
This parameter, calculated at 20°C and 5 Hz, has been used to evaluate the resistance of
asphalt mixtures to cracking and their susceptibility to aging, especially with changes in recycled
content and recycling agent type and dosage (Martin et al., 2019; Ogbo et al., 2019; Zhang et al.,
2020).
Figure 7. Dynamic Modulus |E*| at 38°C and 0.1 Hz
0
200
400
600
800
1000
1200
1400
A B C D E F
|E*|
at
38°C
an
d 0
.1 H
z, M
Pa
Mixture ID
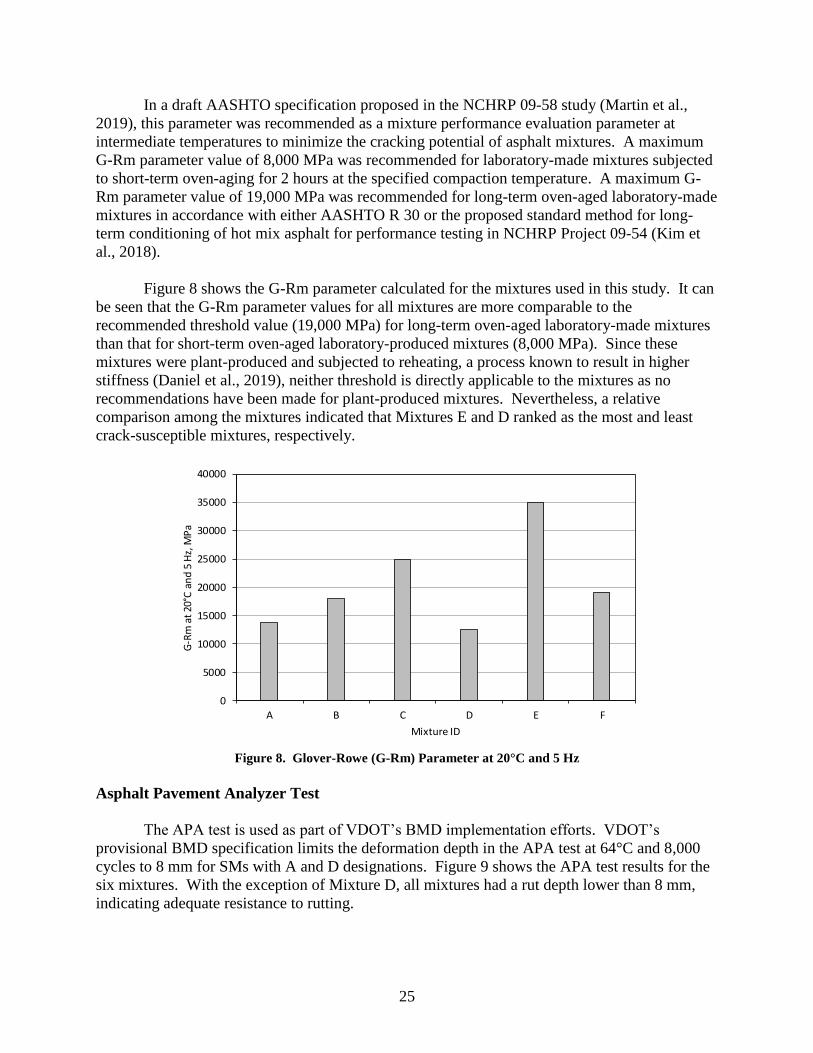
25
In a draft AASHTO specification proposed in the NCHRP 09-58 study (Martin et al.,
2019), this parameter was recommended as a mixture performance evaluation parameter at
intermediate temperatures to minimize the cracking potential of asphalt mixtures. A maximum
G-Rm parameter value of 8,000 MPa was recommended for laboratory-made mixtures subjected
to short-term oven-aging for 2 hours at the specified compaction temperature. A maximum G-
Rm parameter value of 19,000 MPa was recommended for long-term oven-aged laboratory-made
mixtures in accordance with either AASHTO R 30 or the proposed standard method for long-
term conditioning of hot mix asphalt for performance testing in NCHRP Project 09-54 (Kim et
al., 2018).
Figure 8 shows the G-Rm parameter calculated for the mixtures used in this study. It can
be seen that the G-Rm parameter values for all mixtures are more comparable to the
recommended threshold value (19,000 MPa) for long-term oven-aged laboratory-made mixtures
than that for short-term oven-aged laboratory-produced mixtures (8,000 MPa). Since these
mixtures were plant-produced and subjected to reheating, a process known to result in higher
stiffness (Daniel et al., 2019), neither threshold is directly applicable to the mixtures as no
recommendations have been made for plant-produced mixtures. Nevertheless, a relative
comparison among the mixtures indicated that Mixtures E and D ranked as the most and least
crack-susceptible mixtures, respectively.
Figure 8. Glover-Rowe (G-Rm) Parameter at 20°C and 5 Hz
Asphalt Pavement Analyzer Test
The APA test is used as part of VDOT’s BMD implementation efforts. VDOT’s
provisional BMD specification limits the deformation depth in the APA test at 64°C and 8,000
cycles to 8 mm for SMs with A and D designations. Figure 9 shows the APA test results for the
six mixtures. With the exception of Mixture D, all mixtures had a rut depth lower than 8 mm,
indicating adequate resistance to rutting.
0
5000
10000
15000
20000
25000
30000
35000
40000
A B C D E F
G-R
m a
t 20
°C a
nd
5 H
z, M
Pa
Mixture ID

26
Figure 9. APA Test Results at 64°C and 8,000 cycles. I-bars indicate 1 standard deviation. APA = asphalt
pavement analyzer.
The rut results from the APA test were compared to the rut parameters obtained from the
mixture |E*| and binder tests. Figure 10 shows the correlation between the APA rut depth and
|E*| values at 38°C and 0.1 Hz. As seen, the APA rut depth is highly correlated with the |E*|
rutting parameter and the correlation trend is in the right direction (i.e., the higher the stiffness,
the lower the rutting potential). Similarly, the APA rut depth was correlated with the binder
|G*|/sin δ and Jnr,3.2kPa parameters as shown in Figures 11 and 12, respectively. In both cases, the
correlation was moderate with a coefficient of determination (R2) of about 50% to 60%.
However, the extent of correlation significantly increased (R2 of about 96%) when one of the
mixtures (encircled in the figures) was removed.
Figure 10. Correlation Between APA Rut Depth and |E*| at 38°C and 0.1 Hz
0
1
2
3
4
5
6
7
8
9
10
A B C D E F
AP
A R
ut
De
pth
at
64°C
an
d 8
000
Cyc
les,
mm
Mixture ID
y = 2,835.79e-0.27x
R² = 0.89
0
200
400
600
800
1000
1200
1400
0 2 4 6 8 10
|E*|
at
38°C
and 0
.1 H
z,
MP
a
APA Rut Depth at 64°C and 8000 Cycles, mm

27
Figure 11. Correlations Between APA Rut Depth and |G*|/sin δ. The circled data point appears to be an
outlier. R2 improves from 0.50 (lower curve) to 0.95 (upper curve) when the circled point is removed from
the analysis.
Figure 12. Correlations Between APA Rut Depth and Jnr,3.2KPa. The circled data point appears to be an
outlier. R2 improves from 0.59 (upper curve) to 0.97 (lower curve) when the circled point is removed from
the analysis.
Although it is unclear why that specific binder test parameter deviated from the general
trend seen, the behavior can be attributed to differences in binder vs. mixture properties (such as
mixture heterogeneity, aggregate and binder interactions including blending of RAP and virgin
binder) or an experimental error during the process of extraction, recovery, or testing of the
binder.
Nevertheless, for the mixtures tested in this study, the APA test overall provides the
expected trend of rutting potential in relation to that determined from the other mixture and
y = 15.86e-0.18x
R² = 0.50
y = 14.42e-0.14x
R² = 0.95
0
2
4
6
8
10
12
0 2 4 6 8 10
|G*|
/Sinδ
at 70°C
, kP
a
APA Rut Depth at 64°C and 8000 Cycles, mm
y = 0.14e0.26x
R² = 0.59
y = 0.15e0.21x
R² = 0.97
0.0
0.5
1.0
1.5
2.0
2.5
0 2 4 6 8 10
Jnr
at
3200 P
a a
nd 6
4°C
, kP
a-1
APA Rut Depth at 64°C and 8000 Cycles, mm
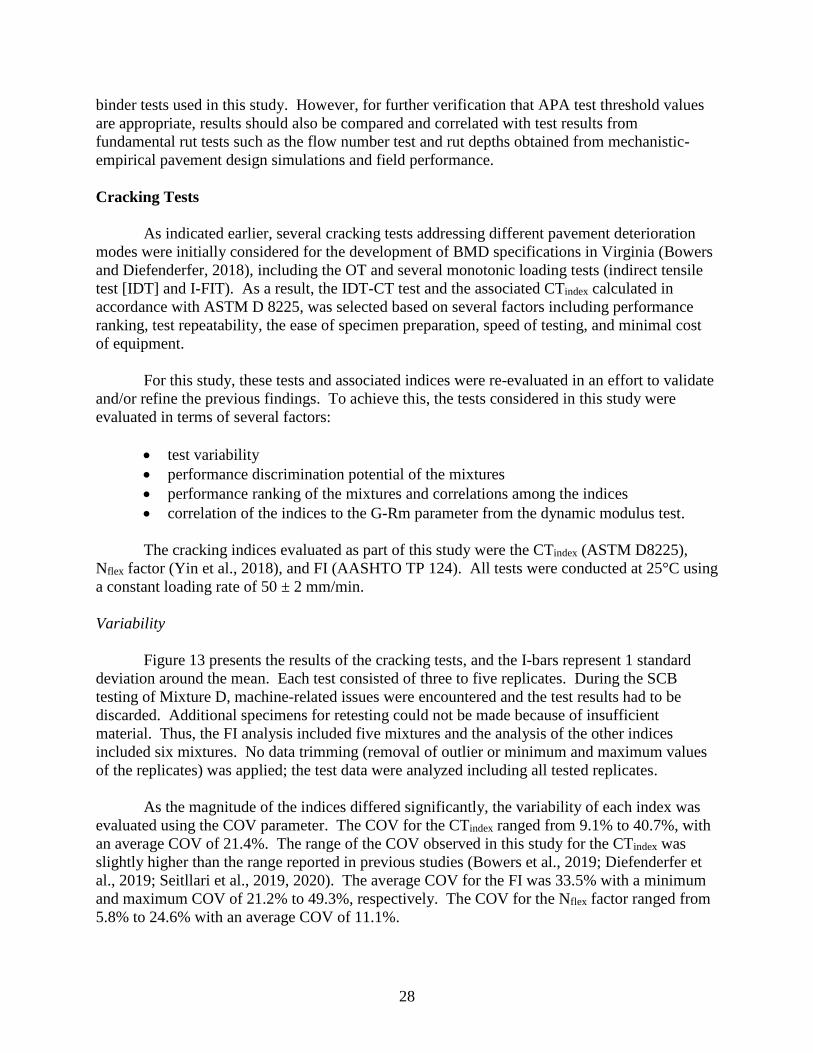
28
binder tests used in this study. However, for further verification that APA test threshold values
are appropriate, results should also be compared and correlated with test results from
fundamental rut tests such as the flow number test and rut depths obtained from mechanistic-
empirical pavement design simulations and field performance.
Cracking Tests
As indicated earlier, several cracking tests addressing different pavement deterioration
modes were initially considered for the development of BMD specifications in Virginia (Bowers
and Diefenderfer, 2018), including the OT and several monotonic loading tests (indirect tensile
test [IDT] and I-FIT). As a result, the IDT-CT test and the associated CTindex calculated in
accordance with ASTM D 8225, was selected based on several factors including performance
ranking, test repeatability, the ease of specimen preparation, speed of testing, and minimal cost
of equipment.
For this study, these tests and associated indices were re-evaluated in an effort to validate
and/or refine the previous findings. To achieve this, the tests considered in this study were
evaluated in terms of several factors:
test variability
performance discrimination potential of the mixtures
performance ranking of the mixtures and correlations among the indices
correlation of the indices to the G-Rm parameter from the dynamic modulus test.
The cracking indices evaluated as part of this study were the CTindex (ASTM D8225),
Nflex factor (Yin et al., 2018), and FI (AASHTO TP 124). All tests were conducted at 25°C using
a constant loading rate of 50 ± 2 mm/min.
Variability
Figure 13 presents the results of the cracking tests, and the I-bars represent 1 standard
deviation around the mean. Each test consisted of three to five replicates. During the SCB
testing of Mixture D, machine-related issues were encountered and the test results had to be
discarded. Additional specimens for retesting could not be made because of insufficient
material. Thus, the FI analysis included five mixtures and the analysis of the other indices
included six mixtures. No data trimming (removal of outlier or minimum and maximum values
of the replicates) was applied; the test data were analyzed including all tested replicates.
As the magnitude of the indices differed significantly, the variability of each index was
evaluated using the COV parameter. The COV for the CTindex ranged from 9.1% to 40.7%, with
an average COV of 21.4%. The range of the COV observed in this study for the CTindex was
slightly higher than the range reported in previous studies (Bowers et al., 2019; Diefenderfer et
al., 2019; Seitllari et al., 2019, 2020). The average COV for the FI was 33.5% with a minimum
and maximum COV of 21.2% to 49.3%, respectively. The COV for the Nflex factor ranged from
5.8% to 24.6% with an average COV of 11.1%.

29
Figure 13. Cracking Test Results at 25°C
The results confirmed the findings of Seitllari et al. (2020), as among the three indices
considered, the Nflex factor had the lowest variability followed by the CTindex and the FI had the
highest variability. The high variability observed with the FI can be associated with several
factors such as the confounding effects of stress concentration at the tip of the notch, the crack
propagation path, the spatial distribution of aggregates and their orientation along the crack tip
and path, and their impact on the resulting load-displacement curve (Seitllari et al., 2020).
Performance Discrimination Potential
The performance discrimination potential of the cracking indices among the six mixtures
was assessed through statistical analysis. The assumptions of normality and equal variances at a
95% confidence interval were first checked. The results indicated that the data from all cracking
indices were normally distributed, but only CTindex data had equal variances. Thus, Welch's
analysis of variance (ANOVA) was performed for the Nflex and FI and the standard one-way
ANOVA was conducted for the CTindex; all were conducted at a 95% confidence interval. The
ANOVA results showed that statically significant differences existed for the indices among the
mixtures. The Tukey and Games-Howell pairwise comparison tests at a 95% confidence interval
were performed for the indices with and without equal variances, respectively. The results of the
analysis are shown in Table 7.
Table 7. Pairwise Statistical Comparisons of Evaluated Cracking Tests
Mixture
Cracking Index
CTindex Nflex Flexibility Index
A b/c a a/b
B b/c a a/b
C b/c a a/b
Da a a -
E c a b
F a/b a a a FI data for Mixture D were not available.

30
The mixtures that do not share a letter indicate a statistically significant difference in their
mean value. As seen, the CTindex resulted in three groupings and the FI resulted in two groupings
among the mixtures evaluated in this study. The Nflex factor did not statistically discriminate the
cracking performance of the mixtures. The results showed that the CTindex was the most sensitive
index among the ones considered in this study.
Ranking and Correlation Among Considered Indices
The indices were compared in terms of their potential to rank the cracking performance
of the mixtures. This was done by sorting the average mean value of each index from the highest
to the lowest to determine the order of the performance rank of the mixtures. Table 8 shows the
order ranking of the mixtures in descending order for each index. As seen from Table 8, all of
the indices indicated that Mixture E was the most susceptible to cracking. The CTindex and Nflex
ranked Mixture D as the most resistant to cracking. The FI ranked Mixture F as the most
resistant to cracking in the absence of Mixture D data. It is also seen that the order of the
ranking for the FI differed slightly from that of the CTindex and Nflex factor. However, this
difference was deemed irrelevant, as the order of ranking was not statistically or practically
different when the results were evaluated with respect to the discrimination potential discussed in
the preceding section.
Figure 14 shows a very strong linear relationship among the indices. In combination with
the performance ranking analysis, the correlation found in this study indicated that the cracking
tests and associated indices could be used interchangeably to evaluate the cracking potential of
asphalt mixtures.
Table 8. Ranking of Cracking Susceptibility
Index
Ranking
Most resistant to Most susceptible
CTindex D F A C B E
Nflex D F C A B E
FIa F B A C E a FI data for Mixture D were not available.
Correlation With the G-Rm Parameter
The correlations between the cracking indices and the G-Rm parameter were evaluated.
Figure 15 indicates that a moderate relationship existed among the indices and the G-Rm
parameter. The FI showed the highest correlation with the G-Rm parameter followed by the
CTindex and Nflex. The scatter in the data points and the differences in performance rankings of
the indices with respect to the G-Rm parameter may be attributed to the differences in the
material response measured in the linear (G-Rm) and nonlinear viscoelastic (cracking indices)
ranges. Zhang et al. (2020) suggested that the cracking susceptibility of asphalt mixtures
evaluated by the G-Rm parameter may indicate the potential for cracking initiation in the early
stages of a pavement's service life whereas the cracking indices may indicate the performance of
asphalt mixtures in the middle or later stages of pavement service life as additional cracking
initiates and propagates.

31
Figure 14. Correlation Among the Evaluated Cracking Indices
Figure 15. Relationships Showing Correlations Between G-Rm Parameter and CTindex, FI, and Nflex
As with the APA test, the need remains for the index cracking tests to be evaluated with
respect to fundamental cracking tests such as the BBF test and cracking obtained from
mechanistic-empirical pavement design simulations and field performance. This will ensure that
the most appropriate cracking test and threshold value(s) are selected for implementation of the
BMD concept.
Table 9 summarizes the factors evaluated in the consideration of the cracking indices.
The evaluations of the indices and desired characteristics of each parameter in Table 9 were
made based solely on relative comparisons of the results obtained in this study. For each

32
evaluation parameter, the index satisfying the desired characteristic is shown in bold italic test.
As shown in Table 9, each index met the desired characteristic for a parameter twice. Further
evaluation of the parameters indicated that the CTindex was ranked as the second index after Nflex
for the variability parameter and after FI for the correlation with the G-Rm parameter. Based on
these findings and the considerations of the ease of specimen preparation, speed of testing, and
minimal cost of equipment, the IDT-CT test and CTindex show promise for evaluating the
cracking potential of asphalt mixtures. However, as recommended earlier, further evaluation of
the cracking test needs to be done through mechanistic-empiric analysis and field performance to
validate or refine these findings.
Table 9. Overall Evaluation of Considered Cracking Indices
Parameter CTindex Nflex FI Desired Characteristic
Variability Moderate Low High Low
Discrimination Potential High Low Moderate High
Performance Ranking Similar Similar Similar N/A
Correlation Between Indices High High High High
Correlation With the G-Rm Parameter Moderate Low High High
FI = flexibility index; N/A = not applicable.
Bold italic text indicates the test meets the desired characteristic.
Validation of BMD Performance Thresholds
Thirteen mixtures (A through M) were sampled and used to evaluate the performance
thresholds proposed for the Cantabro, IDT-CT, and APA tests. The volumetric properties and
gradations for Mixtures A through M were presented in Table 5. Testing for the validation effort
was conducted on several specimen types for each mixture, as previously discussed. LCNR,
LCR, and FC specimens were all available for Mixtures A through F, whereas LCNR-P
specimens were available only for Mixtures B, D, and E. For Mixtures G through M, only
LCNR-P and LCR specimens were available.
Cantabro Mass Loss
Figure 16 shows the Cantabro mass loss of LCR, LCNR, and LCNR-P specimens from
all mixtures. The average mass loss of all tested specimens was 6.3% with an average standard
deviation of 0.7%. The maximum and minimum values for mass loss were 12.8% (Mixture E)
and 4.6% (Mixture H), respectively, for LCR specimens; 7.7% (Mixture A) and 3.6% (Mixture
D), respectively, for LCNR specimens; and 11.0% (Mixture L) and 3.8% (Mixture B),
respectively, for LCNR-P specimens. The variability of the Cantabro test for repetitive
measurements for the same specimen type, quantified in terms of COV and shown in Figure 17,
was less than 20% except for F-LCR specimens. The mean COVs calculated from testing
replicates of LCR, LCNR, and LCNR-P mixtures were 11.7%, 10.9%, and 10.0%, respectively,
with a standard deviation of 6.6%, 5.0%, and 5.1%, respectively. The results indicated
acceptable repeatability for the Cantabro test.
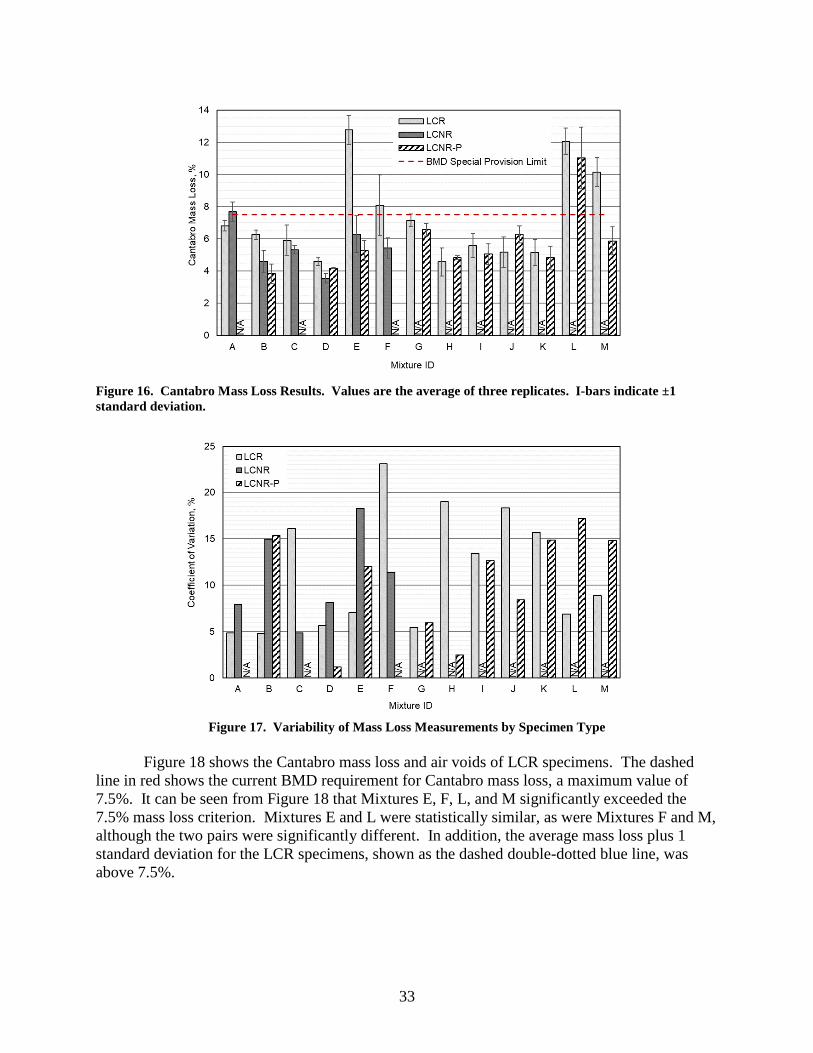
33
Figure 16. Cantabro Mass Loss Results. Values are the average of three replicates. I-bars indicate ±1
standard deviation.
Figure 17. Variability of Mass Loss Measurements by Specimen Type
Figure 18 shows the Cantabro mass loss and air voids of LCR specimens. The dashed
line in red shows the current BMD requirement for Cantabro mass loss, a maximum value of
7.5%. It can be seen from Figure 18 that Mixtures E, F, L, and M significantly exceeded the
7.5% mass loss criterion. Mixtures E and L were statistically similar, as were Mixtures F and M,
although the two pairs were significantly different. In addition, the average mass loss plus 1
standard deviation for the LCR specimens, shown as the dashed double-dotted blue line, was
above 7.5%.
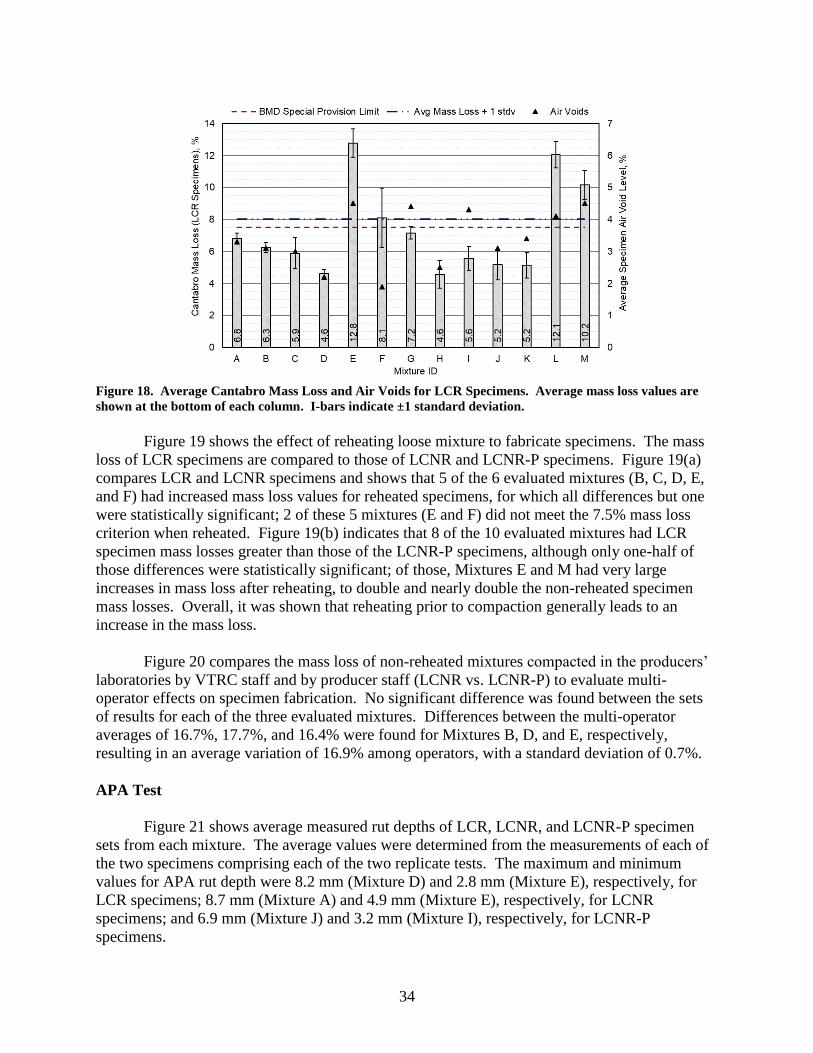
34
Figure 18. Average Cantabro Mass Loss and Air Voids for LCR Specimens. Average mass loss values are
shown at the bottom of each column. I-bars indicate ±1 standard deviation.
Figure 19 shows the effect of reheating loose mixture to fabricate specimens. The mass
loss of LCR specimens are compared to those of LCNR and LCNR-P specimens. Figure 19(a)
compares LCR and LCNR specimens and shows that 5 of the 6 evaluated mixtures (B, C, D, E,
and F) had increased mass loss values for reheated specimens, for which all differences but one
were statistically significant; 2 of these 5 mixtures (E and F) did not meet the 7.5% mass loss
criterion when reheated. Figure 19(b) indicates that 8 of the 10 evaluated mixtures had LCR
specimen mass losses greater than those of the LCNR-P specimens, although only one-half of
those differences were statistically significant; of those, Mixtures E and M had very large
increases in mass loss after reheating, to double and nearly double the non-reheated specimen
mass losses. Overall, it was shown that reheating prior to compaction generally leads to an
increase in the mass loss.
Figure 20 compares the mass loss of non-reheated mixtures compacted in the producers’
laboratories by VTRC staff and by producer staff (LCNR vs. LCNR-P) to evaluate multi-
operator effects on specimen fabrication. No significant difference was found between the sets
of results for each of the three evaluated mixtures. Differences between the multi-operator
averages of 16.7%, 17.7%, and 16.4% were found for Mixtures B, D, and E, respectively,
resulting in an average variation of 16.9% among operators, with a standard deviation of 0.7%.
APA Test
Figure 21 shows average measured rut depths of LCR, LCNR, and LCNR-P specimen
sets from each mixture. The average values were determined from the measurements of each of
the two specimens comprising each of the two replicate tests. The maximum and minimum
values for APA rut depth were 8.2 mm (Mixture D) and 2.8 mm (Mixture E), respectively, for
LCR specimens; 8.7 mm (Mixture A) and 4.9 mm (Mixture E), respectively, for LCNR
specimens; and 6.9 mm (Mixture J) and 3.2 mm (Mixture I), respectively, for LCNR-P
specimens.

35
Figure 19. Effect of Reheating on Mass Loss: (a) LCR vs. LCNR Specimens; (b) LCR vs. LCNR-P Specimens
Figure 20. Effect of Multiple Operators Performing Specimen Fabrication on Mass Loss for LCNR vs.
LCNR-P Specimens

36
In general, the expected trend for rut testing is that reheated specimens should have lower
rut depths than non-reheated specimens because of the anticipation of increased mixture stiffness
from reheating. However, Figure 21 indicates that the impact of reheating on rut depths may be
mixture specific, as 6 of the 13 mixtures had reheated-specimen rut depths greater than or equal
to those for non-reheated specimens.
The variability of the APA test for replicate measurements is shown in Figure 22. The
variability was quantified in terms of COV and was less than 20% for 19 of 28 specimen sets.
The mean COVs calculated from testing replicates of LCR, LCNR, and LCNR-P mixtures were
12.2%, 15.5%, and 11.7%, with standard deviations of 8.3%, 6.6%, and 13.6%, respectively.
The results indicated acceptable repeatability for the APA test.
Figure 21. APA Rut Depths. Averages were computed from individual specimens tested in pairs. I-bars
indicate ±1 standard deviation.
Figure 22. Variability of Rut Depths by Specimen Type
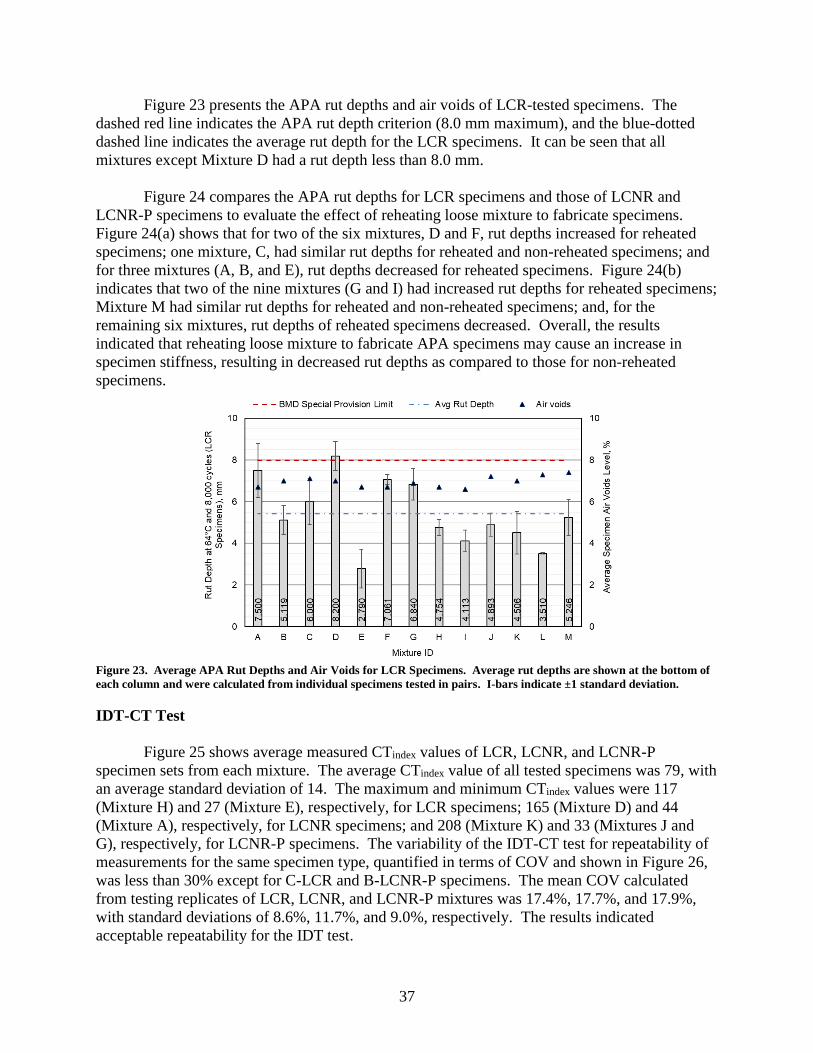
37
Figure 23 presents the APA rut depths and air voids of LCR-tested specimens. The
dashed red line indicates the APA rut depth criterion (8.0 mm maximum), and the blue-dotted
dashed line indicates the average rut depth for the LCR specimens. It can be seen that all
mixtures except Mixture D had a rut depth less than 8.0 mm.
Figure 24 compares the APA rut depths for LCR specimens and those of LCNR and
LCNR-P specimens to evaluate the effect of reheating loose mixture to fabricate specimens.
Figure 24(a) shows that for two of the six mixtures, D and F, rut depths increased for reheated
specimens; one mixture, C, had similar rut depths for reheated and non-reheated specimens; and
for three mixtures (A, B, and E), rut depths decreased for reheated specimens. Figure 24(b)
indicates that two of the nine mixtures (G and I) had increased rut depths for reheated specimens;
Mixture M had similar rut depths for reheated and non-reheated specimens; and, for the
remaining six mixtures, rut depths of reheated specimens decreased. Overall, the results
indicated that reheating loose mixture to fabricate APA specimens may cause an increase in
specimen stiffness, resulting in decreased rut depths as compared to those for non-reheated
specimens.
Figure 23. Average APA Rut Depths and Air Voids for LCR Specimens. Average rut depths are shown at the bottom of
each column and were calculated from individual specimens tested in pairs. I-bars indicate ±1 standard deviation.
IDT-CT Test
Figure 25 shows average measured CTindex values of LCR, LCNR, and LCNR-P
specimen sets from each mixture. The average CTindex value of all tested specimens was 79, with
an average standard deviation of 14. The maximum and minimum CTindex values were 117
(Mixture H) and 27 (Mixture E), respectively, for LCR specimens; 165 (Mixture D) and 44
(Mixture A), respectively, for LCNR specimens; and 208 (Mixture K) and 33 (Mixtures J and
G), respectively, for LCNR-P specimens. The variability of the IDT-CT test for repeatability of
measurements for the same specimen type, quantified in terms of COV and shown in Figure 26,
was less than 30% except for C-LCR and B-LCNR-P specimens. The mean COV calculated
from testing replicates of LCR, LCNR, and LCNR-P mixtures was 17.4%, 17.7%, and 17.9%,
with standard deviations of 8.6%, 11.7%, and 9.0%, respectively. The results indicated
acceptable repeatability for the IDT test.

38
Figure 24. Effect of Reheating on Rut Depth Measurements: (a) LCR vs. LCNR specimens; (b) LCR vs.
LCNR-P specimens
Figure 25. CTindex Results. Averages were computed from a minimum of three replicate specimens. I-bars
indicate ±1 standard deviation.

39
Figure 26. Variability of CTindex Measurements by Specimen Type
Figure 27 presents the average CTindex values and air voids of LCR-tested specimens for
each mixture. The dashed red line shows the current BMD requirement for CTindex, an average
minimum value of 70, and the blue dashed double-dotted line shows the average CTindex minus
1 standard deviation determined from all tested mixtures. Figure 27 shows that only Mixtures D,
F, H, I, J, and M met the CTindex requirement. In addition, the average CTindex minus 1 standard
deviation value was below 70 for LCR specimens, indicating that the majority of the evaluated
mixtures may be susceptible to premature cracking.
Figure 27. Average CTindex and Air Voids for LCR Specimens. Average CTindex values are shown at the
bottom of each column. I-bars indicate ±1 standard deviation.

40
Figure 28 compares the CTindex of LCR specimens with those of LCNR and LCNR-P
specimens. Figure 28(a) shows that only Mixtures A and F had similar or higher CTindex values
after reheating; the remaining four mixtures (B, C, D, and E) had considerable decreases in
CTindex after reheating. Figure 28(b) indicates that five of the nine evaluated mixtures (E, H, K,
L, and M) had decreased CTindex values for reheated specimens; Mixture G showed similar
CTindex values for reheated and non-reheated specimens; and all remaining mixtures (B, J, and I)
showed an increase in the CTindex for reheated specimens. Overall, it was shown that reheating
prior to compaction may lead to an increase in the brittleness of the evaluated specimen, leading
to a decrease in the CTindex values and greater cracking susceptibility.
Figure 28. Effect of Reheating on CTindex Values: (a) LCR vs. LCNR specimens; (b) LCR vs. LCNR-P
specimens
Evaluation of Field Cores
Field core samples were collected immediately after Mixtures A through F were paved.
Once trimmed, the core samples were measured to determine the in-place layer thicknesses and
air voids, shown in Table 10, and the mixtures’ resistance to rutting and cracking using the APA
and IDT-CT tests, respectively. An initial effort was made to determine the Cantabro loss for
field cores. However, field cores were too thin for testing, so no Cantabro data are available.
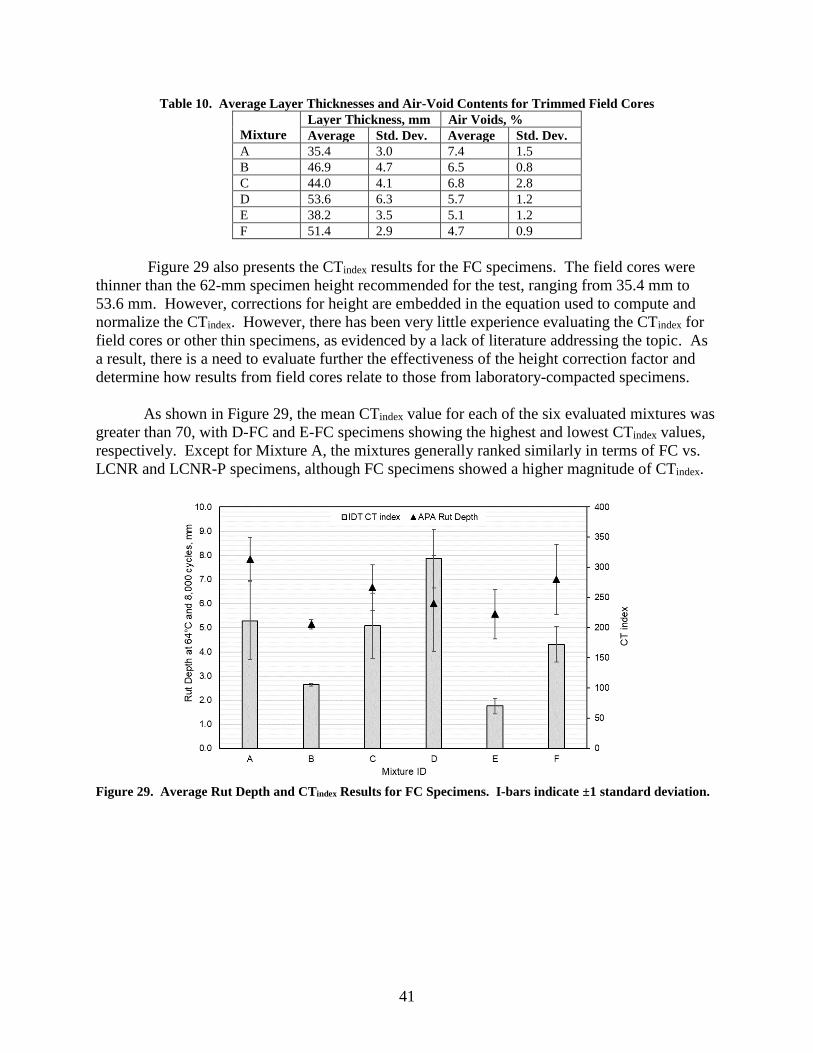
41
Table 10. Average Layer Thicknesses and Air-Void Contents for Trimmed Field Cores
Mixture
Layer Thickness, mm Air Voids, %
Average Std. Dev. Average Std. Dev.
A 35.4 3.0 7.4 1.5
B 46.9 4.7 6.5 0.8
C 44.0 4.1 6.8 2.8
D 53.6 6.3 5.7 1.2
E 38.2 3.5 5.1 1.2
F 51.4 2.9 4.7 0.9
Figure 29 also presents the CTindex results for the FC specimens. The field cores were
thinner than the 62-mm specimen height recommended for the test, ranging from 35.4 mm to
53.6 mm. However, corrections for height are embedded in the equation used to compute and
normalize the CTindex. However, there has been very little experience evaluating the CTindex for
field cores or other thin specimens, as evidenced by a lack of literature addressing the topic. As
a result, there is a need to evaluate further the effectiveness of the height correction factor and
determine how results from field cores relate to those from laboratory-compacted specimens.
As shown in Figure 29, the mean CTindex value for each of the six evaluated mixtures was
greater than 70, with D-FC and E-FC specimens showing the highest and lowest CTindex values,
respectively. Except for Mixture A, the mixtures generally ranked similarly in terms of FC vs.
LCNR and LCNR-P specimens, although FC specimens showed a higher magnitude of CTindex.
Figure 29. Average Rut Depth and CTindex Results for FC Specimens. I-bars indicate ±1 standard deviation.
42
Summary of Findings
Roadmap for BMD Implementation
A comprehensive roadmap for BMD was developed. The roadmap is intended to be a living
and evolving resource for outlining the agenda of activities necessary for implementation of
BMD and will require further refinement from stakeholders to provide robust and effective
guidance in support of BMD implementation.
Validation of BMD Performance Test Selection
Binder testing performed on the extracted and recovered binders from six mixtures indicated
that the binders met or exceeded VDOT specification criteria for binder properties.
Analysis of the critical cracking parameter, ΔTc, showed that the cracking warning limit of
-2.5°C was exceeded by four mixtures (A, C, D, and F). The ΔTc values of the remaining
two mixtures (B and E) exceeded the cracking limit of -5.0°C, indicating a high susceptibility
to non-load related cracking.
Dynamic Modulus Test
The visual inspection of dynamic modulus mastercurves showed that Mixtures A and D had
lower |E*| values (lower stiffness) and Mixture E had higher |E*| values (higher stiffness)
across the loading spectrum. From the phase angle mastercurves, Mixture D had higher δ
values and Mixture E had lower δ values (lower relaxation capability), indicating a higher
cracking potential for Mixture E among the six mixtures.
When |E*| values at 38°C and 0.1 Hz were plotted to quantify the rutting potential, Mixture E
ranked as the most rut-resistant mixture, and Mixture D was potentially the most susceptible
to rutting.
The G-Rm parameter values calculated for the reheated mixtures were more comparable to
the recommended threshold value (19,000 MPa) for long-term oven-aged laboratory-made
mixtures than that for short-term oven-aged laboratory-produced mixtures (8,000 MPa),
although neither threshold is directly applicable to the mixtures. A relative comparison
among the G-Rm parameters indicated that Mixtures E and D ranked as the most and least
crack-susceptible mixtures, respectively.
APA Test
The APA rut depth was highly correlated (R2 = 0.89) with the |E*| rutting parameter; in
addition, the correlation trend was in the right direction (i.e., the higher the stiffness, the
lower the rutting potential).

43
The APA rut depth was moderately correlated with the binder parameters |G*|/sin δ (R2 =
0.50) and Jnr,3.2kPa (R2 = 0.59); when an apparent outlying data point was removed, the
correlations significantly increased (R2 = 0.95 and R2 = 0.97, respectively).
Cracking Tests
Evaluation of the CTindex, FI, and Nflex factor variability using the COV parameter showed
that the Nflex factor had the lowest variability followed by the CTindex and the FI had the
highest variability.
The assessment of the cracking indices for performance discrimination potential showed that
the CTindex was the most sensitive index among those considered in this study. Pairwise
statistical comparisons of the CTindex resulted in three groupings whereas those of the FI
resulted in two groupings among the mixtures evaluated in this study. The Nflex index did not
statistically discriminate the cracking performance of the mixtures.
Ranking of the mixtures by performance indices showed that Mixture E was the most
susceptible to cracking. The CTindex and Nflex ranked Mixture D as the most resistant to
cracking. The FI ranked Mixture F as the most resistant to cracking in the absence of
Mixture D data. The order of the ranking for the FI differed slightly from that of the CTindex
and Nflex index, but the difference was deemed insignificant, as the order of ranking was not
statistically and practically different when evaluated with respect to the discrimination
potential.
A very strong linear relationship was found among the indices. In combination with the
performance ranking analysis, the correlation found in this study indicated that the cracking
tests and associated indices could be used interchangeably to evaluate the cracking potential
of asphalt mixtures.
Moderate relationships were found between the indices and the G-Rm parameter. The FI
showed the highest correlation to the G-Rm parameter, followed by the CTindex and Nflex.
Validation of BMD Performance Thresholds
Thirteen mixtures (A through M) were sampled and used to evaluate the performance
thresholds proposed for the Cantabro, IDT-CT, and APA tests. Testing for the validation effort
was conducted on several specimen types for each mixture to evaluate the differences among
non-reheated specimens, reheated specimens, and field cores.
Cantabro Test
The mean COVs for the Cantabro test calculated from testing replicates of LCR, LCNR, and
LCNR-P mixtures were 11.7%, 10.9%, and 10.0%, respectively, with standard deviations of
6.6%, 5.0%, and 5.1%, respectively. The results indicated acceptable repeatability for the
Cantabro mass loss test.
44
Five of 6 evaluated mixtures had increased mass loss values when reheated specimens were
compared with LCNR specimens; all differences but one were statistically significant. Two
of those mixtures no longer met the 7.5% mass loss criterion when reheated.
Eight of the 10 evaluated mixtures had LCR specimen mass losses greater than those of
LCNR-P specimens, although only one-half of the differences were statistically significant.
Reheated specimens for 2 mixtures showed very large increases in mass loss, to double and
nearly double the LCNR-P specimen mass losses. Overall, it was found that reheating prior
to compaction generally leads to an increase in mass loss.
Comparisons of the mass loss values for 3 non-reheated mixtures compacted in the
producers’ laboratories by VTRC staff and by producer staff (LCNR vs. LCNR-P) to
evaluate multi-operator effects on specimen fabrication showed no significant difference
between the operator results for each mixture. Differences of 16.7%, 17.7%, and 16.4%
between the operator averages were observed for the 3 mixtures; the average variation among
operators was 16.9%, with a standard deviation of 0.7%.
APA Test
The APA rut depth had a COV less than 20% for 19 of 28 specimen sets. The mean COVs
calculated from testing replicates of LCR, LCNR, and LCNR-P mixtures were 12.2%,
15.5%, and 11.7%, with standard deviations of 8.3%, 6.6%, and 13.6%, respectively. The
results indicated acceptable repeatability for the APA test.
Based on LCR specimens, all but 1 mixture had a rut depth less than the 8.0 mm criterion.
This was not surprising, despite the fact that these mixtures were not designed using the
BMD method, as rutting has not been a major problem for VDOT since the adoption of
Superpave.
Comparisons of APA rut depths for reheated and non-reheated specimens indicated that
reheating loose mixture to fabricate APA specimens may or may not cause an increase in
specimen stiffness, resulting in decreases in the measured APA rut depth as compared to that
of non-reheated specimens. Six of the 13 mixtures evaluated had reheated-specimen rut
depths that were greater than or equal to those for non-reheated specimens. The comparisons
of LCR and LCNR specimens from 6 mixtures resulted in 2 mixtures having increased rut
depths for reheated specimens; 1 mixture having similar rut depths for reheated and non-
reheated specimens; and 3 mixtures having a decrease in rut depths for reheated specimens.
Similar results were found in the comparisons of LCR and LCNR-P specimens from 9
mixtures as 2 mixtures had increased rut depths for reheated specimens; 1 mixture had
similar rut depths for reheated and non-reheated specimens; and the remaining 6 mixtures
had decreased rut depths for reheated specimens.
IDT-CT Test
The variability of the IDT-CT test for repeatability of measurements for the same specimen
type in terms of COV was less than 30% except for two specimen sets. The mean COV

45
calculated from testing replicates of LCR, LCNR, and LCNR-P mixtures was 17.4%, 17.7%,
and 17.9%, with standard deviations of 8.6%, 11.7%, and 9.0%, respectively. The results
were judged to indicate acceptable repeatability for the IDT test.
The average CTindex values of LCR specimens from each mixture were compared to the
current CTindex requirement, a minimum value of 70; only 6 of the 13 mixtures met the
requirement. This was not surprising, as these mixtures were not designed using the BMD
method.
Comparisons of the CTindex of reheated and non-reheated specimens indicated that reheating
prior to compaction may increase mixture brittleness and result in a decreased CTindex value,
hence increased cracking susceptibility. The comparisons of LCR and LCNR specimens
from 5 mixtures showed that 4 mixtures had statistically significant decreases in CTindex after
reheating and only 3 mixtures had similar or higher CTindex values after reheating. The
comparisons of CTindex for LCR and LCNR-P specimens found that 5 of the 9 evaluated
mixtures had decreased values for reheated specimens; 1 mixture had similar values for
reheated and non-reheated specimens; and the 3 remaining mixtures had increases for
reheated specimens.
Field Cores
Field cores collected from surface courses were too thin to conduct Cantabro testing. An
attempt to perform the test resulted in destruction of the specimens, rather than an evaluation
of mass loss.
All FC specimens had an average APA rut depth less than 8 mm, meeting current rutting
criteria. All FC specimens had similar or lower rut depths compared to those of the
corresponding LCNR and LCNR-P specimens.
FC specimens were thinner than the 62-mm specimen height recommended for the CTindex
test, ranging from 35.4 mm to 53.6 mm. A specimen height correction factor is used in the
computation of the CTindex, although there has been little experience evaluating the CTindex
for field cores or other thin specimens.
The average field core CTindex for each of the 6 evaluated mixtures was greater than 70.
Except for 1 mixture, the mixtures generally ranked similarly in terms of FC vs. LCNR and
LCNR-P specimens, although FC specimens had a larger CTindex, possibly because of the
difference in thickness or compaction method.
CONCLUSIONS
A roadmap for BMD was developed and is intended to be a dynamic resource for outlining
the agenda of activities necessary for implementation of BMD.
46
The correlations between test parameters for the mixtures tested in this study validated that
the APA and IDT-CT tests selected for use in the BMD method are in agreement with
fundamental performance tests.
Based on the evaluation of desired characteristics and the considerations of the ease of
specimen preparation, speed of testing, and minimal cost of equipment, the IDT-CT test and
CTindex show promise for evaluating the cracking potential of asphalt mixtures.
Based on results from the mixtures tested in this study, the APA test is suitable for continued
use in BMD. The current performance criterion limiting APA rut depth to a maximum of 8.0
mm is reasonable based on additional mixture testing. However, for full assurance that APA
test threshold values used for BMD implementation are appropriate, results should also be
compared and correlated to test results from fundamental rut tests such as the flow number
test and rut depths obtained from mechanistic-empirical pavement design simulations and
field performance. In addition, there is a need to evaluate the acceptable levels of test
variability and develop precision estimates and statements.
Based on results from the mixtures tested in this study, the impact of reheating on rut depths
may be mixture specific. Six of the 13 mixtures evaluated had reheated-specimen rut depths
that were greater than or equal to the rut depths for non-reheated specimens. This is in
contrast to the expected trend for rut testing in which reheated specimens are expected to
show lower rut depths than non-reheated specimens because of increased mixture stiffness
from reheating. There is a need to address the effects of mixture reheating on rut test results.
Based on results from the mixtures tested in this study, the IDT-CT test is the most suitable
test for continued use in BMD. The current performance criterion requiring a minimum
CTindex value of 70 is reasonable based on additional mixture testing. The need remains for
the test to be evaluated with respect to fundamental cracking tests such as the BBF test and
cracking obtained from mechanistic-empirical pavement design simulations and field
performance. In addition, there is a need to evaluate the acceptable levels of test variability
and develop precision estimates and statements. This will ensure that the most appropriate
threshold value(s) is selected for implementation of the BMD method.
Based on results from the mixtures tested in this study, reheating loose mixture prior to
compaction may increase mixture brittleness and result in a decreased CTindex value. Nine of
the 13 mixtures evaluated had CTindex values for reheated specimens that were less than those
for the non-reheated specimens. There is a need to address the impact of mixture reheating
on cracking test results.
Based on results from the mixtures tested in this study, the Cantabro test is suitable for
continued use in BMD. The current performance criterion limiting mass loss to 7.5% is
reasonable based on additional mixture testing. Further, reheating prior to compaction
generally leads to an increase in the Cantabro mass loss. There is a need to evaluate the
acceptable levels of test variability, develop precision estimates and statements, and address
the effects of mixture reheating on test results.
47
RECOMMENDATIONS
1. VDOT’s Materials Division and VTRC should continue to collaborate to support the
implementation of BMD, including cooperative efforts to assemble a group of stakeholders
and key persons to refine the roadmap for BMD. The roadmap should provide a clear
direction regarding the activities necessary for implementation and serve as a resource to
evaluate progress.
2. VDOT’s Materials Division and VTRC should continue to use the APA, IDT-CT, and
Cantabro tests for BMD.
3. VTRC should continue to evaluate the relationships and correlations between the results of
the APA and IDT-CT tests and the results of fundamental tests, mechanistic-empirical
simulations and analyses, and field performance to ensure that the most appropriate
threshold criteria are applied for implementation of the BMD method.
4. VTRC should continue to address the differences in test results attributable to mixture
reheating and to different specimen types, such as laboratory-compacted specimens and field
cores.
5. VTRC should continue to evaluate the APA, IDT-CT, and Cantabro tests to determine the
acceptable variability and establish precision estimates and statements for each test.
IMPLEMENTATION AND BENEFITS
Implementation
Regarding Recommendation 1, VDOT’s Materials Division has committed to the
implementation of BMD beginning in 2023. VTRC is dedicated to supporting this effort and
will continue to collaborate and provide research support. VTRC and the Materials Division will
work together to refine the roadmap for BMD so that it can serve as a guide to the activities
necessary for implementation and a resource to evaluate progress. This recommendation will be
implemented within the first 6 months of 2021.
Regarding Recommendation 2, no further implementation is necessary at this time.
VDOT’s Materials Division and VTRC are continuing the process of BMD implementation
using the three recommended tests.
Regarding Recommendations 3 and 4, VTRC is supporting and will continue to support
the testing and evaluation needs of the BMD implementation effort until full implementation is
achieved. Ongoing work with BMD trial and pilot projects is providing a basis for the
evaluation of field performance and comparison of specimen types. Current collaborations with
Virginia Tech toward the evaluation of high RAP BMD mixture performance at VDOT’s heavy
vehicle simulator site in Blacksburg will be providing accelerated performance results. Project

48
117336, Feasibility of Using Monotonic Loading-Based Tests to Evaluate Rutting Performance
of Asphalt Mixtures, is performing extensive analyses on the IDT test and will be completed in
late 2022.
Regarding Recommendation 5, VTRC is in the process of addressing test variability and
the need for precision estimates and statements. Project 1167473, Round Robin Testing Program
for the Indirect Tensile Cracking Test at Intermediate Temperature—Phase I, has begun to
address this issue for the IDT-CT test. Phase II of the effort addressing the IDT-CT test
variability is expected to begin in spring 2021 to address further the IDT-CT test variability;
additional efforts to develop precision estimates and statements for the APA and Cantabro tests
are expected to be undertaken as part of the BMD implementation effort.
Benefits
Improving the durability of asphalt mixtures is a priority for VDOT. The BMD concept
is intended to improve durability through the incorporation of performance criteria into mix
design and acceptance. This will provide VDOT with a new approach for specifying asphalt mix
designs in an effort to make its roadway network more sustainable, longer lasting, and more
economical. By incorporating performance criteria in the mix design process, mixtures will be
optimized to provide resistance to deterioration, although it must be understood that these
mixtures cannot be expected to compensate for unsound underlying pavement structures or
inappropriate selection of maintenance treatments. The goals of BMD implementation include
extending the lifespan of dense-graded SMs. Further, use of a BMD framework should allow for
the development of new, innovative methods to increase pavement recyclability and enhance
pavement performance through the application of new additives and technologies and through
other means.
ACKNOWLEDGMENTS
The authors thank Drew Barbour, Troy Deeds, Donald Dodds, and Jennifer Samuels, all
of VTRC, and Chris Burns, Tanner Knight, and Zach Robb, all formerly of VTRC, for their
efforts in sample collection and testing. Support for field projects from personnel at VDOT’s
Fredericksburg, Hampton Roads, Lynchburg, and Salem districts and VDOT’s Materials
Division is greatly appreciated. Sincere appreciation is expressed to personnel at Adams
Construction, Basic Construction, Boxley Materials, Lee Hy Paving, and Superior Paving for
their contributions to this effort. In addition, the authors appreciate the assistance provided by
Trenton Clark and Mike Dudley of the Virginia Asphalt Association. Appreciation is extended
to Linda Evans and Andre’ Surles of VTRC for editorial and graphics support, respectively. The
authors are also appreciative of the technical review panel for their expertise, guidance, and
support: Rob Crandol, Sungho Kim, Girum Merine, David Shiells, and Tommy Schinkel, all of
VDOT.

49
REFERENCES
Al-Qadi, I.L., Ozer, H., Zhu, Z., Singhvi, P., Ali, U.M., Sawalha, M., Luque, A.F.E., Mainieri,
J.J.G., and Zehr, T.G. Development of Long-Term Aging Protocol for Implementation of
the Illinois Flexibility Index Test (I-FIT). FHWA-ICT-19-009. Illinois Center for
Transportation, Urbana, 2019.
American Association of State Highway and Transportation Officials. Standard Specifications
for Transportation Materials and Methods of Sampling and Testing, and AASHTO
Provisional Standards. Washington, DC, 2017.
Anderson, R.M., King, G.N., Hanson, D.I., and Blankenship, P.B. Evaluation of the
Relationship Between Asphalt Binder Properties and Non-Load Related Cracking.
Journal of Association of Asphalt Paving Technologists, Vol. 80, 2011, pp. 615-664.
Apeagyei, A.K. Correlating Rutting With Dynamic Modulus of Asphalt Concrete. Proceedings
of the Institution of Civil Engineers-Transport, Vol. 164, No. 4, 2011, pp. 241-249.
Apeagyei, A.K., Diefenderfer, B.K., and Diefenderfer, S.D. Rutting Resistance of Asphalt
Concrete Mixtures That Contain Recycled Asphalt Pavement. Transportation Research
Record: Journal of the Transportation Research Board, No. 2208, 2011, pp. 9-16.
Asphalt Institute. Use of the Delta Tc Parameter to Characterize Asphalt Binder Behavior: State
of the Knowledge. Lexington, KY, 2019.
ASTM International. ASTM D 8225-19: Standard Test Method for Determination of Cracking
Tolerance Index of Asphalt Mixture Using the Indirect Tensile Cracking Test at
Intermediate Temperature. West Conshohocken, PA, 2019.
Bennert, T., Hass, E., Wass, E., and Berger, B. Indirect Tensile Testing for Balanced Mixture
Design and Quality Control Performance Testing. Journal of the Association of Asphalt
Paving Technologists, Vol. 90, 2020.
Bowers, B.F., and Diefenderfer, S.D. Technical Memorandum: Benchmarking of Asphalt
Mixtures—Summary of Findings and Preliminary Recommendations. Virginia
Transportation Research Council, Charlottesville, 2018.
Bowers, B.F., Diefenderfer, B.K., Wollenhaupt, G., Stanton, B., and Boz, I. Laboratory
Properties of a Rejuvenated Cold Recycled Mixture Produced in a Conventional Asphalt
Plant. In Airfield and Highway Pavements 2019: Testing and Characterization of
Pavement Materials. American Society of Civil Engineers, Reston, VA, 2019, pp. 100-
108.
Boz, I., and Solaimanian, M. A Practical Approach to Determine Asphalt Concrete Material
Properties based on Non-destructive Testing. In 7th International Conference on
Bituminous Mixtures and Pavements. CRC Press/Balkema, 2019, pp. 659-665.
50
Boz, I., Tavassoti-Kheiry, P., and Solaimanian, M. The Advantages of Using Impact Resonance
Test in Dynamic Modulus Master Curve Construction Through the Abbreviated Test
Protocol. Journal of Materials and Structures, Vol. 50, No. 3, 2017a.
Boz, I., Chen, X., and Solaimanian, M. Assessment of Laboratory Oven-Aging of Asphalt
Concrete Mixtures Via Impact Resonance Test. In Proceedings of the International
Conference on Advances in Construction Materials and Systems, 2017b.
Boz, I., Chen, X, and Solaimanian, M. Assessment of Emulsified RAP Cold Mixtures Via Non-
destructive Testing. In Airfield and Highway Pavements, 2017c, pp. 107-118.
Coleri, E., Sreedhar, S., and Obaid, I.A. Development of a Balanced Mix Design Method in
Oregon. FHWA-OR-RD-21-03. Oregon State University, Corvallis, 2020.
Cooper, S.B., III, King, W.B., and Kabir, M.S. Testing and Analysis of LWT and SCB Properties
of Asphalt Concrete Mixtures. FHWA/LA/536. Louisiana Department of Transportation
and Development, Baton Rouge, 2016.
Cox, B.C., Smith, B.T., Howard, I.L., and James, R.S. State of Knowledge for Cantabro Testing
of Dense Graded Asphalt. Journal of Materials in Civil Engineering, Vol. 29, No. 10,
2017.
Cross, S.A., and Li, J.Q. Implement Balanced Mix Design in Oklahoma. FHWA-OK-19-01.
Oklahoma State University, Stillwater, 2019.
Daniel, J.S., Corrigan, M., Jacques, C., Nemati, R., Dave, E.V., and Congalton, A. Comparison
of Asphalt Mixture Specimen Fabrication Methods and Binder Tests for Cracking
Evaluation of Field Mixtures. Road Materials and Pavement Design, Vol. 20, No. 5,
2019, pp. 1059-1075.
Diefenderfer, B.K., Boz, I., and Bowers, B.F. Evaluating Cracking Tests for Performance-Based
Design Concept for Cold Recycled Mixtures. In Airfield and Highway Pavements 2019:
Design, Construction, Condition Evaluation, and Management of Pavements. American
Society of Civil Engineers, Reston, VA, 2019, pp. 220-229.
Diefenderfer, S.D., and Bowers, B.F. Initial Approach to Performance (Balanced) Mix Design:
The Virginia Experience. Transportation Research Record: Journal of the
Transportation Research Board, No. 2673, 2019, pp. 335-345.
Diefenderfer, S.D., Bowers, B.F., and McGhee, K.K. Impact of Gyration Reduction and Design
Specification Changes on Volumetric Properties of Virginia Dense-Graded Asphalt
Mixtures. Transportation Research Record: Journal of the Transportation Research
Board, No. 2672, 2018, pp. 143-153.
Harvey, J., Wu, R., Signore, J., Basheer, I., Holikatti, S., Vacura, P., and Holland, T.J.
Performance-Based Specifications: California Experience to Date, Application of Asphalt

51
Mix Performance-Based Specifications. Transportation Research Circular, Number E-
C189, 2014.
Kim, Y.R., Castorena, C., Elwardany, M.D., Rad, F.Y., Underwood, B.S., Gundla, A., Gudipudi,
P., Farrar, M.J., and Glaser, R.R. NCHRP Project 09-54: Long-term Aging of Asphalt
Mixtures for Performance Testing and Prediction. Transportation Research Board,
Washington, DC, 2018.
Martin, A.E., Kaseer, F., Arambula-Mercado, E., Bajaj, A., Cucalon, L.G., Yin, F., Chowdhury,
A., Epps, J., Glover, C., Hajj, E.Y., and Morian, N. NCHRP Report 927: Evaluating the
Effects of Recycling Agents on Asphalt Mixtures with High RAS and RAP Binder Ratios.
Transportation Research Board, Washington, DC, 2019.
Maupin, G.W., Jr. Additional Asphalt to Increase the Durability of Virginia’s Superpave Surface
Mixtures. VTRC 03-R15. Virginia Transportation Research Council, Charlottesville,
2003.
Maupin, G.W., Jr. Investigation of Optimized Mixture Design for Superpave Surface Mixtures.
VTRC 11-R5. Virginia Transportation Research Council, Charlottesville, 2011.
Maupin, G.W., Jr., Diefenderfer, S.D., and Gillespie, J.S. Evaluation of Using Higher
Percentages of Recycled Asphalt Pavement in Asphalt Mixtures in Virginia. VTRC 08-
R22. Virginia Transportation Research Council, Charlottesville, 2008.
Mensching, D.J., Rowe, G.M., and Sias, D.J. A Mixture-Based Black Space Parameter for Low-
Temperature Performance of Hot Mix Asphalt. Road Materials and Pavement Design,
Vol. 27, No. 1, 2017, pp. 404-425.
Mohammad, L.N., Kim, M., and Challa, H. Development of Performance-Based Specifications
for Louisiana Asphalt Mixtures. FHWA/LA.14/558. Louisiana State University, Baton
Rouge, 2016.
Newcomb, D., and Zhou, F. Balanced Design of Asphalt Mixtures. MN/RC 2018-22.
Minnesota Department of Transportation, St. Paul, 2018.
Ogbo, C., Kaseer, F., Oshone, M., Sias, J.S., and Martin, A.E. Mixture-Based Rheological
Evaluation Tool for Cracking in Asphalt Pavements. Road Materials and Pavement
Design, Vol. 20(Suppl. 1), 2019, pp. S299-314.
Oshone, M., Dave, E., Daniel, J.S, and Rowe, G.M. Prediction of Phase Angles From Dynamic
Modulus Data and Implications for Cracking Performance Evaluation. Road Materials
and Pavement Design, Vol. 18(Suppl. 4), 2017, pp. 491-513.
Pellinen, T.K., and Witczak, M.W. Use of Stiffness of Hot Mix Asphalt as a Simple
Performance Test. Transportation Research Record: Journal of the Transportation
Research Board, No. 1789, 2002, pp. 80-90.
52
Rodezno, C., Taylor, A., and Gu, F. Crack Resistance and Durability of RAS Asphalt Mixtures—
Phase I. FHWA-OH-2018-15. National Center for Asphalt Testing, Auburn, AL, 2018.
Rowe, G., Baumgardner, G., and Sharrock, M. Functional Forms for Master Curve Analysis of
Bituminous Materials. In Proceedings of the 7th International RILEM Symposium
ATCBM09 on Advanced Testing and Characterization of Bituminous Materials, Vol. 1,
2016, pp. 81-91.
Seitllari, A., Lanotte, M.A., and Kutay, M.E. Comparison of Uniaxial Tension-Compression
Fatigue Test Results With SCB Test Performance Indicators Developed for Performance-
Based Mix Design Procedure. In Bituminous Mixtures and Pavements VII: Proceedings
of the 7th International Conference on Bituminous Mixtures and Pavements. CRC Press,
2019.
Seitllari, A., Boz, I., Habbouche, J., and Diefenderfer, S.D. Assessment of Cracking
Performance Indices of Asphalt Mixtures at Intermediate Temperatures. International
Journal of Pavement Engineering, 2020.
Tavassoti-Kheiry, P., Boz, I., Chen, X., and Solaimanian, M. Application of Ultrasonic Pulse
Velocity Testing of Asphalt Concrete Mixtures to Improve the Prediction Accuracy of
Dynamic Modulus Master Curve. In Airfield and Highway Pavements, 2017, pp. 152-
164.
Texas Department of Transportation. Tex-248-F: Test Procedure for Overlay Test. Austin,
2014.
Texas Department of Transportation. Special Specification 3074: Superpave Mixtures—
Balanced Mix Design. Austin, 2019.
Virginia Department of Transportation. Road and Bridge Specifications. Richmond, 2016.
West, R., Rodezno, C., Leiva, F., and Yin, F. Development of a Framework for Balanced Mix
Design. National Center for Asphalt Technology, Auburn, AL, 2018.
Yin, F., Garita, J., Taylor, A., and West, R. Refining the Indirect Tensile (IDT) Nflex Factor
Test to Evaluate Cracking Resistance of Asphalt Mixtures for Mix Design and Quality
Assurance. Construction and Building Materials, Vol. 172, 2018, pp. 396-405.
Zhang, R., Sias, J.E., and Dave, E.V. Evaluation of the Cracking and Aging Susceptibility of
Asphalt Mixtures Using Viscoelastic Properties and Master Curve Parameters. Journal
of Traffic and Transportation Engineering (English Edition), 2020.
Zhou, F., Im, S., Sun, L., and T. Scullion, T. Development of an IDEAL Cracking Test for
Asphalt Mix Design and QC/QA. Road Materials and Pavement Design, Vol. 18, No. 4,
2017.

53
Zhou, F., Hu, S., and Newcomb, D. Development of a Performance-Related Framework for
Production Quality Control With Ideal Cracking and Rutting Tests. Construction and
Building Materials, Vol. 261, 2020.

54

55
APPENDIX
BMD SPECIAL PROVISIONS (REV. 3, 7/1/2019)

56

57
VIRGINIA DEPARTMENT OF TRANSPORTATION
SPECIAL PROVISION FOR
BALANCED MIX DESIGN (BMD) SURFACE MIXTURES DESIGNED USING
PERFORMANCE CRITERIA
I. Description
These Specifications cover the requirements and materials used to produce Surface Mixtures,
designed using Performance Criteria. Balanced Mix Design (BMD) Surface Mixtures shall
be designed, produced, and placed as required by this Special Provision and Sections 211 and
315 of the Specifications.
II. Materials
All materials shall be in accordance with Section 211.02 of the Specifications.
III. Job-Mix Formula
Mix Types SM-9.5A, SM-9.5D, SM-9.5E SM-12.5A, SM-12.5D, SM-12.5E may be
designed to meet either the Performance + Volumetric (BP+V) criteria or the Performance
Only (BP) criteria included in this section. Each mix type used shall meet the requirements
of Section 211 and any related Special Provisions included in this contract.
Type Performance + Volumetric (BP+V) asphalt mixtures shall be designed to meet the
requirements of Section 211.03 of the Specifications as well as the requirements of Table 1.
Type Performance Only (BP) asphalt mixtures shall be designed to meet the requirements
of Section 211.03 of the Specifications except that the requirements in Tables II-13 and II-14
are waived. However, the grading and Superpave volumetric properties shall be reported in
the mix design submittal in accordance with AASHTO R35, and shall include the varying
AC analysis.
In addition, these mix types shall meet the criteria of Table 1 herein at the design binder
content. Testing shall be reported as follows:
Cantabro testing: at design and 0.5% below design binder content
CTIndex testing: at design, at 0.5% above, and 0.5% below the design binder content
APA rut testing: at design and 0.5% above the design binder content
The JMF shall meet the nominal max aggregate size (NMAS) of the designated mix type.
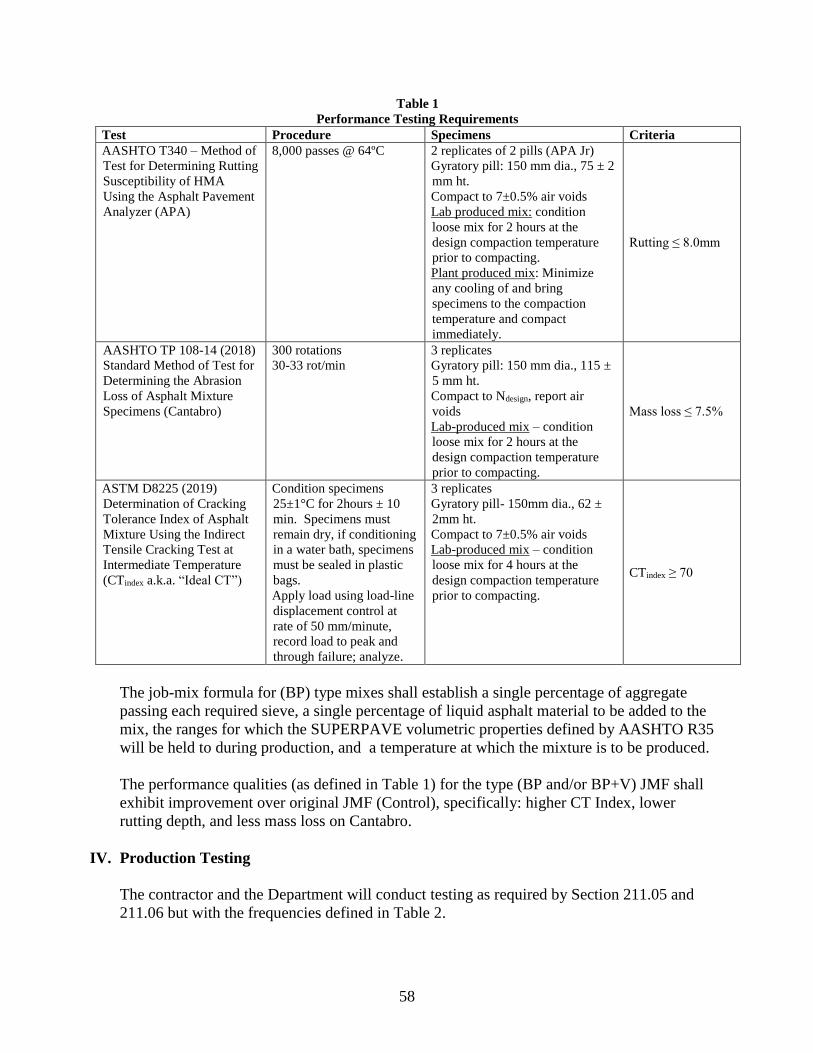
58
Table 1
Performance Testing Requirements
Test Procedure Specimens Criteria
AASHTO T340 – Method of
Test for Determining Rutting
Susceptibility of HMA
Using the Asphalt Pavement
Analyzer (APA)
8,000 passes @ 64ºC
2 replicates of 2 pills (APA Jr)
Gyratory pill: 150 mm dia., 75 ± 2
mm ht.
Compact to 7±0.5% air voids
Lab produced mix: condition
loose mix for 2 hours at the
design compaction temperature
prior to compacting.
Plant produced mix: Minimize
any cooling of and bring
specimens to the compaction
temperature and compact
immediately.
Rutting ≤ 8.0mm
AASHTO TP 108-14 (2018)
Standard Method of Test for
Determining the Abrasion
Loss of Asphalt Mixture
Specimens (Cantabro)
300 rotations
30-33 rot/min
3 replicates
Gyratory pill: 150 mm dia., 115 ±
5 mm ht.
Compact to Ndesign, report air
voids
Lab-produced mix – condition
loose mix for 2 hours at the
design compaction temperature
prior to compacting.
Mass loss ≤ 7.5%
ASTM D8225 (2019)
Determination of Cracking
Tolerance Index of Asphalt
Mixture Using the Indirect
Tensile Cracking Test at
Intermediate Temperature
(CTindex a.k.a. “Ideal CT”)
Condition specimens
25±1°C for 2hours ± 10
min. Specimens must
remain dry, if conditioning
in a water bath, specimens
must be sealed in plastic
bags.
Apply load using load-line
displacement control at
rate of 50 mm/minute,
record load to peak and
through failure; analyze.
3 replicates
Gyratory pill- 150mm dia., 62 ±
2mm ht.
Compact to 7±0.5% air voids
Lab-produced mix – condition
loose mix for 4 hours at the
design compaction temperature
prior to compacting.
CTindex ≥ 70
The job-mix formula for (BP) type mixes shall establish a single percentage of aggregate
passing each required sieve, a single percentage of liquid asphalt material to be added to the
mix, the ranges for which the SUPERPAVE volumetric properties defined by AASHTO R35
will be held to during production, and a temperature at which the mixture is to be produced.
The performance qualities (as defined in Table 1) for the type (BP and/or BP+V) JMF shall
exhibit improvement over original JMF (Control), specifically: higher CT Index, lower
rutting depth, and less mass loss on Cantabro.
IV. Production Testing
The contractor and the Department will conduct testing as required by Section 211.05 and
211.06 but with the frequencies defined in Table 2.

59
Performance testing shall be conducted in accordance with TABLE 1 and at the frequency
shown in TABLE 2. Should any performance tests fail to meet the criteria as specified in
Table 1, the Department may require that production be stopped until corrective actions are
taken by the Contractor.
Table 2
Production Testing Frequency1
Entity Gradation/AC Volumetrics APA rutting Cantabro CTindex
Producer 500T 500T - 500T 500T
VDOT 500T 1,000T - 1000T2 1000T2
VTRC 500T 500T 500T2 500T
(reheat)
500T
(reheat) 1With a minimum of 1 sample per day, per entity, per test. 2Minimize any cooling of the plant produced mix and bring the specimens to the compaction
temperature and compact immediately to the specimen size requirements in TABLE 1. Specimens
shall be fabricated and provided to the Department by the Contractor.
Note: No changes to the standard lot sizes as defined in Sections 211 and 315.
V. Acceptance
Acceptance for mix types (BP+V) and (BP) shall be as required by the Special Provision for
Section 211
Field density shall be determined in accordance with the Special Provision for Density
Determination.
VI. Initial Production
Mix types (BP+V) and (BP) shall be subject to Section 211.15 at the Engineer’s discretion.

60

61
VIRGINIA DEPARTMENT OF TRANSPORTATION
SPECIAL PROVISION FOR
HIGH RECLAIMED ASPHALT PAVEMENT (RAP) CONTENT SURFACE
MIXTURES DESIGNED USING PERFORMANCE CRITERIA
I. Description
These Specifications cover the requirements and materials used to produce High RAP
Content Surface Mixtures, containing 40% RAP and higher, designed using Performance
Criteria. High RAP Content Surface Mixtures shall be designed, produced, and placed as
required by this Special Provision and Sections 211 and 315 of the Specifications. High RAP
Content Surface Mixtures consist of a combination of coarse aggregate, fine aggregate, RAP,
and liquid asphalt binder mechanically mixed in a plant to produce a stable asphalt concrete
paving mixture.
II. Materials
All materials shall be in accordance with Section 211.02 of the Specifications with the
exception that Recycled Asphalt Shingles (RAS) shall not be allowed in these mixes.
III. Job-Mix Formula
Mix Types SM-9.5A, SM-9.5D, SM-12.5A, and SM-12.5D may be designed to meet
either the Performance + Volumetric (P+V) criteria or the Performance Only (P) criteria
included in this section. Each mix type used shall meet the requirements of Section 211 and
any related Special Provisions included in this contract, expect the maximum RAP
percentages as indicated in TABLE II-14A shall be waived. Approval from the Engineer is
required if the use of a PG binder grade not currently approved, or an asphalt rejuvenator is
used to meet the performance criteria.
Although the laboratory mixing and compaction temperatures for the control mixes are per
Section 211.03(d)6, for all pilot mix types (P+V) and (P) the temperatures shall be as
required for mix designation D.
Type Performance + Volumetric (P+V) asphalt mixtures shall be designed to meet the
requirements of Section 211.03 of the Specifications as well as the requirements of Table 1.
Type Performance Only (P) asphalt mixtures shall be designed to meet the requirements
of Section 211.03 of the Specifications except that the requirements in Tables II-13 and II-14
are waived. However, the grading and Superpave volumetric properties shall be reported in
the mix design submittal in accordance with AASHTO R35, and shall include the varying
AC analysis.
In addition, these mix types shall meet the criteria of Table 1 herein at the design binder
content. Testing shall be reported as follows:

62
Cantabro testing: at design and 0.5% below design binder content
CTIndex testing: at design, at 0.5% above, and 0.5% below the design binder content
APA rut testing: at design and 0.5% above the design binder content
The JMF shall meet the nominal max aggregate size (NMAS) of the designated mix type.
Table 1
Performance Testing Requirements
Test Procedure Specimens Criteria
AASHTO T340
Method of Test for
Determining Rutting
Susceptibility of HMA Using
the Asphalt Pavement
Analyzer (APA)
8,000 passes @ 64ºC
2 replicates of 2 pills (APA Jr)
Gyratory pill: 150 mm dia., 75
± 2 mm ht.
Compact to 7±0.5% air voids
Lab produced mix: condition
loose mix for 2 hours at the
design compaction
temperature prior to
compacting.
Plant produced mix: Minimize
any cooling of and bring
specimens to the compaction
temperature and compact
immediately.
Rutting ≤ 8.0mm
AASHTO TP 108-14 (2018)
Standard Method of Test for
Determining the Abrasion
Loss of Asphalt Mixture
Specimens (Cantabro)
300 rotations
30-33 rot/min 3 replicates
Gyratory pill: 150 mm dia.,
115 ± 5 mm ht.
Compact to Ndesign, report air
voids
Lab-produced mix – condition
loose mix for 2 hours at the
design compaction
temperature prior to
compacting.
Mass loss ≤ 7.5%
ASTM D8225 2019
Determination of Cracking
Tolerance Index of Asphalt
Mixture Using the Indirect
Tensile Cracking Test at
Intermediate Temperature
(CTindex a.k.a. “Ideal CT”)
Condition specimens
25±1°C for 2hours ± 10
min. Specimens must
remain dry, if conditioning
in a water bath, specimens
must be sealed in plastic
bags.
Apply load using load-line
displacement control at rate
of 50 mm/minute, record
load to peak and through
failure; analyze.
3 replicates
Gyratory pill- 150mm dia., 62
± 2mm ht.
Compact to 7±0.5% air voids
Lab-produced mix – condition
loose mix for 4 hours at the
design compaction temperature
prior to compacting.
CTindex ≥ 70

63
The job-mix formula for (P) type mixes shall establish a single percentage of aggregate
passing each required sieve, a single percentage of liquid asphalt material to be added to the
mix, the ranges for which the SUPERPAVE volumetric properties defined by AASHTO R35
will be held to during production, and a temperature at which the mixture is to be produced.
The performance qualities (as defined in Table 1) for the type (P) JMF shall exhibit
improvement over the type (P+V) JMF, specifically: higher CT Index, lower rutting depth,
and less mass loss on Cantabro.
IV. Job-Mix Formula
The contractor and the Department will conduct testing as required by Section 211.05 and
211.06 but with the frequencies defined in Table 2.
Performance testing shall be conducted in accordance with TABLE 1 and at the frequency
shown in TABLE 2. Should any performance tests fail to meet the criteria as specified in
Table 1, the Department may require that production be stopped until corrective actions are
taken by the Contractor.
Table 2
Production Testing Frequency1
Entity Gradation/AC Volumetrics APA rutting Cantabro CTindex
Producer 500T 500T - 500T 500T
VDOT 500T 1,000T - 1000T2 1000T2
VTRC 500T 500T 500T2 500T (reheat) 500T (reheat) 1With a minimum of 1 sample per day, per entity, per test. 2Minimize any cooling of the plant produced mix and bring the specimens to the compaction
temperature and compact immediately to the specimen size requirements in TABLE 1. Specimens
shall be fabricated and provided to the Department by the Contractor.
Note: No changes to the standard lot sizes as defined in Sections 211 and 315.
V. Acceptance
Acceptance for mix types (P+V) and (P) shall be as required by the Special Provision for
Section 211.
Field density shall be determined in accordance with the Special Provision for Density
Determination.
VI. Initial Production
Mix types (P+V) and (P) shall be subject to Section 211.15 at the Engineer’s discretion.