Background Papers and Supplementary Technical Information
183
GeoHazards International June 2015 Background Papers and Supplementary Technical Information Part of the Project: Developing Messages for Protective Actions to Take During Earthquake Shaking
-
Upload
khangminh22 -
Category
Documents
-
view
1 -
download
0
Transcript of Background Papers and Supplementary Technical Information

GeoHazards International June 2015
Background Papers and Supplementary Technical Information
Part of the Project: Developing Messages for Protective Actions to Take During Earthquake Shaking

Copies of all or part of this document may be made and freely distributed for noncommercial use, provided that no alterations are made and the source is acknowledged. This document is made possible by the generous support of the American people through the United States Agency for International Development (USAID) Office of Foreign Disaster Assistance (OFDA) under Grant No. AID-OFDA-G-13-00172. The contents are the responsibility of GeoHazards International and do not necessarily reflect the views of USAID or the United States Government. The material presented in this document should not be used for any specific application without competent examination by qualified professionals for its suitability and applicability to local conditions. Users of information from this publication assume all responsibility and liability arising from its use. GeoHazards International and USAID assume no responsibility for the accuracy of opinions expressed herein. Cover photo credit: Janise Rodgers

Papers Included Epidemiology of Deaths and Injuries During Earthquakes - Michele M. Wood, PhD, Department of Health Science, California State University Fullerton Protective Action in Immediate Fuse Events: A Consideration of the Literature - Tricia Wachtendorf, Ph.D., Disaster Research Center and Department of Sociology and Criminal Justice, University of Delaware; and Samantha Penta, M.A., University of Delaware Designing Risk Communication Programs to Promote Adaptive Human Behavior During Earthquakes and Tsunamis - Michael K. Lindell, Texas A&M University Hazard Reduction & Recovery Center and University of Washington Department of Urban Design and Planning On the Nature of Strong Ground Motions during Damaging Earthquakes - Susan E. Hough, U.S. Geological Survey, Pasadena Understanding and Mitigating Building Collapses: A Message for Those Within - Polat Gulkan, Department of Civil Engineering, C ankaya University Developing Guidance on Protective Actions to Take During Earthquake Shaking: Summary of Literature and Discussions, and Survey Results on Common Protective Actions - Vero nica Cedillos, Michelle Meyer, Karma Doma Tshering, and Janise Rodgers Appendices to Developing Guidance on Protective Actions to Take During Earthquake Shaking: Summary of Literature and Discussions, and Survey Results on Common Protective Actions - Vero nica Cedillos, Michelle Meyer, Karma Doma Tshering, and Janise Rodgers

!
Epidemiology of Deaths and Injuries During Earthquakes
Michele M. Wood, PhD Department of Health Science, California State University Fullerton
A Background Paper for the Project: Developing Messages for Protective Actions to Take During Earthquake Shaking
Conducted by:

! 1!
Epidemiology of Deaths and Injuries During Earthquakes
Michele M. Wood, PhD Department of Health Science, California State University Fullerton
1. Introduction,Population growth and the built environment are the primary root causes of morbidity and mortality associated with earthquakes. Earthquakes generally do not cause death and injury, but rather it is the buildings in which people are located and the contents therein that are directly responsible for human mortality and morbidity. Protective action messaging is intended to provide members of the public with information that can be recalled and acted on during earthquake shaking to reduce the chance of death and injury. In order to design appropriate guidance for developing protective action messages for earthquakes, it is important to understand their human impact—that is, how people are injured and killed during earthquake shaking. The purpose of this background paper is to describe the epidemiology of deaths and injuries during earthquakes. The paper will address the major causes of death and injury from earthquakes, including what the research indicates about injuries to building occupants who walk or run, the likelihood of death or injury from earthquakes, the likelihood of death or injury from earthquake-related building collapse, the likelihood of death or injury from substandard building evacuation routes during earthquakes, and other sudden onset threats, such as tsunami or fire. The health effects of earthquakes can be categorized in a variety of ways. Combs, Quenemoen, Parrish, and Davis (1999) developed a typology, which has been adopted by the U.S. Centers for Disease Control and Prevention (CDC), for categorizing the health effects attributable to earthquakes and other disasters based on two parameters: (1) the time the death or injury occurs relative to the event, and (2) whether the event is directly or indirectly related to the disaster. Deaths and injuries that are directly related are those that are caused by the physical forces of the event, whereas indirectly related deaths and injuries are, “those caused by unsafe or unhealthy conditions that occur because of the anticipation, or actual occurrence, of the disaster” (Combs et al., 1999, p. 1125). This paper will focus primarily on human deaths and injuries occurring during earthquakes that are directly related to the event.
2. Major,Causes,of,Injury,and,Death,from,Earthquakes,Many factors are believed to contribute to death and injury during earthquakes. These include characteristics of the event such as earthquake magnitude and shaking intensity; building characteristics such as type of building materials used, building codes, height, occupancy, and use; location indoors or outdoors, and specific location within buildings; personal characteristics such as age, gender, infirmity, and socio-economic status; health system characteristics such as search and rescue availability; human behavior including protective actions taken, and more. Earthquake Mortality Structural collapse stands out as a key factor associated with increased risk of death world-wide (Spence & So, 2009). Repeated evidence for this finding was reported in an extensive review of

! 2!
earthquakes occurring worldwide between 1980 and 2009 (Doocy, Daniels, Packer, Dick, & Kirsch, 2013). Multiple studies found that the major cause of death related to earthquakes was building collapse (Angus et al., 1997; Aoki et al., 2004; Armenian, Melkonian, Noji, & Hovanesian, 1997; Bissell et al., 1994; Chan et al., 2003; Eberhart-Phillips, Saunders, Robinson, Hatch, & Parrish, 1994b; Hatamizadeh et al., 2006; Kuwagata et al., 1997; Liang et al., 2001; Parasuraman, 1995; Peek-Asa, Ramirez, Shoaf, Seligson, & Kraus, 2000; Pretto et al., 1994; Tanaka et al., 1999a; Tanida, 1996). Death in this case is mainly caused by being crushed by falling roofs and walls or struck by debris falling from damaged buildings. Asphyxiation is another related potential cause of death. Building collapse generates an enormous amount of dust. Many individuals experiencing building collapse die from asphyxia caused by airway obstruction as their breathing passages become lined and clogged with dust, and dust fills their lungs (Chen et al., 1988; Hatamizadeh et al., 2006; Hingston & Hingston, 1983; Noji et al., 1990; Spence, 2007). Postmortem examinations of earthquake deaths in Soviet Armenia and Kobe Japan identified large amounts of dust in nasal cavities, throats, and respiratory passages indicating asphyxiation as the cause of death (Hogan & Burstein, 2007). In the 2003 Bam, Iran earthquake, asphyxiation due to dust generated by building collapse has been indicated as a source of many deaths (Movahedi, 2005). In weak masonry buildings, earth used as roofing and walling can bury and suffocate victims during a building collapse (Coburn & Spence, 2002). Compression asphyxia can occur when building collapse causes extreme pressure on the chest, preventing breathing (Coburn & Spence, 2002). In the 1995 Kobe earthquake, 76% of all deaths were caused by compression asphyxia due to collapsed buildings and falling furniture. In the 1999 Taiwan earthquake, 77% of earthquake related deaths occurred in people’s collapsed homes (1441/1862), many of which had relatively open ground floors, and 32% of all earthquake-associated deaths (596/1862) were attributed to asphyxiation (Chan et al., 2003). Furthermore, building collapse can entrap severely injured people, exacerbating morbidity and mortality. Across studies, a majority of deaths occurred indoors (Angus et al., 1997; Armenian, Noji, & Oganesian, 1992; Bissell et al., 1994; Ellidokuz, Ucku, Aydin, & Ellidokuz, 2005; Kuwagata et al., 1997; Parasuraman, 1995; Tanaka et al., 1999b), and often occurred among individuals who were at home. Thus, earthquakes that cause wide-scale building and infrastructure collapse result in mass fatalities. It has been estimated that 75% of earthquake fatalities in the past century have been due to building collapse, and the vast majority of these have been masonry construction (Coburn, Pomonis, & Sakai, 1989; Coburn & Spence, 2002). Cause of Mortality: Event characteristics Another important risk factor for death has to do with the nature of the earthquake. Earthquake intensity (shaking) and distance to the epicenter have been associated with increased risk for mortality in multiple studies (Liang et al., 2001; Liao et al., 2003; Pawar, Shelke, & Kakrani, 2005; Peek-Asa et al., 2000). Cause of Mortality: Building Construction Materials In countries with poor or nonexistent building codes, structures have a greater risk of total collapse (Armenian et al., 1992). Type of material used in building construction has been associated with increased risk of death, although patterns of risk have been inconsistent. Elevated

! 3!
risk of death has been associated with unreinforced masonry (Angus et al., 1997), mud and stone walls (Parasuraman, 1995), concrete (Roces, White, Dayrit, & Durkin, 1992), panel construction (Armenian et al., 1992), and wood construction (Bissell et al., 1994; Ellidokuz et al., 2005; Pretto et al., 1994). Across these studies, no universal, consistent pattern of risk associated with particular building material emerged (Doocy et al., 2013), although, historically, unreinforced masonry buildings have produced the greatest risk to their inhabitants (Spence & So, 2009). This topic is discussed further, below, under the section, Likelihood of Injury or Death: Earthquakes. Cause of Mortality: Individual Characteristics In terms of individual characteristics, being female increased risk of death in some studies (Chan et al., 2003; Chou et al., 2004; Parasuraman, 1995), while sex was not a risk factor in other studies (Eberhart-Phillips, Saunders, Robinson, Hatch, & Parrish, 1994a; Liang et al., 2001; Liao et al., 2003; Pretto et al., 1994; Sullivan & Hossain, 2010). Across all studies reporting on gender, women had a higher risk of death. Across studies reviewed, the overall ratio of risk of death for men compared women was 1:1.2 (Doocy et al., 2013). Age was a risk factor for death in several studies. Being older was a risk factor in ten studies, and being a child was a risk factor in four (Doocy et al., 2013). Cause of Mortality: Health System Characteristics Characteristics of the health system have been associated with elevated risk of death during earthquakes in some studies. The amount of time until rescue (Roces et al., 1992) was one such factor. Another study identified the availability of physicians and hospital beds per capita as protective (Liang et al., 2001). Pertinent prior training of lay uninjured earthquake survivors, that is, first aid or rescue training, protected against mortality in another study (Angus et al., 1997). Earthquake Morbidity Nonfatal injuries are the most common health effect of disasters (Gutierrez, Taucer, De Groeve, Al-Khudhairy, & Zaldivar, 2005). Across 51 research papers on the health effects of earthquakes, 42 included information about the type of injuries sustained (Doocy et al., 2013). Most common were soft tissue injuries, including lacerations and contusions, and fractures, with the extremities being the most common area of the body affected. Across a wide variety of events, the pattern of injury to different body parts remains fairly constant, with injuries to lower extremities being the most common, followed by injuries to the head and upper neck, and then to upper extremities (Spence & So, 2009). These are typically caused by falling and by being struck by non-structural objects such as furniture and lighting fixtures (Kano, 2005; Mahue-Giangreco, Mack, Seligson, & Bourque, 2001; Peek-Asa et al., 2000; Shoaf, Nguyen, Sareen, & Bourque, 1998). Multiple in-patient studies also have reported crush injuries that damage internal organs as the predominant injury type (Bissell et al., 1994; Iskit et al., 2001; Najafi et al., 2009; Uzun, Savrun, & Kiziltan, 2005). Earthquakes can create secondary hazards that also pose health threats. Failure to use proper safety precautions during clean up can results in trauma or respiratory injuries. Fire can erupt after earthquakes causing burns and smoke inhalation. Although rare (Floret, Viel, Mauny, Hoen, & Piarroux, 2006; Morgan, 2004), infectious diseases such as coccidioidomycosis, or “Valley Fever”, have been caused by environmental pollution following earthquakes. Ventura County experienced an increase in cases of Valley Fever following the 1994 Northridge earthquake

! 4!
(Bourque, Siegel, Kano, & Wood, 2006; Centers for Disease Control and Prevention, 1994). Cause of Morbidity: Building Characteristics Several building characteristics have been associated with injury in the research literature. Being indoors during an earthquake was a risk factor for injury in several studies (Armenian et al., 1997; Armenian et al., 1992; Kuwagata et al.; Roces et al., 1992). Being in a middle or upper floor also was a risk factor (Armenian et al., 1997; Armenian et al., 1992; Kuwagata et al., 1997; Roces et al., 1992). The type of construction or construction quality was a risk factor for earthquake injury in several studies, as well (Armenian et al., 1997; Bissell et al., 1994; Jain, Noponen, & Smith, 2003; Mahue-Giangreco et al., 2001; Peek-Asa et al., 1998; Peek-Asa, Ramirez, Seligson, & Shoaf, 2003; Roces et al., 1992). In the 1999 Athens earthquake, it was observed that damage to nonresidential buildings was more severe than damage to residences, but the author urged further study of this general observation (Pomonis, 2002). A population-based case-control study examined the effects of building characteristics on injury in the 1994 Northridge earthquake (Peek-Asa et al., 2003). Individuals in multiple-unit residential structures has 3.8 times the risk of injury for location matched controls and 2.9 times the risk of injury for age and gender matched controls, compared with those in single-unit residential structures. People who were in commercial buildings or those designated as for “other use” had more than six times the risk of injury compared to both types of matched pairs. The age of building structure also influenced risk. Those in buildings that were built between 1950 and 1969 had slightly lower risk of injury compared to those who were in pre-1950 buildings. This finding was significant, however, only for the location-matched pairs. Cause of Morbidity: Personal Characteristics Gender, age, and socio-economic status have been identified as risk factors for injury. Injuries have been reported as more common among men in eleven studies and among women, in sixteen. Combined, these differences tend to even out; however, the few results that were statistically significant consistently indicated that injuries were more common among women (Doocy et al., 2013). Articles reporting age related injury showed that children had lower risk of injury, whereas, young or working-aged adults, elderly individuals, and those with increasing age had higher risk. Lower socio-economic status also was a factor associated with elevated risk of injury (Doocy et al., 2013; Sami et al., 2009). Differences Between Countries Between country differences in health consequences related to earthquakes are due primarily to differences in the built environment and population density. The research record is replete with examples showing that earthquakes of similar magnitudes can result in vastly different amounts of morbidity and mortality. For example, the 2003 Iranian earthquake destroyed 90% of the buildings in Bam, killing almost 27,000 people. In contrast, a California earthquake of similar magnitude occurring four days later resulted in only two deaths and damage to forty buildings (Guha-Sapir, Hargitt, & Hoyois, 2004, p. 32). Injuries to Building Occupants who Walk or Run Multiple studies have shown that movement, including moving to exit a building during an earthquake, increased the chance of injury from falling down and from being struck by falling

! 5!
debris. During the 1994 Northridge earthquake, falls were the leading cause of hospitalized injury and were most common among those who attempted to move (Peek-Asa et al., 1998). Research across multiple California earthquakes found that moving during an earthquake was associated with injury, with 10.4% of those who attempted to move, and 6.1% of those who stayed in place, reporting injury (Shoaf et al., 1998). Likelihood of Injury or Death: Earthquakes The precise risk of death in earthquakes is unknown, but features such as building structure type, building height, occupant characteristics, earthquake characteristics, and more all bear on risk (Spence & So, 2009). In general, unreinforced masonry buildings have been the most dangerous for inhabitants, with weaker masonry leading to higher death tolls (Spence & So, 2009). Experts believe that construction without the use of proper codes and guidance from trained builders will result in highly vulnerable structures. In the 1999 Kocaeli earthquake, in buildings with damage at the D5 (total damage) level, 10% of building occupants were killed (Erdik et al., 2000; Petal, 2009). A study of the 2002 Afyon, Turkey earthquake (Ellidokuz et al., 2005) found that the likelihood of death was 1.6% (16/1,000), and the likelihood of injury was 2.2% (22/1,000). The death-to-injury ratio was 1:1.4. The majority (60%) of buildings either collapsed or were heavily damaged. In the Kashmir and Yogyakarta events, where the majority of buildings were constructed with unreinforced masonry, among buildings with a D5 damage level (total damage), the percentage of occupants killed was 10% in Yogyarkarta and 17% in Kashmir (Spence & So, 2009). Although other factors come into play, the chance of survival in a collapsed building depends largely on the type of structure. A home made of timber will kill far fewer people if it collapses than will a rubble stone masonry home without mortar and with a heavy roof. Reinforced concrete buildings will be more deadly to occupants if they lack sufficient redundancy and experience a pancake collapse. Moreover, the larger the number of floors there are, the greater the proportion of occupants who will be killed therein (Spence & So, 2009). In the 1999 Kocaeli earthquake, among people inside reinforced concrete buildings, there was a 10% mortality rate (Erdik et al., 2000; Petal, 2009). It has been estimated that in a severe earthquake situation, with predominantly weak masonry housing stock, 90% of the buildings can be expected to collapse, with 30% of the population being killed, and 60-80% of the population being injured (Coburn & Spence, 2002). Likelihood of Injury or Death: Evacuation Routes and Sudden Onset Threats Earthquakes are more destructive when they trigger secondary hazards such as fire, landslides, and tsunamis (Roces et al., 1992). In some instances, morbidity and mortality attributed to the secondary disaster can exceed that which is attributed to the earthquake itself. For example, the majority of the 283,106 deaths caused by the 2004 M9.1 Sumatra-Andaman Islands earthquake and tsunami (Marano, Wald, & Allen, 2010) were due to drowning and other traumatic injuries caused by the force of the tsunami waves. With a magnitude of 9.0, the 2011 Great East Japan earthquake was the fifth largest earthquake worldwide since 1900, and it was the single largest earthquake to strike Japan since modern instrumental recordings began 130 years ago. Approximately 20, 000 casualties have been reported, and like the Sumatra-Andaman Islands earthquake and tsunami, the tsunami’s surging

! 6!
water was far more destructive than the earthquake itself. Following damage to four nuclear reactors at the Fukushima Daiichi Nuclear Power Plant, the government issued a state of Atomic emergency and ordered evacuations for residents within a 2 km radius of the plant, which was later incrementally expanded to a 10 km radius, followed by a 20 km radius. Finally, an emergency evacuation was ordered for all patients in the area. As the situation at the nuclear plant deteriorated and the evacuation area expanded, evacuation transportation become more rushed and more dangerous; more than 50 patients died during or soon after evacuation, likely due to hypothermia, dehydration, and the advancement of their underlying medical issues (Ichiseki, 2013). How people respond to earthquakes can influence their survival as well as the survival of others. Stampedes occurred as panicked students sought to exit school buildings, causing a considerable number of injuries in the 1990 Luzon, Philippines earthquake (Roces et al., 1992) and also in the 1992 Egypt earthquake (Malilay, Elias, Olson, Sinks, & Noji, 1995), though such occurrences historically have been rare.
3. Effectiveness,of,Different,Protective,Actions,During,Earthquake,Shaking,Recommended protective actions vary based on where one is located when an earthquake strikes. Several different protective actions exist. Key evidence for the effectiveness of each action is discussed, below. Secure building contents Securing household items is a protective action that can be taken before an earthquake strikes. This includes things like attaching bookshelves to walls, storing heavy and breakable items lower to the ground, bolting down appliances, and the like. Multiple studies of earthquake injury support this protective action. In the 1994 Northridge earthquake, the greatest risk factors contributing to serious injury were falling down and being hit by falling objects (Peek-Asa et al., 1998). In the Whittier Narrows, Loma Prieta, and Northridge earthquakes, falling building contents (nonstructural) caused more injury than any other factor (Shoaf et al., 1998). In the 2010 and 2011 Canterbury earthquakes, projectiles were a major cause of injury (Johnston et al., 2014). These findings support the notion that actions taken pre-event can reduce death and injury and can be included in protective action messages. Move outdoors This protective action is directed towards individuals who are located in a building that is more prone to collapse when an earthquake strikes. This guidance has been directed to individuals who are on the ground floor of an un-engineered adobe building (i.e., mud brick with a heavy roof), unreinforced masonry, or non-ductile concrete building when an earthquake strikes. Individuals in these circumstances have been instructed to quickly move outside to an open space. There is some international evidence supporting evacuation during earthquakes when in buildings with relatively weaker constructions. In the 1988 Armenia earthquake, leaving a building after the first earthquake shock was protective; the odds of being injured were more than four times greater for those who remained indoors compared to those who ran outside (Armenian et al., 1992). In the 1970 Peru earthquake, people who immediately rushed outside into wider streets generally escaped without injury (Clapperton, 1972). In the 1999 Gölcük, Turkey earthquake, the likelihood of death was eleven times higher for those who remained indoors compared to those

! 7!
who evacuated the building (Dedeoglu, Erengin, & Pala, 2000). In the 1980 southern Italy earthquake, survival was related to the ability to flee buildings and depended on the type of building (De Bruycker et al., 1985). There also is counter evidence, however. In the 1999 Kocaeli earthquake, people who evacuated unreinforced masonry buildings during ground shaking were three times more likely to experience injury (Petal, 2009). In the 1976 northern Italy Friuli earthquake, the elderly and very young were slower to evacuate buildings than those who were more agile. Those who more quickly ran out of buildings into the narrow streets were crushed by falling masonry (Hogg, 1980). And, in the 1970 Cellejon de Huaylas earthquake, people who rushed into the narrow streets were immediately buried in rubble (Armenian et al., 1992). Knowing the number of floors in a building can provide some guidance in terms of when this action is most helpful. In the 1980 Southern Italy earthquake, increased death and injury was associated with the number of floors in a building (De Bruycker et al., 1985). In the 1988 Armenia earthquake, the odds of being injured for those in a building with five or more floors were more than three and a half times greater than the odds for those in buildings with fewer floors (Armenian et al., 1992). While there is evidence that supports evacuation as a protective action in some situations, it is not completely clear when fleeing a building is the safest action to take. The evidence does not support evacuation for well-constructed wood-framed buildings; evidence for the safety of evacuating adobe and unreinforced masonry buildings exists, but is mixed. There are situations in which rapidly exiting such buildings can be protective, but the protective effect is inconsistent. Stay outdoors It is recommended that people who are outdoors when an earthquake strikes stay outdoors and refrain from entering a building. In addition to the threat of building collapse and death or injury from objects falling while entering a building, multiple studies provide evidence supporting this recommendation based on the fact that attempting to move during shaking results in injury related to falls and falling objects (Johnston et al., 2014; Peek-Asa et al., 1998; Petal, 2009). The evidence supports this recommendation regardless of type of building construction. Stay indoors Attempting to evacuate a building during an earthquake has been identified as a protective factor for death in some instances and a risk factor for death and injury in others (Peek-Asa et al., 2003). In the United States, multiple studies have shown that exiting a building to go outdoors during an earthquake increased the chance of injuries from falling down and from falling debris. During the 1994 Northridge earthquake, falls, the leading cause of hospitalized injury in that event, were most commonly associated with movement (Peek-Asa et al., 2003). Very few serious non-fatal injuries were associated with building collapse during the Northridge earthquake (Mahue-Giangreco et al., 2001). Research on California earthquakes (Whittier Narrows, Loma Prieta, and Northridge) found that moving during an earthquake was associated with injury. Among people who reported attempting to move during the earthquake, 10.4% reporting injury, whereas among those who stayed in place, only 6.1% reported injury (Shoaf et al., 1998).

! 8!
Residential housing in California is largely wood-framed, which is less prone to collapse than adobe, concrete, and masonry buildings (Peek-Asa et al., 2003). Thus, there is evidence supporting this protective action message for people who are located in well-constructed wood-framed and other sturdy buildings. Drop, cover, hold on This protective action can apply to those indoors and outdoors, alike. Dropping to the floor on one’s hands and knees is recommended to prevent movement and falls and can help protect vital organs. From this position, individuals can crawl a short distance to the nearest cover to protect themselves from falling and moving objects, if they are in range of such objects. Multiple research studies support this protective action. In the 1994 Northridge earthquake, most of the injuries that resulted in hospital admissions were caused either by falling or by being hit by falling objects (Peek-Asa et al., 1998). Among fatalities in this earthquake, the head was the most common area of the body injured (48.5%), followed by thoracic injury (42.4%). In the 2010 and 2011 Canterbury earthquakes, the most common cause of injury was tripping or falling (Johnston et al., 2014). Research on the 1999 Kocaeli earthquake (Petal, 2009) found that staying in place and sitting down appeared to be safer than taking any other protective action. There is evidence that covering one’s head and neck with sturdy furniture or one’s arms if no such furniture is available, is protective, regardless of location. Multiple studies have identified being struck by, caught under, cut, or pierced by falling or moving objects as a primary cause of injury during earthquakes (Peek-Asa et al., 1998; Petal, 2009; Shoaf et al., 1998). Likewise, there is evidence to support holding on to one’s cover, including, moving with it to maintain cover during the shaking, or holding one’s position until it is safe to move. While there is no research that directly supports the “hold” action, the logic supporting this recommendation is based on the evidence for minimizing movement and maintaining cover. Take cover in a corner, near an interior wall, or near low-lying furniture In the absence of sturdy furniture such as a table or desk, recommended protective actions are to cover one’s head and face with one’s arms, and then crouch next to low-lying furniture, in an inside corner, or near an interior wall. Research specifically supporting this guidance has not been identified; however, experts report that compared to crouching near an interior wall, crouching in a corner may be safer because of the protection afforded by two walls as opposed to only one; a corner also may be a sturdier location. Large furniture may provide some protection from falling and moving objects. The protection afforded must be weighed against the potential risks associated with movement during shaking. Thus, there is evidence to support these protective actions, but it is unclear when which action would be best given one’s distance from the different locations. Do/do not take cover in a doorway The recommendation to take cover in a doorway was a common sense recommendation prior to 1970 when the doorframes in masonry buildings were reinforced with wood (Petal, 2009). This logic has been used for a number of years to support the recommendation to move to a doorway for cover and has only recently been excluded from public education materials. Moreover, this recommendation has been reported as a myth in some cases given that many modern doorframes

! 9!
are not reinforced at all. Given the risk of injury from movement, not moving to a doorway for a cover has been offered as a protective action to help counter this persistent “common sense” advice. The relative benefit of standing in a doorway, and of not standing in a doorway, cannot be generalized across situations involving different types of doorframes (Aroni, & Durkin, cited in Petal, 2009, p. 6). Move to a “triangle of life” This recommendation is based on the notion that individuals should identify locations that are likely to create a void or safe space (i.e., life-protecting triangle) during a complete or pancake building collapse. In the U.S. buildings typically do not collapse in this manner, which undermines the premise of this recommendation. Moreover, if a building were to collapse in this manner, experts believe it would be virtually impossible for individuals, including trained professionals, to identify such “safe” locations before collapse. In addition, attempting to move during shaking bears its own risks, discussed above. Rather than instructing individuals to move during earthquake shaking, experts recommend guidance focusing on actions to protect oneself from injury from falls and falling objects for which there is evidence. While some continue to recommend using the “triangle of life”, there is no scientific evidence supporting it. Stay in bed; protect your head with a pillow There is some evidence to support the recommendation to stay in bed if an earthquake strikes at night while sleeping. The Northridge earthquake struck while many were in bed asleep. Research has shown that in this earthquake, those who remained in bed were less likely to become injured (Shoaf et al., 1998). Across the Whittier Narrows, Loma Prieta, and Northridge earthquakes, non-structural falling objects caused more injury than any other cause, leading to the recommendation to protect one’s head and torso with a pillow (Mahue-Giangreco et al., 2001). Similar findings were obtained in the 1999 Kocaeli earthquake, where being in bed and asleep was less hazardous than being in bed and awake, and being in bed in either case was less hazardous than standing or sitting still (Petal, 2009). Given the risks associated with movement during shaking, if one is thrown from bed, it would be safest to take cover there rather than attempt to move back to bed. Pull to the side of the road in a safe location This protective action is recommended for those who are in a moving vehicle when an earthquake strikes. A safe location is defined as clear from poles, overhead wires, bridges/overpasses, and other such hazards. Research has found that during the Northridge earthquake, collapsed or damaged roadways and uncontrolled traffic led to multiple deaths involving moving vehicles and that damage to transportation infrastructure such as nonfunctioning traffic signals and road lighting were associated with fatal vehicle crashes (Peek-Asa et al., 1998; Ramirez & Peek-Asa, 2005). In a study of drivers’ reactions during seismic motion, driver over-correction and delayed driver response time caused drivers to inadvertently maneuver their vehicles into adjacent traffic lanes using driving simulators (Maruyama & Yamazaki, 2004). Move to higher ground This protective action is recommended for people who are near a beach and is intended to mitigate death or injury from a possible tsunami. It is true that tsunamis can cause significant

! 10!
injury and death, potentially surpassing that associated with the initial earthquake (Marano et al., 2010). There is no universal evidence, however, indicating the appropriate time frame for taking this protective action. The risks associated with movement or attempted movement during ground shaking have previously been discussed and are a potential threat to individuals who may attempt to move to higher ground before the ground stops shaking, perhaps in areas that are not vulnerable to tsunamis. Thus, there is evidence supporting this protective action, but as yet there is no evidence to support universally taking this action immediately at the initial onset of shaking. Quality of evidence Overall, the quality of evidence supporting these protective actions is strong, except where recommendations have been based on logic, as noted. The methods used include reviews of patient, hospital, and emergency room records, a population-based case-control study using fatal and hospital-admitted injuries, a standardized interview case-control study, and a large-scale reconnaissance survey of individuals in local tent cities, for example. Using values to communicate messages The California Earthquake Authority (CEA) and California Emergency Management Agency (Cal EMA) have used a values-based approach to communicating earthquake preparedness messages (Long, 2012) so that message recipients can see and feel what matters to them. Emotions and values can be incorporated into earthquake messages using both words and images (Bell, 2011; Guttman, 1997). Values, though embedded in all facets of health communication interventions, are often ignored by practitioners and those who design, implement, and evaluation communication efforts (Guttman, 1996). Research has shown that social marketing approaches to motivating action can be successful (Stead, Gordon, Angus, & McDermott, 2007).
4. Methodological,Issues,The earthquake research literature includes some well-designed studies, but methodological challenges related to the identification of cases and the measurement of earthquake exposure and outcome limit the ability to generalize findings (Stallings, 2006). Research on the 1994 Northridge, 1995 Kobe, 1999 Athens, and 1999 Chi Chi earthquakes has been particularly well documented. Data collection in epidemiological disaster studies often relies on the least costly and most practical means available, and under these circumstances, is often limited to “hot spots” such as hospital and emergency room settings, where earthquake victims are likely to congregate (Killian, 2002; Stallings, 2006). This type of sample selection captures information about the number of people who present themselves with different health concerns without providing information about the appropriate denominator, or number of people composing the larger community from which the presenting individuals emerged. In this situation, the extent to which identified cases appropriately represent the range of earthquake related death and injury is unknown (Stallings, 2006). Consistency of findings across different studies using different methods can increase confidence in findings. In contrast, population-based studies enable researchers to estimate the number and proportion of individuals affected in a given community because they focus on the entire community at risk, that is, the denominator (Bourque, Shoaf, & Nguyen, 1997). Population data collected in three waves following the 1994 Northridge earthquake, for example, provided estimates of the

! 11!
proportion of the population affected, physical and emotional disaster related injuries, utilization of health care and other disaster relief services, and more (Nguyen, Shen, Ershoff, Afifi, & Bourque, 2006). Another methodological challenge is the lack of a clear-cut schema for classifying exposure to an earthquake and defining what constitutes an earthquake-related death, injury, or disease (Bourque et al., 2006). The protocol used by the CDC for classifying outcomes as directly and indirectly attributable to disasters is, in practice, difficult to apply. Research has examined differences across sources in the number of deaths and injuries reported. One explanation is a tendency to “cast the net wide” and include in official counts any case showing up during or immediately after an earthquake, resulting in over-reporting (Peek-Asa et al., 1998). Morbidity estimates are more challenging to determine than are mortality estimates (Bourque et al., 2006). In some instances, estimated morbidity is based on approximations provided by the Red Cross, clinics, and hospitals that may have served individuals whose injuries were not directly related to the disaster. Research has shown that in many cases, those injured may not visit an emergency room. Moreover, persons staffing emergency rooms may not be knowledgeable about which injuries are actually attributable to a given disaster (Peek-Asa et al., 1998). Morbidity estimates often include a substantial margin of error because of both under- and over-reporting (Noji, 1997). A careful review of emergency room logs and other hospital records can help improve validity of estimated deaths; however, uncertainty about whether or not an injury is earthquake-related cannot be fully eliminated (Bourque et al., 2006).
5. Concluding,Remarks,Many epidemiological studies of earthquake related mortality and morbidity have examined case series that present at hospitals and medical centers immediately following an earthquake. In so doing, they ignore the larger physical and social environment within which earthquakes occur. Few studies have examined those who are injured but do not present themselves at treatment centers, how injuries and deaths are distributed across the areas affected by the earthquake, and whether pre-earthquake investment in public education about protective actions, mitigation, and preparedness reduces morbidity and mortality associated with earthquakes.

! 12!
References
Angus, D. C., Pretto, E. A., Abrams, J. I., Ceciliano, N., Watoh, Y., Kirimli, B., . . . Comfort, L. K. (1997). Epidemiologic assessment of mortality, building collapse pattern, and medical response after the 1992 earthquake in Turkey. Disaster Reanimatology Study Group (DRSG). Prehospital and Disaster Medicine, 12(3), 222-231.
Aoki, N., Nishimura, A., Pretto, E. A., Sugimoto, K., Beck, J. R., & Fukui, T. (2004). Survival
and cost analysis of fatalities of the Kobe earthquake in Japan. Prehospital Emergency Care, 8(2), 217-222.
Armenian, H. K., Melkonian, A., Noji, E. K., & Hovanesian, A. P. (1997). Deaths and injuries
due to the earthquake in Armenia: a cohort approach. International Journal of Epidemiology, 26(4), 806-813.
Armenian, H. K., Noji, E. K., & Oganesian, A. P. (1992). A case-control study of injuries arising
from the earthquake in Armenia, 1988. Bulletin of the World Health Organization, 70(2), 251-257.
Bell, R. (2011, 17-19 Oct. 2011). Inspiring sustainable decision-making through strategic
communications planning. Paper presented at the Professional Communication Conference (IPCC), 2011 IEEE International.
Bissell, R. A., Pretto, E., Angus, D. C., Shen, B., Ruiz, V., Ceciliano, N., . . . Abrams, J. (1994).
Post-preparedness medical disaster response in Costa Rica. Prehospital and Disaster Medicine, 9(2), 96-106.
Bourque, L. B., Shoaf, K. I., & Nguyen, L. H. (1997). Survey research. International Journal of
Mass Emergencies and Disasters, 15, 71-101. Bourque, L. B., Siegel, J. M., Kano, M., & Wood, M. M. (2006). Morbidity and mortality
associated with disasters. In Rodríguez, H., Quarantelli, E. & Dynes, R. (Eds.), Handbook of disaster research (pp. 97-112). New York: Springer.
Centers for Disease Control and Prevention. (1994). Emerging Infectious Diseases
Coccidioidomycosis Following the Northridge Earthquake--California, 1994. Morbidity and Mortality Weekly Report, 43(10), 94-95.
Chan, C. C., Lin, Y. P., Chen, H. H., Chang, T. Y., Cheng, T. J., & Chen, L. S. (2003). A
population-based study on the immediate and prolonged effects of the 1999 Taiwan earthquake on mortality. Annals of Epidemiology, 13(7), 502-508.
Chen, Y., Kam-ling, T., Chen, F., Gao, Z., Zou, Q., & Chen, Z. (Eds.). (1988). The great
Tangshan earthquake of 1976: An anatomy of disaster. Oxford: Pergamon Press.

! 13!
Chou, Y.-J., Huang, N., Lee, C.-H., Tsai, S.-L., Chen, L.-S., & Chang, H.-J. (2004). Who is at risk of death in an earthquake? American Journal of Epidemiology, 160, 688-695.
Clapperton, C. (1972). Patterns of physical and humon activity on Mount Etna. Scottish
Geographical Magazine, 88(3), 160-167. Coburn, A., Pomonis, A., & Sakai, S. (1989). Assessing strategies to reduce fatalities in
earthquakes. Paper presented at the International Workshop on Earthquake Injury Epidemiology, Baltimore, MD.
Coburn, A., & Spence, R. (2002). Earthquake protection (2nd ed.). West Sussex, England: John
Wiley & Sons Ltd. Combs, D. L., Quenemoen, L. E., Parrish, R. G., & Davis, J. H. (1999). Assessing disaster-
attributed mortality: Development and application of a definition and classification matrix. International Journal of Epidemiology, 28, 1124-1129.
De Bruycker, M., Greco, D., Lechat, M. F., Annino, I., De Ruggiero, N., & Triassi, M. (1985).
The 1980 earthquake in Southern Italy--morbidity and mortality. International Journal of Epidemiology, 14(1), 113-117.
Dedeoglu, N., Erengin, H., & Pala, K. (2000). Risk factors for death, injury, and entrapment in
the 17 August 1999 Earthquake of Gölcük. Community and Physician, 15, 2-9. Doocy, S., Daniels, A., Packer, C., Dick, A., & Kirsch, T. (2013). The Human Impacts of
Earthquakes: a Historic Review of Events 1980-2009 and Systematic Literature Review. PloS Currents: Disasters. doi: 10.1371/currents.dis.67bd14fe457f1db0b5433a8ee20fb833
Eberhart-Phillips, J. E., Saunders, T. M., Robinson, A. L., Hatch, D. L., & Parrish, R. G. (1994a).
Profile of mortality from the 1989 Loma Prieta earthquake using coroner and medical examiner reports. Disasters, 18(2), 160-170.
Eberhart-Phillips, J. E., Saunders, T. M., Robinson, A. L., Hatch, D. L., & Parrish, R. G.
(1994b). Profile of mortality from the 1989 Loma Prieta earthquake using coroner and medical examiner reports. Disasters, 18(2), 160-170.
Ellidokuz, H., Ucku, R., Aydin, U. Y., & Ellidokuz, E. (2005). Risk factors for death and injuries
in earthquake: cross-sectional study from Afyon, Turkey. Croatian Medical Journal, 46(4), 613-618.
Erdik, M., Ansal, A., Aydinoglu, N, B., A., Yuzugullu, O., Birgoren, G., . . . Sesetyan, K. (2000,
November 12-15). Development of earthquake masterplan for the municipality of Izmir. Paper presented at the Sixth International Conference on Seismic Zonation, Palm Springs, CA.

! 14!
Floret, N., Viel, J. F., Mauny, F., Hoen, B., & Piarroux, R. (2006). Negligible risk for epidemics after geophysical disasters. Emerging Infectious Diseases, 12(4), 543-548.
Guha-Sapir, D., Hargitt, D., & Hoyois, P. (2004). Thirty years of natural disasters 1974-2003:
The numbers. Brussels, Belgium: Presses universitaires de Louvain. Gutierrez, E., Taucer, F., De Groeve, T., Al-Khudhairy, D. H. A., & Zaldivar, J. M. (2005).
Analysis of worldwide earthquake mortality using multivariate demographic and seismic data. American Journal of Epidemiology, 161, 1151-1158.
Guttman, N. (1996). Values and justifications in health communication interventions: An
analytic framework. J Health Commun, 1(4), 365-396. doi: 10.1080/108107396128004 Guttman, N. (1997). Beyond strategic research: A value-centered approach to health
communication interventions. Communication Theory, 7(2), 95-124. doi: 10.1111/j.1468-2885.1997.tb00144.x
Hatamizadeh, P., Najafi, I., Vanholder, R., Rashid-Farokhi, F., Sanadgol, H., Seyrafian, S., . . .
Lameire, N. (2006). Epidemiologic aspects of the Bam earthquake in Iran: the nephrologic perspective. American Journal of Kidney Diseases, 47(3), 428-438. doi: 10.1053/j.ajkd.2005.11.019
Hingston, R. A., & Hingston, L. (1983). Respiratory injuries in earthquakes in Latin America in
the 1970s: a personal experience in Peru (1970), Nicaragua (1972-3) and Guatemala (1976). Disaster Medicine, 1, 425-426.
Hogan, D. E., & Burstein, J. L. (2007). Disaster Medicine (2nd ed.). Philadelphia, PA:
Lippincott Williams & Wilkins. Hogg, S. J. (1980). Reconsutrction Following Seismic Disaster in Venzone, Friuli. Disasters,
4(2), 173-185. doi: 10.1111/j.1467-7717.1980.tb00271.x Ichiseki, H. (2013). Features of disaster-related deaths after the Great East Japan Earthquake.
The Lancet, 381(9862), 204. Iskit, S. H., Alpay, H., Tugtepe, H., Ozdemir, C., Ayyildiz, S. H., Ozel, K., . . . Dagli, T. E.
(2001). Analysis of 33 pediatric trauma victims in the 1999 Marmara, Turkey earthquake. Journal of Pediatric Surgery, 36(2), 368-372. doi: 10.1053/jpsu.2001.20719
Jain, V., Noponen, R., & Smith, B. M. (2003). Pediatric surgical emergencies in the setting of a
natural disaster: Experiences from the 2001 earthquake in Gujarat, India. Journal of Pediatric Surgery, 38(5), 663-667. doi: 10.1016/jpsu.2003.50178
Johnston, D., Standring, S., Ronan, K., Lindell, M., Wilson, T., Cousins, J., . . . Bissell, R.
(2014). The 2010/2011 Canterbury earthquakes: context and cause of injury. Natural Hazards, 73(2), 627-637. doi: 10.1007/s11069-014-1094-7

! 15!
Just in Case Arizona. (2006). How to survive a building collapse. Retrieved October 1, 2014,
from http://www.justincasearizona.com/be-informed/attacks-accidents/building-collapse.asp
Kano, M. (2005). Characteristics of earthquake-related injuries treated in emergency departments
following the 2001 Nisqually earthquake in Washington. Journal of Emergency Management, 3(1), 33-45.
Killian, L. M. (2002). An introduction to the methodological problems of field studies in
disasters. In Stallings, R. A. (Ed.), Methods of disaster research (pp. 49-93). http://www.Xlibris.com: International Research Committee on Disasters, Xlibris Corporation.
Kuwagata, Y., Oda, J., Tanaka, H., Iwai, A., Matsuoka, T., Takaoka, M., . . . Yoshioka, T.
(1997). Analysis of 2,702 traumatized patients in the 1995 Hanshin-Awaji earthquake. Journal of Trauma, 43(3), 427-432.
Liang, N. J., Shih, Y. T., Shih, F. Y., Wu, H. M., Wang, H. J., Shi, S. F., . . . Wang, B. B. (2001).
Disaster epidemiology and medical response in the Chi-Chi earthquake in Taiwan. Annals of Emergency Medicine, 38(5), 549-555. doi: 10.1067/mem.2001.118999
Liao, Y. H., Hwang, L. C., Chang, C. C., Hong, Y. J., Lee, I. N., Huang, J. H., . . . Yang, C. T.
(2003). Building collapse and human deaths resulting from the Chi-Chi Earthquake in Taiwan, September 1999. Archives of Environmental Health, 58(9), 572-578. doi: 10.3200/aeoh.58.9.572-578
Long, K. (2012). Awareness to action: The role of value-based messaging in communicating
actionable risk to the public. Paper presented at the EERI Annual Meeting and National Earthquake Conference, Memphis, TN. http://eqprogram.net/documents/content/2012/05/2012.05.11.Loong_NEC_Abstract.pdf
Mahue-Giangreco, M., Mack, W., Seligson, H., & Bourque, L. B. (2001). Risk factors associated
with moderate and serious injuries attributable to the 1994 Northridge earthquake, Los Angeles, California. Annals of Epidemiology, 2001(11), 347-357.
Malilay, J., Elias, I. F., Olson, D., Sinks, T., & Noji, E. (1995). Mortality and Morbidity Patterns
Associated with the October 12, 1992, Egypt Earthquake. Earthquake Spectra, 11(3), 457-476. doi: 10.1193/1.1585823
Marano, K. D., Wald, D. J., & Allen, T. I. (2010). Global earthquake casualties due to secondary
effects: A quantitative analysis for improving rapid loss analyses. Natural Hazards, 52, 319 - 328.

! 16!
Maruyama, Y., & Yamazaki, F. (2004). Fundamental study on the response characteristics of drivers during an earthquake based on driving simulator experiments. Earthquake Engineering & Structural Dynamics, 33(6), 775-792. doi: 10.1002/eqe.378
Morgan, O. (2004). Infectious disease risks from dead bodies following natural disasters. Pan
American Journal of Public Health, 15(5), 307-312. Movahedi, H. (2005). Search, rescue, and care of the injured following the 2003 Bam, Iran,
earthquake. Earthquake Spectra, 21(S1), 475-485. doi: 10.1193/1.2090469 Najafi, I., Safari, S., Sharifi, A., Sanadgol, H., Hosseini, M., Rashid-Farokhi, F., . . . Boroumand,
B. (2009). Practical strategies to reduce morbidity and mortality of natural catastrophes: a retrospective study based on Bam earthquake experience. Archives of Iranian Medicine, 12(4), 347-352.
Nguyen, L. H., Shen, H., Ershoff, D., Afifi, A. A., & Bourque, L. B. (2006). Exploring the causal
relationship between exposure to the 1994 Northridge earthquake and pre- and post-earthquake preparedness activities. Earthquake Spectra, 22(3), 569-587.
Noji, E. K. (Ed.). (1997). The public health consequences of disasters. New York: Oxford
University Press. Noji, E. K., Kelen, G. D., Armenian, H. K., Oganessian, A., Jones, N. P., & Sivertson, K. T.
(1990). The 1988 earthquake in Soviet Armenia: a case study. Annals of Emergency Medicine, 19(8), 891-897.
Parasuraman, S. (1995). The impact of the 1993 Latur-Osmanabad (Maharashtra) earthquake on
lives, livelihoods and property. Disasters, 19(2), 156-169. Pawar, A. T., Shelke, S., & Kakrani, V. A. (2005). Rapid assessment survey of earthquake
affected Bhuj block of Kachchh District, Gujarat, India. Indian Journal of Medical Sciences, 59(11), 488-494.
Peek-Asa, C., Kraus, J. F., Bourque, L. B., Vimalachandra, D., Yu, J., & Abrams, J. (1998). Fatal
and hospitalized injuries resulting from the 1994 Northridge earthquake. International Journal of Epidemiology, 27, 459-465.
Peek-Asa, C., Ramirez, M., Seligson, H. A., & Shoaf, K. I. (2003). Seismic, structural, and
individual factors associated with earthquake-related injury. Injury Prevention, 9, 62-66. Peek-Asa, C., Ramirez, M., Shoaf, K., Seligson, H., & Kraus, J. F. (2000). GIS mapping of
earthquake-related deaths and hospital admissions from the 1994 Northridge California, earthquake. Annals of Epidemiology, 10(1), 5-13.
Petal, M. (2009). Evidence-based public education for disaster prevention: Causes of deaths and
injuries in the 1999 Kocaeli earthquake. Saarbrücken, Germany: VDM Verlag.

! 17!
Pomonis, A. (2002). The Mount Parnitha (Athens) earthquake of September 7, 1999: A disaster
management perspective. Natural Hazards, 27, 171–199. Pretto, E. A., Angus, D. C., Abrams, J. I., Shen, B., Bissell, R., Ruiz Castro, V. M., . . . Ricci, E.
(1994). An analysis of prehospital mortality in an earthquake. Disaster Reanimatology Study Group. Prehospital and Disaster Medicine, 9(2), 107-117.
Ramirez, M., & Peek-Asa, C. (2005). Epidemiology of traumatic injuries from earthquakes.
Epidemiologic Reviews, 27, 47-55. Roces, M. C., White, M. E., Dayrit, M. M., & Durkin, M. E. (1992). Risk factors for injuries due
to the 1990 earthquake in Luzon, Philippines. Bulletin of the World Health Organization, 70(4), 509-514.
Sami, F., Ali, F., Zaidi, S. H. H., Rehman, H., Ahmad, T., & Siddiqui, M. I. (2009). The October
2005 Earthquake in Northern Pakistan: Pattern of Injuries in Victims Brought to the Emergency Relief Hospital, Doraha, Mansehra. Prehospital and Disaster Medicine, 24(06), 535-539. doi: doi:10.1017/S1049023X00007470
Shoaf, K. I., Nguyen, L. H., Sareen, H. R., & Bourque, L. B. (1998). Injuries as a result of
California earthquakes in the past decade. Disasters, 22(3), 218-235. Spence, R. (2007). Saving lives in earthquakes: successes and failures in seismic protection since
1960. Bulletin of Earthquake Engineering, 5(2), 139-251. doi: 10.1007/s10518-006-9028-8
Spence, R., & So, E. (2009). Estimating shaking-induced casualties and building damage for
global earthquake events: Final technical report, NEHRP Grant Number 08HQGR0102. Cambridge, UK: Cambridge Architectural Research Ltd.
Stallings, R. A. (2006). Methodological issues. In Rodríguez, H., Quarantelli, E. L. & Dynes, R.
R. (Eds.), Handbook of disaster research (pp. 55-82). New York: Springer. Stead, M., Gordon, R., Angus, K., & McDermott, L. (2007). A systematic review of social
marketing effectiveness. Health Education, 107(2), 126-191. doi: doi:10.1108/09654280710731548
Sullivan, K. M., & Hossain, S. M. (2010). Earthquake mortality in Pakistan. Disasters, 34(1),
176-183. doi: 10.1111/j.1467-7717.2009.01121.x Tanaka, H., Oda, J., Iwai, A., Kuwagata, Y., Matsuoka, T., Takaoka, M., . . . Yoshioka, T.
(1999a). Morbidity and mortality of hospitalized patients after the 1995 Hanshin-Awaji earthquake. The American Journal of Emergency Medicine, 17(2).

! 18!
Tanaka, H., Oda, J., Iwai, A., Kuwagata, Y., Matsuoka, T., Takaoka, M., . . . Yoshioka, T. (1999b). Morbidity and mortality of hospitalized patients after the 1995 Hanshin-Awaji earthquake. American Journal of Emergency Medicine, 17(2), 186-191.
Tanida, N. (1996). What happened to elderly people in the great Hanshin earthquake (Vol. 313). Uzun, N., Savrun, F. K., & Kiziltan, M. E. (2005). Electrophysiologic evaluation of peripheral
nerve injuries in children following the Marmara earthquake. Journal of Child Neurology, 20(3), 207-212.

Tricia
Deve
ProtectA
a WachtenSociolog
Sa
loping Mes
tive AcA Consi
ndorf, Ph.gy and Criamantha P
A Bassages for P
tion in ideratio
D., Disasiminal JusPenta, M.A
ackground Protective A
Con
Immedon of th
ter Researstice, UnivA., Unive
Paper for Actions to
nducted by
diate Fuhe Liter
rch Centeversity of ersity of D
the ProjectTake Duri
:
use Everature
er and DeDelaware
Delaware
t: ing Earthqu
ents:
epartmente; and
uake Shakin
t of
ng

1
Protective Action in Immediate Fuse Events: A Consideration of the Literature
Tricia Wachtendorf, Ph.D. University of Delaware and Samantha Penta, M.A. University of Delaware
1. IntroductionFollowing the 2011 Virginia earthquake, thousands of people residing in East Coast cities ran out of office buildings despite commonly understood protective action guidance to drop, cover, and hold in such circumstances. Many residents of effected areas interpreted the shaking of buildings they occupied through a post-9/11 lens (Memmott, 2011). Whereas an office worker in California might have easily interpreted physical cues associated with earthquakes, given the frequency of occurrence and regularity of earthquake education along the West Coast, unfamiliarity with earthquakes on the eastern side of the United States generated quite a different interpretive lens: one that suggested quick building evacuation as a protective strategy compared to the drop, cover and hold approach. Yet were the hazards similar to that of 9/11, perhaps the actions people took would have been most appropriate. How does one make sense of appropriate protective actions, given ambiguous circumstances? How does perception of risk guide behavior during immediate fuse disaster events? What behaviors are expected from people and groups as disasters unfold? This paper examines the literature on human behavior during disasters, and, where possible, earthquakes and other immediate fuse events, such terrorist attacks and building fires. Where possible, broader literature on risk perception, risk communication, and evacuation in general are examined to provide possible implications for the protective action strategies people undertake in earthquake events. The inclusion of general building evacuation behavior (including for fires and terrorism events) is important, given that much of the focus on protective action in earthquakes is on preparedness and mitigation activities (see Asgary and Willis 1997 for an earlier review, or Muttarak and Pothisiri 2013 for more recent literature). As Alexander (2012: 3) states, “The evidence on human behaviour [during earthquakes] is patchy, and hence it is difficult to know the extent to which self-protective behaviour saves lives, or conversely the extent to which rash behaviour increases people's risk of death or injury.” This paper closes with a summary of several implications of this review.
2. RiskPerceptionRisk perception has a strong relationship with risk communication. Exactly how risk information is communicated influences risk perception. More specifically, trust in information sources – be they formal or informal sources – will have an influence on how people think about the risks they encounter (Liao et al 2011; Tierney 1999). Research centered on the United States suggests that risk perception varies by race and gender. Men tend to assess risks as lower, compared to women (Aguirre et al. 1998; Finucane et al. 2000; de Zwart et al. 2007). Results from research examining evacuation behavior following the 1993 World Trade Center bombing showed that female participants in the study reported higher perceived danger than did males (Aguirre et al. 1998). Likewise, Finucane et al.’s (2000) U.S. survey of how race and gender – along with sociopolitical factors – shape risk perception found that men rate many hazards (related to
2
disasters, health interventions, violence, environmental hazards, among others) lower in risk,
compared to women. White respondents rated risks lower than non-white respondents, and non-
white women typically indicated the highest risk ratings of those studied. The patterns were not
generated by age, income, level of education, or political orientation. The study revealed some
exceptions. For example, Asian males ranked some risks as lower than white males. In
examining differences in sociopolitical issues between races and genders, the authors found that
“white males were more sympathetic with hierarchical, individualistic, and anti-egalitarian
views, more trusting of technology managers, less trusting of government, and less sensitive to
potential stigmatization of communities from hazards. These positions suggest greater
confidence in experts and less confidence in public-dominated social processes” (Finucane et al.
2000: 170).
The pertinent finding for cross-cultural research is derived from the interactions between race,
gender, and power. As Finucane et al. (2000: 170) explain, “Compared with white males, many
females and nonwhite males tend to be in positions of less power and control, benefit less from
many technologies and institutions, are more vulnerable to discrimination, and therefore see the
world as more dangerous.” In other words, as the authors speculate, risk perception may be
linked to the power members of those groups feel they have. Identified as an area of future
research, groups with a greater sense of power or with greater benefit from risky systems may
rate risks as lower than those segments of the population who do not. Risk-related messages
must, then, be better directed to the risk-perception levels of these groups.
This finding is even more salient when one considers the role of economic resources and
political economy in shaping exposure to risks, where people with fewer economic resources and
generally those less able to handle the consequences of a risk are more likely to face an imposed
risk (see Tierney 1999 for a review). Tierney (1999) argues that how organizations and the media
frame risks are an important part of understanding public risk perception. It is a finding
consistent with broader theoretical understandings of how frames – presented by the media and
other entities – help people organize information, learn about issues, and socially construct
certain social problems in particular ways (Graber 1984; Gamson et al. 1992; Entman 1993).
Finucane et al. (2000) do note, however, that the tendency of sociopolitical attitudes to align with
race and around particular groups does not negate the variation of beliefs within these groups.
As they state, attitudes towards risks are not uniform within gender and racial categories.
Research suggests that there are other factors that shape risk perception. Wachinger et al. (2013)
offer that the most important factors shaping risk perception were trust in authorities and experts,
as well as past experience with the hazard. In a study comparing risk perception about Avian
Influenza in the United Kingdom, Denmark, Poland, Spain, the Netherlands, People’s Republic
of China, Hong Kong, and Singapore, multivariate analysis revealed the importance of location
in risk perception. Though women consistently perceived greater risk than did men, the
difference in perceptions was greater between men and women in European countries compared
to respondents in Asian nations (de Zwart et al. 2007).
3. RiskCommunicationWhen people receive warnings, they react to them through a collective process. That is, they seek
social confirmation of the warning message from others (Quarantelli 1982). Recipients of a

3
warning message typically want more information and confirm the message, facilitating the steps of the warning response process (Mileti and Sorensen 1990; Sorensen 2000). Once people hear a warning, they reach out to other sources, including friends and family members, to confirm the warning and consult them on their course of action. In this process, people share the warning message with each other, creating the contagion network (Rogers and Sorensen 1991). As many as half of the initial warnings people receive are communicated through this informal network (Sorensen 2000). The more sources from which the warning is heard, the more likely the warning is to be believed (Quarantelli 1982). People turn to backchannel sources of information (like social media and other similar methods) when they: 1) are unable to obtain information through formal channels; 2) cannot access those formal channels; 3) find formal channels are not providing up-to-date information; or 4) find information is not specific or accurate to the local area (particularly in news venues targeted at a national audience) (Sutton et al. 2008). Although most of the research in this area focuses on long fuse (e.g. hurricane) and short fuse (e.g. tornado) events, rather than immediate fuse events such as earthquakes, the use of backchannel information to understand protective action strategies may be similar. That is, when advice on protective actions is not available, accessible, timely, or specific, people may look to backchannel sources for information. However, research has not yet tested this assumption. Past experience shapes information seeking and warning acceptance. According to Rogers and Sorensen, “People respond to emergency warnings in the context of prior experience and the existing social and physical environs that interact with the warning message” (1991: 118). These experiences, along with preconceived ideas about the threat, inform interpretations and subsequent action (Rogers and Sorensen 1991). Recall again the experience of building occupants during the 2011 Virginia Earthquake, as noted above, whose preconceived notions about building movement and shaking contents informed an interpretation of the event as a possible terrorist attack, which led to subsequent protective action to leave the building. Message credibility can be improved by past experience, but that experience can also make the personal threat assessment process more complex (Quarantelli 1982). Consider, for example, findings from the 2001 World Trade Center attack (which will be elaborated on below). Occupant experience led some evacuees to delay evacuation to engage in activities they wish they had done in 1993, such as contact family members to reassure them that they were fine, or to collect belongings in case they were unable to return to work for an extended period. At the same time, other surviving evacuees recounted that they initiated their evacuation sooner because of past experiences with congestion in 1993. The authors (Averill et al. 2005) also suggest that accounts from coworkers who were present in 1993 may have influenced action by those newer to the building. According to Quarantelli, “there is no such thing as a warning message; there is instead what is perceived or believed by people, the meaning they give to the message, which may or may not correspond to the warning message intended by those who issue it” (1982: 2). Thus, factors influencing whether people believe messages and how they interpret them are important considerations in crafting these communications. Perception of warning message credibility and the channel it comes from can be influenced by the perceived relevance receivers give to the message and the mode through which the message is conveyed (Major and Atwood 1997). Because perceived credibility is linked with channel preference, choices in how and where people seek information are affected (Major and Atwood

4
1997). Quarantelli (1982) asserted that personal modes of relaying warning messages are generally assessed as more credible. That said, he also argued that mass media warning messages are more likely to be believed if delivered by government officials or emergency organization personnel than private citizens or members of other groups (Quarantelli 1982). We have just reviewed that white men in the U.S. are less likely than women to have trust in government information sources. Other research supports the finding that minorities are less likely to rely on official government sources for disaster information than family and social networks (Peguero 2006; Donner and Rodriguez 2008; Benavides and Arlikatti 2010). What, therefore, is the best channel of information? Different channels of communicating messages must be selected based on the population to be reached and the type of hazard or event that the population is being warned about (Mileti and Sorensen 1990). Looking in the American context, research indicates that preferences in the way information is communicated can vary with a range of characteristics, including ethnicity, education, gender, and age (Hayden et al. 2007). Official sources may not always be the most effective means of delivering a message. Informal sources can be valuable sources of information related to protective behavior (Liao et al. 2011). In a questionnaire study of 385 heads of households in three cities in Mexico conducted after the 1999 Veracruz floods, Aguirre and Macias (2004) found that few of the respondents reported getting help from municipal government employees, the police department, or the Sistema Nacional de Proteccion Civil. Most respondents received information from the radio and people with whom they had personal relationships, including neighbors, friends and kin. Based on these findings, Aguirre and Macias identified two ways to strengthen communication in this particular area: first, to place a greater emphasis on disaster radio programming and to increase radio access, and second, to create more livable communities and improved warning dissemination by developing communities and social networks through community activities and associations (Aguirre and Macias 2004). Different segments of the population may be better reached in different ways, and cultural context across countries may also vary the preferred communication channels.
4. PerceptiontoAction:CollectiveBehaviorConsidering the translation of risk perception and risk communication into to action, research indicates that risk perception does influence protective action decisions. The following section examines those connections. Liao et al. (2011) examined telephone survey data of Hong Kong residents on avian influenza and pandemic influenza. They found that trust in informal sources as well as formal ones was related to engaging in protective hygiene practices. Knowledge of the flu influenced protective hygiene practices, as did the perceived effectiveness of those practices. Worry was related to engaging in those protective action strategies (Liao et al. 2011). Aguirre et al. (1998) found in their study of evacuation from the World Trade Center (WTC) in the 1993 bombing that study participants who considered the situation more serious evacuated sooner than did those who did not perceive the same level of danger. Similarly, people who suffered injuries during the bombing event decided to evacuate sooner than their non-injured counterparts. However, behavior is also influenced by the collective unit in which a person functions. In their comprehensive review of evacuation simulation models and evacuation behavior, Santos and

5
Aguirre (2004) note that the physical constraints associated with particular structures (including features of stairs, flow rates, and usable area averages) are not sole determinants of successful building egress in sudden-onset evacuations. Equally important are how people interact with each other and the processes that emerge through group interaction. People evacuate as individuals but also as group units. As Santos and Aguirre explain, the decision to evacuate and actual evacuation behavior play key roles in determining the safety of evacuees. Interestingly, other research related to risk perception and evacuation, conducted on the 2001 WTC attacks, suggest a different interpretation in that particular event. Indeed, as part of a National Institute of Standards and Technologies report, Averill et al. (2005) conducted an extensive investigation of the 2001 WTC attack evacuation, involving over 1000 interviews, focus groups, as well as detailed analysis of 911 emergency calls and related documents. Averill et al. found that many occupants actually delayed evacuation due to placement in the structure (higher floors delayed evacuation) and encountering environmental cues that signaled something was wrong (e.g. smoke, seeing debris from windows). Both, they argue, increased risk perception and caused these occupants to seek additional information about the nature of event (e.g. making phone calls to those outside the building or inquiring with others within the structure). This milling behavior (fully explored by Turner and Killian 1987) is well documented in the disaster literature. Milling can include such activities as noted above, but it can also include looking to others in the vicinity for more subtle social cues that could relay fear, concern, agitation, confidence, calmness, dismissiveness, or other sentiments. With a heightened risk perception, these occupants then engaged in actions to prepare for evacuation, which delayed the initiation of the actual evacuation. When one considers the activities conducted prior to evacuating WTC2 (the second tower to be hit), over half of the respondents talked to others or gathered personal items, and approximately one third helped others or searched for others. The most common reason occupants in WTC2 gave for initiating evacuation was having observed the crisis at WTC1, followed by being told to evacuate, being afraid or a perception they were in danger, and seeing friends or co-workers evacuate. Interestingly here, many of the same factors that provided motivation for initiating evacuation also generated delays in the actual evacuation. This is consistent with other research on events such as hurricanes (Bateman and Edwards 2002) and chemical releases (Baron et al. 1988), which find that environmental cues increase response to warning messages, although these other studies are unclear about the role of preparing to evacuate plays in evacuation delay or initiation. Important to remember, however, is that even in the 2001 WTC evacuation case study, most surviving evacuees reported initiating their evacuating in one minute or less, with over 50 percent reporting leaving their floor in 3-5 minutes. Yet some individuals delayed evacuation – as much as 30 minutes – which increased the mean evacuation time for the entire building. Turner and Killian’s (1987) discussion of emergent norm theory is useful to consider, given the extent to which it emphasizes how normative crises – events that bring about a great deal of uncertainty – can lead to the a situation where established norms and social arrangements are set aside or reinvented. Setting aside normative guidelines previously viewed as legitimate, people engage in a milling process to interpret and reinterpret various cues and determine appropriate strategies and arrangements given the emerging context. As Santos and Aguirre (2004) note,

6
larger groups take longer for emergent norms to develop than do smaller groups, move more slowly, and also constrain the egress behavior of smaller groups or individual actors. Moreover, structural features of a building may pose greater difficulties for larger groups. In all of these circumstances, they explain, larger groups evacuate slower than smaller groups. Averill et al.’s (2005) work provides considerable insights into building evacuation. Constraints to evacuation included information directing occupants to return to work, stairwell crowdedness, firefighter counter-flow, lack of instructions, and delays generated by people who were injured or had a disability and were unable to evacuate as quickly as others. Some of the authors’ own modeling refutes the perception that loss of time was generated when responders moved up through the stairwells, perhaps, they speculate, because evacuees could increase their speed to catch up to those ahead. Once in the stairwell, WTC1 evacuees moved quite quickly: an average of 48 seconds per floor. In contrast, photo-luminescent markings in stairwells, and assistance from firefighters and co-workers facilitated egress. Six percent of survivors noted that mobility impairment delayed their own evacuation. The most frequently mentioned mobility impairments were recent (pre-9/11) injuries and chronic illnesses. This note on mobility impairment should not be overlooked. In their study of the 1999 Taiwan earthquake, Chou et al. (2004) found a significant relationship between pre-earthquake health status (for example, if the individual had a cognitive or physical disability or was hospitalized before the event) and socio-economic status and earthquake death. That is, lower incomes and presence of a disability or decreased health status increase earthquake vulnerability. Indeed, individuals who may function well in routine circumstances may find themselves particularly and uniquely vulnerable during a disaster event. Access and functional needs may or may not be directly connected with a legally defined disability, and may emerge as a result of or in the context of a particular disaster event. Furthermore, the disability community is diverse and heterogeneous (Lindell et al. 1985; Kailes and Enders 2007; Brittingham 2014). Simply having a disability does not necessitate that one’s needs are similar to another person who also has a disability. The frail elderly are particular vulnerable in disasters, as demonstrated by disproportionate deaths in this segment of the population in a range of disasters events, including heat waves, hurricanes, and earthquakes (see Klinenberg, 2002; Larson, 2006; Hewitt, 2007; Sharkey, 2007; Chang et al., 2011; Booth and McCurry, 2011). The challenge of taking protective action can be constrained not only in the evacuation, but also in seeking other immediate protective actions, depending on impairments to sensing necessary information (e.g. audible or visual) or mobility. Additional research on evacuation has provided insight on collective behavior. Commenting on other work examining collective behavior, Santos and Aguirre (2004) explain that there are two dimensions of physical settings that affect this behavior: 1) the extent to which everyone in the space can receive the same warning and perceive the same danger; and, 2) the density of people in the space, which can affect the degree to which an individual can choose how to respond. They offer several predictions of evacuation behavior, arguing that that the size of the group will affect the timing of evacuation, with larger groups taking more time to make the decision to evacuate than smaller groups, as well as that the composition of the group, specifically the

7
heterogeneity of the group characteristics can shape collective behavior. Other points may have particular relevance to earthquake protective behavior. Santos and Aguirre predict that mutual assistance may be facilitated by social solidarity within the group. When evacuation behavior may be affected by the social determination of danger, then ambiguous information, inaccurate information, or misunderstanding signs of danger have consequences on behavior (Aguirre, 2005). This may prove a greater problem with new technology advances (Aguirre 2005). As Aguirre et al. (1998) state, “…an enhanced sense of threat as precursor to protective behavior is mediated by the effects of social relationships” (315). The relationship between risk perception and behavior is complex, where the context, trust in the public authorities, and perceptions of personal agency can all shape behavior (Wachinger et al. 2013). Other factors, such as social cohesion, can impact action. Evacuation behavior may become delayed or blocked (Santos and Aguirre 2004) as group members seek out others with whom they have relationships (Aguirre et al. 1998). After the 1977 Beverly Hills Nightclub Fire, Cornwell (2003) found that risk increased as group size and social cohesion increased. The same may be true of other protective actions. As Quarantelli (1982) states, non-evacuation in perceived moderate threats can be interpreted as a rational response, given that evacuation is not a normative behavior. When evacuation behavior is the appropriate action, additional incentives – such as keynoting (Turner and Killian 1987) or directive actions and instructions by others may be necessary to spark action, whether or not appropriate under the ambiguous circumstances. Aguirre writes that the ability for people to “…imagine the physical demands of their response to the crisis” (2005: 127) influences what action they determine as possible within particular time frames. Both quantitative and qualitative analysis based on evacuee responses from 2003 Station Nightclub Fire supports some of these assertions. The researchers (Aguirre et al. 2011) found that the chance of escape improved with familiarity with the building. The role of relationships is apparent through the decrease in the number of injuries among members of groups with intimate relationships and the role increased distance played in increasing evacuation time as group members delayed their evacuation to find each other. Density was also linked to the number of deaths. Victims offered to help others during the evacuation. Some of these offers of help came independent of preexisting bonds, though there were more male than female helpers in this event. Staff who helped generally worked at the nightclub longer than those who did not, and their jobs involved regular interaction with patrons (Aguirre et al. 2011). The disaster research literature has contended with the panic myth for decades (Fischer 2008). The misconception that individuals typically engage in a hysteric antisocial pattern of behavior has been well refuted. It can prove quite challenging to encourage action in non-routine events, as demonstrated by Averill et al.’s (2005) finding of delayed evacuation for some groups in the Twin Towers. Research (summarized in Fischer 2008) has documented pro-social helping behavior as well as general convergence of people (see also Fritz and Mathewson 1957; Kendra and Wachtendorf 2003) to response related sites, including helpers and those anxious about the well-being of loved ones). Rather, mass behavior – what is sometimes misrepresented as panic – can occur when a window of opportunity of escape is closing and occupants press towards limited exits (Santos and Aguirre 2004). As Santos and Aguirre notes, people may not have ability to engage in any form of evacuation decision-making given the movement press they find themselves caught in. In these cases, architectural solutions and decisions made previously and

8
immediately by social control agents (e.g. locking particular exits) become “the most important mechanism impacting the successful outcomes of such evacuations” (Santos and Aguirre, 2004: 30). Indeed, in the Station Nightclub Fire study, the concept of panic failed to provide an accurate characterization of most egress activity, and as Torres (2010: 112), based on his extensive analysis of this event, notes, “people are thinking, feeling, and social beings who during times of crisis interpret their surroundings and use this information to guide how they will behave.” Similar patterns emerged in the evacuation behavior of employees in the World Trade Center following the 1993 bombing. People were calm, cooperative, orderly, and were seen as helpful. They also looked for others (Aguirre et al. 1998). This study utilized statistical analysis of a sample of Twin Tower employees a week following the bombing. The number of people in groups as well as the extent to which they knew each other shaped evacuation behavior, with greater times to starting evacuation associated with participants knowing greater numbers of the group and increased familiarity of those group members, emphasizing the importance of preexisting relationships in collective behavior (Aguirre et al. 1998). Interestingly, Torres (2010) suggests that environmental cues such as sparks and fire may have sped up perceptions that the fire was life threatening. Important to note, however, was that most people at greatest risk were proximate to each other and shared exposure to similar environmental cues. This is unlike Averill et al.’s (2005) examination of the 9/11 attacks, where environmental cues precipitated seeking of additional information. These findings suggest that physical location and the ability to quickly make sense of dynamic and uncertain circumstances with others could play critical roles in determining how long it takes to engage in protective action measures. As Santos and Aguirre (2004) note, it is important to consider whether or not building occupants are able to perceive danger at the same time and in the same ways. If occupants are in close proximity to each other, they may notice similar physical cues in their space. Lindell and Perry’s (2004) sequential outline of how perception influences protective action behavior is useful here. Not only do they note the importance of environmental cues, social context, information sources and channels, message content and receiver characteristics, they also explain how people work to determine sequentially if there is a threat, if they need to take protective action, what protective actions are available, what is the best method, and if they need to take it immediately. Simultaneously, they ask themselves what information is required, how and from where they can obtain it, and if they need the information immediately. Of course, an individual may sequence through the information many times over, particularly as information changes. What these predictions and findings suggest for earthquake protective action behavior is that the available protective measures and information, as well as peoples’ interpretations of those informational resources may shape whether people engage in earthquake protective action or what kinds of behaviors they exhibit to protect themselves. People may be willing to help each other engage in these behaviors, though who takes on these helping roles may be determined, at least partially, by the kinds of positions and roles they occupy prior to the earthquake. Crowds are not homogeneous (Torres 2010) but rather people act from “different motives and in

9
somewhat different fashions” (Turner and Killian 1987: 30). Some might move away from danger, while others move toward it, looking for loved ones, for example. The time it takes to engage in what some people deem as appropriate protective actions may, in fact, be delayed because competing motivations (such as helping behavior) drive people to choose alternative actions, or at least engage in them first. The Japanese message for tsunami protective action – Tendenko, where self-protection encourages all threatened to escape, assuming others will do the same and be reunited later – both saved lives and was also ignored by others who saved those who could not otherwise self-evacuate. Research conducted on disaster human behavior over a half century ago (Fritz and Williams, 1957) asserts that parents will seek to shield and protect their children in earthquake events, even at risk to themselves. Again, motivation for engaging in particular protective action and when may vary across those affected. Returning to Santos and Aguirre’s (2004) remark on the constraints that architectural features and social control agent can enact, it is critical to realize that many individuals lack the freedom to make protective action decisions for themselves. Studies have pointed to how institutionalized populations may rely on others to determine the condition and provisions of spaces they occupy, or even their movements. For example, prisoners are constrained by physical structures (correctional facilities) as well as social control agents. Congregate care facilities, hospitals, day-care facilities, and schools may also house occupants who rely on others during the decision-making process (see the following for a more detailed accounting of various institutionalized populations and disasters: American Civil Liberties Union 2006; Kendra et al. 2012; Fink 2013). Although most studies of earthquake protective action focus on preparedness and mitigation action taken in anticipation of such events, much insight can be extrapolated from research conducted on other short or immediate fuse events. Consider Averill et al.’s (2005) finding that successful building evacuation is a factor of both the time people require to evacuate and the time available for them to actually do so. If we consider a protect strategy such as drop, cover and hold, we must also consider how long it takes for an individual to find an appropriate location to seek cover under and the time available for them to do so safely. The context – for example, their location in a building and the composition of the room they find themselves in – may generate differences in the time it takes to locate such safe cover. Wachtendorf et al. (2008) examined several disaster education programs directed at youth. One program was developed by a group of Seattle high school students who refused to get under their desks during an earthquake drill because they simply did not fit. Undertaking their own study of protective actions, they came to realize that alternative strategies may be advisable aside from drop, cover, and hold: for example, if an individual is in a wheel chair or if one is in a swimming pool. Similar conditions may emerge for others who are in rooms without void-generating furniture or unconventional spaces starkly different from where practice drills previously occurred. Decision-making for individuals becomes limited when the time frame of safety is uncertain or unknown to the affected individuals. Alexander (2012) suggests that very little can be done, personally and during the event, to prevent injury and death from the collapse of over 50% of the structure, and presumably more personal protective action can address damage to or partial collapse of structures and architectural elements as well as damage to walls, fitments, and furniture. Although people can survive for two weeks, trapped in voids or partial voids in an earthquake-collapsed structure, most survivors are rescued much sooner (hours or days) after the

10
disaster (Comfort et al. 2011; Alexander 2012). Aguirre (1994) notes several earthquake events, including in Mexico and Italy, where survivors were primarily rescued by family and bystanders rather than by formalized search and rescue teams. This is particularly so in counties relying on foreign search and rescue teams (Alexander, 2012). Alexander then goes on to suggest guidance to potential building occupants must go beyond the established drop, cover and hold advice and rather include information about risks and safety in various parts of the structure, potentially risky behavior, exit strategies (from rooms or from the structure itself), mutual support networks, and storage of useful equipment. Still, little direct systematic research exists on this topic, and any future research would best be conducted alongside the contribution of scholars who could consult on structural, cultural, and demographic variations among and between communities. Certainly, one of the benefits of the “stop, drop, and roll” fire protective action campaign is its simplicity and ease of recall, even under times of great stress. The homeland security warning system of the early post-9/11 years, while attempting to be broad in threat communication, starkly failed in its inability to clearly convey specific actions community members under various alert levels were to undertake (among other faults) (Aguirre 2003). Other effective campaigns – for example, encouraging seatbelt usage and quitting smoking – were brought about because they raised questions in audiences’ minds; offered relatively simple answers to those questions; and had authorities enforce (or reinforce) those messages (Nathe et al. 1999). These researchers argue that people may indeed be quite knowledgeable about earthquake risks and yet still take no precaution to engage in mitigation actions. Again, however, little attention here is provided on protective actions in the immediate moments of an earthquake. Alexander (2012) argues that the collapse of school structures during events such as the 2008 Wenchuan, China earthquake suggests that other strategies should be considered. At the same time, he notes the challenges of moving during strong motion, evacuating many people (in this case, students) who may be in the care of others, or negotiating the various hazards inside and outside the building. There may be times, however, when the option of moving away from buildings during strong ground motion is a clear necessity, such as during a tsunami warning that initiates with an earthquake and may continue during a subsequent aftershock. Some of Alexander’s assertions run contrary to his (much) earlier (1995) writing, documenting conflicting assertions of panic behavior during some earthquakes. This review work, however, does provide perhaps one of the best accounts of various studies – often conflicting – of earthquake protective actions, such as a Seaman et al. (1984) study that suggested running outside of a building saved residents in a South American event and a (Durkin, 1985) study of California events that posited exiting unreinforced masonry structures while tremors were ongoing was three times as dangerous as opting to remain inside (references from Alexander 1995).
5. IdentifyingSegmentsoftheCommunitytoServeasInformationDisseminators
Certainly, the range of potential hazards that can threaten a community generate different vulnerabilities for different segments of the population. For example, a person unable able to hear tsunami warning messages due to a hearing impairment may fail to evacuate from a low-lying area in time to escape threatening waters. A person who relies on durable medical equipment – such as a wheelchair – for mobility may be unable to find safe cover during an earthquake. A newly arrived migrant to an area may prove unfamiliar with local hazards. At the same time, socially vulnerable groups are generally comprised of individuals who offer specific

11
capacities. In the following consideration of age, we examine the way in which children can be incorporated into the earthquake risk communication cycle to increase overall knowledge and adoption of protective actions. One method of risk and protective action dissemination that has seen some success is classroom based education or other child-directed programs associated with schools. In contrast to the general perception of children as passive in disasters and the general tendency to overlook them as a resource, some research has identified children as potential communication resources and agents of change. Using two case studies—one in El Salvador and the other in New Orleans—Mitchell et al. (2008) showed how youth can become active participants in disaster risk reduction. In the El Salvador example, an international agency strove to raise awareness of disaster risk among youths and encourage their participation in risk management through the establishment of disaster clubs. Through the clubs, children learned about and mapped risks in their area, and learned what they could do in response. The program took place over several years, and as the children aged, the youths received attention from peers, parents, and public forums related to risk reduction. The New Orleans case focused on the Vietnamese community in New Orleans East, where youths served as important conduits of information for adults in their community, translating English messages and acting as trusted information sources given their personal relationships with others in the community. Considering these two cases together, the authors state that children are particularly effective risk communicators in contexts when there are language barriers, the community does not trust political sources of information, there is strong social cohesion, and “an outside agent has helped support the organization of youth groups” (Mitchell et al. 2008: 269). They do, however, note that the decision to rely on children as communicators must consider the tremendous responsibility this places on the young – a responsibility usually shouldered by adults – and thus should be made with care (Mitchell et al. 2008). Another effort in Dushanbe, Tajikistan, developed and implemented a classroom curriculum designed to teach students about the underlying science behind earthquakes, earthquake risks they were exposed to, and appropriate responses to an earthquake. Focus groups with the students at the end of the program revealed that students both gained a better understanding of earthquakes and protective measures following the program, and were spurred into action, sharing what they had learned with family members and working to reduce potential damage in a future earthquake, assembling disaster kits, moving furniture to make rooms safer, and bringing safety concerns to authorities (Mohadjer et al. 2010). The 2011 Virgina Earthquake event prompted some area organizations and schools to participate in a national ShakeOut earthquake drill (Showstack, 2012). But survey research (Johnson 2013) conducted in Washington State following a 2012 ShakeOut drill found that, although there was strong earthquake knowledge on protective actions prior to the drill, students 10 years and older were unable to answer several questions about the causation of injury any better after the drill than before, and many had difficulty applying what they had learned in the classroom. This evaluation suggested that classroom lessons and discussion must accompany disaster drills. Other research suggests that the classroom can prove a solid foundation for learning about earthquake protective action. In 2008, Becker et al. (2011) conducted interviews with residents in

12
three areas of New Zealand. They found that passively receiving information increased knowledge. Interactive information helped people understand hazards and encourage preparedness, particularly school activities such as projects and drills. Experiential information, such as experiencing a small earthquake, helped form key beliefs (such as an earthquake could happen any time), although the authors noted more research was required in this area. Information searching was not common among participants. Preparedness was encouraged by personal beliefs such as a sense of self-efficacy, preparedness beliefs such as a sense that preparing can result in a positive outcome or is a way of life, and hazard beliefs such as inevitability and imminence. Social responsibility and responsibility over others encouraged preparedness. Like other research findings, trust in the information source increased the likelihood that they would follow advice, but distrust of an agency was also suggested as a motivator to engage in self-preparedness rather than rely on the agency itself. Collectively, this research suggests that teaching youths about the hazards in their areas is an effective way of disseminating risk information, not only to children but to others in the community as well. Reaching out to this population has the potential for both wider dissemination of the material to friends and family and to effect change in the larger community. Still, this is but one example of targeted outreach. Alternatives methods may be more appropriate to educate other population segments, based on – for example – age, ability, ethnic group, or livelihood. As Robinson and Kani (2014) note, disaster risk reduction efforts can only progress when we cease excluding some groups (such as the disabilities communities) from the planning process and conversation. Durlak and DuPre (2008) found in their review of program literature that “shared decision-making (community participation, collaboration) enhances implementation” and empowers people to “…exercise some control over local services” by matching the cultural norms of the local constituents as well as their needs and preferences with what is actually delivered (2008: 340-341). Role expectations within the community (e.g. by gender) may lead to differential access to programs and thus protective action information (Mohadjer et al. 2010). Vaughan’s (2011) evaluation of health protective practices supports the importance of context in shaping risk perception and response, even if the emphasis is on a different hazards type. The importance of engaging those affected by the risk is argued for by Finucane et al. (2000) and is echoed by the earthquake mitigation work described by Macabuag et al. (2012). Focusing primarily on retrofitting and mitigation techniques implemented in low-income nations, they also examine the methods used to encourage use of these techniques in the target areas. Near week-long training of local rural masons in the Kathmandu Valley of Nepal was found to be an effective way to communicate the retrofitting information, and the feedback from the masons involved in the program indicated that they were motivated regarding the need for and use of earthquake safety measures. They also found that the community members were interested in protecting their homes following the awareness raising efforts (Macabuag 2010; Macabuag et al. 2012). Yet this is not always the case. A similar program implemented in Arequipa, Peru in the early 2000s was not sustainable, nor was it in another Peruvian town where mass dissemination of the information was lacking (Macabuag 2010). Here, mitigation was competing with basic needs in these low-income communities, which residents found more pressing. Rather than training engagement, the program would have benefited from early involvement to better identify feasibility.
13
6. ConcludingPointsSeveral conclusions can be drawn specifically from this review. Research suggests that men have a higher risk perception than women, and therefore may deem particular hazardous actions safer compared to women. Trust in information source may differ between men and women. In the research presented here, white men were less trusting of government. Findings may differ starkly in different cultural and political circumstances, but the larger message is that trust in risk-related information sources is not always consistent for men and women. Multiple sources may be required to reach different audiences. The same holds true for racial and ethnic groups. While the U.S. research suggests that non-white participants have a higher risk perception than white participants, clearly the function of these disparities is not biological. Rather, the cultural context in which racially and ethnically heterogeneous populations reside may influence risk perception, and it may also influence protective action strategies. As Finucane et al. (2000) note, variations in race and gender risk perception may be more connected to sociopolitical issues, including locus of control and trust in government. Real challenges are present for education about appropriate protective strategies. Clarity of the message is important. Research on warnings has demonstrated that messages must provide receivers clear and personalized directives on what they should do and how the information is directed toward them specifically. Vague information or ambiguity of information can heighten existing uncertainty, generating a range of action outcomes, including seeking backchannel information. The nuanced information for particular circumstances can also pose problems in simplifying messages. A uniform approach to communicating new and nuanced earthquake protective behavior may not be effective. Research from the warning literature indicates different methods are more effective for reaching different groups. While the specific mechanisms of communication may vary, research consistently shows that trust is important for effectively communicating warning and risk messages, and that friends and family are important sources of information on a range of topics, including emergencies and disaster. While much of this work has been conducted in the United States, some work in other countries has revealed similar patterns and suggests that lessons learned from the American context can be useful in crafting messages in middle- and low-income nations. Research examining collective behavior during the evacuation of buildings in sudden onset events (such as fires) shows the importance of individual and group behavior. In addition to density and structural arrangements of the building itself, environmental and social cues are central factors that influence how people act as well as their ability to even initiate protective action. Structural elements, density, mobility, and barriers imposed by social control agents, among other factors, may limit decision-making ability. Social and environmental cues are essential in establishing risk perception. People who are better able to sense danger from their surroundings are more likely to take protective actions. At the same time, information seeking behavior and preparing to take protective action can actually delay the action itself. The proximity of group members to each other can help speed up the milling process, although larger group sizes can generate challenges as well, at least in evacuation. Individuals and groups may come to different understandings about the unfolding event. Accompanied by different

14
motivations, people may come to very different assessments about what constitutes the best method of protective action at particular moments. Research shows that not everyone will interpret risk messages or signs of danger the same way. These messages will be understood and potentially acted upon in a context of experiences, demographic characteristics, power, available resources, and interaction with members of a larger collective. Education work on disaster risk reduction and mitigation through the use of children as delivery agents supports the utility and importance of including friends, family, and members of the broader community into the communication development and implementation process. Likewise, the research also stresses the importance of involving the community from the ground up in designing a successful program. This finding coincides with the importance of considering the resource and need context of the communities to be reached. While the financial burdens discussed in the context of mitigation work or healthcare provision may not be the same as those associated with communicating protective actions in the immediate moments of an earthquake event, it is important for program planners to appreciate that any earthquake safety outreach will be competing for time and attention with other daily needs that may be seen as more pressing, as well as with alternative world views about the causes of disasters and individuals’ roles in protecting themselves against them.

15
References
Aguirre, B. E. 1994. "Planning, Warning, Evacuation and Search and Rescue: A Review of the
Social Science Research Literature." College Station, TX: Hazard Reduction and
Recovery Center, College of Architecture, Texas A&M University.
Aguirre, B.E. and J. M. Macias. 2004. “The 1999 Floods in Veracruz and the Paradigm of
Vulnerability.” Preliminary Paper #341. University of Delaware Disaster Research
Center.
Aguirre, B.E. 2003. “Homeland Security Warnings: Lessons Learned and Unlearned”
Preliminary paper #334. Newark, DE: Disaster Research Center, University of Delaware.
Aguirre, B.E., D. Wenger, and G. Vigo. 1998. “A Test of the Emergent Norm Theory of
Collective Behavior.” Sociological Forum 13(2):301-320.
Aguirre, B. E. 2005. “Emergency Evacuations, Panic, and Social Psychology: Commentary on
‘Understanding Mass Panic and Other Collective Responses to Threat and Disaster.’”
Psychiatry 68(2):121-129.
Aguirre, B.E., M.R. Torres, K.B. Gill, and H. Lawrence Hotchkiss. 2011. “Normative Collective
Behavior in the Station Building Fire.” Social Science Quarterly 92(1):100-118.
Alexander, D. 1995. “Panic during Earthquakes and Its Urban and Cultural Contexts” Built Environment 21(2/3): 171-182
Alexander, D. 2012. “What can we do about Earthquakes? Towards a Systematic Approach to
Seismic Risk Mitigation.” Global Risk Forum GRF Davos, Switzerland. Retrieved on
August 1, 2014 at http://www.nzsee.org.nz/db/2012/Paper001.pdf.
American Civil Liberties Union. 2006. Abandoned and Abused: Orleans Parish Prisoners in the Wake of Hurricane Katrina. New Orleans, LA: National Prison Project, American Civil
Liberties Union.
Asgary, A. and K.G. Willis. 1997. "Household Behaviour in Response to Earthquake Risk: An
Assessment of Alternative Theories" Disasters 21(4):354-365.
Averill, J. D., Mileti, D. S., Peacock, R. D., Kuligowski, E. D., Groner, N., Proulx, G., Reneke,
P. A., & Nelson, H. E. (2005). Federal Building and Fire Safety Investigation of the
World Trade Center Disaster: Occupant Behavior, Egress, and Emergency
Communications (NIST NCSTAR 1-7). U.S. Department of Commerce: National
Institute of Standards and Technology.
Baron, R.C., R. A. Etzel, L.M. Sanderson. 1988. "Surveillance for Adverse Health Effects
Following a Chemical Release in West Virginia." Disasters,12:356-365.

16
Bateman, J. M. and B. Edwards. 2002. "Gender and Evacuation: A Closer Look at Why Women
are More Likely to Evacuate for Hurricanes." Natural Hazards Review 3:107-117.
Becker, J.S., D.M. Johnston, D. Paton, K. Ronon. 2011. “Earthquake Information and Household
Preparedness: Results of Interviews with Residents in Timaru, Wanganui, and Napier.”
Proceedings of the Ninth Pacific Conference on Earthquake Engineering Building and
Earthquake-Resilient Society. Auckland, NZ, April 14-16. Paper Number 21. Retrieved
on August 1, 2014 at: http://www.nzsee.org.nz/db/2011/021.pdf.
Benavides, A. and S. Arlikatti. 2010. “The Role of the Spanish-Language Media in Disaster
Warning Dissemination: An Examination of the Emergency Alert System.” Journal of Spanish Language Media 2: 41-58.
Booth, R. and J. McCurry. 2011. “Japanese earthquake takes heavy toll on aging population.”
The Guardian. Retrieved on January 30 2014 at
http://www.guardian.co.uk/world/2011/mar/17/japanese-earthquake-toll-ageing-
population-deaths.
Brittingham, R. 2014. Framing Matters: Situating the Experiences and Perceptions of Disaster Sheltering and Evacuation for People with Disabilities Doctoral Dissertation. Newark,
DE: University of Delaware.
Chang, S., D. Aldrich, R. Eisner, L. Johnson, T. Norton, K.T. Tierney, T. Wachtendorf, R.
Brittingham, K. Iuchi, S. Safaie, S. and J. Wilson. 2011. “The March 11, 2011, Great East
Japan (Tohoku) Earthquake and Tsunami: Societal Dimensions (EERI Special
Earthquake Report). Retrieved on January 30 2014 at
http://www.eqclearinghouse.org/2011-03-11-sendai/files/2011/03/Japan-SocSci-Rpt-
hirez-rev.pdf.
Chou, Y., N. Huang, C. Lee, S. Tsai, L. Chen and H. Chang. 2004. “Who Is at Risk of Death in
an Earthquake.” American Journal of Epidemiology 160: 688–95.
Comfort, L. K., Siciliano, M. D. and Okada, A. 2011. Resilience, Entropy, and Efficiency in
Crisis Management: The January 12, 2010, Haiti Earthquake. Risk, Hazards & Crisis in Public Policy, 2(3): 1–25. doi: 10.2202/1944-4079.1089
Cornwell, B. 2003. “Bonded Fataliies: Relational and Ecological Dimensions of a Fire
Evacuation.” Sociological Quarterly 44(4):617-638.
de Zwart, O., I.K. Veldhuijzen, G. Elam, A.R. Aro, T. Abraham, G.D. Bishop, J. Hendrik
Richardus, and J. Brug. 2007. “Avian Influenza Risk Perception, Europe and Asia.”
Emerging Infectious Diseases 13(2):290-293.
Donner, W. and H. Rodriguez. 2008. “Population Composition, Migration, and Inequality: The
Influence of Demographic Changes on Disaster Risk and Vulnerability.” Social Forces 87(2): 1089-1114.

17
Durlak, J.A. and E.P. DuPre. 2008. “Implementation matters: A Review of Research on the
Influence of Implementation on Program Outcomes and Factors Affecting Implementation.” Am J Community Psychol 41:327-350.
Entman, R.M. 1993. “Framing: Toward Clarification of a Fractured Paradigm.” Journal of
Communication 43(4):51-58. Finucane, M.L., P. Slovic, C.K. Mertz, J. Flynn, and T.A. Satterfield. 2000. “Gender, race, and
perceived risk: the ‘white male’ effect.” Health, Risk & Society 2(2):159-172. Fink, S. 2013. Five Days at Memorial. New York, NY: Crown Publishers. Fischer, H.W. III. 2008. Response to Disaster: Fact versus Fiction and its Perpetuation. 3rd
edition. Lanham, MD: University Press of America. Fritz, C.E. and J.H. Mathewson. 1957. Convergence Behavior in Disaster. National Research
Council Disaster Study 9. Washington, DC: National Academy of Sciences. Fritz, C.E. and H.B. Williams. 1957. “The Human Being in Disasters: A Research Perspective.”
Annals of the American Academy of Political and Social Science (309):42-51. Gamson, W.A., D. Croteau, W. Hoynes and T. Sasson. 1992. “Media Images and the Social
Construction of Reality.” Annual Review of Sociology 18:373-393. Graber, D.A. 1984. Processing the News: How People Tame the Information Tide. New York,
NY: Longman Inc. Hayden, M.S., S. Drobot, S. Radil, C. Benight, E.C. Gruntfest, L.R. Barnes. 2007. “Information
sources for flash flood warnings in Denver, CO and Austin, TX.” Environmental Hazards 7:211-219.
Hewitt, K. 2007. “Preventable disasters: Addressing social vulnerability, institutional risk, and
civil ethics.” Georgaphischs Rundschau International Edition 3:43-52. Johnson, V. A. 2013. An Impact Evaluation of ShakeOut, an Earthquake and Tsunami Drill in
Two Coastal Washington State School Districts, GNS Science Report. Retrieved on August 1 2014 at http://masseyuniversity.co.nz/massey/fms/Colleges/College%20of%20Humanities%20and%20Social%20Sciences/Psychology/Disasters/pubs/GNS/2013/SR_2013-019.pdf.
Kailes, J. I. and A. Enders. 2007. “Moving beyond ’special needs.’” Journal of Disability Policy
Studies 17(4):230-237. Kendra, J.M., S. Penta, L. Clay, J. Goetschius, J. Lazo, E. Wilson, A. Barlow, B. Aguirre, T.
Wachtendorf. 2012. Nursing Home and Assisted Living Communities: Challenges in

18
Emergency Preparedness. Report to the Delaware Department of Health and Social Services Division of Long Term Care Residents Protection. Newark, DE: Disaster Research Center, University of Delaware.
Kendra, J.M. and T. Wachtendorf. 2003. “Reconsidering Convergence and Converger
Legitimacy in Response to the World Trade Center Disaster.” Terrorism and Disaster: New Threats, New Ideas (ed. Lee Clarke). Research in Social Problems and Public Policy (11):97-122.
Klinenberg, E. 2002. Heat Wave: A Social Autopsy of Disaster in Chicago. Chicago, IL: The
University of Chicago Press. Larson, J. 2006. Setting the record straight: More than 52,000 Europeans died from heat in
summer 2003. Washington, DC: Earth Policy Institute. Liao, G., B.J. Cowling, W. Wing Tak Lam, and R. Fielding. 2011. “The Influence of Social-
Cognitive Factors on Personal Hygiene Practices to Protect Against Influenzas: Using Modeling to Compare Avian A/H5N1 and 2009 Pandemic A/H1N1 Influenzas in Hong Kong.” International Journal of Behavioral Medicine 18:93-104.
Lindell, M. K., P.A. Bolton, R.W. Perry, G.A. Stoetzel, J.B. Martin, and C.B. Flynn. 1985.
Planning Concepts and Decision Criteria for Sheltering and Evacuation in a Nuclear Power Plant Emergency. Washington, DC: National Environmental Studies Project.
Lindell M.K. and R.W. Perry. 2004. Communicating Environmental Risk in Multiethnic
Communities. Thousand Oaks: Sage Publications. Macabuag, J. 2010. “Dissemination of Seismic Retrofitting Techniques to Rural Communities.”
Presentation at Engineers Without Borders UK National Research Conference. February 19, 2010.
Macabuag, J., R. Guragain, and S. Bhattacharya. 2012. “Seismic retrofitting of non-engineered
masonry in rural Nepal.” Structures and Buildings 165(SB6):273-286. Major, A.M. and L. E. Atwood. 1997. “Changes in Media Credibility When a Predicted Disaster
Doesn’t Happen.” J&MC Quarterly 74(4):797-813. Memmott, M. 2011. "Terror Fears Made East Cost Earthquake Especially Unsettling," National
Public Radio, August 24. Retrieved on July 10, 2014 at http://www.npr.org/blogs/thetwo-way/2011/08/24/139903734/terror-fears-made-east-coast-earthquake-especially-unsettling.
Mileti, D.S. and J.H. Sorensen. 1990. “Communication of Emergency Public Warnings: A
Social Science Perspective and State-of-the-Art Assessment.” ORNL-6609, Oak Ridge national Laboratory, Oak Ridge, Tenn.

19
Mitchell, T., K. Haynes, N. Hall, W. Choong, and K. Oven. 2008. “The Role of Children and Youth in Communicating Disaster.” Children, Youth and Environments 18(1):254-279.
Mohadjer, S., R. Bendick, S.J. Halvorson, U. Saydullaev, O. Hojiboev, C. Stickler, and Z.R.
Adam. 2010. “Earthquake Emergency Education in Dushanbe, Tajikistan.” Journal of Geoscience Education 58(2):86-94.
Muttarak, R., and W. Pothisiri. 2013. The role of education on disaster preparedness: case study
of 2012 Indian Ocean earthquakes on Thailand’s Andaman Coast. Ecology and Society 18(4):51. Retrieved on August 1 2014 at http://dx.doi.org/10.5751/ES-06101-180451.
Nathe, S., P. Gori, M. Green, E. Lemmersal, and D. Mileti. 1999. Public Education for
Earthquake Hazards.” Natural Hazards Informer (2) November:1-9. Quarantelli, E. L. 1982. “People’s Reactions to Emergency Warnings.” Preliminary Paper #75.
Newark, DE: Disaster Research Center. Peguero, A. 2006. “Latino Disaster Vulnerability: The Dissemination of Hurricane Mitigation
Information among Florida’s Homeowners.” Hispanic Journal of Behavioral Sciences 28(1):5-22.
Robinson, A., and S. Kani. “Chapter 12: Disability-Inclusive DRR: Information, Risk and
Practical-Action.” Pp. 219-236 In Civil Society Organization and Disaster Risk Reduction: The Asian Dilemma Disaster Risk Reduction: Methods, Approaches and Practices. R. Shaw and T. Izumi (eds.) Springer: Japan 2014.
Rogers, G.O. and J.H. Sorensen. 1991. “Diffusion of Emergency Warning: Comparing
Empirical and Simulation Results.” In Risk Analysis. C. Zervos ed. New York: Plenum Press.
Santos, G. and B.E. Aguirre. 2004. “A Critical Review of Emergency Evacuation Simulation
Models.” Preliminary Paper #339. Newark, DE: Disaster Research Center. Sharkey, P. 2007. “Survival and death in New Orleans: An empirical look at the human impact
of Katrina.” Journal of Black Studies 37:482-501. Showstack, R. 2012. “ShakeOut Drill Emphasizes Importance of Earthquake Preparedness,
Education.” EOS, Transactions American Geophysical Union 93(44):439. Sorensen, J.H. 2000. “Hazard Warning Systems: Review of 20 Years of Progress.” Natural
Hazards Review. 1(2):119-125. Sutton, J., L. Palen, and I. Shklovski. 2008. “Backchannels on the Front Lines: Emergent Uses
of Social Media in the 2007 Southern California Wildfires.” Proceedings of the 5th International ISCRAM Conference. Washington, DC, USA. F. Fiedrich and B. Van de Walle, eds.

20
Tierney, K.J. 1999. “Toward a Critical Sociology of Risk.” Sociological Forum 14(2):215-242. Torres, M.R. 2010. Every Man for Himself? Testing Multiple Conceptual Approaches of
Emergency Egress on Building Evacuation During a Fire. Doctoral Dissertation. Newark, DE: University of Delaware.
Turner R.H. and L.M. Killian. 1987. Collective Behavior. Englewood Cliffs, NJ: Prentice Hall. Vaughan, E. 2011. “Contemporary Perspectives on Risk Perceptions, Health-Protective
Behaviors, and Control of Emerging Infectious Diseases.” International Journal of Behavioral Medicine 18:83-87.
Wachtendorf, T., B. Brown, and M.C. Nickle. 2008. “Big Bird, Disaster Masters, and High
School Students Taking Charge: The Social Capacities of Children in Disaster Education.” Children, Youth and Environments 18(1):456-469. Retrieved August 1 2014 at http://www.colorado.edu/journals/cye.
Wachinger, G., O. Renn, C. Begg, and C. Kuhlicke. 2013. “The Risk Perception Paradox—
Implications for Governance and Communication of Natural Hazards.” Risk Analysis 33(6):1049-1065.

T
Univ
Deve
DesignPromo
Texas A&
versity of
loping Mes
ning Risote Ada
Earth
&M Unive
f Washingt
A Bassages for P
sk Comaptive Hhquake
Michaersity Haz
ton Depa
ackground Protective A
Con
mmunicHumanes and T
ael K. Lindzard Redu
and artment of
Paper for Actions to
nducted by
cation Pn BehavTsunam
dell uction & R
f Urban D
the ProjectTake Duri
y:
Programvior Durmis
Recovery C
Design and
t: ing Earthqu
ms to ring
Center
d Plannin
uake Shakin
ng
ng

1
Designing Risk Communication Programs to Promote Adaptive Human Behavior During Earthquakes and Tsunamis
Michael K. Lindell Texas A&M University Hazard Reduction & Recovery Center
and University of Washington Department of Urban Design and Planning
1. Protective Actions Decision Model The process by which people take protective actions is described by the Protective Action Decision Model (PADM; Lindell & Perry, 1992, 2004, 2012), which summarizes the findings of more than six decades of research on hazards and disasters (Barton, 1969; Drabek, 1986; Dynes, 1970; Fritz, 1961; Janis & Mann, 1977; Lindell & Perry, 1992; Mileti, Drabek, & Haas, 1975; Sorensen, 2000; Tierney et al., 2001) but also contains elements of psychological models such as the classic six component communication model of source-channel-message-receiver-effect-feedback (Lasswell, 1948; McGuire, 1969, 1985; O’Keefe, 2002; Petty & Wegener, 1998) and models of attitude-behavior relationships (Fishbein & Ajzen, 2010). According to the PADM (Figure 1), people act on their perceptions of (a) environmental cues, such as sights, smells, or sounds that indicate the onset of a threat, (b) social cues, such as observations of others responding in a way that indicates there is a threat, and (c) information received from social sources through communication channels that convey messages about the hazard and protective actions. Broadcast media (especially radio and TV, but increasingly including the Internet) are extremely common warning sources in slow onset disasters such as hurricanes, but peers are common first sources in very rapid onset hazards such as flash floods (Perry, Lindell & Greene, 1981). Warning messages are most likely to produce appropriate protective actions if they describe the nature of the threat in terms of high certainty, severity, immediacy, and duration of personal consequences, as well as areas that will be affected (and safe). They also should provide protective action recommendations and sources to contact for additional information and assistance. To act on situational information such as environmental/social cues, or social warnings, people must be exposed to, heed, and properly interpret the environmental or social cues, or else they must receive, heed, and understand the social warnings. Situational information extracted from these sources leads to three sets of core perceptions, the first of which comprises perceptions of stakeholders such as authorities, news media, and peers who differ in their perceived expertise, trustworthiness, and protection responsibility (Arlikatti, Lindell & Prater, 2007). The interrelationships among stakeholders can be defined by their power over each other’s decisions to adopt hazard adjustments. These power relationships can be defined in terms of six bases—reward, coercive, expert, information, referent, and legitimate power (French & Raven, 1959; Raven, 1965).

FS
Figure 1. Inform
Source: Lindell
Warninmessag
Informasource
Receivcharacter
Channel aand prefe
Sociacues
Environmcues
mation Flow in t
& Perry (2004)
ng ges
tion es
ver ristics
access rence
al s
mental s
Pzzz
the Protective A
).
re-decision proce Exposure Attention Comprehension
Action Decision
Sp
p
Protp
esses
2
Model (PADM
Stakeholder perceptions
Threat perceptions
tective actionperceptions
M).
Protective acdecision mak
Behz Inz Pz E
ction king
Situational impediments
Situational facilitators
havioral responsenformation searchProtective respons
motion-focused
e h se

3
Reward and coercive power are the principal bases of regulatory approaches, but these require continuing surveillance so authorities rely on other bases—especially stakeholders’ perceptions of other stakeholders’ hazard-related expertise. French and Raven’s conception of referent power is defined by a person’s sense of shared identity with another (Eagly & Chaiken, 1993)), which is related to that person’s trustworthiness—perceptions of fairness, unbiasedness, willingness to tell the whole story, and accuracy (Meyer, 1988). French and Raven (1959) defined legitimate power by the rights and responsibilities associated with each role in a social network, which leads to perceptions of different stakeholders’ protection responsibility. Stakeholders differ significantly in these perceived characteristics (expertise, trustworthiness, and protection responsibility) and, moreover, these characteristics have significant positive correlations with hazard adjustment intentions and actual adjustment adoption (Arlikatti et al., 2007; Lindell & Whitney, 2000; Mulilis & Duval, 1997). The second set of core perceptions involves environmental threats—especially risk perceptions that are usually defined by the perceived certainty, severity, immediacy, and duration of hazard events and personal impacts. People have prior beliefs about environmental hazards that are sometimes called mental models of these hazards (Bostrom et al., 1992). These prior beliefs comprise different hazards and the attributes that differentiate one hazard from another (Slovic et al., 1980; Lindell, 1994), with some prior beliefs being accurate and others inaccurate. For example, Turner et al. (1986), Whitney et al. (2004), and Becker et al. (2013) documented the widespread prevalence of a variety of erroneous beliefs about earthquakes, some of which were innocuous (having no relevance to preparedness and response actions) and others of which were potentially dangerous because they inhibit appropriate preparedness and response actions. In addition, environmental threats can differ in their degree of intrusiveness, which is the frequency of “thoughts generated by the distinctive hazard-relevant associations that people have with everyday events, informal hazard-relevant discussions with peers, and hazard-relevant information received passively from the media” (Lindell & Perry, 2004, p. 125). Hazard intrusiveness is correlated with the adoption of earthquake hazard adjustments (Lindell & Prater, 2000; Lindell & Whitney, 2000) and expectations of participating in hurricane mitigation incentive programs (Ge et al., 2011). Expected personal impacts and hazard intrusiveness are related to the frequency, intensity, recency, and duration of people’s personal experience with hazard events (see Lindell & Perry, 2012, for a summary). Direct personal experience can involve casualties or damage experienced by the respondent him/herself, by members of the immediate or extended family, or by friends, neighbors, or coworkers. In turn, hazard experience is often correlated with proximity to earthquake (Palm et al., 1990), hurricane (Peacock et al., 2005), and flood (Preston et al., 1983) sources. In addition to the indirect effect of hazard proximity on risk perception (via hazard experience), there can also be a direct relation between hazard proximity and perceived personal risk that is determined by a perceived risk gradient relating increasing proximity to increased risk (Lindell & Earle, 1983). However, the resulting risk judgments can be quite inaccurate because there are cases in which many people have limited ability to identify their location in risk areas (Arlikatti et al., 2006; Zhang et al., 2004).

4
Situational information from environmental/social cues and social warnings, together with prior beliefs about a hazard agent, produces a situational perception of personal risk that is characterized by beliefs about the ways in which environmental conditions will produce specific personal impacts. In earthquakes, for example, risk perceptions have been characterized by people’s beliefs about the degree to which ground shaking and other hazards will cause their death or injury, kill or injure their loved ones, destroy their property, or disrupt their jobs or basic services such as electric power and water (Lindell & Prater, 2000). The third set of core perceptions comprises alternative protective actions that differ in their hazard-related attributes (perceived efficacy in protecting persons and property and utility for other purposes) and resource-related attributes (perceived cost, and required time and effort, knowledge and skill, tools and equipment, and cooperation from others). Hazard-related attributes, such as efficacy in protecting people and property and usefulness for other purposes, have been found to be significantly correlated with adoption intention and actual adjustment (Lindell & Prater, 2000; Lindell & Whitney, 2000; Terpstra & Lindell, 2013). Resource-related attributes (cost, knowledge and skill requirements, time requirements, effort requirements, and required cooperation with others) generally have the predicted negative correlations with both adoption intention and actual adjustment, but these have been small and nonsignificant in studies conducted to date (see Lindell, 2013a, for a recent summary). Disasters are unfamiliar situations, so confusing and conflicting information usually prevents people from relying on habitual responses (Wood & Neal, 2007) although normalcy bias leads them to try to respond using normal routines (Drabek, 1986). The dominant tendency is for such information to prompt protective action, but information seeking occurs when there is uncertainty at a given stage in the decision process. Thus, people try to integrate situational information with their prior beliefs (which are based on personal experience and pre-impact risk communication) to decide how and when to respond. In many cases, there is a feedback loop as additional environmental or social cues are observed or warnings are received. Once the uncertainty is resolved, processing proceeds to the next stage. However, attempts at coping with the situation are not only problem-focused; people sometimes engage in emotion-focused coping to control their affective reactions to a threatening situation. People’s choices of response actions can be frustrated by situational inhibitors (e.g., the lack of a reliable vehicle in which to evacuate) or enhanced by situational facilitators (e.g., the availability of neighbors who have room in their cars) that arise from their physical, social, and household contexts. People often evacuate in cars, especially for hurricanes (Wu et al., 2012), but can walk to safety from flash floods and tsunamis if there is high ground nearby. Sheltering in-place is the recommended protective action for tornadoes (Lindell et al., 2013) and many chemical releases but many people choose to evacuate because sheltering in-place is believed to be less effective than evacuation (Lindell & Perry, 1992, Chapter 6). Finally, people’s personal characteristics affect many of the stages of the protective action process. These include psychological resources—knowledge (especially about hazards and protective actions), skills, abilities and other characteristics such as physical (e.g., strength), psychomotor (e.g., vision and hearing), and cognitive (e.g., primary and secondary languages)

5
abilities as well as economic (money and vehicles) and social (friends, relatives, neighbors, and coworkers) resources. The stages in the PADM characterize the way people “typically” make decisions about adopting actions to protect against environmental hazards. These stages are sequential, as are those within the information seeking process. However, few people are likely to follow every step in the model in the exact sequence listed in Figure 1. For example, people are likely to procrastinate if they think hazard impact is low in probability or remote in time, if the available actions are not completely effective, or if the available actions seem too expensive to implement. Alternately, an extremely credible (or powerful) source might obtain immediate and unquestioning compliance with a directive to evacuate an area at risk—even if there were no explanation why evacuation was necessary or what alternative protective actions were feasible (Gladwin et al., 2001). However, the more elements of the PADM warning sources neglect, the more ambiguity there is likely to be for message recipients, unless warning sources have an extreme amount of credibility or they have substantial power to compel compliance. In turn, greater ambiguity is likely to cause warning recipients to spend more time in seeking and processing information rather than preparing for and implementing protective action (Perry et al., 1981; Perry & Greene, 1983). Indeed, ambiguity can initiate a repetitive cycle of information processing and information seeking that persists until it is too late to complete a protective action before hazard onset.
2. Earthquake Response People’s immediate responses to earthquakes are typically initiated by ambiguous environmental cues such as rumbling noise or ground shaking. The presence of ambiguous environmental cues was a central theme in Alexander’s (1990) report of his own experience in the 23 November 1980 earthquake in Naples and his summary of 18 oral histories from students at a local technical institute. Most of the students had no previous experience with earthquakes, so they relied on older relatives and companions to interpret the shaking for them. Many of those who were indoors tried to escape as soon as the shaking subsided. One student reported a stampede for the exits from a theater, and Alexander himself observed people engaged in apparently aimless running from place to place in a major piazza. Other studies have been based on surveys of population samples to assess the relative frequency of different response actions and identify contextual variables that are associated with each response action. For example, Arnold et al. (1982) reported a high level of adaptive response by occupants of an office building during the 1979 (M6.4) Imperial Valley earthquake. Most people’s first reaction to the shaking was to take cover under a desk (36%) or in a doorway (15%), but many others froze where they were (37%), and a few immediately evacuated into the main corridor (3%) or out of the building (2%). When the shaking stopped, 56% evacuated the building and, although there was crowding at the stairwells, there was no stampede. Ohta and Ohashi’s (1985) report of data from six Japanese earthquakes plotted the percentage of respondents reporting different emotional and behavioral reactions as a function of seismic intensity, concluding that psychological reactions increased, and appropriate behavioral performance decreased, exponentially with shaking intensity. The three major activities in all six earthquakes were: escaping from danger, obtaining information about the situation, and resuming normal activities. Using a behavioral typology similar to that of Canter et al. (1980), the

6
researchers found most housewives’ behavior was influenced by the activities in which they were engaged at the onset of the temblor, as well as their environmental and social context. Those who were preparing dinner turned off the gas burners to prevent fires, and those with small children went to protect them before taking further action. The Goltz et al. (1992) study of the 1987 M5.9 Whittier Narrows earthquake revealed that about 40% of people in buildings took cover in a doorway, in a hall, or under furniture. However, 20% froze where they were or immediately evacuated the building (9% of those at home and 20% of those at work). Forty-six percent of those in cars pulled over and stopped, but 43% continued driving. Females and those who were more fearful of the earthquake were more likely to take cover. The presence of other adults inhibited protective action, whereas the presence of children enhanced it. Higher education, higher income, earthquake preparedness, and earthquake experience combined with level of fear to enhance the likelihood of taking cover. Bourque et al. (1993) elaborated on these findings in their study of the 1989 M6.9 Loma Prieta earthquake. Seventy-two percent of their respondents froze in place or took cover, but responses were contingent upon location. Many of those at home had children, so the typical response (42%) there was to try to protect them. The researchers reported that only 6% of those in buildings evacuated immediately, and those in cars tended to pull over rather than continue driving (38% vs. 13% in their largest sample). The researchers reported significant variations in immediate behavioral response associated with demographic characteristics (e.g., gender, age, education, and ethnicity), fear, earthquake experience, location, and social context at the time the earthquake struck. Prati et al. (2012) reported findings from a study of the 1997 M5.5/6.1 Umbria-Marche earthquakes. The researchers found that, during the shaking, 38% felt fearful, 9% felt helpless, 8% felt worried, 7% felt terrified, and 9% reported that they felt “panicked”. In response to the threat, 38% of the respondents immediately evacuated the building they were in, 22% froze in place, 12% took cover, 10% had no reaction to the earthquake, 7% sought more information, 7% tried to protect others, and 4% tried to protect property. Prati et al. (2012) reported that social context affected one of the behaviors (those who were not with their families were more likely to evacuate) and physical context affected another behavior (those who were at home were more likely to take cover). Immediate Behavioral Response to the 2011 Christchurch and Tōhoku Earthquakes More recently, Lindell et al. (in press) conducted a comparative study of responses to the 2011 Christchurch (M6.3) and Tōhoku (M9.0) earthquakes, with responses to the latter earthquake collected in Hitachi, a city that is similar to Christchurch in its geographic, demographic, and economic characteristics, as well as the intensity of local ground shaking (both cities had a peak Modified Mercalli Intensity = IX). Residents in both cities tended to be higher in fear than shock or vigilance, and Hitachi residents tended to be higher on all three scales of emotional response—perhaps because of the longer duration of shaking. Hitachi residents tended to have higher risk perception on four expected personal impacts, again perhaps due to the longer shaking in their earthquake. Respondents in both earthquakes were similar in reporting that utility disruption was the most likely impact they would experience, and that damage to their homes and casualties within their families were moderately likely. However, Hitachi residents

7
had substantially stronger expectations of disruption to their jobs that would prevent them from working. Overall, the immediate behavioral responses of Christchurch and Hitachi residents were relatively similar to each other and, although they are similar to other earthquake victims in some ways, they are different in others. Only 20% of those at risk evacuated immediately, and this was most common in Hitachi, where the duration of shaking was much longer than in Christchurch. This estimate of immediate evacuation is higher than the 2% reported in Arnold et al. (1982) and 6% reported in Bourque et al. (1993), but is lower than the 38% reported in Prati et al. (2012). The Christchurch/Hitachi results are similar to those of Prati et al. (2012) in the overall percentage of respondents who took cover, which was 12% in both studies. These figures for the Umbria-Marche, Christchurch, and Tōhoku earthquakes are substantially lower than at Whittier Narrows, where the percentages taking cover were 43% for those at home and 40% for those at work. They are also somewhat lower than some groups in Loma Prieta, where the percentages seeking shelter ranged from 0-68%, with a median of 21%, depending upon the respondent’s physical (house, work/school, in transit, public place) and geographical (Five County, San Francisco/Oakland, or Santa Cruz) location. The percentages of the respondents in Christchurch (38.0%) and Hitachi (31.8%) who froze in place are comparable to the corresponding percentages in the Umbria/Marche earthquake (32%), but larger than the corresponding percentages in the Whittier Narrows earthquake (20%—Goltz et al., 1992) and the Loma Prieta earthquake (ranging from 8-48%, with a median of 27%—Bourque et al., 1993). These similarities and differences in immediate behavioral response to earthquakes can partly be explained by statistically significant correlations of demographic variables with immediate behavioral responses. In the Christchurch/Hitachi study, age was consistently correlated with immediate behavioral responses, being related to four of the six variables, but the correlations are modest (median r = .13 in absolute value). The Christchurch/Hitachi study failed to replicate the Bourque et al. (1993) finding that gender correlated with freezing (which they found more likely among women) and immediate evacuation (which they found more likely among men). More generally, the Christchurch/Hitachi study is consistent with the Bourque et al. (1993, p. B11) conclusion that there are “few differences in response behavior at the time of the earthquake by demographic characteristics” and also with Baker’s (1991) similar conclusion about the role of demographic variables in hurricane evacuation. The Christchurch/Hitachi data indicate that experience and emergency preparedness were positively related to vigilance and negatively related to shock and fear. Moreover, prior experience also was significantly negatively related to risk perception. These findings are consistent with the Goltz et al. (1992) study, whose Table 6 makes it possible to calculate that the number of earthquakes experienced (none, vs. one or more) is significantly correlated with lower fear (Φ = -.15) and whose Table 5 provides data from which it is possible to calculate that being well prepared for earthquake is significantly correlated with lower fear (Φ = -.19). Moreover, earthquake experience, information, and emergency preparedness had significant correlations with immediate behavioral response. The Christchurch/Hitachi data show that physical, social, and household contextual variables had relatively few and small correlations with emotional reactions, risk perceptions, and immediate

behaviorreported responseHoweverthem (Bothis studyattempt twith a diare small The data (1985) fishaking iwith riskHoweverdifferenc The findievacuatiocontrol ofrom thisbehaviorsequenceprevious property,expect toleast fear
Figure 2
Mea
n ra
ting
1
2
3
4
5
al response, only two sigs out of the 7r, this study ourque et al.,y extend thato protect vusability are al (r = .14 and
in the Chrisnding that emintensity bec
k perception, r, it is difficuces in the des
ing in the Chon is consist
or nonrationas study reveaal response.
ed from left tactivities, th
, and endingo be the rankr continue th
2. Emotion P
Continue
VigShoFea
which appegnificant cor77 that weredid replicate, 1993; Goltzt finding abo
ulnerable houalso less liked .10, respec
stchurch/Hitamotional rea
cause perceivand r = .13
ult to draw fisigns of the t
hristchurch/Hent with rese
al flight (Agual a broader pAs Figure 2
to right in orhrough freez with immed
k ordering of heir previous
Profiles Asso
Freeze
ilanceockar
ars to be conrrelations of e possible (1e previous finz et al., 1992out protectinusehold memely to freezectively).
achi study aractions increved shaking with immedirm conclusitwo studies.
Hitachi studyearch reportiuirre, 2005; pattern of re
2 indicates, thrder of increzing, trying tdiate evacuatf these action activities an
ociated with
ProPer
8
nsistent withcontextual v1 contextualndings that t2; Ohta and ng children tombers by sho. Once again
re somewhateased and behintensity wa
diate evacuations about th
y that fear wing that fear Mawson, 20
elationships bhe immediatasing fear sc
to protect pertion. This or
ns with respend those with
h Immediat
rs Cov
h the findingvariables witl variables tithose who arOhashi, 198o a broader c
owing that hon, the magnit
t consistent whavioral peras correlatedtion (a generhis issue bec
was positivelyr does not ne005; Quarantbetween emote behavioracores—beginrsons, takingrdering is coect to emotioh the most fe
te Response
ver Pr
s of Prati et th immediateimes 7 behavre with child
85). Moreoveconclusion touseholds hatudes of thes
with Ohta anrformance ded r = .29 withrally inapprocause there a
y related to iecessarily protelli, 1954). otional react
al responses cnning with cg cover, tryin
onsistent withonal arousal—fear evacuate
s.
roProp
al. (2012), we behavioralvioral respondren try to prer, the resultthat people aving a memse correlatio
nd Ohashi’s ecreased with fear, r = .2opriate respoare two majo
immediate oduce loss oHowever, dtions and can be
continuing ng to protecth what one m—those withe immediatel
ImmEvac
who l nses). rotect ts of
mber ns
th 27 onse). r
of ata
t might h the ly.

9
In summary, all of the respondents were rather frightened and not so much shocked or vigilant. In any event, the level of emotional arousal did not strongly determine which action people took; some people with high fear and shock were able to take appropriate protective action and others with low fear and shock were not. It is particularly significant that emotional responses were significantly correlated with earthquake experience, emergency preparedness, and risk perception because these results suggest that providing accurate information about the personal consequences of an earthquake could reduce negative emotional reactions such as fear and, thus, increase more appropriate protective actions during earthquakes.
3. Tsunami Response People’s responses to tsunamis differ from their responses to earthquakes, because environmental and social cues can provide minutes of forewarning for locally-generated tsunamis, and social warnings can provide hours of forewarning for remotely-generated tsunamis. Studies of household response to tsunamis have examined both the interpretation of, and response to, environmental cues as well as the receipt of warnings from social sources. Environmental Cues There are many anecdotal accounts of isolated individuals who correctly interpreted shoreline recession as evidence of a tsunami, took appropriate protective actions, and warned others to do so also (Imamura, 2009; King & Gurtner, 2005; Liu et al., 2005; McAdoo et al., 2006). For example, Iemura et al. (2006) found that most of their respondents experienced strong or very strong earthquake shaking, which led 43% of them to run inland before a tsunami arrived and the remainder to evacuate after seeing the tsunami wave. Similarly, Bird et al. (2011) reported that some victims were aware of the tsunami hazard and ran to high ground when the shoreline receded, whereas others climbed trees or evacuated to sturdy buildings. However, this study also found that other victims didn’t know how to respond because they were completely unaware of tsunami hazard. These victims reported that some of their peers did not believe warnings they received from others and that some people went to the shore to verify the warnings. A more comprehensive survey by Gregg et al. (2006) found that about 24% of their sample of tsunami victims felt ground shaking, but few attributed the shaking to an earthquake and none expected a tsunami to result. Other studies have reported that initial environmental cues of danger can be insufficient, but later cues are more diagnostic. For example, Mori et al. (2007) reported that their respondents felt an earthquake, but the intensity of the shaking was so low that they felt little need to evacuate. Later, shoreline recession that exposed 5-10 meters of beach appeared to have a greater effect on decisions to evacuate. One way to learn the correct interpretation of environmental cues is participation in a formal training program about earthquakes and tsunamis. For example, a small sample of qualitative interviews conducted by Dudley et al. (2011) after the 2009 Samoa tsunami concluded that many people who lacked training did not know that an earthquake could cause a tsunami, so they failed to respond appropriately to ground shaking. Another way to learn the correct interpretation of environmental cues is transmission of indigenous knowledge based upon a community’s past experience. The Gaillard et al. (2008) study of responses by residents of three Indonesian communities to the 2004 Indian Ocean tsunami concluded that one community’s oral history of

10
their ancestors’ failure to evacuate from an earlier tsunami that killed 400-1800 community residents, coupled with a continuous residence in the area over the years, accounted for the higher level of adaptive response in that community than in two other communities, both of which had many recent immigrants that lacked a tradition of tsunami awareness. Social Warnings One way to disseminate warnings of a near-source tsunami is to sound sirens, but some studies indicate that few people can interpret these alerts correctly. For example, the Lachman et al. (1961) study of the 1960 Hilo tsunami reported that sirens were activated before wave arrival. Although 95% of the respondents reported hearing the sirens, 10% interpreted it only as an “alert” or “warning” that had no specific behavioral implications. Another 24% interpreted it as a preliminary signal to prepare for an evacuation warning, 29% interpreted it as an evacuation signal, 15% interpreted it as a signal to await further information or make preparations, and 22% ascribed meanings that the researchers were unable to interpret. Consequently, 15% of the sample continued their normal routine, 45% waited for further information or instructions, and only 32% evacuated. Confusion over what people should do could be explained by several facts, including that the primary source of information about the sirens, which was contained in Hawaii telephone directories, provided no recommendations for behavioral response to tsunamis. In a study of coastal residents on the islands of Hawai‘i, Maui, O‘ahu and Kaua‘i, Gregg et al. (2007) found that 77% of Hawaiian residents knew how frequently sirens are tested (monthly) but only 7% of them could correctly state what to do when they heard a siren (tune to radio or television). When coastal areas are at risk from a remote-source tsunami, there is a greater opportunity to disseminate warnings through the broadcast media. Perry (2007) conducted a large sample survey of tsunami responses using a random sample of 391 residents of Mauritius. The data showed that it took about five hours after the earthquake for governmental authorities to learn about the tsunami, and another hour before the first warnings were issued. Although tsunami waves struck repeatedly between 1.0-4.5 hours after warnings were initiated, only 42% of the respondents received a warning by the time the last wave arrived, and it took almost eight hours to notify 94% of the population. Television was the most common warning channel (51%), followed by radio (28%), face-to-face contact (16%), telephone (5%), and newspaper (1%). People’s first response to learning about the tsunami was to continue normal activities (33%), warn someone face-to-face (30%), phone friends/family (14%), take protective action (13%), go to see the tsunami (8%), send text to friends/family (3%). People sought additional information from TV (58%), radio (36%), face-to-face contacts (31%), telephone (4%), or Internet (4%). One limitation of this study is that the analyses made no distinction between respondents who were in coastal areas and those in inland areas, so it is impossible to tell if—as is likely—the responses of those on the coast differed from those in inland areas. Another limitation is that response to a near-source tsunami is likely to be very different from the response to a remote-source event. Immediate Behavioral Response to the 2009 American Samoa Tsunami Lindell et al. (2013c) conducted a study of the 2009 American Samoa tsunami, which struck the American Samoa shoreline within 15 minutes (only three minutes after the first tsunami warning was issued over the radio) and killed 189 people throughout the islands of American Samoa, Samoa, and Tonga. American Samoa has ten radio stations and two television stations, but the earthquake failed the television stations and telephone landlines, and a spike in demand limited

11
access to cell phone circuits (USACE, 2012). In addition, many villages have large bells that are used to call people to community meetings and are also used to alert them about emergencies. However, local informants said there was no pre-established signal for tsunamis. The majority of the respondents reported that the earthquake shaking was violent (33%) or strong (51%) but a few reported it was moderate (3%), mild (1%), weak (1%) or did not feel any shaking (11%). Nearly one half of the respondents (42.5%) recognized that the earthquake could cause a tsunami, but many other respondents received their first information about the tsunami through social channels such as radio/TV broadcasts (14.9%), bells ringing (14.2%), face-to-face contacts (6.5%), or telephone/text messages (4.2%), or if they observed social cues (10.3% saw people evacuating). These environmental/social cues and social warnings led people to rate the likelihood of a tsunami as moderate (M = 3.03 on a scale from 1-5), although 34.1% of the respondents gave ratings of not at all (= 1) and 32.2% gave ratings of almost certain (= 5). People who expected the tsunami thought it would arrive soon, with the mean time to expected impact being 33 min. Specifically, 70% of the respondents expected it within 30 minutes, 82% expected it within 60 minutes, 96% expected it within 90 minutes, and 98% expected it within 120 minutes (see Figure 3). There was such a wide variation in expected arrival times of the tsunami, which could be due to a lack of understanding of the speed at which tsunamis travel or a belief (for those who experienced weak shaking) that the source of the earthquake was far away. Respondents engaged in extensive efforts to obtain further information via radio (54.6%), face-to-face warnings (40.5%), or telephone calls (28.6%), whereas 33.6% reported seeing people evacuating and 9.2% reported seeing the tsunami wave coming. Very few people received additional information via TV (3.8%), text messages (1.5%), or emails (0.8%). The intensity of warning confirmation can be seen in the fact that only one respondent obtained no further information, whereas 49.2% received at least one additional type of information, 32.4% obtained two additional types, and 17.9% obtained three or more. Surprisingly, there were no significant differences among the first sources of information with respect to the number of additional types of information obtained.
Figure 3. Expected Time of Tsunami Arrival and Actual Time of Evacuation Departure.
0
20
40
60
80
100
15 30 45 60 75 90 105 120
Expected tsunami arrival
Actual evacuation departure
Per
cent
of r
espo
nden
ts
Time (minutes)

12
Respondents who expected a tsunami thought it would severely damage or destroy homes on the island (M = 3.6 on the 1-5 likelihood scale), injure or kill the many people if they did not evacuate (M = 3.8), severely damage or destroy their home (M = 3.6), and injure or kill them or their families if they did not evacuate (M = 3.7). As a consequence of the environmental/social cues and warnings, 66.1% of the respondents evacuated, whereas 17.2% waited for further information, 3.1% tried to reunite their families, 13.4% continued normal activities, and 0.4% (one person) went to see the tsunami. Despite the urgent need for prompt evacuation, people did not leave immediately after the shaking stopped. As Figure 3 indicates, 61.4% evacuated within 15 minutes, 86.4% evacuated within 30 minutes, 88.6% evacuated within 45 minutes, and 95.5% evacuated within 60 minutes. The evacuation delays appear to have been caused, in part, by attempts to obtain additional information from peers (24.0%), authorities (11.5%), and news media (15.6%). Evacuations also appear to have been delayed by people’s attempts to locate family members (36.8%), pack an emergency kit (26.0%), warn others (19.8%), protect property (4.2%), or help others (2.3%). Among those who evacuated, 53.8% took their own cars (which was almost all of the 60.6% of the households that owned cars), 15.8% went in peer’s cars, 9.8% took public transportation, and 2.7% rode in emergency vehicles. Pedestrian evacuation was feasible because close proximity to mountains allowed many people to get to higher ground very quickly, but only 17.9% evacuated on foot. The evacuations were largely successful, because only 4.8% of the respondents reported being caught by the tsunami. The results confirmed that environmental cues, especially the experience of earthquake shaking combined with knowledge that an earthquake can cause a tsunami, were a major source of first information about the tsunami. This is consistent with Iemura et al. (2006) and Gaillard et al. (2008), many of whose interviewees immediately recognized severe shaking as a tsunami cue. Conversely, the results contrast with responses in two of Gaillard and his colleagues’ communities, as well as those of Gregg et al. (2006) and Dudley et al. (2011). In all three of these cases, people who were unaware of earthquake tsunamigenesis failed to evacuate immediately. However, the Gregg et al. (2006) respondents were located several hundred kilometers from the earthquake source, so their shaking intensity was low. The difference between the level of tsunami knowledge in American Samoa and in the area of Indonesia studied by Iemura et al. (2006) can probably account for the difference in the percentage of the two samples that were caught in the two tsunamis—5% in American Samoa vs. 74% in Indonesia. The finding that village bells provided only one-third of the warnings from social sources and one-sixth of all first indications of the potential for a tsunami is likely due to the fact that they, like sirens, provide an ambiguous signal that is susceptible to incorrect interpretation by those who do hear them (Lachman et al., 1961; Gregg et al., 2007) as well as attenuation by white noise generated by high wind and surf (Lindell & Prater, 2010). The results also confirmed that broadcast media were the most common first sources of social warnings, by showing that 57% of the respondents had radio/TV as their source of first warning, followed by peers (26%) and authorities (11%). However, people were more likely to receive an evacuation advisory (as opposed to their first information about the tsunami) from peers (36%) than from authorities (32%) or the media (19%). These results are consistent with those of Perry (2007), who found that 79% of Mauritius residents were first notified of the Indian Ocean tsunami by radio/TV,

13
whereas only 20% were notified by peers (face-to-face and telephone). Overall, the data from Mauritius and American Samoa suggest that radio and TV can reach a large percentages of the risk area population because their broadcast process can transmit messages to many people simultaneously whereas peers can reach a large percentages of the risk area population because their diffusion process involves so many people relaying messages through social networks (Lindell et al., 2007; Rogers & Sorensen, 1988). Authorities are much more limited in their ability to directly warn the risk area population because they lack the broadcast capacity of radio and TV (unless they have a dense array of electronic sirens) and they lack the large number of staff members that would be needed to substitute for the social networks that transmit peer warnings. However, the news media can only function as an effective first source if there are radio and TV stations that have electric power and surviving transmission towers to broadcast warning messages. The results also partially support the idea that broadcast media will be most common sources of additional information. Radio was an extremely important source of additional information (55%) but TV was not (4%), partly because of the larger number of radio stations (10) than TV stations (2). Phone calls were an important source of information (29%) but less so than the face-to-face contacts (41%) that were probably due to the large proportion of respondents who were in their own homes or those of peers (62%). It may also be due to the fact that phone access is lower in American Samoa than in the continental US even in normal conditions. The high level of face-to-face warnings is consistent with the high level of observations of people evacuating (34%) because onlookers could easily speak to those who were evacuating on foot. Moreover, roads in the residential areas are frequently unpaved and relatively narrow so onlookers could easily speak to those evacuating slowly in cars as well. There was also important data about the frequency with which each of the six essential elements of warning messages—nature of the threat, affected areas, recommended protective action, safe areas, sources of additional information, and sources of assistance—were contained in tsunami warning messages. Specifically, the rank order of warning message elements was: safe areas (49%), tsunami threat (46%), protective action recommendation (35%), affected areas (26%), sources of assistance (10%), and sources of additional information (6%). The fact that all were well below 100% is disturbing because all six elements have been found to be associated with higher evacuation rates. Moreover, the relative frequency of these elements is rather surprising because the threat and recommended protective action should be the most common elements. One possible explanation is that the protective action (i.e., evacuation) is implicit in the recommended safe area and that the identification of a safe area implicitly defines the affected area. In any event, the rank order of each individual message element made no difference because none of them was significantly correlated with the decision to evacuate. This result is quite unexpected but might be due to the occurrence of earthquake shaking as a powerful environmental cue that substantially reduced the need for social warnings. Moreover, the higher correlations of message elements with radio/TV than with telephone indicate that broadcast media are more effective for conveying warning messages. One implication for this finding is that radio and TV announcers can be trained to provide the necessary information and stations can store warning message scripts to be referenced during emergency broadcasts.

14
There was also useful information about the length of time after the earthquake shaking that people waited until evacuating. Figure 3 shows that the response curve for actual evacuation departure is consistently above the curve for expected tsunami arrival. For example, 44% of respondents expected tsunami arrival within 15 minutes but 61% actually evacuated within this time period. Thus, on average, people evacuated well before they expected the tsunami to arrive. Somewhat surprising is the finding that risk area residents responded rapidly even though 51% of them took the time to seek more information and perform some preparatory tasks (locate family members, warn others, help others, pack an emergency kit, and protect property) before evacuating. Since many respondents lived well above sea level, and high ground was fairly easily accessible in a short distance, they may have delayed evacuation accordingly. However, tsunami hazard zones were not delineated by signage as they are, for example, in Oregon (Lindell & Prater, 2010). The American Samoa data are rather different from those reported by Perry (2007) because the latter involved a remote-source tsunami, so none of his respondents felt ground shaking caused by the initiating earthquake. That tsunami took just over eight hours to reach Mauritius, so the evacuation curve in Figure 3 is quite different from the one in Perry’s (2007) Figure 1. In American Samoa, 96% of respondents evacuated within 60 min (compared to 10% in Mauritius), 97% within 120 min (compared to 20% in Mauritius), and 100% within 240 min (compared to 45% in Mauritius). In addition, people who received pre-impact tsunami information had higher levels of risk perception and were they more likely to evacuate and to evacuate sooner. Specifically, those who attended earthquake meetings (24.0%) thought a tsunami was more probable, would arrive sooner, and expected more damage and casualties. They were more likely to evacuate to higher ground but were more likely to delay their evacuations, although they were no more likely to be overtaken by the tsunami. Attending a tsunami meeting (27.9%) produced expectations of significantly shorter times to tsunami arrival and some greater expectations of damage and casualties, but had no effect on the outcome variables. Both earthquake (22.9%) and tsunami (19.1%) brochures increased expectations of tsunami occurrence but had no other effects. The low level of participation in earthquake and tsunami meetings and low levels of receipt of earthquake and tsunami brochures seems to conflict with the relatively high level of recognition that an earthquake could produce a tsunami. One possible explanation is that the connection between earthquakes and tsunamis is very easy for participants in meetings or recipients of brochures to pass on to others either before the earthquake or immediately afterward. Indeed, the data indicate 33.5% of the respondents who had not attended an earthquake meeting reported knowing an earthquake could cause a tsunami. Similarly, 35.5% of those who had not attended a tsunami meeting, 37.6% of those who had not received an earthquake brochure, and 36.7% of those who had not received a tsunami brochure reported knowing that an earthquake could cause a tsunami—percentages that would be zero unless the respondents had received this information from another source. This implies that informal diffusion processes can disseminate key hazard concepts to between two and three times as many people as were contacted officially. However, it is important to recognize that—as indicated in Figure 4—social networks are not completely connected so some people will receive this information from multiple sources whereas others will not receive it at all (Lindell et al., 2007; Mileti et al., 1975). Specifically, an original source

15
can transmit a message by means of a broadcast process directly to ultimate receivers (e.g., households) and also by means of a diffusion process through intermediate sources who, in turn, relay messages to ultimate receivers (Rogers & Sorensen, 1988). These ultimate receivers might also transmit messages to each other, thus resulting in some people receiving multiple messages, others receiving only a single message, and some people receiving no messages. The American Samoa tsunami study also provided useful information about the proportion of risk area residents who evacuated vertically, by foot, and by car and whether those who evacuated by car were more likely to be overtaken by the tsunami. Specifically, the data indicate less than 1% of the respondents took advantage of multi-story structures. This finding has significant practical implications because it means local authorities can prepare for tsunamis by conducting a systematic inventory of these structures and publicizing their availability and suitability for vertical evacuation.
Figure 4. Information Flow in a Social Network. Moreover, of those who evacuated farther inland, vehicular evacuation (82.1%) was almost five times as popular as pedestrian evacuation (17.9%). However, it is unclear why people chose to evacuate in cars, especially since most people could easily reach high ground by foot. Whatever the reasons for taking cars, there was not a significant difference in the probability of being overtaken by the tsunami between those who evacuated in vehicles (3.4%) and those who did not (6.2%). More generally, the vulnerability of vehicular evacuees should be addressed by conducting systematic evacuation analyses (CRTWFS, 2010) because the likelihood of vehicles being overtaken by tsunami waves can only be answered by conducting site-specific analyses of the demand for space on the evacuation route system in relation to that system’s capacity to serve the demand (Lindell, 2013b; Murray-Tuite & Wolshon, 2013). There is also information about the extent to which situational characteristics—physical and social context, shaking intensity, and warning sources—were related to risk perceptions and outcome variables. Respondents who were in transit, and those warned face-to-face, by phone, or
Original Source
Information isolate
Ultimate receiver 1
Ultimate receiver 2
Ultimate receiver 4
Intermediate 1
Intermediate 2
No information
High information
flow
Ultimate receiver 3
Ultimate receiver 5

16
by radio/TV tended to think a tsunami was less probable, would arrive later, and would produce lower levels of casualties and damage. Those who experienced more intense ground shaking (not in transit in an automobile) thought a tsunami was more probable, would arrive sooner, and would produce greater levels of casualties and damage. In general, the situational characteristics were also only slightly related to risk perceptions and outcome variables compared to the demographic variables, a finding that is consistent with Lindell and his colleagues’ (in press) findings from surveys of responses to the 2011 earthquakes in Christchurch, New Zealand and Hitachi, Japan. Finally, there was data on the extent to which demographic characteristics—age, sex, ethnicity, marital status, household size, education, income, and homeownership—were related to risk perceptions and outcome variables. Lindell et al. (2013c) found that only household size, home ownership, and community tenure had many correlations with risk perceptions and outcome variables. Specifically, respondents from larger households tended to have lower expectations of casualties and damage. Those with longer community tenure also had lower expectations of damage and casualties but, in addition, thought a tsunami would arrive later. By contrast, homeowners thought a tsunami was more probable and would cause more damage and casualties. The other five demographic variables had very few and inconsistent significant correlations with risk perceptions and outcome variables. This finding is consistent with previous conclusions that demographic variables have few and inconsistent correlations with preparedness (Lindell, 2013a) and response (Baker, 1991; Bourque, et al., 1993; Huang, Lindell & Prater, 2014) for a wide range of disasters.
4. Communicating Risk and Training Effective Response Actions Research on which the PADM is based has led to the development of an extensive set of recommendations for risk communication, particularly in communities with ethnic minorities (Lindell & Perry, 2004). These recommendations for community risk communication programs are based upon the distinct differences between risk communication activities undertaken during the continuing hazard phase (the time between incidents) and those taken during an escalating crisis (when there is adequate forewarning of disaster impact) or emergency response (when forewarning is absent). Risk communication during the continuing hazard phase is directed toward encouraging long-term hazard adjustments such as hazard mitigation, emergency preparedness, and hazard insurance purchase. Risk communication during an escalating crisis or emergency response is directed toward encouraging appropriate emergency responses. However, risk communication during all phases requires the development of an effective risk communication program. Such programs need to be carefully developed during the continuing hazard phase because the human and financial resources available for environmental hazard management are usually limited until a crisis occurs. Although resources are more readily available during a crisis or emergency response, time is often severely limited, so improvised efforts at risk communications can produce spectacular failures (Seeger et al., 2003). One problem with chronic threats, such as earthquakes, that might not occur for years is that they often produce a variety of negative outcomes including low priority by public officials (Prater & Lindell, 2000), as well as denial and procrastination by the risk area population (Becker et al., 2013). The low priority by public officials means that there is limited funding available for risk communication programs, so it is common to find that information sources are limited to

17
emergency managers, information channels are limited to face-to-face meetings, and messages are limited in frequency and duration. Moreover, when local emergency managers do obtain access to the news media (newspapers, TV, and radio), they are often limited to articles on the newspaper back pages or to TV/radio public service announcements that air at hours when few risk area residents are tuned in. In terms of the PADM, emergency managers’ limited resources mean that risk area residents have limited exposure to earthquake risk communication. In addition, many people interpret a low probability event as one that is remote in time (Mileti, Fitzpatrick & Farhar, 1992). Consequently, the fact that messages about earthquake hazard are generally about a low probability threat means that risk area residents pay little attention to these messages or think the threat has little relevance for them. In turn, many people remain in the first two (unaware and unengaged) of the eight (unaware, unengaged, undecided, intended, decided against, decided for, maintaining) stages of Weinstein and Sandman (1992) Precaution Adoption Process. This means that local emergency managers need to carefully design their earthquake risk communication programs to make the most efficient use of their limited resources. Earthquake Risk Communication Program Design There are five basic functions that should be addressed in the continuing hazard phase. These are strategic analysis, operational analysis, resource mobilization, program development, and program implementation (see Table 1). The purpose of strategic analysis is to identify community constraints and set appropriate objectives for the overall risk communication program. In most cases, there are four primary objectives of an earthquake risk communication program. The first is to describe seismic hazards and how they will affect households in the risk area. The second objective is to describe government agencies will respond to an earthquake—especially explaining how earthquake damage will limit agencies’ ability to assist households. For example, emergency managers must emphasize the need for households and neighborhoods to be self-sufficient for at least 3-5 days.
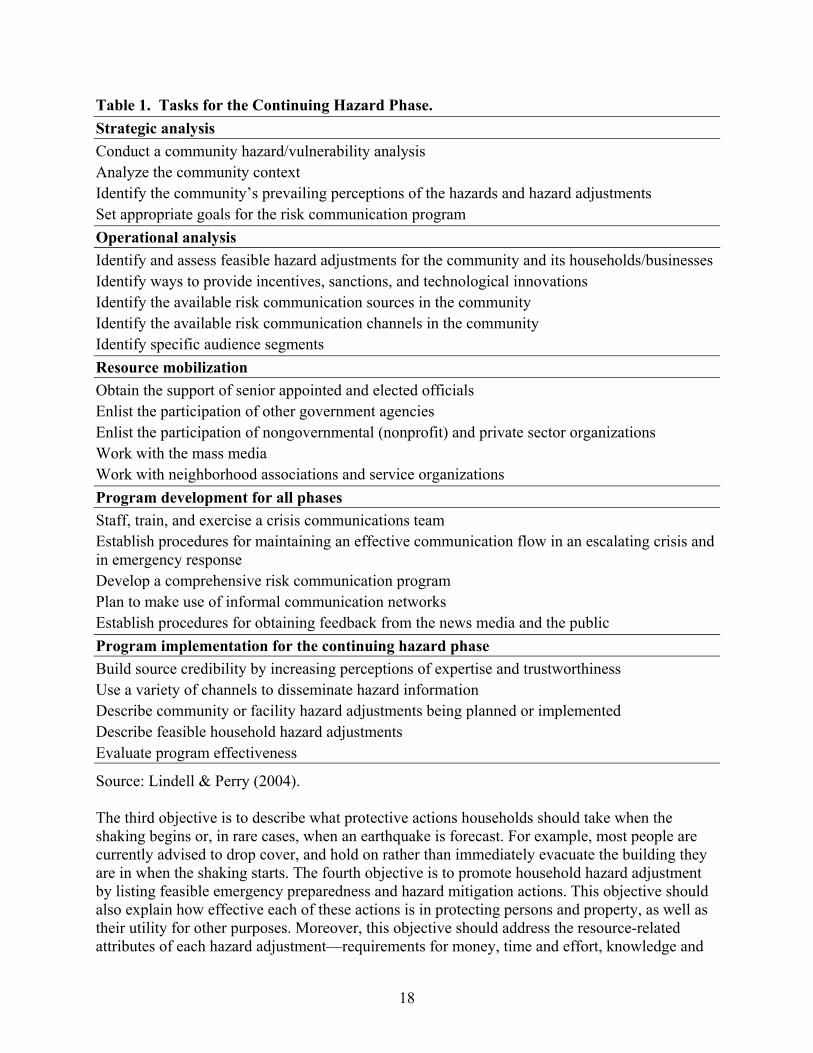
18
Table 1. Tasks for the Continuing Hazard Phase. Strategic analysis Conduct a community hazard/vulnerability analysis Analyze the community context Identify the community’s prevailing perceptions of the hazards and hazard adjustments Set appropriate goals for the risk communication program Operational analysis Identify and assess feasible hazard adjustments for the community and its households/businesses Identify ways to provide incentives, sanctions, and technological innovations Identify the available risk communication sources in the community Identify the available risk communication channels in the community Identify specific audience segments Resource mobilization Obtain the support of senior appointed and elected officials Enlist the participation of other government agencies Enlist the participation of nongovernmental (nonprofit) and private sector organizations Work with the mass media Work with neighborhood associations and service organizations Program development for all phases Staff, train, and exercise a crisis communications team Establish procedures for maintaining an effective communication flow in an escalating crisis and in emergency response Develop a comprehensive risk communication program Plan to make use of informal communication networks Establish procedures for obtaining feedback from the news media and the public Program implementation for the continuing hazard phase Build source credibility by increasing perceptions of expertise and trustworthiness Use a variety of channels to disseminate hazard information Describe community or facility hazard adjustments being planned or implemented Describe feasible household hazard adjustments Evaluate program effectiveness
Source: Lindell & Perry (2004). The third objective is to describe what protective actions households should take when the shaking begins or, in rare cases, when an earthquake is forecast. For example, most people are currently advised to drop cover, and hold on rather than immediately evacuate the building they are in when the shaking starts. The fourth objective is to promote household hazard adjustment by listing feasible emergency preparedness and hazard mitigation actions. This objective should also explain how effective each of these actions is in protecting persons and property, as well as their utility for other purposes. Moreover, this objective should address the resource-related attributes of each hazard adjustment—requirements for money, time and effort, knowledge and
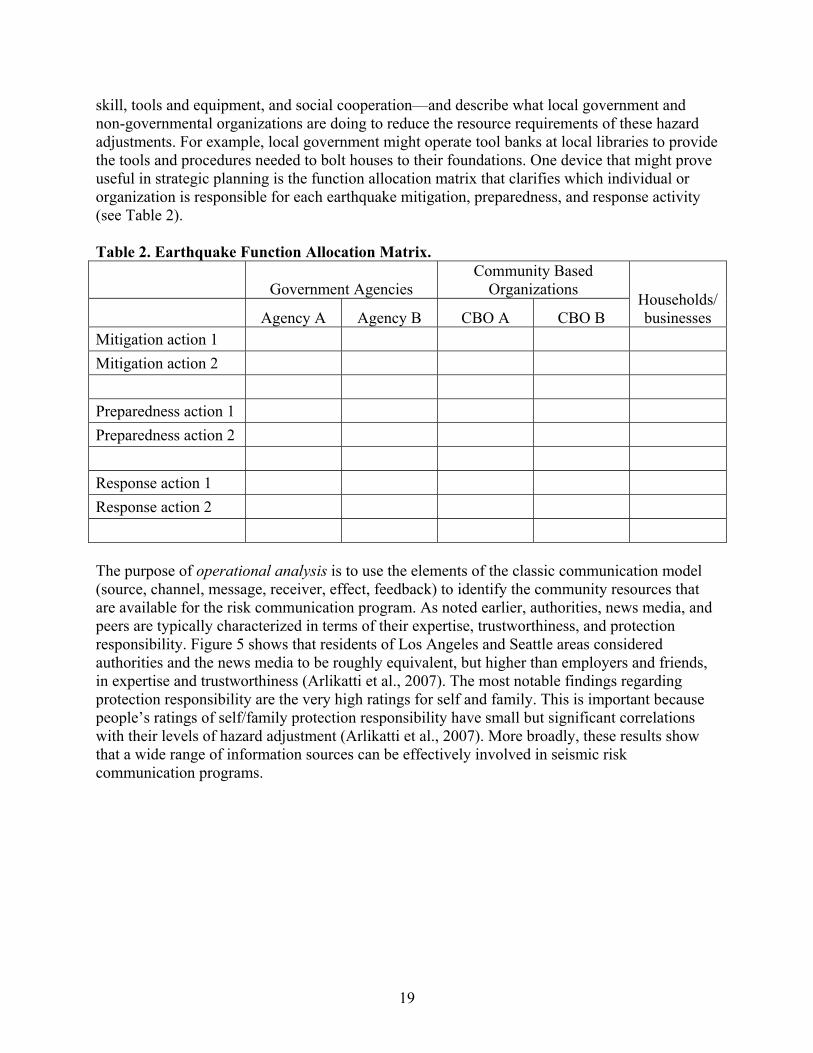
19
skill, tools and equipment, and social cooperation—and describe what local government and non-governmental organizations are doing to reduce the resource requirements of these hazard adjustments. For example, local government might operate tool banks at local libraries to provide the tools and procedures needed to bolt houses to their foundations. One device that might prove useful in strategic planning is the function allocation matrix that clarifies which individual or organization is responsible for each earthquake mitigation, preparedness, and response activity (see Table 2). Table 2. Earthquake Function Allocation Matrix.
Government Agencies Community Based
Organizations Households/ businesses Agency A Agency B CBO A CBO B
Mitigation action 1 Mitigation action 2 Preparedness action 1 Preparedness action 2 Response action 1 Response action 2 The purpose of operational analysis is to use the elements of the classic communication model (source, channel, message, receiver, effect, feedback) to identify the community resources that are available for the risk communication program. As noted earlier, authorities, news media, and peers are typically characterized in terms of their expertise, trustworthiness, and protection responsibility. Figure 5 shows that residents of Los Angeles and Seattle areas considered authorities and the news media to be roughly equivalent, but higher than employers and friends, in expertise and trustworthiness (Arlikatti et al., 2007). The most notable findings regarding protection responsibility are the very high ratings for self and family. This is important because people’s ratings of self/family protection responsibility have small but significant correlations with their levels of hazard adjustment (Arlikatti et al., 2007). More broadly, these results show that a wide range of information sources can be effectively involved in seismic risk communication programs.
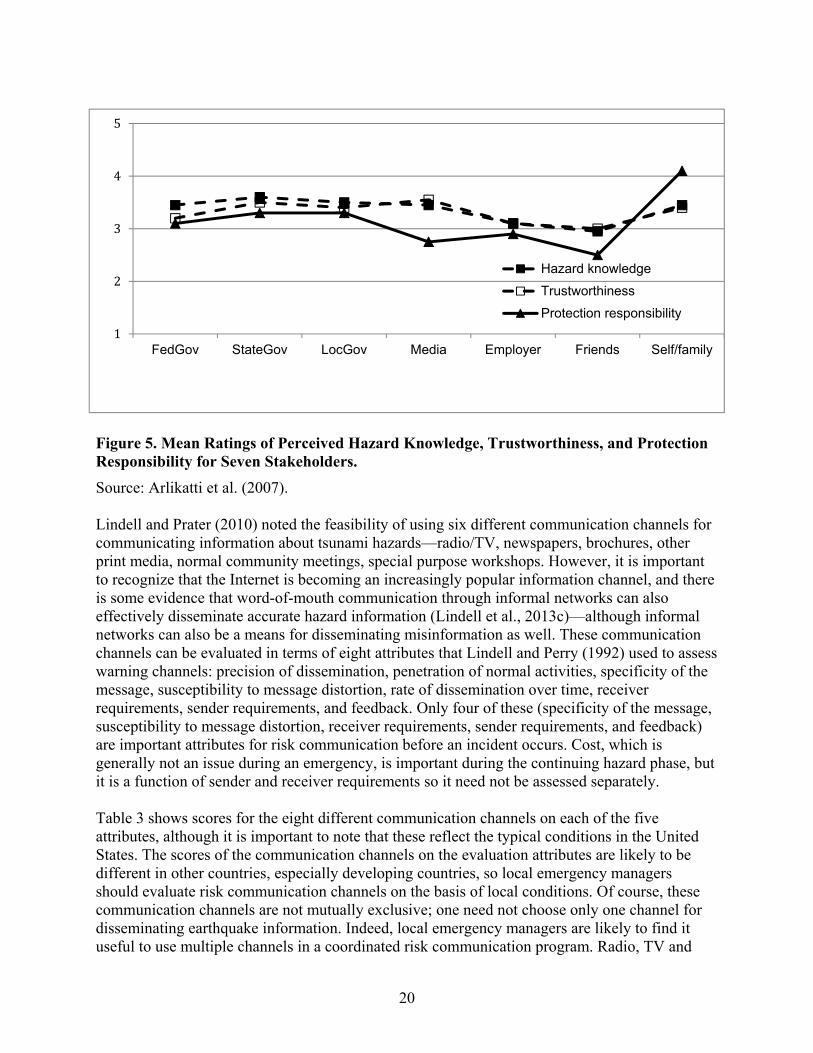
20
Figure 5. Mean Ratings of Perceived Hazard Knowledge, Trustworthiness, and Protection Responsibility for Seven Stakeholders. Source: Arlikatti et al. (2007). Lindell and Prater (2010) noted the feasibility of using six different communication channels for communicating information about tsunami hazards—radio/TV, newspapers, brochures, other print media, normal community meetings, special purpose workshops. However, it is important to recognize that the Internet is becoming an increasingly popular information channel, and there is some evidence that word-of-mouth communication through informal networks can also effectively disseminate accurate hazard information (Lindell et al., 2013c)—although informal networks can also be a means for disseminating misinformation as well. These communication channels can be evaluated in terms of eight attributes that Lindell and Perry (1992) used to assess warning channels: precision of dissemination, penetration of normal activities, specificity of the message, susceptibility to message distortion, rate of dissemination over time, receiver requirements, sender requirements, and feedback. Only four of these (specificity of the message, susceptibility to message distortion, receiver requirements, sender requirements, and feedback) are important attributes for risk communication before an incident occurs. Cost, which is generally not an issue during an emergency, is important during the continuing hazard phase, but it is a function of sender and receiver requirements so it need not be assessed separately. Table 3 shows scores for the eight different communication channels on each of the five attributes, although it is important to note that these reflect the typical conditions in the United States. The scores of the communication channels on the evaluation attributes are likely to be different in other countries, especially developing countries, so local emergency managers should evaluate risk communication channels on the basis of local conditions. Of course, these communication channels are not mutually exclusive; one need not choose only one channel for disseminating earthquake information. Indeed, local emergency managers are likely to find it useful to use multiple channels in a coordinated risk communication program. Radio, TV and
1
2
3
4
5
FedGov StateGov LocGov Media Employer Friends Self/family
Hazard knowledge
Trustworthiness
Protection responsibility

21
newspapers are communication channels that people routinely monitor (i.e., they are routinely high in message exposure), so these can be used for short messages that increase people’s beliefs in their personal risk as well as the feasibility of long-term hazard adjustments and immediate protective actions. These can be followed by brochures such as Putting Down Roots in Earthquake Country (see www.earthquakecountry.org/roots/download_eng.html) and other print media (calendars, phone directories, etc.) that provide moderate amounts of additional information. More detailed information and practice with procedures (e.g., acquiring first aid skills) can be provided in normal community meetings of local service clubs, parent-teacher organizations, and neighborhood associations, as well as in special purpose workshops focusing on earthquake and tsunami preparedness. There should be continuing use of the high exposure channels (radio, TV and newspapers) to ensure that messages are repeated frequently enough to maintain a satisfactory level of hazard intrusiveness in the risk area population. Table 3. Communication Channel Evaluation Matrix.
Radio/TV Internet Newspaper BrochuresOther print
media
Normal community meetings
Special purpose
workshops
Word of
mouth
Specificity of the message Low High High High Low High High Varies
Susceptibility to message distortion
Low Low Low Low Low Low Low High
Receiver requirements Moderate High Low Low Low Low Low Low
Sender requirements Moderate High Moderate High High Moderate Moderate Low
Feedback Low Low Low Low Low High High High
The purpose of resource mobilization is to enlist the support of stakeholders in the community who are likely to share an interest in using risk communication to reduce hazard vulnerability. Stakeholder support can be generated using some of the activities advocated for increasing the effectiveness of Local Emergency Planning Committees (Lindell, 1994; Lindell, Whitney, Futch & Clause, 1996; Lindell & Perry, 2001). These include giving presentations at meetings of elected and senior appointed political officials, community groups, and neighborhood associations. In addition, local emergency managers can establish local disaster planning committees comprising governmental and nongovernmental organizations and develop Community Emergency Response Teams comprising citizens who receive training in earthquake emergency response (Simpson, 2001). Program development for all phases involves the use of available community resources to produce a system that can implement seismic risk communication in both the continuing hazard phase as well as in an escalating crisis or emergency response. Building on earlier work by Sorensen and Mileti (1987), Lindell and Perry (1992, pp. 163-164) and Lindell et al. (1997, pp. 395-399) analyzed a series of broad risk communication themes such as scientific information programs to disseminate scientific information about seismic hazards (e.g., the geological processes involved in tectonic plates and subduction zones), fear appeals (descriptions of the

22
personal consequences of failure to protect oneself and one’s family), practical instructions (e.g., recommendations to drop, cover and hold on during earthquake shaking), attribute portrayal (descriptions of the advantages and disadvantages of different hazard mitigation and emergency preparedness actions), and participative learning (step-by-step practice in performing actions such as developing and implementing a family emergency plan). Other strategies include norm-oriented communications (emphasizing the social consequences of adopting protective action recommendations), educational models using mascots, and modeling that relies on celebrity endorsements to promote hazard adjustment adoption and appropriate protective response. As soon as the risk communication program has been developed, it is possible to begin program implementation for the continuing hazard phase. This function involves conducting the activities that will encourage risk area residents to adopt long-term hazard adjustments. Thus, emergency managers should coordinate the use of different sources to transmit messages through different channels to all segments of the risk area population. This function also involves conducting the types of activities that will allow authorities to determine if the risk communication program has been effective. For example, population surveys such as those conducted by Mileti and Fitzpatrick (1993), Mileti and Darlington (1995, 1997), and Perry (1990), have been used to evaluate the degree to which risk communication programs have changed people’s risk perceptions, beliefs about hazard adjustments and emergency protective actions, levels of hazard mitigation and emergency preparedness, and expectations of engaging in appropriate protective actions in an emergency. The format of Table 1 might seem to imply that the five risk communication functions form a simple linear sequence, but some tasks will be performed concurrently and the entire process will frequently be iterative. For example, some resource mobilization tasks might take place concurrently with the operational analysis, or tasks conducted during the operational analysis phase might be suspended temporarily in order to return to the strategic analysis and refine it. Once authorities have determined that they are in an escalating crisis or emergency response, they need to implement the predetermined risk communication actions that were developed during the continuing hazard phase. These include activating a crisis communication team promptly, determining the appropriate time to release sensitive information, and selecting the communication channels appropriate to the situation. An escalating crisis or emergency response also requires authorities to maintain source credibility with the news media and the public, provide timely and accurate information to the news media and the public, and evaluate performance through post-incident critiques. For further details on the application of the PADM to the development of community risk communication programs, see Lindell and Perry, 2004, Chapter 5).

23
References
Aguirre, B.E. (1988). The lack of warnings before the Saragosa tornado. International Journal of Mass Emergencies and Disasters, 6, 65-74.
Aguirre, B.E. (2005) Emergency evacuations, panic, and social psychology. Psychiatry, 68, 121–
129. Alexander, D. (1990) Behavior during earthquakes: A Southern Italian example. International
Journal of Mass Emergencies and Disasters, 8, 5-29. Available at www.ijmed.org. Arlikatti, S., Lindell, M.K., & Prater, C.S. (2007). Perceived stakeholder role
relationships and adoption of seismic hazard adjustments. International Journal of Mass Emergencies and Disasters, 25, 218-256. Available at www.ijmed.org.
Arlikatti, S., Lindell, M.K., Prater, C.S. & Zhang, Y. (2006). Risk area accuracy and hurricane
evacuation expectations of coastal residents. Environment and Behavior, 38, 226-247. Arnold, C., Durkin, M., Eisner, R., and Whitaker, D. (1982) Occupant behavior in a six story
office building following severe earthquake damage. Disasters, 6, 207-214. Baker, E.J. (1991). Hurricane evacuation behavior. International Journal of Mass
Emergencies and Disasters, 9, 287-310. Available at www.ijmed.org. Barton, A. (1969). Communities in Disaster. New York: Doubleday. Becker, J.S., Paton, D., Johnston, D.M., Ronan, K.R. (2013) Salient beliefs about earthquake
hazards and household preparedness. Risk Analysis, 33, 1710-1727. Bird, D.K., Chagué-Goff, C. & Gero, A. (2011). Human response to extreme events: A review of
three post-tsunami disaster case studies. Australian Geographer, 42, 225-239. Bostrom, A., Fischhoff, B. & Morgan, M.G. (1992). Characterizing mental models of hazardous
processes: A methodology and an application to radon. Journal of Social Issues, 48, 85-100.
Bourque, L.B., Russell, L.A., & Goltz, J.D. (1993). Human behavior during and immediately
after the earthquake. In P.A. Bolton (Ed.), The Loma Prieta, California, Earthquake of October 17, 1989: Public Response, Professional Paper 1553-B (pp. B3-B22). Washington DC: U. S. Geological Survey. Available at pubs.usgs.gov/pp/pp1553/pp1553b/
Bourque, L.B., Shoaf, K.I. and Nguyen, L.H. (1997) Survey research. International Journal of
Mass Emergencies and Disasters, 15, 71-101. Available at www.ijmed.org.

24
Canter, D., Breaux, J., and Sime, J. (1980) Domestic, multiple occupancy, and hospital fires. In D. Canter (Ed.), Fires and Human Behavior (pp. 117-136). Chicester UK: Wiley.
CRTWFS—Committee on the Review of the Tsunami Warning and Forecast System and
Overview of the Nation's Tsunami Preparedness. (2010). Tsunami Warning and Preparedness: An Assessment of the U.S. Tsunami Program and the Nation's Preparedness Efforts. Washington DC: National Research Council.
Drabek, T.E. (1986). Human System Responses to Disaster: An Inventory of Sociological
Findings. New York: Springer-Verlag. Dudley, W.C., Whitney, R., Faasisila, J., Fonolua, S., Jowitt, A. & Chan-Kau, M. (2011).
Learning from the victims: New physical and social science information about tsunamis from victims of the September 29, 2009 event in Samoa and American Samoa. Earth-Science Reviews, 107, 201–206.
Dynes, R. (1970). Organized Behavior in Disaster. Lexington, MA: Heath-Lexington Books. Eagly, A.H., & Chaiken, S. (1993). The Psychology of Attitudes. Ft. Worth TX: Harcourt, Brace
College Publishers. Fishbein, M. & Ajzen, I. (2010). Predicting and Changing Behavior: The Reasoned Action
Approach. New York: Psychology Press. French, J.R.P. & Raven, B.H. (1959). The bases of social power. In D. Cartwright (ed.) Studies
in Social Power (pp. 150-167). Ann Arbor MI: Institute for Social Research. Fritz, C.E. (1961). Disaster. In R.K. Merton & R.A. Nisbet (eds.), Contemporary Social
Problems (pp. 651-694). New York: Harcourt, Brace & World. Fritz, H.M., Borrero, J.C., Synolakis, C.E., Okal, E.A., Weiss, R., Titov, V.V., Jaffe, B.E.,
Foteinis, S., Lynett, P.J., Chan, I-C. & Liu, P. L-F. (2011). Insights on the 2009 South Pacific tsunami in Samoa and Tonga from field surveys and numerical simulations. Earth Science Reviews, 107, 66-75.
Gaillard, J-C., Clavé, E., Vibert, O., Dedi, A., Denain, J-C., Efendi, Y., Grancher, D., Liamzon,
C.C., Sari, D.R. & Setiawan, R. (2008). Ethnic groups’ response to the 26 December 2004 earthquake and tsunami in Aceh, Indonesia. Natural Hazards, 47, 17–38.
Garcia EM. (1989). Earthquake preparedness in California: A survey of Irvine residents. Urban
Resources, 5, 15-19. Ge, Y., Peacock, W.G. & Lindell, M.K. (2011). Florida households’ expected responses to
hurricane hazard mitigation incentives. Risk Analysis, 31, 1676-1691.

25
Gladwin, C.H, Gladwin, H. & Peacock, W.G. (2001). Modeling hurricane evacuation decisions
with ethnographic methods. International Journal of Mass Emergencies and Disasters, 19, 117-143. Available at www.ijmed.org.
Goltz, J.D., Russell, L.A., and Bourque, L.B. (1992) Initial behavioral response to a rapid onset
disaster: A case study of the October 1, 1987 Whittier Narrows Earthquake. International Journal of Mass Emergencies and Disasters. 10, 43-69. Available at www.ijmed.org.
Gregg, C.E., Houghton, B.F., Paton, D., Lachman, R., Lachman, J., Johnston, D.M. &
Wongbusarakum, S. (2006). Natural warning signs of tsunamis: Human sensory experience and response to the 2004 Great Sumatra earthquake and tsunami in Thailand. Earthquake Spectra, 22, S671–S691.
Gregg, C.E., Houghton, B.F., Paton, D., Johnston, D.M., Swanson, D.A. & Yanagi. B.S. (2007).
Tsunami warnings: Understanding in Hawai‘i. Natural Hazards, 40, 71–87. Huang, S.K., Lindell, M.K. & Prater, C.S. (2014). Who Leaves and Who Stays? A Statistical
Meta-Analysis of Hurricane Evacuation Studies. College Station TX: Texas A&M University Hazard Reduction & Recovery Center.
Iemura, H., Takahashi, Y., Pradono, M.P., Sukamdo, P. & Kurniawan, R. (2006). Earthquake
and tsunami questionnaires in Banda Aceh and surrounding areas. Disaster Prevention and Management, 15, 21-30.
Imamura, F. (2009). Dissemination of information and evacuation procedures in the 2004–2007
tsunamis, including The 2004 Indian Ocean. Journal of Earthquake and Tsunami, 3, 59–65.
Janis, I. & Mann, L. (1977). Decision Making. New York: Free Press. King, D. & Gurtner, Y. (2005). After the wave: A wake up warning for Australian coastal
locations. Australian Journal of Emergency Management, 20, 4–9. Lachman, R., Tatsuoka, M. & Bonk, W.J. (1961). Human behavior during the tsunami of May
23, 1960, Science, 133, 1405–1409. Lasswell, H. (1948). The structure and function of communication in society. In L. Bryson (ed.)
Communication of ideas. (pp. 43-71). New York: Harper. Lindell, M.K. (1994). Perceived characteristics of environmental hazards. International Journal
of Mass Emergencies and Disasters, 12, 303-326. Available at www.ijmed.org. Lindell, M.K. (2012). Response to environmental disasters. In S. Clayton (Ed.) Handbook of
environmental and conservation psychology (pp. 391-413). New York: Oxford University Press.

26
Lindell, M.K. (2013a). North American cities at risk: Household responses to environmental
hazards. In T. Rossetto, H. Joffe & J. Adams (Eds.). Cities at Risk: Living with Perils in
the 21st Century (pp. 109-130). Dordrecht: Springer. Lindell, M.K. (2013b). Evacuation planning, analysis, and management. In A.B. Bariru and L.
Racz (eds.). Handbook of Emergency Response: A Human Factors and Systems
Engineering Approach (pp. 121-149). Boca Raton FL: CRC Press. Lindell, M.K., Arlikatti S. & Prater, C.S. (2009). Why people do what they do to protect against
earthquake risk: Perceptions of hazard adjustment attributes. Risk Analysis, 29, 1072-1088.
Lindell, M.K. & Earle, T.C. (1983). How close is close enough: Public perceptions of the risks of
industrial facilities. Risk Analysis, 3, 245-253. Lindell, M.K. & Perry, R.W. (1992). Behavioral Foundations of Community Emergency
Planning. Washington DC: Hemisphere Press. Lindell, M.K. & Perry, R.W. (2000). Household adjustment to earthquake hazard: A review of
research. Environment and Behavior, 32, 590-630.
Lindell, M.K. & Perry, R.W. (2001). Community innovation in hazardous materials
management: Progress in implementing SARA Title III in the United States. Journal of
Hazardous Materials, 88, 169-194. Lindell, M.K. and Perry, R.W. (2004) Communicating Environmental Risk in Multiethnic
Communities. Thousand Oaks CA: Sage. Lindell, M.K. & Perry, R.W. (2012). The Protective Action Decision Model: Theoretical
modifications and additional evidence. Risk Analysis, 32, 616-632. Lindell, M.K. & Prater, C.S. (2000). Household adoption of seismic hazard adjustments: A
comparison of residents in two states. International Journal of Mass Emergencies and
Disasters, 18, 317-338. Available at www.ijmed.org. Lindell, M.K & Prater, C.S. (2002). Risk area residents’ perceptions and adoption of seismic
hazard adjustments. Journal of Applied Social Psychology, 32, 2377-2392. Lindell, M.K. & Prater, C.S. (2010). Tsunami preparedness on the Oregon and Washington
coast: Recommendations for research. Natural Hazards Review, 11, 69-81. Lindell, M.K., Prater, C.S., Gregg, C.E., Apatu, E.J.I., Huang, S-K & Wu, H-C. (2013c).
Households’ Immediate Responses to the 2009 American Samoa Earthquake and
Tsunami. College Station TX: Texas A&M University Hazard Reduction & Recovery Center.

27
Lindell, M.K., Prater, C.S., Wu, H-C., Huang, S-K., Johnston, D.M., Becker, J.S. & Shiroshita,
H. (in press). Immediate behavioral responses to earthquakes in Christchurch New Zealand and Hitachi Japan. Disasters.
Lindell, M.K., Prater, C.S. & Peacock, W.G. (2007). Organizational communication and decision
making in hurricane emergencies. Natural Hazards Review, 8, 50-60. Lindell, M.K., Sutter, D.S. & Trainor, J.E. (2013). Individual and household response to
tornadoes. International Journal of Mass Emergencies and Disasters, 31, 373-383. Lindell MK. & Whitney DJ. (2000). Correlates of seismic hazard adjustment adoption. Risk
Analysis, 20, 13-25. Lindell, M.K., Whitney, D.J., Futch, C.J. & Clause, C.S. (1996). The Local Emergency Planning
Committee: A better way to coordinate disaster planning. In R.T. Silves and W.L. Waugh, Jr. (Eds.) Disaster Management in the U.S. and Canada: The Politics, Policymaking, Administration and Analysis of Emergency Management (pp. 234-249). Springfield, IL: Charles C. Thomas Publishers.
Liu, P.L-F., Lynett, P., Fernando, H., Jaffe, B.E., Fritz, H., Higman, B., Morton, R., Goff, J. &
Synolakis, C. (2005). Observations by the International Tsunami Survey Team in Sri Lanka. Science, 308, 1595.
Mawson, A. R. (2005) Understanding mass panic and other collective responses to threat and
disaster. Psychiatry, 68, 95–113. McAdoo, B.G., Dengler, L., Prasetya, G. & Titov, V. (2006). Smong: How an oral history saved
thousands on Indonesia’s Simeulue Island during the December 2004 and March 2005 Tsunamis. Earthquake Spectra, 22, S661–S669.
McGuire, W. J. (1969). The nature of attitudes and attitude change. In G. Lindsey & E. Aronson
(eds.) Handbook of Social Psychology (pp. 329-348). Reading, MA: Addison-Wesley. McGuire, W. J. (1985). The nature of attitudes and attitude change. In G. Lindzey & E. Aronson
(eds.) Handbook of Social Psychology (pp. 233-256). New York: Random House. Meyer P. (1988). Defining and measuring credibility of newspapers: Developing an index.
Journalism Quarterly, 65, 567-574, 588. Mileti, D.S. & Darlington, J. (1995). Societal response to revised earthquake probabilities in the
San Francisco Bay area. International Journal of Mass Emergencies and Disasters, 13, 119-145.
Mileti, D.S. & Darlington, J. (1997). The role of searching in shaping reactions to earthquake
risk information. Social Problems, 44, 89-103.

28
Mileti, D.S., Drabek, T. & Haas, J.E. (1975). Human Systems in Extreme Environments. Boulder
CO: University of Colorado Institute of Behavioral Science. Mileti, D.S. & Fitzpatrick, C. (1993). The Great Earthquake Experiment. Boulder, CO:
Westview Press. Mileti, D.S., Fitzpatrick, C. & Farhar, B.C. (1992). Fostering public preparations for natural
hazards: Lessons from the Parkfield earthquake prediction. Environment, 34, 16-20 and 36-39.
Mori, J., Mooney, W., Afnimar, Kurniawan, S., Anaya, A.I. & Widiyantoro, S. (2007). The July
17, 2006 West Java Earthquake And Tsunami. Annuals Of Disaster Prevention Research 50, 143-151. Accessed 26 February, 2013 at http://repository.kulib.kyoto-u.ac.jp/dspace/handle/2433/73238.
Mulilis JP & Duval TS. (1997). The PrE model of coping with threat and tornado preparedness
behavior: The moderating effects of felt responsibility. Journal of Applied Social Psychology, 27, 1750–1766.
Murray-Tuite, P. & Wolshon, B. (2013). Evacuation transportation modeling: An overview of
research, development, and practice. Transportation Research Part C, 27, 25–45. Ohta, Y. and Ohashi, H. (1985) Field survey on occupant behavior in an earthquake.
International Journal of Mass Emergencies and Disasters, 3, 147-16. Available at www.ijmed.org.
O’Keefe, D. (2002). Persuasion: Theory and research (2nd Ed.). Thousand Oaks, CA: Sage. Palm, R, Hodgson, M., Blanchard, R.D. & Lyons, D. (1990). Earthquake Insurance in
California. Boulder CO: Westview Press. Peacock, W. G., Brody, S. D., & Highfield, W. (2005). Hurricane risk perceptions among
Florida's single family homeowners. Landscape and Urban Planning, 73(2), 120-135. Perry, R.W. (1990). Volcanic hazard perceptions at Mt. Shasta. The Environmental Professional,
12, 312-318. Perry, R.W. & Greene, M. (1983). Citizen Response to Volcanic Eruptions. New York:
Irvington. Perry, R.W., Lindell, M.K. & Greene, M.R. (1981). Evacuation Planning in Emergency
Management. Lexington, MA: Heath Lexington Books. Perry, S.D. (2007). Tsunami warning dissemination in Mauritius. Journal of Applied

29
Communication Research, 35, 399-417. Petty, R.E. & Wegener, D.T. (1998). Attitude change: Multiple roles for persuasion variables. In
D.T. Gilbert, S.T. Fiske & G. Lindzey (eds.) Handbook of Social Psychology, 4th ed. (pp. 323-390). New York: McGraw-Hill.
Prater, C.S. & Lindell, M.K. (2000). Politics of hazard mitigation. Natural Hazards Review, 1,
73-82. Prati, G., Catufi, V. and Pietrantoni, L. (2012) Emotional and behavioural reactions to tremors of
the Umbria–Marche earthquake. Disasters, 36, 439−451. Preston, V., Taylor, S.M. & Hedge, D.C. (1983). Adjustment to natural and technological
hazards: A study of an urban residential community. Environment and Behavior, 15, 143–164.
Quarantelli, E.L. (1954) The nature and conditions of panic. American Journal of Sociology, 60,
267-275. Raven, B. (1965). Social influence and power. In I. Steiner & M. Fishbein (Eds.), Current
Studies in Social Psychology (pp. 371-382). New York: Holt, Rinehart & Winston. Raven, B. (1993). The bases of power. Journal of Social Issues, 49, 227-251. Rogers, G.O. & Sorensen, J.H. (1988). Diffusion of emergency warnings. Environmental
Professional, 10, 185-198. Seeger, M.W., Sellnow, T.L. & Ulmer, R.R. (2003). Communication and Organizational Crisis.
Westport CT: Praeger. Simpson, D.A. (2001). Community emergency response training (CERTs): A recent history and
review. Natural Hazards Review, 2, 54-63. Slovic P., Fischhoff B. &, Lichtenstein S. (1980). How safe is safe enough: A psychometric
study of attitudes toward technological risks and benefits. In: Slovic P (ed). The
Perception of Risk. (pp. 80-103). London: Earthscan. Sorensen, J.H. (2000). Hazard warning systems: Review of 20 years of progress. Natural
Hazards Review, 1, 119-125. Sorensen, J. H. & Mileti, D.S. (1987). Programs that encourage the adoption of precautions
against natural hazards: Review and evaluation. In N. Weinstein (Ed.), Taking Care: Why
People Take Precautions (pp. 321-339). New York: Cambridge University Press. Terpstra, T. & Lindell, M.K. (2013). Citizens’ perceptions of flood hazard adjustments: An
application of the Protective Action Decision Model. Environment and Behavior, 45,

30
993-1018. Tierney, K.J., Lindell, M.K. and Perry, R.W. (2001) Facing the Unexpected: Disaster
Preparedness and Response in the United States. Washington DC: Joseph Henry Press. Turner, R., Nigg, J. & Heller-Paz, D. (1986). Waiting for Disaster. Los Angeles: University of
California Press. USACE—US Army Corps of Engineers, Honolulu District. (2012). Final Report: American
Samoa Tsunami Study. Honolulu HI: Author. Weinstein, N.D. & Sandman, P.M. (1992). Model of the Precaution Adoption Process: Evidence
from home radon testing. Health Psychology, 11, 170-180. Whitney, D.J., Lindell, M.K. & Nguyen, D.H. (2004). Earthquake beliefs and adoption of
seismic hazard adjustments. Risk Analysis, 24, 87-102. Wood, W. & Neal, D.T. (2007). A new look at habits and the habit-goal interface. Psychological
Review, 114, 843-863. Wu, H.C., Lindell, M.K. & Prater, C.S. (2012). Logistics of hurricane evacuation in Hurricanes
Katrina and Rita. Transportation Research Part F: Traffic Psychology and Behaviour, 15, 445-461.
Zhang, Y., Prater, C.S., & Lindell, M.K. (2004). Risk area accuracy and evacuation from
Hurricane Bret. Natural Hazards Review, 5, 115-120.

On the Nature of Strong Ground Motions during Damaging Earthquakes
Susan E. Hough U.S. Geological Survey, Pasadena
A Background Paper for the Project: Developing Messages for Protective Actions to Take During Earthquake Shaking
Conducted by:

1
On the Nature of Strong Ground Motions during Damaging Earthquakes
Susan E. Hough U.S. Geological Survey, Pasadena
1. Introduction Effective mitigation of earthquake risk requires a multi-faceted approach. One critical aspect of risk mitigation involves communication to the public regarding key questions: What actions do individuals need to take to be prepared for a future earthquake? And, how should they respond if they feel earthquake shaking? Recognizing that seconds matter during an earthquake, the emergency management community has emphasized the need for consistent messaging as well as regular earthquake drills (e.g., Mileti et al., 1992; Johnston et al., 2011). In regions where building codes are designed to ensure life safety, and construction standards are generally good, catastrophic structural collapse is unlikely, and epidemiological data from past earthquake disasters led to development of the recommendation: “Drop, Cover, and Hold On” (DCH). There is a strong if not universal consensus that this response maximizes the likelihood of survival, in particular relative to other reactions, such as running outside, that might be instinctive but pose their own dangers. Whether or not DCH is the best advice in areas with high structural vulnerability has remained unclear, with debate sometimes reaching the popular press (e.g., Padgett, 2010). Patel (2011) concludes that “A strong evidence-basis exists for [either staying] in bed, or [adopting]] ‘the earthquake position’ wherever possible,” further adding that, “Exiting during shaking is advised only when early primary waves can be distinguished or when on the ground floor of an adobe or stone building with a heavy roof and where there is a safe place to exit.” The high death toll caused by the 2010 M7.0 Haiti earthquake (DesRoches et al., 2011) served to highlight the paucity of information regarding earthquake response messaging in areas where structural vulnerability is generally high and catastrophic collapse of structures is more likely than in countries with better levels of preparedness (e.g., Padgett, 2010). Catastrophic collapse poses a singular danger for life safety (e.g., De Bruycker et al., 1985; Alexander, 1996; Ramirez and Peek-Asa, 2005). During the 1980 M6.9 earthquake in southern Italy, death rates were 100 times higher for victims who were trapped within structures versus those who were not trapped (De Bruycker et al., 1985). The death toll from the 1994 M6.7 Northridge, California, earthquake, was low, but over 70% of the fatalities were caused by the relatively small number of instances of full or partial structural collapse (Peek-Asa et al., 1998). The incidence of full or partial structural collapse was orders of magnitude higher during the 2010 Haiti earthquake (Figure 1) than in the 1994 Northridge earthquake. A survey of over 400,000 buildings in the capital city of Port-au-Prince revealed that fully 20% of the buildings collapsed or were damaged beyond repair, with 26% judged to be unsafe for immediate occupation (Miyamoto et al., 2011). The lessons are sobering in other parts of the world, where experts have long expressed concern about the extreme and often growing vulnerability of modern cities (e.g., Bilham, 2004; Hough and Bilham, 2005).

2
Figure 1a (left). Collapsed private school in central Port-au-Prince metropolitan region; a neighboring single-family house sustained no damage; (b, right) Well-built commercial building (left side) adjacent to catastrophic collapse of neighboring structure. Earthquakes cannot be predicted in advance (Hough, 2010), but after a strong earthquake starts it is possible to issue alerts that reach individuals in advance of strong shaking in their location. In regions monitored by state-of-the-art seismic networks, sophisticated earthquake early-warning (EEW) systems can provide a few seconds to tens of seconds of invaluable warning in advance of felt earthquake shaking (e.g., Allen and Kanamori, 2003; Kamagaichi, 2004). A true EEW system requires the identification and characterization of a large earthquake very quickly, typically within seconds after it begins, so that a warning can be sent at the speed of light (300,000 km/s), arriving at a distant location in advance of the shaking, which travels closer to the speed of sound (roughly 3-5 km/s). The most advanced earthquake early warning system in the world at the present time is in Japan (Osamu et al., 2008); systems have also been developed in other countries, including Mexico and Turkey (Espinosa Aranda et al., 1995; Erdik et al., 2003). In most of the world, in particular those areas where vulnerability is high and seismic monitoring networks are limited, EEW technology is far beyond the reach of available resources. Focusing on the example of Haiti, care has moreover been taken by earthquake professionals involved in the response effort to not raise hopes about the feasibility of EEW in the foreseeable future. In a situation where risk mitigation funding is extremely limited, the focus of efforts needs to remain on efforts that can realistically contribute to risk reduction. In the absence of a true EEW system, the fundamental nature of seismic waves provides a measure of warning in advance of the strongest shaking. That is, for individuals who experience potentially damaging earthquake ground motions, there is almost universally a time lag between when shaking is first felt and when the strongest shaking begins at that location. For most of the world, which will not have the benefit of EEW in the foreseeable future, this lag provides the only window of opportunity to take protective action. Because it also potentially provides a window to take actions that might be deemed ill-advised, it is important to consider the expected duration of the lag. The duration during any given earthquake experienced at any given location depends on myriad factors that cannot be predicted in advance. However, basic considerations allow us to consider how much warning individuals are likely to have in a potentially damaging earthquake. The development of appropriate earthquake response messaging involves complex considerations, including sociological as well as technical issues. In this report I consider only

3
the relevant seismological issues, focusing on two questions: 1) in a potentially damaging earthquake, what actions are possible given the likely severity of shaking, both initially and when shaking reaches its maximum severity? And, 2) In a potentially damaging earthquake, how much time are individuals likely to have between the time that shaking is first felt and the time that potentially damaging shaking begins? These questions can be addressed using seismological first principles, results from recent comprehensive probabilistic seismic hazard mapping (PSHA) efforts, and empirical data from the USGS Prompt Assessment of Global Earthquake Shaking (PAGER) system (Wald et al., 2011), which provides a growing volume of data indicating population exposure to different shaking levels during recent large earthquakes. I address the first question by examining the level of shaking severity expected to occur during potentially damaging earthquakes; I then address the question of the expected duration of the lag between initially felt shaking and strongest shaking. In this report I consider only the severity of shaking at the earth’s surface. Shaking can be amplified and modified in multi-story buildings, for example via the excitation of a structural resonance. It is difficult, however, to draw general conclusions about structural response. The results presented here are expected to be valid for the small (1- to 3-story) structures that are ubiquitous in many developing countries. For the development of earthquake response messaging, I note that recommended response actions might depend on the nature of the structures that individuals are in at the time of the earthquake. Apart from issues related to structural amplification, the range of response actions that an individual could take, for better or for worse, will clearly be more limited if one is inside a tall building. For this and other reasons, a one-size-fits-all approach to earthquake response messaging will likely not be appropriate, but rather the development of messaging will need to consider the local situation, including building stock as well as vulnerability.
2. Expected Severity of Shaking
2.1 General Considerations In a strong earthquake initial felt shaking usually corresponds to the P wave, which is a compressional wave, and almost always lower in amplitude than the later arriving S wave (Figure 2). Earthquakes also generate surface waves, with speeds of roughly 90% the speed of the S wave. At distances at which earthquakes cause damage, S waves and surface waves generally do not have time to separate into distinct arrivals, but rather arrive as part of an extended S-wave group. For brevity, throughout this report I refer to this group simply as the S wave.

4
Figure 2. Illustration of a typical seismogram from a small earthquake, showing the time separation between the initial P wave and the later, larger S wave. In this example, the S-minus-P time is approximately 4 seconds. A distinct surface wave arrival cannot be discerned. To inform earthquake response messaging, there are two relevant questions concerning the expected severity of strong shaking: 1) What is the expected level of shaking during the P wave? And, 2) What is the expected level of strongest overall shaking? The severity of earthquake shaking is commonly characterized using an Intensity scale. For example, the USGS “Did You Feel It?” (DYFI) web page uses the modified Mercalli intensity (MMI) scale (Figure 3), which can be related to peak acceleration and peak velocity as indicated in Figure 3. Although intensities are traditionally assigned as whole numbers, the DYFI system assigns decimal values, Community Decimal Intensities (CDI), using an algorithm to analyze data collected with on-line questionnaires. Traditionally, MMI values have been assigned subjectively from assessments of archival or direct accounts of earthquake effects. Hough (2013) concludes that traditional MMI values tend to be controlled by extreme effects while DYFI CDI values, by definition, reflect representative effects within a given spatial footprint. As indicated on Figure 3, MMI VI-VII is generally considered to be the threshold for structural damage. In cases of extreme structural vulnerability, catastrophic collapse can occur at even lower shaking levels. There are no strong motion records of the 2010 Haiti mainshock in Port-au-Prince, but from detailed analysis of macroseismic effects, including specific instances of structural damage, intensities in the city were estimated to range from a low of V to as high as VIII in areas with strong local amplification effects (Goodno et al., 2011; Hough et al., 2012). Hough et al. (2012) presents examples where intensity values of V-VI can be estimated from documented macroseismic effects in relatively well-built buildings, while neighboring buildings collapsed catastrophically (Figure 1). For example, an eyewitness who was in the commercial building shown in Figure 1b reported to the author that during the mainshock, there was no damage or disruption to hanging pictures, furniture, ceiling tiles, etc, and only one small object (a coffee cup) in her office was knocked over.
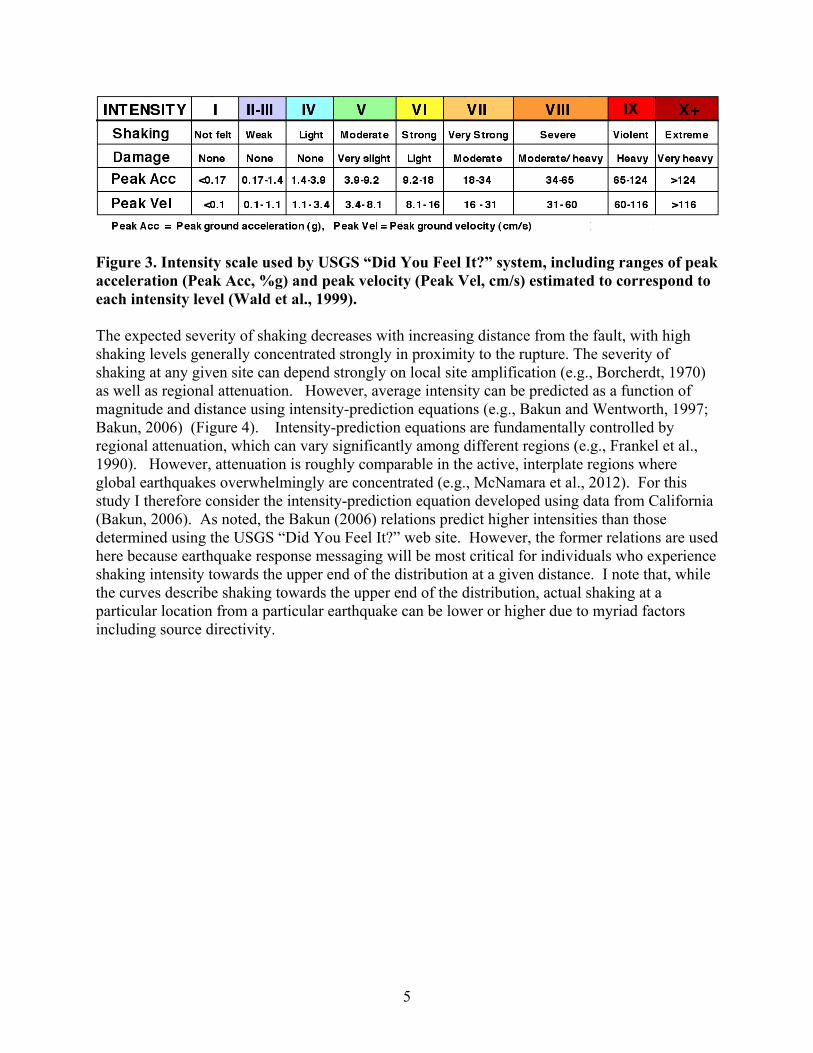
5
Figure 3. Intensity scale used by USGS “Did You Feel It?” system, including ranges of peak acceleration (Peak Acc, %g) and peak velocity (Peak Vel, cm/s) estimated to correspond to each intensity level (Wald et al., 1999). The expected severity of shaking decreases with increasing distance from the fault, with high shaking levels generally concentrated strongly in proximity to the rupture. The severity of shaking at any given site can depend strongly on local site amplification (e.g., Borcherdt, 1970) as well as regional attenuation. However, average intensity can be predicted as a function of magnitude and distance using intensity-prediction equations (e.g., Bakun and Wentworth, 1997; Bakun, 2006) (Figure 4). Intensity-prediction equations are fundamentally controlled by regional attenuation, which can vary significantly among different regions (e.g., Frankel et al., 1990). However, attenuation is roughly comparable in the active, interplate regions where global earthquakes overwhelmingly are concentrated (e.g., McNamara et al., 2012). For this study I therefore consider the intensity-prediction equation developed using data from California (Bakun, 2006). As noted, the Bakun (2006) relations predict higher intensities than those determined using the USGS “Did You Feel It?” web site. However, the former relations are used here because earthquake response messaging will be most critical for individuals who experience shaking intensity towards the upper end of the distribution at a given distance. I note that, while the curves describe shaking towards the upper end of the distribution, actual shaking at a particular location from a particular earthquake can be lower or higher due to myriad factors including source directivity.

6
Figure 4. Predicted shaking intensity for M6, 6.5, 7, and 7.5 earthquakes in California using the intensity-prediction equations of Bakun (2006). The dashed line corresponds to intensity V, the threshold for catastrophic collapse during the 2010 Haiti earthquake (Hough, 2012).
Figure 4 reveals that, in a region with high vulnerability and high attenuation, M6-6.5
earthquakes within 100 km of a given location will be potentially damaging (MMI≥5); M7-7.5
events within approximately 200 km will be potentially damaging. As I will discuss more in a
later section, very large earthquakes, with magnitudes upwards of 7.6, are expected to be
infrequent. For this reason I focus on a consideration of large and moderately large events.
Maximum shaking intensity, as indicated in Figure 4, is almost always controlled by the S wave.
I now consider the corresponding level of shaking intensity expected during the P wave, i.e., the
shaking severity expected in between the time that shaking is initially felt and the time that the
most severe shaking begins. The precise ratio of S/P amplitudes is expected to depend on the
back-azimuth from any location to an event, and can be calculated theoretically (Shearer, 1999).
Hardebeck and Shearer (2003) show that observed S/P ratios from a set of 43 small earthquakes
are consistent with theoretical predictions, with values almost universally above 1, and on
average a factor of 10. In terms of intensities, each unit step in intensity corresponds to a factor
of approximately 2 in ground acceleration (Hough, 2000); the intensity level associated with the
P wave is thus expected to be about 3 units lower than that associated with the S wave. If MMI
V is the threshold for shaking that will be potentially damaging in areas with high vulnerability,
damaging P-wave shaking will generally only occur when S-wave shaking is MMI VIII or
above. This leads to the question, what overall shaking severity is expected during large
earthquakes? The results shown in Figure 4 indicate the expected shaking from an earthquake of
a given magnitude. Estimation of expected shaking levels at a given site requires a consideration
of all possible source zones that could produce damaging earthquakes at a given site, and the
expected frequency of occurrence of earthquakes occurring in those zones – in effect, a full
7
probabilistic seismic hazard assessment (PSHA; Cornell, 1968), which would be beyond the scope of this report. In the following section I instead consider empirical data from 98 recent global earthquakes that were large enough to cause serious damage.
2.2 Empirical Data from the PAGER system Since strong ground motions are highly concentrated in proximity to the fault rupture, especially in active tectonic regions where attenuation is high, the likelihood of very high shaking intensities (IX-X) is low relative to the likelihood of moderate but still damaging intensities (V-VIII). Perhaps the most robust conclusions can be drawn not from calculations but from observations of past damaging earthquakes. The USGS Prompt Assessment of Global Earthquakes for Response (PAGER) system relies on rapid ShakeMap characterization of ground motions following a significant earthquake (Wald et al., 1999) together with global population and fragility information to estimate the number of people exposed to different shaking levels and predict ranges for potential fatalities and economic losses (Wald et al., 2011). For this study I consider M ≥ 6 earthquakes since 2008, the earliest time for which a consistent catalog of PAGER results are available. A total of 104 M ≥ 7 events occurred between Jan. 2008 and Mar. 2014; of these the numbers of red, orange, yellow, and green alerts were 8, 4, 22, and 69, respectively. Of the 69 events that generated a green alert, the strongest reported effects were MMI IV or lower for 27 events, indicating that a significant number of strong earthquakes are barely felt due to their remote locations. The questions of interest for this study are, if an earthquake generates potentially damaging shaking, what conclusions can be drawn about the likely distance of the event from impacted population centers? And what level of shaking is expected? To address this question, I focus on the 34 M ≥ 7 events that generated yellow, orange, or red alerts, as well as an additional five events that generated a green alert but predicted shaking intensity of VIII. I also consider 59 6≤M<7 events that generated Yellow or higher alerts. For each event, one can consider the populations exposed to different shaking levels. For this, I calculate the percentage of the population that experienced each intensity level, normalized by the total population that experienced MMI IV or greater shaking. For nearly all events, the populations that experienced moderate shaking (MMI IV-V) are much larger than the populations that experienced severe shaking. An average normalized distribution of intensities for all events reveals a very low incidence of MMI IX-X shaking (Figure 5). Figure 5 reveals that intensity values as high as IX-X are indeed rare: of the people that experienced shaking above intensity IV from the set of 39 M≥7 earthquakes, intensities IX-X were experienced by only about ½ of 1% of the population. From the set of 59 6.0≤M<7 events, the percentage experiencing IX-X shaking is about 1/3 of 1%. This low number reflects both the unlikeliness of extreme ground motions and the relative unlikeliness that an earthquake will be a direct hit on a population center. That is, while direct hits are clearly possible, and will be especially devastating, PAGER data reveals that, in a potentially damaging earthquake, any given location is more likely to experience moderately damaging shaking (intensities V-VIII) than high intensities (IX-X). Even in the case of the 2010 Haiti earthquake, infamous for having struck close to the capital city of Port-au-Prince, the highest intensity values were experienced by a relatively small percentage of the population that felt the earthquake. Of the 39 M≥7 events, the strongest concentration of high intensity shaking was associated with the M7.0 earthquake of

8
16 June 2010 near Papua, New Guinea. This earthquake did not strike near a major city, but occurred in proximity to 9 coastal villages, destroying over 2500 houses. Overall, if the set of 98 earthquakes can be considered representative of damaging earthquakes, Figure 5 reveals a very high probability, on the order of 99%, that felt shaking from potentially damaging earthquakes will be intensity VIII or lower. Note that, by selecting only earthquakes that generated Yellow or higher PAGER alerts, this set of events is biased towards earthquakes that did strike close enough to population centers to cause serious effects. This selection bias presumably also helps explain why the results for 6.0≤M<7 events are so similar to the results for larger earthquakes.
Figure 5. Distribution of average shaking intensity levels experienced by the impacted populations for 39 recent M≥7.0 global earthquakes that either generated Yellow or higher PAGER alerts (34 events) or generated Green PAGER alerts but had predicted shaking intensities of VIII or higher (5 events) (black circles); gray circles indicate same results for a set of 59 6.0≤M<7 events that generated Yellow or higher PAGER alerts. Fraction indicates the fraction of the population estimated to have experienced each shaking level. To calculate the average, I calculate the distribution for each event, then average the results. Returning to the question of expected shaking during the P wave, if one assumes that severe shaking is generated by the S wave, with MMI V being the threshold for damage, the earlier consideration of expected S/P amplitudes leads to the conclusion that the intensity of P-wave shaking during potentially damaging earthquakes is very likely to be in the range II-V. An especially strong P wave can sometimes produce an abrupt “jolt,” but the overall energy associated with the P wave is expected to be much lower than the energy associated with the later S wave. As noted, at the MMI V level, shaking can cause serious damage to especially vulnerable structures, but in general this level of shaking is felt outdoors and is strong enough to knock over some small, unstable objects, and to cause doors to swing. Of particular note, it is

9
generally possible for people to walk during intensity V shaking. Unsteady walking is one of the indicators for intensity VI. Thus, during the time lag between initially felt shaking and the strongest shaking, it will generally be possible for individuals to walk or run. It follows that, if individuals are inclined to run outside, they will have some time to initiate this action, whether it is deemed advisable or not.
3. Temporal Evolution of Shaking
3.1 S‐ versus P‐wave Times and Amplitudes: Basic Considerations I now address the question, how much time are people likely to have between the time when shaking is initially felt and when potentially damaging shaking begins? The nearly universal lag between initially felt shaking and strongest shaking depends on two factors, the first being the time lag between the initial P wave and the later S arrival, the so-called S-minus-P time. In small-to-moderate earthquakes the P wave is sometimes not noticed; however such events will rarely be damaging. In the following calculations I therefore assume the initial P wave is felt. The speed of S waves is approximately 60-70% of the P-wave speed; the time separation between the two wave arrivals, the S-minus-P time, thus increases with increasing distance from an earthquake. A useful rule of thumb is that the distance in kilometers is approximately 8 times the S-minus-P time in seconds. This rule of thumb breaks down at very close distances, in part because virtually all earthquakes nucleate at depths of at least 6 km in the crust. In practice, S-minus-P times shorter than 2 seconds are rarely observed. The second factor controlling the lag between initially felt shaking and severe shaking stems from the fact that any moderate-to-large earthquake involves a prolonged source process during which time the fault is moving. Seismic waves are radiated along the extent of the fault as long as the rupture continues; the amplitude of radiated energy generally depends on the slip at each point along the fault. Slip distributions vary enormously, but on average slip increases from the hypocenter, reaching a maximum somewhere along the rupture before tapering off (Ward, 1997; Wesnousky, 2008). The overall duration of motion along a fault will be on the order of 3-4 seconds for a magnitude 6 earthquake, increasing to 10-15 seconds in a magnitude 7 event, and to 100 seconds or more in a magnitude 8. As a result, the initial S wave will be stronger than the P wave, but shaking severity will almost certainly continue to build (e.g., Figure 6).

10
Figure 6. Strong motion recordings of earthquakes with magnitudes ranging from 3.1 to 8.1. The above simple considerations reveal that, in almost all potentially damaging earthquakes, there will be a time lag between when shaking is felt and when the most severe shaking occurs at that site. To inform decisions about earthquake response recommendations, it is useful to consider the expected distribution of this lag for potentially damaging earthquakes. For this, it is necessary to consider the expected distributions of earthquake locations that stand to impact a given population center.
3.2 S‐minus‐P time: Expected Distribution from First Principles As discussed earlier, because earthquake shaking attenuates with increasing distance from the fault, with especially strong attenuation in active tectonic areas such as California and the Caribbean (e.g., Frankel et al., 1990; McNamara et al., 2012), earthquakes rarely cause significant damage at distances greater than 200 km. Exceptions are almost always associated with strong local site amplifications, for example basin resonances in the lakebed zone underlying Mexico City during the 1985 M8.1 Michoacan, Mexico, earthquake. Although some authors have noted a tendency for population centers to cluster along active tectonic zones (e.g., Bilham, 2004), it is fair to assume that the point of nucleation of an earthquake along a fault will be random relative to the location of a given population center. For illustration, I consider a city adjacent to a major plate boundary fault that extends several hundred kilometers in both directions. As discussed earlier, in a region where structural vulnerability is high, an M7-7.5 earthquake that nucleates within 200 km of a given location will be potentially damaging, while a M6-6.5 earthquake within 100 km will be potentially damaging. I note that these calculations discount earthquakes that nucleate outside each distance limit but have finite-fault ruptures that extend within the limits. For example, a magnitude 7.5 earthquake at 250 km could potentially be damaging at a given location if the rupture propagates towards

11
that location. Field et al. (2014) show that it can be important to consider this effect in calculating hazard at a given location. I will return to this issue in Section 4. Even for a known fault, the precise nucleation point of a given earthquake is unpredictable; I assume it is equally likely to occur at any point along the fault. At the 90% confidence level, one expects the point of nucleation to be at least 20 km from the city for M7-7.5, and at least 10 km away for M6-6.5 (Figure 7). The expected S-minus-P time is thus at least 2-3 seconds. One can instead consider a population center relative to a two-dimensional (areal) distribution of faults. In this case, earthquakes are more likely to occur at greater distance from a given location because area increases as distance squared as one moves farther away. Again assuming that earthquakes of M6-6.5 and M7-7.5 will be potentially damaging at distances up to 100 and 200 km, respectively, there is a 99% chance a M7.5 earthquake will nucleate at a distance greater than 20 km, and a 90% chance the nucleation will be at a distance of 63 or more km. For a M6-6.5 earthquake, there is a 99% chance the nucleation will be at a distance of 10 km or more, and a 90% chance it will be at a distance of 31 km or more. At the 90% confidence level, the expected S-minus-P time in this case will be at least 4 seconds for M6-6.5 and at least 8 seconds for M7-7.5. I suggest the areal distribution is more realistic, even for most cities adjacent to major faults, because active secondary faults are ubiquitous within plate boundaries.
Figure 7 (a, left). Probability that a M7-7.5 earthquake will nucleate within a given distance of a population center assuming that the location lies along a major linear fault (light line) or that the location is in a two-dimensional space in which nucleations are equally likely. (b, right) Same calculation but for a M6-6.5 earthquake, assumed to be potentially damaging at distances up to 100 km.
3.3 Expected Duration of S wave I now address the question, how is strong shaking likely to evolve at a given site due to the prolonged earthquake rupture process? The expected duration of an earthquake rupture depends on the magnitude of the event. In any region, the magnitude-frequency distribution is almost universally characterized by a so-called b-value distribution, with a b-value close to one

12
(Gutenberg and Richter, 1944). The cumulative number, Nc, of events greater than a given magnitude is given by log(Nc) = a – bM (1) where a is a constant reflecting the overall activity level in a region. One thus expects roughly 10 times as many earthquakes with magnitudes close to 6 as with magnitudes close to 7, etc. Thus, while larger earthquakes are potentially more damaging, they are less likely. For example, given a set of 100 M≥6 earthquakes in a given region, 90% of the events are expected to be smaller than magnitude 7, and only 2% are expected to be M7.7 or larger. Over a suite of 100 6≤M≤8 events, the average expected magnitude is 6.3-6.4. In light of the overall magnitude-frequency distribution of earthquakes, in this report I focus on large and moderately large earthquakes. Returning to the question of expected duration, the average rupture length for M6.3-6.4 earthquake can be inferred from scaling relations (e.g., Wells and Coppersmith, 1994) to be approximately 10 km, which corresponds to a rupture time of 3-4 seconds. On average, assuming the maximum slip is reached at the midpoint of the rupture, the lag between the initial S wave and the strongest shaking will be short, on the order of 1-2 seconds. For infrequent very large events it will be much longer on average. The suite of strong ground motions shown in Figure 6 illustrate the expected difference in character of strong shaking during earthquakes ranging from M3.1-8.1. Because, as noted, large earthquakes are unlikely, one cannot count on a significant lag time between the initial S-wave arrival and the onset of the most severe shaking. The above calculations, based on seismological first principles, reveal that if a region with high structural vulnerability experiences a potentially damaging earthquake, there is a high (90%) probability that the S-minus-P time will be at least ≈5 seconds, and in many cases it will be more. Shaking severity is further expected to increase following the initial S-wave arrival, but this lag is expected to be short in all but the largest earthquakes, which will be relatively infrequent.

13
Figure 8 (a, bottom) Disaggregated seismic hazard for Oakland, CA, and (b, top) Los Angeles, CA (Petersen et al., 2008). Each of these panels is generated from a full PSHA analysis for each location: deaggregations show the sources as a function of both magnitude and distance that contribute to the overall hazard at a particular site. For example, in Oakland, CA (lower panel), the dominant contribution to hazard is from magnitude 6.5-7.5 earthquakes on a nearby fault (the Hayward fault), with a minor contribution from larger earthquakes on a more distant fault (the San Andreas.). A full description of these figures, and results for other locations in the United States, can be found at http://geohazards.usgs.gov/deaggint/2008/) Note again that the above calculations are based on the assumption that intensities as low as V will be potentially damaging, as the 2010 Haiti experience suggests. In a region with good building codes and construction, significant damage is not expected until shaking levels of VI-VII. In such a case, Figure 4 reveals that hazard will be strongly controlled by earthquakes in proximity to a given location. For example, predicted intensities for a M6.5 earthquake are below VII at distances beyond 21 km, and below VI for distances beyond 34 km. This implies

14
that, in regions where structural resilience is generally high, in the absence of local site amplifications, damaging M6.5 earthquakes will generally be within 35 km of a given location. The conclusion that, in well prepared regions like California, hazard will be dominated by earthquakes in proximity to a given location can be compared to the results of modern probabilistic seismic hazard analysis (PSHA), which involves estimation of hazard based on consideration of all potential future earthquakes that contribute to hazard at a particular site. A PSHA map characterizes the level of shaking expected at a given level of exceedance for a certain period of time, considering all possible sources. One can consider how much potential earthquakes at different distances contribute to the hazard, what is known as deaggregation. These results confirm that, in an active plate boundary zone where attenuation is high, hazard is strongly dominated by earthquakes within 25 km of a given location (Petersen et al., 2008; Figure 8), while distant sources become more important in intraplate areas where attenuation is lower and there are fewer potential source zones in the region (Figure 9). Sophisticated PSHA calculations such as those used to generate Figures 8 and 9 depend on extensive characterization of potential source zones, and are not available for most regions. However, I note that, for California, PSHA disaggregations support the inferences derived from first principles, and thus provide a measure of general support for these calculations.

15
Figure 9 (a, top) Deaggregated seismic hazard for St. Louis, Missouri, and (b, bottom) Raleigh, North Carolina. At St. Louis, hazard is dominated by the New Madrid Seismic Zone, at a distance of approximately 200 km; at Raleigh, hazard is dominated by the Charleston, SC, seismic zone, at a distance approximately 350 km. (Petersen et al., 2008).
4. Best and Worst Case Scenarios In all of the above calculations I have considered the level of shaking and S-minus-P time that is expected at a high level of probability, generally >90%. One can also consider both worst- and best-case scenarios. A worst-case scenario for earthquake response will clearly be an event that nucleates and has strong energy release very close to a population center. If, for example, the 2010 Haiti earthquake had nucleated in the same place, approximately 30 km west of Port-au-Prince, but ruptured towards instead of away from the capital city, the lag between initially felt and most

16
severe shaking could have been only 2-3 seconds. The actual lag during the earthquake is unknown, but eyewitness accounts relayed to the author suggest it must have been at least 5 seconds, and that it was possible to run out from small structures during the initially felt shaking, but not during the most severe shaking. Due to directivity, both the initial P wave and the S wave would likely have been stronger than the shaking level experienced in Port-au-Prince in 2010. The results presented in this study suggest that such a true direct hit will be rare but possible. In a worst-case scenario, people will likely be unable to walk or run, and in any case will have very limited time to take any action. The issue of earthquake response messaging might therefore be largely moot for a worst-case scenario. On the other hand, in this study I have considered the minimum S-minus-P time expected at high probability, generally 90% or higher. For a large number of earthquakes, the lag will be longer. For example, Figure 7 reveals that half of all potentially damaging M6 earthquakes will nucleate at distances greater 50 and 70 km, assuming linear and areal distributions, respectively, corresponding to S-minus-P times of roughly 6-9 seconds. Returning to the issue of earthquakes that nucleate at greater distances than the cut-offs used here but rupture towards a given location, a full consideration of this issue is beyond the scope of this report. But I note that, while additional distant earthquakes can certainly pose an additional hazard for a location, in such cases the S-minus-P time will be especially high. Additionally, in locations where strong local amplifications occur as a consequence of shallow sediment layers or local topography, damaging shaking will be generated by earthquakes at greater distances than suggested by Figure 4. Two well-known examples include the 1985 Michoacan, Mexico, earthquake, which caused substantial damage in Mexico City, at a distance of more than 350 km (Singh et al., 1988), and the 1989 M6.9 Loma Prieta, California, earthquake, which caused structural collapse in the San Francisco Bay area at distances of 80-100 km (Hough et al., 1990; Seekins and Boatwright, 1994). Further, as noted, because intraplate regions are characterized by significantly lower attenuation than active plate boundary zones, locations away from active plate boundaries will be exposed to potentially dangerous shaking levels from more distant earthquakes than is the case in active plate boundary regions (see Figure 9). The minimum expected S-minus-P time will therefore, on average, be higher.
5. Conclusions A combination of calculations based on first principals, modeling results from recent PSHA analysis, and empirical data from the USGS PAGER system leads to several conclusions about expected shaking during potentially damaging earthquakes: 1) If shaking severity during the S wave is high enough to be potentially damaging, there is a
high likelihood that the initial P-wave arrivals will be felt. 2) It is highly likely that there will be a delay of at least 5 seconds between the initially felt P
wave and the stronger S wave. In many cases the delay will be longer. During this time, shaking severity is highly likely to be no higher than MMI V.
3) Extreme shaking levels, MMI IX-X, are expected to be very rare. Among the populations that experienced MMI IV or greater shaking in 98 recent damaging recent earthquakes world-wide, only about ½ of 1% experienced MMI IX-X shaking.

17
4) Among the population of damaging earthquakes, true worst-case scenarios, whereby an earthquake nucleates and has strong energy release in proximity to a population center, are expected to be rare, but possible.
Aside from the worst-case scenarios, the results of this study suggest that, in most potentially damaging earthquakes, there will be a minimum lag of 5 seconds after the initial shaking is felt when it is possible for individuals to take action, including attempting to walk or run. Whether or not a particular action is advisable is beyond the scope of this report.
ACKNOWLEDGEMENTS I thank Morgan Page and Bob Dollar for constructive reviews of this manuscript. Figures generated using GMT package (Wessel and Smith, 1991).

18
References
Allen, R.M. and H. Kanamori (2003). The potential for earthquake early warning in southern
California, Science, 300, 786-789, doi: 10.1126/science.1080912.
Alexander, D. (1996) The health effects of earthquakes in the mid-1990s, Disasters, 20, 231-246.
Bakun, W.H. (2006). Estimating locations and magnitudes of earthquakes in southern California
from modified Mercalli intensities, Bull. Seism. Soc. Am., 96, 1278-1295, DOI:
10.1785/0120050205.
Bakun, W.H. and C.M. Wentworth (1997). Estimating earthquake location and magnitude from
seismic intensity data, Bull. Seism. Soc. Am., 87, 1502-1521.
Bilham, R. (2004). Urban earthquake fatalities: a safer world, or worse to come? Seism. Res. Lett., 75, 706-712, doi: 10.1785/gssrl.75.6.706.
Bilham, R. (2010). Lessons from the Haiti earthquake, Nature, 463, 878-879,
doi:10.1038/463878a.
Borcherdt, R.D. (1970). Effects of local geology on ground motion near San Francisco Bay, Bull. Seism. Soc. Am., 70, 29-61.
Cornell, C.A. (1968). Engineering seismic risk analysis, Bull. Seism. Soc. Am., 58, 1583-1606.
De Bruycker, M., D. Greco, and M.F. Lechat (1985). The 1980 earthquake in southern Italy –
morbidity and mortality, Int. J. Epidemiology, 14, 113-117, doi: 10.1093/ije/14.1.113.
DesRoches, R., M. Comerio, M. Eberhard, W. Mooney, G.J. Rix (2011). Overview of the 2010
Haiti earthquake, Earthq. Spectra, 27, S1-S21. doi: 10.1193/1.3630129.
Erdik, M. Y. Fahjan, O. Ozel, H. Alcik, A. Mert, and M.Gul (2003). Istanbul earthquake rapid
response and the early warning system, Bull. Earthq. Eng., 1, 157-163.
Espinosa Aranda, J.M., A. Jimenez, G. Ibarrola, F. Alcantar, A. Aguilar, M. Inostroza, and S.
Maldonado (1995). Mexico City seismic alert system, Seism. Res. Lett., 66, 42-54, doi:
10.1785/gssrl.66.6.42.
Field, E.H., R.J. Arrowsmith, G.P. Biasi, P. Bird, T.E. Dawson, K.R. Felzer, D.D. Jackson, K.M.
Johnston, T.H. Jordan, C. Madden, A.J. Michael, K.R. Milner, M.T. Page, T. Parsons,
P.M. Powers, B.E. Shaw, W.R. Thatcher, R.J. Weldon II, and Y. Zeng (2014). Uniform
California earthquake rupture forecast, Version 3, in press, Bull. Seism. Soc. Am., 104.
Frankel, A., A. McGarr, A. Bicknell, J. Mori, L. Seeber, and E. Cranswick (1990). Attenuation
of high-frequency shear waves in the crust: measurements from New York State, South
Africa, and Southern California, J. Geophys. Res., 95, 17441-17457.

19
Goodno, B.J., N.C. Gould, P. Caldwell, and P.L. Gould (2011). Effects of the January 2010
Haitian earthquake on selected electrical equipment, Earthquake Spectra, 27, S251-S276, doi: 10.1193/1.3636415.
Gutenberg, B., and C.F. Richter (1944). Frequency of earthquakes in California, Bull. Seism.
Soc. Am., 34, 185-188. Hardebeck, J.L. and P.M Shearer (2003). Using S/P amplitude ratios to constrain the focal
mechanisms of small earthquakes, Bull. Seism. Soc. Am., 93, 2434-2444. doi: 10.1785/0120020236.
Hough, S.E. (2000). On the scientific value of “unscientific” data, Seism. Res. Lett., 72, 483-485. Hough, S.E. (2010). Predicting the Unpredictable: The tumultuous science of earthquake
prediction, Princeton Univ. Press, 272 pp., Princeton. Hough, S. E. (2013). Spatial variability of “Did You Feel It?” intensity data: Insights into
sampling biases in historical earthquake intensity distributions. Bull. Seism. Soc. Am., 103(5), 2767-2781.
Hough, S.E. and R. Bilham (2005). After the earth quakes: elastic rebound on an urban planet,
Oxford Univ. Press, 336 pp., New York. Hough, S.E., R.D. Borcherdt, P.A. Friberg, R. Busby, E.F. Field, and K.H. Jacob (1990).
Sediment-induced amplification and the collapse of the Nimitz freeway, Nature, 344, 853-855.
Hough, S.E., T. Taniguchi, and J-R. Altidor (2012). Strong ground motion during the 12 January
2010 Mw7.0 Haiti earthquake: Estimation of peak ground acceleration from rigid body displacement, Bull. Seism. Soc. Am., 102, 2704-2713 (doi:10.1785/0120120047).
Johnston, D., R. Tarrant, K. Tipler, M. Coomer, S. Pedersen, and R. Garside (2011). Preparing
schools for future earthquakes in New Zealand: Lessons from an evaluation of a Wellington school exercise, Australian J. of Emerg. Management, 26, 24-30. Issn: 1324-1530.
Kamigaichi, O. (2004). JMA Earthquake early warning, J. Japan Assn for Earthq. Eng., 4, 134-
137. McNamara, D., M. Meremonte, J.Z. Maharrey, S-L. Mildor, J.R. Altidor, D. Anglade, S.E.
Hough, D. Given, H. Benz, L. Gee, A. Frankel (2012), Frequency Dependent Seismic Attenuation within the Hispaniola Island Region of the Caribbean Sea, Bull. Seism. Soc. Am., 102, 773-782.

20
Mileti, D.S., C. Fitzpatrick, and B.C. Farhar (1992). Fostering public preparations for natural
hazards: lessons from the Parkfield earthquake prediction, Environment, 34, 16-20 and
36-39.
Miyamoto, H.K., A.S.J. Gilani, and K. Wong (2011). Massive damage assessment program and
repair and reconstruction strategy in the aftermath of the 2010 Haiti earthquake, Earthq. Spectra, 27, S1, S219-S237, doi: 10.1193/1.3631293.
Osamu, M.H., Shin’ya, K.M.S., and Hamada, T.N. (2008) Earthquake early warning starts
nationwide in Japan, Eos, Trans. Am. Geophys. U., 89, 73-74, doi:
10.1029/2008EO080001.
Padgett, T. (2010). How to survive an earthquake: two schools of thought, Time Magazine, 1
Feb. 2010.
Patel, M. (2011). Earthquake casualties research and public education, in Human casualties in
earthquakes, advances in natural and technological hazards research 29, R. Spence et al.,
eds, Springer Science, doi:10.1007/978-90-481-9455-1_3.
Petersen, M.D. Frankel, A.D., Harmsen, S.C., Mueller, C.S., Haller, K.M., Wheeler, R.L.
Wesson, R.L., Zeng, Y., Boyd, O.S., Perkins, D.M., Luco, N., Field, E.H., Wills, C.J.,
and Rukstales, K.S. (2008). Documentation for the 2008 update of the United States
National Seismic Hazard Maps, U.S. Geological Survey Open-File Rep. 2008-1128.
Peek-Asa, C., J.F. Kraus, L.B.Bourque, V. Dushyanthi, J. Yu, and J. Abrams (1998). Fatal and
hospitalized injuries resulting from the 1994 Northridge earthquake, Int. J. Epidemiology, 27, 459-465.
Ramirez, M. and C. Peek-Asa (2005). Epidemiology of traumatic injuries from earthquakes,
Epidemiol. Rev., 27, 47-55, doi:10.1093/epirev/mxi005.
Shearer, P.M. (1999). Introduction to Seismology, Cambridge U. Press, New York
Seekins, L. C., & Boatwright, J. (1994). Ground motion amplification, geology, and damage
from the 1989 Loma Prieta earthquake in the city of San Francisco. Bulletin of the Seismological Society of America, 84(1), 16-30.
Singh, S. K., Mena, E. A., & Castro, R. (1988). Some aspects of source characteristics of the 19
September 1985 Michoacan earthquake and ground motion amplification in and near
Mexico City from strong motion data. Bulletin of the Seismological Society of America, 78(2), 451-477.
Wald, D. J., V. Quitoriano, L. Dengler, and J. W. Dewey (1999). Utilization of the Internet for
Rapid Community Intensity Maps, Seism. Res. Lett., 70, No.6, 680-697.
21
Wald, D., Jaiswal, K., Marano, K., Earle, P., & Allen, T. (2011). Advancements in casualty modelling facilitated by the USGS prompt assessment of global earthquakes for response (PAGER) system. In Human Casualties in Earthquakes (pp. 221-230). Springer Netherlands.
Ward, S.N. (1997). Dogtails versus rainbows: synthetic earthquake rupture models as an aid in
interpreting geological data, Bull. Seism. Soc. Am., 87, 1422-1441. Wells, K.J.. and D.L. Coppersmith (1994). New empirical relationships among magnitude,
rupture length, rupture width, rupture area, and surface displacement, Bull. Seism. Soc. Am., 84, 974-1002.
Wesnousky, S.G. (2008). Displacement and geometrical characteristics of earthquake surface
ruptures: issues and implications for seismic hazard analysis and the process of earthquake rupture, Bull. Seism. Soc. Am., 98, 1609-1632, doi: 10.1785/0120070111.
Wessel, P., and W.H.F. Smith (1999). Free software helps map and display data, Eos Trans.
AGU, 72, 441, 445.

Un
Devel
nderstan
loping Me
nding A Me
Dep
A Bssages for
and Message
Popartment
Çank
BackgrounProtective
Co
Mitigatin for Th
olat Gülkt of Civil kaya Univ
nd Paper foe Actions t
onducted
ng Buihose W
kan Engineer
versity
or the Projto Take D
by:
ilding CWithin
ring
ject: During Eart
Collaps
thquake Sh
ses:
haking

1
Understanding and Mitigating Building Collapses: A Message for Those Within1
P. Gülkan Department of Civil Engineering
Çankaya University Ankara 06790, Turkey
PREFACE GeoHazards International (GHI) is developing guidance on how to formulate messages about protective actions that people in low- and middle-income countries can take during earthquake shaking. This guidance is about what research indicates about the likelihood of collapse of different types of buildings (e.g., steel frame, adobe, vernacular) during different levels of earthquake shaking. Of equal priority is finding out what information is available about how quickly different types of buildings collapse, and the relationship between how quickly these building types collapse and ground shaking characteristics, and what role site conditions play. Survival of earthquake victims depends on their awareness of how vulnerable their building enclosures may be, and this awareness can be enhanced by messages that are easily understood. In this contribution, a broad synopsis is presented of building types and their observed performances during past earthquakes. Its primary source is the World Housing Encyclopedia, a joint undertaking of the Earthquake Engineering Research Institute (EERI) and the International Association for Earthquake Engineering (IAEE). Its URL is www.worldhosing.net.
1. IntroductionThere exist many hundreds of millions of buildings in the world, covering every conceivable type, form, size, material and other attribute that may come to mind to fulfill some human need. They range from the simple hut built from vernacular materials by their occupants to the sophisticated multistory skyscraper where every tool of technology has been used in bringing it to the completed stage. Many of these buildings exist in regions with seismic hazard, and many are seismically vulnerable. During the decade 2000-2009, more than 200,000 people are estimated to have lost their lives on account of ground shaking alone. Earthquake-related causes, including tsunamis and fires, may have claimed an equal or larger number of lives. In large part, building collapses are responsible for killing occupants and passers-by. A building collapse is the most egregious form of structural engineering failure, because if it occurs in aggregate form such as during earthquakes it disrupts people’s lives and their economies. Yet, it happens, and not only in less developed regions or countries but also in areas with developed economies and higher standards of living. Many factors, most of which are easy to identify with the benefit of hindsight, combine to contribute to this tragic eventuality. While it may be unaffordable to build buildings that will not suffer any damage during any earthquake, it is possible and relatively easy to build them in a way that will not
1 This work has been performed for GeoHazards International as part of the Project “Developing Guidance on Protective Actions to Take during Earthquake Shaking” funded by USAID/OFDA.

2
lead to abject defeat in the face of natural effects. The engineering measures that must be put into effect to prevent utter collapse have been known for decades, and are not particularly challenging to implement. It is truly unconscionable that such relatively elementary measures cannot be put into practice, for any type of building, to save the thousands of lives each year that are sacrificed to earthquakes. This report deals with building classes in broad outline and their observed earthquake performance. A focused taxonomy of buildings has been prepared by Brzev et al. (2013) where a full compendium of their earthquake performance is also found. This resource is used repeatedly in this text because of its relevance and scope.
2. TheBuildingEnvironmentA building is defined as any enclosed, permanent structure for the purpose of sheltering animals, goods or, primarily, people. The principal actor in shaping a building in a way that will allow it to serve its intended function is the architect, though we can safely state that most buildings that exist now have been created in less formal ways. Vernacular architecture refers to architecture based on localized needs and construction materials, and reflecting local traditions or customs (Brzev et al., 2013).
3. VernacularArchitectureWe must begin with vernacular buildings because that is where most people in the world live. Vernacular architecture is architecture based on localized living styles, climate needs, means of construction technologies, and available materials. All of them reflect local traditions, standards of living and cultural attributes. Vernacular buildings are generally constructed by their owners or journeyman builders without technical training, and are often referred to as “non-engineered” buildings. The majority of vernacular buildings are residential buildings (dwellings). This type of building cannot be ignored because it comprises more than 90 percent of the world’s building stock, believed to be of the order of one billion (Brzev et al., 2013). A very small fraction (perhaps 1 percent) of all dwellings in the world has been designed by architects and engineers. Vernacular buildings are mainly confined to developing countries and are inhabited by people from many different cultures. Houses in informal or squatter settlements must be included in this building type because in many burgeoning urban centers in underdeveloped or developing economies, migration of rural disadvantaged populations to cities has created a ballooning of such buildings that ring the more organized developed urban pockets of cities. In 2001 they provided shelter for some 32 percent of the urban population, or 20 percent of the world’s population. A detailed overview of vernacular buildings around the globe is presented in Oliver (1997). World Housing Encyclopedia offers a wealth of information related to global vernacular housing, including socio-economic, architectural, structural and seismic features, as summarized by Sassu (2004). Vernacular dwellings are usually designed keeping in mind economic and social needs, protection from the elements, and a need to provide a livable atmosphere for the occupants. Seismic safety of these buildings is often not among the key construction considerations. In some areas of the world, heavy earthen roofs and thick stone walls have been used for traditional housing construction despite their negative implications for seismic vulnerability – roof types were primarily a response to day-to-day comfort and functional needs. Vernacular architecture comes in many different forms and sizes, materials and qualities. Virtually the only comprehensive, global compendium of the many different types of houses

3
that conform to this classification is the World Housing Encyclopedia (WHE). Implicit in the phrase “vernacular architecture” is the understanding that, because owners or the poorly qualified foremen they hire build these buildings, little, if any, of the principles of current earthquake-resistant concepts and details are reflected in their load bearing systems. The result is that the finished products are uniformly vulnerable to ground motions of even moderate intensity, and lead to much life and material loss. Figure 1 shows a typical example from an earthquake in Turkey in October 2011.
Figure 1. Vernacular Rural Stone Masonry Architecture, Van Earthquake, 2011 (http://eerc.metu.edu.tr/tr/system/files/images/vaneq2310/van_odtu_dmam_rapor.pdf) Additional views of vernacular construction, peculiar to rural or semi-rural areas in Turkey are shown in Figures 2(a)-(c).

4
Figure 2. Vernacular Masonry Construction WHE lists the following entries for “vernacular” type of construction: Report # 92: Historic, braced frame timber buildings with masonry infill (‘Pombalino’ buildings) Report # 88: Confined brick masonry house Report # 80: Low-strength dressed stone masonry buildings Report # 74: Un-coursed rubble stone masonry walls with timber floor and roof Report # 72: Traditional rural house in Kutch region of India (“bhonga”) Report # 58: Rubble-stone masonry house Report # 56: Timber log building Report # 47: Traditional oval-shaped rural stone house Report # 45: Rammed earth house with pitched roof Report # 43: Rural mud wall building The following commonalities are noted for the array of buildings listed under this heading, as well as under the headings of “adobe,” “unreinforced/confined masonry” and “stone masonry”:
x They are likely to be occupied by people in the lower income segments of the country’s economy, and are typically one or two stories tall.
x Modifications in the load bearing system on account of emerging needs are frequent, and these changes invariably tend to weaken the structural integrity in some way.
(a) Unreinforced Solid Brick Masonry
(b) Rural Stone Masonry with Mud Mortar
(c) Rural Adobe

5
x The cost of construction may range from less than $100/m2 to perhaps $200/m
2, and
there is an established awareness that these buildings have poor resistance against
earthquake effects.
x People continue to live in them, despite this bleak foreboding, because they cannot
afford an alternative, and feel that the risk they take is shared by many in their
community.
x The economic impact of major damage to vernacular buildings is manifested initially
as the injuries and life losses and the damages to the transportation or communication
systems, infrastructure deterioration, unemployment, production losses and adverse
fluctuations of inflation. These losses are restituted in varying degrees by some
central government, usually in the form of compensatory housing.
The WHE contains no information on how long it takes any one of these types of buildings to
collapse wholly or partially, leading to a referenced estimate of the chances of the occupants
to flee to life safety. A generalization may be made here to the effect that, where feeble
vernacular housing exists in seismically hazardous areas, loss of life is very heavy because of
the rapid, brittle failure of the vertical load bearing system. The brunt is borne by the
economically disadvantaged segments of society, meaning, euphemistically, the poor.
4. GeneralizationsfromCollapsesofVernacularBuildingsThe following conclusions stem from many years of personal observations, and accounts of
others that have circulated.
There is usually extensive structural damage throughout a region where elements of the
building stock such as those shown in Figures 1 and 2 exist in large numbers and where
strong earthquake hits. Unreinforced masonry (URM) buildings incorporating a “soft” first
floor attribute (large store windows for commercial use) and adobe structures are most
vulnerable to collapse.
Most people are likely to be indoors at the time of the earthquake. The length of time that
elapses between the perception that an earthquake is occurring (rumbling of the ground or the
sound of distressed structural components) and actual collapse is usually too short to react in
a way to save oneself. Most casualties occur in URMs. Many of the victims die slowly, the
majority being pinned or trapped under furniture or fallen posts and beams. Most victims are
likely to have been occupying the ground floor when compared with survivors.
Official medical and search and rescue responders arrive after most deaths had occurred.
Prior first-aid or rescue training of lay, uninjured survivors has been reported to be associated
with a higher likelihood of rescuing and resuscitating others.
These conclusions are hardly new. It has been known for a long time that during an
earthquake, URMs, especially those with soft ground floor construction are highly lethal,
especially for occupants on the ground floor, suggesting that this building type is
inappropriate for areas of seismic risk. Major US cities (Los Angeles) have enacted
ordinances to identify and retrofit such buildings. The vulnerability of URMs appears to be
due to a lack of lateral force resistance resulting from the use of glass store front windows
and the absence of adequate shear walls. To reduce the large portion of victims who die
slowly at the scene of earthquake injury, prior public first-aid and rescue training programs

6
would increase participation in rescue efforts and may improve chances of survival in major earthquakes.
5. PrecastConcreteConstructionTo reduce forming and false-work at the construction site, concrete members and panels can be precast and produced in a factory. The concept of precast (also known as “prefabricated”) construction includes those buildings where the majority of structural components are standardized and produced in plants in a location away from the building, and then transported to the site for assembly. These components are manufactured by industrial methods based on mass production in order to build a large number of buildings in a short time at low cost. The main features of this construction process are as follows:
x The division and specialization of the human workforce x The use of tools, machinery, and other equipment, usually automated, in the
production of standard, interchangeable parts and products This type of construction requires a restructuring of the entire conventional construction process to enable interaction between the design phase and production planning in order to improve and speed up the construction. One of the key premises for achieving that objective is to design buildings with a regular configuration in plan and elevation. Urban residential buildings of this type are usually five to ten stories high, and rarely exceed 18 stories because of their weight (see Figure 3).
Figure 3. Precast Building under Construction (Brzev and Guevera-Perez, 2008) 5.1 Historical Background, Precast Concrete In response to the widespread damage caused by WWII, many governments in Europe resorted to the use of various precast (used interchangeably with the designation “prefabricated”) building systems during their reconstruction during the second half of the 20th century. The same construction technique also provided low-income housing for the growing urban population of many, mostly socialist economy, countries. In general, precast building systems are more economical when compared to conventional multifamily residential construction (apartment buildings) in many countries (Brzev and Guevera-Perez, 2008). In Turkey, a cast-in-place version of the same type of mass-produced building has evolved, particularly in the post-1980 period. The World Housing Encyclopedia (http://www.world-housing.net/) provides information on categories of precast buildings in the following reports: #32 (Kazakhstan); #33, #38, and #39 (Kyrgyzstan); #55 (Russian

Federattype pec Dependcategor
x x x x
5.2 L The desand floopanels elike strupanels atwo-watransfer
Figure Monten Panel colocationjoints. Vverticalwall andconstruwith cacontinuotherwiconstruof the p
tion); #66 (Uculiar to Tu
ding on the lies: Large-paneFrame systeSlab-columMixed syst
Large-Pane
signation “laor concrete enclose appucture (see Fare usually ay slabs. Whr the lateral
4: A typicanegro)
onnections n within a bVertical joinl seismic shed floor panection methost-in-place c
uity, protrudise connectected by bolt
precast pane
Uzbekistan)urkey is desc
load-bearin
el systems ems
mn systems wems
el Systems
arge-panel spanels conn
propriate spaFigure 4). Bone story hihen properlyloads to the
al precast s
represent thuilding, thents connect ear forces. Hels and resisod, these joiconcrete po
ding reinforced in the joiting or weld
els for this p
); #68 (Serbcribed in Re
g structure,
with walls
system” refnected in thaces for the Both verticaigh. Horizoy joined toge walls.
slab-column
he key strucese connectithe verticalHorizontal jst both gravints can be c
oured betwecing bars froint region beding togethepurpose. We
7
bia and Moneport #101.
precast sys
fers to multihe vertical an
rooms withal and horizontal floor an
gether, the h
n building
ctural compoions can be l faces of adjoints conne
vity and seisclassified as
een the precaom the paneefore the coer steel platet joints mo
ntenegro); #
stems can be
istory structnd horizonthin a buildinontal panelsnd roof pan
horizontal el
(WHE Rep
onents in thclassified in
djoining walect the horizsmic loads.s wet and drast panels. Tels (dowels)oncrete is ples or other re closely a
#83 (Roman
e divided in
tures compotal directionng. These ps resist gravnels span eitlements act
port #68, Se
hese systemsnto vertical ll panels anzontal facesDepending ry. Wet joinTo ensure s) are weldedlaced. Dry jsteel inserts
approximate
nia). The tun
nto the follo
osed of largns so that theanels form
vity load. Wther as one-was diaphrag
erbia and
s. Based onand horizon
nd primarilys of the adjoon the
nts are constructural d, looped, ooints are s cast into the cast-in-pla
nnel
owing
e wall e wall a box-
Wall way or gms that
n their ntal
y resist oining
tructed
or
he ends ace
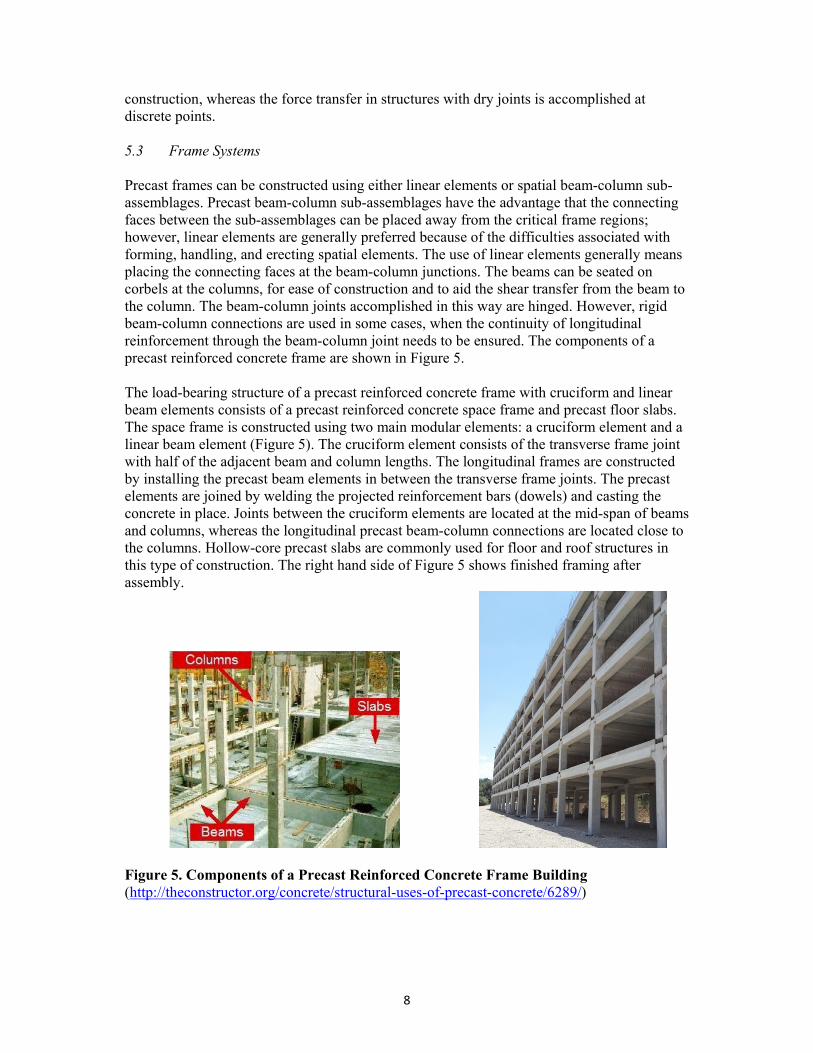
8
construction, whereas the force transfer in structures with dry joints is accomplished at discrete points. 5.3 Frame Systems Precast frames can be constructed using either linear elements or spatial beam-column sub-assemblages. Precast beam-column sub-assemblages have the advantage that the connecting faces between the sub-assemblages can be placed away from the critical frame regions; however, linear elements are generally preferred because of the difficulties associated with forming, handling, and erecting spatial elements. The use of linear elements generally means placing the connecting faces at the beam-column junctions. The beams can be seated on corbels at the columns, for ease of construction and to aid the shear transfer from the beam to the column. The beam-column joints accomplished in this way are hinged. However, rigid beam-column connections are used in some cases, when the continuity of longitudinal reinforcement through the beam-column joint needs to be ensured. The components of a precast reinforced concrete frame are shown in Figure 5. The load-bearing structure of a precast reinforced concrete frame with cruciform and linear beam elements consists of a precast reinforced concrete space frame and precast floor slabs. The space frame is constructed using two main modular elements: a cruciform element and a linear beam element (Figure 5). The cruciform element consists of the transverse frame joint with half of the adjacent beam and column lengths. The longitudinal frames are constructed by installing the precast beam elements in between the transverse frame joints. The precast elements are joined by welding the projected reinforcement bars (dowels) and casting the concrete in place. Joints between the cruciform elements are located at the mid-span of beams and columns, whereas the longitudinal precast beam-column connections are located close to the columns. Hollow-core precast slabs are commonly used for floor and roof structures in this type of construction. The right hand side of Figure 5 shows finished framing after assembly.
Figure 5. Components of a Precast Reinforced Concrete Frame Building (http://theconstructor.org/concrete/structural-uses-of-precast-concrete/6289/)

9
Precast concrete structural systems have many different sub-types, some incorporating shear walls, or walls combined with lift slabs, pre-stressed slab and column systems or combinations of these. All precast structural elements are assembled by means of special joints. Reinforced concrete slabs are poured on the ground in forms, one on top of the other, and lifted from the ground up to the final height by lifting cranes. In the connections, the steel bars (dowels) that project from the edges of the slabs are welded to the dowels of the adjacent components and transverse reinforcement bars are installed in place. The connections are then filled with joint concrete that is poured at the site. Most buildings of this type have some kind of lateral load-resisting elements, mainly consisting of cast-in-place or precast shear walls, etc. In case lateral load-resisting elements (shear walls, etc.) are not present, the lateral load path depends on the ability of the slab-column connections to transfer bending moments. When the connections have been poorly constructed, this is not possible, and the lateral load path may be incomplete. Properly constructed slab-column joints are capable of transferring moments, but this requires good quality control during construction. When this is missing, then poor performance under strong ground shaking is unavoidable. 5.4 Earthquake Performance of Precast Concrete Buildings All precast reinforced concrete buildings have pre-formed joints or planes of discontinuity that may serve as locations of weakness where large displacements occur, which then become sources of failure. There is a general concern among the earthquake engineering community regarding the seismic performance of precast construction. However, based on experience in past earthquakes in Eastern European and in Central Asian countries where these systems have been widely used, it can be concluded that their seismic performance has been fairly satisfactory. When it comes to earthquake performance, the fact is that “bad news” is more widely publicized than “good news,” and the 1988 event in Armenia served as the messenger of that bad news. For example, the very poor performance of precast frame systems of Seria 111 in the 1988 M7.5 Spitak (Armenia) earthquake is well known (see Figure 6) though the good seismic performance (minor damage) of several large-panel buildings under construction at the same site, shown in Figure 7 did not capture any headlines on account of the heavy loss of life caused by the abject collapse of the precast frame buildings that gave their occupants little chance of survival. The UNIDO (1983) report is a summary of recommended good practices that has not always been matured by later experience. In the most adverse case, precast buildings must collapse rapidly, like a badly assembled Lego toy house. Their collapse is progressive, which means that once a vertical element is dislodged its absence triggers others to follow, and the chain continues unbroken. The role that ground characterization plays in their seismic response is uncertain, but given that most of these buildings have short periods of vibration, their susceptibility is due to the ground accelerations.

Figure Earthq
Figure Buildin(Earthq Owing and are performArmenihowevedesigne(M 7.0)(M 7.3)Federat
6. Precast quake
7. Precast ngs in the Bquake Spectr
to their largcharacteriz
med well in tia earthquaker, that largeed with seism), but more d), as some btion, WHE R
Frame Typ
Frame TypBackgroundra (1989), S
ge wall denszed with a rathe past earke and the19e-panel builmic provisiodamage wa
buildings haReport #55)
pe Building
pe Buildingd, 1988 SpiSpecial Issue
sity and boxather short frthquakes in976 Gazly eldings in theons. Most ss observedd been alrea). Large-pan
10
g Collapses
g Collapsestak (Armene on the Arm
x-like structfundamenta
n the formerearthquakese area affectsuch buildinin the seconady weakennel building
s in the 198
s in the Fornia) Earthqmenian Ear
ture, large-pal period. Inr Soviet Unis (Uzbekistated by the G
ngs performend earthquaned by the figs performed
8 Spitak (A
reground anquake rthquake, 5_
panel buildinn general, laion, includinan). It shoulGazly earthqed well in th
ake that occufirst earthqud well in th
Armenia)
nd Large P
_S1 (Augus
ngs are veryarge-panel bng the 1988ld be noted, quakes werehe first earturred the saake (Russia
he 1977 Vran
Panel
t)
y stiff, buildings 8
e not thquake ame year an ncea

11
(Romania) earthquake (M 7.2) and in subsequent earthquakes in 1986 and 1990 (Romania, WHE Report #83).
6. GeneralizationsfromCollapsesofPrecastConcreteBuildingsThe following account is based largely on the experience from Spitak, for which reliable data on mortality and morbidity is given in the chapter on search and rescue of victims of the Earthquake Spectra Special Issue (Earthquake Spectra, 1989). Of the 700,000 people who were exposed to the strong ground shaking in the epicentral area, 25,000 are reported to have lost their lives, and twice that number were seriously injured. This is truly a very high percentage of deaths, caused no doubt by the type of construction that fell down, trapping all those within on a cold winter day. Authorities reported extricating alive some 15,000 persons from the rubble. The precast frame building collapses of 9-story buildings with 32 to 36 apartments each entrapped many residents. The precast panel buildings were typically up to five stories tall, and contained up to 30 apartments. Each type used 0.2 m deep and 1 m wide precast concrete panels for flooring spanning between bearing walls or girders. The panels were not properly connected to the supporting elements and failed to perform as diaphragms. The floor system appeared to have complicated the search and rescue efforts, and reduced significantly the possibility of victim survival. In cases of total vertical collapse, the dislodgment of the floor system above resulted in a tight packing of the fallen rubble with no voids or living spaces for occupant survival. It may be surmised that total descent of the supporting floors occurred very rapidly, certainly faster than the reaction time of most people. Most of the severely injured victims suffered from multiple trauma to their organs, such as skull fracture combined with collapsed lung. Many patients also developed the crush syndrome when injured muscles release harmful intracellular substances that can be lethal to other vital organs. Kidney failure is the diagnosed cause of death, but its origin is traceable to crushing under the structural weight.
7. ReinforcedConcreteBuildingsIn many countries, poured-in-place reinforced concrete is the most economical form of building type. This general type of structural framing is by far the most prevalent form of generic building class known as “reinforced concrete,” and is different from precast concrete in that the material is poured at the site. The seismic design of reinforced concrete systems has evolved and matured during the past fifty years, and, if known principles of earthquake-resistant design and construction practices are followed and enforced in the field, the finished product should be fully reassuring for the life and limb safety of its occupants. Progress notwithstanding, reinforced concrete buildings have been known to collapse in spectacular fashion in earthquakes. Figures 8 and 9 illustrate some examples of notorious cases.
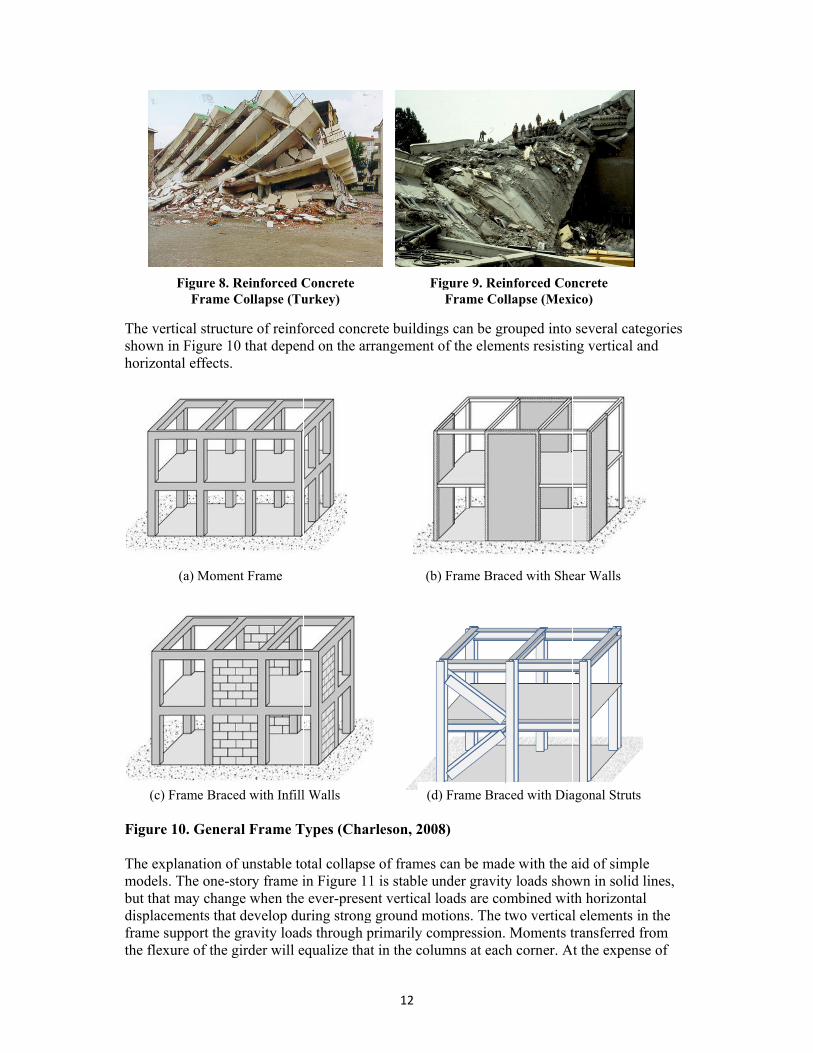
The vershown ihorizon
Figure The expmodels.but thatdisplaceframe sthe flex
(c) F
rtical structuin Figure 10
ntal effects.
10. Genera
planation of. The one-stt may changements that upport the g
xure of the g
(a) Momen
Frame Brace
Figure 8. RFrame C
ure of reinfo0 that depen
al Frame T
f unstable totory frame ige when the
develop dugravity loadgirder will e
nt Frame
ed with Infill
Reinforced CCollapse (Tu
orced concrnd on the arr
Types (Char
otal collapsein Figure 11
e ever-presenuring strongds through pequalize that
l Walls
Concrete urkey)
12
rete buildingrangement
rleson, 200
e of frames 1 is stable unt vertical l
g ground moprimarily cot in the colu
(b)
(d
F
gs can be grof the elem
8)
can be madunder gravityloads are cootions. The tompression.umns at each
) Frame Brac
) Frame Brac
igure 9. ReiFrame Col
rouped into ents resistin
de with the ay loads show
ombined wittwo vertical Moments th corner. A
ced with She
ced with Dia
inforced Conllapse (Mexi
several cateng vertical a
aid of simplwn in solid th horizontal elements itransferred ft the expens
ear Walls
agonal Struts
ncrete ico)
egories and
le lines,
al in the from se of
s

gross siprovidemetaphunder econcretthese sp When thnow auga counteon the cframe dmomendisplaceoccurreresembl Figure When thinertia funder-cand gra Figure
implificationed by a rotator for the pnd rotationse elements
prings retain
he frame is gmented byer-equilibracolumn resudisplacemennt as it rotateements cann
ence takes ples Figures
11. Mecha
he resistingforce transmcapacity flooaphically in
12. Groun
n, the mechtional springlastic hinges. Code requhave the obn their abilit
displaced fy that from tating momenulting from tnt occurs moes further, thnot be held lace in a bu8 and 9.
anism of Un
g capacity ofmitted from or helps to bFigure 12.
d Floor Co
hanism for thg that acts i
e that reinforuirements f
bjective of ety to produc
from its equthe horizontnt to restorethe combinore rapidly then the procin check an
uilding with
nstable Fail
f a single stall of the fl
bring down
ollapse
13
he moment n such a senrced concre
for detailingensuring thace moment
uilibrium potal displaceme equilibriumation of grathan the capcess becom
nymore. Theseveral sto
lure
tory (usuallyloors above all of the re
transfer is nse as to resete elementsg reinforcemat, even undresistance w
osition, the mment, and thm. If the ac
avity loads apacity of the
mes viciouslye result is cories the resu
y the groundbecomes m
emaining flo
shown in thstitute stabis are expect
ment near ender repeated with no loss
moment undhe rotationacretion of aacting throue spring to my circular, aollapse. Whulting heap
d floor whemaximum) th
oors as show
he figure as lity. The spted to develonds of reinfo
cyclic rotats of capacity
der vertical al spring proadditional mugh the horizmobilize resand further hen a similaof floor slab
ere the horizhe failure own schemat
being pring is a op orced tions, y.
load is oduces
moment zontal storing
ar bs
zontal f that tically

14
Figure 13 shows another example with the frame at the weak and higher ground story displaying a residual displacement that is synonymous with near-collapse performance. Note that the building was nearly completed, and the residential units above ground as yet unoccupied. Figure 13. A Reinforced Concrete Frame Building at Near Collapse Multi-residential unit apartment buildings of up to eight stories tall are where most middle- to low-income groups of urban societies in many countries live. Their chain of delivery follows different paths. In countries with a current or past socialist economic order, these were usually designed by central government offices, most far removed from the sites where they would eventually be built. A combination of under-design, negligent quality assurance, and imperfect understanding on the part of the engineers of how to inject seismic resistance has been identified as the prime cause of their poor response. In Turkey as well, where urban development has usually taken a private economy path with developers and land owners reaching parcel-for-apartment-unit agreements, shoddy design and poor workmanship have been the primary causes for the appalling rates of collapse (see the earthquake Spectra Special Issue on the Kocaeli Earthquake, 2000). Poor code enforcement, unwitting designs leading to non-ductile framing, aversion to the use of shear walls, and inadequate robustness also played a major role in the unprecedented losses.
8. AlertTimeforImpactedPersonsAn intriguing question is whether the average person occupying a building that is likely to collapse might have enough time to flee that building immediately after perception of the ground shaking. Earthquake science informs us that the relatively low amplitude, less damaging compression waves that travel at perhaps 5 km/s arrive at a site first, and then the more damaging shear waves that propagate at some 3 km/s arrive next. Converting this information for S minus P arrival times (∆t) to the distance, we see that the apocryphal point from which all waves emanate must be at a distance of 7.5∆t in km. So at an epicentral distance of 45 km, there exists an alert time of some 6 seconds for a person to realize that an earthquake is underway, and make a run for safety.

15
For all but the very rare, fortuitous circumstances, that delay time does not translate into a rational or sufficient reaction interval for anyone to flee the building where they happen to be if that building begins to collapse, or appears to do so imminently. Earthquake early warning systems (EEW) that have been installed in seismically prone cities are really intended to trip shut power circuits in critical facilities or disable pressure valves in gas distribution networks, because signals travel rapidly to enable switching off automatically. Whether people would have enough delay time to exit a building that is about to experience total collapse is dicier. The duration of collapse is not related to the building’s period of vibration, but is controlled by the sequence of elimination of vertical elements as they fail. Whether the collapse will be total as in Figures 8 or 9, or partial as in Figure 12 (where, except for those who happened to reside in the failed ground level, people in the upper levels were probably able to clamber down to safety once the shaking had subsided), or on the brink of collapse though still standing as in Figure 13, is not easy to predict. Structural engineering science does not yet have the tools to say which will occur. Rough calculations of how long it might take an idealized assembly such as in Figure 11 to collapse (defined as the state when the two initially vertical columns become horizontally oriented) show that we are talking of a few seconds, not more than about 3-4 seconds, until degradation of column strength is overcome by supported weight. That situation is of course exacerbated by the simultaneous action of the earthquake ground motion. The M7.1 earthquake near the city of Van on October 23, 2011 was followed by an M5.7 event on November 9 that may not have been an aftershock, but rather a separate but related earthquake. At an estimated epicentral distance of about 12 km, the delay time for the second earthquake was of course shorter, but there exist several video recordings of the aftershock where the collapse of a building is vividly captured also: https://www.youtube.com/watch?v=hfZL-oFO5F0. This rare movie is instructive in several ways. Between October 23 and November 9, many aftershocks had occurred, with some that were felt very strongly in Van and its neighboring cities that had suffered the loss of 550 lives during the initial event. Everyone had been put on edge by the never-ending stream of aftershocks. The time of the aftershock was 21.23 hours. During the first couple of seconds the footage shows people, mostly males, making a frantic dash for the safety of the street from only the ground level of the building, a hotel, on the left of the first segment. That hotel appears to fall down in one or two seconds, raising a cloud of dust which is visible in other video camera segments from other angles. The collapse of the hotel claimed 9 additional lives, one of whom was a Japanese physician who had arrived in Van following the 23 October event.
9. TimberFramedBuildingsIn Turkey and neighboring countries, even as traditional forms of construction for dwellings are being replaced with new buildings that incorporate steel and reinforced concrete, the chances of survival of their occupants during strong earthquakes has not improved. The astounding human losses in many recent earthquakes bear testimony to this truth. The timber frame with masonry infill construction found in many of the countries around the Mediterranean basin evolved over hundreds of years in response to both social and economic needs. One of those needs was protection against collapse in the earthquakes that regularly strike the region. Over the last half-century, this traditional way of building has been replaced with reinforced concrete. As recent earthquakes have tragically demonstrated, the initial promise of this new material has not been realized because of failures in the entire building

16
delivery process. Attempts at improving the quality of concrete buildings have been frustrated by an inability to affect what is largely an unsophisticated and unregulated industry. An examination of traditional Turkish “hımış” construction may bear some important lessons not just for cultural heritage conservation, but also for the introduction of creative approaches to hazard mitigation in contemporary buildings as well. In many areas of the world there is a false belief that modern materials and means of construction are better than time-honored methods of the past, yet the changes brought by industrialization have been so rapid as to cause great changes in local methodologies of building construction without a full assessment of the consequences. Communities in which building traditions had not changed significantly in centuries have been confronted with radical changes in a single generation. Traditional materials, such as timber, have disappeared, to be replaced with steel and concrete, while other materials, such as mud and low-fired brick continue to be used. The resulting buildings have become an amalgam of new and old technologies, where the tragic consequences of some of these combinations of materials and systems in earthquakes, while they may be recognized by earthquake engineers, are not known to those who construct and live in the buildings. Earthquakes are common in many parts of Turkey, providing an opportunity to study the influence of this risk on local building traditions over the centuries. In addition, the traditional construction practices of the Ottoman period were not limited to Turkey because the Ottoman Empire, which lasted for six and one-half centuries, had a broad cultural influence over the Middle East and southeastern Europe. With the related Mughal Empire to the east, this cultural influence extended across a fifth of the circumference of the globe, into Kashmir and India. The Turkish Ottoman-style house, with its tiled roof and overhanging timber-and-brick bays above a heavy stone first floor wall, has become an identifiable icon recognized worldwide. Where they survive, the overhanging upper stories, or jetties, contribute to the visual vitality and delight of historic Turkish towns. The jetties also serve a structural purpose, strengthening the buildings by holding the lower-story masonry walls firmly in place with the joists that cantilever over them to support the bays, and the weight of the infill masonry in the timber frame of the overhanging upper story. This compressive force gives the heavy unreinforced walls below added strength against lateral forces (Figure 14).

17
A feature of traditional Ottoman construction practice is the use of timber lacing in masonry walls. This timber-laced masonry construction can be divided into two broad types: (a) the use of horizontal timbers (“hatıl”) embedded into bearing wall masonry, and (b) the insertion of masonry in between the columns, beams and studs of a complete timber frame (Figures 15 and 16), referred to in Turkish as hımış. Both construction types can frequently be found in the same building, with the bearing wall forming a strong, sometimes fortified, first story base to the structure, and the hımış used for the upper floors. The timber framework of the hımış has studs rarely more than 0.6 m apart. The studs are themselves tied at mid-story height by other timbers. Because the masonry is only one wythe in thickness, the walls are light enough to be supported on the cantilevered timbers. The infill masonry is either brick or rubble stone. The rubble stone type is usually made up with small stones set in a thick lime mortar.
In contrast to the rest of Turkey, the traditional domestic architecture of Istanbul historically included large areas of wooden houses and their affluent sea-front Bosporus counterparts called “yalıs.” The Istanbul house was mandated by an imperial edict in 1509 when a severe earthquake caused destruction in the predominantly stone housing stock. The Istanbul houses had pocket walls, with plaster on wood lath on the inside surface, and wood clapboards on the exterior (Figure 17). These urban dwellings were sometimes of four and five stories, and they were constructed in closely packed rows. In fact, until modern redevelopment had destroyed most of the wooden houses there, Istanbul shared with San Francisco, California, the distinction of being one of the few major city centers in the world with so many buildings with wooden exteriors. It is not a coincidence that both cities share the risk from earthquakes, even while most central urban areas have banned wooden exterior walls to avoid the spread of fires. The predominance of totally wood houses instead of hımış in Istanbul may also be explained by the ease of importing the timber from the borders of the Black Sea through the Bosporus, and the availability of sawmills to make the clapboards and wood lath, in addition to the structural members.
Figure 15. Dwelling with Hatils in the Masonry Bearing Ground Floor Walls, and Hımış Construction Above, Turkey (Gülkan and Langenbach, 2004)
Figure 14. Street of Houses with Overhanging Jetties of Hımış Construction (Gülkan and Langenbach, 2004)

18
Hımış construction is a variation on a shared construction tradition that has existed through history in many parts of the world, from ancient Rome almost to the present. In Britain, where it became one of the identity markers of the Elizabethan Age, it would be referred to as “half-timbered.” In Germany it was called “Fachwerk,” in France, “colombage,” in Kashmir, India as “dhajji-dewari,” Langenbach (1989). In parts of Central and South America, a variant is called “bahareque.” Ancient Roman examples have been unearthed in Herculaneum, several involving interior partitions, but one involving the construction of an entire two story row house. The palaces at Knossos have been identified as having possessed timber lacing of both the horizontal and the infill frame variety, Kienzle (1998). This takes the date of what can be reasonably described as timber-laced masonry construction back to as early as 1500 to 2000 BC. Hımış has continued in common use in Turkey, up until it was rapidly displaced by reinforced concrete frame construction beginning in the middle of the twentieth century. This is a relatively late date for the survival of a construction method that is little different from what was common throughout Europe in the Middle Ages, but which has long since gone out of use in those other countries. Thus, one must ask whether its relatively recent continued use resulted to any extent from the perceptions of earthquake risk. Should it be recognized as an example of a “local seismic culture,” as other traditional elements have been? The answer to this question is complicated by other contributing factors, such as the efficiency and economy of the system compared to using thicker dressed unreinforced masonry or timber alone. Evidence that seismicity influenced hımış’ development and longevity can be found by turning to 18th Century Portugal and Italy where almost simultaneously (and undoubtedly from some cross-fertilization) in Lisbon after the great 1755 earthquake, and in Calabria and Sicily in the late 18th century, similar timber frame and masonry infill wall types were devised and promulgated (and even patented) specifically for resistance to earthquakes.
9.1 Bağdadi Outside of Istanbul, such profligate use of timber was less prevalent, so its combination with masonry was more usual, but one type, known as Bağdadi, was fairly common in areas where hımış was common as well. A sample for Bağdadi is shown in Figure 18 below. It is
Figure 16. Detail of Ornate Variation of Hımış Construction near Düzce (Gülkan and Langenbach, 2004)
Figure 17. Nearly Derelict Row of Timber Houses in the Fatih District of Istanbul (Gülkan and Langenbach, 2004)

19
characterized by the use of short rough pieces of timber for the infilling instead of masonry. These were then usually plastered on the interior and exterior to form a solid wall. In using what must have largely been scrap wood that could not be used for structural elements, Bağdadi houses were light weight, earthquake resistant, economical to build, and did not require industrialized saw mills for the preparation of the timbers. However, Bağdadi is subject to increased rot and insect attack. The masonry infill of hımış construction has generally been considered to be a more permanent and higher grade of infill material.
Figure 18. Detail of Bağdadi Wall, Gölcük
10. GeneralizationsfromCollapsedBuildingsEarthquake Engineering is a subset of the discipline of Earthquake Hazard Mitigation, but it is not the entire field. In practical terms, the problem must be understood in terms of the “building delivery” process as a whole, from the owner, to the builder, the materials suppliers, and then even to the teachers in the local schools. Rarely is knowledge about the basics of safe construction ever delivered to those who need it the most. The problem in a city like Bam, Iran will not be solved simply by switching to reinforced concrete from the masonry and steel that was used there. The 1999 Kocaeli and Düzce earthquakes and 2003 Bingöl earthquake in Turkey, as well as earthquakes in India, Algeria and elsewhere, would also indicate the folly of such an approach. Reinforced concrete can be designed and built to avoid earthquake collapses, but in an unregulated construction market, there is little likelihood that will happen. The almost universal adoption of reinforced concrete in many parts of the world has been remarkably rapid. It is a more revolutionary change than the mere substitution of one construction system for another. It is a change from a system suitable for small-scale itinerant builders to one ideally only suitable to specialized and industrialized contractors, producers, and suppliers. More profoundly, while concrete is thought by its users to be simple and capable of being used by untrained work crews, it is routinely dangerously misunderstood by ordinary builders, resulting in risks from structural faults that remain hidden – until disaster strikes. The epicenter of the Marmara earthquake (also called the Kocaeli earthquake) of August 17, 1999 was just 100 kilometers east of Istanbul. Three months later, a magnitude 7.2 earthquake occurred near Düzce, a town that had been already struck earlier. In some areas of Gölcük and Adapazarı, the earthquake destroyed more than a third of all housing units, almost all of them in reinforced concrete buildings, Earthquake Spectra (2000). There were

20
clusters of hımış buildings in the heart of these districts. These houses, mostly dating from the early part of the twentieth century, pre-dated the ruined reinforced-concrete apartment blocks nearby. Many of the older hımış houses remained intact, and only a few were heavily damaged. This finding was confirmed by researchers who conducted a detailed statistical study in several areas of the damage district who found a wide difference in the percentage of modern reinforced concrete buildings that collapsed, compared to those of traditional construction. In one district in the hills above Gölcük where 60 of the 814 reinforced-concrete, four-to-seven-story structures collapsed or were heavily damaged, only 4 of the 789 two-to-three-story traditional structures collapsed or had been heavily damaged. The reinforced-concrete buildings accounted for 287 deaths against only 3 in the traditional structures. In the heart of the damage district in Adapazarı, where the soil was poorer, their research showed that 257 of the 930 reinforced concrete structures collapsed or were heavily damaged and 558 were moderately damaged. By comparison, none of the 400 traditional structures collapsed or were heavily damaged and 95 were moderately damaged. With evidence that the hımış construction has shown good performance in the 1999 earthquakes compared to concrete construction, one can reasonably ask the following question: even if it did do better, how is this relevant when the reinforced concrete buildings are generally so much larger and taller, and how can its performance be comparable to a well designed and constructed concrete building? It is true that many of the reinforced concrete buildings that collapsed in the 1999 earthquakes were between four and seven stories in height, whereas traditional hımış buildings are two to three stories in height. They are not directly comparable, in terms of size, but properly designed and constructed concrete buildings should be earthquake resistant regardless of size. The massive failure of so many of them is not because of their size. Rather, it appears to be a failure of the entire “building delivery” process, from design to construction and inspection, Gülkan et al., (2002). How does hımış resist earthquakes? Inspections of the interiors of some of the hımış houses in 1999 provided a more complete understanding of the behavior of hımış as a structural system. It was evident that the infill masonry walls responded to the stress of the earthquake by “working” along the joints between the infilling and the timber frame; the straining and sliding of the masonry and timbers dissipated a significant amount of the energy of the earthquake. The only visible manifestation of this internal movement was the presence of cracks in the interior plaster along the walls and at the corners of the rooms, revealing the pattern of the timbers imbedded in the masonry underneath. This level of damage was evident in every house. On the exterior, unless the masonry was covered with stucco, damage was mostly not visible. The bricks themselves infrequently were displaced sufficiently for a crack to be visible except where in some cases, small sections of the infill were shaken out. The movement was primarily along the interface between the timbers and the brick panels where a construction joint already exists. Because of the timber studs, which subdivided the infill, the loss of portions or all of several masonry panels did not lead progressively to the destruction of the rest of the wall. The closely spaced studs prevented propagation of ‘X’ cracks within any single panel, and reduced the possibility of the masonry falling out of the frame.

21
An important additional factor in the performance of the walls was the use of weak, rather than strong mortar. The mud or weak lime mortar encouraged sliding along the bed joints instead of cracking through the masonry units when the masonry panels deformed. This served to dissipate energy and reduced the incompatibility between rigid masonry panels and the flexible timber frame. The basic principle in this weak, flexible-frame-with-masonry-infill construction is that there are no strong and stiff elements to attract the full lateral force of the earthquake. The buildings thus survive the earthquake by not fully engaging with it. This “working” during an earthquake can continue for a long period before the degradation advances to a destructive level. Building delivery must be viewed in the economic/social context, not just in terms of structural engineering. In this context, a comparison needs to be made like-with-like between non-engineered and low-technology construction. The difference between the traditional and the modern systems is not the materials used or the size of the buildings. It is fact that “hımış” is an example of a non-engineered traditional building technique, whereas reinforced concrete is meant to be an engineered building system. When reinforced concrete is used for non-engineered construction – where both design and construction departs from correct building practices – the risk of failure leading to collapse in earthquakes is significantly increased. This is not a problem for a traditional technique such as hımış, as it is already a non-engineered building system. Variations in quality and methodology are inherent in this system, just as commonly occurs in traditional construction in general.
11. TheMessageforthePublicThe overarching challenge the engineering community faces is to determine the best way of providing structural engineering information, to inform safety messages that will help people, in and near buildings, reduce the danger from building collapses to themselves and others during earthquakes. We cannot speculate on the performance of all buildings in all places of the world, but an overall appraisal of the data or principles that have been included here is useful. It is important that structural response operates within large margins of uncertainty. There are many variables of building material types, their quality and ways of construction, configurations, site conditions, proximity to faults, earthquake characteristics, and variances in ground shaking, and always a shortage of good data and analysis. Global messages that do not consider structural engineering knowledge and its limitations are in principle wrong. Masonry buildings (brick, stone or adobe) are liable to lose their structural function when the in-plane load capacity of their walls is overcome. This is usually manifested through X-shaped cracking in the critical wall panels (wall segments that are not pierced by windows or other openings). Then, depending on the level of ground shaking, walls are likely to fall toward the exterior or the interior of the building, resulting in images of rooms visible from the street. In masonry buildings, particularly those with “weak” or “soft” ground level stories, in-plane failure is more frequently observed. In upper stories, where the inertia forces are less, walls are more likely to experience out-of-plane failure because the amplitude of the vibrations are larger, and the gravity weight transmitted to the walls is less. Weak, soft, or open front ground level walls are a source of vulnerability that is difficult to eliminate (Bonowitz and Rabinovici, 2013). Such weaknesses are related to enhanced torsional response of structural assemblies. Unless special measures have been taken, masonry failures are brittle and sudden because they are shear-governed. The life-safety message for the public would be to ensure, through

22
services of a professional, that ground level collapse mechanism is not likely to occur, or else to enact mitigation measures. These measures have been observed to be effective for wood-frame buildings as well. Bonowitz and Rabinovici (2013) have noted that procedures that conventional wisdom has accepted as accurate identifiers of ground story weaknesses are in fact not necessarily deserving of such confidence. For reinforced concrete structures, modern code provisions have made it possible to avoid injecting into the design the possibility of (ground) story mechanisms that are lethal for their occupants. However, the infinitely many structural features of existing buildings in our seismically active globe make it very difficult to prescribe a universal cure that will discriminate between hazardous and safe members of that population. One global remedy that seems to have wide applicability is to ensure that the structural framing contains structural walls whose combined area in both principal directions equals 0.0025 times the total area of the floors above. Simple though it may seem, its validity has been shown for buildings in Japan, China, Haiti and Turkey (Sozen, 2013). Walls serve as safety fuses by limiting drifts pictured in Figure 11. The message for designers, developers and owners would be to ensure that they invest in property that has at least minimal walls.

23
References Bonowitz, D. and S. Rabinovici, (2013), “Soft Story Risk Reduction: Lessons from the
Berkeley Data,” EERI Special Projects and Initiatives Report. Brzev, S., (2007), “Confined Masonry Construction: A Guide for Architects and Builders,”
National Information Center for Earthquake Engineering, Indian Institute of Technology Kanpur, India.
Brzev, S., C. Scawthorn, A.W. Charleson, L. Allen, M. Greene, K. Jaiswal and V. Silva
(2013), “GEM Building Taxonomy Version 2.0,” GEM Technical Report 2013-02, November. http://www.globalquakemodel.org/what/physical-integrated-risk/building-taxonomy/.
Brzev, S. and T. Guevera-Perez (2008), Precast Concrete Construction, WHE Report 38
(Kyrgyzstan), World Housing Encyclopedia (www.worldhousing.net), Earthquake Engineering Research Institute and International Association for Earthquake Engineering.
Charleson, A., (2008), Seismic Design for Architects, Architectural Press/Elsevier. Earthquake Spectra (1989), Special Issue on the Armenian Earthquake: Search and Rescue,
August, (5- S1): 136-149. Earthquake Spectra (2000), Special Issue on the Kocaeli, Turkey Earthquake: December, (16-
S1): 1-449. Faison, H., C. Comartin and K. Elwood, (2004), “Reinforced Concrete Moment Frame
Building without Seismic Details” WHE Report 111 (U.S.A.), World Housing Encyclopedia (www.worldhousing.net). Earthquake Engineering Research Institute and International Association for Earthquake Engineering.
Gülkan, P., M. Aschheim and R. Spence, (2002), “Reinforced Concrete Frame Building with
Masonry Infills,” WHE Report #64 (Turkey), World Housing Encyclopedia (www.worldhousing.net), Earthquake Engineering Research Institute and International Association for Earthquake Engineering.
Gülkan, P. and R. Langenbach, (2004), “The Earthquake Resistance of Traditional Timber
and Masonry Dwellings in Turkey,” 13th World Conference on Earthquake Engineering, Vancouver, B.C., Canada, August 1-6, Paper No. 2297.
Hough, S.E., (2014), “On the Nature of Strong Ground Motions during Damaging
Earthquakes,” Jaiswal, K., D. Wald and D. D’Ayala, (2011), “Developing Empirical Collapse Fragility
Functions for Global Building Types,” Earthquake Spectra, 27(3): 775–795. Kienzle, P., (1998), Conservation and Reconstruction of the Palace of Minos at Knossos,
DPhil Thesis, IAAS, York (UK):122-134.

24
Langenbach, R. (1989), “Bricks, Mortar, and Earthquakes.” APT Bulletin, 31:3-4. (Available on www.conservationtech.com)
Langenbach. R., (2009), Don’t Tear It Down: Preserving the Earthquake Resistant
Vernacular Architecture of Kashmir, UNESCO. MacLeod, I., (1974), Large Panel Structures, in Handbook of Concrete Engineering, Ed. M.
Fintel, Van Nostrand Reinhold. Oliver, P. (ed.) (1997), Encyclopedia of Vernacular Architecture, Cambridge University
Press, UK. Sassu,M. (2004), Vernacular Construction, Chapter 7, World Housing Encyclopedia –
Summary Publication 2004, Brzev, S. and Greene, M. (editors), Earthquake Engineering Research Institute, Oakland, CA, USA, 120 pp.
Sozen, M.A. (2013), “Surrealism in Facing the Earthquake Risk,” in Seismic Evaluation and
Rehabilitation of Structures, Edited by A. Ilki and M. Fardis, Springer. UNIDO, (1983), Design and Construction of Prefabricated Reinforced Concrete Frame and
Shear-Wall Buildings. Building Construction Under Seismic Conditions in the Balkan Region. Volume 2. UNDP/UNIDO Project RER/79/015, Vienna, Austria.

DevDur
an
Veró
Deve
velopinring Ea
nd Disc
ónica Ced
loping Mes
ng Guidarthquaussions
dillos, Mic
A Bassages for P
dance oake Shas, and SProtect
chelle MeyR
ackground Protective A
Con
n Proteaking: SSurvey tive Act
yer, KarmRodgers
Paper for Actions to
nducted by
ective ASummaResultstions
ma Doma T
the ProjectTake Duri
:
Actions ry of Lis on Co
Tshering,
t: ing Earthqu
to Takiteratur
ommon
and Janis
uake Shakin
ke re
n
se
ng

1
Developing Guidance on Protective Actions to Take During Earthquake Shaking Summary of Literature and Discussions, and Survey Results on Common Protective
Actions
Veronica Cedillos1, Michelle Meyer2, Karma Doma Tshering3, and Janise Rodgers4
Overview The purpose of this paper is to provide background information that the GeoHazards International (GHI) staff compiled to provide context for the discussions during the project workshop, Developing Guidance on Protective Actions to Take During Earthquake Shaking. This information is summarized in three sections:
x Section I: Literature Review. This section summarizes a review of the technical literature in relevant disciplines.
x Section II: Messaging Group Discussions. This section summarizes a series of focused discussions with members of the project’s international group of professionals responsible for safety messages (i.e., the messaging professionals group).
x Section III: Professional and Public Surveys. This section summarizes results from an online survey of the messaging professionals group and from online surveys of the general public in India, Peru and Turkey.
GHI also commissioned five additional background papers, addressing specific questions that the GHI staff posed to each of the project’s subject matter experts. These five papers present important background information from the following disciplinary areas: seismology, structural engineering, risk communication, human behavior during earthquakes, and epidemiology of deaths and injuries caused by earthquakes. To avoid repetition, the literature review section of this background paper does not cover these five disciplinary areas, which are well covered in the background papers by the subject matter experts. Instead, the literature review section in this paper focuses on several additional important areas and topics that are not directly covered by other background papers. All background papers, including this one, should be read together to obtain an adequate overview of the technical information necessary for informed discussion of considerations for developing effective messages on protective actions during earthquakes.
Project Background Educating the public about protective actions to take during earthquake shaking is an essential component of simple, targeted preparedness interventions that can save lives. Messaging should compel people to act in ways that give the most people the best chance of surviving an earthquake. However, very limited data exist on the efficacy of the various protective actions during real earthquakes. There are two fundamental categories of protective actions: Shelter within the building and Get
1AppliedTechnologyCouncil,RedwoodShores,California,USA2LouisianaStateUniversity,BatonRouge,Louisiana,USA3GeoHazardsInternational,Thimphu,Bhutan4GeoHazardsInternational,MenloPark,California,USA

2
out (evacuate the building). There are several different variants of these messages currently being advocated by different groups in different geographic locations. “Drop, Cover and Hold On” (DCH) is the most common action being advocated by many international organizations as the safest strategy, and many countries have adopted this as a standard message. DCH refers to a set of related protective actions that primarily involve taking cover under sturdy objects. The DCH protocol reflects the expectation that most buildings will not suffer catastrophic collapse. It also reflects expectations that the risk of being injured by falling objects is significant, and that sturdy furniture under which one can shelter exists. DCH further recognizes the dangers associated with running out of buildings, such as the risk of falls, the risk of being trampled by other people trying to exit, and most importantly, the risk of exiting through and into dangerous areas immediately outside buildings, where portions of building façades and walls tend to fall during shaking. Though many people have survived earthquakes or minimized injuries by practicing DCH, there are numerous accounts of people surviving other earthquakes by instead practicing “running out of buildings,” the second major form of protective action. In these accounts, the buildings often collapsed moments later. Some data support running out as an effective strategy in some contexts; this is discussed further in the background paper on epidemiology of deaths and injuries caused by earthquakes. But people who made either choice–to stay inside or to go out–have died in these extremely dangerous environments: those who ran out of buildings during earthquake shaking have sometimes been killed by falling debris, and those who remained in buildings that collapsed have often died. “Move to a designated, safer location within the building” is a third type of protective action. The safer locations may be near major structural members, such as columns, and are often physically marked on the building. This action is based on the assumption that major structural members are less likely to be completely crushed in a collapse, and that survivable voids will exist next to the damaged structural member. This type of protective action does not protect people from falling hazards, or from falling pieces of the main structural member as it suffers damage. There is less information about the efficacy of this strategy. There is much less information available about another type of protective action, the “Triangle of Life,” and it is unclear to what extent it has been deliberately practiced as a protective strategy during earthquakes. However, the message has been broadly disseminated via the Internet. This action involves seeking shelter next to solid, dense objects, as these can create survivable voids were the building to collapse. Recognizing that significant uncertainty exists regarding the correct safety messages to promote, GHI obtained funding from the US Agency for International Development (USAID) to develop and disseminate guidance for developing local, context- appropriate messages on protective actions to take during earthquake shaking, especially in developing countries. GHI is developing this guidance based on available scientific data and expert judgment, and considers message formulation in a robust, multidisciplinary context. The guidance is intended to help those responsible for developing and communicating safety messages to formulate well-considered messages for the communities they serve.

3
SECTION I: LITERATURE REVIEW
Literature Review Background GHI conducted a literature review of relevant papers, articles and presentation notes around eight disciplinary areas: protective actions, disaster epidemiology, urban search and rescue (USAR), evacuation, human behavior in disasters, risk communication, structural engineering, and seismology. See Appendix I for the full list of reviewed documents and reference citations. Five of these areas are covered in further detail in background papers written by subject matter experts: disaster epidemiology, human behavior in disasters, risk communication, structural engineering, and seismology. In the interest of keeping this paper informative and avoiding repetition, this section focuses on the major findings, shortcomings, gaps, and recommendations on protective actions, USAR and evacuation. The latter two topics are not covered in papers by the five subject matter experts. In the context of this literature survey, evacuation refers to the general process of evacuating the occupants of a building regardless of the triggering event (i.e., fire) rather than solely to rapid evacuations intended as protective actions during earthquakes. The latter are covered under protective actions.
Major Findings from Literature Review
Protective Actions Different protective actions and their documented effectiveness vary significantly. However, the most commonly recommended actions included DCH (drop, cover, hold), evacuation, or triangle of life. In many cases, even the evidence supporting one action over another was either incomplete (i.e. people who survived unscathed by doing a certain action were not interviewed and counted in the analyses), or was particular to one earthquake or region. For example, one document stated that the percentage of injuries related to non-structural and building contents is higher than originally thought, as opposed to due to structural collapse (Rahimi 1992). However, this is primarily based on earthquakes in developed countries. In contrast, a key finding in another paper (So 2008) was “taking evasive actions saves lives.” This paper evaluated and based key findings on the earthquakes in Kashmir and Yogyakarta, where there exist many vulnerable buildings, such as concrete block and other unreinforced masonry buildings (in Pakistan, many had concrete or heavy roofing). A significant difference in type of hazards is reflected in rural versus urban areas. Running out of buildings in rural areas seems to be more accepted and endorsed by literature, especially in vulnerable rural housing. There are several reasons for this—rural regions tend to have more clear, open spaces that are easily accessible, housing tends to be more susceptible to catastrophic collapse (i.e. adobe buildings with heavy roofs), there tend to be less non-structural falling hazards in the building (schools and houses tend to be more austere), and exiting buildings in a quick and safe manner is possible (mostly due to smaller building footprints, and that most buildings are only one to two stories). Urban areas on the other hand, are much more complex and many other hazards are present. Cities have many multi-story buildings that would be
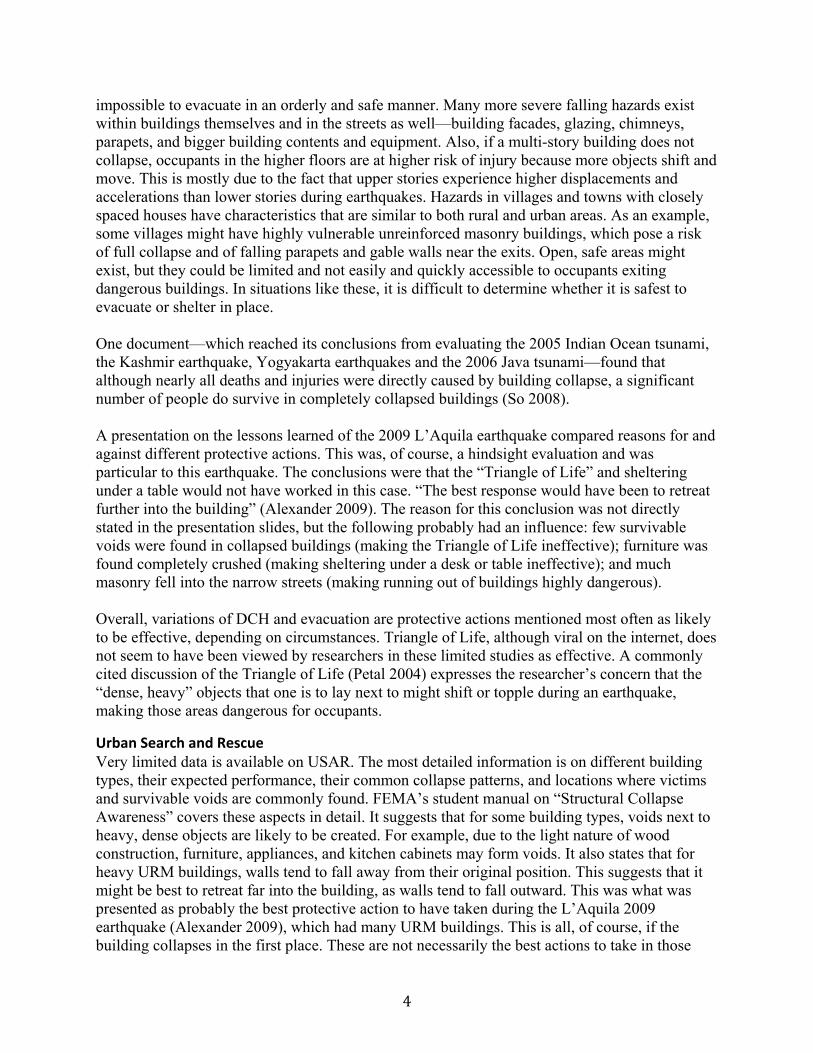
4
impossible to evacuate in an orderly and safe manner. Many more severe falling hazards exist within buildings themselves and in the streets as well—building facades, glazing, chimneys, parapets, and bigger building contents and equipment. Also, if a multi-story building does not collapse, occupants in the higher floors are at higher risk of injury because more objects shift and move. This is mostly due to the fact that upper stories experience higher displacements and accelerations than lower stories during earthquakes. Hazards in villages and towns with closely spaced houses have characteristics that are similar to both rural and urban areas. As an example, some villages might have highly vulnerable unreinforced masonry buildings, which pose a risk of full collapse and of falling parapets and gable walls near the exits. Open, safe areas might exist, but they could be limited and not easily and quickly accessible to occupants exiting dangerous buildings. In situations like these, it is difficult to determine whether it is safest to evacuate or shelter in place. One document—which reached its conclusions from evaluating the 2005 Indian Ocean tsunami, the Kashmir earthquake, Yogyakarta earthquakes and the 2006 Java tsunami—found that although nearly all deaths and injuries were directly caused by building collapse, a significant number of people do survive in completely collapsed buildings (So 2008). A presentation on the lessons learned of the 2009 L’Aquila earthquake compared reasons for and against different protective actions. This was, of course, a hindsight evaluation and was particular to this earthquake. The conclusions were that the “Triangle of Life” and sheltering under a table would not have worked in this case. “The best response would have been to retreat further into the building” (Alexander 2009). The reason for this conclusion was not directly stated in the presentation slides, but the following probably had an influence: few survivable voids were found in collapsed buildings (making the Triangle of Life ineffective); furniture was found completely crushed (making sheltering under a desk or table ineffective); and much masonry fell into the narrow streets (making running out of buildings highly dangerous). Overall, variations of DCH and evacuation are protective actions mentioned most often as likely to be effective, depending on circumstances. Triangle of Life, although viral on the internet, does not seem to have been viewed by researchers in these limited studies as effective. A commonly cited discussion of the Triangle of Life (Petal 2004) expresses the researcher’s concern that the “dense, heavy” objects that one is to lay next to might shift or topple during an earthquake, making those areas dangerous for occupants.
Urban Search and Rescue Very limited data is available on USAR. The most detailed information is on different building types, their expected performance, their common collapse patterns, and locations where victims and survivable voids are commonly found. FEMA’s student manual on “Structural Collapse Awareness” covers these aspects in detail. It suggests that for some building types, voids next to heavy, dense objects are likely to be created. For example, due to the light nature of wood construction, furniture, appliances, and kitchen cabinets may form voids. It also states that for heavy URM buildings, walls tend to fall away from their original position. This suggests that it might be best to retreat far into the building, as walls tend to fall outward. This was what was presented as probably the best protective action to have taken during the L’Aquila 2009 earthquake (Alexander 2009), which had many URM buildings. This is all, of course, if the building collapses in the first place. These are not necessarily the best actions to take in those

5
types of buildings given that they might not even collapse.
Evacuation Effective and orderly evacuation of buildings varies widely depending on many factors. Peacock et al. (2012) attempts to categorize all of these factors into the following: configuration of building/enclosure, procedures within the enclosure, environmental factors inside the structure, and behavior of the occupants. These researchers found that the two most significant variables affecting movement speed of an occupant were the stairwell they used and its density of people. Another paper lists the most important factors that affect evacuation as the height of the building, the area of exit stairs per floor, the width of exit stairs and the average number of occupants per floor (Galbreath 1969). Some key points from workshop proceedings included that panic during evacuation is rare and that building design can significantly facilitate evacuation (i.e. direction that doors open and sufficiency of egress paths) (Keeney 2009).
Shortcomings and Major Gaps in Available Information The amount of information and data and the rigor of investigations varied widely for each disciplinary area. For areas such as USAR and evacuation, actual data from previous earthquakes is completely lacking.
Protective Actions Few data exist on the effectiveness of different protective actions. “A subjective assessment of the risks occupants face in an earthquake appears to be grossly insufficient given the multitude of factors involved” (Rahimi 1992). Although, some literature describes simple methodologies and attempts to explain, categorize and evaluate the various hazard factors, they are mostly case-by-case evaluations. There is a lack of comparison of different protective actions taken in different parts of the world for different earthquakes. Even the time of earthquake occurrence has a significant influence on type and number of injuries. For example, during the Northridge earthquake in California, which occurred in the middle of the night, many people were injured by stepping on broken glass while running to another room during earthquake shaking. Due to the high percentage of these injuries during this earthquake, one could conclude that one is at highest risk of injury if one runs during earthquake shaking. But when stating that conclusion, one must also note the context in which the earthquake occurred. Other earthquakes will have different circumstances (i.e. different time of day, structures with minimal amounts of glass), and therefore this conclusion becomes relevant in only certain circumstances.
Urban Search and Rescue One paper describes why so little is known about injured and trapped victims inside a collapsed building. These are: 1) there are not enough data presenting comprehensive and complete descriptions of events (includes entrapment situation, severity of injury, effectiveness and sequence of rescue activities); 2) there exist no models or theoretical frameworks to describe events that follow the collapse of buildings; and 3) any factors that affect the sequence of rescue efforts have not been identified (Shiono et al., 1992). However, since this paper was written there seems to be some progress toward rectifying those shortcomings, although minimal.
6
Although the FEMA manual on “Structural Collapse Awareness” gives interesting information on collapse patterns and suggests that certain actions are better than others, given the building type, these suggestions are valid only if the building collapses. If the building does not suffer full or partial collapse, other protective actions might be better. The objective of the manual is to give guidance on potential places to find survivors, given that the building has partially or fully collapsed. Although that information is helpful, it is different than stating trends that could help identify areas of highest survivability before an earthquake and without the certainty of knowing how the structure will perform.
Evacuation Numerous models are available to simulate evacuation from buildings. However, there are limited data to support the model inputs/assumptions and even less data from actual emergencies to validate the models. In a NIST technical note (Keeney 2009), evacuation was described as a process that happens in “lumps and bumps”, as opposed to evacuation flows that are usually used in computer simulations. Evacuation times for several buildings were calculated both by models and by actual time during drills (Galbreath 1969). In many cases, the actual times were twice as much as the expected times from the models. Although this is a dated paper, it suggests that evacuation models are highly dependent on their inputs and assumptions and therefore, validating these models is very important, especially if they are to be used as a decision making tool.
Recommendations
Protective Actions There is a need for “integration of engineering studies with those of other disciplines such as architecture, social sciences and epidemiological studies” for “improved understanding of injuries following earthquakes and tsunamis” (So 2008). A presentation on lessons learned from the 2009 L’Aquila earthquake stated that “at the world scale, most injuries occur in nocturnal earthquakes: a sleeping person is not able to react rapidly” and that “50-90% of mortality is nocturnal” (Alexander 2009). Given this statement, it is important to note that giving appropriate messages particular to nocturnal earthquakes is very important and should be investigated further. Alexander’s 2009 presentation on the L’Aquila earthquake recommends that one should pre-determine the safest parts of the house, as well as the most dangerous prior to an earthquake. FEMA, as well as other resources, recommend similar strategies. This, of course, only works if one is proactive and identifies these safe areas in an informed manner (i.e. with guidance on how to identify safe and dangerous locations within their building, and how to make safe locations safer).
Urban Search and Rescue One paper on USAR (Shiono et al., 1992) recommends taking “considerable effort in facilitating

7
the accumulation of data in the future”. In talking to USAR volunteers and experts, this seemed
to be the consensus. There is very little effort to collect this type of valuable data after an
earthquake, though most experts recommend that there should be. USAR teams are usually
comprised of various experts, each with their own responsibility. Members usually include the
structural engineer (which, for example, evaluates the stability and safety of a damaged building
before allowing for the search and rescue crew to enter), fire fighters (who are trained to go into
dangerous areas to save trapped people), and a team leader (who makes executive decisions).
One idea that was discussed with USAR experts was the addition of a person who would
document relevant data during USAR efforts after earthquakes. This would allow for all other
members to continue doing their crucial duties uninterrupted.
The FEMA manual on “Structural Collapse Awareness” provides a starting point for trying to
understand the location of potential survivable voids by structure type. If this is combined with
likelihood of collapse, it might be possible to start narrowing down ideas of what is the best
protective action to take given the predominant building type and surrounding built environment.
Evacuation NIST Technical Note 167 contains a list of ideas to improve egress in buildings. Several are low-
cost enhancements, like installing readily visible directional indicators at key locations,
enhancing visibility of exit signs by installing larger, flashing, or digital signs, using
photoluminescent markings.

8
SECTION II: MESSAGING GROUP DISCUSSIONS
Messaging Group Background GHI created an international group of over 70 professionals (disaster managers, academics, researchers, policy makers, international and local non-profit organizations, etc.) from 23 countries in April 2014. The messaging group participants interacted through Skype call discussions, participated in an online survey, and were expected to provide input on the development of the guidance document, as well as help to disseminate the guide through their professional networks. Over a period of three months, GHI facilitated ten online discussions via Skype. Discussions were organized around three themes: 1) Different Forms of Protective Actions During an Earthquake; 2) Effective/Appropriate Messaging for Protective Actions during Earthquakes; and 3) Earthquake Risk Communication. See Appendix II for more details on each theme. A Google Drive folder containing relevant research papers, studies, documents, etc., was created and shared with all messaging group participants. Transcribed notes of the Skype call discussions were also made available on the drive for further discussion and comments. The messaging group participants also took part in the online professional survey described in Section 3. The messaging group served as a forum to bring together professionals, share information, provide experiences, identify and discuss issues and challenges and motivate each other. The following presents a summary of common issues, concerns, and ideas that came out of the Skype call discussions.
Issues and Comments from Messaging Group Discussions
Drop Cover and Hold On (DCH) x DCH seems to be the most common/ universally accepted message and adopted by
disaster management agencies and governments, especially in schools. x It is important to explain why we do the DCH, the logic behind the procedure. People/
children seem to be unaware of the reasons, which results in improper performance of the procedure and inability to adapt to varying situations. The proper procedure is: 1) To drop to the ground to your knees because in case of strong shaking most people cannot stand up, and there are huge numbers of falling down injuries. Dropping to your knees gives balance and control over movements. 2) Get under a table or make yourself small, and cover your head and neck to avoid injuries from falling hazards. 3) Hold on to the table so that it does not move or slide away during the shaking and provides protection.
x People often take DCH as a slogan and do not really understand the logic behind the procedure and so are unable to interpret it in a flexible critical thinking way that can enable them to adapt to every situation. We have not been successful in giving people situational awareness to modify the slogan according to different situations, and the message has been advocated in a way that is not nuanced enough to make people adopt the general advice to their situation.
9
x DCH is used primarily in places where building collapse is not an issue and the biggest concern is of people running out of buildings and being injured or killed by falling glass, parapets or building objects or other non-structural/falling hazards.
Traditional/ Firm Beliefs x Messaging group participants mentioned several firm traditional beliefs. For example, in
Assam, India the belief is to get under the bed and hold on; in Bhutan it is to stand in the doorway; in Nepal people crouch down and put their thumbs on the floor or touch or hug the middle pillar of the house, or touch something that is brass. Therefore, for effective risk communication and for the protective actions to be effective, messages need to address such beliefs and practices and find ways to incorporate or address these beliefs.
x People’s perceptions and beliefs are built upon their environment, buildings, etc. in the past. But now the built environment is changing, which creates a need to change messages and actions with the changing times. At the same time, messaging professionals must acknowledge the difficulties in changing people’s perceptions and age old beliefs.
Protective Action in Schools x Schools are most vulnerable due to the large number of children assembled in one
building. Most participants felt that DCH was the best option, as this would avoid the risk of stampede, prevent injuries from falling objects, and help facilitate a smooth evacuation after the shaking stops.
x It is important and effective to have protective actions messages and earthquake risk information, generally, included in the school curriculum. Schools serve as important risk communication channels not only to the children but also to their families. Some countries, like Turkey and Iran, have incorporated such materials in the formal school curriculum. Similar efforts to raise awareness through schools and incorporate earthquake risk and DRR materials into school curriculum were being made in many other countries.
x Furniture in schools should be adapted to promote or support DCH. In many schools, desks and tables were not strong enough to protect students, Manufactures/ suppliers of school furniture should have the DCH concept in mind and know that the desks are not only for study purpose but also to protect children during earthquake shaking. In Turkey, there is a policy to buy more open steel desks; over a period of year, replacing their school furniture, they feel that they are making the place safer.
Importance of evidence‐based messages x Participants expressed the importance of having evidence-based advice and the need to
conduct different kinds of epidemiological research to validate and feel confident about the messages being communicated.
x Participants generally felt that the DCH advice is based on evidence, although rigorous evidence is generally lacking, especially for earthquakes in emerging countries. A study following the 1999 Kocaeli, Turkey earthquake (Petal, 2004) showed that more than 50% of injuries are caused by non-structural/falling objects during earthquake shaking.
x One blanket message, like DCH or Evacuation, may not be advisable for all building types. For one-story adobe buildings it would be advisable for inhabitants to evacuate rather than do DCH. More research is required on the impact or damages due to earthquakes on different housing patterns to come up with context-specific protective action messages.

10
x There is a need to study and investigate closely the causes of death while coming up with protective action messages. For example, many deaths are caused by suffocation because of the dust caused by the destruction, and there are no protective action messages for suffocation.
Structural Safety x A lot more needs to be done in terms of awareness and preparedness. Together with
protective action messages we should be giving out messages advocating earthquake safe/resilient building. Protective action messages should not be seen as approval or as license to live in unsafe buildings. Nothing can replace safe construction, and messaging should somehow tie into building safety.
x People may have been safe in the past, because houses were made of bamboo, or because structures were wooden and one story, and because very few buildings had ground plus one. But the scenario has quickly changed, with poorly constructed multiple story buildings that are obviously not earthquake resilient and new or additional non-structural risks in modern buildings such as use of lots of glass. Participants felt that new and additional earthquake risks have accumulated in their countries.
Need for multiple messages/ adapting messages to various situations x In some circumstances DCH is not possible or applicable, or needs to be adapted as per
situation. For example if somebody is in a wheelchair, in a stadium, in crowded hospital corridors, etc.
x There are so many situations where one action works and not another, and therefore we need to have this research done every time there is an earthquake.
x We need to develop messages that could be understood and adapted to various situations. x DCH is just the first part of a protective action message, because after the shaking stops,
people need to evacuate/ go outside. The second part of the main message would be to evacuate the building to an open space or a safer space. People should be reminded to evacuate 90 degrees away from the building (that is, not parallel to the building walls because they may pose falling hazards, such as hanging air conditioner units).
x In a school (or any other public place/ crowded places) one of the biggest safety measures is to have the door open to the outside; second is to have an alternate exit; third, children (people) should exit 90 degrees away from the building. There are also other messages, especially in schools, to instruct the person closest to the door to actually open the door even before doing DCH so that children are not stuck inside the classroom if the doorway gets deformed and jammed.
x Effective protective messages should take into consideration the different building types. This would help countries develop messages based on their own context, their audiences, and their living spaces. The appropriateness and effectiveness of messages depends on how we are able to consider various building types, different situations (rural, urban, outside, inside, special needs elderly, people with mobility issues, etc.), cultural/firm beliefs and people’s awareness level and perceptions about the earthquake risk.
x For the sake of communication, it is important to have a simple pithy message like DCH, but it may be useful to come up with three points on what to do—in terms of familiarizing yourself with the environment, be it outside or indoors, the kind of building you are in—rather than just a single message.

11
x The suffocation issue is important and has not been covered in any risk messaging. This should be an additional message.
x Messaging should cover advice to people to not move into the weaker parts of the buildings.
x One reason why people died in past earthquakes is because many people were injured and hospitals were overwhelmed. This means we should be advocating messages that help reduce injuries, and we should support hospital preparedness.
x Countries need to work out what works best for them. For example, Mexico City’s major earthquake source is so far away that in most cases they actually have time for an early warning; therefore, their messages do not say DCH, but instead talk about where people should take refuge. The soft lake deposits that underlie Mexico City exacerbate its hazard. Because of the soft deposits, long period buildings are particularly vulnerable to large magnitude earthquakes even if they are a great distance from the earthquake source.
x The style of messaging and the words used must be appropriate to the culture and to the particular context.
x The challenge is to come up with messages that can be adapted by countries as per their situation and at the same time make the actions easy enough to be understood and applied by most people.
x Messages should inform people of specific dangers during earthquake shaking and what to avoid, so that people can adapt to their situation. In addition to protective action messages during earthquake shaking, message givers also need to develop simple messages for evacuation, because after doing DCH during shaking occupants need to get out of buildings in a disciplined and safe manner.
Barriers x Where there have not been earthquakes in a long time, people are unaware of, or it is
difficult for them to conceive of, what earthquake shaking feels like. This means rather than learning about the risks, impacts or consequences of earthquake shaking, people are more concerned about day-to-day priorities. This is a big barrier in terms of increasing awareness, communication and preparedness planning. To sensitize people to the effects of earthquake shaking, it is important to help them feel and visualize earthquake shaking through simulations, realistic scenarios, demonstrations, or even showing them videos of what strong shaking looks like.
x If people have not been in damaging earthquakes, seeing photographs of collapsed buildings could lead them to believe that buildings always collapse and that it is safer to run out during earthquakes. So the effective way to communicate would be to provide information and protective action messaging related to their context.
x Messages need to be re-defined according to rural or urban areas, economic conditions, level of education, access to information, etc. and according to the country’s cultural context. For example, in Turkey instructions such as keeping hard shoes next to your bed is not followed because shoes are left outside the door, and people cannot think of taking shoes inside the bedroom. In such cases, messages need to consider and adapt cultural behavior and sensitivities.
x Understanding and considering people’s risk perceptions and concerns are very important while formulating and giving out protective action messages. For example in New Zealand, in the case of Wellington earthquake, people did not follow the well-publicized

12
message of staying indoors and doing DCH; they ran out of buildings because they were more concerned about post-earthquake fires.
Communication Channels x Consensus based key messages, from which countries can adapt national messages to
their particular context, would form an important base for effective communication. Consensus among all stakeholders would ensure a common understanding, consideration of the evidence base, messages that do not conflict, and better chance of being received by people.
x Countries should develop a comprehensive awareness plan or strategy, detailing the various target audiences, the messages/information to be conveyed at different levels, the different channels/ means of communication to be used, and the people/ agency responsible for the communication. Communication channels should always be two-way to ensure receipt of feedback from the audiences and to allow continuous improvement of the awareness plan.
x The education system is one of the best channels for dissemination and for building a culture of resilience. The dissemination works through teacher sensitization, school disaster preparedness drills, and incorporation of risk reduction and preparedness materials in school curriculum.
x Other channels could be community meetings, street plays, drama, activities that draw communities together, and various print, audio, visual and social media. It is important to maintain consistency of messages and use existing community institutions (cooperatives, local groups, volunteer groups, etc.) to help in dissemination.
Other Protective Actions x Besides the DCH protective action, participants discussed other actions they have heard
about or that are being advocated in their countries. In Turkey, the search and rescue and civil defense teams are advocating the “fetal position,” which means to lie down in fetal position and take cover. While some participants felt that the Triangle of Life could work as a second line of defense, especially if the building suffers heavy damages and with danger of collapse, others felt that the Triangle of Life is not evidence based and is actually unsafe.
x There was a need to explore and conduct further research on different forms of protective action and to have a strong evidence base before disseminating messages to the public.
Risk Communication x The tone of messages matters for building a sense of self-efficacy. People might respond
to messages that overplay the severity of risk with the feeling of helplessness and inevitability.
x It is important to know people’s perceptions about earthquake risks, because usually people are not aware of the level of shaking they could experience and the dangers they would face during earthquake shaking.
x People need to understand the science behind earthquakes, and communities need to be involved in the development of realistic and relevant earthquake scenarios. Communities need to learn from such scenarios and come together to plan, prepare and build capacities, rather than talk about these very rare events that could happen tomorrow, or may not happen for another 50 years. It is important to demonstrate and make people feel

13
empowered that they can do something to protect themselves, instead of adopting a fatalistic attitude toward earthquakes. Families and communities need to understand that they can take steps to be more resilient to earthquakes.
x The occurrence of earthquake events makes governments and people more receptive to risk reduction and preparedness information and activities, and as a result, risk communication and awareness programs are easier to execute due to a change in people’s perception and beliefs. For risk communication to be more effective, the linkages to poverty reduction and to millennium development goals should be made clear.
x Schools are important entry points for earthquake safety information in communities. Children are taught to take the messages to their families and communities. Many countries have school safety programs that include training staff, teachers and students; formulation and adopting of school disaster management plans and conduct of preparedness drills and efforts are also ongoing to incorporate risk reduction and preparedness materials into school and college curriculum.
x Participants talked about holding national school preparedness drills, in which every child in every school takes part in a drill at the same time on the anniversary of a previous earthquake. These national events can reach out to communities and attract media attention.
x For effective earthquake risk communication, participants discussed the importance that people have trust in protective action messages. The information source not only has to be credible, but has to be seen as credible. The communication channels being used and how messages account for individual differences like age, gender, special needs, etc., also affect the effectiveness.
x Participants discussed various other forms and channels of communicating risk. At the community level, especially rural communities, face-to-face communication or village/community meetings are effective. Street plays, dramas and other such mediums that bring communities together should be used. Programs on TV and radio were felt to have impact, and participants felt social media channels could also be tapped to disseminate risk information. However, it was felt that the most sustainable and credible channel is the education system and the school curriculum.
x Another important discussion was to include a component of family preparedness planning in every disaster management training course, as this would ensure that the message of risk reduction and preparedness reaches individual families and helps build a culture of resilience.

14
SECTION III: PROFESSIONAL AND PUBLIC SURVEYS
Professional and Public Surveys Background GHI, in collaboration with sociologist Michelle Meyer from Texas A&M University, designed a research project that included two online surveys. One surveyed earthquake messaging professionals across the world, and one surveyed the general public in three earthquake-prone countries: India, Peru, and Turkey. The team surveyed the messaging professionals to determine what messages they are disseminating and why. The team surveyed the general public to determine what protective action messages people are receiving, how they received the messages, their perceptions of the action’s effectiveness, and their trust in the messages and agencies distributing them.
Sampling Online surveys have become especially useful for surveying professionals, such as those we targeted in the first part of this project. While online surveys for the general public in developing countries are less effective, because there is less online access, we targeted our sampling to create representative samples of the general public in each country.
Messaging Professionals The group of messaging professionals included 73 individuals from 23 countries. Messaging professionals were selected for inclusion in the study based on criteria such as geographic distribution, so as to ensure that major world regions are represented; organizational diversity; messaging authority; and interest in the topic. For the sake of simplicity, this broad group of professionals is referred to as “messaging professionals,” or “professionals,” throughout the report. Professionals represented were from academia, international and national disaster management agencies, international and national non-governmental organizations (NGO), and others working in the field of disaster management.
General Public To gather samples of the public from each country, we used Survey Sampling International’s (SSI) online panels. These panels include individuals who agree to take surveys provided by SSI to earn “points” that are redeemable for purchases in various online stores. Our survey participants received the equivalent of $1 for their participation. We aimed to collect 600 individuals overall, 200 from each country. The SSI panels were known to be biased toward higher income and urban individuals. Thus, we stratified our sampling by income and used a spatially distributed sampling strategy in an attempt to gather rural participants. We targeted the sample to include at least 25% of the lowest income strata in each country: Indian participants with annual incomes less than Rupees 200,000, Peruvian participants with annual incomes less than 3,400 Soles, Turkish participants with annual incomes less than 25,000 Turkish Lira. SSI sampled equal numbers of individuals from each province/state in each country to gather both rural and urban participants: approximately 6 people from each of India’s 35 states/territories; 8 people from each of Peru’s 25 regions plus Lima; 2-3 people from each of Turkey’s 81 provinces.

15
Survey Development and Data Collection Three members of GHI along with sociologist Michelle Meyer developed the surveys. The professionals’ survey was conducted in English, while the public surveys were conducted in English (India), Spanish (Peru), and Turkish (Turkey). Both surveys were pre-tested with a group of 10 individuals and revised. Both surveys were approved by the Texas A&M University Internal Review Board for Human Subjects Research. The professionals’ survey included 38 questions covering: 1) wording of messages used, 2) dissemination methods 3) message development, 4) rationale of messages, and 5) perception of message effectiveness and development techniques. See Appendix III.B for the professionals’ survey. We used the Dillman (2000) method for dissemination. This method included an initial survey invite and two reminders (one week apart) to increase participation. A member of the GHI team disseminated the survey. A total of 43 individuals completed at least a portion of the survey for a response rate of 60%. The public survey included 23 questions concerning: 1) previous earthquake experience, 2) protective actions individuals would take during an earthquake, 3) protective action messages heard or seen, and from which organizations and channels, 4) perceptions of effectiveness of various protective actions, 5) trust of agencies distributing messages, and 6) demographics. See Appendix III.A for the public survey. SSI completed survey dissemination and tracked participation. Individuals under the age of 18 were removed from the survey data to focus on adult respondents. The surveys were fielded in June and July 2014. Surveys were closed and data cleaned on August 4, 2014.

16
PUBLIC SURVEY RESULTS
Across the three countries, India, Peru, and Turkey, 652 individuals completed the survey. Table 1 shows the demographics of survey participants. A majority of respondents were men, especially in Turkey and India. As expected with online surveys, respondents were younger with over 80% of participants under 45 years old. Respondents of lower incomes were well-represented in Peru and Turkey, but fewer low-income individuals participated in India. A majority of respondents from all countries were employed outside the home, and respondents were also highly educated with a majority having completed more than 12 years of formal education. Respondents reported living in three different types of homes – single story houses, multi-story houses, and apartment/condos. The results should be considered in light of this representation of participants. A limitation to our results is few responses from individuals with little formal education. Table 1. Public Survey Participant Demographics
India Peru Turkey Total n = 205 n = 216 n = 231 n = 652
GENDER Female 27% 45% 23% 32% Male 73% 55% 77% 68%AGE 18-24 27% 31% 32% 30% 25-34 40% 27% 37% 34% 35-44 24% 23% 23% 23% 45-54 3% 12% 6% 7% 55-64 5% 6% 2% 5% 65-74 1% 0% 0% 0.30% Over 75 0% 0% 1% 0.20%INCOME Low 9% 31% 42% 28% Low Middle 9% 19% 21% 17% Middle 33% 18% 25% 25% Upper Middle 28% 15% 9% 17% Upper 21% 17% 4% 14%EMPLOYED Yes 77% 72% 85% 78% No 23% 28% 15% 22%EDUCATION 0-4 Years 9% 6% 1% 5% 5-8 Years 5% 11% 8% 8% 9-12 Years 8% 11% 25% 15% 12-16 Years 32% 23% 41% 32% Over 16 Years 46% 49% 25% 29%RESIDENCE Single-story House 30% 27% 17% 24% Multi-story House 44% 57% 18% 39% Apartment or Condo 25% 16% 64% 36% Other 1% 0% 1% 1%

17
Previous Earthquake Experience To provide context for individual responses, we began the survey asking participants about their previous experience in earthquakes and earthquake drills. Table 2 presents these results. Over 90 percent of respondents in Peru have participated in a drill in the past two years, while 67 percent similarly participated in Turkey. In comparison, only 48 percent of respondents from India have participated in a drill in the past two years. Throughout the report, highlighted results will be colored gray in the tables for ease of reading. A large majority of participants (over 80%) from each country report having experienced an earthquake before. For those who have experienced an earthquake, less than 25% from each country reported that they or their family members were injured during the quake. Most respondents were at home when the quake occurred, and respondents most commonly ran out of the building in response to the earthquake. Running from the building was most common in India (62%) and least common in Turkey, though it still received the most within country responses (29%). Table 2. Previous Earthquake Experience
India Peru Turkey Total n = 205 n = 216 n = 231 n = 652
Have you been in an earthquake drill in the past 2 years? Yes 48% 91% 67% 69%No 49% 8% 29% 28%Don't know 3% 1% 4% 3%
Have you experienced an earthquake before? Yes 87% 91% 81% 86%No 13% 9% 19% 14%
n = 178 n = 197 n = 185 n = 560 Were you or a family member injured during that earthquake?
Yes 23% 3% 14% 13%No 77% 97% 86% 87%
Where were you when the earthquake happened? At home/awake 62% 50% 51% 54%At home/asleep 21% 6% 33% 20%At work 10% 15% 7% 11%In a public building 4% 10% 4% 6%Outside 2% 13% 3% 6%Driving 1% 5% 1% 2%Don't remember 1% 2% 2% 1%
During last earthquake, what did you do? Took shelter under sturdy object 20% 5% 25% 16%Ran out 62% 41% 29% 44%Triangle of Life 2% 5% 9% 5%Went to designated zone 3% 27% 8% 13%Nothing 10% 12% 23% 15%Don't remember 1% 3% 5% 3%Went near stairs or columns 1% 4% 0% 2%

18
Other 1% 3% 1% 1%
Protective Actions A section of the public survey asked respondents to predict what they would do, if an earthquake were to occur today, to protect themselves from harm; the section also asked respondents how they learned about that protective action. Table 3 shows the responses by country, and Table 4 compares the selected action to the source and channel through which they learned it. In contrast to the actual actions taken among those who have experienced an earthquake, reported above, the most common predicted protective action differed by country. A majority of Indian respondents (53%) selected run out of the building. Going to a designated safe zone was selected by a majority of Peruvian respondents. None of these actions garnered a majority of Turkish respondents, but Drop, Cover, and Hold On was the most common response for Turkey (28%). While each country has a different most-frequently reported predicted action, the source and channel for learning that action were the same: in school and through the news media. Note that respondents could select more than one source and channel, thus percentages total more than 100. Table 3. Predicted Protective Actions, Source, and Channel, by Country and Overall
India Peru Turkey Total n=205 n=216 n=228 n=649
During an earthquake, what would you do to protect yourself from injury?
DCH 8% 5% 28% 14%Run out of building 53% 7% 15% 24%
Triangle of Life 2% 10% 13% 8%Take shelter under sturdy object 23% 7% 21% 17%
Get in doorway 3% 1% 8% 4%Go to designated zone 7% 68% 11% 29%
Don't know 4% 1% 3% 3%Other 0% 1% 1% 1%
SOURCE n=197 n=213 n=220 n=630 School 51% 59% 58% 56%
Work 37% 39% 15% 30%National Government 26% 15% 4% 15%
Regional/State Government 19% 7% 5% 10%Local Government 15% 7% 5% 9%International NGO 14% 2% 9% 8%
National NGO 21% 2% 12% 12%Local NGO 13% 2% 10% 8%
Red Cross 15% 7% 14% 12%United Nations 9% 1% 0% 3%Family/Friends 40% 28% 20% 30%
Apartment building 14% 5% 6% 8%None of the above 4% 2% 6% 4%

19
CHANNEL n=197 n=213 n=220 n=630 News media 68% 70% 37% 58%
Government websites 37% 17% 20% 24%Other website 24% 12% 28% 21%
Email 21% 7% 8% 12%Social Media 46% 24% 17% 29%
Flyer/Brochure/Billboard 15% 34% 11% 20%Word of Mouth 35% 41% 19% 31%
Public Forum 21% 19% 5% 15%None of these 4% 5% 13% 7%
Looking at the data on participation in earthquake drills or practice, along with which action individuals reported they would take, highlights a few interesting points. Figure 2 below shows the comparison for predicted protective action based on whether the respondents had participated in a drill or practice within the past two years. The most common response for those who have not completed a drill is to run out of the building (39%), whereas those that have completed a drill most commonly selected go to designated safe zone (37%). Further, the percentage of respondents who selected Drop, Cover, and Hold On is twice as large among those who have participated in a drill (16% versus 8%). The variation between these two groups of respondents is statistically significant, meaning we can infer these results to the population of respondents (Chi-square 71.9671, p = 0.000).
Figure 2. Percent Predicted Protective Actions by Drill Participation Comparing predicted protective actions based on earthquake experience, the results are more mixed. Respondents who have experienced an earthquake were more likely to select go to a designated zone and run out of the building, but less likely to select Drop Cover and Hold on (Figure 3). These differences by earthquake experience are statistically significant (Chi-square 41.7999, p = 0.000).
8
39
8
24
5
11
5
1618
9
14
4
37
20
5
10
15
20
25
30
35
40
45
DCH Run out ofbuilding
Triangle oflife
Take shelterunder sturdy
object
Get indoorway
Go to adesignated
zone
Do not know
Percent
No Yes

20
Figure 3. Predicted Protective Actions by Previous Earthquake Experience The source and channel of receiving the protective actions messages did not vary by protective action selected. Across messages, in school and through news media were the most common source and channel for learning about the protective action. These results indicate that formal mechanisms of message dissemination are still central to earthquake messaging. Table 4. Predicted Protective Action Sources and Channels
DCH
Run out of
building
Triangle of Life
Take shelter under sturdy object
Get in doorwa
y
Go to designate
d zone
n=90 n=158 n=55 n=111 n=27 n=187 SOURCE
School 70% 46% 45% 60% 52% 59%Work 22% 34% 33% 21% 11% 39%
National Government 13% 19% 11% 6% 4% 20%Regional/State Government 9% 15% 9% 9% 4% 8%
Local Government 7% 11% 11% 11% 4% 6%International NGO 12% 10% 13% 10% 11% 2%
National NGO 17% 15% 15% 16% 0% 4%Local NGO 11% 12% 7% 7% 0% 6%
Red Cross 13% 16% 11% 13% 15% 6%United Nations 2% 7% 2% 5% 4% 1%Family/Friends 20% 38% 16% 27% 39% 31%
Apartment building 9% 13% 7% 5% 0% 6%None of the above 2% 8% 2% 4% 7% 3%
CHANNEL
21%19%
7%
26%
4%
11% 10%13%
25%
9%
16%
4%
32%
2%0%
5%
10%
15%
20%
25%
30%
35%
DCH Runoutofbuilding
TriangleofLife
Takeshelterundersturdyobject
Getindoorway
Gotoadesignated
zone
Donotknow
No Yes

21
News media 46% 59% 51% 54% 41% 70%Government websites 24% 31% 24% 19% 26% 20%
Other website 36% 20% 25% 19% 7% 17%Email 11% 18% 5% 14% 7% 8%
Social Media 28% 39% 24% 25% 26% 25%Flyer/Brochure/Billboard 13% 13% 13% 14% 11% 36%
Word of Mouth 26% 31% 35% 27% 19% 38%Public Forum 6% 20% 7% 16% 4% 17%None of these 7% 9% 2% 11% 11% 5%
Awareness of Different Protective Action Messages So far, we have discussed what protective actions survey respondents have actually taken during a real earthquake and what actions they think they would do during a future earthquake. Now, we look at their awareness of messages related to all types of protective actions. Participants were asked to select all the messages they had seen or heard. Table 5 shows distribution of responses for all messages, as well as how they learned about each message, and what agencies they recall providing each message. The most common messages seen or heard differed by country. Two-thirds of Indian respondents have heard or seen the message to run out of the building, and 60 percent have seen take shelter under a sturdy object. Nearly 90 percent of Peruvian respondents have seen or heard the message to go to a designated safe zone, and over half have seen or heard take shelter under a sturdy object. In Turkey, just over 50 percent have seen or heard take shelter under a sturdy object. For each message respondents selected, they indicated how frequently they heard or saw the messages (1-2 times per year, 3-6 times per year, once a month, 2-3 times per month, once a week, or more than once a week). In Table 5, the most common response for each message is listed by country. In India, no messages are seen or heard more than 1-2 times a year. In Turkey, taking shelter under a sturdy object and going to a designated zone were both most commonly received 3-6 times a year. In Peru, four messages were received 3-6 times a year: run, take shelter, get in a doorway, and go to designated zone. Overall, protective action messages are rarely received, or at least, rarely recalled by participants. Table 5. Protective Action Messages Received, Frequency, Source, and Agency by Country
India Peru Turkey n=205 n=216 n=228
Have you heard or seen the following messages? DCH 33% 34% 46%
Run out of building 66% 6% 20%Triangle of Life 17% 37% 33%
Take shelter under sturdy object 60% 52% 53%Get in doorway 24% 18% 31%
Go to designated zone 36% 89% 35%None 3% 1% 1%
How frequently do you hear or see each of these messages?

22
DCH 1-2 times/year 1-2 times/year 1-2 times/year43% 38% 43%
Run out of building 1-2 times/year 3-6 times/year 1-2 times/year42% 50% 32%
Triangle of Life 1-2 times/year 1-2 times/year 1-2 times/year29% 38% 40%
Take shelter under sturdy object 1-2 times/year 3-6 times/year 3-6 times/year45% 37% 33%
Get in doorway 1-2 times/year 3-6 times/year 1-2 times/year37% 43% 37%
Go to designated zone 1-2 times/year 3-6 times/year 3-6 times/year42% 33% 32%
Where have you seen or heard this message?DCH Work School School
29% 41% 65%Run out of building Family/Friends Family/Friends School
21% 44% 33%Triangle of Life Work News Media School
24% 33% 41%Take shelter under sturdy object News Media News Media School
24% 29% 38%Get in doorway News Media Family/Friends News Media
25% 35% 28%
Go to designated zone News Media News Media News Media/School
25% 36% 23%Which agencies have you seen or heard distribute this message?
DCH
National Disaster Agency
National Disaster Agency
National Disaster Agency
59% 31% 64%
Run out of building
National Disaster Agency Don't remember
National Disaster Agency
47% 29% 38%
Triangle of Life NGO
National Disaster Agency
National Disaster Agency
56% 33% 50%
Take shelter under sturdy object
National Disaster Agency
National Government
National Disaster Agency
34% 32% 49%
Get in doorway NGO Red Cross National Government
43% 33% 51%

23
Go to designated zoneNational Government
National Government
National Disaster Agency
39% 54% 49% Respondents indicated where they recalled receiving each message and from what agency. Again, the most common responses are listed in Table 5. School, work, news media, and family/friends were the most common responses depending on message and country. In Turkey, messages were received from schools or news media. In Peru, family/friends, school, and news media were common channels. In India, work, news media, and family/friends were common. Looking at the agency that respondents associated with each message, Drop, Cover, and Hold On was the only message that was most commonly associated with national disaster agencies in all three countries. But, participants felt that national disaster agencies were also distributing a variety of other messages. For example, Turkish respondents most commonly associated the national disaster agency with all messages except to get in a doorway. Participants ranked how they would prefer to receive earthquake protective action messages. Similar to where participants currently receive messages, formal dissemination channels such as school, news media, and work were the most preferred. Table 6 shows the mean rank for each channel by country. Lower means indicated higher ranking. Interestingly, individuals ranked family and friends low (on average 7.18), yet as we have seen above, social relationships are often where different protective actions are learned. Thus, this informal method of getting information is well used, though individuals would prefer to receive information through a formal channel. Table 6. Preference for Protective Action Messaging Channels, Mean Ranking by Country
India Peru Turkey Total n = 200 n = 205 n = 219 n = 623
School 2.81 2.8 2.19 2.59 News Media 3.06 2.36 3.39 2.94 Work 3.69 3.67 3.83 3.73 Social Media 4.69 4.65 4.65 4.66 Government Websites 5.75 5.9 6.58 6.09 Billboards 6.75 7.35 5.95 6.67 Flyers/Brochures 7.41 6.42 6.62 6.81 Other Websites 7.07 7.79 6.29 7.04 Family/Friends 6.93 7.21 7.38 7.18 Apartment 8.67 9.18 9.4 9.09 Public Forum 9.15 9.09 9.69 9.32
Perceived Effectiveness of Protective Actions Each participant indicated how effective they believed the protective actions would be in protecting them from harm during an earthquake (Table 7). Effectiveness was assessed on a five point scale of (1) “very ineffective” to (5) “very effective.” Mean scores for effectiveness ranged

24
from 2.57 for run out in Turkey to 4.19 for a designated zone in Peru. Go to a designated zone had the highest mean scores for both Peru and Turkey, averaging near 4, or the equivalent of “effective.” This action also received a score near 4 from India, but Indian respondents gave run out the highest score on average (4.14). India respondents had the smallest variance in means among the different actions, indicating the Peruvians and Turkish respondents find larger differences in effectiveness among the different actions. Table 7. Perceived Effectiveness of Protective Actions by Country
India Peru Turkey Total n = 188
n = 204 n = 208
n = 600
How effective do you think each of these is in protecting you from harm during an earthquake?
Go to designated safe zone 3.91 4.19 3.97 4.02Triangle of Life 3.65 3.65 3.80 3.71
Get under sturdy object 3.86 3.07 3.77 3.57Run out 4.14 3.65 2.57 3.43
DCH 3.37 2.70 3.41 3.16Get in doorway 3.36 2.88 3.17 3.13
The effectiveness of different actions will vary based on what type of structure the individual is in when the earthquake occurs. We compared effectiveness scores for run out of the building based on type of residence individuals reported, since run messages can be targeted to individuals in earthen structures. Figure 4 shows that individuals who live in single or multi-story homes perceived higher effectiveness of running out of the building than individuals living in apartments or condos. Yet, approximately 20 percent of apartment dwellers believed running out to be very effective in protecting them from harm. These differences are statistically significant (Chi-square 41.7202, p = 0.000).
Figure 4. Perceived Effectiveness of Running from Building by Residence Type
0.0%
5.0%
10.0%
15.0%
20.0%
25.0%
30.0%
35.0%
40.0%
Very Ineffective Ineffective Neither Effectivenor Ineffective
Effective Very Effective
Single-story home Multi-story home Apartment/Condo

25
The actions that people indicate they would likely do during an earthquake relate to their thoughts on effectiveness. Participants selecting each action felt that it was “Very Effective” in protecting them from harm. While they often indicated other actions were effective or very effective, the chosen action was most frequently thought of as very effective.
Trust in Message Sources Trust in different agencies was measured on a five-point scale: (1) Do not trust at all, (2) Distrust, (3) Neutral, (4) Trust, and (5) Trust very much. Table 8 shows the mean scores on this scale by country. National Red Cross had the highest mean across all three countries, with scores of 3.83 in Turkey to 4.22 in India. Across all three countries, marketing and consulting firms had the lowest means in trust (3.00 to 3.48). Table 8. Trust in Agencies by Country
India Peru Turkey Total n=204 n=214 n=224 n=642
How much would you trust a message from the following: National Red Cross 4.22 4.05 3.83 4.02
International Red Cross 4.18 3.98 3.65 3.93 National Disaster Agency 4.21 3.80 3.77 3.92
United Nations Agency 4.15 3.75 3.45 3.77 Academics/University 3.96 3.51 3.72 3.73
National NGO 3.89 3.55 3.67 3.70 International NGO 4.00 3.37 3.55 3.64
Other nation's disaster agency 3.77 3.39 3.44 3.53 Marketing/Consulting Firm 3.48 3.07 3.00 3.18
PROFESSIONAL SURVEY RESULTS
Forty-three messaging professionals completed at least a majority of the survey, and 34 of those respondents completed the entire survey. They represent countries from all over the world as listed in Table 9 below. India and Peru had the most respondents of any specific country (six and four, respectively). Table 9. Location of Messaging Professional Participants Country N %Afghanistan, Kyrgyzstan, Pakistan, etc. 1 2.94Algeria 1 2.94Bhutan 3 8.82Colombia 2 5.88Costa Rica 1 2.94Ecuador 1 2.94Haiti 3 8.82India 6 17.65

26
Indonesia 1 2.94Iran 1 2.94Mexico 1 2.94Nepal 1 2.94Pakistan 2 5.88Peru 4 11.76Turkey 2 5.88United Kingdom 1 2.94United States 3 8.82Total 34 100
Participants indicated the activities related to earthquake messaging they were engaged in as well (Table 10). The largest frequency was having a government mandate for safety (35%), followed by holding drills (32%). Table 10. Activities Engaged in by Participant Agency Agency Activities 35% We have a government mandate for public safety.
32% We hold earthquake drills / mock drills and must tell people what to do.
19% We conduct earthquake safety education or awareness programs.
24% We conduct multi-hazard or general safety education or awareness programs.
16% We provide training for professionals on earthquake-related topics. 27% We provide safety training for our staff. 11% We produce technical documents or educational materials.
These messaging professionals responded to questions about messages that were distributed throughout their country, messages that their specific organizations/agencies distributed, and their opinions and views on messages and distribution techniques.
Protective Action Messages Distributed First, professional respondents indicated how common different protective actions messages were distributed from official sources within their country. The scores ranged from (1) Not used, (2) Rarely, (3) Sometimes, (4) Often, to (5) Frequently. Figure 5 shows the mean scores for each message type, and high scores indicate the message is more commonly distributed from official sources. Drop, Cover, and Hold On received the highest mean score of 3.54, which corresponds to between “Sometimes” and “Often”. The least common message distributed by official sources was Triangle of Life (2.1 or “Rarely”).

27
Figure 5. Frequency of Protective Action Messages Distribution by Official Sources Respondents were allowed to include other responses not listed in the question. Each of the following was listed once:
x Take 7 Steps (Afghan Tradition to move away from danger) x Fetus position x Take shelter below staircase x Pay attention to doors, since many will want to use them x Go near inner wall x First go to secure area of building then go out x Stay under doorway x Get down on your knees, make yourself small, and cover your head and neck x Lean against a wall x Stay away from windows with glass
Respondents then indicated whether there was one consistent or agreed upon message that is disseminated to the general public in their countries. Seventy percent of respondents said yes, as shown in Figure 6.
Figure 6. Is there one consistent or agreed upon message that is disseminated to the general public
3.54 3.483.18 2.95 2.85
2.1
DCH Get understurdyobject
Go tosuitableplace
Run out ofbuilding
If inearthenbuilding,run out
Triangle ofLife
Mean
Yes70%
No20%
Unknown10%

28
Looking at the respondents’ location for each category, we see that there is some disagreement among respondents from India, Pakistan, and Colombia on whether there is one consistent message. Yes: US, India, Iran, Afghanistan, Mexico, Bhutan, Haiti, Algeria, Peru, Costa
Rica, Nepal No: UK, Colombia, Turkey, Ecuador, India, Pakistan Unknown: India, Pakistan, Colombia, Indonesia
For respondents who indicated yes, there was one consistent message, we asked them to write in that message wording. Drop, Cover, and Hold On was the most common standard message, with 43% of those who believed their country had a standard message indicating that message was DCH. Other standard messages, each mentioned once, included (verbatim):
x Drop, Cover, and Hold On (12, 43%) x Keep calm and go to a safe place x Drop, Cover, and Hold On, check yourself after the shaking stops, then check
others, only evacuate if you need to x Walk out of building towards a point of reunion marked outside buildings x Stand under a door frame x Go out of the building, stay away from wall, trees and electric cables. Sit down
for not fallen down because of the earthquake x During the shaking, do not panic, stay home and find a safe place [at] home x During an earthquake [it] is better to go out of the buildings to save our lives x escribe primero y evita llamar. (write first and avoid calling) x In case an earthquake, no run, no shouts, no push, keep calm. After the
earthquake go to the security place. x If you are in a building, first go to a secure place (like a column) and then go out x Go out from the building x When the earthquake happens go out from the house or building to save x Run
For the eight respondents who indicated there was no consistent message in their country, they ranked the main challenges to creating one agreed upon message. The top ranked challenge was that the variety of building vulnerabilities was too large for one standard message. The second ranked challenge was that the variation in public awareness is too large for one standard message. Thus, feelings of inability to address the risk for different contexts, and feeling that the public is not ready for one message, were challenges perceived by respondents. Respondents could again list their own reasons, which included:
x There has not been such a discussion, authorities and the community are more interested in floods and landslides than earthquakes
x Lack of hazard means advice borrowed from other countries x Lack of community’s trust in government as well as in NGOs to follow such
recommendations x Cultural and social norms and customs refraining women to take a decision for
timely evacuation x Lack of behavioral changes

29
x They believe that bad things happen to others Beyond the distribution of messages within their countries, we asked respondents about the messages that their specific agency distributed to the public (Table 11). Again, Drop, Cover, and Hold On was the most common message distributed (49%). It also was the most likely message to have been assessed for their effectiveness in increasing the public’s knowledge about what protective actions to take during an earthquake, with 28% of the professional respondents having distributing DCH and assessed it. Table 11. Messages Distributed by Participants’ Agencies
Agency Distributes
Messages Have Been Assessed
DCH 49% 28%Run out of building 21% 9%
Triangle of Life 12% 2%If in earthen building, run out 21% 9%
Go to suitable place 33% 12%None 16% ---Other 16% 2%
Unknown --- 14%
Other messages distributed by agencies participating in the survey include the following, each of which was listed once.
x If you are in a small, simple single story unreinforced masonry building, run out
x Stand under a door frame
x Make yourself a smaller target
x Remain calm, identify safest places, identify items that could cause death or injury and work out how to secure them
x If there is tsunami potential, evacuate yourself to higher ground immediately, do not go back home
x Go under a sturdy object
x If you are inside a poorly built building, go out with calm Respondents indicated, if they could recall, when they started using each message they distribute. Average years of use are shown in Figure 6. Triangle of Life had the longest average use with 14 years, followed by go to a suitable place at 13 years. Remember, there are few observations for each of these, so these means should be interpreted with caution.

30
Figure 6. Years Using Specific Message We also asked whether different sectors of the population received specialized messages. Table 12 shows which sectors receive specialized messages. Schools were the most frequently listed sector to have targeted messaging, followed by hospitals and urban areas for both country-broad messages and agency-specific messages. Also, respondents indicated that their agency specifically targeted homes. The least frequently targeted sectors were occupants within specific buildings that are vulnerable, types of vulnerable buildings, or high-rise buildings. Twenty percent of respondents indicated that their agency did not have specialized messages. Table 12. Specialized Messages for Different Sectors Which sectors of the population receive specialized messages? By Country
By Agency
Schools 67% 44%Hospitals or health clinics 42% 26%Urban areas 42% 30%Regions with different seismic hazard 26% 19%Different geographic regions 23% 9%Businesses 21% 12%Rural areas 21% 19%Other institutional or congregate care settings e.g., jails, elderly
care homes, etc. 16% 9%Homes/residential 16% 26%Occupants of specific buildings known to be vulnerable 14% 7%Occupants of types of buildings known to be vulnerable 14% 9%High rise building residents 12% 5%None, there are no specialized messages targeted by sector 9% 19%Unknown 0% 0%Other 19% 0%
Other sectors written in by participants included, each listed once:
x Monastic Institutions x Travelers abroad to earthquake countries x Coastal areas must go up on hill in case of earthquake x General public through campaigns
9
11
14
11
13
DCH
Run out of building
Triangle of life
Earthen bldg, run out
Go to suitable place

31
x Persons with disabilities x People in vehicles x People on public transportation x The mayors x Engineers and masons x Public Information Officer x People with mobility impairments x People in sports stadiums and theatres
Participants indicated whether they included secondary hazards or additional information in their earthquake protective action messages. Table 12 lists the frequency of each hazard included in messaging. Almost all participants indicated that some additional information was included with earthquake protective action messages. Tsunami (44%), Fire (37%), and Landslide (37%) were the most common hazards included with earthquake messages. Flood and Liquefaction (each 19%) were the least likely to be included. Table 12. Secondary Hazards included in Earthquake Messages Does your agency/organization include secondary hazards in your messages?
44% Tsunami 37% Fire 37% Landslide 35% First aid following earthquake 33% How to get help following earthquake 23% Hazardous material release 19% Liquefaction 19% Flood from dam, levee, or glacier lake failure 2% Other 4% We do not include secondary hazards in our messaging
To understand the context of message dissemination within agencies, we asked what those agencies that do disseminate a message think is the main reason to do so. The most frequent response was a government mandate (28% of organizations). Next most frequent was conducting earthquake education and awareness programs (21%). The least common reason was providing safety training for agency staff (0%). Table 13. Reasons for Distributing Messages We have a government mandate for public safety 28% We conduct earthquake safety education or awareness programs 21% Other 17% We hold earthquake drills / mock drills and must tell people what to do 14% We conduct multi-hazard or general safety education or awareness programs 10% We provide training for professionals on earthquake-related topics 7% We produce technical documents or educational materials 4% We provide safety training for our staff 0%
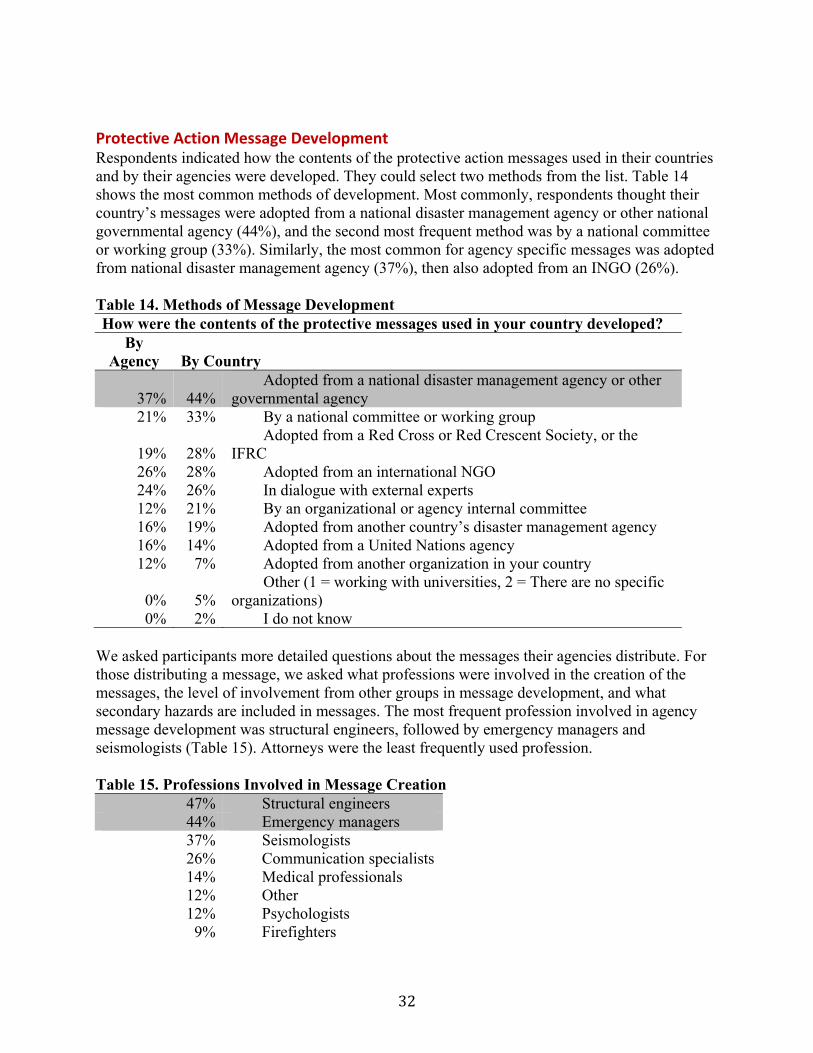
32
Protective Action Message Development Respondents indicated how the contents of the protective action messages used in their countries and by their agencies were developed. They could select two methods from the list. Table 14 shows the most common methods of development. Most commonly, respondents thought their country’s messages were adopted from a national disaster management agency or other national governmental agency (44%), and the second most frequent method was by a national committee or working group (33%). Similarly, the most common for agency specific messages was adopted from national disaster management agency (37%), then also adopted from an INGO (26%). Table 14. Methods of Message Development How were the contents of the protective messages used in your country developed?
By Agency By Country
37% 44% Adopted from a national disaster management agency or other
governmental agency 21% 33% By a national committee or working group
19% 28% Adopted from a Red Cross or Red Crescent Society, or the
IFRC 26% 28% Adopted from an international NGO 24% 26% In dialogue with external experts 12% 21% By an organizational or agency internal committee 16% 19% Adopted from another country’s disaster management agency 16% 14% Adopted from a United Nations agency 12% 7% Adopted from another organization in your country
0% 5% Other (1 = working with universities, 2 = There are no specific
organizations) 0% 2% I do not know
We asked participants more detailed questions about the messages their agencies distribute. For those distributing a message, we asked what professions were involved in the creation of the messages, the level of involvement from other groups in message development, and what secondary hazards are included in messages. The most frequent profession involved in agency message development was structural engineers, followed by emergency managers and seismologists (Table 15). Attorneys were the least frequently used profession. Table 15. Professions Involved in Message Creation
47% Structural engineers 44% Emergency managers 37% Seismologists 26% Communication specialists 14% Medical professionals 12% Other 12% Psychologists 9% Firefighters

33
9% Elected officials 7% None 2% Attorneys
Other professions listed include geographer, geotechnical engineers, geologists, public policy specialist, rescue teams, social promotion groups, and architects. Table 16 below shows participants’ ranking of the importance for certain types of activities and expertise in message development. Again with the ranking, the smaller the mean the more important the item is viewed. Technical assistance to select best message was the most important activity respondents felt would help them with protective action messaging. Recommendations from INGOs had the lowest mean ranking. For expertise, respondents rank structural engineers as the most important on average, followed by emergency managers, and then communication specialists. Table 16. Ranking of Importance of Activities and Expertise for Message Development Mean rank of how important these activities are for developing an appropriate message Technical assistance to select the most appropriate message 1.94 Communications or marketing support to develop a message 3.26 Recommendation or approval of message by a government agency 3.53 Inclusive process for selecting the message 3.55 Language support to translate a simple, clear and easily remembered message into my language 3.97 Recommendation of appropriate message by trusted international organization 4.74Mean rank of professionals considered important to have involved in message development Structural engineers 2.29 Emergency managers 3.38 Communication specialists 3.67 Seismologists 3.71 Psychologists 5.29 Firefighters 5.85 Medical professionals 6.44 Elected officials 7.21 Attorneys 7.44
Protective Action Message Dissemination We asked participants about from whom and how messages were disseminated to the general public in their countries, to understand what sources and channels are commonly used (Table 17). The national government was by far the most common response for the agency that disseminates messages to the public (77%). Next most frequent was NGOs within the country (54%).

34
Table 17. Agencies Disseminating Messages to the Public Which agencies and organizations in your country disseminate protective action messages directly to the public?
77% National government 54% National nongovernmental organizations (NGOs) 47% Regional or state government 44% Local or city or village government 44% International nongovernmental organizations (INGOs) 42% Red Cross or Red Crescent Society 40% Local or community nongovernmental organizations (NGOs) 26% United Nations agency 0% None 2% I do not know
19% Other We asked whether there was coordination between the agencies that disseminate messages. Sixty percent of respondents said yes, while a third said no, and eight percent did not know. Professionals indicated how frequently different channels were used to reach the public with protective action messages. Scores ranged from 1 (Never) to 5 (Always). Table 18 provides the means for each channel. In schools (3.89), word of mouth (3.89), and printed flyers (3.4) had the highest mean usage, while phone calls (1.75) and short message service (SMS) or text messages had the lowest (2.02). Table 18. Frequency of Channels Used for Message Dissemination How often is the following communication channel used to disseminate protective action messages to the public?
3.82 In schools 3.44 Word of mouth/interpersonal communications 3.4 Printed flyers or brochures
3.27 Nongovernmental organization (NGO) or commercial websites 3.08 Newspapers 3.02 Radio 2.92 Social media (e.g., Facebook, Twitter, RSS) 2.89 Government websites 2.89 Television 2.8 Public fora
2.59 General news websites 2.21 Email 2.02 SMS or text messages 1.75 Phone calls or voice messages
Earthquake drills are a method of educating the public on what to do during an earthquake, and most respondents (78%) indicated that there were earthquake drills in their country (Figure 7). The majority of these drills targeted students (Figure 8).

35
Figures 7 and 8. Drills Use and Targeted Groups
Perceptions about Messages and Message Dissemination Participants reported various perceptions and professional opinions on messages, message development, and message dissemination. We asked how aware they felt the public in their countries were of what to do in an earthquake. Responses could range from 1 (Not at all aware) to 5 (Very aware). No respondents felt that the public was very aware of what to do (Figure 9). Most respondents selected either only slightly aware or somewhat aware.
Figure 9. Professionals Belief in Public Awareness of Protective Actions Participants also indicated their agreement to nine statements about each of the common protective action messages. In Table 19, the statements are listed along the left and the messages across the top with mean scores on the 5-point agreement scale ranging from Strongly disagree (1) to Strongly agree (5). On this scale, 3 represents Neutral. Darker-highlighted cells indicate the message that received the most negative score on average for that statement, and the lighter gray cells indicate the message that received the most positive mean score for that statement.
Yes78%
No14%
Don't know8%
Students
55%General public32%
Other13%
Not at all aware10%
Slightly aware29%
Somewhat aware45%
Moderately aware16%
Very aware0%

36
Note that statements six through ten are negative statements, thus higher scores indicate more negative views on that message. From this table we note that Triangle of Life was the most negatively viewed message overall, scoring the worst on all statements except if the message increased the risk of death during an earthquake. Drop, Cover, and Hold On was viewed most positively overall, scoring the most positive means on five of the nine items. Get under a sturdy object was also viewed positively on many statements. Table 19. Opinions on Common Protective Action Messages
DCH
Run out of building
Triangle of life
If in single-story earthen structure, run out
Go to a suitable place
Get under sturdy object
1. I think the message is appropriate for conditions in my country 3.58 2.97 2.68 3.56 3.14 3.61
2. I trust the source of the message 3.74 3.05 2.61 3.36 3.17 3.743. I am confident in the process
used to develop or approve the message 3.58 2.82 2.50 3.31 3.17 3.55
4. I would personally take the action the message recommends 3.74 2.92 2.53 3.64 3.33 3.89
5. I think the message is easy to understand 4.00 3.79 2.74 3.92 3.06 4.03
6. I think this message puts people at risk of being killed in an earthquake 2.55 3.39 3.00 2.78 2.83 2.84
7. This message was taken from somewhere else 3.03 3.29 3.47 2.97 3.03 3.00
8. I think this message is poorly worded 2.24 2.76 3.21 2.39 3.11 2.42
9. I do not think the public believes the message 2.50 2.50 3.05 2.44 2.67 2.47
Participants also indicated the length of messages and number of different messages they felt appropriate for their countries. A majority of respondents felt that 5-10 words was the most appropriate length (52%), and a majority believed that there should be a few different messages but not too many messages (53%).

37
Figure 10 and 11. Opinion on Message Length and Number of Different Messages.
Challenges and Successes in Protective Action Messaging Participants ranked their concerns about developing and disseminated protective action messages to help us understand challenges agencies face in this area (Table 20). Again, the smaller mean rank indicates a larger challenge. Respondents reported a lack of time as biggest challenge, followed by the complexity, lack of clarity, and difficulty to remember current messages. Table 20. Ranking of concerns about Messages and Messaging 2.29 There is a lack of time to develop messages. 2.41 Current messages are too complex. 2.5 Current messages are unclear. 2.5 Current messages are difficult for the public to remember.
2.79 There is a lack of expertise to develop a message. 2.85 Messaging is not in a mandate. 2.97 The government body responsible for messages has not approved a message. 3.05 Many do not feel technically qualified to choose a message. 3.06 There is a lack of funding for message development. 3.09 We need expert advice to develop a message. 3.12 Current messages are not technically accurate. 3.15 There is disagreement regarding which message to distribute. 3.18 There is uncertainty which message to distribute.
3.44 There is concern about the potential consequences if people take the protective actions we recommend but are still injured or killed in an earthquake.
Other challenges added by professionals to our list related to traditional knowledge or cultural contexts within the country. Actually, 76 percent of respondents said that there are firm beliefs or
5 or less
words31%
5-10 words52%
11-20 words17%
More than 20
words0%
Yes, give multiple
messages that are as
context-specific as possible
33%Yes, select a
small number of messages that cover as many contexts
as possible…
No, different message
will confuse people.
14%
38
rumors that are common challenges to educating about the appropriate action to take during an earthquake. These common rumors or beliefs are listed below. The most common was the belief to get in a doorway, which recalling from the public survey above, we see it is still prevalent among the populations of India, Peru, and Turkey.
x Standing in doorway is still used especially by older people (n = 11) x Going under the table (n = 3) x Going to corner of a building, attach to the wall (n = 2) x Nothing to do, it's God sake, or churches are safe (n = 2) x In Afghanistan, there is a traditional saying that when threatened, one is obliged to
take seven steps away from danger. x The building typology has shifted in the last few decades; it is more of
unreinforced masonry and non-engineered concrete buildings. A lot of beliefs have therefore emerged and have got mixed in the society, further combined with new messages which are not authorized or validated.
x Run out of building x The buildings are not seismically safe; in any case the building would be
collapsed, therefore the protective actions would not be workable x We always prepare and nothing happens x Cultural Diversity x Gender norms (women not allowed to evacuate or must evacuate first) x Youth highly exposed to risk x Mountainous areas difficult to give appropriate message x The bad things would be happening to others
Participants listed other concerns not addressed in the survey. Some of the responses included lack of interest from media to disseminate messages, the need for national standardization, that only the national disaster agency is allowed to disseminate such messages and is lacking resources to do so, lack of data on the messaging, that low risk creates a lack of concern, lack of collaboration among agencies, religious leaders promote fatalistic messages, lack of electricity prevents use of different channels. There was concern about promoting messages that conflict, such as run out and DCH. For example, a few professionals felt that promoting run out may reduce the emphasis on building codes and structural improvement, or that the public will have difficulty determining if their building is safe enough to do DCH versus run out. Finally, respondents provided what they saw as successes in protective action messaging. A large majority of respondents mentioned the success of educating school children on protective actions to take during shaking. Other successes listed included the spread of DCH, linking earthquake and tsunami messages, use of slogans in native languages, and the dissemination of a few key messages.
Ap
Ap
Ap
Ap
ppendix I.: L
ppendix II.:
ppendix III.A
ppendix III.B
List of litera
Skype Disc
A: Public S
B: Professio
ature review
ussion Them
urvey
onal Survey
AP
wed
mes
y
PPENDICESS

Appendices - 2
Appendix I.: List of literature reviewed
This literature review is organized around eight disciplinary areas: 1. Protective Actions 2. Epidemiology of Earthquake Casualties 3. Urban Search and Rescue 4. Evacuation 5. Human Behavior in Disasters 6. Risk Communication 7. Structural Engineering 8. Seismology
Some journal articles that were reviewed included information that was applicable to more than one of these disciplinary areas—in those cases, the article is listed under the most relevant area. Areas 2, 5, 6, 7 and 8 are covered in more detail by background papers by relevant subject matter experts, so the GHI staff reviewed few papers in some of these areas. For some disciplinary areas, such as risk communication, excellent summaries of the technical literature already exist, greatly reducing the number of publications that the GHI staff needed to review. The GHI staff also reviewed a number of additional articles during development of the guidance document; those are referenced in the document itself, as well as in the background papers.
1. Protective Actions (primarily discussed in references in below section on Epidemiology of Earthquake Casualties). a. Alexander, D. (2009). Self-protective behavior during earthquakes: some lessons from L’Aquila, 6 April 2009. Retrieved
from PowerPoint presentation slides. www.slideshare.net/dealexander. b. Petal, M. A. (2004). Urban disaster mitigation and preparedness: the 1999 Kocaeli earthquake. Ph.D. Dissertation.
University of California, Los Angeles, Department of Urban Planning. c. Rahimi, M. (1992). Classification and analysis of occupant behavior during earthquake shaking. Earthquake Engineering,
Tenth World Conference, 6085-6090. d. So, E. Spence, R., Khan, A., & Lindawati, T. et al (2008). Building damage and casualties in recent earthquakes and
tsunamis in Asia: a cross-event survey of survivors. Proceedings, 14th World Conference on Earthquake Engineering, Beijing, China.
2. Epidemiology of Earthquake Casualties. a. Alexander, D.E. (2011). Mortality and Morbidity Risk in the L’Aquila, Italy Earthquake of 6 April 2009 and Lessons to be
Learned. Human Casualties in Earthquakes, Advances in Natural and Technological Hazards Research 29, DOI 10.1007/978-90-481-9455-1_13.
b. Armenian, H.K., Noji, E.K. & Oganesian, A.P. (1992). A case - control study of injuries arising from the earthquake in Armenia, 1988. Bulletin of the World Health Organization, 70(2), 251-257
c. Armenian, H.K., Melkonian, A., Noji, E.K., Hovanesian, A.P. (1997). Deaths and Injuries due to the Earthquake in Armenia: A Cohort Approach. International Journal of Epidemiology, 26(4), 806-813.
d. Macintyre, A.G., Barbera, J.A., Smith, E.R. (2006) Surviving Collapsed Structure Entrapment after Earthquakes: A “Time-to-Rescue” Analysis. Prehospital and Disaster Medicine 21(1). (http://pdm.medicine.wisc.edu).
e. Peek-Asa et al (2003). Seismic, structural, and individual factors associated with earthquake related injury. Injury Prevention, 9: 62-66.
f. Petal, M. (2011). Earthquake casualties research and public education. Human Casualties in Earthquakes, Advances in Natural and Technological Hazards Research, 29, 25-50.
g. Ramirez, M. and Peek-Asa, C. (2005). Epidemiology of traumatic injuries from earthquakes, Epidemiologic Reviews, 27, 47-55.
h. Spence, R. and So, E. (2009). Estimating shaking-induced casualties and building damage for global earthquake events. Final technical report, NEHRP Grant Number 08HQGR0102, Cambridge Architectural Research Ltd. ,Cambridge, UK. .
3. Urban Search and Rescue. a. Shiono, K., Krimgold, F., Ohta, Y. (1992). Modeling of search-and-rescue activity in an earthquake. Earthquake

Appendices - 3
Engineering, Tenth World Conference, ISBN 90 5410 060 5, 6043-6048. b. FEMA (2010). Earthquake Safety Checklist (FEMA B-526). Federal Emergency Management Agency, Washington, D.C.: c. USACE (2013). Shoring Operations Guide, 3rd Edition. U.S. Army Corps of Engineers, Urban Search and Rescue
Program, Washington, DC. Accessed December 2013 at:(http://www.disasterengineer.org/LinkClick.aspx?fileticket=Di2ysPL8wjw%3d&tabid=57&mid=394)
d. FEMA (2008). Structural Collapse Awareness, Student Manual. Structure Collapse Awareness Training, National Search and Rescue Response System, Federal Emergency Management Association. Accessed December 2013 at http://rsc.usace.army.mil/Captivate/sca/SCA-FEMA%20SM-17Sep08.pdf.
4. Evacuation. a. Galbreath, M. (1969). Time of Evacuation by stairs in high buildings. National Research Council of Canada, Division of
Building Research. Fire research note no. 8. b. Keeney, R.L. (2009). Rethinking Egress: A Vision for the Future. NIST Technical Note 1647. In Workshop Proceedings
April 1-3, 2008 Warrenton, Virginia, U.S. Department of Commerce: National Institute of Standards and Technology. c. Peacock, R.D. et al. (2012). Overall and local movement speeds during fire drill evacuations in buildings up to 31 stories. I.
U.S. National Institute of Standards and Technology (NIST).
5. Human behavior in disasters. a. Cocking, C., Drury, J., & Reicher, C. (2009). The Psychology of crowd behavior in emergency evacuations: Results from
two interview studies and implications for the Fire & Rescue Service. The Irish Journal of Psychology, 30(1): 59-72. b. Durkin, M. E. (1985) Behavior of Building Occupants in Earthquakes. Earthquake Spectra, 1(2), 271-283. c. Dynes, R. Natural Hazards Observer, Nov 2006, pages 5-6 d. Fahy, R. F., Proulx, G., & Aiman, L. (2009). 'Panic' and human behaviour in fire. Proceedings, 4th International
Symposium on Human Behaviour in Fire: 13 July 2009, Robinson College, Cambridge, UK, 387-398. National Research Council Canada..
e. Mileti, D. & Nigg, J. M. (1984) Earthquakes and Human Behavior. Earthquake Spectra, 1(1), pp. 89-106. e. Rahimi, M. (1992). Classification and analysis of occupant behavior during earthquake shaking. Earthquake Engineering,
Tenth World Conference.
6. Risk Communication. a. American Red Cross (2007). Talking About Disaster: Guide for Standard Messages. Washington, D.C.: Author. b. International Federation of Red Cross and Red Crescent Societies (IFRC) (2013), “Public awareness and public education
for disaster risk reduction: key messages.” Geneva, Switzerland: Author. c. International Federation of Red Cross and Red Crescent Societies (IFRC) (2011), “Public awareness and public education
for disaster risk reduction: a guide.” Geneva, Switzerland: Author. d. Mileti, D., Bandy, R., Bourque, L.B., Johnson, A., Kano, M., Peek, L., Sutton, J., Wood, M. (2006, Revision 4) Annotated
Bibliography for Public Risk Communication on Warnings for Public Protective Actions Response and Public Education. e. Mileti, D. Public Hazards Communication and Education: The State of the Art. f. Tierney, K. (2005). Guidance for Seismic Safety Advocates: Communicating Risk to the Public and Other Stakeholders.
Background paper for FEMA 474, Promoting Seismic Safety
7. Structural Engineering. a. Ibarra, L. and Krawinkler, H. (2005). Global collapse of frame structures under seismic excitations. Report No. 152,
Department of Civil and Environmental Engineering. Stanford University, Stanford, USA. b. Jaiswal, K., Wald, D., & D’Ayala, D. (2011). Developing Empirical Collapse fragility functions for global building types.
Earthquake Spectra, 27(3), 775-795. c. Liel, A. & Deierelein, G. (2012). Using collapse risk assessments to inform seismic safety policy for older concrete
buildings. Earthquake Spectra, 28(4), 1495-1521. d. Miyamoto, K., Gilani, A. S. J., & Wong, K. (2011). Massive Damage Assessment Program and Repair and Reconstruction
Strategy in the Aftermath of the 2010 Haiti Earthquake. Earthquake Spectra, 27(S1), S219-S237. e. Neighbors, C., Cochran, E., Caras, Y., and Noriega, G. (2013). “Sensitivity Analysis of FEMA HAZUS Earthquake Model:

Appendices - 4
Case Study from King County, Washington.” Nat. Hazards Rev., 14(2), 134–146. f. Spence, R. and So, E. (2009). Estimating shaking-induced casualties and building damage for global earthquake events.
Final technical report, NEHRP Grant Number 08HQGR0102, Cambridge Architectural Research Ltd. ,Cambridge, UK. g. Villaverde, R. (2007). ”Methods to Assess the Seismic Collapse Capacity of Building Structures: State of the Art.” J.
Struct. Eng., 133(1), 57–66.
8. Seismology. a. Ghanat, S. (2011). Duration characteristics of the mean horizontal component of shallow crustal earthquake
records in active tectonic regions. Ph.D. dissertation. Arizona State University, Tempe, AZ..

Appendices - 5
Appendix II: Skype Discussion Themes
Theme I – Forms of Protective Actions to Take During an Earthquake
Discussion Topics:
x The most common form/ standard protective action being followed or advocated in the country (What? Why? Rationale?)
x Any other forms of protective action (cultural or firm beliefs?) x Any barriers to taking certain protective actions (i.e., no sturdy furniture to shelter under, limited exits) x Issues
o Building types (size, vulnerability to collapse, heavy vs. light) o Rural vs. urban o Schools vs. general public o Other?
x How are messages being disseminated/ advocated? (Who disseminates? Through what means, channels? Any issues in dissemination? Recommendations to improve dissemination?)
Theme II – Appropriate/Effective Messaging for Protective Action during an Earthquake
Discussion Topics:
x Current protective actions being followed (appropriateness, channels, gaps?) x Need for appropriate protective action messages (type of building, indoor vs. outdoors, age, disability, gender,
cultural beliefs, etc.) x Increasing effectiveness of protective action messages (considering characteristics of target audience, source of
messages, access to information/messages, avoiding technical jargon, etc.) x How are messages being disseminated/ advocated? (Who disseminates? Through what means, channels? Any
issues in dissemination? Recommendations to improve dissemination?) Theme III – Earthquake Risk Communication
Discussion Topics:
x Existing protective action messages (What? Level of detail? Other risk communication messages?) x Effectiveness of risk communication (Community context? Perceptions and beliefs? Source Credibility? Trust in
the message? Communication channels? Individual Differences – age, gender, access to information, disability, etc.)
x Communication channels and tools used (media, communication materials, schools, community meetings, etc.)

Appendices - 6
Appendix III.A: Public Survey You are invited to participate in our study on earthquake protective action messaging entitled, “Developing Guidance on Protective Actions to Take During Earthquake Shaking” funded by USAID/OFDA (United States Agency for International Development and Office of Foreign Disaster Assistance) and conducted by GeoHazards International. Protective actions are those actions that people take, while an earthquake is occurring, to protect themselves from injury or death.
Purpose: We are surveying residents of Peru, India, and Turkey to find out about the different protective action messages in these countries. We are asking you, as a resident, about how often you hear different messages and from what agencies. Your responses along with other residents of your country will allow us to provide advice to government agencies about how to better reach the public with these important messages.
Activities: If you choose to participate, there are about 20 questions that should take you about 5-8 minutes to complete. We would really appreciate your participation, and by clicking on the button below you will be taken to the survey. By completing the survey, you are giving permission for us to use your responses for research purposes.
Benefits: You will receive points to your SSI survey participation account for participation in this survey. These points equal approximately 1 U.S. Dollar, which is 3 Peruvian Nuevo Sol or 2 Turkish Lira or 62 Indian Rupees.
Voluntary and Confidential: Your participation in this study is voluntary and you must be over 18 years of age to participate. You do not have to answer anything you do not want to and you may stop participating at any time. At no point will your name be associated with the responses you provide. Information about you will be kept confidential to the extent permitted or required by law. People who have access to your information include the Principal Investigator and research study personnel. Representatives of regulatory agencies such as the Office of Human Research Protections (OHRP) and entities such as the Texas A&M University Human Subjects Protection Program may access your records to make sure the study is being run correctly and that information is collected properly. The data without personal identifying information will be provided to GeoHazards International upon completion of data analysis.
Risks: You must be over 18 years of age to participate. The things that you will be responding to in the survey create no more risks than you would come across in everyday life. Aside from your time, there are no costs for taking part in the study
For Questions: If you have questions or concerns, simply email Michelle at [email protected]. For questions about your rights as a research participant; or if you have questions, complaints, or concerns about the research, you may call the Texas A&M University Human Subjects Protection Program office at +1-979-458-4067 or email [email protected]. The survey results will be available about one year from the completion of data collection on our website: www.geohaz.org. Please keep this email for your records and in case you have any questions.
Thank you!
Michelle Meyer Texas A&M University - 3137 College Station, TX 77803, USA +1.979-845-7813 (office)
Janise Rodgers GeoHazards International 687 Bay Road Menlo Park, CA 94025, USA +1.650.614.9050 (office)

Appendices - 7
Please select your country:
� India � Peru � Turkey
Have you experienced an earthquake before?
� Yes � No If No Is Selected, Then Skip To Have you been in an earthquake drill ...
Where were you when the earthquake happened?
� In a residential home and awake � In a residential home and asleep � In a workplace building � Inside a public building or other community building � Outside � Driving � Do not remember � Other, please describe: ____________________
During the last earthquake you experienced, what did you do while the ground was shaking?
� Took shelter under a sturdy object (such as a table) � Ran out of the building � Triangle of Life � Went to a designated zone in the building � Nothing � Do not remember � Other, please describe: ____________________
Were you or a family member injured during that earthquake?
� Yes � No
Have you been in an earthquake drill or practiced what to do in an earthquake in the past 2 years?
� Yes � No � Do not know

Appendices - 8
The following few questions ask about what you would do during an earthquake while the ground is shaking to protect yourself from harm. Please answer to the best of your ability.
During an earthquake, what would you do to protect yourself from injury? Please select one.
� Drop, Cover, and Hold on � Run out of the building � Triangle of Life � Take shelter under a sturdy object (such as a table) � Get in a doorway � Go to a designated secure zone in the building � Do not know � Other, please describe: ____________________ If Do not know Is Selected, Then Skip To The following few questions ask about...
Did you learn this action from any of the following organizations? Select all that apply.
� In school � At work � National government � Regional or state government � Local or city or village government � International nongovernmental organizations (INGOs) � National nongovernmental organizations (NGOs) � Local or community nongovernmental organizations (NGOs) � Red Cross or Red Crescent Society � United Nations agency � Family/Friends � Apartment building � None of these � Other, please describe: ____________________
How did you hear or learn about that action? Please, check all that apply.
� News media (Newspaper, Radio, Television, websites) � Government websites � Nongovernmental organization (NGO) or commercial websites � Email � Social media (e.g., Facebook, Twitter, RSS) � Printed flyers or brochures or billboards � Word of mouth/interpersonal communications � Public fora � None of these � Other, please describe: ____________________

Appendices - 9
The following few questions ask about different messages you may or may not have heard about what to do during an earthquake. Please answer to the best of your ability.
Have you ever heard or seen any of these messages about what to do during an earthquake? Please select all that apply.
� Drop, Cover, and Hold on � Run out of the building � Triangle of Life � Take shelter under a sturdy object (such as a table) � Get in a doorway � Go to a designated secure zone in the building � None � Other, please describe: ____________________ If None Is Selected, Then Skip To Please indicate how effective you thi...
How often have you heard or seen these messages?
[selected responses from above]
Please indicate where you have most commonly heard or seen these messages.
[selected responses from above]
Please indicate which organizations you have heard or seen supply these messages. Please select all that apply.
[selected responses from above]
Please indicate how effective you think the following actions would protect you from harm during an earthquake.
Very Ineffective
Ineffective Neither Effective nor Ineffective
Effective Very Effective
Do Not Know
Drop, Cover, and Hold on � � � � � �
Run out of the building � � � � � �
Triangle of Life � � � � � �
Take shelter under a sturdy object (such as a table) � � � � � �
Get in a doorway � � � � � �
Go to a designated secure zone in the building � � � � � �
Other, please describe: � � � � � �

Appendices - 10
How much would you trust a message about what to do during an earthquake from the following agencies or organizations?
Do Not Trust At All
Distrust Neutral Trust Trust Very Much
National disaster management agency or other governmental
agency � � � � �
National Red Cross or Red Crescent Society � � � � �
International Federation of Red Cross and Red Crescent Societies
(IFRC) � � � � �
Nongovernmental (NGO) or local organization in your country � � � � �
Academic institution in your country � � � � �
Communications or marketing consultant � � � � �
Another country's disaster management agency � � � � �
United Nations agency � � � � �
An international nongovernmental organization (INGO) � � � � �
Please rank the following potential sources of earthquake and disaster-related information in order of your preference. Click and move items to order from 1-12, with 1 being your most preferred place to learn about earthquake protection.
______ School ______ Workplace ______ News media (Radio, Television, Newspaper, websites) ______ Social media (e.g., Twitter, Facebook, etc.) ______ Billboards ______ Flyers/brochures ______ Government websites ______ Nongovernmental organization (NGO) or commercial websites ______ Friends and family ______ In an apartment building/ from apartment building officials ______ Public fora ______ Other, please describe:

Appendices - 11
Finally, please answer a few questions about you.
What is your gender?
� Male � Female What is your age?
� Under 18 years � 18 to 24 years � 25 to 34 years � 35 to 44 years � 45 to 54 years � 55 to 64 years � 65 to 74 years � 75 or older Where do you live? Please provide city or village name and state or region name.
What type of house or building do you live in?
� Single story home � Multi-story home � Multi-story apartment or condo building � Other, please describe: ____________________ Are you employed outside the home?
� Yes � No What is the highest level of formal education you completed?
� 0-4 years � 5-8 years � 9-12 years � 13-16 years � More than 16 years Estimate your household yearly income:
� Less than Rs. 100,000 � Rs. 100,001 – 200,000 � Rs. 200,001 – 500,000 � Rs. 500,001 – 1,000,000 � More than Rs. 1,000,000
Thank you for your participation! Please click the >> button below to record your responses and you will be redirected to receive credit for your participation.

Appendices - 12
Appendix III.B: Professional Survey
In this first section, there are several questions about the use and content of protective action messages. Protective action messages are any official message from a government or organization that informs people what to do to protect themselves from harm or death during earthquake shaking. Please answer the following to the best of your ability.
There are a few common protective messages used in different parts of the world. Please indicate how commonly these messages are provided officially - not from unofficial sources - to the general public in your country.
Not used in my country
Rarely Sometimes Often Frequently
Drop, Cover, and Hold on (DCH) � � � � �
Run out of the building � � � � �
Triangle of Life � � � � �
If you are in single story earthen building, run out. � � � � �
Go to suitable place � � � � �
Take shelter under a sturdy object (such as a table) � � � � �
Other: please indicate � � � � �
Other: please indicate � � � � �
Is there one consistent or agreed upon message that is disseminated to the general public about what action to take during an earthquake to protect themselves from harm?
� Yes, please indicate which message: ____________________ � No � I am unsure.
Answer If Does your country use ONE standard protective action message? No Is Selected What are the main challenges to developing a standard protective action message for your country? Please rank the following challenges by clicking and dragging the most challenging one to the top and the least challenging to the bottom.
______ The variety of building vulnerabilities is to too large for one standard message. ______ The variation in public awareness is too large for one standard message. ______ The variation in socio-economic conditions is too large for one standard message. ______ Lack of agreement among organizations and agencies. ______ Other, please describe: ______ Other, please describe:

Appendices - 13
Regarding the messages that are distributed in your country: Which sectors of the population receive specialized messages? Please check all that apply.
� None, there are no specialized messages targeted by sector � Schools � Hospitals or health clinics � Other institutional or congregate care settings (e.g., jails, elderly care homes, etc.) � High rise building residents � Homes/residential � Businesses � Urban areas � Rural areas � Occupants of specific buildings known to be vulnerable � Occupants of types of buildings known to be vulnerable � Different geographic regions � Regions with different seismic hazard � Other, please describe: ____________________ � Unknown
How were the contents of the protective messages used in your country developed? Please select up to two of the following.
� By an organizational or agency internal committee � By a national committee or working group � In dialogue with external experts � Adopted from a national disaster management agency or other governmental agency � Adopted from a United Nations agency � Adopted from a Red Cross or Red Crescent Society, or the International Federation of Red Cross and Red Crescent
Societies (IFRC) � Adopted from an international nongovernmental organization (NGO) � Adopted from another organization in your country � Adopted from another country’s disaster management agency � Other, please describe: ____________________ � I do not know
Is there a government agency responsible for approving protective action messages?
� Yes, please name the agency: ____________________ � No � I do not know

Appendices - 14
Please indicate your level of agreement with each of the following statements about the message: "${lm://Field/1}"
Strongly
Disagree
Disagree Neither Agree
nor Disagree
Agree Strongly Agree
I think the message is appropriate
for conditions in my country � � � � �
I trust the source of the message � � � � �
I am confident in the process used
to develop or approve the message � � � � �
I would personally take the action
the message recommends � � � � �
I think the message is easy to
understand � � � � �
I think this message puts people at
risk of being killed in an
earthquake � � � � �
This message was taken from
somewhere else � � � � �
I think this message is poorly
worded � � � � �
I do not think the public believes
the message � � � � �
Which message(s) does your agency or organization distribute to the general public? Please check all that apply.
� Drop, Cover, and Hold on (DCH)
� Run out of the building
� Triangle of Life
� If you are in a single story earthen building, run out.
� Identify a suitable place and go there.
� We do not distribute a message
� Other, please list: ____________________
� Other, please list: ____________________
If We do not distribute a message Is Selected, Then Skip To End of Block
Have any of these messages undergone any assessments of their effectiveness in your country for increasing the public's
knowledge about what protective actions to take during an earthquake? Please select all those that have been assessed.
� None have been assessed
� I do not know

Appendices - 15
Answer If Have any of these messages undergone any assessments of their effectiveness for increasing the public’s knowledge about what protective actions to take during an earthquake? Please select all those... None have been assessed Is Not Selected Please provide reference or weblink to the assessments, if available.
Does your agency/organization disseminate different protective action messages to sectors? Please check all that apply.
� None, we do not provide specialized messages � Schools � Hospitals or health clinics � Other institutional or congregate care settings (e.g., jails, elderly care homes, etc.) � High rise building residents � Homes/residential � Businesses � Urban areas � Rural areas � Occupants of specific buildings known to be vulnerable � Occupants of types of buildings known to be vulnerable � Different geographic regions � Regions with different seismic hazard � Unknown
How were the contents of the protective messages used by your agency or organization developed? Please select up to two of the following.
� By an organizational or agency internal committee � By a national committee or working group � In dialogue with external experts � Adopted from a national disaster management agency or other governmental agency � Adopted from a United Nations agency � Adopted from a Red Cross or Red Crescent Society, or the International Federation of Red Cross and Red Crescent
Societies (IFRC) � Adopted from an international nongovernmental organization (NGO) � Adopted from another organization in your country � Adopted from another country’s disaster management agency � Other, please describe: ____________________

Appendices - 16
During the development of the protective messages used by your agency or organization, did you receive assistance from staff or literature at any of the following sources?
None Assisted by agency staff
Reviewed technical literature from agency
National disaster management agency or other governmental agency � � �
National Red Cross or Red Crescent Society � � �
International Federation of Red Cross and Red Crescent Societies (IFRC) � � �
Nongovernmental (NGO) or local organization in your country � � �
Academic institution in your country � � �
Communications or marketing consultant � � �
Another country's disaster management agency � � �
United Nations agency � � �
An international nongovernmental organization (NGO) � � �
General public � � �
Other, please describe: � � �
Received no assistance � � �
Which of the following professions were involved in the creation of your agency or organization’s protective action messages? Please select all that apply.
� Structural engineers � Seismologists � Attorneys � Communication specialists � Psychologists � Emergency managers � Firefighters � Medical professionals � Elected officials � Other, please describe: ____________________ � None
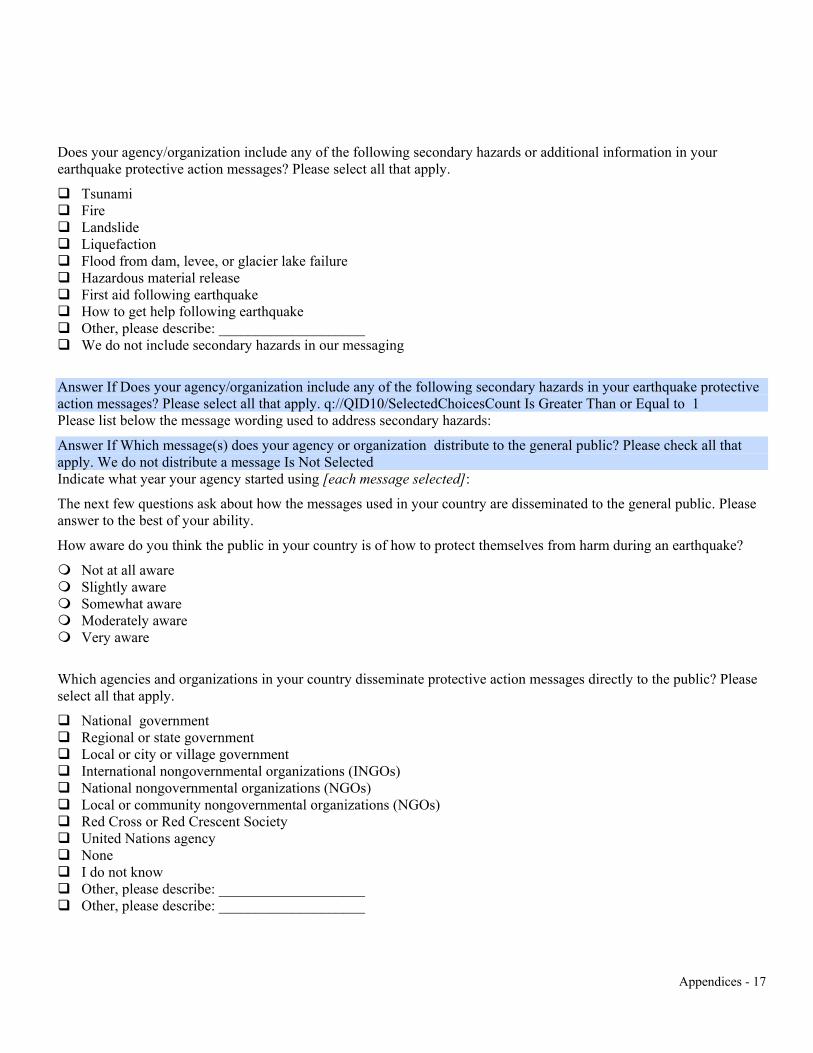
Appendices - 17
Does your agency/organization include any of the following secondary hazards or additional information in your earthquake protective action messages? Please select all that apply.
� Tsunami � Fire � Landslide � Liquefaction � Flood from dam, levee, or glacier lake failure � Hazardous material release � First aid following earthquake � How to get help following earthquake � Other, please describe: ____________________ � We do not include secondary hazards in our messaging
Answer If Does your agency/organization include any of the following secondary hazards in your earthquake protective action messages? Please select all that apply. q://QID10/SelectedChoicesCount Is Greater Than or Equal to 1 Please list below the message wording used to address secondary hazards:
Answer If Which message(s) does your agency or organization distribute to the general public? Please check all that apply. We do not distribute a message Is Not Selected Indicate what year your agency started using [each message selected]:
The next few questions ask about how the messages used in your country are disseminated to the general public. Please answer to the best of your ability.
How aware do you think the public in your country is of how to protect themselves from harm during an earthquake?
� Not at all aware � Slightly aware � Somewhat aware � Moderately aware � Very aware
Which agencies and organizations in your country disseminate protective action messages directly to the public? Please select all that apply.
� National government � Regional or state government � Local or city or village government � International nongovernmental organizations (INGOs) � National nongovernmental organizations (NGOs) � Local or community nongovernmental organizations (NGOs) � Red Cross or Red Crescent Society � United Nations agency � None � I do not know � Other, please describe: ____________________ � Other, please describe: ____________________

Appendices - 18
Is there coordination between different sectors (government, nongovernmental, education, business, etc.) on disseminating these messages to the public?
� Yes � No � I do not know
Are their earthquake drills in your country?
� Yes � No � Unknown
Answer If Yes Is Selected What population do these drills target? Please check all that apply.
� Students � General public � Other, please describe: ____________________
Answer If Are their earthquake drills in your country? Yes Is Selected How often do these drills occur?

Appendices - 19
How often are the following communication channels used to disseminate protective action messages to the public?
Never Rarely Sometimes Often Always Not available in my country
Television � � � � � �
Radio � � � � � �
Phone calls or voice messages � � � � � �
SMS or text messages � � � � � �
Newspapers � � � � � �
Government websites � � � � � �
Nongovernmental organization
(NGO) or commercial
websites
� � � � � �
General news websites � � � � � �
Email � � � � � �
Social media (e.g., Facebook, Twitter,
RSS) � � � � � �
Printed flyers or brochures � � � � � �
Word of mouth/interpersonal
communications � � � � � �
Public fora � � � � � �
In schools � � � � � �
Other, please describe: � � � � � �

Appendices - 20
Please respond yes or no to the following statements about your agency or organization.
No Yes
We have a government mandate for public safety. � �
We conduct earthquake safety education or awareness
programs. � �
We conduct multi-hazard or general safety education or
awareness programs. � �
We provide training for professionals on earthquake-
related topics. � �
We provide safety training for our staff. � �
We produce technical documents or educational materials. � �
We hold earthquake drills / mock drills and must tell people what
to do. � �
Answer If Which message(s) does your agency or organization distribute to the general public? Please check all that apply. We do not distribute a message Is Not Selected In your opinion, what is the main reason that your agency provides a protective action message to the public?
� We have a government mandate for public safety � We conduct earthquake safety education or awareness programs � We conduct multi-hazard or general safety education or awareness programs � We provide training for professionals on earthquake-related topics � We provide safety training for our staff � We produce technical documents or educational materials � We hold earthquake drills / mock drills and must tell people what to do � Other, please describe: ____________________

Appendices - 21
This section of questions asks for your professional opinion about different common messages.
What length of message do you think will be most effective in your country?
� 5 words or less � 6 to 10 words � 11 to 20 words � More than 20 words
For your country, do you think it is appropriate to give different protective action messages, depending on the context? Select the answer that best describes your views.
� Yes, give multiple messages that are as context-specific as possible (such as specific messages for different individual buildings).
� Yes, select a small number of messages that each cover as many contexts as possible. � No, different messages will confuse people. � I am not sure.
Consider the following activities to support message development. Please rank how important you think each of the following activities is for developing an appropriate earthquake protective action message for your country. Click and drag the activity that is most important to the top and the least important to bottom of the list.
______ Technical assistance to select the most appropriate message ______ Communications or marketing support to develop a message ______ Language support to translate a simple, clear and easily remembered message into my language ______ Recommendation of appropriate message by trusted international organization ______ Recommendation or approval of message by a government agency ______ Inclusive process for selecting the message ______ Other, please describe:
Consider the following professionals' potential involvement in the development of earthquake messages. Please rank these professionals in order of those you think are most important to have involved in message development. Click and drag the profession you feel is the most important to the top of the list, and then the second most important into the second spot, and so on.
______ Structural engineers ______ Seismologists ______ Attorneys ______ Communication specialists ______ Psychologists ______ Emergency managers ______ Firefighters ______ Medical professionals ______ Elected officials ______ Other, please describe:

Appendices - 22
Please indicate your agreement with the following concerns that may or may not affect protective action message development and dissemination by organizations and agencies in your country.
Strongly Disagree
Disagree Neutral Agree Strongly Agree
There is uncertainty which message to distribute. � � � � �
Many do not feel technically qualified to choose a message. � � � � �
There is disagreement regarding which message to distribute. � � � � �
Current messages are not technically accurate. � � � � �
Current messages are too complex. � � � � �
Current messages are unclear. � � � � �
Current messages are difficult for the public to remember. � � � � �
There is concern about the potential consequences if people
take the protective actions we recommend but are still injured or
killed in an earthquake.
� � � � �
The government body responsible for messages has not approved a
message. � � � � �
Messaging is not in a mandate. � � � � �
There is a lack of time to develop messages. � � � � �
There is a lack of expertise to develop a message. � � � � �
We need expert advice to develop a message. � � � � �
There is a lack funding for message development. � � � � �

Appendices - 23
Are there any firm beliefs, traditional or common knowledge, or rumors that are common in your country related to earthquake protective actions? For example, belief that getting in doorways is the safest.
� Yes, please describe: ____________________ � No
Are there any particular cultural challenges that you face in developing and disseminating protective action messages? For example, gender norms that prevent women from leaving home during an earthquake without a male relative accompanying them. Please describe:
What other concerns or challenges do you have with protective action messages or messaging channels?
What has been particularly successful about your messages or messaging dissemination?
What is your country?
What agency do you represent? (Reminder, all responses are confidential)
Thank you for your participation! Click >> below to record your responses and exit the survey.