Avian species differences in susceptibility to noise exposure
18
Avian species di¡erences in susceptibility to noise exposure 1 Brenda M. Ryals a ; *, Robert J. Dooling b , Edwina Westbrook c , Micheal L. Dent b , Alison MacKenzie b , Ole N. Larsen d a Department of Communication Sciences and Disorders, Auditory Research Lab, James Madison University, Harrisonburg, VA 22807, USA b Department of Psychology, University of Maryland, College Park, MD 20742, USA c Mcguire Research Institute, Richmond, VA 23249, USA d Centre for Sound Communication, Biologisk Institut, Odense University, DK-5230 Odense, Denmark Received 8 November 1998; received in revised form 31 December 1998; accepted 2 January 1999 Abstract Previous studies of hair cell regeneration and hearing recovery in birds after acoustic overstimulation have involved relatively few species. Studies of the effects of acoustic overexposure typically report high variability. Though it is impossible to tell, the data so far also suggest there may be considerable species differences in the degree of damage and the time course and extent of recovery. To examine this issue, we exposed four species of birds (quail, budgerigars, canaries, and zebra finches) to identical conditions of acoustic overstimulation and systematically analyzed changes in hearing sensitivity, basilar papilla morphology, and hair cell number. Quail and budgerigars showed the greatest susceptibility to threshold shift and hair cell loss after overstimulation with either pure tone or bandpass noise, while identical types of overstimulation in canaries and zebra finches resulted in much less of a threshold shift and a smaller, more diffuse hair cell loss. All four species showed some recovery of threshold sensitivity and hair cell number over time. Canary and zebra finch hearing and hair cell number recovered to within normal limits while quail and budgerigars continued to have an approximately 20 dB threshold shift and incomplete recovery of hair cell number. In a final experiment, birds were exposed to identical wide-band noise overstimulation under conditions of artificial middle ear ventilation. Hair cell loss was substantially increased in both budgerigars and canaries suggesting that middle ear air pressure regulation and correlated changes in middle ear transfer function are one factor influencing susceptibility to acoustic overstimulation in small birds. ß 1999 Elsevier Science B.V. All rights reserved. Key words: Noise exposure; Hearing; Avian; Hair cell 1. Introduction Anatomical and physiological studies of hair cell re- generation and cochlear recovery after acoustic over- stimulation have involved only a few species of birds: chickens (Gallus domesticus), Japanese quail (Coturnix coturnix japonica), and to a lesser extent budgerigars (Melopsittacus undulatus) (see for reviews: Tsue et al., 1994; Cotanche et al., 1994; Duckert and Rubel, 1993; Corwin, 1992; Rubel et al., 1991; Jorgensen, 1991; Saunders et al., 1991). Behavioral studies of the recov- ery of hearing after acoustic overstimulation in birds are also relatively limited, including only chickens (Saunders and Salvi, 1995), quail (Niemiec et al., 1994), budgerigars (Hashino and Sokabe, 1989; Hashi- no et al., 1988; Saunders and Dooling, 1974), and star- lings (Sturnus vulgaris) (Marean et al., 1993). None of these studies has directly or systematically addressed the issue of species di¡erences. The data so far suggest there may in fact be considerable di¡erences among avian species in the degree of damage su¡ered from overstimulation and the extent and time course of re- covery. At the present time, it is impossible to tell whether the variability in susceptibility to acoustic overstimula- 0378-5955 / 99 / $ ^ see front matter ß 1999 Elsevier Science B.V. All rights reserved. PII:S0378-5955(99)00022-2 * Corresponding author. Tel.: +1 (540) 568-3871; Fax: +1 (540) 568-7930; E-mail: [email protected] 1 A preliminary report of these ¢ndings was published in: Manley, G.A., Klump, G.M., Ko «ppl, C., Fast, H., Oeckinghaus, H. (eds.), Advances in Hearing Research: Proceedings of the 10th International Symposium on Hearing. World Scienti¢c, Singapore, 1995. Hearing Research 131 (1999) 71^88
-
Upload
independent -
Category
Documents
-
view
0 -
download
0
Transcript of Avian species differences in susceptibility to noise exposure

Avian species di¡erences in susceptibility to noise exposure1
Brenda M. Ryals a;*, Robert J. Dooling b, Edwina Westbrook c, Micheal L. Dent b,Alison MacKenzie b, Ole N. Larsen d
a Department of Communication Sciences and Disorders, Auditory Research Lab, James Madison University, Harrisonburg, VA 22807, USAb Department of Psychology, University of Maryland, College Park, MD 20742, USA
c Mcguire Research Institute, Richmond, VA 23249, USAd Centre for Sound Communication, Biologisk Institut, Odense University, DK-5230 Odense, Denmark
Received 8 November 1998; received in revised form 31 December 1998; accepted 2 January 1999
Abstract
Previous studies of hair cell regeneration and hearing recovery in birds after acoustic overstimulation have involved relatively fewspecies. Studies of the effects of acoustic overexposure typically report high variability. Though it is impossible to tell, the data so faralso suggest there may be considerable species differences in the degree of damage and the time course and extent of recovery. Toexamine this issue, we exposed four species of birds (quail, budgerigars, canaries, and zebra finches) to identical conditions ofacoustic overstimulation and systematically analyzed changes in hearing sensitivity, basilar papilla morphology, and hair cellnumber. Quail and budgerigars showed the greatest susceptibility to threshold shift and hair cell loss after overstimulation witheither pure tone or bandpass noise, while identical types of overstimulation in canaries and zebra finches resulted in much less of athreshold shift and a smaller, more diffuse hair cell loss. All four species showed some recovery of threshold sensitivity and hair cellnumber over time. Canary and zebra finch hearing and hair cell number recovered to within normal limits while quail andbudgerigars continued to have an approximately 20 dB threshold shift and incomplete recovery of hair cell number. In a finalexperiment, birds were exposed to identical wide-band noise overstimulation under conditions of artificial middle ear ventilation.Hair cell loss was substantially increased in both budgerigars and canaries suggesting that middle ear air pressure regulation andcorrelated changes in middle ear transfer function are one factor influencing susceptibility to acoustic overstimulation in smallbirds. ß 1999 Elsevier Science B.V. All rights reserved.
Key words: Noise exposure; Hearing; Avian; Hair cell
1. Introduction
Anatomical and physiological studies of hair cell re-generation and cochlear recovery after acoustic over-stimulation have involved only a few species of birds:chickens (Gallus domesticus), Japanese quail (Coturnixcoturnix japonica), and to a lesser extent budgerigars(Melopsittacus undulatus) (see for reviews: Tsue et al.,1994; Cotanche et al., 1994; Duckert and Rubel, 1993;
Corwin, 1992; Rubel et al., 1991; Jorgensen, 1991;Saunders et al., 1991). Behavioral studies of the recov-ery of hearing after acoustic overstimulation in birdsare also relatively limited, including only chickens(Saunders and Salvi, 1995), quail (Niemiec et al.,1994), budgerigars (Hashino and Sokabe, 1989; Hashi-no et al., 1988; Saunders and Dooling, 1974), and star-lings (Sturnus vulgaris) (Marean et al., 1993). None ofthese studies has directly or systematically addressed theissue of species di¡erences. The data so far suggestthere may in fact be considerable di¡erences amongavian species in the degree of damage su¡ered fromoverstimulation and the extent and time course of re-covery.
At the present time, it is impossible to tell whetherthe variability in susceptibility to acoustic overstimula-
0378-5955 / 99 / $ ^ see front matter ß 1999 Elsevier Science B.V. All rights reserved.PII: S 0 3 7 8 - 5 9 5 5 ( 9 9 ) 0 0 0 2 2 - 2
* Corresponding author. Tel. : +1 (540) 568-3871;Fax: +1 (540) 568-7930; E-mail: [email protected]
1 A preliminary report of these ¢ndings was published in: Manley,G.A., Klump, G.M., Ko«ppl, C., Fast, H., Oeckinghaus, H. (eds.),Advances in Hearing Research: Proceedings of the 10th InternationalSymposium on Hearing. World Scienti¢c, Singapore, 1995.
HEARES 3206 16-4-99
Hearing Research 131 (1999) 71^88

tion across di¡erent birds re£ects true species di¡eren-ces or whether methodological di¡erences, exposureconditions, or hearing assays are responsible (Saundersand Tilney, 1982; Saunders et al., 1991). For instance,most physiological and anatomical studies of hearingloss in birds following acoustic overstimulation involveyoung chicks (Rubel and Ryals, 1982; Ryals and Rubel,1982, 1985; McFadden and Saunders, 1989; Cotancheet al., 1987; Adler et al., 1992; Saunders and Tilney,1992; Saunders et al., 1993; Marsh et al., 1990; Puglia-no et al., 1993) while most behavioral studies of hearingloss following acoustic overstimulation typically involveadult animals (Hashino and Sokabe, 1989; Niemiec etal., 1993; Saunders and Salvi, 1995; Dooling et al.,1997). The present study was designed to clarify theseissues of species variability in susceptibility and recov-ery by controlling exposure and measurement condi-tions as well as age and hearing sensitivity of the ani-mal. Identical methods for acoustic overstimulation,histological assay of hair cell loss and recovery, andbehavioral assay of hearing recovery were used to sys-tematically investigate hair cell loss and recovery andreturn of hearing in four, sexually mature, diverse spe-cies (passerine and non-passerine) of birds with similarpatterns of auditory sensitivity.
2. Materials and methods
2.1. Subjects
Sexually mature, adult quail, budgerigars, canaries(Serinus canaria), and zebra ¢nches (Taenopyga guttata)were used in this study. These birds were individuallyhoused in an aviary at the University of Maryland atCollege Park and kept on a normal photoperiod corre-lated with the season. Animal housing and care met allstandards of the Animal Care and Use Committee atUMCP.
2.2. Acoustic exposures
Birds of all four species were continuously exposedfor 12^24 h to a high-frequency (2.86 kHz) pure tone ora high-frequency, bandpassed (2^6 kHz) noise at either112, 118 or 120 dB SPL. Speci¢c exposure conditionsand numbers of birds per condition are given belowunder individual experiments. The tones were producedby a JDR Instruments DOS 600 audio oscillator andampli¢ed through a Crown D-75 power ampli¢er.White noise was produced by a noise generator (Lafay-ette Instrument Co., Model 15800C), £attened with anequalizer (Rane, Model GE27), bandpass ¢ltered be-tween 2 and 6 kHz (3 dB down points) by two digital¢lters (Frequency Devices Model 9002), and ampli¢ed
by a Crown D-75 power ampli¢er. This exposure noisewas £at ( þ 5 dB) within the pass band, had slopes of115 dB/octave, and was centered in the region of bestauditory sensitivity for all four of these species (Oka-noya and Dooling, 1987; Linzenbold et al., 1993). Thenoise spectrum was measured with a spectrum analyzer(Stanford Research Instruments Model SR760).
The birds were exposed together in small groups of3^4, in one or two wire mesh cages (15U15U15 cm).These cages were placed directly below (28 cm) an over-head acoustic power horn (Realistic, 5U15 cm) or a 30cm midrange speaker (JBL model E120-8) suspendedfrom the ceiling of a walk-in sound isolation chamber(AS-114 Audio-Shuttle, 183U193U198 cm). Prior toand during exposures, tone and noise intensities weremeasured and kept in calibration using a General Ra-dio Model 1982 sound-level meter with octave band¢lters and a 1.27 cm microphone.
2.3. Behavioral testing apparatus
The apparatus has been described in detail previously(Okanoya and Dooling, 1987; Dooling and Okanoya,1995). A custom-made operant chamber with a foodhopper and two response keys consisting of LEDsand microswitches was used. A standard pigeon grainhopper delivered food with response keys mounted justabove the hopper opening. The noise and tone stimuliwere delivered from a loudspeaker mounted above thetest cage (Realistic Soft Dome midrange speaker, Mod-el 40-1281A). The entire operant apparatus was sus-pended in a small animal, sound isolation chamber (In-dustrial Acoustics, Model IAC-3). A microcomputercontrolled all experimental events including stimulusdelivery and reinforcement contingencies. The behaviorof the animals during test sessions was monitored by avideo camera.
Stimulus calibration was performed using a GeneralRadio Model 1982 sound-level meter with octave band¢lters. Tone intensities were measured by placing themicrophone in front of the keys in the position nor-mally occupied by the bird's head during testing. Theintensities of test tones were measured several timesduring the testing phase to ensure they remained con-stant.
2.4. Training and testing procedures
The training and testing procedures have been de-scribed in detail previously (Okanoya and Dooling,1991; Dooling and Okanoya, 1995). Brie£y, the birdswere food deprived to approximately 80^90% of theirfree feeding weight and trained by a standard operantauto-shaping program to peck at the left microswitchkey (observation key) until a tone was presented. Then,
HEARES 3206 16-4-99
B.M. Ryals et al. / Hearing Research 131 (1999) 71^8872
a peck to the right microswitch key (report key) within2 s produced food reinforcement. A failure to peck thereport key was recorded as a miss, and a new trial wasstarted. Thirty percent of all trials were sham trials inwhich no tone was presented. A peck to the report keyduring a sham trial was recorded as a false alarm. Ses-sions with a false alarm rate of 16% or higher werediscarded.
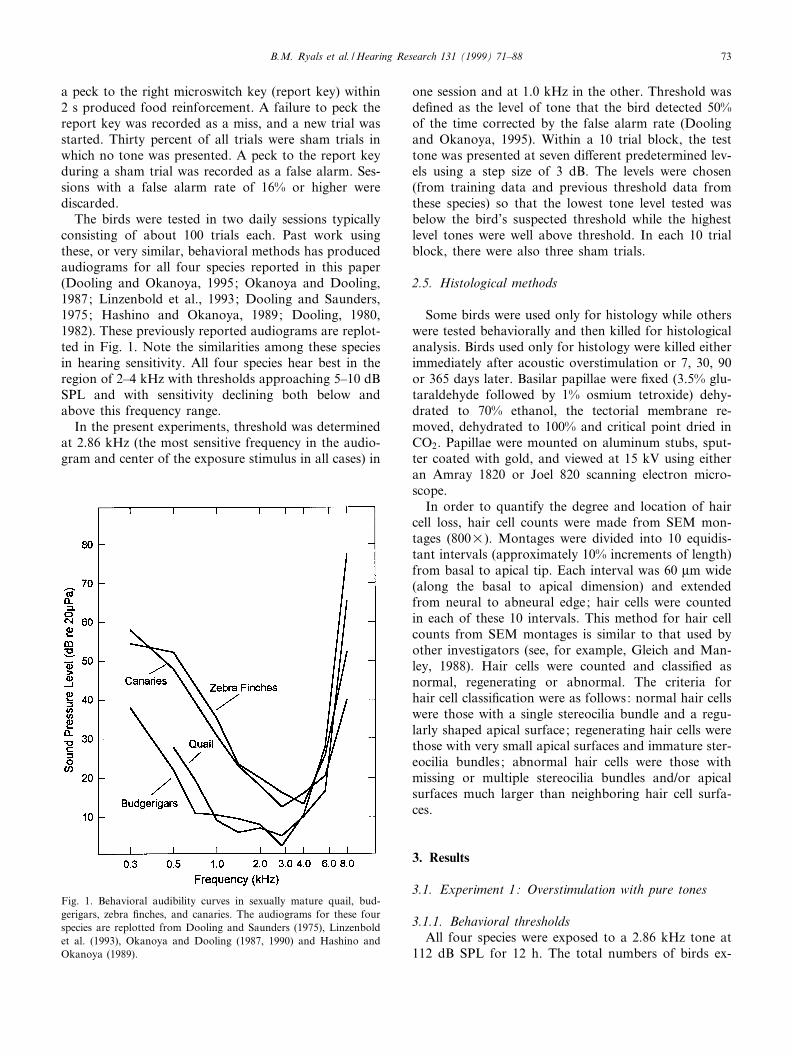
The birds were tested in two daily sessions typicallyconsisting of about 100 trials each. Past work usingthese, or very similar, behavioral methods has producedaudiograms for all four species reported in this paper(Dooling and Okanoya, 1995; Okanoya and Dooling,1987; Linzenbold et al., 1993; Dooling and Saunders,1975; Hashino and Okanoya, 1989; Dooling, 1980,1982). These previously reported audiograms are replot-ted in Fig. 1. Note the similarities among these speciesin hearing sensitivity. All four species hear best in theregion of 2^4 kHz with thresholds approaching 5^10 dBSPL and with sensitivity declining both below andabove this frequency range.
In the present experiments, threshold was determinedat 2.86 kHz (the most sensitive frequency in the audio-gram and center of the exposure stimulus in all cases) in
one session and at 1.0 kHz in the other. Threshold wasde¢ned as the level of tone that the bird detected 50%of the time corrected by the false alarm rate (Doolingand Okanoya, 1995). Within a 10 trial block, the testtone was presented at seven di¡erent predetermined lev-els using a step size of 3 dB. The levels were chosen(from training data and previous threshold data fromthese species) so that the lowest tone level tested wasbelow the bird's suspected threshold while the highestlevel tones were well above threshold. In each 10 trialblock, there were also three sham trials.
2.5. Histological methods
Some birds were used only for histology while otherswere tested behaviorally and then killed for histologicalanalysis. Birds used only for histology were killed eitherimmediately after acoustic overstimulation or 7, 30, 90or 365 days later. Basilar papillae were ¢xed (3.5% glu-taraldehyde followed by 1% osmium tetroxide) dehy-drated to 70% ethanol, the tectorial membrane re-moved, dehydrated to 100% and critical point dried inCO2. Papillae were mounted on aluminum stubs, sput-ter coated with gold, and viewed at 15 kV using eitheran Amray 1820 or Joel 820 scanning electron micro-scope.
In order to quantify the degree and location of haircell loss, hair cell counts were made from SEM mon-tages (800U). Montages were divided into 10 equidis-tant intervals (approximately 10% increments of length)from basal to apical tip. Each interval was 60 Wm wide(along the basal to apical dimension) and extendedfrom neural to abneural edge; hair cells were countedin each of these 10 intervals. This method for hair cellcounts from SEM montages is similar to that used byother investigators (see, for example, Gleich and Man-ley, 1988). Hair cells were counted and classi¢ed asnormal, regenerating or abnormal. The criteria forhair cell classi¢cation were as follows: normal hair cellswere those with a single stereocilia bundle and a regu-larly shaped apical surface; regenerating hair cells werethose with very small apical surfaces and immature ster-eocilia bundles ; abnormal hair cells were those withmissing or multiple stereocilia bundles and/or apicalsurfaces much larger than neighboring hair cell surfa-ces.
3. Results
3.1. Experiment 1: Overstimulation with pure tones
3.1.1. Behavioral thresholdsAll four species were exposed to a 2.86 kHz tone at
112 dB SPL for 12 h. The total numbers of birds ex-
Fig. 1. Behavioral audibility curves in sexually mature quail, bud-gerigars, zebra ¢nches, and canaries. The audiograms for these fourspecies are replotted from Dooling and Saunders (1975), Linzenboldet al. (1993), Okanoya and Dooling (1987, 1990) and Hashino andOkanoya (1989).
HEARES 3206 16-4-99
B.M. Ryals et al. / Hearing Research 131 (1999) 71^88 73

posed and analyzed for behavior and inner ear mor-phology were nine quail, seven budgerigars, two cana-ries, and two zebra ¢nches. Three additional budgeri-gars were also exposed at 118 dB SPL for 12 h when itbecame evident that the 112 dB exposure level producedonly a minor threshold shift. Moreover, since canariesand ¢nches showed no measurable hair cell loss imme-diately after tone exposure, behavioral results areshown in Fig. 2 only for quail and budgerigars. Theaverage pre-exposure absolute thresholds for quailand budgerigar at 1.0 kHz were 3 dB and 12 dB, re-spectively. The average pre-exposure absolute thresh-olds at 2.86 kHz for quail and budgerigar were 8 dBand 5 dB respectively. For quail and budgerigars, inspite of the similarity in absolute thresholds betweenthese three species, there were dramatic di¡erences inthe amount of threshold shift and in the amount andtime course of behavioral recovery. Quail showed aninitial 70 dB threshold shift at 2.86 kHz, which re-mained virtually unchanged for about 8^9 days. From9 to 50 days, thresholds recovered at the rate of about2 dB/day until about day 50 after which no furtherrecovery was observed. This permanent threshold shiftof about 20 dB was still evident 1 year post-exposure(separate data point at end). Budgerigars, by contrast,showed an initial threshold shift of about 40 dB at 2.86kHz, which recovered in 3 days to within 10 dB of pre-exposure threshold levels regardless of the initial expo-sure level (112 or 118 dB SPL). For both quail andbudgerigars, thresholds at 1.0 kHz returned to pre-ex-
posure levels within several days and thus are notshown.
3.1.2. Histology ^ quailImmediately following continuous exposure to a 112
dB, 2.86 kHz pure tone for 12 h, SEM evaluation of thesurface of the quail basilar papillae (n = 3) typically re-vealed hair cell loss in the basal one-third of the papilla.Expanded support cell surface area, and extruded haircells were also seen in the area of hair cell loss (Fig.3A). Hair cell loss extended from the inferior (abneural)edge of the papilla toward, but not reaching, the supe-rior (neural) edge. Birds killed 7 days post-exposure(n = 3) showed hair cell regeneration, as evidenced byimmature stereocilia bundles and smaller than normalcell surface area, in this same region of the papilla (Fig.3B).
In addition, the three quail used in the behavioralmeasurement of hearing loss following noise exposure(from Fig. 2) were killed 1 year post-exposure. In allthree birds, qualitative SEM evaluation of the surfaceof their papillae revealed normal appearance of haircells (that is, a normal surface area and a single stereo-cilia bundle with appropriate orientation) as well as asmall area devoid of hair cells within the previous-ly damaged region. Fig. 4 shows individual quail basi-lar papilla 1 year after pure tone exposure; allthree quail papillae exhibiting regions of missing haircells along the abneural edge of the papilla in the basaltip.
Fig. 2. Recovery of absolute thresholds at 2.86 kHz in quail and budgerigars following continuous exposure to a 112 or 118 dB pure tone at2.86 kHz for 12 h. For clarity only some, representative, error bars (standard deviations) are shown. (Data for quail in this ¢gure were previ-ously published in: Dooling, R.J., Ryals, B.M., 1995. E¡ects of acoustic overstimulation on four species of birds, in: Manley, G.A., Klump,G.M., Koppl, C., Fastl, H., Oekinghaus, H. (Eds.), Advances in Hearing Research: Proceedings of the 10th International Symposium on Hear-ing. World Scienti¢c, Singapore, pp. 32^39.)
HEARES 3206 16-4-99
B.M. Ryals et al. / Hearing Research 131 (1999) 71^8874

It is interesting that, even though all quail killed7 days after noise exposure showed evidence of haircell regeneration, those killed 1 year later showed wholeareas of missing hair cells in roughly the same area ofthe papilla. Other investigators have shown a completeloss of hair cells following acoustic trauma, withoutsubsequent regeneration, in chickens (Cotanche et al.,1995) and pigeons (Danping et al. 1998). There are twopossibilities here. Perhaps the initial trauma in our quailwas severe enough to have resulted in support cell de-struction and an absence of hair cell regeneration sothat the area of missing hair cells seen a year laterde¢ned the most severe regions of the original lesion.This would certainly be supported by the informationwe have from adult pigeons where acoustic trauma wasmost destructive to hair cells on the abneural edge andwhere no regeneration of these cells occurred whentrauma was most severe (Danping et al., 1998). Butanother possibility cannot be ruled out ^ that the orig-
inal lesion was not so severe as to cause support celldestruction. This raises the intriguing possibility thatsubsequent hair cell regeneration occurred (as evidencedin those birds killed 7 days after trauma) but could notbe maintained over an entire year. This is an importantpoint and further studies of birds killed following lon-ger survival times would be necessary to prove whetheran initial hair cell loss, not involving support cells, pro-duces regenerated hair cells which are not maintained inthe long term.
3.1.3. Histology ^ budgerigars, canaries and zebra¢nches
In contrast to the quail, SEM evaluation of the basi-lar papillae of budgerigars (n = 2) immediately after anidentical acoustic overstimulation revealed either nohair cell damage or a very small ¢nger-like projectionof hair cell loss and enlarged support cell surface arealocated at about 35% of length from the basal tip.
Fig. 3. A: Scanning electron photomicrograph (SEM) of quail basilar papilla proximal tip immediately after exposure to a 2.86 kHz pure toneat 112 dB for 12 h. Hair cells are extruded and absent (arrows) in the proximal one-third of the papilla. B: SEM of quail basilar papilla proxi-mal tip 7 days after identical pure tone exposure. The area of previous damage is now occupied by cells (arrows) with smaller apical surfacesand immature stereocilia bundles (presumptive regenerated hair cells).
HEARES 3206 16-4-99
B.M. Ryals et al. / Hearing Research 131 (1999) 71^88 75

Moreover, birds killed 7 days later (n = 3) showed noqualitative evidence of missing cells. SEM evaluation ofcanary (n = 2) and zebra ¢nch (n = 2) basilar papillae,immediately after identical tone overstimulation, alsoshowed no obvious missing hair cells or hair cell orsupport cell abnormalities.
To determine whether hair cell loss and damageequivalent to those obtained in quail could be obtainedin these small birds, we performed an additional experi-ment using the same pure tone but at a higher intensityand longer duration. In this experiment, all four specieswere exposed to a 120 dB SPL, 2.86 kHz pure tone for24 h. The numbers of birds used was as follows: onequail, three budgerigars, two canaries, and two zebra¢nches. Under these conditions, observable hair cell
damage and loss was seen for all four species. Damagewas most severe in quail and budgerigars. In these twospecies, the location of damage remained the same aswith the 112 dB condition (or shifted slightly towardthe basal end of the papilla). However, there was nowalso a complete loss of hair cells and often of adjacentsupporting cells within the area of damage (see Fig.5A,B). In marked contrast to quail and budgerigars,canaries and zebra ¢nches showed only small, ¢nger-like areas of hair cell loss, primarily in the basal one-third of the papilla (see Fig. 5C,D). These results con-¢rmed that even with a higher intensity and longer du-ration of pure tone exposure, canaries and zebra ¢nchesincurred less hair cell damage than quail and budger-igars. No behavioral measures were made after these
Fig. 4. SEM photomicrograph of three quail basilar papillae 1 year after exposure to a 2.86 kHz 112 dB pure tone for 12 h. These three papil-lae are from the birds whose behavioral threshold shifts are shown in Fig. 2 (end-point at 365 days). A crescent-shaped patch devoid of haircells can be seen on the papilla of each bird. This patch is located in the area of hair cell loss and recovery reported for quail exposed to thesame pure tone exposure but killed earlier in time.
HEARES 3206 16-4-99
B.M. Ryals et al. / Hearing Research 131 (1999) 71^8876

higher-intensity, longer-duration exposures since theydid not result in more equivalent patterns of hair celldamage between all four species.
3.2. Experiment 2: overstimulation with bandpass noise
The previous experiment showed that small birds(i.e., budgerigars, canaries, and zebra ¢nches) weremore resistant to hair cell damage and threshold shiftfrom pure tone overstimulation than were quail. In or-der to minimize the e¡ect of standing waves or otherpotential perturbations of the sound ¢eld we used band-pass noise (2^6 kHz) rather than a pure tone for over-stimulation. We also concentrated on just the three spe-cies with smaller, but similar head sizes (budgerigars,canaries, and ¢nches). All three species of small birdswere exposed to this bandpass noise continuously at anoverall level of 120 dB SPL (spectrum level = 84 dBSPL) for 24 h. Behavioral thresholds were obtained inthree budgerigars, two canaries and three zebra ¢nchesimmediately and at daily intervals after noise exposure.Morphological analyses of the inner ears of all threespecies were performed immediately after exposure,7 days after exposure or at the end of behavioral testing(90 days). The total numbers of birds exposed and an-alyzed for inner ear morphology were nine budgerigars,six canaries, and 10 zebra ¢nches.
3.2.1. Behavioral thresholdsIn this experiment, thresholds were also measured at
1.0 kHz and 2.86 kHz. The average pre-exposure abso-lute thresholds at 1.0 kHz for budgerigars, canaries,and ¢nches were 9 dB, 31 dB, and 22 dB SPL, respec-
Fig. 5. A: SEM photomicrograph of proximal tip of quail basilar papilla immediately after 24 h exposure to a 2.86 kHz pure tone at 120 dBSPL. Note crescent-shaped area devoid of hair cells and support cells (arrows). B: SEM photomicrograph of proximal tip of budgerigar basilarpapilla immediately after identical pure tone exposure (120 dB, 2.86 kHz, 24 h). For both quail and budgerigars this intensity and duration ofpure tone exposure resulted in loss of both support and hair cells (arrows). C: SEM photomicrograph of proximal tip of ¢nch basilar papilla.Finger-like projections of hair cell extrusion (arrow) and support cell expansion (arrow) can be seen. D: Canary basilar papilla immediatelyafter identical pure tone exposure. Again, small ¢nger-like projections of expanded support cell surface area and/or hair cell loss can be seen(arrows).
Fig. 6. Recovery of absolute thresholds at 1.0 kHz (top panel) and2.86 kHz (bottom panel) in budgerigars, canaries and zebra ¢nchesfollowing exposure to a 2^6 kHz bandpass noise at 120 dB for 24 h.For clarity only some representative error bars (standard deviations)are shown.
HEARES 3206 16-4-99
B.M. Ryals et al. / Hearing Research 131 (1999) 71^88 77

Fig. 7. A: SEM photomicrograph of budgerigar basilar papilla immediately after 24 h exposure to a bandpass noise (2^6 kHz, 120 dB SPL).Percent length from basal tip is noted above basilar papilla; hair cell extrusion and support cell loss are seen within the white brackets. B:SEM photomicrograph of budgerigar basilar papilla 90 days after the identical bandpass noise exposure. A crescent-shaped area devoid of haircells is now located on the abneural edge of the papilla approximately 30^50% of length from the basal tip (in brackets). C: Higher magni¢ca-tion SEM photomicrograph of a di¡erent budgerigar basilar papilla immediately after this same bandpass noise exposure. Arrow indicates areaof support and hair cell damage and loss. This area is similar in location to the area of most severe damage (at about 40% of length) in A. D:Higher magni¢cation of a di¡erent budgerigar basilar papilla 90 days after this same bandpass noise exposure. Arrow indicates area 30^40% oflength from basal tip devoid of hair cells; similar area shown in B.
HEARES 3206 16-4-99
B.M. Ryals et al. / Hearing Research 131 (1999) 71^8878

tively. The average pre-exposure absolute thresholds at2.86 kHz were 5 dB, 7 dB, and 6 dB for all three speciesrespectively. Following exposure, all three species ofbirds showed a consistent pattern of threshold shift at1.0 kHz with an initial shift of about 10^30 dB and areturn to within 10 dB of pre-exposure thresholds by5 days (Fig. 6, top panel). By contrast, species di¡er-ences were observed at 2.86 kHz, even though behav-ioral thresholds were within 2 dB of one another. Forbudgerigars, there was an initial threshold shift at2.86 kHz of about 50 dB that remained unchangedfor about 10 days. From 10 to 50 days, thresholds re-covered at the rate of about 0.75 dB/day. No furtherrecovery in thresholds was observed beyond 50 days toabout 70 days, suggesting a permanent hearing loss ofabout 20 dB as was observed in quail (see Fig. 2).
Canaries and zebra ¢nches also showed an initialthreshold shift of about 50 dB, but for these two spe-cies, hearing thresholds recovered gradually (1.3 dB/dayfor canaries and 1.6 dB/day for zebra ¢nches) beginningimmediately, and reached within 10 dB of pre-exposurethresholds by about 30 days post-exposure (Fig. 6, bot-tom panel).
3.2.2. Histology after noise ^ budgerigarSEM evaluation of the surface of the budgerigar pa-
pillae immediately following narrow bandpass noise (2^6 kHz) exposure typically revealed an area of hair cellextrusion and support cell surface expansion from 20 to80% of length from the basal tip. The most severe haircell loss was seen at about 40% of length, slightly distalto the position of damage seen after 2.86 kHz pure toneexposure. Fig. 7 shows scanning electron micrographsof a budgerigar basilar papilla immediately after thenoise exposure (panel A) and 90 days later (panel B).Fig. 7C shows a higher magni¢cation of a correspond-ing area of the basilar papilla in a di¡erent budgerigarimmediately after noise exposure. Fig. 7D shows ahigher magni¢cation of a corresponding area of thebasilar papilla in a di¡erent budgerigar 90 days afternoise exposure. There is a complete loss of hair cells ina circumscribed area (between brackets in Fig. 7B andarrow in Fig. 7D) similar to other reports of hair celland support cell loss with no regeneration after severeacoustic trauma (Cotanche et al., 1995; Danping et al.,1998).
Corresponding counts of normal hair cells at 0 day(n = 3), 7 day (n = 3) and 90 day (n = 3) survival timesare shown in Fig. 8. Hair cell counts from individualanimals are expressed as percent di¡erent from normal(n = 2) in order to allow an easy comparison betweenspecies since the normal number of hair cells varies byspecies. Hair cell loss was consistently greatest (around40% loss) in the area from 40 to 60% of length for twobudgerigars immediately after noise exposure (top pan-
el). Hair cell loss was more severe (nearly 100% loss) inthe other bird (missing data points represent areaswhere hair cells could not be counted either becauseof interference from remaining tectorial membrane orbecause of mechanical artifact). Hair cell loss consis-tently increased in this area to an average of nearly70% loss in all three birds surviving for 7 days (middlepanel).
Fig. 8. The percentage di¡erence in hair cell number, as comparedto normal control budgerigar basilar papilla (n = 2), after 2^6 kHzbandpass noise exposure at 120 dB SPL for 24 h. Percentage di¡er-ences are shown for individual budgerigars for 0 day (top panel),7 day (middle panel) and 90 day survival times (bottom panel).Hair cell loss seemed to increase over the 7 days following noise ex-posure and had not fully recovered 90 days after noise exposure.
HEARES 3206 16-4-99
B.M. Ryals et al. / Hearing Research 131 (1999) 71^88 79

Although normal hair cell number remained reducedeven 90 days after noise exposure in all three birds(bottom panel), an average total number of 30 imma-ture hair cells were counted 7 days following noise ex-posure. These regenerating hair cells were generally seenon the margins of the greatest area of hair cell loss. Thebottom panel of this ¢gure represents hair cell loss in
those birds studied behaviorally and allowed to survive90 days after noise exposure. Hair cell number did notreturn to normal levels in any of the three noise-ex-posed budgerigars. Basilar papillae from two of thethree birds allowed to survive for 90 days had areasdenuded of hair cells along the abneural edge in thearea from 40 to 50% of length from the basal tip (see
Fig. 9. A: SEM photomicrograph of the basilar papilla in a zebra ¢nch immediately after 24 h exposure to a bandpass noise (2^6 kHz, 120 dBSPL). Small ¢nger-like projections of hair cell loss and support cell expansion can be seen in bracketed area between 20 and 70% of lengthfrom the basal tip. B: SEM photomicrograph of a zebra ¢nch basilar papilla 90 days after the identical bandpass noise exposure. Hair cells ap-pear normal in shape and size. C: Higher magni¢cation of area of hair cell loss and support cell expansion shown between arrows in A. D:Higher magni¢cation of hair cell surface in the position indicated by arrow in B. Hair cell surface area is regular and normal in size and con-tains only one stereocilia bundle.
HEARES 3206 16-4-99
B.M. Ryals et al. / Hearing Research 131 (1999) 71^8880

Fig. 7B,D). As stated previously, other investigatorshave shown a similar lack of hair cell regeneration aftersevere noise exposure (Cotanche et al., 1995; Danpinget al., 1998). Since we saw severe hair cell, as well assupport cell damage, immediately after this noise expo-sure condition it seems likely that hair cell precursors
(support cells) were so damaged in this area that com-plete recovery of hair cell number could not take place.
3.2.3. Histology after noise ^ zebra ¢nchSEM evaluation of the surface of zebra ¢nch basilar
papillae immediately after identical noise exposure typ-ically showed only scattered hair cell loss throughout
Fig. 11. The percentage di¡erence in hair cell number, as comparedto normal control canary basilar papilla (n = 2), after 2^6 kHz band-pass noise exposure at 120 dB SPL for 24 h. Percentage di¡erencesare shown for individual canaries for 0 day (top panel), 7 day (mid-dle panel) and 90 day (bottom panel) survival times. Hair cell losswas not apparent until 7 days following noise exposure and wasquite variable between the two basilar papillae. Hair cell numberhad returned to within an average of 10% of normal 90 days afternoise exposure.
Fig. 10. The percentage di¡erence in hair cell number, as comparedto normal control zebra ¢nch basilar papilla (n = 2), after 2^6 kHzbandpass noise exposure at 120 dB SPL for 24 h. Percentage di¡er-ences are shown for individual zebra ¢nches for 0 day (top panel),7 day (middle panel) and 90 day (bottom panel) survival times.Hair cell loss became more consistent among individual birds overthe 7 days following noise exposure and had recovered to within anaverage of 10% of normal by 90 days.
HEARES 3206 16-4-99
B.M. Ryals et al. / Hearing Research 131 (1999) 71^88 81

the papilla (see, for example, Fig. 9A). Hair cell lossoccurred in a pattern of ¢nger-like wedges of hair cellextrusion and support cell expansion (Fig. 9A,C). Un-like the budgerigar, there were no areas of support celldamage or areas denuded of hair cells in zebra ¢nchbasilar papilla. Hair cells appeared normal throughoutthe basilar papilla (regular surface area, single stereo-cilia bundle) in zebra ¢nches allowed to survive 90 days(Fig. 9B,D).
Corresponding counts of normal zebra ¢nch haircells at 0 day (n = 4), 7 day (n = 3) and 90 day (n = 3)survival times are shown in Fig. 10. Hair cell countsfrom individual animals are expressed as percent di¡er-ent from normal (n = 2). Hair cell loss was more di¡usein the zebra ¢nch resulting in an average loss of about35% of hair cells from 20 to 50% of length from the
basal tip. Loss was relatively consistent in all four birdsexamined (top panel). Hair cell loss was even moreconsistent in the three zebra ¢nches allowed to survive7 days (middle panel). In these birds, hair cell loss re-mained at the same position but increased slightly(about 45% average loss in this area of the papilla).Unlike the budgerigar, hair cell number returned tonearly normal levels (average of only 10% loss)throughout the zebra ¢nch papilla within 90 days ofnoise exposure (bottom panel). Like the budgerigar,evidence of regenerating hair cells was also seen 7 daysafter noise exposure (average total number of 36 imma-ture hair cells).
3.2.4. Histology after noise ^ canaryCanaries showed the greatest individual variability in
Fig. 12. A: SEM photomicrograph of hair cells in a control canary basilar papilla. Hair cells are regularly spaced, similar in size and have asingle stereocilia bundle. B: SEM photomicrograph of hair cells in canary basilar papilla immediately after exposure to 24 h of bandpass noise(2^6 kHz, 120 dB SPL). Arrow indicates enlarged surface area of supporting cells. Hair cells remain normal in appearance. C: SEM photomi-crograph of canary basilar papilla 7 days after identical noise exposure. Arrow indicates area of complete hair cell loss.
HEARES 3206 16-4-99
B.M. Ryals et al. / Hearing Research 131 (1999) 71^8882

the time course of the response to the identical noiseexposure. Unlike budgerigars and zebra ¢nches, SEMevaluation of the two canary basilar papillae examinedimmediately after identical noise exposure revealed verylittle change in hair cell number (Fig. 11, top panel)throughout the length of the papillae. Inspection ofthe surface of the canary basilar papilla immediatelyafter noise exposure did reveal some enlarged apicalsurfaces of supporting cells surrounding hair cells butmost hair cells appeared relatively undamaged (Fig.12B).
Hair cell loss 7 days later was severe in both canariesexamined (90^100% loss in most severe areas) but var-ied considerably in location (Fig. 11, middle panel).Areas denuded of all but the most neurally locatedhair cells, much like that seen in budgerigars, wereseen in basilar papilla of both canaries 7 days afternoise exposure (see, for example, Fig. 12C). Alongwith loss of normal hair cells, regenerating hair cellswere seen at the edges of the greatest hair cell loss(average total number of regenerating hair cells = 10)7 days after noise exposure.
Somewhat surprisingly, hair cell number returned tonearly normal levels in the two canaries tested behav-iorally. These birds were killed 90 days after noise ex-posure (Fig. 11, bottom panel). In one bird, 30^45% ofthe hair cells were missing in the small area between 40and 50% of length from the basal tip. But in the otherbird, hair cell number in this same region of the papillawas within 10% of normal. Two explanations for thisrecovery of hair cell number in canaries are possible.First, it may be that the original hair cell loss in thesebirds was not as severe as that shown by the two birdskilled 7 days after noise exposure. This seems reason-able since the individual variability following noise ex-posure was high for canaries 7 days following noiseexposure. However, we cannot rule out the second pos-sibility, that this was the original lesion and more haircell recovery and regeneration occurred than mighthave been predicted from results seen in budgerigars.One important factor here could be the relative papillarwidth and absolute hair cell number across the papillain canaries as compared to zebra ¢nches and budgeri-gars. Average hair cell number and basilar papillawidth from control birds (n = 2 for each of the threespecies) are shown in Fig. 13. As with most birds, thesedata show that as papilla width increases, the numberof hair cells across the papilla also increases (Manley,1990).
Both papilla width and hair cell number are smallestin the canary and this may be a factor in the amount ofrecovery seen here after noise. In other words, fewerhair cells need to be replaced in order to provide agreater percent recovery in canaries.
It is interesting that hair cell loss was not consistently
seen in canaries until 7 days after noise exposure. Itmay be that the temporal course of hair cell damageand loss is di¡erent in canaries compared to budgeri-gars and zebra ¢nches. Other investigators have re-ported that the initial response to noise by support cellsis to enlarge their surface area (Cotanche and Dopyera,1990). We saw such enlarged surface areas immediatelyafter the 24 h noise exposure in canaries. On the otherhand, at the end of 24 h exposure in zebra ¢nches andbudgerigars we saw not only some enlarged support cellsurface area but also extruded and enlarged hair cellsurface areas. Thus, zebra ¢nches and budgerigars dem-onstrated a more advanced temporal course of hair celldamage and loss at the end of the 24 h noise exposure.
Fig. 13. Top panel: Average number of hair cells in control canaries(n = 2), zebra ¢nches (n = 2), and budgerigars (n = 2). Standard devia-tions have been omitted for clarity. In general, canaries have thefewest hair cells along the papilla from base to apex while zebra¢nches and budgerigars have similar numbers of hair cells up toabout 70% of length from basal tip. Budgerigars have an increasednumber, the largest of any of the three species, in the apical 25% ofthe basilar papilla. Bottom panel: Average width of the basilar pa-pilla in same birds as in top panel. Width measurements were takenfrom the 800U SEM montages used to count hair cells; measure-ments were made from neural to abneural hair cell in a line perpen-dicular to the neural edge. Width of the basilar papilla increasesfrom basal to apical tip and is generally widest for zebra ¢nchesand budgerigars and narrowest for canaries.
HEARES 3206 16-4-99
B.M. Ryals et al. / Hearing Research 131 (1999) 71^88 83

It is impossible to separate the e¡ects of severity ofinitial damage from the temporal course of damage inthese three species. However, since canaries did showquite severe hair cell loss 7 days after noise exposure,comparable to or greater than budgerigars and zebra¢nches, it seems reasonable to conclude that it takeslonger for the actual hair cell extrusion and loss tooccur in canaries.
3.2.5. Summary histology: species di¡erencesQuantitative analysis of the basilar papillae in these
three species of birds revealed hair cell loss within 7 daysof exposure to a bandpass noise of 2^6 kHz at 120 dBfor 24 h. For zebra ¢nches and budgerigars this losswas obvious immediately following the noise exposurewhile it was only obvious in canaries 7 days later. Sincewe analyzed hair cell loss immediately, and then 7 dayslater, we only know that hair cell loss occurred in thecanary some time within those ¢rst 7 days after expo-sure. Previous studies in chickens have shown that theinitial response of support cells to acoustic trauma is toexpand their surface area. This expansion apparentlytook place in zebra ¢nches and budgerigars during the24 h exposure since hair cell extrusion and loss was seenimmediately after the noise exposure. This support cellsurface expansion was apparently ongoing, or at leastbegan more slowly, in the canary since very little haircell extrusion or loss was seen immediately after noiseexposure but some areas of support cell surface expan-sion were apparent.
Evidence of hair cell regeneration was seen in allthree species within 7 days of noise exposure. More-over, at 90 days after noise exposure, hair cell numberhad increased in all three species. Thus we have bothdirect and indirect evidence of regeneration and haircell recovery after noise exposure in canaries, zebra¢nches and budgerigars. Budgerigars and canaries hadthe most severe hair cell loss, including areas of thepapilla completely denuded of all but the most neurallylocated hair cells 7 days after noise exposure. These twospecies continued to have substantial, localized hair cellloss even 90 days after noise exposure.
Of the two species, canaries were more likely to re-cover to nearly normal hair cell levels throughout thebasilar papilla within 90 days of noise exposure. It isinteresting to note that one inherent species di¡erencebetween canaries and budgerigars is the dimensions ofthe papilla and total number of hair cells. Budgerigarshave the largest papillar dimensions and greatest overallnumber of hair cells while canaries have the smallestbasilar papilla and the lowest number of hair cells. Itis conceivable that these di¡erences could in£uence thetransmission properties of the basilar papilla and sub-sequently its susceptibility to damage by acoustic over-stimulation.
3.3. Experiment 3 ^ Role of intracranial air pressure
All four species of birds studied in these experimentsbegan with fairly similar auditory thresholds at the cen-ter frequency of the noise exposure band (for our indi-vidual birds used in these experiments, thresholds werewithin 3 dB). Since all birds were subjected to identicalacoustic overstimulation (sometimes even at the sametime) and tested under identical conditions, the speciesdi¡erences we observed in susceptibility to damage aremost certainly true species di¡erences. Whether thesespecies di¡erences arise at the level of the cochlea orat the middle ear is more di¤cult to determine. It hasbeen shown in mammals that the middle ear transferfunction can in£uence the e¡ective bandwidth andsound pressure level at the level of the cochlea duringnoise exposure (Hellstroem, 1993; Mills et al., 1981).Moreover, the e¡ect of middle ear muscle contractionon bandwidth and e¡ective sound pressure at the coch-lea is well known in mammals (Borg, 1972).
During sustained noise exposure, middle ear musclecontraction likely plays little, if any, protective role inmammals. This may not necessarily be the case forbirds. It has been suggested that in birds the role ofthe middle ear muscle might be to reduce the maskinge¡ect of wind on the perception of species-speci¢csounds during £ight (Oeckinghaus and Schwartzkop¡,1983). In that case birds would need to activate themiddle ear muscle for prolonged periods of time, per-haps minutes, and thus middle ear muscle fatigue mightoccur at a di¡erent rate in birds than in mammals.Recent work by Larsen et al. (1996) has shown thatbudgerigars show some evidence of a middle ear musclere£ex to the presentation of brief, intense tone bursts ashas been demonstrated in the tawny owl (Counter andBorg, 1982; Oeckinghaus and Schwartzkop¡, 1983).But neither quail, canaries, nor ¢nches show similarevidence of a middle ear muscle re£ex (Larsen et al.,1996). Thus, it is unlikely that this mechanism accountsfor all of the species di¡erences observed here.
Another possible mechanism for a¡ecting middle eartransfer in birds has to do with the interaural pathway.It has long been known that the middle ears of birds areconnected through a pathway referred to as the inter-aural canal (Calford and Piddington, 1988). The mor-phology of this system suggests that this canal providesa means by which air pressure is regulated so that it isalways the same on the interior surface of the two ear-drums and, indeed, intracranial air pressure in awakebirds deviates little from ambient pressure (Larsen etal., 1996). Moreover, direct measures of the intracranialpressure shows a repeated resetting to ambient levelswhen intracranial pressure begins to go negative. Thisresetting is probably accomplished by repeated openingof the single Eustachian tube in the back of the oral
HEARES 3206 16-4-99
B.M. Ryals et al. / Hearing Research 131 (1999) 71^8884

cavity. These same studies showed that in anesthetizedbirds, intracranial air pressure goes negative (probablybecause of di¡usive absorption of gases across the mid-dle ear mucosa ^ gases that are then removed by theblood) and can remain at a fairly large negative valuefor long periods of time. This sustained, negative pres-sure is never seen in normal, awake birds. Laser inter-ferometry has con¢rmed that such a negative air pres-sure pulls both tympana inwards and has a dramatice¡ect on the tympanal transfer function causing themiddle ear transfer to become essentially a high pass¢lter (Larsen et al., 1996).
We hypothesized that if there were species di¡erencesin the ability of awake birds to control the opening andclosing of the Eustachian tube, this might provide amechanism for tempering the e¡ects of acoustic over-stimulation. More importantly, this might also accountfor some of the species di¡erences we observed in sus-ceptibility to noise exposure. To test this hypothesis, weexposed four birds from each of three species (budger-igars, zebra ¢nches, canaries) to a 117 dB SPL broad-band noise over a 12 h period under conditions inwhich the intracranial airspace was either unventilated(the normal condition) or arti¢cially ventilated. Arti¢-cial ventilation would make it impossible for the bird toregulate the air pressure by action of the Eustachiantube.
In this experiment, the intensity level of broadbandnoise was chosen in order to optimize the opportunityto see hair cell loss in all three species while minimizingthe possibility of severe damage to the inner ear. Arti-¢cial ventilation was provided either through tympa-num puncture or skull ventilation as described in Lars-en et al. (1996). Birds were exposed in pairs (one witharti¢cial ventilation, one without), three species at atime (six birds in each 12 h duration exposure).
Birds were killed within 6 h of the cessation of thenoise exposure and their basilar papillae removed.These papillae were prepared for scanning electron mi-croscopy, and hair cells counted from SEM montagesas described above. Only one ear (left) was counted foreach bird.
3.3.1. Histology after arti¢cial middle ear ventilation andwide-band noise exposure
In all three species, under normal conditions of mid-dle ear ventilation, 12 h of continuous wide-band noiseexposure resulted in immediate hair cell extrusion andloss over a relatively widespread area along the papilla.Budgerigars continued to show somewhat greater andmore localized hair cell loss than canaries and zebra¢nches. The area of greatest hair cell loss by specieswas from 40 to 70% of length in budgerigar, from 10to 90% in canary and from 30 to 70% in zebra ¢nch.
Fig. 14 shows the average number of hair cells within
the region of the papillae described above for all threespecies in the control condition (no vent and no noiseexposure) as well as the conditions of noise exposurewith and without an arti¢cial vent. For all three species,comparisons among treatments were conducted using aone-way ANOVA with post hoc comparisons made toelucidate signi¢cant di¡erences between groups. Therewas a signi¢cant e¡ect of treatment for both bud-gerigars (F2=3 = 15.543, P6 0.026) and canaries(F2=3 = 36.825, P6 0.008) but not for zebra ¢nches(F2=3 = 1.407, P6 0.371). Both budgerigars (P6 0.03)and canaries (P6 0.01), but not zebra ¢nches, showedsigni¢cantly more hair cell loss following noise exposureunder conditions of arti¢cial venting of the middle earcompared to the normal, unvented condition. Less haircell loss in the normal, non-vented condition impliesthat middle ear pressure regulation played a role inreducing the e¡ective acoustic overstimulation to thebasilar papilla in these two species. Larsen et al.(1996) found that negative pressure buildup within themiddle ear during anesthesia resulted in a high-pass¢lter e¡ect. This build-up of negative pressure also oc-curred sometimes during intense noise exposure. Thiskind of middle ear pressure regulation would have thee¡ect of attenuating lower frequency sounds (roll-o¡below 3 kHz) yielding less e¡ective sound pressure atthe level of the basilar papilla and resulting in less hair
Fig. 14. Average number of hair cells within the area of hair cellloss (40^70% of length for budgerigar; 10^90% of length for can-ary; 30^70% of length for zebra ¢nch) for budgerigar, canary andzebra ¢nch under control (no vent/no noise) or immediately afternoise exposure (12 h continuous 117 dB SPL broadband noise) witharti¢cial middle ear ventilation (vent/noise) or under conditions ofnormal middle ear ventilation (no vent/noise). For budgerigars andcanaries, there were signi¢cantly more hair cells lost under condi-tions of noise exposure with arti¢cial middle venting than under thecondition of noise exposure under the normal, unvented condition.No signi¢cant di¡erence in hair cell number in vented or non-ventedconditions were seen for zebra ¢nch.
HEARES 3206 16-4-99
B.M. Ryals et al. / Hearing Research 131 (1999) 71^88 85

cell damage and loss. While this appears to be the casefor budgerigars and canaries, arti¢cial ventilation of themiddle ear in zebra ¢nches did not alter the amount ofhair cell loss after wide-band noise exposure. Thus forzebra ¢nches, middle ear pressure regulation does notappear to be a factor in susceptibility to noise exposure.
4. Summary and discussion
This study provides the ¢rst comparative analysis ofhair cell loss, hair cell recovery and regeneration, andreturn of hearing after acoustic overstimulation inbirds. The purpose of these experiments was to deter-mine whether there were still species di¡erences in sus-ceptibility to damage from noise when methodologicaland basic hearing variables were controlled for. To thisend, four diverse (passerine and non-passerine) speciesof birds with similar auditory sensitivity were givenidentical acoustic overexposures. Despite this approachwhich controlled, either through species selection ormethodology, for noise exposure conditions, survivaltimes, initial similarity in auditory sensitivity in the fre-quency area of overstimulation, histological assay, andbehavioral procedures, there were still large di¡erencesin susceptibility to hair cell damage, hearing loss, andauditory recovery. For two of the species used in theseexperiments, budgerigars and quail, there are previousdata available on behavioral recovery following acous-tic overexposure (Dooling, 1982; Niemiec et al., 1994;Saunders and Dooling, 1974) and the present results onthe amount of threshold shift as a function of exposurelevel and the time course of recovery are consistent withthese earlier reports.
It has long been suspected that even if it were possi-ble to specify precisely the energy delivered to the re-ceptor cell, the di¡erences among species with regard tocochlear linearities, receptor cell number, stereocilianumber, as well as tectorial membrane attachments,could all in£uence the ¢nal susceptibility of the organ-ism to damage from acoustic overexposure (Saundersand Tilney, 1982). We attempted to choose speciesthat were similar. However, even though we chose avi-an species with roughly similar basilar papilla size, haircell number and morphology to control for some of theobvious factors that might in£uence susceptibility, thesespecies are not identical with regard to these factors(Gleich et al., 1994; Manley et al., 1993). Thus, speciesdi¡erences in these characteristics might still play alarge role in the species di¡erences we report. For in-stance, canaries and zebra ¢nches have smaller papillae,fewer hair cells, and were less susceptible to noise, whilequail and budgerigars have larger papillae, more haircells, and were more susceptible to noise.
Another critical point is the importance of under-
standing that the e¡ective stimulus reaching the basilarpapilla is similar among species before we can evensuggest that di¡erences in susceptibility can be attrib-uted to species di¡erences within the inner ear. Some ofthe more obvious factors that can in£uence the e¡ectivelevel of the acoustic stimulus reaching the inner earwould include head size, middle ear muscle e¡ects,and middle ear transfer e¡ects. Head size is likely nota large issue here because the species tested had similarhead sizes, especially budgerigars, canaries, and ¢nches.Moreover, we tried to minimize the e¡ect of any dif-fraction or head shadow by using bands of noise ratherthan pure tones. Note that even bandpass noise expo-sure resulted in large species di¡erences in susceptibility.Speci¢cally, budgerigars had a more severe and local-ized area of hair cell loss while zebra ¢nches had amilder, more widespread amount of hair cell loss. Cana-ries showed more individual variability to noise expo-sure and had little hair cell loss until about 7 days afternoise exposure. It is also unlikely that middle earmuscle activity could be relevant to the species di¡er-ences found here. First, the long-term exposures arelikely to fatigue any e¡ective middle ear muscle re-sponse. Second, only one species (the budgerigar)showed any evidence of a middle ear muscle re£ex toexternal sound stimulation and this species typicallyshowed the most susceptibility to acoustic trauma.
Interestingly, our experiments uncovered other waysthat birds might a¡ect the middle ear transfer functionwithout involving muscle activity by altering intracrani-al air pressure. By eliminating any natural or self-regu-lated intracranial pressure changes that might occurduring noise exposure by venting, we prevented intra-cranial pressure regulation. Under these conditions ofarti¢cial middle ear ventilation, hair cell loss was great-er in both budgerigars and canaries, suggesting thatthese birds may regulate middle ear pressure duringnoise exposure presumably through the action of theEustachian tube. Maintaining a closed Eustachiantube would result in negative middle ear pressure, apulling in of the tympanic membrane, a reduction inthe dynamic range of the columella footplate motion,and thus an attenuation in the e¡ective stimulus at thebasilar papilla.
In summary, our ¢ndings con¢rm that large speciesdi¡erence in susceptibility to damage from acousticoverexposure occur in adult birds even when many ofthe known sources of variation are controlled for in-cluding exposure conditions, histological methodology,and behavioral procedures. Moreover, our results pointto the operation of a new, and potentially signi¢cant,source of species variability in susceptibility to acousticoverexposure in birds ^ that of middle ear pressureregulation and subsequent changes in middle ear trans-fer function. This, in fact, may be the largest factor for
HEARES 3206 16-4-99
B.M. Ryals et al. / Hearing Research 131 (1999) 71^8886

the wide variability among small birds in susceptibilityand resistance to the deleterious e¡ects of high-levelnoise exposure.
Acknowledgements
The authors gratefully acknowledge the assistance ofKaren Dench¢eld and Laura Hill in histological datacollection and the expert assistance of Jim Brownie ofthe Veterans A¡airs Medical Center, Richmond Virgin-ia in photomicrograph assembly. This work was sup-ported by NIH Grant DC001372 (B.M.R. and R.J.D.).
References
Adler, H.J., Kenealy, J.F., Dedio, R.M., Saunders, J.C., 1992.Threshold shift, hair cell loss, and hair bundle sti¡ness followingexposure to 120 and 125 dB pure tones in the neonatal chick. ActaOtolaryngol. 112, 444^454.
Borg, E., 1972. Acoustic middle ear re£exes: A sensory control sys-tem. Acta Otolaryngol. 304 ((Suppl.)), 1^34.
Calford, M.B., Piddington, R.W., 1988. Avian interaural canal enhan-ces interaural delay. J. Comp. Physiol. 162, 503^510.
Corwin, J.T., 1992. Regeneration in the auditory system. Exp. Neurol.115, 7^12.
Cotanche, D.A., Dopyera, C.E.J., 1990. Hair cell and supporting cellresponse to acoustic trauma in the chick cochlea. Hear. Res. 46,29^40.
Cotanche, D.A., Saunders, J.C., Tilney, L.G., 1987. Hair cell damageproduced by acoustic trauma in the chick cochlea. Hear. Res. 25,267^286.
Cotanche, D.A., Lee, K.H., Stone, J.S., Picard, D.A., 1994. Hair cellregeneration in the bird cochlea following noise damage or oto-toxic drug damage. Anat. Embryol. 189, 1^18.
Cotanche, D.A., Messana, E.P., Ofsie, M.S., 1995. Migration of hya-line cells into the chick basilar papilla during severe noise damage.Hear. Res. 91, 148^1519.
Counter, S.A., Borg, E., 1982. The avian stapedius muscle. Acta Oto-laryngol. 94, 267^274.
Danping Ding-Pfennigdor¡, J., Smolders, W.Th., Muller, M., Klinke,R., 1998. Hair cell loss and regeneration after severe acoustic over-stimulation in the adult pigeon. Hear. Res. 120, 109^120.
Dooling, R.J., 1980. Behavior and psychophysics of hearing in birds.In: Popper, A.N., Fay, R.R. (Eds.), Comparative Studies of Hear-ing in Vertebrates. Springer-Verlag, New York, pp. 261^288.
Dooling, R.J., 1982. Auditory perception in birds. In: Kroodsma,D.E., Miller, E.H. (Eds.), Acoustic Communication in Birds,Vol. 2. Academic Press, New York, pp. 95^130.
Dooling, R.J., Okanoya, K., 1995. The method of constant stimuli intesting auditory sensitivity in small birds. In: Klump, G.M., Dool-ing, R.J., Fay, R.R., Stebbins, W.C. (Eds.), Methods in Compar-ative Psychoacoustics. Birkhauser Verlag, Basel, pp. 161^169.
Dooling, R.J., Saunders, J.C., 1975. Hearing in the budgerigar (Me-lopsittacus undulatus) : Absolute thresholds, critical ratios, fre-quency di¡erence limen, and vocalizations. J. Comp. Physiol. Psy-chiatry 88, 1^20.
Dooling, R.J., Ryals, B.M., Manabe, K., 1997. Recovery of hearingand vocal behavior after hair cell regeneration. Proc. Natl. Acad.Sci. USA 94, 14206^14210.
Duckert, L.G., Rubel, E.W., 1993. Current concepts in hair cell re-generation. Otolaryngol. Clin. N. Am. 26, 873^901.
Gleich, O., Manley, G.A., 1988. Quantitative morphological analysisof the sensory epithelium of the starling and pigeon basilar papilla.Hear. Res. 34, 69^85.
Gleich, O., Manley, G.A., Mandl, A., Dooling, R.J., 1994. The basilarpapilla of the canary and zebra ¢nch: A quantitative scanningelectron microscopical description. J. Morphol. 221, 1^24.
Hashino, E., Okanoya, K., 1989. Auditory sensitivity of the zebra¢nch (Poephila guttata castanotis). J. Acoust. Soc. Japan (E) 10,51^52.
Hashino, E., Sokabe, M., 1989. Kanamycin induced low-frequencyhearing loss in the budgerigar (Melopsittacus undulatus). J. Acoust.Soc. Am. 85, 289^294.
Hashino, E., Sokabe, M., Miyamoto, K., 1988. Frequency suscepti-bility to acoustic trauma in the budgerigar (Melopsittacus undula-tus). J. Acoust. Soc. Am. 83, 2450^2453.
Hellstroem, P., 1993. The relationship between sound transfer func-tions from free sound ¢eld to the eardrum and temporary thresh-old shift. J. Acoust. Soc. Am. 80, 783^793.
Jorgensen, J.M., 1991. Regeneration of lateral line and inner ear ves-tibular cells. Ciba Found. Symp. 160, 151^170.
Larsen, O.N., Dooling, R.J., Ryals, B.M., 1996. Roles of intracranialair pressure in bird audition. In: Lewis, E.R., Long, G.R., Lyon,R.F., Narins, P.M., Steele, C.R., Hecht-Poinar, E. (Eds.), Diver-sity in Auditory Mechanics. World Scienti¢c, Singapore, pp. 11^17.
Linzenbold, A., Dooling, R.J., Ryals, B.M., 1993. A behavioral audi-bility curve for the japanese quail (Coturnix coturnix japonica).Assoc. Res. Otol. Abstr. 16, 211.
Manley, G.A., 1990. Peripheral Hearing Mechanisms in Reptiles andBirds. Springer Verlag, Berlin.
Manley, G.A., Schwabedissen, G., Gleich, O., 1993. Morphology ofthe basilar papilla of the budgerigar, Melopsittacus undulatus.J. Morphol. 218, 153^165.
Marean, G.C., Burt, J.M., Beecher, M.D., Rubel, E.W., 1993. Haircell regeneration in the European starling (Sturnus vulgaris) : Re-covery of pure-tone detection thresholds. Hear. Res. 71, 125^136.
Marsh, R.P., Lerong, X., Moy, J.R., Saunders, J.C., 1990. Recoveryof the basilar papilla following intense sound exposure in the neo-natal chick. Hear. Res. 46, 229^238.
McFadden, E.A., Saunders, J.C., 1989. Recovery of auditory functionfollowing intense sound exposure in the neonatal chick. Hear. Res.41, 205^215.
Mills, J.H., Adkins, W.Y., Gilbert, R.M., 1981. Temporary thresholdshifts produced by wideband noise. J. Acoust. Soc. Am. 73, 918^923.
Niemiec, A.J., Raphael, Y., Moody, D.B., 1993. Return of auditoryfunction following structural regeneration after acoustic trauma:Behavioral measures from quail. Assoc. Res. Otol. Abstr. 16,119.
Niemiec, A.J., Raphael, Y., Moody, D.B., 1994. Return of auditoryfunction following structural regeneration after acoustic trauma:Behavioral measures from quail. Hear. Res. 79, 1^16.
Oeckinghaus, H., Schwartzkop¡, J., 1983. Electrical and acousticalactivation of the middle ear muscle in a songbird. J. Comp. Phys-iol. 150, 61^67.
Okanoya, K., Dooling, R.J., 1987. Hearing in passerine and psittacinebirds: A comparative study of masked and absolute auditorythresholds. J. Comp. Psychol. 101, 7^15.
Okanoya, K., Dooling, R.J., 1990. Temporal integration in zebra¢nches (Poephila guttata). J. Acoust. Soc. Am. 87, 2782^2784.
Pugliano, F.A., Pribitikin, E., Adler, H.J., Saunders, J.C., 1993.Growth of evoked potential amplitude in neonatal chicks exposedto intense sound. Acta Otolaryngol. 113, 18^25.
HEARES 3206 16-4-99
B.M. Ryals et al. / Hearing Research 131 (1999) 71^88 87

Rubel, E.W., Ryals, B.M., 1982. Patterns of hair cell loss in chickbasilar papilla after intense auditory stimulation: Exposure, dura-tion and survival time. Acta Otolaryngol. 93, 31^41.
Rubel, E.W., Oesterle, E.C., Weisleder, P., 1991. Ciba Found. Symp.160, 77^102.
Ryals, B.M., Rubel, E.W., 1982. Patterns of hair cell loss in chickbasilar papilla after intense auditory stimulation: Frequency or-ganization. Acta Otolaryngol. 93, 205^210.
Ryals, B.M., Rubel, E.W., 1985. Ontogenic changes in the position ofhair cell loss after acoustic overstimulation in avian basillar pap-illa. Hear. Res. 19, 135^142.
Saunders, J.C., Dooling, R.J., 1974. Noise-induced threshold shift inthe budgerigar (Melopsittacus undulatus). Proc. Natl. Acad. Sci.USA 71, 1962^1965.
Saunders, S.S., Salvi, R.J., 1995. Pure tone masking patterns in adultchicken before and after recovery from acoustic trauma. J. Acoust.Soc. Am. 98, 1365^1371.
Saunders, J.C., Tilney, L.G., 1982. Species di¡erences in susceptibilityto noise exposure. In: Hamernick, Henderson and Salvi (Eds.),New Perspectives in Noise-Induced Hearing Loss. Raven Press,New York, pp. 229^248.
Saunders, J.C., Cohen, Y.E., Szymko, Y.M., 1991. The structural andfunctional consequences of acoustic injury in the cochlea and pe-ripheral auditory system: A ¢ve year update. J. Acoust. Soc. Am.90, 136^146.
Saunders, S.S., Adler, H., Pugliano, F., 1992. The structural and func-tional aspects of hair cell regeneration in the chick as a result ofexposure to intense sound. Exp. Neurol. 115, 13^17.
Saunders, J.C., Torsiglieri, A.J., DeDio, R.M., 1993. The growth ofhearing loss in neonatal chicks exposed to intense pure tones.Hear. Res. 69, 25^34.
Tsue, T.T., Oesterle, E.C., Rubel, E.W., 1994. Hair cell regenerationin the inner ear. Otolaryngol. Head Neck Surg. 111, 281^301.
HEARES 3206 16-4-99
B.M. Ryals et al. / Hearing Research 131 (1999) 71^8888