Aversive Reinforcement Improves Visual Discrimination Learning in Free-Flying Honeybees
11
Aversive Reinforcement Improves Visual Discrimination Learning in Free-Flying Honeybees Aurore Avargue ` s-Weber 1,2,3 , Maria G. de Brito Sanchez 1,2 , Martin Giurfa 1,2. , Adrian G. Dyer 3. * 1 Universite ´ de Toulouse, UPS, Centre de Recherches sur la Cognition Animale, Toulouse, France, 2 CNRS, Centre de Recherches sur la Cognition Animale, Toulouse, France, 3 Department of Physiology, Monash University, Clayton, Victoria, Australia Abstract Background: Learning and perception of visual stimuli by free-flying honeybees has been shown to vary dramatically depending on the way insects are trained. Fine color discrimination is achieved when both a target and a distractor are present during training (differential conditioning), whilst if the same target is learnt in isolation (absolute conditioning), discrimination is coarse and limited to perceptually dissimilar alternatives. Another way to potentially enhance discrimination is to increase the penalty associated with the distractor. Here we studied whether coupling the distractor with a highly concentrated quinine solution improves color discrimination of both similar and dissimilar colors by free-flying honeybees. As we assumed that quinine acts as an aversive stimulus, we analyzed whether aversion, if any, is based on an aversive sensory input at the gustatory level or on a post-ingestional malaise following quinine feeding. Methodology/Principal Findings: We show that the presence of a highly concentrated quinine solution (60 mM) acts as an aversive reinforcer promoting rejection of the target associated with it, and improving discrimination of perceptually similar stimuli but not of dissimilar stimuli. Free-flying bees did not use remote cues to detect the presence of quinine solution; the aversive effect exerted by this substance was mediated via a gustatory input, i.e. via a distasteful sensory experience, rather than via a post-ingestional malaise. Conclusion: The present study supports the hypothesis that aversion conditioning is important for understanding how and what animals perceive and learn. By using this form of conditioning coupled with appetitive conditioning in the framework of a differential conditioning procedure, it is possible to uncover discrimination capabilities that may remain otherwise unsuspected. We show, therefore, that visual discrimination is not an absolute phenomenon but can be modulated by experience. Citation: Avargue `s-Weber A, de Brito Sanchez MG, Giurfa M, Dyer AG (2010) Aversive Reinforcement Improves Visual Discrimination Learning in Free-Flying Honeybees. PLoS ONE 5(10): e15370. doi:10.1371/journal.pone.0015370 Editor: Georges Chapouthier, Universite ´ Pierre et Marie Curie, France Received August 2, 2010; Accepted August 30, 2010; Published October 15, 2010 Copyright: ß 2010 Avargue ` s-Weber, et al. This is an open-access article distributed under the terms of the Creative Commons Attribution License, which permits unrestricted use, distribution, and reproduction in any medium, provided the original author and source are credited. Funding: A.A.-W, M.G. de B.S and M.G. thank the National Research Agency (ANR) (Project INSAVEL), the French Research Council (CNRS) and the University Paul Sabatier for support. A.A.-W. was supported by a Travelling Fellowship from The Company of Biologists and by the University Paul Sabatier (ATUPS fellowship). A. G. D. acknowledges the Alexander von Humboldt Foundation, ARC DP0987989 and ARC DP0878968 for support.http://www.arc.gov.au/. The funders had no role in study design, data collection and analysis, decision to publish, or preparation of the manuscript. Competing Interests: The authors have declared that no competing interests exist. * E-mail: [email protected] . These authors contributed equally to this work. Introduction The honeybee is a useful model for the study of complex visual- problem solving by a miniature brain [1–3]. Despite their relative small brain, honeybees learn to navigate mazes [4], use top-down processing to break camouflage [5], solve delayed matching to sample tasks and thus demonstrate rule learning [6], process rotated complex objects like faces [7], categorize complex spatial information [8–10] and exhibit performances akin to numerical counting [11–12]. A crucial aspect to reveal the cognitive capacities of honeybees, and other animals, is the training procedure employed by the experimenter. For instance, in several cases of complex problem solving by bees, learning sets have been used in which insects were confronted with a random succession of changing stimuli in which a specific feature remained constant and associated with reward. In this way, it was possible to ask whether bees are able to extract this feature per se and solve a problem on its basis (e.g. symmetry categorization [8]; orientation categorization [13]; configurational categorization [9–10]). Recent work has also demonstrated that the learning of color stimuli for both bumblebees [14] and honeybees [15] is dependent on the type of conditioning procedure. Specifically, fine color discrimination is achieved when both a target (rewarded conditioned stimulus or CS+) and a distractor (non-rewarded conditioned stimulus or CS2) are present during training (differential conditioning), whilst if the target is learnt in isolation (absolute conditioning), discrimination is coarse and limited to perceptually dissimilar alternatives. Thus, differential conditioning procedures seem to promote high levels of visual discrimination. An explanation provided to account for differences in discrimination resulting from absolute and differen- tial conditioning is the hypothesis that the former, contrary to the latter, recruits attentional processes that are necessary to learn the difference between a target and a distractor [15]. PLoS ONE | www.plosone.org 1 October 2010 | Volume 5 | Issue 10 | e15370
-
Upload
univ-tlse3 -
Category
Documents
-
view
1 -
download
0
Transcript of Aversive Reinforcement Improves Visual Discrimination Learning in Free-Flying Honeybees
Aversive Reinforcement Improves Visual DiscriminationLearning in Free-Flying HoneybeesAurore Avargues-Weber1,2,3, Maria G. de Brito Sanchez1,2, Martin Giurfa1,2., Adrian G. Dyer3.*
1 Universite de Toulouse, UPS, Centre de Recherches sur la Cognition Animale, Toulouse, France, 2 CNRS, Centre de Recherches sur la Cognition Animale, Toulouse,
France, 3 Department of Physiology, Monash University, Clayton, Victoria, Australia
Abstract
Background: Learning and perception of visual stimuli by free-flying honeybees has been shown to vary dramaticallydepending on the way insects are trained. Fine color discrimination is achieved when both a target and a distractor arepresent during training (differential conditioning), whilst if the same target is learnt in isolation (absolute conditioning),discrimination is coarse and limited to perceptually dissimilar alternatives. Another way to potentially enhancediscrimination is to increase the penalty associated with the distractor. Here we studied whether coupling the distractorwith a highly concentrated quinine solution improves color discrimination of both similar and dissimilar colors by free-flyinghoneybees. As we assumed that quinine acts as an aversive stimulus, we analyzed whether aversion, if any, is based on anaversive sensory input at the gustatory level or on a post-ingestional malaise following quinine feeding.
Methodology/Principal Findings: We show that the presence of a highly concentrated quinine solution (60 mM) acts as anaversive reinforcer promoting rejection of the target associated with it, and improving discrimination of perceptually similarstimuli but not of dissimilar stimuli. Free-flying bees did not use remote cues to detect the presence of quinine solution; theaversive effect exerted by this substance was mediated via a gustatory input, i.e. via a distasteful sensory experience, ratherthan via a post-ingestional malaise.
Conclusion: The present study supports the hypothesis that aversion conditioning is important for understanding how andwhat animals perceive and learn. By using this form of conditioning coupled with appetitive conditioning in the frameworkof a differential conditioning procedure, it is possible to uncover discrimination capabilities that may remain otherwiseunsuspected. We show, therefore, that visual discrimination is not an absolute phenomenon but can be modulated byexperience.
Citation: Avargues-Weber A, de Brito Sanchez MG, Giurfa M, Dyer AG (2010) Aversive Reinforcement Improves Visual Discrimination Learning in Free-FlyingHoneybees. PLoS ONE 5(10): e15370. doi:10.1371/journal.pone.0015370
Editor: Georges Chapouthier, Universite Pierre et Marie Curie, France
Received August 2, 2010; Accepted August 30, 2010; Published October 15, 2010
Copyright: � 2010 Avargues-Weber, et al. This is an open-access article distributed under the terms of the Creative Commons Attribution License, which permitsunrestricted use, distribution, and reproduction in any medium, provided the original author and source are credited.
Funding: A.A.-W, M.G. de B.S and M.G. thank the National Research Agency (ANR) (Project INSAVEL), the French Research Council (CNRS) and the University PaulSabatier for support. A.A.-W. was supported by a Travelling Fellowship from The Company of Biologists and by the University Paul Sabatier (ATUPS fellowship). A.G. D. acknowledges the Alexander von Humboldt Foundation, ARC DP0987989 and ARC DP0878968 for support.http://www.arc.gov.au/. The funders had no rolein study design, data collection and analysis, decision to publish, or preparation of the manuscript.
Competing Interests: The authors have declared that no competing interests exist.
* E-mail: [email protected]
. These authors contributed equally to this work.
Introduction
The honeybee is a useful model for the study of complex visual-
problem solving by a miniature brain [1–3]. Despite their relative
small brain, honeybees learn to navigate mazes [4], use top-down
processing to break camouflage [5], solve delayed matching to
sample tasks and thus demonstrate rule learning [6], process
rotated complex objects like faces [7], categorize complex spatial
information [8–10] and exhibit performances akin to numerical
counting [11–12].
A crucial aspect to reveal the cognitive capacities of honeybees,
and other animals, is the training procedure employed by the
experimenter. For instance, in several cases of complex problem
solving by bees, learning sets have been used in which insects were
confronted with a random succession of changing stimuli in which
a specific feature remained constant and associated with reward.
In this way, it was possible to ask whether bees are able to extract
this feature per se and solve a problem on its basis (e.g. symmetry
categorization [8]; orientation categorization [13]; configurational
categorization [9–10]). Recent work has also demonstrated that
the learning of color stimuli for both bumblebees [14] and
honeybees [15] is dependent on the type of conditioning
procedure. Specifically, fine color discrimination is achieved when
both a target (rewarded conditioned stimulus or CS+) and a
distractor (non-rewarded conditioned stimulus or CS2) are
present during training (differential conditioning), whilst if the
target is learnt in isolation (absolute conditioning), discrimination
is coarse and limited to perceptually dissimilar alternatives. Thus,
differential conditioning procedures seem to promote high levels of
visual discrimination. An explanation provided to account for
differences in discrimination resulting from absolute and differen-
tial conditioning is the hypothesis that the former, contrary to the
latter, recruits attentional processes that are necessary to learn the
difference between a target and a distractor [15].
PLoS ONE | www.plosone.org 1 October 2010 | Volume 5 | Issue 10 | e15370
Different procedures allow enhancing attention levels during
differential conditioning. Manipulation of reinforcer intensity and/
or hedonic value is a possible strategy. In any differential
conditioning two specific memory traces are established, an
excitatory one derived from CS+ experiences, and an inhibitory
one derived from CS2 experiences; choice following conditioning
with a CS+ and a CS2 results from the interaction between these
two traces [16]. Thus, increasing the penalty associated with a
CS2 could enhance discrimination performances. In the case of
free-flying bees subjected to visual discrimination problems,
traditional differential conditioning procedures reward the CS+with sucrose solution (usually in a range between 30% and 50%
weight/weight) and do not reward the CS2. In this experimental
framework, one could ask whether coupling the CS2 with an
aversive reinforcement (instead of presenting it without reinforce-
ment) could further improve learning performance in honeybees.
To increase the penalty associated with a CS2, and to potentiate
learning abilities of free-flying bees, we decided to pair the visual
stimulus acting as CS2 with a highly concentrated quinine
solution.
The choice of quinine was based on recent studies reporting that
quinine promotes accurate learning of stimuli in bumblebees [17–20].
These studies, however, contrast with the fact that naturally occurring
concentrations of secondary compounds in nectar that taste bitter to
human do not have a deterring effect in free-flying honeybees but can
even elicit a feeding preference [21]. Moreover, to date there has
been no evidence of bitter gustatory receptors being present in the
honeybee (electrophysiology [22] or genomic study [23]; see [24] for
review). Additionally, experiments in the laboratory with harnessed
bees could not find clear evidence supporting that bitter compounds
are aversive to bees in contention [22,25].
Given this apparent lack of agreement on the aversive nature
of bitter compounds for honeybees, we decided to explicitly test
whether a highly concentrated quinine solution would confer an
enhanced aversive associative strength to a visual CS2, thus
facilitating its discrimination from a CS+. In asking this question
we took into account the perceptual similarity of the visual stimuli
to be discriminated and analyzed whether the negative
reinforcement would indistinctly favor discrimination both for
dissimilar and similar stimuli. To understand the mechanisms
underlying behavioral performances, we analyzed whether
quinine aversion, if any, is based on an aversive sensory input
at the gustatory level or on a post-ingestional malaise following
quinine feeding.
Results
Experiment 1: Does quinine improve visualdiscrimination of perceptually dissimilar colors whenused as negative reinforcer?
The potential aversive effect of quinine leading to an improve-
ment of visual discrimination was investigated using a differential
conditioning protocol in which one color stimulus (CS+) was
associated with sucrose solution 1 M and another color (CS2) with
either a highly concentrated 60 mM quinine solution (quinine
group) or tap water (water group). Colors were presented in a Y-
maze (Fig. 1a) to which honeybees were individually trained. Only
one marked bee was present at a time in the Y-maze.
Color stimuli were cut from broadband HKS-N colored papers.
Four colors were used in this experiment (HKS 8N, 26N, 44N and
54N, which appeared orange, pink, blue and green to humans
respectively; see Fig. 2a). All six dual combinations were used as
conditioning stimuli (8N vs. 26N, 8N vs. 44N, 8N vs. 54N, 26N vs.
44N, 26N vs. 54N, 44N vs. 54N). Bees in the quinine group and in
the water group were matched with respect to its training
combination. All colors were easily distinguishable for bees as
they were well separated from each other irrespective of the color
space used to represent them (color opponent coding space: mean
perceptual distance between stimuli 6 s.e.m. = 6.1561.10 COC
units; hexagon color space: 0.3160.04 hexagon units).
Each bee was trained with its particular CS+ vs. CS2
combination for 15 trials. Afterwards, it was subjected to three
different non-rewarded tests: a learning test presenting the CS+ vs.
the CS2; a test presenting the CS+ vs. a novel stimulus (NS)
(‘appetitive’ test), and a test presenting the CS2 vs. NS (‘aversive’
test). Whilst the learning test allows verifying whether or not bees
learned the discrimination task, the CS+ vs. NS test verified that
the CS+ gained an excitatory associative strength leading the bees
to choose it preferentially; the CS2 vs. NS test, on the contrary,
assesses whether or not the CS2 has gained an inhibitory
associative strength, leading the bees to avoid it and to prefer the
NS. For each bee trained with a particular combination of colors,
one of the two remaining colors not used during the training was
assigned randomly as NS for the tests.
Both groups of bees (quinine group and water group) learned the
task as their acquisition curves significantly increased during the
three blocks of 5 trials (Fig. 2b; ANOVA for repeated measure-
ments; N = 18 bees; block effect: F2,32 = 12.7, p,0.001). There was
no group effect (F1,16 = 1.8, p = 0.20) thus showing that, at least at
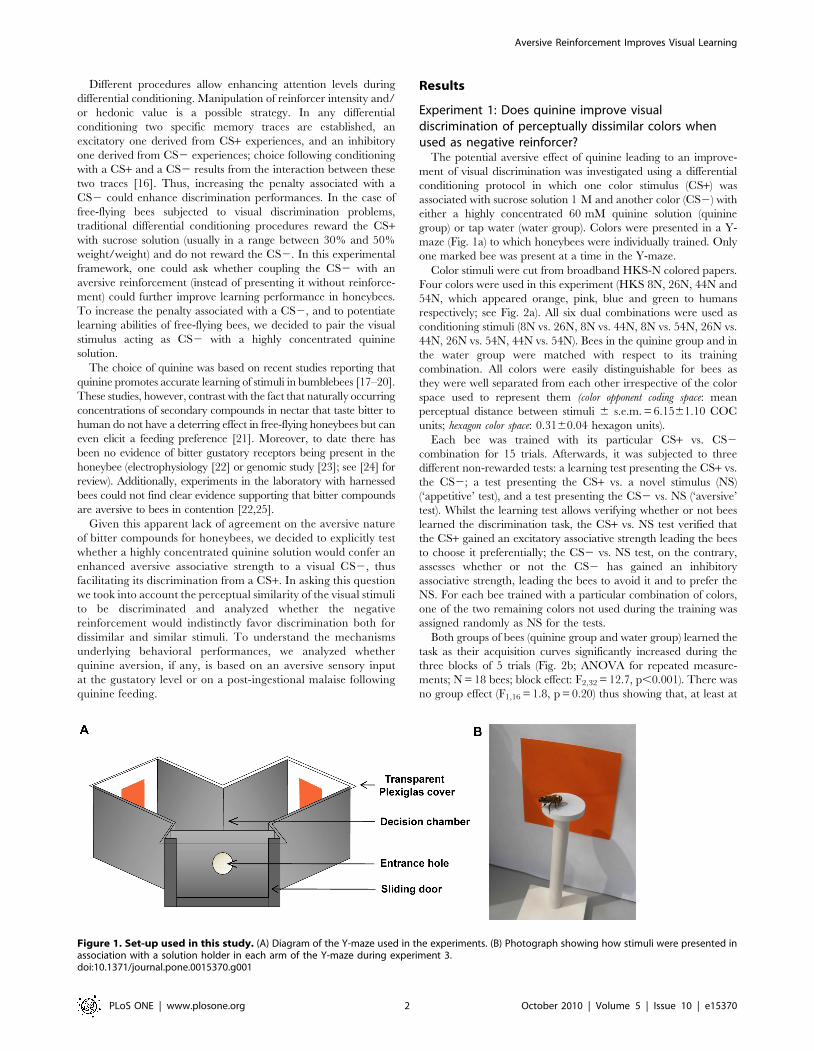
Figure 1. Set-up used in this study. (A) Diagram of the Y-maze used in the experiments. (B) Photograph showing how stimuli were presented inassociation with a solution holder in each arm of the Y-maze during experiment 3.doi:10.1371/journal.pone.0015370.g001
Aversive Reinforcement Improves Visual Learning
PLoS ONE | www.plosone.org 2 October 2010 | Volume 5 | Issue 10 | e15370

the level of acquisition, having quinine or water associated with the
CS2 did not significantly affect discrimination learning.
In the learning test, bees of both groups preferred the CS+ to
the CS2 (quinine group: N = 9 bees; 82.362.7% correct choices;
mean 6 s.e.m., black bar in Fig. 2c ‘learning test’; water group:
N = 9 bees; 75.962.8%, white bar in Fig. 2c ‘learning test’). In
both cases, the percentage of correct choices differed significantly
from a random choice (quinine group: one-sample t-test against
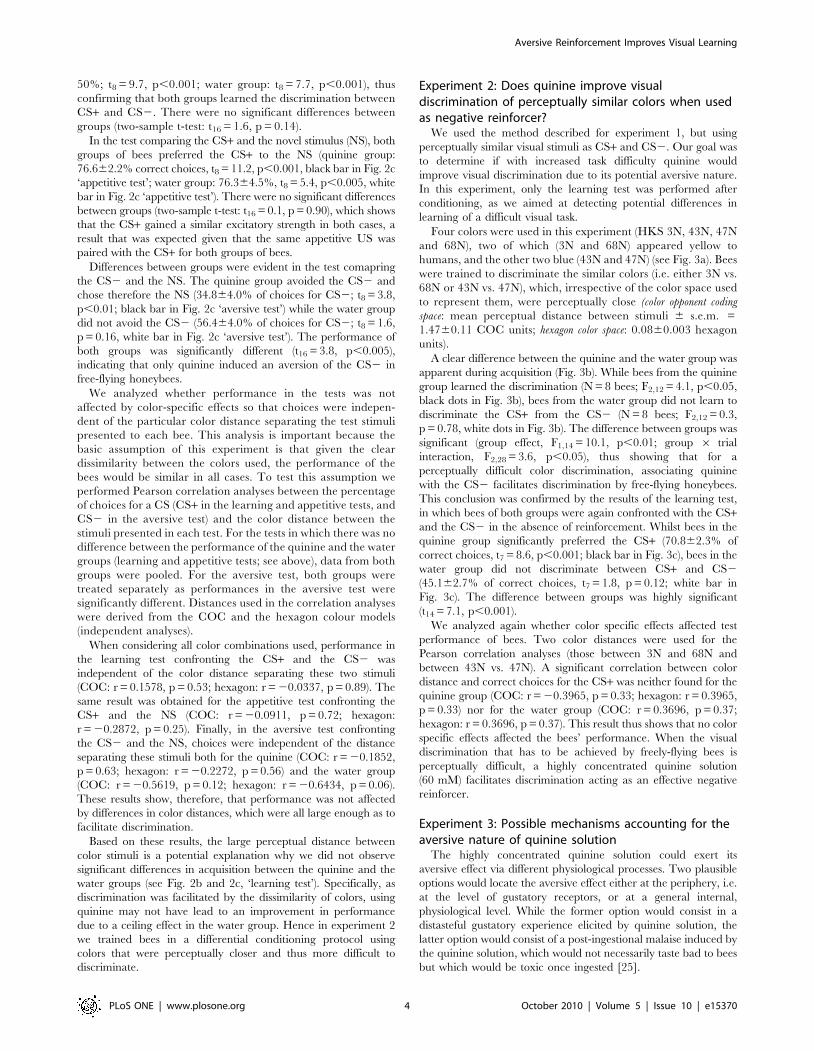
Figure 2. Results of Experiment 1: Does quinine improve visual discrimination of perceptually dissimilar colors when used asnegative reinforcer? (A) Plots of colored stimuli used in experiment 1 in a COC color space (left) and hexagon color space (right) for thetrichromatic vision of honeybees. The colour distances between stimuli are above 2.5 COC units and above 0.2 hexagon units. Numbers refer to theHKS papers references. (B) Learning acquisition (correct choices (%) by blocks of 5 trials; means 6 s.e.m.; N = 9 for each curve). The curve with blackdots represents acquisition by the quinine group (CS2 reinforced with quinine); the curve with white dots represents acquisition by the water group(CS2 reinforced with water). (C) Performance (means + s.e.m. of percentages of CS+ choices (‘learning’ and ‘appetitive’ test) or CS2 choices (‘aversive’test); N = 9 for each bar) in non-rewarded tests. Black bars represent the results of the quinine group; white bars represent the results of the watergroup. The learning performance in this easy colour discrimination task was not significantly different between test groups. Bees from the quininegroups avoided the stimulus associated with quinine during training when proposed versus a neutral stimulus, however this avoidance was notfound in the water group (**: p,0.005).doi:10.1371/journal.pone.0015370.g002
Aversive Reinforcement Improves Visual Learning
PLoS ONE | www.plosone.org 3 October 2010 | Volume 5 | Issue 10 | e15370
50%; t8 = 9.7, p,0.001; water group: t8 = 7.7, p,0.001), thus
confirming that both groups learned the discrimination between
CS+ and CS2. There were no significant differences between
groups (two-sample t-test: t16 = 1.6, p = 0.14).
In the test comparing the CS+ and the novel stimulus (NS), both
groups of bees preferred the CS+ to the NS (quinine group:
76.662.2% correct choices, t8 = 11.2, p,0.001, black bar in Fig. 2c
‘appetitive test’; water group: 76.364.5%, t8 = 5.4, p,0.005, white
bar in Fig. 2c ‘appetitive test’). There were no significant differences
between groups (two-sample t-test: t16 = 0.1, p = 0.90), which shows
that the CS+ gained a similar excitatory strength in both cases, a
result that was expected given that the same appetitive US was
paired with the CS+ for both groups of bees.
Differences between groups were evident in the test comapring
the CS2 and the NS. The quinine group avoided the CS2 and
chose therefore the NS (34.864.0% of choices for CS2; t8 = 3.8,
p,0.01; black bar in Fig. 2c ‘aversive test’) while the water group
did not avoid the CS2 (56.464.0% of choices for CS2; t8 = 1.6,
p = 0.16, white bar in Fig. 2c ‘aversive test’). The performance of
both groups was significantly different (t16 = 3.8, p,0.005),
indicating that only quinine induced an aversion of the CS2 in
free-flying honeybees.
We analyzed whether performance in the tests was not
affected by color-specific effects so that choices were indepen-
dent of the particular color distance separating the test stimuli
presented to each bee. This analysis is important because the
basic assumption of this experiment is that given the clear
dissimilarity between the colors used, the performance of the
bees would be similar in all cases. To test this assumption we
performed Pearson correlation analyses between the percentage
of choices for a CS (CS+ in the learning and appetitive tests, and
CS2 in the aversive test) and the color distance between the
stimuli presented in each test. For the tests in which there was no
difference between the performance of the quinine and the water
groups (learning and appetitive tests; see above), data from both
groups were pooled. For the aversive test, both groups were
treated separately as performances in the aversive test were
significantly different. Distances used in the correlation analyses
were derived from the COC and the hexagon colour models
(independent analyses).
When considering all color combinations used, performance in
the learning test confronting the CS+ and the CS2 was
independent of the color distance separating these two stimuli
(COC: r = 0.1578, p = 0.53; hexagon: r = 20.0337, p = 0.89). The
same result was obtained for the appetitive test confronting the
CS+ and the NS (COC: r = 20.0911, p = 0.72; hexagon:
r = 20.2872, p = 0.25). Finally, in the aversive test confronting
the CS2 and the NS, choices were independent of the distance
separating these stimuli both for the quinine (COC: r = 20.1852,
p = 0.63; hexagon: r = 20.2272, p = 0.56) and the water group
(COC: r = 20.5619, p = 0.12; hexagon: r = 20.6434, p = 0.06).
These results show, therefore, that performance was not affected
by differences in color distances, which were all large enough as to
facilitate discrimination.
Based on these results, the large perceptual distance between
color stimuli is a potential explanation why we did not observe
significant differences in acquisition between the quinine and the
water groups (see Fig. 2b and 2c, ‘learning test’). Specifically, as
discrimination was facilitated by the dissimilarity of colors, using
quinine may not have lead to an improvement in performance
due to a ceiling effect in the water group. Hence in experiment 2
we trained bees in a differential conditioning protocol using
colors that were perceptually closer and thus more difficult to
discriminate.
Experiment 2: Does quinine improve visualdiscrimination of perceptually similar colors when usedas negative reinforcer?
We used the method described for experiment 1, but using
perceptually similar visual stimuli as CS+ and CS2. Our goal was
to determine if with increased task difficulty quinine would
improve visual discrimination due to its potential aversive nature.
In this experiment, only the learning test was performed after
conditioning, as we aimed at detecting potential differences in
learning of a difficult visual task.
Four colors were used in this experiment (HKS 3N, 43N, 47N
and 68N), two of which (3N and 68N) appeared yellow to
humans, and the other two blue (43N and 47N) (see Fig. 3a). Bees
were trained to discriminate the similar colors (i.e. either 3N vs.
68N or 43N vs. 47N), which, irrespective of the color space used
to represent them, were perceptually close (color opponent coding
space: mean perceptual distance between stimuli 6 s.e.m. =
1.4760.11 COC units; hexagon color space: 0.0860.003 hexagon
units).
A clear difference between the quinine and the water group was
apparent during acquisition (Fig. 3b). While bees from the quinine
group learned the discrimination (N = 8 bees; F2,12 = 4.1, p,0.05,
black dots in Fig. 3b), bees from the water group did not learn to
discriminate the CS+ from the CS2 (N = 8 bees; F2,12 = 0.3,
p = 0.78, white dots in Fig. 3b). The difference between groups was
significant (group effect, F1,14 = 10.1, p,0.01; group 6 trial
interaction, F2,28 = 3.6, p,0.05), thus showing that for a
perceptually difficult color discrimination, associating quinine
with the CS2 facilitates discrimination by free-flying honeybees.
This conclusion was confirmed by the results of the learning test,
in which bees of both groups were again confronted with the CS+and the CS2 in the absence of reinforcement. Whilst bees in the
quinine group significantly preferred the CS+ (70.862.3% of
correct choices, t7 = 8.6, p,0.001; black bar in Fig. 3c), bees in the
water group did not discriminate between CS+ and CS2
(45.162.7% of correct choices, t7 = 1.8, p = 0.12; white bar in
Fig. 3c). The difference between groups was highly significant
(t14 = 7.1, p,0.001).
We analyzed again whether color specific effects affected test
performance of bees. Two color distances were used for the
Pearson correlation analyses (those between 3N and 68N and
between 43N vs. 47N). A significant correlation between color
distance and correct choices for the CS+ was neither found for the
quinine group (COC: r = 20.3965, p = 0.33; hexagon: r = 0.3965,
p = 0.33) nor for the water group (COC: r = 0.3696, p = 0.37;
hexagon: r = 0.3696, p = 0.37). This result thus shows that no color
specific effects affected the bees’ performance. When the visual
discrimination that has to be achieved by freely-flying bees is
perceptually difficult, a highly concentrated quinine solution
(60 mM) facilitates discrimination acting as an effective negative
reinforcer.
Experiment 3: Possible mechanisms accounting for theaversive nature of quinine solution
The highly concentrated quinine solution could exert its
aversive effect via different physiological processes. Two plausible
options would locate the aversive effect either at the periphery, i.e.
at the level of gustatory receptors, or at a general internal,
physiological level. While the former option would consist in a
distasteful gustatory experience elicited by quinine solution, the
latter option would consist of a post-ingestional malaise induced by
the quinine solution, which would not necessarily taste bad to bees
but which would be toxic once ingested [25].
Aversive Reinforcement Improves Visual Learning
PLoS ONE | www.plosone.org 4 October 2010 | Volume 5 | Issue 10 | e15370

To determine the process by which quinine solution exerts its
aversive effect, we designed an experiment to compare the
quantities of quinine solution and water imbibed by bees in
similar experimental conditions. While gustatory aversion would
be consistent with bees imbibing significantly less quinine
solution than water, post-ingestional malaise would be consistent
with bees imbibing comparable volumes of water and quinine
solution. In the latter scenario, only after ingestion would bees
experience the malaise effect and thus the aversive nature of
quinine solution.
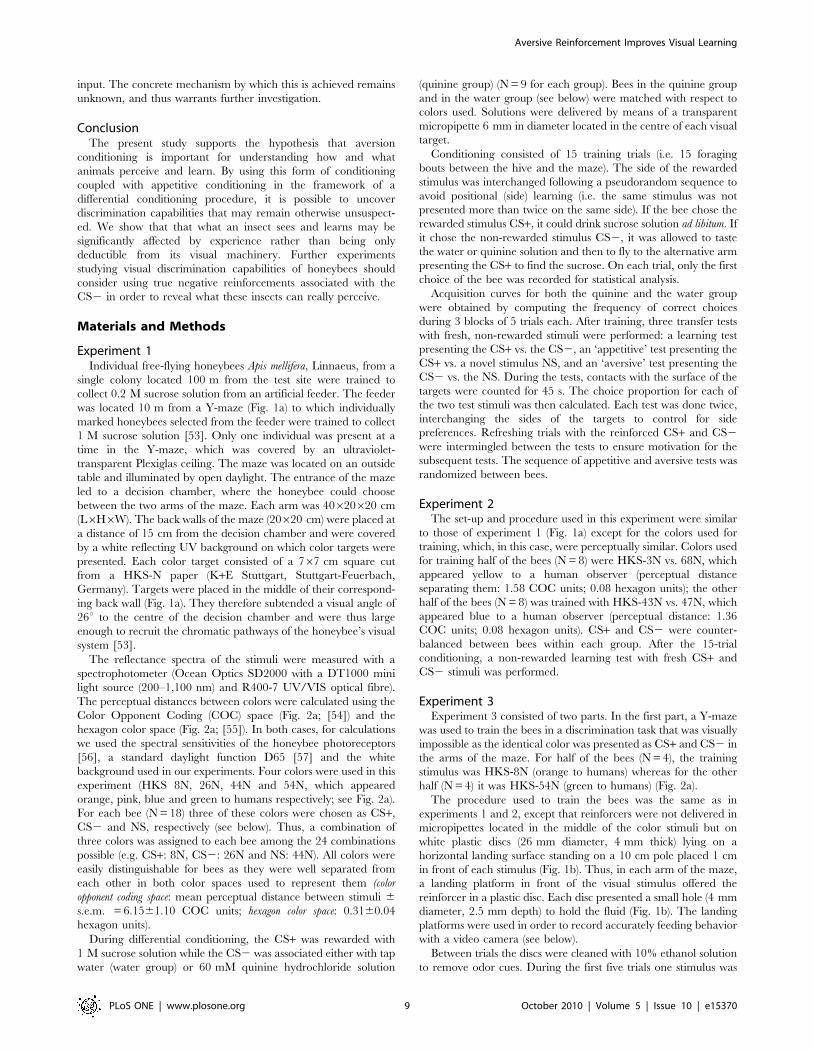
Figure 3. Results of Experiment 2: Does quinine improve visual discrimination of perceptually similar colors when used as negativereinforcer? (A) Plots of colored stimuli used in experiment 2 in a COC color space (left) and in a hexagon color space (right) for the trichromatic vision ofhoneybees. Distances between the two stimuli used for each bee are 1.5 COC units and 0.08 hexagon units for the ‘yellow’ group (3N vs. 68N) and 1.3COC units and 0.08 hexagon units for the ‘blue’ group (43N vs. 47N). Numbers refer to the HKS papers references. (B) Learning acquisition (% of correctchoices by blocks of 5 trials; means 6 s.e.m.; N = 8 for each curve). The curve with black dots represents acquisition by the quinine group (CS2 reinforcedwith quinine); the curve with white dots represents acquisition by the water group (CS2 reinforced with water). (C) Performance (means + s.e.m. ofcorrect choices; N = 8 for each bar) in non-rewarded learning test. The black bar represents the results of the quinine group; the white bar represents theresults of the water group. Only bees from the quinine group solved this difficult discrimination task (**: p,0.005; ***: p,0.001).doi:10.1371/journal.pone.0015370.g003
Aversive Reinforcement Improves Visual Learning
PLoS ONE | www.plosone.org 5 October 2010 | Volume 5 | Issue 10 | e15370

Bees were trained to collect sucrose solution in the Y-maze.
They faced an impossible task as the same visual stimulus was
presented in both arms of the maze during 15 trials. Half of the
bees were trained with HKS 8N (orange to humans) and the other
half with HKS 54N (green to humans). During the first 5 trials the
color chosen for training was rewarded with 35 mL of sucrose 1 M
(‘target’) whilst the same stimulus on the other side contained no
reinforcement (‘distractor’). After the first 5 trials, for one group of
bees the ‘distractor’ was associated with 35 mL of quinine solution
60 mM from trials 6 to 10 and with 35 mL of water from trials 11
to 15; for a second group of bees the sequence was inverted, so that
water was obtained on the distractor from trials 6 to 10 and
quinine solution from trials 11 to 15.
In order to estimate the volume imbibed by each bee, we
established a standard curve relating drinking duration (sec) and
volume of 1 M sucrose solution imbibed (mL). The relationship
between both variables was almost linear (0.7 mL/sec; Pearson
linear correlation analysis: r = 0.9997, p,0.001; N = 8 bees;
Fig. 4a), and is consistent with previous estimations obtained by
Nunez [26].
During the three blocks, bees made random choices between
the ‘target’ and the ‘distractor’, a result that was expected given
that the same stimulus was used for both categories. There was no
block effect (F2,12 = 2.7, p = 0.11), showing that irrespective of
‘distractor’ reinforcement (quinine, water or nothing), the
percentage of choices of the ‘target’ remained the same.
Furthermore, the sequence of presentation of negative reinforce-
ments (nothing, water and quinine vs. nothing, quinine and water;
see above) did not affect the percentage of choices of the ‘target’
(F1,6 = 0.6, p = 0.46). These results show that the sequence of
presentation of quinine and water did not affect performance. The
results also show that the different solutions were not remotely
detected by olfactory cues. A similar analysis was performed on the
time spent by bees drinking the negative reinforcer associated with
the ‘distractor’ (quinine or water). As the experiment included a
block of trials in which there was no reinforcer on the ‘distractor’,
drinking time values assigned to this block was zero in all cases. As
in the previous analysis, the sequence of presentation of negative
reinforcements (nothing, water and quinine vs. nothing, quinine
and water; see above) did not affect drinking time (F1,6 = 0.74,
p = 0.42). However, the block effect was significant (F2,12 = 59.4,
p,0.001), showing that drinking time varied with the type of
reinforcement provided. In fact, post hoc Tukey tests showed that
bees spent significantly less time drinking quinine than water
(mean of 5 trials: water: 1.760.3 sec; quinine: 0.760.2 sec;
p,0.001; see inset in Fig. 4a). This result shows that bees only
consumed very low volumes of quinine, if any. Indeed, such a
short time may be just enough for the bee to extend the proboscis
and taste the solution, and then reject it without significant
drinking. Hence drinking time values indicate that the aversive
effect of quinine was not determined by a post-ingestional malaise
but rather by a distasteful gustatory experience.
As the mean drinking times for quinine solution and water
correspond to theoretical volumes (0.7 mL and 1.7 mL) that are
below the initial point (2 mL) of our time-volume curve (see inset in
Fig. 4a), we performed an additional experiment to more precisely
quantify the imbibing activity of free-flying bees confronted with
16 drops of 1 and 2 mL of 1 M sucrose solution, water or highly
concentrated quinine solution (60 mM). Drops were randomly
placed on a Plexiglas sheet housed within box with a UV
transparent Plexiglas cover. During 6 visits to the setup, each
lasting 180 sec, we quantified for each substance the number of
drops that were consumed. In visits 1, 3 and 6, bees were
presented with 8 drops of sucrose and 8 of water while in visits 2, 4
and 5, they were presented with 8 drops of sucrose and 8 of
quinine solution.
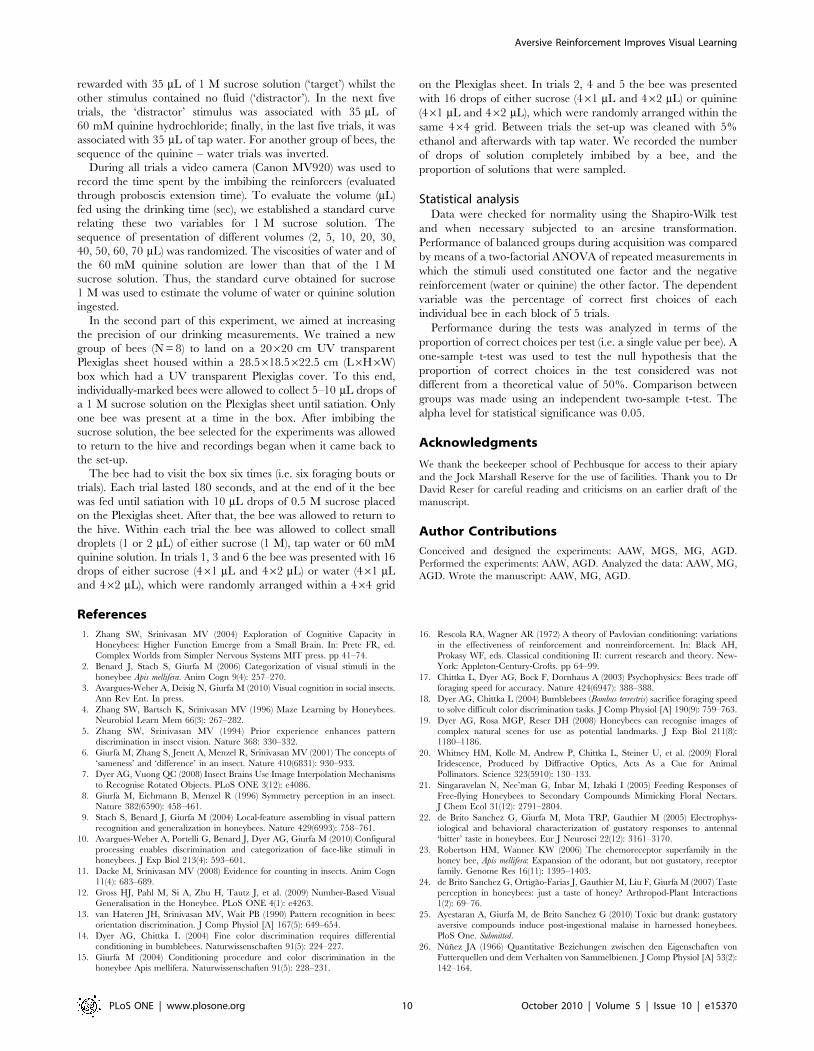
Figure 4. Results of Experiment 3: Possible mechanisms accounting for the aversive nature of quinine solution. (A) Standard curverelating drinking duration (s) and volume of 1 M sucrose solution imbibed (mL). These variables were linearly correlated (p,0.001). The arrows in insetshow the means of water (W) and quinine (Q) drinking duration (***: p,0.001). (B) Percentage of droplets (1 mL in black or 2 mL in white) of sucrose,quinine or water totally imbibed by bees when presented together on a plate. These data show that in a foraging context, free-flying honeybeesdon’t imbibe quinine but do imbibe water (*: p,0.05).doi:10.1371/journal.pone.0015370.g004
Aversive Reinforcement Improves Visual Learning
PLoS ONE | www.plosone.org 6 October 2010 | Volume 5 | Issue 10 | e15370

Figure 4b shows that bees imbibed nearly all presented sucrose
droplets (N = 8 bees, 96.961.7% of 1 mL droplets, 97.461.1% of
2 mL droplets), and a reasonable number of the water droplets
(36.563.5% of 1 mL droplets, 17.761.9% of 2 mL droplets).
However, they almost never imbibed the quinine droplets
(3.161.5% of 1 mL droplets, 0.060.0% of 2 mL droplets). Both
for the 1 mL and the 2 mL droplets, there was a significant
difference between the quantity of water and quinine droplets
imbibed (1 mL droplets: Wilcoxon sign ranks test; Z = 2.52,
p,0.05; 2 mL droplets: Z = 2.52, p,0.05).
One possibility for the very low frequency of bees imbibing
quinine could be that they used olfaction to detect and avoid
quinine droplets at a very close range, even if we showed that this
was not the case in the Y-maze experiment (see above). To test this
possibility the proportion of droplets tasted by bees (droplets for
which proboscis extension was observed) was evaluated (number of
droplets tasted/total number of droplets). The proportion of tasted
droplets was similar for each solution (98.760.5% of sucrose
droplets, 97.961.2% of water droplets and 97.960.9% of quinine
droplets). A similar result was obtained even if data from the first
trial were not taken into account to exclude presentation order
effects. Thus, consistent with the preceding experiment in the Y-
maze, bees showed no evidence of sensing the presence of quinine
prior to tasting it via their proboscis.
These data show that in a foraging context, free-flying
honeybees do not imbibe quinine, even on their first encounter,
which suggests an ability to taste quinine and to label it as an
aversive substance via a gustatory input. The aversive effect
induced by this substance in visual discrimination experiments
would be based on a distasteful gustatory experience rather than
on a post-ingestional malaise.
Discussion
The present work shows that visual discrimination by free-flying
bees is not an absolute phenomenon but a process that can be
modulated in a significant way by the nature of reinforcers
associated with the visual stimuli that have to be discriminated. In
our work we show that the presence of a highly concentrated
quinine solution (60 mM) acts as an aversive reinforcer promoting
rejection of the target associated with it, and improving
discrimination in perceptually difficult tasks (discrimination of
perceptually similar stimuli). We show that bees do not use remote
cues to detect the presence of the quinine solution and that the
aversive effect exerted by this substance, in the case of free-flying
bees, is mediated via a gustatory input, i.e. via a distasteful sensory
experience, rather than via a post-ingestional malaise.
Improving visual discrimination by means of a negativereinforcer
Colour discrimination was usually described as a fast form of
learning [27], compared, for instance, with learning of visual
patterns, which usually takes longer (twenty or more trials). Recent
studies on bumblebee and honeybee color and pattern learning
[14–15,28] have introduced a new view of visual learning by free-
flying bees, by showing that what the insects learn and
discriminate in a given visual task depends on the training
procedure which may or not inculcate the use of specific cues for
solving a discrimination problem. It was previously thought that
what an animal sees and visually learns is constrained by its
perceptual machinery with little or no place for experience-
dependent modulations of perception. The studies mentioned
above and our work show that this idea is wrong: in some cases,
learning a particular color may occur after few trials, but in other
cases with perceptually similar stimuli it may need many more
trials incorporating aversive conditioning.
Previous work has shown that bees [14–15] and ants [29]
exhibit different visual discrimination powers after absolute
conditioning (promoting less discrimination power) and differential
conditioning (promoting more discrimination power) of color
stimuli. Here we show that a negative reinforcer associated with a
distractor in differential conditioning significantly enhances visual
discrimination power. Visual discrimination in free-flying bees is
usually studied in protocols in which one target is rewarded with
concentrated sucrose solution (usually 1 M) and one or various
distractors are presented without any reinforcement. In the current
study when we associated the distractor with a highly concentrated
quinine solution, the discrimination of perceptually similar stimuli
was possible, while it was not when the distractor was associated
with water.
In the context of the hypothesis that differential conditioning to
color stimuli improves performance by recruiting attentional
processes [15], the difference in performance reported in our study
suggests that attentional processes are enhanced by the penalizing
effect of the aversive quinine solution. This may result in an
improvement of the bees’ discrimination performance, when
compared to a situation where the distractor penalty is low or non
existent. Thus our new finding is likely to be of value for testing the
hypothesis of attentional processes in insect brains [15]. In any
case, our results go against the idea that the difference between
two colors is an immutable property constrained by the visual
machinery of the honeybee. Rather, they indicate that aversive
reinforcements may modulate discrimination by acting on
attentional processes.
Previous work, mainly on vertebrate models, has shown that
pairing an aversive reinforcer with a distractor promotes an
increase of the appetitive associative strength of the rewarded
stimulus [16]. This interpretation is not mutually exclusive with
that provided above. In differential conditioning, experience with
a CS+ and a CS2 leads to the formation of an appetitive
(excitatory) and an aversive (inhibitory) memory trace, respective-
ly. Choice results from the interaction between these two traces so
that if the subjective intensity of one of the reinforcers, the
appetitive or the aversive, overcomes that of the alternative
reinforcer, choice would be biased towards the dominant CS. In
our study, although the appetitive reinforce (1 M sucrose)
remained constant on the CS+ for experiments, the presence of
quinine on the CS2 (distractor) may have enhanced the relative
value of the appetitive reinforcer, thus promoting not only
avoidance of the distractor, but also enhanced preference of the
target CS+.
Our findings have several important implications for research
on cognition using free-flying honeybees as a model. In conceptual
terms, they underline the necessity to study attentional processes in
the honeybee and to relate them to specific neural structures in the
bee brain. Moreover, they raise the fundamental question of the
real limits of the bees’ visual capacities. Several studies that have
reported negative results in terms of visual discrimination
capabilities in bees [30–31] may be missing the fact that bees
were not paying attention to the cues that they were supposed to
learn in a given task. Thus, before concluding that bees are not
capable of solving a certain visual discrimination, researchers
should address the critical question of whether their experimental
designs are able to push the cognitive capacities of bees to their
limits. The example provided by the perceptual similar pair of
colors in Fig. 3, which cannot be discriminated if the distractor is
paired with water but which can be distinguished if it is paired
with concentrated quinine solution underlines this point. Besides,
Aversive Reinforcement Improves Visual Learning
PLoS ONE | www.plosone.org 7 October 2010 | Volume 5 | Issue 10 | e15370

using such a more efficient training may allow a more robust
analysis of the cognitive mechanisms contributing to perception,
by decreasing the amount of training necessary to tackle specific
complex experimental questions. For example, recent studies
which had use quinine had been successful in using bees to study
processing of complex pictures such as human faces [7,10,32].
Interestingly, the enhancing effect of the aversive reinforcement
was not evident when stimuli were perceptually distinguishable
(Fig. 2). This lack of effect can be interpreted as the negative
reinforcement not being necessary to solve an easy problem, i.e.
performance without quinine already reached a high level of
correct choices (Fig. 2). An alternative, although not mutually
exclusive, explanation can be raised in term of speed-accuracy
trade-off. For the discrimination of large color distances (a simple
discrimination task) bees making relatively fast decisions easily
choose the correct color with a very low rate of error. Thus, even if
bees made decisions slower and more carefully when the cost of
making an error was increased by adding quinine, it didn’t
significantly change accuracy. For example, a significant differ-
ence in accuracy between fast and slow bumblebees was
consistently found only when colors were perceptually close
[18]. In this case, bumblebees were fast when they solved simple
tasks but when the task became more difficult some individuals
decreased the speed by which they chose, thus leading to an
increase of performance [18]. Such modulation of response time
based on the perceptual difficulty of the task is well-known in
humans [33]. Equivalent data are still missing for honeybees.
Moreover, there may be differences in visual processing between
different bee species [34]. Thus, measuring the time allocated for
decision making by free-flying honeybees confronted with tasks of
different difficulty may constitute an interesting research perspec-
tive for the future [35–36].
Quinine solution as a negative reinforcementThe concentrations of quinine used in our work are far from
being ecologically relevant, as they were highly concentrated. The
use of these highly concentrated solutions is justified by the fact
that we wanted to associate an intense negative experience with
the CS2 and that free-flying bees seem to be more tolerant than
humans to intermediate concentration levels of bitter substances
[37]. Deterrent secondary compounds such as alkaloids or
phenolic compounds are naturally present in nectar or pollen
flowers as a defense against herbivores, but their concentration
levels never reach those used in our experiments. It has even been
reported that at natural concentration levels in the nectar, these
substances may be neutral or even attractive for honeybees [21].
However, when bees have the choice between two nectars or
pollens, one with secondary compounds and another with less
secondary compounds, they usually prefer the latter [38–40].
Thus, the use of unnatural, higher concentrations allows
establishing an effective aversive reinforcement for our studies
and uncovering in this way the real visual discrimination abilities
of honeybees.
In concluding that the use of quinine improves learning
performance, we need to specify that the experimental conditions
in which quinine acts as a negative reinforcement are those
provided by our work, i.e., free-flying bees subjected to visual
discriminations. It therefore appears that the critical aspect of our
experimental procedure is the fact that honeybees could free move
and, more importantly, free express their avoidance of the quinine
solution as a negative reinforcer.
This aspect may explain apparent contradictory results on the
effect of substances like quinine on the behavior of bees in the
laboratory (see [24] for review). In the laboratory, contrary to
the experimental results described above, bees are harnessed in
individual metal tubes, which is the common procedure to test
their sucrose responsiveness and/or learning in olfactory condi-
tioning using the proboscis extension reflex (see [41] for review). In
these experimental conditions, harnessed bees do not show an
aversion for even higher concentrations of quinine solution than
that used in the current study [22,25]. The same lack of aversion
applied to a variety of substances that also taste extremely bitter to
humans (salicine, amygdalin, caffeine, etc.) [22,25]. Furthermore,
harnessed bees imbibe large amounts (20 mL, one third of their
crop capacity) of aversive solutions, including quinine solution,
even if the imbibed solutions turn to be toxic and induce post-
ingestional mortality [25]. In the case of studies on honeybee
gustation in the laboratory (harnessed bees), recent results have
suggested that the main effect produced by bitter substances is not
a distasteful gustatory one, as suggested in our case, but rather a
post-ingestional one, given that in all cases bees drank the aversive
compounds without reluctance [25]. This difference with the
current study may be due to the fact that in both experimental
contexts, the capacity to express an active avoidance of the
aversive reinforcement varies dramatically. When bees are in
contention, the impossibility of movement may induce important
changes in acceptance or rejection thresholds for gustatory
compounds, making the bees more tolerant to substances that
they would otherwise reject, even at the cost of their own death.
This hypothesis is plausible given that harnessed and free-flying
bees exhibit striking differences in performances of other tasks such
as color learning and discrimination. Experiments with free-flying
bees have shown that the Dl discrimination function (i.e. the
function accounting for the bees’ wavelength discrimination along
their visual spectrum) varies depending on the region of the
spectrum. It reaches extremely fine discrimination values of
4.5 nm for wavelengths at the intersection of photoreceptor
sensitivity curves [42]. On the contrary, harnessed bees in the
laboratory, which can be trained to associate a color with sucrose
reward and which extend their proboscis to the learned color [43],
have difficulties in learning this association and show very poor
color discrimination abilities [44]. This difference may be
motivational, as to learn colors in harnessed conditions it is
necessary to cut the bees’ antennae [43,45]. This procedure
substantially decreases the subjective value of sucrose as a reward
[46], thus impairing learning. Therefore our data confirm that
studying free-flying bees remains essential to approach the natural
behavior and learning capabilities of this animal as a model for
neuroscience.
Whilst our study shows that honeybees do have an ability to
detect quinine solution, the physiological mechanisms by which
they do this are still unclear. Our results support a peripheral
detection via gustatory receptors (see Experiment 3), but so far,
bitter receptors have not been found in electrophysiological
experiments [22] nor in genomic analyses comparing honeybee
gustatory receptor genes with those of the fruit fly Drosophila
melanogaster. In the fruit fly, 68 gustatory receptor genes have been
identified [47–50]. Two of these genes have been associated with
bitter taste as they both respond to caffeine and are coexpressed in
the same gustatory receptor neurons [51–52]. In the honeybee, the
picture seems to be drastically different: only ten gustatory
receptor genes were found [23] suggesting that the gustatory
world of a bee might be considered as relatively poor. Among
these receptors, two are similar to the trehalose (‘sweet’) receptor of
flies, but none is similar to their ‘bitter’ receptors. In our
experiments, the bees extended the proboscis before being repelled
by the quinine solution, which leads us to hypothesise that they
detect the presence of the aversive quinine solution via a gustatory
Aversive Reinforcement Improves Visual Learning
PLoS ONE | www.plosone.org 8 October 2010 | Volume 5 | Issue 10 | e15370
input. The concrete mechanism by which this is achieved remains
unknown, and thus warrants further investigation.
ConclusionThe present study supports the hypothesis that aversion
conditioning is important for understanding how and what
animals perceive and learn. By using this form of conditioning
coupled with appetitive conditioning in the framework of a
differential conditioning procedure, it is possible to uncover
discrimination capabilities that may remain otherwise unsuspect-
ed. We show that that what an insect sees and learns may be
significantly affected by experience rather than being only
deductible from its visual machinery. Further experiments
studying visual discrimination capabilities of honeybees should
consider using true negative reinforcements associated with the
CS2 in order to reveal what these insects can really perceive.
Materials and Methods
Experiment 1Individual free-flying honeybees Apis mellifera, Linnaeus, from a
single colony located 100 m from the test site were trained to
collect 0.2 M sucrose solution from an artificial feeder. The feeder
was located 10 m from a Y-maze (Fig. 1a) to which individually
marked honeybees selected from the feeder were trained to collect
1 M sucrose solution [53]. Only one individual was present at a
time in the Y-maze, which was covered by an ultraviolet-
transparent Plexiglas ceiling. The maze was located on an outside
table and illuminated by open daylight. The entrance of the maze
led to a decision chamber, where the honeybee could choose
between the two arms of the maze. Each arm was 40620620 cm
(L6H6W). The back walls of the maze (20620 cm) were placed at
a distance of 15 cm from the decision chamber and were covered
by a white reflecting UV background on which color targets were
presented. Each color target consisted of a 767 cm square cut
from a HKS-N paper (K+E Stuttgart, Stuttgart-Feuerbach,
Germany). Targets were placed in the middle of their correspond-
ing back wall (Fig. 1a). They therefore subtended a visual angle of
26u to the centre of the decision chamber and were thus large
enough to recruit the chromatic pathways of the honeybee’s visual
system [53].
The reflectance spectra of the stimuli were measured with a
spectrophotometer (Ocean Optics SD2000 with a DT1000 mini
light source (200–1,100 nm) and R400-7 UV/VIS optical fibre).
The perceptual distances between colors were calculated using the
Color Opponent Coding (COC) space (Fig. 2a; [54]) and the
hexagon color space (Fig. 2a; [55]). In both cases, for calculations
we used the spectral sensitivities of the honeybee photoreceptors
[56], a standard daylight function D65 [57] and the white
background used in our experiments. Four colors were used in this
experiment (HKS 8N, 26N, 44N and 54N, which appeared
orange, pink, blue and green to humans respectively; see Fig. 2a).
For each bee (N = 18) three of these colors were chosen as CS+,
CS2 and NS, respectively (see below). Thus, a combination of
three colors was assigned to each bee among the 24 combinations
possible (e.g. CS+: 8N, CS2: 26N and NS: 44N). All colors were
easily distinguishable for bees as they were well separated from
each other in both color spaces used to represent them (color
opponent coding space: mean perceptual distance between stimuli 6
s.e.m. = 6.1561.10 COC units; hexagon color space: 0.3160.04
hexagon units).
During differential conditioning, the CS+ was rewarded with
1 M sucrose solution while the CS2 was associated either with tap
water (water group) or 60 mM quinine hydrochloride solution
(quinine group) (N = 9 for each group). Bees in the quinine group
and in the water group (see below) were matched with respect to
colors used. Solutions were delivered by means of a transparent
micropipette 6 mm in diameter located in the centre of each visual
target.
Conditioning consisted of 15 training trials (i.e. 15 foraging
bouts between the hive and the maze). The side of the rewarded
stimulus was interchanged following a pseudorandom sequence to
avoid positional (side) learning (i.e. the same stimulus was not
presented more than twice on the same side). If the bee chose the
rewarded stimulus CS+, it could drink sucrose solution ad libitum. If
it chose the non-rewarded stimulus CS2, it was allowed to taste
the water or quinine solution and then to fly to the alternative arm
presenting the CS+ to find the sucrose. On each trial, only the first
choice of the bee was recorded for statistical analysis.
Acquisition curves for both the quinine and the water group
were obtained by computing the frequency of correct choices
during 3 blocks of 5 trials each. After training, three transfer tests
with fresh, non-rewarded stimuli were performed: a learning test
presenting the CS+ vs. the CS2, an ‘appetitive’ test presenting the
CS+ vs. a novel stimulus NS, and an ‘aversive’ test presenting the
CS2 vs. the NS. During the tests, contacts with the surface of the
targets were counted for 45 s. The choice proportion for each of
the two test stimuli was then calculated. Each test was done twice,
interchanging the sides of the targets to control for side
preferences. Refreshing trials with the reinforced CS+ and CS2
were intermingled between the tests to ensure motivation for the
subsequent tests. The sequence of appetitive and aversive tests was
randomized between bees.
Experiment 2The set-up and procedure used in this experiment were similar
to those of experiment 1 (Fig. 1a) except for the colors used for
training, which, in this case, were perceptually similar. Colors used
for training half of the bees (N = 8) were HKS-3N vs. 68N, which
appeared yellow to a human observer (perceptual distance
separating them: 1.58 COC units; 0.08 hexagon units); the other
half of the bees (N = 8) was trained with HKS-43N vs. 47N, which
appeared blue to a human observer (perceptual distance: 1.36
COC units; 0.08 hexagon units). CS+ and CS2 were counter-
balanced between bees within each group. After the 15-trial
conditioning, a non-rewarded learning test with fresh CS+ and
CS2 stimuli was performed.
Experiment 3Experiment 3 consisted of two parts. In the first part, a Y-maze
was used to train the bees in a discrimination task that was visually
impossible as the identical color was presented as CS+ and CS2 in
the arms of the maze. For half of the bees (N = 4), the training
stimulus was HKS-8N (orange to humans) whereas for the other
half (N = 4) it was HKS-54N (green to humans) (Fig. 2a).
The procedure used to train the bees was the same as in
experiments 1 and 2, except that reinforcers were not delivered in
micropipettes located in the middle of the color stimuli but on
white plastic discs (26 mm diameter, 4 mm thick) lying on a
horizontal landing surface standing on a 10 cm pole placed 1 cm
in front of each stimulus (Fig. 1b). Thus, in each arm of the maze,
a landing platform in front of the visual stimulus offered the
reinforcer in a plastic disc. Each disc presented a small hole (4 mm
diameter, 2.5 mm depth) to hold the fluid (Fig. 1b). The landing
platforms were used in order to record accurately feeding behavior
with a video camera (see below).
Between trials the discs were cleaned with 10% ethanol solution
to remove odor cues. During the first five trials one stimulus was
Aversive Reinforcement Improves Visual Learning
PLoS ONE | www.plosone.org 9 October 2010 | Volume 5 | Issue 10 | e15370
rewarded with 35 mL of 1 M sucrose solution (‘target’) whilst the
other stimulus contained no fluid (‘distractor’). In the next five
trials, the ‘distractor’ stimulus was associated with 35 mL of
60 mM quinine hydrochloride; finally, in the last five trials, it was
associated with 35 mL of tap water. For another group of bees, the
sequence of the quinine – water trials was inverted.
During all trials a video camera (Canon MV920) was used to
record the time spent by the imbibing the reinforcers (evaluated
through proboscis extension time). To evaluate the volume (mL)
fed using the drinking time (sec), we established a standard curve
relating these two variables for 1 M sucrose solution. The
sequence of presentation of different volumes (2, 5, 10, 20, 30,
40, 50, 60, 70 mL) was randomized. The viscosities of water and of
the 60 mM quinine solution are lower than that of the 1 M
sucrose solution. Thus, the standard curve obtained for sucrose
1 M was used to estimate the volume of water or quinine solution
ingested.
In the second part of this experiment, we aimed at increasing
the precision of our drinking measurements. We trained a new
group of bees (N = 8) to land on a 20620 cm UV transparent
Plexiglas sheet housed within a 28.5618.5622.5 cm (L6H6W)
box which had a UV transparent Plexiglas cover. To this end,
individually-marked bees were allowed to collect 5–10 mL drops of
a 1 M sucrose solution on the Plexiglas sheet until satiation. Only
one bee was present at a time in the box. After imbibing the
sucrose solution, the bee selected for the experiments was allowed
to return to the hive and recordings began when it came back to
the set-up.
The bee had to visit the box six times (i.e. six foraging bouts or
trials). Each trial lasted 180 seconds, and at the end of it the bee
was fed until satiation with 10 mL drops of 0.5 M sucrose placed
on the Plexiglas sheet. After that, the bee was allowed to return to
the hive. Within each trial the bee was allowed to collect small
droplets (1 or 2 mL) of either sucrose (1 M), tap water or 60 mM
quinine solution. In trials 1, 3 and 6 the bee was presented with 16
drops of either sucrose (461 mL and 462 mL) or water (461 mL
and 462 mL), which were randomly arranged within a 464 grid
on the Plexiglas sheet. In trials 2, 4 and 5 the bee was presented
with 16 drops of either sucrose (461 mL and 462 mL) or quinine
(461 mL and 462 mL), which were randomly arranged within the
same 464 grid. Between trials the set-up was cleaned with 5%
ethanol and afterwards with tap water. We recorded the number
of drops of solution completely imbibed by a bee, and the
proportion of solutions that were sampled.
Statistical analysisData were checked for normality using the Shapiro-Wilk test
and when necessary subjected to an arcsine transformation.
Performance of balanced groups during acquisition was compared
by means of a two-factorial ANOVA of repeated measurements in
which the stimuli used constituted one factor and the negative
reinforcement (water or quinine) the other factor. The dependent
variable was the percentage of correct first choices of each
individual bee in each block of 5 trials.
Performance during the tests was analyzed in terms of the
proportion of correct choices per test (i.e. a single value per bee). A
one-sample t-test was used to test the null hypothesis that the
proportion of correct choices in the test considered was not
different from a theoretical value of 50%. Comparison between
groups was made using an independent two-sample t-test. The
alpha level for statistical significance was 0.05.
Acknowledgments
We thank the beekeeper school of Pechbusque for access to their apiary
and the Jock Marshall Reserve for the use of facilities. Thank you to Dr
David Reser for careful reading and criticisms on an earlier draft of the
manuscript.
Author Contributions
Conceived and designed the experiments: AAW, MGS, MG, AGD.
Performed the experiments: AAW, AGD. Analyzed the data: AAW, MG,
AGD. Wrote the manuscript: AAW, MG, AGD.
References
1. Zhang SW, Srinivasan MV (2004) Exploration of Cognitive Capacity inHoneybees: Higher Function Emerge from a Small Brain. In: Prete FR, ed.
Complex Worlds from Simpler Nervous Systems MIT press. pp 41–74.
2. Benard J, Stach S, Giurfa M (2006) Categorization of visual stimuli in the
honeybee Apis mellifera. Anim Cogn 9(4): 257–270.
3. Avargues-Weber A, Deisig N, Giurfa M (2010) Visual cognition in social insects.
Ann Rev Ent. In press.
4. Zhang SW, Bartsch K, Srinivasan MV (1996) Maze Learning by Honeybees.
Neurobiol Learn Mem 66(3): 267–282.
5. Zhang SW, Srinivasan MV (1994) Prior experience enhances pattern
discrimination in insect vision. Nature 368: 330–332.
6. Giurfa M, Zhang S, Jenett A, Menzel R, Srinivasan MV (2001) The concepts of
‘sameness’ and ‘difference’ in an insect. Nature 410(6831): 930–933.
7. Dyer AG, Vuong QC (2008) Insect Brains Use Image Interpolation Mechanisms
to Recognise Rotated Objects. PLoS ONE 3(12): e4086.
8. Giurfa M, Eichmann B, Menzel R (1996) Symmetry perception in an insect.
Nature 382(6590): 458–461.
9. Stach S, Benard J, Giurfa M (2004) Local-feature assembling in visual pattern
recognition and generalization in honeybees. Nature 429(6993): 758–761.
10. Avargues-Weber A, Portelli G, Benard J, Dyer AG, Giurfa M (2010) Configural
processing enables discrimination and categorization of face-like stimuli inhoneybees. J Exp Biol 213(4): 593–601.
11. Dacke M, Srinivasan MV (2008) Evidence for counting in insects. Anim Cogn11(4): 683–689.
12. Gross HJ, Pahl M, Si A, Zhu H, Tautz J, et al. (2009) Number-Based VisualGeneralisation in the Honeybee. PLoS ONE 4(1): e4263.
13. van Hateren JH, Srinivasan MV, Wait PB (1990) Pattern recognition in bees:orientation discrimination. J Comp Physiol [A] 167(5): 649–654.
14. Dyer AG, Chittka L (2004) Fine color discrimination requires differentialconditioning in bumblebees. Naturwissenschaften 91(5): 224–227.
15. Giurfa M (2004) Conditioning procedure and color discrimination in thehoneybee Apis mellifera. Naturwissenschaften 91(5): 228–231.
16. Rescola RA, Wagner AR (1972) A theory of Pavlovian conditioning: variations
in the effectiveness of reinforcement and nonreinforcement. In: Black AH,
Prokasy WF, eds. Classical conditioning II: current research and theory. New-York: Appleton-Century-Crofts. pp 64–99.
17. Chittka L, Dyer AG, Bock F, Dornhaus A (2003) Psychophysics: Bees trade offforaging speed for accuracy. Nature 424(6947): 388–388.
18. Dyer AG, Chittka L (2004) Bumblebees (Bombus terrestris) sacrifice foraging speed
to solve difficult color discrimination tasks. J Comp Physiol [A] 190(9): 759–763.
19. Dyer AG, Rosa MGP, Reser DH (2008) Honeybees can recognise images of
complex natural scenes for use as potential landmarks. J Exp Biol 211(8):1180–1186.
20. Whitney HM, Kolle M, Andrew P, Chittka L, Steiner U, et al. (2009) FloralIridescence, Produced by Diffractive Optics, Acts As a Cue for Animal
Pollinators. Science 323(5910): 130–133.
21. Singaravelan N, Nee’man G, Inbar M, Izhaki I (2005) Feeding Responses of
Free-flying Honeybees to Secondary Compounds Mimicking Floral Nectars.J Chem Ecol 31(12): 2791–2804.
22. de Brito Sanchez G, Giurfa M, Mota TRP, Gauthier M (2005) Electrophys-iological and behavioral characterization of gustatory responses to antennal
‘bitter’ taste in honeybees. Eur J Neurosci 22(12): 3161–3170.
23. Robertson HM, Wanner KW (2006) The chemoreceptor superfamily in the
honey bee, Apis mellifera: Expansion of the odorant, but not gustatory, receptorfamily. Genome Res 16(11): 1395–1403.
24. de Brito Sanchez G, Ortigao-Farias J, Gauthier M, Liu F, Giurfa M (2007) Taste
perception in honeybees: just a taste of honey? Arthropod-Plant Interactions
1(2): 69–76.
25. Ayestaran A, Giurfa M, de Brito Sanchez G (2010) Toxic but drank: gustatoryaversive compounds induce post-ingestional malaise in harnessed honeybees.
PloS One. Submitted.
26. Nunez JA (1966) Quantitative Beziehungen zwischen den Eigenschaften von
Futterquellen und dem Verhalten von Sammelbienen. J Comp Physiol [A] 53(2):
142–164.
Aversive Reinforcement Improves Visual Learning
PLoS ONE | www.plosone.org 10 October 2010 | Volume 5 | Issue 10 | e15370

27. Menzel R (1985) Color pathways and color vision in the honeybee In: Ottoson D,
Zeki S, eds. Central and peripheral mechanisms of color vision. London:MacMillan Press. pp 211–233.
28. Giurfa M, Hammer M, Stach S, Stollhoff N, Muller-Deisig N, et al. (1999)
Pattern learning by honeybees: conditioning procedure and recognition strategy.Anim Behav 57(2): 315–324.
29. Camlitepe Y, Aksoy V (2010) First evidence of fine color discrimination ability inants (Hymenoptera, Formicidae). J Exp Biol 213(1): 72–77.
30. Horridge A (2009) Generalization in visual recognition by the honeybee (Apis
mellifera): A review and explanation. J Insect Physiol 55(6): 499–511.31. Horridge A (2009) What does an insect see? J Exp Biol 212(17): 2721–2729.
32. Dyer AG, Neumeyer C, Chittka L (2005) Honeybee (Apis mellifera) vision candiscriminate between and recognise images of human faces. J Exp Biol 208(24):
4709–4714.33. Rival C, Olivier I, Ceyte H (2003) Effects of temporal and/or spatial instructions
on the speed-accuracy trade-off of pointing movements in children. Neurosci
Lett 336(1): 65–69.34. Dyer AG, Spaethe J, Prack S (2008) Comparative psychophysics of bumblebee
and honeybee color discrimination and object detection. J Comp Physiol [A]194(7): 617–627.
35. Burns JG, Dyer AG (2008) Diversity of speed-accuracy strategies benefits social
insects. Curr Biol 18(20): R953–R954.36. Chittka L, Skorupski P, Raine NE (2009) Speed-accuracy tradeoffs in animal
decision making. Trends Ecol Evol 24(7): 400–407.37. von Frisch K (1967) The dance language and orientation of bees. Cambridge,
Massachusets: the Belknap press of Harvard University Press.38. Liu FL, Zhang XW, Chai JP, Yang DR (2006) Pollen phenolics and regulation
of pollen foraging in honeybee colony. Behavi Ecol Sociobiol 59(4): 582–588.
39. Gegear RJ, Manson JS, Thomson JD (2007) Ecological context influencespollinator deterrence by alkaloids in floral nectar. Ecol Lett 10(5): 375–382.
40. Johnson SD, Hargreaves AL, Brown M (2006) Dark, bitter-tasting nectarfunctions as a filter of flower visitors in a bird-pollinated plant. Ecology 87(11):
2709–2716.
41. Giurfa M (2007) Behavioral and neural analysis of associative learning in thehoneybee: a taste from the magic well. J Comp Physiol 193(8): 801–824.
42. Helversen O (1972) Zur spektralen Unterschiedsempfindlichkeit der Honig-biene. J Comp Physiol [A] 80(4): 439–472.
43. Hori S, Takeuchi H, Arikawa K, Kinoshita M, Ichikawa N, et al. (2006)Associative visual learning, color discrimination, and chromatic adaptation in
the harnessed honeybee Apis mellifera L. J Comp Physiol [A] 192(7): 691–700.
44. Niggebrugge C, Leboulle G, Menzel R, Komischke B, de Ibarra NH (2009) Fast
learning but coarse discrimination of colors in restrained honeybees. J Exp Biol
212(9): 1344–1350.
45. Hori S, Takeuchi H, Kubo T (2007) Associative learning and discrimination of
motion cues in the harnessed honeybee Apis mellifera L. J Comp Physiol 193:
825–833.
46. de Brito Sanchez M, Chen C, Li J, Liu F, Gauthier M, et al. (2008) Behavioral
studies on tarsal gustation in honeybees: sucrose responsiveness and sucrose-
mediated olfactory conditioning. J Comp Physiol [A] 194(10): 861–869.
47. Dunipace L, Meister S, McNealy C, Amrein H (2001) Spatially restricted
expression of candidate taste receptors in the Drosophila gustatory system. Curr
Biol 11(11): 822–835.
48. Scott K, Brady R, Cravchik A, Morozov P, Rzhetsky A, et al. (2001) A
Chemosensory Gene Family Encoding Candidate Gustatory and Olfactory
Receptors in Drosophila. Cell 104(5): 661–673.
49. Robertson HM, Warr CG, Carlson JR (2003) Molecular evolution of the insect
chemoreceptor gene superfamily in Drosophila melanogaster. Proc Natl Acad Sci
USA 100: 14537–14542.
50. Scott K (2005) Taste Recognition: Food for Thought. Neuron 48(3): 455–464.
51. Marella S, Fischler W, Kong P, Asgarian S, Rueckert E, et al. (2006) Imaging
Taste Responses in the Fly Brain Reveals a Functional Map of Taste Category
and Behavior. Neuron 49(2): 285–295.
52. Moon SJ, Kottgen M, Jiao Y, Xu H, Montell C (2006) A Taste Receptor
Required for the Caffeine Response In Vivo. Curr Biol 16(18): 1812–1817.
53. Giurfa M, Vorobyev M, Kevan P, Menzel R (1996) Detection of colored stimuli
by honeybees: minimum visual angles and receptor specific contrasts. J Comp
Physiol [A] 178(5): 699–709.
54. Backhaus W (1991) Color opponent coding in the visual system of the honeybee.
Vision Research 31(7–8): 1381–1397.
55. Chittka L (1992) The color hexagon: a chromaticity diagram based on
photoreceptor excitations as a generalized representation of color opponency.
J Comp Physiol [A] 170(5): 533–543.
56. Peitsch D, Fietz A, Hertel H, Souza J, Ventura DF, et al. (1992) The spectral
input systems of hymenopteran insects and their receptor-based color vision.
J Comp Physiol [A] 170(1): 23–40.
57. Judd DB, MacAdam DL, Wyszecki G (1964) Spectral distribution of typical
daylight as a function of correlated color temperature. J Opt Soc Am 54(8):
1031.
Aversive Reinforcement Improves Visual Learning
PLoS ONE | www.plosone.org 11 October 2010 | Volume 5 | Issue 10 | e15370