Available rotation capacity of wide-flange beams and beam-columns Part 1. Theoretical approaches
26
ELSEVIER J. Construct. Steel Res. Vol. 43, Nos.1-3,pp. 219-244, 1997 © 1997 Elsevier Science Ltd.All fights reserved Printed in Great Britain Pn: S0143-974X(97)00045-X 0143-974X/97 $17.00 + 0.00 Available Rotation Capacity of Wide-Flange Beams and Beam-Columns Part 2. Experimental and Numerical Tests Victor Gioncu a & Dana Petcu b apolitechnica University Timi~oara, Timi§oara, Romania OWest University Timi~oara, Timi~oara, Romania ABSTRACT In the first part of the paper, the theoretical approaches for determining the available rotation capacity of wide-flange steel beams and beam-columns are presented. Using a plastic mechanism, the computer program DUCTROT 96 is elaborated to determine this rotation capacity. The present paper is engaged with a comparison between the experimental data and theoretical results (using FEM) and remarks on the numerical tests obtained using the DUCTROT 96 computer program. A systematic study of the influence of the main factors on the rotation capacity is presented. The major conclusion of this study is the proposal to change the concept of cross-section behavioural classes, used in codes for determining the rotation capacity, with the concept of member behavioural classes. © 1997 Elsevier Science Ltd. 1 INTRODUCTION In the companion paper [1] the available rotation capacity of wide-flange beams and beam-columns is determined based on using a local plastic mech- anism, composed of plastic zones and yield lines. A computer program DUC- TROT 96 (DUCTility of ROTation) was elaborated at INCERC Timi~oara by Petcu and Gioncu [2]. The analysis takes into account the main factors influ- encing the available rotation capacity: material properties, member dimen- sions, interaction between flanges and web, moment variation, etc. Nevertheless, a very important question has to be formulated: how realistic are such analyses? In order to obtain answers to this question, experimental investigations play an essential role. In the present paper a comparison between the theoretical results obtained using the DUCTROT 96 computer program and the experimental tests related 219
Transcript of Available rotation capacity of wide-flange beams and beam-columns Part 1. Theoretical approaches

ELSEVIER
J. Construct. Steel Res. Vol. 43, Nos. 1-3, pp. 219-244, 1997 © 1997 Elsevier Science Ltd. All fights reserved
Printed in Great Britain Pn: S0143-974X(97)00045-X 0143-974X/97 $17.00 + 0.00
Available Rotation Capacity of Wide-Flange Beams and Beam-Columns
Part 2. Experimental and Numerical Tests
Victor Gioncu a & Dana Petcu b
apolitechnica University Timi~oara, Timi§oara, Romania OWest University Timi~oara, Timi~oara, Romania
ABSTRACT
In the first part of the paper, the theoretical approaches for determining the available rotation capacity of wide-flange steel beams and beam-columns are presented. Using a plastic mechanism, the computer program DUCTROT 96 is elaborated to determine this rotation capacity. The present paper is engaged with a comparison between the experimental data and theoretical results (using FEM) and remarks on the numerical tests obtained using the DUCTROT 96 computer program. A systematic study of the influence of the main factors on the rotation capacity is presented. The major conclusion of this study is the proposal to change the concept of cross-section behavioural classes, used in codes for determining the rotation capacity, with the concept of member behavioural classes. © 1997 Elsevier Science Ltd.
1 INTRODUCTION
In the companion paper [1] the available rotation capacity of wide-flange beams and beam-columns is determined based on using a local plastic mech- anism, composed of plastic zones and yield lines. A computer program DUC- TROT 96 (DUCTility of ROTation) was elaborated at INCERC Timi~oara by Petcu and Gioncu [2]. The analysis takes into account the main factors influ- encing the available rotation capacity: material properties, member dimen- sions, interaction between flanges and web, moment variation, etc.
Nevertheless, a very important question has to be formulated: how realistic are such analyses? In order to obtain answers to this question, experimental investigations play an essential role.
In the present paper a comparison between the theoretical results obtained using the DUCTROT 96 computer program and the experimental tests related
219
220 V. Gioncu and D. Petcu
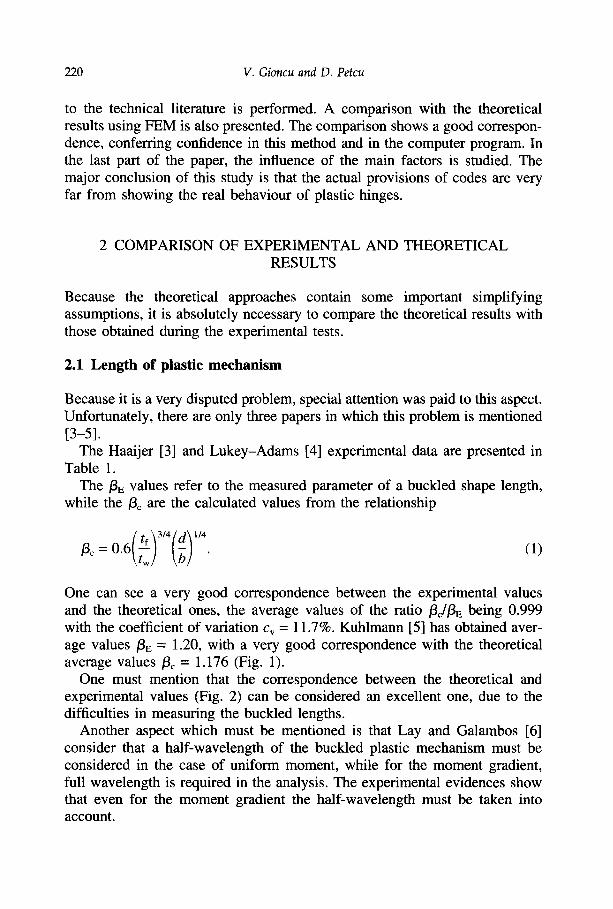
to the technical literature is performed. A comparison with the theoretical results using FEM is also presented. The comparison shows a good correspon- dence, conferring confidence in this method and in the computer program. In the last part of the paper, the influence of the main factors is studied. The major conclusion of this study is that the actual provisions of codes are very far from showing the real behaviour of plastic hinges.
2 COMPARISON OF EXPERIMENTAL AND THEORETICAL RESULTS
Because the theoretical approaches contain some important simplifying assumptions, it is absolutely necessary to compare the theoretical results with those obtained during the experimental tests.
2.1 Length of plastic mechanism
Because it is a very disputed problem, special attention was paid to this aspect. Unfortunately, there are only three papers in which this problem is mentioned [3-5].
The Haaijer [3] and Lukey-Adams [4] experimental data are presented in Table 1.
The /3 E values refer to the measured parameter of a buckled shape length, while the/3c are the calculated values from the relationship
0 6( tf/3/4(d/TM ~ c = " \ t w / \ b / "
(1)
One can see a very good correspondence between the experimental values and the theoretical ones, the average values of the ratio 13c//3~ being 0.999 with the coefficient of variation cv = 11.7%. Kuhlmann [5] has obtained aver- age values /3E = 1.20, with a very good correspondence with the theoretical average values/3c = 1.176 (Fig. 1).
One must mention that the correspondence between the theoretical and experimental values (Fig. 2) can be considered an excellent one, due to the difficulties in measuring the buckled lengths.
Another aspect which must be mentioned is that Lay and Galambos [6] consider that a half-wavelength of the buckled plastic mechanism must be considered in the case of uniform moment, while for the moment gradient, full wavelength is required in the analysis. The experimental evidences show that even for the moment gradient the half-wavelength must be taken into account.

Rotation capacity of beams and beam-columns, part 2
T A B L E 1
Length of Buckled Shape
221
No. Source b (ram) d ty tw fie tic (~dfle)
0 1
2 3 4 5 6 7 8 9 10 11 12 13 14 15 16 17
1
Haaijer
Lukey and
Adams
2 3 4 5 6 7 8 101.00 227.00 10.90 7.47 1.2 0.975 0.813 83.19 184.07 9.73 5.99 1.0 1.053 1.053
101.85 225.00 13.00 8.33 1.1 1.021 0.928 102.62 182.22 12.09 7.82 1.0 0.960 0.960 73.28 234.75 8.08 5.89 1.2 1.080 0.900
101.75 235.1 10.80 7.65 1.04 0.958 0.919 88.0 235.1 10.80 7.65 1.10 0.981 0.894 51.3 191.3 5.28 4.45 0.89 0.948 1.095 36.95 191.3 5.28 4.45 1.03 1.029 0.998 43.05 191.3 5.28 4.45 0.91 0.990 1.088 47.0 191.3 5.28 4.45 0.95 0.969 1.020 48.40 191.3 5.26 4.45 0.8t 0.959 1.184 50.95 241.2 5.26 4.60 0.82 0.979 1.194 36.85 241.2 5.26 4.60 0.93 1.061 1.141 42.95 241.2 5.26 4.60 1.04 1.021 0.982 46.75 241.2 5.26 4.60 0.95 1.00 1.053 44.95 241.2 5.26 4.60 1.30 1.01 0.777
average value 0.999 standard deviation 11.71%
coefficient of variation Cv 0.117
P 1.4
1.2
1.0
0.8
0.6
0.4
0.2
÷
4" + +
1.2 mean of experimental values
+ + + + + .~ . . L . . L
+ 4" 1.176 mean of theoretical values
+theoretical values for Kuhlmann experimental test
' ' ' 6 '~ 8 ' '0 . . . . ' ' ' 8 ' 2 t 2 2 ' ' - 2 4 1 12 14 16 1 0 24 test number
Fig. 1. Length of plastic mechanism for Kuhlmann experimental tests.

222 V. Gioncu and D. Petcu
1.2
1.0
0.8
0.6
0.4
.S / , I
I x I I
equal i ty I I + Lucky & Adams I X Haai jer I I
I I I
018. i i i I i • . 1 . 0 1 . 2 bE
Fig. 2. Correlation theoretical-experimental values for length of plastic mechanism.
2.2 Rotat ion capaci ty
Generally, the scatter area for this type of problem is very large. For the stability problems, this is due to the influence of residual stresses and out-of- straightness. Nakashima [7] shows that in the ductility analysis, neither aspect has a major influence. In exchange, the scatter area is due to the significant influence of hardening characteristics, which are not under the control of the designer. Due to this fact, in the study on variation capacity performed by Nakashima, the coefficient of variation of experimental ductility ratios covers values between 0.03 and 0.93. All these aspects underline that in this problem type it is possible to obtain a large scatter of results, when the theoretical and experimental results are compared.
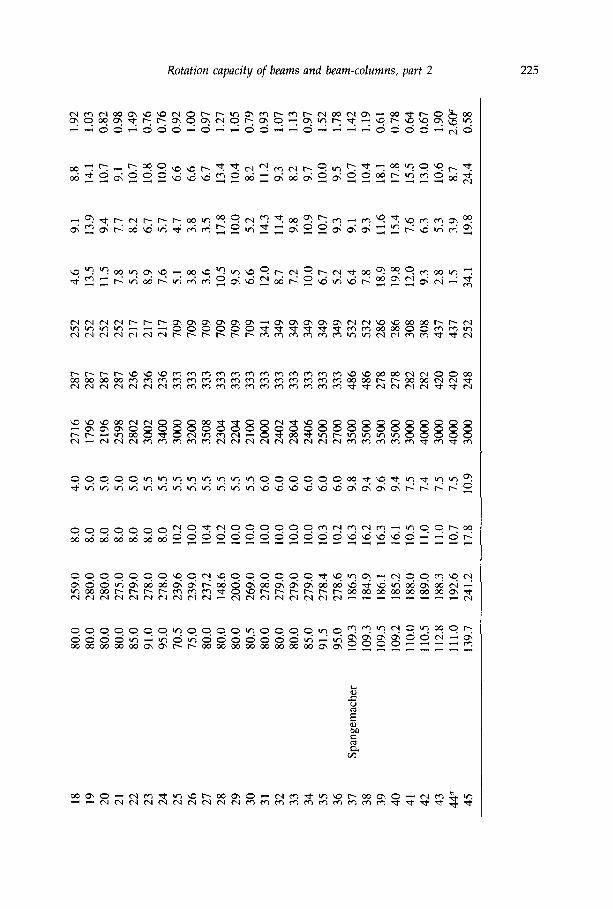
In Table 2 the experimental data for standard beam SB 1, collected from the technical literature, are compared with the theoretical results obtained using the DUCTROT 96 computer program. The geometrical and mechanical properties of experimental specimens are presented.
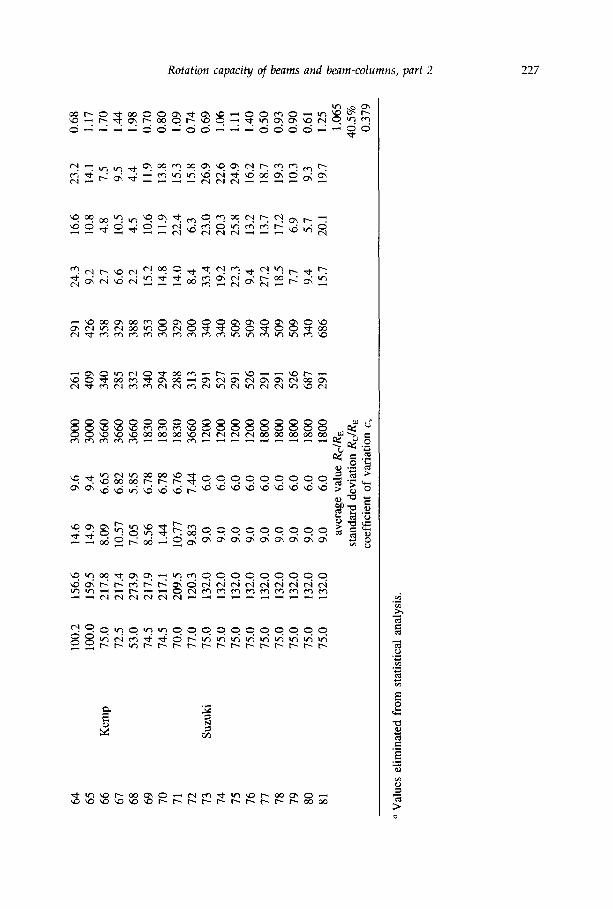
The experimental rotation capacity, RE, is compared with the calculated values, Re, for the two forms of plastic mechanism, in-plane (M1) and out-of- plane (M2). The ratio between these values is determined, and finally the aver- age value, standard deviation and coefficient of variation are calculated. From the 81 experimental tests, six results were eliminated from the statistical analy-
Rotation capacity of beams and beam-columns, part 2 223
sis because of great differences between the other values, showing that some experimental deficiencies were produced.
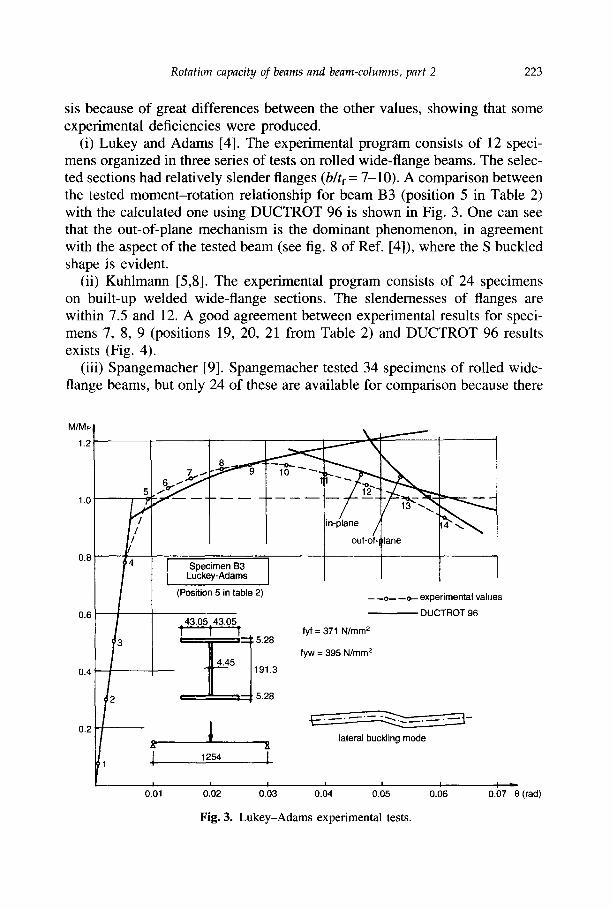
(i) Lukey and Adams [4]. The experimental program consists of 12 speci- mens organized in three series of tests on rolled wide-flange beams. The selec- ted sections had relatively slender flanges (b/tf = 7-10). A comparison between the tested moment-rotation relationship for beam B3 (position 5 in Table 2) with the calculated one using DUCTROT 96 is shown in Fig. 3. One can see that the out-of-plane mechanism is the dominant phenomenon, in agreement with the aspect of the tested beam (see fig. 8 of Ref. [4]), where the S buckled shape is evident.
(ii) Kuhlmann [5,8]. The experimental program consists of 24 specimens on built-up welded wide-flange sections. The slendernesses of flanges are within 7.5 and 12. A good agreement between experimental results for speci- mens 7, 8, 9 (positions 19, 20, 21 from Table 2) and DUCTROT 96 results exists (Fig. 4).
(iii) Spangemacher [9]. Spangemacher tested 34 specimens of rolled wide- flange beams, but only 24 of these are available for comparison because there
M / M p
1.2
1.0
0.8
0.6
0.4.
0.2
Specimen B3 L u c k e y - A d a m s ]
(Posit ion 5 in tab le 2)
.4_3._0_5 43.05
] l != 528
¢ , ~ 5.28
_
x 1254
out-of-~
- --a-- --a-- exper imenta l va lues
DUCTROT 96
fyf = 371 N/mm 2
fyw = 395 N/mm 2
lateral buckl ing m o d e
I -- I I I I =, - 0 .01 0.O2 0.03 0.04 0.05 0.06 0.07 0 ( rad)
Fig. 3. Lukey-Adams experimental tests.

Ix9
lxa
TA
BL
E 2
C
ompa
riso
n w
ith
Exp
erim
enta
l D
ata
No.
So
urce
G
eom
etri
cal
data
(m
m)
Yie
ld s
tres
ses
Rot
atio
n ca
paci
ty
( N/m
m 2 )
b d
t~
tw
l L
i ~
RE
Rc
RdR
E
MI
M~
1 2
3 4
5 6
7 8
9 10
11
12
13
1
Lu
key
-Ad
ams
101.
75
235.
1 10
.8
7.65
34
80
283
308
11.8
7.
9 11
.8
0.67
2
88.0
0 23
5.1
10.8
7.
65
2946
28
3 30
8 13
.6
10.8
12
.2
0.79
3 a
51
.30
191.
3 5.
28
4.45
15
54
371
395
2.9
6.3
7.2
2.48
'~
4 36
.95
191.
3 5.
28
4.45
10
36
371
395
10.4
11
.7
8.0
0.77
5
43.0
5 19
1.3
5.28
4.
45
1254
37
1 39
5 6.
7 8.
8 7.
6 1.
13
6 47
.00
191.
3 5.
28
4.45
13
96
371
395
3.4
7.4
7.4
2.17
7
48.4
0 19
1.3
5.26
4.
45
1448
37
1 39
5 3.
2 7.
0 7.
3 2.
19
8 50
.95
241.
2 5.
26
4.60
13
72
371
350
4.2
6.8
7.2
1.62
9
36.8
5 24
1.2
5.26
4.
60
960
371
350
13.7
12
.3
7.9
0.58
10
42
.95
241.
2 5.
26
4.60
11
68
371
350
8.0
9.0
7.3
0.91
11
46
.75
241.
2 5.
26
4.60
12
96
371
350
4.2
7.7
7.0
1.68
12
44
.45
241.
2 5.
26
4.60
12
80
371
350
6.5
8.0
6.9
1.06
13
K
uhlm
ann
70.5
27
8.0
8.0
5.0
3404
23
6 21
7 8.
0 7.
9 8.
0 0.
99
14
75.0
27
8.0
8.0
5.0
3704
23
6 21
7 7.
0 6.
9 7.
8 0.
99
15 '~
80.0
27
7.0
8.5
5.5
4000
44
9 21
7 1.
0 3.
3 4.
9 3.
3 a
16
80.0
26
1.0
8.0
6.0
2540
28
7 26
0 12
.7
7.2
9.9
0.57
17
80
.0
258.
0 8.
0 5.
0 26
36
287
252
8.6
7.6
9.3
0.88
18
19
20
21
22
23
24
25
26
27
28
29
30
31
32
33
34
35
36
37
38
39
40
41
42
43
44 -
45
Spa
ngem
ache
r
80.0
80
.0
80.0
80
.0
85.0
91
.0
95.0
70
.5
75.0
80
.0
80.0
80
.0
80.5
80
.0
80.0
80
.0
85.0
91
.5
95.0
10
9.3
109.
3 10
9.5
109.
2 11
0.0
110.
5 11
2.8
111.
0 13
9.7
259.
0 28
0.0
280.
0 27
5.0
279.
0 27
8.0
278.
0 23
9.6
239.
0 23
7.2
148.
6 20
0.0
269.
0 27
8.0
279.
0 27
9.0
279.
0 27
8.4
278.
6 18
6.5
184.
9 18
6.1
185.
2 18
8.0
189.
0 18
8.3
192.
6 24
1.2
8.0
8.0
8.0
8.0
8.0
8.0
8.0
10.2
10
.0
10.4
10
.2
10.0
10
.0
10.0
10
.0
10.0
10
.0
10.3
10
.2
16.3
16
.2
16.3
16
.1
10.5
11
.0
11.0
10
.7
17.8
4.0
5.0
5.0
5.0
5.0
5.5
5.5
5.5
5.5
5.5
5.5
5.5
5.5
6.0
6.0
6.0
6.0
6.0
6.0
9.8
9.4
9.6
9.4
7.5
7.4
7.5
7.5
10.9
2716
17
96
2196
25
98
2802
3
~2
34
00
30
~
3200
35
08
23
~
22
~
2100
20
00
~0
2
28
~
2406
25
00
2700
3
5~
35
00
35
~
35
~
30
~
40
~
3000
40
00
30
~
287
287
287
287
236
236
236
333
333
333
333
333
333
333
333
333
333
333
333
486
486
278
278
282
282
420
420
248
252
252
252
252
217
217
217
709
709
709
709
709
709
341
349
349
349
349
349
532
532
286
286
308
308
437
437
252
4.6
13.5
11
.5
7.8
5.5
8.9
7.6
5.1
3.8
3.6
10.5
9.
5 6.
6 12
.0
8.7
7.2
10.0
6.
7 5.
2 6.
4 7.
8 18
.9
19.8
12
.0
9.3
2.8
1.5
34.1
9.1
13.9
9.
4 7.
7 8.
2 6.
7 5.
7 4.
7 3.
8 3.
5 17
.8
10.0
5.
2 14
.3
11.4
9.
8 10
.9
10.7
9.
3 9.
1 9.
3 11
.6
15.4
7.
6 6.
3 5.
3 3.
9 19
.8
8.8
14.1
10
.7
9.1
10.7
10
.8
10.0
6.
6 6.
6 6.
7 13
.4
10.4
8.
2 11
.2
9.3
8.2
9.7
10.0
9.
5 10
.7
10.4
18
.1
17.8
15
.5
13.0
10
.6
8.7
24.4
1.92
1.
03
0.82
0.
98
1.49
0.
76
0.76
0.
92
1.00
0.
97
1.27
1.
05
0.79
0.
93
1.07
1.
13
0.97
1.
52
1.78
1.
42
1.19
0.
61
0.78
0.
64
0.67
1.
90
2.60
~ 0.
58
~2

TA
BL
E 2
C
onti
nued
bo
I,.o
No.
So
urce
G
eom
etri
cal
data
(m
m)
Yiel
d st
ress
es
Rot
atio
n ca
paci
ty
( N/m
m 2)
b d
t:
tw
I fy
: fy
w
RE
Rc
Rcl
RE
M,
M~
1 2
3 4
5 6
7 8
9 10
11
12
13
46
13
9.5
246.
6 17
.7
10.8
40
00
248
252
20.5
14
.2
19.2
0.
69
47
141.
7 24
6.4
17.4
11
.4
3000
48
9 53
9 9.
5 9.
4 12
.6
0.99
48
14
2.0
249.
7 17
.4
11.5
40
00
489
539
8.3
7.0
10.1
0.
85
49
140.
0 24
0.8
12.6
8.
0 30
00
276
311
19.0
9.
3 17
.1
0.49
50
14
0.0
243.
4 12
.8
7.5
4000
27
6 31
1 6.
4 7.
5 13
.3
1.18
51
14
0.5
250.
4 12
.6
9.0
3000
50
4 53
5 6.
4 4.
9 9.
7 0.
76
52
140.
5 24
9.6
12.7
9.
3 40
00
504
535
4.1
3.7
8.0
0.90
53
° 14
1.7
246.
4 17
.3
11.3
30
00
489
535
0.9
9.3
12.3
10
.33
° 54
a 14
1.6
249.
9 17
.4
11.5
30
00
489
535
2.0
9.4
12.3
4.
70 ~
55
14
1.5
246.
9 17
.3
11.3
5 30
00
489
535
10.4
9.
3 12
.3
0.90
56
11
7.8
185.
4 10
.3
7.25
40
00
275
302
10.3
5.
2 13
.7
0.51
57
11
7.8
186.
1 11
.1
7.65
40
00
430
448
2.6
3.7
9.0
1.44
58
15
0.3
320.
0 15
.0
10.0
30
00
248
323
16.9
14
.9
26.7
0.
88
59
150.
3 32
0.0
15.0
10
.0
3000
48
6 99
0 2.
7 5.
1 9.
1 1.
88
60 ~
150.
3 32
0.0
15.0
10
.0
3000
81
7 81
3 0.
9 4.
3 6.
3 4.
78 ~
61
B
oera
ve e
t al
. 10
0.3
155.
1 14
.1
8.8
3000
30
3 34
2 16
.8
13.6
18
.6
0.81
62
10
0.1
153.
9 14
.7
9.5
3000
37
5 42
1 12
.1
11.7
16
.2
0.97
63
10
0.7
154.
4 15
.1
9.5
3000
44
5 46
2 10
.0
9.9
13.4
0.
99
64
100.
2 65
10
0.0
66
Kem
p 75
.0
67
72.5
68
53
.0
69
74.5
70
74
.5
71
70.0
72
77
.0
73
Suz
uki
75.0
74
75
.0
75
75.0
76
75
.0
77
75.0
78
75
.0
79
75.0
80
75
.0
81
75.0
156.
6 14
.6
9.6
3000
26
1 29
1 24
.3
16.6
23
.2
0.68
15
9.5
14.9
9.
4 30
00
409
426
9.2
10.8
14
.1
1.17
21
7.8
8.09
6.
65
3660
34
0 35
8 2.
7 4.
8 7.
5 1.
70
217.
4 10
.57
6.82
36
60
285
329
6.6
10.5
9.
5 1.
44
273.
9 7.
05
5.85
36
60
332
388
2.2
4.5
4.4
1.98
21
7.9
8.56
6.
78
1830
34
0 35
3 15
.2
10.6
11
.9
0.70
21
7.1
1.44
6.
78
1830
29
4 30
0 14
.8
11.9
13
.8
0.80
20
9.5
10.7
7 6.
76
1830
28
8 32
9 14
.0
22.4
15
.3
1.09
12
0.3
9.83
7.
44
3660
31
3 30
0 8.
4 6.
3 15
.8
0.74
13
2.0
9.0
6.0
1200
29
1 34
0 33
.4
23.0
26
.9
0.69
13
2.0
9.0
6.0
1200
52
7 34
0 19
.2
20.3
22
.6
1.06
13
2.0
9.0
6.0
1200
29
1 50
9 22
.3
25.8
24
.9
1.11
13
2.0
9.0
6.0
1200
52
6 50
9 9.
4 13
.2
16.2
1.
40
132.
0 9.
0 6.
0 18
00
291
340
27.2
13
.7
18.7
0.
50
132.
0 9.
0 6.
0 18
00
291
509
18.5
17
.2
19.3
0.
93
132.
0 9.
0 6.
0 18
00
526
509
7.7
6.9
10.3
0.
90
132.
0 9.
0 6.
0 18
00
687
340
9.4
5.7
9.3
0.61
13
2.0
9.0
6.0
1800
29
1 68
6 15
.7
20.1
19
.7
1.25
av
erag
e va
lue
Rcl
RE
1.
065
stan
dard
dev
iati
on R
c/R
E
40.5
%
coef
fici
ent
of v
aria
tion
Cv
0.37
9
Val
ues
elim
inat
ed f
rom
sta
tist
ical
ana
lysi
s.
tO
tO
"--1

228
M/M p 1[i 1.2,
1.0
0.81
0.61
0.4
0.2
/ / / "
V. Gioncu and D. Petcu
Specimen 7,8,9 Kuhlmann
(Position 19,20,21 ; table 2)
80
_ ~ 80
I"
fyf = 287 N/mm 2 fyw = 252 N/mm 2
. . . . experimental values
DUCTROT 96
I = 1798 mm 2198 mm 2598 mm
I I
2 4 I I I I I
6 8 10 12 14 0]8p
F i g . 4 . K u h i m a n n e x p e r i m e n t a l t e s t s .
are 10 very short beams, for which failure is produced by shear. One can see that in all cases the in-plane mechanism produces the beam collapse. The comparison of moment-rotation for specimen DO1A4M (position 37 from Table 2) (Fig. 5) shows a good correspondence between experimental values and theoretical results.
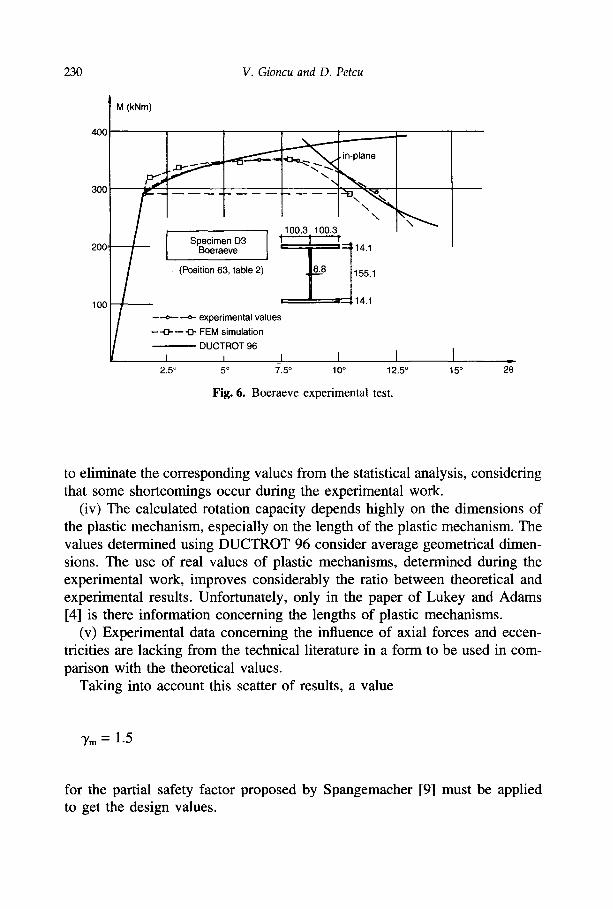
(iv) Boeraeve et al. [10]. Five specimens of hot rolled section (HEB 200) were tested. The experimental moment-rotation for specimen D3 (position 63 in Table 2) is presented in Fig. 6, showing a good correspondence.
(v) Kemp [11,12]. A series of 12 specimens on built-up welded I-beams was tested, but only seven specimens can be used for comparison because for the others some important data are missing.
(vi) Susuki et al. [13]. The testing program contains nine specimens of built- up welded hybrid beam. In the paper only rotation capacities corresponding to the maximum moment are presented, but it is known that the ultimate rotation capacity is R ~ 2Rma x.

Rotation capacity of beams and beam-columns, part 2 229
M/Mp l 1.21
1.0
0.8 ¸
0.6
- .o.- --o-- experimental values I Specimen DOIA4M ]
- - Spangemacher ~ DUCTROT 96
(Position 37, table 2)
I 100, t014- 0. i I ]18.3 fyf = 486 N/mm a ~ '
1.86.5 fyw = 532 N/mm 2 J 3500
0.2; , , - . . . . ~ 1 6 . 3
, , I I 2 4 6 8 10 12 01;P
Fig. 5. Spangemacher experimental test.
2.3 Conclusions concerning the comparison with experimental data
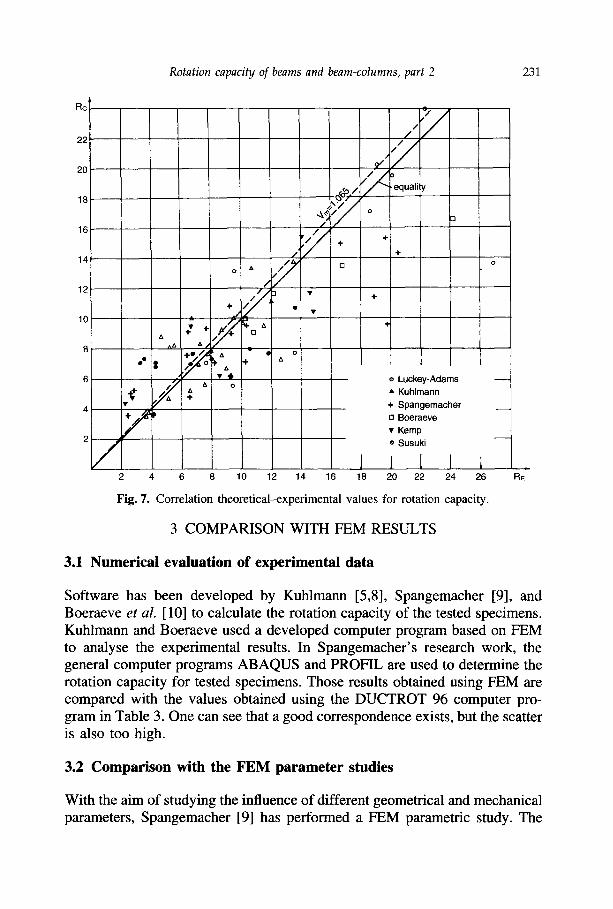
The correlation between the 75 available experimental results, RE, and the calculated rotation capacity, Re, using the DUCTROT 96 computer program is given in Fig. 7. The average value of calculated values and experimental data is 1.065, showing a very good correspondence. But the scatter area is very large, the coefficient of variation being Cv -- 0.379. This high dispersion is due to the following factors.
(i) The characteristics of material in the hardening range are not presented in the analysed papers, so only average values are considered.
(ii) The effect of the transverse stiffener is not considered in the analysis, because its dimensions are not specified in the studied papers. The rigidity of this stiffener can have a great influence on the shape of the plastic mechanism.
(iii) In the papers used not all information requisite to the analysis is given regarding differences between theoretical and experimental data. Only if these differences are very high, in discordance with these values, can one decide
230 V. Gioncu and D. Petcu
I M (kNm)
"<'b,. 300 t'_70 ~
~ ^ ~ ~ 100.3 100.3 . , , ::::~" 1 4 , 1
I / (Position 63, table 2) 8.8 155.1
100 t~/" - ~ 14.1 I / ---o.--.-.- experimental values
~ . ~ FEM simulation DUCTROT 96
I I 2.5 ° 5 ° 7.5 o 10 °
I I 12.5 ° 15 ° 2=0
Fig. 6. Boeraeve experimental test.
to eliminate the corresponding values from the statistical analysis, considering that some shortcomings occur during the experimental work.
(iv) The calculated rotation capacity depends highly on the dimensions of the plastic mechanism, especially on the length of the plastic mechanism. The values determined using DUCTROT 96 consider average geometrical dimen- sions. The use of real values of plastic mechanisms, determined during the experimental work, improves considerably the ratio between theoretical and experimental results. Unfortunately, only in the paper of Lukey and Adams [4] is there information concerning the lengths of plastic mechanisms.
(v) Experimental data concerning the influence of axial forces and eccen- tricities are lacking from the technical literature in a form to be used in com- parison with the theoretical values.
Taking into account this scatter of results, a value
~/m = 1.5
for the partial safety factor proposed by Spangemacher [9] must be applied to get the design values.
Rotation capacity of beams and beam-columns, part 2 231
R G
22
20
18
16
14
12
10
8
6
4
2
& 0
qbro•/./ ~,,./ / 4 / /
, , ' 7 °
/ ' /
• equality
4- 4-
. /
t , 4"~ 13 ^zx ~x /
÷.,,, ° . o ] I *'$ ~ o a + a • 4' e Luckey-Adams ~ / A o
"1~ ~ A Kuhlmann
• + Spangemacher ,,,~ I, o Boeraeve
• Kemp e Susuki
I 1 1 I 2 4 6 8 10 12 14 16 18 20 22 24
1 26 RE
Fig. 7. Correlation theoretical--experimental values for rotation capacity.
3 COMPARISON WITH FEM RESULTS
3.1 Numerical evaluation of experimental data
Software has been developed by Kuhlmann [5,8], Spangemacher [9], and Boeraeve et al. [10] to calculate the rotation capacity of the tested specimens. Kuhlmann and Boeraeve used a developed computer program based on FEM to analyse the experimental results. In Spangemacher's research work, the general computer programs ABAQUS and PROFIL are used to determine the rotation capacity for tested specimens. Those results obtained using FEM are compared with the values obtained using the DUCTROT 96 computer pro- gram in Table 3. One can see that a good correspondence exists, but the scatter is also too high.
3.2 Comparison with the FEM parameter studies
With the aim of studying the influence of different geometrical and mechanical parameters, Spangemacher [9] has performed a FEM parametric study. The

232 V. Gioncu and D. Petcu
TABLE 3 Comparison with FEM results
No. a Source RFE M Rc Rc]RFE M
16 Kuhlmann 8.7 7.2 0.83 17 6.7 7.6 1.13 18 4.2 8.8 2.09 19 10.5 13.9 1.32 20 9.2 9.4 1.02 21 6.5 7.7 1.18 37 Spangemacher 6.9 9.1 1.34 38 6.9 9.3 1.32 39 14.6 11.6 0.79 40 14.6 15.4 1.05 41 11.8 7.6 0.64 42 9.7 6.3 0.65 43 3.5 5.3 1.51 45 17.6 19.8 1.13 46 14.8 14.2 0.96 47 9.8 9.4 1.04 48 7.9 7.0 0.89 49 9.9 9.3 0.94 50 7.7 7.5 0.97 51 4.4 4.9 1.11 52 2.8 3.7 1.32 56 8.3 5.2 0.63 57 2.2 3.7 1.68 58 10.0 14.9 1.49 59 4.1 5.1 1.24 61 Boeraeve et al. 13.2 13.6 1.03 62 11.1 11.7 1.05 63 8.9 9.9 1.11 64 22.8 16.6 0.73 65 9.7 10.8 1.11
average values 1.11 standard deviation 31.2
coefficient variation 0.281
a The test number corresponds to the experimental specimens from Table 2.
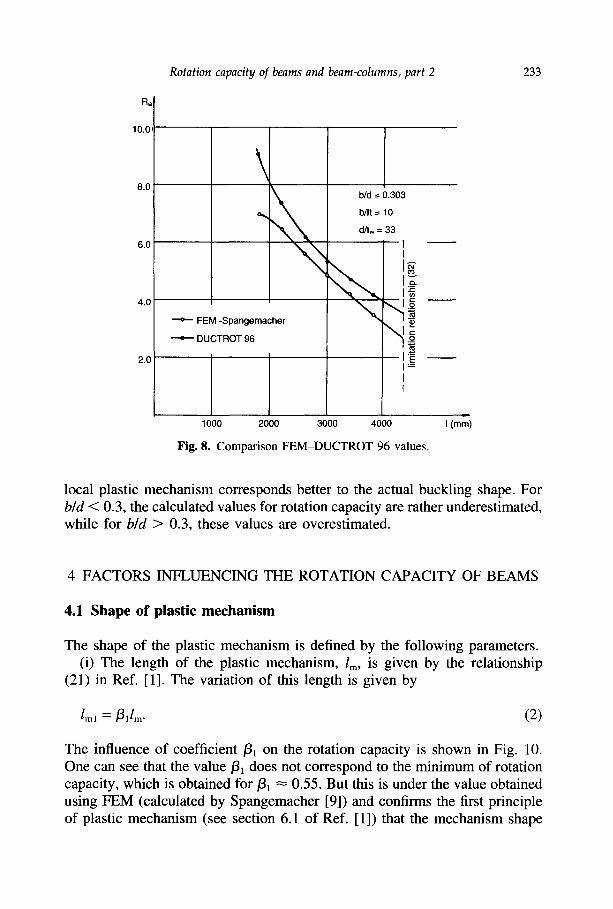
following factors are considered: the influence of beam span, flanges and web thicknesses, flange and web slendernesses and steel grades. Fig. 8 shows the comparison between Spangemacher's studies using FEM and DUCTROT 96 results, considering the variation of beam length. The same comparison for the influence of flange slenderness is presented in Fig. 9. This comparison shows a good enough correspondence. A better concurrence is noticed for the ratio b / d ~ 0.3, very likely due to the fact that in this case the shape of the
Rotation capacity of beams and beam-columns, part 2 233
R~t.
10.0,
8.0
6.0
4.0
2.0
\ o~
-- 'e'--FEM -Spangemacher
a DUI;TROT 96
b/d --- 0.303
b/f t= 10
d/tw = 33
I I
NNN
I= I i
1000 2000 3000 4000 I(mm)
Fig. 8. Comparison FEM-DUCTROT 96 values.
local plastic mechanism corresponds better to the actual buckling shape. For b/d < 0.3, the calculated values for rotation capacity are rather underestimated, while for b/d > 0.3, these values are overestimated.
4 FACTORS INFLUENCING THE ROTATION CAPACITY OF BEAMS
4.1 Shape of plastic mechanism
The shape of the plastic mechanism is defined by the following parameters. (i) The length of the plastic mechanism, /m, is given by the relationship
(21) in Ref. [1]. The variation of this length is given by
lml = /311m- (2)
The influence of coefficient /31 on the rotation capacity is shown in Fig. 10. One can see that the value /31 does not correspond to the minimum of rotation capacity, which is obtained for 131 ~ 0.55. But this is under the value obtained using FEM (calculated by Spangemacher [9]) and confirms the first principle of plastic mechanism (see section 6.1 of Ref. [1]) that the mechanism shape

234 V. Gioncu and D. Petcu
Ra
10
4 . -
• o 6 o
\
b/d = 0.189.....0.340 ~ ' ~ ' ~ ~ ~ "~ ~ " - d/tw = 33
--o.-. FEM-Spangemacher "~
DUCTROT 96
6 7 8 9 10 11 b/tf
Fig. 9. Comparison FEM-DUCTROT 96 values.
R
8.0
6.0
4.0
2.0
lOO
t [
[.,
lOO
33ol 3000 1 StE 460
~ 1 o
, I I 0.4 0.6 0.8
1311m
1
I
S \ F E M
I I I
I ] I I
1.0 1.2
Fig. 10. Influence of length of plastic mechanism.

Rotation capacity of beams and beam-columns, part 2 235
is not obtained by minimizing the rotation capacity as a function of the length of the buckled shape.
(ii) The asymmetry of the plastic mechanism, la, which was observed during experimental works (see section 5.1 of Ref. [1]):
l . = abl (3)
where a is the parameter of asymmetry. Fig. 11 shows the influence of this parameter on the rotation capacity. One can see that the effect of mechanism asymmetry, which occurs due to the presence of the stiffener under the con- centrated force, is not significant, so the rotation capacity can be determined for a symmetric shape (a = 0).
(iii) Parameter of buckled shape (see relationship (43) of Ref. [1]):
/3bl X - & / - (4)
In this relationship, the only variable value is the parameter ~ which defines the height of the web buckled shape (i.e. the centre of rotation of the plastic mechanism), which does not belong to the first plastic buckling shape of flanges, so it must be used in the minimization of plastic moment (Fig. 12). It is very important to notice that the height of the web plastic mechanism increases with increasing flange width (Fig. 13), and this increase is associated with a reduction of rotation capacity.
Ra j
12.0
8.(
4.0
,rot
0.05 0.20
l I oGbl
I '1 0.10 0.15
• 1 0 0 . 100 , - 1 0
10 3O0
~--~ lO Fe 360
1 3000
I 0.25 0.3"5-~'~
Fig. 11. Influence of asymmetry of plastic mechanism.

236 V. Gioncu and D. Petcu
M Mp
1.25
1.00
0.75
0.50- ,[
0.25
I I
960 ] " - - ' - - ' r - - i I I I
I i
36.85. 36.85 I 1 1
, - ' i5.26 1
4.6 - ~ 2 4 1 . 2
L ---~5.26
l J
I I I
0.15 0.20 0.235 0.25 0.30 0.35 0.40 Z
1.08 0.81 0.69 0.65 0.54 0.46 0.41 c5
Fig. 12. Influence of depth of plastic mechanism.
a a ~
12.0 "
6o-.-~
4"0l. ~ '
Ra ~ -
b b i !1,° 1,7
I I I 100 120 140 80 160 180
t .0
0.8
0.6
3.4
0.2
200 b(mm)
Fig. 13. Relation between rotation capacity and depth of plastic mechanism.
4.2 Asymmetry of flanges
The influence of different dimensions of the flanges is presented in Figs 14 and 15. In the first figure, the influence of the ratio of flange depths is plotted, while in the second the effect of different thicknesses is calculated. In these figures, the movement of the position of the rotation point is also presented. One can see that the reduction of the tensile flange dimensions leads to an increase of the rotation capacity of the beam, due to the favourable position of the centre of the mechanism rotation.

o i
0 -h
!
i 0
0
J
o
o
r k
o
Oq
o
o o
C~
o
t i
I
o
c3
o
0~
o
i i
io,~
-
, O
i
o
o IL
..
m
o
J
o
~ /,
/
j- \
ho
ix,.)
bJ

238 V. Gioncu and D. Petcu
4.3 Flange slenderness
Fig. 16 shows the influence of flange slenderness on the rotation capacity. This influence is very high, this factor being one of the most important, influencing decisively this rotation capacity. The limitations refer to preventing the elastic buckling (relationship (32) of Ref. [1]) or the fracture collapse (relationship (24)). In Fig. 16 the classification of cross-section behaviour after EC3 (classes 1, 2, 3) and that for member behavioural classes is given (H - high, M - medium, L - low ductility, see section 8 of Ref. [1]). One can see that the classification in cross-section classes does not correspond to the actual behav- iour, because the member behaviour frames the high ductility, even for class 3. So, it is very clear that the classification after cross-section must be replaced by the member behavioural classes.
4.4 Web slenderness
In Fig. 17 the influence of web slenderness is plotted. The limits refer to preventing the shear plastic collapse (relationship (31) of Ref. [1]) and shear elastic buckling (relationship (28)). It is very interesting to notice that a mini- mum of rotation capacity occurs for d/tw ~ 40, the first part corresponding to the elasto-plastic buckling of the web, the second thus being for plastic buckling of the flange. In Fig. 17 the two classifications are also presented,
Ra
16.0
12.0
8.0
4.0
I , ,
limit to prevent I elastic buckling " ~ 1 L ~ " /
I I -H-- - - - - ~ - - --' , t
!l -'i 100 ~100 !~ t
/
M I1 TI- ll
',t ~ . I i ,=.
"limit to preve fracture collapse
350 . 1_.0
- - - : :~ t
~ . t o l - - - - - - ' l
6 8 10 12 tf(mm) I 8.67 12.56 I0.00 8.33 btlf
Fig. 16. Influence of flange slenderness.

Rotation capacity of beams and beam-columns, part 2 239
T 16
12
' I 1
I I i
i I ~1 ~ I
, . . I '
100 100 1 t t
,--':.10 / - --H-- - - "-~ ~ , ~ :.limit to prevent
shear collapse I I tw 33O
M ~ .limit to prevent elastic buckling of web
. . . . . 1"
I T I I
I L I _ _ I AJ I
. . . . . _ , ', 2 4 6 8 10 12
165.0 82.5 55.0 41.25 33.0 27.6
Fig. 17. Influence of web slenderness.
• '10
/
14 t,,, (mm) d/tw
after EC3 and after the proposed member behavioural classes. One can see that even for classes 4, the member behavioural class belongs to high ductility.
4.5 Beam length
Fig. 18 shows the influence of beam length on the rotation capacity. As a function of this length, the rotation capacity varies from very high ductility for short beams to medium for long beams. One can see that this factor is one of the most important, and the missing of this parameter from the EC3 classification is the most important shortcoming of these rules.
4.6 Steel grade
Fig. 19 shows the effect of steel grade on the rotation capacity for hybrid and homogeneous beams. One can see that the increase of steel grade for homogeneous beams leads to the decrease of rotation capacity. This rotation of hybrid beams with high strength steel webs and mild steel flanges is larger than that of homogeneous beams. Thus, in order to increase the rotation capacity, hybrid beams with mild strength flanges and high strength web are recommended.

240 V. Gioncu and D. Petcu
R a
16 ̧
12
8 H
M 4
L
, ,J~lO
• 10 330
i~10 i 1 0 0 1100 l
h M
2000 3000 4000 5000 6000 I (mm)
Fig. 18. Influence of beam length.
Ra
10.0
8.0
6.0'
4.0
T j 200
I i I I I I
f# = 235 N/ram 2 (Fe360) I I
I
I I % / / . ~ homogeneous beam
I / f f ' ~ '1 ' I 2 It 1 / ~ d . - - " - f~ = 355 N/mm (Fe510)
I , , - : 1 0 I I I I i I I I I I I I I I i I
Fe360 Fe430
I I . 10 330 I .. I , - ; 1 0 I i l oo !1oo l I i 1
300 Fe510 400
Fig. 19. Influence of steel grade.
fyw (N/mm 2)

Rotation capacity of beams and beam-columns, part 2 241
4.7 Mechanism type
There are three mechanism types which can occur in the case of a frame joint: in-plane, symmetric or asymmetric out-of-plane (Fig. 20). The parametric studies show that the rotation capacity for symmetric out-of-plane mechanisms is always higher than that corresponding to asymmetric modes. The out-of- plane mechanism type depends on the torsion rigidity of the column, because the asymmetric form involves the rotation of joints together with column. Thus, the following coupling between the two mechanism types can occur:
(i) between in-plane and asymmetric out-of-plane mechanisms, where lat- eral rotation of joints is free. In this case, one can see that the beam collapse occurs by out-of-plane plastic buckling;
(ii) between in-plane and symmetric out-of-plane mechanisms, if the joint rotation is prevented when the collapse takes place by an in-plane mechanism.
The first case is characteristic for continuous beams, where both in-plane and out-of-plane buckling modes can occur, while the second is characteristic
R
24
20
16
12
~y,,.,,~u,~. vu[-v,-plane
~ ..1-- . ,
I - - t '
in-plane
80 . 80 . I ~ , / ' ~ l l p ~ . / - -
/ asymmetric out-of-plane j~ 8 r 300
, - 12
I 5000 4000 6000
Fig. 20. Influence of mechanism type.
I (mm)

242 V. Gioncu and D. Petcu
for the beams which belong to a frame, where the in-plane buckling mode produces the plastic collapse, due to the rigidity to rotation of the column.
5 FACTORS INFLUENCING THE ROTATION CAPACITY OF BEAM- COLUMNS
5.1 Axial force
The influence of axial force is plotted in Fig. 21. One can see an important decrease in rotation capacity in the first part of the curve, for n p < 0.1, fol- lowed by an almost horizontal plateau. The dimensions of cross-section corre- spond, after EC3, to the first class of ductility, while the framing in the mem- ber behavioural classes shows a low ductility capacity.
5.2 Column slenderness
The influence of column slenderness is very high, as one can see from Fig. 22. A cross-section which belongs to the first class, after EC3, works under conditions of low ductility if the member behaviour is considered. The limi- tation of column slenderness, given in EC3 for braced frames, seems to be too generous. A limitation of values X ~ 0.7-0.8 for columns with plastic hinges is recommended with the aim of preventing a drastic decrease in rotation capacity.
Ra H
L
N p_.,. '
~ l 3850
----I-- ['100 1-100.1"~ ,~) , 0
- -~" ~:~12 ~ = o . 6
Class 1
0.1 0.2 0.3
J nP 1
I 1.0 nip I 0.4 0.5 nP= N/Np
Fig. 21. Inf luence o f axial force.

Rotation capacity of beams and beam-columns, part 2 243
Ra ~
6
100
\ "M
\
100 . i ]
12
nP= 0.1
1 i 0.4 0.6 0.8
N=169.2 kN
= 2570 mm ~, = 0.4 I
i
11, I I limit slenderr I after EC,~ I
I I ] i _
1 .o 1.2
Fig. 22. Influence of column slenderness.
5.3 Upper moments
The rotation capacity for a column in a frame with upper moment is presented in Fig. 23. One can see that an upper negative bending moment increases the rotation capacity, while for positive moment, the rotation capacity is reduced. Thus, it is very important to have a point of inflection on column displace- ments to improve the rotation ductility.
• 1 0 0 1 0 0
. ,d oo
- ~ ' - I ~.o M_ o._~
MP p [ Mp -2.0 -1.0 0
Ra
H "~ = 0.6 rip = 0.1
~ i P_._ __ _ _ ~ P
1.0 2.0
N=169.2 kN
~ , l 3850mm
L
M/Nd
Fig. 23. Influence of upper bending moment.

244 V. Gioncu and D. Petcu
6 CONCLUSIONS
The use of a collapse plastic mechanism allows us to determine the available rotation capacity with an accuracy confirmed by experimental and theoretical research work. The numerical tests, in which the factors influencing the rotation capacity of beams and beam-columns are considered, show that the provisions for ductility classes, given in codes, are not sufficient for a proper design. The cross-section behaviour classes should be substituted by the con- cept of member behavioural classes.
REFERENCES
1. Gioncu, V. and Petcu, D., Available rotation capacity of wide-flange beams and columns, Part 1. Theoretical approaches. Journal of Constructional Steel Research, 1997, 44, JCSR 1487.
2. Petcu, D. and Gioncu, V., Plastic rotation capacity of steel beams and beam- columns. DUCTROT 96, User Guide. INCERC, 1996.
3. Haaijer, G., Plate buckling in the strain-hardening range. Journal of the Engineer- ing Mechanics Division, ASCE, 1957, $3(EM2), 12121-12147.
4. Lukey, A. F. and Adams, P. F., Rotation capacity of beams under moment gradi- ent. Journal of the Structural Division, ASCE, 1969, 95(ST6), 1173-1188.
5. Kuhlmann, U., Definition of flange slenderness limits on the basis of rotation capacity values. Journal of Constructional Steel Research, 1989, 14, 21-40.
6. Lay, M. and Galambos, T. V., Inelastic beams under moment gradient. Journal of the Structural Division, ASCE, 1967, 93(ST1), 381-399.
7. Nakashima, M., Variation of ductility capacity of steel beam-columns. Journal of Structural Engineering, 1994, 120(7), 1941-1960.
8. Kuhlmann, U., Rotations kapazit~it biegenbeanspuchter I - Profile under Beriick- sichtigung des plastischen Beulens. Technical Reports, Mitteilung Nr. 86-5, June 1986.
9. Spangemacher, R., Zum Rotationsnachweis von Stahlkonstruktion, die nach dem traglastverfahren berechnet werden. Dissertation, Technischen Hochshule Aachen, 1991.
10. Boeraeve, Ph., Lognard, B., Janss, J., Gerardy, J. C. and Schleich, J. B., Elasto- plastic behaviour of steel frameworks. Journal of Constructional Steel Research, 1993, 27, 3-21.
11. Kemp, A. R. and Dekker, N. W., Available rotation capacity in steel and com- posite beams. The Structural Engineer, 1991, 69(5), 88-96.
12. Kemp, A. R., Interaction of plastic local and lateral buckling. Journal of Struc- tural Engineering, 1985, 111(10), 2181-2196.
13. Suzuki, T., Ogawa, T. and Ikarashi, K., A study on local buckling behaviour of hybrid beams. Thin-Walled Structures, 1994, 19, 337-351.