Auxotrophic mutations reduce tolerance of Saccharomyces cerevisiae to very high levels of ethanol...
46
Auxotrophic mutations reduce tolerance of Saccharomyces 1 cerevisiae to very high levels of ethanol stress 2 3 Steve Swinnen 1,2,* , Annelies Goovaerts 1,2,* , Kristien Schaerlaekens 1,2 , Françoise 4 Dumortier 1,2 , Pieter Verdyck 1,2 , Kris Souvereyns 1,2 , Griet Van Zeebroeck 1,2 , María 5 R. Foulquié-Moreno 1,2 and Johan M. Thevelein 1,2,# 6 7 1 Laboratory of Molecular Cell Biology, Institute of Botany and Microbiology, KU 8 Leuven 9 2 Department of Molecular Microbiology, VIB, Kasteelpark Arenberg 31, B-3001 10 Leuven-Heverlee, Flanders, Belgium 11 # Corresponding author (Tel.: +32-16-321507, Fax.: +32-16-321979, E-mail: 12 [email protected]) 13 * These authors contributed equally to this work 14 15 Running title: Very high ethanol tolerance in yeast 16 17 Key words: Ethanol tolerance, Saccharomyces cerevisiae, auxotrophy, genetic 18 analysis, stress tolerance, yeast 19 20 EC Accepted Manuscript Posted Online 26 June 2015 Eukaryotic Cell doi:10.1128/EC.00053-15 Copyright © 2015, American Society for Microbiology. All Rights Reserved.
-
Upload
independent -
Category
Documents
-
view
0 -
download
0
Transcript of Auxotrophic mutations reduce tolerance of Saccharomyces cerevisiae to very high levels of ethanol...

Auxotrophic mutations reduce tolerance of Saccharomyces 1 cerevisiae to very high levels of ethanol stress 2
3 Steve Swinnen1,2,*, Annelies Goovaerts1,2,*, Kristien Schaerlaekens1,2, Françoise 4 Dumortier1,2, Pieter Verdyck1,2, Kris Souvereyns1,2, Griet Van Zeebroeck1,2, María 5 R. Foulquié-Moreno 1,2 and Johan M. Thevelein1,2,# 6 7 1 Laboratory of Molecular Cell Biology, Institute of Botany and Microbiology, KU 8
Leuven 9 2 Department of Molecular Microbiology, VIB, Kasteelpark Arenberg 31, B-3001 10
Leuven-Heverlee, Flanders, Belgium 11 # Corresponding author (Tel.: +32-16-321507, Fax.: +32-16-321979, E-mail: 12
[email protected]) 13 * These authors contributed equally to this work 14 15 Running title: Very high ethanol tolerance in yeast 16 17 Key words: Ethanol tolerance, Saccharomyces cerevisiae, auxotrophy, genetic 18 analysis, stress tolerance, yeast 19 20
EC Accepted Manuscript Posted Online 26 June 2015Eukaryotic Cell doi:10.1128/EC.00053-15Copyright © 2015, American Society for Microbiology. All Rights Reserved.
2
Abstract 21 Very high ethanol tolerance is a distinctive trait of the yeast Saccharomyces 22 cerevisiae, with notable ecological and industrial importance. Although many genes 23 have been shown to be required for moderate ethanol tolerance (i.e. 6 to 12%) in 24 laboratory strains, little is known for the much higher ethanol tolerance (i.e. 16 to 25 20%) in natural and industrial strains. We have analysed the genetic basis of very 26 high ethanol tolerance in a Brazilian bio-ethanol production strain by genetic mapping 27 with laboratory strains containing artificially inserted oligonucleotide markers. The 28 first locus contained the ura3Δ0 mutation of the lab strain as the causative mutation. 29 Analysis of other auxotrophies also revealed significant linkage for LYS2, LEU2, 30 HIS3 and MET15. Only tolerance to very high ethanol concentrations was reduced by 31 auxotrophies, while the effect was reversed at lower concentrations. Evaluation of 32 other stress conditions showed that the link with auxotrophy is dependent on the type 33 of stress condition and the type of auxotrophy. When the concentration of the 34 auxotrophic nutrient is close to that limiting growth, more stress conditions can inhibit 35 growth of an auxotrophic strain. We show that very high ethanol concentrations 36 inhibit the uptake of leucine more than that of uracil, but the 500-fold lower uracil 37 uptake activity may explain the stronger linkage between uracil auxotrophy and 38 ethanol sensitivity compared to leucine auxotrophy. Since very high concentrations of 39 ethanol inhibit uptake of auxotrophic nutrients, the active uptake of scarce nutrients 40 may be a major limiting factor for growth under ethanol stress. 41 42
3
Introduction 43 Very high ethanol tolerance is an outstanding property of the yeast Saccharomyces 44 cerevisiae. While laboratory strains of S. cerevisiae have a low to moderate ethanol 45 tolerance [i.e. 6 to 12% (v/v)], many natural and industrial strains are able to 46 accumulate more than 16% ethanol (1, 2). This property is important in industrial 47 processes such as sake brewing and bio-ethanol production that rely on the 48 accumulation of high concentrations of ethanol (3, 4). In bio-ethanol production for 49 example, very high ethanol tolerance of the yeast is a prerequisite to obtain a very 50 high final ethanol titer, reducing distillation costs and contamination levels and 51 lowering liquid volumes in the factory. Very high ethanol tolerance is also important 52 for maintaining a proper fermentation rate in the later stages of the fermentation and 53 for a complete attenuation of the sugar. Adequate completion of the fermentation is 54 also of relevance for the production of beer, wine and other alcoholic beverages by 55 yeast fermentation. 56 57 The cellular membranes are believed to be the main targets of ethanol toxicity in S. 58 cerevisiae, and this is related with the tendency of ethanol to preferentially 59 accumulate in the hydrophobic part of the membranes (5, 6). The need of the cell to 60 compensate for this effect is reflected in several experimental findings. For example, 61 cells that are exposed to ethanol change the lipid composition of their membranes to 62 counteract the detrimental effect of ethanol. In particular, changes in the composition 63 of fatty acids (7-9) and ergosterol (10) have been observed. 64 65 In addition to the crucial role of the plasma membrane, also several amio acids have 66 been associated with ethanol tolerance in S. cerevisiae. In particular, it has been 67 shown that an increased accumulation of intracellular proline improved the cell 68 viability of sake yeast in the presence of ethanol (11). Proline is known to enhance 69 the stability of membranes and proteins (12) and to inhibit aggregation during protein 70
4
refolding (13). Overexpression of either tryptophan biosynthesis genes or the 71 tryptophan permease gene in a sake yeast strain, as well as supplementation of 72 tryptophan in the culture medium, conferred increased tolerance to 5% ethanol (14). 73 Nearly all studies on ethanol tolerance have been performed with laboratory yeast 74 strains, which in general have a lower fitness than natural and industrial strains. 75 Auxotrophic mutations have been indicated as a possible cause of reduced fitness 76 (15, 16), but never in connection with ethanol tolerance. 77 78 Ethanol tolerance is a complex property that is determined by numerous genetic and 79 environmental factors (1, 7, 14, 17-24). Several genome-wide analyses have been 80 performed to decipher the genetic basis of ethanol tolerance in S. cerevisiae, as 81 comprehensively reviewed by Stanley et al. (25). Virtually all of these studies focused 82 on the tolerance of laboratory strains to moderate concentrations of ethanol (i.e. 6 to 83 12%), and were performed by determining the sensitivity of the yeast deletion strain 84 collection to such ethanol concentrations under different conditions (17, 18, 20, 22, 85 23). Another study used genome-wide transcriptomics to study differences between 86 natural S. cerevisiae strains in their response to 5% ethanol (14). Although the 87 above-mentioned studies identified hundreds of genes that are required for ethanol 88 tolerance in S. cerevisiae, they showed little overlap between the genes identified 89 under the different conditions used (14, 17, 18, 20, 22, 23). This discrepancy 90 suggests that the mechanisms of ethanol sensitivity depend on the genetic 91 background, the growth conditions, and the ethanol concentration used. Although the 92 above-mentioned studies provided useful insights into the genetic determinants of 93 tolerance to a range of ethanol concentrations, they did not give insight into those 94 that are specific to very high ethanol concentrations (i.e. in the range of 16 to 18%) in 95 natural and industrial strains. 96 97

5
We have focussed on the very high ethanol tolerance of VR1, a yeast strain used in 98 industrial bio-ethanol production, in comparison with the low tolerance of the S288c-99 derived laboratory strains. The VR1 strain is a natural strain that occurred as a wild 100 yeast contaminant in a Brazilian bio-ethanol production plant (3). It was selected as a 101 production strain because of its dominance in the yeast recycling system and other 102 favourable characteristics for industrial bio-ethanol production, including very high 103 ethanol tolerance. Identification of genetic elements important for the very high 104 ethanol tolerance of VR1 by linkage mapping with a series of S288c laboratory 105 strains containing large numbers of artificially introduced genetic markers, identified 106 the ura3Δ0 mutation of the artificially marked strain as the causative mutation. 107 Further exploration of this finding revealed that other auxotrophic mutations also 108 reduce tolerance to very high ethanol concentrations (although to different extents), 109 and that this effect is not observed with moderate concentrations. For uracil and 110 leucine, the effect could be linked to the relative uptake rate of the auxotrophic 111 nutrient. Examination of other stress conditions showed that the effect of 112 auxotrophies also depends on the type of stress and auxotrophy, and especially the 113 concentration of the auxotrophic nutrient in the medium as compared to the 114 concentration that is limiting growth. 115 116
6
Materials and methods 117 Strains and cultivation conditions 118 All S. cerevisiae strains were routinely maintained on solid YPD medium containing 119 1% yeast extract, 2% bacto peptone, 2% glucose, and 1.5% agar. Ethanol tolerance 120 assays were performed on solid YP and YPD medium containing ethanol at the 121 indicated concentrations (v/v). Other stress tolerance assays were performed on 122 solid YPD medium containing 0.3% or 0.4% (v/v) acetic acid at pH 5; YPD containing 123 4.0 mM or 4.5 mM H2O2; YPD containing 1.50 M or 1.75 M NaCl, and YP containing 124 25% or 30% glucose. Stress tolerance assays with limiting amounts of either uracil or 125 leucine were performed on minimal medium containing complete synthetic drop-out 126 amino acid/nucleotide mixture (amount according to the manufacturer’s instruction), 127 0.17% yeast nitrogen base without amino acids and ammonium sulphate, 0.5% 128 ammonium sulphate, 2% glucose, 1.5% agar, and different amounts of uracil (0.005 129 to 0.400 mM) or leucine (0.05 to 2.00 mM), respectively. The pH of the media was 130 adjusted to 6.5 with 4 M KOH. After autoclaving, different concentrations of ethanol 131 or NaCl were added to the medium as indicated. Transport assays were performed in 132 minimal medium with 2% glucose, or yeast nitrogen base (YNB) medium containing 133 0.17% yeast nitrogen base without amino acids and ammonium sulphate, and 2% 134 glucose. The pH of the YNB medium was adjusted to 4.8 with HCl. All concentrations 135 mentioned above are in weight per volume unless indicated differently. 136 137 Minimal media for the selection of URA3 transformants, and for the linkage analysis 138 of the auxotrophic alleles contained CSM-AA (amounts according to the 139 manufacturer’s instructions), 0.17% yeast nitrogen base without amino acids and 140 ammonium sulphate, 0.5% ammonium sulphate, 2% glucose, and 1.5% agar. The pH 141 of the minimal media was adjusted to 6.5 with 4 M KOH. 142 143
7
All strains used in this study are listed in Table 1. Strain pAMS (ura3Δ0::URA3) was 144 constructed by transforming a partial artificially marked strain with a DNA fragment 145 containing the URA3 open reading frame (ORF) flanked by a 496-bp upstream and a 146 247-bp downstream region homologous to the borders of the ORF. The fragment 147 was obtained by PCR amplification using primers URA3_upstream 148 (5’ATCATCTCATGGATCTGCAC) and URA3_downstream 149 (5’CGTCCATCTTTACAGTCCTG) on genomic DNA from VR1-5B. Transformants 150 were selected on minimal medium without uracil. In the same way, URA3 was 151 integrated in BY4741, BY4742 and seven segregants from the VR1-5B/BY4741 152 hybrid strain. 153 154 Strain S288c leu2∆ was constructed by transforming S288c (MATa) with a KanMX 155 deletion cassette flanked by 50-bp regions homologous to the borders of the LEU2 156 ORF. The KanMX deletion cassette was obtained by PCR amplification using primers 157 leu2-A1 158 (5’TTTTCTTACCTTTTACATTTCAGCAATATATATATATATATTTCAAGGATATACCATTCTA159 GTGGTCGGCTGGAGATCGG) and leu2-A2 160 (5’TTCTATTATGAATTTCATTTATAAAGTTTATGTACAAATATCATAAAAAAAGAGAATCTTT161 AGCCGTTATGGCGGGCATC) on pJET1,2-attB-KanMX-attP plasmid DNA (26). 162 Transformants were selected on minimal medium without leucine. All transformations 163 and DNA manipulations described above were performed by standard methods (27), 164 and verified by PCR and DNA sequence analysis. 165 166 Artificial genetic markers for linkage analysis 167 We have integrated about 550 artificial markers in the genome of the commonly used 168 laboratory strains BY4741 and BY4742 (28). The markers were integrated using a 169 ligase-free, PCR-based allele replacement method (GeneWeaverTM II) (29). The 170 marker sequences are artificial, unique sequences of 20 bp that do not show 171

8
sequence similarity to the S. cerevisiae genome. They are preceded by the 8-bp 172 recognition sequence for the rare-cutting restriction enzyme FseI, which was 173 originally added to allow specific cleavage of genomic fragments at the marker 174 positions. The markers were integrated at a distance of about 20 Kb (~7 cM) at 175 presumably neutral positions, i.e. outside open reading frames, promotor and 176 terminator regions, and possible regulatory sequences. 177 178 The artificial markers were inserted in parallel in a series of BY laboratory strains and 179 subsequently concentrated by a combination of parallel crosses and serial back 180 crosses. In this way we obtained a small number of strains with partially overlapping, 181 and different numbers of artificial markers that together cover the whole genome. 182 These strains were called partial artificially marked strains (pAMS). The artificial 183 markers can be detected by PCR in which the direct primer is complementary to the 184 marker sequence and the indirect primer to a sequence 200 to 400 bp downstream of 185 the marker integration site. 186 187 Linkage mapping 188 The highly ethanol tolerant segregant VR1-5B was crossed with 28 pAMS strains. 189 The pAMS strains were selected based on their total number of markers and the 190 presence of unique markers. We refer to Fig. S1 for the genetic map combining all 191 artificial markers present in the 28 pAMS strains. The VR1-5B/pAMS hybrid strains 192 were then sporulated, and segregants were isolated using a dissection microscope 193 MSM 300 from Singer Instrument Co Ltd (Watchet, UK). Mating, sporulation, and 194 tetrad analysis were performed by standard methods (30), and mating types were 195 determined by diagnostic PCR for the MAT locus (31). The segregants were 196 subsequently scored for ethanol tolerance, as described in the paragraph stress 197 tolerance assays. Next, the presence of the artificial markers in the highly ethanol 198 tolerant segregants was scored by PCR. For each marker, a deviation from 50% 199
9
inheritance was weighed using an exact binomial test with a confidence level of 95%. 200 Correction for multiple testing was carried out using a false discovery rate (FDR) 201 control according to Benjamini-Yekutieli (32). 202 203 Stress tolerance assays 204 Cells taken from solid YPD medium were transferred to 3 mL of liquid YPD or 205 minimal medium in a glass tube, and cultivated for 3 days in an orbital shaker at 200 206 rpm and 30°C. The cultures were then diluted in water to an optical density (OD600) of 207 0.5, and further serially diluted to obtain a twofold (100 until 8.10-3) or tenfold dilution 208 range (100 until 10-3). Exactly 5 μL of the dilution range was spotted on solid YPD, YP 209 or minimal medium containing different stress factors as indicated. Growth was 210 scored after 1 day for control YPD plates, and after 2 to 11 days, as indicated, for 211 plates with different concentrations of ethanol or other stress factors. All plates were 212 incubated at 30°C, except for the heat stress tolerance assay, in which case the 213 plates were incubated at 39°C or 40°C. All stress tolerance assays were repeated at 214 least three times, and representative results are shown. 215 216 Transport assays 217 Cells of S288c, S288c ura3-52 and S288c leu2∆ in 5 mL of minimal medium were 218 cultivated overnight in an orbital shaker at 200 rpm and 30°C. Each preculture was 219 then used to inoculate 200 mL of YNB medium containing 2% glucose (pH 4.8). The 220 cells were grown to an OD600 of 1 to 2, after which they were harvested by 221 centrifugation (3000 rpm for 5 min), washed twice with MES/KOH (25 mM, pH 6), and 222 resuspended in fresh YNB medium to a final cell concentration of 160 mg mL-1. 50 µL 223 of this cell suspension was transferred to a new centrifuge tube, and incubated for 10 224 min at 30°C. In order to start the transport measurement, a volume of 40 µL of a 225 specific ethanol concentration was first added to the cell suspension. After 5 min of 226 incubation, 10 µL of either [3H]-labeled uracil to a final concentration of 0.05 mM 227
10
(Perkin Elmer), or [14C]-labeled L-leucine to a final concentration of 2.5 mM (Perkin 228 Elmer), was added to the suspension. After 2 min of incubation, 5 mL of ice-cold 229 water was added to stop the uptake of the radiolabeled nutrients. The cells were 230 collected using a glass microfiber filter (Whatman GF/C, retention particle size 1.2 231 µm), saturated with unlabelled nutrient solution, and immediately washed twice with 5 232 mL of ice-cold water. For both transport assays (uracil and leucine), three samples 233 with radiolabeled nutrient and two blanks (addition of 5 mL of ice-cold water followed 234 by the addition of radiolabeled nutrient) were analysed. The radioactivity on the filter 235 was counted in a liquid scintillation counter (Beckman Coulter LS6500). A 500 µL 236 aliquot of the cell suspension was taken to determine protein content using Bradford 237 method. Transport activity was expressed as nmol substrate transported per min and 238 mg of protein, and as a percentage of the transport rate in the absence of ethanol. 239
11
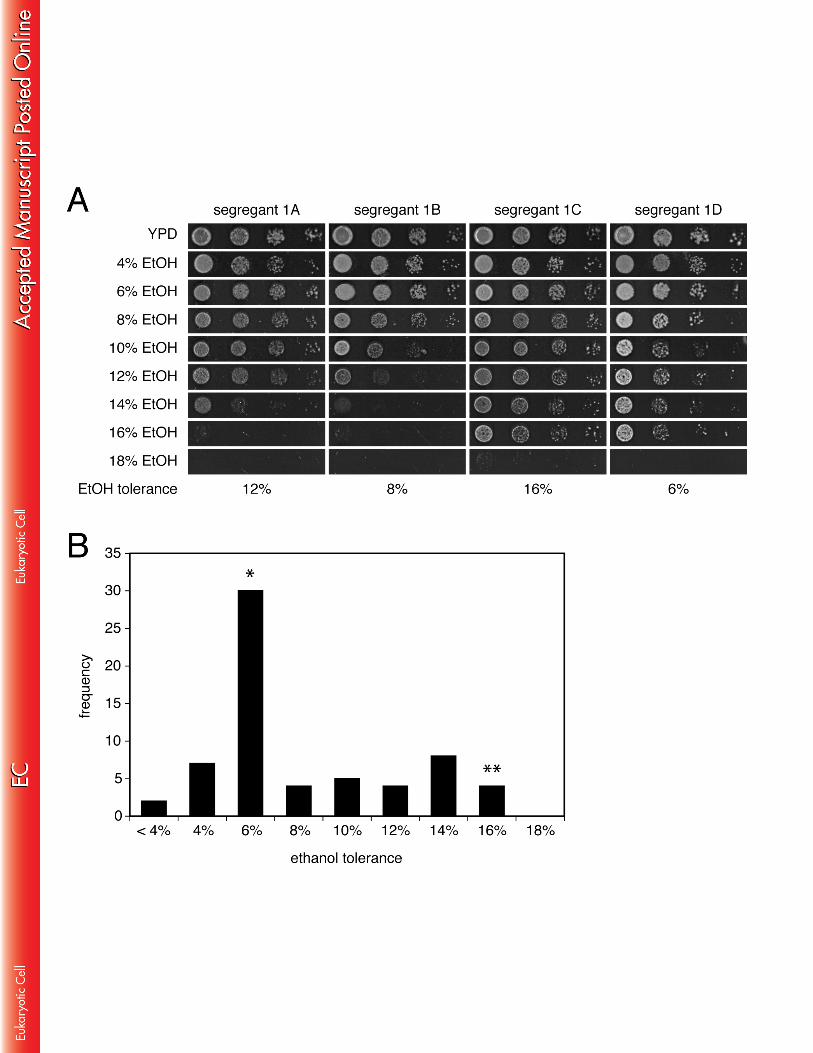
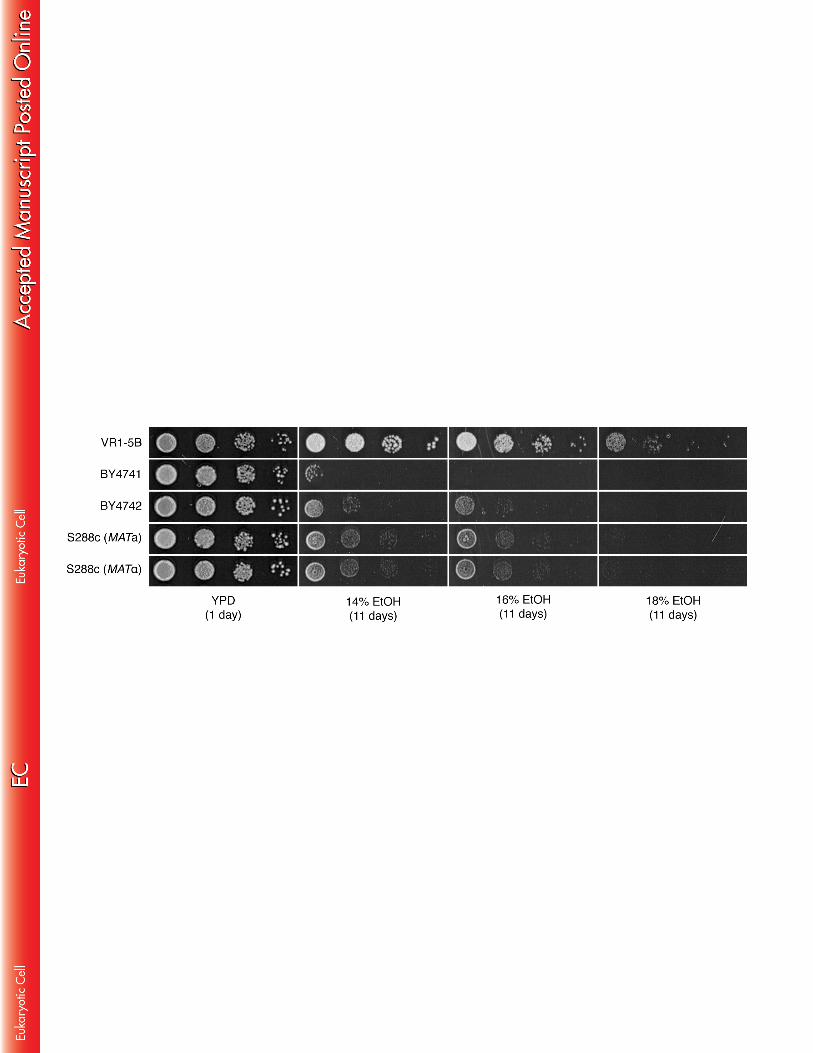
Results 240 Identification of a segregant from VR1 with very high ethanol tolerance 241 VR1 is a diploid strain and thus we first isolated a segregant with similarly high 242 ethanol tolerance in order to be able to perform quantitative trait locus (QTL) 243 mapping by crossing (33). We sporulated VR1 and isolated segregants using a 244 dissection microscope. All segregants were haploid indicating that VR1 is a 245 heterothallic strain. To assay ethanol tolerance of VR1 and its segregants, we scored 246 their growth on solid YP medium containing different concentrations of ethanol. 247 Ethanol tolerance can be scored in different ways; in previous work, ethanol 248 tolerance has usually been determined by measuring growth on glucose in the 249 presence of ethanol (1, 17, 18, 20, 22, 23). However, in the current study, high 250 variability among biological replicates was observed when ethanol tolerance was 251 scored in the presence of glucose. We therefore decided to determine ethanol 252 tolerance by screening on a medium with only ethanol as a carbon source and no 253 added sugar. Although it cannot ruled out that under these conditions also 254 segregants with high ethanol consumption rates are selected, those segregants must 255 also contain genetic determinants of high ethanol tolerance. In fact, cells that grow 256 well on high concentrations of ethanol are expected to also need a high tolerance to 257 such ethanol concentrations. 258 259 VR1 grew on medium containing up to 16% ethanol, which was significantly higher 260 than the diploid BY strain that did not grow on more than 14% ethanol (Fig. 1). We 261 identified a stable haploid segregant from VR1 with an even higher ethanol tolerance 262 (referred to as VR1-5B) (Fig. 1) (33). The difference in ethanol tolerance between 263 VR1 and VR1-5B may be due to the presence of recessive mutations in the diploid 264 strain and/or to the difference in ploidy between the two strains. In fact, it was 265 previously observed that haploid strains are slightly more ethanol tolerant than their 266 corresponding homozygous diploids (34). The diploid VR1-5B/BY4741 hybrid 267
12
displayed an ethanol tolerance phenotype at least as high as VR1, which indicates 268 that the very high ethanol tolerant phenotype of VR1 is dominant (Fig. 1). The fact 269 that VR1-5B/BY4741 has a slightly higher ethanol tolerance as compared to VR1 270 supports the idea that the phenotype is determined (at least in part) by recessive 271 mutations, of which the phenotypic expression is not complemented in the hybrid 272 background. Another explanation for the difference in tolerance between both strains 273 might be that also alleles from BY4741 contribute to the ethanol tolerance phenotype 274 of the hybrid. 275 276 In order to determine the distribution of ethanol tolerance in segregants from the 277 VR1-5B/BY4741 hybrid, we analysed the growth of 16 complete tetrads on solid YP 278 medium with ethanol concentrations ranging from 4% to 18%. The ethanol tolerance 279 of each strain was scored as the maximum ethanol concentration at which its growth 280 was still visually the same as on the control plate without ethanol (Fig. 2A). The 281 segregants exhibited a wide range of ethanol tolerance: the bulk of the segregants 282 displayed an ethanol tolerance phenotype of 6%, while the highest ethanol tolerance 283 observed was 16%, similar to that of VR1-5B (Fig. 2B). This indicates that ethanol 284 tolerance is not a continuous trait, at least not in the segregants from this specific 285 cross. Single or low numbers of causative mutant alleles may have only little effect in 286 conferring high ethanol tolerance while the presence of multiple mutant alleles might 287 be required. Alternatively, a single mutant allele from the BY background may have a 288 detrimental effect on high ethanol tolerance whatever other mutant alleles present. 289 We decided to use growth in the presence of 16% ethanol for the selection of very 290 high ethanol tolerant segregants for the genetic mapping experiment. With this 291 condition, we assumed that the selected segregants must contain at least all major 292 genetic elements from VR1-5B that are responsible for its very high ethanol tolerance. 293 294 Linkage analysis of very high ethanol tolerance using artificial markers 295
13
In our previous study, we have crossed the highly ethanol tolerant segregant VR1-5B 296 with a number of partial artificially marked strains (hereafter referred to as pAMS) 297 (33). These strains contain variable numbers of unique 20-bp oligonucleotide 298 markers that were inserted in presumably neutral genomic locations at intervals of 299 about 20 Kb in the BY genetic background. We refer to the Materials and Methods 300 section for a detailed description of the construction of the pAMS. After sporulation, 301 5974 segregants were isolated and subsequently scored for ethanol tolerance by 302 assaying growth on 16% ethanol. The segregants displayed a wide range of ethanol 303 tolerance, with about 1 in 44 (i.e. 136 of 5974 segregants phenotyped in total) 304 displaying ethanol tolerance similar to the VR1-5B parent strain (16%). This ratio 305 predicts 5 to 6 unlinked loci (1/44 = 1/25.5) that are responsible for the difference in 306 ethanol tolerance between VR1-5B and BY. However, this is only true if all loci are 307 truly unlinked and in case each locus has an indispensable contribution to the 308 phenotype. 309 310 The high ethanol tolerant segregants were then applied in a QTL mapping 311 experiment using pooled-segregant whole-genome sequence analysis, in which 312 genetic differences that naturally occurred between the parent strains were used as 313 markers (33). Our results identified three major QTLs, and further downscaling of the 314 QTL with the strongest linkage (on chromosome XIV) revealed three closely located 315 genes affecting very high ethanol tolerance: MKT1, SWS2, and APJ1. In the current 316 study, the same segregants were applied in a new QTL mapping experiment, with 317 the difference that the artificially introduced sequences were used as markers. We 318 first scored the presence of the artificial markers in each of the high ethanol tolerant 319 segregants by PCR, and then calculated the probability of random segregation for 320 each marker (Fig. S2). Significant linkage with the VR1-5B background, i.e. absence 321 of the artificial markers in most of the segregants, was found for the region between 322 markers 150 and 157 on chromosome V, with the lowest p value for marker 154 323
14
(8.4.10-12; Fig. 3A). The auxotrophic gene URA3 is in close proximity of this marker, 324 and was an obvious candidate gene because of the presence of the ura3Δ0 mutation 325 in the BY genetic background of the pAMS. 326 327 The contribution of URA3 to very high ethanol tolerance 328 In order to evaluate whether URA3 was indeed the causative gene in the linked locus 329 on chromosome V, we integrated the VR1-5B allele of URA3 at its original position in 330 the BY4741 and BY4742 laboratory strains, and in seven segregants from the VR1-331 5B/BY4741 hybrid strain that contained the ura3Δ0 mutation and showed different 332 levels of ethanol tolerance. In all cases, an increase in ethanol tolerance was 333 observed after integration of URA3, thereby confirming the relevance of the gene for 334 the phenotype (Fig. 3C). 335 336 Next, we determined whether URA3 was the only causative gene in the locus by 337 performing a new mapping experiment using a pAMS in which the ura3Δ0 mutation 338 had been replaced by the VR1-5B allele of URA3. This strain contained the artificial 339 markers 149 to 157 that cover the entire locus. The strain was crossed with VR1-5B, 340 and a total of 779 segregants were isolated and assayed for ethanol tolerance. 341 Almost 1 in 30 segregants (i.e. 26 of 779 segregants phenotyped in total) displayed 342 an ethanol tolerance phenotype similar to VR1-5B (16%), predicting 4.9 unlinked 343 genetic loci (1/30 = 1/24.9). This number is lower than the previously calculated 5.5 344 with the pAMS containing the ura3Δ0 mutation, and would therefore be consistent 345 with URA3 being the only causative gene in the identified locus. We scored the 346 presence of the artificial markers 149 to 157 in the 26 highly ethanol tolerant 347 segregants. Calculation of the p values resulted in a value of 1 for all markers (Fig. 348 3B), indicating that the linkage with the high ethanol tolerance phenotype was lost 349 when the wild-type URA3 gene was present in this locus in both parent strains [i.e. 350 VR1-5B and pAMS (ura3Δ0::URA3)]. This result indicated that URA3 was indeed the 351

15
only genetic element in the linked locus on chromosome V that contributed to the 352 difference in ethanol tolerance between VR1-5B and BY. 353 354 The contribution of other auxotrophic marker genes to very high ethanol 355 tolerance 356 After identifying the auxotrophic ura3Δ0 mutation as causing reduced tolerance to 357 very high ethanol concentrations, we examined whether other auxotrophic mutations 358 have a similar effect. The two strains that were used for the construction of the pAMS 359 were the laboratory strains BY4741 and BY4742. These strains share three 360 auxotrophic alleles (ura3Δ0, his3Δ1 and leu2Δ0), and differ in two auxotrophic alleles 361 (met15Δ0 in BY4741 and lys2Δ0 in BY4742) (28). 362 363 We investigated linkage between the very high ethanol tolerance phenotype and the 364 additional auxotrophic mutations of the laboratory yeast strains. We therefore scored 365 the presence of each mutation in the very high ethanol tolerant segregants from the 366 VR1-5B/pAMS hybrid strains (in which pAMS was deleted for the auxotrophic gene 367 under study) by growth tests on minimal media lacking the corresponding 368 auxotrophic nutrient. In this way, significant linkage was found for all auxotrophic 369 genes investigated (i.e. HIS3, LEU2, MET15 and LYS2) (Table 2); however, the 370 linkage was weaker than for URA3. 371 372 In addition we grew the auxotrophic BY strains and their prototrophic S288c 373 counterparts (MATa and MATα) on YP medium containing very high concentrations 374 of ethanol (Fig. 4). The prototrophic strains clearly showed a higher ethanol tolerance 375 than the auxotrophic strains, which supports our finding that auxotrophic mutations 376 increase the sensitivity to very high ethanol stress. 377 378
16
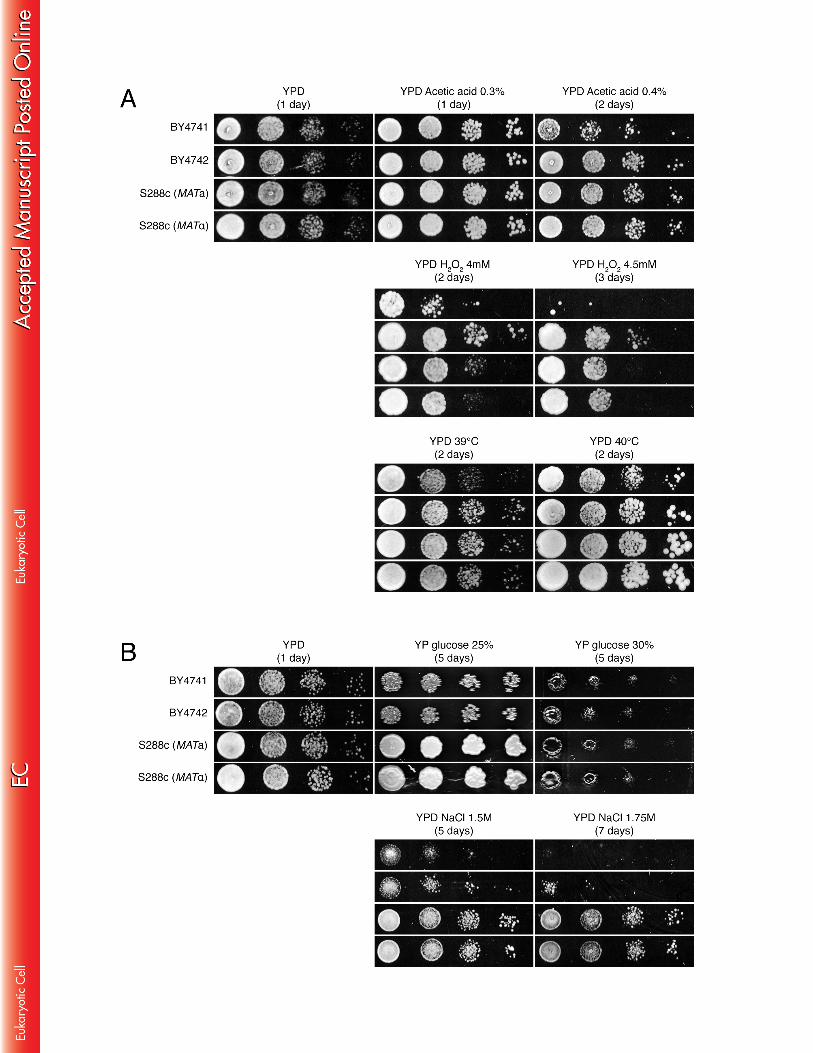
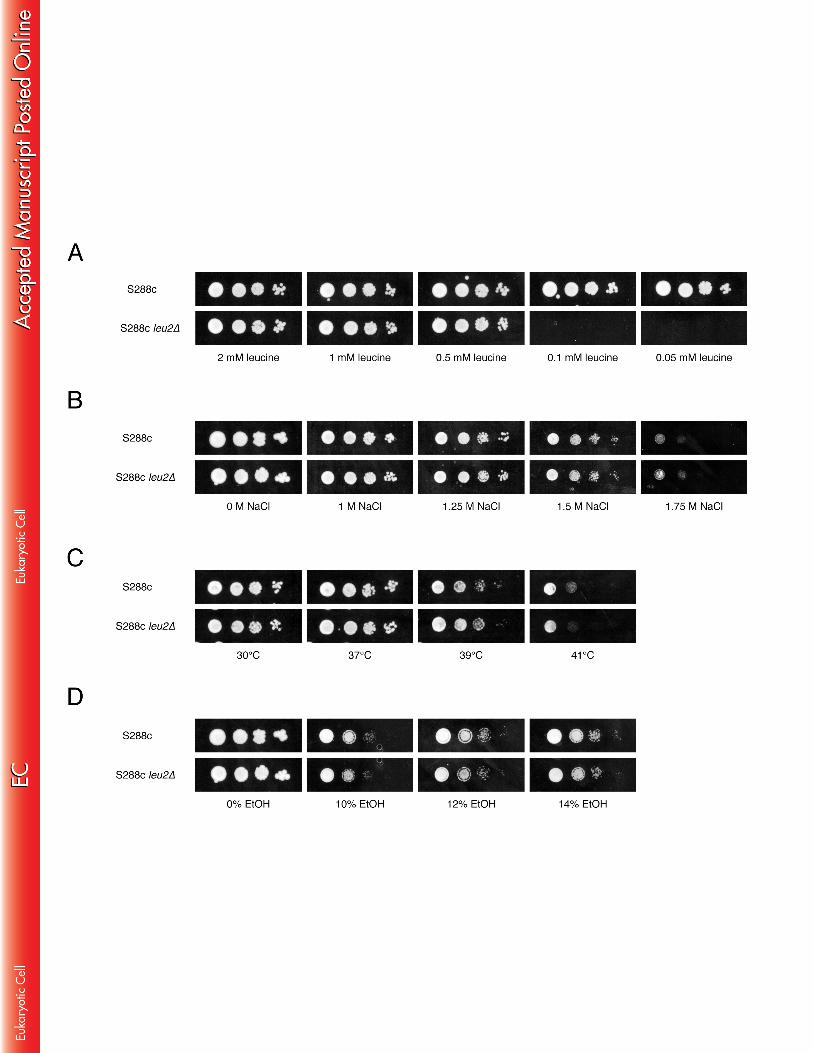
In summary, we have identified five auxotrophic mutations that are to some extent 379 linked to the low ethanol tolerance of BY. However, the ethanol tolerance of VR1-5B 380 was still much higher than that of the prototrophic S288c strains (Fig. 4), indicating 381 that the auxotrophic mutations, although significant, are not the sole cause of the 382 difference in ethanol tolerance between VR1-5B and BY. The identification of genetic 383 elements other than the auxotrophic mutations that contribute to the very high 384 ethanol tolerance phenotype of VR1-5B has been reported previously (33). 385 386 Specificity of the auxotrophic mutations for tolerance to moderate as opposed 387 to very high ethanol concentrations, and to other stress conditions 388 Virtually all previous studies on ethanol tolerance in S. cerevisiae have been 389 performed with moderate concentrations of ethanol (i.e. 6% to 12%). As none of 390 these studies have ever associated auxotropic mutations with ethanol tolerance, we 391 examined whether this association is concentration dependent. This was studied in 392 more detail by comparing growth of the auxotrophic BY4741 and BY4742 strains with 393 that of their prototrophic S288c counterparts on YP medium containing moderate to 394 high concentrations of ethanol (10% to 16%) (Fig. 5). Interestingly, the auxotrophic 395 strains grew better than the prototrophic strains on 10% and 12% ethanol, whereas 396 the opposite was observed on 14% and 16% ethanol (Fig. 5A). When 2% glucose 397 was added to the medium, no difference in growth was observed in the presence of 398 10% ethanol, whereas at higher concentrations, the prototrophic strains grew again 399 better than the corresponding auxotrophic strains (Fig. 5B). The better growth of the 400 prototrophic strains in the presence of high ethanol concentrations may be due to 401 inhibition of uptake of auxotrophic nutrients, but the better growth of the auxotrophic 402 strains at low ethanol concentrations is more difficult to explain. Prototrophic strains 403 must have a balance between uptake and biosynthesis of the nutrients that can only 404 be made available by uptake in auxotrophic strains. Both systems, transport and 405 biosynthesis, require energy and the presence of ethanol may affect the balance 406
17
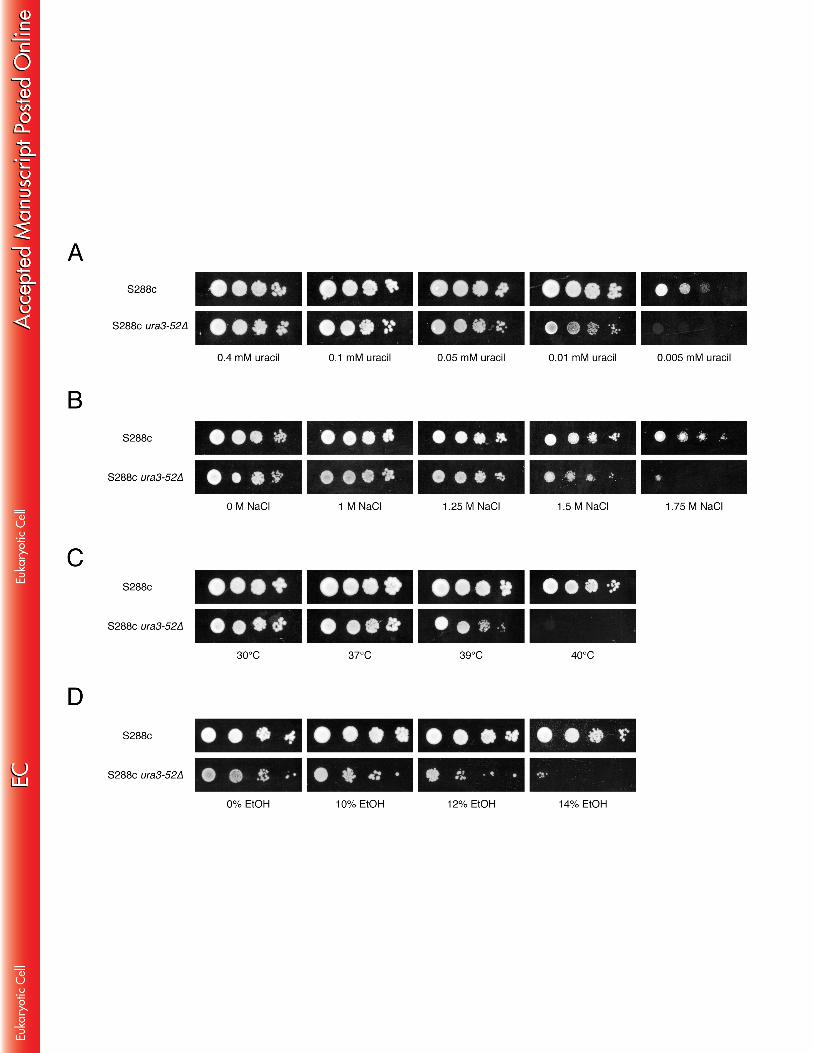
towards a more unfavourable situation in the prototrophic strains. BY4741 and 407 BY4742 are derivatives of S288c. The strains are in principle isogenic except for the 408 auxotrophic markers. BY4741 and BY4742 have the same auxotrophies for his3∆1, 409 leu2∆0 and ura3∆0 while they vary for met15∆0 and lys2∆0, respectively. Hence, the 410 small differences in ethanol tolerance between BY4741 and BY4742 may be due to 411 this difference in auxotrophies or to background mutations spontaneously generated 412 during cultivation of the strains. 413 414 In addition, we determined tolerance to other stress factors on YPD medium: acetic 415 acid at pH 5, hydrogen peroxide, high temperature, and osmotic stress. The doses 416 that were applied are generally considered to cause high levels of stress, and also 417 under our conditions they caused a strong growth delay (Fig. 6). No significant 418 difference between the auxotrophic and prototrophic strains was observed for acetic 419 acid, hydrogen peroxide and high temperature stress (under all conditions BY4741 420 was somewhat more sensitive than BY4742 and both S288c strains) (Fig. 6A). On 421 the other hand, under conditions of osmotic stress caused by either high glucose or 422 NaCl concentrations, the prototrophic strains grew significantly better than the 423 auxotrophic strains (Fig. 6B). Thus, under conditions of osmotic stress a similar 424 difference in growth between the auxotrophic and prototrophic strains as under high 425 ethanol stress could be observed. 426 427 Exposure to very high ethanol concentrations inhibits nutrient uptake 428 In order to determine whether the growth inhibition of auxotrophic strains under 429 stress is due to impairment of nutrient uptake, we compared the growth of the 430 prototrophic S288c strain with that of strains S288c ura3-52 and S288c leu2∆ on 431 minimal medium with limiting amounts of uracil and leucine, respectively, combined 432 with different stress factors (high ethanol and NaCl concentrations, and as control 433 also high temperature). First, we determined the minimal amount of uracil and 434

18
leucine that is required for growth of the respective auxotrophic strains by performing 435 a spot assay on minimal medium with different concentrations of the auxotrophic 436 nutrient. Strain S288c ura3-52 was not able to grow on minimal medium containing 437 less than 0.05 mM uracil (Fig. 7A), while strain S288c leu2∆ was not able to grow on 438 minimal medium containing less than 0.5 mM leucine (Fig 8A). In case of strain 439 S288c ura3-52, growth on minimal medium containing 0.05 mM uracil was inhibited 440 by high osmotic stress (Fig. 7B), high temperature (Fig. 7C), and high ethanol 441 concentrations (Fig.7D). Hence, thermotolerance was now also reduced as opposed 442 to what was previously observed for rich medium (Fig. 6A). On the other hand, no 443 effect on growth of S288c leu2∆ was observed on minimal medium containing 0.5 444 mM leucine under all conditions mentioned above (Fig. 8B-C-D). 445 446 Furthermore, we investigated the effect of different ethanol concentrations on the 447 uptake rate of uracil and leucine. We found that the transport rate of uracil is less 448 sensitive to high ethanol concentrations than the transport rate of leucine. The uptake 449 rate of radiolabeled uracil decreased with ∼40% in the presence of 18% ethanol, 450 while the uptake rate of leucine decreased with ∼80% under the same conditions 451 (Fig.9A-B). On the other hand, the absolute transport rate of uracil was ∼500-fold 452 lower than that of leucine, already in the unstressed condition, which can explain why 453 strains with uracil auxotrophy are more sensitive to high ethanol stress than strains 454 with leucine auxotrophy. The reason for the increase in uracil uptake rate with 455 moderate ethanol concentrations is not clear. It could be due to a direct effect of 456 ethanol on the protein structure of the uracil transporter or to an indirect effect of 457 ethanol on the structure of the phospholipid membrane. 458 459
19
Discussion 460 The analysis of polygenic traits has been very cumbersome even in a powerful 461 genetic model organism such as S. cerevisiae. The interdependent and complex 462 interactions and relationships between the genetic elements involved in such traits 463 make it in practice almost impossible to identify and study these elements separately. 464 Only recently, methodologies have become available that allow the mapping of 465 different genetic elements involved in polygenic traits simultaneously and with 466 reasonable efficiency (35, 36). The most widely used molecular markers in yeast are 467 natural variations detected as hybridization differences onto high-density 468 oligonucleotide arrays (37) or determined by whole-genome sequencing (38, 39). 469 Several polygenic traits have been investigated using these approaches, which has 470 led to the identification of loci, genes and single nucleotide polymorphisms involved 471 in high temperature growth (38, 39), sporulation efficiency (40), mRNA expression 472 profiles (41), acetic acid production (42), resistance to chemical agents (43), high 473 ethanol tolerance (33), maximal ethanol accumulation (44), low glycerol production 474 (45, 46) and thermotolerance (47). 475 476 We have constructed laboratory strains of S. cerevisiae with artificial genetic markers 477 inserted in the genome at predetermined, presumably neutral positions with a relative 478 distance of about 20 Kb. These equidistant markers provide a constant and universal 479 genetic map and can be scored in an easy and reliable manner. We have applied this 480 technology to a crucial polygenic trait of yeast, i.e. very high ethanol tolerance, which 481 is of both fundamental and applied interest. Although the presence of the artificial 482 markers in a laboratory strain may at first seem a disadvantage, for the analysis of 483 very high ethanol tolerance it provided us with two parent strains that are clearly 484 different in the phenotype of interest. Ethanol tolerance in practice can be quite 485 variable and for genetic mapping purposes it is essential that phenotypic differences 486 between segregants are due to genetic differences and not to experimental variability. 487
20
In this regard, we noticed that the variability between the ethanol tolerance 488 measurements was smaller when only ethanol was provided as a carbon source 489 compared to the condition where ethanol was added together with glucose. All 490 segregants selected for very high ethanol tolerance were phenotyped multiple times 491 in order to be sure that the phenotype was truly inherent to the strain and thus had a 492 genetic basis. 493 494 Our results show that the artificial markers provide a convenient approach for linkage 495 analysis. In one of the first mapping experiments, a significant linkage with markers 496 150 to 157 on chromosome V was identified. Calculation of the p values revealed 497 that at least 11 segregants with very high ethanol tolerance are required to obtain a 498 statistically significant conclusion about the presence of linkage between the trait and 499 specific markers. This is the case when a locus is indispensable for the phenotype 500 and therefore the markers in this locus are absent or present in all segregants. The 501 lower the contribution of the locus to the trait, the more segregants are required to 502 demonstrate significance of the linkage. Our results also revealed that with a relative 503 distance of 20 Kb, several consecutive markers showed linkage with very high 504 ethanol tolerance. Therefore, any genetic element with an important contribution to 505 the trait of interest will be revealed with high reliability by this technology. 506 507 The observation that the URA3 gene is linked to the very high ethanol tolerance 508 phenotype of the VR1 bioethanol production strain raised several interesting 509 questions. First, how could an auxotrophic mutation affect ethanol tolerance? Since 510 the plasma membrane is generally considered as an important target of ethanol 511 toxicity (1), the very high ethanol concentrations that have been used in our assays 512 may have inhibited nutrient uptake across the plasma membrane. Therefore, an 513 auxotrophic strain would be more compromised for growth in the presence of very 514 high ethanol concentrations as compared to a prototrophic strain. Inhibition of 515
21
nutrient uptake in the presence of ethanol has been described previously, for 516 instance in the case of amino acid uptake by the proton symporter Gap1 (48). Since 517 ethanol increases the passive influx of protons across the plasma membrane (49), it 518 can be expected that symport is more sensitive to ethanol inhibition than facilitated 519 diffusion. This indeed seems to be reflected in several experimental findings. In the 520 case of acetic acid it has been shown that uptake by symport is inhibited by ethanol, 521 whereas uptake of the compound by passive influx is actually enhanced by ethanol 522 (50). In addition, in S. cerevisiae where glucose transport occurs by facilitated 523 diffusion, transport is not inhibited by ethanol concentrations up to 13% (51), while in 524 mammalian systems, where glucose uptake occurs by Na+-symport, inhibition by 525 ethanol has been shown (52, 53). These results point to the electrochemical ion 526 gradient over the plasma membrane as a major target for high ethanol stress. On the 527 other hand, we cannot exclude that very high ethanol concentrations also have a 528 direct destabilizing effect on the structure and/or functionality of the transporters in 529 the plasma membrane. 530 531 A second question raised by our results was whether other auxotrophic mutations 532 also reduce very high ethanol tolerance. If this were the case, it would support the 533 hypothesis that compromised nutrient uptake is responsible for the impaired growth 534 of auxotrophic strains in the presence of very high concentrations of ethanol. Our 535 results showed that also other auxotrophic genes are linked to the ethanol tolerance 536 phenotype, and this was further supported by our observation that prototrophic 537 S288c strains are clearly more ethanol tolerant than their auxotrophic counterparts. 538 The linkage with very high ethanol tolerance was much stronger for the pyrimidine 539 biosynthesis gene URA3 as compared to the amino acid biosynthesis genes HIS3, 540 LEU2, MET15 and LYS2. A possible explanation might have been that uracil uptake 541 in yeast is more sensitive to very high ethanol levels than the uptake of amino acids. 542 We confirmed that the uptake rate of uracil and leucine is reduced with increasing 543
22
ethanol concentrations. However, the uptake rate of uracil was actually less affected 544 by high ethanol concentrations than that of leucine, but the absolute activity of uracil 545 uptake is 500-fold lower than that of leucine (both in the ura3Δ0 mutant and in the 546 wild type strain, and in the absence of ethanol). This may explain why ura3 mutants 547 are more sensitive to ethanol than leu2 mutants; their uracil uptake activity may 548 easily drop to levels limiting growth. Uracil uptake is carried out by only one carrier, 549 Fur4, and since natural yeast strains are prototrophic for uracil, uptake of uracil by 550 Fur4 might be an auxillary, dispensable function (54). This would explain the very low 551 uptake rate. Amino acid uptake, on the other hand, seems to be much more 552 important for yeast. It is actually essential in media without ammonium and also limits 553 growth in media with low ammonium. All the protein amino acids can be taken up by 554 multiple amino acid permeases (55). The difference in absolute uptake rate and the 555 negative effect of high ethanol on uracil and leucine uptake may not be the only 556 factors responsible for the higher ethanol sensitivity of ura3 mutants compared to 557 leu2 mutants. One or more enzymes involved in uracil incorporation into metabolism 558 may be more sensitive to high ethanol concentrations than the enzymes involved in 559 leucine utilization, which would further compromise the limiting availability of uracil for 560 cell multiplication. We propose that very high ethanol concentrations generally 561 compromise the uptake of nutrients required to fulfil auxotrophic requirements. The 562 ethanol tolerance of VR1-5B, however, was still appreciably higher than that of the 563 prototrophic laboratory strains, indicating that other genetic elements in the VR1-5B 564 background contribute to its very high ethanol tolerance (33). 565 566 In previous research on the molecular basis of ethanol tolerance, a linkage with 567 auxotrophic mutations has never been noticed. However, this research was solely 568 performed with laboratory yeast strains displaying moderate ethanol tolerance, and 569 therefore only moderate ethanol concentrations were added to the medium (17, 18, 570 20, 22-24). We have now confirmed that auxotrophies are not disadvantageous for 571

23
growth in the presence of low to moderate ethanol concentrations, and that with 572 specific ethanol concentrations they even improve growth. It is likely that low to 573 moderate ethanol concentrations have little or no effect on nutrient uptake across the 574 plasma membrane, and that therefore auxotrophic requirements, which strongly 575 depend on nutrient uptake, have always remained unnoticed as an important factor in 576 ethanol tolerance. Another QTL mapping experiment in a cross between the sake 577 strain CBS 1585 and the lab strain BY identified URA3 as a causative gene for 578 maximal ethanol accumulation capacity, but it only had a very weak contribution for 579 ethanol tolerance of cell proliferation in the presence of 18 to 20% ethanol (44). This 580 result may at first seem surprising, but it is not in contradiction to our findings 581 because a different genetic background was used in this study. 582 583 Several previous papers have called for caution when using auxotrophic parent 584 strains in genetic experiments (15, 16, 56-58). We have now shown that in rich 585 medium the auxotrophic mutations do not seem to interfere with tolerance to any of 586 the other stress factors tested, i.e. acetic acid at pH 5, hydrogen peroxide and high 587 temperature, except for osmotic stress caused by either high glucose or NaCl 588 concentrations. Hence, osmotic stress may have a similar inhibiting effect on the 589 uptake of auxotrophic nutrients as high ethanol stress in rich medium. However, 590 when the ura3-52∆ strain was grown in minimal medium with a uracil concentration 591 close to that limiting growth, not only high ethanol and high salt but also high 592 temperature inhibited growth. This suggests that stress conditions inhibit growth of 593 auxotrophic strains depending on the growth conditions, and that they do this by 594 reducing the uptake of the auxotrophic nutrient to a level below what is required for a 595 regular growth rate under the specific growth condition used. 596 597 Cohen and Engelberg (59) reported that some commonly used S. cerevisiae 598 laboratory strains, among which BY4741, do not grow on synthetic complete medium. 599
24
Using a 2μ library, they showed that this growth defect could be complemented by 600 enhancing leucine transport (BAP2 and TAT1) or by restoring the ability to synthesize 601 leucine (LEU2). In another study, a mutated dominant allele of the transcription factor 602 Spt15 was identified that conferred increased ethanol/glucose tolerance to BY4741 603 (60). In an attempt to use this mutated allele to improve the ethanol tolerance of 604 various other yeast strains, it was discovered that the improved growth was only 605 manifested in media with limiting amounts of leucine, irrespective of the presence of 606 ethanol (61). Thus the supposedly improved ethanol tolerance of BY4741 with the 607 mutated SPT15 allele could be attributed to an improved uptake of leucine in media 608 with a limiting concentration of this nutrient. In these two cases, the growth defect of 609 the leucine auxotrophic BY4741 strain was only observed in media with limiting 610 amounts of leucine, suggesting that sufficient leucine in the medium can overcome 611 the poor leucine transport in BY4741. In our study, on the other hand, we found a 612 significant linkage between LEU2 and growth on rich complex medium (YP) 613 containing 16% ethanol. We therefore assume that very high ethanol concentrations 614 have such a detrimental effect on plasma membrane transport that it prevents 615 sufficient leucine uptake to support a high growth rate, irrespective of the amount of 616 leucine present in the medium. Probably, the same conclusion can be drawn for the 617 other auxotrophies in the BY background. 618 619 Very high ethanol tolerance of yeast is a property of great industrial relevance. A 620 general issue in industrial yeast fermentations, whether for the production of alcoholic 621 beverages or for the production of bio-ethanol, is the conspicuous drop in the 622 fermentation rate once the ethanol concentration surpasses 8-12%. A slower 623 fermentation rate lowers the productivity of the ethanol factory, increases the chance 624 of contamination, and especially affects the conversion of the residual sugars. In 625 starch-based fermentations (e.g. with beer wort or with corn starch hydrolysate) the 626 last sugar taken up is maltotriose, which is transported by the low capacity symporter 627
25
Agt1 (62, 63). Also in wine fermentations, incomplete usage of residual fructose is a 628 common cause of sluggish and stuck fermentations (64). Our results suggest that 629 compromised plasma membrane transport may be a common cause of reduced or 630 failing sugar consumption in the second phase of industrial yeast fermentations. 631 Although the auxotrophic mutations clearly point to inadequate nutrient uptake as a 632 possible cause of ethanol sensitivity, they are not directly useful for further 633 improvement of ethanol tolerance in industrial yeast strains. On the other hand, our 634 results suggest that enhanced expression of transporters for micronutrients limiting 635 growth or for residual fermentation substrates may improve substrate to ethanol 636 conversion and thus increase the yield of the fermentations. In addition, causative 637 genes in the other mapped loci have to be identified. This has recently been 638 accomplished, which resulted in the identification of several previously unidentified 639 genes that are involved in tolerance to very high ethanol concentrations (33). 640

26
Acknowledgments 641 We wish to thank Henrique Amorim and Mario Lucio Lopes (Fermentec, Piracicaba, 642 Brazil) for the gift of the VR1 strain and for fruitful discussions. We thank Catherina 643 Coun, Kjell Lenaers, Ilse Palmans, Paul Vandecruys, Evy Vanderheyden and Willy 644 Verheyden for technical help with the experiments, and Nico Vangoethem for 645 preparation of the figures. This work has been supported by a predoctoral fellowship 646 to SS and a post-doctoral fellowship to KS from the Agency for Innovation by Science 647 and Technology (IWT-Flanders), and SBO grants (IWT 50148 and IWT 90043) from 648 IWT-Flanders, the EC 7th Framework program (NEMO project), IOF-Knowledge 649 platform (IKP/10/002 ZKC 1836) and BOF-Program financing (project NATAR) to 650 JMT. 651 652
27
References 653 1. Casey GP, Ingledew WM. 1986. Ethanol tolerance in yeasts. Crit Rev 654 Microbiol 13:219-280. 655 2. Garay-Arroyo A, Covarrubias AA, Clark I, Nino I, Gosset G, Martinez A. 656 2004. Response to different environmental stress conditions of industrial 657 and laboratory Saccharomyces cerevisiae strains. Appl Microbiol 658 Biotechnol 63:734-741. 659 3. Basso LC, de Amorim HV, de Oliveira AJ, Lopes ML. 2008. Yeast 660 selection for fuel ethanol production in Brazil. FEMS Yeast Res 8:1155-661 1163. 662 4. Kodama K. 1993. Sake-brewing yeast, p 129-168. In Rose AH, Harrison JS 663 (ed), The yeasts, vol 3. Academic Press, London. 664 5. Beney L, Gervais P. 2001. Influence of the fluidity of the membrane on 665 the response of microorganisms to environmental stresses. Appl 666 Microbiol Biotechnol 57:34-42. 667 6. Weber FJ, de Bont JA. 1996. Adaptation mechanisms of microorganisms 668 to the toxic effects of organic solvents on membranes. Biochim Biophys 669 Acta 1286:225-245. 670 7. Alexandre H, Rousseaux I, Charpentier C. 1994. Relationship between 671 ethanol tolerance, lipid composition and plasma membrane fluidity in 672 Saccharomyces cerevisiae and Kloeckera apiculata. FEMS Microbiol Lett 673 124:17-22. 674 8. Thomas DS, Hossack JA, Rose AH. 1978. Plasma-membrane lipid 675 composition and ethanol tolerance in Saccharomyces cerevisiae. Arch 676 Microbiol 117:239-245. 677 9. You KM, Rosenfield CL, Knipple DC. 2003. Ethanol tolerance in the yeast 678 Saccharomyces cerevisiae is dependent on cellular oleic acid content. Appl 679 Environ Microbiol 69:1499-1503. 680 10. Swan TM, Watson K. 1998. Stress tolerance in a yeast sterol auxotroph: 681 role of ergosterol, heat shock proteins and trehalose. FEMS Microbiol Lett 682 169:191-197. 683 11. Takagi H, Takaoka M, Kawaguchi A, Kubo Y. 2005. Effect of L-proline 684 on sake brewing and ethanol stress in Saccharomyces cerevisiae. Appl 685 Environ Microbiol 71:8656-8662. 686 12. Rudolph AS, Crowe JH. 1985. Membrane stabilization during freezing: 687 the role of two natural cryoprotectants, trehalose and proline. 688 Cryobiology 22:367-377. 689 13. Samuel D, Kumar TK, Ganesh G, Jayaraman G, Yang PW, Chang MM, 690 Trivedi VD, Wang SL, Hwang KC, Chang DK, Yu C. 2000. Proline inhibits 691 aggregation during protein refolding. Protein Sci 9:344-352. 692 14. Hirasawa T, Yoshikawa K, Nakakura Y, Nagahisa K, Furusawa C, 693 Katakura Y, Shimizu H, Shioya S. 2007. Identification of target genes 694 conferring ethanol stress tolerance to Saccharomyces cerevisiae based on 695 DNA microarray data analysis. J Biotechnol 131:34-44. 696 15. Pronk JT. 2002. Auxotrophic yeast strains in fundamental and applied 697 research. Appl Environ Microbiol 68:2095-2100. 698 16. Cakar ZP, Sauer U, Bailey JE. 1999. Metabolic engineering of yeast: the 699 perils of auxotrophic hosts. Biotechnol Lett 21:611-616. 700
28
17. Auesukaree C, Damnernsawad A, Kruatrachue M, Pokethitiyook P, 701 Boonchird C, Kaneko Y, Harashima S. 2009. Genome-wide identification 702 of genes involved in tolerance to various environmental stresses in 703 Saccharomyces cerevisiae. J Appl Genet 50:301-310. 704 18. Fujita K, Matsuyama A, Kobayashi Y, Iwahashi H. 2006. The genome-705 wide screening of yeast deletion mutants to identify the genes required 706 for tolerance to ethanol and other alcohols. FEMS Yeast Res 6:744-750. 707 19. Ingram LO, Buttke TM. 1984. Effects of alcohols on micro-organisms. 708 Adv Microb Physiol 25:253-300. 709 20. Kubota S, Takeo I, Kume K, Kanai M, Shitamukai A, Mizunuma M, 710 Miyakawa T, Shimoi H, Iefuji H, Hirata D. 2004. Effect of ethanol on cell 711 growth of budding yeast: genes that are important for cell growth in the 712 presence of ethanol. Biosci Biotechnol Biochem 68:968-972. 713 21. Mishra P. 1993. Tolerance of fungi to ethanol, p 189-208. In Jennings DH 714 (ed), Stress tolerance of fungi. Marcel Dekker, New York. 715 22. Teixeira MC, Raposo LR, Mira NP, Lourenco AB, Sa-Correia I. 2009. 716 Genome-wide identification of Saccharomyces cerevisiae genes required 717 for maximal tolerance to ethanol. Appl Environ Microbiol 75:5761-5772. 718 23. van Voorst F, Houghton-Larsen J, Jonson L, Kielland-Brandt MC, 719 Brandt A. 2006. Genome-wide identification of genes required for growth 720 of Saccharomyces cerevisiae under ethanol stress. Yeast 23:351-359. 721 24. Yoshikawa K, Tanaka T, Furusawa C, Nagahisa K, Hirasawa T, 722 Shimizu H. 2009. Comprehensive phenotypic analysis for identification of 723 genes affecting growth under ethanol stress in Saccharomyces cerevisiae. 724 FEMS Yeast Res 9:32-44. 725 25. Stanley D, Bandara A, Fraser S, Chambers PJ, Stanley GA. 2010. The 726 ethanol stress response and ethanol tolerance of Saccharomyces cerevisiae. 727 J Appl Microbiol 109:13-24. 728 26. Wallace-Salinas V, Signori L, Li YY, Ask M, Bettiga M, Porro D, 729 Thevelein JM, Branduardi P, Foulquie-Moreno MR, Gorwa-Grauslund 730 M. 2014. Re-assessment of YAP1 and MCR1 contributions to inhibitor 731 tolerance in robust engineered Saccharomyces cerevisiae fermenting 732 undetoxified lignocellulosic hydrolysate. AMB Express 4:56. 733 27. Sambrook JE, Fritsch E, Maniatis T. 1998. Molecular cloning: a 734 laboratory manual. Cold Spring Harbor Laboratory Press, Cold Spring 735 Harbor, New York. 736 28. Brachmann CB, Davies A, Cost GJ, Caputo E, Li J, Hieter P, Boeke JD. 737 1998. Designer deletion strains derived from Saccharomyces cerevisiae 738 S288C: a useful set of strains and plasmids for PCR-mediated gene 739 disruption and other applications. Yeast 14:115-132. 740 29. Erdeniz N, Mortensen UH, Rothstein R. 1997. Cloning-free PCR-based 741 allele replacement methods. Genome Res 7:1174-1183. 742 30. Sherman F, Hicks J. 1991. Micromanipulation and dissection of asci. 743 Methods Enzymol 194:21-37. 744 31. Huxley C, Green ED, Dunham I. 1990. Rapid assessment of S. cerevisiae 745 mating type by PCR. Trends Genet 6:236. 746 32. Benjamini Y, Yekutieli D. 2005. Quantitative trait Loci analysis using the 747 false discovery rate. Genetics 171:783-790. 748 33. Swinnen S, Schaerlaekens K, Pais T, Claesen J, Hubmann G, Yang Y, 749 Demeke M, Foulquie-Moreno MR, Goovaerts A, Souvereyns K, 750
29
Clement L, Dumortier F, Thevelein JM. 2012. Identification of novel 751 causative genes determining the complex trait of high ethanol tolerance in 752 yeast using pooled-segregant whole-genome sequence analysis. Genome 753 Res 22:975-984. 754 34. Hu XH, Wang MH, Tan T, Li JR, Yang H, Leach L, Zhang RM, Luo ZW. 755 2007. Genetic dissection of ethanol tolerance in the budding yeast 756 Saccharomyces cerevisiae. Genetics 175:1479-1487. 757 35. Swinnen S, Thevelein JM, Nevoigt E. 2012. Genetic mapping of 758 quantitative phenotypic traits in Saccharomyces cerevisiae. FEMS Yeast 759 Res 12:215-227. 760 36. Liti G, Louis EJ. 2012. Advances in quantitative trait analysis in yeast. 761 PLoS Genet 8:e1002912. 762 37. Winzeler EA, Richards DR, Conway AR, Goldstein AL, Kalman S, 763 McCullough MJ, McCusker JH, Stevens DA, Wodicka L, Lockhart DJ, 764 Davis RW. 1998. Direct allelic variation scanning of the yeast genome. 765 Science 281:1194-1197. 766 38. Parts L, Cubillos FA, Warringer J, Jain K, Salinas F, Bumpstead SJ, 767 Molin M, Zia A, Simpson JT, Quail MA, Moses A, Louis EJ, Durbin R, Liti 768 G. 2011. Revealing the genetic structure of a trait by sequencing a 769 population under selection. Genome Res 21:1131-1138. 770 39. Steinmetz LM, Sinha H, Richards DR, Spiegelman JI, Oefner PJ, 771 McCusker JH, Davis RW. 2002. Dissecting the architecture of a 772 quantitative trait locus in yeast. Nature 416:326-330. 773 40. Deutschbauer AM, Davis RW. 2005. Quantitative trait loci mapped to 774 single-nucleotide resolution in yeast. Nat Genet 37:1333-1340. 775 41. Brem RB, Yvert G, Clinton R, Kruglyak L. 2002. Genetic dissection of 776 transcriptional regulation in budding yeast. Science 296:752-755. 777 42. Marullo P, Aigle M, Bely M, Masneuf-Pomarede I, Durrens P, 778 Dubourdieu D, Yvert G. 2007. Single QTL mapping and nucleotide-level 779 resolution of a physiologic trait in wine Saccharomyces cerevisiae strains. 780 FEMS Yeast Res 7:941-952. 781 43. Ehrenreich IM, Torabi N, Jia Y, Kent J, Martis S, Shapiro JA, Gresham D, 782 Caudy AA, Kruglyak L. 2010. Dissection of genetically complex traits 783 with extremely large pools of yeast segregants. Nature 464:1039-1042. 784 44. Pais TM, Foulquie-Moreno MR, Hubmann G, Duitama J, Swinnen S, 785 Goovaerts A, Yang Y, Dumortier F, Thevelein JM. 2013. Comparative 786 polygenic analysis of maximal ethanol accumulation capacity and 787 tolerance to high ethanol levels of cell proliferation in yeast. PLoS Genet 788 9:e1003548. 789 45. Hubmann G, Foulquie-Moreno MR, Nevoigt E, Duitama J, Meurens N, 790 Pais TM, Mathe L, Saerens S, Nguyen HT, Swinnen S, Verstrepen KJ, 791 Concilio L, de Troostembergh JC, Thevelein JM. 2013. Quantitative trait 792 analysis of yeast biodiversity yields novel gene tools for metabolic 793 engineering. Metab Eng 17:68-81. 794 46. Hubmann G, Mathe L, Foulquie-Moreno MR, Duitama J, Nevoigt E, 795 Thevelein JM. 2013. Identification of multiple interacting alleles 796 conferring low glycerol and high ethanol yield in Saccharomyces cerevisiae 797 ethanolic fermentation. Biotechnol Biofuels 6:87. 798 47. Yang Y, Foulquie-Moreno MR, Clement L, Erdei E, Tanghe A, 799 Schaerlaekens K, Dumortier F, Thevelein JM. 2013. QTL analysis of 800

30
high thermotolerance with superior and downgraded parental yeast 801 strains reveals new minor QTLs and converges on novel causative alleles 802 involved in RNA processing. PLoS Genet 9:e1003693. 803 48. Ferreras JM, Iglesias R, Girbes T. 1989. Effect of the chronic ethanol 804 action on the activity of the general amino-acid permease from 805 Saccharomyces cerevisiae var. ellipsoideus. Biochim Biophys Acta 979:375-806 377. 807 49. Leao C, Van Uden N. 1984. Effects of ethanol and other alkanols on 808 passive proton influx in the yeast Saccharomyces cerevisiae. Biochim 809 Biophys Acta 774:43-48. 810 50. Casal M, Cardoso H, Leao C. 1998. Effects of ethanol and other alkanols 811 on transport of acetic acid in Saccharomyces cerevisiae. Appl Environ 812 Microbiol 64:665-668. 813 51. Sousa MJ, Mota M, Leao C. 1995. Effects of ethanol and acetic acid on the 814 transport of malic acid and glucose in the yeast Schizosaccharomyces 815 pombe: implications in wine deacidification. FEMS Microbiol Lett 816 126:197-202. 817 52. Dinda PK, Beck IT. 1981. Ethanol-induced inhibition of glucose transport 818 across the isolated brush-border membrane of hamster jejunum. Dig Dis 819 Sci 26:23-32. 820 53. Tillotson LG, Carter EA, Inui KI, Isselbacher KJ. 1981. Inhibition of Na+-821 stimulated glucose transport function and perturbation of intestinal 822 microvillus membrane vesicles by ethanol and acetaldehyde. Arch 823 Biochem Biophys 207:360-370. 824 54. Jund R, Weber E, Chevallier MR. 1988. Primary structure of the uracil 825 transport protein of Saccharomyces cerevisiae. Eur J Biochem 171:417-826 424. 827 55. Regenberg B, During-Olsen L, Kielland-Brandt MC, Holmberg S. 1999. 828 Substrate specificity and gene expression of the amino-acid permeases in 829 Saccharomyces cerevisiae. Curr Genet 36:317-328. 830 56. Basso TO, Dario MG, Tonso A, Stambuk BU, Gombert AK. 2010. 831 Insufficient uracil supply in fully aerobic chemostat cultures of 832 Saccharomyces cerevisiae leads to respiro-fermentative metabolism and 833 double nutrient-limitation. Biotechnol Lett 32:973-977. 834 57. Gonzalez A, Larroy C, Biosca JA, Arino J. 2008. Use of the TRP1 835 auxotrophic marker for gene disruption and phenotypic analysis in yeast: 836 a note of warning. FEMS Yeast Res 8:2-5. 837 58. Ding J, Bierma J, Smith MR, Poliner E, Wolfe C, Hadduck AN, Zara S, 838 Jirikovic M, van Zee K, Penner MH, Patton-Vogt J, Bakalinsky AT. 839 2013. Acetic acid inhibits nutrient uptake in Saccharomyces cerevisiae: 840 auxotrophy confounds the use of yeast deletion libraries for strain 841 improvement. Appl Microbiol Biotechnol 97:7405-7416. 842 59. Cohen R, Engelberg D. 2007. Commonly used Saccharomyces cerevisiae 843 strains (e.g. BY4741, W303) are growth sensitive on synthetic complete 844 medium due to poor leucine uptake. FEMS Microbiol Lett 273:239-243. 845 60. Alper H, Moxley J, Nevoigt E, Fink GR, Stephanopoulos G. 2006. 846 Engineering yeast transcription machinery for improved ethanol 847 tolerance and production. Science 314:1565-1568. 848 61. Baerends RJ, Qiu JL, Rasmussen S, Nielsen HB, Brandt A. 2009. 849 Impaired uptake and/or utilization of leucine by Saccharomyces cerevisiae 850

31
is suppressed by the SPT15-300 allele of the TATA-binding protein gene. 851 Appl Environ Microbiol 75:6055-6061. 852 62. Alves SL, Jr., Herberts RA, Hollatz C, Trichez D, Miletti LC, de Araujo 853 PS, Stambuk BU. 2008. Molecular analysis of maltotriose active transport 854 and fermentation by Saccharomyces cerevisiae reveals a determinant role 855 for the AGT1 permease. Appl Environ Microbiol 74:1494-1501. 856 63. Stambuk BU, da Silva MA, Panek AD, de Araujo PS. 1999. Active alpha-857 glucoside transport in Saccharomyces cerevisiae. FEMS Microbiol Lett 858 170:105-110. 859 64. Gafner J, Schütz M. 1996. Impact of glucose-fructose-ratio on stuck 860 fermentations: practical experiences to restart stuck fermentations. Vitic 861 Enol Sci 51:214-218. 862 65. Grundmann O, Mosch HU, Braus GH. 2001. Repression of GCN4 mRNA 863 translation by nitrogen starvation in Saccharomyces cerevisiae. J Biol 864 Chem 276:25661-25671. 865 866
867 868

32
Figure legends 869 Figure 1. Growth on media containing different concentrations of ethanol. A 870 tenfold dilution range was spotted on YPD as control, and YP with 14%, 16% and 871 18% ethanol. The diploid BY strain was obtained by crossing BY4741 with BY4742 872 and the diploid VR1-5B/BY4741 strain by crossing VR1-5B with BY4741. 873 874 Figure 2. Distribution of ethanol tolerance in segregants from VR1-5B/BY4741. 875 (A) The segregants of 16 complete tetrads were grown on YP plates containing 4% 876 to 18% ethanol (tenfold dilution range). The spot test for one complete tetrad is 877 shown as an example. For each segregant, the ethanol tolerance was defined as the 878 maximum ethanol concentration on which growth was the same as that on the control 879 YPD plate. (B) BY4741 showed an ethanol tolerance phenotype of 6% (*) and VR1-880 5B of 16% (**). Most segregants showed a similar ethanol tolerance as BY4741, very 881 few showed the same high tolerance as VR1-5B, and the rest showed an 882 intermediate tolerance or even a lower tolerance than BY4741. None of the 883 segregants showed higher tolerance than VR1-5B. 884 885 Figure 3. Linkage of the high ethanol tolerance phenotype of VR1-5B with a 886 locus on chromosome V. (A) The probability of random segregation of 28 artificial 887 markers on chromosome V in high ethanol tolerant segregants was calculated under 888 two-sided binomial distribution with FDR adjustment according to Benjamini-Yekutieli 889 (32). The p values were considered to be significant if smaller than 0.05. The table 890 shows the association percentage (i.e. the percentage of segregants that contain the 891 marker) and the corresponding p value for each marker in the mapped locus and for 892 the two adjacent markers. The markers were checked in at least 44 high ethanol 893 tolerant segregants (indicated by Marker nr.). (B) The probability of random 894 segregation of markers 149 to 157 in 26 high ethanol tolerant segregants from the 895 hybrid strain obtained by crossing VR1-5B with pAMS1(ura3Δ0::URA3) was 896

33
determined as in (A). The linkage with the locus is completely lost. (C) The VR1-5B 897 allele of URA3 was integrated in its genomic position in BY4741, BY4742, and 7 898 segregants from the VR1-5B/BY4741 hybrid that were ura3 deleted and showed 899 different levels of ethanol tolerance. The ethanol tolerance of the untransformed 900 (ura3Δ0) and transformed (ura3Δ0::URA3) strains was determined by growing them 901 on different concentrations of ethanol (twofold dilution range). The result for BY4741 902 (12% ethanol, 9 days), BY4742 (16%, 11 days), and 3 representative segregants [3D 903 (14%, 9 days), 5A (16%, 11 days) and 9B (16%, 9 days)] is shown. 904 905 Figure 4. Growth of the laboratory BY strains and their prototrophic 906 counterparts (S288c MATa and S288c MATα) on media containing high 907 concentrations of ethanol, and comparison with VR1-5B. A tenfold dilution range 908 of each strain was spotted on YP medium containing 14%, 16% and 18% ethanol, 909 and subsequently grown for 11 days. 910 911 Figure 5. Growth of the laboratory BY strains and their prototrophic 912 counterparts (S288c MATa and S288c MATα) on media containing moderate to 913 high concentrations of ethanol. (A) A tenfold dilution range of each strain was 914 spotted on YP medium containing 10%, 12%, 14% or 16% ethanol, and subsequently 915 grown for different periods of time, as indicated. (B) The tenfold dilution range was 916 also spotted on YPD medium with 10% or 16% ethanol. 917 918 Figure 6. Growth of the laboratory BY strains and their prototrophic 919 counterparts (S288c MATa and S288c MATα) on YPD medium while subjected 920 to different stress factors. (A) A tenfold dilution range was spotted on YPD medium 921 containing 0.3% or 0.4% (v/v) acetic acid at pH 5, and on YPD medium containing 922 4.0 mM or 4.5 mM hydrogen peroxide. The cells were incubated for two days at 30°C. 923 To investigate heat tolerance, the strains were spotted on YPD medium and grown at 924

34
39°C and 40°C for two days. (B) The strains (tenfold dilution range) were also 925 spotted on YPD medium with 25% and 30% glucose, and on YPD medium containing 926 1.50 M or 1.75 M NaCl, and incubated at 30°C for the indicated period of time. 927 928 Figure 7. Growth of the prototrophic strain S288c and the auxotrophic strain 929 S288c ura3-52 on media containing different stress factors. (A) The minimal 930 concentration of uracil that is required to allow growth of S288c ura3-52 on minimal 931 medium was determined by growing the strain on CSM-URA with different 932 concentrations of uracil. Strain S288c was included in the assay as a control. The 933 cells were then incubated for two days at 30°C. In order to investigate the effect of 934 different stress factors on growth of the strains under conditions of limited availability 935 of uracil, a tenfold dilution range of both strains was spotted on minimal medium 936 containing 0.05 mM uracil in combination with different concentrations of NaCl, and 937 incubated for six days at 30°C (B); under heat stress, and incubated at the indicated 938 temperatures for three days (C); and in the presence of different concentrations of 939 ethanol, and incubated for seven days at 30°C (D). 940 941 Figure 8. Growth of the prototrophic strain S288c and the auxotrophic strain 942 S288c leu2∆ on medium containing different stress factors. (A) In order to 943 determine the minimal concentration of leucine that is required to allow growth of 944 S288c leu2∆ on minimal medium, a tenfold dilution range of the strain was spotted on 945 CSM-LEU with different concentrations of leucine. The cells were incubated for two 946 days at 30°C. To investigate the effect of different stress factors on growth of the 947 strains in the condition of limited availability of leucine, the dilution ranges were also 948 spotted on minimal medium containing 0.5 mM leucine in combination with different 949 concentrations of NaCl, and incubated for five days at 30°C (B); under heat stress, 950 and incubated at the indicated temperatures for two days (C); and in the presence of 951 different concentrations of ethanol, and incubated for seven days at 30°C (D). 952

35
953 Figure 9. Uptake of uracil and leucine in prototrophic and auxotrophic strains 954 in the presence of different ethanol concentrations. (A) Uptake rate of 0.05 mM 955 uracil by strains S288c (black bars) and S288c ura3-52 (white bars), and (B) uptake 956 rate of 2.5 mM leucine by strains S288c (black bars) and S288c leu2∆ (white bars) in 957 the presence of different concentrations of ethanol. The transport activity measured 958 in the presence of different concentrations of ethanol is expressed as a percentage of 959 transport in the absence of ethanol (left) and in nmol. min-1. (mg protein)-1 (right). 960 Error bars represent the standard deviation from three biological replicates. 961 962
36
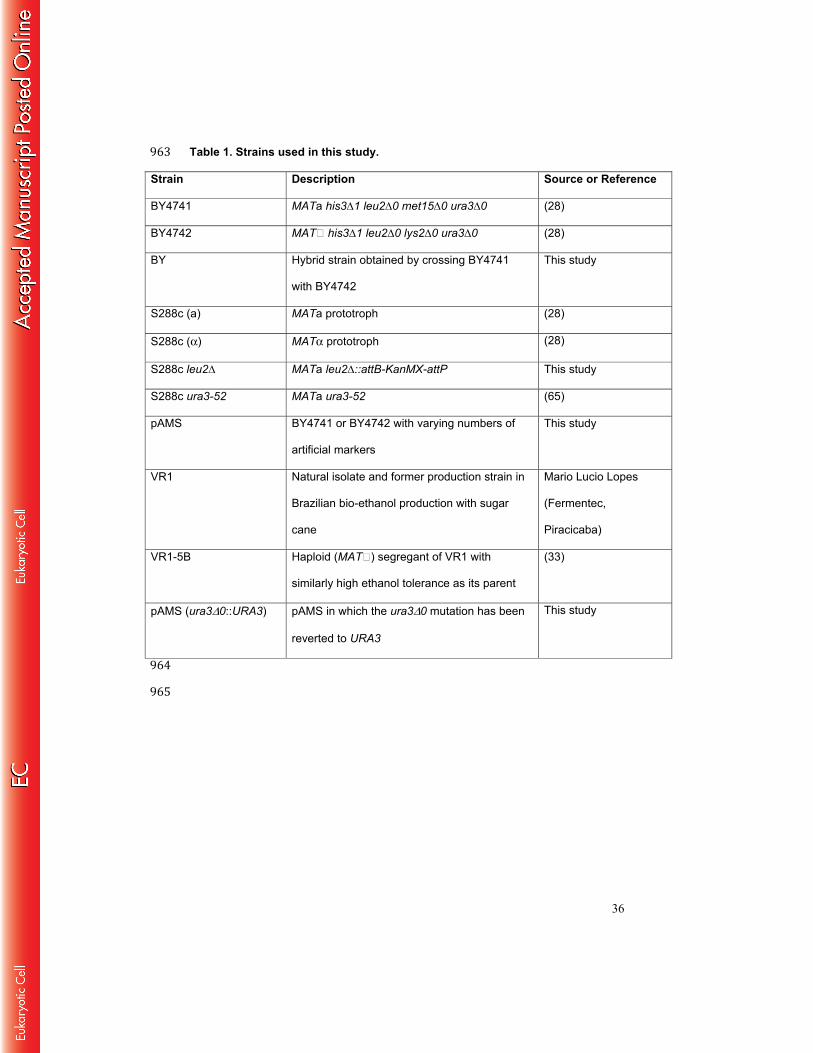
Table 1. Strains used in this study. 963 Strain Description Source or Reference
BY4741 MATa his3∆1 leu2∆0 met15∆0 ura3∆0 (28)
BY4742 MAT his3∆1 leu2∆0 lys2∆0 ura3∆0 (28)
BY Hybrid strain obtained by crossing BY4741
with BY4742
This study
S288c (a) MATa prototroph (28)
S288c (α) MATα prototroph (28)
S288c leu2∆ MATa leu2∆::attB-KanMX-attP This study
S288c ura3-52 MATa ura3-52 (65)
pAMS BY4741 or BY4742 with varying numbers of
artificial markers
This study
VR1 Natural isolate and former production strain in
Brazilian bio-ethanol production with sugar
cane
Mario Lucio Lopes
(Fermentec,
Piracicaba)
VR1-5B Haploid (MAT) segregant of VR1 with
similarly high ethanol tolerance as its parent
(33)
pAMS (ura3Δ0::URA3) pAMS in which the ura3Δ0 mutation has been
reverted to URA3
This study
964 965
37
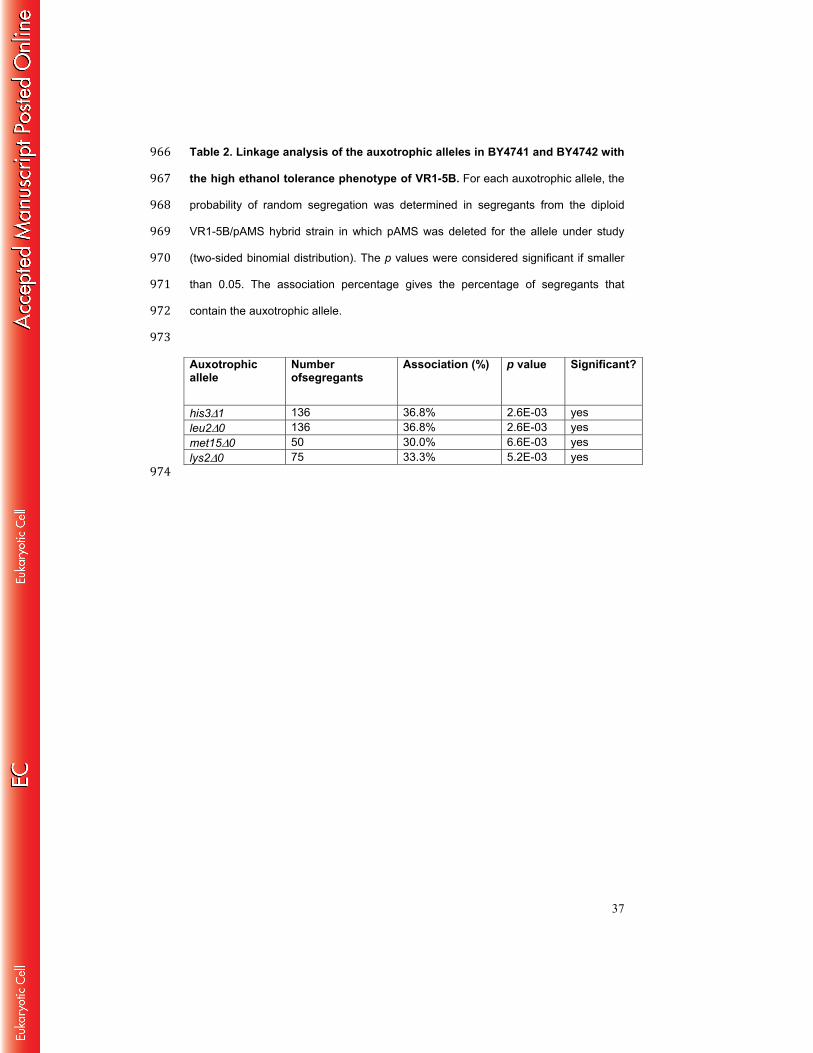
Table 2. Linkage analysis of the auxotrophic alleles in BY4741 and BY4742 with 966 the high ethanol tolerance phenotype of VR1-5B. For each auxotrophic allele, the 967 probability of random segregation was determined in segregants from the diploid 968 VR1-5B/pAMS hybrid strain in which pAMS was deleted for the allele under study 969 (two-sided binomial distribution). The p values were considered significant if smaller 970 than 0.05. The association percentage gives the percentage of segregants that 971 contain the auxotrophic allele. 972 973 Auxotrophic allele
Number ofsegregants
Association (%) p value Significant?
his3Δ1 136 36.8% 2.6E-03 yes leu2Δ0 136 36.8% 2.6E-03 yes met15Δ0 50 30.0% 6.6E-03 yes lys2Δ0 75 33.3% 5.2E-03 yes 974