
Automatic Data for Applied Railway Management: Case Study on the London Overground
10
47 Transportation Research Record: Journal of the Transportation Research Board, No. 2353, Transportation Research Board of the National Academies, Washington, D.C., 2013, pp. 47–56. DOI: 10.3141/2353-05 M. Frumin, Metropolitan Transportation Authority Bus Customer Information Systems, 27th Floor, 2 Broadway, New York, NY 10004. J. Zhao, Department of Civil Engineering, School of Community and Regional Planning, Room 2007, and Z. Zhao, Department of Civil Engineering, Room 2002, University of British Columbia, 6250 Applied Science Lane, Vancouver, British Columbia V6T 1Z4, Canada. N. Wilson, Department of Civil and Environmental Engineering, Massa- chusetts Institute of Technology, 1-238, 77 Massachusetts Avenue, Cambridge, MA 02139. Corresponding author: J. Zhao, [email protected]. of certain aspects of service delivery (the operator’s perspective on system performance) and service quality (passenger’s perspective). Frumin proposed various methods on the basis of smartcard data for origin–destination (O-D) matrix estimation, passenger incidence behavior analysis, and service quality measurement (1). The goal of this paper is to illustrate how automatic data and these methods can be used to contribute to real-world tactical planning processes, given a range of decision factors and variables. This paper is presented as a case study: most of the work it describes was conducted by other analysts and professionals. It depends heavily on in-person and e-mail interviews with key Overground managers and on research conducted for those managers by an industry consultant. It is descriptive in nature rather than prescriptive. NLL: SPRING 2008 This section describes some relevant information about NLL as of spring 2008, first in terms of the existing service plan, next in terms of passenger demand, and last in terms of operating performance as expressed by different measures of service delivery and service quality. Service Plan At the time of this case study, NLL was the backbone of the London Overground network. It served 23 stations and ran 28 km circum- ferentially around central London from Stratford, England, in the northeast to Richmond, England, in the southwest. It connected to the Gospel Oak to Barking Line (GOB) at Gospel Oak Station, and to the Watford DC Line (where DC stands for direct current) and West London Line (WLL) at Willesden Junction Station. Accord- ing to the Chief Transport Economist, TfL London Rail, it was by far the busiest overground line, with the most frequent service, and was estimated to accommodate 58% of all overground boardings (C. Smales, unpublished interviews and electronic communica- tions, 2010). The NLL ran four (end-to-end) trains per hour (tph) over most of the day, and some segments received 6 tph during the peak periods. Figure 1 schematically illustrates the a.m. peak (7:00–10:00) service patterns and frequencies on the NLL and other overground lines in spring 2008. Figure 2a uses a time-distance plot to show the a.m. peak time- table for the NLL in spring 2008. This plot shows a regular 15-min headway (4 tph) service, which made all stops westbound from Strat- ford to Richmond and eastbound from Richmond to Stratford. This regular service was augmented by occasional, irregular, additional Automatic Data for Applied Railway Management Case Study on the London Overground Michael Frumin, Jinhua Zhao, Nigel Wilson, and Zhan Zhao In 2009, London Overground management implemented a new tac- tical plan for a.m. and p.m. peak service on the North London Line (NLL). This paper documents that tactical planning intervention and evaluates its outcomes in terms of certain aspects of service delivery (the operator’s perspective on system performance) and service quality (the passenger’s perspective). Analyses of service delivery and quality and of passenger demand contributed to the development, proposal, and implementation of the new tactical plan. NLL trains were delayed rou- tinely en route, with excessive dwell time a major cause. Near-random passenger incidence behavior suggested that an even headway service for NLL might have been more appropriate. The confluence of these analyses was confirmed by the corresponding excess journey time results. On the basis of longitudinal analysis, an evaluation showed that on- time performance increased substantially and observed journey time decreased with the introduction of the new plan. Overall, the effects of this implementation appeared to have been positive on balance. This case study thus demonstrated the applicability of automatic data gener- ally, and certain measures and techniques in the London Overground specifically, to support the tactical planning of an urban railway. The London Overground network is for the most part circumferential. Primarily it orbits London to the north and west and is part of the integrated network of Transport for London (TfL) and National Rail services. Because the Oyster system (TfL’s automatic fare collection smartcard system) controls entry to and exit from the public transport network, the individual passenger journey data it collects can provide useful assistance for tactical planning for the London Overground. Tactical planning for the Overground is a shared responsibil- ity between TfL and London Overground Rail Operations Limited (LOROL), the contract operator of the London Overground. From 2008 to 2009, London Overground management researched, designed, and implemented a new tactical plan for a.m. and p.m. peak ser- vice on the North London Line (NLL). This paper documents that tactical planning intervention and evaluates its outcomes in terms
Transcript of Automatic Data for Applied Railway Management: Case Study on the London Overground
47
Transportation Research Record: Journal of the Transportation Research Board, No. 2353, Transportation Research Board of the National Academies, Washington, D.C., 2013, pp. 47–56.DOI: 10.3141/2353-05
M. Frumin, Metropolitan Transportation Authority Bus Customer Information Systems, 27th Floor, 2 Broadway, New York, NY 10004. J. Zhao, Department of Civil Engineering, School of Community and Regional Planning, Room 2007, and Z. Zhao, Department of Civil Engineering, Room 2002, University of British Columbia, 6250 Applied Science Lane, Vancouver, British Columbia V6T 1Z4, Canada. N. Wilson, Department of Civil and Environmental Engineering, Massa-chusetts Institute of Technology, 1-238, 77 Massachusetts Avenue, Cambridge, MA 02139. Corresponding author: J. Zhao, [email protected].
of certain aspects of service delivery (the operator’s perspective on system performance) and service quality (passenger’s perspective).
Frumin proposed various methods on the basis of smartcard data for origin–destination (O-D) matrix estimation, passenger incidence behavior analysis, and service quality measurement (1). The goal of this paper is to illustrate how automatic data and these methods can be used to contribute to real-world tactical planning processes, given a range of decision factors and variables. This paper is presented as a case study: most of the work it describes was conducted by other analysts and professionals. It depends heavily on in-person and e-mail interviews with key Overground managers and on research conducted for those managers by an industry consultant. It is descriptive in nature rather than prescriptive.
NLL: SpriNg 2008
This section describes some relevant information about NLL as of spring 2008, first in terms of the existing service plan, next in terms of passenger demand, and last in terms of operating performance as expressed by different measures of service delivery and service quality.
Service plan
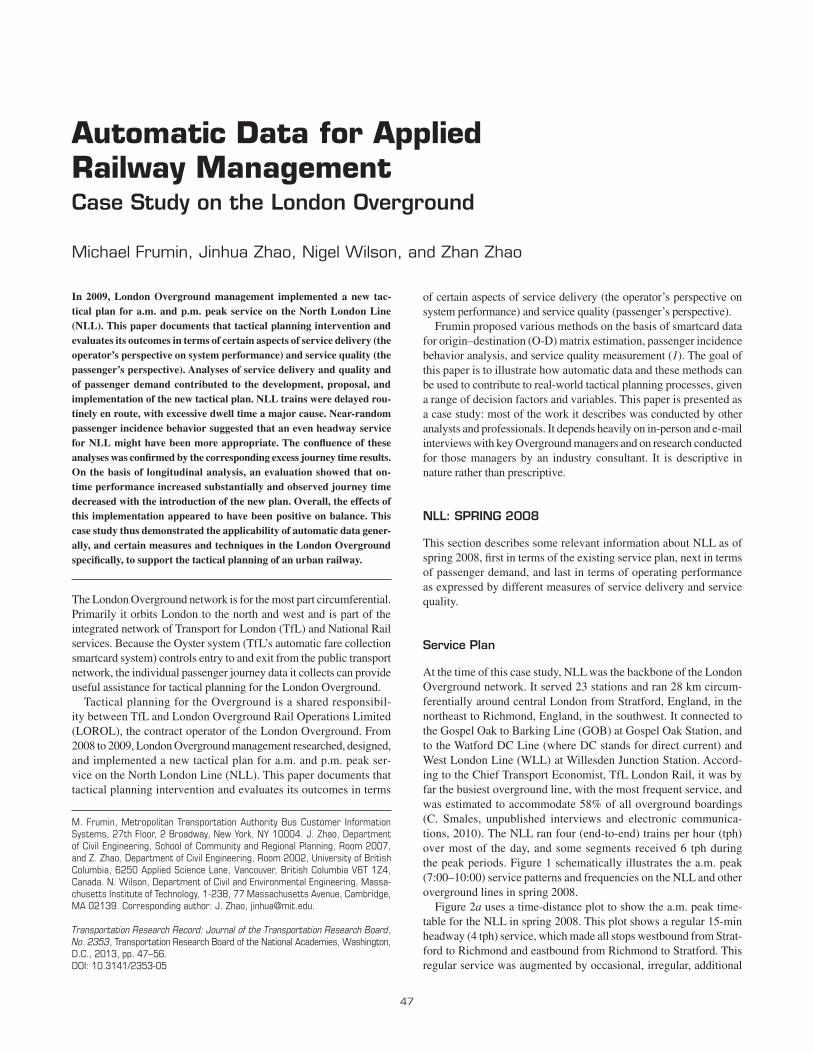
At the time of this case study, NLL was the backbone of the London Overground network. It served 23 stations and ran 28 km circum-ferentially around central London from Stratford, England, in the northeast to Richmond, England, in the southwest. It connected to the Gospel Oak to Barking Line (GOB) at Gospel Oak Station, and to the Watford DC Line (where DC stands for direct current) and West London Line (WLL) at Willesden Junction Station. Accord-ing to the Chief Transport Economist, TfL London Rail, it was by far the busiest overground line, with the most frequent service, and was estimated to accommodate 58% of all overground boardings (C. Smales, unpublished interviews and electronic communica-tions, 2010). The NLL ran four (end-to-end) trains per hour (tph) over most of the day, and some segments received 6 tph during the peak periods. Figure 1 schematically illustrates the a.m. peak (7:00–10:00) service patterns and frequencies on the NLL and other overground lines in spring 2008.
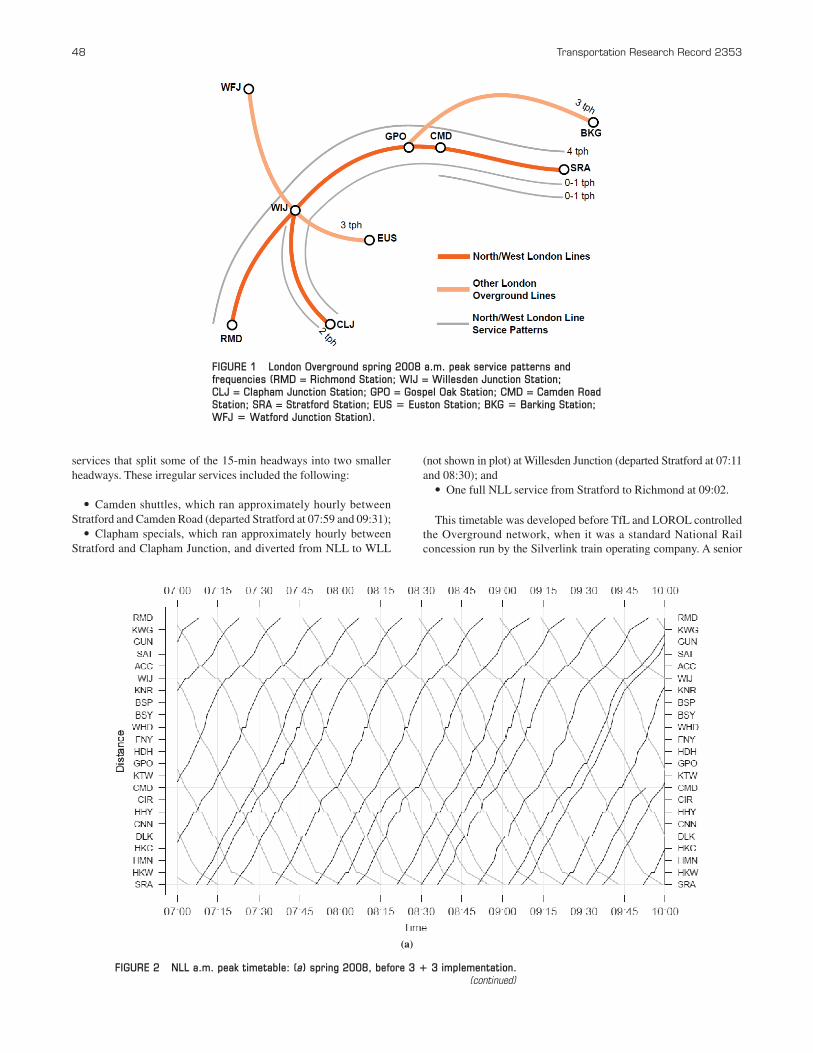
Figure 2a uses a time-distance plot to show the a.m. peak time-table for the NLL in spring 2008. This plot shows a regular 15-min headway (4 tph) service, which made all stops westbound from Strat-ford to Richmond and eastbound from Richmond to Stratford. This regular service was augmented by occasional, irregular, additional
Automatic Data for Applied Railway ManagementCase Study on the London Overground
Michael Frumin, Jinhua Zhao, Nigel Wilson, and Zhan Zhao
In 2009, London Overground management implemented a new tac-tical plan for a.m. and p.m. peak service on the North London Line (NLL). This paper documents that tactical planning intervention and evaluates its outcomes in terms of certain aspects of service delivery (the operator’s perspective on system performance) and service quality (the passenger’s perspective). Analyses of service delivery and quality and of passenger demand contributed to the development, proposal, and implementation of the new tactical plan. NLL trains were delayed rou-tinely en route, with excessive dwell time a major cause. Near-random passenger incidence behavior suggested that an even headway service for NLL might have been more appropriate. The confluence of these analyses was confirmed by the corresponding excess journey time results. On the basis of longitudinal analysis, an evaluation showed that on-time performance increased substantially and observed journey time decreased with the introduction of the new plan. Overall, the effects of this implementation appeared to have been positive on balance. This case study thus demonstrated the applicability of automatic data gener-ally, and certain measures and techniques in the London Overground specifically, to support the tactical planning of an urban railway.
The London Overground network is for the most part circumferential. Primarily it orbits London to the north and west and is part of the integrated network of Transport for London (TfL) and National Rail services. Because the Oyster system (TfL’s automatic fare collection smartcard system) controls entry to and exit from the public transport network, the individual passenger journey data it collects can provide useful assistance for tactical planning for the London Overground.
Tactical planning for the Overground is a shared responsibil-ity between TfL and London Overground Rail Operations Limited (LOROL), the contract operator of the London Overground. From 2008 to 2009, London Overground management researched, designed, and implemented a new tactical plan for a.m. and p.m. peak ser-vice on the North London Line (NLL). This paper documents that tactical planning intervention and evaluates its outcomes in terms
48 Transportation Research Record 2353
FIGURE 1 London Overground spring 2008 a.m. peak service patterns and frequencies (RMD = Richmond Station; WIJ = Willesden Junction Station; CLJ = Clapham Junction Station; GPO = Gospel Oak Station; CMD = Camden Road Station; SRA = Stratford Station; EUS 5 Euston Station; BKG 5 Barking Station; WFJ 5 Watford Junction Station).
FIGURE 2 NLL a.m. peak timetable: (a) spring 2008, before 3 1 3 implementation. (continued)
(a)
services that split some of the 15-min headways into two smaller headways. These irregular services included the following:
• Camden shuttles, which ran approximately hourly between Stratford and Camden Road (departed Stratford at 07:59 and 09:31);
• Clapham specials, which ran approximately hourly between Stratford and Clapham Junction, and diverted from NLL to WLL
(not shown in plot) at Willesden Junction (departed Stratford at 07:11 and 08:30); and
• One full NLL service from Stratford to Richmond at 09:02.
This timetable was developed before TfL and LOROL controlled the Overground network, when it was a standard National Rail concession run by the Silverlink train operating company. A senior
Frumin, Zhao, Wilson, and Zhao 49
business analyst and planner for TfL London Rail noted that the Camden shuttles were added in 2004, and the Clapham specials in 2006. The Deputy Operations Director and Head of Performance and Planning for LOROL noted that “TfL was getting concerned about the overcrowding on the NLL. It therefore agreed to ‘buy’ additional services from Silverlink for the peaks” (O. Bratton, unpublished inter-views and electronic communications, 2009). To add the additional trips, Silverlink planners “put them into the existing schedule . . . amongst the 15 minute service when appropriate.”
In his description of the origins of this timetable, a senior busi-ness analyst and planner with TfL noted that “the service was entirely driven by the rolling stock available, and the incremental nature in which additional trains were added to the timetable. An overall view was not taken” (D. Warner, unpublished interviews and electronic communications, 2010). The Deputy Operations Director for LOROL discussed the timetable development process for the National Rail network more generally and noted that “typically, a timetable evolves. As more and more trains run, the timetable tends to ossify, becoming harder and harder to alter” (O. Bratton, unpublished interviews and electronic communications, 2009). It appears from these comments that the highly irregular NLL peak period timetable was in place largely as a historical artifact. It was not the product of an analytical or data-driven tactical planning process.
Passenger Demand
NLL a.m. Peak O-D Matrix
Passenger demand for a public transport network can be expressed as a matrix of passenger O-D flows. A methodology has been developed
to estimate O-D matrices for rail networks from multiple automatic data sources, including passenger journey data from the Oyster smart-card ticketing system, automatic entry and exit counts from selected station gatelines, and onboard passenger loads estimated from railcar loadweigh data (1). This method was applied to the London Over-ground network to estimate a segment-level, a.m. peak, O-D matrix for NLL (Table 1).
It was estimated that 37,124 passengers used the London Over-ground during an average weekday a.m. peak period. The NLL O-D matrix in Table 1 shows that 22,112, or 60%, of all a.m. peak Over-ground passengers used NLL for some portion of their journey. The
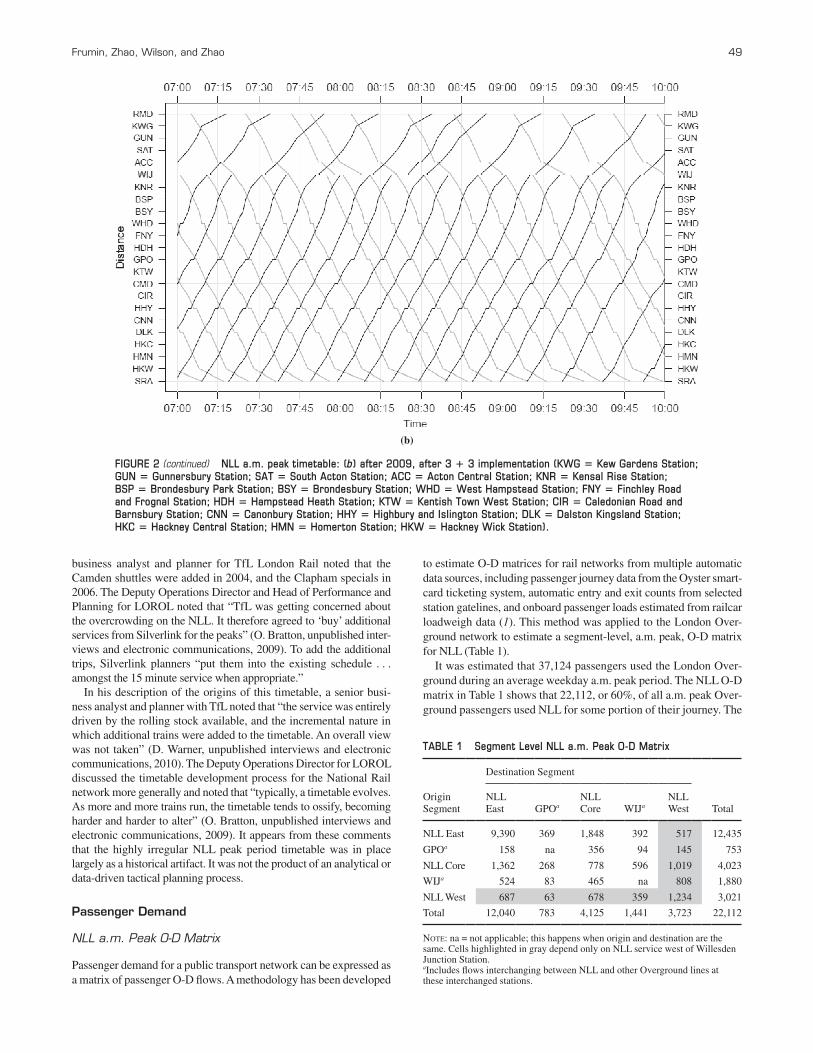
FIGURE 2 (continued) NLL a.m. peak timetable: (b) after 2009, after 3 1 3 implementation (KWG 5 Kew Gardens Station; GUN 5 Gunnersbury Station; SAT 5 South Acton Station; ACC 5 Acton Central Station; KNR 5 Kensal Rise Station; BSP 5 Brondesbury Park Station; BSY 5 Brondesbury Station; WHD 5 West Hampstead Station; FNY 5 Finchley Road and Frognal Station; HDH 5 Hampstead Heath Station; KTW 5 Kentish Town West Station; CIR 5 Caledonian Road and Barnsbury Station; CNN 5 Canonbury Station; HHY 5 Highbury and Islington Station; DLK 5 Dalston Kingsland Station; HKC 5 Hackney Central Station; HMN 5 Homerton Station; HKW 5 Hackney Wick Station).
(b)
TABLE 1 Segment Level NLL a.m. Peak O-D Matrix
Origin Segment
Destination Segment
NLL East GPOa
NLL Core WIJa
NLL West Total
NLL East 9,390 369 1,848 392 517 12,435
GPOa 158 na 356 94 145 753
NLL Core 1,362 268 778 596 1,019 4,023
WIJa 524 83 465 na 808 1,880
NLL West 687 63 678 359 1,234 3,021
Total 12,040 783 4,125 1,441 3,723 22,112
Note: na = not applicable; this happens when origin and destination are the same. Cells highlighted in gray depend only on NLL service west of Willesden Junction Station.aIncludes flows interchanging between NLL and other Overground lines at these interchanged stations.
50 Transportation Research Record 2353
cells of Table 1 highlighted in gray indicate passenger flows, which used NLL only between Willesden Junction and Richmond, inclu-sive. These passenger flows totaled 5,510 a.m. peak passengers, or 25% of total NLL a.m. peak patronage. In other words, 75% of all a.m. peak NLL passengers used NLL only between Stratford and Willesden Junction, inclusive.
Aggregate Load Profiles (NLL a.m. Peak)
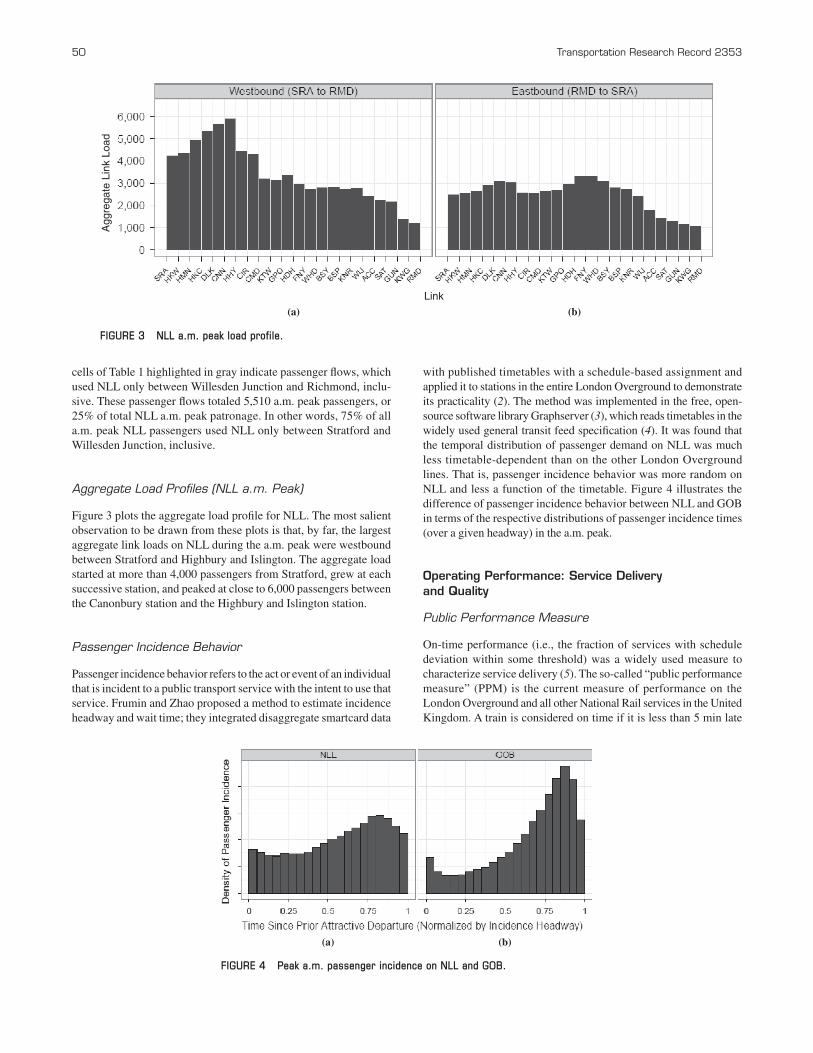
Figure 3 plots the aggregate load profile for NLL. The most salient observation to be drawn from these plots is that, by far, the largest aggregate link loads on NLL during the a.m. peak were westbound between Stratford and Highbury and Islington. The aggregate load started at more than 4,000 passengers from Stratford, grew at each successive station, and peaked at close to 6,000 passengers between the Canonbury station and the Highbury and Islington station.
Passenger Incidence Behavior
Passenger incidence behavior refers to the act or event of an individual that is incident to a public transport service with the intent to use that service. Frumin and Zhao proposed a method to estimate incidence headway and wait time; they integrated disaggregate smartcard data
with published timetables with a schedule-based assignment and applied it to stations in the entire London Overground to demonstrate its practicality (2). The method was implemented in the free, open-source software library Graphserver (3), which reads timetables in the widely used general transit feed specification (4). It was found that the temporal distribution of passenger demand on NLL was much less timetable-dependent than on the other London Overground lines. That is, passenger incidence behavior was more random on NLL and less a function of the timetable. Figure 4 illustrates the difference of passenger incidence behavior between NLL and GOB in terms of the respective distributions of passenger incidence times (over a given headway) in the a.m. peak.
Operating Performance: Service Delivery and Quality
Public Performance Measure
On-time performance (i.e., the fraction of services with schedule deviation within some threshold) was a widely used measure to characterize service delivery (5). The so-called “public performance measure” (PPM) is the current measure of performance on the London Overground and all other National Rail services in the United Kingdom. A train is considered on time if it is less than 5 min late
(a) (b)
Link
Agg
rega
te L
ink
Load
FIGURE 3 NLL a.m. peak load profile.
(a) (b)
FIGURE 4 Peak a.m. passenger incidence on NLL and GOB.
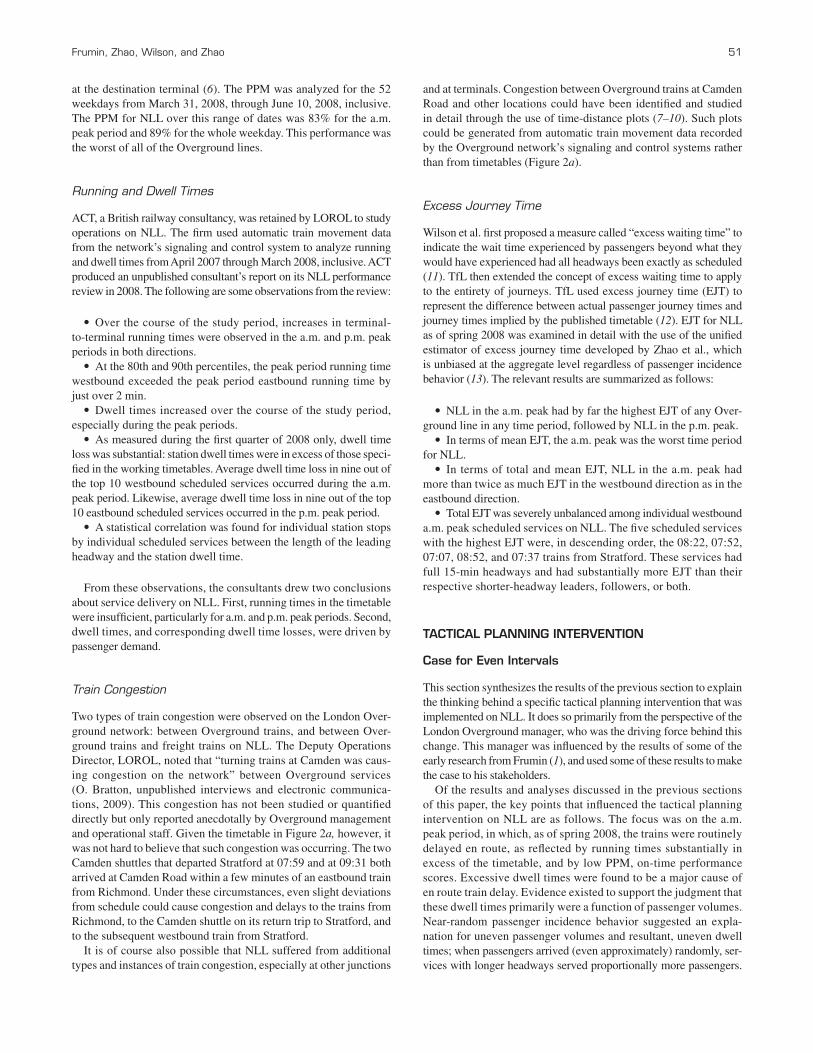
Frumin, Zhao, Wilson, and Zhao 51
at the destination terminal (6). The PPM was analyzed for the 52 weekdays from March 31, 2008, through June 10, 2008, inclusive. The PPM for NLL over this range of dates was 83% for the a.m. peak period and 89% for the whole weekday. This performance was the worst of all of the Overground lines.
Running and Dwell Times
ACT, a British railway consultancy, was retained by LOROL to study operations on NLL. The firm used automatic train movement data from the network’s signaling and control system to analyze running and dwell times from April 2007 through March 2008, inclusive. ACT produced an unpublished consultant’s report on its NLL performance review in 2008. The following are some observations from the review:
• Over the course of the study period, increases in terminal-to-terminal running times were observed in the a.m. and p.m. peak periods in both directions.
• At the 80th and 90th percentiles, the peak period running time westbound exceeded the peak period eastbound running time by just over 2 min.
• Dwell times increased over the course of the study period, especially during the peak periods.
• As measured during the first quarter of 2008 only, dwell time loss was substantial: station dwell times were in excess of those speci-fied in the working timetables. Average dwell time loss in nine out of the top 10 westbound scheduled services occurred during the a.m. peak period. Likewise, average dwell time loss in nine out of the top 10 eastbound scheduled services occurred in the p.m. peak period.
• A statistical correlation was found for individual station stops by individual scheduled services between the length of the leading headway and the station dwell time.
From these observations, the consultants drew two conclusions about service delivery on NLL. First, running times in the timetable were insufficient, particularly for a.m. and p.m. peak periods. Second, dwell times, and corresponding dwell time losses, were driven by passenger demand.
Train Congestion
Two types of train congestion were observed on the London Over-ground network: between Overground trains, and between Over-ground trains and freight trains on NLL. The Deputy Operations Director, LOROL, noted that “turning trains at Camden was caus-ing congestion on the network” between Overground services (O. Bratton, unpublished interviews and electronic communica-tions, 2009). This congestion has not been studied or quantified directly but only reported anecdotally by Overground management and operational staff. Given the timetable in Figure 2a, however, it was not hard to believe that such congestion was occurring. The two Camden shuttles that departed Stratford at 07:59 and at 09:31 both arrived at Camden Road within a few minutes of an eastbound train from Richmond. Under these circumstances, even slight deviations from schedule could cause congestion and delays to the trains from Richmond, to the Camden shuttle on its return trip to Stratford, and to the subsequent westbound train from Stratford.
It is of course also possible that NLL suffered from additional types and instances of train congestion, especially at other junctions
and at terminals. Congestion between Overground trains at Camden Road and other locations could have been identified and studied in detail through the use of time-distance plots (7–10). Such plots could be generated from automatic train movement data recorded by the Overground network’s signaling and control systems rather than from timetables (Figure 2a).
Excess Journey Time
Wilson et al. first proposed a measure called “excess waiting time” to indicate the wait time experienced by passengers beyond what they would have experienced had all headways been exactly as scheduled (11). TfL then extended the concept of excess waiting time to apply to the entirety of journeys. TfL used excess journey time (EJT) to represent the difference between actual passenger journey times and journey times implied by the published timetable (12). EJT for NLL as of spring 2008 was examined in detail with the use of the unified estimator of excess journey time developed by Zhao et al., which is unbiased at the aggregate level regardless of passenger incidence behavior (13). The relevant results are summarized as follows:
• NLL in the a.m. peak had by far the highest EJT of any Over-ground line in any time period, followed by NLL in the p.m. peak.
• In terms of mean EJT, the a.m. peak was the worst time period for NLL.
• In terms of total and mean EJT, NLL in the a.m. peak had more than twice as much EJT in the westbound direction as in the eastbound direction.
• Total EJT was severely unbalanced among individual westbound a.m. peak scheduled services on NLL. The five scheduled services with the highest EJT were, in descending order, the 08:22, 07:52, 07:07, 08:52, and 07:37 trains from Stratford. These services had full 15-min headways and had substantially more EJT than their respective shorter-headway leaders, followers, or both.
TaCTiCaL pLaNNiNg iNTerveNTiON
Case for even intervals
This section synthesizes the results of the previous section to explain the thinking behind a specific tactical planning intervention that was implemented on NLL. It does so primarily from the perspective of the London Overground manager, who was the driving force behind this change. This manager was influenced by the results of some of the early research from Frumin (1), and used some of these results to make the case to his stakeholders.
Of the results and analyses discussed in the previous sections of this paper, the key points that influenced the tactical planning intervention on NLL are as follows. The focus was on the a.m. peak period, in which, as of spring 2008, the trains were routinely delayed en route, as reflected by running times substantially in excess of the timetable, and by low PPM, on-time performance scores. Excessive dwell times were found to be a major cause of en route train delay. Evidence existed to support the judgment that these dwell times primarily were a function of passenger volumes. Near-random passenger incidence behavior suggested an expla-nation for uneven passenger volumes and resultant, uneven dwell times; when passengers arrived (even approximately) randomly, ser-vices with longer headways served proportionally more passengers.

52 Transportation Research Record 2353
The confluence of these analyses was confirmed by the corresponding EJT results.
As described in this paper’s section on the service plan, the typical approach to tactical planning on this network was to update the time-table incrementally. It became evident that more drastic measures were needed in this case. Specifically, it was clear that the timetable should be revised, wholesale, to provide headways as even as pos-sible. To achieve this revision, it was proposed to combine NLL and WLL during the a.m. and p.m. peak periods into an even, 10-min headway (6 tph) service between Stratford and Willesden Junction. From Willesden, alternating trains would go on NLL to Richmond and WLL to Clapham Junction. This arrangement was referred to as the 3 + 3 service.
The core idea behind this strategy was to balance passenger vol-umes across trains and thus reduce dwell times and train and passen-ger delays. It was expected that passenger volumes would increase on some trains (i.e., those with longer headways than in the then-current plan) and decrease on others (i.e., those with shorter headways). Although the change was not expected to materially affect the total volume of passengers, the outcome was expected to be positive on balance. The reasons were twofold.
First, dwell times were found to have a nonlinear relationship to passenger volumes [(14) and A. Puong, unpublished report on dwell time model and analysis for Massachusetts Bay Transit Authority Red Line, 2000]. This finding implied that, to hold the total volume of passengers constant, the decrease in dwell times on trains that lost passengers would be larger than the increase in dwell times on trains that gained passengers. Consequently, overall delays should decrease. Second, consistent with the hypothesis of unbalanced train loads, it was anecdotally reported that some passengers were unable to board overcrowded trains and were left behind on the plat-form. The most crowded trains (with larger headways) would be less crowded and allow more (or all) passengers to board. Passengers that had not been able to board because trains were overcrowded would benefit substantially, while other passengers would benefit (from less crowded trains) or suffer less (on more crowded trains).
3 1 3 Service on NLL
Headway Adjustment and Frequency Reallocation
The new tactical plan that resulted from the above analysis was referred to as the 3 + 3 service because it integrated NLL and WLL into a single trunk-and-branch service for the a.m. and p.m. peak
periods. Effectively, an even, 20-min headway (3 tph) service now existed between Stratford and Richmond, interwoven with an iden-tically spaced service between Stratford and Clapham Junction. The two services were offset by 10 min, which yielded an even, 10-min headway (6 tph) trunk service between Stratford and Willesden Junction.
Figure 2b uses a time-distance plot to show the corresponding published a.m. peak timetable for NLL. Table 2 summarizes the changes in the evenness and frequency of service for each segment of NLL and WLL.
The only part of WLL and NLL to lose any service frequency under this reallocation was the western end of the NLL between Willesden Junction and Richmond. One additional shuttle trip over this segment was added for the entire peak period. Overall, how-ever, the headway increased from 15 to 20 min (4 to 3 tph). Not surprisingly, this aspect was the most contentious of this plan. How-ever, the O-D matrix, whose estimate was discussed in the section of this paper on passenger demand, showed that only 25% of NLL passengers in the a.m. peak used this segment of the line. The 3 + 3 tactical plan thus reallocated service such that more passengers gained service than lost it. In doing so, the plan established a ser-vice pattern with even headways throughout the network, which was easier for customers and operators to understand, remember, and use.
Running Time Adjustment
Timetable running times also were adjusted. The Deputy Operations Officer, LOROL, said that it was conventional practice in National Rail timetable development to add running time between the penulti-mate and final stations on a line (O. Bratton, unpublished interviews and electronic communications, 2009). This additional running time increased PPM scores and the chance that a train would be in place at the beginning of its next trip, but it had little effect on the fidelity of the timetable to actual operating conditions on most of the line.
In the new timetable, the running time between Stratford and Camden Road was shortened by 1 to 2 min on the basis of the assump-tion that to even the headways would drastically reduce dwell times. The running time between Camden Road and Richmond was lengthened by 3 to 4 min to account for discrepancies found in the study done by the consultant firm ACT and reported in 2008. Both changes were effected through 1-min adjustments en route, rather than in large blocks of time at the end of the line or at segments of the line. The total running time between Stratford and Richmond
TABLE 2 NLL and WLL Service Under Spring 2008 and 3 1 3 Tactical Plans
Spring 2008 Service (tph) 3 + 3 Service (tph)
Segment BetweenCore (even)
Additional (uneven) Total
Core (even)
Additional (uneven) Total
NLL
SRA ⇔ CMD 4 1–2 5–6 uneven 6 na 6 even
CMD ⇔ WIJ 4 0–1 4–5 uneven 6 na 6 even
WIJ ⇔ RMD 4 na 4 even 3 0–1 3–4 uneven
WLL
WIJ ⇔ CLJ 2 0–1 2–3 uneven 3 na 3 even
Note: Cells with na show instances in which the service for a segment is perfectly even.
Frumin, Zhao, Wilson, and Zhao 53
was lengthened by approximately 3 min, on average, over the a.m. peak period.
Costs
The Deputy Operations Director, LOROL, noted that the changes in service described here were, for all intents and purposes, cost-neutral (O. Bratton, unpublished interviews and electronic com-munications, 2010). The reallocation of service frequencies and adjustments in running times were such that the 3 + 3 service could be operated at approximately the same costs as the existing time-table. No new rolling stock was required and only two, additional crew members (conductors at an annual salary of $23,000 each) were needed to staff the new timetable.
evaLuaTiON
3 + 3 service went into effect on NLL and WLL on Monday, April 20, 2009. This section of the paper evaluates the outcomes of this tactical planning intervention, primarily through longitudinal analy-sis of measures of service delivery and service quality. These mea-sures were taken for a period directly after the implementation and compared with two periods before the implementation: one directly before and one a year earlier. The goal of this evaluation was to assess, to the degree possible, the causal effects on passengers and on the operation of changing the tactical plan. Despite the large amount of data available, however, any number of uncontrolled factors might confound this analysis.
Because this was an evaluation of a major change to the timetable, it was important to evaluate service quality in absolute as well as relative terms. Consequently, total observed journey time (OJT) was analyzed along with EJT. All else being equal, any change in OJT should have been reflected in a similar change in EJT. However, any adjustment to the timetable would break this link.
Service delivery was evaluated primarily in terms of PPM and dwell times, the latter of which was analyzed in a follow-up study by ACT, which issued a second, unpublished report in 2009. Interviews with London Overground management also were considered.
This evaluation focused on NLL, and used GOB as a control, because no substantial changes occurred to the GOB timetable over this period. GOB was not a perfect control: it had different service and demand characteristics than NLL, but it was assumed to be subject to similar external influences (e.g., weather, overall eco-nomic conditions). NLL was evaluated as a whole and also for the core market passengers that traveled between Stratford and Camden
Road westbound (toward Camden Road). This NLL Core market was analyzed separately, because it was the only section of the line for which a change occurred only in the evenness of headways in the peak hours, and no change occurred in the overall frequency of service.
evaluation Data
The following three study periods were analyzed to evaluate the effects of the introduction of 3 + 3 service. They were determined in part by data availability.
• After 2009: Weekdays from April 20 through May 15 and from June 1 through 5, 2009, inclusive. This period included five of the first 7 weeks that directly followed the introduction of 3 + 3 service.
• Before 2009: Weekdays from March 2 through 13, 2009. This period consisted of 2 weeks shortly before the introduction of 3 + 3 service.
• Spring 2008: Weekdays from April 21 through May 16 and June 2 through 6, 2008, inclusive. These weeks in 2008 corresponded to the weeks in the after 2009 period. Complete PPM and timetable data were available for these study periods. Observed and excess jour-ney times (OJT and EJT) were measured from Oyster journey data. Line and segment running time analysis was drawn from the second follow-up report issued by ACT in 2009. Unfortunately, ACT reported on changes in median rather than mean dwell times. Median values masked the effects of large outliers, which could be quite important for a nonlinear phenomenon such as dwell time. Thus changes in dwell time were not directly analyzed here.
evaluation results
Table 3 shows PPM, EJT, and OJT results for the three network seg-ments for the three study periods. It shows the difference from the spring 2008 period to the before 2009 period to indicate the changes in performance between the time the tactical planning analysis was done and just before 3 + 3 was implemented. It shows the difference from the before 2009 period to the after 2009 period, with the hope to isolate the effects of the introduction of 3 + 3 service.
The differences in EJT and OJT were tested in a single-sided dif-ference of means t-test. All differences on NLL and NLL Core were statistically significant at the 1% level. Differences on GOB between the after 2009 period and the spring 2008 period were significant at the 5% level, but between intermediate periods were not significant, even at the 10% level.
TABLE 3 PPM and Passenger Journey Time Results and Comparisons for 3 1 3 Implementation
GOB NLL NLL Core
Study Period PPM (%) EJT OJT PPM (%) EJT OJT EJT OJT
Spring 2008 95.5 1.27 25.32 85.9 2.77 26.50 2.33 17.97
Before 2009 96.3 1.21 25.25 79.7 2.29 25.69 1.39 17.42
After 2009 95.5 1.19 25.14 92.4 1.68 25.51 1.75 17.06
Before 2009 – spring 2008 0.8 −0.06 −0.07 −6.2 −0.48 −0.81 −0.94 −0.55
After 2009 – before 2009 −0.8 −0.02 −0.11 12.7 −0.61 −0.18 0.36 −0.36
After 2009 – spring 2008 0.0 −0.08 −0.18 6.6 −1.09 −0.99 −0.57 −0.91
54 Transportation Research Record 2353
On GOB, the changes in all three measures were small: PPM fluc-tuated by 0.8% and returned to its original value of 95.5%, while EJT and OJT decreased by 0.08 min (6.3%) and 0.18 min (0.7%), respectively, between the initial and final study period. It was not unexpected that OJT and EJT did not vary by the exact same amount. Although the changes to the GOB timetable were minor, OJT could be affected by slight shifts in (a) passenger incidence behavior, because EJT was calculated against scheduled waiting time, or (b) the temporal distribution of ridership over the a.m. peak, because run-ning times in the timetable did vary slightly over the a.m. peak. This observation illustrates some of the factors that may confound the longitudinal analysis for NLL, if only to a small degree.
On NLL as a whole, changes might be observed in all calculated measures. PPM decreased (i.e., worsened) between the spring 2008 and before 2009 study periods by nearly 6 percentage points. In its follow-up review, ACT found that, over this time, average train journey time from Stratford to Richmond increased by about 30 s.
OJT and EJT decreased (i.e., improved), by 0.81 min (3.1%) and 0.48 min (17.3%), respectively, over the 9 months between the first two study periods. For the NLL Core passengers, OJT and EJT decreased by 0.55 min (3.1%) and 0.94 min (40.3%), respectively. It was of interest in these cases that the changes in EJT and OJT (measures of relative and absolute service quality) were direction-ally opposite of the changes in PPM (a measure of service delivery).
Apparently, absolute and relative service quality on NLL, as expe-rienced by passengers before the implementation of the 3 + 3 service, improved substantially. The Deputy Operations Director, LOROL, attributed improvement primarily to “higher performing Network Rail infrastructure” (O. Bratton, unpublished interviews and electronic communications, 2010). The 2008 TfL Investment Programme indi-cated that $56.9 million of infrastructure upgrades were planned dur-ing this period (15). Much of this investment was to support capacity on NLL to an eventual 12 tph.
For NLL, the comparison between the before 2009 and after 2009 study periods provided the clearest insight into the direct effects of the introduction of the 3 + 3 service. PPM increased by more than 12 percentage points, while the average running time from Stratford to Richmond increased by just under 20 s.
OJT decreased by an additional 0.18 min (0.7%) for NLL as a whole and 0.36 min (2.1%) for the NLL Core, which indicated improved passenger journey times. The changes in EJT, like those in PPM, were more difficult to interpret. For the NLL Core, EJT worsened (i.e., increased away from zero) while PPM and OJT both improved, which was not a surprise, because the running time between Stratford and Camden Road was shortened in the new timetable. OJT decreased, but scheduled journey times decreased even more, so EJT increased. This finding illustrates one of the disadvantages of measures of service quality that have their basis in timetables, such as EJT.
Given the substantial changes to the timetable, the effects of the introduction of 3 + 3 service might best be judged in terms of abso-lute service quality. The decreases in OJT suggested that the tactical planning intervention improved the experience of NLL passengers. The changes in OJT were 22.2% and 65.4% of the changes observed on NLL and NLL Core, respectively, between the spring 2008 and before 2009 study periods.
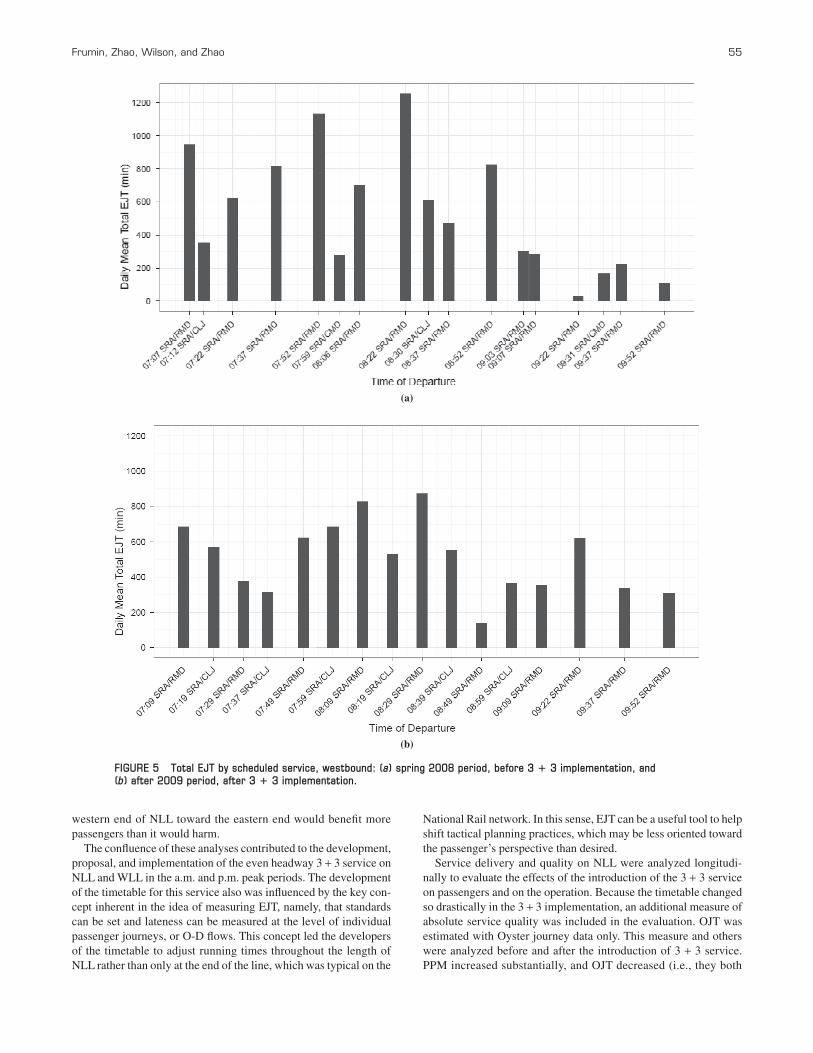
Figure 5 plots total EJT by scheduled service for westbound pas-senger journeys on NLL between Stratford and Willesden Junction in the spring 2008 period and the after 2009 period. A comparison between the two showed a more even distribution of EJT across scheduled services during the height of the peak period. For exam-ple, in the after 2009 period (Figure 5a), the differences between the
services with the highest total EJT (the 08:09 and 08:39 trains from Stratford) and their respective leaders and followers were smaller, even in relative terms, than the same differences for the services with the highest EJT in the spring 2008 period (the 07:52 and 08:22 trains from Stratford).
Because the timetable and headways changed between these two study periods, incidence behavior was examined, but no noticeable change in overall incidence behavior was found. Mean scheduled wait-ing time (which was the part of the scheduled journey time against which EJT was measured) decreased by 0.1 min on the NLL Core and increased by approximately the same amount over the entire NLL. These changes appeared to be a function primarily of changes to the timetable rather than changes in incidence behavior.
A plan delivery manager, who represented TfL in its relationship with LOROL, was interviewed about the effects of the introduction of the 3 + 3 service. He noted that “overall it is good for passen-gers. . . . There has been a lot of good passenger benefit to a greater number of passengers than those that have been disadvantaged. . . . It has also improved train performance and has made the timetable more robust and easier to recover from. . . . Overall I would say we could move more people during the peaks when we were a bit con-strained before” (A. Salique, unpublished interviews and electronic communications, 2010).
CONCLuSiONS
The case study presented in this paper provides a rich example of the use of automatic data to support tactical planning for NLL in the Overground network. The analyses presented here contributed to the development of the new tactical plan for NLL and to the evalu-ation of its implementation, whose effects appeared to have been positive on balance. This case study thus demonstrates the applica-bility of automatic data generally, and the data and methods used in London Overground specifically, for tactical planning for an urban railway.
Various measures of service delivery and service quality, all gener-ated from automatic data sources, contributed to the tactical planning exercise that led to the 3 + 3 service. In terms of service delivery, dwell times, running times, and on-time performance were analyzed with the use of train signaling and control data. They indicated that running times in operation were substantially longer than in the timetable, and that excess dwell time, particularly on certain scheduled services and at certain locations, was one of the main causes of increased running times. Service quality was analyzed primarily in a relative sense in terms of EJT as measured with Oyster journey data and the published timetable. EJT was found to add an element of the passenger’s per-spective to the tactical planning process. EJT can focus tactical plan-ning attention on the segments of passengers that need it most, and can support and enhance analyses that have been initiated from the operator’s perspective.
Two analyses of passenger demand also contributed to the tactical planning process. Passenger incidence behavior on NLL was ana-lyzed with Oyster journey data and the published timetable. Behavior was found to be substantially more random than previously assumed, which contributed to the decision to move NLL to an even headway service. The O-D matrix also was analyzed of overall a.m. peak pas-senger demand on the Overground network, estimated from aggre-gate Oyster passenger volumes, automatic gateline entry counts, and manual onboard passenger counts. This O-D matrix indicated that the proposed reallocation of some service frequency away from the
Frumin, Zhao, Wilson, and Zhao 55
western end of NLL toward the eastern end would benefit more passengers than it would harm.
The confluence of these analyses contributed to the development, proposal, and implementation of the even headway 3 + 3 service on NLL and WLL in the a.m. and p.m. peak periods. The development of the timetable for this service also was influenced by the key con-cept inherent in the idea of measuring EJT, namely, that standards can be set and lateness can be measured at the level of individual passenger journeys, or O-D flows. This concept led the developers of the timetable to adjust running times throughout the length of NLL rather than only at the end of the line, which was typical on the
National Rail network. In this sense, EJT can be a useful tool to help shift tactical planning practices, which may be less oriented toward the passenger’s perspective than desired.
Service delivery and quality on NLL were analyzed longitudi-nally to evaluate the effects of the introduction of the 3 + 3 service on passengers and on the operation. Because the timetable changed so drastically in the 3 + 3 implementation, an additional measure of absolute service quality was included in the evaluation. OJT was estimated with Oyster journey data only. This measure and others were analyzed before and after the introduction of 3 + 3 service. PPM increased substantially, and OJT decreased (i.e., they both
(a)
(b)
FIGURE 5 Total EJT by scheduled service, westbound: (a) spring 2008 period, before 3 1 3 implementation, and (b) after 2009 period, after 3 1 3 implementation.
56 Transportation Research Record 2353
improved). EJT decreased substantially more than did OJT for the line as a whole and increased for the core portion of the line, which was the portion toward which the 3 + 3 service was targeted.
These discrepancies were found because the 3 + 3 timetable had lengthened running times over the whole line and shortened them over the core portion. This effect highlighted the relative nature of EJT and illustrated its value as a relative rather than absolute mea-sure. EJT provided good information about how passenger experi-ence compared with the timetable but not necessarily a clear picture of how it changed in an absolute sense. It thus was similar to on-time performance but measured for and weighted by individual pas-senger journeys. It remained important to include absolute measures of service quality, such as OJT, in the evaluation set along with the relative measures.
aCkNOwLeDgmeNTS
This paper is based in part on the master’s thesis of the first author (1). The authors thank Transport for London for financial and institutional support for this research, for the opportunity to work in the agency, and for access to the data used in this paper. The authors also thank Oliver Bratton of London Overground Rail Operations Ltd. for his insights into the issues and dynamics of the London Overground network.
refereNCeS
1. Frumin, M. Automatic Data for Applied Railway Management: Passen-ger Demand, Service Quality Measurement, and Tactical Planning on the London Overground Network. MS thesis. Massachusetts Institute of Technology, Cambridge, 2010.
2. Frumin, M., and J. Zhao. Analyzing Passenger Incidence Behavior in Heterogeneous Transit Services Using Smartcard Data and Schedule-
Based Assignment. In Transportation Research Record: Journal of the Transportation Research Board, No. 2274, Transportation Research Board of the National Academies, Washington, D.C., 2012, pp. 52–60.
3. Graphserver. Graphserver: The Open-Source Multi-Modal Trip Planner. http://bmander.github.com/graphserver/. 2009.
4. Google. General Transit Feed Specification. http://code.google.com/transit/spec/transit_feed_specification.html. Accessed Nov. 13, 2009.
5. Kittelson & Associates, Inc. TCRP Report 88: Guidebook for Developing a Transit Performance-Measurement System. Transportation Research Board of the National Academies, Washington D.C., 2003.
6. Office of Rail Regulation, United Kingdom. National Rail Trends Year-book, 2007–2008. Technical report. London, 2008.
7. Rahbee, A. Rail Transit Operations Analysis: Framework and Applica-tions. MS thesis. Massachusetts Institute of Technology, Cambridge, 1999.
8. Rahbee, A. Rail Operations Analysis and Strategies for Service Quality Improvement. Technical report. Chicago Transit Authority, Ill., 2006.
9. Vescovacci, M. A. Junction Capacity and Performance in Rail Transit. MS thesis. Massachusetts Institute of Technology, Cambridge, 2001.
10. Lee, D. S.-M. Understanding Capacity and Performance of Urban Rail. Transit Terminals. MS thesis. Massachusetts Institute of Technology, Cambridge, 2002.
11. Wilson, N. H. M., D. Nelson, A. Palmere, T. Grayson, and C. Ceder-quist. Service-Quality Monitoring for High-Frequency Transit Lines. In Transportation Research Record 1349, National Research Council, Washington, D.C., 1992, pp. 3–11.
12. Journey Time Metric: An Overview. London Transport, 1999.13. Zhao, J., M. Frumin, N. Wilson, and Z. Zhao. Unified Estimator for
Excess Journey Time Under Heterogeneous Passenger Incidence Behav-ior Using Smartcard Data. Transportation Research Part C: Emerging Technologies, forthcoming.
14. Wilson, N. H. M., and T. Lin. Dwell Time Relationships for Light Rail System. In Transportation Research Record 1361, TRB, National Research Council, Washington, D.C., 1993, pp. 287–295.
15. Investment Programme 2008: 2005/06 to 2009/10. Transport for London, 2007.
The Rail Transit Systems Committee peer-reviewed this paper.