Automated cardiac event change detection for continuous remote patient monitoring devices
8
Automated Cardiac Event Change Detection for Continuous Remote Patient Monitoring Devices Britty Baby Department of Electronics and Communication Engineering, Amrita Vishwa Vidyapeetham, Tamilnadu, India-641112. M. Sabarimalai Manikandan Center for Excellence in Computational Engineering and Networking Amrita Vishwa Vidyapeetham, Tamilnadu, India-641112. [email protected] K. P. Soman Center for Excellence in Computational Engineering and Networking Amrita Vishwa Vidyapeetham, Tamilnadu, India-641112. ABSTRACT Recently, wireless body area network (WBAN) plays an im- portant role in remote cardiac patient monitoring, and mo- bile healthcare applications. Generally, the use of WBAN technology is restricted by size, power consumption, trans- mission capacity (bandwidth), and computational loads. In this paper, we therefore propose an automated cardiac event change detection for continuous remote patient monitoring devices. The proposed event change detection algorithm consists of two stages: i) ECG beat extraction; and ii) ECG beat similarity measure. In the first stage, the onset of each QRS complex is identified using the Gaussian deriva- tive based QRS detector and the two heuristics rules. In the second stage, we employ the weighted wavelet distance (WWD) metric for finding the similarity between two ECG beats in wavelet domain. The WWD is the weighted nor- malized Euclidean wavelet distance between the wavelet sub- band coefficients vectors of the current and past ECG beats, where weights are equal to the relative wavelet subband energies of the corresponding subbands. The experimen- tal results show that the weighted wavelet distance measure works substantially better than the conventional PRD and the wavelet based weighted PRD (WWPRD) measures un- der noisy environments. The proposed approach has been tested and yielded an accuracy of 99.76% on MIT-BIH Ar- rhythmia Database. Keywords electrocardiogram, QRS detection, cardiac event detection, peak-finding logic, Gaussian derivative, remote cardiac pa- tient monitoring, wavelet distance metric. 1. INTRODUCTION In recent years, wireless remote health monitoring system is widely used for screening, diagnosis and management of cardiac diseases of post-surgical patients and chronic heart failure patients. Cardiac patients with wireless wearable and/or implant medical devices can be checked remotely no matter where they are located. Cardiologists can monitor and access cardiac data of any patient by connecting the mobile devices such as mobile phones, smartphones, per- sonal digital assistants (PDAs), and wireless-enabled (Wi- Fi) laptops to telemedicine network using any of wireless and cellular technologies such as Wi-Fi, Bluetooth, GSM, GPRS, CDMA, WiMAX, UMTS, CDPD, Mobitex, 4G, and satellite-internet technology. The remote patient monitor- ing system has the following advantages: i) monitoring and accessing subjects who are mobile and may reduce hospi- tal readmissions; ii) time-saving and cost-effective means for follow-up; iii) continuous monitoring decreases the risk fac- tors of life threatening cardiac diseases; iv) supports emer- gency patient promptly and appropriately; v) provides the better privacy and peace of mind for patients and extensive care from family members. The electrocardiogram (ECG) records the electrical activity of the heart that can be use- ful to detect signs of poor blood flow, heart muscle damage, abnormal heartbeats, and other heart problems. The contin- uous recording and monitoring of ECG signal can play a ma- jor role in prevention of cardiovascular disease. For clinical evaluation of hospitalized cardiac patients, the ECG signal is recoded for duration of 12-48 hours using an ECG Holter device. Then, the clinical evaluation of long-term ECG sig- nal is performed by physicians. The recent advancements in microelectronics, digital signal processing techniques and wireless communication technologies enable cardiologists to provide medical treatment by monitoring remotely located ambulatory, post-surgical, and chronic cardiac patients. Al- though the wearable cardiac monitoring device collect and transmit the vital signs of cardiac patients continuously, there are limitations in the use of wireless sensor network technology and wearable devices. Generally, the use of wire- less wearable cardiac monitoring device is restricted by size, power consumption, transmission capacity (or bandwidth), memory, and computational loads. Recent growth in 2G and 3G technologies enable to access remote patient car- diac information by cardiologists at any time and location. Although, these technologies provide high bandwidth, pub- lic highly demands cost-effective healthcare services. More- over, the continuous cardiac monitoring device reduces more power for transmission and thus reduces the battery life.
Transcript of Automated cardiac event change detection for continuous remote patient monitoring devices

Automated Cardiac Event Change Detection forContinuous Remote Patient Monitoring Devices
Britty BabyDepartment of Electronics andCommunication Engineering,Amrita Vishwa Vidyapeetham,
Tamilnadu, India-641112.
M. SabarimalaiManikandan
Center for Excellence inComputational Engineering
and Networking Amrita VishwaVidyapeetham, Tamilnadu,
K. P. SomanCenter for Excellence in
Computational Engineeringand Networking Amrita Vishwa
Vidyapeetham, Tamilnadu,India-641112.
ABSTRACTRecently, wireless body area network (WBAN) plays an im-portant role in remote cardiac patient monitoring, and mo-bile healthcare applications. Generally, the use of WBANtechnology is restricted by size, power consumption, trans-mission capacity (bandwidth), and computational loads. Inthis paper, we therefore propose an automated cardiac eventchange detection for continuous remote patient monitoringdevices. The proposed event change detection algorithmconsists of two stages: i) ECG beat extraction; and ii) ECGbeat similarity measure. In the first stage, the onset ofeach QRS complex is identified using the Gaussian deriva-tive based QRS detector and the two heuristics rules. Inthe second stage, we employ the weighted wavelet distance(WWD) metric for finding the similarity between two ECGbeats in wavelet domain. The WWD is the weighted nor-malized Euclidean wavelet distance between the wavelet sub-band coefficients vectors of the current and past ECG beats,where weights are equal to the relative wavelet subbandenergies of the corresponding subbands. The experimen-tal results show that the weighted wavelet distance measureworks substantially better than the conventional PRD andthe wavelet based weighted PRD (WWPRD) measures un-der noisy environments. The proposed approach has beentested and yielded an accuracy of 99.76% on MIT-BIH Ar-rhythmia Database.
Keywordselectrocardiogram, QRS detection, cardiac event detection,peak-finding logic, Gaussian derivative, remote cardiac pa-tient monitoring, wavelet distance metric.
1. INTRODUCTIONIn recent years, wireless remote health monitoring systemis widely used for screening, diagnosis and management ofcardiac diseases of post-surgical patients and chronic heart
failure patients. Cardiac patients with wireless wearableand/or implant medical devices can be checked remotely nomatter where they are located. Cardiologists can monitorand access cardiac data of any patient by connecting themobile devices such as mobile phones, smartphones, per-sonal digital assistants (PDAs), and wireless-enabled (Wi-Fi) laptops to telemedicine network using any of wirelessand cellular technologies such as Wi-Fi, Bluetooth, GSM,GPRS, CDMA, WiMAX, UMTS, CDPD, Mobitex, 4G, andsatellite-internet technology. The remote patient monitor-ing system has the following advantages: i) monitoring andaccessing subjects who are mobile and may reduce hospi-tal readmissions; ii) time-saving and cost-effective means forfollow-up; iii) continuous monitoring decreases the risk fac-tors of life threatening cardiac diseases; iv) supports emer-gency patient promptly and appropriately; v) provides thebetter privacy and peace of mind for patients and extensivecare from family members. The electrocardiogram (ECG)records the electrical activity of the heart that can be use-ful to detect signs of poor blood flow, heart muscle damage,abnormal heartbeats, and other heart problems. The contin-uous recording and monitoring of ECG signal can play a ma-jor role in prevention of cardiovascular disease. For clinicalevaluation of hospitalized cardiac patients, the ECG signalis recoded for duration of 12-48 hours using an ECG Holterdevice. Then, the clinical evaluation of long-term ECG sig-nal is performed by physicians. The recent advancementsin microelectronics, digital signal processing techniques andwireless communication technologies enable cardiologists toprovide medical treatment by monitoring remotely locatedambulatory, post-surgical, and chronic cardiac patients. Al-though the wearable cardiac monitoring device collect andtransmit the vital signs of cardiac patients continuously,there are limitations in the use of wireless sensor networktechnology and wearable devices. Generally, the use of wire-less wearable cardiac monitoring device is restricted by size,power consumption, transmission capacity (or bandwidth),memory, and computational loads. Recent growth in 2Gand 3G technologies enable to access remote patient car-diac information by cardiologists at any time and location.Although, these technologies provide high bandwidth, pub-lic highly demands cost-effective healthcare services. More-over, the continuous cardiac monitoring device reduces morepower for transmission and thus reduces the battery life.

RRint
P
R
T
PRseg
Pamp
Tamp
QRS+amp
QRS-amp
S
P
R
T
U
QPdur
QRSdur
STseg
Tdur
STint
QTint
Q
S
Figure 1: The electrocardiogram (ECG) signal andsome diagnostic parameters.
In such scenarios, there is a great demand for an automatedcardiac event change detector for continuous patient moni-toring applications. The limitations of continuous wirelesspatient monitoring system can be overcome by exploitingand exploring the patterns of ECG beat in the long-termECG signal. In this work, we propose an automated car-diac change detection algorithm for pervasive and continu-ous wireless cardiac monitoring devices. The proposed car-diac monitoring system not only reduces the transmissionand storage cost and power consumption, but also alerts thecardiologists and instantly sends only beat patterns whichexhibit abrupt changes in the ECG signal. In literature,many algorithms have been developed for classification ofECG beats and detection of ST pattern change. The ECGbeat classification algorithms are based on wavelet features,ECG morphology and RR interval features, neural networks,higher order statistics, hermite basis function, support vec-tor machines, fuzzy logic, and principal component anal-ysis. It is well-known that the analytic features capturelocal information in a ECG signal. But the extraction ofthe analytic features is very difficult and challenging taskunder noise environments. Moreover, performance of anyECG beat recognition system highly relies on the accuracyof the QRS complex detector. The beat classification ap-proach based on the ECG templates and distance measureis heavily affected by various kinds of noise.
This paper is organized as follows. Section 2 describes thecharacteristics of ECG beats in a long-term ECG signal.Section 3 presents cardiac event change detection algorithmbased on the ECG beat extractor and weighted wavelet dis-tance metric. The experimental results of the proposed ap-proach for the well-know MIT-BIH arrhythmia database arepresented in Section 4. Finally, conclusions are drawn in theSection 5.
2. PRELIMINARIESThe electrocardiogram (ECG) continues to be a critical com-ponent of the evaluation of patients who have signs andsymptoms of emergency cardiac conditions [1]. Cardiac im-pulses normally originate in the sinoatrial (SA) node andthen are conducted through the atrial tissue to the atri-oventricular (AV) node and into the bundle of His [2]. The
0 2 4 6 8 10 12 14
0
0.5
1
0 2 4 6 8 10 12 14
0
0.5
1
0 2 4 6 8 10 12 14
0
0.5
1
ampl
itude
0 2 4 6 8 10 12 14
0
0.5
1
Time (sec)
Figure 2: One-minute ECG signal taken from 103illustrates the similarity between successive ECGbeats.
0 2 4 6 8 10 12 14−1
−0.5
0
0.5
0 2 4 6 8 10 12 14
−0.5
0
0.5
1
0 2 4 6 8 10 12 14−1
−0.5
0
0.5
ampl
itude
0 2 4 6 8 10 12 14−1
−0.5
0
0.5
Time (sec)
Figure 3: One-minute ECG signal taken from record107 illustrates the dissimilarity between successiveECG beats.
ECG signal represents the changes in electrical potential inthe cardiac muscles during the cardiac cycle as recorded onthe surface of the body. A two cycle ECG signal with vari-ous amplitudes and time intervals is shown in Fig. 1. Anychange in the cardiac rhythm or activity is clearly visible inthe PQRST morphologies. The complete PQRST morphol-ogy is referred to as ECG beat or cycle. Generally, a normalECG signal consists of local waves such as P wave, QRScomplex, and T wave. Computer aided cardiac diagnosisextracts durations (P wave, QRS complex, T wave), inter-vals (PR interval, QT interval, RR interval), segments (PRsegment, ST segment), amplitudes, shapes of local waves ofECG signal and also heart rate. In most of the normal cases,the inter ECG beat patterns are similar in long-term ECGrecordings. Even in the arrhythmia cases, the inter ECGpatterns are similar for a short duration. The significance ofsimilar ECG patterns may not play a major role in diagnosisof heart problems and only change in the ECG patterns pro-
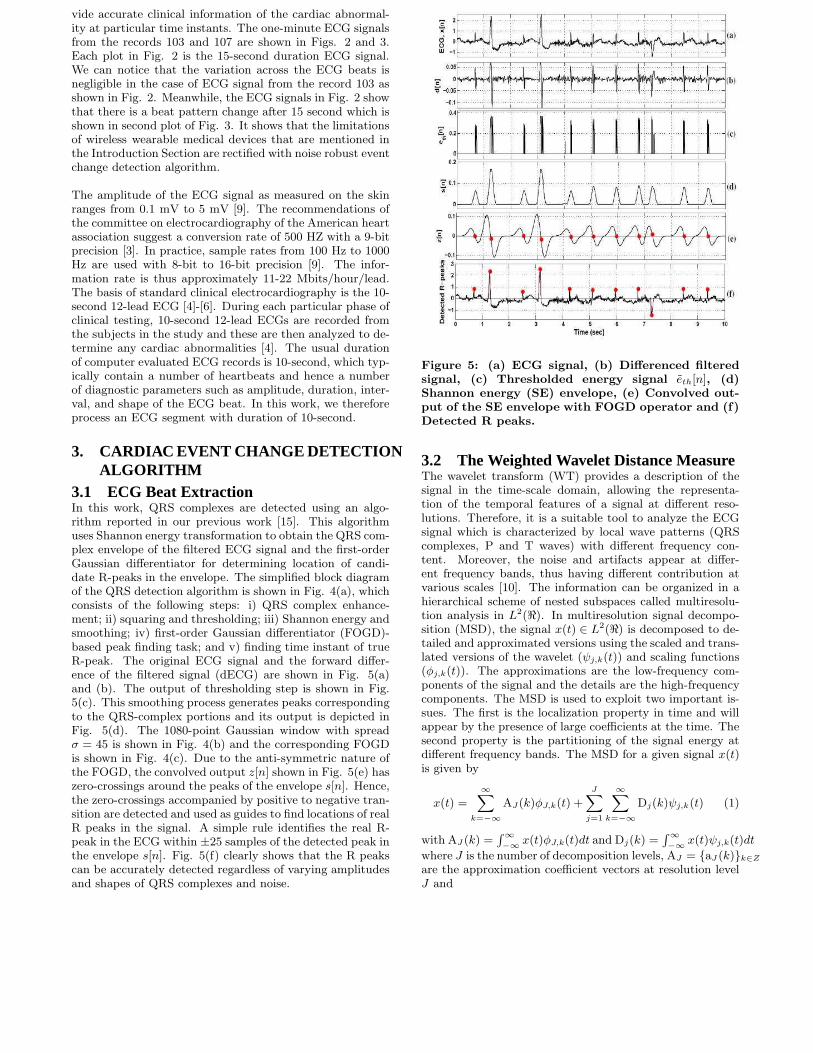
vide accurate clinical information of the cardiac abnormal-ity at particular time instants. The one-minute ECG signalsfrom the records 103 and 107 are shown in Figs. 2 and 3.Each plot in Fig. 2 is the 15-second duration ECG signal.We can notice that the variation across the ECG beats isnegligible in the case of ECG signal from the record 103 asshown in Fig. 2. Meanwhile, the ECG signals in Fig. 2 showthat there is a beat pattern change after 15 second which isshown in second plot of Fig. 3. It shows that the limitationsof wireless wearable medical devices that are mentioned inthe Introduction Section are rectified with noise robust eventchange detection algorithm.
The amplitude of the ECG signal as measured on the skinranges from 0.1 mV to 5 mV [9]. The recommendations ofthe committee on electrocardiography of the American heartassociation suggest a conversion rate of 500 HZ with a 9-bitprecision [3]. In practice, sample rates from 100 Hz to 1000Hz are used with 8-bit to 16-bit precision [9]. The infor-mation rate is thus approximately 11-22 Mbits/hour/lead.The basis of standard clinical electrocardiography is the 10-second 12-lead ECG [4]-[6]. During each particular phase ofclinical testing, 10-second 12-lead ECGs are recorded fromthe subjects in the study and these are then analyzed to de-termine any cardiac abnormalities [4]. The usual durationof computer evaluated ECG records is 10-second, which typ-ically contain a number of heartbeats and hence a numberof diagnostic parameters such as amplitude, duration, inter-val, and shape of the ECG beat. In this work, we thereforeprocess an ECG segment with duration of 10-second.
3. CARDIAC EVENT CHANGE DETECTIONALGORITHM
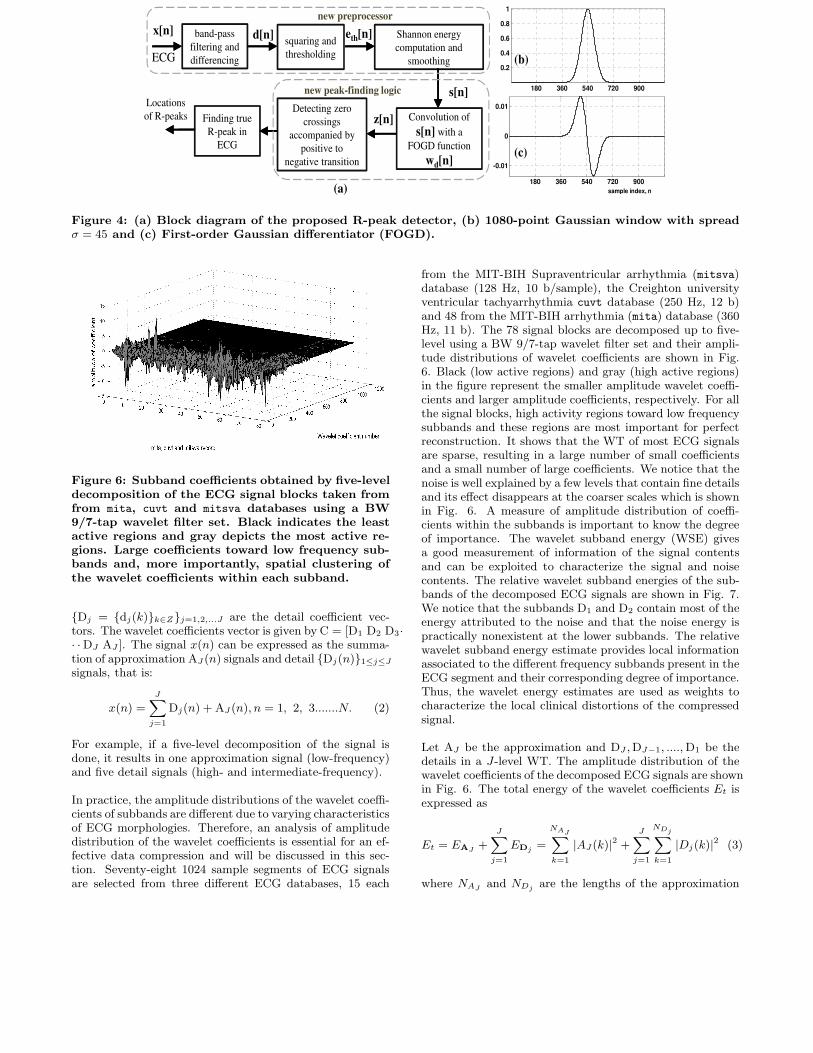
3.1 ECG Beat ExtractionIn this work, QRS complexes are detected using an algo-rithm reported in our previous work [15]. This algorithmuses Shannon energy transformation to obtain the QRS com-plex envelope of the filtered ECG signal and the first-orderGaussian differentiator for determining location of candi-date R-peaks in the envelope. The simplified block diagramof the QRS detection algorithm is shown in Fig. 4(a), whichconsists of the following steps: i) QRS complex enhance-ment; ii) squaring and thresholding; iii) Shannon energy andsmoothing; iv) first-order Gaussian differentiator (FOGD)-based peak finding task; and v) finding time instant of trueR-peak. The original ECG signal and the forward differ-ence of the filtered signal (dECG) are shown in Fig. 5(a)and (b). The output of thresholding step is shown in Fig.5(c). This smoothing process generates peaks correspondingto the QRS-complex portions and its output is depicted inFig. 5(d). The 1080-point Gaussian window with spreadσ = 45 is shown in Fig. 4(b) and the corresponding FOGDis shown in Fig. 4(c). Due to the anti-symmetric nature ofthe FOGD, the convolved output z[n] shown in Fig. 5(e) haszero-crossings around the peaks of the envelope s[n]. Hence,the zero-crossings accompanied by positive to negative tran-sition are detected and used as guides to find locations of realR peaks in the signal. A simple rule identifies the real R-peak in the ECG within ±25 samples of the detected peak inthe envelope s[n]. Fig. 5(f) clearly shows that the R peakscan be accurately detected regardless of varying amplitudesand shapes of QRS complexes and noise.
Figure 5: (a) ECG signal, (b) Differenced filteredsignal, (c) Thresholded energy signal eth[n], (d)Shannon energy (SE) envelope, (e) Convolved out-put of the SE envelope with FOGD operator and (f)Detected R peaks.
3.2 The Weighted Wavelet Distance MeasureThe wavelet transform (WT) provides a description of thesignal in the time-scale domain, allowing the representa-tion of the temporal features of a signal at different reso-lutions. Therefore, it is a suitable tool to analyze the ECGsignal which is characterized by local wave patterns (QRScomplexes, P and T waves) with different frequency con-tent. Moreover, the noise and artifacts appear at differ-ent frequency bands, thus having different contribution atvarious scales [10]. The information can be organized in ahierarchical scheme of nested subspaces called multiresolu-tion analysis in L2(ℜ). In multiresolution signal decompo-sition (MSD), the signal x(t) ∈ L2(ℜ) is decomposed to de-tailed and approximated versions using the scaled and trans-lated versions of the wavelet (ψj,k(t)) and scaling functions(φj,k(t)). The approximations are the low-frequency com-ponents of the signal and the details are the high-frequencycomponents. The MSD is used to exploit two important is-sues. The first is the localization property in time and willappear by the presence of large coefficients at the time. Thesecond property is the partitioning of the signal energy atdifferent frequency bands. The MSD for a given signal x(t)is given by
x(t) =∞∑
k=−∞
AJ(k)φJ,k(t) +J∑
j=1
∞∑
k=−∞
Dj(k)ψj,k(t) (1)
with AJ (k) =∫∞
−∞x(t)φJ,k(t)dt and Dj(k) =
∫∞
−∞x(t)ψj,k(t)dt
where J is the number of decomposition levels, AJ = {aJ (k)}k∈Z
are the approximation coefficient vectors at resolution levelJ and
new peak-finding logic
new preprocessor
band-pass
filtering and
differencing
squaring and
thresholding
Shannon energy
computation and
smoothing
x[n]
ECG
d[n] eth[n]
s[n]
Convolution of
s[n] with a
FOGD function
wd[n]
Detecting zero
crossings
accompanied by
positive to
negative transition
z[n]Finding true
R-peak in
ECG
Locations
of R-peaks
(a)
180 360 540 720 900
0.2
0.4
0.6
0.8
1
180 360 540 720 900
-0.01
0
0.01
sample index, n
(c)
(b)
Figure 4: (a) Block diagram of the proposed R-peak detector, (b) 1080-point Gaussian window with spreadσ = 45 and (c) First-order Gaussian differentiator (FOGD).
Figure 6: Subband coefficients obtained by five-leveldecomposition of the ECG signal blocks taken fromfrom mita, cuvt and mitsva databases using a BW9/7-tap wavelet filter set. Black indicates the leastactive regions and gray depicts the most active re-gions. Large coefficients toward low frequency sub-bands and, more importantly, spatial clustering ofthe wavelet coefficients within each subband.
{Dj = {dj(k)}k∈Z}j=1,2,...J are the detail coefficient vec-tors. The wavelet coefficients vector is given by C = [D1 D2 D3·· ·DJ AJ ]. The signal x(n) can be expressed as the summa-tion of approximation AJ (n) signals and detail {Dj(n)}1≤j≤J
signals, that is:
x(n) =J∑
j=1
Dj(n) + AJ (n), n = 1, 2, 3.......N. (2)
For example, if a five-level decomposition of the signal isdone, it results in one approximation signal (low-frequency)and five detail signals (high- and intermediate-frequency).
In practice, the amplitude distributions of the wavelet coeffi-cients of subbands are different due to varying characteristicsof ECG morphologies. Therefore, an analysis of amplitudedistribution of the wavelet coefficients is essential for an ef-fective data compression and will be discussed in this sec-tion. Seventy-eight 1024 sample segments of ECG signalsare selected from three different ECG databases, 15 each
from the MIT-BIH Supraventricular arrhythmia (mitsva)database (128 Hz, 10 b/sample), the Creighton universityventricular tachyarrhythmia cuvt database (250 Hz, 12 b)and 48 from the MIT-BIH arrhythmia (mita) database (360Hz, 11 b). The 78 signal blocks are decomposed up to five-level using a BW 9/7-tap wavelet filter set and their ampli-tude distributions of wavelet coefficients are shown in Fig.6. Black (low active regions) and gray (high active regions)in the figure represent the smaller amplitude wavelet coeffi-cients and larger amplitude coefficients, respectively. For allthe signal blocks, high activity regions toward low frequencysubbands and these regions are most important for perfectreconstruction. It shows that the WT of most ECG signalsare sparse, resulting in a large number of small coefficientsand a small number of large coefficients. We notice that thenoise is well explained by a few levels that contain fine detailsand its effect disappears at the coarser scales which is shownin Fig. 6. A measure of amplitude distribution of coeffi-cients within the subbands is important to know the degreeof importance. The wavelet subband energy (WSE) givesa good measurement of information of the signal contentsand can be exploited to characterize the signal and noisecontents. The relative wavelet subband energies of the sub-bands of the decomposed ECG signals are shown in Fig. 7.We notice that the subbands D1 and D2 contain most of theenergy attributed to the noise and that the noise energy ispractically nonexistent at the lower subbands. The relativewavelet subband energy estimate provides local informationassociated to the different frequency subbands present in theECG segment and their corresponding degree of importance.Thus, the wavelet energy estimates are used as weights tocharacterize the local clinical distortions of the compressedsignal.
Let AJ be the approximation and DJ ,DJ−1, ....,D1 be thedetails in a J-level WT. The amplitude distribution of thewavelet coefficients of the decomposed ECG signals are shownin Fig. 6. The total energy of the wavelet coefficients Et isexpressed as
Et = EAJ +
J∑
j=1
EDj =
NAJ∑
k=1
|AJ (k)|2 +
J∑
j=1
NDj∑
k=1
|Dj(k)|2 (3)
where NAJ and NDj are the lengths of the approximation

−2
0
2
−2−1
01
−0.50
0.51
−0.5
0
0.5
−0.2
0
0.2
−0.10
0.1
−0.50
0.5
−2
0
2
−2
0
2
A5(n)
D5(n)
D4(n)
D3(n)
D2(n)
D1(n)
x4(n)
x3(n)
x2(n)
x1(n)
x0(n)=x(n)
x(n)
A4(n)
A3(n)
A2(n)
A1(n)
A0(n)
−
+
+
+
+
+
e(n)
Figure 8: The synthesis (reconstruction) structure for a five-level decomposition of the test ECG signal.
Figure 9: Block diagram of weighted wavelet distance (WWD) measure.
and the jth level detail subband, respectively. Then, thedynamic weights that capture the actual contribution of the
subbands are estimated as
w =
[
EAJ
Et
,EDJ
Et
,EDJ−1
Et
, , ..........,ED1
Et
]T
(4)

0 10
2030
4050
6070
80
0
25
50
75
100
Wavelet subband
Re
lative
wa
ve
let
su
bb
an
d e
ne
rgy (
%)
cuvtmitsvaRecord
D1
D3
D4
D2
D5
A5
mita
Figure 7: Relative wavelet subband energy (RWSE)distribution of each record taken from mita, cuvt andmitsva databases. We can note that the RWSE of thebands D2 and D1 is lesser as compared to the otherbands.
Then, the weighted wavelet distance (WWD) is defined as[16]
WWD = wJ ×
√
√
√
√
∑KJk=1
(AJ [k]− AJ [k])2∑Kj
k=1(AJ [k])2
× 100 (5)
+
J∑
j=1
wj ×
√
√
√
√
∑Kj
k=1(Dj [k]− Dj [k])2
∑KJk=1
(DJ [k])2× 100
where j is the subband, wj is the dynamic weight of the jsubband, Kj denotes the number of wavelet coefficients injth subband and Dj(k) is the kth wavelet coefficient in jth
subband. The dynamic weights, wj are estimated from theRWSEs of the subbands. The WWD measures the weightednormalized root-mean-squared difference between the sub-band coefficients of a current ECG beat and the subbandcoefficients of a past ECG beat. The overall architecture ofthe proposed weighted wavelet distance (WWD) metric isshown in 5. The WWD metric provides subband or local er-ror estimation criterion that will focus on diagnostic qualityfor compressed signals. As will be demonstrated, the mea-sure is insensitive to noise suppression and more sensitiveto PQRST complex features distortion. Under noisy envi-ronments, the WWD metric reflects signal distortion andprovides more meaningful results than the conventional dis-tance metrics.
In this experiment, the commonly used dataset-I records(mita 100, 101, 102, 103, 107, 111, 115, 117, 118 and 119)are processed at a PRD1 value of 6%. The weighted localerrors of the WWD and WWPRD [17] are shown in Table1 and the reconstructed or compressed signals are shownin Fig. 10. It is observed that important diagnostic fea-tures are distorted and the small and short local waves aremissing in Figs. 10 (a), (d), (h), (i), (k) and (l). In Figs.10(h), (i) and (k), the duration of the small P wave is pro-longed. Regardless of an apparent large error as reflectedin the PRD’s and in the WWPRD’s, close examination ofthe signals of Fig. 10 reveals that all the local waves ofthe ECG and their diagnostic features are retained. ThePRD1 and WWPRD have poor correlations with the vi-
mita 103 mita 109 mita 115mita 101
(a) (c) (e) (g)
(b) (d) (f) (h)
(k)(i)
mita 118
(l)(j)
mita 100 mita 102 mita 107 mita 111 mita 117 mita 119
mita 119
Figure 10: Compression results (PRD1=6%) ofarrhythmia ECG signals extracted from dataset-I.Some of the distortion of the diagnostic features aremarked in the compressed signals. From top to bot-tom, the plots display the original signal, the com-pressed signal and the difference between originaland compressed signals.
sual quality of the two signals obtained for the widely usedmita noisy records. In WWPRD criterion, insignificant er-rors in subbands D2 and D1 dominate the global error whilesignificant errors in other bands may not reflect any contri-bution to the global error. This may lead to overlapping ofthe quality groups and to confusion in the judgement of thequality. The WWPRD criterion is not a subjectively mean-ingful measure since small and large numerical distortionsdo not correspond to “good” and “bad” subjective quality,respectively. Thus, the selection of upper bound distortionlevel is very difficult which is useful for clinical applications.The proposed WWD measure is superior over other mea-sures in the sense that it is subjectively meaningful sincethe small and large values correspond to good and bad sub-jective quality, respectively. Thus, the WWD measure ismuch more suitable for evaluating compressed signals thanthe other measures, and naturally leads to a new method forquality control in ECG signal compression.
4. RESULTS AND DISCUSSIONIn this section, we evaluate the performance of the pro-posed algorithm using the well-known MIT-BIH arrhyth-mia database. It contains 48 half-hour of two-channel ECGrecordings sampled at 360 Hz with 11-bit resolution overa 10 mV range. The ECG records from this database in-clude signals with acceptable quality, sharp and tall P andT waves, negative QRS complex, small QRS complex, widerQRS complex, muscle noise, baseline drift, sudden changesin QRS amplitudes, sudden changes in QRS morphology,multiform premature ventricular contractions, long pausesand irregular heart rhythms.
In this work, we use three ECG features which include theheart rates, amplitudes of QRS complexes, shape of thePQRSTmorphology. The the shape and amplitude of PQRSTcomplex morphology is the base for ECG diagnosis of variousheart diseases. We use weighted wavelet distance metric forfinding the similarity between shapes of the past PQRSTand the present PQRST complexes. We apply a set of

Table 1: Performance evaluation of objective quality measures. Here, PRD1=6%Rec. Fig. WWD:Weighted PRD (%) of bands WWPRD:Weighted PRD (%) of bands
no. A5 D5 D4 D3 D2 D1 Total A5 D5 D4 D3 D2 D1 Total
100 10(a) 1.02 1.50 1.47 1.28 0.31 0.06 5.65 0.94 0.98 1.22 1.49 4.36 5.03 14.01
101 10(b) 1.56 1.11 1.51 1.06 0.67 0.08 5.99 1.52 1.01 0.74 1.42 5.49 5.33 15.52
102 10(c) 1.70 1.20 0.94 1.01 0.60 0.15 5.61 1.47 0.78 0.67 1.86 3.75 4.28 12.81
103 10(d) 2.25 2.77 1.40 0.33 0.18 0.02 6.97 4.54 1.31 1.14 2.93 3.00 3.63 16.56
107 10(e) 1.59 1.80 0.31 0.49 0.17 0.01 4.38 1.17 2.41 1.10 3.57 4.05 1.94 14.22
109 10(f) 3.89 0.50 0.58 0.29 0.22 0.05 5.52 3.07 0.31 1.61 3.79 6.51 4.43 19.73
111 10(g) 1.91 1.27 0.68 0.40 0.44 0.10 4.81 1.52 0.78 0.77 3.04 9.11 6.17 21.40
115 10(h) 1.22 1.49 1.91 0.94 0.27 0.03 5.86 2.19 1.18 0.82 2.22 2.15 3.53 12.09
117 10(i) 2.05 0.26 0.94 0.65 0.10 0.03 4.03 1.68 0.45 0.56 2.85 2.63 3.46 11.63
118 10(j) 2.18 1.16 0.55 1.10 0.48 0.03 5.50 1.98 0.44 1.43 3.02 8.46 3.65 18.96
119 10(k) 3.35 0.95 0.40 0.14 0.03 0.00 4.87 2.54 2.23 2.59 4.68 2.28 2.06 16.39
119 10(l) 3.35 0.51 0.27 0.14 0.03 0.00 4.30 2.55 1.21 1.72 4.68 2.28 2.06 14.50
Table 2: Performance of the proposed cardiac eventchange detection
Test Record (Pcsb) (Pf )
101 100 0
102 100 0
103 100 0
104 97.26 2.74
105 98.8 1.2
106 100 0
107 100 0
108 100 0
109 100 0
111 100 1.45
112 100 0
113 100 0
114 100 0
115 100 0
116 100 0
117 100 0
Average 99.76 0.317
bounds to decide whether two ECG beats may belong tothe same class or not. The bounds for dissimilar ECG beatsare:
• The RR-interval for the current ECG beat is less than75% of the RR-interval for the past ECG beats.
• The amplitude ratio for the current ECG beat is lessthan 75% of the amplitude ratio for the past ECGbeats.
• The value of weighted wavelet distance is greater than5%.
The performance of the algorithm is validated by comparingthe results of automatic annotations against groundtruth an-notations. Each ECG record is divided into non-overlappingsegments of 10 second duration. The average processingtime required for performing our method on each 1-min ECGdata in the MIT-BIH database is approximately 2.24 s. Each
ECG segment is processed and the detected cardiac eventchange regions are verified by visual inspection. The follow-ing metrics are defined to evaluate the performance of theproposed algorithm.
• Probability of correctly detecting similar and dissim-ilar beats (Pcsb): It is defined as the ratio of the to-tal number of correctly detected similar and dissimilarbeats to the total number of manually marked similarand dissimilar beats.
• Probability of falsely detecting beats (Pf ): It is de-fined as total number of incorrectly detected similarand dissimilar beats to the total number of beats inthe database.
Table 2 shows the overall accuracies obtained for all recordsfrom the well-known MIT-BIH arrhythmia database. Wecan observe that the performance of the proposed cardiacevent change detection approach on the testing ECG recordsis comparable with the results in the ground truth report.The graphical user interface is shown in Figs. 11 and 12 forthe test records 103 and 104.
5. CONCLUSIONIn this paper, a novel automated ECG beat change detectionapproach is proposed and tested using the standard MIT-BIH arrhythmia database. The proposed approach con-sists of ECG beat extraction and weighted wavelet distancemeasure. Experiments show that the proposed approachachieves a better detection performance under signal withnoise. In future work, we consider many clinical features forrepresentation of ECG beat.
6. REFERENCES[1] D. B. Geselowitz, “Origin of the electrocardiogram,”
IEEE Engineering in Medicine and Biology Magazine,vol. 13, no. 4, pp. 479-486, August/September 1994.
[2] A. Mattu, W. Brady, “ECGs for the emergencyphysician,” 2003, BMJ Publishing Group, London.
[3] Report of committee on electrocardiography, Americanheart association, “Recommendations forstandardization of leads and of specifications forinstruments in electrocardiography and

Figure 11: Outputs of the Cardiac Event ChangeDetector for the record 103.
Figure 12: Outputs of the Cardiac Event ChangeDetector for the record 104.
vectorcardiography,”Circulation, vol. XXXV, pp.583-602, March 1967.
[4] Kligfield P, Gettes LS, Bailey J. J. Recommendationsfor the standardization and interpretation of theelectrocardiogram: part I. The electrocardiogram andits technology: a scientific statement from theAmerican Heart Association Electrocardiography andArrhythmias Committee, Council on ClinicalCardiology; the American College of CardiologyFoundation; and the Heart Rhythm Society endorsedby the International Society for ComputerizedElectrocardiology. Heart Rhythm, vol. 4, no 3, 2007.
[5] N. P. Hughes, “Probabilistic models for automated
ECG interval analysis,” PhD thesis, University ofOxford, 2006.
[6] Lt’aszlt’o Gerencsr, Gyrgy Kozmann, ZsuzsannaVt’agt’o, Kristt’of Haraszti, “The use of the SPSAmethod in ECG analysis,” IEEE Trans. BiomedicalEngineering, vol. 49, no. 10, pp. 1094-1101, 2002.
[7] N. V. Thakor, J. G. Webstor, W. J. Tompkins,“Estimation of QRS complex power spectra for designof a QRS filter,” IEEE Trans. Biomedical Engineering,vol. BME-31, no. 11, pp. 702-705, 1984.
[8] G. J. Guang, W. J. Tompkins, “High-frequencyelectrocardiogram analyzer,” IEEE Trans. Biomedical
Engineering, vol. BME-33, no. 12, pp. 1137-1140, 1986.
[9] Laszlo Gerencser, Gyorgy Kozmann, Zsuzsanna Vago,Kristof Haraszti, “The Use of the SPSA Method inECG Analysis,” IEEE Trans. Biomedical Engineering,vol. 49, no. 10, pp. 1094-1101, 2002.
[10] L. Cuiwei, C. Zheng, C. Tai, “Detection of ECGcharacteristic points using wavelet transforms,” IEEETrans. Biomedical Engineering, vol. 42, no. 1, pp.21-28, 1995.
[11] K. Park, B. Cho, D. Lee, S. Song, J. Lee, Y. Chee, I.Kim and S. Kim, “Hierarchical support vector machinebased heart beat classification using higher orderstatistics and hermite basis function.” Computers in
Cardiology, pp. 229-232, 2008.
[12] P. de Chazal, M. OSDwyer and R. B. Reilly,“Automatic Classification of Heart beats using ECGMorphology and Heart beat Interval Features,” IEEETrans. on Biomedical Engineering, vol. 51, no. 7, pp.1196-1206, 2004.
[13] H. H. Haseena, A. T. Mathew, J. K. Paul, “Fuzzyclustered probabilistic and multi layered feed forwardneural networks for electrocardiogram arrhythmiaclassification,” Journal of Medical Systems, pp. 1-10,2009.
[14] M. G. Tsipouras, D. I. Fotiadis, D. Sideris, “Anarrhythmia classification system based on theRR-interval signal,” Artificial Intelligence in Medicine,
vol. 33, pp. 237-250, 2005.
[15] P. Kathirvel, M. Sabarimalai Manikandan, S. R. M.Prasanna, K. P. Soman, “An efficient R-peak detectionbased on new nonlinear transformation and first-orderGaussian differentiator”Cardiovascular Engineering
and Technology, Spinger, DOI:10.1007/s13239-011-0065-3, 2011.
[16] M. Sabarimalai Manikandan, S. Dandapat, “Waveletenergy based diagnostic distortion measure for ECG”,Biomed. Signal Process. and Control., vol. 2, no. 2, pp.80-96, 2007.
[17] A. S. Al-Fahoum, “Quality assessment of ECGcompression techniques using a wavelet-baseddiagnostic measure,” IEEE Trans. Information
Technology in Biomedicine, vol. 10, no. 1, pp. 182-191,2006.