Formation of thermal plumes in an autocatalytic exothermic chemical reaction

Autocatalytic Loop, Amplification and Diffusion: AMathematical and Computational Model of CellPolarization in Neural ChemotaxisPaola Causin*, Giuseppe Facchetti
Department of Mathematics ‘‘F. Enriques’’, Universita degli Studi di Milano, Milano, Italy
Abstract
The chemotactic response of cells to graded fields of chemical cues is a complex process that requires the coordination ofseveral intracellular activities. Fundamental steps to obtain a front vs. back differentiation in the cell are the localizeddistribution of internal molecules and the amplification of the external signal. The goal of this work is to develop amathematical and computational model for the quantitative study of such phenomena in the context of axon chemotacticpathfinding in neural development. In order to perform turning decisions, axons develop front-back polarization in theirdistal structure, the growth cone. Starting from the recent experimental findings of the biased redistribution of receptors onthe growth cone membrane, driven by the interaction with the cytoskeleton, we propose a model to investigate thesignificance of this process. Our main contribution is to quantitatively demonstrate that the autocatalytic loop involvingreceptors, cytoplasmic species and cytoskeleton is adequate to give rise to the chemotactic behavior of neural cells. Weassess the fact that spatial bias in receptors is a precursory key event for chemotactic response, establishing the necessity ofa tight link between upstream gradient sensing and downstream cytoskeleton dynamics. We analyze further crosslinkedeffects and, among others, the contribution to polarization of internal enzymatic reactions, which entail the production ofmolecules with a one-to-more factor. The model shows that the enzymatic efficiency of such reactions must overcome athreshold in order to give rise to a sufficient amplification, another fundamental precursory step for obtaining polarization.Eventually, we address the characteristic behavior of the attraction/repulsion of axons subjected to the same cue, providinga quantitative indicator of the parameters which more critically determine this nontrivial chemotactic response.
Citation: Causin P, Facchetti G (2009) Autocatalytic Loop, Amplification and Diffusion: A Mathematical and Computational Model of Cell Polarization in NeuralChemotaxis. PLoS Comput Biol 5(8): e1000479. doi:10.1371/journal.pcbi.1000479
Editor: Anand R. Asthagiri, California Institute of Technology, United States of America
Received November 7, 2008; Accepted July 21, 2009; Published August 28, 2009
Copyright: � 2009 Causin et al. This is an open-access article distributed under the terms of the Creative Commons Attribution License, which permitsunrestricted use, distribution, and reproduction in any medium, provided the original author and source are credited.
Funding: This work was supported by the Italian government funding program PRIN ‘Advanced Numerical Methods for Partial Differential Equations’. Thefunders had no role in study design, data collection and analysis, decision to publish, or preparation of the manuscript.
Competing Interests: The authors have declared that no competing interests exist.
* E-mail: [email protected]
Introduction
Eukaryotic cells like neutrophils or amoebas migrate in response
to chemical stimuli. External graded signals are transduced into
internal pathways, giving rise to cell front–back asymmetrization,
which leads to cytoskeleton reorganization and, eventually,
directional motion. The process by which regulatory proteins and
other molecular species, initially uniformly distributed in the
membrane and cytosol, differentially localize is called polarization
and is a steering event in the chemotactic response. Polarization in
eukaryotic cells has been the object of intense in vivo and in vitro
studies (see, e.g., [1–3] and references therein). In silico models
represent a third viable approach to explore this complex
phenomenon. A mechanism of polarization advocated in several
computational models is the interplay in the cell of a local activator–
global inhibitor effect (the so–called LEGI mechanism, see, e.g., [4–
6]); alternative mechanisms have also been envisaged, which do not
require the introduction of the global inhibitor, which is a somewhat
controversial topic, but generate front–back asymmetrization
relying on some sort of interaction – say, competition, coincidence
of action, feedback – between different pathways (see, e.g., [1,7–10]).
In this paper, we propose a mathematical and computational
model which addresses polarization in the far less studied case of
neural cells. We focus on axon chemotactic pathfinding, a
fundamental process for the innervation of synaptic targets in
the developing embryo. In order to perform turning decisions,
axons develop front–back polarization in their distal structure, the
growth cone (GC). Internal polarization differentially induces
microtubule protrusion or collapse in the GC cytoskeleton
determining directional migration [11]. Mathematical models in
this context most often do not enter into the details of the
biochemical signalling cascade, but rather adopt phenomenolog-
ical simplified descriptions that provide a ‘‘black box’’ information
of the functional behavior of the system. A first class of approaches
(see, e.g., [12,13]) is based on persistent random walk models. The
GC trajectory is typically described by a system of ordinary
differential equations accounting for a deterministic velocity field
and random ‘‘kicks’’ arising from stochastic terms, macroscopically
representing fluctuations in gradient sensing and signal transduc-
tion. Evolutions of these models are presented in [14] and further
in [15], where the GC trajectory is described by more
sophisticated stochastic partial differential systems of equations,
including diffusion and inertia contributions. A second class of
models are investigated in [16–18], where there is the attempt of
introducing a description of the intracellular chain. Namely, the
probability of finding a transmembrane receptor at a certain
PLoS Computational Biology | www.ploscompbiol.org 1 August 2009 | Volume 5 | Issue 8 | e1000479

angular position on the GC is supposed to be linked to some
significant intracellular parameter, for example the local concen-
tration of ionic calcium [16]. This latter approach is prodromal to
the present study of the spatial organization of the GC during
guidance.
The biophysical starting point of the present work is the
experimental finding, recently obtained by Bouzigues et al. [19],
that GC receptors subjected to the graded field of an attractant cue
undergo two fundamental types of motion on the membrane: free
diffusion, which is always present -also under an uniform external
field- and drift motion. This latter kind of motion interestingly
makes neural cells different from nonneural ones, whose receptors
seem to undergo both in uniform and graded fields an unbiased
continual diffusion [20]. Due to the drift motion, GC receptors
rearrange on the membrane asymmetrically concentrating on the
side facing the source. The redistribution is driven by the physical
interaction of bound receptors with microtubules, which serve as
conveyor belts [21]. An autocatalytic loop is then established: bias in
receptor localization induces, via internal polarization of molecules,
preferential growth of the microtubules toward the leading edge of
the GC. This, in turn, enhances convey of receptors on that same
side. In order to mathematically investigate the sustainability of this
hypothesis of receptor autocatalytic loop, we model the chemical
pathway triggered upon receptor binding. In such a pathway, cyclic
nucleotides act as second messengers. Their role is monitored with
particular attention in the simulation, since they are known to be
key–regulators of GC motility [22]. In particular, whole cell
recordings of inward calcium currents at Xenopus spinal neuron GCs
indicate that cyclic nucleotide signalling modulates the opening of
L–type voltage–dependent calcium channels (LCC) [23,24]. We
make here the modelling assumption that the driving force which
induces biased recruitment of receptors is the uneven distribution
(that is, the gradient) of such calcium channels. This is a lumped
representation of the complex mechanical events connected with
cytoskeleton reorganization induced by calcium dynamics, i.e., actin
dynamics, microtubule polymerization and depolymerization [25].
Intracellular reactions constitute the bridge between the upstream
receptor and the downstream calcium dynamics. Due to their
enzymatic nature, which triggers a one–to–more activation of
molecules, they represent an amplification process, fundamentally
sustaining polarization. We use the model to obtain quantitative
information on this delicate interlacing.
To work on a practical groundfield, we consider here the
pathway activated by exposure of GCs to a graded signal of the
diffusible molecule netrin, which role as chemoattractant in
conjunction with its receptor Deleted in Colorectal Cancer (DCC) [26]
is well recognized and studied in axon guidance [27]. The model of
the intracellular cascade takes as a biophysical reference the
pathway proposed in the work by Nishlyama et al. [28], which
addresses in a detailed manner netrin–induced signalling. We also
refer to the work by Clement et al. [29]: albeit treating a different
topic (the regulation of ovarian follicles by the FSH hormone), this
work provides a mathematical description of biochemical processes
from receptor binding to second messenger cyclic AMP activation,
which can be conveniently taken as a starting point also for our case.
Eventually, we propose an extension of the model to perform a
quantitative study of a characteristic chemotactic behavior
exhibited by GCs. While in nonneural cells transmembrane
receptors are a limited and well identified set, receptors for neural
navigation are much more heterogeneous. In particular, the
emerging picture is that in most cases there are several receptors
for each guidance cue and these receptors might work in
complexes [30]. Engagement of receptor complexes is involved
in the specificity of the response to a cue. The UNC5 receptor [31]
forms a complex with DCC via interaction of the cytoplasmic
domains. Binding of the complex with netrin converts the
attractive into repulsive response [22,24]. Repulsion arises due
to activation by the DCC–UNC5 complex of an alternative
pathway leading to the production of cyclic GMP, linked to
cytoskeleton collapse [32]. Genetic manipulations can modulate
the GC response in presence of different percentages of UNC5
expression, ideally allowing to observe a passage from attraction
(for low percentages of the DCC–UNC5 complex) to repulsion (for
high percentages of the DCC–UNC5 complex). In [28], it is
proposed that a synthetic parameter that describes in this
framework the chemotactic response may be represented by the
ratio between the average concentrations of cyclic AMP and
GMP: high ratios would favor attraction, whereas low ratios favor
repulsion. We use our model to quantitatively assess the
significance of such an hypothesis, highlighting a possible
mechanism of synergistic interaction of the two pathways, which
provides an interpretation of the chemotactic response.
Mathematical ModelGrowth cones are 3D hand-shaped structures, which dynam-
ically change their conformation. Filopodia protrude from the GC
membrane, continuously extending and retracting to explore the
environment and to create adhesion to the substratum. These
phenomena are highly complex and take place at a time frequency
faster than the one we are interested into, typically seconds vs. a
few minutes. For the purposes of the present model, we neglect
fine local details of the shape and we represent GCs as 2D disk-like
structures with diameter of 10 mm. This simplification models the
average shape assumed by GCs in their state prior to actual
motion (the ‘‘pausing state’’ cited in [19]). The same assumption
has been made by other authors interested in GC mathematical
modelling, see [16,33,34]. We refer as a paradigm to the in vitro
chemotactic assay for neural cells, where GCs are exposed to
steady graded concentrations of a chemical ligand released by a
pipette (see, e.g., [35,36]). Observe that this is essentially a two–
dimensional situation.
Author Summary
The ability of cells to respond to chemical signals presentin the environment is of upmost importance for life. In thedeveloping embryo, cells crawl along graded fields ofchemical cues to aggregate into organized patterns. Thisprocess is an example of chemotaxis. It is a complexphenomenon, where external signals are transduced intointernal chemical pathways leading to directional move-ment. Differential reorganization of the internal structure iscalled polarization, and it involves regulatory proteins aswell as cytoskeletal elements. In this work, we propose amathematical and computational model for the quantita-tive study of chemotactic pathfinding in neural cells. Ourstarting point is the recent finding that, for such cells, anearly polarization event is the redistribution on themembrane of cue–ligated receptors, transported by thecytoskeletal structures, which act as a sort of conveyorbelt. We show that this proposed mechanism, connectingin a closed loop cue sensing and cytoskeleton dynamics, isqualitatively and quantitatively adequate to producepolarization. We also investigate the role of the internalbiochemical chain in producing signal amplification and itstight interlacing with polarization. An extension of themodel is used to study chemotactic behaviors as theattractive/repulsive response of axons exposed to thesame cue.
Modelling of Polarization in Neural Chemotaxis
PLoS Computational Biology | www.ploscompbiol.org 2 August 2009 | Volume 5 | Issue 8 | e1000479

Polar coordinates are used, the origin of the axes being
positioned in the center of the GC. The angle w denotes the
azimuthal coordinate on the membrane and its origin is set along
the direction connecting the GC center with the pointwise source,
which we always suppose to lay on the right hand side of the cell
(see Fig. 1). We denote by r the radius of the GC.
In the model, we deal with membrane species (receptors,
cyclases and calcium channels) and cytosolic species (G–proteins,
cyclic AMP, cyclic GMP, kinases and their corresponding
precursors). To connect membrane and cytosolic concentrations
(and vice versa), we use the dimensional corrective factor s~2=r(or its inverse). We use the notation ½:� to represent concentration
of a certain species; moreover, we denote by the superscript � the
bound or active form of the molecules. The nomenclature for the
species is reported in Tab. 1.
DCC-activated biochemical pathway. In the following, we
connect receptor ligation to calcium channel dynamics by
proposing a biochemical pathway, where elevation of
intracellular cAMP level is a pivotal event. We refer to Fig. 2 for
a schematic representation of such a pathway.
Binding of netrin to its receptor DCC results in the formation of
the ligated complex DCC�
NetrinzDCC'DCC�
The activated site of the bound DCC receptor on the intracellular
side catalyzes the release of the guanosin-diphosphate (GDP)
contained in the cell G protein (for example Rac1, CDC42 or
RhoA) and its substitution with a molecule of guanosin-
triphosphate (GTP) [37]
GzGTPG�zGDP
The released G� combines with the membrane protein adenylate
cyclase (ACyclase)
G�zACyclase'GACyclase�
which, in turn, enzymatically catalyzes the synthesis of cAMP from
the available substrate ATP
ATP {?GACyclase�
cAMP {?PDE
AMP
cAMP molecules bind the substrate prekinase protein ((PKA)2R2,
R being the regulatory subunit) to give the active kinase adenosine-
dependent protein (PKA)
4cAMPz(PKA)2R2'2PKAz2(cAMP)2R
which enzymatically activates the opening of LCC channels
LCCclose LCCopen
Diffusive and advective fluxes. Let ni~ni(w,t),i~1, . . . ,Mbe a generic chemical species of the model. Each chemical species
is subjected to Brownian diffusion which causes its spreading in a
homogenization process. In the present model, we only consider
lateral diffusion of the species, neglecting radial diffusion (see [7,9]
for similar hypotheses and discussions on this subject).
We model the Brownian diffusive flux Ji,d of the species using
the standard Fick’s law
Ji,d~{ai,d+½ni�, ð1Þ
ai,d being the diffusion coefficient.
The directional motion of bound receptors due to the
interaction with microtubules mathematically represents a drift
term. In the lumped description we adopt, the convective field is
the lateral gradient of open calcium channels. The form of the flux
Jfb due to feedback we consider reads
Jfb~afb+½LCCopen�½DCC��, ð2Þ
where afb is a multiplicative coefficient, and where we have
supposed the feedback flux to be an increasing function of the
Figure 1. GC schematization. The GC is represented in themathematical model as a disk subdivided in angular sectors. Weconsider the settings of the chemotactic assay for neural cells, where apipette (here on the right) establishes a steady graded field of achemotropic molecule.doi:10.1371/journal.pcbi.1000479.g001
Table 1. Nomenclature of the species entering themathematical model.
Symbol Definition
ACyclase inactive adenylate cyclase
ATP adenosine triphosphate
(PKA)2R2 pre–kinase protein in cAMP pathway
cAMP cyclic adenosine monophosphate
cGMP cyclic guanosine monophosphate
DCC DCC receptor
G G–protein in the DCC pathway
G� activated G–protein
GACyclase� G–activated adenylate cyclase complex
GCyclase inactive guanylate cyclase
(PKG)2R2 pre–kinase protein in cGMP pathway
GTP guanosine triphosphate
HPETE 12-hydroxyperoxyeicosatetraenoic acid
LCCopen open Ca2z L-channel
LCCclose close Ca2z L-channel
Netrin extracellular signal netrin
PDE phosphodiesterase
PKA adenosine–dependent kinase protein
PKG guanosine–dependent kinase protein
Q G–protein in the UNC pathway
UNC DCC–UNC5 receptor complex
doi:10.1371/journal.pcbi.1000479.t001
Modelling of Polarization in Neural Chemotaxis
PLoS Computational Biology | www.ploscompbiol.org 3 August 2009 | Volume 5 | Issue 8 | e1000479

concentration of bound receptors (see [38] for a similar
modelling assumption in a more general context). Note that
the minus sign in (1) represents the fact that diffusion smooths
away concentration gradients, while the positive sign in (2)
indicates motion toward the convective field, here the increasing
gradient of calcium channels (positive feedback). This latter
effect is shown in Fig. 2, where we have represented with a
dashed arrow the displacement of receptors induced by open
calcium channels.
The total flux of molecules of the i{th species is then given by
Ji,tot~Ji,dzJfb if i~DCC�,
Ji,d otherwise :
�
Model equations for the DCC signal transduction
pathway. Conservation laws give the rate of change of
concentrations of each species. For the generic species ni, we have
L½ni�Lt
~{div(Ji,tot)zXMj~1
fij(½ni�,½nj �), ð3Þ
where the nonlinear functions fij at the right hand side account for
reaction terms arising from the application of the mass action law
to the chemical reactions in the above described pathway. The
following system of partial differential equations of the form (3)
represents our model for the DCC signal transduction pathway:
given the appropriate initial and boundary conditions, solve for
time t[(0,T �
L½DCC��Lt
~kN ½Netrin�½DCC�{k{N ½DCC��
zam
r2
L2½DCC��Lw2
{afb
r2
LLw
(L½LCCopen�
Lw½DCC��),
ð4aÞ
L½DCC�Lt
~{kN ½Netrin�½DCC�
zk{N ½DCC��z am
r2
L2½DCC�Lw2
,
ð4bÞ
L½G��Lt
~k G½DCC��½G�{k{G½G��{kACyc(s½G��
{s½GACyclase��)s½GACyclase��z ac
r2
L2½G��Lw2
,
ð4cÞ
L½G�Lt
~{kG½DCC��½G�zk{G½G��zac
r2
L2½G�Lw2
, ð4dÞ
L½GACyclase��Lt
~kACyc(s½G��{s½GACyclase��)½GACyclase��
zam
r2
L2½GACyclase��Lw2
,
ð4eÞ
L½cAMP�Lt
~kcAMPs½GACyclase��{dPDE½cAMP�
{4kPKA½cAMP�2½(PKA)2R2�
z4k{PKA½PKA�z ac
r2
L2½cAMP�Lw2
,
ð4f Þ
L½(PKA)2R2�Lt
~{kPKA½cAMP�2½(PKA)2R2�
zk-PKA½PKA�z ac
r2
L2½(PKA)2R2�Lw2
,
ð4gÞ
L½PKA�Lt
~2kPKA½cAMP�2½(PKA)2R2�
{2kPKA½PKA�z ac
r2
L2½PKA�Lw2
,
ð4hÞ
L½LCC�open
Lt~kLCC(1z
iPKA
s½PKA�2)½LCCclose�
{k{LCC½LCCopen�zam
r2
L½LCC�open
Lw2,
ð4iÞ
Figure 2. Proposed path for GC chemotaxis induced by netrin binding with DCC receptors. Solid arrows indicate the prevalent directionof chemical reactions, the dashed arrow indicates physical displacement (recruitment) of receptors induced by open calcium channels.doi:10.1371/journal.pcbi.1000479.g002
Modelling of Polarization in Neural Chemotaxis
PLoS Computational Biology | www.ploscompbiol.org 4 August 2009 | Volume 5 | Issue 8 | e1000479

L½LCC�close
Lt~{kLCC(1z
iPKA
s½PKA�2)½LCCclose�
zk{LCC½LCCopen�zam
r2
L½LCC�close
Lw2:
ð4jÞ
Note that in the case of the activation of adenylate cyclase (Eq.
(4–c)), where a complex protein conformational change occurs, we
have used a ‘‘physiological’’ and not a biochemical representation,
introducing a logistic–type law as in [29]. The s coefficient in this
term is an amplification parameter which represents the average
number of adenylate cyclase molecules activated by one G�
molecule.
We refer to the Methods Section for a discussion on the choice
of initial and boundary conditions and of the kinetic parameters.
Attractive vs. Repulsive Behavior: The DCC–UNC5Complex Pathway
In this section, we propose an extended version of the model to
study the bifunctional response to a guidance cue, a phenomenon
known to interest the response to netrins [27]. Engagements of
receptor complexes is known to control the specificity and the
polarity of the response of the neuron to the guidance cue. Here
we will not deal with the details of the dynamics of the formation
of the DCC–UNC5 complex, and we will always consider such a
dynamics at the equilibrium. From the modelling point of view,
this amounts to prescribe a priori the percentage of DCC
receptors forming a complex with UNC5 (on this issue, see also
the discussion in the Methods Section). Setting in the tests various
percentages, we analyze a wide spectrum of situations. To
describe the DCC–UNC5 complex, we follow here the idea
proposed in [28], and namely that such a complex leads to cGMP
synthesis, regulated by 12-hydroxyperoxyeicosatetraenoic acid
(HPETE) via direct activation of guanylate cyclase [39].
Enhancement of the cGMP level causes to calcium channel
closure [40]. This fact is at the origin of the significant decrease of
inward calcium flux in UNC5–overexpressing GCs, repelled by
netrin.
Due to the substantial similarity with the sole DCC pathway,
many mechanisms are modeled here in the same way. The
binding reaction for the DCC–UNC5 complex (for clarity
indicated just as UNC) reads
UNCzNetrin'UNC�
The ligated complex induces dissociation of a G–protein (probably
of Rho type, see [12]), that we denote here by Q , giving
QzGTP'Q �zGDP
This process leads to the formation of HPETE. Not being yet
completely explained, we consider here a second order reaction to
occur (see the Methods Section for a more detailed discussion of
this aspect)
Q � {? ? {? HPETE
HPETE activates soluble guanylate–cyclase (GCyclase)
HPETEzGCyclase {? GCyclase�
which, in turn, catalyzes the synthesis of cGMP from the
guanosine triphosphate (GTP) substrate
GTP {?GCyclase�
cGMP {?PDE
GMP
Formation of the guanosine–dependent kinase protein (PKG)
4cGMPz(PKG)2R2'2PKGz2(cGMP)2R
enzymatically enhances closure of calcium channels
LCCclose LCCopen
Model equations for the DCC-UNC5 signal transduction
pathway. The rates of change of concentrations for the DCC–
UNC5 pathway are modeled by the following system: given the
appropriate initial and boundary conditions, solve for time t[(0,T �
L½UNC��Lt
~hN ½Netrin�½UNC�{h{N ½UNC��
zam
r2
L2½UNC��Lw2
{afb
r2
LLw
(L½LCCclose�
Lw½UNC��),
ð5aÞ
L½UNC�Lt
~{hN½Netrin�½UNC�zk{N½UNC��zam
r2
L2½UNC�Lw2
, ð5bÞ
L½Q ��Lt
~hQ ½UNC��½Q �{dQ ½Q �� zac
r2
L2½Q ��Lw2
, ð5cÞ
L½Q �Lt
~{hQ ½UNC��½Q �zdQ ½Q ��z ac
r2
L2½Q �Lw2
, ð5dÞ
L½HPETE�Lt
~hHPETE½Q ��2{dHPETE½HPETE�
{hGCyc
s½HPETE�(½HPETE�{½GCyclase��)
zac
r2
L2½HPETE�Lw2
,
ð5eÞ
L½GCyclase��Lt
~hGCyc
s½HPETE�(½HPETE�{½GCyclase��)
zac
r2
L2½GCyclase��Lw2
,
ð5f Þ
L½cGMP�Lt
~hcGMPs½GCyclase��{dcGMP½cGMP�
{4hPKG½cGMP�4½(PKG)2R2�
z4h{PKG½PKG�z ac
r2
L2½cGMP�Lw2
,
ð5gÞ
L½(PKG)2R2�Lt
~{hPKG½cGMP�2½(PKG)2R2�
zh{PKG½PKG�z ac
r2
L2½(PKG)2R2�Lw2
,
ð5hÞ
Modelling of Polarization in Neural Chemotaxis
PLoS Computational Biology | www.ploscompbiol.org 5 August 2009 | Volume 5 | Issue 8 | e1000479

L½PKG�Lt
~2hPKG½cGMP�2½(PKG)2R2�
{2h{PKG½PKG�z ac
r2
L2½PKG�Lw2
:
ð5iÞ
The last term at the right hand side of Eq. (5–a) represents the
feedback of the calcium dynamics on the redistribution of
receptors. Note that here the feedback effect is exerted from
closed channels: such a term must not be interpreted from a strict
biochemical point of view, but again as a lumped phenomenolog-
ical description of a more complex mechanism.
Equations for the calcium channels still must be added. In the
following, we will be interested in the coupling of the DCC and
DCC–UNC5 pathways. To model this situation, we consider Eq.
(4i) and (4j) modified as
L½LCC�open
Lt~kLCC(1z
iPKA
s½PKA�2)½LCCclose�
{k{LCC(1ziPKG
s½PKG�2)½LCCopen�
zam
r2
L½LCC�open
Lw2,
ð6aÞ
L½LCC�close
Lt~{kLCC(1z
iPKA
s½PKA�2)½LCCclose�
zk{LCC(1ziPKG
s½PKG�2)½LCCopen�
zam
r2
L½LCC�close
Lw2:
ð6bÞ
where now the rate of opening of calcium channels is determined
by two competing effects, the enhancing action of the DCC
pathway and the inhibitory action of the DCC–UNC5 pathway.
Fig. 3 schematically depicts the model of the interaction.
Results
We refer to Eqs. (4a–j) as the DCC model, while we refer to Eqs.
(4a–h),(4a–i) and (4a–b) as the coupled DCC–UNC5 model. In all
the tests presented in the following sections, we have assigned a
steady exponential profile of netrin concentration with 5%steepness, such that the concentration at the source is equal to
10 nM (dissociation constant of netrin [26]).
DCC Model: Achievement of PolarizationWe first demonstrate that the model correctly achieves polariza-
tion and reaches a steady state condition, where front–back
differentiation is established. In Fig. 4, we plot the concentration
Figure 3. Schematization of the antagonist pathways induced by netrin binding with DCC (left column) and DCC-UNC5 receptorcomplex (right column). The dashed arrows indicate the feedback effect in the closed loop model.doi:10.1371/journal.pcbi.1000479.g003
Modelling of Polarization in Neural Chemotaxis
PLoS Computational Biology | www.ploscompbiol.org 6 August 2009 | Volume 5 | Issue 8 | e1000479

profiles as a function of time, obtained from simulations carried out
till T~2 h. In Fig. 5, we plot for the different species the abscissa of
the barycenter of the molecules as a function of time. Since at the
initial time the distribution of molecules is homogeneous, the
displacement of their spatial barycenter from x~0 represents an
index of the intensity of the polarization. In Fig. 6, we plot the
concentrations after 2 h as a function of w. Significant polarization of
the receptors takes place in tenth of minutes; polarization is inherited
by all the internal species. An interesting behavior is shown by
calcium channels, which undergo in all sectors a first phase of
opening, reaching a fairly similar maximum value, followed by
closure, more pronounced in the rear side. This mechanism might
represent a sort of LEGI, global ‘‘inhibition’’ being constituted by
collective opening and local ‘‘activation’’ by differential closure. Note
that this is to be intended only as a qualitative interpretation (see also
the discussion in [11]). The position of the barycenter of bound
receptors presents a sigmoid behavior, which is characteristic of
autocatalyzing processes: a first phase of relatively slow accumulation
(lag time) followed by a quick growth till a steady state. This is in
agreement with the experimental result of [19, Fig.1e]. In Fig. 7, we
Figure 4. DCC model: concentration profiles as a function of time (in minutes). Curves are relative to the four most representative angularsectors, perceiving a cue concentration ranging from minimal to maximal value, respectively. Legend: green [Netrin] = 9.52 nM (max value), cyan[Netrin] = 9.36 nM, blue [Netrin] = 9.16 nM, magenta [Netrin] = 9.08 nM, red [Netrin] = 9.07 nM (min value).doi:10.1371/journal.pcbi.1000479.g004
Figure 5. DCC model: abscissa (in [mm]) of the barycenter of the molecules as a function of time (in minutes).doi:10.1371/journal.pcbi.1000479.g005
Modelling of Polarization in Neural Chemotaxis
PLoS Computational Biology | www.ploscompbiol.org 7 August 2009 | Volume 5 | Issue 8 | e1000479

plot the concentration profiles as a function of time for a simulation
with a longer integration interval T~12 h. A steady state is
definitely reached.
Contribution of Feedback and Amplification toPolarization
In [19], an experiment is reported, where a chelator is used to
subtract the calcium available in the cytosol, obtaining a
suppression in the asymmetric relocalization of receptors. To
perform an in silico investigation of this experiment, we have
studied the effect of the variation of the feedback coefficient afb.
Fig. 8 (left) shows that significant receptor relocalization is
obtained only above a nonzero threshold of afb. More importantly,
the model predicts that the lack of receptor relocalization implies
absence of chemotactic response and not only a weaker, but still
existing, response. Fig. 8 (right) quantifies how the asymmetry in
DCC receptors localization is reflected in downstream differential
opening of the calcium channels. This indicates that a sufficient
active relocalization of receptors is an upstream enhancing event
needed to produce chemotactic response.
In a second investigation, we have considered the effect of
amplification due to chemical kinetics. In the signalling pathway,
we may identify –loosely speaking– two families of reactions. The
first family consists of stoichiometric reactions, as for example
ligand–receptor or G–cyclase binding, involving one–to–one
molecule synthesis. The second family consists instead of
enzymatic reactions, which, involving a one–to–more molecule
production, drive an internal amplification processes. We focus
our attention on this latter family, taking as a representative case
the cAMP production catalyzed by cyclase. We perform different
simulations with a decreasing kinetic constant kcAMP, which
quantitatively modulates how many molecules of cAMP are
produced starting from an available molecule of activated cyclase.
In Fig. 9, we plot the position of the barycenter of the bound
receptors as a function of kcAMP. This result suggests that
polarization is also indissolubly crosslinked with internal amplifi-
Figure 6. DCC model: concentration profiles of selected species after 2 h as a function of the angle Q.doi:10.1371/journal.pcbi.1000479.g006
Figure 7. DCC model: concentration profiles as a function of time (in minutes), integration till T = 12 h. Curves are relative to the fourmost representative angular sectors, perceiving a cue concentration ranging from minimal to maximal value, respectively. Legend: green[Netrin] = 9.52 nM (max value), cyan [Netrin] = 9.36 nM, blue [Netrin] = 9.16 nM, magenta [Netrin] = 9.08 nM, red [Netrin] = 9.07 nM (min value).doi:10.1371/journal.pcbi.1000479.g007
Modelling of Polarization in Neural Chemotaxis
PLoS Computational Biology | www.ploscompbiol.org 8 August 2009 | Volume 5 | Issue 8 | e1000479

cation. A parametric constraint appears: below a non–zero
threshold in the enzymatic (that is, amplifying) efficiency of the
pathway, no polarization occurs.
The above investigations show that both feedback and
amplification are precursor events for the achievement of
polarization. Their respective actions are necessary and concur-
ring contributions.
Diffusion vs. Feedback: Antagonist RolesThe results discussed above were obtained setting in the model
the diffusion and feedback coefficients as indicated in Tab. 2.
While the diffusion coefficient can be measured as a well defined
physical parameter, it is much more difficult to quantify the
feedback parameter. This fact has a strong implication, since the
ratio of the two parameters influences the dominating behavior of
the system. To fix the ideas, we perform the tests varying the
feedback coefficient, and we keep constant the diffusion coeffi-
cients am~ac, (that we denote here for simplicity as a). The results
of the simulations are shown in Fig. 10, where the abscissa xDCC�
of the barycenter (in mm) of the bound receptors is plotted as a
function of a=afb. They suggest that under a certain threshold,
diffusion overwhelms drift, leading to an unbiased receptor
distribution on the membrane, that is xDCC�?0, as if the external
field were uniform.
Time Scales in Front and Back Biochemical ProcessesWe use the model to study the time scales that characterize the
process on the front and back sides, respectively. To perform this
mathematical analysis, we consider a simplified version of the
DCC model, neglecting diffusion and feedback terms. By doing so,
we yield a system of ordinary differential equations, decoupled
sector by sector. In this study, we prescribe a-priori an asymmetric
receptor distribution to describe the polarized situation reached
after a sufficient time of exposure to the cue. In particular, we start
from the steady state distribution of receptors obtained from the
simulation of the DCC model with T~12 h. We compute in each
sector the eigenvalues of the Jacobian matrix of the system in
correspondence to its steady state. All the eigenvalues are real
negative, indicating that the steady state is an attractive point.
Based on the principal component of the corresponding
eigenvector, we associate a chemical species with each eigenvalue.
Then, using standard tracking techniques [41], we follow the
variation of each eigenvalue along the GC perimeter. In Fig. 11,
we plot the modulus of the eigenvalue associated with each species
as a function of the angle w. The eigenvalue associated with the
slowest process on the front side (w~0) appears to be connected to
PKA, while on the back side (w~p) it appears to be connected to
GACyclase�. Observe that all the eigenvalues undergo a variation
Figure 8. Effect of the variation of the feedback coefficient afb.Top: abscissa xDCC� (in mm) of the barycenter of bound DCC receptorsas a function of the feedback coefficient afb . Bottom: abscissa xLCCopen
(in mm) of the barycenter of open calcium channels as a function of theabscissa of the barycenter of bound receptors (in mm). Each markercorresponds to a simulation carried out with a different value of afb .doi:10.1371/journal.pcbi.1000479.g008
Figure 9. Effect of the variation of the parameter kcAMP. Abscissa(in mm) of the barycenter of the bound receptors as a function of kcAMP,index of the enzymatic amplification. Below a non–zero threshold, nopolarization occurs.doi:10.1371/journal.pcbi.1000479.g009
Table 2. Diffusion and feedback coefficients.
Parameter Definition Value Dimension Ref.
ac cytosolic diffusion coefficient 2:10{2 mm2s{1
afb feedback coefficient 1:5:10{3 mm3#{1s{1
am membrane diffusion coefficient 2:10{2 mm2s{1 [7]
doi:10.1371/journal.pcbi.1000479.t002
Modelling of Polarization in Neural Chemotaxis
PLoS Computational Biology | www.ploscompbiol.org 9 August 2009 | Volume 5 | Issue 8 | e1000479

along the angle, even if for some of them this is not apparent in the
logarithmic scale, required to appreciate the different relative
behaviors. The graph shows the strong variation of the eigenvalue
connected with GACyclase�. Moreover, the general trend of
reduction of the absolute values passing from the front side to the
back side indicates that the front dynamics is faster than the back
one.
Coupled DCC–UNC5 Model: Attractive vs. RepulsiveResponses
We use the coupled DCC–UNC5 model to study the response
of the system to the (bifunctional) netrin cue when the DCC–
UNC5 complex is formed. Denoting by #DCC and #UNC the
number of receptors on the membrane belonging to the two
populations, respectively, we introduce the quantity
c~#UNC
#DCCz#UNC
which represents the fraction of DCC–UNC5 receptors. Neurons
which display a chemoattractive response when exposed to a netrin
gradient are typically characterized by low values of c. Neurons
genetically manipulated to overexpress the UNC5–type receptors,
which display a chemorepulsive response when exposed to the same
netrin gradient, are typically characterized by values of c near 1.
As a representative situation of the first case, we set c~0:2. In
Fig. 12, we plot the concentration contours of the main species as a
function of angular position w and time. This model suggests the
following explanation of the attractive behavior: DCC receptors
migrate toward the source, while DCC–UNC5 ones migrate away
from it, causing a differential opening of calcium channels on front
vs. back.
Then, we consider the dual case, setting c~0:8. In Fig. 13, we
plot the concentration contours of the main species as a function of
angular position w and time. The model suggests a dual behavior
with respect to the situation with c~0:2: DCC–UNC5 receptors
migrate toward the front, while DCC receptors migrate toward the
back, giving rise to the repulsive response.
Role of second messengers: the cAMP vs. cGMP
ratio. Using the DCC-UNC5 model, we can analyze more in
detail the role of second messengers cyclic AMP and GMP (activated
by DCC and DCC–UNC5 pathways, respectively) in modulating the
response. We explore a large set of values of c in the range ½0,1� and
we compute from each corresponding simulation the
½cAMP�=½cGMP� ratio as a function of time (see Fig. 14, (left)).
Moreover, in Fig. 14 (right), we show the position of the barycenter
of the open calcium channels as a function of the [cAMP]/[cGMP]
ratio after 1 h. The position of the barycenter indicates here the
direction of incipient motion and thus the type of response. These
results quantify the idea of Nishlyama-et-al-2003, where the
chemotactic response (experimental measure of the axon turning
angle) is qualitatively connected to the ½cAMP�=½cGMP� ratio. In
particular, the model quantitatively explains the presence of extremal
points in the curve reported in [28, Fig.4c] as the outcome of the
synergistic interaction of receptors, which enhances the polarization
produced in the single receptor case, and of the characteristics of
the internal amplification process, which is nonlinear.
Discussion
We have proposed a mathematical model to study the polarization
phenomenon triggered by the exposure of GCs to an external cue,
taking as a paradigm the in vitro chemotactic assay. The key
hypothesis is that symmetry breaking occurs as early as at the level of
transmembrane receptors, which undergo a biased distribution after
exposure to the cue. This finding appears in the recent work [19], (see
also the analysis of [42]), where experimental evidence of such a
process is provided and an idea is proposed of an autocatalyzing loop
connecting receptors and downstream actin dynamics. Our main
contribution is to quantitatively demonstrate via the mathematical
model how such a loop is able to achieve GC ‘‘front–back’’
polarization. More precisely, we assess the fact that spatial bias in
receptors is a precursor necessary event for chemotactic response, so
that upstream gradient sensing and downstream cytoskeleton
dynamics cannot be decoupled. Moreover, we analyze further
crosslinked effects and, namely, the contribution to polarization of
internal enzymatic reactions, which entail activation of a one–to–
more production of molecules. The model shows that the enzymatic
Figure 11. Spectral analysis of the model. Eigenvalues (in absolutevalue) of the Jacobian matrix of the DCC simplified model at steadystate, as a function of the angular coordinate w (for symmetryrepresented here only in the range ½0,p�).doi:10.1371/journal.pcbi.1000479.g011
Figure 10. Diffusive vs. convective phenomena. When diffusionoverwhelms drift effects, the species are homogenized and polarizationis not created. The abscissa of the bounded DCC receptors tends tozero, as if under an uniform chemotropic field.doi:10.1371/journal.pcbi.1000479.g010
Modelling of Polarization in Neural Chemotaxis
PLoS Computational Biology | www.ploscompbiol.org 10 August 2009 | Volume 5 | Issue 8 | e1000479
efficiency of such reactions must overcome a threshold in order to
produce a sufficient amplification, which is another fundamental
precursor step for obtaining polarization. A simplified version of the
model is used to provide preliminary indications about time scales in
the front and back processes, via eigenvalue tracking. The findings
suggest that the two processes take place with different speeds, the
front one being faster than the rear one. This element could play a
significant role, even if further investigations should be carried out, A
preliminary analysis of the role of diffusion vs. convection is also
sketched, establishing the nature of a strongly advection–dominated
system. Eventually, we have proposed an extension of the model to
address a peculiar behavior arising when two families of receptors
interact to produce the response to the same cue. The study of this
case allows to propose some ideas on the mechanism of chemorepul-
sion, as the synergistic interaction of pathways, that contribute to
better understand this less studied phenomenon.
The present model demands for improvement. We have run
simulations considering a time dependent gradient of ligand. The
laboratory experiments (among the very few on this issue for neural
cells) reported in [19, Fig.1g], show reversibility of the distribution of
the receptors, upon removal of the gradient. Our model tested
under these conditions tends instead to maintain the receptor
asymmetric configuration and removal of the cue itself is demanded.
This fact has led us to conjecture the need for introducing inhibitory
effects on receptors. At present, we have indeed assumed that the
GC has a pool of receptors capable at each time to bind the ligand
Figure 12. Attractive chemotaxis (c~0:2). Concentration contours as a function of time (in minutes, x axis) and angular coordinate w (y axis).doi:10.1371/journal.pcbi.1000479.g012
Figure 13. Repulsive chemotaxis (c~0:8). Concentration contours as a function of time (in minutes, x axis) and angular coordinate w (y axis).doi:10.1371/journal.pcbi.1000479.g013
Modelling of Polarization in Neural Chemotaxis
PLoS Computational Biology | www.ploscompbiol.org 11 August 2009 | Volume 5 | Issue 8 | e1000479

and we have not considered their physiological cycle, comprising
deactivation by phosphorylation and recycling back in the
membrane (as done for example in [29]). Attempts have been
made to consider such processes, establishing a life–time for each
receptor, after which the receptor is removed and substituted by
another one without bias in its angular position on the membrane
(keeping in this way the total number of receptors constant in time).
Including these effects in the model does not seem to significantly
change the results, but deeper investigations on these ideas should
be carried out, possibly supported by the availability of further
information from the biochemical viewpoint (as done in the context
of nonneural cells, for example, in [43]).
Methods
Initial and Boundary ConditionsTo derive initial conditions for the mathematical model, which
are not readily available from experiments, we start assuming the
total number of molecules per cell (indicated with the subscript tot)of the following species to be conserved during the integration
time, leading to, for all t[½0,T �
#DCCð Þ tð Þz #DCC�ð Þ tð Þ~ #DCCð Þtot ð7aÞ
(#G)(t)z(#G�)(t)z(#G�ACyclase)(t)~(#G)tot ð7bÞ
1
2(#PKA)(t)z(#(PKA)2R2)(t)~(#(PKA)2R2)tot ð7cÞ
(#UNC)(t)z(#UNC�)(t)~(#UNC)tot ð7dÞ
(#Q )(t)z(#Q �)(t)~(#Q )tot ð7eÞ
1
2(#PKG)(t)z(#(PKG)2R2)(t)~(#(PKG)2R2)tot ð7f Þ
(#LCCopen)(t)z(#LCCclose)(t)~(#LCC)tot ð7gÞ
Total values used in the simulations are reported in Tab. 3.
Moreover, we assume that:
N at time tv0, the GC is in a homogeneous state, corresponding
to the absence of chemoattractant concentration. This implies
that all receptors are in a free state
N adenyl cyclase has an initial value which represents a small
fraction of the corresponding conserved total quantity. This is
needed to trigger time evolution of the corresponding equation
N at the initial time calcium channels are assumed to be half in
open and half in close state.
Using assumptions (1),(2) and (3), we recover from the total
values the corresponding concentrations at the left hand sides of
Eqs. (7a–g) at t~0. Values are in Tab. 4.
As for the boundary conditions, since the GC is modeled as a
circular structure, concentrations and fluxes must coincide at w~0and w~2p. Thus, for each species ni,i~1, . . . ,M, we impose the
periodic boundary conditions
Figure 14. Study of the effect of the [cAMP]/[cGMP] ratio. Top:[cAMP]/[cGMP] ratio as a function of time (in minutes) for differentvalues of c (reported in the legend). Bottom. Position xLCCopen
of theabscissa of the barycenter of the open calcium channels (in mm) as afunction of the ratio [cAMP]/[cGMP] after 1 h. Each marker correspondsto a simulation carried out with a different value of c.doi:10.1371/journal.pcbi.1000479.g014
Table 3. Total values of species concentration.
Parameter Value (#/cell) Ref.
(#DCC)tot 103 [11]
(#G)tot 104 [46]
(#LCC)tot 105
(#PKA)tot 104
(#PKG)tot 104
(#Q )tot 104 [46]
(#UNC)tot 103 [11]
doi:10.1371/journal.pcbi.1000479.t003
Modelling of Polarization in Neural Chemotaxis
PLoS Computational Biology | www.ploscompbiol.org 12 August 2009 | Volume 5 | Issue 8 | e1000479

½ni�(0,t)~½ni�(2p,t), Ji,tot(0,t)~Ji,tot(2p,t), t[(0,T �:
Modelling AssumptionsUnknown chemical processes. At the best of our
knowledge, the chemical mechanism which gives HPETE from
Q � is not known yet. In any case, we can suppose that a multistep
reaction is taking place. We denote by X its (unknown)
intermediate products. If Q � {? X {? HPETE, the mass
action law gives
d½X�=dt~k1½Q ��:
Based on the fact that the processes responsible of the formation of
Q � are much faster, we suppose that its production rate can be
considered constant, that is d½Q ��=dt~a, which gives
½Q ��(t)~k2tz½Q ��(0). Under such hypothesis and setting
½Q ��(0)~0 (see the previous section), we have
½X�(t)&k3½Q��2(t)
and, eventually
d½HPETE�=dt~k4½X �(t)&k5½Q��2(t)
which gives the form in Eq. (5e).
DCC-UNC5 receptor complex dynamics. In literature it
has been shown (see for example [24]) that UNC5 in order to
initiate the repulsive response is to be coupled with a DCC
receptor and that both must be ligated to a cue molecule, that is in
active form. If one wants to add a detailed model of receptor–
receptor interaction, the following reaction should also be
considered
DCC�zUNC5�½ki�kf CM�,
where CM� denotes the bound DCC–UNC5 complex. This leads
to the following set of kinetic equations for the receptor dynamics
L½DCC��Lt
~kN½Netrin�½DCC�{k{N½DCC��zki½CM��
{kf ½DCC��½UNC5��z spatial terms ,
ð8aÞ
L½UNC5��Lt
~kN½Netrin�½UNC5�{k{N½UNC��zki½CM��
{kf ½DCC��½UNC5��z spatial terms ,
ð8bÞ
L½CM��Lt
~{ki½CM��zkf ½DCC��½UNC5��z spatial terms : ð8cÞ
Then, one should consider CM� as the species triggering the
production of cGMP. The above equations reduce to the model
we have proposed in this work by supposing that 1) all the
ligated UNC5 receptors bind to DCC� receptors; 2) binding
of the complex is instantaneous, which amounts to consider
that the formation of the complex is always at the equilibrium;
3) the percentage of DCC receptors coupled with UNC5 is
prescribed a–priori using the parameter c, that is we neglect
the dynamics given in the equation for DCC� the term
kf ½DCC��½UNC��. Using the complete model of the receptor
dynamics is interesting but too complex to be addressed
immediately, above all to give a correct biological interpre-
tation of the results.
Kinetic ConstantsSeveral kinetic constants entering the model are available from
literature references for the same reactions we are dealing with or
for very similar reactions. The value of the other parameters has
been estimated, based on the following considerations:
(1) kPKA and k{PKA: in [44], the half-life time for the exchange
cAMPzR /{R:cAMP
is evaluated to be t1=2~870 s. Moreover, in the same paper it is
observed that in presence of the catalytic subunit PKA, as in our
case, the process
cAMPzR:PKA /{R:PKA:cAMP 'f ast
R:cAMPzPKA
is characterized by a significantly reduced t1=2. We assume here
t1=2~80 s, so that
k-PKA~ln(2)
80~0:0087&10{2:
To estimate the direct kinetic constant kPKA, we then use
½PKA�½(PKA)2R2�:½cAMP�2
~Keq~kPKA
k{PKA
:
Table 4. Initial value of species concentration.
Parameter Value (#/cell)
#cAMP(0) 0
#cGMP(0) 0
#DCC�(0) 0
#DCC(0) 103
#G�(0) 0
#G(0) 9:99:103
#GACyclase�(0) 10
#GCyclase(0) 10
#HPETE(0) 10
#LCCopen(0) 5:104
#LCCclose(0) 5:104
#PKA(0) 0
#PKG(0) 0
#(PKA)2R2(0) 104
#(PKG)2R2(0) 104
#Q �(0) 0
#Q (0) 9:99:103
#UNC�(0) 0
#UNC(0) 103
doi:10.1371/journal.pcbi.1000479.t004
Modelling of Polarization in Neural Chemotaxis
PLoS Computational Biology | www.ploscompbiol.org 13 August 2009 | Volume 5 | Issue 8 | e1000479

In [29], the concentration of cAMP reaches (0:2{20):104#=cell
Considering the maximum value, we impose that at the
equilibrium the (PKA)2R2 conversion is almost total with a yield
of 80–90%. We get
kPKA&5:10{9:
We observe that the order of magnitude of cyclic AMP
concentration attained with our model is comparable to the one
of [29], used for estimation of this parameter.
(2) kLCC and k{LCC: as already mentioned above, in absence of
stimulation we have assumed equipartition of open and close
channels, which implies
1~½LCCopen�½LCCclose�
~kLCC
k{LCC
,
and thus kLCC~k{LCC. We have chosen kLCC~5:10{3, based on
a kinetic with speed comparable to the other processes.
(3) iPKA: we use the following relations, which establish the
equilibrium of the channels on the front side, on the rear side and
the ratio of open channels between front and rear, respectively yielding
iPKA&4:10{3
(4) DCC–UNC5 pathway: kinetic constants are not easily
accessible from literature. Thus, where possible, parameters
have been chosen based on analogy with the DCC pathway.
Moreover, we have assumed
hHPETE~1:10{4, dHPETE~4:10{4:
Tab. 5 summarizes the value of the kinetic constants used in the
model.
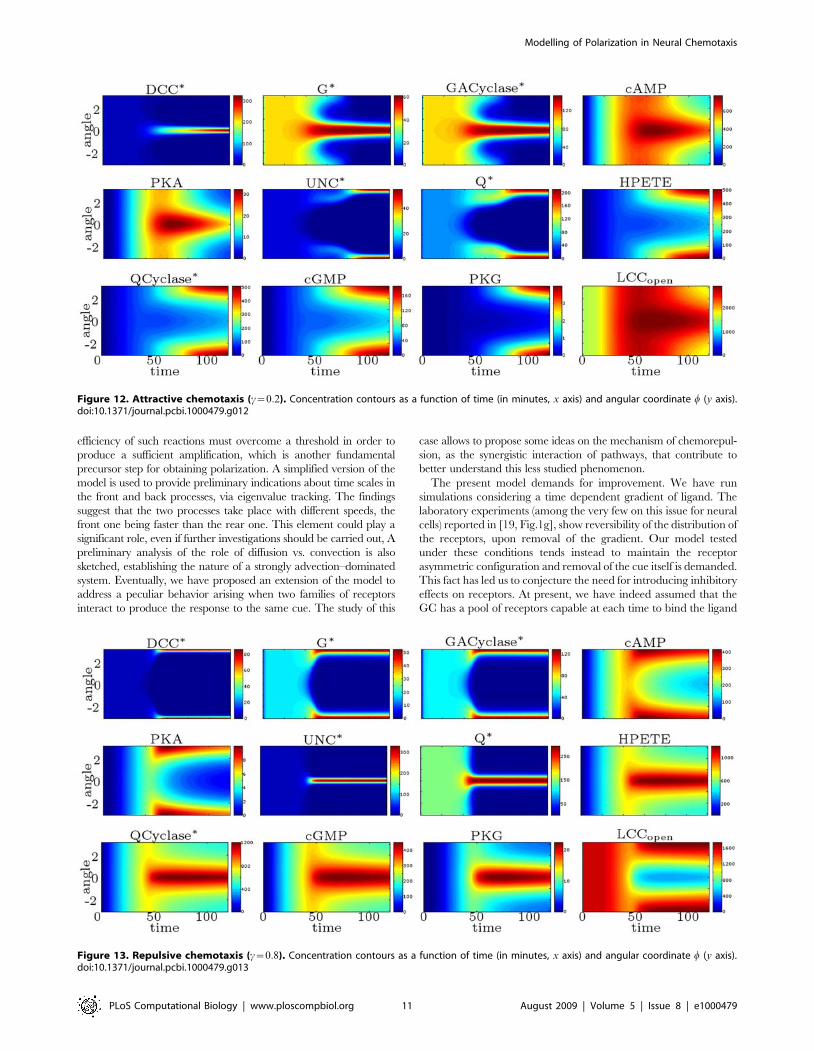
We conclude this discussion exploring the overall influence
of the parameters over the model predictions. To do this, we
consider the DCC model and we perform a set of 300 trial
tests prescribing a random variation of all kinetic constants. We
monitor the displacement of the barycenter of the bound DCC
receptors after 2 h. The results are shown in Fig. 15, where on the
x axis we report the total parameter variation TV computed
as log TV~PNk
i~1 log ~kki=ki
�� ��, Nk being the total number of
parameters, ki the value of the i-th parameter and ~kki its perturbed
value. A 50% percentage of the tests show a perturbation in the
barycenter displacement lower than the 10%.
Table 5. Kinetic constants.
Parameter Definition Value Dimension Ref.
dcAMP cAMP hydrolysis rate 4:10{4 s{1 [29]
dcGMP cGMP hydrolysis rate 4:10{4 s{1 [29]
dHPETE HPETE degradation rate 1:10{4 s{1
hcGMP cGMP synthesis rate 1:10{2 s{1 [29]
hGCyc GCyclase activation rate 1:10{2 s{1
hHPETE HPETE synthesis rate 1:10{4 s{1
hN ligand-UNC complex binding rate 6:67:10z6mol=Lð Þ{1
s{1 [47]
h{N ligand-UNC complex unbinding rate 2:10z1 s{1 [47]
hPKG PKG synthesis rate 5:10{9 #{2s{1
h{PKG PKG deactivation rate 1:10{2 #{1s{1
hQ G–protein synthesis rate in UNC pathway 1:10{3 #{1s{1 [47,48]
h{Q G–protein deactivation rate in UNC pathway 2:3:10{2 s{1 [47,48]
iPKA enhancement factor due to PKA 4:10{3 #{2
iPKG enhancement factor due to PKG 4:10{3 #{2s
kACycl ACyclase activation rate 1:10{2 #{1s{1 [29]
kcAMP cAMP synthesis rate 1:10{2 s{1 [29]
kG G–protein synthesis rate in DCC pathway 1:10{3 #{1s{1 [46]
k{G G–protein deactivation rate in DCC pathway 2:3:10{2 #{1s{1 [46]
kLCC LCC opening rate 5:10{3 s{1
k-LCC LCC closure rate 5:10{3 s{1
kN ligand-DCC binding rate 6:67:10z6mol=Lð Þ{1
s{1 [47]
k{N ligand-DCC unbinding rate 2:10z1 s{1 [47]
kPKA PKA synthesis rate 5:10{9 #{2s{1 [49]
k{PKA PKA deactivation rate 1:10{2 s{1
s amplification factor 1 dimensionless [29]
doi:10.1371/journal.pcbi.1000479.t005
Modelling of Polarization in Neural Chemotaxis
PLoS Computational Biology | www.ploscompbiol.org 14 August 2009 | Volume 5 | Issue 8 | e1000479
Diffusion and feedback coefficients. The following choices
have been made:
(1) membrane diffusion coefficient am: we have taken as a
reference the value considered in [7], am~2:10{2m m2 s{1.
The same coefficient is used for all the membrane species
(2) cytosolic diffusion coefficient ac: we set ac~am. In the context
of eukaryotic cells, see [9] for a similar choice, while see [7] for
a model with acwwam. The same coefficient is used for all
the cytoplasmatic species
(3) feedback coefficient afb: there are no available data. Based
on the plausibility of the results, we have chosen afb~1:5:10{3m m3#{1s{1.
Tab. 2 summarizes the value of the above coefficients.
Simulation AlgorithmBoth DCC and DCC–UNC5 models constitute nonlinear time
dependent diffusion–advection–reaction systems of partial differ-
ential equations. Their numerical approximation is a very
challenging task: to start with, we partition the GC perimeter
into Ns~128 angular sectors (see Fig. 1) and we discretize the
spatial derivative operators using finite differences, with a node
collocated at the center of each sector. Observe that conservation
relations like Eqs. (7) do not hold sector by sector, but they rather
apply to the integral on the angle (which represents the number of
molecules per cell). Attention must be paid to the fact that the
feedback terms in Eqs. (4a) and (5a) dominate the diffusive terms.
To avoid spurious oscillations, upwind finite differences or a
sufficiently fine discretization should be adopted [45]. Once finite
difference discretization is carried out, a system of coupled
nonlinear ordinary differential equations is obtained. Due to the
different speeds in the reaction dynamics (refer for this issue also to
the Results and Discussion), these systems are very stiff and require
an implicit time integrator. We have adopted the ode15s MATLAB
routine with adaptive choice of the time integration step.
Numerical evaluation of the Jacobian matrix has been used for
the linearization.
The MATLAB software package developed by the authors can be
made available upon request.
Acknowledgments
We wish to thank dr. G. Aletti, prof. G. Naldi and dr. M. Semplice for
useful discussions on mathematical modelling. We wish to thank dr. A.
Gamba for pointing out to our attention literature papers that greatly
stimulated our interest. We wish to thank the anonymous Referees of the
paper for their useful and constructive comments.
Author Contributions
Conceived and designed the experiments: PC GF. Performed the
experiments: PC GF. Analyzed the data: PC GF. Contributed reagents/
materials/analysis tools: PC GF. Wrote the paper: PC GF.
References
1. Bourne H, Weiner O (2002) Cell polarity: a chemical compass. Nature 419: 21.
2. van Haastert P, Devreotes P (2004) Chemotaxis: signalling the way forward. Nat
Rev Mol Cell Biol 5: 626–634.
3. Li S, Guan J, Chein S (2005) Biochemistry and biomechanics of cell motility.
Annu Rev Biomed Eng 7: 105–150.
4. Rappel W, Thomas P, Levine H, Loomis W (1998) Establishing direction during
chemotaxis in eukaryotic cells. Biophys J 83: 1361–1367.
5. Meinhardt H (1999) Orientation of chemotactic cells and growth cones: models
and mechanisms. J Cell Sci 112: 2867–2874.
6. Levchenko A, Iglesias P (2002) Models of eukaryotic gradient sensing:
application to chemotaxis of amoebae and neutrophils. Biophys J 82: 50–63.
7. Narang A, Subramanian KK, Lauffenburger DA (2001) A mathematical model
for chemoattractant gradient sensing based on receptor–regulated membrane
phospholipid signalling dynamics. Ann Rev Biomed Eng 29: 677–69.
8. Gamba A, de Candia A, Di Talia S, Coniglio A, Bussolino F, et al. (2005)
Diffusion-limited phase separation in eukaryotic chemotaxis. PNAS 102(47).
9. Onsum M, Rao C (2007) A mathematical model for neutrophil gradient sensing
and polarization. PLoS Comput Biol 3: e36.
10. Mori Y, Jilkine A, Edelstein-Keshet L (2008) Wave-pinning and cell polarity
from a bistable reaction-diffusion system. Biophys J 94: 3684–97.
11. Mortimer D, Fothergill T, Pujic Z, Richards L, Goodhill G (2007) Growth cone
chemotaxis. Trends Neurosci 31: 90–98.
12. Buettner HM, Pittman RN, Ivins J (1994) A model of neurite extension across
regions of nonpermissive substrate: simulations based on experimental
measurements of growth cone motility and filopodial dynamics. Dev Biol 163:
407–422.
13. Maskery SM, Shinbrot T (2005) Deterministic and stochastic elements of axonal
guidance. Annu Rev Biomed Eng 7: 187–221.
14. Hentschel HGE, van Ooyen A (2000) Dynamic mechanisms for bundling and
guidance during neural network formation. Physica A 288: 369–379.
15. Aletti G, Causin P (2008) Mathematical characterization of the transduction
chain in growth cone pathfinding. IET Sys Biol 2: 150–161.
16. Aeschlimann M, Tettoni L (2001) Biophysical model of axonal pathfinding.
Neurocomputing 38–40: 87–92.
17. Goodhill GJ, Gu M, Urbach JS (2004) Predicting axonal response to molecular
gradients with a computational model of filopodial dynamics. Neural Comp 16:
2221–2243.
18. Xu J, Rosoff W, Urbach J, Goodhill G (2005) Adaptation is not required to
explain the long-term response of axons to molecular gradients. Development
132: 4545–4562.
19. Bouzigues C, Morel M, Triller A, Dahan M (2007) Asymmetric redistribution of
GABA receptors during GABA gradient sensing by nerve growth cones analyzed
by single quantum dot imaging. PNAS 104: 251–256.
20. Ueda M, Sako Y, Tanaka T, Devreotes P, Yanagida T (2001) Single-molecule
analysis of chemotactic signaling in Dictyostelium cells. Science 294: 864–867.
21. Saxton M (1994) Single{particle tracking: models of directed transport. Biophys J
67: 2110–2119.
22. Song H, Poo MM (1999) Signal transduction underlying growth cone guidance
by diffusible factors. Curr Opin Neurobiol 9: 355–363.
23. Ruiz-Velasco V, Zhong J, Hume J, Keef K (1998) Modulation of Ca2+ channels
by cyclic nucleotide cross activation of opposing protein kinases in rabbit portal
vein. Circ Res 82: 557–565.
24. Hong K, Hinck L, Nishiyama M, Poo M, Tessier-Lavigne M, et al. (1999) A
ligand–gated association between cytoplasmatic domains of UNC5 and DCC
family receptors converts Netrin-induced growth cone attraction to repulsion.
Cell 97: 927–941.
Figure 15. Scatter plot of the position of the barycenter ofbound DCC receptors (in mm) as a function of the totalparameter variation. Perturbation in the barycenter displacementis lower than 0:5 mm in more than 50% of the tests.doi:10.1371/journal.pcbi.1000479.g015
Modelling of Polarization in Neural Chemotaxis
PLoS Computational Biology | www.ploscompbiol.org 15 August 2009 | Volume 5 | Issue 8 | e1000479
25. Ming Gl, Song Hj, Berninger B, Holt C, Tessier-Lavigne M, et al. (1997) cAMP-
dependent growth cone guidance by netrin-1. Neuron 19: 1225–1235.26. Keino-Masu K, Masu M, Hinck L, Leonardo ED, Chan SSY, et al. (1996)
Deleted in Colorectal Cancer (DCC) encodes a netrin receptor. Cell 87:
175–185.27. Tessier-Lavigne M, Goodman C (1996) The molecular biology of axon
guidance. Science 274: 1123–1133.28. Nishiyama M, Hoshino A, Tsai L, Henley J, Goshima Y, et al. (2003) Cyclic
AMP/GMP-dependent modulation of Ca2+ channels sets the polarity of nerve
growth-cone turning. Letters to Nature 423: 990–995.29. Clement F, Monniaux D, Stark J, Hardy K, Thallabrd J, et al. (2001)
Mathematical model of FSH-induced cAMP production in ovarian follicles.Am J Physiol Endocrinol Metab 281: E35–E53.
30. Song H, Poo MM (2001) The cell biology of neuronal navigation. Nat Cell Biol3: E81–E88.
31. Hamelin M, Zhou Y, Su M, Scott I, Culotti J (1993) Expression of the UNC-5
guidance receptor in the touch neurons of C. elegans steers their axons dorsally.Nature 364: 327–330.
32. Hong K, Nishiyama M, Henley J, Tessier-Lavigne M, Poo M (2003) Calciumsignalling in the guidance of nerve growth by netrin–1. Nature 403: 93–98.
33. Goodhill GJ (1997) Diffusion in axon guidance. Eur J Neur 9: 1414–1421.
34. Goodhill GJ, Urbach JS (1999) Theoretical analysis of gradient detection bygrowth cones. J Neurobiol 41: 230–241.
35. Zheng JQ, Felder M, Connor JA, Poo M (1994) Turning of nerve growth coneinduced by neuro-transmitters. Nature 368: 140–144.
36. Tessier-Lavigne M, Placzek M, Lumsden AG, Dodd J, Jessell TM (1988)Chemotropic guidance of developing axons in the mammalian central nervous
system. Nature 336: 775–778.
37. Cirulli V, Yebra M (2007) Netrins: beyond the brain. Nature Reviews 8:296–306.
38. Murray JD (2004) Mathematical Biology. Vol I,II. New York: Springer.
39. Brune B, Ulrich V (1991) 12–Hydroperoxyeicosatetraenoic acid inhibits main
platelet functions by activation of soluble guanylate cyclase. Mol Pharmacol 39:
671–678.
40. Carabelli V, D’Ascenzo M, Carbone E, Grassi C (2002) Nitric oxide inhibits
neuroendocrine Cav1 L–channel gating via cGMP–dependent protein kinase in
cell–attached patches of bovine chromaffn cells. J Physiol 541: 351–366.
41. Courant R, Hilbert D (1989) Methods of mathematical physics. John Wiley and
Sons.
42. Bouzigues C, Dahan M (2007) Transient directed motions of GABAA receptors
in growth cones detected by a speed correlation index. Biophys J 92: 654–660.
43. Jekely G, Song HH, Luque C, Rorth P (2005) Regulators of endocytosis
maintain localized receptor tyrosine kinase signaling in guided migration. Dev
Cell 9: 197–207.
44. Bell J, Biltonen R, Brunton L (1989) Non-steady state kinetic analysis of the
regulation of Adeny-late Cyclase by GTP-binding proteins. Mol Pharmacol 37:
535–545.
45. Quarteroni A, Valli A (1997) Numerical Approximation of Partial Differential
Equations. Springer-Verlag.
46. Brinkerhoff C, Sun Choi J, Linderman J (2008) Diffusion-limited reactions in G–
protein activation: unexpected consequences of antagonist and agonist
competition. J Theor Biol 251: 561–569.
47. L M, Linderman J (1997) Mechanism model of G-protein signal transduction.
Bioch Pharm 53: 518–530.
48. Modchang C, Triampo W, Lenbury Y (2008) Mathematical modeling and
application of genetic algorithm to parameter estimation in signal transduction:
Trafficking and promiscuous coupling of G-protein coupled receptors. Comput
Biol Med 38: 574–582.
49. Chau V, Huang L, Romero G, Biltonen R, Huang C (1980) Kinetic studies on
the dissociation of adenosine cyclic 39–59-monophosphate from the regulatory
subunit of protein kinase from rabbit skeletal muscle. Biochemistry 19: 924–928.
Modelling of Polarization in Neural Chemotaxis
PLoS Computational Biology | www.ploscompbiol.org 16 August 2009 | Volume 5 | Issue 8 | e1000479
Copyright © 2022 FDOKUMEN