Auto-DR and Pre-cooling of Buildings at Tri-City Corporate Center
141
LBNL-XXXXX Auto-DR and Pre-cooling of Buildings at Tri-City Corporate Center Rongxin Yin, Peng Xu, Sila Kiliccote Lawrence Berkeley National Laboratory 1 Cyclotron Road, MS90R3111 Berkeley CA 94720 November 3, 2008 This work described in this report was coordinated by the Demand Response Research Center and funded by Southern California Edison through SCE project DR-0802, California Institute for Energy and the Environment contract SCE-08-01, and by the U.S. Department of Energy under Contract No. DE-AC02-05CH11231.
Transcript of Auto-DR and Pre-cooling of Buildings at Tri-City Corporate Center
LBNL-XXXXX
Auto-DR and Pre-cooling of Buildings at Tri-City Corporate Center
Rongxin Yin, Peng Xu, Sila Kiliccote Lawrence Berkeley National Laboratory
1 Cyclotron Road, MS90R3111
Berkeley CA 94720
November 3, 2008
This work described in this report was coordinated by the Demand Response Research Center and funded by Southern California Edison through SCE project DR-0802, California Institute for Energy and the Environment contract SCE-08-01, and by the U.S. Department of Energy under Contract No. DE-AC02-05CH11231.

Acknowledgements
This work described in this report was coordinated by the Demand Response Research Center and funded by Southern California Edison through SCE project DR-0802, California Institute for Energy and the Environment contract SCE-08-01, and by the U.S. Department of Energy under Contract No. DE-AC02-05CH11231.
DISCLAIMER This document was prepared as an account of work sponsored by the United States Government. While this document is believed to contain correct information, neither the United States Government nor any agency thereof, nor The Regents of the University of California, nor any of their employees, makes any warranty, express or implied, or assumes any legal responsibility for the accuracy, completeness, or usefulness of any information, apparatus, product, or process disclosed, or represents that its use would not infringe privately owned rights. Reference herein to any specific commercial product, process, or service by its trade name, trademark, manufacturer, or otherwise, does not necessarily constitute or imply its endorsement, recommendation, or favoring by the United States Government or any agency thereof, or The Regents of the University of California. The views and opinions of authors expressed herein do not necessarily state or reflect those of the United States Government or any agency thereof or The Regents of the University of California.
Design & Engineering Services
Auto-DR and Pre-cooling of Buildings at Tri-City Corporate Center
Prepared by:
Rongxin Yin, Peng Xu, Sila Kiliccote
Lawrence Berkeley National Laboratory 1 Cyclotron Road, MS90R3111 Berkeley CA 94720
November 3, 2008
DR 06.22
Southern California Edison Design & Engineering Services November 2008
Acknowledgements
Lawrence Berkeley National Laboratory is responsible for this project. It was developed as part of Southern California Edison’s (SCE’s) Emerging Markets & Technology program under internal project number DR 08-02. Project manager Angelo Rivera conducted this technology evaluation with overall guidance and management from Carlos Haiad of SCE’s Design & Engineering Services For more information on this project, contact [email protected]. The authors would like to thank the California Energy Commission’s PIER Program for their on-going support of the LBNL Demand Response Research Center pre-cooling research.
Disclaimer
This report was prepared by Lawrence Berkeley National Laboratory (LBNL) and funded by Southern California Edison (SCE). Reproduction or distribution of the whole or any part of the contents of this document without the express written permission of LBNL is prohibited. This work was performed with reasonable care and in accordance with professional standards. However, neither SCE nor any entity performing the work pursuant to SCE’s authority make any warranty or representation, expressed or implied, with regard to this report, the merchantability or fitness for a particular purpose of the results of the work, or any analyses, or conclusions contained in this report. The results reflected in the work are generally representative of operating conditions; however, the results in any other situation may vary depending upon particular operating conditions.
DR 06.22
Southern California Edison Page i Design & Engineering Services November 2008
CONTENTS ABSTRACT________________________________________________________ 1
EXECUTIVE SUMMARY _______________________________________________ 2 Introduction ..........................................................................2 Purpose ................................................................................2 Project Objectives ..................................................................2 Project Outcomes...................................................................2
INTRODUCTION ____________________________________________________ 1 Background and Overview .......................................................1 Project Objectives ..................................................................2 Report Organization................................................................2
DEVELOPMENT OF OPTIMAL PRE-COOLING STRATEGIES______________________ 3 Introduction ..........................................................................3 Data Collection of Tri-City Corporate Center ...............................3 Simulation Model Development ................................................3
Inputs for the Initial Simulation Model .................................3 Building Description ......................................................3 Internal Loads .............................................................4 HVAC System ..............................................................6
Simulation Results.............................................................6 Simulation Model Calibration....................................................8
Simulation Model Calibration Criteria....................................8 Real Weather Data ............................................................9 Internal Loads adjustments ................................................9 Calibrated Initial Simulation Models ...................................12
Comparison of Monthly Measured Data ..........................12 Comparison of Daily Measured Data ..............................13 Comparison of Hourly Measured Data............................14
Summary............................................................................16
OPTIMIZATION OF PRE-COOLING STRATEGIES ____________________________ 17 Optimal Pre-cooling Strategies ..........................................17
When to Pre-cool: CPP Versus Non-CPP?........................17 Pre-cooling Strategies ......................................................19 Simulation Results of Pre-cooling Strategies........................20
Optimal Pre-cooling Strategies .....................................20 Summary of Simulation Results.........................................21
DR 06.22
Southern California Edison Page ii Design & Engineering Services November 2008
PRE-COOLING FIELD TEST ANALYSIS ___________________________________ 23 Pre-cooling and DR Event Field Test Results .............................23
Pre-cooling Strategy Field Test ..........................................23 DR Event Field Test .........................................................23
Confirmation of the simulation model ............................23 Lbnl baseline model ....................................................25
DR Event Field Test Results ..............................................26 Comparison of actual data and simulation prediction .................27 Summary............................................................................29
COMPARISON OF DRQAT WITH EQUEST AND BEST ______________________ 30 Introduction to Energy Simulation Tools ..................................30 Functionality........................................................................31
General Features.............................................................31 Difference in Building Dynamics Prediction ..........................32
Comparison of simulations with real building data .....................33 Pre-cooling strategy.........................................................33 Thermal mass level .........................................................33
Summary............................................................................34
CONCLUSIONS AND RECOMMENDATIONS ______________________________ 35 Conclusions .........................................................................35 Recommendations................................................................36
REFERENCES _____________________________________________________ 37
APPENDIX A - BUILDING AUDITS______________________________________ 38 Two Carnegie Plaza ..............................................................38 One Carnegie Plaza ..............................................................39 One Carnegie Plaza (smaller building) .....................................40 One Vanderbilt.....................................................................41 One Parkside .......................................................................42 Lakeside Tower....................................................................43 Two Parkside .......................................................................44 Three Carnegie Plaza ............................................................45 Brier Corporate Center..........................................................46 Vanderbilt Plaza ...................................................................47 Inland Regional Center..........................................................48
APPENDIX B - BUILDING INTERNAL LOADS AND SCHEDULES__________________ 49 Lighting and Plug schedules ...................................................50
DR 06.22
Southern California Edison Page iii Design & Engineering Services November 2008
APPENDIX C – CALIBRATION RESULTS __________________________________ 56 Monthly Calibration Results....................................................56 Weekly and Daily Calibration Results.......................................58
Two Carnegie Plaza .........................................................58 One Carnegie Plaza .........................................................60 One Carnegie Plaza (smaller building) ................................62 One Vanderbilt................................................................64 One Parkside ..................................................................66 Lakeside Tower ...............................................................68 Two Parkside ..................................................................70 Three Carnegie Plaza .......................................................72 Brier Corporate Center .....................................................74 Vanderbilt Plaza ..............................................................76 Inland Regional Center.....................................................78
APPENDIX D – FIELD RESULTS ________________________________________ 80 Energy Analysis on Auto-DR Event Days ..................................80 Demand Plot on Auto-DR Events Days.....................................91 Economic Analysis on Auto-DR Events Days .............................97
APPENDIX E – SIMULATION RESULTS OF RECALIBRATED MODEL ______________ 119
DR 06.22
Southern California Edison Page iv Design & Engineering Services November 2008
FIGURES Figure 1: Schedule of Occupancy on Weekdays .............................5 Figure 2: Schedules of Lighting and Plug Power Densities on
Weekdays ..................................................................6 Figure 3: Calibrated Schedules of Lighting and Plug Power
Densities on Weekdays ..............................................11 Figure 4: Calibrated Schedules of Lighting and Plug Power
Densities on Weekend and Holidays .............................12 Figure 5: Daily Electrical Consumption of Simulation Model vs.
Actual Electrical Consumption in July..........................14 Figure 6: Daily Electrical Consumption of Simulation Model vs.
Actual Electrical Consumption in August........................14 Figure 7: Hourly Electrical Consumption of Simulation Model vs.
Actual Electrical Consumption One day in August ...........15 Figure 8: Hourly Electrical Consumption of Simulation Model vs.
Actual Electrical Consumption One day in August ...........15 Figure 9: Distribution of Daily Max Demand throughout Summer
Period-Three Carnegie Plaza .......................................18 Figure 10: Distribution of daily max demand throughout summer
period-One Vanderbilt ................................................19 Figure 13: Simulation Results of Optimal Pre-cooling Strategies ......21 Figure 14: Pre-cooling Strategies – Auto-DR.................................23 Figure 15: Outside Air Temperature Comparison Between Baseline
Day and Auto-DR Day ................................................24 Figure 16: Field Test Results of Pre-cooling Strategies on Auto-DR
Day.........................................................................26 Figure 17: DOE-2 Loads Calculation Procedure..............................32 Figure 18: EnergyPlus Loads Calculation Procedure........................32 Figure 19: Simulation Results of Different Thermal Mass Level for
eQUEST and DRQAT ..................................................34
DR 06.22
Southern California Edison Page v Design & Engineering Services November 2008
TABLES Table 1: initial simulation model inputs .......................................4 Table 2: Building Internal Loads For Initial Simulation Models ........5 Table 3: Building Internal Loads for Initial Simulation Model ..........7 Table 4: Comparison between Simulation Results and Actual
Data in Summer 2007..................................................7 Table 5: Acceptable tolerance for Monthly, Daily and Hourly
Calibration .................................................................9 Table 6: Building Internal Loads for Calibrated Simulation Model ..11 Table 7: Comparison between Calibrated Simulation Results and
Actual Data in Summer 2007 ......................................12 Table 8: Simulation Results of Different Pre-cooling Strategies .....21 Table 9: Simulation Results of Optimal “Step Temperature Set
Up” Pre-cooling Strategy (Three Carnegie Plaza)............22 Table 10: Temperature Comparison between Baseline Days and
Auto-DR Days ...........................................................24 Table 11: Summary of Auto-DR days and Corresponding Baseline
Days .......................................................................25 Table 12: Summary of Auto-DR Field Test Results – Three
Carnegie Plaza ..........................................................27 Table 13: Summary of Optimal Pre-cooling Strategy –
Recalibrated Model ....................................................28 Table 14: General Features of Building Energy Simulation Tool .....31 Table 15: Simulation Results of Demand Shed for DR Strategy
(kW) .......................................................................33
EQUATIONS Equation 1: Criteria for Assessing the Difference between
Simulation Model and Measured Data .............................9 Equation 2: Average Variance of Hourly Outside Air Temperature .....24 Equation 3: Computed Baseline Model..........................................25 Equation 4: Regression Model With Morning Load Adjustment..........25
DR 06.22
Southern California Edison Page 1 Design & Engineering Services November 2008
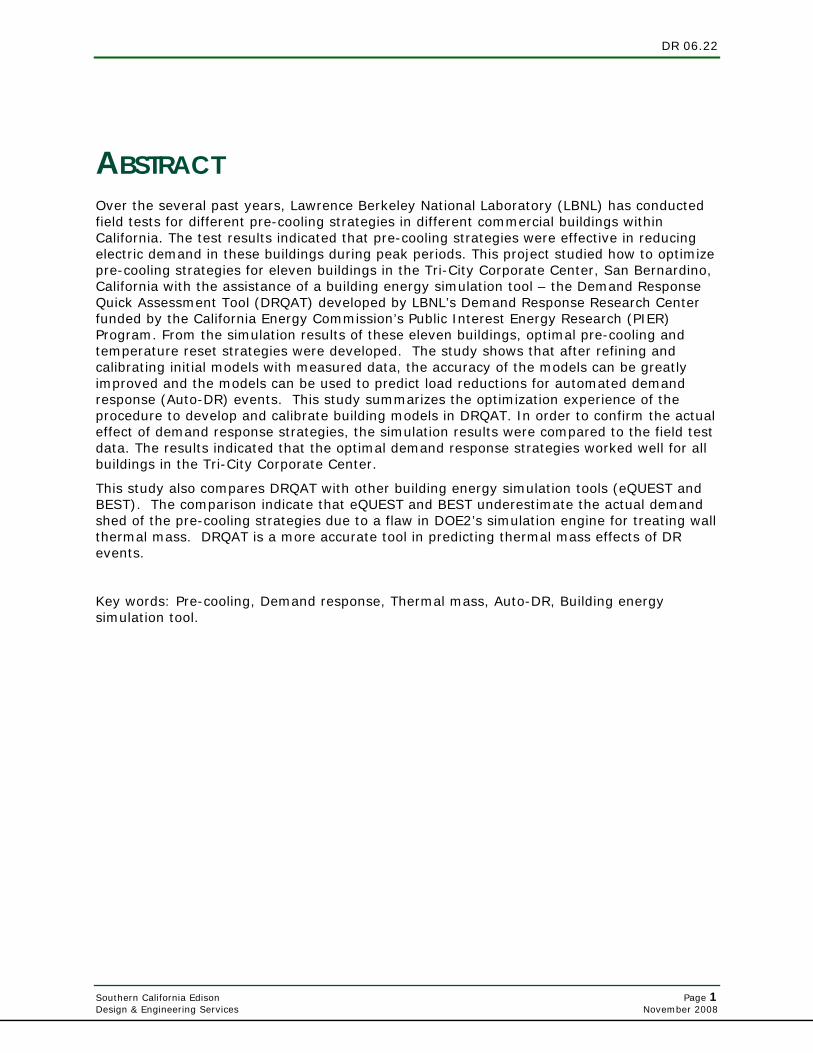
ABSTRACT Over the several past years, Lawrence Berkeley National Laboratory (LBNL) has conducted field tests for different pre-cooling strategies in different commercial buildings within California. The test results indicated that pre-cooling strategies were effective in reducing electric demand in these buildings during peak periods. This project studied how to optimize pre-cooling strategies for eleven buildings in the Tri-City Corporate Center, San Bernardino, California with the assistance of a building energy simulation tool – the Demand Response Quick Assessment Tool (DRQAT) developed by LBNL’s Demand Response Research Center funded by the California Energy Commission’s Public Interest Energy Research (PIER) Program. From the simulation results of these eleven buildings, optimal pre-cooling and temperature reset strategies were developed. The study shows that after refining and calibrating initial models with measured data, the accuracy of the models can be greatly improved and the models can be used to predict load reductions for automated demand response (Auto-DR) events. This study summarizes the optimization experience of the procedure to develop and calibrate building models in DRQAT. In order to confirm the actual effect of demand response strategies, the simulation results were compared to the field test data. The results indicated that the optimal demand response strategies worked well for all buildings in the Tri-City Corporate Center.
This study also compares DRQAT with other building energy simulation tools (eQUEST and BEST). The comparison indicate that eQUEST and BEST underestimate the actual demand shed of the pre-cooling strategies due to a flaw in DOE2’s simulation engine for treating wall thermal mass. DRQAT is a more accurate tool in predicting thermal mass effects of DR events.
Key words: Pre-cooling, Demand response, Thermal mass, Auto-DR, Building energy simulation tool.
DR 06.22
Southern California Edison Page 2 Design & Engineering Services November 2008
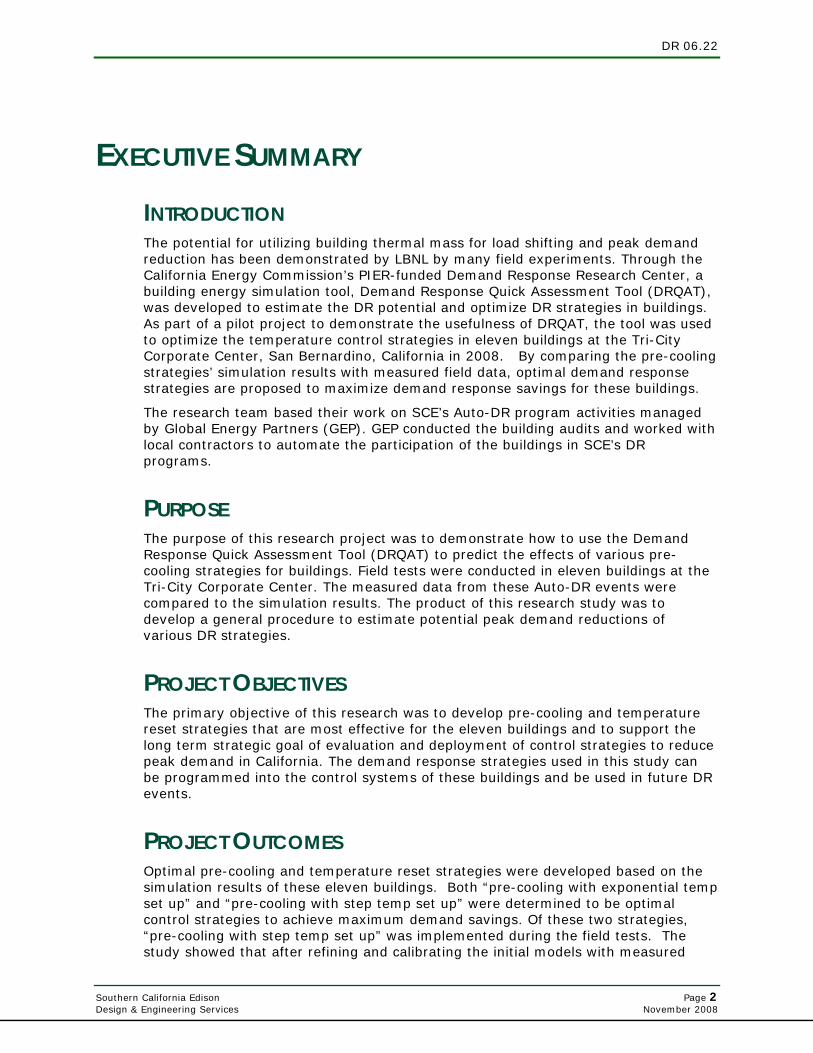
EXECUTIVE SUMMARY INTRODUCTION The potential for utilizing building thermal mass for load shifting and peak demand reduction has been demonstrated by LBNL by many field experiments. Through the California Energy Commission’s PIER-funded Demand Response Research Center, a building energy simulation tool, Demand Response Quick Assessment Tool (DRQAT), was developed to estimate the DR potential and optimize DR strategies in buildings. As part of a pilot project to demonstrate the usefulness of DRQAT, the tool was used to optimize the temperature control strategies in eleven buildings at the Tri-City Corporate Center, San Bernardino, California in 2008. By comparing the pre-cooling strategies’ simulation results with measured field data, optimal demand response strategies are proposed to maximize demand response savings for these buildings.
The research team based their work on SCE’s Auto-DR program activities managed by Global Energy Partners (GEP). GEP conducted the building audits and worked with local contractors to automate the participation of the buildings in SCE’s DR programs.
PURPOSE The purpose of this research project was to demonstrate how to use the Demand Response Quick Assessment Tool (DRQAT) to predict the effects of various pre-cooling strategies for buildings. Field tests were conducted in eleven buildings at the Tri-City Corporate Center. The measured data from these Auto-DR events were compared to the simulation results. The product of this research study was to develop a general procedure to estimate potential peak demand reductions of various DR strategies.
PROJECT OBJECTIVES The primary objective of this research was to develop pre-cooling and temperature reset strategies that are most effective for the eleven buildings and to support the long term strategic goal of evaluation and deployment of control strategies to reduce peak demand in California. The demand response strategies used in this study can be programmed into the control systems of these buildings and be used in future DR events.
PROJECT OUTCOMES Optimal pre-cooling and temperature reset strategies were developed based on the simulation results of these eleven buildings. Both “pre-cooling with exponential temp set up” and “pre-cooling with step temp set up” were determined to be optimal control strategies to achieve maximum demand savings. Of these two strategies, “pre-cooling with step temp set up” was implemented during the field tests. The study showed that after refining and calibrating the initial models with measured

DR 06.22
Southern California Edison Page 3 Design & Engineering Services November 2008
data, the accuracy of the models could be greatly improved and the models could be used to predict load reductions in these buildings on Auto-DR event days within ±5% of accuracy. This report summarizes the optimization experience and the procedure to develop and calibrate building models in DRQAT.
DR 06.22
Southern California Edison Page 1 Design & Engineering Services November 2008
INTRODUCTION BACKGROUND AND OVERVIEW The potential for utilizing building thermal mass for load shifting and peak demand reduction has been demonstrated by LBNL in many field experiments (Xu et al. 2005, Xu and Yin 2006, Xu and Zagreus 2007). Over the past five years, a series of research studies have been conducted to investigate strategies for using building thermal mass to shift building cooling load in cooperation with three utilities in California (PG&E, SCE and SMUD). In these studies and tests, significant demand reduction in large commercial buildings has been demonstrated with relatively small impacts on occupant comfort.
The California Energy Commission’s Public Interest Energy Research (PIER) PRogram has funded LBNL’s Demand Response Research Center’s (DRRC) studies regarding how to use pre-cooling strategies to reduce building peak electricity demand. As part of this CEC-funded research, LBNL tested the pre-cooling strategy in one office building at the Tri-City Corporate Center in San Bernardino, Southern California. The strategy involved maintaining zone temperatures at the lower end of the comfort range (72 °F) during the occupied hours before the peak period and floating the zone temperatures up to the high end of the comfort range (78 °F) during the peak period. With this strategy, the cooling plant-related electricity demand was reduced by 30 to 50% during peak hours from 12 pm to 5 pm without any thermal comfort complaints submitted to the operations staff.
The DR and pre-cooling strategies worked well on test days with peak outside air temperatures as high as 110 °F. The load sheds in hot climates were more predictable and stable than for load sheds in cooler climates, primarily because electricity used for cooling on hot days tend to be a larger portion of the whole building electricity load than that for cooler days.
In 2006, with support from the California Energy Commission’s PIER Demand Response Research Center, a quick assessment simulation tool was developed that could be used to predict demand reduction, operating cost savings, and occupant thermal comfort impacts associated with using building thermal mass control. The tool is the Demand Response Quick Assessment Tool (DRQAT). The tool incorporates prototypical buildings and equipment and allows the user to specify a relatively small number of important parameters in order to determine a quick assessment for building thermal mass strategies. The tool compares peak power demand, operating costs, and comfort between conventional and building thermal mass control strategies. The input parameters of the tool include building type, floor area, location, occupancy schedule, utility rates, and few other variables that change the demand-limiting strategy. These parameters are believed to have the greatest influence on demand reduction and cost savings. Since the release of the beta version of the tool, more than 100 users from all over the world have requested copies of the tool and have used it.
With the help of the simulation tool and the previous field test experience, the pre-cooling tests were expanded to all eleven buildings in the Tri-City Corporate Center in 2008. All of these buildings participated in SCE’s automated DR (Auto-DR) programs. In 2008, the buildings participated in the Critical Peak Pricing (CPP)
DR 06.22
Southern California Edison Page 2 Design & Engineering Services November 2008
Program manually and continued to enable automation of DR in their facilities. Auto-DR is a DR signaling infrastructure that delivers DR event related information to the customers’ energy management and controls systems (EMCS). The technology platform has been developed by the California Energy Commission’s PIER Demand Response Research Center and it is currently being considered to be an open, interoperable standard to deliver DR signals to end uses. The eleven buildings in this study are the first buildings in SCE’s service territory that will be automated through an embedded software client within their EMCS. The embedded software client “listens” to the DR event information being published by the DR automation server (DRAS) and calls for pre-programmed strategies when the DR event is called. All the other participants are using a device that is external to their system that listens to the DR event related information and converts these to relay closures to indicate price information (Piette et al. 2008). Regardless of which client is being used, the customers have the flexibility to opt-out at anytime before or during the event.
Field tests and simulation analyses were conducted for all eleven buildings. The simulation activity involved developing calibrated DRQAT models for each building. Using the calibrated models, the demand response strategies were optimized to maximize the corresponding demand response savings.
PROJECT OBJECTIVES The primary objective of this research is to develop pre-cooling and temperature reset strategies that are most effective for the eleven Tri-City Corporate Center buildings and to support the long term strategic goal of evaluation and deployment of control strategies to reduce peak demand in California. The demand response strategy determined to be most effective in this study will be programmed into the control systems of these buildings so the building owner can utilize them in future DR events.
REPORT ORGANIZATION Chapter 1, Development of Optimal Pre-Cooling Strategies, provides an introduction with descriptions of previous studies, the theory and the objectives of this research. Chapter 2, Optimization of Pre-Cooling Strategies, covers the use of DRQAT to develop optimal pre-cooling strategies. Chapter 3, Pre-Cooling Field Test Analysis, provides field test results and procedures that were followed to refine the DRQAT models with the test data of the eleven office buildings. Chapter 4, Comparison of DRQAT with EQUEST and BEST, compares DRQAT with two building energy simulation tools. Chapter 5, Conclusions and Recommendations, completes the report and discusses future work. The Appendices include building descriptions, calibration results and field results.
DR 06.22
Southern California Edison Page 3 Design & Engineering Services November 2008
DEVELOPMENT OF OPTIMAL PRE-COOLING STRATEGIES
INTRODUCTION This section describes data collection, initial DRQAT model development, and model calibration of eleven buildings. Based on the calibrated simulation models, simulation analyses were conducted to determine how to discharge thermal mass efficiently and smoothly with no rebound.
DATA COLLECTION OF TRI-CITY CORPORATE CENTER Data collection for simulation of the buildings was coordinated with Global Energy Partners’ (GEP) technical audit process. The technical person visiting the site was provided with a site survey that was used to collect data from facilities and was then used for the simulations. Due to lack of time, forms were not completed. The feedback suggested that most of the information related to schedules and demand intensities was not available for these facilities anyway. The approach was then modified to use default values because the buildings were “typical” office buildings. Additional information on the DR strategies was collected by LBNL through a half hour interview with the facility engineer.
SIMULATION MODEL DEVELOPMENT The simulation models were developed after available building information was collected. The sufficiency and precision of the collected data, such as building envelope, building load data, HVAC system characteristics, building operation had direct impact on the accuracy of the simulation results. The more sufficient and precise the collected data, the more accurate the models’ predictions.
INPUTS FOR THE INITIAL SIMULATION MODEL
BUILDING DESCRIPTION
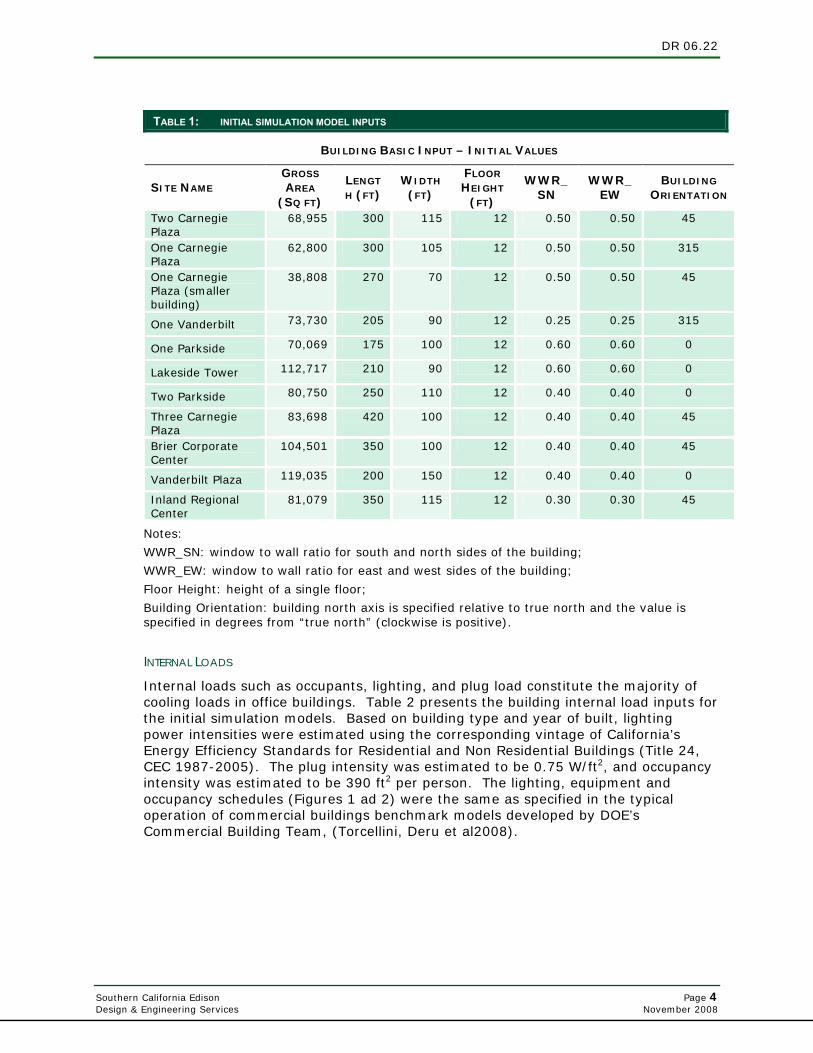
Table 1 presents a summary of the building description and the internal loads of eleven Tri-City Corporate Center buildings. The building audits provided general building information, such as number of stories, gross area, and other relevant information. The axis, length and width of each building were measured by using Google Earth, which provides maps and satellite images of the buildings.
DR 06.22
Southern California Edison Page 4 Design & Engineering Services November 2008
TABLE 1: INITIAL SIMULATION MODEL INPUTS
BUILDING BASIC INPUT – INITIAL VALUES
SITE NAME GROSS
AREA (SQ FT)
LENGT
H (FT) WIDTH
(FT)
FLOOR
HEIGHT
(FT)
WWR_SN
WWR_EW
BUILDING
ORIENTATION
Two Carnegie Plaza
68,955 300 115 12 0.50 0.50 45
One Carnegie Plaza
62,800 300 105 12 0.50 0.50 315
One Carnegie Plaza (smaller building)
38,808 270 70 12 0.50 0.50 45
One Vanderbilt 73,730 205 90 12 0.25 0.25 315
One Parkside 70,069 175 100 12 0.60 0.60 0
Lakeside Tower 112,717 210 90 12 0.60 0.60 0
Two Parkside 80,750 250 110 12 0.40 0.40 0
Three Carnegie Plaza
83,698 420 100 12 0.40 0.40 45
Brier Corporate Center
104,501 350 100 12 0.40 0.40 45
Vanderbilt Plaza 119,035 200 150 12 0.40 0.40 0
Inland Regional Center
81,079 350 115 12 0.30 0.30 45
Notes:
WWR_SN: window to wall ratio for south and north sides of the building;
WWR_EW: window to wall ratio for east and west sides of the building;
Floor Height: height of a single floor;
Building Orientation: building north axis is specified relative to true north and the value is specified in degrees from “true north” (clockwise is positive).
INTERNAL LOADS
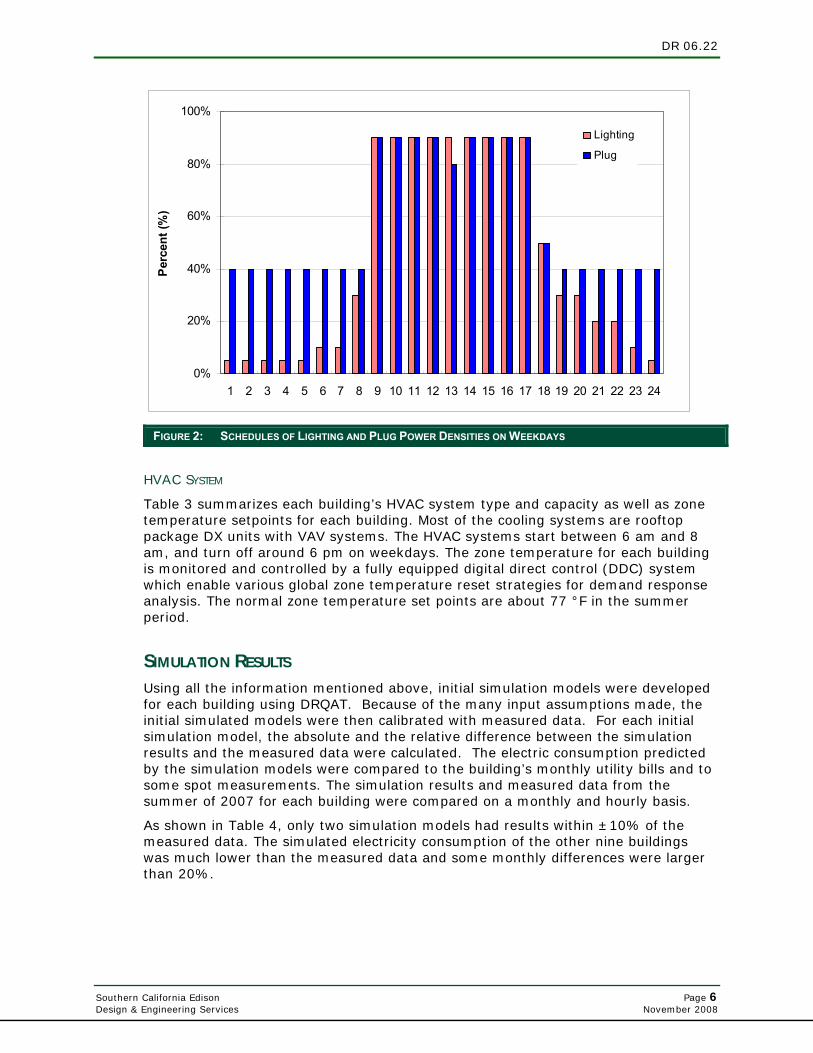
Internal loads such as occupants, lighting, and plug load constitute the majority of cooling loads in office buildings. Table 2 presents the building internal load inputs for the initial simulation models. Based on building type and year of built, lighting power intensities were estimated using the corresponding vintage of California’s Energy Efficiency Standards for Residential and Non Residential Buildings (Title 24, CEC 1987-2005). The plug intensity was estimated to be 0.75 W/ft2, and occupancy intensity was estimated to be 390 ft2 per person. The lighting, equipment and occupancy schedules (Figures 1 ad 2) were the same as specified in the typical operation of commercial buildings benchmark models developed by DOE’s Commercial Building Team, (Torcellini, Deru et al2008).

DR 06.22
Southern California Edison Page 5 Design & Engineering Services November 2008
TABLE 2: BUILDING INTERNAL LOADS FOR INITIAL SIMULATION MODELS
BUILDING INTERNAL LOAD
SITE NAME YEAR
CONSTRUCTED
LIGHTING
DENSITY (W/SQ FT)
PLUG DENSITY
(W/SQ FT)
OCCUPANCY (SQ FT/PER
PERSON)
Two Carnegie Plaza 1990 1.60 0.75 390
One Carnegie Plaza 1988 1.60 0.75 390
One Carnegie Plaza 1988 1.60 0.75 390
One Vanderbilt 1988 1.60 0.75 390
One Parkside 1993 1.60 0.75 390
Lakeside Tower 1990 1.60 0.75 390
Two Parkside 2001 1.20 0.75 390
Three Carnegie Plaza 2003 1.20 0.75 390
Brier Corporate Center 2005 1.10 0.75 390
Vanderbilt Plaza 2002 1.20 0.75 390
Inland Regional Center 1994 1.60 0.75 390
0%
20%
40%
60%
80%
100%
1 2 3 4 5 6 7 8 9 10 11 12 13 14 15 16 17 18 19 20 21 22 23 24
Perc
ent (
%)
Occupancy
FIGURE 1: SCHEDULE OF OCCUPANCY ON WEEKDAYS
DR 06.22
Southern California Edison Page 6 Design & Engineering Services November 2008
0%
20%
40%
60%
80%
100%
1 2 3 4 5 6 7 8 9 10 11 12 13 14 15 16 17 18 19 20 21 22 23 24
Per
cent
(%)
Lighting
Plug
FIGURE 2: SCHEDULES OF LIGHTING AND PLUG POWER DENSITIES ON WEEKDAYS
HVAC SYSTEM
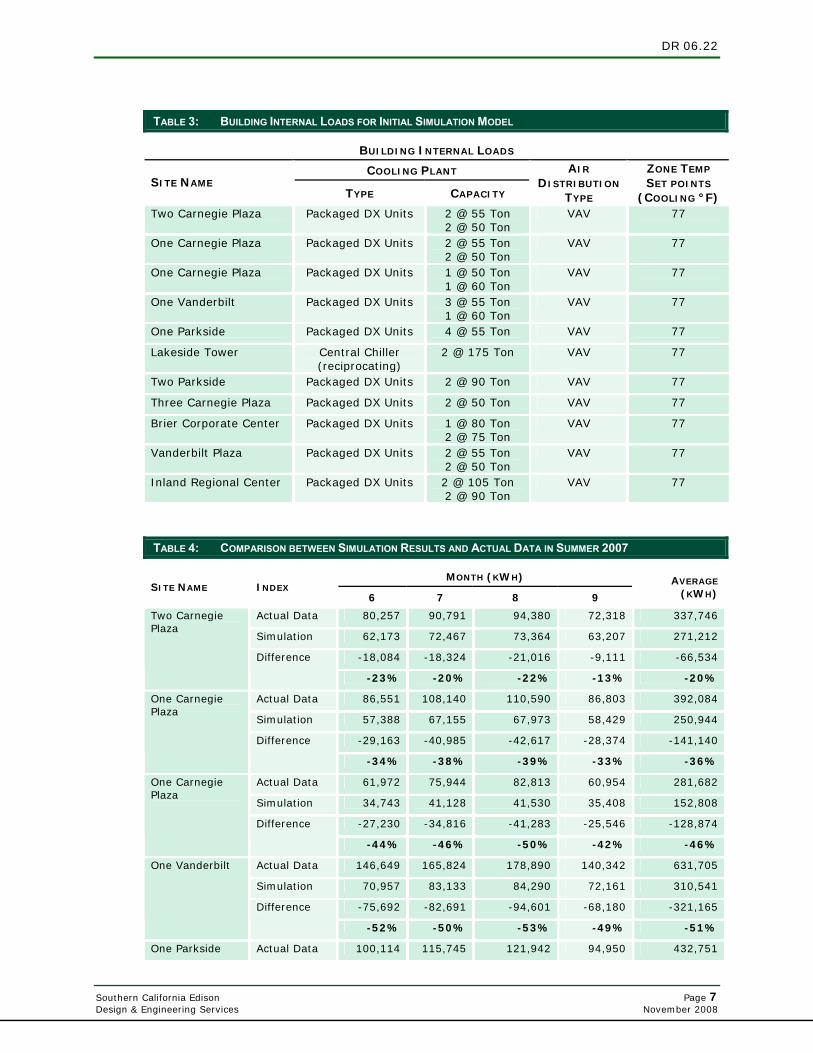
Table 3 summarizes each building’s HVAC system type and capacity as well as zone temperature setpoints for each building. Most of the cooling systems are rooftop package DX units with VAV systems. The HVAC systems start between 6 am and 8 am, and turn off around 6 pm on weekdays. The zone temperature for each building is monitored and controlled by a fully equipped digital direct control (DDC) system which enable various global zone temperature reset strategies for demand response analysis. The normal zone temperature set points are about 77 °F in the summer period.
SIMULATION RESULTS Using all the information mentioned above, initial simulation models were developed for each building using DRQAT. Because of the many input assumptions made, the initial simulated models were then calibrated with measured data. For each initial simulation model, the absolute and the relative difference between the simulation results and the measured data were calculated. The electric consumption predicted by the simulation models were compared to the building’s monthly utility bills and to some spot measurements. The simulation results and measured data from the summer of 2007 for each building were compared on a monthly and hourly basis.
As shown in Table 4, only two simulation models had results within ±10% of the measured data. The simulated electricity consumption of the other nine buildings was much lower than the measured data and some monthly differences were larger than 20%.
DR 06.22
Southern California Edison Page 7 Design & Engineering Services November 2008
TABLE 3: BUILDING INTERNAL LOADS FOR INITIAL SIMULATION MODEL
BUILDING INTERNAL LOADS
COOLING PLANT SITE NAME
TYPE CAPACITY
AIR
DISTRIBUTION
TYPE
ZONE TEMP
SET POINTS
(COOLING °F) Two Carnegie Plaza Packaged DX Units 2 @ 55 Ton
2 @ 50 Ton VAV 77
One Carnegie Plaza Packaged DX Units 2 @ 55 Ton 2 @ 50 Ton
VAV 77
One Carnegie Plaza Packaged DX Units 1 @ 50 Ton 1 @ 60 Ton
VAV 77
One Vanderbilt Packaged DX Units 3 @ 55 Ton 1 @ 60 Ton
VAV 77
One Parkside Packaged DX Units 4 @ 55 Ton VAV 77
Lakeside Tower Central Chiller (reciprocating)
2 @ 175 Ton VAV 77
Two Parkside Packaged DX Units 2 @ 90 Ton VAV 77
Three Carnegie Plaza Packaged DX Units 2 @ 50 Ton VAV 77
Brier Corporate Center Packaged DX Units 1 @ 80 Ton 2 @ 75 Ton
VAV 77
Vanderbilt Plaza Packaged DX Units 2 @ 55 Ton 2 @ 50 Ton
VAV 77
Inland Regional Center Packaged DX Units 2 @ 105 Ton 2 @ 90 Ton
VAV 77
TABLE 4: COMPARISON BETWEEN SIMULATION RESULTS AND ACTUAL DATA IN SUMMER 2007
MONTH (KWH) SITE NAME INDEX
6 7 8 9
AVERAGE (KWH)
Actual Data 80,257 90,791 94,380 72,318 337,746
Simulation 62,173 72,467 73,364 63,207 271,212
-18,084 -18,324 -21,016 -9,111 -66,534
Two Carnegie Plaza
Difference
-23% -20% -22% -13% -20%
Actual Data 86,551 108,140 110,590 86,803 392,084
Simulation 57,388 67,155 67,973 58,429 250,944
-29,163 -40,985 -42,617 -28,374 -141,140
One Carnegie Plaza
Difference
-34% -38% -39% -33% -36%
Actual Data 61,972 75,944 82,813 60,954 281,682
Simulation 34,743 41,128 41,530 35,408 152,808
-27,230 -34,816 -41,283 -25,546 -128,874
One Carnegie Plaza
Difference
-44% -46% -50% -42% -46%
Actual Data 146,649 165,824 178,890 140,342 631,705
Simulation 70,957 83,133 84,290 72,161 310,541
-75,692 -82,691 -94,601 -68,180 -321,165
One Vanderbilt
Difference
-52% -50% -53% -49% -51%
One Parkside Actual Data 100,114 115,745 121,942 94,950 432,751
DR 06.22
Southern California Edison Page 8 Design & Engineering Services November 2008
Simulation 66,596 77,666 79,672 69,114 293,048
-33,518 -38,079 -42,270 -25,836 -139,703
Difference
-33% -33% -35% -27% -32%
Actual Data 141,811 168,731 179,926 140,137 630,606
Simulation 136,240 156,353 160,384 139,776 592,754
-5,571 -12,377 -19,542 -361 -37,852
Lakeside Tower
Difference
-4% -7% -11% 0% -6%
Actual Data 103,487 117,825 124,713 98,815 444,840
Simulation 63,266 72,744 74,712 65,006 275,728
-40,221 -45,081 -50,001 -33,809 -169,112
Two Parkside
Difference
-39% -38% -40% -34% -38%
Actual Data 67,019 80,051 86,552 67,728 301,350
Simulation 66,147 77,643 78,657 67,455 289,901
-872 -2,408 -7,895 -273 -11,449
Three Carnegie Plaza
Difference
-1% -3% -9% 0% -4%
Actual Data 159,325 178,754 187,255 164,857 690,191
Simulation 87,988 104,465 106,174 90,453 389,080
-71,337 -74,289 -81,081 -74,404 -301,111
Brier Corporate Center
Difference
-45% -42% -43% -45% -44%
Actual Data 127,048 152,719 165,028 125,764 570,559
Simulation 93,818 108,881 111,544 96,429 410,672
-33,230 -43,838 -53,484 -29,335 -159,887
Vanderbilt Plaza
Difference
-26% -29% -32% -23% -28%
Actual Data 95,139 109,179 115,479 89,562 409,359
Simulation 75,484 87,581 88,892 76,719 328,677
-19,655 -21,598 -26,587 -12,843 -80,682
Inland Regional Center
Difference
-21% -20% -23% -14% -20%
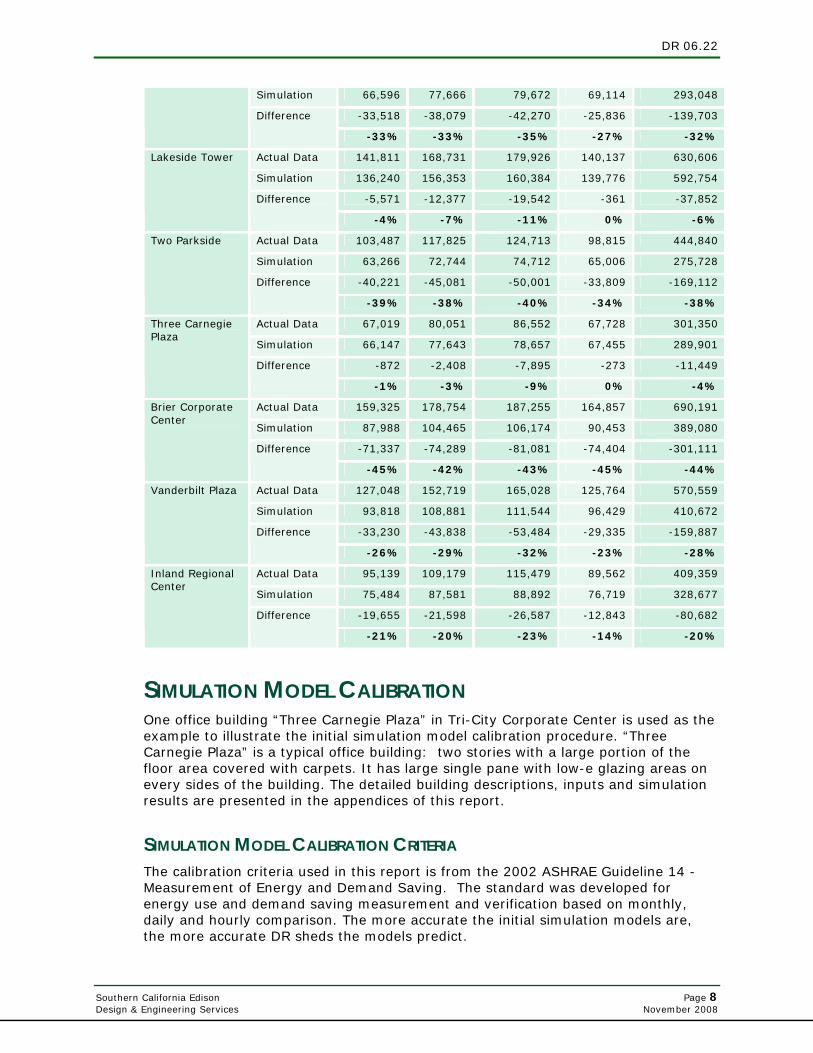
SIMULATION MODEL CALIBRATION One office building “Three Carnegie Plaza” in Tri-City Corporate Center is used as the example to illustrate the initial simulation model calibration procedure. “Three Carnegie Plaza” is a typical office building: two stories with a large portion of the floor area covered with carpets. It has large single pane with low-e glazing areas on every sides of the building. The detailed building descriptions, inputs and simulation results are presented in the appendices of this report.
SIMULATION MODEL CALIBRATION CRITERIA The calibration criteria used in this report is from the 2002 ASHRAE Guideline 14 -Measurement of Energy and Demand Saving. The standard was developed for energy use and demand saving measurement and verification based on monthly, daily and hourly comparison. The more accurate the initial simulation models are, the more accurate DR sheds the models predict.
DR 06.22
Southern California Edison Page 9 Design & Engineering Services November 2008
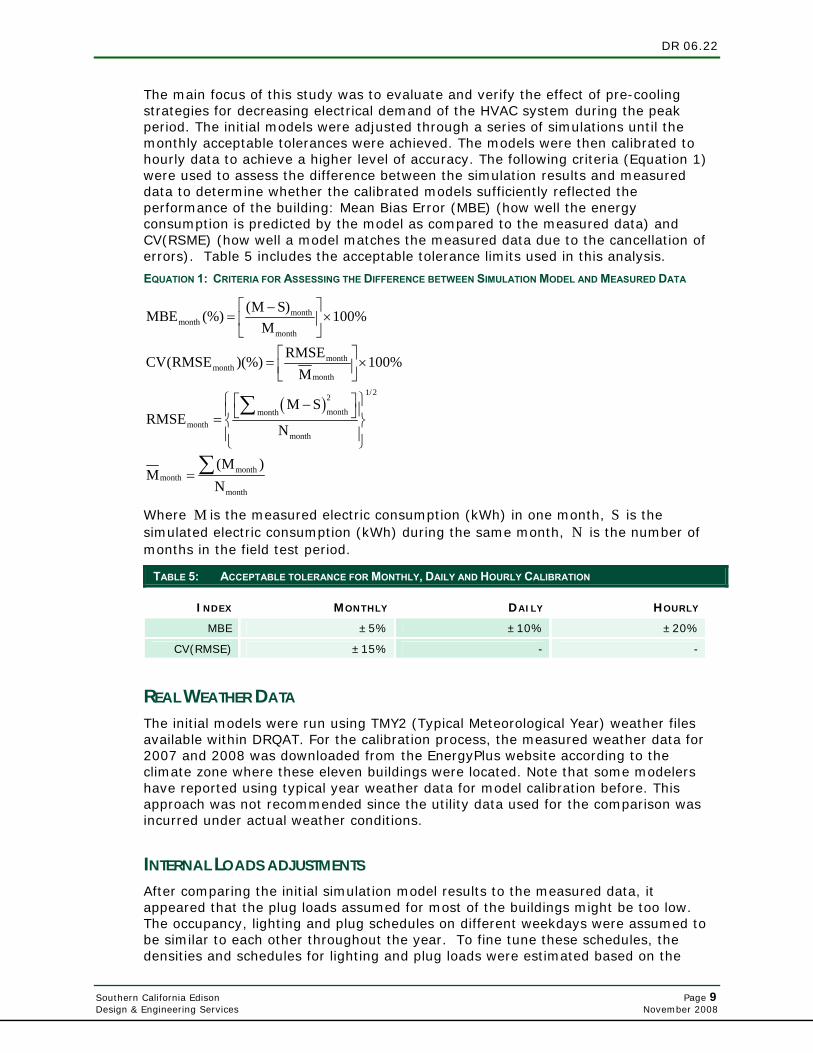
The main focus of this study was to evaluate and verify the effect of pre-cooling strategies for decreasing electrical demand of the HVAC system during the peak period. The initial models were adjusted through a series of simulations until the monthly acceptable tolerances were achieved. The models were then calibrated to hourly data to achieve a higher level of accuracy. The following criteria (Equation 1) were used to assess the difference between the simulation results and measured data to determine whether the calibrated models sufficiently reflected the performance of the building: Mean Bias Error (MBE) (how well the energy consumption is predicted by the model as compared to the measured data) and CV(RSME) (how well a model matches the measured data due to the cancellation of errors). Table 5 includes the acceptable tolerance limits used in this analysis.
EQUATION 1: CRITERIA FOR ASSESSING THE DIFFERENCE BETWEEN SIMULATION MODEL AND MEASURED DATA
( )
monthmonth
month
monthmonth
month
1/22
monthmonthmonth
month
monthmonth
month
(M S)MBE (%) 100%M
RMSECV(RMSE )(%) 100%M
M SRMSE
N
(M )M
N
⎡ ⎤−= ×⎢ ⎥⎣ ⎦
⎡ ⎤= ×⎢ ⎥⎣ ⎦
⎧ ⎫⎡ ⎤−⎪ ⎪⎣ ⎦= ⎨ ⎬⎪ ⎪⎩ ⎭
=
∑
∑
Where M is the measured electric consumption (kWh) in one month, S is the simulated electric consumption (kWh) during the same month, N is the number of months in the field test period.
TABLE 5: ACCEPTABLE TOLERANCE FOR MONTHLY, DAILY AND HOURLY CALIBRATION
INDEX MONTHLY DAILY HOURLY
MBE ±5% ±10% ±20%
CV(RMSE) ±15% - -
REAL WEATHER DATA The initial models were run using TMY2 (Typical Meteorological Year) weather files available within DRQAT. For the calibration process, the measured weather data for 2007 and 2008 was downloaded from the EnergyPlus website according to the climate zone where these eleven buildings were located. Note that some modelers have reported using typical year weather data for model calibration before. This approach was not recommended since the utility data used for the comparison was incurred under actual weather conditions.
INTERNAL LOADS ADJUSTMENTS After comparing the initial simulation model results to the measured data, it appeared that the plug loads assumed for most of the buildings might be too low. The occupancy, lighting and plug schedules on different weekdays were assumed to be similar to each other throughout the year. To fine tune these schedules, the densities and schedules for lighting and plug loads were estimated based on the

DR 06.22
Southern California Edison Page 10 Design & Engineering Services November 2008
whole building electricity data for the heating period from November 1st, 2007 to February 28th, 2008. During this time period, the maximum outside temperature was 55 °F or lower and the cooling plants were completed locked out. The whole building power during this period thus only included lighting, plug and fan power. The internal loads were separated out by analyzing the daily energy use of the buildings under extreme cold weather conditions. This method is applied to buildings where the heating sources are gas, steam, or hot water from other facilities.
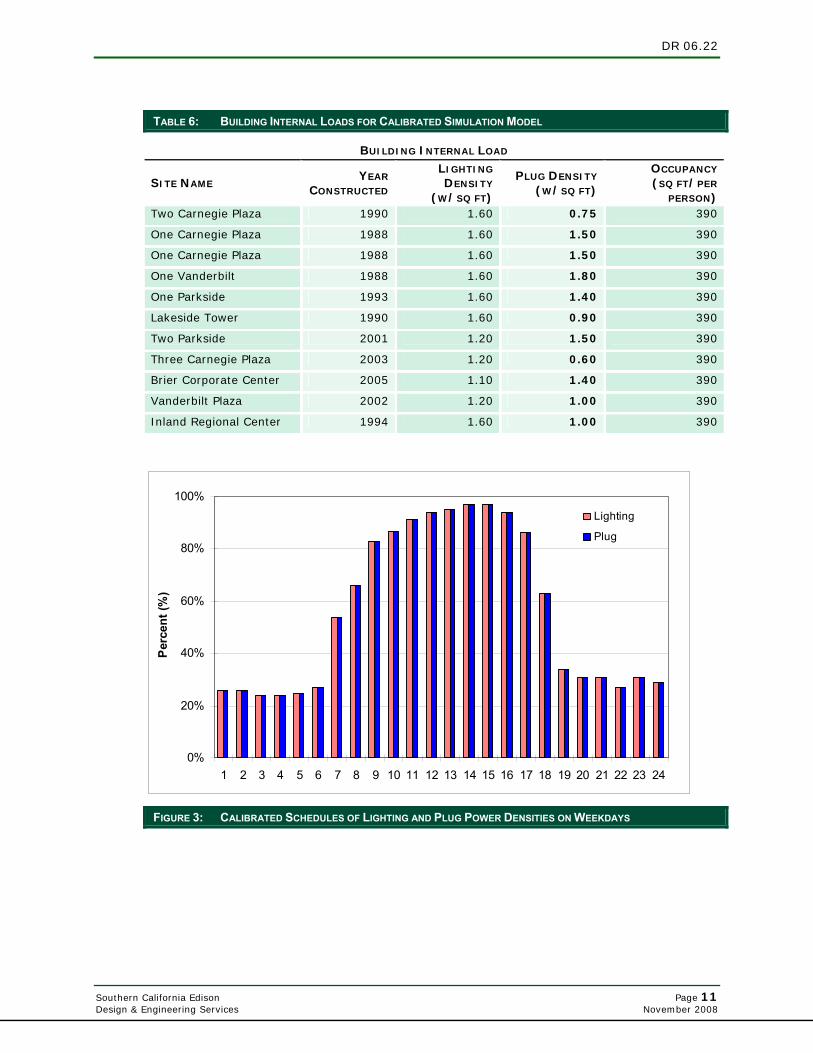
Table 6 lists the inputs of the building internal loads for the calibrated simulation models. The lighting and occupancy schedules were similar to the initial simulation models, but the plug loads were increased.
Using “Three Carnegie Plaza” as an example, Figure 3 and Figure 4 show the lighting and plug load schedules on weekdays and weekend & holiday after the calibration. The electricity usage was constant during the unoccupied period. The occupancy schedule of the calibrated model was the same as that used for the initial simulation model.
DR 06.22
Southern California Edison Page 11 Design & Engineering Services November 2008
TABLE 6: BUILDING INTERNAL LOADS FOR CALIBRATED SIMULATION MODEL
BUILDING INTERNAL LOAD
SITE NAME YEAR
CONSTRUCTED
LIGHTING
DENSITY (W/SQ FT)
PLUG DENSITY
(W/SQ FT)
OCCUPANCY (SQ FT/PER
PERSON) Two Carnegie Plaza 1990 1.60 0.75 390
One Carnegie Plaza 1988 1.60 1.50 390
One Carnegie Plaza 1988 1.60 1.50 390
One Vanderbilt 1988 1.60 1.80 390
One Parkside 1993 1.60 1.40 390
Lakeside Tower 1990 1.60 0.90 390
Two Parkside 2001 1.20 1.50 390
Three Carnegie Plaza 2003 1.20 0.60 390
Brier Corporate Center 2005 1.10 1.40 390
Vanderbilt Plaza 2002 1.20 1.00 390
Inland Regional Center 1994 1.60 1.00 390
0%
20%
40%
60%
80%
100%
1 2 3 4 5 6 7 8 9 10 11 12 13 14 15 16 17 18 19 20 21 22 23 24
Per
cent
(%)
Lighting
Plug
FIGURE 3: CALIBRATED SCHEDULES OF LIGHTING AND PLUG POWER DENSITIES ON WEEKDAYS
DR 06.22
Southern California Edison Page 12 Design & Engineering Services November 2008
0%
20%
40%
60%
80%
100%
1 2 3 4 5 6 7 8 9 10 11 12 13 14 15 16 17 18 19 20 21 22 23 24
Per
cent
(%)
Lighting
Plug
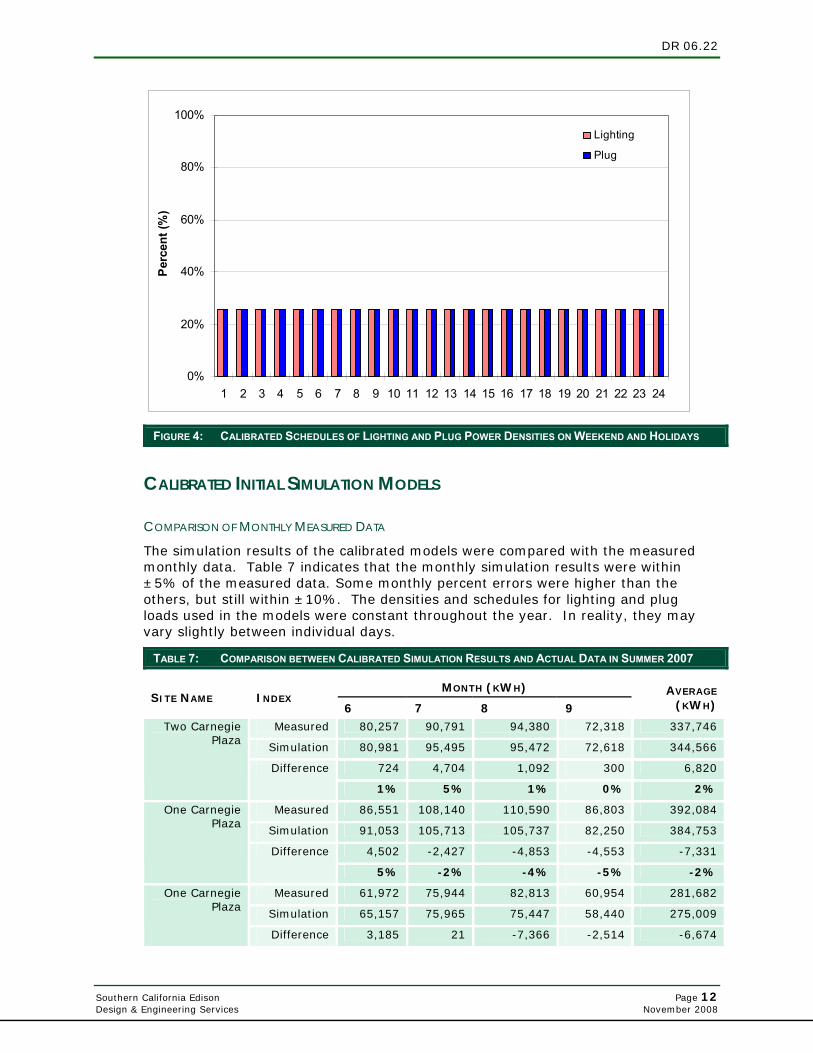
FIGURE 4: CALIBRATED SCHEDULES OF LIGHTING AND PLUG POWER DENSITIES ON WEEKEND AND HOLIDAYS
CALIBRATED INITIAL SIMULATION MODELS
COMPARISON OF MONTHLY MEASURED DATA
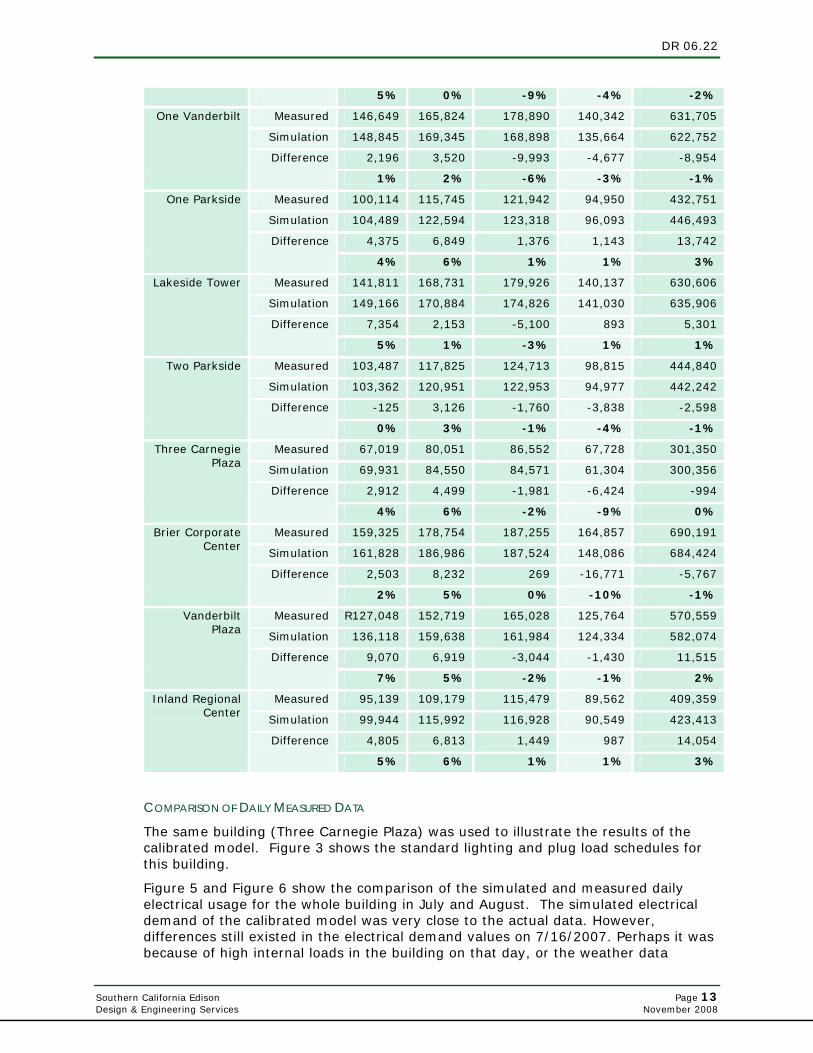
The simulation results of the calibrated models were compared with the measured monthly data. Table 7 indicates that the monthly simulation results were within ±5% of the measured data. Some monthly percent errors were higher than the others, but still within ±10%. The densities and schedules for lighting and plug loads used in the models were constant throughout the year. In reality, they may vary slightly between individual days.
TABLE 7: COMPARISON BETWEEN CALIBRATED SIMULATION RESULTS AND ACTUAL DATA IN SUMMER 2007
MONTH (KWH) SITE NAME INDEX
6 7 8 9 AVERAGE
(KWH)
Measured 80,257 90,791 94,380 72,318 337,746
Simulation 80,981 95,495 95,472 72,618 344,566
724 4,704 1,092 300 6,820
Two Carnegie Plaza
Difference
1% 5% 1% 0% 2%
Measured 86,551 108,140 110,590 86,803 392,084
Simulation 91,053 105,713 105,737 82,250 384,753
4,502 -2,427 -4,853 -4,553 -7,331
One Carnegie Plaza
Difference
5% -2% -4% -5% -2%
Measured 61,972 75,944 82,813 60,954 281,682
Simulation 65,157 75,965 75,447 58,440 275,009
One Carnegie Plaza
Difference 3,185 21 -7,366 -2,514 -6,674
DR 06.22
Southern California Edison Page 13 Design & Engineering Services November 2008
5% 0% -9% -4% -2%
Measured 146,649 165,824 178,890 140,342 631,705
Simulation 148,845 169,345 168,898 135,664 622,752
2,196 3,520 -9,993 -4,677 -8,954
One Vanderbilt
Difference
1% 2% -6% -3% -1%
Measured 100,114 115,745 121,942 94,950 432,751
Simulation 104,489 122,594 123,318 96,093 446,493
4,375 6,849 1,376 1,143 13,742
One Parkside
Difference
4% 6% 1% 1% 3%
Measured 141,811 168,731 179,926 140,137 630,606
Simulation 149,166 170,884 174,826 141,030 635,906
7,354 2,153 -5,100 893 5,301
Lakeside Tower
Difference
5% 1% -3% 1% 1%
Measured 103,487 117,825 124,713 98,815 444,840
Simulation 103,362 120,951 122,953 94,977 442,242
-125 3,126 -1,760 -3,838 -2,598
Two Parkside
Difference
0% 3% -1% -4% -1%
Measured 67,019 80,051 86,552 67,728 301,350
Simulation 69,931 84,550 84,571 61,304 300,356
2,912 4,499 -1,981 -6,424 -994
Three Carnegie Plaza
Difference
4% 6% -2% -9% 0%
Measured 159,325 178,754 187,255 164,857 690,191
Simulation 161,828 186,986 187,524 148,086 684,424
2,503 8,232 269 -16,771 -5,767
Brier Corporate Center
Difference
2% 5% 0% -10% -1%
Measured R127,048 152,719 165,028 125,764 570,559
Simulation 136,118 159,638 161,984 124,334 582,074
9,070 6,919 -3,044 -1,430 11,515
Vanderbilt Plaza
Difference
7% 5% -2% -1% 2%
Measured 95,139 109,179 115,479 89,562 409,359
Simulation 99,944 115,992 116,928 90,549 423,413
4,805 6,813 1,449 987 14,054
Inland Regional Center
Difference
5% 6% 1% 1% 3%
COMPARISON OF DAILY MEASURED DATA
The same building (Three Carnegie Plaza) was used to illustrate the results of the calibrated model. Figure 3 shows the standard lighting and plug load schedules for this building.
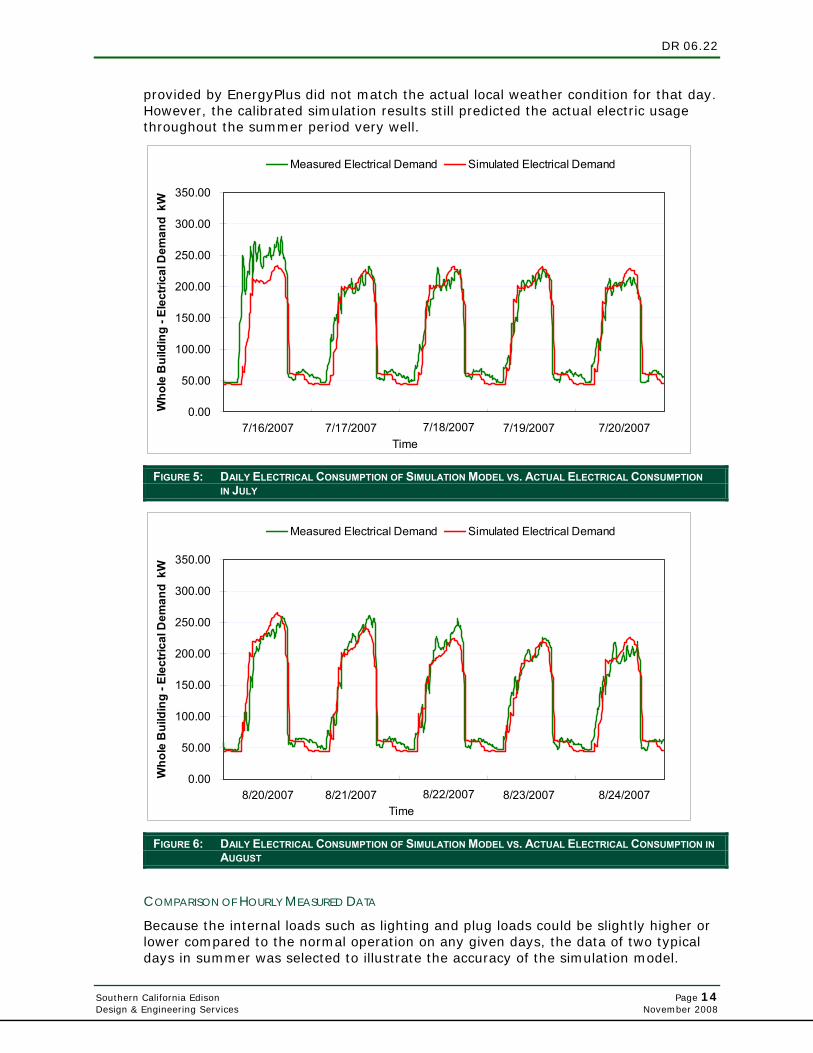
Figure 5 and Figure 6 show the comparison of the simulated and measured daily electrical usage for the whole building in July and August. The simulated electrical demand of the calibrated model was very close to the actual data. However, differences still existed in the electrical demand values on 7/16/2007. Perhaps it was because of high internal loads in the building on that day, or the weather data
DR 06.22
Southern California Edison Page 14 Design & Engineering Services November 2008
provided by EnergyPlus did not match the actual local weather condition for that day. However, the calibrated simulation results still predicted the actual electric usage throughout the summer period very well.
0.00
50.00
100.00
150.00
200.00
250.00
300.00
350.00
Time
Who
le B
uild
ing
- Ele
ctric
al D
eman
d k
WMeasured Electrical Demand Simulated Electrical Demand
7/16/2007 7/17/2007 7/18/2007 7/19/2007 7/20/2007
FIGURE 5: DAILY ELECTRICAL CONSUMPTION OF SIMULATION MODEL VS. ACTUAL ELECTRICAL CONSUMPTION IN JULY
0.00
50.00
100.00
150.00
200.00
250.00
300.00
350.00
Time
Who
le B
uild
ing
- Ele
ctric
al D
eman
d k
W
Measured Electrical Demand Simulated Electrical Demand
8/20/2007 8/21/2007 8/22/2007 8/23/2007 8/24/2007
FIGURE 6: DAILY ELECTRICAL CONSUMPTION OF SIMULATION MODEL VS. ACTUAL ELECTRICAL CONSUMPTION IN AUGUST
COMPARISON OF HOURLY MEASURED DATA
Because the internal loads such as lighting and plug loads could be slightly higher or lower compared to the normal operation on any given days, the data of two typical days in summer was selected to illustrate the accuracy of the simulation model.
DR 06.22
Southern California Edison Page 15 Design & Engineering Services November 2008
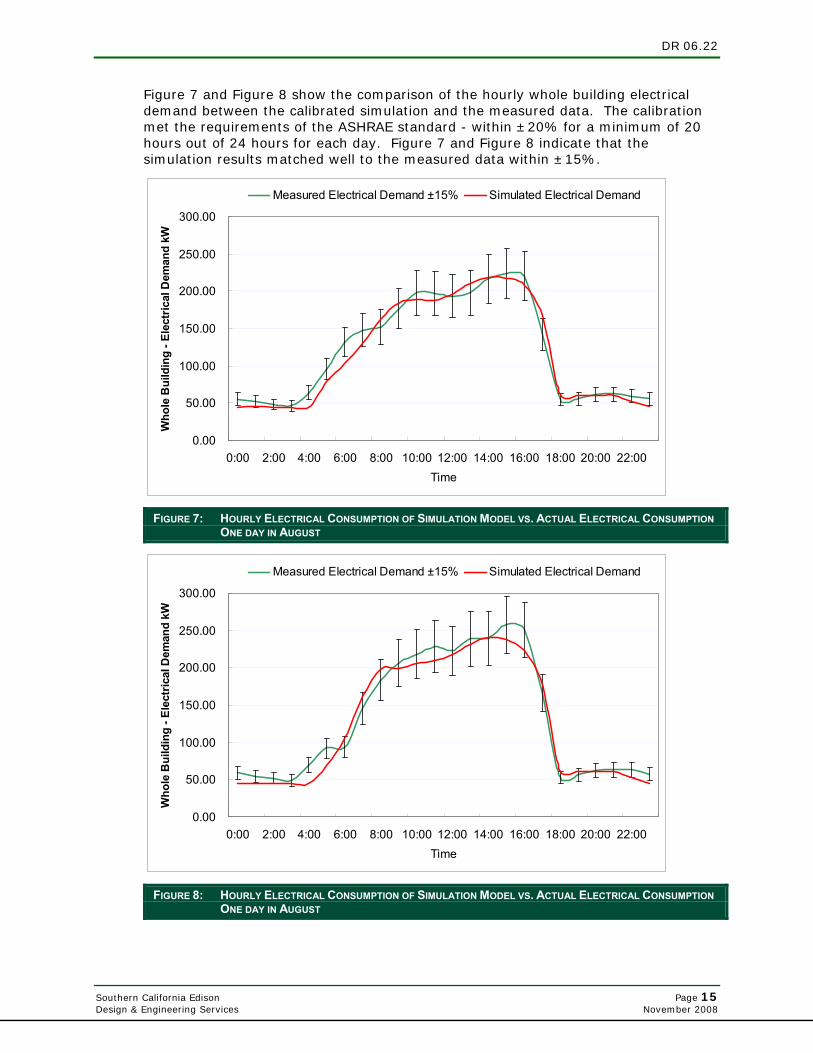
Figure 7 and Figure 8 show the comparison of the hourly whole building electrical demand between the calibrated simulation and the measured data. The calibration met the requirements of the ASHRAE standard - within ±20% for a minimum of 20 hours out of 24 hours for each day. Figure 7 and Figure 8 indicate that the simulation results matched well to the measured data within ±15%.
0.00
50.00
100.00
150.00
200.00
250.00
300.00
0:00 2:00 4:00 6:00 8:00 10:00 12:00 14:00 16:00 18:00 20:00 22:00Time
Who
le B
uild
ing
- Ele
ctric
al D
eman
d kW
Measured Electrical Demand ±15% Simulated Electrical Demand
FIGURE 7: HOURLY ELECTRICAL CONSUMPTION OF SIMULATION MODEL VS. ACTUAL ELECTRICAL CONSUMPTION ONE DAY IN AUGUST
0.00
50.00
100.00
150.00
200.00
250.00
300.00
0:00 2:00 4:00 6:00 8:00 10:00 12:00 14:00 16:00 18:00 20:00 22:00Time
Who
le B
uild
ing
- Ele
ctric
al D
eman
d kW
Measured Electrical Demand ±15% Simulated Electrical Demand
FIGURE 8: HOURLY ELECTRICAL CONSUMPTION OF SIMULATION MODEL VS. ACTUAL ELECTRICAL CONSUMPTION ONE DAY IN AUGUST
DR 06.22
Southern California Edison Page 16 Design & Engineering Services November 2008
SUMMARY The initial simulation models for the buildings generated from the basic building information were not able to predict the load profiles of the buildings within a reasonable range of accuracy. However, the refined models after adjusting the internal load schedules predicted the load profiles of the buildings within ±5% range. A standard procedure of model development and calibration was developed. The procedure takes the following steps:
• Generate a DRQAT initial model with basic building information
• Replace the TMY weather file in DRQAT and regenerate a .epw EnergyPlus file with real weather data collected from the site or the nearby weather stations
• Use whole building power under the extreme cold weather conditions to estimate the actual internal load schedule. The method will not work when electricity or heat pumps were used as heating sources
• Conduct simulation and compare the simulated result with the measure ones
• Readjust the internal loads until the measured electricity data match the simulated ones
The internal load had the largest impact on the accuracy of the building simulations when the basic building descriptions were accurate. However, it was hard to get the actual energy usage of the lighting and plug loads without historical data. For more accurate modeling, users should sub-meter end uses in the building for one or two weeks (weekdays) to separate out the internal and lighting electricity use from the HVAC electricity usage. Models generated from this procedure will be able to predict building electricity demand profile very accurately.
DR 06.22
Southern California Edison Page 17 Design & Engineering Services November 2008
OPTIMIZATION OF PRE-COOLING STRATEGIES OPTIMAL PRE-COOLING STRATEGIES
WHEN TO PRE-COOL: CPP VERSUS NON-CPP?
CPP (Critical Peak Pricing) days are called by the utility and tend be the 12 hottest days throughout the summer period. Normally, peak demand occurs on CPP days due to the high outside air temperature. Utility analyses were conducted to determine the strategy that could offer the highest economic savings to the building owner. From previous experience with similar buildings in this region, often the CPP incentives were not large enough to obtain enough demand charge savings and thus the owners may want to just use the pre-cooling strategies to reduce the peak demand in the summer months.
The utility charge includes energy charge, demand charge, customer charge and other charges. The energy and demand charges account for the majority of the total utility charge. The demand charge is the time-related demand charge per month, which is proportional to the monthly maximum demand. Customers can achieve economic savings by decreasing the monthly maximum demand. Therefore, it is recommended that the customers run the demand response strategies for a number of hot weather days.
The distribution of daily maximum demand throughout the summer period was different for each building in Tri-City Corporate Center. One goal of this analysis was to figure out whether to operate pre-cooling strategy throughout the summer period or only on hot days and determine how much demand charge could be reduced on test days under reasonable zone temperature reset strategy.
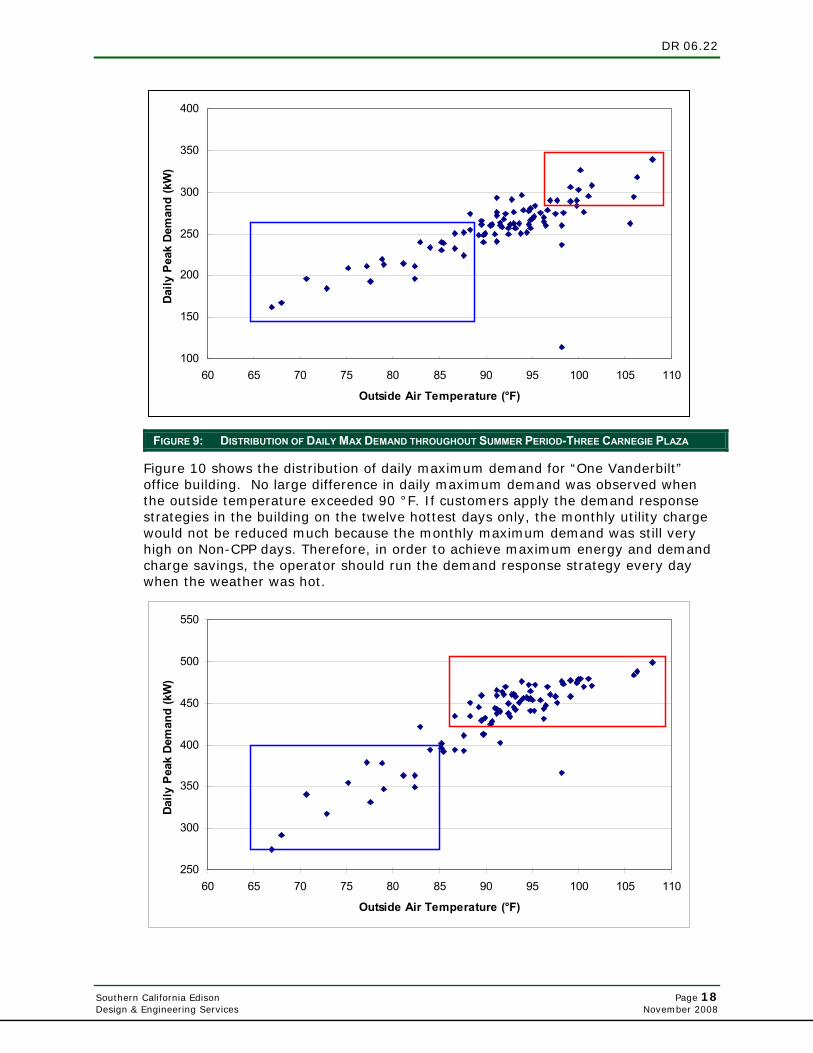
Figure 9 shows the distribution of daily peak demand on weekdays of the building tested in summer 2007. The peak demand was 339 kW, and the peak outside air temperature was 108 °F. In order to reduce the demand charge, operators need to run the pre-cooling strategy on hot days throughout the summer period, but not on cool days. The data points in the left rectangle in Figure 9 indicate that the peak demand were lower than 250 kW when the peak outside temperature was below 90 °F. Data in the right rectangle illustrate higher peak demand on the hot days. Since the goal of the optimization was to reduce the peak demand of the summer months and the difference between the peak demand on hot days and warm days was about 50~70 kW, operators should run pre-cooling only in these right rectangular days.
DR 06.22
Southern California Edison Page 18 Design & Engineering Services November 2008
100
150
200
250
300
350
400
60 65 70 75 80 85 90 95 100 105 110
Outside Air Temperature (°F)
Daily
Pea
k De
man
d (k
W)
FIGURE 9: DISTRIBUTION OF DAILY MAX DEMAND THROUGHOUT SUMMER PERIOD-THREE CARNEGIE PLAZA
Figure 10 shows the distribution of daily maximum demand for “One Vanderbilt” office building. No large difference in daily maximum demand was observed when the outside temperature exceeded 90 °F. If customers apply the demand response strategies in the building on the twelve hottest days only, the monthly utility charge would not be reduced much because the monthly maximum demand was still very high on Non-CPP days. Therefore, in order to achieve maximum energy and demand charge savings, the operator should run the demand response strategy every day when the weather was hot.
250
300
350
400
450
500
550
60 65 70 75 80 85 90 95 100 105 110
Outside Air Temperature (°F)
Daily
Pea
k De
man
d (k
W)

DR 06.22
Southern California Edison Page 19 Design & Engineering Services November 2008
FIGURE 10: DISTRIBUTION OF DAILY MAX DEMAND THROUGHOUT SUMMER PERIOD-ONE VANDERBILT
PRE-COOLING STRATEGIES The pre-cooling and zone temperature reset strategies evaluated in this study are shown in Figure 11. According to the trended operational data, all of these buildings were normally operated at constant temperature set points near 77 °F throughout the warm-up and occupied hours. The set points in individual zones ranged from 75 to 80 °F, with an average value of about 77 °F. After 6 pm, the system was shut off and zone temperatures started to float.
72
73
74
75
76
77
78
79
80
81
1 2 3 4 5 6 7 8 9 10 11 12 13 14 15 16 17 18 19 20 21 22 23 24
Zone
Tem
p S
etpo
ints
°F
current precooling + linear set up
precooling + exp set up No precooling + exp set up
pre-cooling + step set up
Unoccupied hours Occupied hours Unoccupied hours
Zonal set upfloating
floating
FIGURE 11: PRE-COOLING AND ZONE TEMPERATURE RESET STRATEGIES
The “pre-cooling + linear set up” strategy was the first strategy evaluated. From 5 am to 12 pm, mostly during the occupied hours, all of the zone temperature set points were reduced to 75 °F. From 12 pm to 6 pm (the high price period) the set points were raised linearly to 80 °F. After 6 pm, before the system was shut off, the set points were rolled back to 77 °F.
The second strategy was the “pre-cooling + exponential set up” strategy. While the pre-cooling period was same as for the first strategy, the temperatures were raised exponentially rather than linearly during the afternoon high price period.
The third strategy was the “no pre-cooling + exponential set up” strategy. The zone temperatures were raised exponentially in the afternoon in the same way as in the ”pre-cooling + exponential set up” strategy, but without pre-cooling from 5 am to 12 am. One aim of the tests was to determine the effect of pre-cooling on peak demand shedding.
The fourth strategy was the “pre-cooling + step set up” strategy. The zone temperature set points were reduced to 75 °F. From 12 pm to 3 pm, the set points were raised to 79 °F. After 3 pm, the zone temperature set points were kept at 80 °F.
DR 06.22
Southern California Edison Page 20 Design & Engineering Services November 2008
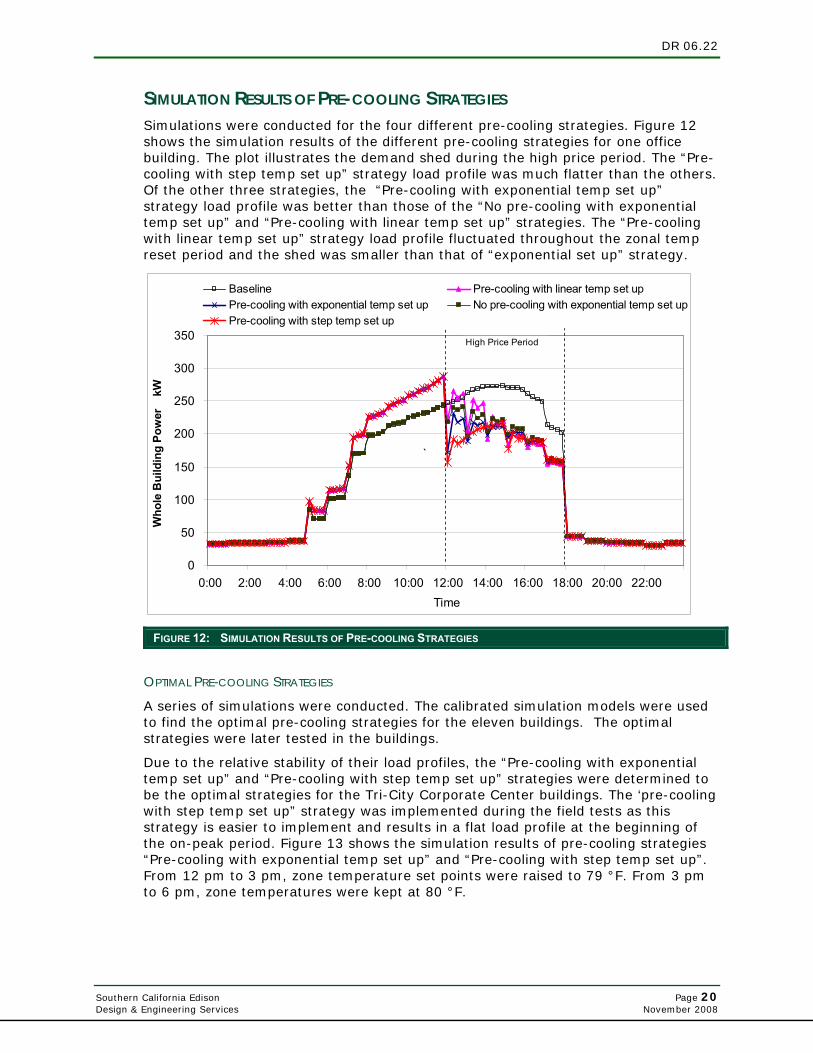
SIMULATION RESULTS OF PRE-COOLING STRATEGIES Simulations were conducted for the four different pre-cooling strategies. Figure 12 shows the simulation results of the different pre-cooling strategies for one office building. The plot illustrates the demand shed during the high price period. The “Pre-cooling with step temp set up” strategy load profile was much flatter than the others. Of the other three strategies, the “Pre-cooling with exponential temp set up” strategy load profile was better than those of the “No pre-cooling with exponential temp set up” and “Pre-cooling with linear temp set up” strategies. The “Pre-cooling with linear temp set up” strategy load profile fluctuated throughout the zonal temp reset period and the shed was smaller than that of “exponential set up” strategy.
0
50
100
150
200
250
300
350
0:00 2:00 4:00 6:00 8:00 10:00 12:00 14:00 16:00 18:00 20:00 22:00Time
Who
le B
uild
ing
Pow
er
kW
Baseline Pre-cooling with linear temp set upPre-cooling with exponential temp set up No pre-cooling with exponential temp set upPre-cooling with step temp set up
High Price Period
`
FIGURE 12: SIMULATION RESULTS OF PRE-COOLING STRATEGIES
OPTIMAL PRE-COOLING STRATEGIES
A series of simulations were conducted. The calibrated simulation models were used to find the optimal pre-cooling strategies for the eleven buildings. The optimal strategies were later tested in the buildings.
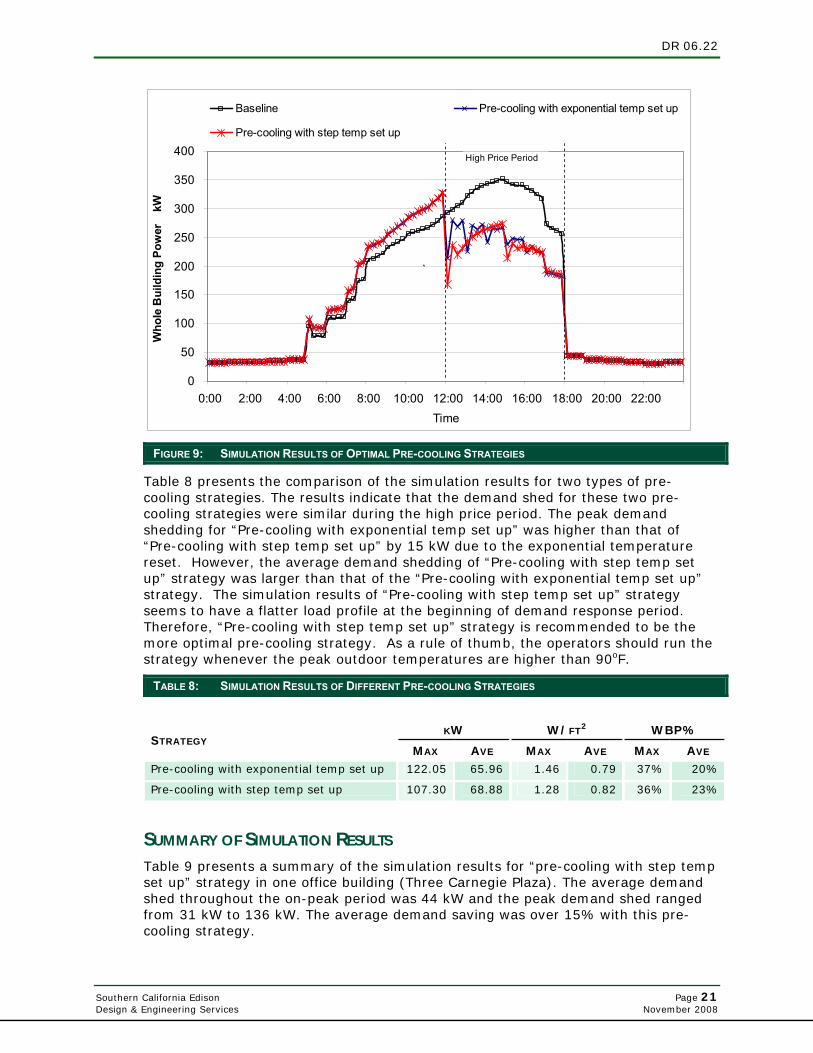
Due to the relative stability of their load profiles, the “Pre-cooling with exponential temp set up” and “Pre-cooling with step temp set up” strategies were determined to be the optimal strategies for the Tri-City Corporate Center buildings. The ‘pre-cooling with step temp set up” strategy was implemented during the field tests as this strategy is easier to implement and results in a flat load profile at the beginning of the on-peak period. Figure 13 shows the simulation results of pre-cooling strategies “Pre-cooling with exponential temp set up” and “Pre-cooling with step temp set up”. From 12 pm to 3 pm, zone temperature set points were raised to 79 °F. From 3 pm to 6 pm, zone temperatures were kept at 80 °F.
DR 06.22
Southern California Edison Page 21 Design & Engineering Services November 2008
0
50
100
150
200
250
300
350
400
0:00 2:00 4:00 6:00 8:00 10:00 12:00 14:00 16:00 18:00 20:00 22:00Time
Who
le B
uild
ing
Pow
er
kW
Baseline Pre-cooling with exponential temp set up
Pre-cooling with step temp set up
High Price Period
`
FIGURE 9: SIMULATION RESULTS OF OPTIMAL PRE-COOLING STRATEGIES
Table 8 presents the comparison of the simulation results for two types of pre-cooling strategies. The results indicate that the demand shed for these two pre-cooling strategies were similar during the high price period. The peak demand shedding for “Pre-cooling with exponential temp set up” was higher than that of “Pre-cooling with step temp set up” by 15 kW due to the exponential temperature reset. However, the average demand shedding of “Pre-cooling with step temp set up” strategy was larger than that of the “Pre-cooling with exponential temp set up” strategy. The simulation results of “Pre-cooling with step temp set up” strategy seems to have a flatter load profile at the beginning of demand response period. Therefore, “Pre-cooling with step temp set up” strategy is recommended to be the more optimal pre-cooling strategy. As a rule of thumb, the operators should run the strategy whenever the peak outdoor temperatures are higher than 90oF.
TABLE 8: SIMULATION RESULTS OF DIFFERENT PRE-COOLING STRATEGIES
KW W/FT2 WBP%
STRATEGY MAX AVE MAX AVE MAX AVE
Pre-cooling with exponential temp set up 122.05 65.96 1.46 0.79 37% 20%
Pre-cooling with step temp set up 107.30 68.88 1.28 0.82 36% 23%
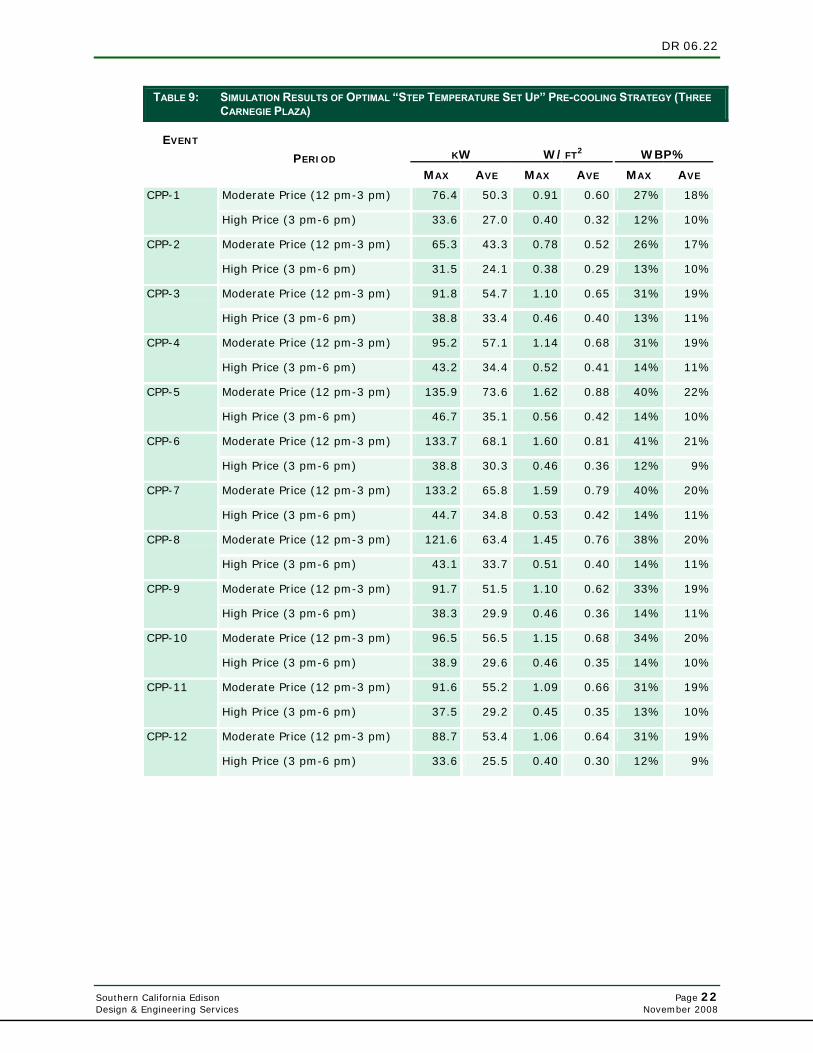
SUMMARY OF SIMULATION RESULTS Table 9 presents a summary of the simulation results for “pre-cooling with step temp set up” strategy in one office building (Three Carnegie Plaza). The average demand shed throughout the on-peak period was 44 kW and the peak demand shed ranged from 31 kW to 136 kW. The average demand saving was over 15% with this pre-cooling strategy.
DR 06.22
Southern California Edison Page 22 Design & Engineering Services November 2008
TABLE 9: SIMULATION RESULTS OF OPTIMAL “STEP TEMPERATURE SET UP” PRE-COOLING STRATEGY (THREE CARNEGIE PLAZA)
KW
W/FT2
WBP%
EVENT
PERIOD MAX AVE MAX AVE MAX AVE
Moderate Price (12 pm-3 pm) 76.4 50.3 0.91 0.60 27% 18% CPP-1
High Price (3 pm-6 pm) 33.6 27.0 0.40 0.32 12% 10%
Moderate Price (12 pm-3 pm) 65.3 43.3 0.78 0.52 26% 17% CPP-2
High Price (3 pm-6 pm) 31.5 24.1 0.38 0.29 13% 10%
Moderate Price (12 pm-3 pm) 91.8 54.7 1.10 0.65 31% 19% CPP-3
High Price (3 pm-6 pm) 38.8 33.4 0.46 0.40 13% 11%
Moderate Price (12 pm-3 pm) 95.2 57.1 1.14 0.68 31% 19% CPP-4
High Price (3 pm-6 pm) 43.2 34.4 0.52 0.41 14% 11%
Moderate Price (12 pm-3 pm) 135.9 73.6 1.62 0.88 40% 22% CPP-5
High Price (3 pm-6 pm) 46.7 35.1 0.56 0.42 14% 10%
Moderate Price (12 pm-3 pm) 133.7 68.1 1.60 0.81 41% 21% CPP-6
High Price (3 pm-6 pm) 38.8 30.3 0.46 0.36 12% 9%
Moderate Price (12 pm-3 pm) 133.2 65.8 1.59 0.79 40% 20% CPP-7
High Price (3 pm-6 pm) 44.7 34.8 0.53 0.42 14% 11%
Moderate Price (12 pm-3 pm) 121.6 63.4 1.45 0.76 38% 20% CPP-8
High Price (3 pm-6 pm) 43.1 33.7 0.51 0.40 14% 11%
Moderate Price (12 pm-3 pm) 91.7 51.5 1.10 0.62 33% 19% CPP-9
High Price (3 pm-6 pm) 38.3 29.9 0.46 0.36 14% 11%
Moderate Price (12 pm-3 pm) 96.5 56.5 1.15 0.68 34% 20% CPP-10
High Price (3 pm-6 pm) 38.9 29.6 0.46 0.35 14% 10%
Moderate Price (12 pm-3 pm) 91.6 55.2 1.09 0.66 31% 19% CPP-11
High Price (3 pm-6 pm) 37.5 29.2 0.45 0.35 13% 10%
Moderate Price (12 pm-3 pm) 88.7 53.4 1.06 0.64 31% 19% CPP-12
High Price (3 pm-6 pm) 33.6 25.5 0.40 0.30 12% 9%
DR 06.22
Southern California Edison Page 23 Design & Engineering Services November 2008
PRE-COOLING FIELD TEST ANALYSIS
PRE-COOLING AND DR EVENT FIELD TEST RESULTS
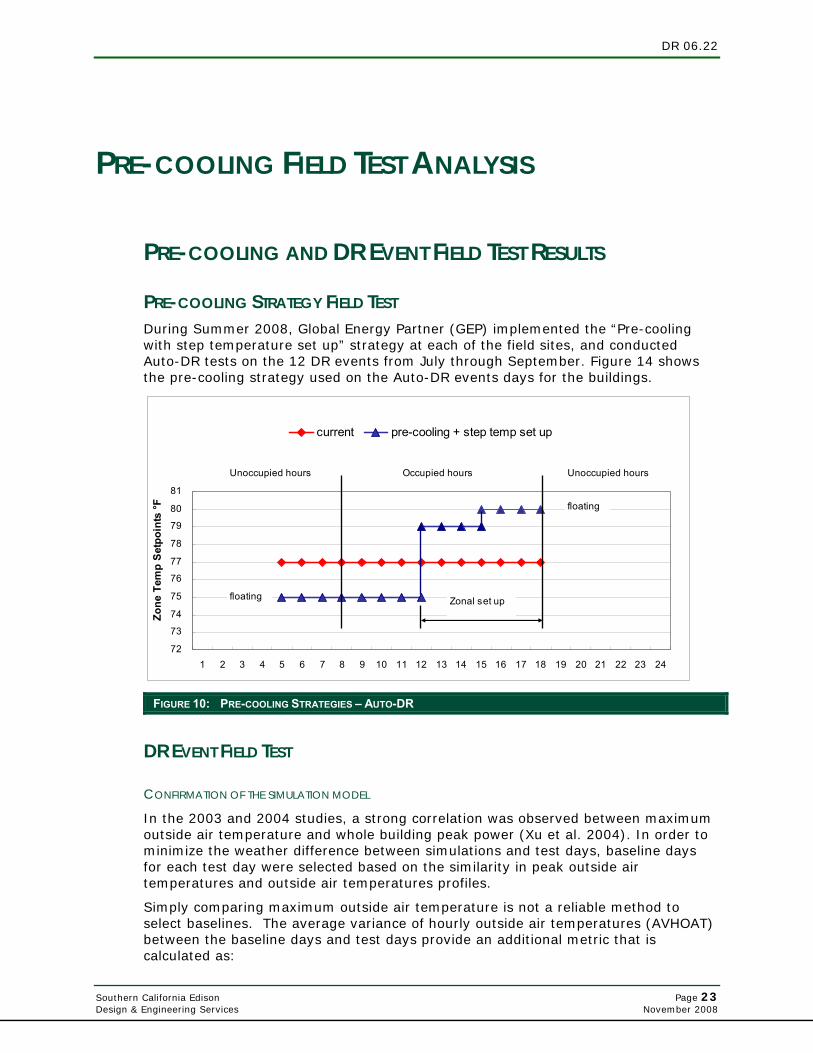
PRE-COOLING STRATEGY FIELD TEST During Summer 2008, Global Energy Partner (GEP) implemented the “Pre-cooling with step temperature set up” strategy at each of the field sites, and conducted Auto-DR tests on the 12 DR events from July through September. Figure 14 shows the pre-cooling strategy used on the Auto-DR events days for the buildings.
72
73
74
75
76
77
78
79
80
81
1 2 3 4 5 6 7 8 9 10 11 12 13 14 15 16 17 18 19 20 21 22 23 24
Zone
Tem
p S
etpo
ints
°F
current pre-cooling + step temp set up � � 3
Unoccupied hours Occupied hours Unoccupied hours
Zonal set upfloating
floating
FIGURE 10: PRE-COOLING STRATEGIES – AUTO-DR
DR EVENT FIELD TEST
CONFIRMATION OF THE SIMULATION MODEL
In the 2003 and 2004 studies, a strong correlation was observed between maximum outside air temperature and whole building peak power (Xu et al. 2004). In order to minimize the weather difference between simulations and test days, baseline days for each test day were selected based on the similarity in peak outside air temperatures and outside air temperatures profiles.
Simply comparing maximum outside air temperature is not a reliable method to select baselines. The average variance of hourly outside air temperatures (AVHOAT) between the baseline days and test days provide an additional metric that is calculated as:
DR 06.22
Southern California Edison Page 24 Design & Engineering Services November 2008
EQUATION 2: AVERAGE VARIANCE OF HOURLY OUTSIDE AIR TEMPERATURE
242
1
1 ( )24 i i
iAVHOAT B T
=
= −∑
Bi = the hourly outside air temperature for baseline days
Ti = the hourly outside air temperature for test days
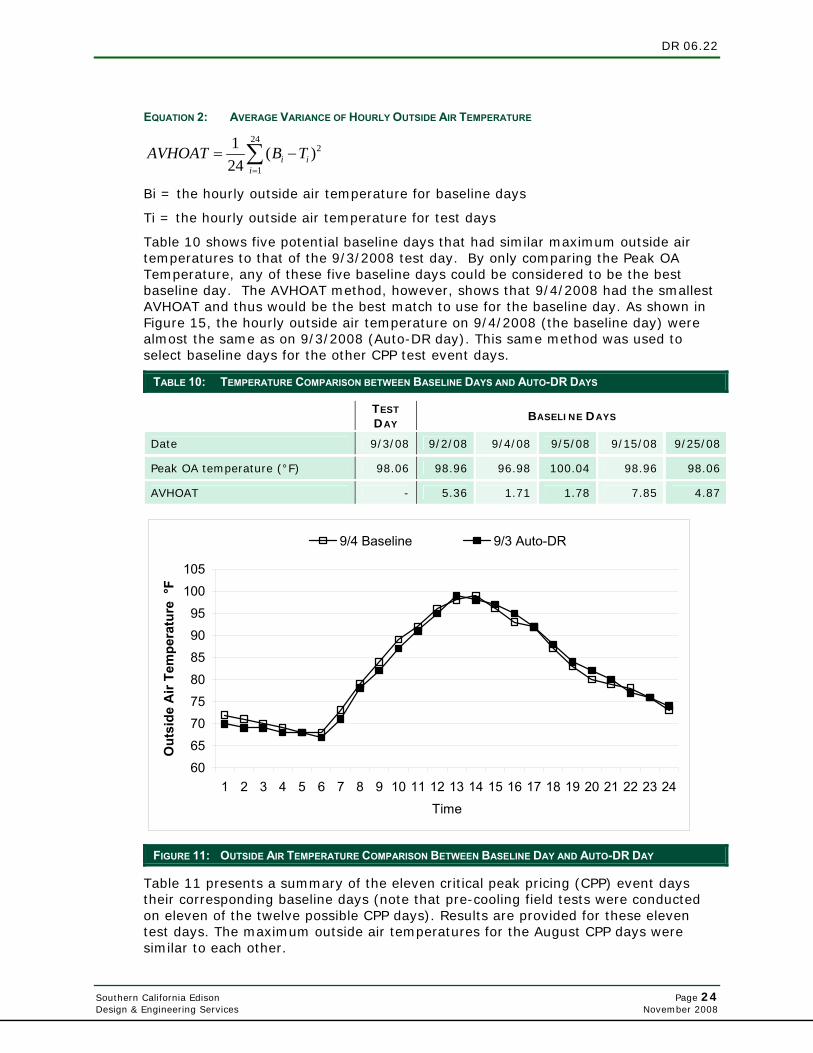
Table 10 shows five potential baseline days that had similar maximum outside air temperatures to that of the 9/3/2008 test day. By only comparing the Peak OA Temperature, any of these five baseline days could be considered to be the best baseline day. The AVHOAT method, however, shows that 9/4/2008 had the smallest AVHOAT and thus would be the best match to use for the baseline day. As shown in Figure 15, the hourly outside air temperature on 9/4/2008 (the baseline day) were almost the same as on 9/3/2008 (Auto-DR day). This same method was used to select baseline days for the other CPP test event days.
TABLE 10: TEMPERATURE COMPARISON BETWEEN BASELINE DAYS AND AUTO-DR DAYS
TEST
DAY BASELINE DAYS
Date 9/3/08 9/2/08 9/4/08 9/5/08 9/15/08 9/25/08
Peak OA temperature (°F) 98.06 98.96 96.98 100.04 98.96 98.06
AVHOAT - 5.36 1.71 1.78 7.85 4.87
6065
707580
859095
100105
1 2 3 4 5 6 7 8 9 10 11 12 13 14 15 16 17 18 19 20 21 22 23 24
Time
Out
side
Air
Tem
pera
ture
°F
9/4 Baseline 9/3 Auto-DR
FIGURE 11: OUTSIDE AIR TEMPERATURE COMPARISON BETWEEN BASELINE DAY AND AUTO-DR DAY
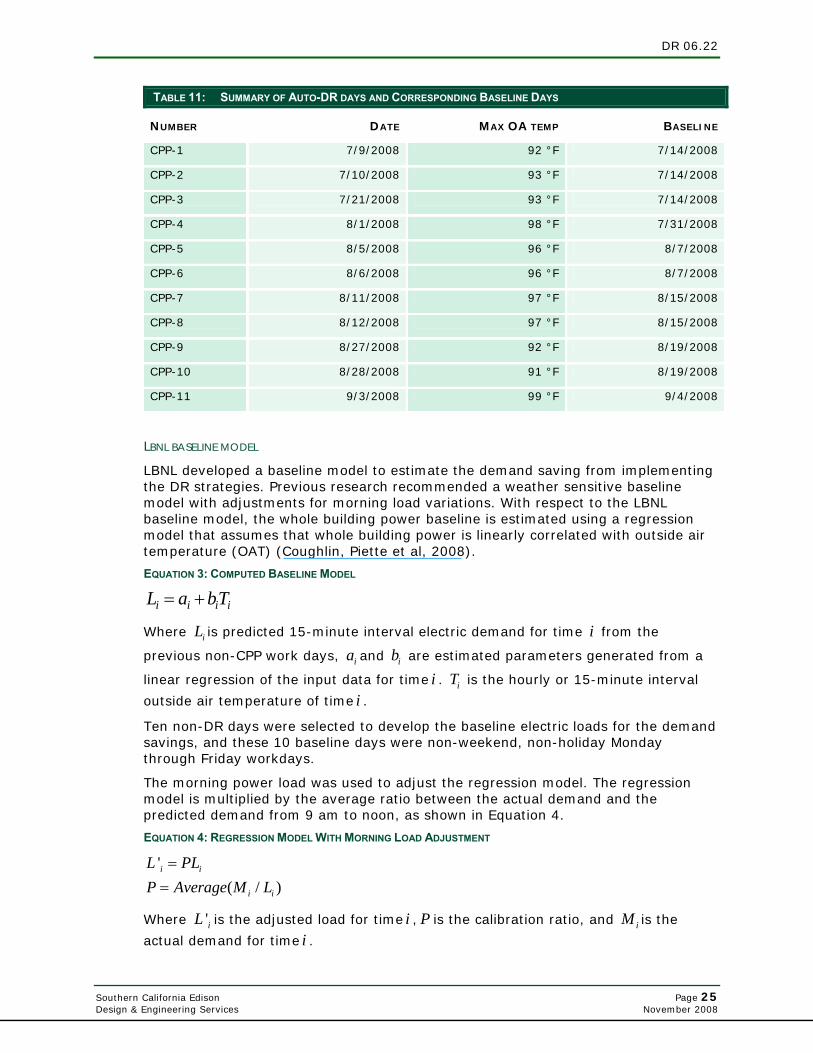
Table 11 presents a summary of the eleven critical peak pricing (CPP) event days their corresponding baseline days (note that pre-cooling field tests were conducted on eleven of the twelve possible CPP days). Results are provided for these eleven test days. The maximum outside air temperatures for the August CPP days were similar to each other.
DR 06.22
Southern California Edison Page 25 Design & Engineering Services November 2008
TABLE 11: SUMMARY OF AUTO-DR DAYS AND CORRESPONDING BASELINE DAYS
NUMBER DATE MAX OA TEMP BASELINE
CPP-1 7/9/2008 92 °F 7/14/2008
CPP-2 7/10/2008 93 °F 7/14/2008
CPP-3 7/21/2008 93 °F 7/14/2008
CPP-4 8/1/2008 98 °F 7/31/2008
CPP-5 8/5/2008 96 °F 8/7/2008
CPP-6 8/6/2008 96 °F 8/7/2008
CPP-7 8/11/2008 97 °F 8/15/2008
CPP-8 8/12/2008 97 °F 8/15/2008
CPP-9 8/27/2008 92 °F 8/19/2008
CPP-10 8/28/2008 91 °F 8/19/2008
CPP-11 9/3/2008 99 °F 9/4/2008
LBNL BASELINE MODEL
LBNL developed a baseline model to estimate the demand saving from implementing the DR strategies. Previous research recommended a weather sensitive baseline model with adjustments for morning load variations. With respect to the LBNL baseline model, the whole building power baseline is estimated using a regression model that assumes that whole building power is linearly correlated with outside air temperature (OAT) (Coughlin, Piette et al, 2008).
EQUATION 3: COMPUTED BASELINE MODEL
i i i iL a bT= +
Where iL is predicted 15-minute interval electric demand for time i from the
previous non-CPP work days, ia and ib are estimated parameters generated from a
linear regression of the input data for time i . iT is the hourly or 15-minute interval
outside air temperature of time i .
Ten non-DR days were selected to develop the baseline electric loads for the demand savings, and these 10 baseline days were non-weekend, non-holiday Monday through Friday workdays.
The morning power load was used to adjust the regression model. The regression model is multiplied by the average ratio between the actual demand and the predicted demand from 9 am to noon, as shown in Equation 4.
EQUATION 4: REGRESSION MODEL WITH MORNING LOAD ADJUSTMENT
'( / )
i i
i i
L PLP Average M L
==
Where 'iL is the adjusted load for time i , P is the calibration ratio, and iM is the
actual demand for time i .
DR 06.22
Southern California Edison Page 26 Design & Engineering Services November 2008
Based on the analysis of multiple baselines using the 2004 Auto-DR tests, the OAT regression model with morning load shape adjustment provided a better estimate than the OAT regression model without the morning load shape adjustment. The demand savings on Auto-DR days between the baseline model (AVHOAT) and the LBNL baseline model were compared. The results are listed in Appendix D (Figures D1-11). There was no significant difference between these two baseline models due to the similarity between the selected baseline days and the Auto-DR days.
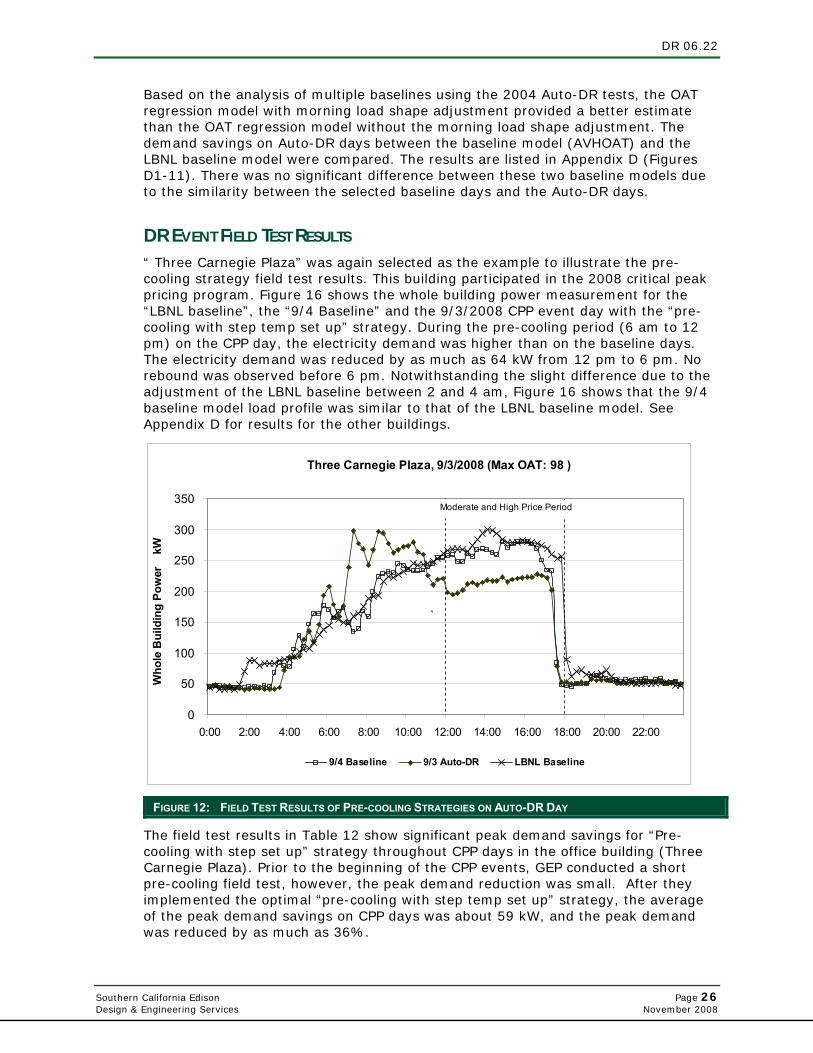
DR EVENT FIELD TEST RESULTS “ Three Carnegie Plaza” was again selected as the example to illustrate the pre-cooling strategy field test results. This building participated in the 2008 critical peak pricing program. Figure 16 shows the whole building power measurement for the “LBNL baseline”, the “9/4 Baseline” and the 9/3/2008 CPP event day with the “pre-cooling with step temp set up” strategy. During the pre-cooling period (6 am to 12 pm) on the CPP day, the electricity demand was higher than on the baseline days. The electricity demand was reduced by as much as 64 kW from 12 pm to 6 pm. No rebound was observed before 6 pm. Notwithstanding the slight difference due to the adjustment of the LBNL baseline between 2 and 4 am, Figure 16 shows that the 9/4 baseline model load profile was similar to that of the LBNL baseline model. See Appendix D for results for the other buildings.
Three Carnegie Plaza, 9/3/2008 (Max OAT: 98 )
0
50
100
150
200
250
300
350
0:00 2:00 4:00 6:00 8:00 10:00 12:00 14:00 16:00 18:00 20:00 22:00
Who
le B
uild
ing
Pow
er
kW
9/4 Baseline 9/3 Auto-DR LBNL Baseline
Moderate and High Price Period
`
FIGURE 12: FIELD TEST RESULTS OF PRE-COOLING STRATEGIES ON AUTO-DR DAY
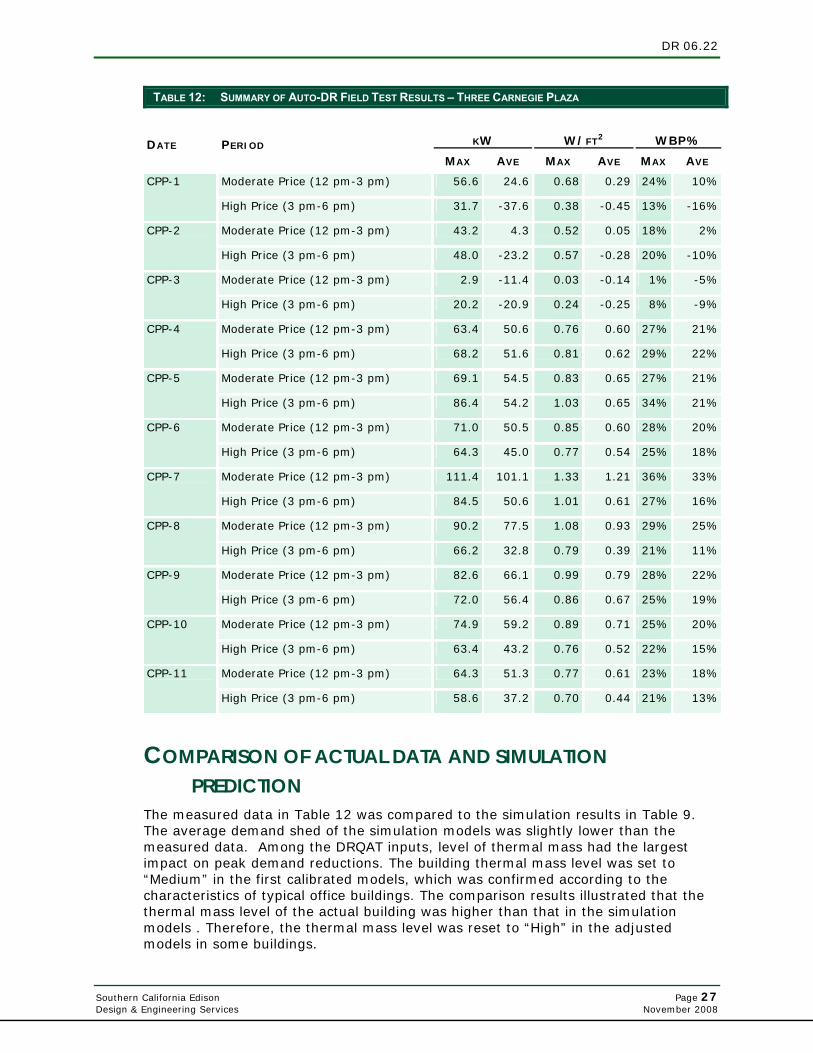
The field test results in Table 12 show significant peak demand savings for “Pre-cooling with step set up” strategy throughout CPP days in the office building (Three Carnegie Plaza). Prior to the beginning of the CPP events, GEP conducted a short pre-cooling field test, however, the peak demand reduction was small. After they implemented the optimal “pre-cooling with step temp set up” strategy, the average of the peak demand savings on CPP days was about 59 kW, and the peak demand was reduced by as much as 36%.
DR 06.22
Southern California Edison Page 27 Design & Engineering Services November 2008
TABLE 12: SUMMARY OF AUTO-DR FIELD TEST RESULTS – THREE CARNEGIE PLAZA
KW
W/FT2
WBP% DATE PERIOD
MAX AVE MAX AVE MAX AVE
Moderate Price (12 pm-3 pm) 56.6 24.6 0.68 0.29 24% 10% CPP-1
High Price (3 pm-6 pm) 31.7 -37.6 0.38 -0.45 13% -16%
Moderate Price (12 pm-3 pm) 43.2 4.3 0.52 0.05 18% 2% CPP-2
High Price (3 pm-6 pm) 48.0 -23.2 0.57 -0.28 20% -10%
Moderate Price (12 pm-3 pm) 2.9 -11.4 0.03 -0.14 1% -5% CPP-3
High Price (3 pm-6 pm) 20.2 -20.9 0.24 -0.25 8% -9%
Moderate Price (12 pm-3 pm) 63.4 50.6 0.76 0.60 27% 21% CPP-4
High Price (3 pm-6 pm) 68.2 51.6 0.81 0.62 29% 22%
Moderate Price (12 pm-3 pm) 69.1 54.5 0.83 0.65 27% 21% CPP-5
High Price (3 pm-6 pm) 86.4 54.2 1.03 0.65 34% 21%
Moderate Price (12 pm-3 pm) 71.0 50.5 0.85 0.60 28% 20% CPP-6
High Price (3 pm-6 pm) 64.3 45.0 0.77 0.54 25% 18%
Moderate Price (12 pm-3 pm) 111.4 101.1 1.33 1.21 36% 33% CPP-7
High Price (3 pm-6 pm) 84.5 50.6 1.01 0.61 27% 16%
Moderate Price (12 pm-3 pm) 90.2 77.5 1.08 0.93 29% 25% CPP-8
High Price (3 pm-6 pm) 66.2 32.8 0.79 0.39 21% 11%
Moderate Price (12 pm-3 pm) 82.6 66.1 0.99 0.79 28% 22% CPP-9
High Price (3 pm-6 pm) 72.0 56.4 0.86 0.67 25% 19%
Moderate Price (12 pm-3 pm) 74.9 59.2 0.89 0.71 25% 20% CPP-10
High Price (3 pm-6 pm) 63.4 43.2 0.76 0.52 22% 15%
Moderate Price (12 pm-3 pm) 64.3 51.3 0.77 0.61 23% 18% CPP-11
High Price (3 pm-6 pm) 58.6 37.2 0.70 0.44 21% 13%
COMPARISON OF ACTUAL DATA AND SIMULATION PREDICTION
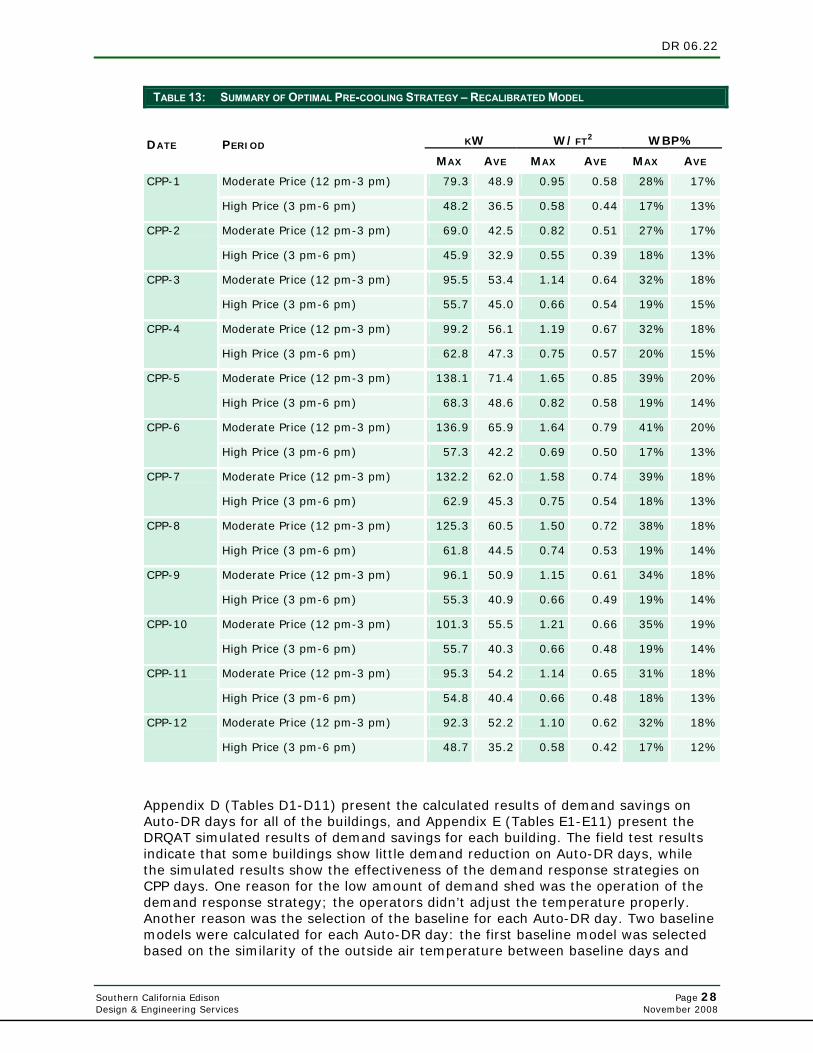
The measured data in Table 12 was compared to the simulation results in Table 9. The average demand shed of the simulation models was slightly lower than the measured data. Among the DRQAT inputs, level of thermal mass had the largest impact on peak demand reductions. The building thermal mass level was set to “Medium” in the first calibrated models, which was confirmed according to the characteristics of typical office buildings. The comparison results illustrated that the thermal mass level of the actual building was higher than that in the simulation models . Therefore, the thermal mass level was reset to “High” in the adjusted models in some buildings.
DR 06.22
Southern California Edison Page 28 Design & Engineering Services November 2008
TABLE 13: SUMMARY OF OPTIMAL PRE-COOLING STRATEGY – RECALIBRATED MODEL
KW
W/FT2
WBP% DATE PERIOD
MAX AVE MAX AVE MAX AVE
Moderate Price (12 pm-3 pm) 79.3 48.9 0.95 0.58 28% 17% CPP-1
High Price (3 pm-6 pm) 48.2 36.5 0.58 0.44 17% 13%
Moderate Price (12 pm-3 pm) 69.0 42.5 0.82 0.51 27% 17% CPP-2
High Price (3 pm-6 pm) 45.9 32.9 0.55 0.39 18% 13%
Moderate Price (12 pm-3 pm) 95.5 53.4 1.14 0.64 32% 18% CPP-3
High Price (3 pm-6 pm) 55.7 45.0 0.66 0.54 19% 15%
Moderate Price (12 pm-3 pm) 99.2 56.1 1.19 0.67 32% 18% CPP-4
High Price (3 pm-6 pm) 62.8 47.3 0.75 0.57 20% 15%
Moderate Price (12 pm-3 pm) 138.1 71.4 1.65 0.85 39% 20% CPP-5
High Price (3 pm-6 pm) 68.3 48.6 0.82 0.58 19% 14%
Moderate Price (12 pm-3 pm) 136.9 65.9 1.64 0.79 41% 20% CPP-6
High Price (3 pm-6 pm) 57.3 42.2 0.69 0.50 17% 13%
Moderate Price (12 pm-3 pm) 132.2 62.0 1.58 0.74 39% 18% CPP-7
High Price (3 pm-6 pm) 62.9 45.3 0.75 0.54 18% 13%
Moderate Price (12 pm-3 pm) 125.3 60.5 1.50 0.72 38% 18% CPP-8
High Price (3 pm-6 pm) 61.8 44.5 0.74 0.53 19% 14%
Moderate Price (12 pm-3 pm) 96.1 50.9 1.15 0.61 34% 18% CPP-9
High Price (3 pm-6 pm) 55.3 40.9 0.66 0.49 19% 14%
Moderate Price (12 pm-3 pm) 101.3 55.5 1.21 0.66 35% 19% CPP-10
High Price (3 pm-6 pm) 55.7 40.3 0.66 0.48 19% 14%
Moderate Price (12 pm-3 pm) 95.3 54.2 1.14 0.65 31% 18% CPP-11
High Price (3 pm-6 pm) 54.8 40.4 0.66 0.48 18% 13%
Moderate Price (12 pm-3 pm) 92.3 52.2 1.10 0.62 32% 18% CPP-12
High Price (3 pm-6 pm) 48.7 35.2 0.58 0.42 17% 12%
Appendix D (Tables D1-D11) present the calculated results of demand savings on Auto-DR days for all of the buildings, and Appendix E (Tables E1-E11) present the DRQAT simulated results of demand savings for each building. The field test results indicate that some buildings show little demand reduction on Auto-DR days, while the simulated results show the effectiveness of the demand response strategies on CPP days. One reason for the low amount of demand shed was the operation of the demand response strategy; the operators didn’t adjust the temperature properly. Another reason was the selection of the baseline for each Auto-DR day. Two baseline models were calculated for each Auto-DR day: the first baseline model was selected based on the similarity of the outside air temperature between baseline days and
DR 06.22
Southern California Edison Page 29 Design & Engineering Services November 2008
Auto-DR days, and the second baseline model was calculated using a weather sensitive baseline model with adjustments for morning load variations (LBNL baseline model). By comparing these two baseline models to electricity loads on Auto-DR days, the LBNL baseline model was almost the same as the first baseline model.
For some buildings, the difference in energy usage for the lighting, plug and miscellaneous loads between the baseline days and Auto-DR days could lead to the inaccurate calculation of demand savings for the demand response strategy. More attention needs to be paid to these buildings, including sub-metering the electric usage of lighting, plug, and HVAC system, to find reasons for the little demand shed on Auto-DR days.
SUMMARY The pre-cooling and CPP field tests results were analyzed, the energy and economic analyses were conducted, and the DRQAT models were readjusted with the test data. Baseline days for the CPP test days were selected based on the similarity of the outside air temperature between the baseline days and the test days. In selecting baseline days, effort was taken to match the maximum outside air temperature and also to minimize the hourly temperature difference between the baseline days and CPP test days.
The optimal pre-cooling strategy worked very well in the office buildings and was able to reduce the demand significantly (15~30% throughout the summer period). The whole building power profiles on the CPP days indicated no rebound in the afternoon. The refined models can be used to predict the demand saving from other demand response strategies.
DR 06.22
Southern California Edison Page 30 Design & Engineering Services November 2008
COMPARISON OF DRQAT WITH EQUEST AND BEST
Many building energy simulation tools have been developed to simulate building performance. These building energy simulation tools were used to simulate performance of building envelopes and HVAC systems to improve building design and operation. Building simulation models have also been used to establish DR baselines and calculate the energy and demand savings of DR strategies.
Features and capabilities of three building energy simulation tools were compared: Quick Energy Simulation Tool (eQUEST), Building Energy Simulation Tool (BEST), and Demand Response Quick Assessment Tool (DRQAT). All three tools are capable of simulating energy usage and predicting hourly building electric demand. However, because each software tool uses different calculation engines, they have different levels of accuracy and not all of them are suitable for simulating thermal mass effects.
INTRODUCTION TO ENERGY SIMULATION TOOLS eQUEST is a sophisticated, yet easy to use, freeware building energy use analysis tool that provides professional-level results with an affordable level of effort. It was designed to allow users to perform detailed comparative analysis of building designs and technologies by applying sophisticated building energy simulation techniques but without requiring extensive experiences in the “art” of building performance modeling. It is accomplished by combining a building creation wizard, an energy efficiency measure (EEM) wizard and a graphic results display module with a complete DOE2.2 building energy use simulation program.
BEST is a building energy simulation tool linking DOE2.2 with custom building models. The tool is licensed to Global Energy Partners, LLC. Projects in BEST include CEC Demand Control, lowa Utilities and DEEM Project. The project “CEC Demand Control” implements Demand-Control measures for a range of commercial building types. Each building type has default values for 4 vintages (Very Old, Old, Recent and New) that vary with climate zones. The 16 Standard CEC weather files are installed in BEST.
DRQAT is a tool for simulating large commercial buildings DR strategies, developed by LBNL’s Demand Response Research Center with funding from the California Energy Commission’s PIER Program. This tool is based on EnergyPlus simulations of prototypical buildings and HVAC equipment. It incorporates prototypical buildings and equipment and requires the user to specify only a relatively small number of important parameters in order to run a quick assessment of DR strategies. DRQAT predicts energy and peak electrical demand savings, economic savings, and thermal comfort impacts of various demand response strategies.
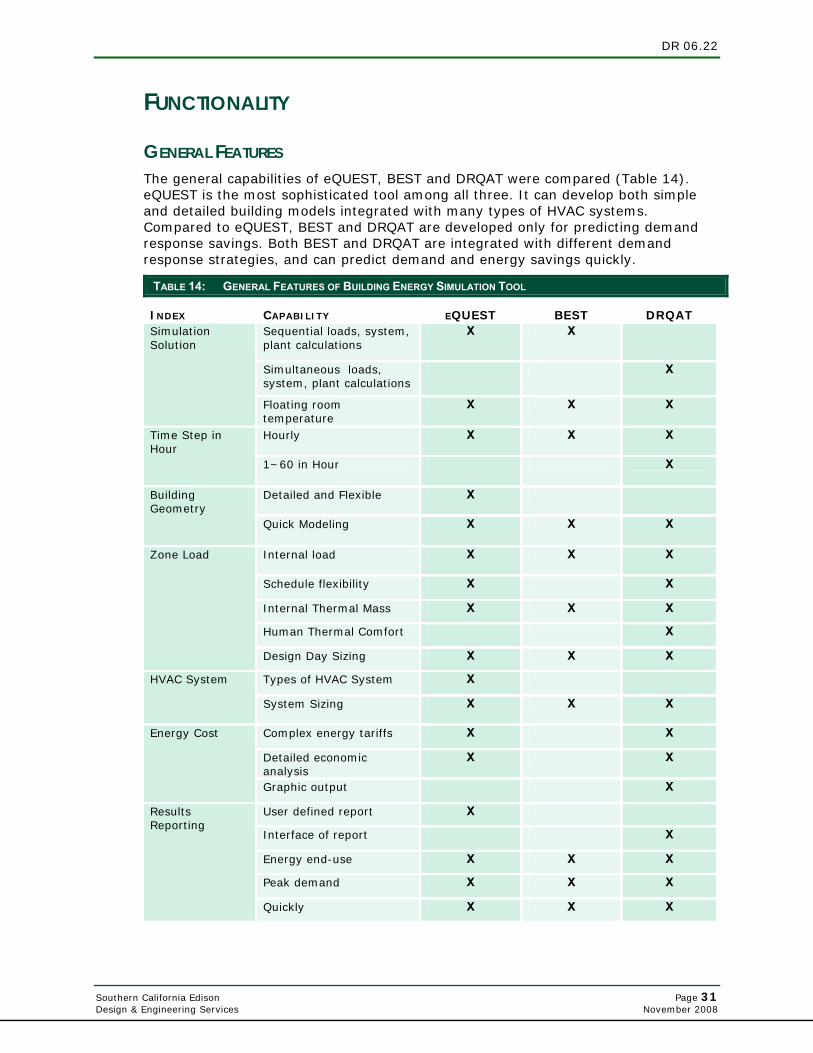
DR 06.22
Southern California Edison Page 31 Design & Engineering Services November 2008
FUNCTIONALITY
GENERAL FEATURES The general capabilities of eQUEST, BEST and DRQAT were compared (Table 14). eQUEST is the most sophisticated tool among all three. It can develop both simple and detailed building models integrated with many types of HVAC systems. Compared to eQUEST, BEST and DRQAT are developed only for predicting demand response savings. Both BEST and DRQAT are integrated with different demand response strategies, and can predict demand and energy savings quickly.
TABLE 14: GENERAL FEATURES OF BUILDING ENERGY SIMULATION TOOL
INDEX CAPABILITY EQUEST BEST DRQAT Sequential loads, system, plant calculations
X X
Simultaneous loads, system, plant calculations
X
Simulation Solution
Floating room temperature
X X X
Hourly X X X Time Step in Hour
1~60 in Hour X
Detailed and Flexible X Building Geometry
Quick Modeling X X X
Internal load X X X
Schedule flexibility X X
Internal Thermal Mass X X X
Human Thermal Comfort X
Zone Load
Design Day Sizing X X X
Types of HVAC System X HVAC System
System Sizing X X X
Complex energy tariffs X X
Detailed economic analysis
X X
Energy Cost
Graphic output X
User defined report X
Interface of report X
Energy end-use X X X
Peak demand X X X
Results Reporting
Quickly X X X
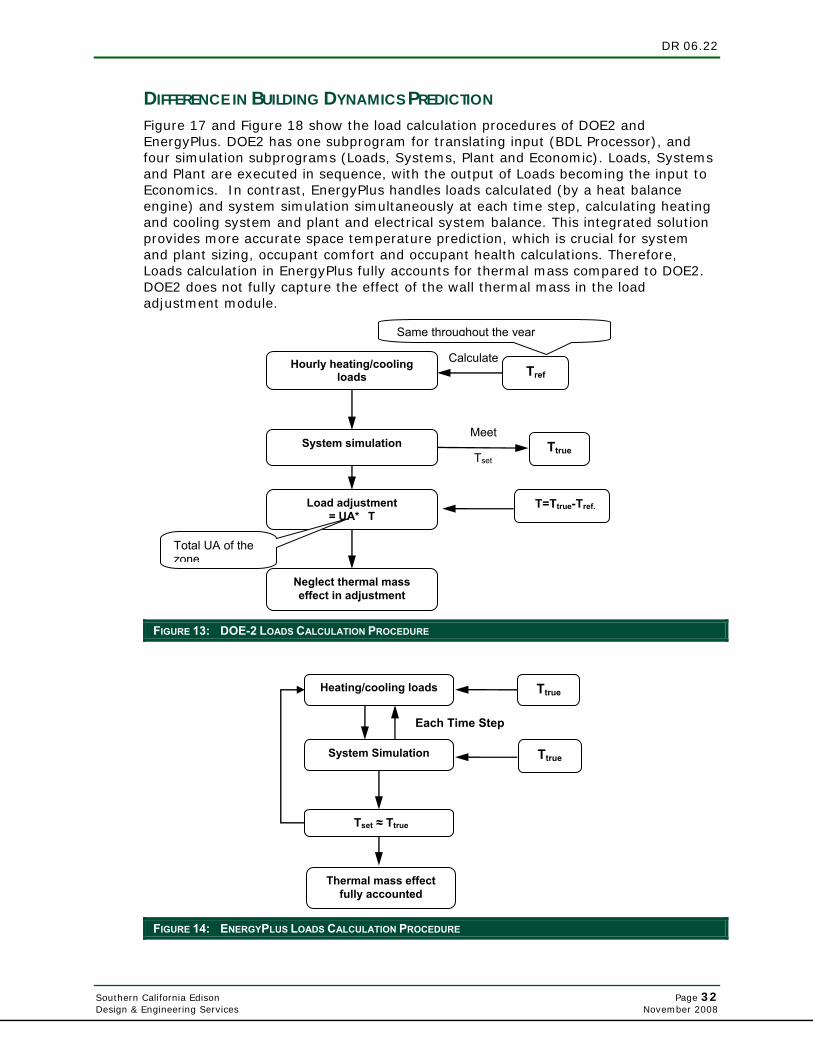
DR 06.22
Southern California Edison Page 32 Design & Engineering Services November 2008
DIFFERENCE IN BUILDING DYNAMICS PREDICTION Figure 17 and Figure 18 show the load calculation procedures of DOE2 and EnergyPlus. DOE2 has one subprogram for translating input (BDL Processor), and four simulation subprograms (Loads, Systems, Plant and Economic). Loads, Systems and Plant are executed in sequence, with the output of Loads becoming the input to Economics. In contrast, EnergyPlus handles loads calculated (by a heat balance engine) and system simulation simultaneously at each time step, calculating heating and cooling system and plant and electrical system balance. This integrated solution provides more accurate space temperature prediction, which is crucial for system and plant sizing, occupant comfort and occupant health calculations. Therefore, Loads calculation in EnergyPlus fully accounts for thermal mass compared to DOE2. DOE2 does not fully capture the effect of the wall thermal mass in the load adjustment module.
FIGURE 13: DOE-2 LOADS CALCULATION PROCEDURE
FIGURE 14: ENERGYPLUS LOADS CALCULATION PROCEDURE
Heating/cooling loads
System Simulation
Tset ≈ Ttrue
Thermal mass effect fully accounted
Each Time Step
Ttrue
Ttrue
Hourly heating/cooling loads
Calculate
System simulation Meet
Tset
Load adjustment= UA*�T
Total UA of the zone
Neglect thermal mass effect in adjustment
Same throughout the year
�T=Ttrue-Tref.
Ttrue
Tref
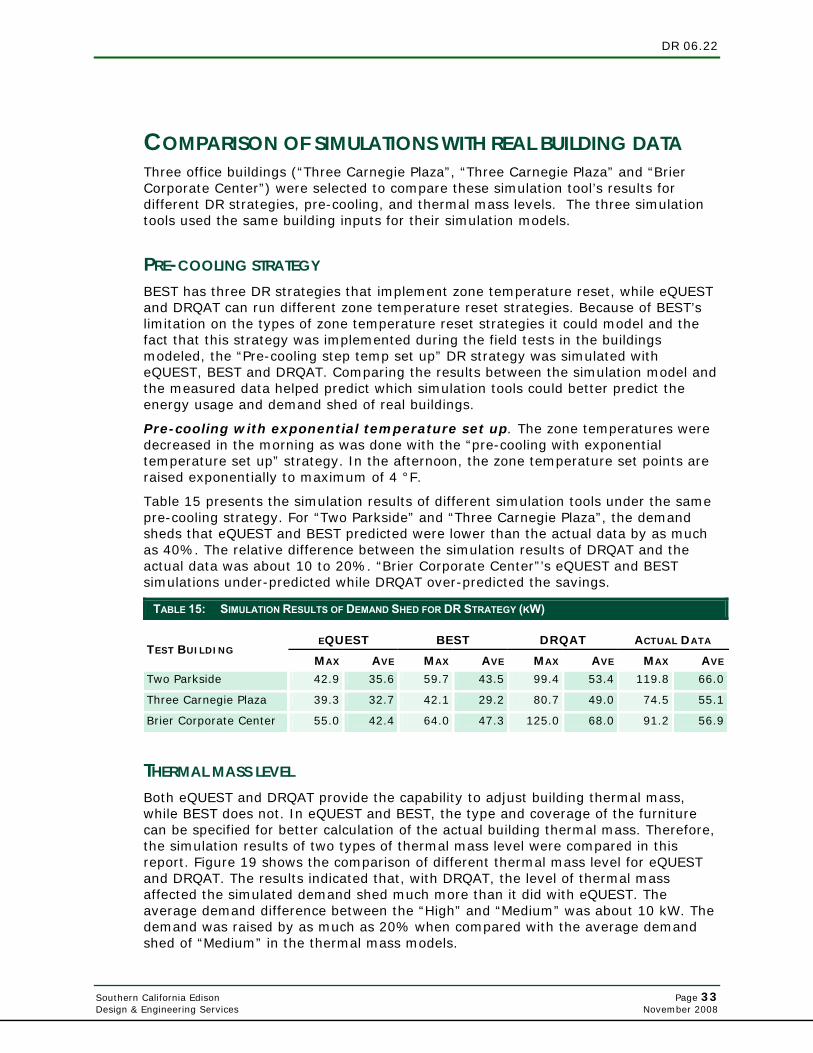
DR 06.22
Southern California Edison Page 33 Design & Engineering Services November 2008
COMPARISON OF SIMULATIONS WITH REAL BUILDING DATA Three office buildings (“Three Carnegie Plaza”, “Three Carnegie Plaza” and “Brier Corporate Center”) were selected to compare these simulation tool’s results for different DR strategies, pre-cooling, and thermal mass levels. The three simulation tools used the same building inputs for their simulation models.
PRE-COOLING STRATEGY BEST has three DR strategies that implement zone temperature reset, while eQUEST and DRQAT can run different zone temperature reset strategies. Because of BEST’s limitation on the types of zone temperature reset strategies it could model and the fact that this strategy was implemented during the field tests in the buildings modeled, the “Pre-cooling step temp set up” DR strategy was simulated with eQUEST, BEST and DRQAT. Comparing the results between the simulation model and the measured data helped predict which simulation tools could better predict the energy usage and demand shed of real buildings.
Pre-cooling with exponential temperature set up. The zone temperatures were decreased in the morning as was done with the “pre-cooling with exponential temperature set up” strategy. In the afternoon, the zone temperature set points are raised exponentially to maximum of 4 °F.
Table 15 presents the simulation results of different simulation tools under the same pre-cooling strategy. For “Two Parkside” and “Three Carnegie Plaza”, the demand sheds that eQUEST and BEST predicted were lower than the actual data by as much as 40%. The relative difference between the simulation results of DRQAT and the actual data was about 10 to 20%. “Brier Corporate Center”’s eQUEST and BEST simulations under-predicted while DRQAT over-predicted the savings.
TABLE 15: SIMULATION RESULTS OF DEMAND SHED FOR DR STRATEGY (KW)
EQUEST BEST DRQAT ACTUAL DATA TEST BUILDING
MAX AVE MAX AVE MAX AVE MAX AVE Two Parkside 42.9 35.6 59.7 43.5 99.4 53.4 119.8 66.0
Three Carnegie Plaza 39.3 32.7 42.1 29.2 80.7 49.0 74.5 55.1
Brier Corporate Center 55.0 42.4 64.0 47.3 125.0 68.0 91.2 56.9
THERMAL MASS LEVEL Both eQUEST and DRQAT provide the capability to adjust building thermal mass, while BEST does not. In eQUEST and BEST, the type and coverage of the furniture can be specified for better calculation of the actual building thermal mass. Therefore, the simulation results of two types of thermal mass level were compared in this report. Figure 19 shows the comparison of different thermal mass level for eQUEST and DRQAT. The results indicated that, with DRQAT, the level of thermal mass affected the simulated demand shed much more than it did with eQUEST. The average demand difference between the “High” and “Medium” was about 10 kW. The demand was raised by as much as 20% when compared with the average demand shed of “Medium” in the thermal mass models.
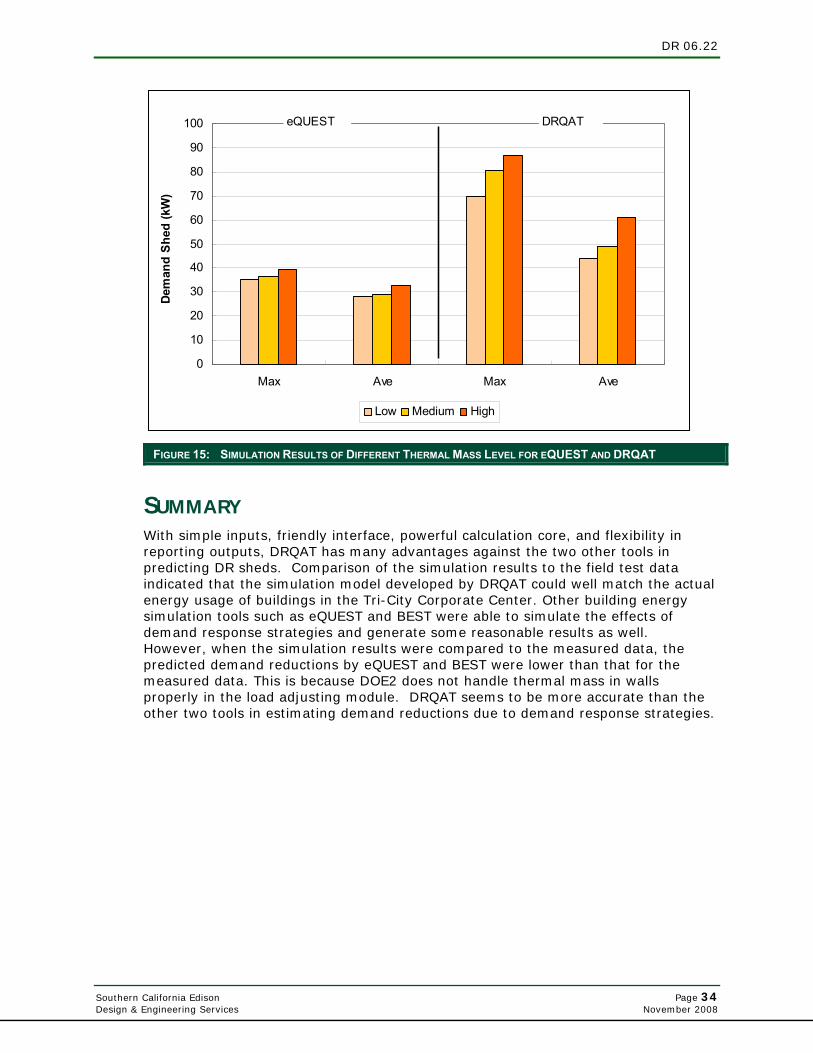
DR 06.22
Southern California Edison Page 34 Design & Engineering Services November 2008
0
10
20
30
40
50
60
70
80
90
100
Max Ave Max Ave
Dem
and
Shed
(kW
)
Low Medium High
eQUEST DRQAT
FIGURE 15: SIMULATION RESULTS OF DIFFERENT THERMAL MASS LEVEL FOR EQUEST AND DRQAT
SUMMARY With simple inputs, friendly interface, powerful calculation core, and flexibility in reporting outputs, DRQAT has many advantages against the two other tools in predicting DR sheds. Comparison of the simulation results to the field test data indicated that the simulation model developed by DRQAT could well match the actual energy usage of buildings in the Tri-City Corporate Center. Other building energy simulation tools such as eQUEST and BEST were able to simulate the effects of demand response strategies and generate some reasonable results as well. However, when the simulation results were compared to the measured data, the predicted demand reductions by eQUEST and BEST were lower than that for the measured data. This is because DOE2 does not handle thermal mass in walls properly in the load adjusting module. DRQAT seems to be more accurate than the other two tools in estimating demand reductions due to demand response strategies.
DR 06.22
Southern California Edison Page 35 Design & Engineering Services November 2008
CONCLUSIONS AND RECOMMENDATIONS CONCLUSIONS This project studied how to optimize pre-cooling strategies for the buildings in the Tri-City Corporate Center, San Bernardino, California, with the assistance of Demand Response Quick Assessment Tool (DRQAT) - a building energy simulation tool.
Eleven DRQAT models were built for the buildings in the Tri-City Corporation Center. The simulation results from calibrated simulation models matched well with the measured monthly, daily and hourly data. Using the calibrated simulation models, a series of simulations were conducted to determine the optimal pre-cooling strategies for the eleven buildings. The “Pre-cooling with step temp set up” and “Pre-cooling with exponential temp set up” strategies turned out to be the optimal strategies. The ”Pre-cooling with step temp set up” was used in the field tests as it was easier to implement and had a flatter load shape at the beginning of the peak demand period.
The resulting simulation-based DR optimization is summarized into a procedure to develop and calibrate DRQAT building models with the following steps:
Generate a DRQAT initial simulation model with basic building information.
Replace TMY weather file in DRQAT and regenerate a .epw EnergyPlus file with real weather data collected from the site or nearby weather stations.
Use whole building power under extreme cold weather conditions to estimate the actual internal load schedules. The method will not work if electricity or heat pumps were used as heating sources.
Run simulations and compare the simulated results with the measure data.
Readjust the internal load schedule until the simulated daily and monthly demand data match with the measured data.
The field test results indicated that the pre-cooling strategies were able to reduce the peak demand as expected on CPP event days. The demand reductions for each building were different and pre-cooling strategies to each building should be matched based on demand reductions.
If a building owner decides not to sign up for the CPP program, but wants to use the pre-cooling strategies to reduce their monthly demand charge, the buildings should operate the pre-cooling strategies on days when the weather forecast predicts outside air temperature above 90oF. From the thermal comfort point of view, it will be better to operate the pre-cooling strategies throughout summer periods because the occupants can predict the temperature variation in advance and dress accordingly.
The demand shed predicted by DRQAT matched well with the measured data on CPP event days. The study showed that after refining and calibrating the initial simulation models with measured data, the accuracy of the models are greatly improved and the models can be used to predict load reductions in these buildings on DR event days within ±10% of accuracy.
DR 06.22
Southern California Edison Page 36 Design & Engineering Services November 2008
The simulation results of eQUEST, BEST, the two simulation tools built on different versions of DOE2, indicate that these tools did not work as well as the DRQAT in predicting demand reduction. The predicted demand sheds from these two tools seemed to be lower than the actual data. DRQAT can better simulate the DR effects because both eQUEST and BEST underestimate the effect of thermal mass of walls.
RECOMMENDATIONS Although the carefully calibrated baseline model can match the measured interval meter data within the requirements of the ASHRAE Guide, we believe the efforts in the following areas can further improve the accuracy of the simulations and usefulness of the DRQAT tool.
Real weather data. The real weather file that we use to calibrate the simulation model may be different than the actual weather data for the building. An outside air sensor or weather station should be installed in the building to measure the outside air temperature on site. This measured data can be converted into a weather file and used in the DRQAT simulation. This will greatly improve the accuracy of the model prediction.
Sub-metered HVAC and whole building power. It was hard to estimate the internal loads without sub-metering. The winter data can be used to estimate the internal load schedules in summer. However, the internal load estimate could be improved by sub-metering key HVAC equipment. Direct measurement or short term spot measurements could provide strong evidence in backing up the models and predicting savings.
Determine internal mass level. It is difficult to estimate the mass level in different buildings. The default value in DRQAT was inherited from EnergyPlus prototypical models and those values may not be representative of real buildings in California.
Adding utility baselines to the DRQAT. Utilities use different baseline methodologies for their various DR programs. A simulated baseline day was used in the simulation analysis which, except for the zone temperature setpoints for the pre-cooling strategies, have the same operating conditions as the DR event day. In estimating the DR savings from the field, baselines with similar outdoor temperature profiles were used. However, in reality, no baseline day exists with same weather condition, internal loads and other electrical usage for an actual DR event day. Adding specific utility baselines to DRQAT will improve usability and predicting economic savings.
Refining accuracy requirements for DR simulations. While the calibration met the requirement in the ASHRAE standard, within ±20% for a minimum of 20 hours out of 24 hours for each day, this standard was established for energy simulations. DR reductions are usually within 10% to 15% of the peak load and may be within the error margin between the simulated and measured data. Accuracy requirements for DR simulations have to be developed.
DR 06.22
Southern California Edison Page 37 Design & Engineering Services November 2008
REFERENCES ASHRAE. 21002. ASHRAE Guideline 14-2002, Measurement of Energy and Demand Savings.
Atlanta: American Society of Heating, Refrigerating and Air-Conditioning Engineers, Inc.
California’s Energy Efficiency Standards for Residential and Nonresidential Buildings, 1987, 1988, 1992, 1995, 1998, 2001 and 2005.
Yiqun Pan, Zhizhong Huang, Gang Wu, Chen Chen. 2006. The Application of Building Energy Simulation and Calibration in Two High-rise Commercial Buildings in Shanghai, Proceedings of SimBuild 2006, August 2-4, 2006.
Yiqun Pan, Rongxin Yin, Zhizhong Huang. 2008. Energy modeling of two office buildings with data center for green building design, Energy and Buildings, October 2, 2008.
Peng Xu, Leah Zagreus, Demand Shifting With Thermal Mass in Light and Heavy Mass Commercial Buildings, LBNL 61172, July 2007.
Peng Xu, Philip Haves, MaryAnn Piette. 2005. Demand Shifting With Thermal Mass in Large Commercial Buildings: Field Tests, Simulations and Audits. LBNL 58815, December 2005.
Peng Xu, Rongxin Yin, etc. 2006. Demand Shifting With Thermal Mass in Large Commercial Buildings in California Hot Climate Zone. LBNL 61172.
M.A Piette, D. Watson, N.Motegi, S.Kiliccote. 2007. Automated Critical Peak Pricing Field Tests: 2006 Pilot Program Description and Results, LBNL 62218, August 30, 2007.
Joe Huang, Hashem Akbari, Leo Rainer, and Ron Ritschard. Lawrence Berkeley Laboratory, Applied Science Division. “481 Prototypical Commercial Buildings For 20 Urban Market Areas”. Technical documentation of building loads data base developed for the GRI Cogeneration Market Assessment Model. April 1991.
A. Pedrini, F.S. Westphal, R. Lamberbs, A methogology for building energy modeling and calibration in warm climates, Building and Environment, 2002.
Katie Coughlin, Mary Ann Piette, Charles Goldman and Sila Kiliccote, Estimating Demand Response Load Impacts: Evaluation of Baseline Load Models for Non-Residential Buildings in California, LBNL 63728, January 2008.
M.A Piette, D. Watson, N. Motegi, S. Kiliccote, P. Xu, Automated Critical Peak Pricing Field Tests: Program Description and Results, LBNL 59531, April 2006.
Torcellini, P., M. Deru, et al. DOE Commercial Building Benchmark Models. Proceeding of 2008 ACEEE Summer Study on Energy Efficiency in Buildings, Pacific Grove, California. August 17-22, 2008.
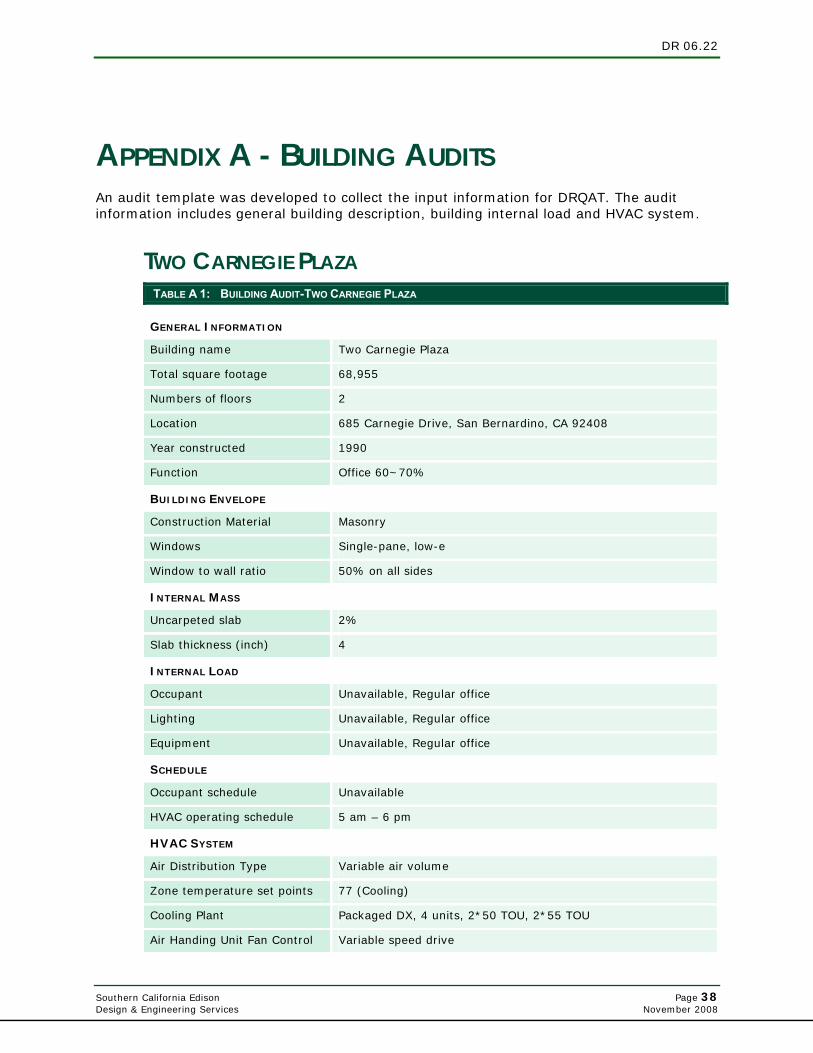
DR 06.22
Southern California Edison Page 38 Design & Engineering Services November 2008
APPENDIX A - BUILDING AUDITS An audit template was developed to collect the input information for DRQAT. The audit information includes general building description, building internal load and HVAC system.
TWO CARNEGIE PLAZA TABLE A 1: BUILDING AUDIT-TWO CARNEGIE PLAZA
GENERAL INFORMATION
Building name Two Carnegie Plaza
Total square footage 68,955
Numbers of floors 2
Location 685 Carnegie Drive, San Bernardino, CA 92408
Year constructed 1990
Function Office 60~70%
BUILDING ENVELOPE
Construction Material Masonry
Windows Single-pane, low-e
Window to wall ratio 50% on all sides
INTERNAL MASS
Uncarpeted slab 2%
Slab thickness (inch) 4
INTERNAL LOAD
Occupant Unavailable, Regular office
Lighting Unavailable, Regular office
Equipment Unavailable, Regular office
SCHEDULE
Occupant schedule Unavailable
HVAC operating schedule 5 am – 6 pm
HVAC SYSTEM
Air Distribution Type Variable air volume
Zone temperature set points 77 (Cooling)
Cooling Plant Packaged DX, 4 units, 2*50 TOU, 2*55 TOU
Air Handing Unit Fan Control Variable speed drive
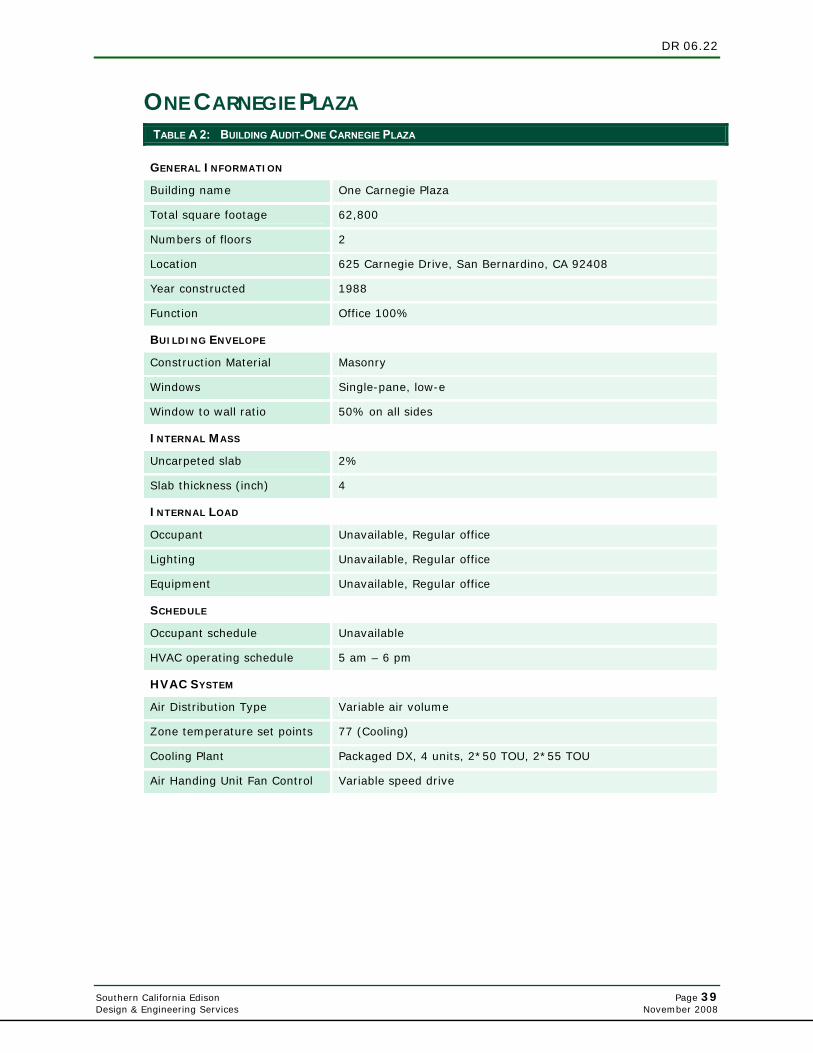
DR 06.22
Southern California Edison Page 39 Design & Engineering Services November 2008
ONE CARNEGIE PLAZA TABLE A 2: BUILDING AUDIT-ONE CARNEGIE PLAZA
GENERAL INFORMATION
Building name One Carnegie Plaza
Total square footage 62,800
Numbers of floors 2
Location 625 Carnegie Drive, San Bernardino, CA 92408
Year constructed 1988
Function Office 100%
BUILDING ENVELOPE
Construction Material Masonry
Windows Single-pane, low-e
Window to wall ratio 50% on all sides
INTERNAL MASS
Uncarpeted slab 2%
Slab thickness (inch) 4
INTERNAL LOAD
Occupant Unavailable, Regular office
Lighting Unavailable, Regular office
Equipment Unavailable, Regular office
SCHEDULE
Occupant schedule Unavailable
HVAC operating schedule 5 am – 6 pm
HVAC SYSTEM
Air Distribution Type Variable air volume
Zone temperature set points 77 (Cooling)
Cooling Plant Packaged DX, 4 units, 2*50 TOU, 2*55 TOU
Air Handing Unit Fan Control Variable speed drive
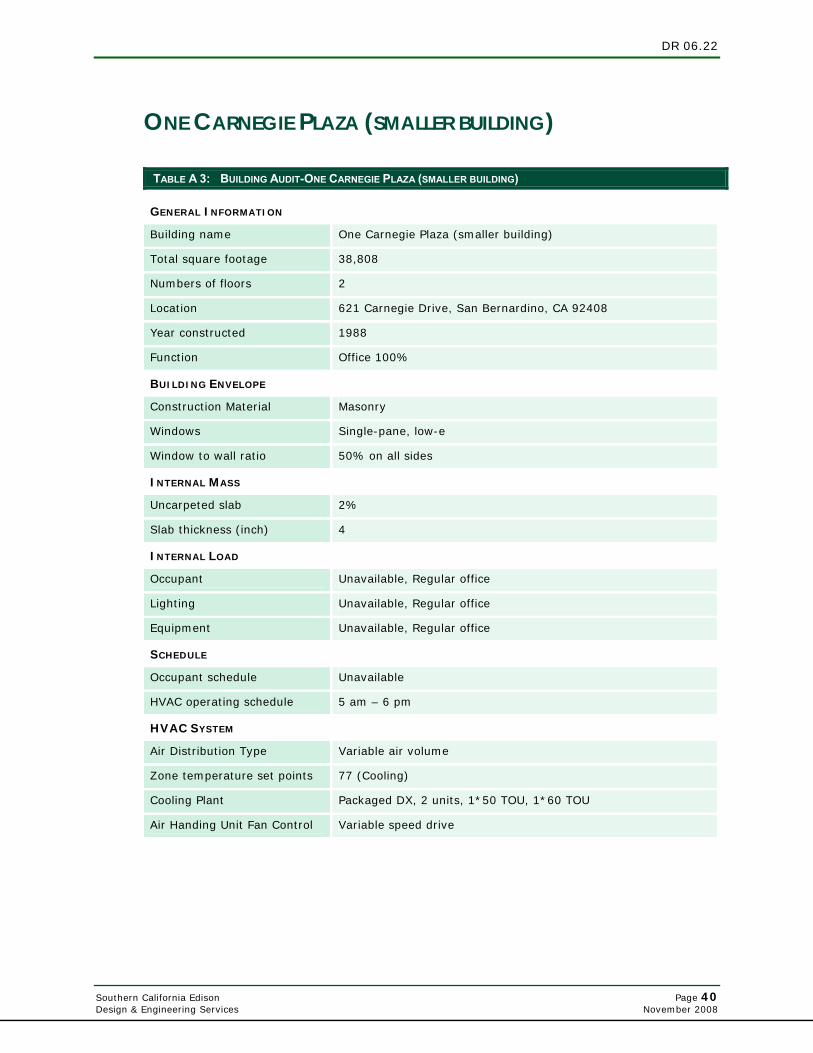
DR 06.22
Southern California Edison Page 40 Design & Engineering Services November 2008
ONE CARNEGIE PLAZA (SMALLER BUILDING)
TABLE A 3: BUILDING AUDIT-ONE CARNEGIE PLAZA (SMALLER BUILDING)
GENERAL INFORMATION
Building name One Carnegie Plaza (smaller building)
Total square footage 38,808
Numbers of floors 2
Location 621 Carnegie Drive, San Bernardino, CA 92408
Year constructed 1988
Function Office 100%
BUILDING ENVELOPE
Construction Material Masonry
Windows Single-pane, low-e
Window to wall ratio 50% on all sides
INTERNAL MASS
Uncarpeted slab 2%
Slab thickness (inch) 4
INTERNAL LOAD
Occupant Unavailable, Regular office
Lighting Unavailable, Regular office
Equipment Unavailable, Regular office
SCHEDULE
Occupant schedule Unavailable
HVAC operating schedule 5 am – 6 pm
HVAC SYSTEM
Air Distribution Type Variable air volume
Zone temperature set points 77 (Cooling)
Cooling Plant Packaged DX, 2 units, 1*50 TOU, 1*60 TOU
Air Handing Unit Fan Control Variable speed drive
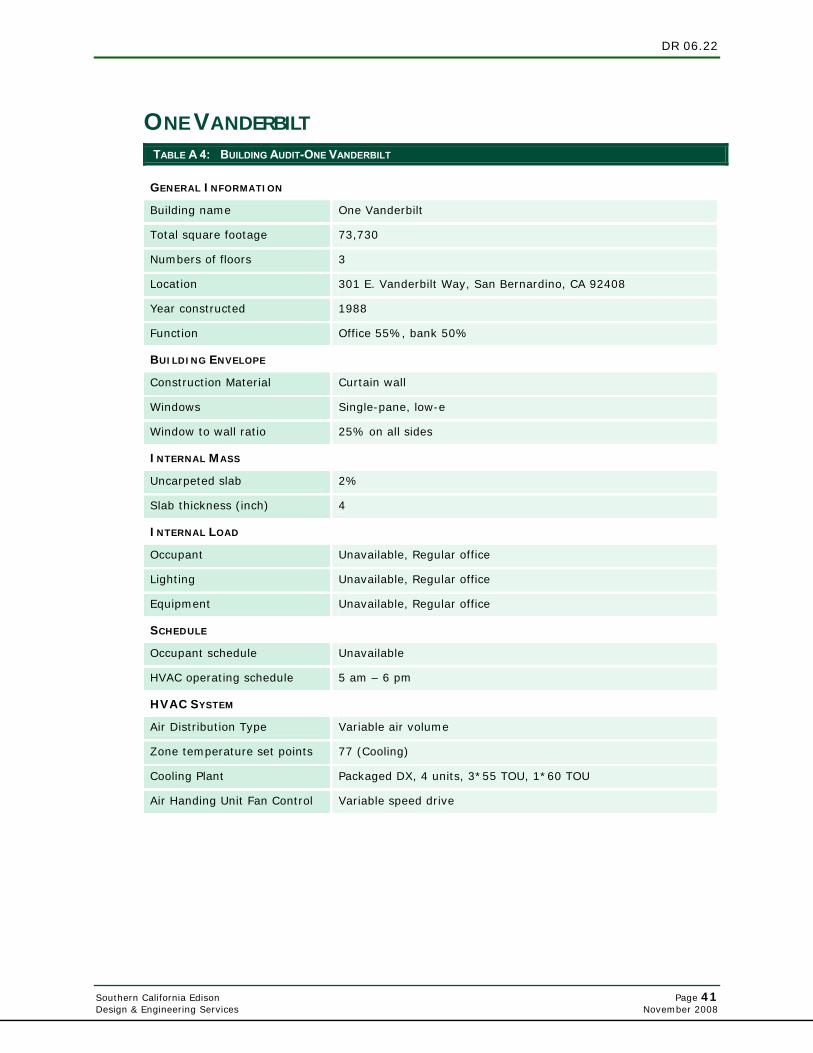
DR 06.22
Southern California Edison Page 41 Design & Engineering Services November 2008
ONE VANDERBILT TABLE A 4: BUILDING AUDIT-ONE VANDERBILT
GENERAL INFORMATION
Building name One Vanderbilt
Total square footage 73,730
Numbers of floors 3
Location 301 E. Vanderbilt Way, San Bernardino, CA 92408
Year constructed 1988
Function Office 55%, bank 50%
BUILDING ENVELOPE
Construction Material Curtain wall
Windows Single-pane, low-e
Window to wall ratio 25% on all sides
INTERNAL MASS
Uncarpeted slab 2%
Slab thickness (inch) 4
INTERNAL LOAD
Occupant Unavailable, Regular office
Lighting Unavailable, Regular office
Equipment Unavailable, Regular office
SCHEDULE
Occupant schedule Unavailable
HVAC operating schedule 5 am – 6 pm
HVAC SYSTEM
Air Distribution Type Variable air volume
Zone temperature set points 77 (Cooling)
Cooling Plant Packaged DX, 4 units, 3*55 TOU, 1*60 TOU
Air Handing Unit Fan Control Variable speed drive
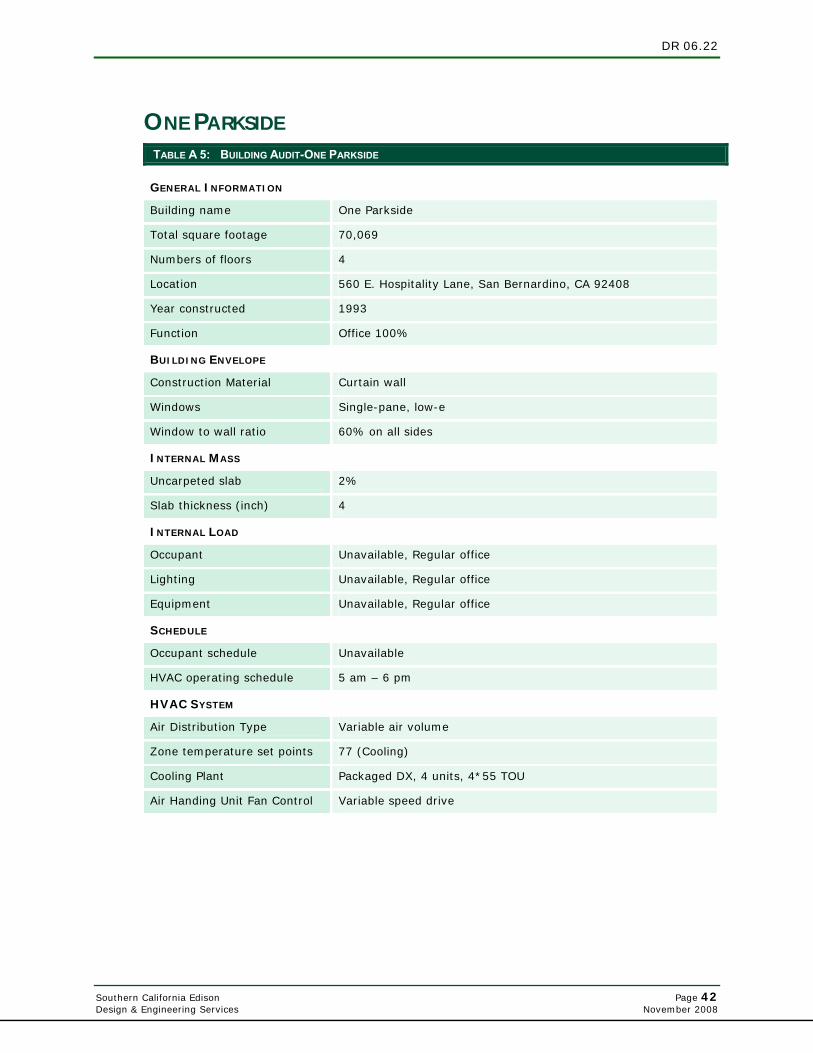
DR 06.22
Southern California Edison Page 42 Design & Engineering Services November 2008
ONE PARKSIDE TABLE A 5: BUILDING AUDIT-ONE PARKSIDE
GENERAL INFORMATION
Building name One Parkside
Total square footage 70,069
Numbers of floors 4
Location 560 E. Hospitality Lane, San Bernardino, CA 92408
Year constructed 1993
Function Office 100%
BUILDING ENVELOPE
Construction Material Curtain wall
Windows Single-pane, low-e
Window to wall ratio 60% on all sides
INTERNAL MASS
Uncarpeted slab 2%
Slab thickness (inch) 4
INTERNAL LOAD
Occupant Unavailable, Regular office
Lighting Unavailable, Regular office
Equipment Unavailable, Regular office
SCHEDULE
Occupant schedule Unavailable
HVAC operating schedule 5 am – 6 pm
HVAC SYSTEM
Air Distribution Type Variable air volume
Zone temperature set points 77 (Cooling)
Cooling Plant Packaged DX, 4 units, 4*55 TOU
Air Handing Unit Fan Control Variable speed drive

DR 06.22
Southern California Edison Page 43 Design & Engineering Services November 2008
LAKESIDE TOWER TABLE A 6: BUILDING AUDIT-LAKESIDE TOWER
GENERAL INFORMATION
Building name Lakeside Tower
Total square footage 112,717
Numbers of floors 6
Location 650 E. Hospitality Lane, San Bernardino, CA 92408
Year constructed 1990
Function Office 100%
BUILDING ENVELOPE
Construction Material Frame
Windows Single-pane, low-e
Window to wall ratio 60% on all sides
INTERNAL MASS
Uncarpeted slab 2%
Slab thickness (inch) 4
INTERNAL LOAD
Occupant Unavailable, Regular office
Lighting Unavailable, Regular office
Equipment Unavailable, Regular office
SCHEDULE
Occupant schedule Unavailable
HVAC operating schedule 5 am – 6 pm
HVAC SYSTEM
Air Distribution Type Variable air volume
Zone temperature set points 77 (Cooling)
Cooling Plant Central chiller, 2*175 reciprocating chiller
Air Handing Unit Fan Control Variable speed drive
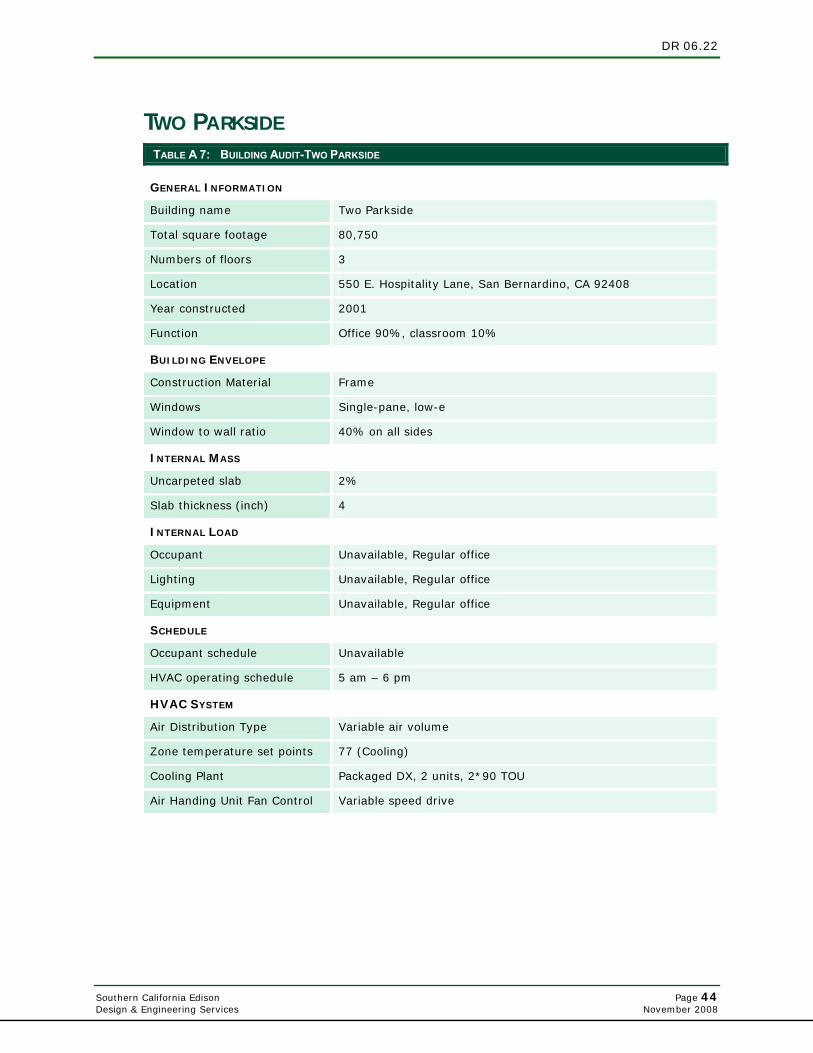
DR 06.22
Southern California Edison Page 44 Design & Engineering Services November 2008
TWO PARKSIDE TABLE A 7: BUILDING AUDIT-TWO PARKSIDE
GENERAL INFORMATION
Building name Two Parkside
Total square footage 80,750
Numbers of floors 3
Location 550 E. Hospitality Lane, San Bernardino, CA 92408
Year constructed 2001
Function Office 90%, classroom 10%
BUILDING ENVELOPE
Construction Material Frame
Windows Single-pane, low-e
Window to wall ratio 40% on all sides
INTERNAL MASS
Uncarpeted slab 2%
Slab thickness (inch) 4
INTERNAL LOAD
Occupant Unavailable, Regular office
Lighting Unavailable, Regular office
Equipment Unavailable, Regular office
SCHEDULE
Occupant schedule Unavailable
HVAC operating schedule 5 am – 6 pm
HVAC SYSTEM
Air Distribution Type Variable air volume
Zone temperature set points 77 (Cooling)
Cooling Plant Packaged DX, 2 units, 2*90 TOU
Air Handing Unit Fan Control Variable speed drive
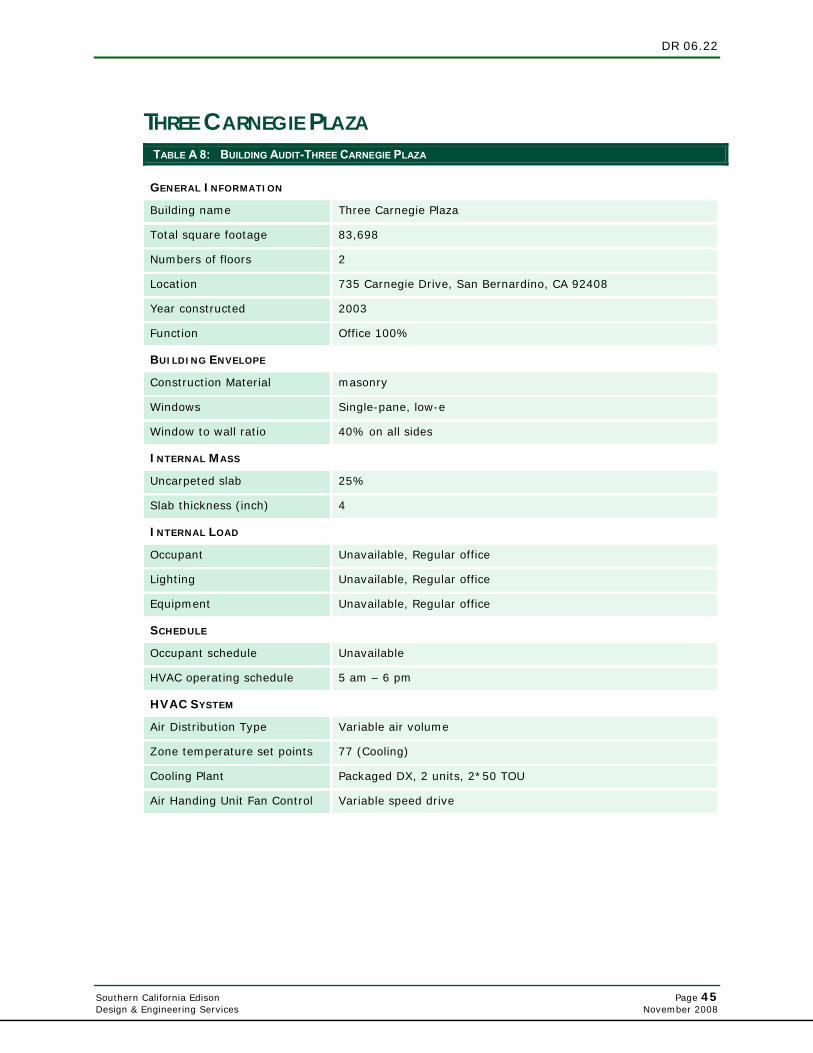
DR 06.22
Southern California Edison Page 45 Design & Engineering Services November 2008
THREE CARNEGIE PLAZA TABLE A 8: BUILDING AUDIT-THREE CARNEGIE PLAZA
GENERAL INFORMATION
Building name Three Carnegie Plaza
Total square footage 83,698
Numbers of floors 2
Location 735 Carnegie Drive, San Bernardino, CA 92408
Year constructed 2003
Function Office 100%
BUILDING ENVELOPE
Construction Material masonry
Windows Single-pane, low-e
Window to wall ratio 40% on all sides
INTERNAL MASS
Uncarpeted slab 25%
Slab thickness (inch) 4
INTERNAL LOAD
Occupant Unavailable, Regular office
Lighting Unavailable, Regular office
Equipment Unavailable, Regular office
SCHEDULE
Occupant schedule Unavailable
HVAC operating schedule 5 am – 6 pm
HVAC SYSTEM
Air Distribution Type Variable air volume
Zone temperature set points 77 (Cooling)
Cooling Plant Packaged DX, 2 units, 2*50 TOU
Air Handing Unit Fan Control Variable speed drive
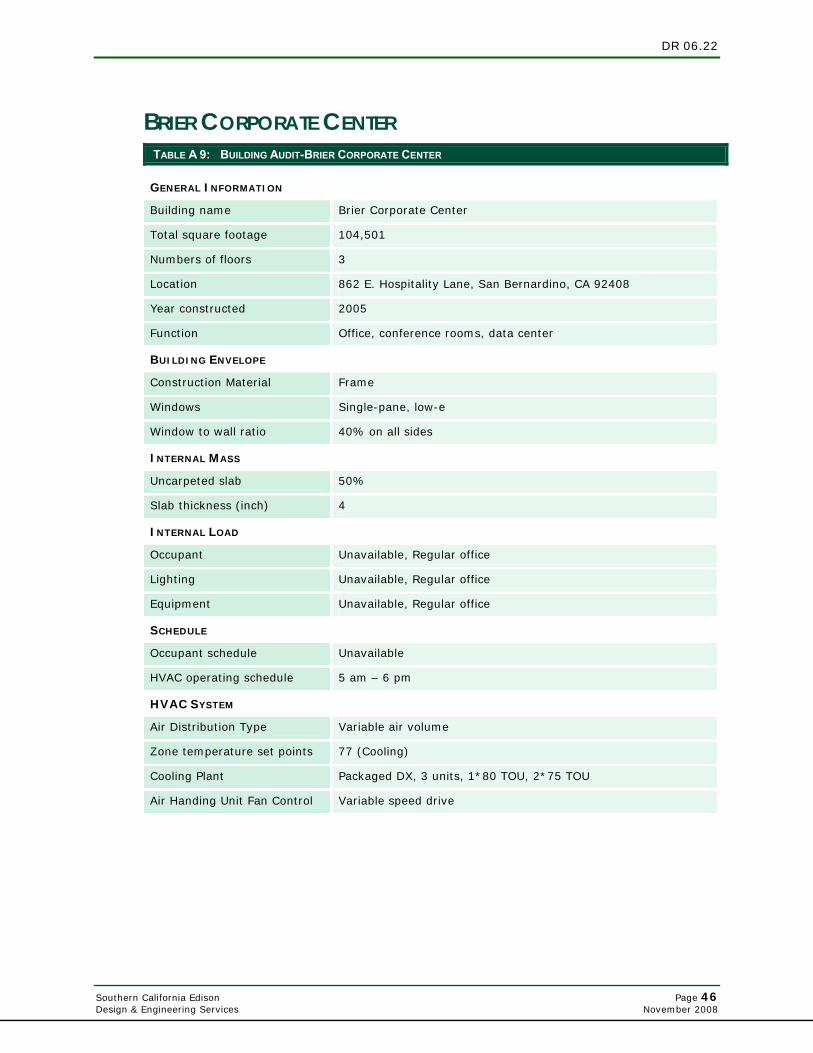
DR 06.22
Southern California Edison Page 46 Design & Engineering Services November 2008
BRIER CORPORATE CENTER TABLE A 9: BUILDING AUDIT-BRIER CORPORATE CENTER
GENERAL INFORMATION
Building name Brier Corporate Center
Total square footage 104,501
Numbers of floors 3
Location 862 E. Hospitality Lane, San Bernardino, CA 92408
Year constructed 2005
Function Office, conference rooms, data center
BUILDING ENVELOPE
Construction Material Frame
Windows Single-pane, low-e
Window to wall ratio 40% on all sides
INTERNAL MASS
Uncarpeted slab 50%
Slab thickness (inch) 4
INTERNAL LOAD
Occupant Unavailable, Regular office
Lighting Unavailable, Regular office
Equipment Unavailable, Regular office
SCHEDULE
Occupant schedule Unavailable
HVAC operating schedule 5 am – 6 pm
HVAC SYSTEM
Air Distribution Type Variable air volume
Zone temperature set points 77 (Cooling)
Cooling Plant Packaged DX, 3 units, 1*80 TOU, 2*75 TOU
Air Handing Unit Fan Control Variable speed drive

DR 06.22
Southern California Edison Page 47 Design & Engineering Services November 2008
VANDERBILT PLAZA TABLE A 10: BUILDING AUDIT-VANDERBILT PLAZA
GENERAL INFORMATION
Building name Vanderbilt Plaza
Total square footage 119,305
Numbers of floors 4
Location 451 E. Vanderbilt Way, San Bernardino, CA 92408
Year constructed 2002
Function Office 75%, classroom 25%
BUILDING ENVELOPE
Construction Material Frame
Windows Single-pane, low-e
Window to wall ratio 40% on all sides
INTERNAL MASS
Uncarpeted slab 20%
Slab thickness (inch) 4
INTERNAL LOAD
Occupant Unavailable, Regular office
Lighting Unavailable, Regular office
Equipment Unavailable, Regular office
SCHEDULE
Occupant schedule Unavailable
HVAC operating schedule 5 am – 6 pm
HVAC SYSTEM
Air Distribution Type Variable air volume
Zone temperature set points 77 (Cooling)
Cooling Plant Packaged DX, 4 units, 2*50 TOU, 2*55 TOU
Air Handing Unit Fan Control Variable speed drive
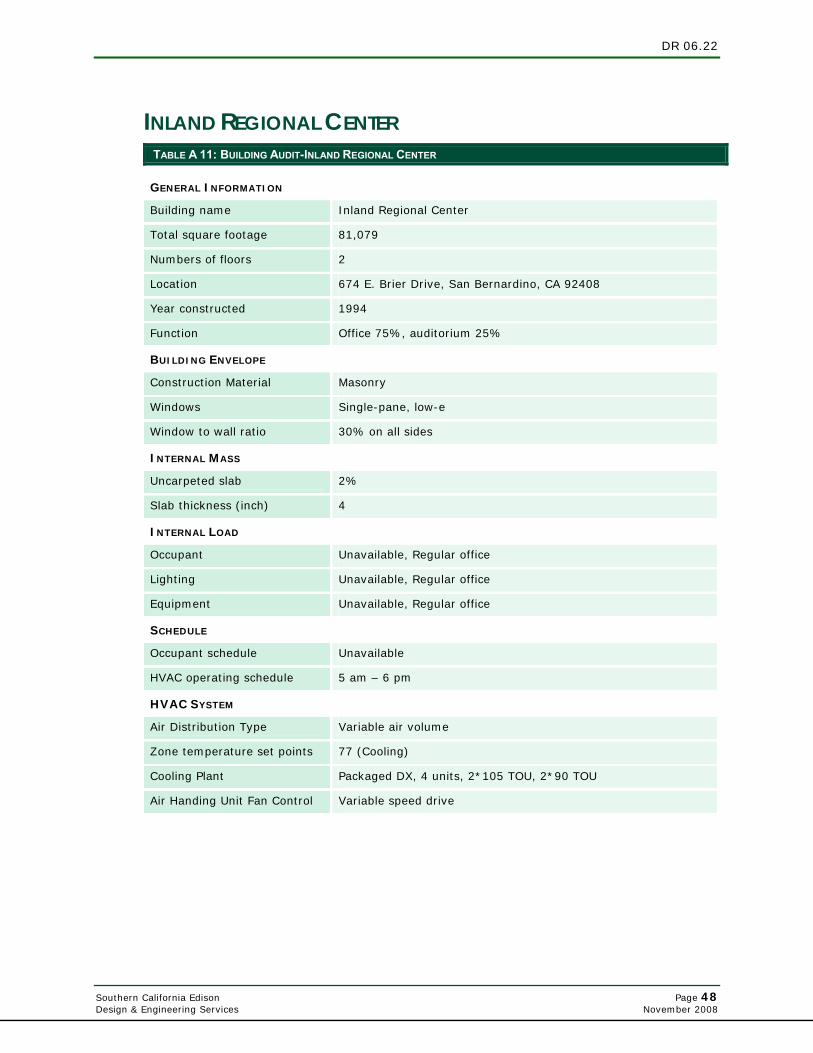
DR 06.22
Southern California Edison Page 48 Design & Engineering Services November 2008
INLAND REGIONAL CENTER TABLE A 11: BUILDING AUDIT-INLAND REGIONAL CENTER
GENERAL INFORMATION
Building name Inland Regional Center
Total square footage 81,079
Numbers of floors 2
Location 674 E. Brier Drive, San Bernardino, CA 92408
Year constructed 1994
Function Office 75%, auditorium 25%
BUILDING ENVELOPE
Construction Material Masonry
Windows Single-pane, low-e
Window to wall ratio 30% on all sides
INTERNAL MASS
Uncarpeted slab 2%
Slab thickness (inch) 4
INTERNAL LOAD
Occupant Unavailable, Regular office
Lighting Unavailable, Regular office
Equipment Unavailable, Regular office
SCHEDULE
Occupant schedule Unavailable
HVAC operating schedule 5 am – 6 pm
HVAC SYSTEM
Air Distribution Type Variable air volume
Zone temperature set points 77 (Cooling)
Cooling Plant Packaged DX, 4 units, 2*105 TOU, 2*90 TOU
Air Handing Unit Fan Control Variable speed drive
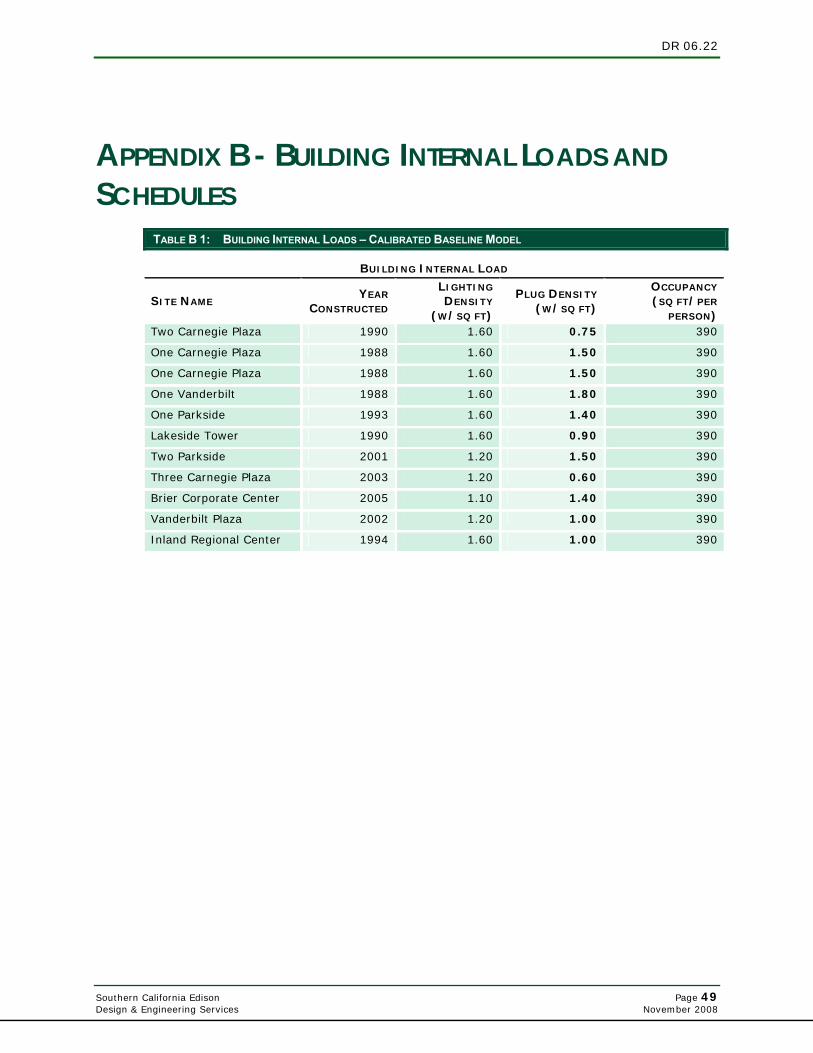
DR 06.22
Southern California Edison Page 49 Design & Engineering Services November 2008
APPENDIX B - BUILDING INTERNAL LOADS AND SCHEDULES
TABLE B 1: BUILDING INTERNAL LOADS – CALIBRATED BASELINE MODEL
BUILDING INTERNAL LOAD
SITE NAME YEAR
CONSTRUCTED
LIGHTING
DENSITY (W/SQ FT)
PLUG DENSITY
(W/SQ FT)
OCCUPANCY (SQ FT/PER
PERSON) Two Carnegie Plaza 1990 1.60 0.75 390
One Carnegie Plaza 1988 1.60 1.50 390
One Carnegie Plaza 1988 1.60 1.50 390
One Vanderbilt 1988 1.60 1.80 390
One Parkside 1993 1.60 1.40 390
Lakeside Tower 1990 1.60 0.90 390
Two Parkside 2001 1.20 1.50 390
Three Carnegie Plaza 2003 1.20 0.60 390
Brier Corporate Center 2005 1.10 1.40 390
Vanderbilt Plaza 2002 1.20 1.00 390
Inland Regional Center 1994 1.60 1.00 390
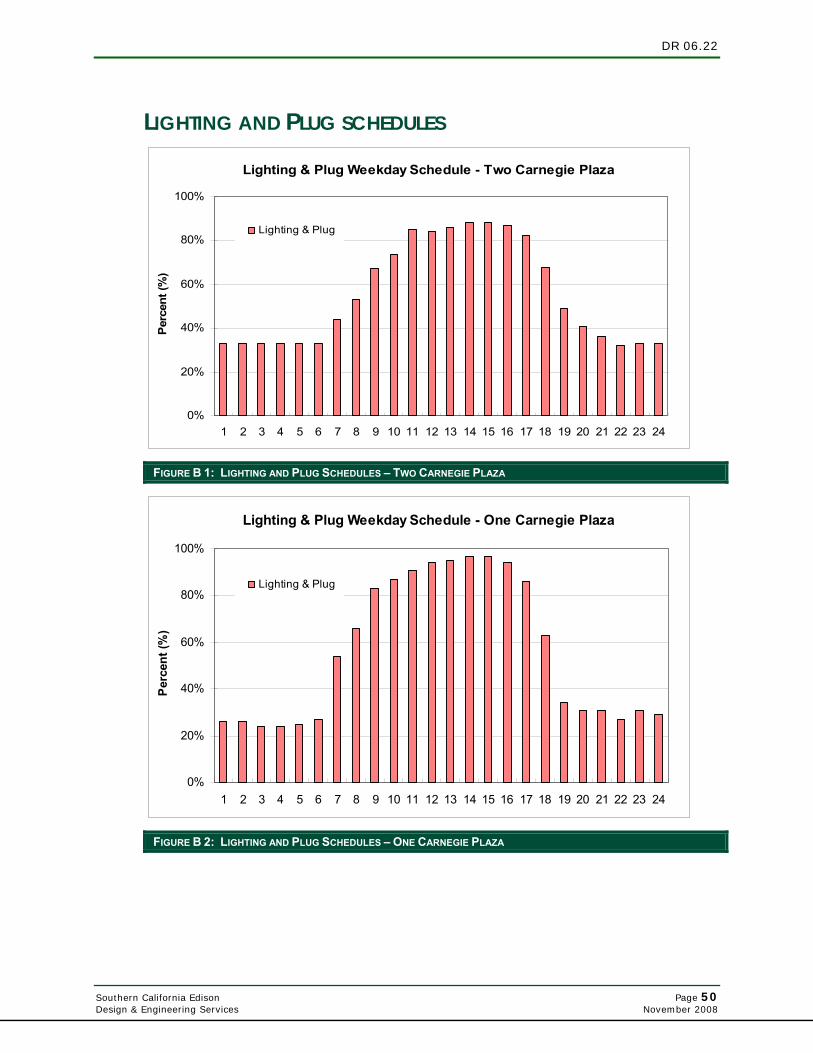
DR 06.22
Southern California Edison Page 50 Design & Engineering Services November 2008
LIGHTING AND PLUG SCHEDULES
Lighting & Plug Weekday Schedule - Two Carnegie Plaza
0%
20%
40%
60%
80%
100%
1 2 3 4 5 6 7 8 9 10 11 12 13 14 15 16 17 18 19 20 21 22 23 24
Perc
ent (
%)
Lighting & Plug
FIGURE B 1: LIGHTING AND PLUG SCHEDULES – TWO CARNEGIE PLAZA
Lighting & Plug Weekday Schedule - One Carnegie Plaza
0%
20%
40%
60%
80%
100%
1 2 3 4 5 6 7 8 9 10 11 12 13 14 15 16 17 18 19 20 21 22 23 24
Per
cent
(%)
Lighting & Plug
FIGURE B 2: LIGHTING AND PLUG SCHEDULES – ONE CARNEGIE PLAZA
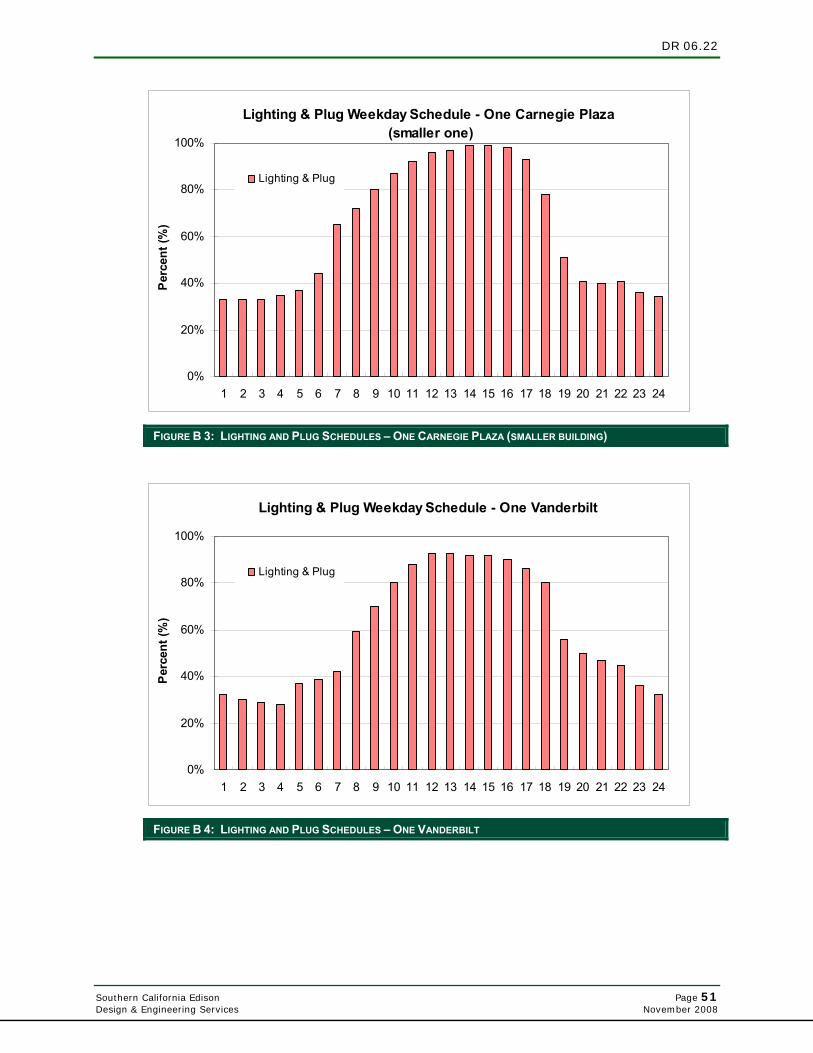
DR 06.22
Southern California Edison Page 51 Design & Engineering Services November 2008
Lighting & Plug Weekday Schedule - One Carnegie Plaza (smaller one)
0%
20%
40%
60%
80%
100%
1 2 3 4 5 6 7 8 9 10 11 12 13 14 15 16 17 18 19 20 21 22 23 24
Per
cent
(%)
Lighting & Plug
FIGURE B 3: LIGHTING AND PLUG SCHEDULES – ONE CARNEGIE PLAZA (SMALLER BUILDING)
Lighting & Plug Weekday Schedule - One Vanderbilt
0%
20%
40%
60%
80%
100%
1 2 3 4 5 6 7 8 9 10 11 12 13 14 15 16 17 18 19 20 21 22 23 24
Per
cent
(%)
Lighting & Plug
FIGURE B 4: LIGHTING AND PLUG SCHEDULES – ONE VANDERBILT
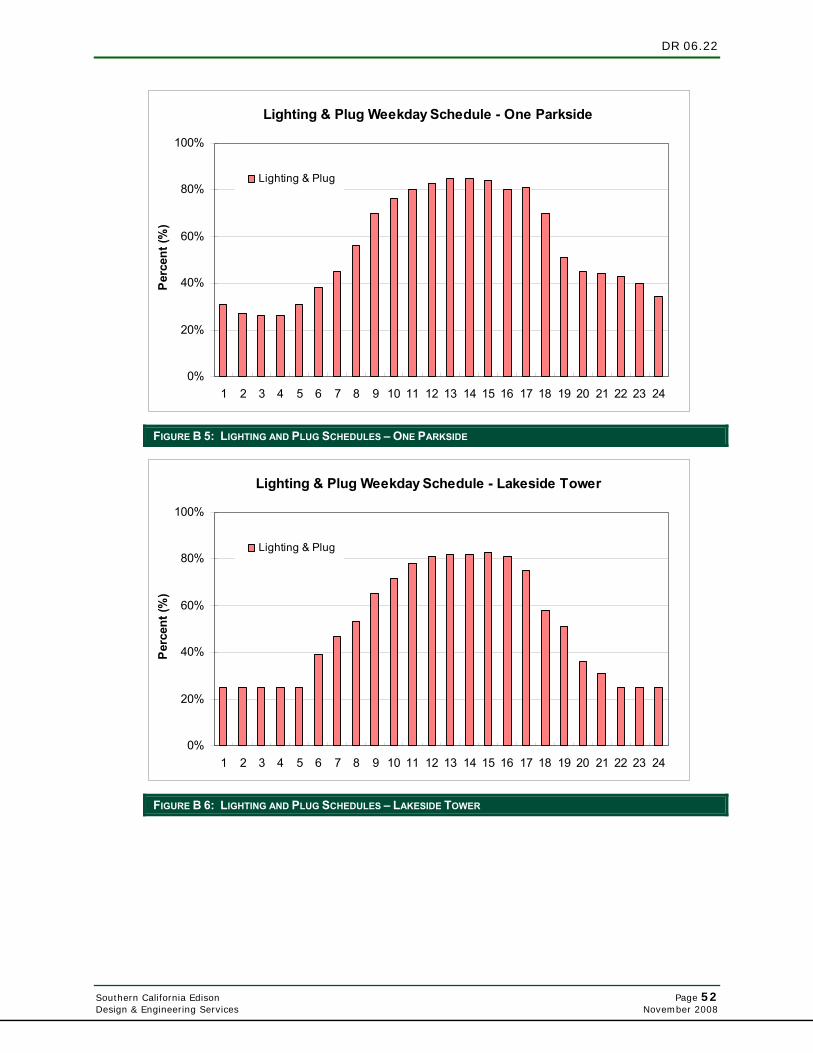
DR 06.22
Southern California Edison Page 52 Design & Engineering Services November 2008
Lighting & Plug Weekday Schedule - One Parkside
0%
20%
40%
60%
80%
100%
1 2 3 4 5 6 7 8 9 10 11 12 13 14 15 16 17 18 19 20 21 22 23 24
Per
cent
(%)
Lighting & Plug
FIGURE B 5: LIGHTING AND PLUG SCHEDULES – ONE PARKSIDE
Lighting & Plug Weekday Schedule - Lakeside Tower
0%
20%
40%
60%
80%
100%
1 2 3 4 5 6 7 8 9 10 11 12 13 14 15 16 17 18 19 20 21 22 23 24
Per
cent
(%)
Lighting & Plug
FIGURE B 6: LIGHTING AND PLUG SCHEDULES – LAKESIDE TOWER
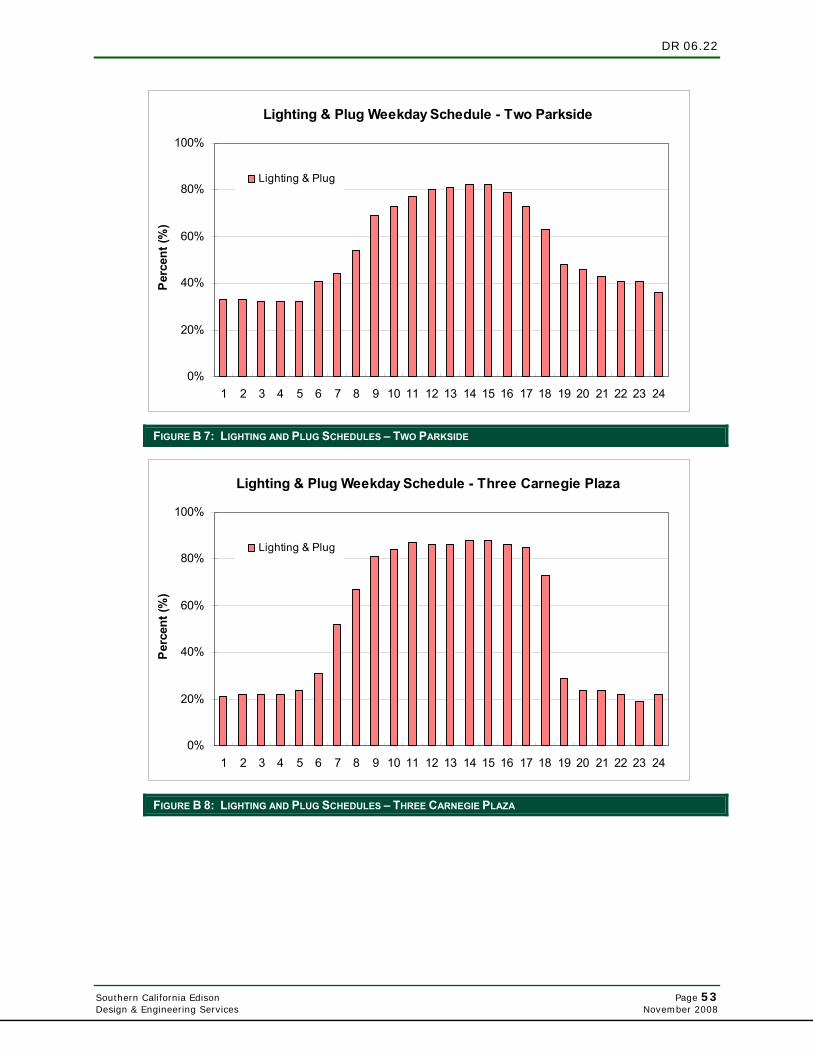
DR 06.22
Southern California Edison Page 53 Design & Engineering Services November 2008
Lighting & Plug Weekday Schedule - Two Parkside
0%
20%
40%
60%
80%
100%
1 2 3 4 5 6 7 8 9 10 11 12 13 14 15 16 17 18 19 20 21 22 23 24
Per
cent
(%)
Lighting & Plug
FIGURE B 7: LIGHTING AND PLUG SCHEDULES – TWO PARKSIDE
Lighting & Plug Weekday Schedule - Three Carnegie Plaza
0%
20%
40%
60%
80%
100%
1 2 3 4 5 6 7 8 9 10 11 12 13 14 15 16 17 18 19 20 21 22 23 24
Per
cent
(%)
Lighting & Plug
FIGURE B 8: LIGHTING AND PLUG SCHEDULES – THREE CARNEGIE PLAZA
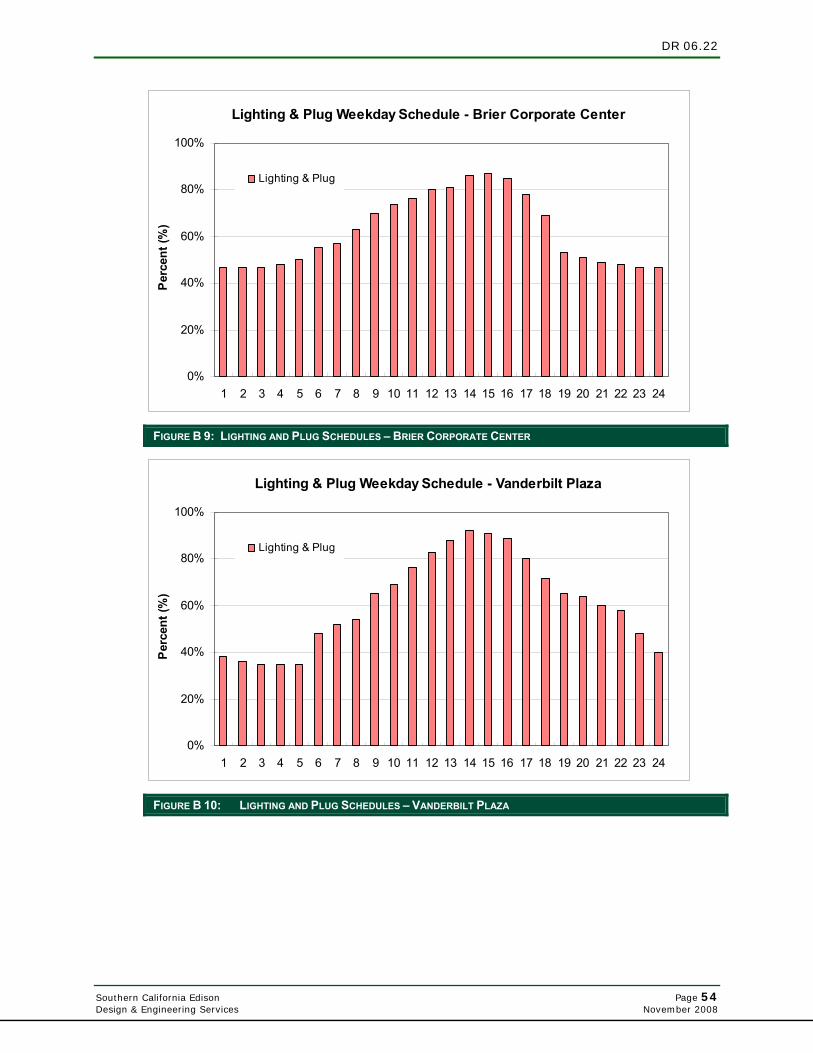
DR 06.22
Southern California Edison Page 54 Design & Engineering Services November 2008
Lighting & Plug Weekday Schedule - Brier Corporate Center
0%
20%
40%
60%
80%
100%
1 2 3 4 5 6 7 8 9 10 11 12 13 14 15 16 17 18 19 20 21 22 23 24
Per
cent
(%)
Lighting & Plug
FIGURE B 9: LIGHTING AND PLUG SCHEDULES – BRIER CORPORATE CENTER
Lighting & Plug Weekday Schedule - Vanderbilt Plaza
0%
20%
40%
60%
80%
100%
1 2 3 4 5 6 7 8 9 10 11 12 13 14 15 16 17 18 19 20 21 22 23 24
Per
cent
(%)
Lighting & Plug
FIGURE B 10: LIGHTING AND PLUG SCHEDULES – VANDERBILT PLAZA
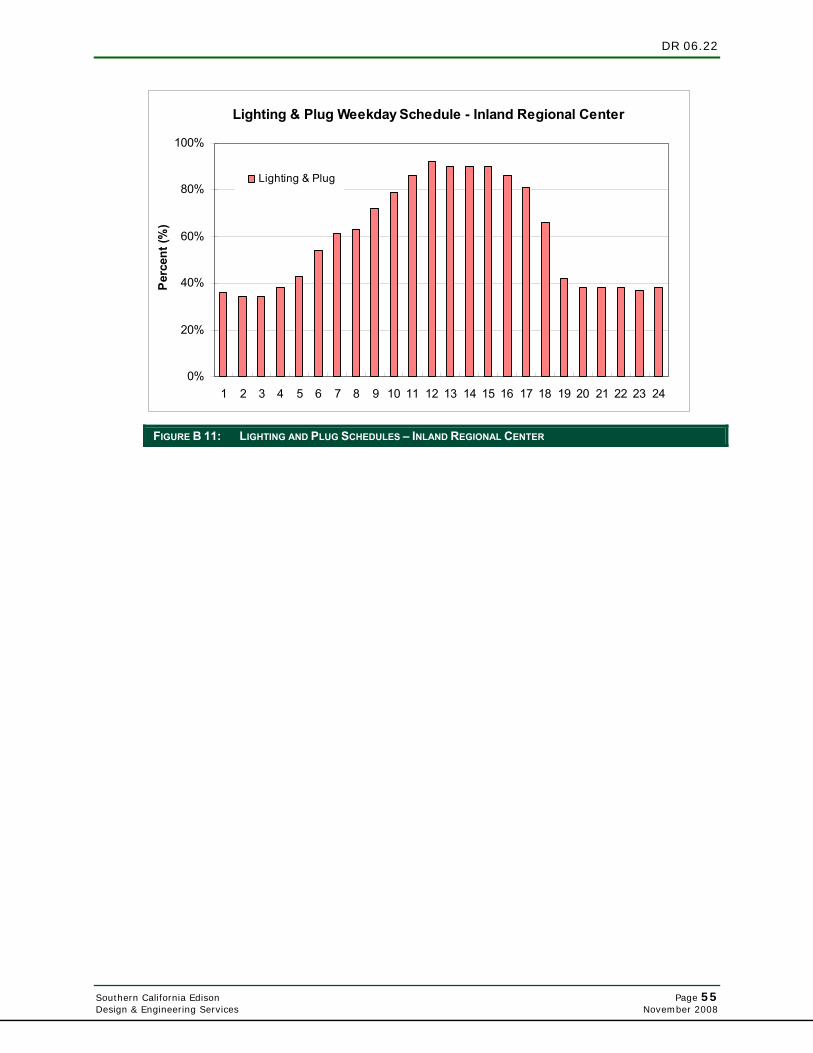
DR 06.22
Southern California Edison Page 55 Design & Engineering Services November 2008
Lighting & Plug Weekday Schedule - Inland Regional Center
0%
20%
40%
60%
80%
100%
1 2 3 4 5 6 7 8 9 10 11 12 13 14 15 16 17 18 19 20 21 22 23 24
Per
cent
(%)
Lighting & Plug
FIGURE B 11: LIGHTING AND PLUG SCHEDULES – INLAND REGIONAL CENTER
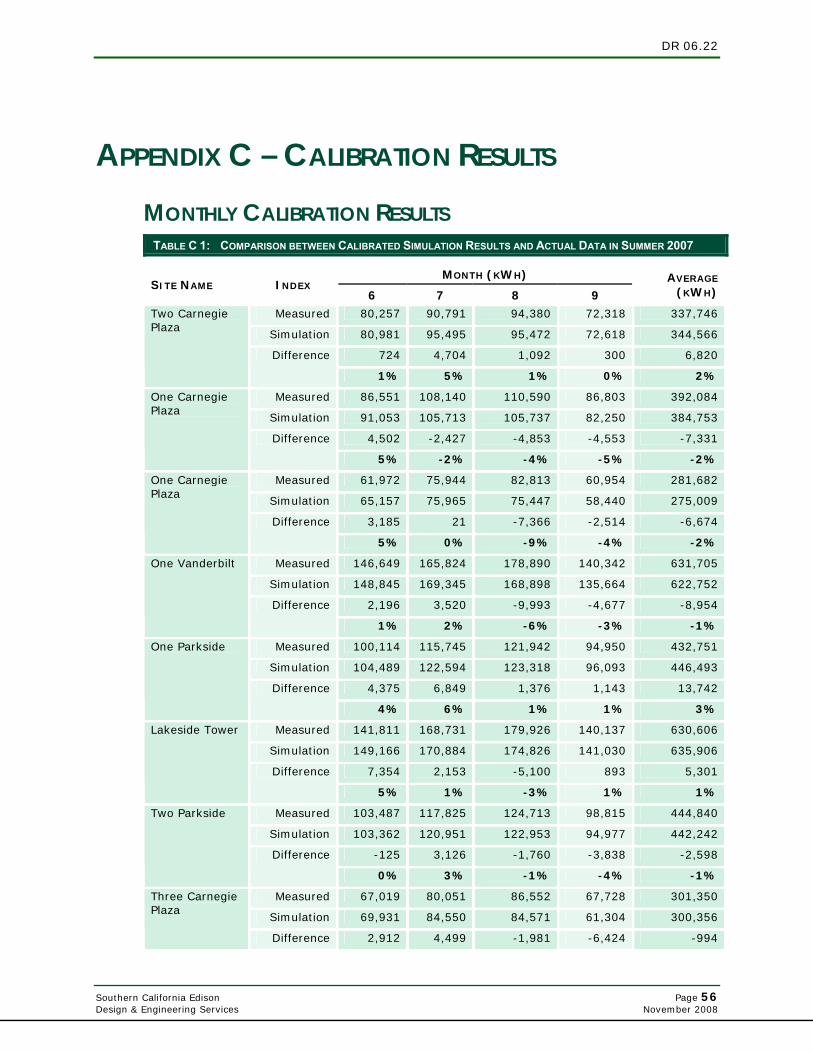
DR 06.22
Southern California Edison Page 56 Design & Engineering Services November 2008
APPENDIX C – CALIBRATION RESULTS MONTHLY CALIBRATION RESULTS
TABLE C 1: COMPARISON BETWEEN CALIBRATED SIMULATION RESULTS AND ACTUAL DATA IN SUMMER 2007
MONTH (KWH) SITE NAME INDEX
6 7 8 9 AVERAGE
(KWH)
Measured 80,257 90,791 94,380 72,318 337,746
Simulation 80,981 95,495 95,472 72,618 344,566
724 4,704 1,092 300 6,820
Two Carnegie Plaza
Difference
1% 5% 1% 0% 2%
Measured 86,551 108,140 110,590 86,803 392,084
Simulation 91,053 105,713 105,737 82,250 384,753
4,502 -2,427 -4,853 -4,553 -7,331
One Carnegie Plaza
Difference
5% -2% -4% -5% -2%
Measured 61,972 75,944 82,813 60,954 281,682
Simulation 65,157 75,965 75,447 58,440 275,009
3,185 21 -7,366 -2,514 -6,674
One Carnegie Plaza
Difference
5% 0% -9% -4% -2%
Measured 146,649 165,824 178,890 140,342 631,705
Simulation 148,845 169,345 168,898 135,664 622,752
2,196 3,520 -9,993 -4,677 -8,954
One Vanderbilt
Difference
1% 2% -6% -3% -1%
Measured 100,114 115,745 121,942 94,950 432,751
Simulation 104,489 122,594 123,318 96,093 446,493
4,375 6,849 1,376 1,143 13,742
One Parkside
Difference
4% 6% 1% 1% 3%
Measured 141,811 168,731 179,926 140,137 630,606
Simulation 149,166 170,884 174,826 141,030 635,906
7,354 2,153 -5,100 893 5,301
Lakeside Tower
Difference
5% 1% -3% 1% 1%
Measured 103,487 117,825 124,713 98,815 444,840
Simulation 103,362 120,951 122,953 94,977 442,242
-125 3,126 -1,760 -3,838 -2,598
Two Parkside
Difference
0% 3% -1% -4% -1%
Measured 67,019 80,051 86,552 67,728 301,350
Simulation 69,931 84,550 84,571 61,304 300,356
Three Carnegie Plaza
Difference 2,912 4,499 -1,981 -6,424 -994
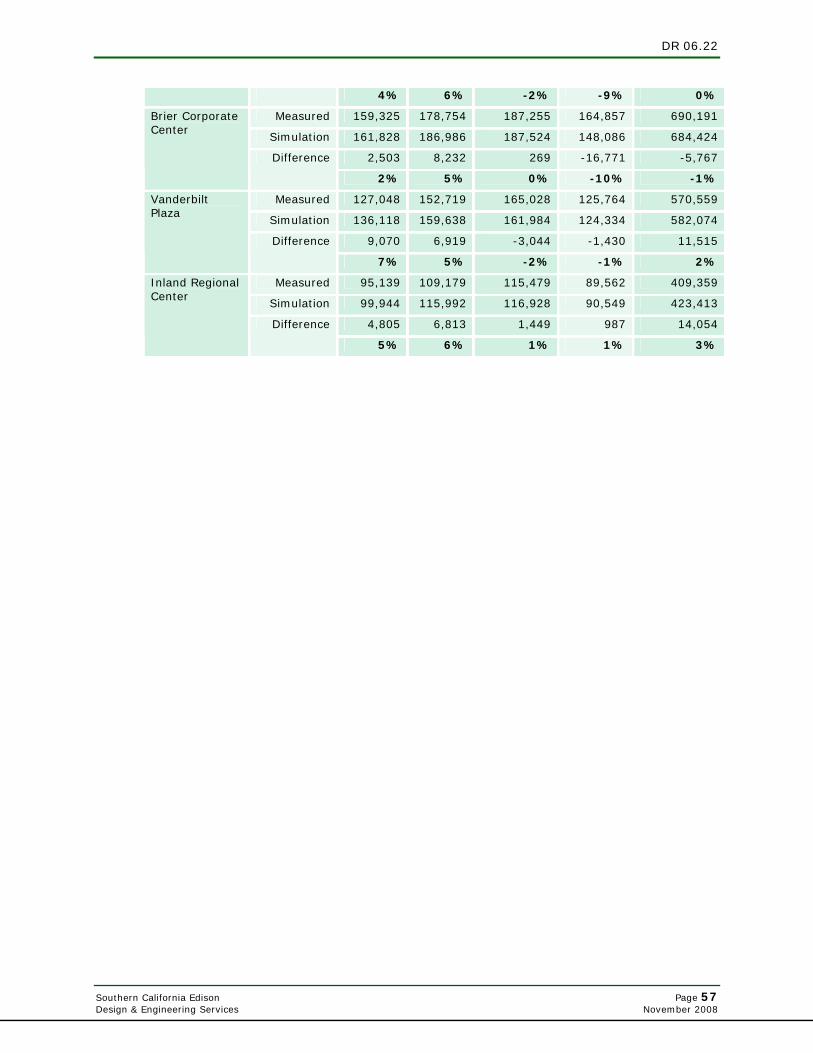
DR 06.22
Southern California Edison Page 57 Design & Engineering Services November 2008
4% 6% -2% -9% 0%
Measured 159,325 178,754 187,255 164,857 690,191
Simulation 161,828 186,986 187,524 148,086 684,424
2,503 8,232 269 -16,771 -5,767
Brier Corporate Center
Difference
2% 5% 0% -10% -1%
Measured 127,048 152,719 165,028 125,764 570,559
Simulation 136,118 159,638 161,984 124,334 582,074
9,070 6,919 -3,044 -1,430 11,515
Vanderbilt Plaza
Difference
7% 5% -2% -1% 2%
Measured 95,139 109,179 115,479 89,562 409,359
Simulation 99,944 115,992 116,928 90,549 423,413
4,805 6,813 1,449 987 14,054
Inland Regional Center
Difference
5% 6% 1% 1% 3%
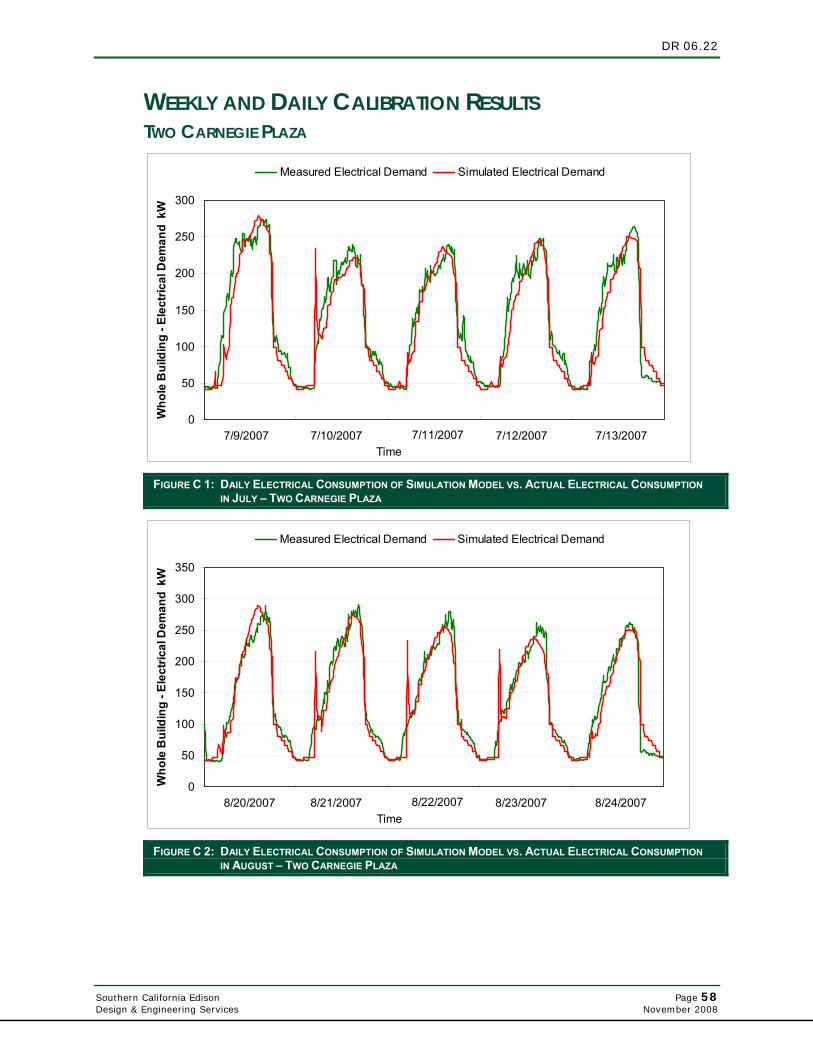
DR 06.22
Southern California Edison Page 58 Design & Engineering Services November 2008
WEEKLY AND DAILY CALIBRATION RESULTS TWO CARNEGIE PLAZA
0
50
100
150
200
250
300
Time
Who
le B
uild
ing
- Ele
ctric
al D
eman
d k
WMeasured Electrical Demand Simulated Electrical Demand
7/9/2007 7/10/2007 7/11/2007 7/12/2007 7/13/2007
FIGURE C 1: DAILY ELECTRICAL CONSUMPTION OF SIMULATION MODEL VS. ACTUAL ELECTRICAL CONSUMPTION IN JULY – TWO CARNEGIE PLAZA
0
50
100
150
200
250
300
350
Time
Who
le B
uild
ing
- Ele
ctric
al D
eman
d k
W
Measured Electrical Demand Simulated Electrical Demand
8/20/2007 8/21/2007 8/22/2007 8/23/2007 8/24/2007
FIGURE C 2: DAILY ELECTRICAL CONSUMPTION OF SIMULATION MODEL VS. ACTUAL ELECTRICAL CONSUMPTION IN AUGUST – TWO CARNEGIE PLAZA
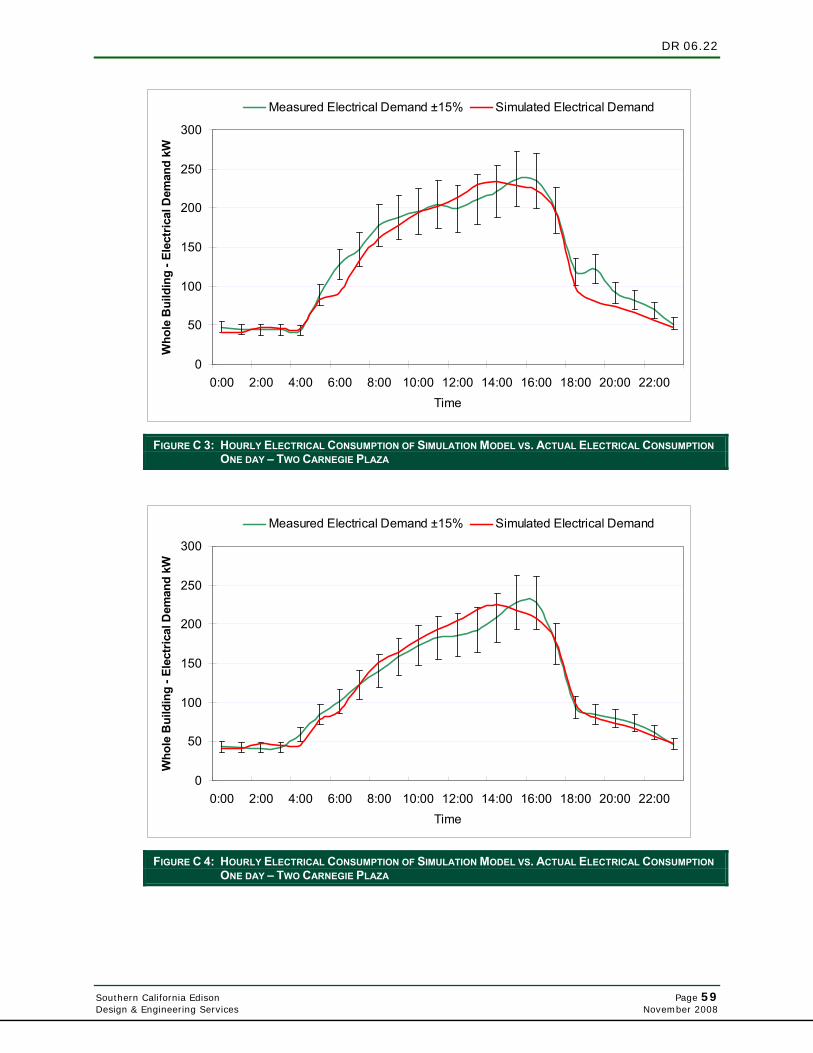
DR 06.22
Southern California Edison Page 59 Design & Engineering Services November 2008
0
50
100
150
200
250
300
0:00 2:00 4:00 6:00 8:00 10:00 12:00 14:00 16:00 18:00 20:00 22:00Time
Who
le B
uild
ing
- Ele
ctric
al D
eman
d kW
Measured Electrical Demand ±15% Simulated Electrical Demand
FIGURE C 3: HOURLY ELECTRICAL CONSUMPTION OF SIMULATION MODEL VS. ACTUAL ELECTRICAL CONSUMPTION ONE DAY – TWO CARNEGIE PLAZA
0
50
100
150
200
250
300
0:00 2:00 4:00 6:00 8:00 10:00 12:00 14:00 16:00 18:00 20:00 22:00Time
Who
le B
uild
ing
- Ele
ctric
al D
eman
d kW
Measured Electrical Demand ±15% Simulated Electrical Demand
FIGURE C 4: HOURLY ELECTRICAL CONSUMPTION OF SIMULATION MODEL VS. ACTUAL ELECTRICAL CONSUMPTION ONE DAY – TWO CARNEGIE PLAZA
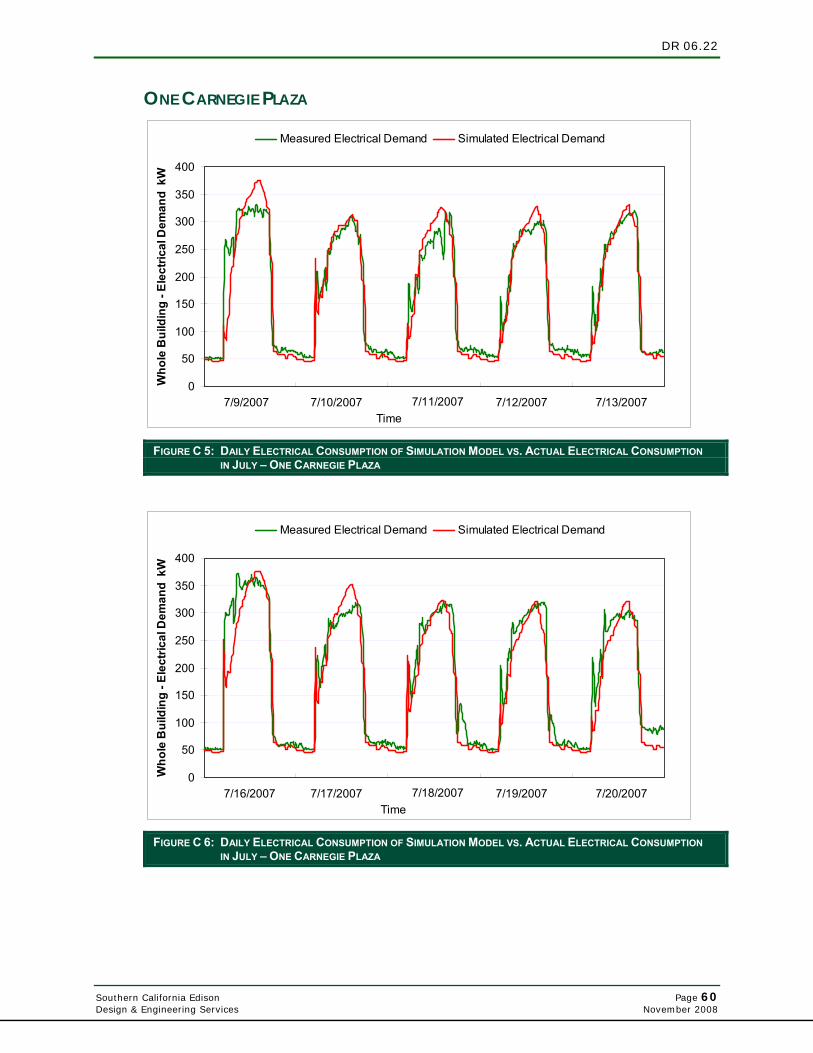
DR 06.22
Southern California Edison Page 60 Design & Engineering Services November 2008
ONE CARNEGIE PLAZA
0
50
100
150
200
250
300
350
400
Time
Who
le B
uild
ing
- Ele
ctric
al D
eman
d k
W
Measured Electrical Demand Simulated Electrical Demand
7/9/2007 7/10/2007 7/11/2007 7/12/2007 7/13/2007
FIGURE C 5: DAILY ELECTRICAL CONSUMPTION OF SIMULATION MODEL VS. ACTUAL ELECTRICAL CONSUMPTION IN JULY – ONE CARNEGIE PLAZA
0
50
100
150
200
250
300
350
400
Time
Who
le B
uild
ing
- Ele
ctric
al D
eman
d k
W
Measured Electrical Demand Simulated Electrical Demand
7/16/2007 7/17/2007 7/18/2007 7/19/2007 7/20/2007
FIGURE C 6: DAILY ELECTRICAL CONSUMPTION OF SIMULATION MODEL VS. ACTUAL ELECTRICAL CONSUMPTION IN JULY – ONE CARNEGIE PLAZA

DR 06.22
Southern California Edison Page 61 Design & Engineering Services November 2008
0
50
100
150
200
250
300
350
400
0:00 2:00 4:00 6:00 8:00 10:00 12:00 14:00 16:00 18:00 20:00 22:00Time
Who
le B
uild
ing
- Ele
ctric
al D
eman
d kW
Measured Electrical Demand ±15% Simulated Electrical Demand
FIGURE C 7: HOURLY ELECTRICAL CONSUMPTION OF SIMULATION MODEL VS. ACTUAL ELECTRICAL CONSUMPTION ONE DAY – ONE CARNEGIE PLAZA
0
50
100
150
200
250
300
350
0:00 2:00 4:00 6:00 8:00 10:00 12:00 14:00 16:00 18:00 20:00 22:00Time
Who
le B
uild
ing
- Ele
ctric
al D
eman
d kW
Measured Electrical Demand ±15% Simulated Electrical Demand
FIGURE C 8: HOURLY ELECTRICAL CONSUMPTION OF SIMULATION MODEL VS. ACTUAL ELECTRICAL CONSUMPTION ONE DAY – ONE CARNEGIE PLAZA
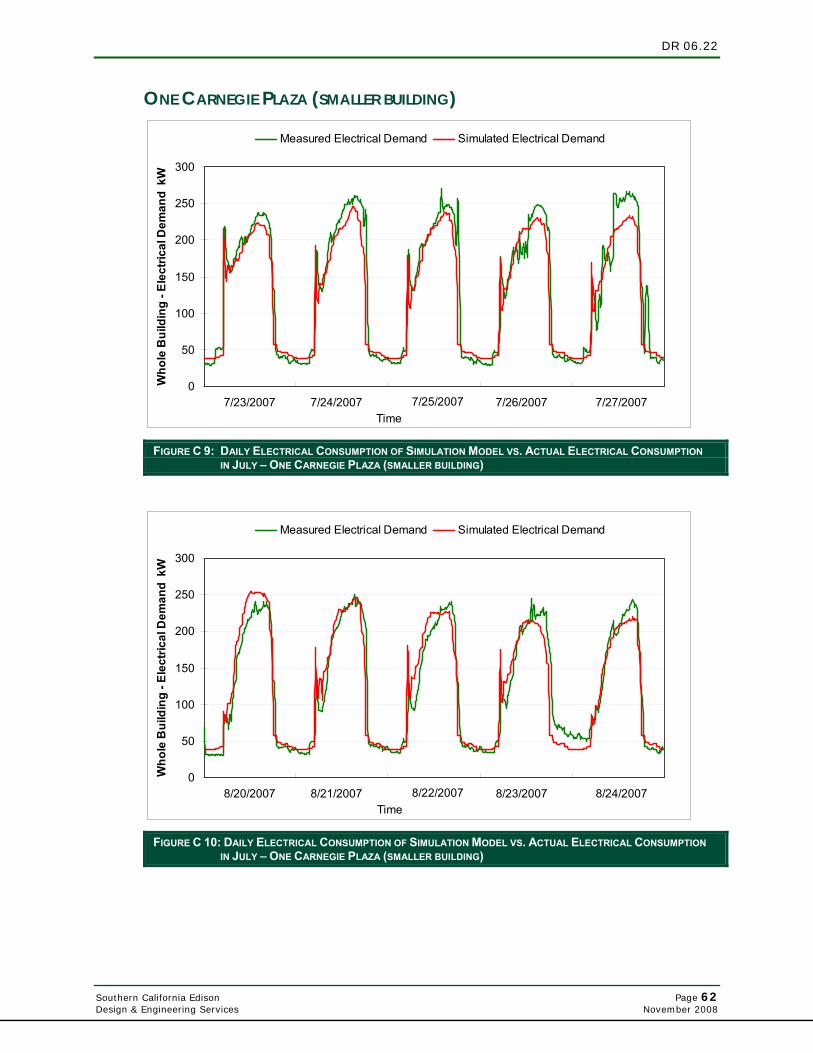
DR 06.22
Southern California Edison Page 62 Design & Engineering Services November 2008
ONE CARNEGIE PLAZA (SMALLER BUILDING)
0
50
100
150
200
250
300
Time
Who
le B
uild
ing
- Ele
ctric
al D
eman
d k
W
Measured Electrical Demand Simulated Electrical Demand
7/23/2007 7/24/2007 7/25/2007 7/26/2007 7/27/2007
FIGURE C 9: DAILY ELECTRICAL CONSUMPTION OF SIMULATION MODEL VS. ACTUAL ELECTRICAL CONSUMPTION IN JULY – ONE CARNEGIE PLAZA (SMALLER BUILDING)
0
50
100
150
200
250
300
Time
Who
le B
uild
ing
- Ele
ctric
al D
eman
d k
W
Measured Electrical Demand Simulated Electrical Demand
8/20/2007 8/21/2007 8/22/2007 8/23/2007 8/24/2007
FIGURE C 10: DAILY ELECTRICAL CONSUMPTION OF SIMULATION MODEL VS. ACTUAL ELECTRICAL CONSUMPTION IN JULY – ONE CARNEGIE PLAZA (SMALLER BUILDING)
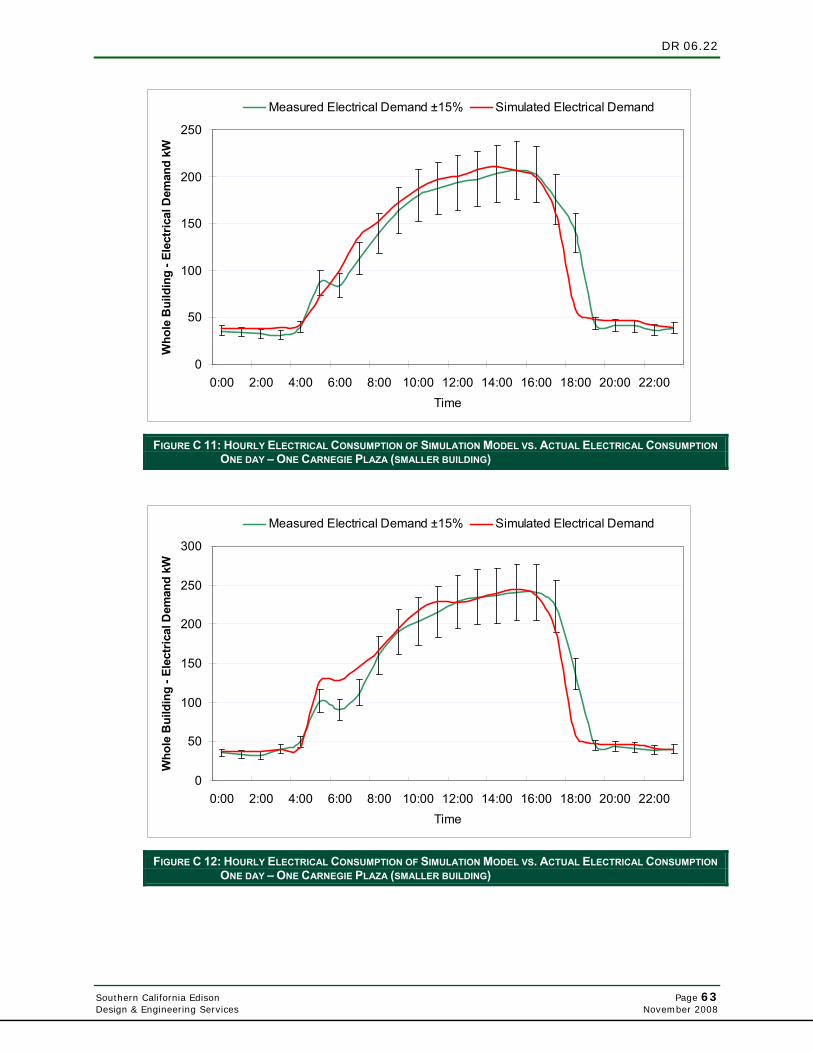
DR 06.22
Southern California Edison Page 63 Design & Engineering Services November 2008
0
50
100
150
200
250
0:00 2:00 4:00 6:00 8:00 10:00 12:00 14:00 16:00 18:00 20:00 22:00Time
Who
le B
uild
ing
- Ele
ctric
al D
eman
d kW
Measured Electrical Demand ±15% Simulated Electrical Demand
FIGURE C 11: HOURLY ELECTRICAL CONSUMPTION OF SIMULATION MODEL VS. ACTUAL ELECTRICAL CONSUMPTION ONE DAY – ONE CARNEGIE PLAZA (SMALLER BUILDING)
0
50
100
150
200
250
300
0:00 2:00 4:00 6:00 8:00 10:00 12:00 14:00 16:00 18:00 20:00 22:00Time
Who
le B
uild
ing
- Ele
ctric
al D
eman
d kW
Measured Electrical Demand ±15% Simulated Electrical Demand
FIGURE C 12: HOURLY ELECTRICAL CONSUMPTION OF SIMULATION MODEL VS. ACTUAL ELECTRICAL CONSUMPTION ONE DAY – ONE CARNEGIE PLAZA (SMALLER BUILDING)
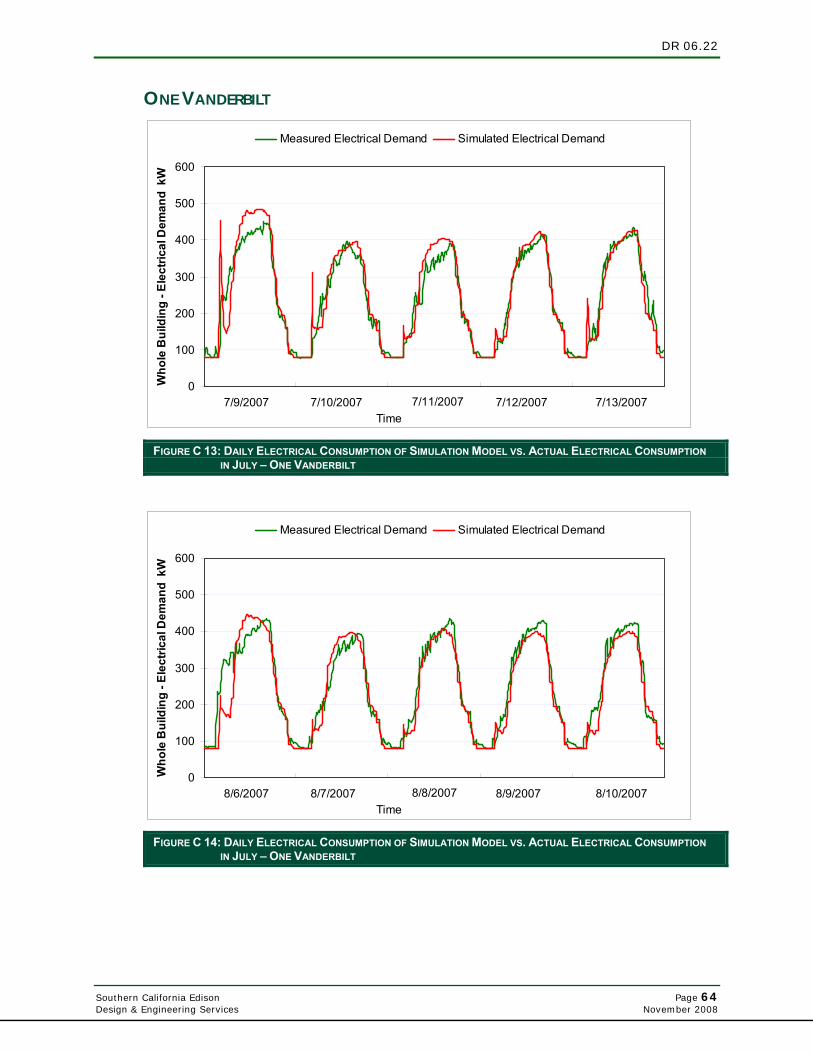
DR 06.22
Southern California Edison Page 64 Design & Engineering Services November 2008
ONE VANDERBILT
0
100
200
300
400
500
600
Time
Who
le B
uild
ing
- Ele
ctric
al D
eman
d k
W
Measured Electrical Demand Simulated Electrical Demand
7/9/2007 7/10/2007 7/11/2007 7/12/2007 7/13/2007
FIGURE C 13: DAILY ELECTRICAL CONSUMPTION OF SIMULATION MODEL VS. ACTUAL ELECTRICAL CONSUMPTION IN JULY – ONE VANDERBILT
0
100
200
300
400
500
600
Time
Who
le B
uild
ing
- Ele
ctric
al D
eman
d k
W
Measured Electrical Demand Simulated Electrical Demand
8/6/2007 8/7/2007 8/8/2007 8/9/2007 8/10/2007
FIGURE C 14: DAILY ELECTRICAL CONSUMPTION OF SIMULATION MODEL VS. ACTUAL ELECTRICAL CONSUMPTION IN JULY – ONE VANDERBILT
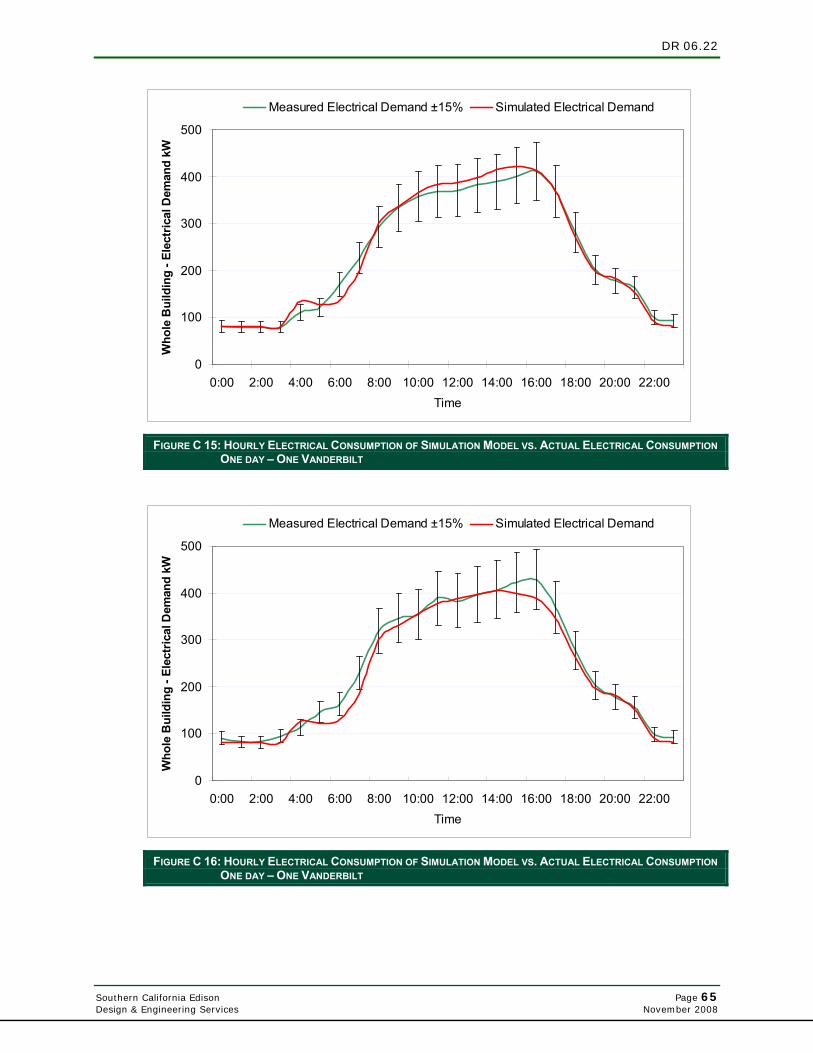
DR 06.22
Southern California Edison Page 65 Design & Engineering Services November 2008
0
100
200
300
400
500
0:00 2:00 4:00 6:00 8:00 10:00 12:00 14:00 16:00 18:00 20:00 22:00Time
Who
le B
uild
ing
- Ele
ctric
al D
eman
d kW
Measured Electrical Demand ±15% Simulated Electrical Demand
FIGURE C 15: HOURLY ELECTRICAL CONSUMPTION OF SIMULATION MODEL VS. ACTUAL ELECTRICAL CONSUMPTION ONE DAY – ONE VANDERBILT
0
100
200
300
400
500
0:00 2:00 4:00 6:00 8:00 10:00 12:00 14:00 16:00 18:00 20:00 22:00Time
Who
le B
uild
ing
- Ele
ctric
al D
eman
d kW
Measured Electrical Demand ±15% Simulated Electrical Demand
FIGURE C 16: HOURLY ELECTRICAL CONSUMPTION OF SIMULATION MODEL VS. ACTUAL ELECTRICAL CONSUMPTION ONE DAY – ONE VANDERBILT
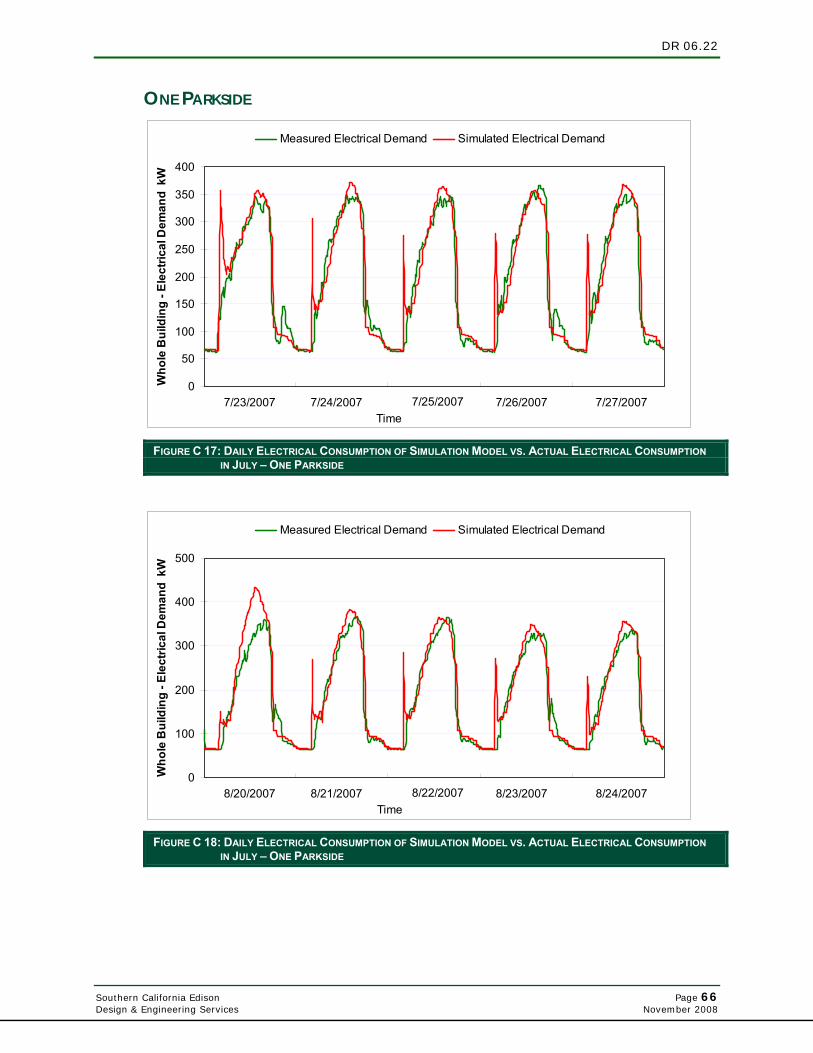
DR 06.22
Southern California Edison Page 66 Design & Engineering Services November 2008
ONE PARKSIDE
0
50
100
150
200
250
300
350
400
Time
Who
le B
uild
ing
- Ele
ctric
al D
eman
d k
W
Measured Electrical Demand Simulated Electrical Demand
7/23/2007 7/24/2007 7/25/2007 7/26/2007 7/27/2007
FIGURE C 17: DAILY ELECTRICAL CONSUMPTION OF SIMULATION MODEL VS. ACTUAL ELECTRICAL CONSUMPTION IN JULY – ONE PARKSIDE
0
100
200
300
400
500
Time
Who
le B
uild
ing
- Ele
ctric
al D
eman
d k
W
Measured Electrical Demand Simulated Electrical Demand
8/20/2007 8/21/2007 8/22/2007 8/23/2007 8/24/2007
FIGURE C 18: DAILY ELECTRICAL CONSUMPTION OF SIMULATION MODEL VS. ACTUAL ELECTRICAL CONSUMPTION IN JULY – ONE PARKSIDE
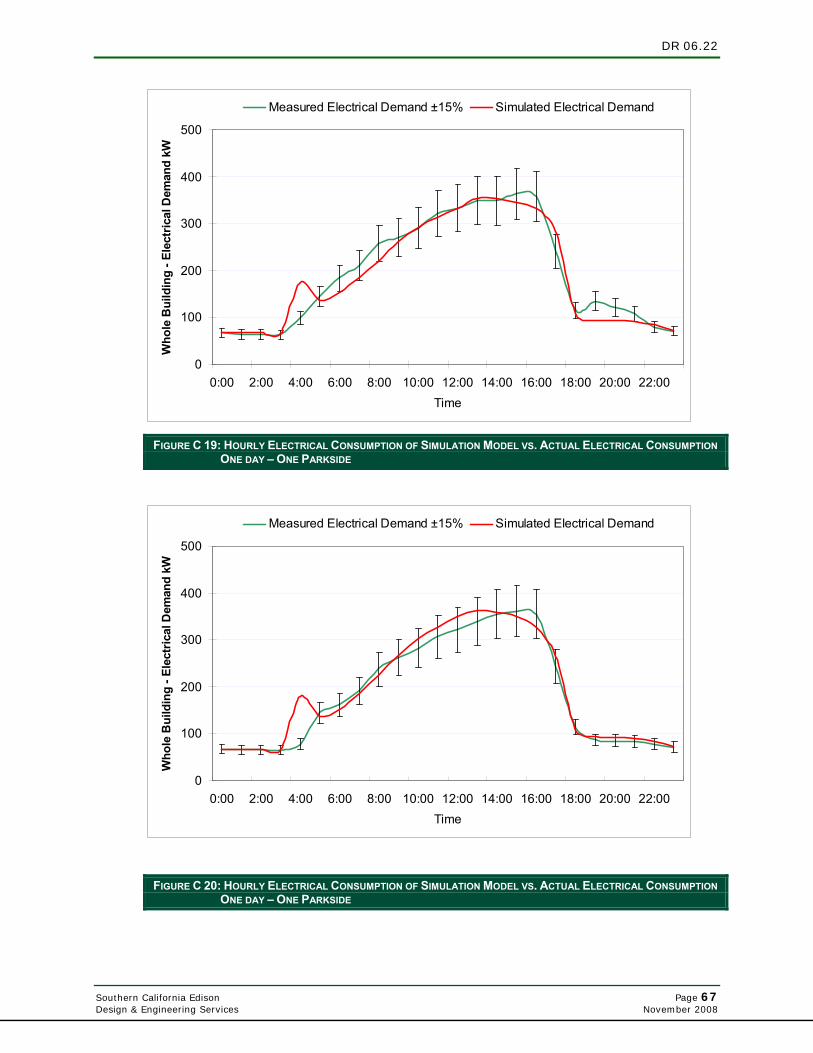
DR 06.22
Southern California Edison Page 67 Design & Engineering Services November 2008
0
100
200
300
400
500
0:00 2:00 4:00 6:00 8:00 10:00 12:00 14:00 16:00 18:00 20:00 22:00Time
Who
le B
uild
ing
- Ele
ctric
al D
eman
d kW
Measured Electrical Demand ±15% Simulated Electrical Demand
FIGURE C 19: HOURLY ELECTRICAL CONSUMPTION OF SIMULATION MODEL VS. ACTUAL ELECTRICAL CONSUMPTION ONE DAY – ONE PARKSIDE
0
100
200
300
400
500
0:00 2:00 4:00 6:00 8:00 10:00 12:00 14:00 16:00 18:00 20:00 22:00Time
Who
le B
uild
ing
- Ele
ctric
al D
eman
d kW
Measured Electrical Demand ±15% Simulated Electrical Demand
FIGURE C 20: HOURLY ELECTRICAL CONSUMPTION OF SIMULATION MODEL VS. ACTUAL ELECTRICAL CONSUMPTION ONE DAY – ONE PARKSIDE
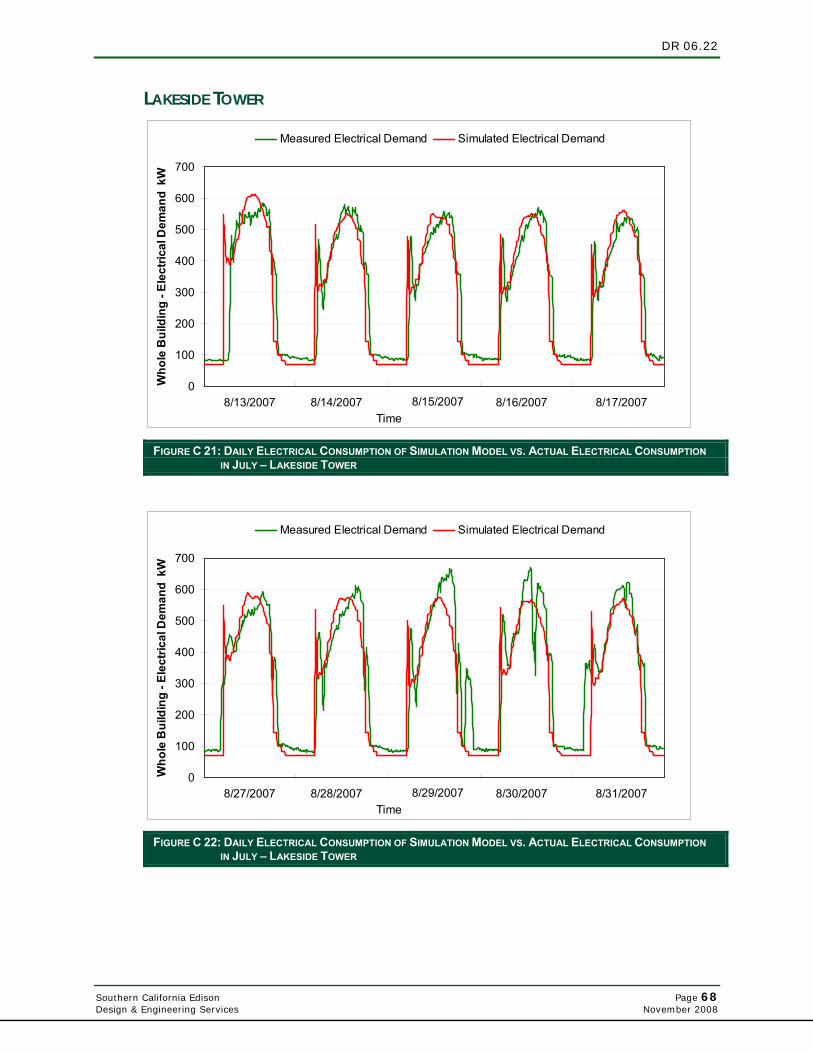
DR 06.22
Southern California Edison Page 68 Design & Engineering Services November 2008
LAKESIDE TOWER
0
100
200
300
400
500
600
700
Time
Who
le B
uild
ing
- Ele
ctric
al D
eman
d k
W
Measured Electrical Demand Simulated Electrical Demand
8/13/2007 8/14/2007 8/15/2007 8/16/2007 8/17/2007
FIGURE C 21: DAILY ELECTRICAL CONSUMPTION OF SIMULATION MODEL VS. ACTUAL ELECTRICAL CONSUMPTION IN JULY – LAKESIDE TOWER
0
100
200
300
400
500
600
700
Time
Who
le B
uild
ing
- Ele
ctric
al D
eman
d k
W
Measured Electrical Demand Simulated Electrical Demand
8/27/2007 8/28/2007 8/29/2007 8/30/2007 8/31/2007
FIGURE C 22: DAILY ELECTRICAL CONSUMPTION OF SIMULATION MODEL VS. ACTUAL ELECTRICAL CONSUMPTION IN JULY – LAKESIDE TOWER
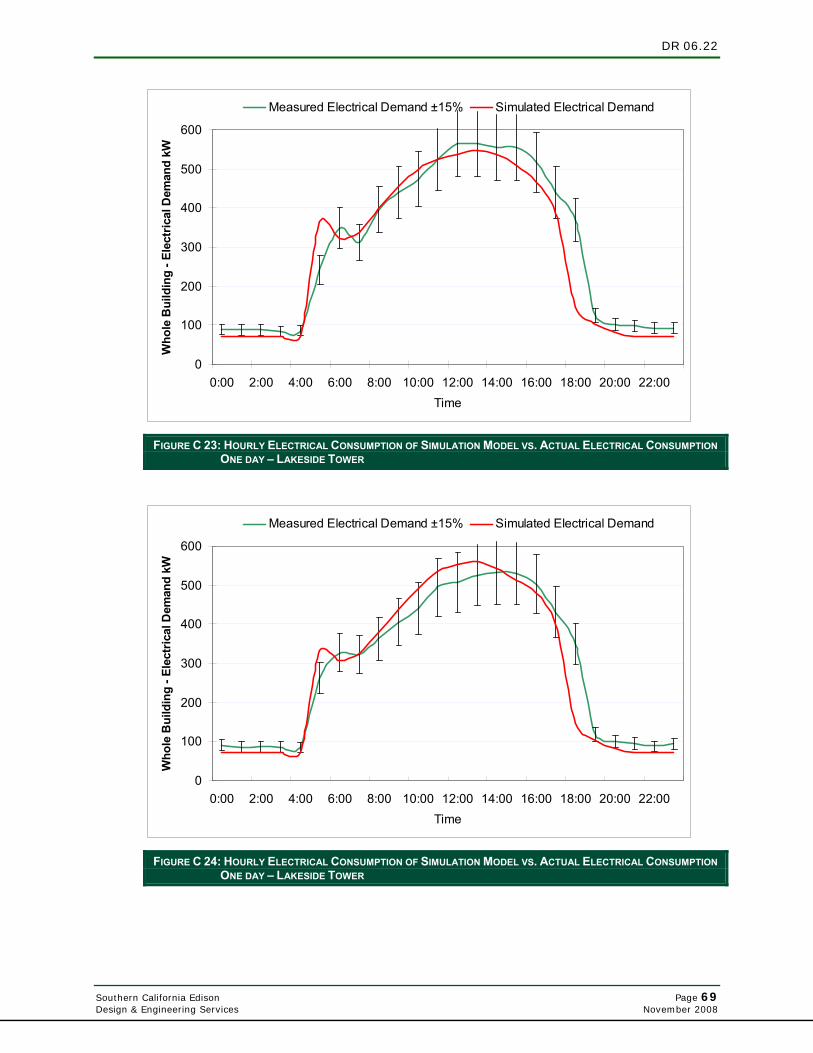
DR 06.22
Southern California Edison Page 69 Design & Engineering Services November 2008
0
100
200
300
400
500
600
0:00 2:00 4:00 6:00 8:00 10:00 12:00 14:00 16:00 18:00 20:00 22:00Time
Who
le B
uild
ing
- Ele
ctric
al D
eman
d kW
Measured Electrical Demand ±15% Simulated Electrical Demand
FIGURE C 23: HOURLY ELECTRICAL CONSUMPTION OF SIMULATION MODEL VS. ACTUAL ELECTRICAL CONSUMPTION ONE DAY – LAKESIDE TOWER
0
100
200
300
400
500
600
0:00 2:00 4:00 6:00 8:00 10:00 12:00 14:00 16:00 18:00 20:00 22:00Time
Who
le B
uild
ing
- Ele
ctric
al D
eman
d kW
Measured Electrical Demand ±15% Simulated Electrical Demand
FIGURE C 24: HOURLY ELECTRICAL CONSUMPTION OF SIMULATION MODEL VS. ACTUAL ELECTRICAL CONSUMPTION ONE DAY – LAKESIDE TOWER
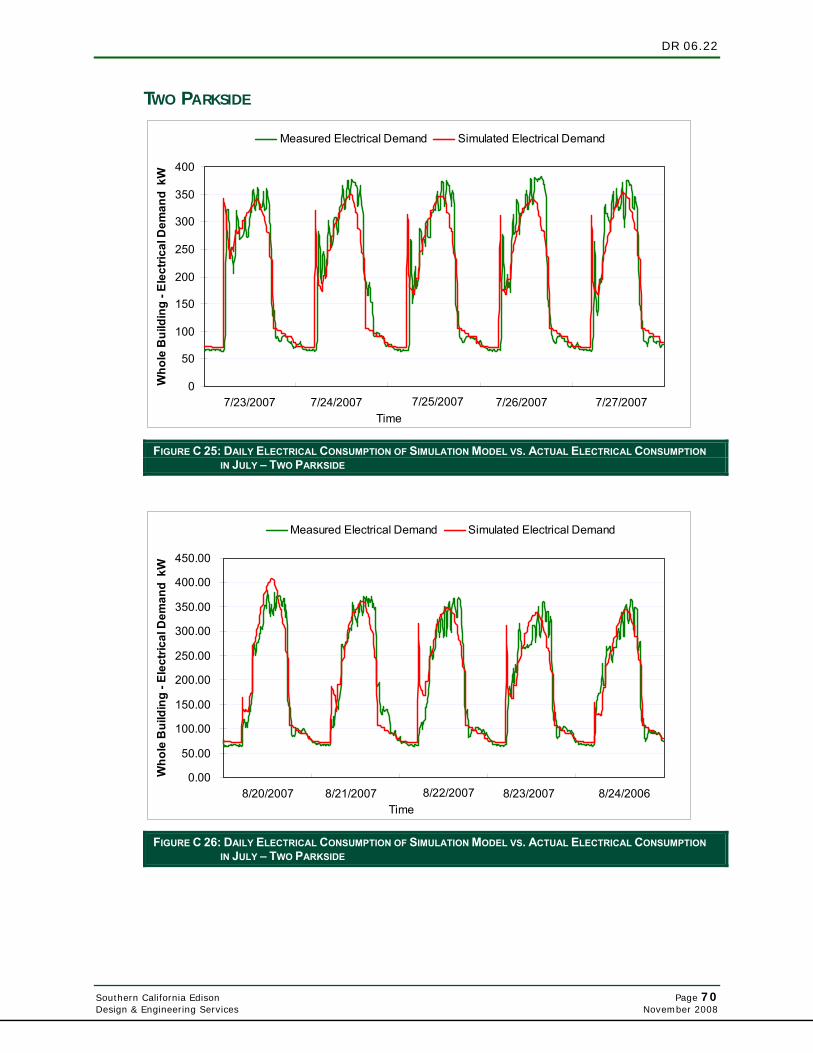
DR 06.22
Southern California Edison Page 70 Design & Engineering Services November 2008
TWO PARKSIDE
0
50
100
150
200
250
300
350
400
Time
Who
le B
uild
ing
- Ele
ctric
al D
eman
d k
W
Measured Electrical Demand Simulated Electrical Demand
7/23/2007 7/24/2007 7/25/2007 7/26/2007 7/27/2007
FIGURE C 25: DAILY ELECTRICAL CONSUMPTION OF SIMULATION MODEL VS. ACTUAL ELECTRICAL CONSUMPTION IN JULY – TWO PARKSIDE
0.00
50.00
100.00
150.00
200.00
250.00
300.00
350.00
400.00
450.00
Time
Who
le B
uild
ing
- Ele
ctric
al D
eman
d k
W
Measured Electrical Demand Simulated Electrical Demand
8/20/2007 8/21/2007 8/22/2007 8/23/2007 8/24/2006
FIGURE C 26: DAILY ELECTRICAL CONSUMPTION OF SIMULATION MODEL VS. ACTUAL ELECTRICAL CONSUMPTION IN JULY – TWO PARKSIDE
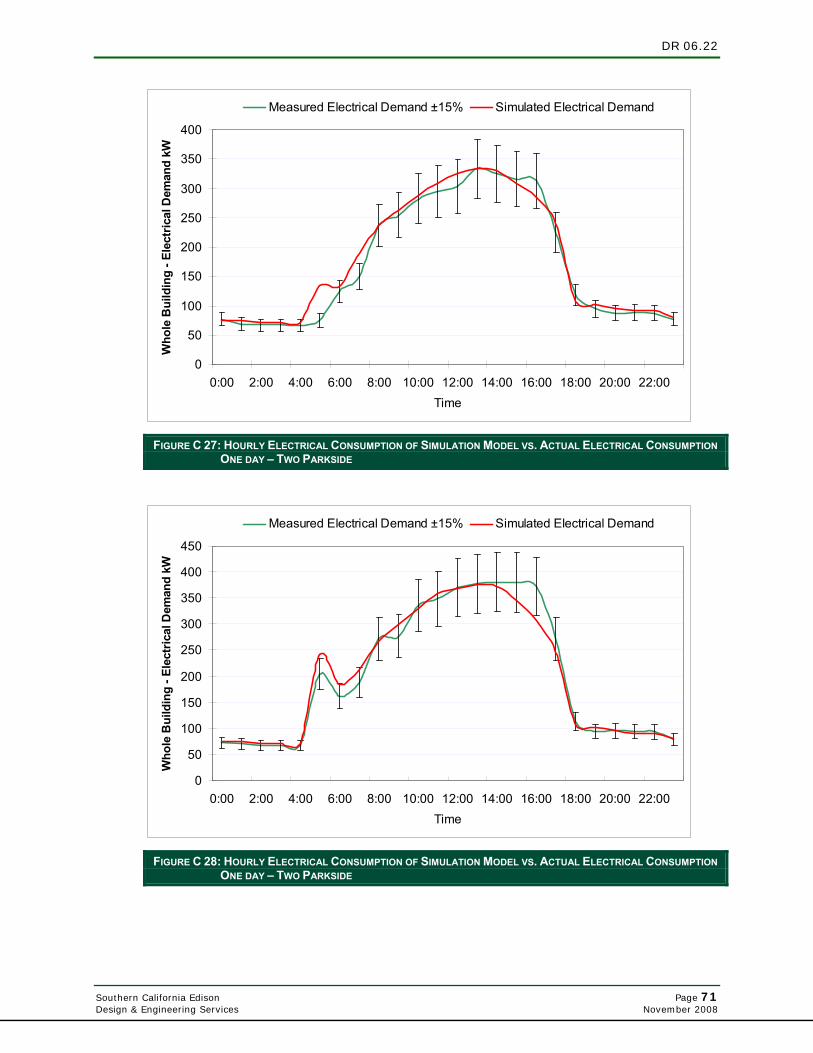
DR 06.22
Southern California Edison Page 71 Design & Engineering Services November 2008
0
50
100
150
200
250
300
350
400
0:00 2:00 4:00 6:00 8:00 10:00 12:00 14:00 16:00 18:00 20:00 22:00Time
Who
le B
uild
ing
- Ele
ctric
al D
eman
d kW
Measured Electrical Demand ±15% Simulated Electrical Demand
FIGURE C 27: HOURLY ELECTRICAL CONSUMPTION OF SIMULATION MODEL VS. ACTUAL ELECTRICAL CONSUMPTION ONE DAY – TWO PARKSIDE
0
50
100
150
200
250
300
350
400
450
0:00 2:00 4:00 6:00 8:00 10:00 12:00 14:00 16:00 18:00 20:00 22:00Time
Who
le B
uild
ing
- Ele
ctric
al D
eman
d kW
Measured Electrical Demand ±15% Simulated Electrical Demand
FIGURE C 28: HOURLY ELECTRICAL CONSUMPTION OF SIMULATION MODEL VS. ACTUAL ELECTRICAL CONSUMPTION ONE DAY – TWO PARKSIDE
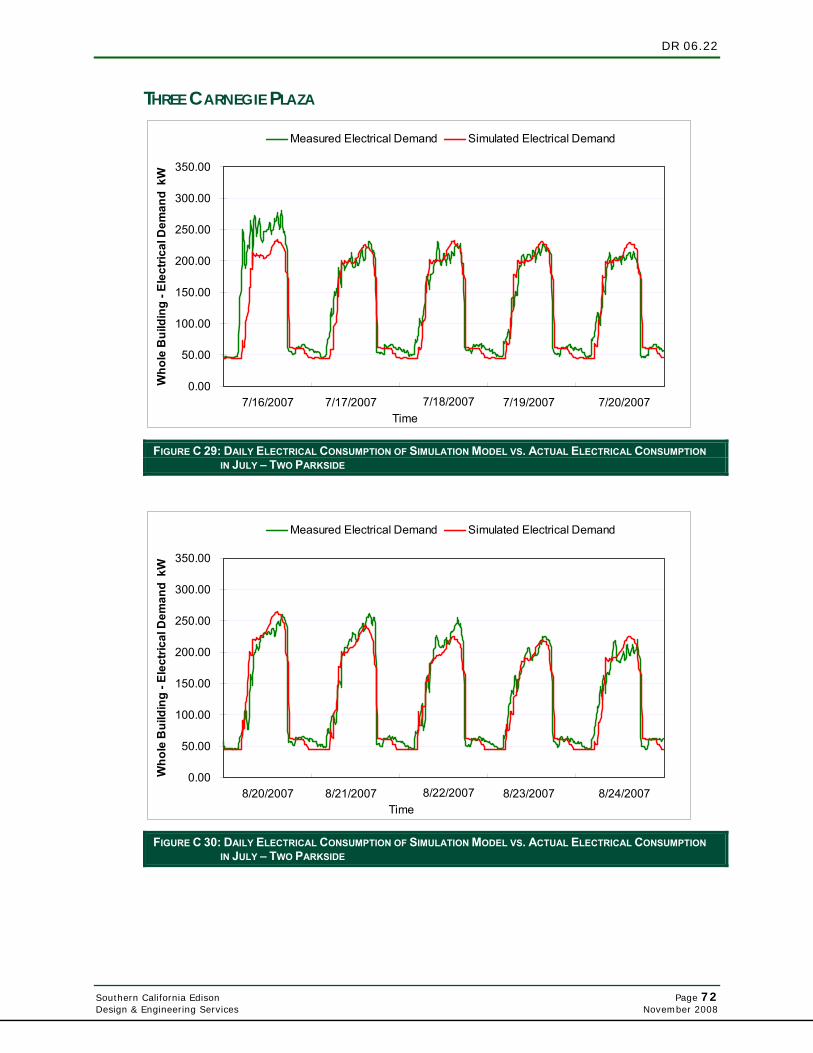
DR 06.22
Southern California Edison Page 72 Design & Engineering Services November 2008
THREE CARNEGIE PLAZA
0.00
50.00
100.00
150.00
200.00
250.00
300.00
350.00
Time
Who
le B
uild
ing
- Ele
ctric
al D
eman
d k
W
Measured Electrical Demand Simulated Electrical Demand
7/16/2007 7/17/2007 7/18/2007 7/19/2007 7/20/2007
FIGURE C 29: DAILY ELECTRICAL CONSUMPTION OF SIMULATION MODEL VS. ACTUAL ELECTRICAL CONSUMPTION IN JULY – TWO PARKSIDE
0.00
50.00
100.00
150.00
200.00
250.00
300.00
350.00
Time
Who
le B
uild
ing
- Ele
ctric
al D
eman
d k
W
Measured Electrical Demand Simulated Electrical Demand
8/20/2007 8/21/2007 8/22/2007 8/23/2007 8/24/2007
FIGURE C 30: DAILY ELECTRICAL CONSUMPTION OF SIMULATION MODEL VS. ACTUAL ELECTRICAL CONSUMPTION IN JULY – TWO PARKSIDE
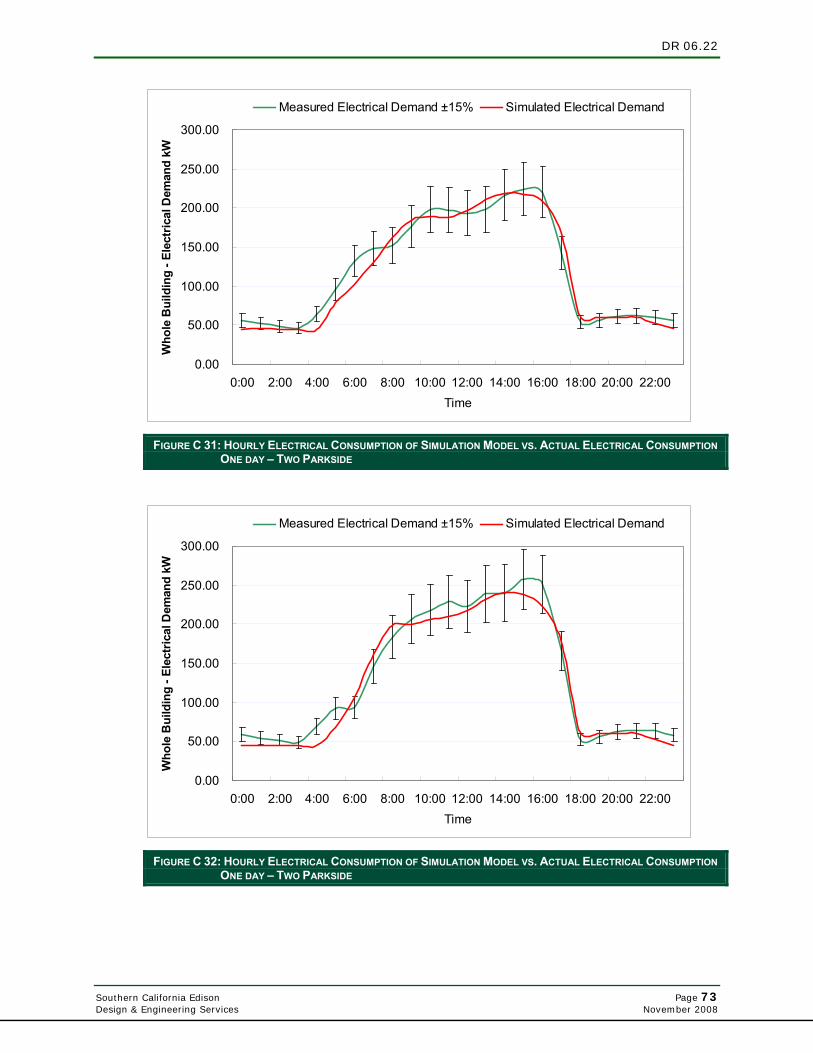
DR 06.22
Southern California Edison Page 73 Design & Engineering Services November 2008
0.00
50.00
100.00
150.00
200.00
250.00
300.00
0:00 2:00 4:00 6:00 8:00 10:00 12:00 14:00 16:00 18:00 20:00 22:00Time
Who
le B
uild
ing
- Ele
ctric
al D
eman
d kW
Measured Electrical Demand ±15% Simulated Electrical Demand
FIGURE C 31: HOURLY ELECTRICAL CONSUMPTION OF SIMULATION MODEL VS. ACTUAL ELECTRICAL CONSUMPTION ONE DAY – TWO PARKSIDE
0.00
50.00
100.00
150.00
200.00
250.00
300.00
0:00 2:00 4:00 6:00 8:00 10:00 12:00 14:00 16:00 18:00 20:00 22:00Time
Who
le B
uild
ing
- Ele
ctric
al D
eman
d kW
Measured Electrical Demand ±15% Simulated Electrical Demand
FIGURE C 32: HOURLY ELECTRICAL CONSUMPTION OF SIMULATION MODEL VS. ACTUAL ELECTRICAL CONSUMPTION ONE DAY – TWO PARKSIDE
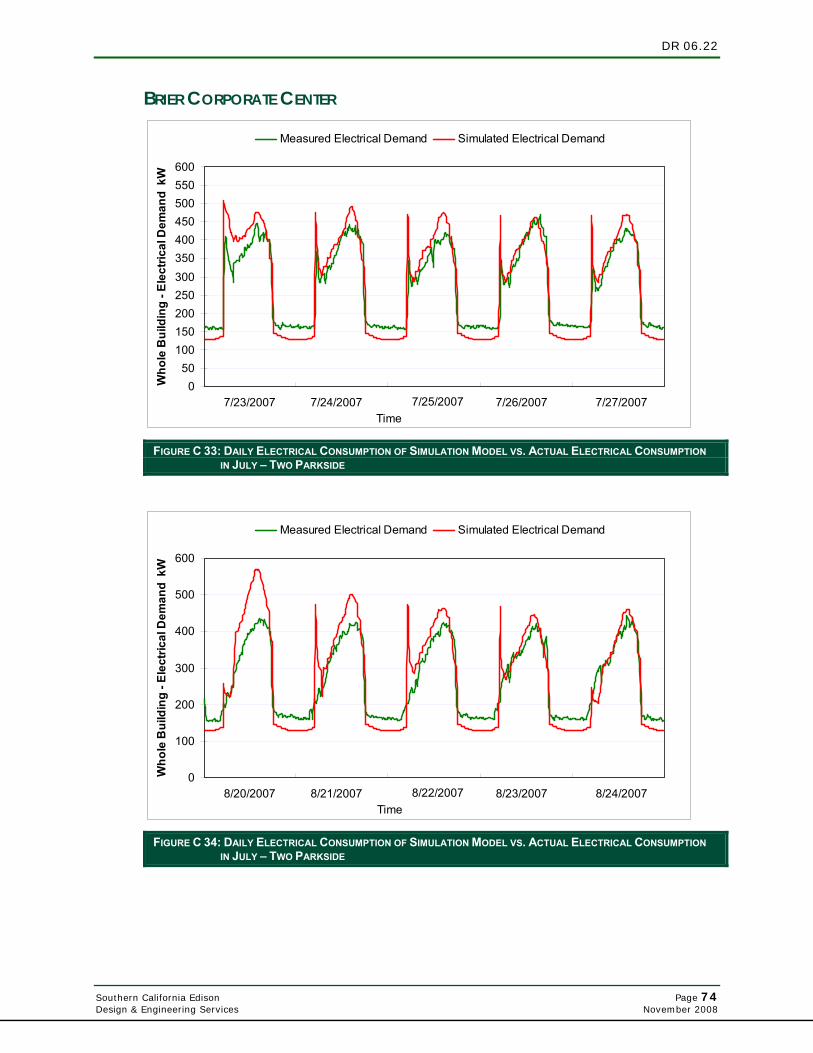
DR 06.22
Southern California Edison Page 74 Design & Engineering Services November 2008
BRIER CORPORATE CENTER
050
100150200250300350400450500550600
Time
Who
le B
uild
ing
- Ele
ctric
al D
eman
d k
W
Measured Electrical Demand Simulated Electrical Demand
7/23/2007 7/24/2007 7/25/2007 7/26/2007 7/27/2007
FIGURE C 33: DAILY ELECTRICAL CONSUMPTION OF SIMULATION MODEL VS. ACTUAL ELECTRICAL CONSUMPTION IN JULY – TWO PARKSIDE
0
100
200
300
400
500
600
Time
Who
le B
uild
ing
- Ele
ctric
al D
eman
d k
W
Measured Electrical Demand Simulated Electrical Demand
8/20/2007 8/21/2007 8/22/2007 8/23/2007 8/24/2007
FIGURE C 34: DAILY ELECTRICAL CONSUMPTION OF SIMULATION MODEL VS. ACTUAL ELECTRICAL CONSUMPTION IN JULY – TWO PARKSIDE
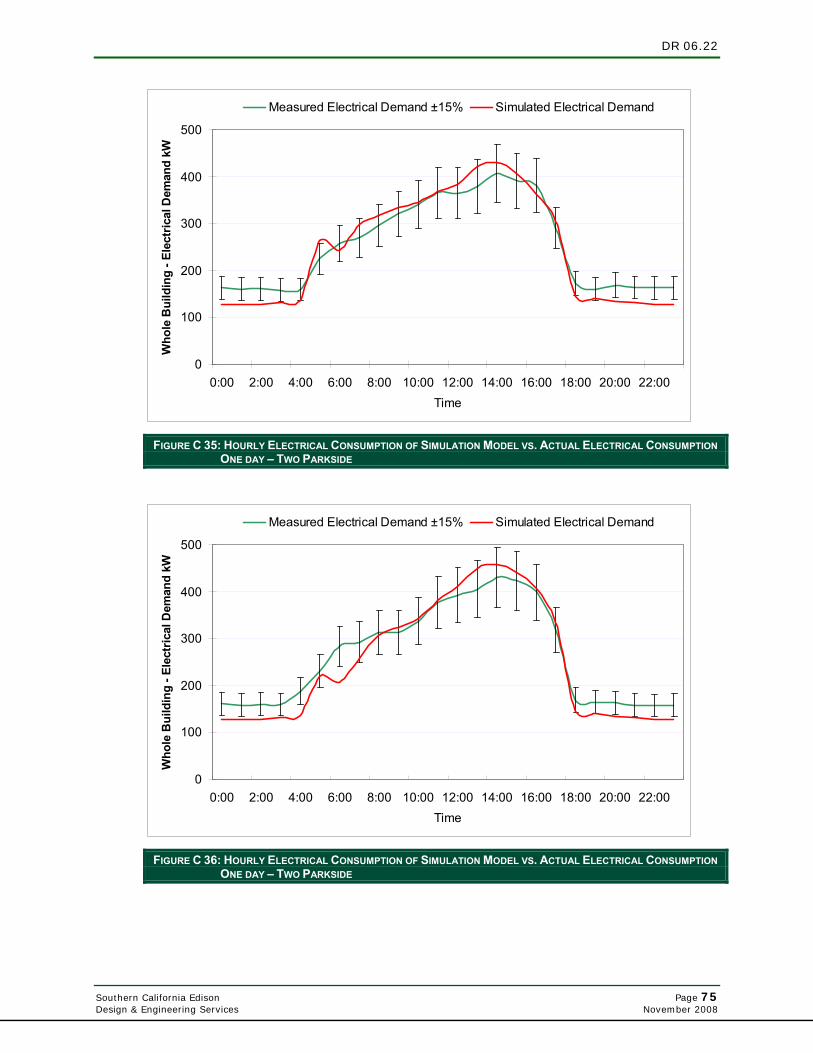
DR 06.22
Southern California Edison Page 75 Design & Engineering Services November 2008
0
100
200
300
400
500
0:00 2:00 4:00 6:00 8:00 10:00 12:00 14:00 16:00 18:00 20:00 22:00Time
Who
le B
uild
ing
- Ele
ctric
al D
eman
d kW
Measured Electrical Demand ±15% Simulated Electrical Demand
FIGURE C 35: HOURLY ELECTRICAL CONSUMPTION OF SIMULATION MODEL VS. ACTUAL ELECTRICAL CONSUMPTION ONE DAY – TWO PARKSIDE
0
100
200
300
400
500
0:00 2:00 4:00 6:00 8:00 10:00 12:00 14:00 16:00 18:00 20:00 22:00Time
Who
le B
uild
ing
- Ele
ctric
al D
eman
d kW
Measured Electrical Demand ±15% Simulated Electrical Demand
FIGURE C 36: HOURLY ELECTRICAL CONSUMPTION OF SIMULATION MODEL VS. ACTUAL ELECTRICAL CONSUMPTION ONE DAY – TWO PARKSIDE
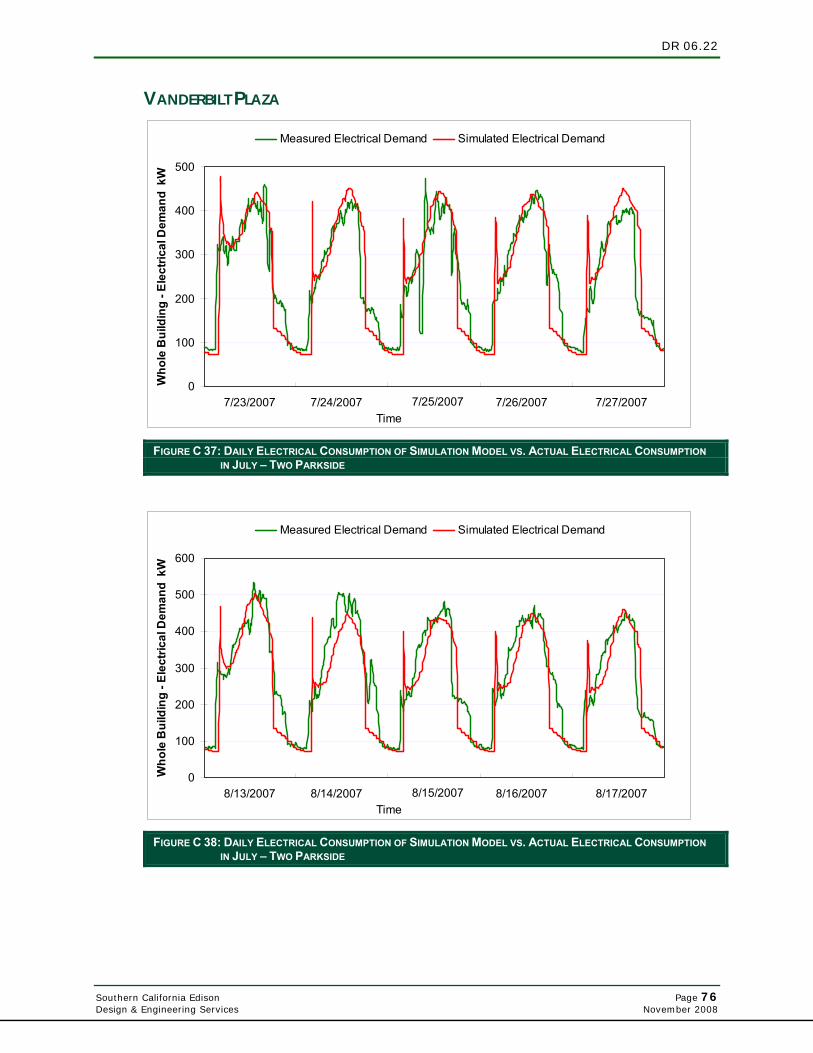
DR 06.22
Southern California Edison Page 76 Design & Engineering Services November 2008
VANDERBILT PLAZA
0
100
200
300
400
500
Time
Who
le B
uild
ing
- Ele
ctric
al D
eman
d k
W
Measured Electrical Demand Simulated Electrical Demand
7/23/2007 7/24/2007 7/25/2007 7/26/2007 7/27/2007
FIGURE C 37: DAILY ELECTRICAL CONSUMPTION OF SIMULATION MODEL VS. ACTUAL ELECTRICAL CONSUMPTION IN JULY – TWO PARKSIDE
0
100
200
300
400
500
600
Time
Who
le B
uild
ing
- Ele
ctric
al D
eman
d k
W
Measured Electrical Demand Simulated Electrical Demand
8/13/2007 8/14/2007 8/15/2007 8/16/2007 8/17/2007
FIGURE C 38: DAILY ELECTRICAL CONSUMPTION OF SIMULATION MODEL VS. ACTUAL ELECTRICAL CONSUMPTION IN JULY – TWO PARKSIDE
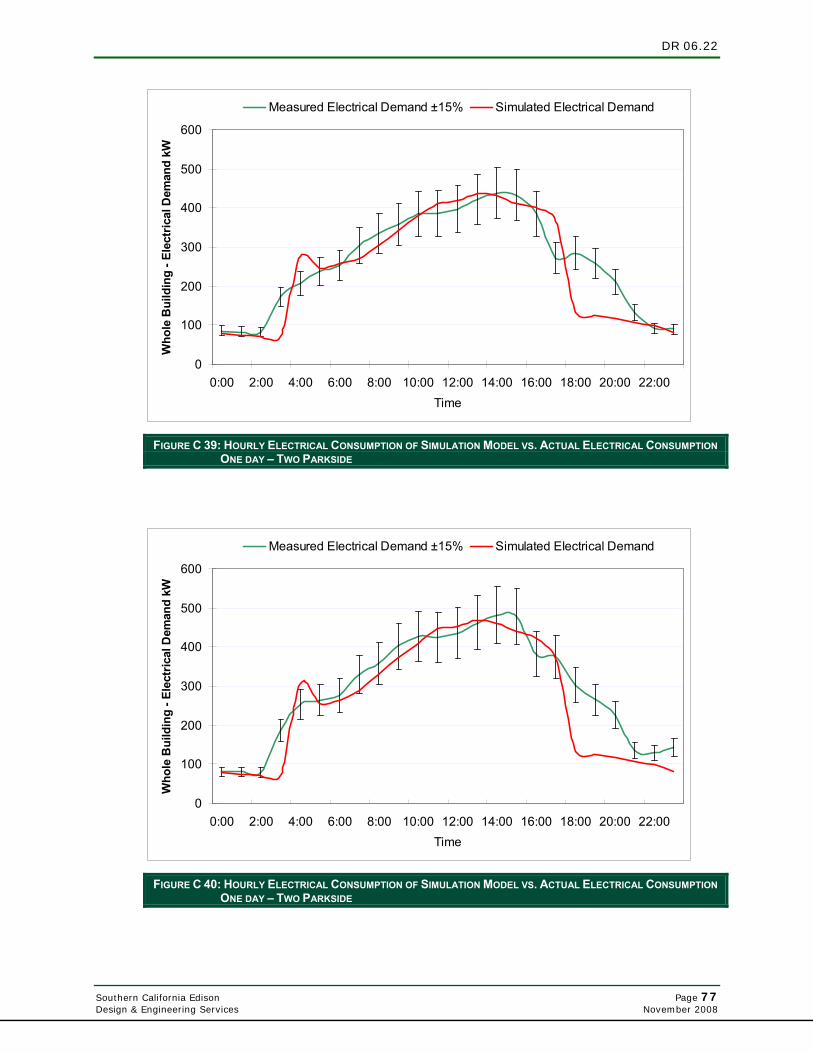
DR 06.22
Southern California Edison Page 77 Design & Engineering Services November 2008
0
100
200
300
400
500
600
0:00 2:00 4:00 6:00 8:00 10:00 12:00 14:00 16:00 18:00 20:00 22:00Time
Who
le B
uild
ing
- Ele
ctric
al D
eman
d kW
Measured Electrical Demand ±15% Simulated Electrical Demand
FIGURE C 39: HOURLY ELECTRICAL CONSUMPTION OF SIMULATION MODEL VS. ACTUAL ELECTRICAL CONSUMPTION ONE DAY – TWO PARKSIDE
0
100
200
300
400
500
600
0:00 2:00 4:00 6:00 8:00 10:00 12:00 14:00 16:00 18:00 20:00 22:00Time
Who
le B
uild
ing
- Ele
ctric
al D
eman
d kW
Measured Electrical Demand ±15% Simulated Electrical Demand
FIGURE C 40: HOURLY ELECTRICAL CONSUMPTION OF SIMULATION MODEL VS. ACTUAL ELECTRICAL CONSUMPTION ONE DAY – TWO PARKSIDE
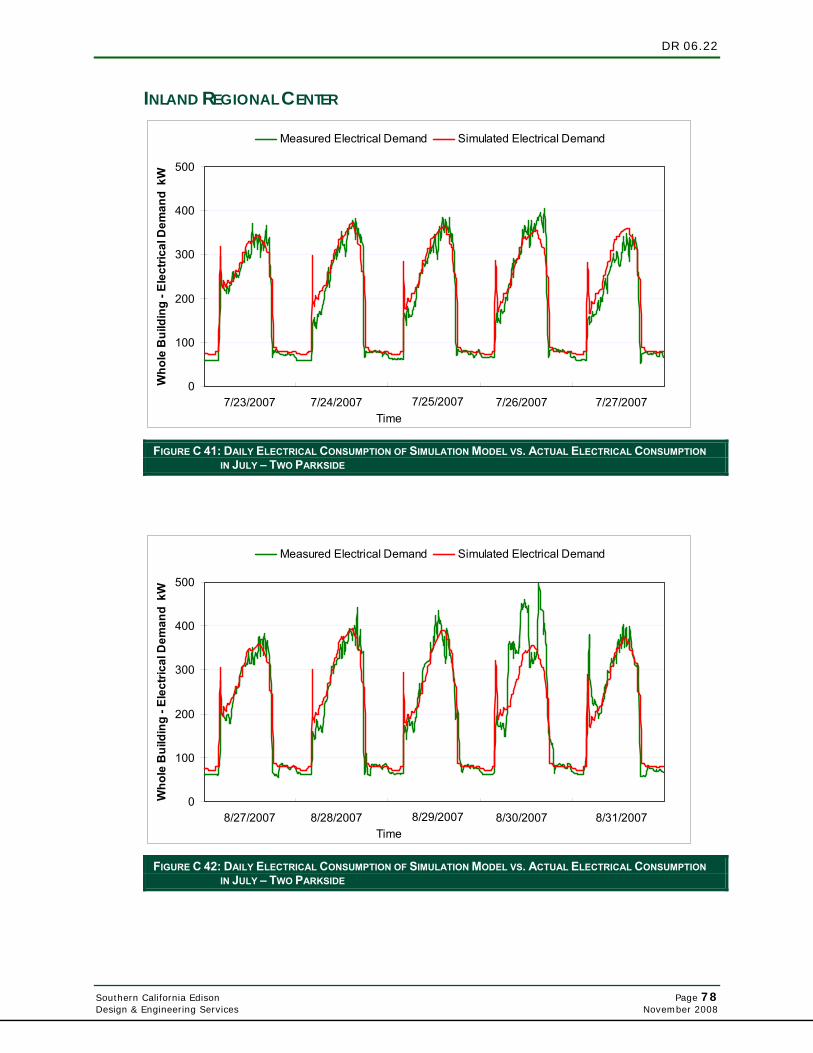
DR 06.22
Southern California Edison Page 78 Design & Engineering Services November 2008
INLAND REGIONAL CENTER
0
100
200
300
400
500
Time
Who
le B
uild
ing
- Ele
ctric
al D
eman
d k
W
Measured Electrical Demand Simulated Electrical Demand
7/23/2007 7/24/2007 7/25/2007 7/26/2007 7/27/2007
FIGURE C 41: DAILY ELECTRICAL CONSUMPTION OF SIMULATION MODEL VS. ACTUAL ELECTRICAL CONSUMPTION IN JULY – TWO PARKSIDE
0
100
200
300
400
500
Time
Who
le B
uild
ing
- Ele
ctric
al D
eman
d k
W
Measured Electrical Demand Simulated Electrical Demand
8/27/2007 8/28/2007 8/29/2007 8/30/2007 8/31/2007
FIGURE C 42: DAILY ELECTRICAL CONSUMPTION OF SIMULATION MODEL VS. ACTUAL ELECTRICAL CONSUMPTION IN JULY – TWO PARKSIDE
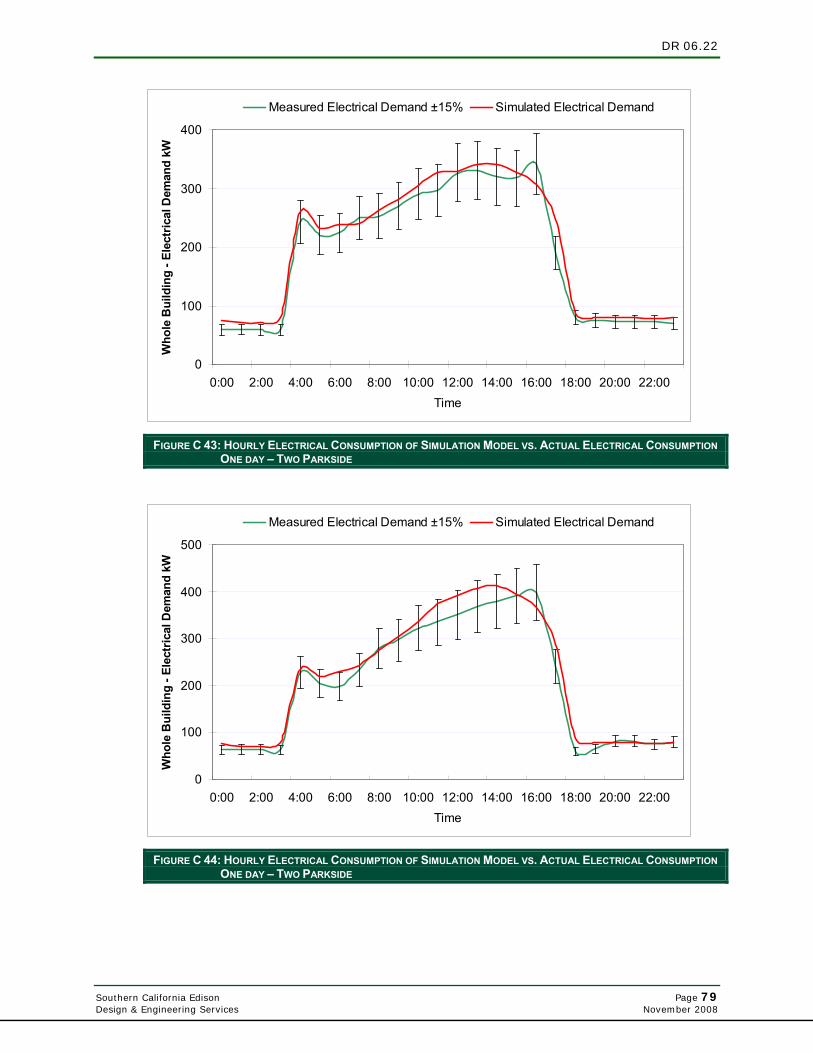
DR 06.22
Southern California Edison Page 79 Design & Engineering Services November 2008
0
100
200
300
400
0:00 2:00 4:00 6:00 8:00 10:00 12:00 14:00 16:00 18:00 20:00 22:00Time
Who
le B
uild
ing
- Ele
ctric
al D
eman
d kW
Measured Electrical Demand ±15% Simulated Electrical Demand
FIGURE C 43: HOURLY ELECTRICAL CONSUMPTION OF SIMULATION MODEL VS. ACTUAL ELECTRICAL CONSUMPTION ONE DAY – TWO PARKSIDE
0
100
200
300
400
500
0:00 2:00 4:00 6:00 8:00 10:00 12:00 14:00 16:00 18:00 20:00 22:00Time
Who
le B
uild
ing
- Ele
ctric
al D
eman
d kW
Measured Electrical Demand ±15% Simulated Electrical Demand
FIGURE C 44: HOURLY ELECTRICAL CONSUMPTION OF SIMULATION MODEL VS. ACTUAL ELECTRICAL CONSUMPTION ONE DAY – TWO PARKSIDE
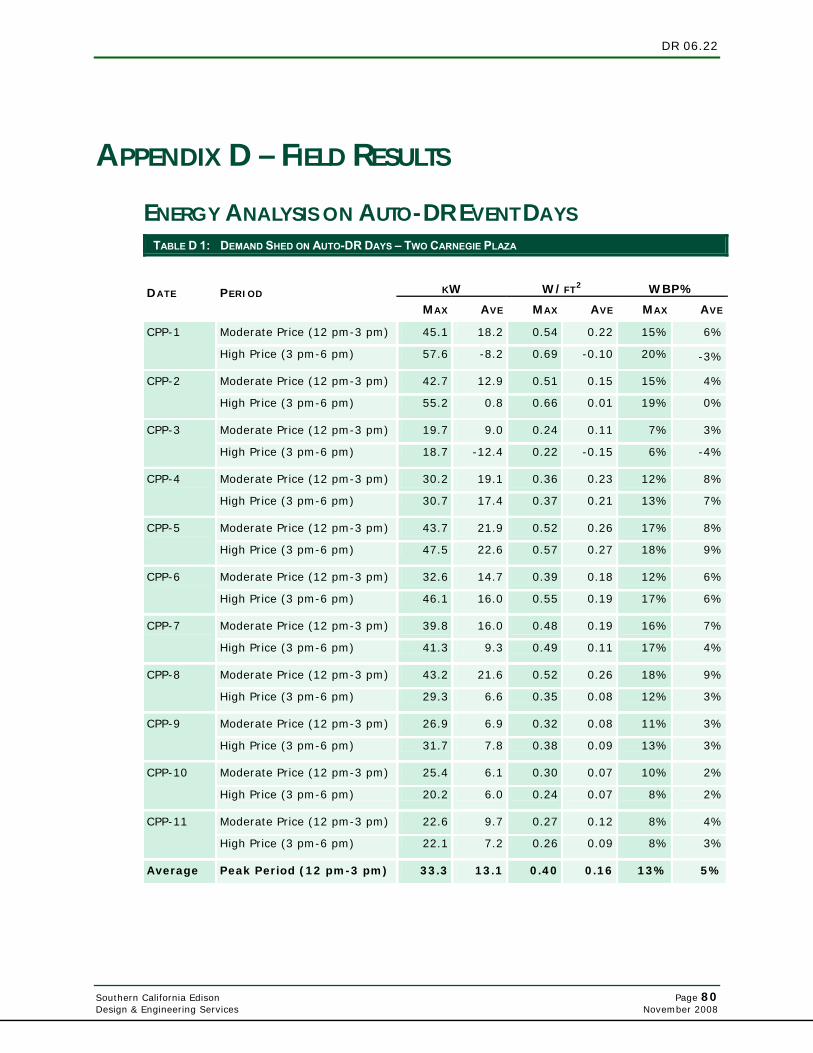
DR 06.22
Southern California Edison Page 80 Design & Engineering Services November 2008
APPENDIX D – FIELD RESULTS ENERGY ANALYSIS ON AUTO-DR EVENT DAYS
TABLE D 1: DEMAND SHED ON AUTO-DR DAYS – TWO CARNEGIE PLAZA
KW
W/FT2
WBP% DATE PERIOD
MAX AVE MAX AVE MAX AVE
Moderate Price (12 pm-3 pm) 45.1 18.2 0.54 0.22 15% 6% CPP-1
High Price (3 pm-6 pm) 57.6 -8.2 0.69 -0.10 20% -3%
Moderate Price (12 pm-3 pm) 42.7 12.9 0.51 0.15 15% 4% CPP-2
High Price (3 pm-6 pm) 55.2 0.8 0.66 0.01 19% 0%
Moderate Price (12 pm-3 pm) 19.7 9.0 0.24 0.11 7% 3% CPP-3
High Price (3 pm-6 pm) 18.7 -12.4 0.22 -0.15 6% -4%
Moderate Price (12 pm-3 pm) 30.2 19.1 0.36 0.23 12% 8% CPP-4
High Price (3 pm-6 pm) 30.7 17.4 0.37 0.21 13% 7%
Moderate Price (12 pm-3 pm) 43.7 21.9 0.52 0.26 17% 8% CPP-5
High Price (3 pm-6 pm) 47.5 22.6 0.57 0.27 18% 9%
Moderate Price (12 pm-3 pm) 32.6 14.7 0.39 0.18 12% 6% CPP-6
High Price (3 pm-6 pm) 46.1 16.0 0.55 0.19 17% 6%
Moderate Price (12 pm-3 pm) 39.8 16.0 0.48 0.19 16% 7% CPP-7
High Price (3 pm-6 pm) 41.3 9.3 0.49 0.11 17% 4%
Moderate Price (12 pm-3 pm) 43.2 21.6 0.52 0.26 18% 9% CPP-8
High Price (3 pm-6 pm) 29.3 6.6 0.35 0.08 12% 3%
Moderate Price (12 pm-3 pm) 26.9 6.9 0.32 0.08 11% 3% CPP-9
High Price (3 pm-6 pm) 31.7 7.8 0.38 0.09 13% 3%
Moderate Price (12 pm-3 pm) 25.4 6.1 0.30 0.07 10% 2% CPP-10
High Price (3 pm-6 pm) 20.2 6.0 0.24 0.07 8% 2%
Moderate Price (12 pm-3 pm) 22.6 9.7 0.27 0.12 8% 4% CPP-11
High Price (3 pm-6 pm) 22.1 7.2 0.26 0.09 8% 3%
Average Peak Period (12 pm-3 pm) 33.3 13.1 0.40 0.16 13% 5%
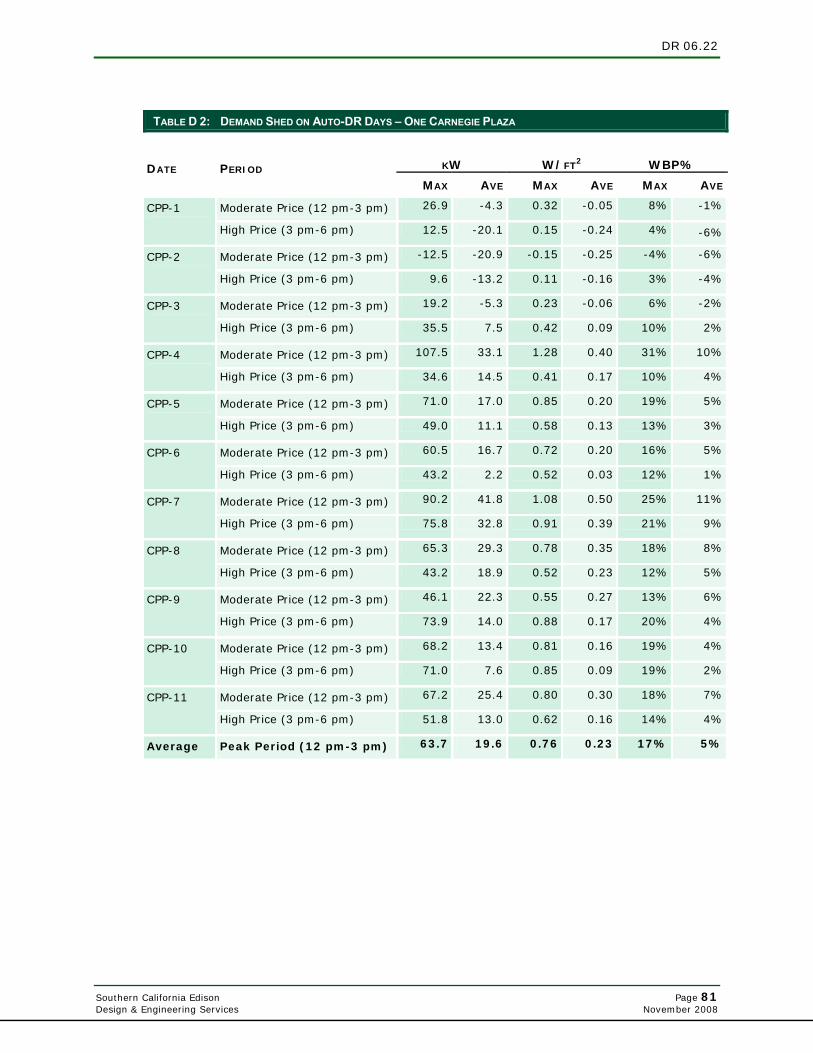
DR 06.22
Southern California Edison Page 81 Design & Engineering Services November 2008
TABLE D 2: DEMAND SHED ON AUTO-DR DAYS – ONE CARNEGIE PLAZA
KW
W/FT2
WBP% DATE PERIOD
MAX AVE MAX AVE MAX AVE
Moderate Price (12 pm-3 pm) 26.9 -4.3 0.32 -0.05 8% -1% CPP-1
High Price (3 pm-6 pm) 12.5 -20.1 0.15 -0.24 4% -6%
Moderate Price (12 pm-3 pm) -12.5 -20.9 -0.15 -0.25 -4% -6% CPP-2
High Price (3 pm-6 pm) 9.6 -13.2 0.11 -0.16 3% -4%
Moderate Price (12 pm-3 pm) 19.2 -5.3 0.23 -0.06 6% -2% CPP-3
High Price (3 pm-6 pm) 35.5 7.5 0.42 0.09 10% 2%
Moderate Price (12 pm-3 pm) 107.5 33.1 1.28 0.40 31% 10% CPP-4
High Price (3 pm-6 pm) 34.6 14.5 0.41 0.17 10% 4%
Moderate Price (12 pm-3 pm) 71.0 17.0 0.85 0.20 19% 5% CPP-5
High Price (3 pm-6 pm) 49.0 11.1 0.58 0.13 13% 3%
Moderate Price (12 pm-3 pm) 60.5 16.7 0.72 0.20 16% 5% CPP-6
High Price (3 pm-6 pm) 43.2 2.2 0.52 0.03 12% 1%
Moderate Price (12 pm-3 pm) 90.2 41.8 1.08 0.50 25% 11% CPP-7
High Price (3 pm-6 pm) 75.8 32.8 0.91 0.39 21% 9%
Moderate Price (12 pm-3 pm) 65.3 29.3 0.78 0.35 18% 8% CPP-8
High Price (3 pm-6 pm) 43.2 18.9 0.52 0.23 12% 5%
Moderate Price (12 pm-3 pm) 46.1 22.3 0.55 0.27 13% 6% CPP-9
High Price (3 pm-6 pm) 73.9 14.0 0.88 0.17 20% 4%
Moderate Price (12 pm-3 pm) 68.2 13.4 0.81 0.16 19% 4% CPP-10
High Price (3 pm-6 pm) 71.0 7.6 0.85 0.09 19% 2%
Moderate Price (12 pm-3 pm) 67.2 25.4 0.80 0.30 18% 7% CPP-11
High Price (3 pm-6 pm) 51.8 13.0 0.62 0.16 14% 4%
Average Peak Period (12 pm-3 pm) 63.7 19.6 0.76 0.23 17% 5%
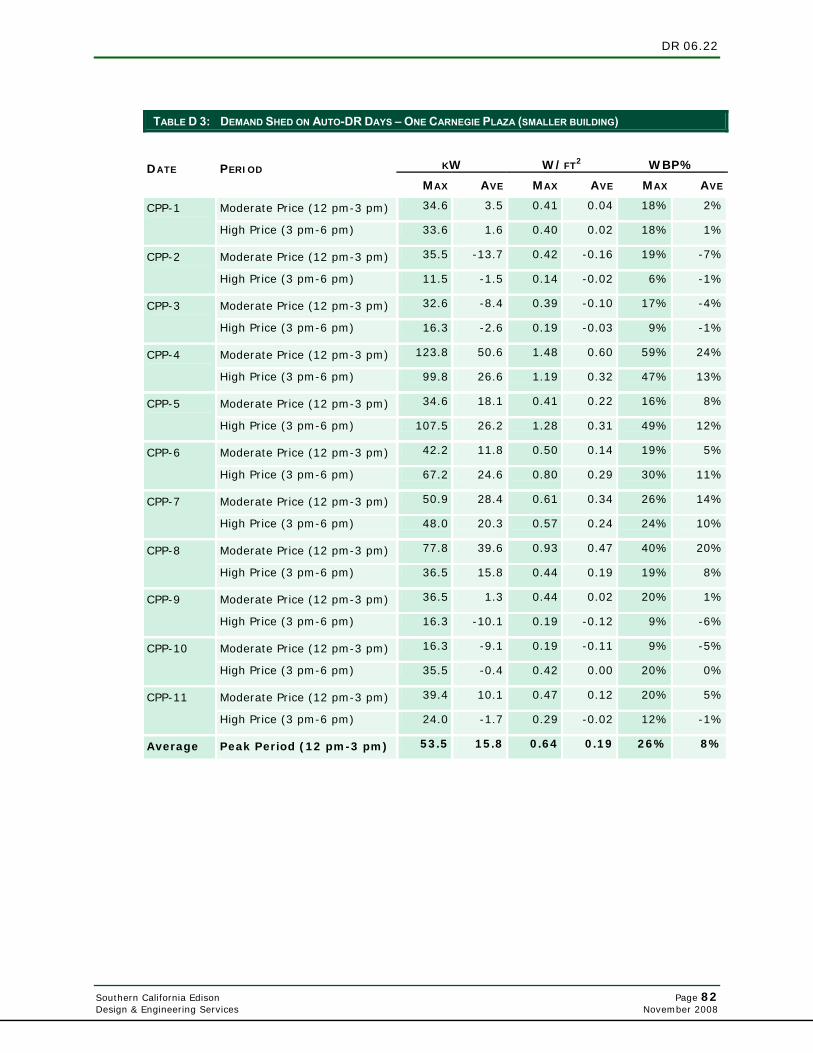
DR 06.22
Southern California Edison Page 82 Design & Engineering Services November 2008
TABLE D 3: DEMAND SHED ON AUTO-DR DAYS – ONE CARNEGIE PLAZA (SMALLER BUILDING)
KW
W/FT2
WBP% DATE PERIOD
MAX AVE MAX AVE MAX AVE
Moderate Price (12 pm-3 pm) 34.6 3.5 0.41 0.04 18% 2% CPP-1
High Price (3 pm-6 pm) 33.6 1.6 0.40 0.02 18% 1%
Moderate Price (12 pm-3 pm) 35.5 -13.7 0.42 -0.16 19% -7% CPP-2
High Price (3 pm-6 pm) 11.5 -1.5 0.14 -0.02 6% -1%
Moderate Price (12 pm-3 pm) 32.6 -8.4 0.39 -0.10 17% -4% CPP-3
High Price (3 pm-6 pm) 16.3 -2.6 0.19 -0.03 9% -1%
Moderate Price (12 pm-3 pm) 123.8 50.6 1.48 0.60 59% 24% CPP-4
High Price (3 pm-6 pm) 99.8 26.6 1.19 0.32 47% 13%
Moderate Price (12 pm-3 pm) 34.6 18.1 0.41 0.22 16% 8% CPP-5
High Price (3 pm-6 pm) 107.5 26.2 1.28 0.31 49% 12%
Moderate Price (12 pm-3 pm) 42.2 11.8 0.50 0.14 19% 5% CPP-6
High Price (3 pm-6 pm) 67.2 24.6 0.80 0.29 30% 11%
Moderate Price (12 pm-3 pm) 50.9 28.4 0.61 0.34 26% 14% CPP-7
High Price (3 pm-6 pm) 48.0 20.3 0.57 0.24 24% 10%
Moderate Price (12 pm-3 pm) 77.8 39.6 0.93 0.47 40% 20% CPP-8
High Price (3 pm-6 pm) 36.5 15.8 0.44 0.19 19% 8%
Moderate Price (12 pm-3 pm) 36.5 1.3 0.44 0.02 20% 1% CPP-9
High Price (3 pm-6 pm) 16.3 -10.1 0.19 -0.12 9% -6%
Moderate Price (12 pm-3 pm) 16.3 -9.1 0.19 -0.11 9% -5% CPP-10
High Price (3 pm-6 pm) 35.5 -0.4 0.42 0.00 20% 0%
Moderate Price (12 pm-3 pm) 39.4 10.1 0.47 0.12 20% 5% CPP-11
High Price (3 pm-6 pm) 24.0 -1.7 0.29 -0.02 12% -1%
Average Peak Period (12 pm-3 pm) 53.5 15.8 0.64 0.19 26% 8%
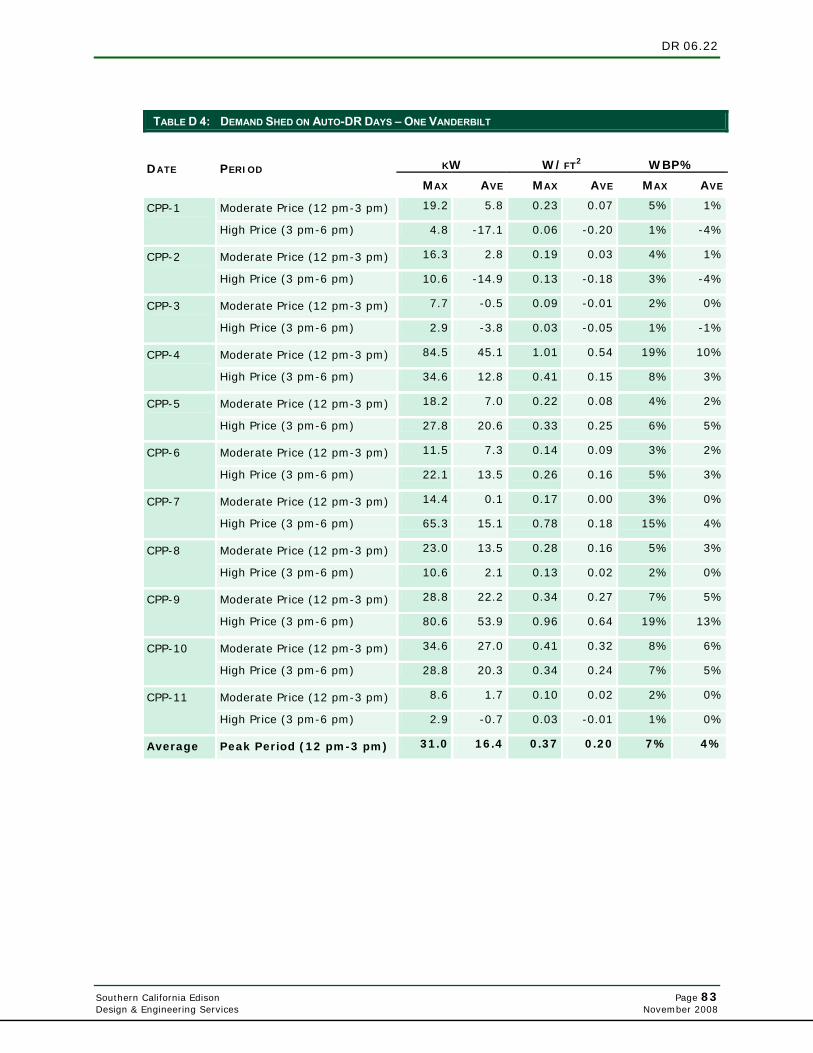
DR 06.22
Southern California Edison Page 83 Design & Engineering Services November 2008
TABLE D 4: DEMAND SHED ON AUTO-DR DAYS – ONE VANDERBILT
KW
W/FT2
WBP% DATE PERIOD
MAX AVE MAX AVE MAX AVE
Moderate Price (12 pm-3 pm) 19.2 5.8 0.23 0.07 5% 1% CPP-1
High Price (3 pm-6 pm) 4.8 -17.1 0.06 -0.20 1% -4%
Moderate Price (12 pm-3 pm) 16.3 2.8 0.19 0.03 4% 1% CPP-2
High Price (3 pm-6 pm) 10.6 -14.9 0.13 -0.18 3% -4%
Moderate Price (12 pm-3 pm) 7.7 -0.5 0.09 -0.01 2% 0% CPP-3
High Price (3 pm-6 pm) 2.9 -3.8 0.03 -0.05 1% -1%
Moderate Price (12 pm-3 pm) 84.5 45.1 1.01 0.54 19% 10% CPP-4
High Price (3 pm-6 pm) 34.6 12.8 0.41 0.15 8% 3%
Moderate Price (12 pm-3 pm) 18.2 7.0 0.22 0.08 4% 2% CPP-5
High Price (3 pm-6 pm) 27.8 20.6 0.33 0.25 6% 5%
Moderate Price (12 pm-3 pm) 11.5 7.3 0.14 0.09 3% 2% CPP-6
High Price (3 pm-6 pm) 22.1 13.5 0.26 0.16 5% 3%
Moderate Price (12 pm-3 pm) 14.4 0.1 0.17 0.00 3% 0% CPP-7
High Price (3 pm-6 pm) 65.3 15.1 0.78 0.18 15% 4%
Moderate Price (12 pm-3 pm) 23.0 13.5 0.28 0.16 5% 3% CPP-8
High Price (3 pm-6 pm) 10.6 2.1 0.13 0.02 2% 0%
Moderate Price (12 pm-3 pm) 28.8 22.2 0.34 0.27 7% 5% CPP-9
High Price (3 pm-6 pm) 80.6 53.9 0.96 0.64 19% 13%
Moderate Price (12 pm-3 pm) 34.6 27.0 0.41 0.32 8% 6% CPP-10
High Price (3 pm-6 pm) 28.8 20.3 0.34 0.24 7% 5%
Moderate Price (12 pm-3 pm) 8.6 1.7 0.10 0.02 2% 0% CPP-11
High Price (3 pm-6 pm) 2.9 -0.7 0.03 -0.01 1% 0%
Average Peak Period (12 pm-3 pm) 31.0 16.4 0.37 0.20 7% 4%
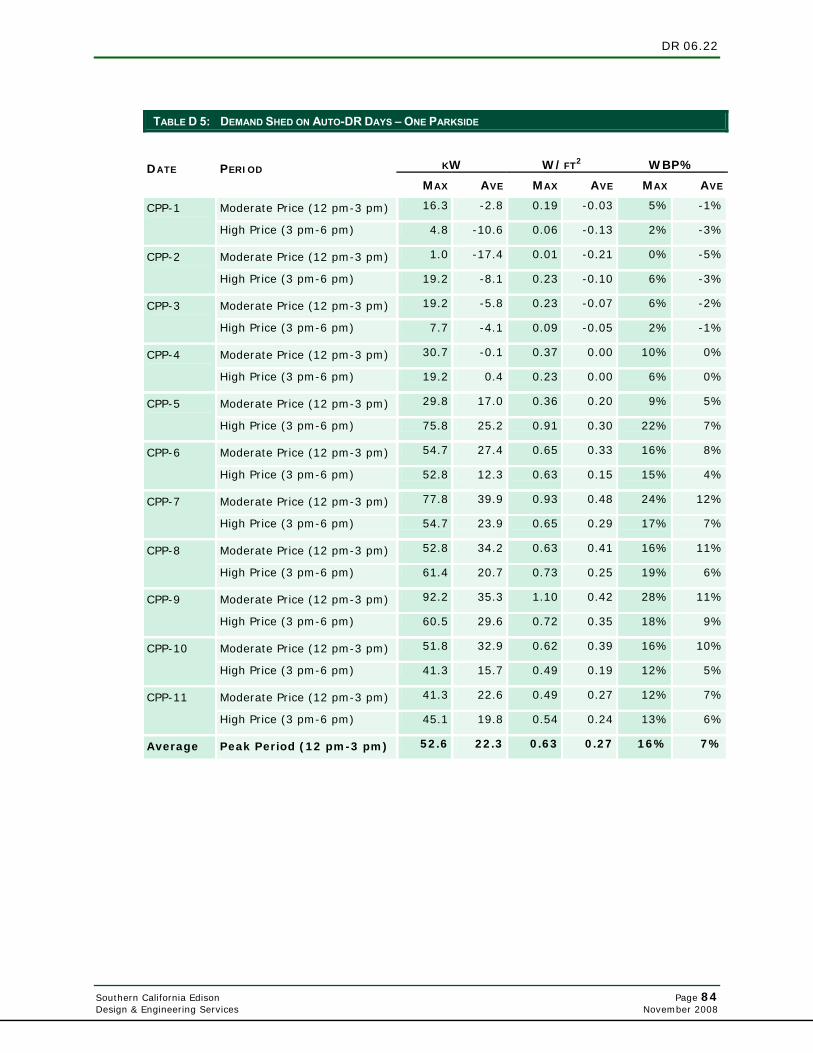
DR 06.22
Southern California Edison Page 84 Design & Engineering Services November 2008
TABLE D 5: DEMAND SHED ON AUTO-DR DAYS – ONE PARKSIDE
KW
W/FT2
WBP% DATE PERIOD
MAX AVE MAX AVE MAX AVE
Moderate Price (12 pm-3 pm) 16.3 -2.8 0.19 -0.03 5% -1% CPP-1
High Price (3 pm-6 pm) 4.8 -10.6 0.06 -0.13 2% -3%
Moderate Price (12 pm-3 pm) 1.0 -17.4 0.01 -0.21 0% -5% CPP-2
High Price (3 pm-6 pm) 19.2 -8.1 0.23 -0.10 6% -3%
Moderate Price (12 pm-3 pm) 19.2 -5.8 0.23 -0.07 6% -2% CPP-3
High Price (3 pm-6 pm) 7.7 -4.1 0.09 -0.05 2% -1%
Moderate Price (12 pm-3 pm) 30.7 -0.1 0.37 0.00 10% 0% CPP-4
High Price (3 pm-6 pm) 19.2 0.4 0.23 0.00 6% 0%
Moderate Price (12 pm-3 pm) 29.8 17.0 0.36 0.20 9% 5% CPP-5
High Price (3 pm-6 pm) 75.8 25.2 0.91 0.30 22% 7%
Moderate Price (12 pm-3 pm) 54.7 27.4 0.65 0.33 16% 8% CPP-6
High Price (3 pm-6 pm) 52.8 12.3 0.63 0.15 15% 4%
Moderate Price (12 pm-3 pm) 77.8 39.9 0.93 0.48 24% 12% CPP-7
High Price (3 pm-6 pm) 54.7 23.9 0.65 0.29 17% 7%
Moderate Price (12 pm-3 pm) 52.8 34.2 0.63 0.41 16% 11% CPP-8
High Price (3 pm-6 pm) 61.4 20.7 0.73 0.25 19% 6%
Moderate Price (12 pm-3 pm) 92.2 35.3 1.10 0.42 28% 11% CPP-9
High Price (3 pm-6 pm) 60.5 29.6 0.72 0.35 18% 9%
Moderate Price (12 pm-3 pm) 51.8 32.9 0.62 0.39 16% 10% CPP-10
High Price (3 pm-6 pm) 41.3 15.7 0.49 0.19 12% 5%
Moderate Price (12 pm-3 pm) 41.3 22.6 0.49 0.27 12% 7% CPP-11
High Price (3 pm-6 pm) 45.1 19.8 0.54 0.24 13% 6%
Average Peak Period (12 pm-3 pm) 52.6 22.3 0.63 0.27 16% 7%
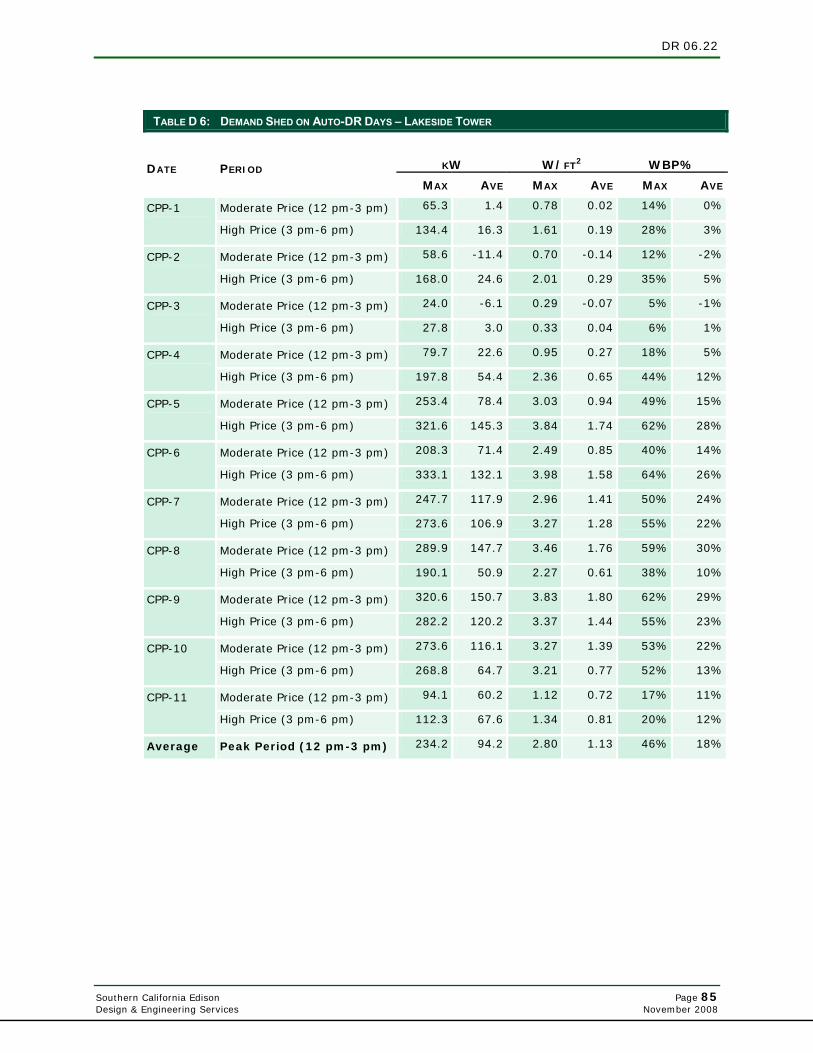
DR 06.22
Southern California Edison Page 85 Design & Engineering Services November 2008
TABLE D 6: DEMAND SHED ON AUTO-DR DAYS – LAKESIDE TOWER
KW
W/FT2
WBP% DATE PERIOD
MAX AVE MAX AVE MAX AVE
Moderate Price (12 pm-3 pm) 65.3 1.4 0.78 0.02 14% 0% CPP-1
High Price (3 pm-6 pm) 134.4 16.3 1.61 0.19 28% 3%
Moderate Price (12 pm-3 pm) 58.6 -11.4 0.70 -0.14 12% -2% CPP-2
High Price (3 pm-6 pm) 168.0 24.6 2.01 0.29 35% 5%
Moderate Price (12 pm-3 pm) 24.0 -6.1 0.29 -0.07 5% -1% CPP-3
High Price (3 pm-6 pm) 27.8 3.0 0.33 0.04 6% 1%
Moderate Price (12 pm-3 pm) 79.7 22.6 0.95 0.27 18% 5% CPP-4
High Price (3 pm-6 pm) 197.8 54.4 2.36 0.65 44% 12%
Moderate Price (12 pm-3 pm) 253.4 78.4 3.03 0.94 49% 15% CPP-5
High Price (3 pm-6 pm) 321.6 145.3 3.84 1.74 62% 28%
Moderate Price (12 pm-3 pm) 208.3 71.4 2.49 0.85 40% 14% CPP-6
High Price (3 pm-6 pm) 333.1 132.1 3.98 1.58 64% 26%
Moderate Price (12 pm-3 pm) 247.7 117.9 2.96 1.41 50% 24% CPP-7
High Price (3 pm-6 pm) 273.6 106.9 3.27 1.28 55% 22%
Moderate Price (12 pm-3 pm) 289.9 147.7 3.46 1.76 59% 30% CPP-8
High Price (3 pm-6 pm) 190.1 50.9 2.27 0.61 38% 10%
Moderate Price (12 pm-3 pm) 320.6 150.7 3.83 1.80 62% 29% CPP-9
High Price (3 pm-6 pm) 282.2 120.2 3.37 1.44 55% 23%
Moderate Price (12 pm-3 pm) 273.6 116.1 3.27 1.39 53% 22% CPP-10
High Price (3 pm-6 pm) 268.8 64.7 3.21 0.77 52% 13%
Moderate Price (12 pm-3 pm) 94.1 60.2 1.12 0.72 17% 11% CPP-11
High Price (3 pm-6 pm) 112.3 67.6 1.34 0.81 20% 12%
Average Peak Period (12 pm-3 pm) 234.2 94.2 2.80 1.13 46% 18%
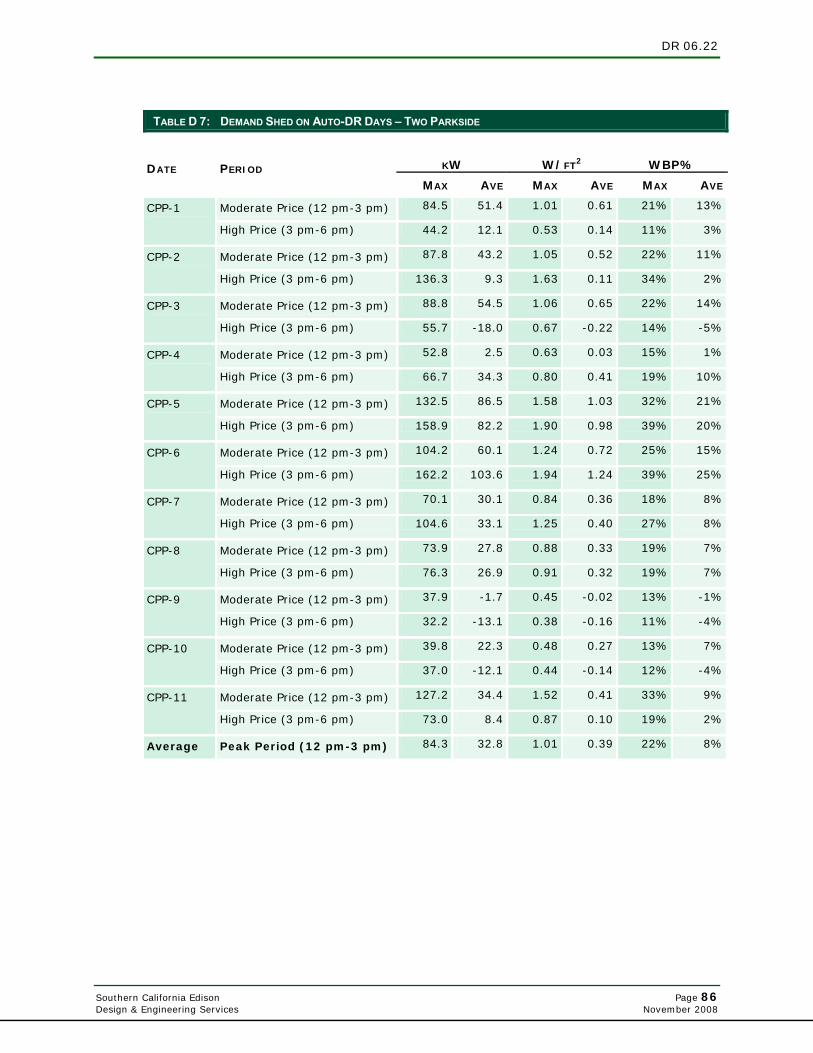
DR 06.22
Southern California Edison Page 86 Design & Engineering Services November 2008
TABLE D 7: DEMAND SHED ON AUTO-DR DAYS – TWO PARKSIDE
KW
W/FT2
WBP% DATE PERIOD
MAX AVE MAX AVE MAX AVE
Moderate Price (12 pm-3 pm) 84.5 51.4 1.01 0.61 21% 13% CPP-1
High Price (3 pm-6 pm) 44.2 12.1 0.53 0.14 11% 3%
Moderate Price (12 pm-3 pm) 87.8 43.2 1.05 0.52 22% 11% CPP-2
High Price (3 pm-6 pm) 136.3 9.3 1.63 0.11 34% 2%
Moderate Price (12 pm-3 pm) 88.8 54.5 1.06 0.65 22% 14% CPP-3
High Price (3 pm-6 pm) 55.7 -18.0 0.67 -0.22 14% -5%
Moderate Price (12 pm-3 pm) 52.8 2.5 0.63 0.03 15% 1% CPP-4
High Price (3 pm-6 pm) 66.7 34.3 0.80 0.41 19% 10%
Moderate Price (12 pm-3 pm) 132.5 86.5 1.58 1.03 32% 21% CPP-5
High Price (3 pm-6 pm) 158.9 82.2 1.90 0.98 39% 20%
Moderate Price (12 pm-3 pm) 104.2 60.1 1.24 0.72 25% 15% CPP-6
High Price (3 pm-6 pm) 162.2 103.6 1.94 1.24 39% 25%
Moderate Price (12 pm-3 pm) 70.1 30.1 0.84 0.36 18% 8% CPP-7
High Price (3 pm-6 pm) 104.6 33.1 1.25 0.40 27% 8%
Moderate Price (12 pm-3 pm) 73.9 27.8 0.88 0.33 19% 7% CPP-8
High Price (3 pm-6 pm) 76.3 26.9 0.91 0.32 19% 7%
Moderate Price (12 pm-3 pm) 37.9 -1.7 0.45 -0.02 13% -1% CPP-9
High Price (3 pm-6 pm) 32.2 -13.1 0.38 -0.16 11% -4%
Moderate Price (12 pm-3 pm) 39.8 22.3 0.48 0.27 13% 7% CPP-10
High Price (3 pm-6 pm) 37.0 -12.1 0.44 -0.14 12% -4%
Moderate Price (12 pm-3 pm) 127.2 34.4 1.52 0.41 33% 9% CPP-11
High Price (3 pm-6 pm) 73.0 8.4 0.87 0.10 19% 2%
Average Peak Period (12 pm-3 pm) 84.3 32.8 1.01 0.39 22% 8%
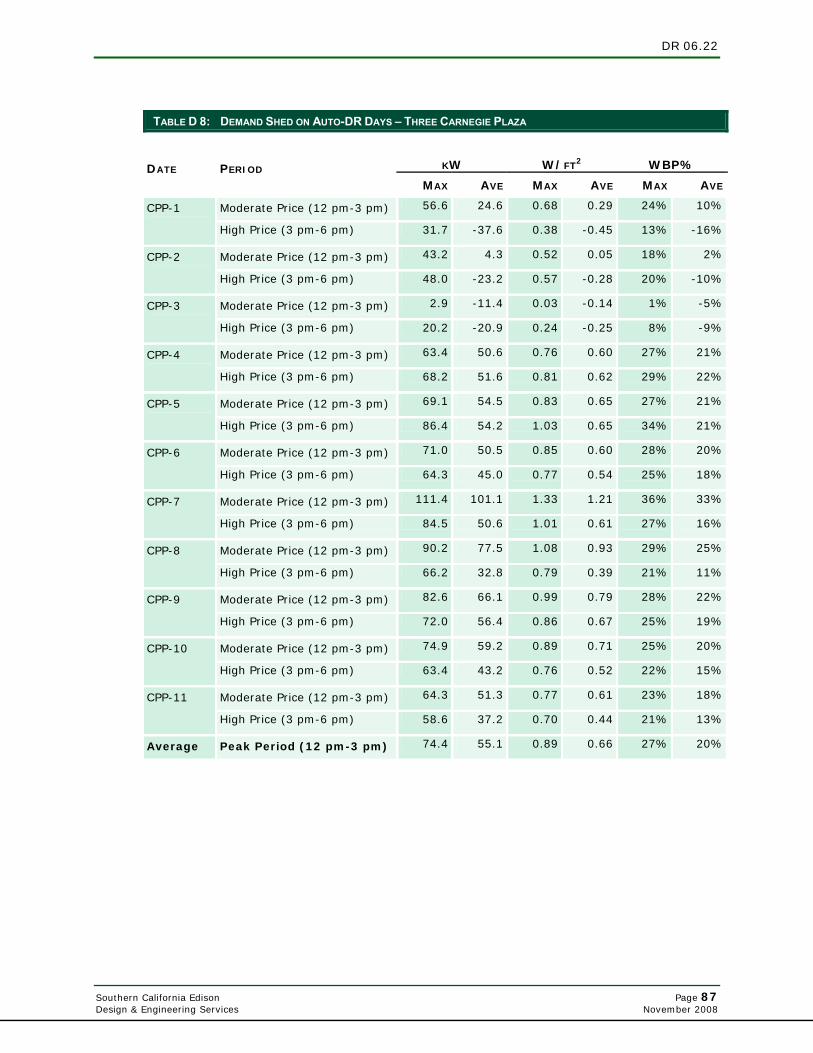
DR 06.22
Southern California Edison Page 87 Design & Engineering Services November 2008
TABLE D 8: DEMAND SHED ON AUTO-DR DAYS – THREE CARNEGIE PLAZA
KW
W/FT2
WBP% DATE PERIOD
MAX AVE MAX AVE MAX AVE
Moderate Price (12 pm-3 pm) 56.6 24.6 0.68 0.29 24% 10% CPP-1
High Price (3 pm-6 pm) 31.7 -37.6 0.38 -0.45 13% -16%
Moderate Price (12 pm-3 pm) 43.2 4.3 0.52 0.05 18% 2% CPP-2
High Price (3 pm-6 pm) 48.0 -23.2 0.57 -0.28 20% -10%
Moderate Price (12 pm-3 pm) 2.9 -11.4 0.03 -0.14 1% -5% CPP-3
High Price (3 pm-6 pm) 20.2 -20.9 0.24 -0.25 8% -9%
Moderate Price (12 pm-3 pm) 63.4 50.6 0.76 0.60 27% 21% CPP-4
High Price (3 pm-6 pm) 68.2 51.6 0.81 0.62 29% 22%
Moderate Price (12 pm-3 pm) 69.1 54.5 0.83 0.65 27% 21% CPP-5
High Price (3 pm-6 pm) 86.4 54.2 1.03 0.65 34% 21%
Moderate Price (12 pm-3 pm) 71.0 50.5 0.85 0.60 28% 20% CPP-6
High Price (3 pm-6 pm) 64.3 45.0 0.77 0.54 25% 18%
Moderate Price (12 pm-3 pm) 111.4 101.1 1.33 1.21 36% 33% CPP-7
High Price (3 pm-6 pm) 84.5 50.6 1.01 0.61 27% 16%
Moderate Price (12 pm-3 pm) 90.2 77.5 1.08 0.93 29% 25% CPP-8
High Price (3 pm-6 pm) 66.2 32.8 0.79 0.39 21% 11%
Moderate Price (12 pm-3 pm) 82.6 66.1 0.99 0.79 28% 22% CPP-9
High Price (3 pm-6 pm) 72.0 56.4 0.86 0.67 25% 19%
Moderate Price (12 pm-3 pm) 74.9 59.2 0.89 0.71 25% 20% CPP-10
High Price (3 pm-6 pm) 63.4 43.2 0.76 0.52 22% 15%
Moderate Price (12 pm-3 pm) 64.3 51.3 0.77 0.61 23% 18% CPP-11
High Price (3 pm-6 pm) 58.6 37.2 0.70 0.44 21% 13%
Average Peak Period (12 pm-3 pm) 74.4 55.1 0.89 0.66 27% 20%
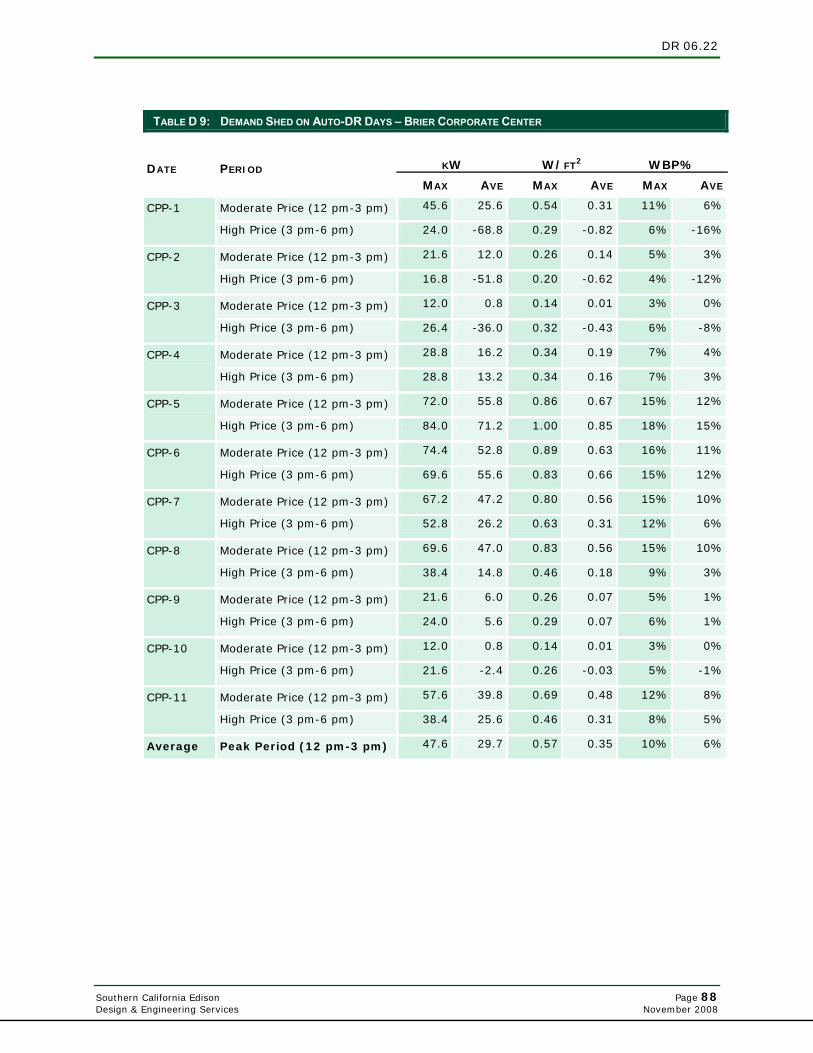
DR 06.22
Southern California Edison Page 88 Design & Engineering Services November 2008
TABLE D 9: DEMAND SHED ON AUTO-DR DAYS – BRIER CORPORATE CENTER
KW
W/FT2
WBP% DATE PERIOD
MAX AVE MAX AVE MAX AVE
Moderate Price (12 pm-3 pm) 45.6 25.6 0.54 0.31 11% 6% CPP-1
High Price (3 pm-6 pm) 24.0 -68.8 0.29 -0.82 6% -16%
Moderate Price (12 pm-3 pm) 21.6 12.0 0.26 0.14 5% 3% CPP-2
High Price (3 pm-6 pm) 16.8 -51.8 0.20 -0.62 4% -12%
Moderate Price (12 pm-3 pm) 12.0 0.8 0.14 0.01 3% 0% CPP-3
High Price (3 pm-6 pm) 26.4 -36.0 0.32 -0.43 6% -8%
Moderate Price (12 pm-3 pm) 28.8 16.2 0.34 0.19 7% 4% CPP-4
High Price (3 pm-6 pm) 28.8 13.2 0.34 0.16 7% 3%
Moderate Price (12 pm-3 pm) 72.0 55.8 0.86 0.67 15% 12% CPP-5
High Price (3 pm-6 pm) 84.0 71.2 1.00 0.85 18% 15%
Moderate Price (12 pm-3 pm) 74.4 52.8 0.89 0.63 16% 11% CPP-6
High Price (3 pm-6 pm) 69.6 55.6 0.83 0.66 15% 12%
Moderate Price (12 pm-3 pm) 67.2 47.2 0.80 0.56 15% 10% CPP-7
High Price (3 pm-6 pm) 52.8 26.2 0.63 0.31 12% 6%
Moderate Price (12 pm-3 pm) 69.6 47.0 0.83 0.56 15% 10% CPP-8
High Price (3 pm-6 pm) 38.4 14.8 0.46 0.18 9% 3%
Moderate Price (12 pm-3 pm) 21.6 6.0 0.26 0.07 5% 1% CPP-9
High Price (3 pm-6 pm) 24.0 5.6 0.29 0.07 6% 1%
Moderate Price (12 pm-3 pm) 12.0 0.8 0.14 0.01 3% 0% CPP-10
High Price (3 pm-6 pm) 21.6 -2.4 0.26 -0.03 5% -1%
Moderate Price (12 pm-3 pm) 57.6 39.8 0.69 0.48 12% 8% CPP-11
High Price (3 pm-6 pm) 38.4 25.6 0.46 0.31 8% 5%
Average Peak Period (12 pm-3 pm) 47.6 29.7 0.57 0.35 10% 6%
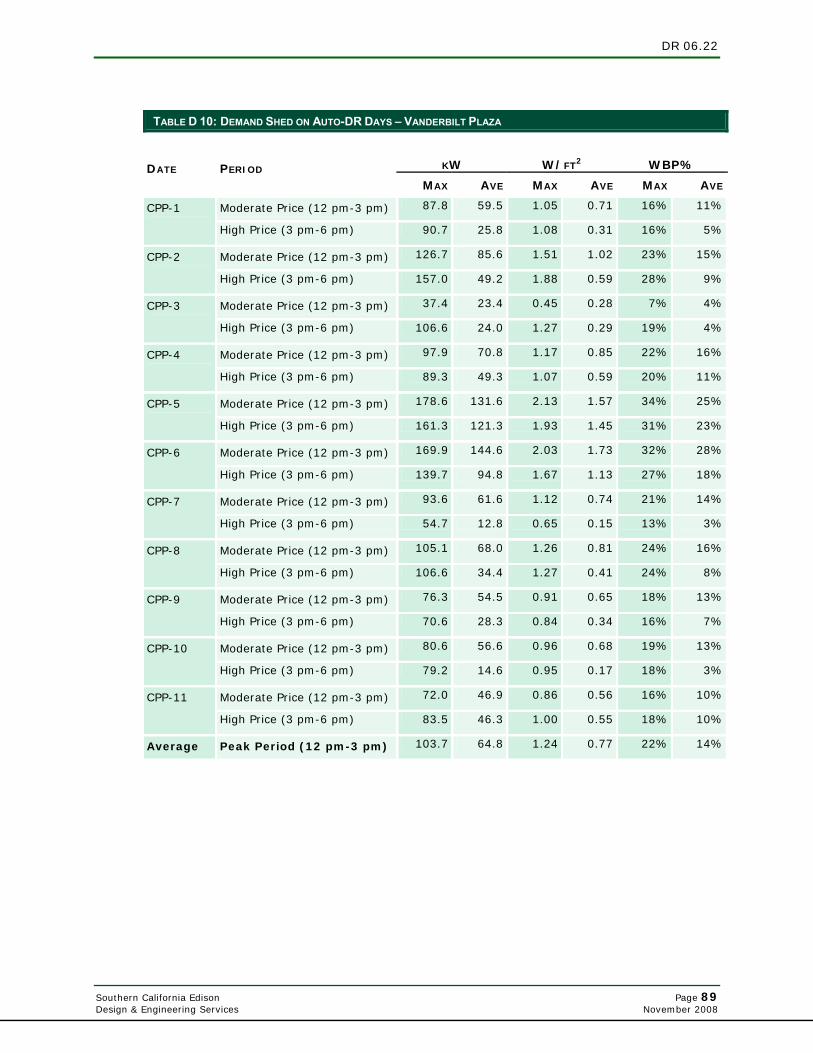
DR 06.22
Southern California Edison Page 89 Design & Engineering Services November 2008
TABLE D 10: DEMAND SHED ON AUTO-DR DAYS – VANDERBILT PLAZA
KW
W/FT2
WBP% DATE PERIOD
MAX AVE MAX AVE MAX AVE
Moderate Price (12 pm-3 pm) 87.8 59.5 1.05 0.71 16% 11% CPP-1
High Price (3 pm-6 pm) 90.7 25.8 1.08 0.31 16% 5%
Moderate Price (12 pm-3 pm) 126.7 85.6 1.51 1.02 23% 15% CPP-2
High Price (3 pm-6 pm) 157.0 49.2 1.88 0.59 28% 9%
Moderate Price (12 pm-3 pm) 37.4 23.4 0.45 0.28 7% 4% CPP-3
High Price (3 pm-6 pm) 106.6 24.0 1.27 0.29 19% 4%
Moderate Price (12 pm-3 pm) 97.9 70.8 1.17 0.85 22% 16% CPP-4
High Price (3 pm-6 pm) 89.3 49.3 1.07 0.59 20% 11%
Moderate Price (12 pm-3 pm) 178.6 131.6 2.13 1.57 34% 25% CPP-5
High Price (3 pm-6 pm) 161.3 121.3 1.93 1.45 31% 23%
Moderate Price (12 pm-3 pm) 169.9 144.6 2.03 1.73 32% 28% CPP-6
High Price (3 pm-6 pm) 139.7 94.8 1.67 1.13 27% 18%
Moderate Price (12 pm-3 pm) 93.6 61.6 1.12 0.74 21% 14% CPP-7
High Price (3 pm-6 pm) 54.7 12.8 0.65 0.15 13% 3%
Moderate Price (12 pm-3 pm) 105.1 68.0 1.26 0.81 24% 16% CPP-8
High Price (3 pm-6 pm) 106.6 34.4 1.27 0.41 24% 8%
Moderate Price (12 pm-3 pm) 76.3 54.5 0.91 0.65 18% 13% CPP-9
High Price (3 pm-6 pm) 70.6 28.3 0.84 0.34 16% 7%
Moderate Price (12 pm-3 pm) 80.6 56.6 0.96 0.68 19% 13% CPP-10
High Price (3 pm-6 pm) 79.2 14.6 0.95 0.17 18% 3%
Moderate Price (12 pm-3 pm) 72.0 46.9 0.86 0.56 16% 10% CPP-11
High Price (3 pm-6 pm) 83.5 46.3 1.00 0.55 18% 10%
Average Peak Period (12 pm-3 pm) 103.7 64.8 1.24 0.77 22% 14%
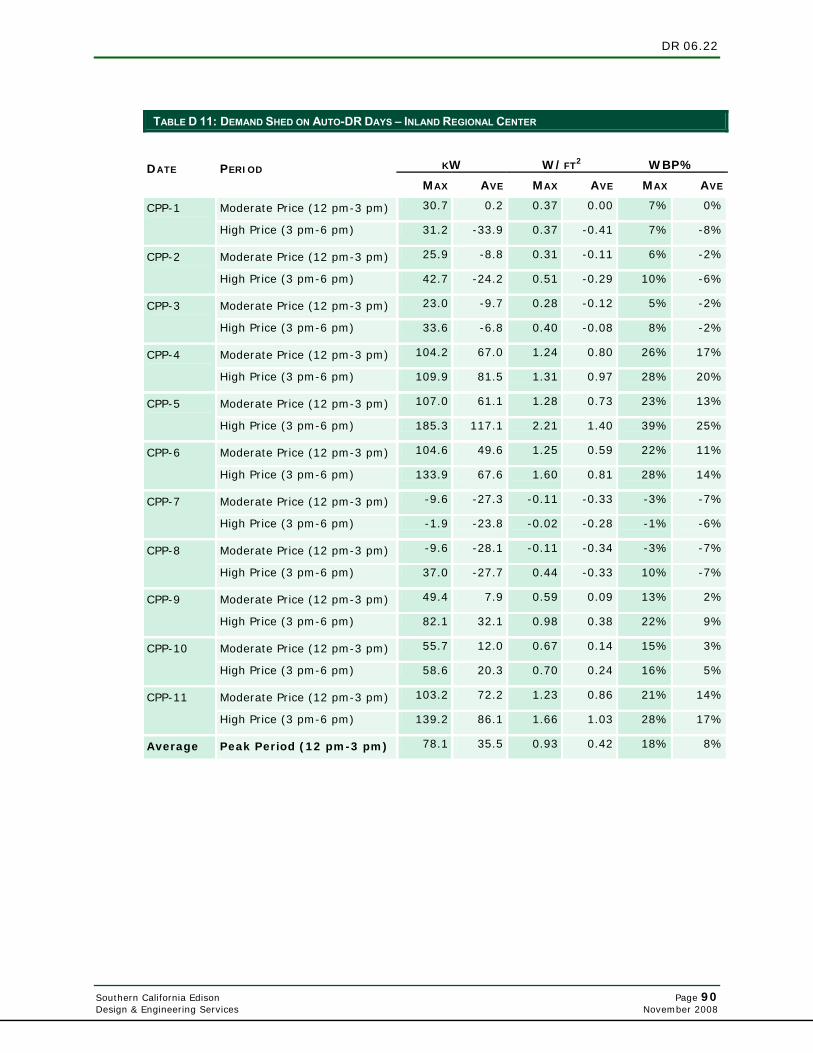
DR 06.22
Southern California Edison Page 90 Design & Engineering Services November 2008
TABLE D 11: DEMAND SHED ON AUTO-DR DAYS – INLAND REGIONAL CENTER
KW
W/FT2
WBP% DATE PERIOD
MAX AVE MAX AVE MAX AVE
Moderate Price (12 pm-3 pm) 30.7 0.2 0.37 0.00 7% 0% CPP-1
High Price (3 pm-6 pm) 31.2 -33.9 0.37 -0.41 7% -8%
Moderate Price (12 pm-3 pm) 25.9 -8.8 0.31 -0.11 6% -2% CPP-2
High Price (3 pm-6 pm) 42.7 -24.2 0.51 -0.29 10% -6%
Moderate Price (12 pm-3 pm) 23.0 -9.7 0.28 -0.12 5% -2% CPP-3
High Price (3 pm-6 pm) 33.6 -6.8 0.40 -0.08 8% -2%
Moderate Price (12 pm-3 pm) 104.2 67.0 1.24 0.80 26% 17% CPP-4
High Price (3 pm-6 pm) 109.9 81.5 1.31 0.97 28% 20%
Moderate Price (12 pm-3 pm) 107.0 61.1 1.28 0.73 23% 13% CPP-5
High Price (3 pm-6 pm) 185.3 117.1 2.21 1.40 39% 25%
Moderate Price (12 pm-3 pm) 104.6 49.6 1.25 0.59 22% 11% CPP-6
High Price (3 pm-6 pm) 133.9 67.6 1.60 0.81 28% 14%
Moderate Price (12 pm-3 pm) -9.6 -27.3 -0.11 -0.33 -3% -7% CPP-7
High Price (3 pm-6 pm) -1.9 -23.8 -0.02 -0.28 -1% -6%
Moderate Price (12 pm-3 pm) -9.6 -28.1 -0.11 -0.34 -3% -7% CPP-8
High Price (3 pm-6 pm) 37.0 -27.7 0.44 -0.33 10% -7%
Moderate Price (12 pm-3 pm) 49.4 7.9 0.59 0.09 13% 2% CPP-9
High Price (3 pm-6 pm) 82.1 32.1 0.98 0.38 22% 9%
Moderate Price (12 pm-3 pm) 55.7 12.0 0.67 0.14 15% 3% CPP-10
High Price (3 pm-6 pm) 58.6 20.3 0.70 0.24 16% 5%
Moderate Price (12 pm-3 pm) 103.2 72.2 1.23 0.86 21% 14% CPP-11
High Price (3 pm-6 pm) 139.2 86.1 1.66 1.03 28% 17%
Average Peak Period (12 pm-3 pm) 78.1 35.5 0.93 0.42 18% 8%
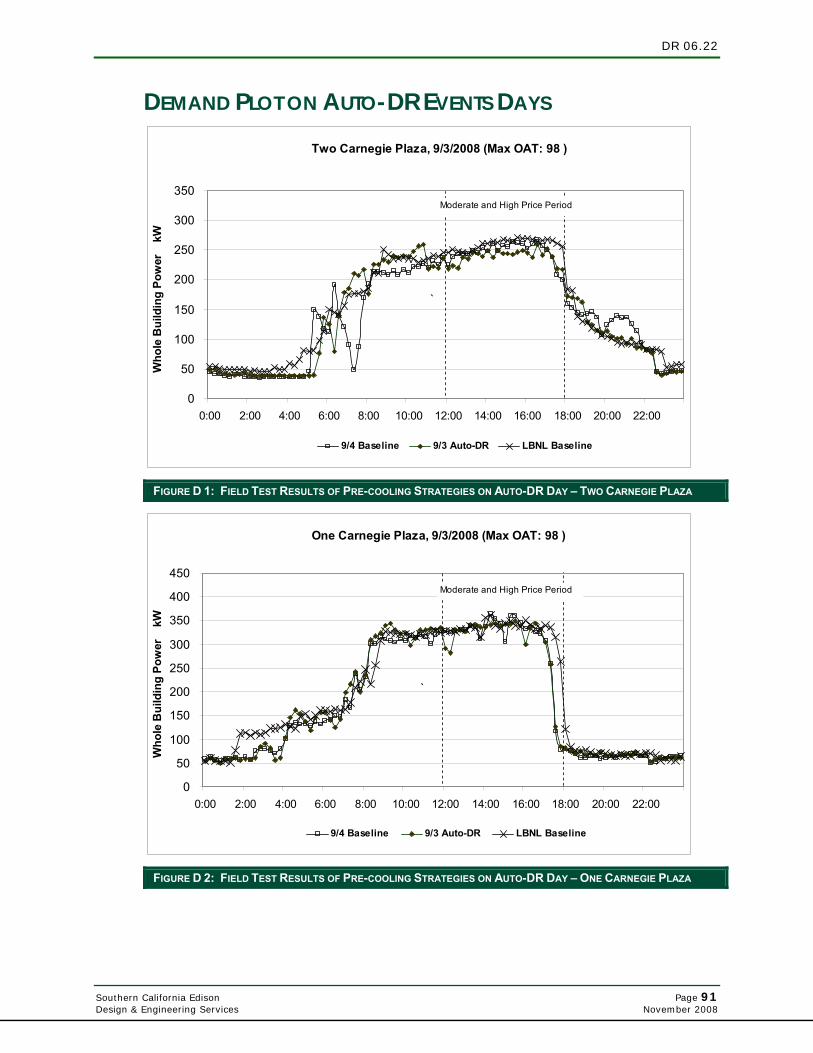
DR 06.22
Southern California Edison Page 91 Design & Engineering Services November 2008
DEMAND PLOT ON AUTO-DR EVENTS DAYS
Two Carnegie Plaza, 9/3/2008 (Max OAT: 98 )
0
50
100
150
200
250
300
350
0:00 2:00 4:00 6:00 8:00 10:00 12:00 14:00 16:00 18:00 20:00 22:00
Who
le B
uild
ing
Pow
er
kW
9/4 Baseline 9/3 Auto-DR LBNL Baseline
Moderate and High Price Period
`
FIGURE D 1: FIELD TEST RESULTS OF PRE-COOLING STRATEGIES ON AUTO-DR DAY – TWO CARNEGIE PLAZA
One Carnegie Plaza, 9/3/2008 (Max OAT: 98 )
0
50
100
150
200
250
300
350
400
450
0:00 2:00 4:00 6:00 8:00 10:00 12:00 14:00 16:00 18:00 20:00 22:00
Who
le B
uild
ing
Pow
er
kW
9/4 Baseline 9/3 Auto-DR LBNL Baseline
Moderate and High Price Period
`
FIGURE D 2: FIELD TEST RESULTS OF PRE-COOLING STRATEGIES ON AUTO-DR DAY – ONE CARNEGIE PLAZA
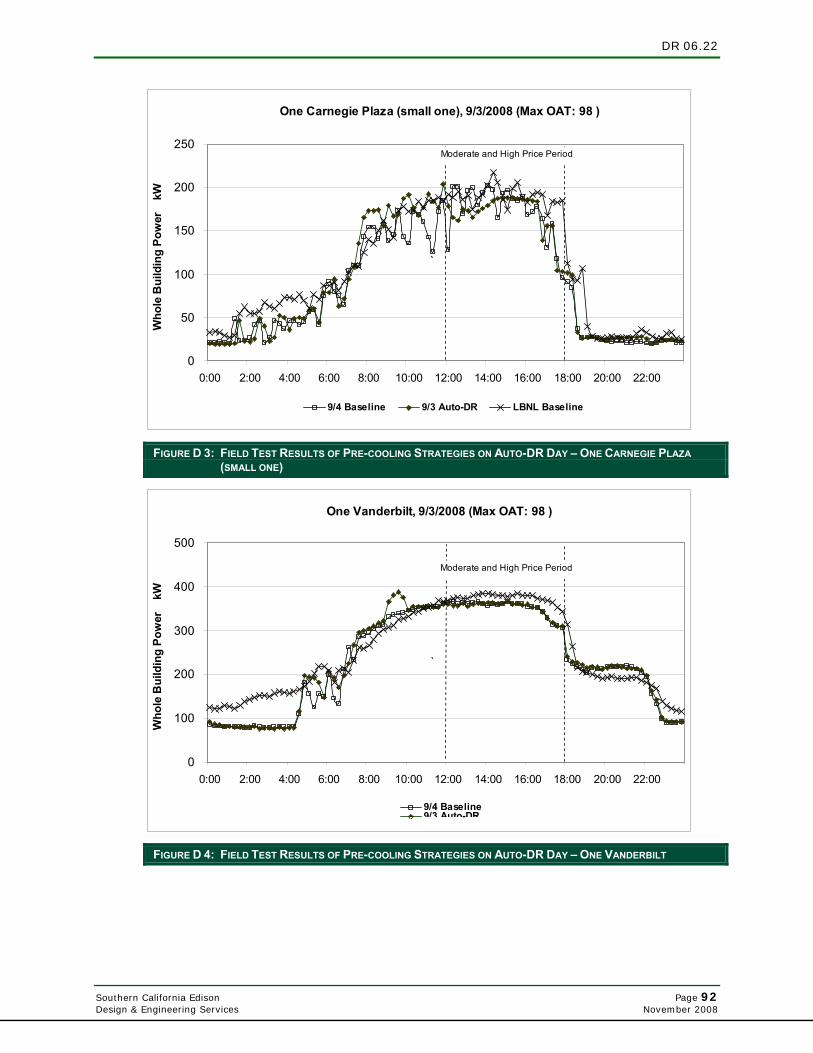
DR 06.22
Southern California Edison Page 92 Design & Engineering Services November 2008
One Carnegie Plaza (small one), 9/3/2008 (Max OAT: 98 )
0
50
100
150
200
250
0:00 2:00 4:00 6:00 8:00 10:00 12:00 14:00 16:00 18:00 20:00 22:00
Who
le B
uild
ing
Pow
er
kW
9/4 Baseline 9/3 Auto-DR LBNL Baseline
Moderate and High Price Period
`
FIGURE D 3: FIELD TEST RESULTS OF PRE-COOLING STRATEGIES ON AUTO-DR DAY – ONE CARNEGIE PLAZA (SMALL ONE)
One Vanderbilt, 9/3/2008 (Max OAT: 98 )
0
100
200
300
400
500
0:00 2:00 4:00 6:00 8:00 10:00 12:00 14:00 16:00 18:00 20:00 22:00
Who
le B
uild
ing
Pow
er
kW
9/4 Baseline9/3 Auto-DR
Moderate and High Price Period
`
FIGURE D 4: FIELD TEST RESULTS OF PRE-COOLING STRATEGIES ON AUTO-DR DAY – ONE VANDERBILT
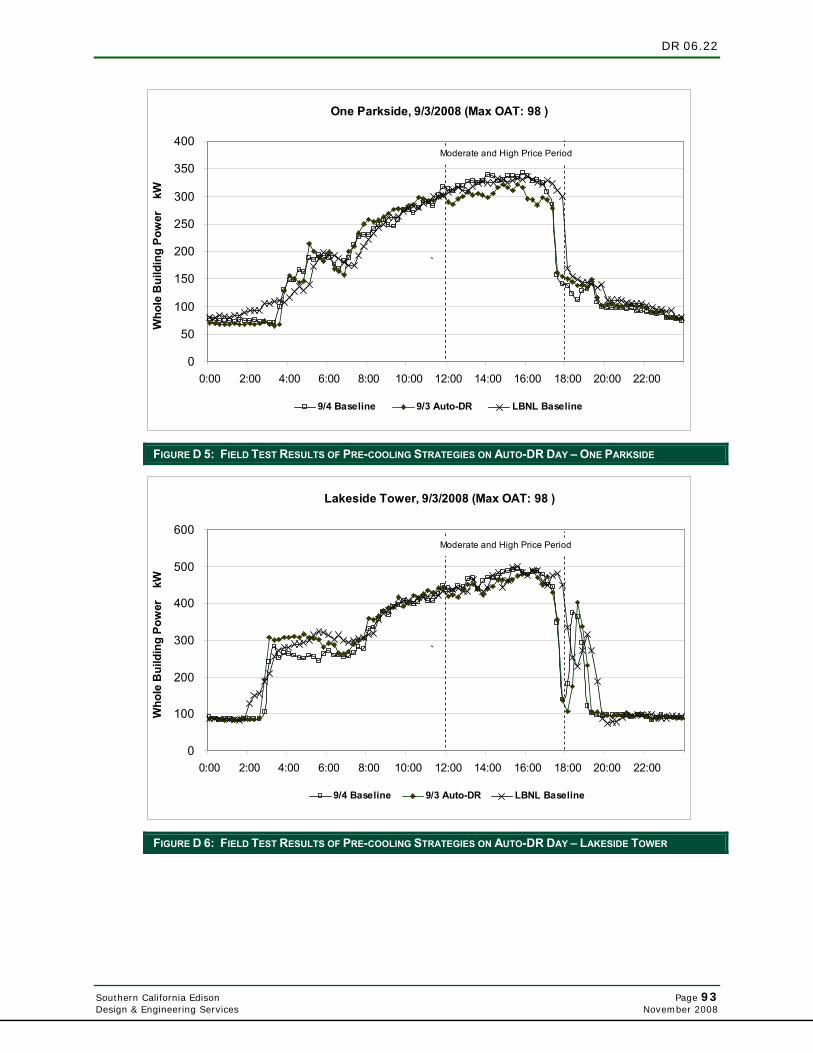
DR 06.22
Southern California Edison Page 93 Design & Engineering Services November 2008
One Parkside, 9/3/2008 (Max OAT: 98 )
0
50
100
150
200
250
300
350
400
0:00 2:00 4:00 6:00 8:00 10:00 12:00 14:00 16:00 18:00 20:00 22:00
Who
le B
uild
ing
Pow
er
kW
9/4 Baseline 9/3 Auto-DR LBNL Baseline
Moderate and High Price Period
`
FIGURE D 5: FIELD TEST RESULTS OF PRE-COOLING STRATEGIES ON AUTO-DR DAY – ONE PARKSIDE
Lakeside Tower, 9/3/2008 (Max OAT: 98 )
0
100
200
300
400
500
600
0:00 2:00 4:00 6:00 8:00 10:00 12:00 14:00 16:00 18:00 20:00 22:00
Who
le B
uild
ing
Pow
er
kW
9/4 Baseline 9/3 Auto-DR LBNL Baseline
Moderate and High Price Period
`
FIGURE D 6: FIELD TEST RESULTS OF PRE-COOLING STRATEGIES ON AUTO-DR DAY – LAKESIDE TOWER
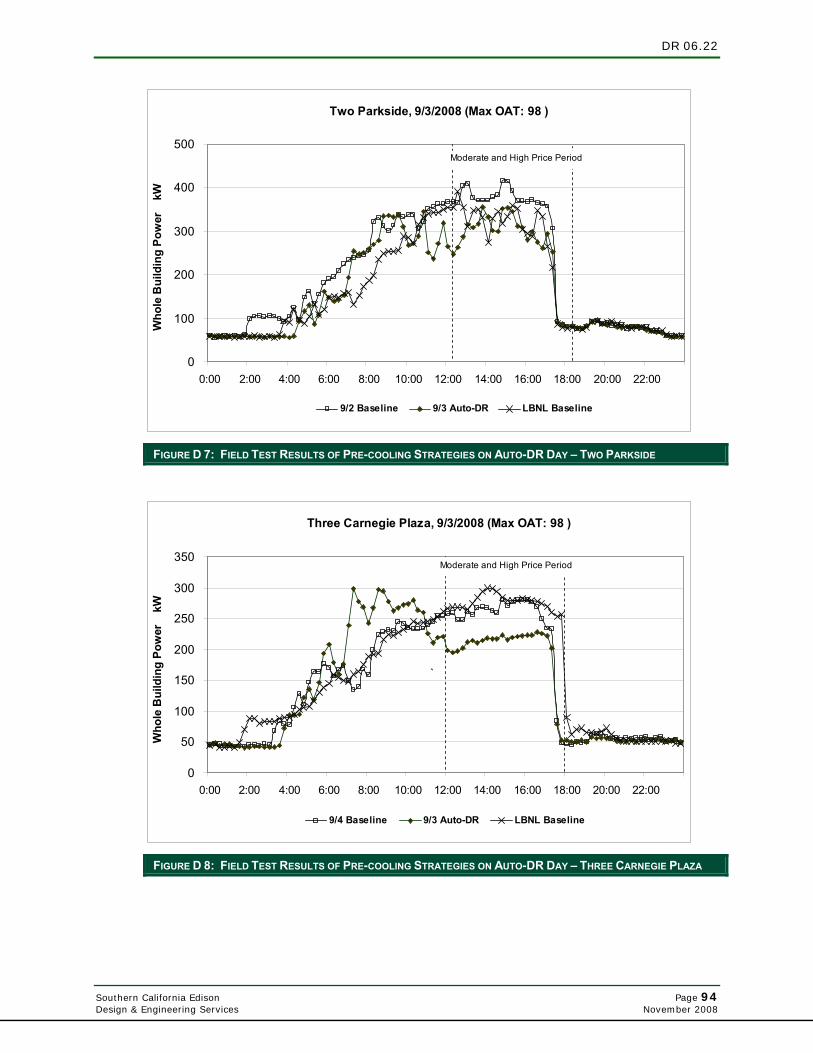
DR 06.22
Southern California Edison Page 94 Design & Engineering Services November 2008
Two Parkside, 9/3/2008 (Max OAT: 98 )
0
100
200
300
400
500
0:00 2:00 4:00 6:00 8:00 10:00 12:00 14:00 16:00 18:00 20:00 22:00
Who
le B
uild
ing
Pow
er
kW
9/2 Baseline 9/3 Auto-DR LBNL Baseline
Moderate and High Price Period
`
FIGURE D 7: FIELD TEST RESULTS OF PRE-COOLING STRATEGIES ON AUTO-DR DAY – TWO PARKSIDE
Three Carnegie Plaza, 9/3/2008 (Max OAT: 98 )
0
50
100
150
200
250
300
350
0:00 2:00 4:00 6:00 8:00 10:00 12:00 14:00 16:00 18:00 20:00 22:00
Who
le B
uild
ing
Pow
er
kW
9/4 Baseline 9/3 Auto-DR LBNL Baseline
Moderate and High Price Period
`
FIGURE D 8: FIELD TEST RESULTS OF PRE-COOLING STRATEGIES ON AUTO-DR DAY – THREE CARNEGIE PLAZA
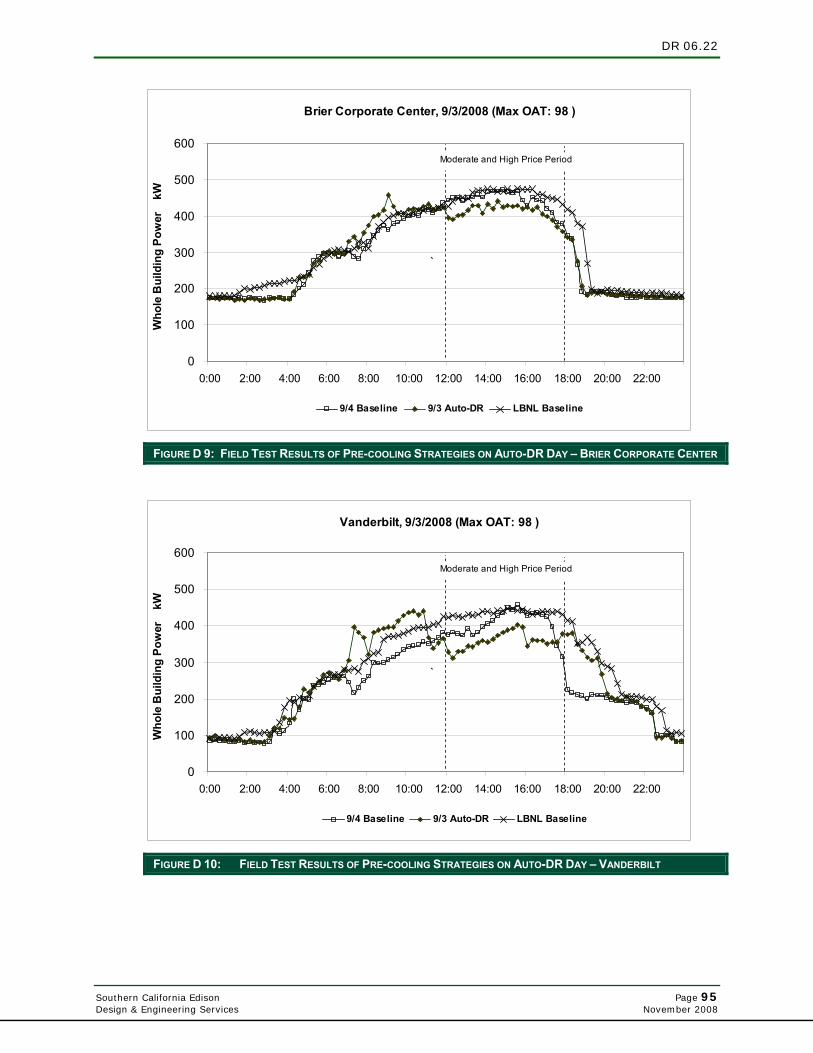
DR 06.22
Southern California Edison Page 95 Design & Engineering Services November 2008
Brier Corporate Center, 9/3/2008 (Max OAT: 98 )
0
100
200
300
400
500
600
0:00 2:00 4:00 6:00 8:00 10:00 12:00 14:00 16:00 18:00 20:00 22:00
Who
le B
uild
ing
Pow
er
kW
9/4 Baseline 9/3 Auto-DR LBNL Baseline
Moderate and High Price Period
`
FIGURE D 9: FIELD TEST RESULTS OF PRE-COOLING STRATEGIES ON AUTO-DR DAY – BRIER CORPORATE CENTER
Vanderbilt, 9/3/2008 (Max OAT: 98 )
0
100
200
300
400
500
600
0:00 2:00 4:00 6:00 8:00 10:00 12:00 14:00 16:00 18:00 20:00 22:00
Who
le B
uild
ing
Pow
er
kW
9/4 Baseline 9/3 Auto-DR LBNL Baseline
Moderate and High Price Period
`
FIGURE D 10: FIELD TEST RESULTS OF PRE-COOLING STRATEGIES ON AUTO-DR DAY – VANDERBILT
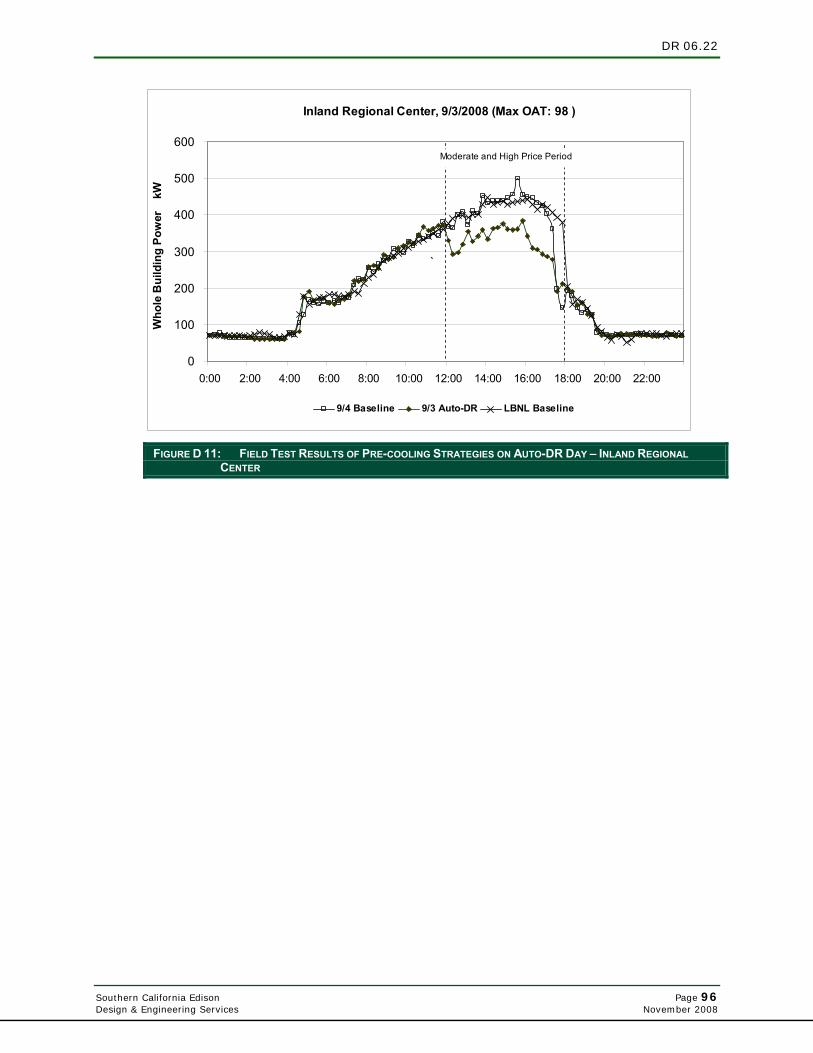
DR 06.22
Southern California Edison Page 96 Design & Engineering Services November 2008
Inland Regional Center, 9/3/2008 (Max OAT: 98 )
0
100
200
300
400
500
600
0:00 2:00 4:00 6:00 8:00 10:00 12:00 14:00 16:00 18:00 20:00 22:00
Who
le B
uild
ing
Pow
er
kW
9/4 Baseline 9/3 Auto-DR LBNL Baseline
Moderate and High Price Period
`
FIGURE D 11: FIELD TEST RESULTS OF PRE-COOLING STRATEGIES ON AUTO-DR DAY – INLAND REGIONAL CENTER
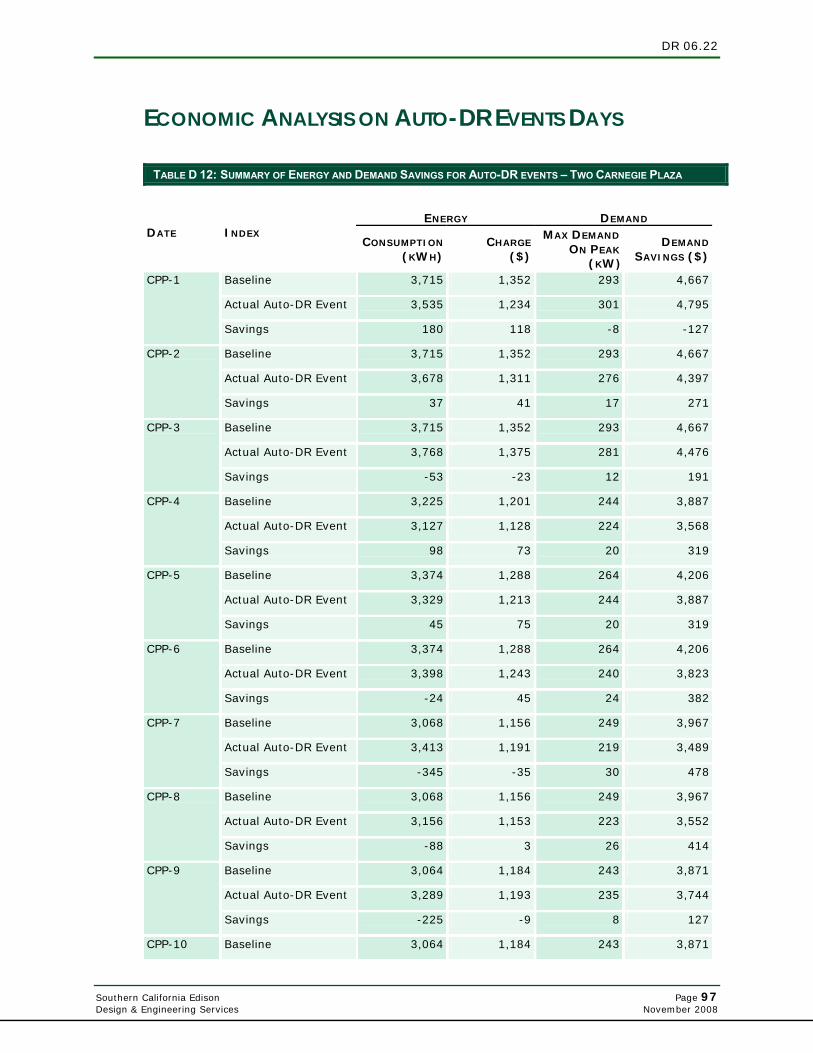
DR 06.22
Southern California Edison Page 97 Design & Engineering Services November 2008
ECONOMIC ANALYSIS ON AUTO-DR EVENTS DAYS
TABLE D 12: SUMMARY OF ENERGY AND DEMAND SAVINGS FOR AUTO-DR EVENTS – TWO CARNEGIE PLAZA
ENERGY
DEMAND
DATE INDEX CONSUMPTION
(KWH)CHARGE
($)
MAX DEMAND
ON PEAK
(KW)
DEMAND
SAVINGS ($)
Baseline 3,715 1,352 293 4,667
Actual Auto-DR Event 3,535 1,234 301 4,795
CPP-1
Savings 180 118 -8 -127
Baseline 3,715 1,352 293 4,667
Actual Auto-DR Event 3,678 1,311 276 4,397
CPP-2
Savings 37 41 17 271
Baseline 3,715 1,352 293 4,667
Actual Auto-DR Event 3,768 1,375 281 4,476
CPP-3
Savings -53 -23 12 191
Baseline 3,225 1,201 244 3,887
Actual Auto-DR Event 3,127 1,128 224 3,568
CPP-4
Savings 98 73 20 319
Baseline 3,374 1,288 264 4,206
Actual Auto-DR Event 3,329 1,213 244 3,887
CPP-5
Savings 45 75 20 319
Baseline 3,374 1,288 264 4,206
Actual Auto-DR Event 3,398 1,243 240 3,823
CPP-6
Savings -24 45 24 382
Baseline 3,068 1,156 249 3,967
Actual Auto-DR Event 3,413 1,191 219 3,489
CPP-7
Savings -345 -35 30 478
Baseline 3,068 1,156 249 3,967
Actual Auto-DR Event 3,156 1,153 223 3,552
CPP-8
Savings -88 3 26 414
Baseline 3,064 1,184 243 3,871
Actual Auto-DR Event 3,289 1,193 235 3,744
CPP-9
Savings -225 -9 8 127
CPP-10 Baseline 3,064 1,184 243 3,871
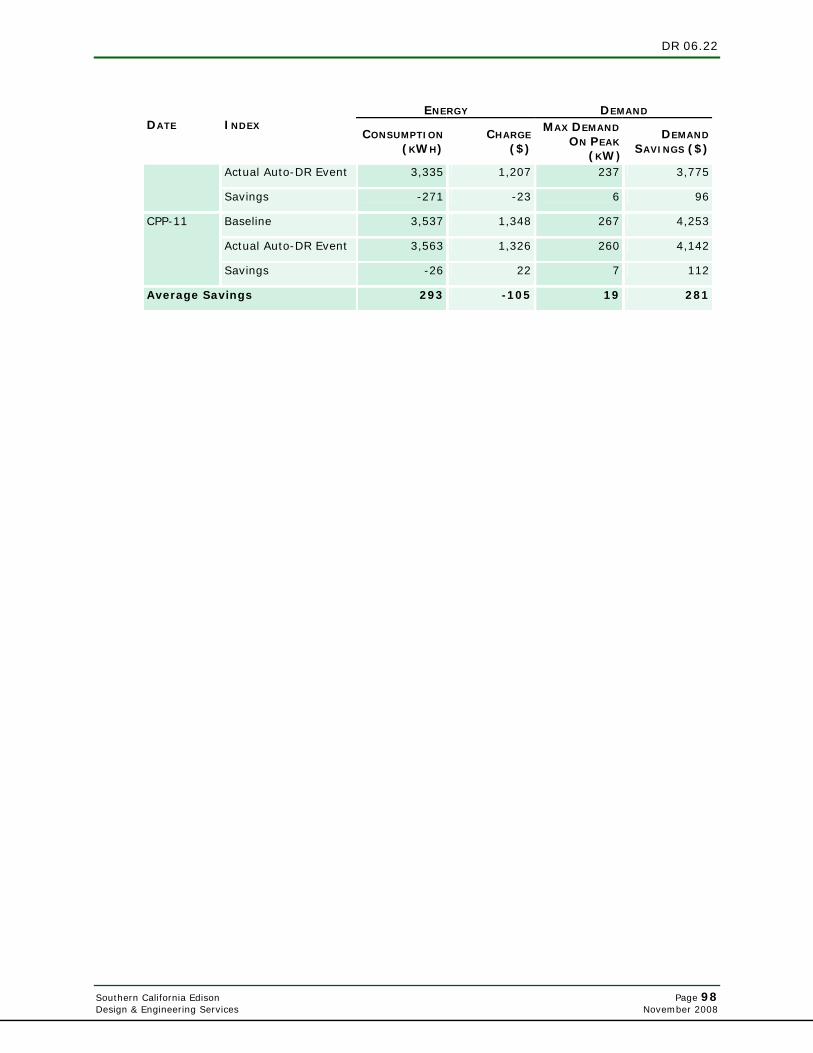
DR 06.22
Southern California Edison Page 98 Design & Engineering Services November 2008
ENERGY
DEMAND
DATE INDEX CONSUMPTION
(KWH)CHARGE
($)
MAX DEMAND
ON PEAK
(KW)
DEMAND
SAVINGS ($)
Actual Auto-DR Event 3,335 1,207 237 3,775
Savings -271 -23 6 96
Baseline 3,537 1,348 267 4,253
Actual Auto-DR Event 3,563 1,326 260 4,142
CPP-11
Savings -26 22 7 112
Average Savings 293 -105 19 281
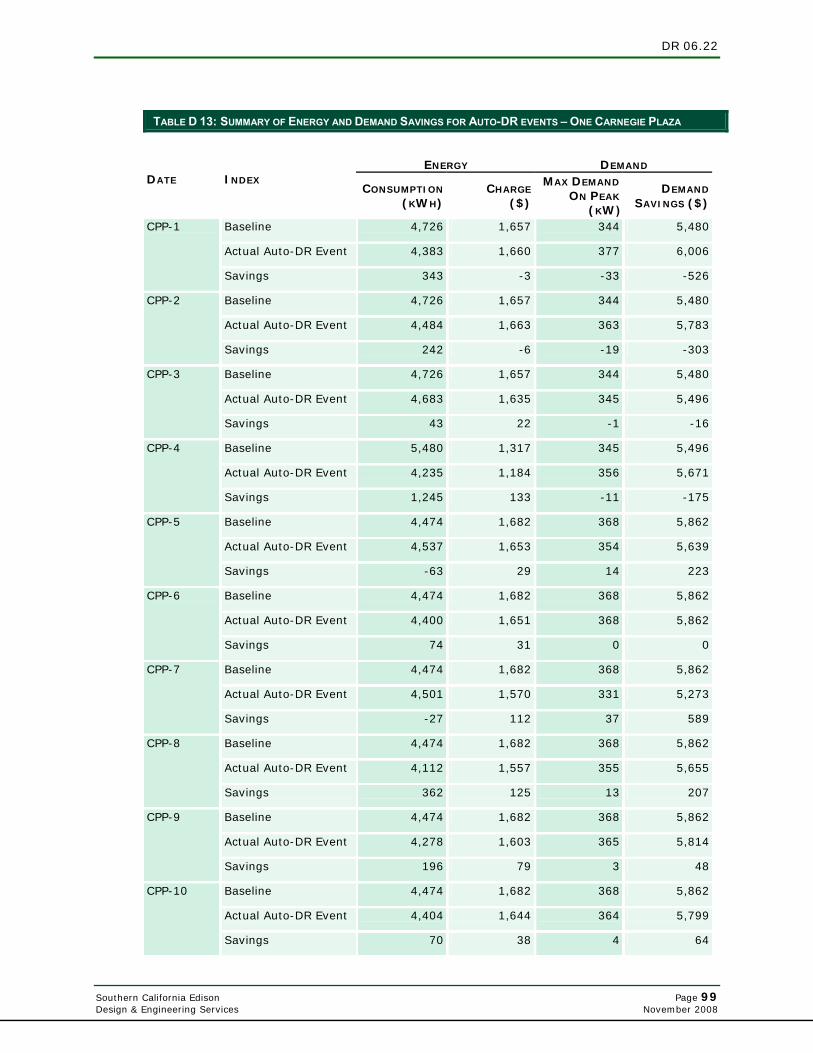
DR 06.22
Southern California Edison Page 99 Design & Engineering Services November 2008
TABLE D 13: SUMMARY OF ENERGY AND DEMAND SAVINGS FOR AUTO-DR EVENTS – ONE CARNEGIE PLAZA
ENERGY
DEMAND
DATE INDEX CONSUMPTION
(KWH)CHARGE
($)
MAX DEMAND
ON PEAK
(KW)
DEMAND
SAVINGS ($)
Baseline 4,726 1,657 344 5,480
Actual Auto-DR Event 4,383 1,660 377 6,006
CPP-1
Savings 343 -3 -33 -526
Baseline 4,726 1,657 344 5,480
Actual Auto-DR Event 4,484 1,663 363 5,783
CPP-2
Savings 242 -6 -19 -303
Baseline 4,726 1,657 344 5,480
Actual Auto-DR Event 4,683 1,635 345 5,496
CPP-3
Savings 43 22 -1 -16
Baseline 5,480 1,317 345 5,496
Actual Auto-DR Event 4,235 1,184 356 5,671
CPP-4
Savings 1,245 133 -11 -175
Baseline 4,474 1,682 368 5,862
Actual Auto-DR Event 4,537 1,653 354 5,639
CPP-5
Savings -63 29 14 223
Baseline 4,474 1,682 368 5,862
Actual Auto-DR Event 4,400 1,651 368 5,862
CPP-6
Savings 74 31 0 0
Baseline 4,474 1,682 368 5,862
Actual Auto-DR Event 4,501 1,570 331 5,273
CPP-7
Savings -27 112 37 589
Baseline 4,474 1,682 368 5,862
Actual Auto-DR Event 4,112 1,557 355 5,655
CPP-8
Savings 362 125 13 207
Baseline 4,474 1,682 368 5,862
Actual Auto-DR Event 4,278 1,603 365 5,814
CPP-9
Savings 196 79 3 48
Baseline 4,474 1,682 368 5,862
Actual Auto-DR Event 4,404 1,644 364 5,799
CPP-10
Savings 70 38 4 64

DR 06.22
Southern California Edison Page 100 Design & Engineering Services November 2008
ENERGY
DEMAND
DATE INDEX CONSUMPTION
(KWH)CHARGE
($)
MAX DEMAND
ON PEAK
(KW)
DEMAND
SAVINGS ($)
Baseline 4,932 1,777 362 5,767
Actual Auto-DR Event 4,416 1,646 349 5,560
CPP-11
Savings 516 131 13 207
Average Savings 293 206 62 992
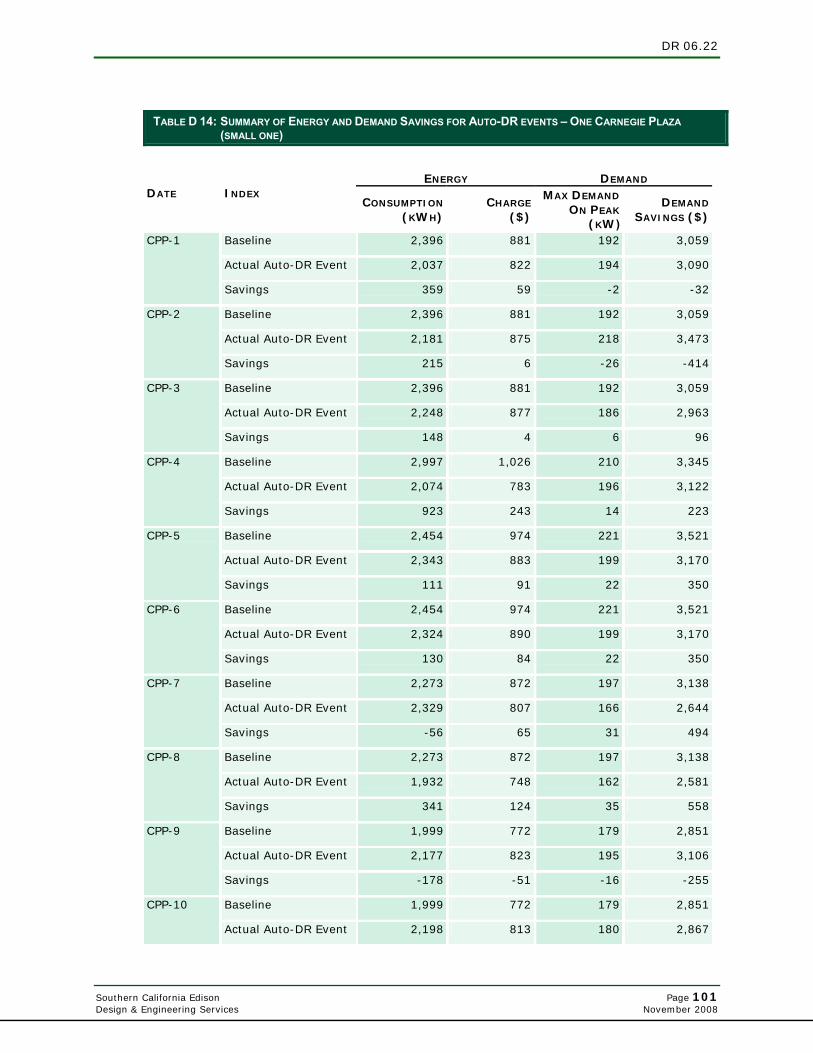
DR 06.22
Southern California Edison Page 101 Design & Engineering Services November 2008
TABLE D 14: SUMMARY OF ENERGY AND DEMAND SAVINGS FOR AUTO-DR EVENTS – ONE CARNEGIE PLAZA (SMALL ONE)
ENERGY
DEMAND
DATE INDEX CONSUMPTION
(KWH)CHARGE
($)
MAX DEMAND
ON PEAK
(KW)
DEMAND
SAVINGS ($)
Baseline 2,396 881 192 3,059
Actual Auto-DR Event 2,037 822 194 3,090
CPP-1
Savings 359 59 -2 -32
Baseline 2,396 881 192 3,059
Actual Auto-DR Event 2,181 875 218 3,473
CPP-2
Savings 215 6 -26 -414
Baseline 2,396 881 192 3,059
Actual Auto-DR Event 2,248 877 186 2,963
CPP-3
Savings 148 4 6 96
Baseline 2,997 1,026 210 3,345
Actual Auto-DR Event 2,074 783 196 3,122
CPP-4
Savings 923 243 14 223
Baseline 2,454 974 221 3,521
Actual Auto-DR Event 2,343 883 199 3,170
CPP-5
Savings 111 91 22 350
Baseline 2,454 974 221 3,521
Actual Auto-DR Event 2,324 890 199 3,170
CPP-6
Savings 130 84 22 350
Baseline 2,273 872 197 3,138
Actual Auto-DR Event 2,329 807 166 2,644
CPP-7
Savings -56 65 31 494
Baseline 2,273 872 197 3,138
Actual Auto-DR Event 1,932 748 162 2,581
CPP-8
Savings 341 124 35 558
Baseline 1,999 772 179 2,851
Actual Auto-DR Event 2,177 823 195 3,106
CPP-9
Savings -178 -51 -16 -255
Baseline 1,999 772 179 2,851 CPP-10
Actual Auto-DR Event 2,198 813 180 2,867
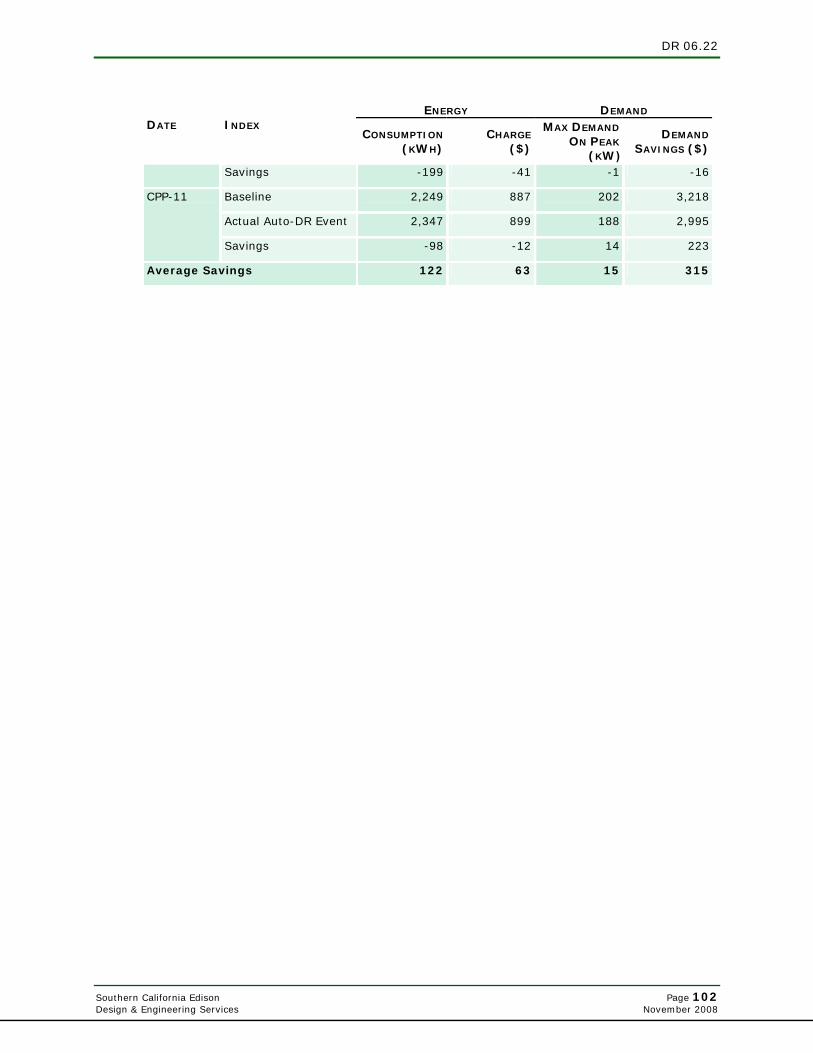
DR 06.22
Southern California Edison Page 102 Design & Engineering Services November 2008
ENERGY
DEMAND
DATE INDEX CONSUMPTION
(KWH)CHARGE
($)
MAX DEMAND
ON PEAK
(KW)
DEMAND
SAVINGS ($)
Savings -199 -41 -1 -16
Baseline 2,249 887 202 3,218
Actual Auto-DR Event 2,347 899 188 2,995
CPP-11
Savings -98 -12 14 223
Average Savings 122 63 15 315

DR 06.22
Southern California Edison Page 103 Design & Engineering Services November 2008
TABLE D 15: SUMMARY OF ENERGY AND DEMAND SAVINGS FOR AUTO-DR EVENTS – ONE VANDERBILT
ENERGY
DEMAND
DATE INDEX CONSUMPTION
(KWH)CHARGE
($)
MAX DEMAND
ON PEAK
(KW)
DEMAND
SAVINGS ($)
Baseline 6,849 2,287 419 6,675
Actual Auto-DR Event 6,404 2,256 417 6,643
CPP-1
Savings 445 31 2 32
Baseline 6,849 2,287 419 6,675
Actual Auto-DR Event 6,380 2,247 420 6,691
CPP-2
Savings 469 40 -1 -16
Baseline 6,849 2,287 419 6,675
Actual Auto-DR Event 6,756 2,290 416 6,627
CPP-3
Savings 93 -3 3 48
Baseline 7,550 2,464 435 6,930
Actual Auto-DR Event 6,109 2,175 404 6,436
CPP-4
Savings 1,441 289 31 494
Baseline 6,730 2,400 445 7,089
Actual Auto-DR Event 6,623 2,331 432 6,882
CPP-5
Savings 107 69 13 207
Baseline 6,730 2,400 445 7,089
Actual Auto-DR Event 6,525 2,332 431 6,866
CPP-6
Savings 205 68 14 223
Baseline 6,473 2,280 425 6,770
Actual Auto-DR Event 6,688 2,277 416 6,627
CPP-7
Savings -215 3 9 143
Baseline 6,473 2,280 425 6,770
Actual Auto-DR Event 6,055 2,200 415 6,611
CPP-8
Savings 418 80 10 159
Baseline 6,817 2,356 429 6,834
Actual Auto-DR Event 6,248 2,126 407 6,484
CPP-9
Savings 569 230 22 350
Baseline 6,817 2,356 429 6,834
Actual Auto-DR Event 6,191 2,187 408 6,499
CPP-10
Savings 626 169 21 335
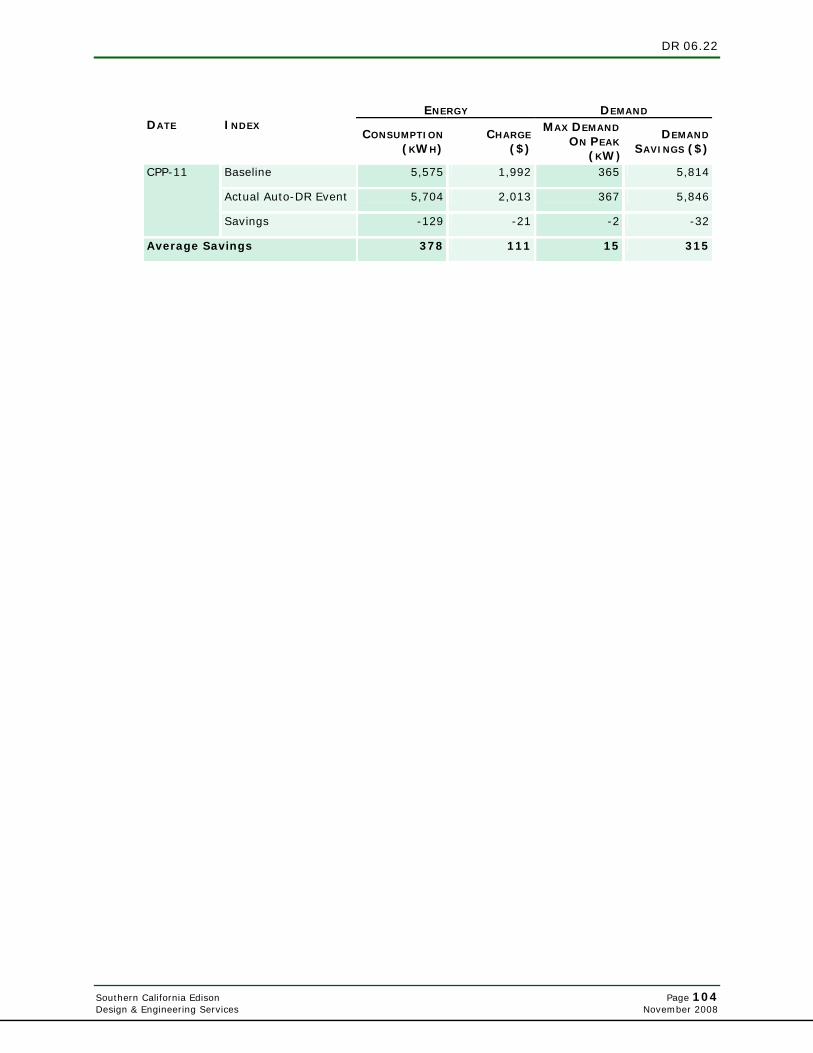
DR 06.22
Southern California Edison Page 104 Design & Engineering Services November 2008
ENERGY
DEMAND
DATE INDEX CONSUMPTION
(KWH)CHARGE
($)
MAX DEMAND
ON PEAK
(KW)
DEMAND
SAVINGS ($)
Baseline 5,575 1,992 365 5,814
Actual Auto-DR Event 5,704 2,013 367 5,846
CPP-11
Savings -129 -21 -2 -32
Average Savings 378 111 15 315
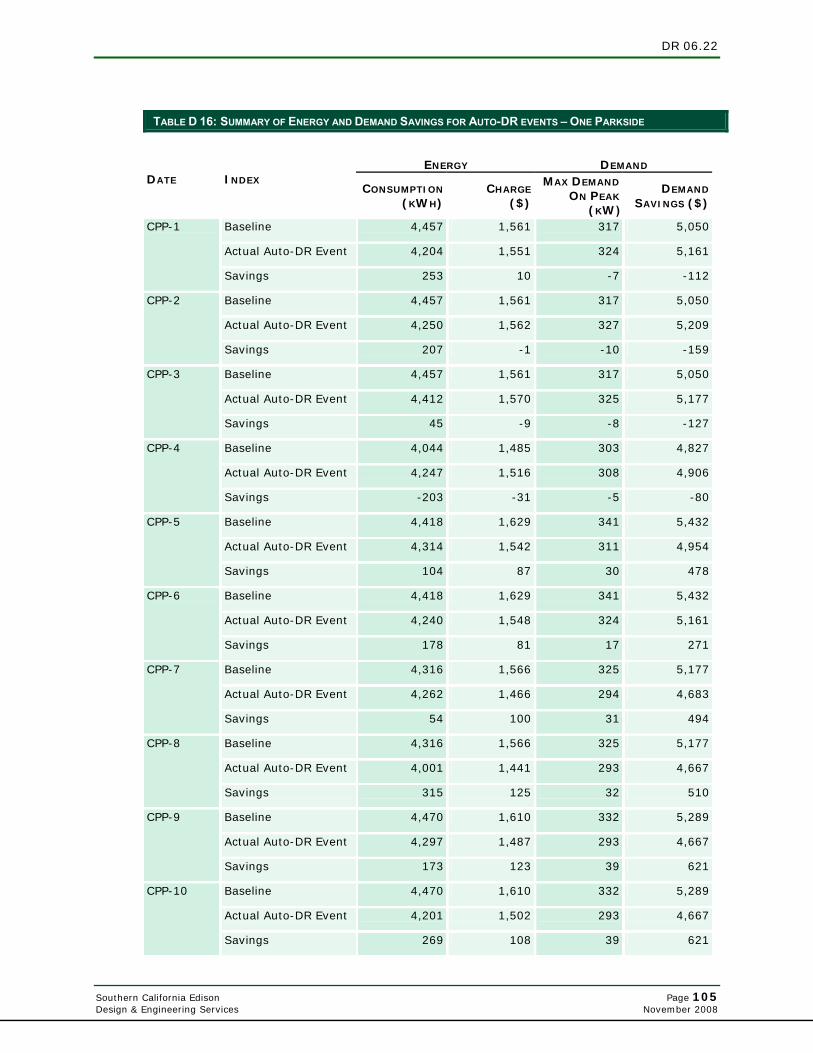
DR 06.22
Southern California Edison Page 105 Design & Engineering Services November 2008
TABLE D 16: SUMMARY OF ENERGY AND DEMAND SAVINGS FOR AUTO-DR EVENTS – ONE PARKSIDE
ENERGY
DEMAND
DATE INDEX CONSUMPTION
(KWH)CHARGE
($)
MAX DEMAND
ON PEAK
(KW)
DEMAND
SAVINGS ($)
Baseline 4,457 1,561 317 5,050
Actual Auto-DR Event 4,204 1,551 324 5,161
CPP-1
Savings 253 10 -7 -112
Baseline 4,457 1,561 317 5,050
Actual Auto-DR Event 4,250 1,562 327 5,209
CPP-2
Savings 207 -1 -10 -159
Baseline 4,457 1,561 317 5,050
Actual Auto-DR Event 4,412 1,570 325 5,177
CPP-3
Savings 45 -9 -8 -127
Baseline 4,044 1,485 303 4,827
Actual Auto-DR Event 4,247 1,516 308 4,906
CPP-4
Savings -203 -31 -5 -80
Baseline 4,418 1,629 341 5,432
Actual Auto-DR Event 4,314 1,542 311 4,954
CPP-5
Savings 104 87 30 478
Baseline 4,418 1,629 341 5,432
Actual Auto-DR Event 4,240 1,548 324 5,161
CPP-6
Savings 178 81 17 271
Baseline 4,316 1,566 325 5,177
Actual Auto-DR Event 4,262 1,466 294 4,683
CPP-7
Savings 54 100 31 494
Baseline 4,316 1,566 325 5,177
Actual Auto-DR Event 4,001 1,441 293 4,667
CPP-8
Savings 315 125 32 510
Baseline 4,470 1,610 332 5,289
Actual Auto-DR Event 4,297 1,487 293 4,667
CPP-9
Savings 173 123 39 621
Baseline 4,470 1,610 332 5,289
Actual Auto-DR Event 4,201 1,502 293 4,667
CPP-10
Savings 269 108 39 621
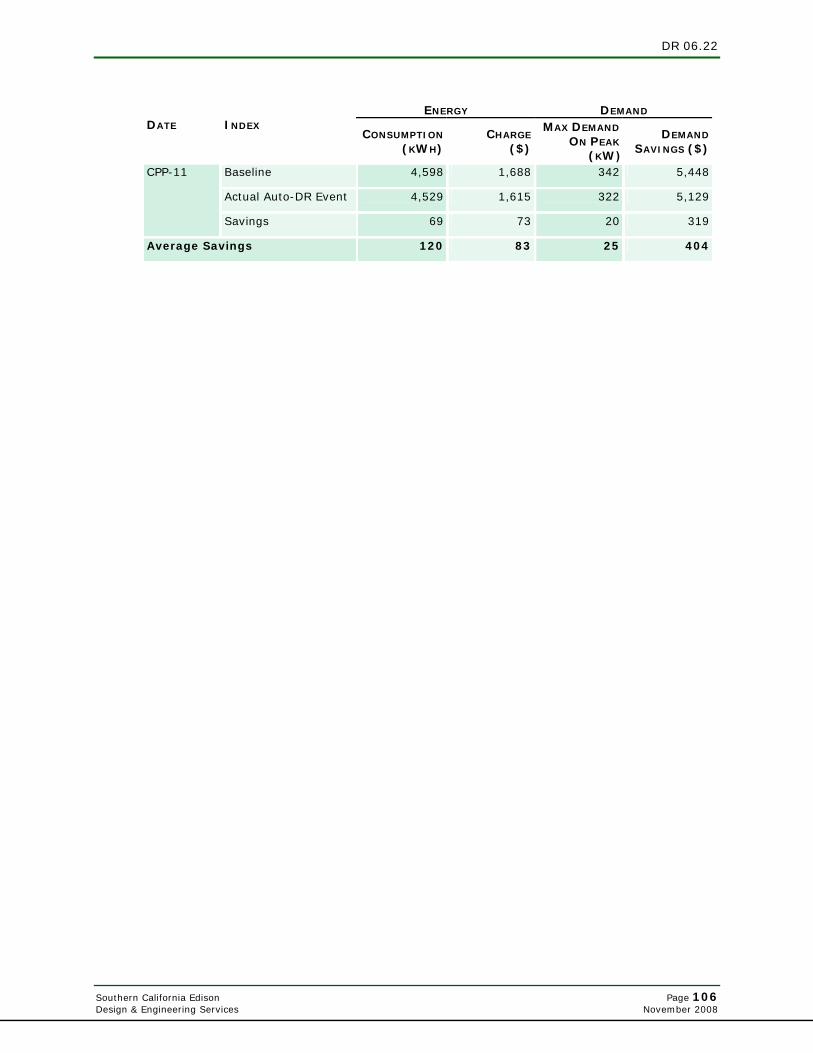
DR 06.22
Southern California Edison Page 106 Design & Engineering Services November 2008
ENERGY
DEMAND
DATE INDEX CONSUMPTION
(KWH)CHARGE
($)
MAX DEMAND
ON PEAK
(KW)
DEMAND
SAVINGS ($)
Baseline 4,598 1,688 342 5,448
Actual Auto-DR Event 4,529 1,615 322 5,129
CPP-11
Savings 69 73 20 319
Average Savings 120 83 25 404
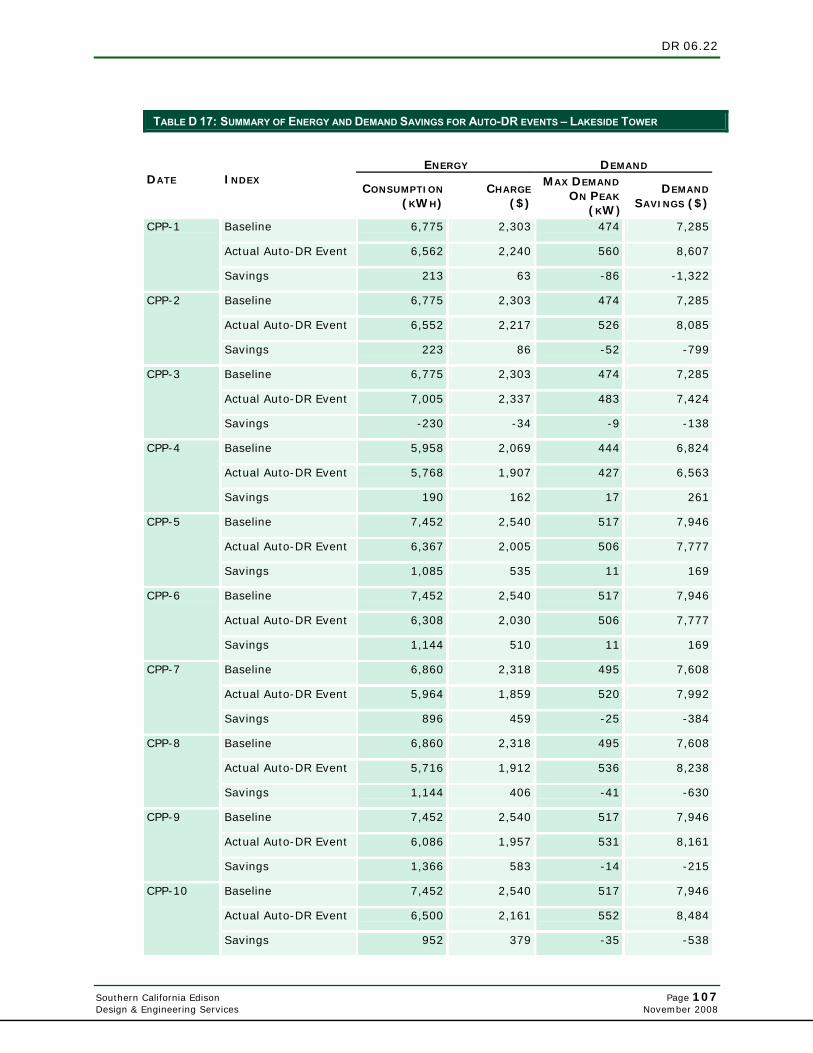
DR 06.22
Southern California Edison Page 107 Design & Engineering Services November 2008
TABLE D 17: SUMMARY OF ENERGY AND DEMAND SAVINGS FOR AUTO-DR EVENTS – LAKESIDE TOWER
ENERGY
DEMAND
DATE INDEX CONSUMPTION
(KWH)CHARGE
($)
MAX DEMAND
ON PEAK
(KW)
DEMAND
SAVINGS ($)
Baseline 6,775 2,303 474 7,285
Actual Auto-DR Event 6,562 2,240 560 8,607
CPP-1
Savings 213 63 -86 -1,322
Baseline 6,775 2,303 474 7,285
Actual Auto-DR Event 6,552 2,217 526 8,085
CPP-2
Savings 223 86 -52 -799
Baseline 6,775 2,303 474 7,285
Actual Auto-DR Event 7,005 2,337 483 7,424
CPP-3
Savings -230 -34 -9 -138
Baseline 5,958 2,069 444 6,824
Actual Auto-DR Event 5,768 1,907 427 6,563
CPP-4
Savings 190 162 17 261
Baseline 7,452 2,540 517 7,946
Actual Auto-DR Event 6,367 2,005 506 7,777
CPP-5
Savings 1,085 535 11 169
Baseline 7,452 2,540 517 7,946
Actual Auto-DR Event 6,308 2,030 506 7,777
CPP-6
Savings 1,144 510 11 169
Baseline 6,860 2,318 495 7,608
Actual Auto-DR Event 5,964 1,859 520 7,992
CPP-7
Savings 896 459 -25 -384
Baseline 6,860 2,318 495 7,608
Actual Auto-DR Event 5,716 1,912 536 8,238
CPP-8
Savings 1,144 406 -41 -630
Baseline 7,452 2,540 517 7,946
Actual Auto-DR Event 6,086 1,957 531 8,161
CPP-9
Savings 1,366 583 -14 -215
Baseline 7,452 2,540 517 7,946
Actual Auto-DR Event 6,500 2,161 552 8,484
CPP-10
Savings 952 379 -35 -538

DR 06.22
Southern California Edison Page 108 Design & Engineering Services November 2008
ENERGY
DEMAND
DATE INDEX CONSUMPTION
(KWH)CHARGE
($)
MAX DEMAND
ON PEAK
(KW)
DEMAND
SAVINGS ($)
Baseline 7,704 2,623 558 8,576
Actual Auto-DR Event 6,751 2,290 490 7,531
CPP-11
Savings 953 333 68 1,045
Average Savings 966 421 -1 -15
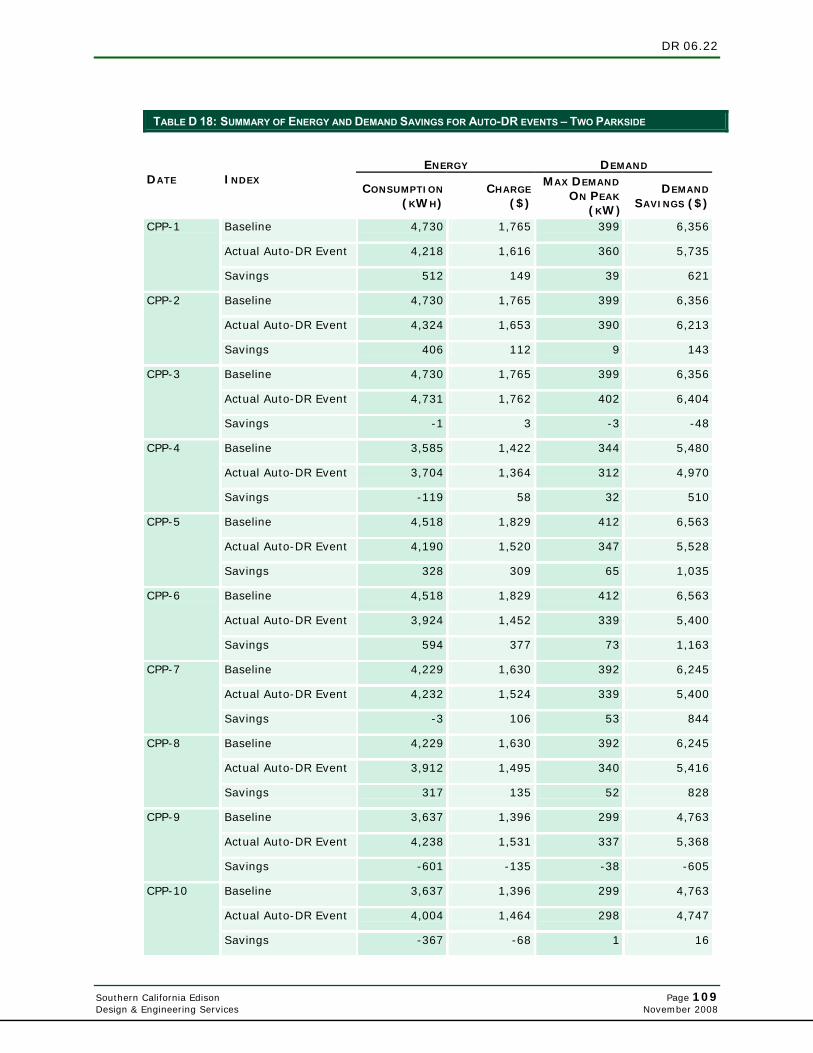
DR 06.22
Southern California Edison Page 109 Design & Engineering Services November 2008
TABLE D 18: SUMMARY OF ENERGY AND DEMAND SAVINGS FOR AUTO-DR EVENTS – TWO PARKSIDE
ENERGY
DEMAND
DATE INDEX CONSUMPTION
(KWH)CHARGE
($)
MAX DEMAND
ON PEAK
(KW)
DEMAND
SAVINGS ($)
Baseline 4,730 1,765 399 6,356
Actual Auto-DR Event 4,218 1,616 360 5,735
CPP-1
Savings 512 149 39 621
Baseline 4,730 1,765 399 6,356
Actual Auto-DR Event 4,324 1,653 390 6,213
CPP-2
Savings 406 112 9 143
Baseline 4,730 1,765 399 6,356
Actual Auto-DR Event 4,731 1,762 402 6,404
CPP-3
Savings -1 3 -3 -48
Baseline 3,585 1,422 344 5,480
Actual Auto-DR Event 3,704 1,364 312 4,970
CPP-4
Savings -119 58 32 510
Baseline 4,518 1,829 412 6,563
Actual Auto-DR Event 4,190 1,520 347 5,528
CPP-5
Savings 328 309 65 1,035
Baseline 4,518 1,829 412 6,563
Actual Auto-DR Event 3,924 1,452 339 5,400
CPP-6
Savings 594 377 73 1,163
Baseline 4,229 1,630 392 6,245
Actual Auto-DR Event 4,232 1,524 339 5,400
CPP-7
Savings -3 106 53 844
Baseline 4,229 1,630 392 6,245
Actual Auto-DR Event 3,912 1,495 340 5,416
CPP-8
Savings 317 135 52 828
Baseline 3,637 1,396 299 4,763
Actual Auto-DR Event 4,238 1,531 337 5,368
CPP-9
Savings -601 -135 -38 -605
Baseline 3,637 1,396 299 4,763
Actual Auto-DR Event 4,004 1,464 298 4,747
CPP-10
Savings -367 -68 1 16
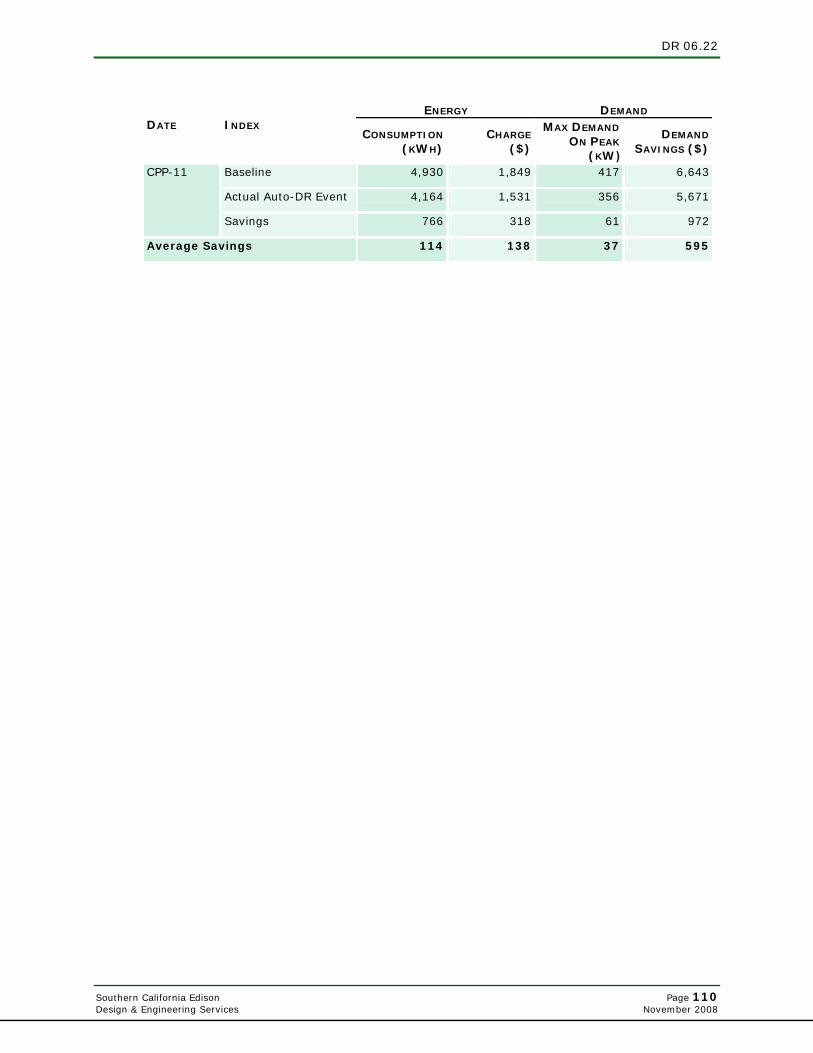
DR 06.22
Southern California Edison Page 110 Design & Engineering Services November 2008
ENERGY
DEMAND
DATE INDEX CONSUMPTION
(KWH)CHARGE
($)
MAX DEMAND
ON PEAK
(KW)
DEMAND
SAVINGS ($)
Baseline 4,930 1,849 417 6,643
Actual Auto-DR Event 4,164 1,531 356 5,671
CPP-11
Savings 766 318 61 972
Average Savings 114 138 37 595
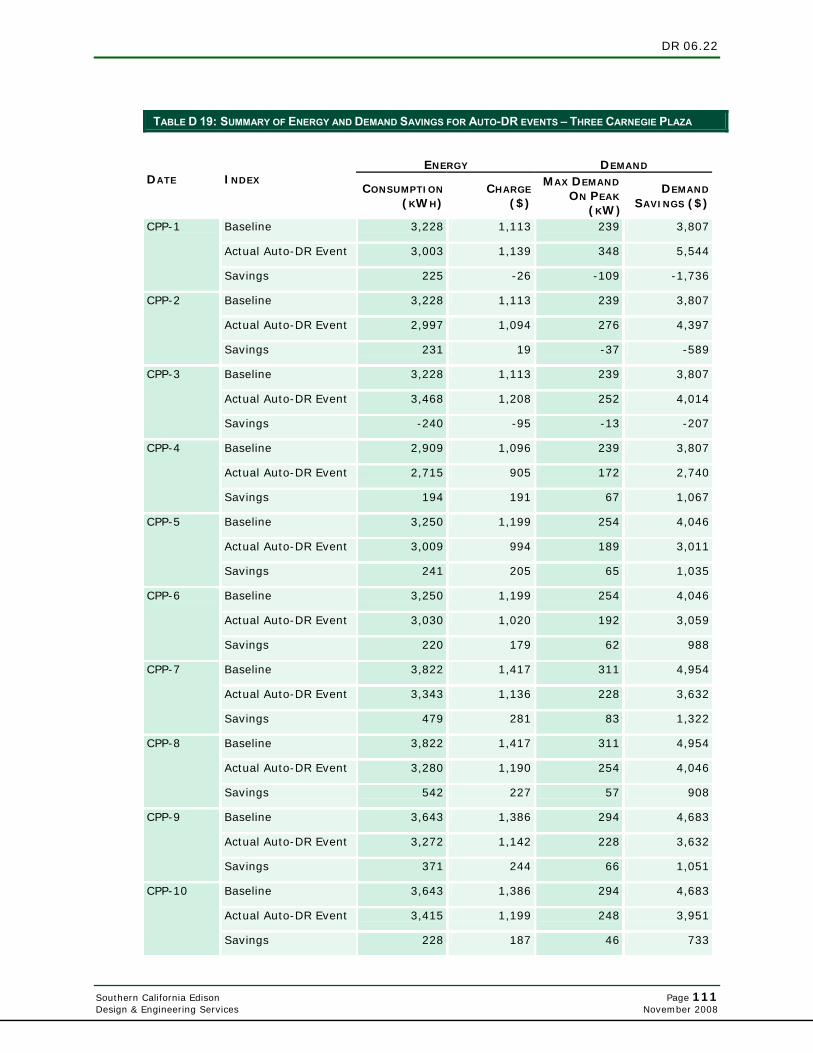
DR 06.22
Southern California Edison Page 111 Design & Engineering Services November 2008
TABLE D 19: SUMMARY OF ENERGY AND DEMAND SAVINGS FOR AUTO-DR EVENTS – THREE CARNEGIE PLAZA
ENERGY
DEMAND
DATE INDEX CONSUMPTION
(KWH)CHARGE
($)
MAX DEMAND
ON PEAK
(KW)
DEMAND
SAVINGS ($)
Baseline 3,228 1,113 239 3,807
Actual Auto-DR Event 3,003 1,139 348 5,544
CPP-1
Savings 225 -26 -109 -1,736
Baseline 3,228 1,113 239 3,807
Actual Auto-DR Event 2,997 1,094 276 4,397
CPP-2
Savings 231 19 -37 -589
Baseline 3,228 1,113 239 3,807
Actual Auto-DR Event 3,468 1,208 252 4,014
CPP-3
Savings -240 -95 -13 -207
Baseline 2,909 1,096 239 3,807
Actual Auto-DR Event 2,715 905 172 2,740
CPP-4
Savings 194 191 67 1,067
Baseline 3,250 1,199 254 4,046
Actual Auto-DR Event 3,009 994 189 3,011
CPP-5
Savings 241 205 65 1,035
Baseline 3,250 1,199 254 4,046
Actual Auto-DR Event 3,030 1,020 192 3,059
CPP-6
Savings 220 179 62 988
Baseline 3,822 1,417 311 4,954
Actual Auto-DR Event 3,343 1,136 228 3,632
CPP-7
Savings 479 281 83 1,322
Baseline 3,822 1,417 311 4,954
Actual Auto-DR Event 3,280 1,190 254 4,046
CPP-8
Savings 542 227 57 908
Baseline 3,643 1,386 294 4,683
Actual Auto-DR Event 3,272 1,142 228 3,632
CPP-9
Savings 371 244 66 1,051
Baseline 3,643 1,386 294 4,683
Actual Auto-DR Event 3,415 1,199 248 3,951
CPP-10
Savings 228 187 46 733

DR 06.22
Southern California Edison Page 112 Design & Engineering Services November 2008
ENERGY
DEMAND
DATE INDEX CONSUMPTION
(KWH)CHARGE
($)
MAX DEMAND
ON PEAK
(KW)
DEMAND
SAVINGS ($)
Baseline 3,515 1,312 280 4,460
Actual Auto-DR Event 3,450 1,175 228 3,632
CPP-11
Savings 65 137 52 828
Average Savings 293 206 62 992

DR 06.22
Southern California Edison Page 113 Design & Engineering Services November 2008
TABLE D 20: SUMMARY OF ENERGY AND DEMAND SAVINGS FOR AUTO-DR EVENTS – BRIER CORPORATE CENTER
ENERGY
DEMAND
DATE INDEX CONSUMPTION
(KWH)CHARGE
($)
MAX DEMAND
ON PEAK
(KW)
DEMAND
SAVINGS ($)
Baseline 6,626 2,238 430 6,850
Actual Auto-DR Event 6,803 2,386 494 7,869
CPP-1
Savings -177 -148 -64 -1,020
Baseline 6,626 2,238 430 6,850
Actual Auto-DR Event 6,786 2,322 418 6,659
CPP-2
Savings -160 -84 12 191
Baseline 6,626 2,238 430 6,850
Actual Auto-DR Event 6,742 2,326 422 6,722
CPP-3
Savings -116 -88 8 127
Baseline 6,497 2,241 406 6,468
Actual Auto-DR Event 6,473 2,192 391 6,229
CPP-4
Savings 24 49 15 239
Baseline 7,226 2,549 470 7,487
Actual Auto-DR Event 6,817 2,278 413 6,579
CPP-5
Savings 409 271 57 908
Baseline 7,226 2,549 470 7,487
Actual Auto-DR Event 6,907 2,327 422 6,722
CPP-6
Savings 319 222 48 765
Baseline 6,949 2,373 451 7,184
Actual Auto-DR Event 6,704 2,232 401 6,388
CPP-7
Savings 245 141 50 797
Baseline 6,949 2,373 451 7,184
Actual Auto-DR Event 6,682 2,258 413 6,579
CPP-8
Savings 267 115 38 605
Baseline 6,673 2,292 425 6,770
Actual Auto-DR Event 6,894 2,310 418 6,659
CPP-9
Savings -221 -18 7 112
Baseline 6,673 2,292 425 6,770
Actual Auto-DR Event 7,027 2,351 427 6,802
CPP-10
Savings -354 -59 -2 -32
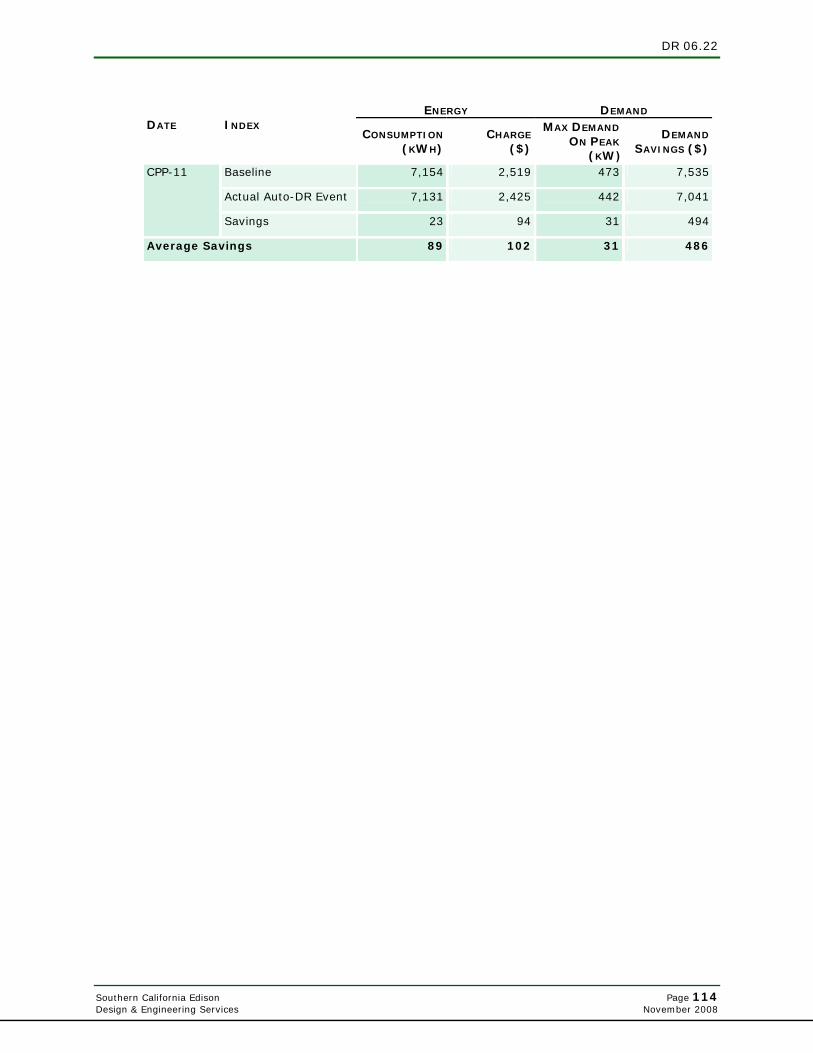
DR 06.22
Southern California Edison Page 114 Design & Engineering Services November 2008
ENERGY
DEMAND
DATE INDEX CONSUMPTION
(KWH)CHARGE
($)
MAX DEMAND
ON PEAK
(KW)
DEMAND
SAVINGS ($)
Baseline 7,154 2,519 473 7,535
Actual Auto-DR Event 7,131 2,425 442 7,041
CPP-11
Savings 23 94 31 494
Average Savings 89 102 31 486
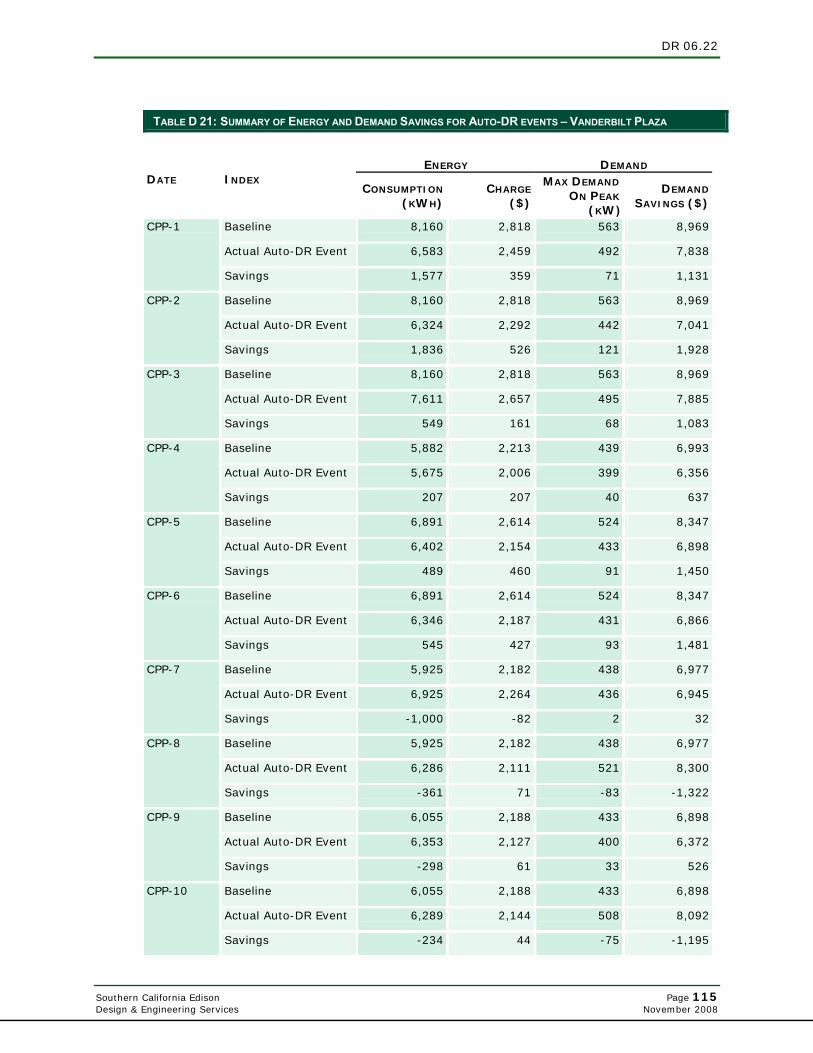
DR 06.22
Southern California Edison Page 115 Design & Engineering Services November 2008
TABLE D 21: SUMMARY OF ENERGY AND DEMAND SAVINGS FOR AUTO-DR EVENTS – VANDERBILT PLAZA
ENERGY
DEMAND
DATE INDEX CONSUMPTION
(KWH)CHARGE
($)
MAX DEMAND
ON PEAK
(KW)
DEMAND
SAVINGS ($)
Baseline 8,160 2,818 563 8,969
Actual Auto-DR Event 6,583 2,459 492 7,838
CPP-1
Savings 1,577 359 71 1,131
Baseline 8,160 2,818 563 8,969
Actual Auto-DR Event 6,324 2,292 442 7,041
CPP-2
Savings 1,836 526 121 1,928
Baseline 8,160 2,818 563 8,969
Actual Auto-DR Event 7,611 2,657 495 7,885
CPP-3
Savings 549 161 68 1,083
Baseline 5,882 2,213 439 6,993
Actual Auto-DR Event 5,675 2,006 399 6,356
CPP-4
Savings 207 207 40 637
Baseline 6,891 2,614 524 8,347
Actual Auto-DR Event 6,402 2,154 433 6,898
CPP-5
Savings 489 460 91 1,450
Baseline 6,891 2,614 524 8,347
Actual Auto-DR Event 6,346 2,187 431 6,866
CPP-6
Savings 545 427 93 1,481
Baseline 5,925 2,182 438 6,977
Actual Auto-DR Event 6,925 2,264 436 6,945
CPP-7
Savings -1,000 -82 2 32
Baseline 5,925 2,182 438 6,977
Actual Auto-DR Event 6,286 2,111 521 8,300
CPP-8
Savings -361 71 -83 -1,322
Baseline 6,055 2,188 433 6,898
Actual Auto-DR Event 6,353 2,127 400 6,372
CPP-9
Savings -298 61 33 526
Baseline 6,055 2,188 433 6,898
Actual Auto-DR Event 6,289 2,144 508 8,092
CPP-10
Savings -234 44 -75 -1,195

DR 06.22
Southern California Edison Page 116 Design & Engineering Services November 2008
ENERGY
DEMAND
DATE INDEX CONSUMPTION
(KWH)CHARGE
($)
MAX DEMAND
ON PEAK
(KW)
DEMAND
SAVINGS ($)
Baseline 6,033 2,251 456 7,264
Actual Auto-DR Event 6,427 2,177 402 6,404
CPP-11
Savings -394 74 54 860
Average Savings -131 158 19 309

DR 06.22
Southern California Edison Page 117 Design & Engineering Services November 2008
TABLE D 22: SUMMARY OF ENERGY AND DEMAND SAVINGS FOR AUTO-DR EVENTS – INLAND REGIONAL CENTER
ENERGY
DEMAND
DATE INDEX CONSUMPTION
(KWH)CHARGE
($)
MAX DEMAND
ON PEAK
(KW)
DEMAND
SAVINGS ($)
Baseline 5,121 1,918 420 6,691
Actual Auto-DR Event 4,566 1,903 492 7,838
CPP-1
Savings 555 15 -72 -1,147
Baseline 5,121 1,918 420 6,691
Actual Auto-DR Event 4,607 1,877 509 8,108
CPP-2
Savings 514 41 -89 -1,418
Baseline 5,121 1,918 420 6,691
Actual Auto-DR Event 4,962 1,914 440 7,009
CPP-3
Savings 159 4 -20 -319
Baseline 4,656 1,832 399 6,356
Actual Auto-DR Event 4,027 1,492 322 5,129
CPP-4
Savings 629 340 77 1,227
Baseline 5,137 2,061 471 7,503
Actual Auto-DR Event 4,608 1,655 351 5,591
CPP-5
Savings 529 406 120 1,912
Baseline 6,891 2,614 524 8,347
Actual Auto-DR Event 4,703 1,799 387 6,165
CPP-6
Savings 2,188 815 137 2,182
Baseline 4,492 1,747 377 6,006
Actual Auto-DR Event 4,859 1,882 403 6,420
CPP-7
Savings -367 -135 -26 -414
Baseline 4,492 1,747 377 6,006
Actual Auto-DR Event 4,581 1,849 418 6,659
CPP-8
Savings -89 -102 -41 -653
Baseline 4,318 1,702 372 5,926
Actual Auto-DR Event 4,454 1,649 357 5,687
CPP-9
Savings -136 53 15 239
Baseline 4,318 1,702 372 5,926
Actual Auto-DR Event 4,565 1,687 355 5,655
CPP-10
Savings -247 15 17 271

DR 06.22
Southern California Edison Page 118 Design & Engineering Services November 2008
ENERGY
DEMAND
DATE INDEX CONSUMPTION
(KWH)CHARGE
($)
MAX DEMAND
ON PEAK
(KW)
DEMAND
SAVINGS ($)
Baseline 5,097 2,061 501 7,981
Actual Auto-DR Event 4,683 1,742 385 6,133
CPP-11
Savings 414 319 116 1,848
Average Savings 365 214 52 826
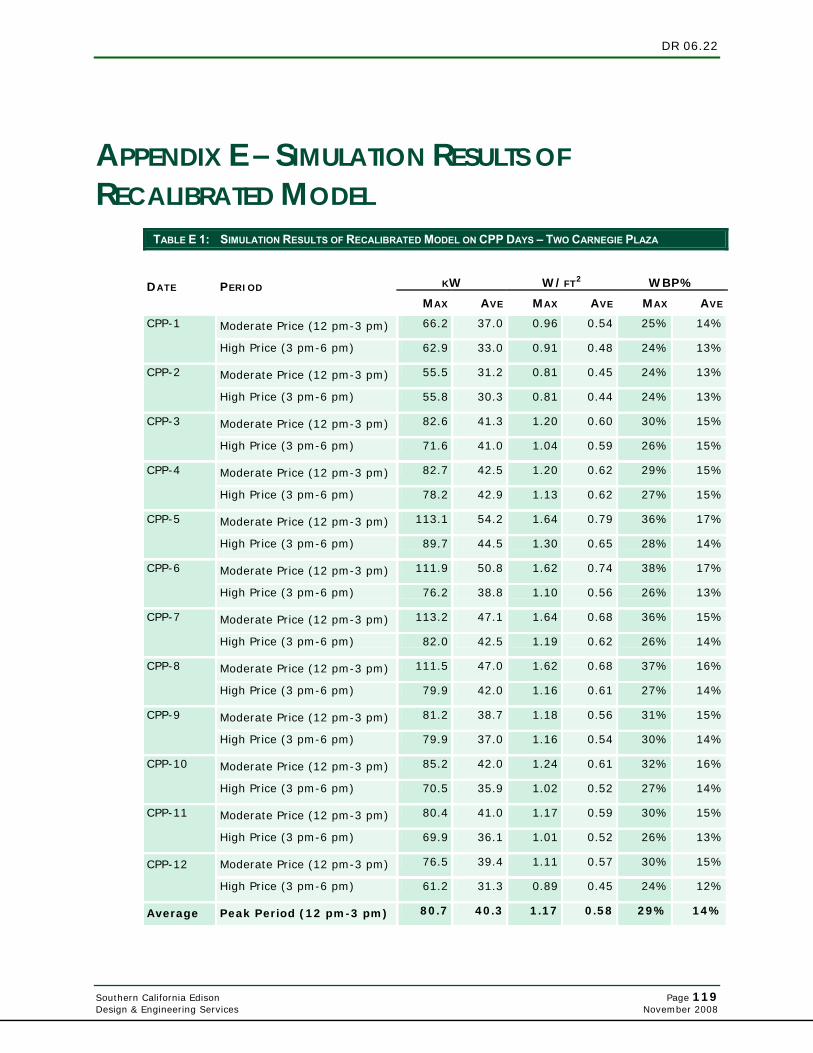
DR 06.22
Southern California Edison Page 119 Design & Engineering Services November 2008
APPENDIX E – SIMULATION RESULTS OF RECALIBRATED MODEL
TABLE E 1: SIMULATION RESULTS OF RECALIBRATED MODEL ON CPP DAYS – TWO CARNEGIE PLAZA
KW
W/FT2
WBP% DATE PERIOD
MAX AVE MAX AVE MAX AVE
Moderate Price (12 pm-3 pm) 66.2 37.0 0.96 0.54 25% 14% CPP-1
High Price (3 pm-6 pm) 62.9 33.0 0.91 0.48 24% 13%
Moderate Price (12 pm-3 pm) 55.5 31.2 0.81 0.45 24% 13% CPP-2
High Price (3 pm-6 pm) 55.8 30.3 0.81 0.44 24% 13%
Moderate Price (12 pm-3 pm) 82.6 41.3 1.20 0.60 30% 15% CPP-3
High Price (3 pm-6 pm) 71.6 41.0 1.04 0.59 26% 15%
Moderate Price (12 pm-3 pm) 82.7 42.5 1.20 0.62 29% 15% CPP-4
High Price (3 pm-6 pm) 78.2 42.9 1.13 0.62 27% 15%
Moderate Price (12 pm-3 pm) 113.1 54.2 1.64 0.79 36% 17% CPP-5
High Price (3 pm-6 pm) 89.7 44.5 1.30 0.65 28% 14%
Moderate Price (12 pm-3 pm) 111.9 50.8 1.62 0.74 38% 17% CPP-6
High Price (3 pm-6 pm) 76.2 38.8 1.10 0.56 26% 13%
Moderate Price (12 pm-3 pm) 113.2 47.1 1.64 0.68 36% 15% CPP-7
High Price (3 pm-6 pm) 82.0 42.5 1.19 0.62 26% 14%
Moderate Price (12 pm-3 pm) 111.5 47.0 1.62 0.68 37% 16% CPP-8
High Price (3 pm-6 pm) 79.9 42.0 1.16 0.61 27% 14%
Moderate Price (12 pm-3 pm) 81.2 38.7 1.18 0.56 31% 15% CPP-9
High Price (3 pm-6 pm) 79.9 37.0 1.16 0.54 30% 14%
Moderate Price (12 pm-3 pm) 85.2 42.0 1.24 0.61 32% 16% CPP-10
High Price (3 pm-6 pm) 70.5 35.9 1.02 0.52 27% 14%
Moderate Price (12 pm-3 pm) 80.4 41.0 1.17 0.59 30% 15% CPP-11
High Price (3 pm-6 pm) 69.9 36.1 1.01 0.52 26% 13%
Moderate Price (12 pm-3 pm) 76.5 39.4 1.11 0.57 30% 15% CPP-12
High Price (3 pm-6 pm) 61.2 31.3 0.89 0.45 24% 12%
Average Peak Period (12 pm-3 pm) 80.7 40.3 1.17 0.58 29% 14%
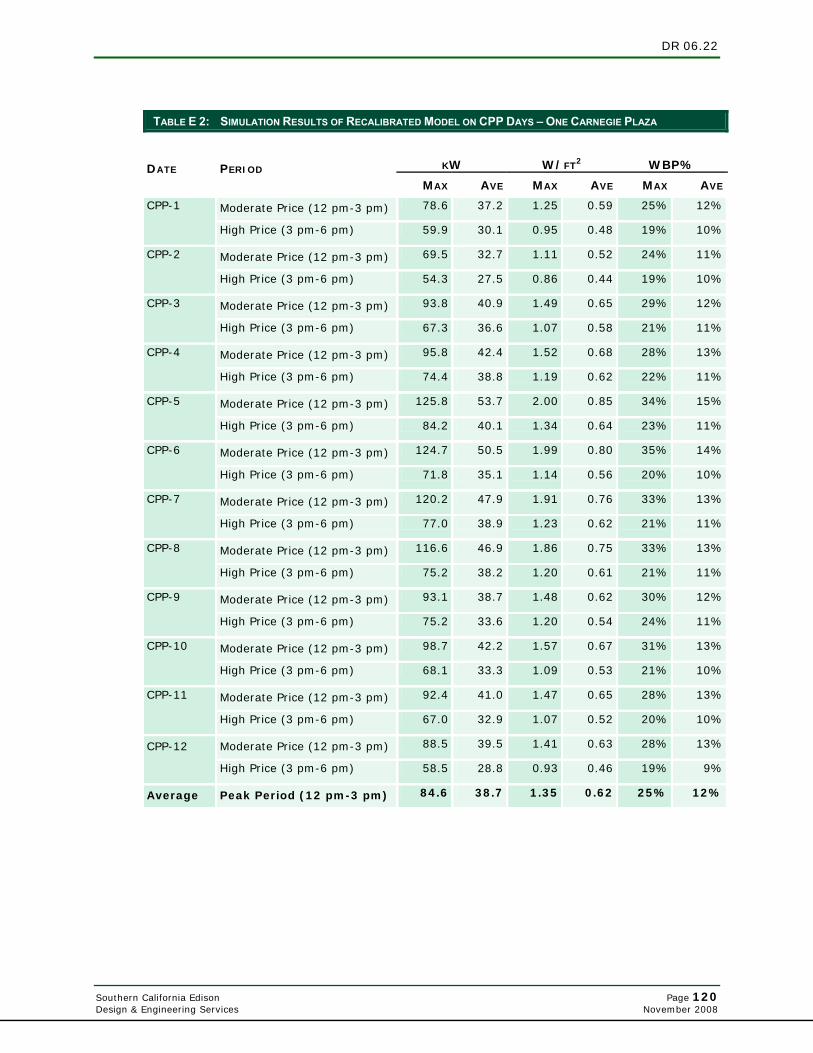
DR 06.22
Southern California Edison Page 120 Design & Engineering Services November 2008
TABLE E 2: SIMULATION RESULTS OF RECALIBRATED MODEL ON CPP DAYS – ONE CARNEGIE PLAZA
KW
W/FT2
WBP% DATE PERIOD
MAX AVE MAX AVE MAX AVE
Moderate Price (12 pm-3 pm) 78.6 37.2 1.25 0.59 25% 12% CPP-1
High Price (3 pm-6 pm) 59.9 30.1 0.95 0.48 19% 10%
Moderate Price (12 pm-3 pm) 69.5 32.7 1.11 0.52 24% 11% CPP-2
High Price (3 pm-6 pm) 54.3 27.5 0.86 0.44 19% 10%
Moderate Price (12 pm-3 pm) 93.8 40.9 1.49 0.65 29% 12% CPP-3
High Price (3 pm-6 pm) 67.3 36.6 1.07 0.58 21% 11%
Moderate Price (12 pm-3 pm) 95.8 42.4 1.52 0.68 28% 13% CPP-4
High Price (3 pm-6 pm) 74.4 38.8 1.19 0.62 22% 11%
Moderate Price (12 pm-3 pm) 125.8 53.7 2.00 0.85 34% 15% CPP-5
High Price (3 pm-6 pm) 84.2 40.1 1.34 0.64 23% 11%
Moderate Price (12 pm-3 pm) 124.7 50.5 1.99 0.80 35% 14% CPP-6
High Price (3 pm-6 pm) 71.8 35.1 1.14 0.56 20% 10%
Moderate Price (12 pm-3 pm) 120.2 47.9 1.91 0.76 33% 13% CPP-7
High Price (3 pm-6 pm) 77.0 38.9 1.23 0.62 21% 11%
Moderate Price (12 pm-3 pm) 116.6 46.9 1.86 0.75 33% 13% CPP-8
High Price (3 pm-6 pm) 75.2 38.2 1.20 0.61 21% 11%
Moderate Price (12 pm-3 pm) 93.1 38.7 1.48 0.62 30% 12% CPP-9
High Price (3 pm-6 pm) 75.2 33.6 1.20 0.54 24% 11%
Moderate Price (12 pm-3 pm) 98.7 42.2 1.57 0.67 31% 13% CPP-10
High Price (3 pm-6 pm) 68.1 33.3 1.09 0.53 21% 10%
Moderate Price (12 pm-3 pm) 92.4 41.0 1.47 0.65 28% 13% CPP-11
High Price (3 pm-6 pm) 67.0 32.9 1.07 0.52 20% 10%
Moderate Price (12 pm-3 pm) 88.5 39.5 1.41 0.63 28% 13% CPP-12
High Price (3 pm-6 pm) 58.5 28.8 0.93 0.46 19% 9%
Average Peak Period (12 pm-3 pm) 84.6 38.7 1.35 0.62 25% 12%
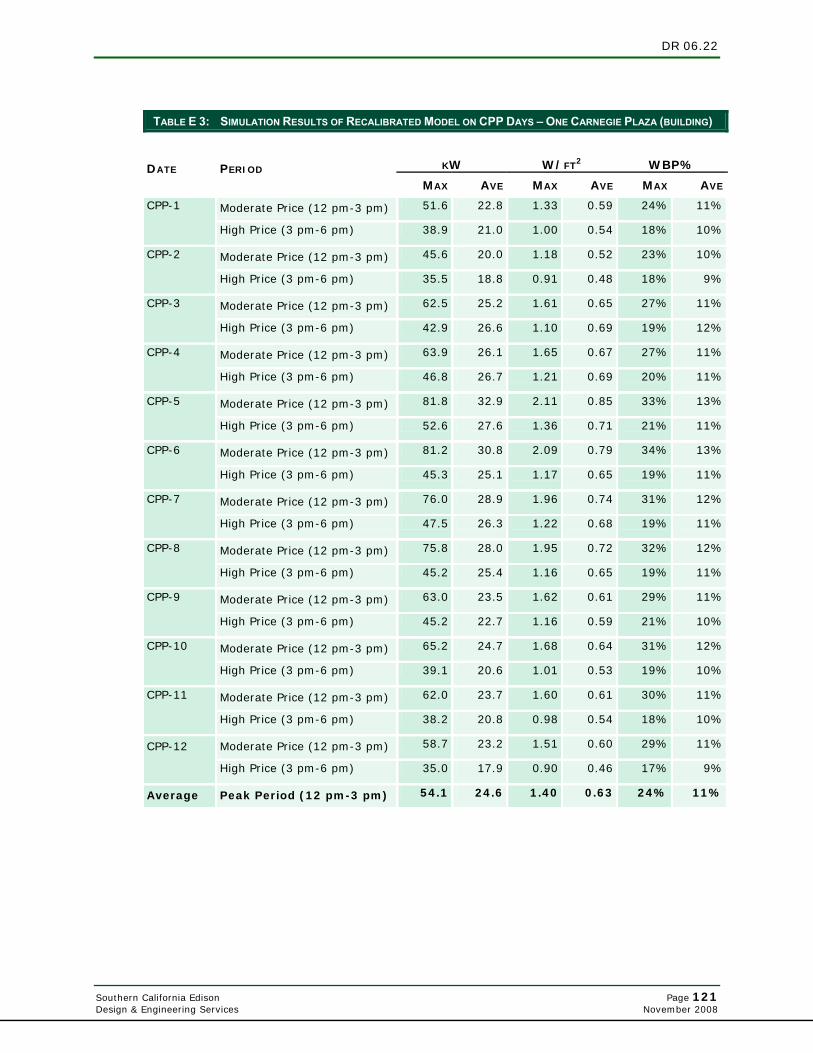
DR 06.22
Southern California Edison Page 121 Design & Engineering Services November 2008
TABLE E 3: SIMULATION RESULTS OF RECALIBRATED MODEL ON CPP DAYS – ONE CARNEGIE PLAZA (BUILDING)
KW
W/FT2
WBP% DATE PERIOD
MAX AVE MAX AVE MAX AVE
Moderate Price (12 pm-3 pm) 51.6 22.8 1.33 0.59 24% 11% CPP-1
High Price (3 pm-6 pm) 38.9 21.0 1.00 0.54 18% 10%
Moderate Price (12 pm-3 pm) 45.6 20.0 1.18 0.52 23% 10% CPP-2
High Price (3 pm-6 pm) 35.5 18.8 0.91 0.48 18% 9%
Moderate Price (12 pm-3 pm) 62.5 25.2 1.61 0.65 27% 11% CPP-3
High Price (3 pm-6 pm) 42.9 26.6 1.10 0.69 19% 12%
Moderate Price (12 pm-3 pm) 63.9 26.1 1.65 0.67 27% 11% CPP-4
High Price (3 pm-6 pm) 46.8 26.7 1.21 0.69 20% 11%
Moderate Price (12 pm-3 pm) 81.8 32.9 2.11 0.85 33% 13% CPP-5
High Price (3 pm-6 pm) 52.6 27.6 1.36 0.71 21% 11%
Moderate Price (12 pm-3 pm) 81.2 30.8 2.09 0.79 34% 13% CPP-6
High Price (3 pm-6 pm) 45.3 25.1 1.17 0.65 19% 11%
Moderate Price (12 pm-3 pm) 76.0 28.9 1.96 0.74 31% 12% CPP-7
High Price (3 pm-6 pm) 47.5 26.3 1.22 0.68 19% 11%
Moderate Price (12 pm-3 pm) 75.8 28.0 1.95 0.72 32% 12% CPP-8
High Price (3 pm-6 pm) 45.2 25.4 1.16 0.65 19% 11%
Moderate Price (12 pm-3 pm) 63.0 23.5 1.62 0.61 29% 11% CPP-9
High Price (3 pm-6 pm) 45.2 22.7 1.16 0.59 21% 10%
Moderate Price (12 pm-3 pm) 65.2 24.7 1.68 0.64 31% 12% CPP-10
High Price (3 pm-6 pm) 39.1 20.6 1.01 0.53 19% 10%
Moderate Price (12 pm-3 pm) 62.0 23.7 1.60 0.61 30% 11% CPP-11
High Price (3 pm-6 pm) 38.2 20.8 0.98 0.54 18% 10%
Moderate Price (12 pm-3 pm) 58.7 23.2 1.51 0.60 29% 11% CPP-12
High Price (3 pm-6 pm) 35.0 17.9 0.90 0.46 17% 9%
Average Peak Period (12 pm-3 pm) 54.1 24.6 1.40 0.63 24% 11%
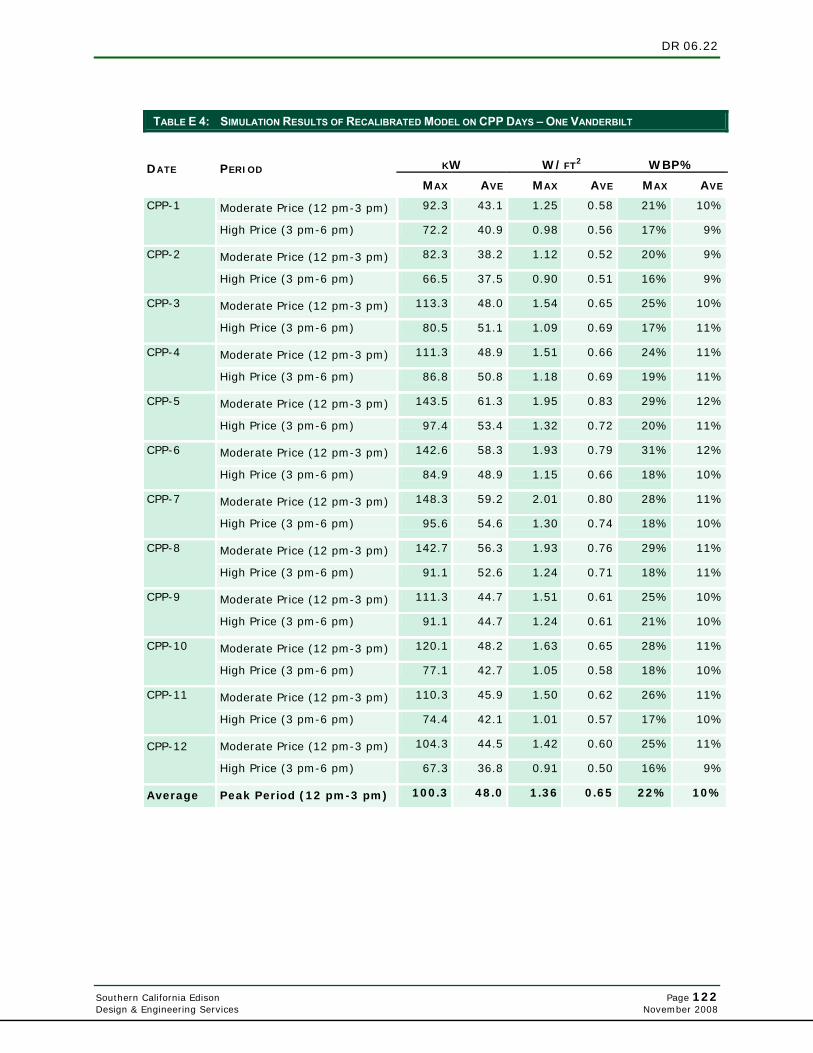
DR 06.22
Southern California Edison Page 122 Design & Engineering Services November 2008
TABLE E 4: SIMULATION RESULTS OF RECALIBRATED MODEL ON CPP DAYS – ONE VANDERBILT
KW
W/FT2
WBP% DATE PERIOD
MAX AVE MAX AVE MAX AVE
Moderate Price (12 pm-3 pm) 92.3 43.1 1.25 0.58 21% 10% CPP-1
High Price (3 pm-6 pm) 72.2 40.9 0.98 0.56 17% 9%
Moderate Price (12 pm-3 pm) 82.3 38.2 1.12 0.52 20% 9% CPP-2
High Price (3 pm-6 pm) 66.5 37.5 0.90 0.51 16% 9%
Moderate Price (12 pm-3 pm) 113.3 48.0 1.54 0.65 25% 10% CPP-3
High Price (3 pm-6 pm) 80.5 51.1 1.09 0.69 17% 11%
Moderate Price (12 pm-3 pm) 111.3 48.9 1.51 0.66 24% 11% CPP-4
High Price (3 pm-6 pm) 86.8 50.8 1.18 0.69 19% 11%
Moderate Price (12 pm-3 pm) 143.5 61.3 1.95 0.83 29% 12% CPP-5
High Price (3 pm-6 pm) 97.4 53.4 1.32 0.72 20% 11%
Moderate Price (12 pm-3 pm) 142.6 58.3 1.93 0.79 31% 12% CPP-6
High Price (3 pm-6 pm) 84.9 48.9 1.15 0.66 18% 10%
Moderate Price (12 pm-3 pm) 148.3 59.2 2.01 0.80 28% 11% CPP-7
High Price (3 pm-6 pm) 95.6 54.6 1.30 0.74 18% 10%
Moderate Price (12 pm-3 pm) 142.7 56.3 1.93 0.76 29% 11% CPP-8
High Price (3 pm-6 pm) 91.1 52.6 1.24 0.71 18% 11%
Moderate Price (12 pm-3 pm) 111.3 44.7 1.51 0.61 25% 10% CPP-9
High Price (3 pm-6 pm) 91.1 44.7 1.24 0.61 21% 10%
Moderate Price (12 pm-3 pm) 120.1 48.2 1.63 0.65 28% 11% CPP-10
High Price (3 pm-6 pm) 77.1 42.7 1.05 0.58 18% 10%
Moderate Price (12 pm-3 pm) 110.3 45.9 1.50 0.62 26% 11% CPP-11
High Price (3 pm-6 pm) 74.4 42.1 1.01 0.57 17% 10%
Moderate Price (12 pm-3 pm) 104.3 44.5 1.42 0.60 25% 11% CPP-12
High Price (3 pm-6 pm) 67.3 36.8 0.91 0.50 16% 9%
Average Peak Period (12 pm-3 pm) 100.3 48.0 1.36 0.65 22% 10%

DR 06.22
Southern California Edison Page 123 Design & Engineering Services November 2008
TABLE E 5: SIMULATION RESULTS OF RECALIBRATED MODEL ON CPP DAYS – ONE PARKSIDE
KW
W/FT2
WBP% DATE PERIOD
MAX AVE MAX AVE MAX AVE
Moderate Price (12 pm-3 pm) 92.8 45.0 1.33 0.64 26% 13% CPP-1
High Price (3 pm-6 pm) 70.3 38.2 1.00 0.54 20% 11%
Moderate Price (12 pm-3 pm) 82.2 39.8 1.17 0.57 25% 12% CPP-2
High Price (3 pm-6 pm) 64.7 35.5 0.92 0.51 19% 11%
Moderate Price (12 pm-3 pm) 115.9 50.3 1.65 0.72 31% 13% CPP-3
High Price (3 pm-6 pm) 77.6 46.5 1.11 0.66 21% 12%
Moderate Price (12 pm-3 pm) 115.9 51.7 1.65 0.74 30% 13% CPP-4
High Price (3 pm-6 pm) 85.5 48.4 1.22 0.69 22% 13%
Moderate Price (12 pm-3 pm) 147.6 65.8 2.11 0.94 34% 15% CPP-5
High Price (3 pm-6 pm) 98.6 52.0 1.41 0.74 23% 12%
Moderate Price (12 pm-3 pm) 147.0 62.3 2.10 0.89 35% 15% CPP-6
High Price (3 pm-6 pm) 84.2 45.6 1.20 0.65 20% 11%
Moderate Price (12 pm-3 pm) 140.7 59.6 2.01 0.85 32% 13% CPP-7
High Price (3 pm-6 pm) 91.3 49.4 1.30 0.70 21% 11%
Moderate Price (12 pm-3 pm) 136.9 57.4 1.95 0.82 32% 13% CPP-8
High Price (3 pm-6 pm) 88.7 47.8 1.27 0.68 21% 11%
Moderate Price (12 pm-3 pm) 114.5 48.0 1.63 0.69 31% 13% CPP-9
High Price (3 pm-6 pm) 88.7 42.1 1.27 0.60 24% 12%
Moderate Price (12 pm-3 pm) 123.6 53.2 1.76 0.76 33% 14% CPP-10
High Price (3 pm-6 pm) 81.5 43.2 1.16 0.62 22% 11%
Moderate Price (12 pm-3 pm) 114.9 51.6 1.64 0.74 30% 13% CPP-11
High Price (3 pm-6 pm) 78.6 41.6 1.12 0.59 20% 11%
Moderate Price (12 pm-3 pm) 109.9 50.0 1.57 0.71 29% 13% CPP-12
High Price (3 pm-6 pm) 72.6 38.0 1.04 0.54 19% 10%
Average Peak Period (12 pm-3 pm) 101.0 48.4 1.44 0.69 26% 12%
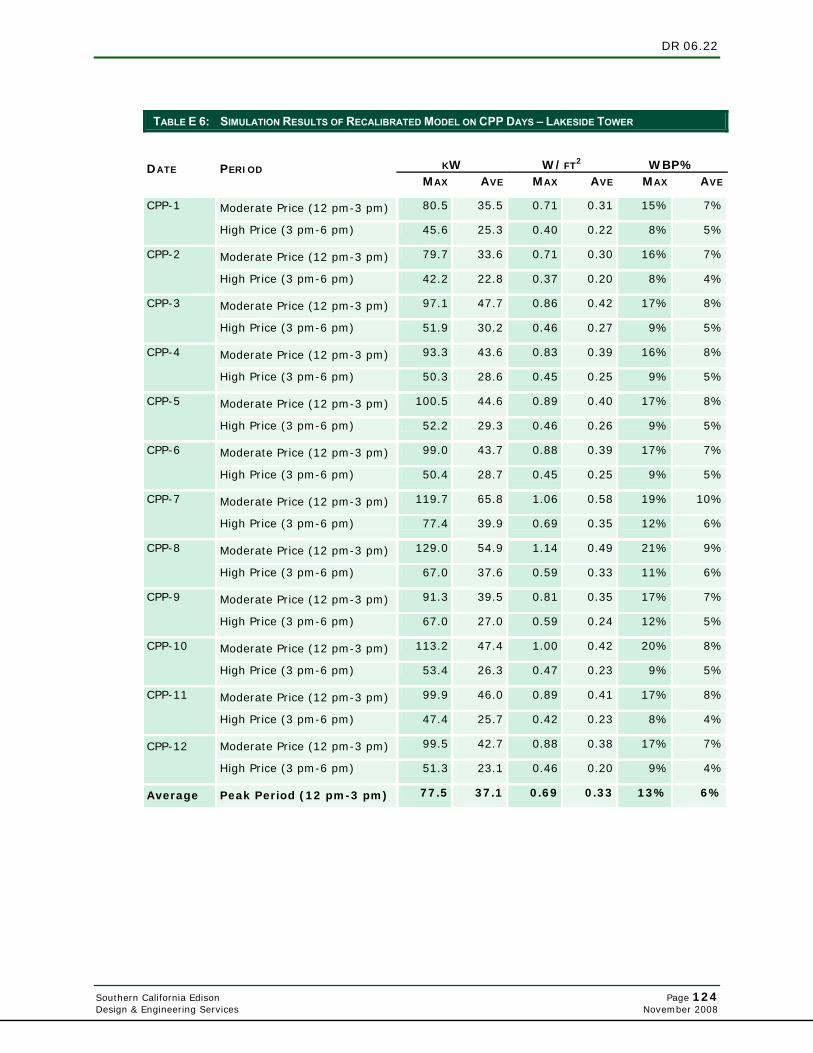
DR 06.22
Southern California Edison Page 124 Design & Engineering Services November 2008
TABLE E 6: SIMULATION RESULTS OF RECALIBRATED MODEL ON CPP DAYS – LAKESIDE TOWER
KW
W/FT2
WBP% DATE PERIOD
MAX AVE MAX AVE MAX AVE
Moderate Price (12 pm-3 pm) 80.5 35.5 0.71 0.31 15% 7% CPP-1
High Price (3 pm-6 pm) 45.6 25.3 0.40 0.22 8% 5%
Moderate Price (12 pm-3 pm) 79.7 33.6 0.71 0.30 16% 7% CPP-2
High Price (3 pm-6 pm) 42.2 22.8 0.37 0.20 8% 4%
Moderate Price (12 pm-3 pm) 97.1 47.7 0.86 0.42 17% 8% CPP-3
High Price (3 pm-6 pm) 51.9 30.2 0.46 0.27 9% 5%
Moderate Price (12 pm-3 pm) 93.3 43.6 0.83 0.39 16% 8% CPP-4
High Price (3 pm-6 pm) 50.3 28.6 0.45 0.25 9% 5%
Moderate Price (12 pm-3 pm) 100.5 44.6 0.89 0.40 17% 8% CPP-5
High Price (3 pm-6 pm) 52.2 29.3 0.46 0.26 9% 5%
Moderate Price (12 pm-3 pm) 99.0 43.7 0.88 0.39 17% 7% CPP-6
High Price (3 pm-6 pm) 50.4 28.7 0.45 0.25 9% 5%
Moderate Price (12 pm-3 pm) 119.7 65.8 1.06 0.58 19% 10% CPP-7
High Price (3 pm-6 pm) 77.4 39.9 0.69 0.35 12% 6%
Moderate Price (12 pm-3 pm) 129.0 54.9 1.14 0.49 21% 9% CPP-8
High Price (3 pm-6 pm) 67.0 37.6 0.59 0.33 11% 6%
Moderate Price (12 pm-3 pm) 91.3 39.5 0.81 0.35 17% 7% CPP-9
High Price (3 pm-6 pm) 67.0 27.0 0.59 0.24 12% 5%
Moderate Price (12 pm-3 pm) 113.2 47.4 1.00 0.42 20% 8% CPP-10
High Price (3 pm-6 pm) 53.4 26.3 0.47 0.23 9% 5%
Moderate Price (12 pm-3 pm) 99.9 46.0 0.89 0.41 17% 8% CPP-11
High Price (3 pm-6 pm) 47.4 25.7 0.42 0.23 8% 4%
Moderate Price (12 pm-3 pm) 99.5 42.7 0.88 0.38 17% 7% CPP-12
High Price (3 pm-6 pm) 51.3 23.1 0.46 0.20 9% 4%
Average Peak Period (12 pm-3 pm) 77.5 37.1 0.69 0.33 13% 6%
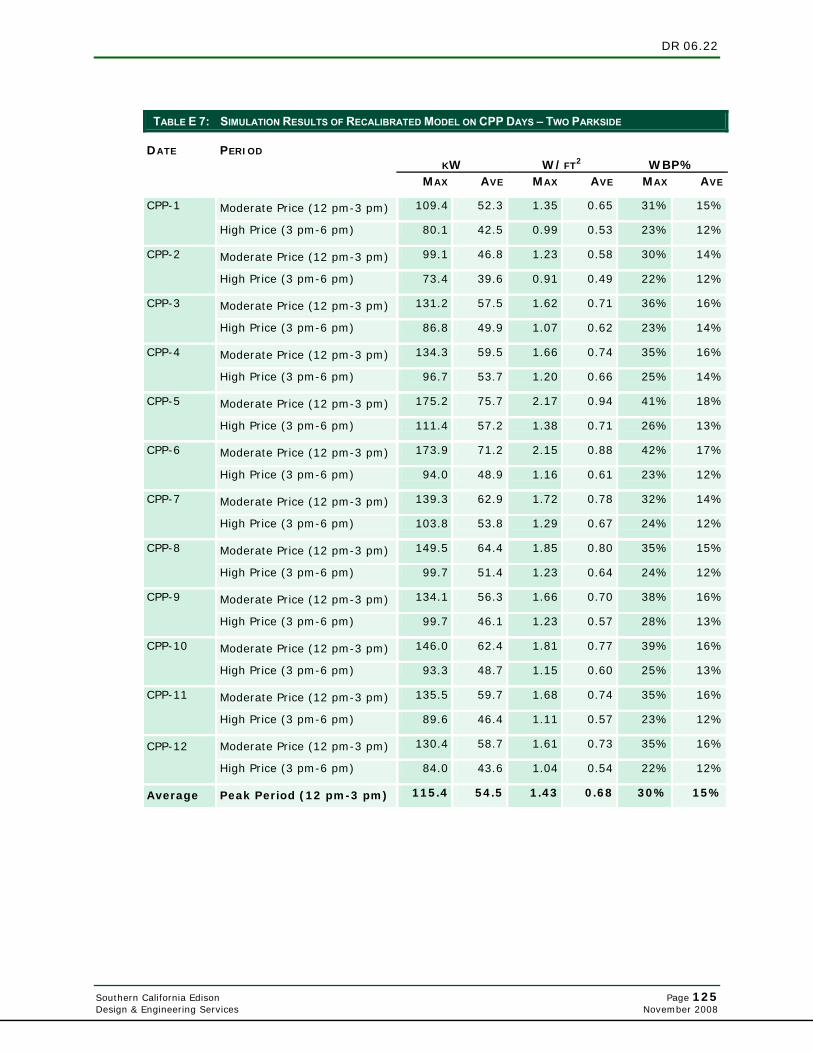
DR 06.22
Southern California Edison Page 125 Design & Engineering Services November 2008
TABLE E 7: SIMULATION RESULTS OF RECALIBRATED MODEL ON CPP DAYS – TWO PARKSIDE
KW
W/FT2
WBP%
DATE PERIOD
MAX AVE MAX AVE MAX AVE
Moderate Price (12 pm-3 pm) 109.4 52.3 1.35 0.65 31% 15% CPP-1
High Price (3 pm-6 pm) 80.1 42.5 0.99 0.53 23% 12%
Moderate Price (12 pm-3 pm) 99.1 46.8 1.23 0.58 30% 14% CPP-2
High Price (3 pm-6 pm) 73.4 39.6 0.91 0.49 22% 12%
Moderate Price (12 pm-3 pm) 131.2 57.5 1.62 0.71 36% 16% CPP-3
High Price (3 pm-6 pm) 86.8 49.9 1.07 0.62 23% 14%
Moderate Price (12 pm-3 pm) 134.3 59.5 1.66 0.74 35% 16% CPP-4
High Price (3 pm-6 pm) 96.7 53.7 1.20 0.66 25% 14%
Moderate Price (12 pm-3 pm) 175.2 75.7 2.17 0.94 41% 18% CPP-5
High Price (3 pm-6 pm) 111.4 57.2 1.38 0.71 26% 13%
Moderate Price (12 pm-3 pm) 173.9 71.2 2.15 0.88 42% 17% CPP-6
High Price (3 pm-6 pm) 94.0 48.9 1.16 0.61 23% 12%
Moderate Price (12 pm-3 pm) 139.3 62.9 1.72 0.78 32% 14% CPP-7
High Price (3 pm-6 pm) 103.8 53.8 1.29 0.67 24% 12%
Moderate Price (12 pm-3 pm) 149.5 64.4 1.85 0.80 35% 15% CPP-8
High Price (3 pm-6 pm) 99.7 51.4 1.23 0.64 24% 12%
Moderate Price (12 pm-3 pm) 134.1 56.3 1.66 0.70 38% 16% CPP-9
High Price (3 pm-6 pm) 99.7 46.1 1.23 0.57 28% 13%
Moderate Price (12 pm-3 pm) 146.0 62.4 1.81 0.77 39% 16% CPP-10
High Price (3 pm-6 pm) 93.3 48.7 1.15 0.60 25% 13%
Moderate Price (12 pm-3 pm) 135.5 59.7 1.68 0.74 35% 16% CPP-11
High Price (3 pm-6 pm) 89.6 46.4 1.11 0.57 23% 12%
Moderate Price (12 pm-3 pm) 130.4 58.7 1.61 0.73 35% 16% CPP-12
High Price (3 pm-6 pm) 84.0 43.6 1.04 0.54 22% 12%
Average Peak Period (12 pm-3 pm) 115.4 54.5 1.43 0.68 30% 15%
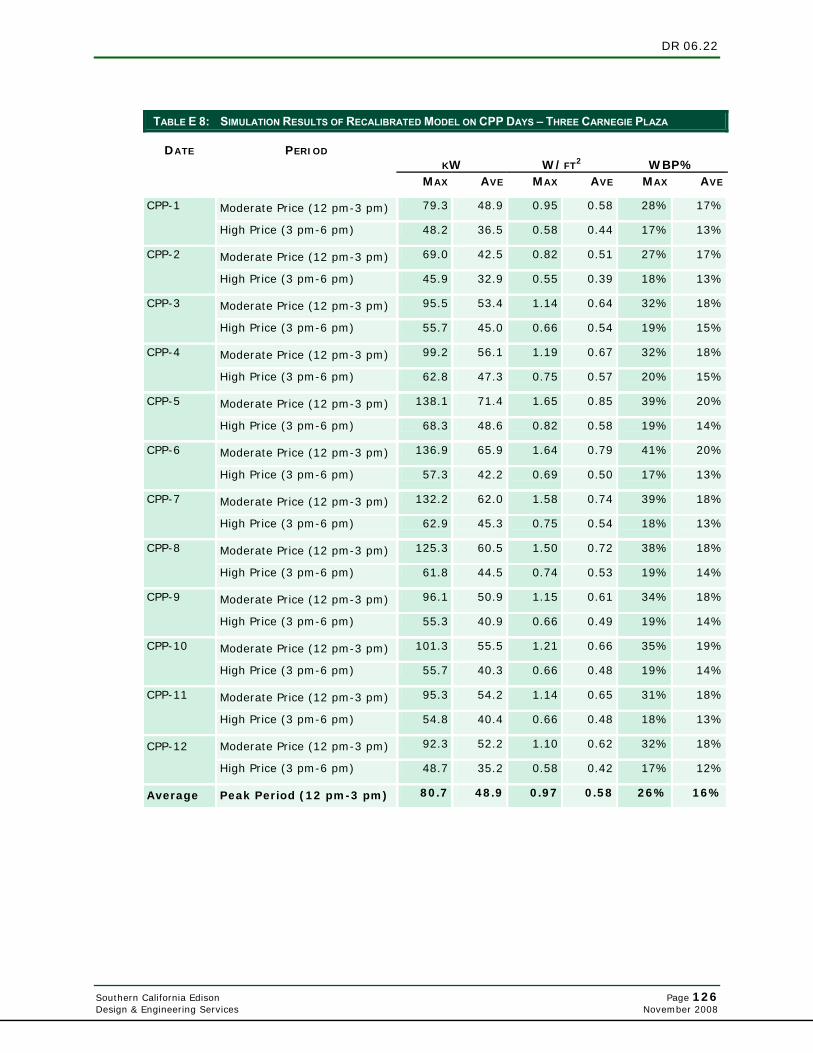
DR 06.22
Southern California Edison Page 126 Design & Engineering Services November 2008
TABLE E 8: SIMULATION RESULTS OF RECALIBRATED MODEL ON CPP DAYS – THREE CARNEGIE PLAZA
KW
W/FT2
WBP%
DATE PERIOD
MAX AVE MAX AVE MAX AVE
Moderate Price (12 pm-3 pm) 79.3 48.9 0.95 0.58 28% 17% CPP-1
High Price (3 pm-6 pm) 48.2 36.5 0.58 0.44 17% 13%
Moderate Price (12 pm-3 pm) 69.0 42.5 0.82 0.51 27% 17% CPP-2
High Price (3 pm-6 pm) 45.9 32.9 0.55 0.39 18% 13%
Moderate Price (12 pm-3 pm) 95.5 53.4 1.14 0.64 32% 18% CPP-3
High Price (3 pm-6 pm) 55.7 45.0 0.66 0.54 19% 15%
Moderate Price (12 pm-3 pm) 99.2 56.1 1.19 0.67 32% 18% CPP-4
High Price (3 pm-6 pm) 62.8 47.3 0.75 0.57 20% 15%
Moderate Price (12 pm-3 pm) 138.1 71.4 1.65 0.85 39% 20% CPP-5
High Price (3 pm-6 pm) 68.3 48.6 0.82 0.58 19% 14%
Moderate Price (12 pm-3 pm) 136.9 65.9 1.64 0.79 41% 20% CPP-6
High Price (3 pm-6 pm) 57.3 42.2 0.69 0.50 17% 13%
Moderate Price (12 pm-3 pm) 132.2 62.0 1.58 0.74 39% 18% CPP-7
High Price (3 pm-6 pm) 62.9 45.3 0.75 0.54 18% 13%
Moderate Price (12 pm-3 pm) 125.3 60.5 1.50 0.72 38% 18% CPP-8
High Price (3 pm-6 pm) 61.8 44.5 0.74 0.53 19% 14%
Moderate Price (12 pm-3 pm) 96.1 50.9 1.15 0.61 34% 18% CPP-9
High Price (3 pm-6 pm) 55.3 40.9 0.66 0.49 19% 14%
Moderate Price (12 pm-3 pm) 101.3 55.5 1.21 0.66 35% 19% CPP-10
High Price (3 pm-6 pm) 55.7 40.3 0.66 0.48 19% 14%
Moderate Price (12 pm-3 pm) 95.3 54.2 1.14 0.65 31% 18% CPP-11
High Price (3 pm-6 pm) 54.8 40.4 0.66 0.48 18% 13%
Moderate Price (12 pm-3 pm) 92.3 52.2 1.10 0.62 32% 18% CPP-12
High Price (3 pm-6 pm) 48.7 35.2 0.58 0.42 17% 12%
Average Peak Period (12 pm-3 pm) 80.7 48.9 0.97 0.58 26% 16%

DR 06.22
Southern California Edison Page 127 Design & Engineering Services November 2008
TABLE E 9: SIMULATION RESULTS OF RECALIBRATED MODEL ON CPP DAYS – BRIER CORPORATE CENTER
KW
W/FT2
WBP%
DATE PERIOD
MAX AVE MAX AVE MAX AVE
Moderate Price (12 pm-3 pm) 98.3 59.9 0.94 0.57 23% 14% CPP-1
High Price (3 pm-6 pm) 83.8 47.7 0.80 0.46 20% 11%
Moderate Price (12 pm-3 pm) 85.5 51.3 0.82 0.49 22% 13% CPP-2
High Price (3 pm-6 pm) 75.4 44.8 0.72 0.43 19% 11%
Moderate Price (12 pm-3 pm) 109.1 63.2 1.04 0.61 24% 14% CPP-3
High Price (3 pm-6 pm) 92.3 59.1 0.88 0.57 21% 13%
Moderate Price (12 pm-3 pm) 109.9 65.9 1.05 0.63 23% 14% CPP-4
High Price (3 pm-6 pm) 102.9 63.1 0.98 0.60 22% 13%
Moderate Price (12 pm-3 pm) 147.1 84.3 1.41 0.81 28% 16% CPP-5
High Price (3 pm-6 pm) 115.5 64.4 1.11 0.62 22% 12%
Moderate Price (12 pm-3 pm) 149.9 81.7 1.43 0.78 30% 17% CPP-6
High Price (3 pm-6 pm) 99.2 55.1 0.95 0.53 20% 11%
Moderate Price (12 pm-3 pm) 106.5 51.2 1.02 0.49 19% 9% CPP-7
High Price (3 pm-6 pm) 106.5 71.0 1.02 0.68 19% 13%
Moderate Price (12 pm-3 pm) 110.6 63.0 1.06 0.60 20% 12% CPP-8
High Price (3 pm-6 pm) 117.3 68.2 1.12 0.65 21% 12%
Moderate Price (12 pm-3 pm) 110.4 60.8 1.06 0.58 26% 15% CPP-9
High Price (3 pm-6 pm) 117.3 51.3 1.12 0.49 28% 12%
Moderate Price (12 pm-3 pm) 118.3 65.5 1.13 0.63 28% 15% CPP-10
High Price (3 pm-6 pm) 89.6 50.5 0.86 0.48 21% 12%
Moderate Price (12 pm-3 pm) 108.5 63.1 1.04 0.60 25% 14% CPP-11
High Price (3 pm-6 pm) 88.8 50.3 0.85 0.48 20% 11%
Moderate Price (12 pm-3 pm) 109.2 63.3 1.05 0.61 26% 15% CPP-12
High Price (3 pm-6 pm) 81.1 45.8 0.78 0.44 19% 11%
Average Peak Period (12 pm-3 pm) 105.5 60.2 1.01 0.58 23% 13%
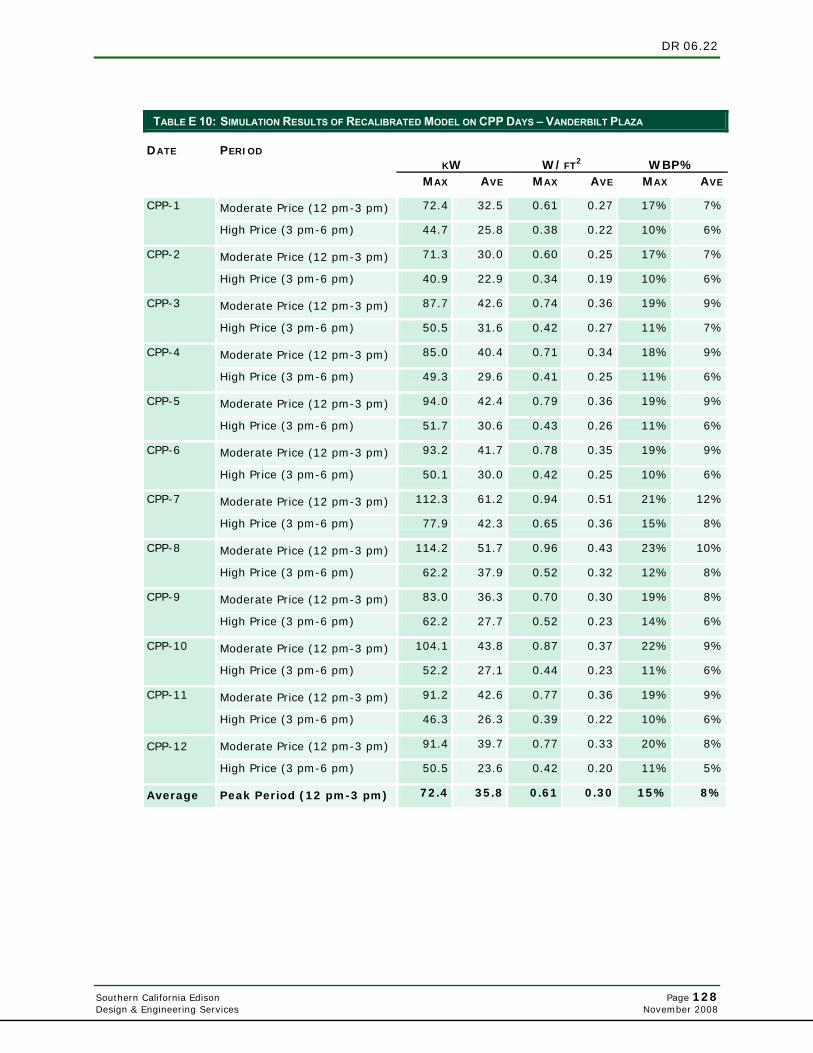
DR 06.22
Southern California Edison Page 128 Design & Engineering Services November 2008
TABLE E 10: SIMULATION RESULTS OF RECALIBRATED MODEL ON CPP DAYS – VANDERBILT PLAZA
KW
W/FT2
WBP%
DATE PERIOD
MAX AVE MAX AVE MAX AVE
Moderate Price (12 pm-3 pm) 72.4 32.5 0.61 0.27 17% 7% CPP-1
High Price (3 pm-6 pm) 44.7 25.8 0.38 0.22 10% 6%
Moderate Price (12 pm-3 pm) 71.3 30.0 0.60 0.25 17% 7% CPP-2
High Price (3 pm-6 pm) 40.9 22.9 0.34 0.19 10% 6%
Moderate Price (12 pm-3 pm) 87.7 42.6 0.74 0.36 19% 9% CPP-3
High Price (3 pm-6 pm) 50.5 31.6 0.42 0.27 11% 7%
Moderate Price (12 pm-3 pm) 85.0 40.4 0.71 0.34 18% 9% CPP-4
High Price (3 pm-6 pm) 49.3 29.6 0.41 0.25 11% 6%
Moderate Price (12 pm-3 pm) 94.0 42.4 0.79 0.36 19% 9% CPP-5
High Price (3 pm-6 pm) 51.7 30.6 0.43 0.26 11% 6%
Moderate Price (12 pm-3 pm) 93.2 41.7 0.78 0.35 19% 9% CPP-6
High Price (3 pm-6 pm) 50.1 30.0 0.42 0.25 10% 6%
Moderate Price (12 pm-3 pm) 112.3 61.2 0.94 0.51 21% 12% CPP-7
High Price (3 pm-6 pm) 77.9 42.3 0.65 0.36 15% 8%
Moderate Price (12 pm-3 pm) 114.2 51.7 0.96 0.43 23% 10% CPP-8
High Price (3 pm-6 pm) 62.2 37.9 0.52 0.32 12% 8%
Moderate Price (12 pm-3 pm) 83.0 36.3 0.70 0.30 19% 8% CPP-9
High Price (3 pm-6 pm) 62.2 27.7 0.52 0.23 14% 6%
Moderate Price (12 pm-3 pm) 104.1 43.8 0.87 0.37 22% 9% CPP-10
High Price (3 pm-6 pm) 52.2 27.1 0.44 0.23 11% 6%
Moderate Price (12 pm-3 pm) 91.2 42.6 0.77 0.36 19% 9% CPP-11
High Price (3 pm-6 pm) 46.3 26.3 0.39 0.22 10% 6%
Moderate Price (12 pm-3 pm) 91.4 39.7 0.77 0.33 20% 8% CPP-12
High Price (3 pm-6 pm) 50.5 23.6 0.42 0.20 11% 5%
Average Peak Period (12 pm-3 pm) 72.4 35.8 0.61 0.30 15% 8%
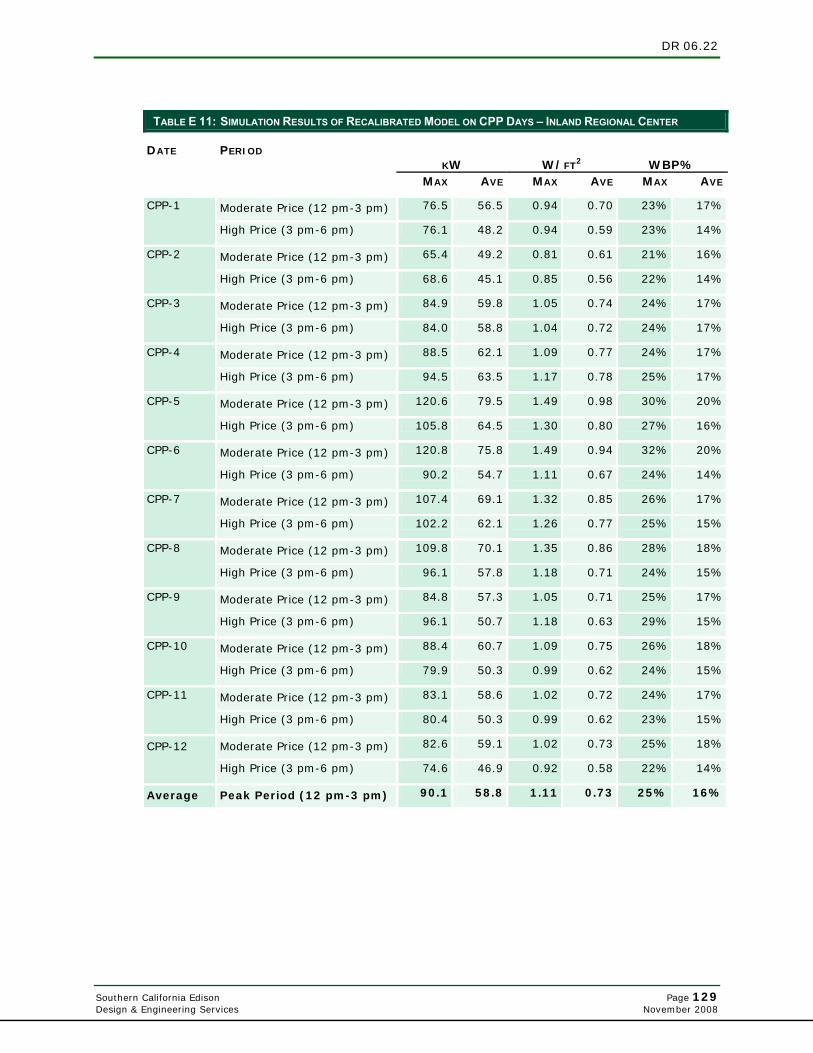
DR 06.22
Southern California Edison Page 129 Design & Engineering Services November 2008
TABLE E 11: SIMULATION RESULTS OF RECALIBRATED MODEL ON CPP DAYS – INLAND REGIONAL CENTER
KW
W/FT2
WBP%
DATE PERIOD
MAX AVE MAX AVE MAX AVE
Moderate Price (12 pm-3 pm) 76.5 56.5 0.94 0.70 23% 17% CPP-1
High Price (3 pm-6 pm) 76.1 48.2 0.94 0.59 23% 14%
Moderate Price (12 pm-3 pm) 65.4 49.2 0.81 0.61 21% 16% CPP-2
High Price (3 pm-6 pm) 68.6 45.1 0.85 0.56 22% 14%
Moderate Price (12 pm-3 pm) 84.9 59.8 1.05 0.74 24% 17% CPP-3
High Price (3 pm-6 pm) 84.0 58.8 1.04 0.72 24% 17%
Moderate Price (12 pm-3 pm) 88.5 62.1 1.09 0.77 24% 17% CPP-4
High Price (3 pm-6 pm) 94.5 63.5 1.17 0.78 25% 17%
Moderate Price (12 pm-3 pm) 120.6 79.5 1.49 0.98 30% 20% CPP-5
High Price (3 pm-6 pm) 105.8 64.5 1.30 0.80 27% 16%
Moderate Price (12 pm-3 pm) 120.8 75.8 1.49 0.94 32% 20% CPP-6
High Price (3 pm-6 pm) 90.2 54.7 1.11 0.67 24% 14%
Moderate Price (12 pm-3 pm) 107.4 69.1 1.32 0.85 26% 17% CPP-7
High Price (3 pm-6 pm) 102.2 62.1 1.26 0.77 25% 15%
Moderate Price (12 pm-3 pm) 109.8 70.1 1.35 0.86 28% 18% CPP-8
High Price (3 pm-6 pm) 96.1 57.8 1.18 0.71 24% 15%
Moderate Price (12 pm-3 pm) 84.8 57.3 1.05 0.71 25% 17% CPP-9
High Price (3 pm-6 pm) 96.1 50.7 1.18 0.63 29% 15%
Moderate Price (12 pm-3 pm) 88.4 60.7 1.09 0.75 26% 18% CPP-10
High Price (3 pm-6 pm) 79.9 50.3 0.99 0.62 24% 15%
Moderate Price (12 pm-3 pm) 83.1 58.6 1.02 0.72 24% 17% CPP-11
High Price (3 pm-6 pm) 80.4 50.3 0.99 0.62 23% 15%
Moderate Price (12 pm-3 pm) 82.6 59.1 1.02 0.73 25% 18% CPP-12
High Price (3 pm-6 pm) 74.6 46.9 0.92 0.58 22% 14%
Average Peak Period (12 pm-3 pm) 90.1 58.8 1.11 0.73 25% 16%