AUTHORITY THIS PAGE IS UNCLASSIFIED - DTIC
301
UNCLASSIFIED AD NUMBER LIMITATION CHANGES TO: FROM: AUTHORITY THIS PAGE IS UNCLASSIFIED AD801897 Approved for public release; distribution is unlimited. Distribution authorized to U.S. Gov't. agencies and their contractors; Administrative/Operational Use; SEP 1966. Other requests shall be referred to Air Force Rocket Propulsion Lab., Edwards AFB, CA. AFRPL ltr 20 Dec 1971
-
Upload
khangminh22 -
Category
Documents
-
view
0 -
download
0
Transcript of AUTHORITY THIS PAGE IS UNCLASSIFIED - DTIC

UNCLASSIFIED
AD NUMBER
LIMITATION CHANGESTO:
FROM:
AUTHORITY
THIS PAGE IS UNCLASSIFIED
AD801897
Approved for public release; distribution isunlimited.
Distribution authorized to U.S. Gov't. agenciesand their contractors;Administrative/Operational Use; SEP 1966. Otherrequests shall be referred to Air Force RocketPropulsion Lab., Edwards AFB, CA.
AFRPL ltr 20 Dec 1971
.«,>«..
.'M
AFRFL-TR-66-229
CO
ao
COMBUSTION STABILITY RATING TECHNIQUES
Final Report
L. P. Combs F. W. Hoehn S. R. Webb
et al*
Rocketdyne A Division of North American Aviation, Inc.
Canoga Park, California
September 1966
This document is subject to special export controls and each trans- mittal to foreign governments or foreign nationals may be made only with prior approval of AFRPL (RPPR/STINFO), Edwards, California 93523.
Air Force Rocket Propulsion Laboratory Research and Technology Division
Edwards Air Force Base, California Air Force Systems Command
United States Air Force
5

·•·
THIS DOCUMENT IS BEST QUALITY AVAILABLE. THE COPY
FURNISHED TO DTIC CONTAINED
A SIGNIFICANT NUMBER OF
PAGES WHICH DO NOT
REPRODUCE LEGIBLYo
When U.S. (iovinimc-nt drawiti^s, specificate nu, or
othor data ar<> uscil for any purpose other than u
definitely related Uovermnent procurement operation,
the Government thereby incurs no reHpontuhi 1 i ty nor
any obli(;ution whatsoever, and the fact that the
(fovernment may have formulated, furnished, or in
any way supplied the said drawings, spec i i'i cat ions ,
or other data, is not to be regarded by implication
or otherwise, or in any manner licensing the holder
or any other person or corporation, or conveying any
rights or permission to manufacture, use, or sell
any patented invention that may in any way be
related thereto.

\niPL-TIKi6-229
COHBUSTION STABILITY RATING TfCIINIQUES
Final Report
L. P. Combs F. W. Hoehn S. H. Webb
et al.
W
Bocket«^ yne A Division of North American Aviation, Inc.
Canoga Park, California
September 1966
This document is subject to special export control« and each transmittal to foreign governments or foreign nationals may be made only vith prior approval of AFRPL (RPPR/STINFO), Edwards, California 93523.
Air Force Rocket Propulsion Laboratory Research and Technology Division
Edwards Air Force Base, California Air Force Systems Command United States Air Force
•
'■
PORKWOHD
This report was prepared in cumpliance with Contract
AF04(6ll)-lO811, FN 3058, PSN 750G, BPSN 623058.
Mr. Thoaa* J. C. Chew was the project officer for
the Air Force Bocket Propulaion Laboratory.
Dr. B. B. Lavhead waa Bocketdyne'a program manager,
and Mr. L. P. Combs waa project engineer. Additional
Rocketdyne Beaearch Diviaion peraonnel who contri-
buted to thia report were: E. E. Lockwoodr J. A.
Murphy, and M. J. Olaaaky in cold-flow characteriza-
tion; Ü. T. Coopbcll in hot-firing evaluation;
Madeline Alexander and H. Kaspar in analysis and
correlation; and S. Zeldin in technical
photography.
Thia report has been aasigned the Bocketdyne Beport
N*. 6355-4.
This technical report has been reviewed and is
approved.
THOMAS J. C. CHEW Sr. Project Engineer, BPB3C
ii
Vn
\
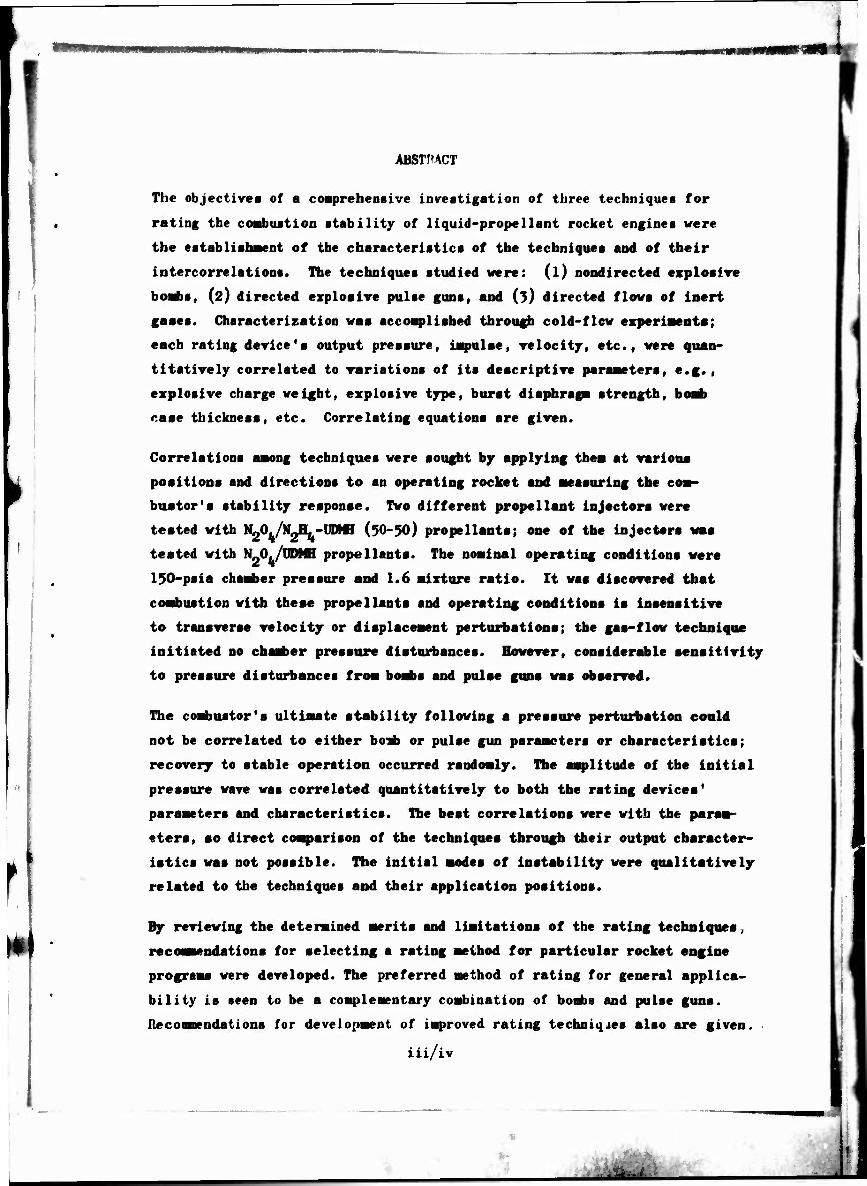
ABSTPACT
The objectives of a comprehensive investigation of three techniques for
rating the combustion stability of liquid-propellant rocket engines were
the establislusent of the characteristics of the techniques and of their
intercorrelations. The techniques studied were: (l) nondirected explosive
bombs, (2) directed explosive pulse guns, and (3) directed flows of inert
gaaes. Characterization was accomplished through cold-flew experiments;
each rating device's output pressure, impulse, velocity, etc., were quan-
titatively correlated to variations of its descriptive parameters, e.g.,
explosive charge weight, explosive type, burst diaphragm strength, bosd>
case thickness, etc. Correlating equations are given.
Correlations among techniques were sought by applying them at various
positions and directions to an operating rocket and measuring the com-
buator'a stability response. Two different propellent injectors were
teated with NgO^/NgH^-UDMH (50-50) propellents; one of the injectors was
tested with N 0./UDMH propellents. The nominal operating conditions were
130-psia chariter pressure and 1.6 mixture ratio. It was discovered that
cofldiustion with these propellants and operating conditions is insensitive
to transverse velocity or displacement perturbations; the gas-flow technique
initiated no chamber pressure disturbances. However, considerable sensitivity
to pressure disturbances from bombs and pulse guns was observed.
r
The combustor's ultimate stability following a pressure perturbation could
not be correlated to either bo-ab or pulse gun parameters or characteristics;
recovery to stable operation occurred randomly. The amplitude of the initial
pressure wave was correlated quantitatively to both the rating devices'
parameters and characteristics. The best correlations were with the param-
eters, so direct comparison of the techniques through their output character-
istics was not possible. The initial modes of instability were qualitatively
related to the techniques and their application positions.
By reviewing the determined merits and limitations of the rating techniques,
recommendations for selecting a rating method for particular rocket engine
programs were developed. The preferred method of rating for general applica-
bility is seen to be a complementary combination of bombs and pulse guns.
Ilecoamendations for developsKnt of improved rating techniqiies also are given.
iii/iv
v I ^^t^^i
m* ■■ vrmmmm
CONTENTS
Foreword ii
Abstract iii
Sunmiary and C uticlusion» 1
Bomb Characterization 1
Cold Characterization of Bombs 3
Pulse üun Characterization 5
Cold Characterization of Pulse Guns 0
üas Flow Characteri/alion 7
Engine Stability Evaluation 8
Uesponse of Corabustor to Gas Flow Rating Technique .... 9
Initial Combustor Response to Explosive
Bomb Hatinii Technique 10
Initial Combustor Response to Explosive Pulse
Gun Ratini! Technique 12
Ultimate Combustion Stability 13
Comprehensive Comparison and Recommendations 14
Introduction 17
Background 17
Rating Combustion Stability 18
Recorded Pressure Terminology 21
Cold-Flow Characterization 23
Explosive Bombs 23
Experimental Program 24
Bomb Design Parameter Variations 44
Experimental Results 46
Data Correlations 63
Pulse Guns 7k
Experimental Apparatus 7^»
Experimental Procedure 81
Experimental Results 84
Data Correlations 94
.
Directed Flovs of Gases 108
Ezperinental Approach 110
Experimental Results 114
Additional Flov Generator System Modifications 120
Simulated Chamber Study 123
Hot-Firing Program 125
Experimental Program 126
Test Conditions 126
Test Hardvare Description 127
Supporting Test Equipment 138
Experimental Results 142
Operational Test Results 142
Stability Results 152
Transparent Chamber Results 173
Analysis and Correlation 179
Combustor's Stability Response 179
Initial Wave Amplitudes 181
Initial Instability Modes 222
Subsequent Modes 223
Demonstration Tests 233
Comprehensive Comparison of Rating Techniques 241
Comparison of Merits and Limitations 242
Applicability and Physical Size 242
Effectiveness 245
Repeatability 246
Reliability 248
Handling Characteristics 249
Rating Technique Selection for Current Usage 250
Recommendations for Improved Rating Technique 252
Additional Correlations 252
Improvements for Bombs and Pulse Guns 253
Investigation of Other Rating Technique Concepts 253
j
VI
«
Append i« A
The Application of Statiatiral Ccrrelation Analyaip 233
Nomenclature 259
Reference« 203
Contractual Distribution 263
vii/\iii
"v .
-«i
ILLUSTRATIONS
1. Apparatus for Cold-Characterization of Explosive Boräs . . . 25
2. Summary of Kistler Model 603A (Early Version)
Transducer Evaluation Experiaents 29
3. Summary of Results for Kistler Model 603A
Transducer With DADEE 31
4. Pressure Record From Explosion of a Bare
Olin Plasticap (5.5 Grains RDK) 33
5. Sectional View of Final Configuration for
Transducer Mounting Plate 35
6. Sequence of Framing Photographs From Explosion of
a Bare 50/50 Pentolite Charge 37
7. Pressure Records From Explosion of a Bare Spherical
Charge of 50/^0 Pentolite (108 Grains) 38
6. Correlation of Peak Pressure Data From Spherical
50/50 Pentolite Explosions 42
9. Typical Explosive Bomb Assemblies 47
10. Streak Photograph of High-Explosive Nylon-Case
Boid> Detonation 50
11. Some Examples of Pressure Records From Explosion cf
High-Explosive, Nylon-Case Bombs 53
12. Some Examples of Pressure Records From Explosion of
High-Explosive, Micarta-Case Boobs 54
13. Some Examples of Pressure Records From Explosion of
Low-Explosive, Nylon-Case Bonft» 55
14. Correlation of Unit Impulse Measured 10.00 Inches From
Cylindrical High-Explosive, Nylon-Case Bombs 66
15. Initial Shock Wave Amplitude Calculated From Streak
Velocity Near the Boob-Case Surface 69
16. Air-Shock Wave Overpressures From High-Explosive,
Nylon-Case Boobs 73
■
._ .
17. Pulse Gun Cold-Characterization Apparatus 76
18. Modified Pulse Gun Barrel Details 78
19. Examples of Pressure Surges Before Burst Diaphragm Rupture . 83
20. Pressure Reconis From Pulse Guns Fired Into a
ISO-psig Back Pressure Tank 83
21. Examples of Pulse Gun Blast Waves From Nonstandard Charge
Weight and Diaphragm Strength Combinations 86
22. Examples of Pulse Gun Blast Waves From Slower Burning
duPont Military 3031 Powder 87
23. Maximum Blast Pressure Amplitude at l.kk Inches
From Pulse Gun Burst Diaphragm 92
24. Maximum Blast Pressure Amplitude at 6.00 Inches
From Pulse Gun Burst Diaphragm 93
23. Maximum Blast Pressure Amplitude at 1.44 Inches From
Pulse Gun Burst Diaphragm. (Hercules Bullseye Powder) ... 97
26. Maximum Blast Pressure Amplitude at 6.00 Inches From
Pulse Gun Diaphragm. (Hercules Bullseye Powder,
150-psi Backpressure) .98
27. Impulse From Pulse Gun Blast Waves. (Hercules Bullseye
Powder, 130-p8i Backpressure) 100
28. Average Velocity of Initial Shock Wave in Pulse Gun
Barrel. (Hercules Bullseye Powder, 130-psi Backpressure) . . 101
29. Initial Shock Wave Pressure Amplitude at 1.44 Inches From
Pulse Gun Burst Diaphragm. (Hercules Bullseye Powder,
130-psi Backpressure) 103
30. Initial Shock Wave Pressure Amplitude at 6.00 Inches
From Pulse Gun Diaphragm. (Hercules Bullseye Powder,
130-psi Backpressure) 104
31. Maximum Pulse Gun Blast Pressure Amplitude. (duPont
Military 3031 Powder, 130-psi Backpressure) 103
32. Impulse From Pulse Gun Blast Waves. (duPont Military
3031 Powder, 130-p8i Backpressure) 106
33. Average Velocity of Initial Shock Wave in Pulse Gun
Barrel. (duPont 3031 Powder, 130-psig pressure) 107
—
■ I

>"
._
34. Gas Flow Generator System Ill
3?. Assembly of Gas Flow Generator 112
36. Nitrogen Flowrate vs Valve Position Calibration for
Modified Gas Flow Generator 116
37. Helium Flowrate vs Valve Position Calibration for
Modified Gas Flow Generator 117
38. Linear Ramp Nitrogen Flowrates Produced by
the Modified Gas Flow Generator 118
39. Linear Ramp Helium Flowrates Produced by
the Modified Gau Flow Generator 119
40. Effects of Surge Tank Volume and Linear Ramp Duration
on Maximum Gas FIovTates 122
41. Hot-Firing Chamber 128
4'J. Combustion Chamber Section With Multiple Pulse and
Pressure Transducer Bosses 129
43. Snap Attachment Explosive Bomb Caae 130
44. Typical Explosive Bomb Cases and Fixtures 132
43. Locations on the Chamber for Pulse Bosses and
Photocon Pressure Transducers 133
46. Transparent Combustion Chamber Assembly 134
47. Triplet Pattern Injector 136
48. Doublet Pattern Injector 137
49. Propellant System 139
30. Orientation of Four Streak Cameras During
Transparent Chamber Tests 143
31. Transparent Chamber Firing 144
32. Typical Pressure Record Showing Some Instability
Modal Interrelationships (Refer to Fig. 43 for
Transducer Locations) 137
33. Summary of Hot-Firing Stability Response; Explosive
Bombs With Triplet Injector and N^-UDtfi (30-30) Fuel . . .139
34. Summary of Hot-Firing Stability Response; Explosive
Boobs With Doublet Injector Except as Noted 160
33. Summary of Hot-Firing Stability Response; Pulse Guns
With Triplet Injector and N^-UDMH (30-30) Fuel 163
xi
----- I ^ k' " 4&
96. Suaaary of Hot-Firing Stability Response: Selected Pulse
Guns With Doublet Injector and N^-imfl (90-90) Fuel ... 166
97. Suaaary of Hot-Firing Stability Response: Reaaining Pulse
Guns With Doublet Injector and N^-UUfl (90-90)
Fuel Except as Noted 16?
98. Typical Gas Pulse Raap Flows With Triplet Injector . ... 169
99. Selected Fraaes Froa Motion Photography of
Coabustion Process 174
60. Streak Photographs of Boab Triggered Codbustion
Instability During Test 079 177
61. Streak Photographs of Pulse Gun Triggered Combustion
Instability During Test 079 178
62. Relationships Among Various Sets of Characteristics
and Coabustion Process Responses 180
69. Chaaber Geoaetrical Relationships for Correlations .... 183
64. Initial Overpressures Froa Bombs at the Chaaber Axis
(Triplet Injector, N^-UDIffl (50-50) Fuel) 189
69. Initial Overpressures Froa Bombs at 2.89-Inch Radius
(Triplet Injector, N^-UIMI (90-90) Fuel) 187
66. Initial Overpressures From Bonbs at 4.99-Inch Radius
(Triplet Injector, H^-VUm (90-90) Fuel) 188
67. Initial Overpressures Froa Bonbs at 4.99-Inch Radius
(Doublet Injector, N^-IH»« (90-90) Fuel) 189
68. Initial Overpressures Froa Bombs at 2.89-Inch Radius
(Doublet Injector, N^4-UD»fi (90-90) Fuel) 190
69. Initial Overpressures Froa Bombs Having 0.17-Inch
Case Thickness (Z - 9.79 Inches) 191
70. Effects of BOB* Case Thickness on Initial Over-
pressure Froa 13.9-Grain Bonbs (Doublet Injector) .... 192
71. Effects of Chaaber Pressure and Fuel on Initial •
Overpressures Froa Bombs 194
72. Initial Overpressure Froa Fulse Guns With Doublet
Injector and Tangential Entry 209
L .ST.ÖB22, 'iir^vw jLtll MUMM - --- ■ _ / . '
—
XI 1 1 XIV
73. Initial Overpressures Fron Pulse Guns with Doublet
Injector and Chordal Entry 206
74. Initial Overpressures From Pulse Guns with Doublet
Injector and Radial Entry 207
75. Initial Directional Pulse Gun Disturbance Wave Growth
With Doublet Injector and Tangential Entry 208
76. Effect of Fuel Type on Initial Overpressure Fron Pulse
Guns With Doublet Injector and Tangential Entry 209
77* Effect of Port Size on Initial Overpressures From Pulse
Guns With Doublet Injector and Tangential Entry 210
78. Effect of Mixed Charge Sizes on Initial Overpressures
From Pulse Guns With Doublet Injector and
Tangential Entry 211
79. Effect of Powder Type on Initial Overpressures From
Pulse Guns With Doublet Injector and Tangential Entry .... 212
80. Effect of Injector Type on Initial Overpressures From
Pulse Guns With Radial Entry 213
81. Pressure Traces Superimposed From Two Tests With
kom 20K Pulse Gun Charges 229
82. Stability of Tests With Bombs (30-30 Fuel) 227
83. Stability of Tests With Pulse Guns (30-30 Fuel) 228
84. Pressure Oscillation Damp Times for Bombs and Pulse
Guns, Doublet Injector (30-30 Fuel) 230
83. Amplitudes of Sustained Instabilities 232
86. Demonstration Hot-Firing Results With Bombs 233
87. Demonstration Hot-Firing Results With Bomb at
Elevated Chamber Pressures 236
88. Demonstration Hot-Firing Results With Pulse Guns 237
89. Demonstration Hot-Firing Results With Pulse Guns at
Elevated Chamber Pressures 238
• MSk
I
TABUS
1. Air Blast Data From Explosion of Bare Spherical
Pentolite Charge» 39
2. Bomb Design Details for High Explosive Charges 45
3. Bomb Design Details for Hercules-Bullseye-Powder
Charges in Nylon Cases ... kB 4. Initial Shock Wave Data (High-Explosive,
Nylon-Case Bomb Series) 57
5. Air Blast Wave Data (High-Explosive,
Nylon-Case Bomb Series) 58
6. Air Blast Wave Data (High Explosive,
Micarta-Case Series) . . 61
7. Air Blast Wave Data (Low Explosive,
Nylon Case Series) 62
8. Comparison of Micarta and Nylon Case Transducer
Transit Time Velocity Data 75
9. Blast Wave Data From Pulse Gun Firings 90
10. Components of Flow Generator System for Gas Julse
Bating Device 113
11. Engine Operational Parameters Measured During
Stable Combustion 146
12. Average Values of Operational Parameters 151
13. High-Explosive Bombs Used During the Hot-Firing
Program 153
14. Pulse Guns Used During the Hot-Firing Program 161
15« Directed Flows of Gases Used During the
Hot-Firing Program . . 168
16. Theoretical Chamber Acoustic Frequencies 172
17. Reduction of Initial Wave Amplitudes by Incidence
Coefficients for Bombs 197
18. Coefficients for Terms in Equations Relating Initial
Pressure Amplitude to Pulse Gun Characteristics
(Triplet Injector) 220
'
—
^fc- :^-
meß

»
19.
20.
21.
22.
Coefficients for Teras in Equations Relating Initial
Prtssure Aaplitude to Puls« Gun Characteristic!
(DoubUt Injector) 221
Rnting Device Paraattors for Doaonstration Firings 234
DeMnatration Firing Results 240
Msrita and Liaitations of Rating Techniques 243
xvi
,a»
\ •> '
■ Vs .
SUMMARY AND CONCLUSIONS
Results are reported from a coaprebensive study of three techniques for
rating the coabustion stability of liquid propellant rocket engines:
(1) nondirected explosive boobs positioned within the cosibusMon chasiber,
(2) pulse gun blast wave and explosion products directed into the coabus-
tion chamber, and (3) metered flows of inert gases directed into the coa-
bustion chamber. The objectives of the study were to characterize the
techniques by means of cold-flow fluid dynamic experiments and to estab-
lish correlations among them through hot-firing determination of a particu-
lar coabustor's stability responses to them.
BOMB CHABACTERIZATION
Cold-flow characterization of explosive boabs consisted of exploding thea
in the open air and measuring specific characteristics of the resultant
air blast waves. High-explosive charges were encased in closed-end cylin-
drical nylon and Micarta shells and variations of charge weight, charge
length-to-diameter ratio and case thickness were made. Soae low-explosive
(fast burning, double-base pistol powder), nylon-case boabs were also
tested.
A Beckaan and Vhitley Model 200 camera was employed to obtain siaultaneous
high-speed streak and fraaing photographs of the blast waves and Kistler
Model 603A pressure transducers were used for aeasuring blast-wave pressure-
time histories at specific distances froa the boabs. Blast-wave over-
pressures were obtained in three ways, viz., by direct transducer aeasure-
aent and by calculation with the normal air shock relationships using both
transducer-trans it-time-derived velocities and streak-photograph-derived
velocities. The direct transducer overpressure data were less reproducible
and had consistently lower values than the corresponding velocity-derived
overpressures. Direct transducer data were used, therefore, primarily for
aeasuring blast-wave unit positive-impulse values.
i
Velociiy-deriv«d overpressure data were compared with correlation« from
the literature for blast wavea froa large, bare, high-explosive charges.
Data fro« two bare charge« agreed «ell with the literature correlations,
bat overpressures were considerably reduced by encasing the explosives.
Overpressures near the bosibs «ere one to two orders of magnitude low,
depending open the case thickness. Blast-wave overpressuree fron the
bonbs did not decay as rapidly with increasing distance as do those from
bare charges ao the bare charge values were reached at some distance fron
the bomb. Again, that distance depended upon the case thickness.
The initial overpressure data (i.e., at the outer surface of the bomb)
were quite well correlated by multiple regression techniques to the high-
explosive charge weight and case thickness by an initial velocity
correlation:
In (es) - -4.507 ♦ 0.186 In V - 0.557 In T
"•U^M (AP)
Neither changes in charge length-to-diameter ratio nor from nylon to
Micarta ease material affected the correlation.
Blast-wave velocities measured at distances of 5 to 10 inches from the
bomb were similarly correlated with time from the explosion as an addi-
tional variable:
In c - constant ♦ 5.21 t - 4.82 t2 + 0.186 In V - a
1.05 t2 In W - 0.557 In T + 1.86 t In T - 1.19 t2 In T c c c
A different value of the constant was required, however, for each method
or position of data acquisition so this correlation is not nearly as use-
ful as the one for initial blast-wave velocity or overpressure.
,
•Lf- , ; ■ •
■ • < I * II' I« 1
Blast-wave unit positive-impulse values were obtained by planiaeter inte-
grations of the area tinder the pressure-time records measured with a trans-
ducer 10.0 inches fron the bombs. These data were well correlated by:
In I - 3.62 ♦ 1.04 In W - 0.074 (in W) - 0-377 In I ♦ II c
4-0.112 In (L/D)
While the unit positive impulse is specific to the 10.0-inch transducer
location, it is still a valid and useful comparative bomb characteristic.
Durations vt blast-wave positive overpressures were nearly constant and
were only weakly correlated to charga weight. This is, therefore, not a
useful characteristic of a bomb.
The low-explosive bombs tested exhibit greater scatter in their pressure
amplitude-charge weight-case thickness relationships than did the bigfa-
exploaive bombs. Further, with thin cases, multiple pressure waves were
irreproducibly observed and there was evidence of incomplete powder com-
bustion. Thus, high-explosive charges are preferred.
Cold Characterixation of Bombs
nie cold characterisation of explosive bombs resulted in the following
conclusions:
1. High-explosive charges are better for this application than are
low-explosive charges. The low-explosive tested exhibited greater
scatter in explosion time-delay (fire signal to ease rupture)
and pressure amplitude- charge weight- case thickness relation-
ships, irreproducible production of multiple pressure waves,
and evidence of incomplete powder combustion, ^mong charges
variously composed of PETN, RDX, and Composition C-4, it did
not seem to matter which high explosive is used.
- . • j., ■. ?■■ - '
JIII 'i«iH|ii—lii —0* —'mm-
*'
2, fkm duration of the first positiv« overpreoanre portion of the
blast ware ia not a valid output characteristic; ita value at
- 10.0 inches fron the bonto vas nearly constant and was only
weakly related to the charge weight.
3.
*.
5.
Naziansi blast «are overpreaaure ia a valid and useful output
characteristic. Ita value in snbient air waa found to be uniquely
detemined by the charge weight and confining caae thickness.
It «us found not to vary significantly with the charge shape
paraswter, cylindrical length/diameter ratio. Overpressures
iasMdiately adjacent to the outer surface of the bomb caae were
those beat correlated. Overpressures in the interval 3 to 10
inches «way fro« the bo«b surface were quite well correlated by
the aasM expression only if a variable conatant were introduced
to account for the source of the data. This seriously limite
the general uaefulness of the correlation; the font baaed en
overpressures at the bosd» surface is preferred for calculating
thia hodb characteristic.
Chit iapulse of the boo* is a valid characteristic. Its vslue,
as detensined at 10.0 inches fro« the bos*, waa correlated well
with explosive charge weight, beak caae thickness, and, aoaewhat,
with charge length/disaeter ratio. A graphical correlation of
overpreaaure and a reduced diatance paraneter suggests that the
obtained correlation ia apecific to the 10.0-inch location, and
that values at greater distances would presonably be less de-
pendent on the bead) par—etare.
The characteriatic overpreaaure and inpulae correlatlona obtained
for high exploaivea were not affected by a change of bonb case
«aterial fro« nylon to Micarta. Substantially fewer spurious
signala were recorded in the tranadaeer-aeaaured preeeuro-tine
data, however, when Micarta
,
I ^H
'.'
I El ..... .
PULSE GUN CHAKACTERIZATION
Pulse guns wer«, cold characterized bv firing then into a pressurized tuak
and measuring some blast-wave characteristics with two Kistler Model 607L
pressure transducers in the gun's discharge barrel. These guns character-
istically produce blast waves having two distinct pressure fronts. The
initial front results from the burst diaphragm rupture and is usually steep-
fronted or shock-like. The second pressure rise, resulting from continued
burning of the explosive charge, is not steep-fronted at first but ampli-
fies the blast wave to its maximum value. This second pressure front prop-
agates at a higher velocity than the initial shock wove and, as it progresses
down the gun barrel, steepens into a second shock wave.
The pressure amplitudes of both of these waves are related to the explosive
charge weight, the burst diaphragm strength, the backpressure in the
receiving tank, and the transducer position downstream of the burst dia-
phragm. The multiple regression correlating equation for the maximum
blast wave pressure is:
In P x = 8.32 -1.5k In W + 0.32 (in W)2 + 0.15 In W In D -
0.06 (in W)2 In D + 0.19 In W In Pdb + 0.008 (in Pb)2
The positive impulse of the pulse gun blast wave was primarily determined
by the charge weight, with tank backpressure exerting only a weak effect
and burst diaphragm strength not even entering the correlation:
In 1 -6.43 + 1.73 In W - 0.11 (in W^ - 0.28 In D + 0.123 In Pv
The positive durations of the blast waves, much as found with explosive
bombs, were found to be nearly coustant and were not considered to be a
useful characteristic. Blast-wave velocity was correlated but there was
so much scatter in the df.ta that little confidence can be placed in the
correlation.
- • Htfc
Several pulse gun charges were fired in which the fast-bumirg pistol
powder (Hercules Bullseye No. 2) was replaced with a slower burning mili-
tary rifle powder (duPont Military 3031). Very similar trends in initial
shock-wave amplitude, maximum blast pressure and impulse were observed
although the values were approximately halved by using the less energetic,
slower burning powder. Repeatability did not seem to be improved so
there was no indication that a change from the "standard" Bullseye powder
would be beneficial.
Cold Characterization of Pulse Guns
The cold characterization of explosive pulse guns resulted in the follow-
ing conclusions:
1. The blast wove produced by the pulse gun characteristically
has two pressure spikes. The first is a shock wave resulting
from thj burst diaphragm.rupture. Its amplitude varies both
with burst diaphragu pressure rating and charge weight. The
second wave is frequently not steep-fronted; it is believed to
result from continued combustion, at a high rate, of explosive
that had not yet burned when the diaphragm burst. Its amplitude
also varies with burst diaphragm strength and charge weight.
2. There was considerable scatter in the pressure data, but valid
mean values were obtained by firing replicate charges. Correla-
tion of characteristics to the input parameters made use of those
mean values.
3. The maximum blast wave overpressure was correlated with the
charge weight, burst diaphragm strength, transducer location
(distance from the diaphragm) and pressure of the vessel into
which the guns were fired, and was found to be a valid and use-
ful pulse gun characteristic.
k. The blast wave impulse was found to be a valid and useful pulse
gun characteristic related primarily to the charge weight and
transducer location.
mr*
■ -■■ T
;
■
■

m
•
3. Initial shock wave velocity, while correlated to the pulse gun
parameters, is of questionable validity as a characteristic
because of excessive scatter, even in the averaged data.
6. Maximum blast wave overpressures were only slightly influenced
by downstream pressure; values at 230 psig were approximately
3 percent higher than values at 130 psig.
7. Values of initial shock wave overpressure, maximum blast wave
overpressure, and impulse were approximately halved by replacing
the normal fast-burning Hercules Bnllseye double-base pistol pow-
der with a lower-burning (by approximately 3:1)» less-energetic
(by approximately 70 percent), duPont Military 3031. double-
base rifle powder.
8. Blast wave positive duration was not a valid pulse gun character-
istic, since it exhibited only random variations even when the
powder burning rate was changed.
I
GAS FLOW CHARACTERIZATION
Cold characterization of the gas flow technique consisted mainly of demon-
strating that the apparatus assembled could be operated in a Banner that
would give reproducibly controlled flowrate vs time profiles. The approach
taken was: (l) measure the gas flowrate delivered from a fixed gaseous
supply system as a function of flow control valve position and downstream
pressure, and (2) preprogram the valve position as a function of time so
that a particular desired flowrate vs time profile could be produced.
This approach permitted selection of any arbitrary flow profile; it was
nnticipated that linear rates of increase in gas flowrate, momentum or
kinetic energy might be used at various times during the rocket engine
test program.
Preprogramning of valve position vs time made use of a Donner Model 3750
Hiode function generator. Satisfactory control was den. mstrated by gen-
erating ramp flows with linear flowrate increases ranging from approximately
- -■
Utk
/ 2 / 2 h to 29 lb/a«e with nitrogen and approximately 1.8 to 3*9 Ib/aec with
holiuB. At the higher rates, full flow was reached in approximately
250 milliseconds.
The systea originally aaaeabled had maximum flowrates of approximately 3
and 1.5 lb/sec with nitrogen and helium, respectively. Higher values
ware desired for engine pulsing, so an additional surge tank was intalled
in the gas flow generation system without re-evaluating its characteristics.
ENGINE STABILITY EVALUATION
The relative effectiveness of the stability rating techniques in deter-
mining a rocket combustor's stability traits was investigated by applying
the techniques at various positions in an operating rocket and observing
their effects on its stability. The nominal 10,000-pound-thrust, cylin-
drical rocket conbustor employed was operated at fixed conditions of 150-
psia chamber pressure and 1.5 to 1.6 mixture ratio with No0./N9H.-UDMH(5O-50)
propellanta. Straight UEMH was also used as the fuel during some tests.
Two different injectors were tested: one had an unlike triplet injection
element pattern, the other had a pattern.composed of both self-impinging
doublet and unlike doublet elements. The injection end of the combustion
chamber was fitted with a three-radial vane, uniformly spaced baffle
assembly that had provided dynamic combustion stability in an earlier
ablative chamber use of these injectors. During the current studies, a
metal-walled chamber waa used to better accoanodate a multiplicity of
rating technique positions and instability-monitaring pressure transducers.
The response of the combustor to each disturbance was measured by three
or more flush-mounted Photocon Model 1323 pressure transducers. The
transient pressure data were reduced and recorded in "ufficiently detailed
form that the rating techniques could be correlated successively to:
(l) the initial response of the combustion processes, (2) the initial mode
of combustion instability triggered, (3) transitions to other instability
modes, and (4) whether recovery to stable operation or a sustained insta-
bility was experienced.
- ■ «
-
^■fli ^^^^M - - - l
■
Quantitative correlation« were obtained which relate the initial reeponee
of the cofflbuator, aa indicated by the amplitude of the first obeenred
pressure wave, to the parametera and characteristics of the rating tech-
nique. The initially triggered ■ode(a) of conbuation inatability - Id
be related only qualitatively to the position and orientation of th« rat-
ing device; quantitative correlationa broke down at this step.
Responae of Combuator to Gas Flow Bating Technique
r From the hot-firing teats in which directed flows of gaseous nitrogen
and helium were admitted to the conbuation chamber, the following
conclusions have been drawn:
1.
2.
h.
Steady-state combustion of the storable N.O./NgH.-ÜDie (50-50)
propellent combination, under the conditions tested, is insen-
sitive to transverse gaseous displacement disturbancea; i.e.,
such disturbancea do not result in measurable pressure
disturbancea.
Inert gas f lowrates ranged up to about 23 percent of the main
propellent flowrates and were injected at velocitiea 19 to the
inert gaa stream sound velocities with no apparent change in
the lack of displacement sensitivity. Even quite high rates of
flowrate changes (which may be comparable with the transient
propellent spray gasification and conbuation triggered by a
pressure wave's passage) were not able to affect the spray
conbuation enough to generate e pressure wave.
Among testa with tangential, chordal and radial directions
of gas injection, no apparent differences in the lack of dis-
placement sensitivity were discerned.
The tangential and chordal gaa injection established vigorous
transverse eddy flow patterns near the injector on a scale
that is large compared to the spacing between injection elements.
Observation of eventa within the chamber by neana of high apeed
motion cameras looking up the exhaust nozzle was invaluable in
determining thia fact.
9
i ...
- --■
- . ;
-
\ .
1 ■
InitUi CoMbMtor fUtPop«« to Explo»ive
Bc«b Bating Ttehaique
Tht atteapt« to eorrolato oboonrod initial pressure wave amplitude data
to tht cold-flow charaetoristioa aad/or input paraneters of non-directional
ezploaire bonba reanltod in the following conclusions:
1. The initial coabustor response to pressure disturbances froa
boabs, aa indicated by the aaplitude of the initial pressure
wave, can be successfully correlated to the device's character-
istics and/or design paraaeters and its location in the coabustor.
Boab charge weight and case thickness are very influential paraa-
eters, while charge shape (LTD) is uniaportant. The case thick-
ness had a strong residual effect in correlations using boab
output characteristics that is unexplained. Of the boab position
variables, the distance froa the injector is clearly the most
influential.
2. The initial pressure wave data, as recorded, can be used as an
adequate aeasure of the coabustor*s stability response. The
resultant correlation aodels are very coaplez, however, and
cross-comparisons aaong injectors, chambers, rating devices or
other variables are aade very difficult and qualitative. Ad-
justaent of the data by aeans of an incidence coefficient, which
accounts for variations in pressure «rave incidence aaong the
transducers, any reaove auch of the coaplexity and iaprove the
ease and validity of coaparing correlations.
3. Measureable pressure waves resulted froa detonation of every
boab used in the hot-firing tests. High-explosive charge weights
froa 3*2 to 25 grains were used.
4. Increased aaplitudes of the initial pressure waves resulted
froa increased charge weights. This effect had an upper liait,
however, since 23 grain charges resulted in aaplitudes com-
parable to those from 13*3 grain charges. Beasons for the effect
and for its upper limit were not determined.
10
■
•
5.
6.
The prefigure wave amplitudes, a« adjusted by an approximate
incidence coefficient, remained essentially invariant with
transverse distance from bombs in the triplet injector tests
and increased slowly in the doublet injector tests. The re-
sponse which the propellant spray combustion field is capable
of exhibiting is apparently a direct function of the disturbance
amplitude, otherwise each wave would continue to groir in time
to the same equilibrium amplitude. Some fundamental investiga-
tion of this phenomenon appears to be needed.
The spray combustion field established by the doublet injector
was distributed over a longer portion of the combustion chamber
and contained more spray than that from the trip'^t injector.
This was deduced from observation with the doublet injector of:
(a) higher initial wave amplitudes, (b) smaller effect of bomb
distance downstream from the injector, (c) continued wave growth
in the transverse directions, and (d) lower combustion efficiency,
than with the triplet injector.
7. Similar observations for NgH.-UWfflC50-50) fuel aa compared with
neat UDMEI fuel suggest that the combustion process is more dis-
tributed with the formor, mixed fuel. Considering the higher
latent heat of wporization and surface tenaion of hydraiine,
this is a physically realistic result.
8. Bomb orientatioi effects were not included in the data correla-
tions, which were based wfaoJ: on cylindrical bombs whoso axes
were parallel to the chamhe. 'e cylindrical axis. Results from
a few bombs installed with their axes normal to the chamber*a
axis indicated appreciable effects which deserve continued
investigation.
9. Similarly, bombs installed in or near the converging section of
the exhaust nozzle gave inexplicably high initial wave amplitudes
and should be investigated further.
11
- -• ..
tab ' H
Initial C«rim«tor Be«pon«e to Exp)o»ive Pulse
Bating TeclmiQue
Tht «ttMpta to correlate observed initial pressure wave tuapliiude data
to the cold-flow characteristics and/or input parameters of the directed
pulst guns led to the folloving conclusions:
{
1. The Initial coubustor response to blast waves fro« pulse guns,
a« indicated by the aaplitude of the initial pressure wave, was
correlated aneeoasfally to the device's parsaeters and character-
istics and to the position and direction of application to the
coabustor. Charge weight, hurst diaphragu strength, barrel
diaseter and barrel length were all influential parasieters but
were overshadowed by application effects.
2. The correlation nodels were complicated by a nuaber of chaaber
distance tana which, unlike the boab models, were not particu-
larly sinplified by adjusting the initial wave aaplitude data
with incidence coefficients. This probably resulted froa a
directieaal, rather than siaply spherical, wave propagation.
3« The initial pressure wave propagated with an apparently pseudo-
spherical expansion froa the pulse entry point. Its front
appeared to be aore like a shock wave and propagated faster in
the direction of pulse gun orientation than in other directions.
4« The initial pressure wave aaplitudes, near the pulse gun entry'
point, generally increased with increasing charge weight, burst
diaphraga strength and barrel diaaeter 'and decreased with in-
creasing distance of the entry point froa the injector.
3. The aaplitudes at greater distances froa the entry point con-
tinued to depend upon the paraaeters when the pulses were
directed radially or chordally. Tangentially directed pulses,
however, tended to give higher and nearly equal initial wave
aaplitudes on the opposite side of the chaaber froa the entry
point.
12
1^ aa ^■ais
v
*...--.-»
6. With tangentially directed pulaea, the initial wave aaplitude
near the entry point aajr be priaarily controlled by burst
diaphrafw strength.
7« Ware« whose initial aaplitudes near the entry point wer« lets
than 40 psi were attenuated rather than anplified.
8. Higher initial ware aaplitudes resulted fro« using the doublet,
rather than the triplet, injector and fron using N H.-UDIB (90-50)
fuel, rather than neat UDB fuel. These observations are con-
sistent with the bonb ratings.
UltisMite Cosibustion Stability
The ultinate stability appeared to be only renotely related to the rating
techniques. Rather, it seened to be detenined by a conylex interaction
aaong the initial acoustic ■ode(s), a lev-frequency ehng, and the transi-
tion to oubneqaent instability nodes. Suatained instabilities were alaost
invariably a coexistent conbination of the third tangential and first radial
acoustic nodes. Driving of the third tangential, or first transverse baf-
fle cosqpartnent node, appeared to be the key to a suatained instability.
That node was rarely observed in the first 3 to 5 nilliseconds after the
initial preaaure wave. That tine period included an initial surge in aean
chanber preaaure and a decay to the lowest pressure portion of the frequency
chug. The appearance of the third tangential node depended upon appreciable
anplification of the first tangential acoustic siode during the period of
recovery fron the depth of the chug. These phenoswna were not snceessfnlly
correlated to the trigger devices.
The sustained instability was the second tangential node during several
tests with the doublet injector, notably those in which a boab waa inserted
radially through the chanber wall and approximately one-half of those in
which UDMH was the fuel. Thia difference waa not explained.
13
■»_ " ".' '
?3*«|iiMM ill <m *» « my m ••"'
'
OQNPSfBENSIVE COMPARISON AND RECOMIENDATIONS
A coaprebensive coapariaon is drawn aaong the ratine techniques by con-
sidering their relative aerits and liaitations for engine application and
other attributes such as effectiveness, repeatability, reliability, and
handling characteristics. A auaaarization of the relative aerits and
liaitations is presented on the frllowing page.
The fact that the correlations derived froa boab data were best described
by a linear aodel and the pulse gun data were best described by a loga-
rithaic aodel aakes it difficult to make a direct coapsrison of the effects
of the techniques. It was apparent that variations in charge weight had
a auch stronger influence on the resultant pressure disturbance with boabs
than with pulse guns. The other variables cannot be directly compared.
Aside froa the coaplexity of the aodels, an additional difficulty is that
the characteristics of the techniques, chough related, were not absolutely
coaparable. The initial cold-flow blast-wave pressures produced by a
given boab charge weight, for ezaaple, were lower than the maximum blast-
wave pressures sMasured in the pulse gun barrel by factors ranging froa
approxiaately 2 to 50, depending upon case thickness and diaphragm strength.
A acre directly coaparable characteristic of the pulse gun might be the
blast-wave pressure aaplitude iaaediately downstream of the termination
of the barrel in the coabustion chaaber wall.
This study has yielded considerable detailed information on the effective-
ness sad applicability of stability rating techniques to liquid rockets.
The ultiaate stability of the coabustor could not be correlated to either
boab or pulse gun parameters or characteristics; recovery to stable oper-
ation occurred randoaly. The aaplitude of the initial overpressure was
correlated quantitatively to both the parameters and characteristics of
the rating devices. Generalized correlations between techniques were not
established, however. The initisl aodes of instability were qualitatively
related to the techniques and their position of application.
V.
»■■* -■•
i
. x.:^
fa
J
I
3
-a UK
a s { i 8 i
S s a^- 0 i 8 5
I 15 I 511 £ I 3
3 5 -. V ■ *> • • •
^ J S. 5 S I 5 • ? A 1 1 •*4 %4 ^ ««^
J
I 8
i I
mj s i a •* - , ^
i a * £' : - - g I j
iiihiillll
T t
li s
Ill Ml [2
1 f 1
I j 5!!il 93 »r 8
a, -3 J ■ 5 ■ *4fa • M o -^
s It *» l8 i! 't "s
I 8 •a
h 1 n it Ss si 11 :: 88 88 8 8. • - ■ • a 2 8il!8 8 4 K -^ »< ■»• 4> -M
M --sI»
I a e I 2 « 8J 5
5 If fill * t* i tt 5 s8'- 8 ''S « "fl"
t
2 i Mfliil iUlm Itim
i s
III ,- lljjif a * I 5:i 11 h
1 8 •«4
7 ••4 4»
:
»aagB
15
.. _
li s 1 . i
r ■ ,*T^J^^^ y 1
'V mm* IT
Th« carrent effort with the explosive boab and pulse gun rating devices
ha« ahown that although both are capable of producing a disturbance which
in turn nay cauae a sustained coabustion instability, each of the methods
has certain operational disadvantages. An additional effort is required
to investigate iaproveawnts on theae two basic aethods of combustion insta-
bility rating devices aa «ell as new rating devices.
It ia expected that a relatively siaple Modification of the design of
theae devices would partially overcosw aoae of their sbortconiogs. For
instance, either the nae of a high-burning-rate powder or modification
of the barrel length of the pulse gun should introduce a more definite
and ateep-fronted wave into the chamber. Modification of the bomb case
material would produce less shrapnel than the nylon or Nicarta cases
which are currently need.
Although the existing rating devicea can be improved to the point of
increased versatility, it ia doubtful that a particular technique can be
made into n universally applicable device.
16
■ . V
" mt,
— ■ —.—
INTHOWJCTION
BACKGROUND
Experience has shovn that liquid proptlJant rocket engines occasionally
operate unstably, with moderate to high amplitude oscillations in pro-
pel lant burning rates and, therefore, in combustion chamber pressure.
While several types of coodmstion instability have been identified «ad
studied extensively, the most difficult to control and eliminate have
been those destructive oscillation» corresponding to the crnaa-sectional
acoustic resonances of the rocket combustion chamber. Because Ihe fre-
quencies, pressure distributions, and phases exhibited by these insta-
bilities are similar to those obtained from linear solution of the wave
equations, they are cotmaonly referred to as "acoustic instabilities,"
even though they are usually nonlinear and sometimes resemble detonation
waves.
The sources of energy for driving acoustic instabilities are predominantly
the propellant atomization, mixing, gasification, and combustion processes*,
i.e., those processes that are confined within the combustion chamber.
Pressure wave motion within the chamber interacts with the propel lant
spray combustion process and effects transient changes in the local pro—
pellant burning rates. For the wave motion to be sustained (i.e., the
pressure wave amplitude increased or maintained), a proper phase relation-
ship must exist between the oscillating pressure and the oscillating burn-
ing rate. In most cases of acoustic instability, the coupling appears
to be quite direct because each wave affects the propellant combustion
strongly enough that sustaining combustion energy is added directly to
that wave. A single, finite-amplitude pressure disturbance thus can be
amplified and result in oscillatory coodiustion. Additionally, however,
*It is possible, even probable, that propellant injection rate oscillations occur during an acoustic instability and thus influence the instability driving processes. This may be an important factor in the establishment of a sustained instability. Once an instability is established, however, injection rate oscillation is usually considered to be a second-order effect, resulting in a somewhat higher or lower pressure oscillation amplitude than if the injection rates were invariant.
17
- • ■
j
- ... —
sustaining an acoustic instability requires that the altered spray com-
bustion field must be capable of responding positively to successive
wave passages, adding at least as much or more energy to each wave as
the damping processes remove.
The initiation of acoustic instabilities it, frequently a nonlinear
phenomenon, (i.e., a weak disturbance or oscillation in the combustion
chamber may not be capable of affecting the combustion processes enough
for the disturbance to be amplified), while a somewhat larger disturbance
m.iy Ix- amplificii very rapidly. It liu.s long Ijoon brlieved that a relation-
ship »'xi;<t.'- bctwoon a rocl.ct's inherent «tahility of eombuution and its
.ibililv to absorb laijie d i ;M uibaincs yet maiiituin it.-: steady—atote opera-
tion. Thin bei id' form.'* the basis for rombusti on stability rating.
Rating Combustion Stability
The objective of stability rating testing is the determination, in as
few tests as possible, of the relative resistance of candidate engine
systems or components to the initiation and sustaining of destructive
or otherwise objcctional oscillatory combustion. Rating techniques may
be divided into two broad categories: (l) those that rely upon the
spontaneous occurrence of unstable combustion, and (2) those that intro-
duce finite disturbances into the combustion chamber in attempts to
initiate instabilities artificially. Techniques in each category have
definite advantages as well as some specific shortcomings.
Disturbances that arc large enough to trigger an instability may occur
naturally during normal rocket engine operation. If they occur frequently,
«•very test may be unstable; if infrequently, only an occasional test may
be unstable. One method for rating a system's inherent stability, then,
has been the observation of the percentage of tests that are spontaneously
unstable during normal operation. This approach is obviously prohibitively
expensive for evaluating the effects on system stability of seemingly
minor component variations or improvements. An alternate spontaneous
rating method that has occasionally been used involves a systematic
18
>
variation of operating conditions until a region of spontaneous insta-
bility is found and its boundary at least partially mapped out. The
rating then consists of determining how the instability boundary shifts
when an engine component change is made. Distance of the normal or de-
sign operating conditions from the boundary of an unstable region is pre-
sumed to be synonymous with resistance to spontaneously occurring
instabilities.
Parameters that have been varied in this kind of stability rating are the
injection mixture ratio, the chamber pressure (by variation of either
propel 1 ant flowrates or chamber contraction ratio), and propellant tem-
perature. The majority of such rating has been carried out in research-
scale rocket motors designed for relatively inexpensive and frequent
testing. This method has been used only infrequently for large engine
ratings; by far the greatest use in this regard has been in the rating
of L0-/Ho engines by varying the hydrogen injection temperature.
The following advantages may be ascribed to rating techniques that rely
on spontaneous occurrence of instability:
1. The ratings are associated with naturally-occurring disturbances.
2. Application of the technique does not disrupt the normal com-
bustion chamber flow patterns by foreign bodies or substances.
3. The ratings may be quite reproducible.
Conversely, some disadvantages may be:
1. A relatively large number of tests aay be required for obtaining
a single rating.
2. The instability rated may not be the one racst likely to be
initiated by an occasional large disturbance at the normal
operating conditions.
19
* . JoSH - V
3* No Indication is obtained of the initial disturbance magnitudes
experienced in obtaining ratings. (The amplitude of the result-
ant pressure wave, however, may be related to that magnitude.)
k. If operating conditions are varied, the rating may be obtained
at conditions far removed from normal or realistically useful
operating conditions.
9« If, operating conditions are varied, determined boundaries may
be associated with driving mechanisms which ore different than
those experienced under normal operating cunditions (e.g., a
region may be encountered where instability is driven by feed-
system-coupled injection rate oscillations).
The second category—the introduction of a finite amplitude disturbance
for artificial instability initiation—provides a means of rating at
the normal operating point. Advantages are:
1. The disturbance can nominally be controlled as to time of
initiation so that limited hardware exposure to a destructive
condition may be scheduled.
2. Disturbances can be sequenced in graduated sizes to provide
quantitative relative magnitudes.
3. More than one disturbance can sometimes be introduced in a
single test.
4. The mode of instability initiated may be controlled by proper
selection and positioning of the disturbance source.
Disadvantages are imposed by the disruption of normal propellant flow
if a device is inserted in the chamber, by irreproducible device be-
havior or combustion response from test to test, and by uncertainties
as to whether the artificial disturbance bears any relationship to
naturally occurring triggers that might occasionally be encountered.
These disadvantages are so outweighed by the advantages and by the need
for valid stability ratings that the rating techniques based on artificial
initiation of instability have been employed in a large number of engine
development and research programs during the past 10 to 12 years.
20
.
'.; ■<.
■' & i
t \-
mmtt m i ■ ■ ■

r Three basic techniques have been used for the majority of the ratings
obtained or sought using artificial instability initiation:
1. Nondirected explosive bombs placed at various locations within
the combustion chamber
2. Explosive blast waves from pulse guns directed into the com-
bustion chamber through the chamber sidewall
3« Directed flows of inert or reactive gases similarly introduced
near the injector
Various investigators have preferred one or another technique, and
different rocket systems (with variations of size, combustor configura-
tion, injector concept, operating conditions, propellant combination,
etc.) have exhibited varying degrees of sensitivity to a particular
technique. Since ratings have been sought with all three methods only
in a few isolated and incomplete studies, meaningful comparisons among
the stability traits of systems or the applicability of techniques have
not been possible.
The investigation that is the subject of this report was conducted in
an attempt to establish generalized correlations among rating techniques
and their effects in initiating unstable combustion.
'I
Recorded Pressure Terminology
The cold-flow characterization of the explosive bombs were obtained in
ambient surroundings. Such terms as blast wave peak overpressure, peak
ove pressure, blast wave pressure, shock wave overpressure, etc. refer
to the amplitude of steep-fronted shock waves measured at a finite dis-
tance from the center of the explosion. The magnitude was obtained from
either direct pressure transdu T recordings or calculated from Ilankine-
Ilugoniot shock relationships. The initial shock wave overpressure, how-
ever, refers to the amplitude measured at the bomb-case surface.
21
—
..
\
[
M
JCL.
The cold-flow characteristics of the pulse guns wore obtained by firing
them into a pressurized vessel. Pressure transducers were located within
the gun barrel at two different positions. All records, with one exception,
were obtained photogruphicaily from an oscilloscope trace. A point of
similarity among the various pressure traces was the apparent occurrence
of two shock waves. The initial steep-fronted pressure rise was undoubtedly
a shock wave resulting from the burst-diaphragm rupture. The magnitude
of this recorded pressure is referred to us the initial overpressure or
initial shock wave pressure. The secondary shock wave usually propagated
faster than the initial wave and thus tended to overtake it. It is identi-
fied as the second pressure rise or front, maximum blast overpressure,
maximum blast wave pressure, or simply as the ;ieak pressure.
Pressure transducer outputs during the hot-firing program wore recorded
on a seven-channel tape recorder. The response of the combustor to the
device disturbonce was indicated by the amplitude of the first observed
pressure wave. This wave is interchangeably referred to as the initial
peak pressure, initial overpressure, initial peak overpressure, peak
pressure and initial pressure wave.
22
I ma .-■
.,*.
COLD-FLOW CHARACTERIZATION
EXPLOSIVE BOMBS
In rating rocket combustion stability with explosive bombs, small ex-
plosive charges are detonated at strategic locations within an operating
rocket combustion chamber, and the response of the propellant combustion
processes to the bomb disturbances are observed. Bomb charges must be
insulated from the combustion gases to avoid premature thermal detonation.
Protective cases made of Micarta, Teflon, nylon, and composite ablative
materials have been used in previous investigations. If thermal detona-
tion is to be avoided for more than 2 to 3 seconds of mainstage operation,
it may be necessary to use such protective assemblies as a spun fiberglass
heat shield slipped over a machined nylon bomb case.
Bomb disturbances are usually intended to be nondirectional, i.e., to
produce a blast wave which propagates spherically from the bomb location.
An ideal bomb coniiguration, then, might be a spherical explosive charge,
containing an electrically initiated detonator, tightly confined in a
spherical insulating shell. Production of the ideally spherical blast
has not been emphasized however, because of great practical advantages
in making cylindrical, rather than spherical, charges, viz., lower case
machining costs, ability to firmly pack different charge weights into
one siae of case, easier explosive loading, conformity to the cylindrical
shape of most electrical initiators, and easier design for supporting
the bomb»
Most previous rating studies employed a simple cylindrical bomb design;
this design was used exclusively in this program, as well. Each bomb
case was machined from a solid piece of a single material. The explosive
charges were packed into the closed end of the protective cases and made
to conform, as nearly as practicable, to a cylindrical shape. The Lomb
assemblies were attached or supported from the opposite, or open end.
23
- ■ V
gCTwltnt»! Prograa
Cold-characteriEation experinents provided data for relating boob output
characttriatico to boab doacriptiro puraneters. The experiments con-
■ietsd of exploding a large number of bombs in the open air and measuring
specific characteristics of the resultant air blast waves, e.g., velocity,
peak pressure amplitude, the duration of the positive pressure portion
of the wave, and positive unit impulse. The characteristics were measured
by simultaneous use of pressure transducer and high-speed photographic
instrumentation. To get satisfactory records, particularly from the
pressure transducers, some development of the experimental arrangement
was necessary* In this section, the experimental approach taken, the
instrumentation uaed, and the various modifications made are discussed.
Experimental Approach. A schematic diagram of the experimental apparatus
is shown in Fig. 1; a bomb is shown mounted near the edge of a large
metal plate in which two pressure transducers are mounted. In an edge
view (Fig. la), it can be seen that the center of the explosive charge
is in the same plane aa the top surface of the plate. The transducers
are thus oriented to measure the pressure-time history of the bomb blast
wave in "side-on" or grazing incidence as it propagates across the plate.
This orientation was chosen to minimize the possibilities for spurious
pressure signals and transducer damage resulting from bomb fragments
impacting the transducers. The use of two transducers gives data regard-
ing the average wave velocity, and changes in wave shape and amplitude
between the two positions.
Photographic equipment is shown in Fig. lb as being aligned with a trans-
ducer station to obtain simultaneous jtreak and framing photographic
records of the blast wave traversing that position. From the wave velocity
determined from the streak film, together with knowledge of the ambient
air properties, the peak pressure associated with the wave can be calcu-
lated from Rankine-Rugoniot shock relationships. In some experiments,
streak photography was used to obtain peak pressure measurements at the
24
<<•
W)
( ■i
t
! s
I s s
5 s 1 3
e
I e I
i 25
i M^^A^
V I
transducer locations for coapariaon with the direct transducer pressure
data. In ether tests, the photographic equipment vas aligned with the
boab to provide data on the peak pressure at the bomb surface. The se-
quence of fraaing photograpns provided a visual record of the shock wave
and particle action as an aid to interpreting the pressure data.
Photographic Instmaentation. Siaultaneous streak and fraaing photographs
of the blast waves were obtained with a Beckaan and Whit ley Model 200
caaera. That air-turbine-driven, rotating-^urror caaera had previously
been used in a study of detonator fragaentation and so was essentially
already set up and checked out. The camera control circuitry includes
an event-initiating (fire-control) circuit which signaled boab detonation
when the caaera achieved a preselected speed. For al 1 but a few of the
initial checkout experiments, the caaera was set to record at a turbine
(mirror) speed of 333 revolutions per second. At that speed, the streak
fila writing rate was 0.9206 ma/microsec and the framing pictures were
taken at 73,260 pictures per second. With the framing stop used, ex-
posure tiaes were 3*23 microseconds per picture. A total of seven
pictures were obtained in each sequence.
The photographs, both fraaing and streak, were shadowgraphs, having been
obtained with a focused backlight beaa. The light source was a 0.75-
inch-long, 5-ail exploding tungsten wire;the duration of usable light
was approxiaately 100 microseconds. An 11-1/2 by 11-1/2-inch plastic
Fresnel lens with a 19-inch focal length was used to converge the light
into the caaera lens. The boab was fired between the Fresnel lens and
the caaera. The effective field of view was approxiaately 8 inches
high by 10 inches wide.
Pressure Instmaentation. A review of connercially available transducers
led to selection of the Kistler Model 603A piezoelectric transducer as
the one most likely to be suitable for obtaining satisfactory pressure-
time records from boab explosions. Since costly transducer daaage could
26
*lr.<' ■■■ _____

—
result from direct iapingement of bomb fragnents on the transducer sensing
diapiiragm, mounting the transducer for side-on, rather than face-on, wave
incidence was selected. Side-on incidence was also expected to permit
direct comparison between the transducer-derived and wave-velocity-
derived peak pressure data without need for considering wave-reflection
coefficients.
Preliminary Evaluation. Before ordering transducers for this ex-
perioental work, a series of development tests was conducted to deter-
mine whether adequate transducer mounting and placement could be achieved,
and whether fragment damage might be a major or a minor problem. An early
version of the Kistler Model 603A transducer (on loan from another program)
was flush-mounted, off-center in a 24-inch by 24-inch by 1-inch-thick
aluminum plate. This transducer mounting plate was placed on a 6-inch-
deep bed of sand for dampening plate vibrations. Initially, no attempt
was made to shock mount the transducer; the available unit was neither
acceleration compensated nor supplied in a shock-resistant adapter.
Available surplus 13.5-grain, plastic-cased detonators were used (without
protective bomb cases) to provide blast waves. Tests were made initially
with the center of each detonator located 18 inches horizontally from
and k inches above the transducer. When no evidence of transducer damage
was observed, those distances were reduced in successive tests. Some
sketches of bomb and transducer locations, and examples of the recorded
signals are sunmarized in Fig. 2.
Two undesirable characteristics were recorded in the transducer output
signal: (l) A low-frequency (< 5000 cps) oscillation or wandering
about the ambient pressure line occurred before the arrival of the air-
blast wave (Fig. 2b and 2c), and (2) a high-frequency (~ I'iO.OOO cps)
oscillation followed the passage of the shock wave. By striking the
plate at the bomb position with a haosner, the low-frequency oscillation
27
tl
MB ■
•
, ill
• .
waa deterain«d to be resonant ringing of the transducer mounting plate
(Fig. 2d). Three changes were made which helped to miniaiae this spurious
aignal:
1. The transducer was floated in a mass of RTV rubber.
2. The detonator waa moved off the edge of the transducer mounting
plate and lowered so that the center of the explosion was in the
plane of the plate aurface.
3« The edge of the plate neareat the bomb was shielded from direct
bomb fragment cod blast wave impact by a separate, isolated
reflection member (Fig. 2h). The bed of sand was replaced with
a wooden mounting block when this isolation shield was added.
The high-frequency oscillation waa identified as a resonant frequency of
the particular pressure transducer. This oscillation was reduced to a
satisfactorily low amplitude by electronic compensation using a Rocketdyne
Dynamic Analog Differential Equation Equalizer (DADEE). The resonant
frequency of this transducer is just at the upper limit of the DADEE which
was available, so precise Batching was not accomplished. The amplitude
of the reaonance in the recorded signal was reduced acceptably in most
caaea; however, the DADEE electronics introduced a noise at about 1 mega-
cycle which was removed by using a 200-kilocycle cutoff filter. Some
typical results using this unit and conditions comparable with Fig. 2i
are shown in Fig. 3. The pressure calibration for Fig. 3 is uncertain
because of undetermined gain introduced by the DADEE. That preliminary
evaluation demonstrated that satisfactory pressure-time data could be
obtained with transducers as close as 11 inches to the plastic-cased
detonators. This evaluation waa terminated after firing a 50-grain bomb
in a 3/l6-inch-thick nylon case, and observing no transducer damage or
adverse degradation of the pressure measurement.
'f- Continued Transducer Evaluation. Discussion with Kistler represen-
tatives disclosed that the newer Model 603A transducers are acceleration
t 28
INITIAL LOCATION
KISTLER COM
+ 18 INCHES-
•4- LATEN
RJtITION
+" II INCHES H
(A) Plan Vl«w of PUt«
20/4-8EC/CN
(e) DetonaUr 4 tm*m AWTA PeAitloa «1th l/2-In
ZO^-SEC/CN I MILLISEC/CN
r (b) Detonator 4 Ineho« ikort Pint« in
Initial Boab Pouition (d) Plata Stmok at Initial
With a ■iiiwir
A
- •,- •
. —
20fi - SEC/CM 20** - SEC/CM
Ator k Incheti Abort Plat« Position With l/2-Iiioh F Dotonator
in Initial Bnbbor
(«) Dotonator Ltrol With Plato in Later Bomb Position
I MILLISEC/CM
NOTE: All oscilloacope photographs in Fijr. 2 and 3 have equal vertical ieneitivitie« equivalent to approximately 5 p»i/cm.
t« Struck et Initial Bomb Position a a
Figure 2. Suanary of Kistler Model 603A (Early Version) Transducer Evaluation Experiments
29
e M
l/SHfcCH 6AP FILLED WITH OC-4 GREASE
KNIFE EDGE k
TRANSDUCER IN
BOMB
-EDGE OF SAND BOX
(f) 8«etlonal Vi«w of Transdnotr Hoonting Plat« With Knlfo-Edgt Isolator
20M - SEC/CM
(b) Sectional Viov of Mo Translncer Mounting
90/^-SEC/CM
ig) Detonator 18 "nolwa Fron Transducer, In Plane of Plate With Knife-Edge Isolator
(i) Detonator 11 Inches Plane of Plate of Fig.
A
.
■TRANSDUCER IN ANGLE EME k
FOAM RUBBER
(fa) Sectional Vi«v of Modified Configuration for Trausdncor Mounting Plato
SQ^-SCC/CM
(i) Detonator 11 Inchea Fro« Tranaducor In Piano of Plato of Fig. 2h
30
^
Figaro 2. (Concluded)
^
i
•
OAOEE
TRANSDUCER
CHARGE AMPLIFIER BAND-PASS FILTER 10 CYCLES
TO MO KILOCYCLES
OSCILLOSCOPE
(a) Blook Dlagnv* of SnudaMr Kl*otxt»nl« drenit (c) SMU Cat
SOM - SEC/CM
(b) Detonator and Traoaducor C jnf iguration Saao aa Fig. 2i bat With DADEE, Unfiltarod
(«)
f\
Jm
Mp-MC/CM
lit (c) SUM MI Fig. 5b bat vith 200,000 op« Cutoff Pilt«r
W/*-SEC/CM
NOTE: All oieilloscop« photo- graph! in Fig. 2 and 3 have equal vertical •entitivitiee äquiva- lent to approximately 5 p«i/cm.
(d) Replicate of Fig. 3c Condition«
31
on
Figaro 3. Suanary of Reoulta for Kiotler Model 603A Tranaducer Vith DADEE
6 „•'
•'
coapenuted and are obtainable in a special shock ■ount; one «as purchased
for ■easoring the blast ware pressure. Its response and resonance charac-
teristics were evaluated in a nanner siailar to that just described for
the transducer which was not acceleration coapensated. The transducer
was flash Mounted in the transducer Bounting plate, and subjected to the
blasts from n.5-grain and 5.5-frain plaatic-caaed detonators. As before,
the detonators were placed 11 inches froa the transducer, and were oriented
so that the center of the explosion occurred in the plsne of the upper
surface of the aounting plate. The electrical output of the charge aapli-
fier of the transducer was fed directly, without coapcnsation or filtering,
to a Hewlett-Packard Model 175A single-beaa oscilloscope equipped with a
Polaroid caaera.
In addition to ita acceleration coapcnsation, the new transducer was
obtained with a Delrin (plastic) shock-aount adapter. It was found that
appreciable disturbances were transmitted through the aounting plate and
through the adapter before the air shock arrived. These disturbances
were eliainated by reaoving the adapter and potting the transducer into
the aounting piste with RTV rubber. A typical pressure-time record ob-
tained with a bare detonator is shown in Fig. k.
Multiple ftreaaure Transducers. To obtain backup data on blast-wave
velocity, both Kistler Model 603A transducers were installed in the mount-
ing plate. They were placed in line with the bomb and spaced 3 inches
spsrt. Their nominal distances from the bomb were 7 inches for the un-
compenssted transducer and 10 inches for the new transducer. The external
IUDEE and filtering previously used with the uncompensated transducer were
not used; that transducer was merely used to indicate the time of arrival
of the blast wave at its position.
The outputs from both transducers were recorded on a Tektronix Model 555
dual-beam oscilloscope to obtain an accurate value of the blast-wave
transit time between their locations. The output of the new compensated
transducer was recorded also with the Hewlett-Packard oscilloscope noted
32
.'...,-
«
, .„,._ ^ VW ..- . ^
^0 ■icrosee/ea
a u
10
Direct Oscilloscope Photo of the Output of an Acceleration-Coapensated Kistlcr 60^ Transducer
Figure fe. Pressure Record Pros Exploaion of a Bare Olin Plasticap (5.3 Grains IIDX)
33
^ ■$ I. 1
earlier. Both oscilloscopes were voltage calibrated daily, and the sweep
rates were checked weekly to ensure accurate determination of time.
Simultaneously with this transducer change, the bomb fragment deflector
plate was mounted differently from that shown in Fig. 2h to obtain better
isolation of the transducers from transmission of extraneous signals
through the mounting plate. The configuration finally used is shown in
Fig« 9* This change allowed the transducers to be positioned 1 inch closer
to the bomb than the earlier position.
'
Overall Checkout of Experimental Methods. Before undertaking the bomb
test series, the complete system was checked out by firing explosive
charges having known blast-wave characteristics. Bare spherical charges
of 50/50 Pentolite (50-percent PETN, 50-percent TNT) were selected for
this purpose because free-air blast data for this explosive have been
compiled (Ref. I).
Two cast charges weighing 108 grains each were made available from another
program. Plastic-cased, l.^-grain detonators were used to initiate the
charges, which were cast with a detonator well that extended to the center
of the charge. Thus, an explosion having a blast wave as spherical as
practically possible, ana having essentially no fragments to affect the
measurements, was available to check out the system.
The charges were fired from the same location as the bombs would be in
subsequent tests. The centerline of the charge was in the plane of the
tranaducer mounting plate in both tests, but the detonator orientation
was varied. In the first test, the detonator axis was normal to the plane
of the mounting plate (detonator above the plate), while in the second
test the detonator was in the plane of the mounting plate and extended
from the charge diametrically opposite from the transducers.
When the first charge was fired, the delay time from fire signal to
oscilloscope sweep signal was set at 150 microseconds. As a result, the
.».
(U
ifi .- * -4>- ■
^^^— —
a a.
i u u 9
e £ U o
c 5
3
c o
a c
a c c
u CO
35
in
paaMf« of lb« blast wire orer the first transduc r was not recorded, nor
was the ware frost ohsorred on the atronk fil«. That delay vis shortened
to 100 aicroaeconds for the second tost, and adequate data were obtained.
Second-test data are shown in Fig. 6 and 7. Figure 6 is a framing camera
soquoaco showing the nearly spherical blast wave propagating over the
transducer aounting plat« and Fig. 7 shows the pressure tine records dis-
playod on the two oscilloscopes. The pressure scale noted there is ba»ed
upon the factory-supplied calibration for the acceleration-compensated
tranaincor.
The appearance of the pressure records is excellent. The total time
elapsed fro« the beginning of the pressure rise to the peak pressure is
OB the order of 3 to 4 microseconds, a value that is hardly noticeable
AB photographs taken at the 90 nicrosec/cn sweep rate used in Fig, 7«
There ia a rmry minimal indication of transducer ringing (st a resonant
frequency of 330,000 cpo). The indicated pressure decay folloving the
front of the blast WSTO appears to be s faithful reproduction.
Data reduced from the two 108-grain Pentolite tests are tabulated in
Table 1, and, as indicated, loss of transit time and streak data greatly
limits the usefulness of the first tost. The tabulation for the second
tost ia divided into pressure-transducer-derived and stresk-photograph-
derived infonsation. from the blast-wave transit tine between the two
transducers, a wave velocity was calculated:
I
10-7 ± <'.)7-io - Tt^y ■ 5T^
The shock Nach number:
Vio T—
(i)
(2)
I
i
.
Figure 6. Sequenc« of Fraalng Ihotogrnha Fro« Explosion of a Baro 50/50 Pentolite Charg«
37
zJatk
"50 microsoc/cm
a. Photo for Obtaining Wave Transit Time
50 microBCc/cm
s •H
s.
10
b. Output of Acceleration Compensated Kistler 603A Transducer
Figure 7. Pressure Records From Explosion of a Bare Spherical Charge of 50/50 Pentolite (108 Grains)^
38
mm •riMH^MaMMa
^
■
■
—n.» 'hf'^ii— — ■'•■.
■
TABI£ 1
AIR BLAST DATA FROM TXPLOSION OF BARF
SPHERICAL PENTOLITE CHARGES
Variable Units Test
Number 1 Test
Number 2 Average
10
At
M, 7-10
AP 7-10 (calc)
AP 10
IlftA if R' 10
M8.5
AP8 5 (calc)
M10
AP10 (calc)
Transducer Data Microseconds
Microseconds 157
Microseconds
None
psi«
psig '12
psi-microsec 3365
Microseconds 160
Streak Camera Data
None
psig
None
psig
72
133
61
3.62
210
100
33^3
141
3.40
172
3.09
139
147
96
3354
151
39
■
V. S
rtnm. mmmmm-
was then ■ubttitut^d in the Rankine-Hugoniot relation for air shock vraves:
7P
AVio-nrLvW2-1] (3)
to obtain a calculated value of the ahock-wave overpressure. This value
la followed in the table by the measured peak pressure at 10 inches from
the charge. Next are listed the impulse per unit area und the duration
of the positive pressure portion of the record measured at the 10-inch
station. The unit impulse was obtained by planimeter measurement of the
area under the pressure record for time t.. < t < (t.- + T ). That is:
I10 r. 10 +
'iim" J pdt (M
10
From the streak record, wave velocities were reduced at 8.5 and 10 inches
from the bomb, and were used to calculate peak shock-wave overpressure
by relutions equivalent to Eq. 2 and 3. The calculated value of 172 psig
at S.*) inches is approximately 18 percent below the value of A P calculated
from blnst-wave transit time. However, the 8.5-inch distance measured in
the slit plane of the camera is approximately 0.5 inch farther (radially)
from the bomb than the midpoint distance between the two transducers.
Therefore, the "streak" pressure should be somewhat below the "transducer-
derived" pressure, and the agreement is believed to be quite good.
The meurtured peak pressures, AP10. 'or the two tests were only 8 percent
different from each other, and their values were approximately 31 percent
below the streak-velocity-derived calculated overpressure at 10 inched
(Ap. (Calc) = 139 paig). This discrepancy is believed to be caused pri-
marily by the inability of the transducer to respond faithfully and repro-
duce the firft few microseconds of wave passage. In the following dis-
cussion, this discrepancy is further examined by comparing these limited
data with those available in the literature.
I
, 'V -
40
,
mmmmt
•
—.
Transducer inability to measure the leading edges of a steep-fronted shock
wave and to measure peak pressure if the shock is iamediately followed by
a rarefaction wave was recognized at the outset of this program. It was
intended to calculate peak shock overpressure from velocity measurements,
and to use the pressure data of the transducer to obtain positiv« pressure
duration and unit impulse. Aside from general interest in bow close the
transducer actually comes to indicating true peak pressure, primary interest
is in how deficiencies here affect the accuracy of unit impulse measurement.
Goodman (Ref. 1) compiled data on blast-wave properties resulting from
detonation of !X)/30 Pentolite charges of 0.25-pound and larger. He
reported that pectk-pressure data could be correlated as a function of
radial distance, R, from an explosive charge of weight, W:
APB f (B, W1/3) (5)
His correlating line is reproduced in Fig. 8. In the region of interest
to this study, the data were obtained with pressure transducers, and
exhibited scatter of about ±25 percent.
.
*»
Reutenik and Lewis (Ref. 2) detonated large charges (21? and 12,000 pounds)
of both 50/50 Pentolite and TNT. Their strain-gage pressure transducer
data lie substantially higher than Goodman's curve, however, their data
had been treated analytically to obtain an improved estimate of peak
over-pressure by extrapolating backward in time along the pressure-decay
curve. Their correlating curve is also shown in Fig. 8; values of over-
pressure greater than kO psig were extrapolated by them, baaed on Goodman's
data.
Data points from the current two 50/50 Pentolite tests are also shown
in Fig. 8. It is seen that the direct-pressure transducer data agree
with Goodman's correlation, while those derived from velocity data agree
with the Reutenik and Lewis correlation. The implication of this is that
the current measurements are as good as direct-pressure transducer measure-
ments normally are found to be. The data correction technique used by
41
^^M>_
T-r.- "*■— II
gg s e •H m o
&
o c
i 3
on
I
c o
•H
h O u
c/lfln/ij 'z 'aoNVisio oaDnaad
42
^
,
^ ^_
*
-

""»I ■ MM ■*. » ■■ Hi ,^mjv <WMMMM*raa"*
Reutenik and Lewis could not be applied with precision to the current data
because Rocketdyne had both considerably higher amplitudes and shorter
positive durations.
Another factor demonstratii. that the current transducer pressure data
are comparable with those of other investigators, is the unit impulse.
The measured values in Table 1 are not only less than I percent different
from each other, but their average is only 1.3 percent higher than a value
of 3310 psi-microsec obtained from a unit impulse correlation given by
Goodman (Ref. 1).
The error in measuring unit impulse is therefore believed to be Just that
resulting from the failure of the transducer to reproduce the very steep
and very narrow leading edge of the pressure front. Consider the following
values:
Pressure, psig
Time, microseconds
The area between the dotted "true" pressure curve and the solid transducer-
indicated pressure curve is approximately 320 pairmicrosec; i.e., approxi-
mately 9.5 percent of the tabulated unit impulse, and approximately 8.7
percent of the sum of the tabulated and error values. If the total indi-
cated rise time were only 3 microseconds, these errors would be reduced
to 7*1 and 6.3 percent, respectively.
43
« MB
/
MMM
Bo«b Dtatgn Füra—IT VarUtiont
The bomb design parameters which were varied were:
1. Explosive charge weight, V
2. Case thickness, T ' c
3* Charge length-to-diameter ratio, L/D
k. Case material
5» Type of explosive
Charge weights of 5.5i 13.% and 30 grains were selected for the cold-flow
characterization studies. Approximately equal intervals of In [W ' ^] were
believed to be desirable because in previous studies blast wave peak pres-
sure and impulse had been correlated on that basis.
r.smb case thicknesses of 0.063, 0.123, 0.250, and 0.500 inch were used.
It was thought that this range would certainly include the thinnest cases
likely to be used in a hot-firing program, and that the range was broad
enough to delineate clearly the effect of thickness on bomb characteristics.
Explosive charge L/D ratios of 1.0 and 4.0 were selected as nominal design
values. Whenever a coBuercial detonator constituted the entire charge,
however, the L/D ratio had some intermediate value.
The bomb caaes were made of nylon or Micarta. These materials have been
observed to break up differently in this application; nylon tends to
fragment into moderately large chunks, while Micarta tends to fragment
into lighter weight shreds characteristic of the cloth matrix.
High explosive charges were used for the majority of the bombs fired.
The design detaila are listed in Table 2, which shows that three differ-
ent kinds of high explosive were used: PETN, HDX, and Composition C-4
plastic explosive. HDX and PETN have been found to produce nearly identi-
cal air-shock characteristics (Ref. 3). Vith similar confinement. Compo-
sition C-4 is equally as brissant and energetic as PETN; hence, it was
44
Ji
■
«MMS^il
^
•
CJ
£
I G
5
f * I«
ssj! tulc
1,1 ! .
Ml
* I - I
,1. _j_
Mi
^-p 5 !
Ml
M r ii
II l(l«t|A|^«MM||||
i i T T . , II^IK 2 s ►. JIIK ill J
K •*■% VN K ir\ r r f ! f ä ! r f j? r ! r « - . , . ,
111 r 1 rn 1 n n In n n S 8 3 ■7*S!S9fia
JZsssJsMSJirigJgJiJalJJ
o o P< e e e c e e e e • »4 e c e »4 «< P4 P4
SS 1*1 ISII ESSSIIASHS eeoeecoeeeeee c o c e
**S*&3*SK]«S*&!*S*3* 9 o o e x
o o o d o o o o o o o e o o o o o o o e
«« l«««S2S«Kggggg||8?
r» K\ f»
R R »^ © ir\ KN o »^ C «rs »^ o i^ © »A o
*4m*m4m4mlm*w**k*49k
I t I ? I k
1 r a
I
r i
iiii
Ml'
If Ii 2 3 I 9t 2 I S
mil •• M i^ «'
I
45
■to«.
II 1
..I
not anticipated that tbt use of different bi|fh explosive« would influence
tbe characteristic!. Composition C-4 vat selected mainly because of its
plastic properties, i.e., it is easier to handle than granular explosives,
and hazardous spills and loss of a portion of a weighed charge during bomb
loading are lass likely to occur. The bombs were assembled as sketched
in Fig. 9, with the initiating detonator either constituting the entire
charge or partially insnersed in the base charge. For L/D ratio purposes,
the eqoivalent charge length was calculated as:
4 i Wb Wd1 (6)
where subscripta b and d denote base and detonator charges, respectively.
A small amount of foamed polyurethane packing was inserted in the open end
of the case to keep the detonator in place.
A series of tests was made with the high explosive replaced by Hercules
Bullseye No. 2 (a fast-burning, double-base pistol powder) which was
selected because of its previous history of use in stability-rating
pulse guns. Explosion of the powder was initiated by a miniature electric
match containing 1.5 grains of pyrotechnic, which is little more than a
source of heat for igniting the powder charge. The entire charge weight
waa thus pistol powder. Bather than redesign the bomb cases to account
for the lower density of the pistol powder than that of the Composition
C-4, the same caaes were used, and the L/D ratio was allowed to vary.
Bomb design details are listed in Table 3. The number of tests conducted
with each bomb design are also indicated.
Experiswntal Beaults
Three kinds of raw data were obtained from open-air bomb explosions:
(l) framing shadowgraph sequences, (2) streak shadowgraph sequences, and
(3) pressure records; all were recorded directly at test time on 3- by
4-inch Polaroid prints. In this section, examples of the raw data and
46
&
■*fcM—- - - -
.
rl oamod Plastic Padding
/ r~ rase
Klectric Detonator
a. Electric Detonator as the Entire Explosive Charge
Foamed Plastic Waddi ng
Explosive Base Charge
Case Electric Detonator
1
b. Electric Detonator for Initiation of o High-Explosive Base Charge
Figure 9. Typical Explosive Domb Assemblies
47
i
■-■
M
I
11 1 h
«I «
31 5S
.5
O ► " •H V ■
03 so bo a» -P O l- J3
I o «
W ■ M « +i O fc. J3
1 fl ü ^
u
ja H
O XI •M U o .A a
3 £ 5 o
•H •H M
»4
O > ■ •H 5
•P • -H
I*6
1I n u
NCMKNCIi-l KNKNI^CJ
• ••• • •••• -HOOOr-HOOOO
in ir» r- pi
cJ IA o <-< d
—(r-lOi-HO'-lOrHO
o o o o o o o o
8 0mK\O K>mOO invooovo^omin
mCMOOU-NOOClCM • ••• • •••• ooooooooo
mKSOK\Oi-tO\<HO\ • ••• • ••••
oooooiriiniAin
O O Q in in in
o o m m m m m m i—t i-H i-t pi
8 5 9 I I § I I i
48
the methods of their reduction to quantitative data are discussed, and the
tabulated data are presented.
Framing Photograph Sequences. An example of the framing shadowgraphs has
already been given, Fig. 6, for a 50/50 Pentolite charge. The uncomplicated
propagation of a nearly spherical blast wave over the transducer mounting
plate shown there is considerably more distinct (because the charge is
larger and bare) than similar records with bombs. The blast wave is also
more cleanly separated from the explosion products because there was no
case debris thrown ahead of the explosion products. Nevertheless, Fig. 6
does present a typical picture of the blast-wave-mounting plate interaction.
.
No direct quantitative data were taken from the framing shadowgraphs. They
were used principally for indications of unusual occurrences that might
invalidate the data, and for auxiliary, blast-wave, position-time informa-
tion in instances where case-particle impacts near a transducer made it
difficult to determine when the blast wave crossed that transducer.
Streak Photographs. Streak shadowgraphs were obtained simultaneously with
the framing shadowgraph sequences. In those taken in the neighborhood of
the transducer mounting plate, the blast waves were usually distinguishable
on the original prints, but sometimes Juct barely. The method of data
reduction was identical to that for the streak photographs taken with
boinbs in the field of view, described below.
.
A direct streak photograph of a bomb detonation «is reproduced in Fig. 10.
It was taken by aligning the camera so that its internal slit viewed a
10-inch-long by about 0.020-inch-wide field normal to the axial center-
line of the bomb. The bomb was backlighted (Fig. 1) so that its diareter
formed u dark shadow near the center of the camera's field of view, which
extends upward in time from the bottom of the photograph in Fig. 10. The
thin, dark lines parallel with that bomb image are s.00-inch grid
49
1:
- - ~äm.
Figure 10. Streak Photograph of High-Explosive, Nylon-Case Bomb Detonation
50
,
.
r ♦■
-
1
marks (and some scratches from previous tests) on the l/4-inch-thick
Plexiglas fragment shield for the backlighting apparatus.
Detonation of the bomb resulted in simultaneous radial propagation of a
blast wave, case debris, and explosion products. At that time, the back-
lighted image of the bomb on the streak photograph was replaced by their
cumulative backlighted images. The slope of the edge of an image is
proportional to the velocity of the material that made the image. Most
of the dark "fan" on the photograph is from case debris and explosion
products. In most cases, the shock trace quickly separated from and led
the material flow. The slope of the shock trace then is proportional to
the shock velocity.
These particular photographs were taken to obtain initial velocities of
the shock waves. With moderately large charges, the initial wave is
readily distinguishable on such a record; as the charge weight is reduced
and the bomb case becomes proportionately more massive, the initial shock
wave becomes more and more difficult to identify. Many times during these
experiments, the only direct evidence of the initial shock was a diffrac-
tion of the grid line images as it passed over them. For that reason,
each photograph was examined carefully with a stereoscopic microscope,
and each shred of evidence of the passage of the initial wave was care-
fully marked with a sharp stylus. These marks were subsequently used as
the basis for constructing a line tangent to the initial shock wave at
the instant of bomb rupture. The slope of the tangent line was converted
to initial shock velocity.
Two values of initial shock velocity were obtained from each bomb firing,
one from the right side and another from the left side of the streak
photograph. Usually, the bomb was not centered in the photograph, but
was offset to the left. The left- and right-hand velocities generally
agreed within about 5 to 10 percent of each other. In cases of wide
disparity between them, it is believed that the right-band side should be
preferred. This is because fragments may have initial velocities higher
than the initial shock velocity, so that discrimination of the shock
51
»
— *&T1 i
i :—"—~.—
very soon after detonation is not as reliable as it is at later times;
the right-hand side has a longer time period through which to examine the
photograph and extrapolate backward to the instant of detonation.
Blast-wave overpressure was calculated for each value of wave velocity
by means of Bq. (?) and (3).
Tranaducer-Measured Pressures. A few examples of typical pressure records
obtained with the acceleration-compensated Kistler Model 603A located
10 inches from high-explosive, nylon-case bombs are shown in Fig. 11.
Measurement difficulties imposed by the shower of bomb-case fragments
attending the blast vave are apparent; each pressure trace had from a few
to many spurious signals superimposed on the "real" pressure histories*
Their interpretation as fragment impacts on or near the transducer was
supported by observations of entering in the RTV rubber potting around
the transducers and of occasional complete obscuration of the shock front
on the streak photographs by particles traveling both ahead of and behind
the front. Such loss of data made it necessary to run a large number of
replicate tests; as seen in Table 2, a total of 75 bombs was fired to
accomplish characterization for 20 high-explosive, nylon-case configura-
tions.
Several examples of pressure data obtained with high-expiosive, Micarta-
case bombs are shown in Fig. 12. The pressure traces were considerably
less complicated by spurious signals from particle impact than had been
experienced with nylon cases. This beneficial result, probably caused
by the tendency of the Micarta bomb to fragment into shred« rather than
chunks, may be an important effect to consider in selecting bombs for
rating engines which have potentially delicate chamber components.
Pressure records from low-explosive, nyion-case bomb explosions are shown
in Fig. 13. Here again, there were fewer difficulties with case-fragment
impacts giving spurious pressure signals; this was a result of the explo-
sion having been less brissant than with high explosives. With 0.063-inch-
thick cases, however, the pressure records were considerably different .
52
i
,■
■
■ — -
p ■
*'
• e
« m 2 t
»/l«I fi
/I
r
■ o u o t
»/T»d fi
I 'S u
o u I I «
■»»
00
I
s
a e
§
!
!
i
./Trffi m/jM fi
53
•»Wfi <■»>« ,'--,-
■%
4»
O
5
I in
a u u «I a o u «
•H ■
CJ
0*
o
5
m ci
KM
■o/Tfd i ■3 /T»d fi
v o
5
o
ir»
8 o ■ 2 «
j/ytd £ ■o ./T«d fi
/I
,
-
(N .-I
V
t
&
I m CM
r
■ o u
■H
a
^■d fi ■3 /ltd c
4)
a ■ri
o
8 o ■ 2 u
o u
j
<N
•4
I
|
^
.'2 «A o
ft <4
P
8
o
• o.
fi I ■
■ • «4 • -HO«
I-3
I
2
11
/T«d fi ia/T«d 01
54
^
'- v.
,,,'-* , ■ .
■o/T«< Z w/T»d z
a
18
o e
s a»
•o o u
5
I
o
I
a
o «I • o Pi u
£
o u Ü
a
/?- 9/iad s »/?,,d 2
■ fel
■
I o
s
o u
5
I
o
I
I
j/t«d i
»/T»d i
1 03
o
I
I in
<
•a
■ 2 u
•H B
8
1
i
o »
fl •H
!
>/T«d fi
B I ■ in
f
CM
O
fl"
g I
fl o
o a.
s ■
•e fa a o e 4 u u B
: li
fl li Bo
If 1
55 &
^
than any that had been observed with previous bombs. There were frequently
two pr««sure waves (and twice there were three) spaced at irreproducible
timm intervals. The first wave was steep fronted and sometimes had only
a aoderate amplitude; it apparently resulted from case rupture prior to
complete burninc of the powder. The second wsve was less steep and had
a peak amplitude that is probably related to charge weight and its time
af appearance after the initial wave. Two of the records appeared remark-
ably similar to pressure records obtained with pressure transducers in
the barrel of the pulse gun, which are discussed later. With 0.230- and
0.5O0-inch-thick cases, the pressure traces had an appearance much like
those from high-explosive charges. It was initially thought that these
charges were so well confined that s high deflagration rate was achieved,
and the powder was essentially consumed prior to case disintegration. As
is noted later in the correlation of these low-explosive data, the fact
that pressure amplitudes increased with increasing case thickness (as
contrasted with the opposite effect with high explosives) belies such a
conclusion.
The pressure record photographs were analyzed to obtain direct-measured
values of peak overpressure, positive unit impulse, and positive duration
of the blast wave. Additionally, the transit time for wave travel between
the two transducers gave an average wave velocity from which an overpres-
sure was calculated.
Data Tabulations. A complete tabulation of the data concerning the initial
blast wave near high-explosive, nylon-case bombs is given in Table 4.
These data are from the streak photographic records; no pressure transducer
data were recorded during these experiments. Data concerning the blast
wave in the neighborhood of the pressure transducers are tabulated in
Table 5 for the high-explosive, nylon-caae bombs, in Table 6 for the high-
explosive, Micarta-case bombs, and in Table 7 for the low-explosive, nylon-
case boadbs. The time increment from electrical fire signal to actual rup-
ture of the nylon case was not as reproducible with low explosives ss it
had been with high explosives. The variability was aeveral times the
56
3
s
i i
1
[ I [I I
ii
i
U frt
Sä
Hi
I >{ - V
hi ill
If! ni
* i- mo
I I *55r-«RIIS2IR8s;S:5,''2l«r-
I i %%ii'isii%tit$tt%ittilt*%i
11 uinuiuuumuniu e © a d o e e e o o e o d o o o o o e d o o o o e o
«. ff IfH I»*
KfliiSIP^s^J&ES««*?»8?^?8
slpg ! IR5SS|r. SRigr. |g|?||Kr
lili.Hllllliflllliiin o o o o o e ooooooooooo
g|g=i5s»»»l»e8SJl«2SRS|55«
ISIIilSIS^I^SSSIBISSH^S
§«lil§fllllllllllllirill i i O OOOOOOOOOJ o o o o
o cooooooi-r-or-r-f-oor^or-
? ? itetttttsssssieetiifsiss ooooooooo
57

I
i
i a
ii
JJ
ii Ü !m 1
1|'
ü 9
1}
111 !|i| hi
'JJ ili «i
St?! ll ► ••^« 1111 i^"s s-si iss a1"« i" n*i
11 , I»,,! «55 ISS ImfllB ,,«
I I I I ill S SIIHII l'lifl "ff
,,,, snjiia 5531 ".':•. ^ x \ ,'• ••••': i i53
ie|| in ill ifli fff RfEiS liK KSSS
iE!3 IIIIIS IISI HS SSSSS S!! £55«
rt^fii* 111««« llr^l ># r^« ö «^S^S *• «^ ^ * S "^
***** I I («»r* I I Q« s; ' s« R'U iB&fis *'-•• »-aBa
528! iiiCHf n« Si» 5£2I£ 15E SfiES
tm tnUi M18 lil iiiHUI iiil > o e< ••• oo<
SSSS ><■*» !ESE2i^ S!B»I SS! 1232
33» n iMS «32s Eis S&S2B ^ f&U
r* r\
S-* I ► 3— 5- 3—^ »— R-
" s
|!
• ^ • b
5 ä
a x 1 2 a a
Ü 3 i
I
1 Ii
i! !
I! IN
ill
58
(U
■
0
•I
m,jf» h »4iw
I
m 'S
i n
s •
Im Al m
ill
11 1
,1
ii 71
jl! i
M ill r iti lii
'SRC« 'SS^R »BJt&S CflliR11 J«t*# SEK51
.MSS ,!$iE ,,8E, me,, £55« 15111
jisi .till Ulli min mumi
'22:2 '5S53 l|::1 s:::11 525:2 522s'
5"S18 U"* 'Ml1 ll"tl "'M f'SI
S'^l SS11? SSiSS SlllSS ''Si1 '''Si
SII53 S2i22 's'ä' a"«« "Ml '"ss
^ii*:'? •j^iS-! ".'i*.".*, -.,,,*.". iiSüi 1 1 if a''as ««'as JSIIKS s''1*« ''«s' '''si
$II*S Mlii Miii i,,,» ,,{$, ,,,1,
\Ji UM m MJ nis, n.i,
S"SS «S'«5 SSSSS SS"S5 "«SS '«'S1
S«'SS S$»cB SSSSI Si "IS "Mi 'SSS'
8 ► B— S ► B » f— 5—
j
59
■

"f"
. ■•T
in ■s a H i
i ' i
\ i
1 *
li )]•• Ml u» 553 235 it*' 513353 33333
a MM ??! !!§! m IU 1,6 EseiijE issii 333 33d m'ü 33533d 333S3
k 1!" m ••• Uli 3333
ill in i.f mm urn • o« ••• o o eeeeee o r> o o o
h ::" ma«
: U 4 I'll 'SI §1«' *!' "1 !IS "I'll 'Sll1
11! SIS! III ■in s!> 2si in <ssi^i I'M' •
t e
2iS< sga 'its Blh ■ 's ' ' ' ""li l^ll
1 i
• i <
i i. 1 r
| [i i* ■ ^23 ««' «e« RSR 'SKKli PKCPR |
n H!! !>! "H! !!> !!! 55! '!!!!! !!!B 1 •!
in SMI • ••• ■ o .Hi u. m p ,iisii nm
oo oeo oso oooee eeeoo {
lii > ill
S8&S 513 •ISA! »8 1 »S« ««8 IMR&S 9*941
»Si S's ■Ill S!S S^S IS* 3!SSSK ^'S»' I
HI • • • •••-»*•" »• • ' «»«»*• ^ •» •
• • • »^ S- S_ i » i_ | O • • • O
III • ^ '
»i S a i «•-«-' M
60
• >
1
TABLE 6
AIR BIAST WAVE DATA (HIGH-EXPLOSIVE. MICAICTA-CASE SF31IE5)
Bomb Charge Charge Case
Data Derived Fro« Pressure '
7- to 10-inch Transit Time Information |
A Time (7 | Code Weight, L/D Thickness, to 10 Inches), Velocity, Mach Overpressure,
Nhunber Grains Ratio inches microsec in./microsec Number P"«
5 5.5 1.3 0.063 179.7 0.0167 1.227 8.2 # 177.5
175.2 0.0169 0.0171
1.243 1.259
8.8 9.4
# 172.9 0.0174 1.276 10.0
\ r \ 1 — — — —
Ik 0.250 176.8 0.0170 1.247 9.0 155.0 0.0194 1.423 16.4
« 153.4 152.1
0.0196 0.0197
1.438 1.450
17.2 17.7
T* T i f 150.4 0.0199 1.466 18.5
4 13.5 2.7 0.063 )00.0 0.0300 2.206 62.5 1.0 0.063 113.0 0.0265 1.952 45.2
f f 98.5 0.030'> 2.239 64.9
12 13.5 2.7 0.250 121.7 0.0247 1.813 36.8
\ \
1.0 1 136.2 0.0220 1.619 26.1 142.0 0.0211 1.553 22.7
1 50 0.063 105.8 0.0284 2.085 54.0 82.6 0.0363 2.670 99.2 82.6 0.0363 2.670 99.2
r f 82.7 0.0363 2.670 99.2
13 0.250 124.6 0.0241 1.770 34.4
1 * 137.7 0.0218 1.602 25.2
1 f 143.5 0.0209 1.537 22.0
16 50 4.0 0.250 115.9 0.0259 1.903 42.2
2 50 4.0 0.063 92.7 0.0324 2.379 75.4
"Rows 0 larked vith
4
an aster isk arc data
1 1 - • » *» . ' - - ( ■
w^m
—^P^T«-
mm
TABLE 6
WAVE DATA (HIGH-FOTLOSIVE. MICAirTA-CASE SF31IES)
Data Derived Fro« Pre8sure Traosducers
7- to 0-inch Transit Tine Information
Measured Overpressure,
P»ig
Positive Duration, microsec
Unit Impulse
psi-microsec
»(7 aches), otec
Velocity, in./aicrosec
Nach Number
Overpressure, P«ig
.5
.2
.9
0.0167 0.0169 0.0171 0.0174
1.227 1.243 1.259 1.276
8.2 8.8 9.4 10.0
7.5 7.8 7.7 8.1
199 196 230 233 177 170
415 428
^30
- — — — 6.3 '.20
».8 .0
A 1.1 I.«
0.0170 0.0194 0.0196 0.0197 0.0199
1.247 1.423 1.438 1.450 1.466
9.0 16.4 17.2 17.7 18.5
9.0 10.6 10.5 10.0 10.2
163 166 161 179 179
350 341 328
363
1.0 \.o
J.5
0.0300 0.0265
0.0305
2.206 1.952
2.239
62.5 45.2
64.9
20.5 16.9 18.5 20.2
199 183 169 179
934
901
1.7 ».2 1.0
0.0247 0.0220 0.0211
1.813 1.619 1.553
36.8 26.1 22.7
13.5 18.6 14.6
194 173 170
642 522 541
J.8 !.6 !.6
2.7
0.0284 0.0363 0.0363 0.0363
2.085 2.670 2.670 2.670
54.0 99.2 99.2 99.2
31.5 35.8 >40 55.1
184 210 179 179
1'.36 1759
2280
1.6
r.7 1.5
0.0241 0.0218 0.0209
1.770 1.602 1.537
34.4 25.2 22.0
23.5 21.8 22.9
144 171 176
1109 1057 980
J.9
!-7
0.0250
0.0324
1.903
2.379
42.2
75.4
34.3
30.6
150
186
1297
1933
with a second oscilloscope simultaneously with the data in the preceding row.
61
r -
ß
TABLE 7
Am BUST WAVE DATA (LOW IXPI/)SIVE, NYLON CASE SHU ES)
1 Data Derived Prom Pressure Tran«
Bomb Code
Number
Churge Weight, Grains
Case Thickness,
Inches
Charge L/D
Ratio
7- to 10-inch Transit Time Information
A Time (7 to 10 Inches),
microsec Velocity
in./microsec Nach
Number Overpressure, H
16HB
f 5< ) 0.250
♦ 7.3 149
160 0.0201 "5 0.01875
1.480 1.379
19.2 14.4
11
1
IB
f #
0.(
\
63 2.
\
0
1
189 186 182 186 183
0.01587 0.01612 0.01648 0.01612 0.01639
1.167 1.185 1.212 1.185 1.205
5.8 6.5 7.5 6.5 7.3
20HB \
1 0.500
1 7.3 t
146 162
0.02054 0.01851
1.510 1.361
20.6 13.7
2HB
f
50 #
r
0.063
f
7.3
f
190 181 183 179
0.0XJ78 0.01604 0.01639 0.01675
1.160 1.179 1.205 1.232
5.5 6.3 7.3 8.4
3HB 0.500 12.0 167 0.01796 1.321 12.0
4HB
1 13.5
1 0.063
1 2.1 202
199 194
0.01485 0.01507 0.01546
1.092 1.108 1.137
3.1 3.7 4.7
6HB
i 13.5 0.063 3.9 196
200 197
0.01530 0.01500 0.01522
1.125 1.103 1.119
4.3 3.5 4.1
12HB
f
1!
\
.5
f
0.2
\
50 2.
i
1
f
152 164 161 168 164
0.01973 0.01829 0.01863 0.01785 0.01829
1.451 1.345 1.370 1.313 1.345
17.8 13.0 14.1 11.7 13.0
15HB
f
13.5 »
0.250
f
3.9
f
171 167 171 167
0.01754 0.01796 0.01754 0.01796
J.290 1.321 1.290 1.321
10.7 12.0 10.7 12.0
*Il0WS BU irked with an asterisk are data obtained with a s econd oscilloscope simultaneously with thai
A
- . i i*
•
L
ittr»»^» ■iipi. mw T mm
TABLE?
WAVE DATA (LOW EXPLOSIVE, NYLON CASE SFHIFS)
Data Derived Fro« Pressure Transducers
7- to 10-inch Transit Tiae Inforaation
Measured Overpressure,
psig
Positive Duration, microsec
Unit Impulse
psi-inicrosec
tfim (7 10 Inch««), ■icroRec
Velocity in./mieroaec
Nach NuMber
Overpressure, psig
U9 160
0.02013 0.01875
1.480 1.379
19.2 14.4
13.5 9.9
186 172
910 656
109 186 182 186 183
0.01587 0.01612 0.01648 0.01612 0.01639
1.167 1.185 1.212 1.185 1.205
5.8 6.5 7.5 6.5 7.3
4.4 5.2 5.3 4.3 4.3
182 224 223 203 199
383 364 395 323 362
146 162
0.02054 0.01851
1.510 1.361
20.6 13.7
19.2 27.6
199 193
1410 1640
190 181 183 179
0.01578 0.01604 0.01639 0.01675
1.160 1.179 1.205 1.232
5.1- 6.3 7.3 8.4
4.2 4.3 4.3 4.4
182 182 150 158
290 297 274 270
167 0.01796 1.321 12.0 9.0 204 710
202 199 194
0.01485 0.01507 0.01546
1.092 1.108 1.137
3.1 3.7 4.7
2.5 2.0 3-7
179 205 U»7
195 171 273
196 200 197
0.01530 0.01500 0.01522
1.125 1.103 1.119
4.3 3.5 4.1
2.4 1.3 2.3
208 160 302
225 87-5
168
152 164 161 168 164
0.01973 0.01829 0.01863 0.01785 0.01829
1.451 1.345 1.370 1.313 1.345
17.8 13.0 14.1 11.7 13.0
>8.0 8.6 8.6 7.6 7.9
188 195 197 189 191
Off Scale 591 593 538 563
171 167 171 167
0.01754 0.01796 0.01754 0.01796
1.290 1.321 1.290 1.321
10.7 12.0 10.7 12.0
6.6 6.8 8.3 8.7
195 195 182 182
460 476 505 521
Gained with a second oscilloscope simultaneously with that in the preceding row.
62
^
,-<
■
L. ■ .■:■. ^■^2J:^v.:A.-:-w ..^
* ~w —- I
approximate lOO-microsecond duration of a streak film record; therefore,
after several attempts, streak photography was abandoned and only pres-
sure transducer data were taken. Streak photography was then alto omitted
from the high-explosive, Micarta-case experiments so that a larger number
might be fired.
Data Correlations
Correlating Method. The experimental data were analyzed to establish corre-
lations between individual output characteristics and the bomb input para-
meters. The multiple regression correlating techniques used are summarized
in Appendix A.
*
HeaponseB Considered for Characterization. The output parameters which were
considered in characterizing the bomb were positive duration, positive im-
pulse, and peak pressure. Positive duration is the time duration of over-
pressure; i.e., the time interval between the first indication of a pressure
rise and the instant that the pressure next falls below its initial level.
For each test, unit positive impulse was obtained by integrating the pres-
sure time curve, using a planimeter or photographic records such as those
in Fig. 11 through 13. The time base used was the positive duration (Bq. k).
Peak pressure data may be obtained directly from the pressure traces, but
the pressures derived from wave velocity data were believed to be more
accurate and were the ones correlated.
Positive Duration. The positive duration developed as being of little
value in the characterization. From the raw data it appeared that posi-
tive duration did not vary significantly over the range of input parameters
(explosive weight, explosive shape, and case thickness). Actually, a weak
correlation (multiple correlation coefficient of 0.6) with charge weight
was found:
In T = 4.97 + 0.064 In W + (7)
63
,
, Jmk.
i'
"T"
■"Wpi
m
wjbvr« T is positiv« duration in aicroseconda aeaiured 10.0 inches fron
tks bonb esntsrlins snd V is charge weight in grains. FTo« this fitted
sqnation, the STcrngc durstions for charge weights of 5.5, 13.3, and 50
grains arc, respectirely, 161, 171, and 186 nicroseconds.
Vait PssitiTs Iminlse. Conrersely, the unit positive inpulse was very well
correlated to the bonb paraneters for charactericing the bonb data. Not
only are UMSO data nore repeatable, but also nost of the variation in im-
pulse can be explained in terns of the input paraneters. A model for high-
explosive, nylon-case bombs was obtained which had a multiple correlation
coefficient of 0.996, thus, the model accounts for nore than 99 percent of
the variation in impulse. Farther, all three input paraneters were signifi-
cant in describing impulse. Case material was found not to be significant
when Micarta was used in place of nylon; thus the following single model
can be used for high-explosive charges encased with either material:
In I,, - 3.62 ♦ 1.04 In V - 0.07* (in V) - 0.353 In T + (8) U C
0.112 In (l/D)
In this model, I is unit positive impulse, measured in psi-microseconds
at a location 10.00 inches from the bonb centerline; V, charge weight in
grains; T , the case thickness in inches; and L/D, the shape factor.
The error in unit positive impulse is about 8 percent as measured by the
residual standard deviation (see Appendix A).
It should be noted that the term (in W) is included in the correlation
to account for a slight nonlinearity in the effect of bomb weight. Be-
cause such a tern is included, the correlating equation cannot be used to
infer what would happen for charge weights much larger than the 50-grain
sise used in this program. For larger weights, the square term becomes
dominant to give unreasonably low predictions.
6k
: • • ^-
The data points correlated are shown in Fig. 14 together with correlating
lines fros Bq. (8). The effect of case thickness, while not as great as
that of weight over the range of variation considered for each variable,
is still appreciable.
In the bonb data analyzed, the variable weight and case thickness appear
to be independent in their effects on unit impulse. That is, the effect
of thickness is apparently the sane for each charge weight (and viae versa).
Similarly, there is no apparent interaction of shape and case thickness or
of charge weight and shape.
I
When the high explosive was replaced by the low-explosive Hercules Bullseye
No. 2 powder, quite different effects were observed. The nodel for unit
impulse became:
In Iu - 6.08 ♦ 0.560 In W ♦ 0.777 In T - 0.152 (in l/»)2 (9)
It is of the sane general fans as the model for high explosives, but the
signs of two of the terms have been reversed. The most significant reversal
is that, with pistol powder, the impulse increased, rather than decreased,
with case thickness. Further, the effect of weight is somewhat less impor-
tant than that of case thickness. These reversals offer positive evidence
that low-explosive bomb output characteristics are predominantly controlled
by the parameters that control case rupture. This is further substantiated
by the observed secondary pressure waves (Fig. 13) which apparently resulted
from continued burning of residual explosive after case breakage. Although
data were not obtained with low-explosive, Nicarta-case bombs, such a
change in case material with this explosive should be expected to have a
strong influence on the output characteristics.
The error in the fit for the low-explosive bombs was only slightly greater
than for high-explosive bombs, being about 13 percent. The increase can
be attributed to the fact that there are fewer data in the analysis.. For
simplicity of analysis, all raw unit-impulse data from bombs of the
65
.
1 ►.•:-A^'i^f^--
i L.
8 o
^
0
g 6
00 M
s 0 § s
« X O
0
Ö z *
CD »
CO ft
IS: ÜJ ■
2 6
z 1 pu
lse
Exp
lo
8 z 1-
O UJ •H«
0> 5- < O
S u *H Ü
u O 1
0 ■♦J i-> n SS
i. 0 •
Hi & Q O 1
-I o o
8 o o « o M M
o o 10
O O O O Q Q O OOOOO O 5 O • • ^ * *> ♦
2Ni/03S-Jffi 'asnndwi imn 66
O O 10
s M
8 6
i '
- «P '■*■
, 1 ■.'.v.
configuration were averaged before the correlations were computed. Thus,
the In I was the logarithm of the average, not the average of the loga-
rithms. It is not expected that this procedure has any significant effect
on the values of the coefficients obtained. Since the numbers of observa-
tions on the bombs of various configurations varied somewhat (last columns
of Tables 2 and 3), some of the data included in the analysis were more
stable than others, being averages of a greater number of raw observations.
While a more rigorous analysis would take these differences into account,
it was not felt that the improved precision oi' the results was worth the
added expense and trouble of analyzing all the data separately. This pro-
cedure does not affect the average accuracy of the results.
Peak Pressure. There are four kinds of peak pressure data that have
been obtained from these experiments:
i 1. Direct-pressure transducer data obtained with a Kis'tler Model
603A transducer, located 10.00 inches from the bomb centerlines
2. Pressure calculated from an average blast-wave velocity as de-
termined by measuring its transit time between two pressure
transducers, located 7.00 and 10.00 inches from the bombs,
respectively
3. Pressures calculated from local blast-wave velocity as determined
by streak photography
a. In the neighborhood of the bombs
b. In the neighborhood of the transducers
As indicated earlier, the direct-pressure transducer measurements are
believed to provide valid indications of unit impulse, positive duration,
and wave shape, and yet give the least reliable measure of peak pressure.
The other methods for obtaining peak pressures are all based on calculating
shock-wave overpressure from wave velocity data. The correlation of peak
pressure was attacked, therefore, through a correlation of wave velocity..
if: 67
~^~
f
\m
Tht blatt-vaye Telocity data were obtained at varioae distances from the
boaba. Sine« tine from detonation and distance from the bomb are related
through the wave Telocity, either time or distance may be used in the
correlation. It was thought to be reasonable that the wave velocity
•ould decay exponentially with time and in a more complicated manner with
distance. Time was selected, therefore, as the correlating variable.
Correlating models of the form
(e8)0 - A A^ (V»)C (10)
for the initial wave velocity, and
cs " (cs)o "p [B ^ C *] (11)
for the data in the neighborhood of the transducers, were attempted. The
model for initial vave velocity gave:
In (CB) . -4.507 + 0.186 In W - 0.557 In Tc (12)
No significant effect of the charge shape factor (l/D ratio) was found.
Curve« of initial shock-wave over pressure, calculated from velocities
derived from this equation, are shown in Fig. 15 with the individual,
velocity-derived, initial-overpressure data points. This graph employs
a semi-logarithmic scale, rather than the log-log scale which would be
more appropriate for the correlating equation, so as to show that the data
can very reasonably be extrapolated to the value of overpressure given in
the literature for bare charges of 50/50 Pentolite. It is seen that a con-
fining case around the charge greatly decreases the initial-shock-wave
amplitude. The reduction is nearly an order of magnitude even for the
thin case of the Olin Plasticap 5.5-grain detonator. This effect is ob-
viously lessened by increasing charge weight, but, within the charge sizes
of interest in stability rating, it is a very strong effect.
68
sBj - • >»^'
. r
■
'
mm
C
111
s
20,000
10,000
5000
2000
1000
900
1
200
100
0.2 03 0.4
BOMB CASE THICKNESS, INCH
Figure 13. Initial Sbock Wave .Amplitude Calculated From Streak Velocity Near the Bomb-Case Surface
69
. - • ,
1
RF^^HI
The Bodel for exponential decay of blast-wave amplitude, Eq. (ll), did not
yield •atiafactory correlations. A more complex model, employing quadratic
terms, was found to correlate the data veil; the error in velocity was
about 8 percent as indicated by the residual standard deviation. This
model, however, required a variable constant whose value depended upon the
method or position of data acquisition:
In o - constant * 3.21 t - 4.82 t + 0.186 In W -
1.05 t2 In W - 0.557 In T + 1.86 t In T - c c
1.19 t2 In T (13) c
where t ia measured in milliseconds and velocity in in./microsec. The
constant term which depends on the type of measurement involved, is as
followa:
- 5«286 for streak photograph data taken in vicinity of
transducer
- 5*397 for transducer transit-time velocities
- 4.507 for streak photograph data taken in vicinity of bomb.
No significant effect of the «hape factor i/o was found. The quadratic
terms in time were uaed to account for what are probably asymptotic effects,
auch aa the wave velocity approaching the sound velocity as time increases.
While the correlation of the data by the model of Eq. (13) was quite good
(9.0 percent error baaed on the standard deviation), the need for a variable
constant is not particularly satisfying. It is of interest to note that
the cwo values of this constant which correlated the '.ata from the neighbor-
hood of the transducers ware in essential agreement, giving velocities
that differed by about 12 percent [exp (5.397 - 5.286) -l].
70
.w .
•~v ^^^^MPfiSS
t«r'
■
i I
— a
■ j -
Conversely, the mean value of those constants, inserted in Eq. (13) with
t = 0, gives velocities that are smaller by a factor of 2.3 Cexp (3.341 -
4.307)1 than those given by Bq. (12). This large disparity might partially
be attributed to the fact that the data were obtained from two sets of
experiments (Table k and 5)» but is more likely a result of the data having
been obtained in two discrete spatial groupings, one at the bomb surface,
and the other in the interval of 5 to 10 inchev from the surface, with no
intermediate points to bridge the gap.
The lack of intermediate data is made clearly evident by plotting the data
on an overpressure vs reduced distance basis, such as that used earlier to
show that the instrumentation system gave peak-pressure data in agreement
with other investigators' results (Fig. 8). In Fig. 16, a separate graph
is given for each of the three charge weights tested. The heavy, solid line
that sweeps down to the right across each graph is the mean correlating line
of Goodman (Ref. 1), and the heavy, dashed line is that of Ruetenik and
Lewis (Ref. 2) for large, bare high-explosive charges. As discussed earlier,
small bare charges of 30/30 Pentolite gave direct transducer peak pres-
sures that agreed with Goodman's correlation and wave-velocity-derived
pressures that agreed with Reutenik and Lewis'.
All three sets of velocity-derived data for nylon-case bombs are plotted
in Fig. 16. The initial-shock-wave amplitude data appear at low values
of reduced distance, i.e., the outer radius of the case divided by the
cube root of the charge weight for those data. It is noted that this
convention forces data for a high i/o ratio to move to the left of data
for a low L/D ratio. Data obtained by transducer transit time and streak
photography near the transducers appear at high values of reduced distance,
and are indistinguishable from cue another.
The strong attenuating effect that the presence of a confining case has
on the initial-shock-wave overpressure is again seen. In some cases,
the plotted initial-shock values are as much as two orders of magnitude
lower than Goodman's correlation. As compared with Fig. 13, this type
71
, -
' •
w/
■^\
■
of plot coma reasonably close to pomittinf a single correlating line for
all of the initial-ohock-waro aaplitude data. If one assumes a single
straight lino, its equation would be of the form
In P. - a - b In Z (14)
or, substituting for Z,
In P. - a 4- 1/3 b In V - b In R (15)
Recognising a correspondence of P. to (c ) and of 11 to T , it is interesting
to compare this expression with Bq. 12, and note the precise agreement of
the coefficients of the logaritfanic terms.
Somewhat arbitrary dashed lines have been sketched in Fig. 16 to connect
data points from similar bombs. The shapes of these connecting lines were
suggested by one set of streak-velocity-derived data from a single bare
13.5-grain, plastic-cased detonator that was fired in the preliminary
transducer evaluation. Those points are plotted as X's in Fig. 16b. There
is a strong implication that the blast-wave strength is maintained (or
degraded at a much lower rate) for some distance from the bomb, and that
the wave amplitude sooner or later becomes asymptotic to the behavior of
a wave from a bare charge. Whether or not this effect, which is almost
certainly attributable to the behavior of bomb-case fragments, is still
appreciable at a distance 10 inches from the bomb, is obviously related
to both charge weight and case thickness.
Except for the variable constant, the velocity correlation model could be
used to calculate the pressure vs reduced distance curves vhich were roughly
sketched in Fig. 16. An attempt to obtain a fit for all the data with a
single constant, however, resulted in a very poor model, and several attempts
to obtain a model in terms of velocity and distance were unsuccessful.
It was concluded that the bomb-to-transducer distance had unfortunately
been chosen such that a number of the observed blast waves had acheived
72
■ - -■
I« t 4 • • K>
wsTfMtcc (Z), rr/La"*
9A 0« 0« U>
REDUCED DISTOHCE (
a. 5.5-Grain Boaba b. 13.5-Graiii
A
-
—
^ s^
3£
5!^
üatii
(«Fit
4-1-
\ \r ^
M I i tkammtwät
, L/O-IO
s; N
k c
W
A^ m w
0.4 o« o« IJO t 4«an m
Eo osnucE (Z). rr/uf*
>. 13.5-Grain Boaba c. 50-Graiii Boaba
Figure 16. Air-Shock Wave Orerpreaaurea Fro« High~£xploaiTef Nylon- Caae Boaba
73
e
- I,

«fin H 0mm* w«— \
• - ■
•■yaptotic recovery to bare-charge behavior, while others were at various
•tage« in the recovery process. The difficulty in obtaining adequate cor-
relation probably steas froa nixing data frost those two categories. Had
■ore streak-velocity data been sought in the 0- to 5-inch range, a valid
■odel for the recovery process probably woulA have been obtained.
Fron the available aodels, however, it is apparent that the initial-shockwave
correlation is the one of nost value for characterising bonbs for stability
rating. Even though they did not correlate as well, the direct pressure
and distant velocity dots provided useful inforaation on the blastwave
shape, iapulse, duration, case aaterial, and explosive-type changes which
could not have been discerned froa streak records alone.
Effect of Csse Msterial. The transducer transit-tiae velocity data
for Nicarta and nylon cases sre coapared in Table 8. These result« sug-
gest that the nylon and Nicarta cases are quite siailar in their behavior.
PULSE WINS
The coabustion stability rating device known aa the "pulse gun," introduces
a blast wave into a rocket coabustion chaaber that is followed by a trans-
ient directed flow of coabustion product gases. Pulse guns were cold-flow
characterised in this prograa by firing thea into a 50-gallon tank that
was prepressurised with an inert pressurant, and by aeasnring various
psraaeters near the inlet of the gun to the tank.
Biperiaental Apparatus
Pnlse-Ciun Hsrdware. Ihe pulse guns evaluated were fabricated by Bocketdyne
froa prints of engineering drawings supplied by AFRPL, The guns are ostensibly
identical to those developed at Aerojet-General Corp., and used for stability
ratings there and at AFRPL. A cross-sectional view of an asseabled pulse
gun is shown in Fig. 17a, essentially reproduced froa Bef. 4. It consists
of an explosive charge loaded in a center-fire cartridge, contained within
a sealed coabustion chaaber (breech); a aechanisa for initiating explosion
of the charge; a passageway (barrel) for conducting the explosion products
7*
i.
♦%
i
i
TABLE 8
COMPARISON OF NICABTA AM) NYLON CASE TRANSDUCEE
TRANSIT TIME VELOCITY DATA
Charge Weight, grains
Case Thickness,
inches
Charge L/D
Batio
Wave Velocity, inches/aicroseconds
Micarta Nylon
5.5 0.063 1.3 0.0170 -
5.5 0.250 1.3 0.0188 -
13.5 0.063 2.7 0.0300 0.0273
13.5 0.250 2.7 0.0247 0.0227
13.5 0.063 1.0 0.0285 0.0314
13.5 0.250 1.0 0.0215 0.0189
50 0.063 k.O 0.0324 0.0408
50 0.250 4.0 0.0259 0.0313
50 0.G63 1.0 0.0337 0.0408
50 0.250 1.0 0.0223 -
75
;wiii -iiiiwii^wiiii ̂m
mim mmmßmammmm —7» 1^^
i
i
1 C ?: S
I
I
s es
a o
•H
a
u 01
■p u 2 o
I •a i-H o u
0)
cu u
•H
76
Si ,« ■■
■
v
- - ■
4
into the coabuator to be perturbed and a burnt-diaphragn, pre-explosion
closure for that passage. The pulae-gun assembly ia attached to the c
buator with a threaded connection that has a roopression seal. The ex-
perimental arrangement used in cold-characteriaation firings ia shovn
schematically in Fig. 17b.
There are two difference breeches: one acoepta caliber .38 Special pistol
cartridges which are uaed for 10- and 15-grain charges the other accepts
caliber .300 Magnun rifle cartridges for 20-grain and larger charges^.
Standard center-fire primers are uaed to initiate explosion of the charges;
these are fired by impact witL a firing pin, which is driven, in turn, by
combustion gases from a small, electrically initiated primer**.
nie pulse-gun barrel design was modified to accommodate pressure tranaducers.
A modified barrel having the same length aa the standard barrel (Fig. 17a)
ia shown in Fig. 18a. In the first firings, with the gun discharged into
the ambient air, the blast wave had not coalesced into a well-defined,
steep-fronted shock wave by the time it passed the last tranaducer location
of that barrel. Therefore, a longer barrel was built, having a total length
equivalent to the longest blast-wave travel path in the subsequent rocket
motor firing program. This longer barrel deaign ia detailed ia Fig. 18b.
In the barrel, tranaducer ports were centered at distances of 1.44, 3«72,
and 6.00 inchea downstream of the seating surface for the burst diaphragm
flange.
^Maxinau charge weighta of 80 grains were uaed in this program. Even larger charges have been uaed with larger breechea at Aerojet-Gcaral Corp. (Ref. 4). The resultant combustion chamber disturbance amplitudes were found, however, to be related to the fraction of the breech volume occupied by the explosive charge ao that smaller disturbances resulted from 160-grain charges that filled only 63 percent of the breech than from 80-grain chargea that filled 88 percent of the smaller breech. These data were obtained with a single burst-diaphraga rating (20,000 pai).
**The Bermite MK113 Primer designated in tte pulse-gun specification ob- tained from AFRPL, was replaced after about 16 charges were fired with a similar primer that was available as surplus equipment from another program. This change had no observable effect upon the behavior of the
77
1 J-r 1-1-4-4 I ttl
i ■s a 1 JO I "2
a
W
^ £
<s
■
'S
•o ^
ao
i
78
•
MHAiiHl
si
m ;•
I
Burst diaphragms having 7300-, 10,000-, and 20,000-psi pressure ratings
were purchased from Fike Mfg. Co. The diaphragms served the triple function
of protecting the charges from exposure to combustion-product gas tempera-
tures, prohibiting explosion products to escape from the breech until the
charges were nearly completely burned, and forming a shock wave to initiate
the pulse.
Pulse Charges. A fast-burning, double-base, smokeless pistol powder (Hercules
Bullseye No. 2, or equivalent) is designated in the pulse-gun specification
received from AFRPL. This specification was adhered to for the majority of
the pulse charges fired, both in the cold-characterisation and hot firings.
One of the desired evaluations was the effect of explosive type on the char-
acteristics of the gun. Several charges were tested, therefore, with a dif-
ferent explosive.
Some consideration was given to using a high explosive for the change in
explosive type. This idea was soon rejected because of the possibility
that the breech might be ruptured before the diaphragm could break and
provide pressure relief from a highly brissant explosion.
It was desired to evaluate the effect of a substantial change in the ex-
plosive burning rate. The characteristics of commercial powders were ex-
amined, and it was found that a larger change could be effected by going
to slower burning powders. Among Olin powders, for example, WC230 (com-
parable with Hercules Bullseye No. 2) has a relative quickness of about
3 in comparison with WC846 (a 7.62-millimeter NATO military cartridge pow-
der and Olin's standard of comparison), while their fastest burning powder,
WC Blank, has a relative quickieas of about 10. There are some rifle pow-
ders that burn even more slowly than WC846 so changes by a factor of 5
or more could be made by using blower burning powbers and by a factor of
only about 2 by using faster burning powders. It was decided, therefore,
to select a slower burning powder. A check of those available locally
led to the selection of duPont Military 3031 which has characteristics
comparable with the Olin WC846 referred to earlier. Because the slower
burning rate is partial}v achieved by reducing the percentage of nitro-
glycerin, the heat of combustion of the duPont Military powder is only
79
- • tm
!
, .*?r±
•bout 70 percent that of Her col •■ Bull «eye powder. For comparable charge
veight, therefore, the change in powder should be expected to give reduced
preasure amplitudes.
Charge «eights tested were the same as those used by other investigators:
10- and 13-grain charges loaded in caliber .38 Special cartridges and 20-,
30-, 40- and 80-grain charges loaded in caliber .300 H&H Magnum cartridges.
The blaat-wave magnitude may be predominantly controlled by the charge size,
hut is also influenced by the burst-diaphragm rating, particularly if the
powder is only partially burned when the diaphragm ruptures (Ref. 5)- For
that reaaon, both charge weight and burst-diaphragm strength are quoted in
apecifying a pulse charge.
To avoid confusion in presenting and interpreting data, a more completely
descriptive charge nomenclature is used in this report: each pulse will be
identified by the base charge weight, powder identification, and burst-
diaphragm rating. As illustrative examples, IJHB/lOK designates a 15-grain
charge of Hercules Bullseye powder with a 10,000-psi burst diaphragm, and
40 duIM/iZOK designates a 40-grain charge of duPont Military powder with a
20,000-pai burst diaphragm.
Inatnmwntation. Because the transients involved during testing required
instrumentation having the highest frequency response available, a search
was made to obtain components permitting high-frequency response compatible
with good precision and reliability in the explosive environment. This
led to the selection of the Kistler 607L pressure transducer which has a
range of 0 to 30,000 psi, and good linearity. Its natural frequency is
approximately 130 kc.
The output of the transducer was amplified by a charge amplifier flat to
130 kc. Primary data records were obtained by photographing the outputs
of two such transducers displayed on an oscilloscope. The two pressure
signals, together with an amplified temperature signal were also recorded
simultaneously on magnetic tape. The magnetic tape provided backup in
caae of malfunction of the oscilloscope, and also permitted more versatile
analysis and data reduction after the tests.
80
The frequency response of the primary pressure measurcaent system was Uni-
ted by the natural frequency of the pressure transducer (130 kc), since the
oscilloscope and charge amplifier have flat responses shove thst frequency.
The tape-recorded data were limited in frequency response to 100 kc by the
electronics of the tape system. For this reaaon, leading edges of pressure
traces were analyzed uaing directly recorded oscilloscope traces only.
The pressure tranaducers were installed in the outermost two transducer ports
of the pulse-gun barrel (Fig. 18) in all tests. A 3-mil, chrome 1-alumel thermo-
couple was mounted in the middle port; the thermocouple tip was recessed ap-
proximately l/l6 inch to avoid damaging it with burst-diaphragm and charge-
cartridge fragments. The response time of the thermocouple was quite long,
on the order of l/k second; nevertheless, it proved to be useful in identi-
fying explosion product leakage past improperly tightened or cleaned diaphragm
seating surfaces.
Experimental Procedure
It was originally planned to fire a total of six charges from each charge
category with the six charges distributed as follows: (l) one charge fired
into open air, (2) three charges fired into a 30-gallon tank contaiiing gaseous
nitrogen at ambient temperature and 150-psig back-pressure, and (3) two charges
with a back-pressure of 250 psig. A typical test sequence involved the fol-
lowing steps:
1. The components for a pulse-charge assembly, consisting of one dia-
phragm, one loaded cartridge, and one sqv.ib, were obtained from
storage, and the pulse gun was thoroughly examined.
2. The primer chamber, firing pin assembly, and diaphragm seating sur-
faces of the pulse gun were cleaned, and the hardware waa inspected
for damage resulting from previous firings.
3. ie diaphragm, cartridge, and primer were installed, and the pulse
gun assembly was mounted in the receiving tank.
k. The transducer lines were connected, the pressure in the receiving
tank was adjusted to the des "ed value, the electronic instruaien-
tation was checked and the pulse gun was fired.
81
-
'■V J
{taring the coarse of the firings, certain difficulties and problem area«
were encountered repeatedly. Theue are listed in «one detail to provide
infomstion which nay prove helpful in future pulse-gun firings.
1. The weakest coaponent in the pulse-gun assenbly was the firing
pin. Three firing pins were lost because of severe cracks in
the body of the pin. Two firing pins jaraned within the obdurator
dirk during the early firings. No solution to the cracking of
the firing pins was found, but the janming was apparently
elininated by a careful cleaning of the pin and holder after
each firing, combined with a careful alignment of the pin within
its enclosing cylinder during the pulse-gun assembly. Future
pulse-gun designs might be improved by lengthening the piston
portion of the firing pin to improve the alignment.
2. Daring the first firing of the larger charges (40 to 80 grains),
it was noted that some runs showed leakage of combustion gases
under the seating surface of the diaphragm. This was first
discovered by examining the thermocouple trace and comparing it
with that of the upstream pressure transducer. In cases where
leakage occurred before rupture of the diaphragm, a definite out-
pat from the thermocouple was noted before the upstream pressure
step appeared. In severe leakage cases, the leakage was also
visible on the upstream pressure trace as a small pressure pulse
visible before the large pressure step caused by diaphragm
rupture (Fig. 19). Leakage was practically eliminated by care-
ful attention to the cleaning procedure used on the seating
surface and by using a methodical tightening sequence during
pulse-gun assembly.
?. Examination of pressure traces from several firings showed con-
siderable ringing in the pressure transducers before rupture of
the burst diaphragm. Apparently this was caused by the mechanical
shock transmitted to the body of the pulse gun by the actuation
of the firing pin. In some runs showing an unusual amount of
ringing before diaphragm rupture, it was found by later examination
82
(U
■
t^ u
100 microjM'o cm
8
?l
a. An »0 IID/2GK Charge
200 microsec/ci
E u
O
:
b. A 40 dum/20K Charge
Figure 19. Examples of Pressure Surges Before Burst Diaphragm Rupture
83
- • ■ m* Ill l^^llJ--^^- *££
4.
of the pulse-fun aasMibly that th« firinf pin exhibited conaiderable
friction within ita containinff cylinder that apparently retarded
conpletion of ita noraal atroko. Roplaceaont of those firing pina
reiulted is a aaoothor preahock trace.
Italao-ffai firinfi into the receiving tank resulted in conaiderable
postrun ribration, which often looaened the pressure transducers in
their Bounta. It was necessary to check the transducers after every
firing to see whether they had become looaened by vibration.
E»pari»antal Baanlta
The aajority of the inforaation obtained fron pulse-gun firings is derived
fro« the recorded pressure-tine data. In thia aection, examples of these
raw data are presented and diacuaasd, and tabulations of the data reduced
from them are given.
Typical examples of prefsure-time traces obtained with the standard charge
catogorioa tooted are ahown in Fig. 20. With the exception of Fig. 20c,
all records wore photographed directly from an oscilloscope. The record
of Fig. 20c waa obtained from playback of tape-recorded data from the same
firing aa that ahown in Fig. 20b. The reduction in reaponae incurred in
the tape-recording process, using available equipment, is apparent. Addi-
tional examplea of nonatandard combinations of charge weight and burst-
diaphragm strength appear in Fig. 21, and three of duPont Military powder
charges are ahown in Fig. 22.
Many points of similarity can be discerned among the oscilloscope data aa
well aa a few points of diaaimilarity. There are alao some unexplained
phenomena. In discussing these data, the same convention will be used aa
waa earlier in presenting bomb data: a numerical subscript of a para-
meter denotes distance from the source, in thia instance, downstream of
the burst diaphragm. Thus P. .. ia the static pressure at a position 1.44
inches from the diaphragm, and ^. ,,, is the blast-wave transit time
between transducers located at 1.44 and 6.00 inches from the diaphragm.
84
Mi^itab
.. -.■ , ,,..-.. ■-;
m
< Wilt
^—^—
MM
o u b
M
i a" 8
B o o 0* c o o
8
■V^"- OfiBT ■a/t«d QOfiZ
a u u ■ o u u
•H
8
/ltd fi29 ■o/ttd ofiSl ^x*^«BTXojddv
L^
a> B IS
B o
5
o
a m EH rH
b to
i u M O
o a» ■ o u
•H B O I
r
a h 6 5 ü U •
m w o O 14 CJ u ^^^ -H
a a o o (N 8
.^ fc a •»< • ä s ■ vO • or u a t» h u H a h ■
• S. 55 Sf ^g? J HSi u •• h o
K 4) -P M 1: > o s g^fi
cs
a o
55 O 0)
U o • o
Pi •-*
i|
0)
o
o 8
3
■9/i»d 06S9
a u « « ■ o u o a
I o
SiS * A*5 fc. • i §0 U £:
'S 1 S-8 i <S£ • M • si ■ i
is
j ■a/T«d 00fi*8I i
ta/xwi QOfiZ 85
e
m 1 ■■

900 mierufc/t
l.kk
r6.00
rl.U
r6.00
a. A 20aB/7.5K Chaifc
■ e
§
b. A 20 BB/1QK Charge
c. A 20 HB/20K Cbarg«
Ficarc 21. Bnmla« of Ailae Gun Blast Ware» Pro« New Weight and Diaphrag« Stra^th C«Äl»atloM
86
■ e
-m
m*m^ .... .
—^
i
r 4
A. Pi pi0
87
rhe aoit obvious point of •iailarity among the presiure tracts is the
apparent occurrence of two shook waves. This is most clearly seen with
the larger charges, hut is readily identified with the smaller charges
as well. The initial steep-fronted pressure rise is undoubtedly a ahock
wave resulting from the burst-diaphragm rupture. A se end, sometimes less
steep-fronted, pressure wave follows the initial shock wave. The secondary
ware usually propagates faster than the initial wave (and thus tends to
overtake it), and often is seen to steepen between the 1.44- and 6.00-inch
transducer positions.
The mechanism by which this secondary pressure wave is produced, has not
been established; certainly it must come from within the pulse-gun breech,
since the wave propagates in & downstream directicn. At first it was
thought that the secondary pressure wave resulted from shock reflections
within the pulse-gun breech, e.g., an init.al explosion wave reflected
from the burst diaphragm before it ruptured and subsequently reflected
from the primer end of the effectively empty cartridge. This interpre-
tation could not be supported in attempts at constructing a wave diaphragm
because of the variable time increment between the waves. The appearance
of similar multiple waves, spaced at nonreproduced time intervals, in
the low-explosive-bomb pressure records (Fig. 13) offers a strong clue
to the probable cause, i.e., continued burning of residual powder after
the diaphragm ruptures is at high enough rate to produce a succession
uf pressure wavelets which eventually coalesce into a second shock wave
as ^hey propagate down the gun barrel.
Another point of similarity is the essentially constant duration of the
positive pressure portion of the pulses, regardless of charge size,
burst diaphragm atrength, or breerh volume.
The initial shock wave is recorded with a total rise time of approximately
4 to 3 microseconds. (This is not apparent on the traces reproduced here,
but was observed on direct oscilloscope photographs with farter oscillo-
scope beam sweep rates.) The measured rise time may be limited both by
88
' *
— _— •• -J--
the natural frequency of the transducer and by the response of the
transducer when a plane pressure wave propagates across the finite width
of its sensing surface. The transducer limiting rise time is only slightly
less than k microseconds ([(2)(l30,000)]' ) and, at the measured initial-
wave velocity, the wave takes approximately 5 microseconds to cross the
transducer face. Within the ability of the transducerti to resolve it, then,
the initial wave is indicated to be a pressure discontinuity or shock wave.
The precursor disturbances resulting from pressure-wave transmission through
the pulse-gun structure are particularly evident in Fig. 20s and 20d
Transducer ringing at the natural frequency of 130,000 cps appears to be
worse with the smaller charges because of the greater gain used in recording,
but is probably not actually of any different amplitude than with large
charges.
Data reduced from the pressure-time records are: initial-shock amplitude,
maximum-pressure amplitude, positive-pressure duration, total impulse, and
initial-shock-wave transit time between transducers. This latter value is
used to calculate an average wave velocity. These data, for all firings made,
are presented in Table 9'
« To give J qualitative feeling for the pulse gun data before proceeding with
the correlation, plots of two complete sets of data are shown in Fig. 23
and 24. Both plots are of the maximum blast wave pressure from "standard"
pulse charge designations, and both show data obtained with three different
downstream backpressures. Figure 23 shows data from the transducer located
l.kk inches downstream of the burst diaphragm, while the data in Fig. 24
are from the 6.00-inch position.
The only correlating line shown in Fig. 23 And 24 is that reported by
Peoples (Ref. 5) at Aerojet General Corporation for data obtained with
pulse guns fired into the open air, using a transducer location comparable
with the 6.00-inch position of Fig. 24. The effect of explosive charge
89
-- ■;
' M " ■ " ^'.
I
i
i
i I pa
lliii mi mmr i ^H?III'8HI?|
1 " w
4 1
S t »f 1 I i I i i I«*KS«£SI i \ i n p- r. r- ft z \ tt a $ t nl
m »Ml iiisssi > i i i^-?i f i i iM§ 8
m 0S \
1 H 1 i i i S 11 = 11 i i i B1 S S S 1 & i 8 K S s i oooe • eeoeoo oodoood dddddl
[ill« iSISi ' i i i • > SiSIH i fSISMI >mu\
h SSIS HSHi' i •IMiüMHul
m 1111 i i i i i i i 111S | H i i i | i 1 § 1 i 1 i 111 i ll
\m 1111; 111 i i i i $ i s s 111 i i2ssi!S!i«iXfi«Kx a>d*dj J| oddded ddddddd dddddl
p IIHIIM'JHIIIHyilinHIISIIiid
h |i§lj,|, , , , .|§||i?' i ifHIHI'iliiS
\m s e! s 11 e 11111 s s s s g»111 ? ? e s e g g 1 ? ? * ? g
1! uijinililjinniii in J in J mini
'1 \ i i i H »asa-"a2Ess »SBRRJSRitRRSSRSs«« «RR
90
,>*%*
' , ■
:
. •
C\ 'S
4 i
«ill
• " 9 ■
.% -,«}1
3 It -rill
«liJ
-Jii fli
iiii 1! !1 si
MISII' :5|S|?5!J8äS?|n?ISS
s i*ss*£i i iFus^ssjg'-sjagsssJiepj
I i S|l|l i i i 8§l8SS8§ig8||§iilil
i i2?gSgi i : K S £ g F I = k" « I 11 IB 5 § 1 a S ooee OOOOOOOOOOOOOOOOOQ
e, e e r g x, , § i K § § s s § g! s n n i m i , -•. ■-. -. -. -. i • i M f< M * *
*. i S I MJ. i i i * * 11 * S ? I * ! S II I. i S i ? I 8
! > l§l|! ! i ' iM'MclHlliiy III
£ i SSSS! i i i *l~£*s;;ä8li3i§2SSgg o o - o eooeeoooo
M. M. £ M. M. 18. 8 S 8 8 i 8 8 8 I 8 8 ß S i X 8 8 8 r~ o a « «SKRRRR-,''''<--Me,,,,',"wS
E , 8 S £ U , i , 8 M 8 U X S 8 & 8 E 3 S S 3( X f X r* ir rs ir« ITS M 1^ «N M M « - - ^
iiiininiiifiuiiiifijijifif
i I mnmm * t R J( ? S S C S r- ? R ' 9 8 S S = 9 S S I I I I ! S S
il • i »J Is tl
if II in iJil
Ji II tl ii
I i" till — « ^
I
91
94000
89,000
19,000
10,000
3
3 (ft
1 Hi > o
^ J
(ft < 1900
0 ISO-MI« BACK PflESSURE IN RECEIVING TANK A MO- Ml« BACK PNESBURC IN RECEIVING TANK O FIRED IN OPEN AIR
10 20 90 40 CHARGE SIZE IN GRAINS
Fipurc 23. Maximum Dlast Pressure Amplitude at l.'j'i Inches From Pulse Gun Durst Dinphruga
92
i '-«.^i, ■
■iWMMpr- r--., .
20,000
15,000
10,000 9000
CM
CD -I
UJ Q£
HI DC 0. oc
ä
1000 20 SO 40
CHARGE SIZE IN GRAINS •0 100
Figure 24. Maximum Blast Pressure Amplitude at 6.00 nclies From Pulse Gun Durst Diaphragm
93
vtight on MUiiBnB pressure in the current data fro« the 1.44-inch position
appears to parallel the Aerojet correlation hut with about 50 percent
higher aaplitudes, while the effect at the 6.00-inch position appears to
bo grossly distorted. This waa a surprising result. That appearance was
not restricted to the aaxiaus pressure aaplitude data, however, because the
ease type of currature waa seen in siailar plots of initial shock wave
aaplitude and of total iapulae.
As a further check of the validity of what Beeaed to be a discrepancy
between the two sets of data, the pressure transducers were recalibrated
after all but nine of the firings had been made. The recalibration data
fell within three percent of the factory-supplied calibrations and exhibited
excellent linearity. It was concluded that the apparent data distortion
at the 6.00-inch position was a valid characteristic of the data.
Data Correlatiena
Variables Considered in the Correlation. The primary pulse gun parameters
varied in the cold characterisation teats wer«:
1. Charge Weight, V (grains)
2. Powder Type, FT
3. Diaphragm Burst Pressure, Pdb (lOOO's of psi)
4. Pulse Gun Barrel Length, X (inch)
5. Back Pressure, Pb (psi)
Hie distance D from the diaphragm t' each of tho two transducers was also
oonaid'ired in the analyais. The output data used as the dependent variables
were:
1. Maximum Bläst Pressure, P^ (psi)
2. Positive Impulse, I+ (ibf-sec)
3. Velocity of the Initial Shocks, c (ft/sec)
94
- -v» V1« - "-'■•-'*■■«.-
The response is the aaplitude of the higher, and ordinarily the second
of the two pressure peaks neasured at the pressure sensors in the pulse
gun barrel. Unit positive impulse was obtained with a planiaeter in the
same way as for the boabs. Because the blast waves were confined, rather
than expanding spherically, the integrated values, Eq. 4 , ware ■altipliad
by the cross-sectional area of the pulse gun barrel. The correlated values
were thus total positive impulse. The velocity was obtained from the
transit time between the transducers located at 1.%% and 6.0 inches.
A fourth response parameter, the positive duration, was not analyzed
quantitatively. It is fairly clear that the positive duration data, as
given in Table 9, behave essentially the same as for the bombs; that is,
there is only a very weak correlation with charge weight.
Correlation of Peak Pressure. Hie multiple linear ragiession techniques
described in Appendix A were used to obtain eapirical models to fit the
peak pressure data. The correlation included all of the available peak
pressure data for Hercules Bullseye powder except the few data obtained
with the short barrel. As for the bosi) data, the averages of the responses
for each aet of conditions were used, rather than the individual data
points. The final model obtained is the following:
ln p-., - 8''2 - 1'5* In W ♦ 0.32 (in W)2 +0.15 In W In D -
0.06 (in W)2 In D ♦ 0.19 In W In Pdb ♦ 0.008 (la Pj2 (16)
A total of more than 98 percent of the variation in In (P _ ) i« now
explained by the right-hand side of Eq. 16 with a standard deviation of
0.093 about the regression line. A cursory examination of the peak pressure
data for fixed transducer diatance and back pressure (Fig. 23) shows that
the logarithm of peak pressure is essentially linearly related to the
logarithm of charge weight. This simple apparent relationship leada one
95
. . ■•■ -J ( ■' t
—
^
to qocation th« coaplexity of the aodel given, and in particular the
preaenca of the tonn in (in V)2, (in V)2 In D, and In V In Pdb, One
poaaible explanation for the appearance of theae terns in the model is
that the refreaaion ia spurious and the extra terms are effectively
"explaininf" what ia in reality randoa fluctuations in the data. A
preponderance of available evidence, however, indicates that the func-
tional relationahip between In P and In V ia actually, though only
aoderately, curved. Figures 25 and 26 are logarithnic plots of the
average valuea P^^ against V for the tranaducera at l.kk and at 6.00
inchea reapectively, and for a back pressure of 150 psi. Since three
rated atrengths of burst diaphragms were used, the data ahould fall on
three different parabolas according to Eq. 16. The fit, especially for
the 20,000-pound burst diaphragm rating is excellent. Note that although
the quadratic term in In V ia smaller at D - 6.00 than at D - 1.44, the
linear tana changea enough so that the curvature is greater at the longer
distance. It now aeems clear that the apparent anomaly of the nonlinear
behavior at 6.00 inchea may be accounted for by the curvature with charge
weight and the effect of the burst diaphragm.
The maximua charge weight used in the program was 80 grains due to the
limitation in the brooch size of the pulae gun. As noted previously,
larger chargea have been used with larger breeches at Aerojet General
Corporation (Ref. 5) which reaultod in an apparent relationahip between
conbustion chamber diaturbance amplitudes and the fraction of the breech
voloao occupied by the explosive charge.
Two brooch sises were also used in the current program, but the character-
ization testing reveals no effect of breech site. The 10- and 15-grain
chargea were fired in the smaller breech; if there were a breech-volume
effect, reaults using these charge weights would have been higher than
would bo expected by extrapolating back from the larger charge sizes.
Because the results ware lower, we conclude that either there ia no
breech-volume effect or it ia completely masked by the effect of diaphragm
burst pressure.
.
■

00 -I
UJ
a. a: UJ
§ i-
< -I CD
30,000
25,000
20,000
15,000
M 10,000
CHARGE WEIGHT, GRAINS Maximuin Blast Pressure Amplitude at l.kh Inches From Pulse Gun Durst Diaphrogn. (llercuics Bullseye Powder)
97
'^*^wpK ^|W3^P^^
30.000
»,000
20,000
15,000
10,000 M
~ »000
9 6000
9000
4000
3000
2500
2000
1900
< J a
A <
A Y 1
/
y J s
J */\
►.COOPSII IURST DIARMR MM
S \
IA »«1
\^i i^p^ 79001
1
kMB
be00**^
CORRELATING LINES 1 ARE EO 16 r
1000 10
Figure 26.
20 30 40 60 60 100
CHARGE WEIGHT,GRAINS Naximn Blast Pressure Acplitudc at 6.00 Inches Fro« Pulse Gun Diaphragm. (Hercules Bullsoye Powder, lUO-psi Backpressure)
■
♦JJIfljq^ A||h% ■
Correlation of PoaitiT« lapoltt. A logarltlMic «ode! of the for«
In I+ - -6.*3 ♦ 1.78 In W - 0.11 (la W)2 - 0.28 In D ♦
0.123 In R (Bq. 17)
woo found to be ■otiofactory for ostiaatinf pooitiv» inpaloe. Again over
98 percent cf the total Tariation in la I io explained by the teat input
pariuaetera in Eq. 17. A atandard error of 0.067 about the regreoaion line
waa obtained.
As was the case with the boafct, a very good fit of positive iapulse was
obtained with a very aiaple nodel. Particularly striking ia the fact that
the effect of charge weight doea not interact with tranducer diataaco.
unlike the peak pressure data, for which the curves at the two distances
actually cross and have different curvatures, two parallel curves are
sufficient to fit the poaitive iapalse data (Fig. 27 )
While the inclusion of MM (in W)2 tera ia Eq. 17 iaproves the overall fit
of the data, there are aoiee iadicatioaa that thia tern ia tht correlation
aay be apurioua. First, tLc data at the high «ad low ends ol the curves
are fit just as well by straight lines which can be visually fit to the
data aa by the regression curves. Second, the direction of curvature is
opposite that observed for peak pressure. At asy rate, the «■aunt of
curvature ia ao alight that the deviations froa linearity are probably
not of any real iaportance.
Correlation of Velocity. A comparison of Fig. 28 with Fig. 25 through 27
ahowo that there is auch aore variability in the velocity data than in the
p*ak pressure or positive iapulse. It ia therefore not possible to develop
a aodel which is physically aeaningful and which fits the data well. The
best aodel obtained fit only the larger charges even approxiaately:
In cs « li.l - 1.9* IhW + 0.130 (in ¥)2 - 0.149 (in Pdb)
2 + (18x
0.411 In W In Pdb - 0.0549 In Pb
99
* .
10
1.00
0.80
060
0.40
(0 a 0.30
Uj 0.25
| 0.20
UJ
% 0.15
M < -1 a
0.10
0.08
(
x\ TRANSOUC FROM BU
.ER 1.44 INCHES RST DIAPHRAGM—^
1 J
/
/
A
\ /
y\
/ /
/ /
A <A Y
/ /
v. 00 INCHES
Lr > /
i
f/ /
0.06 CORRELATING LINES ARE EO 17
0.04 15 20 30 40 60 80 100
CHARGE WEIGHT.GRAINS Figure 127. Impulse From Pulse Gun Blast Waves. (llcrcules
Dullseye Powder, 150-pai Dackprossure)
100
yn
8000
^
7000
a ^ 6000 u.
Ü o UJ 9000 >
o o I 0)
g 4000 < tu >
r
3000
2000
y ^
^ >
< > y /
. < -E0 18 FOR t ) ^ ^^ 20.000 PSIA
BURST
** ****^ ' b DIAPHRAGMS i
i ) 6
10
Figure 28.
15 20 30 40 60 80 100
CHARGE WEIGHT.GRAINS Average Velocity of Initial Shock Wave in Pulse Gun Barrel (llcrcules Bullseye Powder, 150-iJ8i Backpress "o)
101
r
L
■nam mmm MM wnm»
Inltlfl Shock Wart Pretiure. In addition to the maximum peak presiure
(tht amplitude of the aecond preaaure peak), data on the initial shock
ware preaaure v«ie reduced from the photographic recorda. These are
plotted aa a function of charge weight in Fig. 29 and 30 for transducers
at l.kk and 6.00 inches, respectively. Since the initial ahock wave
pressure data are ao aimilar to thoaa for secondary (maximum) peak
pressure diacussed earlier, no formal correlation vaa run. Several
pointa of similarity and diaaimilarity will be noted in a qualitative
faahion.
The general functional form of the initial shock wave preaaure relation-
ship ia obviously quite similar to that for maximum peak preaaure. For
small chargea, the two pressures are nearly the same; however, for higher
charge weighta, the maximum peak ia greater by a factor approaching 2 for
150 pai back pressures. The curvature with In W for fixed P.. and P. is
more pronounced in the initial ahock wave preaaure data. The effect of
burst diaphragm appeara to be about the same. Finally, there is some
evidence that the initial pressures are degraded more by an increase in
back preaaure than are the maximum pressures.
Raaulta Vith duPont Military Powder. A total of 10 pulae gun charges
uaing the alow-burning powder (duPont Military 3031) vere fired during
the cold characterization portion of the program. Because few data were
available, the results were not correlated statistically, but qualitative
observationa may be made for plots of the data. Figurea 31 through 33,
which are analogous to Fig. 29 through 28,contain individual valuea in
the reaulting data rather than averages. In generrl, the reaulta were
aimilar but of appreciably lower magnitude.
With the duPont Military powder, a diaphragm of 10,000 pai rated burst
pressure waa used with a 20-grain charge and 20,000 pai diaphragms were
used with charge weights of 30, 40, and 80 graina. Once again the effect
102
*m ^
....
■
.
-
i spoor
i IOOO 10
Figure 29.
16 20 SO 40 6C
CHARGE WEIGHT .GRAINS
80 100
Initial Shock Wave Prcssiu'c Amplitude at l.kk Inches From Pulse Gun Burst Diaphragm. (Hercules Bullseyc Powder, l^O-psi Backpressure)
103
'■■f
• 1.
ISjOOOr
(M
lopoo
•000
CD _J •000 UJ Qf 6000 3
w UJ 4000
ac
% 3000
»-
3 2500 -i OD
axxMf
1900
1000
Figure 30.
»20 30 40
CHARGE WEIGHT .GRAINS
Initial Shock Vovo Pressure Amplitude at 6.00 Inches From Pulse Gun Diaphragm (Hercules Bullscye Powder, l^O-psi Backpressure)
10'*
m
v* *
-
«*«
I
20 30 40 60 CHARGE WEIGHT. GRAINS
Figure 31* Maximum Pulse Gun Blast Pressure Amplitude (duPont Military 3031 Powder, 150-psi Backpressure)
105
a^m-. *
'
CHARGE WEIGHT. GRAINS Figure 32, Impulse From Pulse Gun Blast Waves. (duPont
Military 3031 Powder, 150-psi Backpressure)
!
• 106
&
.
7000
ö 6000
5000
>-
o o
>
O 4000 X
w
r J| 3000
2000
o
■ «
0
i ! < >
)
>
c
<
>
>
10 1 5 2 0 » 3 41 D 6 0 • > n 0
f!
CHARGE SIZE,GRAINS Figure 53. Average Velocity f Initial Shock Wave in Pulse Gun
Barrel (duPont 3031 Powder, l^O-psig pressure)
107
i
BHi
of charge vreigut on peak pressure for fixed diaphragm rating is slightly
curved on a logarithnic plot, and the effect of diaphragm rating is also
noticeable. The consistency of the duPont Military powder peak pressure
data with that for Hercules Bullseye powder gives a corroboration with
independent data of the functional font used earlier. Superpositico of
the curves for maxinn pressure amplitude, Fig. 31 , shows that, as with
the Hercules powder, the difference in peak pressure between the trans-
ducers at 1.44 and 6.00 inches is appreciably greater at the higher
weights. Ibo aaplitudea of the pressure wares with the slower burning
duPont powder is in general less than half those with the Hercules powder.
The slop« of the In W ra In P plot is slightly greater, so that the
effect of charge weight is f lightly greater with the duPont powder.
As before, the impulse data appesr to be quite reproducible and easy to
interpret, with parallel lines serving to model the impulse at 1.44 and
at 6.00 inches. The impulse values are lower by a factor of about 2-1/2
than these for the faster burning powder. There is a slight suggestion
of positive curvature of In I for the largest three weighto. The velocity
data are once again quite scattered. There is no indication of any effect'
besides that of weight. The velocities are about 1000 or 1500 ft/sec lower.
Finally, initial shock wave pressure plots (not illustrated) show the same
relationship to the maximum pressure ao was observed with the Hercules
powder.
DIRECTED FLOWS OF GASES
The third cosibustion stability rating method investigated consists of intro-
ducing a directed gas flow into the rocket combustion chamber and determining
the gas flowrate (or other characteriatic) at the instant of instability.
The technique haa been found to be most effective when applied to the region
just downstream of the injector, the gas flow may suo be more effective if
directed tangentially or chordally rather than radially acroas the injector.
Inert gases have been used almost exclusively, although some limited inves-
tigations have made use of both oxidiser and fuel gases (fief. 6).
108
'. o» ■ "
;
m i£äb
11*

Several gas flow control mcthoils have been useJ. lach method containa ele-
ments for Jimitiair the ultimate eventual flowrate (e.g., source pressure regu-
lation), and for controlling the transient flowrate (e.g., a flow control
valve). The simplest method involves rapid actuation cf a simple sbutoff
valve to effect a more or less impulsively initiated flow having constant
flowrate. In an extreme application, the valve may be opened fast enough
that a weak shock wave attends the onset of gac flow into the combustor.
This method provides a single data point for each rocket engine firing so
that multiple firings and staircase testing techniques are required.
A more productive flow control method utilizes slow actuation of a linear or
proportioning flow control valve, so that the gas flowrate increases gradually
in a controlled and reproducible manner. Most often, linear variation of
flowrate with time has been sought; in at least one study, control was for
linear variation of momentum flux with time. In this manner a range of rat-
ing technique characteristics can be covered in a single engine firing and,
potentially, a valid stability rating may a« obtained for each firing in
which an instability is initiated.
The mechanisms whereby an injected gas flow disturbs the steady-state com-
bustion processes to produce a finite amplitude pressure wave and ultimately
initiate a sustained instability are not at all well understood. A concept
that thio technique affects displacement or velocity-sensitive combustion
processes rather than pressure—sensitive processes is rather widely held.
This technique probably accomplishes less close simulation of naturally
occurring triggering mechanisms than do the bomb and pulae gun techniques.
Nevertheless, its potential for accomplishing a quantitative rating in a
minimum number of tests stakes it an attractive candidate for stability
rating work.
109
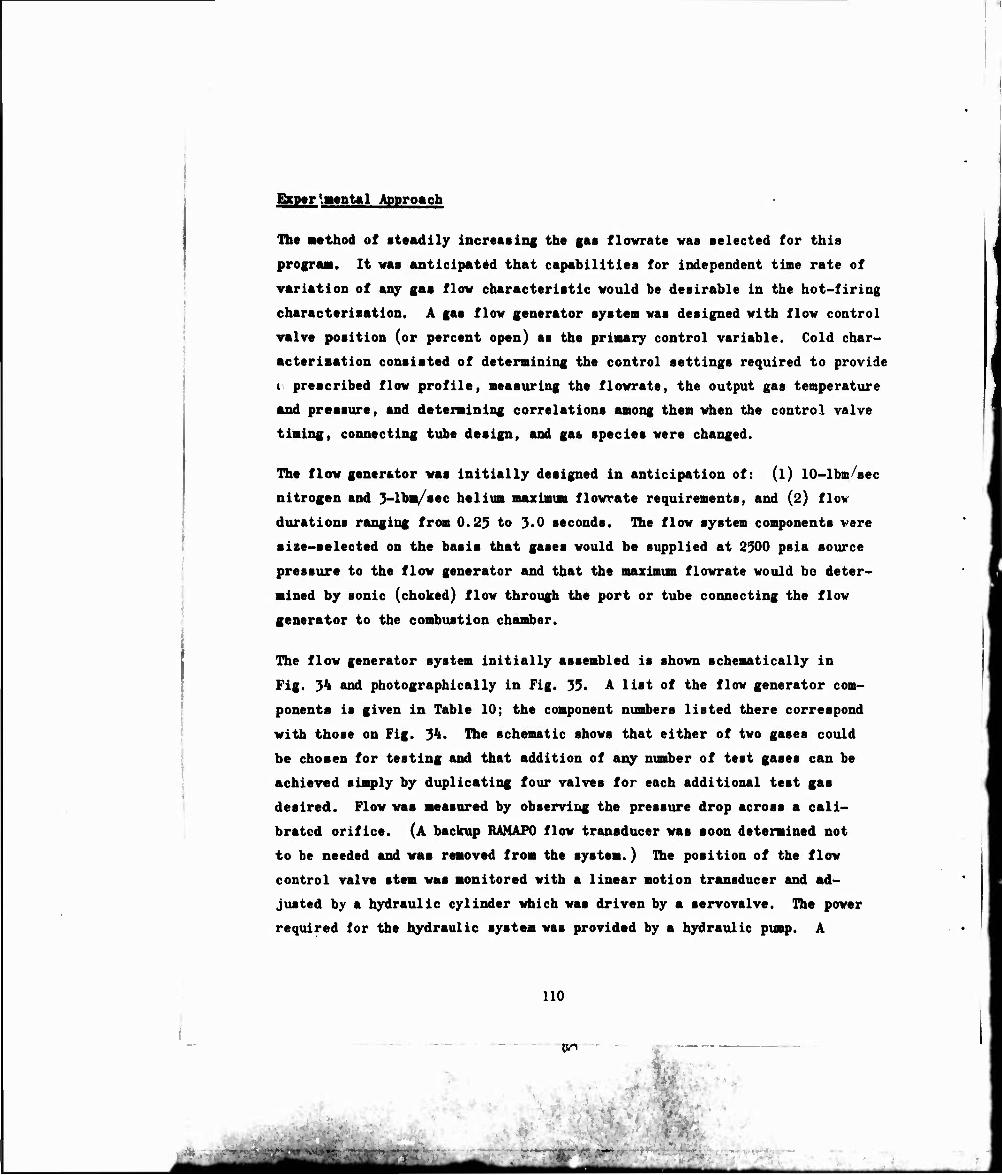
Expr'-tntal Approach
The aethod of steadily increasing the gas flovrate vas selected for this
program. It was anticipated that capabilities for independent time rate of
variation of any gas flow characteristic would be desirable in the hot-firing
characterisation. A gas flow generator system was designed with flow control
valve position (or percent open) as the primary control variable. Cold char-
acterisation consisted of determining the control settings required to provide
4 prescribed flow profile, measuring the flowrate, the output gas temperature
and pressure, and determining correlations among them when the control valve
timing, connecting tube design, and gas species were changed.
The flow generator was initially designed in anticipation of: (l) 10-lbm/sec
nitrogen and 3-lbm/8ec helium mazimm flowrate requirements, and (2) flov
durations ranging from 0.23 to 3.0 seconds. The flow system components vere
size-selected on the basis that gases would be supplied at 2300 psia source
pressure to the flow generator and that the maximun flowrate would be deter-
mined by sonic (choked) flow through the port or tube connecting the flow
generator to the combustion chamber.
The flow generator system initially assembled is shown schematically in
Fig. 34 and photographically in Fig. 33. A list of the flow generator com-
ponents is given in Table 10; the component numbers listed there correspond
with those on Fig. 34. nie schematic shows that either of two gases could
be chosen for testing and that addition of any number of test gases can be
achieved simply by duplicating four valves for each additional test gas
desired. Flow was measured by observing the pressure drop across a cali-
brated orifice. (A backup RAMAPO flow transducer was soon determined not
to be needed and was removed from the system.) The position of the flow
control valve stem was monitored with a linear motion transducer and ad-
justed by a hydraulic cylinder which was driven by a servovalve. The power
required for the hydraulic system was provided by a hydraulic pump. A
110
lyi
«■MMHHMI
•
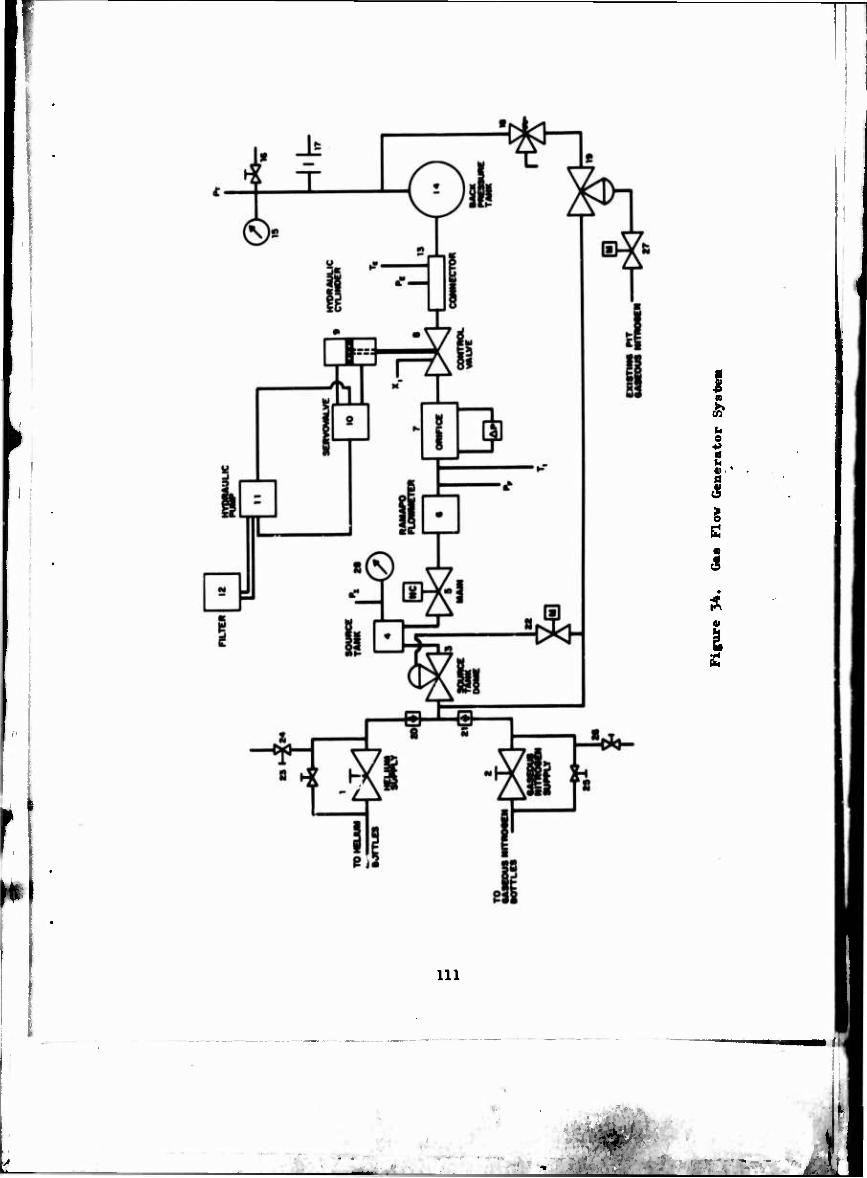
I oo
to U o «
g
■
i
111
«'U
*•
^ /.I*
"
u o ■p
2 S S g
j o
PH
I ■
112
. «
f^'^ ^ -
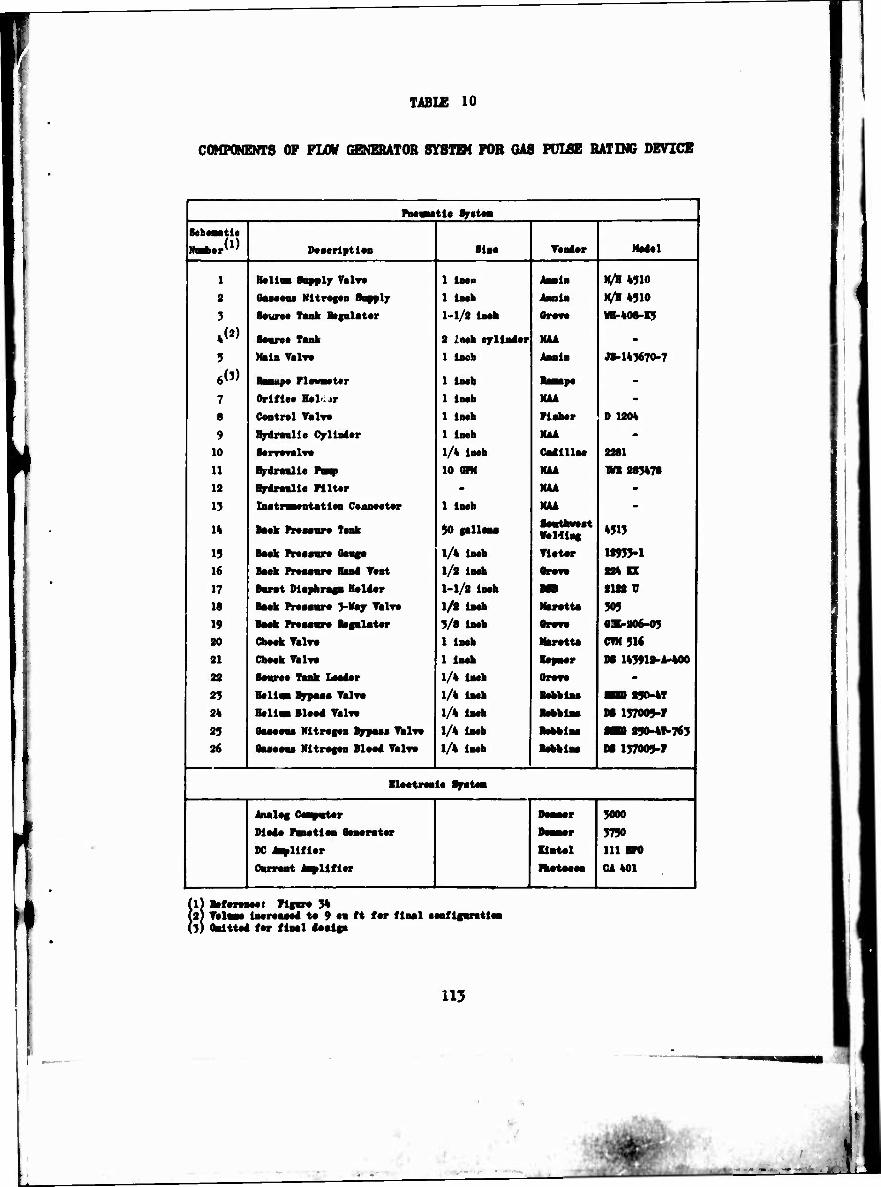
TAB1E 10
COMPONENTS OF FLOV GENEBATOR SYSTDf FOB GAS PULSE RATING DEVICE
fmmm tie fltratea
Behtmtlt
Daserlptlon Siae Teadar Nadel
i bllaa Snpplr Valv« 1 iaen Aaalo H/B 4910
3 Oaaaaaa Nltreftn Bafplj 1 laeb ioaln M/B 4510
5 Saure« Tank Btgalatar 1-1/2 laak QT9T9 W-40S-I9
4(2) Soar«* Tank 2 Inek cfllador NiA -
5 Main Val-r» 1 laeb ADOID JB-143670-7
6«') Um*po TlmimUr 1 laeb BaMpo -
7 Orlflea Hoi. *r 1 laeb MM -
8 Control ValT» 1 laeb Fiaher 0 1804
9 Hrdranllc Cjrllnd.r 1 laeb NAA -
10 1/4 laeb Cadlllae 28S1
11 %dr««aie limp 10 CTM NU «1803478
12 H^raalle Wlttr - NU -
13 InatrawDtatleo Coonaetar 1 laeb NU -
14 Baak Proaaor« Tank 50 falleu Saothveat WoMta« 4513
15 Baak Proaaor« Oaaga 1/4 laeb Tleter 18933-1
16 Baak Proaaor« Hani Taat 1/8 laeb «rave 224 n
17 Borat Diaphraga Bal4ar 1-1/8 laeh BB 8188 V
10 BMk Praaaor« VKaj Valr» 1/8 laeb Ifaretta 305
19 Baak PNaaor« lagolator 3/S laeb ai*T0 081-206-05 20 Chook TalT« 1 laeb Maretta CIN516
21 Chook Vtlr» 1 laek leyaer B0 143910-1-400
22 Sooro« hak laaiar 1/4 laeh VT0W9 -
23 Bell« Brpae« Valro 1/4 laeb Bahbiaa SSBD 290-4T
24 Belloi Bleed Yalta 1/4 laeb Bebblaa B0 137OO9-r
25 Oaaeaoa Nltrogon ^yaaa Ymlr» 1/4 laeh Babblaa BSD 850.4»-7<3 26 Oaaeau Nltrojon Blood Vtl-r» 1/4 laeb Bebblaa 00 137005-?
BleetroD le %at«a
inaloc Coaqrator Oooaot 3000
Wodo Ponetloa Oonorater DoBBor 3750
DC iapllflor Uatal 111 BW
Corroat l^llflor ^k#w##MI CA401
Befanaaei Plgor« 34 rahM laenaaed t« 9 e« ft for flaal «Mflgoratl« telited far flaal doalgn
113
J L.
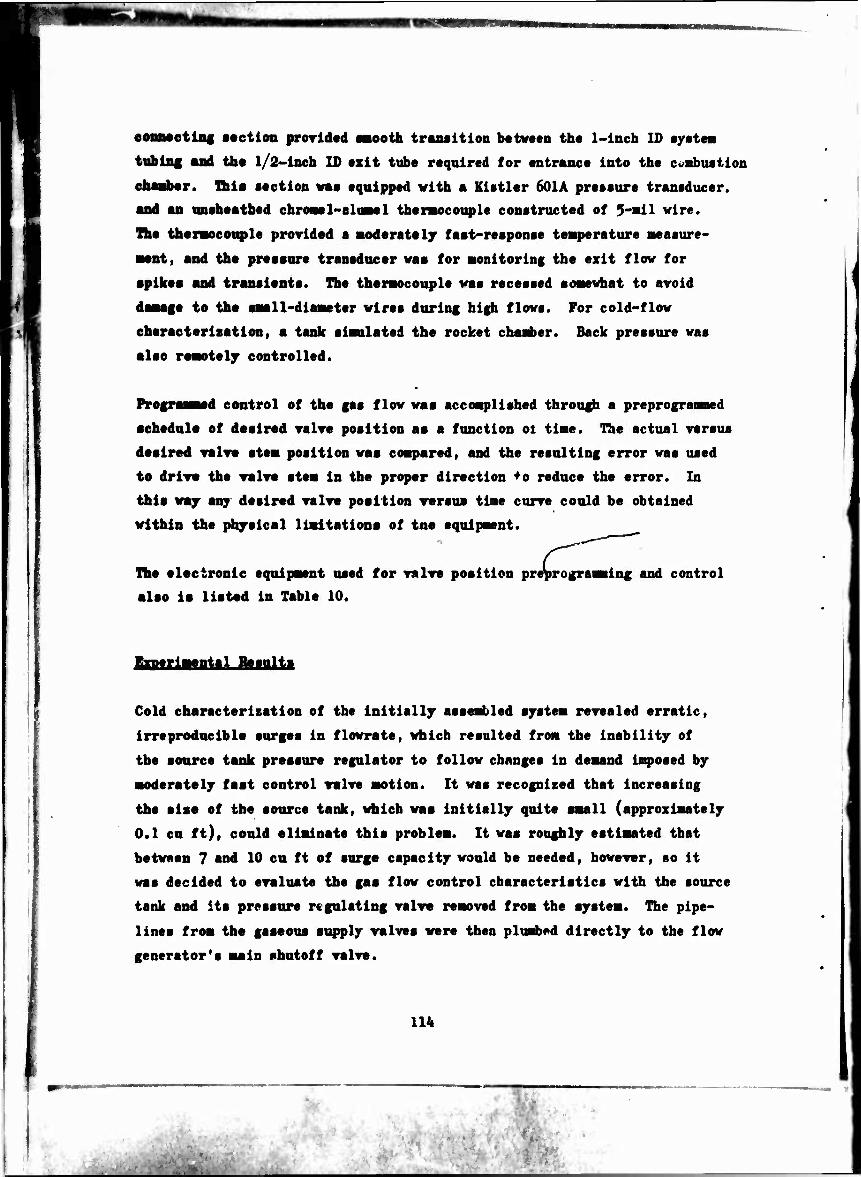
eoaMcting «ection provided nooth traasition between the 1-inch ID system
tubing and the l/2-inch ID exit tube required for entrance into the c^abuation
chaaber. Thia aection vaa equipped vith a Kietler 601A preeaure transducer,
and an uneheatbed chroael-aluael tbemocouple constructed of 5-nil wire.
The thenwcouple provided a aoderately faat-reaponse teaperature aeaeure-
aent, and the pressure transducer vaa for aonitoring the exit flow for
apikea and transients. The theraocouple was recessed aoaewfaat to avoid
daaage to the saall-diaaeter vires during high flow«. For cold-flow
characterisation, a tank aiaulated the rocket charter. Back pressure was
alae reaotely controlled.
Prograaaed control of the gaa flow waa accoapliahed throu^i a preprogramed
schedule of desired valve poaition aa a function ot tiae. The actual versus
desired valve atea position waa coapared, and the resulting error was used
to drive the valve atea in the proper direction +0 reduce the error. In
this way any desired valve poaition versus tine curve could be obtained
within the physical liaitationa of tne equipaent.
The electronic equipaent used for valve poaition preprograming and control
also ia listed in Table 10.
Cold characterization of the initially asseobled aystea revealed erratic,
irre producible surges in flowrate, which resulted froa the inability of
the source tank preeaure regulator to follow changes in deaand imposed by
aoderately faat control valve action. It was recognized that increasing
the eise of the source tank, which waa initially quite aaall (approximately
0.1 en ft), could eliminate thia problea. It waa roughly eotiaated that
between 7 and 10 en ft of surge capacity would be needed, however, so it
was decided to evaluate the gaa flow control characteriatics with the source
tank and ita preeaure regulating valve removed froa the ayatea. The pipe-
lines froa the gaseous supply valves were then plumbed directly to the flow
generator's aain ahutoff valve.
114
•»■
-...
■
■
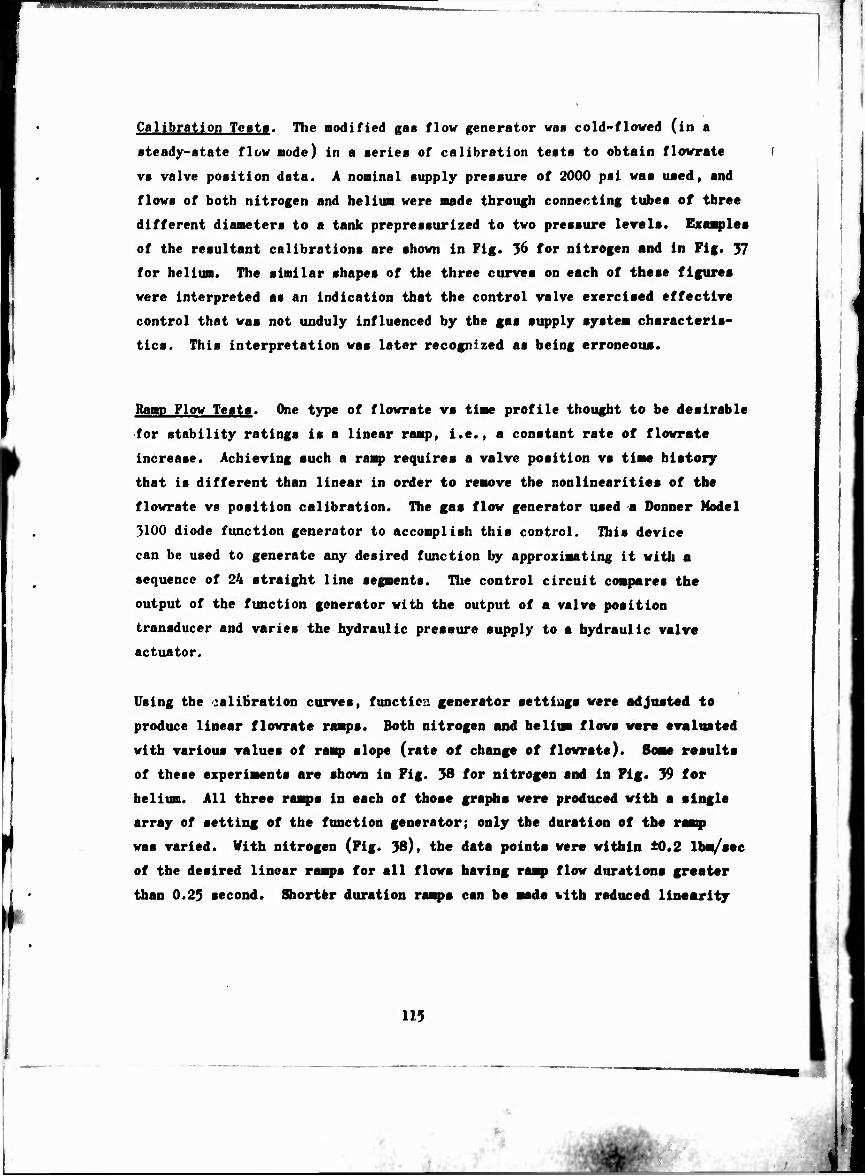
■BMHHHHMHMMWVP*
Calibration Teat». The modified gas flow generator wa« cold-floved (in a
steady-state flow mode) in a aeries of calibration teats to obtain flowrate
vs valve position data. A nominal supply pressure of 2000 psi was used, and
flows of both nitrogen and helium were made through connecting tubes of three
different diameters to a tank prepressurized to two pressure levels. Examples
of the resultant calibrations are shown in Fig. 36 for nitrogen and in Fig. 37
for helium. The similar shapes of the three curves on each of these figures
were interpreted as an indication that the control valve exercised effective
control that was not unduly influenced by the gas supply system characteris-
tics. This interpretation was later recognized as being erroneous.
Ramp Flow Tests. One type of flowrate vs time profile thought to be desirable
for stability ratings is a linear ramp, i.e., a constant rate of flowrate
increase. Achieving such a ramp requires a valve position vs time history
that is different than linear in order to remove the nonlinearities of the
flowrate vs position calibration. The gas flow generator used a Donner Model
3100 diode function generator to accomplish this control. This device
can be used to generate any desired function by approximating it with a
sequence of 24 straight line segments. The control circuit compares the
output of the function generator with the output of a valve position
transducer and varies the hydraulic pressure supply to a hydraulic valve
actuator.
Using the calibration curves, functics generator settings were adjusted to
produce linear flowrate ramps. Both nitrogen and helium flows were evaluated
with various values of ramp slope (rate of change of flowrate). SOBK results
of these experiments are shown in Fig. 38 for nitrogen and in Fig. 39 for
helium. All three raaqps in each of those graphs were produced with a single
array of setting of the function generator; only the duration of the raaip
was varied. With nitrogen (Fig. 38)1 the data points were within ±0.2 Ibm/sec
of the desired linear ramps for all flows having ramp flow durations greater
than 0.23 second. Shorter duration ramps can be made vitb reduced linearity
115
!
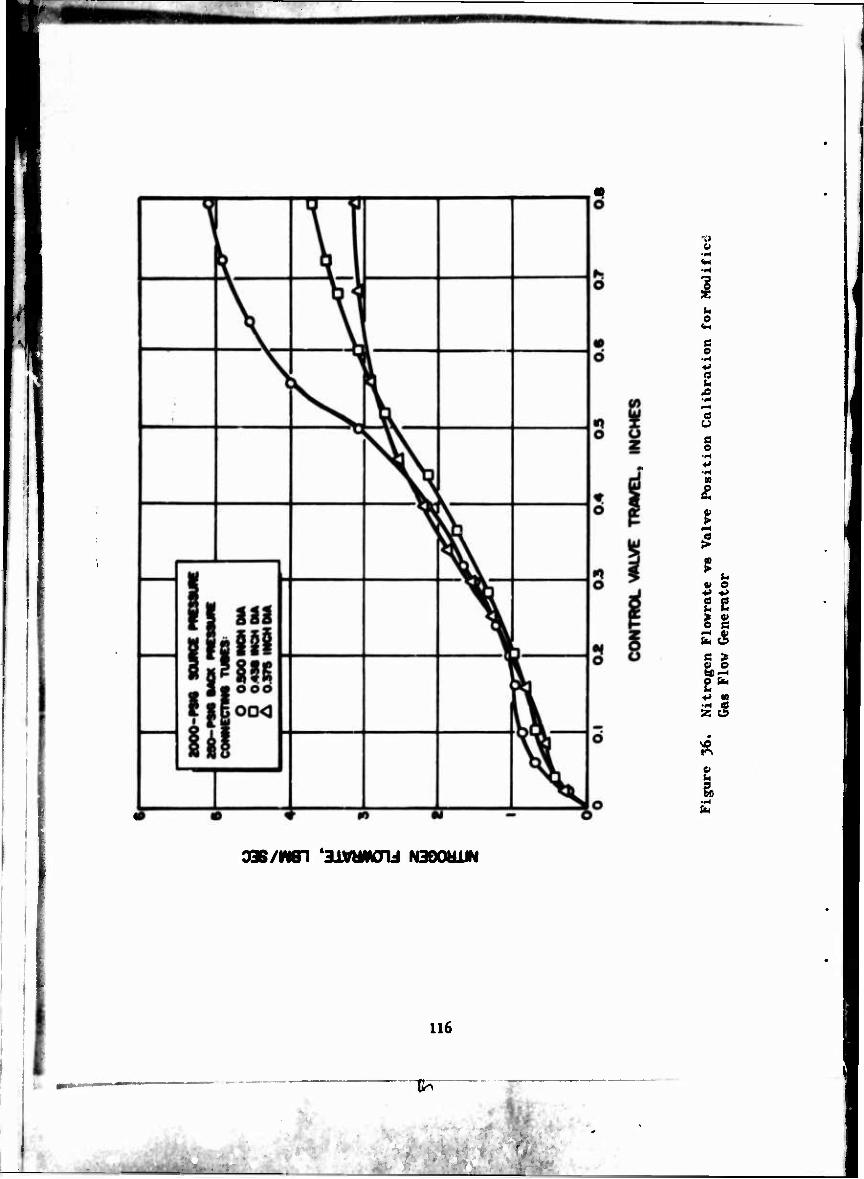
o
c o
o
c u
§
en
I t
i-H
P u v e ■*» ■**
il 5 s fa £ fl > u o O Gb b v w
»
aas/NBi 'aüMMiaru NaoouiM
116
I« C^
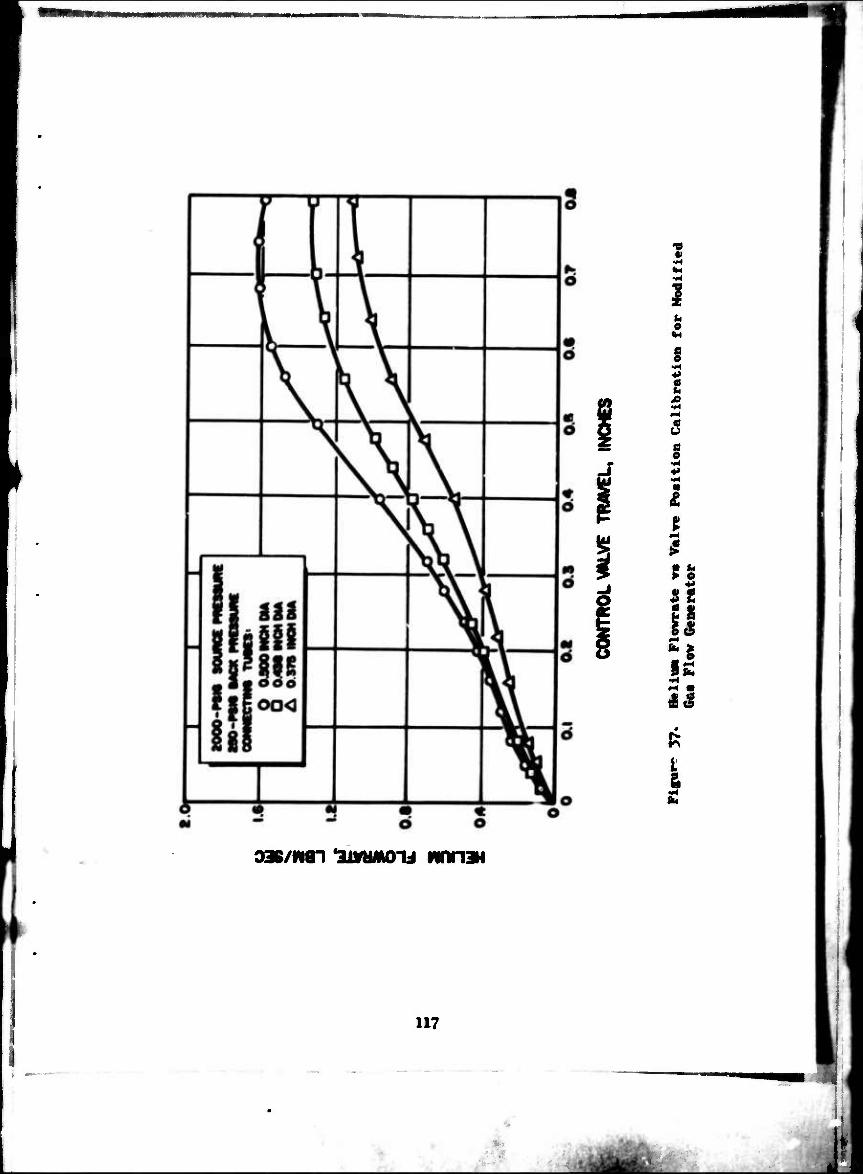
I
I ■H
I
«I
pH
IS
t
&ä
D36/wan lurBMOij wnn»
117
-•
i
t i-i
J
s
I i
9M/«n moii
118
?%M 1 !
ft
t
I
m 5
^
0»
01
9 •H
I I
2
oas/wn 'Moii
119
mu~ ' '■' a
«■■n
using the MHM array of function generator aettinga or, given additional
cold flows, a corrected array of aettinga for inproved linearity could be
dereloped. Usable ra^ta with durationa aa abort aa 0.1 aecond are poaaible,
but eren ahorter durationa are united by ingireciaion of gaa flowrate
■aaaurenenta. The aaazinnB attainable nitrogen flowrate was juat over
5 Vbm/wc and «aa a—awhat dependant tqion the tank back preaanre.
Vlth belinn, the naxiaain attainable flowrate waa approzirately 1.3 Ibm/aec,
the raaq> alopea for particular durationa were correspondingly reduced, and
the data pointa were within 0.07 Ibn/aec of being linear for ramp durations
greater than 0.29 aecond. These data adequately demonstrated that any
deaired flow function could be produced by uaing the function generator
flowrate control technique.
in the connecting tube showed little TsrAibility during
All Talnea were within 10 degrees Fahrenheit of the supply
Mo attempt to correlate theae email changes to the flow condi-
the flow
tien waa
Similarly, IM tranaient preaanre apikea or surges were observed with the
Kiatler tranadncer in the connecting tube. The static preaanre at that
point waa not maaaured.
idditional Flow Generator Bvaten Modificationa
The foregoing experimsnta alao demonstrated, however, that the maximum
flowrate through the modified gas generator ia a strong function of the
gaaeou* aupply ayatem'a preaanre drop characteristics aa well aa a function
of that ayatem'a initial preaanre. The firat factor linita the generator'a
general utility in that every installation would have to be cold-flow
characterised individually for the particular gas aupply syatem. Ibe
second factor limits the generator'a local utility because it would normally
bo supplied from a gaa aource that supplies other test stand needa, auch aa
propellent tank preaanrisation, propellent line purging, and pnenaatic valve
120
i ■

*
actuation. A particular value of source gas preoaure at the time of the
teat cannot normally be guaranteed, ao the alope of the raap would be an
essentially uncontrolled variable.
Calculations were thua aade to detenaine how auch aurge tank capacity
would be required to sake the flow generator independent of the gaa supply
system and simultaneously increaae the maxinmi attainable flowratea. The
calculationa were baaed on using the gaa supply system to pressurise a
source tank of arbitrary volume, located in the system as shown by tank (k)
in Fig. 34, and operating the system in a blowdown manner with no addi-
tional gaa supplied from the gas supply system. The calculationa are som*—
what conservative, therefore, in that longer durations or slightly higher
maximum flowratea would be possible if additional gas were admitted during
the ramp flow.
The previous, flowrate calibrationa were used to estimate pressure drops of
the system downstream of the source tank as functions of maximum gas
flowratea. Added to the chamber pressure, this gave s minimuD tank pressure
which would supply a particular maximum flowrate. The tank /oltmw was than
calculated from
w d -SS3L
'T " 2(pi - Pf) (19)
The calculated results (Fig. 40) show that a surge tank volume of approxi-
mately 2 cu ft would have provided adequate ieolation of the original gen-
erator from the gaa systems. The anticipated maximum flowrate requirements
of 3 Ibm/sec helium and 10 Ibm/sec nitrogen could not be met, bows vor; even
a moderately large surge tank cannot provide these naxianaa flowrates.
Similar calculations for higher initial pressures and larger diameter tubes
connecting the gas flow generator to the coad>aator revealed that the deaired
maximum flowrates could be obtained by replacing the l/2-inch diameter
connecting tube with a 3/4-inch tube and providing approximately 8 ou ft of
aurge tank.
121
1
im
CM O CO W ^ M
eld 'awmoA MNVI 39dns
I I §
s
£
i i-H
s I fefi 3 a
(O «
O S en o
0) <H a
122
Accordingly, six 1-1/2 cu ft caiftxm diozldt cylinders were installed in
parallel to proride 9 on ft of surge capacity. Siaultaneoualy, the flow
generator vas moved to the hot firing teat stand and close-coupled to the
rocket motor hardware.
This system was activated on the test stand Just as the hot-firing program
was ready to he initiated. When the repetition of the flowrate Torsos
valve position calibration tests were began, it was found that the addi-
tional surge volwe made it possible to control the gaseous flowrate for
a linear ramp by full servo control; i.e., by comparing the actual instan-
taneous flowrate with the derived flowrate and bypassing the valve position
control per so. Ibis mode of control made use of an existing analog com-
puter network which was already partially utilized for preprogramed valve
position function ijput and for computation of flowrate for direct readout.
Linear gas flowrate rasps were scheduled for initial use in the hot-firing
program, and, because the cold-flow calibrations would delay starting the
hot-firings by approximately a week, it waa decided to use the full servo-
control of flowrate.
Gas flows with characteristics other than linear flowrate ramps would atill
require valve position, rather than direct flowrate, control. It was intended,
therefore, to conduct the calibration tests at some later, more convenient
time in the program« As is discussed later in this report, however, the gas
flows were so ineffectual in initiating combustion instabilities that the
rating technique was eliminated from further evaluation before this addi-
tional work waa performed.
SIMULATED CHAMBER STUDY
A chamber assembly from the hot-firing hardware waa temporarily modified
for examining the effects of the rating devicea on sprays formed by one
of the injectors during simulated propellent flowa using water. The triplet
pattern injector, described later, was modified by plugging all orificea
123
"
I
_^L
m «I ■
•zccpt thest in th« outer three ring« in two baffle coapartaente. All
orifices were plnggod in the reneining baffle conpartaent, thns learinf
a field of Tiew for a Paetax eanera daring the water flows. The injector
waa aasoabled to the coaboition chanber aection without the nossle aection.
In thia aanner, all of the chanber pulse boaa and bomb nounting poaitiona
were nade arailable for uae duriag the sinulated propellent flows.
Tests were conducted with water supplied to both propellent manifolds at
flovrates such that the nosdoal aainstage propellent injection Tolocitles
were nodeled. Blaata fro* pulse guns and gaseous nitrogen flows were in-
troduced radially and chordally through the chanber wall and bonbs were
■ousted at the 4.95-inch radial position on the downstream edge of a baffle
rane. High-speed photographic records were taken with a 16-millimeter
Fastax camera baring a capacity of 400 feet of film and a maximum framing
rate of about 6000 frames/sec. Photoflot lamps were used to illuminate
the water sprays in the neighborhood of the injector.
The photographic results were generally leaa than satisfactory. The blast
wares from both the bomb and pulse gun devices so rapidly generated and
dispersed a denee fog that the camera's field of riew was completely ob-
scured within one to five fraaes and remained so for several milliseconds.
These photographs were dramatic illustrations of the powerful disruption
of steady state conditions that must occur in an operating rocket when one
of these devices is discharged, but nathing quantitative could be gained
from them. With the gaseous nitrogen flow, spray displacement could be
observed to proceed rapidly across the chamber in a sequence of fraaes,
and the camera's field of view remained clear until the first-displaced
spray had splashed onto the chamber vail oppoaite the gas flow's entry
point. While it appeared that quantitative spray behavior data could be
obtained from continued studies with gaseous flows, the simulated chamber
experiments were terminated because thay could not (without major modifi-
cation, at any rate) provide quantitative information to advance the
characterisation of boabs and pulse guns.
124
.
■a^Ml^^^k
HOT-FIRING PROGRAM
Hie relative effectiveneaa of the stability rating techniques in eatab"
liahing a rocket coabuator's stability traits waa investigated by applying
them at v<trioas positiona in an operating racket and obaerving their effecta
on its stability. Major objectives were the eatablishaent of correlationa
between the rating techniques' characteriatiea and the conbuator'a reaponae
and establishment of practical correlationa between different rating techniques.
There has been a growing trend under rocket engine development contracta over
the paat few years toward requiring a more or leaa definitive demonatration
of dynastic stability, i.e., rapid recovery to steadyetate operation after a
aizeable disturbance. Frequently, one of the stability rating techniques
investigated in this program ia specified as the disturbance source. For
that reason, it aeemed appropriate that an engine that had previously been
evaluated aa dynamically atable, at least under aome operating conditiona.
be used during this program. An engine from an earlier program was deter-
mined to have the right coad>ination of thrust level, propellent experience,
range of injector experience, and stability characteriatiea to form a baas
level for this study of the rating techniqnea.
A mmber of modifications were necessary to make exiating coaponents from
that enfine program suitable for use during thia program. An ablative-
walled combustion chamber waa replaced with a metal-walled chamber to
permit installation of a multiplicity of pulse bosses and preaaore trans-
ducer ports. An aluminum baffle aaaedAly, built aa an integral part of
the injector and cooled by a through-flow of fuel which waa then aprayed
from the baffles' downstream edges, waa replaced by an uncooled copper
aaaembly. Two existing injectors that had not had integral baffles were
then reworked to obtain the deaired injection patterns.
125
■
•*
•m*
fmmt ÜBittigM
Tbt hot-firing prograa was conducted on Pad 3 at the Beaoarch Combaation
and Haat Tranafor Laboratoiy. Baaoto control of tha notor dnrinf the
hot firinga van accoayliahad vith proaot aoqnancad ralre aignala. Two
Eagla tiaara varo naad for thia porpoao. Tha firat, a 5-Becond-duration
tinar, controllod tho operating aignala for tha coabustion atability
rating doricaa and tha aain propallant ralTaa. Tha second, a 25-aacond-
dnration timer aaqnancad tha high-apead caaaraa and the fnel-aide water
flnahing ayaten. Tha 2.9-aocond prograiaaed teit firinga began with a
100 ±29 nilliaecond ozidicer lead at start, with a 120 ±25 millisecond
fuel-rich cutoff. The fuel ralre pneumatic cylinder waa orificed to
cloaa nore alowlj than tha ozidiaor ralre to ensure a fuel-rich cutoff
in the erent of premature teat termination. A water flush waa aequenced
to flow through the fuel aide of the injector after the fuel main ralre
waa closed. Gaaeoua nitrogen purges were applied to each injector pro-
pellent aupply line during startup and shutdown. The purge waa auto-
matically terminated during the start aequenee by a check ralre aa chamber
pressure approached the mainatage lerel.
Nominal operating target conditiona for all hot-firing teata were:
Propellent: N^O^ ozidicer, N^-ÜDN^^O-ÜO) and UDNH fuels
Mixture Ratio: 1.6 o/f
Chamber Pressure: 150 paia
Disturbances from marl mi of four reting derices were introduced during
each teet. The ezploaire bombs were always signaled firat to avoid thermal
initiation; eech subsequent derice waa aequenced at 400-milliaecond inter»
vals. A total of 148 disturbances by the rarioua rating devices were
introduced into the coabustion chaütber during 86 hot-firing teata.
126
.;
"*"
Teit Brdvare Pe.erintion
The notor test hardware consisted of sn injector and thrust chaaber
asaeablj aa shown in Fig. 41. The aotor developed 10,900 pounda of tbruat
at 150-psia chsaber pressure.
Cosd>ustiOD Chaaber. The coabnation chaaber was of conventional design,
being coaprised of s right circular cylindrical section and s deLaval
nozzle. The cylindrical portion had an inaide diaaeter of 11.41 incbea
and extended to 8.00 incbea froa the flat-faced injector plane; the
first 6.25 inches of that length was fanned hj an unoooled copper aection
which waa fitted with pulae inlet and tranaducer ports and alotted to
receive the baffle assembly as shown in Fig. 42.
The coabustor contained nine pulae boaa poaitiona, offering chordal,
tangential, and radial directiona at three different axial distances fi
the injector fsce. Esch boss position was designed to sccept the burst
diaphragm holder (barrel) aection of the pulae gun apparatus and a aschined
adapter for the gaa flow generator pulsing device. Further, each boss port
disaster could be varied to provide a diaaeter of 0.515, 0.450, and 0.370
incbea for theae two pulse rating devicea. Bight Photocon preaaure trana-
ducer ports were initially located within the coabustion chaaber; two
additional porta were strategically added during later hot-firing teats.
The explosive boaba were installed at three different radial poaitiona in
the chaaber by attaching thea to the downatreaa edge of one baffle blade.
An attachaent aethod waa devised to avoid aanual screw thresd sngageaent of
the hotit case. The new aethod, sketched in Fig. 43, eaploys a alotted end
on the boab caae, with a ahoulder that engagea an enlarged aection in the
anting baffle hole by anap action. Quick, poaitive engageaent waa thua
achieved without the riak of breaking the electrical connectiona by twisting
the leads.
127
* '
-
~-''*** 1
■«*?»— —p— ^^^ *l «fc ia i -
-
5AE21-2/9/66-S1C
a. Side View
5AE21-2/9/66-S1B
b. Injector-Ehd View
Figure 41. Hot-Firiof Chaaber
128
.
.^.m-l!***^^**
>'
_.
i 1 :
s, a.
14
5
s ■4» O
u
§
i »4
OH
3 V
i s
I»
1
m
W ^ ' "'"*
.
ELECTRICAL LCAM
xmmm Mfng
INTCrtHUL GROOVE
SLOT
CTKMA-A
EXPLOSIVE CHARGE
Figure 43. Snap Attachment Explosive Boob Case
130
.
±L
MM - i , .
I f
- -
■np" 3
Bercral exaaplea of typical boHb* are afaown in Fig. 44 , Two BT—ploa
of the anap-action attachaent derice ara abovn; ana baa a threaded and
for engaging feaale threada in the boab caae, and the other baa a blind
end for plagging bonb-noanting porta that are not in uae.
A three-coapartaent, 1.6-inch-long, oncoolod baffle configuration waa
uaed. The baffle aoetion vaa nacbined fron a ainglc copper block and
fitted into the aaehined alata in the copper coabuation chani>er aectioo
{7im. 42). The baffle blade containing the boab receptacle bo lea had an
internal drilled channel for conducting the electrical leada throngb the
cbaaber «all. The leada were externally aealed at the cbaaber wall with
a drilled Teflon coapreaiion fitting. Tbr geoaetrical relationahipa
aaong the rariona boaaea and bafflea ara abown in Fig. 45, which ia drawn
aa if the viewer were leaking through the injector.
Trananairt ^H^r A tranapare.it caarmatar aection waa deaigned to
pexait photographic Tianalisation of the coabnation proceaa. The trana-
parent aection waa interchangeable with the capper coaboator. 1 photograph
of the aaaeably ia given in Fig. 46 . «The tranaparent chamber wna aaehiaad
froa Pleziglaa and conaiated of a cylindrical aection with 1-inch-tbick
walla with aerrationa aaehined at both enda far aealing. A radial capper
pulae gun boaa waa attached far one teat firing. The walla of the trana-
parent aection were alatted to hold the baffle aaoadbly in a aanner aiailar
to the aolid copper aection deaign. Each tranaparent coaboator waa uaeable
for only one abort duration teat firing.
Not ale. Tbe noeale aection waa of oncoolod, Bokide-coatod, type 4130
atoel conatmction. Ita 1.75**inch-lang cylindrical aection aatcbed that of
the cylindrical coabnator aection and waa followed by convergence to a
7.17*-inch diaaeter throat 15.00 inchea froa tbe injector plane. Ihe naainal
chamber contraction ratio waa 2.54. The naaale exit waa 6.25 inchea froa
the throat with an ezpanaion ratio of 2.35* Ihe nessle aection contained
one Fbotocon inatroaentation purt and an ezplaaive boai> aaanting hole.
131
J "..
•mm» «w»
•
(0 0)
(0
I O
§ a. M 4
es o H a.
JT vr
fc<
L 172
■ :e
*
iUdi«l (XBO) 2.00
1^U«1 (MO) 3.00 B^i«l (MO) 4.00
k. ClionUl (139) 2.00
OkmHal (139) 3.00
ChonUl (139) 4.00
TMCoBtlal (90) 2.00
f^«ti^(90) 3.00 T«««»ti«l (90) 4.00
rtoeoo Port UontifiMtlon (T..t Ni^>.r.) Axial timtmm
ICl C (03). F (l»-37) 1.90 K.2 B (03). P (3^77. BO-«) 4.00
IC-3 A (01-77, 00^6) 1.90 WC-h 4.00
IC-5 B (01. 01. Ok.77. BO-Bb) 190
re-6 4.00
ic-7 C (01, OS, Ob-77, BO-BO) 1.90 rc-8 4.no w-» B («Mt) 1.90 IC-10 I (BO^) 1.90
Nond« G (9M4, 7«, 79) 10.S (h.diior NnlfaU D (01-09, 70. 79) ■ hoi Itoifold ■ (01-79) K
Figure 43. Locations on the Chaaber for Poloe Fhotocon Pressure Transdneers
133
iwii i ' ]tm iifii
i
■
I
134
jM trsxm&nz- - —
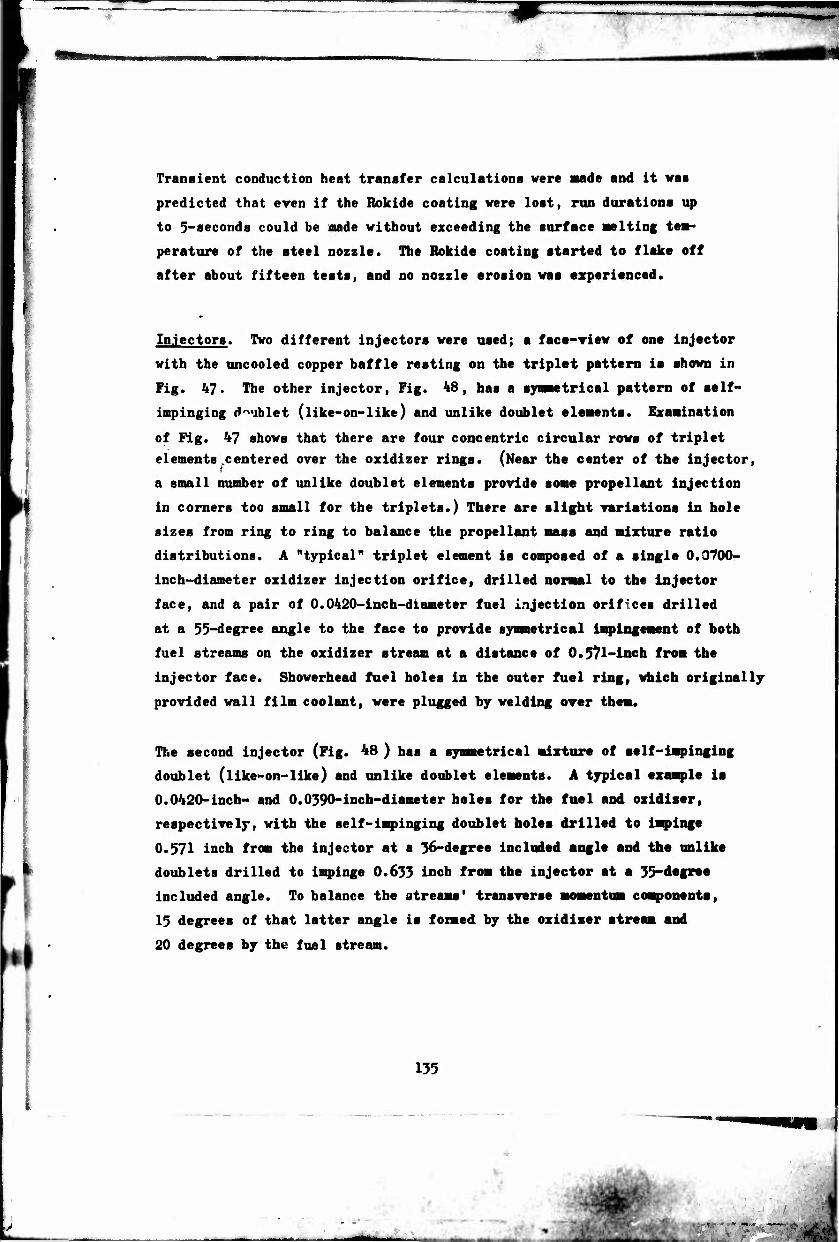
Transient conduction heat transfer calculations were made and it was
predicted that even if the Rokide coating were lost, run durations up
to ^-seconds could be made without exceeding the surface melting tem-
perature of the steel nozzle. The Rokide coating started to flake off
after about fifteen tests, and no nozzle erosion was experienced.
Injectors. Two different injectors were used; a face-view of one injector
with the uncooled copper baffle resting on the triplet pattern is shown in
Fig. 47. The other injector, Fig. 48, has a synmetrical pattern of self-
impinging doublet (like-on-like) and unlike doublet elements. Examination
of Fig. 47 shows that there are four concentric circular rows of triplet
elements .centered over the oxidizer rings. (Near the center of the injector,
a small number of unlike doublet elements provide some propellant injection
in corners too small for the triplets.) There are slight variations In hole
sizes from ring to ring to balance the propellant mass and mixture ratio
distributions. A "typical" triplet element is composed of a single 0.0700-
inch-diameter oxidizer injection orifice, drilled normal to the Injector
face, and a pair of 0.0420-lnch-diameter fuel injection orifices drilled
at a 55-degree angle to the face to provide synmetrical impingement of both
fuel streams on the oxidizer stream at a distance of 0.5?l-lncb from the
injector face. Showerhead fuel holes in the outer fuel ring, which originally
provided wall film coolant, were plugged by welding over them.
The second injector (Fig. 48 ) has a synmetrical mixture of self-Impinging
doublet (like-on-like) and unlike doublet elements. A typical example Is
0.0420-inch- and 0.0390-inch-diameter holes for the fuel and oxidizer,
respectively, with the self-impinging doublet holes drilled to impinge
0.571 inch from the injector at a 36-degree included angle and the unlike
doublets drilled to impinge 0.633 inch from the injector at a 35-degree
included angle. To balance the streams' transverse momentum component*,
15 degrees of that latter angle is formed by the oxidizer stream and
20 degrees by the fuel stream.
135
—
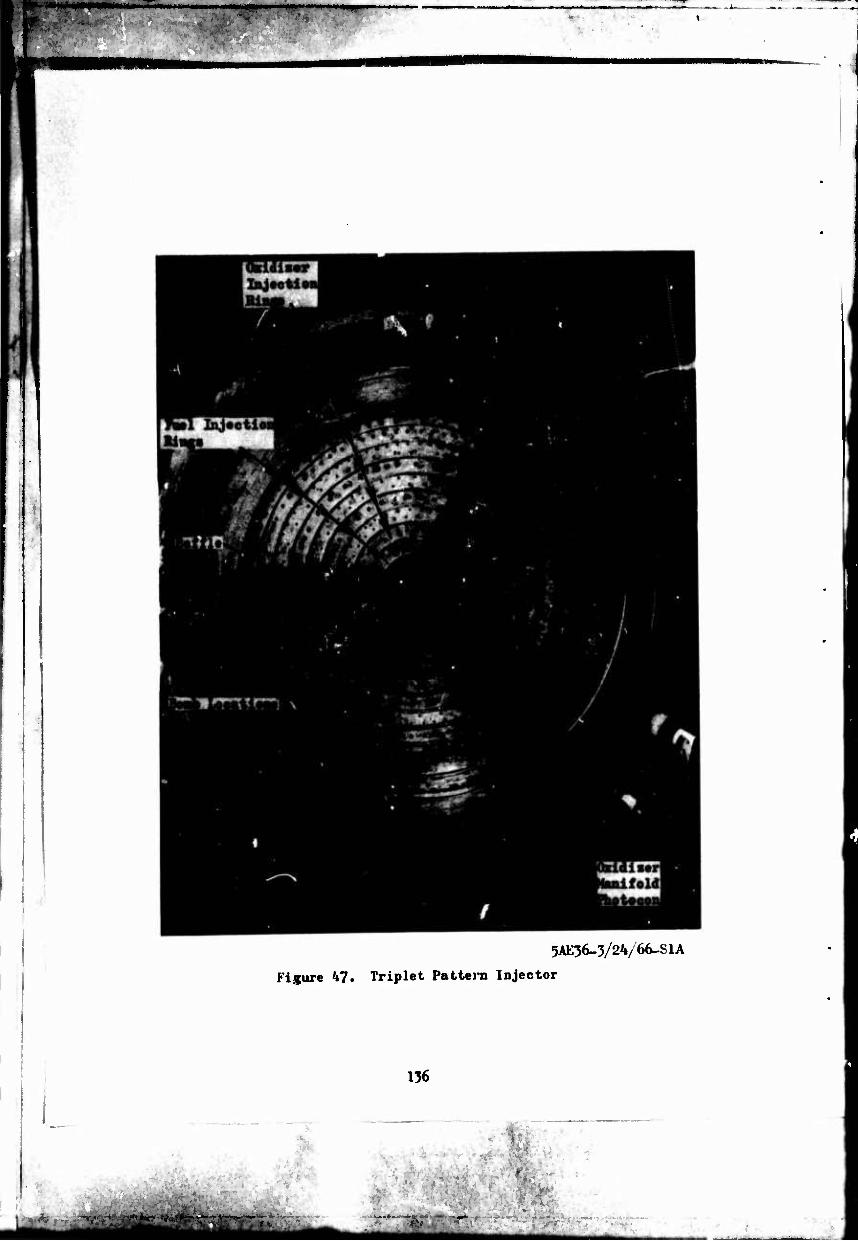
I <■>■— "-«P" «WHIP1
5AE36-3/24/66-S1A
Figure hi. Triplet Pattern Injector
136
'& "
5AE36-3/24/66-S1B Figure 48. Doublet Pattern Injector
137
. !■■ ' -
' 4 i
•mfm
rtiM Ttit
Th« t*st aotor vat Mounted horixontally within a baffled steel teat pit
encloanre to proride iaolatioo froai the propellent ran tonka. A drainage
ajrotoa voo inatalled for voter dilation and eubaequent runoff of all
apilled propellonta to a aafe area.
Prooollont BrotoM. The NTO voa supplied fro« a 5000-p8i, 39-gallon
spherical ran tank and vaa pressurised vith a 2400-pai gaseous heHUB
bottle bank. The NTO vaa stored in a 2000-pound forged steel cylinder,
end vaa peraanently connected to the ran tank. Approzioately thirty
toata at IJO-paia chanber pressure were achieved per cylinder of NTO.
The fool vaa supplied fro« a 5000-psi, 33-gallon run tank and waa prea-
aurited with 5000-pai gaseous heliua. A scheaatic drawing of the complete
systea la a. ivn in Pig. 49 • Both propel lent systeas were plaAed normally
eloaod to prer».-^t atmospheric contamination with vapors. Band operated
want valvea wore «.callable on each tank for emergency venting operations.
Baeh propellent food ayt'ea conaiated nominally of fifty feet of 1-1/2-
inch diameter plumbing and contained two l-l/2-inch ahutoff valvea. Average
values for the NTO and fuel t^nk preaaarisationa were 345 peig »nd 263 peigi
reapectively, for 150-psia chambvr pressure operation.
Inotrfantation. Baaically, two kinds ci transducer data were acquired from
each firing: steady-state operational control data and transient stability
data. Steady-atate data include propellent flovratea, static pressures in
propellent tonka, injection manifolds, the cvmbuatiop chanber and gas pulse
supply system, as veil aa valve timing and sequence information. These data
were recorded vith on 18-channel oscillograph tnd several recording poten-
tiometers.
The primary tranaient data were rapid pressure flu vtuationa in the conbustion
chanber and in the propellent manifolds. These wire measured with strategically
138
'
«sras. ♦
■■
i ! 2Ji \
J h s
i-l
s, e
139
%
• ■•
S ̂
,..:
^ ' ■
■ * •
su. ̂ ^^ ■» _^ 4i
■»«r ^w
located, vat«r-cool«d, fl—h-aowntad Fbotocon prcsrar« transdoeen.
Ili«tocOB loeatioDi darinf each hot firiag are ■hown in Fig. k5.
Modal 13*5 traaadocoro «aro aaed ia Btaavro chaabor praooora fine-
taatioao. Lator ia tho prograa, two Nodal 525 traaadocoro were added
ia ike chamber ia pooitiona H and I. Preaaore oocillationa ia the
prapollaat aaaifolda were aeoaiired with two Model 779 ironadacora.
A Bough Co^boatioa Monitor (BCM) ojaten waa eaylojed to autoMtically
toradaato each teat firing when a certain Icral of coadmation inata-
bilitT waa achiered. UM inpnt to the KM daring all aolid wall teata
waa the aipial generated by chaaher preaaore Fhotocon A. The output
of faal aanifold Ihoton E wao aaed daring the two tranoparent wall
■otor firingo. The KM unit wao co lib rated to teminate the teat
firing when the Fhotocon tranadneer input exceeded 50 pai peak-to-
peak preaaore oacillation for 100 ailliaecooda.
For each toot firiag, a naTi—a of five Fhotocon outputa were recorded
on an inpex Model Hh-lOO ooTon-ohannol tape recorder. Aloe recorded
there waa the output of aa acceleroaeter noaated on the outaide of
the iajoctor plate and a lOOO-cpo tine baoe that waa oaed for croaa-
eorrolation between recorded data and the streak and notion picture
fil
Teat FhatoeraahT. Dnring the aolid-wall chariter teata, high-speed
notion picturea ware taken af the exhauat plane with a 16-nillineter
Faatax caaara located at one aide of the chaabar and af the coribnation
within the chaabar with a Faatax canera poaitianed beaide the exhauat
pliaae aad looking ap the exhauat aosalo. The latter cansra'a field of
140
■.'•.fc.- *:>»£•-,.— ,

,^
view covered about one-third of the injector face and naoalljr included
the baffle vane on which the aajority of the explosive boaba «are
■ounted:
•MJECTOR FACE
M0UNTM6 HOLES I
Fraaing ratea op to about $ to 6000 fraaea/ooc with the etaadard 16-
■illiaeter caaera aad 10 to 12,000 fraaea/aec with a half-fraae eawra
were noraally taken. The total ezpoanre tiaa for a 400-foot rail of
fila waa approximately equal to the 2-l/2-aecond aeqneuced run dnratiea.
Modified 16 alllianter Faitax caaeraa were aaad ta obtain rosale view
atreak photographo siaultaneouslj with the Motion picture«. Ihe streak
filaa were taken priaarily to obtain continuous recorda af the laainoua
eaission fro« particular narrow fields of view; the filaa gave data an
the type of eluafeer instabilities. In the earlieat atteapts ta uae this
technique on this prograa, the caaera viewed a circnafereatial sspasat
just downatreaa of the nossle exhauat plane; aa auccesa in inatability
aode identificatiaa waa achieved here. later, toward the ead af the
prograa, the atreak caaera waa positioned to view portions af the injector
face, just aa the aotion picture caaeras had.
141
-%^
**m
:
im> n nup ■f ■— -. J
HW rtrMk fikM wn« «btainwl by rmwriag the fnaiag prinM fro« the
emmrmm mi laeUlliaf 0.002 to 0.005-inch wide «lite at the fil«
plaM, peryMiiemUr te the fil« edgei. The rapidly Boriiig fila waa
eaatiMWwlp expaaad te the co^baation proce«« Itainooa eaiaaion from
a aarraw field af Tiew af iatereat. tee caaera waa aligaed te provide
a fleU af riev parallel to one faffle Taoe. father atreak caaera,
eesUiaiag a eircalar are alit, waa aligaad alone; the injector periphery far an apprexiaate lOO-degree are aefaeat.
ceverafe waa aaed on the two tranaparent aotor firinga.
la addiiioa te the two Faatax aad two atreak caaeraa previoualy diacnaaed
fer the aelid-wall chamber taata, three aore aotion and two nore atreak
»raa were utilised far the tranaparent aotor bet firinga. (be of the
atreak caaeraa waa aligood with ita alit field of view parallel to
laaher azia aad «xtoadiac froa the baffle tip te a point 4.73 inchea
dowaatreaa. fte other atreak caaera waa aligaed vertically (er circua-
fereatially) with the narrow field of riew located 0.25 inchea downatreaa
of the baffle edge. The phyaical arrangeaent of the fear atreak caaeraa
is depicted in Fig. 90 . Two new aotion Faatax caaeraa were added te
obtain cloooap riewa of the propel)ant injection region. The ether caaera
waa a 70 ailliaeter 20 fpe device whtch provided overall viewa of the
firinga. Fig. 51.
EXPERIMENTAL RESULTS
1 total of 86 hot-firing teata ^aa conducted daring thia prograa; 148
coabuatioo chaaber diattirbancea were generated by the rating devicea.
Pwrntiiyli T*it »tiHi
A ainiana noaber of probleaa waa eacoaatered daring operation ef the
experiaental teat prograa. Only two teata reaulto£ in hardware
142
- ' ,
■•'<%■• ^k
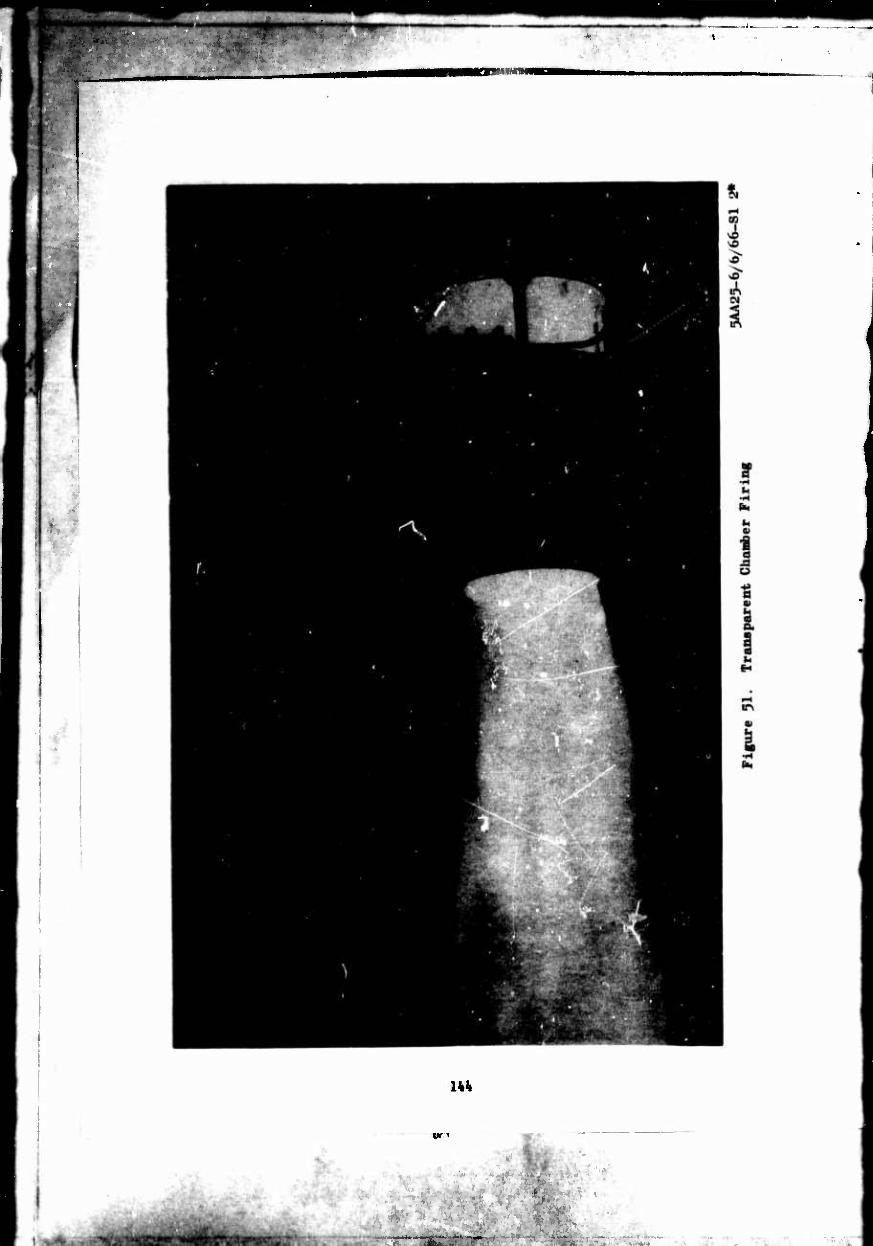
mmnamm mm '■' mr
wmm
•
144
" ^.'AL," .. ,
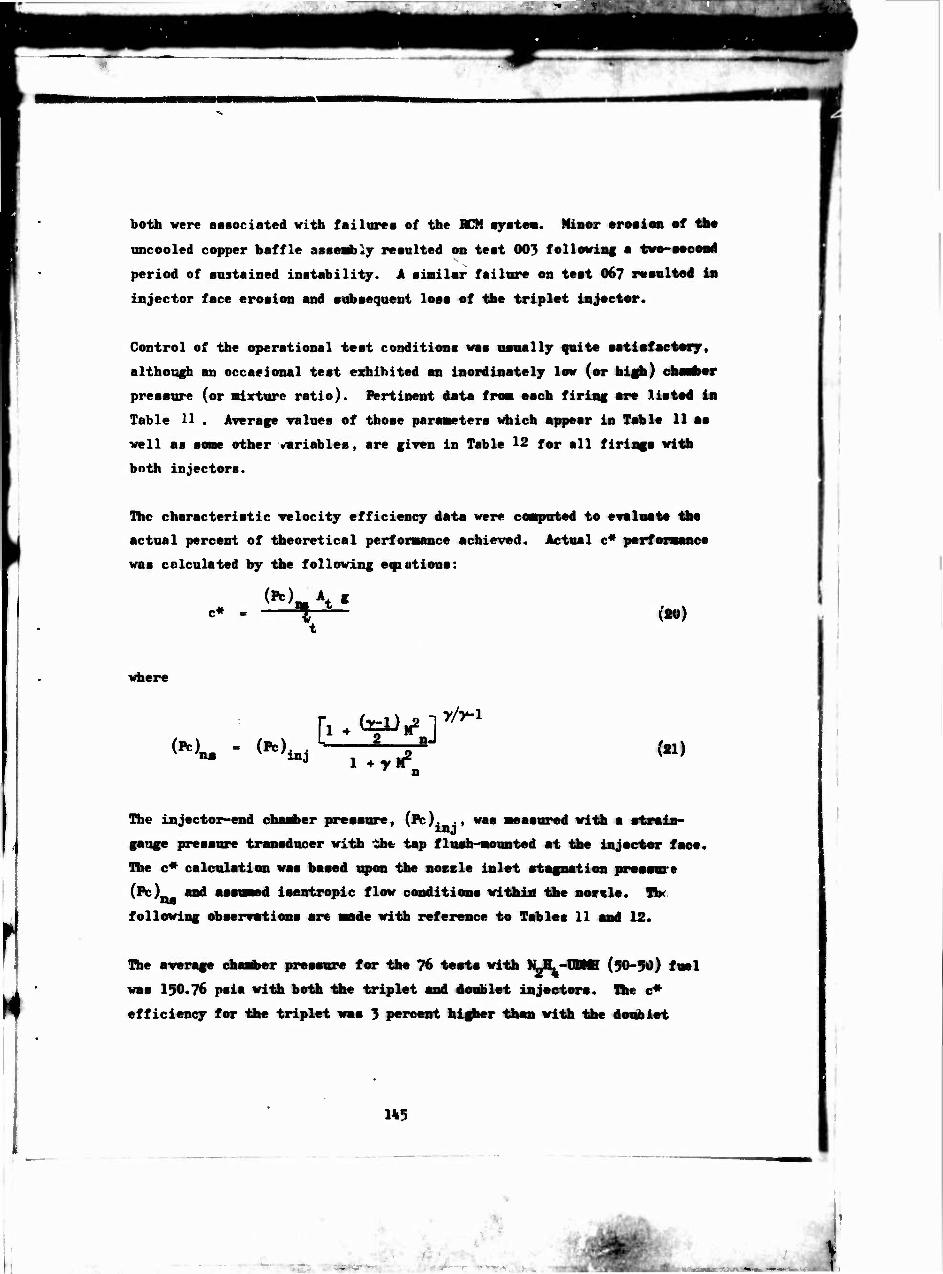
both were associated with failures of the KM syaten. Minor erosion sf the
uncooled copper baffle asseabljr resulted on test 003 follotriag a two-socowl
period of sustained instability. A similar failure on teat 06? resulted in
injector face erosion and subsequent loss of the triplet injector.
Control of the operational test conditions was usually quite satisfactory,
although an occasional test exhibited an inordinately low (or high) chanber
pressure (or mixture ratio). Pertinent data from each firing are listed in
Table 11 . Average values of those parameters which appear in Table 11 as
well as some other variables, are given in Tsble 12 for all firings with
both injectors.
The characteristic velocity efficiency data were computed to evaluate the
actual percent of theoretical performance achieved. Actual c* performance
was calculated by the following eqiutioas:
m
where
(*), n« (Tc) inj III
(y-l) <1 y/y-i
1 + y M2 (21)
Hie injector-end chamber pressure, (Pc). ., was measured with a strain*- inj
gauge pressure transducer with tht tap flush-mounted at the injector face,
nie c* calculation was based upon the nozzle inlet stagnation pressure
(Ft) and assumed isentropic flow conditions within the nozzle. Tb<
following observations are made with reference to Tables 11 and 12.
The average chamber pressure for the 76 tests with ILL-HUB (50-50) fuel
was 150.76 psia with both the triplet and doublet injectors. The c*
efficiency for the triplet was 3 percent higher than with the doublet
145
• ,,
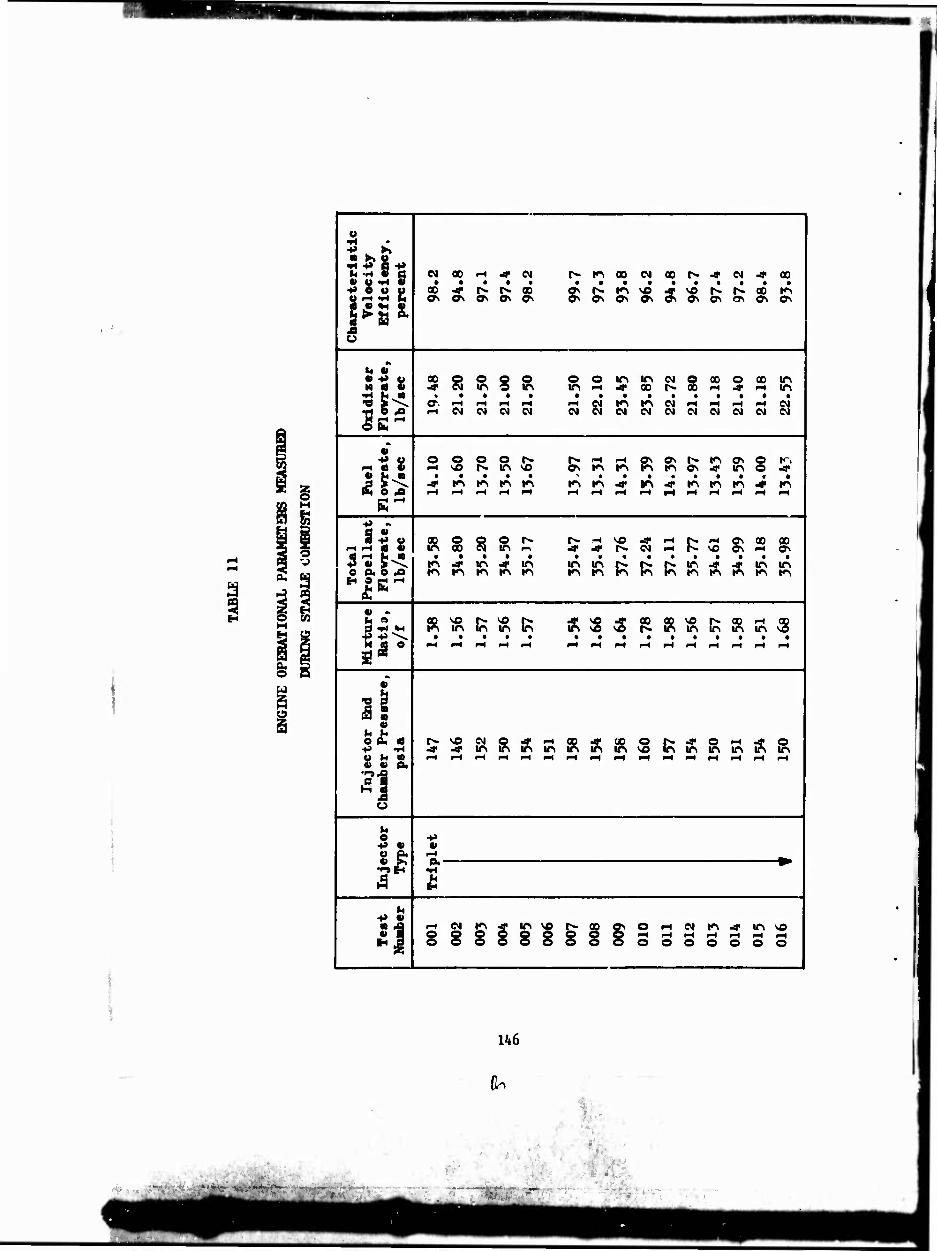
■■.■-■ ■
O
it O CO
1 « 1 •H •** >» * ►, «
cteri
locit
icien
rcent
CM 00 F-t Jf CM r- m 00 CM 00 1^ •* CM •* 00 jl • • • * • • • • « • • • • • • £ -* t^ !>• co g^ r^ m VÖ •# NO t>. •>- 00 »^ ON o\ 0> ON Ov o< ON Os ON ON ON ON ON ON
i « ,« Vt «
S^ö6" ^ Io
I •» u • • -P u H « S
00 •* s O 8 R £ o
rH in 00
CM 8 2 o 00 m rH in
Oxidi
Flowr
lb/a * • » • • • • • • • • • • * * 1
o\ 1—( rH i-i i-l i-H g| m m CM rH rH rH rH CM <-< CM CM CM CM CM CM CM CM CM CM CM CM CM 1
1 •» •
-al« o s O O r- r^- nH i-H ON ON r- m ON § 5' ! fi r^ ITi VÖ Os m m m «n ON JT in « H ■ • • • • • • • • • • • • < • 1
J" 1^ K\ KN r-4
m m •V tr\ -f m KN m ■* ^
ß" ■p «
9 * « 1 i-H PH 4 w »
o 8 O r^ r^ -H ^o <p rH K 5 ON oo go | 00 in p^ j" JT r*- CM rH ON rH ÖS
•P • 5^^ • • • • • • V • • • • • • t • 1 K\ J" ITi ■V ITt in in P^ P; P^ in .* •^ in in
o o. e ,£ l<^ K> KN m 1^ m m m m m m m
riE- 1 * *
Mao 1 S5
• in
• i-H
1^ •
PH
• PH
• • • F-t
• rH
• rH
in In • • rH rH
• rH
in S * *
rH rH
1 •> « ^ ä Ha
« 11 Ö £ a
-P -H & CM
in Ä iri SR « » s 1^ Ä R rH in Ä ^ o >< a
Sao. i—i cH rH r-H i-t PH l-H PH rH rH fH FH rH rH rH rH
■•^^ ! ^1 i o
i ** o ■P ■♦» « «
^ P.
•H
^ 1
i ^ £ u
i -p a ■ •€ f-H CM !D ^* in v«
1
00 0\ o rH CM m ■# m \o g s s
S s s
1 s rH O
rH O
l-t rH o o
rH O
rH rH ! o o
146
fh
, ■
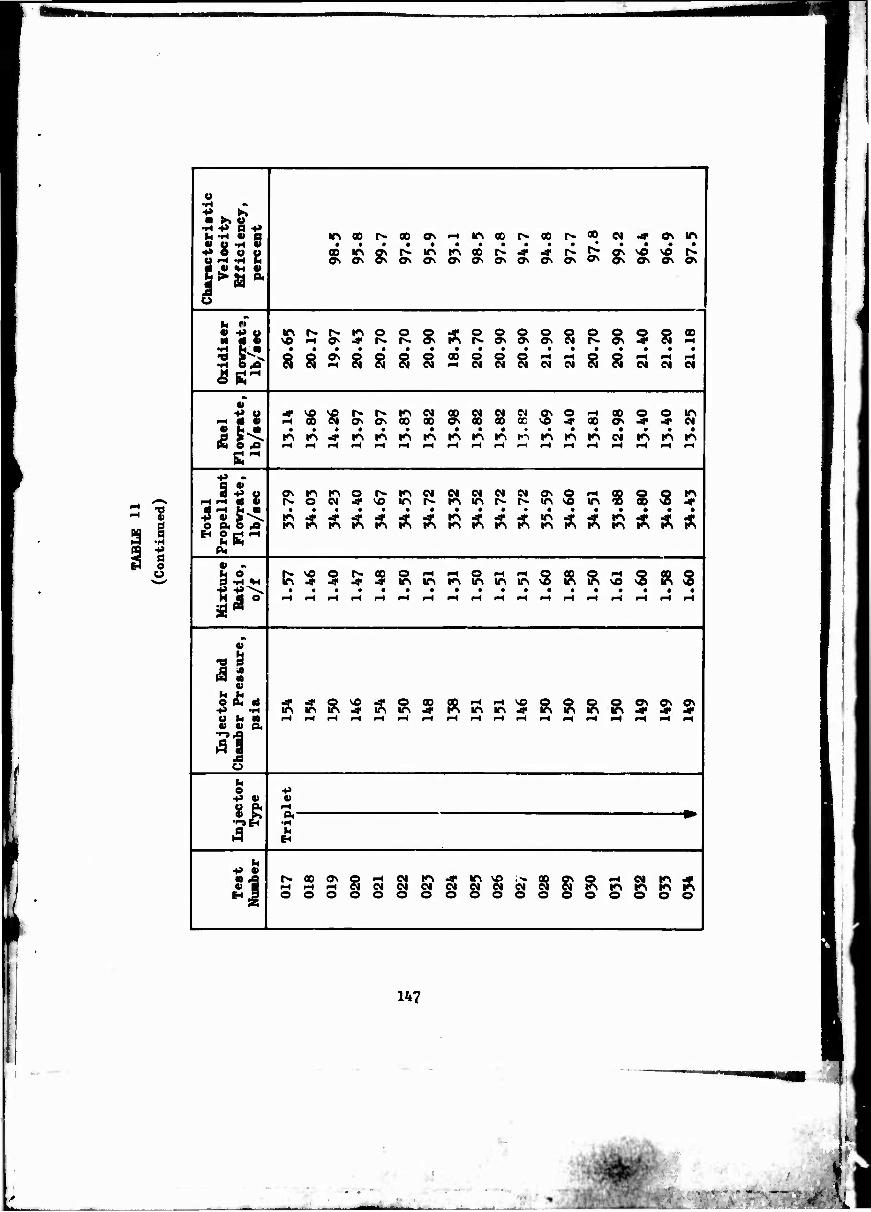
iH 5
H ■p a o
Characteristic
Velocity
Efficiency,
percent
. oo
oo • Ov
t^
S 00 .
95.9
93.1
in oo t^ oo .... 00 1^ ■* .* 9\ 9\ ON ON
fs. oo CM .* ON in • • .... ON ^ ON ON ON ON
v -P a
<SB^
5 • 8 2
• 8
ft • 8
• 8 8 2
f^ O» O» ON .... 8 8 8 ci 2
1.20
20.70
20.90
21.40
21.20
21.18
Fuel
Plowrate,
lb/aec
l-t • • • • « i-H
• . . FH FH
CM OJ CJ ON 00 00 00 «o
a • • . KN r\ ^'^ K> FH FH rH FH
o FH oo o o in J- 00 ON J« J- CM
KN IA CM K\ m K>
Total
Propellant
Flowrate,
lb/sec
• r> K\ o r^ O CM .* VO
Ä Ä Ä Ä •
Ä
CM CM CM 0\ IO r*. r^ in . • • * ?i K\ Ä r<*>
NO in TO oo S j«
Ä Ä R Ä Ä «
Mixture
Ratio,
o/f
• • • » 5 • O ITi • 1-1
F-t ft IT» 1^ . • FH rH
S in m S • • • . F-) F-l FH FH
® ® 5 S R S • •••••
Injector End
Chaaber Pressure,
psia
Ä 5 ■-H F-t FH SSSSSSSSS5
Injector
Type P «
•H
■ 4 iH O
00 (7\ i-l iH o o 1 i si m NO .^ oo
s s s § llslg?
147
. . ,. .
k!
1 « 1 -H V fes
cteria
loeity
icienc
rcent
• • 00 • • oo • 00 • m in m m r» FH oo • • • • • • •
m •
in • 00 • CM r* • • 1
GO in VO r>. r^- ^ in m in m -* •* M ON ON ON O» ON ON ON
in m in « 81 ON o\ ON o\ o\ ON ON ON ON « » %< « |{>Jia
| B i
u • M « • SI s o R s ir\
1^ S S S & 8 cJ 3 in NO
in NO
in NO
m t>- in oo
1 3»- • •
PH ■
r-i CM
• ON FH
a a
§i si ^ si s oi s si •
Si •
CM CM
oi oi CM CM
i .gß" i •
-«s o CM r\ CJ o i-t m m CM oi ^ o> M m N« O VO ON O ON s c^ r^ 00 00
•«• oo ITi \o FH 00 00 00 ON ON
3i< • 1—1
• PH
• PH
0 • FH
a w FH
• •••■•• mm-* r» m .* in
• in FH
• in FH
• m FH
• «I m m FH FH 1
1 S"
III 11 li
9 ^ m Ol o \o FH m •* r^ ON o d« vo .# FH so FH m in
m O o FH m 1^ -f oo ON r^ in in in in 00 00
Ä R Ä » * P^ mmmmmmmmininin mi
•"|B- i m - '•
s.s^ « K » Cl s »n o>
(^ r^ 'H ei o m FH vo N« in NO vo in vo
m NO
m NO © m ml
NO NO 1
L s • • • •
FH a •
FH FHFHFHF-tFHr'tFH •
FH •
FH •
FH * * 1
rH FH 1
i v
l§ 1 •
u «
3Ä« o O R tn $
ON FH Ol O Ol 01 00 o in in in in in .* in
in 01 NO NO CM
-fes, IC\ m J« in in in in in ml
^l s o
^ o ■♦» +>
•J» • 0» •
*£ 3
FH
I 1
h -p •
o ^ P^ R o o o 1
3
FH oi m ^ in NO r^
3 S S 1 S 3 3 l_ ON
3 o FH CM
148
rii •
lin
MM
FH «
^ g a 5 EH O
r
« ^^^^" ■^^^"
1 -H •P >, • >> «
•H +J a -p h -H « a m 00 r>- oo CM CM CM CM O O o 00 r^ CM r^ CM
1 41 ü H «) • • • • • « • • • • • • • • • 1
■f> O Ü O U rH -H h
* £ * »
-* CM CM Ov 0\ C\
CJ ^ ^f ^ CK Qs *
in « « S^ »
« V <H « In > «M CS-
5 w u
K
9» •** » Ä CM CM iri o in in o ^ 8 R CM 00 00 O & 3 H « « FH vO CM in CM CM in in -» -* •* 3g<
1 -H O tf
• • • • • • • • • • • • • • * * 1 Si CM
CM CM CM
FH CM
FH CM S SI Si 13 S S FM
CM FH CM CM S 5i S
i <5S" ^-s —s
i * M CM « t —^ ^x I -P o ao s FH 00 in » fl 8 a\ o o O r- !B in
ON 3 r-t ed o> CM O Oi CM o\ r^ i^. r- ON ON
S SJ< •v •
^" rö • • • •
m m m in in in •
m in •
in in in in CM O 4 FH FH FH FH FH FH FH FH FH FH FH FH FH FH FH F4 1-4 1
lH FH
1 D"
o « « -P o
FH >H « « 01
FH CM in
SJ 5; S£ ? S 8 s in Ä ^ % Ä o a. o ja ^ ^ ^ ^
in in ^ 5R R ^ Ä R R
• m m
• ^ Ä Ä
H O '•« F4
> * CM
;i « • ! U o vO 00 FH CM FH CM CM 0\ FH J« VO VO ■41 in o ^ m j
3 -H *H lf\ in vO IT» in tc\ \0 <& ^ in m m m in vO m m ■P -n-\ • . • • • • • • • • • • • * • 1
1 -3 5° FH FH FH FH FH FH FH FH i-H rH ^H ^H FH FH FH FH FH 1
1 X
1 v •9 U
3 9 W •
i ■ ^^ ^^ ^ ̂ N
u « ^H rH M
■p £ « N»»• «-Lf* > M?
■^ VO m o FH CM 00 1^ O VO f^ r* CM ON in ON FH 1 O -H \r\ ITi m KN in m ^ ^ in j- -f j- m ■«• m JT m t» u m FH FH FH »H FH FH FH FH FH FH FH FH FH FH FH FH FH 1
•»"s « a. a ä
"I i "
! ^ o •P -P •P -** i ■** S V « • * ! u ß« 1—1 ^ FH J^ FH ^ ^ 1 i * r» •H
JO 9 •H 1 1 a
H 2 5
1 »4 ! -P «
KN J" ir> \o r^ ao 9\ o s s« FH CM m 1 m 1 r^ 9 ON 1 1 «1
HS £ ir\ -> £ g s « « « s «
a • •H O
•H •■4
i s I fcl
•o • FH ■P « i 5 FH «4 0
^ CM
149
. ,
i,
■
* e u o
C > *4 o.
r» *• i^ oo oo r^ r^ r^ 00 ^ r^ KN 1^. FH KN ^ ^
R Os 9v O« 00 ON ON Ov KN ON Os ^ <7N 9N 9N ON ON ON
■SCS
5S-
• IC « 8 8 ^ 2 « s O Q O W CM r^ in SO O ^H r-H ON ON r»
8 8 e3 ei 2 S § l-H O ^H N -H O rH O <N (N Cl (M CI KN J"
Fuel
Flows
to,
lb/sec
ON
1^
00 SO ON ON ON 00 ON » R o i-i oo oo r^ o in ON Ol K> t^ ON M r-
KN J- KN j" KN m m GO -H
Total
Propellant
Flowrate
lb/sec
5 • IfN ITI »H ON r* Ov 00 £ SJ O FH » O ON t^- O in N * ON 00 >-- in
*•> •i
~ 1 KN 1^ KN KN 1^ 1^ Ks *
IfN ■# in in ■? •« o oi K\ KN KN KN KN m vO
a s
Mixture
Ratio,
o/f •
o J- CM « J; I^V o m ir. in ITN r\ ir! in
o IfN • •* *
00 00 in JT O so 00 j" j> vo in in r* oo
w* ^
•ctor End
■ Pressure,
lia 00 -* r^- o r^ t^ m m •» sO ON O 00 -H t^ p^ so .* in .» in .* ^H vo
Chaabei P«
Injector
Type «
2
Test
Number
o & & & & s § s O
J. J. J. ^J. J. J- Ji
O>%H 01 in J; in <o g g g g g g $
y »
^ s.
■P -H a +> « «
N
■ a a o
£ 3 Ol K\ Jt
130
■!,
* ■ :' s ■
»«•
*
29
V 9 a
•H -P a o o
1 w "^"^^ ""' •H «
•»» ►. ■ >» U
•H .p a ■** h -H ai a »^ 00 r^. 00 CM CM CM CM O O 0 ao 1^. CM i^- e
| « U -H M • • • ■ • • • • • • • • 1
>> o u u j- «
•* ■41 ■» CM CM CM J- «
•* in ■* v* in qp 1 O fH -H 1, Ov <^ Ox 0\ 0\ 9* 9* a\ Ov 9 ON Cr» * * «M O u > v. a Li w
« -P u N a « Ä S in
CM O in
in in 0 0 CM CM in in s A CM
in 00 00 O & 3
■H O ^S
• §2 Si si PH
CM a si si si •
FH
CM
• FH
CM
• FH
CM
■ FH
CM
* FH CM
• SI
1 «SE^ * "•»s ■^""X I
i ** M Ol m N ̂ ^ ^^^ 1 1 -2 u
li ^ 08 4> S 8 r-H O
oo in CM ^ SI 8 g^ O O O 8 m
ON <S
3 >"\ -* •a- -» m J- m m m m m in in KN m ^ •n «n 1 t* o x> ^H ^H ^H i-H fH »-< 1-^ 1—1 1—i FH FH FH FH FH FH FH FH I
—• —t
i fe
1 -p -
« 4* O <N •v r> m «n in r^ 00 ON 00 s s m * in 00 CM 1 M FH « 41 vO pH vo CM r^ CM o\ 1^ J- r- -* m ON VI
^ ^ Ä * in in
« • • a •
Ä R R ^ Ä •
in m R
• m m
• in Ä Ä Ä
H O "-• <-"
1 A'"4
« - Ä 00
m CM in
PH
in CM CM 9» ^H tr\ ^0 ^0 \o m » » Ä m
m 0 M m 1
in m 1 ■♦» -t»"^. • ■ • • • « • • * • • • 1
35° ^H 1—' •-* FH 1-1 ^ ^H ^ rH F^ fH FH F^ FH FH FH FH 1
v T) h O 9
W ■ • * <•» i ̂ ^ * ■S
u » ** FH F^
■P £ a v ■-^ * «•«' > ■M»
■* VO ITi O FH CM 00 1^ O vO 1^. 1^ CM av in ON - 1 O -^1 in m ir» m in m ^> J> m ^ J« .* m * m •* ^ 1 « h II 1-^ 1-^ »H f-4 F^ t-H rH rH 1—( F-t FH F-l F^ FH FH FH rH I
•^9 • (U a ä Mi
1 w
i 0 ■P -P ■p -** •p 0 « 0» « • 1
1 SS r-t P.* «.Mi H^. _ FH
^ •^E? •H 9 •H 9 0
| M u
6H <s 2 1 i ki
J -P tt) a ,0
1 a 1 § ir» r^
8 00 Ov O FH
g S « « 1 1 s 1 1^ 00 ON I
a
i s §
^H CM
149
1
- .
M ^MML.'
- .,-
t1

• <* Js Ox 00 SNONOSO\ON(^9\ON9V^ONO\
•
•«4 E ■
Ss5 •
e«
R « 8 8 ^ 2 « 8 S S 8 2 2 » & P eo^H'H oo ^ d -H ^ o -H ci »^ o -H o 1
Fa«l
Flowrat«,
lb/aac
"et '
•
M et 'w' en 'c? c*" oi
^4^^^4^H^H^H^H^Hi-^#-H^^Hi-H<-H^H Oil
Total
Propollant
Flowrat«
lb/a«c
5 * 1 R
»^^»^^S^^^SS^S^^
=1 ääRäRäääRÄR^ääSS
II
Mixtur«
Batio,
o/f
1 ^
o^w-H^-rNOOj'QoaoirNJ'O^« inir\ir\ifNK\iriir»ir«^'^"j'vo »n m f^- ao
tctor End
* Pressure,
lia 5
Inj«
Chaa
bei P«
Injector
Typ« «
fa
H o ^4 C4 KN ■« ITN SO t-^^^^^^cT'd:^^^ 1
■ ■
y •H I
- s I P
« fa fa S « V
«M 5. •
I s 3 5 H O <—» /-N ^-V C* KN •»
150
.
.
■
TABU: 12
AVISAGE VALUES OF OPESATIGNAL R4BAMETEBS
Injection Perfowmce
MMI
Injector Bid Pc> psia
Characteristic Velocity, ft/sec
Characteriatic Velocity Efficiency, percent
Mixture Ratio, o/f
I^ecUr Tyi» TrUlet Pw*let
J0-»
190.76 190.76 145.10
5,*66 5.295 5,258
97.6(1)94.6(1) 95.6 (2)
1.54 1.59 1.50
Injection Btraaetera
Noaber Ozidiaer Orificea
Nunber Fatl Orificea
Oxidiaer Injector Area, sq in.
FViel Injector Area, aq in.
Oxidiaer Flovrate, Ihm/tec
Fuel Flowrate, Ihm/mec
Oxidiaer Injector Preaaure Drop, pai
Fuel Injector Preaaure Drop, pai
Oxidiaer Discharge Coefficient
Fuel Discharge Coefficient
Oxidiaer Injection Velocity, ft/sec
Fuel Injection Velocity, ft/aec
(1) Baaed upon 5604 ft/aec froaen theoretical at noaale inlet stagnation conditions.
(2) Baaed upon 5500 ft/aec froaen theoretical at noaale inlet stagnation conditions.
180 420 420
348 420 420
0.6519 0.5077 0.5877 0.4661 0.4872 0.4872
21.09 22.07 20.81
13.66 13.80 13.86
77.1 102.4 99.4
50.5 49.9 56.7 0.578 0.584 0.598
0.820 0.798 0.803
51.3 59.5 56.2
74.3 72.1 83.3
characteristic velocity
characteristic velocity
151
. .
:m'i mm >■■ T
iaj*et«r. A «llfhtly higher efficiency «•■ obtained with ONI fuel than
vith HJL-UBM (90-90) fuel. The exidiser-side injector presiore drop
«M 29 pal higher vith the da* let dne to the Malier total arifica
iajactar area.
1 tatal af 1*8 diatarbaaces by the rating technique ■ were introduced into
the coadmatiaa chwdiir during the 86 hat-firing testa. Ihre« or four
diaturbaacea were achedulod to occur within the uainatage portion of each
taut; if oue af the earlier diaturbaacea initiated a auatained instability,
the teat uaa uaually teminated by the KM device before the next dia-
turi>aace waa aequenced to occur. Because thenaadirectional explosive boabs
ware auaceptible to theraal initiation during their exposure to the higfa-
teaperatnre coabuation chaaber environaent and alaa because they were
likely to be broken ar dialadged by even a few cycles af transverse pres-
sure «art action, aaly aaa boab waa installed far a firing and it wna
alwaya the first aequenced of the rating devices. The directed gaa flow
rating technique waa intended to be aaad as a standard pulse, with a fixed
paaitiaa af application to the chaaber, far eatabliahiag bath long-tera
caaaiataaey af the coabuator'a atability aad repreducibility. This dis-
turbance waa therefore alaoat invariably aequenced aa the laat one, with
the anticipation of obtaining a rating whenever the coabuation proceaa
»red froa all af the earlier diaturbaacea.
^P^MiT? f. A total af 96 boaba all froa the high-explaaive aeriea,
waa iaatalled in the caabuatar. The hot-firing tests which had boabs,
the boab paraaeters, aad their locations in the coaliuation chapter are
presented in Table 13« Alaa tabulated are the values of the initial
disturbance peak preaaurea recorded froa the apeed-reduced oscillographs.
All except three boabs are believed to have produced valid perturbations.
i I ■
152
■
i-"**«? v^tr^-,- M
I T-ll -llf
TABLE 13
HK-H-EXPLOSIVi: BOMBS USED DURING THE HOT-EDtTN«. «
Test i NO.
1 Bend» Design Far
| Cbsaber Locations
Injector Type Fuel
■Beters
! Radius, j inches
Distance j Pro«
Injector, inches
Charge Weight, grains
| Charge L/D
Ratio
j Case Thickness,
| inches
002 Triplet 50-50 13.5 2.7 0.1 70 j 4.95 ! 2.%
003 5.5 1.3 | 4.95 3.12
i 004 1 5.5 1.3 j 0 3.12
1 005 5.5 1.3 0 3.12
j 006 50 4.0 o 3.85
| 007 13-5 2.7 4.95 2.15
Oil 13-5 2.7 *.95 5.67
014 13.5 2.7 2.85 4.48
| 015 25 4.5 2.85 3.23
j 016 13.5 2.7 1 2.85 3.23
017 5.5 1.3 2.85 3.33
018 5.5 1.3 2.85 4.58
019 13.5 2.7 0 3.79
{ 021 5.5 1.3 0 1 022 13.5 2.7 0 I
| 023 5.5 1.3 4.95 5.77 ■
I 025 25 4.5 2.85 5.67 1 | 027 5.5 1.3 3.97 4.00 1
1 050 5.5 1.3 3.97 4.00 1
031 3.2 1.0 4.95 3.33 1 032 3.2 1.0 f 2.85 j 3.33 ■ 039 Doublet 13.5 2.7 0.280 4.95 3.23 P 040 13.5 2.7 0.170 4.95 3.23 1 041 3.2 1.0 0.170 1 4.95 1 3.33 1 042 | 13.5 2.7 0.280 2.85 3.23 m
043 1 i 13.5 2.7 0.170 j 2.85 3.23 ■
.4
?
• /
«— «* mm ^»«^t—■M^—
1 m -
HOT-FTRP«. JltOliRAM
•lion«
listuce
ajtcUr, inch«*
I Fhotocon Transducer Initial Pretiure, pmi Stability Re suits 1
A B C F ü 1 I M^O)
2.96 154 130 178 2T 11 1
5.12 83 254 156 2T,lT-2Tf3T-lH
3.1« Stable
5.1« Stable
3.85 Stable
2.15 196 187 233 21,11-21,1T-3T,3T-1R RCM 1
5.67 159 92 160 2T,3T-1R RCM I
4.48 170 162 204 200 1T-2T,2T 5 |
3.25 239 238 255 280 1T-2T,1T,1T-3T,3T-1R RCM
3.23 239 234 263 260 1T-2T,1T-3T,3T-1R RCM
3.53 62 81 140 88 1T,1T-3T,3T-1R RCM i
4.58 42 43 66 66 1T-2T,1T-3T,3T-1R RCM
5.79 218 220 260 207 1R#3T-1R RCM
4.65 43 42 40 41 Stable
4.55 178 190 140 159 1R,3T-1R RCM
5.77 38 39 63 70 1T-2T,1T,1T-3T,3T-1R RCM
5.67 140 131 178 206 2T,1T,1T-3T,3T-1R RCM
4.00 130 167 92 UMt, 3T-1R RCM
4.00 81 63 156 198 UNK, 3T-1R RCM
| 5.53 70 70 147 228 2T-1T,3T-IR RCM
3.55 74 70 10b 94 1T,1T-3T,3T-IR RCM
3.23 207 183 227 305 21-11,11-31,31 38
3.23 2"54 189 250 352 21,11,11-31 10
5.55 103 7» 194 207 21-11,11 8 1
5.23 360 305 382 362 31,11,11-31 14 |
3.23 295 | 244 310 31,21-11,11-31 18 |
153
ß
■r-
TABLE 13
(Continued)
Test No.
Bomb Chamber Locations
Injector Type Fuel
Design Paraaeters
Radius, inches
Distance Fro«
Injector, inches
Charge Weight, grains
Charge L/D
Batio
Case Thickness,
inches
1
A
044 Doublet 50-50 1
13.5 2.7 0.280 2.85 3.23 225
045 13.5 2.7 0.170 3.97 4.00 281
046 13.5 2.7 0.170 4.95 5.67 107
047 5.5 1.3 0.170 4.95 5.77 81
048 13.5 2.7 0.170 0 3.79 517
049 13.5 2.7 0.170 4.95 3.23
050 5.5 1.3 0.170 4.95 3.33 144
051 5.5 1.3 0.170 4.22 4.00 258
052 13.5 2.7 0,170 2.85 4.55 208
053 5.5 1.3 0.170 2.85 3.33 155
054 5.5 13 0.170 2.85 5.77 65
055 5.5 1.3 0.280 4.95 3.33 70
060 3.2 1.0 0.170 0 "5 TJ 188
061 13.5 2.7 0.500 4.95 J.23 100
063 13.5 1.0 0.170 4.95 3.40 165
064 13.5 2.7 0.110 3.62 10.2 245
065 ( 13.5 1.0 0.170 2.85 3.40 230
067 Triplet ♦ 13.5 2.7 i 0.110 3.62 10.2 220
068 Pnublet UDMH 13.5 2.7 0.170 4.95 3.23 160
069 13.5 2.7 0.170 0 3.23 304
073 15.5 2.7 0.170 0 3.23 271
075 5.5 1.3 0.170 4.95 3.12 83
077 1 f 3.2 1.0 0.170 4.95 3.35
079 50-50 13.5 2.7 0.110 3.62 10.2
080 \ 1 i 13.5 2.7 0.062 4.95 3.23 200
4
.
Photocon Transducer Initial Pressure, psi Stability Results
25
HI
'7
81
17
kk
38
108
55
05
70
S8
DO
<>5
^5
30
•.20
60
>04
71
83
00
B
234
282
119
69
260
192
131
308
196
J il
75
85
217
195
197
392
338
208
287
235
92
75
263
285
219
165
270
265
214
180
227
273
118
189
139
188
232
220
240
144
240
268
26.
168
136
280
272
154
182
180
337
122
260
260
183
264
141
G
12.
310
68
133
125
H
122
208
Node 8 Damptime,ns
1T-2T,1T- •3T, 1T, 1T-3T,3T 33 1T,2T i 26
1T-3T,IT 6 1T-2T>1T, 1T-3T, 3T-1R RCN
1R,3T-1R ROM
2T-6T,1T, 1T- ■3T 28
2T-6T,3T 21
2T-6T,2T 6
IT 4
2T,1T>1T- ■3T, 3T- ■1R 18
2T,1T-3T, 3T- -1R RGM
2T-6T,1T 8
iR,3T 4
RO.
IT 6
1T,1T-3T,3T- -1R ROM
1T,1T-3T 16
1T,1T-3T,3T 20
UNK, 3T-1R RCM
2T#1T,1T- -3T,3T- ■1R ROM
1R,3T-1R RCM
1R,2T RCM 1T-2T,2T RCM
1T-2T,2T RCM
IT 22
1T,3T 17
154
&
".t"*-** ■*c^"
TABLE 13
(Concluded)
Test
1 No-
Bomb Chamber Locations
Injector Type Fuel
Design Parameters
Radius inches
Distance From
Injector, inches
Charge Weight, grains
Charge L/D Ratio
Case Thickness,
inches
081 Doublet 50-50 13.5 2.7 0.170 4.95 2.55
082 6.9 0.170 4.95 3.33
083 13.5 2.7 0.250 0 3.23
083 13.5 2.7 0.170 4.95 3.23
086 i 13.5 2.7 0.170 4.95 3.23
(1), T represents a tangential mode
R represents a radial mode
T-R represents coexistent modes
(2V CM represents premature cutoff due to sustained instabilities
f
it ions
[stance From gee tor, ncbes
Ftaotocon Transducer Initial Pressure, pai Stability Results
A B C F G 1 I Modes Dafflptiaer ma
12.55 215 245 260 308 254 225 1T-2T,3T-1R RCN
|3.33 137 189 231 223 138 118 11-21,11,31-111 ROf
3.23 500 320 315 271 268 344 1R,3T-1R RCM 3.23 205 295 248 243 1T-2T,3T-1R 22
r, , 213 288 303 265 2T,3T-1R 14
155
s
■ ■ \,
T^
■
The first three bombs inatalled at the center of the chamber (during
Teats No. 004, 005, and 006) were subsequently determined not to have
fired within the time increment from bomb fire-signal to the first pulse
gun firing. The Insulation was presumably melted from the electrical
lead wires where they passed under open bomb-installation ports in the
baffle assembly so thut the bomb-fire signal was shorted; the later
practice of putting a blind plug in any of those ports which hud lead
wires under them eliminated that problem. The bombs in Tests No. 042
and 051 detonated thermally after the nylon case broke loose and slipped
off the n.5-grain blasting cap. The data from these two tests were
treated as though the bomb case consisted of zero thickness.
Pressure records from combustion chamber Fhotocons were examined to
determine the combustor's stability response for each perturbation. A
typical pressure record is reproduced in Fig. 52 , where it is seen that
the stability response may be quite complex. In this case, the initial
disturbance triggered a moderately high-amplitude, second tangential
acoustic instability. At the same tine, however, the propellent sprays
which had been burning with a steady-state distribution in the combustion
chamber were burned at a much higher than average rate. As a result, the
mean chamber pressure was momentarily substantially higher than average.
As a further result, the propellent injection rate must have been drastically
reduced. The initial second tangential mode found little sustaining energv,
and, as the chamber pressure decayed below normal, it was attenuated.
Resumption of propellent injection apparently re-established a propellant
spray field better able to sustain a first tangential acoustic mode since
that mode was seen to, arise out of the depth of the chamber pressure's
lowest level. After about 5 milliseconds, that mode was replaced by a
pair of coexistent acoustic modes: the third tangential (baffle compartment
mode) and the first radial. This combination was then sustained to engine
cutoff.
156
■
>w»»il» ■imtrii , - — - -—
r M
157
n
fkm coabostor'a stability behavior in response to the bombs is sumarized
la bar-chart fona for the triplet injector in Fig. 53 and the doublet
injector la Fig. 5% . In addition to changes in honb charge weight and
ch«ri>er locationa, parametric changea in caae material, L/D ratio, wall
thickneaa sad fuel type were made with the doublet injector.
Along the abacisaa of these charts are liated increasing values of axial
diatance from the injector face to the center of the bomb'a explosive
charge for three different values of radial diatance from the center of
the chanber to the honb'a cylindrical axia. (Four bombs which were
Inserted into the chanber through Fhotocon porta. Testa No. 027. 030, 043,
and 051, and two bombs inserted i.car the nozzle, Tests No. 064 and 067
also ahown.) The vertical height of each bar represents the explosive
charge weight and the teat number appears above the bar.
Stability information, as determined by frequency and phase analyaia of
the chanber pressure records, la preaented within each bar. The mode
(or modes) of acoustic inatability initiated ümaediately by the honb is
denoted by the kind of cross-batching in the bottom 0.2-inch of the b*r.
lammdiately above that is sn indication of whether some other mode replaced
that initially triggered mode. Finally, above that is an indication of
whether an inatability was sustained until HTM cutoff (by continued cross»
hatching to the top of the bar) or recovery to stable combustion waa
szpsrienced. The height of s particular cross-hatched bar-segment is not
quantitatively related to time. The time required for the combustion
process to recovery to stable operation ia tabulated along the abscissa
where applicable.
Pulse Guns. A total of 81 pulae gun chargea were fired during tnc «xperi-
mental teat program. The hot-firing testa in which pulse guns were fired,
the pulse gun chsrge parametera, the position and direction of blast-wave
entry into the chanber and the initial peak pressures recorded at several
Biotocons are preaented in Table 14 . All but five of the chargea wore
158
- -
•TISOM
t-M jR|
2-M
}Q 8 ir> in
8
8
eg Q
1^
5
%
31
eg S
1 S e
p • PH
KN Sf E
t- H 10 • IT» 5
» !R • i
• f ^- •H
S •
KN
• KN
••
i ■ R (S KN
^
I II «S4 e
If
I
BUTBJJ) ^q3T»/l »»JBqo %
'^Jisis.-- ■ ■ <*.■!'
mm**~~*^ 'mm
.
'
J-Ot!
«XCBON
iiwcn
HHcm
&
St
SC
an
si
IT« ir>
euT«uf5 «^TUJ», aSj^qo
160
IG'k
OO (H
2-01 a • a
ü'i
te't
6L*i. 9 1 t£'£ 5
>
0>'£ 1 ffl ß'C ^•fc
ß'C ■ o l-l
CC'C 1 «.•fr • •>
9)
U'fi §
?I'4 IN
K'C •H
tt'C J3
5 tt't
^•t a
wi. « £ Ofr'i 4 Jj 1 0 •*>
te't »sg «M
us S O «
A9*^ 1 St a 1 « tt't •H a 1.3
tt't «8 •H •
fc'i a «
I
«H
. -
■ ■ • i
" ^pp

TABLE 14
PULSE GUNS USED DURING THE HOT-FIRING PROGRAM
Teat No. Fuel Designation
Chaaiber Inlet Description Phofl Initj
Injector Type
Boss No.
Direction/2^ degrees
Port Diaaeter
inches
Distance Fro«
Injector, inches
I 003 Triplet 50-50 ISHB/lOK 1 180 «•515 2.00 J 00k 40BB/20K 1 180 2.00 li 005 40HB/20K 7 90 2.00 m
i 006 10HB/7.5K 7 90 2.00 m 008 80HB/20K 7 90 2.00 m OW«" ltHB/7.5K 9 90 4.00 i W*" 30HB/20K 7 90 2.00 I 010 15HB/10K 9 90 4.00 1 012 10HB/7.5K 8 90 3.00 I 012 40BB/20K 7 90 2.00 m 013 10HB/7.5K 8 90 3.00 m OU 10HB/7,5K 9 90 4.00 m 020 4(flB/2(K 1 180 2.00 m 020 4QHB/2(K 4 135 2.00 m 021 lQBt/7,5K. 1 180 2.00 1 022 10BB/7.5K 4 135 2.00 1 022 15BB/1« 1 180 2.00 1 024 lflHB/7.5K 3 180 4.00 1 024 20BB/20K 1 180 2.00 1 026 lOduPM/7.5K 1 026 lOduH4/7.5K I 028 40HB/20K 4 135 2.00 ■ 028 I0HB/7.5K 6 135 4.00 1 029 20dnPM/20K 4 135 2.00 1 029 10HB/7.5K 2 180 3.00 1 033 15HB/10K 2 180 3.00 m 034 10HB/7.5K 4 135 2.00 1 035 - 1 15Hb/lOK 4 135 i 2.00 ___.r
4
r J* Bk"
i ■"' ^
rm Bor-FiRiNG PROGRAM
r Inlet Deacripiion
•irtctio«/2^ iegree*
180
180
90
90
9©
9*
90
90
90
90
90
90
180
135
180
155
180
180
180
155
155
153
180
180
155
155
Port Oiaaeter
inchea
0.515
Distance-
Frin Injector,
inchea
2.00
2.00
2.00
2.00
2.00
'i.OO
2.00
'•.00
3.00
2.00
3.00
4.00
2.00
2.00
2.00
2.00
2.00
4.00
2.00
2.00
k.OO
2.00
3.00
3.00
2.00
2.00
Photocon Transducer Initial Pressure psi
B
142
258
158
258
240
20
252
116
196
112
218
88
86
10
48
208
10
170
158
52
240
242
78
47
90
355
155
130
168 60
17 17
223 178
160 238
178 40
166 178
182 100
176
132
10
148
130
10
38 35
254
95
197
10
118
80
62
70
258
60
98
10
98
97
10
28
70
i_80- 108 80
250
10
22
121
240
2':5
StJhility Bf
Nodes (5)
iitj
Damp Time, ns
Already Unstable
1T-3T, IT
IT
1T,1T-3T,3T-1R
1T,3T-1R
IT
2T,1T-2T,1T-3T,3T-1R
1T-3T,5T-1R
21
IT,3T-1R
nvjT,5T-lR
1T,3T-IR
lT-3T,ir
1T-3T,1T
1T-3T,3T-IR
Already Unstable
1T-3T,5T-1R
Stable
IT
IT
Stable
Stable
IT
1T-3T,3T-1R
1T-3T,3T-1R
1T-3T,3T-1R
7
7
RCM
RCM
6
RCM
RCM
2
RCM
RCM
RCM
2
4
RCM
235
2
RCM
RCM
RCM
_r*.A»- jfrXmimj^lJUf
161
-
- -
fe
TABLI^ U
(Continued)
1
Test | No.
Charge ^ Designation
1
Boss No.
| Chaaber Inlet Descn ption
Injector Type Fuel
(2) Direction v ' degrees
Port Diameter
i inches
Distance (YOB
1 Injector, inches
1 ■
A
036 Triplet 50-50 20HB/20K 4 135 1 0.515 2.00 168
030 20HB/20K 2 180 3.00 300 ■
037 |f 15HB/10K 3 180 4.00 10
039 Doublet 10HB/7.5K 9 90 4.00 352 •
039 10HB/7.5K 8 90 5.00 140 1
040 40HB/20K 7 90 2.00 360
040 10HB/7.5K 1 180 2.00 82
041 20HB/20K 7 90 2.00 400 2
041 20HB/20K 1 180 2.00 250 2
042 40HB/20K 1 Ibo 2.00 256 1.
042 40HB/2DK 4 155 2.00 190
043 40HB/20K 7 90 0.370 2.00 360
043 20HB/20K 4 135 0.515 2. JO 155
044 40HB/20K 7 90 0.430 2.00 366
044 10HB/7.5K 4 135 0.515 2.00 133
045 10HB/7.5K 7 90 0.370 2.00 318
045 10HB/7.5K 6 135 0.515 4.00 90
045 10HB/7.5K 3 180 4.00 32
04b 40MB/20K 3 180 4.00 192
04b 10HB/7.5K 7 90 2.00 322
049 15HB/10K 3 180 4.00 40
049 40HB/20K 9 90 4.00 358
050 20HB/20K 3 180 1 4.00 152
050 20KB/20K 9 90 | 4.00 362
051 40HB/20K 6 135 4.00 46
051 15HB/10K 1 180 2.00 17$ 052 1 1 l 1 15HB/10K 6 135 4.00 152
052 15HB/10K 4 1 j
135 | 2.00
\
■
1 Chaaber Inlet Deacri ption Stability ) lesults
Distance ;
Lion (2) Port From
Diameter Injector, |reea inches inches A B C F Modes | Damptime,ms|
155 0.515 2.00 I08 72 75 1T-3T,1T 10
ISO 3.00 300 272 135 160 1T,3T-1R RCM 1
1 0 4.00 10 10 10 10 IT 1 2
190 4.00 352 225 100 60^ IT 7 1 |90 3.00 140 146 282 82 IT 6
|90 2.00 360 265 154 208 1T,1T-3T,1T,1T-3T,1T 28
[so 2.00 82 85 190 52 lT-3TflT 7
[90 2.00 400 252 122 185 2T,2T-1T 18
180 2.00 250 220 312 194 2T,2T-1T 5
pso 2.00 256 21^280 1
208 IT 7 |
bs 2.00 190 168 200 372 / ■ \
IT 6
[90 0.370 2.00 360 262 132
3.5*»'
IT 30
135 0.515 2.00 155 180 191 IT 7
90 0.430 2.00 3bb 238 138 190 IT 20 I
135 0.515 2.00 133 152 150 272 1T,3T-1R RCM
90 0.370 2.00 318 210 78 IT 9 Il35 0.515 4.00 90 70 58 1T,3T 20 i
180 4.00 32 25 40 Stable
180 4.00 192 186 291 127 IT 7 j
i 90 2.00 322 231 100 93
30^
IT 8
180 4.00 40 70 78 Stable
90 4.00 358 302 116 1T-2T>1T,1T-3T,3T-1R RCM !
180 4.00 152 208 365 1T-2T 6 i 90 4.00 362 255 121 1T,1T-6T,1T,3T-IR RCM j
135 4.00 46
17(0 44 88 1T,1T-3T,1T,1T-3T)3T 17 j
180 2.00 155 130 IT 6 135 4.00 152 136 158 IT 5
135 2.00 170 128 IT 7 1 162
'
■
t ...
- -

TABLE U
(Concluded)
K
(1) The charge designation includes first the charge weight in grains, next the explosive t> duPont Military) and finally, the burst diaphragm pressure rating in 1000 psi.
(2) Directions of 90, 135, and 180 degrees are referred to elsewhere in this report as tangei respectively.
(3) The gaseous nitrogen flow was admitted to the chamber first during Test 009 and had not were fired.
{k) Photocon transducer struck by bomb case fragment from previous pulse.
, f
1 Chamber I nlet Description
1 Distance |
Test 1 No.
Injector 1 Type
Fuel (hydrazine/UDMH)
j Charge^1' | Designation
Boss No.
! (2) Direction,x ' degrees
Port Diameter inches
1 From Injector,
| inches
052 Ooub let 50-50 13HB/10K 9 90 0.515 4.00 i 1 053 15HB/10K 7 90 2.00 1
1 055 20KB/20K 6 135 4.00 j 1 055 10HB/7.5K 135 3.00 I
1 056 4OHB/I0K 90 2.00
1 057 IOHB/IOK 90 2.00
m 058 20HB/10K 90 2.00
1 059 20duPM/20K 180 2.00
1 061 40duPM/20K 180 2.00
062 20duPM/20K 90 2.00
062 80duPM/20K 180 2.00
06'i 80duPM/20K 90 2.00
065 \ f
40duPM/20K 90 2.00
070 UDMH 4OHB/20K 90 4.00
070 40HB/2ÖK 90 2.00
070 10HB/7.5K 135 2.00
071 15HB/10K 90 2.00
072 20HB/20K 90 4.00
076 1 15HB/10K 180 2.00
079 50-50 15HB/10K (0 180 2.37
080 40HB/2GK 135 3.00
» ^ 084 40HB/20K 90 3.00 r 084 I 4QHB/7.5K 135 3.00
085 15HB/10K 90 2.00
u I 086 V 1 1 15HB/1QK j 90 1 2.00
■
1 -^ 1 I
4
— ,
Lr Inlet Deecr iption Photocon Transducer
Initial Pressure psia Stabil^ tv lleaulLa
t) Port Diameter inches
Distance From
Injector, inches
A B C F H I Modes Domptime, ins
0.515 4.00 372 252 112 IT 7 2.00 338 250 118 2T,1T,1T-3T,3T-1R BGN 4.00 135 97 50 1T,IT-3T,1T,1T-3T,3T 25 3.00 128 130 70 2T,1T-3T,3T 16 2.00 390 241 118 118 2T,lT,lT-3T,3T-iR RCN 2.00 371 248 106 117 2T,1T,1T-3T,3T-1R RCM 2.00 382 238 104 118 1TI1T-3T,3T-1R RCM 2.00 IkO 140 340 120 1T-2T 2 2.00 90 141 258 88 1T-2T 4 2.00 322 238 135 1T,1T-3T,3T 34 2.00 249 249 298 255 1T-3T,1T,3T 14 2.00 323 268 149 155 1TI1T-3T,3T 23 2.00 338 26? 122 160 1T#1T-3T,3T-1R RCM 4.00 365 272 98 222 IT 9 2.00 318 210 92 128 IT 8 2.00 15 8 8 6 Stable
2.00 292 122 85 118 1T-2T,2T RCM 4.00 293 156 90 173 IT-2T RCM 2.00 115 82 230 86 1T-2T,2T RCM
2.37 UNK 14 3.00 1T-2T,3T 19 3.00 253 302 312 217 388 IT 15 3.00 177 162 150 212 167 1T,3T-1R 23 2.00 362 170 448 422 1T-2T,1T,3T 14
i 2.00 3'»2 138 442 448 1T,3T-1R 63
ins, next the explosive type (HB - Hercules Bullseye No. 2, log in 1000 psi. •e in this report as tangential, chordal, and radial,
ilif Test 009 and had not been turned off when the pulse guns
ulse. 163
'
mm -
«MM
■
_
—• *■"■
believed to have given valid combuiitor perturbationa. Two of thoa»?
(during ToBiB No. 00T and 022) wore fired during previously existing
bomb-initiated inatabilitiea. Three pulse charges made up of duPont
Military powder instead of Horu^tes Dullspyc No. 2 wore inadvertently
fired in Tests No. 026 and 029. The 10duPM/7.5K charges failed to burst
their diaphragms. The first 31 charges (including all five of those Just
conuputed upon) were used during hot firings of the triplet injector and
the remaining were with the mixed doublet injector. The coobustor's sta-
bility behavior in response to the pulse guns is summarized in bar-chart
form in Fig. 5,3i 50, and 57. Figure T) presents the data obtained with
the triplet injector and N^H.-UDMIl i'')0-50) fuel. As can be ascertained
by referring to Table Ik, only "standard" charge weight/diaphragm strength
conbinotions of Hercules Bullseye powder are represented there. Figure r)()
contains those data from the doublet injector firings which are directly
comparable with the triplet data. Then the other data from the doublet
injector firings (in which variations were made in the pulse gun param-
eters powder burning rate, charge weight/diaphragm strength combination
and barrel port diameter and in the propellant combination) are given in
Fig. 57« The stability information on these charts is presented in the
same manner as that for bombs in Fig. '33 and Jk except that the pulse guns
were directed in three angular directions whereas the bombs were located
at three radial positions.
Directed Gas Flows. Directed flows of gaseous nitrogen and helium failed
to initiate any chamber pressure oscillations during II tests. Hie test
numbers, positions and directions of admission into the chamber and data
on the gas species used and the gaseous flowrate are presented in Table 15*
The maximum flowrate achieved with gaseous nitrogen vas 8.08 lb/sec
which corresponded to a linear ramp slope of 300 lb/sec . The maximum
helium flowrate was 2.24 lb/sec. Typical ramp profiles are shown in
Fig. 38. All gaseous flow« were introduced into the combustion chamber
at an axial distance of 2 inches from the injector face. One teat with
the doublet injector utilized a 0.370-diameter port connecting tube; all
others were with a 0.515-inch diameter port.
I6'i
— --.
•
ft :■.
/ •2 c
cd •rt •H
4*
I
o m m
i
S <
«
o X! O
!3C »c
l-l
aCZl i
O
Ü
*
■H h H
■H
* « d o «
in
I
8 S fc R 8
BUTOJC 'iUST»« »SJoqo 165
11
J

KM«»«""«!
S 9. 8
3 I «
!
5
^ I I
3 s
I
OT«2 •H O u in
5* s
,
I
«UT«JO •»^•M •»Jt^n 166
'
.
t
■ m
e2
wa 3C wa wa
wa JC wa
m
Kwan
Hwan
iwan gl
HHan
Hwan ^C
Hwan
3IOI xoi xox
xoi
ÜOLi.'
aoz,i* aoi>*
S 5^ ^ 8 S
•UTWO *V(*T»ft «»JWitO
167
•
-* -
I 2
d
I £1
e
•H O >H in
35
f
I
• ^**:-
'..
/
%
i I c
i «3 *
s'S ic:
tfi
xi ^ o © o ^o r- o >-' I « I • • • £ VS |^ I ^88 8
S KN 8 — SS85R vc \o oo r~ CM ci o vo
» • i^\ • • • • • • i*>
IIIHhiHI 9B »feSBfeasBK iexae
§
I*
1-5 I
I
* 9^ i^ l^ i^v ^ 9s 9 do do oo
i ■
ti tl
I M r\ * m & <& w & r^_rv>« SO © © O W •M 6l KN^7
© © © © © o o 4<
© o o
•H
■ « o
• « ♦> "C « B 'H «
■SU B
■ -H
t s
o
o SE
I
I © * • «i «a
IS « t-.. J f
I - ft. •
* b n.
8 I8: §1 .»58,
•H o o o c o <*> SB ^< Ü fi. o > <H a c
huh
168
fc
r «I
o o
o CO VÜ
o CO
088/qt '•itJMO'I.J MT^d «»O
169
4>
01
u
5
I I I I2 as a I
■-4
■H
I
■
On several occasions, a port through which a gas pulse was directed fell
within the field of view of the Foetax camera looking up the nozzle into
the coahustion chamber. The high-speed motion pictures showed clearly
that gas flows directed in the chordal or tangential direction resulted
in a large circulating eddy motion, or vortex, within the baffle compart-
ment. In terms of the camera's field of view as it was sketched on
page 141, a chordally directed pulse produced motion on about the following
scale: , ^ PULSE DIRECTION
During those tests for which the gas flow ramp was the longest duration,
the eddy became more and more distinct as the flowrate increased. During
that time, the accelerometer on the injector recorded a vibration that,
as shown below, steadily increased in amplitude. There were however, no
attendant chamber pressure disturbances or oscillations.
H K »100 Milliseconds
IMIIIJW»
As* Ramp Flow Duration H
i. 72 g
T Accelerometer Output During Gas Pulse Flow
170
•
_«_, __
It is interesting to note that most production-type rocket engine testa
utilize accelerometer transducers for rough combustion indicatora and
often provide a RCM signal for engine cutoff. The accelerations on the above
mentioned test exceeded 250 g peak-to-peak and could have been sufficient
to generate an erroneous cutoff signal under moat normal operating test
conditions.
Also observed by the nozzle-end view camera were a few brief flaahes of
brighter-than-usual combustion products emanating from the general
neighborhood of the corner formed by the intersections of the injector
face and the baffle vith the chamber wall. Two of these were seen during
the nitrogen gas flow in Test No. 037 and are listed in Table 15 as "pops".
They were first observed in the motion picture and, from their appearance,
were immediately thought of in terms of the isolated random pressure dis-
turbances that occur occasionally with NgO. and hydrazine-based propellents.
Close examination of the pressure records revealed, however, only very
slight disturbances were felt at the nearest Photocon position. In at
least one case, the flash of brighter products appeared to penetrate about
half the chamber radius at about 1000 ft/sec for about l/2 millisecond.
These results offer a strong indication that the propellent combustion
processes with these injectors and propellents are not sensitive to transverse
flow disturbances.
Instability Mode Identification and Modal Belatlonships. The information
presented in Fig. 53 through 57 is wholly concerned with the identification
of and relationships among particular chamber acoustic modes. For the
majority of the tests, these data were derived from examination of the
frequency, amplitude, and phase relationships cmong pressures recorded by
the three or four Photocon transducers and displayed by making time-base-
expanded oscillographs of the taped data. Data from Photon transducer
positions PCI through PCS provided positive identification between the
first tangential and second tangential acoustic modes. The transducers
171
■
I
wer« located, however, on pressure nodal points for the standing third
tangential mode. Therefore, it was impossible to positively distinguish
between the third tangential and the first radial acoustic modes, since
all pressure oscillations would be in phase for both modes. Based upon a
>5*C feet per second acoustic velocity, the following theoretical modal
frequencies were calculated.
TABU! 16
THEORETICAL CHAMBER ACOUSTIC FREQUENCIES
Chamber Acoustic Mode Theoretical Acoustic Frequency, cps
First Tangential 2188
Second Tangential 3629
Third Tangential 4992
First Radial 4553
It is observed from Table 16 that only 439 cps separate the third tangential
and first radial modes. Additional instrumentation techniques were needed,
therefore, to ascertain conclusively the chamber acoustic behavior. late
in the Hrlng program, two additional Fhotocons (H and l) were installed;
each was located 15 degrees on either side of a pressure nodal point for
the third tangential acoustic mode. These transducer output data, in
conjunction with streak film data, indicated that both the first radial
and third tangential modes were coexistent.
1.25 MILLISECONDS
PHOTOCON H
172
, . ■
-'
illlWMWM
I A beat frequency, for example, was recorded on both (H) and (l) Photocona,
180 degrees out of p •W»e, and represented the differential frequency between the two fflod3S. Additional corroborating evidence from the streak photo-
graphic records is discussed in a following section.
Transparent Chaaiber Beaults
Two hot-firing tests were made with a transparent corfr stor ■action
using the doublet injector and NJL-UDMB (50-50) fuel. The tnitial
test, run number 078, was nearly nonproductiTt because the majority
of the films were somewhat under exposed and the single scheduled
rating disturbance was not activated. A shorting circuit on the
explosive bomb firing circuit had not been removed. The second teat,
run number 079» contained a 13.9-grain bonb located in the nozzle
section and a 15HB/10K pulse gun charge directed radially through the
transparent side. Both 600-mllllsecond tests were successful from an
operational standpoint.
The moat pertinent results of transparent chamber experiments at
rocket operating conditions are photographic. Detailed study of high-
speed motion pictures can yield semi-quantitative understanding of the
combuation processes in depth that la not attainable by any other current
means, unfortunately, in reproducing a few framea of 16 millimeter film
for publication, little (if any) of the dynamic quality Is transmitted.
Some film sequences that are fairly informative when projected In motion
may lose all meaning when reproduced aa still phbtographa. Figure 99
shows reproductions of two frames taken with a Fastaz camera through
the transparent combuetor wall during test 079. The axial field of view
of the transparent section was 5>56-lnches. The first picture, Fig. 99a,
was taken several milliseconds prior to initiation of the bonb. The
length of the propellent atreama during stable combustion is seen to be
about 9 to 6 inches. Since the outer injector ring consisted of fuel
elements, the observed unbumed propellents are probably JLIL-DDMH (5O-50)
fuel fans from the self-impinging doublet elements. Figure 99b shows
the interruption of the combustion process several microseconds after the
boab blast. The propellent streams are almoat entirely consumed by the
173
i
•
In 1
a. Steady State Stable Combustion
b. Shock Wave Following Bomb Perturbation
Figure 99. Selected Frames From Motion Photography of Combustion Process
174

quasi-spherical shock wave generated by the boat in the nozzle. The fuel
spray fans were shortened to about one-half of their original lengths dur-
ing unstable combustion and when viewed in projected notion, could be seen
to oscillate in the transverse directions.
Streak Fil« Analysis. Streak films, taken for aiding in the identifica-
tion of instability modes and understanding of the various phenoaena that
occur when a rating technique is employed, are illustrated in Fig. 60 and 61.
Segments of films exposed to light emission through the transparent com-
bustion chamber wall at the time of bomb detonation are shown in Fig. 60.
Later-time segments from those same films, when the pulse gun was fired,
together with a segment from a baffle-vane-aligned streak film are re-
produced in Fig. 61. The geometrical relationships between the streak
camera alignments and the chamber are shown in Fig. 50. The nozzle-view
streak camera aligned with one baffle vane was obscured behind an NTO
cloud during the bomb dirturbance and did not produce any naeable data
until the pulse gun fired.
r
All streak photographs were correlated with other photographic and tape-
recorded data by means of a common 1000-cps reference timing signal.
Voltage pulses were simultaneously recorded on the ran oscillograph, one
channel of the magnetic tape and supplied to each Fastaz earners where they
powered a timing light for exposing s small portion of the film's edge
every millisecond. Crors-correlation was assured by providing a unique
blanking or broadening of the voltage pulses during one specific time
interval in each test. The pulses to some of the streak cameras were
specially shaped to provide more abrupt initiation and termination of
lamp luminosity.
Examination of the axial and circumferential streaks in Fig. 60 show the
existence of the standing first tangential mode for approximately 7.5
milliseconds following the steep-fronted bomb shock ware. This is typified
by the parallel,normally orientated, luminous bsrs or the axial streaks
and the corresponding sinusoids 1-1 ike wave appearance in the circumferential
175
m
I i
li
PF "= r
•treaks. The observed frequency la 2130 cpa which coaparea favorably
with the 2188-cps frequency lilted in Table 16. During this period the
chaaber presoure dropped below noraal, causing increaaed injector £ P's
and flovrates, as shown on the axial streak film. About 8 milliseconds
after the boab disturbance, the combustion process recovered from the chug
and the chamber pressure reached a high value causing the luminosity to
increase as shown. At about this same time a change in the stability
behavior can be noted. The frequency increaaed to 4370 cps. This new
wave form can be identified as the first radial acoustic mode and is
seen to coexist with the first tangential, particularly on the circum-
ferential streak film. Both modes were damped after 22 milliseconds
and stable combustion continued until the pulse gun was fired.
The three streak films taken during the pulse gun disturbance are shown
in Fig. 61. In addition to the axial and circumferential orientation,
a streak record waa obtained with a camera looking up the nozzle with a
0.005-inch-wide slit aligned parallel to a baffle vane. This is shown
in Fig. 6lc. (The less precise lOOO-cps reference time base was recorded
on this film and the framing rate waa approximately 4100 fpa.)
All three films show increaaed combustion luminosity for about 1.5 milli-
seconds following the initiation of the pulse gun disturbance. The first
tangential mode is again clearly indicated at approximately 2100 cpa,
primarily on the circumferential streak. A baaic difference with the
pnlae gun disturbance waa the presence of the first radial utode immediately
following the perturbation. This is again shown by the luminous parallel
bars of light on the axial streak and the corresponding saw-toothed pattern
observed on the baffle-oriented streak. The instability waa damped after
5 milliseconds. The pulse gun did not cause a feed system coupled chugging
instability.
176
,
r- 0,.001 Second --1
A
Do,~-'}J] /,~,'I :.:"':l":3 B:Jg~ f'lf
~·~~==~=================================================
Axial Streak - BoW>
ii'·c·7--~=-~·-=··~===~~============================================""""""'""""""""""""
r~1T .f0/AILA3lE COPY
Coexistent Firi:Jt. T~n.gent1n1 AcN;:tttie Hnde
x':t$'~U''>. 60. Strer..k Photogrnph:'5 rd. !hn;;tb 'P:t,~jts:~:Br~C.Hi f!ombn.s-t,:lon InatnbU.i':;y :l')ur~.n;r; Tt:ll!t :·;
177
c
ä - «M» -■■i iirt' '
Downatrean Edge of Baffle
Axial Streak - Pali
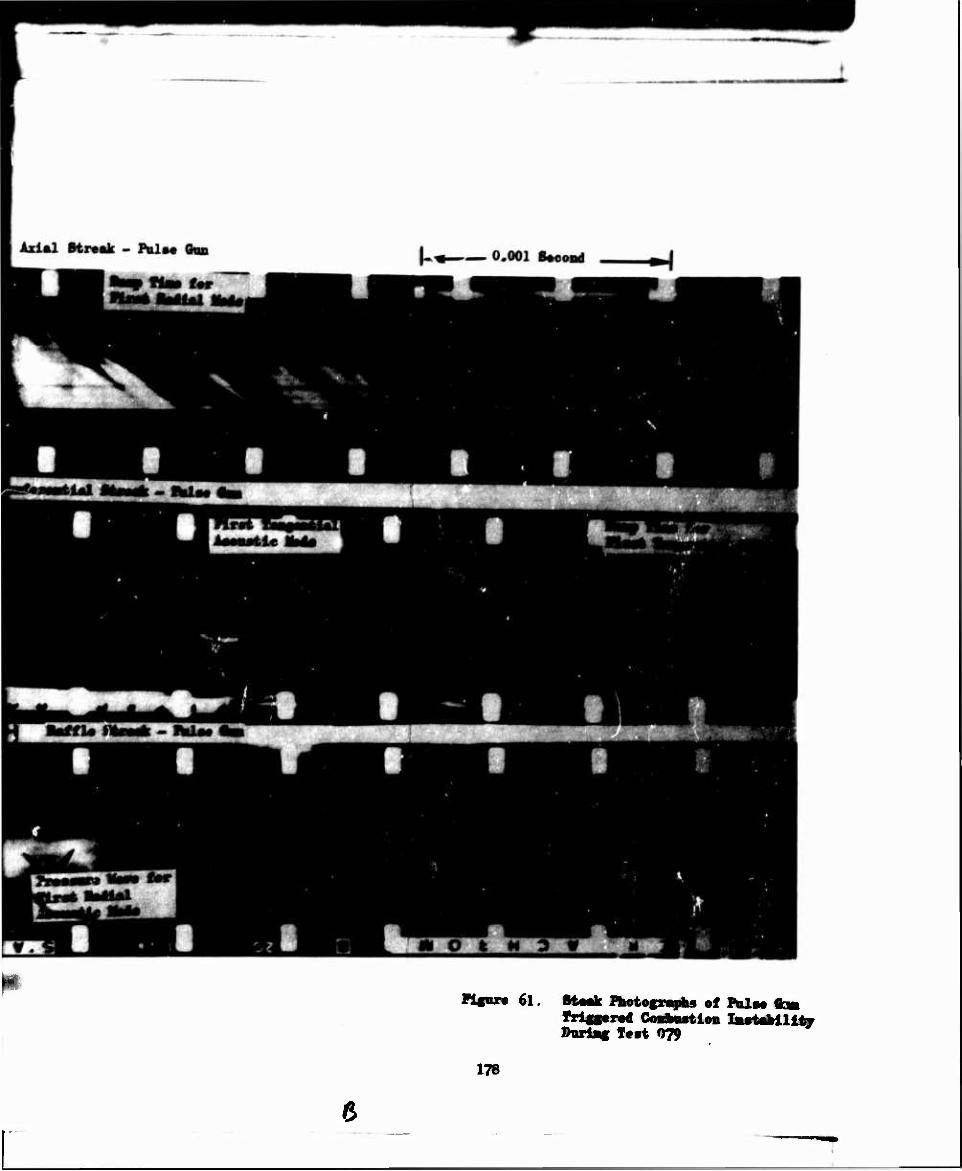
61. 8tMk Photofrmph» of PBLIM ft» friggtvi CoiiMution InrUbillty »urlag T«st 079
178
ANALYSIS AND CORRELATION
COMBUSTOR'S STABILITY RESPONSE
From previoua stability experience with the particular rocket ayatem em-
ployed, it was anticipated that recovery to stable operation would be
experienced with all but a few of the rating devices' perturbations. The
projected correlations were based, therefore, on relating the devices'
characteriatics to response variables such as the initial pressure dis-
turbance amplitude, the recovery or damp time, and the pressure oscilla-
tion amplitude decay rate. It wa.4 further expected that instances of
sustained instability could be clearly related to rating device applica-
tion variables; e.g., introduction into the chamber at a preferred loca-
tion for driving a particular mode of instability.
A few tests dispel these promising expectations. The triplet injector,
which had previously been found insensitive to bomb perturbations, was
found to recover its stability from only a small fraction of the bombs
used and only about half of the pulse guns. The least expected revelation
was that there was no inmediately apparent relationship between the rating
device parameters varied and the ultimate stability of the combustor.
In other vords, recovery to stable operation appeared to occur randomly.
Thougbtftil examination of Fig. 52, 33 and 55 will clearly reveal the com-
plexity that the first several tests began to reveal.
The projected correlation technique was not appropriate for the stability
responses experienced. In view of the responses' complexity, an alternate
correlation approach was devised which was based on conceptual interrela-
tionships among characteristics and responses as depicted in Fig. 62.
There the correlation is broken down into several separate steps, each
of which forma a logical stepping stone for relating the rating device
to the combustor's ultimate stability behavior. This approach has a great
advantage over a simple beginning-to-end correlation: If the ultimate
stability is unrelated to the rating techniques' variations, it should
be possible to determine at which point an hypothesized relationship
breaks down.
179
.
m mm
- -

*
2 a u
•H -*>
•H
s 41 -H Ü ft
■H 0) • • t» "P 2|
+» (0
5
I
I •
ll 1—1 rH «
fc B ^ •H » •O h >» PH 4»
«3 O Pi
"öl
I « u
•^
a P 0)
5. « S1
-H
a a H8 +» Ä
00 <H * o a ■ 0» 0) « o a o
CM OB a a a (4 o
-p •H CO <-< -P
a m •H Ö
S| a o M O
•H O h
<d -p .o w «J B •^ +> « ^ O ja P< « u
o o Ü h -p
•H O
•H oo a
-

■i mmm 'Wliii i^" ■■!"
wummmtm
*■
■
§m m
•H « V ► •H ^ •
A** • 4» fa *H
.. SJ PH
til 1*
o a ■»» o g •H h e ■»»
9 ►> Sß 'S SS.! 3 U -H o « .. » «5
tpa
t ta
bl .2S
5M
5OT 1
■ ■ «■ ma
I ■
II
Si
«e •H-t»
li •H O
IS" lH<0
a
180 <5
^-, ;- ^
The cold characterization, step (l), has already been discussed at length.
As indicated by the dashed line input to step (2), it is conceivable that
direct correlation of the input parameters may be desirable or required,
but use of the characteristics should lead to a more fundamental under-
standing of the processes involved.
This section is concerned with the analysis and correlation of informa-
tion regarding steps (2), (3), and (4). Each of these is shown in
Fig. 62 as having the propellant spray combustion characteristics as
an input; these were certainly not determined, but were considered to
be held constant for three distinct groups of tests (viz., the triplet
injector, the doublet injector, and the doublet injector with UDMH fuel).
In step (2), quantitative correlations were sought between the rating
techniques and the initial response of the combustion processes. Since
the gas flow disturbances did not induce any measuraable pressure dis-
turbances, no further consideration will be given that technique here.
For the bomb and pulse gun techniques, the correlations are in terms of
the initial pressure wave amplitude.
The continued response, following the establishment of an initial pres-
sure wave, is interpreted in step (3) as the driving of an initial mode
of combustion instability. The available infurmction has been related
qualitatively, and somewhat heuristically, to the position and orienta-
tion of the rating device in thr combustor but the quantitative correla-
tion appears to break down at this step.
The ultimate stability is discussed in step (4) in terms of interactions
between the initial mode, a low-frequency chug, and* subsequent instability
modes. Again, quantitative correlations are lacking.
Initial Wave Amplitudes
The direct analog pressure records ware analyzed to obtain quantitative
data on the initial bomb and pulse gun-initiated blast wave amplitudes .
181
,
.
«rw.jfc
i 1
M fimetiona of tiat and distanct fro« tht «ource. Correlation of the«*
data «a tho initial ororproaauro to tht doricc«' cold-flow characteristics
or to thoir doaoriptiro paraaotora was the principal goal of this tffort.
Tho «agnitudo of tho ororpreaauro and its growth or decay wert also of
intorttt aa proriding possiblt txplanations for tht types of acoustic
taodoa initiattd, thtir aaplitudts, and ptrhaps tht nltiaatt dynamic
•tability of tho toata.
feploaiTO Bortba« Tht way in which tht bonb position was described in
tht analyois ia illustrated in Fig. 63 . The axial distance of the bomb
froa tho injtctor fact, denoted by I, varied from 2.95 to 10.2 inches.
Tho radial distance r of tho bomb from the chamber axis had values of
aoro (bomb at tht center), 2.89 inches (bomb at the midradiua), and 4.95
inehtt (boab ntar tht chamber wall) for the teats included in the
corrtlatlon.
Tho Photocons wtrt located at axial distances x from the injector face
of 1.5 and k inches at several different positions around the circumference
of tho chamber (Fig. 45)* Tht positions were characterised in terms of
tht projtcted distance y from tht bomb to the Photocon; that is, the dis-
tance from tht Photocon (A in Fig. 63 ) to the projection of the bomb
into tho Photocon plant (D in tht fianrt). Tht direct distance from the
bomb to tht Photocon is z - 'y + (4 - x) . Of subsequent interest in
tht analysis is tht angle a between the lines CA and AB. The former is
tht normal to tht Photocon fact and tht latttr is tht direction of propa-
gation of tht initial shock wave from the bomb. Tht cosine of this angle
which may be obtained from tht sidt lengths of the triangle ABC, is given
by
cos a 2 (5.75) s
(22)
where
5.75 inches is tht chamber radius CA and Vr2 + (^ - x)2 is the
distance from B to C.
182
■
.
1. n. -■■-^.■.. ^iriK'k.' UM ■mti
I,' '' : '
mmmim m&$&%r&wi ̂^^^j^^^^^
■m w
BOMB PLANE
PHOTOCON PLANE
PHOTOCON
INJECTOR PLANE
Figure 63. Chamber Geoaetrical Belationshipi for Correlations
183
- *
/ *M

s A. H'' t^^
V .*■
——■tywi i '^i i ■ mmfm* .. «. ■
ifl \
mmmmmm
.
1m ill* BMi few pagM, data on tbt eoabuttor'n reaponac to howb» arc
diaeussod and txtonaiToly eroaa-plottod to present a good overview of
the roaulta. Occasionally aoso data fro« the deaonatration teats, des-
cribed later-, are drawn in to enphaaite a point. Deaonatration teat data
wore not used in the atatistical correlation of the bodb data, however.
The initially developed correlations were based on the aa-neaaured trans-
ducer data, aa are the following cross-plots. The final correlations
are aeon to be ■neb siap^r when the data are tree tod with a pseudo-
reflection coefficient.
It waa originally anticipated thai the disturbance fron the bonbs would
propagate synaetrically in all directions; i.e., that the bonba are non-
directional. This hypthosis was tested by observing the response to boabs
aounted on the baffle at the chamber axis (r - 0). Figure 64 shows
this to be reasonably valid for the5.5-grain boabs. The degree of scatter
for the 13.5-grain boabs indieatea that the preaaure aeasured at a dis-
tance of one chaaber radiua (5.75 inches) froa the boabs had a aean devi-
ation of ±10 percent froa the average value.
Further indication of departure froa a truly synaetrical initial wave is
evidenced by an overall average difference in the initial overpressure
at Photoeons A and B of about 11 percent. These preaaure transducers
were ayaaetrieally located with retpect to all baffle-aounted boabs.
Aayasetry of the initial wave wa« particularly aarked with the thickest
(0.500-inch wall) boab oaae teated.
The varying distances froa the boabs to the different pressure transducers
provided a means of deteraining the rate of growth or decay of the initial
preaaure wave. However, the inhoaogeneity of the coabustion environaent
posed a problea aa to the correct distance to use. In one Unit, a hoaog-
eneous bipropellant apray could be aasuaed to be distributed quite far
down the chaaber, in which caae the overpressure waa plotted aa a function
of the direct distance, s, froa boab to Photocon. Aa another liait, the
actual coabustion tone could be aasuaed to be thin in the axial direction
and located near the injector. It is convenient to assume that it ia in
the plane of Photocons A, B, C (and, also, F for triplet injector runs)
18%
i i
^ '•■•
- .w1 —
, fl r
./
500
250
&
«
&
I
200
150
100
b0
^^^^^" 1 1 D 0
T'.b /rrain
5.0 era in
a Test 019 (
sl « P 0
Test 022
'i ■
oJ
—
8T »t 021
2 3 4 5
Bomb Distance from Injector, jt, inches
Figure 64. Initial Overpressures Fro« Bosibs at the Chamber Axis (Triplet Injector, N^-UDMHC50-50) Fuel)
185
.' jti^la^ i
'40
SIHI
.
.*
At 1.9 inches fro« the injector. In this case the ihock wave fro* the
he«h (which wn« nlvny« at ienet 2.19 inches dovnstresn of the injector)
WMli 4—mr rmtil it reached the burning sane, «herein it «avid then be
aaplifiod. In the latter ease, the grevth would occur only over the pro- jected distance frosi boab to Photocon, or y (Fig. 63). The actual physical
situation should lie between these two extremes with a burning zone of
finite width concentrated reasonably near the injector and attenuating in
intensity further downstresa.
Ths initial overpressure data wore plotted against both y and z for each
run. In aost cases the curves were «ore nearly linear as a function of z
than as a function of y. Otherwise, the two paraaeters indicated siailar
trends. Typical curves in terns of s only are shown in Fig. 65 through 68.
In all cases the wave strength increased ss it traveled through the burn-
ing spray. Mast of the curves tended to level out at y or z distances
bet' n about 6 and 10 inches. Notable exceptions to this were the curves
for the doublet injector with the boabs near the chanber wall. In this
case, for both N^-WIMK50-50) (Fig. 67), and UDMH fuels, the curves
which exceeded 150 psi at y or z of about 3 inches showed an increasing
slope with distance (concave upward); while, if the overpressure at
3 inches was below about 150 psi, the curves were concave downward.
Another exception was the case of the boab aounted in the converging posi-
tion of the nozzle (see run 064 which is superimposed on Fig. 68 contain-
ing "aid-radial* boabs). The wave strengthened abruptly as it aoved into
the vicinity of the injector.
To examine the effect of boab size, shape, caae thickness, and bomb loca-
tion on the initial wave, a single value of overpressure for each test
was obtained. The points arbitrarily selected were those taken frou the
initial overpressure curves at z - 5*75 inches, or one chamber radius
froa the boab. The effects of varying only axial location of the boab
(t), radial position of the boab (r), bomb charge weight (v), and boab case thickness (T ) were inveotigated. The latter two are illustrated in
Fig. 69 and 70.
186
tOdUik« I,
I 3
500
250
200
150
IX
50
■ ' • i
4 6 B
Bomb to Fhotocon Distance, X, inches
Figure 66. Initial Overpressure Pro« Bonbs at 4.95-Inch Badius (Triplet Injector, nJ^-OOmiSO-SO) Fuel)
186
i

^
s.
400
550
300 -
250
200 -
n m
i I r-l cd •H
•H C « 150 •
100
50 .
4 6 8 10
Bomb to Photocon Distance, 2t inches
Figure 6?. Initial Overpressures Fro« Bosiba st 4.95-Inch Badius (Doublet Injector, N2E4-UMB(50-50) Fuel)
189
400
8.
I 2
550
500 -
250
200
150 .
100
50 . .
2 4 6 8 10
Bomb to Photocor. Distance, Z, inches
Figui d 68. Initial Grerpressures From Bombs at 2.85-Inch Radius (Doublet Injector, NgH^UDMH^O-SO) Fuel)
190
■ -

« ■ »"■■■..I ~ -
&
350
300
250
200
150
100
50
0 5 10 15 • 20 25
Bomb Charge Weig t, grains
Figure 69. Initial Overpressure From Bombs Having 0.17-Inch Case Thickness (Z - 9.75 inches)
191
imft
■
S'
mmmmmmm/fßllimmium ii' "*ip U. »- —
'«
■
f
400
I 3
350
■H 300
250
200
150
100
0.1 0.2 0.3 0.4 0.5
Bomb Case Thickness, inches
0.6
Figure 70. Effects of Boi»b Case Thickness on Initial Overpressure From 13.5-Grain Bombs (Doublet Injector)
192
■aMMMMMftii
■ "
•
Two testa (040 ac^ 049) show that changing the bomb case material from
nylon to Nicarta had negligible effect on the initial wave. Comparison
of tests 040 and 041 with 068 and 077, respectively, showed a slightly
stronger initial wave with N^-Unflf50-50) fuel than with UDNS. As
expected, increasing chamber pressure increased the initial wave strength.
This is illustrated, together with the effect of using UDMi, in Fig. 71.
In general, the initial overpressures were greater with the doublet injector
than with the triplet, which is somewhat surprising in view of the higher
incidence of sustained instability with the latter.
A regression analysis was performed to obtain mathematical models corre-
lating the experimental initial overpressure data with the bomb input
parameters.
Descriptive Correlations. It was hoped that one model would be suf-
ficient to describe all rf the initial peak pressure data from the motor
hot-firings. It was found,however, that different models were required
for the doublet and triplet injectors. In particular the projected dis-
tance y which appears as a (fiadratic expression in both models has opposite
curvature in the two cases. For both injectors, number of descriptive
models with a number of different types of terms were tried. Among the
best models (i.e., highest multiple correlation coefficient and lowest
standard deviation) for the triplet and doublet injector, respectively,
were the following:
P - - 2.11 W + 1.47 W2 - 2.12 ¥1 + 32.1 y - 2.25 y2
+ 210 ^ - 108 i2 + 13.2 & + 52.3 r - 16.6 r2 (23)
P - 200 + 3.98 W/T - 0.022 (w/P ) + 21 n - 29-7 y c c
+ 4.04 y2 - 13.4 x - 4.45 *2 - 2.49 r2 (24)
The variable n in the model for the doublet assumes the value 1 for
nylon-case bombs and the value 0 for RLcarta. The variable thickness
193
•
I
. . .-.■^. mft m^a MtfMHA.Mfa. ■ -™ - •
■
450
400
350
8.
n i B A) I,
I 1 250
200
150
100
■UDI!H( 50-50). Pc . 211 psia
H-"^-- »'2H4-UMH(5O-50). ?e , 266 p«la
»2H4-UDI«(5O-50))
UDKII
N2H4-I
150 paia
Doublet Injector, 13.5 grain Bombs with 0.17-in. Case Thickness at 4.95-ln. Radius and 3.23-in. from Injector
-L X 4. 4 6 3 10
Boeib to Photocon Distance, Zt inches
12 14
Figure 71. Effects of Cbaaber Pressure and Fuel on Initial Orerpreesures Fro* Boabs
194
■:
(T ), case aaterial (n) and Pbotocon axial poaition (z) were held con-
atant in the teata with the triplet injector; hence, do not appear in
the aatheaatical nodel. Other teraa which appear in other aodela tried
include the direct transducer to bonb distance t, acre powers of V, y,
^, and r, and auch tens aa V ft .
Sone of the ezperiaental data were not included in the analytical node lei
the 25-grain boabs with the triplet injector and data with the doublet
injector which introduced an additional factor (different orientation of
boob, different type fuel, etc.). Cross plotting the data had indicated
that for boabs aaaller than 13.5-graas peak pressure increased with in-
creasing weight but an asyaptotic value waa approached with larger charges
Because of the large ouaber of independent boab paraaetera it vtu. not
feaaible to introduce a aodel which would allow for asyaptotic effeeta.
Instead, peak pressures were calculated froa the aodel uaing the teat
conditiona for the 25-grain boabs but aasuaing a weight of 13.5 grains.
These were, in fact, higher than the obaerved values which tend to con-
fira the asyaptotic assumption. The saae procedure, i.e., coaparing
predicted and observed values, waa used when additional factors were in-
troduced with the doublet injector. In all cases the two valuea were
sufficiently different to believe that each factor had an effect on the
process. This could not be explored acre thoroughly without aore data.
Correction for Direction of Incidence Effecta. A nuaber of anoaaliea
appeared in the raw peak pressure data which were difficult to attribute to
chance variation. For exaaple, the aodela contained a nuaber of tenaa in the
geoaetrical variables ^, y, x, and r. Cross-plots of P va y showed dif-
ferent curvature effects aa a function of transducer poaition x. Al-
though the aodela given above are quite useful for saoothing the data
and predicting peak pressures for future teata with the saae ayatea,
they give no physical insight into the growth of the preaaure wave in
the chaaber.
In an atteapt to obtain aore realiatic aodela, the raw data were corrected
by a...ns of a aiaplified wave incidence coefficient. In lien of aaking
195
-
-if
^M^MM 'i*.^,^ .-' -",«
labor!out calculations, it \mu aaanaed that the incidence coefficient vould be equal to unity plus the cosine of the angle between the path
ef the blaat and the nonsal to the transducer (the angle 8 in Fig. 63).
The corrected pressures, obtained by dividing the observed pressure by the incidence coefficient, are tabulated for 16 tests with the doublet
injector and 12 tests for the triplet injector in Table 17. These data
«ere correlated to give the following nodel for the doublet injector:
! 4 eoe tt " 124 * 5*25 V " 147 fc + 5.0 y - 18.6 * ♦ 3-3 r (25)
The standard error of this nodel wms 16.7 psi, which ia coaparable to
that obtained with the «ore coaplicated aodel for uneorreeted pressure,
Bq. 24. There ia no evidence of curvature with V, y, or T . The effect
of thickneaa appears the sane at each charge weight, ao that an interaction
tern ia unnecessary. It is inportant to note that y ia preferred to 1
and ^ to (4— x) aa correlating variables. Thus, peak pressure grows slightly
in the radial direction but there ia no apparent effect of transducer
axial location, x. If a hodb ia exploded at a position further downstreaa,
ita shock front ia weaker and this effect cannot be explained solely in
terns of the distance frost the bonb to the sensor.
For the triplet injector data, the resulting aodel with incidence co-
efficients was:
1 ♦ cos CK - 46.3 ♦ 7.63 W - 10.4 I (26)
The Multiple correlation coefficient and residual standard deviation re-
sulting fro« the aodel are 0.94 and 14.2 pai, reapettively. The variables
a, y, and (4 - x) were not at all significant. There ia no effect of the
radial position of the bonb nor curvature in the effect of -t.
The effect of V in Bq. 26 requires son« coanent. The data fron 25-grain
boabs were net used in the analysis, since, as was noted earlier, they
appear to be essentially the aaaw aa those for 13.5-frain boabs due to
196
• ■•
-r i itttlm
TABLE 17
REDUCTION OF INITIAL WAVE AMPLITUDES BT
INCIDENCE COEFFICIENTS FOR BOMBS
Obserred Corrected Teat Preaaure Preaaure No. Transducer Aaplitude, psi Aaplitude, pel
Doublet Injector
039 A and B 196 136.5 C 227 129.9 F 305 155.4
040 A and B 247 172.0 C 250 143.1 F 352 179.3
041 A and B 90 63.0 C 194 111.1
F 260 132.4
043 A and B 270 147.9 C 310 165.7
044 A and B 230 126.0
C 285 152.3 P 272 137.3
046 A and B 113 87.7 C 165 98.6
047 A and B 75 58.4 F 182 93-3
048 A, B, and c
282 146.2
F 180 90.0
049 B 192 133.7 C 265 151.6
030 A and B 138 96.7 C 214 122.6
197
■
ÜCT*-"" ??f*VllM-1: 1-
mm
TABLE 17 (Contlimed)
TMi V«. TnaUme„
Obaerrad Preaaore
A^litod«, pai
Corrected Pressure
Anplitude, pai
0 oublet Injector
092 A and B 202 118.9 C 227 125.0
053 A aad B 153 8%. 2
C 273 146.2
05k A «ad B 70 44.0
C 118 67.3
055 A and B 78 54.6
C 189 108.3
060 A, B. and C
181 92.7
F 122 61.2
061 A and B 148 103.1
C 188 107.6
F 260
riplat Injector
132.5
002 A and B 142 95.9
C 178 101.1
007 A 196 131.0
C 233 132.1
011 A and B 126 97.8
C 160 95.6
F 135 71.3
01% A and B 166 97.* C 204 112.1
F 200 103.7
016 A and B 2)6 129.3 C 263 140.6
F 260 132.3
198
■■
ik^rä
Hl
■
. _-

199
■■■■■
t
TABI£ 17 (Concluded)
Teat No. Tranoducer
Obaerred Preasure
Aaplitade, pai
Corrected Presaure
Aaplitode, pai
Triplet Injector
017 A and B 72 39.7
P 88 43.0
018 A and B M 24.8
C 66 36.4
P 66 34.3
019 A, B, C and P
226 117.2
021 A and B 42 22.4
022 A, B, C and P
167 88.7
023 A 38 29.6
C 63 . 37.7
P 70 37.0
032 A and B 72 39.6
C 106 56.8
P 9* 47.9
- J
mMiiimm I ■IM^»MIII | III T 1
'
1
•" Mywptotic effect. An attest wac made to inaert a V2 term into
Eq. 26 to aodel thi« effect. The Vr tern «mo •tatiotically oignifi-
cmnt, but its oign va« positive, which vma ma unexpected result. Ex-
amination of the raw data showed that the curvature was due to unusually
low peak pressures for the 5.5-graia boo* used in toot 016. Therefore,
the linear model is preferred.
Somewhat surprising is the fact that for a bomfc in a fixed axial position,
no significant radial amplification of the initial peak overpressure was
ohaerrod from 2 to 10 inches from the bond». This contrasts with the re-
sults from the mar« stable doublet injector, in which radial ware growth
«ma observed. Thus, difference in wave growth does not appear to relate
to the stability characteristics of the two injectors.
Correlation With Cold-Characteristics. The preceding correlating
models related the stability respoaoe directly to the rating techniques'
parameters, rather than to their characteristics established in the cold
flow experiments. The latter correlations would be of more fundamental
value to the understanding of the rating techniques' effects and in
comparing one technique to another.
Since the decay in initial peak pressure of a blast wave in air will in
general be totally different than the blast wave behavior in a chamber
full of burning propellants, the cold flow equationwere used to find
the initial peak pressure at the bomb surface. First, Eq. 12 was used
to compute In c at the bomb our face for each bomb used in the engine
firings. Then the shock Bogoniot relation (Eq. 3 ) was used to con-
vert to pressure. The predicted bomb initial pressures are as follows:
Weight Thickness In c
s rv psi
13.5 0.17 -3.035 199.1 13.5 0.28 -3.312 113.3 15.5 0.50 -3.635 58.3 5.5 0.17 -3.199 142.5 5.5 0.28 -3.*77 80.8 3.2 0.17 -3.299 116.4
200
m. ■
■"
Because of the aiaplicity of the model■ obtained using then, the pressure
data Modified by incidence coefficients will be used. The bombs used
with the triplet injectrr varied only in charge weight. For the three o
charge weights used, the equation V - 3.6? - 0.0793 P. + 0.000646 P.
holds. This may be substituted directly into Bq. 26 to obtain the
model:
~. —z m 74-3 - 0.605 P. + 0.00493 P.2 - 10.4 * 1 + COS Of 11 (27)
Due to the inclusion of the curvature term in P., this model is hard tc i
visualise immediately. The peak pressure predicted at £ - 3 inches for
Pi - 200 is 120 psi and for Pi = 50 is 25 psi. At the midpoint P. - 125,
the prediction is 45 psi, which is considerably less than the result of
72 psi obtained by linear interpolation between the iwo extremes.
The behavior of bombs in the doublet injector tests «ras described by a
somewhat more complex model because the bomb case thickness was allowed
to vary. Therefore a direct substitution into Eq. 25 is mot possible.
Instead, a new correlation was computed using the predicted peak pressure
as a substitute for charge weight and case thickness. The resulting model
is as follows:
■: = 106.7 + 0.406 P.+ 5.84 y - 22.2 I 1 + cos Of i '
(28)
Examination of the results indicated a residual effect of case thickness
apart from the effect of P.. Therefore the fallowing additional model
containing a T term plus the effect of radial position was computed:
1 ^ cos tt = 26.0 + 0.643 (P. + 244 Tc) + 5.17 y - 21.1 I * 3.03 r
(29)
The multiple correlation coefficient and residual standard deviation for
this model are 0.87 and 18.8 ppi, respectively.
201
'i. Ukti*
The failure of tht bonb'e characteristic initial pressure to account
completely for the effect of case thickness in the engine tests nay be
interpreted in several ways. The simplest is to assume that the case
thickness is reduced by ablation before the bomb is fired, thereby giving
results corresponding to a thinner case. To check this hypothesis, the
composite term (P ♦ 244 T ) was evaluated for each bomb configuration to
obtain an effective cold-characterization pressure. This was converted
to velocity and used in Eq. 12, the «old-characterization equation, to
compute an effective case thickness. For the six bomb types, these are
as follows:
Charge Case Effective Case Weight Thickness Thickness
13.5 0.17 0.13 13.5 0.28 0.17 13.5 0.50 0.17 5.5 0.17 0.12 5.5 0.28 0.13 3.2 0.17 0.12
Although there is a great deal of error in approximating an ablation rate
in this way, these data seem not to support the hypothesis. First, they
indicate an excessively high ablatiou rate. Second, the reduction in
thickness is not a constant for the six bombs. The discrepancy for the
0.30-inch case may be discounted as possibly due to a nonlinearity in
the effect of case thickness, but even the remaining data do not support
the .asumption. The effect of ablation may be present, but it cannot
account for the magnitude of observed anomalies.
Within the range of bombs considered, thickness has a very important
effect on cold initial pressure. Therefore, another possible explanation
is that the thickness term is expressing a nonlinearity in the model.
Such a nonlinearity could arise from the fact that the cold character-
izations were done at ambient pressure whereas the engine tests had a
chamber pressure of 150 psi. Such a change bad a minor effect on ehe
cold-flow characteristics of the pulse gun, but was not exaoincd exper-
imentally for bombs.
202
w ,
MB
Bomb Orientation Effect«. In addition to the usual method of mounting the
bombs from the baffle at different radial distances from the chamber axis,
some tests were also made with the bombs installed with their cylindrical
axes perpendicular to the chamber wall surface. Four teats (027» 030,
043, and 051) were run with the explosive bombs inserted through Photocon
ports; two tests each with the triplet and doublet injectors, respectively.
No significant difference could be noted in the observed initial overpres-
sures with respect to this different orientation. A difference was observed,
however, with respect to the acoustic modal behavior. The first several
cycles of instability with the triplet injector could not be identified in
terms of any fundamental acoustic mode. The ultimate sustained instability,
however, was the familiar coexistent third tangential and first radial
modes. Slightly different results were observed with the doublet injector;
the sustained instability initiated by bombs in Photocon ports was the
second tangential mode for both firings. It will be noted that a similar
behavior was obtained with the doublet injector and UDMH fuel. No apparent
explanation can be given at this time.
Three doublet injector firings (064, 06?, and 079) were made with bombs
installed in the nozzle convergent section, 10.2 inches downstream of
the injector face. A transparent combustor section was used on the last
test, so that only one Photocon pressure measurement was obtained and
that one was in the nozzle section. Results from the other two tests were
considerably different from those obtained with baffle-mounted bombs.
The observed experimental values of initial overpressure were approximately
five times greater than those calculated by Eq. 23» Obviously, the same
correlation does not hold for the nozzle-mounted bombs as for bombs only
half as far from the injector. Although no direct explanation for this
effect was apparent, it is thought that it may be du« either to reinforce-
ment of the initial blast wave by a higher velocity nozzle-reflected shock
or simply to a cumulative effect from the initial waves having propagated
through burning sprays over a longer path. Whatever the reason for the
phenomenon, it deserves further study since it is sometimes found—much to
the investigators' confusion—that bombs placed in the nozzle are more
effective in initiating instability thar those located near the injector
(Hef. 4). v / 203
L
.
--

—
PuU« Gun«. The aaplitude* of the initial disturbances generated by the
pulse gun charges hare also been reduced from the time-base expanded oscil-
lographs. Soae pressure data have been plotted in Fig. 72 through 80 vs
the direct distance i from the chamber entry port to the Photocons. The
solid data points represent those tests with sustained instabilities. The
following trends are observed with respect to the initial wave growth.
Figure 72, 73» and 7k show the effect of the pulse gun charge size
and axial distance from the injector upon the initial wave growth for
the three different angular directions* Typical data are plotted for
two charge sizes; 40 HB/20K and 10 HB/7.5K for the doublet injector. In
all cases with the dynamically stable or unstable tests, the initial wave
amplitude increased with distance from the transducer, and reached a maxi-
mum value diametrirally opposite the point of entry of the disturbance.
Negligible wave growth was observed for completely stable tests. A test
was considered to be dynamically stable if it recovered from a rating
device disturbance in less than 100 milliseconds. The initial pressure
wave growth was attributed to energy addition from accelerated combustion
as the wave traveled through the burning sprays. A definite trend was
shown for the larger pulse charge sizes to generate higher combustion cham-
ber initial peak pressures. This trend was most pronounced with radially
and chordally directed pulse guns; differences observed near the pulse
entry point with tangential pulse direction were effectively obscured by
the time the initial waves had propagated across the chamber. The size
of the disturbance, however, had no apparent relationship to the ultimate
stability of the system.
With the exception of a few anomalous data from tangentially directed pulses
with the triplet injector, weaker initial peak pressures were generated with
pulse entry ports at distances further downstream from the injector face.
This suggests that less unburned propellants were available at increased
axial distances to support and amplify the disturbances.
In some instances the test-to-test reproducibility was poor. For example,
two repeat pulse gun firings were made with 40 HB/2QK charges during Test
No. 003 and 012. The initial waveb started out at greatly different
204
i Pi LÜ
9k,. ,• m ium TWU"'V""
- -

i i
400
2 4 6 8 10
ir.try Port to Pnc' ocon Distance, Z, inches
Figure 72. Initial Overpressure Fron Pulse Guns With Doublet Injector and Tangential Entry
205
■
- - ^*^. „ , . -^ fm-:' m\"?'-?3M
W^- W 'tvrll1- V
■^^—^^ I*-*
400
550
500
250
I
100
50
0 2 4 6 8 10 12
Entry Port to Photocon Distance, Z » inches
Figure 75» Initial Orerpresaarea Fro« Pulse Grins With Doublet Injector and Chorda1 Entry
206
-
— rr
&
i
I 3
350
300
250
200 _
150
100 -
50
Figure 74.
2 4 6 8 10
Entry Fort to Photocon Distance,2 , inches
Initial Overpressures From Pulse Guns With Doublet Injector and Radial Entry
20?
.
■
-
. 2 TC
■
^Jk.
I

50
Hercules Bullseye No. 2 Powder 0.515 Dia. Port 50-50 Fuel
|2iCX^xia^)intann<n
L ± ± 100 200 300
Angular Distance fron Entry Port, degrees
400
Figure 73. Initial Directional Pulse Gun Disturbance Wave Growth With Doublet Injector and Tangential Entry
i
■
r - . - «..«—
II
400
a
n n g a. U 0)
5
550
300
250
c 150
100
200
(
T T Hercules Bullneye No. 2 Powder
0.515 Dia. Port 2.X Axial Distance
50
2 .4 6 8 10
Entry Port to Photocon Distance, Z » inches
12 14
Figure 76. Effect of Fuel Type oa Initial Overpressure From Pulse Guns With Doublet Injector and Tangential Entry
209
it.. 1 ■
MA
H
fers
■
400
3 I
500
150
100
50
T T
Bercules Bulls«/* !«o. 2 lowder 2.X Axial Distance 50-50 Fuel
2 4 6 3 10 12
Entry Port to Photocon Distance, 21 , inches
14
Figure 77• Effect ef Port Sise on Initial Overpressures Fro« Pulse Guns With Doublet Injector and Tangential Entry
210
^i&-*- ~^-
^
400
350
300
?50 «
a. 200 -
Ä 150
100 -
50
iHercule« Bullsoye No. 2 Powder 2.00 Axial Distance 0.515 Dia. Port 50-50 Tvml
2 4 6 8
Entry Port to Photocon Distance,
10
inches
Figure 78. Effect of Nixed Charge Sixes on Initial Overpressures Fro« False Guns With Doublet Injector and Tangential Entry
211
\ ■
mä ■,_
I
1
' ■
400
500
200
100
2ntry j'ort to i'hotocor. Distnnce, X« inches
Figure 79. Effect of Powder Type on Initial Overpressures From Pulse Guns With Doublet Injector and Tuugential Entry
212
•
>
■
350
300 -
250
200 -
.2 150
100 -
50
2 4 6 8
Entry Port to Photocon Distance,
Figure 80. Effect of Injector Type on Initial Overpressures From Pulse Guns With Radial Entry
213
.
'"•."■■ J '■«•■''..IPPÜi
amplitudes (about 80 and 180 psi, respectively), but eventually converged
to the aame value at a point opposite the shock entry. The mathematical
corrolatione were difficult to obtain with the pulse guns due to the large
data scatter. Nevertheless, generalizations can be drawn based upon the
experimental results.
Initial wave growth from the tangentially orientated pulse gun propagated
both spherically and circumferentially from the entrance port. The di-
rectionality effect is shown in Fig. 75. The angular displacement of
each Photocon from tKe point of entry of the disturbance into the chamber,
measured in the direction of wave propagations, is plotted as the abscissa.
Thus, 180 degrees represents a wave travel half way around the chamber,
or to a point diametrically opposite the point of introduction of the
disturbance. As indicated previously, thia point on the chamber represents
the region of maximum wave growth. . [:
As shown in Fig. 76, higher initial wave amplitudes were demonstrated
with N2fl,-UDMH( 50-50) fuel than with UDMH. This is in agreement with the
bomb results. Larger disturbances resulted with increased pulse gun barrel r
and port diameters as graphically illustrated in' Fig. 77- this was
probably caused by the increased attenuation of the blast wave as it
propagated out of a smaller bore barrel into the chamber.
Three tests were made with mixed pulse gun charge sizes; 10,000 pound
burst diaphragms were used for all tests. The standard charge consisted
of a lr fffl/lOK cartridge; the other three charges were 10 HB/lOK, 20 Iffi/lOK,
and 40 HB/lOK cartridges. No significant differences in the initial pulse
amplitude were attributed to the variation in charge size with a fixed
burst diaphragm, as shown in Fig. 78 • Six hot-firing tests were made
using charges of the slowe- burning duPont Military powder; results from
three firings made at the 2-inch tangential boss are shown in Fig. 79.
For comparison purposes, two'.similar test results are shown with Hercules
Bullseye powder. The minor differences observed probably are not signif-
icant. Interestingly, all the charges plotted in Fig. 79 were with
20,000 psi burst diaphragms. Comparison with Fig. 78 suggests the
possibility that the initial pressure wave amplitude is determined
2lk
■
-—rfcv~ r : .-•
solely by the burst diaphragm strength (and the propellant spray combustion
field characteristics). This possibility is particularly intriguing when
it is recalled thtt both the initial shock ware and the maximum blast
wave pressure were reduced by a factor of 2 when the Hercules powder was
replaced by the duPont powder in the cold-characterization testing.
A cross-plot of the data from both injectors using the radial entry pulst
gun port is shown in Fig. 80. Almost identical wave growth behavior was
obtained with the smaller 10 HB/7.5K pulse gun charges with the triplet
and doublet injectors. Increased wave growth was observed with the doublet
injector with the larger 40 HB/20K charges.
Descriptive Correlation». As with the bombs, the initial peak pres-
sure in the rocket chamber due to the pulse gun firings have been studied
as a function of pulse gun and engine parameters. In addition to the
parameters which describe the charge (charge weight and burst diaphragm
rating), the following additional parameters were included in the hot-
firing experiment:
1. Pulse Gun-Transducer Angle
2. Axial Distance
3. Pulse Gun Diameter
4. Pulse Gun Chamber Angle
6, degrees/ISO
4, inches
D , inches gun'
ß, degrees/180
The angle ß between the pulse gun and the chamber is equal to 90 degrees
for tangential bosses, 180 degrees for radially directed bosses, and
135 degrees for the intermediate (chordal) bosses. Th<j barrel lengths, BL,
(the distance from the burst diaphragm to point of chamber entry) associ-
ated with these three angles were 7*23, 3.69, and 6.12 inches, respectively.
Both these variables cannot be used in the correlations since they are
so closely related. Because barrel length is the more easily quantified,
it was chosen as the independent variable. The pulse gun-transducer
angle was. measured from the center of the chamber and normalised by
dividing by 180 degrees.
213
. . ■ ■
« i ■. 1 «... --
1 ''' I
r"-
PULSE ENTRY
TRANSOUCER-
Aa one would expect from the result« using bombs, the pressure wave re-
sulting from the pulse-gun firings behaved differently with the two in-
jectors. From the »hape of the data, logarithmic models were chosen to
represent the in tial peak overpressure. The model found to best repre-
sent the triplet injector data is as follows:
In P - 32.4 - 12.0 ki z + 0.459 (in z)2 + 0.189 In V
- 15.4 In BL - 2.98 In BL In 6 + 6.11 BL In z + 5.4? tn 8
(30)
The multiple correlation coefficient is 0.92; the residual standard
deviation is 0.215.
The only parameter in Eq. 30 that is a function solely of the pulse
gun is the charge weight V. Over the range of variation of this parameter,
from 10 to 80 grains, a 50-percent increase in A P was produced. This
is a considerably smaller effect of charge weight than was observed with
a much smaller range of charges for bombs. The burst diaphragm strength
was not included in the model because it was not varied independently.
Unlike the boob model, the pulse gun model contains no term in ^, the
axial position of the triggering device. Although it does not show up
in fiq. 30, the results of the data plots consistently agree that the
216
■
■
■ • ■
• ms r.
initial waves from pulse guns at 4 inches from the injector had lever amplitudes than those from guns at 2 inches.
The effect of transducer distance s is complex; as it was in the bomb
models before employing incidence coefficients. An examination of the
three term« involving In z suggests that there is pressure growth away
from the pulse entry port. This effect is further complicated by the
presence of the angle between the pulse gun and the transducer. For
some ports, hence for some barrel lengths, the transducer distance i
and transducer angle 9 are nearly linearly related. It seems plausible,
therefore, that the three terms involving barrel length are simply further
manifestation of the effect of transducer distance.
It was hoped that modifying the raw peak pressure data by incidence co-
efficients would clear up the complexities of the model as it did with
the bomb data. If the propagation of the shock wave is essentially
spherical from the pulse entry port, then the incidence coefficients
are calculated in exactly the same way as for bombs. The following model
was lit using the pressure data adjusted in this way:
In C l /cos « y " 3*69 + 0•183 ln v * 0'080k l - 0«259 «
+ 0.0223 y2 + 0.650 ß (31)
The residual standard deviation, which should be smaller by a factor of
l/(l + c), where c - 0.64 is the average value of the cosine of the angle
tt, has increased from 0.213 to 0.27, and the multiple correlation coef-
ficient has correspondingly decreased from 92 percent to 77 percent.
Further, the signs on some of the terms appear to be of questionable
validity.
Modification of the data by the simple incidence coefficients used for
bombs thus does not permit a good fit with a simplf model. We conclude,
therefore, that with the triplet injector the pressure waves produced
by pulse guns have a strong directional effect, rather than being
217
,
,
.}>
MawiUlly apkwi«*! with only a alight distortion in tho direction of
tha barrol. A further analysis of tho angla with which tho shock front
hit aaeh transdueor would ho difficult and tenuous baaed on the data
Mia aTailahle by this prograu.
The aodol vhieh beat fits tho oncorreeted pulse-gun data using tha doublet
Injector, 90-90 fuel, and Hercules Bullseye powder la aa follows:
2 1« P • 90.8 + 1.40 la V - 0.244 (l-n V)' * 0.0728 Pn W In P db
2 - 4.92 In a ♦ 1.96 (la a)' ♦ 0.912 Im BL
- 0.104 1« * - 9.91 In BL In 9 (32)
Tho ailtiplo correlation coefficient and residual standard deviation
using the aodol are 99 percent and 0.19, respectively.
The tems involving the gun parameters are the sane as those which appear in
tho fits of the cold characteriiation data. The way in which they appear
differs froai tho cold results in two respects: (l) The nagnitude of the
inflor « of those paraaetors on tho pressure is auch less (an increase
in ohai_e weight from 10 to 40 grains produced nearly a fourfold increase
in pressure during tho sold tests but only about a 29-percent increase
during engine firings), and (2) the coefficients on the In V and (in V)
terms have reversed in sign. The curve still has positive slope, but the
curvature has reversed. Thus, we are seolqpg an asymptotic effect of
charge weight.
The involvement of tho transducer distance and angle terns in Eq. 32
is much loaa than for the triplet-injector model. The general appearance
of the terms in a, BL, and 8 suggests that the pressure waves may bo much
more nearly spherical with the doublet than with the triplet injector.
Although, these look like good data with which to continue evaluation
of tho incidence coefficient concept, this was not accomplished in the
current program.
218
..,;'...
4 *.. *iE*r-^->,
L
m ■
■
■
■
Correlation with Cold Chwcteristici. The parunters which have
to do with the pulse after it arrives in the chaaber and which were
therefore allowed to remain in the aodels are: s, 6, <-, D (which
was not varied in the cold-flow experisients), fi, and fuel type F. The
data for the pulse gun characteristics were eatiaated using Eq. 16, 17.
and 18 and the hot-firing input parameter values were taken fro« the
previous analysis. For each injector design, eapirical aodels were COB-
puted using each of the eatiaated pulse gun characteristics peak pressure,
impulse, and velocity. In Table 18 the eatiaated coefficients for all
three cases are entered with the coefficient for the pulse gun character-
istic heading the corresponding column. Bach coluan of the table aay
easily be converted into an equation. For example, the first coluan be-
comes hi P - 0.386? In P ♦ 4.70 In z ♦ 0.4746 In 9 + etc. The multiple
correlation coefficients were all over 93 percent, indicating that about
87 percent of the variations in In P are explained by hot firing input
parameters and pulse gun characteristics. The standard errors about the
regression lines were 0.214, 0.221, and 0.217 for coluians one, two, and
thre^ respectively.
Since the peak pressure, positive impulse, and shock wave velocity were
so highly related, the three equations are very similar, except for the
constant term. The constant is different froa aodel to aodel because
the three parameters are measured in different units. Once again, the
models contain an abundance of terms in a, 9, and ß, which were used in
these aodels in place of BL and reflection coefficients.
Similar results were obtained for the doublet injector as shown in
Table 19. The data for duPont Military powder and for the UWC fuel
were included in the analysis. The fits are aoaewhat worse than for the
triplet. The standard errors are 0.209, 0.204, and 0.202 for the three
aodels, respectively; the aulciple correlation coefficients are all over
0.85.
219
«
TABU 18
CQeFFICnMTS FOR TiBMS IN EQUATIONS REIATING
INITIAL RESSUBE ANPLXTUIB TO PULSE GUN
CHABACTHIISTICS
(TRIPIET INJECTOR)
^^N^Coeffloiwt Characteristics
Naxiw» Shock Wave Teni ^^^ Blast Pressure Positive Impulse Velocity
la ^Character istic) 0.5867 0.1542 0.1570 Constant 0.0 -6.48 -8.75 In i 4.70 -3.15 -3.12 In 6 0.4746 0.4812 0.4846 Int 3.12 3.09 3.12 In fi 1.71 1.79 1.69 (in .)2 0.8749 0.8799 0.8706 (Int)2 -2.51 -2.49 -2.54 In i • In t 0.8368 0.8397 0.8546
in s - In ß -0.6580 -0.6663 -0.6523 In B • Inl -0.6430 -0.6465 -0.65*3
220
t .*■■
.
- ^Ä i

TABU: 19
COEFFICIENTS FOR TERMS IN EQUATIONS REIATING
INITIAL HffiSSURE AMPLITUK TO PULSE GUN
CHARACTHIISTICS
(DOUBIET INJECTOR)
^^«v^Coef fie lent Characteristic« |
Maxiau» Shock Wave Tem ^^v^ Blast Pressure Positive Impulse Velocity
In Characteristic) 0.8785 0.2327 0.2593 Constant 0.0 6.38 8.75
In B -4.89 -4.98 -4.98
In e 0.0 -0.1785 -0.1756
l?i? -0.1446 -0.0926 -0.1185 p(l) 0.217 0.248 0.251
(in .)2 1.54 1.58 1.57 In 9 • In -t -0.1725 0.0 0.0
(1) The fuel factor F was set equal to 1.0 for NgH^-UDMH (50-50)
fuel and to 0.0 for UDlfl/fuel
221
- .
.- • - ■ f rtiifc
■*W-f
I
.«■■*.♦ ♦.— i^
I
IkitUl iMtoHlitT IM-
C«itid«rfttiOB of tk« first f«v cjclta of iaatobilitj initiated by bodb«
•«ggest« that th«r« «r« at least fear eatagoriea of initial behavior vbich
mj bo identified:
1. Bonbt in the center of the eonbnation ehanher initiated the
first radial acoustic node.
2. The «aal lest boaba, nssr the «all or at the aidradius, s
tiaei initiated the first taafontial scouatic node.
3« Other boahs in those locations initiated the second tangential
scouatic node.
k. Soao bodbs near the wall aad at the aidradius initiated coozia-
tont first aad second tangential acoustic aodoa.
Siailarly, the initial instabilities caused by the pulse gun diaturbancea
can be categorised as follows:
1. Pulse guns directed taagentially with both injectors initiated
prodoainantly the spinning first tangential acouatic node.
2. Pulae guns directed chordally with the triplet injector
initiated eoosistsnt firat aad third tangential acoustic Bodss.
3. Pulss guns directed chordally with the doublet injector initi-
ated either the apinning firat or atanding second tangential
scouatic aodea.
4. Pulae guna directed radially with both injectora initiated either
the atanding firat, second, or third tangential acouatic modes,
singularly or ooexiatent.
T
'~*— -■-■*—■~" -■
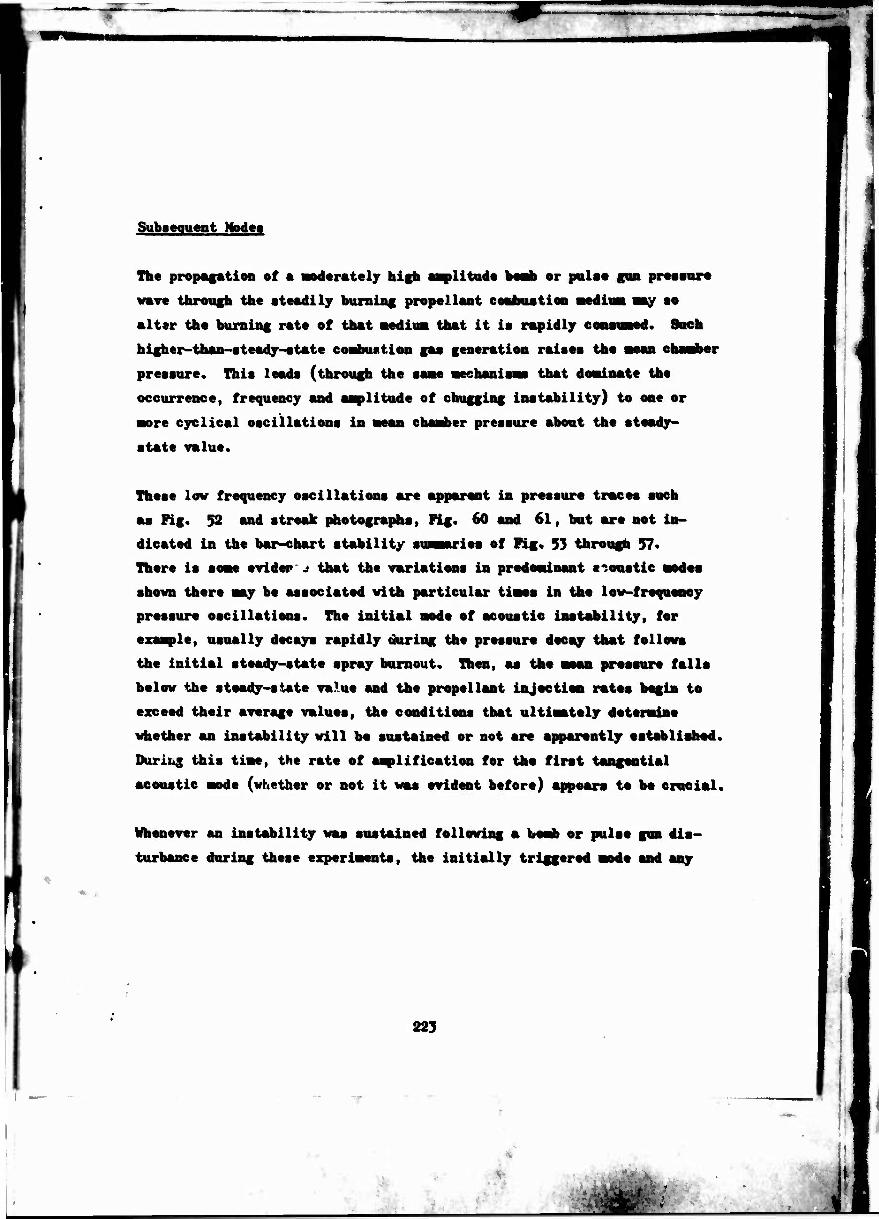
Sttbaequwat Mud««
The propacation of • Moderately high aaplitude boab or puloe gun prosaoro
wave through the steadily buminf propellant coafeostion aediuB mmy «a
alter the burning rate of that aediua that it is rapidly consuaed. 8aeh
higher-than-ateady-state coabuation gaa generation raises the aoaa chaaber
pressure. This loads (through the sane ■eehaniaas that doainate the
occurrence, frequency and aaplitude of chugging instability) to one or
acre cyclical oacillationa in aeaa chaaber preaaure about the steady-
state value.
These low frequency oacillationa are apparent in preaaure traces such
as Fig. 52 and streak photographs, Fig. 60 and 61, but are not in-
dicated in the bar-chart stability stiiiies of Fig. 53 through 57*
There is soae evider J that the variations in prodoainant t nous tic asdoa
shovn there aay be associated with particular tiaaa in the low-frequency
preaaure oacillationa. The initial aodo of acoustic inatability, for
ezanple, usually decays rapidly during the pressure decay that follows
the initial steady-state spray burnout. That, as the asaa pressure falls
below the steady-state value and the propellent injection rates begin to
exceed their average values, the conditions that ultinataly doteraine
whether an instability will be sustained or not are apparently established.
Ihiriug this tiae, the rate of anplification for the first tangential
acoustic aode (whether or not it was evident before) appears to bo crucial.
Whenever an instability was sustained following a boab or pulae gun dia-
turbance during these experiaenta, the initially triggered aode and any
223
j s
i . 4j Ojfcv (
-2Z <fifcfe'''
fj 1
imumimt •Kfi* **P- —> -
iat«r«*4iat« ■•do were replaced vithin a few ■illieeeeads by coexistent
third taagentUl and first radial acouatic nodes. Because the third
taafontial la the lovest order tangential acoustic mod« whose velocity
—dal pattera Matches the boundary conditions iaposed by a three-vane
baffle eoafigoratioa, it ia the one sustained and, since the first radial
■ado ia a« near in frequency and can alao natch the baffle boundary con-
ditiona, it ia excited, too. With the exception of the first radial node
initiated by bonbs at the chanber's axis, the sustained third tanfential
appears to have bean diiven only by the first tangential node having
anplified above sone threshold anplitude before the law-frequency,
preaaure oacillations had decayed and converged an an equilibrium
chanber pressure. Once the crucial point waa passed and it was es-
tabliahed that the third tangential node would be sustained, the first
tangential ■ado was aaro or leaa rapidly daapsd and disappeared. An in-
tt eating corollary of thia observation that the first tangential node
cannot survive the presence of the third tangential is suggested by
several af the pulse gun tests: if the third tangential node were present
ia the iaitial preaaure oscillations, it appeared to prevent the first
tangential node fron being anplified enough to drive a sustained third
tangential node following the low-frequency oscillation in nean pressure.
When the doublet injector waa fired with UMI fuel, the second tangential
■ode waa a predoninant contributor to about half of the instances of
sustained instability. The rensan for this tendency was not discerned.
The occurrence of at least sone conflicting evidence in such a prograa
ia inevitable. As an exanple, the preaaure records following explosion
of rOHB/20K pulse gun charges during Teata No. 005 and 012 are super-
inpoaed on each other in Fig. 81. These testa were essentially pre-
ciao replicates (fable ll) and the preaaure traces are nearly identical
for about 4 billiseconds after pulse gun initiation. Then the spinning
first tangential acoustic node during Teat No. 003 decayed while that
in Test No. 012 continued to be anplified and, after about 3 nore milli-
seconds, drove the conbined third tangential and firat radial nodes.
224
'AA% .
trr
*4
,
*

*.
I
1
Suitftin or Damp Characteriatica. It would be highly desirable to be
able to predict dynamic stability of the motor as a function of the
location and/or characteristic of the rating device; for example, the
magnitude of the initial overpressure in the chamber. With the pulse
gun disturbances, there appeared to be a threshold value of peak over-
pressure of 40 psia, below which the combustion process remained stable
and was insensitive to wave amplification. Such was not the case with
bombd. Once the initial thretihoid was exceeded with pulse guns such a
relationship to ultimate stability ceased. The darkened points on
Fig. 72 through 80 represent those tests with sustained combustion
instabilities. The unstable tests occurred randomly without regard to
the initial peak pressures.
The only parameters having an unambiguous effect on ultimate stability
as determined by bombs were injector type and fuel. With the triplet
injector the bomb-induced disturbances damped only k times in 18 tests,
whereas 19 of 26 tests damped with the doublet injector. With UDMH fuel,
all 3 bomb tests led to sustained oscillations. The ultimate damp/sustain
behavior of the bomb-induced disturbances is shown in Fig. 82.
! The pulse gun-induced disturbance with the triplet damped 19 times in
31 tests. Similiarly, 39 tests in 30 recovered with the doublet injector.
Using UDMH fuel, 3 of 6 tests with pulse guns recovered. Combustor damp/
sustain behavior with pulse guns is sunmarized in Fig. 83.
For the triplet injector, the dynamic stability with bombs depended
randomly on bomb parameters ( W and T ), bomb radial (r) and axial (^)
coordinate», and on the magnitude of the initial overpressure. This is
implied by the fact that for any dynamically stable test, tests with
sustained instabilities can be fouftd with higher or lower bomb sizes
and greater or smaller ^'s or r's.
The sane can be said for the.doublet injector with the following exception.
All three bombs on the chamber axis caused sustained instabilities. It
appeared reasonable that this was a most sensitive location for the
226
- «a • • —
■
•,■
-
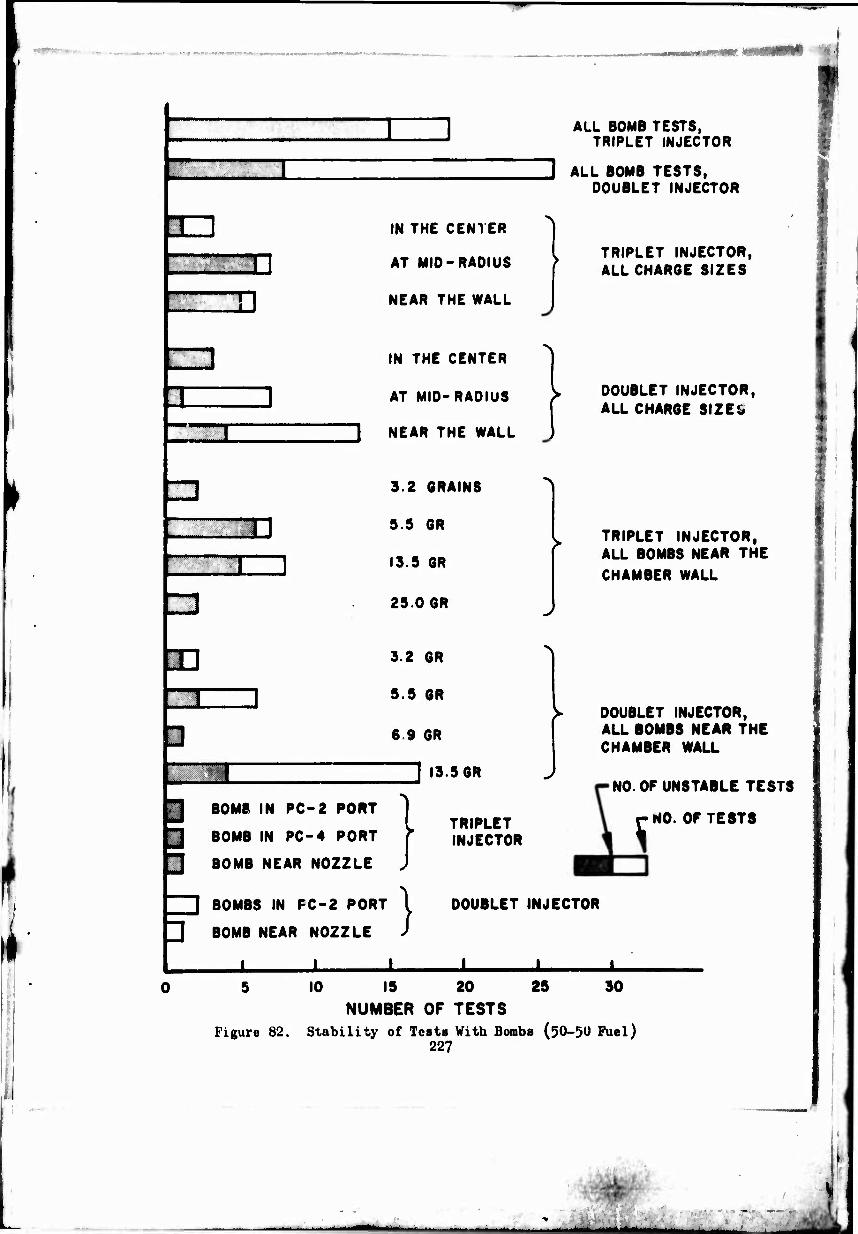
■M
1 l
I
. ■■..■ :>.;
HD
3ZZI
IN THE CENTER
AT MID-RADIUS
NEAR THE WALL
IN THE CENTER
AT MID-RADI
3 NEAR THE WAL
32 GRAINS
5.5 6R
13.5 GR
250 GR
3.2 GR
5.5 GR
6 9 GR
"~| 13.5 GR
BOMB IN PC-2 PORT
BOMB IN PC-4 PORT
BOMB NEAR NOZZLE
BOMBS IN PC-2 PORT
BOMB NEAR NOZZLE
ALL BOMB TESTS, TRIPLET INJECTOR
D ALL BOMB TESTS, DOUBLET INJECTOR
TRIPLET INJECTOR, ALL CHARGE SIZES
N
US >
ILL J
DOUBLET INJECTOR, ALL CHARGE SIZE&
TRIPLET INJECTOR, ALL BOMBS NEAR THE CHAMBER WALL
TRIPLET INJECTOR
DOUBLET INJECTOR
DOUBLET INJECTOR, ALL BOMBS NEAR THE CHAMBER WALL
NO. OF UNSTABLE TESTS
r NO. OF TESTS
J. J. i. ± ± 5 10 25 30 15 20
NUMBER OF TESTS Figure 82. Stability of Test« With Bombs (30-30 Fuel)
227
^BO^MMft^
/
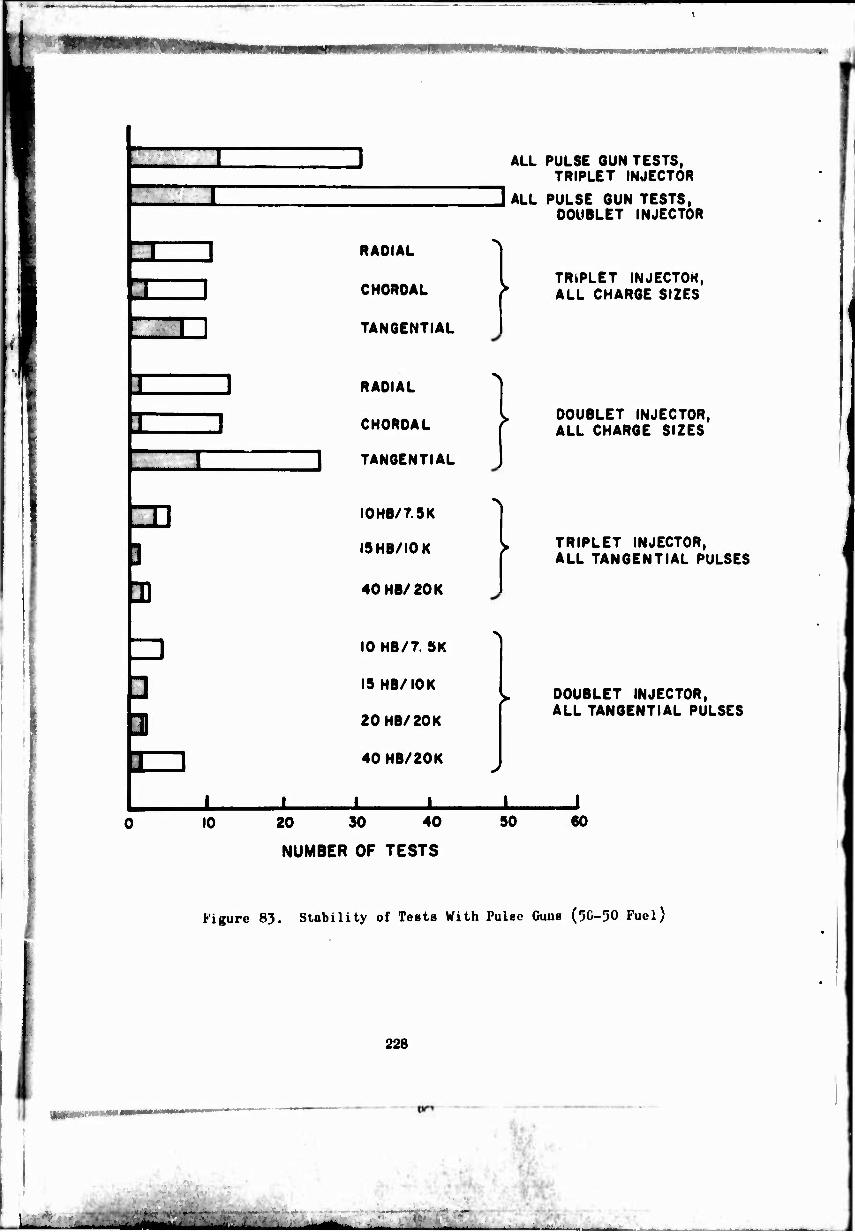
Ml —■
^MHMHPMBM
1 1 T 1
IJ
10
RADIAL
CHORDAL
TANGENTIAL
RADIAL
CHORDAL
] TANGENTIAL
I0HB/7.5K
I9HB/I0K
40HB/20K
IOHB/7. 9K
15 HB/IOK
20HB/20K
40 HB/20K
I ± 20 y> 40
NUMBER OF TESTS
ALL PULSE GUN TESTS, TRIPLET INJECTOR
ALL PULSE GUN TESTS, DOUBLET INJECTOR
TRIPLET INJECTOK, ALL CHARGE SIZES
90
DOUBLET INJECTOR, ALL CHARGE SIZES
TRIPLET INJECTOR, ALL TANGENTIAL PULSES
DOUBLET INJECTOR, ALL TANGENTIAL PULSES
60
Figure 83. Stability of Tests With Pulee Guns (50-50 Fuel)
228
■ -■■ - M I ^MfeMMMf^lHi " """"TSSBHABK
-* '^ -
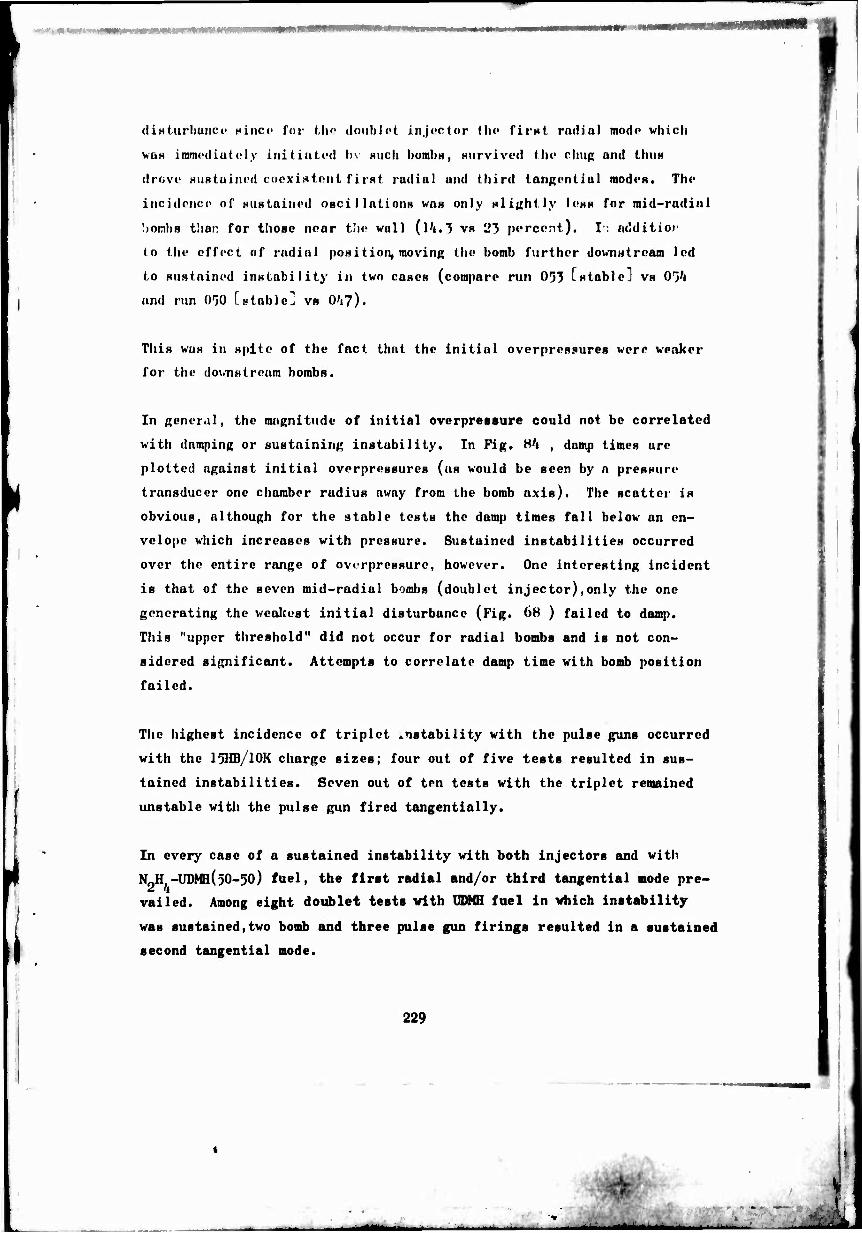
I: .
diHturlmiici' nincc for the doublet injoctor the firnt radial modo which
was immediately initiated by HUCII bumbH, Hiirvived flic rhug and (IIUM
drcve HiiHtuincd coexistent first radial and third tangential moden. The
incidence of HiiBtained oscillationH wag only sliyhMy II-HS for mid-radial
I)onb8 tliar. for those near tlie wall (14.5 VB 2'5 percent). I', ddditior
to the effect of radial position, moving the bomb further downstream led
to Rustained inwtability in two cases (compare run 053 LBtableJ vs OVi
nnd run O'JO [stable] vs 0'i7).
This was in spite of the fact that the initial overproBsures wero weaker
for the downstreum bombs.
In general, the magnitude of initial overpressure could not be correlated
with damping or sustaining instability. In Fig. H'I , damp times arc
plotted against initial overpreBsure» (us would be seen by a pressure
transducer one chamber radius away from the bomb axis). The scatter is
obvious, although for the stable tests the damp times fall below an en-
velope which increaseB with pressure. Sustained instabilities occurred
over the entire range of ovcrprcBsurc, however. One interesting incident
is that of the seven mid-radial bombs (doublet injector),only the one
generating the weakest initial disturbance (Fig. 68 ) failed to damp.
This "upper threshold" did not occur for radial bombs and is not con-
sidered significant. Attempts to correlate damp time with bomb position
failed.
The highest incidence of triplet instability with the pulse guns occurred
with the 15HB/10K charge sizes; four out of five tests resulted in sus-
tained instabilities. Seven out of ten tests with the triplet remained
unstable with the pulse gun fired tangentially.
In every case of a sustained instability with both injectors and with
N0H-UDMH(30-50) fuel, the first radial and/or third tangential mode pre-
vailed. Among eight doublet tests with UDMH fuel in which instability
was sustained»two bomb and three pulse gun firings resulted in a sustained
second tangential mode.
229
M^M.
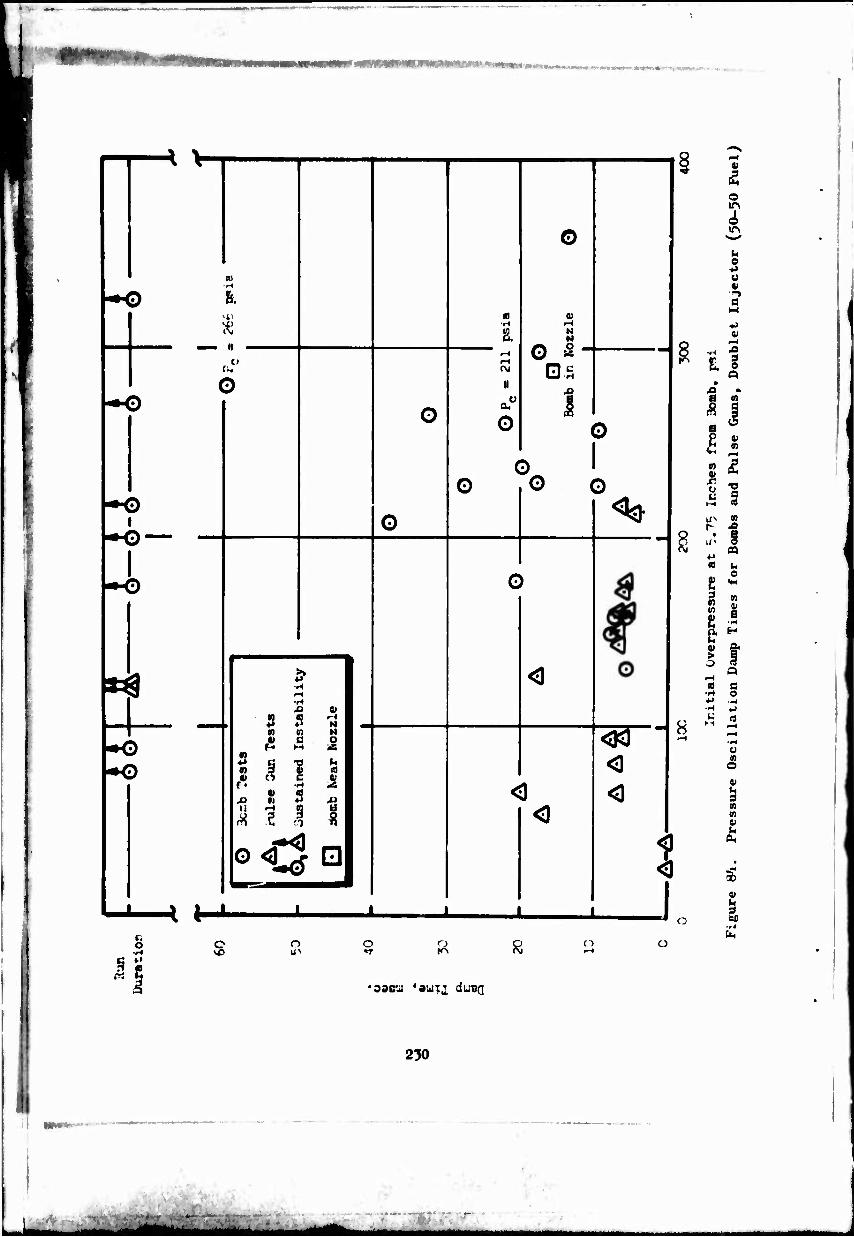
mmmm tmmmmmt
4 V
~o
^
Uo
m
s. ■»I
ei
o
>• ♦* ■H ^ •H JO 0)
9 5 N (0 V) H i 1 2
n ^ § ^ IS
r«! 5 .5 Jl SI t) ** 4J 11 d a 1 0<ö □
G
O
& r-« IH CNJ
II
o
©
N N
o »
O O
O
<
<l
4 M-
<3
o
«
»
•oocu 'a'oiij, dünn
R
O
o o <^
0 <]
8
s <]
_l C5
<) O
01
Ä o m 4
o 01
•t-> tl
M B to iß i a
a
^ §
3 CD w
g
o
w 1) a
at a M « s
•<-t o ♦• -^ •H w
M 2
U to o i>
(0 o I-
230
MMMM
... - . V*. ~ .« I ä II <W
•
^tt ac;^
Amplitudn« of Sugtained InHtahil itinH. Th«' Hm|il itudfH of ■U4tain»d in-
HtabiliticH with both injector« und fuel tyuci are comjiari'd in Fif. H'j .
For each run, cBtimatod average oscillation ampl itud«1» wen* meaHurud
With I'hotocons at two axial poHitions. In oach caao those transducers
were located essentially on the third tangential mode nodal points so it
is primarily the amplitude of the accompanying first radial mode that is
measured. For three runs with the doublet injector (ü'«7. 0'iH, 082) with
Nr)H;-UDfB(,)ü-5ü) fuel, the agreement is within the accuracy of measuring
the average amplitude (^10 psi). This seems to verify the concept that
the amplitude of the sustained mode is dependent only on the run conditions
and not the initiating disturbance. UDMH fuel with the doublet injector
and N0H,-ÜDMR(,)ü-'50) fuel with the triplet injector gave amplitudes of
the sustained instabilities which were higher than those with N(,H.-UD^(50-50)
and the doublet injector. These data are consistent with the same UDMH
and triplet tests having exhibited lower initial pressure wave amplitudes.
Both phenomena probably stem from more concentrated combustion nearer to
the injector.
As described previously, in all sustained instabilities with N-H,-UDm( 50-50)
fuel, coexisting first radial and third tangential modes are believed to
be present. Analysis of the records of Photoconn H and I* in runs 080
through ÜH3 indicates that the sustained peak-to-peak-oscillation amplitude
of the first radial mode v/as about 81 psi while that of the third tangential
mode was about 164 psi. I'hotocons A, B, and C (which are supposedly on
the third tangential tiode and measure only the first radial) average about
90 psi peak-to-peak which may be due to their "seeing" a little of the
third tangential mode.
♦I'hotocons H and I show a distinct "beat" which has a frequency close to the difference in the theoretical frequencies of the first radial and third tangential modes. Applying simple sinusoidal analysis, the beat maximum is the sum of the amplitudes of the two modes, while the beat minimum is the difference of the respective amplitudes. Since these transducers were midway between the third tangential nodes and antinodes, the third tangential amplitude calculated still had to be corrected to its value at the antinode.
231
mmmmmamma
tm*: »WWW>!M'WiimiWM J
ly;
&
^ 100
I I
I
8
2 3 4 5 6
Photocon Distance from Injector, inches
Figure 83. Amplitudes of Sustained Instabilities
232
. ssi«:
iM'monBtration Tegtn
Baaed upon the data obtained during the experimental hot-firing program,
analytical models were developed that correlated tlie combustor reaponse
(in terms of the initial peak overpressure) to the rating device's input
parameters or characteriatics. A short series of additional hot-firings
using the doublet injector and N2H.-UWB(50-50) fuel were made to demon-
strate the accuracy of the analytical models. The triplet injector vaa
damaged earlier in the program and therefore could not be used during
the demonstration firings. The correlationa obtained (Eq. 25 and 32)
during the analyaia were used to predict the motor's initial disturbance
pressure growth for rating devices' parameters or motor conditions not
previously tested.
A total of seven demonatration teats were made; six bombs were fired,
two at elevated chamber pressures of 211 and 266 psia, respectively.
Four pulse gun charges were fired with two at the higher chamber preaaurea.
The input parameters varied for the demonatration firings are listed in
Table 20 . A complete description of the rating device parameters were
given in Tables 13 and 1'».
f
In addition to the parametric changes made in the rating devices, two
new chamber Photocons were installed with different values of transducer
distance, z. In nome instances, a Photocon used in the demonstration
firings wes as close as 1.80 inches from the disturbance. The correla-
tions were based upon data with Photocons no closer than 2.95 and 2.60
inches for the bombs and pulse guns, respectively. Those points below
2.60 inches, therefore, represent input conditions outside of the range
upon which the model was baaed.
The demonatration firing reaults are iown in Fig. 86 through 89 • A
correlating line has been drawn through the individual predicted points
(solid) for each test. The experimental points are also plotted. The
percent error between the predicted values and the actual experimental
data were calculated at several discrete values "f z by the following
equation.
233
MBH
» . -•*-• *-*-.--*•-.
TABLE 20
BATING DFYICE I'ABAMWFKS FOB DPMONSTRATION FIRINGS*
| Test No. Device Besson for Selection
080 Bomb The vail thickness was 0.062-inch, which was half the thickness of the nylon cases previously fired. j
081 Bomb The axial distance was 2.55 inches, which was closer to the doublet injector face than bomba previously tested.
082 Bomb The charge size was 6.9-grains of PETN, which was intermediate between the previous charge sizes of 5.5 and 15.5 grains.
083 Bomb The wal' thickness was 0.250 inch, which was inter- mediate between the previous 0.170- and 0.280-inch | nylon wall case thickness. j
084-8»« Pulse Gun The axial distance was 3«00 inches, which was inter- mediate between 2.00 and k.OO inches for previous tests with 40HB/2OK charges and tangential entry.
08<i-5 Pulse Gun The axial distance was 3.00 inches, which was inter- j mediate and also the charge size 40HB/7.5K was mixed.
085 Bomb A repeat charge size of 13.5-grain8 with a 3«23-inch axial distance was made at 211—psia chamber pressure.
085-7 Pulse Gun A repeat charge size of 15HB/10K and 2.00-inch axial distance was made at 211—psia chamber pressure.
086 Bomb Same as 085 except at 266-psia chamber pressure.
086-7 Pulse Gun Same as 085 except at 266-psia chamber pressure.
«Complete descriptions are given in Tables 13 and Ik
««The dash number refers to the boss orientation (Fig. 45)
234
m
,:. 'n.amr r •--

^P^NMHDMRPnMi
400
S. 3X -
t 200 -
100 -
b
&
6 _ A
A n ^ ̂ l
^^"T O
—^T i 3 ^
\_ Equation 25
II Q •
, _.. 1 OB? 087 ] A Actual 1 I G
J 1
1 ■ A Predicted { HHHHHHHHMHBHBHW^
. ! . 1
500
* 400
1 300
200
100
5 10 Boob to Photocon Distance, Z » inches
10
Boob to Photocon Distance, Z , inches
Figure 86. Demonsirution Hot-Firing Resulta With Bombs
235
■ 1
c
«1
t _ •5 c o •((
■»->
o •H •o
• s OH
c O •rl
\
K 3
• m
i a i 1 rl
\
(0 1
x^ 1
Ul
•r 1
rt 1 a) « url
r-t \ü i 1
(NJ CsJ ul
*
"i -1
t ]
V o < • 1
<D u i i
11 i • i 1 1
. o
l^
n
<J
N »
0) o
•»J m •H n c o o o
■»->
I o
E3 I
8 ^ 8 ^H
Ted ♦aineseadJaAO x^T^TUI
1 PQ J3
gg -P i^ 3 « m oi
0} tU 0} Ö 0)
•H U U OH
I
O a a o
■H -P a
ca at
CO
u i) I -p
d o H
0)
236
-
800
700 -
600
500
&
400
300 •
200
100 .
A
§84-5 84-8 0 A Actual ■ A Predicted
1 1 1 1 1 1
A
A . 7 X
6 X Ü quation 32 —
o y
/
\ 0
1 ̂
"^ /
(§. / ^--—-
1 5 10
Entry Port to Photocor. Distance, 21, inches Figure 88. Demonstration Hot-Firing Results With Pulse Guns
237
!
'XX)
I
1 1 1
F 05-7 (211 paia Pc) j
1* 86-7 (266 peU Pc) j
L Predicted (150 psla Fc) 1
400 -
300
200
100 0 5 10
Entry Port to Photocon Distance, Z . inches
Figure 89. Demonstration Hot-Firing Results With Pulse Guns at Elevated Chamber Pressures
238
■
Percent Error I Predicted Value - Experimental Value!
Predicted Value (100)
These data are presented in Table 21.
The negative signs indicate that the pre(Mcted values of peak overpressure
were less than the experimental values. Results from the first four tests
with bombs are shown in Fig. 86 . The actual data obtained on tests 080,
081, and 082 were on the average, within 10.3 to 12.5 percent of the pre-
dictions. With a bomb (0.280-inch wall thickness) located at the chamber
center for test 083» the percent error increased to 28.0 percent. The
effects of chamber pressure upon the initial wave amplitudes are shown
in Fig. 87 • In all instances the actual run values were higher than
the predictions based upon 150-p8ia chamber pressure. The percent de-
viation from the correlation line, however, was not significantly higher
than the data obtained for only changes in the bomb parameters. Thus,
a < .ear trend is not indicated for the effect of chnmber pressure upon
the initial wave growth of the disturbance. (Refer also to Fig. 71.)
h
A larger data scatter was obtained for the pulse gun results as shown
in Fig. 88 . The model is highly suspect below a z value of 2.60 inches.
A data point at k,50 inches for the -8 location (tangential) was con-
sidered in error and was not included in the average data. The average
percent error for the -3 location (chordal) was 44.6 compared to only
19.8 for the -8. The more accurate prediction for the latter is probably
due to the fact that only one pulse gun parameter was varied from those
on which the correlation was based, i.e., axial distance. For test 084-3
both the axial distance and the pulse gun charge weight/diaphragm size
were changed.
The effect of chamber pressure on the pulse gun initial wave grrwth is
shown in Fig. 89 . The actual data points were scattered about the
130-p8ia chamber pressure correlating line. No definite effect of
chamber pressure on initial wave amplitude can be noted.
2j*)
I
1

TABLF 21
DEMONSTRATION FIRING RESULTS
TeBt No. Device
Percent Error in Prediction
z - 2 to 4 z - 4 to 7 z - 7 to 10 z - 10 to 11.5 Average 1
>i80 Bomb 9.1 10.8 17.6 12.5 ;
081 Bomb 4.0 0 16.1 16.5 12.2 i
082 Bomb 5.5 13.2 -4.0 18.6 10.3 1
083 Bomb -28.0 28.0 |
084-8 Pulse Gun -22.2 -157.1* -19.8 17.3 19.8
08'i-5 Pulse Gun -58.9 -30.4 4'.. 6
085 Bomb -4.1 -22.0 -3.1 9.7
085-7 Pulse Gun -23.2 -23.2 -5.1 14.1
086 Bomb -«.1 -42.2 0 25.1 1
086-7 Pulse Gun 0 -10.5 10.5
*Deta point not included in average value
240
* MSMM
it. -j f
'"'■r^SBMHMBBMBBiiHHPRBir
COMPRHIFNSrVE COMI'ARISON OF RATING TBCHNIQIJES
The three combustion stability rating techniques investigated have been
found to affect the propellant spray combustion field in two fundamentally
different ways. The bomb and pulse gun techniques introduce, primarily,
finite amplitude pressure disturbances and their ratings reveal the com-
bustion field's pressure sensitivity. The gas flow technique, on the
other hand, primarily introduces flow velocity or propellant displacement
disturbances and its ratings are based on the combustion field's displace-
ment sensitivity. Such a fundamental distinction has often been alluded
to but, prior to this program, the two fundamental effects had not been
shown to be separable and independent.
The NgO./NJ.-UDMHC50-50) and NJ) /UDMI propellant combinations, under
the conditions tested, had no demonstrable displacement sensitivity.
As a result, the gas flow rating technique was at a great disadvantage
in this cc .paxative program. With other propellant combinations (or
perhaps at other conditions), displacement sensitivity may be an important
contributor to initiation of combustion instabilities and the gas flow
technique thus may be a valuable investigative tool. Discussions in-
cluded in this section of the gas flow technique's effectiveness and re-
peatability are based, therefore, on previous experience with LOX/RP-1
propellants.
The flow of explosion products that follows the initial blast wave out
of the pulse gun's barrel may be thought to make this rating dsvice one
that acts upon both the pressure sensitivity and displacement sensitivity.
The flow of explosion product gases, however, persists no longer than the
positive pressure duration. That characteristic was seen in the cold-flow
studies to be of the order of a millisecond for the pulse guns. While
this is about three times longer than the bombs' positive pressure dura-
tions, it is one to two orders of magnitude shorter than the initiation
of flow to initiation of Instability typically observed with the gas
flow rating technique. It seems likely, therefore, that the pulse gun
and bomb techniques both fulfill the singular role of pressure disturbance
sources.
2%1
4? \
COMPARISON OF MERITS AND LIMITATIONS
The three rating techniques are critically compared in this section in
terms of specific individual attributes. When a single attribute is
considered, one technique may appear to exhibit distinct advantages over
the other techniques. In order to arrive at a choice of the technique(s)
to be used for a particular rocket engine rating, however, merits and
limitations in terms of all the attributes oust be taken into account.
A listing of merits and limitations is given in Table 22 to place the
following in sharper perspective.
1
Applicability and Physical Size
The rating technique attribute termed applicability is concerned with
the suitability of the technique for a particular engine rating. Questions
concerned with the length of the projected test series, time available
for preparations, the physical size of the rating device, the type of
combustion chamber to be rated, potential engine damage, and the devices'
external and internal engine access requirements must be considered.
If the projected test series is necessarily short, the gas flow rating
technique's potential for obtaining comparative ratings in a very few
testa may be important. Again, however, its use is restricted to pro-
pel lants and conditions exhibiting displacement sensitivity. The pulse
gun, similarly, can potentially supply ratings in a limited number of
tests through use of several graduated size charges fired sequentially
during each test. The requirement of a separate chamber access port may
impose a limitation on how rapidly the rating may be obtained. By con-
trast, only a single bomb can usually be scheduled for use in each test
because of the likelihood that a few eye leu of wave motion induced by
one bomb would dislodge any additional bombs.
Concerning time available for preparation before a rating program is
to begin, the techniques would normally be ranked: bombs, pulse guns,
gas flows. Bombs can be prepared quite quickly because they require
2%2
■.' ■ I ^—
•
CM
i c a 5
a
if s i s S | st 8 •
8 S 1 1 1 J S ü 1 " 1 ^ J
i*jlhi? Hi a a a «• a ^ &
II: llili II
» -
«-it
1 ii.lljtl Pi iiill
1 S 1
1 7 I ? fHi 1 1 || ^ • 5 8 1 5 1 n nil jsi; s 1 §: t .^1 = S fa bo-H-M M afaj fa a a. a* •, g g3 a
* ISU 3* SI 11
il, 11 M^ <«• D E a -H
if ill 1 j ** 1 H 85 l-s.8 air. s 1 *s
llllflilllill
a
i
I t — 1 ti ;l ill :- 1 HI 8 i II S i 1 !l 2 i l|i a! 5 ha a ••» 9 • fa ♦» • III u n A ji | fa o ■ a 5, u a 9 o f o. o 9 _a a« -N v -H T< X
M * 1 HI ii tl tt s
a fa ^ ^ ^ <• m ■*
fi. hi« ||i
ill ill! Ill 11 III! *%i*m j •oaftnTan
243
•
wwmmmmmmm^mmmmmmmmmmmmmammmmm m «
minimal amount« of simple machining operations and they are constructed
of readily available materials; preparing the combustor to receive ttiem
may require the longest time. Preparation of pulse gun equipment requires
somewhat longer times than bombs. More complete machining operations and
case hardening processes are used in fabricating a pulse gun. Further,
the burst diaphragms required may not be immediately available. (Some
of the orders placed during this program were delivered in six to eight
weeks.) An adequate gas flow system may be the slowest prepared because
an extensive jas supply system and the attendant flow control systems are
needed even before calibration tests can begin.
The rating devices' physical size is important in relationship to the ex-
ternal and internal engine access required. The gas flow apparatus is
certainly the largest of the techniques but it usually can be mounted in
some unobtrusive location within a few feet of the combustor. Its onlv
required connection to the engine is usually a simple flow line which,
unless the flow entry point is varied from test to test, does not require
continuous accessibility. Bombs and pulse guns, on the other hand, must
be removed from the combustor and rebuilt after each test. This requires
that each entry port be readily accessible from the outside of the engine,
a requirement which may severely limit selection of application points
and the number of pulse guns that may be used. If there is good access
to ihe inside of the combustor, external access problem.for bombs may be
avoided by installing them inside the chamber. Minimum external access
for making electrical connections is then needed.
With regeneratively cooled combustion chambers, installation of rating
technique application ports may be very difficult, very expensive or even
prohibited. Bombs enjoy clear advantages over the other devices in this
regard. As Just noted, they may be mounted wholly within the combustion
chamber with only an electrical connection port required. ^Even the
electrical connection nay be eliminated if thermal initiation and its
random variation in explosion time are acceptable.) Rirther, some
variation in bomb chamber position can be achieved from aq individual
attachment point by means of extension wands.
244
I
mmm --"•» m
Bombs in regcncratively cooled combuHtions chamberB have a distinct
disadvantage, however, in that their shrapnel may distort, or even
penetrate and cause leakage from thin-walled structures. A similar
potential for damaging injector components exists but it is usually not
of as much concern as is regeneratively cooled wall damage. Other com-
bustor damage potential comes from the disruption of the normal propellant
flow paths. When any of the techniques is admitted through the chamber
wall, increased turbulence may lead to wall melting or erosion downstream
of the entry port. Again this may be minimized for bombs by mounting them
on injector or baffle components and making the flow disruption a free-
stream rather than a wall effect.
Effectiveness
How effective a rating device is for delineating a particular engine's
instability traits depends, as has been seen, on the propellant combina-
tion, propellant injection pattern, combustor configuration and operating
conditions. Additionally, there is strong dependency upon the devices'
directionality (or lack of it) and versatility in the location of
application.
The evaluation of a device's effectiveness may also vary from one appli-
cation to another with differences in the rating goal. A greater effec-
tiveness would surely be ascribed to pulse guns, for example, to be used
for a study of tangential acoustic instability of an unbaffled injector
than those used for general evaluation of any instabilities that might
occur at a baffled engine's normal operating point. In the latter in-
stance, a pulse gun might not effectively initiate baffle compartment
or longitudinal acoustic resonances nor give any clues to a potential
feed system coupled (chug or buzz) instability problem. (Only the
effective initiation of wave motion within the chamber will be considered
here.)
Tor general purpose stability investigations, bombs may be more effective
than gas flows or pulse guns because of the nearly spherical, essentially
2%5
nondirectional pretaure waves generated by bomb«; this permits (conceivably
at least) initiation of the longitudinal acoustic code. In the current
experiments, where no longitudinal mode was observed, radially directed
pulse guns were apparently as effective as bombn positioned near the chamber
wall and initiated the same standing acoustic modes. Chordally and tangen-
tial ly directed pulse guns, however, nearly invariably initiated the spin-
ning first tangential mode. While the ultimate stability appeared to be
critically dependent upon the behavior of the first tangential mode, there
was no evidence linking that effect preferentially to either the spinning
or standing mode.
Direct initiation of the first radial acoustic mode occurred only with
bombs mounted at the center of the combustion chamber, a strong pressure
anti-node for that mode. Its initiation with bombs in other positions and
pulse guns was indirect, i.e., by the third tangential mode, and appeared
not to be related to the rating techniques. Again, the bomb technique's
versatility in mounting locations gives it a clear advantage over the
pulse guns, which are restricted to applications at the combustor's wall.
The gas flow technique is similarly limited to applications near the wall.
This technique's effectiveness may be enhanced by using a gas that is
chemically reactive with one or both propellants; this was not investigated
in the current program.
The apparent advantages in effectiveness of bombs are lessened somewhat
by the fact that bomb orientation did affect initial wave growth in this
program. This suggests that bomb blast waves do have some directional
characteristics.
Repeatability
Somewliat facetiously, it might be said that the gas flow method was the
most repeatable of the rating techniques investigated—not very appli-
cable, but consistent and repeatable. From previous studies, it is noted
t 246
■■
that thi« technique has a reputation for precise control and good repro-
ducibility, e.g., ratinfr» have been eatubÜHhed with individual values
falling within about tr) to 10 percent of the mean value.
Few replicate tentH with the explosiv«1 devices were attempted in this
hot-firing program. AmoMg five sets of replicate pulse gun firings,
four sets exhibited comparable initial wave amplitudes (within about ±10
percent) and the other gave completely conflicting data (i.e., only a
very low amplitude wave wan produced in one case). With the exception
of that same set, the initial modes triggered were also duplicated.
Ultimate stability was duplicated in three of the five sets; in view of
the apparent lack of correlation of ultimate stability to the rating
techniques, this is perhaps surprisingly good repeatability. The fact
that the amplitudes of the initial waves were moderately well correlated
to the variations of pulse gun parameters is further evidence of reasonably
acceptable pulse gun repeatability.
Pulse gun r peatability appeared to be better in tho hot-firing testa
than in cold-characterization experiments. It seems reasonable that im-
proving the device to reduce lata scatter in the latter would also improve
the former as well. Another potential source of scatter in the hot-firing
tests was that the burst diaphragms were exposed to heat transfer from
the combustion gases for varied lengths of time and may have undergone
changes in their burst pressures.
That the initial pressure wave amplitudes produced by bombs were corre-
lated even more closely to the bomb parameters than those from pulse guns
is convincing evidence of bomb repeatability. They were also quite con-
sistent in the Initial modes of instability induced. The correlations
were based on averages, however, and each average value represented some
degree of scatter. An indication of repeatability was given by several
bombs mounted at the center of the chamber. Depending upon the charge
weight, tome random variations in amplitude were observed among the
pressure transducers in each test and from test-to-test that were not
2%7
i
J
^■fcw«*—■■■■—■ ** -
apparently related to the injector pattern. This was believed to be a
result of non-uniform case rupture; fabrication variability, such as
eccentric or off-center cavities in the cases, or operational variability,
such as asymmetric beating (softening) or ablation, might be the cause.
It is apparent from the foregoing that repeatability was not very well
established in this program but that it was not so poor for either pulse
guns or bombs as to represent a major obstacle to fulfilling the program
objectives.
Reliability
Gas pulse technique reliability is determined primarily by the reliability
of the electronic and servo control systems for producing the desired
flowrate-time function. With the full servo control of flowrate system
used in the hot-firing program, non-linear ramps were produced in two of
eleven tests, an inordinately high 18 percent. That system was used as
an expedient; for considerably greater versatility and essentially com-
plete reliability, the indirect flow control using the function generator
is preferred.
The protective case design for explosive bombs has a strong influence on
bomb reliability. Being mounted within the combustion chamber, bombs are
subjected to the high temperature environment and if the case is too thin,
may be prematurely detonated due to thermal sensitivity of the explosive
charge. Only one instance of thermal detonation occurred in this test
series but it has been common enough in other programs that it is some-
times relied upon for bomb initiation when routing of lead wires out of
the chamber has appeared particularly inconvenient or difficult. Internal
mounting also exposes bombs to the stresses of transverse combustion gas
flow and any pressure wave motion within the combustor. This has usually
meant that only one bomb could be used in each test because the first
sequenced bomb is likely to break or dislodge any others. Structural
failure of a single bomb (e.g., by a brief disturbance such as a transient
instability during the engine start sequence) co\ a then mean that no
bomb rating data would be obtained from that test.
248
Inadequate protection of detonator lead vires as they were routed out
of the combustor caused three bombs to fail to detonate and another was
aborted by a disconnected lead wire terminal. Thu% components through-
out the bomb design and fire circuit affect its reliability.
By comparison, the pulse gun was foun 1 to be relatively trouble-free and
reliable. Some difficulties were experienced in the cold-flow experi-
ments with diaphragm leakage prior to its rupture and with firing pin
jamming and breakage. These problems were overcome by devoting more
careful attention to tightening and cleaning operations and were not ex-
perienced during the hot-firing tests. The burst diaphragms apparently
offer adequate protection to the explosive charges; no problem with thermal
initiation wab evperienced.
Handling Characteristics
Some discussion pertinent to the handling characteristics of each rating
device has been given earlier. The relative effort required to effect
changes or replacement between tests and the hazards associated with each
technique are discussed briefly here.
Once the basic flow system has been installed for the gas pulse apparatus,
very little additional handling is required. The only test hardware
preparation consists of relocating the connecting line between the con-
trol valve and the appropriate chamber boss. The operation of the device,
however, requires additional preparation. This Includes the manipulation
of numerous valves and the pressurlzation of the source tank to the de-
sired valve. Other than personnel association with high pressure gas
systems, no particular hazard is associated with the gas pulsing equipment.
The bomb and pulse gun devices both contain small amounts of high explo-
sives. Safety with explosives requires knowledge of the hazards Involved
and rigid adherence to the proper methods of performing each function.
The greatest hazards to be guarded against are stray currents, static
249
|M>- .«Ma "m m*
electricity, frictional heat, inpact and carelessness. Pulse guns are
Its» hatardous than boabs because the cartridge-loaded charges and the
unidirectional blast make it easier to avoid direct personal exposure.
Following a hot-firing test, any bombs that have not been detonated must
be disposed of insaediately. Extra precautions are called for because of
the potentially higher sensitivity of explosives that have been heated;
this work should be performed by personnel specifically trained in ex-
plosives disposal techniques. Residual pulse gun charges, jn the other
band, nay simply be returned to storage and used in a subsequent test
(unless there is external evidence of excessive heating of the pulse gun
assembly).
Another hazard associated with bombs is the possibility that one may be
dislodged and ejected from the combustion .amber as a live bomb. This
Is even more hazardous than having a residual bomb in the combustor; per-
sonnel may be completely unaware of its presence and so may unwittingly
detonate it without benefit of protective equipment. Periodically, the
test area should be searched thoroughly and a specific search should be
conducted whenever there is not positive evidence that a bomb actually
detonated in the combustor.
RATING TECHNIQUE SELECTION FOR CURRENT USAGE
From the foregoing comparisons, it is apparent that there is not a single
stability rating technique that is universally applicable, effective, re-
liable, etc., for use in any and all engine rating studies. Rather, the
particular engine, with its particular injection pattern, combustor geometry
and propellant combination, must be considered in terms of the various
rating devices' characteristics and attributes and a particular single
device (or combination of devices) selected for use.
The choice of a rating technique is also influenced by xhe goals estab-
lished for the rating program. From previous experience, for example,
250
.
it may be well known that an engine is especially senaitive to on« par-
ticular acoustic mode of instability. A short rating program's goal
might well be an evaluation of how that sensitivity is affected by a
change in injection pattern (or by an acoustic liner or baffle assembly).
The rating device that is best suited to initiation of that particular
mode of instability would probably be selected, even though another tech-
nique might initiate more and other modes with bettor repeatability or
reliability.
ii
Another rating program might have as its goal the establishment, with
reasonable assurance, that no destructive instabilities can be initiated
within the engine's normal operating range. The rating technique selected
might then be a complementary combination of devices, utilizing both bombs
and pulse guns. For a cylindrical chamber, this should certainly include
tangentially directed pulse guns, bombs at the chamber's axis and bombs
near the exhaust nozzle. For other chamber configurations, there may be
other specific modal triggering requirements to account for by combina-
tions of rating techniques.
This latter example fits in the category of dynamic stability evaluation
or demonstration. Among the rating techniques, there exist today suffi-
cient versatility and range of experience to accomplish such ratings
rapidly and efficiently. It appears that such ratings may best be
accomplished by making more use of complementary combinations of rating
techniques.
251
»■*
I i
"1
KKCOW^DATIÜNS WH IMIHOVU) RATINU TKGKMyii:
It has been ahown in thin study that certain of the purametera and charac-
terietica of exploaive bombs and pulae gun» can bv quantitativeiy corre-
lated with Home aapecta of the atability reaponse of an operating liquid
rocket conbuator to then. Each of the rating techniques has been found
to have apftcific advantages and limitations; some minor design changes
should be investigated us means of enhancing the advantages and reducing
the limitutiona. It does not now uppeur that such improvements will
advance either device to a position of general applicability. For that
reason, it is reenmmended thut some ultetnate devices be designed to
incorporate ns many of the advantages ami as few of the limitations of
tl.e existing rating techniques as possible and evaluated in terms of
(lie attributes required of a generally applicable rating technique.
Additional Correlationa
Somewhat expanded statistical correlations of the data obtained in this
program might include the effects of pulae gun initial shock wave amplitude,
effects of powder burning rate, and effects of improved models for the
wave incidence coefficieit at each transducer. Some additional data
would be required to ensure statistical significance; e.g., small bombs,
bombs closer to the injector and pulse guns farther from the injector.
Ddtailed spectral analysis could conceivably give initial node of insta-
bility data for quantitative correlation to the initial wave information.
The validity and value of the results would be enhanced greatly if a por-
tion of the additional experimental data correlated were obtained from
another program, such as those conducted in recent years at AFRPL.
252
m •
—
!' " I
Improvementa for Bombs and Pulse Guns
Bombs would be considerably more useful if their reliability were improved.
In particular, their susceptibility to thermal detonation and physical
failure under stress need to be eliminated. The possibility of using more
than one bomb per test and of reliable scheduling of the explosion are
highly desirable got-1«. Simultaneously, however, the potential for
chamber damage should be reduced by designing the case to produce less
shrapnel. Finally, if the bomb is to be a truly non-directional dis-
turbance, the directional effects introduced by the cylindrical charge
design should be investigated and eliminated.
Pulse guns should be improved by determining and correcting the causes of
the excessive variability in pressure amplitude and impulse among replicate
charges observed in the cold-flow tests. Means could also be determined
for eliminating the complex wave form and providing a single, clean pres-
sure wave. Better correlations might be obtained if the pressure wave
amplitude just outside the muzzle of the gun were determined; the streak
photographic techniques used in the current bomb characterization should
be directly applicable here.
Investigation of Other Rating Technique Concepts
By combining the beneficial attributes of the various rating techniques,
several candidate rating systems can be conceived, one or more of which
might be developed into a single device with universal applicability.
In the preceding section, it was recommended that a combination of bombs
und pulse guns be used for general stability rating and that the combina-
tion be selected by considering the characteristics of the engine system
to be rated. Perhaps this is too permissive; continued investigation
might show that one particular combination is adequate for general rating
use. In that case, a single integrated design should be developed.
253
I -a
w
Iht possibility of bringing the gas flow technique back into the picture
by initiating ita flow with a high aaplitude shock wave is intriguing.
Both pressure eensitive and displacement sensitive mechanisms would be
perturbed. The ahock wave could be provided by mechanically rupturing a
diaphragm sealing n prepressnrized high pressure gaa from the chamber or
by simply plosfcing th« gaa flow through a modified pulse gun.
Another concept worthy of investigation is the repetitive generation of
pressure pulses, perhaps by a chemically fueled shock or detonation tube,
to establish ratings based on the minimum sensitivity that occurs in a
given time interval as opposed to the instantaneous sensitivity at the
instant of detonation of a single charge.
Finally, means of achieving the versatility in chamber position now avail-
able for bombs need to be developed so that the improved, more generally
applicable devices may, indeed, be applied more generally.
254
fc
.
■■ "
APPENDIX A
THE APPLICATION OF STATISTICAL CORRELATION ANALYSIS
In applying multiple correlation or regression methods, one begins by
listing potentially important independent variables, each suitably quan-
tified. Dependent variables or responses are selected which describe the
physical process under investigation as completely as possible. Then from
previous experimental experience, knowledge of underlying physical prin-
ciples, or judicious application of physical intuition, one hypothesizes
specific algebraic forms or models relating each dependent variable with
the independent variables. The parameters of these models (i.e., the
coefficients and exponents in the algebraic expressions) are generally un-
known, however, and it is ;he basic purpose of the statistical correlation
to obtain best estimates for these parameters.
Generally speaking, a satisfactory model is one which can account for
most of the variation in the dependent variable. It should include only
those functions of the independent variables which have importance in
describing the dependent variable. When such a model has been determined,
it is possible to describe past test results from a quantitative point
of view and, in addition, make statistically qualified estimates of the
behavior of the dependent variable for any combination of the independent
variables within the general test ranges.
More specifically, two distinct types of models have been developed and
reported in the course of this program. The first, which might be called
descriptive models, are designed to fit the available data as well as
possible. Descriptive equations generally contain many terms, any one
of which may have only a small effect, in order to model well the peculi-
arities of a particular data set. The criterion for the inclusion of a
specific term is whether it will help, rather than hurt, the fit. Such
models may therefore contain terms which appear to be meaningless or of
the wrong sign on physical grounds, but which do serve to reduce a
certain amount of variation in the data. If one is interested in
255
- ^ ' ■
n mtmm
i m
*
' - %•
■^
'
pr*4ieting the future perfonaance of the name eyetea from which the
original data aet is obtained, and if no extrapolation ia made beyond
the original rangea of the independent variable«, then auch a model ia
probably the moat useful for prediction. It is sure to contain ell the
really important effects, even though they be small.
The second class consists of what ve will call interpretive models. A
tarn ia included in auch a model only if the evidence of its reality is
overwhelming in a statistical sense. Statistical methods called tests
of hypotheses are generally used to assess the significance of terms in
auch models. If one wishes to generalize the results of experimental
work to different systems or to extrapolate the results on the same
system, auch modele should be uaed. Only those terms which are sure to
be real should be employed; for example, one will often avoid the "whiplash"
effect caused by extrapolating on the basis of spurious curvature terms.
All the correlations determined in this program were obtained by using
the Rocketdyne Stepwise Regression Routine, a computer program for which
a card deck is on file at Rocketdyne's computer facility. This program
can be uaed for any model which either is linear or some transformation
of it ia linear in the unknown parameters. By a stepwise procedure
functional variables are added or deleted until a final multiple linear
regression equation ia obtained. This model will include only those
functional variables which have a significant effect on the dependent
variable. By specifying in advance the confidence levels used to Include
or delete terms, one can obtain either a descriptive or interpretive
correlation.
To determine whether a useful correlation has been obtained, the multiple
correlation coefficient is evaluated. The square of this index is the
fraction of the total variation in the dependent variable which has been
accounted for by the independent variables using the chosen model. For .
example, a coefficient of 0.8 indicates that 64 percent of the variation
can be attributed to the variables used in the model. The other 36 percent
may be identified with other variables not included in the analysis, in-
consistencies in the data, a poor choice of the original model, and/or
256
1
■
.—»—. — ■■-■
■^^r
simply "random error." The maximum value cf this coefficient i« unity
which corresponds to perfect correlation. Thus a correlation coefficient
close to one indicates thai the correlation is of significant practical
value.
The model predictions should not differ greatly from the corresponding
observed values. A measure of these deviations is given by the standard
error about the fit or residual standard deviation. This is defined as
the root mean square of the deviations of the actual data from this pre-
diction based on the model, with an adjustment factor depending on the
number of terms in the model. When the logarithm of the response is used
as the dependent variable then the sttndard error is roughly the percent
error in the response. Thus, if the t^audard error for In y is 0.05,
then the deviations between observed values and predicted values of y
are approximately 5 percent.
257/258
1
■ #
Or, A, b, B, c, d, e, f
A
BL
(c )
d
D
exp'
F
I
I u
L
L/D
M
o
PT
AP
r
R
t
#-
I A*- m *,.>••
NOMENCMTLIU-;
arbitrary constantB
area, sq in.
pulse gun barrel length, inch
characteristic exhaust velocity, ft/sec
shock or blast vave velocity, ft/sec or in./aicrosec
initial value of c at the blast source
velocity of sound in the undisturbed medium, ft/sec or in./microsec
duration of gas flow ramp, sec
diameter, inch
e where e ■ 2.71828 (base for Naperian logarithms)
a correlating parameter for fuel type, Table 19
impulse, Ibf-sec or Ibf-microsec
unit impulse, li-sec or psi-microsec
axial distance from the injector face to the centerline of a rating device, inch
length of a cylindrical explosive charge, inch
length to diameter ratio of a cylindrical explosive charge
shock or blast vave Mach number (= c /c )
pressure, psia
back pressure downstream of a pulse gun, paig
initial pressure in the undisturbed medium, psia
explosive powder type correlating «parameter
shock or blast wave overpressure, psi
radial position, inch (Fig. 63)
radius, inch or feet
time, sec or microsec
259
I
■4
s
'•^Wmmmmm
""
\
At ■ time interval or duration, sec or microsec T+ - duration of the positive presoura portion of a blast
wave, sec or microsec
T m bomb case thickness, inch c
V ■ velocity, ft/sec V_ ■ surge tank volume, ft
w - weight flowrate, Ibm/sec
V - explosive charge weight, grains or pounds
x - axial distance from the injector face to the centerline
of a pressure transducer, inch
X = axial distance from pulse gun diaphragm to the centerline
of a pressure transducer, inch
y = projected transverse distance between the centerline of
a bomb and a pressure transducer, in (Fig. 63)
z - straight line distance between the center of a bomb
charge and a pressure transducer, inch (Fig. 63)
Z = blast wave correlating parameter (= Rtf ' )
Greek Symbols
<y - approximate angle of blast wave incidence on a pressure
transducer (Fig. 63)
R = angle between pulse gun's centerline and the chamber
radius which intersects it at the chamber wall
y " ratio of specific heats (c^Cy) for air or combustion gases p
p «= density, lbm/ft
ß - projected angle between combustion chamber radii which intersect the pulse gun's centerline at the wall and intersect the center of a pressure transducer (measured in the pulse direction)
260
■aa^MMi ■
■ -
■MW
Subscripts
numeral
b
c
d
db
f
gun
i
inj
max
n
ns
R
t
+
•f'^VW^'flW^'
value of a parameter at that distance, in inches, from a blast source
value for a base explosive charge
value for an explosive charge
value for an explosive detonator
value for a burst diaphragm
final value
value for a pulse gun (barrel)
initial value
injection value or at the injector
maximum value
value at the nozzle inlet
nozzle stagnation conditions value
value at a radial distance from a source
value at the nozzle thrust
positive value
261/262
» ^ummmmm
■;WV
^_«*M.
m -"•v ■ i »Hi ill i
'
KM
REFERENCES
1. Goodman, H. J.: Compiled Free-Air Blast Data on Bare Spherical
Pentolite. Report No. 1092, Ballistic Research Laboratories, I960.
2. Ruetenik, J. R. and S.D. Lewis: Pressure Probe and System for
Measuring Large Blast Vavea. Massachusetts Institute of Technology,
Cambridge, Massachusetts, Technical Report AFFDL-TDR-6I)-35, June 1965.
3. Savit, J. and R. H. F. Stresau: J. Appl. Phvs.. Vol. 25, 195^, 89.
k. An Experimental Investigation of Combustion Stability Characteristica
at High Chamber Pre a sure. Interim Report ll?1»!-!, Aerojet-General
Corp., Sacramento, California, September 1965.
5. Peoples, R. G. and P. D. Baker: Stability Rating Techniques. WSS/CI
Paper No. 64-11, Western States Section, The Combustion Institute,
1964 Spring Meeting, Stanford University, Palo Alto, California,
April 1964.
6. Combs, L. P.: "A Sumnary of Experience With Combustion Stability Rating
Techniques," ICRPG Second Combustion Conference. Volume 2. CPIA Publ.
No. 105, Chemical Propulsion Information Agency, Silver Spring, Maryland,
Nay 1966.
263/264
mm
1
■
*!*™
■ ^MW— !■■ 'if* Itllgl» ■! »II mm
. i
UNCLASSIFIED Security Cl—>ific«Uon
DOCUMENT CONTROL DATA • RAD (SMurtlr «toM'AMMan nl MUu. **4r «f •tolmcl tm4 tHttrntnt mumlmMm mmmt *• m*—l mttit a» 0mmt' mgm i* C1M*WIMU
I OmOIMATINC ACTIVITY rCeiywal» aulfMri
Rocketdyne, a Division of North American Aviation, Inc., 6633 Canoga Avenue, Canoga Park, California
UNCLASSIFIED I* »mourn
» RIPOMT TITLB
COMBUSTION STABILITY RATING TECHNIQUES
4 OtSCRlPTIVC NOTU (Typt »I mpon m* mtkiulwt *IM>
I AUTNONft; rLMI Ma«. Hmlnm». MMaM
Combs, L. P., Hoehn, F. V., Webb, S. R.
• MM NT OATf
September 1966 296 • a. CONTHACT ON «KAMT NO.
AF04(6ll)-10811 b. PROJBCT NO.
3058
tiC) R^6355-4
t» pjHMn mmfomr NOT» MnrvMar
AF,RPL-TR-66-229 10 AVAIL ASILITV/LIMITATION NOTICU
This document is subject to special export controls and each trausmittal to for eign governments or foreign nationals may be made only with prior approval of AFRPL (HPPR/STINFO). Edvards. California 93523
n SUP >TtI It SOONSOMINO WLITARV ACTIVITY
Air Force Rocket Propulsion Laboratory Research and Technology Division Edtmrds. California
13 ABSTRACT
The objectives of a comprehensive investigation of three techniques for rating the combustion stability of liquid-propellant rocket engines were the establish- ment of the characteristics of the techniques and of their intercorrelations. The techniques studied vere: (l) nondirected explosive bombs, (2) directed explo- sive pulse guns, and (3) directed flows of inert gases. Characterization was accomplished through cold-flow experiments; each rating device's output pressure, impulse, velocity, etc., were quantitatively correlated to variations of its de- scriptive parameters, e.g., explosive charge weight, explosive type, burst dia- phragm strength, bomb case thickness, etc. Correlations among techniques were sought by applying them at various positions and directions to an operating rocket and measuring the combustor's stability response. Two different propellant injectors were tested with N204/N2H^-UDMH (5Q-50) propellants; one of the injec- tors was tested with N2O4/UDMH propellants. It was discovered that combustion with these propellants and operating conditions is insensitive to transverse vel- ocity or displacement perturbations; the gas-flow technique initiated no chamber pressure disturbances. However, considerable sensitivity to pressure disturbaooes from bombs and pulse guns was observed. The combustor's ultimate stability foil» ing a pressure perturbation could not be correlated to either bomb or pulse gun parameters or characteristics; recovery to stable operation occurred randomly. The amplitude of the initial pressure wave was correlated quantitatively to both the rating devices' parameters and character!««tics.
DD /?*"".. 1473 UNCLASSIFIED Security Classification
I

■ »I
■
•
M« 1
wamBBM i«.
HT.ASSTFT.m . Sgcwity ClMtidcatiow
RIV VOMOI
Rocket Enginea Injectors Conbuetion Stability Bating Techniques Explosive Boobs Explosive Pulses Cold-Flow Testing
LINK A ■OU» mt
LINK S •Okl • T
LINK C neu«
INtTIIUCTlONt
\. ORIOINATINO ACTIVITY: Xmar UM nwnt Mi aMrMi •t IM caMractet, MbcMirMMr, pant*«. DapwtMMt of 0» (•nM activity «r «UMT wpSiSSMSS (ctpotM* mttht) laaulnt
3«. RIPORT »CU1ITY CLAtttPICATION! Bntat llw ev«f •II ••curlty tlMctfltatlaii »f UM ra^ert. late«« «hMhar "■••<rtct«4 0«t«M I« iMelute* Mafklag 1» to b« In M«or* «IM« with «>»i«»H«i« ««curlty rogulation«.
3%. GROUP: Attit..->«He dewn«radlnc la i»acUt«4 ta DoO Dl- rwtlv« 1300.10 «ad Armad Pore«« tnduatrlal Manual. Cntar tlw group nuatbar. Al««, whan «ppUcabl«, «how thai epttenal i«fl«S« k«v« bMn uaad far Oreup 3 and Oroup 4 aa »uthor*
3. RIPORT TITLE: Bat«r tlw eonplM« rtpoit litt« In all c«elt«l l«tt«ra. TltlM 1« all caaa« «hould b« itncltaalflod. If a «taaalaifwl tut« caiwet ba Mivetae without ctaaatflc» tim% «haw till« «l««alflaailaa la «It capital« la pmaihaala lauaadlataty tottowinc UM Utlo.
4. DBCRIPTtVt MOTE» U approprtat«, ant«f th« lyp« of r«s«rt. «■»• Mwl«, prey«««. Naunary, annual, er flaai. Olea th« IncluaW« data« «kaa « «pacific rapertlng period 1«
5. AUTH0R(*> Em«r UM n««M(a) «f «wtbeK«) a« «hewn o« or in the r«p«rt Bat« («at aaaM, flret name, aüddla Initial. If mlUUry, «to« rank and brench «f aarvlee. The M«M «f th« prlnclp«! •uthof ie «a abaolut« ailnlmu« i«fiilt«i«nt
•. REPORT DATE» Eatar tha dat« of UM rep«rt «« day. menlh, year, or menih. yea» If MM« than «aa data «ppa«r« on th« raport, MM d«t« ef publlcetlen. 7a. TOTAL NUMBER Of PAGE* The total pege count aheuld rotte« normal pagination procedurae. La., enter the number ef page« ccmelAing tnfermatloiw
7b. NUMBER OF REFERENCE» E"»«r UM total numbar ef ref«r«M«« cited I« IM raport. •a. CONTRACT OR GRANT NUMBER: If »proprlat«. enter tha applicable number ef the contract er grant under which tha report waa written, M. fe. B M. PROJECT NUMBER: Enter the eppreprlete military department identlflcetlon, wich ee project muabcr, «ubpieject numbar, ayatem number«, 1Mb numbar, etc. f«. ORIGINATOR'! REPORT NUMBERd): Enter the efft- elat report numbar by which the document wUI M Identified Md controlled by the erlglaatlai activity. Thl« numb«r muat b« unique te thte raport, •b. OTHER REPORT KUMBBRCI): If the report haa MM «««ign«d any ether report numbera (»iihir ty ibe ori|<na(er or by ibe »ponrorj, alao enter thl« number(»). 10. AVAtLABILITY/LIMITATION NOTICE» Enter My 11» (teilen« on furih«r dtaaeminetien of the report, ether than theee|
Impoaed by eecurtly claeelflcetlen, Ming elendard etetement« auch aa:
(1) "Qiallflad regMetere may obtain eoplee of tble report »em DOC"
(3) "Foreign announcement end dleaeminetlon of this report by DOC Ie net authoriaeA"
(3) "U. E Government egenciee mey ebteln ceplee ef tble raport direcUy from DOT. Other qualified DDC uaare ehalt re«ueet through
(4) "U. E military agenelaa may obtain cople« ef thla rapart directly from DDC Other qualified ueere «Mil r«qu«at through
(I) "All dlatribuUeaef thl« report iaeentrolled. Qual- Iflad DDC uear* «hall requeet through
If tha report Me been furnlahed te the Office of Technical iervicee. Department ef Commerce, for Miete tka public, indi- cete thl« feet and «Mar th« price, If hnowiw IL SUPPLEMENT AR Y NOTE» UM for additional eeplane- tary notee.
IX IPONiORING MIUTARY ACTIVITY: Enter the name of tha dapcrtmental project office or leberetory apeneoring (p»r Ind lot) th« reeeerch md d«v«lepmMt Include eddree«. 13 ABSTRACT: Enter aa ebetiact giving a brief Md fectuel eummary of the document Indicative ef the report, «van though it mey alao appeer eteewhere in the body of the technlcel re- pert. If additional apac* la required, e continuation eheet ihell M ettached.
It la highly deetrabla thel the abatrect ef claaalfiad reperte be Mcleeelfled. Eech peregreph ef the ebetrect ahall and with «n Indication of the military aecurlty Glaealflcation of tha In- formation In the Mregreph, repre««nt«d ea (TS) (H. ie>. ar (V)
Thar« la no limitation en th« length of the ebetrect. How- ever, the euggeeted length le from ISO to 23S wordr
14. XEY WORM! Bey wo.dr. ere technically meaningful tarma or ebon phracea that «harMterlae a report and may ba uaed aa indei Mirtee for eeteteging the report. Key word« muat ba eelectcd ee that ne aecurlty ctaaalflcatlM la required. Identi- fier«, auch aa •qulpmtnt model darlpieticn, trad« nam«, military I proiret cod« Mm«, gcogrephic location, may M uaad ee key I werde but will be followed by M Indication of technlcel CM- i teat. The aaalgnment ef tlnke, rule«, and weight* 1« optional.
UNCLASSIFIED Security Claasificatlon
— ■
. - -