Author Guidelines for 8 - International Journals: Publishing ...
164
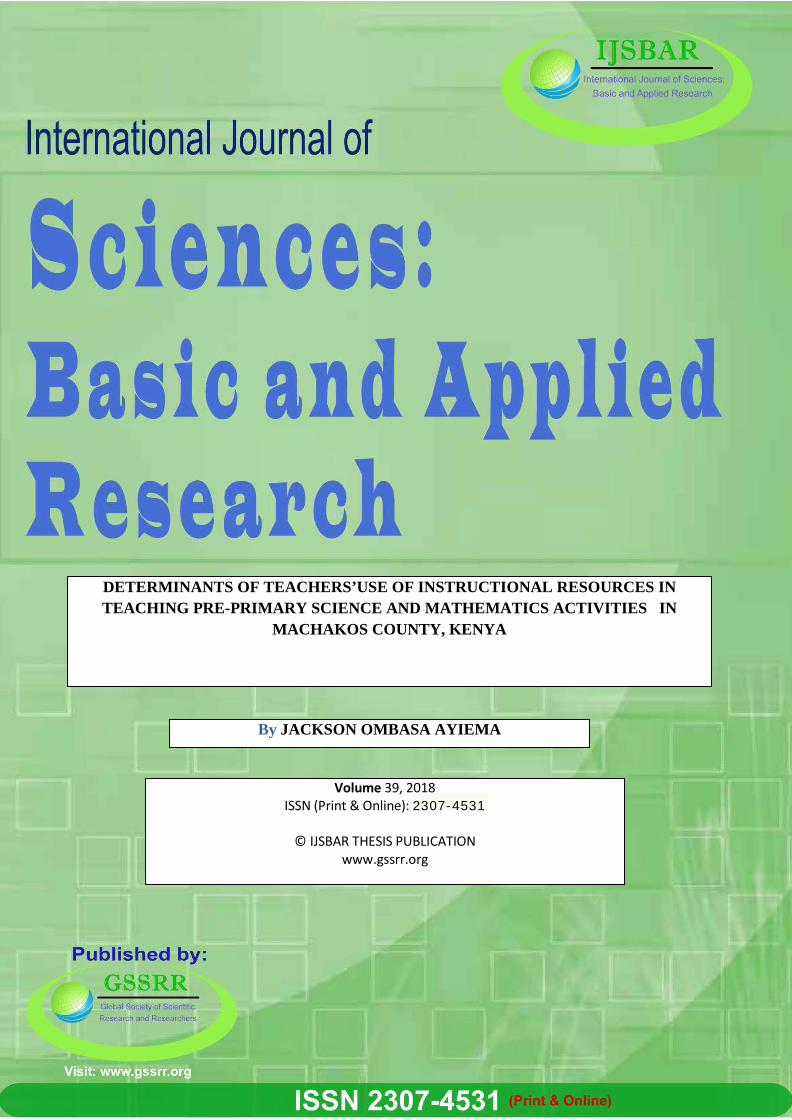
By JACKSON OMBASA AYIEMA Volume 39, 2018 ISSN (Print & Online): 2307-4531 © IJSBAR THESIS PUBLICATION www.gssrr.org DETERMINANTS OF TEACHERS’USE OF INSTRUCTIONAL RESOURCES IN TEACHING PRE-PRIMARY SCIENCE AND MATHEMATICS ACTIVITIES IN MACHAKOS COUNTY, KENYA
-
Upload
khangminh22 -
Category
Documents
-
view
3 -
download
0
Transcript of Author Guidelines for 8 - International Journals: Publishing ...
By JACKSON OMBASA AYIEMA
Volume 39, 2018 ISSN (Print & Online): 2307-4531
© IJSBAR THESIS PUBLICATION www.gssrr.org
DETERMINANTS OF TEACHERS’USE OF INSTRUCTIONAL RESOURCES IN TEACHING PRE-PRIMARY SCIENCE AND MATHEMATICS ACTIVITIES IN
MACHAKOS COUNTY, KENYA
IJSBAR research papers are currently indexed by:
© IJSBAR THESIS PUBLICATION www.gssrr.org
Copyright © 2018 by JACKSON OMBASA AYIEMA
All rights reserved. No part of this thesis may be produced or
transmitted in any form or by any means without written permission of the author.
ISSN(online & Print) 2307-4531
The IJSBAR is published and hosted by the Global Society of Scientific Research and Researchers (GSSRR).
DETERMINANTS OF TEACHERS’USE OF INSTRUCTIONAL RESOURCES IN TEACHING PRE-PRIMARY SCIENCE AND MATHEMATICS ACTIVITIES IN MACHAKOS COUNTY,
KENYA
Members of the Editorial Board
Editor in chief Dr. Mohammad Othman Nassar, Faculty of Computer Science and Informatics, Amman Arab University for Graduate Studies, Jordan, [email protected] , 00962788780593
Editorial Board Prof. Dr. Felina Panas Espique, Dean at School of Teacher Education, Saint Louis University, Bonifacio St., Baguio City, Philippines. Prof. Dr. Hye-Kyung Pang, Business Administration Department, Hallym University, Republic Of Korea. Prof. Dr. Amer Abdulrahman Taqa, basic science Department, College of Dentistry, Mosul University, Iraq. Prof. Dr. Abdul Haseeb Ansar, International Islamic University, Kuala Lumpur, Malaysia Dr. kuldeep Narain Mathur, school of quantitative science, Universiti Utara, Malaysia Dr. Zaira Wahab, Iqra University, Pakistan. Dr. Daniela Roxana Andron, Lucian Blaga University of Sibiu, Romania. Dr. Chandan Kumar Sarkar, IUBAT- International University of Business Agriculture and Technology, Bangladesh. Dr. Azad Ali, Department of Zoology, B.N. College, Dhubri, India. Dr. Narayan Ramappa Birasal, KLE Society’s Gudleppa Hallikeri College Haveri (Permanently affiliated to Karnatak University Dharwad, Reaccredited by NAAC), India. Dr. Rabindra Prasad Kayastha, Kathmandu University, Nepal. Dr. Rasmeh Ali AlHuneiti, Brunel University, United Kingdom. Dr. Florian Marcel Nuta, Faculty of Economics/Danubius University of Galati, Romania. Dr. Suchismita Satapathy, School of Mechanical Engineering, KIIT University, India. Dr. Juliana Ajdini, Department of Social Work and Social Policy, Faculty of Social Science, University of Tirana, Albania. Dr. Arfan Yousaf, Department of Clinical Sciences, Faculty of Veterinary and Animal Sciences, PMAS-Arid Agriculture University Rawalpindi, Pakistan. Dr. Rajamohan Natarajan, Chemical Engineering, Faculty of Engineering, Sohar university, Oman. Dr. Tariq Javed, Lahore Pharmacy College (LMDC), University of Health Sciences, Lahore, Pakistan. Dr. Rogers Andrew, Sokoine University of Agriculture, United Republic Of Tanzania Dr Feras Fares, Amman Arab University for graduate studies, Jordan.
DETERMINANTS OF TEACHERS’USE OF INSTRUCTIONAL RESOURCES IN TEACHING PRE-PRIMARY SCIENCE AND
MATHEMATICS ACTIVITIES IN MACHAKOS COUNTY, KENYA
JACKSON OMBASA AYIEMA
E83/24610/2013
A RESEARCH THESIS SUBMITED FOR THE PARTIAL FULFILMENTOF THE D AWARD OF THE
DEGREE OF DOCTOR OF PHILOSOPHY (EARLY CHILDHOOD STUDIES) IN THE SCHOOL OF
EDUCATION, KENYATTA UNIVERSITY
JANUARY, 2018
ii
DECLARATION
I confirm that this research thesis is my original work and has not been presented
in any other university/institution. This thesis has been complemented by
referenced works duly acknowledged. Where text, data, graphics, pictures or tables
have been borrowed from other works- including the internet, the sources are
specifically accredited through referencing in accordance with anti-plagiarism
regulations.
Signature_________________________ Date ____________________
AyiemaJackson Ombasa- E83/24610/2013 Department of Early Childhood Studies Kenyatta University.
Supervisors
We confirm that the work reported in this thesis was carried out by the candidate
under our supervision as University supervisor(s).
Signature __________________________ Date _________________ Dr.Teresa Mwoma Department of Early Childhood Studies Kenyatta University
Signature_________________________ Date________________
Dr. Ong’ang’a Hudson Ouko
iii
Department of Early Childhood Studies Kenyatta University.
DEDICATION
Special dedications goes to my family members for the daily prayers they used to
offer for me that is: my beloved wife Mary Nyaboke and children Deborah
Nyakerario, DiavineBochaberi, Ruth Moraa, Daniel Mokaya and Naomi Kerubo
may God shower them with blessings always.
iv
ACKNOWLEDGEMENT
I am highly indebted to Dr.Teresa Mwoma and Dr. Ong’ang’a Hudson Ouko as
my supervisors, besides being busy with other duties, they always found time to
offer assistance to my research work. They really helped me sail through the
murky waters of my PhD. thesis work appropriately. May God bless them
abundantly? My endless gratitude also goes to my family which encouraged and
provoked me to think higher which guided my research work. They shared great
ideas with me so sincerely that I came out a more mature scholar. God bless them
accordingly. I can’t forget to acknowledge very supportive people especially Dr.
Begi for his personal encouragement, support and his guidance on my document
may God the father keep you through your leadership as a chairman and beyond.
I also thank other people, like Kennedy Obat and John Nyongesa who offered
unlimited help in my studies and the encouragement which built me up
academically. God grant them mighty strength in their lives. To all those who gave
constructive criticism, comments and compliments, I sincerely appreciate them ,
finally yet importantly, my appreciation goes to my brother and friend especially
Dr. Ayaga of Masinde Muliro University of Science and Technology(MMUST)
for his personal thoughts and many contributions towards completion of this
study.May God in a more special ways reward himabundantly?
v
TABLE OF CONTENTS
DECLARATION ..................................................................................................... ii
DEDICATION ........................................................................................................ iii
ACKNOWLEDGEMENT ....................................................................................... iv
LIST OF TABLES .................................................................................................... x
ABBREVIATIONS AND ACRONYMS ................................................................ xi
ABSTRACT .......................................................................................................... xii
CHAPTER ONE ..................................................................................................... 1
INTRODUCTION AND CONTEXT OF THE STUDY ..................................... 1
1.1 Introduction.................................................................................................................... 1
1.2 Background to the Study ............................................................................................... 1
1.3 Statement of the Problem............................................................................................... 7
1.4 Purpose of the Study ...................................................................................................... 9
1.5 Objectives of the Study .................................................................................................. 9
1.6 Research Questions ...................................................................................................... 10
1.7 Significance of the Study ............................................................................................. 11
1.8 Delimitation and Limitations of the Study .................................................................. 12
1.8.1 Delimitations of the Study ................................................................................. 12
vi
1.8.2 Limitations of the Study .................................................................................... 12
1.9 Assumptions of the Study ............................................................................................ 13
1.10 Theoretical Framework .............................................................................................. 14
1.10 Conceptual Framework .............................................................................................. 15
1.11 Operational Definition of Terms ............................................................................... 18
CHAPTER TWO .................................................................................................. 19
REVIEW OF RELATED LITERATURE ......................................................... 19
2.1 Introduction.................................................................................................................. 19
2.2 Use of Instructional Resources in Science and mathematics ....................................... 19
2.3 Teachers Level of Training and Use of Instructional Resources ................................. 25
2.4 Teacher’s Gender and use of Instructional Resources in Teaching Science and
mathematics activities. ....................................................................................................... 32
2.5 Teachers’ Attitude and Use of Instructional Resources in Science and
mathematics activities. ....................................................................................................... 37
2.6 Teachers’ motivation and use of instructional resources in teaching science and
mathematics in pre-primary schools .................................................................................. 40
2.7 Summary of Literature Reviewed ................................................................................ 44
CHAPTER THREE .............................................................................................. 47
RESEARCH DESIGN AND METHODOLOGY .............................................. 47
vii
3.1 Introduction.................................................................................................................. 47
3.2 Research Design .......................................................................................................... 47
3.3 Variables ...................................................................................................................... 49
3.3.1 Dependent variable ............................................................................................ 49
3.2 Independent Variables ................................................................................................. 49
3.4 Location of the Study................................................................................................... 50
3.5 Target Population......................................................................................................... 52
3.5.1 Sampling Techniques ........................................................................................ 53
3.5.2 Sample Size ....................................................................................................... 54
3.6 Research Instruments ................................................................................................... 55
3.6.1 Questionnaire for Teachers ............................................................................... 55
3.6.2 Interview Schedule for Head Teachers ............................................................. 56
3.6.3 Focused Group Discussion for Pupils ............................................................... 58
3.6.4 Observation Guide ............................................................................................. 58
3.7 Validity and Reliability of Research Instruments ........................................................ 59
3.7.1 Validity of Research Instruments. ..................................................................... 59
3.7.2 Reliability .......................................................................................................... 60
3.8 Data Collection Procedures ......................................................................................... 62
3.9 Data Analysis Procedure ............................................................................................. 63
3.9.2 Quantitative Data Analysis Matrix .................................................................... 65
3.10 Logistical and Ethical Considerations ....................................................................... 68
CHAPTER FOUR ................................................................................................ 70
viii
DATA ANALYSIS, INTERPRETATION AND DISCUSSIONS .................... 70
4.1 Introduction.................................................................................................................. 70
4.2 Return Rate .................................................................................................................. 71
4.3 Teachers Demographic Information ............................................................................ 72
4.4 Use of Instructional Resources in Teaching Science and Mathematics ...................... 76
4.5 Teachers’ Levels of Training and Use of Instructional Resources .............................. 80
4.5 Teachers’ Gender and the Use of Instructional Resources in Teaching Science
and mathematics in Pre-Primary Schools .......................................................................... 87
4.6 Teacher’s Attitude towards the Use of Instructional Resources in Teaching
Science and mathematics Activities .................................................................................. 92
4.7 Teachers’ motivation level and the use of instructional resources in teaching
science and mathematics in pre-primary schools .............................................................. 98
CHAPTER FIVE ................................................................................................ 114
SUMMARY, CONCLUSIONS AND RECOMMENDATIONS .................... 114
5.1 Introduction................................................................................................................ 114
5.2 Summary of Findings ................................................................................................ 114
5.3 Conclusions ............................................................................................................... 116
5.4 Recommendations of the Study ................................................................................. 118
5.5 Recommendations for Further Research ................................................................... 119
ix
REFERENCES ..................................................................................................... 120
APPENDICES ...................................................................................................... 130
Appendix I: Teachers’ Questionnaire ................................ Error! Bookmark not defined.
APPENDICES ........................................................ Error! Bookmark not defined.
Appendix I: Teachers’ Questionnaire .............................................................................. 130
Appendix II: Head Teachers’ Interview Guide ............................................................... 136
Appendix III: Pupils’ Focused Group Discussion Questions .......................................... 139
Appendix IV: Observation Schedule ............................................................................... 141
Appendix V: Research Approval from Kenyatta University. .......................................... 142
Appendix V: Research Authorization from NACOSTI................................................... 144
x
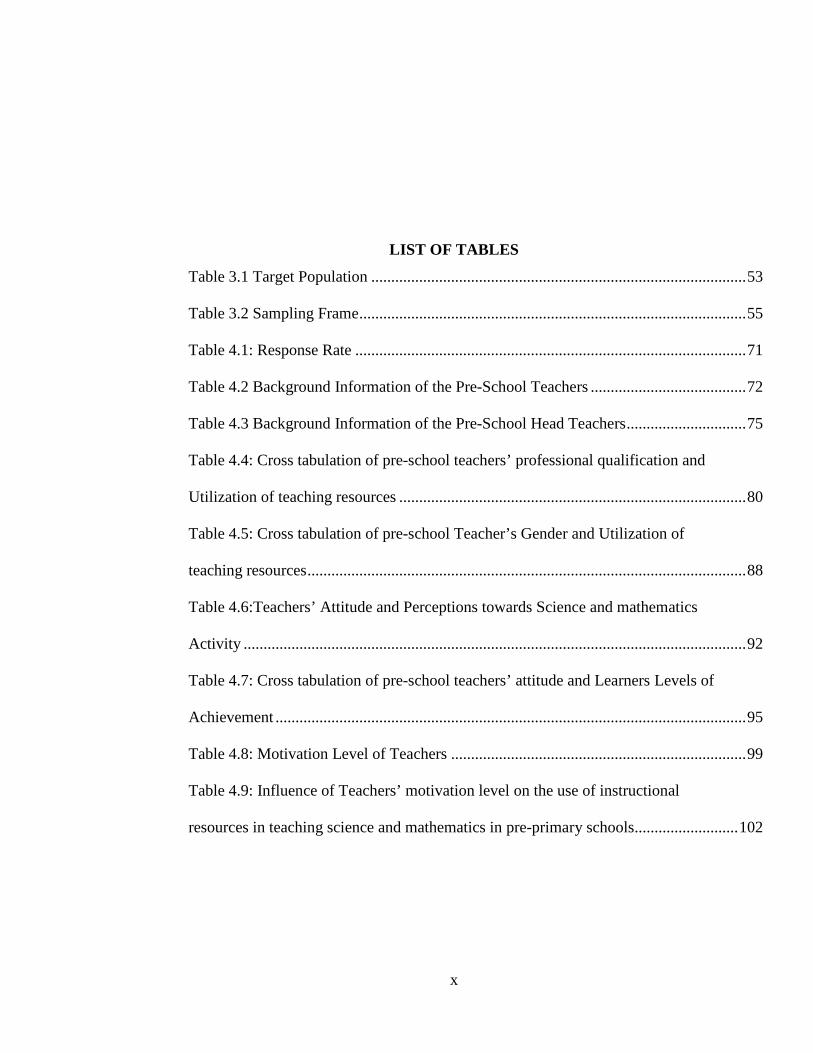
LIST OF TABLES
Table 3.1 Target Population .............................................................................................. 53
Table 3.2 Sampling Frame ................................................................................................. 55
Table 4.1: Response Rate .................................................................................................. 71
Table 4.2 Background Information of the Pre-School Teachers ....................................... 72
Table 4.3 Background Information of the Pre-School Head Teachers .............................. 75
Table 4.4: Cross tabulation of pre-school teachers’ professional qualification and
Utilization of teaching resources ....................................................................................... 80
Table 4.5: Cross tabulation of pre-school Teacher’s Gender and Utilization of
teaching resources .............................................................................................................. 88
Table 4.6:Teachers’ Attitude and Perceptions towards Science and mathematics
Activity .............................................................................................................................. 92
Table 4.7: Cross tabulation of pre-school teachers’ attitude and Learners Levels of
Achievement ...................................................................................................................... 95
Table 4.8: Motivation Level of Teachers .......................................................................... 99
Table 4.9: Influence of Teachers’ motivation level on the use of instructional
resources in teaching science and mathematics in pre-primary schools.......................... 102
xi
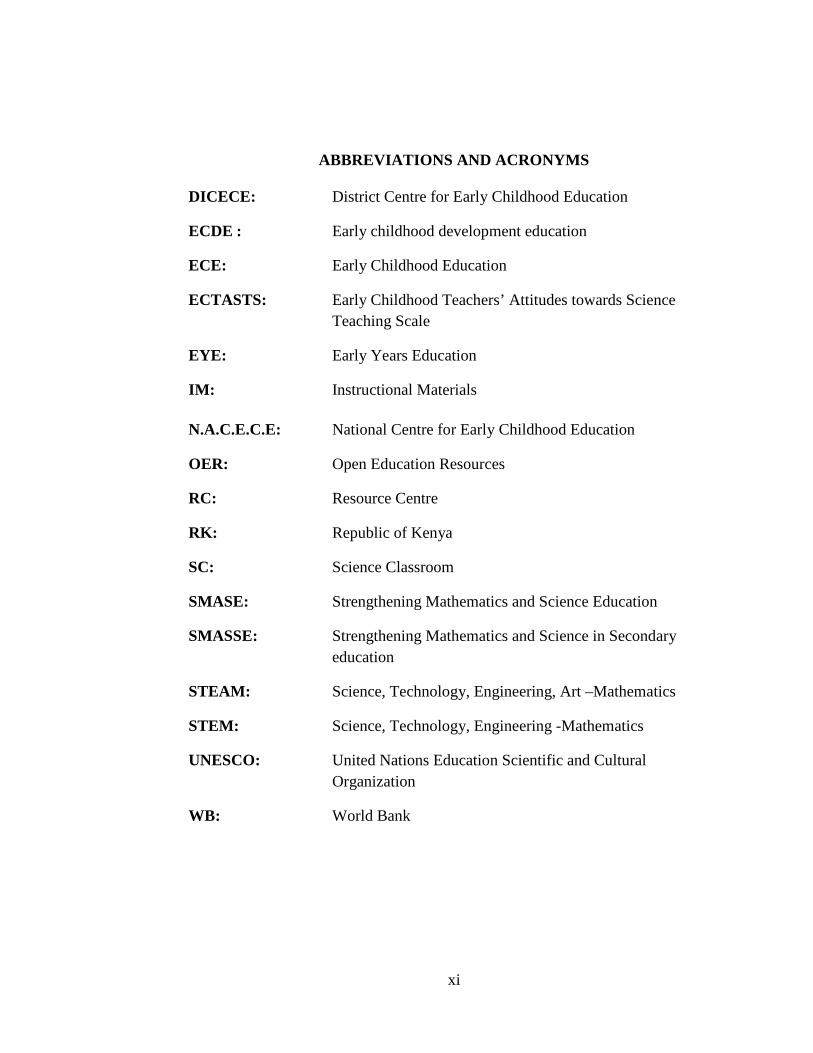
ABBREVIATIONS AND ACRONYMS
DICECE: District Centre for Early Childhood Education
ECDE : Early childhood development education
ECE: Early Childhood Education
ECTASTS: Early Childhood Teachers’ Attitudes towards Science Teaching Scale
EYE: Early Years Education
IM: Instructional Materials
N.A.C.E.C.E: National Centre for Early Childhood Education
OER: Open Education Resources
RC: Resource Centre
RK: Republic of Kenya
SC: Science Classroom
SMASE: Strengthening Mathematics and Science Education
SMASSE: Strengthening Mathematics and Science in Secondary education
STEAM: Science, Technology, Engineering, Art –Mathematics
STEM: Science, Technology, Engineering -Mathematics
UNESCO: United Nations Education Scientific and Cultural Organization
WB: World Bank
xii
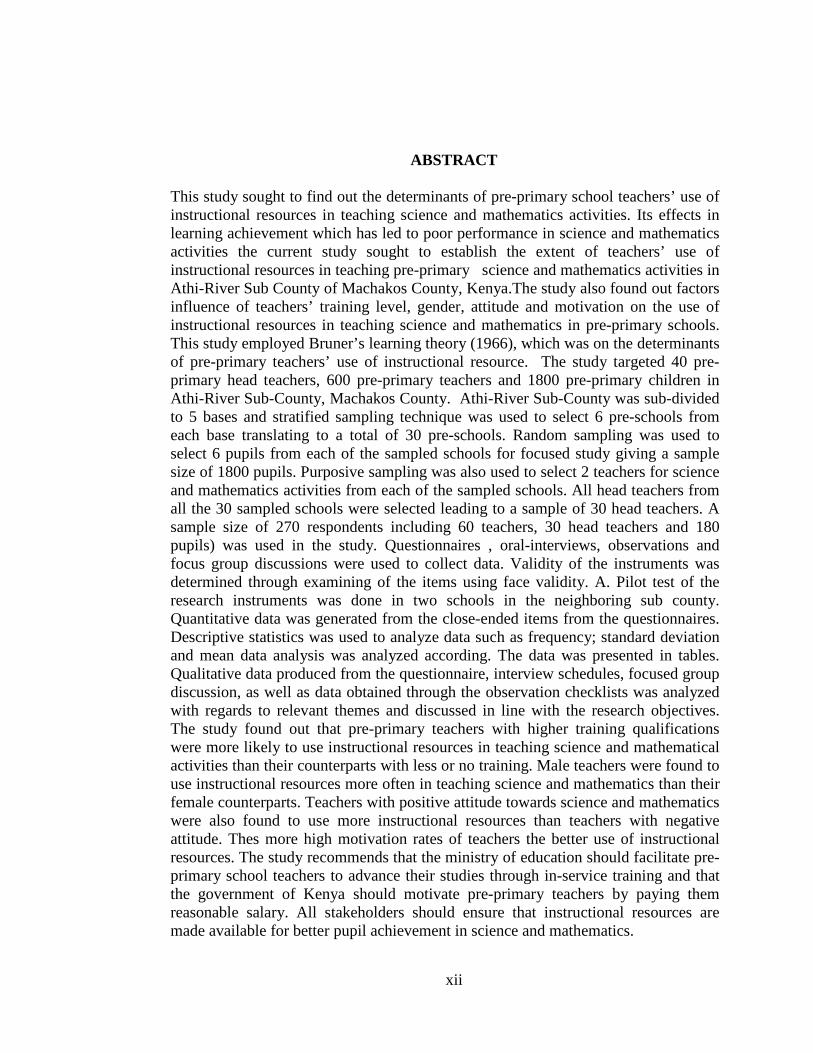
ABSTRACT
This study sought to find out the determinants of pre-primary school teachers’ use of instructional resources in teaching science and mathematics activities. Its effects in learning achievement which has led to poor performance in science and mathematics activities the current study sought to establish the extent of teachers’ use of instructional resources in teaching pre-primary science and mathematics activities in Athi-River Sub County of Machakos County, Kenya.The study also found out factors influence of teachers’ training level, gender, attitude and motivation on the use of instructional resources in teaching science and mathematics in pre-primary schools. This study employed Bruner’s learning theory (1966), which was on the determinants of pre-primary teachers’ use of instructional resource. The study targeted 40 pre-primary head teachers, 600 pre-primary teachers and 1800 pre-primary children in Athi-River Sub-County, Machakos County. Athi-River Sub-County was sub-divided to 5 bases and stratified sampling technique was used to select 6 pre-schools from each base translating to a total of 30 pre-schools. Random sampling was used to select 6 pupils from each of the sampled schools for focused study giving a sample size of 1800 pupils. Purposive sampling was also used to select 2 teachers for science and mathematics activities from each of the sampled schools. All head teachers from all the 30 sampled schools were selected leading to a sample of 30 head teachers. A sample size of 270 respondents including 60 teachers, 30 head teachers and 180 pupils) was used in the study. Questionnaires , oral-interviews, observations and focus group discussions were used to collect data. Validity of the instruments was determined through examining of the items using face validity. A. Pilot test of the research instruments was done in two schools in the neighboring sub county. Quantitative data was generated from the close-ended items from the questionnaires. Descriptive statistics was used to analyze data such as frequency; standard deviation and mean data analysis was analyzed according. The data was presented in tables. Qualitative data produced from the questionnaire, interview schedules, focused group discussion, as well as data obtained through the observation checklists was analyzed with regards to relevant themes and discussed in line with the research objectives. The study found out that pre-primary teachers with higher training qualifications were more likely to use instructional resources in teaching science and mathematical activities than their counterparts with less or no training. Male teachers were found to use instructional resources more often in teaching science and mathematics than their female counterparts. Teachers with positive attitude towards science and mathematics were also found to use more instructional resources than teachers with negative attitude. Thes more high motivation rates of teachers the better use of instructional resources. The study recommends that the ministry of education should facilitate pre-primary school teachers to advance their studies through in-service training and that the government of Kenya should motivate pre-primary teachers by paying them reasonable salary. All stakeholders should ensure that instructional resources are made available for better pupil achievement in science and mathematics.
1
CHAPTER ONE
INTRODUCTION AND CONTEXT OF THE STUDY
1.1 Introduction
This chapter presents the background of the study, statement of the problem,
purpose of the study and objectives of the study. It also presents research
questions, significance of the study, limitations and delimitations of the study,
assumptions as well as the theoretical and conceptual framework and the
operational definition of terms.
1.2 Background to the Study
Use of Instructional resources especially in the teaching of science and
mathematics is vital in instruction process (Oladejo, Olosunde, Ojebisi & Isola,
2011)since they have the potential of helping the teacher explain new concepts
clearly (Okobia, 2011), resulting in better understanding. Instructional resources
aid the teacher in the effective transfer of knowledge to learners (Karaka & Fabian,
2007)and add value in class performance and the acquisition of content learned
(Baylor and Ritchie, 2002). Eison, (2010).suggested that instructional resource
helps in enhancing retention which makes learning more permanent. According to
Eison, (2010) instructional resources stimulate and sustain interest in learning by
providing first-hand experience with the realities of the physical and social
2
environment of the child. Finally, Sapire(2011) posits that the use of instructional
resources assists children in opening up all developmental aspects leading to
holistic learning process. It has been observed that children who are exposed to
various instructional resources are actively and better involved in the learning
process (Hattie, & Yates, 2013).
In Kenya pre-primary school centers are the receiver of the innocent innate
children as they transit from home to school. Hirst, Jewis, Sojo and Cavagh (2011)
posits that pre -primary school is basis for learning and it helps children to develop
skills, knowledge, personal competence, confidence and a sense of social
responsibility. As children move to school, they need to adapt to the new
environment which they meet and environment ought to be favorable and rich of
instructional resource. Instructional resources encourage children to like schooling
and also make learning experiences interesting and enjoyable. Therefore, teaching
becomes easier with the use of instructional resources in pre-school (Afshari et al.,
2009).Hirst et al. (2011) found that the use of instructional resources in pre-
primary schools had a greater value to all children in learning of science and
mathematics.
Science and mathematics are essential for the development of any nation (Loucks-
Horsley et al., 2009).According to Banilower et al. (2013), learning of science and
mathematics enables learners to understand their environment and solve their life
problems. At Early Childhood Development (ECD) level, science and
3
mathematics refers to basic concepts, skills and attitudes that enhance children’s
understanding of the natural environment (Charlesworth, 2015).The use of
instructional resources in teaching science and mathematics therefore enables
learners to explore basic scientific and mathematical skills of observation,
manipulation, classification, communication, designing experiments,
measurement, hypothesis, predictions, problem-solving, recording, and
questioning of the events(Ministry of Education, Science and Technology
(MoEST),2008). Young children are naturally curious which makes their
interaction with nature a learning experience and hence the presence of instruction
resources in pre-school cannot overstated. Children are inherently, mathematical
and scientific minded hence it is essential to provide a conducive and stimulating
environment rich of instructional resources so as to enhance their inherent
potential (National Research Council, 2009). The scientific and mathematical
process of curiosity, discovery, experimentation, measurement and organization of
information and reporting builds positive attitudes towards studying science and
mathematics among children.
Science and Mathematics play a critical role in development of a country
(Catchan, 2013). Appropriate teaching of science and mathematics leads to
effective development in digital era and modern technologies in order to achieve
the vision 2030.Many countries have come up with initiatives to alleviate the
performance of sciences and mathematics. The creation of Science, Technology,
Engineering and Mathematics (STEM) curricula was meant to prepare children for

4
lifelong learning and the demands of the future. There has been a proposal to
expand STEM to Science, Technology, Engineering, Arts - Language, Visual and
Performing— and Mathematics (STEAM) to ensure that creativity and innovation
are held in all their forms (Catchan, 2013).In 2007, the government of Kenya in
conjunction with World Bank international monetary fund and Japanese initiated
Strengthening Mathematics and Science in Secondary Education(SMASSE) in
order to improve science and mathematics. This implied that science and
mathematics had a problem in the curriculum that needed to be addressed
appropriately, the current study has found out that the teachers’ use of instructional
resources will automatically promote science and mathematics activities.
The importance of pre-primary teachers’ use of instructional resources in teaching
science and mathematics activities provides skills, knowledge and competence to
the children’s learning process (Lampert et al., 2010) and provides stimulating
environment in the learning process. When instruction resources are effectively
used by teachers in science and mathematics activities, they make children to
create stimulating interaction with them, hence automatically promoting children’s
academic achievements (Shonkoff and Philips, 2013).
Harris and Sass (2009) found out that teachers with a standard certification had a
statistically significant positive impact on student test scores relative to teachers
who either held private school certification or were not certified in their subject
area. This study showed that teachers’ training has an impact on the teaching
5
methods, use of instructional resources and content knowledge which are key for
children achievement.Kosgei, Mise, Odera, and Ayugi (2013) investigated the
influence of teachers’ experience and qualification on students’ academic
achievement in Biology. The study findings showed that 80 % of teachers who
participated in professional development programs such as SMASSE showed
better and improved student performance.
Eccles and Wigfield (2002) asserts that teacher’s gender plays a major role in
shaping pupils' ability of self-concepts and hence influences pupils’ academic
achievement. Kueckeny and Valfortz (2012) examined the impact of student-
teacher gender interactions on learning outcomes. The study result established that
both male and female pupils performed better in reading when instructed by
female teachers than male teachers while learners performed better in mathematics
with male teachers. This study sought to establish the influence of teachers’ gender
on the use of instructional resources.Odunaike, Ijaduola and Amoda (2013) did an
analysis of teachers’ gender and secondary school students’ academic performance
in Ogun State in Nigeria.The study found that female teachers put extra effort in
ensuring high standard of performance by students than their male counterparts
who perceived teaching as a profession for the weaker sex (females). Similarly, in
2012, Okoro, Ekanem and Udoh investigated the effect of teacher gender on the
academic achievement performance of children in primary schools in Uyo
Metropolis - Nigeria. The results showed that teacher-pupil gender interactions
significantly affected pupil’s academic performance.
6
There are mixed findings on the relationship between teachers’ use of instructional
resources educational practice. Some studies show that the use of instructional
resources is associated with higher educational achievement in pre-primary school.
Ng’asike (2012) did a study on training of science teachers for early childhood and
primary grade in Kenya and discovered that though the government of Kenya
emphasizes science as critical subject for advancement of technologies and
attainment of the vision 2030 science activities and resources are not yet offered in
the trainings to meet the demands of science for understanding knowledge and
logical thinking. This implies that there is still lack of information on proper
utilization of instructional resources among teachers at all level of learning since
there is minimum scientific training on the use of these resources in instruction.
According to Pram ling and Samuelsson (2010) increasing teacher education does
not produce as good academic achievements as the appropriate use of instructional
resources among the teachers. The use of instructional resources effectively
contribute toward positive academic achievements. Similarly, Hiebert&
Grouws(2007)argues that science and mathematics teaching-learning activities
depend on teaching aids or use of instructional resources and teaching methods
used by young children which makes learning to be more interesting and enjoyable
in the class environment, study by Ngololo (2012) in Namibia, found that teachers’
competencies in mastering the curriculum contents missed the subjects due to
shortage of teachers, insufficiency of instructional resources and poor teaching
methods. Reviewing the vast body of knowledge on the characteristics of teachers
7
and their influence on learner performance, this study takes advantage of the
enormous gap on pre-school especially on factors that influence the teachers’
selection, adoption and utilization of instructional resources in teaching science
and mathematics activities among pre-school children in Athi River Sub-county of
Machakos County.
1.3Statement of the Problem
When teaching science and mathematics, early childhood teachers have
tremendous impact and influence on shaping the thoughts and opinions of children
(Clements& Sarama, 2014). Research shows that most children have formed an
opinion (either positive or negative) about science and mathematics by the time
they reach the age of 7 (Hattie & Yates, 2013). That puts a tremendous
responsibility on early childhood professionals, especially with all of the emphasis
being placed on STEM education. Sarama and Clements(2009) asserts that
children who are taught math early and learn the basics at a young age are set up
for a lifetime of achievement in all aspects of their academic performance.
Considering the known importance of mathematics and science in the society, it’s
important to carry out studies that are geared toward their improvement in our
schools.
An analysis of Kenya Certificate of Primary Education (KCPE) results from 2012
to 2015 show a downward trend in performance of science and mathematics in
Athi River Sub-County (District Education Officer - Athi- River, 2015). The
8
results show that the performance of Science is below average. The introduction of
the Strengthening Mathematics and Science Education (SMASE) and SMASSE
with a view to improve student achievement has not achieved much. Furthermore,
most of the teachers who are allowed to attend these forum are high school
teachers yet the requisite knowledge and the basis in mathematics and sciences is
laid at pre-school level hence there is need for preschool teachers to be given
priority.
In Athi River Early Childhood Development and Education (ECDE) has been left
to parents resulting to poor and adequate science and mathematics instructional
resources. Other than the availability, appropriateness and adequacy of the
instructional resources in preschools, their use for instructions by teachers is key in
ensuring that children’s achievements in science and mathematics activities are
assured. However, performance related studies have focused on teacher
professional characteristics(Ng’asike, 2012), teacher training (Goldhaber
&Brewer, 2000; Harris &Sass, 2011), teacher education and experience (Zhang,
2008),availability and adequacy of teaching and learning materials (Czerniewicz &
Brown, 2005). None of the studies focused on influence of the use of the
instructional resources by the teachers on learner performance. Furthermore, most
of the studies have focused on primary and secondary schools yet these factors
established at pre-school level can help to avoid performance issues at higher
levels. This study took advantage of this gap to seek the use of instructional
9
resources and teachers’ characteristics and determine the use of these resources in
teaching science and mathematics activities among pre-school teachers.
1.4 Purpose of the Study
The purpose of this study was to establish the extent of use of instructional
resources in teaching science and mathematics among pre-primary school teachers
in Athi-River, Machakos County, Kenya. The study was to explore teacher factors
influencing the use of instructional resources in teaching science and mathematics
activities in pre-school in Athi River sub-county.
1.5 Objectives of the Study
The study sought to achieve the following objectives;
i) To establish the extent of use of instructional resources in teaching science and
mathematics activities among pre-primary school teachers in Athi –River sub-
county.
ii) To determine the influence of teachers’ level of training on the use of
instructional resources in teaching Science and Mathematics activities among
pre-primary teachers.
iii) To examine how teachers’ gender influence the use of instructional resources
in teaching science and mathematics activities among pre-primary school
teachers.
10
iv) To find out how teacher’s attitude influence the use of instructional resources
in teaching science and mathematics activities
v) To determine the influence of teachers’ motivation on use of instructional
resources in teaching science and mathematics in pre-primary school in Athi-
River Sub-County.
1.6Research Questions
This study sought to answer the following research questions:
i. To what extent do teachers use instructional resources in teaching science and
mathematics activities in Athi –River sub-county?
ii. How does teachers’ level of training influence the use of instructional
resources in teaching Science and Mathematics activities?
iii. What influence does teachers’ gender have on the use of instructional
resources in teaching science and mathematics activities?
iv. How does teacher’s attitude influence the use of instructional resources in
teaching science and mathematics activities?
v. How is the use of instructional resources in teaching science and mathematics
influenced by teachers’ motivation level?

11
1.7 Significance of the Study
It is anticipated that these study findings will provide information on the
importance of the use of instructional resources in teaching science and
mathematics in pre-primary schools
• The quality Assurance and Standard Officers may use the findings of the
study for assessing teaching during their routine assessment programs.
• Kenya institute of curriculum development will use the study to develop
appropriate models for use of instructional resources in the teaching of
science and mathematics activities.
• The study will make Parents to understand that effect of motivation of
teachers will promote teaching and learning.
.
• Teachers will use this study to improve on the use of instructional
resources in teaching science and mathematics activities in their respective
schools.
• School management will avail the instructional resources in schools for
teachers to use in teaching science and mathematics activities.
12
• Finally, the MoEST could use the findings of this study to increase
budgetary allocation for pre-primary school education in order to purchase
instructional resources for better educational implementations in pre-
primary school levels
1.8Delimitation and Limitations of the Study
This section presents the delimitations and limitations of this study.
1.8.1 Delimitations of the Study
This study sought to examine how teachers’ characteristic influence use of
instructional resources in teaching science and mathematics in pre-primary schools
in Athi-River Sub-county. Among the characteristics, this study focused on are;
teachers’ level of training, teachers’ gender, teachers’ attitude and their
motivation. The study sampled only 30 schools (20 private and 10 public) and 270
respondents (30 head teachers, 60 teachers and 180 pupils) despite the fact there
are more schools in the study area.
1.8.2 Limitations of the Study
• The findings of the study were based on 30 pre-primary schools in Athi-
River Sub County of Machakos County and therefore generalisations to
other pre-primary schools in other counties with similar conditions that
may be done with caution. However, this limitation was addressed by
13
assuring them for their confidentiality. In addition, poor roads proved a
challenge but the researcher used a motor bike to traverse the sub-county
and rescheduled the dates when the schools were accessible due to bad
weather.
1.9 Assumptions of the Study
The study assumed that there was inadequate use of instructional resources in
many pre- primary schools teaching science and mathematics activities.
• Teachers’ level of training greatly influence the use of instructional
resources in teaching science and mathematics activities.
• Teacher-gender, affects use of instructional resources in teaching science
and mathematics activities.
• Teachers’ attitude promotes or demotes the use of instructional resources
in teaching science and mathematics activities.
• Well motivated teachers use instructional resource than under motivated
teachers in teaching of science and mathematics activities.
14
1.10 Theoretical Framework
This study employed Jerome Bruner’s learning theory framework which was
drawn from Bruner (1966). Bruner described his developmental human
psychology in early childhood that pre- primary school children think and reason
about their environment through learning, Bruner show pre scholars as being
active in the process of learning by manipulating their environment. Bruner was
very much opposed to the expectations of the passive learner which automatically
associating stimulating responses. This theory is called learning theory by
Bruner(1960), he developed three modes of learning by young children in order to
effectively enjoy learning process:namely enactive representation-where children
manipulate objects andiconic - children represents internal objects on visual and
image or icons and symbolic representations of external objects into words,
formulas or other symbolic means among children.
Bruner’s learning theory is related to the current studies which tend to investigate
determinant of teachers use of instructional resource in teaching science and
mathematics because the theory encourages intuition thinking (creativity) it is here
where knowledge hunches or guesses are extended in learning. The theory also
explains the basis of discovery learning which was realized during the study. And
usually the discovery method is through the use of instructional resources which
children enjoy to use. According to Bruner any child can be ready and able to learn
anything if he is taught intellectually and in an honest fashion, young children
15
understand complex concepts if they are talked in the mode of representation that
corresponds them accordingly this will only be done through the use of
instructional resources which matches with Bruner’s three major learning process
that is enactive, iconic and symbolic representations. This was merely the
appropriate use of instructional resources in teaching especially science and
mathematics in young children.
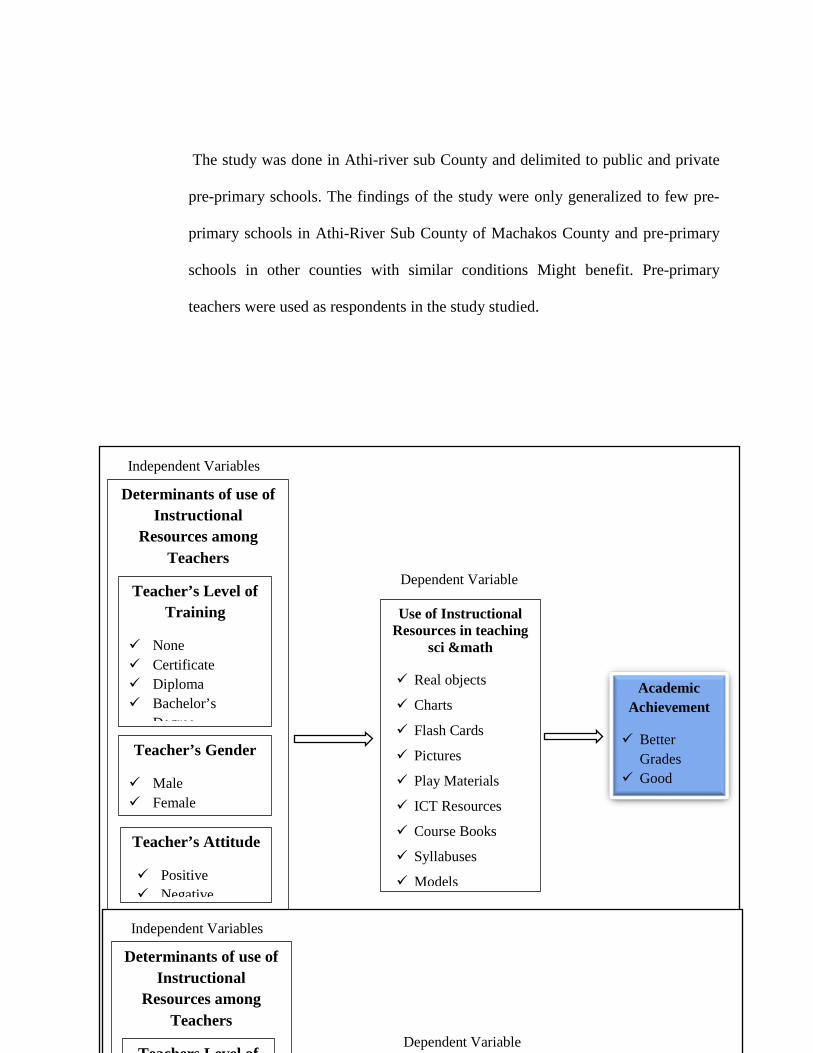
1.11 Conceptual Framework
The conceptual frame work represented how teacher’s determinants on the use of
instructional resources influence teaching pre-primary school science and
mathematics activities. It shows how teachers use instructional resources in
teaching science and mathematics activities in pre-primary schools.
Independent variables were teachers’ training level, teachers ‘gender, teachers’
attitudes and teachers’ motivational level towards science and mathematics
activities in Athi-River Sub County of Machakos County Kenya. Dependent
variable is the extent of use of instructional resources by pre-primary school
teachers in teaching science and mathematics activities which are as seen on the
conceptual diagram below, in order to create better results and good academic
achievement, good grades and well transitions of children in science and
mathematics and the application of technologies effectively.
16
The study was done in Athi-river sub County and delimited to public and private
pre-primary schools. The findings of the study were only generalized to few pre-
primary schools in Athi-River Sub County of Machakos County and pre-primary
schools in other counties with similar conditions Might benefit. Pre-primary
teachers were used as respondents in the study studied.
“’’
Independent Variables
Determinants of use of Instructional
Resources among Teachers
Teacher’s Level of Training
None Certificate Diploma Bachelor’s
Degree
Teacher’s Gender
Male Female
Teacher’s Attitude
Positive Negative
Teachers’ Motivation
Higher Lower
Use of Instructional Resources in teaching
sci &math
Real objects
Charts
Flash Cards
Pictures
Play Materials
ICT Resources
Course Books
Syllabuses
Models
Academic Achievement
Better Grades
Good
Dependent Variable
Study Variables
Key
Independent Variables
Determinants of use of Instructional
Resources among Teachers
Teachers Level of Dependent Variable
17
Figure: 1.1 Use of Instructional Materials in Science and Mathematics
Activities
18
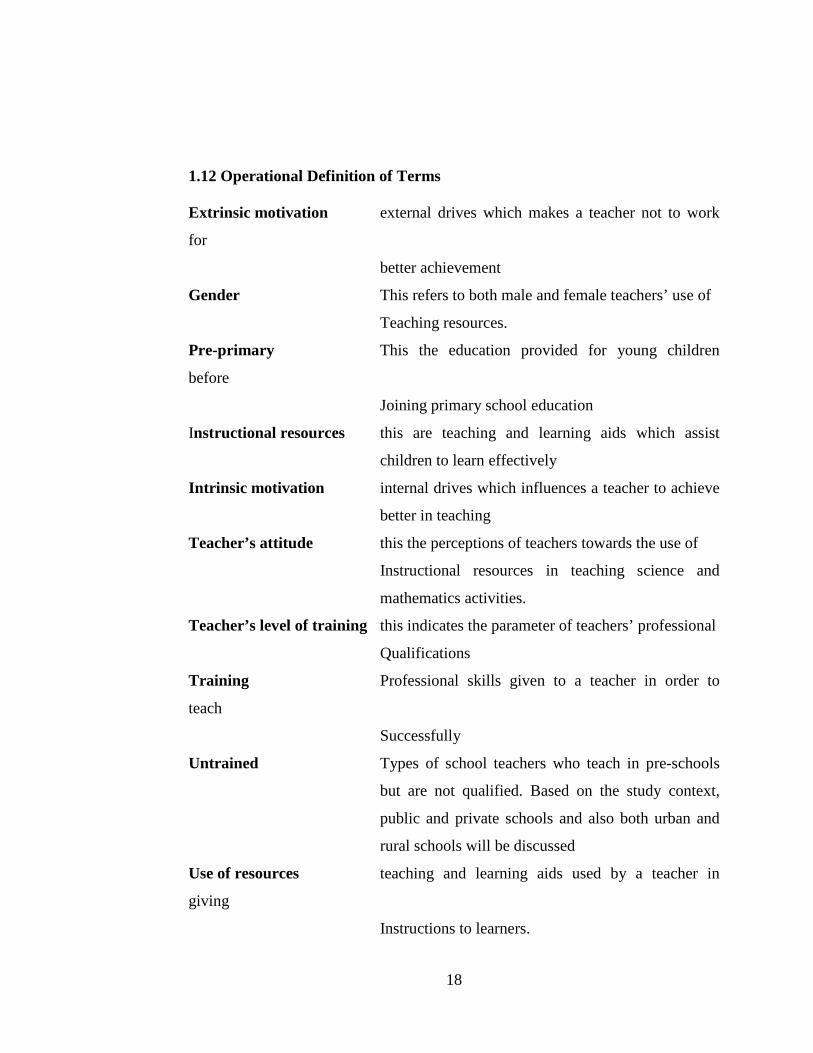
1.12 Operational Definition of Terms
Extrinsic motivation external drives which makes a teacher not to work
for
better achievement
Gender This refers to both male and female teachers’ use of
Teaching resources.
Pre-primary This the education provided for young children
before
Joining primary school education
Instructional resources this are teaching and learning aids which assist
children to learn effectively
Intrinsic motivation internal drives which influences a teacher to achieve
better in teaching
Teacher’s attitude this the perceptions of teachers towards the use of
Instructional resources in teaching science and
mathematics activities.
Teacher’s level of training this indicates the parameter of teachers’ professional
Qualifications
Training Professional skills given to a teacher in order to
teach
Successfully
Untrained Types of school teachers who teach in pre-schools
but are not qualified. Based on the study context,
public and private schools and also both urban and
rural schools will be discussed
Use of resources teaching and learning aids used by a teacher in
giving
Instructions to learners.
19
CHAPTER TWO
REVIEW OF RELATED LITERATURE
2.1 Introduction
This chapter reviews relevant related literature on the determinants use of
instructional resources in teaching science and mathematics activities among pre-
school teachers. Specifically, the chapter reviews literature on use of instructional
resources in teaching science and mathematics in pre-primary schools; teacher
training and use of teaching resources in teaching science and mathematics
activities; teacher gender and use of teaching resources in teaching science and
mathematics activities; use of teachers’ attitude and use of instructional resources
in teaching science activities between male and female; and teachers’ motivation
and use of instructional resources in teaching science and mathematics activities.
2.2 Use of Instructional Resources in Science and mathematics
Use of instructional resources in teaching science and mathematics vital in
improving the academic achievement of the young children. A study done by
Mwong and Wanyama (2012) revealed that teaching and learning resources not
only enhances a Child’s acquisition of science and mathematics skills but also
ensures good and smooth transition from preprimary to primary school. Therefore,
20
the school, parents, teachers and the education officers should warrant that the
teaching and learning resources are available in pre-primary school centers for
effective learning of science and mathematics to be realized. Muilkiungu (2003)
said that teachers should use many of teaching/learning resources locally found
within their local environment to avoid purchasing instructional resources which
are very expensive for teaching and learning in the preprimary schools. Parents
have the responsibilities to ensure that all the required learning and teaching
instructional resources are available in all the pre-primary schools for children to
without any tricky.
Muikiungu (2003) suggested that the teacher is the major driving source of
instructional resources and he/she has to influence children and parents to provide
or collect the teaching and learning materials to use during the mathematics and
science activities. Muithungu (2003) further adds that teaching and learning
resources can be made available by parents and the community as a whole for the
ECDE centers within the locality. This can be successfully done by organizing for
material development day in school. The community members and parents can
collect and others can donate to the school, meet and share thus encouraging early
enrolment and learn to provide learning resources.
A study on the approaches to young children’s science and mathematics concepts
and scientific problem-solving skills on the classroom environment found that
there were moderating effects of classroom surroundings on the application of
21
science and mathematics concepts the study used theories of both Vygoskey and
Piaget and it was done in Indiana by Colgrove (2012), while the current study was
conducted in Athi-River. The study used only Bruner’s learning theory in the
theoretical framework, and its focuses are on the relationship between teacher
factors influencing the use of instructional resources in teaching science and
mathematics activities in pre-primary schools.
The Kindergarten children of Year 6 (K-6) Australian classrooms in 2002 reported
that the average exposure of children to science was only 36 minutes per week in
Australia in 2003. In 2006, over the full range of primary school experience,
science occupied 45 minutes per week (3% of an average teaching week of 1486
minutes) while mathematics occupied 263 minutes (18% of an average week
according to the study done byAngus, Olney &Ainley, (2007).This study found
out that there was higher mean scores in the teachers’ use of instructional
resources in teaching science and mathematics in pre-primary schools in Athi-
River sub county of Machakoscounty Kenya.
In Bangladesh, Mondal (2011) did a study on teaching practices on Biology in
rural and urban secondary schools. The study found that there was a difference in
teaching/learning materials in urban and rural in teaching biology. Biology is a
science study which was also done in secondary level, while the current study was
based on pre –primary school level and the study sought to investigate the use of
22
instructional resources by pre-primary school teachers in teaching science and
mathematics activities in Athi-river sub-county of Machakoscounty Kenya.
In India, Bartsch (2009) found that the use of teaching and learning resources can
be relevant in teaching science in schools. The study was similar to the current but
this was done in India and the study focused on only science activities contrary to
the current study which was conducted inAthi-River, Machakos County, Kenya on
pre-primary school and focused on the determinants of pre-primary school
teachers” use of instructional resources in teaching science and mathematics
activities in order to solve the poor performance of science and mathematics in
Athi-River Sub –county Kenya.
Okobia (2011) sought to assess the availability and teachers’ use of instructional
materials and resources in the implementation of junior secondary school social
studies curriculum in Edo state. A sample of fifty social studies teachers were
randomly selected from fifty junior secondary schools in five local government
areas of Edo State. Data analysis was carried out using t-test for the hypothesis and
simple percentages for questions one and two. The results showed that
instructional materials and resources available were grossly inadequate. It was also
observed that there was no difference in the use of instructional materials between
specialist social studies teachers and non-specialist teachers. It is therefore
recommended that instructional materials and resources be made available for the
teaching of social studies
23
In Kenya, studies done by Ogolla (2015) on the relationship between teaching and
learning materials on performance in KCSE in Nyakach found that biology has
been poorly done over five years. Yes, biology is a science but taught in secondary
schools; on contrary the current study which focused on the use of teaching and
learning resources in teaching science and mathematics activities in pre-primary
schools in Athi-River not Nyakach which has a different demographic zone.
Ambogo (2012), in his study on effects learning equipment on chemistry found out
that there was significance correlation between KCSE Performance in science and
availability of learning materials or equipment, the study was focusing the poor
performance of science but in the secondary level, while the current study’s
focuses on preschool level and on science and mathematics activities. In 2007 the
government of Kenya in conjunction with World Bank, international monetary
fund and Japanese initiated SMASSE to strengthening mathematics and science in
secondary education. There is need to focuses on the improvements of science
from preschools which the focuses the basic of science.
Mutai (2006) suggested that learning is strengthened when there are enough
teaching and learning materials which increase academic achievements, the study
is similar to current studied study on determinant of teachers’ use of instructional
resources in teaching science and mathematics activities, but, Mutai focused on the
performance of the KCPE. There is need therefore to study the topic determinant
of teachers’ use of instructional resources in teaching science and mathematics in
pre-primary schools to whether there was any difference between primary and pre-
24
primary school on the use of instructional resources in teaching of science and
mathematics activities. The use of computer and internet applications are
technologies used in today’s teaching/learning, but there is need for skills and
knowledge of the teacher to apply in teaching according to the claim by, Butera,
Czaja,Harison, Liberal &Plamer (2009).
In science and mathematics activities, children learn physical science which are
the study of energy, light, measurement, heat movement and change in early
childhood (Allen, 2002). Pre-primary school teachers should use instructional
resources in teaching and learning of science and mathematics activities, the
science activities involved are; observation, investigation, measurement and
communication on the results and therefore there was a need to use materials in
teaching science and mathematics as the case study.
Wanyonyi, and Makokha, (2015) also investigated the utilization of instructional
resources by Kiswahili teachers in the teaching of poetry in secondary schools in
Nandi North Sub - County. This was guided by the operant conditioning theory,
the study used systematic sampling to select 20 Kiswahili teachers in secondary
schools in the sub-county. Using questionnaire, observation and interview
schedule to collect data, the study established that secondary schools in the study
area had good facilities and resources. The study further revealed that poor
performance in Kiswahili poetry was contributed by poor and inadequate
utilization of instructional resources among teachers. The study recommended that
25
there was need for teachers to utilize instructional resources in teaching Kiswahili
poetry to enhance the amount of information a student could learn and retain.The
current study investigated characteristics of teachers that influence the utilization
of instructional resources in teaching mathematics and sciences in pre-schools.
2.3 Teachers Level of Training and Use of Instructional Resources
A study done by Westbury (2000) recognizes the teacher as the agent of
curriculum implementation. Fullan (2014) argues that the importance of the
teacher as a central change agent, as the teacher is the one who is primarily
responsible for the successful implementation of a new curriculum. According to
Morrison, Bachman, & Connor (2005) the teacher’s pedagogy, classroom
management strategies, and interactions with students at classroom level can
determine how much is learned or trained for the same profession.
A study by Brill & McCartney (2008) revealed that lack of teachers training and
poor teacher retention as key barriers to effective curriculum implementation. The
key to getting teachers committed to an innovation is to enhance their knowledge
of the program. This means teachers need to be trained and workshops organized
for professional development. Certainly an adequate teacher education program
should include curriculum development if teaching is to be a profession and if
opportunities for learners are really to be improved. Content knowledge aside, it is
only when a teacher can communicate effectively that he will be able to draw upon
the various social cultural contexts of the learner to facilitate learning (Tsui, 2001).
26
Effective classroom interaction can also be enhanced by individual attention of
teachers to their students.
Teacher qualifications has great influence on the use of instructional resources in
teaching science and mathematics and mechanically promotes children
‘achievements. teacher trainings are related to children’s achievements. Goe,
(2007); Rice, (2003) and Zeichner& Conklin, (2005) came up with their uniform
test scores to find on the connection between teacher qualifications and children’s
performance, the measurement of the connection between teacher trainings and
any learner’s performance, are predisposed by attendance or grades, which was
generally beyond the scope of this study.
Some developing countries have started computer literacy training for teachers,
which has led to a vital factor for participating ICT in education; however, it is
notable that operative training should not stop at computer literacy but should
model effective teaching practices (Infodev, 2015). Nonetheless, there are many
other countries that provide little or insignificant teacher training related to ICT in
education. For example, indication from Europe shows that 70% and 65% of
children in Lithuania and Romania, correspondingly, are taught by teachers for
whom it is necessary to participate in ICT training, compared to just 13% or fewer
of students in Luxembourg, Austria and Italy (European Commission, 2013).
Learning might also emerge and be reinforced through apps that evoke the use of
multiple senses, according to Carr, (2012), which is usually done through the use
27
of teaching and learning by the use of instructional resources. With mobile devices
such as smart phones, there is direct interaction with the phenomena, rather than
being mediated through a mouse or keyboard, making the iPad more suitable for
children than desktop computers as discussed by Sinclair and Heyd-
Metzuyanim,(2014).Use of instructional resources in teaching science and
mathematics is very necessary for children to remember concepts appropriately
during the learning process. Hegedus, (2013). Suggested that this app also evokes
multi-touch functionality, enabling children to make sense of individual effects of
particular instructional resources therefore very necessary for teachers to train on
the appropriate use of instructional resources for better teaching to be realized.
The avoidances of instructional resources in teaching of science and mathematics
activities shall led to cognitive risks and make it very difficult to achieve the
expected objectives from the learner’s feedback activities. (Calder and Campbell,
2016). The instructional resources allow children to model in a dynamic, reflective
way. According to Meyer (2015) established that instructional resources provides
new forms of personal ownership that in turn supports children’s personal
understanding and conceptual frames as they learn science or mathematics
activities (Melhuish and Falloon, 2010).The problem of lack of qualified teachers
has been renowned in the teaching professional
A study by Yeboah-Appiagyei, Joseph, & Fentim (2014) on the effects of
professional qualifications of financial accounting on academic performance in
28
Ghana, revealed that teachers with sound training were equipped with the requisite
competence that enable them to produce effective service in teaching compared to
less trained teachers. In South Africa, Mathevu (2014) did a study on the effect of
trained teacher use of computer; Data were collected in research using
questionnaires from 146 participants in twelve secondary schools located in the
Groot Letaba Circuit, Mopani District Municipality in Limpopo Province, South
Africa. The findings revealed that with the exception of a TVs, photocopiers and
laptop/desktop computers, there is a scarcity of ICT resources available at schools.
Most teachers have been negatively affected by a lack ICT equipment and/or
insufficient use of these ICT resources but well trained teachers have abilities and
confidence to use ICT and any other learning resources in their teaching (Summak,
Samancioglu, Goyal, Purohit&Bhaga, 2011). This was a study done in South
Africa, but the current study was done in Athi-River sub county ofMachakosin
Kenya and the focus was how pre-primary teacher use of instructional resources in
teaching science and mathematics activities in preschools. Currently, a major issue
is intensifying the dynamics of the public schools. Most children are increasingly
reflecting negative attitudes towards learning especially as they move from lower
class or grade to another in search of knowledge.
Jenkins, Floress and Reinke (2015) in their study sought to establish how teachers
are motivated in the use of instructional resources in teaching science and
mathematics and the desire for children to use materials for effective teaching in
schools. In pre-primary schools there is about 95% satisfaction; and then it goes
29
steadily down until it bottoms out in standard eight at 37%. This represents a
marvelous extent of bored children. For teachers one could say that there is only
one thing worse than being bored. Moreover, the last two Met-Life surveys (2008
and 2010) have shown an intense decline in teacher satisfaction, reducing from
some 54% to 40% or less. Thus, school, as it is currently organized and practiced,
is mentally and literally “pushing” students and teachers out of school. Information
and communication technology (ICT) has the potential to transform teaching and
learning processes.
However, most countries face challenges in measuring the impact of investments
in infrastructure, massive roll-outs of teacher training initiatives, and usage in the
classroom. The lack of a comprehensive set of indicators can partly explain current
challenges. Moreover, there is a growing recognition that added focus is needed to
measure teacher training and usage holistically within a systems perspective
whereby indicators are not viewed in isolation but reflect a complex pattern of
how teachers are prepared and how teaching activities with pupils, in and out
schools and the classroom are executed (Partnership on Measuring ICT for
Development, 2010). Following a technical advisory panel (TAP) meeting that
brought together a diverse group of statisticians and subject matter experts in the
area of ICT in education from 9 to 10 December 2014 in Paris (France), this paper
has been developed to help strengthen the conceptual framework of ICT in
education with specific reference to the importance of collecting data relevant to
teacher training in relation to ICT and its usage in the classroom. This paper is
30
complementary to a paper authored by Broadley, Downie and Gibson (2015)on
‘Evolving Learning Paradigms’ as well as another by Twining et al., (2015)on
‘Developing new indicators to describe digital technology infrastructure in
primary and secondary education’. These three papers were commissioned by UIS
to inform the planning of new ICT in education data collections and identifying
core indicators for the post-2015 developmental agenda.
The UNESCO-UIS Guide to Computing Data and Communication Technologies
(ICT) in Education, Technical Paper No. 2 (UIS, 2009), put in place a shared set of
uniform internationally agreed indicators on ICT in education including a number
related to teachers’ professional development and practice, which are haggard
from organizational sources. This paper however argues that a more holistic
approach, as per example the ICT Education 2013 Survey (CETIC.Br, 2013) on
the use of ICT in Brazilian schools, may be useful for shedding additional light on
teacher dimensions of ICT in education.
More specifically, this paper attempts to assess current indicator gaps in teacher
professional development and training by asking basic questions, including who is
being trained in the use of ICTs, where and how are teachers trained, what kind of
ICT training is provided and based on which certification standards, and finally,
when and for how long are teachers trained? Based on an analysis of these issues,
additional indicators are suggested. This paper also examines teacher usage of ICT
in delivering instruction and makes a case for including cross-cutting elements that
31
point to teachers’ usage of ICT-enhanced pedagogy, digital curriculum and
assessment, ICT in education policy, ICT infrastructure, and ICT used for
structural and organizational purposes. The teaching of basic computer skills and
computing is also addressed.
On enhancing the competence of electronics teachers in the utilization of
instructional resources for effective electronics subject delivery which has been
reported byOkwelle, and Allagoa, (2014) as lacking among secondary school
technology teachers and according to Nigeria.Okwelle, and Allagoa, (2014) study
established that problems associated with the effective use of these instructional
resources in secondary schools such as poor teachers’ professional knowledge and
insufficient awareness of types of instructional materials for use in teaching
different electronics contents, were highlighted. Also, the electronics teachers
developing positive attitude towards the use of instructional materials; maintaining
appropriateness of the materials to instructional objectives and multidimensional
presentations of these materials among others, were strategies postulated for
enhancing teachers’ competence in instructional material utilization.
Lastly, the rank of obtaining better gender-related statistics regarding teacher
exercise and usage of ICT in education, including indicators influenced by sex, is
highlighted. digital curriculum and assessment seem to be mostly applicable in
countries at more advanced stages of ICT development, various digital materials
are increasingly available for use, while Open Education Resources (OER) are also
32
increasingly available for re-use and adaptation within developing countries. Open
Educational Resources (OERs) are any type of educational materials that are in the
public domain or introduced with an open license. The nature of these open
materials means that anyone can legally and freely copy, use, adapt and re-share
them. OERs range from textbooks to curricula, syllabi, lecture notes, assignments,
tests, projects, audio, video and animation (UNESCO, 2015b). The increasing
availability of OERs do not necessarily translate into use by teachers. For example,
in Europe it is reported that 15% of students in all grades are taught by teachers
declaring that they create digital resources almost every day, and about an
additional 15% at least once a week (European Commission, 2013).
2.4 Teacher’s Gender and use of Instructional Resources in Teaching Science
and mathematics activities.
Eccles and Wigfield (2002) have shown that teacher’s gender plays a major role in
shaping pupils' ability of self-concepts. Studies have established that in primary
education, pupils instructed by women teachers tend to perform better
(Neugebauer, Helbig & Landmann, 2011) than their counterparts taught by male
teachers.Eccles and Wigfield (2002) asserts that female teachers are usually
supportive, they offer a more positive classroom environment, and are more likely
to use pupil-oriented methods of instruction emphasizing the significance of
stimulation. Antecol, Erin and Ozbeklik (2012) reported that female teachers have
a positive effect on female pupils’ performance. Having a female teacher has a
negative effect on female pupil math achievement in primary school. The presence
33
of female teachers in primary schools will enhance both girls’ enrollment and
educational success.
Most teachers have difference in explanation for gender according to their level of
interactions in the classroom and many teachers hold difference expectations for
their children according to gender(Erden, 2009).All these expectations are based
on either the child’s behavior or his or her academic achievements. One important
aspect of student behavior is how they use their body, how active they are in class,
and how they use their voice, which may be different between female and male
pre-primary school children.
Gender differences in the way children frequency interact physically among
themselves and in the way they use their body during quiet time as well as play
time have been found as early as in three-year and five-year old children usually
behave differently among boys and girls (Chaplin& Aldao, 2013). These gender
differences are, according to the researcher, partially validated by the pre-school
teachers whose physical interactions with girls and boys differed. Chaplin& Aldao,
(2013) observed that boys were more frequently physically restrained or
disciplined by teachers than girls. Teachers in Canada tend to hold higher
academic expectations for adolescent boys than for girls in mathematics and
science but lower expectations in reading and writing.
Antecol, Eren and Ozbeklik (2012) assessed the effect of teacher gender on
student achievement in primary school. Using a randomized experiment, the study
34
found out that having a female teacher lowered the mathematics test scores of
female primary school students in disadvantaged neighborhoods. However, the
study did not find any effect of having a female teacher on male students’ test
scores (mathematics or reading) or female students’ reading test scores. These
findings ruled out explanations pertaining to the unobserved quality differences
between male and female teachers. The study also observed that this negative
effect seemed to persist only for female students who were assigned to a female
teacher with a limited mathematics background.
Dee (2007) examined the effect of teachers’ gender on learners’ academic
achievement. He analyzed data from the National Education Longitudinal Survey
of 1988. With a sample of 25,000 8th graders, the study found out that same-
gender teachers had a positive influence on learners’ academic success. The study
established that the influence of teacher-gender was different on the different
subject.
Chudgar and Sankar (2008) investigated the relationship between teacher gender
and student achievement: Evidence from five Indian states. Findings from the
study showed that male and female teachers differed in terms of their classroom
management practices and their belief in students’ learning ability. The study also
found out that being in a female teacher’s classroom is advantageous for language
learning but teacher gender has no effect on mathematics learning.Winters, Haight,
Swaim and Pickering, (2013) did a study on the effect of same-gender teacher
assignment on student achievement in the elementary and secondary grades. The
35
study utilized information from an administrative panel dataset following the
universe of test-taking public school students in Florida over a period of five years
to estimate the relationship between same-gender teacher assignment and student
achievement. The main objective of the stud was to estimate how a student's
achievement changes as he/she is assigned to teachers of different genders
throughout his/her academic career, holding constant both observed and
unobserved factors related to academic outcomes. The study also provided
estimates from models that evaluate how the relative performance of male and
female student assigned to the same teacher or in the same classroom relates to the
gender of the teacher. The study findings showed that there was no statistically
distinguishable relationship between same-gender teacher assignments and student
math or reading achievement in elementary school. However, the study found a
statistically significant relationship between being assigned to a female teacher and
student achievement in middle and high school, however the magnitude of the
effect was small. This inconsistency in the findings of the relationship between
teachers; gender and learner achievement warranted further studies.
Hoque and Zohora (2014) found out the impact of gender in primary teaching
profession on student achievement. Using a quantitative method of research, the
study employed test scores of primary grades for five consecutive years which
were obtained from a school in Bangladesh. The study findings showed that men
were slightly better to teach in primary when the test scores were analyzed.
Although there were some differences in the breakdown analysis, the combined
36
result analysis did not find strong evidence to claim whether students had to be
taught by teachers of same or alternative gender.
In India, the issue of women education has always been a matter of grave concern
for educationists. In India, till to date there exists a disparity in the ratio between
boys and girls in school and so does in the status of man and woman in the society.
Historically it has been found that women education had led to the production of
women scholars and social advocate who in turn have helped in the development
of women education. The study focuses on the work of an investigation on how
women scholars have helped in the development of women education, in Bengal,
through their literary works. The findings were literary works of these ladies have
helped in providing force to women education in Bengal and has led to the
development of the foundation on which stands the super-structure of women
education of modern times(2014) Indian journal for education research.
In Procedia, a Social and Behavioral Sciences journal (2014) did study on gender
wise comparison of trained and untrained teachers’ performance on students’
learning achievement in science and mathematics and found out that trained male
and female teachers are significantly better than untrained male and female
teachers and the teachers conduct in private schools are different from public
schools’ teachers and more devoted in private than public school teachers.
Traditional methods are the most method used in teaching science and
mathematics both rural and urban areas. Discussion method is used in small scale
37
only in urban area. Other types of activities like field work, project work are
greatly minimized by mostly female teachers the current study examined the
difference between male and female teachers in the use of instructional resources
in teaching science and mathematics activities in Athi-River ,Machakos in Kenya a
different demographic and social-economical area. The current study focused on
gender and saw how female or male teachers used instructional resources in
teaching science and mathematics in preschools not secondary schools’ contrary,
the current study focused on pre-primary teachers’ use of instructional resources in
teaching science and mathematics activities in pre –primary schools in Athi-River.
2.5 Teachers’ Attitude and Use of Instructional Resources in Science and
mathematics activities.
Attitude encompasses the thoughts, behavior, feelings and beliefs a person has
about the object or an item or a person. In our case, this could be the belief that
science and mathematics are hard to understand, the belief that men are more
interested in scientific activities and better suited for a career in technology than
female or the belief that science is of essential economic value. These beliefs may
range from a positive to a negative. A positive attitude is categorized by the
understanding of positive physical reactions and emotions when opposed with the
object, while a negative attitude is accompanied by negative affective reactions.
Attitude (general attitude toward use of instructional resources in teaching science
and mathematics, attitudes towards science and mathematics in high school, or
38
attitudes towards effective teaching of science and mathematics) this affects the
use of instructional resources in the teaching of preschool science and
mathematics. This consists of feelings and behavior a person involvements in
relation to the attitude object. For instance, feelings of anxiety when confronted
with science and mathematics teaching, or feeling of a sense of insecurity during
teaching may modify teacher’s feeling towards science (Ajzen, 2001).
In Ethiopia, research conducted with 292 preschool teachers who work in public
and private institutes in different districts of Ankara during the second semester of
2006-2007 academic years. The data were collected by administering Early
Childhood Teachers' Attitudes toward Science Teaching Scale (ECTASTS) there
is a statistically significant relationship between preschool teachers' attitudes
toward science teaching in public school to public school but difference in public
school to private schools in teaching science and mathematics activities. Also, all
factors were found highly related with the teachers' attitudes toward science and
mathematics teaching and the frequency of science and mathematics activities
except for age and in-service training (Ahmed, 2014). The study was conducted in
Ethiopia and not in Kenya where current study will be based on different numbers
of teachers’ sample study.
In addition, Emine (2010) did a study on the problems that preschool teachers
face in the curriculum implementation the study aimed at investigating the
challenges preschool teachers faced in the use of instructional resources in rural
39
schools due to the high rate of poverty which made it difficult to acquire
appropriate resources for teaching young children in order to implementation the
curriculum and whether these challenges differ in relation to teachers’ attitude of
education, department they graduated from, the type of the school they are
working in, teachers’ training level and level of in-service training, the study
aimed to find out the underlying reasons of most frequently stated issues of
implementation from the teachers’ perspectives.
Colgrove (2012) did a study on the approaches to teaching young children science
concepts and vocabulary and scientific problem-solving skills and role of
classroom environment the findings were effective with the appropriate teaching
and learning resources and found out that private and public school differs in their
methods of teaching the young children in order to acquire the expected demands
for learning to take place accordingly. Attitude is not a single unitary concept, but
a construct consisting of multiple subcomponents and attributes. The separate
evaluations of each of these attributes contribute in varying degrees towards the
overall attitude towards the object (Ajzen, 2001).
Ndawula (2014) sought to examine the teachers’ attitudes towards using sponsored
instructional materials provided by the Aga Khan Education Service (AES) to
primary schools in Uganda. The objectives of the study were: to establish teachers’
attitudes towards the AES materials in relation to the level of class taught, size of
classes and the nature of subject (s) taught. Data was gathered from twenty-five
40
class teachers, using interview schedules. Majority of the teachers (93%)
expressed positive attitude, while only 7% had negative attitudes over using the
AES materials. Conclusions were drawn and recommendations focused on:
sensitization of teachers on importance AES; improving on close work relationship
between primary schools and AES; extending AES materials to non-project
schools and; further research on other variables rather than teachers’ attitudes.
While the reviewed study examined the teachers’ attitudes towards using
sponsored instructional materials provided by the Aga Khan Education Service
(AES), the present study sought to focus on teachers’ attitudes towards using
instructional materials and resources for teaching science and mathematics.
Consequently, low performing female students’ needs are more often overlooked
than the needs of underachieving male students (Jones, 2005). By interviewing
teachers along with female and male students that were identified by those
teachers as either high achieving or underachieving. However, this study focused
on the determinants of pre-primary school teachers’ use of instructional resource
in teaching science and mathematics activities.
2.6 Teachers’ motivation and use of instructional resources in teaching
science and mathematics in pre-primary schools
In America, Kentucky, teacher partners had a monthly meeting with math and
science teachers in rural district, most of the families gathered were from the south
Texas rural and speaks Spanish, in the: mathematics and science night meeting
41
they learnt English language and talked, but by the end of the evening they have
learned how to reinforce lessons taught in school. Parents were reminded to
include their children when they cook their foods and talking about native plants
and encouraging their children to count and measure ingredients those are simple
ways to reinforce science and math in their daily lives. Learning science and
mathematics always become excellence during a family project, even at
mealtimes. According to the nationwide movement for education reform, rural
schools are disadvantage in the use of materials in teaching science and
mathematics activities in preschools. And it is frequently said that the smallest and
poorest schools, especially, cannot afford to offer the rich menu of advanced math
and science classes as found at larger suburban schools. There is lack of space and
equipment for computers and science laboratories to teach mathematics and
science in some more attractive ways, these are common complaints across rural
America. The Rural Systemic Initiative cannot on its own, balance the scale of
equity. But it is helping rural educators make the most of the resources they do
have and, especially, encouraging schools to look for support beyond the
classroom. By viewing the whole community as an extension of the school and the
members of that community as potential teachers’ rural schools become, not the
poorest, but among the richest in America. More than in many wealthier districts,
residents of tight knit rural regions are willing to rally around “their” school and
share time and expertise according to Boyer (2014). The current study will attempt

42
to compare rural and urban schools in Athi-River Sub County on the use of
instructional resources in teaching science and mathematics.
According to Carnegies Science Centre (2014), stated that most researchers
suggest that rural schools and their students are educationally disadvantaged
compared to urban counterparts in terms of their academic achievement. This is
particularly true because the rural pre-primary school teachers are poorly
motivated compared to their counterparts. Rural areas and their populations have
long been linked with lesser prospects, one of which are being the provision of
education in terms of staff and teaching and learning materials. However, the
sources for this disparity have long been uncertain in the literature these include
individual children factors and educational environment related factors. On an
individual level, factors affecting rural learners’ science and mathematics
achievement have been found to be related to children’s academic achievement.
Educational factors particularly in subject areas such as mathematics and science
have been found to include teacher retention and shortages issues, lack of access to
resources has also been stated as an issue for rural attainment. This research
examined differences between science and mathematics achievement in rural and
urban Lincolnshire and how teachers’ motivation influences the appropriate
teachings the more motivation of the teacher the better academic achievement. The
current study focused on the use of instructional resources in teaching science and
mathematics activities in Athi-River Sub county of Machakos Kenya.
43
Klassen and Chiu (2010) sought to examine the relationships among teachers'
years of experience, teacher characteristics (gender and teaching level), three
domains of self-efficacy (instructional strategies, classroom management, and
student engagement), two types of job stress (workload and classroom stress), and
job satisfaction. The study indicated that female teachers had greater workload
stress, greater classroom stress from student behaviors, and lower classroom
management self-efficacy. Teachers with greater workload stress had greater
classroom management self-efficacy, whereas teachers with greater classroom
stress had lower self-efficacy and lower job satisfaction. Those teaching young
children (in elementary grades and kindergarten) had higher levels of self-efficacy
for classroom management and student engagement. The study also showed that
teachers with greater classroom management self-efficacy or greater instructional
strategies self-efficacy had greater job satisfaction.
Use of teaching aids is totally absent in rural areas and insufficient in urban areas.
Learners ‘contribution in classroom activities is too narrow in rural area as
teachers do not make scope for learners to do so. In urban areas learners share in
classroom activities in few cases. There is a need to make classroom teaching-
learning activities “learner centered” both in rural and urban areas to ensure
learners quality learning. This study also advocates a commanding need to conduct
a broader study on this issue to make the classroom activities more effective (Israt,
44
Farha &Shah, 2014). The problem was discovered in Bangladesh and in secondary
school level. The researcher wants to see its applicability in Kenya today, by
addressing the determinants of pre-primary school teachers’ use of instructional
resources in teaching science and mathematics in in Athi-River, Machakos County
Kenya.
2.7 Summary of Literature Reviewed
While studies have been carried out on the utilization of instructional resources in
sciences and mathematics and its influence on learner performance, (Mondal,
(2011); Bartsch (2009); Okobia (2011); Ogolla (2015); Ambogo (2012); Mutai
(2006) ad Wanyonyi, and Makokha, (2015), all these studies focused on secondary
school and partly on primary schools. However, this study focused on pre-schools
since the right opinion among children on science and mathematics is set at this
level of learning. Evaluating teacher characteristics that influence use of teaching
resources at this level in thus important since, studies show a significant
relationship between the use of instruction resources and pupil achievement. The
use of instructional resources improves achievement of science and mathematics
activities and promote good performance of science and mathematics in both
primary and secondary levels according to Baylor and Ritchie (2000).
Beggs (2000) pointed out that new technologies, when first met, bring mixed
feelings of anxiety, fear, as well as frustration, which sometimes lead to not using
the new technologies. The researcher observed similar reactions among preschool
45
teachers in the classroom, where they teach to see whether they are fully
materializing the use of instructional resources or not in their classroom teaching
and learning process. As a result, some teachers took up the challenge and
managed the frustrations they experienced as they learned how to operate
computers for example, while others did not make any attempt to use any
instructional resource in teaching of science and mathematics activities. It is clear
that the use of instructional resource of all forms continues to advance, and that
there is need to keep pace with those developments. Thus, this study focused on
use of instructional resources as they are used in teaching pre- primary schools.
Wang and Ye (2002) stated that the understanding of teachers on the use of
instructional resources makes teaching and learning programmes appropriate to
learners and that only technology which is instructional resources will greatly
promote teaching and learning this is linked to the study on determinants of pre-
primary school teachers’ use of instructional resources in teaching science and
mathematics activities.
Ajzen, 2001; Emine, 2010; Colgrove, 2012 and Ahmed, 2014 delved into the
influence of attitude of teachers on learner performance. However, the studies
were carried out in secondary schools and tertiary colleges. Furthermore. The
studies were done in other countries. Considering the fact that Kenyan teachers
have unique characteristics in terms of environment, social and financial
motivations, and this study will focus on Athi River sub-county and delve on how

46
attitude of the teachers in pre-schools determine their use of instructional materials
in teaching mathematics and science activities.
47
CHAPTER THREE
RESEARCH DESIGN AND METHODOLOGY
3.1 Introduction
This chapter discussed the research design, location of the study, the target
population, sampling procedure, sampling size, research instruments, validity,
reliability, data collection procedures, data analysis procedures and ethical
considerations when carrying out the study.
3.2 Research Design
The study applied descriptive survey research design with both qualitative and
quantitative approaches. This design is defined by Fraenkel and Wallen (2014) as
asking a large group of people questions about a particular issue. In this design, the
researcher collected both qualitative and quantitative data at the same time and
then integrated the information in the interpretation of the overall results
(Denscombe 2008; Creswell 2009; Creswell and zhang 2009; Creswell and Plano
Clark 2011).
The combination of qualitative and quantitative approaches occurred at different
stages of the research process, such as formulation of research hypothesis, data
collection and data analysis (Bryman 2006; Teddlie and Tashakkori 2009;
Creswell and Plano Clark 2011). This approach to research enabled the study to
48
gather adequate information that provided better understanding of the research
problem and answering the entire research questions than using either qualitative
or quantitative research approach alone (Creswell and Plano Clark 2011). This
design is more appropriate because it increases the overall strength of a study by
enhancing the validity and trustworthy of data collected (Denscombe 2010). In
handling qualitative data, the design has the capacity of collecting data concerning
the current status of the problem in which the researcher has no direct control of
the independent variables because the manifestation had already occurred
(Denscombe 2008). The design was also more appropriate because it allowed the
researcher to gather information from a large number of cases through
questionnaires.
This research design was also chosen because it enabled the researcher to explore,
collect and explain in-depth empirical data about determinants of Pre-Primary
School Teachers’ Use of Instructional Resources in Teaching of Science and
Mathematics Activities in Athi-River, Machakos County Kenya. The researcher
also preferred the descriptive research design since it is broad-based. This implies
that it enabled the researcher to collect primary data from a diverse category of
subjects. Interviews, questionnaires and observations were the main tools used for
collecting data.
Oso and Onen (2009) state that descriptive survey provides numeric descriptions
of a sample as they were, as they would be and did not involve manipulation of the
49
independent variable. The design allowed an economic, rapid data collection, and
generalization from a sample suitable for extensive research (Kothari, 2004;
Grinnel and Unrau, 2010) as was appropriate in this study.
3.3Variables
A variable is an object, event, idea, feeling, time period, or any other type of
category you are trying to measure. There are two types of variables-independent
and dependent. They are described in the following sub headings.
3.3.1 Dependent variable
According to the present study, use of instructional resources in teaching science
and mathematics is dependent variable which was measured by determining how
frequent the instructional resources were used in teaching science and mathematics
activities by pre-primary school teachers. Oso and Onen (2009) define dependent
variables as attributes that represent the output or outcome whose variation is
being studied. This variable was measured using a four level Likert Scale of -
Always, Sometimes, Rarely and Never defined by individual instructional resource.
3.2 Independent Variables
According to the current study the independent variables were as follows;
teachers’ training levels, gender, teachers’ attitudes and teachers’ motivational
levels. Bryman (2006) independent variable is exactly what it sounds like. It is a
variable that stands alone and isn't changed by the other variables you are trying to
50
measure. Creswell and Plano Clark (2011) also defines it as that which represent
inputs or causes, i.e. potential reasons for variation. In this study,
i) Teachers’ level of training was measured by highest certification attained by
the teachers given as certificate, diploma and degree levels.
ii) Teachers’ gender was measured by indicating the gender of teacher, as male or
female.
iii) Teachers ’attitudes were measured by indicating whether positive or negative
attitude towards instructional resources.
iv) Teachers’ motivation this was measured by measuring teachers’ lower and
higher motivation.
3.4 Location of the Study
The study was done in Athi River Sub-County, one of the eight Sub-Counties in
Machakos County in the Eastern Kenya. The sub-county has four wards namely
Athi River Town, Katani/Muthwani, Kinanie/Mathatani and Syokimau/Mlolongo.
The sub-county has 9 locations and 19 sub-locations. The economic mainstay for
Athi River Sub-County is agriculture, mining, fruit farming and poultry keeping.
Therefore, 70% of the population is employed in agricultural activities with very
low incomes. Levels of poverty are high where children engage in mining to
supplement family income. Due to this poverty index and involvement of children
in various forms of child labour, the access to education is hampered and this may
51
even influence appropriate utilization of instructional materials for teaching
science and mathematics in preschools.
Despite the fact that most households in the sub-county depend on small scale
agriculture and mining as the main source of livelihood, the sector faces a number
of constraints which, unless removed continued to work against poverty reduction
efforts. Some of these include the high incidences of HIV/AIDS which has led to
the loss of life and depletion and diversion of badly needed family incomes, un-
economical subdivision of land due to the high population pressure, low
agricultural productivity, unaffordable input prices that discourage farmers from
investing in agriculture and unstable cash crop prices. This situation is further
aggravated by landlessness among women and youth, and mismanagement and
near collapse of cooperative societies especially coffee and pyrethrum and poor
agricultural produce marketing.
The low level of human resource development is one of the causes of poverty in
the sub county. For most people, the cost of education is too high therefore the
level of literacy is quite low. This coupled with the fact that further education and
training are hampered by the limited number of institutions and low quality of
education acquired from them, meaning that the population particularly the labour
force is not well equipped to compete effectively in the local job market and
therefore the ability to secure remunerative jobs or other income generating
opportunities (GDP, 2002-2008).
52
This area was chosen for the study because of its cosmopolitan presentations of
both rural and urban settings and it clearly presented the approximate picture of
Kenya and accordingly to ministry of education monitoring report (2015) the
performance of science and mathematics in both primary and secondary schools
in Athi river sub county was poorly done and therefore the researcher wanted to
investigate whether the use of instructional resources in teaching science and
mathematics activities may be the cause or not. The prevailing trend of poor
performance of science and mathematics in the sub-county made it necessary for
the research to choose the locale.
3.5 Target Population
A target population comprises membership from real or hypothetical set of
subjects, persons or occurrences to which the researcher would make
generalization of the findings of the study (Misigah, Kinyanjui and Ohaya, 2013;
Borg and Gall, 2003). Mugenda and Mugenda, (2010) also reiterated that
population is the entire group of individuals, events or objects having a common
observable characteristic. The study targeted teachers in 40 pre-primary schools in
Athi-River Sub-County, Machakos County. This is presented in Table 3.1.
53
Table 3.1 Target Population
Category Target Population
Schools 40
Head Teachers 40
3.5.1 Sampling Techniques
Sample selection was guided by stratified random sampling technique since the
population was stratified. The study used random sampling techniques identifying
the schools selected for the study, Kombo& Tromp (2013) stated that in purposive
sampling method the researcher purposively target a group of people believed to
be reliable for the study. Therefore, purposeful sampling was used to select Athi-
River Sub-County, among other seven Sub-Counties of Machakos namely;
Machakos, Kathiani, Mwala, Kangundo, Matungulu, Yatta and Masinga because
Athi-river has unique locations or sites for the intended study to be applicable
more conveniently. Athi-River Sub-County was sub-divided to 5 bases and a
stratified sampling technique was used to select 6 pre-schools from each base
translating to a total of 30 pre-schools. Creswell (2005) states that in stratified
sampling, researchers divide (stratify) the population on some specific
characteristics and then randomly sample from each sub-group of the population.
This guarantees that the sample included specific characteristics that the researcher
wants included in the sample. Stratification ensures that the stratum was
represented in the sample in proportion to that in the population. The schools were
54
stratified into public and private primary schools and also according to bases in
Athi River Sub County.
Random sampling was used to select 6 pupils for focused group discussion, from
each sampled school leading to a sample of 180 pupils. Random sampling method
helped the researcher to give all subjects equal chances to be selected for the
study. Purposive sampling was used to select 2 teachers teaching science and
mathematics activities from each sampled school and all the 30 head teachers from
all the sampled schools leading to a sample of 60 teachers and 30 head teachers
respectively. Purposive sampling technique was appropriate to enable all the key
respondents to take part in the study.
3.5.2 Sample Size
The sample size of the study were 5 public rural schools, 10 private rural schools,
5 public urban schools and 10 private urban pre-primary school centers in Athi-
River Sub-County of Machakos. A sample size of 270 respondents (30 head
teachers, 180 pupils and 60 teachers) were included in the study. The sample size
was summarized in Table 3.2.
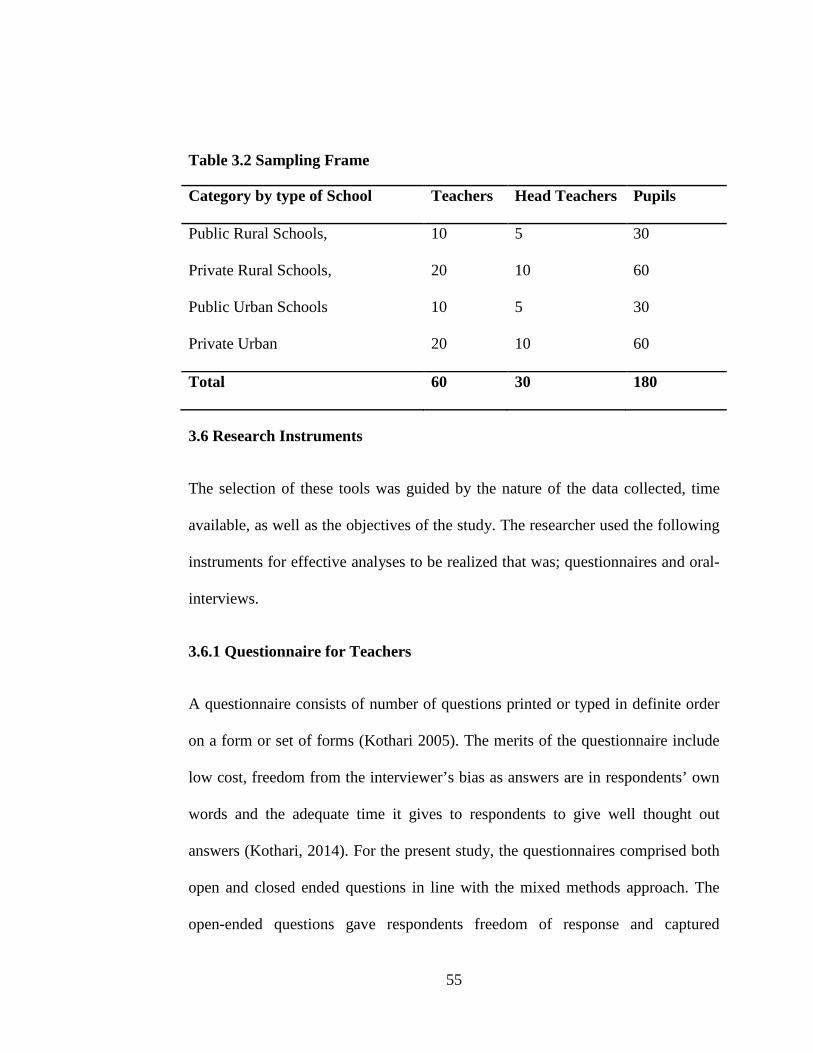
55
Table 3.2 Sampling Frame
Category by type of School Teachers Head Teachers Pupils
Public Rural Schools, 10 5 30
Private Rural Schools, 20 10 60
Public Urban Schools 10 5 30
Private Urban 20 10 60
Total 60 30 180
3.6 Research Instruments
The selection of these tools was guided by the nature of the data collected, time
available, as well as the objectives of the study. The researcher used the following
instruments for effective analyses to be realized that was; questionnaires and oral-
interviews.
3.6.1 Questionnaire for Teachers
A questionnaire consists of number of questions printed or typed in definite order
on a form or set of forms (Kothari 2005). The merits of the questionnaire include
low cost, freedom from the interviewer’s bias as answers are in respondents’ own
words and the adequate time it gives to respondents to give well thought out
answers (Kothari, 2014). For the present study, the questionnaires comprised both
open and closed ended questions in line with the mixed methods approach. The
open-ended questions gave respondents freedom of response and captured
56
qualitative data. The closed ended questions facilitated consistency of certain data
across respondents and were quantitative. The questionnaire was utilized to
capture data from pre-primary school teachers who had no problem or difficulties
in responding to questionnaire items. Additionally, questionnaires are popular in
data collection because of their relative ease and cost-effectiveness with which
they were constructed and administered.
3.6.2 Interview Schedule for Head Teachers
Interviews involved conversations that were used to gain personal information,
knowledge, attitudes or opinions from a list of prepared questions asked to each
participant in the same manner. Head teachers of the sampled schools were
interviewed to gather information on determinants of Pre-Primary School
Teachers’ Use of Instructional Resources in Teaching of Science and Mathematics
Activities in Athi-River, Machakos County Kenya. Head teachers were
interviewed to understand their diverse opinions about determinants of Pre-
Primary School Teachers’ Use of Instructional Resources. A set list of structured
and unstructured questions was used to interview the head teachers on
determinants of Pre-Primary School Teachers’ Use of Instructional Resources in
Teaching of Science and Mathematics Activities. Interview schedules were
prepared in advance and these were conducted on the selected head teachers. The
semi-structured interview involved the interviewer initiating questions and probes
were used in responding to interviewee's descriptions while structured interview
57
involved the Interviewer following scripted questions and no deviation from
question order.
The semi-structured interview was appropriate for the study because the language
Level of the respondents could be adjusted, Interviewer could answer questions
and make clarifications, the researcher could prompt and probe deeper into the
given situation, the interviewer was able to probe or ask more detailed questions,
situations and not adhere only to the interview guide but the researcher could
explain or rephrase the questions whenever respondents were unclear about the
questions. Structured interview was also appropriate for the study because the
researcher had control over the topics and the format of the interview by the use of
a detailed common interview guide, which made it easier to analyze code and
compare data.
Ader, Van, Deltaan and Beekman, (2008) reiterate that the interviews was to
solicit data concerned with views, perceptions, and feelings about the implication
of the use of instructional resources in teaching science and mathematics activities.
In this study, in depth interviews was conducted to collect the required information
from the sampled pre-school head teachers. The data were gathered from interview
schedule to help to authenticate data acquired through questionnaire. This study
preferred to use interview schedule because an interview schedule provided a free
environment for the respondents to express themselves and even gave rise to
further information which was not catered for in a questionnaire. All interviews

58
were recorded and transcribed for analysis purposes, with the consent of the
respondents.
3.6.3 Focused Group Discussion for Pupils
Focused Group Discussions assisted in determining detailed information about
personal feelings, perceptions and opinions of teachers and the kind of
instructional resources they used for instruction. The use of focus group discussion
was cheap compared to conducting individual interview and it also offered an
opportunity to seek clarification on various issues.
3.6.4 Observation Guide
Observation checklist was used where it was impossible to collect data using
interviews or questionnaires, such as when participants were young children like
the case in the current study. For the above reasons, observation checklist was
used for direct observation of the pre-primary teachers use of instructional
resources in teaching science and mathematics activities, and to check whether
conditions in pre-school in terms ofapplication for materials and its environment
was encouraged, productive and engagement or not. Kombo and Tromp (2006)
argue that direct observation presents data in its natural form, making the observer
an active participant in the study and permits time to think about what is occurring
rather than on how to record it.
59
3.7 Validity and Reliability of Research Instruments
3.7.1 Validity of Research Instruments.
This study adopted the triangulation approach so as to measure the validity of the
instruments. Triangulation is a powerful way of demonstrating concurrent validity
in both qualitative and quantitative research (Campbell and Fiske 1959). In other
words, the study used multiple methods of data collection: interviews,
questionnaires as well as observation checklist. By so doing, areas that had been
overlooked by one method were strengthened and checked by the other. The cross-
checking of data through multiple method approach made the data collected valid.
This is in line with Cresswell (2009) who contends that the use of multi-model
technique to data collection averts the possibility of having invalid and unreliable
data. Validity of research instrument refers to the extent to which a test or
instrument measures what it is intended or supposed to measure (Mbwesa, 2006).
To ensure that the data gathered measures what the study purported to measure,
the research study further adopted content validity. Here the research instrument
was scrutinized by the two supervisors to assert that the instrument logically
appeared to reflect accurately what it purported to measure and covered what it
was intended to cover (Mbwesa, 2006). The two supervisors read through the
questions that were used in the study. The ones that were not correct were
rephrased and others modified. This helped the researcher to ensure that there was
content validity of the instruments.
60
3.7.2 Reliability
Before the actual study, a pilot study was conducted in two pre-primary schools.
These schools were not included in the actual study. Through piloting, item
deficiency and ambiguity was uncovered (Faranenkel&Wallen, 2009).
The study employed the split-half method to find out the reliability of the
questionnaire. The developed questionnaires were administered once and the
scores of each half was recorded separately. On the interview guide for head
teachers, item 7 to 9 were deleted completely and some were modified to focus on
the purpose of the study. During the first administration is when the items were not
filled but during the second one, all the items were filled. The reliability of
qualitative responses involved bringing about objectivity to the qualitative data,
the truthfulness or credibility of data. The aim of trustworthiness in a qualitative
inquiry is to support the argument that the study results are worth paying attention
to (Lincoln and Guba, 2000).
Credibility was ensured through random sampling of individuals serving as
informant and interactive questioning in data collection dialogues (Lincoln and
Guba, 2000). To ensure transferability, the researcher provided sufficient
contextual information about the fieldwork sites, which enabled the readers
believe their situations to be similar to that described in the study, making them
relate the findings to their own positions (Lincoln and Guba, 2000). The researcher
ensured dependability by employing In-depth methodological description to allow

61
for the study to be repeated. Credibility was censured by thick description of the
phenomenon under scrutiny. Transferability was ensured by the provision of
background data to establish the context of the study and detailed description of
phenomenon in question to allow comparisons to be made. Information about the
fieldwork sites was provided to enable the findings to be applied to other situations
(Shenton, 2004). In order to ensure dependability, the processes within the study
was reported in detail, thereby enabling a future researcher to repeat the work, if
not necessarily to gain the same results. In depth coverage allowed the researcher
to assess the extent to which proper research practices had been followed
(Shenton, 2004).
3.8 Pilot Study
Pilot testing of research instruments that was used for this study was done among
the two schools in the neighboring sub county. Simple random sampling was used
to generate a sample size of 10 schools (5 public preschools and 5 private
preschools schools), which accounted for 33% of the sample size (30 preschools
both private and public schools). According to (Connelly, 2008), extant literature
suggests that a pilot study sample should be 10%-30% of the sample projected for
the larger parent study. Questionnaires were administered to the respondents and
interpretation of the response alternatives and queries were carried out to form
items that bear the same meaning but are not identical. Order of response
alternatives were similarly changed for questions with normal scale to assess the
62
validity and reliability. Meanwhile, respondents’ choices were evaluated for
appropriateness.
The questions were also verified to check if all the respondents understood them
the same way. In addition, average time taken to complete the questionnaires were
noted and the overall pilot test results were analyzed and adjustments made
according to the results of the instruments review and pilot test prior to the
production of the final instruments.
3.8 Data Collection Procedures
The researcher used the interviews and questionnaires in collecting data: The use
of instructional resources in teaching science and mathematics activities personally
and found out how pre-primary teachers use instructional resources in teaching
science and mathematics activities. Questionnaires were used to answer the extent
of pre-primary school teachers use instructional resources in teaching science and
mathematics activities.
Interviews, the researcher conducted interviews to children in the sample pre-
primary schools on the use of instructional resources in teaching science and
mathematics activities on all the sampled schools to establish the general objective
of the study on teacher’s use of instructional resources in teaching science and
mathematics and its applicability in Athi-River Sub County, Machakos county
63
Kenya. Lastly, the researcher distributed all questionnaires to sampled schools
Head teachers
3.9 Data Analysis Procedure
According to Mbwesa (2006). The data was organized according to the objectives
that guided the study. Data collected was both qualitative and quantitative. With
the qualitative data, the researcher used the analytical technique including; quick
impressionistic summary, thematic analysis and content analysis. Quantitative
data, descriptive was used to analyze the raw data.
Quantitative data was first coded and entered into the computer for analysis using
the Statistical Package for Social Sciences (SPSS) version 22.0. The descriptive
statistics that was used include frequency counts and percentages. The purpose of
descriptive statistics enabled the researcher to meaningfully describe a distribution
of scores or measurements using a few indices (Mugenda and Mugenda 2010).
This enabled the researcher to transform large groups of data into a more
manageable form that was easy to understand and interpret (Mbwesa 2006).
The data was reflectively analyzed starting from the time it was collected while
still in the field just like what researchers say that data analysis in qualitative
research is in parallel with data collection (Creswell, 2009; Gall et al., 2007;
Maxwell, 2005). This enabled the researcher to discover important sources and
information that may be overlooked in the design. This was achieved in three
64
ways: 1. Having consultative meetings or sessions with respondents and
supervisors. 2. Having field note summaries 3. Having data summary sheets
(Drew, Hardman & Hosp, 2008). The recorded interviews were transcribed, while
the memos, observational & teaching documents and recorded reports and notes
were read and analyzed. Field notes were analyzed and interpreted in readiness for
coding in relation to the answers of the structured questions. Creswell (2009)
defines coding as, “…the process of organizing the material into chunks or
segments of texts before bringing meaning to information…segmenting
sentences…or images into categories…”
Transcripts were read carefully. They were then coded into themes in relation to
the research questions and information collected (Gerstenfeld and Berger, 2011).
Then a list of all topics was made and sorted according to similarities and
differences using highlighters of different colours. The topics were later
abbreviated as codes and the codes written near the related text in word document.
Then these topics were turned into categories – major topics, unique topics,
leftovers and emerging themes.
Finally, the information assembled according to category and a preliminary
analysis was made (adapted from Creswell, 2009). The categories were developed
from both the data and research questions based on theory and determined at the
formulation of the research instrument. The sub-themes were mostly developed
65
from the data. The data from questionnaires, interviews and observation were also
sorted according to themes.
Therefore, interpretational analysis largely examined carefully so as to find
constructs, themes and patterns that were useful in understanding the phenomenon
under study. Above all, the researcher tried by all means to make sense of the
meanings that the respondents attached to the phenomenon just like argued by
Cohen et al., (2007). This was a challenging task but through reading books and
consulting the two supervisors, a meaningful analysis was made.
3.9.2 Quantitative Data Analysis Matrix
Data from questionnaires was analyzed using descriptive method. The raw data
was analyzed as per the objective as illustrated in table 3.3.
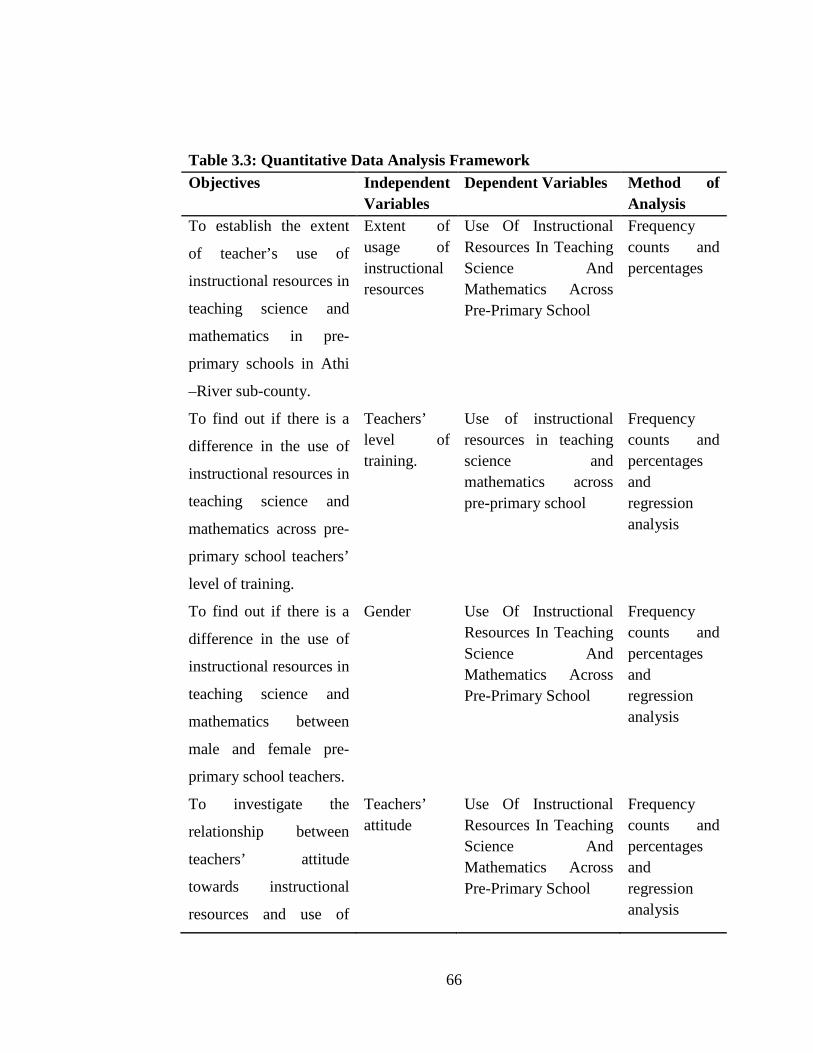
66
Table 3.3: Quantitative Data Analysis Framework Objectives Independent
Variables Dependent Variables Method of
Analysis To establish the extent
of teacher’s use of
instructional resources in
teaching science and
mathematics in pre-
primary schools in Athi
–River sub-county.
Extent of usage of instructional resources
Use Of Instructional Resources In Teaching Science And Mathematics Across Pre-Primary School
Frequency counts and percentages
To find out if there is a
difference in the use of
instructional resources in
teaching science and
mathematics across pre-
primary school teachers’
level of training.
Teachers’ level of training.
Use of instructional resources in teaching science and mathematics across pre-primary school
Frequency counts and percentages and regression analysis
To find out if there is a
difference in the use of
instructional resources in
teaching science and
mathematics between
male and female pre-
primary school teachers.
Gender
Use Of Instructional Resources In Teaching Science And Mathematics Across Pre-Primary School
Frequency counts and percentages and regression analysis
To investigate the
relationship between
teachers’ attitude
towards instructional
resources and use of
Teachers’ attitude
Use Of Instructional Resources In Teaching Science And Mathematics Across Pre-Primary School
Frequency counts and percentages and regression analysis
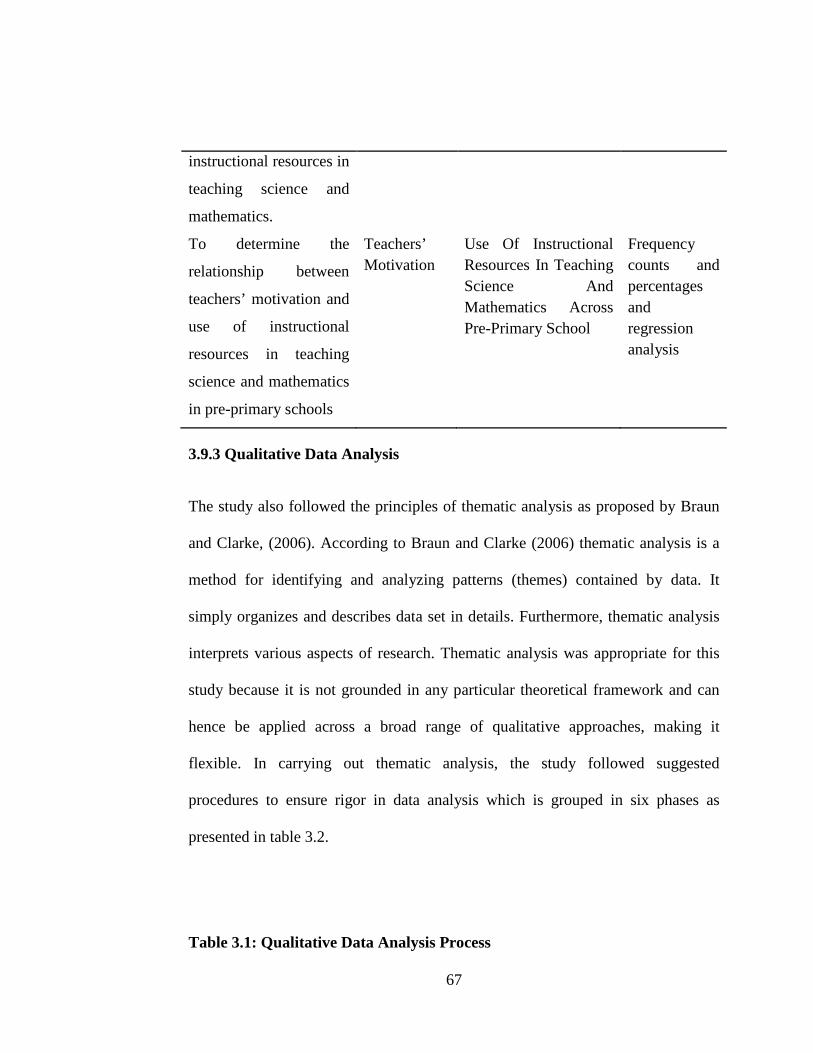
67
instructional resources in
teaching science and
mathematics.
To determine the
relationship between
teachers’ motivation and
use of instructional
resources in teaching
science and mathematics
in pre-primary schools
Teachers’ Motivation
Use Of Instructional Resources In Teaching Science And Mathematics Across Pre-Primary School
Frequency counts and percentages and regression analysis
3.9.3 Qualitative Data Analysis
The study also followed the principles of thematic analysis as proposed by Braun
and Clarke, (2006). According to Braun and Clarke (2006) thematic analysis is a
method for identifying and analyzing patterns (themes) contained by data. It
simply organizes and describes data set in details. Furthermore, thematic analysis
interprets various aspects of research. Thematic analysis was appropriate for this
study because it is not grounded in any particular theoretical framework and can
hence be applied across a broad range of qualitative approaches, making it
flexible. In carrying out thematic analysis, the study followed suggested
procedures to ensure rigor in data analysis which is grouped in six phases as
presented in table 3.2.
Table 3.1: Qualitative Data Analysis Process
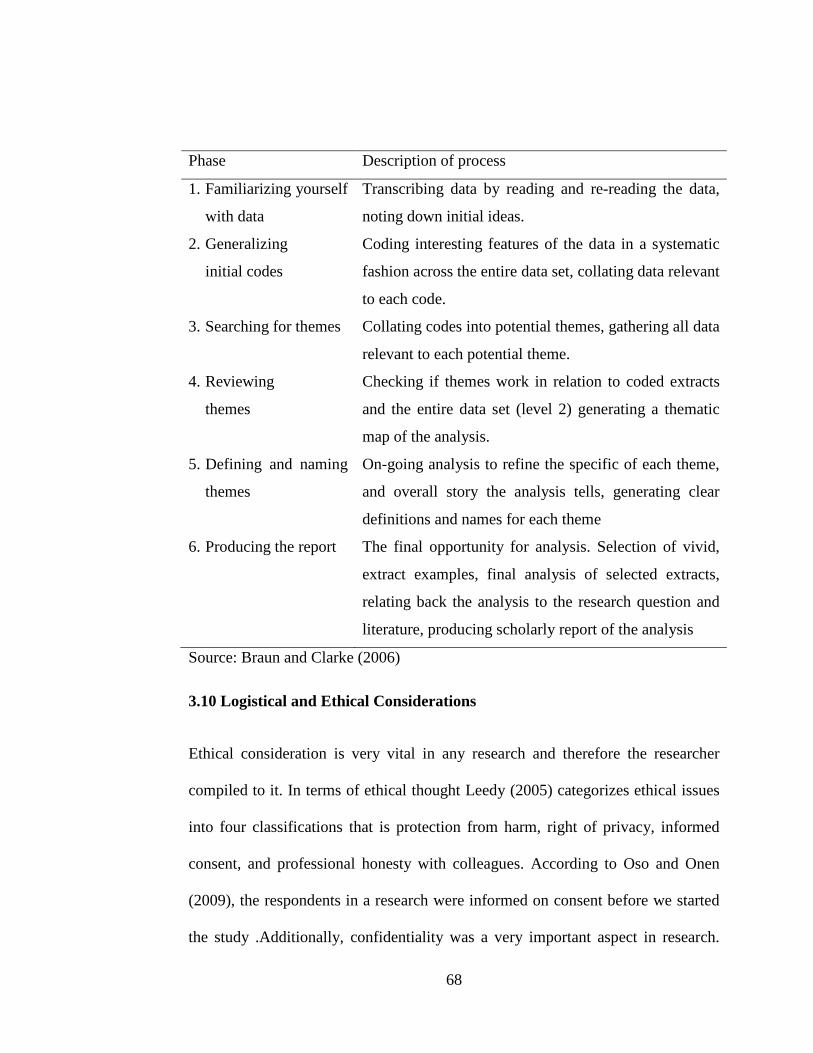
68
Phase Description of process
1. Familiarizing yourself
with data
Transcribing data by reading and re-reading the data,
noting down initial ideas.
2. Generalizing
initial codes
Coding interesting features of the data in a systematic
fashion across the entire data set, collating data relevant
to each code.
3. Searching for themes Collating codes into potential themes, gathering all data
relevant to each potential theme.
4. Reviewing
themes
Checking if themes work in relation to coded extracts
and the entire data set (level 2) generating a thematic
map of the analysis.
5. Defining and naming
themes
On-going analysis to refine the specific of each theme,
and overall story the analysis tells, generating clear
definitions and names for each theme
6. Producing the report The final opportunity for analysis. Selection of vivid,
extract examples, final analysis of selected extracts,
relating back the analysis to the research question and
literature, producing scholarly report of the analysis
Source: Braun and Clarke (2006)
3.10 Logistical and Ethical Considerations
Ethical consideration is very vital in any research and therefore the researcher
compiled to it. In terms of ethical thought Leedy (2005) categorizes ethical issues
into four classifications that is protection from harm, right of privacy, informed
consent, and professional honesty with colleagues. According to Oso and Onen
(2009), the respondents in a research were informed on consent before we started
the study .Additionally, confidentiality was a very important aspect in research.
69
Getu and Tegbar (2006) argues that in order to deal with confidentiality, one
should state confidentiality of information right on the top of the first page of the
questionnaire, use code numbers instead of names and aim of the study was
explained at the beginning. Due to the above deliberations, confidentiality was
ensured by putting statements on confidentiality on the questionnaires and verbally
by explaining during the administration of instruments. The researcher also
obtained a permit from the National Commission of Science, Technology and
Innovation through the Post Graduate Studies of Kenyatta University. The
researcher sent introductory letters to all respondents. The first visitation was made
to the pre-schools concerned and the researcher met the heads of institutions and
briefed them about the study and date for data collection upon the agreement.
70
CHAPTER FOUR
DATA ANALYSIS, INTERPRETATION AND DISCUSSIONS
4.1 Introduction
This chapter focuses on the findings and discussion of data on the determinants of
pre-primary schoolteachers’ use of instructional resources in teaching science and
mathematics activities in Athi-River Sub-County, Kenya. Two teachers were
selected from each of the 30 pre-schools using simple random sampling.
The findings were analyzed and discussed under the following objectives:
i) To establish the extent of use of instructional resources in teaching science
and mathematics in pre-primary schools in Athi –River sub-county.
ii) To find out if there is a difference in the use of instructional resources in
teaching science and mathematics with regard to pre-primary school
teachers’ levels of training.
iii) To find out if there is a difference in the use of instructional resources in
teaching science and mathematics between male and female pre-primary
school teachers.
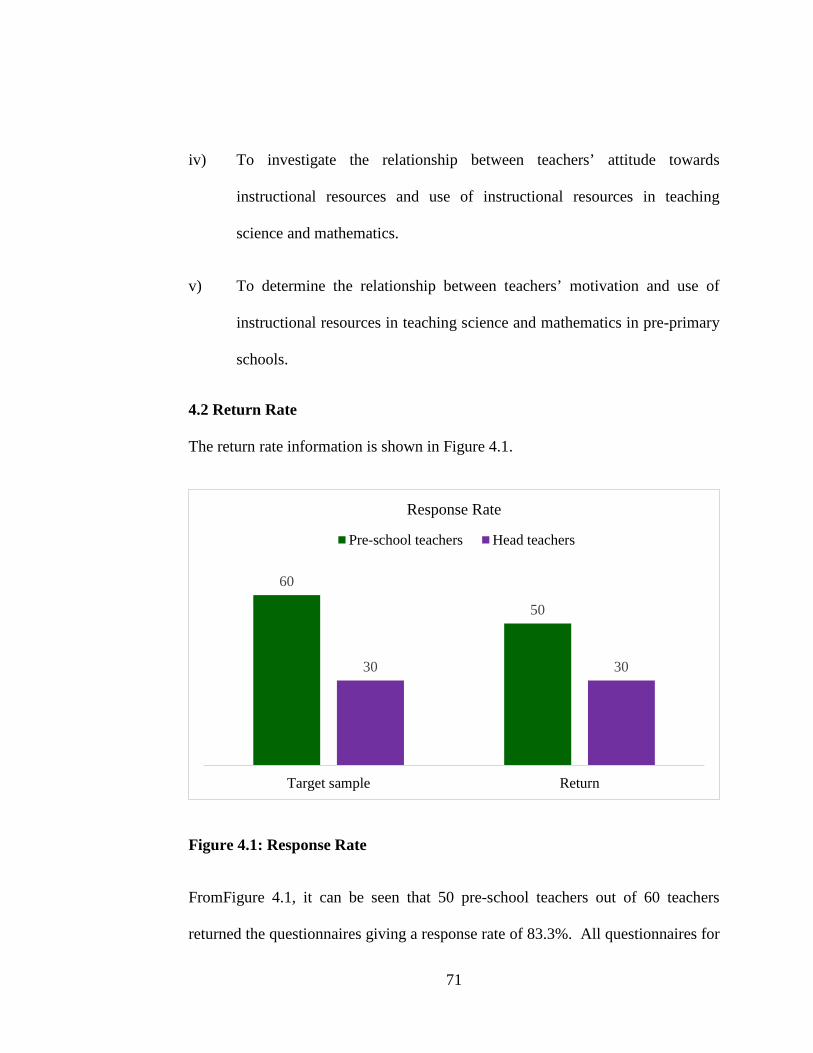
71
iv) To investigate the relationship between teachers’ attitude towards
instructional resources and use of instructional resources in teaching
science and mathematics.
v) To determine the relationship between teachers’ motivation and use of
instructional resources in teaching science and mathematics in pre-primary
schools.
4.2 Return Rate
The return rate information is shown in Figure 4.1.
Figure 4.1: Response Rate
FromFigure 4.1, it can be seen that 50 pre-school teachers out of 60 teachers
returned the questionnaires giving a response rate of 83.3%. All questionnaires for
60
50
30 30
Target sample Return
Response Rate
Pre-school teachers Head teachers
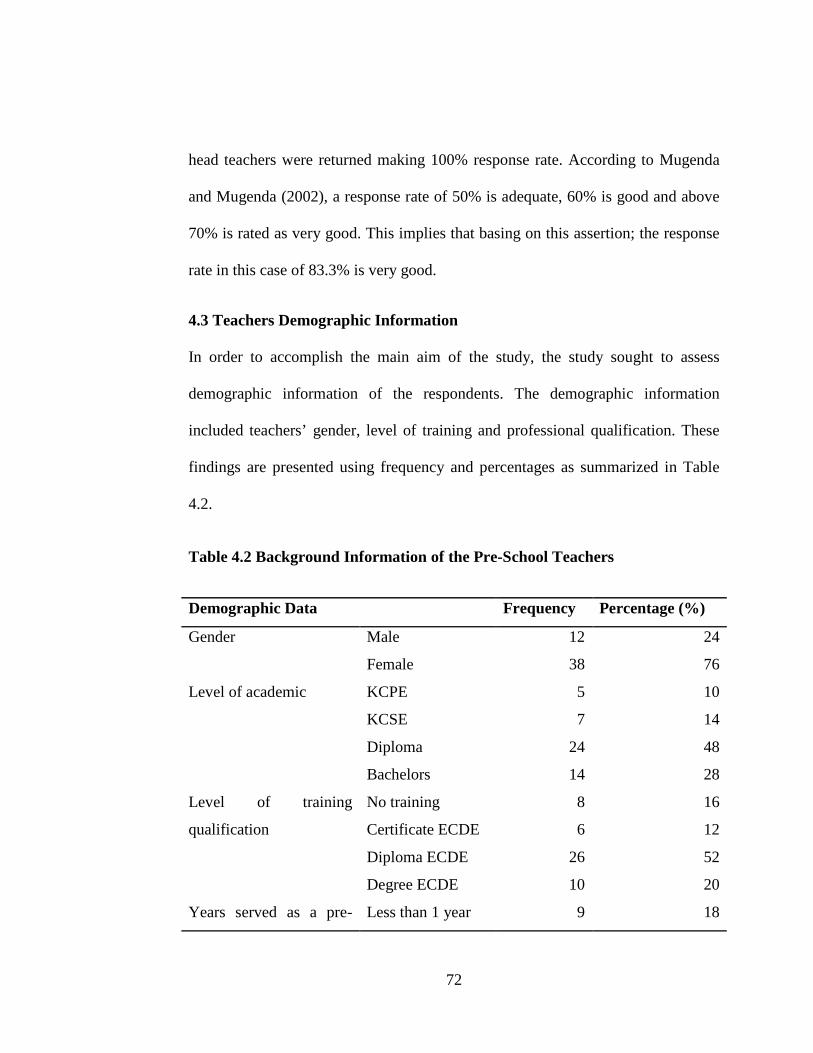
72
head teachers were returned making 100% response rate. According to Mugenda
and Mugenda (2002), a response rate of 50% is adequate, 60% is good and above
70% is rated as very good. This implies that basing on this assertion; the response
rate in this case of 83.3% is very good.
4.3 Teachers Demographic Information
In order to accomplish the main aim of the study, the study sought to assess
demographic information of the respondents. The demographic information
included teachers’ gender, level of training and professional qualification. These
findings are presented using frequency and percentages as summarized in Table
4.2.
Table 4.2 Background Information of the Pre-School Teachers
Demographic Data Frequency Percentage (%)
Gender Male 12 24
Female 38 76
Level of academic KCPE 5 10
KCSE 7 14
Diploma 24 48
Bachelors 14 28
Level of training
qualification
No training 8 16
Certificate ECDE 6 12
Diploma ECDE 26 52
Degree ECDE 10 20
Years served as a pre- Less than 1 year 9 18
73
primary school teacher 1-3 years 15 30
4-6 years 20 40
Above 6 years 6 12
Table 4.2 indicates that majority 38(76%) of the pre-school teachers (n = 50) were
female while 12(24%) were male. These findings revealed a gender imbalance
among pre-school teachers in Athi-River Sub-County. This means that pre-school
teaching is a profession preferred by more women than men. However, the high
number of female teachers in pre-schools could be a pointer to poor performance
in mathematics and science activities among children in the pre-schools agreeing
with Antecol, Erin &Ozbeklik (2012) findings that showed that female teachers
had a negative effect on female pupil mathematics achievement in primary
school.Kueckeny and Valfortz (2012) also established that all learners performed
better in mathematics with male teachers.
Majority 24(48%) of the pre-school teachers had diploma level of education,
14(28%) attained bachelors’degree of education, 7(14%) attained certificate level
of education, while 5(10%) had form four level of education. table 4.2 also shows
that 26(52%) of teachers attained diploma training in ECDE, 10(20%) attained
bachelor’s degree training in ECDE, 69(12%) attained certificate in ECDE while
6(12%) had no formal training in ECDE. The high number of trained teachers is
attributed to the fact that training of pre-school teachers is enhanced by the
government through in-service programs. This is a positive sign that most teachers
hold at least a minimum requirement for teaching at the pre-school level. This
74
renderedpre-schools in Athi-River Sub-County in a better place with regards to
capacity building and creates a better foundation for achievement of better results.
This study shows that most pre-school teachers are qualified toteach science or
mathematics activities in ECDE centers. Kirembu (2012) found out that students
taught by teachers with high academic and professional training qualifications
performed better in mathematics than their counterparts taught by teacher with
lower qualifications in Kirinyaga district.
Findings in Table 4.2 further indicated that majority 20(40%) had a teaching
experience of between 4 - 6 years. The study also revealed that at least 50% of the
pre-school teachers who participated in the study had taught for more than one
year and hence were eligible to provide relevant information as required by the
study to meet the objectives.Darling-Hammond (2010)established that learners
taught by more experienced teachers score highly because experienced teachers
had better mastery of subject content and had gained classroom management skills
which helped them handle learners with care. The study showed that 48% of the
teachers had only taught for a maximum of three (3) years indicating that they had
just joined the teaching profession and therefore with less experience undertheir
belts. This partly contributed to the low performance of pupils in pre-schools in the
study area.
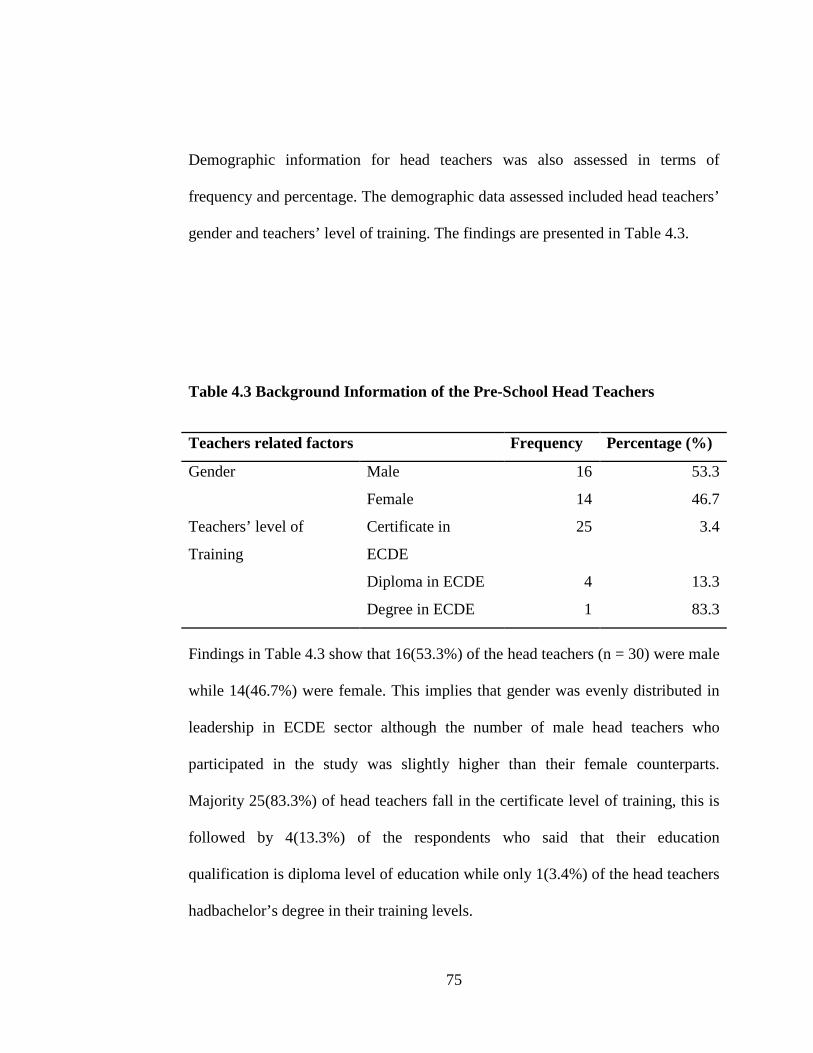
75
Demographic information for head teachers was also assessed in terms of
frequency and percentage. The demographic data assessed included head teachers’
gender and teachers’ level of training. The findings are presented in Table 4.3.
Table 4.3 Background Information of the Pre-School Head Teachers
Teachers related factors Frequency Percentage (%)
Gender Male 16 53.3
Female 14 46.7
Teachers’ level of
Training
Certificate in
ECDE
25 3.4
Diploma in ECDE 4 13.3
Degree in ECDE 1 83.3
Findings in Table 4.3 show that 16(53.3%) of the head teachers (n = 30) were male
while 14(46.7%) were female. This implies that gender was evenly distributed in
leadership in ECDE sector although the number of male head teachers who
participated in the study was slightly higher than their female counterparts.
Majority 25(83.3%) of head teachers fall in the certificate level of training, this is
followed by 4(13.3%) of the respondents who said that their education
qualification is diploma level of education while only 1(3.4%) of the head teachers
hadbachelor’s degree in their training levels.
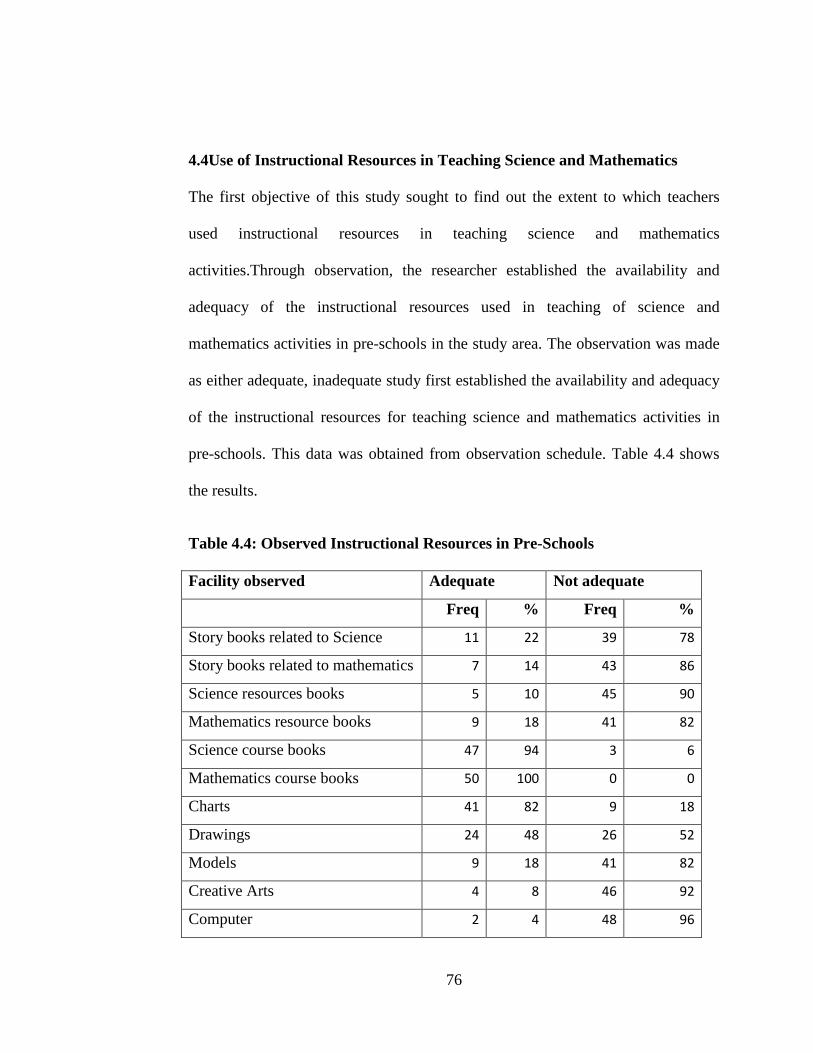
76
4.4Use of Instructional Resources in Teaching Science and Mathematics
The first objective of this study sought to find out the extent to which teachers
used instructional resources in teaching science and mathematics
activities.Through observation, the researcher established the availability and
adequacy of the instructional resources used in teaching of science and
mathematics activities in pre-schools in the study area. The observation was made
as either adequate, inadequate study first established the availability and adequacy
of the instructional resources for teaching science and mathematics activities in
pre-schools. This data was obtained from observation schedule. Table 4.4 shows
the results.
Table 4.4: Observed Instructional Resources in Pre-Schools
Facility observed Adequate Not adequate
Freq % Freq %
Story books related to Science 11 22 39 78
Story books related to mathematics 7 14 43 86
Science resources books 5 10 45 90
Mathematics resource books 9 18 41 82
Science course books 47 94 3 6
Mathematics course books 50 100 0 0
Charts 41 82 9 18
Drawings 24 48 26 52
Models 9 18 41 82
Creative Arts 4 8 46 92
Computer 2 4 48 96
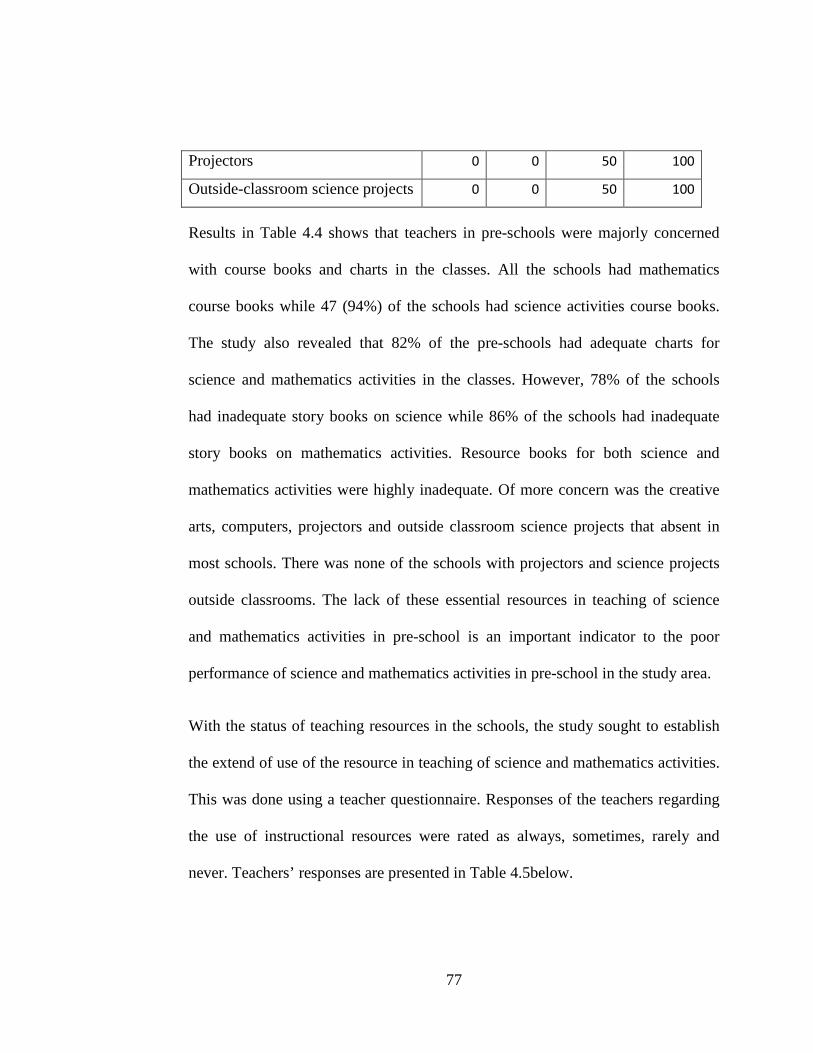
77
Projectors 0 0 50 100
Outside-classroom science projects 0 0 50 100
Results in Table 4.4 shows that teachers in pre-schools were majorly concerned
with course books and charts in the classes. All the schools had mathematics
course books while 47 (94%) of the schools had science activities course books.
The study also revealed that 82% of the pre-schools had adequate charts for
science and mathematics activities in the classes. However, 78% of the schools
had inadequate story books on science while 86% of the schools had inadequate
story books on mathematics activities. Resource books for both science and
mathematics activities were highly inadequate. Of more concern was the creative
arts, computers, projectors and outside classroom science projects that absent in
most schools. There was none of the schools with projectors and science projects
outside classrooms. The lack of these essential resources in teaching of science
and mathematics activities in pre-school is an important indicator to the poor
performance of science and mathematics activities in pre-school in the study area.
With the status of teaching resources in the schools, the study sought to establish
the extend of use of the resource in teaching of science and mathematics activities.
This was done using a teacher questionnaire. Responses of the teachers regarding
the use of instructional resources were rated as always, sometimes, rarely and
never. Teachers’ responses are presented in Table 4.5below.
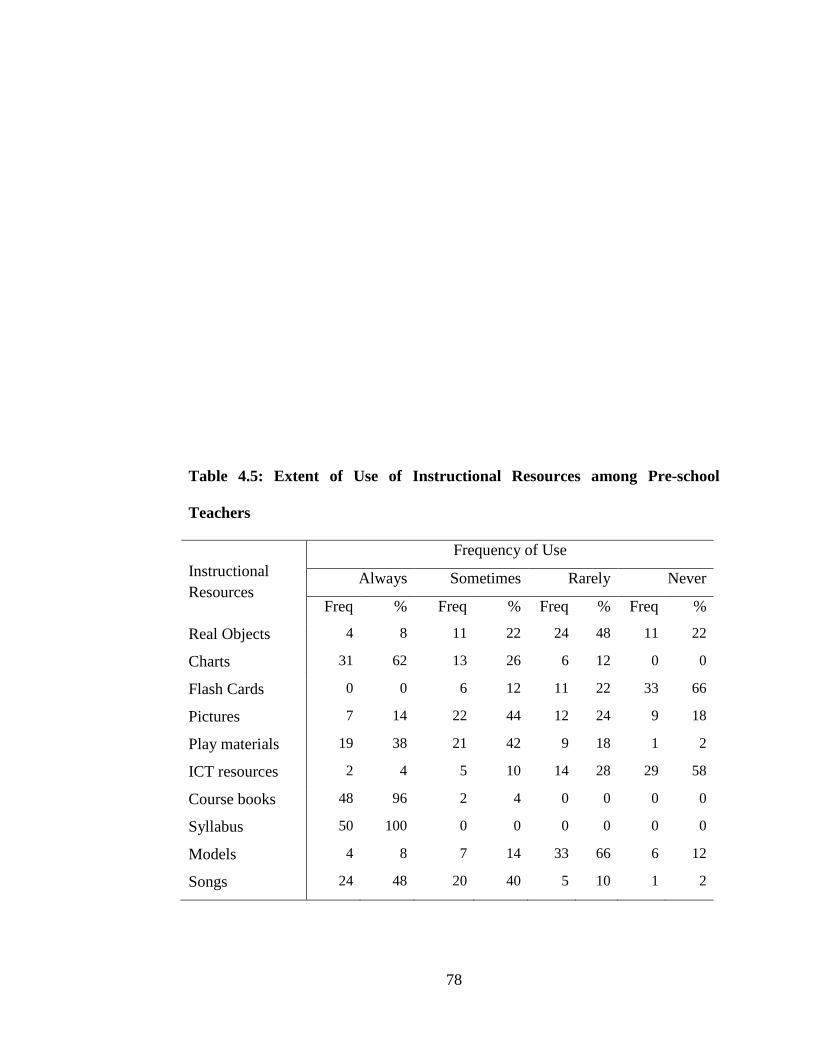
78
Table 4.5: Extent of Use of Instructional Resources among Pre-school
Teachers
Instructional Resources
Frequency of Use
Always Sometimes Rarely Never
Freq % Freq % Freq % Freq %
Real Objects 4 8 11 22 24 48 11 22
Charts 31 62 13 26 6 12 0 0
Flash Cards 0 0 6 12 11 22 33 66
Pictures 7 14 22 44 12 24 9 18
Play materials 19 38 21 42 9 18 1 2
ICT resources 2 4 5 10 14 28 29 58
Course books 48 96 2 4 0 0 0 0
Syllabus 50 100 0 0 0 0 0 0
Models 4 8 7 14 33 66 6 12
Songs 24 48 20 40 5 10 1 2
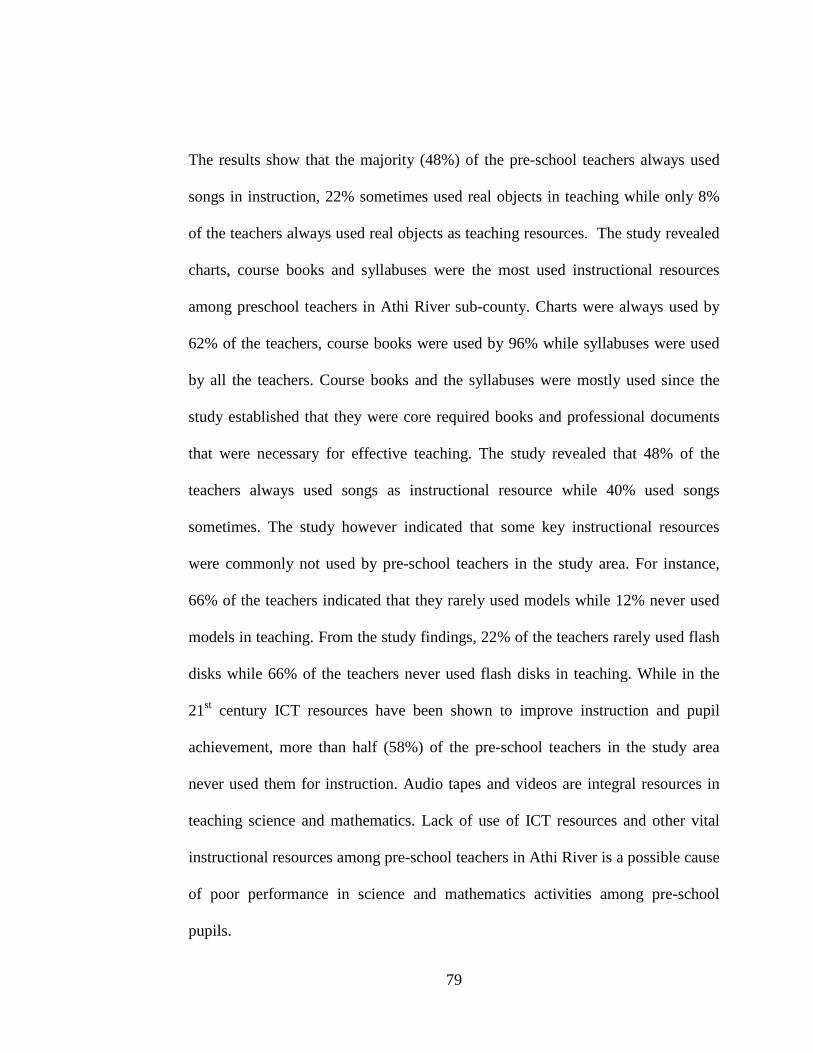
79
The results show that the majority (48%) of the pre-school teachers always used
songs in instruction, 22% sometimes used real objects in teaching while only 8%
of the teachers always used real objects as teaching resources. The study revealed
charts, course books and syllabuses were the most used instructional resources
among preschool teachers in Athi River sub-county. Charts were always used by
62% of the teachers, course books were used by 96% while syllabuses were used
by all the teachers. Course books and the syllabuses were mostly used since the
study established that they were core required books and professional documents
that were necessary for effective teaching. The study revealed that 48% of the
teachers always used songs as instructional resource while 40% used songs
sometimes. The study however indicated that some key instructional resources
were commonly not used by pre-school teachers in the study area. For instance,
66% of the teachers indicated that they rarely used models while 12% never used
models in teaching. From the study findings, 22% of the teachers rarely used flash
disks while 66% of the teachers never used flash disks in teaching. While in the
21st century ICT resources have been shown to improve instruction and pupil
achievement, more than half (58%) of the pre-school teachers in the study area
never used them for instruction. Audio tapes and videos are integral resources in
teaching science and mathematics. Lack of use of ICT resources and other vital
instructional resources among pre-school teachers in Athi River is a possible cause
of poor performance in science and mathematics activities among pre-school
pupils.
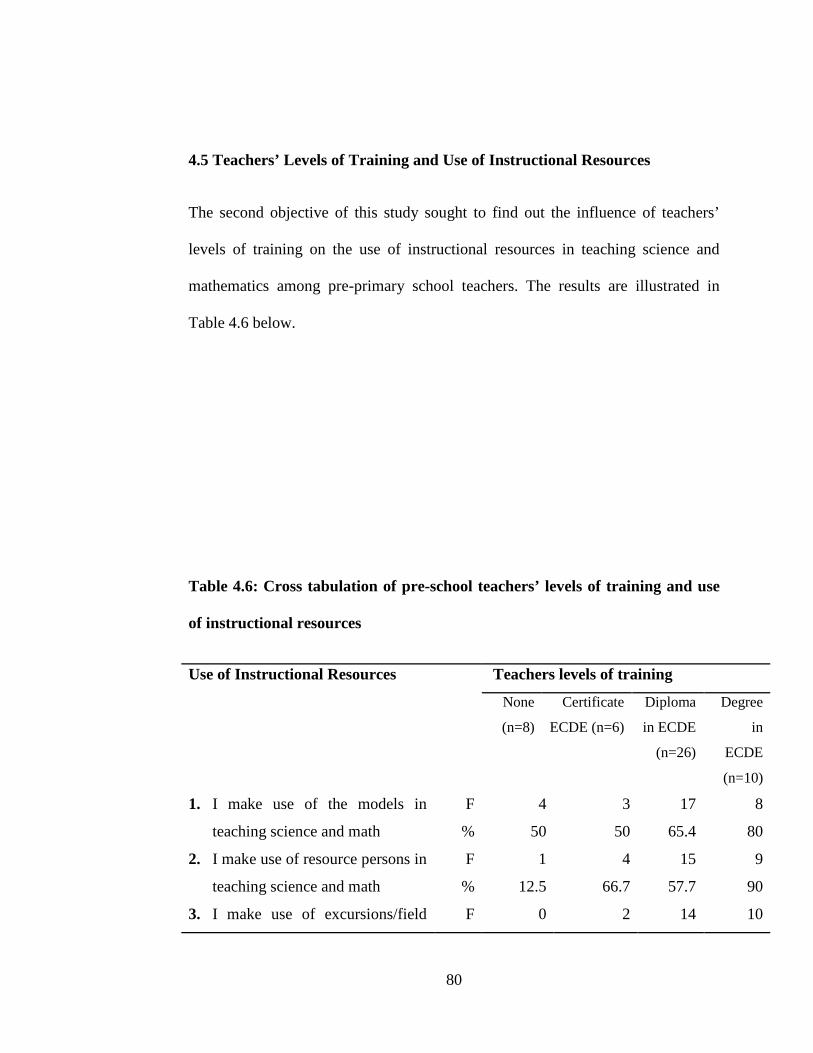
80
4.5 Teachers’ Levels of Training and Use of Instructional Resources
The second objective of this study sought to find out the influence of teachers’
levels of training on the use of instructional resources in teaching science and
mathematics among pre-primary school teachers. The results are illustrated in
Table 4.6 below.
Table 4.6: Cross tabulation of pre-school teachers’ levels of training and use
of instructional resources
Use of Instructional Resources Teachers levels of training
None
(n=8)
Certificate
ECDE (n=6)
Diploma
in ECDE
(n=26)
Degree
in
ECDE
(n=10)
1. I make use of the models in
teaching science and math
F 4 3 17 8
% 50 50 65.4 80
2. I make use of resource persons in
teaching science and math
F 1 4 15 9
% 12.5 66.7 57.7 90
3. I make use of excursions/field F 0 2 14 10
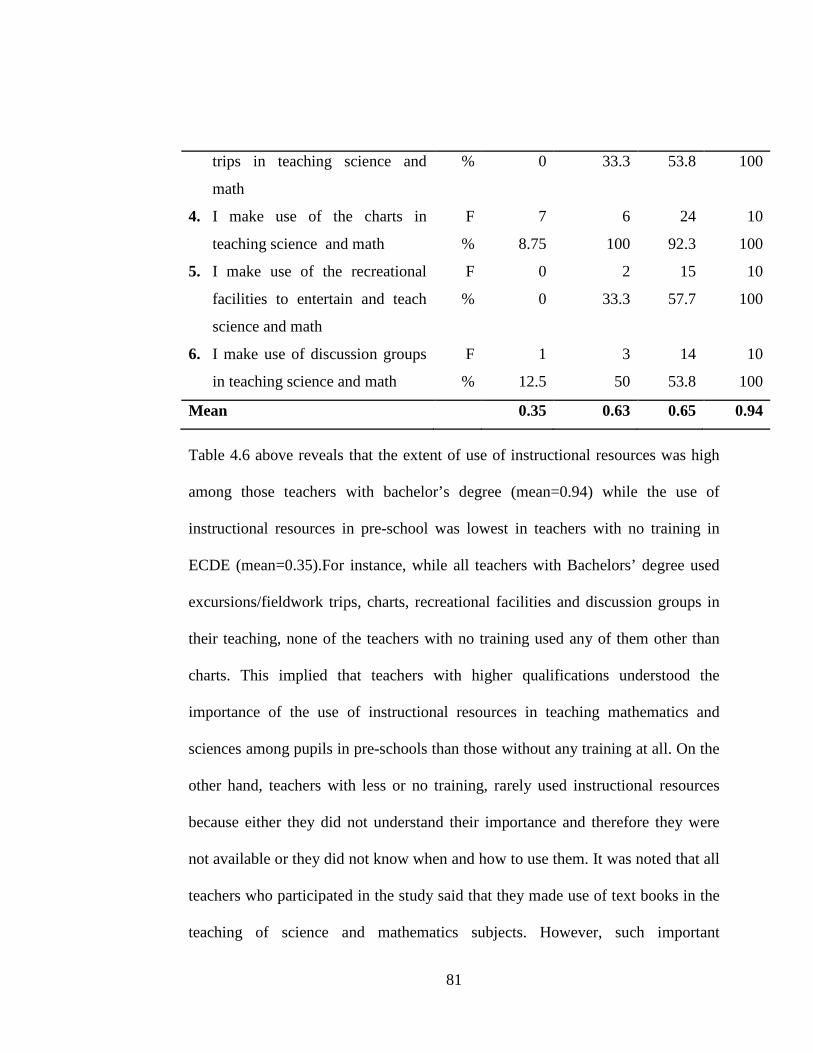
81
trips in teaching science and
math
% 0 33.3 53.8 100
4. I make use of the charts in
teaching science and math
F 7 6 24 10
% 8.75 100 92.3 100
5. I make use of the recreational
facilities to entertain and teach
science and math
F 0 2 15 10
% 0 33.3 57.7 100
6. I make use of discussion groups
in teaching science and math
F 1 3 14 10
% 12.5 50 53.8 100
Mean 0.35 0.63 0.65 0.94
Table 4.6 above reveals that the extent of use of instructional resources was high
among those teachers with bachelor’s degree (mean=0.94) while the use of
instructional resources in pre-school was lowest in teachers with no training in
ECDE (mean=0.35).For instance, while all teachers with Bachelors’ degree used
excursions/fieldwork trips, charts, recreational facilities and discussion groups in
their teaching, none of the teachers with no training used any of them other than
charts. This implied that teachers with higher qualifications understood the
importance of the use of instructional resources in teaching mathematics and
sciences among pupils in pre-schools than those without any training at all. On the
other hand, teachers with less or no training, rarely used instructional resources
because either they did not understand their importance and therefore they were
not available or they did not know when and how to use them. It was noted that all
teachers who participated in the study said that they made use of text books in the
teaching of science and mathematics subjects. However, such important
82
instructional activities in science as excursions/field trips in teaching science and
mathematics recreational facilities were not fully used by pre-school teachers who
had no training in ECDE.
These findings imply that they had limited skills and knowledge to incorporate
different instructional resources in teaching and learning of science and
mathematics in ECDE centers. The findings also meant that teachers who were
more qualified academically and professionally were likely to influence pre-school
children to highly achieve in science and mathematics activity than less qualified
teachers. The conclusion is that there is a difference among pre-school teachers’
levels of training and the extent at which they effectively select and use
instructional resources in teaching Science and mathematics in ECDE centers.
On the same vein, Nannyonjo’s (2007) study of factors influencing learning
achievement in Ugandan schools, found out that teachers’ characteristics may
contribute to the improvement of learners’ performance; these characteristics
include; teachers’ training levels, in-service training of teachers, age, teachers’
experience, tenure of leadership, teaching strategies and evaluation systems in a
school. This finding concurs with that of Olembo, Wanga and Karangu (2002) on
role of teachers in school performance in Nyanza Province, who also pointed out
that, learners’ performance depends on the role of the teacher in curriculum
planning, classroom management, instructional programme and general
83
curriculum implementation. Hence, the role of the teacher is significant in
influencing learners ‘performance in examinations.
According to UNESCO (2012), though the Kenyan government has made efforts
to ensure “education for all” as previously suggested by the Millennium
Development Goals as well as the UNESCO Medium Term Strategy (2008-2013),
Kenya still however, faces serious shortage of qualified teachers which is causing
schools performance to be negatively affected. The report also reiterated that the
problems of shortage of financial and human resources, particularly physical
infrastructures and teaching personnel are factors influencing children’s education.
Beecher (2009) also echoed these sentiments when he found that lack of trained
teachers in schools contributes to the poor performance. It was for these reasons
that the government of Kenya established an institution referred to as KESI, Kenya
Education Staff Institute (KESI) to scale up professional and managerial training
for the provision of quality education
Kangori (2014) also revealed that teachers with bachelors’degree were the best in
implementing science and mathematics activities while those with no formal
training in ECDE were the poorest. In his study, Kangori (2014) also revealed that
a whole class of 14 children taught by an untrained teacher achieved very low and
76.7% of the low achievers were under care of teachers with certificate in ECDE.
The study findings also concur with Jacob (2007) that full certification of teachers
is positively related to student achievement in Science and mathematics. The
84
subject area of teachers is one of the teacher qualification most consistently and
strongly related to improved student success in academics. The findings also agree
to those of Raymond (2001) who showed that teachers with higher licensure test
scores have a marginal positive impact on middle school science and mathematics
achievement. According to Kathuri (1986), a professionally trained teacher
contributes more positively to effective learning than untrained one. This explains
why teacher training exists as a major part of education systems throughout the
world.
A study by Karuga (1996) revealed that only 80% of science and mathematics
teachers in Kenya were qualified and the issue of teachers could be enhanced by
advancing in education through in-service training. The findings are in line with
Darling-Hammond (2001) who noted that sustained professional development that
is aligned with the curriculum and focused on instruction positively effect on
school level achievement in Science and mathematics at both Early childhood and
high school studies. Therefore, higher quality early childhood education programs
are those where teachers have bachelor’s degrees specifically in majors of child
development or similar areas (Whitebook& Ryan, 2011)
During another interview with the head teachers, the respondents were asked to
explain how teachers’ qualification influenced the use of instructional resources in
teaching science in pre-primary schools. One of the head teachers reported that:
85
“Training of teachers in ECDE is important in acquisition of basic skills in
selecting suitable instructional resources for teaching specific concepts in Science
and mathematics in pre- primary schools.”
Another respondent added that:
“Teacher qualification is significant in preparation and updating of
professional documents which ensure proper planning, set the pace
and scope for work coverage and help in evaluation. It generally
enables the teachers to prepare before presenting science and
mathematics related activities to learners. Thus, the higher the
qualification of the teacher the higher the performance among
pupils in their tests because they effective use the instructional
resources available”
In disagreement with the findings of the current study, Xu, Jane and Collin (2011)
reported that there is no association between teachers holding master’s degree and
students’ science and mathematics test score gains in any level or grade. Also in
contrast to the study findings, Early et al (2006) found that teachers who had more
than a Bachelor’s degree received higher scores on the teaching and interaction
subscales of the Early Childhood Environment Rating Scale (ECERS) than those
teachers who had an associate’s degree. Nevertheless, only a few studies have
proved these claims which are mostly based at the school level.
86
During the interview with the head teachers, it was found that teachers’ training
levels and professional qualification have positive influence on the achievement of
pre-school children in science and mathematics activities. One of the head teachers
had this to say when interviewed;
Instructional resources are not ends in themselves but means of
attaining specific instructional functions. The ability of the teacher to
effectively use the available instructional resources optimizes the
attainments of instructional situation; this varies with the level of use,
teacher competency and teachers ‘levels of training. For instance, a
situation where an electronics teacher pays “lip service” to activity-
oriented instructional methods and resources that could enhance
creative thinking in the learners negates the objectives of electronics
education for learners in preschools [Interview, Head teacher, 10,
23/6/2017].
This implies that the delivery of quality instruction in the classroom in any
education system depends largely on academic qualification, quality and
competence of the teachers. This is because the teachers are expected to perform
the important function of guiding, directing, evaluating, imparting, asking and
answering questions among others for maximum benefits of the learners.
Similarly, Goe, (2007) in his study reiterated that teacher qualifications have
87
greatly influence the use of instructional resources in teaching science and
mathematics and mechanically promotes children ‘achievements.
Moreover, studies done by Rice, (2003); Zeichner& Conklin, (2005) found that
teacher trainings are related to children’s achievements, as stated by came up with
their uniform test scores to find on the connection between teacher qualifications
and children’s performance. Zeichner& Conklin, (2005) also in their study on the
effects of professional qualifications of financial accounting on academic
performance, revealed that teachers with sound training were equipped with the
requisite competence that enable them to produce effective service in teaching
compared to less trained teachers. A survey by GOK and UNICEF (1995)
revealed that lack of teachers training and poor teacher retention as key barriers to
effective curriculum implementation. The key to getting teachers committed to an
innovation is to enhance their knowledge of the program. This means teachers
need to be trained and workshops organized for professional development.
4.6 Teachers’ Gender and the Use of Instructional Resources in Teaching
Science and mathematics in Pre-Primary Schools
The third objective of this study sought to find out the influence of teachers’
gender on the use of instructional resources in teaching science and mathematics in
pre-primary schools in Athi-River sub county Kenya. The use of instructional
resources was assessed through aLikert scale consisting of 12 items. The
researcher then cross-tabulated pre-school teachers’ gender and the use of
88
instructional resources in teaching science and mathematics activities. The results
have been presented and discussed using mean as shown in Table 4.5.
Table 4.7: Cross tabulation of pre-school Teacher’s Gender and Use of
instructional resources
Teachers extent of use of instructional resources in teaching Science and mathematics
Gender of Teachers
Male(n=12) Female (n=38)
1. I make use of the facilities in the classroom in teaching Science and mathematics
F 11 24
% 91.7 63.2
2. I make use of the facilities in the library in teaching Science& math
F 10 21
% 83.3 55.3
3. I make use of the facilities in the Science or mathematics room in teaching
F 9 19
% 75 50
4. I make use of the computer room teaching Science and mathematics
F 10 15
% 83.3 39.5
5. I make use of reference books for further inquiry in teaching Science or math
F 12 25
% 100 65.8
6. I make use of text books in the teaching of science or mathematics subject
F 12 38
% 100 100
7. I make use of the models in teaching science and mathematics
F 11 21
% 91.7 55.3
89
8. I make use of resource persons in teaching science or mathematics
F 11 18
% 91.7 47.4
9. I make use of excursions/field trips in teaching science
F 12 14
% 100 36.8
10. I make use of the charts in teaching science or mathematics
F 12 35
% 100 92.1
11. I make use of the recreational facilities to entertain and teach science or mathematics
F 11 16
% 91.7 42.1
12. I make use of discussion groups in teaching science or mathematics
F 11 17
% 91.7 44.7
Mean 0.92 0.58
Findings in Table 4.7 reveal that both male and female teachers equally make use
of text books in teaching and learning of science and mathematics. However, it
was revealed that 12(100%) of the male teachers used excursions/field trips in
teaching science or mathematics as compared to 14(36.8%) of the female teachers
who used the same resource. The findings indicated that the extent of utilization of
instructional resources in teaching science and mathematics was high among male
teachers (mean=0.92) while the use of instructional resources in pre-school was
lowest in female teachers (mean=0.52). These findings imply that more male
teachers made use of variety of teaching resources than the female teachers.
90
Therefore, it can be concluded that there is significant association between gender
and utilization of teaching resources.
Findings from the interview guides also showed that female teachers did not like
Science or mathematics even though they were teaching it. Ina statement of one of
the respondents, it was reported;
“Most female teachers do not like Science or mathematics because
they involve more activities that are tedious and require more
energy to accomplish.”
During the study, it was observed that female teachers did not fully involve pupils
especially those with slow learning abilities during science or mathematics lessons
where demonstrations were carried out in classes. In one of the pre-school, male
teachers used groups of 10 pupils during experiments and the learners were given
opportunities to report what they physically observed. Three senses (sight, smell
and sound) were emphasized during Science and mathematics activities even
though learners were not provided with special treatment with regards to
difference in learning ability.
These findings are in line with the findings of Procedia (2014) who revealed that
trained male and female teachers are significantly better than untrained male and
female counterparts. Further, Procedia (2014) showed that male teachers were
more involved in selection of appropriate teaching and learning resources related
91
to Science and Mathematics. In contrary, public female teachers were more
devoted in private schools than their male teachers in public schools with regards
to use of teaching instructional resources related to Science and mathematics.
The findings also agree with Ashley (2015) that girls in secondary schools who
were taught by female teachers were considered not capable to perform better in
Science and Mathematics in Zimbabwe. The passion for Science and mathematics
as subjects begins at early stages of learning in which parents and teachers are
opted to give courage to the child. Lest the desire for Science and mathematics is
established at early stages of a female child, she is likely to drop and develop
negative attitude towards the subjects. This encouragement ought to be embraced
and facilitated by teachers among learners at pre-primary school level.
In support of the findings of the current study, Muchimba (2015) revealed that
many teachers not only believe that girls are less capable in Science or
Mathematics but also believed that girls are less interested in Science and
mathematics activities and more easily troubled by the subjects. This stereotype is
still being felt today in most schools by female teachers who are specialized to
teach Science and mathematics in most cases become afraid or somehow nervous
to apply certain instructional resources in Science and mathematics activities.
Perhaps the female teachers believe that certain instructional methods are
masculine and henceforth change the attitude of the learners.
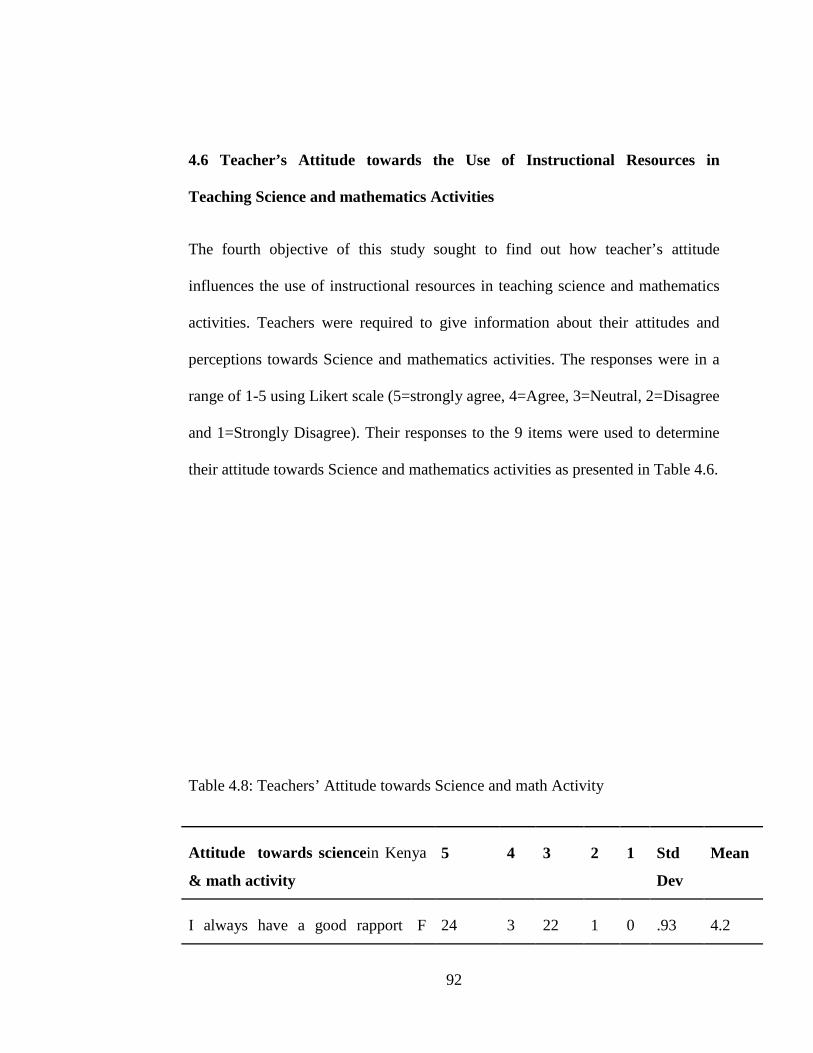
92
4.6 Teacher’s Attitude towards the Use of Instructional Resources in
Teaching Science and mathematics Activities
The fourth objective of this study sought to find out how teacher’s attitude
influences the use of instructional resources in teaching science and mathematics
activities. Teachers were required to give information about their attitudes and
perceptions towards Science and mathematics activities. The responses were in a
range of 1-5 using Likert scale (5=strongly agree, 4=Agree, 3=Neutral, 2=Disagree
and 1=Strongly Disagree). Their responses to the 9 items were used to determine
their attitude towards Science and mathematics activities as presented in Table 4.6.
Table 4.8: Teachers’ Attitude towards Science and math Activity
Attitude towards sciencein Kenya
& math activity
5 4 3 2 1 Std
Dev
Mean
I always have a good rapport F 24 3 22 1 0 .93 4.2
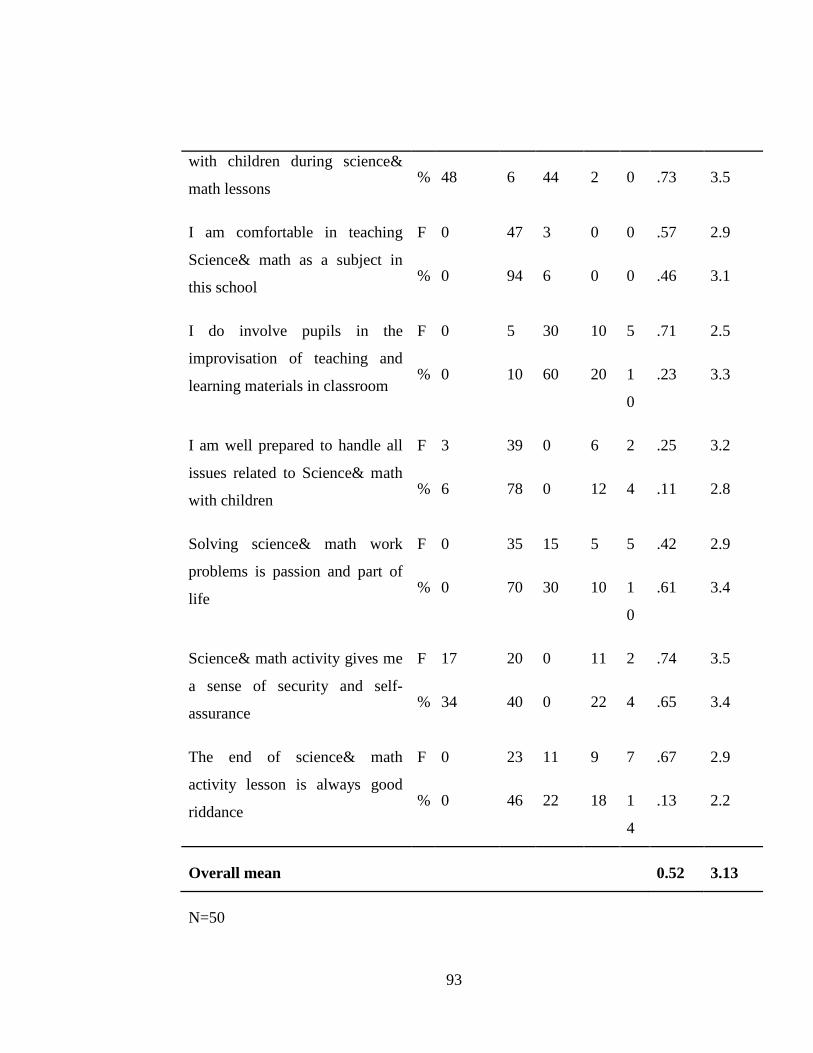
93
with children during science&
math lessons % 48 6 44 2 0 .73 3.5
I am comfortable in teaching
Science& math as a subject in
this school
F 0 47 3 0 0 .57 2.9
% 0 94 6 0 0 .46 3.1
I do involve pupils in the
improvisation of teaching and
learning materials in classroom
F 0 5 30 10 5 .71 2.5
% 0 10 60 20 1
0
.23 3.3
I am well prepared to handle all
issues related to Science& math
with children
F 3 39 0 6 2 .25 3.2
% 6 78 0 12 4 .11 2.8
Solving science& math work
problems is passion and part of
life
F 0 35 15 5 5 .42 2.9
% 0 70 30 10 1
0
.61 3.4
Science& math activity gives me
a sense of security and self-
assurance
F 17 20 0 11 2 .74 3.5
% 34 40 0 22 4 .65 3.4
The end of science& math
activity lesson is always good
riddance
F 0 23 11 9 7 .67 2.9
% 0 46 22 18 1
4
.13 2.2
Overall mean 0.52 3.13
N=50
94
Table 4.8 shows that the scores were very high as indicated by the overall mean
score of teachers ‘attitude and use of instructional resources in the teaching of
science and mathematics activities
This indicates that majority of the pre-school teachers had a positive attitude
towards the Science and mathematics subjects and this might be influencing the
implementation of Science and mathematics as a subjects in pre-schools. These
findings concur with the Myers and Fouts (1992) who found that positive attitudes
toward Science and mathematics related to students’ participation, supportive
social learning environment, positive association with classmates and the use of
variety of teaching strategies and interest in Science and mathematics activities.
in support to these findings, studies revealed that teachers with negative attitudes
towards Science and mathematics spend less time teaching it and also use didactic
methods rather than approaches that focus on learners’ active participation and
explorations (Fulp, 2002; Varelas, Plotnick, Wink, Fan & Harris, 2008). These
researchers pointed out that there is a significant association between teachers’
attitude and use of instructional resources for Science and mathematics activities.
In an interview with the head teachers, one of the respondents reported that;
“Science and mathematics classes in previous ECDE colleges give
teachers broader background or foundation knowledge to
comprehend Science and mathematics, but not necessarily the
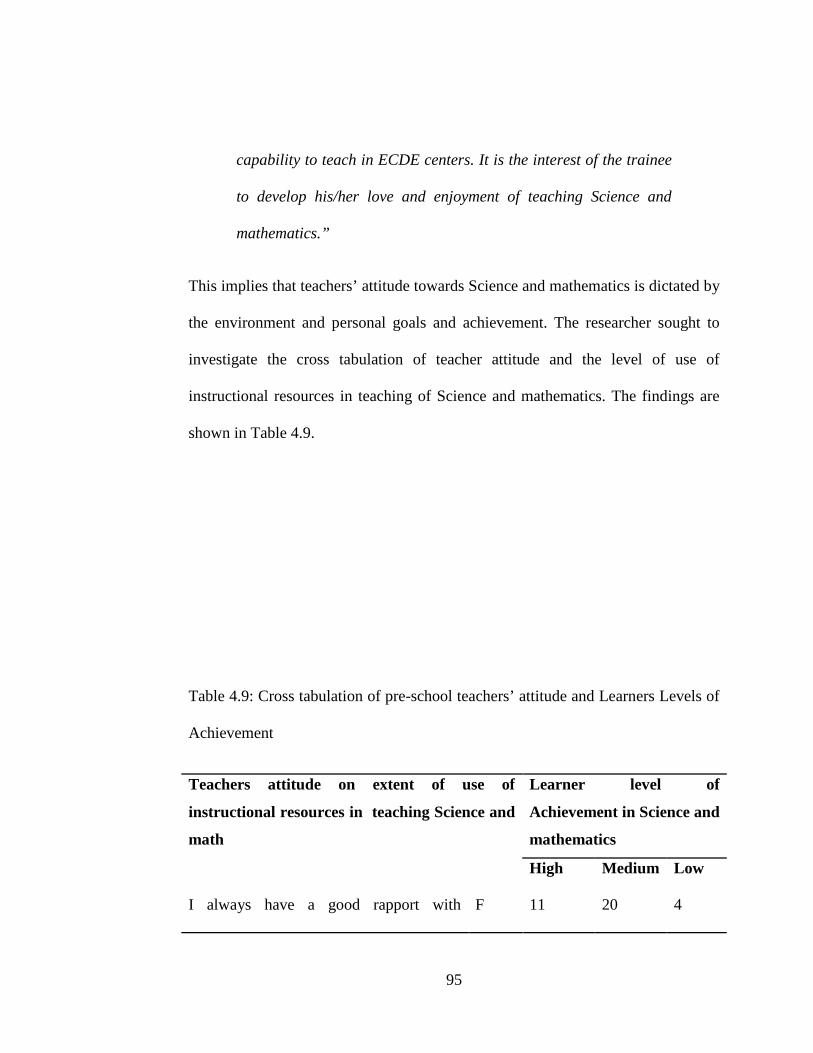
95
capability to teach in ECDE centers. It is the interest of the trainee
to develop his/her love and enjoyment of teaching Science and
mathematics.”
This implies that teachers’ attitude towards Science and mathematics is dictated by
the environment and personal goals and achievement. The researcher sought to
investigate the cross tabulation of teacher attitude and the level of use of
instructional resources in teaching of Science and mathematics. The findings are
shown in Table 4.9.
Table 4.9: Cross tabulation of pre-school teachers’ attitude and Learners Levels of
Achievement
Teachers attitude on extent of use of
instructional resources in teaching Science and
math
Learner level of
Achievement in Science and
mathematics
High Medium Low
I always have a good rapport with F 11 20 4
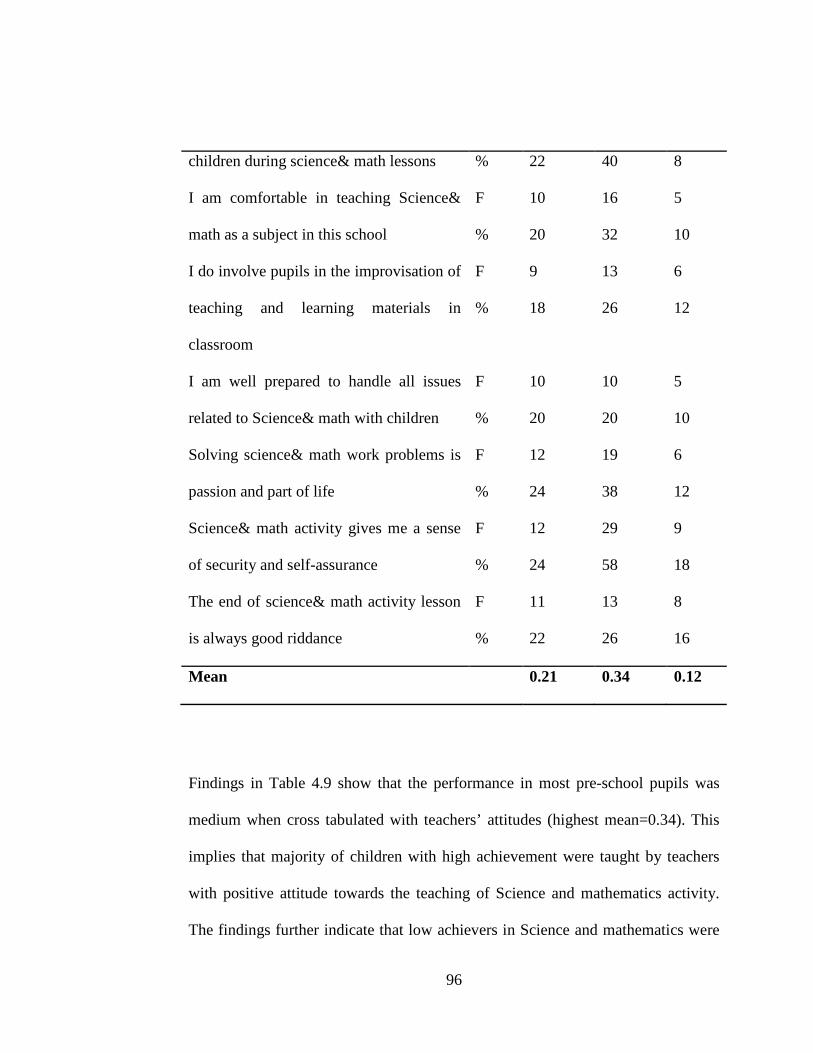
96
children during science& math lessons % 22 40 8
I am comfortable in teaching Science&
math as a subject in this school
F 10 16 5
% 20 32 10
I do involve pupils in the improvisation of
teaching and learning materials in
classroom
F 9 13 6
% 18 26 12
I am well prepared to handle all issues
related to Science& math with children
F 10 10 5
% 20 20 10
Solving science& math work problems is
passion and part of life
F 12 19 6
% 24 38 12
Science& math activity gives me a sense
of security and self-assurance
F 12 29 9
% 24 58 18
The end of science& math activity lesson
is always good riddance
F 11 13 8
% 22 26 16
Mean 0.21 0.34 0.12
Findings in Table 4.9 show that the performance in most pre-school pupils was
medium when cross tabulated with teachers’ attitudes (highest mean=0.34). This
implies that majority of children with high achievement were taught by teachers
with positive attitude towards the teaching of Science and mathematics activity.
The findings further indicate that low achievers in Science and mathematics were
97
also taught by the same teachers with positive attitude in Science and mathematics
activities. This implies that the achievement of pupils could not be pegged on
teachers’ attitude alone. The interaction of other factors like learners’ ability,
teachers’ experience and attitude of pre-school children towards science and
mathematics activities could be an issue of concern. These findings implied that
there was no relationship between teachers’ attitude and achievement of the pre-
school learners. However, it is the attitude to direct the teachers to select and use
appropriate instructional resources in Science and mathematics activities.
These findings are in line with Aiken (1970) who concluded that the association
between attitude and performance is certainly the congruence of reciprocal
influence in that, attitude affects achievements and in turn influences attitude. The
findings also concur with Onasanya (2008) who observes that the change and
behaviours from teachers would be beneficial to the learners. Even when the
resources are available but the management does not show commitment and
teachers do not see the need, no utilization can possibly occur.
The findings are in agreement with Eble (1988) when he found out that pleasure in
teaching and learning is the basic foundation essential to sustain great teaching. If
teachers are more enthusiastic in teaching Science and mathematics, their positive
attitude will show through and will have a powerful influence on learners’
motivation and hence causing the learners to acquire knowledge in the subject
effectively and therefore achieve good grades in the subject.
98
However, these results are in disagreement with Ndawula (2014) who sought to
examine the teachers’ attitudes towards using sponsored instructional materials
provided by the Aga Khan Education Service (AES) to primary schools in
Uganda. The study established that the majority of the teachers (93%) expressed
positive attitude, while only 7% had negative attitudes over using the AES
materials. Conclusions were drawn and recommendations focused on: sensitization
of teachers on importance AES; improving on close work relationship between
primary schools and AES; extending AES materials to non-project schools and;
further research on other variables rather than teachers’ attitudes. The low attitude
of the teachers in science and mathematics among teachers was an important factor
in their choice and use of instructional resources in teaching of science and
mathematics activities in pre-schools
4.7 Teachers’ motivation level and the use of instructional resources in
teaching science and mathematics in pre-primary schools
The fifty objective of this study sought to determine the influence of teachers’
motivation level on use of instructional resources in teaching science and
mathematics in pre-primary school in Athi-River Sub-County. Teachers were
required to give information about their motivation (both intrinsic and extrinsic)
on Science and mathematics activities. The responses were in a range of 1-5 using
Likert scale (5=strongly agree, 4=Agree, 3=Neutral, 2=Disagree and 1=Strongly
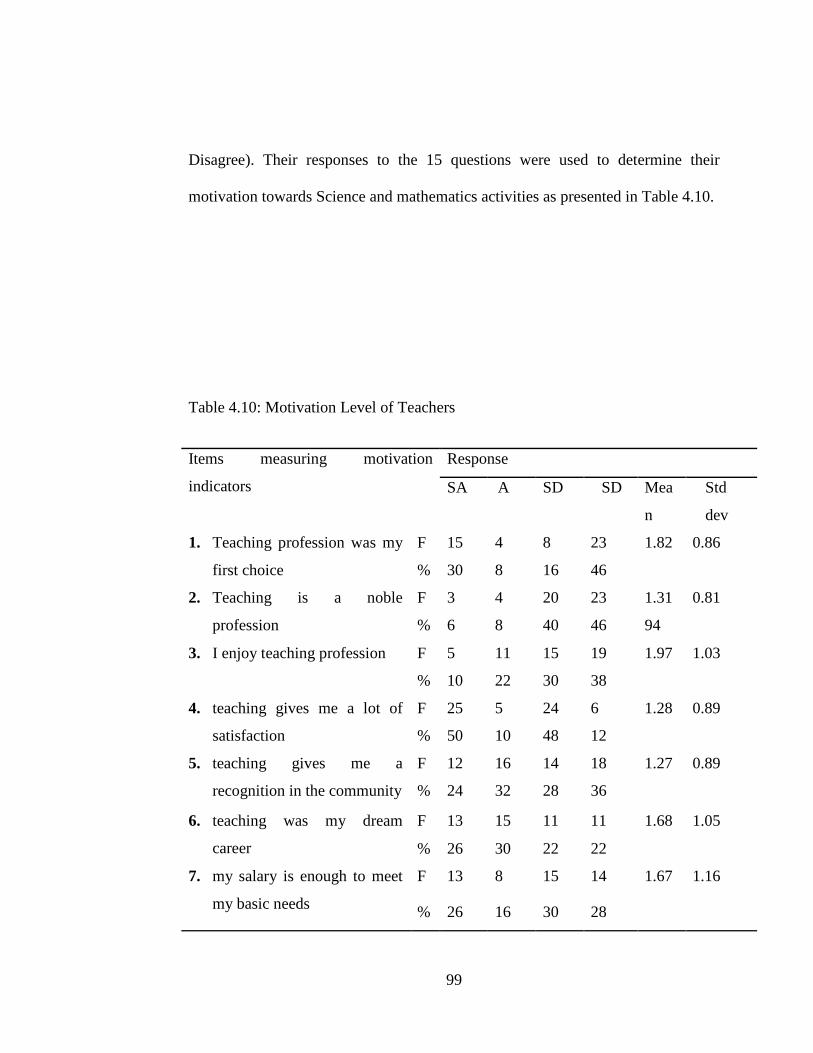
99
Disagree). Their responses to the 15 questions were used to determine their
motivation towards Science and mathematics activities as presented in Table 4.10.
Table 4.10: Motivation Level of Teachers
Items measuring motivation
indicators
Response
SA A SD SD Mea
n
Std
dev
1. Teaching profession was my
first choice
F 15 4 8 23 1.82 0.86
% 30 8 16 46
2. Teaching is a noble
profession
F 3 4 20 23 1.31
94
0.81
% 6 8 40 46
3. I enjoy teaching profession F 5 11 15 19 1.97 1.03
% 10 22 30 38
4. teaching gives me a lot of
satisfaction
F 25 5 24 6 1.28 0.89
% 50 10 48 12
5. teaching gives me a
recognition in the community
F 12 16 14 18 1.27 0.89
% 24 32 28 36
6. teaching was my dream
career
F 13 15 11 11 1.68 1.05
% 26 30 22 22
7. my salary is enough to meet
my basic needs
F 13 8 15 14 1.67 1.16
% 26 16 30 28
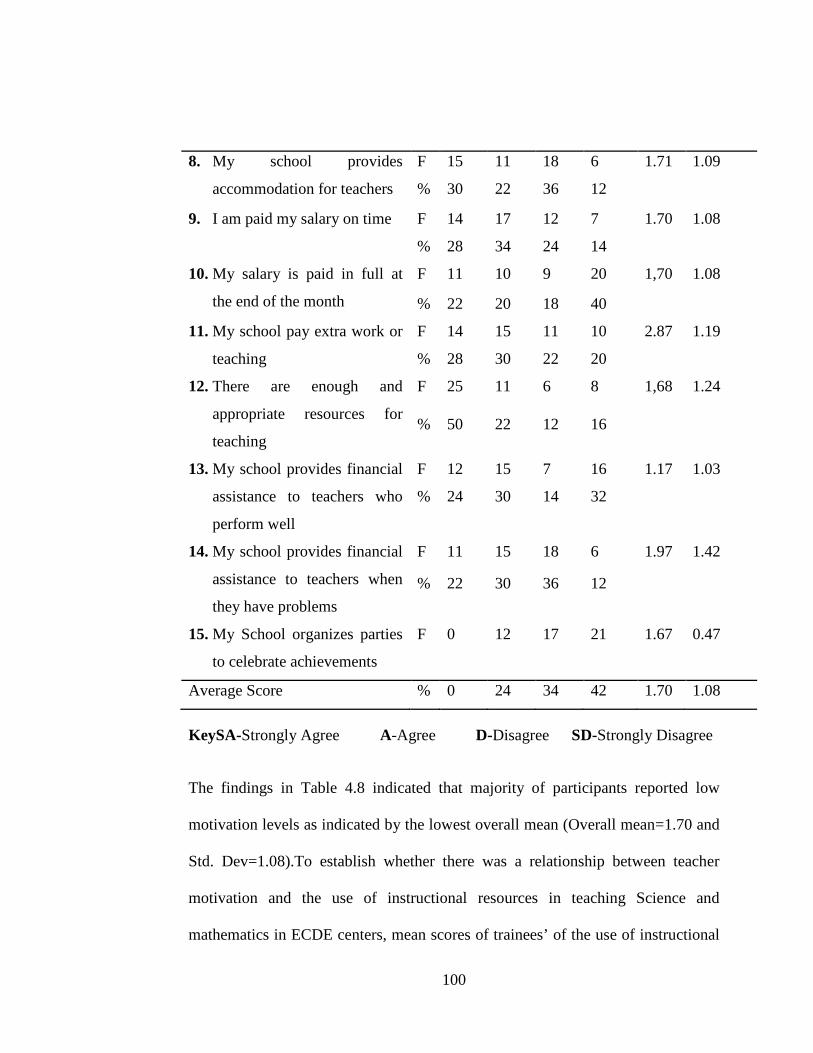
100
8. My school provides
accommodation for teachers
F 15 11 18 6 1.71 1.09
% 30 22 36 12
9. I am paid my salary on time F 14 17 12 7 1.70 1.08
% 28 34 24 14
10. My salary is paid in full at
the end of the month
F 11 10 9 20 1,70 1.08
% 22 20 18 40
11. My school pay extra work or
teaching
F 14 15 11 10 2.87 1.19
% 28 30 22 20
12. There are enough and
appropriate resources for
teaching
F 25 11 6 8 1,68 1.24
% 50 22 12 16
13. My school provides financial
assistance to teachers who
perform well
F 12 15 7 16 1.17 1.03
% 24 30 14 32
14. My school provides financial
assistance to teachers when
they have problems
F 11 15 18 6 1.97 1.42
% 22 30 36 12
15. My School organizes parties
to celebrate achievements
F 0 12 17 21 1.67 0.47
Average Score % 0 24 34 42 1.70 1.08
KeySA-Strongly Agree A-Agree D-Disagree SD-Strongly Disagree
The findings in Table 4.8 indicated that majority of participants reported low
motivation levels as indicated by the lowest overall mean (Overall mean=1.70 and
Std. Dev=1.08).To establish whether there was a relationship between teacher
motivation and the use of instructional resources in teaching Science and
mathematics in ECDE centers, mean scores of trainees’ of the use of instructional
101
resources were calculated and presented alongside the intent to which teachers
used instructional resources to teach Science and mathematics activities in pre-
primary schools in Athi river sub county Machakos county Kenya. Table 4.9
summarizes the findings.
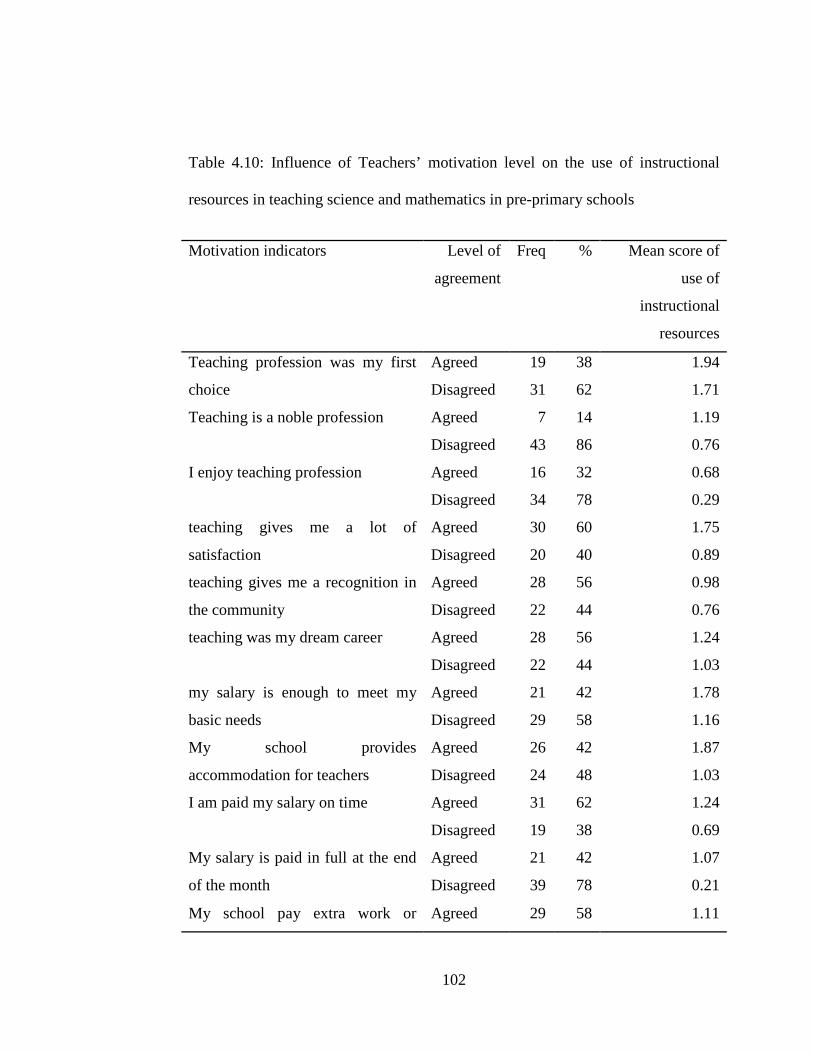
102
Table 4.10: Influence of Teachers’ motivation level on the use of instructional
resources in teaching science and mathematics in pre-primary schools
Motivation indicators Level of
agreement
Freq % Mean score of
use of
instructional
resources
Teaching profession was my first
choice
Agreed 19 38 1.94
Disagreed 31 62 1.71
Teaching is a noble profession Agreed 7 14 1.19
Disagreed 43 86 0.76
I enjoy teaching profession Agreed 16 32 0.68
Disagreed 34 78 0.29
teaching gives me a lot of
satisfaction
Agreed 30 60 1.75
Disagreed 20 40 0.89
teaching gives me a recognition in
the community
Agreed 28 56 0.98
Disagreed 22 44 0.76
teaching was my dream career Agreed 28 56 1.24
Disagreed 22 44 1.03
my salary is enough to meet my
basic needs
Agreed 21 42 1.78
Disagreed 29 58 1.16
My school provides
accommodation for teachers
Agreed 26 42 1.87
Disagreed 24 48 1.03
I am paid my salary on time Agreed 31 62 1.24
Disagreed 19 38 0.69
My salary is paid in full at the end
of the month
Agreed 21 42 1.07
Disagreed 39 78 0.21
My school pay extra work or Agreed 29 58 1.11
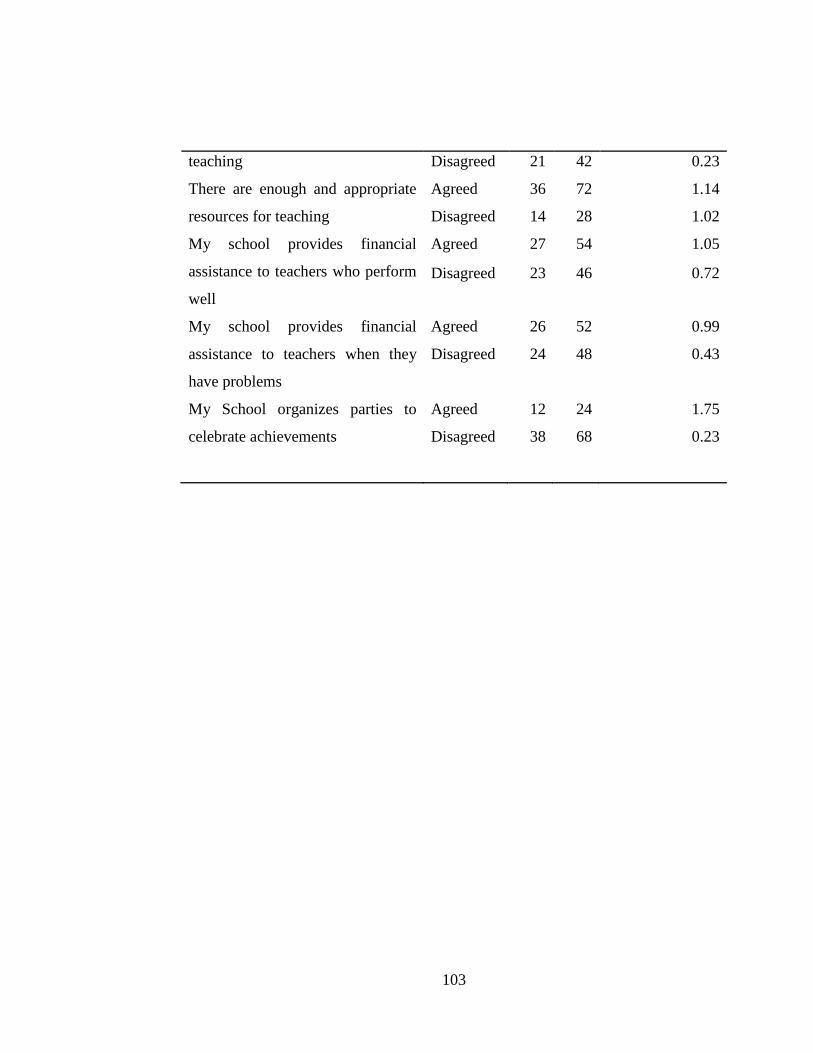
103
teaching Disagreed 21 42 0.23
There are enough and appropriate
resources for teaching
Agreed 36 72 1.14
Disagreed 14 28 1.02
My school provides financial
assistance to teachers who perform
well
Agreed 27 54 1.05
Disagreed 23 46 0.72
My school provides financial
assistance to teachers when they
have problems
Agreed 26 52 0.99
Disagreed 24 48 0.43
My School organizes parties to
celebrate achievements
Agreed 12 24 1.75
Disagreed 38 68 0.23
104
The result from Table 4.10shows the relationship between teachers’ motivation
level on the use of instructional resources in teaching science and mathematics in
pre-primary schools. Findings revealed that there were higher scores in the
columns where the items were agreed with by the respondents. On the other hand,
the mean score was relatively lower in the columns where the items were
disagreed with by the respondents. This implies that the higher the motivation
levels among teachers the more the use of instructional resources in teaching
Science and mathematics. This means that teacher motivation directly influences
the utilization of instructional resources in teaching Science and mathematics.
Teacher motivation is the application of certain measures that tend to energize the
teacher in the work place and which in turn encourages the use of instructional
recourses. According to Herzberg (1968), motivators are the factors that energize
teachers to perform in order to accomplish set objectives.
During the interview with the head teachers, it was found that poor working
conditions of teaching may also influence negatively effective utilization of
instructional resources in teaching science and mathematics in pre-primary
schools. For instance, one of the head teachers had this to say;
Large class sizes and inadequacy of instructional resources have an
effect on distribution of instructional resources. The teacher-learner
ratio of say 1:50 is a threat to delivery of quality mathematics
education among the preschool learners. This is because preschool
105
teachers with large classes are not able to meet the needs of all
learners with regard to provision of individualized attention.
Mathematics teachers with heavy work load have little or no time to
prepare and develop, select and organize teaching and learning
materials. It is also a challenge to improvisation of learning
materials from the environment because it requires time. With
manageable classes, preschool teachers are able to determine the
learners needs so the instruction can be adapted and adjusted
accordingly [Interview, Head teacher, 5, 23/6/2017].
These views by the head teacher was also supported by the findings of
Wasiche(2006), who also found that large class size and teachers’ heavy work load
were also found to affect mathematics teaching techniques. Keeping learners
actively engaged in a large class and helping them perform better in mathematics
is a challenge to teachers. Similarly, a study conducted by Tayyab (2010) in India,
Rawalpindi found that teachers who were not satisfied with their working
condition, compromised their professionalism and service delivery. Kilgallon
(2006) also examined factors that influence early childhood classroom teachers’
sustainment in the profession and in teaching in Perth, Western Australia and
found that ECE teachers were sustained through maintenance of personal well-
being and a life with balance, that is enjoyment of daily interactions with learners
and the relationships developed with work colleagues; positive attitudes towards
106
learning, teaching and change were found to impact on sustainment as did
participants emotional intelligence and personal well-being.
Class size had also come out strongly as one of the determinants for utilization of
instructional resources in teaching science and mathematics in pre -primary
schools. For instance, one of the head teachers said that:
Class size is one of the significant factors that would influence
utilization of instructional resources in teaching science and
mathematics in preschools.In smaller classes, teachers have more
contact with individual learners and learners have more support for
learning. In large classes there are more and larger groups, which
pose instructional and management difficulties for teachers. Learners
in large classes are more often inattentive or off-task [Interview, Head
teacher, 3, 23/6/2017]
These findings concur with that of O’Sullivan (2006) who also did a study in
Ugandan primary schools based on the size of classrooms, teacher-pupil ratio,
class equipment, site and appropriateness of latrines, playground and their
effectiveness in relation to appropriate application of instructional materials in
schools. O’Sullivan (2006) found that even though these are important factors for
primary schools in Uganda, they were not provided to children thereby affecting
instructional activities of the teachers. O’Sullivan notes that most schools in
107
Uganda do not offer conducive environment to facilitate effective utilization of
instructional resources in teaching science and mathematics in preschools.
The other factor influencing utilization of instructional resources in teaching
science and mathematics in preschools according to the head teachers was
availability of adequate instructional resources. When asked to comment on this
one of the head teachers said:
“Appropriate application of instructional materials/resources
for teaching science and mathematics is effectively checked
when learners are given variety of instructional resources such
as number charts, picture books and wall charts to read. This
helps preschool teachers develop proper number work skills
and science knowledge” [Interview, Head teacher, 3,
23/6/2017].
Another head teacher when asked to explain how instructional materials help in
teaching science and mathematics in preschools said that:
“Instructional resources help the learners learning number
work properly, identify colours, shapes and pronounce the
words correctly. This helps them achieve much in learning
science and mathematics in their later years in education”
[Interview, Head teacher, 8, 23/6/2017].
108
A head teacher in another school continued that:
“Instructional resources in learning environment improve the
performance of the learner in various learning activities such
as ability to read and write. Compared to children that are
taught with instructional resources, these children perform
generally well in letter writing, identification of shapes and
sentence construction”. [Interview, Head teacher, 7, 23/6/2017]
Another head teacher when probed on this said:
“Instructional resources improve the number work
performance of the learner, because they are ready to draw
letters, draw and name pictures and use small letters, color
shapes and copy patterns with the help of available materials”
[Interview, Head teacher, 2, 23/6/2017]
These findings reinforce the need to use instructional resources for teaching
science and mathematics in preschools. During the interview with the head
teachers, when asked to indicate the implication of instructional materials on
teaching science and mathematics in preschools, one of them had remarked:
“With the availability of instructional resources such as
pencils, crayons, papers and markers, learners are able to
model shapes, letters and objects, join letters, and draw
109
pictures. These activities can significantly help in improving
use of instructional resources for teaching science and
mathematics in preschools”. [Interview, Head teacher, 9,
23/6/2017]
Another head teacher echoed these sentiments when he said that:
“through instructional resources, learners are able to draw the
named pictures rewrite small letters and copy letters, since
when they interact more with these instructional resources, they
become more innovative and are ready to write letters”
[Interview, Head teacher, 5, 23/6/2017]
From these statements made by the head teachers, it can be concluded that
instructional resources and utilization of instructional resources for teaching
science and mathematics in preschools is paramount in the current teaching and
effective learning process. Instructional resources promote learners’ readiness to
learn how to construct sentences and learn number work. This is also supported by
the findings of Barclay (2009) who found that with the availability of different
instructional resources, children in lower primary are able to experiment with
writing by forming scribbles, letters-like forms, and random writing of letters.
Barclay further found that children begin to use “mock writing” or wavy scribbles
to imitate adult cursive writing. Letter like forms or mock letters are the young
child’s attempt to form alphabetic letters. Such writing readiness activities when
110
practiced on daily schedules lead to fluent or actual writing amongst preschool
learners.
These findings support the findings of Nsa, Ikot and Udo (2013) in their study
conducted in Nigeria, where they also found that there was a significant difference
between the reading performance between learners taught with instructional chart
and those without and there was significant difference between the performance of
learners taught with instructional pictures and those taught without. A study by
Momoh (2010) also indicated that instructional materials had implications on early
learners’ performance on prerequisite skills taught in an early childhood education
such that they offer variety of experiences to the lesson and thus keep monotony
and boredom at bay.
Similarly, the findings also agree to those reported by Myers (2011) who noted
that the use of sand to “write” words also helps the learners to make letters and
words out of materials like sand. Learners can also model numbers, alphabets and
simple pictures using clay. This helps learners to recognize words and also help
build the muscles in their fingers and enhance the fine motor skills they will need
to write.
Moreover, the findings agreed to the words by KIE, (2011), which stated that at
preschool level children should be given writing readiness activities to prepare
them for the actual writing. They need activities which prepare them physically for
the activity of writing but also mentally so that they will have ideas and concepts
111
to write about. Many activities which children do in school such as scribbling,
painting, drawing, coloring, tracing, lacing, threading are writing readiness
activities that prepare them for actual writing. These activities strengthen and
develop control of the finger muscles used in the number work activity.
The findings are in agreement to the emphasis made by Hall and Williams (2010)
that writing may be the most important part of kindergarten curriculum. Further,
Hall and Williams (2010) argue that the goal of a kindergarten is to admit all
children regardless of their status and assist them to develop their literacy skills.
Creating a positive, risk-free environment is important to enhancing literacy.
Learning to read and write is essential and provides the basic foundation for all
future school success. The American National Association for Education of Young
Children (NAEYC) stated that one of the best predictors of whether a child will
function competently in school and go on to contribute actively in our increasingly
literate society is the level to which the child progresses in writing. Although
reading and writing abilities continue to develop throughout the lifespan, the early
childhood years-from birth through age eight is the most important period for
literacy development.
These sentiments show that using instructional materials, learners are able to
speedily learn number work and also encourage teachers in using instructional
materials in teaching science and number work among learners. Similarly,
112
Wangui (2011) found that factors affecting a child’s readiness to learn number
work are inadequate facilities and failure to appropriately use teaching methods.
On teacher motivation, qualitative data from interview schedule with the head
teachers that sought to find out the extent to which to teacher motivation such as
monetary incentives influence pre-school teachers’ utilization of instructional
materials found that most of the respondents reported that salary for the teachers
was inadequate to meet their needs in the current increase cost of living, hence
demoralizing them to effectively carry out their functions, which included
effective utilization of instructional materials for teaching science and
mathematics in preschools. In fact, one of the head teachers said;
Most of my teachers earn little salary and the inadequacies
discouraged them to perform their work effectively up to including
appropriate application of instructional materials in teaching
science and mathematics in preschools. [Interview, Head teacher,
11, 23/6/2017].
The above finding reveals that salary has not been able to increase teachers’
morale to perform their professional duties. This study finding is concurs to that of
Fraise (2012) whose study emphasized the value of financial rewards when he said
that money provides the means to achieve a number of different ends.
The observation was also reiterated by another respondent who reported that,
113
In most schools, low pay has forced teachers to find the additional
sources of income inform of petty trading and other secondary
sources of income. These secondary income activities have created
divided attention and loyalty to teaching and thus impacting
negatively on the quality of teacher performance [Interview, Head
teacher, 12, 23/6/2017].
In agreement, Cissokho (2010) cited that when teacher’s salary fail to keep pace
with the cost of living they undergo a reduction unreal income their morale suffers
and the able ones shift to better paying jobs thus pulling down the quality of
education. Theimplication of the above findings will benefit the community to
invest on the payment of teaching force for them to be well motivated, hence they
can achieve much for the quality of education even against great odds.
114
CHAPTER FIVE
SUMMARY, CONCLUSIONS AND RECOMMENDATIONS
5.1 Introduction
This study aimed at establishing the extent to which teachers use instructional
resources in teaching science and mathematics in pre-primary schools in Athi-
River sub county of MachakosCounty, Kenya. The study also sought to find out
the influence of teachers factors in use of instructional resources in teaching
science and mathematics in pre-primary schools. This chapter presents the
summary of the study, conclusions, and recommendations by the researcher and
areas of further research.
5.2 Summary of Findings
The first objective of the study sought to establish the extent of teachers’ use of
instructional resources in teaching science and mathematics in pre-primary schools
in Athi-River Sub-County in MachakosCounty,Kenya. The researcher used
descriptive statistics such as frequency, percentage and mean. Findings indicated
that there was highest mean score in the use of instructional resources in teaching
Science and mathematics among the teachers whom always use instructional
resources in teaching of science and mathematics. However, teachers with no
115
training in ECDE had the lowest mean score in the utilization of instructional
resources in teaching Science and mathematics in pre-primary schools.
The second objective of the study sought to establish the influence of teachers’
training levels on the use of instructional resources in teaching science and
mathematics in pre-primary schools in Athi-River Sub-County. Findings indicated
that teachers with degrees tending to use instructional resources more than the
diploma and certificate levels of trainings in teaching of Science and mathematics
activities in pre-schools. For instance, the extent of utilization of instructional
resources in teaching Science and mathematics was high among those teachers
who had degree followed by teachers with diploma levels and those with teachers’
certificate seem to be rated lowest in terms of use of instructional resources in
teaching of science and mathematics activities.
The third objective of the study sought to find out the influence of teachers’ gender
on the use of instructional resources in teaching science and mathematics in pre-
primary schools in Athi-River sub county Kenya. The findings indicated that
gender was a factor of utilization of instructional resources in teaching Science and
mathematics. It was found that more male teachers made use of variety of teaching
resources than the female teachers.
The fourth objective of the study sought to find out how teacher’s attitude
influences the use of instructional resources in teaching science and mathematics
activities. The findings indicated that majority of pre-school teachers had positive
116
attitude towards Science and mathematics. Attitude was found to influence the
selection and use of instructional resources in teaching Science and mathematics.
However, there was no direct influence of teachers’ attitude on the performance of
pre-school children in Science and mathematics activities since both high and low
achievers were taught by the same teacher.
The fifty objective of this study sought to determine the influence of teachers’
motivation level on use of instructional resources in teaching science and
mathematics in pre-primary school in Athi-River Sub-County. Majority of teachers
in pre-schools were not motivated to execute their instructional duties in pre-
schools. It was revealed that motivation influenced the extent to which teachers
use instructional resources and employ certain teaching methodologies with
regards to presentation of Science and mathematics activities to learners.
5.3 Conclusions
The following conclusions were drawn from the findings:
Teacher training is a significant factor since it enables teachers acquires basic
skills in implementing curriculum. Well trained teachers have the capability to
select and use suitable instructional resources in teaching specific concepts in
Science and mathematics. The study concludes that there is a positive relationship
between the teacher qualification and the extent to which teachers utilize
instructional resources in implementing Science and mathematics activities.

117
Gender is a significant determinant in effectiveness of selecting and use of
instructional resources in implementing Science and mathematics activities. Male
teachers are therefore perceived to perform better than their female counterparts
with regards to making use of variety of teaching resources in teaching Science
and mathematics in pre-schools. Teachers attitude influences the use of the use of
instructional resources in teaching science and mathematics activities but does not
direct influence the performance of pre-school children in Science and
mathematics activities since both high and low achievers were taught by the same
teacher.
There is a positive relationship between teacher motivation and the extent to which
teachers use instructional resources and employ certain teaching methodologies
with regards to presentation of Science and mathematics activities to learners
which consequently affects performance of children in Science and mathematics
activities.
High teacher training levels enhances the familiarity of teachers with suitable
teaching approaches in the field of Science and mathematics. A more
qualifiedteacher is capable to appropriately select and use instructional resources
in implementing Science and mathematics activities since he/she is in a position to
compare and contrast the validity of the contemporary approaches with the
previous ones, through experience, weaknesses of approaches can be identified
118
and adjusted appropriately based on the emerging issues in Science and
mathematics education.
5.4 Recommendations of the Study
Based on the study findings and conclusions the following recommendations were
made:
1. A pre-school teacher is recommended to have a roper academic background
and be professionally trained and specialize on child development. This should
be facilitated by the Ministry of Education through in-service training.
2. Male and female teachers should be equally encouraged to undergo frequent
seminars and in-service courses to equip themselves with various teaching
methods to enhance their teachings and rip off the fear of Science and
mathematics from female teachers.
3. Teachers’ attitudes towards the use of instructional resources should be created
by teachers as way of loving their profession
4 The government and stakeholders should motivate teachers through salary
increment and other incentives that will have a positive attitude towards Science
and mathematics teaching.
5. The Ministry of Education should ensure proper implementation of curriculum
which needs effective use if instructional media in teaching. This would ensure
119
production of pre-primary school teachers who have the ability to utilize
instructional media in teaching regardless of their teaching experience.
5.5 Recommendations for Further Research
The study found out there is need for further research in the following areas:
1. A similar should be replicated to a wider population of pre-schools Athi-River
Sub-County and other parts of Machakos County to establish factors
influencing implementation of Science and mathematics activity and compare
the findings.
2. A similar study should be done in pure urban area to establish the dynamics of
utilization of instructional resources in these ECDE centers which would
establish a good platform for comparison with the findings of the current
study.
3. Further research should be done to establish whether factors that had not been
attained at the time of study like teacher participation of the parents and pupils’
attitude towards Science and mathematics influence the use of instructional
resources in teaching Science and mathematics among teachers in pre-schools.
120
REFERENCES
Ader, H., Van M., Deltaan, M., &Beekman, A. (2008). Advising on research methods: A consultant’s comparison. Netherlands: Johannes Van Kessel Publishers.
Afshari, M., Bakar, K. A., Luan, W. S., Samah, B. A., & Fooi, F. S. (2009). Factors Affecting Teachers' Use of Information and Communication Technology. Online Submission, 2(1), 77-104.
Aiken, L. R. (1970). Attitude towards mathematics and science. Review of Educational Research p.558.
American Psychological Association (2009). Publication Manual of the American Psychological Association, 6th edition. http://www.apastyle.org/manual.aspx.
An analysis of Nils’s data. Paper presented at the American Education Research Association Annual Meeting. New Orleans.
Angus, M., Olney, H., &Ainsley, J. (2007). In the balance: The future of Australia’s primary schools. Canberra: Australian Primary Principals’ Association.
Antecol, H., Eren, O., & Ozbeklik, S. (2012). The effect of teacher gender on student achievement in primary school: evidence from a randomized experiment.
121
Banilower, E. R., Smith, P. S., Weiss, I. R., Malzahn, K. A., Campbell, K. M., & Weis, A. M. (2013). Report of the 2012 National Survey of Science and Mathematics Education. Horizon Research, Inc.
Baylor, A.L. & Ritchie, D. (2002). What factors facilitate teacher skill, teacher morale? and perceived student learning in technology using classrooms? Computer and Education, 39, 395-414.
Beggs, T. A. (2000). Influences and barriers to the adoption of instructional technology. Proceedings of the Mid-South Instructional technology.
Beggs, T.A. (2000). Influences and barriers to the adoption of instructional technology. Proceedings of the Mid-South Instructional Technology Conference. Murfreesboro,
Begi, N. (2007). A comparative study of preschool and lower primary school teachers, computer technology usage in teaching in Nairobi Province Kenya. VDM Verlag, Dr. Muller.
Brill, S., & McCartney, A. (2008). Stopping the revolving door: Increasing teacher retention. Politics & Policy, 36(5), 750-774.
Broadley, T., J. Downie and D. Gibson. (2015). “Evolving learning paradigms: Re-setting the baselines and collection methods of information and communication technology in education statistics post-2015”. Montreal: UNESCO Institute for Statistics.
Calder, N.S.; Campbell, (2016). Using mathematical apps with reluctant learners.DEME 2016, 2, 50–69.
Canadian Association of University Teachers. (2007). CAUT Almanac of Post-SecondaryEducation in Canada 2007. Ottawa, ON: Canadian Association of University Teachers
Carr, J. (2012) Does math achievement h‘APP’en when iPads and game-based learning are incorporated into fifth-grade mathematics instruction? J. Inf. Technol. Educ. 2012, 11, 269–286.
Catchan, R. (2013). Reflections: How STEM becomes STEAM. The STEAM Journal, 1(1), Art. 22.
Chaplin, T. M., & Aldao, A. (2013). Gender differences in emotion expression in children: A meta-analytic review.
122
Charlesworth, R. (2015). Math and science for young children. Cengage Learning.
Chudgar, A. & Sankar, V. (2008). The relationship between teacher gender and student achievement: Evidence from five Indian states. Compare: A Journal of Comparative and International Education, 38 (5), 627-642
Clements, D. H., & Sarama, J. (2014). Learning and teaching early math: The learning trajectories approach. Routledge.
Colgrove, A. (2012). Approaches to Teaching Young Children Science Concepts and Vocabulary and Scientific Problem-solving Skills and Role of Classroom Environment.
Comput. N. Z. Sch. Learn.Lead. Technol. 2010, 22, 1–16.
Czerniewicz, L., & Brown, C. (2005). Access to ICTs for teaching and learning: From single artefact to inter-related resources. International Journal of Education and Development using ICT, 1(2).
Darling-Hammond, L. (2000). The research and rhetoric on teacher certification: A response to ‘Teacher certification considered’. New York: National commission on teaching and America’s future.
Eble, E. K. (1988). The craft of teaching. A guide to mastering the profession Art (2nd Ed.). San Francisco: The Jossey Bass publishers. Delhi: New Age International. Education. Retrieved from http://bit.ly/OD4Gsb
Eccles, J. S., & Wigfield, A. (2002). Motivational beliefs, values, and goals. Annual Review of Psychology, 53, 109–132.
Eison, J. (2010). Using active learning instructional strategies to create excitement and enhance learning. Jurnal Pendidikantentang Strategi Pembelajaran Aktif (Active Learning) Books, 2(1), 1-10.
Erden, F. T. (2009). A course on gender equity in education: Does it affect gender role attitudes of preservice teachers? Teaching and teacher education, 25(3), 409-414.
European Commission. (2013). Survey of Schools: ICT in Education. Benchmarking Access, Use and Attitudes to Technology in Europe’s Schools. Belgium: European Commission.
Fullan, M. (2014). Leading in a culture of change personal action guide and workbook. John Wiley & Sons.
123
Goe, L. (2007). The link between teacher quality and student outcomes: A research synthesis. Washington, DC: National Comprehensive Center for Teacher Quality. Retrieved from http://www.tqsource.org/link.php.
Harris, D. N., & Sass, T. R. (2009). The effects of NBPTS‐certified teachers on student achievement. Journal of policy analysis and management, 28(1), 55-80.
Hattie, J., & Yates, G. C. (2013). Visible learning and the science of how we learn. Routledge.
Hattie, J., & Yates, G. C. (2013). Visible learning and the science of how we learn. Routledge.
Hegedus, S. (2013) Young Children Investigating Advanced Mathematical Concepts with Haptic Technologies: Future Design Perspectives. Math. Educ. 2013, 10, 87–107.
Herzberg, F. (1968). The Motivation-Hygiene concept and problems of man-power.Retrieved13thFebruaryfromhttp//en.wikipedia.org.http://www.col.org/resources/ublications/Pages/detail.aspx?PID=421https://www.oercommons.org/about#about-open-educational-resources.
Hiebert, J., & Grouws, D. A. (2007). The effects of classroom mathematics teaching on students’ learning. Second handbook of research on mathematics teaching and learning, 1, 371-404.
Hoffmann, F., & Oreopoulos, P. (2009). A professor like me the influence of instructor gender on college achievement. Journal of Human Resources, 44(2), 479-494.
Hoque, K. E., & Zohora, M. F. (2014). Impact of teacher-gender on primary students’ achievement: A study at Bangladesh standpoint. International Journal of Learning, Teaching and Educational Research, 3(1).
Infodev.(2015). “Teachers, Teaching and ICTs”. Retrieved from http://www.infodev.org/articles/teachers-teaching-and-icts.
Jacob, B.A (2007). ‘Teacher,’ the future of children and the challenges of staffingurban schools effectively 17(1): 129-153.
Jenkins, L. N., Floress, M. T., & Reinke, W. (2015). Rates and types of teacher praise: A review and future directions. Psychology in the Schools, 52(5), 463-476.
124
Jones, S. (2005). The Invisibility of the Underachieving Girl. International Journal of Inclusive Education, 9(3), 269-286.
Kathuri, N. S. (1986). Factors that influence pupils in KCPE. KU. Bureau of educational Research.
Kind, P., Jones, K., & Barmby, P. (2007). Developing attitudes towards science measures. International Journal of Science, 29, 871-893.
Klassen, R. M., & Chiu, M. M. (2010). Effects on teachers' self-efficacy and job satisfaction: Teacher gender, years of experience, and job stress. Journal of educational Psychology, 102(3), 741.
Kosgei, A., Mise, J. K., Odera, O., & Ayugi, M. E. (2013). Influence of teacher characteristics on students' academic achievement among secondary schools. Journal of Education and Practice, 4(3), 76-82.
Kothari, R.C., (2004). Research Methodology: Methods and Techniques, 2nd ed. Delhi: New Age International.
Kuecken, M., & Valfort, M. A. (2012). The impact of student-teacher gender interactions on learning outcomes. Evidence from Sub-Saharan Africa. Mimeo.
Lampert, M., Beasley, H., Ghousseini, H., Kazemi, E., & Franke, M. (2010). Using designed instructional activities to enable novices to manage ambitious mathematics teaching. In Instructional explanations in the disciplines (pp. 129-141). Springer US.
Loucks-Horsley, S., Stiles, K. E., Mundry, S., & Hewson, P. W. (Eds.). (2009). Designing professional development for teachers of science and mathematics. Corwin Press.
Melhuish, K.; Falloon, G (2010). Looking to the future: M-learning with the iPad.
Meyer, B. (2015) iPads in inclusive classrooms: Ecologies of learning. In E-Learning Systems, Environments and Approaches Theory and Implementation; Isaias, P., Spector, J.M., Ifenthaler, D., Eds.; Springer: Dordrecht, The Netherlands, 2015.26. Gibson, J.J. The Ecological Approach.
Mondal, N. K. (2011). Evaluation of English Language Teaching Methods Used in Higher Secondary Education in Bangladesh. Language in India, 11(12).
125
Morrison, F. J., Bachman, H. J., & Connor, C. M. (2005). Current perspectives in psychology. Improving literacy in America: Guidelines from research.
Muithungu CE (2003): Teaching resources for young children. Longhorn Publishers Nairobi
Mutekwe, E., Modiba, M., & Maphosa, C. (2012). Female students’ perceptions of gender and academic achievement: a case of sixth form girls in Zimbabwean school. Journal of Social Sciences, 32(1), 111-120.
Mwonga, S. C. J., & Wanyama, M. N. (2012). Dealing with the prevailing attitudes and challenges for effective implementation of early childhood music and movement curriculum in Eldoret municipality, Kenya. Research Journal in Organizational Psychology and Educational Studies (RJOPES), 1(5), 295.
National Research Council. (2009). learning science in informal environments: People, places, and pursuits. National Academies Press.
Ndawula S., (2014). Teaching with Sponsored Instructional Materials: Attitudes of Teachers in Uganda, Journal of Educational Media & Library Sciences 47:1
Ng'asike, J. T. (2012). Training of Science Teachers for Early Childhood and Primary Grades in Kenya. New Zealand Journal of Teachers' Work, 9(1).
Ngololo, E. N. (2012). Factors affecting ICT policy implementation in rural Namibian schools.
Odunaike, K. O., Ijaduola, K. O., & Amoda, M. B. (2013). Empirical Analysis of Teachers' Gender and Secondary School Students' Academic Performance. Asian Economic and Financial Review, 3(3), 355.
Okobia, E. O. (2011). Availability and teachers’ use of instructional materials and resources in the implementation of social studies in junior secondary schools in Edo State, Nigeria. Review of European studies, 3(2), 90.
Okobia, E.O. (2011). Availability and Teachers’ Use of Instructional Materials and Resources in the Implementation of Social Studies in Junior, Secondary Schools in Edo State, Nigeria Review of European Studies Vol. 3, No. 2
Okoro, C. C., Ekanem, I. E., & Udoh, N. A. (2012). Teacher gender and the academic performance of children in primary schools in Uyo Metropolis,
126
Akwa Ibom State, Nigeria. Journal of Educational and social Research, 2(1), 267-273.
Okwelle, P. C. and Allagoa, F. O. N (2014). Enhancing Teachers’ Competence in the Use of Instructional Materials in Electronics Education in Senior Secondary Schools in Nigeria, Research on Humanities and Social Sciences, Vol .4, No. 2
Oladejo, M. A., Olosunde, G. R., Ojebisi, A. O., & Isola, O. M. (2011). Instructional materials and students’ academic achievement in physics: some policy implications. European Journal of Humanities and Social Sciences, 2(1).
Onasanya, S. A. (2008). Preparing the primary school teachers on selection, Production and use of instructional media for effective classroom teaching. University of Ilorin, Nigeria.
Pramling, N., & Pramling Samuelsson, I. (2010). Evolving activities and semiotic mediation in teacher-child interaction around simple objects. Educational and Child Psychology, 27(4), 22.
Rice, J. K. (2003). Teacher quality: Understanding the effectiveness of teacher attributes. Washington, DC: Economic Policy Institute.
Sapire, I. M. (2011). Investigating the take-up of Open Educational Resources for Maths Teacher Education: a case study in six Higher Education sites in South Africa (Doctoral dissertation).
Sarama, J., & Clements, D. H. (2009). Early childhood mathematics education research: Learning trajectories for young children. Routledge.
Shonkoff, J. P., & Phillips, D. A. (2013). Committee on Integrating the Science of Early Childhood Development; National Research Council and Institute of Medicine 2000. From neurons to neighborhoods: the science of early childhood development.
Sinclair, N.; Heyd-Metzuyanim, E (2014). Learning number with Touch Counts: The role of emotions and the body in mathematical communication. Technol. Knowl. Learn. 2014, 19, 81–99.
Summak, M. S., & Samancioglu, M. (2011). Assessment of technology integration in vocational education and training schools. International Journal of Education and Development using Information and Communication Technology, 7(1), 68.
127
teachers’ professional development”. Journal of Computer Assisted Learning. DOI:10.1111/jcal.12031
Tsui, A. B. (2001). Classroom interaction. The Cambridge guide to teaching English to speakers of other languages, 120-125.
Twining, J et al. (2013). “Moving education into the digital age: The contribution of
Twining, P. and F. Henry (2014). “Enhancing ‘ICT Teaching’ in English Schools: Vital Lessons”. World Journal of Education, Vol. 4, No. 2, 2014.
Twining, P., Davis, N., Charania, A., Chowfin, A., Henry, F., Nordin, H., & Woodward, C. (2015). Developing new indicators to describe digital technology infrastructure in primary and secondary education.
Twining, P., N. Davis, A. Charania, A. Chowfin, F. Henry, H. Nordin and C.
UNESCO (2015a). Capacity Building on UNESCO’s OER platform under the Kenya ICT Competency Framework for Teachers”.
UNESCO (2015b). “What are Open Educational Resources (OERs)?”. Paris: UNESCO. Retrieved from http://www.unesco.org/new/en/communication-and-information/access-to-knowledge/open-educational-resources/what-are-open-educational-resources-oers/.
UNESCO (2015b). “What are Open Educational Resources (OERs)?”. Paris: UNESCO. Retrieved from http://www.unesco.org/new/en/communication-and-information/access-to-knowledge/open-educational-resources/what-are-open-educational-resources-oers/.
UNESCO-UIS (2006). Teachers and Educational Quality: Monitoring Global Needs for 2015. Montreal: UNESCO Institute for Statistics.
UNESCO-UIS (2009). Guide to Measuring Information and Communication Technologies (ICT) in Education. Technical Paper No. 2. Montreal: UIS.
UNESCO-UIS (2009). Guide to Measuring Information and Communication Technologies (ICT) in Education. Technical Paper No. 2. Montreal: UIS.
UNESCO-UIS (2015). “Information and communication technology in education in sub-Saharan Africa: A comparative analysis of basic e-readiness in
128
schools”. Information paper No. 25. Montreal: UNESCO Institute for Statistics.
Van Aalderen-Smeets, S.I., Walma van der Molen, J.H., & Asma, L.J.F. (in press). Primary teachers’ attitudes towards science: A new theoretical framework. Science Education.
Wang, X., Wang, T. & Ye, R. (2002). Usage of instructional materials in high schools: An analysis of Nils’s data. Paper presented at the American Education Research Association Annual Meeting. New Orleans.
Wang, X., Wang, T. & Ye, R. (2002). Usage of instructional materials in high schools:
Wanyonyi, K. M. and Makokha, R.N. (2015). The Utilization of Instructional Resources in Teaching Kiswahili Poetry in Secondary Schools in Kenya, International Journal of Academic Research in Business and Social Sciences, Vol. 5, No. 8
Westbury, I. (2000). Teaching as a reflective practice: What might Didaktik teach curriculum. Teaching as a reflective practice: The German Didaktik tradition, 15-39.
Whitebook, M. (2003). Early education quality: Higher teacher qualifications for better learning environments. A review of the literature. Berkeley: University of California www.col.org/resources/publications/Pages/detail.aspx?PID=421
Winters, M. A., Haight, R. C., Swaim, T. T., & Pickering, K. A. (2013). The effect of same-gender teacher assignment on student achievement in the elementary and secondary grades: Evidence from panel data. Economics of Education Review, 34, 69-75.
Xu, Z., Jane H., & Colin, T. (2011). ‘Making a difference? The effects of teaching for America in High School’, Journal of policy Analysis and Management, 30(3): 447-469.
Xu, Z., Jane H., & Colin, T. (2011). ‘Making a difference? The effects of teaching for America in High School’, Journal of policy Analysis and Management, 30(3): 447-469.
Yates, S., & Goodrum, D. (1990). How confident are primary school teachers in teaching science? Research in Science Education, 20, 300 - 305.
129
Yates, S., & Goodrum, D. (1990). How confident are primary school teachers in teaching science? Research in Science Education, 20, 300 - 305.
Yeboah-Appiagyei, K. A. T. E., Joseph, O. T., & Fentim, B. (2014). Effects of professional qualifications of financial accounting teachers on academic performance of financial accounting students in Tamale Metropolis of Ghana. International Journal, 4(8), 2307-227X.
Zeichner, K. M., & Conklin, H. G. (2005). Teacher education programs. In M. Cochran-Smith & K. M. Zeichner (Eds.), Studying teacher education: The report of the AERA panel on research and teacher education (pp. 645-736). Mahwah, NJ: Lawrence Erlbaum Associates.
Zeichner, K. M., & Conklin, H. G. (2005). Teacher education programs. In M. Cochran-Smith & K. M. Zeichner (Eds.), Studying teacher education: The report of the AERA panel on research and teacher education (pp. 645-736). Mahwah, NJ: Lawrence Erlbaum Associates.
Zhang, D. (2008). The effect of teacher education level, teaching experience, and teaching behaviors on student science achievement. Utah State University.
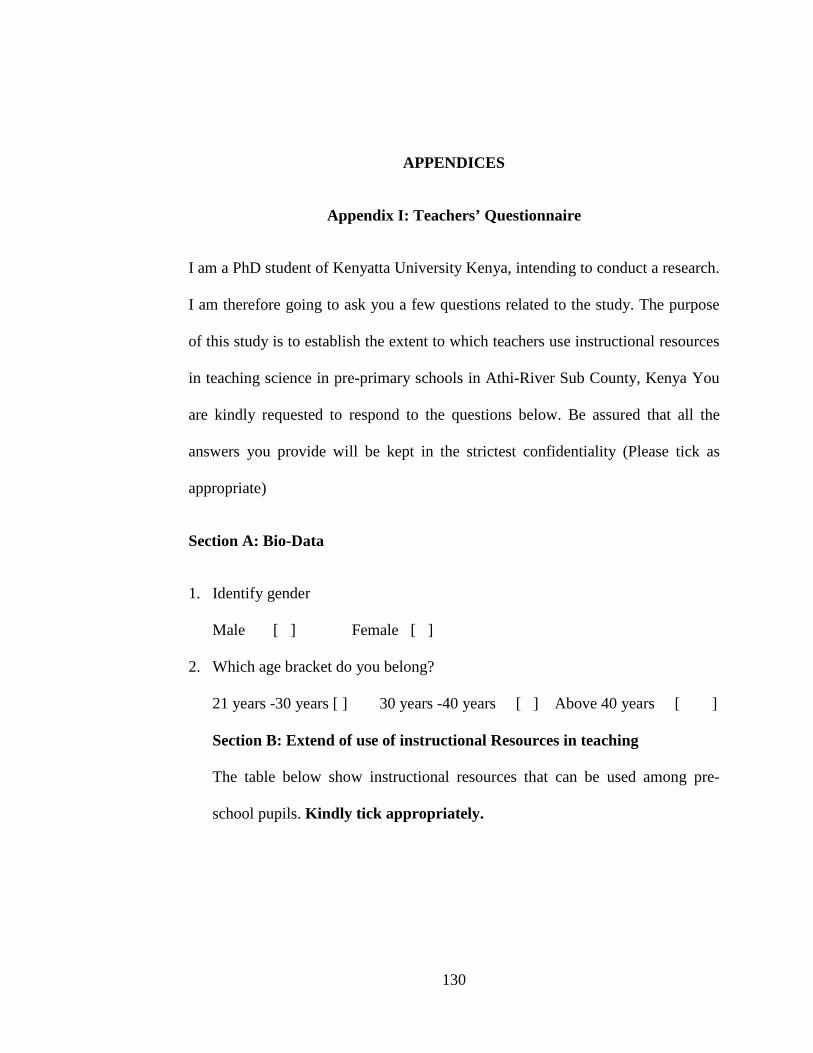
130
APPENDICES
Appendix I: Teachers’ Questionnaire
I am a PhD student of Kenyatta University Kenya, intending to conduct a research.
I am therefore going to ask you a few questions related to the study. The purpose
of this study is to establish the extent to which teachers use instructional resources
in teaching science in pre-primary schools in Athi-River Sub County, Kenya You
are kindly requested to respond to the questions below. Be assured that all the
answers you provide will be kept in the strictest confidentiality (Please tick as
appropriate)
Section A: Bio-Data
1. Identify gender
Male [ ] Female [ ]
2. Which age bracket do you belong?
21 years -30 years [ ] 30 years -40 years [ ] Above 40 years [ ]
Section B: Extend of use of instructional Resources in teaching
The table below show instructional resources that can be used among pre-
school pupils. Kindly tick appropriately.

131
Instructional
Resources
Frequency Of Use
Always Sometimes Rarely Never
Real Objects
Charts
Flash Cards
Pictures
Play materials
ICT resources
Course books
Syllabus
Models
Songs
Section C: Teachers’ Education Level and Experience
3. Please indicate by ticking your level of education
KCPE/KCSE [ ] Certificate [ ] Diploma [ ]
Degree [ ] Others specify………………………………..
4. Which school did you attend during your studies?
Private ( ) Public () Rural ( ) Urban ( )
5. How long have you served as a pre-primary school?
Less than 1 Year [ ] 1-3 Years [ ] 4-6 Years [ ] Above 6 years [ ]
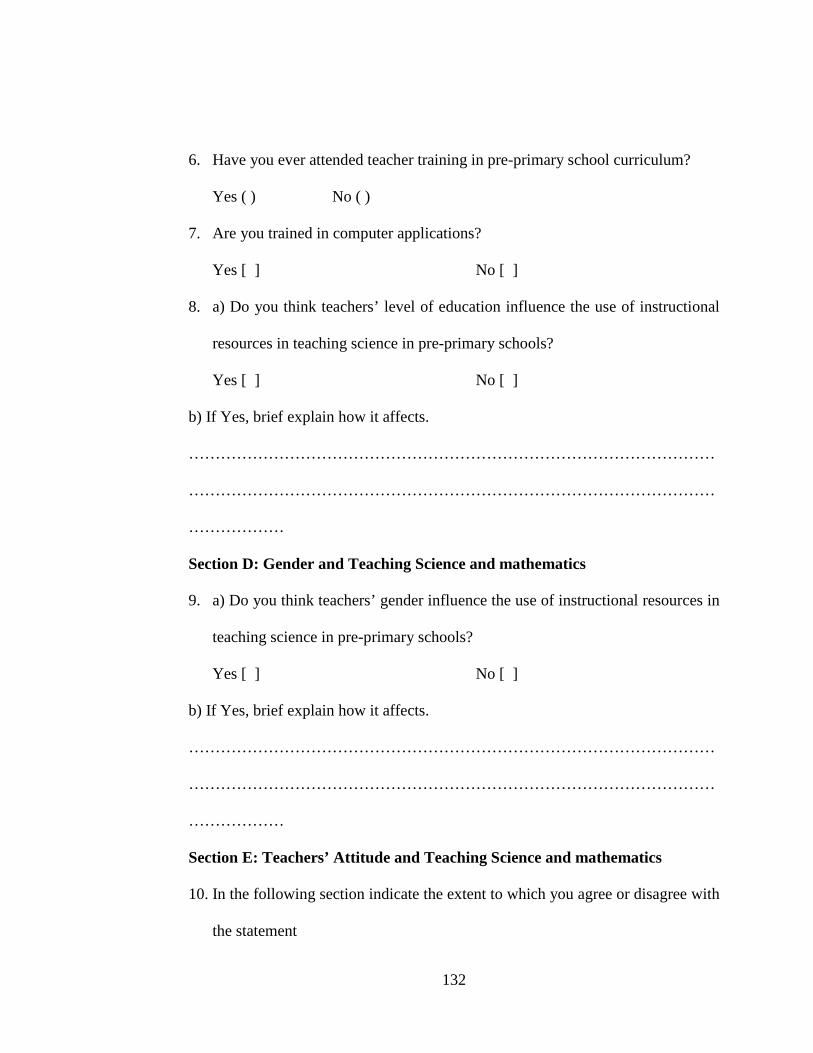
132
6. Have you ever attended teacher training in pre-primary school curriculum?
Yes ( ) No ( )
7. Are you trained in computer applications?
Yes [ ] No [ ]
8. a) Do you think teachers’ level of education influence the use of instructional
resources in teaching science in pre-primary schools?
Yes [ ] No [ ]
b) If Yes, brief explain how it affects.
………………………………………………………………………………………
………………………………………………………………………………………
………………
Section D: Gender and Teaching Science and mathematics
9. a) Do you think teachers’ gender influence the use of instructional resources in
teaching science in pre-primary schools?
Yes [ ] No [ ]
b) If Yes, brief explain how it affects.
………………………………………………………………………………………
………………………………………………………………………………………
………………
Section E: Teachers’ Attitude and Teaching Science and mathematics
10. In the following section indicate the extent to which you agree or disagree with
the statement
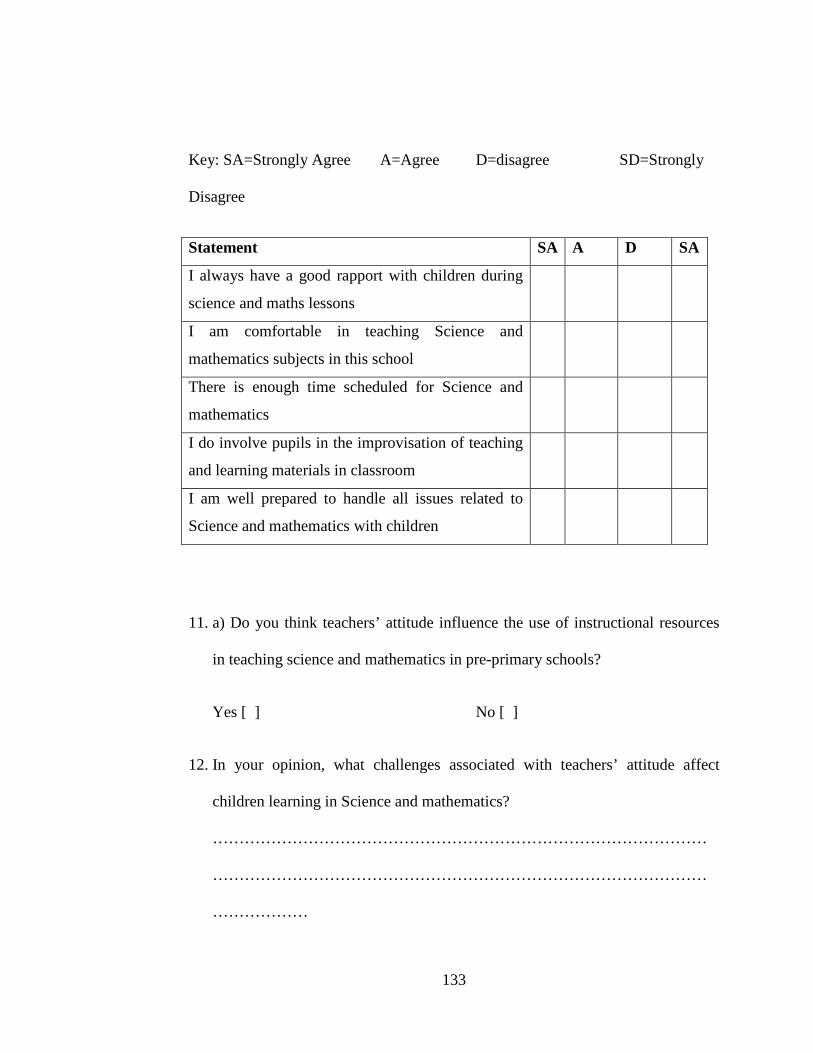
133
Key: SA=Strongly Agree A=Agree D=disagree SD=Strongly
Disagree
Statement SA A D SA
I always have a good rapport with children during
science and maths lessons
I am comfortable in teaching Science and
mathematics subjects in this school
There is enough time scheduled for Science and
mathematics
I do involve pupils in the improvisation of teaching
and learning materials in classroom
I am well prepared to handle all issues related to
Science and mathematics with children
11. a) Do you think teachers’ attitude influence the use of instructional resources
in teaching science and mathematics in pre-primary schools?
Yes [ ] No [ ]
12. In your opinion, what challenges associated with teachers’ attitude affect
children learning in Science and mathematics?
…………………………………………………………………………………
…………………………………………………………………………………
………………
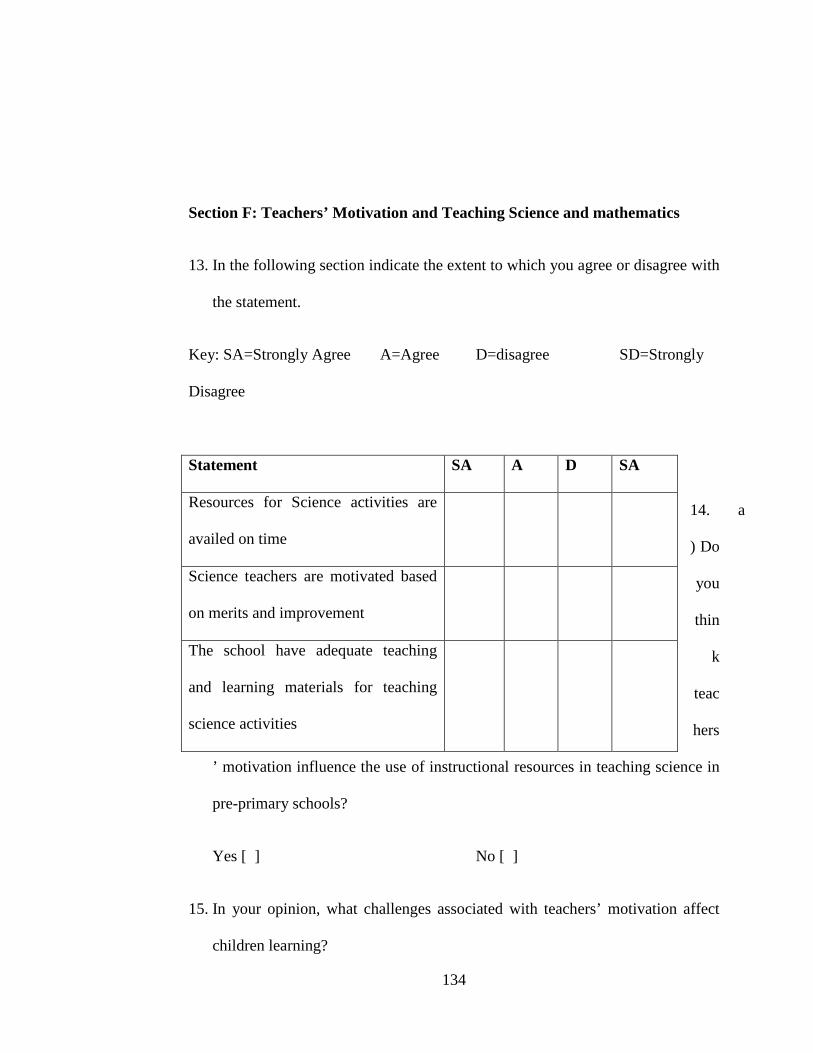
134
Section F: Teachers’ Motivation and Teaching Science and mathematics
13. In the following section indicate the extent to which you agree or disagree with
the statement.
Key: SA=Strongly Agree A=Agree D=disagree SD=Strongly
Disagree
14. a
) Do
you
thin
k
teac
hers
’ motivation influence the use of instructional resources in teaching science in
pre-primary schools?
Yes [ ] No [ ]
15. In your opinion, what challenges associated with teachers’ motivation affect
children learning?
Statement SA A D SA
Resources for Science activities are
availed on time
Science teachers are motivated based
on merits and improvement
The school have adequate teaching
and learning materials for teaching
science activities
135
…………………………………………………………………………………
…………………………………………………………………………………
………………
Section G: Teachers’ Experience and Teaching Science and mathematics
16. a) Do you think teachers’ experience influence the use of instructional
resources in teaching science and mathematics in pre-primary schools?
Yes [ ] No [ ]
b) If Yes, brief explain how it affects.
………………………………………………………………………………………
………………………………………………………………………………………
………………
136
Appendix II: Head Teachers’ Interview Guide
I am a PhD student of Kenyatta University Kenya, intending to conduct a research.
I am therefore going to ask you a few questions related to the study. The purpose
of this study is to establish the extent to which teachers use instructional resources
in teaching science and mathematics in pre-primary schools in Athi-River Sub
County, Kenya. You are kindly requested to respond to the questions below. Be
assured that all the answers you provide will be kept in the strictest confidentiality.
1. Gender……………………………………………………………………….
2. Level of education……………………………………………………….
3. Duration served as a head of pre-primary school?
………………………………
4. How does teachers’ level of education influence the use of instructional
resources in teaching science and mathematics in pre-primary schools?
………………………………………………………………………………
………………………………………………………………………………
What challenges, associated with teachers’ gender, influence the use of
instructional resources in teaching science and mathematics in pre-primary
schools?

137
………………………………………………………………………………
………………………………………………………………………………
Do you think teachers’ attitude influence the use of instructional resources
in teaching science and mathematics in pre-primary
schools?..........................................................................
5. In your opinion, what challenges associated with teachers’ attitude affect
children learning in Science and mathematics?
…………………………………………………………………………………
…………………………………………………………………………………
………………
6. How do you motivate Scienceand mathematics teachers in your school?
…………………………………………………………………………………
…………………………………………………………………………………I
n your opinion, what challenges associated with teachers’ motivation affect
children learning?
…………………………………………………………………………………
…………………………………………………………………………………
Are you satisfied with the teaching personnel in Science and
mathematics?...............................
138
7. How does teachers’ experience influence the use of instructional resources
in teaching science and mathematics in pre-primary schools?
………………………………………………………………………………………
………………………………………………………………………………………
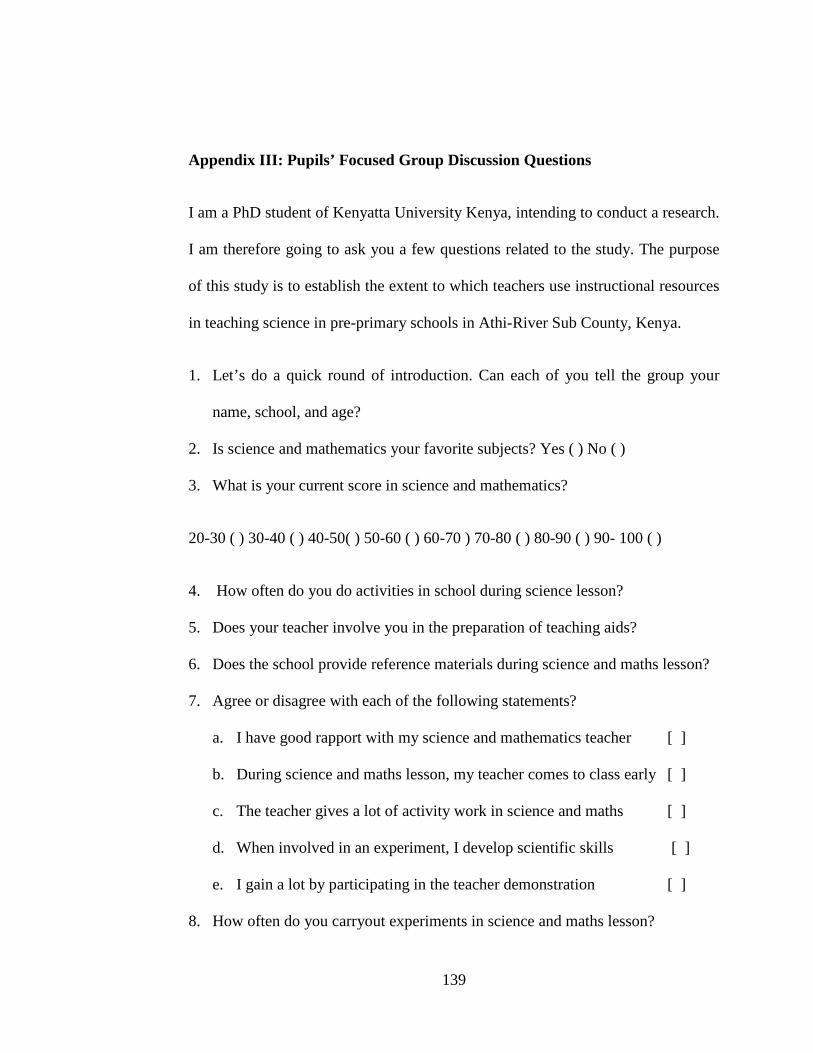
139
Appendix III: Pupils’ Focused Group Discussion Questions
I am a PhD student of Kenyatta University Kenya, intending to conduct a research.
I am therefore going to ask you a few questions related to the study. The purpose
of this study is to establish the extent to which teachers use instructional resources
in teaching science in pre-primary schools in Athi-River Sub County, Kenya.
1. Let’s do a quick round of introduction. Can each of you tell the group your
name, school, and age?
2. Is science and mathematics your favorite subjects? Yes ( ) No ( )
3. What is your current score in science and mathematics?
20-30 ( ) 30-40 ( ) 40-50( ) 50-60 ( ) 60-70 ) 70-80 ( ) 80-90 ( ) 90- 100 ( )
4. How often do you do activities in school during science lesson?
5. Does your teacher involve you in the preparation of teaching aids?
6. Does the school provide reference materials during science and maths lesson?
7. Agree or disagree with each of the following statements?
a. I have good rapport with my science and mathematics teacher [ ]
b. During science and maths lesson, my teacher comes to class early [ ]
c. The teacher gives a lot of activity work in science and maths [ ]
d. When involved in an experiment, I develop scientific skills [ ]
e. I gain a lot by participating in the teacher demonstration [ ]
8. How often do you carryout experiments in science and maths lesson?
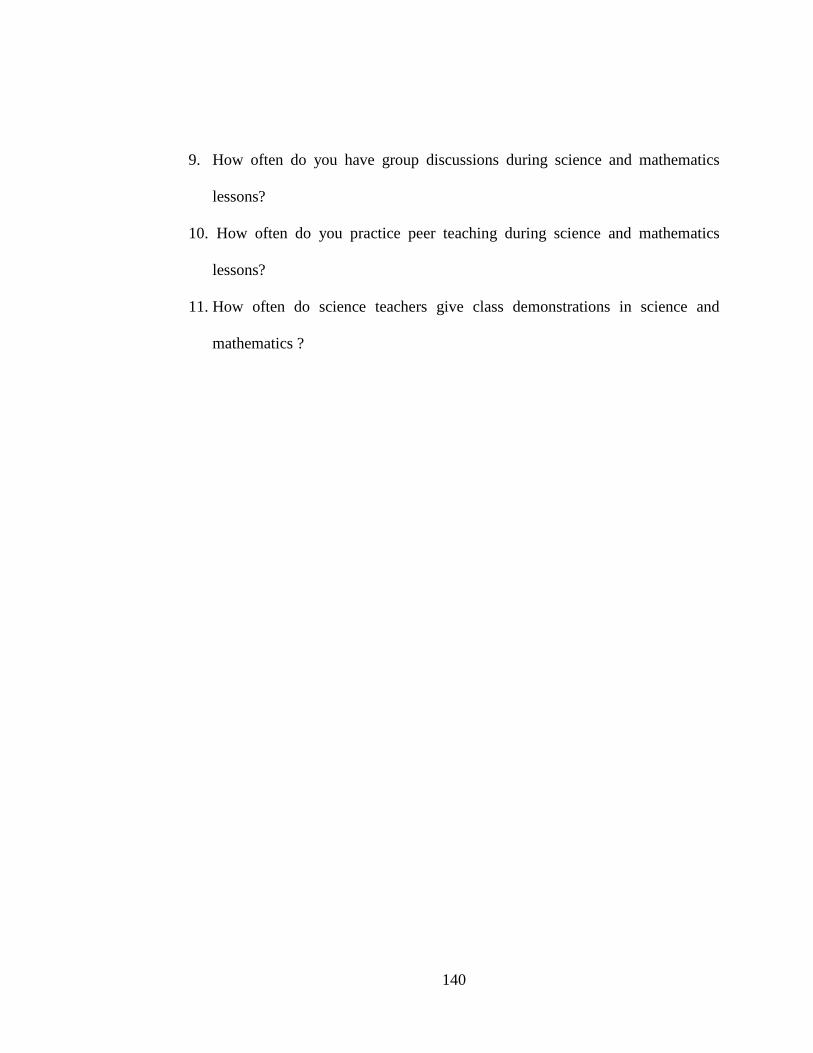
140
9. How often do you have group discussions during science and mathematics
lessons?
10. How often do you practice peer teaching during science and mathematics
lessons?
11. How often do science teachers give class demonstrations in science and
mathematics ?
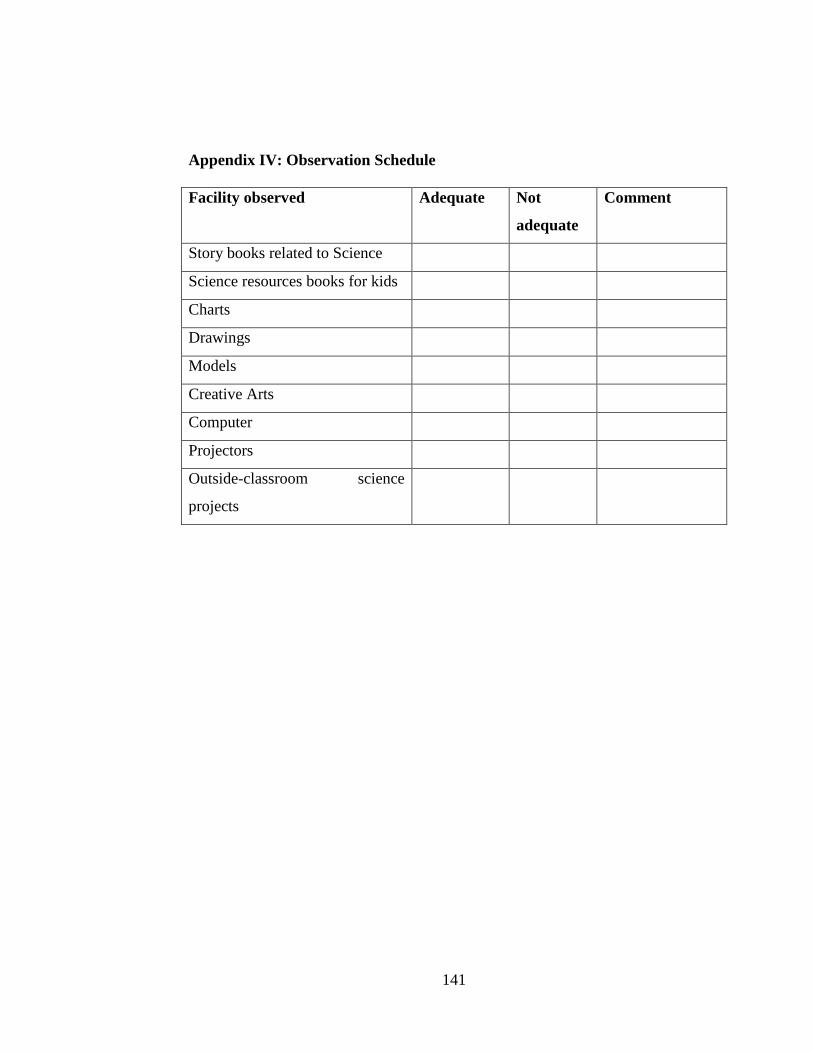
141
Appendix IV: Observation Schedule
Facility observed Adequate Not
adequate
Comment
Story books related to Science
Science resources books for kids
Charts
Drawings
Models
Creative Arts
Computer
Projectors
Outside-classroom science
projects

142
Appendix V: Research Approval from Kenyatta University.
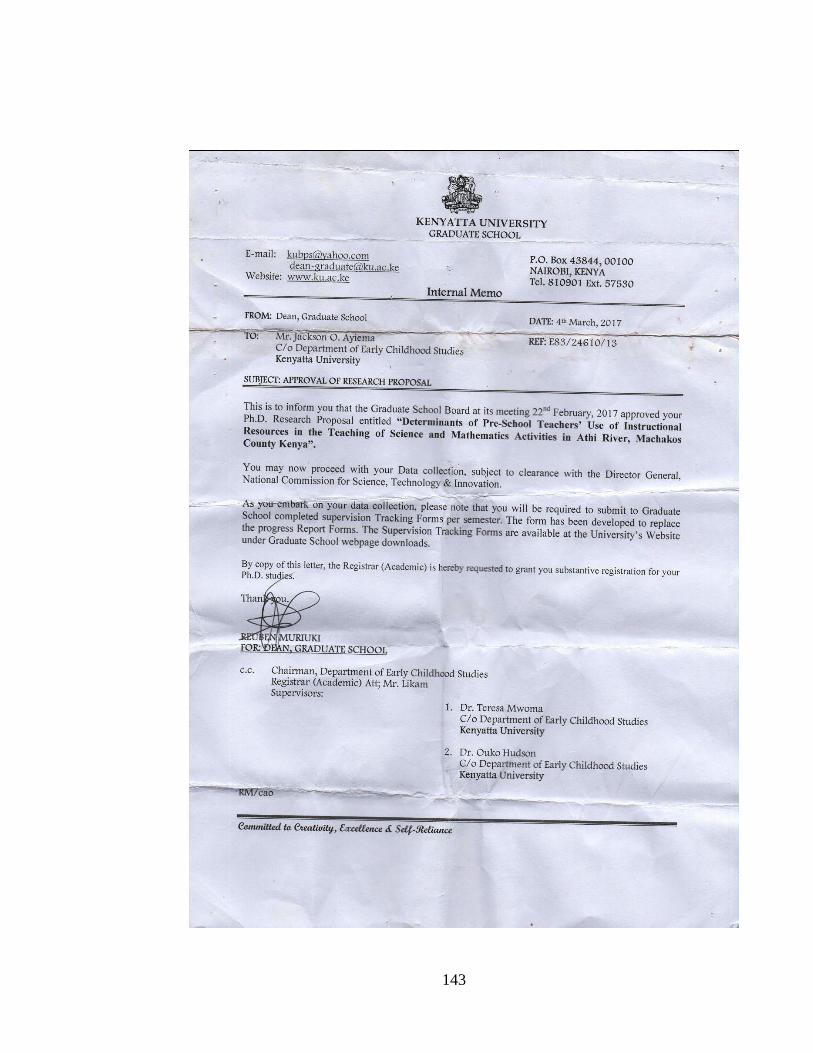
143
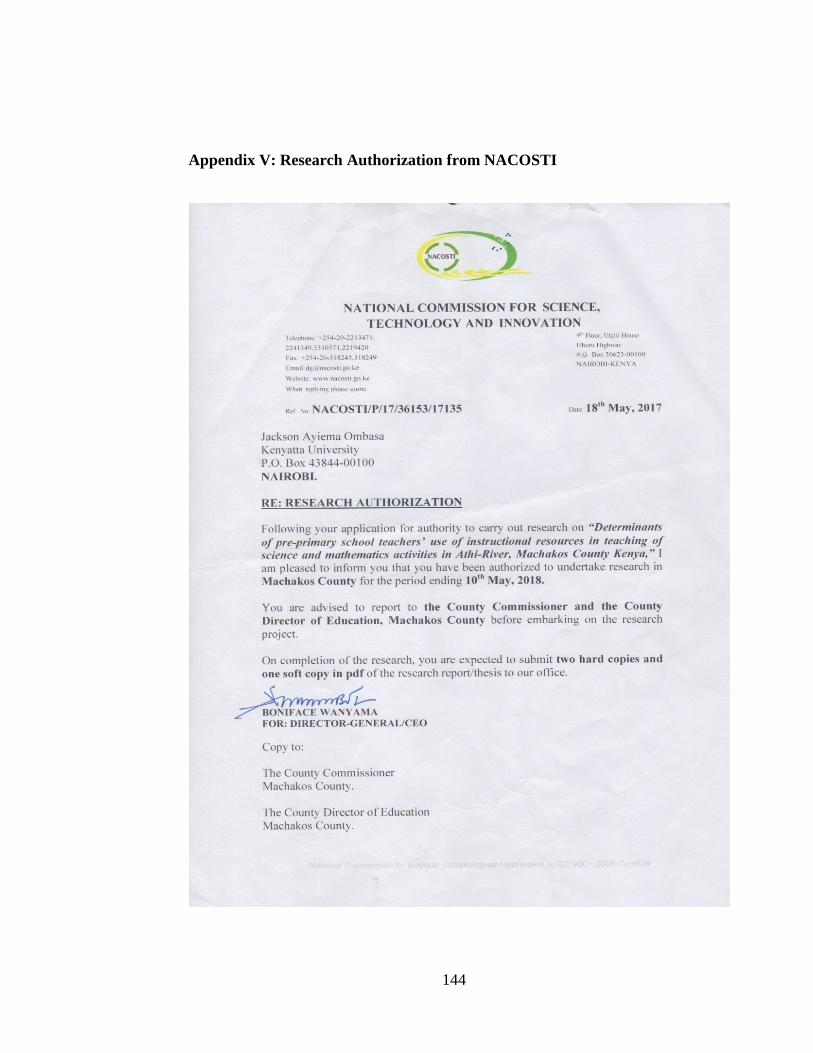
144
Appendix V: Research Authorization from NACOSTI
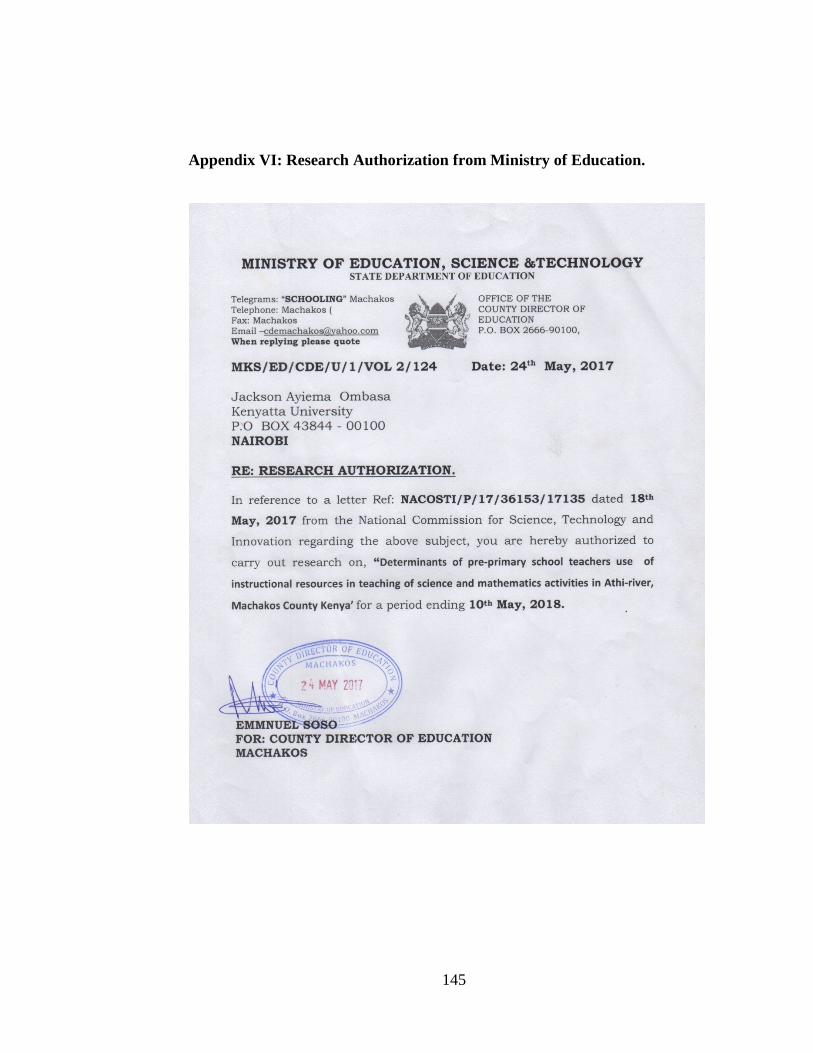
145
Appendix VI: Research Authorization from Ministry of Education.
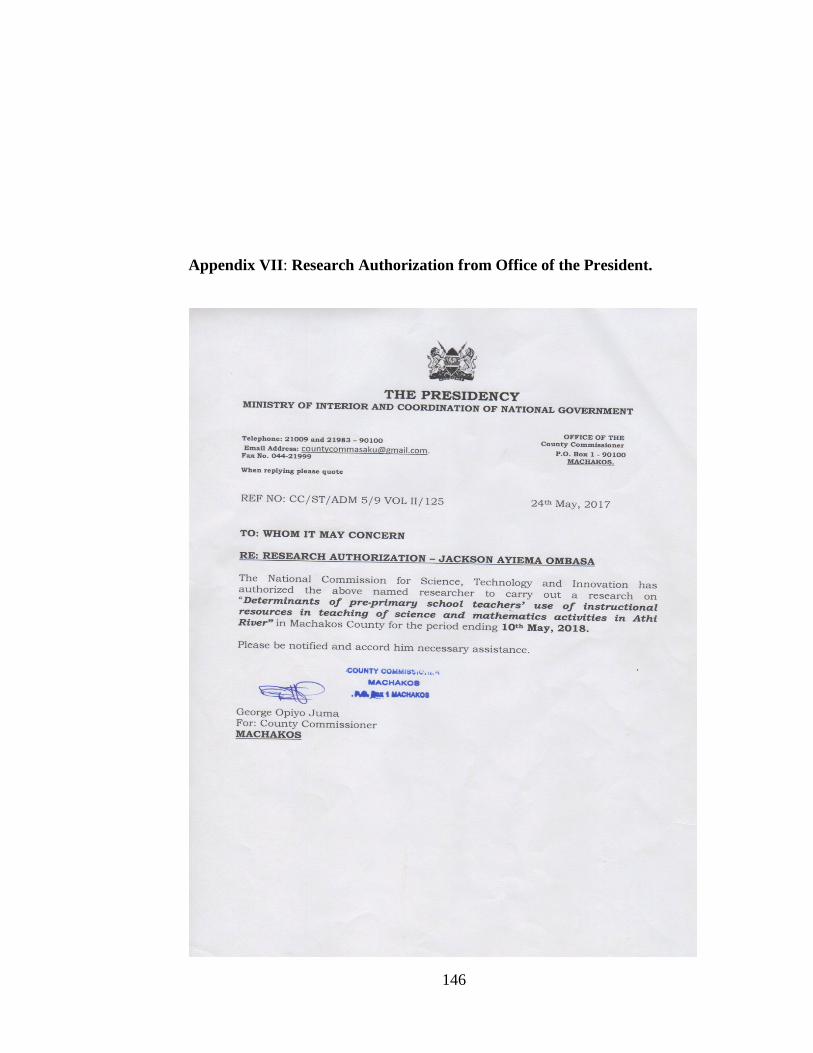
146
Appendix VII: Research Authorization from Office of the President.

147
Appendix:VIII:Reseach Permit From NACOSTI
Print & Online