
Auroville Water Management - AuroRepo
216
Auroville Water Management A pre-feasibility study Auroville Planning and Development Committee July 2007 Final Report
-
Upload
khangminh22 -
Category
Documents
-
view
6 -
download
0
Transcript of Auroville Water Management - AuroRepo
Auroville Water Management A pre-feasibility study
Auroville Planning and Development Committee
July 2007 Final Report
���������� ��
Document title Auroville Water Management A pre-feasibility study
Document short title Pre-feasibility Auroville Water Management Status Final Report
Date July 2007 Client Auroville Planning and Development
Committee Ref erence R001A/JKO/Nijm

- i - R001A/JKO/Nijm Final Report July 2007
- ii - R001A/JKO/Nijm Final Report July 2007
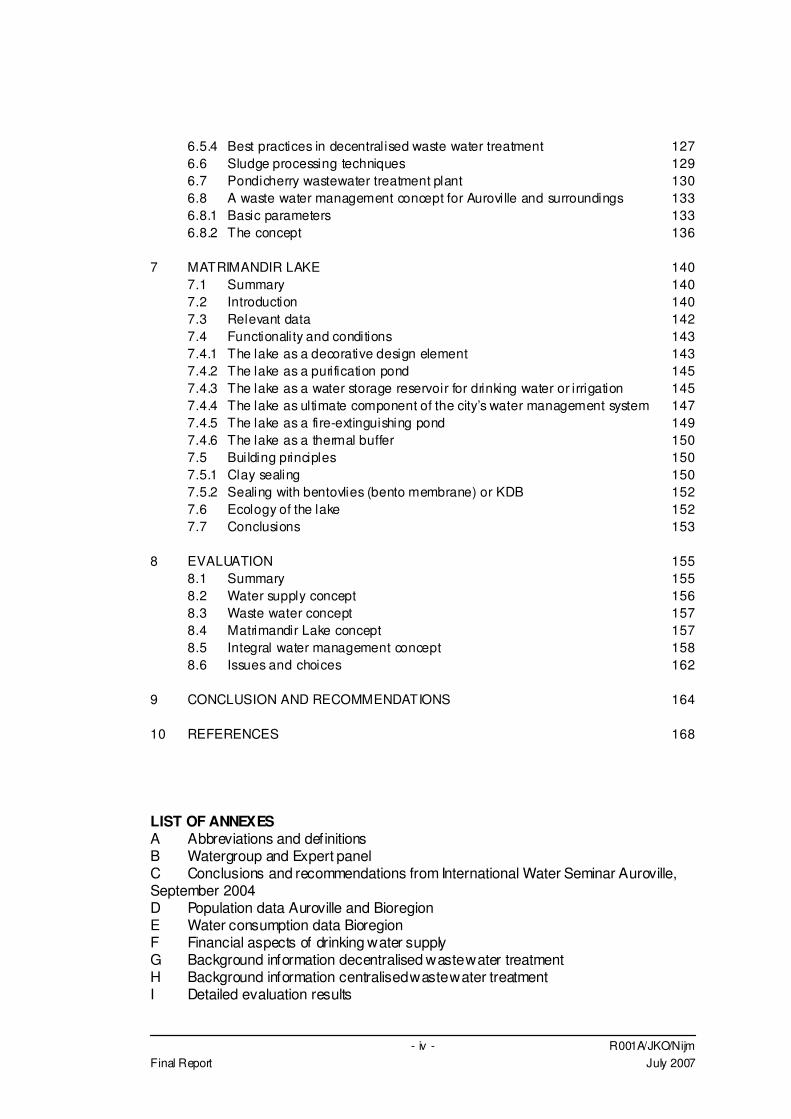
CONTENTS Page
1 EXECUTIVE SUMMARY 2 1.1 Introduction 2 1.2 Resources 3 1.3 Demand 5 1.4 Water supply 6 1.5 Waste water management 7 1.6 Matrimandir Lake 8 1.7 Evaluation 9 1.8 Conclusions and Recommendations 10
2 INTRODUCTION 15 2.1 Summary 15 2.2 Context of the Report 15 2.3 Organisation of the study, client, water group and expert panel 16 2.4 Aim of the study 16 2.5 Definition of the study area and brief description 17 2.5.1 Physical characteristics of the area 18 2.5.2 Administrative boundaries of the area 20 2.5.3 Final geographic area proposed for the study 21
3 RESOURCES 24 3.1 Summary 24 3.2 Groundwater 25 3.2.1 Formations and lithology 25 3.2.2 Hydrogeology 27 3.2.3 Past and present use of groundwater, development and potential 32 3.2.4 Aquifer system 34 3.2.5 Results of recent investigations 34 3.3 Surface water 40 3.3.1 Village ponds, irrigation tanks and their functioning 41 3.3.2 Kaliveli Swamp 42 3.3.3 Usteri Lake 45 3.3.4 Canyons 46 3.3.5 New developments in surface water 49 3.4 Rainwater 49 3.4.1 Introduction 49 3.4.2 Base data and definitions 50 3.4.3 Various origins of harvested rainwater 53 3.4.4 Components of rainwater harvesting systems 54 3.4.5 Present practice in rainwater harvesting and stormwater management in
the study area 59 3.4.6 Centralised (regional) versus decentralised (on-site) stormwater
management 60 3.4.7 Best practices in design of stormwater drainage facilities 61 3.4.8 Stormwater drainage, sustainability and Aurovil le 62 3.4.9 Most recent development in rainwater storage 64
- iii - R001A/JKO/Nijm Final Report July 2007
3.5 Saline water 65 3.5.1 Introduction 65 3.5.2 Desalination processes 65 3.5.3 Other aspects of desalination processe s 67 3.5.4 Source of saline water 71 3.5.5 Desalination in India 71 3.5.6 Scope for desalination in Auroville 72 3.6 Waste water 72 3.6.1 Introduction 72 3.6.2 Waste water from Auroville 73 3.6.3 Waste water from Pondicherry 76 3.6.4 Waste water from villages in the Bioregion 78 3.6.5 Waste water re-use potential 78 3.7 Sustainable water resources management 80 3.7.1 Sustainability and management 80 3.7.2 Definitions of sustainable water management 81 3.7.3 Sustainable Water Management in India 81 3.7.4 Water resources management and sustainable urban planning 82
4 DEMAND 84 4.1 Summary 84 4.2 General 84 4.3 The Auroville Masterplan 86 4.4 Alternative scenario (moderate) 88 4.5 Water Demand 89 4.5.1 Domestic water 90 4.5.2 Irrigation demand 90 4.5.3 Water saving measures 91 4.6 Water demand and future development 92
5 WATER SUPPLY 95 5.1 Summary 95 5.2 Actual situation 96 5.3 Requirements for water supply 97 5.4 Different water supply concepts 98 5.4.1 Design principles and boundary conditions 98 5.4.2 Cost aspects 100 5.4.3 Scalability 100 5.4.4 Centralized water supply 101 5.4.5 Decentralized water supply 109 5.4.6 Combination of centralized and decentralized water supply 111
6 WASTE WATER MANAGEMENT 122 6.1 Summary 122 6.2 Introduction 123 6.3 Centralised versus decentralised treatment 123 6.4 Sustainability in waste water treatment 124 6.5 Decentralised wastewater treatment 125 6.5.1 Introduction of decentralised wastewater treatment 125 6.5.2 Limitation and appropriateness of decentralised wastewater systems 126 6.5.3 Water savings in decentralised waste water management 126
- iv - R001A/JKO/Nijm Final Report July 2007
6.5.4 Best practices in decentralised waste water treatment 127 6.6 Sludge processing techniques 129 6.7 Pondicherry wastewater treatment plant 130 6.8 A waste water management concept for Auroville and surroundings 133 6.8.1 Basic parameters 133 6.8.2 The concept 136
7 MATRIMANDIR LAKE 140 7.1 Summary 140 7.2 Introduction 140 7.3 Relevant data 142 7.4 Functionality and conditions 143 7.4.1 The lake as a decorative design element 143 7.4.2 The lake as a purification pond 145 7.4.3 The lake as a water storage reservoir for drinking water or irrigation 145 7.4.4 The lake as ultimate component of the city’s water management system 147 7.4.5 The lake as a fire-extinguishing pond 149 7.4.6 The lake as a thermal buffer 150 7.5 Building principles 150 7.5.1 Clay sealing 150 7.5.2 Sealing with bentovlies (bento membrane) or KDB 152 7.6 Ecology of the lake 152 7.7 Conclusions 153
8 EVALUATION 155 8.1 Summary 155 8.2 Water supply concept 156 8.3 Waste water concept 157 8.4 Matrimandir Lake concept 157 8.5 Integral water management concept 158 8.6 Issues and choices 162
9 CONCLUSION AND RECOMMENDATIONS 164
10 REFERENCES 168 LIST OF ANNEXES A Abbreviations and definitions B Watergroup and Expert panel C Conclusions and recommendations from International Water Seminar Auroville, September 2004 D Population data Auroville and Bioregion E Water consumption data Bioregion F Financial aspects of drinking water supply G Background information decentralised waste water treatment H Background information centralised waste water treatment I Detailed evaluation results
- v - R001A/JKO/Nijm Final Report July 2007
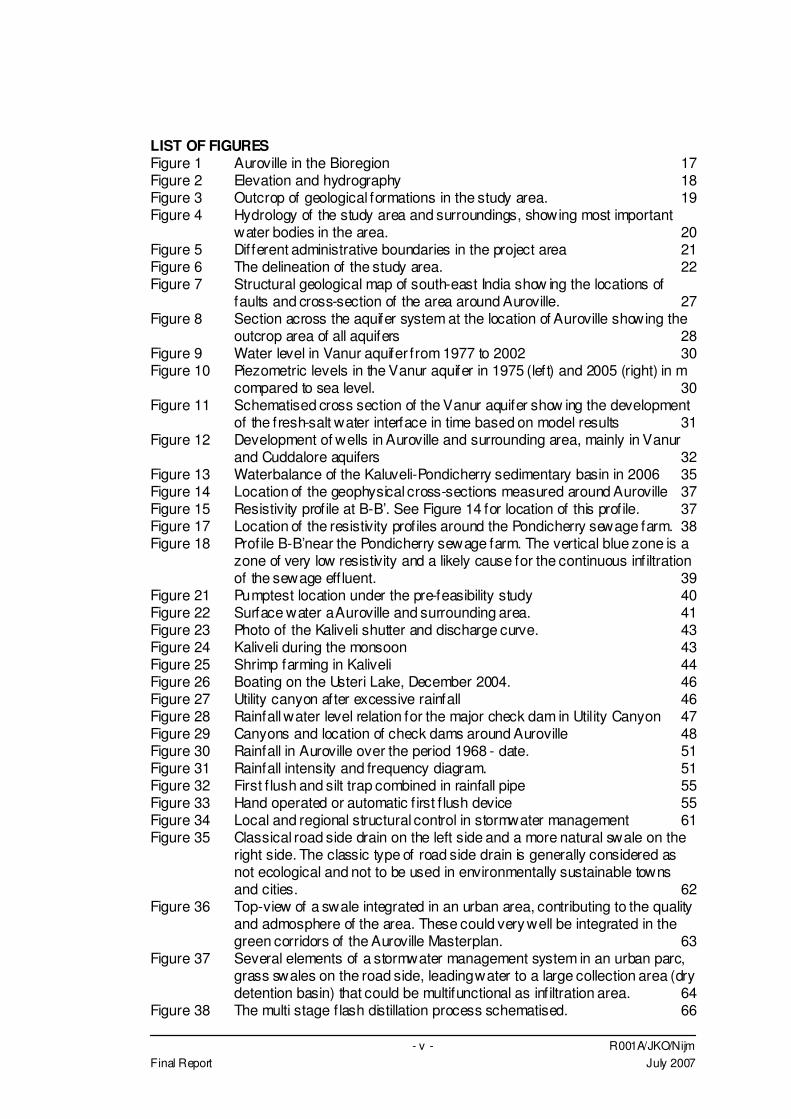
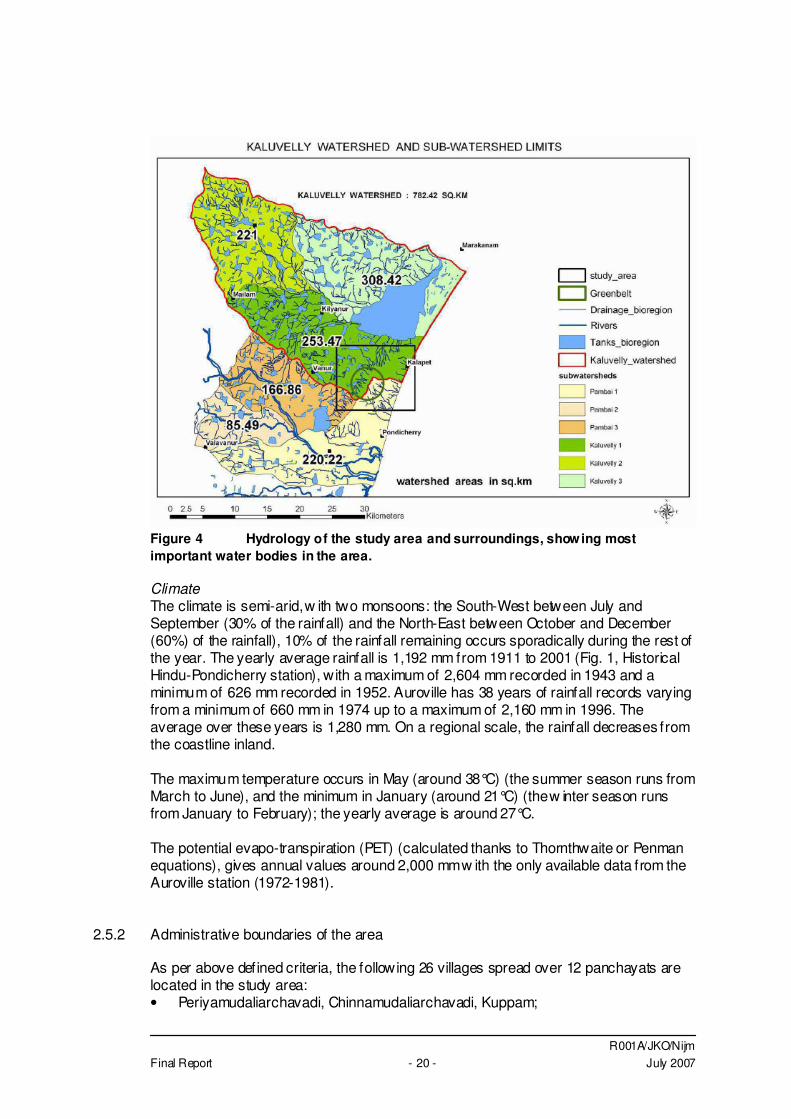
LIST OF FIGURES Figure 1 Auroville in the Bioregion 17 Figure 2 Elevation and hydrography 18 Figure 3 Outcrop of geological formations in the study area. 19 Figure 4 Hydrology of the study area and surroundings, showing most important
water bodies in the area. 20 Figure 5 Different administrative boundaries in the project area 21 Figure 6 The delineation of the study area. 22 Figure 7 Structural geological map of south-east India show ing the locations of
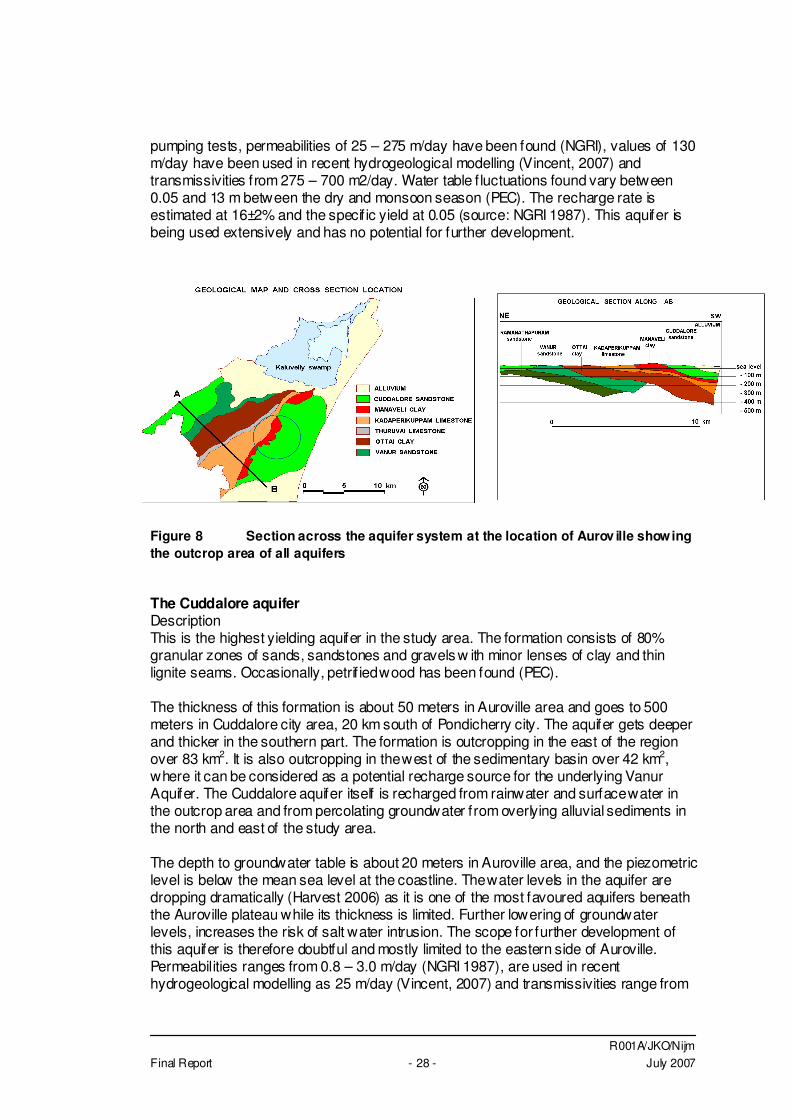
faults and cross-section of the area around Auroville. 27 Figure 8 Section across the aquifer system at the location of Auroville showing the
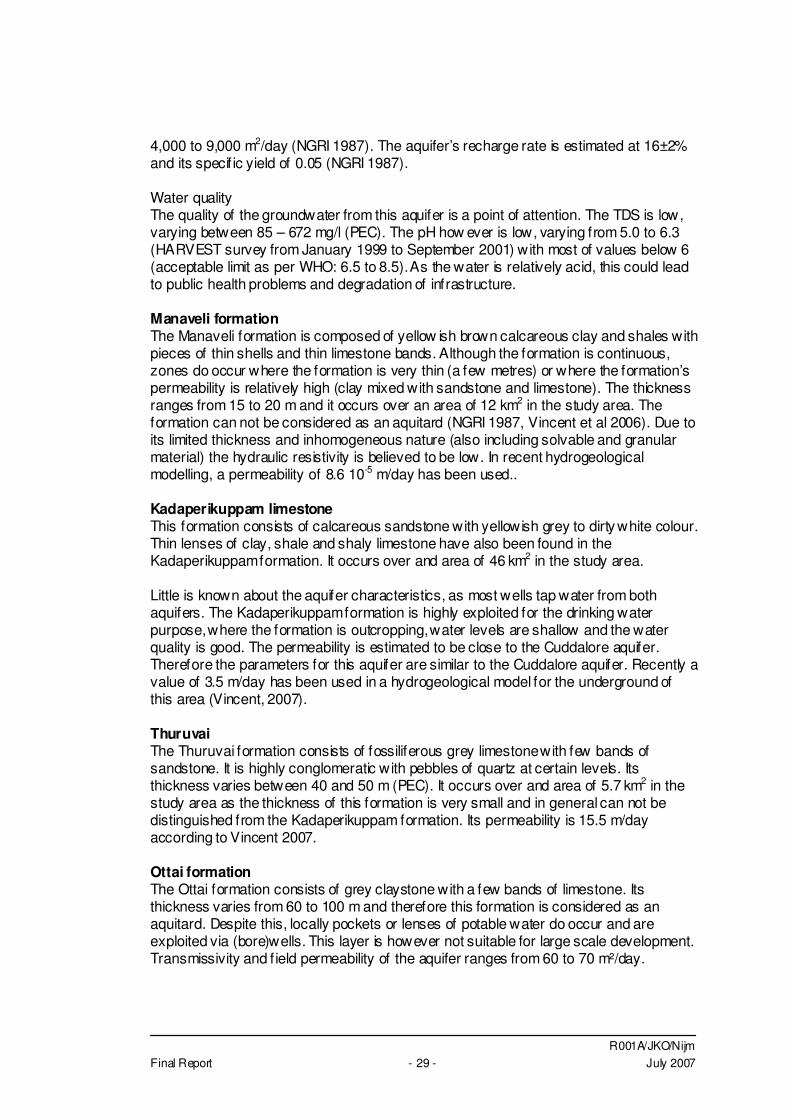
outcrop area of all aquifers 28 Figure 9 Water level in Vanur aquifer from 1977 to 2002 30 Figure 10 Piezometric levels in the Vanur aquifer in 1975 (left) and 2005 (right) in m
compared to sea level. 30 Figure 11 Schematised cross section of the Vanur aquifer show ing the development
of the fresh-salt water interface in time based on model results 31 Figure 12 Development of wells in Auroville and surrounding area, mainly in Vanur
and Cuddalore aquifers 32 Figure 13 Waterbalance of the Kaluveli-Pondicherry sedimentary basin in 2006 35 Figure 14 Location of the geophysical cross-sections measured around Auroville 37 Figure 15 Resistivity profile at B-B’. See Figure 14 for location of this profile. 37 Figure 17 Location of the resistivity profiles around the Pondicherry sewage farm. 38 Figure 18 Profile B-B’near the Pondicherry sewage farm. The vertical blue zone is a
zone of very low resistivity and a likely cause for the continuous infiltration of the sewage eff luent. 39
Figure 21 Pumptest location under the pre-feasibility study 40 Figure 22 Surface water a Auroville and surrounding area. 41 Figure 23 Photo of the Kaliveli shutter and discharge curve. 43 Figure 24 Kaliveli during the monsoon 43 Figure 25 Shrimp farming in Kaliveli 44 Figure 26 Boating on the Usteri Lake, December 2004. 46 Figure 27 Utility canyon after excessive rainfall 46 Figure 28 Rainfall water level relation for the major check dam in Utility Canyon 47 Figure 29 Canyons and location of check dams around Auroville 48 Figure 30 Rainfall in Auroville over the period 1968 - date. 51 Figure 31 Rainfall intensity and frequency diagram. 51 Figure 32 First f lush and silt trap combined in rainfall pipe 55 Figure 33 Hand operated or automatic f irst f lush device 55 Figure 34 Local and regional structural control in stormwater management 61 Figure 35 Classical road side drain on the left side and a more natural swale on the
right side. The classic type of road side drain is generally considered as not ecological and not to be used in environmentally sustainable towns and cities. 62
Figure 36 Top-view of a swale integrated in an urban area, contributing to the quality and admosphere of the area. These could very well be integrated in the green corridors of the Auroville Masterplan. 63
Figure 37 Several elements of a stormwater management system in an urban parc, grass swales on the road side, leading water to a large collection area (dry detention basin) that could be multifunctional as infiltration area. 64
Figure 38 The multi stage f lash distillation process schematised. 66
- vi - R001A/JKO/Nijm Final Report July 2007
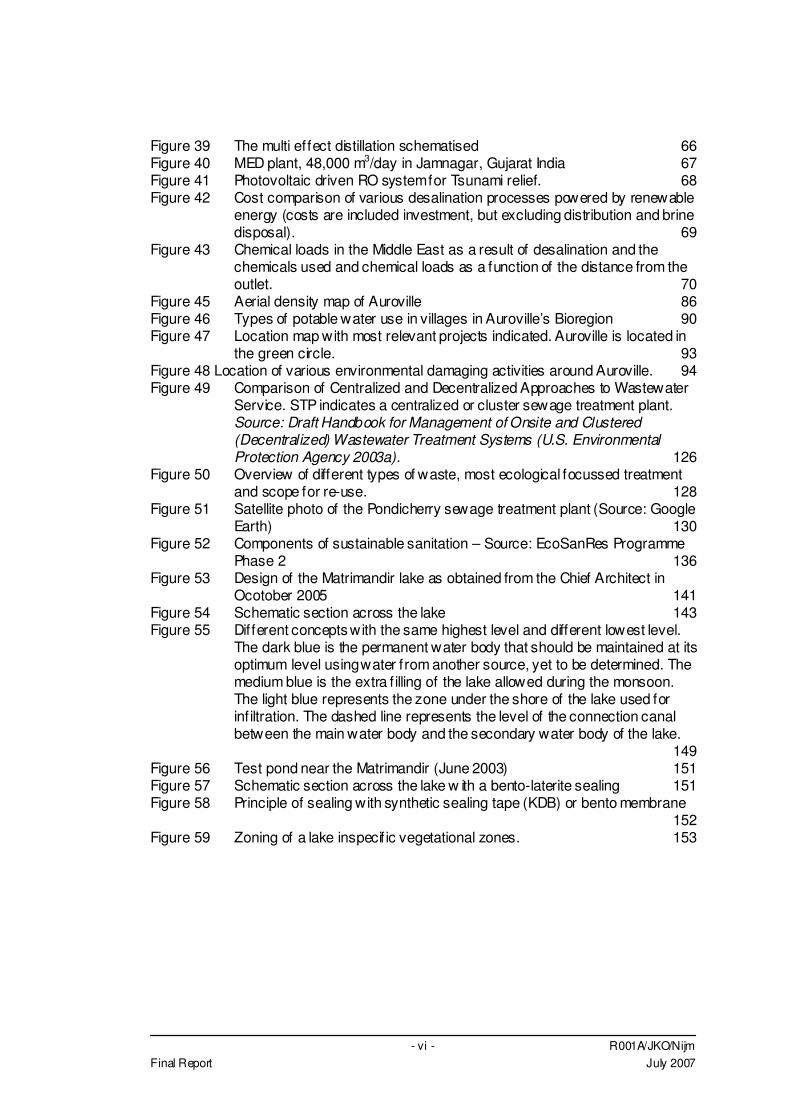
Figure 39 The multi effect distillation schematised 66 Figure 40 MED plant, 48,000 m3/day in Jamnagar, Gujarat India 67 Figure 41 Photovoltaic driven RO system for Tsunami relief. 68 Figure 42 Cost comparison of various desalination processes powered by renewable
energy (costs are included investment, but excluding distribution and brine disposal). 69
Figure 43 Chemical loads in the Middle East as a result of desalination and the chemicals used and chemical loads as a function of the distance from the outlet. 70
Figure 45 Aerial density map of Auroville 86 Figure 46 Types of potable water use in villages in Auroville’s Bioregion 90 Figure 47 Location map with most relevant projects indicated. Auroville is located in
the green circle. 93 Figure 48 Location of various environmental damaging activities around Auroville. 94 Figure 49 Comparison of Centralized and Decentralized Approaches to Wastewater
Service. STP indicates a centralized or cluster sewage treatment plant. Source: Draft Handbook for Management of Onsite and Clustered (Decentralized) Wastewater Treatment Systems (U.S. Environmental Protection Agency 2003a). 126
Figure 50 Overview of different types of waste, most ecological focussed treatment and scope for re-use. 128
Figure 51 Satellite photo of the Pondicherry sewage treatment plant (Source: Google Earth) 130
Figure 52 Components of sustainable sanitation – Source: EcoSanRes Programme Phase 2 136
Figure 53 Design of the Matrimandir lake as obtained from the Chief Architect in Ocotober 2005 141
Figure 54 Schematic section across the lake 143 Figure 55 Different concepts with the same highest level and different lowest level.
The dark blue is the permanent water body that should be maintained at its optimum level using water from another source, yet to be determined. The medium blue is the extra f illing of the lake allowed during the monsoon. The light blue represents the zone under the shore of the lake used for inf iltration. The dashed line represents the level of the connection canal between the main water body and the secondary water body of the lake. 149
Figure 56 Test pond near the Matrimandir (June 2003) 151 Figure 57 Schematic section across the lake w ith a bento-laterite sealing 151 Figure 58 Principle of sealing with synthetic sealing tape (KDB) or bento membrane
152 Figure 59 Zoning of a lake inspecif ic vegetational zones. 153
- vii - R001A/JKO/Nijm Final Report July 2007
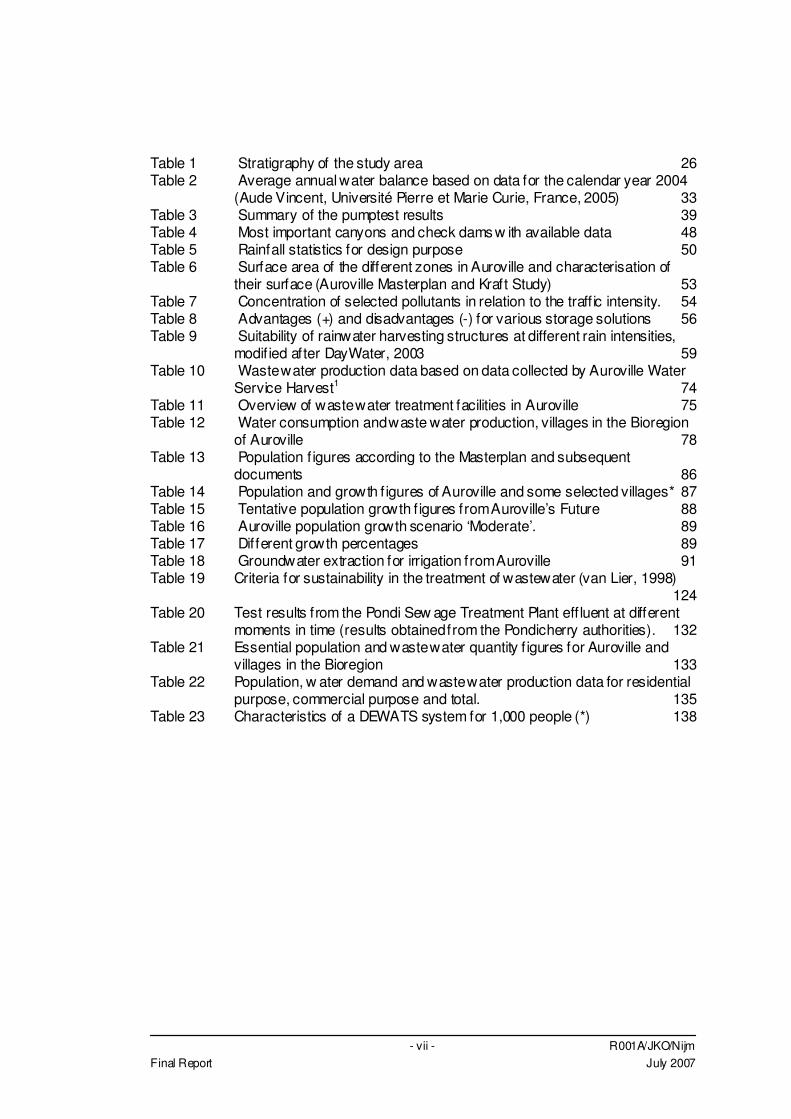
Table 1 Stratigraphy of the study area 26 Table 2 Average annual water balance based on data for the calendar year 2004
(Aude Vincent, Université Pierre et Marie Curie, France, 2005) 33 Table 3 Summary of the pumptest results 39 Table 4 Most important canyons and check dams w ith available data 48 Table 5 Rainfall statistics for design purpose 50 Table 6 Surface area of the different zones in Auroville and characterisation of
their surface (Auroville Masterplan and Kraft Study) 53 Table 7 Concentration of selected pollutants in relation to the traff ic intensity. 54 Table 8 Advantages (+) and disadvantages (-) for various storage solutions 56 Table 9 Suitability of rainwater harvesting structures at different rain intensities,
modif ied after DayWater, 2003 59 Table 10 Waste water production data based on data collected by Auroville Water
Service Harvest1 74 Table 11 Overview of waste water treatment facilities in Auroville 75 Table 12 Water consumption and waste water production, villages in the Bioregion
of Auroville 78 Table 13 Population f igures according to the Masterplan and subsequent
documents 86 Table 14 Population and growth f igures of Auroville and some selected villages* 87 Table 15 Tentative population growth f igures from Auroville’s Future 88 Table 16 Auroville population growth scenario ‘Moderate’. 89 Table 17 Different growth percentages 89 Table 18 Groundwater extraction for irrigation from Auroville 91 Table 19 Criteria for sustainability in the treatment of wastewater (van Lier, 1998)
124 Table 20 Test results from the Pondi Sew age Treatment Plant eff luent at different
moments in time (results obtained from the Pondicherry authorities). 132 Table 21 Essential population and waste water quantity f igures for Auroville and
villages in the Bioregion 133 Table 22 Population, w ater demand and waste water production data for residential
purpose, commercial purpose and total. 135 Table 23 Characteristics of a DEWATS system for 1,000 people (*) 138

R001A/JKO/Nijm Final Report - 2 - July 2007
1 EXECUTIVE SUMMARY
1.1 Introduction
The start Auroville is presently wrestling with the issue of water resources management. A Masterplan prepared in 2003 by Harald Kraft has lead to severe opposition from within Auroville and from outside. Several international experts have commented the masterplan as un-sustainable, unrealistic and not in line with Auroville’s principles. A small group in Auroville is still supporting the Masterplan and during an international water conference held in September 2003 it was decided to prepare an alternative pre-feasibility study for sustainable water management for Auroville. Study Area A self-appointed Watergroup made up from Aurovillians w ith signif icant experience in water management and assisted by an international committee made up from experts in the f ield of water supply and water management from Israel,France, Germany and The Netherlands innitiated and coordinated the pre-feasibility study. It was soon agreed that only Auroville was a too limited scope for this study and that it shouldbe extended. A study area of 70 km2 was agreed based on hydro(geo)logical and administrative conditions.
Figure 1 The study area Aim of the study The aim of the study is to come to an objective evaluation of the demand and available resources and to propose a most suitable water management concept for Auroville and the study area. Starting in 2004, the study was completed in 2007 w ith the f inal results presented in Auroville in April 2007.
R001A/JKO/Nijm Final Report - 3 - July 2007
1.2 Resources
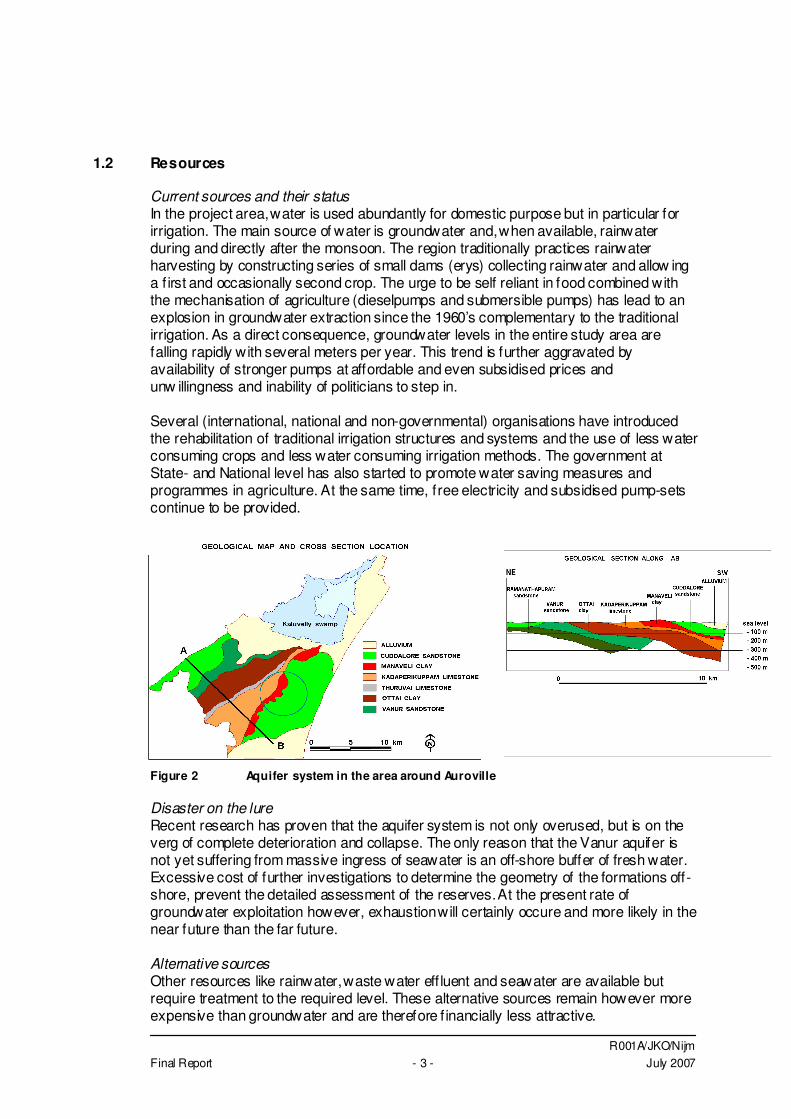
Current sources and their status In the project area, water is used abundantly for domestic purpose but in particular for irrigation. The main source of water is groundwater and, when available, rainwater during and directly after the monsoon. The region traditionally practices rainwater harvesting by constructing series of small dams (erys) collecting rainwater and allow ing a f irst and occasionally second crop. The urge to be self reliant in food combined with the mechanisation of agriculture (dieselpumps and submersible pumps) has lead to an explosion in groundwater extraction since the 1960’s complementary to the traditional irrigation. As a direct consequence, groundwater levels in the entire study area are falling rapidly with several meters per year. This trend is further aggravated by availability of stronger pumps at affordable and even subsidised prices and unw illingness and inability of politicians to step in. Several (international, national and non-governmental) organisations have introduced the rehabilitation of traditional irrigation structures and systems and the use of less water consuming crops and less water consuming irrigation methods. The government at State- and National level has also started to promote water saving measures and programmes in agriculture. At the same time, free electricity and subsidised pump-sets continue to be provided.
Figure 2 Aquifer system in the area around Auroville Disaster on the lure Recent research has proven that the aquifer system is not only overused, but is on the verg of complete deterioration and collapse. The only reason that the Vanur aquifer is not yet suffering from massive ingress of seawater is an off-shore buffer of fresh water. Excessive cost of further investigations to determine the geometry of the formations off-shore, prevent the detailed assessment of the reserves. At the present rate of groundwater exploitation however, exhaustion will certainly occure and more likely in the near future than the far future. Alternative sources Other resources like rainwater, waste water eff luent and seawater are available but require treatment to the required level. These alternative sources remain however more expensive than groundwater and are therefore f inancially less attractive.
R001A/JKO/Nijm Final Report - 4 - July 2007
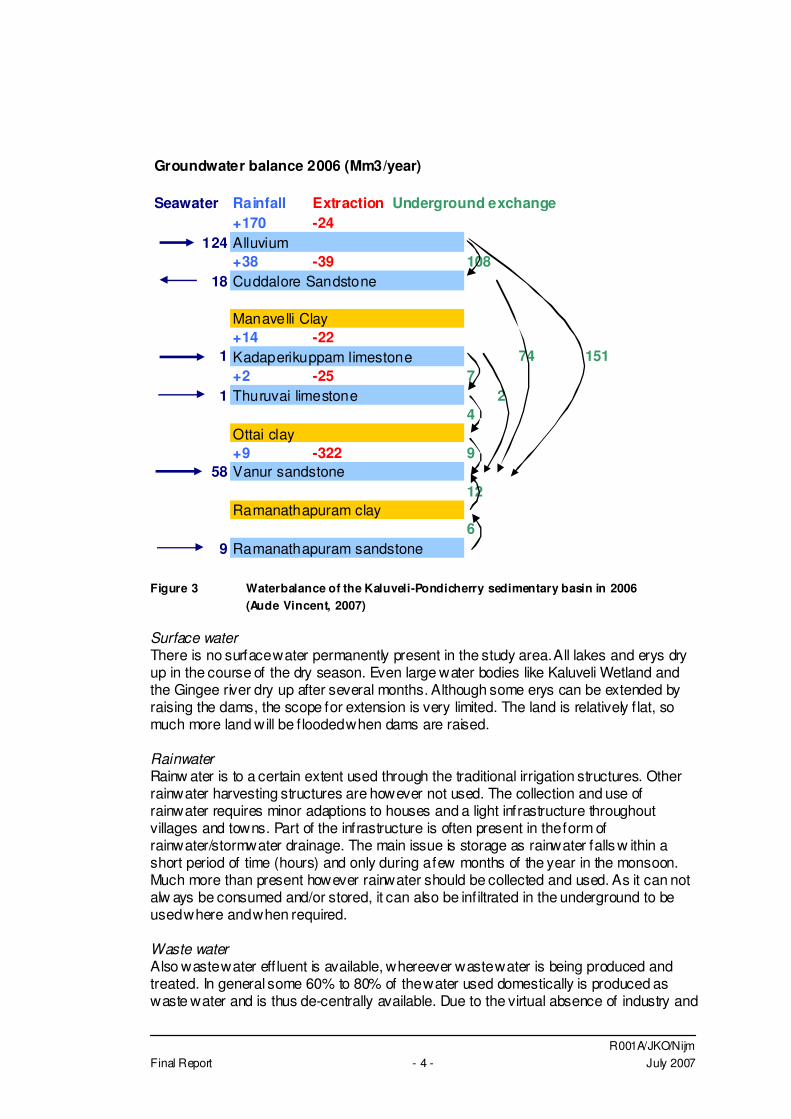
Groundwater balance 2006 (Mm3/year)
Seawater Rainfall Extraction Underground exchange+170 -24
124 Alluvium+38 -39 108
18 Cuddalore Sandstone
Manavelli Clay+14 -22
1 Kadaperikuppam limestone 74 151+2 -25 7
1 Thuruvai limestone 24
Ottai clay+9 -322 9
58 Vanur sandstone12
Ramanathapuram clay6
9 Ramanathapuram sandstone
Figure 3 Waterbalance of the Kaluveli-Pondicherry sedimentary basin in 2006
(Aude Vincent, 2007) Surface water There is no surface water permanently present in the study area. All lakes and erys dry up in the course of the dry season. Even large water bodies like Kaluveli Wetland and the Gingee river dry up after several months. Although some erys can be extended by raising the dams, the scope for extension is very limited. The land is relatively f lat, so much more land will be f looded when dams are raised. Rainwater Rainw ater is to a certain extent used through the traditional irrigation structures. Other rainwater harvesting structures are however not used. The collection and use of rainwater requires minor adaptions to houses and a light infrastructure throughout villages and towns. Part of the infrastructure is often present in the form of rainwater/stormwater drainage. The main issue is storage as rainwater falls w ithin a short period of time (hours) and only during a few months of the year in the monsoon. Much more than present however rainwater should be collected and used. As it can not alw ays be consumed and/or stored, it can also be infiltrated in the underground to be used where and when required. Waste water Also waste water eff luent is available, whereever waste water is being produced and treated. In general some 60% to 80% of the water used domestically is produced as waste water and is thus de-centrally available. Due to the virtual absence of industry and
R001A/JKO/Nijm Final Report - 5 - July 2007
workshops in Auroville and surrounding area, the sewage can be re-usd w ith limited treatment. The treatment can be organised in a de-centralised way per Auroville community or group of communities in case these are located nearby and per village or neighbourhood in the surrounding areas. Commercial activities can have treatment at source for the particular constituents. Waste water from Pondicherry is centrally available at the waste water treatment plant. If a suitable treatment method can be developed, this water could be used in an organised way for irrigation purposes. Sewage can be treated to a level that it can either be used as irrigation water or can be infiltrated in the underground. Seawater Seawater and brackish water from the coastal aquifers can be desalinised to serve as domestic water. Desalinised seawater could never serve as irrigation water due to the high cost related to desalination. The costs are mainly related to the high energy use of the process. Renewable energy (wind and solar) can be used to a certain extent to reduce energy costs but require large investments. The process of desalination produces a considerable amount of brine mixed with chemicals. This eff luent needs to be disposed off which often results in opposition of population concerned. Sustainability Further use of groundwater is not sustainable and a single best alternative source is not available. Sustainability and appropriateness are important to prevent similar problems in the future. A combination of sources, each used for the best purpose is therefore the key to sustainability. Groundwater can only continue to be used IF extraction is strongly reduced AND massive recharge is undertaken to equilibrium the water balance.
1.3 Demand
Population The city of Auroville is presently with 3,500 inhabitants and dependants a small entity in the Bioregion w ith which it is interacting. The much smaller study area ( 70 km2 for the study area against some 1,500 km2 for the Bioregion) has some 75,000 inhabitants at present. In the year 2025 Auroville w ill have theoretically 50,000 inhabitants and the study area will have 146,500 inhabitants. To achieve this number in 2025, Auroville w ill have to grow with more than 19% average for the coming 20 years, which is beyond realistic f igures. Based on past developments, it is however impossible to predict how Auroville w ill grow in the coming years. Water demand Water demand in the Aurobille Masterplan is 200 litre per capita per day (lcd), of which only 130 lcd needs to be of potable quality. The Kraft study and other studies including this one, maintain 150 lcd as demand figure for Auroville. Certain communities in Auroville use as much as 300 lcd. Irrigation demand (small plots and gardens) in Auroville is limited to some 1,575 m3/day but this will increase w ith the development of the Matrimandir- and other gardens in Auroville. The water consumption in the study area is a multitude of the above f igures. For irrigation in the study area, some 56 Mm3/yr is being used from groundwater only. For domestic purpose, 1.4 Mm3/yr is being used.
userr
Resaltar
userr
Resaltar
userr
Resaltar
userr
Resaltar
R001A/JKO/Nijm Final Report - 6 - July 2007
Scope for reduction There is scope for reduction of water use in Auroville. This mainly lies with the reduction of the use of water for gardening by reducing gardens or using recycled waste water. Also ecological-sanitation can be used to reduce water use. An actual use of 100 – 140 lcd would be realistic for Auroville. Dual w atersupply (potable water AND grey water) within housholds is not recommended as risks are too high and benefits are relatively low. Only the use of grey water for gardening and irrigation is recommended. The domestic use in lcd in the project area is low but could still be further reduced by the reduction of wastage. The main water use reduction can be established by the reduction of water for irrigation. Numerous possibilities exist such as rehabilitation of rainwater irrigation structures and facilities, introduction of low-water yielding crops, introduction of sprinkler and drip irrigation and stoppage of irrigation of crops that do not need irrigation. It is not possible to achieve any reduction without intensive campaigns of promotion and eduction in water saving measures and techniques and Auroville could play a key role in this.
1.4 Water supply
Present practice in Auroville Currently all of Auroville’s domestic water originates from wells. These wells are not alw ays shared between communities and there is no organisation is on the ground to coordinate the construction of wells, use of materials, standardisation of pumps or billing. Some shortage exists in the centre of Auroville where the Vanur aquifer is being tapped. Sharing of wells could solve the problem for the time being but more permanent solutions need to be found. The east side of Auroville uses the Cuddalore aquifer for its water supply. This is a very productive aquifer resulting in relatively high consumption per capita in this area of Auroville. Recent investigations have shown that groundwater in general and the Vanur aquifer in particular is not sustainable on the long term. The villages In the villages, supply of domestic water occurs from borewells through overhead tanks to standpipes and occasionally house connections. Systems are not reliable and as a result illegal tapping points are made causing the system to further deteriorate. Concepts for water supply Several concepts for water supply have been evaluated, ranging from groundwater only to combinations of groundwater, recycled waste water, rainwater and desalinised seawater. This evaluation clearly shows that mixed or hybrid systems perform best in all aspects (technical, social, environmental and f inancial). As Auroville at present and in the near future can not be considered as a city, centralised water supply is neither required nor feasible. Water supply needs to be coordinated though and on the long term desalinised brackish or seawater may gradually replace groundwater as a source for domestic water supply.
userr
Resaltar
userr
Resaltar
userr
Resaltar
userr
Resaltar
userr
Resaltar
R001A/JKO/Nijm Final Report - 7 - July 2007
Scalability is important as the growth of Auroville is unpredictable. Groundwater can continue to be used but at the same time requires massive recharge and strong reduction of groundwater extraction for agricultural purpose. Auroville w ith 1,800 inhabitants has very limited resources for water supply infrastructure. At present there is also no tariff structure and water fees are arranged per community and only cover operational expenses. As the costs vary per community following pump type, water level and number of ‘customers’ Auroville could best introduce a unif ied tariff structure covering operation, maintenance and future investments to a certain extent. A ‘Water organisation’ would then be responsible for the introduction of supply standards and billing and payments. This organisation could as control production and consumption and introduce water saving devices and practices where needed. Water supply organised by Auroville should be further extended to the villages in the Bioregion. Less dependency should be created from groundwater. Treated rainwater during monsoon and desalinised brackish water or seawater in the dry season are best alternatives. This should go hand-in-hand with waste water management and rainwater harvesting. Supply of irrigation water from groundwater should be strongly reduced to be in balance with recharge. Traditional irrigation structures should be rehabilitated and where possible extended to reduce dependence on groundwater. Also harvested rainwater and recycled waste water should be used combined with introduction of water saving measures, -crops and -irrigation techniques.
1.5 Waste water management
Present practice in Auroville Waste water is relatively well organised in Auroville. Some 60% of the total quantity of 655 m3 waste water per day is treated and part of this is being re-used, 40% is disposed in soak pits. Optimisation of decentralised waste water treatment techniques have resulted in the general adoption of baff le tank reactors w ith polishing ponds as most succesfull technique under the present circumstances. Waste water treatment could best be better coordinated with baff le tank reactors and polishing ponds as the standard for Auroville. Situation in villages The situation in the studyarea isless positive. Virtually none of the 3,200 m3 of waste water is treated and re-used. Black waste water (toilets) is generally deposited in soak pits while grey waste water from washing, cooking and cleaning is generally drained away by gravity. Scope for further optimisation The treatment of waste water should be further organised and optimised per community or neighbouring comminities could be connected to one treatment facilitiy while maintaining a decentralised approach for the near future. Facilities need to be provided for the structural re-use of the eff luent for gardening or irrigation and allow any excess eff luent to inf iltrate. Multi-criteria analysis clearly shows that a decentralised approach combined with ecological sanitation f its best w ith Auroville’s ideals and present size.
userr
Resaltar
userr
Resaltar
userr
Resaltar
userr
Resaltar
userr
Resaltar
R001A/JKO/Nijm Final Report - 8 - July 2007
In the villages much could be gained by decentralised waste water treatment through the introduction of baff le tank reactors and polishing ponds in villages in the study area. This would necessitate the construction of sewers and the introduction of the re-use of treated waste water for irrigation and infiltration. At the same time, this wouldreduce the use of groundwater. Pondicherry waste water treatment plant This waste water teratment plant presently produces 13 million litre per day (MLD) of eff luent (poorly treated waste water) that is disposed in an open areafrom where it inf iltrates into the undergroung. The constitution of the waste water is only known to a limited extent and there are strong indications that the waste water contains reminants of industrial activities in Pondicherry. The coming 30 years the treatment plant is expected to be extended to 70-80 MLD. His huge quantity offers in principle a great opportunity to reduce the dependency on groundwater once a suitable and suff icient treatment is used. The eff luent could then either be used directly in irrigation or could be infiltrated at a suitable location into the underground. Although Auroville would interfere w ith the responsibility of Pondicherry to treat its own waste water, this opportunity is too valuable to be unused or at least unexploited. Presently innitiatives are developed by Auroville’s CSR in cooperation w ith MIT and the Smithsonian Institute to develop natural treatment methods for the Pondicherry sewage by using algae. These algae could be used to produce fertiliser or generate bio-energy which could in principle provide the treatment plant w ith the required energy.
1.6 Matrimandir Lake
Origin of thelake idea A lake around the Matrimandir has been a vision of the founder of Auroville and since then is the long cherished wish of many Aurovilians. Such a lake has been designed by Auroville’s Chief Architect and ideally should have a signif icant function in water management. Design and function of the lake Studying the various functions of a lake around the Matrimandir, it is concluded that the aesthetical boundary conditions set by the Chief Architect can not be combined with the required role in water management. Therefore it is advised to allow the lake to f luctuate more in accordance with the seasons and to vary in size as well. With an excess of water, large zones along the shore of the lake could inundate at the same time allow ing reeds to f ilter the water in the lake. In the dry season the water receeds to a minimal shap and level of the lake that can be maintained by supplementing water from groundwater. Excess water should be infiltrated to close the water balance for the lake. The absolute level of the lake could be slightly reduced to allow run-off water from the oval to be f iltered before entering the lake. Still dikes will have to be constructed at the western part of the lake to prevent the area around the Townhall from flooding. Aestetics and symbolism mainjustification
userr
Resaltar
R001A/JKO/Nijm Final Report - 9 - July 2007
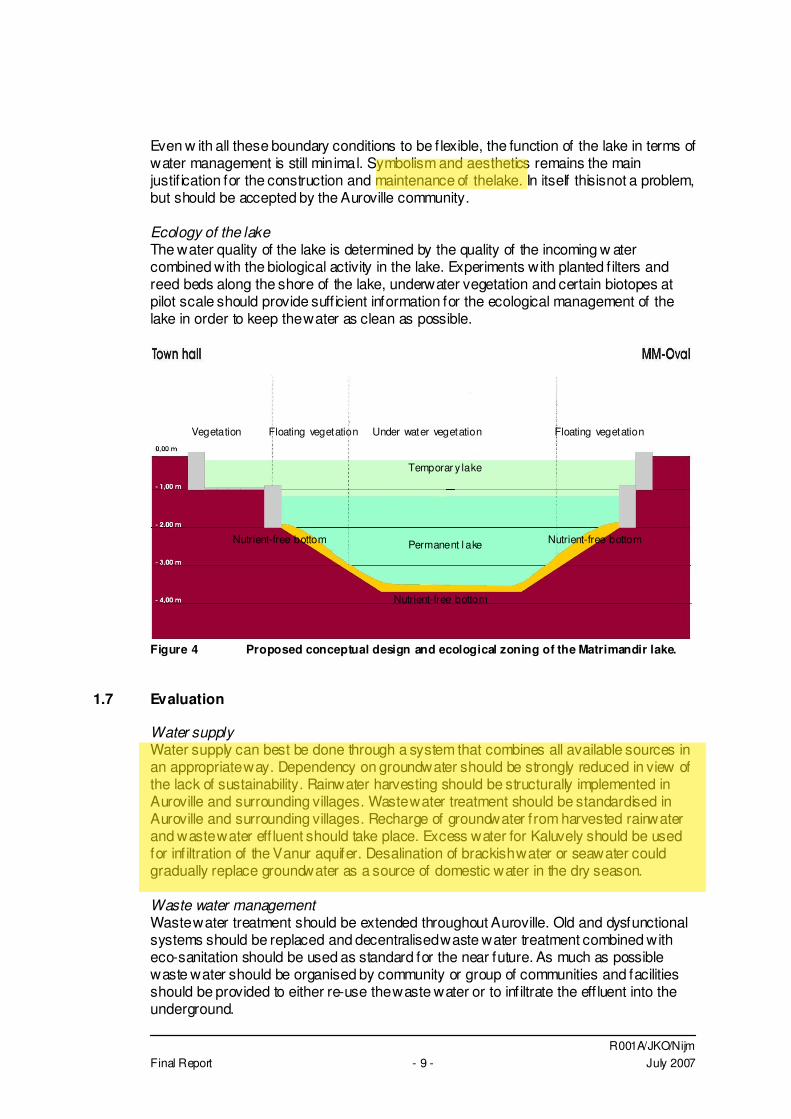
Even w ith all these boundary conditions to be f lexible, the function of the lake in terms of water management is still minimal. Symbolism and aesthetics remains the main justif ication for the construction and maintenance of thelake. In itself thisisnot a problem, but should be accepted by the Auroville community. Ecology of the lake The water quality of the lake is determined by the quality of the incoming w ater combined with the biological activity in the lake. Experiments with planted f ilters and reed beds along the shore of the lake, underwater vegetation and certain biotopes at pilot scale should provide suff icient information for the ecological management of the lake in order to keep the water as clean as possible. Figure 4 Proposed conceptual design and ecological zoning of the Matrimandir lake.
1.7 Evaluation
Water supply Water supply can best be done through a system that combines all available sources in an appropriate way. Dependency on groundwater should be strongly reduced in view of the lack of sustainability. Rainwater harvesting should be structurally implemented in Auroville and surrounding villages. Waste water treatment should be standardised in Auroville and surrounding villages. Recharge of groundwater from harvested rainwater and waste water eff luent should take place. Excess water for Kaluvely should be used for inf iltration of the Vanur aquifer. Desalination of brackish water or seawater could gradually replace groundwater as a source of domestic water in the dry season. Waste water management Waste water treatment should be extended throughout Auroville. Old and dysfunctional systems should be replaced and decentralised waste water treatment combined with eco-sanitation should be used as standard for the near future. As much as possible waste water should be organised by community or group of communities and facilities should be provided to either re-use the waste water or to inf iltrate the eff luent into the underground.
Vegetation
Nutrient-free bottom
Temporar y lake
Floating vegetation
Permanent l ake Nutrient-free bottom
Under water vegetation
Nutrient-free bottom
Floating vegetation
userr
Resaltar
userr
Resaltar
R001A/JKO/Nijm Final Report - 10 - July 2007
Matrimandir Lake The justif ication of the Matrimandir lake mainly lies in the symbolism, aesthetics and social function of the lake. If boundary conditions from the Chief Architect are somewhat relaxed, the lake could also play a minor role in water management and could at least capture the rainwater directly falling on the lake. The lake can not have a purifying function and should not be deeper than 4 m. Larger depth only works adverse on water quality and amount of soil movement to be done. Laterite mixed with bentonite can be used as sealant while its borders in view of the required water level f luctuations can best be made of gabions. Experiments at pilot scale should prove the necessity of the introduction of certain plants and animals to keep the water free of algae and in a healthy condition. Integral water management concept Thé integral water management concept for Auroville does not exist as it needs to be decided on in the coming years by the community at large and the various committees and groups active in this f ield. A decision tool has been presented in the report to assist with the outstanding issues and make well balanced choices. These choices need to be made by Auroville however and not by outsiders. Outsiders can only advise on the choices which is done in this comprehensive document providing a full overview of present status an various possibilities en techniques in water resources management, water supply, waste water management and the design, construction and operation of a lake around the Matrimandir. As much as possible the principles of Auroville have been used as a basis for the formulation of possible solutions. An integral water management plan for Auroville alone is not feasible. Coverage of and participation from the villages and inhabitants in the study area is an absolute necessity for the successful realisation of such plan. Auroville’s vulnerability but also Auroville’s image as change agent and trend setter in many f ields is often underestimated, not the least by Aurovilians. Auroville has the capacity to bend the present negative trend by organising itself and by interacting w ith local-, regional- and national level government into a positive trend. Auroville has the knowledge and ability to interact w ith the local population and has proven in the past that it is able to change behaviour for the purpose of sustainability.
1.8 Conclusions and Recommendations
This study does not provide Auroville with a ready made plan. In view of Auroville’s present situation and uncertain future in terms of population and resources, such a plan is neither believed necessary nor appropriate at this moment in time. This study thus only analyses and evaluates various solutions and shows the best solutions for various problems according to today’s level of knowledge, predictions on future developments. Whether these solutions are indeed chosen is entirely up to Auroville and its inhabitants. This document serves as background information for the choices to be made, can be used as a decision supporting document and provided recommendations on water supply, waste water treatment and integral management based on present knowledge and Auroville’s principles. Water resources
userr
Resaltar
userr
Resaltar
userr
Resaltar
R001A/JKO/Nijm Final Report - 11 - July 2007
Groundwater is and will on the short term be the most important source of water for Auroville. Recent study has shown that groundwater is unsustainable at the short term and urgently alternatives need to be found and groundwater management should be drastically changed. At this moment resources suff ice for the inhabitants. Some sharing is however required. To achieve this, the water supply systems of several communities will have to be connected. Long term reliability of water resources entirely depends on the developments in the agricultural sector and the possible recharge from surface water, rainwater and waste water eff luent. In how far these measures are effective and where best they can be applied, still needs to be seen. Other sources such as waste water eff luent and rainwater are for several reasons not suitable for domestic water supply. They should thus be used for irrigation and gardening only (appropriate use). To ensure that this is actually being done as much as possible, standardisation of methods and materials and the obligation related to building permits are strongly advised. If immediate re-use of rainwater and waste water eff luent is not possible, it should be used for recharge of the groundwater w ith the emphasis of the Vanur and Cuddalore aquifers. Several studies have been carried out showing the most reliable and successful recharge areas. Should these areas not be feasible in the context of the Masterplan, then this Masterplan should be applied with a certain level of f lexibility to ensure that these areas remain available for recharge. Rainw ater harvesting and stormw ater drainage also require buffering of water. Areas w ill have to be identif ied where the storage and buffering of the rainwater can be combined with a park, inf iltration area etc. Desalination of brackish and salt water as an alternative for groundwater and a supplement for rainwater in the dry season is an alternative that should be further exploited. Eff luent from the Pondicherry waste water treatment plant may endanger the entire hydrogeology of the area. Investigations have to be conducted towards the qualitative and quantitative impact of the free-f low ing eff luent that continues to infiltrate in this area. Also the solid waste present may contribute to the pollution of the underground in this area. Simultaneously, investigations can focus on the treatment of the eff luent to enable the re-use as either irrigation water or clean infiltration and recharge water. Water demand The water demand in Auroville is still high compared to the surrounding area, even compared to Europe. Auroville being a sustainable community is able to reduce further and give a good example for the surrounding area. Embarking on programmes to reduce water use in agriculture, Auroville w ill have to show that they are amongst the best pupils in class. Water demand should be separated in domestic and gardening/irrigation as far as the present infrastructure allows. Further development should aim at the supply of appropriate water e.g. groundwater for domestic water and waste water eff luent and rainwater and stormwater for gardening and irrigation.
R001A/JKO/Nijm Final Report - 12 - July 2007
Large integral programs should be carried out to reduce irrigation and work on water saving irrigation practices and crops. At the same time, the use of waste water eff luent and rainwater harvesting/storm water drainage should be promoted. Water supply Water supply should continue decentralised. Some schemes will be connected to provide suff icient sources for all. On the long term, more schemes may be linked and supply may be partially centralised. The water supply scheme are not providing potable water. This does not need to be changed. In the far future when population numbers have grown and the water supply is much more centralised, the system may provide potable water. The system is simple and appropriate for the present situation. Supply security and pressure are w ithin reasonable limits and can not be raised unless considerable investments are made. Priorities lie elsewhere. Waste water management Waste water should continue to be treated decentralised and used decentralised organised per community or group of communities. Successful treatment methods should be universally applied to achieve standardisation in eff luent quality and materials and equipment. Facilities should be provided to re-use the eff luent for gardening and irrigation. Organisation An organisation is lacking in water supply, in waste water treatment as well as in rainwater harvesting. As a result, various techniques, materials and equipment are used in Auroville. A new organisation can streamline activities in these f ields, can coordinate between the various services in Auroville and can function as spokesperson towards external local and regional authorities. The organisation can initially focus on water supply in Auroville, providing technical support, operation and maintenance and billing and f inancial services. At a later stage, the organisation can expand towards a broader water management organisation. Matrimandir Lake The Matrimandir Lake is of almost unconceivable importance for the completion of the Matrimandir and surrounding gardens. Foreseen and spoken of by the Mother, it appears that the lake is of great symbolic and aesthetic value. Under the given boundary conditions, the lake can not perform a signif icant role in the management of water resources in Auroville. Rainwater from the lake’s surface will have to be evacuated during monsoon whereas it has to be replenished by groundwater during the dry season. Techniques for the storage of rainwater in underground reservoirs exist, but are excessively expensive. As long as the Matrimandir recharges to the underground an amount of rainwater equal to the rainwater being evacuated and evaporated, then one can speak of a balanced situation in terms of water resources. How the quality of the lake w ill develop and what measures can help with or are counterproductive for the water quality are to be determined in a pilot lake. SHORT TERM ACTIONS Technical Auroville 1. Waste water treatment and re-use should be obliged and standardised. Where not
yet practiced it should be introduced, where already practiced it should be optimised.
userr
Resaltar
userr
Resaltar

R001A/JKO/Nijm Final Report - 13 - July 2007
2. Rainw ater harvesting should be obliged and standardised. Where not yet practiced, it should be introduced and where already practiced it should be optimised;
3. The most beneficial locations for rainwater and waste water eff luent inf iltration in Auroville should be identif ied. Provision should be made to connect as much as possible the rainwater harvesting and waste water treatment to these areas. Facilities should be constructed to allow infiltration possibly combined with temporary storage;
4. Desalination should be further investigated as an option to replace domestic water supply in periods of non-availability of rainwater;
5. In all aspects of water supply and water resources management, as much as possible the decentralised ‘village’ approach should be followed;
6. The possibilities for treatment of the Pondi eff luent to a standard that it can be used for irrigation and safe recharge of groundwater resources should be investigated.
7. In close cooperation w ith Auroville’s Future, possibilities to design infiltration areas in green areas and corridors in the Masterplan should be investigated. In view of the importance of these infiltration zones, the Masterplan should be implemented in a f lexible way;
8. Near the Matrimandir, a pilot lake can be made and f illed with rainwater and being replenished by groundwater. This will allow to investigate the most suitable sealing materials for the bottom of the lake, the most suitable border construction and materials and methods and species in ecological management;
9. Follow ing the outcome of the above investigations, Auroville should outline an Integral Water Strategy (Waterplan) clearly outlining how to deal with water from household level to city level and dealing with domestic water supply, waste water, rainwater and stormwater.
Technical Bioregion 1. The possibilities to recharge the Vanur aquifer from the excess f low into the Kaliveli
swamp should be investigated; 2. A study needs to be conducted towards the impact of the infiltrating eff luent of the
Pondi Sew age Treatment Plant; 3. A campaign should be designed to introduce at large scale water saving crops and
practices in agriculture. Organisational Auroville 1. Auroville should organise itself, unify and agree on an approach in water supply,
waste water treatment and water resources management; 2. Auroville should rely more on internal expertise and stop f lying in external experts; 3. A water organisation should take up this task and gradually develop itself to a water
services company on non-profit basis to streamline and standardise water supply and waste water in Auroville. Eventually, this entity will also deal with water management, both inside and outside Auroville;
Organisational Bioregion 1. Auroville should liaise w ith local and regional authorities to persuade recharge of the
Vanur aquifer from the excess f low from the Kaliveli watershed; 2. Auroville should liaise w ith local and regional authorities, proactively promoting water
saving measures in irrigation and agriculture and participate in large programs such as IAMWARM;
3. Auroville should search for all means to publicise the recent f indings on the problems with groundwater from Vanur and Cuddalore aquifers.
R001A/JKO/Nijm Final Report - 14 - July 2007
LONG TERM ACTIONS 1. Continued efforts in reduction of water use both inside and outside of Auroville, in
particular in irrigation and gardening; 2. Continue to focus on large scale infiltration and recharge of excess surface water,
waste water eff luent and rain- and stormwater; 3. Continued monitoring of groundwater to enable timely and appropriate actions in
case of groundwater deterioration;
R001A/JKO/Nijm Final Report - 15 - July 2007
2 INTRODUCTION
2.1 Summary
The start Auroville is presently wrestling with the issue of water resources management. A Masterplan prepared in 2003 by Harald Kraft has lead to severe opposition from within Auroville and from outside. Several international experts have commented the masterplan as un-sustainable, unrealistic and not in line with Auroville’s principles. A small group in Auroville is still supporting the Masterplan and during an international water conference held in September 2003 it was decided to prepare an alternative pre-feasibility study for sustainable water management for Auroville. Study Area A self-appointed Watergroup made up from Aurovillians w ith experience in water management and assisted by an international committee made up from experts in the f ield of water management from Israel,France, Germany and The Netherlands innitiated and coordinated the pre-feasibility study. It w as soon agreed that only Auroville was a too limited scope for this study and that it shouldbe extended. A study area of 70 km2 was agreed based on hydro(geo)logical and administrative conditions. Aim of the study The aim of the study is to come to an objective evaluation of the demand and available resources and to propose a most suitable water management concept for Auroville and the study area. Starting in 2004, the study was completed in 2007 w ith the f inal results presented in Auroville in April 2007.
2.2 Context of the Report
In the course of 2002, Mr. Kraft from Engineering Firm Kraft from Berlin worked on a pre-feasibility study for a water management plan for Auroville. The f inal report was presented in February 2003. In the period after the completion of the report, several Aurovillians expressed their concern about the contents of the report. External and independent experts were requested to assess the Kraft report and the documents prepared by concerned Aurovillians and to advise on an alternative concept for the water management. Published studies and several information available in Auroville was made available or accessible to Mr. Kraft during and after his study. Concerned Aurovilians and external parties all agreed that the concept proposed by Harald Kraft was not feasible and would not solve several pending issues adequately. Their independent view and information made available was appreciated but it was not considered necessary to review any part of the Kraft study. Roger Anger, Chief Architect of Auroville, was concerned about the feasibility of the proposal of Mr. Kraft and requested for a counter study. In September 2004, a 3-day seminar was organised by the Auroville Centre for Scientif ic Research and by the Auroville Water Service – Harvest. The title of the seminar was “Towards a sustainable water resources management for Auroville and the bioregion”. The purpose of the seminar was to probe national and international experts in the f ield of water management and related political issues to recommend a strategy for
userr
Resaltar
userr
Resaltar
R001A/JKO/Nijm Final Report - 16 - July 2007
sustainable water management for Auroville and its Bioregion. The recommendations of this seminar have been included in Annex C to this report. There was a general consensus amongst the experts in general and those sitting in the expert panel in particular that Auroville should follow an integral approach covering all possible water resources and act as a leading organisation in this respect. Also the focus should be not only on resources but also on demand, minimising of demand and the justif ication of the demand in the social-cultural context and in the light of modern water management concepts. The participants of the seminar advised the community of Auroville to carry out a broad pre-feasibility study. The reality and the general concern of Auroville for the surrounding it and the population justif ied a study to address the issue of water management at a much larger scale and in an integrated way.
2.3 Organisation of the study, client, water group and expert panel
Follow ing the water seminar, a water group was formed from some participants being active in some aspect of water in Auroville. The water group was to coordinate the study on behalf of APDC (Auroville Planning and Development Council), the client for the study. Annex B presents a list of people taking seat in the water group For daily issues, Harvest’s Executive Director has coordinated activities in Auroville, chaired and minuted the meetings of the water group and provided technical input. The coordination of the input from different experts was left to Jeen Kootstra as independent expert. Several experts from Auroville and external experts have provided technical input for issues such as waste water, desalination, groundwater, surface water, rainwater harvesting and storm water drainage. In order to obtain some crucial data, specif ic investigations were carried out as part of the pre-feasibility study. An expert panel has reviewed the contents of this report. The members of the expert panel have been listed in Annex B.
2.4 Aim of the study
The aim of this study is dual. On one hand, the study is to propose an integrated water management plan that should provide an alternative for the concept proposed by Harald Kraft and should thus aim at the provision of water for the ultimate city of 50,000 people and (contrary to Mr. Kraft’s terms of reference) address the water supply requirements of the surrounding population as well including the interrelation w ith Auroville. The level of detail prepared by Kraft is however considered neither necessary nor feasible at this stage. At present several important issues have to be dealt with and choices have to be made. The information to make these choices is available and is contained in this study. Once the choices are made, further detailed studies and designs are to be done. Therefore, this pre-feasibility makes an inventory of what resources are available in broadest sense, defines the advantages and disadvantages of using these sources, describes possibilities of combined resources and boundary conditions for further
userr
Resaltar
userr
Resaltar
userr
Resaltar
userr
Resaltar
R001A/JKO/Nijm Final Report - 17 - July 2007
developments. The study presents the issues and choices that have to be dealt w ith and formulates an approach to be followed. Based on this, the study determines the short and long term actions to carry out and issues to deal with as well as hiatuses in know ledge that have to be fulf illed on short term to enable Auroville to make a w ell balanced choice. Safe water supply refers to a good quality, well protected against pollution. Sustainable refers to the resources (not to over-exploit the resource, to put in as much as is taken out), the use of environmental friendly material and techniques, the use of energy and the production and processing of waste material. Technical feasibility refers to the know-how available and appropriate to apply in this environment, resources available and exploitable. The f inancial-economical feasibility refers to the cost of the construction and the operation and maintenance of the water management system, taking into account water fees and fair costs for operation and maintenance. Social feasibility refers to the acceptance of the water management system by its target population and by the organisation that will be responsible for the operation and maintenance of the system. Valuating all proposed concepts on the bases of these main criteria then results in a clear score for every concept. Based on these scores, selective concepts can then be considered for further studies and implementation.
2.5 Definition of the study area and brief description
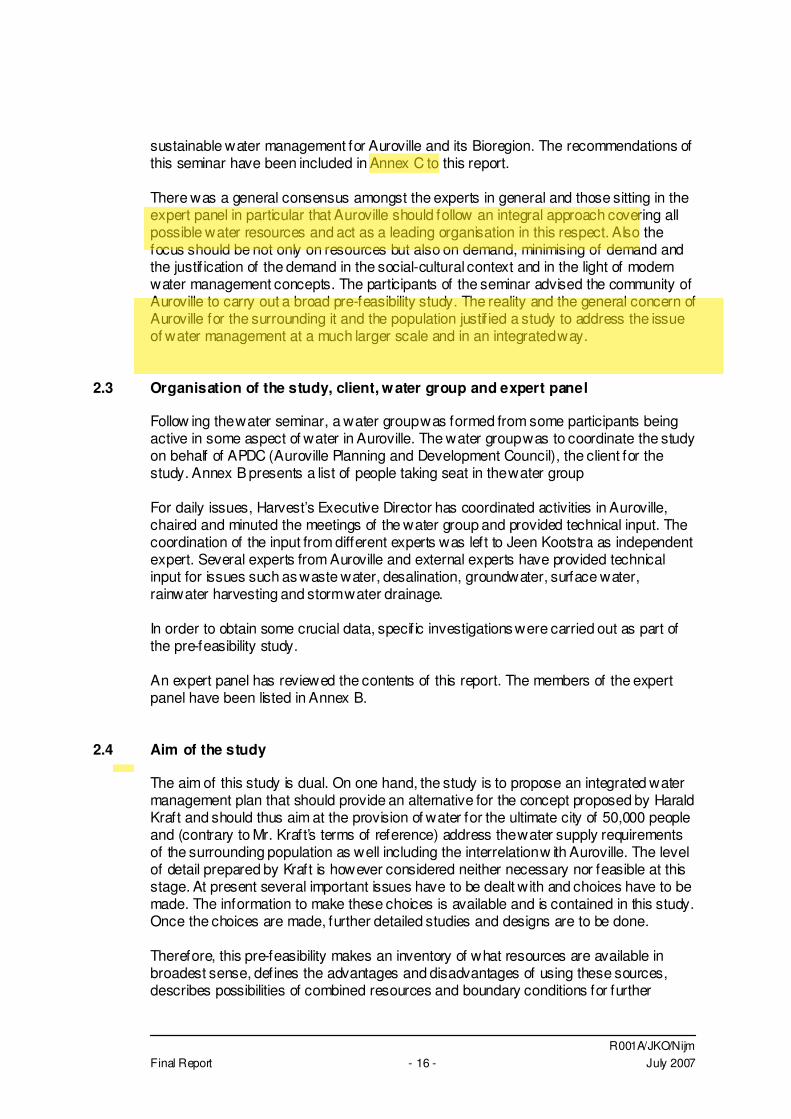
The extent of an area for the study has been determined according to physical, social and administrative parameters. The study area should be limited in size as f inancial and human resources for the study are limited. It w ill how ever not limit in any w ay the choices or excludes relevant issues or items.
The study and the study area w ill be a reference for the application of the concept of Integrated Water Resources Management to the entire bio-region, as was also recommended during the seminar of September 2004. The entire bio-region covering 1400 km2 can not be covered by such study, for practical reasons. The investigation and application of this concept at smaller scale w ill therefore form a learning case of application of the same at a much larger scale. Figure 1 Aurov ille in the Bioregion
R001A/JKO/Nijm Final Report - 18 - July 2007
2.5.1 Physical characteristics of the area
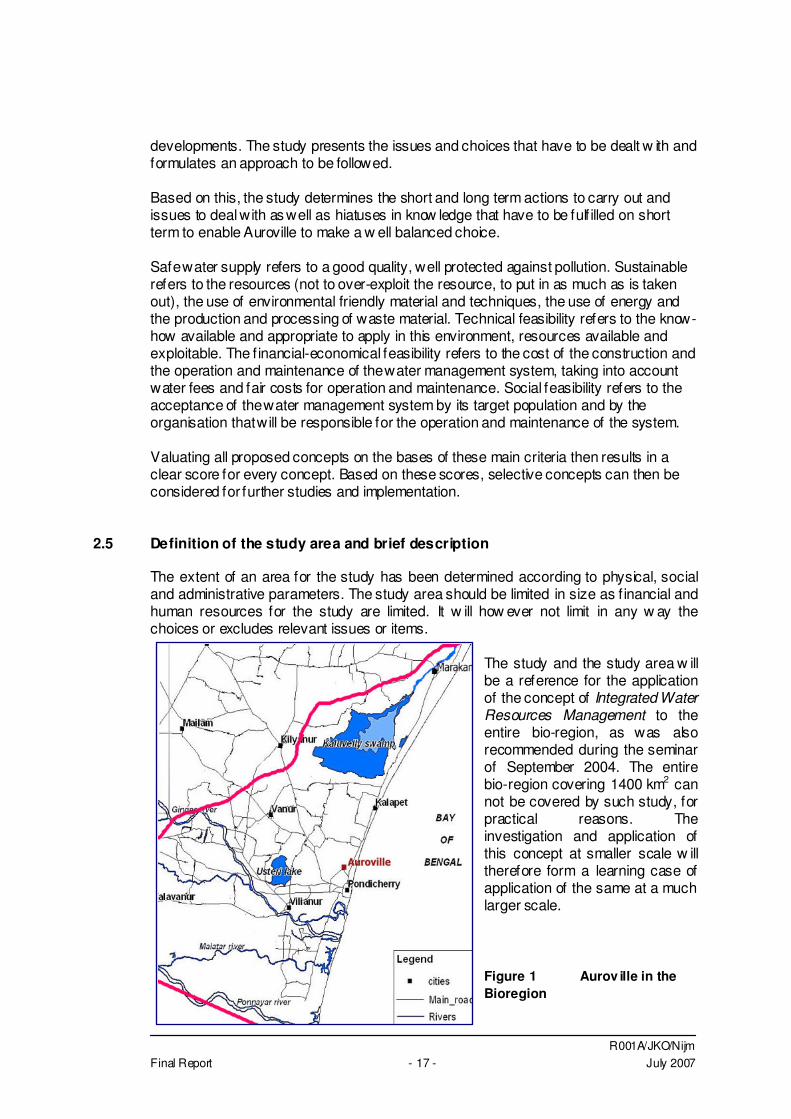
Elevation and morphology Auroville is situated on an elevated and elongated plateau of maximum 50 m above sea level oriented NNE-SSW near the coast. Due to deforestation for f irewood in the course of the past century, vegetation completely disappeared exposing the soil to sun, wind
and rain. As a result, several canyons formed running in a radius outward from the plateau. The location of Auroville on the top of an elevated and elongated plateau is unfavourable for water harvesting. The west of Auroville is relatively favourable due to the more clayey soil type, run-off from the higher situated terrain further to the west. The east side of Auroville slopes steeply towards the sea is much less favourable for agriculture and rainwater harvesting. The catchment area is small and the f low will be directly related to the rainfall w ith strong variance according to the rain intensity. Figure 2 Elevation and hydrography
Geology and soil The geological formations outcropping in the area surrounding Auroville are the upper six layers occurring in the area and the surrounding alluvium. These are the layers that are affected by recharge from rain in the area and these are the layers that can be reached by wells from the area. The 5th
layer (Ottai clay) is a thick clay formation and can be considered to a certain extent as a natural vertical barrier and forms a natural limit of the study area towards the west and towards the deeper underground. The 6th layer (Vanur sandstone) is a high yielding aquifer currently being over-exploited to the west of the project area. Under the present conditions, there is very little scope for further development as the Vanur only occurs at large depth in the project area and is presently already severely over-exploited. In itself the aquifer has a considerable potential conditional to proper reduction and control of present exploitation and focus on recharge. Towards the north, the formations are covered by the alluvium underlying the Kaliveli swamp. The east of the area is limited by the sea. Under the sea bottom, the layers extend eastward.
R001A/JKO/Nijm Final Report - 19 - July 2007
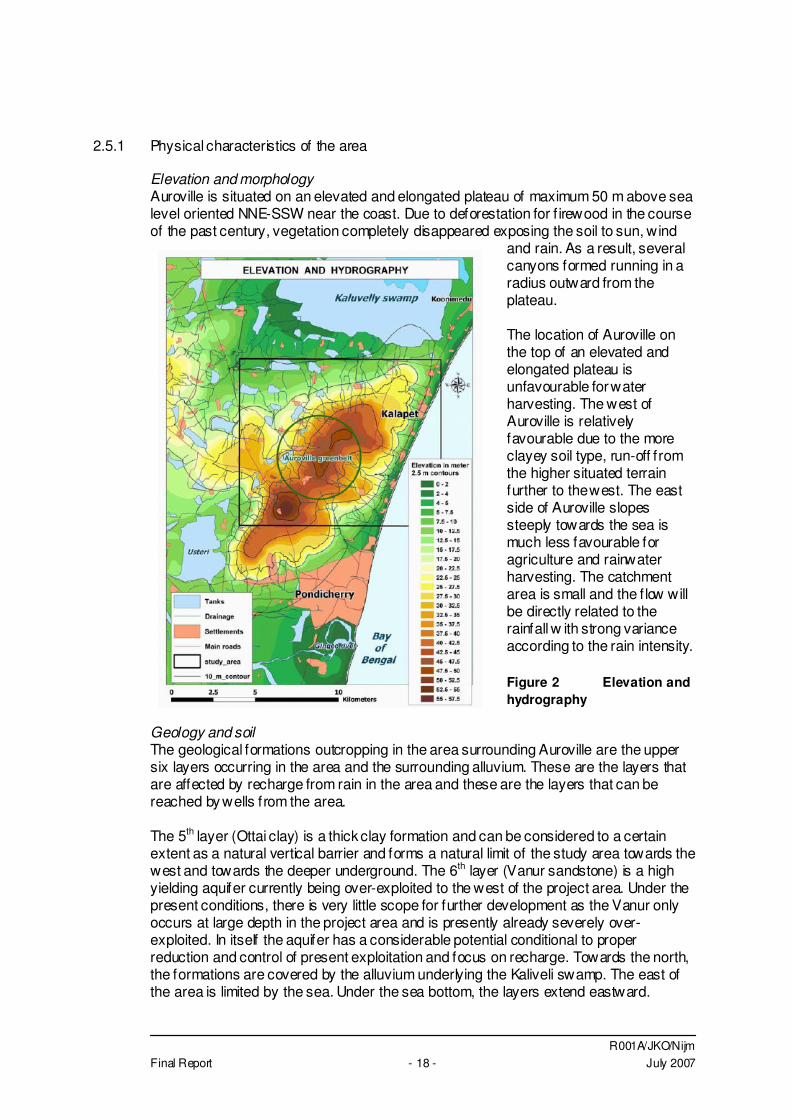
The 5 formations of signif icance that outcrop in the area are: Alluvium 5.3 km2 Cuddalore 55.1 km2 Manavali 9.8 km2 Kadaperikuppam 13.5 km2 Thuruvai 2.3 km2 TOTAL 86.0 km2
Figure 3 Outcrop of geological formations in the study area. Hydrology The surface drainage system includes channels and tanks and forms an extensive network over the area. Three main watersheds around Auroville are Kaliveli in the north covering, Gingee in the southwest and coastal in the southeast along the coast. The southern side, f lowing towards Usteri lake and the Gingee river, can be excluded from the study area as this portion is part of a different watershed system and will not affect hydrological parameters of the targeted area. The coastal system will be included as this originates from the centre of Auroville on the top of the elongated ridge and covers a considerable part of the study area. The majority of the study area lies in the Kaliveli w atershed, which totals 750 km2.
R001A/JKO/Nijm Final Report - 20 - July 2007
Figure 4 Hydrology of the study area and surroundings, showing most important water bodies in the area. Climate The climate is semi-arid, w ith two monsoons: the South-West between July and September (30% of the rainfall) and the North-East between October and December (60%) of the rainfall), 10% of the rainfall remaining occurs sporadically during the rest of the year. The yearly average rainfall is 1,192 mm from 1911 to 2001 (Fig. 1, Historical Hindu-Pondicherry station), with a maximum of 2,604 mm recorded in 1943 and a minimum of 626 mm recorded in 1952. Auroville has 38 years of rainfall records varying from a minimum of 660 mm in 1974 up to a maximum of 2,160 mm in 1996. The average over these years is 1,280 mm. On a regional scale, the rainfall decreases from the coastline inland. The maximum temperature occurs in May (around 38°C) (the summer season runs from March to June), and the minimum in January (around 21°C) (the w inter season runs from January to February); the yearly average is around 27°C. The potential evapo-transpiration (PET) (calculated thanks to Thornthwaite or Penman equations), gives annual values around 2,000 mm w ith the only available data from the Auroville station (1972-1981).
2.5.2 Administrative boundaries of the area
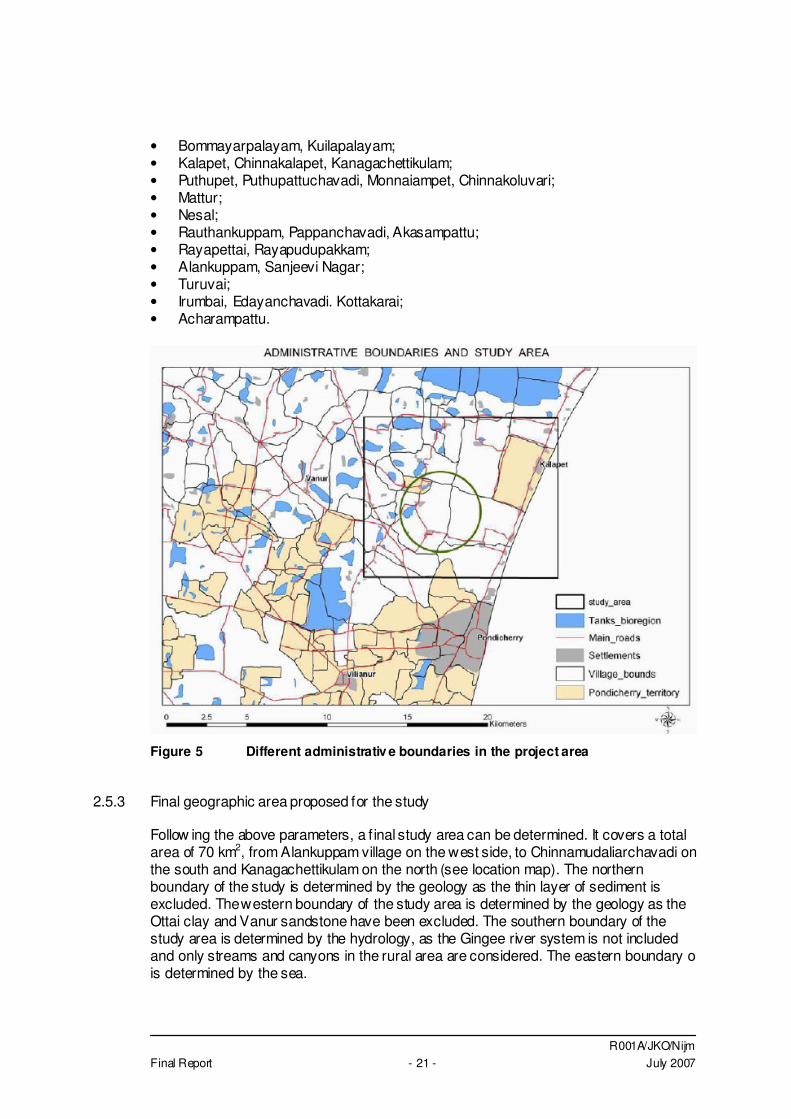
As per above defined criteria, the following 26 villages spread over 12 panchayats are located in the study area: • Periyamudaliarchavadi, Chinnamudaliarchavadi, Kuppam;
R001A/JKO/Nijm Final Report - 21 - July 2007
• Bommayarpalayam, Kuilapalayam; • Kalapet, Chinnakalapet, Kanagachettikulam; • Puthupet, Puthupattuchavadi, Monnaiampet, Chinnakoluvari; • Mattur; • Nesal; • Rauthankuppam, Pappanchavadi, Akasampattu; • Rayapettai, Rayapudupakkam; • Alankuppam, Sanjeevi Nagar; • Turuvai; • Irumbai, Edayanchavadi. Kottakarai; • Acharampattu.
Figure 5 Different administrativ e boundaries in the project area
2.5.3 Final geographic area proposed for the study
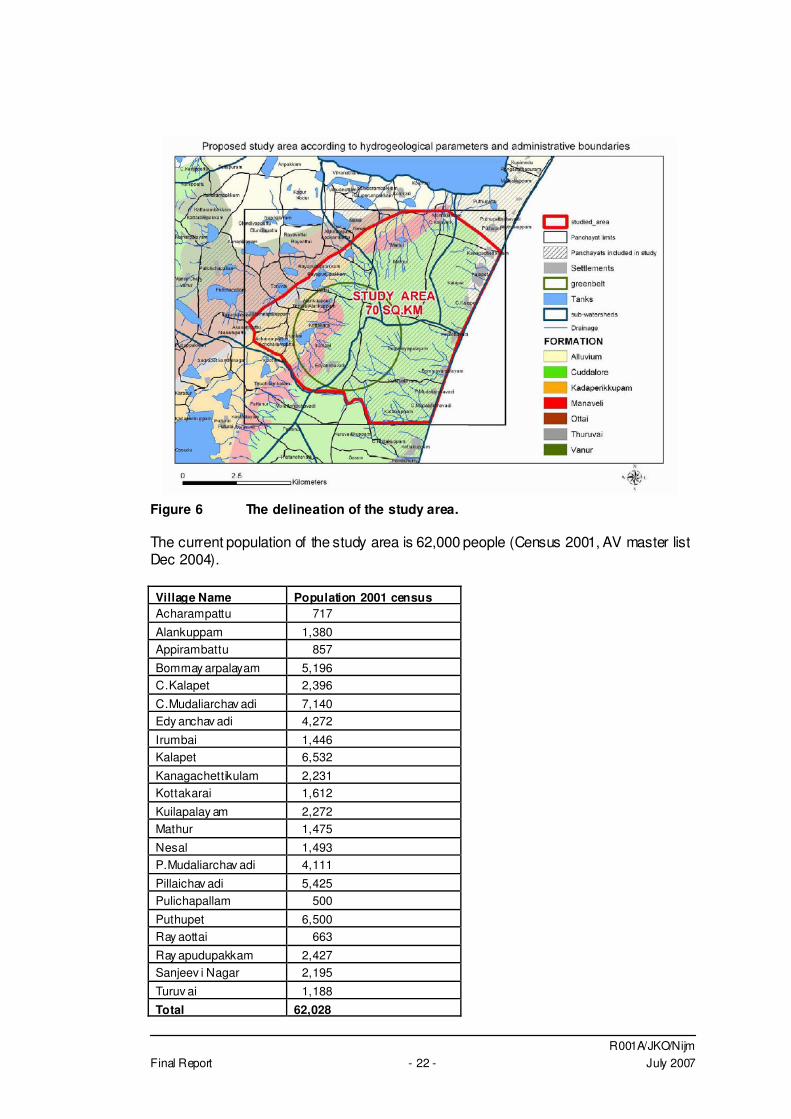
Follow ing the above parameters, a f inal study area can be determined. It covers a total area of 70 km2, from Alankuppam village on the west side, to Chinnamudaliarchavadi on the south and Kanagachettikulam on the north (see location map). The northern boundary of the study is determined by the geology as the thin layer of sediment is excluded. The western boundary of the study area is determined by the geology as the Ottai clay and Vanur sandstone have been excluded. The southern boundary of the study area is determined by the hydrology, as the Gingee river system is not included and only streams and canyons in the rural area are considered. The eastern boundary o is determined by the sea.
R001A/JKO/Nijm Final Report - 22 - July 2007
Figure 6 The delineation of the study area. The current population of the study area is 62,000 people (Census 2001, AV master list Dec 2004). Village Name Population 2001 census Acharampattu 717
Alankuppam 1,380 Appirambattu 857
Bommay arpalayam 5,196 C.Kalapet 2,396
C.Mudaliarchav adi 7,140 Edy anchav adi 4,272
Irumbai 1,446 Kalapet 6,532
Kanagachettikulam 2,231 Kottakarai 1,612
Kuilapalay am 2,272 Mathur 1,475
Nesal 1,493 P.Mudaliarchav adi 4,111
Pillaichav adi 5,425 Pulichapallam 500
Puthupet 6,500 Ray aottai 663
Ray apudupakkam 2,427 Sanjeev i Nagar 2,195
Turuv ai 1,188
Total 62,028
R001A/JKO/Nijm Final Report - 23 - July 2007
In addition to the above list, the study covers Auroville with its entire population as well, which is 1,800 according to the 2001 census. In total the population in 2001 is therefore set at a round f igure of 64,000 inhabitants. The chapter demand presents the future development of the population in the area and the related demand for (drinking) water.
R001A/JKO/Nijm Final Report - 24 - July 2007
3 RESOURCES
3.1 Summary
Current sources and their status In the project area, water is used abundantly for domestic purpose but in particular for irrigation. The main source of water is groundwater and, when available, rainwater during and directly after the monsoon. The region traditionally practices rainwater harvesting by constructing series of small dams (erys) collecting rainwater and allow ing a f irst and occasionally second crop. The urge to be self reliant in food combined with the mechanisation of agriculture (dieselpumps and submersible pumps) have lead to an explosion in groundwater extraction since the 1960’s complementary to the traditional irrigation. As a direct consequence, groundwater levels in the entire study area are falling rapidly with several meters per year. This trend is further aggravated by availability of stronger pumps at affordable and even subsidised prices and unw illingness and inability of politicians to step in. Several (international, national and non-governmental) organisations have introduced the rehabilitation of traditional irrigation structures and systems and the use of less water consuming crops and less water consuming irrigation methods. The government at State- and National level has also started to promote water saving measures and programmes in agriculture. At the same time, free electricity and subsidised pump-sets continue to be provided. Disaster on the lure Recent research has proven that the aquifer system is not only overused, but is on the verg of complete deterioration and collapse. The only reason that the Vanur aquifer is not yet suffering from massive ingress of seawater is an off-shore buffer of fresh water. Excessive cost of further investigations to determine the geometry of the formations off-shore, prevent the detailed assessment of the reserves. At the present rate of groundwater exploitation however, exhaustion will certainly occure and more likely in the near future than the far future. Alternative sources Other resources like rainwater, waste water eff luent and seawater are available but require treatment to the required level. These alternative sources remain however more expensive than groundwater and are therefore f inancially less attractive. Surface water There is no surface water permanently present in the study area. All lakes and erys dry up in the course of the dry season. Even large water bodies like Kaluvely Wetland and the Gingee river dry up after several months. Although some eryscanbeincreased by raising the dams, the scope for extension is very limited. The land is relatively f lat, so much more land will be f looded when dams are raised. Rainwater Rainw ater is to a certain extent used through the traditional irrigation structures. Other rainwater harvesting structures are however not used. The collection and use of rainwater requires minor adaptions to houses and a light infrastructure throughout villages and towns. Part of the infrastructure is often present in the form of rainwater/stormwater drainage. The main issue is storage as rainwater falls w ithin a
R001A/JKO/Nijm Final Report - 25 - July 2007
short period of time (hours) and only during a few months of the year in the monsoon. Much more than present however rainwater should be collected and used. As it can not alw ays be consumed and/or stored, it can also be infiltrated in the underground to be used where and when required. Waste water Also waste water eff luent is available, whereever waste water is being produced and treated. In general some 60% to 80% of the water used domestically is produced as waste water and is thus de-centrally available. Due to the virtual absence of industry and workshops in Auroville and surrounding area, the sewage can be re-usd w ith limited treatment. The treatment can be organised in a de-centralised way per Auroville community or group of communities in case these are located nearby and per village or neighbourhood in the surrounding areas. Commercial activities can have treatment at source for the particular constituents. Waste water from Pondicherry is centrally available at the waste water treatment plant. If a suitable treatment method can be developed, this water could be used in an organised way for irrigation purposes. Sewage can be treated to a level that it can either be used as irrigation water or can be infiltrated in the underground. Seawater Seawater and brackish water from the coastal aquifers can be desalinised to serve as domestic water. Desalinised seawater could never serve as irrigation water due to the high cost related to desalination. The costs are mainly related to the high energy use of the process. Renewable energy (wind and solar) can be used to a certain extent to reduce energy costs but require large investments. The process of desalination produces a considerable amount of brine mixed with chemicals. This eff luent needs to be disposed off which often results in opposition of population concerned. Sustainability Further use of groundwater is not sustainable and a single best alternative source is not available. Sustainability and appropriateness are important to prevent similar problems in the future. A combination of sources, each used for the best purpose is therefore the key to sustainability. Groundwater can only continue to be used IF extraction is strongly reduced AND massive recharge is undertaken to equilibrium the water balance.
3.2 Groundwater
3.2.1 Formations and lithology
In the study area, the geology consists of a crystalline bedrock hinterland overlaid by a sedimentary series of several layers from Cretaceous and Tertiary, and with alluvium from Quaternary. Bed Rock The bed rock from the Archean age is outcropping west of the sedimentary basin. It corresponds to the Eastern Ghat Complex which extends into the area. The bed rock is made of charnockites which are mainly composed of quartz, plagioclases (often perthitic ones), pyroxenes (mainly hyperstene) often ouralitized, biotite sometimes chloritized, hornblende, apatite. They are considered to be highly fractured in the upper 100-meters
R001A/JKO/Nijm Final Report - 26 - July 2007
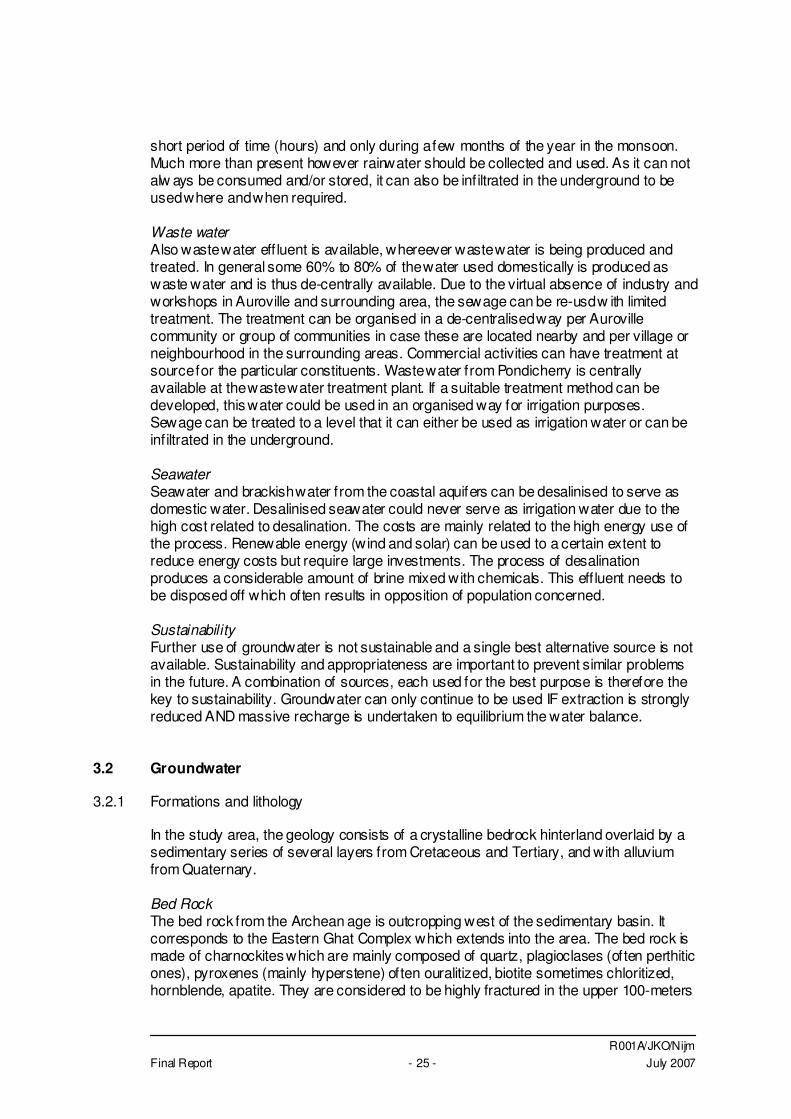
but compact further down. The top of the bed rock gently slopes down in south-eastern direction under an angle of 1.5° reaching a depth of about 500 m at the coast line. Sedimentary series The sedimentary beds are made of deposits from the charnockite bedrock, overlying the basement. The Cretaceous sediment layers are from bottom to top the Ramanathapuram sandstone, then the Vanur sandstone, the Ottai clay, and f inally the Thuruvai limestone. The Tertiary layers are the Kadaperikuppam limestone, the Manaveli clay for the Palaeocene period, and the Cuddalore sandstone for the Miocene and Pliocene period. Quaternary Alluviums, from Pleistocene period is the top layer of the serie. Between the basement and the Tertiary, between the Tertiary and the Pliocene and between the Pliocene and the Miocene/Pliocene, unconformities are located. Table 1 Stratigraphy of the study area Era Period Formation Lithology Quaternary Recent Alluv ium Sands, Clays, silts, kankar and gravels Tertiary Mio-Pliocene Cuddalore f ormation Sandstone, Pebbly and gravely and
coarse grained with minor clay and siltstones and thin seams of lignite.
UNCONFORMITY Tertiary
Pliocene Manav eli Yellow and yellowish-brown, grey calcareous siltstone and claystone and shale with thin bands of limestone.
Tertiary Pliocene Kadaperikuppam Yellowish white to dirty white, sandy, hard f ossilif erous limestone, calcareous sandstone and clay.
UNCONFORMITY Mesozoic Upper Cretaceous Thuruv ai formation Highly fossilif erous limestone,
conglomeratic at places, calcareous sandstone and clays.
Mesozoic Upper Cretaceous Ottai formation Grey ish to greyish-green claystone with thin bands of sandy limestone and f ine grained calcareous sandstone
Mesozoic Upper Cretaceous Vanur f ormation Quartz sandstone, hard, coarse grained, occasionally felspathic, or calcareous with minor clay.
Mesozoic Lower Cretaceous Ramanathapuram Formation
Black carbonaceous, silt clays and f ine to medium grained sandstone with bands of lignite and sandstone, medium to coarse grained
UNCONFORMITY
Achaeans Eastern Ghat complex
Charnockite and biotite Hornblende gneisses.
Structure The formations are from sedimentary origin and dip 2º-5º towards the east and south and increase in thickness towards the east and south. All formations are outcropping in north-south running bands with the most recent formations towards the east. The
R001A/JKO/Nijm Final Report - 27 - July 2007
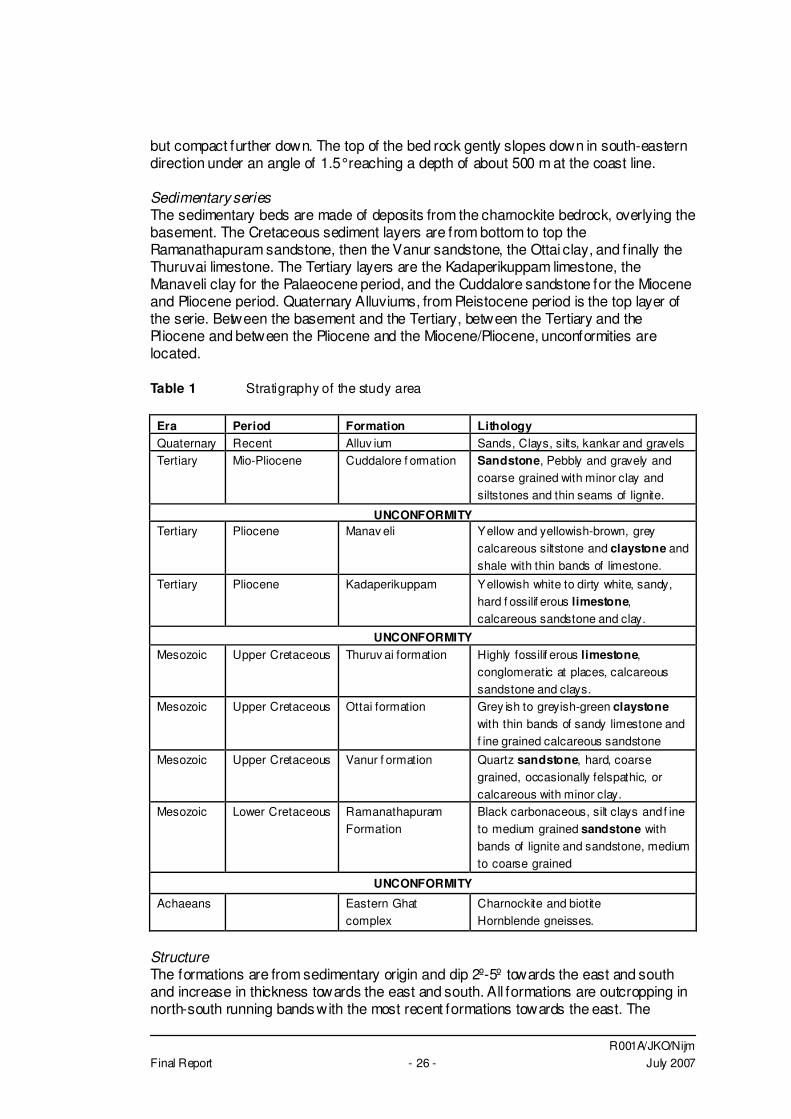
outcrop area is limited from the Kaliveli Swamp in the north towards the Gingee River in the south. Faulting in the area occurs in 2 predominant directions. One direction is parallel to the coast, northeast-southwest east of Auroville. The second direction is east-west along the Gingee river. The Auroville plateau can be interpreted as a horst, formed by the elevation of the sedimentary layers at least from the Ottai clay. Two other deeper faults seem to be present. They could be normal faults explaining the increase of the sedimentary thickness towards the East (Aude Vincent 2004). The location of the faults is not exactly known. Their signif icance in terms of permeability is also not well understood. Figure 7 shows the supposed location of the faults at the surface and in the deeper underground with the location of Auroville in green and the location of the section in blue.
Figure 7 Structural geological map of south-east India showing the locations of faults and cross-section of the area around Aurov ille.
Lithology The lithology of every formation is described in Table 1. The predominant facies of each formation occurring in the project area are printed in bold.
3.2.2 Hydrogeology
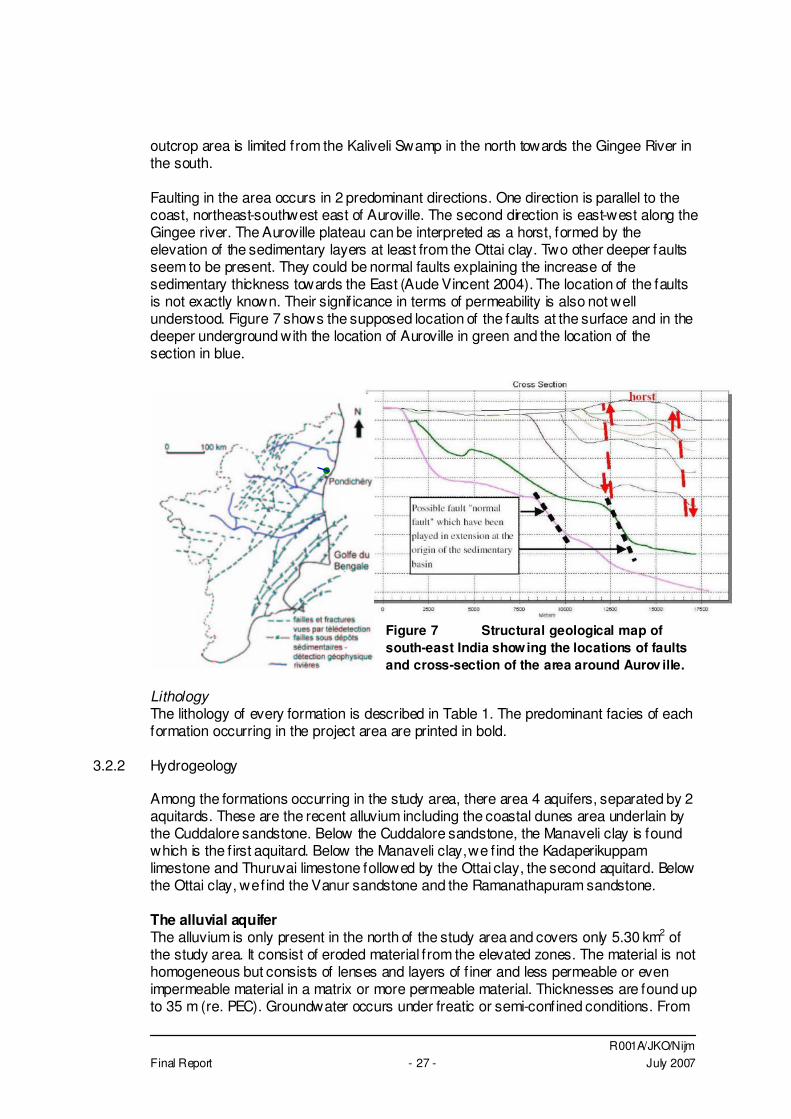
Among the formations occurring in the study area, there area 4 aquifers, separated by 2 aquitards. These are the recent alluvium including the coastal dunes area underlain by the Cuddalore sandstone. Below the Cuddalore sandstone, the Manaveli clay is found which is the f irst aquitard. Below the Manaveli clay, we f ind the Kadaperikuppam limestone and Thuruvai limestone followed by the Ottai clay, the second aquitard. Below the Ottai clay, we f ind the Vanur sandstone and the Ramanathapuram sandstone. The alluvial aquifer The alluvium is only present in the north of the study area and covers only 5.30 km2 of the study area. It consist of eroded material from the elevated zones. The material is not homogeneous but consists of lenses and layers of f iner and less permeable or even impermeable material in a matrix or more permeable material. Thicknesses are found up to 35 m (re. PEC). Groundwater occurs under freatic or semi-confined conditions. From
R001A/JKO/Nijm Final Report - 28 - July 2007
pumping tests, permeabilities of 25 – 275 m/day have been found (NGRI), values of 130 m/day have been used in recent hydrogeological modelling (Vincent, 2007) and transmissivities from 275 – 700 m2/day. Water table f luctuations found vary between 0.05 and 13 m between the dry and monsoon season (PEC). The recharge rate is estimated at 16±2% and the specif ic yield at 0.05 (source: NGRI 1987). This aquifer is being used extensively and has no potential for further development.
Figure 8 Section across the aquifer system at the location of Aurov ille showing the outcrop area of all aquifers The Cuddalore aquifer Description This is the highest yielding aquifer in the study area. The formation consists of 80% granular zones of sands, sandstones and gravels w ith minor lenses of clay and thin lignite seams. Occasionally, petrif ied wood has been found (PEC). The thickness of this formation is about 50 meters in Auroville area and goes to 500 meters in Cuddalore city area, 20 km south of Pondicherry city. The aquifer gets deeper and thicker in the southern part. The formation is outcropping in the east of the region over 83 km2. It is also outcropping in the west of the sedimentary basin over 42 km2, where it can be considered as a potential recharge source for the underlying Vanur Aquifer. The Cuddalore aquifer itself is recharged from rainwater and surface water in the outcrop area and from percolating groundwater from overlying alluvial sediments in the north and east of the study area. The depth to groundwater table is about 20 meters in Auroville area, and the piezometric level is below the mean sea level at the coastline. The water levels in the aquifer are dropping dramatically (Harvest 2006) as it is one of the most favoured aquifers beneath the Auroville plateau while its thickness is limited. Further lowering of groundwater levels, increases the risk of salt water intrusion. The scope for further development of this aquifer is therefore doubtful and mostly limited to the eastern side of Auroville. Permeabilities ranges from 0.8 – 3.0 m/day (NGRI 1987), are used in recent hydrogeological modelling as 25 m/day (Vincent, 2007) and transmissivities range from
R001A/JKO/Nijm Final Report - 29 - July 2007
4,000 to 9,000 m2/day (NGRI 1987). The aquifer’s recharge rate is estimated at 16±2% and its specif ic yield of 0.05 (NGRI 1987). Water quality The quality of the groundwater from this aquifer is a point of attention. The TDS is low, varying between 85 – 672 mg/l (PEC). The pH how ever is low, varying from 5.0 to 6.3 (HARVEST survey from January 1999 to September 2001) with most of values below 6 (acceptable limit as per WHO: 6.5 to 8.5). As the water is relatively acid, this could lead to public health problems and degradation of infrastructure. Manaveli formation The Manaveli formation is composed of yellow ish brown calcareous clay and shales with pieces of thin shells and thin limestone bands. Although the formation is continuous, zones do occur where the formation is very thin (a few metres) or where the formation’s permeability is relatively high (clay mixed with sandstone and limestone). The thickness ranges from 15 to 20 m and it occurs over an area of 12 km2 in the study area. The formation can not be considered as an aquitard (NGRI 1987, Vincent et al 2006). Due to its limited thickness and inhomogeneous nature (also including solvable and granular material) the hydraulic resistivity is believed to be low. In recent hydrogeological modelling, a permeability of 8.6 10-5 m/day has been used.. Kadaperikuppam limestone This formation consists of calcareous sandstone with yellowish grey to dirty white colour. Thin lenses of clay, shale and shaly limestone have also been found in the Kadaperikuppam formation. It occurs over and area of 46 km2 in the study area. Little is known about the aquifer characteristics, as most wells tap water from both aquifers. The Kadaperikuppam formation is highly exploited for the drinking water purpose, where the formation is outcropping, water levels are shallow and the water quality is good. The permeability is estimated to be close to the Cuddalore aquifer. Therefore the parameters for this aquifer are similar to the Cuddalore aquifer. Recently a value of 3.5 m/day has been used in a hydrogeological model for the underground of this area (Vincent, 2007). Thuruvai The Thuruvai formation consists of fossiliferous grey limestone with few bands of sandstone. It is highly conglomeratic with pebbles of quartz at certain levels. Its thickness varies between 40 and 50 m (PEC). It occurs over and area of 5.7 km2 in the study area as the thickness of this formation is very small and in general can not be distinguished from the Kadaperikuppam formation. Its permeability is 15.5 m/day according to Vincent 2007. Ottai formation The Ottai formation consists of grey claystone with a few bands of limestone. Its thickness varies from 60 to 100 m and therefore this formation is considered as an aquitard. Despite this, locally pockets or lenses of potable water do occur and are exploited via (bore)wells. This layer is however not suitable for large scale development. Transmissivity and f ield permeability of the aquifer ranges from 60 to 70 m²/day.
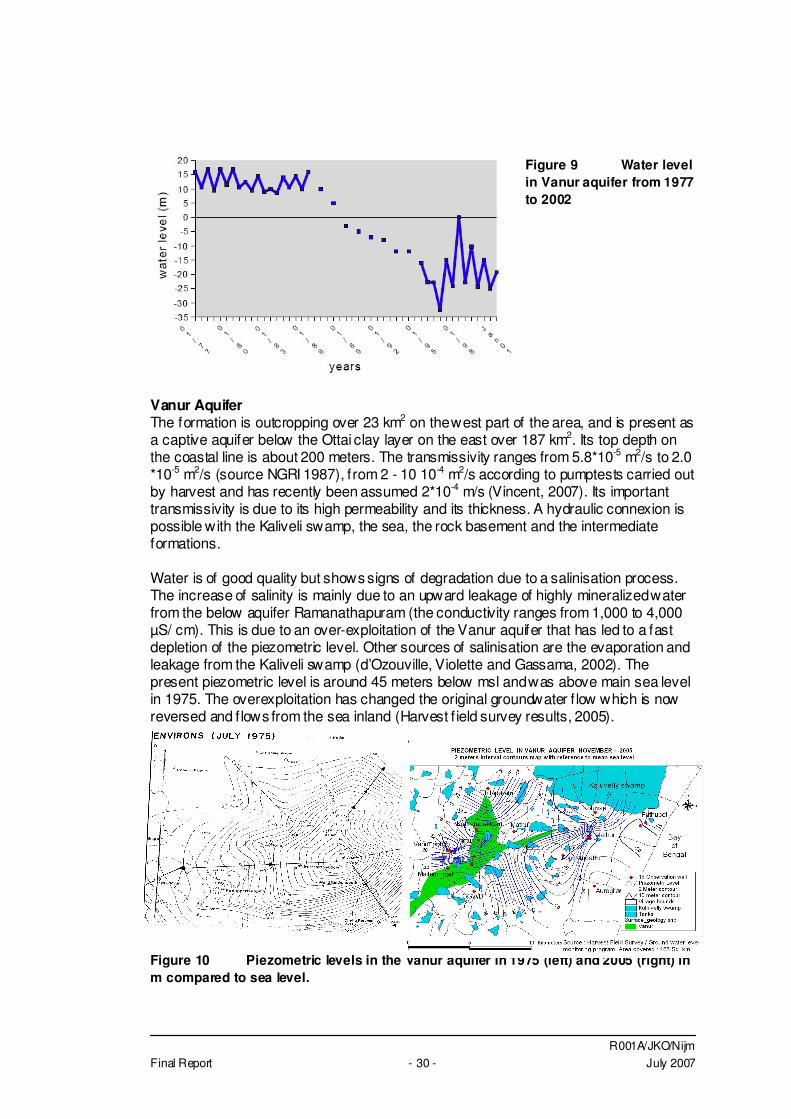
R001A/JKO/Nijm Final Report - 30 - July 2007
Figure 9 Water level in Vanur aquifer from 1977 to 2002
Vanur Aquifer The formation is outcropping over 23 km2 on the west part of the area, and is present as a captive aquifer below the Ottai clay layer on the east over 187 km2. Its top depth on the coastal line is about 200 meters. The transmissivity ranges from 5.8*10-5 m2/s to 2.0 *10-5 m2/s (source NGRI 1987), from 2 - 10 10-4 m2/s according to pumptests carried out by harvest and has recently been assumed 2*10-4 m/s (Vincent, 2007). Its important transmissivity is due to its high permeability and its thickness. A hydraulic connexion is possible with the Kaliveli swamp, the sea, the rock basement and the intermediate formations. Water is of good quality but shows signs of degradation due to a salinisation process. The increase of salinity is mainly due to an upward leakage of highly mineralized water from the below aquifer Ramanathapuram (the conductivity ranges from 1,000 to 4,000 µS/ cm). This is due to an over-exploitation of the Vanur aquifer that has led to a fast depletion of the piezometric level. Other sources of salinisation are the evaporation and leakage from the Kaliveli swamp (d’Ozouville, Violette and Gassama, 2002). The present piezometric level is around 45 meters below msl and was above main sea level in 1975. The overexploitation has changed the original groundwater f low which is now reversed and f lows from the sea inland (Harvest f ield survey results, 2005). Figure 10 Piezometric levels in the Vanur aquifer in 1975 (left) and 2005 (right) in m compared to sea level.
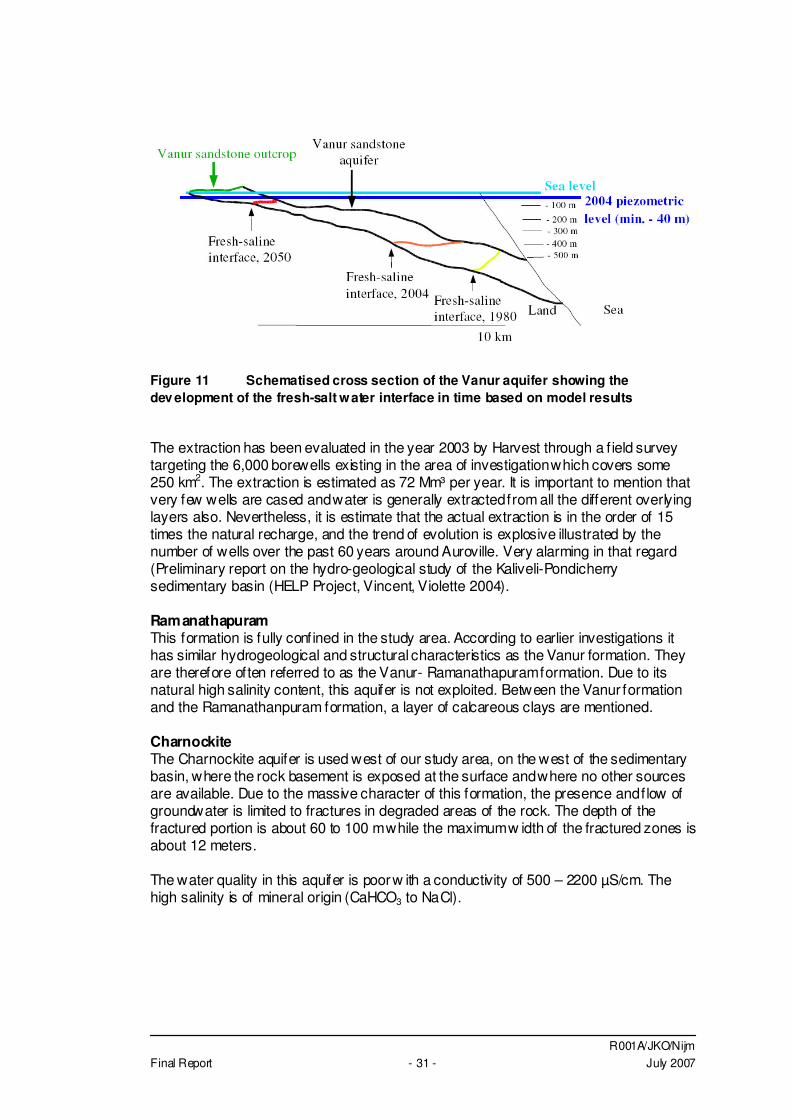
R001A/JKO/Nijm Final Report - 31 - July 2007
Figure 11 Schematised cross section of the Vanur aquifer showing the dev elopment of the fresh-salt water interface in time based on model results The extraction has been evaluated in the year 2003 by Harvest through a f ield survey targeting the 6,000 borewells existing in the area of investigation which covers some 250 km2. The extraction is estimated as 72 Mm³ per year. It is important to mention that very few wells are cased and water is generally extracted from all the different overlying layers also. Nevertheless, it is estimate that the actual extraction is in the order of 15 times the natural recharge, and the trend of evolution is explosive illustrated by the number of wells over the past 60 years around Auroville. Very alarming in that regard (Preliminary report on the hydro-geological study of the Kaliveli-Pondicherry sedimentary basin (HELP Project, Vincent, Violette 2004). Ramanathapuram This formation is fully confined in the study area. According to earlier investigations it has similar hydrogeological and structural characteristics as the Vanur formation. They are therefore often referred to as the Vanur- Ramanathapuram formation. Due to its natural high salinity content, this aquifer is not exploited. Between the Vanur formation and the Ramanathanpuram formation, a layer of calcareous clays are mentioned. Charnockite The Charnockite aquifer is used west of our study area, on the west of the sedimentary basin, where the rock basement is exposed at the surface and where no other sources are available. Due to the massive character of this formation, the presence and f low of groundwater is limited to fractures in degraded areas of the rock. The depth of the fractured portion is about 60 to 100 m while the maximum w idth of the fractured zones is about 12 meters. The water quality in this aquifer is poor w ith a conductivity of 500 – 2200 µS/cm. The high salinity is of mineral origin (CaHCO3 to NaCl).
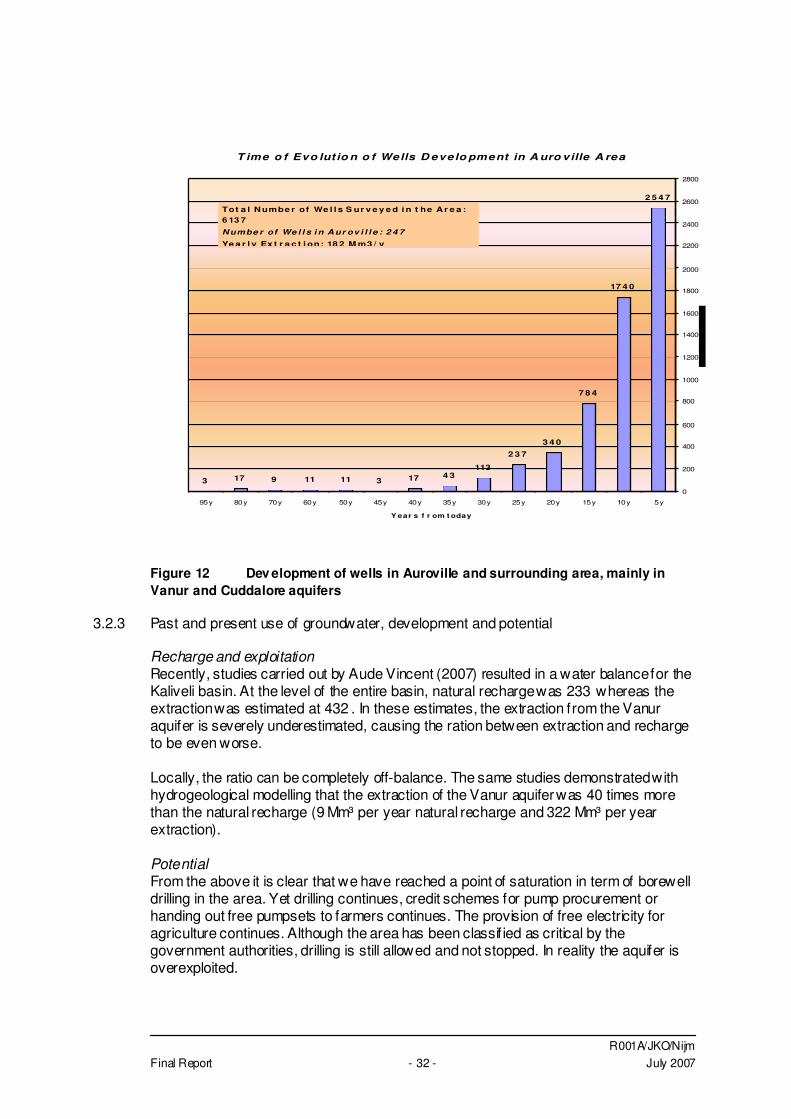
R001A/JKO/Nijm Final Report - 32 - July 2007
T ime o f Evo lut io n o f Wells D evelo pment in A uro ville A rea
2 5 4 7
17 4 0
7 8 4
3 4 0
2 3 7
1134 317311119173
0
200
400
600
800
1000
1200
1400
1600
1800
2000
2200
2400
2600
2800
5 y10 y15 y20 y25 y30 y35 y40 y45 y50 y60 y70 y80 y95 y
Y ear s f r om t oday
Tot a l Numbe r of We l l s S ur v e y e d i n t he Ar e a : 6 13 7
Numbe r of We l l s i n Aur ov i l l e : 2 4 7
Ye a r l y Ex t r a c t i on: 18 2 M m3 / y
Figure 12 Dev elopment of wells in Auroville and surrounding area, mainly in Vanur and Cuddalore aquifers
3.2.3 Past and present use of groundwater, development and potential
Recharge and exploitation Recently, studies carried out by Aude Vincent (2007) resulted in a water balance for the Kaliveli basin. At the level of the entire basin, natural recharge was 233 whereas the extraction was estimated at 432 . In these estimates, the extraction from the Vanur aquifer is severely underestimated, causing the ration between extraction and recharge to be even worse. Locally, the ratio can be completely off-balance. The same studies demonstrated with hydrogeological modelling that the extraction of the Vanur aquifer was 40 times more than the natural recharge (9 Mm³ per year natural recharge and 322 Mm³ per year extraction). Potential From the above it is clear that we have reached a point of saturation in term of borewell drilling in the area. Yet drilling continues, credit schemes for pump procurement or handing out free pumpsets to farmers continues. The provision of free electricity for agriculture continues. Although the area has been classif ied as critical by the government authorities, drilling is still allowed and not stopped. In reality the aquifer is overexploited.
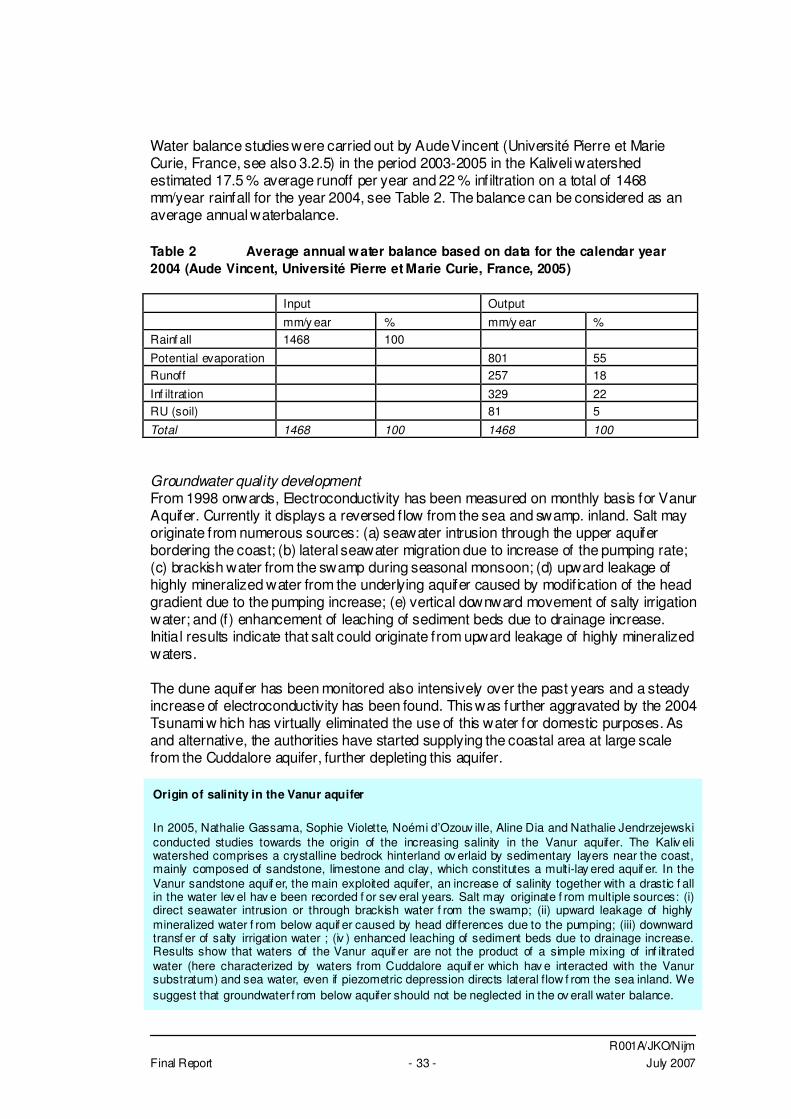
R001A/JKO/Nijm Final Report - 33 - July 2007
Water balance studies were carried out by Aude Vincent (Université Pierre et Marie Curie, France, see also 3.2.5) in the period 2003-2005 in the Kaliveli watershed estimated 17.5 % average runoff per year and 22 % infiltration on a total of 1468 mm/year rainfall for the year 2004, see Table 2. The balance can be considered as an average annual waterbalance. Table 2 Average annual water balance based on data for the calendar year 2004 (Aude Vincent, Université Pierre et Marie Curie, France, 2005) Input Output
mm/y ear % mm/y ear % Rainf all 1468 100
Potential evaporation 801 55 Runoff 257 18
Inf iltration 329 22 RU (soil) 81 5
Total 1468 100 1468 100 Groundwater quality development From 1998 onwards, Electroconductivity has been measured on monthly basis for Vanur Aquifer. Currently it displays a reversed f low from the sea and swamp. inland. Salt may originate from numerous sources: (a) seawater intrusion through the upper aquifer bordering the coast; (b) lateral seawater migration due to increase of the pumping rate; (c) brackish water from the swamp during seasonal monsoon; (d) upward leakage of highly mineralized water from the underlying aquifer caused by modif ication of the head gradient due to the pumping increase; (e) vertical downward movement of salty irrigation water; and (f) enhancement of leaching of sediment beds due to drainage increase. Initial results indicate that salt could originate from upward leakage of highly mineralized waters. The dune aquifer has been monitored also intensively over the past years and a steady increase of electroconductivity has been found. This was further aggravated by the 2004 Tsunami w hich has virtually eliminated the use of this water for domestic purposes. As and alternative, the authorities have started supplying the coastal area at large scale from the Cuddalore aquifer, further depleting this aquifer.
Origin of salinity in the Vanur aquifer In 2005, Nathalie Gassama, Sophie Violette, Noémi d’Ozouv ille, Aline Dia and Nathalie Jendrzejewski conducted studies towards the origin of the increasing salinity in the Vanur aquifer. The Kaliv eli watershed comprises a crystalline bedrock hinterland ov erlaid by sedimentary layers near the coast, mainly composed of sandstone, limestone and clay, which constitutes a multi-lay ered aquif er. In the Vanur sandstone aquif er, the main exploited aquifer, an increase of salinity together with a drastic f all in the water lev el hav e been recorded f or sev eral years. Salt may originate f rom multiple sources: (i) direct seawater intrusion or through brackish water f rom the swamp; (ii) upward leakage of highly mineralized water f rom below aquif er caused by head differences due to the pumping; (iii) downward transf er of salty irrigation water ; (iv ) enhanced leaching of sediment beds due to drainage increase. Results show that waters of the Vanur aquif er are not the product of a simple mixing of inf iltrated water (here characterized by waters from Cuddalore aquif er which hav e interacted with the Vanur substratum) and sea water, even if piezometric depression directs lateral flow f rom the sea inland. We suggest that groundwater f rom below aquifer should not be neglected in the ov erall water balance.
R001A/JKO/Nijm Final Report - 34 - July 2007
3.2.4 Aquifer system
As discussed earlier, the investigated area has three important hydrogeological units viz Cuddalore, Alluvial and Vanur-Ramanathapuram and three partially important viz Manaveli Thuruvai and Kadapperikuppam. Alluvial and Cuddalore are interconnected (NGRI 1997). Recent investigations also prove the Thuruvai limestone, the Kadapperikupam limestone and the Manaveli clay to be interconnected. These have to be considered as one groundwater reservoir. As recent investigations also show that the Manaveli Clay layer between Kadapperikupam limestone and Cuddalore sandstone is frequently very thin, hydrogeologically the series from the Thuruvai limestone until the Cuddalore sandstone are to a certain extent connected although hydrochemically they are different. Despite the geological variation in strata Cuddalore and Kadapperikuppam aquifers seem to have very good communication with each other (NGRI 1997). It should be anyhow underlined that the mentioned variation in Manaveli strata may lead to large f luctuation of connectivity locally. Considering the thickness and texture of the Ottai formation, while limited exchanges exist locally explaining the potential for groundwater extraction it has, it is generally considered as a barrier (aquiclude) between the Vanur formation and the upper formations. Accordingly, it is realistic to envisaged the management of the groundwater system by limiting its exploitation to the upper strata, above Ottai : Thuruvai, Kadaperikuppam, Manaveli, Cuddalore, and the Dune formation along the shore. �
3.2.5 Results of recent investigations
Hydrological and hydrogeological study of the coastal sedimentary basin of Kaluveli-Pondicherry (TamilNadu, India), Aude Vincent PhD Thesis, University Pierre and Marie Curie, Paris-France Between 2003 and 2006, Aude Vincent conducted studies towards the hydrology and hydrogeology of the Kaluveli-Pondicherry sedimentary basin. Aim of the study was to: • assess the status of exploitation of the entire sedimentary system and in particular
the Vanur aquifer; • determine why salinisation of the aquifers does not (yet) take place; • determine scope for sustainable development of the aquifer system. Important conclusions were drawn towards the working of the man-made system of erys, canals and irrigation systems of the area, run-off parameters of the area, the relation between surface hydrology and deeper hydrogeology, local geology and the working of the entire aquifer system. The entire aquifer system including surface hydrology was modeled in a 3-dimensional model w ith 9 layers covering a 1,000 km2 area. Results are presented in Figure 13 in the form of a realistic water balance.
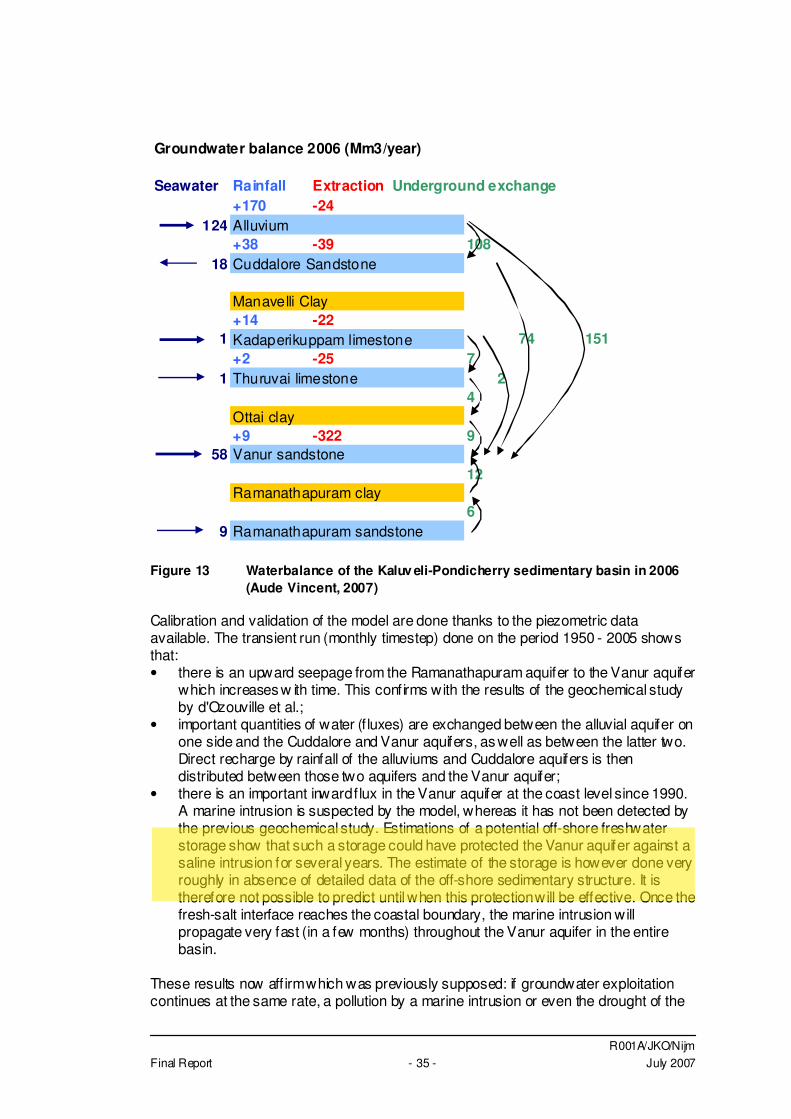
R001A/JKO/Nijm Final Report - 35 - July 2007
Groundwater balance 2006 (Mm3/year)
Seawater Rainfall Extraction Underground exchange+170 -24
124 Alluvium+38 -39 108
18 Cuddalore Sandstone
Manavelli Clay+14 -22
1 Kadaperikuppam limestone 74 151+2 -25 7
1 Thuruvai limestone 24
Ottai clay+9 -322 9
58 Vanur sandstone12
Ramanathapuram clay6
9 Ramanathapuram sandstone
Figure 13 Waterbalance of the Kaluv eli-Pondicherry sedimentary basin in 2006
(Aude Vincent, 2007) Calibration and validation of the model are done thanks to the piezometric data available. The transient run (monthly timestep) done on the period 1950 - 2005 shows that: • there is an upward seepage from the Ramanathapuram aquifer to the Vanur aquifer
which increases w ith time. This confirms with the results of the geochemical study by d'Ozouville et al.;
• important quantities of water (f luxes) are exchanged between the alluvial aquifer on one side and the Cuddalore and Vanur aquifers, as well as between the latter two. Direct recharge by rainfall of the alluviums and Cuddalore aquifers is then distributed between those two aquifers and the Vanur aquifer;
• there is an important inward f lux in the Vanur aquifer at the coast level since 1990. A marine intrusion is suspected by the model, whereas it has not been detected by the previous geochemical study. Estimations of a potential off-shore freshwater storage show that such a storage could have protected the Vanur aquifer against a saline intrusion for several years. The estimate of the storage is however done very roughly in absence of detailed data of the off-shore sedimentary structure. It is therefore not possible to predict until when this protection will be effective. Once the fresh-salt interface reaches the coastal boundary, the marine intrusion will propagate very fast (in a few months) throughout the Vanur aquifer in the entire basin.
These results now aff irm which was previously supposed: if groundwater exploitation continues at the same rate, a pollution by a marine intrusion or even the drought of the
userr
Resaltar
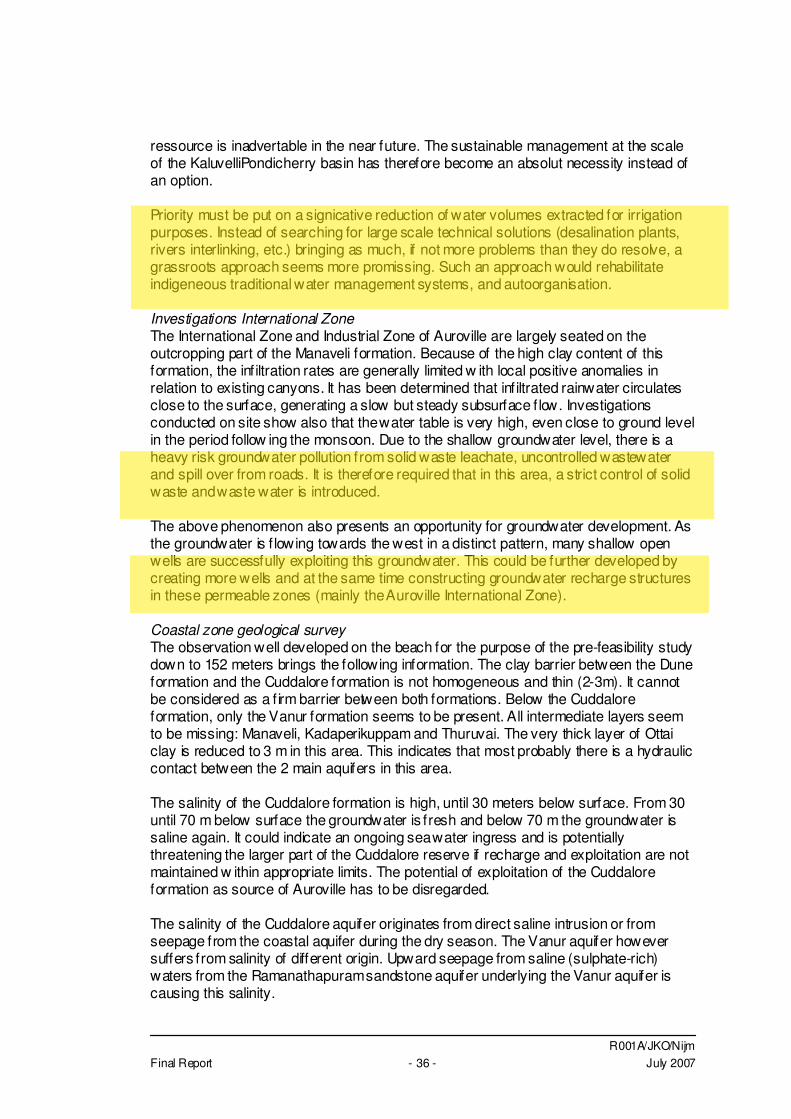
R001A/JKO/Nijm Final Report - 36 - July 2007
ressource is inadvertable in the near future. The sustainable management at the scale of the KaluvelliPondicherry basin has therefore become an absolut necessity instead of an option. Priority must be put on a signicative reduction of water volumes extracted for irrigation purposes. Instead of searching for large scale technical solutions (desalination plants, rivers interlinking, etc.) bringing as much, if not more problems than they do resolve, a grassroots approach seems more promissing. Such an approach would rehabilitate indigeneous traditional water management systems, and autoorganisation. Investigations International Zone The International Zone and Industrial Zone of Auroville are largely seated on the outcropping part of the Manaveli formation. Because of the high clay content of this formation, the infiltration rates are generally limited w ith local positive anomalies in relation to existing canyons. It has been determined that inf iltrated rainwater circulates close to the surface, generating a slow but steady subsurface f low. Investigations conducted on site show also that the water table is very high, even close to ground level in the period follow ing the monsoon. Due to the shallow groundwater level, there is a heavy risk groundwater pollution from solid waste leachate, uncontrolled wastewater and spill over from roads. It is therefore required that in this area, a strict control of solid waste and waste water is introduced. The above phenomenon also presents an opportunity for groundwater development. As the groundwater is f lowing towards the west in a distinct pattern, many shallow open wells are successfully exploiting this groundwater. This could be further developed by creating more wells and at the same time constructing groundwater recharge structures in these permeable zones (mainly the Auroville International Zone). Coastal zone geological survey The observation well developed on the beach for the purpose of the pre-feasibility study down to 152 meters brings the following information. The clay barrier between the Dune formation and the Cuddalore formation is not homogeneous and thin (2-3m). It cannot be considered as a f irm barrier between both formations. Below the Cuddalore formation, only the Vanur formation seems to be present. All intermediate layers seem to be missing: Manaveli, Kadaperikuppam and Thuruvai. The very thick layer of Ottai clay is reduced to 3 m in this area. This indicates that most probably there is a hydraulic contact between the 2 main aquifers in this area. The salinity of the Cuddalore formation is high, until 30 meters below surface. From 30 until 70 m below surface the groundwater is fresh and below 70 m the groundwater is saline again. It could indicate an ongoing sea water ingress and is potentially threatening the larger part of the Cuddalore reserve if recharge and exploitation are not maintained w ithin appropriate limits. The potential of exploitation of the Cuddalore formation as source of Auroville has to be disregarded. The salinity of the Cuddalore aquifer originates from direct saline intrusion or from seepage from the coastal aquifer during the dry season. The Vanur aquifer however suffers from salinity of different origin. Upward seepage from saline (sulphate-rich) waters from the Ramanathapuram sandstone aquifer underlying the Vanur aquifer is causing this salinity.
userr
Resaltar
userr
Resaltar
userr
Resaltar
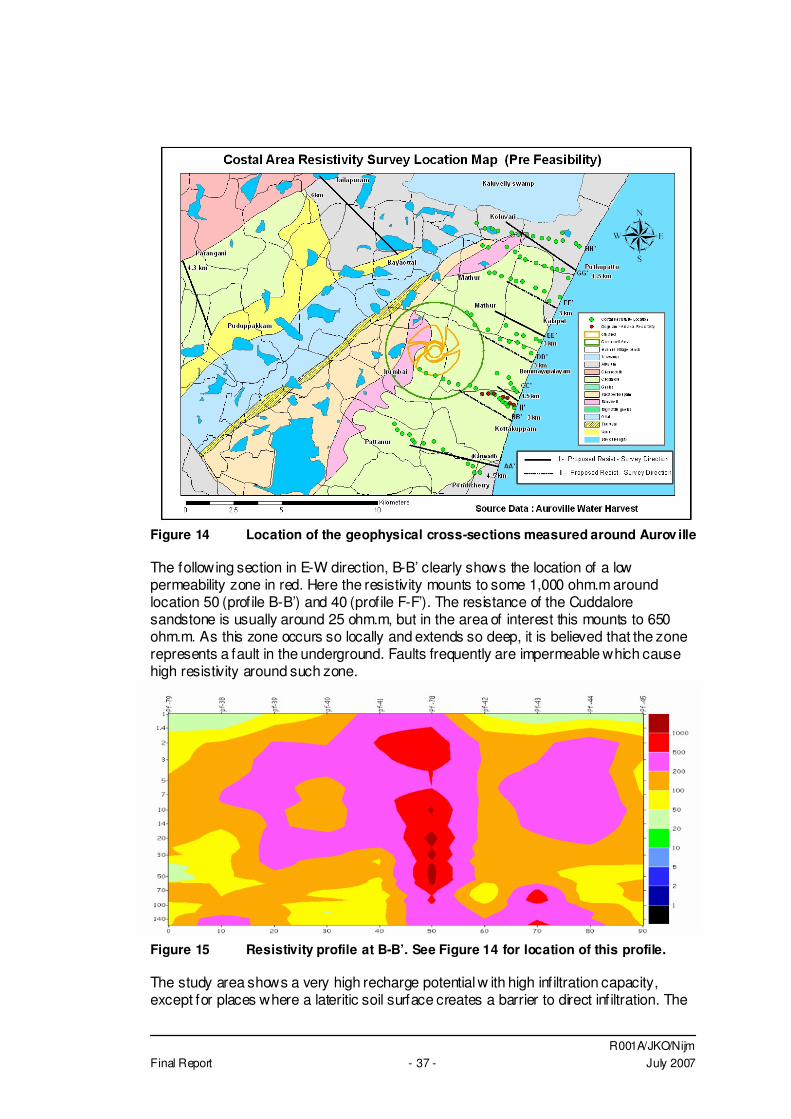
R001A/JKO/Nijm Final Report - 37 - July 2007
Figure 14 Location of the geophysical cross-sections measured around Aurov ille The following section in E-W direction, B-B’ clearly shows the location of a low permeability zone in red. Here the resistivity mounts to some 1,000 ohm.m around location 50 (profile B-B’) and 40 (profile F-F’). The resistance of the Cuddalore sandstone is usually around 25 ohm.m, but in the area of interest this mounts to 650 ohm.m. As this zone occurs so locally and extends so deep, it is believed that the zone represents a fault in the underground. Faults frequently are impermeable which cause high resistivity around such zone.
Figure 15 Resistivity profile at B-B’. See Figure 14 for location of this profile. The study area shows a very high recharge potential w ith high infiltration capacity, except for places where a lateritic soil surface creates a barrier to direct inf iltration. The
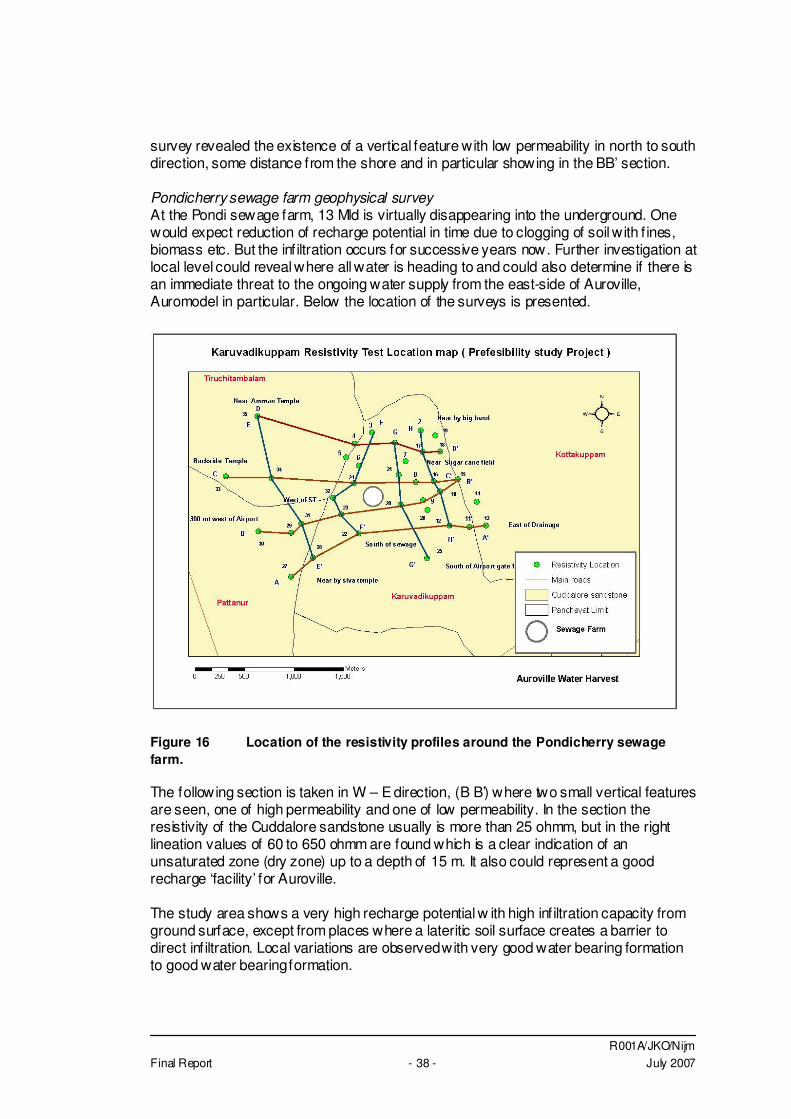
R001A/JKO/Nijm Final Report - 38 - July 2007
survey revealed the existence of a vertical feature with low permeability in north to south direction, some distance from the shore and in particular showing in the BB’ section. Pondicherry sewage farm geophysical survey At the Pondi sewage farm, 13 Mld is virtually disappearing into the underground. One would expect reduction of recharge potential in time due to clogging of soil with f ines, biomass etc. But the infiltration occurs for successive years now. Further investigation at local level could reveal where all water is heading to and could also determine if there is an immediate threat to the ongoing water supply from the east-side of Auroville, Auromodel in particular. Below the location of the surveys is presented.
Figure 16 Location of the resistivity profiles around the Pondicherry sewage farm. The following section is taken in W – E direction, (B B’) where two small vertical features are seen, one of high permeability and one of low permeability. In the section the resistivity of the Cuddalore sandstone usually is more than 25 ohmm, but in the right lineation values of 60 to 650 ohmm are found which is a clear indication of an unsaturated zone (dry zone) up to a depth of 15 m. It also could represent a good recharge ‘facility’ for Auroville. The study area shows a very high recharge potential w ith high infiltration capacity from ground surface, except from places where a lateritic soil surface creates a barrier to direct inf iltration. Local variations are observed with very good water bearing formation to good water bearing formation.
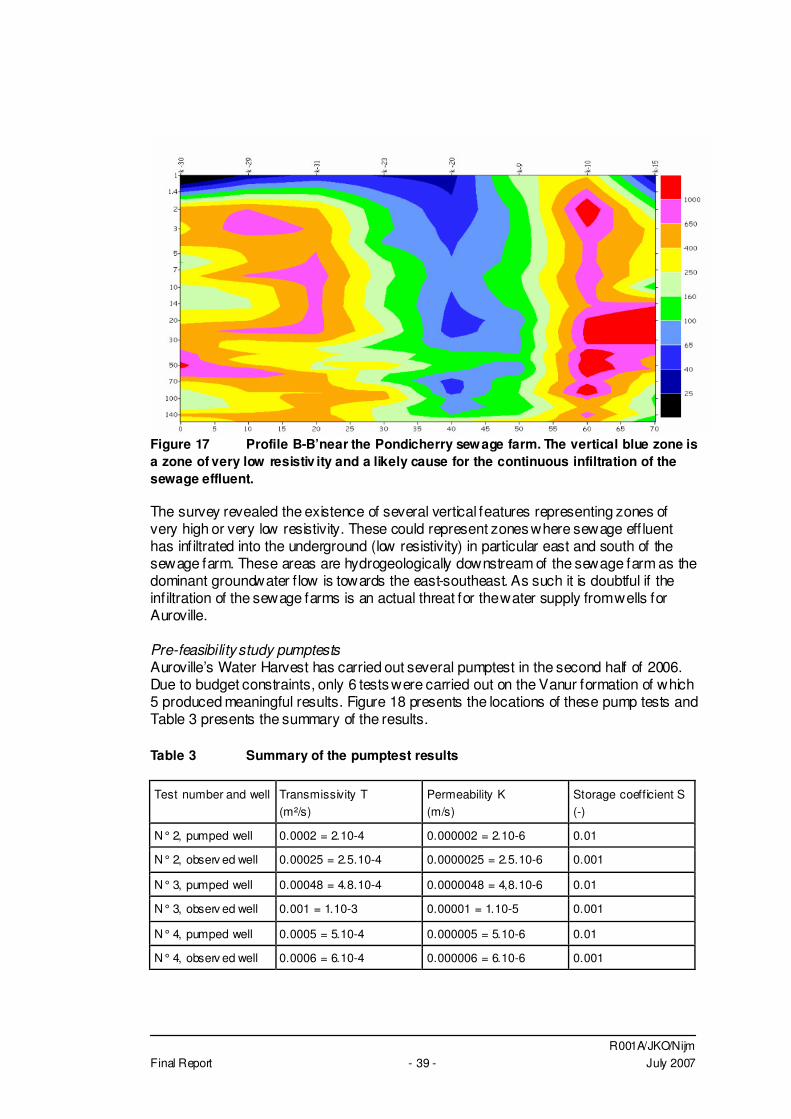
R001A/JKO/Nijm Final Report - 39 - July 2007
Figure 17 Profile B-B’near the Pondicherry sewage farm. The vertical blue zone is a zone of very low resistiv ity and a likely cause for the continuous infiltration of the sewage effluent. The survey revealed the existence of several vertical features representing zones of very high or very low resistivity. These could represent zones where sewage eff luent has infiltrated into the underground (low resistivity) in particular east and south of the sewage farm. These areas are hydrogeologically downstream of the sewage farm as the dominant groundwater f low is towards the east-southeast. As such it is doubtful if the infiltration of the sewage farms is an actual threat for the water supply from wells for Auroville. Pre-feasibility study pumptests Auroville’s Water Harvest has carried out several pumptest in the second half of 2006. Due to budget constraints, only 6 tests were carried out on the Vanur formation of which 5 produced meaningful results. Figure 18 presents the locations of these pump tests and Table 3 presents the summary of the results. Table 3 Summary of the pumptest results Test number and well Transmissivity T
(m²/s) Permeability K (m/s)
Storage coefficient S (-)
N° 2, pumped well 0.0002 = 2.10-4 0.000002 = 2.10-6 0.01
N° 2, observ ed well 0.00025 = 2.5.10-4 0.0000025 = 2.5.10-6 0.001
N° 3, pumped well 0.00048 = 4.8.10-4 0.0000048 = 4,8.10-6 0.01
N° 3, observ ed well 0.001 = 1.10-3 0.00001 = 1.10-5 0.001
N° 4, pumped well 0.0005 = 5.10-4 0.000005 = 5.10-6 0.01
N° 4, observ ed well 0.0006 = 6.10-4 0.000006 = 6.10-6 0.001
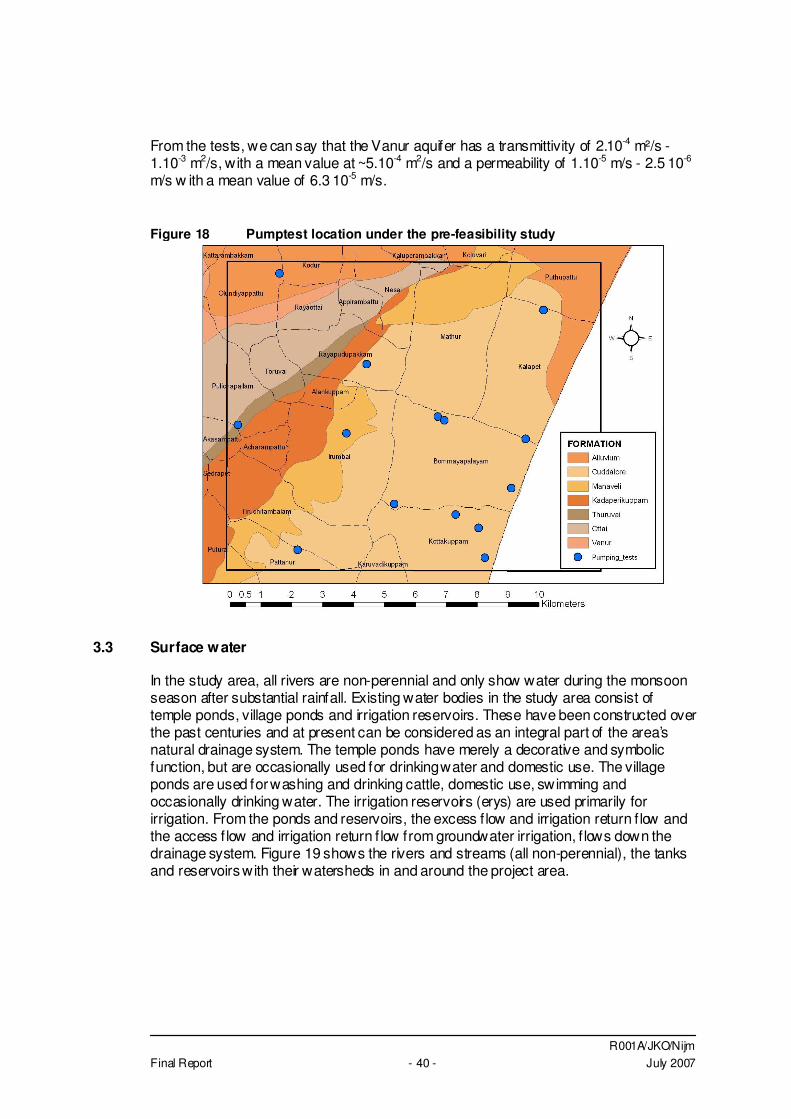
R001A/JKO/Nijm Final Report - 40 - July 2007
From the tests, we can say that the Vanur aquifer has a transmittivity of 2.10-4 m²/s - 1.10-3 m2/s, with a mean value at ~5.10-4 m2/s and a permeability of 1.10-5 m/s - 2.5 10-6 m/s w ith a mean value of 6.3 10-5 m/s. Figure 18 Pumptest location under the pre-feasibility study
3.3 Surface water
In the study area, all rivers are non-perennial and only show water during the monsoon season after substantial rainfall. Existing water bodies in the study area consist of temple ponds, village ponds and irrigation reservoirs. These have been constructed over the past centuries and at present can be considered as an integral part of the area’s natural drainage system. The temple ponds have merely a decorative and symbolic function, but are occasionally used for drinking water and domestic use. The village ponds are used for washing and drinking cattle, domestic use, swimming and occasionally drinking water. The irrigation reservoirs (erys) are used primarily for irrigation. From the ponds and reservoirs, the excess f low and irrigation return f low and the access f low and irrigation return f low from groundwater irrigation, f lows down the drainage system. Figure 19 shows the rivers and streams (all non-perennial), the tanks and reservoirs with their watersheds in and around the project area.
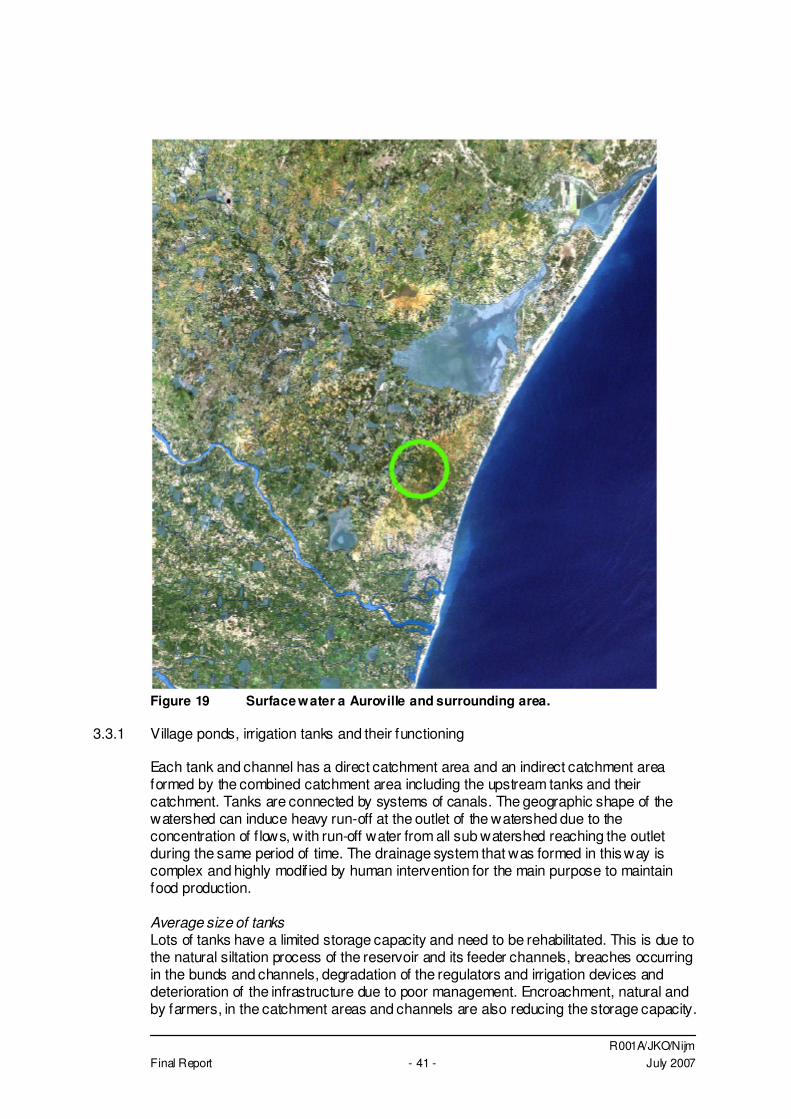
R001A/JKO/Nijm Final Report - 41 - July 2007
Figure 19 Surface water a Auroville and surrounding area.
3.3.1 Village ponds, irrigation tanks and their functioning
Each tank and channel has a direct catchment area and an indirect catchment area formed by the combined catchment area including the upstream tanks and their catchment. Tanks are connected by systems of canals. The geographic shape of the watershed can induce heavy run-off at the outlet of the watershed due to the concentration of f lows, with run-off water from all sub watershed reaching the outlet during the same period of time. The drainage system that was formed in this way is complex and highly modif ied by human intervention for the main purpose to maintain food production. Average size of tanks Lots of tanks have a limited storage capacity and need to be rehabilitated. This is due to the natural siltation process of the reservoir and its feeder channels, breaches occurring in the bunds and channels, degradation of the regulators and irrigation devices and deterioration of the infrastructure due to poor management. Encroachment, natural and by farmers, in the catchment areas and channels are also reducing the storage capacity.
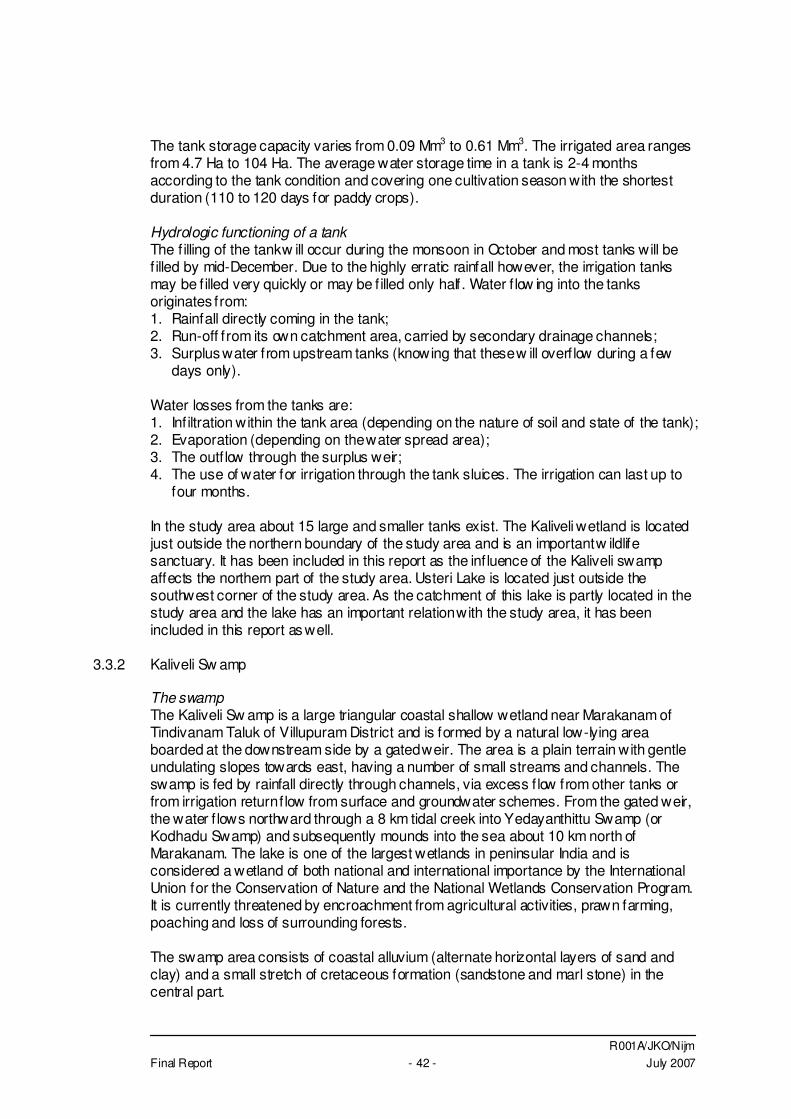
R001A/JKO/Nijm Final Report - 42 - July 2007
The tank storage capacity varies from 0.09 Mm3 to 0.61 Mm3. The irrigated area ranges from 4.7 Ha to 104 Ha. The average water storage time in a tank is 2-4 months according to the tank condition and covering one cultivation season with the shortest duration (110 to 120 days for paddy crops). Hydrologic functioning of a tank The filling of the tank w ill occur during the monsoon in October and most tanks will be f illed by mid-December. Due to the highly erratic rainfall however, the irrigation tanks may be f illed very quickly or may be f illed only half. Water f low ing into the tanks originates from: 1. Rainfall directly coming in the tank; 2. Run-off from its own catchment area, carried by secondary drainage channels; 3. Surplus water from upstream tanks (knowing that these w ill overf low during a few
days only). Water losses from the tanks are: 1. Infiltration within the tank area (depending on the nature of soil and state of the tank); 2. Evaporation (depending on the water spread area); 3. The outf low through the surplus weir; 4. The use of water for irrigation through the tank sluices. The irrigation can last up to
four months. In the study area about 15 large and smaller tanks exist. The Kaliveli wetland is located just outside the northern boundary of the study area and is an important w ildlife sanctuary. It has been included in this report as the influence of the Kaliveli swamp affects the northern part of the study area. Usteri Lake is located just outside the southwest corner of the study area. As the catchment of this lake is partly located in the study area and the lake has an important relation with the study area, it has been included in this report as well.
3.3.2 Kaliveli Sw amp
The swamp The Kaliveli Sw amp is a large triangular coastal shallow wetland near Marakanam of Tindivanam Taluk of Villupuram District and is formed by a natural low-lying area boarded at the downstream side by a gated weir. The area is a plain terrain with gentle undulating slopes towards east, having a number of small streams and channels. The swamp is fed by rainfall directly through channels, via excess f low from other tanks or from irrigation return f low from surface and groundwater schemes. From the gated weir, the water f lows northward through a 8 km tidal creek into Yedayanthittu Swamp (or Kodhadu Swamp) and subsequently mounds into the sea about 10 km north of Marakanam. The lake is one of the largest wetlands in peninsular India and is considered a wetland of both national and international importance by the International Union for the Conservation of Nature and the National Wetlands Conservation Program. It is currently threatened by encroachment from agricultural activities, prawn farming, poaching and loss of surrounding forests. The swamp area consists of coastal alluvium (alternate horizontal layers of sand and clay) and a small stretch of cretaceous formation (sandstone and marl stone) in the central part.
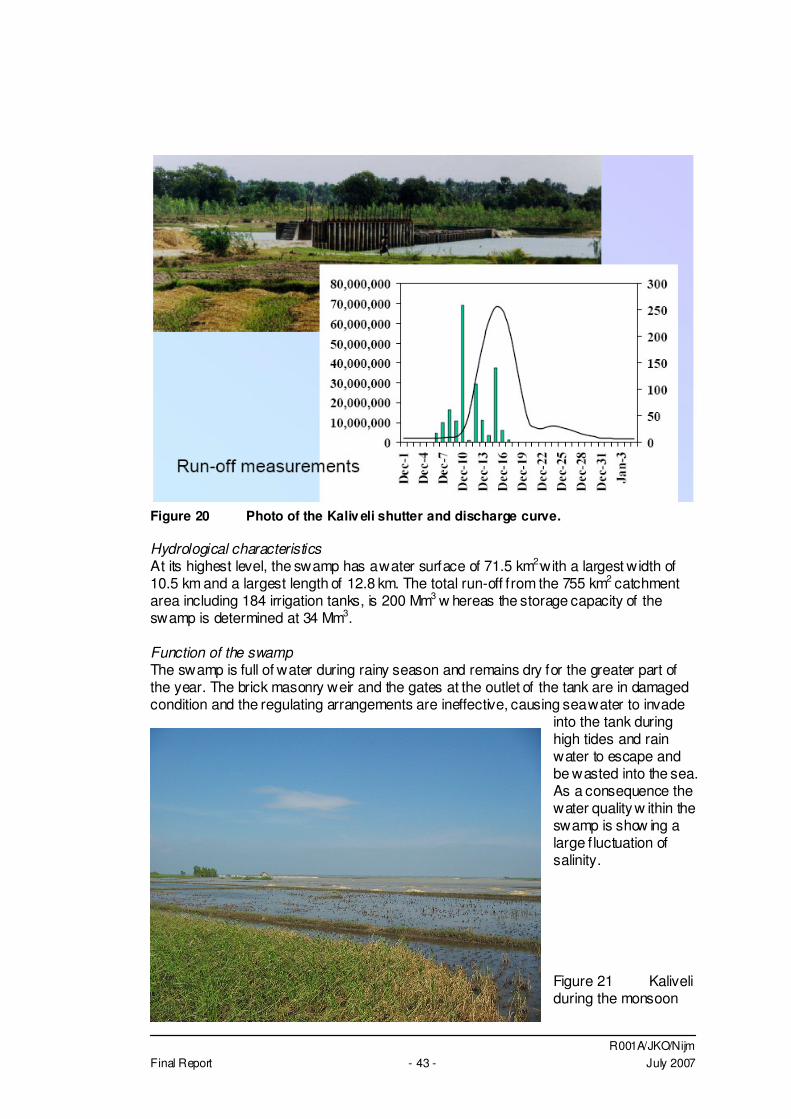
R001A/JKO/Nijm Final Report - 43 - July 2007
Figure 20 Photo of the Kaliv eli shutter and discharge curve. Hydrological characteristics At its highest level, the swamp has a water surface of 71.5 km2.with a largest width of 10.5 km and a largest length of 12.8 km. The total run-off from the 755 km2 catchment area including 184 irrigation tanks, is 200 Mm3 w hereas the storage capacity of the swamp is determined at 34 Mm3. Function of the swamp The swamp is full of water during rainy season and remains dry for the greater part of the year. The brick masonry weir and the gates at the outlet of the tank are in damaged condition and the regulating arrangements are ineffective, causing sea water to invade
into the tank during high tides and rain water to escape and be wasted into the sea. As a consequence the water quality w ithin the swamp is show ing a large f luctuation of salinity. Figure 21 Kaliveli during the monsoon
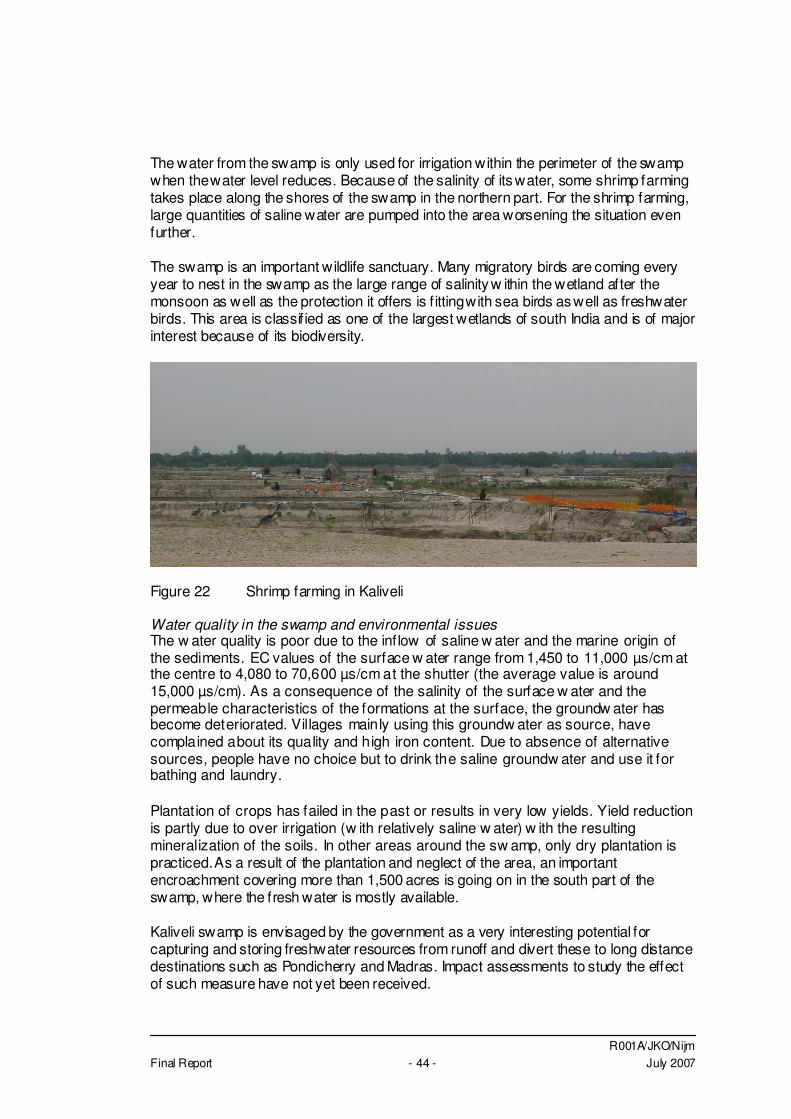
R001A/JKO/Nijm Final Report - 44 - July 2007
The water from the swamp is only used for irrigation within the perimeter of the swamp when the water level reduces. Because of the salinity of its water, some shrimp farming takes place along the shores of the swamp in the northern part. For the shrimp farming, large quantities of saline water are pumped into the area worsening the situation even further. The swamp is an important wildlife sanctuary. Many migratory birds are coming every year to nest in the swamp as the large range of salinity w ithin the wetland after the monsoon as well as the protection it offers is f itting with sea birds as well as freshwater birds. This area is classif ied as one of the largest wetlands of south India and is of major interest because of its biodiversity.
Figure 22 Shrimp farming in Kaliveli Water quality in the swamp and environmental issues The w ater quality is poor due to the inflow of saline w ater and the marine origin of the sediments. EC values of the surface w ater range from 1,450 to 11,000 µs/cm at the centre to 4,080 to 70,600 µs/cm at the shutter (the average value is around 15,000 µs/cm). As a consequence of the salinity of the surface w ater and the permeable characteristics of the formations at the surface, the groundw ater has become deteriorated. Villages mainly using this groundw ater as source, have complained about its quality and high iron content. Due to absence of alternative sources, people have no choice but to drink the saline groundw ater and use it for bathing and laundry. Plantation of crops has failed in the past or results in very low yields. Yield reduction is partly due to over irrigation (w ith relatively saline w ater) w ith the resulting mineralization of the soils. In other areas around the sw amp, only dry plantation is practiced. As a result of the plantation and neglect of the area, an important encroachment covering more than 1,500 acres is going on in the south part of the swamp, where the fresh water is mostly available. Kaliveli swamp is envisaged by the government as a very interesting potential for capturing and storing freshwater resources from runoff and divert these to long distance destinations such as Pondicherry and Madras. Impact assessments to study the effect of such measure have not yet been received.
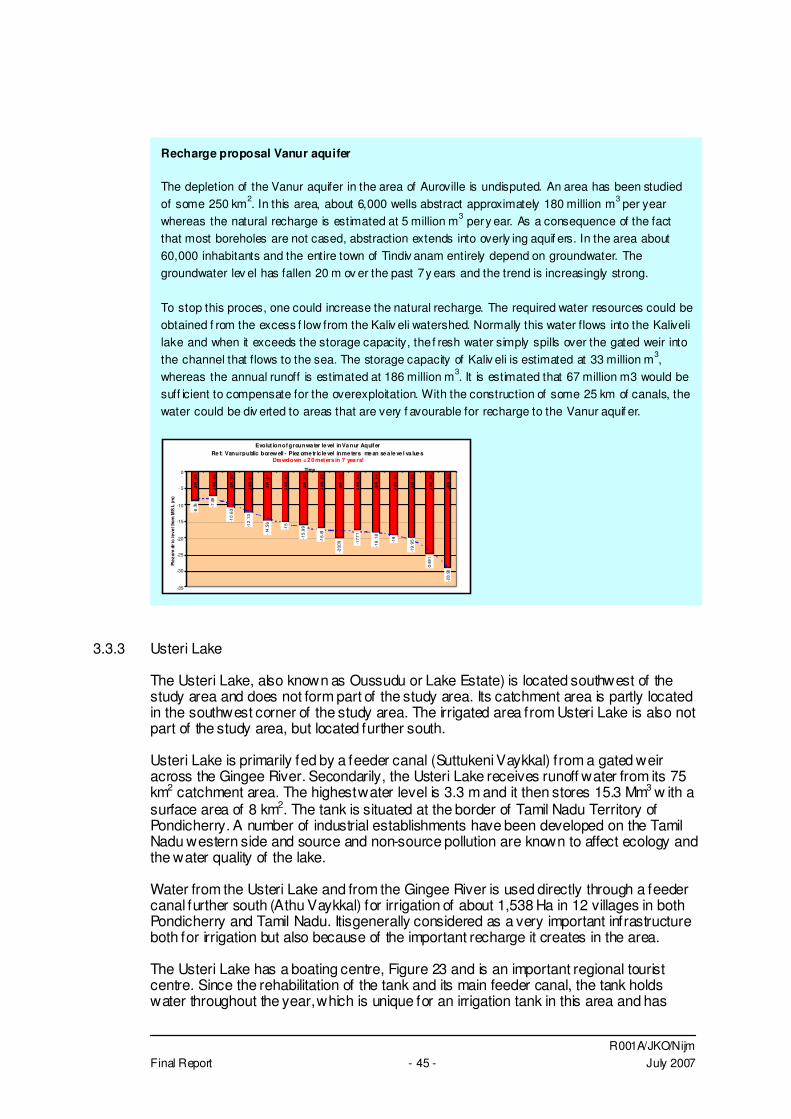
R001A/JKO/Nijm Final Report - 45 - July 2007
3.3.3 Usteri Lake
The Usteri Lake, also known as Oussudu or Lake Estate) is located southwest of the study area and does not form part of the study area. Its catchment area is partly located in the southwest corner of the study area. The irrigated area from Usteri Lake is also not part of the study area, but located further south. Usteri Lake is primarily fed by a feeder canal (Suttukeni Vaykkal) from a gated weir across the Gingee River. Secondarily, the Usteri Lake receives runoff water from its 75 km2 catchment area. The highest water level is 3.3 m and it then stores 15.3 Mm3 w ith a surface area of 8 km2. The tank is situated at the border of Tamil Nadu Territory of Pondicherry. A number of industrial establishments have been developed on the Tamil Nadu western side and source and non-source pollution are known to affect ecology and the water quality of the lake. Water from the Usteri Lake and from the Gingee River is used directly through a feeder canal further south (Athu Vaykkal) for irrigation of about 1,538 Ha in 12 villages in both Pondicherry and Tamil Nadu. Itisgenerally considered as a very important infrastructure both for irrigation but also because of the important recharge it creates in the area. The Usteri Lake has a boating centre, Figure 23 and is an important regional tourist centre. Since the rehabilitation of the tank and its main feeder canal, the tank holds water throughout the year, which is unique for an irrigation tank in this area and has
Recharge proposal Vanur aquifer The depletion of the Vanur aquifer in the area of Auroville is undisputed. An area has been studied of some 250 km2. In this area, about 6,000 wells abstract approximately 180 million m3 per year whereas the natural recharge is estimated at 5 million m3 per y ear. As a consequence of the fact that most boreholes are not cased, abstraction extends into overly ing aquif ers. In the area about 60,000 inhabitants and the entire town of Tindiv anam entirely depend on groundwater. The groundwater lev el has fallen 20 m ov er the past 7 y ears and the trend is increasingly strong. To stop this proces, one could increase the natural recharge. The required water resources could be obtained f rom the excess f low from the Kaliv eli watershed. Normally this water flows into the Kaliveli lake and when it exceeds the storage capacity, the f resh water simply spills over the gated weir into the channel that flows to the sea. The storage capacity of Kaliv eli is estimated at 33 million m3, whereas the annual runoff is estimated at 186 million m3. It is estimated that 67 million m3 would be suff icient to compensate for the overexploitation. With the construction of some 25 km of canals, the water could be div erted to areas that are very f avourable for recharge to the Vanur aquif er.
Evolut ion of grounwa ter le vel in Va nur AquiferRe f: Vanur public borew ell - Piez ome tric le vel in me ters me an se a le ve l va lue s
Dra wdown = 2 0 meters in 7 yea rs!
-8.7
6 -7.0
9
-10
.63
-12
.13
-14
.56
-15
-15
.99
-16
.81
-20.
09 -1
7.7
1
-18
.18
-19
-19
.95
-24
.91
-28
.90
-35
-30
-25
-20
-15
-10
- 5
0
JUN
_99
JA
N_
00
JUN
_00
JA
N_
01
JUN
_01
JA
N_
02
JUN
_02
JA
N_
03
JUN
_03
JA
N_
04
JUN
_04
JA
N_
05
JUN
_05
JA
N_
06
JUN
_06
Time
Piez
ometr
ic le
vel f
rom
MS
L (m
)
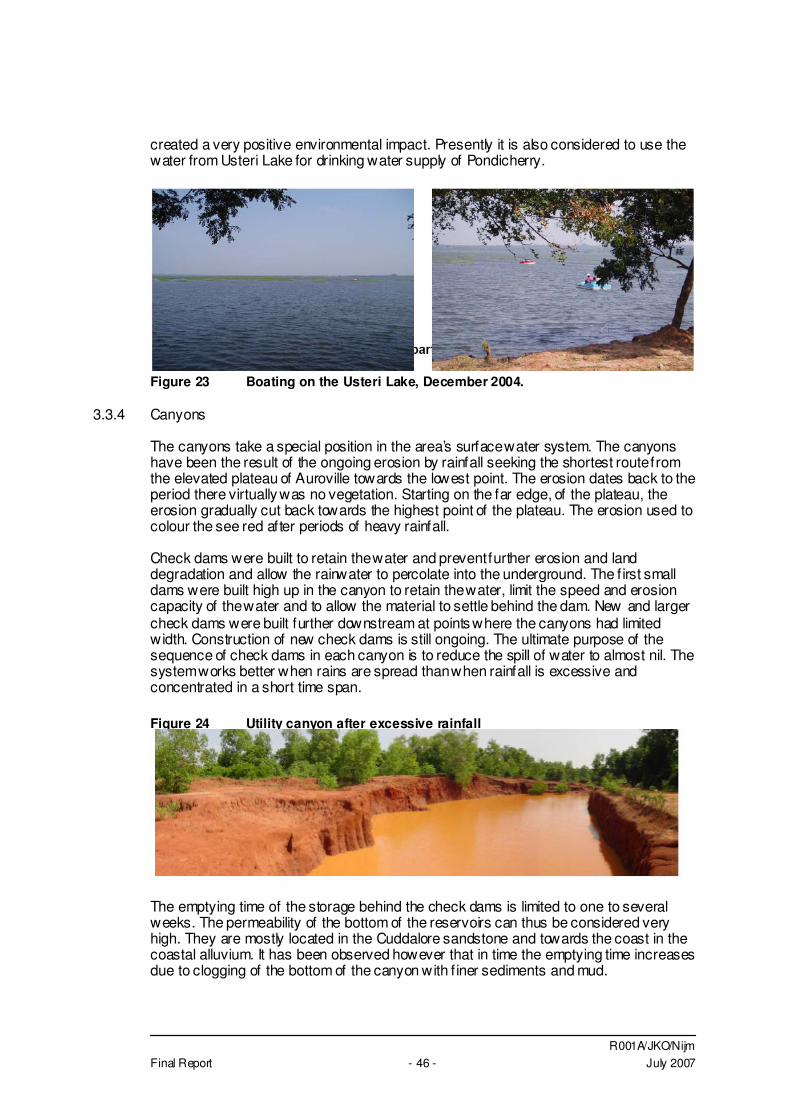
R001A/JKO/Nijm Final Report - 46 - July 2007
created a very positive environmental impact. Presently it is also considered to use the water from Usteri Lake for drinking water supply of Pondicherry.
Figure 23 Boating on the Usteri Lake, December 2004.
3.3.4 Canyons
The canyons take a special position in the area’s surface water system. The canyons have been the result of the ongoing erosion by rainfall seeking the shortest route from the elevated plateau of Auroville towards the lowest point. The erosion dates back to the period there virtually was no vegetation. Starting on the far edge, of the plateau, the erosion gradually cut back towards the highest point of the plateau. The erosion used to colour the see red after periods of heavy rainfall. Check dams were built to retain the water and prevent further erosion and land degradation and allow the rainwater to percolate into the underground. The f irst small dams were built high up in the canyon to retain the water, limit the speed and erosion capacity of the water and to allow the material to settle behind the dam. New and larger check dams were built further downstream at points where the canyons had limited width. Construction of new check dams is still ongoing. The ultimate purpose of the sequence of check dams in each canyon is to reduce the spill of water to almost nil. The system works better when rains are spread than when rainfall is excessive and concentrated in a short time span. Figure 24 Utility canyon after excessive rainfall
The emptying time of the storage behind the check dams is limited to one to several weeks. The permeability of the bottom of the reservoirs can thus be considered very high. They are mostly located in the Cuddalore sandstone and towards the coast in the coastal alluvium. It has been observed however that in time the emptying time increases due to clogging of the bottom of the canyon with f iner sediments and mud.
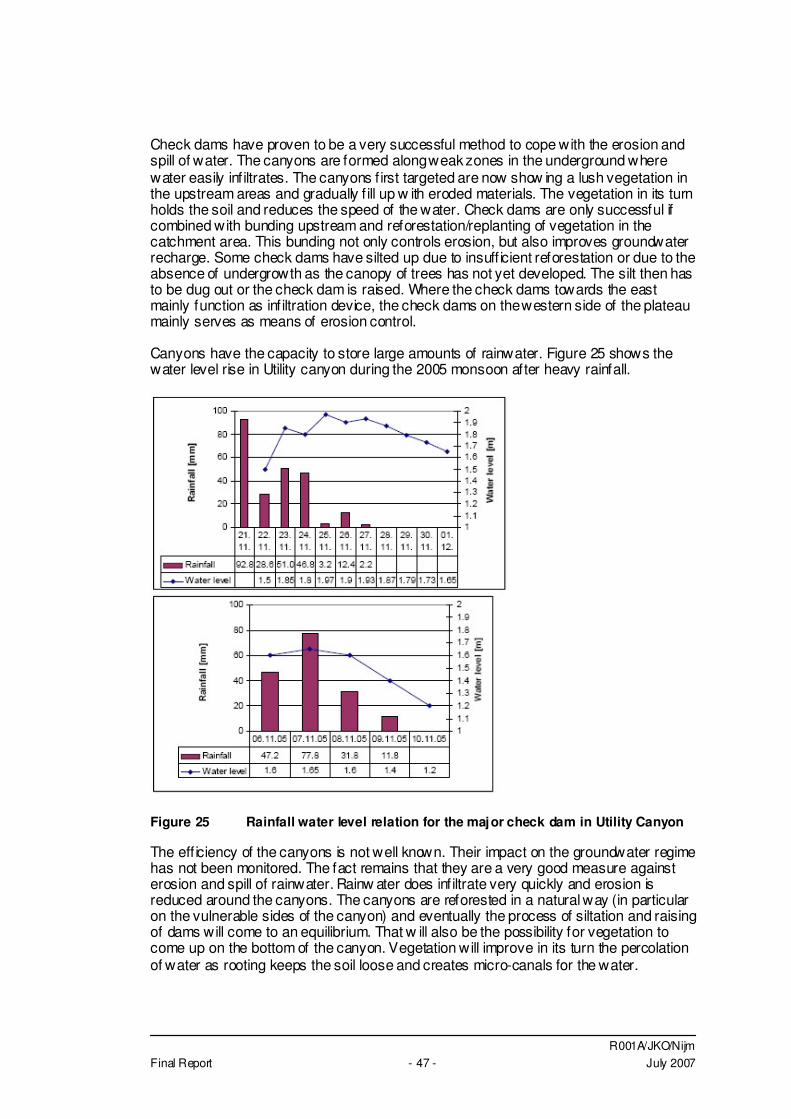
R001A/JKO/Nijm Final Report - 47 - July 2007
Check dams have proven to be a very successful method to cope with the erosion and spill of water. The canyons are formed along weak zones in the underground where water easily inf iltrates. The canyons f irst targeted are now show ing a lush vegetation in the upstream areas and gradually f ill up w ith eroded materials. The vegetation in its turn holds the soil and reduces the speed of the water. Check dams are only successful if combined with bunding upstream and reforestation/replanting of vegetation in the catchment area. This bunding not only controls erosion, but also improves groundwater recharge. Some check dams have silted up due to insuff icient reforestation or due to the absence of undergrowth as the canopy of trees has not yet developed. The silt then has to be dug out or the check dam is raised. Where the check dams towards the east mainly function as infiltration device, the check dams on the western side of the plateau mainly serves as means of erosion control. Canyons have the capacity to store large amounts of rainwater. Figure 25 shows the water level rise in Utility canyon during the 2005 monsoon after heavy rainfall.
Figure 25 Rainfall water level relation for the major check dam in Utility Canyon The eff iciency of the canyons is not well known. Their impact on the groundwater regime has not been monitored. The fact remains that they are a very good measure against erosion and spill of rainwater. Rainw ater does infiltrate very quickly and erosion is reduced around the canyons. The canyons are reforested in a natural way (in particular on the vulnerable sides of the canyon) and eventually the process of siltation and raising of dams will come to an equilibrium. That w ill also be the possibility for vegetation to come up on the bottom of the canyon. Vegetation will improve in its turn the percolation of water as rooting keeps the soil loose and creates micro-canals for the water.
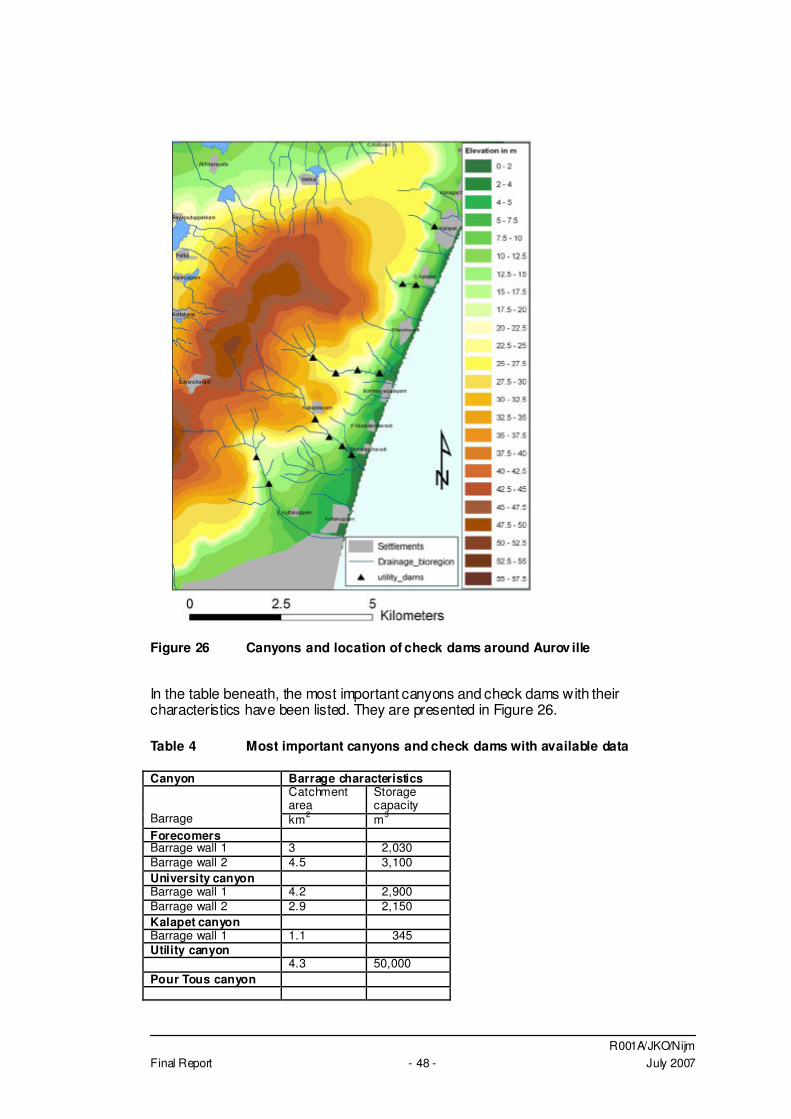
R001A/JKO/Nijm Final Report - 48 - July 2007
Figure 26 Canyons and location of check dams around Aurov ille In the table beneath, the most important canyons and check dams with their characteristics have been listed. They are presented in Figure 26. Table 4 Most important canyons and check dams with available data Canyon Barrage characteristics
Catchment area
Storage capacity
Barrage km2 m3 Forecomers Barrage wall 1 3 2,030 Barrage wall 2 4.5 3,100 University canyon Barrage wall 1 4.2 2,900 Barrage wall 2 2.9 2,150 Kalapet canyon Barrage wall 1 1.1 345 Utility canyon 4.3 50,000 Pour Tous canyon
R001A/JKO/Nijm Final Report - 49 - July 2007
From Table 4 and Figure 26 it can be seen that check dams have been built in the canyons in particular in the east and much less on the western side of the plateau. Apart from the check dams, several minor structures (contour bunding, diversion bunds) have been constructed all over the plateau in relation to the canyons and check dams. The reason that erosion control features are less developed along the western side of the plateau is that these give access to several village ponds and small lakes. Constructing check dams here w ill undoubtedly lead to f ierce discussions w ith the operators of these ponds. In general, bunding and the construction of check dams has resulted in a remarkable reduction of run-off and erosion and an excellent overall control of surface water in the area.
3.3.5 New developments in surface water
Kaliveli Wetland The Indian authorities have recently developed great interest in the Kaliveli wetland as a fresh water resource for urban water supply to Pondi and Chennai. By repairing the shutters and raising dikes along the borders of the reservoir, more fresh water can be stored and diverted. Auroville (Auroville’s Water Harvest) recently developed a plan to divert part of the excess f low to Kaliveli towards an area from where the overexploited Vanur formation can be recharged at rapid rate. This and any other proposed development in relation to Kaliveli will have to be studied carefully for its social and ecological impact to prevent further deterioration of this valuable wetland. Buckingham Canal A proposal from the Indian Waterways Authorities has been submitted for the renovation and extension of the existing waterway ‘Buckingham canal’ from Tamil Nadu to Pondicherry territory, as part of a National inter states water linking program. The project is to renovate the entire way course of more than 1,000 km and to extend the waterway for the missing portion between Marakanam to Pondicherry, at 30km distance. Presently, the f inal way has not been sanctioned yet, as there are various options from extending the waterway along the east coast road, or through the Kaliveli swamp w ith possibilities of creating a fresh water reservoir connecting the Gingee river and the major tanks of Pondicherry territory like the Usteri Lake. The waterways rehabilitation program budget and its extension to Pondicherry Territory has been off icially sanctioned by the Lok Shaba (National Parliament) w hile the details of the program are not yet available.
3.4 Rainwater
3.4.1 Introduction
Rainw ater harvesting and stormw ater management are strongly related, but differ in the required techniques to cope with the different quantities and intensities. In general rainwater harvesting is the collection of rainwater from relatively clean surfaces such as rooftops for small scale domestic use. It is generally associated with lack of water. Stormwater management mainly deals with the control of rainwater in large volumes in order to prevent damage and nuisance and mainly aims at draining away the water as quickly as possible with the least damage.
R001A/JKO/Nijm Final Report - 50 - July 2007
As Auroville suffers both from a lack of water and from torrential rains, rainwater harvesting and stormwater management are discussed and dealt w ith in this single chapter. Where necessary or desirable, they will be discussed separately. Through an ordinance titled “Tamil Nadu Municipal Laws ordinance, 2003”, dated July 19, 2003, the government of Tamil Nadu has made rainwater harvesting mandatory for all buildings, both public and private, in the state. The deadline to construct rainwater harvesting structures was August 31, 2003. The ordinance cautions, "Where the rain water harvesting structure is not provided as required, the Commissioner or any person authorized by him in his behalf may, after giving notice to the owner or occupier of the building, cause rain water harvesting structure to be provided in such building and recover the cost of such provision along with the incidental expense thereof in the same manner as property tax". It also warns the citizens they may be penalized by the disconnection of their water supply if rainwater harvesting structures are not provided. Auroville has made a large effort over the past decades to cope w ith rain and storm water by systematic contour bunding, construction of silt traps and checkdams and recharge structures.
3.4.2 Base data and definitions
Rainfall In chapter 1, the rainfall data have been discussed to a limited extent. The yearly average rainfall is 1,192 mm from 1911 to 2005 (Historical Hindu-Pondicherry station), with a maximum of 2,604 mm recorded in 1943 and a minimum of 626 mm recorded in 1952. As design of rainfall-related structures are generally based on shower intensities, in Table 5 a list of maximum rainfall events has been given Table 5 Rainfall statistics for design purpose Sources: Aurov ille Certitude, Pondicherry, Auroville Harv est Ev ent Value
Av erage rainf all per year 1,192 mm Av erage rainy days per y ear 62 days
Maximum rainf all per y ear 2,604 mm (1943) Minimum rainf all per year 626 mm (1952)
Maximum rainf all in 1 day 362 mm Maximum rainf all in 2 days 416 mm
Maximum rainf all in 3 days 478 mm Maximum rainf all in 1 month 700 mm From the Indian Meteorological Department (sourcing f igures nationwide) the heaviest rainfall in 2 days is suppose to be around 600mm and 700 for 3 days, about 50% above the recorded values in this region. Another import design criteria is the rainfall frequency: how often does rainfall w ith a particular intensity occur? An analysis of the period 1968 – 2002 Figure 27 results in Figure 28. From this f igure, it appears that for the years 1968 – 2002 show that a rainfall
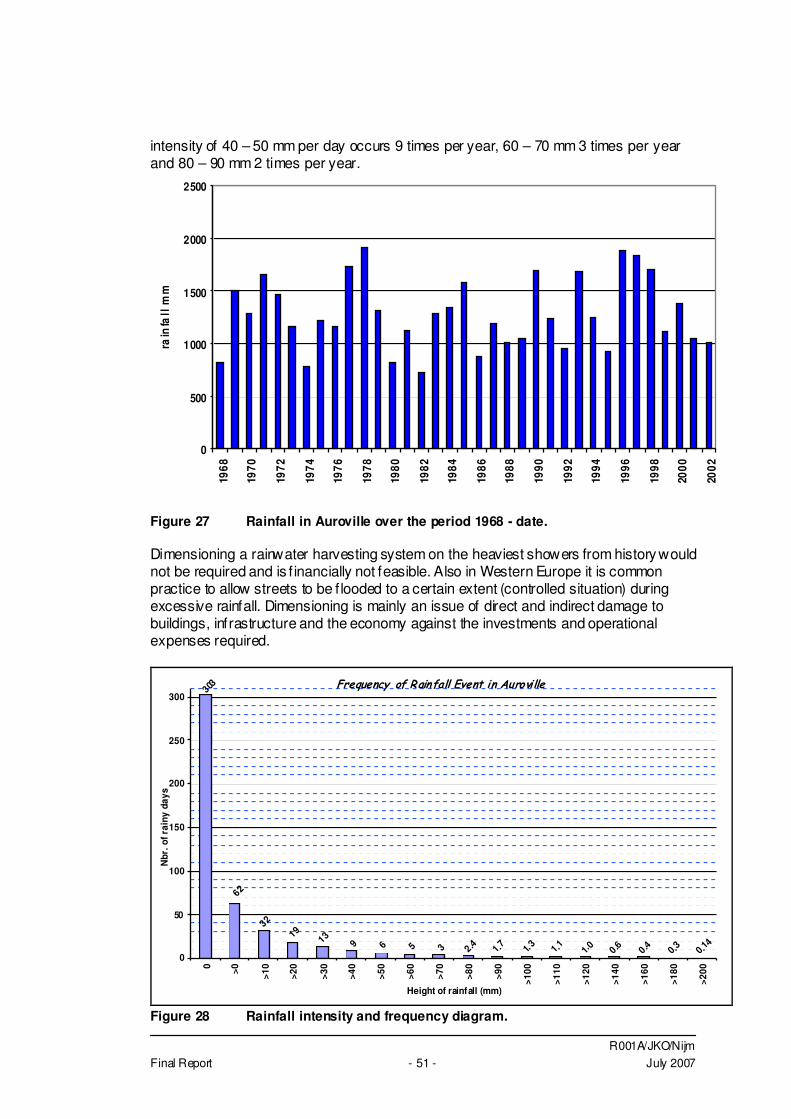
R001A/JKO/Nijm Final Report - 51 - July 2007
intensity of 40 – 50 mm per day occurs 9 times per year, 60 – 70 mm 3 times per year and 80 – 90 mm 2 times per year.
0
500
1000
1500
2000
2500
1968
1970
1972
1974
1976
1978
1980
1982
1984
1986
1988
1990
1992
1994
1996
1998
2000
2002
rain
fall
mm
Figure 27 Rainfall in Auroville over the period 1968 - date. Dimensioning a rainwater harvesting system on the heaviest showers from history would not be required and is f inancially not feasible. Also in Western Europe it is common practice to allow streets to be f looded to a certain extent (controlled situation) during excessive rainfall. Dimensioning is mainly an issue of direct and indirect damage to buildings, infrastructure and the economy against the investments and operational expenses required.
����������� ��� �����������������
3219
139 6 5 3 2.4 1.7 1.3 1.1 1.0 0.6 0.4 0.3 0.14
62
303
0
50
100
150
200
250
300
0 >0 >10
>20
>30
>40
>50
>60
>70
>80
>90
>100
>110
>120
>140
>160
>180
>200
Height of rainfall (mm)
Nbr
. of r
ainy
day
s
Figure 28 Rainfall intensity and frequency diagram.
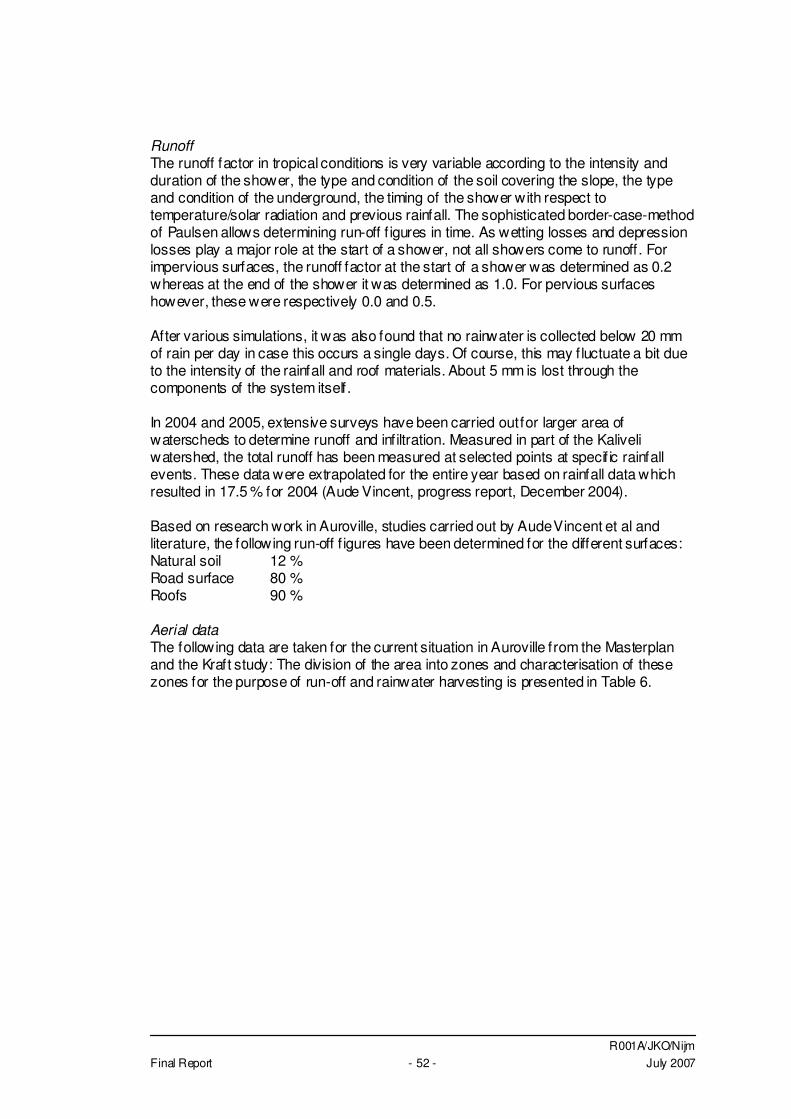
R001A/JKO/Nijm Final Report - 52 - July 2007
Runoff The runoff factor in tropical conditions is very variable according to the intensity and duration of the shower, the type and condition of the soil covering the slope, the type and condition of the underground, the timing of the shower with respect to temperature/solar radiation and previous rainfall. The sophisticated border-case-method of Paulsen allows determining run-off f igures in time. As wetting losses and depression losses play a major role at the start of a shower, not all showers come to runoff. For impervious surfaces, the runoff factor at the start of a shower was determined as 0.2 whereas at the end of the shower it was determined as 1.0. For pervious surfaces however, these were respectively 0.0 and 0.5. After various simulations, it was also found that no rainwater is collected below 20 mm of rain per day in case this occurs a single days. Of course, this may f luctuate a bit due to the intensity of the rainfall and roof materials. About 5 mm is lost through the components of the system itself. In 2004 and 2005, extensive surveys have been carried out for larger area of waterscheds to determine runoff and infiltration. Measured in part of the Kaliveli watershed, the total runoff has been measured at selected points at specif ic rainfall events. These data were extrapolated for the entire year based on rainfall data which resulted in 17.5 % for 2004 (Aude Vincent, progress report, December 2004). Based on research work in Auroville, studies carried out by Aude Vincent et al and literature, the following run-off f igures have been determined for the different surfaces: Natural soil 12 % Road surface 80 % Roofs 90 % Aerial data The following data are taken for the current situation in Auroville from the Masterplan and the Kraft study: The division of the area into zones and characterisation of these zones for the purpose of run-off and rainwater harvesting is presented in Table 6.
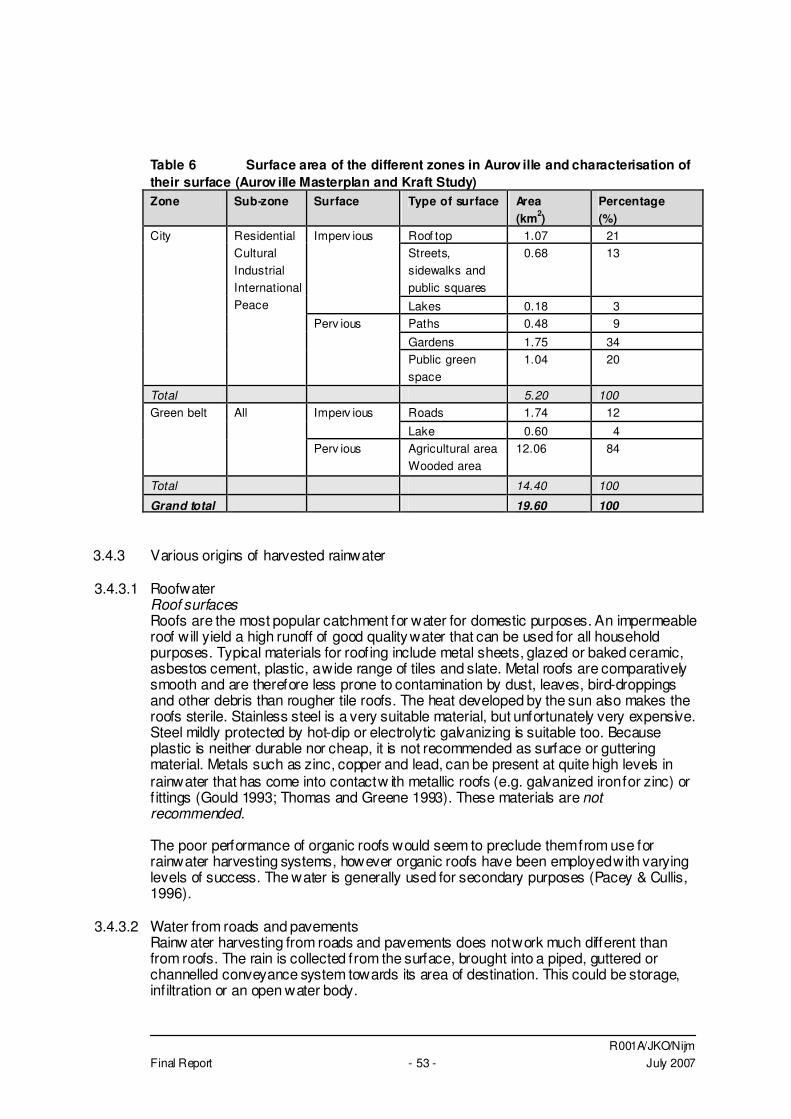
R001A/JKO/Nijm Final Report - 53 - July 2007
Table 6 Surface area of the different zones in Aurov ille and characterisation of their surface (Aurov ille Masterplan and Kraft Study) Zone Sub-zone Surface Type of surface Area
(km2) Percentage (%)
Roof top 1.07 21 Streets, sidewalks and public squares
0.68 13 Imperv ious
Lakes 0.18 3 Paths 0.48 9
Gardens 1.75 34
City Residential Cultural Industrial International Peace
Perv ious
Public green space
1.04 20
Total 5.20 100 Roads 1.74 12 Imperv ious
Lake 0.60 4
Green belt All
Perv ious Agricultural area Wooded area
12.06 84
Total 14.40 100
Grand total 19.60 100
3.4.3 Various origins of harvested rainwater
3.4.3.1 Roofwater Roof surfaces Roofs are the most popular catchment for water for domestic purposes. An impermeable roof will yield a high runoff of good quality water that can be used for all household purposes. Typical materials for roofing include metal sheets, glazed or baked ceramic, asbestos cement, plastic, a wide range of tiles and slate. Metal roofs are comparatively smooth and are therefore less prone to contamination by dust, leaves, bird-droppings and other debris than rougher tile roofs. The heat developed by the sun also makes the roofs sterile. Stainless steel is a very suitable material, but unfortunately very expensive. Steel mildly protected by hot-dip or electrolytic galvanizing is suitable too. Because plastic is neither durable nor cheap, it is not recommended as surface or guttering material. Metals such as zinc, copper and lead, can be present at quite high levels in rainwater that has come into contact w ith metallic roofs (e.g. galvanized iron for zinc) or f ittings (Gould 1993; Thomas and Greene 1993). These materials are not recommended. The poor performance of organic roofs would seem to preclude them from use for rainwater harvesting systems, however organic roofs have been employed with varying levels of success. The water is generally used for secondary purposes (Pacey & Cullis, 1996).
3.4.3.2 Water from roads and pavements Rainw ater harvesting from roads and pavements does not work much different than from roofs. The rain is collected from the surface, brought into a piped, guttered or channelled conveyance system towards its area of destination. This could be storage, inf iltration or an open water body.
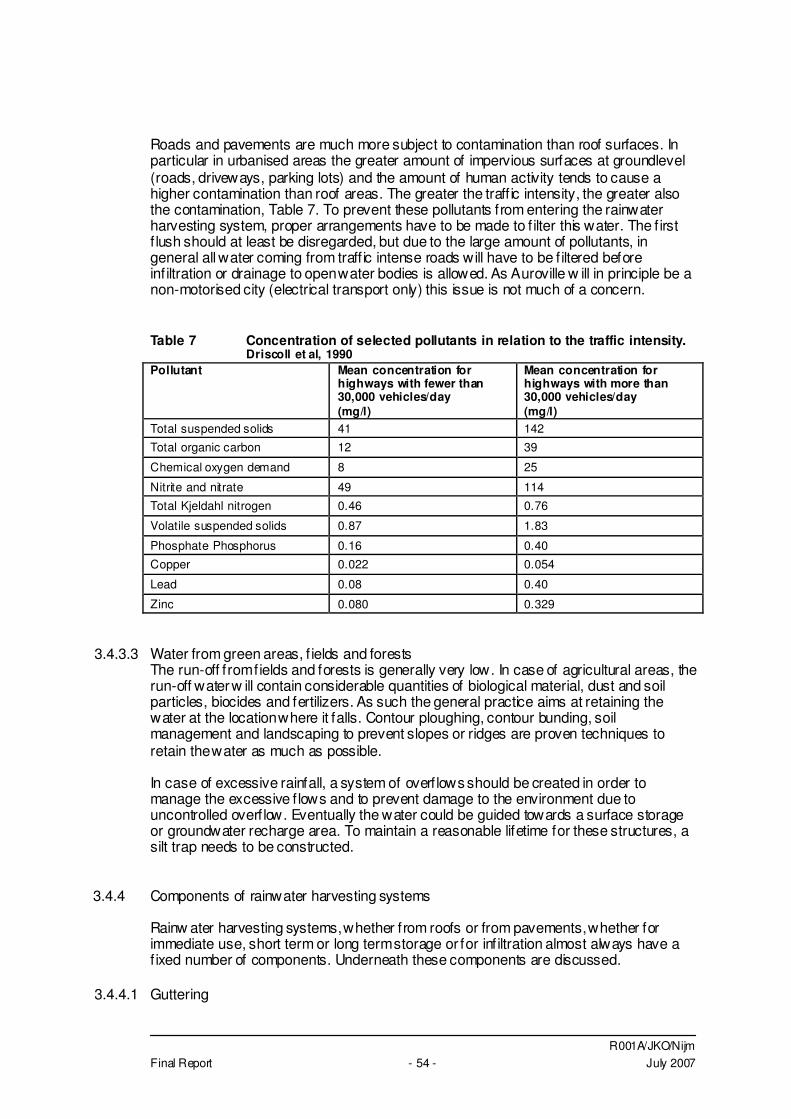
R001A/JKO/Nijm Final Report - 54 - July 2007
Roads and pavements are much more subject to contamination than roof surfaces. In particular in urbanised areas the greater amount of impervious surfaces at groundlevel (roads, driveways, parking lots) and the amount of human activity tends to cause a higher contamination than roof areas. The greater the traff ic intensity, the greater also the contamination, Table 7. To prevent these pollutants from entering the rainwater harvesting system, proper arrangements have to be made to f ilter this water. The f irst f lush should at least be disregarded, but due to the large amount of pollutants, in general all water coming from traff ic intense roads will have to be f iltered before infiltration or drainage to open water bodies is allowed. As Auroville w ill in principle be a non-motorised city (electrical transport only) this issue is not much of a concern. Table 7 Concentration of selected pollutants in relation to the traffic intensity. Driscoll et al, 1990 Pollutant Mean concentration for
highways with fewer than 30,000 vehicles/day (mg/l)
Mean concentration for highways with more than 30,000 vehicles/day (mg/l)
Total suspended solids 41 142
Total organic carbon 12 39
Chemical oxygen demand 8 25
Nitrite and nitrate 49 114
Total Kjeldahl nitrogen 0.46 0.76
Volatile suspended solids 0.87 1.83
Phosphate Phosphorus 0.16 0.40
Copper 0.022 0.054
Lead 0.08 0.40
Zinc 0.080 0.329
3.4.3.3 Water from green areas, f ields and forests The run-off from fields and forests is generally very low. In case of agricultural areas, the run-off water w ill contain considerable quantities of biological material, dust and soil particles, biocides and fertilizers. As such the general practice aims at retaining the water at the location where it falls. Contour ploughing, contour bunding, soil management and landscaping to prevent slopes or ridges are proven techniques to retain the water as much as possible. In case of excessive rainfall, a system of overflows should be created in order to manage the excessive f lows and to prevent damage to the environment due to uncontrolled overflow. Eventually the water could be guided towards a surface storage or groundwater recharge area. To maintain a reasonable lifetime for these structures, a silt trap needs to be constructed.
3.4.4 Components of rainwater harvesting systems
Rainw ater harvesting systems, whether from roofs or from pavements, whether for immediate use, short term or long term storage or for inf iltration almost always have a f ixed number of components. Underneath these components are discussed.
3.4.4.1 Guttering
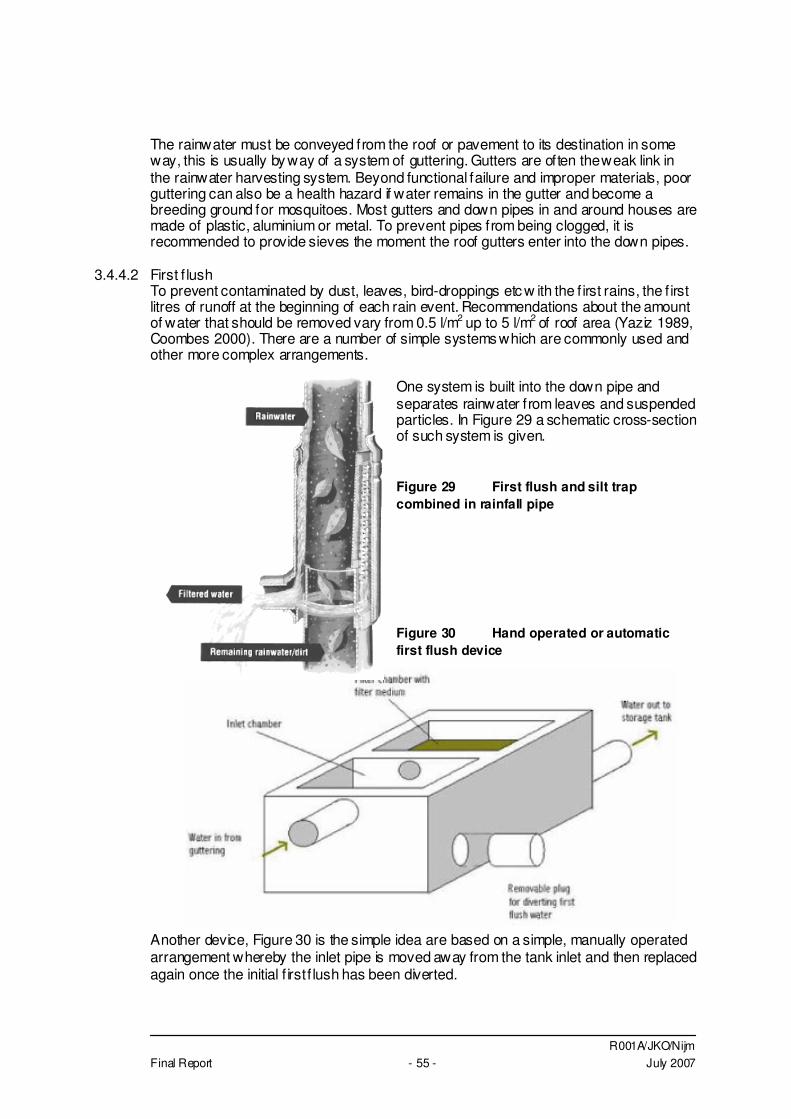
R001A/JKO/Nijm Final Report - 55 - July 2007
The rainwater must be conveyed from the roof or pavement to its destination in some way, this is usually by way of a system of guttering. Gutters are often the weak link in the rainwater harvesting system. Beyond functional failure and improper materials, poor guttering can also be a health hazard if water remains in the gutter and become a breeding ground for mosquitoes. Most gutters and down pipes in and around houses are made of plastic, aluminium or metal. To prevent pipes from being clogged, it is recommended to provide sieves the moment the roof gutters enter into the down pipes.
3.4.4.2 First f lush To prevent contaminated by dust, leaves, bird-droppings etc w ith the f irst rains, the f irst litres of runoff at the beginning of each rain event. Recommendations about the amount of water that should be removed vary from 0.5 l/m2
up to 5 l/m2 of roof area (Yaziz 1989,
Coombes 2000). There are a number of simple systems which are commonly used and other more complex arrangements.
One system is built into the down pipe and separates rainwater from leaves and suspended particles. In Figure 29 a schematic cross-section of such system is given. Figure 29 First flush and silt trap combined in rainfall pipe Figure 30 Hand operated or automatic first flush device
Another device, Figure 30 is the simple idea are based on a simple, manually operated arrangement whereby the inlet pipe is moved away from the tank inlet and then replaced again once the initial f irst f lush has been diverted.
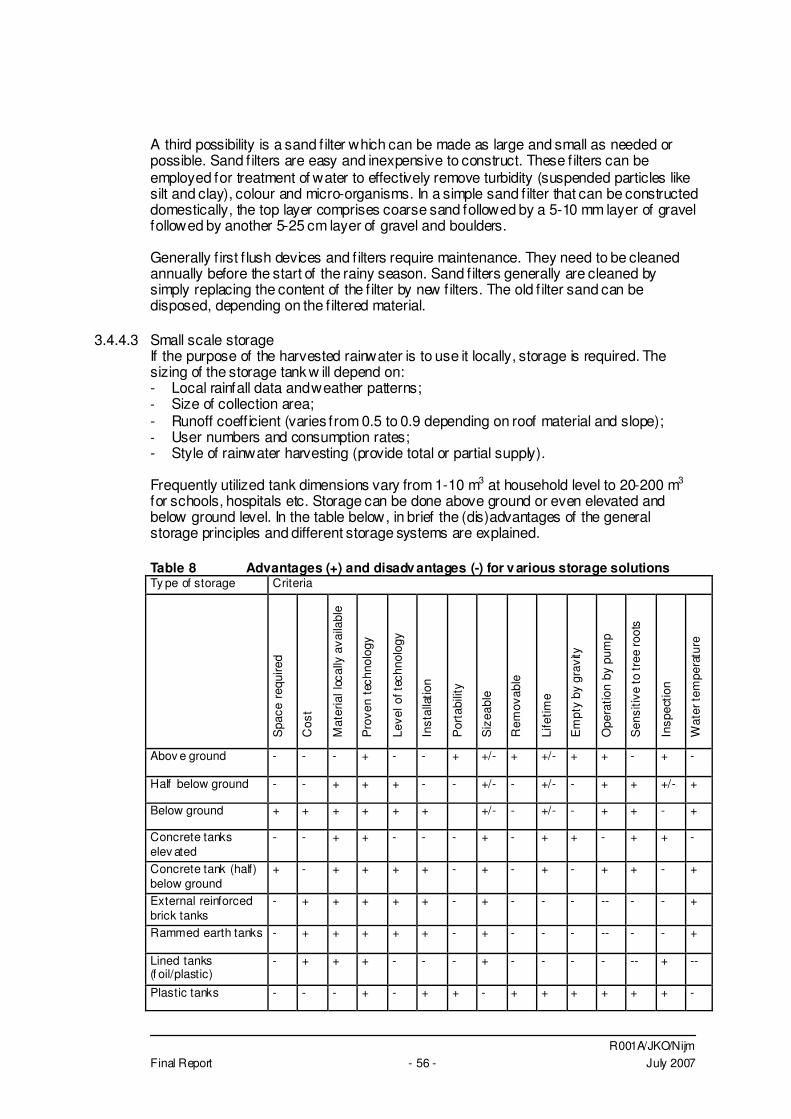
R001A/JKO/Nijm Final Report - 56 - July 2007
A third possibility is a sand f ilter which can be made as large and small as needed or possible. Sand f ilters are easy and inexpensive to construct. These f ilters can be employed for treatment of water to effectively remove turbidity (suspended particles like silt and clay), colour and micro-organisms. In a simple sand f ilter that can be constructed domestically, the top layer comprises coarse sand followed by a 5-10 mm layer of gravel followed by another 5-25 cm layer of gravel and boulders. Generally f irst f lush devices and f ilters require maintenance. They need to be cleaned annually before the start of the rainy season. Sand f ilters generally are cleaned by simply replacing the content of the f ilter by new filters. The old f ilter sand can be disposed, depending on the f iltered material.
3.4.4.3 Small scale storage If the purpose of the harvested rainwater is to use it locally, storage is required. The sizing of the storage tank w ill depend on: - Local rainfall data and weather patterns; - Size of collection area; - Runoff coeff icient (varies from 0.5 to 0.9 depending on roof material and slope); - User numbers and consumption rates; - Style of rainwater harvesting (provide total or partial supply). Frequently utilized tank dimensions vary from 1-10 m3 at household level to 20-200 m3 for schools, hospitals etc. Storage can be done above ground or even elevated and below ground level. In the table below, in brief the (dis)advantages of the general storage principles and different storage systems are explained. Table 8 Advantages (+) and disadv antages (-) for v arious storage solutions Ty pe of storage Criteria
Spa
ce r
equi
red
Cos
t
Mat
eria
l loc
ally
ava
ilabl
e
Pro
ven
tech
nolo
gy
Leve
l of t
echn
olog
y
Inst
alla
tion
Por
tabi
lity
Siz
eabl
e
Rem
ovab
le
Life
time
Em
pty
by g
ravi
ty
Ope
ratio
n by
pum
p
Sen
sitiv
e to
tre
e ro
ots
Insp
ectio
n
Wat
er te
mpe
ratu
re
Abov e ground - - - + - - + +/- + +/- + + - + -
Half below ground - - + + + - - +/- - +/- - + + +/- +
Below ground + + + + + + +/- - +/- - + + - +
Concrete tanks elev ated
- - + + - - - + - + + - + + -
Concrete tank (half) below ground
+ - + + + + - + - + - + + - +
External reinforced brick tanks
- + + + + + - + - - - -- - - +
Rammed earth tanks - + + + + + - + - - - -- - - +
Lined tanks (f oil/plastic)
- + + + - - - + - - - - -- + --
Plastic tanks - - - + - + + - + + + + + + -
R001A/JKO/Nijm Final Report - 57 - July 2007
3.4.4.4 Large scale storage and infiltration
In regions such as Auroville with strong variation of intensity, the main issue with rainwater harvesting is to smooth out the amount of runoff through a combination of inf iltration, storage and drainage. Here the specif ic local conditions are to be taken into account and incorporated. The most important demand of a near-natural rainwater management concept is to reduce paving to an absolutely necessary minimum. Drainage should be accomplished by infiltration to the degree possible. Water should be allow ed to be stored in the landscape and infiltrate from the storage. The follow ing principle applies: given high underground infiltration capacity the components infiltration and storage are predominant, given low underground infiltration capacity the components storage and drainage are predominant. Basically, inf iltration should occur through the vital upper soil layers, which within the area of a few decimetre possess an exceptionally good cleaning effect to normally contaminated rainwater runoff (also from traff ic areas). Concerning groundwater protection, direct underground infiltration (i.e. via shafts) is to be avoided. In certain cases, however, underground infiltration can make sense after a previous clean up. In practice, decentralised measures have proven to offer signif icant benefits in terms of f lexibility, maintenance, and reliability over centralised systems. Last but not least, by making successive installations, decentralised systems offer the possibility to reduce the investment costs and to spread it out over a longer period of time. Grass f ilter strips Grass f ilter strips are densely vegetated, uniformly graded areas that intercept sheet runoff from impervious surfaces such as parking lots, highways and rooftops. Soak away pits Soak away pits (inf iltration pits) provide attenuation of surface runoff by allowing gradual inf iltration into the surrounding soil. Inf iltration sewers Rainw ater sewers (pipes) can be made of permeable material allow ing rainwater to inf iltrate. The infiltration capacity per unit of time is limited. Rainw ater needs to be cleaned to prevent these pipes from clogging. Cleaning of these pipes on regular basis is cumbersome and requires specialised equipment. Inf iltration trenches Infiltration trenches are a linear version of soak away pits and operate in an identical way. They are f illed with stone or rubble and in comparison to soak away pits require low er volumes of inf iltration material for a given water inf low. Infiltration basins Infiltration basins are designed to store surface water runoff and to allow it to slowly percolate through the soil of the basin f loor or through a specially constructed under-drain system containing gravel or sand f ilter beds. Lagoons/Sedimentation tanks Lagoons are constructed by excavating natural earth basins which can be covered with vegetation. They may be lined where it is necessary to prevent inf iltration. Detention Basins (dry ponds) Detention basins are naturally vegetated impounding systems which are dry during normal conditions but provide storage of storm runoff during periods of heavy rainfall.
R001A/JKO/Nijm Final Report - 58 - July 2007
They are often used in combination w ith constructed wetlands or retention ponds as a kind of sedimentation basin. Retention Ponds (wet ponds) Wet ponds are storm water control structures that provide both retention and treatment of (contaminated) storm water runoff. Constructed Wetlands Most of these systems have been designed and operated w ith the sole purpose of treating wastewater. But constructed wetlands are becoming increasingly popular in combination with retention/detention basis. Porous Paving/Porous Asphalt Porous pavement is a special type of pavement that allows rain to pass through it, thereby reducing the runoff from a site and surrounding areas. Stormwater can either drain across the surface to the edge of the road or drain through the surface to a porous structure below (temporary reservoir). A f ilter fabric is often placed beneath this porous structure and stone layers to screen out f ine soil particles Modif ied injection well In areas w ith distinctive seasonal rain distribution and low porosity topsoil, it may be quite sensible to feed surface runoff more or less directly into the aquifer as long as it is equipped with adequate protection equipment.
3.4.4.5 Basic dimensioning Considering that per year there are 6 months of potential rainfall, 1.5 month in April-May and 4.5 month in August-December, it would be acceptable: - to have streets f looded twice per year, not higher than the plinth; - to have the water level in the gutters at street level 5-10 times per year; - to have the water level in the gutters at 0.3 m below the surface maximum for the
rest of the year. Based on the rainfall intensities this would mean the follow ing: - Normal functioning Rainfall < 40 mm/day, < 20 mm/hr; - Critical limit Rainfall 40 – 80 mm/day, 20 – 50 mm/hr; - Streets limited f looded Rainfall 80 – 200 mm/day, 50 – 100 mm/hr; - Streets severely f looded Rainfall > 150 mm/day, > 100 mm/hr. If one would look at analysis of rainwater management structures under western European conditions, one could relate the European showers to the Indian rain intensities as follows: R = 2 ~ R < 40 mm/day R = 10 ~ R 40 - 200 mm/day R = 100 ~ R > 200 mm/day Based on this, Table 9 shows which rainwater management structures would be suitable for which rain intensities.
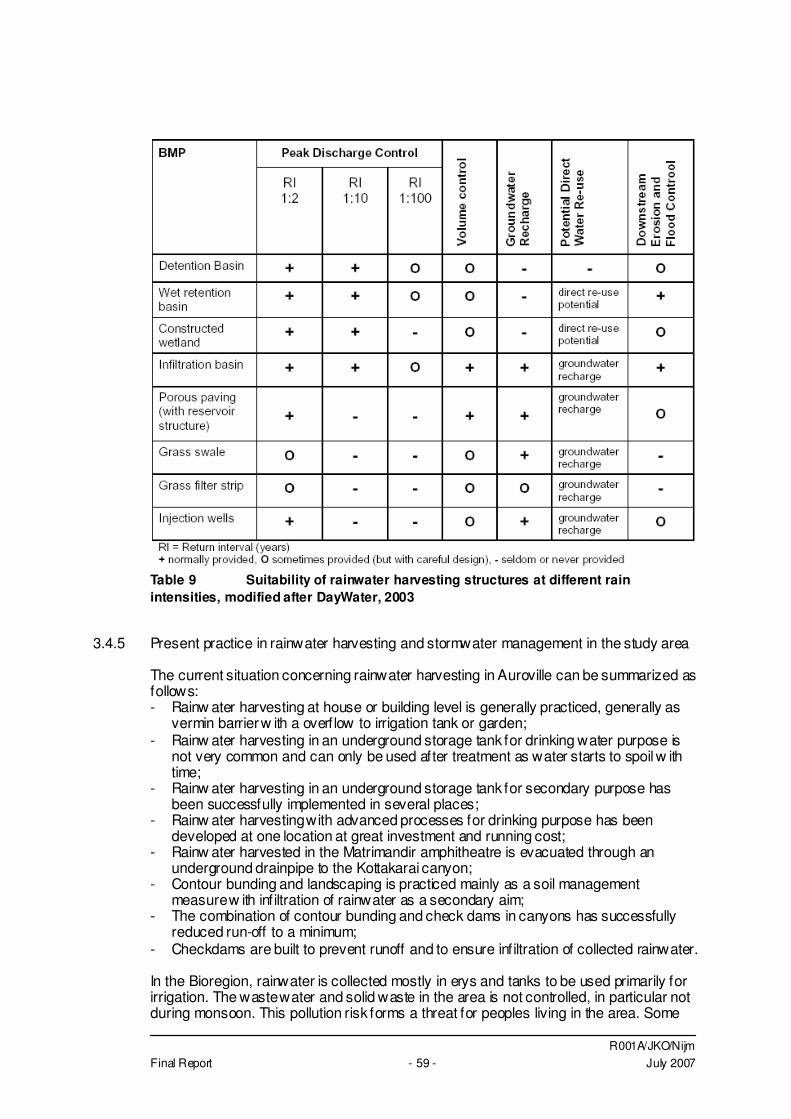
R001A/JKO/Nijm Final Report - 59 - July 2007
Table 9 Suitability of rainwater harvesting structures at different rain intensities, modified after DayWater, 2003
3.4.5 Present practice in rainwater harvesting and stormwater management in the study area
The current situation concerning rainwater harvesting in Auroville can be summarized as follows: - Rainw ater harvesting at house or building level is generally practiced, generally as
vermin barrier w ith a overflow to irrigation tank or garden; - Rainw ater harvesting in an underground storage tank for drinking water purpose is
not very common and can only be used after treatment as water starts to spoil w ith time;
- Rainw ater harvesting in an underground storage tank for secondary purpose has been successfully implemented in several places;
- Rainw ater harvesting with advanced processes for drinking purpose has been developed at one location at great investment and running cost;
- Rainw ater harvested in the Matrimandir amphitheatre is evacuated through an underground drainpipe to the Kottakarai canyon;
- Contour bunding and landscaping is practiced mainly as a soil management measure w ith infiltration of rainwater as a secondary aim;
- The combination of contour bunding and check dams in canyons has successfully reduced run-off to a minimum;
- Checkdams are built to prevent runoff and to ensure infiltration of collected rainwater. In the Bioregion, rainwater is collected mostly in erys and tanks to be used primarily for irrigation. The waste water and solid waste in the area is not controlled, in particular not during monsoon. This pollution risk forms a threat for peoples living in the area. Some
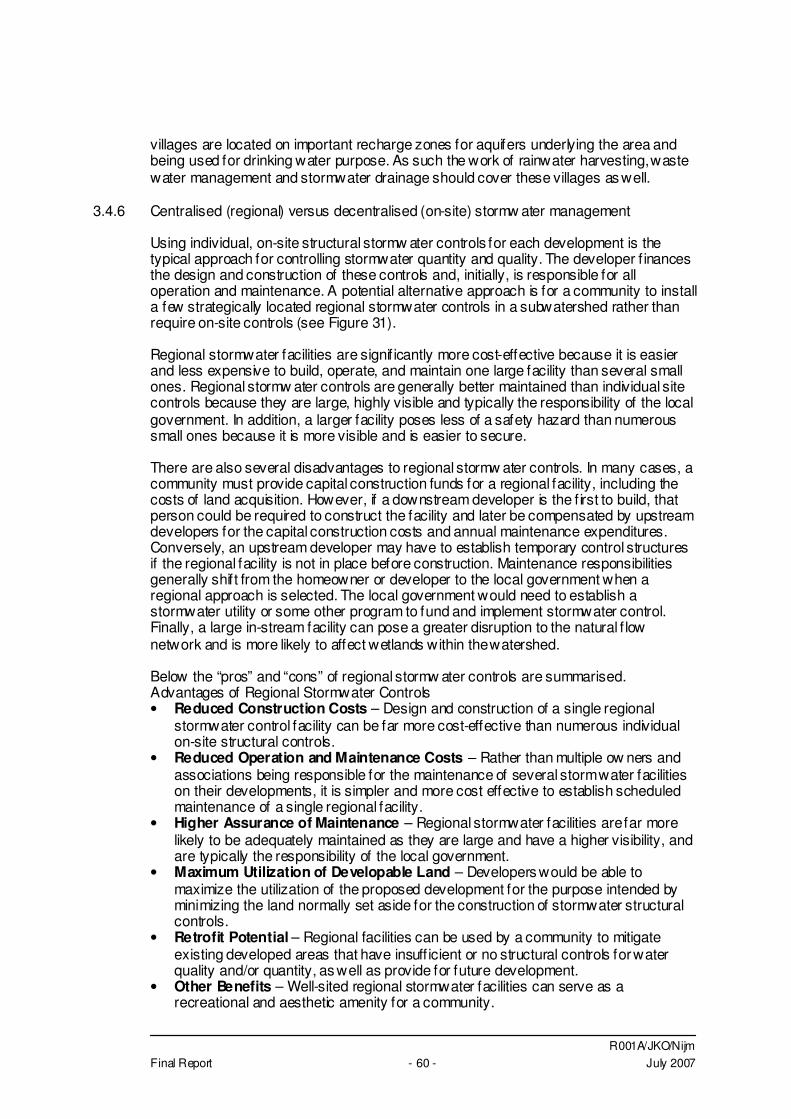
R001A/JKO/Nijm Final Report - 60 - July 2007
villages are located on important recharge zones for aquifers underlying the area and being used for drinking water purpose. As such the work of rainwater harvesting, waste water management and stormwater drainage should cover these villages as well.
3.4.6 Centralised (regional) versus decentralised (on-site) stormw ater management
Using individual, on-site structural stormw ater controls for each development is the typical approach for controlling stormwater quantity and quality. The developer f inances the design and construction of these controls and, initially, is responsible for all operation and maintenance. A potential alternative approach is for a community to install a few strategically located regional stormwater controls in a subwatershed rather than require on-site controls (see Figure 31). Regional stormwater facilities are signif icantly more cost-effective because it is easier and less expensive to build, operate, and maintain one large facility than several small ones. Regional stormw ater controls are generally better maintained than individual site controls because they are large, highly visible and typically the responsibility of the local government. In addition, a larger facility poses less of a safety hazard than numerous small ones because it is more visible and is easier to secure. There are also several disadvantages to regional stormw ater controls. In many cases, a community must provide capital construction funds for a regional facility, including the costs of land acquisition. However, if a downstream developer is the f irst to build, that person could be required to construct the facility and later be compensated by upstream developers for the capital construction costs and annual maintenance expenditures. Conversely, an upstream developer may have to establish temporary control structures if the regional facility is not in place before construction. Maintenance responsibilities generally shift from the homeowner or developer to the local government when a regional approach is selected. The local government would need to establish a stormwater utility or some other program to fund and implement stormwater control. Finally, a large in-stream facility can pose a greater disruption to the natural f low network and is more likely to affect wetlands within the watershed. Below the “pros” and “cons” of regional stormw ater controls are summarised. Advantages of Regional Stormwater Controls • Reduced Construction Costs – Design and construction of a single regional
stormwater control facility can be far more cost-effective than numerous individual on-site structural controls.
• Reduced Operation and Maintenance Costs – Rather than multiple ow ners and associations being responsible for the maintenance of several storm water facilities on their developments, it is simpler and more cost effective to establish scheduled maintenance of a single regional facility.
• Higher Assurance of Maintenance – Regional stormwater facilities are far more likely to be adequately maintained as they are large and have a higher visibility, and are typically the responsibility of the local government.
• Maximum Utilization of Developable Land – Developers would be able to maximize the utilization of the proposed development for the purpose intended by minimizing the land normally set aside for the construction of stormwater structural controls.
• Retrofit Potential – Regional facilities can be used by a community to mitigate existing developed areas that have insuff icient or no structural controls for water quality and/or quantity, as well as provide for future development.
• Other Benefits – Well-sited regional stormwater facilities can serve as a recreational and aesthetic amenity for a community.
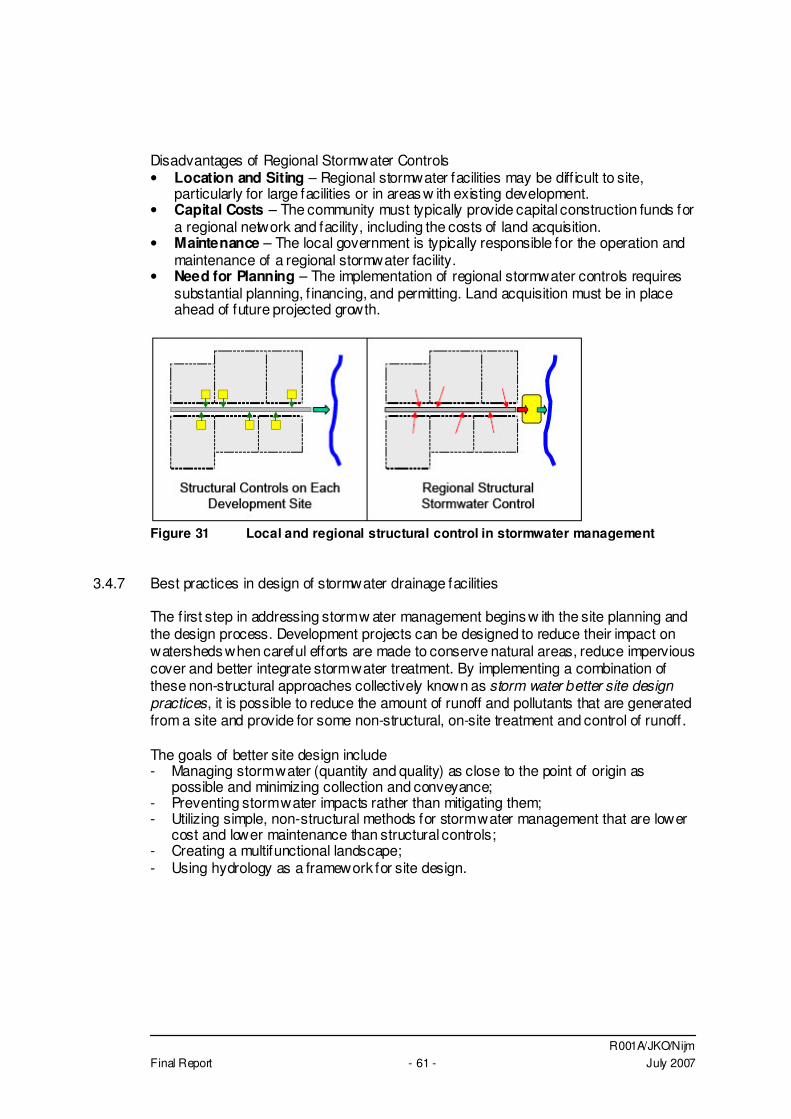
R001A/JKO/Nijm Final Report - 61 - July 2007
Disadvantages of Regional Stormwater Controls • Location and Siting – Regional stormwater facilities may be diff icult to site,
particularly for large facilities or in areas w ith existing development. • Capital Costs – The community must typically provide capital construction funds for
a regional network and facility, including the costs of land acquisition. • Maintenance – The local government is typically responsible for the operation and
maintenance of a regional stormwater facility. • Need for Planning – The implementation of regional stormwater controls requires
substantial planning, f inancing, and permitting. Land acquisition must be in place ahead of future projected growth.
Figure 31 Local and regional structural control in stormwater management
3.4.7 Best practices in design of stormwater drainage facilities
The f irst step in addressing storm w ater management begins w ith the site planning and the design process. Development projects can be designed to reduce their impact on watersheds when careful efforts are made to conserve natural areas, reduce impervious cover and better integrate storm water treatment. By implementing a combination of these non-structural approaches collectively known as storm water better site design practices, it is possible to reduce the amount of runoff and pollutants that are generated from a site and provide for some non-structural, on-site treatment and control of runoff. The goals of better site design include - Managing storm water (quantity and quality) as close to the point of origin as
possible and minimizing collection and conveyance; - Preventing storm water impacts rather than mitigating them; - Utilizing simple, non-structural methods for storm water management that are lower
cost and lower maintenance than structural controls; - Creating a multifunctional landscape; - Using hydrology as a framework for site design.
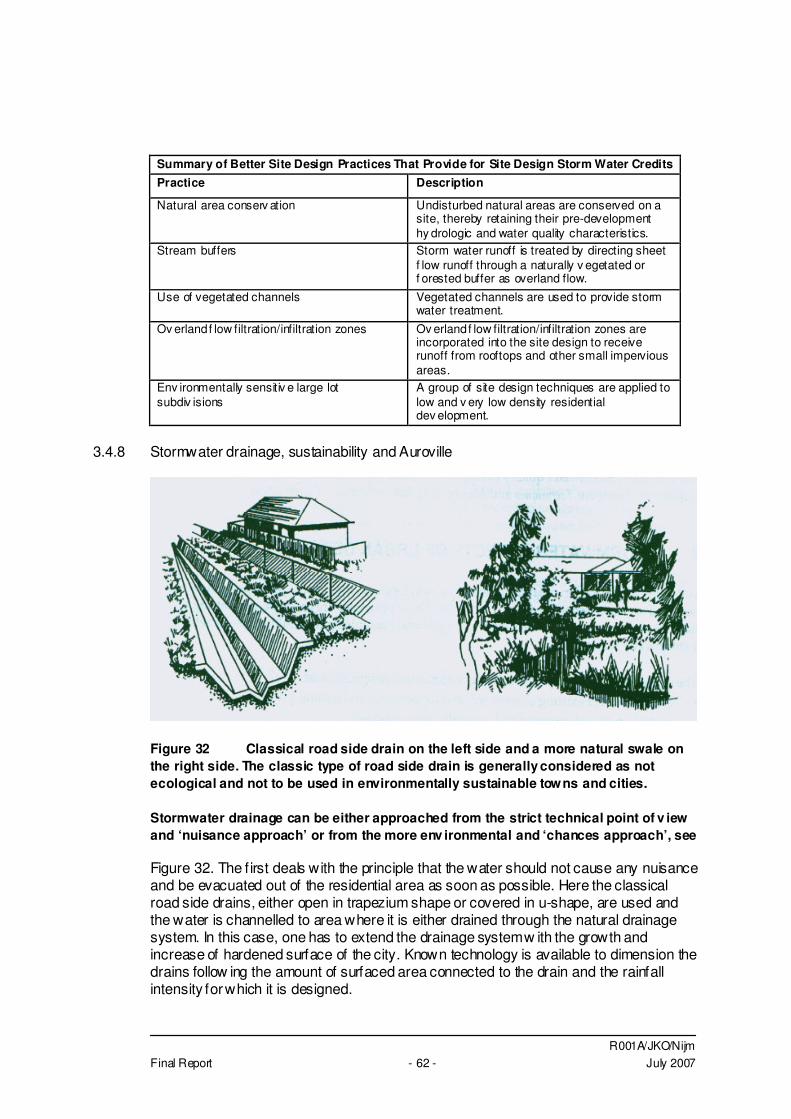
R001A/JKO/Nijm Final Report - 62 - July 2007
Summary of Better Site Design Practices That Provide for Site Design Storm Water Credits Practice Description
Natural area conserv ation Undisturbed natural areas are conserved on a site, thereby retaining their pre-development hy drologic and water quality characteristics.
Stream buffers Storm water runoff is treated by directing sheet f low runoff through a naturally v egetated or f orested buffer as overland flow.
Use of vegetated channels Vegetated channels are used to provide storm water treatment.
Ov erland f low filtration/infiltration zones Ov erland f low filtration/infiltration zones are incorporated into the site design to receive runoff from rooftops and other small impervious areas.
Env ironmentally sensitiv e large lot subdiv isions
A group of site design techniques are applied to low and v ery low density residential dev elopment.
3.4.8 Stormwater drainage, sustainability and Auroville
Figure 32 Classical road side drain on the left side and a more natural swale on the right side. The classic type of road side drain is generally considered as not ecological and not to be used in environmentally sustainable towns and cities. Stormwater drainage can be either approached from the strict technical point of v iew and ‘nuisance approach’ or from the more env ironmental and ‘chances approach’, see Figure 32. The f irst deals with the principle that the water should not cause any nuisance and be evacuated out of the residential area as soon as possible. Here the classical road side drains, either open in trapezium shape or covered in u-shape, are used and the water is channelled to area where it is either drained through the natural drainage system. In this case, one has to extend the drainage system w ith the growth and increase of hardened surface of the city. Known technology is available to dimension the drains follow ing the amount of surfaced area connected to the drain and the rainfall intensity for which it is designed.
R001A/JKO/Nijm Final Report - 63 - July 2007
Figure 33 Top-v iew of a swale integrated in an urban area, contributing to the quality and admosphere of the area. These could very well be integrated in the green corridors of the Auroville Masterplan. The other line is to capture the water, even in large quantities, where it falls, lay out buffer zones that can be inundated during rains, preferably combined with either tanks used for irrigation or inf iltration facilities or a combination of both. Infiltration facilities normally can cope only with a limited amount of rainwater per unit of time. Severe rains therefore have to be buffered near the infiltration site. Dimensioning depends on the amount of surfaced area connected to the drains and buffer areas and the size and infiltration capacity of the infiltration zone. Already, the drains can be designed to hold as much rainwater as possible, Figure 33. Integrated in a green city, these drains are more looking like low-lying green areas with natural bunds or weirs to allow as much storage as possible on one hand and prevent erosion due to high stream velocity on the other hand. Auroville as a sustainable city w ith lots of green in the form of parks, forest and existing canyons, is a typical environment to practice stormw ater drainage in an environmental sustainable way, using the water as a valuable landscaping agent. Buffer areas, swales, inf iltration areas can be combined with green corridors and canyons to form a sound and green stormwater management system. At present, stormwater drainage is not paid attention, except for the built-up areas around Matrimandir, Visitors Centre etc. Stormwater f inds its way through existing gulleys on the road side to canyons being natural drains. The canyons have been provided with subsequent weirs of various sizes to ensure the preservation and infiltration of as much rainwater as possible. In the course of time, w ith the continuous urbanisation of Auroville, there will be a need for carefully planned stormwater drainage. As mentioned earlier, this could be combined with rainwater harvesting. Ideally, decentralised rainwater harvesting at house or community level should be provided. The rainwater harvesting can not cope with high intensity rainfall or lower intensity rainfall over a longer period. An overflow to green swales should be provided. Once surfaced roads are being constructed, green swales should be provided guiding the water to designated storage and infiltration areas. Generally, suitable infiltration areas have already been identif ied. Integrated urban
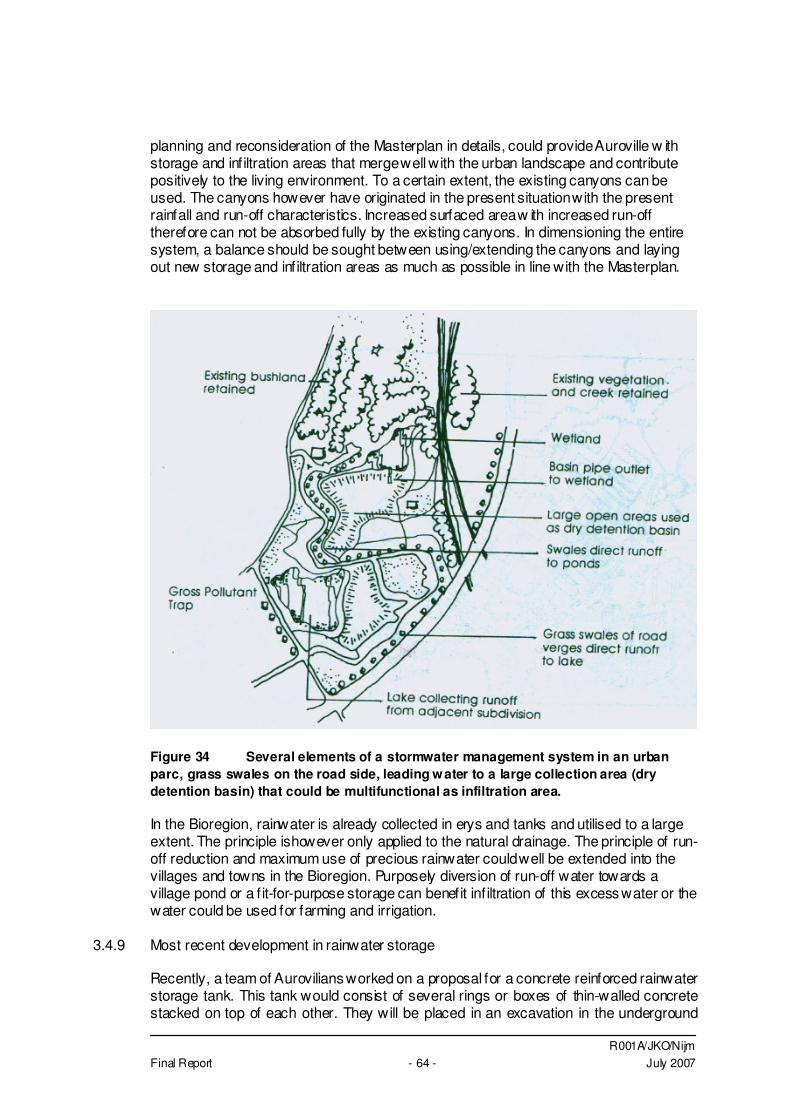
R001A/JKO/Nijm Final Report - 64 - July 2007
planning and reconsideration of the Masterplan in details, could provide Auroville w ith storage and infiltration areas that merge well with the urban landscape and contribute positively to the living environment. To a certain extent, the existing canyons can be used. The canyons however have originated in the present situation with the present rainfall and run-off characteristics. Increased surfaced area w ith increased run-off therefore can not be absorbed fully by the existing canyons. In dimensioning the entire system, a balance should be sought between using/extending the canyons and laying out new storage and infiltration areas as much as possible in line with the Masterplan.
Figure 34 Several elements of a stormwater management system in an urban parc, grass swales on the road side, leading water to a large collection area (dry detention basin) that could be multifunctional as infiltration area. In the Bioregion, rainwater is already collected in erys and tanks and utilised to a large extent. The principle ishowever only applied to the natural drainage. The principle of run-off reduction and maximum use of precious rainwater could well be extended into the villages and towns in the Bioregion. Purposely diversion of run-off water towards a village pond or a f it-for-purpose storage can benefit inf iltration of this excess water or the water could be used for farming and irrigation.
3.4.9 Most recent development in rainwater storage
Recently, a team of Aurovilians worked on a proposal for a concrete reinforced rainwater storage tank. This tank would consist of several rings or boxes of thin-walled concrete stacked on top of each other. They will be placed in an excavation in the underground
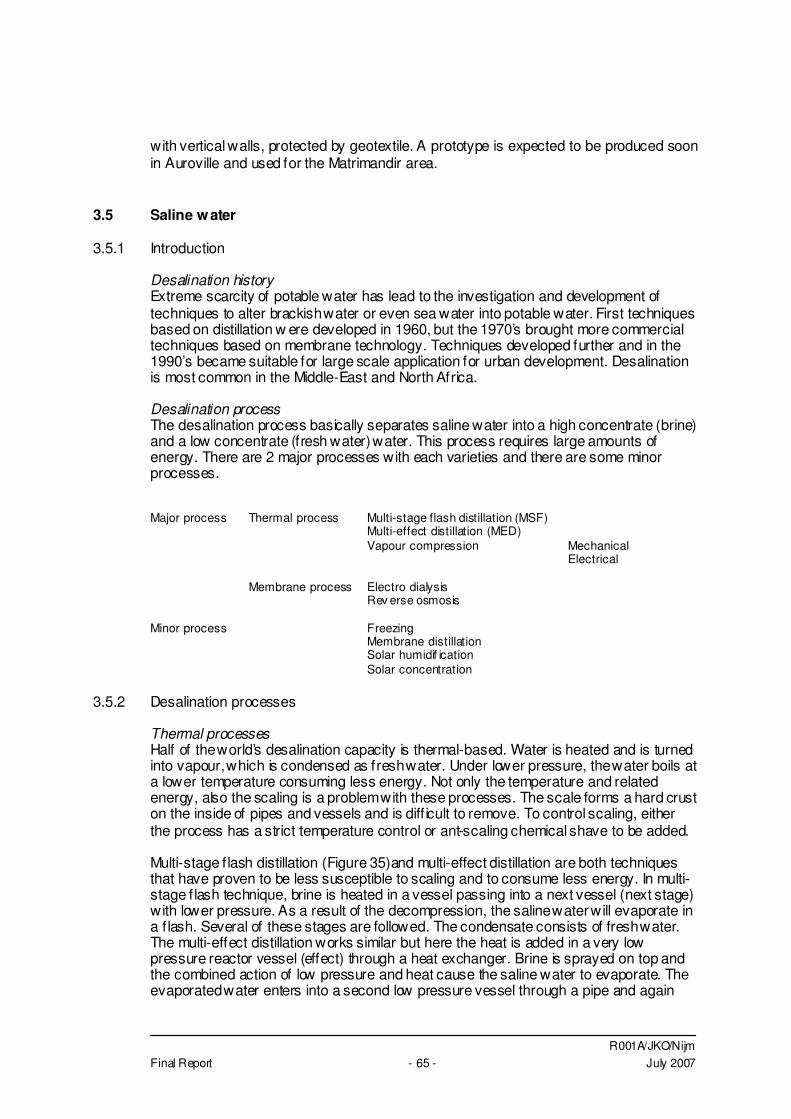
R001A/JKO/Nijm Final Report - 65 - July 2007
with vertical walls, protected by geotextile. A prototype is expected to be produced soon in Auroville and used for the Matrimandir area.
3.5 Saline water
3.5.1 Introduction
Desalination history Extreme scarcity of potable water has lead to the investigation and development of techniques to alter brackish water or even sea water into potable water. First techniques based on distillation w ere developed in 1960, but the 1970’s brought more commercial techniques based on membrane technology. Techniques developed further and in the 1990’s became suitable for large scale application for urban development. Desalination is most common in the Middle-East and North Africa. Desalination process The desalination process basically separates saline water into a high concentrate (brine) and a low concentrate (fresh water) water. This process requires large amounts of energy. There are 2 major processes with each varieties and there are some minor processes. Major process Thermal process Multi-stage flash distillation (MSF) Multi-effect distillation (MED) Vapour compression Mechanical Electrical Membrane process Electro dialysis Rev erse osmosis Minor process Freezing Membrane distillation Solar humidif ication Solar concentration
3.5.2 Desalination processes
Thermal processes Half of the world’s desalination capacity is thermal-based. Water is heated and is turned into vapour, which is condensed as fresh water. Under lower pressure, the water boils at a lower temperature consuming less energy. Not only the temperature and related energy, also the scaling is a problem with these processes. The scale forms a hard crust on the inside of pipes and vessels and is diff icult to remove. To control scaling, either the process has a strict temperature control or ant-scaling chemical shave to be added. Multi-stage f lash distillation (Figure 35)and multi-effect distillation are both techniques that have proven to be less susceptible to scaling and to consume less energy. In multi-stage f lash technique, brine is heated in a vessel passing into a next vessel (next stage) with lower pressure. As a result of the decompression, the saline water will evaporate in a f lash. Several of these stages are followed. The condensate consists of fresh water. The multi-effect distillation works similar but here the heat is added in a very low pressure reactor vessel (effect) through a heat exchanger. Brine is sprayed on top and the combined action of low pressure and heat cause the saline water to evaporate. The evaporated water enters into a second low pressure vessel through a pipe and again
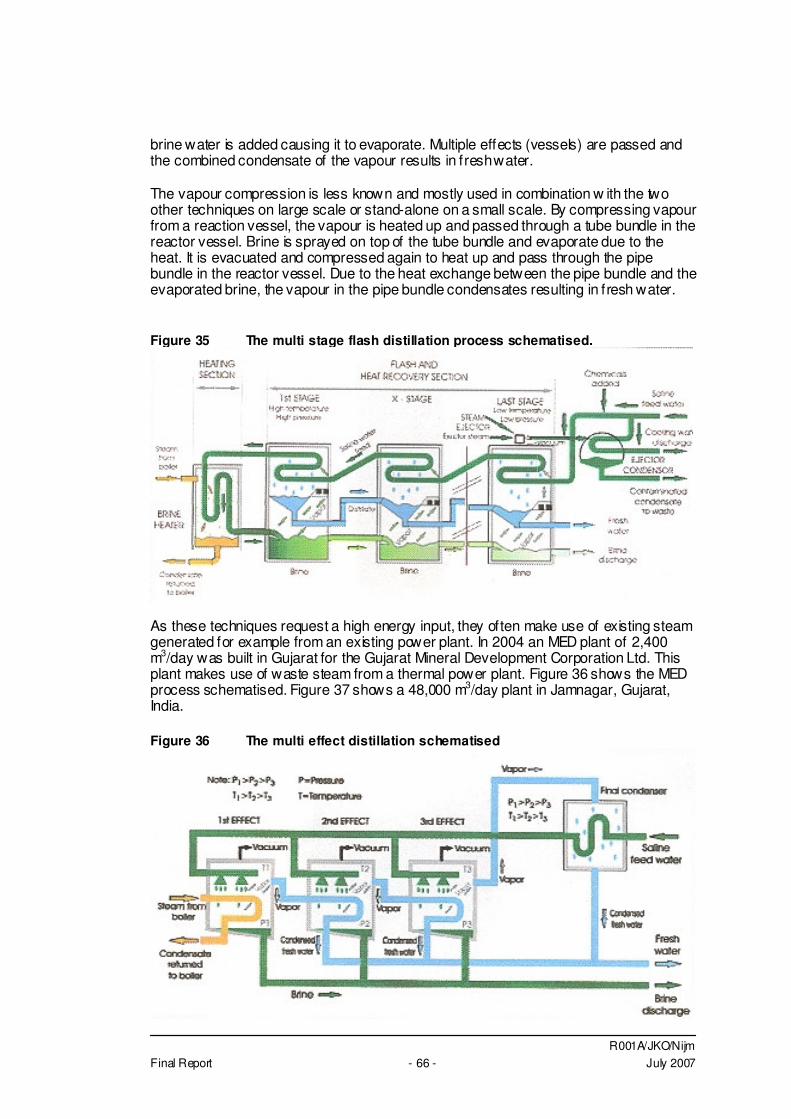
R001A/JKO/Nijm Final Report - 66 - July 2007
brine water is added causing it to evaporate. Multiple effects (vessels) are passed and the combined condensate of the vapour results in fresh water. The vapour compression is less known and mostly used in combination w ith the two other techniques on large scale or stand-alone on a small scale. By compressing vapour from a reaction vessel, the vapour is heated up and passed through a tube bundle in the reactor vessel. Brine is sprayed on top of the tube bundle and evaporate due to the heat. It is evacuated and compressed again to heat up and pass through the pipe bundle in the reactor vessel. Due to the heat exchange between the pipe bundle and the evaporated brine, the vapour in the pipe bundle condensates resulting in fresh water. Figure 35 The multi stage flash distillation process schematised.
As these techniques request a high energy input, they often make use of existing steam generated for example from an existing power plant. In 2004 an MED plant of 2,400 m3/day was built in Gujarat for the Gujarat Mineral Development Corporation Ltd. This plant makes use of waste steam from a thermal power plant. Figure 36 shows the MED process schematised. Figure 37 shows a 48,000 m3/day plant in Jamnagar, Gujarat, India. Figure 36 The multi effect distillation schematised
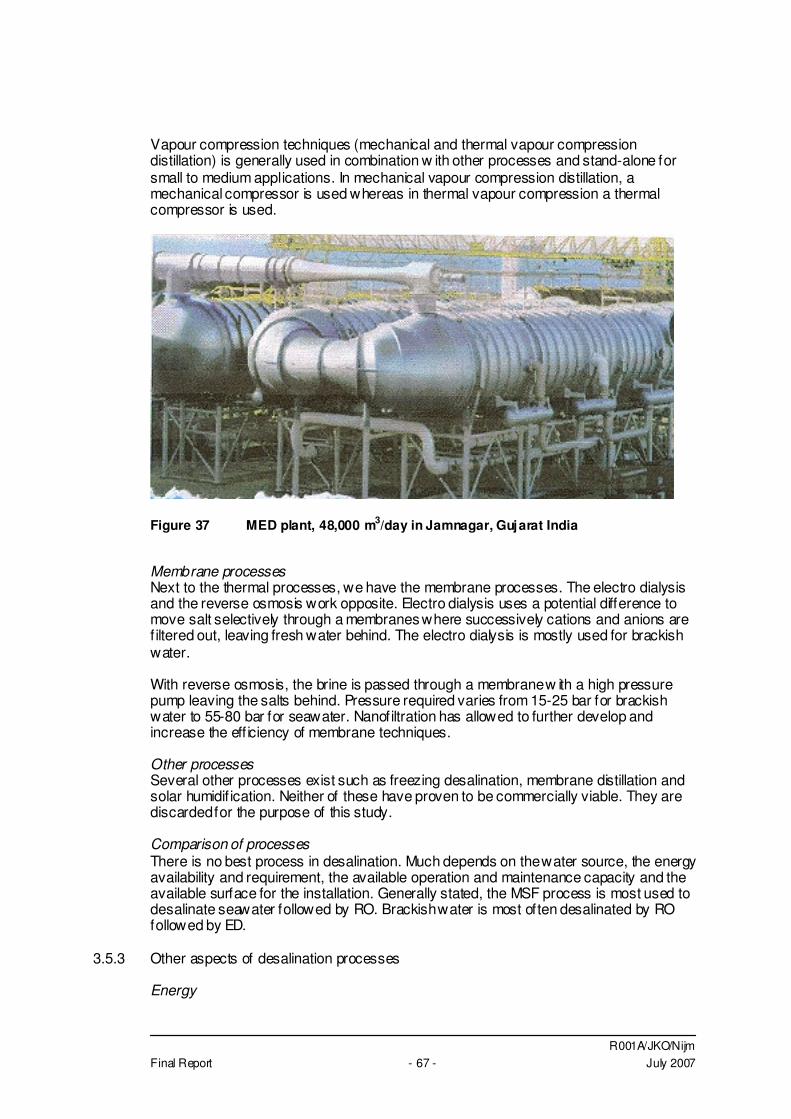
R001A/JKO/Nijm Final Report - 67 - July 2007
Vapour compression techniques (mechanical and thermal vapour compression distillation) is generally used in combination w ith other processes and stand-alone for small to medium applications. In mechanical vapour compression distillation, a mechanical compressor is used whereas in thermal vapour compression a thermal compressor is used.
Figure 37 MED plant, 48,000 m3/day in Jamnagar, Gujarat India Membrane processes Next to the thermal processes, we have the membrane processes. The electro dialysis and the reverse osmosis work opposite. Electro dialysis uses a potential difference to move salt selectively through a membranes where successively cations and anions are f iltered out, leaving fresh water behind. The electro dialysis is mostly used for brackish water. With reverse osmosis, the brine is passed through a membrane w ith a high pressure pump leaving the salts behind. Pressure required varies from 15-25 bar for brackish water to 55-80 bar for seawater. Nanofiltration has allowed to further develop and increase the eff iciency of membrane techniques. Other processes Several other processes exist such as freezing desalination, membrane distillation and solar humidif ication. Neither of these have proven to be commercially viable. They are discarded for the purpose of this study. Comparison of processes There is no best process in desalination. Much depends on the water source, the energy availability and requirement, the available operation and maintenance capacity and the available surface for the installation. Generally stated, the MSF process is most used to desalinate seawater followed by RO. Brackish water is most often desalinated by RO followed by ED.
3.5.3 Other aspects of desalination processes
Energy
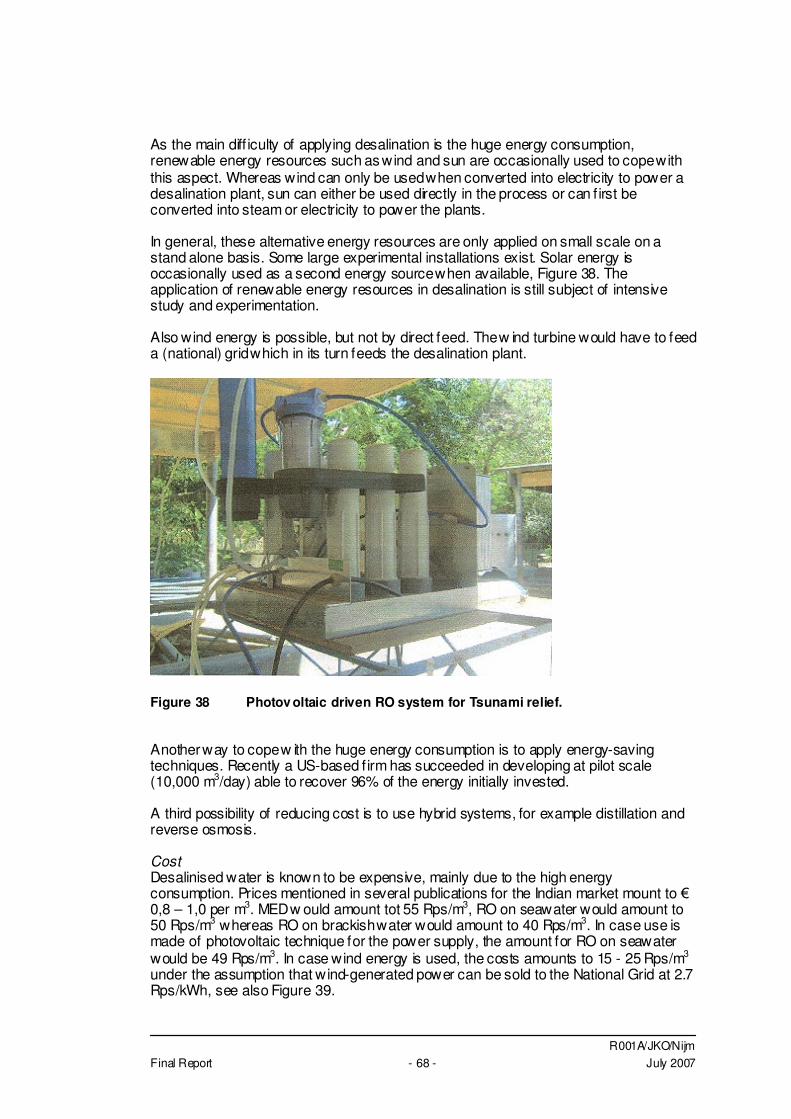
R001A/JKO/Nijm Final Report - 68 - July 2007
As the main diff iculty of applying desalination is the huge energy consumption, renewable energy resources such as wind and sun are occasionally used to cope with this aspect. Whereas wind can only be used when converted into electricity to power a desalination plant, sun can either be used directly in the process or can f irst be converted into steam or electricity to power the plants. In general, these alternative energy resources are only applied on small scale on a stand alone basis. Some large experimental installations exist. Solar energy is occasionally used as a second energy source when available, Figure 38. The application of renewable energy resources in desalination is still subject of intensive study and experimentation. Also wind energy is possible, but not by direct feed. The w ind turbine would have to feed a (national) grid which in its turn feeds the desalination plant.
Figure 38 Photov oltaic driven RO system for Tsunami relief. Another way to cope w ith the huge energy consumption is to apply energy-saving techniques. Recently a US-based f irm has succeeded in developing at pilot scale (10,000 m3/day) able to recover 96% of the energy initially invested. A third possibility of reducing cost is to use hybrid systems, for example distillation and reverse osmosis. Cost Desalinised water is known to be expensive, mainly due to the high energy consumption. Prices mentioned in several publications for the Indian market mount to � 0,8 – 1,0 per m3. MED w ould amount tot 55 Rps/m3, RO on seawater would amount to 50 Rps/m3 whereas RO on brackish water would amount to 40 Rps/m3. In case use is made of photovoltaic technique for the power supply, the amount for RO on seawater would be 49 Rps/m3. In case wind energy is used, the costs amounts to 15 - 25 Rps/m3 under the assumption that wind-generated power can be sold to the National Grid at 2.7 Rps/kWh, see also Figure 39.
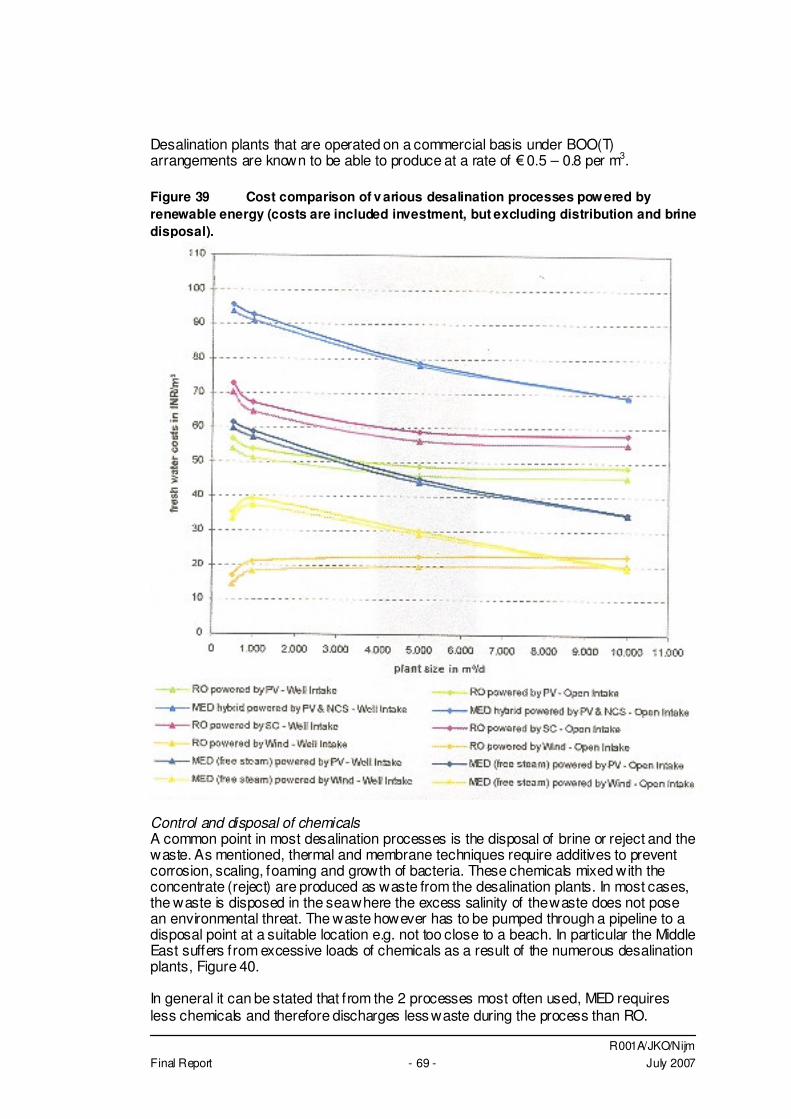
R001A/JKO/Nijm Final Report - 69 - July 2007
Desalination plants that are operated on a commercial basis under BOO(T) arrangements are known to be able to produce at a rate of � 0.5 – 0.8 per m3. Figure 39 Cost comparison of v arious desalination processes powered by renewable energy (costs are included investment, but excluding distribution and brine disposal).
Control and disposal of chemicals A common point in most desalination processes is the disposal of brine or reject and the waste. As mentioned, thermal and membrane techniques require additives to prevent corrosion, scaling, foaming and growth of bacteria. These chemicals mixed with the concentrate (reject) are produced as waste from the desalination plants. In most cases, the waste is disposed in the sea where the excess salinity of the waste does not pose an environmental threat. The waste however has to be pumped through a pipeline to a disposal point at a suitable location e.g. not too close to a beach. In particular the Middle East suffers from excessive loads of chemicals as a result of the numerous desalination plants, Figure 40. In general it can be stated that from the 2 processes most often used, MED requires less chemicals and therefore discharges less waste during the process than RO.
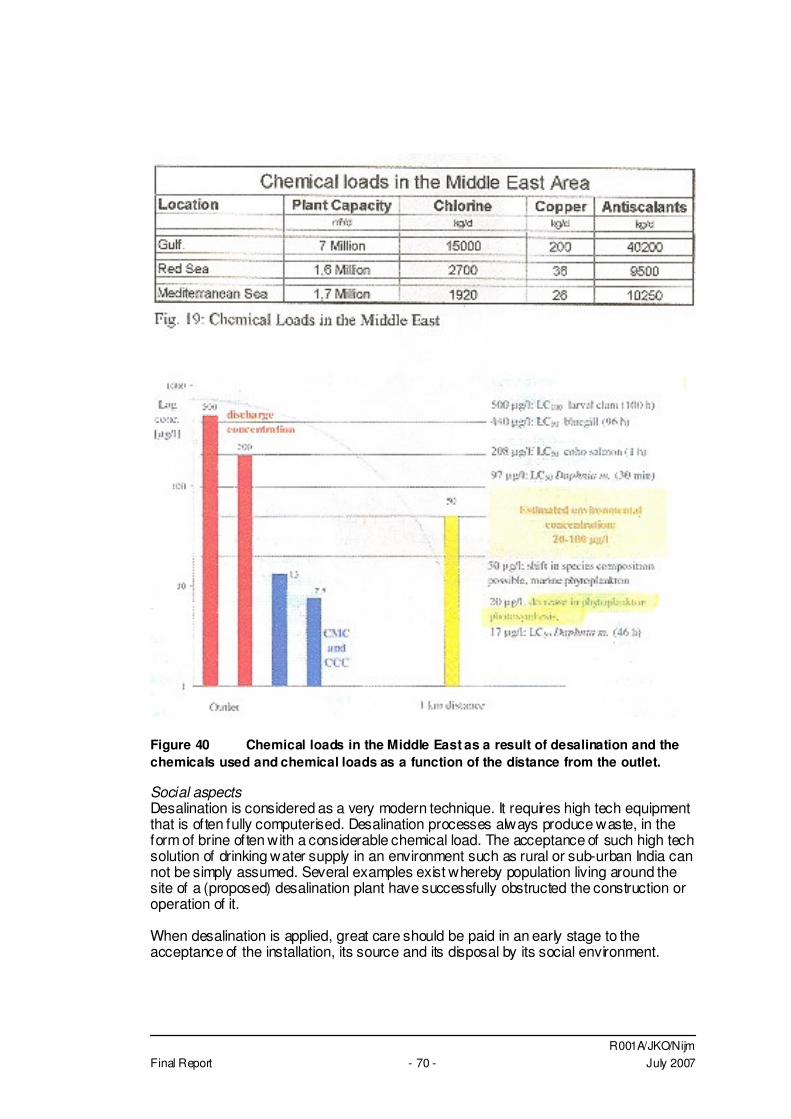
R001A/JKO/Nijm Final Report - 70 - July 2007
Figure 40 Chemical loads in the Middle East as a result of desalination and the chemicals used and chemical loads as a function of the distance from the outlet. Social aspects Desalination is considered as a very modern technique. It requires high tech equipment that is often fully computerised. Desalination processes always produce waste, in the form of brine often with a considerable chemical load. The acceptance of such high tech solution of drinking water supply in an environment such as rural or sub-urban India can not be simply assumed. Several examples exist whereby population living around the site of a (proposed) desalination plant have successfully obstructed the construction or operation of it. When desalination is applied, great care should be paid in an early stage to the acceptance of the installation, its source and its disposal by its social environment.
R001A/JKO/Nijm Final Report - 71 - July 2007
3.5.4 Source of saline water
Brackish vs seawater Desalination plants can use either seawater or brackish water as a source. The salinity of seawater is higher, requiring thus more processing and resulting in installations that require more energy per m3 of produced water and produce more waste per m3 of produced water. If brackish water is available, the choice for brackish water as a source would be logical as the production costs are considerably lower. Around a seawater intake, also algae and molusque can develop. In the area of Auroville, there is a sand barrier that will result in a relatively high turbidity in the seawater, unless the intake will be further placed into the sea. This would require a few hundred meter extra pipeline and a longer/deeper intake structure. Use of brackish water, would also prevent to construct a seawater intake which will be very diff icult due to the required government permission and the strict laws regarding construction on beaches in India. The same would apply to the laying of a pipeline across the beach to pump up the saline water and a pipeline to dispose the waste. An inland located brackish water desalination plant would thus prevent crossing the beach for the intake. Only the waste would have to be disposed in an orderly manner. Availability of brackish water In the project area, it is known that certain aquifers like Ramanathapuram and the deeper charnokites are known to have brackish groundwater or are subject to saline intrusion. In considering large scale groundwater extraction from the Ramanathapuram aquifer, one has to realise that in the coastal zone of the project area, this aquifer lies at a depth of 300 – 500 m. The extraction may have effects on over- and underlying aquifers and should be carefully studied. It is known that there is only a thin layer of calcareous clay between Vanur and Ramanathapuram. Also the coastal sedimentary aquifer has brackish water. As this aquifer is very small, the salinity will be subject to f luctuation due to tidal f luctuation and the influence from the monsoon. Availability of salt water Salt water is available from the sea, requiring a concrete or steel intake structure in a shallow area or a suction line to be laid out further in the sea. The water w ill have to be transported to the desalination plant that can then be located at any suitable or favourable area. The more inland the treatment will be located, the more the pumping charges will be and the more the transport distance will be for the waste disposal.
3.5.5 Desalination in India
Desalination is relatively new to India and has been applied in several regions at various scales and for various purposes. Several micro RO installations working on photovoltaic cells have been donated for the Tsunami Relief Action. Auroville through its water supply unit Aquadyn has developed several reverse osmosis models that are able to handle water until a light brackish character. In Gujarat, a 2,400 m3/day MED plant has been for the Gujarat Mineral Development Corporation and a 48,000 m3/day MED plant for drinking water supply in Jamnagar. IIT Chennai has started a pilot combining photovoltaic and reverse osmosis techniques.
R001A/JKO/Nijm Final Report - 72 - July 2007
At present a 100,000 m3/day reverse osmosis plant is under development in Chennai. The estimated production cost, all included, is 45 Rs/m3. This development will be closely followed by the water group to see where advantage and learning can be taken.
3.5.6 Scope for desalination in Auroville
Several systems for desalination have been studied and compared. The conclusion is that a system combined w ith a renewable (f.e. solar or wind) or free (next to thermal power plant) energy source are the only methods that are f inancially feasible. An RO plant operating on wind energy with variable capacity (500 – 10,000 m3/day) w ill produce fresh water from brackish water at rates of 14 – 20 Rps/m3. Fresh water from seawater can be produced at 17 – 23 Rps/m3. Transport, distribution and brine disposal charges are not included in these f igures. An issue to be dealt with is the disposal of brine, which has to be socially acceptable. Another issue is the legal implication. As it is not allowed to build any structure on the beach or in the sea, it may be very complex to obtain permits for construction of the brackish/salt water intake. Also the social acceptance by surrounding population has proven to be of the utmost importance. If the surrounding population would already accept desalination (and there are many cases whereby the surrounding population has not accepted desalination and even caused major strikes and damages, then this population should be covered by this water as well (provided that they would accept this water). There must be a positive benefit to the population in order to obtain co-operation and support, such as the supply of desalinised water at reduced rate.
3.6 Waste water
3.6.1 Introduction
Waste water is produced at every place where water is being used. Waste water is being produced in houses, off ices, factories, farms, schools, restaurants and bars etc. In the current world of water scarcity, there is a general consensus that waste water can be re-used. In the western world, waste water is being purif ied to a certain extent and then disposed on the surface water system. In other countries eff luent from waste water treatment plants is inf iltrated underground and through natural purif ication is being pumped up again as drinking water. In general, there is consensus that treated waste water can be used as irrigation water. With the development in the western world came also a larger chemical load in the waste water: Dissolvent, aggressive cleaning agents, medications left over and f lushed through the toilet and high loads of hormones from the use of contraceptives. This required highly sophisticated treatment steps before the treated water could be spilled in the surface water system. Purif ication of waste water is costly and its usefulness depends much on the waste load of the water, the usability of the treated water and the availability of alternative resources of water. Domestic waste water can be treated w ith simple techniques at a relatively low
R001A/JKO/Nijm Final Report - 73 - July 2007
cost. Industrial waste water is however much more costly and is mostly treated to limit the environmental impact and less to be re-used. The origin of the waste water often determines the ‘quality’ of the waste water. Therefore, the chapter deals w ith waste water from various origins (Auroville, villages, Pondicherry). The chapter distinguishes in waste water from Auroville, from the Bioregion and from Pondi due to the large difference in constitution of the waste water, collection, required treatment and possibilities for re-use.
3.6.2 Waste water from Auroville
Description and origin of the waste water Waste water in Auroville can be separated in domestic waste water and industrial waste water. Domestic waste water is produced in the residences, off ices, communal services, schools, canteens and guest houses. Larger quantities are generated by larger and dense communities. Smaller quantities are produced by isolated houses and small communities spread over a large area. Industrial waste water is Industrial wastewater is generated in the crafts and Industrial Zone (food processing, construction technology, textile dyeing and tailoring, pottery, leather factory, soap and corporal hygiene products and essences. For example, in Fraternity (Lumiere – screen printing press, Papyrus – paper processing) and around Aspiration (Aureka – metal workshop, Auroville paper factory, Maroma – incense and aromatic oils and essences), and at a few places scattered throughout including green belt (e.g. potteries in Dana). In the Cultural Zone (residences, schools, sportsground, theatre) and the International Zone (residences, boutiques, auditorium, restaurant, library, conference halls etc.) there is only generation of domestic sewage The Green Belt consists of farms and the residences of farm and forest stewards. There are a few crafts and industrial activities such as mechanical and plumbing workshop in Abri, pottery in Dana, carpentry in Samriddhi, environmental lab in Aurobrindavan, and there are several highly-frequented off ices such as in Pitchandikulam, Aurobrindavan, and increasingly in Botanical Garden. The outlying areas are defined as being located outside the circularly defined green belt and include, in the East, various beach communities w ith residences, guest houses, and some agricultural activities; Auromodel which is primarily residential; Fraternity and Aspiration mentioned above; and in the West, Hope w ith carpentry, the farms of Auro-Orchard, AuroAnnam, Brihaspati Farm, Service Farm, and Annapurna Farm, the forestry-oriented settlements of the Hermitage and Aurobrindavan area. Wastewater is domestic (and agricultural) except for the environmental lab at Aurobrindavan. Sanitation facilities and waste water In Auroville very little attention is paid to eco-sanitation, aiming at separation of waste and reduction of waste quantities. In 99% of the cases, waste water from toilets, showers, washing and kitchen is being mixed. Toilet waste water is not separated in
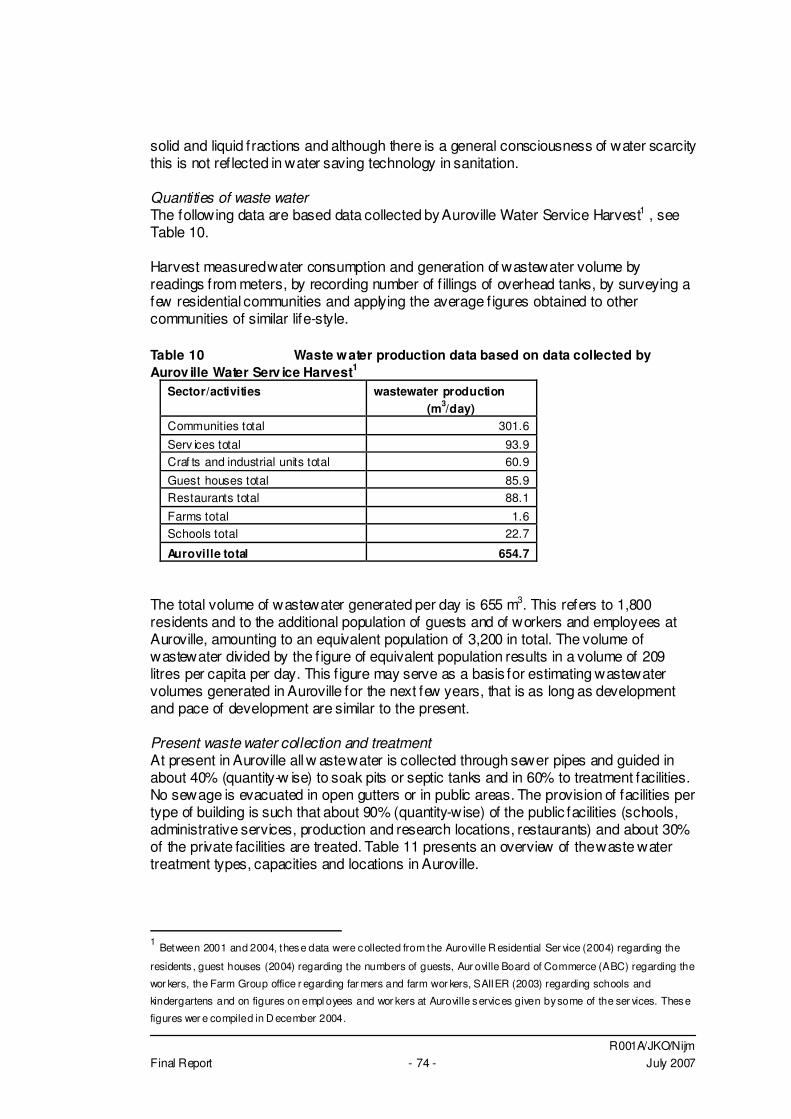
R001A/JKO/Nijm Final Report - 74 - July 2007
solid and liquid fractions and although there is a general consciousness of water scarcity this is not reflected in water saving technology in sanitation. Quantities of waste water The following data are based data collected by Auroville Water Service Harvest1 , see Table 10. Harvest measured water consumption and generation of wastewater volume by readings from meters, by recording number of f illings of overhead tanks, by surveying a few residential communities and applying the average f igures obtained to other communities of similar life-style. Table 10 Waste water production data based on data collected by Aurov ille Water Serv ice Harvest1
Sector/activities wastewater production (m3/day)
Communities total 301.6
Serv ices total 93.9 Craf ts and industrial units total 60.9
Guest houses total 85.9 Restaurants total 88.1
Farms total 1.6 Schools total 22.7
Auroville total 654.7 The total volume of wastewater generated per day is 655 m3. This refers to 1,800 residents and to the additional population of guests and of workers and employees at Auroville, amounting to an equivalent population of 3,200 in total. The volume of wastewater divided by the f igure of equivalent population results in a volume of 209 litres per capita per day. This f igure may serve as a basis for estimating wastewater volumes generated in Auroville for the next few years, that is as long as development and pace of development are similar to the present. Present waste water collection and treatment At present in Auroville all w aste water is collected through sewer pipes and guided in about 40% (quantity-w ise) to soak pits or septic tanks and in 60% to treatment facilities. No sewage is evacuated in open gutters or in public areas. The provision of facilities per type of building is such that about 90% (quantity-wise) of the public facilities (schools, administrative services, production and research locations, restaurants) and about 30% of the private facilities are treated. Table 11 presents an overview of the waste water treatment types, capacities and locations in Auroville.
1 Between 2001 and 2004, these data were collected from the Auroville R esidential Ser vice (2004) regarding the
residents , guest houses (2004) regarding the numbers of guests, Aur oville Board of Commerce (ABC) regarding the
wor kers, the Farm Group office r egarding far mers and farm wor kers, SAIIER (2003) regarding schools and
kindergartens and on figures on empl oyees and wor kers at Auroville services given by some of the ser vices. These
figures wer e compiled in D ecember 2004.
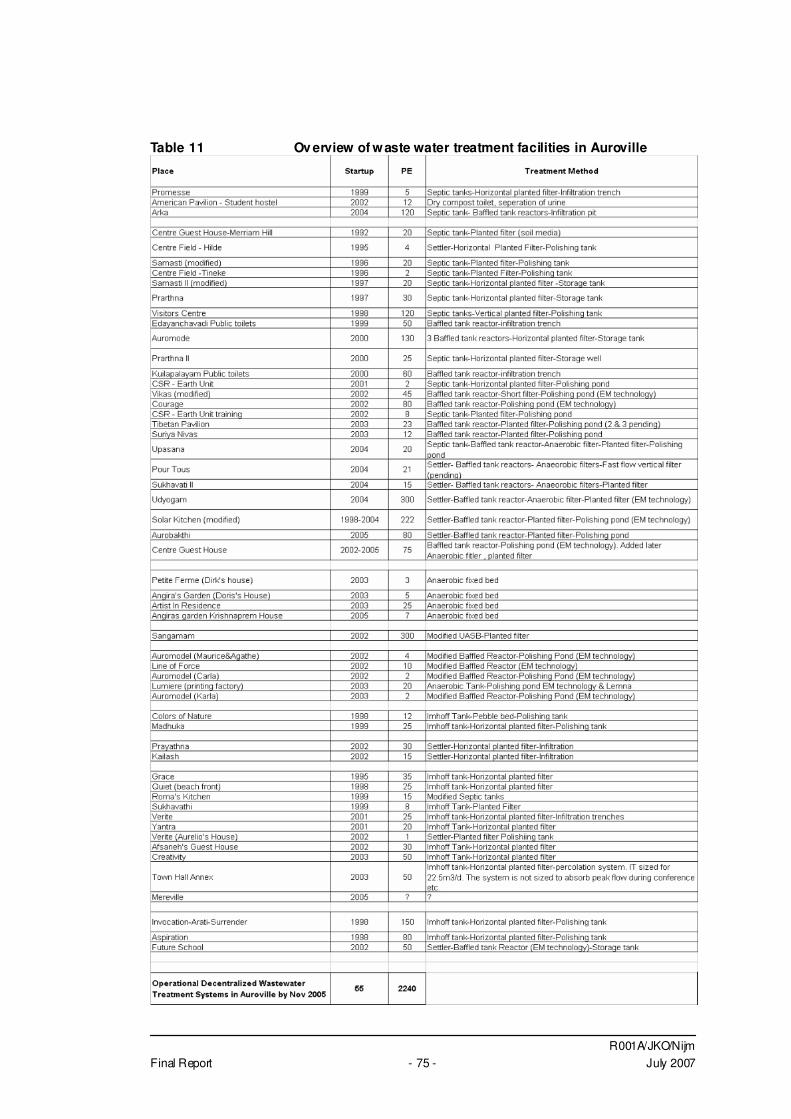
R001A/JKO/Nijm Final Report - 75 - July 2007
Table 11 Ov erview of waste water treatment facilities in Auroville
R001A/JKO/Nijm Final Report - 76 - July 2007
In the initial years of Auroville, treatment facilities would consist of Imhoff tanks w ith reed ponds, sceptic tanks with reed ponds or only reed ponds. These have however been proven to consume much space and be less effective in the climatic conditions prevailing in this area. Presently, baff le tank reactors are being used and polishing ponds are used as an after treatment. Only in rare cases reed f ilters are being used for post-treatment and in general only when odour is an issue. All Dewats systems are offering discharge at high standard, most of the time the highest standards of CPCB. The area required for highest discharge standard is about 0.8 m2/ec. The cost w ill f luctuate as per pollution type and load, discharge requirement, site condition, sewer length etc. but can be as low as 1,500 Rs/ec (Tsunami temporary shelters for public toilet) and up to 7,000 Rs/ec with an average value around 4,000 Rs/ec for higher discharge standards. The running cost is usually very low, as the only routine work necessary is to de-sludge the systems once every 12 to 24 months as per specif ication, to clean once in a while the grit chambers, check the outlet f low and for the sophisticated systems to cut the vegetation once in year maximum. Very few systems require pumps and this only because of site constraints. The eff luent is either discharged in a canyon or natural drain or used for gardening or irrigation. The experience with Dewats systems is generally good. The degree of treatment is high, the costs are low (in particular in operation) and the area occupation is low .
3.6.3 Waste water from Pondicherry2
Pondicherry Pondicherry Union Territory covers 293 km2 whereas Pondicherry urban limits covers 24 km2. The urban population counts about 1.6 million (2001 census). Sewage collection The sewer system in Pondicherry is partly underground and is divided in 9 zones. Zone I is the town area within the Boulevard and measures 203 ha. Sewage from zone I gets collected at Kuruchikuppam Main Pumping Station from where it is pumped via an Intermediate Pumping Station to the oxidation ponds 6 km north of Kuruchikuppam. The zone II sewer system is partially lif ted and partially f lows under gravity to Main Pumping Station Kuruchikuppam. In zone III (Mudaliarpet), works on the sewer system have been started. The zone IV (Nellithope) sewer system was commissioned in April 2003 and is connected to the systems of Zone I and II. In the remaining parts of the town there are open sewers Isolated septic tanks are constructed in many new development areas. PWD envisages an extension of the underground sewer system and upgrading of wastewater treatment facilities. Treatment facilities The sewage farm located at Lawspet (north of Pondicherry) was established in 1980 when the f irst underground drainage system in Pondicherry town was commissioned.
2 The following infor mati on, information on present sewage tr eatment and on pl anned sewage treatment facilities at
Pondicherr y, is taken mainl y fr om a presentation of Pondicherry Public Wor ks Department (PWD) with the titl e
“Sewerage System for urban and suburban areas of Pondicherry” published i n 2005, and from personal
communication with Mr. Anandane, PWD, and engineers and staff of PWD.
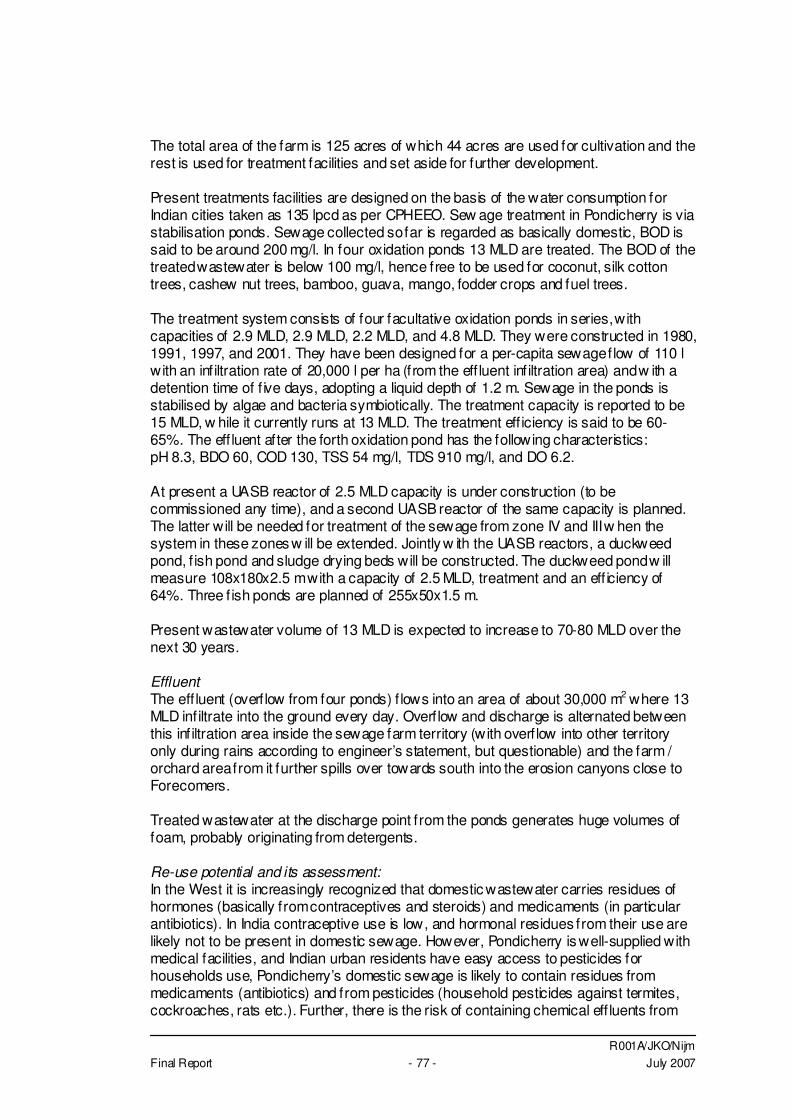
R001A/JKO/Nijm Final Report - 77 - July 2007
The total area of the farm is 125 acres of which 44 acres are used for cultivation and the rest is used for treatment facilities and set aside for further development. Present treatments facilities are designed on the basis of the water consumption for Indian cities taken as 135 lpcd as per CPHEEO. Sew age treatment in Pondicherry is via stabilisation ponds. Sewage collected so far is regarded as basically domestic, BOD is said to be around 200 mg/l. In four oxidation ponds 13 MLD are treated. The BOD of the treated wastewater is below 100 mg/l, hence free to be used for coconut, silk cotton trees, cashew nut trees, bamboo, guava, mango, fodder crops and fuel trees. The treatment system consists of four facultative oxidation ponds in series, with capacities of 2.9 MLD, 2.9 MLD, 2.2 MLD, and 4.8 MLD. They were constructed in 1980, 1991, 1997, and 2001. They have been designed for a per-capita sewage f low of 110 l with an infiltration rate of 20,000 l per ha (from the eff luent inf iltration area) and w ith a detention time of f ive days, adopting a liquid depth of 1.2 m. Sewage in the ponds is stabilised by algae and bacteria symbiotically. The treatment capacity is reported to be 15 MLD, w hile it currently runs at 13 MLD. The treatment eff iciency is said to be 60-65%. The eff luent after the forth oxidation pond has the following characteristics: pH 8.3, BDO 60, COD 130, TSS 54 mg/l, TDS 910 mg/l, and DO 6.2. At present a UASB reactor of 2.5 MLD capacity is under construction (to be commissioned any time), and a second UASB reactor of the same capacity is planned. The latter will be needed for treatment of the sewage from zone IV and III w hen the system in these zones w ill be extended. Jointly w ith the UASB reactors, a duckweed pond, f ish pond and sludge drying beds will be constructed. The duckweed pond w ill measure 108x180x2.5 m with a capacity of 2.5 MLD, treatment and an eff iciency of 64%. Three f ish ponds are planned of 255x50x1.5 m. Present wastewater volume of 13 MLD is expected to increase to 70-80 MLD over the next 30 years. Effluent The eff luent (overflow from four ponds) f lows into an area of about 30,000 m2 where 13 MLD infiltrate into the ground every day. Overflow and discharge is alternated between this inf iltration area inside the sewage farm territory (with overflow into other territory only during rains according to engineer’s statement, but questionable) and the farm / orchard area from it further spills over towards south into the erosion canyons close to Forecomers. Treated wastewater at the discharge point from the ponds generates huge volumes of foam, probably originating from detergents. Re-use potential and its assessment: In the West it is increasingly recognized that domestic wastewater carries residues of hormones (basically from contraceptives and steroids) and medicaments (in particular antibiotics). In India contraceptive use is low, and hormonal residues from their use are likely not to be present in domestic sewage. However, Pondicherry is well-supplied with medical facilities, and Indian urban residents have easy access to pesticides for households use, Pondicherry’s domestic sewage is likely to contain residues from medicaments (antibiotics) and from pesticides (household pesticides against termites, cockroaches, rats etc.). Further, there is the risk of containing chemical eff luents from
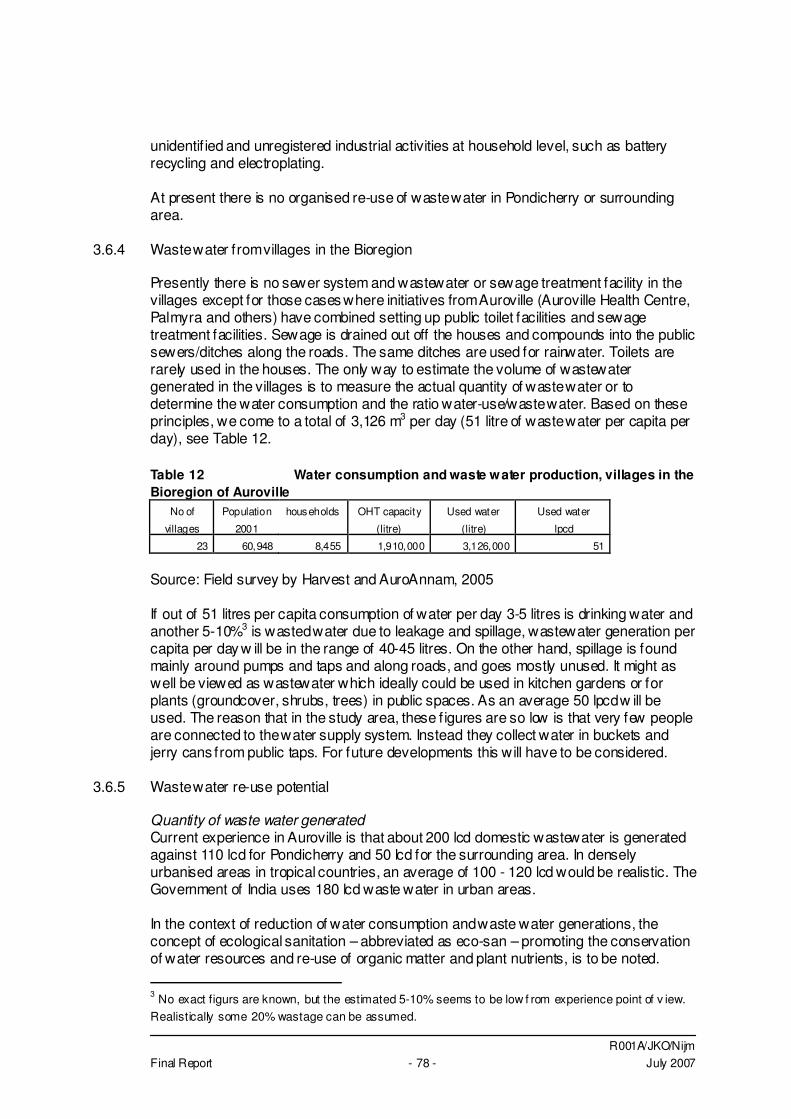
R001A/JKO/Nijm Final Report - 78 - July 2007
unidentif ied and unregistered industrial activities at household level, such as battery recycling and electroplating. At present there is no organised re-use of waste water in Pondicherry or surrounding area.
3.6.4 Waste water from villages in the Bioregion
Presently there is no sewer system and wastewater or sewage treatment facility in the villages except for those cases where initiatives from Auroville (Auroville Health Centre, Palmyra and others) have combined setting up public toilet facilities and sewage treatment facilities. Sewage is drained out off the houses and compounds into the public sewers/ditches along the roads. The same ditches are used for rainwater. Toilets are rarely used in the houses. The only way to estimate the volume of wastewater generated in the villages is to measure the actual quantity of waste water or to determine the water consumption and the ratio water-use/waste water. Based on these principles, we come to a total of 3,126 m3 per day (51 litre of waste water per capita per day), see Table 12. Table 12 Water consumption and waste water production, villages in the Bioregion of Auroville
No of
villages
Population
2001
households OHT capacity
(litre)
Used water
(litre)
Used water
lpcd
23 60,948 8,455 1,910,000 3,126,000 51
Source: Field survey by Harvest and AuroAnnam, 2005 If out of 51 litres per capita consumption of water per day 3-5 litres is drinking water and another 5-10%3 is wasted water due to leakage and spillage, wastewater generation per capita per day w ill be in the range of 40-45 litres. On the other hand, spillage is found mainly around pumps and taps and along roads, and goes mostly unused. It might as well be viewed as wastewater which ideally could be used in kitchen gardens or for plants (groundcover, shrubs, trees) in public spaces. As an average 50 lpcd w ill be used. The reason that in the study area, these f igures are so low is that very few people are connected to the water supply system. Instead they collect water in buckets and jerry cans from public taps. For future developments this will have to be considered.
3.6.5 Waste water re-use potential
Quantity of waste water generated Current experience in Auroville is that about 200 lcd domestic wastewater is generated against 110 lcd for Pondicherry and 50 lcd for the surrounding area. In densely urbanised areas in tropical countries, an average of 100 - 120 lcd would be realistic. The Government of India uses 180 lcd waste water in urban areas. In the context of reduction of water consumption and waste water generations, the concept of ecological sanitation – abbreviated as eco-san – promoting the conservation of water resources and re-use of organic matter and plant nutrients, is to be noted. 3 No exact figurs are known, but the estimated 5-10% seems to be low f rom experience point of v iew. Realistically some 20% wastage can be assumed.
R001A/JKO/Nijm Final Report - 79 - July 2007
Sanitation that can dispense w ith 90-95% of water – only a very small fraction of toilet water use is for anal cleaning – should be made a readily available technical option for all users. Composting toilets without the need for f lushing, urine diversion toilets with direct re-use of urine in gardens and f ields, f lush-free urinals, and possible also higher-tech versions of eco-san could decrease the consumption of water for gardening and irrigation, decrease the volume of wastewater that requires treatment, and increase agricultural production. The problem w ith eco-san is often the social acceptance of it. Another effect of the management of waste water is that pest nuisance is strongly reduced. Domestic waste water Auroville and bio-region villages Domestic sewage is characterized by a BOD:COD ratio of 1:3, by the absence of signif icant amounts of hazardous substances, and by the presence of organic matter and plant nutrients. Organic matter and plant nutrients ideally should be channelled towards (re-)use in agricultural/horticultural contexts and not be let to pollute water bodies, soil, and groundwater. Present waste water production (about 655 m3/day for Auroville and 3,125 m3/day for its Bioregion) could after treatment well be utilised in agriculture and gardening directly or for aquifer recharge. The water to be sued for recharge should fulf il the WHO-standards for this purpose. After aquifer recharge, the water could be used even for drinking water purpose as a transition time of 60 days underground w ill make the water sterile (Vollrath Hopp – Wasser Krise – Wasser, Natur, Mensh, Technik und Wirtshaft, 2004). For the discharge of treated waste water in open water, an upper limit of BOD=30 is maintained by the CPCB. Off course this limit has to be seen in the context of the amount of discharged waste water per unit of time, the size of the water body receiving this waste water and the general environmental conditions. For irrigation and gardening and upper limit of BOD=100 is maintained by the CPCB. Here, odour generally plays and important role. Also for gardens w ith extensive lawns being intensively used by children (playground, private gardens) or by the public (public park, sport facility), this limit has to be reviewed in the specif ic context of the use of the irrigated area. A condition for the re-use of treated waste water is the use close to the source. Long distances require often storage and pumping facilities, pushing up the cost and making it less attractive to use recycled water. The separation of grey- and black water at the source is easy. However, due to wrong connections occurring in neighbourhoods in the west, the low cost of piped drinking water and the low financial benefit, the western world has stopped the w ide spread promotion of split water systems. Only at building level, these systems are occasionally used. Scale versus expenses The smallest scale re-use of water (at household level) requires little investment, operation and maintenance. The wastewater can be used in the gardens and small farms plots near the houses. The largest scale re-use of water (a centralised waste water collection system covering the entire city) requires an extensive underground sewage network, pumps at several points as the entire system can not work on gravity alone, an underground storage reservoir and distribution pumps to the target area.
R001A/JKO/Nijm Final Report - 80 - July 2007
These facilities require a considerable investment and a large operational budget and technical support. Facilities of this size can also not be operated by renewable energy generated at local level. In general such centralised systems are only applied in densely populated areas or industrial zones. Intermediate systems would operate at community-, village- or neighbourhood level whereby the sewage is collected in a small reservoir, treated according to the requirements of the destination of the sewage and distributed with small pumps.
3.7 Sustainable water resources management
3.7.1 Sustainability and management
The Bruntland Report popularized the term sustainability for human and environmental development when it was published in 1987.In the report, sustainable activities were defined as ones where the needs of the present generation are met w ithout compromising the needs of future generations. There has been a shift in recent years from the traditional ‘top-down’ approach to a more open management system where all levels have a say in the allocation and use of the resource. If properly done, this system ensures that the needs and concerns of those most affected by the use of the resource are addressed, without loosing sight of the wider issues touching the society as a whole.
Information is key to good management. Understanding the needs of the stakeholders, as well as the possibilities and limitations of the resource, is needed to manage it effectively. This requires sharing both indigenous and modern scientif ic know ledge, as well as establishing a dialogue between individuals and large institutions. With the right information, appropriate strategies can be formulated to deal w ith the realities of resource management, such as distribution, access, rights, etc. Needless to say, effective communication necessary to manage a resource shared between various users and governed by different levels. Only once the needs of each user are understood can the resource be allocated and managed in a sustainable manner.
Rather than continuing to search for more and more water to meet the anticipated demands, it is time that we adopt the idea that water is a finite and vulnerable natural resource and that excessive withdrawal from natural water bodies is exponentially costly and is likely to cause considerable harm to ecosystems’ functioning and downstream areas generally (Gleick et al. 1995, Postel 1996, Heyns et al 1997).
"Water development and management should be based on a participatory approach, involving users, planners and policy-makers at all levels. The participatory approach...means that decisions are taken at the lowest appropriate level, with full public consultation and involvement of users in the planning and implementation of water projects." (ICWE 1992)
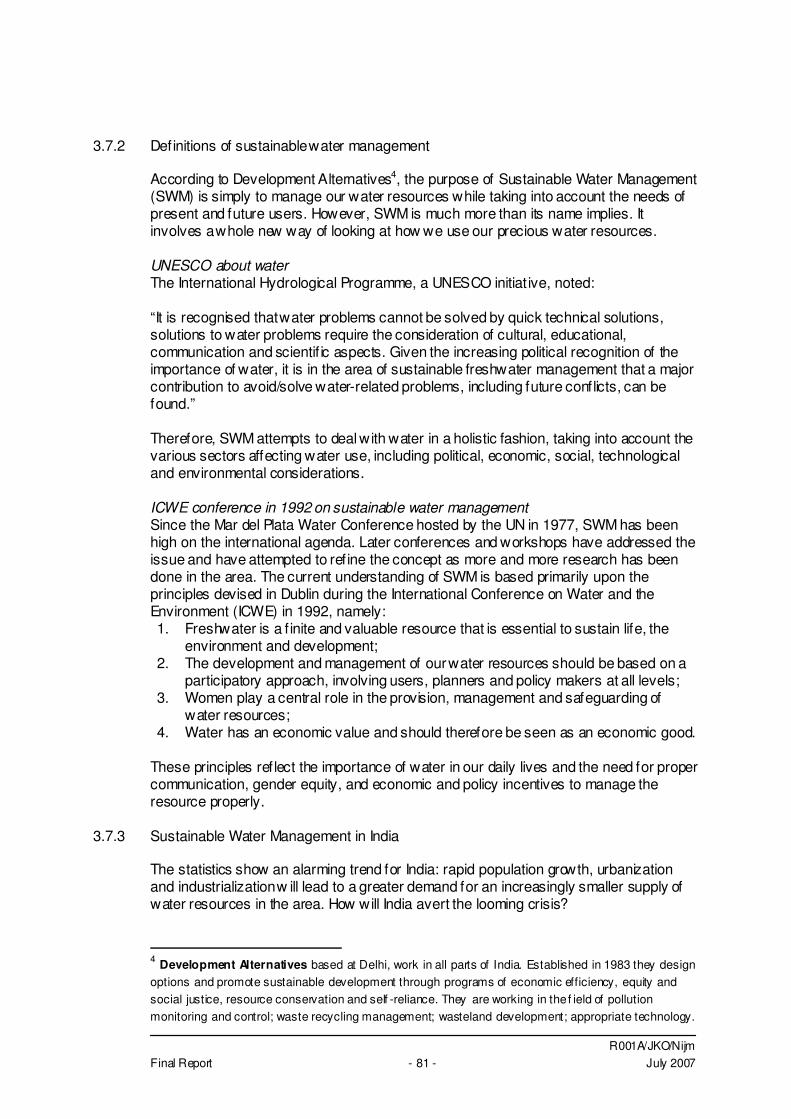
R001A/JKO/Nijm Final Report - 81 - July 2007
3.7.2 Definitions of sustainable water management
According to Development Alternatives4, the purpose of Sustainable Water Management (SWM) is simply to manage our water resources while taking into account the needs of present and future users. However, SWM is much more than its name implies. It involves a whole new way of looking at how we use our precious water resources. UNESCO about water The International Hydrological Programme, a UNESCO initiat ive, noted: “It is recognised that water problems cannot be solved by quick technical solutions, solutions to water problems require the consideration of cultural, educational, communication and scientif ic aspects. Given the increasing political recognition of the importance of water, it is in the area of sustainable freshwater management that a major contribution to avoid/solve water-related problems, including future conflicts, can be found.” Therefore, SWM attempts to deal with water in a holistic fashion, taking into account the various sectors affecting water use, including political, economic, social, technological and environmental considerations. ICWE conference in 1992 on sustainable water management Since the Mar del Plata Water Conference hosted by the UN in 1977, SWM has been high on the international agenda. Later conferences and workshops have addressed the issue and have attempted to refine the concept as more and more research has been done in the area. The current understanding of SWM is based primarily upon the principles devised in Dublin during the International Conference on Water and the Environment (ICWE) in 1992, namely: 1. Freshwater is a f inite and valuable resource that is essential to sustain life, the
environment and development; 2. The development and management of our water resources should be based on a
participatory approach, involving users, planners and policy makers at all levels; 3. Women play a central role in the provision, management and safeguarding of
water resources; 4. Water has an economic value and should therefore be seen as an economic good.
These principles reflect the importance of water in our daily lives and the need for proper communication, gender equity, and economic and policy incentives to manage the resource properly.
3.7.3 Sustainable Water Management in India
The statistics show an alarming trend for India: rapid population growth, urbanization and industrialization w ill lead to a greater demand for an increasingly smaller supply of water resources in the area. How will India avert the looming crisis?
4 Development Alternatives based at Delhi, work in all parts of India. Established in 1983 they design options and promote sustainable development through programs of economic efficiency, equity and social justice, resource conservation and self -reliance. They are working in the f ield of pollution monitoring and control; waste recycling management; wasteland development; appropriate technology.
R001A/JKO/Nijm Final Report - 82 - July 2007
The needs of India, and indeed the South Asian region to which it belongs, are unique. Now here else in the world does population growth and poverty play such a large role in affecting water resource issues. To address the specif ic concerns of the region, the World Water Council formed a Regional Water Vision 2025 for South Asia. A product of dialogue and debate between organizations from the region, the Vision 2025 reflects the current position of South Asia on the sustainable development of their water resources: “Poverty in South Asia will be eradicated and living conditions of all people will be uplifted to sustainable levels of comfort, health and well-being through co-ordinated and integrated development and management of water resources in the region.” This vision reflects the importance of providing for basic human needs to ensure that the livelihoods of all can be improved. In the case of South Asia, poverty and reduced access to safe water resources has limited the ability of the poor to improve their situation, which has only served to perpetuate the poverty cycle especially among rural populations and women. The South Asia Regional Water Vision 2025 identif ied a number of common issues for water management in the region: - Welfare for the people and equitable distribution of resources; - Economic growth and development; - Eff icient use of water resources; - Sustainability and environmental aspects; - Policy and institutional aspects; - Increasing role of the market in water management. These issues affect both the region as a whole and the individual nations in varying degrees. For India, the two most important issues are how to balance the country’s rapid economic growth with the need to ensure equitable distribution to all sectors, in particular the urban and rural drinking water supply.
3.7.4 Water resources management and sustainable urban planning
Urban planning and water used to be closely related in early ages. Water as the source of life was a precondition to development of settlements. Suitable locations for wells, rivers and springs have dictated much of urban development in history. This all changed with the discovery of water transport allowing houses to be constructed away from water resources under the pressure of the world’s population. Thus the ‘makeable city’ was born where all could be adjusted as per men’s requirements. The last decennium however, we have seen a turning point in environmental awareness and sustainability. We borrow the world from our children and we therefore have the obligations to leave it to our children and our children’s children in good condition. Sustainable urban planning by the Dutch ministry of urban planning (VROM) Sustainable urban development is a form of urban development that uses all opportunities to achieve a higher spatial quality combined w ith a lower environmental impact. Additionally, both spatial quality and limited impact should be maintained in time as future generations can share in this as well.
R001A/JKO/Nijm Final Report - 83 - July 2007
• The quality of the planning process determines the involvement of stakeholders. For (social) sustainability it is crucial that all stakeholders, including the future stakeholders, are involved;
• Spatial quality has to do with the way the urban environment is built. Flexibility plays an important role and plans that are robust w ill last longer;
• Environmental quality has to do with ecology, biodiversity, saving on resources and on occupation of area.
It is important that above three aspects are in balance. So the key to sustainable urban development is to achieve the highest feasible of the three aspects in a stepwise process of constant reconsideration. Sustainable Urban Development in India It is reported that water supply and sanitation had been one of the major considerations in ancient town planning in India, and water bodies played an important role in the selection of site for settlement planning. A study of the works on Town Planning of the Southern and Northern Schools of India (700 A.D.) reveals that ancient town planning was based on several principles, and the f irst and second principles dwelt upon this subject.
R001A/JKO/Nijm Final Report - 84 - July 2007
4 DEMAND
4.1 Summary
Population The city of Auroville is presently with 3,500 inhabitants and dependants a small entity in the Bioregion w ith which it is interacting. The much smaller study area ( 80 km2 for the study area against 1,500 km2 for the Bioregion) has some 75,000 inhabitants at present. In the year 2025 Auroville w ill have theoretically 50,000 inhabitants and the study area will have 146,500 inhabitants. To achieve this number in 2025, Auroville w ill have to grow w ith more than 19% average for the coming 20 years, which is beyond realistic f igures. Based on past developments, it is however impossible to predict how Auroville will grow in the coming years. Water demand Water demand in the Aurobille Masterplan is 200 litre per capita per day (lcd), of which only 130 lcd needs to be of potable quality. Certain communities in Auroville use as much as 300 lcd. Irrigation demand (small plots and gardens) in Auroville is limited to some 1,575 m3/day but this will increase with the development of the Matrimandir- and other gardens in Auroville. The water consumption in the study area is a multitude of the above f igures. For irrigation in the study area, some 56 Mm3/yr is being used from groundwater only. For domestic purpose, 1.4 Mm3/yr is being used. Scope for reduction There is scope for reduction of water use in Auroville. This mainly lies with the reduction of the use of water for gardening by reducing gardens or using recycled waste water. Also ecological-sanitation can be used to reduce water use. An actual use of 100 – 140 lcd would be realistic for Auroville. Dual w atersupply (potable water AND grey water) within housholds is not recommended as risks are too high and benefits are relatively low. Only the use of grey water for gardening and irrigation is recommended. The domestic use in lcd in the project area is low but could still be further reduced by the reduction of wastage. The main water use reduction can be established by the reduction of water for irrigation. Numerous possibilities exist such as rehabilitation of rainwater irrigation structures and facilities, introduction of low-water yielding crops, introduction of sprinkler and drip irrigation and stoppage of irrigation of crops that do not need irrigation. It is not possible to achieve any reduction without intensive campaigns of promotion and eduction in water saving measures and techniques and Auroville could play a key role in this.
4.2 General
As the supply of water needs to meet the demand for water and as the demand is only generated by population, the development scenario for the population is of the utmost importance. The population development can be distinguished between Auroville and the surrounding villages in the study area.
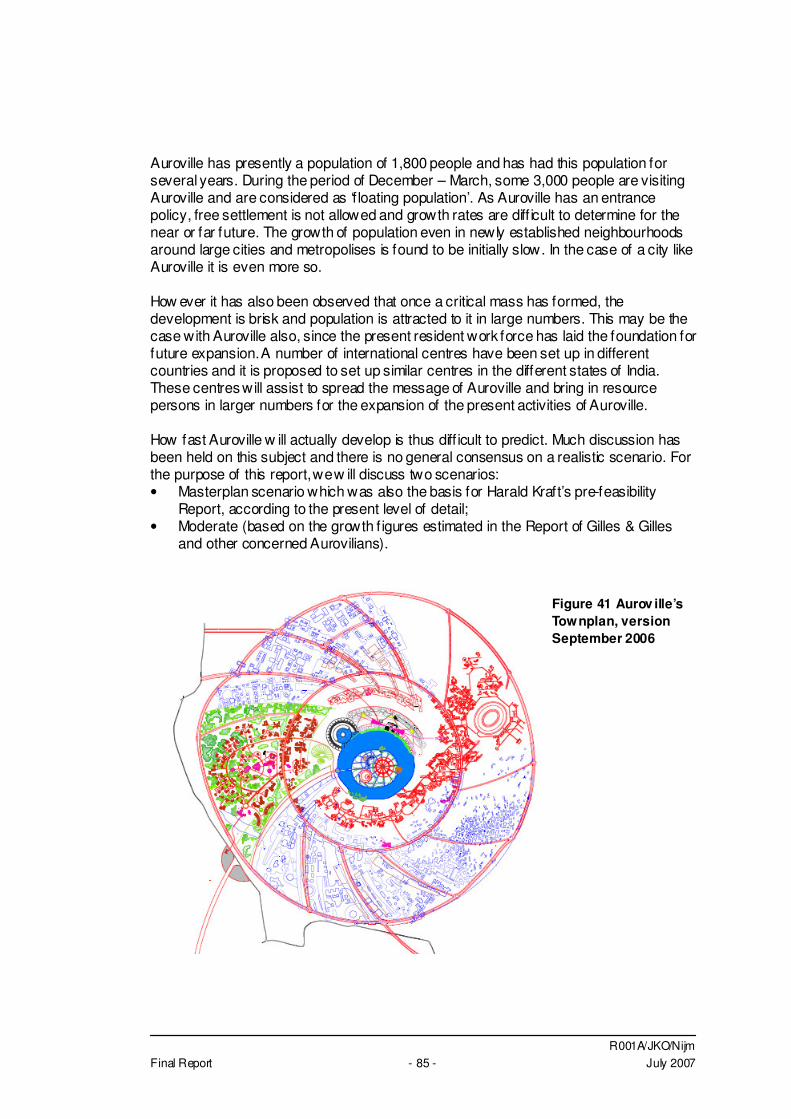
R001A/JKO/Nijm Final Report - 85 - July 2007
Auroville has presently a population of 1,800 people and has had this population for several years. During the period of December – March, some 3,000 people are visiting Auroville and are considered as ‘f loating population’. As Auroville has an entrance policy, free settlement is not allowed and growth rates are diff icult to determine for the near or far future. The growth of population even in newly established neighbourhoods around large cities and metropolises is found to be initially slow. In the case of a city like Auroville it is even more so. How ever it has also been observed that once a critical mass has formed, the development is brisk and population is attracted to it in large numbers. This may be the case with Auroville also, since the present resident work force has laid the foundation for future expansion. A number of international centres have been set up in different countries and it is proposed to set up similar centres in the different states of India. These centres will assist to spread the message of Auroville and bring in resource persons in larger numbers for the expansion of the present activities of Auroville. How fast Auroville w ill actually develop is thus diff icult to predict. Much discussion has been held on this subject and there is no general consensus on a realistic scenario. For the purpose of this report, we w ill discuss two scenarios: • Masterplan scenario which was also the basis for Harald Kraft’s pre-feasibility
Report, according to the present level of detail; • Moderate (based on the growth f igures estimated in the Report of Gilles & Gilles
and other concerned Aurovilians).
Figure 41 Aurov ille’s Townplan, version September 2006
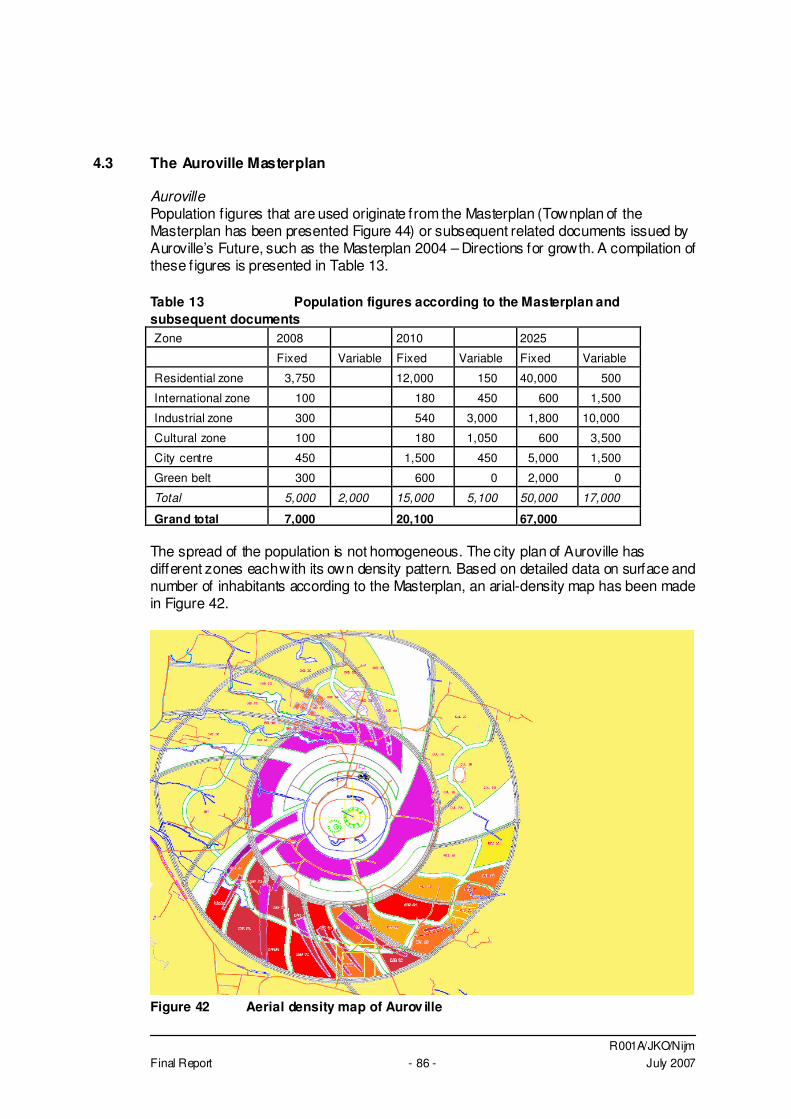
R001A/JKO/Nijm Final Report - 86 - July 2007
4.3 The Auroville Masterplan
Auroville Population f igures that are used originate from the Masterplan (Townplan of the Masterplan has been presented Figure 44) or subsequent related documents issued by Auroville’s Future, such as the Masterplan 2004 – Directions for growth. A compilation of these f igures is presented in Table 13. Table 13 Population figures according to the Masterplan and subsequent documents Zone 2008 2010 2025
Fixed Variable Fixed Variable Fixed Variable
Residential zone 3,750 12,000 150 40,000 500
International zone 100 180 450 600 1,500
Industrial zone 300 540 3,000 1,800 10,000
Cultural zone 100 180 1,050 600 3,500
City centre 450 1,500 450 5,000 1,500
Green belt 300 600 0 2,000 0
Total 5,000 2,000 15,000 5,100 50,000 17,000
Grand total 7,000 20,100 67,000 The spread of the population is not homogeneous. The city plan of Auroville has different zones each with its own density pattern. Based on detailed data on surface and number of inhabitants according to the Masterplan, an arial-density map has been made in Figure 42.
Figure 42 Aerial density map of Aurov ille
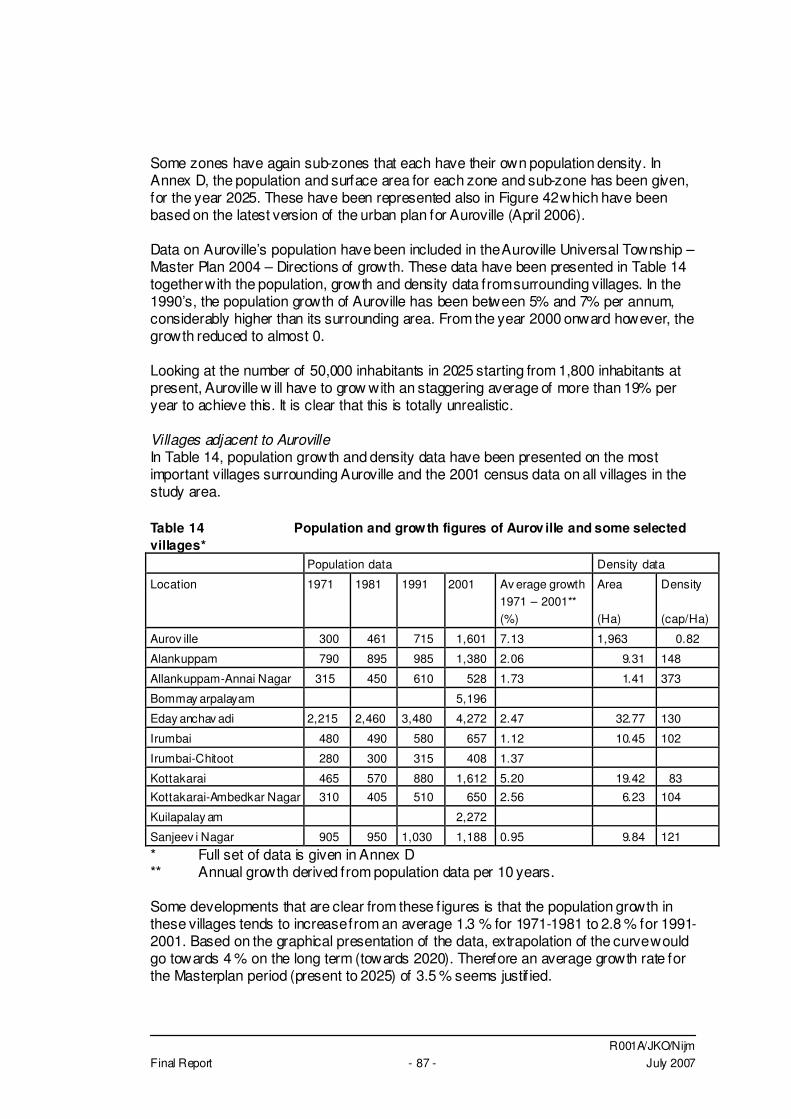
R001A/JKO/Nijm Final Report - 87 - July 2007
Some zones have again sub-zones that each have their own population density. In Annex D, the population and surface area for each zone and sub-zone has been given, for the year 2025. These have been represented also in Figure 42 which have been based on the latest version of the urban plan for Auroville (April 2006). Data on Auroville’s population have been included in the Auroville Universal Township – Master Plan 2004 – Directions of growth. These data have been presented in Table 14 together with the population, growth and density data from surrounding villages. In the 1990’s, the population growth of Auroville has been between 5% and 7% per annum, considerably higher than its surrounding area. From the year 2000 onward however, the growth reduced to almost 0. Looking at the number of 50,000 inhabitants in 2025 starting from 1,800 inhabitants at present, Auroville w ill have to grow with an staggering average of more than 19% per year to achieve this. It is clear that this is totally unrealistic. Villages adjacent to Auroville In Table 14, population growth and density data have been presented on the most important villages surrounding Auroville and the 2001 census data on all villages in the study area. Table 14 Population and growth figures of Aurov ille and some selected villages* Population data Density data
Location 1971 1981 1991 2001 Av erage growth 1971 – 2001** (%)
Area (Ha)
Density (cap/Ha)
Aurov ille 300 461 715 1,601 7.13 1,963 0.82
Alankuppam 790 895 985 1,380 2.06 9.31 148
Allankuppam-Annai Nagar 315 450 610 528 1.73 1.41 373
Bommay arpalayam 5,196
Eday anchav adi 2,215 2,460 3,480 4,272 2.47 32.77 130
Irumbai 480 490 580 657 1.12 10.45 102
Irumbai-Chitoot 280 300 315 408 1.37
Kottakarai 465 570 880 1,612 5.20 19.42 83
Kottakarai-Ambedkar Nagar 310 405 510 650 2.56 6.23 104
Kuilapalay am 2,272
Sanjeev i Nagar 905 950 1,030 1,188 0.95 9.84 121
* Full set of data is given in Annex D ** Annual growth derived from population data per 10 years. Some developments that are clear from these f igures is that the population growth in these villages tends to increase from an average 1.3 % for 1971-1981 to 2.8 % for 1991-2001. Based on the graphical presentation of the data, extrapolation of the curve would go towards 4 % on the long term (towards 2020). Therefore an average growth rate for the Masterplan period (present to 2025) of 3.5 % seems justif ied.
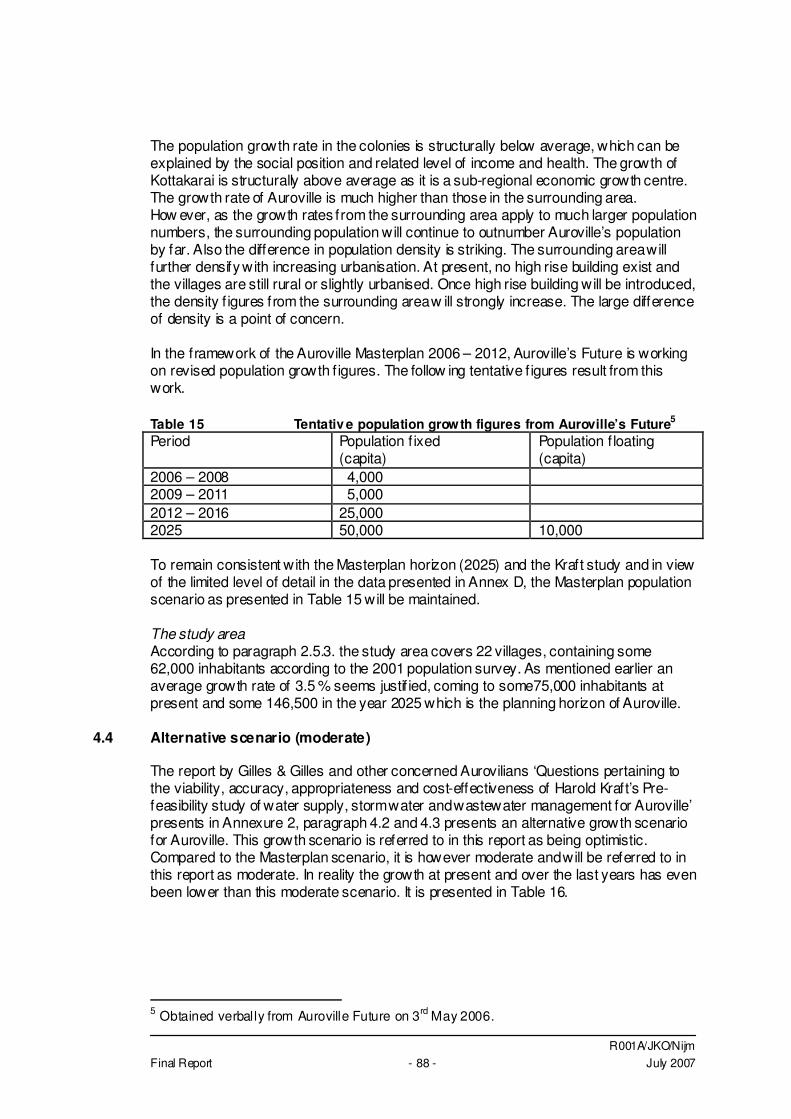
R001A/JKO/Nijm Final Report - 88 - July 2007
The population growth rate in the colonies is structurally below average, which can be explained by the social position and related level of income and health. The growth of Kottakarai is structurally above average as it is a sub-regional economic growth centre. The growth rate of Auroville is much higher than those in the surrounding area. How ever, as the growth rates from the surrounding area apply to much larger population numbers, the surrounding population will continue to outnumber Auroville’s population by far. Also the difference in population density is striking. The surrounding area will further densify with increasing urbanisation. At present, no high rise building exist and the villages are still rural or slightly urbanised. Once high rise building will be introduced, the density f igures from the surrounding area w ill strongly increase. The large difference of density is a point of concern. In the framework of the Auroville Masterplan 2006 – 2012, Auroville’s Future is working on revised population growth f igures. The follow ing tentative f igures result from this work. Table 15 Tentativ e population growth figures from Auroville’s Future5 Period Population f ixed
(capita) Population f loating (capita)
2006 – 2008 4,000 2009 – 2011 5,000 2012 – 2016 25,000 2025 50,000 10,000 To remain consistent with the Masterplan horizon (2025) and the Kraft study and in view of the limited level of detail in the data presented in Annex D, the Masterplan population scenario as presented in Table 15 will be maintained. The study area According to paragraph 2.5.3. the study area covers 22 villages, containing some 62,000 inhabitants according to the 2001 population survey. As mentioned earlier an average growth rate of 3.5 % seems justif ied, coming to some75,000 inhabitants at present and some 146,500 in the year 2025 which is the planning horizon of Auroville.
4.4 Alternative scenario (moderate)
The report by Gilles & Gilles and other concerned Aurovilians ‘Questions pertaining to the viability, accuracy, appropriateness and cost-effectiveness of Harold Kraft’s Pre-feasibility study of water supply, storm water and wastewater management for Auroville’ presents in Annexure 2, paragraph 4.2 and 4.3 presents an alternative growth scenario for Auroville. This growth scenario is referred to in this report as being optimistic. Compared to the Masterplan scenario, it is however moderate and will be referred to in this report as moderate. In reality the growth at present and over the last years has even been lower than this moderate scenario. It is presented in Table 16.
5 Obtained verbally from Auroville Future on 3rd May 2006.
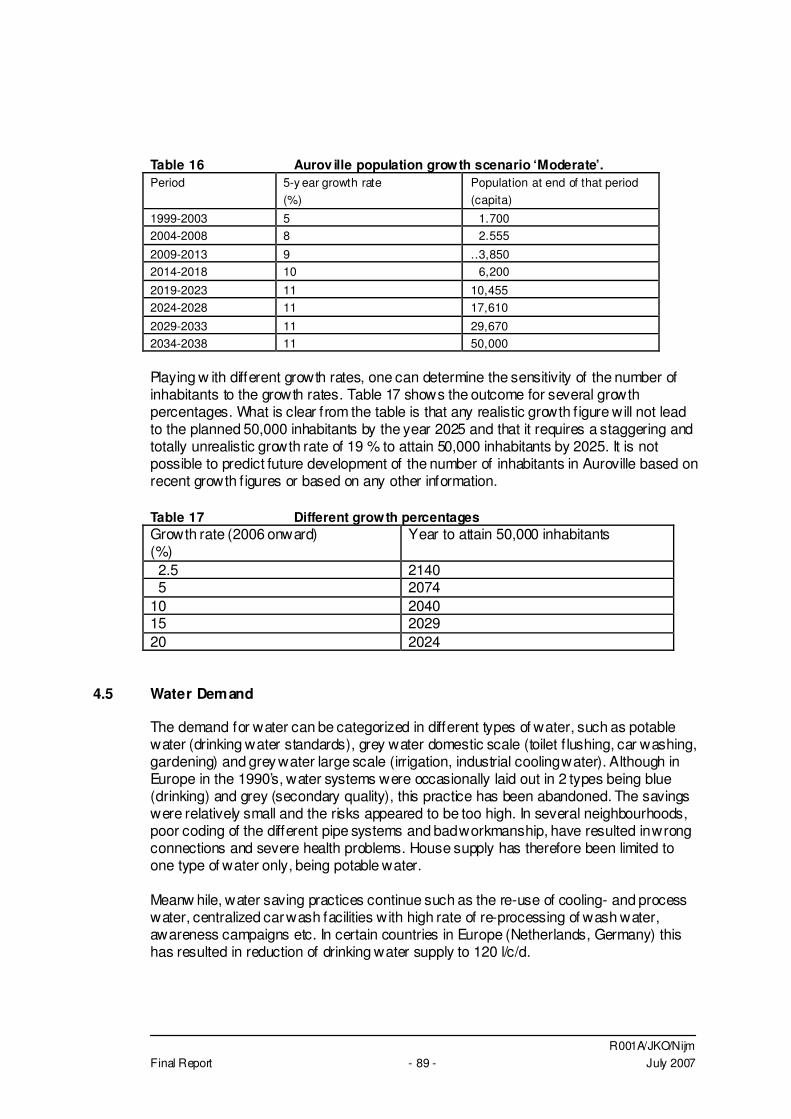
R001A/JKO/Nijm Final Report - 89 - July 2007
Table 16 Aurov ille population growth scenario ‘Moderate’. Period 5-y ear growth rate
(%) Population at end of that period (capita)
1999-2003 5 1.700 2004-2008 8 2.555
2009-2013 9 ..3,850 2014-2018 10 6,200
2019-2023 11 10,455 2024-2028 11 17,610
2029-2033 11 29,670 2034-2038 11 50,000 Playing w ith different growth rates, one can determine the sensitivity of the number of inhabitants to the growth rates. Table 17 shows the outcome for several growth percentages. What is clear from the table is that any realistic growth f igure will not lead to the planned 50,000 inhabitants by the year 2025 and that it requires a staggering and totally unrealistic growth rate of 19 % to attain 50,000 inhabitants by 2025. It is not possible to predict future development of the number of inhabitants in Auroville based on recent growth f igures or based on any other information. Table 17 Different growth percentages Growth rate (2006 onward) (%)
Year to attain 50,000 inhabitants
2.5 2140 5 2074 10 2040 15 2029 20 2024
4.5 Water Demand
The demand for water can be categorized in different types of water, such as potable water (drinking water standards), grey water domestic scale (toilet f lushing, car washing, gardening) and grey water large scale (irrigation, industrial cooling water). Although in Europe in the 1990’s, water systems were occasionally laid out in 2 types being blue (drinking) and grey (secondary quality), this practice has been abandoned. The savings were relatively small and the risks appeared to be too high. In several neighbourhoods, poor coding of the different pipe systems and bad workmanship, have resulted in wrong connections and severe health problems. House supply has therefore been limited to one type of water only, being potable water. Meanw hile, water saving practices continue such as the re-use of cooling- and process water, centralized car wash facilities with high rate of re-processing of wash water, awareness campaigns etc. In certain countries in Europe (Netherlands, Germany) this has resulted in reduction of drinking water supply to 120 l/c/d.
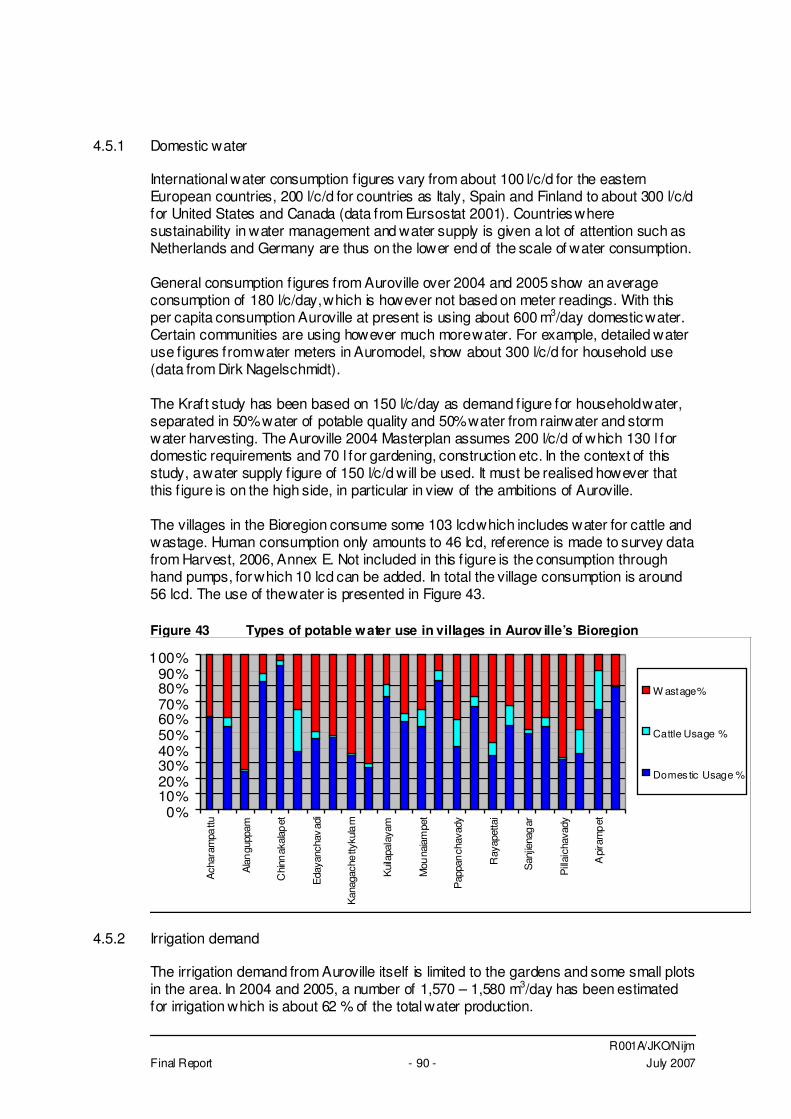
R001A/JKO/Nijm Final Report - 90 - July 2007
4.5.1 Domestic water
International water consumption f igures vary from about 100 l/c/d for the eastern European countries, 200 l/c/d for countries as Italy, Spain and Finland to about 300 l/c/d for United States and Canada (data from Eursostat 2001). Countries where sustainability in water management and water supply is given a lot of attention such as Netherlands and Germany are thus on the lower end of the scale of water consumption. General consumption f igures from Auroville over 2004 and 2005 show an average consumption of 180 l/c/day, which is however not based on meter readings. With this per capita consumption Auroville at present is using about 600 m3/day domestic water. Certain communities are using however much more water. For example, detailed water use f igures from water meters in Auromodel, show about 300 l/c/d for household use (data from Dirk Nagelschmidt). The Kraft study has been based on 150 l/c/day as demand figure for household water, separated in 50% water of potable quality and 50% water from rainwater and storm water harvesting. The Auroville 2004 Masterplan assumes 200 l/c/d of which 130 l for domestic requirements and 70 l for gardening, construction etc. In the context of this study, a water supply f igure of 150 l/c/d will be used. It must be realised however that this f igure is on the high side, in particular in view of the ambitions of Auroville. The villages in the Bioregion consume some 103 lcd which includes water for cattle and wastage. Human consumption only amounts to 46 lcd, reference is made to survey data from Harvest, 2006, Annex E. Not included in this f igure is the consumption through hand pumps, for which 10 lcd can be added. In total the village consumption is around 56 lcd. The use of the water is presented in Figure 43. Figure 43 Types of potable water use in villages in Aurov ille’s Bioregion
0%10%20%30%40%50%60%70%80%90%
100%
Ach
aram
pattu
Ala
ngu
ppam
Chi
nnak
alap
et
Eda
yanc
hav
adi
Kan
agac
hetty
kula
m
Kui
lapa
laya
m
Mou
naia
mpe
t
Pap
pan
chav
ady
Ray
apet
tai
San
jiena
gar
Pill
aich
avad
y
Api
ram
pet
W astage%
Cattle Usage %
Domes tic Usage %
4.5.2 Irrigation demand
The irrigation demand from Auroville itself is limited to the gardens and some small plots in the area. In 2004 and 2005, a number of 1,570 – 1,580 m3/day has been estimated for irrigation which is about 62 % of the total water production.
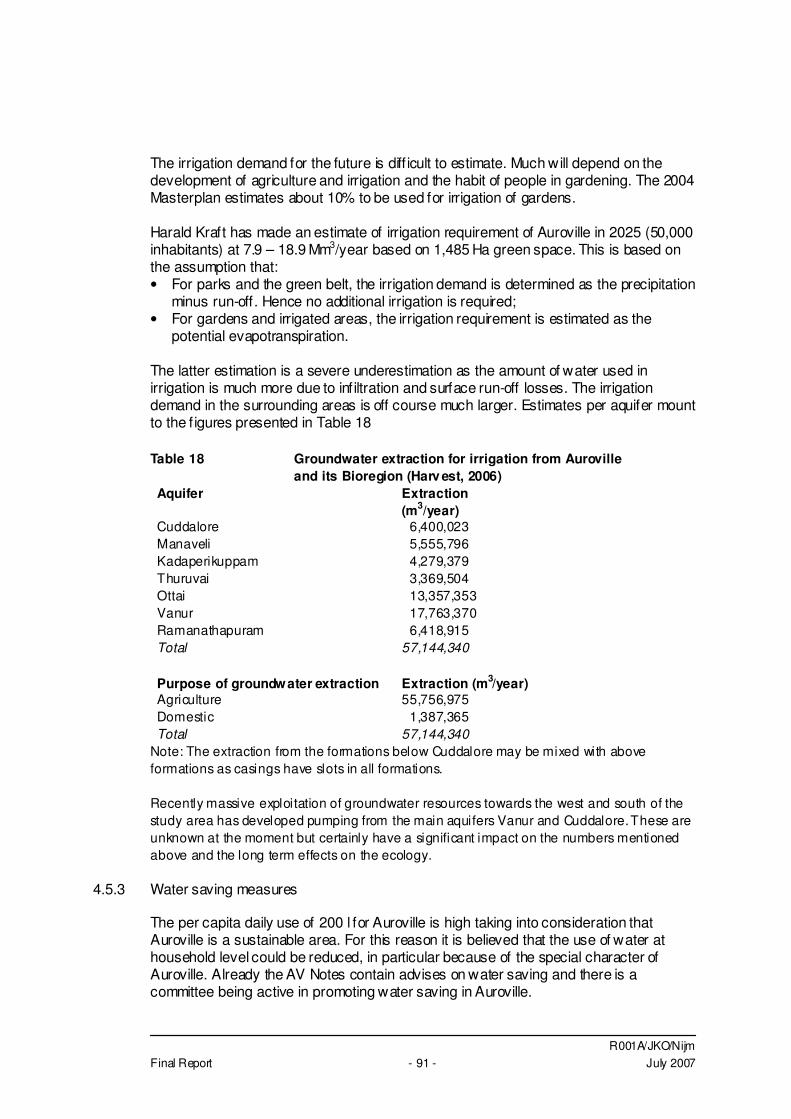
R001A/JKO/Nijm Final Report - 91 - July 2007
The irrigation demand for the future is diff icult to estimate. Much will depend on the development of agriculture and irrigation and the habit of people in gardening. The 2004 Masterplan estimates about 10% to be used for irrigation of gardens. Harald Kraft has made an estimate of irrigation requirement of Auroville in 2025 (50,000 inhabitants) at 7.9 – 18.9 Mm3/year based on 1,485 Ha green space. This is based on the assumption that: • For parks and the green belt, the irrigation demand is determined as the precipitation
minus run-off. Hence no additional irrigation is required; • For gardens and irrigated areas, the irrigation requirement is estimated as the
potential evapotranspiration. The latter estimation is a severe underestimation as the amount of water used in irrigation is much more due to infiltration and surface run-off losses. The irrigation demand in the surrounding areas is off course much larger. Estimates per aquifer mount to the f igures presented in Table 18 Table 18 Groundwater extraction for irrigation from Auroville
and its Bioregion (Harv est, 2006) Aquifer Extraction
(m3/year) Cuddalore 6,400,023 Manaveli 5,555,796 Kadaperikuppam 4,279,379 Thuruvai 3,369,504 Ottai 13,357,353 Vanur 17,763,370 Ramanathapuram 6,418,915 Total 57,144,340
Purpose of groundwater extraction Extraction (m3/year) Agriculture 55,756,975 Domestic 1,387,365 Total 57,144,340
Note: The extraction from the formations below Cuddalore may be mixed with above formations as casings have slots in all formations. Recently massive exploitation of groundwater resources towards the west and south of the study area has developed pumping from the main aquifers Vanur and Cuddalore. These are unknown at the moment but certainly have a significant impact on the numbers mentioned above and the long term effects on the ecology.
4.5.3 Water saving measures
The per capita daily use of 200 l for Auroville is high taking into consideration that Auroville is a sustainable area. For this reason it is believed that the use of water at household level could be reduced, in particular because of the special character of Auroville. Already the AV Notes contain advises on water saving and there is a committee being active in promoting water saving in Auroville.
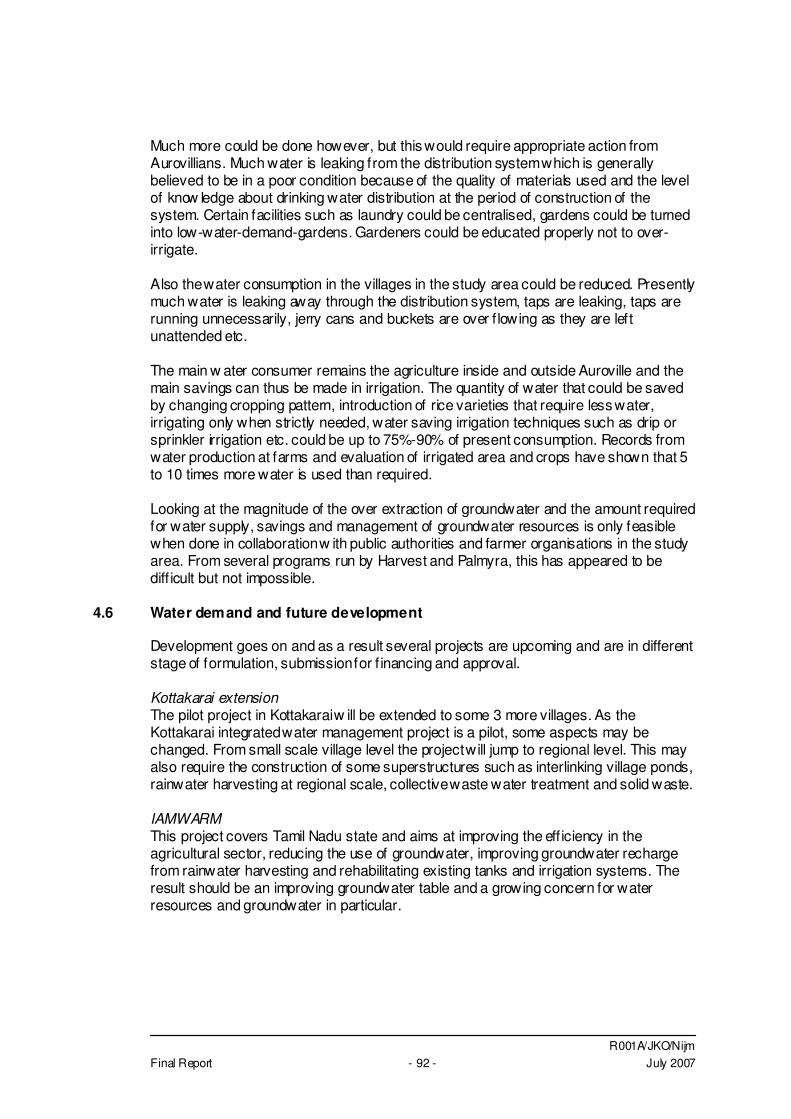
R001A/JKO/Nijm Final Report - 92 - July 2007
Much more could be done however, but this would require appropriate action from Aurovillians. Much water is leaking from the distribution system which is generally believed to be in a poor condition because of the quality of materials used and the level of know ledge about drinking water distribution at the period of construction of the system. Certain facilities such as laundry could be centralised, gardens could be turned into low-water-demand-gardens. Gardeners could be educated properly not to over-irrigate. Also the water consumption in the villages in the study area could be reduced. Presently much water is leaking away through the distribution system, taps are leaking, taps are running unnecessarily, jerry cans and buckets are over f lowing as they are left unattended etc. The main w ater consumer remains the agriculture inside and outside Auroville and the main savings can thus be made in irrigation. The quantity of water that could be saved by changing cropping pattern, introduction of rice varieties that require less water, irrigating only when strictly needed, water saving irrigation techniques such as drip or sprinkler irrigation etc. could be up to 75%-90% of present consumption. Records from water production at farms and evaluation of irrigated area and crops have shown that 5 to 10 times more water is used than required. Looking at the magnitude of the over extraction of groundwater and the amount required for water supply, savings and management of groundwater resources is only feasible when done in collaboration w ith public authorities and farmer organisations in the study area. From several programs run by Harvest and Palmyra, this has appeared to be diff icult but not impossible.
4.6 Water demand and future development
Development goes on and as a result several projects are upcoming and are in different stage of formulation, submission for f inancing and approval. Kottakarai extension The pilot project in Kottakarai w ill be extended to some 3 more villages. As the Kottakarai integrated water management project is a pilot, some aspects may be changed. From small scale village level the project will jump to regional level. This may also require the construction of some superstructures such as interlinking village ponds, rainwater harvesting at regional scale, collective waste water treatment and solid waste. IAMWARM This project covers Tamil Nadu state and aims at improving the eff iciency in the agricultural sector, reducing the use of groundwater, improving groundwater recharge from rainwater harvesting and rehabilitating existing tanks and irrigation systems. The result should be an improving groundwater table and a growing concern for water resources and groundwater in particular.
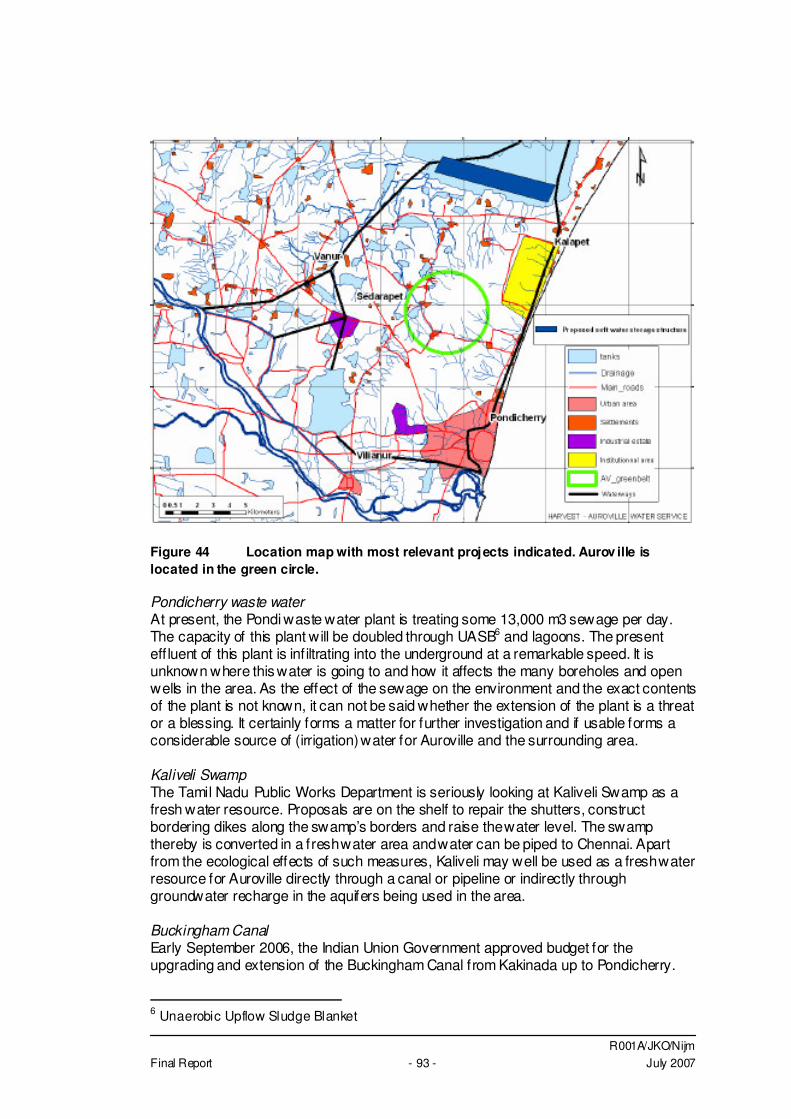
R001A/JKO/Nijm Final Report - 93 - July 2007
Figure 44 Location map with most relevant projects indicated. Aurov ille is located in the green circle. Pondicherry waste water At present, the Pondi waste water plant is treating some 13,000 m3 sewage per day. The capacity of this plant will be doubled through UASB6 and lagoons. The present eff luent of this plant is inf iltrating into the underground at a remarkable speed. It is unknown where this water is going to and how it affects the many boreholes and open wells in the area. As the effect of the sewage on the environment and the exact contents of the plant is not known, it can not be said whether the extension of the plant is a threat or a blessing. It certainly forms a matter for further investigation and if usable forms a considerable source of (irrigation) water for Auroville and the surrounding area. Kaliveli Swamp The Tamil Nadu Public Works Department is seriously looking at Kaliveli Swamp as a fresh water resource. Proposals are on the shelf to repair the shutters, construct bordering dikes along the swamp’s borders and raise the water level. The swamp thereby is converted in a fresh water area and water can be piped to Chennai. Apart from the ecological effects of such measures, Kaliveli may well be used as a fresh water resource for Auroville directly through a canal or pipeline or indirectly through groundwater recharge in the aquifers being used in the area. Buckingham Canal Early September 2006, the Indian Union Government approved budget for the upgrading and extension of the Buckingham Canal from Kakinada up to Pondicherry.
6 Unaerobic Upflow Sludge Blanket
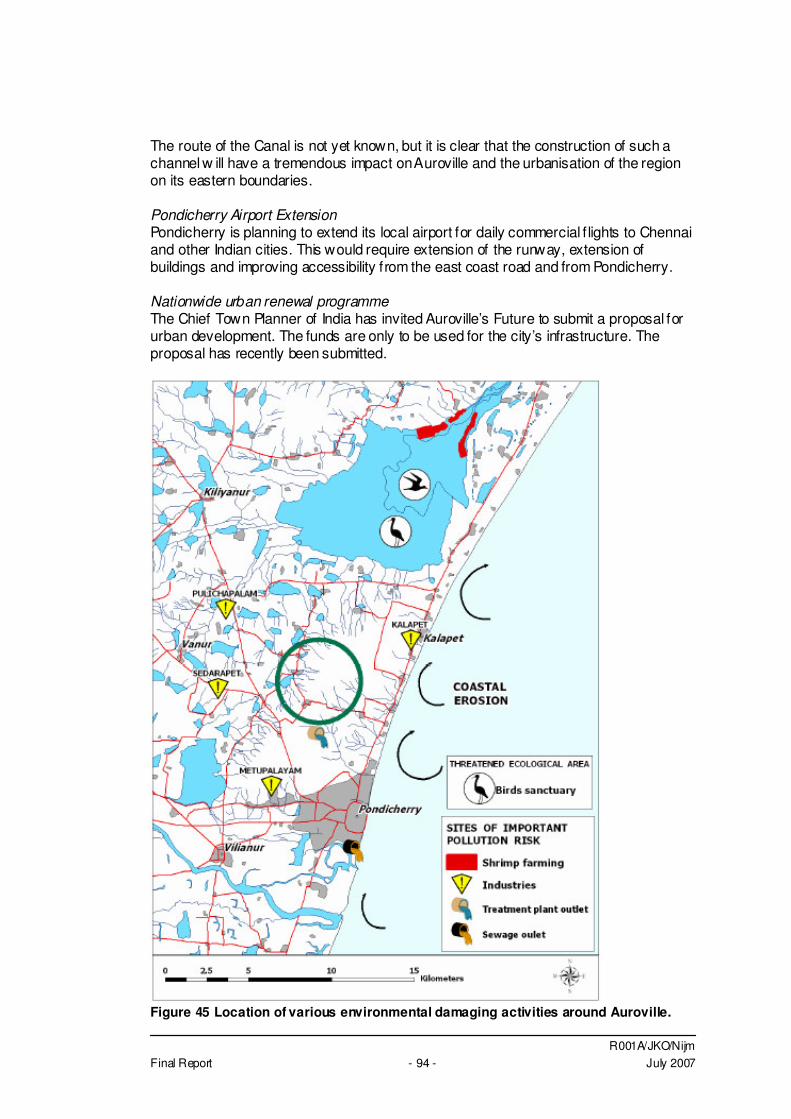
R001A/JKO/Nijm Final Report - 94 - July 2007
The route of the Canal is not yet known, but it is clear that the construction of such a channel w ill have a tremendous impact on Auroville and the urbanisation of the region on its eastern boundaries. Pondicherry Airport Extension Pondicherry is planning to extend its local airport for daily commercial f lights to Chennai and other Indian cities. This would require extension of the runway, extension of buildings and improving accessibility from the east coast road and from Pondicherry. Nationwide urban renewal programme The Chief Town Planner of India has invited Auroville’s Future to submit a proposal for urban development. The funds are only to be used for the city’s infrastructure. The proposal has recently been submitted.
Figure 45 Location of various environmental damaging activities around Auroville.
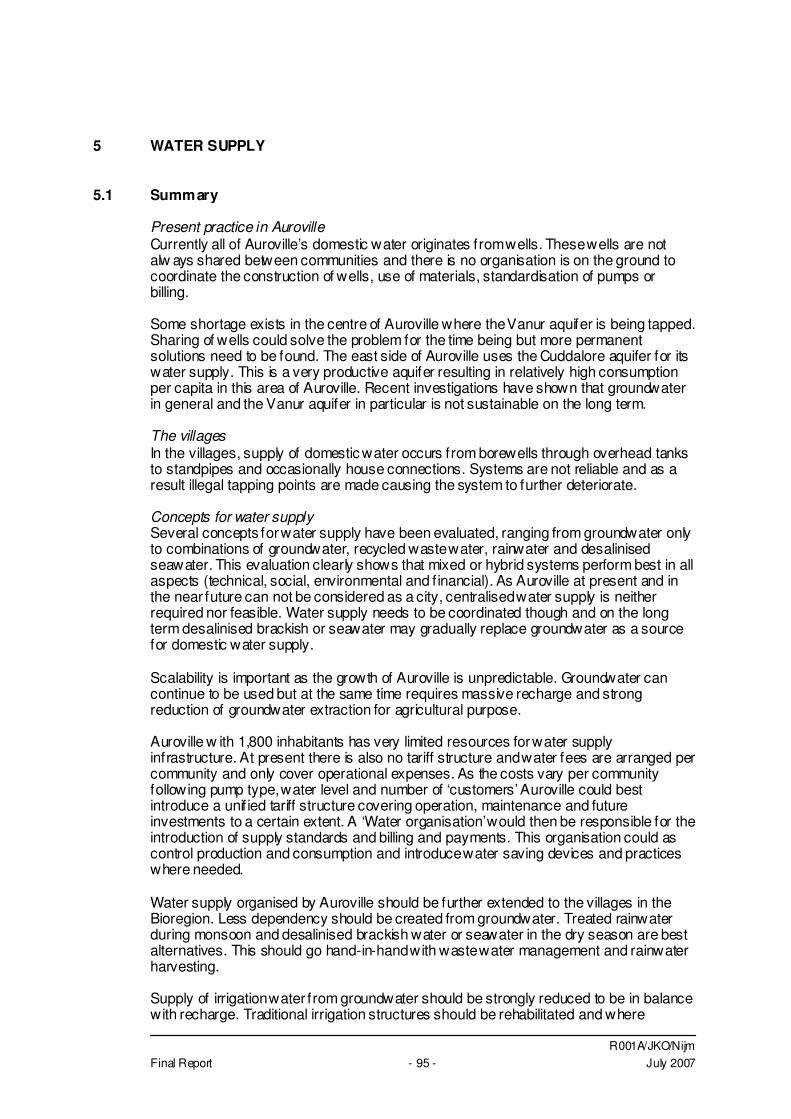
R001A/JKO/Nijm Final Report - 95 - July 2007
5 WATER SUPPLY
5.1 Summary
Present practice in Auroville Currently all of Auroville’s domestic water originates from wells. These wells are not alw ays shared between communities and there is no organisation is on the ground to coordinate the construction of wells, use of materials, standardisation of pumps or billing. Some shortage exists in the centre of Auroville where the Vanur aquifer is being tapped. Sharing of wells could solve the problem for the time being but more permanent solutions need to be found. The east side of Auroville uses the Cuddalore aquifer for its water supply. This is a very productive aquifer resulting in relatively high consumption per capita in this area of Auroville. Recent investigations have shown that groundwater in general and the Vanur aquifer in particular is not sustainable on the long term. The villages In the villages, supply of domestic water occurs from borewells through overhead tanks to standpipes and occasionally house connections. Systems are not reliable and as a result illegal tapping points are made causing the system to further deteriorate. Concepts for water supply Several concepts for water supply have been evaluated, ranging from groundwater only to combinations of groundwater, recycled waste water, rainwater and desalinised seawater. This evaluation clearly shows that mixed or hybrid systems perform best in all aspects (technical, social, environmental and f inancial). As Auroville at present and in the near future can not be considered as a city, centralised water supply is neither required nor feasible. Water supply needs to be coordinated though and on the long term desalinised brackish or seawater may gradually replace groundwater as a source for domestic water supply. Scalability is important as the growth of Auroville is unpredictable. Groundwater can continue to be used but at the same time requires massive recharge and strong reduction of groundwater extraction for agricultural purpose. Auroville w ith 1,800 inhabitants has very limited resources for water supply infrastructure. At present there is also no tariff structure and water fees are arranged per community and only cover operational expenses. As the costs vary per community following pump type, water level and number of ‘customers’ Auroville could best introduce a unif ied tariff structure covering operation, maintenance and future investments to a certain extent. A ‘Water organisation’ would then be responsible for the introduction of supply standards and billing and payments. This organisation could as control production and consumption and introduce water saving devices and practices where needed. Water supply organised by Auroville should be further extended to the villages in the Bioregion. Less dependency should be created from groundwater. Treated rainwater during monsoon and desalinised brackish water or seawater in the dry season are best alternatives. This should go hand-in-hand with waste water management and rainwater harvesting. Supply of irrigation water from groundwater should be strongly reduced to be in balance with recharge. Traditional irrigation structures should be rehabilitated and where
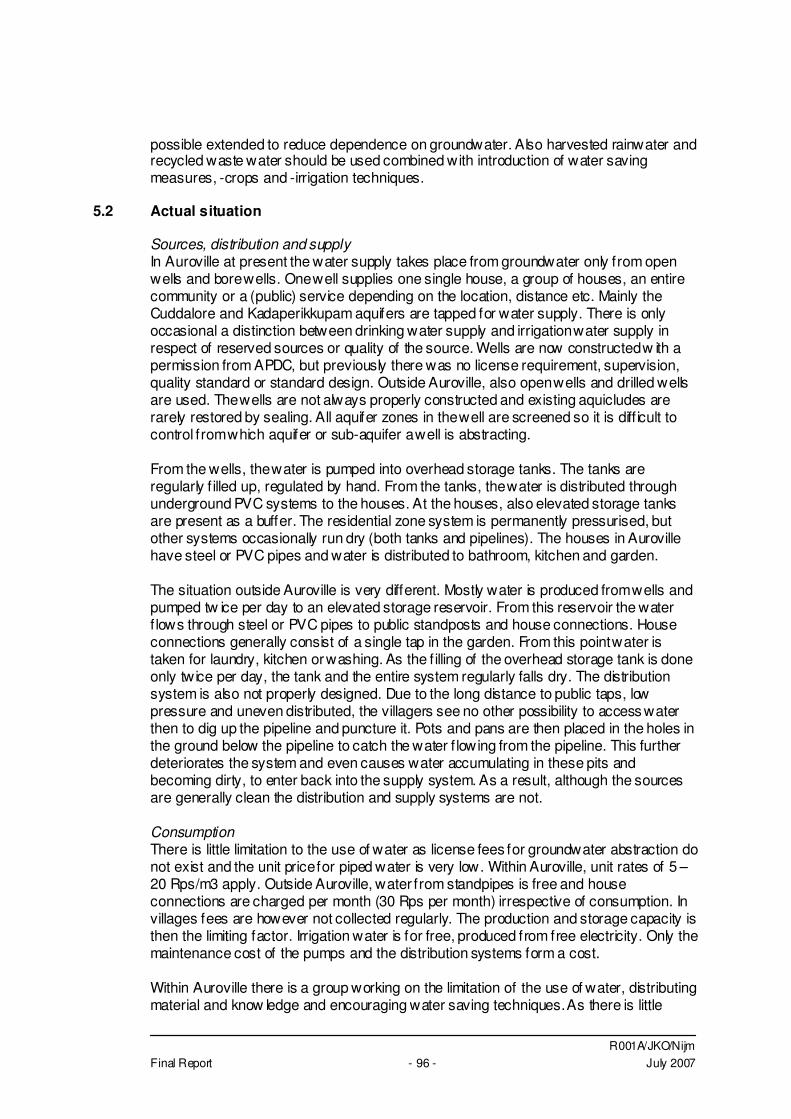
R001A/JKO/Nijm Final Report - 96 - July 2007
possible extended to reduce dependence on groundwater. Also harvested rainwater and recycled waste water should be used combined with introduction of water saving measures, -crops and -irrigation techniques.
5.2 Actual situation
Sources, distribution and supply In Auroville at present the water supply takes place from groundwater only from open wells and bore wells. One well supplies one single house, a group of houses, an entire community or a (public) service depending on the location, distance etc. Mainly the Cuddalore and Kadaperikkupam aquifers are tapped for water supply. There is only occasional a distinction between drinking water supply and irrigation water supply in respect of reserved sources or quality of the source. Wells are now constructed w ith a permission from APDC, but previously there was no license requirement, supervision, quality standard or standard design. Outside Auroville, also open wells and drilled wells are used. The wells are not always properly constructed and existing aquicludes are rarely restored by sealing. All aquifer zones in the well are screened so it is diff icult to control from which aquifer or sub-aquifer a well is abstracting. From the wells, the water is pumped into overhead storage tanks. The tanks are regularly f illed up, regulated by hand. From the tanks, the water is distributed through underground PVC systems to the houses. At the houses, also elevated storage tanks are present as a buffer. The residential zone system is permanently pressurised, but other systems occasionally run dry (both tanks and pipelines). The houses in Auroville have steel or PVC pipes and water is distributed to bathroom, kitchen and garden. The situation outside Auroville is very different. Mostly water is produced from wells and pumped tw ice per day to an elevated storage reservoir. From this reservoir the water f lows through steel or PVC pipes to public standposts and house connections. House connections generally consist of a single tap in the garden. From this point water is taken for laundry, kitchen or washing. As the f illing of the overhead storage tank is done only twice per day, the tank and the entire system regularly falls dry. The distribution system is also not properly designed. Due to the long distance to public taps, low pressure and uneven distributed, the villagers see no other possibility to access water then to dig up the pipeline and puncture it. Pots and pans are then placed in the holes in the ground below the pipeline to catch the water f lowing from the pipeline. This further deteriorates the system and even causes water accumulating in these pits and becoming dirty, to enter back into the supply system. As a result, although the sources are generally clean the distribution and supply systems are not. Consumption There is little limitation to the use of water as license fees for groundwater abstraction do not exist and the unit price for piped water is very low. Within Auroville, unit rates of 5 – 20 Rps/m3 apply. Outside Auroville, water from standpipes is free and house connections are charged per month (30 Rps per month) irrespective of consumption. In villages fees are however not collected regularly. The production and storage capacity is then the limiting factor. Irrigation water is for free, produced from free electricity. Only the maintenance cost of the pumps and the distribution systems form a cost. Within Auroville there is a group working on the limitation of the use of water, distributing material and know ledge and encouraging water saving techniques. As there is little
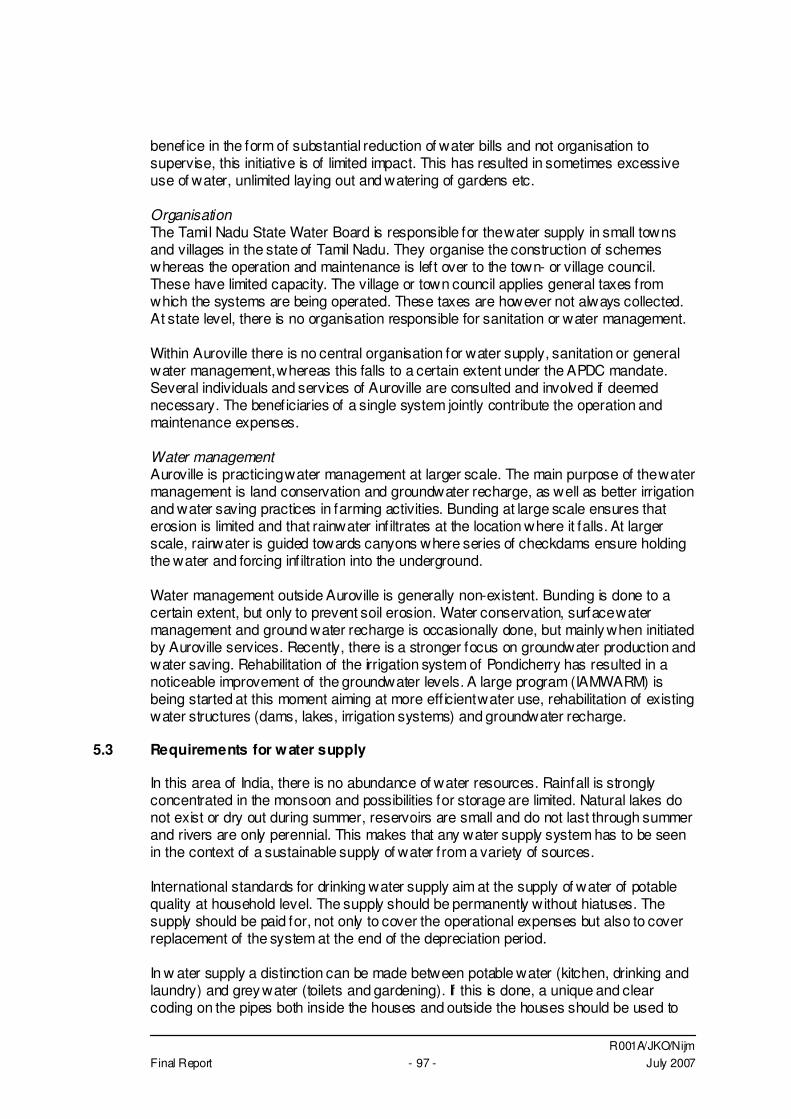
R001A/JKO/Nijm Final Report - 97 - July 2007
benefice in the form of substantial reduction of water bills and not organisation to supervise, this initiative is of limited impact. This has resulted in sometimes excessive use of water, unlimited laying out and watering of gardens etc. Organisation The Tamil Nadu State Water Board is responsible for the water supply in small towns and villages in the state of Tamil Nadu. They organise the construction of schemes whereas the operation and maintenance is left over to the town- or village council. These have limited capacity. The village or town council applies general taxes from which the systems are being operated. These taxes are however not always collected. At state level, there is no organisation responsible for sanitation or water management. Within Auroville there is no central organisation for water supply, sanitation or general water management, whereas this falls to a certain extent under the APDC mandate. Several individuals and services of Auroville are consulted and involved if deemed necessary. The beneficiaries of a single system jointly contribute the operation and maintenance expenses. Water management Auroville is practicing water management at larger scale. The main purpose of the water management is land conservation and groundwater recharge, as well as better irrigation and water saving practices in farming activities. Bunding at large scale ensures that erosion is limited and that rainwater inf iltrates at the location where it falls. At larger scale, rainwater is guided towards canyons where series of checkdams ensure holding the water and forcing infiltration into the underground. Water management outside Auroville is generally non-existent. Bunding is done to a certain extent, but only to prevent soil erosion. Water conservation, surface water management and ground water recharge is occasionally done, but mainly when initiated by Auroville services. Recently, there is a stronger focus on groundwater production and water saving. Rehabilitation of the irrigation system of Pondicherry has resulted in a noticeable improvement of the groundwater levels. A large program (IAMWARM) is being started at this moment aiming at more eff icient water use, rehabilitation of existing water structures (dams, lakes, irrigation systems) and groundwater recharge.
5.3 Requirements for water supply
In this area of India, there is no abundance of water resources. Rainfall is strongly concentrated in the monsoon and possibilities for storage are limited. Natural lakes do not exist or dry out during summer, reservoirs are small and do not last through summer and rivers are only perennial. This makes that any water supply system has to be seen in the context of a sustainable supply of water from a variety of sources. International standards for drinking water supply aim at the supply of water of potable quality at household level. The supply should be permanently without hiatuses. The supply should be paid for, not only to cover the operational expenses but also to cover replacement of the system at the end of the depreciation period. In w ater supply a distinction can be made between potable water (kitchen, drinking and laundry) and grey water (toilets and gardening). If this is done, a unique and clear coding on the pipes both inside the houses and outside the houses should be used to
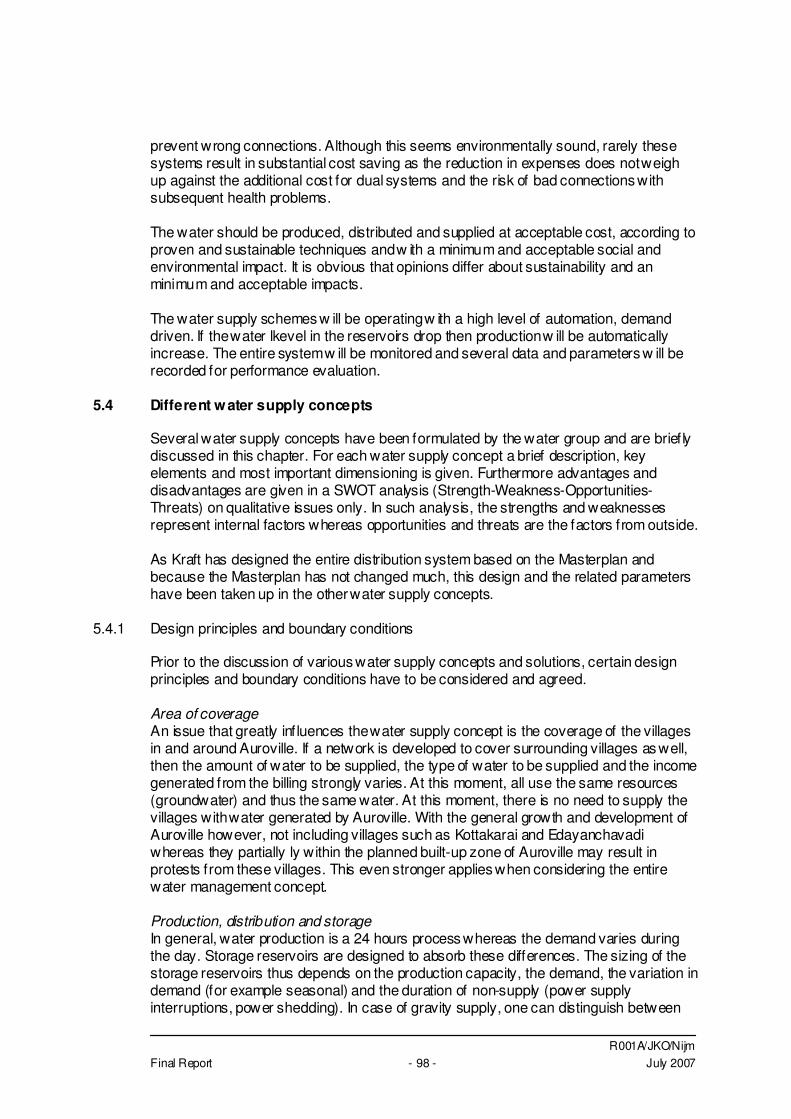
R001A/JKO/Nijm Final Report - 98 - July 2007
prevent wrong connections. Although this seems environmentally sound, rarely these systems result in substantial cost saving as the reduction in expenses does not weigh up against the additional cost for dual systems and the risk of bad connections with subsequent health problems. The water should be produced, distributed and supplied at acceptable cost, according to proven and sustainable techniques and w ith a minimum and acceptable social and environmental impact. It is obvious that opinions differ about sustainability and an minimum and acceptable impacts. The water supply schemes w ill be operating w ith a high level of automation, demand driven. If the water lkevel in the reservoirs drop then production w ill be automatically increase. The entire system w ill be monitored and several data and parameters w ill be recorded for performance evaluation.
5.4 Different water supply concepts
Several water supply concepts have been formulated by the water group and are briefly discussed in this chapter. For each water supply concept a brief description, key elements and most important dimensioning is given. Furthermore advantages and disadvantages are given in a SWOT analysis (Strength-Weakness-Opportunities-Threats) on qualitative issues only. In such analysis, the strengths and weaknesses represent internal factors whereas opportunities and threats are the factors from outside. As Kraft has designed the entire distribution system based on the Masterplan and because the Masterplan has not changed much, this design and the related parameters have been taken up in the other water supply concepts.
5.4.1 Design principles and boundary conditions
Prior to the discussion of various water supply concepts and solutions, certain design principles and boundary conditions have to be considered and agreed. Area of coverage An issue that greatly inf luences the water supply concept is the coverage of the villages in and around Auroville. If a network is developed to cover surrounding villages as well, then the amount of water to be supplied, the type of water to be supplied and the income generated from the billing strongly varies. At this moment, all use the same resources (groundwater) and thus the same water. At this moment, there is no need to supply the villages with water generated by Auroville. With the general growth and development of Auroville however, not including villages such as Kottakarai and Edayanchavadi whereas they partially ly within the planned built-up zone of Auroville may result in protests from these villages. This even stronger applies when considering the entire water management concept. Production, distribution and storage In general, water production is a 24 hours process whereas the demand varies during the day. Storage reservoirs are designed to absorb these differences. The sizing of the storage reservoirs thus depends on the production capacity, the demand, the variation in demand (for example seasonal) and the duration of non-supply (power supply interruptions, power shedding). In case of gravity supply, one can distinguish between
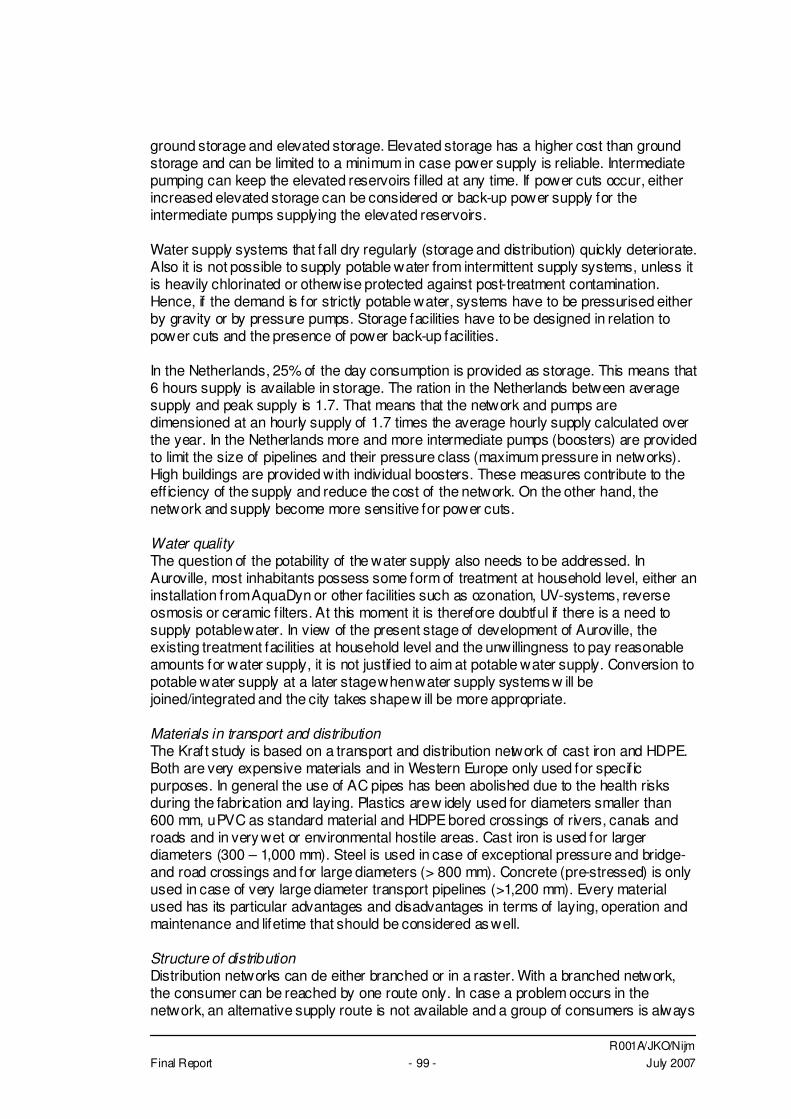
R001A/JKO/Nijm Final Report - 99 - July 2007
ground storage and elevated storage. Elevated storage has a higher cost than ground storage and can be limited to a minimum in case power supply is reliable. Intermediate pumping can keep the elevated reservoirs f illed at any time. If power cuts occur, either increased elevated storage can be considered or back-up power supply for the intermediate pumps supplying the elevated reservoirs. Water supply systems that fall dry regularly (storage and distribution) quickly deteriorate. Also it is not possible to supply potable water from intermittent supply systems, unless it is heavily chlorinated or otherwise protected against post-treatment contamination. Hence, if the demand is for strictly potable water, systems have to be pressurised either by gravity or by pressure pumps. Storage facilities have to be designed in relation to power cuts and the presence of power back-up facilities. In the Netherlands, 25% of the day consumption is provided as storage. This means that 6 hours supply is available in storage. The ration in the Netherlands between average supply and peak supply is 1.7. That means that the network and pumps are dimensioned at an hourly supply of 1.7 times the average hourly supply calculated over the year. In the Netherlands more and more intermediate pumps (boosters) are provided to limit the size of pipelines and their pressure class (maximum pressure in networks). High buildings are provided with individual boosters. These measures contribute to the eff iciency of the supply and reduce the cost of the network. On the other hand, the network and supply become more sensitive for power cuts. Water quality The question of the potability of the water supply also needs to be addressed. In Auroville, most inhabitants possess some form of treatment at household level, either an installation from AquaDyn or other facilities such as ozonation, UV-systems, reverse osmosis or ceramic f ilters. At this moment it is therefore doubtful if there is a need to supply potable water. In view of the present stage of development of Auroville, the existing treatment facilities at household level and the unwillingness to pay reasonable amounts for water supply, it is not justif ied to aim at potable water supply. Conversion to potable water supply at a later stage when water supply systems w ill be joined/integrated and the city takes shape w ill be more appropriate. Materials in transport and distribution The Kraft study is based on a transport and distribution network of cast iron and HDPE. Both are very expensive materials and in Western Europe only used for specif ic purposes. In general the use of AC pipes has been abolished due to the health risks during the fabrication and laying. Plastics are w idely used for diameters smaller than 600 mm, uPVC as standard material and HDPE bored crossings of rivers, canals and roads and in very wet or environmental hostile areas. Cast iron is used for larger diameters (300 – 1,000 mm). Steel is used in case of exceptional pressure and bridge- and road crossings and for large diameters (> 800 mm). Concrete (pre-stressed) is only used in case of very large diameter transport pipelines (>1,200 mm). Every material used has its particular advantages and disadvantages in terms of laying, operation and maintenance and lifetime that should be considered as well. Structure of distribution Distribution networks can de either branched or in a raster. With a branched network, the consumer can be reached by one route only. In case a problem occurs in the network, an alternative supply route is not available and a group of consumers is always
R001A/JKO/Nijm Final Report - 100 - July 2007
cut-off. A raster network allows the supply from different direction but requires more and often dual (2 small instead of one large) pipelines.
5.4.2 Cost aspects
In the context of this pre-feasibility study, there is no room for extensive quantitative cost comparison of various methods of water supply and distribution. A qualitative comparison only has been made, in terms of more and less expensive. This has been used in the multi criteria analysis. During the stage of the feasibility study, these aspects should be worked out and compared to international standards, available budgets for investment and operational expenses and previous proposals. Some aspects of the cost of various types of drinking water and a related budget for Auroville has been presented in Annex F. Investment Investment cost for water supply rapidly increase with heavy infrastructure, whether above, in or underground. Infrastructure expenses increase with centralisation and with erratic sources for which dimensioning provides for the extremes. Reliability of drinking water supply also heavily inf luences the investment cost. Supply systems that have to supply always, under all circumstances and have to be permanently pressurised in the Indian context require power back-up facilities, large storage etc. The quality of the raw water and the required quality of the treated water also influence the investment cost: large and complex treatment facilities require high investment costs. This is partly overcome by using appropriate water sources i.e. use treated waste water and harvested rainwater for gardening, use desalinised water and disinfected groundwater for drinking water purpose only. Operational Operational expenses strongly increase with complex treatment processes and centralisation. Then much energy is required, large amounts of chemical dosing are needed and large quantities eff luent and sludge are produced requiring post treatment. Operational expenses generally decrease w ith decentralised systems. In general the alternatives are more aimed towards reuse of eff luent and composting and reuse of sludge.
5.4.3 Scalability
The development of Auroville is not a natural process. The past years have proven that predictions on the growth of population in Auroville are very diff icult and growth can even be zero or negative. It is also anticipated that growth can be explosive once a critical number of some 5,000 inhabitants is reached. Income for Auroville is equally erratic. Whereas some businesses exist and a steady amount of funds f lows in from contributions and visitors, f inancial resources for Auroville are very limited in terms of operational funds and even more so for investment funds. Investment occasionally can be obtained by external assistance, but this is rarely related to infrastructure and basic facilities. In principle, the operational expenses either directly or though repayment of loans for investments, should cover the necessary investments.
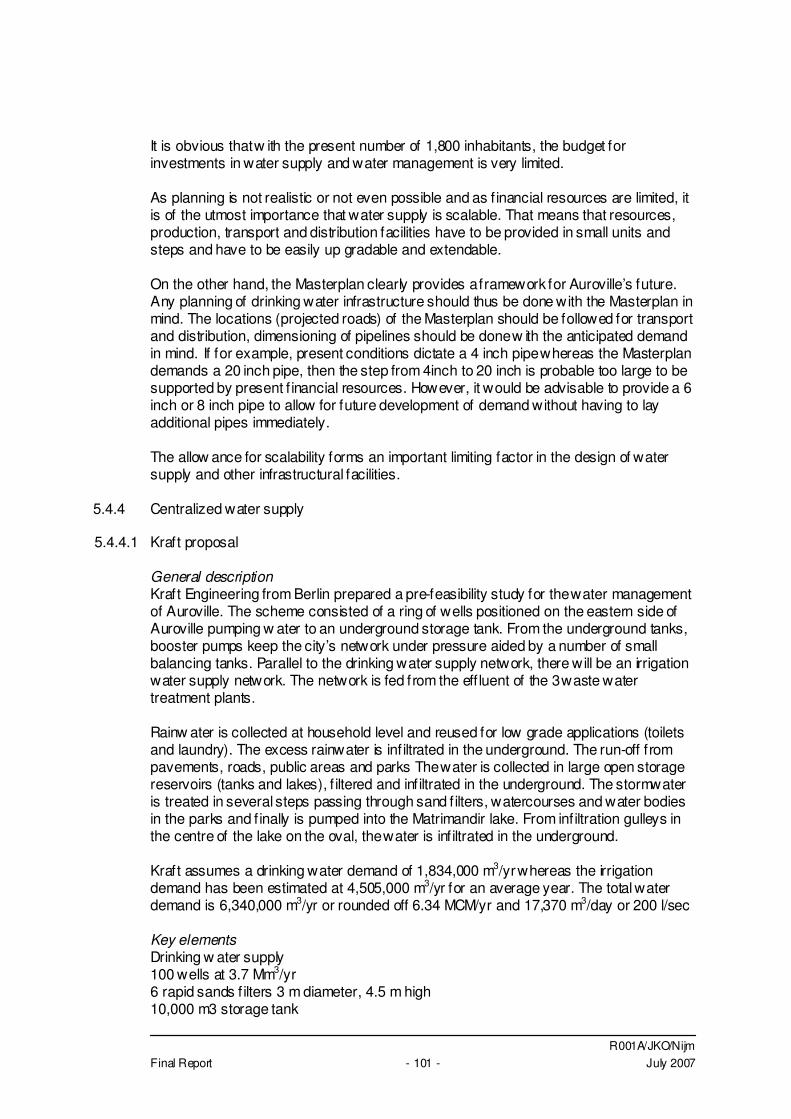
R001A/JKO/Nijm Final Report - 101 - July 2007
It is obvious that w ith the present number of 1,800 inhabitants, the budget for investments in water supply and water management is very limited. As planning is not realistic or not even possible and as f inancial resources are limited, it is of the utmost importance that water supply is scalable. That means that resources, production, transport and distribution facilities have to be provided in small units and steps and have to be easily up gradable and extendable. On the other hand, the Masterplan clearly provides a framework for Auroville’s future. Any planning of drinking water infrastructure should thus be done with the Masterplan in mind. The locations (projected roads) of the Masterplan should be followed for transport and distribution, dimensioning of pipelines should be done w ith the anticipated demand in mind. If for example, present conditions dictate a 4 inch pipe whereas the Masterplan demands a 20 inch pipe, then the step from 4inch to 20 inch is probable too large to be supported by present f inancial resources. However, it would be advisable to provide a 6 inch or 8 inch pipe to allow for future development of demand without having to lay additional pipes immediately. The allow ance for scalability forms an important limiting factor in the design of water supply and other infrastructural facilities.
5.4.4 Centralized water supply
5.4.4.1 Kraft proposal General description Kraft Engineering from Berlin prepared a pre-feasibility study for the water management of Auroville. The scheme consisted of a ring of wells positioned on the eastern side of Auroville pumping w ater to an underground storage tank. From the underground tanks, booster pumps keep the city’s network under pressure aided by a number of small balancing tanks. Parallel to the drinking water supply network, there will be an irrigation water supply network. The network is fed from the eff luent of the 3 waste water treatment plants. Rainw ater is collected at household level and reused for low grade applications (toilets and laundry). The excess rainwater is inf iltrated in the underground. The run-off from pavements, roads, public areas and parks The water is collected in large open storage reservoirs (tanks and lakes), f iltered and infiltrated in the underground. The stormwater is treated in several steps passing through sand f ilters, watercourses and water bodies in the parks and f inally is pumped into the Matrimandir lake. From infiltration gulleys in the centre of the lake on the oval, the water is inf iltrated in the underground. Kraft assumes a drinking water demand of 1,834,000 m3/yr whereas the irrigation demand has been estimated at 4,505,000 m3/yr for an average year. The total water demand is 6,340,000 m3/yr or rounded off 6.34 MCM/yr and 17,370 m3/day or 200 l/sec Key elements Drinking w ater supply 100 wells at 3.7 Mm3/yr 6 rapid sands f ilters 3 m diameter, 4.5 m high 10,000 m3 storage tank
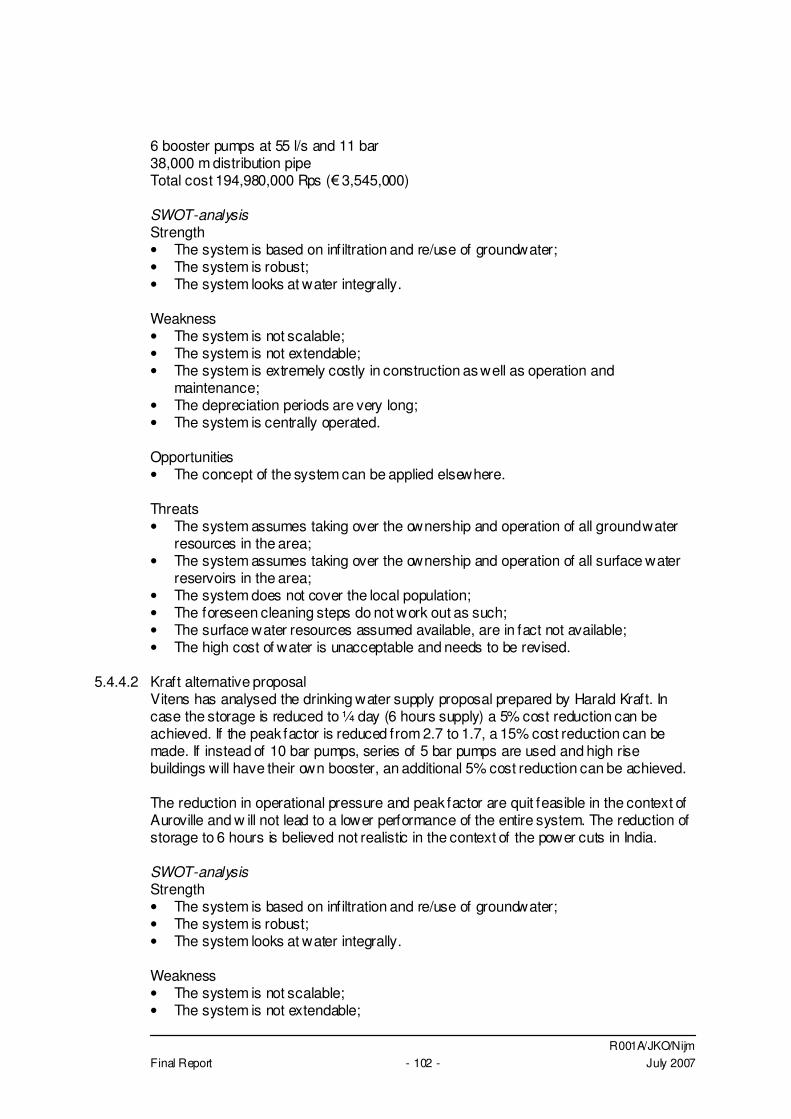
R001A/JKO/Nijm Final Report - 102 - July 2007
6 booster pumps at 55 l/s and 11 bar 38,000 m distribution pipe Total cost 194,980,000 Rps (� 3,545,000) SWOT-analysis Strength • The system is based on infiltration and re/use of groundwater; • The system is robust; • The system looks at water integrally. Weakness • The system is not scalable; • The system is not extendable; • The system is extremely costly in construction as well as operation and
maintenance; • The depreciation periods are very long; • The system is centrally operated. Opportunities • The concept of the system can be applied elsewhere. Threats • The system assumes taking over the ownership and operation of all ground water
resources in the area; • The system assumes taking over the ownership and operation of all surface water
reservoirs in the area; • The system does not cover the local population; • The foreseen cleaning steps do not work out as such; • The surface water resources assumed available, are in fact not available; • The high cost of water is unacceptable and needs to be revised.
5.4.4.2 Kraft alternative proposal Vitens has analysed the drinking water supply proposal prepared by Harald Kraft. In case the storage is reduced to ¼ day (6 hours supply) a 5% cost reduction can be achieved. If the peak factor is reduced from 2.7 to 1.7, a 15% cost reduction can be made. If instead of 10 bar pumps, series of 5 bar pumps are used and high rise buildings will have their own booster, an additional 5% cost reduction can be achieved. The reduction in operational pressure and peak factor are quit feasible in the context of Auroville and w ill not lead to a lower performance of the entire system. The reduction of storage to 6 hours is believed not realistic in the context of the power cuts in India. SWOT-analysis Strength • The system is based on infiltration and re/use of groundwater; • The system is robust; • The system looks at water integrally. Weakness • The system is not scalable; • The system is not extendable;
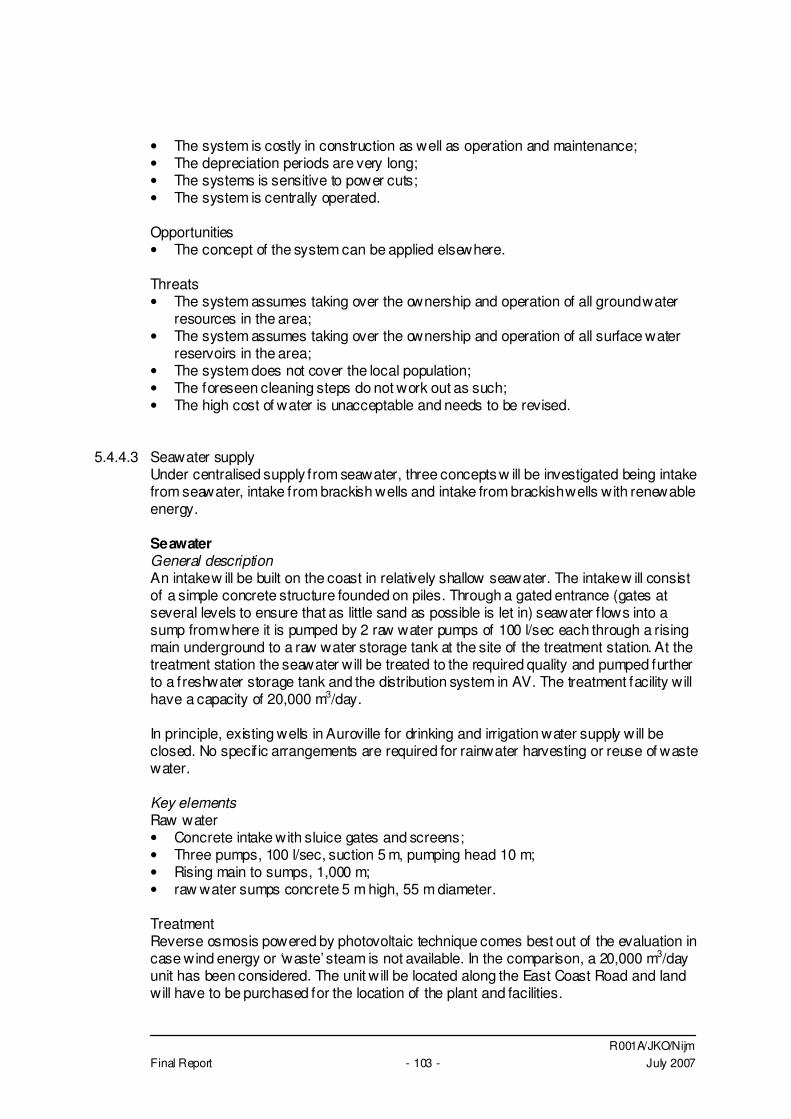
R001A/JKO/Nijm Final Report - 103 - July 2007
• The system is costly in construction as well as operation and maintenance; • The depreciation periods are very long; • The systems is sensitive to power cuts; • The system is centrally operated. Opportunities • The concept of the system can be applied elsewhere. Threats • The system assumes taking over the ownership and operation of all ground water
resources in the area; • The system assumes taking over the ownership and operation of all surface water
reservoirs in the area; • The system does not cover the local population; • The foreseen cleaning steps do not work out as such; • The high cost of water is unacceptable and needs to be revised.
5.4.4.3 Seawater supply Under centralised supply from seawater, three concepts w ill be investigated being intake from seawater, intake from brackish wells and intake from brackish wells with renewable energy. Seawater General description An intake w ill be built on the coast in relatively shallow seawater. The intake w ill consist of a simple concrete structure founded on piles. Through a gated entrance (gates at several levels to ensure that as little sand as possible is let in) seawater f lows into a sump from where it is pumped by 2 raw water pumps of 100 l/sec each through a rising main underground to a raw water storage tank at the site of the treatment station. At the treatment station the seawater will be treated to the required quality and pumped further to a freshwater storage tank and the distribution system in AV. The treatment facility will have a capacity of 20,000 m3/day. In principle, existing wells in Auroville for drinking and irrigation water supply will be closed. No specif ic arrangements are required for rainwater harvesting or reuse of waste water. Key elements Raw water • Concrete intake with sluice gates and screens; • Three pumps, 100 l/sec, suction 5 m, pumping head 10 m; • Rising main to sumps, 1,000 m; • raw water sumps concrete 5 m high, 55 m diameter. Treatment Reverse osmosis powered by photovoltaic technique comes best out of the evaluation in case wind energy or ‘waste’ steam is not available. In the comparison, a 20,000 m3/day unit has been considered. The unit will be located along the East Coast Road and land will have to be purchased for the location of the plant and facilities.
R001A/JKO/Nijm Final Report - 104 - July 2007
To dispose of the eff luent (brine mixed with chemicals), an outfall to sea will have to be constructed, possibly with treatment. Storage and distribution One day storage is assumed suff icient if suff icient generation capacity is available. Generation facility will have to cover the raw water pumps, treatment facility and booster pumps. Storage capacity for fresh water should be 8,750 m3 (5 m high and 47 m diameter). The distribution system does not differ fundamentally from the other. SWOT-analysis Strength • The system is independent from any other source, climate etc.; • The system is scalable as additional RO units can be easily purchased and
connected. Weakness • The system requires much energy to operate; • The system is therefore costly in operation; • Operation and maintenance of desalination plants is relatively complex; • The location of the system is limited to the coast to reduce transportation cost
(pumping); • The process produces eff luent consisting of chemical waste and concentrated brine. Opportunities • The concept of the system can be applied elsewhere. Threats • Desalination occasionally meets much opposition from local population because of
the disposal of eff luent. Similar systems have known to be boycotted elsewhere in India;
• The system is a single source system. If there is a problem w ith that source (an oil spill, legal problems, a break-down) then the entire water supply stops;
• Desalination requires some complex legal procedures, such as building a structure on the coastal area, passing a pipeline over beach area, etc.;
Brackish water General description From w ells in brackish aquifers, water is pumped to a desalination plant, treated and pumped to a clean water storage. Key elements In the project area, certain aquifers like Ramanathapuram, the deeper charnokites and the entire coastal zone are known to have brackish groundwater or are subject to saline intrusion. Shallow wells from the coastal sedimentary aquifer would be the most cost eff icient method to abstract brackish groundwater.
R001A/JKO/Nijm Final Report - 105 - July 2007
Wells will be constructed in the coastal zone. Caution has to be paid to the proper siting of the wells in respect of fresh-salt water interface, available space, location of treatment plant and transport pipelines to Auroville. The treatment plant will be operating according to the reverse osmosis principle. The location will be in the coastal area. An outfall to sea has to be constructed to dispose of the eff luent from the desalination plant. From the desalination plant, the treated water will be disinfected and transported to a clean water storage reservoir. From this reservoir, the water w ill be pumped to the distribution system of Auroville. SWOT-analysis The comparative advantages of this method over pure seawater are the follow ing: Weakness • The system requires much energy but less than seawater osmosis to operate; • The system is therefore costly in operation but less costly than seawater osmosis; • The process produces eff luent consisting of chemical waste and concentrated brine,
but less than with pure seawater. Threats • It is a single source system though to a lesser extent as pure seawater which implies
a certain risk on the downstream (user) end; • The system requires less legal procedures than is the case for seawater osmosis. Brackish water with renewable energy General description From w ells in brackish aquifers, water is pumped to a desalination plant, treated and pumped to a clean water storage. Energy is provided from a renewable source. This may be wind energy and/or solar energy. An entirely different system is desalination based on thermal energy from Key elements SWOT-analysis The comparative advantages of this method over pure seawater and brackish water with renewable energy are the following: Weakness • The system requires much energy but less than seawater osmosis to operate; • The system is therefore costly in operation but less costly than seawater and
brackish water osmosis as the source of energy is renewable; • Although it is less costly on the long term, the investment costs are much higher due
to the investment cost of the renewable energy source; • The process produces eff luent consisting of chemical waste and concentrated brine,
but less than with pure seawater. Threats • It is a single source system though to a lesser extent as pure seawater which implies
a certain risk on the downstream (user) end; • The system requires less legal procedures than is the case for seawater osmosis.
R001A/JKO/Nijm Final Report - 106 - July 2007
5.4.4.4 Use of aquifer at Auromodel General description The aquifer around Auromodel is believed to have a very high capacity and can be used to supply all of Auroville. Hydrogeologically, the southeast of Auroville is on the lower side of the large Cuddalore aquifer that is known to have a very high yield. Safe yields and long term groundwater perspectives are not known and may result from the groundwater studies carried out by the University of Paris. Assuming a yield of 10 l/sec, some 20 wells are required. The wells spacing will depend on the local aquifer characteristics, but will be some 150 m. The wells will pump via a central treatment (chlorination or ozonation) to a treated water storage reservoir at groundlevel from w here booster pumps will distribute the water throughout Auroville. There will be no raw water reservoir as the aquifer itself functions as one. The pumping hours of the wells w ill be demand regulated. Key elements and key dimensioning Source 20 wells up to 30 m depth, drilling diameter 0.3 m, average well spacing 150 m, screen 150 mm, screen length 4 m. Each wells will be equipped with a submersible pump, an automatic sw itch-off when running dry, a 5 inch feeder pipe towards a 20 inch main. Treatment and storage The groundwater will be aerated, treated with lime to reach the proper pH, f iltered, disinfected and pumped into a ground storage tank. As the water is very acid, lime w ill be added to obtain the required pH. Distribution A booster pumps will pump the water into Auroville’s distribution system. SWOT-analysis Strength • Using groundwater does not require a raw water storage; • With 20 wells, the system is not very susceptible to breaking down; • The base quality of the water is very good and requires little treatment; • The system can be extended easily by drilling more wells; • As much groundwater is already being produced, the existing facilities can be used
and further extended. Weakness • The well f ield requires much space for the wells and for the pipelines; • As the entire town is provided from one relatively small area, much costly
infrastructure is required. Opportunities • -- Threats • Salinisation in the coastal area is known to form a threat for the quality of the
aquifer;
R001A/JKO/Nijm Final Report - 107 - July 2007
• The water table is lowering rapidly due to overexploitation. On the long term, there may be too little water to feed the wells;
• It is a single source system although the source consists of several smaller sources (individual wells) which implies a certain risk on the downstream (user) end;
• The pipelines are running along and over land that is not (yet) the property of Auroville and can be easily damaged.
5.4.4.5 Rainw ater harvesting Although the use of the single source of rainwater implies centralisation, the captioning of the rainwater has to occur decentralised. With a centralised treatment however, this system is considered as centralised. Key elements All houses, public buildings, roads and other surfaced areas w ill be provided with rainwater harvesting structures, diverting rainwater to large (sub)surface reservoirs. First f lush devices and sand f ilters w ill have to ensure that the solids and nutrients are as much as possible removed. Still water will quickly contaminate and deteriorate in quality in the storage. The amount of storage is enormous, as are the cost related to this. Surface water storage is cheaper, but evaporation is substantial and much water is lost. Underground storage is very costly, but prevents that water is lost to evaporation. From the centralised storage, the water is conventionally treated (f locculation, f iltration, disinfection) and boostered to several elevated storage reservoirs throughout Auroville. From there the water f lows under gravity to the various users. SWOT-analysis Strength • This system makes direct use of the single real water source that is present; • The centralised storage and treatment is convenient for operation and maintenance. Weakness • In case surface storage is used, much surface is required and substantial amounts
of water are lost to evaporation; • Due to the long transport distances to centralised storage or from storage to
centralised treatment, much costly infrastructure is required; • In case ground storage is used, high costs are involved for the underground storage
of large quantities of water; • As it is of high importance that all water is captured, all related infrastructure has to
be dimensioned for extremes, which is both inconvenient in spatial and town planning and very costly.
Opportunities • Surface storage has a multiple function and can have a decorative character. Threats • In case of surface storage, there is limited control on contamination possible; • Collection of rainfall is sensitive to contaminants from roads, pavements, roofs and
gutters;
R001A/JKO/Nijm Final Report - 108 - July 2007
• It is a single source system entirely depending on a highly erratic water source.
5.4.4.6 Pondicherry waste water combined with own waste water The wastewater from Pondicherry and own waste water will be collected and processed to suff icient (potable) quality. As the own waste water is always less than the water required, always waste water from an external source is required. As discussed already, the type of waste water from Auroville differs considerably from the type of waste water from Pondi, mixing of both types means that the required treatment will be based on the worst quality (from Pondi) thus Treatment of wastewater to potable quality is very rare. The state of Singapore and the city of Windhoek (Namibia) has such a system as the alternatives are not existent. For social reasons, the treated waste water is often infiltrated and then pumped up after a minimal circulation time in the underground of 60 days under anaerobe conditions. When pumped up it is considered as ground water. Key elements A centralised eff luent treatment plant will be built next to the existing Pondicherry waste water treatment plant. As the exact constitution of the eff luent is not known, it is not possible to even conceptualise the treatment process. The treated water is disinfected and pumped into a groundlevel storage tank. SWOT-analysis Strength • This source of water also helps to solve the problems of the treatment of sewage
eff luent. Weakness • Purifying sewage into drinking water is extremely expensive; • Purifying sewage into drinking water is socially rarely accepted; • Purifying sewage into drinking water is culturally rarely accepted; • As the waste water from Pondi is very different from the waste water from Auroville,
treatment of all will have to be designed for the worst of two or separate treatment plants have to be provided which is very costly;
• A treatment plant, treating waste water to drinking quality is complex in operation and maintenance;
• Due to the large transport distances, heavy and costly infrastructure is required. Opportunities • The promotional value and exposure from such revolutionary system is quit
considerable; • In terms of innovative techniques and sustainability it may attract substantial funds
from national and international agencies. Threats • The drinking water from sewage can cause non-acceptance from both Aurovillians
and local population;
R001A/JKO/Nijm Final Report - 109 - July 2007
• The treatment of sewage to acceptable quality eff luent task of the producer (Pondicherry in this case). Taking over this task interferes with the responsibility of Pondicherry to process its own wastewater;
• It is a single source system which implies considerable risk on the downstream (user) end;
• Strong variations and f luctuations in type and concentration of components may not be entire coped with by the treatment process.
5.4.5 Decentralized water supply
5.4.5.1 Groundwater General description The present scattered groundwater abstraction w ill be optimised by sharing production sources w ith more communities by small diameter transport pipelines. There will be no raw water reservoir as the aquifer itself functions as one. The pumping hours of the wells w ill be demand regulated. Key elements and key dimensioning Source Some 20 to 30 wells will be selected, equipment will be standardised 20 wells up to at least 30 m depth, drilling diameter 0.3 m, average well spacing 150 m, screen 150 mm, screen length 4 m. Each wells will be equipped w ith a submersible pump, an automatic switch-off when running dry, a 4 inch feeder pipe towards a 6 inch main. Treatment and storage The groundwater will be aerated, treated with lime to reach the proper pH, f iltered, disinfected and pumped into a ground storage tank. Distribution As much as possible the well pumps will be used in combination with strategically placed reservoirs and booster pumps. SWOT-analysis Strength • Using groundwater does not require a raw water storage; • With 20 to 30 wells, the system is not very susceptible to breaking down; • The base quality of the water is very good and requires little treatment; • The system can be extended easily by drilling more wells; • As much groundwater is already being produced, the existing facilities can be used
and further extended; • Investment costs are very limited. Weakness • The system requires a careful coordination of production and supply; • The system requires sharing of prime resources between different communities. Opportunities • --
R001A/JKO/Nijm Final Report - 110 - July 2007
Threats • Salinisation in the coastal area is known to form a threat for the quality of the
aquifers; • The water table is lowering rapidly due to overexploitation. On the long term, there
may be too little water to feed the wells; • It is a single source system although the source consists of several smaller sources
(individual wells) which implies a certain risk on the downstream (user) end; • The pipelines are running along and over land that is not (yet) the property of
Auroville and can be easily damaged.
5.4.5.2 Rainw ater harvesting Description Although the use of the single source of rainwater implies centralisation, the captioning of the rainwater has to occur decentralised. In the context of decentralised water supply, we will consider also decentralised storage, treatment and distribution. Key elements All houses, public buildings, roads and other surfaced areas w ill be provided with rainwater harvesting structures, diverting rainwater to (sub)surface reservoirs at community level. The rainwater will quickly contaminate when stored. First f lush devices or sand f ilters w ill have to be placed between collection and storage to limit as much as possible the nutrient and solids load of the water. From the storage that is arranged at household or community level, depending on the spread of houses and size of the community, is pumped up and treated through conventional treatment method (f locculation, f iltering, disinfection) before being distributed to the overhead tank and users. SWOT-analysis Strength • This system makes direct use of the single real water source that is present; • The system is less sensitive to contamination due to the short distances between
origin and storage. Weakness • In case surface storage is used, much surface is required and substantial amounts
of water are lost to evaporation; • In case ground storage is used, high costs are involved for the underground storage
of large quantities of water; • As it is of high importance that all water is captured, all related infrastructure has to
be dimensioned for extremes, which occupies a lot of space and is very costly. Opportunities • Surface storage has a multiple function and can have a decorative character. Threats • In case of surface storage, there is limited control on contamination possible;
R001A/JKO/Nijm Final Report - 111 - July 2007
• Collection of rainfall is sensitive to contaminants from roads, pavements, roofs and gutters;
• It is a single source system entirely depending on a highly erratic water source.
5.4.5.3 Ow n waste water Description Waste water from houses in one community or group of communities is collected and processed. As the waste water generated in general is at the most 80% of the water used (required), this system is per definition insuff icient in sources. Key elements Eff luent treatment plants w ill be built in most communities or groups of communities. As the exact constitution of the eff luent is not known, it is not possible to even conceptualise the treatment process. The treated water is disinfected and pumped into a groundlevel storage tank. SWOT-analysis Strength • This source of water also helps to solve the problems of the treatment of sewage
eff luent. Weakness • Per definition, there is no suff icient water as waste water is formed by 80% of the
water used (irrigation water not even considered); • The operation and management of several tens of these treatment plants is
complex; • Purifying sewage into drinking water is extremely expensive; • Purifying sewage into drinking water is socially rarely accepted; • Purifying sewage into drinking water is culturally rarely accepted. Opportunities • The promotional value and exposure from such revolutionary system is quit
considerable; • In terms of innovative techniques and sustainability it may attract substantial funds
from national and international agencies. Threats • The drinking water from sewage will cause non-acceptance from both Aurovillians
and local population; • It is a single source system which implies considerable risk on the downstream
(user) end; • Strong variations and f luctuations in type and concentration of components may not
be entire coped with by the treatment process.
5.4.6 Combination of centralized and decentralized water supply
5.4.6.1 Seawater with groundwater
R001A/JKO/Nijm Final Report - 112 - July 2007
Description The main source will be the groundwater at lower cost supplemented by seawater in case of scarcity or, from strategic point of view, to be independent from the surrounding environment. Key elements The present situation will continue and wells w ill be used for the primary water supply. On short term a desalination plant will be built, most likely brackish water from w ells in the coastal zone. When groundwater provides problems (seasonal quality f luctuation) or in periods of high demand, the desalination unit will be switched on. If desirable and/or in case of problems with the supply of groundwater on the long term, gradually more desalinised water can be used and groundwater production be limited. SWOT-analysis Strength • Using groundwater does not require a raw water storage; • With 20 to 30 wells, the system is not very susceptible to breaking down entirely; • The base quality of the water is very good and requires little treatment; • As much groundwater is already being produced, the existing facilities can be used
and further extended; • The system is a multiple source system; Weakness • The system requires a careful coordination of production and supply; • The system requires sharing of prime resources between different communities; • The system produces substantial chemical eff luent. Opportunities • The system allows for the careful consideration of the development of groundwater
and timely actions by stepping up desalination in case of negative developments; • Desalination is in rapid developingt and further cost reduction in desalination is
expected. Threats • Salinisation in the coastal area is known to form a threat for the quality of the
aquifers; • The water table is lowering rapidly due to overexploitation. On the long term, there
may be too little water to feed the wells; • Auroville has little property in the coastal zone where the wells for brackish water w ill
be situated; • Desalination occasionally meets much opposition from local population because of
the disposal of eff luent. Similar systems have known to be boycotted elsewhere in India;
• Desalination system requires some complex legal procedures, such as building a structure on the coastal area, passing a pipeline over beach area, etc.
5.4.6.2 Seawater with rainwater harvesting
R001A/JKO/Nijm Final Report - 113 - July 2007
Description The main source will be the rainwater at lower cost supplemented by seawater in case of scarcity or, from strategic point of view, to be independent from the surrounding environment. Key elements Rainw ater will be harvested from paved surfaces. All houses, in particular new houses will be equipped with rainwater harvesting facilities. Per community or group of houses, a rainwater collection tank will be constructed. Per mini-system, a small but complete treatment will be constructed based on the traditional components of f locculation, f iltration and disinfection. On short term a desalination plant will be built, most likely brackish water from w ells in the coastal zone. When rainwater is depleted or in case of a poor monsoon or in periods of high demand, the desalination unit will be sw itched on. If desirable gradually more desalinised water can be used and rainwater collection be limited. SWOT-analysis Strength • The system makes mainly use of the only real water source; • The system is a multiple source system; Weakness • In case surface storage is used, much surface is required and substantial amounts
of water are lost to evaporation; • In case ground storage is used, high costs are involved for the underground storage
of large quantities of water; • As it is of high importance that all water is captured, all related infrastructure has to
be dimensioned for extremes, which occupies a lot of space and is very costly; • The system produces substantial chemical eff luent. Opportunities • Desalination is in rapid development and further cost reduction is desalination is
anticipated. Threats • In case of surface storage of rainwater, there is limited control on contamination
possible; • Collection of rainfall is sensitive to contaminants from roads, pavements, roofs and
gutters; • It partly depends on a highly erratic water source; • Auroville has little property in the coastal zone where the wells for brackish water w ill
be situated; • Desalination occasionally meets much opposition from local population because of
the disposal of eff luent. Similar systems have known to be boycotted elsewhere in India;
• Desalination system requires some complex legal procedures, such as building a structure on the coastal area, passing a pipeline over beach area, etc.;.
R001A/JKO/Nijm Final Report - 114 - July 2007
5.4.6.3 Seawater with own waste water
Description Waste water will be the primary source, being quantity wise very constant. Where and when necessary, the waste water will be supplemented by seawater. Key elements In the coastal area a desalination plant w ill be constructed taking water from brackish water wells in the coastal area. At community level or per group of houses, a waste water treatment plant will be constructed treating collected waste water to drinking water quality. SWOT-analysis Strength • The system is a multiple source system. Weakness • Both sewage treatment and desalination produce considerable amounts of eff luent; • With decentralised waste water treatment, the operation and management of several
of these plants is complex; • The operation of a desalination plant is complex. Opportunities • Desalination is in rapid development and further cost reduction ins desalination is
expected; • Treatment of waste water to drinking water quality w ill receive much positive
attention and possibly funding. Threats • The drinking water from sewage will cause non-acceptance from both Aurovillians
and local population; • Variations and f luctuations in type and concentration of components may not be
entire coped w ith by the treatment process. • Auroville has little property in the coastal zone where the wells for brackish water w ill
be situated; • Desalination occasionally meets much opposition from local population because of
the disposal of eff luent. Similar systems have known to be boycotted elsewhere in India;
• Desalination system requires some complex legal procedures, such as building a structure on the coastal area, passing a pipeline over beach area, etc.;.
5.4.6.4 Auromodel aquifer w ith groundwater General description The present scattered groundwater abstraction w ill be optimised by sharing production sources w ith more communities by small diameter transport pipelines supplemented with groundwater from Auromodel area.
R001A/JKO/Nijm Final Report - 115 - July 2007
There will be no raw water reservoir as the aquifer itself functions as one. The pumping hours of the wells w ill be demand regulated. Key elements and key dimensioning Source Some 20 to 30 wells will be selected, equipment will be standardised 20 wells up to 30 m depth, drilling diameter 0.3 m, average well spacing 150 m, screen 150 mm, screen length 4 m. Each wells will be equipped with a submersible pump, an automatic switch-off when running dry, a 4 inch feeder pipe towards a 6 inch main. Treatment and storage The groundwater will be aerated, treated with lime to reach the proper pH, f iltered, disinfected and pumped into a ground storage tank. Distribution As much as possible the well pumps will be used in combination with strategically placed reservoirs and booster pumps. SWOT-analysis Strength • Using groundwater does not require a raw water storage; • With 20 to 30 wells, the system is not very susceptible to breaking down; • The base quality of the water is very good and requires little treatment; • The system can be extended easily by drilling more wells; • As much groundwater is already being produced, the existing facilities can be used
and further extended; • The Auromodel aquifer as supplementary source is known to be highly productive; • Investment costs are very limited. Weakness • The system requires a careful coordination of production and supply; • The system requires sharing of prime resources between different communities. Opportunities • -- Threats • Salinisation in the coastal area is known to form a threat for the quality of the
aquifers; • The water table is lowering rapidly due to overexploitation. On the long term, there
may be too little water to feed the wells; • It is a single source system although the source consists of several smaller sources
(individual wells) which implies a certain risk on the downstream (user) end; • The pipelines are running along and over land that is not (yet) the property of
Auroville and can be easily damaged.
5.4.6.5 Auromodel aquifer w ith rainwater harvesting General description
R001A/JKO/Nijm Final Report - 116 - July 2007
Rainw ater will be used when available, supplemented with groundwater from the Auromodel aquifer. Key elements and key dimensioning Source Some 10 to 20 wells will be drilled, equipment will be standardised 20 wells up to 30 m depth, drilling diameter 0.3 m, average well spacing 150 m, screen 150 mm, screen length 4 m. Each wells will be equipped with a submersible pump, an automatic switch-off when running dry, a 4 inch feeder pipe towards a 6 inch main. Rainw ater will be harvested from paved surfaces. All houses, in particular new houses will be equipped with rainwater harvesting facilities. Per community or group of houses, a rainwater collection tank will be constructed. Per mini system, a small but complete treatment will be constructed based on the traditional components of f locculation, f iltration and disinfection. Treatment and storage The groundwater will be aerated, treated with lime to reach the proper pH, f iltered, disinfected and pumped into a ground storage tank. The rainwater will be treated to drinking water quality using traditional treatment techniques, such as f locculation, f iltration and disinfection. Distribution As much as possible the well pumps will be used in combination with strategically placed reservoirs and booster pumps. SWOT-analysis Strength • The system makes partly use of the only real water source; • Using groundwater does not require a raw water storage; • With 10 to 20 wells, the system is not very susceptible to breaking down; • The base quality of the water is very good and requires little treatment; • The system can be extended easily by drilling more wells; • As much groundwater is already being produced, the existing facilities can be used
and further extended; • The Auromodel aquifer as supplementary source is known to be highly productive; • Investment costs are very limited; • It is a dual source system. Weakness • The system partly depends on erratic sources The system requires a careful
coordination of production and supply; • The system requires sharing of prime resources between different communities. Opportunities • -- Threats • Salinisation in the coastal area is known to form a threat for the quality of the
aquifers;
R001A/JKO/Nijm Final Report - 117 - July 2007
• The water table is lowering rapidly due to overexploitation. On the long term, there may be too little water to feed the wells.
5.4.6.6 Auromodel aquifer w ith own waste water General description At community level or per group of houses, a waste water treatment plant will be constructed treating collected waste water to drinking water quality. This constant source will be supplemented with groundwater from the highly productive Auromodel aquifer. Key elements and key dimensioning Source Some 10 to 20 wells will be selected, equipment will be standardised 20 wells up to 30 m depth, drilling diameter 0.3 m, average well spacing 150 m, screen 150 mm, screen length 4 m. Each wells will be equipped with a submersible pump, an automatic switch-off when running dry, a 4 inch feeder pipe towards a 6 inch main. Houses w ill be connected to a treatment facility at community level or per group of houses. Treatment and storage The groundwater will be aerated, treated with lime to reach the proper pH, f iltered, disinfected and pumped into a ground storage tank. The waste water will be treated to drinking water quality. Distribution As much as possible the well pumps will be used in combination with strategically placed reservoirs and booster pumps. SWOT-analysis Strength • Using groundwater and waste water does not require a raw water storage; • With 10 to 20 wells, the system is not very susceptible to breaking down; • The groundwater quality is very good and requires little treatment; • The system can be extended easily by drilling more wells; • As much groundwater is already being produced, the existing facilities can be used
and further extended; • The Auromodel aquifer as supplementary source is known to be highly productive; • Investment costs are very limited; • It is a dual source system. Weakness • The system requires sharing of prime resources between different communities; • A large number of small waste water treatment plants are complex in operation and
maintenance; • Treatment of waste water to drinking water quality is socially not always accepted. Opportunities • Treatment of waste water to drinking water quality w ill receive much positive
attention and possibly funding. Threats
R001A/JKO/Nijm Final Report - 118 - July 2007
• Salinisation in the coastal area is known to form a threat for the quality of the aquifers;
• The water table is lowering rapidly due to overexploitation. On the long term, there may be too little water to feed the wells;
• The drinking water from sewage will cause non-acceptance from both Aurovillians and local population;
• Variations and f luctuations in type and concentration of components may not be entire coped w ith by the treatment process.
5.4.6.7 Pondicherry waste water w ith groundwater General description The wastewater from Pondicherry w ill be collected and processed to suff icient (potable) quality. Current supply from groundwater w ill be continued and supplemented with the treated waste water. Treatment of wastewater to potable quality is very rare. The city of Windhoek (Namibia) has such a system as the alternatives are not existent. For social reasons, the waste water is often infiltrated and then pumped up after a minimal residence time in the underground of 60 days under anaerobe conditions. When pumped up it is considered as ground water. The present scattered groundwater abstraction w ill be optimised by sharing production sources w ith more communities by small diameter transport pipelines supplemented with groundwater from Auromodel area Key elements A centralised eff luent treatment plant will be built next to the existing Pondicherry waste water treatment plant. As the exact constitution of the eff luent is not known, it is not possible to even conceptualise the treatment process. Some 20 to 30 wells will be selected, equipment will be standardised, wells upto 30 m depth, drilling diameter 0.3 m, average well spacing 150 m, screen 150 mm, screen length 4 m. Each wells will be equipped with a submersible pump, an automatic switch-off when running dry, a 4 inch feeder pipe towards a 6 inch main. SWOT-analysis Strength • This source of water also helps to solve the problems of the treatment of sewage
eff luent; • The continuation of groundwater requires minimal investment; • It is a dual source system. Weakness • Purifying sewage into drinking water is extremely expensive; • Purifying sewage into drinking water is socially rarely accepted; • Purifying sewage into drinking water is culturally rarely accepted; • As the waste water from Pondi is very different from the waste water from Auroville,
treatment of all will have to be designed for the worst of two or separate treatment plants have to be provided which is very costly;
R001A/JKO/Nijm Final Report - 119 - July 2007
• A treatment plant, treating waste water to drinking quality is complex in operation and maintenance;
• Due to the large transport distances, heavy and costly infrastructure is required. Opportunities • The promotional value and exposure from such revolutionary system is quit
considerable; • In terms of innovative techniques and sustainability it may attract substantial funds
from national and international agencies. Threats • The drinking water from sewage will cause non-acceptance from both Aurovillians
and local population; • The treatment of sewage to acceptable quality eff luent task of the producer
(Pondicherry in this case). Taking over this task interferes with the responsibility of Pondicherry to clean up its own mess;
• Strong variations and f luctuations in type and concentration of components may not be entire coped with by the treatment process;
• Salinisation in the coastal area is known to form a threat for the quality of the aquifers;
• The water table is lowering rapidly due to overexploitation. On the long term, there may be too little water to feed the wells.
5.4.6.8 Pondicherry waste water w ith rainwater harvesting General description The wastewater from Pondicherry w ill be collected and processed to suff icient (potable) quality. Current supply from groundwater w ill be continued and supplemented with the treated waste water. Rainw ater will be harvested from paved surfaces. All houses, in particular new houses will be equipped with rainwater harvesting facilities. Per community or group of houses, a rainwater collection tank will be constructed. Per mini system, a small but complete treatment will be constructed based on the traditional components of f locculation, f iltration and disinfection. Key elements A centralised eff luent treatment plant will be built next to the existing Pondicherry waste water treatment plant. As the exact constitution of the eff luent is not known, it is not possible to even conceptualise the treatment process. The rainwater will be treated to drinking water quality using traditional treatment techniques, such as f locculation, f iltration and disinfection. SWOT-analysis Strength • This source of water also helps to solve the problems of the treatment of sewage
eff luent; • The system makes partly use of the only real water source.
R001A/JKO/Nijm Final Report - 120 - July 2007
Weakness • Purifying sewage into drinking water is extremely expensive; • Purifying sewage into drinking water is socially rarely accepted; • Purifying sewage into drinking water is culturally rarely accepted; • As the waste water from Pondi is very different from the waste water from Auroville,
treatment of all will have to be designed for the worst of two or separate treatment plants have to be provided which is very costly;
• A treatment plant, treating waste water to drinking quality is complex in operation and maintenance;
• Due to the large transport distances, heavy and costly infrastructure is required; • Sources partly consist of very irregular rainwater; • Waste water treatment can not simply be stopped in case of excessive rainfall. Opportunities • The promotional value and exposure from such revolutionary system is quit
considerable; • In terms of innovative techniques and sustainability it may attract substantial funds
from national and international agencies. Threats • The drinking water from sewage will cause non-acceptance from both Aurovillians
and local population; • The treatment of sewage to acceptable quality eff luent task of the producer
(Pondicherry in this case). Taking over this task interferes with the responsibility of Pondicherry to clean up its own mess;
• Strong variations and f luctuations in type and concentration of components may not be entire coped with by the treatment process.
5.4.6.9 Others Many more possibilities of water supply exist, combining several sources. For the sake of completeness of the evaluation, a system combining all available sources will be briefly discussed here. The sources will however only be used for an appropriate purpose. General description Rainw ater and waste water will be a source for non-drinking water (e.g. irrigation and gardening). The rainwater and waste water will be collected and treated in a decentralised way per community of house. Surplus of rainwater and waste water will be infiltrated to balance the use of groundwater. Groundwater w ill be used a prime drinking water source, supplemented by seawater in case of scarcity. Key elements Existing water supply from groundwater w ill be maintained, but will be limited to domestic water supply. Houses and communities will be provided w ith rainwater harvesting and waste water treatment facilities aiming at the provision of drinking water. Decentralisation will be used and applied when and where necessary and centralisation will be applied when needed and beneficiary.
R001A/JKO/Nijm Final Report - 121 - July 2007
SWOT-analysis Strength • The system makes maximum use of existing and renewable sources; • It provides solutions for waste water; • Sources can be used as and when available (seasonal). Weakness None Opportunities • The promotional value and exposure from such revolutionary system is quit
considerable; • In terms of innovative techniques and sustainability it may attract substantial funds
from national and international agencies. Threats • The treatment of sewage to acceptable quality eff luent is the task of the producer
(Pondicherry in this case). Taking over this task interferes with the responsibility of the producer;
• Strong variations and f luctuations in type and concentration of components may not be entire coped with by the treatment process.
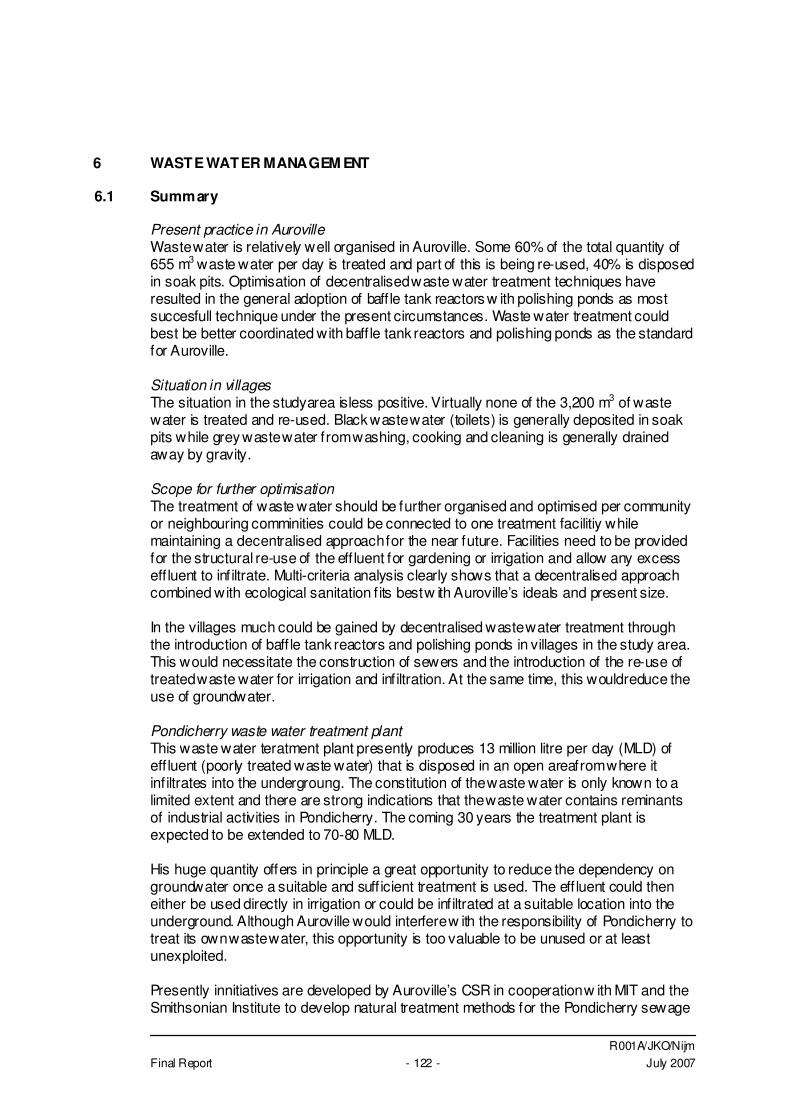
R001A/JKO/Nijm Final Report - 122 - July 2007
6 WASTE WATER MANAGEM ENT
6.1 Summary
Present practice in Auroville Waste water is relatively well organised in Auroville. Some 60% of the total quantity of 655 m3 waste water per day is treated and part of this is being re-used, 40% is disposed in soak pits. Optimisation of decentralised waste water treatment techniques have resulted in the general adoption of baff le tank reactors w ith polishing ponds as most succesfull technique under the present circumstances. Waste water treatment could best be better coordinated with baff le tank reactors and polishing ponds as the standard for Auroville. Situation in villages The situation in the studyarea isless positive. Virtually none of the 3,200 m3 of waste water is treated and re-used. Black waste water (toilets) is generally deposited in soak pits while grey waste water from washing, cooking and cleaning is generally drained away by gravity. Scope for further optimisation The treatment of waste water should be further organised and optimised per community or neighbouring comminities could be connected to one treatment facilitiy while maintaining a decentralised approach for the near future. Facilities need to be provided for the structural re-use of the eff luent for gardening or irrigation and allow any excess eff luent to inf iltrate. Multi-criteria analysis clearly shows that a decentralised approach combined with ecological sanitation f its best w ith Auroville’s ideals and present size. In the villages much could be gained by decentralised waste water treatment through the introduction of baff le tank reactors and polishing ponds in villages in the study area. This would necessitate the construction of sewers and the introduction of the re-use of treated waste water for irrigation and infiltration. At the same time, this wouldreduce the use of groundwater. Pondicherry waste water treatment plant This waste water teratment plant presently produces 13 million litre per day (MLD) of eff luent (poorly treated waste water) that is disposed in an open areafrom where it inf iltrates into the undergroung. The constitution of the waste water is only known to a limited extent and there are strong indications that the waste water contains reminants of industrial activities in Pondicherry. The coming 30 years the treatment plant is expected to be extended to 70-80 MLD. His huge quantity offers in principle a great opportunity to reduce the dependency on groundwater once a suitable and suff icient treatment is used. The eff luent could then either be used directly in irrigation or could be infiltrated at a suitable location into the underground. Although Auroville would interfere w ith the responsibility of Pondicherry to treat its own waste water, this opportunity is too valuable to be unused or at least unexploited. Presently innitiatives are developed by Auroville’s CSR in cooperation w ith MIT and the Smithsonian Institute to develop natural treatment methods for the Pondicherry sewage
R001A/JKO/Nijm Final Report - 123 - July 2007
by using algae. These algae could be used to produce fertiliser or generate bio-energy which could in principle provide the treatment plant w ith the required energy.
6.2 Introduction
As the f irst sewage collection and treatment was practiced in cities, the traditional sewage treatment system is a centralised system whereby the sewage is collected in open or closed sewers, transported over relatively long distances, treated at one location and then disposed in the nearest surface water body or via a outfall into the sea. It was only recently that decentralized systems have been developed. In developed countries, these systems where mainly developed to replace sceptic tanks in remote areas. In developing countries, the decentralized systems were mainly introduced to cope w ith the dispersed population and the limited budgets available for sewage collection and treatment.
6.3 Centralised versus decentralised treatment
Optimal scale for wastewater systems is not a technical issue, but a matter of community needs and resources. Wastewater can be treated to any existing regulatory standard, indeed to drinking water quality, at a scale ranging from treatment plants that process the waste of individual homes to ones that serve millions of people. The conventional w isdom in the lay population and among many professionals in the wastewater f ield is that centralising treatment is the best wastewater management strategy for most communities. This common view, however, is not universally accepted anymore. In a 1997 report to Congress, the U.S. EPA found that adequately managed decentralised systems are a cost-effective and long-term solution for many communities (U.S. Environmental Protection Agency 1997). Sanitation experts who serve developing countries do not universally accept that conventional, centralized wastewater treatment is the standard toward which developing countries should aim. Comparing centralised and decentralised systems, the follow ing considerations have to be made: • �Centralised systems are relatively expensive for many small communities. A
conventional wastewater treatment facility (not counting sewers) can cost a community of less than 1,000 people $15,000 to $20,000 per connection, compared to $6,000 per connection for a community of 10,000 or more people (English et al. 1999).
• �Centralised treatment can only to a very limited extent be phased. Therefore estimates of future urban and population development have to be made and estimates can be wrong resulting in a signif icant f inancial burden for a small population;
• �Centralised treatment requires sewer systems that can dramatically impact the hydrology of watersheds due to leakage that can work either way: inf iltration of ground water into sewers is a substantial problem all over the world as well is leakage from sewers. In the f irst case, the sewers start transporting groundwater that later is being treated. In the latter, the system looses sewage that can contaminate (ground)water resources;
R001A/JKO/Nijm Final Report - 124 - July 2007
• When the sewage is collected in sewer systems, it is not always possible to separate the industrial waste water. Nutrients from domestic sources (N, P, K and S) are lost and sludge may contain trace elements (f.e. heavy metals) that make it not useful for fertilizer;
• When the sewage is collected in sewer systems, often rainwater and stormw ater is mixed in, causing ineff iciency of the treatment process and variations in eff luent quality beyond acceptable limits for eff luent disposal;
• �Centralised systems are maintenance intensive and require careful f inancial planning of maintenance funds. There is a tendency of underestimating these expenses and only attending to problems once they are substantial and require considerable and often external funding.
In view of present practices in Auroville and near future developments, most focus will be on decentralised systems, while in the far future and for particular zones, centralised systems can be considered.
6.4 Sustainability in waste water treatment
Based on experience from past mistakes in sewage treatment technology, the definition of what is sustainable is clearer. Developers should base the selection of technology upon specif ic site conditions and f inancial resources of individual communities. Although site-specif ic properties must be taken into account, there are core parts of sustainable treatment that should be met in each case. The criteria for sustainable technology are summarized in Table 19. Table 19Criteria for sustainability in the treatment of wastewater (v an Lier, 1998) 1) No dilution of high strength wastes w ith clean water. 2) Maximum of recovery and re-use of treated water and by-products obtained from the pollution substances. (i.e. irrigation, fertilisation) 3) Application of eff icient, robust and reliable treatment/conversion technologies, which are low cost (in construction, operation, and maintenance), which have a long life-time and are plain in operation and maintenance.
4) Applicable at any scale, very small and very big as well. 5) Leading to a high self-suff iciency in all respects. 6) Acceptable for the local population. One approach to sustainability is through decentralisation of the wastewater management system. This system consists of several smaller units serving individual houses, clusters of houses or small communities. Black and gray water can be treated or reused separately from the hygienically, more dangerous excreta. Non-centralised systems are more f lexible and can adapt easily to the local conditions of the urban area as well as grow w ith the community as its population increases (Schertenlieb, 2000). This approach leads to treatment and reuse of water, nutrients, and by-products of the technology (i.e. energy, sludge, and mineralised nutrients) in the direct location of the settlement. Communities must take great care when reusing wastewater, both chemical substances and biological pathogens threaten public health as well as accumulate in the food chain when used to irrigate crops or in aquaculture. In most cases, industrial pollution poses
R001A/JKO/Nijm Final Report - 125 - July 2007
greater risk to public health than pathogenic organisms. Therefore, more emphasis is being placed on the need to separate domestic and industrial waste and to treat them individually to make recovery and reuse more sustainable. The system must be able to isolate industrial toxins, pathogens, carbon, and nutrients (Rose, 1999).
6.5 Decentralised wastewater treatment
6.5.1 Introduction of decentralised wastewater treatment
Decentralised wastewater management may be defined as the collection, treatment, and disposal/reuse of wastewater from individual homes, clusters of homes, isolated communities, industries, or institutional facilities, as well as from portions of existing communities at or near the point of waste generation (Tchobanoglous 1995). Decentralised systems include onsite systems that treat wastewater from individual homes or buildings, and cluster systems that treat wastewater from groups of two or more homes. Typically cluster systems serve less than a hundred homes, but they can serve more. The “line” between decentralized and centralized systems becomes vague when some cluster systems are considered, see also Figure 46. Wastewater professionals make the distinction in several ways: • Volume. Decentralized systems treat relatively small volumes of water: up to
1000m3/d (8,000 to 10,000 equivalent people) is the considered the maximum for one single DEWATS system. The largest existing DEWATS in India is sized to treat 500m3/d.
• Sewer type. Cluster systems typically use small-diameter pressurized pipes, small-diameter gravity, and vacuum sewers, often employing on-lot settling tanks and/or grinder pumps before wastewater f lows from a lot into the sewer system. One must note that the sewer cost represent often 50% and more of the total sewage system investment. This is of considerable importance for investment but also for installation and maintenance.
• Treatment type. Cluster systems typically use sand f ilters, trickling f ilters, anaerobic f ilter, baff led reactor etc as treatment type. A large part of such technology is well mastered in Auroville.
• Discharge method. Cluster systems typically discharge treated wastewater for recycling, helping then tremendously to reduce freshwater consumption for greenery and other secondary requirements, or for inf iltration into soil, those helping to reduce the pressure on groundwater resources.
• Ownership. Cluster systems are usually owned by a developer, homeowners’ association, or other private entity. In the context of Auroville where no private ownership prevail, this will refer to operation and maintenance, for which the authority and to a large extend the practical aspects of the work can lay with the connected population.
• Relative scale. Cluster systems serve only a portion of a community.
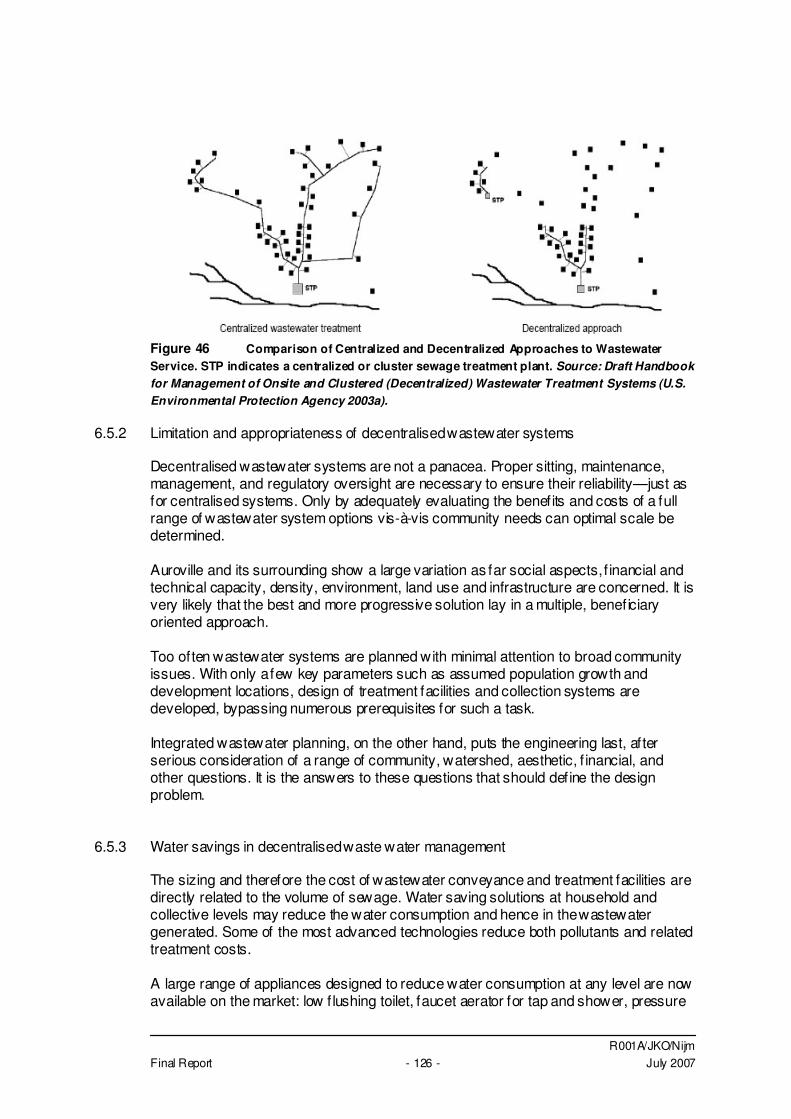
R001A/JKO/Nijm Final Report - 126 - July 2007
Figure 46 Comparison of Centralized and Decentralized Approaches to Wastewater Service. STP indicates a centralized or cluster sewage treatment plant. Source: Draft Handbook for Management of Onsite and Clustered (Decentralized) Wastewater Treatment Systems (U.S. Environmental Protection Agency 2003a).
6.5.2 Limitation and appropriateness of decentralised wastewater systems
Decentralised wastewater systems are not a panacea. Proper sitting, maintenance, management, and regulatory oversight are necessary to ensure their reliability—just as for centralised systems. Only by adequately evaluating the benefits and costs of a full range of wastewater system options vis-à-vis community needs can optimal scale be determined. Auroville and its surrounding show a large variation as far social aspects, f inancial and technical capacity, density, environment, land use and infrastructure are concerned. It is very likely that the best and more progressive solution lay in a multiple, beneficiary oriented approach. Too often wastewater systems are planned with minimal attention to broad community issues. With only a few key parameters such as assumed population growth and development locations, design of treatment facilities and collection systems are developed, bypassing numerous prerequisites for such a task. Integrated wastewater planning, on the other hand, puts the engineering last, after serious consideration of a range of community, watershed, aesthetic, f inancial, and other questions. It is the answers to these questions that should define the design problem.
6.5.3 Water savings in decentralised waste water management
The sizing and therefore the cost of wastewater conveyance and treatment facilities are directly related to the volume of sewage. Water saving solutions at household and collective levels may reduce the water consumption and hence in the wastewater generated. Some of the most advanced technologies reduce both pollutants and related treatment costs. A large range of appliances designed to reduce water consumption at any level are now available on the market: low f lushing toilet, faucet aerator for tap and shower, pressure
R001A/JKO/Nijm Final Report - 127 - July 2007
regulators, water eff icient cloth and dish washers etc. New washing machines are now able to do a perfect job w ith as little than 50 liters of water per 5kg wash. The reduction can be as important as 50% for domestic water consumption and therefore for the wastewater generated. Collective facilities like laundry, canteen, kitchen etc are known for a much better water eff iciency than domestic family likes facilities, providing they are properly designed and equipped. With standard equipment, the water consumption for similar activities (cooking, dish washing etc) may be halved if to compare to household pattern. By combining regulations and guidelines on water saving appliances in each and every buildings, promotion of collective facilities and usage of innovative technologies, a very important saving can be generated on wastewater infrastructure, maintenance, space requirement, but also on power consumption and potential arm to the environment.
6.5.4 Best practices in decentralised waste water treatment
DEWATS For the last 25 years and with grow ing intensity, Auroville has been deeply engaged in research and development and then dissemination of innovative natural decentralized wastewater management and promotion of appropriate sanitation solutions. Auroville became the place of Asia where the largest and most diversif ied systems and techniques related to this f ield can be found. The set of selected solutions was then approved by Central Pollution Control Board. While other Auroville groups and individuals are also involved in such techniques, the leading for the development and promotion of sustainable technical solutions, the Centre for Scientif ic Researches CSR, started then to be engaged in training process, consultancy work all over India and advocacy towards government authorities. The set of technology selected by CSR and its partners to address decentralised wastewater management, grouped under the label DEWATS, go much further than decentralized conditions as such as they: • make use of natural process only, w ithout chemical or mechanical part, by gravity
and without power requirement as far as the process is concerned; • are modular and can be split and grouped at various level of treatment to address
space- and treatment requirements and cost constraints. They also allow for scalability f itting closely with demand and investment;
• achieve high treatment eff iciency w ithout nuisance and allow safe recycling of wastewater;
• are space eff icient and can easily be integrated in the landscaping and general layout of the area.
To date, about 80 systems has been realized by CSR, and more than 300 with the Indian partners in a Consortium for DEWATS Dissemination working all over India. Tailored to address wastewater treatment demand from residences and settlements, hostels, public facilities, factories, institutions etc. for domestic or non domestic wastewater, all of systems are developed through decentralized technology. While the main area of experience of CSR is in Tamil Nadu, projects have been executed successfully in West Bengal, Gudjarat, Maharastra, Nepal etc, with processed f low ranging from few hundreds of litres to 500 cubic meters per day, treated consistently
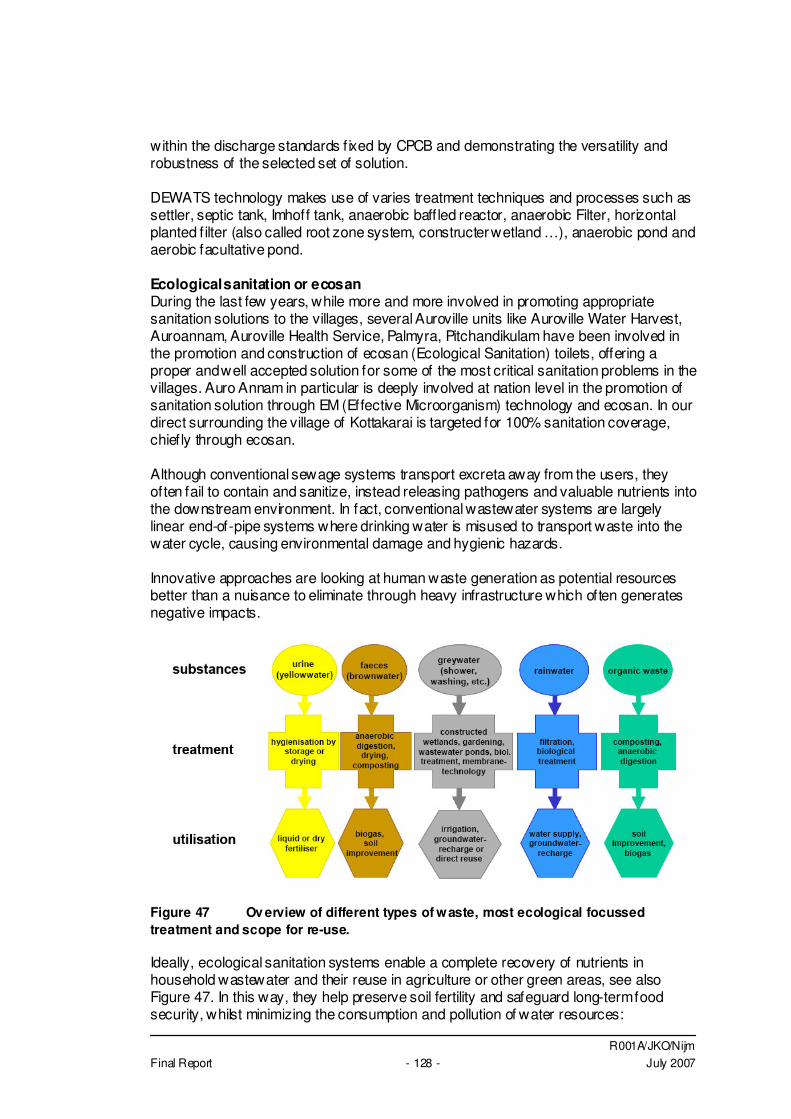
R001A/JKO/Nijm Final Report - 128 - July 2007
within the discharge standards f ixed by CPCB and demonstrating the versatility and robustness of the selected set of solution. DEWATS technology makes use of varies treatment techniques and processes such as settler, septic tank, Imhoff tank, anaerobic baff led reactor, anaerobic Filter, horizontal planted f ilter (also called root zone system, constructer wetland …), anaerobic pond and aerobic facultative pond. Ecological sanitation or ecosan During the last few years, while more and more involved in promoting appropriate sanitation solutions to the villages, several Auroville units like Auroville Water Harvest, Auroannam, Auroville Health Service, Palmyra, Pitchandikulam have been involved in the promotion and construction of ecosan (Ecological Sanitation) toilets, offering a proper and well accepted solution for some of the most critical sanitation problems in the villages. Auro Annam in particular is deeply involved at nation level in the promotion of sanitation solution through EM (Effective Microorganism) technology and ecosan. In our direct surrounding the village of Kottakarai is targeted for 100% sanitation coverage, chiefly through ecosan. Although conventional sewage systems transport excreta away from the users, they often fail to contain and sanitize, instead releasing pathogens and valuable nutrients into the downstream environment. In fact, conventional wastewater systems are largely linear end-of-pipe systems where drinking water is misused to transport waste into the water cycle, causing environmental damage and hygienic hazards. Innovative approaches are looking at human waste generation as potential resources better than a nuisance to eliminate through heavy infrastructure which often generates negative impacts.
Figure 47 Ov erview of different types of waste, most ecological focussed treatment and scope for re-use. Ideally, ecological sanitation systems enable a complete recovery of nutrients in household wastewater and their reuse in agriculture or other green areas, see also Figure 47. In this way, they help preserve soil fertility and safeguard long-term food security, whilst minimizing the consumption and pollution of water resources:
R001A/JKO/Nijm Final Report - 129 - July 2007
• Many villages are chronically short of water, which makes the use of water borne sanitation an unrealistic option.
• The capital cost required for water borne sanitation is prohibitive in most of the cases.
• It has conclusively been proven that nitrate loaded eff luent from pit latrines is directly responsible for w idespread contamination of valuable groundwater resources.
• The regular operating and maintenance costs of sanitation systems such as bucket latrines, septic tanks, chemical and water borne toilets are very high.
• Large part of the water consumption in urbanized area is used to f lush latrines and to carry wastes away.
• A very large part of the domestic wastewater pollution load is coming from human excreta and faeces are the great carrier of pathogens which contaminate the entire wastewater f low in conventional systems.
6.6 Sludge processing techniques
One of the unwanted side-products of waste water treatment is sludge. Sludge from primary settling basins, called primary or "raw" sludge, is a noxious, smelly, gray-black, viscous liquid or semi-solid. It contains very high concentrations of bacteria and other micro-organisms, many of them pathogenic, as well as large amounts of biodegradable organic material. Because of the high concentrations, any dissolved oxygen w ill be consumed rapidly, and the odorous and toxic products of anaerobic biodegradation will be produced. Ult imately, the sludge must all be disposed of. The w ay in w hich this is done depends on the quality of the sludge-- and determines how it needs to be treated. The most desirable f inal fate for these solids would be for beneficial use in agriculture, since the material has organic matter to act as a soil conditioner, as w ell as some fertilizer value. This requires the highest quality biosolids, free of contamination w ith toxic metals or industrial organic compounds, and low in pathogens. At a somew hat low er quality, it can be used for similar purposes on non-agricultural land and for land reclamation (e.g., strip mines). Poorer quality sludge can be disposed of by landfilling or incineration but these are not required for decentralised w aste systems that are used in Auroville. One commonly used method of sludge treatment, called digestion, is biological. Since the material is loaded w ith bacteria and organic matter; w hy not let the bacteria eat the biodegradable material? Digestion can be either aerobic or anaerobic. Aerobic digestion requires supplying oxygen to the sludge; it is similar to the activated sludge process, except no external "food" is provided. In anaerobic digestion, the sludge is fed into an air-free vessel; the digestion produces a gas which is mostly a mixture of methane and carbon dioxide. The gas has a fuel value, and can be burned to provide heat to the digester tank and even to run electric generators. Some localities have compressed the gas and used it to pow er vehicles. Digestion can reduce the amount of organic matter by about 30 to 70 percent, greatly decrease the number of pathogens, and produce a liquid w ith an inoffensive, "earthy" odour. This makes the sludge safer to dispose of on land, since the odour does not attract as many scavenging pests, such as f lies, rodents, gulls, etc., w hich spread pathogens from the disposal site to other areas-- and there are fewer pathogens to be spread.
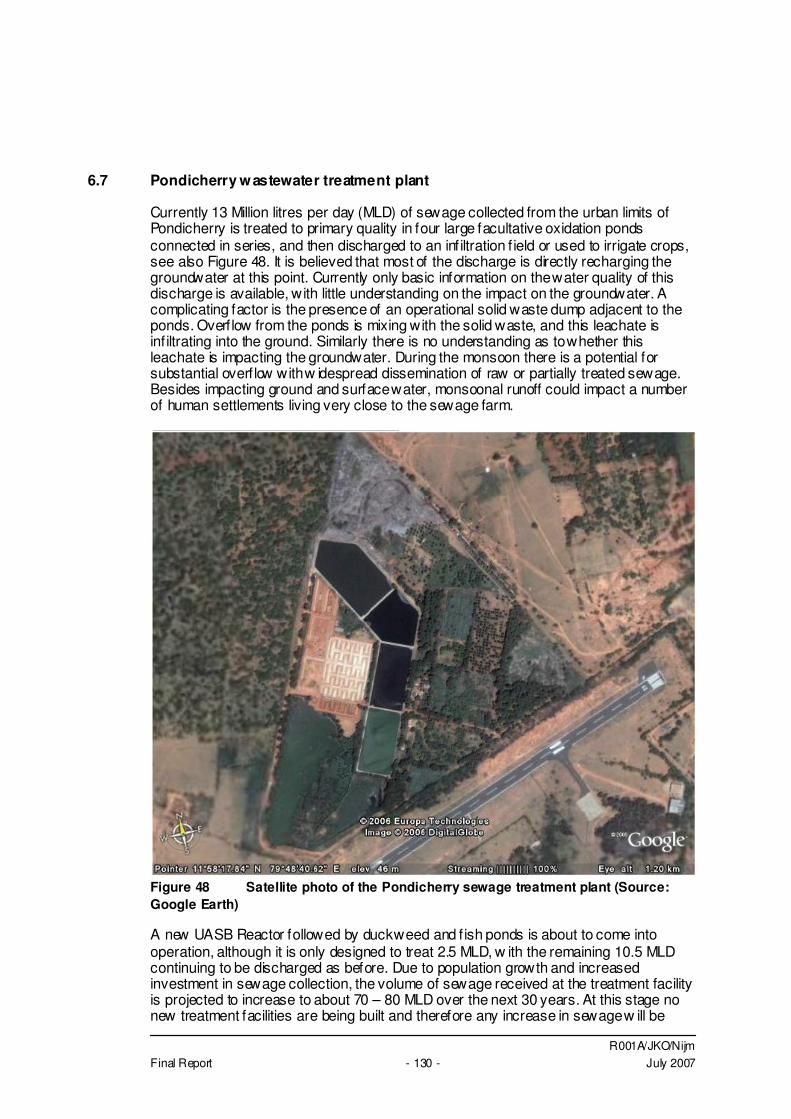
R001A/JKO/Nijm Final Report - 130 - July 2007
6.7 Pondicherry wastewater treatment plant
Currently 13 Million litres per day (MLD) of sewage collected from the urban limits of Pondicherry is treated to primary quality in four large facultative oxidation ponds connected in series, and then discharged to an infiltration f ield or used to irrigate crops, see also Figure 48. It is believed that most of the discharge is directly recharging the groundwater at this point. Currently only basic information on the water quality of this discharge is available, with little understanding on the impact on the groundwater. A complicating factor is the presence of an operational solid waste dump adjacent to the ponds. Overflow from the ponds is mixing with the solid waste, and this leachate is inf iltrating into the ground. Similarly there is no understanding as to whether this leachate is impacting the groundwater. During the monsoon there is a potential for substantial overf low with w idespread dissemination of raw or partially treated sewage. Besides impacting ground and surface water, monsoonal runoff could impact a number of human settlements living very close to the sewage farm.
Figure 48 Satellite photo of the Pondicherry sewage treatment plant (Source: Google Earth) A new UASB Reactor followed by duck weed and f ish ponds is about to come into operation, although it is only designed to treat 2.5 MLD, w ith the remaining 10.5 MLD continuing to be discharged as before. Due to population growth and increased investment in sewage collection, the volume of sewage received at the treatment facility is projected to increase to about 70 – 80 MLD over the next 30 years. At this stage no new treatment facilities are being built and therefore any increase in sewage w ill be
R001A/JKO/Nijm Final Report - 131 - July 2007
added to the current four facultative ponds, and discharged. As a result retention time will decrease as water volume increases, w ith a concurrent decrease in primary treatment of the discharge. Understanding the source, transport and attenuation of chemicals and human pathogens from a point source such as the infiltration area of the Pondicherry Waste Water Treatment Plant is fundamental to effective management of the risks posed by these pollutants. At the same time this large volume of water represents a high scope for recycling, providing the sewage is treated at appropriate level. The present scenario of massive ground water inf iltration of polluted water and irrigation of limited area while creating massive danger, can anyhow not scope w ith the increasing load the treatment facilities will handle soon. Larger usage in the surrounding can be done only on the area North of the treatment facilities as the area South is largely under rampant urbanization process. The North area is offering a large scope for irrigation but also groundwater depletion remediation. At present, the Auroville Centre for Scientif ic Research, Auroville Water Harvest and the Center for Environmental Restoration together w ith the Smithsonian Institute are working on a project proposal to evaluate: • Water quality of inf luent and eff luent at the Pondicherry Sewage Treatment Facility; • The basic hydrology of groundwater under and around the Treatment Facility; • To identify and set up an appropriate borehole groundwater monitoring program to
evaluate what impact recharge from the Waste Water Treatment Facility and associated Solid Waste Facility is having on groundwater;
• To rapidly identify the scope for recycling after proper processing of sewage. Pondicherry is well-supplied with medical facilities and Indian urban residents have easy access to pesticides for households use (against termites, cockroaches, rats etc). Pondicherry’s domestic sewage is likely to contain substantial residues from these sources, Table 20. The presence of Lindane in the data above indicates the potential for widespread contamination. Current EPA standards set drinking water limits for Lindane at 0.2 parts per billion. The fact that it is not detected in Table 20 is most likely due to detection limits rather than it not being there. The wide spread pharmaceutical industry in Pondi as well as the various education facilities w ith laboratories in this f ield, likely cause a signif icant load in the sewage. Specif ic testing should be conducted and has not been done thus far. Furthermore there is substantial risk of eff luent containing chemical eff luents from unidentif ied and unregistered industrial activities at the household level, such as battery recycling and electroplating. The high chromium level of 6.8 mg/l is a strong indication in this direction. It is therefore a matter of urgency that the eff luent at the WWTP is fully characterized, both in metals and organics, especially in the light of the fact that this eff luent is freely discharged to the environment The volume sewage collected in the Pondicherry Sewage Treatment Facilities offer a large potential for recycling. The actual scenario is of heavy over extraction from groundwater resources due to agricultural activities and the resulting fast depletion of the aquifer system. This is creating an alarming situation on the coastal line but also further inland as sea water intrusion is already monitored in the vicinity. Tw o scenarios, may be combined, can be imagine out of such large water resource. The f irst one is to deliver processed water to the irrigated area. This would create a very large scope for larger area under irrigation, prolonged farming activities through the year and important reduction of extraction from the over tapped groundwater resources. As such, the actual volume of sewage of 13Mld could be utilized to irrigate 650ha at the minimum, w hile the f inal expected f low of 80Mld could be used to irrigate at least 4000
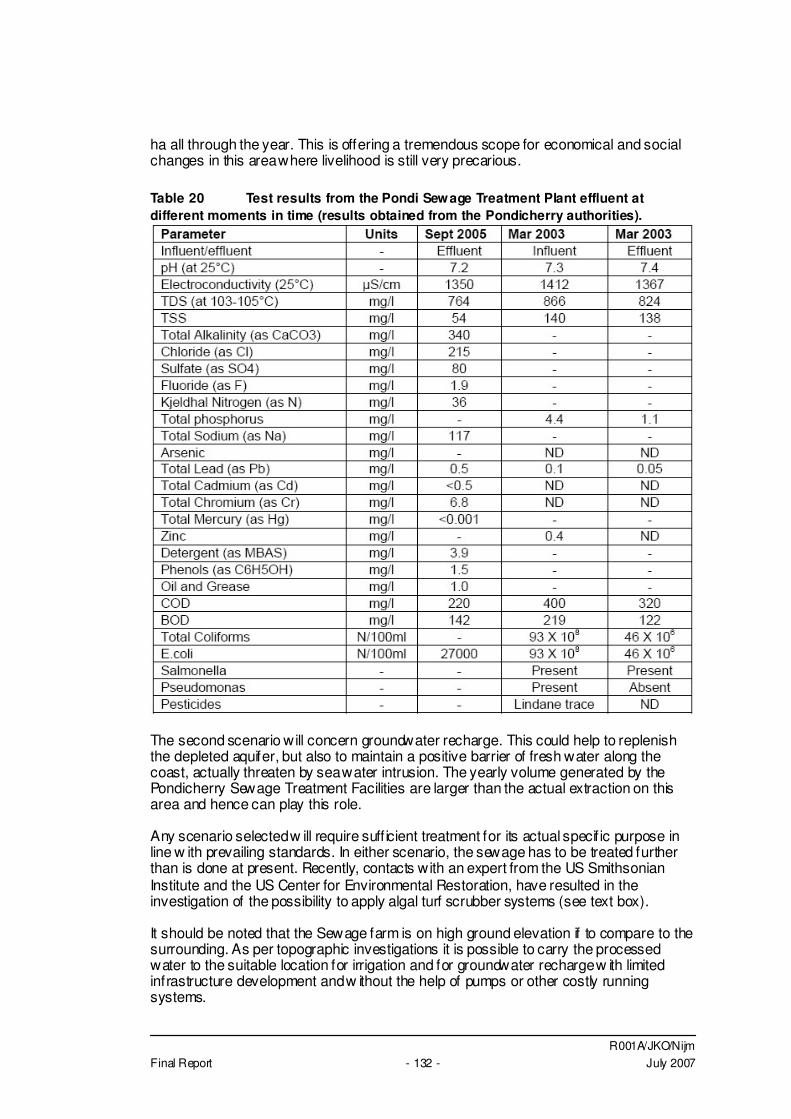
R001A/JKO/Nijm Final Report - 132 - July 2007
ha all through the year. This is offering a tremendous scope for economical and social changes in this area where livelihood is still very precarious. Table 20 Test results from the Pondi Sewage Treatment Plant effluent at different moments in time (results obtained from the Pondicherry authorities).
The second scenario will concern groundwater recharge. This could help to replenish the depleted aquifer, but also to maintain a positive barrier of fresh water along the coast, actually threaten by sea water intrusion. The yearly volume generated by the Pondicherry Sewage Treatment Facilities are larger than the actual extraction on this area and hence can play this role. Any scenario selected w ill require suff icient treatment for its actual specif ic purpose in line w ith prevailing standards. In either scenario, the sewage has to be treated further than is done at present. Recently, contacts with an expert from the US Smithsonian Institute and the US Center for Environmental Restoration, have resulted in the investigation of the possibility to apply algal turf scrubber systems (see text box). It should be noted that the Sewage farm is on high ground elevation if to compare to the surrounding. As per topographic investigations it is possible to carry the processed water to the suitable location for irrigation and for groundwater recharge w ith limited infrastructure development and w ithout the help of pumps or other costly running systems.
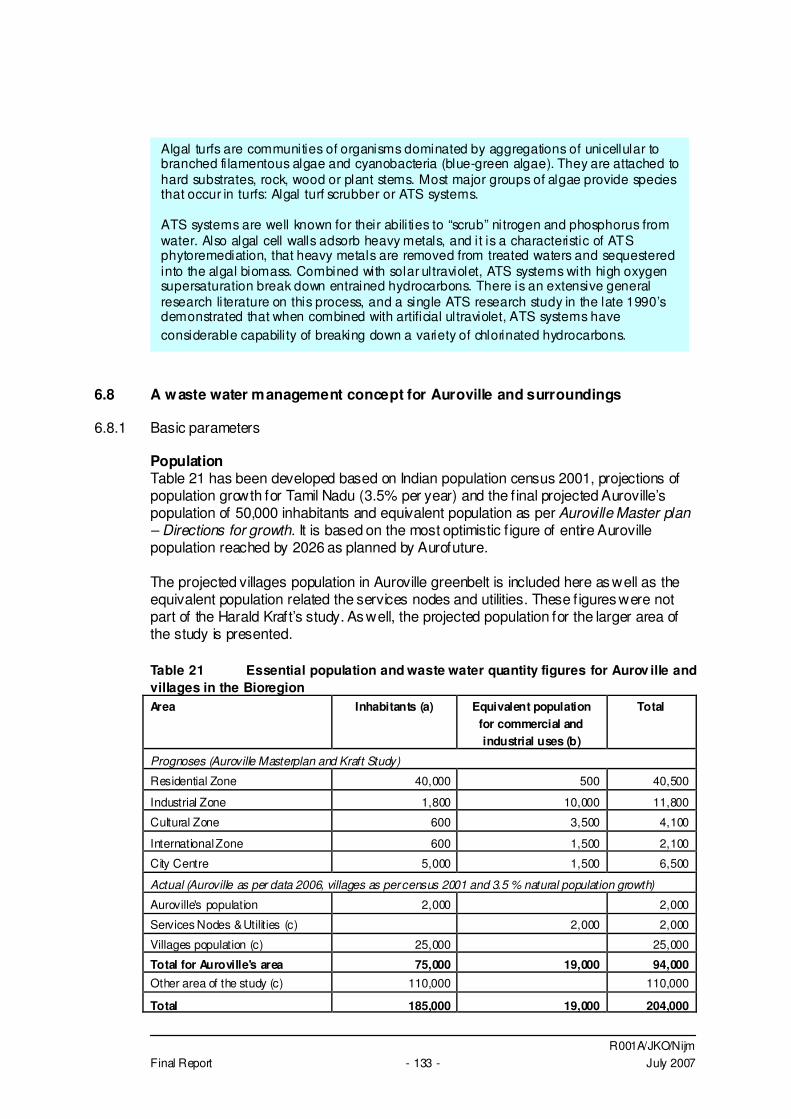
R001A/JKO/Nijm Final Report - 133 - July 2007
6.8 A waste water management concept for Auroville and surroundings
6.8.1 Basic parameters
Population Table 21 has been developed based on Indian population census 2001, projections of population growth for Tamil Nadu (3.5% per year) and the f inal projected Auroville’s population of 50,000 inhabitants and equivalent population as per Auroville Master plan – Directions for growth. It is based on the most optimistic f igure of entire Auroville population reached by 2026 as planned by Aurofuture. The projected villages population in Auroville greenbelt is included here as well as the equivalent population related the services nodes and utilities. These f igures were not part of the Harald Kraft’s study. As well, the projected population for the larger area of the study is presented. Table 21 Essential population and waste water quantity figures for Aurov ille and villages in the Bioregion Area Inhabitants (a) Equivalent population
for commercial and industrial uses (b)
Total
Prognoses (Auroville Masterplan and Kraft Study)
Residential Zone 40,000 500 40,500
Industrial Zone 1,800 10,000 11,800
Cultural Zone 600 3,500 4,100
International Zone 600 1,500 2,100
City Centre 5,000 1,500 6,500
Actual (Auroville as per data 2006, villages as per census 2001 and 3.5 % natural population growth)
Auroville's population 2,000 2,000
Services Nodes & Utilities (c) 2,000 2,000
Villages population (c) 25,000 25,000
Total for Auroville's area 75,000 19,000 94,000 Other area of the study (c) 110,000 110,000
Total 185,000 19,000 204,000
Algal turfs are communities of organisms dominated by aggregations of unicellular to branched fi lamentous algae and cyanobacteria (blue-green algae). They are attached to hard substrates, rock, wood or plant stems. Most major groups of algae provide species that occur in turfs: Algal turf scrubber or ATS systems. ATS systems are well known for their abilities to “scrub” nitrogen and phosphorus from water. Also algal cell walls adsorb heavy metals, and it is a characteristic of ATS phytoremediation, that heavy metals are removed from treated waters and sequestered into the algal biomass. Combined with solar ultraviolet, ATS systems with high oxygen supersaturation break down entrained hydrocarbons. There is an extensive general research literature on this process, and a single ATS research study in the late 1990’s demonstrated that when combined with artificial ultraviolet, ATS systems have considerable capability of breaking down a variety of chlorinated hydrocarbons.
R001A/JKO/Nijm Final Report - 134 - July 2007
While not included under this study, the villages surrounding Auroville w ill most probably attract many activities, institutional, commercial and industrial, in relation to Auroville, and hence will increase the water demand and wastewater generated. As well, the coastal area is planned to host tourist attractions, institutions (Kalapet), but also a growing urban tissue w ith the related population. Existing facilities such as the university and Pondicherry Institute for Medical Science (PIMS) are growing fast student-w ise and facility-w ise. In the absence of a proper set of information on these issues, it is decided to limit the parameters to average predicted growth, for far it may be from ground reality in this particularly attractive context. It is recommended to conduct a socio-economic study on this aspect to consolidate the evaluation of the population f inally present at term. The proposed consumption for additional water demand, similar to Kraft’s study, is questionable as it refers to a definition of the activities and related requirements for each area, which is not available for the time being. It is anyhow kept as it is for comparative purpose. Water use and waste water parameters Auroville • The water consumption is evaluated to 150 litres per day and per capita; • The Equivalent Population (EP) is based on the water demand amounting to
equivalent volume 150 lcd. • The wastewater generated is f ixed as 85% of the water consumption or 128lcd. • By implementing water saving devices systematically, it is evaluated that the water
consumption will fall to 120lcd, while the wastewater generated would be 100lcd only.
Considering the available technology and Auroville’s sustainable character, the following calculation will give the two sets of f igures, with and without water saving. The latest will be applied for more detailed calculation on wastewater generation. Villages • The water consumption is evaluated to 65lcd; • The wastewater generated is evaluated to 60% of the initial f low or 40lcd. Urbanised and institutional areas • The water consumption is evaluated to 120lcd as per Indian standards; • The wastewater generated is evaluated to 75% of the initial f low or 90lcd. The wastewater f low from areas further than the Greenbelt is not included in Table 22 because of the little possibility of direct control to such large and diversif ied area but also the diff iculty to forecast realistic population growth and Land Use pattern. Anyhow the management concept w ill be discussed in the following section.
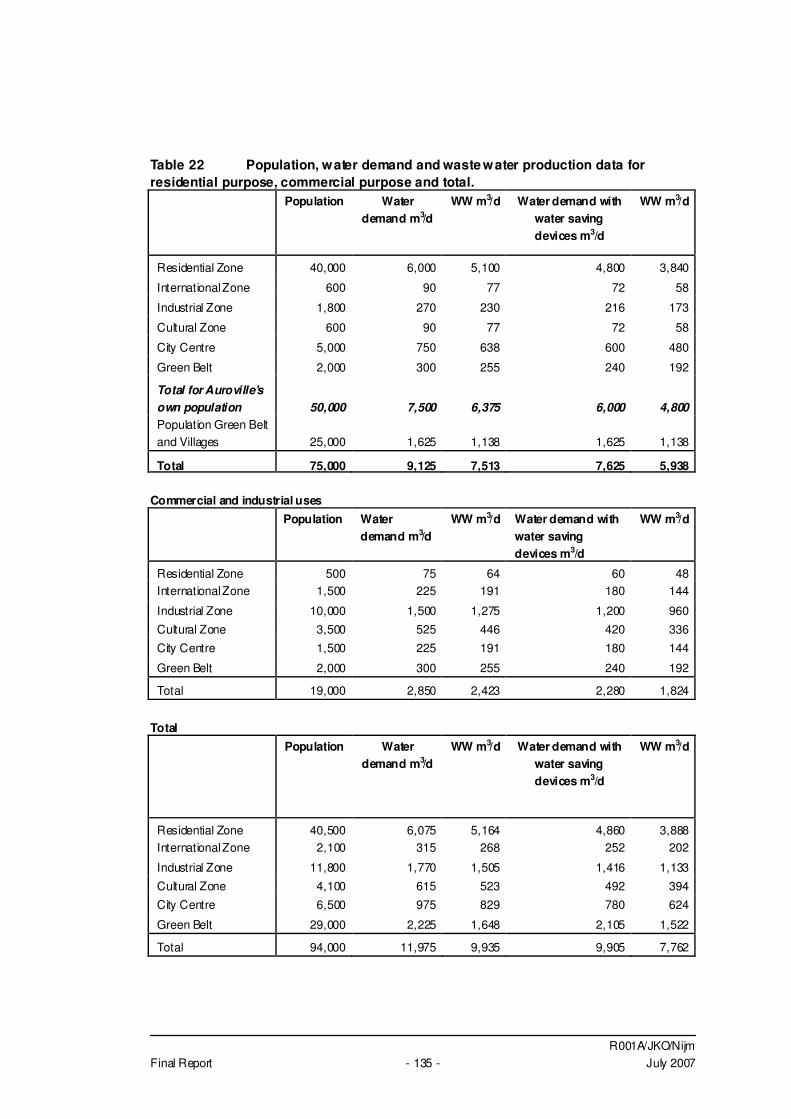
R001A/JKO/Nijm Final Report - 135 - July 2007
Table 22 Population, water demand and waste water production data for residential purpose, commercial purpose and total.
Population Water demand m3/d
WW m3/d Water demand with water saving devices m3/d
WW m3/d
Residential Zone 40,000 6,000 5,100 4,800 3,840
International Zone 600 90 77 72 58
Industrial Zone 1,800 270 230 216 173
Cultural Zone 600 90 77 72 58
City Centre 5,000 750 638 600 480
Green Belt 2,000 300 255 240 192
Total for Auroville's own population 50,000 7,500 6,375 6,000 4,800 Population Green Belt and Villages 25,000 1,625 1,138 1,625 1,138
Total 75,000 9,125 7,513 7,625 5,938
Commercial and industrial uses Population Water
demand m3/d WW m3/d Water demand with
water saving devices m3/d
WW m3/d
Residential Zone 500 75 64 60 48 International Zone 1,500 225 191 180 144
Industrial Zone 10,000 1,500 1,275 1,200 960
Cultural Zone 3,500 525 446 420 336
City Centre 1,500 225 191 180 144
Green Belt 2,000 300 255 240 192
Total 19,000 2,850 2,423 2,280 1,824
Total Population Water
demand m3/d WW m3/d Water demand with
water saving devices m3/d
WW m3/d
Residential Zone 40,500 6,075 5,164 4,860 3,888 International Zone 2,100 315 268 252 202
Industrial Zone 11,800 1,770 1,505 1,416 1,133
Cultural Zone 4,100 615 523 492 394
City Centre 6,500 975 829 780 624
Green Belt 29,000 2,225 1,648 2,105 1,522
Total 94,000 11,975 9,935 9,905 7,762
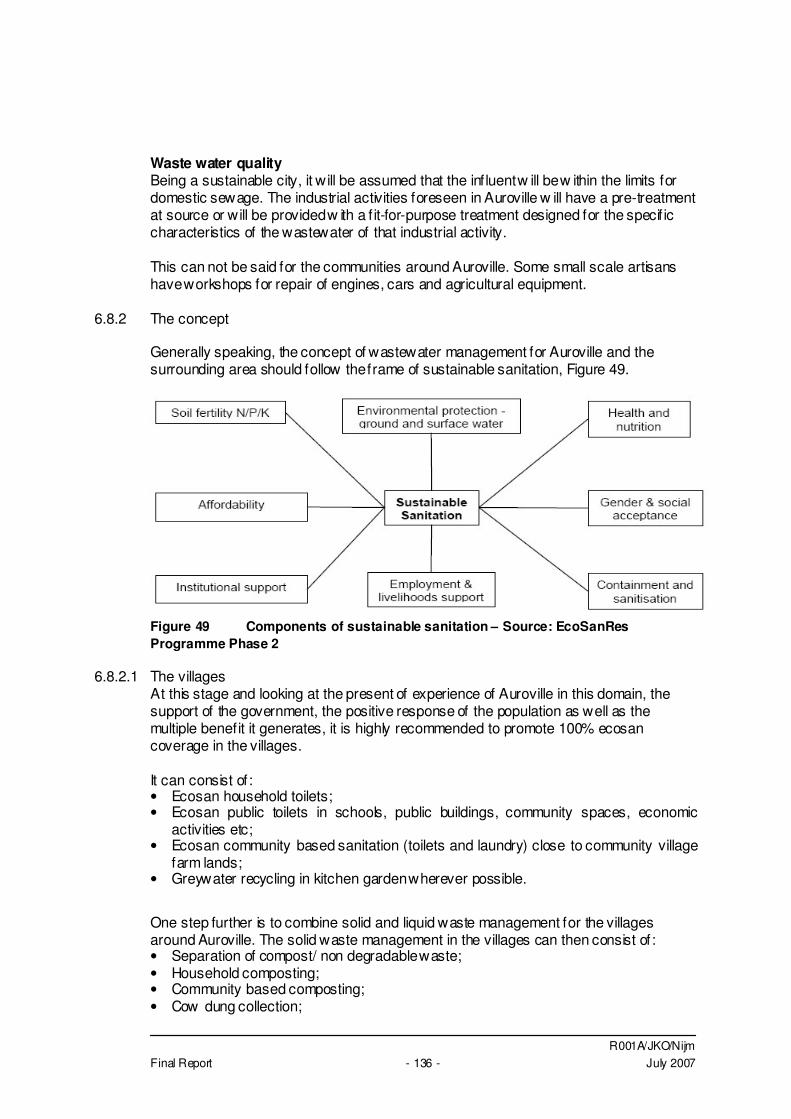
R001A/JKO/Nijm Final Report - 136 - July 2007
Waste water quality Being a sustainable city, it will be assumed that the influent w ill be w ithin the limits for domestic sewage. The industrial activities foreseen in Auroville w ill have a pre-treatment at source or will be provided w ith a f it-for-purpose treatment designed for the specif ic characteristics of the wastewater of that industrial activity. This can not be said for the communities around Auroville. Some small scale artisans have workshops for repair of engines, cars and agricultural equipment.
6.8.2 The concept
Generally speaking, the concept of wastewater management for Auroville and the surrounding area should follow the frame of sustainable sanitation, Figure 49.
Figure 49 Components of sustainable sanitation – Source: EcoSanRes Programme Phase 2
6.8.2.1 The villages At this stage and looking at the present of experience of Auroville in this domain, the support of the government, the positive response of the population as well as the multiple benefit it generates, it is highly recommended to promote 100% ecosan coverage in the villages. It can consist of: • Ecosan household toilets; • Ecosan public toilets in schools, public buildings, community spaces, economic
activities etc; • Ecosan community based sanitation (toilets and laundry) close to community village
farm lands; • Greywater recycling in kitchen garden wherever possible.
One step further is to combine solid and liquid waste management for the villages around Auroville. The solid waste management in the villages can then consist of: • Separation of compost/ non degradable waste; • Household composting; • Community based composting; • Cow dung collection;
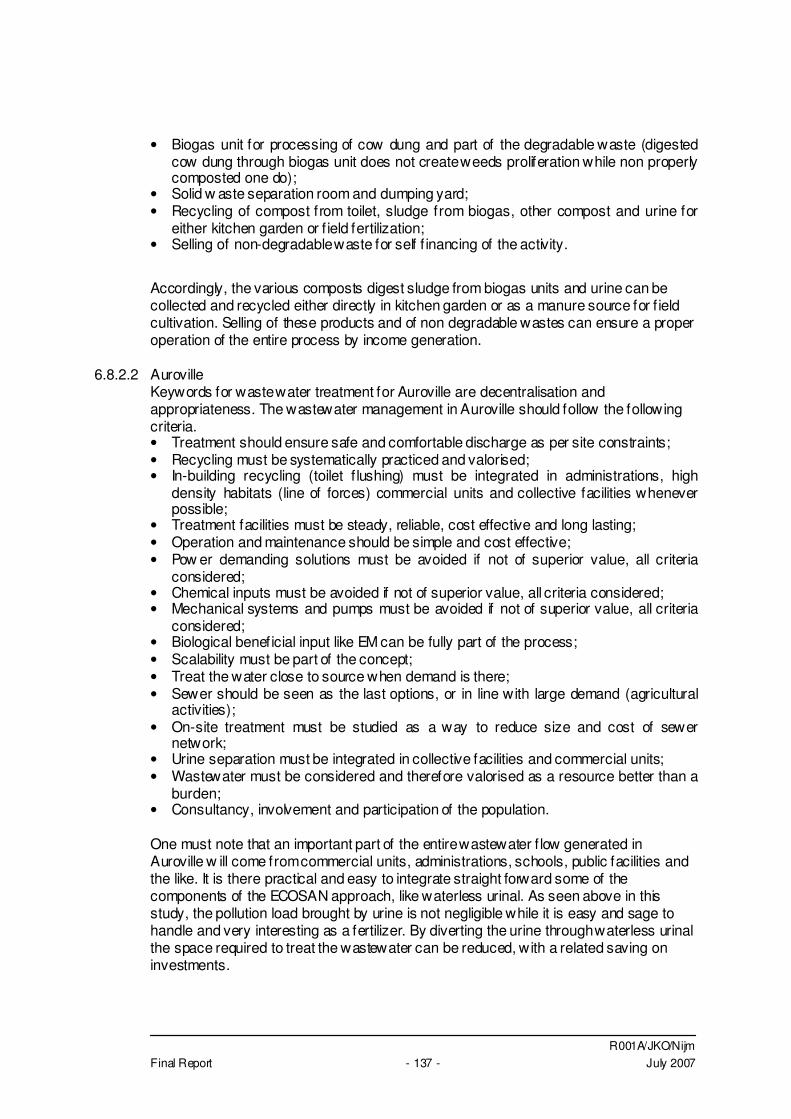
R001A/JKO/Nijm Final Report - 137 - July 2007
• Biogas unit for processing of cow dung and part of the degradable waste (digested cow dung through biogas unit does not create weeds proliferation while non properly composted one do);
• Solid w aste separation room and dumping yard; • Recycling of compost from toilet, sludge from biogas, other compost and urine for
either kitchen garden or f ield fertilization; • Selling of non-degradable waste for self f inancing of the activity.
Accordingly, the various composts digest sludge from biogas units and urine can be collected and recycled either directly in kitchen garden or as a manure source for f ield cultivation. Selling of these products and of non degradable wastes can ensure a proper operation of the entire process by income generation.
6.8.2.2 Auroville Keywords for waste water treatment for Auroville are decentralisation and appropriateness. The wastewater management in Auroville should follow the following criteria. • Treatment should ensure safe and comfortable discharge as per site constraints; • Recycling must be systematically practiced and valorised; • In-building recycling (toilet f lushing) must be integrated in administrations, high
density habitats (line of forces) commercial units and collective facilities whenever possible;
• Treatment facilities must be steady, reliable, cost effective and long lasting; • Operation and maintenance should be simple and cost effective; • Pow er demanding solutions must be avoided if not of superior value, all criteria
considered; • Chemical inputs must be avoided if not of superior value, all criteria considered; • Mechanical systems and pumps must be avoided if not of superior value, all criteria
considered; • Biological beneficial input like EM can be fully part of the process; • Scalability must be part of the concept; • Treat the water close to source when demand is there; • Sewer should be seen as the last options, or in line with large demand (agricultural
activities); • On-site treatment must be studied as a way to reduce size and cost of sewer
network; • Urine separation must be integrated in collective facilities and commercial units; • Wastewater must be considered and therefore valorised as a resource better than a
burden; • Consultancy, involvement and participation of the population. One must note that an important part of the entire wastewater f low generated in Auroville w ill come from commercial units, administrations, schools, public facilities and the like. It is there practical and easy to integrate straight forward some of the components of the ECOSAN approach, like waterless urinal. As seen above in this study, the pollution load brought by urine is not negligible while it is easy and sage to handle and very interesting as a fertilizer. By diverting the urine through waterless urinal the space required to treat the wastewater can be reduced, with a related saving on investments.
R001A/JKO/Nijm Final Report - 138 - July 2007
Indicatively, a DEWATS system for 1,000 people will have characteristics as presented in Table 23. Table 23 Characteristics of a DEWATS system for 1,000 people (*)
Full wastewater flow – 120lcd
With urine separation (Waterless urinal) – 100lcd
For Grey water only
m2/ EC
Cost/ EC
m2/ m3
Cost/ m3
m2/ EC
Cost/ EC
m2/ m3
Cost/ m3
m2/ EC
Cost/ EC
m2/ m3
Cost/ m3
CPCB lower standard requirement
0.3 1,800 2.3 15,000 0.3 1,500 2.4 15,000 0.2 800 1.2 8,000
CPCB higher grade 0.4 2,600 3.3 22,000 0.3 1,900 2.9 19,000 0.2 1,400 1.7 15,000
Fully hygienic and odourless discharge
0.8 3,800 6.7 32,000 0.8 3,300 7.7 33,000 0.6 2,400 5.5 26,000
* The costs are f or treatment facilities only, without sewer lines and further equipment. The second and third series are including the costs for collection equipment of urine or f aeces which any how remains marginal f or such large v olume. ** This would require an extra 0.40m2/EC with the present techniques in use (no mechanical part, no pump, no chemical input) Future possibility Concerning other aspects of Ecosan technology (like composting toilets or vacuum line), one cannot conclude at this stage about the pertinence it may present in the future wastewater management of Auroville as it generate many questions not easy to integrate in large building design at this stage. One can only recommend to develop a proper follow-up and trials on this emerging approach, as it will surely generate very interesting solutions in the coming years, completely in line with Auroville’s concern for sustainability and innovation. We would like to underline other techniques which w ill be play a growing role in wastewater management in the near future: • membrane technology. Although power demanding with high investment and O&M
costs, it is a fast developing technology. New and cost effective solutions emerge actually and systems of all sizes are now developed.
• roof gardening. In this technology, the grey water is pumped to the roof which is equipped with a planted f ilter. Apart from space saving, it also regulates very effectively the temperature inside the building by avoiding overheating in summer and hot climate, and reduce heat lost during winter and cold climate. This concept can even be adapted to green walls where the entire interior climate can be regulated creating a very pleasant inner space.
Sewer lines A very important part of the investment and operation and maintenance costs in regard to sewage management is linked to sewer network. Sewers are costly and are usually sized and installed for full capacity, even at very initial stage of development to avoid further damage to roads and other infrastructures. The technical solutions available through decentralised technology may help to reduce tremendously this burden. Sewer lines are minimised in decentralised technology and gradually upgraded w ith the growth of the city.
R001A/JKO/Nijm Final Report - 139 - July 2007
Effluent characteristics Applying Auroville’s principles, its activities should not be harmful to environment or to public health. The individual and social activities and the usual impact they generate must be evolved to promote such concerns. One can safely assume that Auroville will as much than possible not generate harmful pollutants, and that the wastewater will generally be of domestic characteristics. Some economic activities or services may anyhow generate waste that is more diff icult to process or is even potentially harmful stuff like hospital or food processing units, cosmetic units etc. Considering that this is definitively specif ic and limited cases, this cannot be treated w ithin this study. Proposed wastewater management strategy It is proposed to adapt the solution to the context. For example: • It is in principle better to recycle wastewater when available for watering greenery,
where and when necessary, than to use fresh water resources. • In-house recycling, providing hygienic concern is secured, could be of interest in
densely populated areas as the necessary double piping it requires is then easy to integrate, while it may raise diff iculties, important extra cost and risks for lower density.
• It is better to inf iltrate processed wastewater when others recycling are covered if the leftover volume is meagre and if the cost of connecting to a sewer line is comparatively not economic.
• Some areas show a relatively important slope which should be used to optimize the design of the system and reduce costs.
R001A/JKO/Nijm Final Report - 140 - July 2007
7 MATRIMANDIR LAKE
7.1 Summary
Origin of thelake idea A lake around the Matrimandir has been a vision of the founder of Auroville and since then is the long cherished wish of many Aurovilians. Such a lake has been designed by Auroville’s Chief Architect and ideally should have a signif icant function in water management. Design and function of the lake Studying the various functions of a lake around the Matrimandir, it is concluded that the aesthetical boundary conditions set by the Chief Architect can not be combined with the required role in water management. Therefore it is advised to allow the lake to f luctuate more in accordance with the seasons and to vary in size as well. With an excess of water, large zones along the shore of the lake could inundate at the same time allow ing reeds to f ilter the water in the lake. In the dry season the water receeds to a minimal shap and level of the lake that can be maintained by supplementing water from groundwater. Excess water should be infiltrated to close the water balance for the lake. The absolute level of the lake could be slightly reduced to allow run-off water from the oval to be f iltered before entering the lake. Still dikes will have to be constructed at the western part of the lake to prevent the area around the Townhall from flooding. Aestetics and symbolism mainjustification Even w ith all these boundary conditions to be f lexible, the function of the lake in terms of water management is still minimal. Symbolism and aesthetics remains the main justif ication for the construction and maintenance of thelake. In itself thisisnot a problem, but should be accepted by the Auroville community. Ecology of the lake The water quality of the lake is determined by the quality of the incoming w ater combined with the biological activity in the lake. Experiments with planted f ilters and reed beds along the shore of the lake, underwater vegetation and certain biotopes at pilot scale should provide suff icient information for the ecological management of the lake in order to keep the water as clean as possible.
7.2 Introduction
Since the establishment of the city of Auroville, its founders and inhabitants intended to create as its central zone an oval with the Matrimandir, the Amphitheatre and gardens, and to surround it w ith a lake, which should also assume a central function. Meanwhile, the Amphitheatre and the Matrimandir are nearing completion. What remains is the completion of the design of the oval with the construction of the lake. Apart from practical considerations, the lake will in any case be of signif icant symbolical value. In October 2005, the Chief Architect of Auroville provided the follow ing design and related boundary conditions:
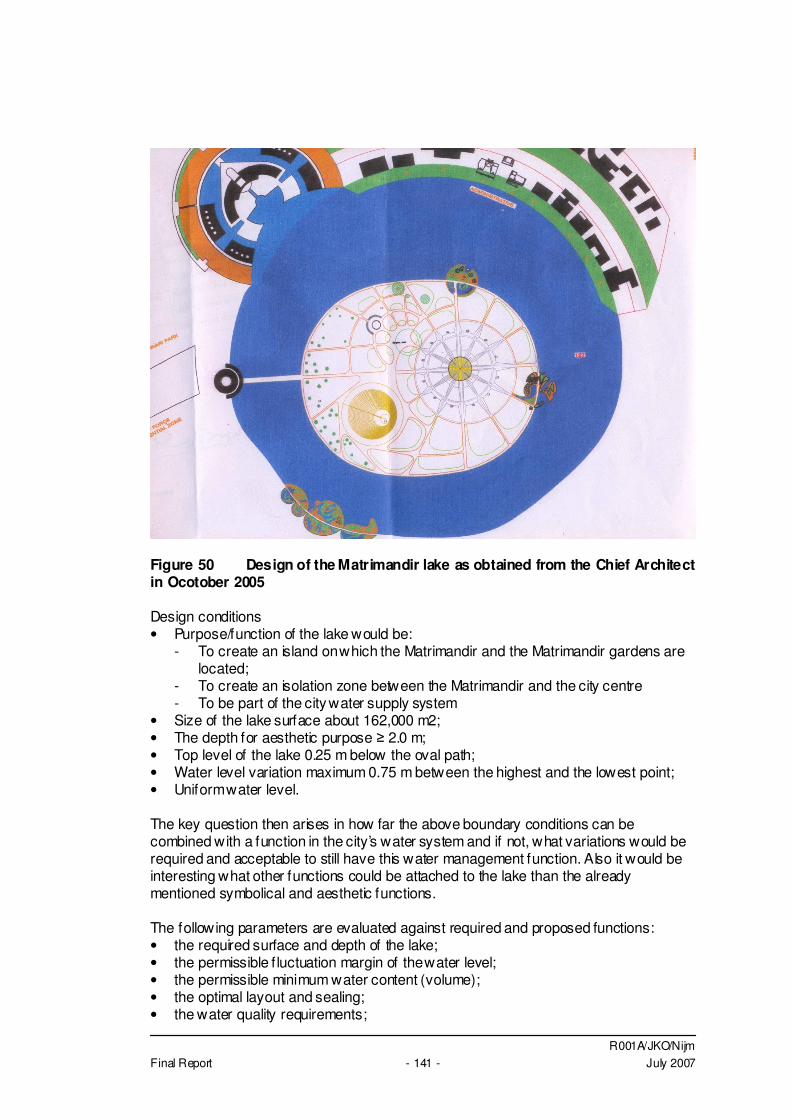
R001A/JKO/Nijm Final Report - 141 - July 2007
Figure 50 Design of the Matrimandir lake as obtained from the Chief Architect in Ocotober 2005 Design conditions • Purpose/function of the lake would be:
- To create an island on which the Matrimandir and the Matrimandir gardens are located;
- To create an isolation zone between the Matrimandir and the city centre - To be part of the city water supply system
• Size of the lake surface about 162,000 m2; • The depth for aesthetic purpose � 2.0 m; • Top level of the lake 0.25 m below the oval path; • Water level variation maximum 0.75 m between the highest and the lowest point; • Uniform water level. The key question then arises in how far the above boundary conditions can be combined with a function in the city’s water system and if not, what variations would be required and acceptable to still have this water management function. Also it would be interesting what other functions could be attached to the lake than the already mentioned symbolical and aesthetic functions. The following parameters are evaluated against required and proposed functions: • the required surface and depth of the lake; • the permissible f luctuation margin of the water level; • the permissible minimum water content (volume); • the optimal layout and sealing; • the water quality requirements;
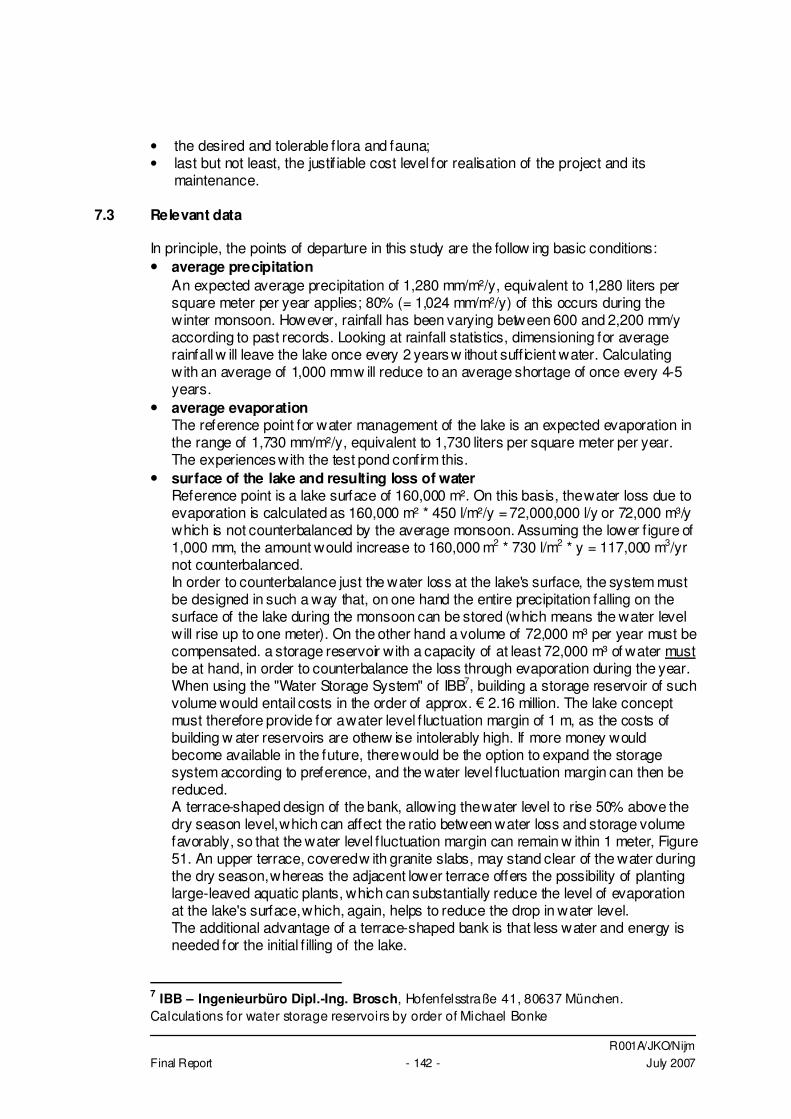
R001A/JKO/Nijm Final Report - 142 - July 2007
• the desired and tolerable f lora and fauna; • last but not least, the justif iable cost level for realisation of the project and its
maintenance.
7.3 Relevant data
In principle, the points of departure in this study are the follow ing basic conditions: • average precipitation An expected average precipitation of 1,280 mm/m²/y, equivalent to 1,280 liters per
square meter per year applies; 80% (= 1,024 mm/m²/y) of this occurs during the winter monsoon. However, rainfall has been varying between 600 and 2,200 mm/y according to past records. Looking at rainfall statistics, dimensioning for average rainfall w ill leave the lake once every 2 years w ithout suff icient water. Calculating with an average of 1,000 mm w ill reduce to an average shortage of once every 4-5 years.
• average evaporation The reference point for water management of the lake is an expected evaporation in
the range of 1,730 mm/m²/y, equivalent to 1,730 liters per square meter per year. The experiences with the test pond confirm this.
• surface of the lake and resulting loss of water Reference point is a lake surface of 160,000 m². On this basis, the water loss due to
evaporation is calculated as 160,000 m² * 450 l/m²/y = 72,000,000 l/y or 72,000 m³/y which is not counterbalanced by the average monsoon. Assuming the lower f igure of 1,000 mm, the amount would increase to 160,000 m2 * 730 l/m2 * y = 117,000 m3/yr not counterbalanced.
In order to counterbalance just the water loss at the lake's surface, the system must be designed in such a way that, on one hand the entire precipitation falling on the surface of the lake during the monsoon can be stored (which means the water level will rise up to one meter). On the other hand a volume of 72,000 m³ per year must be compensated. a storage reservoir with a capacity of at least 72,000 m³ of water must be at hand, in order to counterbalance the loss through evaporation during the year. When using the "Water Storage System" of IBB7, building a storage reservoir of such volume would entail costs in the order of approx. � 2.16 million. The lake concept must therefore provide for a water level f luctuation margin of 1 m, as the costs of building w ater reservoirs are otherw ise intolerably high. If more money would become available in the future, there would be the option to expand the storage system according to preference, and the water level f luctuation margin can then be reduced. A terrace-shaped design of the bank, allowing the water level to rise 50% above the dry season level, which can affect the ratio between water loss and storage volume favorably, so that the water level f luctuation margin can remain w ithin 1 meter, Figure 51. An upper terrace, covered w ith granite slabs, may stand clear of the water during the dry season, whereas the adjacent lower terrace offers the possibility of planting large-leaved aquatic plants, which can substantially reduce the level of evaporation at the lake's surface, which, again, helps to reduce the drop in water level. The additional advantage of a terrace-shaped bank is that less water and energy is needed for the initial f illing of the lake.
7 IBB – Ingenieurbüro Dipl.-Ing. Brosch, Hofenfelsstraße 41, 80637 München. Calculations for water storage reservoirs by order of Michael Bonke
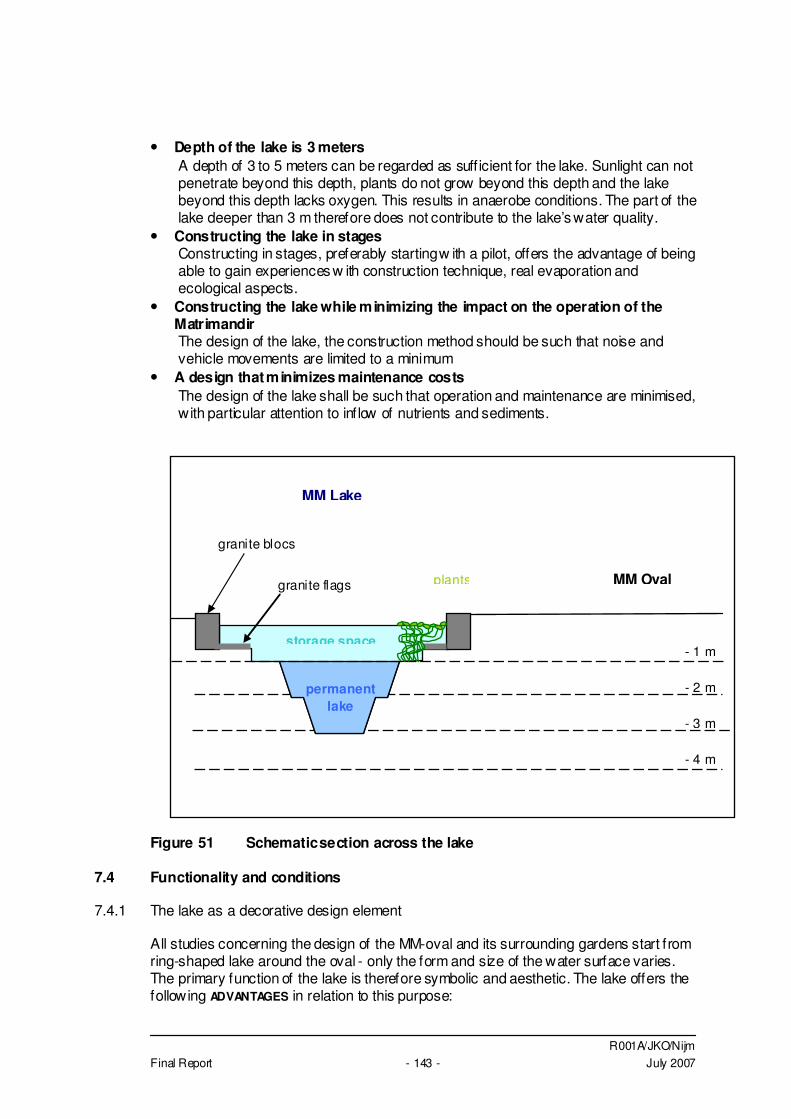
R001A/JKO/Nijm Final Report - 143 - July 2007
• Depth of the lake is 3 meters A depth of 3 to 5 meters can be regarded as suff icient for the lake. Sunlight can not penetrate beyond this depth, plants do not grow beyond this depth and the lake beyond this depth lacks oxygen. This results in anaerobe conditions. The part of the lake deeper than 3 m therefore does not contribute to the lake’s water quality.
• Constructing the lake in stages Constructing in stages, preferably starting w ith a pilot, offers the advantage of being able to gain experiences w ith construction technique, real evaporation and ecological aspects.
• Constructing the lake while minimizing the impact on the operation of the Matrimandir The design of the lake, the construction method should be such that noise and vehicle movements are limited to a minimum
• A design that minimizes maintenance costs The design of the lake shall be such that operation and maintenance are minimised, with particular attention to inflow of nutrients and sediments.
Figure 51 Schematic section across the lake
7.4 Functionality and conditions
7.4.1 The lake as a decorative design element
All studies concerning the design of the MM-oval and its surrounding gardens start from ring-shaped lake around the oval - only the form and size of the water surface varies. The primary function of the lake is therefore symbolic and aesthetic. The lake offers the following ADVANTAGES in relation to this purpose:
MM Oval
MM Lake
storage space
permanent lake
granite flags
granite blocs
- 1 m
- 2 m
- 3 m
- 4 m
plants
R001A/JKO/Nijm Final Report - 144 - July 2007
• Decoration Water surfaces reflect, mirror and break light in various forms and thereby create an irresistible decorative effect. Planting a broad shore area with f lowering water plants will further enhance the decorative effect. Water organisms make lakes appear more alive and interesting.
• Psychological effect Large water surfaces have a reassuring, balancing and relaxing effect on the observer.
• Social effect Water bodies generally are gathering places for people during the pleasant moments of the day.
• Barrier The water surface represents an almost insurmountable barrier, so that visitors to the MM-oval can enjoy their visit in peace and solitude.The presence of the lake will help keeping animals - which, importantly, would include species than can be harmful to humans - away from the MM oval.
• Construction style In simple terms, the lake must retain water and display it. As long as no water extraction or purif ication effects are supposed to be possible at the same time, a f lat lake w ith a depth of 3 - 4 meters is quite suff icient. The advantages of this are relatively low construction costs (dispense with installations) and - depending on the type of sealing - a short construction time, synonymous with less restrictions on the prevalent use of the MM oval. With the construction of a suitable overflow system based on the principle of communicating vessels, excess of water during the monsoon could possibly be used to regularly draw water with sediment and plant residue from the bottom, to prevent harmful oxygen deficits. In addition and if needed, aeration wells could be installed, which could be operated at noon, for example, to oxygenate the lake and simultaneously cool the air in the surrounding area. The main requirement for the water quality is to maintain suff icient oxygen levels, so that decay and unpleasant smells are avoided.
• Microclimate It may be expected that the presence of the lake will result in a slightly improved microclimate at the MM oval area and the adjacent gardens.
• Maintenance costs As the operation of the lake does not require any special technical installations and as, in principle, power for pumping water will hardly be needed, the operation is both ecologically sensible and economically tenable.
• Employment and income A construction project of the intended size represents a long-term source of income for local workers and companies, and could simultaneously cause a bond to form between them and the project.
The DISADVANTAGES of a lake with a purely decorative function are: • Construction costs and filling
The initial f illing of the lake, and - depending on the engineering techniques used - its construction, w ill required substantial funds.
• No functional use Under the given climatic conditions in connection with the requirements of a
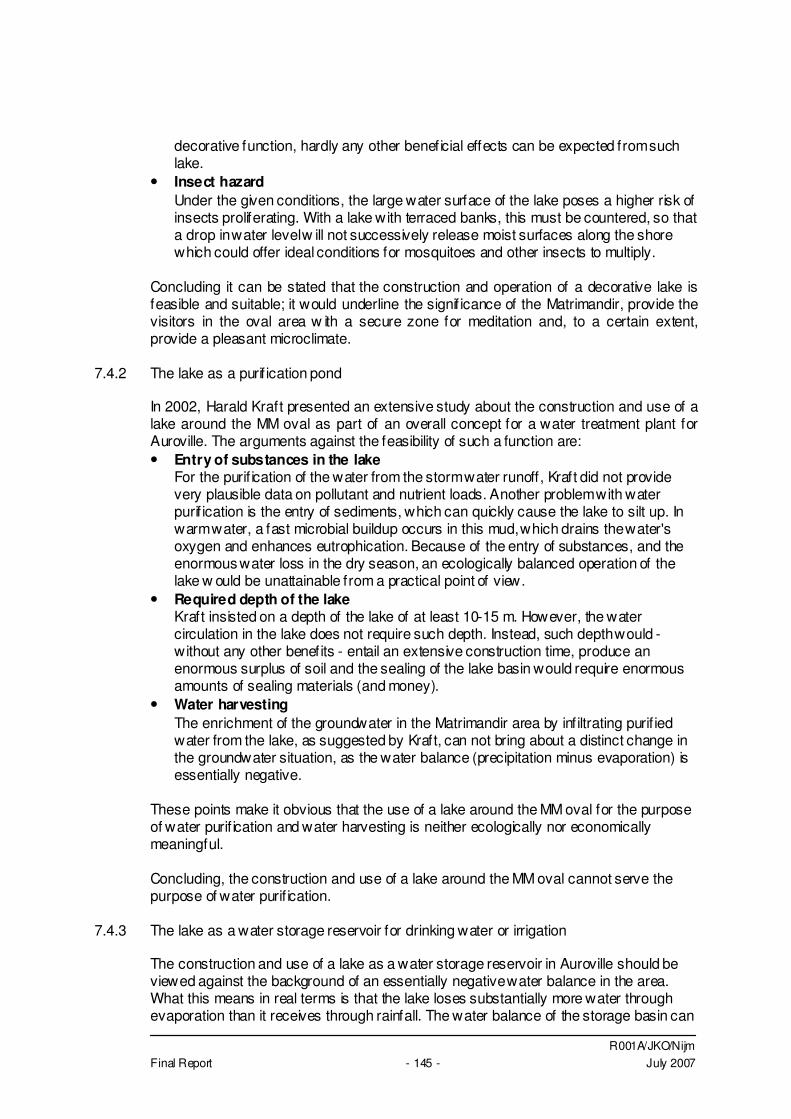
R001A/JKO/Nijm Final Report - 145 - July 2007
decorative function, hardly any other beneficial effects can be expected from such lake.
• Insect hazard Under the given conditions, the large water surface of the lake poses a higher risk of insects proliferating. With a lake with terraced banks, this must be countered, so that a drop in water level w ill not successively release moist surfaces along the shore which could offer ideal conditions for mosquitoes and other insects to multiply.
Concluding it can be stated that the construction and operation of a decorative lake is feasible and suitable; it would underline the signif icance of the Matrimandir, provide the visitors in the oval area w ith a secure zone for meditation and, to a certain extent, provide a pleasant microclimate.
7.4.2 The lake as a purif ication pond
In 2002, Harald Kraft presented an extensive study about the construction and use of a lake around the MM oval as part of an overall concept for a water treatment plant for Auroville. The arguments against the feasibility of such a function are: • Entry of substances in the lake
For the purif ication of the water from the storm water runoff, Kraft did not provide very plausible data on pollutant and nutrient loads. Another problem with water purif ication is the entry of sediments, which can quickly cause the lake to silt up. In warm water, a fast microbial buildup occurs in this mud, which drains the water's oxygen and enhances eutrophication. Because of the entry of substances, and the enormous water loss in the dry season, an ecologically balanced operation of the lake w ould be unattainable from a practical point of view.
• Required depth of the lake Kraft insisted on a depth of the lake of at least 10-15 m. However, the water circulation in the lake does not require such depth. Instead, such depth would - without any other benefits - entail an extensive construction time, produce an enormous surplus of soil and the sealing of the lake basin would require enormous amounts of sealing materials (and money).
• Water harvesting The enrichment of the groundwater in the Matrimandir area by infiltrating purif ied water from the lake, as suggested by Kraft, can not bring about a distinct change in the groundwater situation, as the water balance (precipitation minus evaporation) is essentially negative.
These points make it obvious that the use of a lake around the MM oval for the purpose of water purif ication and water harvesting is neither ecologically nor economically meaningful. Concluding, the construction and use of a lake around the MM oval cannot serve the purpose of water purif ication.
7.4.3 The lake as a water storage reservoir for drinking water or irrigation
The construction and use of a lake as a water storage reservoir in Auroville should be viewed against the background of an essentially negative water balance in the area. What this means in real terms is that the lake loses substantially more water through evaporation than it receives through rainfall. The water balance of the storage basin can
R001A/JKO/Nijm Final Report - 146 - July 2007
thus only become "positive" if the lake is connected to a water collection system, which supplies it w ith large quantities of rainwater from the surrounding area. If in addition, water is to be drawn for a particular purpose, the basic prerequisite for this would be that during the monsoon time, the basin would have a substantial free storage capacity in the higher/lower area, so that the water level can be raised substantially if needed. Despite the climatic conditions with its negative water balance, water could then be drawn from such water reservoir during the dry season. As LGA has already shown earlier, the collected water could theoretically also be stored below the lake, along its banks or underground in the direct vicinity, where it would be protected against evaporation. See also 3.4.9. Regarding the construction of a lake for the purpose of collecting drinking water and spray irrigation water for the city center or the larger Auroville region, the following advantages apply: • Central water storage reservoir
The pros of constructing a centrally located water reservoir are low pumping costs and energy use, and the short distance to end users (low risk of microbial contamination).
• Careful use of resources The collection and storage of rainwater for the purpose of providing drinking water and/or spray irrigation water is a particularly positive concept in terms of ecological balance. After all, in the case of Auroville, such use not only means the preservation of underground water buffers, but also substantial energy savings, as this energy would otherwise be needed to pump up water from wells, thereby reducing the consumption of fossil fuels (scarce in India) and improving the CO2 balance (climate protection). Operating such a 'drinking water lake' would however require that large quantities of water can be caught from its environment and stored in the lake. And above all, it would require a lake with a water level f luctuation margin in excess of several meters.
• High fluctuation of water level On the other hand, the negative aspects, particularly of a high f luctuation of the water level, are the consequences as described under point 2, i.e. the esthetics, the insect hazard, and in addition, the possible long-term effects on the durability of the sealing materials. Also, a storage lake would require a greater 'draught'. This means higher construction costs (time and money) and a larger width of the lake - even with very steep embankments.
• Water quality requirements Using the water stored in the lake for the purpose of drinking water collection puts the highest demands on the hygiene of the reservoir. It means that when water is collected during the monsoon, the water has to pass through retention systems before entry into the lake; these systems would ensure that the sediment load is kept at a minimum (see also above) and, above all, no waste materials and organic residues enter into the lake. The use of water pollutants (gasoline, pesticides etc. in garden maintenance) in the catchment area of the lake would be possible only if it could be ensured, through appropriate interception ditches and retention basins at the lakeshore, that no pollutants could enter the lake. Naturally, bathing and washing activities in the lake would be prohibited for the same reason.
R001A/JKO/Nijm Final Report - 147 - July 2007
Whatever precautions are taken w ith respect to water quality, water from the lake alw ays requires treatment before it is suitable for human consumption. The treatment can be minimized by taking the precautions prescribed, but either way using water from the lake as drinking water will result in a very high price per unit. Using the stored water for irrigation purposes would be possible at any time, w ithout restriction.
Weighing the advantages and disadvantages, it is clear that the decorative function and the storage function are virtually incompatible. Combining these functions would be conceivable only if water can actually be stored "invisibly", below the lake or the allow able f luctuation is strongly increased. The benefits of an underground storage should be weighed against the enormous building expenditures and the extensive construction time. It should also not be overlooked here that creating the proper conditions for collecting and pre-treating water would entail construction activities in the lake's wider surrounding area.
7.4.4 The lake as ultimate component of the city’s water management system
Function of the lake For the MM lake to be part of AV’s water system, the lake itself should be dynamic as the weather is dynamic. The extent of the dynamism is then subject to discussion. The discussion should cover both the form of f lexibility of the lake (lateral and/or vertical) and the dimensioning. The lake should be capable to store at least the rain that falls on the lake. Additionally the lake could store rain from the inner oval. The water in the lake may then be used for the water supply system in AV. If more storage is required on/in the lake, then the lake needs to be more f lexible. Dynamism of the lake could be sought in the level of the lake (one level or different levels), the size or surface of the lake and the surface level of the lake. If the dynamism of the climate is reflected in the level, size or shape of the lake, then this will also keep the population more conscious about nature and its dependence on climatic conditions and f luctuations. As the water quality will be comparable to open waters in these areas of India, the water from the lake can not be used for drinking purpose as this would require extensive treatment. Drinking of animals would be possible through. Other secondary uses for the water would be irrigation of the gardens, irrigation of farms or inf iltration of to replenish groundwater resources. Instead of storage a lake can also be used for inf iltration or a combination of both. In such a case, only the upper part should allow infiltration as the lake needs to be kept at operational level as long as possible. This is represented in f igure 1E. Level of the lake The level could be allowed to f luctuate with the incoming rainfall and the outgoing irrigation water. The shores of the lake will have to be capable of coping with this f luctuating water level. The shores will have to be cleaned annually as the receding water w ill leave a deposit of mud and algae on the side. See also f igure 1B.
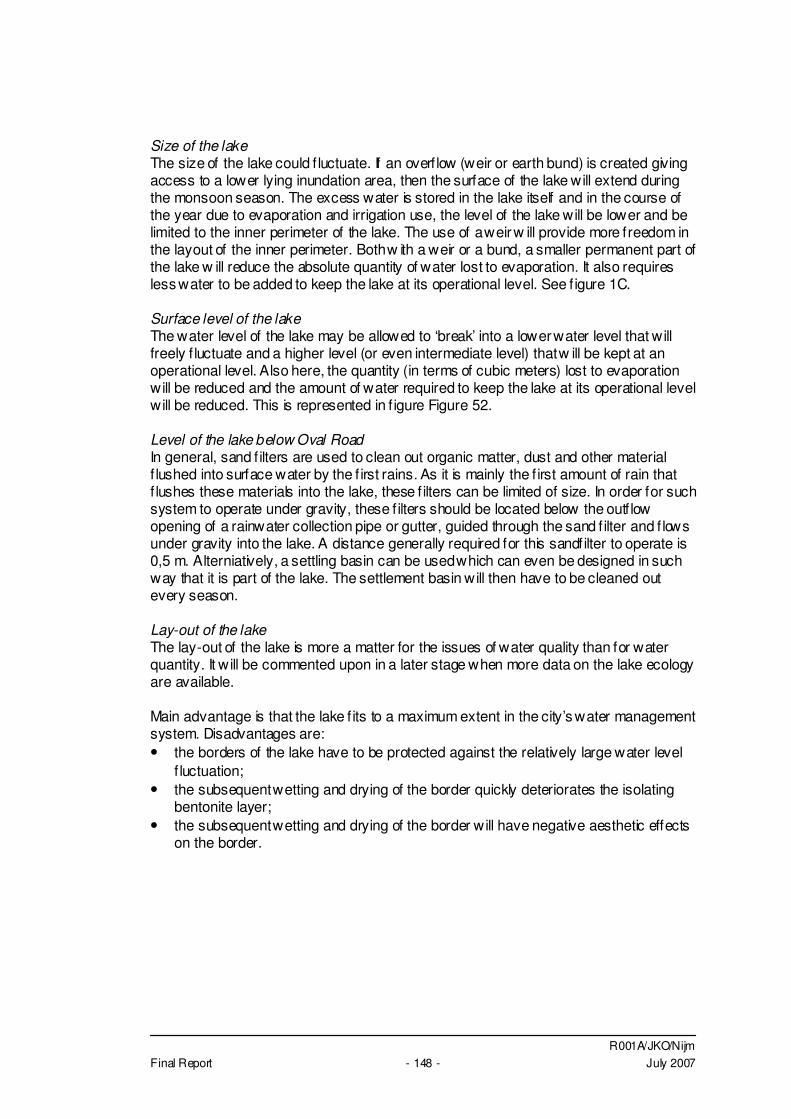
R001A/JKO/Nijm Final Report - 148 - July 2007
Size of the lake The size of the lake could f luctuate. If an overflow (weir or earth bund) is created giving access to a lower lying inundation area, then the surface of the lake will extend during the monsoon season. The excess water is stored in the lake itself and in the course of the year due to evaporation and irrigation use, the level of the lake will be lower and be limited to the inner perimeter of the lake. The use of a weir w ill provide more freedom in the layout of the inner perimeter. Both w ith a weir or a bund, a smaller permanent part of the lake w ill reduce the absolute quantity of water lost to evaporation. It also requires less water to be added to keep the lake at its operational level. See f igure 1C. Surface level of the lake The water level of the lake may be allowed to ‘break’ into a lower water level that will freely f luctuate and a higher level (or even intermediate level) that w ill be kept at an operational level. Also here, the quantity (in terms of cubic meters) lost to evaporation will be reduced and the amount of water required to keep the lake at its operational level will be reduced. This is represented in f igure Figure 52. Level of the lake below Oval Road In general, sand f ilters are used to clean out organic matter, dust and other material f lushed into surface water by the f irst rains. As it is mainly the f irst amount of rain that f lushes these materials into the lake, these f ilters can be limited of size. In order for such system to operate under gravity, these f ilters should be located below the outf low opening of a rainwater collection pipe or gutter, guided through the sand f ilter and f lows under gravity into the lake. A distance generally required for this sandfilter to operate is 0,5 m. Alterniatively, a settling basin can be used which can even be designed in such way that it is part of the lake. The settlement basin will then have to be cleaned out every season. Lay-out of the lake The lay-out of the lake is more a matter for the issues of water quality than for water quantity. It will be commented upon in a later stage when more data on the lake ecology are available. Main advantage is that the lake f its to a maximum extent in the city’s water management system. Disadvantages are: • the borders of the lake have to be protected against the relatively large water level
f luctuation; • the subsequent wetting and drying of the border quickly deteriorates the isolating
bentonite layer; • the subsequent wetting and drying of the border will have negative aesthetic effects
on the border.
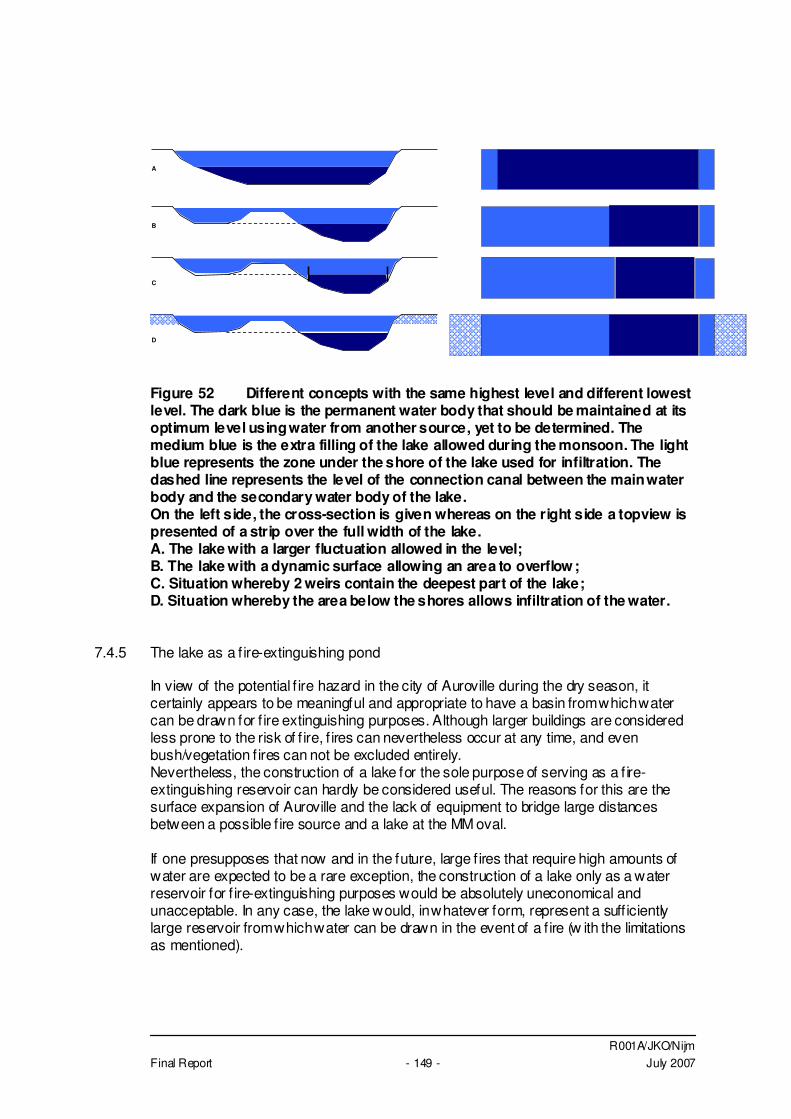
R001A/JKO/Nijm Final Report - 149 - July 2007
A
B
C
D
Figure 52 Different concepts with the same highest level and different lowest level. The dark blue is the permanent water body that should be maintained at its optimum level using water from another source, yet to be determined. The medium blue is the extra filling of the lake allowed during the monsoon. The light blue represents the zone under the shore of the lake used for infiltration. The dashed line represents the level of the connection canal between the main water body and the secondary water body of the lake. On the left side, the cross-section is given whereas on the right side a topview is presented of a strip over the full width of the lake. A. The lake with a larger fluctuation allowed in the level; B. The lake with a dynamic surface allowing an area to overflow; C. Situation whereby 2 weirs contain the deepest part of the lake; D. Situation whereby the area below the shores allows infiltration of the water.
7.4.5 The lake as a f ire-extinguishing pond
In view of the potential f ire hazard in the city of Auroville during the dry season, it certainly appears to be meaningful and appropriate to have a basin from which water can be drawn for f ire extinguishing purposes. Although larger buildings are considered less prone to the risk of f ire, f ires can nevertheless occur at any time, and even bush/vegetation f ires can not be excluded entirely. Nevertheless, the construction of a lake for the sole purpose of serving as a f ire-extinguishing reservoir can hardly be considered useful. The reasons for this are the surface expansion of Auroville and the lack of equipment to bridge large distances between a possible f ire source and a lake at the MM oval. If one presupposes that now and in the future, large f ires that require high amounts of water are expected to be a rare exception, the construction of a lake only as a water reservoir for f ire-extinguishing purposes would be absolutely uneconomical and unacceptable. In any case, the lake would, in whatever form, represent a suff iciently large reservoir from which water can be drawn in the event of a f ire (w ith the limitations as mentioned).
R001A/JKO/Nijm Final Report - 150 - July 2007
7.4.6 The lake as a thermal buffer
In the South-Indian climate, ponds and lakes have a tendency to heat up considerably, which means that thermal energy is stored in the water. A basic examination was therefore conducted in the current study to see whether this energy could be used directly or indirectly. The average year temperature for the Matrimandir lake was assumed to be clearly above 30°C. With this, it would be conceivable in principle to pump water from the lake through an eff icient heat exchanger or a heat pump, and use the extracted energy for operating an evaporator for air conditioning systems. The extracted "coldness" could be used to air-condition the Matrimandir or neighboring spaces and buildings. At the same time, the extraction of heat would have as added advantage that by returning the cooled-down water to the lake, the temperature of the water in the lake would drop, and following the convection process, additional water movements would occur. LGA contacted the BBS planning off ice in Hallbergmoos and had them examine this idea. The feedback it received from them w as that, although such a procedure certainly appears to be technically feasible, the technology is not yet available to carry out such a procedure cost-effectively. Concluding, the use of the lake as a thermal buffer under the present conditions is not an option.
7.5 Building principles
Whatever w ill be attached to the lake and whatever will be the f inal shape and depth of the lake, certain general building principles can be formulated.
7.5.1 Clay sealing
From March 15 to 21, 2003 a test pond was constructed in Auroville under the guidance of the LGA geologists, see Figure 53, with a sealing of laterite and treated w ith bentonite (bento-laterite). The objective of this undertaking was to demonstrate that, in principle, the sealing of the MM Lake can be accomplished with local soil materials and with minimal funds. The test pond showed that, by using locally available laterite soil and adding approx. 2% of bentonite powder, equivalent to 20 kg/t, a high-quality and durable sealing material can be obtained w ith a permeability of 10-9 m/day. A typical cross-section of the construction of the side of the lake is given in Figure 54. Matrimandir staff made observations and quantif ied data on water loss at the test pond, which was sealed with bento-laterite, by performing comparative measurements in the lake and on the bank. They came to the conclusion that water was lost almost entirely through evaporation, and that the test pond's sealing was virtually perfect. The advantages of constructing a lake with a sealing of locally available laterite were: Required materials are locally available at low cost; • Extremely low permeability;
R001A/JKO/Nijm Final Report - 151 - July 2007
• Employment for many (local) workers; • Flexible building method allow ing any geometrical.
Figure 53 Test pond near the Matrimandir (June 2003) Some disadvantages are: • Necessary to use some simple machines for mixing and compacting; • Considerable construction time.
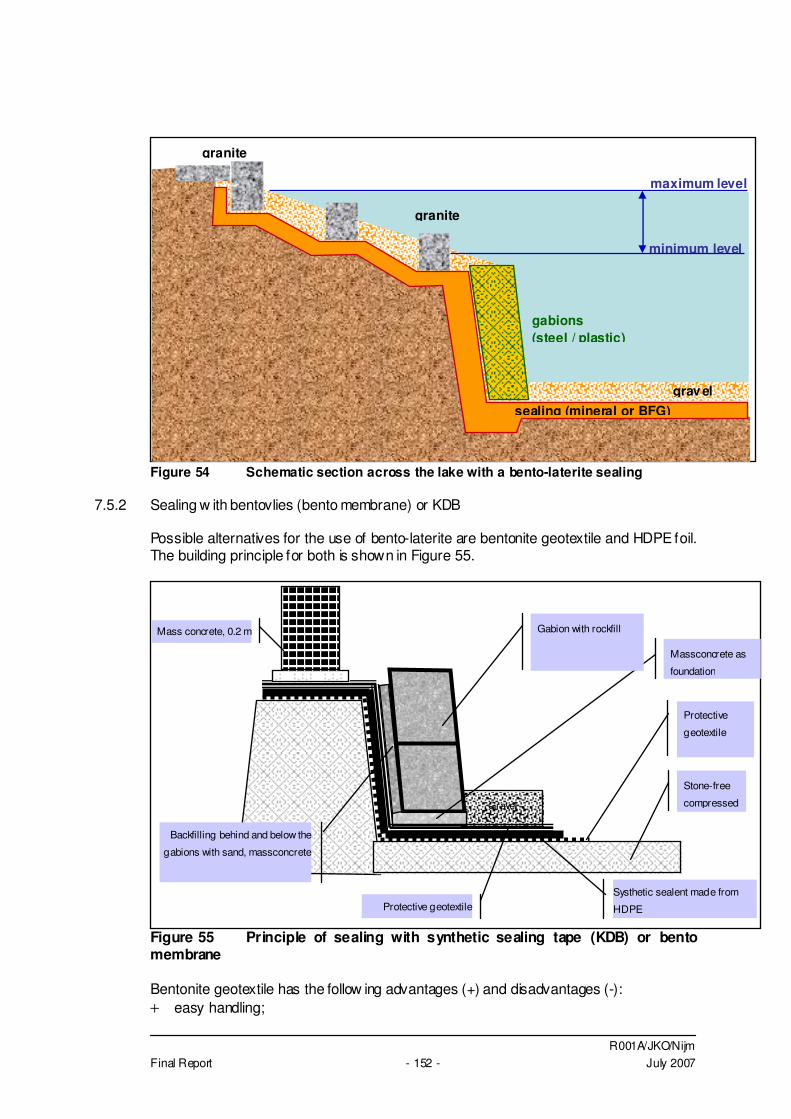
R001A/JKO/Nijm Final Report - 152 - July 2007
Figure 54 Schematic section across the lake with a bento-laterite sealing
7.5.2 Sealing w ith bentovlies (bento membrane) or KDB
Possible alternatives for the use of bento-laterite are bentonite geotextile and HDPE foil. The building principle for both is shown in Figure 55.
Figure 55 Principle of sealing with synthetic sealing tape (KDB) or bento membrane Bentonite geotextile has the follow ing advantages (+) and disadvantages (-): + easy handling;
Gravel
Stone-free
compressed
Protective
geotextile
Systhetic sealent made from
HDPE Protective geotextile
Massconcrete as
foundation
Backfilling behind and below the
gabions with sand, massconcrete
Gabion with rockfill Mass concrete, 0.2 m
maximum level
minimum level
gabions (steel / plastic)
sealing (mineral or BFG)
granite
granite
grav el
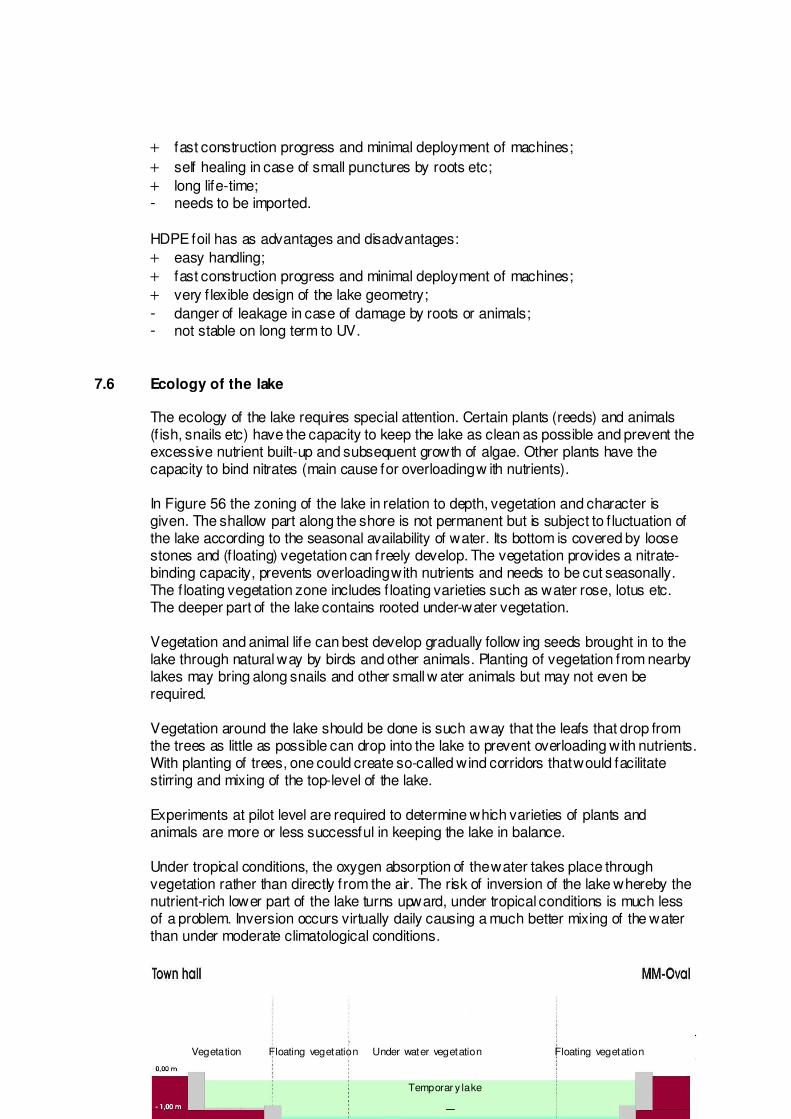
R001A/JKO/Nijm Final Report - 153 - July 2007
+ fast construction progress and minimal deployment of machines; + self healing in case of small punctures by roots etc; + long life-time; - needs to be imported. HDPE foil has as advantages and disadvantages: + easy handling; + fast construction progress and minimal deployment of machines; + very f lexible design of the lake geometry; - danger of leakage in case of damage by roots or animals; - not stable on long term to UV.
7.6 Ecology of the lake
The ecology of the lake requires special attention. Certain plants (reeds) and animals (f ish, snails etc) have the capacity to keep the lake as clean as possible and prevent the excessive nutrient built-up and subsequent growth of algae. Other plants have the capacity to bind nitrates (main cause for overloading w ith nutrients). In Figure 56 the zoning of the lake in relation to depth, vegetation and character is given. The shallow part along the shore is not permanent but is subject to f luctuation of the lake according to the seasonal availability of water. Its bottom is covered by loose stones and (f loating) vegetation can freely develop. The vegetation provides a nitrate-binding capacity, prevents overloading with nutrients and needs to be cut seasonally. The f loating vegetation zone includes f loating varieties such as water rose, lotus etc. The deeper part of the lake contains rooted under-water vegetation. Vegetation and animal life can best develop gradually follow ing seeds brought in to the lake through natural way by birds and other animals. Planting of vegetation from nearby lakes may bring along snails and other small w ater animals but may not even be required. Vegetation around the lake should be done is such a way that the leafs that drop from the trees as little as possible can drop into the lake to prevent overloading with nutrients. With planting of trees, one could create so-called wind corridors that would facilitate stirring and mixing of the top-level of the lake. Experiments at pilot level are required to determine which varieties of plants and animals are more or less successful in keeping the lake in balance. Under tropical conditions, the oxygen absorption of the water takes place through vegetation rather than directly from the air. The risk of inversion of the lake whereby the nutrient-rich lower part of the lake turns upward, under tropical conditions is much less of a problem. Inversion occurs virtually daily causing a much better mixing of the water than under moderate climatological conditions.
Vegetation
Temporar y lake
Floating vegetation Under water vegetation Floating vegetation
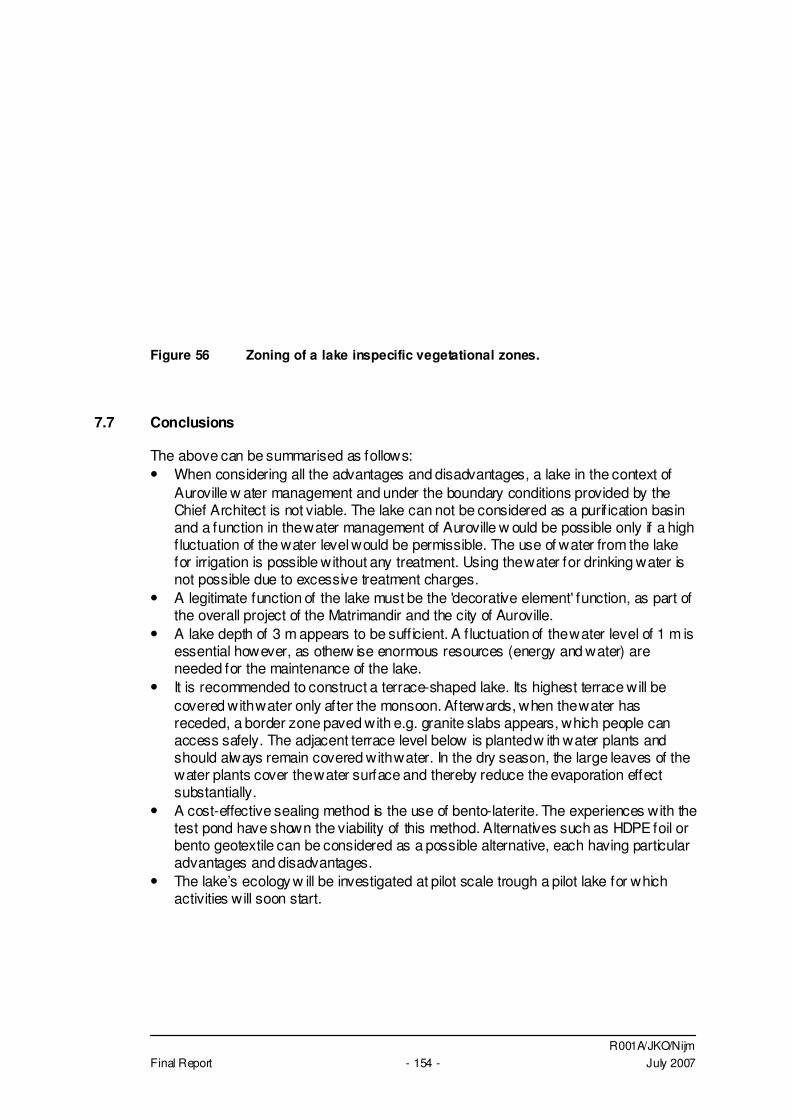
R001A/JKO/Nijm Final Report - 154 - July 2007
Figure 56 Zoning of a lake inspecific vegetational zones.
7.7 Conclusions
The above can be summarised as follows: • When considering all the advantages and disadvantages, a lake in the context of
Auroville w ater management and under the boundary conditions provided by the Chief Architect is not viable. The lake can not be considered as a purif ication basin and a function in the water management of Auroville w ould be possible only if a high f luctuation of the water level would be permissible. The use of water from the lake for irrigation is possible without any treatment. Using the water for drinking water is not possible due to excessive treatment charges.
• A legitimate function of the lake must be the 'decorative element' function, as part of the overall project of the Matrimandir and the city of Auroville.
• A lake depth of 3 m appears to be suff icient. A f luctuation of the water level of 1 m is essential however, as otherw ise enormous resources (energy and water) are needed for the maintenance of the lake.
• It is recommended to construct a terrace-shaped lake. Its highest terrace will be covered with water only after the monsoon. Afterwards, when the water has receded, a border zone paved with e.g. granite slabs appears, which people can access safely. The adjacent terrace level below is planted w ith water plants and should always remain covered with water. In the dry season, the large leaves of the water plants cover the water surface and thereby reduce the evaporation effect substantially.
• A cost-effective sealing method is the use of bento-laterite. The experiences with the test pond have shown the viability of this method. Alternatives such as HDPE foil or bento geotextile can be considered as a possible alternative, each having particular advantages and disadvantages.
• The lake’s ecology w ill be investigated at pilot scale trough a pilot lake for which activities will soon start.
R001A/JKO/Nijm Final Report - 155 - July 2007
8 EVALUATION
In chapter 5, 6 and 7 several techniques for the provision of (drinking) water, irrigation water, the treatment of waste water and the possible function for a lake around the Matrimandir have been presented and systematically discussed. In this chapter for all 3 major items, an evaluation table has been presented listing the scores of these various schemes on the different evaluation criteria. The details of the evaluation have been presented in Annex I.
8.1 Summary
Water supply Water supply can best be done through a system that combines all available sources in an appropriate way. Dependency on groundwater should be strongly reduced in view of the lack of sustainability. Rainwater harvesting should be structurally implemented in Auroville and surrounding villages. Waste water treatment should be standardised in Auroville and surrounding villages. Recharge of groundwater from harvested rainwater and waste water eff luent should take place. Excess water for Kaluvely should be used for inf iltration of the Vanur aquifer. Desalination of brackish water or seawater could gradually replace groundwater as a source of domestic water in the dry season. Waste water management Waste water treatment should be extended throughout Auroville. Old and dysfunctional systems should be replaced and decentralised waste water treatment combined with eco-sanitation should be used as standard for the near future. As much as possible waste water should be organised by community or group of communities and facilities should be provided to either re-use the waste water or to inf iltrate the eff luent into the underground. Matrimandir Lake The justif ication of the Matrimandir lake mainly lies in the symbolism, aesthetics and social function of the lake. If boundary conditions from the Chief Architect are somewhat relaxed, the lake could also play a minor role in water management and could at least capture the rainwater directly falling on the lake. The lake can not have a purifying function and should not be deeper than 4 m. Larger depth only works adverse on water quality and amount of soil movement to be done. Laterite mixed with bentonite can be used as sealant while its borders in view of the required water level f luctuations can best be made of gabions. Experiments at pilot scale should prove the necessity of the introduction of certain plants and animals to keep the water free of algae and in a healthy condition. Integral water management concept Thé integral water management concept for Auroville does not exist as it needs to be decided on in the coming years by the community at large and the various committees and groups active in this f ield. A decision tool has been presented in the report to assist with the outstanding issues and make well balanced choices. These choices need to be made by Auroville however and not by outsiders. Outsiders can only advise on the choices which is done in this comprehensive document providing a full overview of present status an various possibilities en techniques in water resources management, water supply, waste water management and the design, construction and operation of a
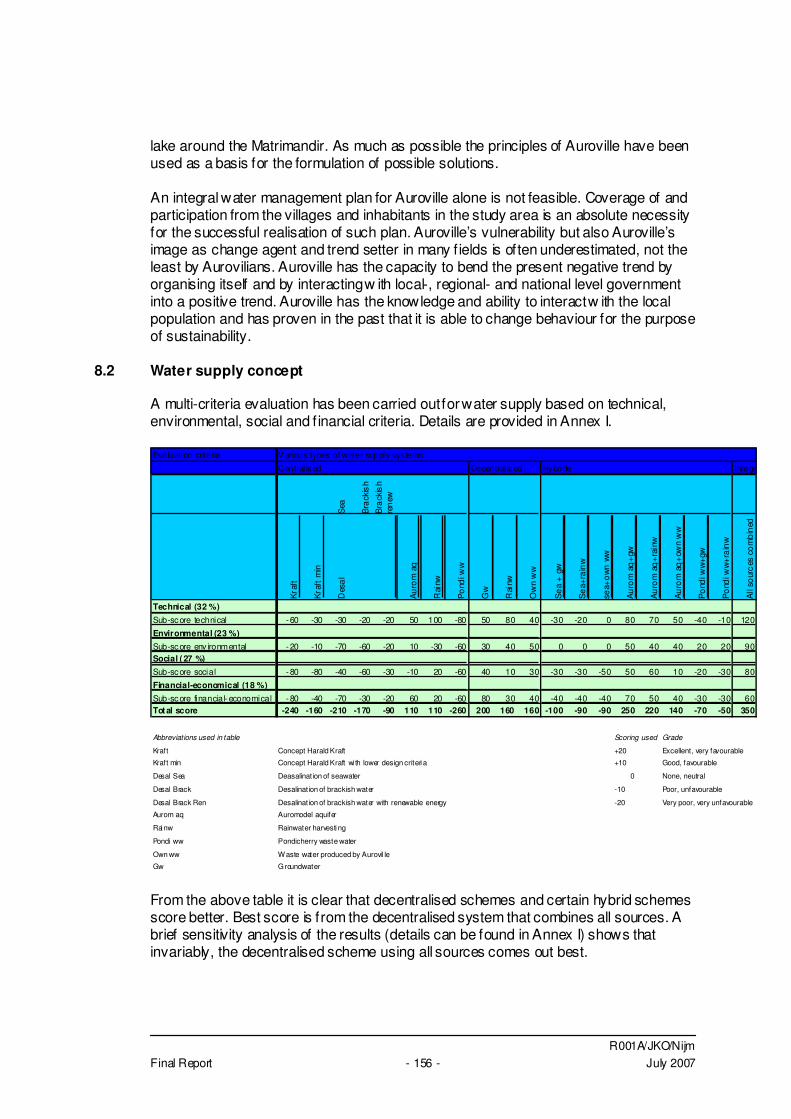
R001A/JKO/Nijm Final Report - 156 - July 2007
lake around the Matrimandir. As much as possible the principles of Auroville have been used as a basis for the formulation of possible solutions. An integral water management plan for Auroville alone is not feasible. Coverage of and participation from the villages and inhabitants in the study area is an absolute necessity for the successful realisation of such plan. Auroville’s vulnerability but also Auroville’s image as change agent and trend setter in many f ields is often underestimated, not the least by Aurovilians. Auroville has the capacity to bend the present negative trend by organising itself and by interacting w ith local-, regional- and national level government into a positive trend. Auroville has the knowledge and ability to interact w ith the local population and has proven in the past that it is able to change behaviour for the purpose of sustainability.
8.2 Water supply concept
A multi-criteria evaluation has been carried out for water supply based on technical, environmental, social and f inancial criteria. Details are provided in Annex I. Evaluation criteria
Central ised Decentral ised Hybride Integr
Sea
Bra
ckis
h
Bra
ckis
h re
new
Kra
ft
Kra
ft m
in
Des
al
Au
rom
aq
Rai
nw
Po
ndi w
w
Gw
Rai
nw
Ow
n w
w
Se
a +
gw
Se
a+ra
inw
sea+
ow
n w
w
Au
rom
aq
+gw
Au
rom
aq
+ra
inw
Au
rom
aq
+ow
n w
w
Po
ndi w
w+
gw
Po
ndi w
w+
rain
w
All
sour
ces
co
mb
ined
Technical (32 %)Sub-score technical - 60 -30 -30 -20 -20 50 100 -80 50 80 40 -30 -20 0 80 70 50 -40 -10 120
Environmental (23 %)Sub-score env ironmental - 20 -10 -70 -60 -20 10 -30 -60 30 40 50 0 0 0 50 40 40 20 20 90Social ( 27 %)Sub-score social - 80 -80 -40 -60 -30 -10 20 -60 40 10 30 -30 -30 -50 50 60 10 -20 -30 80
Financial-economical (18 %)Sub-score financial- economical - 80 -40 -70 -30 -20 60 20 -60 80 30 40 -40 -40 -40 70 50 40 -30 -30 60Total score -240 -160 -210 -170 -90 110 110 -260 200 160 160 -100 -90 -90 250 220 140 -70 -50 350
Abbreviations used in table Scoring used Grade
Kraft Concept Harald Kraft +20 Excellent, very favourable
Kraft min Concept Harald Kraft wi th lower design criteri a +10 Good, favourable
Desal Sea Deasalination of seawater 0 None, neutral
Desal Brack Desalination of brackish water -10 Poor, unfavourable
Desal Brack Ren Desalination of brackish water with renewable energy -20 Very poor, very unfavourable
Aurom aq Auromodel aquifer
Rainw Rainwater harvesti ng
Pondi ww Pondicherry waste water
Own ww Waste water produced by Aurovil le
Gw Groundwater
Various types of water supply sys tems
From the above table it is clear that decentralised schemes and certain hybrid schemes score better. Best score is from the decentralised system that combines all sources. A brief sensitivity analysis of the results (details can be found in Annex I) shows that invariably, the decentralised scheme using all sources comes out best.
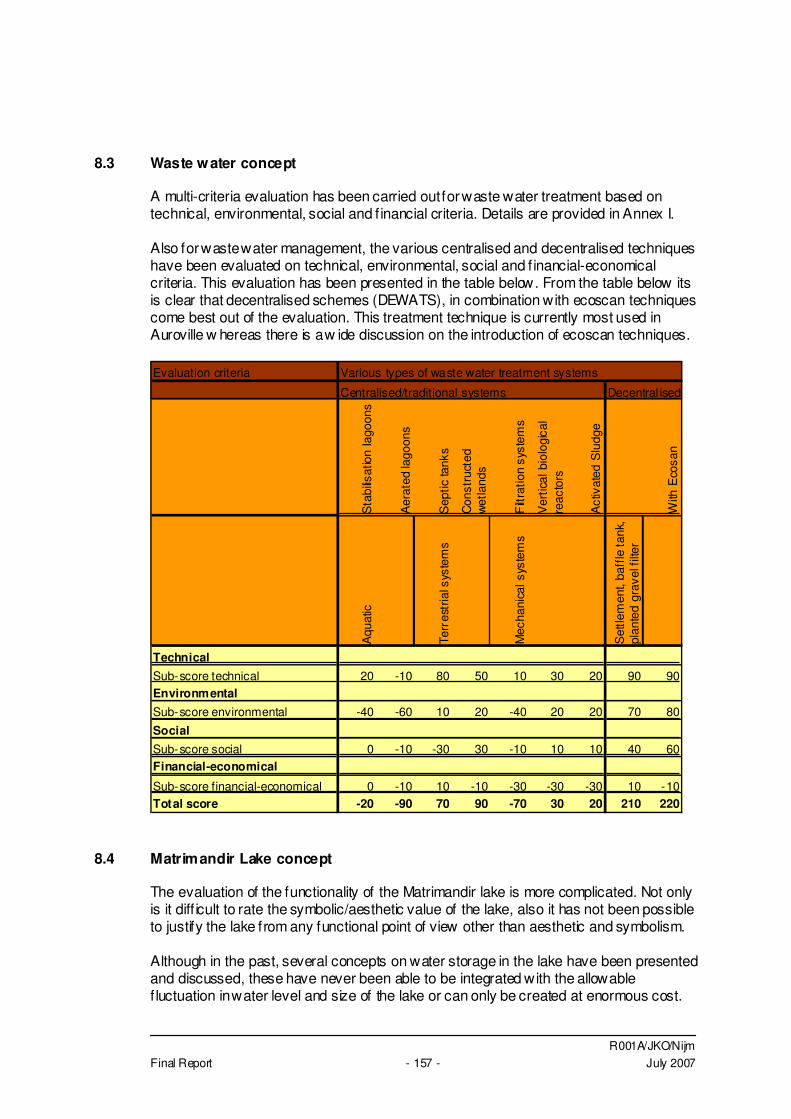
R001A/JKO/Nijm Final Report - 157 - July 2007
8.3 Waste water concept
A multi-criteria evaluation has been carried out for waste water treatment based on technical, environmental, social and f inancial criteria. Details are provided in Annex I. Also for waste water management, the various centralised and decentralised techniques have been evaluated on technical, environmental, social and f inancial-economical criteria. This evaluation has been presented in the table below. From the table below its is clear that decentralised schemes (DEWATS), in combination with ecoscan techniques come best out of the evaluation. This treatment technique is currently most used in Auroville w hereas there is a w ide discussion on the introduction of ecoscan techniques. Evaluation criteria
Centralised/traditional systems Decentral ised
Sta
bilis
atio
n la
goon
s
Aer
ated
lago
ons
Sep
tic ta
nks
Con
stru
cted
w
etla
nds
Filt
ratio
n sy
stem
s
Ver
tical
bio
logi
cal
reac
tors
Act
ivat
ed S
ludg
e
With
Eco
san
Aqu
atic
Terr
estr
ial s
yste
ms
Mec
hani
cal s
yste
ms
Set
tlem
ent,
baff
le ta
nk,
plan
ted
grav
el fi
lter
TechnicalSub-score technical 20 -10 80 50 10 30 20 90 90EnvironmentalSub-score environmental -40 -60 10 20 -40 20 20 70 80SocialSub-score social 0 -10 -30 30 -10 10 10 40 60Financial-economical
Sub-score financial-economical 0 -10 10 -10 -30 -30 -30 10 -10Total score -20 -90 70 90 -70 30 20 210 220
Various types of waste water treatment systems
8.4 Matrimandir Lake concept
The evaluation of the functionality of the Matrimandir lake is more complicated. Not only is it diff icult to rate the symbolic/aesthetic value of the lake, also it has not been possible to justify the lake from any functional point of view other than aesthetic and symbolism. Although in the past, several concepts on water storage in the lake have been presented and discussed, these have never been able to be integrated with the allowable f luctuation in water level and size of the lake or can only be created at enormous cost.
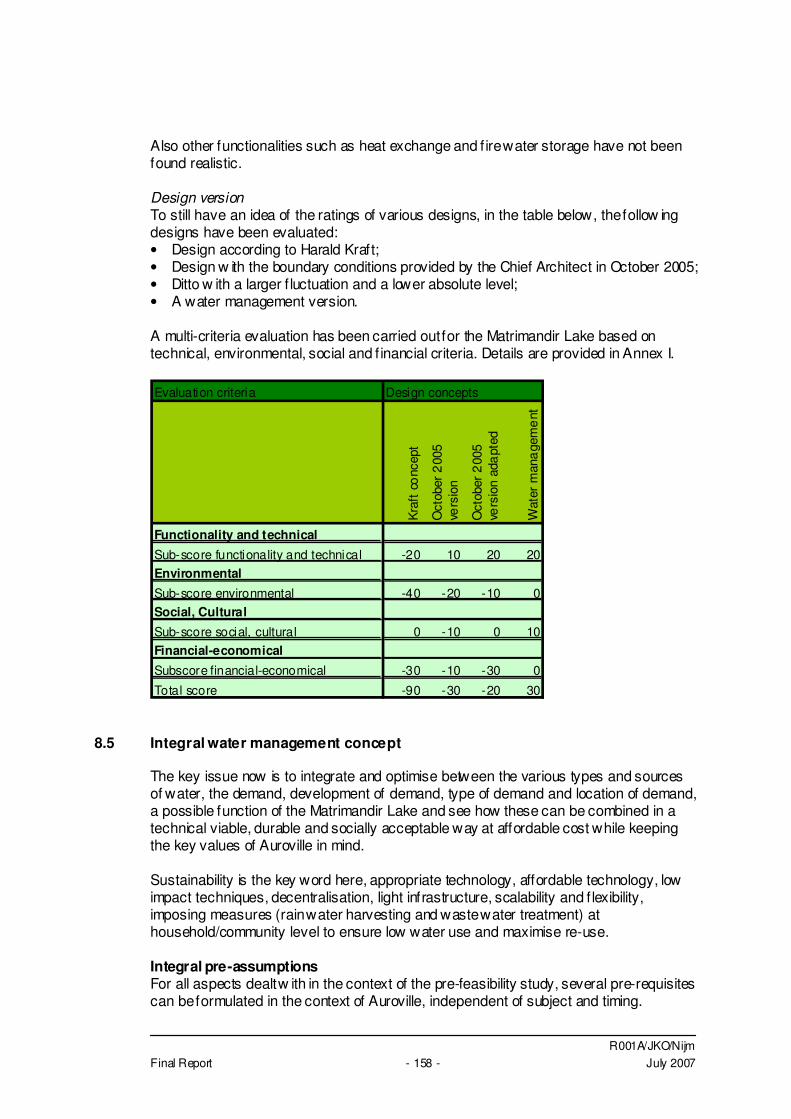
R001A/JKO/Nijm Final Report - 158 - July 2007
Also other functionalities such as heat exchange and f ire water storage have not been found realistic. Design version To still have an idea of the ratings of various designs, in the table below, the follow ing designs have been evaluated: • Design according to Harald Kraft; • Design w ith the boundary conditions provided by the Chief Architect in October 2005; • Ditto w ith a larger f luctuation and a lower absolute level; • A water management version. A multi-criteria evaluation has been carried out for the Matrimandir Lake based on technical, environmental, social and f inancial criteria. Details are provided in Annex I. Evaluation criteria Design concepts
Kra
ft c
onc
ept
Oct
ober
200
5
vers
ion
Oct
ober
200
5
vers
ion
ada
pted
Wat
er m
ana
gem
ent
Functionality and technical
Sub-score functionality and technical -20 10 20 20Environmental
Sub-score environmental -40 -20 -10 0Social, Cultural
Sub-score social, cultural 0 -10 0 10Financial-economical
Subscore financial-economical -30 -10 -30 0
Total score -90 -30 -20 30
8.5 Integral water management concept
The key issue now is to integrate and optimise between the various types and sources of water, the demand, development of demand, type of demand and location of demand, a possible function of the Matrimandir Lake and see how these can be combined in a technical viable, durable and socially acceptable way at affordable cost while keeping the key values of Auroville in mind. Sustainability is the key word here, appropriate technology, affordable technology, low impact techniques, decentralisation, light infrastructure, scalability and f lexibility, imposing measures (rain water harvesting and waste water treatment) at household/community level to ensure low water use and maximise re-use. Integral pre-assumptions For all aspects dealt w ith in the context of the pre-feasibility study, several pre-requisites can be formulated in the context of Auroville, independent of subject and timing.
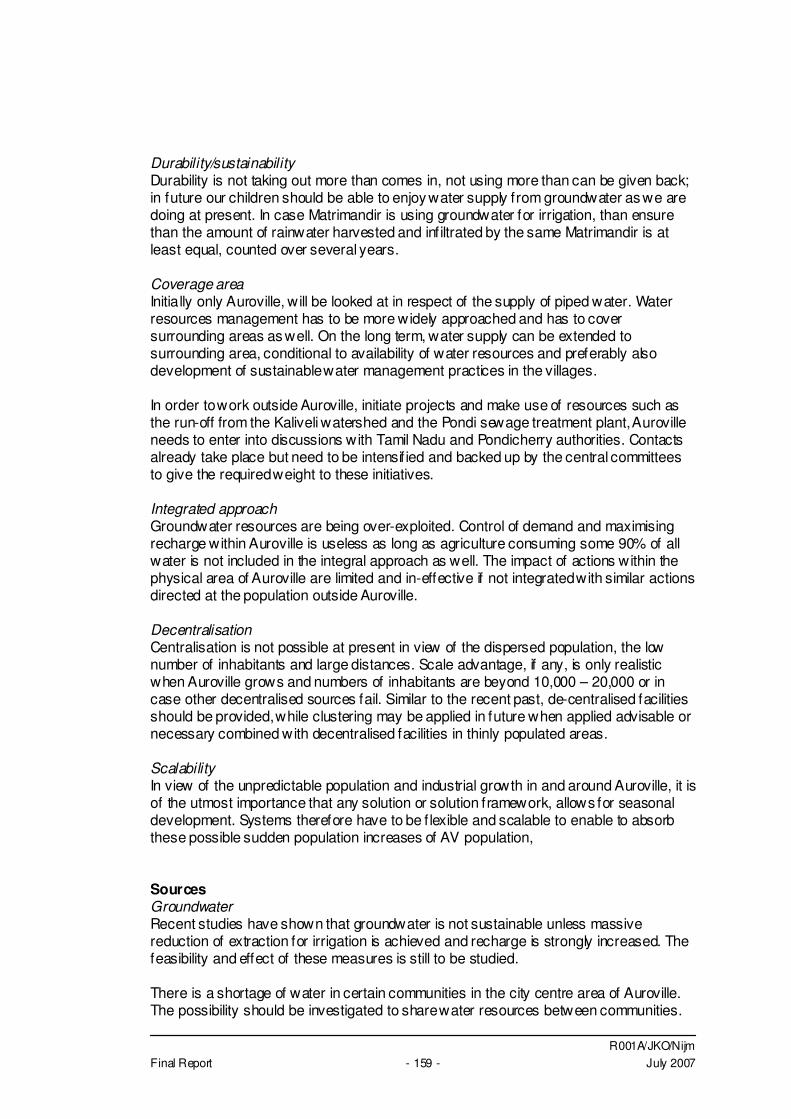
R001A/JKO/Nijm Final Report - 159 - July 2007
Durability/sustainability Durability is not taking out more than comes in, not using more than can be given back; in future our children should be able to enjoy water supply from groundwater as we are doing at present. In case Matrimandir is using groundwater for irrigation, than ensure than the amount of rainwater harvested and infiltrated by the same Matrimandir is at least equal, counted over several years. Coverage area Initially only Auroville, will be looked at in respect of the supply of piped water. Water resources management has to be more widely approached and has to cover surrounding areas as well. On the long term, water supply can be extended to surrounding area, conditional to availability of water resources and preferably also development of sustainable water management practices in the villages. In order to work outside Auroville, initiate projects and make use of resources such as the run-off from the Kaliveli watershed and the Pondi sewage treatment plant, Auroville needs to enter into discussions with Tamil Nadu and Pondicherry authorities. Contacts already take place but need to be intensif ied and backed up by the central committees to give the required weight to these initiatives. Integrated approach Groundwater resources are being over-exploited. Control of demand and maximising recharge within Auroville is useless as long as agriculture consuming some 90% of all water is not included in the integral approach as well. The impact of actions within the physical area of Auroville are limited and in-effective if not integrated with similar actions directed at the population outside Auroville. Decentralisation Centralisation is not possible at present in view of the dispersed population, the low number of inhabitants and large distances. Scale advantage, if any, is only realistic when Auroville grows and numbers of inhabitants are beyond 10,000 – 20,000 or in case other decentralised sources fail. Similar to the recent past, de-centralised facilities should be provided, while clustering may be applied in future when applied advisable or necessary combined with decentralised facilities in thinly populated areas. Scalability In view of the unpredictable population and industrial growth in and around Auroville, it is of the utmost importance that any solution or solution framework, allows for seasonal development. Systems therefore have to be f lexible and scalable to enable to absorb these possible sudden population increases of AV population, Sources Groundwater Recent studies have shown that groundwater is not sustainable unless massive reduction of extraction for irrigation is achieved and recharge is strongly increased. The feasibility and effect of these measures is still to be studied. There is a shortage of water in certain communities in the city centre area of Auroville. The possibility should be investigated to share water resources between communities.

R001A/JKO/Nijm Final Report - 160 - July 2007
An organisation (water service) could be helpful or even necessary in overstepping inter-community boundaries and get the resources organised. Groundwater investigation to Pondicherry waste water treatment is required to determine the (potential) impact of the infiltrated eff luent, both quality and quantity-w ise. Should it appear to be feasible to use this eff luent, after being purif ied, as a source for irrigation, then the effect of the diversion of this large volume of water from infiltration into the underground to irrigation areas nearby should be carefully studied: although not intentional, the infiltration of the sewage eff luent at its present location may have a signif icant inf luence on the present groundwater regime. Stopping this inf iltration will certainly inf luence this regime. The design of new wells and the use of materials and equipment should be investigated and as far as possible standardised. Measuring is knowing and monitoring should be continued, both aimed at quantity and quality. Reporting should be publicised in an effort to mobilise community awareness and result of peoples efforts to save water and support sustainability in water management. Rainwater and stormwater Rainw ater and stormwater should be harvested for irrigation and gardening use. At household level and community level, facilities for rainwater harvesting should be constructed. Standardisation of methods and materials are essential. Stormw ater drainage should be an extended component of rainwater harvesting, aiming at holding water as close as possible to the area where it falls, using green swales to convey the water, providing weirs in the swales to hold as much water as possible and f inally directing it to suitable storage/buffering and infiltration areas. Existing canyons and constructed check dams form an excellent example of how to deal sustainable with rainwater and stormwater. Modelling exercises should determine the most suitable location for inf iltration and the Masterplan should allow certain f lexibility in incorporating these areas as much as possible in green corridors, green zones and parks. Successful practices should be applied in the Bioregion, further increasing the amount of rainwater harvested and recharged. Programmes like the Kottakarai project should assist in the mobilisation of awareness of the importance of rainwater as single source and the use of it in irrigation and recharge. Surface water Surface water in the area is already well utilised. Due to the high evaporation, this resource has limited use in Auroville, in particular as Auroville is located on a plateau. Looking at the Bioregion, the surface water runoff towards Kaliveli is not well utilised. While the runoff is in the order of 180 Mm3/yr, the storage capacity is only some 35 Mm3. The excess is presently running through the reservoir and disappearing into the coastal lagoons and eventually the sea. Diverting the excess before it reaches the reservoir towards a recharge zone would offer the overexploited aquifers a valuable new source. This initiative needs to be carefully coordinated with the proper authorities. Farmers should be informed while the efforts to reduce groundwater exploitation should continue.
R001A/JKO/Nijm Final Report - 161 - July 2007
Waste water and sanitation Waste water treatment in Auroville is already well organised. The present practice of DEWATS should be universally applied throughout Auroville and new houses and projects should have a standardised waste water treatment system working according to proven technology. ECOSAN may be introduced a broad scale, further reducing the water required in sanitation and increasing the re-use of waste water and its eff luent. Standardised systems have to be imposed at construction as well as re-use facilities such as storage, pump and garden watering. Seawater Seawater is an infinite source but requires large amounts of energy and produces considerable amounts of chemical waste that has to be disposed off. Is should only be provided as a last resort when al other sources have been found unsuitable or unsustainable. If applied, maximum use should be made of renewable energy (wind, sun) for the production, treatment and distribution of the water. A timely reservation of the required area of land has to be made in case this techniques is required in the future. Water Demand Although the consumption of Auroville is very small compared to the water consumption for both domestic and agricultural purposes in the surrounding area, it is still felt that the average consumption in Auroville should be lowered. Auroville being and example and working on programmes to limit the consumption in the area surrounding Auroville, should be unspoken of in this respect. Clearly separating the demand between domestic and gardening/irrigation would help to still discussions on these subjects. A common reasonability towards careful and appropriate use of water can be reached through awareness and social control. This may require a change in gardening in Auroville from permanently water-demanding plants and lawns towards wild gardens that require little to no water. The area around Auroville and in particular the agricultural sector, remains the focus of awareness and campaigns on water saving in irrigation and agriculture. Large programs as IAMWARM (aiming at modernisation of agricultural sector in Tamil Nadu) help, but much more benefit can be obtained from programs through NGO’s and Auroville services like Harvest and Palmyra. Successes have been made in the past to introduce water saving practices in irrigation an less water demanding crops. Water supply Production Supply of water continues to aim at clean but not at potable water. Long term supply, once the city develops further may aim at potable water, but that is yet to be seen. Groundwater shall be treated for its iron content and acidity and further treatment shall be carried out at community of household level. Water supply needs to shift from groundwater to rainwater, supplemented with desalinised seawater in periods of shortage. Desalination should be investigated in further detail and necessary precautions (land acquisition, legal pre-conditions) should be investigated.
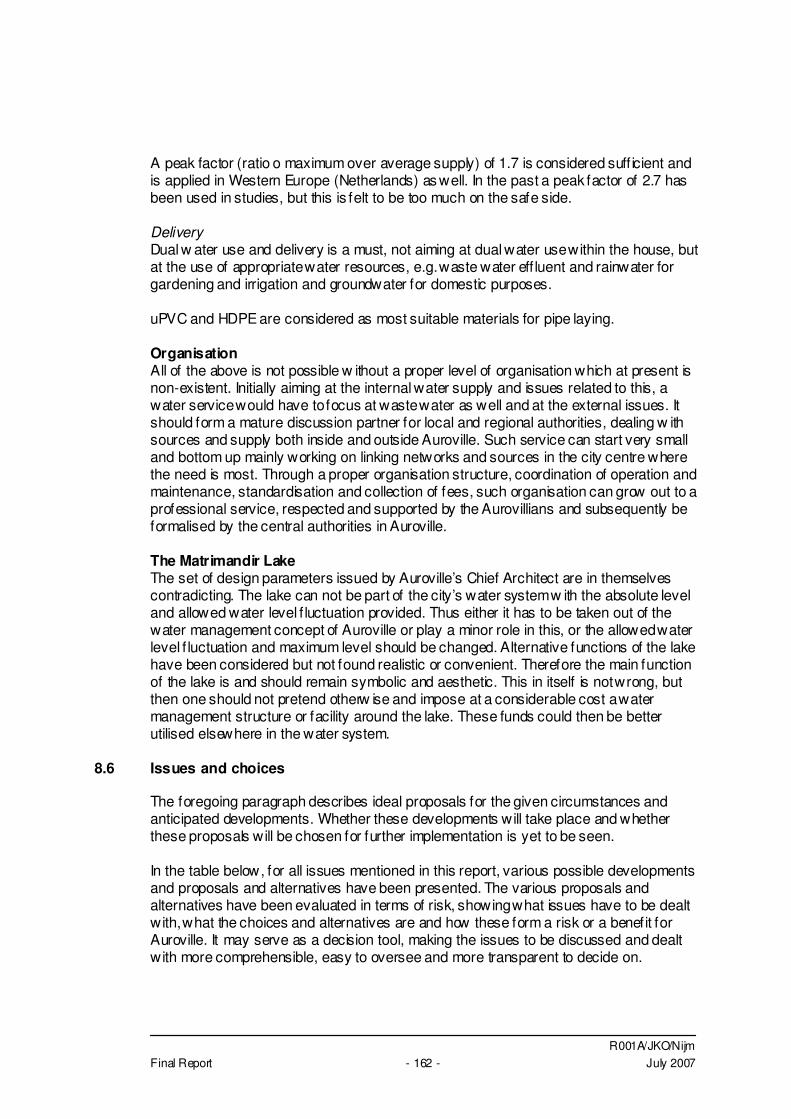
R001A/JKO/Nijm Final Report - 162 - July 2007
A peak factor (ratio o maximum over average supply) of 1.7 is considered suff icient and is applied in Western Europe (Netherlands) as well. In the past a peak factor of 2.7 has been used in studies, but this is felt to be too much on the safe side. Delivery Dual w ater use and delivery is a must, not aiming at dual water use within the house, but at the use of appropriate water resources, e.g. waste water eff luent and rainwater for gardening and irrigation and groundwater for domestic purposes. uPVC and HDPE are considered as most suitable materials for pipe laying. Organisation All of the above is not possible w ithout a proper level of organisation which at present is non-existent. Initially aiming at the internal water supply and issues related to this, a water service would have to focus at waste water as well and at the external issues. It should form a mature discussion partner for local and regional authorities, dealing w ith sources and supply both inside and outside Auroville. Such service can start very small and bottom up mainly working on linking networks and sources in the city centre where the need is most. Through a proper organisation structure, coordination of operation and maintenance, standardisation and collection of fees, such organisation can grow out to a professional service, respected and supported by the Aurovillians and subsequently be formalised by the central authorities in Auroville. The Matrimandir Lake The set of design parameters issued by Auroville’s Chief Architect are in themselves contradicting. The lake can not be part of the city’s water system w ith the absolute level and allowed water level f luctuation provided. Thus either it has to be taken out of the water management concept of Auroville or play a minor role in this, or the allowed water level f luctuation and maximum level should be changed. Alternative functions of the lake have been considered but not found realistic or convenient. Therefore the main function of the lake is and should remain symbolic and aesthetic. This in itself is not wrong, but then one should not pretend otherw ise and impose at a considerable cost a water management structure or facility around the lake. These funds could then be better utilised elsewhere in the water system.
8.6 Issues and choices
The foregoing paragraph describes ideal proposals for the given circumstances and anticipated developments. Whether these developments will take place and whether these proposals will be chosen for further implementation is yet to be seen. In the table below, for all issues mentioned in this report, various possible developments and proposals and alternatives have been presented. The various proposals and alternatives have been evaluated in terms of risk, showing what issues have to be dealt with, what the choices and alternatives are and how these form a risk or a benefit for Auroville. It may serve as a decision tool, making the issues to be discussed and dealt with more comprehensible, easy to oversee and more transparent to decide on.
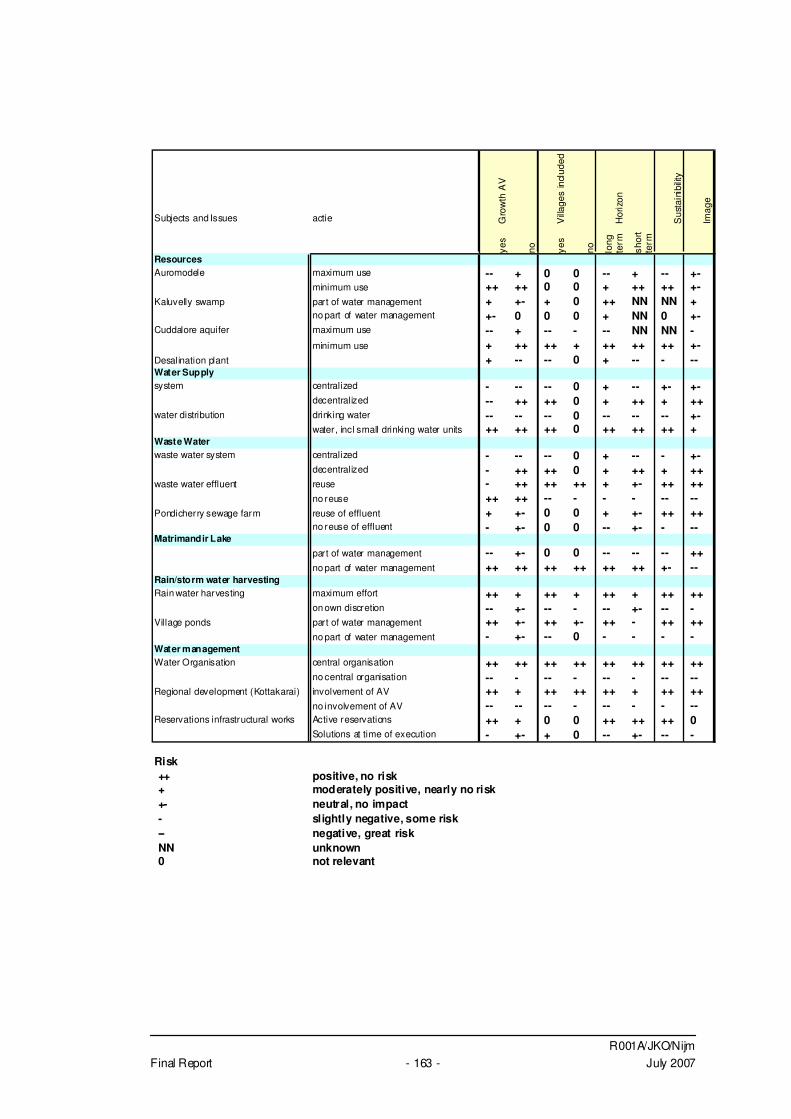
R001A/JKO/Nijm Final Report - 163 - July 2007
Subjects and Issues actie Gro
wth
AV
Villa
ges
incl
uded
Hor
izon
Sus
tain
ibilit
y
Imag
e
yes
no yes
no long
te
rm
shor
t te
rm
ResourcesAuromodele maximum use -- + 0 0 -- + -- +-
minimum use ++ ++ 0 0 + ++ ++ +-Kaluvelly swamp part of water management + +- + 0 ++ NN NN +
no part of water management +- 0 0 0 + NN 0 +-Cuddalore aquifer maximum use -- + -- - -- NN NN -
minimum use + ++ ++ + ++ ++ ++ +-Desalination plant + -- -- 0 + -- - --Water Supplysystem centralized - -- -- 0 + -- +- +-
decentralized -- ++ ++ 0 + ++ + ++water distribution drinking water -- -- -- 0 -- -- -- +-
water, incl small drinking water units ++ ++ ++ 0 ++ ++ ++ +Waste Waterwaste water system centralized - -- -- 0 + -- - +-
decentralized - ++ ++ 0 + ++ + ++waste water effluent reuse - ++ ++ ++ + +- ++ ++
no reuse ++ ++ -- - - - -- --Pondicherry sewage farm reuse of effluent + +- 0 0 + +- ++ ++
no reuse of effluent - +- 0 0 -- +- - --Matrimandir Lake
part of water management -- +- 0 0 -- -- -- ++no part of water management ++ ++ ++ ++ ++ ++ +- --
Rain/storm water harvestingRain water harvesting maximum effort ++ + ++ + ++ + ++ ++
on own discretion -- +- -- - -- +- -- -Village ponds part of water management ++ +- ++ +- ++ - ++ ++
no part of water management - +- -- 0 - - - -Water managementWater Organisation central organisation ++ ++ ++ ++ ++ ++ ++ ++
no central organisation -- - -- - -- - -- --Regional development (Kottakarai) involvement of AV ++ + ++ ++ ++ + ++ ++
no involvement of AV -- -- -- - -- - - --Reservations infrastructural works Active reservations ++ + 0 0 ++ ++ ++ 0
Solutions at time of execution - +- + 0 -- +- -- -
Risk ++ positive, no risk + moderately positive, nearly no risk +- neutral, no impact - slightly negative, some risk -- negative, great risk NN unknown 0 not relevant
R001A/JKO/Nijm Final Report - 164 - July 2007
9 CONCLUSION AND RECOMMENDATIONS
General Auroville f inds itself at an important moment in time. Land acquisition has restarted, there is a growing unrest w ithin and outside Auroville regarding water and water resources, numerous developments around Auroville take place or are about to take place and groundwater resources are nearing depletion. It is time for choices and subsequent action. The study After 2 years of work and several important and productive side steps, this report provides a clear framework and direction of development for the water resources in and around Auroville. From the work it has been clear that a sectoral approach and/or a small scale approach will never solve the problems regarding water. The problems are widespread and integral and should be dealt with in the same way. This study does not provide Auroville with a ready made plan. In view of Auroville’s present situation and uncertain future in terms of population and resources, such a plan is neither believed necessary nor appropriate at this moment in time. This study thus only analyses and evaluates various solutions and shows the best solutions for various problems according to today’s level of knowledge, predictions on future developments. Whether these solutions are indeed chosen is entirely up to Auroville and its inhabitants. That solutions need to be found or at least directions need to be taken may be suff iciently clear from this document. Water resources Groundwater is and will on the short term be the most important source of water for Auroville. Recent study has shown that groundwater is unsustainable at the short term and urgently alternatives need to be found and groundwater management should be drastically changed. At this moment resources suff ice for the inhabitants. Some sharing is however required. To achieve this, the water supply systems of several communities will have to be connected. Long term reliability of water resources entirely depends on the developments in the agricultural sector and the possible recharge from surface water, rainwater and waste water eff luent. In how far these measures are effective and where best they can be applied, still needs to be seen. Other sources such as waste water eff luent and rainwater are for several reasons not suitable for domestic water supply. They should thus be used for irrigation and gardening only (appropriate use). To ensure that this is actually being done as much as possible, standardisation of methods and materials and the obligation related to building permits are strongly advised. If immediate re-use of rainwater and waste water eff luent is not possible, it should be used for recharge of the groundwater w ith the emphasis of the Vanur and Cuddalore aquifers. Several studies have been carried out showing the most reliable and successful recharge areas. Should these areas not be feasible in the context of the Masterplan, then this Masterplan should be applied with a certain level of f lexibility to ensure that these areas remain available for recharge.
R001A/JKO/Nijm Final Report - 165 - July 2007
Rainw ater harvesting and stormw ater drainage also require buffering of water. Areas w ill have to be identif ied where the storage and buffering of the rainwater can be combined with a park, inf iltration area etc. Desalination of brackish and salt water as an alternative for groundwater and a supplement for rainwater in the dry season is an alternative that should be further exploited. Eff luent from the Pondicherry waste water treatment plant may endanger the entire hydrogeology of the area. Investigations have to be conducted towards the qualitative and quantitative impact of the free-f low ing eff luent that continues to infiltrate in this area. Also the solid waste present may contribute to the pollution of the underground in this area. Simultaneously, investigations can focus on the treatment of the eff luent to enable the re-use as either irrigation water or clean infiltration and recharge water. Water demand The water demand in Auroville is still high compared to the surrounding area, even compared to Europe. Auroville being a sustainable community is able to reduce further and give a good example for the surrounding area. Embarking on programmes to reduce water use in agriculture, Auroville w ill have to show that they are amongst the best pupils in class. Water demand should be separated in domestic and gardening/irrigation as far as the present infrastructure allows. Further development should aim at the supply of appropriate water e.g. groundwater for domestic water and waste water eff luent and rainwater and stormwater for gardening and irrigation. Large integral programs should be carried out to reduce irrigation and work on water saving irrigation practices and crops. At the same time, the use of waste water eff luent and rainwater harvesting/storm water drainage should be promoted. Water supply Water supply should continue decentralised. Some schemes will be connected to provide suff icient sources for all. On the long term, more schemes may be linked and supply may be partially centralised. The water supply scheme are not providing potable water. This does not need to be changed. In the far future when population numbers have grown and the water supply is much more centralised, the system may provide potable water. The system is simple and appropriate for the present situation. Supply security and pressure are w ithin reasonable limits and can not be raised unless considerable investments are made. Priorities lie elsewhere. Waste water management Waste water should continue to be treated decentralised and used decentralised organised per community or group of communities. Successful treatment methods should be universally applied to achieve standardisation in eff luent quality and materials and equipment. Facilities should be provided to re-use the eff luent for gardening and irrigation. Organisation An organisation is lacking in water supply, in waste water treatment as well as in rainwater harvesting. As a result, various techniques, materials and equipment are used in Auroville. A new organisation can streamline activities in these f ields, can coordinate
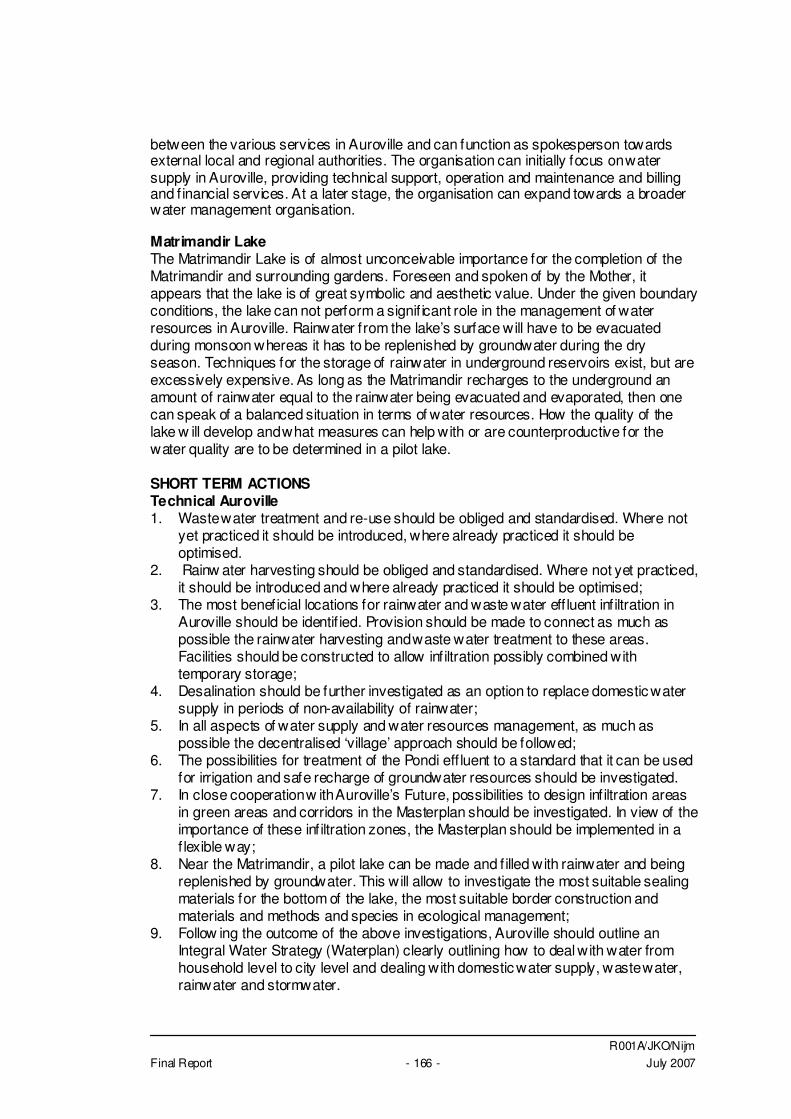
R001A/JKO/Nijm Final Report - 166 - July 2007
between the various services in Auroville and can function as spokesperson towards external local and regional authorities. The organisation can initially focus on water supply in Auroville, providing technical support, operation and maintenance and billing and f inancial services. At a later stage, the organisation can expand towards a broader water management organisation. Matrimandir Lake The Matrimandir Lake is of almost unconceivable importance for the completion of the Matrimandir and surrounding gardens. Foreseen and spoken of by the Mother, it appears that the lake is of great symbolic and aesthetic value. Under the given boundary conditions, the lake can not perform a signif icant role in the management of water resources in Auroville. Rainwater from the lake’s surface will have to be evacuated during monsoon whereas it has to be replenished by groundwater during the dry season. Techniques for the storage of rainwater in underground reservoirs exist, but are excessively expensive. As long as the Matrimandir recharges to the underground an amount of rainwater equal to the rainwater being evacuated and evaporated, then one can speak of a balanced situation in terms of water resources. How the quality of the lake w ill develop and what measures can help with or are counterproductive for the water quality are to be determined in a pilot lake. SHORT TERM ACTIONS Technical Auroville 1. Waste water treatment and re-use should be obliged and standardised. Where not
yet practiced it should be introduced, where already practiced it should be optimised.
2. Rainw ater harvesting should be obliged and standardised. Where not yet practiced, it should be introduced and where already practiced it should be optimised;
3. The most beneficial locations for rainwater and waste water eff luent inf iltration in Auroville should be identif ied. Provision should be made to connect as much as possible the rainwater harvesting and waste water treatment to these areas. Facilities should be constructed to allow infiltration possibly combined with temporary storage;
4. Desalination should be further investigated as an option to replace domestic water supply in periods of non-availability of rainwater;
5. In all aspects of water supply and water resources management, as much as possible the decentralised ‘village’ approach should be followed;
6. The possibilities for treatment of the Pondi eff luent to a standard that it can be used for irrigation and safe recharge of groundwater resources should be investigated.
7. In close cooperation w ith Auroville’s Future, possibilities to design infiltration areas in green areas and corridors in the Masterplan should be investigated. In view of the importance of these infiltration zones, the Masterplan should be implemented in a f lexible way;
8. Near the Matrimandir, a pilot lake can be made and f illed with rainwater and being replenished by groundwater. This will allow to investigate the most suitable sealing materials for the bottom of the lake, the most suitable border construction and materials and methods and species in ecological management;
9. Follow ing the outcome of the above investigations, Auroville should outline an Integral Water Strategy (Waterplan) clearly outlining how to deal with water from household level to city level and dealing with domestic water supply, waste water, rainwater and stormwater.
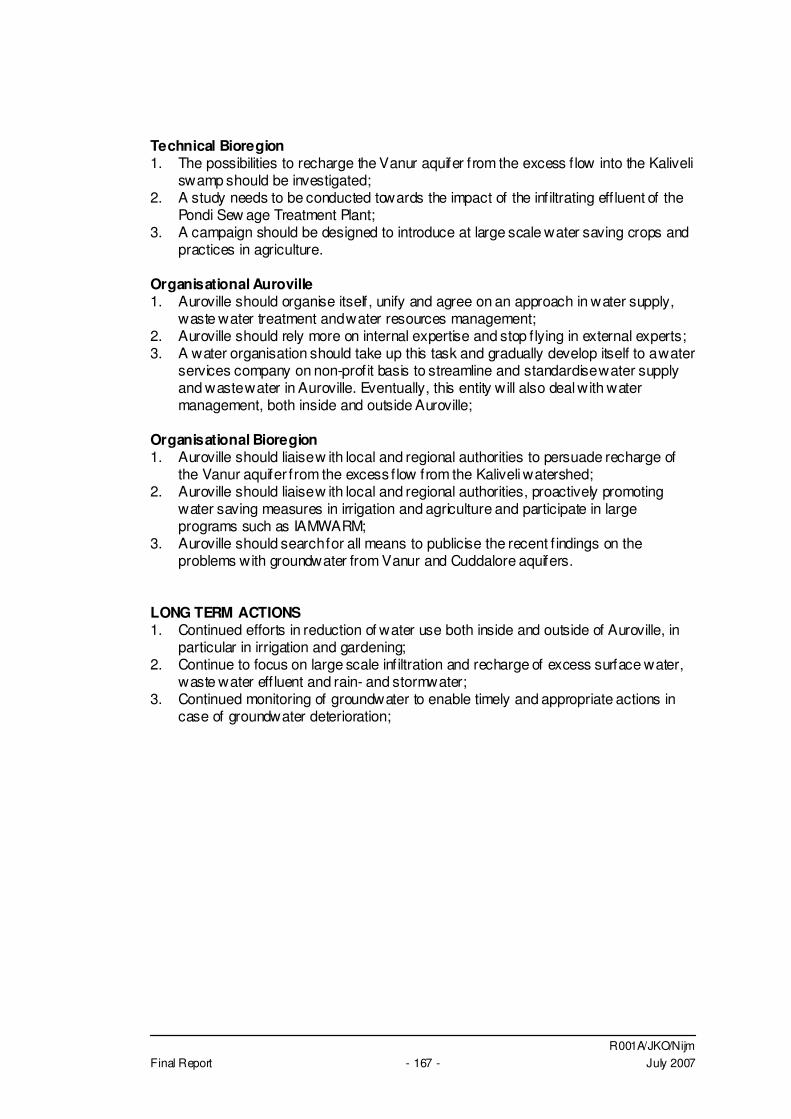
R001A/JKO/Nijm Final Report - 167 - July 2007
Technical Bioregion 1. The possibilities to recharge the Vanur aquifer from the excess f low into the Kaliveli
swamp should be investigated; 2. A study needs to be conducted towards the impact of the infiltrating eff luent of the
Pondi Sew age Treatment Plant; 3. A campaign should be designed to introduce at large scale water saving crops and
practices in agriculture. Organisational Auroville 1. Auroville should organise itself, unify and agree on an approach in water supply,
waste water treatment and water resources management; 2. Auroville should rely more on internal expertise and stop f lying in external experts; 3. A water organisation should take up this task and gradually develop itself to a water
services company on non-profit basis to streamline and standardise water supply and waste water in Auroville. Eventually, this entity will also deal with water management, both inside and outside Auroville;
Organisational Bioregion 1. Auroville should liaise w ith local and regional authorities to persuade recharge of
the Vanur aquifer from the excess f low from the Kaliveli watershed; 2. Auroville should liaise w ith local and regional authorities, proactively promoting
water saving measures in irrigation and agriculture and participate in large programs such as IAMWARM;
3. Auroville should search for all means to publicise the recent f indings on the problems with groundwater from Vanur and Cuddalore aquifers.
LONG TERM ACTIONS 1. Continued efforts in reduction of water use both inside and outside of Auroville, in
particular in irrigation and gardening; 2. Continue to focus on large scale infiltration and recharge of excess surface water,
waste water eff luent and rain- and stormwater; 3. Continued monitoring of groundwater to enable timely and appropriate actions in
case of groundwater deterioration;
R001A/JKO/Nijm Final Report - 168 - July 2007
10 REFERENCES
All possible information has a source. The nature and history of this study requires a careful listing of all sources of information to allow checking and verif ication. Agarwal, A et al. (2001). Making water everybody´s business. Center for Science and Environment, New Delhi ATV-DVWK-M 153 (2000). Handlungsempfehlungen zum Umgang mit Regenw asser, ATV-DVWKRegelwerk 1/2000 ATV-Arbeitsblatt A121: „Niederschlag – Starkregenauswertung nach Wiederkehrzeit und Dauer, Niederschlagsmessungen, Auswertung“, Gesellschaft zur Förderung der Abwassertechnik e.V., St. Augustin, 1985 CGWB (1984). Hydrogeological conditions in Auroville Coombes, P., Kuczera, G., & Kalma, J. (2000). "Rainwater Quality from Roofs Tanks and Hot Water Systems at Fig Tree Place" Proceedings of the 3rd International Hydrology and Water Resources, Symposium, Perth. CWP (Center for Watershed Protection, 1998), Environmental Quality Resources and Loiederman Associates. Maryland Stormw ater Design Manual. Draft. Prepared for: Maryland Department of the Environment. Baltimore, MD. DayWater (2003): Report 5.1. Review of the Use of stormwater BMPs in Europe, prepared by Middlesex University Driscoll, E., Shelley, P., Strecker, E. (1990): Pollutant Loadings and Impacts from Highw ay Stormw ater Runoff, Volume 1. Federal Highway Administration, Washington, D.C. Gassama, N., Violette S., Ozouville d’ N., Dia A. (2002). Multiple origin of water salinization in a coastal aquifer, south India - Geochemical point of view. Goldschmidt Conference, Davos (Swiss) & Geochimica and Cosmochimica Acta. vol.66 A2/65. Gassama, N., S. Violette, Ozouville d’ N., Dia A., Jendrzejewski N. (2003). Multiple origin of water salinization in a coastal aquifer in the Bay of Bengal. Water Quality Management International Conference New Delhi (Inde), III-98/III-105. Gassama, N., S. Violette, Ozouville d’ N., Dia A., Jendrzejewski N. (2003). Multiple origin of water salinization in a coastal aquifer, Bay of Bengal. Hydrology of the mediterranean and semi-arid regions International Conference, Montpellier (France), AISH eds. 6p. Gould, J.C. (1993). Roof runoff as a diffuse source of metals and aquatic toxicity in stormwater. Water, Science Technology 28: 317-322. Gvt of India (1979). Report on the scope for further groundwater development in Pondicherry region
R001A/JKO/Nijm Final Report - 169 - July 2007
Hopp, Vollrath (2004) Wasser Krise?. Wasser, nature, Mensch, Technik und Wirtshaft. IIT Delhi (July 2000). Water Quality in domestic roofwater harvesting systems (DRWH), C-3 Report Kraft, H. (2003): Pre-Feasibility Study on Water Supply, Stormwater- and Wastewater Management; City of Auroville, page 119 MDE (2000): Standards and Specif ication for Storm Water Management: Infiltration Practices. Maryland Department of the Environment. Annapolis NGRI (1987). Study of groundwater ressources of Pondicherry and its environ Ozouville d’, N. (2002). Contributions à l'étude hydro-géochimique du bassin versant de Kaliveli, Sud-Est de l'Inde. Mémoire de DEA de l’Université Pierre et Marie Curie. 53 p. O´Meara, G. F. (1993). Mosquitoes Associated w ith Stormw ater Detention/Retention Areas, Institute of Food and Agricultural Sciences, University of Florida Ozouville d’ N., Violette S., Gassama N., Dia A. and Jendzejewski N., Origin of water salinization in a coastal aquifer of the Bay of Bengal: the Kaliveli watershed, Tamil Nadu, India, Journal of Contaminant Hydrology, submitted Pacey, A., Cullis, A. (1996). Rainwater harvesting: The collection of rainfall and runoff in rural areas. IT Publications London. Palmyra (2005). Annual Report 2004 – 2005, PALMYRA, Centre for Ecological Landuse, Water Management and Rural Development, Aurobrindavan, Auroville Ranade, R. (2001) A Water Harvesting Manual for Urban Areas: Case Studies From Delhi, Centre for Science and Environment, Delhi. Scheuler (1987) Controlling Urban Runoff: A Practical Manual for Planning and Designing Urban BMPs. Metropolitan Washington Council of Governments Still, G. T., Thomas, T. H. (2002). The optimum sizing of gutters for domestic roofwater harvesting. DTU, University of Warwick, UK Thomas, P.R., Greene, G.R. (1993). Rain water quality from different roof catchments. Water Science Technology 28: 291-297. Thomas, T. H. (1997). Guttering design for rainwater harvesting, working paper No. 50. DTU, University of Warwick, UK Vincent, A (2007), Hydrological and Hydrogeological study of the coastal sedimentary basin of Kaluveli-Pondicherry (Tamil Nadua, India), Thesis. Violette, S., N. Gassama, Jendrzejewski N. (2001). Coastal aquifer in the Bay of Bengal - Is water salinization due to seawater intrusion or does it have multiple origins ? SWICA First International Conference, Essaouira (Morocco). 4p.
R001A/JKO/Nijm Final Report - 170 - July 2007
Violette S., Vincent A., de Marsily G., Boulicot G., (2004). HELP proposal for the Kaliveli & Pondicherry sedimentary coastal basin, Tamil Nadu India WHO (1996). Guidelines for Drinking Water Quality, 2nd Edition, Vol. 2. World Health Organization, Geneva. Yaziz, M., Gunting, H., Sapiari, N., Ghazali, A. (1989). Variation in rainwater quality from roof catchments. Water Research 23: 761-765.

R001A/JKO/Nijm Final Report July 2007
���������� ��
Annex A Abbreviations and Definitions
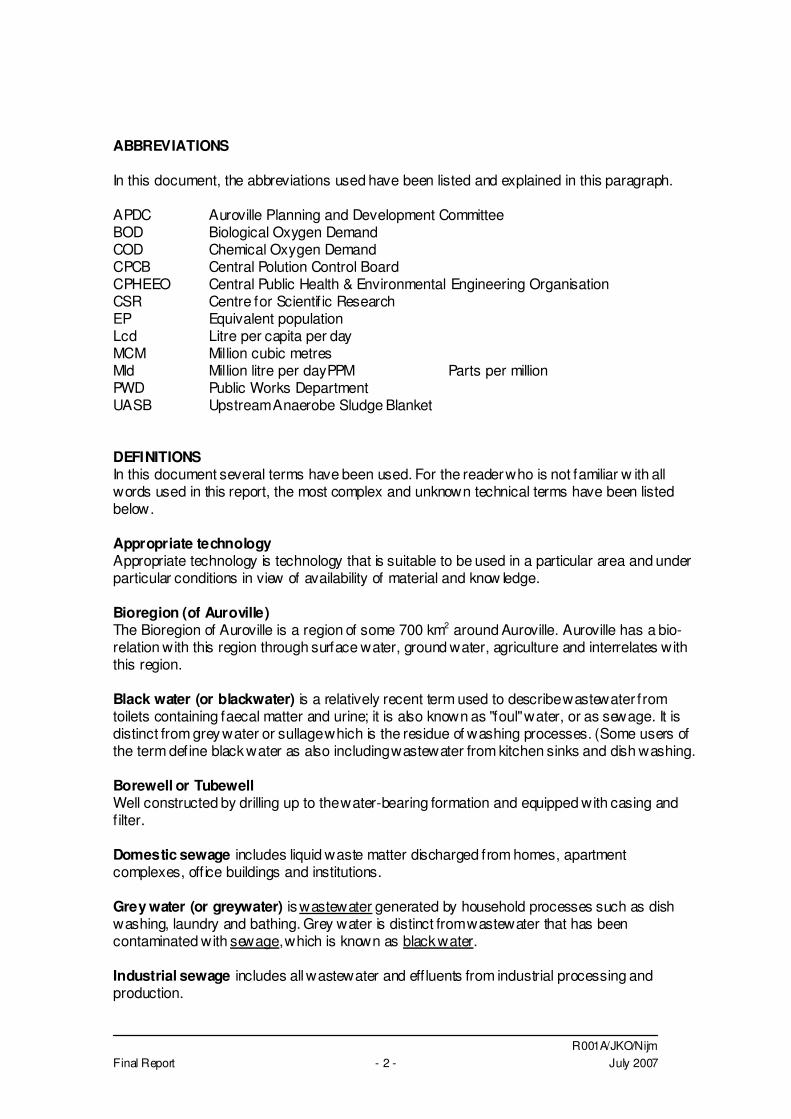
R001A/JKO/Nijm Final Report - 2 - July 2007
ABBREVIATIONS In this document, the abbreviations used have been listed and explained in this paragraph. APDC Auroville Planning and Development Committee BOD Biological Oxygen Demand COD Chemical Oxygen Demand CPCB Central Polution Control Board CPHEEO Central Public Health & Environmental Engineering Organisation CSR Centre for Scientif ic Research EP Equivalent population Lcd Litre per capita per day MCM Million cubic metres Mld Million litre per dayPPM Parts per million PWD Public Works Department UASB Upstream Anaerobe Sludge Blanket DEFINITIONS In this document several terms have been used. For the reader who is not familiar w ith all words used in this report, the most complex and unknown technical terms have been listed below. Appropriate technology Appropriate technology is technology that is suitable to be used in a particular area and under particular conditions in view of availability of material and know ledge. Bioregion (of Auroville) The Bioregion of Auroville is a region of some 700 km2 around Auroville. Auroville has a bio-relation with this region through surface water, ground water, agriculture and interrelates with this region. Black water (or blackwater) is a relatively recent term used to describe wastewater from toilets containing faecal matter and urine; it is also known as "foul" water, or as sewage. It is distinct from grey water or sullage which is the residue of washing processes. (Some users of the term define black water as also including wastewater from kitchen sinks and dish washing. Borewell or Tubewell Well constructed by drilling up to the water-bearing formation and equipped with casing and f ilter. Domestic sewage includes liquid waste matter discharged from homes, apartment complexes, off ice buildings and institutions. Grey water (or greywater) is wastewater generated by household processes such as dish washing, laundry and bathing. Grey water is distinct from wastewater that has been contaminated with sewage, which is known as black water. Industrial sewage includes all wastewater and eff luents from industrial processing and production.
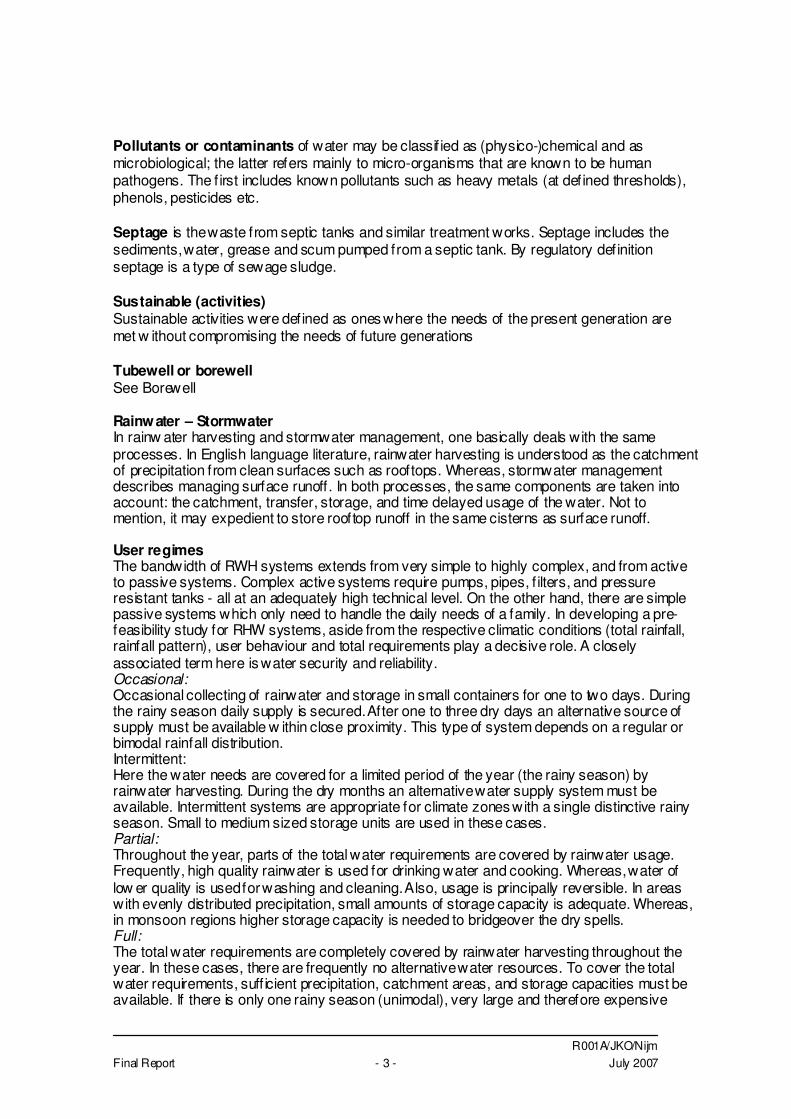
R001A/JKO/Nijm Final Report - 3 - July 2007
Pollutants or contaminants of water may be classif ied as (physico-)chemical and as microbiological; the latter refers mainly to micro-organisms that are known to be human pathogens. The f irst includes known pollutants such as heavy metals (at defined thresholds), phenols, pesticides etc. Septage is the waste from septic tanks and similar treatment works. Septage includes the sediments, water, grease and scum pumped from a septic tank. By regulatory definition septage is a type of sewage sludge. Sustainable (activities) Sustainable activities were defined as ones where the needs of the present generation are met w ithout compromising the needs of future generations Tubewell or borewell See Borewell Rainwater – Stormwater In rainw ater harvesting and stormwater management, one basically deals with the same processes. In English language literature, rainwater harvesting is understood as the catchment of precipitation from clean surfaces such as rooftops. Whereas, stormwater management describes managing surface runoff. In both processes, the same components are taken into account: the catchment, transfer, storage, and time delayed usage of the water. Not to mention, it may expedient to store rooftop runoff in the same cisterns as surface runoff. User regimes The bandwidth of RWH systems extends from very simple to highly complex, and from active to passive systems. Complex active systems require pumps, pipes, f ilters, and pressure resistant tanks - all at an adequately high technical level. On the other hand, there are simple passive systems which only need to handle the daily needs of a family. In developing a pre-feasibility study for RHW systems, aside from the respective climatic conditions (total rainfall, rainfall pattern), user behaviour and total requirements play a decisive role. A closely associated term here is water security and reliability. Occasional: Occasional collecting of rainwater and storage in small containers for one to two days. During the rainy season daily supply is secured. After one to three dry days an alternative source of supply must be available w ithin close proximity. This type of system depends on a regular or bimodal rainfall distribution. Intermittent: Here the water needs are covered for a limited period of the year (the rainy season) by rainwater harvesting. During the dry months an alternative water supply system must be available. Intermittent systems are appropriate for climate zones with a single distinctive rainy season. Small to medium sized storage units are used in these cases. Partial: Throughout the year, parts of the total water requirements are covered by rainwater usage. Frequently, high quality rainwater is used for drinking water and cooking. Whereas, water of low er quality is used for washing and cleaning. Also, usage is principally reversible. In areas with evenly distributed precipitation, small amounts of storage capacity is adequate. Whereas, in monsoon regions higher storage capacity is needed to bridgeover the dry spells. Full: The total water requirements are completely covered by rainwater harvesting throughout the year. In these cases, there are frequently no alternative water resources. To cover the total water requirements, suff icient precipitation, catchment areas, and storage capacities must be available. If there is only one rainy season (unimodal), very large and therefore expensive

R001A/JKO/Nijm Final Report - 4 - July 2007
storage is required. It is simpler to install systems in regions with a bimodal rainfall pattern, because the dry spells are shorter, and therefore, a smaller amount of storage capacity is suff icient.
R001A/JKO/Nijm Final Report - 5 - July 2007
Annex B The Water Group
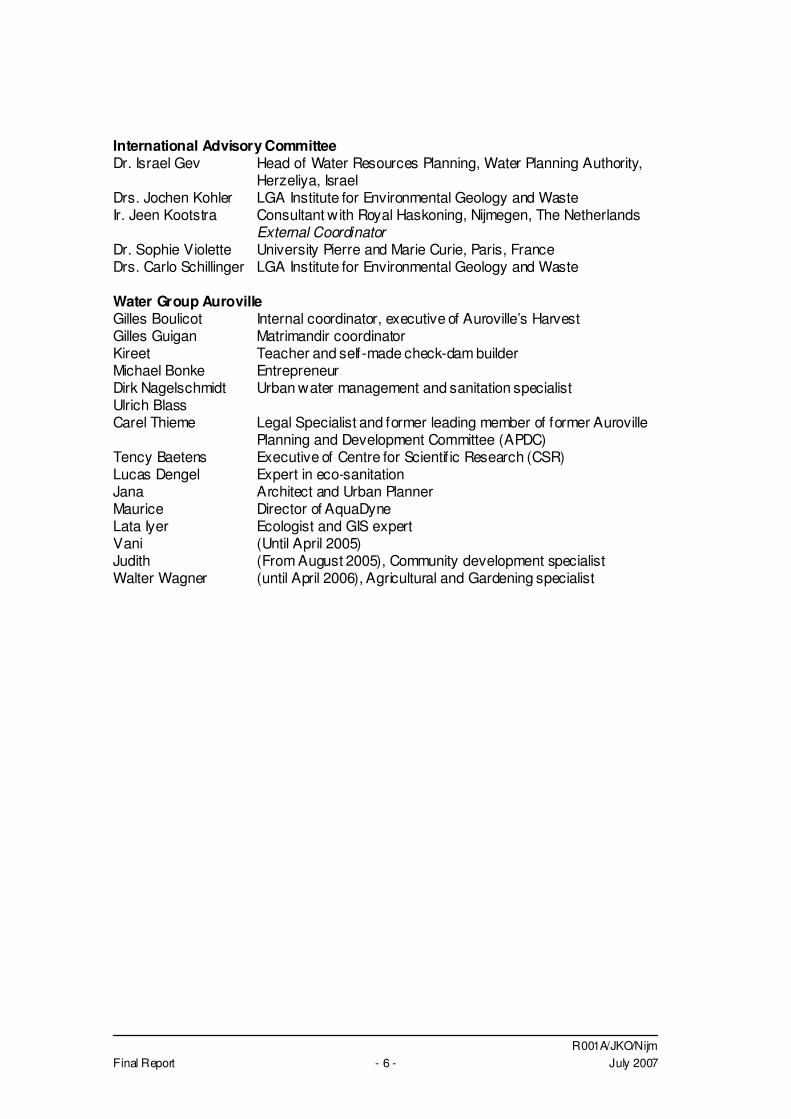
R001A/JKO/Nijm Final Report - 6 - July 2007
International Advisory Committee Dr. Israel Gev Head of Water Resources Planning, Water Planning Authority, Herzeliya, Israel Drs. Jochen Kohler LGA Institute for Environmental Geology and Waste Ir. Jeen Kootstra Consultant with Royal Haskoning, Nijmegen, The Netherlands
External Coordinator Dr. Sophie Violette University Pierre and Marie Curie, Paris, France Drs. Carlo Schillinger LGA Institute for Environmental Geology and Waste Water Group Auroville Gilles Boulicot Internal coordinator, executive of Auroville’s Harvest Gilles Guigan Matrimandir coordinator Kireet Teacher and self-made check-dam builder Michael Bonke Entrepreneur Dirk Nagelschmidt Urban water management and sanitation specialist Ulrich Blass Carel Thieme Legal Specialist and former leading member of former Auroville
Planning and Development Committee (APDC) Tency Baetens Executive of Centre for Scientif ic Research (CSR) Lucas Dengel Expert in eco-sanitation Jana Architect and Urban Planner Maurice Director of AquaDyne Lata Iyer Ecologist and GIS expert Vani (Until April 2005) Judith (From August 2005), Community development specialist Walter Wagner (until April 2006), Agricultural and Gardening specialist
R001A/JKO/Nijm Final Report - 7 - July 2007
Annex C Findings of the September 2004 Seminar
Towards a Sustainable Water Resources Management for Auroville and the Bioregion
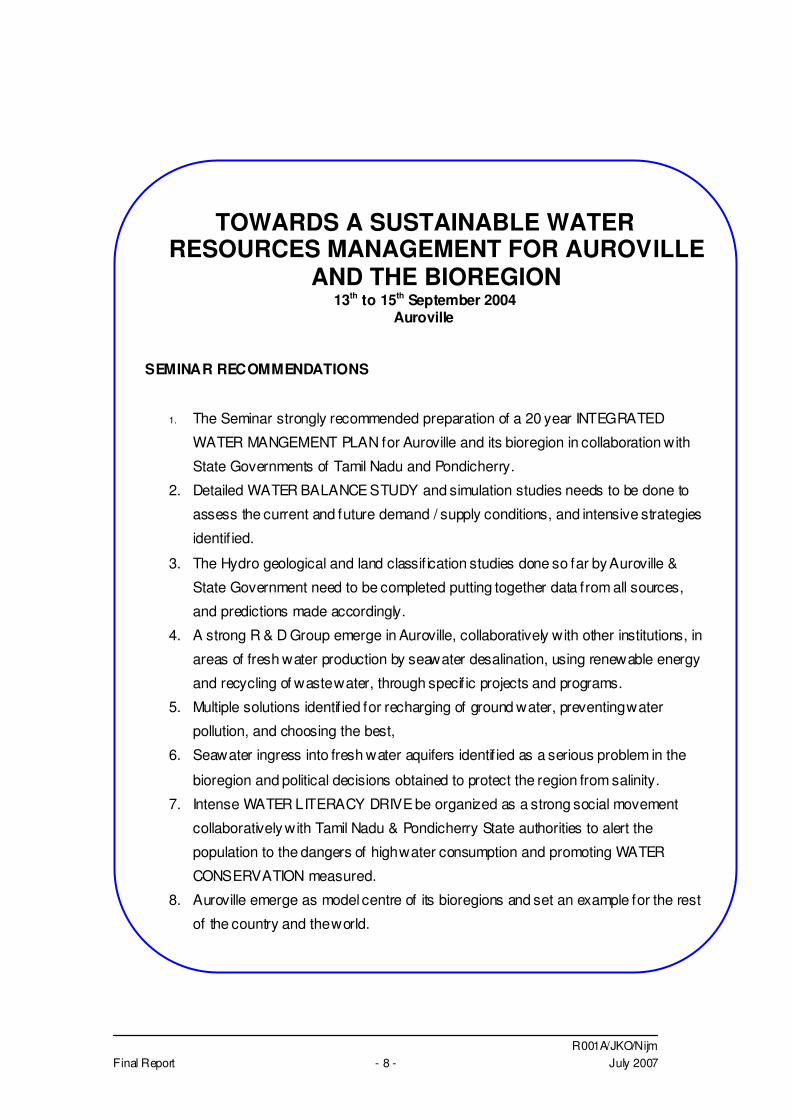
R001A/JKO/Nijm Final Report - 8 - July 2007
TOWARDS A SUSTAINABLE WATER RESOURCES MANAGEMENT FOR AUROVILLE
AND THE BIOREGION 13th to 15th September 2004
Auroville
SEMINAR RECOMMENDATIONS
1. The Seminar strongly recommended preparation of a 20 year INTEGRATED
WATER MANGEMENT PLAN for Auroville and its bioregion in collaboration with
State Governments of Tamil Nadu and Pondicherry.
2. Detailed WATER BALANCE STUDY and simulation studies needs to be done to
assess the current and future demand / supply conditions, and intensive strategies
identif ied.
3. The Hydro geological and land classif ication studies done so far by Auroville &
State Government need to be completed putting together data from all sources,
and predictions made accordingly.
4. A strong R & D Group emerge in Auroville, collaboratively with other institutions, in
areas of fresh water production by seawater desalination, using renewable energy
and recycling of waste water, through specif ic projects and programs.
5. Multiple solutions identif ied for recharging of ground water, preventing water
pollution, and choosing the best,
6. Seawater ingress into fresh water aquifers identif ied as a serious problem in the
bioregion and political decisions obtained to protect the region from salinity.
7. Intense WATER LITERACY DRIVE be organized as a strong social movement
collaboratively with Tamil Nadu & Pondicherry State authorities to alert the
population to the dangers of high water consumption and promoting WATER
CONSERVATION measured.
8. Auroville emerge as model centre of its bioregions and set an example for the rest
of the country and the world.

R001A/JKO/Nijm Final Report - 9 - July 2007
Annex D Population data Auroville and the Bioregion
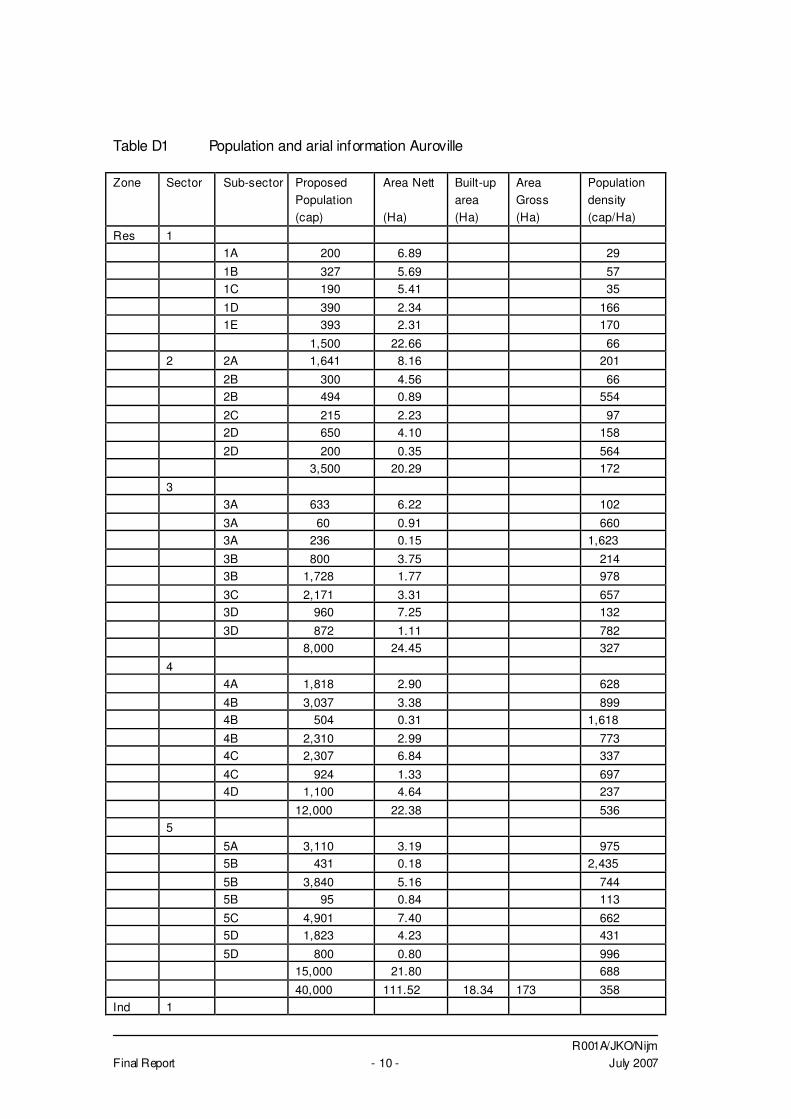
R001A/JKO/Nijm Final Report - 10 - July 2007
Table D1 Population and arial information Auroville Zone Sector Sub-sector Proposed
Population (cap)
Area Nett (Ha)
Built-up area (Ha)
Area Gross (Ha)
Population density (cap/Ha)
Res 1 1A 200 6.89 29
1B 327 5.69 57 1C 190 5.41 35
1D 390 2.34 166 1E 393 2.31 170
1,500 22.66 66 2 2A 1,641 8.16 201
2B 300 4.56 66 2B 494 0.89 554
2C 215 2.23 97 2D 650 4.10 158
2D 200 0.35 564 3,500 20.29 172
3 3A 633 6.22 102
3A 60 0.91 660 3A 236 0.15 1,623
3B 800 3.75 214 3B 1,728 1.77 978
3C 2,171 3.31 657 3D 960 7.25 132
3D 872 1.11 782 8,000 24.45 327
4 4A 1,818 2.90 628
4B 3,037 3.38 899 4B 504 0.31 1,618
4B 2,310 2.99 773 4C 2,307 6.84 337
4C 924 1.33 697 4D 1,100 4.64 237
12,000 22.38 536 5
5A 3,110 3.19 975 5B 431 0.18 2,435
5B 3,840 5.16 744 5B 95 0.84 113
5C 4,901 7.40 662 5D 1,823 4.23 431
5D 800 0.80 996 15,000 21.80 688
40,000 111.52 18.34 173 358 Ind 1
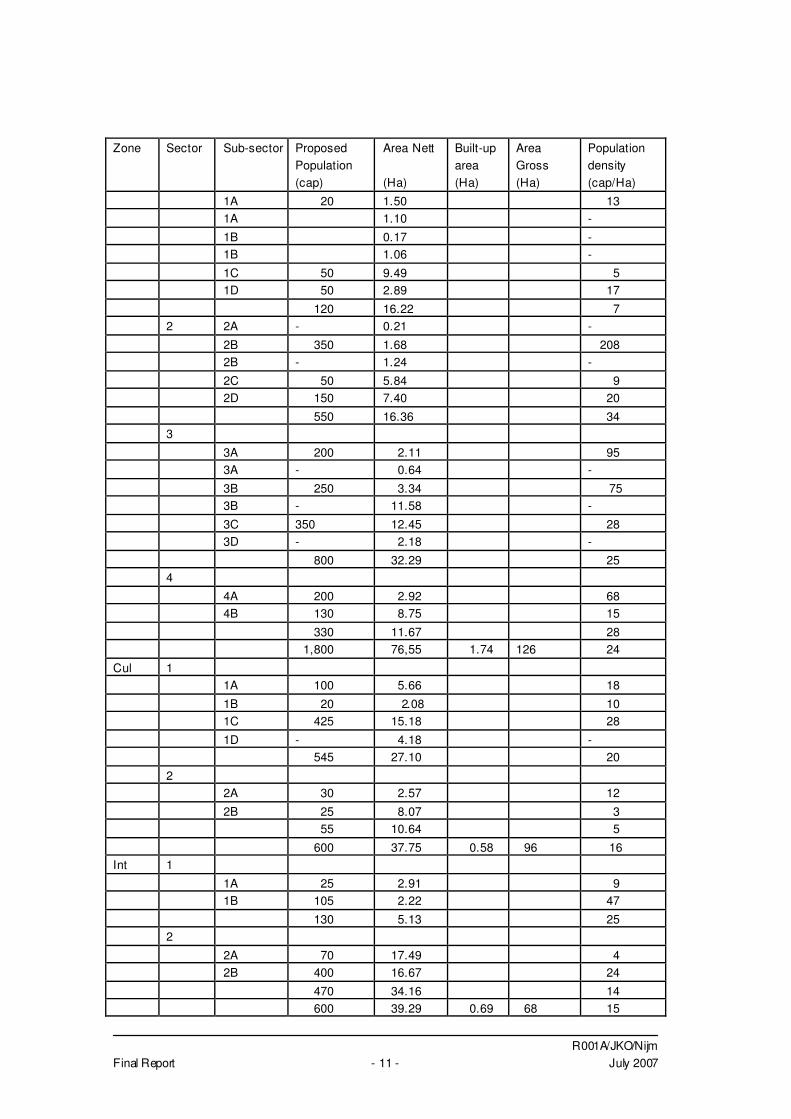
R001A/JKO/Nijm Final Report - 11 - July 2007
Zone Sector Sub-sector Proposed Population (cap)
Area Nett (Ha)
Built-up area (Ha)
Area Gross (Ha)
Population density (cap/Ha)
1A 20 1.50 13 1A 1.10 -
1B 0.17 - 1B 1.06 -
1C 50 9.49 5 1D 50 2.89 17
120 16.22 7 2 2A - 0.21 -
2B 350 1.68 208 2B - 1.24 -
2C 50 5.84 9 2D 150 7.40 20
550 16.36 34 3
3A 200 2.11 95 3A - 0.64 -
3B 250 3.34 75 3B - 11.58 -
3C 350 12.45 28 3D - 2.18 -
800 32.29 25 4
4A 200 2.92 68 4B 130 8.75 15
330 11.67 28 1,800 76,55 1.74 126 24
Cul 1 1A 100 5.66 18
1B 20 2.08 10 1C 425 15.18 28
1D - 4.18 - 545 27.10 20
2 2A 30 2.57 12
2B 25 8.07 3 55 10.64 5
600 37.75 0.58 96 16 Int 1
1A 25 2.91 9 1B 105 2.22 47
130 5.13 25 2
2A 70 17.49 4 2B 400 16.67 24
470 34.16 14 600 39.29 0.69 68 15
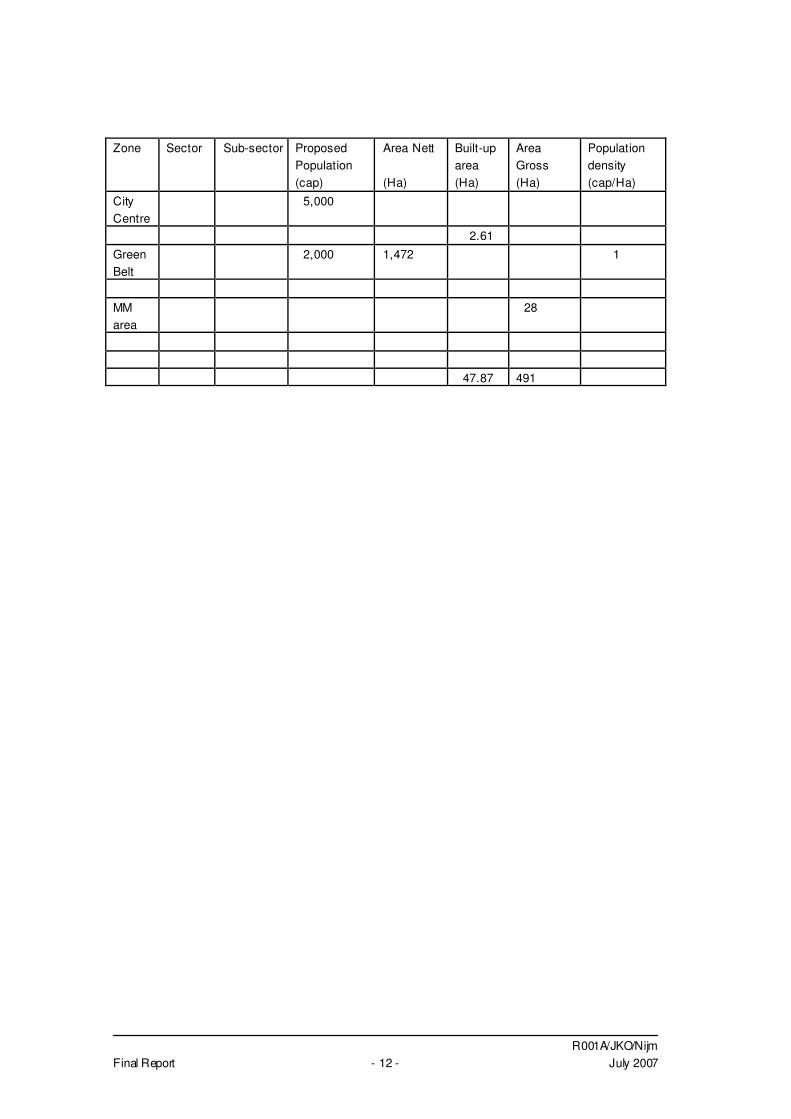
R001A/JKO/Nijm Final Report - 12 - July 2007
Zone Sector Sub-sector Proposed Population (cap)
Area Nett (Ha)
Built-up area (Ha)
Area Gross (Ha)
Population density (cap/Ha)
City Centre
5,000
2.61
Green Belt
2,000 1,472 1
MM area
28
47.87 491
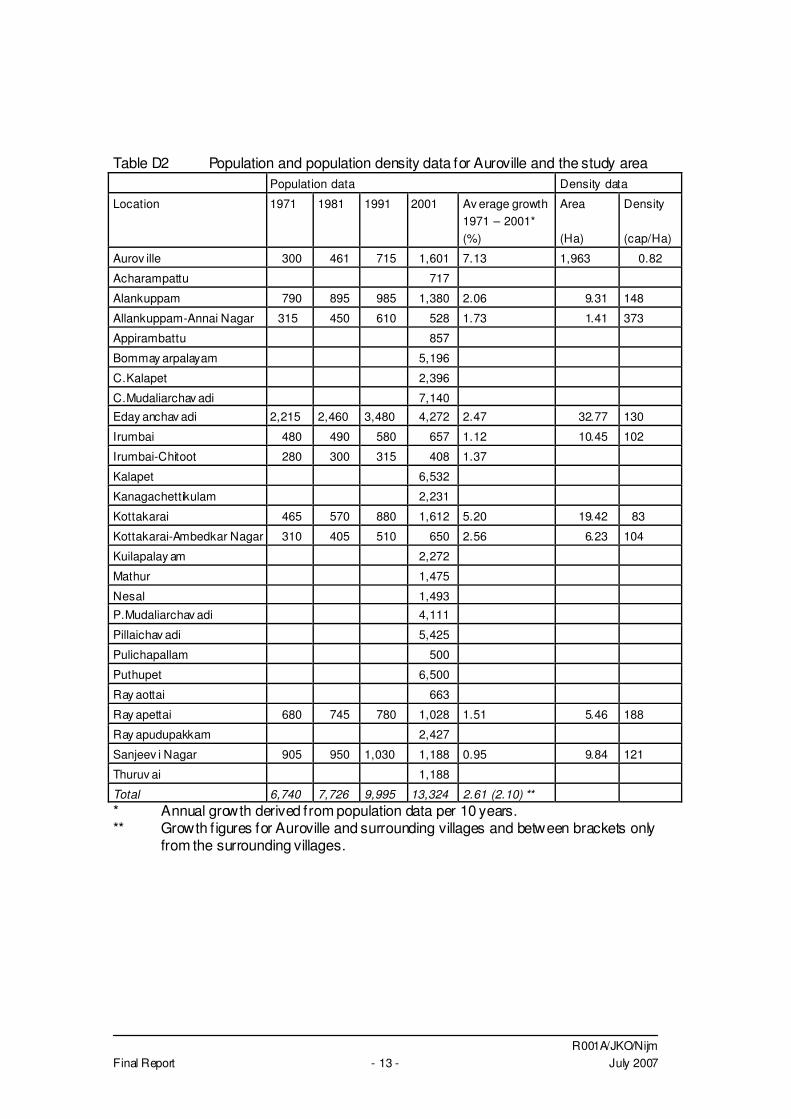
R001A/JKO/Nijm Final Report - 13 - July 2007
Table D2 Population and population density data for Auroville and the study area Population data Density data
Location 1971 1981 1991 2001 Av erage growth 1971 – 2001* (%)
Area (Ha)
Density (cap/Ha)
Aurov ille 300 461 715 1,601 7.13 1,963 0.82
Acharampattu 717
Alankuppam 790 895 985 1,380 2.06 9.31 148
Allankuppam-Annai Nagar 315 450 610 528 1.73 1.41 373
Appirambattu 857
Bommay arpalayam 5,196
C.Kalapet 2,396
C.Mudaliarchav adi 7,140
Eday anchav adi 2,215 2,460 3,480 4,272 2.47 32.77 130
Irumbai 480 490 580 657 1.12 10.45 102
Irumbai-Chitoot 280 300 315 408 1.37
Kalapet 6,532
Kanagachettikulam 2,231
Kottakarai 465 570 880 1,612 5.20 19.42 83
Kottakarai-Ambedkar Nagar 310 405 510 650 2.56 6.23 104
Kuilapalay am 2,272
Mathur 1,475
Nesal 1,493
P.Mudaliarchav adi 4,111
Pillaichav adi 5,425
Pulichapallam 500
Puthupet 6,500
Ray aottai 663
Ray apettai 680 745 780 1,028 1.51 5.46 188
Ray apudupakkam 2,427
Sanjeev i Nagar 905 950 1,030 1,188 0.95 9.84 121
Thuruv ai 1,188
Total 6,740 7,726 9,995 13,324 2.61 (2.10) ** * Annual growth derived from population data per 10 years. ** Growth f igures for Auroville and surrounding villages and between brackets only
from the surrounding villages.
R001A/JKO/Nijm Final Report - 14 - July 2007
Annex E Water consumption data Bioregion
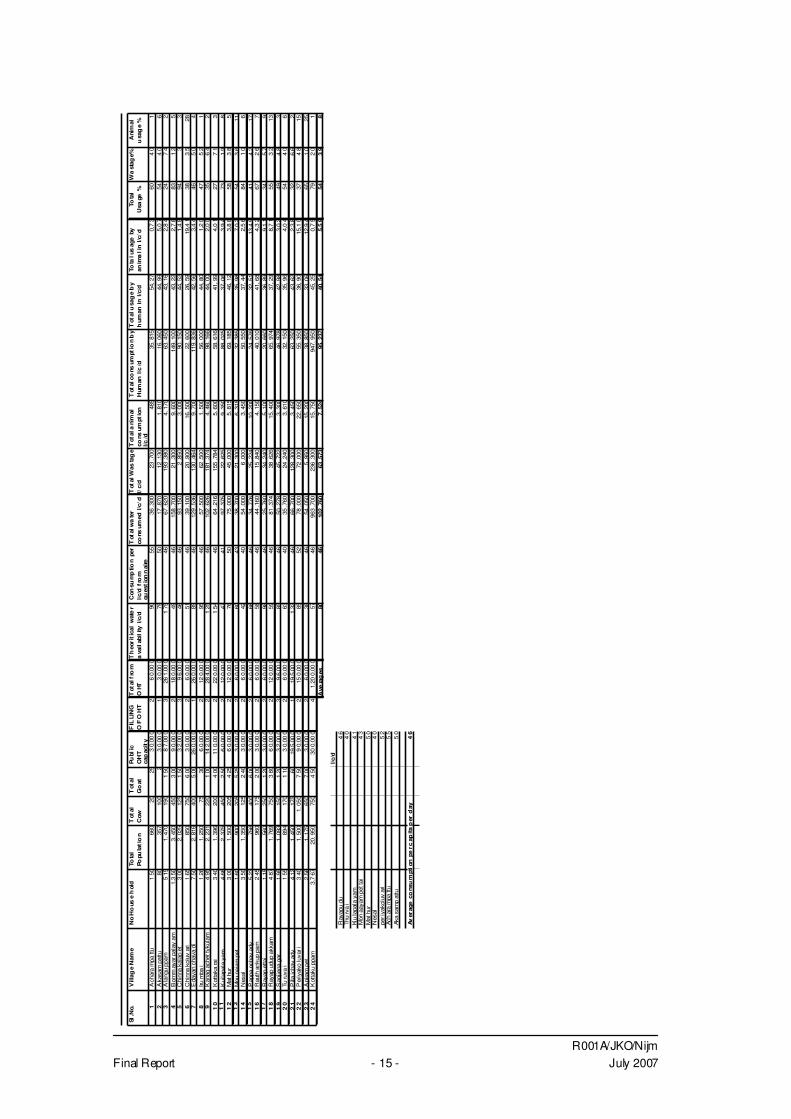
R001A/JKO/Nijm Final Report - 15 - July 2007
Sl.N
o.V
illag
e N
ame
No
Ho
use
hol
dTo
tal
Popu
lati
on
Tot
al
Cow
Tot
al
Go
atPu
blic
O
HT
cap
acit
y
FIL
LIN
G
OF
OH
TT
otal
fro
m
OHT
Th
eori
tica
l w
ate
r a
vail
abil
ity l
/c/d
Con
sum
ptio
n pe
r l/c
/d f
rom
qu
esti
onn
aire
Tot
al w
ate
r co
nsum
ed l/
c/d
Tot
al W
asta
ge
l/c/
dT
otal
ani
mal
co
nsum
ptio
n
l/c/d
Tot
al c
ons
umpt
ion
by
Hum
an l/
c/d
Tot
al u
sag
e b
y h
uman
in
l/c/d
Tota
l us
age
by
an
ima
l in
l/c/
dTo
tal
Usa
ge %
Wa
stag
e%A
nim
al
usa
ge
%
1A
char
am
pattu
150
660
2025
30.
000
26
0.00
090
5536
.300
23.7
0048
535
.815
54,2
70,
73
604
01
2A
kasa
mpa
ttu80
357
100
23
0.00
01
30.
000
7950
17.8
7012
.130
1.81
016
.060
44,9
95,
07
544
06
3A
lang
upp
am5
151.
470
190
150
87.
000
326
1.00
01
7546
67.6
2019
3.3
804.
170
63.4
5043
,16
2,8
424
74
24
Bom
may
arpa
lay
am1.
350
3.45
045
03
009
0.00
02
180.
000
4946
158
.700
21.3
009.
600
149.
100
43,2
22,
78
831
25
5C
hinn
aka
lap
et3
002.
025
125
150
32.
000
39
6.00
046
4693
.150
2.8
503.
000
90.1
5044
,52
1,4
894
33
6C
hinn
ako
luv
ari
165
850
750
600
30.
000
26
0.00
051
4639
.100
20.9
0016
.500
22.6
0026
,59
19,4
138
35
287
Eda
yan
chav
adi
750
2.81
640
05
0026
0.00
01
260.
000
8946
129
.536
130
.464
9.70
011
9.83
642
,56
3,4
446
50
48
Irum
bai
126
1.25
075
306
0.00
02
120.
000
9546
57.5
0062
.500
1.50
056
.000
44,8
01,
20
475
21
9K
anag
ache
ttyk
ulam
495
2.23
122
01
0014
2.00
02
284.
000
125
4610
2.6
2618
1.3
744.
460
98.1
6644
,00
2,0
035
64
21
0K
otta
kara
i3
401.
396
200
400
110.
000
222
0.00
01
5446
64.2
1615
5.7
845.
600
58.6
1641
,99
4,0
127
71
31
1K
uila
pala
yam
466
2.37
545
02
506
0.00
02
120.
000
4741
97.3
7522
.625
9.35
088
.025
37,0
63,
94
731
98
12
Mat
hur
300
1.50
020
54
256
0.00
02
120.
000
7650
75.0
0045
.000
5.81
569
.185
46,1
23,
88
583
85
13
Mou
naia
mpe
t1
6090
020
55
253
0.00
02
60.
000
6043
38.7
0021
.300
6.31
532
.385
35,9
87,
02
543
611
14
Nes
al3
501.
350
125
240
30.
000
26
0.00
042
4054
.000
6.0
003.
450
50.5
5037
,44
2,5
684
10
61
5P
appa
ncha
vad
y5
2375
640
06
003
0.00
02
60.
000
6646
34.7
7625
.224
10.2
0024
.576
32,5
113
,49
414
217
16
Rau
than
kup
pam
245
960
175
200
30.
000
26
0.00
058
4644
.160
15.8
404.
150
40.0
1041
,68
4,3
267
26
71
7R
ayap
etta
i1
1556
025
01
203
0.00
02
60.
000
9846
25.7
6034
.240
5.10
020
.660
36,8
99,
11
345
79
18
Ray
apud
upak
kam
487
1.76
975
03
806
0.00
02
120.
000
5946
81.3
7438
.626
15.4
0065
.974
37,2
98,
71
553
213
19
San
jiena
gar
195
1.09
315
01
203
2.00
03
96.
000
8546
50.2
7845
.722
3.30
046
.978
42,9
83,
02
494
83
20
Turu
vai
155
894
170
110
30.
000
26
0.00
063
4035
.760
24.2
403.
610
32.1
5035
,96
4,0
454
40
62
1P
illaic
hav
ady
412
1.45
017
560
195.
000
119
5.00
01
3246
66.7
0012
8.3
003.
450
63.2
5043
,62
2,3
832
66
22
2P
eriy
ako
luva
ri3
401.
500
1.05
07
509
0.00
02
150.
000
8552
78.0
0072
.000
22.6
5055
.350
36,9
015
,10
374
815
23
Api
ram
pet
256
1.17
565
07
003
0.00
02
60.
000
3846
54.0
505
.950
15.2
0038
.850
33,0
612
,94
651
025
24
Kot
taku
ppam
3.7
6720
.950
750
450
300.
000
41.
200.
000
5746
963
.700
236
.300
15.7
5094
7.95
045
,25
0,7
579
20
1A
vera
ges
8046
102
.760
63.5
737.
524
95.2
3740
,54
5,5
954
39
8
l/c/d
Ray
apu
du4
6Th
urv
ai
40
Kiu
lapa
laya
m4
1M
onaa
yam
pett
ai4
3M
athu
r5
0N
esal
40
peri
yako
luv
ari
52
Ach
ara
mpa
ttu5
5Ak
asa
mp
attu
50
Aver
age
co
nsu
mpt
ion
pe
r cap
ita p
er d
ay4
6
R001A/JKO/Nijm Final Report - 16 - July 2007
Annex F Financial aspects of drinking water supply
R001A/JKO/Nijm Final Report - 17 - July 2007
Financial Aspects of Water Supply Tariffs and tariff built-up A relevant question is how much drinking water may or should cost as this partly determines the choice of material, the size op pipes etc. Looking at the built-up of the tariff of drinking water, about 20% are f inancial expenses (profit, f inancing, reserves), some 40 % is for material (material replacement and write-off), 25% is for personnel and 15 % for subcontracted work. Water tariffs in general consist of a f ixed part (connection fee) and a part related to consumption. Occasionally also the waste water charges are billed together w ith the drinking water charges or a percentage is topped up to cover waste water treatment as it directly relates to water consumption. In general costs in Netherlands are around � 45 per year connection fee and � 1.35 per 1,000 l. With a consumption in the Netherlands of 135 lcd, the annual amount paid by a family of four for water amounts thus to about � 310 per year (200 m3/y). The ratio of variable (related to quantity of water produced) and f ixed cost for production is 10/90, for consumption this comes to 80/20. A 1 to 1 reflection of the product ration in the tariff would lead to an unrestricted consumption of water! In absolute terms, tariffs may vary due to the sources (surface water requires more expenses in both treatment and infrastructure than groundwater, not to speak about brackish or seawater), the number and concentration of customers and differences in f inancial management. As waste water treatment is directly related to the amount of water consumed, several countries include a small amount for waste water treatment in the unit rate for drinking water. An interesting comparison is the integral cost of different types of water for the consumer. For different water in the Netherlands and India, the consumer prices have been listed below: India (�/l) Ghana (�/l) Netherlands (�/l)
Piped water groundwater 0.00007 0.00009 – 0.00012 (AV)
0.00034 0.00077
Piped water surface water 0.00007 0.00034 0.0016
Purif ied water bag (0.5 l) 0.15 0.017 Not available Purif ied water bottle 0.22 0.25 Not available
Spring water bottle NA 0.35 0.50 Spring water restaurant NA 1.00 4.00 Budget for construction To determine the available budget for water production in Auroville, one could use different scenarios. We use population f igures of 5,000 (present including workers and guests), 25,000 (2015) and 50,000 (2020). We assume a tariff at present of Rps 25/m3, a consumption of 150 lcd and 35% of the tariff for replacement and write-off and a term of 10 years for complete write-off (relatively short in view of the operational conditions in India). Under these assumptions, the annual total income would be 6.8M Rps and the budget available for investment would be 24 M Rps for an installation of 5,000 people (0.94 Mld), 120 M Rps for an installation of 25,000 people (4.5 Mld) and 240 M Rps (� 4.4 M) for an installation for 50,000 people (9 Mld). A surface water installation in the Netherlands would cost for production and storage some � 4 per m3 produced water. Groundwater would cost some � 2.5 per m3 produced water.

R001A/JKO/Nijm Final Report - 18 - July 2007
Transportation and distribution costs about � 500 - � 1000 per metre diameter and per metre length. A budget for construction is thus diff icult to give. It strongly depends on acceptable tariffs for consumption, consumption per capita, type of sources, f inancial boundary conditions (write-off period, interest rates) and operational expenses.
R001A/JKO/Nijm Final Report - 19 - July 2007
Annex G Background information on
De-centralised waste water treatment
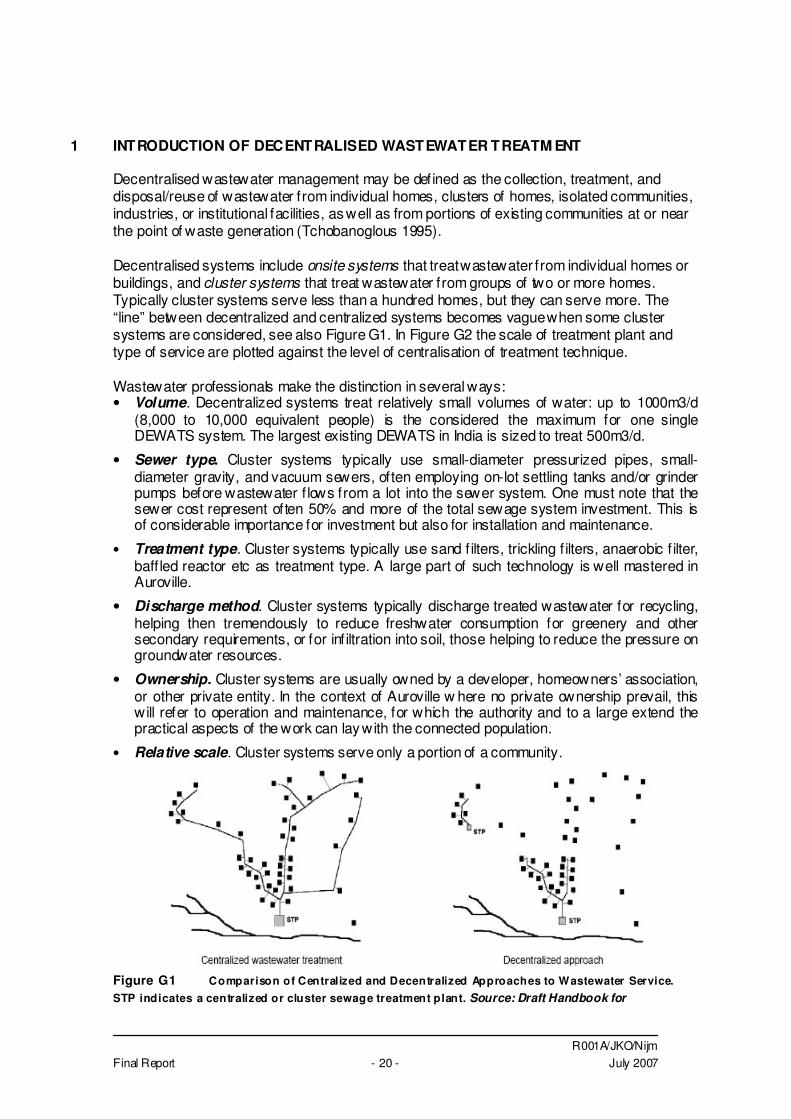
R001A/JKO/Nijm Final Report - 20 - July 2007
1 INTRODUCTION OF DECENTRALISED WASTEWATER TREATM ENT
Decentralised wastewater management may be defined as the collection, treatment, and disposal/reuse of wastewater from individual homes, clusters of homes, isolated communities, industries, or institutional facilities, as well as from portions of existing communities at or near the point of waste generation (Tchobanoglous 1995). Decentralised systems include onsite systems that treat wastewater from individual homes or buildings, and cluster systems that treat wastewater from groups of two or more homes. Typically cluster systems serve less than a hundred homes, but they can serve more. The “line” between decentralized and centralized systems becomes vague when some cluster systems are considered, see also Figure G1. In Figure G2 the scale of treatment plant and type of service are plotted against the level of centralisation of treatment technique. Wastewater professionals make the distinction in several ways: • Volume. Decentralized systems treat relatively small volumes of water: up to 1000m3/d
(8,000 to 10,000 equivalent people) is the considered the maximum for one single DEWATS system. The largest existing DEWATS in India is sized to treat 500m3/d.
• Sewer type. Cluster systems typically use small-diameter pressurized pipes, small-diameter gravity, and vacuum sewers, often employing on-lot settling tanks and/or grinder pumps before wastewater f lows from a lot into the sewer system. One must note that the sewer cost represent often 50% and more of the total sewage system investment. This is of considerable importance for investment but also for installation and maintenance.
• Treatment type. Cluster systems typically use sand f ilters, trickling f ilters, anaerobic f ilter, baff led reactor etc as treatment type. A large part of such technology is well mastered in Auroville.
• Discharge method. Cluster systems typically discharge treated wastewater for recycling, helping then tremendously to reduce freshwater consumption for greenery and other secondary requirements, or for inf iltration into soil, those helping to reduce the pressure on groundwater resources.
• Ownership. Cluster systems are usually owned by a developer, homeowners’ association, or other private entity. In the context of Auroville w here no private ownership prevail, this will refer to operation and maintenance, for which the authority and to a large extend the practical aspects of the work can lay with the connected population.
• Relative scale. Cluster systems serve only a portion of a community.
Figure G1 Comparison of Centralized and Decentralized Approaches to Wastewater Service. STP indicates a centralized or cluster sewage treatment plant. Source: Draft Handbook for
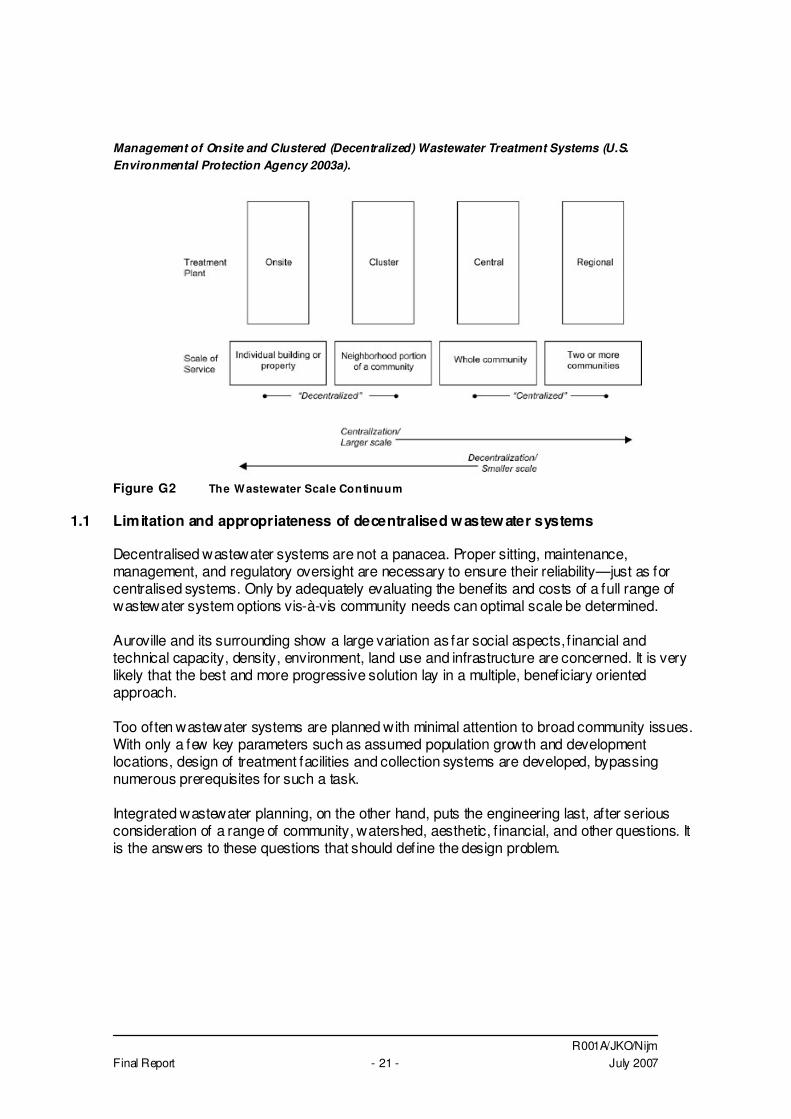
R001A/JKO/Nijm Final Report - 21 - July 2007
Management of Onsite and Clustered (Decentralized) Wastewater Treatment Systems (U.S. Environmental Protection Agency 2003a).
Figure G2 The Wastewater Scale Continuum
1.1 Limitation and appropriateness of decentralised wastewater systems
Decentralised wastewater systems are not a panacea. Proper sitting, maintenance, management, and regulatory oversight are necessary to ensure their reliability—just as for centralised systems. Only by adequately evaluating the benefits and costs of a full range of wastewater system options vis-à-vis community needs can optimal scale be determined. Auroville and its surrounding show a large variation as far social aspects, f inancial and technical capacity, density, environment, land use and infrastructure are concerned. It is very likely that the best and more progressive solution lay in a multiple, beneficiary oriented approach. Too often wastewater systems are planned with minimal attention to broad community issues. With only a few key parameters such as assumed population growth and development locations, design of treatment facilities and collection systems are developed, bypassing numerous prerequisites for such a task. Integrated wastewater planning, on the other hand, puts the engineering last, after serious consideration of a range of community, watershed, aesthetic, f inancial, and other questions. It is the answers to these questions that should define the design problem.
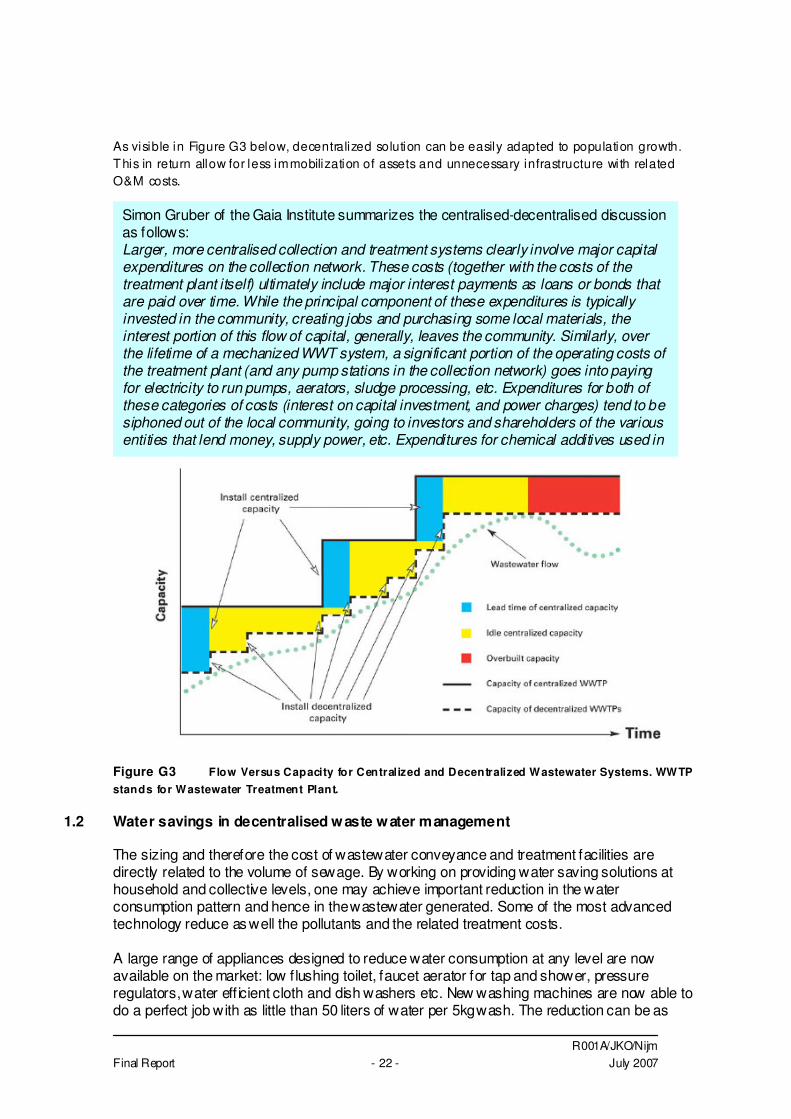
R001A/JKO/Nijm Final Report - 22 - July 2007
As visible in Figure G3 below, decentralized solution can be easily adapted to population growth. This in return allow for less immobilization of assets and unnecessary infrastructure with related O&M costs.
Figure G3 Flow Versus Capacity for Centralized and Decentralized Wastewater Systems. WWTP stands for Wastewater Treatment Plant.
1.2 Water savings in decentralised waste water management
The sizing and therefore the cost of wastewater conveyance and treatment facilities are directly related to the volume of sewage. By working on providing water saving solutions at household and collective levels, one may achieve important reduction in the water consumption pattern and hence in the wastewater generated. Some of the most advanced technology reduce as well the pollutants and the related treatment costs. A large range of appliances designed to reduce water consumption at any level are now available on the market: low f lushing toilet, faucet aerator for tap and shower, pressure regulators, water eff icient cloth and dish washers etc. New washing machines are now able to do a perfect job with as little than 50 liters of water per 5kg wash. The reduction can be as
Simon Gruber of the Gaia Institute summarizes the centralised-decentralised discussion as follows: Larger, more centralised collection and treatment systems clearly involve major capital expenditures on the collection network. These costs (together with the costs of the treatment plant itself) ultimately include major interest payments as loans or bonds that are paid over time. While the principal component of these expenditures is typically invested in the community, creating jobs and purchasing some local materials, the interest portion of this flow of capital, generally, leaves the community. Similarly, over the lifetime of a mechanized WWT system, a significant portion of the operating costs of the treatment plant (and any pump stations in the collection network) goes into paying for electricity to run pumps, aerators, sludge processing, etc. Expenditures for both of these categories of costs (interest on capital investment, and power charges) tend to be siphoned out of the local community, going to investors and shareholders of the various entities that lend money, supply power, etc. Expenditures for chemical additives used in treatment also tend to leave the community.
R001A/JKO/Nijm Final Report - 23 - July 2007
important as 50% for domestic water consumption and therefore for the wastewater generated. Collective facilities like laundry, canteen, kitchen etc are known for a much better water eff iciency than domestic family likes facilities, providing they are properly designed and equipped. With standard equipment, the water consumption for similar activities (cooking, dish washing etc) may be halved if to compare to household pattern. The worldwide concern for forecasted water crises is generating a lot of effort in innovative solutions that the water can be used more eff iciently such as cloth and dishwashing machines using electrolysis, ultrasound and occasionally air. These water- and soap-free washing machines require much less energy, no water. As detergents and other whiteners are widespread but amongst the most diff icult in waste water treatment, these innovative techniques contribute greatly to reduce waste water f low. By combining regulations and guidelines on water saving appliances in each and every buildings, promotion of collective facilities and usage of innovative technologies, a very important saving can be generated on wastewater infrastructure, maintenance, space requirement, but also on power consumption and potential arm to the environment.
R001A/JKO/Nijm Final Report - 24 - July 2007
Annex H Background information on
centralised waste water treatment
R001A/JKO/Nijm Final Report July 2007
���������� ��
1 CENTRALISED WASTE WATER TREATM ENT TECHNIQUES
For the sake of completeness of this study, a brief overview is given of centralised waste water treatment.
1.1 Treatment Techniques and stages
Waste water treatment techniques are basically operated according to biological processes or physical/chemical processes. Biological processes are more commonly used to treat domestic or combined domestic and industrial wastewater from a municipality. They use basically the same processes that would occur naturally in the receiving water, but give them a place to happen under controlled conditions, so that the cleansing reactions are completed before the water is discharged into the environment. Parts of a biological plant are based on chemical principles. Physical/chemical processes are more often used to treat industrial wastewaters directly, because they often contain pollutants which cannot be removed eff iciently by micro-organisms although industries that deal w ith biodegradable materials, such as food processing, dairies, breweries, and even paper, plastics and petrochemicals, may use biological treatment. Treatment plants often combine these processes in various stages being primary, secondary and tertiary. Primary treatment involves: 1. Screening- to remove large objects, such as stones or sticks, that could plug lines or
block tank inlets; 2. Grit chamber- slows down the f low to allow grit to fall out; 3. Sedimentation tank (settling tank or clarif ier, Figure H1)- settleable solids settle out
and are pumped away, while oils f loat to the top and are skimmed off Secondary treatment typically utilizes biological treatment processes, in which micro-organisms convert nonsettleable solids to settleable solids. Sedimentation typically follows, allowing the settleable solids to settle out. Three options include: 1. Activated Sludge- The most common option uses micro-organisms in the treatment
process to break down organic material with aeration and agitation, then allows solids to settle out. Bacteria-containing “activated sludge” is continually recirculated back to the aeration basin to increase the rate of organic decomposition;
2. Trickling Filters- These are beds of coarse media (often stones or plastic) 3-10 ft. deep. Wastewater is sprayed into the air (aeration), then allowed to trickle through the media. Micro-organisms, attached to and grow ing on the media, break down organic material in the wastewater. Trickling f ilters drain at the bottom; the wastewater is collected and then undergoes sedimentation;
3. Lagoons- These are slow, cheap, and relatively ineff icient, but can be used for various types of wastewater. They rely on the interaction of sunlight, algae, micro-organisms, and oxygen (sometimes aerated).
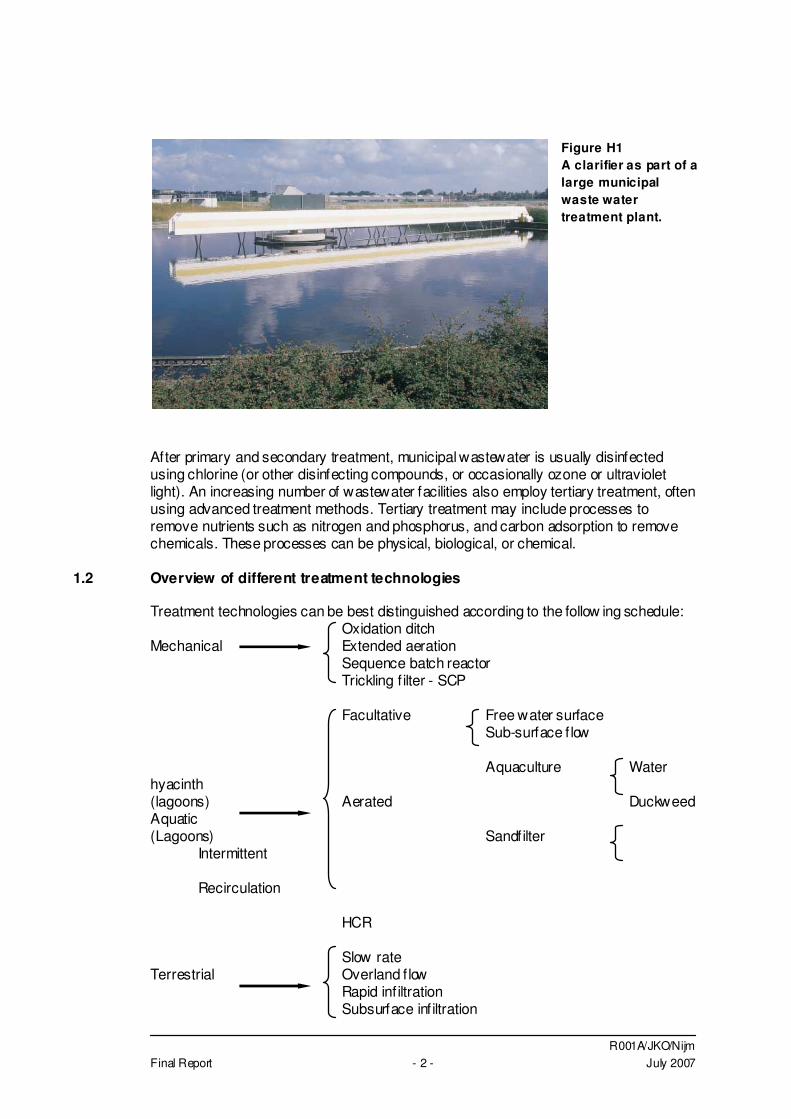
R001A/JKO/Nijm Final Report - 2 - July 2007
Figure H1 A clarifier as part of a large municipal waste water treatment plant.
After primary and secondary treatment, municipal wastewater is usually disinfected using chlorine (or other disinfecting compounds, or occasionally ozone or ultraviolet light). An increasing number of wastewater facilities also employ tertiary treatment, often using advanced treatment methods. Tertiary treatment may include processes to remove nutrients such as nitrogen and phosphorus, and carbon adsorption to remove chemicals. These processes can be physical, biological, or chemical.
1.2 Overview of different treatment technologies
Treatment technologies can be best distinguished according to the follow ing schedule: Oxidation ditch Mechanical Extended aeration Sequence batch reactor Trickling f ilter - SCP Facultative Free water surface Sub-surface f low Aquaculture Water hyacinth (lagoons) Aerated Duckweed Aquatic (Lagoons) Sandfilter Intermittent Recirculation HCR Slow rate Terrestrial Overland f low Rapid infiltration Subsurface infiltration
R001A/JKO/Nijm Final Report - 3 - July 2007
1.3 Mechanical Treatment Technologies
Mechanical systems utilize a combination of physical, biological, and chemical processes to achieve the treatment objectives. Using essentially natural processes within an artif icial environment, mechanical treatment technologies use a series of tanks, along w ith pumps, blowers, screens, grinders, and other mechanical components, to treat wastewaters. Flow of wastewater in the system is controlled by various types of instrumentation. Sequencing batch reactors (SBR), oxidation ditches, and extended aeration systems are all variations of the activated-sludge process, which is a suspended-growth system. The trickling f ilter solids contact process (TF-SCP), in contrast, is an attached-growth system. These treatment systems are effective where land is at a premium.
1.4 Aquatic Treatment Technologies
Facultative lagoons are the most common form of aquatic treatment-lagoon technology currently in use. The water layer near the surface is aerobic while the bottom layer, which includes sludge deposits, is anaerobic. The intermediate layer is aerobic near the top and anaerobic near the bottom, and constitutes the facultative zone. Aerated lagoons are smaller and deeper than facultative lagoons. These systems evolved from stabilization ponds when aeration devices were added to counteract odours arising from septic conditions. The aeration devices can be mechanical or diffused air systems. The chief disadvantage of lagoons is high eff luent solids content, which can exceed 100 mg/l. To counteract this, hydrograph controlled release (HCR) lagoons are a recent innovation. In this system, wastewater is discharged only during periods when the stream flow is adequate to prevent water quality degradation. When stream conditions prohibit discharge, wastewater is accumulated in a storage lagoon. Constructed wetlands, aquacultural operations, and sand f ilters are generally the most successful methods of polishing the treated wastewater eff luent from the lagoons. These systems have also been used with more traditional, engineered primary treatment technologies such as Imhoff tanks, septic tanks, and primary clarif iers. Their main advantage is to provide additional treatment beyond secondary treatment where required. In recent years, constructed wetlands have been utilized in two designs: systems using surface water f lows and systems using subsurface f lows. Both systems utilize the roots of plants to provide substrate for the growth of attached bacteria which utilize the nutrients present in the eff luents and for the transfer of oxygen. Bacteria do the bulk of the work in these systems, although there is some nitrogen uptake by the plants. The surface water system most closely approximates a natural wetland. Typically, these systems are long, narrow basins, w ith depths of less than 2 feet, that are planted with aquatic vegetation such as bulrush (Scirpus spp.) or cattails (Typha spp.). The shallow groundwater systems use a gravel or sand medium, approximately eighteen inches deep, which provides a rooting medium for the aquatic plants and through which the wastewater f lows. Aquaculture systems are distinguished by the type of plants grown in the wastewater holding basins. These plants are commonly water hyacinth (Eichhornia crassipes) or duckweed (Lemna spp.). These systems are basically shallow ponds covered with f loating plants that detain wastewater at least one week. The main purpose of the plants
R001A/JKO/Nijm Final Report - 4 - July 2007
in these systems is to provide a suitable habitat for bacteria which remove the vast majority of dissolved nutrients. Sand f ilters have been used for wastewater treatment purposes for at least a century in Latin America and the Caribbean. Two types of sand f ilters are commonly used: intermittent and recirculating. They differ mainly in the method of application of the wastewater. Intermittent f ilters are f looded w ith wastewater and then allowed to drain completely before the next application of wastewater. In contrast, recirculating f ilters use a pump to recirculate the eff luent to the f ilter in a ratio of 3 to 5 parts f ilter eff luent to 1 part raw wastewater. Both types of f ilters use a sand layer, 2 to 3 feet thick, underlain by a collection system of perforated or open joint pipes enclosed w ithin graded gravel. Water is treated biologically by the epiphytic f lora associated w ith the sand and gravel particles, although some physical f iltration of suspended solids by the sand grains and some chemical adsorption onto the surface of the sand grains play a role in the treatment process.
1.5 Terrestrial Treatment Technologies
Terrestrial treatment systems include slow-rate overland f low, slow-rate subsurface infiltration, and rapid infiltration methods. In addition to wastewater treatment and low maintenance costs, these systems may yield additional benefits by providing water for groundwater recharge, reforestation, agriculture, and/or livestock pasturage. They depend upon physical, chemical, and biological reactions on and within the soil. Slow-rate overland f low systems require vegetation, both to take up nutrients and other contaminants and to slow the passage of the eff luent across the land surface to ensure maximum contact times between the eff luents and the plants/soils. Slow-rate subsurface infiltration systems and rapid infiltration systems are "zero discharge" systems that rarely discharge eff luents directly to streams or other surface waters. Each system has different constraints regarding soil permeability. Although slow-rate overland f low systems are the most costly of the natural systems to implement, their advantage is their positive impact on sustainable development practices. In addition to treating wastewater, they provide an economic return from the reuse of water and nutrients to produce marketable crops or other agriculture products and/or water and fodder for livestock. The water may also be used to support reforestation projects in water-poor areas. In slow-rate systems, either primary or secondary wastewater is applied at a controlled rate, either by sprinklers or by f looding of furrows, to a vegetated land surface of moderate to low permeability. The wastewater is treated as it passes through the soil by f iltration, adsorption, ion exchange, precipitation, microbial action, and plant uptake. Vegetation is a critical component of the process and serves to extract nutrients, reduce erosion, and maintain soil permeability. Overland f low systems are a land application treatment method in which treated eff luents are eventually discharged to surface water. The main benefits of these systems are their low maintenance and low technical manpower requirements. Wastewater is applied intermittently across the tops of terraces constructed on soils of very low permeability and allowed to sheet-f low across the vegetated surface to the runoff collection channel. Treatment, including nitrogen removal, is achieved primarily through sedimentation, f iltration, and biochemical activity as the wastewater f lows across the vegetated surface of the terraced slope. Loading rates and application cycles are designed to maintain active micro-organism growth in the soil. The rate and length of
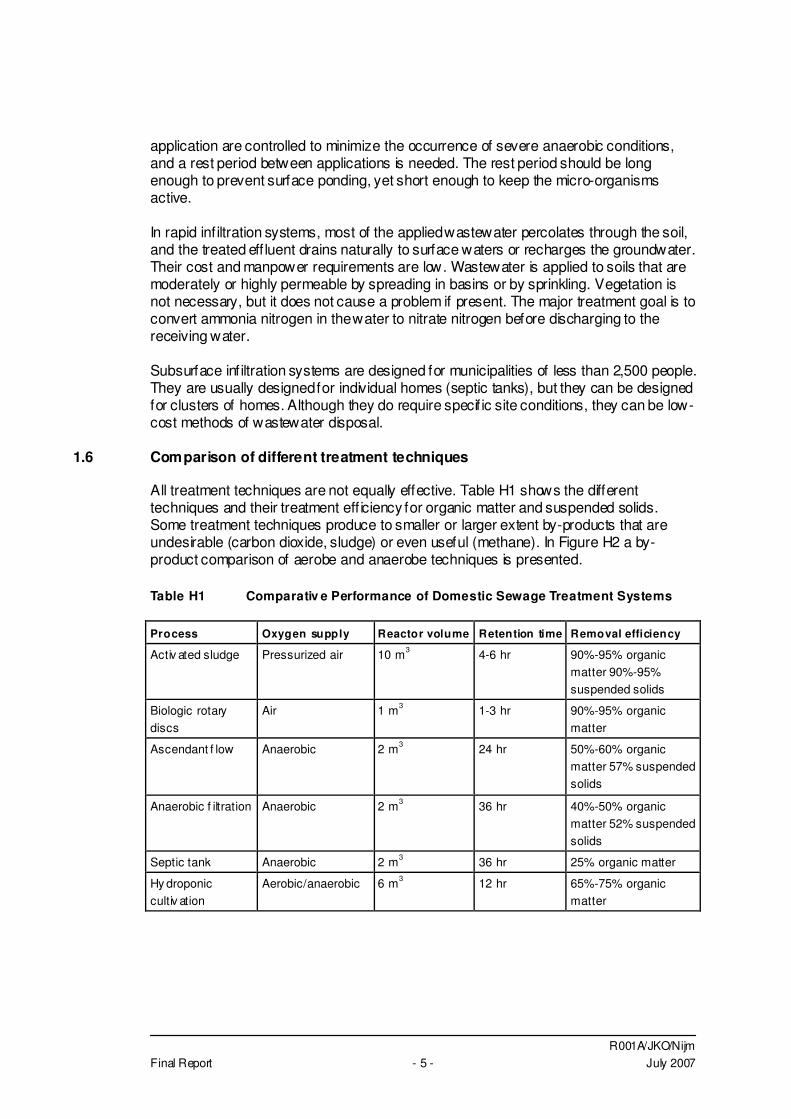
R001A/JKO/Nijm Final Report - 5 - July 2007
application are controlled to minimize the occurrence of severe anaerobic conditions, and a rest period between applications is needed. The rest period should be long enough to prevent surface ponding, yet short enough to keep the micro-organisms active. In rapid infiltration systems, most of the applied wastewater percolates through the soil, and the treated eff luent drains naturally to surface waters or recharges the groundwater. Their cost and manpower requirements are low. Wastewater is applied to soils that are moderately or highly permeable by spreading in basins or by sprinkling. Vegetation is not necessary, but it does not cause a problem if present. The major treatment goal is to convert ammonia nitrogen in the water to nitrate nitrogen before discharging to the receiving water. Subsurface infiltration systems are designed for municipalities of less than 2,500 people. They are usually designed for individual homes (septic tanks), but they can be designed for clusters of homes. Although they do require specif ic site conditions, they can be low-cost methods of wastewater disposal.
1.6 Comparison of different treatment techniques
All treatment techniques are not equally effective. Table H1 shows the different techniques and their treatment eff iciency for organic matter and suspended solids. Some treatment techniques produce to smaller or larger extent by-products that are undesirable (carbon dioxide, sludge) or even useful (methane). In Figure H2 a by-product comparison of aerobe and anaerobe techniques is presented. Table H1 Comparativ e Performance of Domestic Sewage Treatment Systems Process Oxygen supply Reactor volume Retention time Removal efficiency
Activ ated sludge Pressurized air 10 m3 4-6 hr 90%-95% organic matter 90%-95% suspended solids
Biologic rotary discs
Air 1 m3 1-3 hr 90%-95% organic matter
Ascendant f low Anaerobic 2 m3 24 hr 50%-60% organic matter 57% suspended solids
Anaerobic f iltration Anaerobic 2 m3 36 hr 40%-50% organic matter 52% suspended solids
Septic tank Anaerobic 2 m3 36 hr 25% organic matter
Hy droponic cultiv ation
Aerobic/anaerobic 6 m3 12 hr 65%-75% organic matter
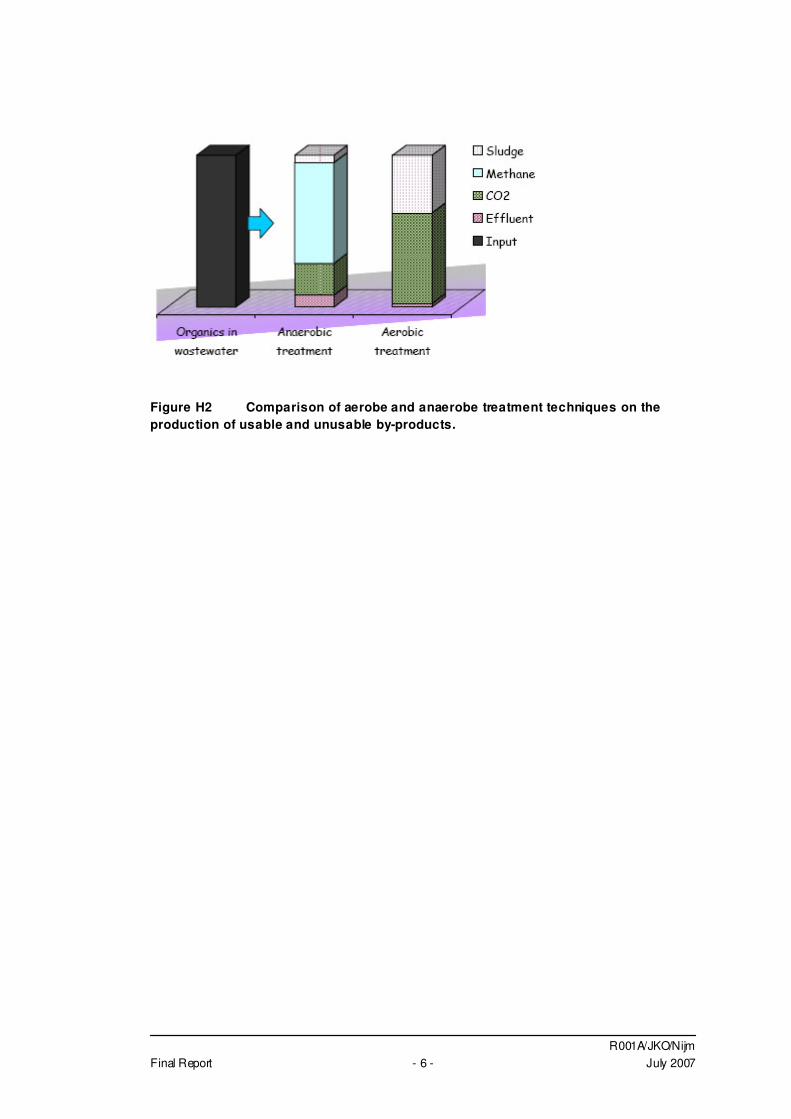
R001A/JKO/Nijm Final Report - 6 - July 2007
Figure H2 Comparison of aerobe and anaerobe treatment techniques on the production of usable and unusable by-products.
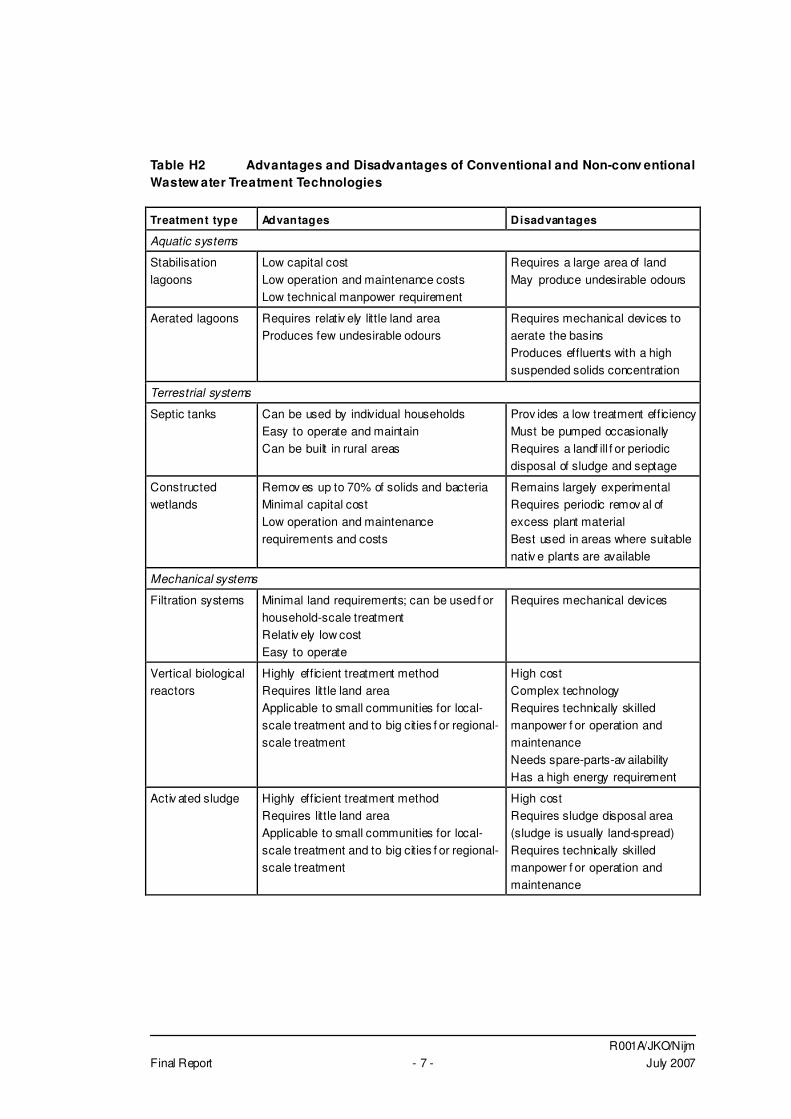
R001A/JKO/Nijm Final Report - 7 - July 2007
Table H2 Advantages and Disadvantages of Conventional and Non-conv entional Wastew ater Treatment Technologies Treatment type Advantages Disadvantages
Aquatic systems
Stabilisation lagoons
Low capital cost Low operation and maintenance costs Low technical manpower requirement
Requires a large area of land May produce undesirable odours
Aerated lagoons Requires relativ ely little land area Produces few undesirable odours
Requires mechanical devices to aerate the basins Produces effluents with a high suspended solids concentration
Terrestrial systems
Septic tanks Can be used by individual households Easy to operate and maintain Can be built in rural areas
Prov ides a low treatment efficiency Must be pumped occasionally Requires a landf ill f or periodic disposal of sludge and septage
Constructed wetlands
Remov es up to 70% of solids and bacteria Minimal capital cost Low operation and maintenance requirements and costs
Remains largely experimental Requires periodic remov al of excess plant material Best used in areas where suitable nativ e plants are available
Mechanical systems
Filtration systems Minimal land requirements; can be used f or household-scale treatment Relativ ely low cost Easy to operate
Requires mechanical devices
Vertical biological reactors
Highly efficient treatment method Requires little land area Applicable to small communities for local-scale treatment and to big cities f or regional-scale treatment
High cost Complex technology Requires technically skilled manpower f or operation and maintenance Needs spare-parts-av ailability Has a high energy requirement
Activ ated sludge Highly efficient treatment method Requires little land area Applicable to small communities for local-scale treatment and to big cities f or regional-scale treatment
High cost Requires sludge disposal area (sludge is usually land-spread) Requires technically skilled manpower f or operation and maintenance
R001A/JKO/Nijm Final Report - 8 - July 2007
Annex I Detailed evaluation results
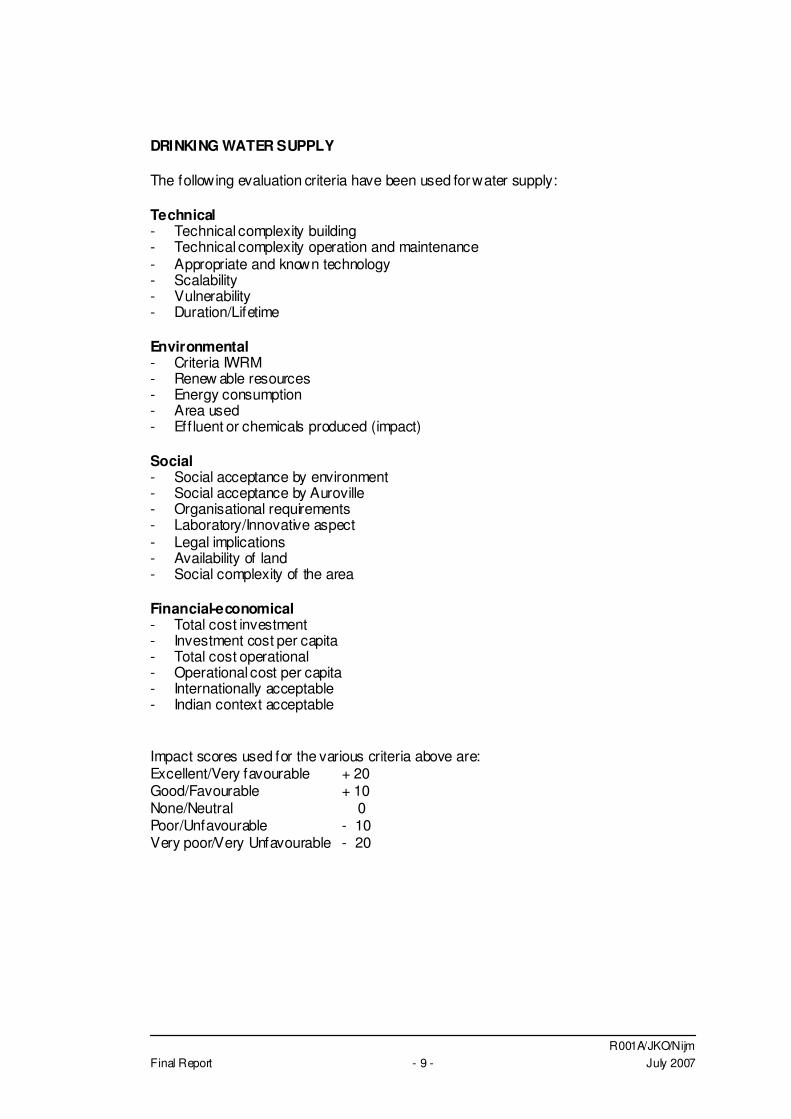
R001A/JKO/Nijm Final Report - 9 - July 2007
DRINKING WATER SUPPLY The following evaluation criteria have been used for water supply: Technical - Technical complexity building - Technical complexity operation and maintenance - Appropriate and known technology - Scalability - Vulnerability - Duration/Lifetime Environmental - Criteria IWRM - Renew able resources - Energy consumption - Area used - Eff luent or chemicals produced (impact) Social - Social acceptance by environment - Social acceptance by Auroville - Organisational requirements - Laboratory/Innovative aspect - Legal implications - Availability of land - Social complexity of the area Financial-economical - Total cost investment - Investment cost per capita - Total cost operational - Operational cost per capita - Internationally acceptable - Indian context acceptable Impact scores used for the various criteria above are: Excellent/Very favourable + 20 Good/Favourable + 10 None/Neutral 0 Poor/Unfavourable - 10 Very poor/Very Unfavourable - 20
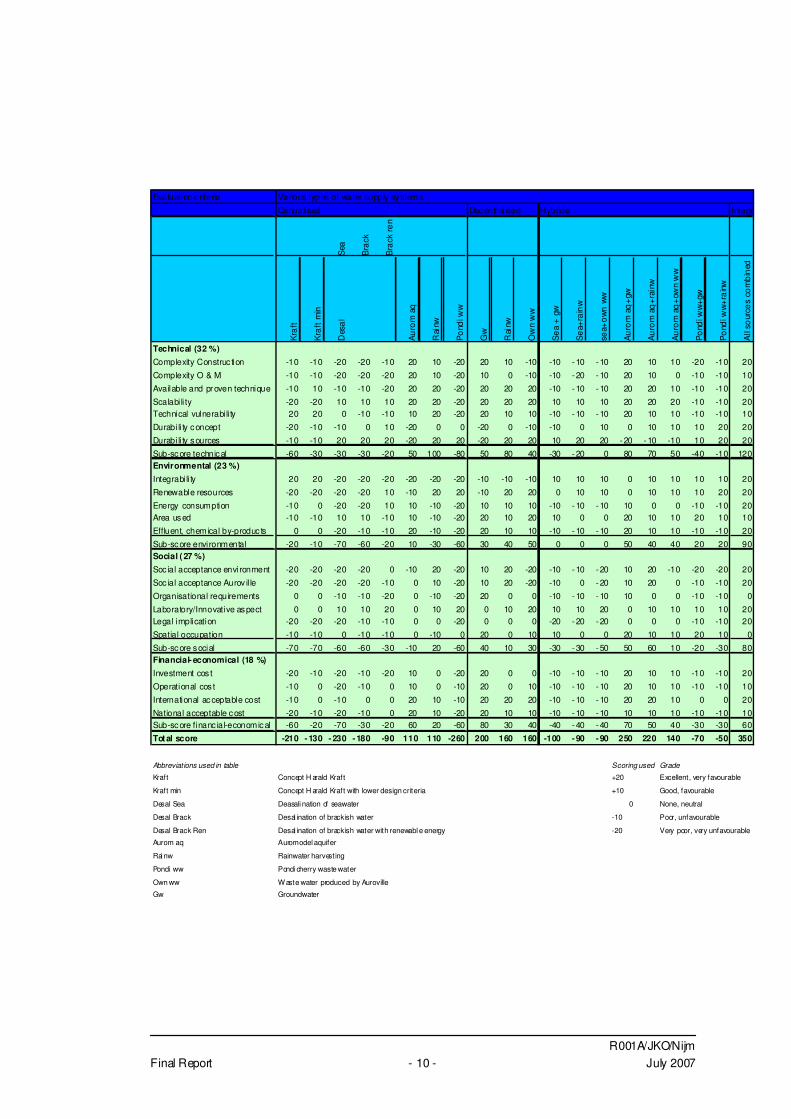
R001A/JKO/Nijm Final Report - 10 - July 2007
Evaluation c riteria
Centralised Decentral ised Hybride Integr
Sea
Bra
ck
Bra
ck r
en
Kra
ft
Kra
ft m
in
Des
al
Au
rom
aq
Rai
nw
Po
ndi w
w
Gw
Rai
nw
Ow
n w
w
Se
a +
gw
Se
a+ra
inw
sea+
ow
n w
w
Au
rom
aq
+gw
Au
rom
aq
+ra
inw
Au
rom
aq
+ow
n w
w
Po
ndi w
w+
gw
Po
ndi w
w+
rain
w
All
sour
ces
com
bin
ed
Technical (32 %)Complexity Construc tion -10 -10 -20 -20 -10 20 10 -20 20 10 -10 -10 -10 -10 20 10 10 -20 -10 20
Complexity O & M -10 -10 -20 -20 -20 20 10 -20 10 0 -10 -10 -20 -10 20 10 0 -10 -10 10
Available and proven technique -10 10 -10 -10 -20 20 20 -20 20 20 20 -10 -10 -10 20 20 10 -10 -10 20
Scalabi li ty -20 -20 10 10 10 20 20 -20 20 20 20 10 10 10 20 20 20 -10 -10 20Technical vulnerabi li ty 20 20 0 -10 -10 10 20 -20 20 10 10 -10 -10 -10 20 10 10 -10 -10 10
Durabi li ty concept -20 -10 -10 0 10 -20 0 0 -20 0 -10 -10 0 10 0 10 10 10 20 20
Durabi li ty sources -10 -10 20 20 20 -20 20 20 -20 20 20 10 20 20 -20 -10 -10 10 20 20
Sub-score technical -60 -30 -30 -30 -20 50 100 -80 50 80 40 -30 -20 0 80 70 50 -40 -10 120Environmental (23 %)Integrabi li ty 20 20 -20 -20 -20 -20 -20 -20 -10 -10 -10 10 10 10 0 10 10 10 10 20
Renewable resources -20 -20 -20 -20 10 -10 20 20 -10 20 20 0 10 10 0 10 10 10 20 20
Energy consumption -10 0 -20 -20 10 10 -10 -20 10 10 10 -10 -10 -10 10 0 0 -10 -10 20Area used -10 -10 10 10 -10 10 -10 -20 20 10 20 10 0 0 20 10 10 20 10 10
Effluent, chemical by-produc ts 0 0 -20 -10 -10 20 -10 -20 20 10 10 -10 -10 -10 20 10 10 -10 -10 20
Sub-score environmental -20 -10 -70 -60 -20 10 -30 -60 30 40 50 0 0 0 50 40 40 20 20 90Social ( 27 %)Soc ial acceptance environment -20 -20 -20 -20 0 -10 20 -20 10 20 -20 -10 -10 -20 10 20 -10 -20 -20 20
Soc ial acceptance Aurov il le -20 -20 -20 -20 -10 0 10 -20 10 20 -20 -10 0 -20 10 20 0 -10 -10 20
Organisational requirements 0 0 -10 -10 -20 0 -10 -20 20 0 0 -10 -10 -10 10 0 0 -10 -10 0
Laboratory/Innovative aspect 0 0 10 10 20 0 10 20 0 10 20 10 10 20 0 10 10 10 10 20Legal implication -20 -20 -20 -10 -10 0 0 -20 0 0 0 -20 -20 -20 0 0 0 -10 -10 20
Spatial occupation -10 -10 0 -10 -10 0 -10 0 20 0 10 10 0 0 20 10 10 20 10 0
Sub-score social -70 -70 -60 -60 -30 -10 20 -60 40 10 30 -30 -30 -50 50 60 10 -20 -30 80Financial-economical (18 %)Investment cos t -20 -10 -20 -10 -20 10 0 -20 20 0 0 -10 -10 -10 20 10 10 -10 -10 20
Operational cos t -10 0 -20 -10 0 10 0 -10 20 0 10 -10 -10 -10 20 10 10 -10 -10 10
International acceptable cost -10 0 -10 0 0 20 10 -10 20 20 20 -10 -10 -10 20 20 10 0 0 20
National acceptable cost -20 -10 -20 -10 0 20 10 -20 20 10 10 -10 -10 -10 10 10 10 -10 -10 10Sub-score financ ial-economical -60 -20 -70 -30 -20 60 20 -60 80 30 40 -40 -40 -40 70 50 40 -30 -30 60
Total score -210 -130 -230 -180 -90 110 110 -260 200 160 160 -100 -90 -90 250 220 140 -70 -50 350
Abbreviations used in table Scoring used Grade
Kraft Concept H arald Kraft +20 Excellent, very favourable
Kraft min Concept H arald Kraft with lower design criteria +10 Good, favourable
Desal Sea Deasali nation of seawater 0 None, neutral
Desal Brack Desal ination of brackish water -10 Poor, unfavourable
Desal Brack Ren Desal ination of brackish water with renewable energy -20 Very poor, very unfavourable
Aurom aq Auromodel aquifer
Rainw Rainwater harvesting
Pondi ww Pondi cherry waste water
Own ww Waste water produced by Auroville
Gw Groundwater
Various types of water supply systems
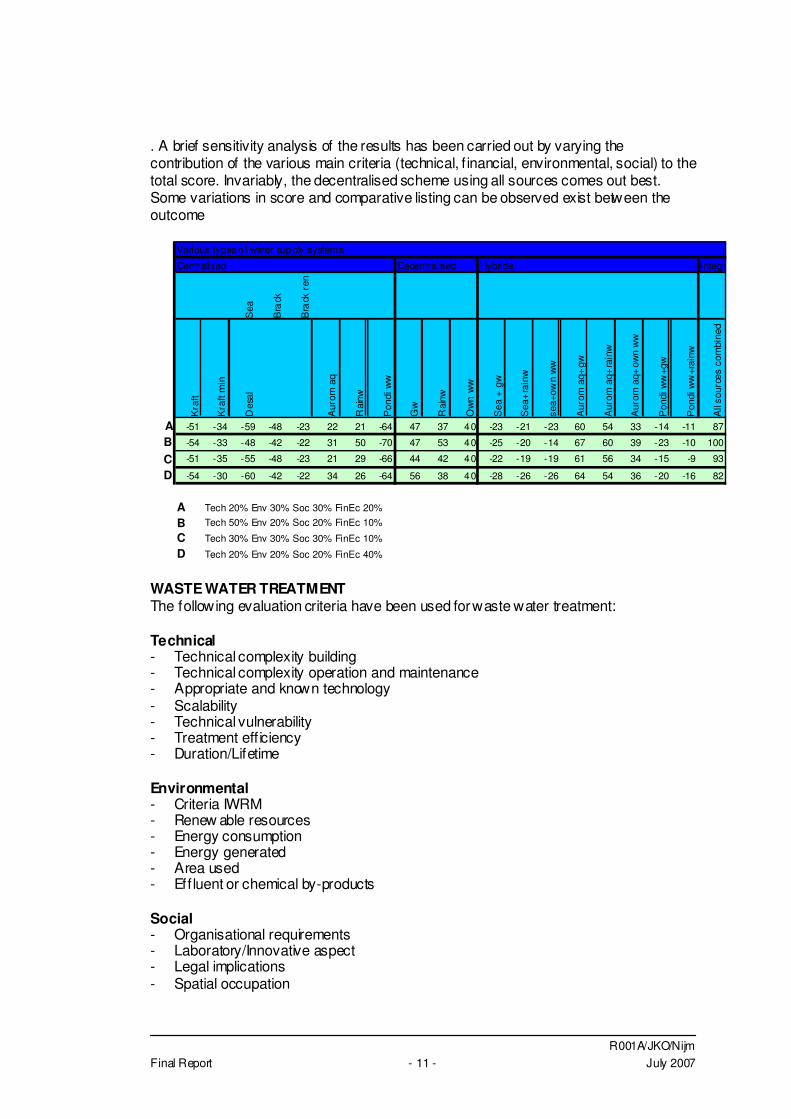
R001A/JKO/Nijm Final Report - 11 - July 2007
. A brief sensitivity analysis of the results has been carried out by varying the contribution of the various main criteria (technical, f inancial, environmental, social) to the total score. Invariably, the decentralised scheme using all sources comes out best. Some variations in score and comparative listing can be observed exist between the outcome
Centralised Decentralised Hybride Integr
Sea
Bra
ck
Bra
ck r
en
Kra
ft
Kra
ft m
in
Des
al
Aur
om a
q
Rai
nw
Pon
di w
w
Gw
Rai
nw
Ow
n w
w
Sea
+ g
w
Sea
+ra
inw
sea+
own
ww
Aur
om a
q+gw
Aur
om a
q+ra
inw
Aur
om a
q+ow
n w
w
Pon
di w
w+g
w
Pon
di w
w+r
ainw
All
sour
ces
com
bine
d
A -51 -34 -59 -48 -23 22 21 -64 47 37 40 -23 -21 -23 60 54 33 -14 -11 87
B -54 -33 -48 -42 -22 31 50 -70 47 53 40 -25 -20 -14 67 60 39 -23 -10 100
C -51 -35 -55 -48 -23 21 29 -66 44 42 40 -22 -19 -19 61 56 34 -15 -9 93
D -54 -30 -60 -42 -22 34 26 -64 56 38 40 -28 -26 -26 64 54 36 -20 -16 82
A Tech 20% Env 30% Soc 30% FinEc 20%
B Tech 50% Env 20% Soc 20% FinEc 10%
C Tech 30% Env 30% Soc 30% FinEc 10%
D Tech 20% Env 20% Soc 20% FinEc 40%
Various types o f water supply systems
WASTE WATER TREATMENT The following evaluation criteria have been used for waste water treatment: Technical - Technical complexity building - Technical complexity operation and maintenance - Appropriate and known technology - Scalability - Technical vulnerability - Treatment eff iciency - Duration/Lifetime Environmental - Criteria IWRM - Renew able resources - Energy consumption - Energy generated - Area used - Eff luent or chemical by-products Social - Organisational requirements - Laboratory/Innovative aspect - Legal implications - Spatial occupation
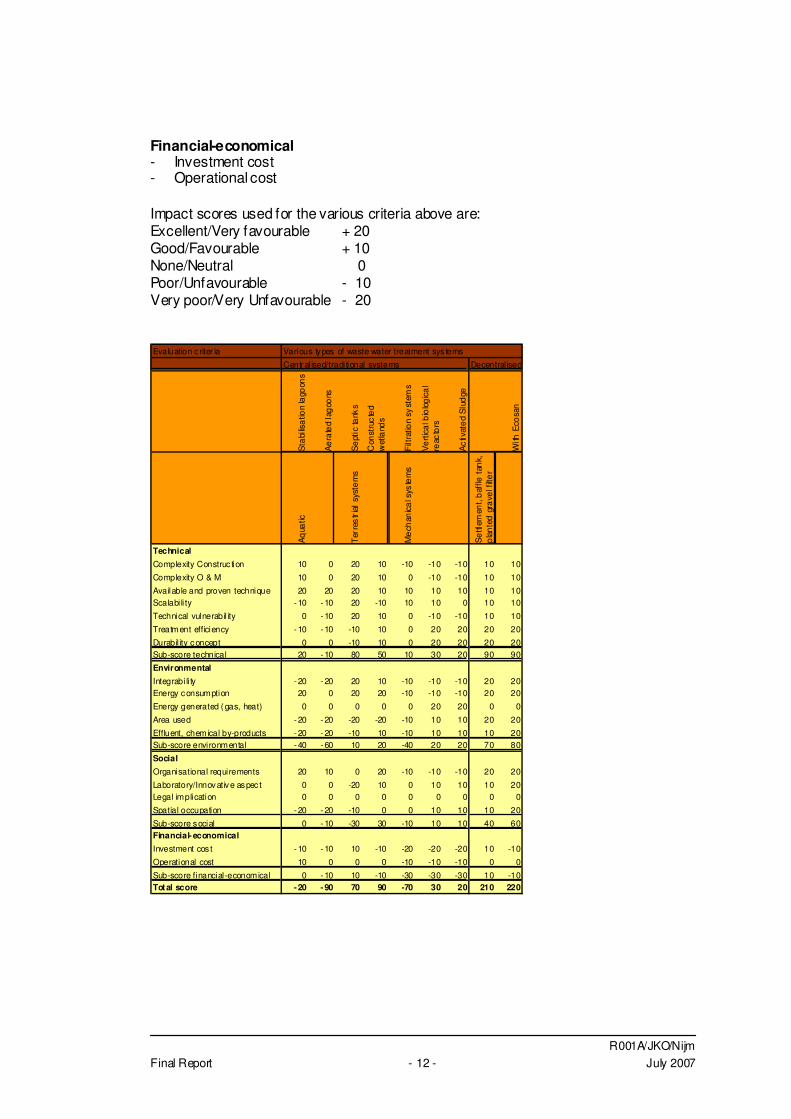
R001A/JKO/Nijm Final Report - 12 - July 2007
Financial-economical - Investment cost - Operational cost Impact scores used for the various criteria above are: Excellent/Very favourable + 20 Good/Favourable + 10 None/Neutral 0 Poor/Unfavourable - 10 Very poor/Very Unfavourable - 20 Evaluation c riter ia
Central ised/traditional systems Decentral ised
Sta
bilis
atio
n la
goon
s
Ae
rate
d la
goo
ns
Se
ptic
tank
s
Con
stru
cte
d
wet
land
s
Filt
ratio
n sy
stem
s
Ve
rtic
al b
iolo
gic
al
reac
tors
Ac
tivat
ed
Slu
dge
With
Eco
san
Aq
uatic
Ter
res
tria
l sy
ste
ms
Me
chan
ica
l sys
tem
s
Se
ttlem
ent,
baf
fle t
ank,
p
lan
ted
gra
vel f
ilte
r
Technical
Complexity Construc tion 10 0 20 10 -10 -10 -10 10 10
Complexity O & M 10 0 20 10 0 -10 -10 10 10
Available and proven technique 20 20 20 10 10 10 10 10 10Scalabi li ty - 10 -10 20 -10 10 10 0 10 10
Technical vulnerabil ity 0 -10 20 10 0 -10 -10 10 10
Treatment efficiency -10 -10 -10 10 0 20 20 20 20
Durabil ity concept 0 0 -10 10 0 20 20 20 20Sub-score technical 20 -10 80 50 10 30 20 90 90
Environmental
Integrabi li ty - 20 -20 20 10 -10 -10 -10 20 20Energy consumption 20 0 20 20 -10 -10 -10 20 20
Energy generated (gas, heat) 0 0 0 0 0 20 20 0 0
Area used -20 -20 -20 -20 -10 10 10 20 20
Effluent, chemical by-products -20 -20 -10 10 -10 10 10 10 20Sub-score environmental - 40 -60 10 20 -40 20 20 70 80
Social
Organisational requirements 20 10 0 20 -10 -10 -10 20 20
Laboratory/Innovative aspec t 0 0 -20 10 0 10 10 10 20Legal implication 0 0 0 0 0 0 0 0 0
Spatial occupation -20 -20 -10 0 0 10 10 10 20
Sub-score social 0 -10 -30 30 -10 10 10 40 60Financial- economical
Investment cos t - 10 -10 10 -10 -20 -20 -20 10 -10
Operational cost 10 0 0 0 -10 -10 -10 0 0
Sub-score financial-economical 0 -10 10 -10 -30 -30 -30 10 -10Total score -20 -90 70 90 -70 30 20 210 220
Various types of waste water treatment sys tems
R001A/JKO/Nijm Final Report - 13 - July 2007
MATRIMANDIR LAKE The following evaluation criteria have been used for the Matrimandir Lake: Technical - Rainw ater storage - Cleaning - Technical complexity building - Technical complexity operation and maintenance Environmental - Signif icant role in water management - Energy balance - Area used - Volume used Social - Organisational requirements - Laboratory/innovative aspects - Legal implications Financial-economical - Investment cost - Operational cost Impact scores used for the various criteria above are: Excellent/Very favourable + 20 Good/Favourable + 10 None/Neutral 0 Poor/Unfavourable - 10 Very poor/Very Unfavourable - 20
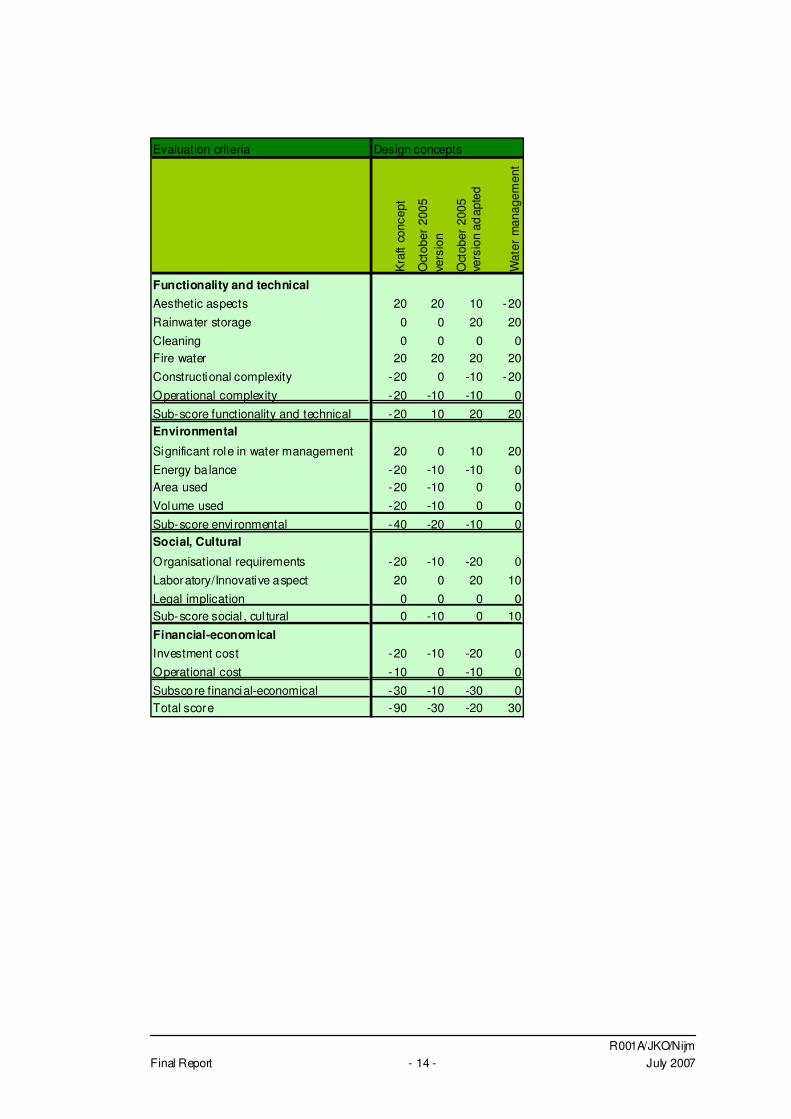
R001A/JKO/Nijm Final Report - 14 - July 2007
Evaluation criteria Design concepts
Kra
ft co
ncep
t
Oct
ober
200
5 ve
rsio
n
Oct
ober
200
5 ve
rsio
n ad
apte
d
Wat
er m
anag
emen
t
Functionality and technicalAesthetic aspects 20 20 10 -20Rainwater storage 0 0 20 20Cleaning 0 0 0 0Fire water 20 20 20 20Constructional complexity -20 0 -10 -20Operational complexity -20 -10 -10 0Sub-score functionality and technical -20 10 20 20Environmental
Significant role in water management 20 0 10 20Energy balance -20 -10 -10 0Area used -20 -10 0 0Volume used -20 -10 0 0Sub-score envi ronmental -40 -20 -10 0Social, Cultural
Organisational requirements -20 -10 -20 0Laboratory/Innovative aspect 20 0 20 10Legal implication 0 0 0 0Sub-score social , cul tural 0 -10 0 10Financial-economicalInvestment cost -20 -10 -20 0Operational cost -10 0 -10 0Subscore financial-economical -30 -10 -30 0Total score -90 -30 -20 30