August 2019 - Silicon Institute of Technology
40
1 Vol. 21 l June 2019 - August 2019 SPECIAL FEATURE Key Frame Extraction & Video Summarization
-
Upload
khangminh22 -
Category
Documents
-
view
1 -
download
0
Transcript of August 2019 - Silicon Institute of Technology

1
Vol. 21 l June 2019 - August 2019
SPECIAL FEATURE
Key Frame Extraction & Video Summarization

2
Chandrayaan 2 is a totally indigenous mission unlike any before. Leveraging nearly a decade of scientific research and engineering development, India’s second lunar expedition will shed light on a completely unexplored section of the Moon — its South Polar region. First earth bound orbit raising maneuver for Chandryaan-2 spacecraft was performed successfully on July 24, 2019 at 1452 hrs (IST) as planned, using the onboard propulsion system for a firing duration of 48 seconds. This mission will help us gain better understanding of the origin and evolution of the Moon. The primary objective of Indian Space Research Organization to launch Chandrayaan-2 is to demonstrate the ability to soft-land on the lunar surface and operate a robotic rover on the surface. Scientific goals are to study lunar topography, mineralogy, elemental abundance, the lunar exosphere and signatures of hydroxyl and water ice. A successful landing would make India the fourth country to achieve a soft landing on the Moon, after the space agencies of the USSR, US and China. The team of women scientists will also go down in history for breaking the shackles of stereotypes and male preponderance in the space sector force angle, Ritu Karidhal the Mission Director of Chandrayaan-2 and M Vanitha, the Project Director of Chandrayaan-2 played crucial roles in this mission. The journey of Chandrayaan-2 is around 3.84 lakh km to the Moon. It will be injected into an earth parking 170 x40400 km orbit. It will collect data on water, minerals and formations of rock. The Lander and Rover of Chandrayaan-2 are targeted for a location of about 600 km or 375 miles approx from the South Pole. It would be the first time any mission touched down so far from the equator. The Orbiter and Lander modules will be mechanically interfaced and stacked together like an
integrated module and accommodated inside the GSLV MK-III launch vehicle where as the Rover is housed inside the Lander.
After launching, the integrated module will reach the moon orbit by using the Orbiter propulsion module. Then, Lander (also known as Vikram) will automatically separate from the Orbiter and land at the site close to lunar South Pole. The rover also known as Pragyan, will have two instruments on board. It is it will send information from the moon to Vikram Lander, Lander will send data to Orbiter, then the Orbiter will send it to the ISRO centre. This whole process will take about 15 minutes. So, it can be said that information sent from Pragyan Robot will take about 15 minutes to reach the ISRO centre in India. The Lander’s initial design was made by ISRO’s Space Application Centre Ahmedabad. Later, it was developed by the URSC of Bengaluru. ISRO has made an indigenous Lander on Russia’s refusal. An Orbiter of Chandrayaan-2 will also be installed at 100 km above the moon and consists of eight instruments. There is an Imaging Infra-red Spectrometer (IIRS) which will try to identify minerals and indicators of hydroxyl and water molecules. It will operate on solar power and will be relaying the information from Lander and Rover to the ISRO Centre. It will also transmit the commands sent from ISRO to the lander and the rover. It was designed and fabricated by Hindustan Aeronautics Limited and handed over to ISRO in 2015. The aim through this mission is to improve our understanding of the Moon – discoveries that will benefit India and humanity as a whole. The insights and experiences from this lunar expedition may propel further voyages into the farthest frontiers.
INDIA’s MISSION TO THE MOON: CHANDRAYAAN 2
Dr. Lopamudra MitraSr. Asst. Prof., Dept. EEE.
Editorial
3
Key Frame Extraction and Video SummarizationAbstract : Video summarization is the process of condensing the visual information in a video clip to its textual equivalent. It involves multiple steps starting from selection of a subset of frames that represent the entirety of the video and ends at generation captions for the selected frames. Video summarization is of great interest to use since the amount of information stored in video format has exploded over the past decade. In this work, a two stage strategy is applied to summarize video clips. The first step is the selection of key frames which is achieved by creation of color histograms in HSV (Hue Saturation Values) color space. The selected frames are passed on to the show and tell model. The image is encoded using CNN (Convolutional Neural Network) and the feature vector generated is used as an input to the RNN (Recurrent Neural Network). The task of the RNN is to find the best possible sentence that describes the selected image. Cap-tions are generated with the help of beam search which essentially makes sentence generation an optimal path finding problem if a finite vocabulary set is present.
Special Feature
I. INTRODUCTION Millions of hours of videos are recorded and uploaded across the internet on a weekly basis. Most of them contains little meta data apart from their title (and sometimes even those are misleading or incorrect), this makes efficient searching difficult. The task of extracting information from videos without human intervention has gained attention in recent year. Video summarisation is an inherently tricky task because it is subjective in nature. Two humans might see the same video but choose to describe it in strikingly different ways, and both of them might be correct. To overcome this, the key events in the video are needed to be identified along with the relationship between objects in those key frames. Video summarisation presents some unique challenges, the first of which is the overabundance of redundant information in a video. Typical video clips have 30 frames per second and each frame is an image with three channels. All the frames are not needed to form an accurate representation of the video since it often happens that successive frames only have small changes that simulate motion and action.
A video file contains a multitude of information that is presented rapidly and can be easily assessed by human eyes. The explosion in amount of video being recorded has made it difficult to manually review all of them. To tackle this problem a framework is needed to be build that takes a video as input and returns the key events that happen in it along with textual description of said frames. The objective of this work is to identify key
events and provide meta data for videos that can be used to search, classify or tag videos.
This work combines machine learning with image processing techniques like color space conversion and color histogram construction. Frame selection is the initial and one of the most important steps. Key frame selection can be done using a number of methods such as sampling frames at uniform or random interval. The color histograms are used to find frames which are sufficiently unique to warrant attention. Color spaces are used to represent the visual information of an image in a digitized form. The most common color space RGB (Red, Green, Blue) is often enough for image processing tasks. However, for this work frames are needed to be identified where there is a change in either the objects or the setting, therefore RGB is not suited as it combines luminosity with chrominance. To overcome this, HSV color space [1] is used. Each frame has its color histogram calculated and used for comparison with the last key frame.
A video might have hundreds of frames but the presented model takes one frame at a time and treats it as an image and generates a caption. Image Caption Generation is the process of generating the captions describing an image, given the image as input. The greatest difficulty in caption generation is the detection of objects present in the image. The objects come in all shape, size and color. To be able to differentiate different objects or group
Keywords: Convolutional Neural Network, Recurrent Neural Network, HSV, Bhattacharyya Distance, Beam Search

4
similar objects comes with great difficulty. Extracting useful features from the objects is a challenging task and for which the Deep Neural Networks concepts are used.
CNNs are specialized DNN architectures, especially built for processing visual and speech data. CNNs utilize convolution to produce a compact representation of the input. By layering many Convolution units one after another, a really efficient and compact representation of the input can be produced. The second part of the problem, natural language processing is achieved using an ANN architecture called Recurrent Neural Networks (RNNs). RNNs process sequential data i.e. if the input is a sequence where one input depends on the previous inputs, RNNs are used.
II. PROPOSED APPROACHTo summarize a video, the key frames that mark the most important events that take place in a video are needed to be identified. The process of determining what constitutes as a key frame is explained in the next section. The presented model takes a video file in a standard encoding and format as input and outputs a very short video (in mp4 format) made up of key frames and captions for each key frame with a timestamp.
A. The Algorithm
1. Read all frames and calculate histogram with masks.
2. Select the key frames on the basis of Bhattacharyya distance [2].
3. Pass the frames to show and tell model.
4. Load model, building vocabulary.
5. Beam search in vocabulary search space to generate a sentence.
6. Accumulate the generated sentences to form a summary.
B. Frame Selection
In order to obtain the key frames, the frames are divided into 5 sections: Four rectangular sections and an ellipse in the center. The choice of rectangular sections around the four corners and an ellipse in the centre is due to the fact that in any video, most of the
happenings and changes occur in the central region and hence more focus for distinguishing frames from the central elliptical section of the frames. Selection of key frames is an iterative process which takes into account all frames before selecting a proper subset. The algorithm for frame selection using HSV color space is presented in Algorithm-1. The working of the baseline comparison function used in Algorithm-1 is described in Algorithm-2.
C. SHOW AND TELL WITH BEAM SEARCH
The selected frames are then passed onto the show and tell model [3] which is responsible for caption generation. The show and tell model is discussed in detail in section III. Beam search is an approximate search strategy that aims to find the correct result without being extremely memory intensive. Beam search takes three components as its input: a problem to be solved, a set of heuristic rules for pruning, and a memory with a limited available capacity. The problem is the problem to be solved, usually represented as a graph, and contains a set of nodes in which one or more of the nodes represents a goal. The set of heuristic rules are rules specific to the problem domain and prune unfavorable nodes from the memory in respect to the problem domain. The memory is where the beam is stored, where when memory is full and a node is to be added to the beam, the most costly node will be deleted, such that the memory limit is not exceeded.
5
III. SHOW AND TELL MODELThe Show and Tell model proposes a neural and probabilistic framework to generate descriptions from images. It has been seen that, given a powerful sequence model, it is possible to achieve state-of-the-art results by directly maximizing the probability of the correct translation given an input sentence in an end-to-end fashion both for training and inference. These models make use of a recurrent neural network which encodes the variable length input into a fixed dimensional vector, and uses this representation to decode it to the desired output sentence. This model proposes to directly maximize the probability of the correct description given the image by using equation (1):
Where θ are the parameters of the model, I is an image, and S its correct transcription. Since S represents any sentence, its length is unbounded. Thus, it is common to apply the chain rule to model the joint probability over S0,….,SN, where N is the length of any particular sentence,
It is natural to model p (St | I, S0,…,St-1) with a Recurrent Neural Network (RNN), where the variable number of words we condition upon up to t-1 is expressed by a fixed length hidden state or memory ht. This memory is updated after seeing a new input xt by using a non-linear function f :
To make the above RNN more concrete two crucial design choices are to be made: what is the exact form of f and how are the images and words fed as inputs xt. For f we use a Long-Short Term Memory (LSTM) net, which has shown state-of-the art performance on sequence tasks such as translation. This model is outlined in the next section. For the representation of images, we use a Convolutional Neural Network (CNN).
A. LSTM-based Sentence Generator
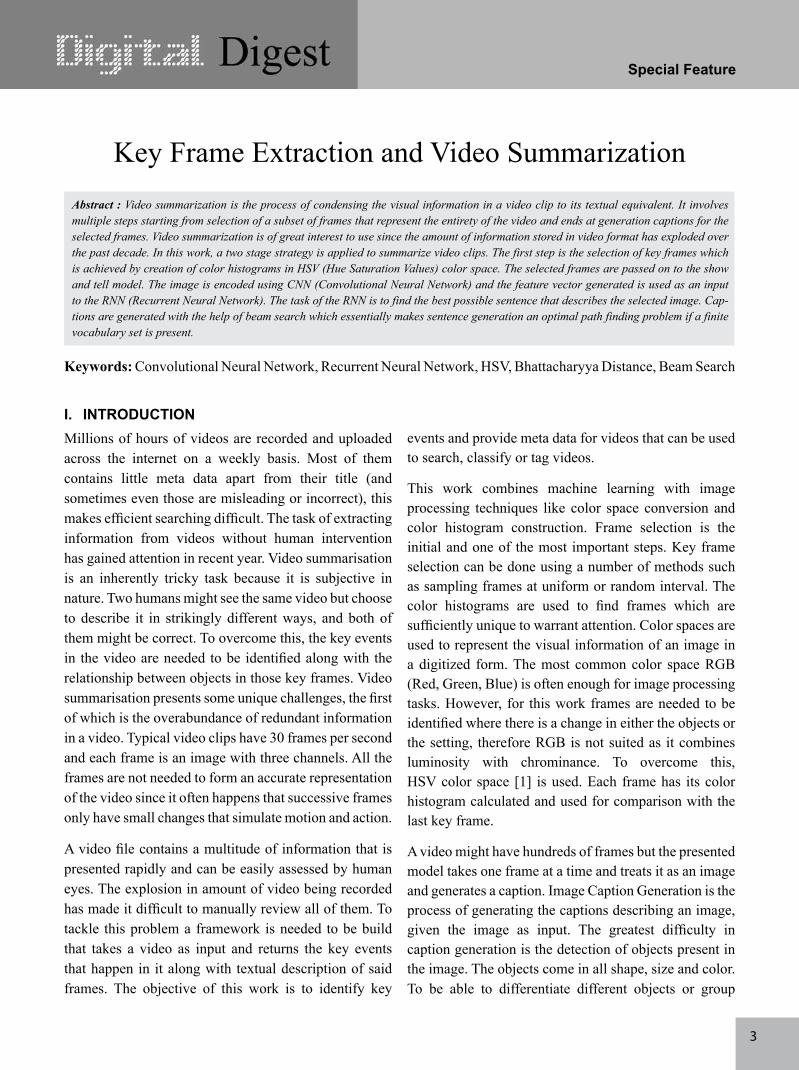
The choice of f in equation (3) is governed by its ability to deal with vanishing and exploding gradients [4], the most common challenge in designing and training RNNs. To address this challenge, a particular form of recurrent nets, called LSTM (Long Short Term Memory), was introduced, and applied with great success to translation [5], [6] and sequence generation [7] [8]. The core of the LSTM model is a memory cell c encoding knowledge at every time step of what inputs have been observed up to this step as shown in figure(1).
The behavior of the cell is controlled by gates layers which are applied multiplicatively and thus can either keep a value from the gated layer if the gate is 1 or zero this value if the gate is 0. In particular, three gates are being used which control whether to forget the current cell value (forget gate f), if it should read its input (input gate i) and whether to output the new cell value (output gate o). The definition of the gates and cell update and output are as follows:
Where ʘ represents the product with a gate value, and the various W matrices are trained parameters. The last
6
Fig. 1: LSTM: the memory block contains a cell c which is controlled by three gates.
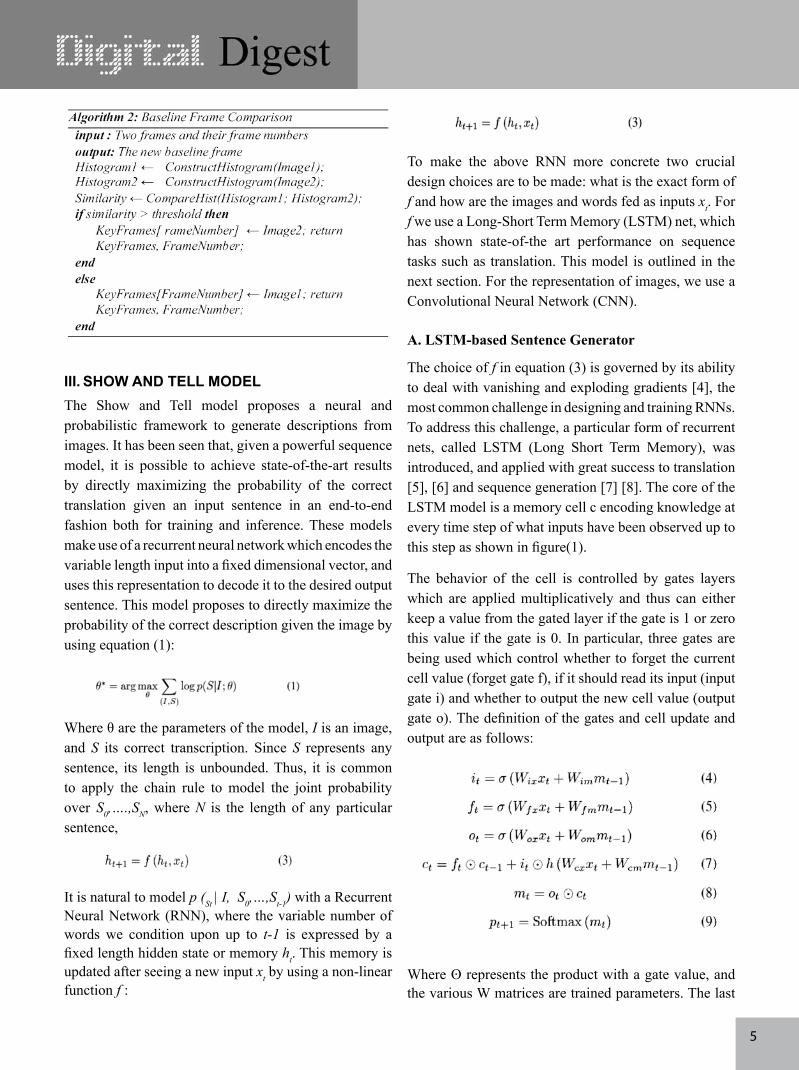
The LSTM model is trained to predict each word of the sentence after it has seen the image as well as all preceding words as defined by p (St
| I, S0, …., St-1). For
this purpose, it is instructive to think of the LSTM in
Fig. 2: LSTM model combined with a CNN image embedder and word embeddings. All LSTMs share the same parame-ters.
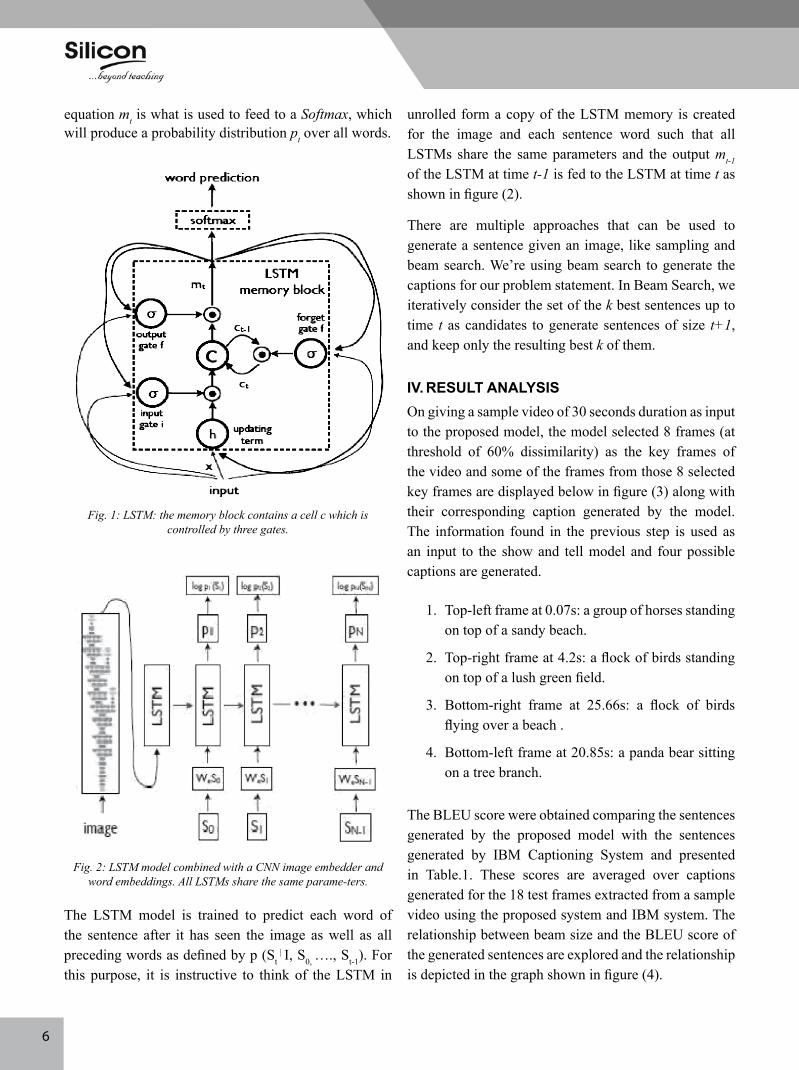
IV. RESULT ANALySISOn giving a sample video of 30 seconds duration as input to the proposed model, the model selected 8 frames (at threshold of 60% dissimilarity) as the key frames of the video and some of the frames from those 8 selected key frames are displayed below in figure (3) along with their corresponding caption generated by the model. The information found in the previous step is used as an input to the show and tell model and four possible captions are generated.
1. Top-left frame at 0.07s: a group of horses standing on top of a sandy beach.
2. Top-right frame at 4.2s: a flock of birds standing on top of a lush green field.
3. Bottom-right frame at 25.66s: a flock of birds flying over a beach .
4. Bottom-left frame at 20.85s: a panda bear sitting on a tree branch.
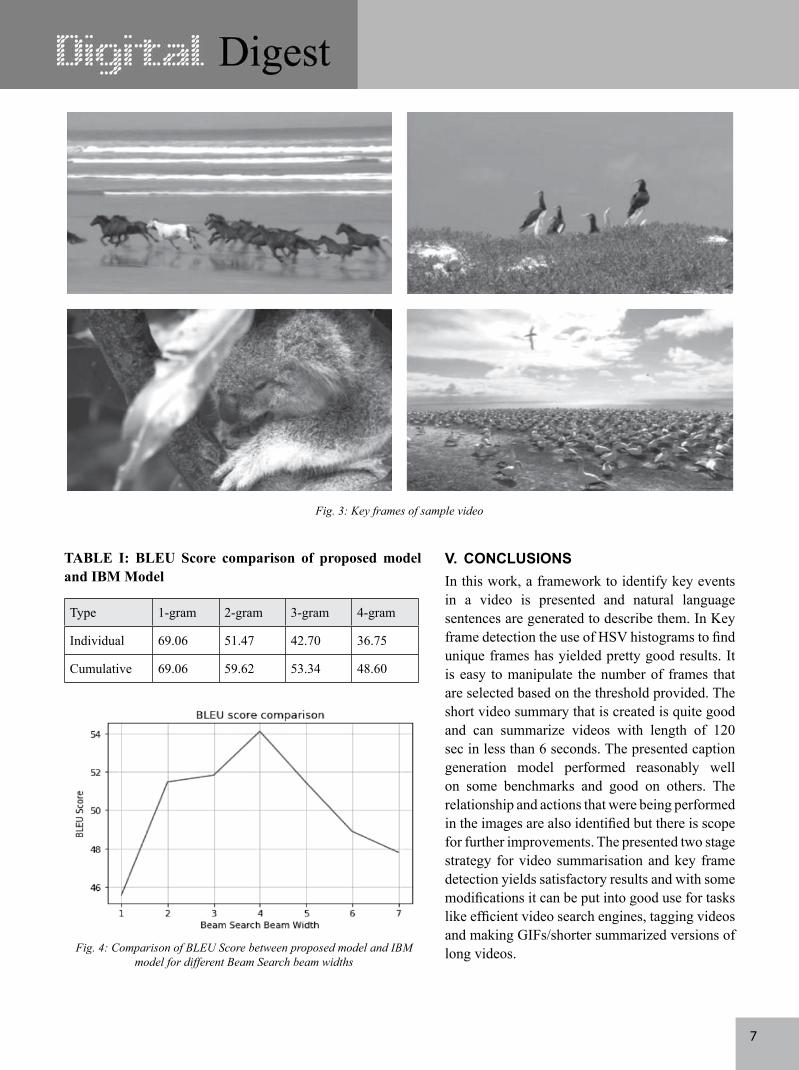
The BLEU score were obtained comparing the sentences generated by the proposed model with the sentences generated by IBM Captioning System and presented in Table.1. These scores are averaged over captions generated for the 18 test frames extracted from a sample video using the proposed system and IBM system. The relationship between beam size and the BLEU score of the generated sentences are explored and the relationship is depicted in the graph shown in figure (4).
unrolled form a copy of the LSTM memory is created for the image and each sentence word such that all LSTMs share the same parameters and the output mt-1 of the LSTM at time t-1 is fed to the LSTM at time t as shown in figure (2).
There are multiple approaches that can be used to generate a sentence given an image, like sampling and beam search. We’re using beam search to generate the captions for our problem statement. In Beam Search, we iteratively consider the set of the k best sentences up to time t as candidates to generate sentences of size t+1, and keep only the resulting best k of them.
equation mt is what is used to feed to a Softmax, which will produce a probability distribution pt over all words.
7
Fig. 3: Key frames of sample video
TABLE I: BLEU Score comparison of proposed model and IBM Model
Type 1-gram 2-gram 3-gram 4-gram
Individual 69.06 51.47 42.70 36.75
Cumulative 69.06 59.62 53.34 48.60
Fig. 4: Comparison of BLEU Score between proposed model and IBM model for different Beam Search beam widths
V. CONCLUSIONSIn this work, a framework to identify key events in a video is presented and natural language sentences are generated to describe them. In Key frame detection the use of HSV histograms to find unique frames has yielded pretty good results. It is easy to manipulate the number of frames that are selected based on the threshold provided. The short video summary that is created is quite good and can summarize videos with length of 120 sec in less than 6 seconds. The presented caption generation model performed reasonably well on some benchmarks and good on others. The relationship and actions that were being performed in the images are also identified but there is scope for further improvements. The presented two stage strategy for video summarisation and key frame detection yields satisfactory results and with some modifications it can be put into good use for tasks like efficient video search engines, tagging videos and making GIFs/shorter summarized versions of long videos.

8
ACKNOWLEDGEMENTWe express our sincere gratitude to our project guide Dr. Pradyumna Kumar Tripathy of CSE department for his guidance and encouragement in carrying out this work.
REFERENCES
[1] O. Vinyals, A. Toshev, S. Bengio, Dumitru Erhan. Show and Tell: A Neural Image Caption Generator arXiv:1411.4555, 2014.
[2] K. Greff, R. K. Srivastava, J. Koutnk, B. R. Steunebrink, J. Schmidhuber. LSTM: A Search Space Odyssey. arXiv:1503.04069, 2015.
[3] K. Cho, B. Merrienboer, C. Gulcehre, F. Bougares, H. Schwenk, and Y. Bengio. Learning phrase representations using RNN encoder-decoder for statistical machine translation. arXiv:1406.1078,2014.
[4] X Li, T. Xu. Face Video Key-Frame Extraction Algorithm Based on Color Histogram. DOI: 10.7763/IPCSIT.2012.V51. 112
[5] P. A. Marn-Reyes, J. Lorenzo-Navarro, M. Castrilln-Santana. Comparative study of histogram distance measures for re-identification. arXiv:1611.08134, 2016.
[6] K. Papineni, S. Roukos, T. Ward, and W. Zhu. BLEU: a Method for Automatic Evaluation of Machine Translation ACL, Philadelphia, July 2002.
[7] A. Graves. Generating sequences with recurrent neural networks. arXiv:1308.0850, 2013.
[8] I. Sutskever, O. Vinyals, and Q. V. Le. Sequence to sequence learning with neural networks. In NIPS, 2014.
Amit Kumar, Debasish Patnaik, Sudhanshu Ranjan
Dept. of CSE
9
In conversation with Dr. Ambarish Mohapatra on his work with FBG sensors to test the stress on suspension bridges.
Dr. Ambarish Mohapatra is currently the department head of Electronics & Instrumentation Engineering department. He was working on SRPS project based on the application of FBG sensors in a suspension bridge environment. The main objective was to identify the strain distribution over the bridge structure during various load conditions. Static analysis and dynamic analysis of the bridge structure was performed using three FBG sensors fabricated in a Single mode fiber cable interfaced with the Micron-Optics FBG Interrogator. The complete FBG sensor fabrication is done at CGCRI, Kolkata and the prototype of the suspension bridge model is made at Silicon Institute of Technology, Bhubaneswar. The prototype model was tested successfully at Silicon Institute of Technology.
Dr. Pamela : Tell us something about the application of FBG sensor in Civil Instrumentation developed under the SRPS project
Dr. Ambarish: Nowadays structural health monitoring is a fundamental tool to assess the behavior of existing structures but also to control the performance of large new structures, foreseen to give information to monitor their lifetime. Infrastructure decay is a big problem faced by many developed countries in the world. After years of service, many structures, such as bridges, tunnels, dams and power plants, are showing severe deterioration. To ensure safety of these structures and to perform proper maintenance/rehabilitation, there is a need to monitor the structural condition or “health” over time. Also, for important new structures, sensors are often installed during the construction phase so minor degradations can be identified at an early stage. Low-cost minor repair can then be performed to avoid major damages that require costly renovations or even reconstruction. The use of any structural health monitoring system, if correctly designed and used, can have a positive impact on the lifetime cost of a structure. By providing quantitative information on the state of a structure, it allows a better management of its maintenance and inspections, resulting in a positive benefit to cost comparison.
Dr. Pamela: What is the specialty of the FBG sensor?
Dr. Ambarish: Since FBG sensors are an all-in-fiber technology, they take advantage of the optical fiber properties, presenting also advantages over traditional electronic sensors due to the possibility to multiplex a large number of different sensors (temperature, displacement, pressure, pH value, humidity, high magnetic
field and acceleration) into the same optical fiber, reducing the need for multiple and heavy cabling used in traditional electronic sensing. Other advantage of the optical sensors is the inherent fact that the information is codified in the optical domain, so, this kind of sensor can be used in hostile environments, where electrical currents of electronic devices might pose a hazard.
Dr. Pamela: How does the FBG sensor work?
Dr. Ambarish: In optical sensing, the sensing element is part of an optical fiber which transforms a change in the monitored parameter into a corresponding change in the properties of the guided light, which can be its intensity, phase, spectral content, polarization state or a combination of these. The sensor is linked to the data acquisition system through an optical fiber communication link. In some cases, the signal from many sensors can be transmitted through the same fiber link. Field installation can hence be simplified. Fiber Bragg gratings can then be used as direct sensing elements for strain and temperature. They can also be used as transduction elements, converting the output of another sensor, which generates a strain or temperature change from the measurement. For example fiber Bragg grating gas sensors use an absorbent coating, which in the presence of a gas expands generating a strain, which is measurable by the grating. Technically, the absorbent material is the sensing element, converting the amount of gas to a strain. The Bragg grating then transduces the strain to the change in wavelength.
Specifically, fiber Bragg gratings are finding usage in instrumentation applications such as seismology, pressure sensors for extremely
In Conversation with
10
harsh environments, and as downhole sensors in oil and gas wells for measurement of the effects of external pressure, temperature, seismic vibrations and inline flow measurement. As such they offer a significant advantage over traditional electronic gauges used for these applications in that they are less sensitive to vibration or heat and consequently are far more reliable. In the 1990s, investigations were conducted for measuring strain and temperature in composite materials for aircraft and helicopter structures. Many applications has been found for this type of sensors in structural sensing: strain monitoring in civil infrastructures; pile load monitoring; strain monitoring in reinforced concrete beams; early age cement shrinkage; strain monitoring in smart structures; moisture and humidity measurements in civil applications; geodynamic applications.
Dr. Pamela: How was the FBG sensor fabricated and were there any challenges faced during the fabrication process?
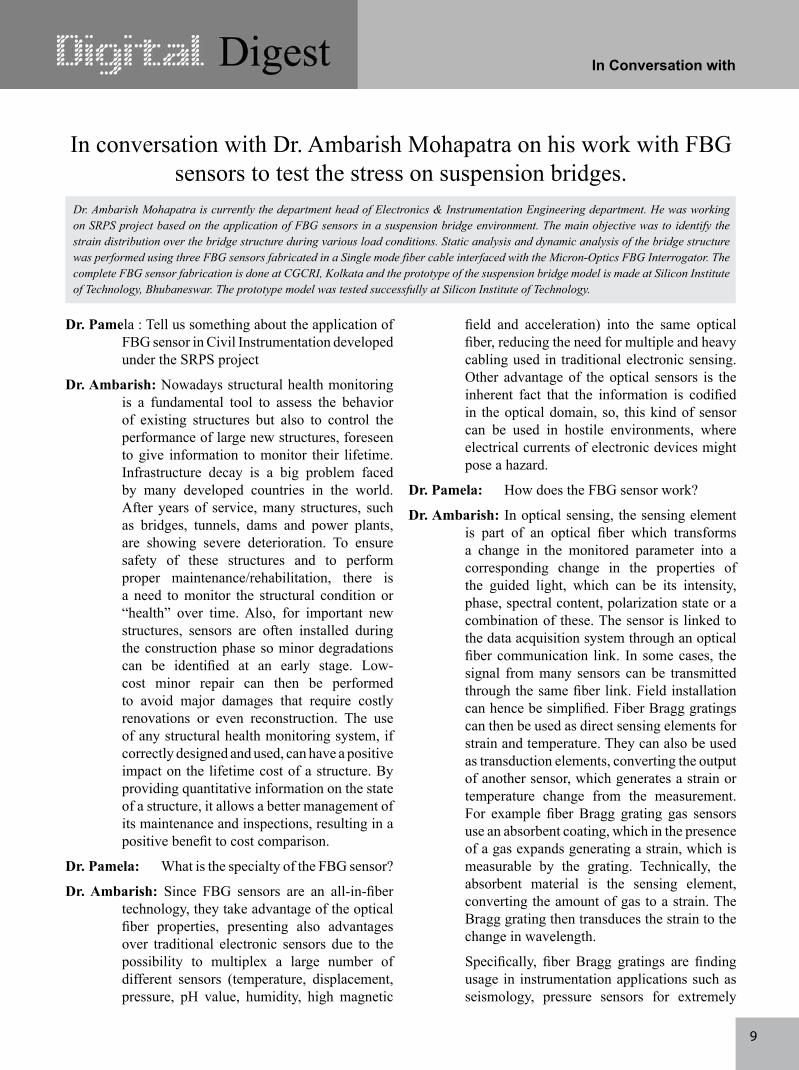
Dr. Ambarish: The focused high-power laser pulses change the index of refraction of the glass material in the core of the optical fiber due to
nonlinear absorption processes. These effects are nearly independent of the doping level of the optical fiber or the type of glass, which uniquely sets this process to offer an advantage in its ability to modify any type of optical fiber. The laser pulses are guided via special optics to form a unique interference pattern, which is geometrically co-aligned with the longitudinal axis of a stationary standard optical fiber. The impinging pattern creates the desired modulated index of refraction onto a selected local length along the core of the optical fiber. This inscription defines the required reflected Bragg wavelength. In addition, an array of desired FBGs can be inscribed by translating the optical fiber along its longitudinal axis. It was fabricated at CGCRI, Kolkata. It was an amazing experience to see the strain results of the bridge prototype flashing in front of our eye. We also used Micron Optics SM130 interrogator system as an input light source to the FBG system (1550 nm to 1570 nm) and DSP of the reflected spectrum at a grating. it was a privilege working with Dr. Palas Biswas (Sr. Scientist, Fibre Optics Facility, CGCRI, Kolkata) and Mr. Tanoy Kumar Dey (RA) for their support to make this project successful.
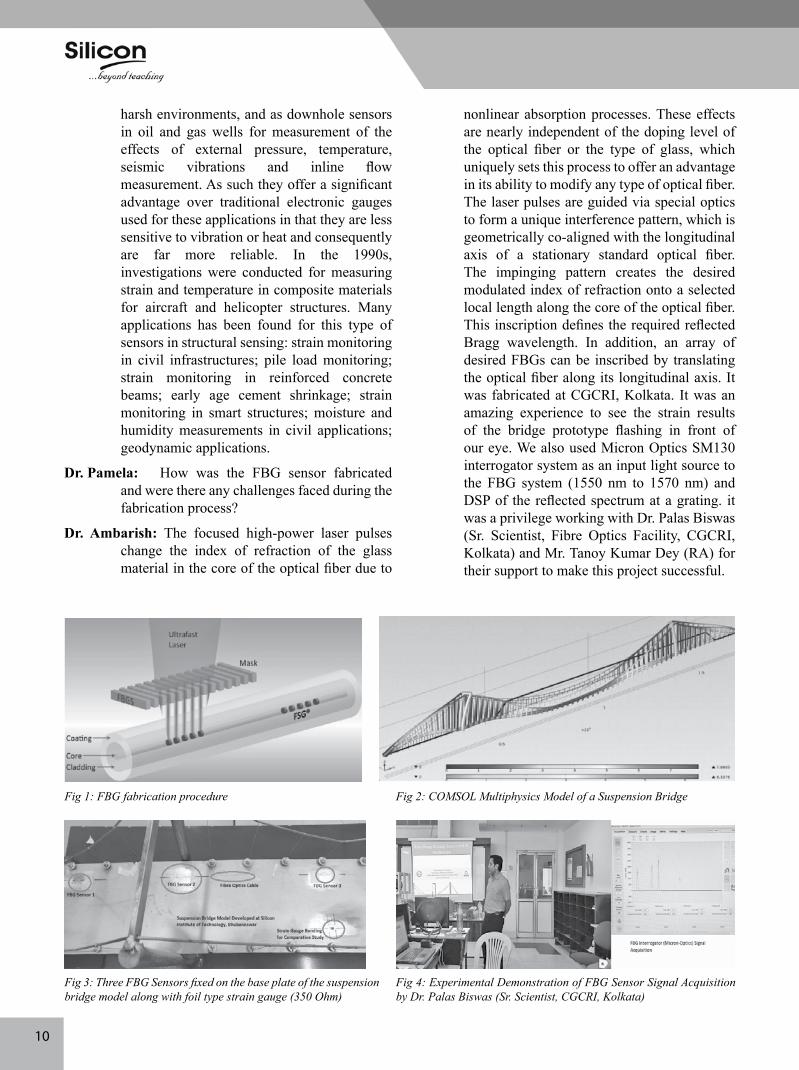
Fig 1: FBG fabrication procedure Fig 2: COMSOL Multiphysics Model of a Suspension Bridge
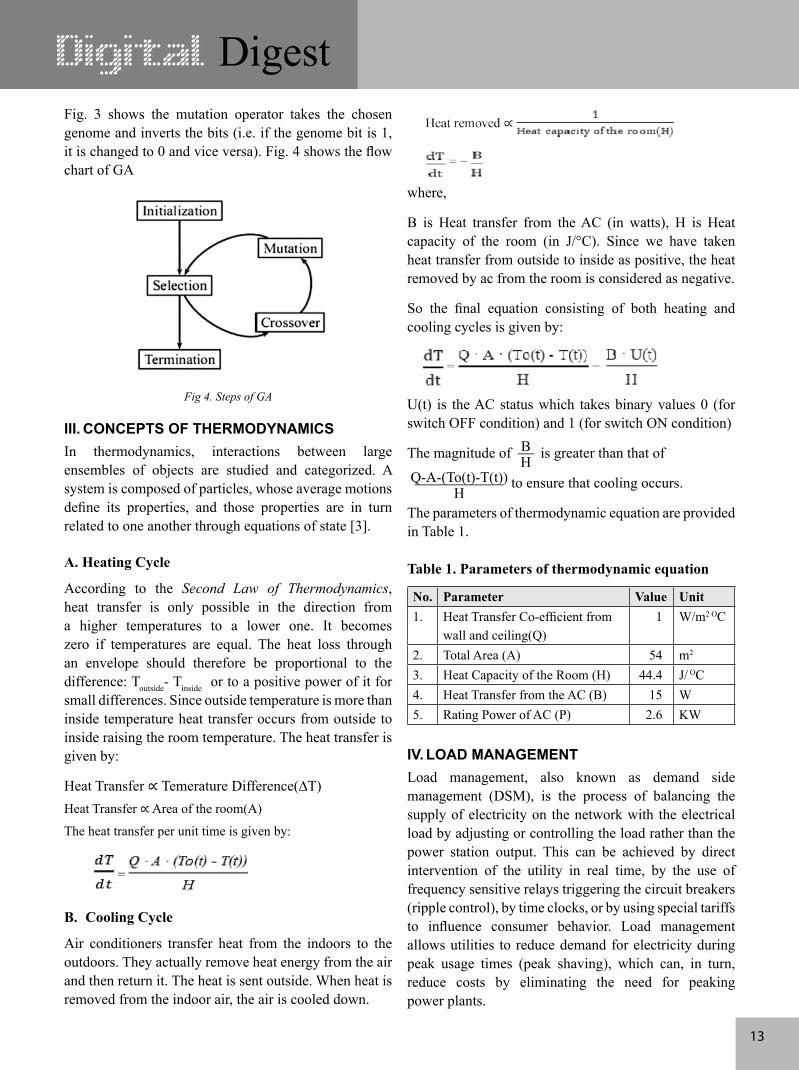
Fig 3: Three FBG Sensors fixed on the base plate of the suspension bridge model along with foil type strain gauge (350 Ohm)
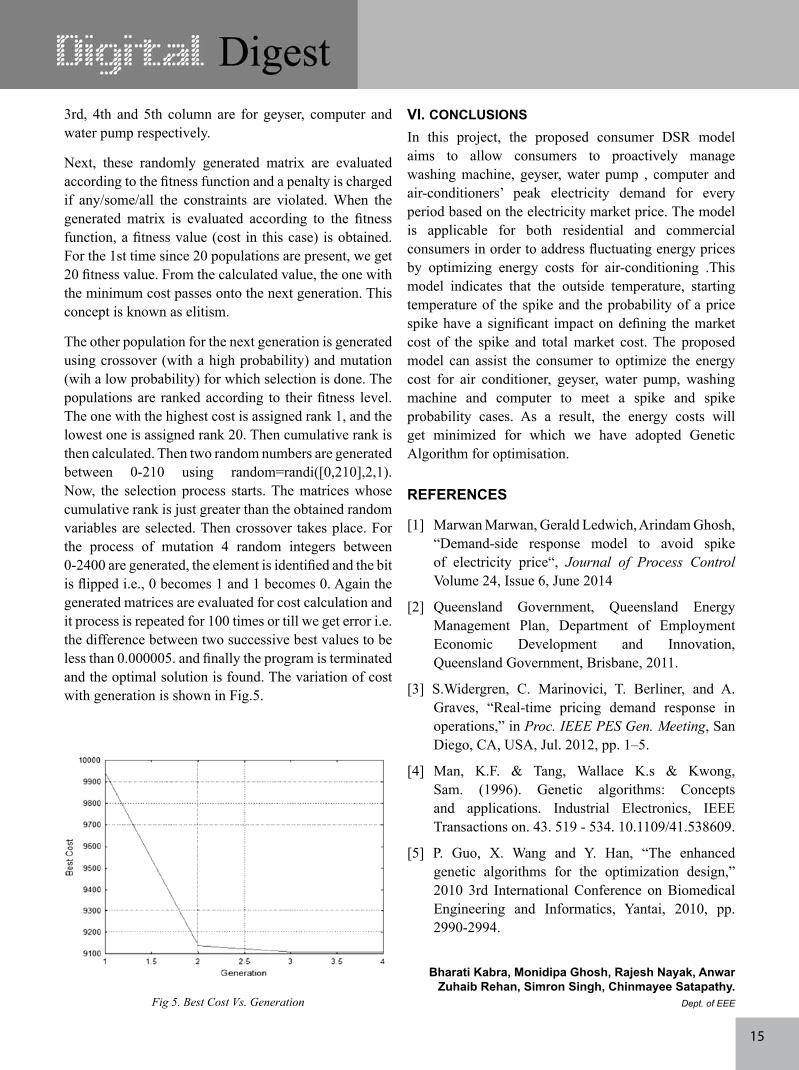
Fig 4: Experimental Demonstration of FBG Sensor Signal Acquisition by Dr. Palas Biswas (Sr. Scientist, CGCRI, Kolkata)

11
Consumer Load Management to Minimize the Surge in Electricity Price
Abstract: Electricity is a critical component which drives economy, a fact which is uncontested. But the irony lies behind the fact that India is a power surplus country; the problem lies between power generation and power consumption-transmission and distribution. Peak power management is one of the major issues for power grids as it incurs excessive reactive power in the system which can prove to be harmful to both the grids and the consumers. Thus, Indian power scenario needs a shift from the present power tariff model to a dynamic pricing system which will result beneficial to both the distributors and the consumers. This model also investigated how air-conditioning applies a pre-cooling method when there is a substantial risk of a price spike. The results indicate the potential of the scheme to achieve financial benefits for consumers and target the best economic performance for electrical generation distribution and transmission. This project aims to optimize the domestic energy cost of air-conditioning systems under dynamic pricing system in India. It also involves the economic benefits for both the consumer and distributor under this model for optimizing their system.
I. INTRODUCTIONPower systems engineering is a subfield of electrical engineering that deals with the generation, transmission, distribution and utilization of electric power, and the electrical apparatus connected to such systems. An electrical load is an electrical component or portion of a circuit that consumes (active) electric power. Electric lamps, air conditioners, motors, resistors etc. are some of the examples of electrical loads. Domestic load consists of lights, fans, home electric appliances (including TV, AC, refrigerators, heaters etc.), small motors for pumping water etc. Most of the domestic loads are connected for only some hours during a day. Depending upon this, the domestic loads are classified as Deferrable loads and Non- Deferrable load.
A non-deferrable load is an electrical load that requires a certain amount of energy whose time of operation is fixed. Lights, fans, television are some examples of non-deferrable loads. Lights, fans are base loads whose time of operation depends upon environmental conditions and cannot be changed according to the pricing. Loads are normally classified as deferrable when they are associated with storage. Water pumping is a common example—there is some flexibility as to when the pump actually operates, provided the water tank does not run dry. The deferrable load is second in priority after the primary load. The amount of money frame by the supplier for the supply of electrical energy to various types of consumers is known as an electricity tariff [1].
The total bill of the consumer has three parts, namely, fixed charge D, semi-fixed charge Ax and running charge given by: C=Ax+By+D
where,C–total charge for a period (say one month)x–maximum demand during the period (kW or kVA)y– total energy consumed during the period (kW or kVA)A–cost per kW or kVA of maximum demand.B–cost per kWh of energy consumed.D–fixed charge during each billing period.
Every tariff consists of fixed cost (‘D’) that is charged for the network installation. Depending upon the values of A and B, tariffs are classified as fixed price electricity tariff (A and B are constants) and differential price electricity tariff (at least one or both A and B are variable).
II. CONCEPTS OF GENETIC ALGORITHMThe process of natural selection starts with the selection of fittest individuals from a population. They produce offspring which inherit the characteristics of the parents and will be added to the next generation. If parents have better fitness, their offspring will be better than parents and have a better chance at surviving. This process keeps on iterating and at the end, a generation with the fittest individuals will be found.
A. Initialisation
Any possible feasible solution is considered as population. The population size depends on the nature of the problem, but typically contains several hundreds or thousands of possible solutions. Often, the initial population is generated randomly, allowing the entire range of possible solutions (the search space). Occasionally, the solutions may be “seeded” in areas where optimal solutions are likely to be found.
DD Feature

12
Fig.1 Roulette Wheel Selection
B. Evaluation
The initialized population is evaluated based on the considered fitness function. A fitness function is a particular type of objective function that is used to summarise, as a single figure of merit, how close a given design solution is to achieving the set aims. Fitness functions are used in genetic programming and genetic algorithms to guide simulations towards optimal design solutions.
C. Selection
Selection is an important part of an evolutionary algorithm. Without selection directing the algorithm towards fitter solutions there would be no progress. Selection must favour fitter candidates over weaker candidates but beyond that there are no fixed rules. Furthermore, there is no one strategy that is best for all problems. Some strategies result in fast convergence, others will tend to produce a more thorough exploration of the search space.
The fitness function is defined over the genetic representation and measures the quality of the represented solution. The fitness function is always problem dependent. For instance, in the knapsack problem one wants to maximize the total value of objects that can be put in a knapsack of some fixed capacity.
For example, Fitness proportionate selection, also known as roulette wheel selection, as shown in Fig.1 is a genetic operator used in genetic algorithms for selecting potentially useful solutions for recombination [2].
This fitness level is used to associate a probability of selection with each individual chromosome. If fi is the fitness of individual i in the population, its probability of being selected is per the following equation.
D. Cross-Over
In genetic algorithms and evolutionary computation, crossover, also called recombination, is a genetic operator used to combine the genetic information of two parents to generate new offspring. Solutions can also be generated by cloning an existing solution, which is analogous to asexual reproduction. Newly generated solutions are typically mutated before being added to the population. Different algorithms in evolutionary computation may use different data structures to store genetic information, and each genetic representation can be recombined with different crossover operators as shown in fig. 2.
E. Mutation
In Genetic Algorithm, Mutation is a genetic operator used to maintain genetic diversity from one generation of a population of genetic algorithm chromosomes to the next. It is analogous to biological mutation. Mutation alters one or more gene values in a chromosome from its initial state. In mutation, the solution may change entirely from the previous solution. Hence GA can come to a better solution by using mutation.
Fig 2. Matrix Cross-Over
Fig 3. Mutation
13
Fig. 3 shows the mutation operator takes the chosen genome and inverts the bits (i.e. if the genome bit is 1, it is changed to 0 and vice versa). Fig. 4 shows the flow chart of GA
Fig 4. Steps of GA
III. CONCEPTS OF THERMODyNAMICSIn thermodynamics, interactions between large ensembles of objects are studied and categorized. A system is composed of particles, whose average motions define its properties, and those properties are in turn related to one another through equations of state [3].
A. Heating Cycle
According to the Second Law of Thermodynamics, heat transfer is only possible in the direction from a higher temperatures to a lower one. It becomes zero if temperatures are equal. The heat loss through an envelope should therefore be proportional to the difference: Toutside- Tinside or to a positive power of it for small differences. Since outside temperature is more than inside temperature heat transfer occurs from outside to inside raising the room temperature. The heat transfer is given by:
Heat Transfer ∝ Temerature Difference(∆T)Heat Transfer ∝ Area of the room(A)
The heat transfer per unit time is given by:
B. Cooling Cycle
Air conditioners transfer heat from the indoors to the outdoors. They actually remove heat energy from the air and then return it. The heat is sent outside. When heat is removed from the indoor air, the air is cooled down.
where,
B is Heat transfer from the AC (in watts), H is Heat capacity of the room (in J/°C). Since we have taken heat transfer from outside to inside as positive, the heat removed by ac from the room is considered as negative.
So the final equation consisting of both heating and cooling cycles is given by:
U(t) is the AC status which takes binary values 0 (for switch OFF condition) and 1 (for switch ON condition)
The magnitude of B------H is greater than that of
Q-A-(To(t)-T(t))---------------------------------H
to ensure that cooling occurs.
The parameters of thermodynamic equation are provided in Table 1.
Table 1. Parameters of thermodynamic equation
No. Parameter Value Unit1. Heat Transfer Co-efficient from
wall and ceiling(Q)1 W/m2 OC
2. Total Area (A) 54 m2
3. Heat Capacity of the Room (H) 44.4 J/ OC4. Heat Transfer from the AC (B) 15 W5. Rating Power of AC (P) 2.6 KW
IV. LOAD MANAGEMENTLoad management, also known as demand side management (DSM), is the process of balancing the supply of electricity on the network with the electrical load by adjusting or controlling the load rather than the power station output. This can be achieved by direct intervention of the utility in real time, by the use of frequency sensitive relays triggering the circuit breakers (ripple control), by time clocks, or by using special tariffs to influence consumer behavior. Load management allows utilities to reduce demand for electricity during peak usage times (peak shaving), which can, in turn, reduce costs by eliminating the need for peaking power plants.

14
Where,
S(t): Energy Price Matrix
P(t): Power Rating five equipment
D(t): Duration of Operation
U(t): Switch Status Matrix Of the Five equipment
This minimization problem is subjected to various constraints:
(1) Temperature Constraint for AC:
The main purpose of AC is to maintain the room temperature. We have assumed that the temperature should ideally be 21OC to 25OC. If the room temperature exceeds 27OC, then a penalty is charged since the comfort level of consumers is hampered.
(2) Duration of Operation Constraint for loads except AC:
In our problem, if all the appliances are switched off, then the cost of operation will be 0 i.e., minimum. But this is not the desired case as it compromises with the comfort level of the end users. Hence, a duration of operation constraint is imposed on loads except AC as time and duration of operation of AC is solely determined by the room temperature.
A.Optimization Of Loads
The objective function is to minimize energy costs with constraints on room temperatures and duration of operation. The energy cost is based on the switch status, that is, no cost when the switch status is off (U = 0) and market cost if the switch status is on (U = 1). In our project, five deferrable loads namely, air conditioner, washing machine, geyser, computer and water pump. The pricing scheme is differential i.e., price varies throughout the day. So, the time of operation of the equipment is to be adjusted so that the cost of the operation of the appliances i.e., electricity bill is minimum [4]. The time of operation of the equipment are set according to various constraints. If the constraint is violated, a penalty is added to the bill which is a huge value, which makes the situation worse. The problem statement for scheduling various domestic loads is given as following:
A predetermined duration of operation of each appliance except AC is set which can be changed according to the needs. If the appliance is operated for a duration either more than or less than the threshold value, then a penalty is charged.
(3)Time of day Constraint for Geyser:The time of operation of geyser is ideally set between 5am and 12 noon. If the geyser doesnot operate in this interval hen additional penalty is charged. Which when violated, a penalty is charged.
Why Penalty?As we are randomly generating switch statuses, we have to exclude cases where constraints are violated. In order to do so, we introduce penalty factor. The feasible solutions are evaluated to calculate the electricity costs of a domestic household along with suitable penalty factor [5].
It can be formulated as: Total Cost + Penalty
RESULTS AND DISCUSSIONBy simulating the algorithm in MATLAB, the results we came across are as follows:-
We have assumed that a day is divided into 24 intervals each of 1hour. In this interval of 1 hour, both the outside and inside temperature remains constant. The value gets updated after each interval. Similarly, the switch status of different appliances used (AC, washing machine, geyser, computer and water pump) and the price of energy is also assumed to be constant for that interval. The value of inside temperature, switch status gets updated after each 1 hour. The cost, outside temperature and other required parameters are provided as input. Then this optimization problem is solved using genetic algorithm.
The solution process starts with initialization of feasible solution i.e., creating a population. For this a matrix of dimension 24X5 is created with 0’s and 1’s as the elements using randi([0,1],24,5,20) ,where number of rows indicates hours of the day and columns indicate the number of appliances used. 0 represents off status while 1 represents on condition. 20 such matrices are created in order to start the process. The 0’s and 1’s indicates switch status. For example, the 0 element in 1st row and 1st column indicates that the AC is switched off for the first hour. The 2nd column is for washing machine. Similarly,
15
3rd, 4th and 5th column are for geyser, computer and water pump respectively.
Next, these randomly generated matrix are evaluated according to the fitness function and a penalty is charged if any/some/all the constraints are violated. When the generated matrix is evaluated according to the fitness function, a fitness value (cost in this case) is obtained. For the 1st time since 20 populations are present, we get 20 fitness value. From the calculated value, the one with the minimum cost passes onto the next generation. This concept is known as elitism.
The other population for the next generation is generated using crossover (with a high probability) and mutation (wih a low probability) for which selection is done. The populations are ranked according to their fitness level. The one with the highest cost is assigned rank 1, and the lowest one is assigned rank 20. Then cumulative rank is then calculated. Then two random numbers are generated between 0-210 using random=randi([0,210],2,1). Now, the selection process starts. The matrices whose cumulative rank is just greater than the obtained random variables are selected. Then crossover takes place. For the process of mutation 4 random integers between 0-2400 are generated, the element is identified and the bit is flipped i.e., 0 becomes 1 and 1 becomes 0. Again the generated matrices are evaluated for cost calculation and it process is repeated for 100 times or till we get error i.e. the difference between two successive best values to be less than 0.000005. and finally the program is terminated and the optimal solution is found. The variation of cost with generation is shown in Fig.5.
VI. CONCLUSIONSIn this project, the proposed consumer DSR model aims to allow consumers to proactively manage washing machine, geyser, water pump , computer and air-conditioners’ peak electricity demand for every period based on the electricity market price. The model is applicable for both residential and commercial consumers in order to address fluctuating energy prices by optimizing energy costs for air-conditioning .This model indicates that the outside temperature, starting temperature of the spike and the probability of a price spike have a significant impact on defining the market cost of the spike and total market cost. The proposed model can assist the consumer to optimize the energy cost for air conditioner, geyser, water pump, washing machine and computer to meet a spike and spike probability cases. As a result, the energy costs will get minimized for which we have adopted Genetic Algorithm for optimisation.
REFERENCES
[1] Marwan Marwan, Gerald Ledwich, Arindam Ghosh, “Demand-side response model to avoid spike of electricity price“, Journal of Process Control Volume 24, Issue 6, June 2014
[2] Queensland Government, Queensland Energy Management Plan, Department of Employment Economic Development and Innovation, Queensland Government, Brisbane, 2011.
[3] S.Widergren, C. Marinovici, T. Berliner, and A. Graves, “Real-time pricing demand response in operations,” in Proc. IEEE PES Gen. Meeting, San Diego, CA, USA, Jul. 2012, pp. 1–5.
[4] Man, K.F. & Tang, Wallace K.s & Kwong, Sam. (1996). Genetic algorithms: Concepts and applications. Industrial Electronics, IEEE Transactions on. 43. 519 - 534. 10.1109/41.538609.
[5] P. Guo, X. Wang and Y. Han, “The enhanced genetic algorithms for the optimization design,” 2010 3rd International Conference on Biomedical Engineering and Informatics, Yantai, 2010, pp. 2990-2994.
Bharati Kabra, Monidipa Ghosh, Rajesh Nayak, Anwar Zuhaib Rehan, Simron Singh, Chinmayee Satapathy.
Dept. of EEEFig 5. Best Cost Vs. Generation
16
Profile of a Scientist
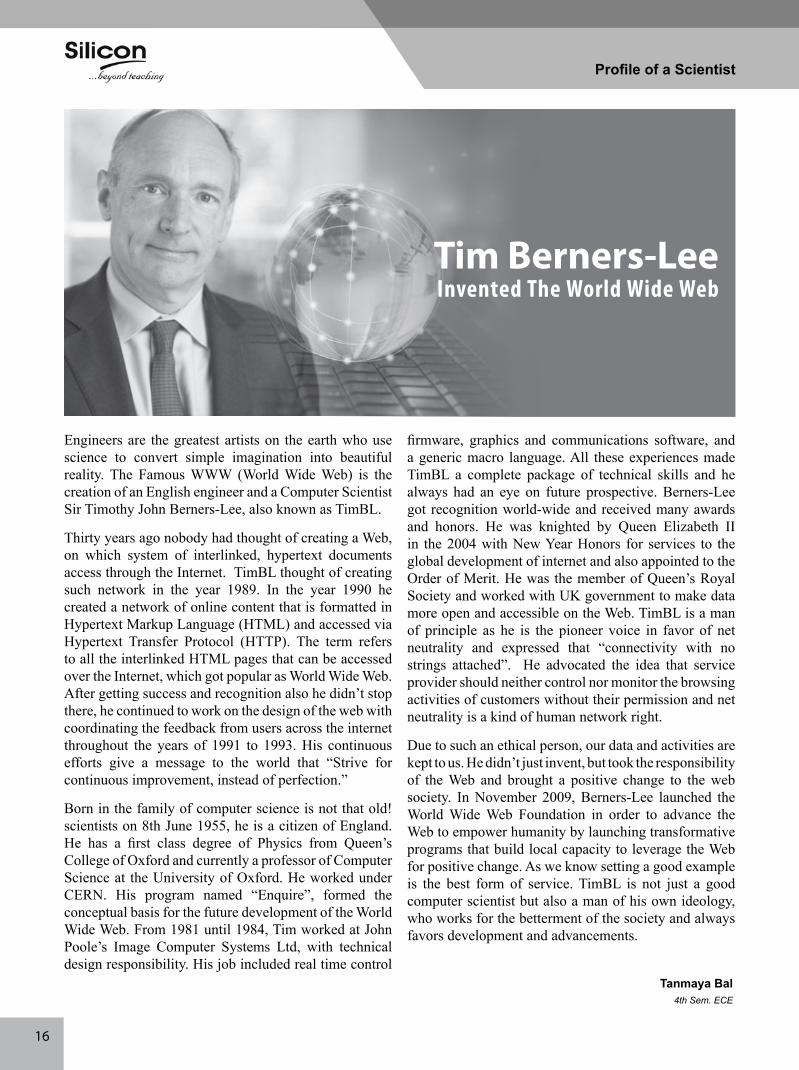
Engineers are the greatest artists on the earth who use science to convert simple imagination into beautiful reality. The Famous WWW (World Wide Web) is the creation of an English engineer and a Computer Scientist Sir Timothy John Berners-Lee, also known as TimBL.
Thirty years ago nobody had thought of creating a Web, on which system of interlinked, hypertext documents access through the Internet. TimBL thought of creating such network in the year 1989. In the year 1990 he created a network of online content that is formatted in Hypertext Markup Language (HTML) and accessed via Hypertext Transfer Protocol (HTTP). The term refers to all the interlinked HTML pages that can be accessed over the Internet, which got popular as World Wide Web. After getting success and recognition also he didn’t stop there, he continued to work on the design of the web with coordinating the feedback from users across the internet throughout the years of 1991 to 1993. His continuous efforts give a message to the world that “Strive for continuous improvement, instead of perfection.”
Born in the family of computer science is not that old! scientists on 8th June 1955, he is a citizen of England. He has a first class degree of Physics from Queen’s College of Oxford and currently a professor of Computer Science at the University of Oxford. He worked under CERN. His program named “Enquire”, formed the conceptual basis for the future development of the World Wide Web. From 1981 until 1984, Tim worked at John Poole’s Image Computer Systems Ltd, with technical design responsibility. His job included real time control
firmware, graphics and communications software, and a generic macro language. All these experiences made TimBL a complete package of technical skills and he always had an eye on future prospective. Berners-Lee got recognition world-wide and received many awards and honors. He was knighted by Queen Elizabeth II in the 2004 with New Year Honors for services to the global development of internet and also appointed to the Order of Merit. He was the member of Queen’s Royal Society and worked with UK government to make data more open and accessible on the Web. TimBL is a man of principle as he is the pioneer voice in favor of net neutrality and expressed that “connectivity with no strings attached”. He advocated the idea that service provider should neither control nor monitor the browsing activities of customers without their permission and net neutrality is a kind of human network right.
Due to such an ethical person, our data and activities are kept to us. He didn’t just invent, but took the responsibility of the Web and brought a positive change to the web society. In November 2009, Berners-Lee launched the World Wide Web Foundation in order to advance the Web to empower humanity by launching transformative programs that build local capacity to leverage the Web for positive change. As we know setting a good example is the best form of service. TimBL is not just a good computer scientist but also a man of his own ideology, who works for the betterment of the society and always favors development and advancements.
Tanmaya Bal4th Sem. ECE
Tim Berners-LeeInvented The World Wide Web
17
Smart Wireless Luggage CarrierAbstract: We, as an inquisitive human race, have been trying to lessen human effort easier since the dawn of human time. The objective here is to develop a fully functioning prototype of a wireless follower system which has simple maneuvering and load bearing capabili-ties while following a user. An automated personal luggage carrying system can add comfort to the explorer inside an infrastructure. The system consists of automated vehicle that can be borrowed and be used to automatically follow the borrower inside an infrastructure with luggage. The Autonomous Luggage carrier is a hands-free load carrying propulsion system that maintains a safe following distance behind the user; thus, allowing total freedom of movement. The intention is to automate the act of hauling luggage which is commonly encountered while going through the tedious and often exhaustive routines associated with airport travel. The idea was experimentally verified with the help of a prototype in which all the proposed technologies are experimentally implemented, and the desired outcome was obtained successfully.
Keywords: Luggage, Arduino, IR sensor, GPS module, L298N.
I. INTRODUCTIONAutomation is the use of machines, control systems and information technologies to optimize productivity in the production of goods and delivery of services. It is the use of control systems and information technologies to reduce the need for human work in the production of goods and services. In the scope of industrialization, automation is a step beyond mechanization [1, 2]. In Airport, Automated luggage loading system is introduced so many years ago which moves the luggage from the check-in to the belts servicing the flights but a passenger need to carry his/her own luggage’s from the entrance of the airport till the check-in into the airport with the help of conventional luggage carrying system. Conventional luggage carrying system is both time consuming and labor intensive. At the same time, it is an expensive process and slow.
II. THE PROPOSED LUGGAGE CARRIER SySTEM
The proposed luggage carrier system consists of different sensor modules like Arduino Mega, Ultrasonic sensor, IR sensor (TSOP1838), L298N motor driver and DC motors which forms the basic follower circuit. Additionally, an GPS module is attached using which there can be some real time tracking of our luggage. The proposed system has two advantages over the conventional system:
• Very less human effort is involved.
• Hassle free
A. Basic working and featuresi. First the ultrasonic transmitter sends a signal
when received upon but the receiver the system
gets activates and then the ultrasonic sensors start sending out ultrasonic which return the echo after reflecting upon a surface. Then the system starts following in the direction from which the echo is received [3].
ii. If by any chance the user goes or moves away from the system more than the required distance then the system will follow the user from the direction in which the strongest infrared signal is being received.
iii. If the user moves further than expected then a Buzzer has been added to the circuit that will go off warning the user of his/her belongings.
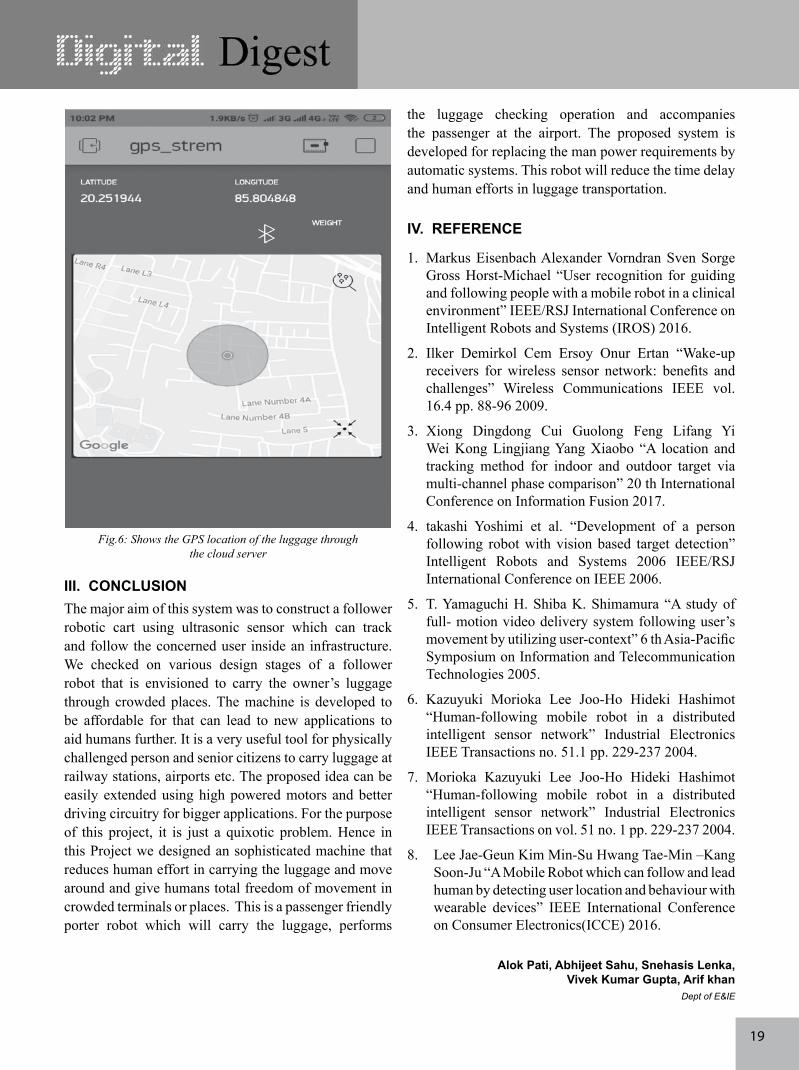
iv. In case of theft or any other mishap, the GPS tracker placed on the system will give away the pin pointed coordinates of the system on through the cloud server that will show the location of it on a map [4].
DD Feature
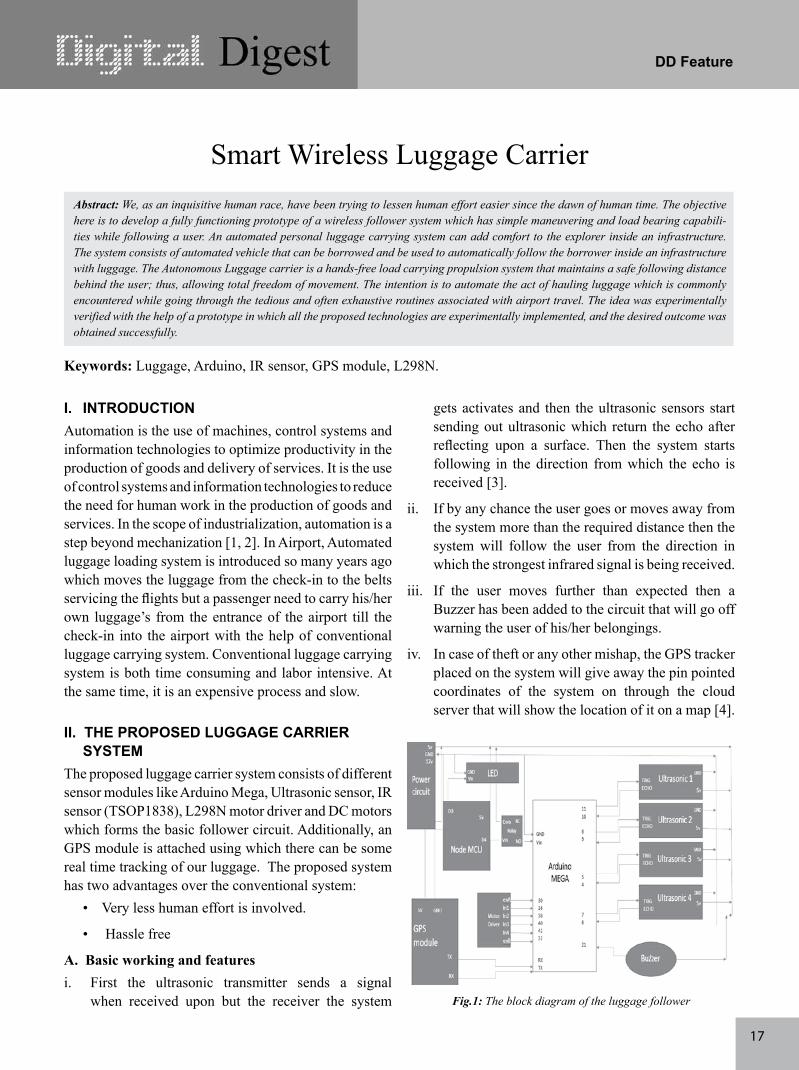
Fig.1: The block diagram of the luggage follower

18
B. User follower and detection
We are using an ultrasonic sonic sensor interfaced with the Arduino micro controller board to send and receive the echo. Further it gives instructions to the motor driver as shown in figure 2.
Fig.2: Interfacing the ultrasonic sensor and a follower circuit
Fig.3: Arduino interfaced with L298N motor driver
D. Getting the coordinates using the GPS module
The inputs are given to pin 2,7,10 and 15 whereas the outputs are obtained at 3,6,11 and 14 pins. Two DC motors can be driven simultaneously in forward and reverse direction. The motor operation is controlled by logic inputs. Logic 01 and 10 will rotate the motor in clockwise and anticlockwise directions. The L298ND basically drives two DC motors which are responsible for the movement of the cart in forward and reverse direction. The left and right direction movement is achieved by changing the speed of one motor [7, 8]. The cart turns in right direction if left motor speed in greater than right motor. Similarly, the cart turns in left direction if the right motor speed is greater than left motor, as shown in figure 3 & 4.
Fig.4: Arduino interfaced with IR sensor
In order to get the coordinates of the luggage in case of theft of any other mishap the GPS module that has been hardwired with the System can be used to get the coordinates and exact location on a map using the cloud server i.e blynk, as shown in figure 5 & 6.
C. Startign the System using the IR sensor (TSOP 1838)
As soon as the user sends the signal from the IR remote control towards the system the receiver mounted on the system and wired with the Arduino board that further gives the proper command signal for the power circuit [5, 6] as shown in figure 4.
Fig.5: GPS module interfaced with the Arduino
Fig. 1 shows the schematic block diagram of the proposed system along with description of its other components used. The Bluetooth module placed will be used to make the link between user and the system .The circuit basically follows the principle of a line follower circuit but several changers were made in order to make it follow the user perform accordingly.
19
the luggage checking operation and accompanies the passenger at the airport. The proposed system is developed for replacing the man power requirements by automatic systems. This robot will reduce the time delay and human efforts in luggage transportation.
IV. REFERENCE
1. Markus Eisenbach Alexander Vorndran Sven Sorge Gross Horst-Michael “User recognition for guiding and following people with a mobile robot in a clinical environment” IEEE/RSJ International Conference on Intelligent Robots and Systems (IROS) 2016.
2. Ilker Demirkol Cem Ersoy Onur Ertan “Wake-up receivers for wireless sensor network: benefits and challenges” Wireless Communications IEEE vol. 16.4 pp. 88-96 2009.
3. Xiong Dingdong Cui Guolong Feng Lifang Yi Wei Kong Lingjiang Yang Xiaobo “A location and tracking method for indoor and outdoor target via multi-channel phase comparison” 20 th International Conference on Information Fusion 2017.
4. takashi Yoshimi et al. “Development of a person following robot with vision based target detection” Intelligent Robots and Systems 2006 IEEE/RSJ International Conference on IEEE 2006.
5. T. Yamaguchi H. Shiba K. Shimamura “A study of full- motion video delivery system following user’s movement by utilizing user-context” 6 th Asia-Pacific Symposium on Information and Telecommunication Technologies 2005.
6. Kazuyuki Morioka Lee Joo-Ho Hideki Hashimot “Human-following mobile robot in a distributed intelligent sensor network” Industrial Electronics IEEE Transactions no. 51.1 pp. 229-237 2004.
7. Morioka Kazuyuki Lee Joo-Ho Hideki Hashimot “Human-following mobile robot in a distributed intelligent sensor network” Industrial Electronics IEEE Transactions on vol. 51 no. 1 pp. 229-237 2004.
8. Lee Jae-Geun Kim Min-Su Hwang Tae-Min –Kang Soon-Ju “A Mobile Robot which can follow and lead human by detecting user location and behaviour with wearable devices” IEEE International Conference on Consumer Electronics(ICCE) 2016.
Alok Pati, Abhijeet Sahu, Snehasis Lenka, Vivek Kumar Gupta, Arif khan
Dept of E&IE
III. CONCLUSIONThe major aim of this system was to construct a follower robotic cart using ultrasonic sensor which can track and follow the concerned user inside an infrastructure. We checked on various design stages of a follower robot that is envisioned to carry the owner’s luggage through crowded places. The machine is developed to be affordable for that can lead to new applications to aid humans further. It is a very useful tool for physically challenged person and senior citizens to carry luggage at railway stations, airports etc. The proposed idea can be easily extended using high powered motors and better driving circuitry for bigger applications. For the purpose of this project, it is just a quixotic problem. Hence in this Project we designed an sophisticated machine that reduces human effort in carrying the luggage and move around and give humans total freedom of movement in crowded terminals or places. This is a passenger friendly porter robot which will carry the luggage, performs
Fig.6: Shows the GPS location of the luggage through the cloud server
20
Combating Military Infiltration using IOT
Abstract: Infiltration is the main issue which causes causalities and death of soldiers and civilians. Terrorists infiltrate into our country by crossing the border. Since India has a vast border line it is very difficult to monitor them. This problem can be solved if we constantly monitor the activities around the border line through camera motion sensor and touch sensor. This will eventually decrease the casualties and death of the soldiers. The objective of this work is to propose a system that will detect the activity that occurs around the border to avoid causalities and death of soldiers during cross border firing.
I INTRODUCTIONSecurity and safety are one of the major concerns of any organization in present age. The countries put a lot of resources and wealth on border security and surveillance. Thus there is a need for the surveillance systems which are both cost and application efficient. The traditional method used for surveillance has been through manpower. However with the need for 24 hours surveillance, the camera surveillance systems came into existence. These traditional camera systems lacked the intelligence of the humans and it was challenging to cover large area with these systems as it would require more number of cameras and manpower to monitor. Therefore, there is a need to combine both the intelligence of humans and the working efficiency of camera systems to come up with “Intelligent Camera Systems” where the camera will have an ability to track the intruder and ensure requirement of less number of cameras to cover a particular area.
Surveillance cameras are video cameras used for the purpose of observing an area. They are often connected to a recording device or IP network, and may be watched by a security guard. Camera motion sensors have been widely used for security purpose. Motion detection in consequent images is nothing but the detection of the moving object in the scene. In video surveillance, motion detection refers to the capability of the surveillance system to detect motion and capture the events. Motion detection is a software based monitoring technique which signals the surveillance camera to begin capturing the event when it detects motions. In this, a camera fixed to its base has been placed and is set as an observer at the outdoor for surveillance. Any small movement with a level of tolerance it picks is detected as motion.
There are three conventional approaches to moving object detection- Temporal differencing, Averaging and Optical flow. Motion tracking depends on the efficiency of motion detection. In order to achieve real time motion tracking the motion should be detected with least possible time lag.
India has a very vast border line. It shares its border with Pakistan, Bangladesh, China, Nepal, Myanmar, Afghanistan and Bhutan. Due to extreme geographical barriers and weather condition, the monitoring of the border area becomes difficult. This creates a loop-hole for enemies to cross the border line which leads to death of soldiers and civilians. Thus, this results in increase of smuggling and terrorist activities [1]. Most infiltration, terrorist activities and ceasefire violations occur at some sensitive areas shared by India and Pakistan border. According to the report by Home Ministry, there has been an increase over 230% in ceasefire violation compared to 2016.[2] The ceasefire violations are generally intended to infiltrate terrorist and smugglers into India. Over 300 infiltrations were reported from LOC in Jammu and Kashmir in 2017.
The objective of this work is to propose a system that can detect the activity that occurs around the border to avoid causalities and death of our soldiers during cross border firing. The system consists of a movable camera which is able to capture images when motion occurs. The camera consists of an Infrared sensor which is an electronic sensor that measures infrared light radiating from object in its field of view. The camera motion sensor is used to store images when they detect motion. These images are stored in the database. Accordingly, the database operator will have the authority to operate the
Keywords: Military Infiltration, Motion detection, IOT
DD Feature
21
database and analyze the pictures and videos recorded to take the actions accordingly. The camera also consists of infrared sensor which is an electronic sensor that measures infrared light radiating from objects in its field of view. The touch sensor detects touch or near proximity without relying on physical contact. Hence, touch sensors are fitted on the boundary of the border line which will get alert when it is touched.
The aim of this system is to implement reliable techniques for security enhancement and minutiae extraction. The performances of these techniques are evaluated on a camera image database. In combination with these development techniques, statistical experiments can then be performed on the camera motion sensing and face detection. The results from these experiments can be used to help better understand what is involved in determining the statistical uniqueness of the images detected. This system would test whether the camera motion sensing and touch sensor at the border line is enough for identification of the person.
II. PROJECT SPECIFICATIONThe goal of this project is to enhance the security at the border through camera motion sensing and touch sensing using alarms. The project design and implements software architecture for camera motion sensing and touch sensing analysis. The system should be able to extract key features from image captured and should provide necessary details to the database operator for future use. The system also has a touch sensor attached with alarm which is activated when someone tries to penetrate through the border line. The architecture of the system is presented below in figure (1).
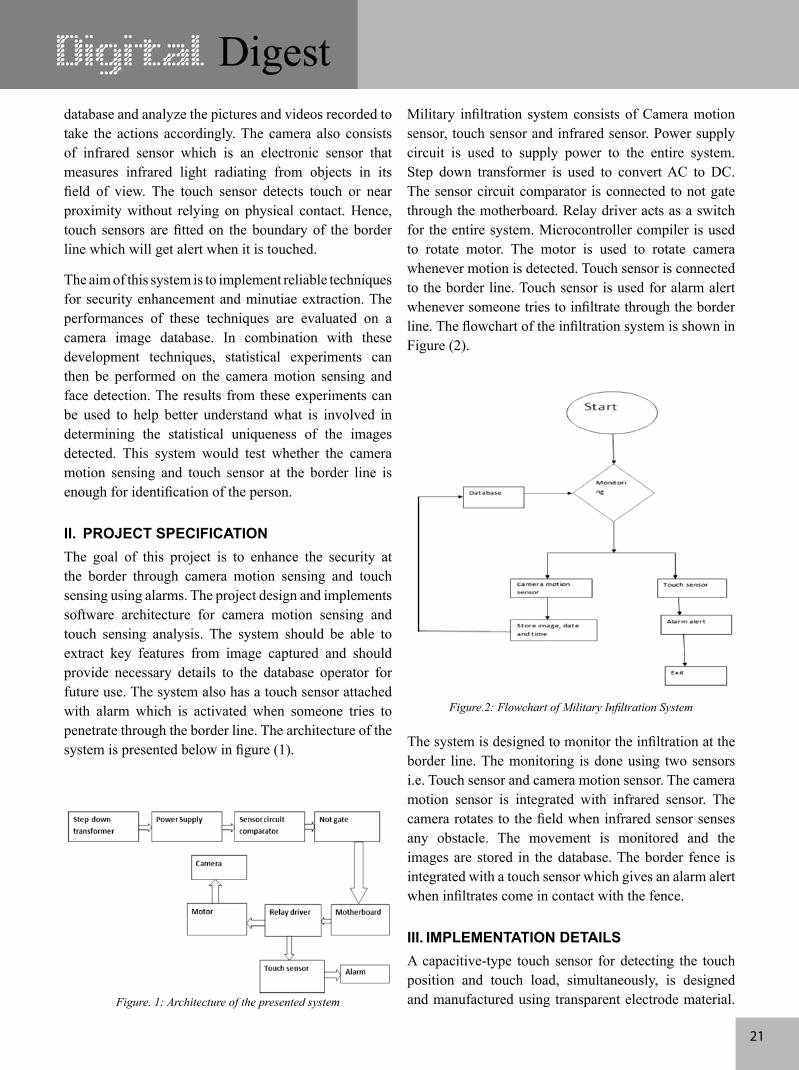
Military infiltration system consists of Camera motion sensor, touch sensor and infrared sensor. Power supply circuit is used to supply power to the entire system. Step down transformer is used to convert AC to DC. The sensor circuit comparator is connected to not gate through the motherboard. Relay driver acts as a switch for the entire system. Microcontroller compiler is used to rotate motor. The motor is used to rotate camera whenever motion is detected. Touch sensor is connected to the border line. Touch sensor is used for alarm alert whenever someone tries to infiltrate through the border line. The flowchart of the infiltration system is shown in Figure (2).
Figure. 1: Architecture of the presented system
The system is designed to monitor the infiltration at the border line. The monitoring is done using two sensors i.e. Touch sensor and camera motion sensor. The camera motion sensor is integrated with infrared sensor. The camera rotates to the field when infrared sensor senses any obstacle. The movement is monitored and the images are stored in the database. The border fence is integrated with a touch sensor which gives an alarm alert when infiltrates come in contact with the fence.
III. IMPLEMENTATION DETAILSA capacitive-type touch sensor for detecting the touch position and touch load, simultaneously, is designed and manufactured using transparent electrode material.
Figure.2: Flowchart of Military Infiltration System

22
Generally, a touch sensor senses only the touch position. However, as the touch sensor proposed in this study is designed by separating the touch position and touch load sensing parts, it is possible to recognize the touch load, in addition to the touch position. The touch sensor is mainly composed of a polyethyleneterephthalate (PET) film substrate coated by an indium tin oxide (ITO), an ITO glass substrate, and a transparent elastomer. The ITO, as the transparent electrode, has an approximately 86% light transmittance and a sheet resistance of 30 Ω/square, and is patterned by photo-lithography process.
A transparent elastomer, for load recognition, is sandwiched between the two transparent substrates and senses the magnitude of the touch load by detecting the change in capacitance value due to the change in the distance between the upper and lower electrodes, generated by the touch load. The fabricated touch sensor is 183 mm in width and 234 mm in length with a 10 in. touch area. It has 32 transmit lines for signal driving, 47 receive lines for signal detection, and two channels of ground lines. It can detect multi-touch with more than 10 points and sense loads up to 700 gf, simultaneously.
The Keil C51 C Compiler for the 8051 microcontroller is used for this system. PHP is used to design a web page where the admin can view the no of infiltrates using a local server. Further it can be modified so the data of the infiltrates can be stored in cloud storage where it can be secure. The MySQL open source Relational Database Management System (RDBMS) is used for storage and manipulation of data.
Algorithm of the system:
Step-1: Initialize monitoring system Step-2: Get sensor information from camera Step-3: Create new Session for database Step-4: If system is exit, go to step-10 Step-5: Store image date & time in database Step-6: Get sensor information from touch sensor Step-7: Wait till the information is monitored Step-8: Alarm alert Step-9: Go to step-7 Step-10: Stop
Algorithm of Camera Motion Sensor:
Step-1: Initialize the camera Step-2: Wait for 5 seconds Step-3: If photocount > 0, read pin 2.0 on MSP Step-4: Rotate anti-clockwise 900 Step-5: Take photo and reduce the photo count by 1 Step-6: Rotate clockwise 900 Step-7: If photocount < 0, read pin 2.2 on MSP Step-8: Rotate anti-clockwise 900 Step-9: Repeat step-5 Step-10: Rotate clockwise 900 Step-11: Blink a LED Step-12: Stop
Algorithm of Touch Sensor:
Step-1: Initialize the sensor Step-2: Sense the touch Step-3: Alarm alert Step-4: Go to step-1 Step-5: Stop
IV. HARDWARE DESCRIPTIONS
A. Microcontroller
A microcontroller is a small computer on a single integrated circuit. In modern terminology, it is similar to, but less sophisticated than a system on a chip (SoC), a SoC may include a microcontroller as one of its components. A microcontroller contains one or more CPUs (processor cores) along with memory and programmable input/output peripherals. Microcontrollers are designed for embedded applications, in contrast to the microprocessors used in computers or other general purpose applications consisting of various discrete chips.
Microcontrollers are used in automatically controlled products and devices, such as automobile engine control systems, implantable medical devices, remote controls, office machines, appliances, power tools, toys and other embedded systems. By reducing the size and cost compared to a design that uses a separate microprocessor, memory, and input/output devices, microcontrollers make it economical to digitally control even more devices and processes. Mixed signal microcontrollers are common, integrating analog components needed to

23
Figure.3: AT89C51 microcontroller
AT89C51 is an 8-bit microcontroller that belongs to Atmel’s 8051 family. ATMEL 89C51 has 4KB of Flash programmable and erasable read only memory (PEROM) and 128 bytes of RAM. It can be erased and program to a maximum of 1000 times. AT89C51 consists of 40 pins. In 40 pin AT89C51, there are four ports designated as P1, P2, P3 and P0. All these ports are 8-bit bi-directional ports i.e., they can be used as both input and output ports. Except P0 which needs external pull-ups, rest of the ports have internal pull-ups. When 1s are written to these port pins, they are pulled high by the internal pull-ups and can be used as inputs. These ports are also bit addressable and so their bits can also be accessed individually. Port P0 and P2 are also used to provide low byte and high byte addresses, respectively, when connected to an external memory. Port P3 has multiplexed pins for special functions like serial communication, hardware interrupts, timer inputs and read/write operation from external memory. AT89C51 has an inbuilt UART for serial communication. It can be programmed to operate at different baud rates. Including
control non-digital electronic systems. In the context of the internet of things, microcontrollers are an economical and popular means of data collection, sensing and actuating the physical world as edge devices. For this work, the AT89C51 microcontroller is used as shown in figure 3.
two timers & hardware interrupts, it has a total of six interrupts.
B. Camera Motion Sensor A motion sensor is a device that detects moving objects, particularly people. Such a device is often integrated as a component of a system that automatically performs a task or alerts a user of motion in an area. They form a vital component of security, automated lighting control, home control, energy efficiency and other useful systems. An electronic motion detector contains an optical, microwave, or acoustic sensor, and in many cases a transmitter for illumination. However, a passive sensor senses a signature only from the moving object via emission or reflection, i.e., it can be emitted by the object, or by some ambient emitter such as the sun or a radio station of sufficient strength. Changes in the optical, microwave, or acoustic field in the device’s proximity are interpreted by the electronics based on one of the technologies listed below. Most low-cost motion detectors can detect up to distances of at least 15 feet (4.6 m). Specialized systems cost more, but have much longer ranges. Tomographic motion detection systems can cover much larger areas because the radio waves are at frequencies which penetrate most walls and obstructions, and are detected in multiple locations, not only at the location of the transmitter.
Motion sensor has found wide use in domestic and commercial applications. One common application is activating automatic door openers in businesses and public buildings. Motion sensors are also widely used in place of a true occupancy sensor in activating street lights or indoor lights in walkways, such as lobbies and staircase. A motion detector may be among the sensors of a burglar alarm that is used to alert the owner or security service when it detects the motion of a possible intruder. Such a detector may also trigger a security camera to record the possible intrusion.
C. Touch Sensor A touch sensor detects touch or near proximity without relying on physical contact. Touch sensors are used in many applications like mobile phones, remote controls, control panels, etc. Touch sensors with simple rotational sliders, touch pads and rotary wheels offer significant advantages for more intuitive user interfaces. Touch
24
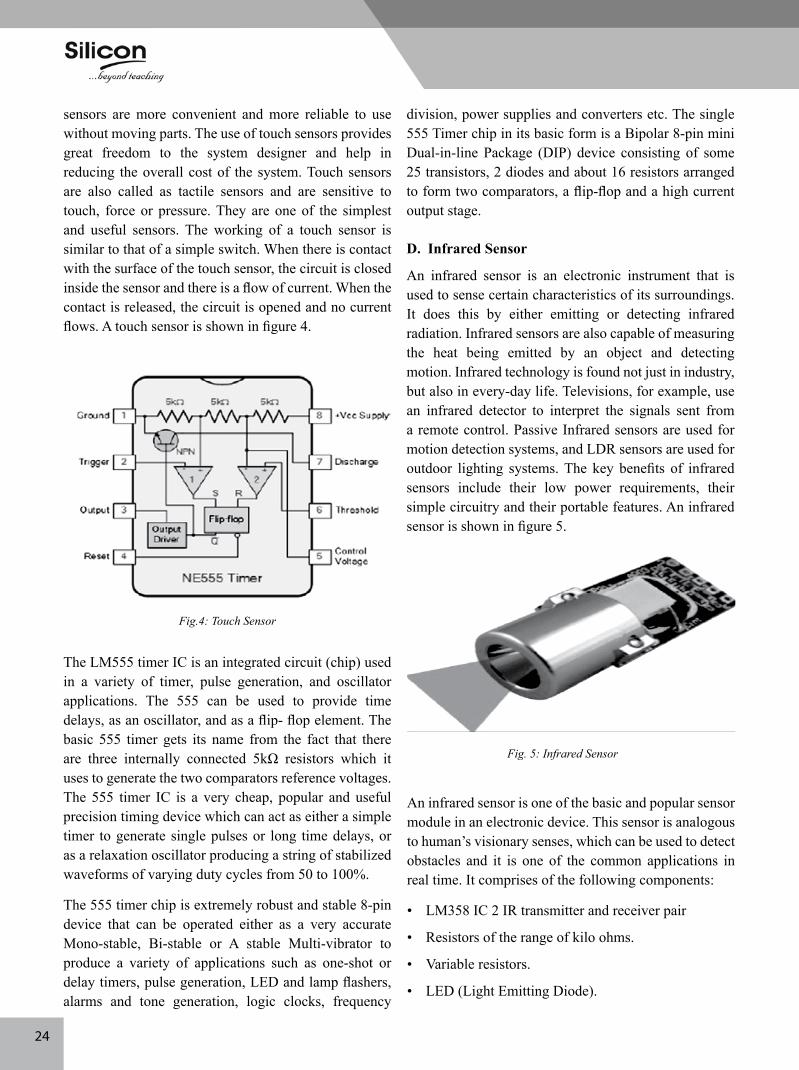
sensors are more convenient and more reliable to use without moving parts. The use of touch sensors provides great freedom to the system designer and help in reducing the overall cost of the system. Touch sensors are also called as tactile sensors and are sensitive to touch, force or pressure. They are one of the simplest and useful sensors. The working of a touch sensor is similar to that of a simple switch. When there is contact with the surface of the touch sensor, the circuit is closed inside the sensor and there is a flow of current. When the contact is released, the circuit is opened and no current flows. A touch sensor is shown in figure 4.
Fig.4: Touch Sensor
The LM555 timer IC is an integrated circuit (chip) used in a variety of timer, pulse generation, and oscillator applications. The 555 can be used to provide time delays, as an oscillator, and as a flip- flop element. The basic 555 timer gets its name from the fact that there are three internally connected 5kΩ resistors which it uses to generate the two comparators reference voltages. The 555 timer IC is a very cheap, popular and useful precision timing device which can act as either a simple timer to generate single pulses or long time delays, or as a relaxation oscillator producing a string of stabilized waveforms of varying duty cycles from 50 to 100%.
The 555 timer chip is extremely robust and stable 8-pin device that can be operated either as a very accurate Mono-stable, Bi-stable or A stable Multi-vibrator to produce a variety of applications such as one-shot or delay timers, pulse generation, LED and lamp flashers, alarms and tone generation, logic clocks, frequency
division, power supplies and converters etc. The single 555 Timer chip in its basic form is a Bipolar 8-pin mini Dual-in-line Package (DIP) device consisting of some 25 transistors, 2 diodes and about 16 resistors arranged to form two comparators, a flip-flop and a high current output stage.
D. Infrared Sensor
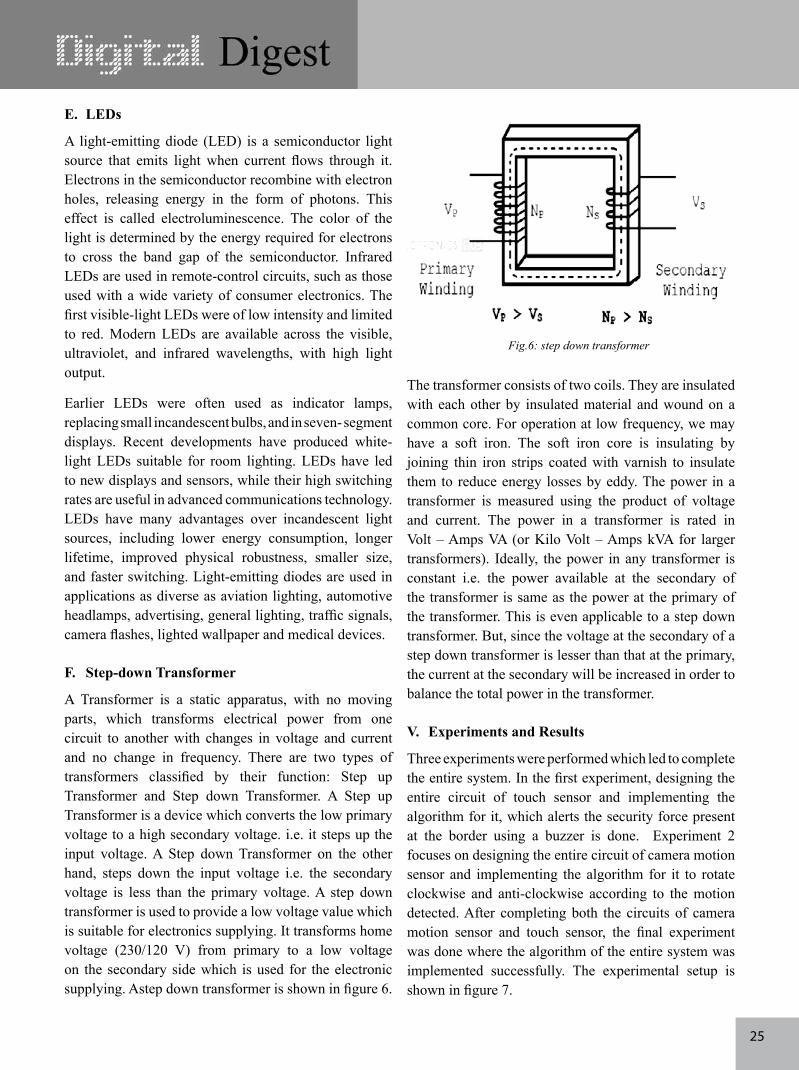
An infrared sensor is an electronic instrument that is used to sense certain characteristics of its surroundings. It does this by either emitting or detecting infrared radiation. Infrared sensors are also capable of measuring the heat being emitted by an object and detecting motion. Infrared technology is found not just in industry, but also in every-day life. Televisions, for example, use an infrared detector to interpret the signals sent from a remote control. Passive Infrared sensors are used for motion detection systems, and LDR sensors are used for outdoor lighting systems. The key benefits of infrared sensors include their low power requirements, their simple circuitry and their portable features. An infrared sensor is shown in figure 5.
Fig. 5: Infrared Sensor
An infrared sensor is one of the basic and popular sensor module in an electronic device. This sensor is analogous to human’s visionary senses, which can be used to detect obstacles and it is one of the common applications in real time. It comprises of the following components:
• LM358 IC 2 IR transmitter and receiver pair
• Resistors of the range of kilo ohms.
• Variable resistors.
• LED (Light Emitting Diode).
25
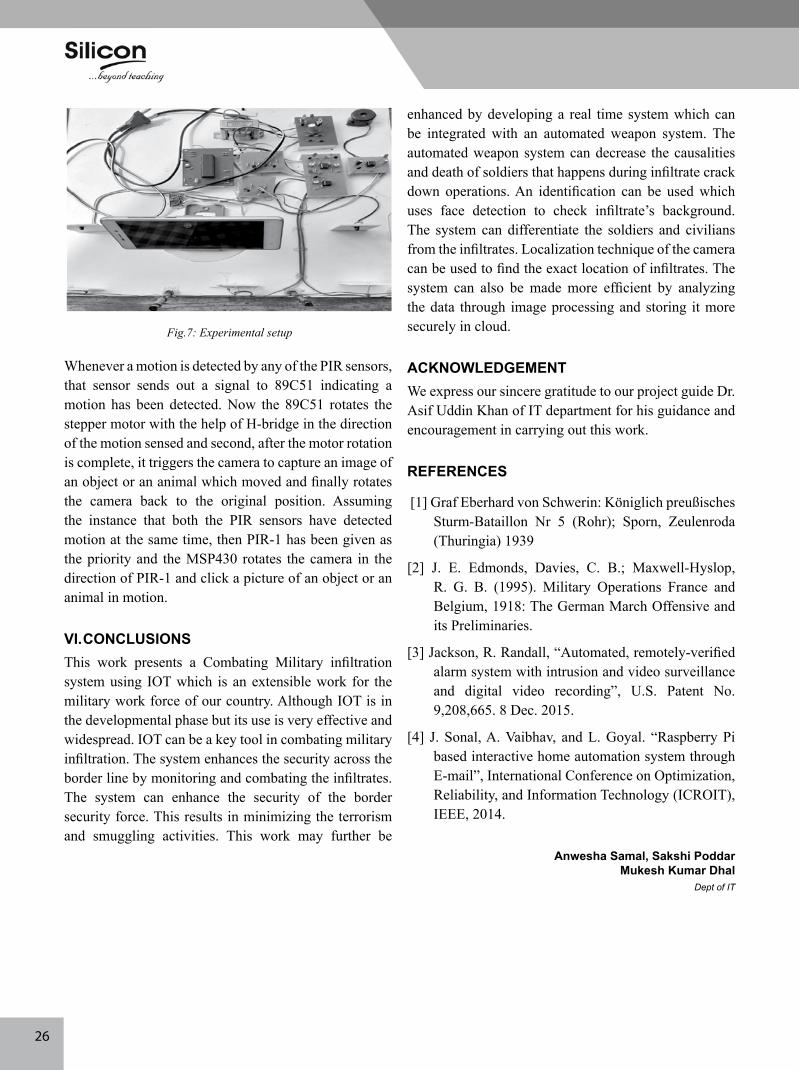
Fig.6: step down transformer
The transformer consists of two coils. They are insulated with each other by insulated material and wound on a common core. For operation at low frequency, we may have a soft iron. The soft iron core is insulating by joining thin iron strips coated with varnish to insulate them to reduce energy losses by eddy. The power in a transformer is measured using the product of voltage and current. The power in a transformer is rated in Volt – Amps VA (or Kilo Volt – Amps kVA for larger transformers). Ideally, the power in any transformer is constant i.e. the power available at the secondary of the transformer is same as the power at the primary of the transformer. This is even applicable to a step down transformer. But, since the voltage at the secondary of a step down transformer is lesser than that at the primary, the current at the secondary will be increased in order to balance the total power in the transformer.
V. Experiments and Results
Three experiments were performed which led to complete the entire system. In the first experiment, designing the entire circuit of touch sensor and implementing the algorithm for it, which alerts the security force present at the border using a buzzer is done. Experiment 2 focuses on designing the entire circuit of camera motion sensor and implementing the algorithm for it to rotate clockwise and anti-clockwise according to the motion detected. After completing both the circuits of camera motion sensor and touch sensor, the final experiment was done where the algorithm of the entire system was implemented successfully. The experimental setup is shown in figure 7.
E. LEDs
A light-emitting diode (LED) is a semiconductor light source that emits light when current flows through it. Electrons in the semiconductor recombine with electron holes, releasing energy in the form of photons. This effect is called electroluminescence. The color of the light is determined by the energy required for electrons to cross the band gap of the semiconductor. Infrared LEDs are used in remote-control circuits, such as those used with a wide variety of consumer electronics. The first visible-light LEDs were of low intensity and limited to red. Modern LEDs are available across the visible, ultraviolet, and infrared wavelengths, with high light output.
Earlier LEDs were often used as indicator lamps, replacing small incandescent bulbs, and in seven- segment displays. Recent developments have produced white-light LEDs suitable for room lighting. LEDs have led to new displays and sensors, while their high switching rates are useful in advanced communications technology. LEDs have many advantages over incandescent light sources, including lower energy consumption, longer lifetime, improved physical robustness, smaller size, and faster switching. Light-emitting diodes are used in applications as diverse as aviation lighting, automotive headlamps, advertising, general lighting, traffic signals, camera flashes, lighted wallpaper and medical devices.
F. Step-down Transformer
A Transformer is a static apparatus, with no moving parts, which transforms electrical power from one circuit to another with changes in voltage and current and no change in frequency. There are two types of transformers classified by their function: Step up Transformer and Step down Transformer. A Step up Transformer is a device which converts the low primary voltage to a high secondary voltage. i.e. it steps up the input voltage. A Step down Transformer on the other hand, steps down the input voltage i.e. the secondary voltage is less than the primary voltage. A step down transformer is used to provide a low voltage value which is suitable for electronics supplying. It transforms home voltage (230/120 V) from primary to a low voltage on the secondary side which is used for the electronic supplying. Astep down transformer is shown in figure 6.
26
enhanced by developing a real time system which can be integrated with an automated weapon system. The automated weapon system can decrease the causalities and death of soldiers that happens during infiltrate crack down operations. An identification can be used which uses face detection to check infiltrate’s background. The system can differentiate the soldiers and civilians from the infiltrates. Localization technique of the camera can be used to find the exact location of infiltrates. The system can also be made more efficient by analyzing the data through image processing and storing it more securely in cloud.
ACKNOWLEDGEMENTWe express our sincere gratitude to our project guide Dr. Asif Uddin Khan of IT department for his guidance and encouragement in carrying out this work.
REFERENCES
[1] Graf Eberhard von Schwerin: Königlich preußisches Sturm-Bataillon Nr 5 (Rohr); Sporn, Zeulenroda (Thuringia) 1939
[2] J. E. Edmonds, Davies, C. B.; Maxwell-Hyslop, R. G. B. (1995). Military Operations France and Belgium, 1918: The German March Offensive and its Preliminaries.
[3] Jackson, R. Randall, “Automated, remotely-verified alarm system with intrusion and video surveillance and digital video recording”, U.S. Patent No. 9,208,665. 8 Dec. 2015.
[4] J. Sonal, A. Vaibhav, and L. Goyal. “Raspberry Pi based interactive home automation system through E-mail”, International Conference on Optimization, Reliability, and Information Technology (ICROIT), IEEE, 2014.
Anwesha Samal, Sakshi PoddarMukesh Kumar Dhal
Dept of IT
Fig.7: Experimental setup
Whenever a motion is detected by any of the PIR sensors, that sensor sends out a signal to 89C51 indicating a motion has been detected. Now the 89C51 rotates the stepper motor with the help of H-bridge in the direction of the motion sensed and second, after the motor rotation is complete, it triggers the camera to capture an image of an object or an animal which moved and finally rotates the camera back to the original position. Assuming the instance that both the PIR sensors have detected motion at the same time, then PIR-1 has been given as the priority and the MSP430 rotates the camera in the direction of PIR-1 and click a picture of an object or an animal in motion.
VI. CONCLUSIONS This work presents a Combating Military infiltration system using IOT which is an extensible work for the military work force of our country. Although IOT is in the developmental phase but its use is very effective and widespread. IOT can be a key tool in combating military infiltration. The system enhances the security across the border line by monitoring and combating the infiltrates. The system can enhance the security of the border security force. This results in minimizing the terrorism and smuggling activities. This work may further be

27
Junctionless Surrounding Gate MOSFET for Application as a Biosensor
Abstract: This paper presents the sensitivity analysis of a junctionless based surrounding gate (SRG) biosensor, for the first time. The sensitivity and the surface potential for different bio molecules are measured. The device shows different values for different bio mol-ecules for making detection easier. The results obtained using TCAD simulation reveals that the proposed biosensor outperforms the SRG MOSFET- based biosensor counterpart.
I. INTRODUCTIONBiosensor is used to detect the bio molecules [1]. Among many SRG Junctionless-based biosensors, dielectric-modulated biosensors evinced itself as the most potential candidate for the design of next generation of bio senosrs. The presence or absence of bio molecules causes change in the electrical characteristics of the device. The threshold voltage or current in the device changes when bio molecules with certain permittivity are present in the nano gap cavity regions as compared to the presence of air in the cavity regions. Recently, nano gap-based dielectric modulated bio sensors are increasingly drawing attention due to their label-free detection capability and high sensitivity [2, 3, 4]. A combination of novel device structures and material property improvement can overcome the SCEs in order to sustain the historical cadence of scaling. In this paper, a comprehensive analysis on the effect of downscaling in the performance of a novel gate-engineered Junctionless Surrounding Gate (SRG) Metal Oxide Semiconductor Field Effect Transistor (MOSFET) is presented. With the help of device simulator Silvaco ATLAS, the effect of variation of the radius (R) and the channel length (Lg) on the surface potential, the Electric Field and the drain current is reported in order to provide an enticement for future theoretical studies and experimental researches of the critical aspects of the gate-engineered surrounding gate MOSFET. Results indicate that a trade-off between gate length Lg and channel radius R is necessary to achieve higher immunity against SCEs with a lower OFF-state leakage current to find its usage in ultra-low-power applications. Abstract Continuous downscaling of conventional MOSFETs suffers from various detrimental short channel effects (SCEs). This work presents the
analysis of junction less surrounding gate MOSFET for the application as a biosensor. The biosensor has been measured using conventional change in threshold voltage. In this work we have introduced the nano gap concept and the bio molecules. The analysis of the change in the threshold voltage with dielectric constants of different bio molecules is done and the variations in different parameters are found in order to provide enticement for future theoretical studies and experimental researches of the critical aspects of the gate-engineered surrounding gate MOSFET. Results indicate that a trade-off between gate length L g and channel radius R is necessary to achieve higher immunity against SCEs with a lower OFF-state leakage current to find its usage in ultra- low-power applications. An innovative idea is implemented regarding addition of bio molecules in order to serve as biosensor and its application in real world.
II. SIMULATION SETUPThe cross-sectional device structure is shown in Fig. 1. For gate contact, a mid band gap material with work function equals to 4.61eV has been chosen.
Keywords: Biosensor, Junctionless, Surrounding gate, sensitivity
Accumulation mode junctionless model has been incorporated to model carriers from source-to-channel region. The doping profile is Gaussian in nature with a gradient 2mV/dec and a peak concentration of 5x10¹⁹/cc. Gummel Newton model is used to calculate the current .The analysis of the 3D SRG MOSFET is done by taking the 2D cross section of the 3D structure. In the oxide layer, we have taken two materials having one material with high permittivity and another SiO2 layer having low permittivity [5, 6].
DD Feature
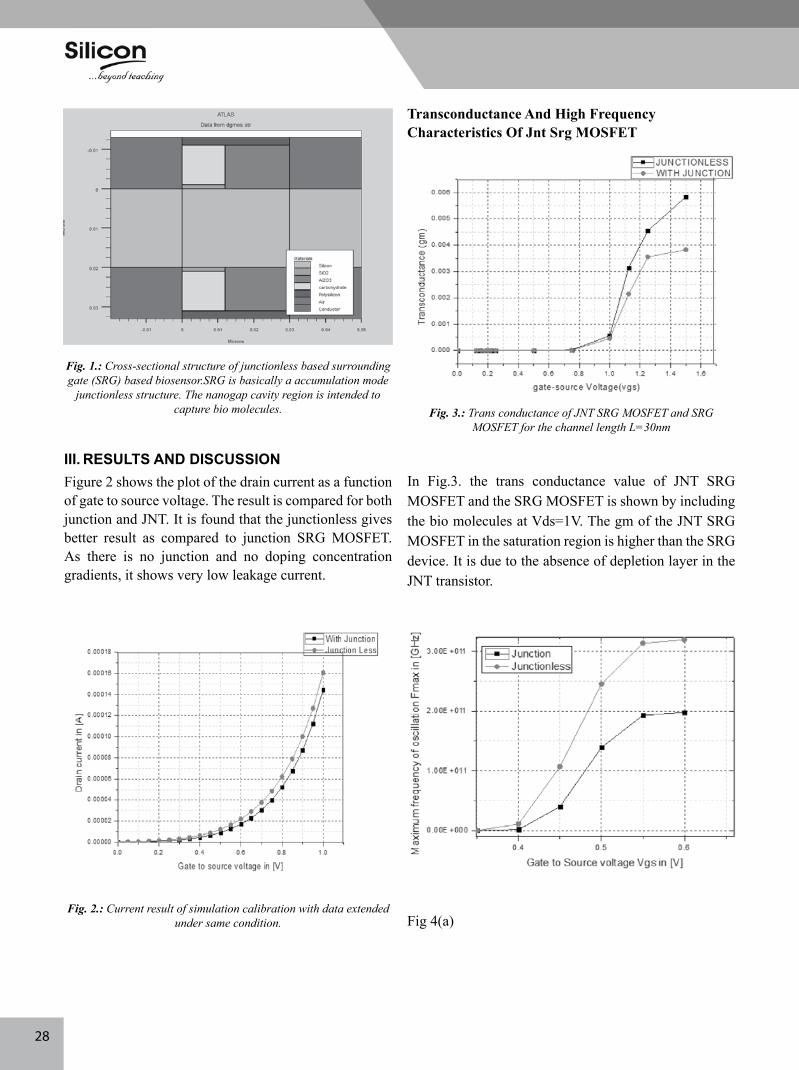
28
III. RESULTS AND DISCUSSIONFigure 2 shows the plot of the drain current as a function of gate to source voltage. The result is compared for both junction and JNT. It is found that the junctionless gives better result as compared to junction SRG MOSFET. As there is no junction and no doping concentration gradients, it shows very low leakage current.
Fig. 2.: Current result of simulation calibration with data extended under same condition.
Transconductance And High Frequency Characteristics Of Jnt Srg MOSFET
Fig. 3.: Trans conductance of JNT SRG MOSFET and SRG MOSFET for the channel length L=30nm
In Fig.3. the trans conductance value of JNT SRG MOSFET and the SRG MOSFET is shown by including the bio molecules at Vds=1V. The gm of the JNT SRG MOSFET in the saturation region is higher than the SRG device. It is due to the absence of depletion layer in the JNT transistor.
Fig 4(a)
Fig. 1.: Cross-sectional structure of junctionless based surrounding gate (SRG) based biosensor.SRG is basically a accumulation mode
junctionless structure. The nanogap cavity region is intended to capture bio molecules.
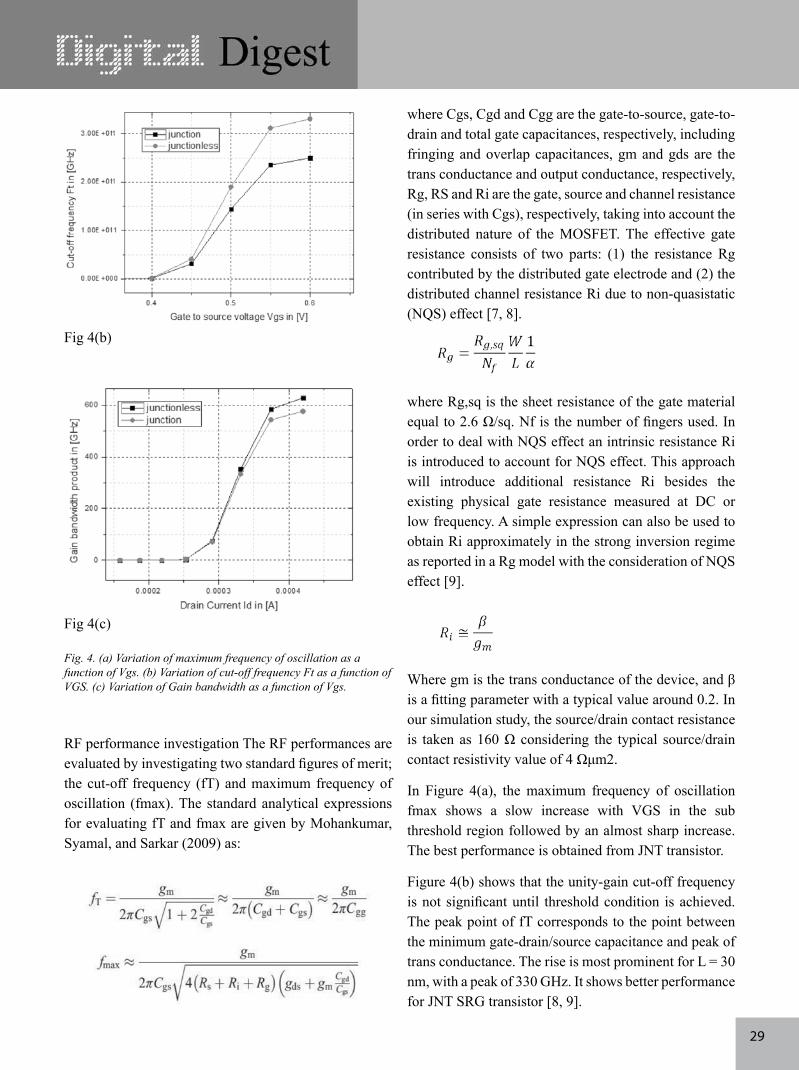
29
Fig 4(b)
Fig 4(c)
Fig. 4. (a) Variation of maximum frequency of oscillation as a function of Vgs. (b) Variation of cut-off frequency Ft as a function of VGS. (c) Variation of Gain bandwidth as a function of Vgs.
where Cgs, Cgd and Cgg are the gate-to-source, gate-to-drain and total gate capacitances, respectively, including fringing and overlap capacitances, gm and gds are the trans conductance and output conductance, respectively, Rg, RS and Ri are the gate, source and channel resistance (in series with Cgs), respectively, taking into account the distributed nature of the MOSFET. The effective gate resistance consists of two parts: (1) the resistance Rg contributed by the distributed gate electrode and (2) the distributed channel resistance Ri due to non-quasistatic (NQS) effect [7, 8].
RF performance investigation The RF performances are evaluated by investigating two standard figures of merit; the cut-off frequency (fT) and maximum frequency of oscillation (fmax). The standard analytical expressions for evaluating fT and fmax are given by Mohankumar, Syamal, and Sarkar (2009) as:
where Rg,sq is the sheet resistance of the gate material equal to 2.6 Ω/sq. Nf is the number of fingers used. In order to deal with NQS effect an intrinsic resistance Ri is introduced to account for NQS effect. This approach will introduce additional resistance Ri besides the existing physical gate resistance measured at DC or low frequency. A simple expression can also be used to obtain Ri approximately in the strong inversion regime as reported in a Rg model with the consideration of NQS effect [9].
Where gm is the trans conductance of the device, and β is a fitting parameter with a typical value around 0.2. In our simulation study, the source/drain contact resistance is taken as 160 Ω considering the typical source/drain contact resistivity value of 4 Ωμm2.
In Figure 4(a), the maximum frequency of oscillation fmax shows a slow increase with VGS in the sub threshold region followed by an almost sharp increase. The best performance is obtained from JNT transistor.
Figure 4(b) shows that the unity-gain cut-off frequency is not significant until threshold condition is achieved. The peak point of fT corresponds to the point between the minimum gate-drain/source capacitance and peak of trans conductance. The rise is most prominent for L = 30 nm, with a peak of 330 GHz. It shows better performance for JNT SRG transistor [8, 9].
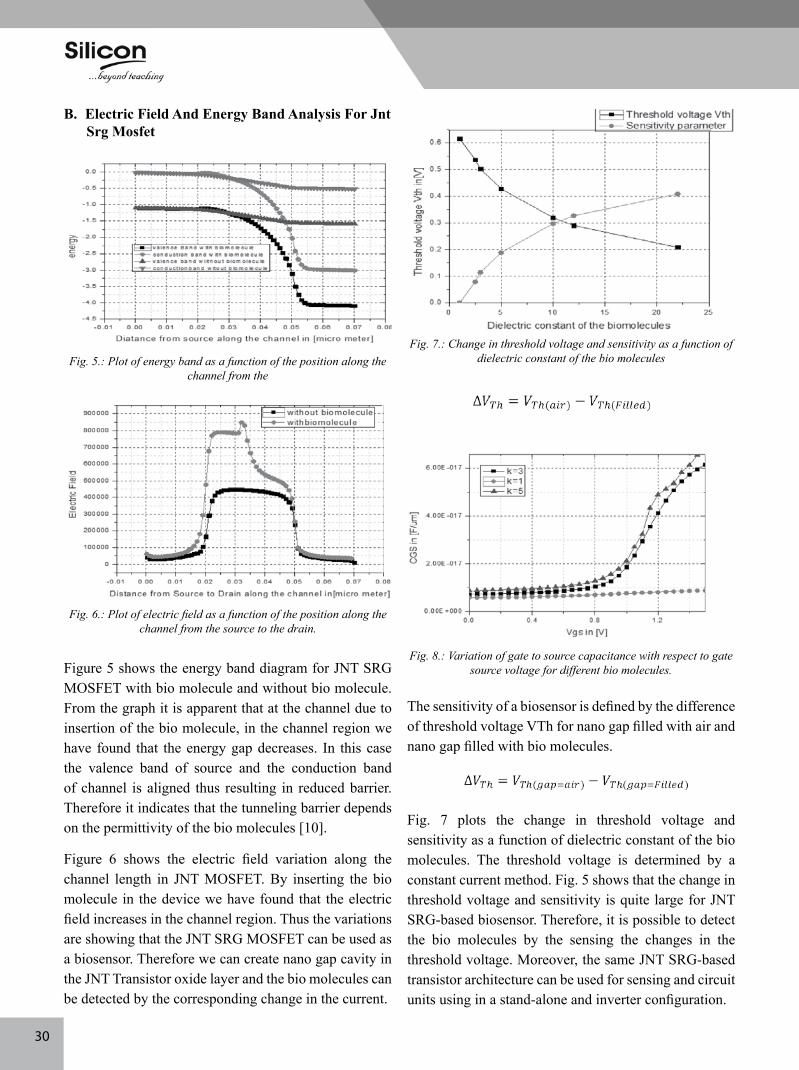
30
Fig. 7.: Change in threshold voltage and sensitivity as a function of dielectric constant of the bio molecules
Fig. 8.: Variation of gate to source capacitance with respect to gate source voltage for different bio molecules.
The sensitivity of a biosensor is defined by the difference of threshold voltage VTh for nano gap filled with air and nano gap filled with bio molecules.
Fig. 7 plots the change in threshold voltage and sensitivity as a function of dielectric constant of the bio molecules. The threshold voltage is determined by a constant current method. Fig. 5 shows that the change in threshold voltage and sensitivity is quite large for JNT SRG-based biosensor. Therefore, it is possible to detect the bio molecules by the sensing the changes in the threshold voltage. Moreover, the same JNT SRG-based transistor architecture can be used for sensing and circuit units using in a stand-alone and inverter configuration.
Fig. 5.: Plot of energy band as a function of the position along the channel from the
Fig. 6.: Plot of electric field as a function of the position along the channel from the source to the drain.
Figure 5 shows the energy band diagram for JNT SRG MOSFET with bio molecule and without bio molecule. From the graph it is apparent that at the channel due to insertion of the bio molecule, in the channel region we have found that the energy gap decreases. In this case the valence band of source and the conduction band of channel is aligned thus resulting in reduced barrier. Therefore it indicates that the tunneling barrier depends on the permittivity of the bio molecules [10].
Figure 6 shows the electric field variation along the channel length in JNT MOSFET. By inserting the bio molecule in the device we have found that the electric field increases in the channel region. Thus the variations are showing that the JNT SRG MOSFET can be used as a biosensor. Therefore we can create nano gap cavity in the JNT Transistor oxide layer and the bio molecules can be detected by the corresponding change in the current.
B. Electric Field And Energy Band Analysis For Jnt Srg Mosfet

31
Figure 8 shows the variation of gate to source capacitance with respect to gate source voltage for different bio molecules. We have found from the result that the capacitance is the function of the permittivity of the material present inside the oxide layer. As the permittivity (k) of the bio molecule increases, the capacitance also increases. So, from the variations in the capacitance, the current value also changes for different values of the permittivity. As different bio molecules have different permittivity so detection of bio molecules is done in the nano cavity through threshold voltage and the current variations in the device [7, 9].
IV. CONCLUSIONSIn summary, an analysis of the sensitivity and bio moleule detection capability of the JNT SRG-MOSFET-based biosensor has been provided. The results indicate that the proposed biosensor will evince itself as an potential alternative to the conventional SRG MOSFET-based biosensors primarily due to its high sensitivity, no depletion region formation, high current. The JNT SRG MOSFET shows better performance like high current variation, high saturation trans conductance, high cut-off frequency in the range of 300 GHz as compared to the normal SRG MOSFET. Therefore, JNT SRG MOSFET-based biosensors can facilitate detection of bio molecules of low concentration, which is crucial to prevent biological accidents or attacks. Therefore, the proposed biosensor can pave the way for a paradigm shift in bio sensing applications.
V. REFERENCES
1. P. Bergveld, “The development and application of FET-based biosensors,” Biosensors, vol. 2, no. 1, pp. 15–33, 1986.
2. B. Gu, T. J. Park, J.-H. Ahn, X.-J. Huang, S. Y. Lee, and Y.-K. Choi, “Nanogap field-effect transistor biosensors for electrical detection of avian influenza”, Small, vol. 5, no. 21, pp. 2407–2412, Nov. 2009.
3. Sarkar, Deblina, and Kaustav Banerjee. “Proposal for tunnel-field-effecttransistor as ultra-sensitive and label-free biosensors.” Applied Physics Letters 100, no. 14 (2012): 143108.
4. Abdi, Dawit Burusie, and M. Jagadesh Kumar. “Dielectric modulated overlapping gate-on-drain tunnel-FET as a label-free biosensor.” Superlattices and Microstructures 86 (2015): 198-202.
5. Gao, Anran, Na Lu, Yuelin Wang, and Tie Li. “Robust ultrasensitive tunneling-FET biosensor for point-of-care diagnostics.” Scientific reports 6 (2016).
6. Kanungo, S.; Gupta, P.S.; Rhaman, H., “Effects of Germanium mole fraction variation at the source of a dielectrically modulated Tunneling FET based biosensor,” Devices, Circuits and Systems (ICDCS), 2014 2nd International Conference on , vol., no., pp.1,5, 6-8 March 2014
7. Narang, R.; Reddy, K.V.S.; Saxena, M.; Gupta, R.S.; Gupta, M., “A Dielectric-Modulated Tunnel-FET-Based Biosensor for Label-Free Detection: Analytical Modeling Study and Sensitivity Analysis,” Electron Devices, IEEE Transactions on , vol. 59, no.10, pp. 2809-2817, Oct. 2012
8. Baravelli, Emanuele, Elena Gnani, Roberto Grassi, Antonio Gnudi, Susanna Reggiani, and Giorgio Baccarani. “Complementary n-and ptype TFETs on the same InAs/Al 0.05 Ga 0.95 Sb platform.” In Solid- State Device Research Conference (ESSDERC), 2013 Proceedings of the European, pp. 69-72. IEEE, 2013.
9. Wang, Lingquan, Edward Yu, Yuan Taur, and Peter Asbeck. “Design of tunneling field-effect transistors based on staggered heterojunctions for ultralow-power applications.” IEEE Electron Device Letters 31, no. 5 (2010): 431-433.
10. Chakraborty, Avik, and Angsuman Sarkar. “Staggered Heterojunctions- Based Nanowire Tunneling Field-Effect Transistors for Analog/Mixed- Signal System-on-Chip Applications.” NANO 10, no. 02 (2015): 1550027.
Subhasish Lenka Nickey Singhal
Sworup Kumar Behuria Priyanka Sharma Abhisekh Kumar
Dept. of ECE

32
Falcon Heavy
SpaceX is a private US aerospace manufacturer and space transportation services company headquarter in Hawthorne, California. It was founded in 2002 by Elon Musk. Aiming towards reduction of space and transportation costs to enable the colonization of Mars. SpaceX has the finest technology among the space technology. SpaceX has developed the Falcon launch vehicle family and the Dragon spacecraft family.SpaceX has privately funded liquid-propellant rocket to reach orbit (Falcon 1 in 2008). It was the first private company to successfully launch, orbit, and recover a spacecraft
Developed by SPACEX
(Dragon in 2010) and also the first to send a spacecraft to the International Space Station (Dragon in 2012). It also has the achievement of first propulsive landing for an orbital rocket (Falcon 9 in 2015) and the first company to make reuse of an orbital rocket (Falcon 9 in 2017). SpaceX reusable launch system development program: In December 2015, a Falcon 9 successfully accomplished a propulsive vertical landing. This was the first such achievement by a rocket for orbital spaceflight. In 2017, Musk unveiled an updated configuration of the system, now named Star ship and Super Heavy, which is
Space Technology
33
planned to be fully reusable and will be the largest rocket ever on its debut, currently scheduled for the early 2020s.SpaceX manufactured and developed the falcon launch vehicle and the Dragon spacecraft family.
The Falcon Heavy is a partially reusable heavy-lift launch vehicle designed and manufactured by SpaceX. It is derived from the Falcon 9 vehicle and consists of a strengthened Falcon 9 first stage as the centre core with two additional first stages as strap-on boosters. The Falcon Heavy has the highest payload capacity of any currently operational launch vehicle, the second-highest capacity of any rocket ever to reach orbit, trailing the Saturn V, and the third-highest capacity of any orbital-class rocket ever launched (behind the Saturn V and Energia). SpaceX conducted the Falcon Heavy’s maiden launch on February 6, 2018, at 3:45 p.m. EST. The second Falcon Heavy launch occurred on April 11, 2019 and all three booster rockets successfully returned to earth. The Falcon Heavy was designed to carry humans into space beyond low Earth orbit, although as of February 2018, Musk does not plan to apply for a human-rating certification to carry NASA astronauts. The Falcon Heavy and Falcon 9 will be replaced by the Star ship and Super Heavy launch system.
Falcon Heavy vehicle were launched initially in the year 2004. In the 2005, the three core booster stages of the company’s changed his name to FALCON 9 HEAVY. In April 2011, SpaceX unveiled the plan for Falcon heavy to the public at the Washington DC news conference and it has initially tested the flight in 2013. In July 2017, Elon Musk said, “It actually ended up being way harder to do Falcon Heavy than we thought, it way more difficult than we originally thought. We were pretty naive about that.” The First planned space technology was Falcon 5 which has many of disadvantages for this reason it was never flown .The Falcon 9 used nine first stage engine which
helped to fly in 2017. It is cost effective and most reliable than another spaceships. Musk was the man behind who took this to another level, who developed the Falcon Heavy with a private capital of his own which cost was more than $500 millions. No Government financing was provided for its development. The Falcon Heavy design is based on Falcon 9’s fuselage and engines. SpaceX had been aiming for the first launch in 2008. Meanwhile Falcon 9 Heavy would be in a couple of years in 2009.Engine of Falcon 9 is named as Merlin engines and the fuel used is burning liquid oxygen(LOX) and Rocket grade kerosene(RP-1)propellants.
Falcon Heavy has more lift capacity than any other rocket, with a payload of 64000kg to low earth orbit and 16800kg to Trans-Mars injection. This was designed to meet all the current requirements of Human Rating. SpaceX has a motive to reduce the cost of the Rocket, enable people to live on other planets and also rocket reusability is the main motive of the SpaceX .which is most important that we can reuse the rockets with a less cost.SpaceX conducted a new development of reusable rocket architecture for Falcon 9 which is a part of Falcon Heavy. Earlier SpaceX had idea that all rocket stages would eventually be reusable. SpaceX has demonstrated routine land and sea recovery of the Falcon 9 first stage, and has made attempts to recover the payload. In the case of Falcon Heavy, the two outer cores separate from the rocket earlier in the flight, and are thus moving at a lower velocity than in a Falcon 9 launch profile. For the first flight of Falcon Heavy, SpaceX had considered attempting to recover the second stage, but did not execute this plan. SpaceX has seen that the Falcon heavy payload performance to Geosynchronous transfer orbit (GTO) will be reduced due to the addition of the reusable technology, but the rocket would fly at a much lower cost. This is a very important part where the cost is low and the rocket can be reused again.
Rohit Kumar Nayak

34
Microcontroller Based Solar Tracker
Abstract: Today all around the world, renewable energy power plants are being promoted to resolve the power crises. Renewable power is a green power and is available all around the world in various forms. India is blessed with ample solar radiation and most of the country receives between 300 to 330 sunny days a year. Harnessing solar radiation through photovoltaic panels is an economical and convenient way to fulfil the demand of electrical power.We have designed and developed a solar power plant with single axis auto track-ing system. To improve the power generation capacity (up to 30%), an indigenously designed and developed single axis tracking system is attached with the plant. This is the first of its kind indigenously designed auto solar tracker system in the country.
I. INTRODUCTION
BackgroundClimate change is a subject that has been discussed profusely these recent years. An example of a cleaner source of energy is the electricity generated by solar panels. It is known that “In two hours, the Earth receives as much energy from the sun as the whole world’s population uses for a year”. It is important to find ways to use the solar energy smartly.This shows that there is great potential in solar energy and any improvements to solar panels could be of great help for society. Solar panels work by absorbing the sunlight and converting it to electricity through the photovoltaic effect. The goal is to capture as much sun energy as possible. The amount of energy that can be collected is determined by the amount of light intercepted by the panel, or in other words, the area of the shadow from the solar panel on a perpendicular surface to the direct beam is equivalent to the energy intercepted. Most solar panels are fixed and do not move. The angle and direction the solar panel should be pointing is determined by various calculations, and can vary depending on season and location of the panel. Solar panels with an automatic mechanism that can adjust the angle and the direction of the panel are able to capture more sunlight, but also require energy to move the solar panel.
Purpose
The purpose of this project is to examine how a system of light sensors can be used as a solar tracker for a solar panel. The light sensors will be mounted to the solar panel rig and be exposed to the sun. By examining which light sensor is exposed to the most sunlight, the
solar panel will change the direction it is pointing and its angle relative to the ground so that it is pointing towards the sun, and thereby capturing more of the sun’s energy. The goal is to determine the efficiency and viability of this kind of system [1].
ScopeThis project focuses on constructing a model mechanism which allows a solar panel to be able to follow a light source. In this project, the scope has been reduced due to time and resource limitations. Because of this, only a small-scale version of the tracking solar panel will be built as a basis for the data collection. The small size of the solar panel and the other involved parts also means that the structure will not be subjected to big loads [2]. Therefore, there will not be any major calculations for the strength of the structure. As a continuation for the project, a full- scale version could be built.
II. SySTEM OVERVIEW
Method
The work process for the project began with a literature study. This included researching of solar panels, different kinds of motors, and light sensors among other things. This was done to give a better idea of what components would suit this project the best. After the literature study was complete, a first concept design was drafted [3]. After testing the prototype and making sure that the software was working, necessary changes were made to the design and final version of the construction was built.
DD Feature
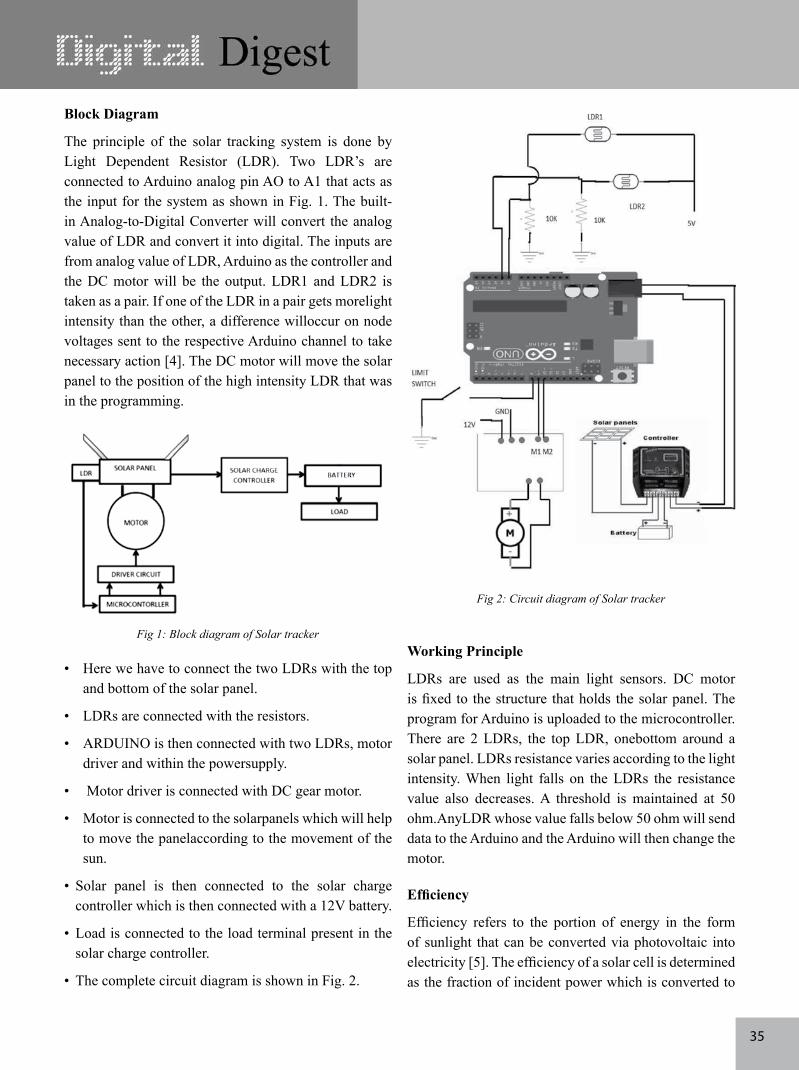
35
Block Diagram
The principle of the solar tracking system is done by Light Dependent Resistor (LDR). Two LDR’s are connected to Arduino analog pin AO to A1 that acts as the input for the system as shown in Fig. 1. The built-in Analog-to-Digital Converter will convert the analog value of LDR and convert it into digital. The inputs are from analog value of LDR, Arduino as the controller and the DC motor will be the output. LDR1 and LDR2 is taken as a pair. If one of the LDR in a pair gets morelight intensity than the other, a difference willoccur on node voltages sent to the respective Arduino channel to take necessary action [4]. The DC motor will move the solar panel to the position of the high intensity LDR that was in the programming.
Fig 1: Block diagram of Solar tracker
• Here we have to connect the two LDRs with the top and bottom of the solar panel.
• LDRs are connected with the resistors.
• ARDUINO is then connected with two LDRs, motor driver and within the powersupply.
• Motor driver is connected with DC gear motor.
• Motor is connected to the solarpanels which will help to move the panelaccording to the movement of the sun.
• Solar panel is then connected to the solar charge controller which is then connected with a 12V battery.
• Load is connected to the load terminal present in the solar charge controller.
• The complete circuit diagram is shown in Fig. 2.
Fig 2: Circuit diagram of Solar tracker
Working Principle
LDRs are used as the main light sensors. DC motor is fixed to the structure that holds the solar panel. The program for Arduino is uploaded to the microcontroller. There are 2 LDRs, the top LDR, onebottom around a solar panel. LDRs resistance varies according to the light intensity. When light falls on the LDRs the resistance value also decreases. A threshold is maintained at 50 ohm.AnyLDR whose value falls below 50 ohm will send data to the Arduino and the Arduino will then change the motor.
Efficiency
Efficiency refers to the portion of energy in the form of sunlight that can be converted via photovoltaic into electricity [5]. The efficiency of a solar cell is determined as the fraction of incident power which is converted to
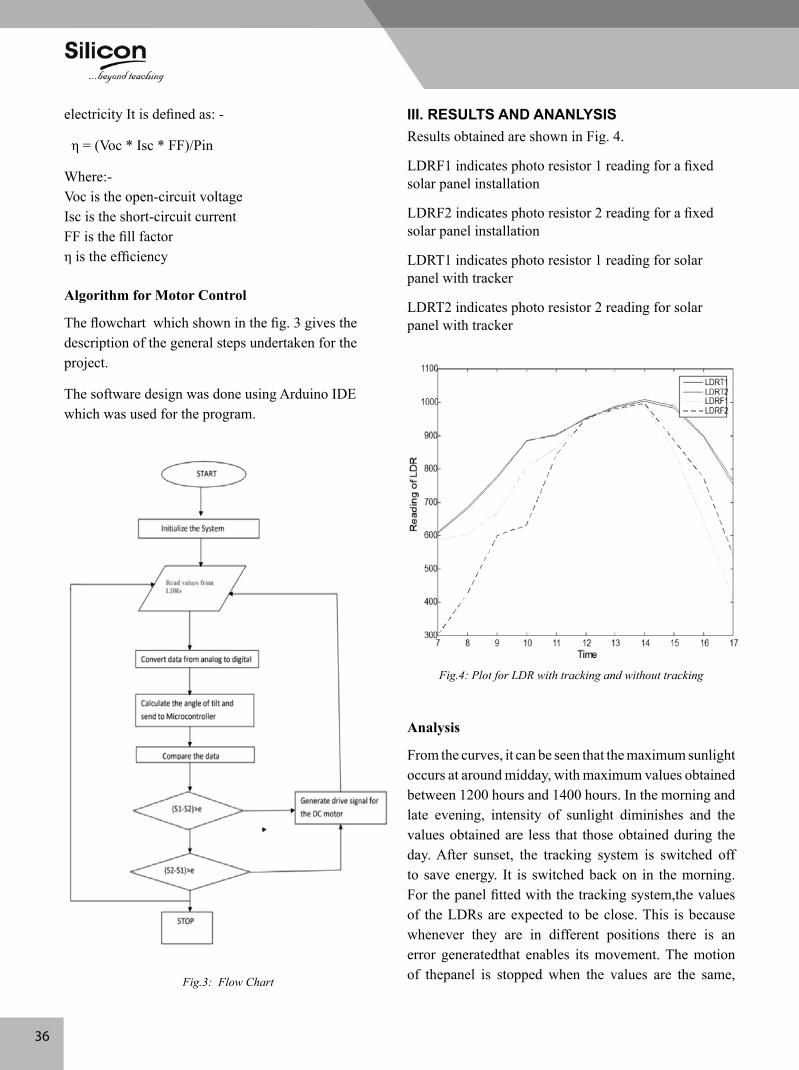
36
Fig.4: Plot for LDR with tracking and without tracking
Analysis
From the curves, it can be seen that the maximum sunlight occurs at around midday, with maximum values obtained between 1200 hours and 1400 hours. In the morning and late evening, intensity of sunlight diminishes and the values obtained are less that those obtained during the day. After sunset, the tracking system is switched off to save energy. It is switched back on in the morning. For the panel fitted with the tracking system,the values of the LDRs are expected to be close. This is because whenever they are in different positions there is an error generatedthat enables its movement. The motion of thepanel is stopped when the values are the same,
III. RESULTS AND ANANLySISResults obtained are shown in Fig. 4.
LDRF1 indicates photo resistor 1 reading for a fixed solar panel installation
LDRF2 indicates photo resistor 2 reading for a fixed solar panel installation
LDRT1 indicates photo resistor 1 reading for solar panel with tracker
LDRT2 indicates photo resistor 2 reading for solar panel with tracker
Fig.3: Flow Chart
electricity It is defined as: -
η = (Voc * Isc * FF)/Pin
Where:-Voc is the open-circuit voltageIsc is the short-circuit current FF is the fill factorη is the efficiency
Algorithm for Motor Control
The flowchart which shown in the fig. 3 gives the description of the general steps undertaken for the project.
The software design was done using Arduino IDE which was used for the program.
37
seen a tremendous growth, in particular because of the economic considerations and smooth operation of thesolar panels. Even though the initial costs are high, but operation costs and maintenance costs are low. Solar tracking system today offer an innovative method to track the solar insolation and provide economic compatibility of the generation of electric power where grid connections are difficult to setup and costly. The solar tracker can be still enhanced additional features like rain protection and wind protection which can be done as future work. From the design of experimental set up with Micro Controller Based Solar Tracking System Using If we compare Tracking by the use of LDR with Fixed Solar Panel System we found that the efficiency of Micro Controller Based Solar Tracking System is improved by 20 - 30% and it was found that all the parts of the experimental setup gavegood results.
REFERENCES
1. “Sun Tracking and Solar Renewable Energy Harvesting: Solar Energy Harvesting”, GerroPrinsloo, Robert Dobson,2014, 1, 4-5.
2. “Fabrication of single-Axis Solar Tracking Controller Project”, Nader Barsoum, Curtin University, Sarawak, Malaysia, Intelligent Control and Automation, 2011, 2, 57-68.
3. “Making sense of light sensors”, T.A. Papalias and M. Wong, http://www.embedded.com, 2006.
4. “Microcontroller based automatic sun tracking system”, International Journal of Electrical Engineering and Technology (IJEET), ISSN 0976-6553(Online) Volume 4, Issue 1, January- February 2013.
5. “A versatile microprocessor based controller for solar tracking’’,A. K. Saxena and V. Dutta Photovoltaic Specialists Conference, vol. 2, pp. 1105-1109, 1990.
AmanKumar, Ajay Prakash Abhishek Rath, Prasant Ku. Samad
Satya Singh, Saroj Ku. Gouda.Dept. of EEE.
meaning the LDRs receive the same intensity of sunlight. For the fixed panel, the values vary because the panel is at a fixed position. Therefore, at most times the LDRs are not facing the sun at the same inclination. This is apart from midday when they are both almost perpendicular to the sun days with the least cloud cover are the ones that have the most light intensity and therefore the outputs of the LDRs will be highest. For cloudy days, the values obtained for the tracking system and the fixed system do not differ too much because the intensity of light is more or less constant. Any differences are minimal. The tracking system is most efficient when it is sunny. It will be able to harness most of the solar power which will be converted into energy. In terms of the power output of the solar panels for tracking and fixed systems, it is evident that the tracking system will have increased power output. This is because the power generated by solar panels is dependent on the intensity of light. The more the light intensity the more the power that will be generated by the increase in efficiency can be.
For a bright sunny day, we can take the averages for LDR 2 and other LDRS for the entire day. We then use 2 as the base because it is the maximum value of the LDR output. It is calculated as a percentage and the two values compared. While this may not give the clearest indication of the exact increase in efficiency, it shows that the tracking system has better efficiency.
IV. CONCLUSIONSPresent day technologies stress on being clean and green. Being environmentally friendly, solar power generators and panels are reasonably easy, safe and convenient to install. Hence enhancing the solar powered systems with intelligent trackers proves to be the optimal solution for utilizing the available solar energy. In recent years, the generation of electricity using solar technology has
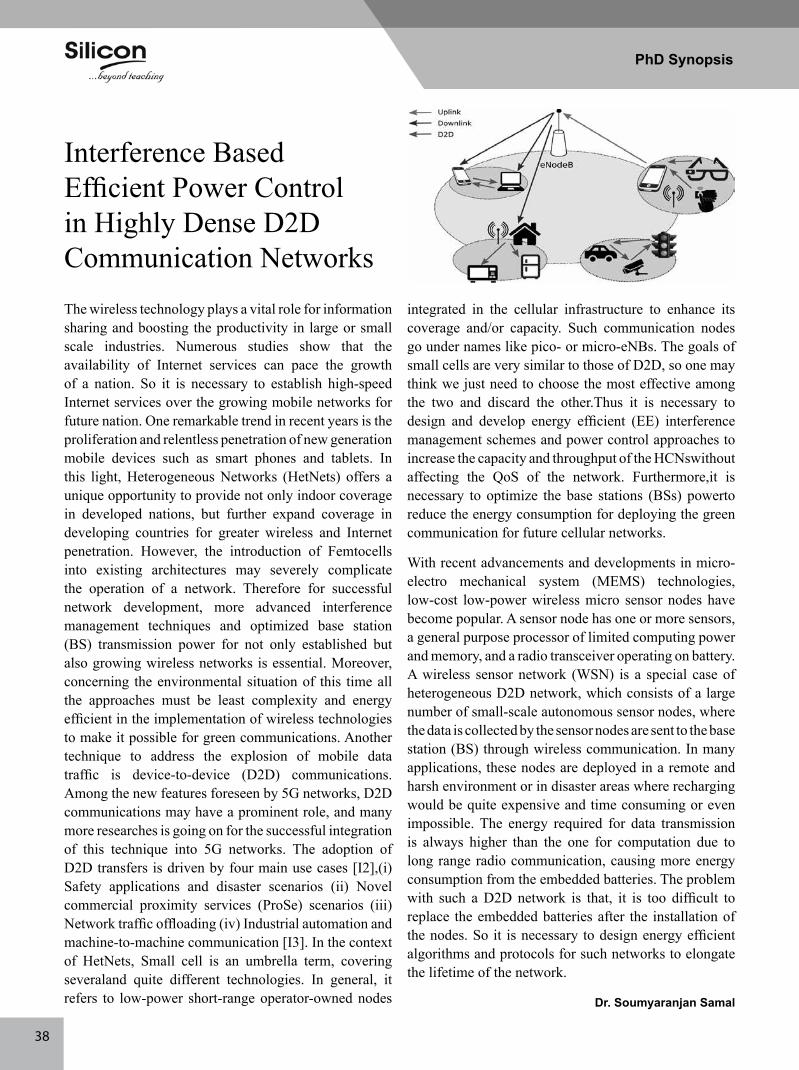
38
Interference Based Efficient Power Control in Highly Dense D2D Communication NetworksThe wireless technology plays a vital role for information sharing and boosting the productivity in large or small scale industries. Numerous studies show that the availability of Internet services can pace the growth of a nation. So it is necessary to establish high-speed Internet services over the growing mobile networks for future nation. One remarkable trend in recent years is the proliferation and relentless penetration of new generation mobile devices such as smart phones and tablets. In this light, Heterogeneous Networks (HetNets) offers a unique opportunity to provide not only indoor coverage in developed nations, but further expand coverage in developing countries for greater wireless and Internet penetration. However, the introduction of Femtocells into existing architectures may severely complicate the operation of a network. Therefore for successful network development, more advanced interference management techniques and optimized base station (BS) transmission power for not only established but also growing wireless networks is essential. Moreover, concerning the environmental situation of this time all the approaches must be least complexity and energy efficient in the implementation of wireless technologies to make it possible for green communications. Another technique to address the explosion of mobile data traffic is device-to-device (D2D) communications. Among the new features foreseen by 5G networks, D2D communications may have a prominent role, and many more researches is going on for the successful integration of this technique into 5G networks. The adoption of D2D transfers is driven by four main use cases [I2],(i)Safety applications and disaster scenarios (ii) Novel commercial proximity services (ProSe) scenarios (iii) Network traffic offloading (iv) Industrial automation and machine-to-machine communication [I3]. In the context of HetNets, Small cell is an umbrella term, covering severaland quite different technologies. In general, it refers to low-power short-range operator-owned nodes
integrated in the cellular infrastructure to enhance its coverage and/or capacity. Such communication nodes go under names like pico- or micro-eNBs. The goals of small cells are very similar to those of D2D, so one may think we just need to choose the most effective among the two and discard the other.Thus it is necessary to design and develop energy efficient (EE) interference management schemes and power control approaches to increase the capacity and throughput of the HCNswithout affecting the QoS of the network. Furthermore,it is necessary to optimize the base stations (BSs) powerto reduce the energy consumption for deploying the green communication for future cellular networks.
With recent advancements and developments in micro-electro mechanical system (MEMS) technologies, low-cost low-power wireless micro sensor nodes have become popular. A sensor node has one or more sensors, a general purpose processor of limited computing power and memory, and a radio transceiver operating on battery. A wireless sensor network (WSN) is a special case of heterogeneous D2D network, which consists of a large number of small-scale autonomous sensor nodes, where the data is collected by the sensor nodes are sent to the base station (BS) through wireless communication. In many applications, these nodes are deployed in a remote and harsh environment or in disaster areas where recharging would be quite expensive and time consuming or even impossible. The energy required for data transmission is always higher than the one for computation due to long range radio communication, causing more energy consumption from the embedded batteries. The problem with such a D2D network is that, it is too difficult to replace the embedded batteries after the installation of the nodes. So it is necessary to design energy efficient algorithms and protocols for such networks to elongate the lifetime of the network.
Dr. Soumyaranjan Samal
PhD Synopsis

3939
Wastewater treatment can be broadly categorized into two main areas – domestic and industrial. Industrial wastewater requires specialized and additional processing techniques to render it relatively innocuous. Although the term ‘sewage’ usually refers to toilets, it is used to describe all types of domestic wastewater generated from dwellings. There are two types of sewage: blackwater, or wastewater from toilets, and graywater, which is wastewater from all domestic sources except toilets. Blackwater and graywater have different characteristics, but both contain pollutants and disease-causing agents that require treatment to reduce BOD and total solids content.
Let us take a brief look at the overall domestic scenario of sewage production and treatment.
Discharge of untreated sewage in water bodies, both surface and ground water, is probably the most important water polluting source in India. Out of about 62000 million liters per day of sewage generated in the country, treatment capacity exists for only about 23000 million liters per day; this means that about 39000 million liters per day of untreated sewage is released to the environment, a truly alarming statistic. To make matters worse, the existing treatment capacity is also not effectively utilized due to operation and maintenance problems – about 40% of the treatment plants are non-conforming under the Environmental (Protection) Rules for discharge into streams as per the CPCB’s survey report. In a number of metropolitan cities, the existing treatment capacity remains underutilized while a lot of sewage is discharged without treatment to water bodies.
This scenario demands immediate attention from all citizens, villages, cities and organizations. Without a concerted and sustained effort, the environment will be irreparably damaged for future generations
Environmental Awareness & Concerns
WASTEWATERTREATMENT
(Some data and content excerpted from ENVIS Centre and thirdpole.net)

40
Publication Cell
Tel: 99372 89499 / 8260333609
Email: [email protected] www.silicon.ac.in
Editorial 2
DD Feature 3
Profile of a Scientist 15
PhD Synopsis 36
Environmental Awareness & Concerns 37
Contents
Editorial TeamDr. Jaideep TalukdarDr. Pamela ChaudhuryDr. Lopamudra Mitra
MembersDr. Bhagyalaxmi JenaNalini SinghDr. Soumya Priyadarshini PandaDr. Priyanka Kar
Student MembersTanmaya BalRohit Kumar Nayak
Media ServicesG. Madhusudan
CirculationSujit Kumar Jena
Make your submissions to:[email protected]