AUDIT AND REDUCTION MANUAL FOR INDUSTRIAL ...
122
UNITED NATIONS INDUSTRIAL DEVELOPMENT ORGANIZATION Vienna International Centre, P.O. Box 300, 1400 Vienna, Austria Tel: (+43-1) 26026-0 · www.unido.org · [email protected] OCCASION This publication has been made available to the public on the occasion of the 50 th anniversary of the United Nations Industrial Development Organisation. DISCLAIMER This document has been produced without formal United Nations editing. The designations employed and the presentation of the material in this document do not imply the expression of any opinion whatsoever on the part of the Secretariat of the United Nations Industrial Development Organization (UNIDO) concerning the legal status of any country, territory, city or area or of its authorities, or concerning the delimitation of its frontiers or boundaries, or its economic system or degree of development. Designations such as “developed”, “industrialized” and “developing” are intended for statistical convenience and do not necessarily express a judgment about the stage reached by a particular country or area in the development process. Mention of firm names or commercial products does not constitute an endorsement by UNIDO. FAIR USE POLICY Any part of this publication may be quoted and referenced for educational and research purposes without additional permission from UNIDO. However, those who make use of quoting and referencing this publication are requested to follow the Fair Use Policy of giving due credit to UNIDO. CONTACT Please contact [email protected] for further information concerning UNIDO publications. For more information about UNIDO, please visit us at www.unido.org
-
Upload
khangminh22 -
Category
Documents
-
view
2 -
download
0
Transcript of AUDIT AND REDUCTION MANUAL FOR INDUSTRIAL ...

UNITED NATIONS INDUSTRIAL DEVELOPMENT ORGANIZATION Vienna International Centre, P.O. Box 300, 1400 Vienna, Austria
Tel: (+43-1) 26026-0 · www.unido.org · [email protected]
OCCASION
This publication has been made available to the public on the occasion of the 50th
anniversary of the
United Nations Industrial Development Organisation.
DISCLAIMER
This document has been produced without formal United Nations editing. The designations
employed and the presentation of the material in this document do not imply the expression of any
opinion whatsoever on the part of the Secretariat of the United Nations Industrial Development
Organization (UNIDO) concerning the legal status of any country, territory, city or area or of its
authorities, or concerning the delimitation of its frontiers or boundaries, or its economic system or
degree of development. Designations such as “developed”, “industrialized” and “developing” are
intended for statistical convenience and do not necessarily express a judgment about the stage
reached by a particular country or area in the development process. Mention of firm names or
commercial products does not constitute an endorsement by UNIDO.
FAIR USE POLICY
Any part of this publication may be quoted and referenced for educational and research purposes
without additional permission from UNIDO. However, those who make use of quoting and
referencing this publication are requested to follow the Fair Use Policy of giving due credit to
UNIDO.
CONTACT
Please contact [email protected] for further information concerning UNIDO publications.
For more information about UNIDO, please visit us at www.unido.org

AUDIT AND REDUCTION MANUAL
for
INDUSTRIAL EMISSIONS AND WASTES
UNIDO UNITED NATIONS INDUSTRIAL
p__Jy_E!P.f't!_ENT QR GANI~ TIO~ VIENNA INTERNATIONAL CENTRE PO BOX 300 A-1400 VIENNA, AUSTRIA TEL: 431 211 310 FAX: 431232156
UNEP UNITED NATIONS ENVIRONMENT
~ROGMt!ME INDUSTRY AND ENVIRONMENT OFFICE 39-43, QUA: ANDRE-CITROEN 75739 PARIS CEOEX I 5 - FRANCE TEL: 33 (I) '40 58 88 50 TLX: 204997F FAX: 33 (:) 40 58 88 7'1

This is the seventh puhlication in a new Technical Series that regroups the
Guidelines. Overviews.. Technical Rc"iews and Workshop Proceedings prc\i
otLc;ly puhlic;hed hy UNEP/1EO. The regrouping into a single scril·s VI.ill ~nsun: a
greater cohesion among futur~ puhlication.<,. and allows a single documenl to
include the \-ariou.c; clements of IEO work ihat had eadier hcen presented
separately.
Ac; hcfore, the Technical Series aims to meet the necdc; of a V1.ide range of
government_official<,. industry managers and en\ironmenl prote<.1ion associa
tions. hy prmiding information on the issues and methods of environmenlal
management relevant to variotLc; indu.c;trial scction.c;.
Copyright (C} 1991 UNEP
All rights Reserved. No part of this puhlication may he reproduced, stored in a
retrieval system or lransmitted in any form or hy 3ny mean.'i: electronic, clc<.1ro
static. magneric tape, mechanical, photocopying. recording or olherwisc. wilhoul
permission in \\Tiling from copyri1?-ht holders.
First edition 1991
The designalion cmphiyed and lhe pn:senlalion of lhc malerial in rhis puhlil·ation do nol imply the expression of any opinion whatsoever on the part of the United Nations Environment Pro~ramme conl·erning the legal statuo; of ;1ny country. territory, city ,ir area or of its authorities. 11r conl·ernin~ delimit at inn of ito; frontiers or houndaric~. Moreover, the view'\ expreo;sed do nol ncn;o;sarily n:presenl the decision or the staled policy ol the United Narions Environment Programme, nor docs <.·iring of trade names or commercial processes con~1i111tc endoro;emcnl.
UNITED NATIONS PUBLICATION
Sales N° I) 1-111-1 )(1
ISBN 1>2-X07-1."\IH·:i

Table of Contents
Acknowlcdgcmenls
Foreword
Chapter 1 Flow Diagram:
Chapter2
Phase 1 Slep 1:
Step 2:
Slep 3:
Phase2 Slep4:
Slep 5:
Slcp 6:
Slep 7:
SlcpR:
Step9:
Step 10:
Step 11:
S1ep 12:
Step 13: Step 14:
Phase3 Step 15:
Step 16:
Step 17:
Step IX:
Step I'>:
Step 20:
Chapter 3 Case Study I:
Case Study 2:
Case Sludy 3:
Introduction to Waste Auditing O:iiclt Reference Audit Guide
The Audit Procedure
Preassessment Audit Focus and Preparation
Listing Unit Operations
Constructing Process Flow Diagrams
Material Balance: Process Inputs and Outputs Determining Inputs
Recording Water Usage
Measuring Current Levels of Waste Reuse/Recycling
Quantifying Process Outputs
Accounting for Wastewater
Accounting far Gaseous Emissions
Accounting for Off-~itc Wastes
As.~mhling Input and Output Information for Unit Operations
Deriving a Preliminary Material Balance for Unit Opcration.s
Evaluating the Material Balance • Refining the Malerial Balance
Synthesis Examining <>hvious Waste Reduction Measures
Targetling and Characlerizing Prohlem Wastes
Segrcgal ion
Developing Long-Term Waste Reduction Options
Environmental and Economic Evaluation of Waste Reduction Options
Developing and Implementing an Action Plan: Reducing Wastes and
Increasing Production Efficiency
Case Studies Beer Production
Leather Manufaclure
Printed Circuil Board Mann~acture
Ill
v
1
5
7
9
9
II
12
15
15
18
19
20
21
21
24 25
2h
2h 27
28 29
JO JI
JI
J2 JS
37 39 5(,
78

Table c;f Contents continued
Chapter 4
Appendix I
Appendi"t2
Appendix 3
Appendix4
Resource Section
Was1ewater and Cas Aow Measurement Methods
Glo..-..<;ary
Rdcrences UNEP/IEO Cleaner Production Programme
Pull-Out Quick Reference At•dit Guide
II
101
103
111
115
119

ACKNOWLEDGEMENTS
This lechnical guide has been prepared 011 behalf of lhe United Nalions Environmenl Programme
- Industry and En,,ironmenl Office (lTNEP/IEO) and lhe lJniled Nalions lndu..'\lrial Dcvclopmcnl
Organi:talion (UNIDO). using the input and guidance of an international group of experts:
Mr M Bdliappa. Environmental Research Foundation. India
Mr K Bradley. Wastart Ltd, Environmental Consultancy. Canada
Ms L Brown, Environmental Prot.:<.1.1on Agcm:y, USA and Netherlands Organization for
T cchnology Asses."ment, The Netherland"
Ms T Harten. Em·i~1mmental Protection Agency, USA and Netherland" Organization for
Technology As.c;es.c;ment. The Nelherlandc;
Prof E Kempa. Institute of Sanitary Engineering, Poland
Mr D Mehratu. Sintec pk, lnduslrial and Wal">te Management Consultancy, Fthiopia
Mr A Somani, The World Bank. Wa<;hington DC USA
Dr P Modak, ('ESE, Bomhay, India.
l': ~&:P/IEO and ll!'llDO would al1".n like to acknowledge the as.c;istance of the Ontario Wasle
Management Corporation (OWMC) whose expertise and puhlications provided much valuahle
guidance. The present technical guide has been adapted from an existing waste audit and ri:duc
tion manual puhlished hy the OWMC.
This guide has hccn prepared hy ASH ACT Ltd. Proces.c; and Emironmental Management
Consultants (UK), under contract to UNEP/IEO.
UNEP/IEO staff participating in this project w•.:re:
Mme J Aloisi de Lardercl, Director
Mr F Balkau, Senior Programme Officer
Mr J Krygcr, Senior C 'onsultant
Ms K OldenhurJ!, Senior Consultanl.
Within I JNIDO the project was coordinaled by Dr R A Luken, Senior Environmental Advisor,
Environment ('oordination llnil.
"fhe ( iovernment of Norway, acting through lJNIDO. contrihuted financially to the preparation of
this ma:111al.

FOREWORD
SlL'ilainahle dcvclopmenl will only hcl'1 me a realily if we adopt melhods or production 1ha1
gencralc less Wa..'ile and fewer emission.<; lhan lradilional induslrial processes. Somelimes lhe
change im·olves lhc adoption of new, cleaner lcchnologics or produl1ion. Even wi1hou1 new
technologies how(:vcr. improvements in operation can often dramatically rcdul-e the level of
release. A reduced lc\·cl of emissions and wa..'\tcs frequen1ly means sa\ings in cosls of production,
as less valuable raw material is squandered.
Accurale informalion ahoul lhc origins and sources of emironmenlal rclea~s is a prerequisilc for
dfcc1ive reduction of induslrial emissions and Wa..'\les. Once the sources arc idcnlified, the most
cost-effeclive oplions for avoiding, reducing ard recovering wastes can he cvalualcd.
In ord<:r lo assisl in lhe diagnosis of cmis.'iion and waste sourn·s UNEP/IEO and UNIDO ha>c
joined forces lo pnxluce lhis audit manual. The manual is hased on an earlier puhlication by the
Ontario Waste Management Corporation in 1987. In order to adapt it to as Vllide an international
audience as pos.'\ible, UNEP/IEO and lfNIDO ob1aincd 1hc ad"ice of an in1erna1ional group of
experts who met in Paris tor the (WO days or I,! August 1991.
The manual is a practical working document intended for use within industry. It can be used hy:
• fa<:to:y personnel al all levels interested in upgra<ling their own proces.'ics;
• consult;mts reporting to an industrial client;
• government pcrso.mcl re\·icwing existing factory opcralions.
Depending on the outcome of lhe audit procedure. informal ion on reducti1 n options can come
from ;1 numhcr of lechnical sour<.·es. In particular the lnlernational Cleaner Production Informa
l ion Clearinghouse (l('PI('), estalllishcd hy UNEP/IEO under ils Cleaner Production Pro~rammc
with the support of lhe US EPA. allows rapid worldwide accco;s lo information on lechnologies.
programmes and expcrls in a number nf key industry sectors. UNEP/IEO and l !NIDO arc also
ahlc t.1 provide direcl advice and follow-up 11.:chnical assistance in many cases. Further informa-
l ion ahoul these progrotmmcs Glli he found in the appendices of this manual.
II is hoped I hat dccision-m;1kers in industry and government will find in 1his document lhe cle
ments lo develop waste audits as 1inc of lhe new managcmcnl tools thal bu.I to cleaner industrial
production t>cwming a reality in the fulurc.
v

'/~
CHAPTER 1 INTRODUCTION TO WASTE AUDmNG

CHAPTER 1: INTRODUCTION TO WASTE AUDmNG
In the context of this manual. waste j_c; taken as a hroaJ term to include any non-product discharge
from a process. Thu.-;. it descrihcs di'icharges in the gaseou.-;. liquid and solid pha'iCs.
In the past. waste management has concentrated on end-of-pipe waste treatment; designing
wa .. te treatment plants and installing !lOllution control equipment to prevent contaminatio:t of the
cn\ironment.
A different philnsophy hac; emerged in recent times, that of waste pre\·cntion and rcdul.1ion.
Now we ask how can we prevent the generation of this waste? How can we reduce this waste?
Can we reuse or rccm·er this wa .. te?
This progressive shift from waste treatment towards waste prevention ha" the following hcnefits:
• wac;tc quantities are reduced;
• raw material cnnsumption and therefore costs arc reduced;
• waste treatment costs arc reduced;
• the pollution potential ic; reduced;
• working conditions arc impnwed;
• process efficiency is improved.
In order to prevent or reduce waste generation you need to examine your process to identify the
origins of wac;tes. the 1)pcra1ional prohlcms associated with your procec;s and those areas where
improvements can he made.
A waste audit is the first step in an on-going programme designed to achieve maximum n:c;ource
optimisatio'l and improved process performance. It is a common sense approach to prohlcm
identification and prohlcm solving.
A waste audit enahlcs you In take a comprehensive look at your c;ite or proc~·ss to facilitate your
understanding of material nows and lo focu~ your allention on areas where waste reduc:ion and
therefore cost saving is posc;ihle.
Undertaking a \;'aste audit involves ohscn-ing, measuring, recording data and collecting and
analysing waste samples. To he effective it muc;t he <lone methodically and thoroughly together
will full management and operator support.
A good waste audit:
• defines sources, quantities and types of wac;tc heing generated;
• collates informal ion on unit operations, raw ma!crials, produclc;, waler usage and wastes;
.1

Oiapter 1: lntrodi.ction to Waste Auditing
• highlights process indficiencics and areas or poor management;
• helps set targeb for waste rcdu<.1ion;
• permits the development of cost-effective wasle management strategics:
• raises awareness in the workforce regarding the henefits or waste rcdu<.1ion:
e in<.Te3SCS your knowledge or the process;
• helps to improve process efficiency.
The waste audit procedure can he applied on various sc<\les. A waste audit or a region can
indicate prohlem industries. Al the plant level, wastes can he traced to particular processes
allowing ailocation or trcalmenl charges where necessary; and at the process lc\"el the cxad
origins of wastes can he identified cnahling waste reduction measures lo : >e established.
This manual is designed to he used hy staff al all levels: technical as well as non-technical. It is a
practical guide 10 help you understand your processes.
How To Use the Manual
A waste audii approach leading lo lhe implemenlalion or a wasle reduction action plan is illus
trated in the form or a flow diagram overlcar (sec also lhe pull-out Ouick Rderenl"C Audit Guide
at the hack of the manual).
To undertake this approach use the ()uick Reference Audit (iuide and refer to the Audit Proce
dun.: in Chapter::'. for instructions for each step.
As a starling point reproduce ti'hlcs along the lines or Tahlcs I - 9 to give you a ha:.is for your
data collection and organis?.tion.
Three case studies arc included lo illuslrale the wide applicalior. of 1his waste audil and n.:duclion
approach.
4
QUICK REFERENCE AUDIT GUIDE
AUDIT PREPARATION
PHASE I: PREASSESSMENT Step I prepare and organise audit team and resources
Step 2 divide process into unit operations
Step 3 construe• j:>rocess flow diagrams linking unit operations
PROCESS INPUTS PROCESS OUTPUTS
Step 4
Step S
Step 6
PHASE 2: MATERIAL BALANCE
determine inputs
rec.,. J water usage
mc;1,.,re currenr levels
of waste reuse/recycling
Step 7
Ste~ 8
Step 9
Step 10
DERIVS: A MATERIAL Bl-LANCE
quantify products/by-proc!ucts
account for wastewater
account for gase-xJs emi:.sions
accoun~ for off-site wastes
Step I I assemble in,xit anci output information
Step 12 derive a preliminary material balance
Step 13 and 14 evaluate and refine material balance
IDENTIFY WASTE REDUCTION OPTIONS
Step IS identify obvious waste reduction measures
Step 16 target and characterize problem waste~
Step I/ investigate the possibility of waste segregation
Step 18 identify long-term waste reduction meuurf's
PHASE 3: SYNTHESIS
EVALUATE WASTE RH'JCTION OPTIONS
Step 19 undertak'. environmental and economic
evaluation of waste reduction options.
list viable options
WASTE REDUCTION ACTION PLAN
Step 20 <lcsign and implement ;1 waste
reductit)n ar.tion plan to achieve
improved process eff1r.1ency
)

CHAPTER2 THE AUDIT PROCEDURE

CHAPTER 2: THE AUDIT PROCEDURE
This Chapter dcscrihes a slep-hy-slcp approach for carrying out a was'c audit. h is designed lo
he generic to apply lo a hro;id spectrum of industry. The approach comprises three phases; a
prcasscssmenl ph;isc for audit preparation: a data collection phase lo derive a material halance;
and a synthesis phase where the findings from the material balance arc. translatcd into a waste
reduction action plan.
It is possihlc that not all of the audit steps will he rclcv~nl lo every situation. Similarly, in some
situations additional steps may be required. However. the following approach should form the
basis of your ir.vestigations.
Use the Quick Reference Audit Guide at thc hack of the manual in conjunction with the follow
ing explanatory notes lo carry out your audit.
PHASE1:PREASSESSMENT
Step 1: Audit Focus and Preparation
A !horough preparation for a waste audit is a prerequisite for an efficient and cost-effective study.
Of particular importance is to gain support for the audit from top-level management, and for the
implementation of results; otherwise there will he no real action.
The waste audit team should he identified. Thl: number of people required on an audit team will
depend on the si1e and complexity of the processes to he investigated. A waste audit of a small
factory may he undertaken hy one person with contrihutions from the employees. A more compli
cated process may require at least :; or 4 people: technical staff, production employees and an
environmental spl·cialist. Involving personnel from each stage of the manufacturing operations
will increase employee awareness of waste reduction and promote input and support for the
programme.
A waste audit will prohahly require external resources, such as lahoratory analytical facilities and
possibly equipment for sampling and now measurements. You should attempt to identify external
resource requirements at the outset of the project.
Analytical services and equipment may not he availahlc to a sma:l factory. If this is the case,
investigate rhc possibility of forming a waste auditing association with other factories or indus
tries; under this umhrclla the external rcsouH"e costs l"an he shared.
I)
Phase 1: Preassessment
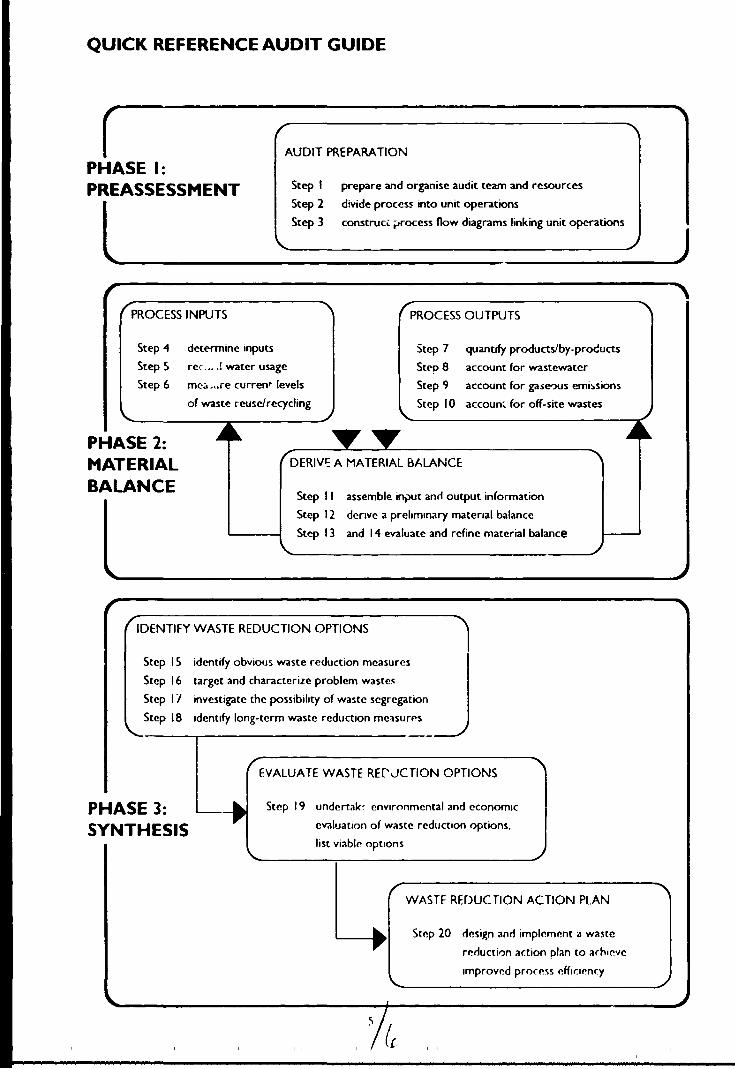
al is important to select the focus of your audit at the preparation stage. You may wish the , . .stc
audit to cover a complete process or you may want to concentrate on a selection of unit opera
tions within a process. The focus will depend on the objectives of the waste audit. You
may wish to look al waste minimisation as a whole or you may wish to concentrate on particular
wastes, for example:
• raw material losses;
• wastes that cause processing problems;
• wastes considered to be ha7ardous or for which regulations exist;
• wastes for which disposal costs arc high.
A good starting point for designing a waste audit is to determine the major problems/wastes
associated with your particular process or industrial sector. The Rapid Assessment of Sources of
Air, Water and Land Pollution published hy the World Health Organisarjon (WHO, 1982) is
a useful reference for identifying the type and typical quantities of wastes associated with partic:.:
lar industries. For example, T·-1ble 1 desi:rihcs the likely waste quantities for the tanning industry.
Table 1: Manufacture of Leather and Products of Leather, Leather Substitutes and Fur, except Footwear and Wearing Apparel
Pulp hair/ Save hair/ Save hair/ chrome tanning/ chrome tanning/ vegetable tanning finishing finishing finishing
Waste volume (m3.'t of hides) 53 63 50 BOD5 (kg/I of hides) 95 69 67 COD (kglt of hides) 260 140 250 Suspended Solids (kg/I of hides) 140 145 135 Total Solids (kg/t of hides) 525 480 345 Total Chromium (kg/t of hides) 4.3 4.9 0.2 Sulphides (kg/t of hides) 8.5 0.8 1.2 Oil and Grease (kg/t of hides) 19 43 33 Total N (kg/t of hides) 17 13 9.2 pH 1-13 4-12.6 2·13
(Source: WHO. 1982)
All existing documentation and information regarding the process, the r•lant or the regional
industrial sector should he collated and reviewed as a preliminary step. Regional or plant surveys
may have hccn undertaken; these could yield useful information indicating the areas for concern
and will also show gaps where no data arc available. The following prompts give some guidelines
on useful documcnlation.
• Is a silc ;Jlan available?
• Arc any process now diagrams available?
• JI ave lhc process waslcs ever been monilored - do you have acc..css lo 1he records?
• Do you have a map of lhc surrounding area indicating watcrcour:.cs. hydrology and human
sclllcmcnts?
• Arc there any other factories/plants in the area which may have similar processes?
10

Phase t: Preassessment
Other general data which can he collated quickly and which are useful orienlation material are
dcscrihcd below.
• What arc the ohvious wasles as.-;ocialed with your proccs.-;?
• Where is waler used in g.reatcst volume?
• Do you use chemicals that have special instructions for their use and handling?
• Do you have waste treatment and disposal costs - what arc they?
• Where arc your discharge points for liquid, solid and gaseous emissions?
The plant employees should be informed that the audit will be taking place, and they should be
encouraged lo lake par!. The support of the staff is imperative for I his type of inlcractive study.
It is important to undertake the audit during normal working hours so that the employees and
operalors can be consulled, lhc equipment can be observed in operation and, most importanlly,
wastes can be quaillificd.
Step 2: Listing Unit Operations
Your prot·cs.'\ will comprise a numhcr of uni! operalions. A unit operalion may be defined as an
area of the proccs.-; or a piece of cquipmenl where malcrials arc input, a funclion occurs and
materials arc oulpul, possibly in a diffe~ent form, slalc or composilion. For example, a proccs.-;
may comprise lhc following uni! opcralions: raw material slorage, surface lreatmenl of compo
nents, rinsing, painting, drying, product storage and waste lreatment.
An inilial site survey should include a walk anm.1d !he entire manufacturing plan! in order to gain
a sound understanding of all the processing operations and their interrelalionships. This will help
the audit learn decide I · ,.,.1 to describe a process in lerms of unit operations. During this initial
overview, it is useful to fl :Jlrd visual ohservations and discussions and lo make ske1ches of pro
cess layoul, drainage systems, vents, plumhing and other material transfer areas. These help lo
Cllsure thal imporlanl factors arc nol overlooked.
The audit learn should consult the produc1ion slaff regarding normal operaling condilions. The
production or plant staff arc likely to know ahout wasle discharge points, unplanned waste
generating operations such as spills and washouts, and can give !he audi1ors a good indicalion of
actual opcraling procedures. lnvesligalions may reveal thal nighH;hift procedures arc different
from day-shifl procedures; also, a plant tour may disclose !hat actual material handling practices
arc different from those set out in written procedures.
A long-standing employee could give some insight into recurring process problems. In the
absence of any historical monitoring this information can he very useful. Such emplo1ee partici
pation must however he a non-blaming process; otherwise it will not he as useful as it could he.
II

Phase 1: Preassessment
Durin,~ lhe initial survey, note imminent problems that need to be addressed bc~ore the audit is
complelc.
The waste audit learn r.eedo; to understand the function and process variables associated ""ith
each unit operation. Similarly, all the available information on the unit operations and the
process in general should be collated, possibly in separate files. It is useful to tabulate this
information, as shown in Table 2.
Table 2: Identification of Unit Operations
Unit Operation Function File Number
(A) Surface Treatment Surface 1reatment of metal products 10 m3 spray chamber. 6 jets, 100 Umin pump
(B) Rinsing Washing metal products before painting 2
Identification of materials handling opera~ions (manual, aulomatic, bulk, drums etc) covering raw
materials, transfer practices and products is also an important aspect which could usefully be
included in lhe above tabulation ai; a prelude to development of a materials balance (Phase 2).
Step 3: Constructing Process Flow Diagrams
By connecting the individual unit operations in the form of a block diagram you can prepare a
process flow diagram. Intermittent operations such as cleaning, make-up or tank dumping may
he distinguished by using broken lines to link the boxes. Figure 1 is an example of a simplified
process flow diagram for a metal finishing process.
12

Figure 1 : A Process Row Diagram for • Metal Finishing Process
UNTREATED PRODUCT
...... SURFACE
TREATMENT
SJrface Trear,.,enl i r•atme~r F'lu1d
r-1
'
© SUrtFACE
TREATMENT CHEM.TANK
Water
Wast..-ater rose-.r
@ RINSE
.. ®
RINSEVIATErt TANK
Water
I I L ..
~ 1: Preassessment
Wast• Pa1nt,'Cl•anrng Flutd Oaspos.al
© PAINTING
Paint
-
, r ' •
© PAINT
RECIAC. TANK
t I __ .J
-PAINTED PRODUCT
® PAINT
STORAGE
For complex processes prepare a general now diagram illustrating the main process areas and, on
separate sheets of paper, prepare detailed flow diagrams for each main processing area. The
printed circuit hoard manufacture case study in Chapter 3 shows hnw this can he done (Case
Study 3).
Now you must decide on the level of detail that )OU require to achieve your objectives.
II is important to realise that !he lc~s detailed or larger scale the audit hccomes. the more infor
mation is likely lo he lost or masked hy oversimplification. Esrahlishing the correct level of detail
and homing in on specific areas is very important al an early stage.
Pay particular allention to correcting any ohvious waste arisings which can he redun:d or pre
vented easily, hefore proceeding to rhe development of a material halance (Phase 2). By mJking
simple changes al this early stage, rhe resultant hcnefits will hdp enlist the participation and
stimulate the enthusiasm of employees for the lolal waste audit/rcduc·tion programme.
n

Phase t: Preassessment
Phase 1 Summary
At lhe end or the waste audit preas.c;e.<;..c;menr stage the audit team should be organised and
be aware or the ohjcctivcs or lhe waste audit.
Plant personnel should have been informed of the audit purpose in order to maximi.c;c co
operation be1wcen all parties concerned.
Any required financial resources should have been secured and external facilities checked
out for a\·ailability and capability.
The team should be aware or the overall history and local surrounding.c; or lhe plan!.
The scope and focus or lhe wac;te audit should have been established, and a rough
timetable worked oul to fil in wilh production panerns
The audit team should be familiar with the layout of the procc.<;..c;e.c; within the plant and
should have listed the unit operations associaled wilh each process. Sources of wastes and
their caac;es should also have been identified.
It should be possible to draw process flow diagrams highlighting those areas to be covered
in the waste audit
Any very obvious waste saving measure.'\ which can be introduced easily should be imple
mented immedialcly.
The finding:c; of lhc Phase 1 invesligalions could usefully he prc.c;cnled to lhe management
in lhe form of a brief preassc:c;:c;menl report in order 10 reaffirm their commitmenl inlo 1he
next phase.
14

PHASE 2: MATERIAL BALANCE: PROCESS INPUTS AND OUTPUTS
A malcrial halancc may he defined as a precise accounl or 1he inpuls and oulpuls or an opcra-
1ion.
This phase dcscrihcs a procedure for lhc ~-ulkction and arrangemcnl nf inpul and oulpul dal:1.
The procedure can he applied lo derive 1hc malcrial halancc or a plan!. a prnccs.c; or a unil
opcralion. Figure 2 is an example of a sci or components lhal need lo he quantified lo dcri\·c a
malerial halance. Nole that infrcqucnl outpuls (cg the occa.c;ional dumping of an declroplaling
ha1h) mzy he as significanl ac; eonlinous daily discharges.
Figure 2: Typical Components of a Material Balance
RAW MATERIALS
~ r
.r ""I CATALYST .
PLANT. WATER/AIR .
PROCESS OR
POWER . UNIT OPERATION
. ' ~
RECYCLE I ~REUSABLE WASTE IN
ANOTHER OPERATION
The manual uses unil opcralions lo illustrate the waste audit procedure.
. . GASEOUS EMISSIONS
. . PRODUCT
---+BY- PRODUCTS NG WASTES RECOVERY
INCLUDI FOR
l>w ASTEWATER
.. LIQUID WASTES FOR RAGEANO,'OR
E DISPOSAL
.
.. .
STO OFF-SIT
SOLID T
WASTES FOR S ORAGE ANO/OR
OFF-SITE DISPOSAL
Although lhe prtKedure is laid down in a step-hy-Mcp fashion it ~hould he emphasised that the
outpul informal ion can he collected al the s;ime time or hcforc 1hc input data; it is up to you to
organise your time efficiently.
Step 4: Determining Inputs
lnpuls lo a process or a unit opa;ition may indudc raw marcr;;1ls, <.·hemirab, w;iler, air and
power (Figure 2). The inpuls lo lhl· prnl·c~s and 1t1 each unit opcralion need lo h~· qu;mtifinl.
,\s a fir.,I ~tep Inwards quantifyini! raw mah.:rial u•.ai!C. l'Xaminl' purch;ic,ini! rl'conk thi"' rapidly
~ivcs you an idea 11f lhc sort nf quanlitics involn·d.
15

Phase 2: Material Balat\Cl': Precess Inputs and 0.Jtputs
In many situations the unit operations where raw material losses arc greatest arc raw material
storage and tran.c;fc:r. You should ltx1k at these operation.-; in conjunction with the purcha.c;ing
records to determine the al..1ual net input to the process.
Make notes regarding raw material storage and handling practices. i.'t,nsider evaporation losses.
spillages. leaks rrnm underground storage tanks_ \·apour losses through storage tank prcssure
rclicf vents and contamination or raw material<;. or1en these can be rectified very simply.
Record raw material purchases and storage and handling losses in a tahlc in order to derive the
net input to the proccs.'i (Table 3).
Table 3: Raw Material Storage and Handling Losses
Raw Material
Raw Material 1 (Surface treatrr.ent chemical)
Raw Material 2
Raw Material 3
Qtyof Raw Material
100kg
Otyof Raw Materi31 Purcr.a>ed (per annum)
95kg
Type of Storage Used in Production (per annum)
Oosed
Average Length of Storage
1 month
Estimated Annual Raw Material Losses
5kg
Once the nel input or raw materials to your procCS.'i has heen determined you should proceed
with quan1irying lhc raw material input to each unit operation.
tr accurate information aboul raw material consumption rates for individual unit operations is nol
available then you ,, ·11 need lo take measurements to determine average figures. Measurements
should he taken for an dppropria1e length or lime. For example, ir a hatch lakes one week 10 run.
then measurements should he taken over a period or al leas! three weeks; these figures can he extrapolated for monthly or annual figures.
Some quantification is possible hy observation and some simple accounting procedures.
• For solid raw materials, ask the warehouse operator how many sacks arc stored al lhc
heginning or the week or priflr lo a unit opcrnlion; then ask him again at the end or the week
or unit operation. Weigh a selection or sacks lo check rnmpliance with spe(·ificalions.
• For liquid raw materials such as waler or solvents, check storage lank capacities and ask
operators when a lank was lasl filled. Tank volumes can he eslimaled from the lank diamelcr
and lank depth. Monitor lhe lank levels and the numher or tankers arriving on site.
16
Pha3e ;>: ,,..a~al Bal8fK"9: Process Inputs and Outputs
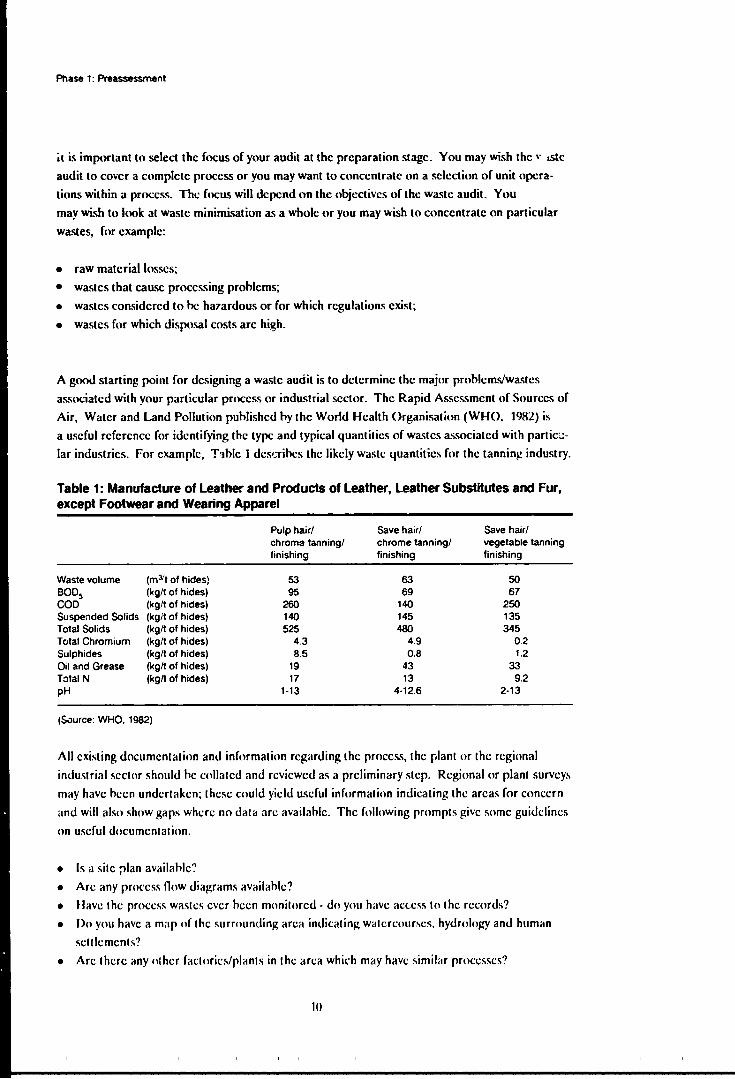
Whik investigating the inputs. t3lking lo staff arid ohser\ing the unit operations in action. the
waste audit team should he thinking ahout how to improve the efficiency of unit operations.
<.:on.sider the follo'IAling question.s.
• Is the si7c of the raw ma1etial inventory appropriate to ensure that material-handling losses
can he minimised?
• Transfer distances between storage and process or hetween unit operations - could these he
reduced to minimise potential wa~.tagc·~
• Do the same tanks store different raw IT'aterials depending on the hatch product'? ls there a
risk of C"rl-SS-contaminalion?
• Arc sacks of materials fully emptied or is some material wasted'?
• Arc \iscous raw materials used on site - io; il possihle !n reduce residual wastage in drums?
• ls the raw material storage area secure? Could a huilding be kicked at night, or could an area
he fenced off to restrict access?
• How could the raw materials he prolc<,1cd from direct sunlight or from heavy downpours?
• ls dust from stockpiles a prohlcm'!
• Is th.: equipment used lo pump or transfer materials working efficiently'? Is it maintained
regularly?
• Could spillages he avoided?
• Is the process adequately manned?
• How could the inpul of raw materials he monitored?
• Arc !here any oh"ious equipment items in need of repair?
• Arc pipelines self-draining?
• ls vacuum pump water recirculated?
The energy inpul lo a unit operation should he considered al this stage; however. energy uc;c
deserves a full audit in its own right. For waste auditing purposes make a note of the energy
source and whether waste reduction could reduce energy costs. Ir energy usage is a particularly
prominent factor mayhc you should recommend that an energy audit he undertaken.
Input data should he recorded on your pnx-ess flow diagram or in tahular form as shown in
Tahlc 4.
Water is frequently used in the production process, for cooling. gas scruhhing. washouts. product
rinsing and [.(cam cleaning. This waler usar_e needs to he quantified as :m input.
Some unit operations may receive recycled waste:-. from other uni! 1~pera1ions. These also reprc·
sen! an input.
Steps 5 and<• descrihe how these two factors should he included in your wa~te audit.
17

Phase 2: Material Balance: Process lnl)uts and Outputs
Table 4: Input Data
Unit Operation
Surface Treatment (A)
Rinse (8)
Painting (C)
Total Raw Material Used in All Unit Operations
Raw Material 1 (m3(annum)
Raw Material 2 itonnes/annum)
Step 5: Recording Water Usage
Water (m3.1annum)
Energy Source
The use or water. other than for a pro<.·css reaction. is a f;Klor that should he nm:rL·d in all waste
audits. The u.-;c or water lo wash. rin.-;e and cool is often ovcrlooked. all hough ii represcnh an
;>re~, where wasle reductions can fre4uen1ly hc achievt:<l simply and cheaply.
Consider these general points ahout the sitc water supply heforc asse!>.'ing the water usage for
indi\iJual units.
• ldentiry water sour<:es'! Is water ahstral·tcd directly from a hort:hnk. ri\'er or reservoir: i"
water stored on silt: in tanks or in a lagoon'?
• What is the storage capacity for water on site?
• How is water transkrred - hy pump. hy gra\'ily. manuall~·?
• Is rainfall a signilicant factor on site'!
For each unit operation consider the following.
• What is waler used for in each operation? Coolin~ gas scruhhing. washing. produ<.·t rinsing.
dampening stockpiles, general mainlcnancc, safety quench clc.
• How often docs each a<.1ion take pbcc?
• How much waler is used for each at·tion'!
It is unlikely that lhe answers lo these questions will he readily a\'ailahk - you will need lo under
take a monitoring programme to assess the: use nf water in e;Kh unit nperalion. Again. the
mca.'iuremenls must c1iver a sufficient period or lime to ensure lhal ;111 al'lions arc monilorl·d. P;iy
partin1lar allcntion lo in1ermi11en1 al'tions su<.·h ao; steam cleaning and !;ink washouts; waler u'c i"
often indiscriminak durinit the~c operations. Find oul when thc,c •Kl ions will he undertaken Ml
that detailed mc;isuremenls r;in he made.
IX

Pl'lase 2: Material Balance: Process Inputs and Outputs
Record water usage information in a tabular form - er..sure that the units used to descrilic inter
mittent action.s indicate a time period (Tahlc 5).
Table s: Water Usage
Deaning Steam Cooling Other
Unit Operation A
Unit Operation B
Uni: Operation C
All measurements in standard units. for example m31annum or m3fday.
Using less water can he a rnsl-sa\ing exercise. Consider the following poirJs while investigating
water U$C:
• tighter control of Water USC can reduce the Volume of Wastewater requiring treatment and
result in cost sa\·ing.o; - in the extreme. it can somclimes reduce \·olumes and increase concen
trations lo the point of pnwiding economic material recovery in place of costly wastewater
tre;itment:
• attention to good housc-l:ccping practices often rL·dnces water usage and. in turn. the
amount or wastewater pa .. si112 to drain:
• the cost of storing wastewater for suhsequent reuse may he far less than the trc.::itmcnt and
disposal costs:
• countcr-currcnl rinsing and rinsewatcr reuse arc highlighted in the case studies as useful tips
for reducing water usage.
Step 6: Measuring Current Levels of Waste Reuse/Recycling
Some wastes lend themscl :cs to direct rc.:usc in production and may he tr;msfcrrc.:d from one unit
lo another (cg reuse.: of the final rinse in a soft-drink '1011lc W;ishing pl;anl 1s the.: initial rinse);
others require some modification hcforc they arc suitahk for rc.:usc in a process. These reused
waste streams should he quantified.
tr reused wastes arc not properly documented douhlc-counting may ocrnr in the material halancc
partil·ularly at the process or complete plant level; that is. a waste will he quantified as an out pm
from one process and as an input to another.
The reuse or rc,·ycling of wastes can reduce the amount of frl·sh water and raw materials required
for a process. While looking at the inputs to unit operations think ahout the opportunities for
reusing and recycling outputs from other operations.
I'>
Phase 2: Material Balance: Process Inputs and Outputs
Steps 4, 5 and 6 Summary
By the end of Step fl y1iu should have quanlilied all your pnx·es.-; inpuls.
The ocl inpul of r;1w materials and waler lo !he proces.s should he est.ihlishcd having
laken into acniunt ar.y l11s.<;cs incurred al the storage and transkr stages.
Any reused or rcl·yckd inputs should he d1x-umentcd.
All note" regarding raw matcri;1l handling. proces.'> layout. water losses. ohvious areas
where prohlcms exist shoul:.I all he documented for consideralion in Phase 3.
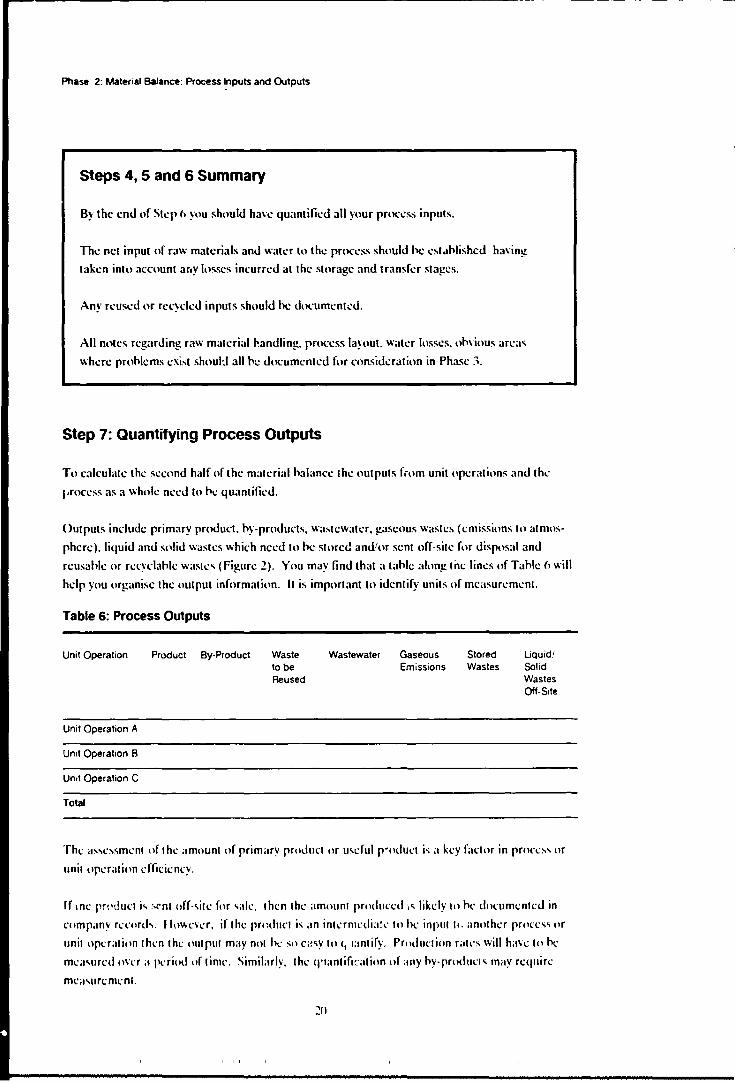
Step 7: Quantifying Process Outputs
To cakulale !he sewnd h;1lf of !he malerial halance !he oulpuls from unit opcralions and !he
1•rocess as a whole need lo he quantifil·d.
Outpuls include primary product. hy-products. wa;;1ewater. gaseous wastes (emissions 10 almos
phere). liquid and solid w;1stes whil·h need lo hc stored and/or sent off-sile for dispos;1I and
reusable or recyclahlc w;1stcs (Figure 2). You may lind that ;1 tahlc along tile lincs ofTahlc 6 will
help you organise the output information. It is important to identify units of me;1surement.
Table 6: Process Outputs
Unit Operation Product By-Product
Unit Operation A
Unit Operation B
Unit Operation C
Total
Waste to be Reused
Wastewater Gaseous Emissions
Stored Wastes
Liquid' Solid Wastes Off-Site
Th, a,.,c.,smcnl nf 1he amounl of primary prnducl or U\cful p•oduct is a key factor in pnircs' or
uni1 operalinn dfi1.:icncy.
If inc pr~·ducl i., :-rnl off-'\ilc for '\;tic. I hen lhc amounl produced'" likely Ill hl· dornmcnlcd in
company rn·onk l l11wcvcr. if lhe prodtKl is an inlcrmcdiar,· lo hl· inp11111. anolher proce'" or
uni1 opcralion Ihm the 0111p111 may nol h,· s11 c;:'\y to <1 1an1ify. Production rah·., will have In he
mea,ured 11\'l'f ;i prriod of time. Similarly. lhe q·1anl ifwalion of any hy-pr11duct \ may require
mea,uH:mcnl.

Phase 2: Material Balance: Process Inputs and Outputs
Hints on how to approach the quantifiG1tion of wastewah:r. gaseous emissions and wastes for :lff
sitc removal arc dcscrihcd in Steps K 11 and Ill.
Step 8: Accounting for Wastewater
( )n many sitc.:s signifi<.·anl quantities or hoth dean and contaminatc.:d wat.:r :ire.: disehargc.:d lo
sc.:wcr or to a \\alcrcoursc. In many casc.:s. this wastcwatc.:r has environmental implications and
incurs tr::almcnl costs. In addition. wastewater may wash out valuahle unused raw matc.:rials from
the prncc.:ss arc.:as.
Thcrdorc. it is extrcmc.:ly important ltl knnw how mul·h wastcwatc.:r is going down the drain and
what the wastewatn contains. The wastewatc.:r llows. from each unit operation as wc.:11 as frnm the
process as a whole. nc.:c.:d ti1 he quantified. samplc.:d and analy,l·<l.
Herc arc sor11c suggesl;ons 11n how lo carry out a th11rough sur\ey 11f Wi1S1cwah:r llows on your
site.
• Identify the cflluc.:nt discharge pnints: that is. whc.:r~· dncs w:istcw;1tcr leave the.: site.:? Wasll:
watc.:r may go to an efllucnt treatment plant or dircclly to a puhlic sewer or watan1ur,....:. On.:
factor that is 11ftcn ovcrlnokcd is the.: use or '-C.:\"l"fal disl·harg..: points - it i~ import;ml lo identify
the l<Kation. type and sit.: of all dischargl· t11m-...
• Identify where llow\ from difkrcnt unit opcr;itions 11r prnccss areas ointrihute to the overall
llnw. In this way. it is possible to pi1.:cc togcthn the drainage network fnr your site. This can
lead to startling discoveries of what goes where!
• Once the.: drainage system is undnstood it is Jl•'''ihk to dcsi!!n an appnipri;ih: sampling and
llow measurement progr;1mme to monitor the \\;1st..:walc.:r llows ;ind strengths from each unit
ope rat inn.
• Plan your monitoring progr;immc 1.111roughly and try to t;1kc samph.·, ovn a range of opnatin!!
omditions such;!' full prod1Kti11n. <>tart up. shut 1h1wn and w;i,hing out. In the c1sc.: of rnm
hinc.:d -~tormw;itcr ;ind w;istc.:w;1tn drai11;1!!c sy,ll'ms. cnsurl· that -..;impling ;ind llow mc.:;isurc.:
mcnh arc carried out in dry wc.:;ithcr.
• For small or hatl·h wastcwat1.:r ll11ws it may hi: physic1lly po.,sihlc t11 c11lb.:1 all the llow f11r
mcasu,.cmi.:nt 11\in!! a pail ;md \Hi-..t\\atd1. I .argcr or nintin:rous w;i-..tt:watn li11ws (·an lie.:
a''csscd usinf! llow mi.:;1surcnll·nt tcchniqul·,. A method u~ing ;1 'impk tri;mgular notch(\"
not("h) or re("tangular weir ;irrang·.·mi.:nt j, 011tlinc.:d in 1\ppc.:ndix I.
The \Um of I he w;.-..tcwatc.:r !!C.:ncrall·d from ,·ad1 unit opi.:rat i1 in should h1· approximately I he.: \ame
;i-.. th;tt input to the pron-''· "' indic1kd in \fl"p Ii. note.: th;it douhk-c1111nling ,·an otnrr whcr,·
21

Phase 2: Material Balance: Process Inputs and Outputs
was1cwaler is r~.-u~ed. This cmph;tsiS\.·s lhe imporlance of undcrslanding your unil or,;.:r;1lion-. and
!heir in1errcla1ionships.
The w;tslcwalcr should he analysed ltl dclcrminc lhc com:entr;1lit~n of con~:iminani...
• You sh,,uld indude w;1-.tcwalcr analyses such :1s pH. d1emi<:al 1lXY!!Cn dem;md (COD).
hi1l(:hemical 11xy!!en demand ( BOD5 ). suspended solids and !!re;·~..: and nil.
Other paramelcrs 1h;11 should he measured depend on 1he raw m;1lerial ir.puh. Fnr exampk.
an ekc1ropla1ing process is likely to use 11ickd and chromium. The me1:1l 1:orn:cnlrati11ns of 1he
was1ewatcr should he measured lo ensure lhal lhe concenlralions do nol exn:ed di,1:h;1r!!e
rq?ulalions. hut al'io lo ensure lhal raw maleri;1ls ;ire n11l hein!! losl lo drain. Any h•Xil· -;uh·
slam:cs used in 1hc process should~· measun:d.
• Take sample-; for lahoralory analysis. C'ompo-;i1e '>ampks '\hou'.d he lakcn for nintinu11usly
running waslewalcr. For example. a '\mall volume. llKI ml. rn<!Y he collecled nery hour
lhrough a pniducti,,n period of len hours lo gain a I Iii re compo.,ile s;1mpk. The n•mpo,ile
sample n:prcsenls 1he :m.:ragc waslcWater condi1!ons n\er 1h.11 lime. Where signific;ml no\\
\arialions occur during 1hc disch;1rgc period. con-.ideralion should he !!iven lo v;iryin!! !he sil'e
of individual samples in proporlion lo !low rale in order lo ensure 1ha1 a reprcsrnlalivc
composilc sample is ohtained. For halch lanks and periodic draindown. a ... in!!lc spol "ampk
may he a<lequale (check for \·arialions hctw1·en h:11che" hdorc decidin!! on the appropriate
sampling melhod).
W;i.,lcwaler !lows and conn:nlralions should he l<1hulatcd (Table 7).
Table 7: Wastewater Flows
Source of Wastewater
Unit Operation A
Unit Operation B
Unit Operation C
Oischc.rge to
Public Sewer
Flow Conc·n
Stormwater Drain
Flow Conc'n
Reuse
Flow Conc'n
Flows in m~/d; concentrations of contaminants of concern in mgil
Storage
Flow Conc·n
Total Wastewater Output
Flow Conc·n
Phase 2: Material Balance: Process Inputs and Outputs
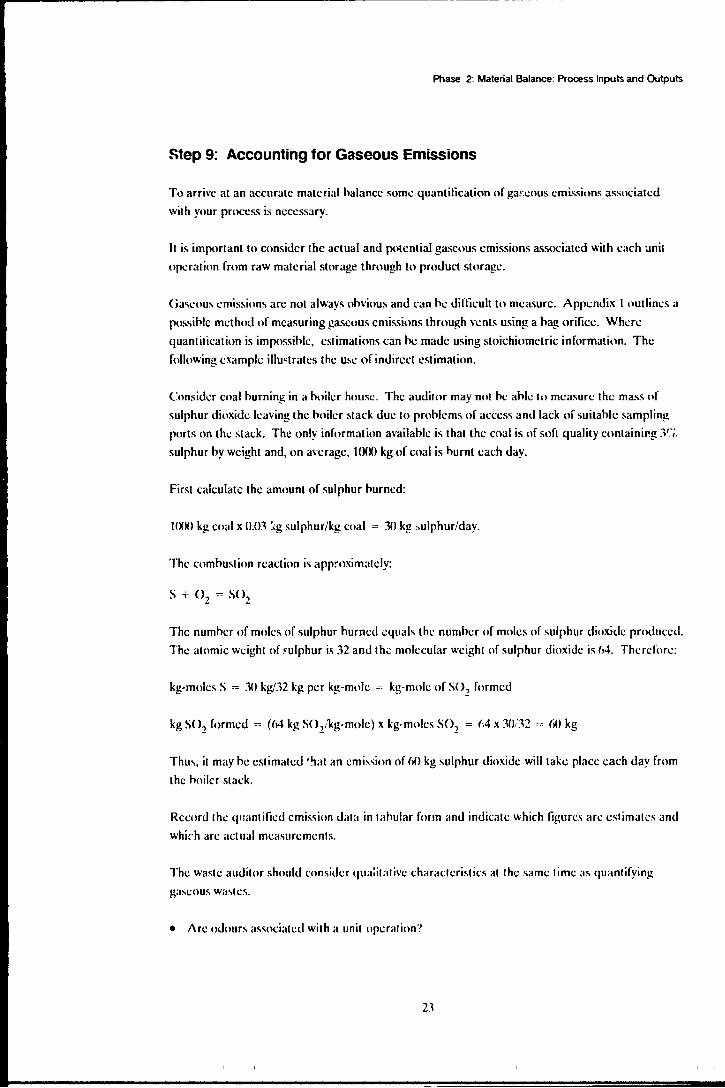
Step 9: Accounting for Gaseous Emissions
To arrive al an accurate material halancc some quantification of ga~:eous emissions associated
with your process is necessary.
It is important lo consider the actual and p<>tential gaseous emissions associated with each ;mil
operation from raw material storage through to product storage.
Gaseous emissions arc not always ohvious and (·;m he difficult to measure. Appcndix I 1>utlines a
possihlc method of measuring gaseous emissions through vents using a hag orifice. Where
quantilicalion is impossihlc. estimations can he made using stoichiometric information. The
following example illu<trates the use of indirect estimation.
Consider coal hurning in a hoilcr house. The auditor may not he ahlc lo measure the mass of
sulphur dioxide leaving the hniler stack due to pmhlcms of access and lack of suitahlc sampling
ports on the stack. The only information available is that the coal is of soft quality containirg y·;,
sulphur by weight and, on average. lfXXl kg of coal is hurnt each day.
First calculate the amount of sulphur hurned:
HXJO kg coal x n.cn :,g sulphur/kg coal = 30 kg :.ulphur/day.
The comhustion reaction is app~oximalcly:
The number of moles of sulphur hurned equals the nurnher of moles of sulphur dioxide produced.
The atomic weight of rnlphur is 32 and th;; molecular weight of sulphur dioxide is M. Therefore:
kg-moles S = 30 kg/32 kg per kg-mole = kg-mole of S{ >2 formed
kg S02 formed = (M kg SO/kg-mole) x kg-moles S02 = M x 30/32 """ (,()kg
Thus, it may he estimated •'iat an emi~sion of 60 kg sulphur dioxide will take place each day from
the hoilcr stack,
Record the quantified emission data in lahular form and indicate which figures arc cslimates and
which arc actual measurements.
The wasll: auditor should rnnsidcr qua:irarive charactcrisli(·s al !hr; same rime as quanrifying
gaseous waslcs.
• Arc odours associarcd with a unit opcrarion?

Phase 2: Material Balance: Process Inputs and Outputs
• Arc there certain times when gaseous emissions arc more prominent - an.: they linked to
temperature?
• Is any pollution control equipment in place?
• Arc gaseous emissions from confined spaces (including fugitive emissions) vented lo the
outside?
• If gas scruhhing is practised. what is done with the spent sauhher solution"? Could it he
converted to a useful product?
• Do employees wear protective clothing, such as masks?
Step 1 o : Accounting for Cff-Site Wastes
Your process may produce wastes which cannot he treated on-site. These need to he transported
off-site for treatment and disposal. Wastes of this type arc usually non-aqueous liquids. sludges
or solids.
Often, wastes for off-site disposal arc costly to transport and to treat. Therefore. minimisation of
these wastes yields a direct cost hcncfit.
Measure the quantity and note the composition of any wastes associated with your process which
need to he sent for off-site disposal. Record your results in a tahlc (sec Tahle 8).
Table 8: Wastes for Off-site Disposal
Sludge Solid Unit Operation Qty
Liquid Composition Qty Composition Qty Composition
Unit Operltion A
Unit Operation 8
Unit Operation C
Quantities in m3/annum or I/annum
You should ask :-.evcral questions during the data collection stage.
• Where docs the waste :iriginatc?
• ( "ould the manufacturing operations he optimised to produce less waste'?
• Could alternative raw materials he used which would produce lc~s waste?
• Is there a p;1rtieular component that renders the whole waste ha1ardous - could this compo
nent he isolated?
• Docs the waste cont;1in valuahle materials?
Wastes for off-silc disposal need to he stored on-silc prior lo dispatch. Docs stnral-?c of thcse
wash.:s l"ausc additional emission prohlcms? For example. arc solvent wastes stored in d•iscd
tanks? flow long arc waslcs stored on-si!c'! Arc stol·kpilcs of solid waslc secure or arc dust
slorms a rq~ular on:urrcncc'?
24

Phase 2: Material Balance: Process Inputs and Outputs
Steps 7, 8, 9 and 1 O Summary
At the end of Step 10 the waste audit team should have collated all the information re
quired for evaluating a material halance for each unit operation and for a whole process.
All actual and potential wastes should be quantified. Where direct measurement is impos
sihlc. estimates based on stoichiometric information should be m<1de.
The data should be arranged in clear lahles with standardised units. Throughout the Jala
collection phase the auditors should make notes regarding actions, procedures and
operations that could be improved.
Step 11: Assembling Input and Output Information for Unit Operations
One of the hasic laws applied lo chemical engineering is lhal ,>f the material hal:mce which stales
that the total of what goes ir.to a process must equal the total of what comes oul. Prepare a
material halance at a scale appropriate for the level of detail required in your study. For example.
you may require a material balance for each unit operation or one for a whole process may be
sufficient. In this manual the preparalion of a malerial halance for the unit operation scale is
illuslraled.
Preparing a material balance is designed lo gain a helter understanding of lhe inpuls and outputs,
especially waste, of a unit operation such 1ha1 areas where informal ion is inaccurate or lacking
can he identified. Imbalances require further invesligalion. Do not expecl a perfect balance -
your inilial balance should he considered as a rough asscssmcnl lo be relined and improved.
Assemble lhe inpul and oulpul informalion for each unil oper;ilion and lhen decide whelher all
lhe inpuls ;ind 0111p111s need to he included in 1he malerial balance. For example. 1his is nol
essenlial where the cooling waler inpul lo a unil operalion equals lhe cooling w;iler output.
Slandardise unils of mca~urcmenl (Iii res, lonnes or kilogrammes) on a per day. per year or per
halch basis.
Summarise 1hc measured values in slandard unils hy reference lo your process now dia~r;::r:. !:
may h;tve heen necessary lo modify your process now diagram following lhe in-dcplh s111dy of lhe
planl.
25

Phase 2: Material Balance: Process Inputs and Outputs
Step 12: Deriving a Preliminary Material Balance for Unit Operations
'.fow it is possible to complete a preliminary material balance. For each unit operation utilise the
data developed in Steps 1 - 10 and construct your material balance. Disrlay your information
clearly. Figure 3 is one way or presenting the material halance information.
F19ure 3: Preliminary Material Balance for Each Unit Operation
Inputs (amounts in standard units per annum)
Raw Material 1 Raw Material 2 Raw Material 3 Waste Reuse Water Total
Outputs (amounts in standard units per annum)
Product By-product Raw Material Storage and Handling Losses Reused Wastes Wastewater Gaseous Emissions Stored Wastes Hazardous Liquid Waste Transportec •Jff-Site Hazardous Solid Waste Transported Vff-Site Non-Hazardous Liquid Waste Transported Off-Sito Non-Hazardous Solid Waste Transported Off-Site Total
Note that a material balance will ortcn need to he carried ou• in weight units since vr '•1mes arc
nol always conserved. Where volume measurements have lo he converted lo weight units, take
account or the density or the liquid, gas or solid concerned.
Once the material balance for each unit operation haor; been completed for raw material inputs
and waste outputs it might he worthwhile repealing the procedure with respect lo each contami
nant of concern. It is highly desirable lo carry out a water balance for all water inputs and
outputs lo and from unit operations because water imbalanct.:" may indicate serious underlying
process problems such as leaks or spills. The individual material balances may he summed lo give
a balance for the whole process, a productmn area or factory.
Step 13: Evaluating the Material Balance
The individual and sum totals making up the material balan,·c should he reviewed lo determine
information gaps and inacrnracics. tr you do have a significant material imhalancc then further
investigation is needed. For example, if outputs arc less than inputs look for potential losses or
26

I Phase 2: Material Balance: Process Inputs and Outputs
wasle dischargc..c; (such as evaprn lion). Oulpuls may appear lo be grealer lhan inpuls if large
mca.c;urcmcnl or eslimaling errors arc made or some inpuls have hcen overlooked.
Al lhic; slage you should lake lime lo re-examine lhe unil opcrali•lns lo anempt lo identify where
unnoticed los..c;cs may he oct.-urring. ll may he ncccs..c;·,ry lo repeal some dala collection acti,,ilie.c;.
Remember lhal you need lo he thorough and consi<;lenl lo obtain a satisfactory material balance.
The material balance not only reflects lhe adequacy of your dala collection, bur by ils very na1ure.
ensures thal you ha\·e a sound unrlerslanding of 1hc proces.c;cs inmlvcd.
Step 14: Refining the Material Balance
Now you can recon.<iidcr the material balance equa1ion by adding lhose addi1ional fac'..>rs idcnli
ficd in lhc pre\ious slcp. If ncces.<;ary. cslimatcs of unaccountable los.c;cs ""ill have lo he calcu
lated.
Note 1hal, in lhc ca'ic of rclarivcly simple manufat.1uring plants, preparation of a preliminary
malerial balance and ils refinement (Slcps 13 and 14) can usefully he combined. For more
complex waste audits however, two separate steps arc likely lo be more approprialc.
Rememher, rhc inpuls should ideally equal lhc oulpuls hul in practice 1his will rarely he the case
and some judgemenl will he required lo dclerminc whal level of accuracy is acceplahlc.
In lhc case of high-slrcnglh or hai"ardous wastes, accurate mcasurcmenls arc ne..:ded lo design
waslc reduclion oplions.
II is possihle thal lhe malerial balance for a numher of unil operations will need lo be repealed.
Again, conlinue lo review, reline and, where necessary, expand your database. The compilation
of accurate and comprehensive dala i" esscnlia! for a successful waslc audil and subscquenl waslc
reduction action plan. You cannol reduce whal you do not know is there.
Steps 11, 12, 13 and 14 Summary
By lhe end of Slep l·J, you should have assembled informal ion covering process inpuls and
process oulputs. These dala should he org;miscd and prcse111cd dearly in lhc form of
malcrial b:11"nccs for each unil opcralion.
The~c d;,ta form lhc hasis for 1he devclopmenl of an aclion plan for waste minimi!<>alion.
27

PHASE 3: SYNTHESIS
Phases l and 2 have covered planning and undertaking a waste audil, rcsulling in lhe prcparalion
or a malerial balance for each unil opcralion.
Phase 3 reprcscnls lhc inlerprelalion or the malerial balance lo iden1iry process area.c; or compo
nenls or concern.
The malerial balance focuses the allenlion or the audilor. The arrangemenl or lhe inpul and
oulpul dala in lhc form or a material balance facililales your underslanding or how malerialc; flow
lhrough a produdion proces.c;.
To inlerprel a malerial balance ii is neces.c;ary lo have an underslanding or normal opcraling
performance. How can you a.'isess whelher a unit operation is working efficiently ir you do not
know what i.c; normal? A memhcr or your team musl ha"·c a good working knowledge or the
proccs.'i. This knowledge can he supported by texts such as the Rapid A<;.c;cs.<;mcnl or Sources or
Air. Land and Waler Pollulion (WHO, 1982).
To a trained eye the material balance will indicate area'i for concern and help lv priorili.'iC
problem wastes.
You should u.c;c the Material balance lo identiry the major sources ofwa!>!e, to look for dcvialions
from the norm in lerm'i or W3.'i(e production, (O identify areas or unexplained losses and (O pin
point operation.<; which conlribute lo flows thal exceed nalional or site di'iCharge regulation.<;.
Proces.c; efficienq is synon)mous wilh wa.c;le minimisation.
Differen1 waste reduction measures require varying degrees or effort, lime and financial re
sources. They can he categorised ac; two woups.
• Ob\iou.'i waste reduction mea'iures, including improvemenls in management techniques and
house-keeping procedures that can hc implemented cheaply and quickly.
• Lmg-term reduction measures involving process modifications or process suhstilulions to
eliminate problem wastes.
Increased reuse/rr.:cycling lo reduce wa,.te falls hctween the immediate and the more substantial
waste reduction me;ssures.
Sleps 15, )(1 and 17 describe how lo identify waste reduction measures.

Phase 3:Synlhesis
Step 15: Examining ObVious Waste Reduction Measures
II may have hccn possihle h: implemcnl 1.-ery oll\"ious wasie rcjuction measures already, hcforc
emharking on ohtaining a malerial halancc (ref Slcp_J). Now con.o;ider lhe malcrial balan<.-c
informal ion in conjunction wilh vio;ual ohservalions made during lhe whole or lhc dala collection
period in order lo pinpoin1 areao; or opcralions where simple adj1L'ilmenls in proc-cdurc could
greally improve lhC effici1:ncy or lhe proCCS.'i hy reducing Unneccs.c;ary los.'iCS.
Use the information galhered for each unit opcralion to develop heller opcra!ing pract:ccs for all
unils.
Significant wa._.c reduction.' can often Ix· achieved hy improved opcralinn. heller handling and
generally laking more care. The follov.ing lisl of wa.o;lc reduction hinls can he implemented
immedialcly with no or only small enra costs.
Specifying and Ordering Materials
• Do not over-order malerials especially if the raw malcrials or componenls can spoil or arc
<lifficull 10 slore.
• Try lo purchao;c raw malerialo; in a form which io; easy lo handle. for example, pcllels in.o;lcad of
powders.
• II is often more t•fficienl and certainly cheaper lo huy in hulk.
Receiving Materials
• Demand quali1y control from suppliers hy refusing damaged, leaking or unlahcllcd ·or1lainers.
Undertake a ,-isual inspc<.1ion of all malerials coming on lo the si1c.
• Check 1ha1 a sack weighs whal ii should weigh and thal lhc volume •ndered is lhe volume
supplied.
• Check 1ha1 cnmposilion and qualily arc correct.
Material Storage
• lns1all high-level con1rol on hulk lanks lo amid mcrnows.
• Bund lanks In conlain spillage-;.
• t :se tanks 1ha1 Gtn he pilched ;ind deva1ed. with rounded edges for case of draining and
rin.-.ing.
• Dcdicaled lanks, ren:ivi·.g only one lypc of matt:rial. do nol need 10 he wac;hcd oul as oflcn
as lank~ receiving a range of materials.
• Make ~urc lhal drums arc slored in a slahlc arrangement lo avnid damaging drum~ while in
slorage.
• Implement a lank checking procedure · dip lanks rq~ularly and documenl lo avoid discharging
a material inlo lhe wrong lank.
• Evaporalion (o,,cs arc rcdut·ed hy using nwered or dosed lanks.

u.terial and Water Transfer and Handling
• Minimise the number of times material-. arc moved on site.
• Cbcdt transfer lines for spills and leak.-..
• Is flcD'blc pipework too long?
• Catch drainings from transfer h.llSCS.
• Plug leaks and fit flow rcstrictors to reduce excess water con.-.umption.
Process Conlrol
• Feedback on how waste reduction is improving the proccs .. -. motivates the operators - it is \ital
that the employees are informed of why actions arc taken and what it i-. hoped they will
achieve.
• Design a monitoring programme to check the emi<;.-.ion.'i and wa..aes from each unit operation.
• Regular maintenance of all equipment will help to reduce fugitive process losses.
Cleaning Procedures
• Minimise the amount of water used to wash out and rin.-.c vcs...cl-. - on many sites indis
criminate water u...c contrihutc..'i a large amount to wa..acwatcr nows. Ensure that hoses arc
not ldt running by fitting self-scaling valves.
• Investigate how wa4'hing water can he contained and used again before di4'Chargc to drain.
The same applies to solvents u.4'Cd to dean; these can often he used more than once.
Tightening up hou.-.c-kecping procedures can reduce wa'ite considerahly. Simple. quick adjust
ments should he made to your procC..4'.'i to achieve a rapid improvement in proccs.4' efficiency.
Where such obvious reduction mca<;urcs do not however solve the cntirr wa<;tc disposal problem,
more detailed con.4'ideration of Wa'ilc rcducti,m option.'i will needed (Steps 16 - 18).
Step 16: Targetting and Characterizing Problem Wastes
Use the material balance for each unit operation lo pinpoint the problem areas a'i.'iociatcd with
your process.
The material balance exercise may have brought to light the origin of wastes with high treatment
costs or may indicate which Wa'itcs arc causing proces.o; protilcms in which operations. The
matcri::d balance should he used to focus your priorities for long-term waste reduction.
At this slagc, it may he worthwhile considering the un<lcrlyin~ causes as to why wastes arc gener
ated and lhe factor:c; which lead to these; for cxair.pk, poor technology, lack of maintenance and
non-compliance with company procedures.
~)

Additional sampling and charaderoation or your wastes might be necessary involving more in
deplh analysis to ascertain the exact concentrations oi contaminants.
List the wastes in order or priority for reduction actions.
Step 17: Segregation
Segregation per se j_., arguably not properly part or a waste audit's step-by-step sequence. h:ing
but one of numerous measure.<; which can lead to waste reduction adivitics. It is however the
most ccntr31 or such options and is a universal issue which needs to be addressed.
Segregation of wastes can offer enhanced opportunities for recycling and rcu.<;e with resultant
sa\ings in raw material costs. Concentrated simple wa<;tcs arc more likely to be of value than
dilute or complex wa'iles.
Mixing wastes can enhance pollution problems. If a hghly-concentratcd waste is mixed with a
large quantity of weak, relatively uncontaminated effluent the result is a larger volume of waste
requiring treatment. Isolating the concentrated wa<;te from the weaker waste can reduce
treatment costs. The concentrated wa<;le could be recycled/reused or may require physica~
chemical and biological treatment to comply with discharge consent levels whereas the weaker
effluent could be reu.<;ed or may only require settlement before discharge.
Therefore, waste segregation can provide more scope for recycling and reuse while at the same
time reducing treatment costs.
Review your wa<;te collection and slorage faciliries lo determine ir wasle scgregalion is pos.<iible.
Adju<;t your list of priorily wa<;les accordingly.
Step 18: Developing Long-Tann Waste Reduction Options
Waste proOlems thal cannot be solved hy simple procedural adjuslmenls or improvcmenls in
house-keeping practices will require more substantial lc1ng·lerm changes.
It is necc..-..<;ary lo dch.lop pc~o;ihle prevention options for the waste problems.
Proces.<; or production changes which may increase production efficiency and reduce waste
generation include:
• changes in the production process· continuous versus hatch;
• equipmcnl and installation changes;
• changes in process control - automation;
11
.......................................................................................................... ~~~~~~~~~~--~--- -~
Phase 3: Synthesis
• changes in proccs.."i conditions such a."i retention times. tempcratun:s. agitation. pres.-.ure.
catalysts;
• u.c;c of dispcrsants in pla(."C of organic sol\-cnts where appropriate:
• reduction in the GUantity or type of raw material<; u.."iCd in produ(.1ion;
• raw material suhstitutitm through the u."iC of wastes a_<; raw material-. or the u..o;c of diITen:nt
raw material"i that produ(."C less wa."ile or less hvardou.."i wa"ite:
• proccs..<; substitution with cleaner technology.
Waste rcu..'iC can often he implemented if material-. of sufficient purity can he concentrated or
purified. T ..:<.·hnologies such a.-. reverse osmosis, ultra filtration. d..:ctmdial~-sis. distillation. ck1..1w
lysis and ion exchange may cnahle malerial"i 10 he reu..'iCd and reduce: or eliminate the nccd for
wa."ile treatment.
Where wa.-.te treatment is necessary. a \·aricty of technologies should he considered. These
indu&: physical. chemical and hiological treatment pnx·esscs. In some cases the treatment
method can also recover \·aluahlc materials for reuse. Another industry or fa1..1ory may he ahle to
use or treat a waste I hat ynu cannot treat on-site. It may he worth investigating the pos.sihilily of
setting up a waste exchange hureau as a structure for sharing waste lrcalmenl and rcuse facilities.
The Resource Section (Chapter 4) cites sources of lc<.·hnical information relating: II' recow~·
reu..<;e, waste treatment and as.o;1x.;;t1ed technologies.
Consider also lhe pos.-.ihilities for product impnwem..:nts or changes yicldin!o! cleaner. more
environmentally-friendly products, ho1h for existing products and in the dcwlopment of ncw
products.
Steps 15, 16, 17 and 18 Summary
Al the end of Step 18 you should have idenri'ied ail the wasle rcduclion options which
could he implcmenh:d.
Step 19: Environmental and Economic Evaluation of Waste Reduction Options
In order lo <let:ide which oplions shoul<l he developed lo formub1e a wasle redu<:lion ar1ion plan
each option should he cnn<.i<lered in lcrms of cnvin'nmental and ernnnmil' hcnclils.
a) E111•rio11mmtul fa·al11ati1111
It is often laken for granled 1ha1 reduction of a waslc will have environmcn1al hcnclils. This is
generally lrnc; howcvcr, lhcrc arc cxccplions lo lhc rule. For example, rcducin~ one wa~lc
."\2
Phase 3 SynlheSls
m;1y !!i\·c ri-..l· 10 pl I imh.1bnl-c-.. or may produce anolhcr \\"hil·h i' more diflil·L 11 lo lrc;1I.
rc-..uhin!! in ;1 nd cnvirnnmcnlal di~J\·;mla!!L
In m;tny l"aSt: .... 1hc tl\:ndih m;1y fl\: olwious ... uch ;1" lhc n:m1•\·;1I of a lo:til· dcmcnl from an
aq1.1::ous cfnucnl hy .,l.·!!rc!!;11in!! lhc.: pollulcd w;1slc or h~· changin!! lhc.: pnw.:es.' in sul·h ;1 w;1y
1hal lhc.: w;"ll" j, prncnlnl.
In olhc.:r cases lhc l.·nvirnnml.·n1;1l hcndir... may he.: ks.<. lan!!ihk. C"rc;1tin!! a de;mcr. hc;1hhier
wori.:pl;1l"I.." will innl·;1w produdion dlil·icnl.·~ hu1 1hi' may fl\: diftirnh 111 qu;mlify.
• Consider !he dkl"I of e;1l.·h oplion on lhl· \olumc and dq?rt:c of umlaminalion of pron:s. ...
1.1.aslc-...
• Doc\ ;1 1.1.a ... 1c rnlul·tit•n 11plion ha\e no ... -.-media dTn·"'? F11r cx;1mpk. doc' lhc rcdul·lion
t•f a !!;"c11u\ w;"ll" proc.lucc ;1 liquid \\;t,ll .. !
• Docs lhe tiplion l·h;mge lhc.: 111xil·i!y. dcgr;lll;1hili1y or lrc.:;t1;1hili1y of lhc \\;..,le-;'!
• Don lhc oplion u•.e more or k's nnn-rcncw;1hlc re-.011H"C-.·!
• Doc.:\ I he 11pl ion u--c le.:" energy'!
fl J Enmomi<' f:'i·a/11utio11
A o•mp;ir;1li\t: comomic.- an;1ly ... i~ oflhc.: w;"lc rl·duclion oplion ... ;ind lhc cxi ... 1ing -.itualion
... houl<l Ix· umkrlakcn. Whcre tx·ndits or l·h;mgc' Gmnol tx· qu;m1ilicd (cg rnluction in
fu1ure liahilily. worker health and ';1fcl\ c1,...h) some form of q11ali1;1li\·c a,c;l·,.,mcnl ... hould tl\:
made; ii m;1y tx· ncce•;o,;1ry lo nino;ult ;m cxpcrl for ;lll\icc on how lo judge a d1angc.
E(.·onomic cv;1luation' of w;"le rcdul'lion opliono; o;h1111kl m\"oln· ;1 u•mpari,on of 11pcr;1tinl!
co-.1-. lo ill11-.1ralc whcre n"I '"ving' 1.1.t>uld tl\: madc For l·xampk. a w;"lc rcd11l'lion ml.·a,urc
lhal rcd1t'-'C' 1he amounl of r;1w m;1lcri;1l lm.1 lo drain during lhc prncc" re,uli• in rcducnl
raw
makri;1l 01-.h. R;1w malcrial -.11h,1i1111i11n or proceo;, change' may rnlun· lhc amount or '"lid
wa,lc thal ha' lo hc 1ran\(14•rlnl 11ff·,itc. Thcrdorc. lhl· tr;in'Jl4•rl co\h for wa<,il: di-.po-.al
would he rcdun:d.
In many l·;1'c'. it i' ;1ppropri;ill" lo n1mparc 1hc w;"lc lrcalmcnl c.·mh under l·xi ... 1ing 01nd1-
lion' wi1h lho ... l' ;1,.,.K"ia1cd 1.1.i1h lhc wa ... :c rcd1Kli11n oplion.
The si1c of Ire ;11 ml·n1 pl;ml :md I hc I rl·;1I nll·nl p:n~:c,,n rn111i•nl may hl· a lined 'ignilicmlly
h~ lhc implrnwnl;tlinn of wa,ll' rnlurtion oplion ... Thi' 'hould he nm,idnnl in an cronomic.·
nalualion.
( 'alrulalc lhl· ann11.1l op1:r;11ing l'"'" for lhl· ni ... 1inl! pron'" induding wa,lc lrralml·nl and
r'tim;1le h111.1. llll'w 1.1.ould hr ;1ltrrnl wi1h lhr introdm·lion of ;1;;1,I(' rnlurlion option,, T.1h11·

Phase 3 Synthesis
late and n1mpan: the pnx·c"-' and w;istc lrealmcnl 11111:ra1ing l·11sts for llo.•th the existing and
propos..:d future· w;1ste m;m;igcmcnl options. Table I) shows the 1ypi1.:al cost compt1ncnts. In
addition. if there arc any m1>nct;1ry h.:ncfils (cg rcl·yckd or r.-uscd m;itc ri;1ls or \\aslc' ). then
the:..: :;h1iuld h.: suhlraclcd from the h•lal pn>ecss or Wa.'ilc 1r.-;t1mcnl 1.:ost-; as ;1ppropri;itc.
:\,1w that you ha\·c dc·termincd the likely sa\ing-; in term~; of ;mnual pr.ices' ;ind wa:-.tc lrcat
mcnt 1•pcralin!! c11'ils ass,>eiatcd with each opt inn. n1nsidcr the nc1..·c:-.s;1ry inv.:stmcnl r.:4uin.:d
lo impkmcnl 1.·;Kh 11plion.
ln\"1.:slmc·n1 l·an h.: asscssc·d by lookin!! al th..: p;1yhack period for ..:ach 11pti11n. Pa~hacl pcri1•J
is the time taken for a project In r.:oi\·cr its finanl·ial out by. A m11rc del;1ikd im·..:stmcnl
analysis may imuh·c an as-;.:ssmcnl oflhl· inlcrnal r;1lc ofrclurn (IRR) and n..:1 pn:senl \aluc
( l'iPV) of the imcstmcnt hao;..:d on disn1un1cd c·ash llow<;.
Analysis of in\"estmcnl risk allows y11u lo r;mk options.
Consider th..: cmironmc·ntal ticnclil" and the s;1\·ings in pro<:css and w;1slc tn.:atmcnl opt·rating
co,ts al11ng with the payh.ick period for ;in in\·..:-.tmcnt. tn decide \\hich options an: \iabk.
Table 9: Annual Process and Waste Treatment Operating Costs
Process Operating Costs
Raw Material 1 Raw Material 2 W?.ter Energy Labour Maintenance Administration Other
Total
Waste Treatment Operating Costs
Raw Material eg Lime Raw Material eg Flocculant Water Energy Trade Effluent Discharge Costs Transportation Off-Site D;spo~al Labour Maintenance Administration Oti1er. eg vi":'tion. fires
Total
Annual Cost
Annual Cost

Phase 3: Synthesis
Step 19 Summary
Al !he end of Slep 1'1 you should he ahle lo lisl lho!>e waslc r<.;ouclion oplions Iha! arc
en\lironmcntal!y and economically \liaMc.
Step ~O: Developing and Implementing An Action Plan: Reducing Wastes and Increasing Production Efficiency
Consider 1he immcdialc reduclion measures idenlificd in Step 15 along wi1h lhe long-term waste
reduction measures that have hcen evaluated in Slcps I~ and 19. These measures should form the
hasis of the waste reduction ac.:lion plan. Discuss your fin:Jing.s with members of slaff and develop
a workable action plan.
Prepare the ground for the waste reduction ac.:lion plan. Its implementation should he preceded
hy ar. explanation of the clhos hchind undertaking a waste audit: Waslc Prevention Makes Sense.
It is necessary lo convince 1hose who must work to new procedures thal 1he change in philosophy
from cn~-of-pipc treatment lo waste preven1ion makes sense and serves to improve efficiency.
Use posters around 1he silc lo emphasise the importance of waste reduction to minimise produc-
1ion and w;1slc trcatment!disposal costs and, where appropriate. for improving the health and
safety of company personnel.
Scl out the inlcnded action plan within an approprialc scheduk·. Remember it may take time for
the s1aff to feel comfortable with a new way of thinking. Therefore, ii is a good idea to imple
ment waste reduction measun:s slowly bu1 consic;tently to allow cverynne time to adapt to these
changes.
Set up a monitoring programme lo run alongside the wasle reduction .1C1ion plan so that actual
improvements in process efficiency can he measured. R··lay these results back to the workrorl"e
as evidence of the bel!dits of waste reduction. Adopt an internal record-keeping system for
maintaining and managing data lo support material balance~ and wa-.tc reduction assc~smenls.
It is likely that you will have highlighted signilicanl information gaps or inconsistencies during the
waste audit invcstigalions. You should concentrate on 1hese gaps and explore ways of dcvdoping
the additional data. Is outside help required?
A good way of providing waslc rcdurtion inn:ntivcs is lo set up an internal waste charging .. yslcm,
I hose pron:.sscs thal ncate waste-; in great volume or lhal arc diffirnlt and expensive lo handle
having lo ('ontrihulc lo the lreatmcnl co~I~ on ;1 prcporlional hasis. Anothcr mclhod of mo1ivat-

Phase 3: Synthesis
ing staff is to offer financial rcw;ird for indi\idual wa<.h:-saving effort<.. drawing on the saving-.
gaim:d from implement in!! waste rcdm:tion measuJ"es.
Waste auditing shuuld he :1 rc!?ular event - all empt to develop a specific wa.,le audit appn •a<.·h for
your 1lWn situation. keeping ahn:;L'\~ or le1:hnologic;1l advann:s th;1t could kad Ill Waste rcdu1.·tinn
and the development of 'cleaner· produch. Train process employees to um.!crt.1kc m.iicrial
halancc cxaciscs.
Training JX:npk who W1lrk on the :-irn<:ess to undertake a waste audit will help to r;ti'>c aw;1rcncss
in the workf1•r<x. Without the support of the op..-rators wa,te n:ducliPn actions will he inclTcctual
- lhl .;e arc the people who can rc,1lly make a diffcn:nee to pnx:css JX:rformancc.
Step 20 Summary
Prepare the ground for the wa-.le reduction ;Kt ion pl;m. ensuring that support for the ;rndit.
and implcmcntalion of the results. is g;iined from seninr man;1gcmen1. Implement the plan
slowly to allow thc workforce to adjust.
Monitor process efficiency.
Relay re.'\uhs hack to the workfor<.·e to show them the direct hcnclits.
Train personnel lo undcrtake your own waste audit for waste redm:tion.
·'''

CHAPTER3 CASE STUDIES
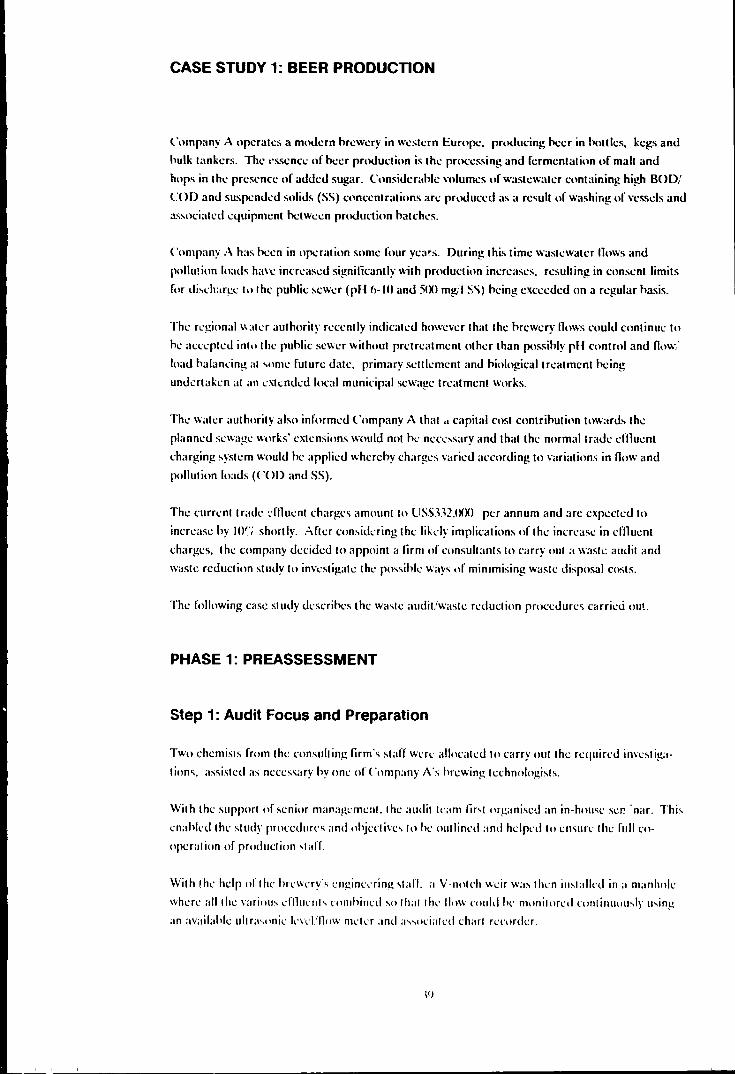
CASE STUDY 1: BEER PRODUCTION
( 'omp;my A operates a modern hn.:wery in western Europe. producing hcer in hottlcs, kegs and
hulk tankers. The essencc of hcer production is the pro<.·essing and fermentation of malt and
hops in the presence of added sugar. Considerahk: \·olumes of wastewater <.·ontaining high BOD/
( '( >D and suspended solids (SS) concentrations an.: produced as a result of washing of ws.c;cls and
associated equipment hctwi.:en production hatches.
Company:\ has hcen in operation some four years. During this time wastewater llows and
pollu!ion loads ha\·e inneased significantly with production increases. resulting in consent limits
for disdt:in.:c In the puhlic sewer (pH 6-10 and 500 mg/I S"i) heing exceeded on a rq!ular hasis.
The rc!!ional \\;111.:r authority recrntly indicated howe 1.-er that the hrewery llows niuld continue to
he a1.:cepll.:u intn the puhlic sewer without pretreatment other than possihly pH l'ontrol and flow/
load halancing al "ome future date. primary selllo..:ment and hiological treatment heing
undcrtak<:n al an cxtcndcd local municipal sewag<: trcatmcnt works.
Thc water authority also informed ( 'ompany ,.\that .. capital cost contrihution towards the
planned scwa!!e works' ext<:nsions would not hc n1:n-ss;1ry and that th<: normal tradc dllm.:nt
charging !'.yst<:m would he appli<:d whcrchy charg<:s varied a<.-cording to variations in flow and
pollution loads (C'OD and SS).
Th<: currcnl trade ::flluenl charges amount to USS:H2,000 per annum and arc expected to
increase by 10r; shortly. Aflcr con-.idL·ring the likdy implications nfthc increase in efllm:nt
charges, the company <kcidcd to appoint a lirm of consultants to carry out a waste audit and
waste reduction study to inwstigatc th<: possihk ways of minimising waste disposal costs.
The following case study dL·scrihes the wa.;te audit/waste reduction procedures carrie<.i nu!.
PHASE1:PREASSESSMENT
Step 1: Audit Focus and Preparation
Two chemists from the con'iulting lirm's staff wrn.: allocated to carry out the requin·d invcstig;1-
tions, assisted as necessary by onr of ( 'ompany A's hn.:wing technologists.
With the support of senior managL·mcnt. l he audit 1l';1m lir'1 organised an in-house scr. · nar. This
enabled thl' study procedures and ohjrl'li\'l'\ to hl' outlim·d and hclpl·d to enstirl· thl' full co
opcral ion of product ion '1 ;tff.
With !hL· help of the hrcwcry\ rnginening \la ff. a V-notrh wt:ir Wa\ lhL·n in\lalkd in a manhok
whcr<: all the \'arinu' dll11,·11h ('omhinrd .\o lhal lhl· llow rould he monitorrd ronlinuou\ly thing
an available ultra-..onic lr\'d/llow nwkr ;ind a'>~ori;11rd char! flTorder.

Case Study 1: Beer Production
Sim:c an automatic -;ampkr was nnl readily availaMc, it w;1s decidcd that composite sampk·s
would hc taken daily hy comhining manually-taken samples in proportion lt) now. It was also
estahlished that the hrewery's lahoratory w;1s well-equipped to carry out the rel1uired wastewater
analyses.
In \icw of the Sl·alc of the hrewery operations and the time and hudgct constraints imposed on the
projcl·t, it was dclidcd that the study should concentrate on:
• water usage aspects (rather than attempt to nhtain a wmpkte materials h;1lanl·c):
• im·cstigale ml·thods of reducing COD and SS loads discharging to drain.
In order lo put the brewery operations in perspective from a waste management \·icwpoint, a
preliminary check on wastewater and pollution loads discharged per cuhic metre ofhcer pro
duced was carried out hased on past records of water usa~e and pn"1ul1 data together with some:
limited information on comhincd wastcwatcr stren!!lh.
It was concluded that. in general. the brewery operated with a very low degn:e of water wastage
with most of the useful by-products nr wastes already hcing recycled nr rccovercd for off-site
disposal. These asP':cts had hcen considered al an e;1rly stage in the design of the hrewery and
had clearly paid dividr;.~I~ in reducing wa.~te volumes and pollution loads discharged. Neverthe
kss, it was considercd that 1he1.: was still scope for further waste saving measures to he imple
mented.
The success of the measures already practised can he illustrated as follows:
Table 1: Waste Contributions from Beer Production
Wastewater Flow (m3/m3 beer) BOD Load (kg/m3 beer)
Company A
2 4.1
('1) Based on the consulting firm·s project experience elsewhere (b) Based on data published by WHO. 1982
Typical Btewery
(a)
7 4.5
Old Btewery
(b)
75
Another factor in favour of Company A is th<tl most of the beer is tr;msportcd from the hrewcry
in road tankers rather than hottlcs or kq!s, both of whkh give rise lo more waste heing pnKluced.
This simplifo.:s the hrcw.:ry operations and makes for more efficient and e<..onomical operation
in term~ of wati.:r ron~umption.
40
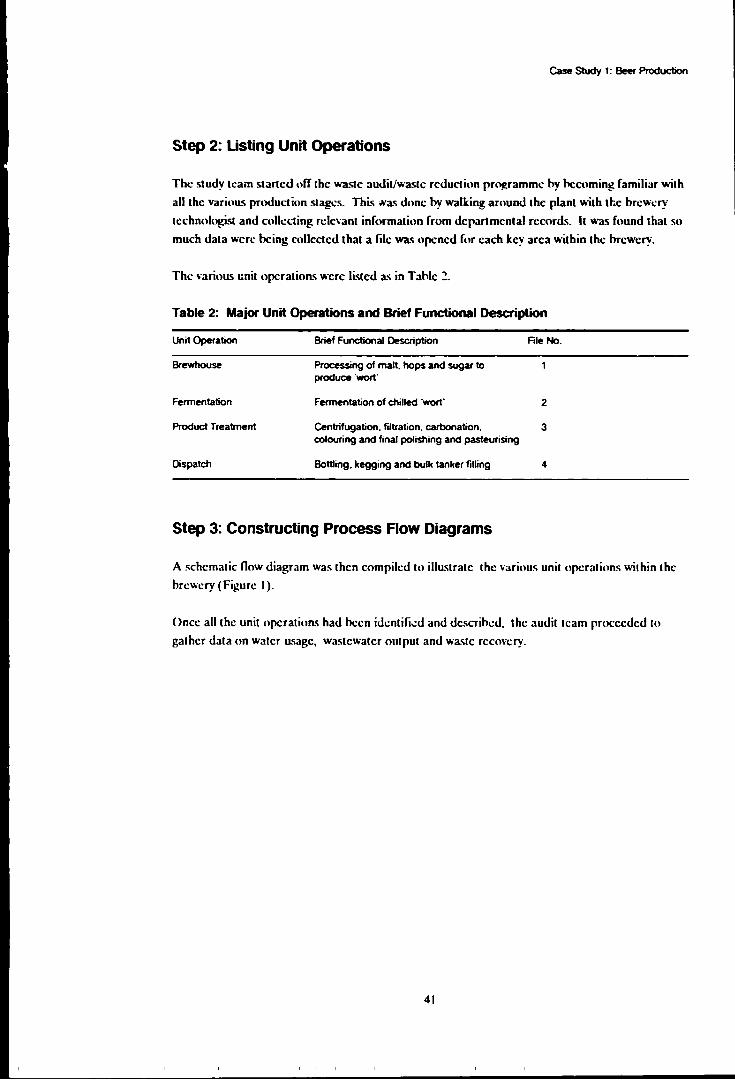
Case Study 1: Beer Production
Step 2: listing Unit Operations
The study learn started off the waste audil/wa.~e reduction pro~ramme by hccoming familiar with
all the variou."i production stages. This Na.<; done by walking around the planl \\lilh the brewery
technologi"it and collc<..1ing rcle\·anl information from departmental record<;. h wa.<; found that so
much data were being collected 1ha1 a file was opened for each key area \\lilhin the brewery.
The \·arious cnit operations were listed a.o; in Tahlc :!.
Table 2: Major Unit Operations and Brief Functional Description
Unit Operation Brief Functional Description File No.
Brewhouse Processing of malt. hops and sugar to produce "wort"
Fermentation Fermentation of chilled 'wort' 2
Product Treatment Centrifugation. filtration. carbonation. 3 colouring and final polishing and pasteurising
Dispatch Bottling. kegging and bulk tanker filling 4
Step 3: Constructing Process Row Diagrams
A schematic now diagram was then compiled lo illuslrale the various unit operations within the
brewery (Figure I).
Once all the unit operations had been idcnlifi..:d and describl!d, the audit team proceeded to
gather data on water usage, wastewater oulpul and waste recovery.
41

M4lT W.SHTUN l.AUTERTUN SPF.NT GRAIN i STORAGE ANO KETT\.E
c HOPS PRE·RUN VESSEL
OAAINANO i STORAGE WASH .... LIOUOA TO . .
"' SUGAR l--tl HOlDING J-+f OISSOt.\llNG WORT KETTLE .... r-+l-'UTERTUN
I STORAGE TANKS _VESSELS ~
MAINS ~YCOl 1-+1 WHIRLPOOL ~ SEPARATOR I-+ OO:i:ecrlNci WATER CHILLER VESSEL
WORT CHILLERS ........ 7, "''"" I "1Mi ii j WATER CENTM
JAUGINO VESSELS "" TO FV1 ......... '" 1 • O\lf.RFLOW OAAINFAOM ! CIPWABH TO DRAIN COOt.f.RI YEAST
CIPWASH YEAST
RECO\IE RED 11£ER FERMENTING VESSELS TO STOf\MIE TANKS ;
3 STORAGE TANKS t-+f CIP WASHI I WASH I
~ CENTRIFUGES ~ CHILLER
f AOOITl\IES
TREATMENT TANKS m AOOITl\IES J ~ KIESELGUHR FIL TEAS N
AOOITl\IES
~ SHEET FILTERS
ll.IPORTED BEER
I ~ FILLING ~EADS I PASTEURISER
PASTE!SER EXTERNAL RACKING HEADS WASHING I WASH 14 BOTTLE WASHER WASHER
~ HEADS
T i ~ RETURNED KEG BEER RETURNED BOTTLES KEGS R

PHASE 2: MATERIAL BALANCE: PROCESS INPUTS AND OUTPUTS
Step 4: Determining Inputs
The audit team first prol."Cedcd to gather data lln material inputs, cont:"cnlrating on water u.~e.
hoth for the 1-trc,.,.cry process a.-; a whole and for indi"idual unit operations. These al.1i\ilics arc
dcscrihcd furth.:r in Step 5.
Step 5: Recording Water Usage
The hllal waler consumption from water meter readings for the pre"ious three month period was
found lo he 24? 5<Xl m3, equivalent lo an average 2,750 m3/d.
Thi-; included a small domestic water allowance. evaporation make-up and water entering the
hcer produl.1S a.-; well as general washdown waler for equipment for deaning operations.
The audit team 1ticn proceeded t•> examine how water u.-;agc was split between the various unit
operations.
Step 6: Measuring Current Levels of Waste Reuse/Recycling
No allempl lo quantify the extenl of current waste reuse/recycling was made during lhe waste
audit programme since it was fell 1ha1 this would have involved a considerable time inpul dispro
portionate lo lhe likely hcndils obtained.
However. ii was noted that reuse of caustic and slerilanl rinses following discharge lo drain of
initial water rinses generally formed an integral part of the automatic cleaning-in-place (CIP)
system employed for equipment washing.
Step 7: Quantifying Process Outputs
The principal procc~s oulpuls of concern were the wastewater discharges arising from production
operations and also the hccr product~ lhcmsclves.
II was also noled Iha! minor domestic sewage con1rihu1ions discharged lo the same drainage
network as the brewery process was1cwalcrs.
The audit lcam I hen proceeded lo quantify these oulpuls.
41

Case Study 1: Beer Production
Step 8: Accounting for Wastewater
The hllal ..vaslcwalcr flow recorded during a two-week monitoring period averaged 1.730 m3/d. II
was noted. however. from lhe flow pauerns during each day lhal was1ewalcr discharges were
extremely variahk \\ilh a peak flow rale of up lo HX> m3/h occurring when a hol waler lank
overflow was discharged. On lhc ha.'iis of this and a numhcr of olhcr assumptions, lhc audit lcam
cslimaled lhal the maximum flow on any one day could reach 2.00) m3!d.
The corresponding comhincd waslcwater pollu1ion load'i averaged 5,'>80 kg COD/d and 1..500 kg
SS/d. These figures equaled lo wasle quanlilics per cuhic metre of hccr produced of 2..1 m3• 7.1
kg COD and 1.8 kg SS. Assuming an average COD:BOD ra:io of 1.7. lhe corresponding BOD
waslc load Wa.'i 4.2 L:g!m3 hccr produced. These unil Wa'ilewater now and BOD load contrihu
lions prm·cd lo he similar to lhe approximate estimalcs calculated in S1ep 1.
An estimate of domeslic waler u...age and hence domeslic sewage discharges lo the trade effiuent
drainage c;ystem were also made. together °"'ilh an assessment of the quantity of water entering
lhc hcer products. Calculations indicated that these additional outputs averaged a hltal of 850
m3/d. of which only 10 m3/d ( 140 employees at 711 litres per head per day) rclaled lo domestic
sewage.
Studies were then carried out to develop a hreakdown of the main process outputs (wastcwalcr
and product) for each key unit operation. This involved sampling and flow mcac;uremenl of
individual discharges around the hrewery. Since the mlume and composition of some of these
discharges varied considerahly with the type of hccr produced, the survey was undertaken over
several weeks to allow a realistic assessment of the silu;.tion lo he made.
Step 9: Accounting for Gaseous Emissions
Gaseous emissions were nol of particular concern in the conlext of the terms of n.:fcrence drawn
up hy Company A for the study. However, it was noted that 1he hrewery hoilers were gas-fired
and that hoilcr flue-gas emissions were discharged via a tall slack such that they were not likely
lo give rise to any concern.
It was noted thal if conlrol of alkaline wastewater discharges associdled with use of caustic soda
in the CIP systems proved to he necessary in the fu1ure (a po~sihility if alkaline waste di~chargcs
could not he conlrolled at source), then use of acidic flue-gas (a source <'f carhon dioxide) could
he considered for this purpose.
The audit team also observed that pockets of carhon dioxide in the fermentation areas could
cause prohlcms of drowsine.o;s amongst the hrewing staff and that improved ventilation would help
lo ensure I heir grneral health and safety.

Case Study t: Bffr Production
Step 1 O: Accounting for Off-Site Wastes
At the time or the survey. wastes produced for transptlrtation and disp<'l!>al off-site were limited
to •pent !!fain and hops generated in the hn:whousc a.<o hy-products. These were disp<lSCd or oIT
site hy a local r?rmer, for callle food and as a soil conditioner respel.1i\·cly. al no cost lo the
hrewery. Total quantities were estimated al some 25.IXlll tonnes (wet weight) per annum.
Step 11: Assembling Input and Output Information for Unit Operations
As previously indicated, the prime interest in this waste audit and reduction programme wa.o; to
concentrate on the potential for reducing wa:;tewater and associated pollution load-;.
Hence, for the purp<lscs or the proje<.1 in question, the material halance was confined to consid
eration or Waler i!\.'>Ue'.'. only.
Step 12: DeriVing a Preliminary Material Balance for Unit Operations
It was decided to conduct a preliminary material halance for the hn.:wery as a whole, hascd on
water usage, before cmharking on the more complicated step or ohtaining a balance for each key
unit operation. This was then constructed as sci out in below.
Inputs m3/d
Water 2,750 .. Overall Brewery Operations
..Ir Outputs m3/d
Domestic Sewage 10
Product 840
Wastewater 1,730
Total 2.580
4.'i

Case Study 1: Beer Production
Step 13: Evaluating the Material Balance
The material balance with respect t<' overall water usage showed a remarkably good agreement.
the a\"Crage daily wa~er input amounting lo 6.6% abm-c the daily waler output a.'>.o;cssed.
Although raw materials in the form of malt, hops, sugar, additi\·cs and other process chemicals -
and also wastes disposed of off-site - had not hcen included in the halance. ii wa.-; noted that
these item-; arc relatively small in the case of breweries where water is the dominant raw material
used.
Step 14: Refining the Material Balance
On studying the data collated, it wa-; observed thal no allowance for evaporation had hcen
included in the material balance and that, from the consultant's previous experience of hrcwery
operations, evaporation alone could accounl for up to 5r.;, of total water usage. This allowanc.:
therefore effeL1ivcly dosed the small difference between water input and output indicated in
Step 13.
The waste audit team then proceeded In huild up material halanceo; for all I he major unit opera
tions within the brewery. When this work had hccn complcled, they felt that they had gained
considerable knowledge ahoul lhe various production activities, !heir inpllls, ou1pu1s. wastes
and operational problems.

PHASE 3: SYNTHESIS
Step 15: Examining ObvioLis Waste Reduction Measures
The audil learn coasidercd that the cost of wa.<.tcw3ter disposal al lhe hre"'rcry could he minimised
in two ways:
• reduclion in volume, Boo• and/or SS load of the waslewalcr produced in lhe brewery;
• •.:lluclion in 1he Boo• and/or SS load of 1he waslewaler discharged lo sewer hy prelrealmenl.
(*or ralher COD. as used in the water au1hori1y's charging formula)
In 1hc lighl of a comprehensive cxaminalion of lhe waste producing areas, ii was pos.<.ihle lo study
hoth these alternatives_ To as.<.ist the investigations inlo waste sa\ing pos.o;ibilities, reference was
made 10 availahle information (including database) sources, as well as lhe consuhanl's own
e:•pcrience of underlaking similar projccls.
The various seclions of lhe hrewhouse were sludied in turn as follows_
a) Brcwlwuse
The two principal discharges in the hrewhouse were lhe drain from lhe Laulertuns and a 75°C
hol water lank overflow_ Togelher lhesc con1ribu1ed 12% of the tolal wastewaler flow from
1he hrewery_
Study of the flow and analytical dala oh1ained indica1cd that lhc Llulertun drain contrihuled
J.5''.';, of 1he flow. 23'.-~ of lhe COD and 4"; of the SS load. Discussions with the company
indicaled that it should he possible to store this waste flow for use as make-up water for 1he
subsequent hrew and that this should he possible without de1riment lo brewing standards_ A
15 m\aainlcss-stecl storage tank with associated pumps. valves and pipework would need to
he installed with the advantage that the system would:
• reduce raw water costs;
• climinale effluent charges previously incurred hy I his discharge;
•
•
reduce energy requirements since the liquor returned as make-up water would not need
healing;
climinale exisling shock load discharges from 1his source which should remove any need
for now/load balancing of lhe tolal sile waslewalt'.r now_
The hol waler lank overflow accounled for nearly 1)';1,, o'. lhe lolal was1ewa1er flow. Since I his
waler was dean and hol, conlinual reuse was lhe olwious possihili1y. Unforlunalcly lhis
proved lo he impossihlc owing lo lhe spasmolic prmlm:lion of 1his waler.
47

Case Study t: Beer Production
pro\"ed to he impossihle t•Wing to the spasmotic production of this water.
As the 75''C tank was very large howe\·er. it was considered that its inherent halaneing capac
ity· could he utilised if the suppl) for reuse wa.c; taken part way down ~he lank ralner than from
the overn,.w when ii occurred.
Reuse of this water would he prcferahle in a proces.s that consumed hot water al approxi
mately the same rate as the 75"C ht•I v.-alcr produ<."tion. 1h;1I is 150 mJ·d. The only prnces.o; in
the hrewery which utilised this quantity of hot water was the pasteuri.c;ing machine which had a
waler consumption of some 170 m3 d. Howe\·er. all of this now was not hot watc.:r sinn; a
temperature gradient had to he maintained within the pasteuriser lo ensure lhal hollies were
not warmed up or cooled l!own loo rapidly.
It wa.c; considered that the 7Y'C hot waler should he injc<:ted dirc<:tly ~!!h• the pasteuriser lo
replace the healin!? of cold water lo (i()''C In addition. the hol water could he hlended with
the supply of cold water lhal already existed lo gi\"e the required temperature profile
thoughoul the pasteuriser. II was estimated that such a system would cnahle al least 75 m1 of
the exccs.c; hot-waler lo he reused each day.
b) Fcnnentation Cellar
The majority of waste produced in this ar.:a of the hrcwi:ry originated from the ("IP systems.
the discharges from which contained a high COD load du..: principally 10 the high yeast
conlenl. Wi!h the exception of the initial rinse from prc-fcrmenlalion stage gauging \-..:ssds.
the initial rinses from other tanks - fermentation tanks. storage \'esscls and yeasl rern\'ery
\'esscls - all exceeded <•.11110 mg/I ('OD and together acnmnled for over 90';-; of the COD load
produced in the f..:rmcnlalion cellar.
Proposah for reducing/lrealing these &;charges were developed as follows.
Gauging Vessels
Possihili1ies for reducing the pollution load from this source of CIP effluent were limited as no
yeasl was present which could he filtered oul. However, reuse of the rclati••cly-clean final
rinse as the inilial rim;..: for the next CIP wash would reduce the efnuent now to drain hy a
lot;il of 26 m.l/d from 8 vessels.
It was also noted 1hat the caustic wash from the hrcwhouse which m:curred usually e\'ery week
was discharged to drain from these gauging vessels every weekend and 1ha1 this, logcrher with
the acid wash from Wort Ket1lc No.2 <li;l:harge<l via ;i fermenlation (halancing) tank, had a
major cffel·t on the combined wastewater pH giving valu1.:s frcqucn1ly outside lhe allowahlc
pH range for discharge lo the public sewer of <1- IO.
Tests showed I hat if the acid and causlic discharges were run lo drain togelher, lhe nculralis
ing cffecl of the acid on lhc c.rnslic was ncglihle owing to the different volumes. ~lrcngth~ and

Case Study 1: Beer Production
neutralise the predominant caustic load. it was envisaged that do.sing up the system by
providing additional holding tank capacity would be suitable. This could be achieved using a
similar arrangement to the existing closed CIP units in order to standardise on equipment; it
wo&1ld reduce effluent flows to drain. raw water costs and also chemical-cleaning costs.
Fttmentation Tanks
The load produced by the initial rinse was found to be 210 kg COD/d and 150 kg SS/d which
could be reduced by al lea.st 75% by pa'i.Sing the rinse through a yeast press. It wa-; considered
that the final CIP 1.:lSe could also be reused as the initial rinse, reducing effluent flow by 25
m3/d from 8 tanks.
As referred to above, acid washes from the brcwhouse were being discharged from the
fermentation tanks; on occasions, these depressed the pH to 2.4. Containment and
recirculation via a new CIP unit was considered to be the most suitable and practicable
control measure.
Storage Tanks
The initial rinse in the CIP sequence was foun<l to contain 75 kg COD/d and 10 kg SS/d. It
was estimated that pas.-;ing these rinses through a yeast press would reduce overall loads from
this source to 22 kg COD/d and 3 kg SS/d. Also, reuse of the final rinse as the initial rinse of
the next sequence would reduce effiuent flows hy 5 m3/d.
Yeast Recovery Plant
Discharges from centrifuge cleaning were difficult to arrange at the time of the waste audit
and reduction investigations. However, from visual observations the initial rinse clearly
contained a significant quantity of yeast and so it was recommended that such wastes should
alrn be passed to a yeast filter pres.c;. Similarly, recovery of the final rinse and reuse as a
suhsequent initial rinse was proposed. It was also suggested that the initial rinses from yeast
storage vessels should be filtered through a yeast pres.c;.
Company A had aln:ady purchased a new yeast pres.c; to filter yeast liquors which at the time
were stored until press capacity became availahlc. This proposal was expected to reduce
storage requirements, allowing a small amount of hcer recovery (pres.c; filtrate) and elimina
tion of the frequent storage tank merflow.
Therefore, instead of treating each of the fcrmenlation cellar discharges separa1cly which
would he uneconomic, the audit team considered that the proposed filter-press installalion
for lhe yeasl recovery area should he arranged lo filter lhe initial rinses from fermentation
tanks, stnr.tge vessels and ycasl recovery equipment. This would not only prevent lhr majority
of yeast from flowing lo drain hut would cnahle its recovery for resale lo a food manufaclurer.
41)

~se Study 1: Beer Production
In addition, any other liquor containing yeast that had to be dumped to drain, such as the
initial drop from the stor3gc tanks when the yeast storage vcs..\ds were full. could he filtered
and the yeast and beer reco\"ered. The expected increase in flow to the proposed filter pres.c;
was estimated al .50 m3/d containing 100 kg SS!d, well within tht unit's design capacity.
c) Treatment Cellar
A number of waste sa"ing options were recommended for this area. Tile principal measures
proposed related to the bottling and kegging areas. The possibilities of utilising the 75°C hot
water tank tl"'~~~'lw for the pasteuriser supply ha,·c already hcen highlighted in the hrewhouse
section abo\"C. The ~·udit team felt that the water flowing out of the pasteuriser could h:.: used
as an initial rin'\C in the bottle washer.
The existing hottlc washer system used 9 m\h fresh deionised water. It was proposed that the
final sparge pipes should continue to be supplied with deionised water hut that the pasteuriser
water be used lo supply the remainder and also for continual replenishment of the water in the
final rinse tank. Mains water would be pro\"ided as a standby supply in the event for any
reason that thl.! pasteuriser water ceased.
In the kegging area, dumping of returned Ocer to drain was tx:curring periodically giving a
very significant rise in BOD and ('OD load during the dmnping periods. It was indicated lo
the company that separate disposal. possibility directly to land. should he seriously considered
as often adopted hy other breweries. It was noted. however, that this would require the
pcrmis.c;ion of Customs and Excise officials and be suhjccl to the hcer bcing destroyed in an
approved manner such as hy dyeing.
Step 16: Targetting and Characterizing Problem Wastes
Following comr-lction of Step 15, the audit team realised that significant reductions in wastewater
flows and pollution loads could he achie\"ed hy carrying out all the improvement measures hil;!h
lighied, all of which were relatively straightforward lo implement.
It was decided it would he usdul lo obtain an ,1\"erall picture of the Witsle Sit""ings which <:ould he
achieved. Thus, a summary of the existing and proposed reduced waste contrihutions for the unit
operations highlighted in Step 15 was drawn up as presentt:d in Tahlc 1. At thi-. stage, no allow
ance was made for the t"it:ndits of avoidin~ returned heer heing discharged to drain since this was
dependent on ft;tun: discus-.ions wi, h CuslOms and Exci~e pf.:rsonnel.

Case Study 1: Beer Production
Table 3: Summary of Existing and Proposed Reduced Waste Contributions
Unit Waste Existing Recommendation Predicted Operation Description Composition Composition
ml kg kg ml kg kg coo SS coo SS
Lautertun Final run to 60 1392 60 Reuse 0 0 0 Drain
75"C Hot Water Oterflow 150 ~ reuse as make-up Tank for pasteuriser 75 0 0
Brewhouse Caustic and 36 152 16 lnstallatio..-i of CIP 1m:t 0 0 0 Vessels acidic wash at
weekends
Gauging CIPwash 26 Reuse rinsewater 0 0 0 Vessels
Fermenting CIPwash 65 248 188 Reuse and yeast 40 62 44 Vessels separation
Storage Tanks CIPwash 17 89 13 Reuse of rinsewaters and 12 22 3 pressing of initial rinse
Yeast Storage CIPwash 2 17 Yeast recovery 2 4 0.2 and recovery
Pasteuriser Process water 100 Reuse in bottlewasher 0 0 0
Total 456 1898 278 129 88 47.2
For flow. COD and SS load savings of 327 m3/d, 1,810 kg COD/d and 230 kg SS/d (ref. Table 3),
the predict~d reductions on the total wastewater discharges assessed: .• Step 8 were approxi-
mately I .. , 30% and 15~ respectively.
Step 17: Segregation
In formulating a series of recommendations for waste reuse and recovery which could he imple
mented relatively quickly (ref. Step 16), the waste audit team had recognised at an early stage
that waste segregation would form an integral part of the waste reduction strategy.
The proposals were discus.'ied \\'ilh the management v.ho, in principle, were in agreement that
the various measures put forward were sensible and practicahlc, subject lo the audit team being
able to demonstrate that the likely long-term cost "avings to he achieved would he appreciable.
51
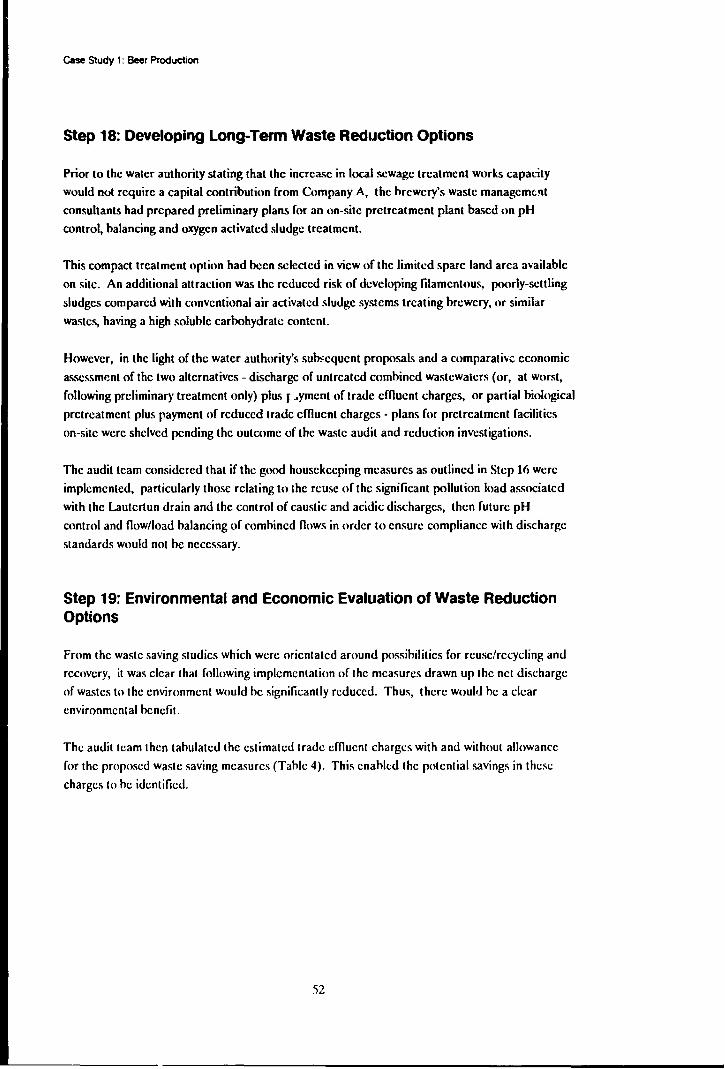
Case Study 1: Beer Production
Step 18: Developing Long-Term Waste Reduction Options
Prior to the water authority slating that the increase in local sewage treatment works capacity
would not require a capital contribution from Company A, the hrewery's waste managemc!lt
consultants had prepared preliminary plans for an on-site pretreatment plant based on pH
control, balancing and oxygen activated sludge treatment.
This compact treatment option had been selected in view of the limited spare land area available
on site. An additional attraction was the reduced risk of developing filamentous, poorly-settling
sludges compared with conventional air activated sludge systems treating brewery, or similar
wastes, having a high soluble carbohydrate content.
However, in the light of the water authority's su~equenl proposals and a comparafo;.: economic
asses.c;mf!nl of the two alternatives - discharge of untreated combined wastewaters (or, al worst,
following preliminary treatment only) plus r ... yment of trade effluent charges, or partial biological
pretreatment plus payment of reduced trade effluent charges - plans for pretreatment facilities
on-site were shelved pending the outcome of the waste audit and reduction investigations.
The audit learn considered that if the good housekeeping measures as outlined in Step 16 were
implemented, particularly those relating to the reuse of the significant pollution load as.c;ociated
with the Laulerlun drain and the control of caustic and acidic discharges, then future pH
control and flow/load balancing of combined flows in order to ensure compliance with dischaq~e
standards would not he necessary.
Step 19: Environmental and Economic Evaluation of Waste Reduction Options
From the waste saving studies which were orientated around possibilities for reuse/recycling and
recovery, it was clear that following implcmcnlalion of the measures drawn up the ncl discharge
of wastes lo the environment would he significantly reduced. Thus, there would he a clear
environmental benefit.
The audit learn then lahulalcd the estimated trade effluent charges with and without allowance
for the proposed waste saving measures (Table 4). This enabled the potential savings in these
charges lo he identified.
52

Case Study 1: Beer Production
Table 4: Estimated Trade Emuent Charges
Unit Waste Estimated Estimated Estimated Operation Description Current Reduced Savings in
Charges Charges Charges US$/annum US$/ annum US$/ annum
Lautertun Final run to 58.000 0 58,000 drain
75° Hot Water Tank Overflow 7,000 3,500 3.500
Brewhouse Vessels Caustic and 7,800 0 7,800 Acidic Wash at Weekends
Gauging Vessels CIPWash 1,200 0 1,200
Fermenting Vessels CIPWash 25,000 7,000 18,000
Storage Tanks CIPWash 5.000 1,500 3.500
Yeast Storage and CIPWash 800 200 600 Recovery
Pausteriser Process Water 4,300 0 4,300
Total 109,100 12,200 96,900
The trade efnuent charges listed in Table 4 were then compared wilh the expected total trade
efnuenl charge for the existing combined wastewalers, eslimaled al USS365,000 per annum for
lhe forlhcoming year. This indicated a 26% reduction resulling from implcmenlation of the now/
load reduction proposals.
Based on lhe data set out for Step 16, lhe reduced average nows and loads would he some 1,4(X)
m3/d, 4,170 kg COD/d and 1,270 kg SS/d. This corresponded 10 reduced average waste quanti
ties per cubic melre of beer produced of 1.7 m3, 5.0 kg COD and 1.5 kg SS.
Furlher examinalion of all the waste audil dala obtained indicated that peak wastewater nows and
loads on any one production day could rise lo 707r ahove lhese average discharge levels. J-!ow
<;Ver, lhc assessmenl of lrade efnuent charges hased on average discharges was considered to give
a realislic cslimale of lhe savings which could he expccled over a full produclion year.
The audil learn appreciated 1hat in addition to savings in trade efnuent charges, there would he other cost benefits which were difficult lo quanlify during the lime-frame of lh,. consuhanl's brief
hut which included cosls associalcd with raw water, energy and the prohahle elimination of
combined wa~tewaler lreatment which would otherwise he required lo meet discharge consent
conditions consiste'lt ly.
.'i.\

Case Study 1: Beer Produc.tion
It was also recognised that some capital expenditure would be required to implement the pro
posed wa-;te reduction programme. It wa-; agreed with the brewery management that this aspect
was best costed by their m.1rn engineering staff but that since the capital sums involved would be
relatively small compared lo the company's capital expenditure budget for the current year. and
related to progressive improvements in the brewery production operations. the company would
be likely to accept the waste savings proposals on the ba-;is of the significantly reduced trade
effiuent charge sa\ings alone.
Step 20: Developing and Implementing an Action Plan: Reducing Wastes and Increasing Production Efficiency
The results of the waste audit and waste reduction studies were formally presented to Company
A's ma.::agcmei:it in the form of a technical report. The recommendations made were accepted
and plans were then made to implement the recommendations.
The waste audit had provided a sound understanding of all principal sources of wa-;te arising
within the brewery. Furthermore, the brewery technologist assigned to assi-;t the wa-;te audit
team had bcnefitted greatly from being involved in the step-hy-step approach adopted by the
company's consultants.
It was considered that the experience gained by the brewery would enable company staff to take
the lead in any future waste audit programme, particularly the assessment of the actual waste
reductions achieved following commissioning of the plant modifications and additions proposed.
54
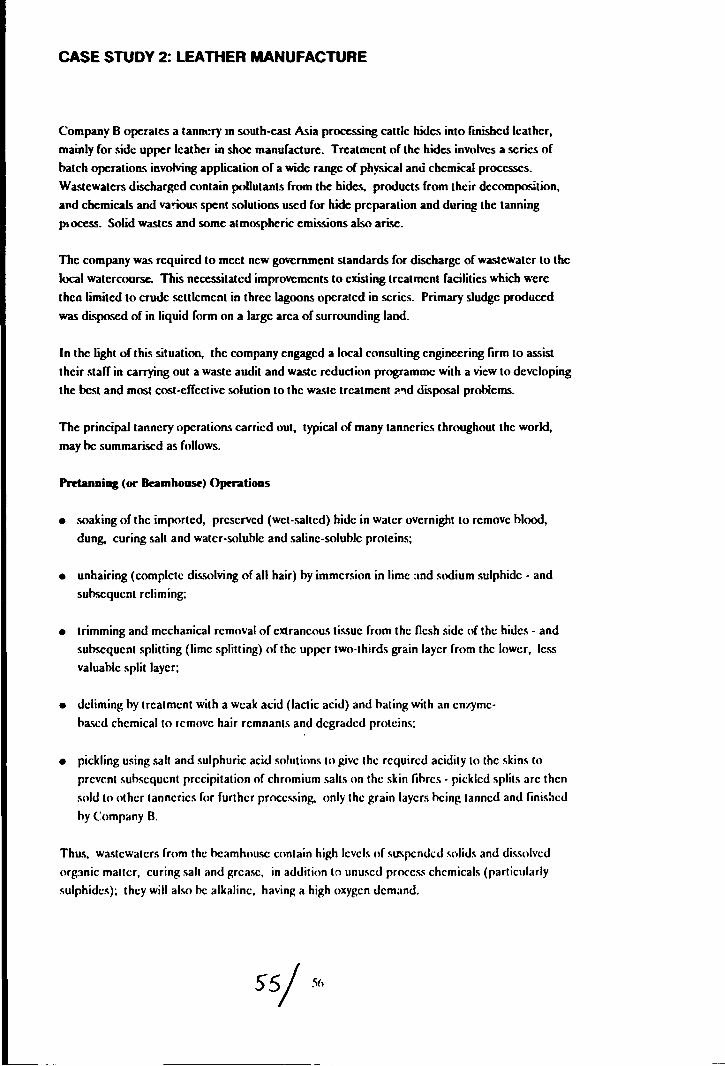
CASE STUDY 2: LEATHER MANUFACTURE
Company B operates a tannery 10 south-cast Asia processing calllc hides into finished leather,
mainly for side upper leather in shoe manufacture. Treatment of the hides involves a series of
batch operation.o; involving application of a wide range of physical ami chemical processes.
Wastewatcrs discharged contain pollutants from the hides, products from their decomposition,
artd chemicals and va!lou.'\ spent solution.o; used for hide preparation and during the tanning
p1occss. Solid wastes and some atmospheric emissions also arise.
The company was required lo meet new government standards for discharge of waslewaler lo lhe
local watercourse. This necessitated improvements lo existing lrcalmcnl facililics which were
then limited lo crude sculcmenl in three lagoons operated in series. Primary sludge produced
was disposed of in liquid form on a large area of surrounding land.
In the light of this situation, lhc company engaged a local consulting engineering firm to a'i..'iist
lheir staff in carrying out a waslc audit and wac;le reduction programme with a view lo developing
the best and most cost-effective solution lo lhe waste treatment ?'ld dic;posal problems.
The principal tannery operation.-; carried out, tYPical of many tanneries throughout the world,
may be summarised as follows.
Pfttanning (or Beamhouse) Opuations
• soaking of the imported, preserved (wel-salted) hide in water overnight lo remove blood,
dung. curing sail and water-soluble and saline-soluble proteins;
• unhairing (complete di'i..'iolving of all hair) by immersion in lime :md sodium sulphide - and
subsequent rcliming;
• trimming and mechanical removal of extraneous tissue from the flesh side of the hides - and
subsequent splilling (lime splitting) of the upper two-thirds grain layer from the lower, les.c;
valuable split layer;
• dcliming by treatment with a weak acid (lactic acid) and hating with an enzyme
hac;ed chemical to remove hair remnants and degresded proteins;
• pickling using salt and sulphuric acid solutions to ~ivc the required acidity to the skins lo
prevent subsequent precipitation of chromium salts on the skin fibres - pickled splits arc then
sold to other tanneries for further processing. only the grain layers hcing tanned and finis:1ed
hy Company 8.
Thus, wastewaters from the hcamhousc contain high levels of suspended s1)lids and dissolved
organic matter, curing salt and grease, in addition lo unused proces.~ chemicals (particularly
sulphides); they will also he alkaline, having a high oxygen demand.

Case Study 2: Leather Manufacture
Tanning
Chrome tanning L'i carried out using chromic sulphate. The tanning process stabilises the
proteineous (collagen) network or the hide. Acidic effluents are produced which contain unused
trivalent chromium salts.
Post-Tanning Operations
These involve:
• pressing (samming) to remove moisture;
• a second levelling by shaving;
• dyeing and sortening or the tanned hide with emulsified oil'i (fatliquoring), preceded by
occasional secondary tanning using synthetic tannins (syntans) and tanning extracts;
• drying and final trimming;
• surface coating and buffing (finishing)
The following case study describes the waste audit/waste reduction approach taken.
57

PHASE1:PREASSESSMENT
Step 1: Audit Focus and Preparation
II was decided that the study in\'estigations would he l·arried out hy a chemical engineer from the
con:-.ulting firm·s staff who had pre\'ious cxperienl-c of carrying out w;iste audits. assisted hy the
t;mncry·s plant chl·mist.
( 'ompany B"s o\\TI lahoralory wa ... not equipped to carry out many of the tesb normally <1s.o;ociah:d
with wash:wall.:r <1nalysis and so arrangements h.id to he madl· to dcli\W samples lo a hx·al pri\';ite
nimpany pro\idinp. lahoratmy analytical sn\'ices.
In \·i~·w of g1wernmcnl prcs.sun:s. it was decided to concentrate on wastewater disl·harges arising
from the heamhou .: and suhscquent tanning opcralions. Howe1 er. almo:-.pherii: emis.-;ions were
also in\'estigatcd ha\·ing particular regard to health and safety. Solid waste arisings. in partirnlar
w<1stewa1cr treatment pbnt sludges. wcre also studied.
The waste audit team was keen to gain the support of produl·tion pcrsonn..:I in order to ensur..:
that comprehensive information on all t;mnery operations l·ould he readily ohtained. As a first
step thl:reforc, the study ohjccti\'cs were fully explained to scl..:l·ted staff rcsponsihlc for the
various productinn activities.
The in\'cstigations were initiati.:d by gathering n.:k:\ant information from 1:omp;my files. This
preliminary search yielded site and drainage plans, raw material purchase rc1:ords and water
mder records associated with on-site horchole abstraction.
A preliminary check on water usage was carried out by calculating the water usage per tonne of
wet-salted hide processed. This Was found hi he <11 m1.itonne. It was noted that this was some
'22"( higher than !he typical a\'erage working figure of 50 m1,'tonoe reportc.:d in techni~·al litera
ture, suggest in!! that ways of introducing considerahlc water savings should he possible as a result
of the waste audit'\':aste reduction .study.
Step 2: Listing Unit Operations
The com.ult;ml and the plant chemist started the tannery study hy walking around the processing
and waste treatment areas. listing all the unit processes and makin!! notes on their function and
use. llclp wa ... al~o sou!!ht from various plant operator~ who were familiar with the day lo Jay
plant operations. The unit opcratinns were listed in Table I. wi!h processes which did not
produce liquid wash: shown in orackcts.

Table 1: Unit Operations
Soaking Unhairing and Aeliming (Trimming. Fleshing and Splitting) Deliming and Bating Pickling Chrome Tanning Pressing (Shaving) Secondary Tanning, Dyeing and Fatliquoring (Drying. Trimming and Sorting) (Finishing)
Case Study 2: Leather Manufacture
As part or the company's long-term planning. the plant chemist noted that consideration was
being given lo moving the hide splitting operations further downstream the process line (after
tanning) in order to improve the accuracy or splitting and hence overall process control, as
commonly practised at other tanneries. The existing arrangement and design or process units,
many or which were relatively old, did not however lend themselves to thio; change being imple
mented rapidly.
Step 3: Constructing Process Row Diagrams
A flow diagram was then prepared to illustrate the interrelationship between the various unit
operations (Figure 1 ).

Figure 1: Schematic Diagram of Tannery Operations
INPUTS
Imported -t-salted hide
Bactericide. soda ash, ------· water
Lactic acid, bate, ammonium chloride. water
Salt, sulphuric acid. water
Chromic sulphate, salt. syntan. sodiu1,, formate. soda /\Sh. bactericide
Tanning extracts. syntan,dyes. calcium formate, flour. glue. titanit:m dioxide. oil. water
UNIT~SS
S31ted Stock
Soaking
Trimming. Fleshing and Splitting
Pickling
Picklet1 Stock
OUTPUTS
.,_ ________ Dirt-laden. saline
liquors
t---------1• Trimmings and ffesh';igs
Brine and ...-------• acid dilution
waters
t------~· Pickled splits
Grain-layer hides
Chrome Tanning
Pressing
Shaving
Acidic wastewaters .,_-------•containing 03 ·.
o;yntan. salts
t----·---~~- Press liquors
t-------_,• Shavings containing Ct3.
Acidic wastewater
Secondary Tanning, containing 03 ·. Dyeing & Fatliquoring ... -------• tanning extracts.
syntan, dyes. fats
Drying, Trimming and Sorting
J---------~• Trimmings ,. containing Ct3 • .... ---..----~
Surface coatings
•containing hair. dirt. organic matter. salt and excess lime. sodium sulphide
Finishing
Leather Product
Liquids ~
- - - - } Solvent vapours
Solids

PHASE 2: MATERIAL BALANCE: PROCESS INPUTS AND OUTPUTS
Step 4: Determining Inputs
The audit preparation phase (Step 1) had already highlighted the availabilit) of well-documented
raw material purcha..,ing record-;. The data produced also proved lo be a good check on the raw
material quantities quoted by the plant foremen per unit operation.
The raw material usage data obtained were sci out as in Tahlc 2.
Table 2: Annual Consumption of Process Chemicals
Process Chemicals
Sodium Chloride (other than curing salt present in raw hide)
Hydrated lime Sodium Sulphide (62% ~S) Sulphuric Acid Soda Ash (anhydrous sodium carbonate) Bate (95% ammonium sulphate.
5%enzymes) Calcium Formate Lactic Acid (30%) Sodium Formate Bactericide Ammonium Chloride
Sub-total
Chemicals Absorbed by the Hide p)
Tanolin (16~. chromium) Syntans A & B Dyes 0-1 Oil Other Oils Tannin Extracts Soyarich Flour Titanium Dioxide Methyl Cellulose Semi-Sol Glue
Sub-total
Total
tonnes/annum
622
1,123 445 160 74 65
40 :SS 26 19 9
2,618
760 424 n 17
295 190 45 30
9 17
1,864
4,482
(i) Absorption estimated at 90%. 10% discharged to waste - except for Tanolin. absorption 75%. 25~o discharge to waste
Due to the nature of the raw material!-> and the well-organised maler;,,1., storage system which was
found lo he in opcralion, no si!!nilicanl handlir.g losses were occurring.
It wa" nole<l 1ha1 the company incurred no char~cs for nmsumplion of waler drawn from a site
borehole. A scpar<1te town waler (polahlc) supply was avail;ihlc for domestic use. Domestic
Wa'.,le\V:iler passed to the nearby watcrco11rsc via a septic lank.

Case Study 2: Leather Manufacture
Having already tahulated the key production stages (Step 2), raw material usage listi.:d in Table 2
was used to derive average quantities per unit operation throughout the tannery, on both a daily
basis and per tonne of hide processed.
The data compiled were set out in Table 3.
Table 3: Chemical Inputs per Tannery Unit Operation
Unit kg/tonne hide kg/tonne kg/d Operation (at unit operation) wet-salted hide
Soaking: Bactericide 1.6 fl) 1.E 64 Sodium Carbonate 0.8 fl) 0.8 32
Unhairinp/Re~ Hydrated Lime (unh~ring) 48 fl) 48 1.920 Sodium Sulphide (6:.'ll. Na:iSl 43 fl) 43 1,720 Hydrated Lime (relimtng) 58 fr) 58 2,320
Deliminf/Bating: lactic Acid 5 (ri) 4.3 172 Bate 10 [Ii) 8.7 348 Ammonium Chloride 1.3 fii) 1.1 44
PicklinK-Sodium Chloride 60 fii) 51.9 2.076 Sulphuric Acid 21 fli) 18.2 728
Ouvrne Tanning: lanolin (basic chromic sulphate, 16% Cr3 •) 60 fii) 51.9 2.076 Sodium Chloride 60 (ri) 51.9 2,076 Syntan A 25 fli) 21.6 864 Sodium Formate 8.9 (ri) 7.7 308 Sodium Carbonate 10 fii) 8.7 348 Bactericide [Ii) 0.9 36 Syntan B 41 fli) 35.5 1,420
S econdmy Tann~ Dyeing and Fatliqunring: Dyes 20 (rii) 7.0 28f' Calcium Formate 10.3 3.6 145 Syntan B 44 [Iii) 15.4 616 Soyarich Flour 16 [Iii) 5.6 224 Titanium Dioxide 8 [Iii) 2.8 112 Glue/Methyl Cellulose 8 (iii) 2.8 112 Tannin Extrac1s & Oils 118 (iii) 41.3 1.652
Total 19,693
fr) Based on 40 tonnes wet-salted hide per day (ri) Based on fleshed. split/trimmed hide. after reliming - 34.6 tonnes per day (Iii) Based on chrome tanned leather, after pressing/sMving - 14.0 tonnes per day
62

Case Study 2: LHther Manufacture
Step 5: Recording Water Usage
The next step was to reCllrd the water t:sage al the tannery and determine how it was used. It was
noted that water ohtaincd hy the company from the site horcholc was pumped lo a CtWered
storage tank al ground level and then pumped again tn a nigh-level storage tank. Water then
gra\ilated to the site distrihution mains under ~latil: head via a water meter. readings fr•!" u.·hich
were recorded weekly in a log hook.
Analysi.-; of these records indicated a daily a\·erage total water consumption for the site of 2..i5o m3/d. This figure was then hroken down into a\·crage water usage per tannery unit operation in a
similar manner to that carried out for the process chemicals. Since the tannery wet processes
were all carried out in rcvol\'ing vessels of known capacity. providing mechanical agitation lo
accelerate the wet-chemical operations, hatch process water inputs were readily quantifiahlc.
Rinscwater usage whil·h was continuous for a fixed duration per hatch was also known from
previous work carried out hy the company. This had inrnlvcd checking the time taken to fill a
vessel of known volume for a given water valve selling.
The results were summarised as set out in Ta hie 4.
"-~

Case Study 2: Leather Manufacture
Table 4: Water Inputs per Tannery Operation
Unit m 3/ton!"le hide m 31tonne m 3/d Operation (at unit operation) -I-salted hide
Soaking: Prewash 4.3 fl) 4.3 172.0 Process Water 1.9 fl) 1.9 76.0 Rinse Water 2.1 fl) 2.1 84.0
Unhairing! Reliming: Process Water 19 fl) 1.9 76.0 Rinse Water 11.0 fl) 11.0 440.0 Soak Water (reliming) 1.9 fl) 1.9 76.0 Rinse Water 2.1 (i) 2.1 84.0
DeliminKf Bating: Pre-rinse 4.2 (ii) 3.635 145.4 Process Water 1.0 M 0.865 34.6 Rinse Water 1.385 (ii) 1.2 48.0
Pickling: Brine Water 2.49 fli) 0215 13.6 Acid Dilution w~.ter 0.84 M 0.073 2.9
Chrome Tanning: Process Water 0.586 fli) 0.507 20.3 Rinsing 4.51 fli) 3.9 156.0
Preuing: 0.202 fli) 0.175 7.0
Secondary Tanning, Dyeing and Fatliq11oring: Prerinse 9.15 (iii) 3.2 128.0 Process Water 0.4 (iii} 0.14 56 Rinse Water 18.6 flii) 6.5 2600 Process Water 0.4 flii) 0.14 5.6
General Floor and Plant Washwater 15.5 62CO
Total Process Waters 12.115 484.6 Rinse Waters 33.635 1.345.4 General Washdown 15.500 620.0 Total 61.250 2,450.0
(I) Based on 40 tonnes wet-salted hide per day (ii) Based on fleshed, split/trimmed hide. after reliming · 34.6 tonnes per day (iii) Based on chrome tanned leather. after pressing/shaving - 14.0 tonnes per day
Step 6: Measuring Current Levels of Waste Reuse/Recycling
It was noted thal no wastes were reused/recycled at the tannery.

Case Study 2: Leather Manufacture
Step 7: Quantifying Process Outputs
The audit team !isled the process outputs from each lanncry uni! operation as sci out in Tahk 5 he low.
Table 5: Process Outputs
Unit Operation Was!ewater By-Product/ Atmospheric Waste Reuse Emissions
Soaking Process and Wash/Rinse Waters
Unhairing/Reliming Process and Hydrogen Sul~hide Rinse Waters
Trimming, Fleshing and Splitting Trimmings and Fleshings
Oeliming/Bating Process and Ammonia Rinse Waters
Pickling Process Brine/ Acid Dilution Waters
Pickled Hide Storage Pickled Splits
Chrome Tanning Process and Rinse Waters
Pressing and Shaving Press Liquors Shavings
Secondary Tanning. Dyeing and Process and Fatliquoring Rinse Waters
Drying, Trimming and Sorting Trimmings
Finishing Solvent Vapou·s
Final Product Finished Leather (grain layer)
Action was then taken lo quantify lhesc outputs in Sleps 8, CJ anJ 10.
Step 8: Accounting for Wastewater
Process wastewater flows were based on lotalling up hatch waler inpuls and makin~ allowances
where appropri;1le for waler retention hy the hide at each process slage based on percenlages
reported in technical li1era1Ure.
( 'omposite samples of the various discharges were also taken for lahoralory analy~is.
The resulls of I his exercise were summari~ed in Tahle (1.

Case Study 2: Leather Manufacture
Table 6: Average Flows, Strengths and Pollution Loads of Strt'OQ Liquors
Unit Operation ___ F]_q_w ___ - -- _!!_QQ_ _ ---~---m3 /d '\of pH mg1l kgld a.Q of mg/I kg id OJ, of
total total total
Soaking 276 42.1 6.8 2.200 607 19.8 4.-;00 1.215 30.0 Unhairing 103 15.7 11.5 15.500 1.597 52.0 22.100 2.276 56.1 Aeliming 103 15.7 11.7 650 67 2.2 1.650 170 4.2 Dehme and Bating 66 10 1 9.5 6.000 396 12.9 2.100 139 3.4 Pickling 37 5.6 27 2.900 108 3.5 5.200 192 4.7 Chrome Tan & Press Liquors 33 5.0 3.6 6.500 215 7.0 1.100 36 0.9 Secondary Tanning. Dyeing & Fatliquoring
- 1st dump 19 2.9 4.0 2.000 38 1.2 600 11 03 -2nd dump 19 2.9 3.7 2.200 42 1.4 850 16 0.4
Total 656 100.0 3,070 100.0 4.055 100.0
II was decided that having '-tUantirii.:d the main. strong-liquor pollution loads per unit operation.
separate quantification of running rinscwaLer pollution loads per unit operation was not justified
since this would have meant selling up numerous V-notch weirs and many additional sampling
points, thus increasing significantly the lime input and analytical work required.
The relatively weak continuous-now rinse waters were thus monitored using a V-nolch weir
located in a common drain within the tannery and comhining frequent spot samples to give a
daily composile for the whole tannery. Total rinsewatcr now including general noor and plant
washdown was cstimaled 10 be 1,944 m3/d with an asstx-iatc<l BOD and SS slrcngth of 27'!> mg/I
and~% mg/I SS. Corresponding pollution loads (now x strength) were thus 510 kg BOD/d and
-:' 70 kg SS/d.
The overall wa~lewatcr nows and BOD and SS strengths and pollution loads wcre then rahulated
in Tahlc 7.
Table 7: ComiJined Wastewater Flows, Strengths and Pollution Loads
Wastewater Flow ---~QD_ s~ m 3/d mg/I kg/d mg/I kg/d
Strong Liq1Jors 656 4.680 (i) 3.G70 6180 (i) 4.055
Rinse Waters/General 1.944 273 530 396 770 Washdown
Total 2.600 1.430 (i) 3.600 1.950 (i) 4.825
(i) Concentrations calculated from flow/pollution load data
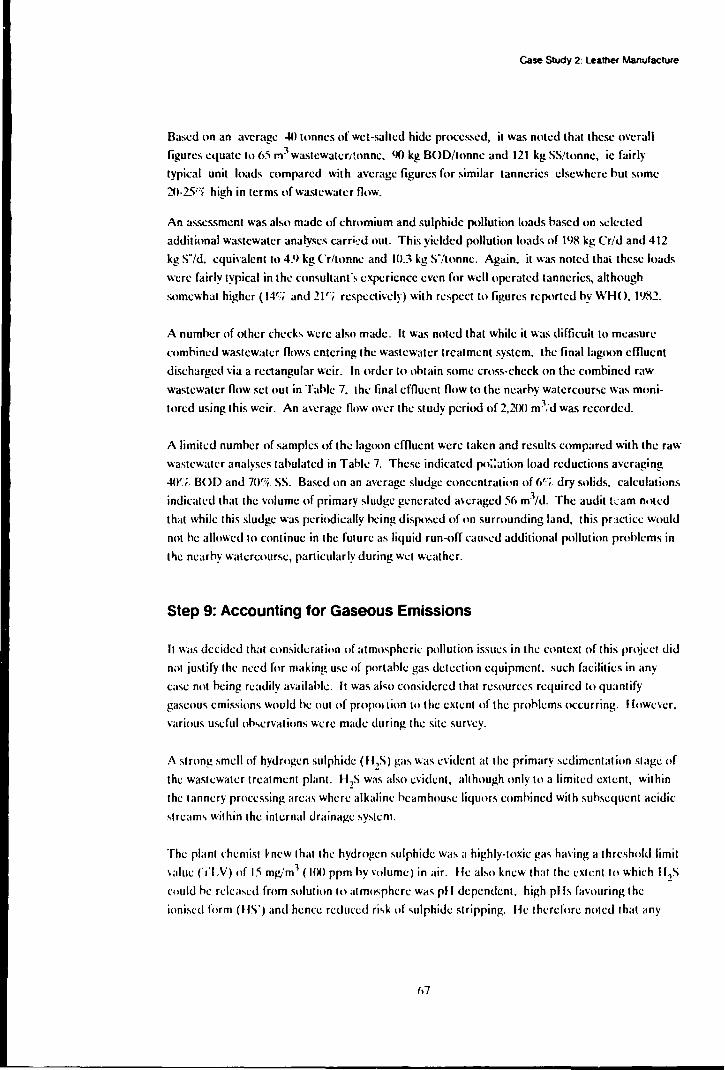
Case Study 2: Leather Manufacture
Based on an average -to tonnes of wet-sailed hide processed, it was noted that these O\'crall
figures equate lo 65 m3 wastcwatcr1tonne. 1IO kg BOD/tonne and 121 kg SS/tonne, ie fairly
typical unit loads compared with average figures for similar tanneries elsewhere hut some
211-2)'') high in terms of WasleWaler now.
An assessment was also made of chromium and sulphide pollution loads hased on selected
additional wastewater analyses carri::d mu. This yielded pollution loads of 198 kg Cr/d and 412
kg S"/d. equi\·alenl lo 4_9 kg Cr/tonne and 111.3 kg S"/tonne. Again. it was noted thai these loads
were fairly typical in the consuhanl"s experience even for well operated tanneries, although
somewhat higher ( 14'-:; and 21 '·; respectively) with n:spccl lo figures reported hy WHO. 1982_
A numhcr of other check.., wae also made. It was noted that while it was difficult lo measure
comhined wastewater nows entering the wastewater treatment system. the final lagoon effluent
discharged \"ia a rectangular weir. In onkr lo ohtain some cross-check on the comhincd r;iw
wastewater now set out in Tahle 7. the final effluent now lo the nearhy watercourse wa~ moni
tored using this weir. An average llow 1m:r the study period of 2,200 m\d was recorded.
A limih:d numhcr of samples of the lagoon effluent were taken and results compared with the raw
wastewater analyses lahulated in Tahl..: 7. These indicated po::;ition load reductions averaging
40'.;, B< >D and 70"1;. SS. Based on an average sludge concentration of 6':;, dry solids. calculations
indicated that the \"olume of primary sludge generated an:raged 56 m1/d. The audit t.:am n1lll:d
that while this sludge was periodically hcing dispo~ed of on surrounding land, this pnctict: would
not he allowed lo continue in the fu1ure as liquid run-off cau..,t:d additional pollution problems in
Ilic neoirhy watercourse, particularly during wet weather.
Step 9: Accounting for Gaseous Emissions
II was decided that con.,ideralion of atmospheric pollution issm:s in the <:<mtext of this project did
n;11 justify the need for makin~ use of portahlc gas detection equipment. such fa<:ilitics in any
c;1s<: nol heing readily available. It was alo;o considered thal resources required lo quanlify
gaseous emissions would he oul of propo1 lion to the extent of the prohlems occurring. Howe\'er.
various useful oh-.crvalions were made during the site sur\'ey_
A strong smell of hydrogen sulphide (H2S) gas was e\'idcnt al 1he primary ~edimenlation slage of
the wastewater treatment plant. H 2S was also evident, all hough only to ;1 limilcd extent, within
the tannery proces<,ing arc<ts where alblint: heamhou-.e liquors combined with subsequent acidic
~lream' wi1hin lhc internal drainage ~y .. 1cm.
The planl rhcmist ~new 1ha1 the hydrogen sulphide Wit.., a highly-1oxic gas having a threshold limil
\'alue ('i'LV) of I) mw'm 1 ( 100 ppm hy rnlumc) in air. He also knew that lhe cxtenl to whirh 112S
rould he released from solution to otlmosphcrc was pl I dependent. high pl Is favouring the
ioni~cd form (llS') and hence redurcd ri'k of ~ulphidc slripping. lk th1:rcfore noled I hat any
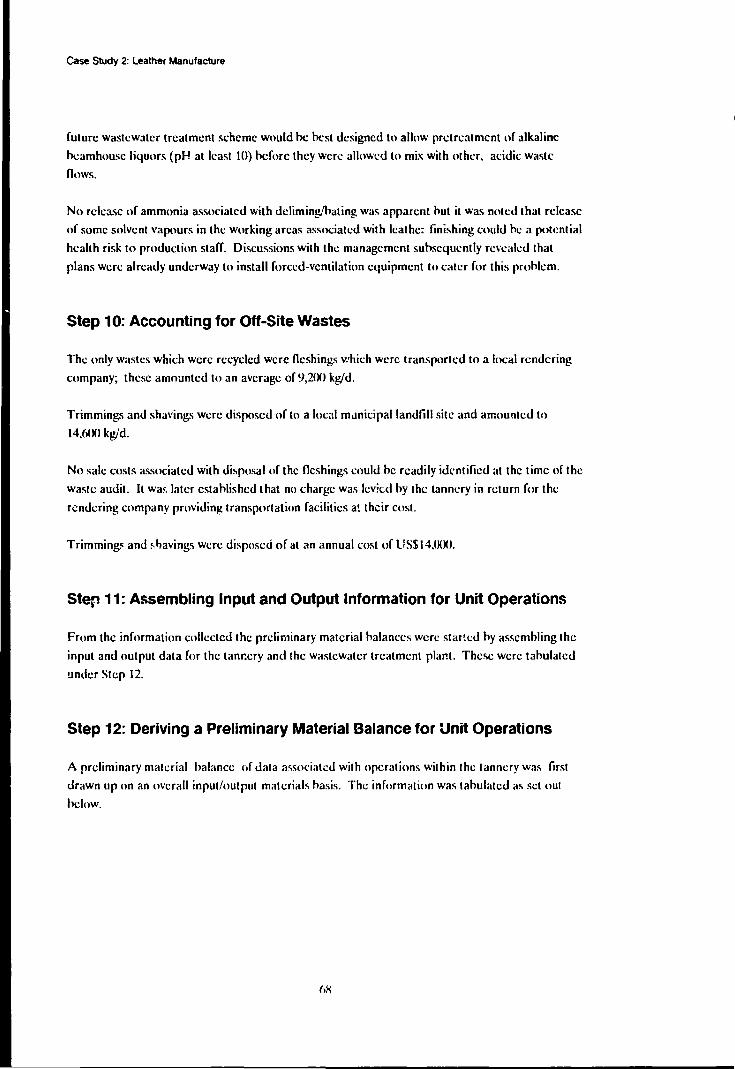
C.ase Study 2: Leather Manufacture
future wastewater treatment scheme would he hcst designed lo allow pretreatment of alkaline
hcamhousc liquors (pH at least 10) before they were allow::d lo mix with other, acidic waste
nows.
No release of ammonia associated with deliming/haling was apparent hut it was noted that release
of some solvent vapours in the working areas associated with leathe: finishing could he a potential
health risk lo production staff. Discussions with the management suhsequently revealed that
plans were already underway lo install forced-ventilation equipment to cater for this prohlcm.
Step 10: Accounting for Off-Site Wastes
The only wastes which were recycled were fleshings which were transported to a local rendering
company; these amounted to an average of9,21KI kg/d.
Trimmings and shavings were disposed of to a loc;ll m.micipal landfill site and amounted lo
14,61Kl kg/d.
No sale costs associated with disposal of the fleshings could he readily identified al the time of the
waste audit. It wa~ later established that no charge was levied hy the tannery in return for the
rendering company providing transportation facilities a! their cost.
Trimming.< and ~'1avings were disposed of at an annual cost of US$14,ll1Ml.
Step 11: Assembling Input and Output Information for Unit Operations
From the information collected the preliminary material halanccs were star!cd hy assembling the
input and output data for the tanr.ery and the wastewater treatment plant. These were tahulated
under Step 12.
Step 12: Deriving a Preliminary Material Balance for Unit Operations
A preliminary material balance of data associated with operations within lhc tannery was first
drawn up on an overall input/output materials hasis. The information was tabulated as set oul
below.

Case Study 2: Leather Manufacture
~puts kg/d
Raw Hide 40,000 Chemicals (other than curing salt present in 19.693
raw hides) Water 2,450.000
Total 2.509.693
l Overall Tannery Operations
! Outputs kg/d
Trimmings and Shavings 14.600 Fleshings 9.200 Pickled Split Layer 13,500 Finished Leather 5.600 Wastewater 2.600,000 Gaseous Emissions Not quantified but not considered
to be a major output
Total 2.642.90G
A material halance was then drawn up on a unit operation basis with specific reference to chro
mium and sulphide. A material halance for the wastewater treatment plant was also compiled.
~puts kg/d s·
Unhairing 430 (a)
(a) Based on 1.720 kg/d sodium sulphide containing 25% s·
l Unhairing
l Outputs kg/d
s·
Unh•i•iog l Reliming 412 (a) Delime and Bating
Rinsewaters 5 (b)
Total 417
(a) Based on 103 m 3/d unhairing liquors at 4.000 mg/I S" (b) Based on 1 944 m 3/d rinsewaters containing 2 5 mg11 s·

Cl.w Study 2: Leather Manufacture
Inputs kg/d Cr
Otrome Tanning 332 'a)
(a) Based on 2,076 kg/d Tano!in containing 15' Cr3 •
i Ovome Tanning
l Outputs kg/d
Cr
Otrome Tan & Press Liquors 83 (a)
Otrome Leather 249 (b) Rinsewaters 3 (c)
Total 335
(a) Based on 33 m3/d chrome lic;uors at 2.500 mg/I Cr3 · (b) Bosed on 2.076 kg/d Tanolin containing 16' Cr3 · and 75% chrome absorption into hide (c) Based on 1 .944 m3/d rinsewaters containing 1 .5 mg/I Cr3 •
Inputs
Raw Wastewater
Primary Effluent Primary Sludge
Total
2.600
! Wastewater Treatment Plant
l 2,200
56
2.256
Step 13: Evaluating the Material Balance
The waste audit team were confidenl 1hat they had oh1aincd an adequate malerial halance (wi1hin
5-10%) for the tannery as a whole as well as for 1hc specific chromium and sulphide chemicals
used.
70

Case Study 2: Leather Manufacture
The material balance for the wastewater treatment plant wa..o; alo;o considered reasonable taking
into account that some water seepage was possibly occurring through the base of the crude
lagoons, thus contributing to the 13~'.f, difference between inflow and total outflows recorded.
Step 14: Refining the Material Balance
It wa..o; considered that the material balance information obtained was sufficient to meet immedi
ate requirements but that it wou;J be useful to carry out a further waste audit once any waste
reduction .ncasures had been implemented.
71

PHASE 3: SYNTHESIS
Step 15: Examining Obvious Waste Reduction Measures
It was noted thal the rinsewater usage following unhairing was appreciahle, amounling to some
18% or 1he lotal water usage thrnughoul the tannery.
It was considered that significant savings could be achieved at this stage by changing from a 4-
hour running rinse to a two-stage hatch wash operation. each or 20-25 minutes duration. It was
anticipated following a short-term trial that it should he possible to achieve a consistent '10%
reduction in rinscwater usage, that is. from 440 m3/d to 176 m3/d.
The audit team al<;o realised that considerable water wastage was taking place by tannery staff
leaving numerous hoses running in between general floor and equipment washdown operations.
On the basis or an average of 15 hoses in continuous use, it was cstimaled thal waler pas ... ing lo
drain surplus to aclual requirements could he as much as 136 m3/d, some 5% of the lolal waste
waler flow. Recommendations were 1herefore made for the filling of pistol-grip self-closing
valves on all hoses in use throughout the tannery.
Thus, it was concluded that total wastewater flows could he reduced from 2,6()(} m3/d to 2,2()(}
m3/d, reducing the wastewater production to a more respectable 55 m3/tonne wet-salted hide
processed.
Step 16: Targetting and Characterizing Problem Wastes
a) Sulphide Liquors
As indicated in Step 9, it was evident that pretreatment of all sulphide-containing liquors was
needed before they became mixed with other acidic flows; the possibility also existed of at
least partial recycle of fine-scrcer.cd sulphide liquors in subsequent unhairing operations.
The management favoured a flexible approach with the treatment system designed to handle
the total daily sulphide liquor flow if required, conscious that sulphide liquor recycle would
probably require a higher level of surveillance of the efficiency of the unhairing operation
which might not he readily achieved on a consistent basis in practice.
The audit tc.1m then proceeded to draw up design flow and strength data for the pretreatment
of sulphide-hearing waste streams; and also for the subsequent combined wastewater treat
ment facility required to meet the government's new discharge requirements.
Sulphide-hearing liquors wnc taken as heing all the process and rinscwatcrs associated with
the unhairing process and all wastewater associated with dcliming.'haling other than the final
rinse. The resultant average design flow and sulphide load assessed were as shown in Table 8.
72

Case Study 2: Leather Manufacture
Table 8: Characteristics of Sulphide-Bearing Wastewaters
Parameter
Flow Sulphide
Actual
590m3,d 4t2kg.d (700mg;1)
Design
600m3fd 420 kg.'d 600kg/d
(700 mg I - ave.) (1.000 mgl - max.)
assuming unhairing-stage rinsing carried out on a 2-stage batch basis to reduce water usage (equivalent to 27% of total wastewater flows following instigation of water saving)
An asses.o;ment was made of lhe likdy BOD redul.1ion due lo oxidation of sulphide. The
thcorelical o:o..-ygen uptake rale due to m:idation of sulphide was takl'n as 11.75-2.ll kg O/kg sdepcnding on the ratio of the thiosulphale:sulphate oxidation pmdul.1S. Taking an average
1.4 kg 0 1/kg S" and a q7r;; s· reduction (down to 20 mgi1 S"), this gave a BOO reduction of
5<10 kg/d.
Wilh reference to Tahle 7, the combined was1ew;1ler BOO load can he expected to reduce
from 3.61Ml kg!d to 3Jl40 kg/d, equivalent to 1.::\~l mg. I BOD in a reduced now of 2,2ll0 m·':d.
Regarding the effect on suspended solids loads as a result of fine-screening of sulphide
liquors, ac•ual remo\·als were difficult lo predict accurately wi1hou1 further test work. As a
conserva1ive approach therefore, it was dc<.·ided that the calculated tolal SS load of .J,825 kg/d
(Tahlc 7) should he carried forward as a design SS load for si:1ing and hudgctary costing of lhc
combined waslewater lre;1lment plan!; this gave a concenlralion of 2. I'll\ m!!,.1 SS al lhe
predicted fulure reduced now.
h) Chrome Liquors
The audit learn wnsidered !he possihilily of recovering chrome from lhe chrome-hearing
liquor!' .1y fine screening. addi1ion of sodium carhonate to precipilale chrome hydroxide (at
pH 8-8.5). filler-plate pressing of lhe resullanl sludge and !hen conversion of lhe chrome
precipilate to soluble <.·hromic sulphate using sulphuric acid.
Discussions wi1h lhe management revealed lhat this possihilily had hccn considi:red in the pa:-.!
hut was not favoured on overall le<.·hnical ;ind cost grounds unlcs.' lhe hcnefits of economy of
sralc could he introduced hy providing a ccnlraliscd chrome recovery pl;ml lo serve all
lannerics in 1!1e local area. While some preliminary discus.o;ions had heen held throu~h the
naiional lanncry association, such a sl·hcml· was nol forcscen al this o;tage.
II was agreed therefore that for lhe present the desi~n of a new wastewater treatmenl plant
should assume I hat chrome would he precipitated and disposed of off-sile as part of the
primary sh1d~e gen<.·r;1lcd.

Case Study 2: Leather Manufacture
Step 17: Segregation
In order to scgn:gah: sulphide lit.4uors for scpaute prclrealmcnt. ii was decided hl di\·crt c:U.,ting
drainage oullcts in the unhairing area to a hatch trcatmcnl planl located v.i1hin lhe cxisling
1annery proccs..-. huilding_
Trcalt•d nows Wl'Uld I hen he combined with all other wa.-.1ewa1crs at a new lrealment planl
located dose to lhe e:ici.;ting scttlcmenl lagoon facility.
Step 18: Developing Long-Term Waste Reduction Options
The waste audit consuhant was rcsponsihlc for drawing up outline proposal"' for the required new
wastewah:r treatment facilities.
Consideralion W;LC, gi,·cn lo a\ailahlc methods or sulphide treatment. These indud.:d:
• acidilica1ion lo pH 2-3 and aeration, wit:1 ah...orplion or the resultanl hydrogen sulphide gas in
caustic soda solution within packed-tower scruhhcrs prior to discharge or the resultant liquor
hi drain or reuse;
• prccipitalion with ferrous or ferric sahs;
• oxidation using chlorine or hydrogen peroxide;
• oxidalion using acralion with a manganc"'c catalyst.
The laller melhod was con'\idcrcd the mosl technically salisfactory and <.·osl-eff.:ctivc solu1ion
following line screening. This view was supporh:d hy reference to availahh.: informal ion sources
concerning opcration;1I expcrienn: elsewhere.
It was decided lo diverl cxisling drainage outlets in lhe unhairing area 10 a mechanical sdf
deaning scrern (I mm) located in a modified noor channel, the upper end hcing de,igned lo
convey screenings to an adj;ll'enl skip.
Srrecm;d flows would lh..:n gra\·i1a1e lo a suhmcrsihlc pumping stalion to lift nows into one 11f two
llatrh-trcalmenl oxidalinn t;inks. om: to he used for trealmcnt and lhe olher lo he a\aibhk for
receiving lhc next hatt·h of liquor. A diffused-air syslem, using non·dog coarsc-huhhlc diffusers.
was ~clertcd to providl' mixinl! and acralion in each tank and a farilily for dosing a sohllion of
mangane'>c sulphale calalyst was inrorporaled.
The main trealmcnl pbnl for prclrcatcd 'ulphidl' liquors 01mhinnl with all olhl'r w;i,lcwalcr
n11ws involved the folh1wing features:

Case Study 2: Leather Manufacture
• llow'pollution load halancing. incorporating coarse-huhhlc aeration/mixing;
• pH correl."tion (if required). l·hemical llo(:culation wilh alum and polydectrolyte and suhsc
quenl primary sculc.:men<:
• extended aeration lrealmcnl using low-speed mechanical surface aerators (si7cd lo pro .. idc a
rohusl hiological sy-.tem capahlc of withstanding fiul."tualir.g load'i);
• hatch storage/thickening of mixed primary and surplus secondary sludges prior lo pumping lo
drying bcd'i and suhscqucnl disposal of sludgl.! cakl.! lo landfill.
Provision for iron ~It dosing lo the sludge storage/thickening tank was incorporated to precipi
tate any sulphide formed a'i a result of anacrohic acti .. ·ity v.ithin the lank and hence lo minimise
odour problems occurring.
A schematic diagram of the proposed treatment plant was compiled as illu5lrated in Figure 2.
Step 19: Environmental and Economic Evaluation of Waste Reduction Options
Company B was placed in a position of having to upgrade its wastc•.vater treatment system in
order to comply with new dis.:harge standard<; imposed hy the governme.1t, part of a new empha
sis on the need to eontrol l"'llution of the environment.
The new effluent discharge standards laid down were 40 mg,'I BOD and (i() mg,'I SS. Hence.
provision of a new treatment facility designed to meet these standards consistently was expected
to improve lhe q1· ·lily of the local watercourse suhstanlially.
There was a dear need lo minimise capilal and operating costs of 1he trealmcnl scheme to ensure
the o••erall linancial viahili1y of the company's operations. Therefore. in preparing outline de ... igns
for hudgctary purposes. particular attention was paid lo providing a plant which would he robust
and relatively simple to operate.
The cost of the treatment scheme drawn up was es1ima1cd al US$500,IKKI including contingencies
and design/conslnKtion supervision fees. This rellecled a rnnservative approarh to the sizing of
lhe activated sludge process, parlieularly in lerms of acralion eaparily. It also took inlo accounl
lhe availability of two redundanl water :i;lorage vessels sui1ahlc for U'ie as sulphide-liquor lreal
ment tanks.
This approarh was adopted lo provide some !lexihi!ilj over lhc mode of up~·ration of the plant
with a view lo minimi ... in~ opcralin~ rnsls - ii would allow lhe primary scltkmcnl sta~c lo opnale
without addilion of chemical Ooccul;inh if dc ... irnl. with rnnsequcnt higher slren~lh diluent

Figure 2: Schematic Diagram of Proposed Wastewater Treatment Plant
Manganese Sulphate Catalyst
Air
Alkaline Sulphide LiquOlS
Screenings to Landfill
Possible Recycle to __ _.11;;;;;;.;;;;;;-.;;;;- 4 Unhairing Process
Batch Catalytic Oxidation
Sludge Liquors
Sludge Storage!
Thickening
Sludge Drying Beds
Sludge Cake to Landfill
Primary Sludge
Surplus Secondary Sludge
76
Other Wa..o;tewaters
Fine Screening Screenings 1-----to Landfill ------
Balancing N----Air
Sulphuric Acid!
pH Correction ... .,__ ___ Caustic Soda (if necessary)
Flocculation Alum
L------'..----Polye:ectrolyte
Extended Aeration
Treatment (Mechanical
Aeration)
Fi~:ll Effluent To Watercourse

Gase Study 2· Leather Manufacture
pas.-;ing forw;ird t.11he hiologiG1I slage: 1wcr;1ll ,.(udc..: yidds reqt.iring uhim;1le disposal off-si1..:
woukl also tl\: minimised. Pnwision f11r l·h..:mic1l llocculanh al 1he primary sla!!'-' was indudn.I
howe\..:r sinc1.: ii was f..:h 1ha1 1hcir u<.e could 1.:nahk lhe ;..:quired final dtlu..:nl 4u;1lity to tl\:
achi..:,·ed more ninsist..:n1ly.
Step 20: Developing and Implementing an Action Plan: Reducing Wastes and Increasing Production Efficiency
Th..: n•nsult;1111-. ..:n!!;1ged to c1rr~ out th..: wast.: audit.'wa-..le rcduclion s1uJie:, pre-;enkJ th .. ·
resuh' 11f lh..:ir linJings t.1 Comp;iny B's man;:gemenl. The dal;1 pres..:nt..:d wcr..: uscJ as a b;1sis
for submitting a pbnning application to the l1Kal grnernmcnt office for :1ppnwal to J..:-..ign and
ins1all 1he propo.,ed w;1st..:watcr trea1mcn1 plant.
During a suh-..cqm:nt mL"ding wi1h 1he gmernmcnt conn·rning liming of the proposed d..:,ign and
con-;lrudion work. \.'omp;my B w;is inform .. ·d that 1h1.: introduclion of a charging sy ... 1em fl•r
1't1n.:hok ahstraction was under consideralion for P''''ibk implcmenlation the followinc !c:1r.
This development emphasised 111 1hc lanncr~ m;m;1g1.:m1.:nt th1.: import;ml·1.: of h;1\·ing c1rricd oul
the waste audi1:wash.: reduction in\·csligaliom, and the need lo he alive lo further walcr-:,a\ing
possibilities in 1hc fulun.:.
The wask am.litwast..: n:dul·tion investi)!alinns achieved lhe following ohjccti\'es.
• A 1h11rough appreciation of all I he s11urc..:-; 11f wa,lc al the t;innery.
• Identification ;md quan1ifica1inn of the major s11urc1.:s of \\aslcWalcr including waslc 'ulphidc
and <:hromium c11n1rihu1ions.
• Evalualion of pnKcssing dlicicnl·ics from "''cmhkd informal ion on unit opcr;1lions. nw
millnials. Wiill.:r us;:gc. products and v.aslc !!em:r;11ion.
• ldcn1ifica1ion of prohkm wastes (i,· sulphid..: liq1111r') r..:quiring sp..:cial ;1lknlion.
• l>c\'dopm..:nl of ;1 wa-..lc mana~mcnl syslcm \\ hid1 \\ould n1mplv wi1 h discharge rcgulat ion-;
and r1.:~ul1 in a murh-improvnl local cn\'ironmcnt.
n

CASE STUDY 3: PRINTED CIRCUIT BOARD MANUFACTURE
Company C: manufactures douhlc-si,kd and multi-layered cin:uit ho;irds for the lekcommunil·a
tions ;md computer m:1rke1s. The manufal·turing of printed circuit hoards in'liolvl·s a complex
scri~·s of ph~~ical and chemi~·al pwcessing .. 1age .. and as a n·sult the waslcwatcrs which arc
generah:d ;ire n1mpl1::ic.. of \'<1ri;1hlc t:omposition and diflicult to I real. To ci1mpound the lrcat
menl problems. many of the processing solutions et>nlain propriclary l·hcmicals whose composi
tion is not readily availahlc.
The main pollut;mts in printed l·iKuit hoard manufal·turing wastcwatcrs arc heavy metals. par
til·ularly wppcr. Comp;my l"s wastewater frequently cxcecdcd the local authority's standard,, for
discfotrgcs to the puhlic sewerage .. yslcm. Although the company had implemented some im
pron:ments to its wastcw:itcr lrcatmcnt .. ystem in recenl years. discharges in excess of the 5 mg/I
limit on copper continued to occur and the local authority eventually decidt:d to take legal action.
In resp,mse lo these prohlcms thl' nimp;my dl.'l·ided to conduct a \\as'c audit in order to:
• bring to the attention of production pcr .. onncl lhc importance of minimising wastage al souH·e
with a view to impro\"ing overall production efficiency while at the s;ime time reducing hoth
r;iw material costs ~ind waste treatnn:nl costs;
• identify lhe sources of contaminalion:
• dcvclop a waste n.:duclion strategy to minimise coiltaminants at sourn::
• develop a sound understanding of the wastewater problems lo facilitate the design of a cosl
cffecti\·e wastewater treatment system to rnmply with dischargt: sland:ud~.
The printed circuil hoard material is eompmcd of a glass-fihre sheet with copper laminated on
ho1h sides. The uncut hoards arc received from the suppliers in larg..: sheets and pass t~.r,iugh a
shearing stage to cut I hem to I he desin:d site. The hoards arc then drilled and pass through a
surface l·on<lilioning stage ( dchurring) he fore undergoing a series of trealmcnts in the scnsili.,ing
area (ckc1rolcs" plating). This ln:almenl essentially coals copper inlo the holes and prepares th<.:
ho!cs for elcl·troplaling.
The next stage involves !he applil«1lion of a pholopolymcr-rcsisl material whil·h masks off areas
which do not nt:ed lo he ckl·lroplatnl. The printed l·ireuit areas arc suhscqucntly dt:vclopcd (lo
rcmo\"c unexposed resist arc;1s whii.:h arc 10 he plated) anJ p:iss through mii.:rocli.:hing. copper
clcl'lroplalin!!. sPlder clcrlropbting, rcsiq slrippinµ. l·oppcr cti.:hing and a number of other
sclci.:lcd linishin·~ lrralmenls as spccificd hy the rnstomcr. The lasl stages of m:inuf;11:ture inrnhc
final fabrication and ekclrical tC\ting.
II ran thus he seen lhat the printed circuit hoard manufol·turing plan! is nimplcx ;ind a grcal
numb;;~ of different proct:ss waslcs arc gi.:ncralCll. The following l·a\c sludy dcscrihes lhl' ap
pro;:rh taken to ovc1romc thc lon!!·'.landing wask lrl·almenl problems rnrounlcrul by the
company. The invc.\ligal11ms were hascd on thr ">tl·p-hy-slcp approarh dc\nihcd in 1hi, wask
audil manual and 1hc sl11dic\ highlighlnl a number of areas where prolT\\ing and lrcalmcnl
dficicnrics cu1:ld hc improVrd.
78
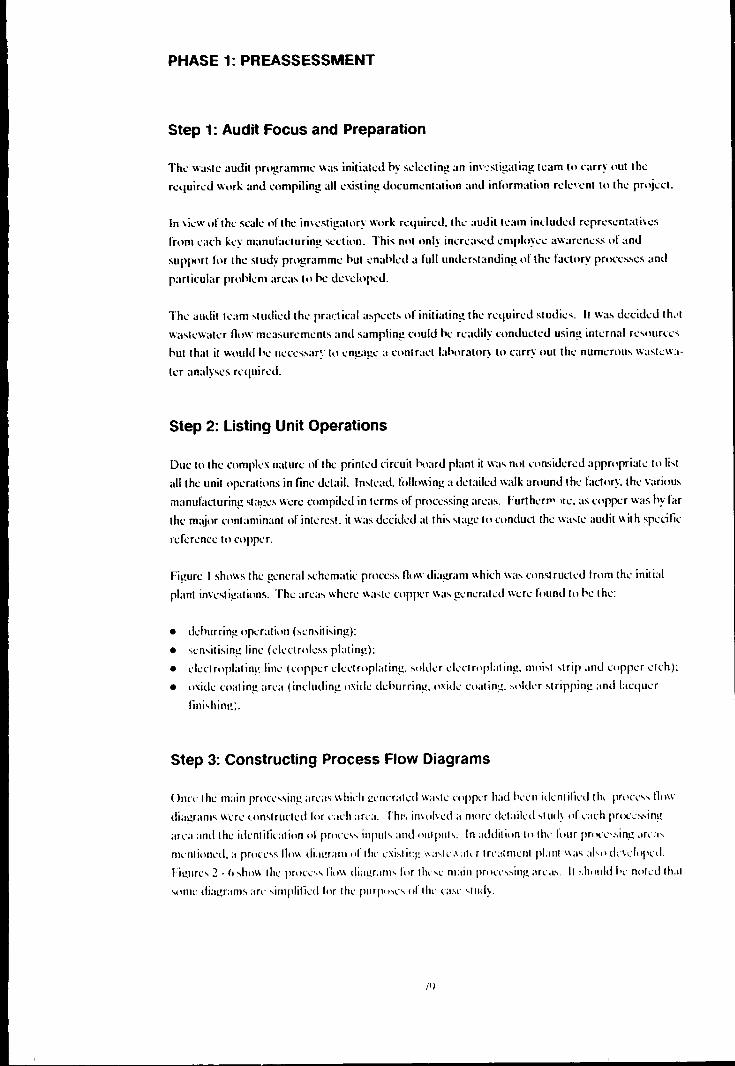
PHASE1:PREASSESSMENT
Step 1: Audit Focus and Preparation
Th1.: waslc audi1 pm!!r;1mme was inilialed hy sdedin!! an in\··:s1iµa1ing learn lo l·arry out 1he
required w11rk and l·ornpiling all •. :x.isting dm:urnentali1m and infnrmalion rde1·enl to the proj1.:ct.
In \i1.:w of thc s<:alc of !he imesligalory work required. thL· audit learn indudcd represenlali\es
from cach h·y manufaduring \el·tion. This not only inne;1;.eJ employee aw;iren1.:ss of and
supporl for the sludy prograrnm..: hut cnahlcd a full umkrsl;mJing of lhe factory pnKes.-.es ;1ml
particular prohkm ;ire;t\ to he Je\doped.
Th..: ;1udit ll'am ~1udie<l the pra•:lical as1x:cts of initiating the n:quin:d sludies. II was dccid..:d 1h.•t
waslewaler llow mcasurcmenls and sampling nmlJ he readily omducted using inlernal re"lllrles
hul 1ha1 it would h..: nece•"ar'.: 111 engage a conlr;Kt bhoratory to carry oul th1.: numcrou-. was1ew:1-
h.:r analyses rn1uircd.
Step 2: Listing Unit Operations
Due lo thc compkx nature nf lhe printed l·ircuil ho;ird pbnl ii wa-. n11t 01n.-.i<lered appropri;111.: to li-;1
all the unil nperations in linc dctail. In-.lcad. follo\\ing a dc1ailcd walk around lhc faclory. the various
manufal1uring slag1.:" wcn.: compikd in tcrms of processing areas. FurlhL·rlT' in.:. as copp1.:r washy for
lhc major cllnlaminant of intcrcst. it was dccide<l al 1hi, slagc lo rnndul1 rhc wa ... 1c audir wirh speliliL·
rcfcr..:nce lo nippn.
Figure I shows lhe gencr;1( sl·hemalic prnn:s;, llow diagram whil·h wa ... ciinslruclnl fr.1m rhe inirial
pbnl im·csliµalions. Thc arc a-; where W;hh.: coppn \\as gi:ncrakd wcre found 111 hc I he:
• dehurrinµ opcralion (scn-.iri,ing):
• ,cn,ilising linc (elcl"!rolc"s plaring);
• elcctroplarinµ line· (nippcr ckrtropbting. sokkr ckclrnpLiring. moi,t ;.I rip and l·oppcr clch):
• oxidc coaling arl·a ( induding oxidc dchurring. oxidc co;1I inµ. -.okkr slripping ;111d bcqucr
lini ... hinc;.
Step 3: Constructing Process Flow Diagrams
Once I he main prncL·;,;,ing arl·;i;, which g,·m:ratcd wa-.lc cnpp..-r had h,·l·n idrnl ili,·d I h, prP\"<"" n,,w dial!r;1111;, wnc uin,truclnl f,,r c;1d1 ;irv;1. Thi" i11\1il\cd a mnrl' ddaikd .,111d~ nf v;1l·h proc..:<...,inµ
arl'a and thc idl'ntiliration of pron:,., inpuh ;111d lllllpuh. In addilion Ill llw four prnl'l".•.ing ;1r,·;"
mvnlionnl. a pron-'' !lo\\ di:11!r;1111 nf I hr cxi .... 1 i1:g ,\;I'll·,\ :1kr t rl·;1l mcnt pL1111 \\;i'i ;1l·,1' dv\clnpnl.
Fic1m.:;. 2 · fl ;,ho11. t hc rm ll"l·•,;, Iii i\\ di;11.!.r;1111' f, ir I hv-.i.: 111:1i11 rm in·"'ing ;1r1.· ;..,_ 11 J11 iuld bl· nnkd lh.11
'""ll" diagram' an· ;.implili,·d for I hr p11111"""' of 1 lw c;1.,v ,1 ttd).
/'I
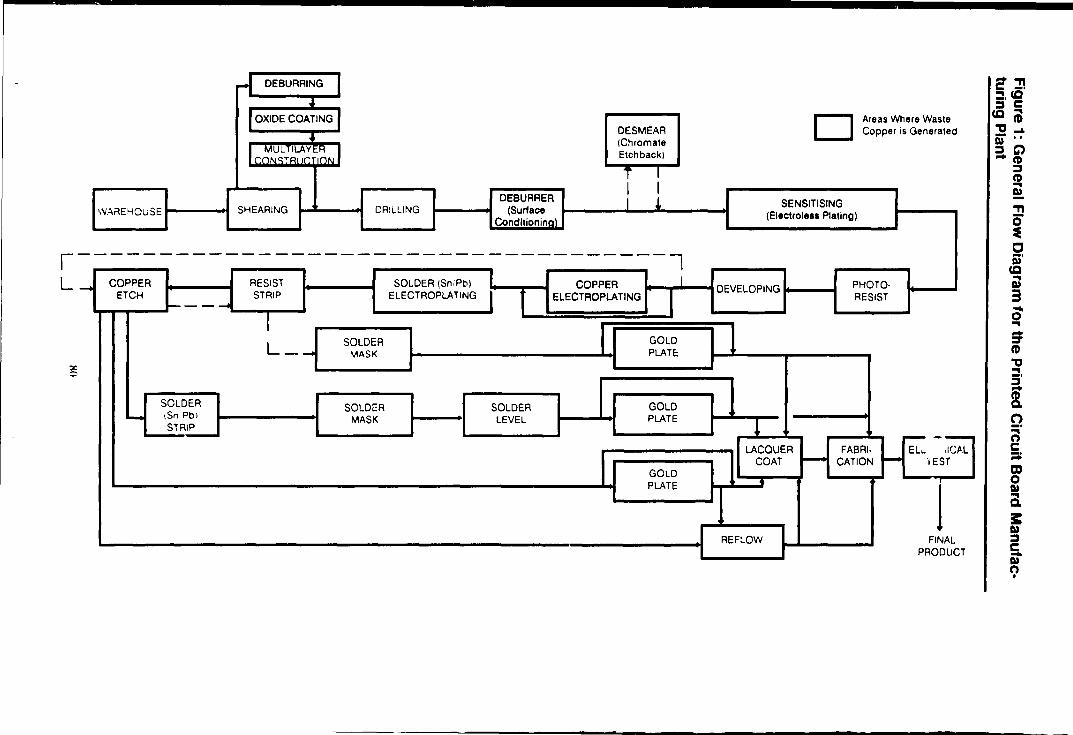
r L
s
•
DE BURRING I " I OXIDE COATING I
DE SMEAR + (Chromate I MUL TILAYt:H I Etch back)
CONST~11r ·1nN
T I I I
DEBUAAER I l WAi'IEHOUSE SHEARING DRILLING (Surface
Condltioninal
-----------------------------------1 COPPER RESIST SOLDER (SnPbl COPPER I
ETCH STRIP ELECTROPLATING l ELECTROPLATING I t-----......,j
I L _ _. SOLDER GOLD
MASK PLATE:
SOLDER SOLDER SOLDER GOLD .... 1Sn Pbt MASK LEVEL PLATE STRIP
GOLD PLATE
D Areas Where Was1e Copper is Generated
SENSITISING (Electrole11 Plating)
PHOTO· DEVELOPING RESIST
1 ,_.. --LACQUER FABRI- EL ... ,IC,6.L
COAT ~ CATION ...... ·1 EST
•
J I REF:..ow FINAL I
- -
.. "T1 c -· :!.<C :J c cc ; "ti ...a.
~ C;; - C1) :J
C1) ... !. "T1
i c ;· cc ; 3 ..... 0 ... :;: ~ "ti ~.
~ 0 ~· c = ca 0 I» a 3: I» :J 5. I» 9

~
DRILLED BOARDS
'NATER SPRAY (Feedwater Suspended Solids Concentration Before Backwash 104 mg/I)
WIRF drlUSH ,,- I' ROLLERS
CARTRIDGE FILTER
MAKE-UP (Mains Water
CONDITIONED
DRIER I BOARDS
R1:>turn Water
FILTERED WATER (Susp. Solids) • Before Backwash: 2.0 mg/I · .l\fter Backwash: 1.0 mg/I
MULTI-PORT VALVt:
_,/ ___ _ RETURN WATER (Susp. Solids) ·Before Backwash: 26 rng/I ·After Backwash: 14 mg/I
SEPARATION TANK (Bag Filters fo, Backwash Filtration)
BAGS· 2.6 kg OF COPPER (3 Days Production)
h
SAND FILTER
l'! c ; ~ .,,
I Jl i c ii'
iil 3 O' ~
i :a: Ut 5'
8 c
~

Mains Water
COPPER FINES ON BOARDS MILD
ALKALINE -11111IHI CLEANER
(Contains Chelators)
I D;+
RINSE
~ Drain
RINSE
~
Boards 30.7 k
10% H2S04
(Neutralisation)
I
* ~y. \.i"'S I) ; I 1-----92,.---~
I Day Clm9:n Qfl,hl f Day. C1mgill :ic N
r':...A ED
BOARDS (24.0 kg)
I 3 s1.J j'
I 5 6•'
HOT DI
... Jl
' 1
I 3 I 5
Note: Tank Volumes all 0.4m3
Except Those Shown Thus •. which are 0.58m3
04 02 . ,
ANTITARNISH
... ~
574 462 I
I
5 ~.3
Mains Water
RINSE (Air)
~ D•
o~atn
I Day ~\mg n Q(U"' j 1 34 JSO ~61 _J
I
Etch Sol'n 3.0kg
I
* Day 1 2 3 4 5
10% H2S04
(Neutralisaticn)
_C(mglll 9400
18300 30300 42600 50000
Mains Water
RINSE (Air)
10% H2S04
,,.J; ..... I D*
Day .clm911) .C[I h) f Day. C(mg'I) 1 116 4 76 I 5 199 2 154 3 169 635 4 252 364 5 310
I Mains Water
RINSE (Air)
ELECTROLESS COPPER PLATING
BATH - Contains Chelators (Air)
Drum * D•a'n Sto1age
I D...,1 ~ [ Day_ c,mg.1i\ Day .C\"'9;~_Qll'h.;-i I Day _C[mg'I) .C\l,h~ 'I
5 50.5 J • , 4 . I 'I 1 10200 9
2 d 7 I 2 9080 9 3 4 d 55" 3 1 ~200 9 '
! 4 7 3 979 I 4 12400 9 I I 5 10 d I 5 13400 9 L_ _________ , L____ _____ __J
Mai mi
Water
RINSE (Air)
D*
PER· SULPHATE
ETCH (Air)
PRE-DIP 10% HCI
ACTIVATOR
Pd/Sn
RINSE (Air)
Mains Water
RINSE (Air)
D2+ D4. D~ D~ DUMPS 01 ·Weekly 10 Procell Drain D2 ·Weekly 10 Holding Tank 03 · Every 2 Weeki 10 Drumt CH Holding Tani< D4 · Eveiy 8 Mon1h1 to D1um1 for Storage D5 · Eveiy 10 Wook1 to Holding Tank 06 · Yearry fo Holding Tank D7 · Eveiy B· 7 Wotkl to D1um1 for Balch T11a1monl
(Not dumped during 11udy pellOd} DS · Daily to Proc.111 Drain
SPARE COPPER PLATING
BATH
Mains Water
RINSE (Air)
...
RINSE (Air)
ACCELER· ATOR
(Fluoride, Acid)
I os+ I ___ _J
... v D1
FOR TANK CLEANING
D1 Drain D5
Key: C. Total Copper Concentration Q · Flowrate
> .,, ... -· CD CC «» c c;; ~ .,,
I i IC ~· ; 3 0 ... "' ~ en ;:; c;;· 5' cc -m ~ a m "ti
~ ~ cc -
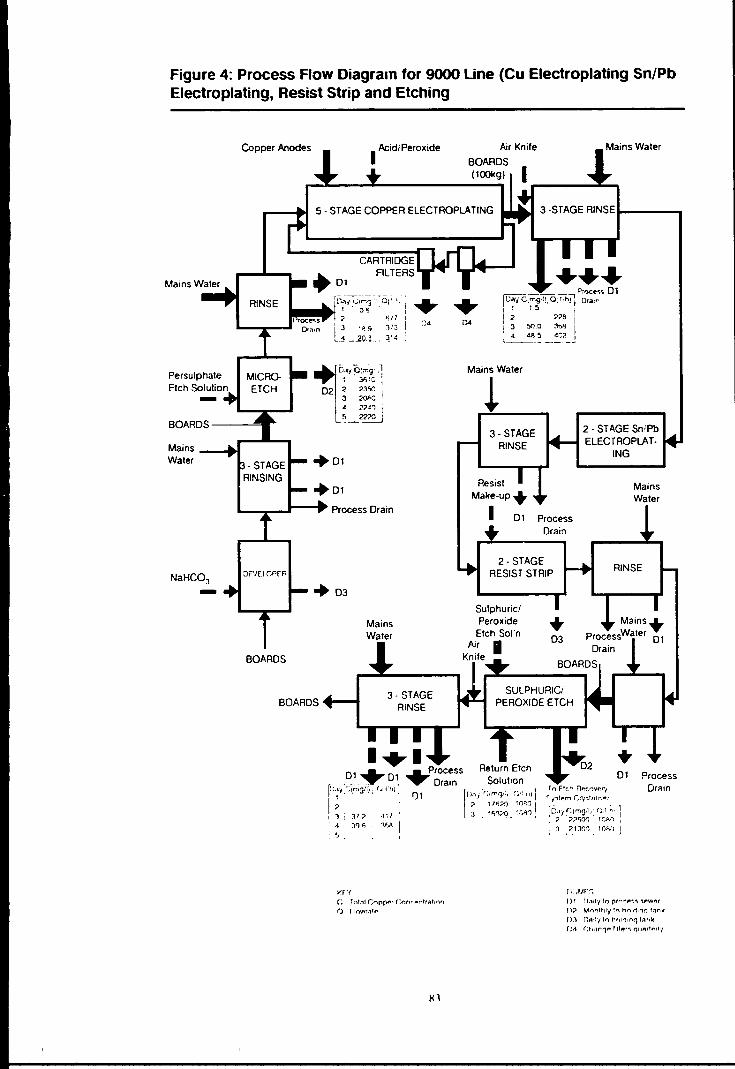
Figure 4: Process Flow Diagram for 9000 Line (Cu Electroplating Sn/Pb Electroplating, Resist Strip and Etching
Copper Anodes Air Knife
BOARDS (100kg)
5 - STAGE COPPER ELECTROPLATING 3 -STAGE RINSE1----..
Persulphate Etch Solution -Mains __ ..
Water
RINSE
MICROETCH
- STAGE RINSING
CARTRIDGE FILTERS
L __ ...Jt--~ Process Drain
- DF'J[I OPtR
+ D3
BOARDS
BOARDS
>'f'(
Mains Water
3- STAGE RINSE
c fnl.:11 r:opf)f'r r:()nrp~i!r"f1r)f)
() r 10wr.1f#t
Xl
Mains Water
! 3- STAGE
RINSE
Resist Make-up+
I D1 Process Drain
2 - STAGE Sn;Pb ELECTROPLAT
ING
Mains Water
2- STAGE RESIST STRIP
RINSE
Sulphuric/ Peroxide
Etch Sol'n Air I
Knife
• D3
Mains+ ProcessWater D1
Drain
BOARDS
SULPHURIC/ PEROXIDE ETCH
T () Flc:h n~r.t")VP,r'j
~.r.t~m r,ry .. ,1"1, ...... r
+ D1
[D"i r:1rngdi- (J:I h· 1
;> ;>;>'i()() f(;;.,ri
1 . ~t.1()0. tnS::D I
r1:JW''-
Process Drain
f)t fl.1i1•;!0 prr-"._. .. ,,.,._,.wt?r fl? M'nnfttly In h1'11r1•n(j f-.niif
().1 Dn1I'/ ,,, t',....,;11nq !nr1k
r>1 r:h.lf'1" r,11,,r-;.1111nrt,.r1·1

Mains Water Persulp1:ate Etch Sol'n Mains Water
DE· BJRRER
SOAP CLEAN El\ (Alkaline Organic
Salts)
+ D1
Process Drain
'"'2 3 •3. '20 • 23 ~
~ • 6
(Flow Only While Deburrer in Operation)
BOARDS 0522 kg
RINSE
+ D2
I I
SODIUM PERSUL· PHATE ETCH
I ... RINSE
• D2
10% H2S04
I
D1 Process Drain f Day:qmg.1)
J&~_C,mg,111 'toa~. Cl"1S'l .O[lhJj 5 u 9
~ 5 10400 1 28 . .& .
---~ 12 •8.3 220 I Persulphate 1 3 30·
8 2561 Etch Scl'n
I. 15.3 261 I I ; 1.s
I s LACQUER FIMSH
BOARDS 0.303 kg
BOARDSW SOAP C~EAN
+ D2
KEY
RINSE \Air)
+ D2
5'\. H2SO•
(Air)
+ D3
C · Total Copper Concentration a. Flowrate
DI RINSF. ~Air)
+ D2
DI RINSE
• D2
SODIUM PER
SULPHAT ETCH
I .... D3 ~~ [ s ,, oc»I
OXIDE COATING
RIN!::it=
I
3% H2S04
I
D2
OXIDE COATED BOARDS TO MULTILAYER PROD'N
DI RINSE
OXIDE TANK
(Filtered periodi· cally)
RINSE DI RINSE t----9
+ + D2 D2
+
Sn/Pb STRIPPED BOARDS
RINSE
Day. 5
-- I I
DUMPS D1 · Every 2 • 5 Weeks to Holding Tank D2. Weekly to Process Drain D3 ·Weekly to Holding Tank
D3 +-
~·l! c~r:;S1'4m1 • ~....-
DI RINSE LACQUER! LACQUER D2
+ D2
DIP FINISHED
+
---
BOARDS
USED STRIPPER RETURNED TO SUPPLIER
ACID CLEAN
RINSE
NEW STRIPPER
USED STRIPPER
ecwo;
-i
~ ::;; > CJ V1 -i
"' ~
.,, .,, s·ca· -· c Ut ... :::Z CD I» Cll :::s •• a. "O :1 a ~2 ~ Ut I» Ut a. !I (1)0 ~~ -s·c
ii' ca Dl 3 ~ ... 0 )C a: CD (") 0 I» er. :::s ~ !;' .B c ~

JC . .,,.
.:''!.: - .. Si - ~- .. • ., :) ~·'5--,.""C
• .. • .:· 5:'5
·2 ~ ·:>.)c;~
'4'3-...~2
~-·~--- ~-~-
DQLYM~R
• ~"'1.J • ----~ ~ . ·2c.; ·3-U~
'':f~-:l
J.d.:'..l
2~
''5 ~ 'l; ... $C\'i.O.·~q '"'~'"
)5
-~---- -- - --
~ .. i - :_--i • 5)
2J -i :~; a I -~ ~ ..... ~ ~~ ,:;:.·,\"..\. .. :-: •. :.C\• • .i. -:l ... ]'"• .\~ • .\~::. . .\S
~---2.:_..: __ _
_ Key
CDSSQ.
Total C.:iooe~ Co1cent1at1on Dissolved C.:ipper Concentraticrn Su;.penaea s::i,,as Concentrat;Or F!owrate
FLOCCULAT10··1
TANt\
CAUSTIC SODA
SEDIMENTATION TANK (45m 3)
Bactc'Wasn
-------- ----~ t Jay C:mg :1 0,1 ~, 'TI91''
36 2~600 · 1a : 60 21526 " I
J 23 15Jti4 20 4 6 •46d2 34
' ~ 4 . 35 _J ~- ------- was!e S!uelge
ALUM
22\iC~\i~~·: .J ~Ol:~.._,. ____________ _ ~0 .. '\';:i ~·:" S..:> ·"l·;..
:..e:::·..>enC. .... ..\.:.,j. ~-.:i.,. .• - BATCH TREATMENT
TANK (5.5m3\
Qo.erilow
SLUDGE TANK (2.3m3;
:JISC.HAf<Qf ii
'0 ~lWER L
-------55-' . Cim9.1 1 , 01l•h1 . D•mg.111, m9:111'
33 2H>OO 21 '!»
55 21526 ., 121 2 J 25 755 2 2 , & 4 ' 20872 J 5 2~
~···
7 ! 6 0 38 I ------------ - --
BATCH TREATMENT
(1m 3 )
SPENT rl[SISl AND DEVELOPER
•• ------- ~~~~i~6':~~UYL;~~~F
SAMPLING TANK
tCu.: 5ppm?)
THE.ATM Ee NT
------t Filtrate
_-:-_1K~B~~-PLATE
-- -·P-RESS-
SLUDGE CAKE 110 Secu1e L•ndfllll -·
!1 CCI c ; ~ ,, a a tn
!I i c &'
CCI ii.1 3 0 . ...,
~
I i ~
g I» -3 ct> :J -"CJ ii a

PHASE 2: MATERIAL BALANCE: PROCESS INPUTS AND OUTPUTS
Dul· lt11he rda1ivl complcxily of lhl· prinl~d l·irrnil hoard plan! lhl· inpuh and oulpul inform;1-
lion 01llcclnl for lh..: unit opl:rations were reconkd 1in the pnKess fiow di;t!!rams llasl·d on Steps
-t - Ill of the wash: ar"!it m:mual. Any arl·as of ineflil·icnt operalion and any oppmtun111es for
waste reductiun were abo nt1ted. These opportunities arc discussed lalcr in Steps 15 -18.
Step 4: Determining Inputs
Input informal ion was ohtainl·d from measurin!! chemi<:<tl additions and wa1er u.,e and recording
I he an: a t1f copper circuit hoards processed (etched );etching oft hc n 1ppcr l·irl·uit hoard-; inmlws
al·id tre;1tment for surfal·l· conditioning. or finishing. and represents a significint copper input. In
!he case of the elcclroplating line 1he wei!!hl of copper annde USl'd (!he.: s\1urce of copper for
e~1:l·1ropla1ing) was eslimaled from pas! dala. The waslewalcr lrcalment plant inpuh wen.:
determined hy measuring 1he total w;islcWalcr flows ;md ninccntrations.
Copper inpul informa1im1 for the live procc.:ssin)! arc.: as was 1hc.:n rc.:rnnlcd on the pron:ss llow
di;igrams in Figures 2 - (1.
Due lo the nature of thi.: copper raw makrials (rnpp1:r sulphalc.: solurions and copper laminated
boards) no handling losses wen: considered lo occur prior lo the pnin: ... sing opcralions.
Step 5: Recording Water Usage
The rinscwatcr llowrah.:s wc.:n: mc.:asmc.:d al the inlet lo lhc rinse tanks h~ ml·;Nirin)! lhc.: time lo
till a known volume.: container or hy draining do\l.n the rinse lanb and mt·asurin!! !he rime to
rdill. The company had n:<:enlly installed flow rl· ... 1ric.:11m, on thc rinscwakr frc.:d pipes, a good
waler lonsenalion mea .... ure. in order In limit 1h1: ;ini.iunl of waler hcin!! usnl in lhc rinsin)!
operalions. In general. the lluwralcs mca·,urcd w::re in accord;incc with the ratings for the.: flow
rc.:sl ril·t 11rs.
Step 6: Measuring Current Levels of Waste Reuse/Recycling
Coppcr-ninlaining wa ... tcs were 1101 gl·nc.:rally rc.:u ... c.:d at lhe planl. I lowc.:n·. '.inc was an on-line
crystallise• on rhc sulphuric/pcroxid1: c.:lrh sL1gc.: of rhc dcctrnplating line. The rich s11l111ion i'
pumped from rhc ctl"h tank rhrough the heat exl"han~cr and inlo lhe nipper \Ulp'1atc ny,ralli ... cr
where rhc spent c.:lrn sol111ion is n1olnl lo l<i"C ·. < "opper sulph.11l" rry.,ral' ;ir1: prtTipirared a11d
lhcn rnnwycd lo \loragc lanb, drainnl and suhscqucnrly 'old lo ;1 l11ral plarin~ .\hop. The
rrrovrrcd c.:ll"h solution i .... r1·111rnrd lo tht· rich frnl rank. The quanriry of crd1;inl rcll\cd i, dr.,(·rihcd a' an input in Figure 4.

Case Study 3: Printed Circuit Board ~.1anufacture
Step 7: Quantifying Process Outputs
Thc.: nippcr-rcbt..:J pro<.·css outputs were idcntificd and thcn quantified from coppcr plating
rr.:nnds and thc m;:asurement of waste masses. volumes and nmccntralions. Apart from the
quantity 1if wppcr plated on to thc printed circuit hoards. which was d..:termined from production
inform~11inn and plating thickncss used. th..: process output information was ohtaincd from m..:as
url·me11!s l;1k..:n in the pbnl.
Step 8: Accounting for Wastewater
All th..: wastewater streams which wen: id..:ntilied as oml;1ining l·oppcr (from Sll:ps I and 7) were
in\·cstigall:d in ;1 1h11roughly pbnncd and nmceivcd sampling programmc. Th..: sampling w;I'-.
performed ov..:r a production wc..:k in order lo cover the full r;mgc of operating conditions and In
l·nsure repn·senlalive data. <. ·ompo,ile sampks were.: taken for all running wastewater streams
whereas spot sampks wen: obtained in th..: c1,e of h;11h tanks and dumpings. Samples were also
taken of the outputs from the wastewater trealmenl plant. The ~amples were.: carefully lahclkd.
loggnl and sent nut lo an imkpemknl lahorat<>ry for co;1pcr and supporting analyses. \\"astewa
tcr llows and lank volumes were also renirded. The wastewater information is desnihed in
Figures 2 - <•.
In addition. a process llo\\i diagram dcscrihing the layout of the process drains was cnnstnKll·d
(Figure 7). Dye tests were performed lo determine the fate of the wastl"\\'atcr slrcams and the
layout and inten:onnn·tinm of the surface drains. These studies highlighted some unnecessary
and rnmplcx rinsewaler piping arrangements \\hil·h wcrc.: suh<>n1uently nmdifil·J hy plan! engi
neering stall

Case Study 3: Printed Circuit Board Manufacture
Figure 7: Layout of Process Drains
Dumps. F\Jnning
Water ~-~~- (Sub-surface Drain)
Electroless Cu ·----------------------------
Platin Rmsewater (Sub-surface Drain)
SENSITISING AREA
ii !i
WASTEWATER TREATMENT
,.. .
~ ~. c c:> /> .,,, ,.
·::> :') •
11 Floor :r washings 'I
ij n /_}I> ~ :
["'> • '7 .---::J :
..,, -~ C ._,--7
Etch • JI - - Rinsewaters • LAY TILE DRAIN
Developer Rinsewater & Floor _ -- ._ _____ ...;.-.;;;;;;.;.==~--1-1..1_ Microetch Rinse - ELECTROPLATING c:
Washings from Electroplatim;( MICROPLATE 9000 AREA .. - Resist Strip Rinse
Floor Spillage _ --
(Sub-surface Drain) -- - --
OXIDE I .EA
Step 9: Accounting for Gaseous Emissions
o · Electroplate rinse .. v
•\. ~ ;, :>
'!!-
Washer Rino;e
Deburring & Oxide Coating Ainsewaters All Discharge to Process Drain
The silc.: inwsl igal ions indiratnl evidenre of a number of gast'.llll\ emissions. Thc.:sc.: wc.:re largely
a<;sociatc.:d with forred-vrntilatcd fume.: hoods to ~emovc air-borne parlirnlale\ from grinding
operations and al-.o ;l('id and solvent fumes from <;uhseqm:nl prores:-. arras.
As wa:-lewalcr i"ues Wl'fl- ronsidrrrd lo he of priority ('onrc.:rn for lhe n1rrrnl wasll" audil, ii was
decided that gasnlll\ emissions would he a suhjt·cl for further study at a lain dale.
xx

Case Study 3: Prin•ed Circuit Board Manufacture
Step 1 O: Accounting for Off-Site Wastes
The quantity nf waste: m:1tc:rial stored on site and trans(l'lrlc:d off-site for disposal was c:stimatc:d
from in-plant i'lvestigations and study of wmpany records_ The registcrahlc wastc:s diS(l\lSed of
off-site: included copper finc:s ( 271lg.' 11Klm2 ,lr hoard). <:artriJgc filters. and filter-press cake (I ~10 kg/week)_ The tin kad acli\ator dump (0.7 m3.'arnum) was stored lln-site as rcgistcrahlc liquid
waste.
Step 11: Assembling Input and Output Information for Unit Processes
The material halances were started hy assemhline the complete input and output data. ciJnvcrtcd
to standard units. on the process llow diagrams ( Fit?urcs 2 - fi ).
Step 12: Deriving a Preliminary Material Balance for Unit Processes
From the c:ollated inforn<=tion the: preliminary halann:s wcre construt·ted for each proces,ing
area.
a) Smsitisi11g Dcf111m·r
The dehurrcr located in the sensitising area is operated in a recycle mode (sec Figure 2).
Return water is continuously filtered lo remove copper lines before hcing fed hack lo the
dchurrcr. Captured copper fines arc suhscqucntly hackwashcd from the sand filter and
collected in the hag filter. Essentially the copper inputs arc from the hrushcd hoards and the
outputs arc from the sand filter hackwash hag filler and the cartridge filler. An accurate mass
halancc could not he constructed f•om the availahle information as the thicknt:ss of copper
removed from the ho;,rds could not he determined precisely. However. the company did plan
to purchase a high-rc~olution miuoscopc in the near future which would ·:nahlc accurate
determination and control of coppcr thickne~scs rcmon:d.

Case Study 3: Printed Circuit Board Manufacture
b) Sensitising f Elcctmless PlutinK)
The preliminary material halancc for the clcctrolcss plating line is ~.hown he low.
Copper Inputs (kg/week)
Copper fines from deburrer 0.040 Boards (microetch) 30.700 Etch solution 3.000 Bectroless plating solution 25.000
Total 58.743
i Bectroless Plating
i Copper Outputs (kg/week) I Boards (plated) 21.283 Rinsewaters 4.867 Dumps 0.261 Microetch dump 29.000 Electroless copper (storage) 4.400
Total 60.811
c) ElcctmplutinK Line (Microplatr <)()()(}:inc)
Copper Inputs (kg/week)
Boards (microetch) 0667 Boards (sulphuric/peroxide etch) 209.586 Copper anodes 124.500 Return etch solutic.r. 743.904
Total 1078.657
i Microplate 9000 Line
+ Copper Outputs (kg/week)
Board:; (plated) 100078 Rinsewaters 1 474 Dumps 0 523 To etch recover 1181/min) including 217.000 kg crystallised copper) 948240
Total 1050 315
<)()
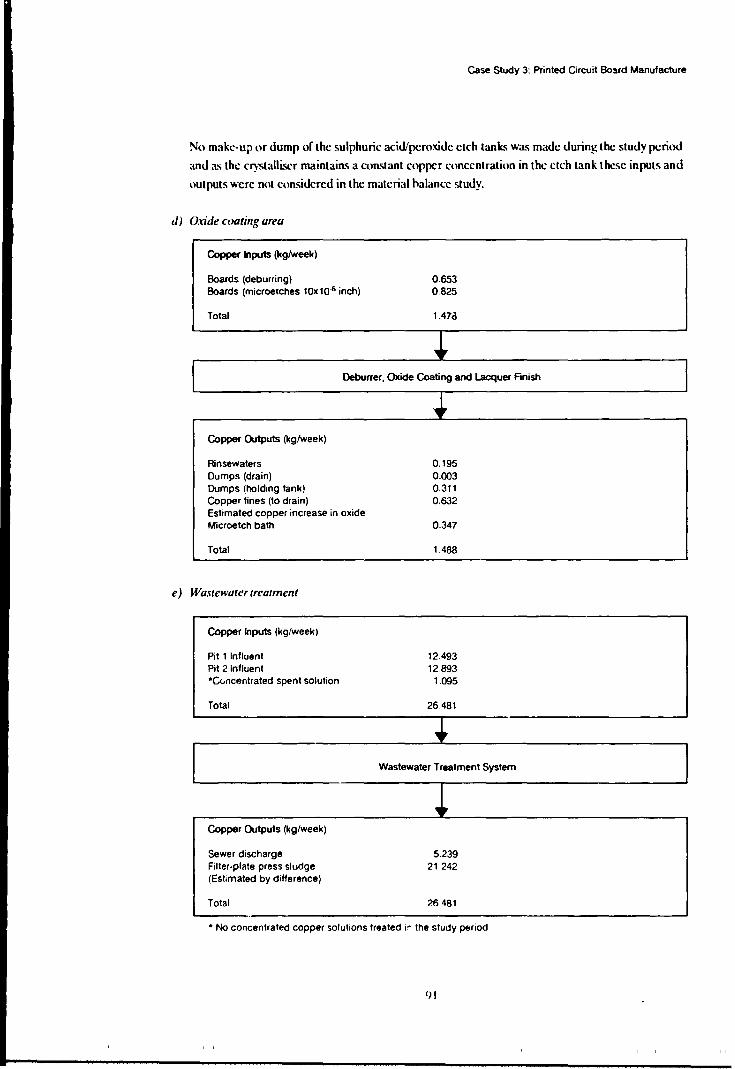
Case Study 3: Printed Circuit Bosrd Manufacture
No make-up or dump of the sulphuric acid/peroxide etch tanks wa" made during the study period
and ;Lo; the crystalli.'iCr maintail'l" a constant copper concentration in the etch lank these inputs and
outputs were not considered in the material halance study.
d) Oxide coating urea
Copper Inputs (kg/Week)
Boards (deburring) 0.653 Boards (microetches 10x106 inch) 0.825
Total 1.47c3
~ Deburrer, Oxide Coating and Lacquer Finish
J: Copper Outputs (kg/Week)
Rinsewaters 0.195 Dumps (drain) 0.003 Dumps (holding tank) 0.311 Copper fines (to drain) 0.532 Estimated copper increase in oxide Microetch bath 0.347
Total 1488
e) Wastewater treatment
Copper Inputs (kg/week)
Pit 1 Influent 12.493 Pit 2 Influent 12893 •Cvncentrated spent solution 1.095
Total 26.481
~
I Wastewater Treatment System
~ Copper Outputs (kg/week)
Sewer discharge 5239 Filler-plate press sludge 21.242 (Estimated by difference)
Total 26481 ..
• No concentrated copper solutions treated i~ the study period
'"

Case Study 3: Printed Circuit Soard Manufacture
The volume oflhe fiher-pblc pre~'\ sludge w;1s eslimatcd hy difference as the ~ludge was with
drawn from lhe cbrilier on an irregular and infrcqucnl h;L-.;is.
In addition. a matcria: halance W;L'\ rnnstrm.1ed from all the nrL'\eWatcrs and daily dumps to lhc
pn1<:css dr;1ins and the feed hi 1hc wastewah.:r tn.:almcnt system over days I - -1. (llii., ll':•s.'
halance jlrimarily represents the rinsew;1h.:rs as most of the dumps arc carried out on day :'i.)
Copper Inputs (kg)
Rinses
S1•mitisi11K Alkaline cleaner rinse 0014 Microetch rinse 4404 Acid rinse 0 115 Electro less 0.259 Acid rinse 0019
1-:tl'ctmplati11K Lim• Mircoetch 0.191 Floor capture 0276 Electroplating 0607 Etch rinse 0.600
Oxidt• Art•a Deburrer 0653 Etch 0025
Dumps Electr1Jplating line Mircoetch rinse 0.048 Electroplate rinse 0.235 Etch rinse 0180
Total 8.346
• Drains .. Copper Outputs (kg)
Treatment plant influent (total) 9 192
Step 13: Evaluating the Material Balance
Ead1 malL:rial halann: drawn up .">howcd a good agrccmrnl con,idering lhe r11mpkxity nf lhc prinlnl
rin:uit hoard man.ifol"luring plant and tht· large numhcr of \'.a">I..: nippn soum;,. Approxim;1tcly 'JI
percent of the roppcr lmding into thr trcalmcnt plant during production day' I - 4 wa' ;tcn•tmlcd for
hy lht· mc;l\urnl wa,1l"w;1lcr 'oun·c">. The cxlra 'J pcrn-nl wa."> prohahly due lo ropper being wa,hnl
from ronlaminalnl f11Kir areas and furl her minor 'ourcc' of ropper whid1 were nol indudnl in lhc
'urvcy (q.~gold plating line).
'JJ.

Case Study 3. Printed Circuit Board Manufacture
The following nmdusi,ms were made.
• The mi<:roc.:11.:h rinse .u:counle<.I for approximalcly '10 pcrcenl nf lhe lolal sensitising area
wppcr loading.
• The microdch rinse.: acu1unted for approximalc.:ly 5<1 (lCrcrnt of the plant's tolal rinsewater
copper loading on the treatment plant.
• < >thcr major sources of rinse waler omlamination were electroplating rinse. st•lphuric, perox
ide eh:h rim.c and the dc.:burrer (oxide area) rinse.
I)'

PHASE 3: SYNTHESIS
Step 14: Refining the Material Balance
The preliminary makrial hal;mn: work. whik giving very -.a1isfac1t>ry resulis. hac.J indmkd a
numhn or as.o;umptions anc.J eslimall·s (hy diffc:rem.:d had to he made: this parlicularly ·1pplic.:d lo
the nxide-n>atin!! and w;1sll"w;1ter lreatmenl areas. A del·i-.ion was lhcrl.·fnn: made.: lo refine the.:
material h;1l;rnce hading up the estimates hy fort her monitoring and informal ion !!alhering.
Step 15: Examining Obvious Waste Reduction Measures
From thl· information an-umulah:c.J from lhe waste auc.Ji1 ;ind nhsenations which \\t:re made while
im·esti!!aling the.: phnt in detail a numher or ohvi1>US Waste n:dul·tion and cffil·ier.q· impnwin!!
me<1sures werl· identified. These a!!ain split inlo the four pn'<:essin!! areas ;ind thl." \\"astewater
treatment plant.
t1 I Dd111rri11g opaatiom (sc11.~itisi11g t1rt•t1)
It was noted that the sand filter as.~1l<.·iatnl with dehurrin!! operati1>ns was hackwashc.:c.J with
rdurn (dirty) wa!L'r which would le;id lo entrainment or 1·oppl·r finl·:-. throu~hout lhl· sanc.J bed.
This could k;1d to lines hcing released into the filtered water. The dehurred Sj1ray water had
a suspended solids concentration of 1114 m!!t'I. This high concentration prohahly a<.-countcd for
the fine powder layer which was ohsc.:rved on the printed circuit hoards arll'r the dehurrer
drier. While this only reprc: .. ;cnted a small input of copper into the sensitisin!! line (O.ll-1 k!!-'
wed), it acatnl a potential adverse dkct on pnxluct quality nmtrol.
The wa,11· nipper fines whil·h were nilkcted on the h;Kkwash ha!! filter systi:m (.U1 k!! per
.\days prodtKtion) arc lransportcd to a senm: landfill site to!!ethcr with slud!!e 1·ake from the.:
filin pre.,s. llowcwr. the lines arc relatively pure l·oppn and inn·:-.ti!!ations nmfirmed them
to have a value of approximately l IS~ll.'1.lg corr1·spondin!! to a small potential income of
l 1 S~275 per annum.
h) n11· .\·1•mitisi11g li111· ( l'(('("(rt 1/1·.u plating)
A.; disni,,cd prl'.Viou'ily, I he resulh or the Wa,t1·watn di;irartcri,at ion 'howed that a very high
copper lo;1ding w;1s from the mirrodch rinse ('10 percent of the ,ensiti.,in!! rin'il"Watcr nipper
load). The 'cn,itising line is a manuallv-op..-r;itcd plating line and it was oh-.cnnl that no drip
lime wa., u'nl afrcr lhe microetrh. A onc minute drip lime was thus inlrodur .. ·d and a moni-
1oring programme inil iated to rn·ord improved waste loadings. It w;" suhscqucnt ly rondudcd
th;11 a statir-rinse dra!!-out t;rnk .'ihould he installed in the longer ll"rm to rnlul"l' furthn thl:
running rin"·waler loading from thi, sounT.
c J F/ntrt1{'lari11g /i111•
II wa., nolnl lhat th1· rcrirrnlation pump' on the nipper rln·1ropbtinµ line had lca~inµ
rnrd1anic al sr;tl, kadinµ t11 roppcr rryst;1lli ... ation on thr pump shafh and surrounding lloor
;1rea'i. This copper matnial was _,uh,<·qucnlly picked up hy thr 1kvrlopcr rin'\l". which llownl
dir1Ttly onlo lhr lloor. and di,rhargrd lo thr lloor drain l1·;ulinv to l'il I~. The roppcr loadin~~
frnm thi, 'llllr("(" at llfll' llllor drain dosrd lo lhl" Ckdroplalr rin,c· W;" approximatdy 711 v;d.
•1.1

Case Study 3: Printed Circuit Board Manufacture
II w;1s omsidcre<l th;1t ahht•u;h this pollulion load pa~sin!! to a drain was small. ;1 salisfa..:lt•ry
r.tain11.:n;tnl·e prn!!ramm..: lo pr..:v..:nt all su..:h l..:aks and inst;1lb1itm .,f drip trays and !!..:ncr;1I
deanlin..:ss in 1h..: n•ppc.:r dn-irnplaling areas could rc<lul·c 1his snurw of w;1stc lo;1<lin!! on the.:
tre;1lmenl plant. ( ;, ... ,J housc.:kcepin!! in all 1:oppc.:r pnll·c.:s..;ing and handlin~ areas n•uld
pr..:vt·nt enppc.:r wask loading from otha ar~;1s ( ..:g cnpocr c.:lch and cryslallisalion) frnm
rc.:achin!! the.: drain systl·m.
d! < >ritft• n 1ati11g area
The rinst·w:ikr fnim the <lchurrn in 1he oxide.: coat in;? ar..:a was disl·harg..:d din.:ctly to 1h..:
prrn:..:s" drain. :\ h;1g fiha was all:Khed to th~ pipe.: al lhc outlet I.> the.: drain hul <luring the.:
in-pbnl srudy tht· l·apturing dt·\·in: was incflil·ic.:nt k;1ding to .;i!!niliGtnl quantilies of cnppc.:r
lines lx·in!! 1ck:1snl to th..: drain sy,.,t..:m. ( "onl:tl"I wi1h acid wa,.,l..:Wal..:rs wnuld suh,.,equcntly
dissllh..: the line' in lhe proce-.s drains. lfsing exisling cquipmenl stocks. a dnsc<l-loop
filtralion sy,.,lcm simibr lo rhc.: one.: in lhe -.cnsitising ;m:a was ;1dd..:d as a n.:bti\dy "impk
control measure. diminaring 1hi,., sllurce nf waste n1ppcr.
(') II as/1'1\"tJ/l'T (Tl'tlfllll'lll .ff.Wl'/11
A numht·r of indlicicnt opt·r:itinns in the \\: .... r..:watcr tre;1lm..:nl syst..:m were highlighkd in lhc
wasl..: :111di1. Firs!. alum w:is :1dc.kd 111 thc pit n•rrccled (pit S5) was1ewa1er in Pit I. ,\ham is
:tn dkctive o>agulanl for cnlloidal m;1tcri;1I hul is nnt neces,ary for metal hy<lro~ide precipita·
tion and increase" the volume of ,.,(udge pn•ducnl.
Second. lhl" cxisling o;cdimrnlalion ha ... in w:1s ,,f po11r de,.,ign. ln:1lkquat..: sh1dge removal
capability and floaling sludge wne crt·:1ling efflm·nt di,.,l·h:irgc prohkms.
Third. in an cfforl In o\ncome the pcrindic high k\cls nf copper being di,.,d1arged to the
puhlil· sewn. lwo sand lilters Wt·rc installnl in par:1lkl after the ,t·dimt·nrarion tank. 11111\..:ver.
from lht· rcsulls in Figure (1 ii c;in he su.:n 1h;1I lht· ,;ind tilter" Wert· nol dfcclivt· in r, rnn\in!.!
suspended solids or copper from the.: wastcwaler.
t\s,uminl! a .'ifl pl·rn·nr redudion of l"oppc.:r l11;1ding from !he \t'n .. irisint: micrnl·ll"h rinsL'
tlm111gh improved rin ... ing. and climinalion of rhc et•ppn l11;1din!.! fr.im !ht· dehurrn' and
ekl"tr11pla1ing ;1rea llnor drain. ;i 40 pnn-nl rnlucrion in rir.'t"\\akr loadinl! lo rhe waslt"\\;1ln
lrl·arment plant nu.Id hc achievnl.
Step 16: Targeting and Characterizing Problem Wastes
From Figure f1 ir can I'.,· ... n·n rhal rhc ,;ind lilrn inpul c11nccnlra1i11n•. of \ll'>(h"ndnl '"lid ... ;111d
cnppn arc apprl'ximar.-1~ L'<fU;1l 111 lhc 1tt1lp111 l'1tnn·n1ra1i.111 .. lrom rlw lihn. F11r1lwrmnrl·. rlw
,.,,ppn di .. d1;1rt!nl 111rlw1•11lilic ,cwn \\;h prinurily di"nhnl (1-; · "-"' pvr.,·n111fl11t;il n•ppn
,·111HTnlrali111) and in nn·" 111 lhc "'"\h·r di.,d1ar1'.•' limih ''" d.1~' .1 ;111d .~. 1'r,·vi1111' cxpni1·1Kt·
\\ilh the lr1·a1ahili1v ••I Iii.· prin1rd 1 irn1i1 hn;ird \\;i>ll"Walt·r, h:ul v .. rahli .. h,·d rh.11 lhc dcdrnk"
copper wa>ll'l\al1·r, \\\'fl" 11;ir1inal;1rh dininalr 11111v.11 hn ;111".- 11l 1h1· pr1·,cnn- 111 dwLi1i1H'. ;11~L'nls
.,.,

Case Study 3 Printed Circuit Board Manufacture
in tht.: dc.:ctrok,.s Cl'(l(l\:r plat in!! solution. In additinn. d11.:b1in!! "!!l·nh wcrl· pre,.:nt in tht.: rc..·'i't
strippin!! solution. It w;1" n••tc:d that \\hc..·n the: trc..-;llc..·d rc:,.ist ,.rrip wa' dumpt.:d '" l'it ~''"days~
and ·t si!-!nilic..·;intly hi!!hn n•ppc.:r o•nlYntration' were: 1•hsc:rvnl in the dis1..·har!!c: tn tht.: puhli1..·
s.:wl·r th;m 1•n 1..by' I and-~- Day:' (Friday) r.:pr.:sents ;in atypiGtl wa..;k trealnKnt day a" wc:dJy
dumpin!! of tanks in thl· ,.l·nsiti-;iri!! ;ind 1•xid.: art·as otxurs on thi-; d;I\.
The t.·hd;1k o'lltainin!! o>ppcr wa,tew;1tn ;ind 1..·omhin;1tion" nf l"l'Pll\."r ;1ml l·hdatl· c..·ontainin!!
\\;1s11:wa1.:rs wl·r.: th.:rd1•rc: omsiJi:rnl t•1 h.: "prnhkm w;1o;t1..·,·.
W;1o;t.:watc.:r trc:;1tahility t.:"t" uo;in!! alum. s1~ium h~Jroxid.:. liml· and a rail!!.: ,,f llnn·ufanh were:
conducted on "tmpks from each indi,·i<lual pollutant source: and on nimbin.:J ,.;mtpks. The: tc..·,ts
imli1.:al.:<l that most o•ppc:r n1nt;1inin!! w;1,t1.:w;1tc.:rs n•uld ht: trc..·atcd vn~ 'un:e,.,fully hy mdal
hydnixic..k pn.:.:ipit;1tinn. H1mcvc.:r. the: t.·hdalin!! a!!c..·nh in the dc:t.·troks" rin,l· and n·sist strip
rin"t.: affcctc:J coppc:r hydroxide: prc:cipit;1li1ln and 'honlJ th• rdmc..· he.: "q.!rc!!aled and trc:;1kd
sq1ar;1td~.
As indicatc:d in Tahk I. the tc..·sts on the: inlluc..·nt w;1stt.·w;1kr trc..·atnKnl plant indicall"d th;1t o•ppc:r
could he.: redtKcd from rcbri·.-dy hi!!h com·entr;1ti••ns lo k'\S lhan the:' m!! I st;m1..tml u"i"!! lime..·
anJ ani1,nit.· polym.:r lln<.-cubnl. In !!l.:nc..·ral. lim..: proJucc:J a .nurc.: 1.kn'c.: ;ind s.:ttkahlc: pn:cipi
talt: than sodium hydrnxide ahhon).!h ii !!.:ncratc:d mor1.: slml!!c:.
'1(1

~ Study 3 Printed Circuit Board Manufacture
Table 1: Treatability Tests using Lime and Anionic Polymer
Sample
Microetch rinse
B~troless rinse
Microetch rinse
Copper electroplate rinse
Copper electroplate rinse Resist strip rinse (50:50)
Electroplate floor drain
Sulphuric/peroxide etch rinse
Oxide CoatinJ:
Microetch rinse
n--aJl<'K'Otrr Trcatmc;ll
Influent
"Hourly spot samples
Step 17: Segregation
Raw/Treated
Raw Treated
Raw Treated
Raw Treated
Raw Treated
Raw Treated
Raw Treated
Raw Treated
Raw Treated
Raw Treated
Total Copper 1n Supernata:it (m~,11
260.0 0.3
9.1 9.0
22.0 02
33.0 0.2
19.0 20.0
44.0 0.1
400 J.1
1500 1.1
11 74 13 73 8.4° 0 4 0.6 0.4 4.0 0.7
II wa:-. dl.'.ar from the findin~-; of lhc waslc audil im'l·stigalion~ that waste sq?rq?alion would form
a necessary part of any lori!!·lcrm wa ... lc rcdu,·tion pro!!ramme in order lo dl.'.vclop a technically
sa1i ... fac1ory and l'O..,h:fkl'livc ... y ... 1cm. Thi ... a\pcl'I will he dcsnihcd in Step IH hclow.
Step 18: Developing Long-Term Waste Reduction Options
While lh<.: \\aslc rcd11c1i11n ahrrnarivcs dc~i:rihcd in Slcp IS will rnhKl' pollulanl loadin!!:-. and
rcsuh in ,j~nifirnnl wsl savin~s. an cfficirntly dc,igncd and op~ratL·d cnd-of-pipt· lrcalmrnl
97

Case Study 3: Printed Circuit Board Manufacture
scction dcscri~s the wash:waler lrealmenl and rc~·o\\:rv system design whil·h wa:, Jl.'vdtlpcd frnm
1hc w;1s1e audit and 1r.:a1ahili1y studies \\ilh the assistance of ;1 ninsuhanl engin1.:c.:ring 01mp;111y.
Thl· major points for n1nsider;11ion in the sy!\tem design wen: as follows.
• Segreg;ilion of all the l·heble-conlaining waslcwalers frum lhe ninwntional m:lal hydroxide
precipi1;11i11n system.
• Segrl.'galion and separall.' 1rea1menl.1renwery of all I he chdalc-ninlainin!! rin"l waters and
l"Onl·enlralnl hath-dumps.
• Colk<:lion uf all gl:'nl.'ral hath dumps (nnn-cheblc rnn1aini11g) in a holding lank fnr metering
h;u:k 10 the nin\·enlional tn:;1lment system al ;1 cnnlrolled rate (In prevent surg1.·s in copper
hiding).
• Upgrading of existing plf adjustment. polymer addition. darilic:11ion and san<l lihr;1li11n
systems for cllicil·nl mct;1I hy<lrnxi<ll.' prel·ipilalion and suhseqm:nt <lisch;1rge tlf high qu;1li1y
,·rnuenl.
Informal ion tln the type of chclator or l·hd;1tl.' n1ncentra1ion was nol n:;1dily a\·aih1hk from the
l·hemic;1I suppliers.
The sources of chelate containing w;1stcwa1ers were as follows:
Source Flowrate (l'h) Copper Concentration or Volume (litres) (mg·I)
Mild Alkaline Cleaner Bath 400 litres 637 Mild Alkaline Cleaner Rinse 518 litres 0 8 (max t.7 mg l) Electroless Plating Bath 588 litres 11000
Electroless Plating Bleed 10 l.'h 11000
Electroless Plating Rinse 7701/h 7 7 (max TO 3 mg'I) Resist Strip Bath 9201itre:. Less than 5 0 Resist Strip Rinse 390 llh
The proposed lrlalmenl system incorporates the following key clements.
• ( ·olkclion of all non-complexed rinsew;itcrs in a nimmon sump for pl I adju,lml·nt with
c111'1 il· (or lime) lo pll '>.II - '15. • Installation 11f a static-rinse !;ink after the clcctrolcss rnpper platinl! hath. The static· rinse
lank will coll.:cl mosl of the drag-mu huling from the declrokss plating h;1I h and will
lhl·n he dumped daily for dn-irolytic recovery. The suhsequenl l'11ntinuou,-now rinsewa1cr
(l·hcble·nintaining). operated on a counlcr-rnrrcnl prinl·iplc. will thl·n he disl·hargnl
directly to lhc puhlic 'l"\\U.
• Scgrrg;1I inn. r;1rl ridgl· fill ral ion and dirlTI di,chargc of rcsi'I ''rip rinsl·walns ( rhdall' ·
conlaininl-!) 1111hr darilird w;11cr sloragr t;111k.
• Segrrgalion and din·n dischar,~r of dn·trnlc'" plalinl-! running rinsl'\~akr' and ckann
rinsl·warcr .. (rhrlalt .. ronlaining) 111 lhc darilicu w;1ln slor;;gc lank.
11X

Case Study 3: Printed Circuit Board Manufacture
• Segn.:gation ;ind colln:tion of resio;t strip ;ind de\"clopcr dumps (or hked) in ;1 o;c.:parate
holdin!! t;1nk for pH adjustmt·nt and din.:ct d.schargt.:.
• St·gregation and colle<.·tion of dectroless <.·upper ( chebtt·-nintaining) hath dump<;. control
led hlet·d and dra!!-out tank n•nlt.:nls together with alkaline deaner (t·helate-nin\aining)
and microett·h (sen'iitising) hath dump<; in ;1 separate hat<.·h rn:irculation tank for electro
l~tic copper renwc.:r. p,,.,_.,ihle alternati\"es invoh·ing sulphide precip;ta1ion or sodium
ht1rohydride tn.:atment \\;:re ;if,o ninsidered hut discounted on kchnic1l and n•st grounds.
• Polishing of dt.:drnl~tically tre;1h:d solutions in a chelating ion ext-hange resin bed prior to
dist·harge to the cbrifit·d water storage tank.
• Se!!regatinn ;ind collc..Ttion of gen.:ral h;ith dump'\ (cg miaoetchcs. predips. a,·ids. alkalis.
etc) in a h11lding tank for suhsequcnt mct.:rin!! into the pH adjustment sump.
• \lodificati11n of the existing sedimi:ralalion tank to incorporate a darificd water storage
tank and prmision for t·;1pturc of a<.Tidental spills ;md emergen<.·y wa-.te storage.
• Pn1\ision nf :•" =~dined-pbte darifier foll11wing exi->ting pH ointml and llo.:rnlati11n units with
sludge pumped 111 a <;fudge <;lora!!C thickcnin!! tank. Thickened <;fudge will then he pcriodi
G1lly pumped from the storage lank for dewatering in the filter-plate pn:ss. The· reduced
rnlumc of sludge cake will then he di<;pos.:d of in a secure landlill silt:.
• Although it is considered tiut the eflluc..·nt copper co11centr;1ti11n fmm the pr11p<1'icd
treatment system will t·omply with the cxi-;ting discharge standard 11f :'i m!!,'I. it was reeom
mcnded that the comp;my·s sand filters he upgraded and indudc<l in the ln:almenl s<.·heme
in anticipation of !he propo·,::<l lowcring of the slandanl lo 2 m!!-1 of <.·opp.:r. In this case. the
darified wastt·water should he polished through a <;an<.Lmthracitc dual-media hcd to in
nease the solids loading c1pa<.·i1v of the filters.
Step 19: Environmental and Economic Evaluation of Waste Reduction Options
J\<; Company(' was facin!! lc!!al acti11n from the h1cal authority with rcspn·t to viobtion of di-.-
~ harge standards. th.: return on im1..·stmenl was not of prime conn-rn in this Gtse <;ludy; of more..
importann: was the development of the most cosl-l'ff<.Ttivc reduction 'w;iste !r<.'<tlmenl <;ystem
avail:ihlc. and a •1uali1y of fin;1l efllucnl for sewer di,1·haf!!t" compatihlc with the loG1l authnrity\
cn\ironmental poilut ion <.·ont ml r.:quirrmcnl~.
From Slep IX a numher of waste lrl·atmenl reuivcy alle1 natives wl·rc identified and a pron·,,
desi!!n suhscqm:ntly derived on the h;1sis of tn·hnic1l considcrati11ns. I !owner. through !he wa,li.:
rcdtKI ion op port unit il·, donihcd and I he segre!!al ion and recovery of copper from thi.: chela1i.:
ninl;1inin!! and mirroctch (sen<;iti\ing) w;1-;tcs ii was rslimated th;1I a n"I s;1ving of l iS~22,!KKl per
annum on slud!!e lramporlalion and \c;ure landlill lhpmal nish n111ld he realised. In addirion.
it was esl imalcd that apprnximatdy l IS~.~.51Kl per ann11m of copper could he rt·rov,· .:d usin!! I he
.:kr1rnl~1ic rcwvery unil.
Tlw lnlal inslalled ro'I of thc propo<;nl 'Y'l1:m indudin!! llw m;1j11r cquipmrnt i1c1m (inrlinnl
plalc rlarilin. 'ludi~l' 'loragt-.'thickc11ing tank, lilrcr-plalr pre". rkl'lrolylic copper rcna\,·ry unil,

Case Study 3 Printed Circuit Board Manufacture
ion exchange unit) segregation pumping and piping. inslrumenlation an<l conlrol and .UI m2
h11ildir.g was USS~65.000. Howe\·er. considering the company·s history uf pollution pnihkms. the
impending legal action and lhe amount of lime hcing spent hy seni:ir personnel on day tu day
waste management prohkms. the implementation or lhe waste segrt·g;1tion ;ind trealmenl.'renw
ery system could he considered money wdl spent and an investmenl for the future.
Step 20: Developing and Implementing an A~tion Plan: Reducing Wastes and Increasing Production Efficiency
The results or the waste audit and the waste reduction.'lreatment studies were presented lo lhe
company's management ;.nd plans were made lo implement the recommended wash: redudiun
measures and the lreatmcnt/recuvery system.
The waste audit-reduction appmach achie·:cd lhe rnllowing ohjectivc-;.
• A sound understanding of all the sources or waste cnppcr al the manufacturing pbnt.
• ldentificatiun ;ind quantifo:ation of the major sourn:s of wash· copper.
• E\·alualion of processing cfficicnci.:s from assemhlcd informal ion on un!1 pro<.-.:<~t:s.
raw materials. waler usage, products and wasle gen•;ralion.
• Identification of waste reduction opportunities.
• Elimination of some wastes and associated disposal prohlcms.
• ldentifica1i11n of prnhlem wasles requiring special altenlion.
• The development or a cost-effel'livc. ink·graied waste s.:greg;11ion and wash:Walcr treat
menl/recon:ry system.
• The development or a waste management system which would comply wi1h discharge
regulations and n:sulr in improved puhli<.· rebtions.
100

CHAPTER4 RESOURCE SECTION

APPENDIX 1: WASTEWATER FLOW AND GAS MEASUREMENT METHODS
Wastewater Flow Measurements
Thi-. -.cdi.lll Jc·snit~- ... impk mc·1h11J-. llf m1:;1 ... urin!.! n .. m ... in opi:n diannd.; u.;m!.! triall!.!Ubr
lll)ICh ( \' -no1d1) 11r rcrtan!!uLir thin-pbk wi:ir,,.
Th1.: dis .. ·h;1r!!l: o\·cr thin-pbk wi:ir- i-. a fun,·1i1lll of lh.: depth (hc:1d) of liquid 1lll the weir. the
,,i11.: and 'h;1p1.· ,,f 1h1.· di ... charl!c ar,·;1. am! an o.pi:ronK·ncallv tkll'rmiri .. ·J ,. •1.:ffi..-i.:nl.
Thin-pLit.: \\cir-. ,,h111ild he \crlicil ;111J p .. ·rpcndi~·ubr tP th1.· \\;111,, 11f th.: ch;innd. r11n,,lrul"lnl
in ... r..:d. w1 '"J 1 •r 'imibr "mllot h-,,urf;K-:d n ihu,t m;1t.:ri:1L
Th1.· in1c.- ..... · .. ·1inn 11f thc· \\cir pbll' with the \\;111.; and llllllr nf the ,·hannd 'h"uld he \\;tlcrlil!hl
;ind firm. pull~ 11r ,1th1.·r ,,uit.1hk nu1.:ri;1f hcin!.! 1i-cd ;1:-. a ,,c;1bnt as appwp~i;1le. \\cir-. arc
h1.·-.t in,talkd under no-llow ,-, 111Jit i1 in-. to cn,urc I hat a !!110d "c1I i-. ,1h1 ;1in.:d. \\.her.: \\ a ... 11.·\\ ;11.:r
lln\\' nllrm;11ly ;1risc.: ~.t h11ur" p..-r d:1\. 7 d:1y' p.:r \\1.·d.. chi ... c;in crc;1l.: prohkms unk-.-; proJ1K-
1inn cm he.· 1.:mp11r;1rily slnpp1.·d. In sut·h cirn1mstan.....- .... 1h1.· \\<.:ir \hould ;11 ka.,l b.: in-.t;1lkJ
under l11w-ll1m n,nJi1i11n-. in 11rder I" Ltcili1;1lc ;h,· in-.1;1lb1inn pr.1C.:durc :ind 111 minimi-. .. ·
ri,i.. nf k;1k-. :mHmd or unJ.:r the \\<.:ir 11c..-t1rrint:.
In !.!1.·n1.·ral. the weir -.h1n1ld h .. · l11c1lcd in ;1 ... 1r;1id11. hmi11111L1I. r..-rlanl!ul.ir d·:mnd if
pn"ihk. hk:1lly the kn!.!lh of the· ;1ppn1;1,·h dunnd 'h.iuld nol h1.· k,_, th;1n 111 tim.:-. the \\idth of
th.: ic1 ( nappe) f11rmnl hy ch,· lln\\ 11\cr the \\1.:ir ;1t 111;1\imum h,·;id.
Th1.· ,f1.1pe :ind -.i1.: 11f the· rhannd d1mn,1r..-:im fnm1 lh1.· \\1.·i~ j, 111 n11 ,i!!nific1nc1.-. hut th,· k\L·I
,,f the \\;tin in the down,lream t·hann .. ·1-.hould h,· a -.uflici,·nc \crli,·;il di ... 1:11K ... hd11\\ lhl· cr..:-.1
ln cri...ur..- fr..-,·. full~ -\·entibtnl di,durl! .. ·'·
\"-nolrh \\1.·ir' pnmir !he accurate· n1t.::1,ur1.·ni..·n1 11f much lowc~ di-.d1:1rl!C'- rhan rl11 rn·r 111!.!U·
br w,·ir .... .-\f,11. rh .. · di,charl!,. 11.-..·r a\" ·n111,·h inn1·:1>1·, nH1r1· r:ipidly with th1.: he:1d than in th1·
c1 ..... · 11f ;1 r1.·l"l:1ncul.1r wc·ir. Thth, \\h,·re 11,m \ari;1ti11ri.. ,,\.t·r ;1 \\·orkinl! da! arc· brl!'" the 11f ;1
tri:1111!11hr-n11fd1 I \"-11111dl) weir j, prekrahk. l'or brl!e 1111\\s however. a hroad-nl·,fl'd rcl"f:m
l!lllar \\..:ir may h,· nl·..-,·"·'n.
\\here 'ii.!nilil·;1nl 'l"P' ndnl '"lid' arc pr1·.,..·n1. care· .. h1111ld he 1:1krn ro en,urL· 1h:1r tlwrc· j,
no an·1111111bri11n of tl11,irin1! drbri, or ... v11kd "'lic.f, hd1inc.l 1h1.· \\1.·ir :rl rh~ 1im1· 11f \\;1tn k\,·I
(lw:1•l) mr;1,11r,·mt·nt.
Triangular-Notch (V-notch) Weirs
The· rri.1m'.t1Lir \\c·ir 111n'i'h 111 ;1 '\n1111L·1ril;1f \ ,h;1pnl nPfch in ;i -..-rric.·al thin plafl'. ,\ dia
)'.r;1111111.1ti1· il111 ... 1r;1ri11n j, ... h11\\n in h1'.llrl' 1\.
If ll
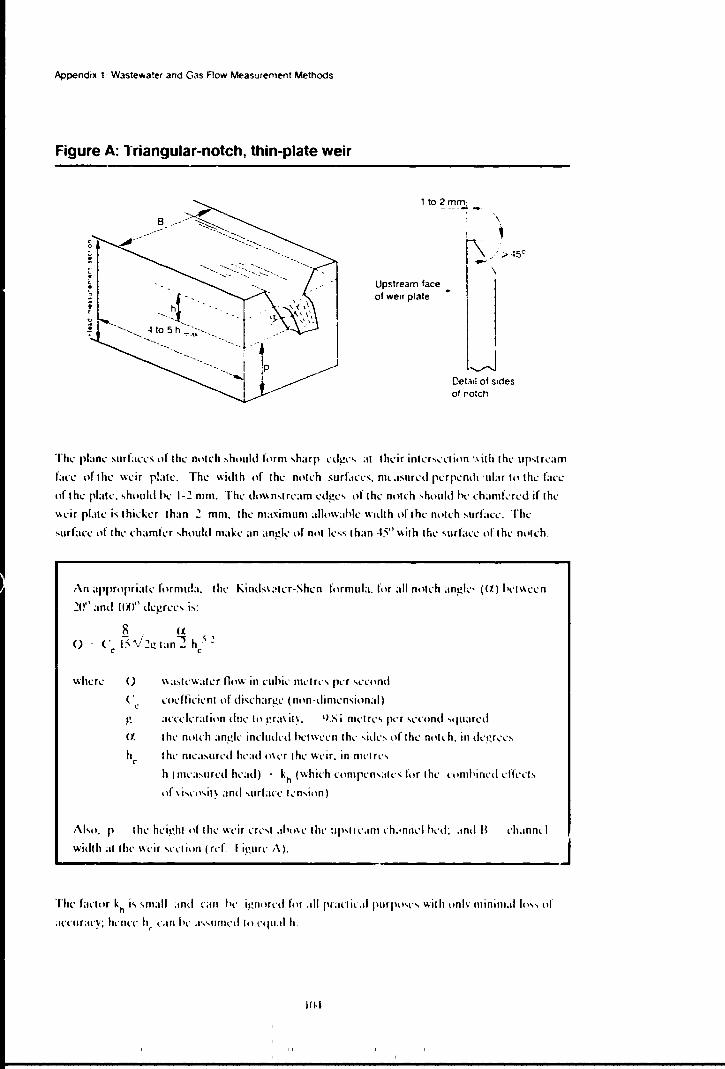
Appendix 1 · Wastewater and Gas Flow Measurement Methods
Figure A: Triangular-notch, thin-plate weir
. ~ r u .
B
hi- ---. -. ... _ ~ ~ -- .
j
1to2mm·
Upstream face of weir plate
-- ... ~
-\ , \
Detail of sides of notch
Th1: pbnl· surf.Kcs nf the notch ,hould form ,harp l·d!!"' .1t tht·ir inkrst·<·linn •.\ilh the up,trt·am
bet· nf I he \\t·ir pbtc. Th1: width of 1h1: notch surf.Kcs. mt ;isurt·d p1:rpl·nd1 ·uLir ll • t ht· face
nf the plak. ,hould h.: 1-2 mm. The d11\\n,trt·am nl!!e' t•f the n1•trh ,h .. uld h<· ch;1mf,·rcJ if the
\\t·ir pbtc is thit·kn than 2 mm. the maximum ;1ll1•wahk width of the n1•t<·h '11rf;ll'1.'. Tlw
,urfon: of the <·h;1mkr ,hould make an an!-!k of n1•t k's than -l'i" with the surfarc 1•f tht· n1•1l'h.
An ;1pprnpri;11l' formub. till· Kindsv;•ter-Sh.:n formub. for ;111 n1•ll'h ;tn!!h:' (U) h<·l\\l.'l'n
20'' and ((i(I" dq.!rt-.:' j,:
0
()
(' c
\\;1.,1l'w;1tn ll11w in n1hir nll'tr1.·, per 'erond
rodfi<·irnt of dischar!-!t' ( n1in-dimt·nsi1111;1I)
CY. the notch ;tngk indudnl hrt\\L'l'll 1h1· ,ido 1•flhe notd1. in drgr1.'t'\
hr the ml'a,urrd lll':1d 1t\1·r tht· weir. in ml'lrt''
h I nlt';1,urnl h<·ad) ' kh (\~hi<·h n1111rll·n,alrs for lhc u•mhinnl dfcrh
11f \i,.-,,,il~ and ,urbcr kn,ion)
Al,11. p lht· lll'i1'.hl nf rhc weir nc'I .1hc1\1· lilt' :1p,l1L':1111 ch;•nncl hnl: .ind B rh;tnncl
widrh ;11 lhc \\t·ir '<'l"li11n (ref. h1'.ur1· :\). J ----------Thl' far111r kh j, \l11;11l ;111d ran he ignornl fnr ;ill pr:KI i1·.il purp1 "<'' wi1 h onl\ minim.ii 111" of
.1rn1rary; hcnn- h .. 1·.111 h,· .1·,,11111l'll le1 rqu.il h.
111·1

Appendix t · Wastewater and Gas Flow Measu,em- nt Methods
(" i..; ;1 funcli1>n ,;f the llm.:e \;1ri;ibks - h :'· p B :ind a. h•r mllsl purpp..;,·s. use· :•I ;1 ,1;md
;1rd \;ilu,· .,f 0.1• \\ill gi\c -.uffi.·i,·n1 ;1<Tur:u:y. For fur!i11.·r inf<>rm;11i1>n on 1h1.· 'm;1ll v:iri;i-
1ions ,,f ( ·., und..-r difkr1.·n1 \\1.·ir n•ndi1;ons. rd .. -r .. ·nce may !>1.: m;1d1.· lo 1h1.· ln1.:rn;1li1•n:tl \l:ind
:inl '\\.:iln Flo\\ \le;1sur.:nll..'nl in ( )pcn l 'h:mneb u,,ing \\ .. ·ir' :md ·; .. ·n1uri Flume<. IS<) 1-l.'-'-' I.
('1:-;o.
!!. () ' - ,,
h•r rc;i"'"" n:blcd I•• m.:;1-;ur.:menl-.:rn•r ;111d Lid ,,r ._·xpcrimcnl;1I da1;1. limi1:11inn-; applic.1hk
10 I h.: u'e '1f I his formub arc
• h ·r limi1cd In 1h .. · ran!!L· ll.1-2.fl f11r :1 1111'' \'-nPlch. ;111d n1>I gr.:;111.:r 1h;in .'5 for all olhcr
angks within the range 20"- lf)(I'':
• pBlimitcdll• 11.1-1.11 f1•r a'IO"\'·nolch. :inJ!l.l-l."ifprplhen:ih1 .. ·soffl.:
• h n1•I kss 1han II.fl" m .. ·1r.:':
• n nol k-.s lh;tn 0.tl'I mdres.
In lhc ;111' .. ·ncc of n>nlinuous kvd r..:nirding ..:quipml'nl (\\hi.-h ni;,y he ,,f :1 lypc which :11110-
n1;11ically r.:l·nrtl, k\d, ;1, llow f1•r a giVL·n \\ .. ·ir l\p .. · ;ind 'i1e ). weir height re;1ding-. m;1\ h,:
taken 11-.ing a c1lihralcd dip~li<·k i1'"ition,·d in 1h .. · centre ,,f 1h .. · ch;mnd up,lr..:;1111 llf 1h .. ·
w .. ·ir. ;1\\ay from 1h .. · immnliall' r·oinl of 1urh11knc .. · al the \\cir. Till' l1K;1tion llf !he dip-.ri,·k
\\ill he -.;1ti-.Ltch•ry if it i-. :11 a di-.1:inn· .. ·qual In .t-.'i 1ime-.1he maximum ;111ti<ip;1h'd lll'.1d (-l·"
hm .• J up-.1r .. ·am from !he weir.
\\'irh 1h .. · hnllom of 1h .. · dip,tid; in n1nlad wi1h 1h,· base of lhl· diannd. 1h,· dq11h n' irnrnn
sion ;11 ;iny 011,· p11inl in rim .. · \\ill equ;il h · p. Knnwi11~· p, !! c.in lhvn h .. · c1kub1L"d h\ difkr·
L'lll'L' and in'l·rll'd inlo lhc \\cir f,.rmub In t1hl:1in l~•l' 1 ... :.,;1ondinv !low rail' (0).
:\ltnn;11ivdy. iii-. r,Tt1mn1<·1Hlnl 1li;11 ;1 ~·.tlihr;1lio·1 cunc he ,(r;1\\l1 up for ;111\ on .. · \\l'Jr \Ill'
for ;1 r;1n1'.l' of h v;ilucs and n•rr..:,pnndinf'. () \;ih11·.,. T;1i, shnuld hr d11nl' hdnr,· r11rnrnn1Cinl'.
llm\ m,·;1.,11r .. ·nwnl \\11rk .,,, !h;il () \;i(u,·-. c;tn h,· ;i.....,c.,.,cd quid.I\ frnrn lhc l'.r;1ph "' '""n "'
\ahtl'\ 111 h ar .. · r,Tnr<kd.
Ind rl11\\ rail' rnl'.1-.url'llll'llh 'h1111ld h,· lal..cn ;11 !..;1,1 onrl' p.-r h1111r. \lnr,· fr,·q1;1·111 me;...,.
11rcmenh m;i\· h,· m·n·.....,;n\ dqi..·ndirw. •lit 1h1· p;1llnn 111' 1111\\\ ,·\pl·ri,·nl'l'd. Th,· d:1L1 c111 lhl'n
lil' ·""'"'·d 111 pi\l' .1n ;1vn;1!'.<' 1Ltilv .:<1W 1m' d) .ts v.,11 ;1-. .111 indic;ili111111l 111inim11111 :t11d nu\i
11111111 i11"Ltnl;ir1t·,.1i... di,d1.1r1'.<' r;il··,.
(( )~

Appendix 1 Waste.~ater and Gas Flow Measu1emen! Me!"lods
Rectangular Weir~
.-\ rn·tangubr thin-pbh: \\L·ir is :1 ~..:n..:ral da."itic.1ti1>n in whid1 ilK· r..:d:1n~ubr-n.>kh \\l·ir i, th,·
h;1:-i.- fprm .md thL· full-\\idlh wL·ir j, ;1 limiting ,·;is..: .
.-\ di;1gr:1mm;1lic ill11'1uli1>n is -;h,mn in Fi!.'.urc.: B \\ilh inkrmc·di:1r.: \;iluc» 11f h B :111d hp. \\ h..:n
h B - I. th:11 i'. \\h~·n lh..: widlh 11f lhl· \\..:ir (h) j, c:qu;il :11 !he: \\idlh 111 !he.: d1:1nn.-l .11 1h,·
\\l·ir -;l·di1>n l Bl. 1h..: \\l·ir j, ;1 full-\\idth \\cir f\pL· ( :1!"' rl·krr..:d I<' ;i' ;i ·,uppr..:,,l·,r \\,·ir. hl·
cn1,,· ih napp..: bd.s -;id.- L·1intr:1di.in,).
Figure B: Rf!ctangular-notch, thin-plate weir
()
wh,·r1· <) \\;1,(1•\\;1kr fl,1\\ in l llhic llldr,·, rwr "·c1111d
,., id lici,·111 , ,f di,, h:trl!,. 1n•111 drm.-n'i' •r1.1l)
1 to 2 mn1
Upstream face of ,.,eir plate--
I I
I l~
Detail of erect ard
s1c!ec of no!.:n
I• lmv:1q1r.-d 1\id1h1 · k1, 111:1id1 ,·,1m1"·m.1ln lnr rh.· ,nmhin,·d ,·Ike!' .. 1
'i"·11,i11 :111d -,11rL11·,· k11'i1111 l
h lh.- nh":1,11r1·d h1·.1d "'"r 1h.- ,,,·ir. i11 mdr.-, ,.
ri.·I hnl: .111d II
11 lh

Appendix 1 : Wastewater and Gas Row Measurement Methods
The factors kb am! kh arc small and can he ignored for all practical purposes with only minimal
loss of an:ur:u:~; hence he: and he can he assumed to equal hand h respectively.
For rectangular weirs. Ce is a function of th ... two vari;1hlcs. hip. piB. As for V-nctch weirs.
use of a standard "·alue of 0.6 will give sufllcient accuracy in most cases.
The rcl'langular weir formula can therefore he simplilieJ to:
0 = 1.77 h h:i:z
For conservative practice. limitations applicahle to the use of this formula arc:
• hip not greater than 25;
• h not less than IUl3 metres;
• h not less than 0.15 metres;
• p not less th;:n 0.1 metres;
• either (B-h),'2 ""' 0 (weir full width of channel) or
(R-h),2 is not less than II.I metres (concentrated weir).
As in the case of V-notch weirs. th1: lm:ation of the head-mcasur1:m1:nt scl"lion will he
satisfactory if ii is at a distance equal lo 4-5 1im1:s the maximum anticipated head (4-:'i hm;ix)
upstream from the weir.
Gas Flow Measurements
In the cour~e of gathering gas now data for environmental control or a waste audit. now mca·mr
ing equipment is often lacking, or the vdocity of the gaseous emi~sion is loo low for measw1:
menl. Even when the velocity is high enough for mell:r mclhod~. the grnmetry of the system
may make the mea~.•1rcmcnl diflieult or ~uhjerl lo error. C'onseqm:ntly, a method is needed
for a qui(·k ;rnd fairly arrnrale measurcm<:nl of gas now, that can he operal<:d without the use of
cxpen~ive or time-consuming installations.
In mo~I cas<:s the following method will work (or serve as a \alid do11hlc-('hlTk) if only the gas
ran he made lo now I hrough an <t<.Tessihlc oprn-cndcd pipe or duct: it has h<:cn developed hy
the C'hl'sapcakc Corporal ion, Virginia, l ISA
107

Appendix 1: Wastewater and Gas Flow Measurement Methods
A plastic bag with a hole clit in it is placed 1m:r the end of the pipe or duel. causing a small
resistance hl the now. depending on the size of the hole. Hence. a manomckr reading of the
pressure drnp acrns~ 1hc bag orifice accomplishes the purpose of an ordinary orifice. A dia
gram of the bag or~licc is shown in Figure C.
Figure C: Measuring Gaseous Emissions Through a Vent Using a Bag Orifice
Manometer probe
' \ -01 .· 1,-...i ,--
~~, .-L .
.c...~:'\ ,. , I
.. - Orifice
,,,' I ~- -
Heavy 1 ~' Vent pipe . I
Hand-held manometer
twine 3: 1
~ Sine.: compressihilily can be ignored for small pressure drop~;. lhe general orifice equal ion
applies:
when~ () gas now
g - lhe acceleralion due lo gravi1y
;\ ·- lhe orifice area
h I he pressure drop
K - lhc disrharge rodlicienl
indu<ling lht: vdorily-of-approach faclor
Where lht: hag site is large rdalivc lo 1hc orifirc di;1mcler, 1he vclot:ily-of-approarh farlor can he
takt:n as I.fl. Expnim1:n1s wi1h diffcrenl hag 1hicknesscs, now rates and air densilics havt: 1hen
shown Iha I the orilirc cqual ion ran hc rcwrillcn, intkpcndenlly of hag lhirkncs.'i.
IOH

Appendix 1: Was;ewater and Gas Flow Measurement Methods
The "implificd formula is as follows:
when; () g;1s llow in lilrt·s per sec:ond ( 111 wi1hin ± ~'; ) D !he orifice diamclcr in millimelres
h !he prc-;sure drop in millimelres
f1 !he g;1, dcn-;i1y al lh..: gas l.:mjl<.·ralur..: in grammes per lilr..:
In sdn·1ing a sui1ahk orilic..: site. ;i prcssur..- dnip of 25- lflll mm waler !!;Hl!!C should he soughl.
Less lh;in ~5 mm is diflicuh lo m..:a·mrc. ;md !ffl';tl..:r lhan 11111 mm m:1y make lhc hag ,.,lip oil
!he pipe. If a r11ugh c..·'ilimal..: of lh..: gas lfow is known. lhe h,1k diam..:h.:r (mm). nc..T..:";ir~ lo
produt·..: ;1 pr..:ssun: drop of h_; mm. is approximaldy:
S..:\..:ral kalurc~ of I he d..:si!!n can minimise c..·m ir. T!ws..: an: as foll11w ....
• The posi1ion of 1h..: manon;dcr proh..: -;hnuld proj..:cl sli!!hlly throu!!h 1h..: hag wall. so lh;1I
1h..: axt·.·. of lhe \'ent pip..:. the h;ig orilin: and lh..: prohe rnd arc all p..:rpenJinilar (rd. Figure
( '). and so Iha! a I rue indiration of sl;ilic pressure can he ohlained.
• Th..: hag :-.hould he large rn11ugh ':> minimi.,e lhc dfel·ls of approach vdori1y and lo pre
vrnl !lapping or lcarinµ.
• Th..: orilic·e di;.mcler should he measured durin.l! opaalion. so as lo ohtain tru..: op..:r.11in1!
dimension-.; if slretrhi;ig r;mscs ;in cllip1ic;1l orilin:, the ar..:a sh11uld h..: l>ascd on th..:
prndtKI of the major and minor axe:-..
• Thin-walkd I -'1!'· high lernpcralur..:s and hi).!h vdociti..::-. .,hould he..· a\11ided ,inn: llutinl!
outward of lhc..'. orifice nlgc..·-; '>I.ill lc.."nd lo occur; when pronouncc..·d. lhc..: dkcl would he 10
inn1:;1"•: th.: Ji-;d1argc..: codlicicnl as 1hc shape of 1'1e nrilin: approadie' Iha! 11f ,1 no11k.
hnall}. when members of the wast..: audit lc..";1111 make..· a h;1g nrilin- mc;.,.,urt·mcnl. ii i' important to
ensure that adcqu;1lc..: slqh arc..· lakc..-n to prc..·\c..·nl hurn' or fnmit'.alion.

APPENDIX 2: GLOSSARY
RODS: hinchemical tlxygen demand; a measure of 1he qu;mlil~ of <liss,1ln:J •>XY!!en o>n-.um..:J hy
mil·r,,org;misms as ;1 rt·suh of hreakdown llf hi11de!!r;ubh!c tlrganit· 01ris1i1uen1S. The slanJarJ
1e-.1 is carried oul al 21l"C 1wer a .'i-Jay period.
Ry-Product: a secondary or inc.:idenlal prodtll'I of a rr.anufac:lurin;: prnc.:-.s.
( ·atal~·!'>t: a -;uhs1;mn: that im:re;i,es the rah.: of a l-hcmic:;1l reaction\\ i1hou1 ii-.df undergoing any
permanc:nl l·hanl!I.'.-
(·on: 1.:hemical ox~g.:n JcmanJ; a measure of 1he quanlily of Ji-.,olveJ nxyl!cn o>nsumcJ during
chcmic.il oxidation of waslc\\;11cr \\ith polas,ium dil·hromat..:.
Counter-Current Rinsing: lhe in1rod111:1ion pf walcr or a soh.:nl in lh.: opposite Jircc1ion I•> lhc
prnducl tl11w.
Discharge Points: 1hi-; lcrm rdcr-. lo lh..: poinh of cxit 1-.1r w;1..;1cw;1lcr lc;1vinl! !he sile ,\Ji,
c:harge poinl may ab11 rdcr lo llll' pbr.: \\h..:rc ;m inromir.!! l;mk..:r di-;c:h;1r)!CS a lo;1<l.
Emis!'>ion: an cmi.,si11n usually rdcr-. lo fugili\c "r \\;1stc Jj,l·hargcs from ;1 pn>cess. Emi,,ion'
arc tradilionall~ as,ociah:d \\ilh ;1lmosph..:ric di,d1argcs. :\II -.ut·h di,l·hargc' arc h:rmvl wa,ll'
wi1hin the conlcxt ofthi' manual.
Energy Audit: a quantilali\c ;Kcotml of lhc energy inpuh and outpuh to and fr11m a unil op.: ra
tion. ·1 proc.:". a plant 11r an ind1hlry.
(;a!'>t'OUS Emis!'>ions: ga,.:ou-. cmi,,ion' cm he cb"ilinl into ,c,eral c1t•·!.!1>ri,·,: pure· c'.a''' or
\ ;1pour'. comhinat ions 11f l!ase' and ''•lids. c• m1hin:il i11n' 11f I!;,,,., and liquid, ;ind u 1rnhin;1I i, 111' 111
case\, liquid' ;111d solid,. Th..: f;i,t I hr..:c G1lcgori..:' ar,· l 11nsid..:rc·d ti 1 he l!;"c' HI' l·mi"ion-;
h,·c.1Usl· the l':t' i-. thl· rarricr f11r lh.: -.olid 11r liquid ph;1'<'
\laterial R;ilance: ;1 prL-ci'.: acn111n1 11f all till' inp11h and oulpuh ,,fa pr11n·, .... h;1-.cd nn 1h, l;1\\ ,,f
t·1111'..: f\ al ion of 111."'·
:\lnnitorini: Pro..:ramme: ;1 111oni111rim~ pre wr.11111110..: I h.1t de" rih1·, .1 I imd ;,hie- f11r rc.!.!uLtr ,;im
plinl! and 1t·,1in.L'.11f cquipnwnt. purnp'. pr11chKh.1.1.;htl'' ;rnd l'•·nnal "l•.:ralinn' In l·n,ur..: that
;rn~ d..:\iatinn' frnm th...- norm ;11,· nolirL·d ;ind can h,· rcctificd bd11r,· pr11bl.-rn-. r..:,1111.
OJK'rat in~ ( ·o.,h: ;ii'" !-. 1111\\ n ;r, \ .1ri;1hk 11r runninl'. u "": th,-~ r• · k r In ,., ''', 1.1. hid1 \ ;1r~ dirn·t f\
\\ilh the rat,· of lllllpu!. lor' \;11npk l.1hour l'•''·"· r;i\\ rn.11l'ri;1l l·"'"· ru.-1. (hl\\l"f, l"ll-.
111
Appendix 2. Glossary
Plant: in the conlcxt of !his manu;1l a pbni rekrs hl the factory sitL·. A pl;ml may nimpri'it." a
numhcr of prnc:css..:s. adminis1r;11ion buildings. sile \\a .... le 1r;;;ilmcn1 f;Kiliiie ........ iie ... h>ra!!<.: f;Kili
tie-;. de
.-ollution: the lcrm desnihes the pn.:scncc of harmful. ha:.r;1rd1Jus 1Jr di.:triment;1l om .... iitucnts in
an cn\"ironmi:n• .. -\ pollukd en\"irnnment descrihcs a stale that tllTUrs wh..:n !ht: assimilati,·e
l·ap;Kity of the ~m·ironment is t.·xn:edt.·d. ri:suhin!! in undesirahk ewlo!!ic1l chan!!L"S.
Process: in the cnntexl of th:-.. m;inu;1I ;1 prtll"t.·ss i .... l;1ken hl indudc ;ill operation" im·ol\"nl in
production. Therefore. a pro<:t:s.., m;1y hc!!in with receipt of raw materials. stora!!C ;md handling
through pro1:ess technolo!!Y to prodm:t handling ;md wasle lrt:atmenl.
Process How Diagram f Pt'I)): an essential lool in dt:\"clopin!! ;in or!!;mi.,ed dia!!rammalic presen
tation of a prtJcess.
Process Inputs: defined as one half of the m;111:rial h;1lance equal ion. Inpuh Ill a process may
comprise raw mall:rials. waler. cnergy. clc.
PrCM.~s Outputs: 1hc sccond half of the material habnce cqualion. Output ... from a pron·ss may
indude a prnducl. a hy-pro<lul·t. w;islewaler. !!ascous. liquid and solid w;istes. hcal. etc
Product: the u .... dul material outpul from a priin:ss.
Raw Material: a malerial on \\hich a parlicubr m;mufoclurinl! proi:css is carrit:d out.
Rel·mery: W;ISIC minimisation cm hL· ;Khic\"cd hy rcrovcrinl! valuahlc mali.:rial frnm ;1 waslc. for
cxampk. dcaninl! solvcn~ ran h1: rcrmacd frtJm wasl1: oil. ReoJ\·cry often involws advanccd
lt.•t.·hnolo!!Y sud1 "" ultrafillr;ition 11r rL·\cr ... c tJ-.mo .... i .... allhoul!h .:.impk scllkmcnt ran sqMratc oil
and \\ akr solution ....
Rel'~c:lt•: thi' 11.:rm rcpr1:st.·ni... an important asprl'I of \\;1ste minimi ... ;ition. Thc n:rydinl! of \\;ist1:s
within ;1 prorl's' oftcn rnlun·., thi.: fri.:sh m;1h:ri;il input rn111ircmi.:n1. For L'Xamplc. a 'ol\cnt u ... cd
ftJr 1·k;minl! cn,!in.: p;1rls r;sn ofti.:n ht.· \h;.·d twirt.· hdorc ih di.:an ... inl! powi.:r i .... t.·xhau.,lnl.
Reuw: 1hi' j.., an imporl;mt r11nsidn;11i11n in w,....,k minimisalinn. If a \\,1,tt.· cannot l>L· rt.·dun-d
c1n ii he rt.·11.,t:d'.' Rrusr rcprt.·.,l:nh ;1 'L"l'ondar~ lint: of .1dion in ;1 \\;l\lc r,·du«lion pl.in.
St·~n·~alion: I hl' I nm 'C!-!HT.<11 ion rl'frr, Ill i'obl inl! h;11;1rdo11., ;ind or st ron!! \\ a\IL's from ks'
poll111inf' wa"k". hir 1.:xampk. 1111c11nL1rnina1rtl .,urfan- drainage ... h,,uld hr nillcdnl in a "·p;1-
r;11t' ,~,11·m frllm roclaminalt:d dllucnh from pr"t'l'" aH·a,. If llw 1w11 w;i_,k., arr nol ,,._l.!rq!alnl
1h,· \nl11nll· of wa,tcwalrr rcquirinl! lfl·alml'nl i, f'.rratrr.
II~

Appendix 2: Glossary
~rvias: in thc contc.:xt of 1hi-; manual thc len11 scniccs i-; taken lo mean supporting facilities
such as a power supply.
Stockpile: refers to: olid material such as coal or gra\"cl stored outside on the ground. Stockpiling
should comply with lcgisla1ion to minimi-;c pollution.
Stoichiometric Estimations: ma<;.-; er concentration calculations hased on the exa<.1 molecular
relationship between constituent clements. taking into consideration atomic and molecular
weights.
Unit Operation: a process will compri-;e a series of unit operations. A unit operation may he pulping or hark stripping in a pulp and paper mill, or distillation in a chemical manufacturing
process. Unit operations may be intermittent such a.-; tank washing and steam deaning.
Waste: in the context of this manual waste i-; taken as a 1'1 oad term to cover any non-prodt:cl
discharge from a process. Thus, it describes discharges in the gaseous, liquid and solid phases.
Waste Audit: a wa.-;tc audit is a thorough account of the wastes from an industry, a plant. a
proces.-; or a unil operation. A wasl~ audit requires the derivation of a material balance for each
scale of operation. The waste audit should result in the idenlificalion of wastes, their origin,
quantity, composition and their potential for reduction.
Waste Reduction Plan: a waste reduction plan should include a series of scheduled actions 10 he
undertaken with the overall aim of reducing the amount of waste generated.
Wastewater: the aqueous emuents from a proccs.o; that pass to drain or to storage.
Wet Scrubber: pollution control equipment designed to treat off-gases. A wet scruhhcr will
involve water or a chemical :-olution to strip certain gases from the gaseous phase before dis
charge to atmosphere. The wet component may he a once-through scruh or a recirculating
solution (with a hlccd to drain), the rnlution strength needing to he topped-up either continuously
or periodically.

APPENDIX 3: REFERENCES
(a) R<-J<·n·11n•s 11.n·1l i11 tire Pn:purutio11 of this Mumu;/
Rapid A.~'immt of' SourttS of Air. Watn- and Land Pollution. \\1-IC > C >ff set Puhlication
'.':o h2. World Health Organu.ation. < icncva. l'~Z..
Profiting from \Va'ite Reduction in Your Small Rusine;s: a guidr to hrlp you idmtify.
inlplnnml ;md r"Valuate an industrial waste rrductioo progrc1m. D Wigglcsw1 lrth. Ala.o;ka
Health Prnjcl.1. l'JAA.
Towartt~ Zero Waste: IOI Waste Rusting lips. Orr & Bos.c;. Michigan. l'SA. I'm.
Pnparr Manual: A Manual for the ~-ention ofWa'itr an~ Emis.'iions. D1"ch Minic;tl) of
Economic Affairs. June l?H.
cF.nC G11idrlinrs on Wa<itr Minimi<iation. European Chemical lm.lusuy Federation.
CEFIC. 1990.
Calculation and Shortcut Deskbook, puhli"hcd by Chemical Engineering. USA
Watu tlow Measumnmt in Opm Channels using Weirs and Venturi Humes, ISO 1438.'1.
19~1. International Organization for Standardii'.ation (ISO).
Industrial Waste Audit and Reduction Manual. Onlario W a.'ile Management Corporation
(OWMC). Canada. Second Edition July J9X9.
(h) Emiro11mmtul ,\.fu11ui:f.'l11ent i11 lndmtry
Environmmtal Auditing. Technical Rl·port Series No 2. UNEP/IEO, l'l'lO.
Environmental Auditing ·special issue of 'Industry and En,ironment', Vol 11, No 4, I 1>88.
l;NEP,1EO.
Environmental Auditing in Cleaner Production Strc1te,;rs. Seminar Pr1l<:ecding.c;. April
11>'>1. Dcpl of Indu~1rial Environmental Ernnomics. Lun<l llniversity, Sweden.
Our Common t"uture. World ( 'ommis.~ion on Environ men I and Devd 1pmenl, C >xfor<l
U nivcr~ity Press, l'IX7.
Rm;irwss and the Environment. (; Y., inter, ~k< iraw·l lill. 1% I.
Environmental ( ;uidelines for World lnd•1stry, 11.l'XJ, I nlcrnal ional C 'hamhcr of< 'ommcrn.:.
'IX.< 'our~ 1\lhcrt lcr, 7:\0llX, P<tri~.
I l.'i

AppendiJ1< 3: Refenmces
Environmental Impact AsSt'Ssment - Basic Pruc'l'CluJTS for ~'-doping Countri~ UNEP.
t·~~-
(c) Ocaner Protl1u1io11 a11d Poll11tio11 Pm·e11tio11
Waste Minimization Opportunities A.'i.~'>mmt Manual, llS EPA. 198K
Techniques for lndui.1rial Pollution Prnention, MR Overcash, l.cY.is Puhlishcrs, 1986.
Profit from Pollution PrYvmtion. M E Camphcll and W M < ilcnn. Pollution Prohc foun
dalion, Toronto, 1982.
Prosperity without Pollution - the PIYvention Strategy for Industry and Comumers. JS
Hir'i<.·hhorn and K U Oldenburg. Van Nostrand Reinhold 1991.
Tanneriei and the Enlironmcnt - A Technical Guide to Reducing the Impact of Tanner)
Operations. Te.:hnical Report Series No .i. UNEP/IEO, 1991.
Entironmental Aspects orthe Metal •·inishing Industry- A Tetimical Guide. Techuical
Report Series No I, UNEP/IEO, 1989.
The Storc1ge or Hazardous Materials - A Guide to Safe Warehousing or Hazardous
Materials, Technical Report Series No J. UNEP/JEO, 1'1Xl. (Availahlc in Engfo;h and
French)
(ti) Trai11i111: Matt•rial~
Environmental Management Training (5 Vols), joint UNEP- IU> puhlication, 1'>8<1.
'The Competitive Edge', video hy ( )ntario Wa .. tc Managcmrnt ( ·orporalinn. ( 'anada.
'Money Down the Drain'. \ideo hy Ontario Waste Managemenl ( 'orporalion. ( ·anada.
'Prepare for Tomorrow'. video for lhe Prepare Projct·1. NOTA. The Nethc:rbnds.
'Pollution Prevention -The Bottom Line', a video hy C ·oaslal Video ( 'omm11nica1ions
( ·orporation, l iSA.
'Pollution Prewnlion - Reducing Wastrs in the WorkplalT'. ;i video hy ( ·oa~lal Video
C '11mm1111ir<1lion~ C 'orporalion, l lSA.

Appendix 3 !-referP.nc"s
(c) fllfomwti:m .\~nto11.s B11/l1·ti11s· :\'t'lnlcucn
·ck-.mer Prnduction·. a hiannual nc.:wslc:llc.:r of th..: ( ·1c.:anc.:r Prodm:tinn Prngr;immc.: of
l il\EP IEO.
lntrmational lltanfl" Production Information l 1e-.aringhoust> ( ICPIC). ;in nn-lin1... umpu
tc.:r-h;L<;ed information sc.:nicc.:. l 'l'<EP:lEO ( sc.:..: this maau;1L Appendix 4 ).
NF.Tr. ;i network for cmironn • ..:ntal t..:chnology tr;m<,fc.:r. r\vc.: Liuisc.: )17. Box Ill. Brus.'iel!\.
Bd¢um.
"' /11 R
APPENDIX 4: UNEP/IEO CLEANER PRODUCTION PROGRAMME
Rn·.,!!ni,in!! th1..· n.:nl ll• pn:\"1..·nt P"lluli1•n ;111ll minimi,_- \\;1,1.:. thl.· l "'\EP < ;,.-.1..·rnin!! ( ·nun.:il. in
\by i'l~N. ll><•t.. 1>..-,-i,i1m .•7 torl:tin~ l""\EP ·,,, nmtinu.: ih c11al~1il· wk !1• rr.•m1•k. \\ith c.1•\·.:rn
m.:nh. ind1htry. r.:-...:;1rl·h •'r!!;mis;ttion' and olha rd.:\;llll in,.,liluli1in,.,. lhl· .:-;1;1bli,hnll.·nt .,f ;1
n.:1w1•rt.. \\hid1 \\ill ;1lluw th.: lranskr .,f .:min>nmL·nt:1I pro11..·di1•n ll'L·hn1>lnc.~·.
T1> impkmi.:nl thi, d.:cisiun. th1..· l '\El' lndtl'ilr~ ;md En\ir.•nm.:nt Offic.: (IE<>) c11n\.:n1..·d ;1
!!f"ll(l of~-' '.:nior k\d .:x1x:rh from \·;irinu' l"••unlri.:' ;ind int.:rna1ion;1l 1•rc.;mi-..:11i1•n-.. fur :u.hi.:t·
1>n th.: -.1.:ps tub..: tak.:n. Th1.:ir r1..·.:1•mm.:mb1iun' kd '"th.: ..--.1:1hli-..hm.:n1 of th.: l '\EP IEO
Ck;m1..·r Pr1•ducti11n Pr11)!r;1mm.:. Th1..· l'ro!!ramnll· lir:..• .:\i-..tin!! sourn:-.. 11f inf,1rm;11i,1n on 111\\
;mJ non-\\;i,.,(I." kl"hno(ugi.:-.. ;ind prumol.:-. d.:;m.:r [1'11<.(Udion W11rkh\id.: lhrnU!!h f11llf prim:tr~
:Kl j\ ii j..-,: th.: ln1.:rnati11n;1I Ck:1m.:r Prodtll"linn ( ·1.:arin!!h"ll'l" ( ICPIC I. ;:xp.:rt w, 1rkinc. !!f< >up-.. .. 1
nl."\\'>ktt.:r. and tr;1inin!! al"li\·i1i..-,.
I a I II i 1rki11g < ;ro11p~ \\"11rkin!! < ir11ups an: C<llll(l<"l'd uf .:xr11.:rh \\h11,1..·.:t..1.1 id.:ntif~ d,·;111..:r pr11du.:1i1111 m1.:1h .. d-.. in
'-(ll."l"ilic indu-.tri.:-.. (kalh.:r-tanninc.. l.:\1ik. -..•lv..:nt. m .. :tal-lini ... hin;! and pulp and p;1p1..·r ind11'lriL·,1,
;111d i. 1 id.:nl if~ .. 1h,·r l.'Xlll.:rh :md 'om.: \\ .ir kin!! puhlical i11n-... ( irPup,., :11 ... 11 o 1\ 1..·r \\ id..:r i''ll-"'· -..ud1
;1, •hla n1..·1workim.! . .:duc1li11n :t11d l'"lici1..·, pr1m1t11ini.: d..:;1n. .. r pnxlu..:ti11n.
r /I/ ( k1111a Prod11t"fio11 .\, ·~nkttcr
Thl· n.:w ... kth.:r indud.:, n<:\'' :md inf Prm:11i1111 • 111 d1..·.1111..·r ll'chnnh "..!it·, :t11d pr• •dul"I .... :ind 'ti.: P'
lah·n b~ !!"\1..·rnm..:nh :t11d 11r!!;1ni ... ;1t inn-;!" rr"m"I.: di: :t11.:r pr111.lurl i .. n.
fl" 1 !111,·mari111wl C k1111cr l'rotl11dio11 f11Jim1wtio11 < k11n11g'101111· - I< 1'1< ·
l"hi' cnmpull' r-h:i,..-d inf, 1r111;1l inn cxrhan!!,. h11ld, n\cr tiU I c.-.,· .. 1 udi,·-.. :t11d 1m 'l!r.1111111.: '11111111;1 ·
riL"•. ;1dir.:r1<1ry11f n:p.:rh :ind an ,·,1cn,i\c hihli11c.r:ipln. l"h.: '!'km ,·;111 h1..· ;11T1..·,,cd h\ lh-T-.. Ill
m11r..: 1h:111 IOO r1111n1ri,·,.
I,/ I "frt1111111g. ft'til"ltil'I
In 11nkr 111 .. upport the ini1i:1li11n .ind dc\.·l,•pllll"llf 11f n;11i .. 11;1I dv.1n,·r pr11d11,·1i11n pr1•.>r;111111i. ·,in
difkr.:nl rn!inn' 11fthc \\111ld l "'\LI' ILO "rl!;tni"·' \\11r~ .. h11p' ;111d 'l·min;ir ....
lhr l11t1·nwti111111f ( l.-1111t·r l'r11tf11< f/1•11 l11/i1r11111111111 < k11rini;ho1111· I< 1'1< ·
I< ·pl( · c11nl.1i11-. inf11rma1 i"n 1111 ck· ;111d pr• 1d11d j, •II nwl h1 •d ... ;ind '•II indthl ri,·' 11,irw '11' h 1,, h n.ilc •
1~il·,. II ;11"' :id-,·" ;1p11inkr111 m11r,· d, 1.11kd '"un-.·, 111 inl11rm.1li1ir1. IC TIC \\,1, ,·,1.1h(i,lh·d in
("""lll.·r.1ti11n with 1h, I'\ l·I'.-\ ;ind 1. h.1-...·d •Hl llh ir 1'111l111i"11 l'rn,·11ti11n lnl11rn1.11i1111 I.\• h.11w,·
..,,,1,·111 l'IF\. lh1.1 :ir, .tl ... •«•rtlri'111kd "' 1h·r, · 1.:i1hn 111di\1d11.1I" 11r 11rp.1ni,.111.•11' ·•I th,· IC Pl<
11'1

Appendix 4: UNEP.IEO Cleaner Production Programme
In addition to the main da1aha.o;c. the ICPIC sySlem im:orporales an in1erac1ive mcs.-;a~ centn: whl:rc
IL'iers car> lca\·c information and 4ucstion.o; for other network 1Lo;crs. Also li:-1ed an: hullctin" wno:rn
ing dcvclopmt:nl<; in the field or' leaner ~roJm.1ion. and SUhsiJiary J;1tahasc.:s on individual suhjL'<.'IS.
The main databases contain:
Message Centre
An on-line.: katurc allo\\ing commt1nication \\ith other network memhi.:rs.
Bulletins
Latc."'1 news and announcements in the international clean technology community.
Calmdar or Events
Listing or upcoming national and international conferences. trainin!? 'ieminars and workshops.
Case Studies
A dataha.o;e ofti.:t:hniG1l and programme case studies highligh1ing indm.try and wa.,li.: in\·ol\"cd.
economic inci.:ntives am! cost recovery time.
Programllll' Summaries
Dcsnipti.ms of national and intemation.11 programmes on de;mcr pnidul1inn, as wdl ;ts
programmes adopted hy ind1L<.tries.
On-line Bibli~raphy
A hihliography of hundreds of clean technology documents. wi1h inform;t1i11n for ordering.
Dim:tory or Contacts
An automated vcr,ion of UNEP's C'leaner Production Diri.:ctory.
120

uy,,,
·tL ss s.: ot 1-n- ;iu!x•·_1 .\q < u 1 .rt-.:. 1 woJ_1 uo! wwJ01u! n11un.1
"(HI !U•UJ ·'1'1 1:1 11 :\t:
·'P!ll~) P'>. J. H.f. )I ·'41 LI! ·'Jq1:1!1:,1: "'II''! l·'U.'J·'J. 1:!\. >Id. >I p.,uuo.) 01110.\ W>JJI! 4.1111.\\
'))Jll\\PU ;iu!4.)ll\\'-l·')).1t:d .J" 1'!1 \' ·.>lei. >I .,.,.,u.w 01 ·'W!Jd0Jdd1: ''P""1.1u ;iu!4·'1! "' l·'l't:d
-p:u••!WU J" '"·'Jpp1: .1.)!.U·'' 1.1u.11.'.l. J1:.)111mu\111'• pu~l "I ILJ!Jds-s.1 J<• < UI ,r I'\. I p1:1uo. >
·r:i'n ;iu1."1 v1 •.\q . ..,u .141 .\q P·'WP!P pui:
1u;'IJ.)Jl!P :iq \1:w ,jll!IPS ."IJl!.\\l.I"' .11)1 "."1'1!.) J.'IWJ :i41 u1 ·1x1t11 •)(Ml i:'I!.. fll If'! :ipo.) '"·'·'-'':
. >I.I. >I pui: Pll.'l·'J. ;ll)I ·v••\\l.)U ';1U!4·11!''' l·'l'•:d J.14111u1: I!!\ \JP.'J!PU! ;iu!P.1UU•).) J! •
'.fMXIHI 'lfMI c'IL ·'PllJ '-"·'.UI:
J.11u.' pui: .1p.1u ,-..,:nw Pll.'J·'.1.1':.-..•J ;iu!uo4J.'l·'l .\q (J.'ll.'1-'.ll .Ll,.L,nt.IS •:!·' .\p1.';1p •
::i.1ui:J:J lUllJJ ;iu!111:.1 .JI ·'W!Jd1ud1k "' ·'1)\1.) \J!.'l pm· \JIU!lll.) '1ll!ll!Wtl - S!.. SS s.: flt· )-ff UI
J.'qtunu .1uu4d:ip1 pUI: \J!J1:d 11u ·1!q d111s t ·'l!'I 1:1"p s 01.1J1:\\l.I"'11111.\ l·" ·p:!P J.'l.'J!P 1:!' •
:w.lJ'(" .llll ,.._l..l.)r. OJ 'i.\l!" JU.l.l.l.U!(I
·vu.\· pu <iu!4·'l!"' p-p1:1.J-1:wp PU·'l·'.L 11n11 .. J41 Jo ·.,._..,u!I .'U1•41bJ.'I
p:iJ!P 4;i111u41 J.)411.) p.">p.1UUll.) ;i,, UI!.) 1u.11s\, :i4_1_ ·:i11:\\))ll'> Ull!W.1!ll11Wlllll.1 ·'Jl:!Jd0Jd1h:
pUI: ('"-'I JU p111:q IMlt'l) ui:ip, nu 1: 41! \\ p:xld!nh . .., 11:u!lUJ.11 1: Jo J:i1111lwo.'l :i1q!wd1u'l.'l· I\ HI
u1: · . ..,Jddy UI: 41!.\\ Sllll!J•:...1m:;iJ\I pur 'l1:np1.\lpU! 111 .1;i;1:4.1 .1'' ·'·'J.1 "! ._,_..,_1.11: 111114 Jll".(·.\111.1\\J_
31d31 ~NISS333V
awwe1601d uo1pnpo1d ;au11at:J 03! d3Nn t- "1puadd\f
-----

QUICK REFERENCE AUDIT GUIDE
PHASE I: PREASSESSMENT
PROCESS INPuTS
AUDIT PREPARATION
Step I
Step 2
Step 3
prepare and orgar.ise audit team an:i resources
divide process into unit operation~
construct process flow diagrams linking unit operations
PROCESS OUTPUTS
Step 4 determine inputs Step 7 quantify product:siby-products
Step S record water usage Step 8 account for wasteV' ater
Step 6 <neasure current levels
of waste re•~se/recycling
Step 9 account for gaseous emis~ions
Step 10 account for off-site wastes
PHASE 2: MATERIAL BALANCE
DERIVE A MATERIAL BALANCE
StP.p I I assemble input ~nd output information
Step 12 derive a preliminary material balance
Step 13 and 14 evaluate and refine material balanr.e
IDENTIFY WASTE REDUCTION OPTIONS
Step 15 identify obvious waste reduction meast:-~s
Step 16 target and characterize problem wastes
Step 17 investigate the possibility of waste segregation
Step 18 identify long-term waste reduction meas•Jres
PHASE 3: SYNTHESIS
EVALUATE WASTE REDUCTION OPTIONS
Step 19 undertake env1ronmenul and economic
evaluation of waste reduction options.
list viable options
WASTE REDUCTION ACTION PLAN
Step 20 design and implement a waste
reduction action plan to achieve
improved process efficiency

•
UNEP INDUSTRY AND ENVIRONMENT OFFICE
Abow U:\"EI' 1£0
The Industry and En\·ironment Office (IEO) \\;1s c.:sl;ihli:-.:;.:d hy l'.~f:P in !<~75 to bring. indu.;1r~
;iml govcrnmcnl togelhcr 10 promole cnvironmcnl;1lly sound induslrial de\.:l,1pmc.:nl. The lf::O is
locatc.:d in Paris. Its goals arc:
(I) to encourage.: the incorp<1ration of cfi\ironmental cri1cri;1 in industrial de\d\lpmcnt plans:
(2) to facili1atc the implementation of procedures and pri1Kipks for the pn>tec·.,n ,,f the
environment:
(3) to promote the use of s;1fc and "dean· terhnologie,;:
( ~) to stimulate the exc !lange of information and experience throughout lhe v.nrld.
IEO provides access 10 praclical informal ion and de\-dops co-opi:rali\e on-sile action and
inform.:lion exchange hack.:d hy regular lollow-up and a<:scssmcnl. To promolc the lr;m,ft:r of
inform;1ti,m and lhc sharing of knowledge and expl·rience. IEO has de\ doped 1hrec compkmen
lary loots: lcrhnical re\·ic·"'·s and guidelines. "lnduslry and En\in1nmenr re\iev.: and ;1 te•:hni•:al
query-response service. In keeping with its emphasis on technical w-11pcra1i.m. IEO facilitate'
technology transfer and 1hc implcmentatitm of praclices to s.1fcguard 1hc en\ironmcnt 1hr11ugh
promoling awareness and in1crac1ion. !raining <Klivi1ics and Jiagn11~1ic sludics.
Some recent UN EP.· IE 0 publicatio11x
Industry and Environmenl Review (quarterly), 1ss;-..; ll.Hx-11'19.t Issues deal with topic, such ;1s:
hazardous w;1slc managcmenl. technological au.:idenls. ::n\·ironmenlal audi1ing. induslr~ specific
prnhlcms, cnvmmmental news.
Environmcnlal Aspecls of the Mclal Finishing Induslry - A Ter.:hnical ( iuidc. T cchnical Rcporl
Series N" I. ISBN 92 807 12 IW, 'JI p. 1'>89.
Environmcnlal Auditing. Technical Report Series N° 2. !SR:-.i •12 Xll7 12.'iJS. 125 p, I 11'.111
Sloragc of Ha;rardous Malerials - A Technical (iuidc for Safe Warehou,ing of •tv;ird11us '.\l;i1cri
als. Technical Report Series N" .\ISBN 92 807 12.~t. 80 p. l'>'Xl.
Directory of Information Soun .. 1.:s on Air and Waler Pollution - INFOTERRA IE<>. ISB'.\ •12 Sll7
t2.H0, 1X7 p. llJIN.
APELL - Awareness and Preparedness for Emer!!encies at Local Level: a Prnn:.,~ for R1.:spond
ing lo Technological Acridents, ISBN 1>2 807 I IX.\11. <•2 p. I<>XK
Tannin,g and the Environment - A Technical ( i11ide to Rcd1King the Emiro:imenr;il lmparl of
Tannery Operation~. Tcrhniral Report Series N" 4, llNEP,'IEO. ISBN 112 '\07 127<>4. I Ill;;, 111<11.

UNIDO AND THE ENVIRONMENT
As thc kad agency for industrial dcvdopmcnt in thc t:nitcd i\ations system, L:NtDO is dosdy
in\'o)\'cd in thc growing international co-operation on industry-rdatcd cn\'ironmental mallcrs. In
mid- (li90 lTNIDO rnnsolidatcd its \"arious cn\'ironmcntal acti\'ilics under the umbrella of the
UNI DO En\'ironmenl Programme. UNIDO is well placed lo transfer new te1,:hnologics and
dcancr production proresscs to dc\'doping countries in such important sectors as lcathc.:r,
cement. le\1ilcs, food processing. metal working, iron and steel. and others. Its assistanre takes
such forms as technical projects, pnwision of equipment and/or ad\'isory scr\'ices. investment
promotion schemes. human resource d..:\'clqpment through training and fellowships.
The immcdiatc emphasis of the UNIDO Environment Programme is on: (I) incorporating
cn\'irnnmcntal considerations into the acli\'itics of UNIDO: (2) enhancing the awareness of
dc\'cloping countries of the nc•_~d lo indude ..:nvironmcntal considcrations in their industrial plants
and policies: and (3) assisting developing countries lo prevent and cure the effects of environmen
tal degradation allrihutahle lo industry through practical technical assistance projects and other
activities such as cleaner technologies aml procc~scs, em-ironmcntal audits. cnvinmmcntal impa•·t
assessments. energy efficiency. studics and technical reports. and provision of training and
information. Specific support can also he given in design. installation and operation of indu.-;1rial
pollution ahatcment facilities.
Inquiries ahout UNIDO"s program111cs can he channelled through UNDP offices in developing
countries. or sent directly to UNIDO headquarters. P 0 Bnx 300. A-1400 Vienna. Austria.
127