Audio-Visual Multisensory Integration in Superior Parietal Lobule Revealed by Human Intracranial...
47
Audio-visual multisensory integration in superior parietal lobule revealed by human intracranial recordings. Sophie Molholm 1,5 ± , Pejman Sehatpour 1 , Ashesh D. Mehta 2 , Marina Shpaner 1,5 , Manuel Gomez-Ramirez 1,5 , Stephanie Ortigue 4 , Jonathan P. Dyke 3 , Theodore H. Schwartz 2 , & John J. Foxe 1,5,± . 1 The Cognitive Neurophysiology Laboratory, Program in Cognitive Neuroscience and Schizophrenia, Nathan S. Kline Institute for Psychiatric Research, 140 Old Orangeburg Road, Orangeburg, NY 10962 2 Department of Neurological Surgery 3 Department of Radiology Weill Cornell Medical College New York Presbyterian Hospital 525 East 68th St. New York, N.Y. 10021 4 Dartmouth Functional Brain Imaging Center Center for Cognitive Neuroscience Dartmouth College 6162 Moore Hall Hanover, NH, 03755 5 Program in Cognitive Neuroscience Department of Psychology The City College of the City University of New York North Academic Complex 138th St. & Convent Avenue New York, NY 10031 ± Correspondence to SM ([email protected] ) or JJF ([email protected] ). Running head: Multisensory Integration in Human SPL The Cognitive Neurophysiology Laboratory, Program in Cognitive Neuroscience and Schizophrenia Page 1 of 47 Articles in PresS. J Neurophysiol (May 10, 2006). doi:10.1152/jn.00285.2006 Copyright © 2006 by the American Physiological Society.
-
Upload
northshorelij -
Category
Documents
-
view
0 -
download
0
Transcript of Audio-Visual Multisensory Integration in Superior Parietal Lobule Revealed by Human Intracranial...

Audio-visual multisensory integration in superior parietal lobule revealed by human intracranial
recordings.
Sophie Molholm 1,5 ±, Pejman Sehatpour 1, Ashesh D. Mehta 2,Marina Shpaner 1,5, Manuel Gomez-Ramirez 1,5, Stephanie Ortigue 4,
Jonathan P. Dyke 3, Theodore H. Schwartz 2, & John J. Foxe 1,5,±.
1 The Cognitive Neurophysiology Laboratory, Program in Cognitive Neuroscience and Schizophrenia,
Nathan S. Kline Institute for Psychiatric Research, 140 Old Orangeburg Road,
Orangeburg, NY 10962
2 Department of Neurological Surgery 3 Department of Radiology
Weill Cornell Medical College New York Presbyterian Hospital
525 East 68th St. New York, N.Y. 10021
4Dartmouth Functional Brain Imaging Center
Center for Cognitive Neuroscience Dartmouth College 6162 Moore Hall
Hanover, NH, 03755
5 Program in Cognitive Neuroscience Department of Psychology
The City College of the City University of New York North Academic Complex
138th St. & Convent Avenue New York, NY 10031
± Correspondence to SM ([email protected]) or JJF ([email protected]). Running head: Multisensory Integration in Human SPL
The Cognitive Neurophysiology Laboratory, Program in Cognitive Neuroscience and
Schizophrenia
Page 1 of 47 Articles in PresS. J Neurophysiol (May 10, 2006). doi:10.1152/jn.00285.2006
Copyright © 2006 by the American Physiological Society.
Multisensory Integration in Human SPL
1
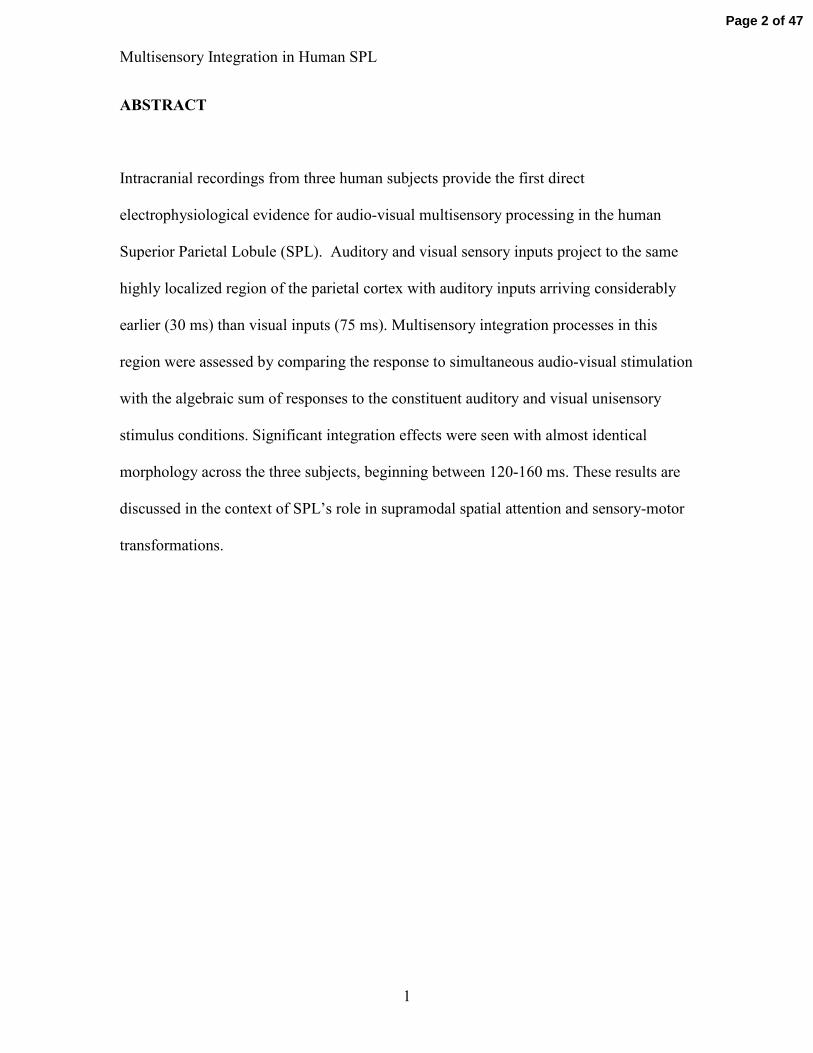
ABSTRACT
Intracranial recordings from three human subjects provide the first direct
electrophysiological evidence for audio-visual multisensory processing in the human
Superior Parietal Lobule (SPL). Auditory and visual sensory inputs project to the same
highly localized region of the parietal cortex with auditory inputs arriving considerably
earlier (30 ms) than visual inputs (75 ms). Multisensory integration processes in this
region were assessed by comparing the response to simultaneous audio-visual stimulation
with the algebraic sum of responses to the constituent auditory and visual unisensory
stimulus conditions. Significant integration effects were seen with almost identical
morphology across the three subjects, beginning between 120-160 ms. These results are
discussed in the context of SPL’s role in supramodal spatial attention and sensory-motor
transformations.
Page 2 of 47

Multisensory Integration in Human SPL
2
INTRODUCTION
The bulk of our knowledge regarding multisensory processing in the parietal
cortex comes from intracranial recordings in animals (Andersen et al. 1997; Barth et al.
1995; Brett-Green et al. 2004; Di et al. 1994; Cohen, Cohen, & Gifford, III, 2004;
Mazzoni et al. 1996; Schlack et al. 2005; Wallace et al. 1993; 2004). Single unit
recordings in non-human primates, with the greatest across-species anatomical
correspondence to humans, have revealed multisensory neurons in the inferior parietal
sulcus (IPS) that are responsive to combinations of visual, auditory, and tactile stimuli
(Andersen et al. 1997; Cohen, Cohen, & Gifford, III, 2004; Mazzoni et al. 1996; Schlack
et al. 2005). However the homologies between primate and human multisensory parietal
regions remain to be fully established (Astafiev et al. 2003; Sereno and Tootell 2005).
Human functional imaging studies have shown that multiple sensory inputs are indeed
co-localized to regions of the parietal lobe, including the IPS and the superior parietal
lobule (SPL) (Bremmer et al. 2001; Bushara et al. 1999; Calvert et al. 2001; Lewis et al.
2000; 2005; Macaluso and Driver 2001). A subset of these studies also shows nonlinear
interactions of multisensory inputs suggesting that this information is integrated (Calvert
et al. 2001; Lewis et al. 2000; Miller and D'Esposito 2005). That is, these studies have
shown that the response to a bisensory stimulus differs from the sum of the responses to
its unisensory constituents (so-called super- or sub- additivity; see e.g. Stanford et al.
2005).
While hemodynamic imaging has provided excellent spatial localization of
multisensory processing in humans, the temporal resolution of this method precludes the
Page 3 of 47

Multisensory Integration in Human SPL
3
study of dynamic information processing, where meaningful distinctions are seen on the
order of 10s and 100s of milliseconds. Hence, it is not possible to resolve whether this
multisensory processing represents direct sensory-perceptual level interactions, or if it
reflects later cognitive processes (Foxe and Schroeder 2005; Schroeder and Foxe 2005).
This lack of timing information may be the reason that imaging data can lend itself to
alternate and equally plausible interpretations. For instance, Ojanen and colleagues
(2005) attribute SPL activation for conflicting auditory-visual speech compared to
matching auditory-visual speech to increased attentional processing, a function more
often associated with superior parietal regions than multisensory processing.
Here, we took advantage of the excellent spatial and temporal resolution provided
by intracranial electrical recordings in humans to directly investigate multisensory
processing in parietal cortex. Using a simple reaction-time task (Molholm et al. 2002) in
which subjects responded to visual and auditory stimuli that were presented
simultaneously or alone, we identified a highly localized region of parietal cortex, in the
region of the lateral superior parietal lobule, that responded to both auditory and visual
stimulation. Auditory and visual inputs to this region occurred early in time (<80 ms)
and multisensory integration processes were evident shortly thereafter. The timing of the
inputs and ensuing multisensory interactions are consistent with sensory-perceptual level
processing in the SPL.
Page 4 of 47
Multisensory Integration in Human SPL
4
MATERIALS AND METHODS
Subjects
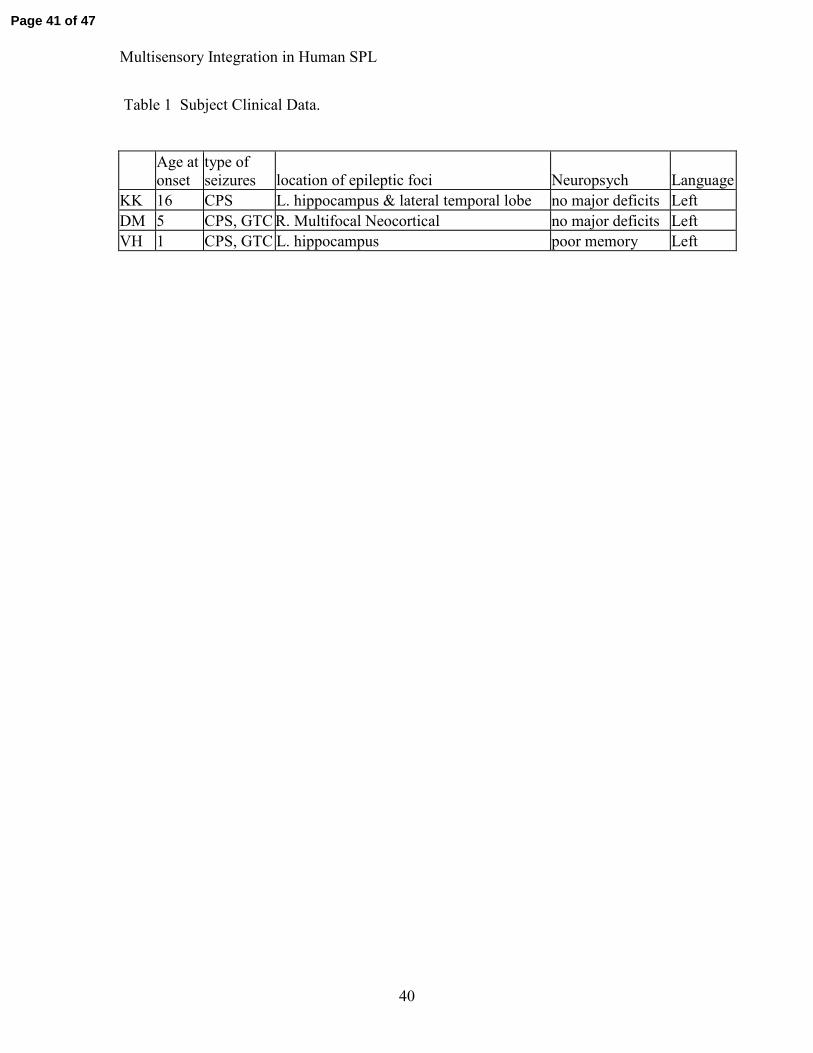
Data from three individuals with epilepsy are reported (ages 29, 35, and 45).
The patients were implanted with subdural electrodes for evaluation of the foci of
pharmacologically intractable epilepsy. They were all males and two were right handed.
Recordings were made after all clinical procedures related to seizure localization were
completed. During localization procedures, subjects were removed from their anti-
epileptic medications until sufficient numbers of seizures were recorded, but when these
clinical measures were completed, they were immediately returned to their regular
dosages. All three were receiving a combination of levetiracetam (keppra) and
zonisamide (zonegran). All recordings for the present study were made after subjects had
been re- started on their medications. Clinical data are presented in Table 1. Two of the
three subjects had left hippocampal foci with the third showing a multifocal right-
hemisphere neocortical disorder. Two of the three had relatively early seizure onsets at
ages 1 and 5, whereas the third had relatively late onset at age 16. This latter subject was
one of the left hippocampal patients. In studies examining electrical responses in patients
with long-term epilepsy there is always the possibility that reorganization has occurred.
Nevertheless, given the different histories of the patients, there is no reason to expect that
subjects would have undergone similar cortical reorganization. As such, patterns of
activity seen consistently across the three subjects quite likely reflect “normal”
information processing.
Page 5 of 47

Multisensory Integration in Human SPL
5
All subjects provided written informed consent after the procedures were fully
explained to them prior to entering into this study. The Institutional Review Boards at
both Nathan S Kline Institute and at Weill Cornell Medical College approved all
experimental procedures.
Stimuli and task
Auditory alone: 1000 Hz tone pips (60 ms duration, 10ms rise-fall; 75 dB SPL)
were presented over headphones (Sennheiser HD600).
Visual alone: a disk (60 ms duration), subtending 1.2° in diameter (140 cm
viewing distance) and appearing red on a black background, was presented centrally on a
CRT computer monitor.
Bisensory Audio-visual: the auditory and visual stimuli described above were
presented simultaneously.
Procedure: Subjects were instructed to make button press responses as quickly as
possible using their right index finger when a stimulus in either or both stimulus
modalities was detected. The purpose of this task was to ensure that subjects attended the
stimuli. Subjects were instructed to maintain fixation on a centrally located cross. They
were visually monitored by two experimenters throughout recordings to ensure that
fixation was maintained and were verbally prompted to re-engage when/if necessary.
Stimulation was immediately aborted if subjects became fatigued or found difficulty in
fixation. Inter-stimulus interval (ISI) varied randomly between 690 and 2940 ms. The
three stimulus conditions were presented with equal probability in random order, such
Page 6 of 47

Multisensory Integration in Human SPL
6
that subjects could not predict either when or what would occur next1. Stimuli were
blocked into sequences of 150 trials. Frequent breaks were provided to maintain
concentration and prevent fatigue.
EEG recordings
Continuous EEG from 75 to 118 subdurally placed electrodes was recorded using
BrainAmpTM amplifiers (Brain Products GmbH, München, Germany). The data were
band-pass filtered online from 0.05 to 100 Hz and digitized at 1000 Hz. A frontally
placed intracranial electrode was used as the reference. The continuous EEG was divided
into -100 ms pre- to 250 ms post- stimulus onset epochs and baseline corrected over the
full epoch. An artifact criterion of ± 300 µV was applied to electrodes within the region
of interest to reject trials with excessive noise transients. An average of 542 trials were
accepted per stimulus condition. When clean averages had been obtained, baseline was
redefined as the epoch from -100 to 0 ms prior to stimulus onset.
For all subjects, the electrode site(s) from which data were analyzed was chosen
based on the following criteria: 1) it was over parietal cortex; 2) both auditory and visual
stimuli elicited a robust unisensory response at the site; and 3) both the auditory and the
visual responses were larger than the corresponding responses from the surrounding
electrodes. We reasoned that if the maximum auditory and visual responses were at
different electrode sites, this would indicate that largely different sets of neurons were
responding to the two stimulus types. No analyses were performed on data from non-
ideal sites.
1 It is important that systematic eye- or head- movements can be ruled out since regions of the parietal lobe are well-known to be responsive to such movements (e.g. Andersen et al., 1992). The fact that the nature of an impending stimulus was completely unpredictable, both in terms of what it would be and when it would arrive makes it extremely unlikely that any systematic differences could have occurred.
Page 7 of 47
Multisensory Integration in Human SPL
7
EEG epochs were sorted according to stimulus condition and averaged for each
subject to compute the event-related potential (ERP). Statistics were performed on
individual subject data. For each subject, the EEG epochs for a given condition were
used to calculate the standard error of the ERP response at each time point. Differences
between conditions (or from baseline) that fell outside the error of the mean were
considered significant (for a similar application to human intracranial data see (Rizzuto et
al. 2005). Performing tests on multiple time-points increases the probability of a false
positive. We therefore only considered significant differences that were present for 10
consecutive time-points, since the likelihood of getting 10 false-positives in a row is
considerably low (Molholm et al. 2002; Murray et al. 2001). Multisensory interactions
were defined as a significant difference between the AV response and the summed A and
V responses (Foxe et al. 2000; Molholm et al. 2002; 2004;Murray et al. 2001).
Individual epochs of A and V were summed and used in the calculation of the standard
error for the summed response (A+V).
Electrode placement and localization
In two left hemisphere cases, an 8 x 8 grid of electrodes was placed that spanned
frontal, parietal and temporal lobe neocortex. Several 6-contact strips were slid under the
dura to extend the coverage towards the interhemispheric fissure and beneath the
temporal lobe. A depth electrode was placed stereotactically in the body of the
hippocampus. In the third case, bilateral strip electrodes were placed in a starburst pattern
over both frontal, parietal, temporal and occipital lobes. Bilateral depth electrodes were
Page 8 of 47

Multisensory Integration in Human SPL
8
placed in the hippocampi. Interelectrode spacing within a grid or strip was 1 cm. High-
resolution pre-surgical MRIs were co-registered with post-surgery MRIs using a method
that lines up the anterior and the posterior commissures. These were reconstructed into
3D images. Next the 3D coordinates of each electrode were calculated from the post-
surgery MRI and mapped to the pre-surgery MRI. The BrainVoyagerTM software suite
(Brain Innovation B.V., Maastricht, The Netherlands) was used for co-registration and
reconstruction of the MRIs, as well as to calculate the electrode coordinates. The
BrainVoyager-BESATM (Version 5.0.2) software package (MEGIS Software GmbH,
Munich, Germany) was used to project the electrode coordinates onto the pre-surgical
MRI.
The localization of electrodes within parietal cortex was done with respect to the
IPS. Since the central sulcus is a prominent landmark, we first identified this sulcus
(black arrows in Figure 2). We then identified the post central sulcus (POCS) as a sulcus
that runs parallel and posterior to the central sulcus. The intraparietal sulcus (IPS, yellow
arrows in Figure 2) was identified as a sulcus that runs somewhat perpendicular to the
plane of the POCS with an inclination towards the midline (Ebeling and Steinmetz,
1995).
Behavioral Measures
Button press responses to the three stimulus conditions were acquired during the
recording of the EEG and processed offline. For this simple reaction-time task, a hit was
recorded when a response following any of the stimuli fell within a predefined response
window of 100 to 800 ms post stimulus onset. This window was used to avoid the double
categorization of a response. The percent hits and average response-time were calculated
Page 9 of 47

Multisensory Integration in Human SPL
9
for each stimulus condition for each subject. Misses were simply the remainder of the
percent hits and thus were not analyzed. Faster reaction-times for the multisensory
compared to each of the unisensory stimuli was followed by a test of Miller’s race model
(Miller 1982), to determine if response facilitation could be accounted for by simple
probability summation of the fastest responses triggered by two independently operating
inputs (i.e., the race model). When probability summation cannot account for the
observed response facilitation (i.e., the race model is violated), response facilitation is
unquestionably due to interactions between the auditory and visual information during
neural processing (see Molholm et al. 2002 for a detailed description of the race model
and its implementation).
The race model places an upper limit on the cumulative probability (CP) of RT at
a given latency for stimulus pairs with redundant targets. For any latency, t, the race
model holds when this CP value is less than or equal to the sum of the CP from each of
the single target stimuli (the unisensory stimuli) minus an expression of their joint
probability (CP(t)AV < ((CP(t)Aud-unisensory + CP(t)Vis-unisensory) - (CP(t)Aud-unisensory * CP(t)Vis-
unisensory)). For each subject the RT range within the valid RTs (100-800 ms) was
calculated over the three stimulus types (auditory-visual-bisensory, auditory-unisensory
and visual-unisensory) and divided into quantiles from the fifth to the hundredth
percentile in 5% increments (5%, 10%,…, 95%, 100%). Violations were expected to
occur for the quantiles representing the lower end of the RTs, because this is when it was
most likely that interactions of the visual and auditory inputs would result in the
fulfillment of a response criterion before either source alone satisfied the same criterion
Page 10 of 47

Multisensory Integration in Human SPL
10
(Miller, 1982). It should be noted however that failure to violate the race model is not
evidence that neural interactions between the two information sources did not occur.
Page 11 of 47

Multisensory Integration in Human SPL
11
RESULTS
Behavioral Data
Across the three subjects, response times were fastest for the multisensory
condition (average = 279 ms), intermediate for the auditory condition (334 ms) and
slowest for the visual condition (355 ms). This pattern of mean-RT data is equivalent to
that observed in our earlier study on a larger sample of 12 subjects (Molholm et al. 2002).
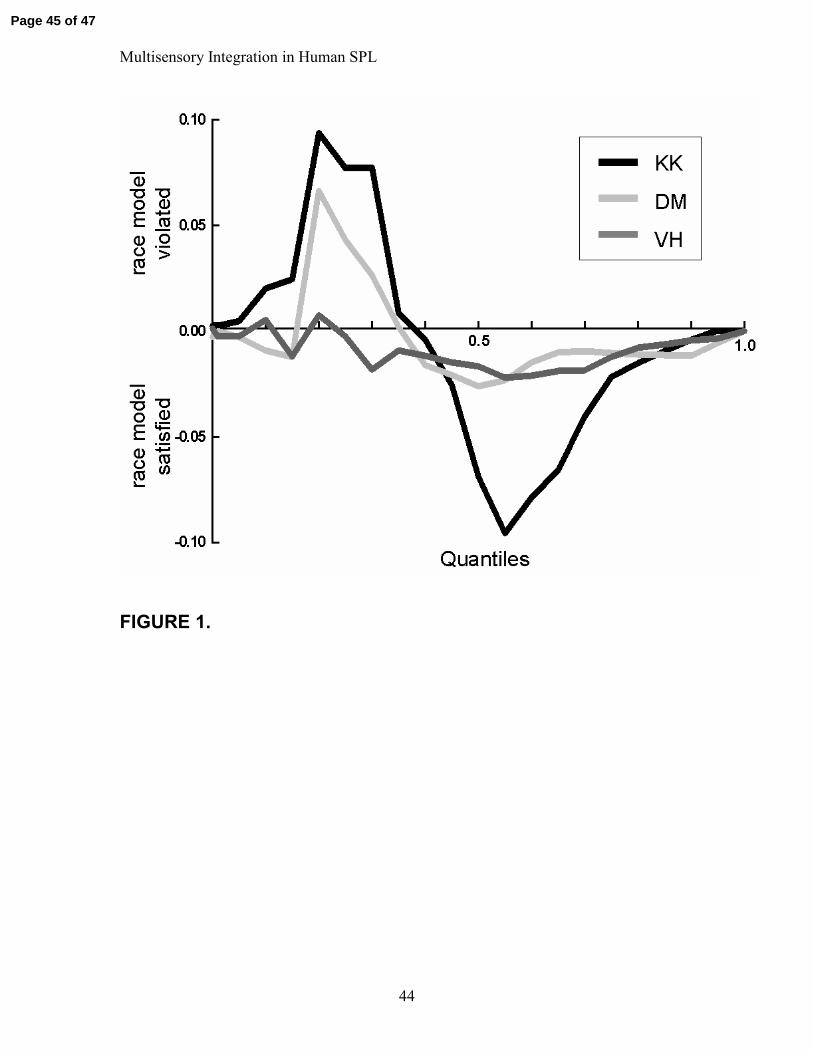
The race model was violated in all three subjects, strongly in two and only weakly in the
third, indicating that when presented together the auditory and visual information were
integrated causing speeded RTs. The race model violation was particularly pronounced
for subjects DM and KK. That is, if one compares the distribution of RTs that is predicted
by a simple probability summation account to the actual recorded bisensory RT data,
fully 7% and 9% of the RTs to the bisensory AV condition fall to the left of the predicted
distributions (i.e. are faster). For subject VH, only 1% of the RTs to the multisensory
condition exceeded the predictions of probability summation. Race model violations are
illustrated in Figure 1, where positive values indicate that the probability of the RTs to
the AV trials exceeded that predicted by the race model.
To further elaborate on these results we used the following strategy to determine
if this speeding of RT was statistically significant on a within-subjects basis. 1) For each
subject, all individual RTs to each of the unisensory stimuli were collapsed into a single
distribution and arranged from the fastest to the slowest. 2) The slower half of this
combined distribution was discarded since there were twice as many unisensory RTs as
bisensory. 3) The faster half of the unisensory RT distribution was then binned into 20
Page 12 of 47

Multisensory Integration in Human SPL
12
quantiles as defined by the total number of trials (e.g., if there were 400 trials, then a
quantile would include 20 RTs). The same binning procedure was performed on the
entire bisensory RT distribution. 4) RTs within each quantile were then compared
between the unisensory and bisensory conditions using 2-tailed Student’s t-tests (Student,
1908).
Not surprisingly, for the two subjects where the Race model was clearly violated,
significantly faster RTs were seen across a large part of the distribution. For KK this was
seen across quantiles 1 through 13 with an average speeding of 26.0 msec, and for DM, it
was the case across quantiles 4 through 14 with an average speeding of 4.1 msec. In the
case of VH, for whom the Race model was not systematically violated, there was a very
close match between the combined unisensory RT distribution and the bisensory
distribution. Nonetheless, across five of the early quantiles (2 through 6), bisensory RTs
were also significantly faster than unisensory, albeit by a modest 1.4 msecs.
For individual subjects, the pattern of RTs was for the most part paralleled by
percent hits. The individual performance data (reaction-times and percent hits) are
presented in Table 2.
Electrophysiological Data
Parietal electrode locations
In two of the subjects, in which left hemisphere grids were placed, the electrode
that met the predetermined criteria was located just anterior to the intraparietal sulcus
over the superior parietal lobule. In the third subject the location was located on a
Page 13 of 47
Multisensory Integration in Human SPL
13
somewhat more lateral and anterior portion of the left parietal lobe. However, the sparser
electrode coverage in this subject prevented as precise a localization of this activity as
was possible for the first two subjects (strips rather than grids were used). Nonetheless,
the highly similar morphology and timing of the responses to those of the other subjects
strongly suggests a similar origin. The middle column of Figure 2 displays the location of
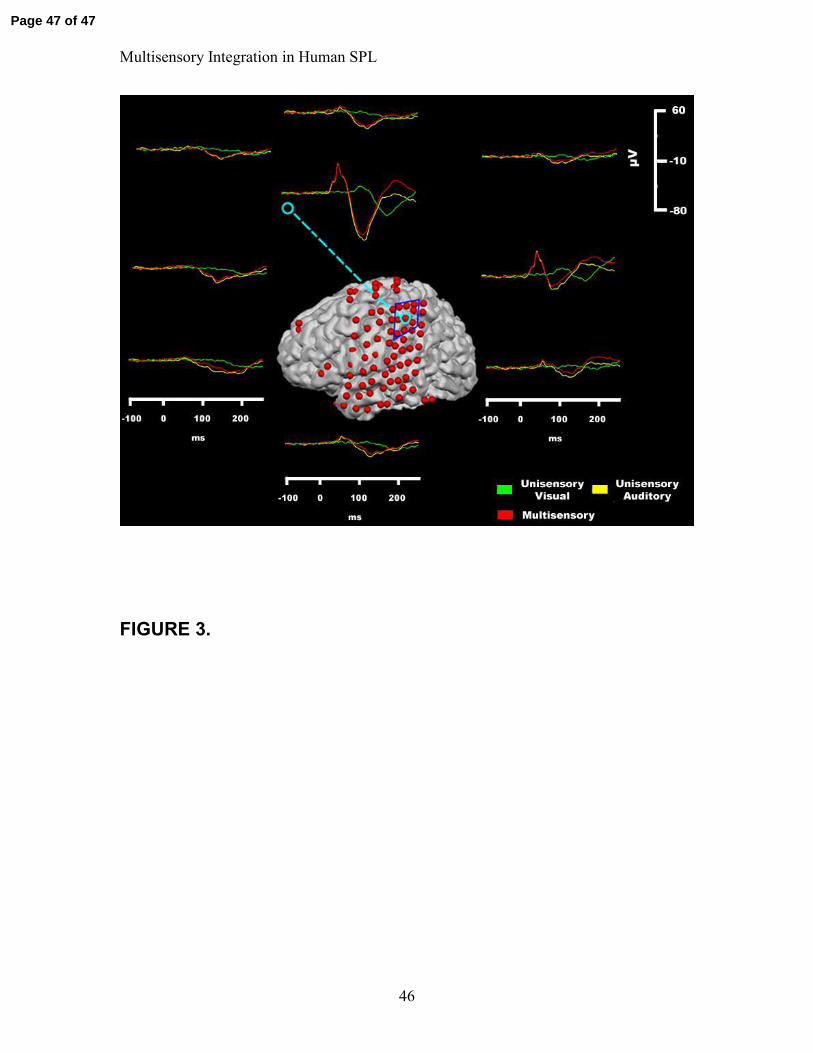
the electrode for each of the subjects. The specificity of the response is illustrated in
Figure 3, in which the response of interest and the responses at the surrounding electrodes
are shown, for subject VH. To facilitate the comparison of these data to group data
acquired from functional neuroimaging studies, the talairach coordinates of the electrode
of interest (see Figure 2) are given for each of the subjects in Table 3, determined
following talairach normalization of their brains. It should be kept in mind that this
highly useful talairach normalization procedure nonetheless distorts the anatomy of the
individual brains, and thus reference to electrode placement with respect to the
surrounding sulci and gyri in the untransformed individual brains is highly informative
given the cortical geometric variability we observe.
The sites from which data were analyzed did not exhibit interictal epileptiform
activity, and in at least two of the three cases the sites were far from the epilectic foci (for
comparison, see Table 1 for the location of epileptic foci and Figure 2 for the electrode
location).
Auditory response in the SPL
In all subjects, the response to the auditory condition exhibited an initial positive
deflection followed by a negative deflection. This positive-then-negative complex was
largest at the site of interest when compared to the surrounding sites. The initial
Page 14 of 47

Multisensory Integration in Human SPL
14
deflection was statistically different from baseline starting between 24 and 34 ms across
the three subjects. Auditory onset latencies for the individual subjects are presented in
Table 4, and the auditory responses are shown in grey in the first column of Figure 2.
Visual response in the SPL
Similar to the auditory response, in the visual response there was an initial
positive deflection followed by a negative deflection for all subjects. And again, this
positive-then-negative complex was largest at the site of interest when compared to the
surrounding sites. The initial deflection was statistically different from baseline starting
between 62 and 90 ms across the 3 subjects. Visual onset latencies for the individual
subjects are presented in Table 4, and the visual responses are shown in red in the first
column of Figure 2.
Multisensory responses in the SPL
The multisensory response was very similar to the auditory alone response, with an initial
positive deflection followed by a negative deflection (see red trace in the last column of
Figure 2). This positive-then-negative complex was largest at the site of interest when
compared to the surrounding sites. The multisensory response initially behaved in a linear
fashion, that is, it was identical to the artificially summed A+V response. However,
beginning between 120 and 160 ms, multisensory interactions were clearly evident, with
the multisensory response differing significantly from the algebraic sum of the
unisensory responses. The difference-onsets for the individual subjects are presented in
Table 4. The multisensory (red) and summed (blue) responses are presented in the
rightmost column of Figure 2. In all three cases, the multisensory response appears to
return more quickly to baseline than the summed response, although in the first case
Page 15 of 47
Multisensory Integration in Human SPL
15
(VH) this response rebounds and significantly exceeds baseline in the positive direction.
It is tempting to interpret this as evidence for so-called sub-additivity, but it is important
to point out that event-related potential measures cannot distinguish between inhibition,
disinhibition, or excitation. For example, in the present case it is perfectly possible that
an additional positive going generator has become active (e.g., EPSPs in the supralaminar
layers).
Page 16 of 47

Multisensory Integration in Human SPL
16
DISCUSSION
These intracranial data provide the first direct electrophysiological evidence of
multisensory processing in the human Superior Parietal Lobule (SPL). Auditory and
visual sensory information projected to the same highly localized parietal region with
auditory inputs arriving considerably earlier (~30 ms) than visual inputs (~75 ms). These
multisensory inputs were also clearly integrated in this same region, showing a consistent
nonlinear response across all three subjects that onset between 120 and 160 ms. The
morphology and timecourse of the responses were also remarkably similar across
subjects, strongly suggesting that the recordings were from a functionally homologous
region of cortex. In the two subjects for whom we had extensive coverage of the
surrounding region and were therefore able to precisely localize the source of the activity,
the electrodes were placed 1) on the anterior aspect of the IPS (KK), and 2) just superior
to the IPS (VH). Thus, these recordings likely reflect activity from a region just anterior
to the IPS on the lateral SPL. The results are consistent with the human neuroimaging
literature, which consistently shows co-localization of auditory and visual or tactile and
visual processing in these regions (Bushara et al. 1999; Calvert et al. 2001; 2005;
Macaluso and Driver 2001; Sereno and Huang 2005), and that these inputs also show
non-linear multisensory interactions within this region (Calvert et al. 2001).
The role of a “Multisensory” Superior Parietal Lobule
Human SPL is well known for its role in spatial attention and in particular in
shifts of spatial attention. (Bushara et al. 1999; Corbetta et al. 1993; Pardo et al. 1991;
Vandenberghe et al. 2001) Also, considerable evidence now indicates that spatial
Page 17 of 47

Multisensory Integration in Human SPL
17
attention is supramodal (Driver and Spence 1998; Eimer 2001), and further that SPL is
involved in both auditory and visual spatial localization (Bushara et al. 1999). As such,
the co-registration of visual and auditory spatial processing in SPL could well account for
oft-seen multimodal spatial attention effects. For example, a number of studies have
shown that when subjects attend to stimuli in a given modality, responses to co-localized
inputs in another modality are also enhanced, even when this second modality
information is completely task-irrelevant (Hillyard et al. 1984; Macaluso and Driver
2001; McDonald and Ward 2000; Teder-Salejarvi et al. 1999). Shomstein & Yantis
(2004) have also found SPL involvement in switching attention between auditory and
visual streams of information, although it should be noted that their SPL activations were
somewhat more medially focused than those in the present study. Further evidence for a
role in spatial representation comes from a very recent imaging study by Sereno and
Huang (2005) who found both visual and somatosensory inputs to a similar region of the
SPL as seen here, where these inputs showed both retinotopic and somatotopic
organizations. Although spatial attention was not an overt factor in our study, we would
nevertheless argue that attending to and processing a stimulus almost always involves
processing its location. Indeed, in her well-known model of feature integration, Treisman
argues that attention to an object necessarily involves attention to its location (Treisman
& Gelade, 1980; Treisman, 1982; Evans & Treisman, 2005). At the same time, it should
be pointed out that due to the adverse conditions inherent in making recordings in a
hospital room, the stimuli were not actually presented to identical locations insofar as
visual stimuli were presented on a monitor placed in front of the subject and the auditory
stimuli were presented over headphones. Spence and Driver (1997; also Driver and
Page 18 of 47

Multisensory Integration in Human SPL
18
Spence, 1998) have argued the importance of spatial register for spatial attention effects
and it is possible that this mismatch would preclude spatial attention effects.
The SPL also plays an important role in the transformation of multisensory inputs
into the same spatial reference frames (e.g., body centered or head centered), and in
sensory-motor integration (Andersen et al. 1997; Cohen and Andersen 2004; Iacoboni et
al. 1998; Lacquaniti and Caminiti 1998; Stricanne et al. 1996; Tanabe et al. 2005). For
example, it was shown using fMRI that regions in and around the SPL, including the
anterior IPS, were activated during sensorimotor transformations for both eye and finger
movements when these movements were triggered by either somatosensory or visual cues
(Tanabe et al. 2005). Similarly, a PET study has shown co-localization of SPL activation
for auditory or visual cueing of motor responses (Iacoboni et al. 1998). From our data, it
is tempting to speculate that since subjects responded with the right index finger, the left
hemisphere SPL multisensory activity reflects sensory-motor integration processes.
However, this remains to be explicitly tested with subjects alternating the hand of
response and electrode coverage over the equivalent region in the right hemisphere.
While these particular functions associated with the SPL would greatly benefit
from the co-registration and integration of multisensory inputs, it is obvious that further
work is necessary to specify the exact role of the multisensory zone of the SPL that we
have identified here. The ultimate goal of any such future work will not only be to
characterize the zone in terms of its functionality, but also to determine the underlying
principles for multisensory convergence and interactions, as has been done for the
superior colliculus in the seminal work of Stein and colleagues (Stein and Meredith
1993).
Page 19 of 47

Multisensory Integration in Human SPL
19
The timing of the onset of multisensory processing is key to understanding the
functional role of these SPL activations. Of course, integration cannot begin until the
later visual input arrives in SPL, which occurs here at an average latency of 75ms.
However, the convergent auditory and visual inputs sum linearly for a considerable
period thereafter, with multisensory integration lagging visual onset by an average of 60
ms (ranging from 54 to 70 ms). The average onset of multisensory processing in SPL at
135 ms is therefore noticeably late. Previous studies have shown that multisensory
processing can onset within the timeframe of early sensory processing, revealing the
possibility of very early multisensory influences on sensory processing. For example, in
our previous study using surface recorded potentials and employing a nearly identical
paradigm (Molholm et al., 2002), we found a series of multisensory interactions with the
earliest effects beginning at just 45 msecs (also Giard and Peronnet, 1999). However this
was over right parieto-occipital scalp and clearly not due to neural generators in the SPL.
Later modulations however could very conceivably have included contributions from
SPL generators. Thus, the SPL integrations seen in the present study would have to be
considered relatively late in processing and might well have been due to feedback
processes from higher-order regions (see Foxe and Schroeder, 2005).
SPL versus IPS?
One might wonder why it is in the SPL that we find co-localization of the
maximal auditory and visual responses and ensuing multisensory interactions, when the
bulk of the monkey intracranial data points to more inferior and posterior regions within
the IPS? Here we present two potential explanations. First, the grid electrodes used here
Page 20 of 47

Multisensory Integration in Human SPL
20
are nestled directly against the surface of the cortex but do not extend down into the sulci.
As such, they will be much more sensitive to responses coming from the gyri directly
beneath them than to deeper regions within the sulci. Second, it is possible that regions of
SPL in the human are in fact the same as those that have been identified in the monkey
IPS as these homologies are still in dispute. For example, Watson et al. (Watson et al.
1994) point out that Brodmanns area 7, a well-established multisensory region in non-
human primates (Bremmer 2005; Hyvarinen 1981; Leinonen 1980; Schlack et al. 2005),
is below and within the IPS of the monkey, whereas it is significantly more dorsal within
the SPL of the human. Bushara et al. (1999) also found co-localization of auditory and
visual responses within the SPL during a spatial localization task and similarly reasoned
that the SPL might in fact be a more dorsal homologue of monkey IPS. At the same time,
although cytoarchitectonic homology is typically thought to be consistent with functional
homology (Geyer et al. 2000), they may not necessarily go hand-in-hand (Sereno and
Tootell 2005). Brodmanns areas 39 and 40 in the inferior parietal lobule, which are
unique to humans, correspond more closely in anatomical space to monkey area 7, and it
could be argued that in this case human-monkey functional homology is based on
anatomical rather than cytoarchitectonic organization.
Latency and Amplitude Considerations
In all three subjects, auditory responses clearly onset earlier than visual responses
and were also greater in amplitude, although it should be pointed out that no systematic
manipulation of stimulus intensity was made. Rather, a single moderate intensity level
was chosen for each sensory stimulus. Nonetheless, these rather large differences in
responses can help us to make some inferences about putative homologies between
Page 21 of 47

Multisensory Integration in Human SPL
21
monkeys and humans. First, the presence of large auditory responses would appear to
argue against the lateral intraparietal region (LIP) as a realistic candidate. A number of
studies have shown that auditory responsiveness is only found in LIP neurons after
animals have learned that specific auditory stimuli are important for occulomotor tasks
(e.g. Stricanne et al., 1996; Grunewald et al., 1999; Linden et al., 1999). A refinement of
this position was made by Gifford and Cohen (2004) who showed that stimulus driven
responses could in fact be seen in LIP to unlearned auditory stimuli when monkeys
fixated and sounds were presented in a darkened environment such that they were the
only salient information present (i.e. there was no distracting visual input). Even when
these auditory responses are elicited in LIP, they tend to be weakly stimulus-driven,
generally showing lower firing rates than visual neurons do in this region (e.g. Mullette-
Gillman et al., 2005; Cohen et al., 2004). Also, the proportion of cells in LIP that show
auditory stimulus-driven responsiveness is lower than those showing visual
responsiveness (Mazzoni, et al., 1996; Grunewald et al., 1999; Mullette-Gillman et al.,
2005). As such, our finding of more robust auditory responses in this human SPL region,
in a task where subjects were not required to make any eye-movements at all, renders it
somewhat unlikely that these responses originate from a homologue of monkey LIP. A
better case for homology can be made for the neighboring ventral intraparietal region
(area VIP) where a far greater proportion of cells have been found to be responsive to
auditory stimuli and where auditory responses tend to be more robust (Schlack et al.,
2005). Schlack and colleagues found that fully 80% of neurons tested in VIP responded
to auditory stimuli, stimuli that had no particular behavioural significance, with 92% of
neurons showing visual responsiveness. While there was a tendency for visual responses
Page 22 of 47

Multisensory Integration in Human SPL
22
in bisensory neurons to be stronger, no significant differences in amplitude were seen in
the majority of cells recorded from. Nonetheless, the fact that the auditory response was
stronger in all three subjects than the visual response also casts some doubt on VIP as a
potential homologue and leaves open the distinct possibility that this SPL region is not a
homologue of any of the well-characterized monkey IPS regions.
Turning now to the rather substantial difference in onset latencies for auditory and
visual responses that we find in the SPL (a mean of 29 msec versus 75 msec
respectively). The first thing to note is that these differences appear to largely preserve
transmission time differences from the periphery to the primary auditory and visual
sensory cortices (A1 and V1). Intracranial recordings of primary auditory cortical
responses to tone-pips in humans have shown an initial cortical response at just 10 ms
(Celecia, 1976; Celesia and Puletti, 1969, 1971). On the other hand, the onset of visual
responses in V1 is seen considerably later, typically between 45 and 60 msec (e.g. Clark
and Hillyard, 1996; Foxe and Simpson, 2002; Molholm et al., 2002). Thus, there is a 35-
50 msec delay between the arrival of these two sources of information into their
respective primary sensory cortices, much the same as the latency difference observed
here in the multisensory zone of the SPL, where there was a mean difference of
approximately 46 ms across the three subjects (range from 38 to 56 msec).
These latency differences also appear to be largely consistent with onset times
seen in a number of monkey intracranial studies. Schlack et al. (2005) established a lower
limit of 15 ms for auditory inputs to VIP and this agrees very well with our own
recordings from monkey LIP where we found both local field potential (LFP) and multi-
unit onsets in layer IV at just 15 ms (Schroeder et al., 2004). We have also shown average
Page 23 of 47

Multisensory Integration in Human SPL
23
visual onsets in the IPS of awake-behaving macaques at about 28 msecs (see Schroeder et
al., 1998; 2001; Schroeder and Foxe, 2002). A similar onset-latency difference is
observed between somatosensory and visual input latencies to the IPS with
somatosensory inputs arriving at just 10 msec and visual inputs, as above, arriving at
approximately 28 msec (see Figure 7 of Schroeder and Foxe, 2002). Avillac et al (2005)
also found very similar onset latency differences for somatosensory and visual inputs to
VIP (10 msec versus 40 msec respectively). In LIP the story appears to be much the
same. Mazzoni et al. (1996) observed auditory and visual onset latency differences of
some 30 msec, with a lower limit of about 30 msec for auditory responses and 60 msec
for visual responses. It should be mentioned that they also found a very wide range of
onset latencies for both sensory inputs, so although the fastest neurons were auditory,
many other auditory neurons had quite late onsets such that the median response latency
of auditory neurons was somewhat slower than that to visual neurons (155 versus 125
msec respectively). However, since the ERP measure used in our study samples net
activity from all neurons in a given region, onset latency will be determined by the fastest
inputs; thus the differential onset found here appears to be quite consistent with
recordings from both LIP and VIP.
Hemispheric Specialization?
The electrode sites that met our criteria were all from the left hemisphere. This
does not, however, necessarily imply a left lateralized function. Rather this may reflect
our restricted sampling of cortical space: In two of our subjects, electrodes were only
placed in the left hemisphere, while in the remaining there was bilateral coverage, but it
was relatively more sparse. Further, in a high-density scalp ERP study in which an
Page 24 of 47

Multisensory Integration in Human SPL
24
identical paradigm was used, multisensory AV integrations were observed at very similar
latencies to those found here. Scalp mapping of these effects showed a strong focus over
left parieto-central scalp but also a second focus, albeit weaker, over the right centro-
parietal scalp (see Figure 4, bottom panel of (Molholm et al. 2002).
Reaction Times and SPL Multisensory Integration
As in our previous study (Molholm et al., 2002), all three subjects showed
reaction times that were faster for multisensory AV stimuli compared to either of the
unisensory stimuli. In two of the three subjects, this speeding of reaction time exceeded
the so-called Race model, indicating that multisensory interactions must necessarily have
contributed to the production of responses. However, in the third subject (VH), no
violation of the Race model was observed. This is of particular interest because VH’s
electrophysiological responses in the SPL were identical to the other two subjects,
showing the same extent of multisensory integration. Although this is only a single
subject, these data appear to suggest that SPL may not be playing a role in the speeding
of RTs typically seen in such paradigms. Clearly, this needs further testing in a larger
sample.
Conclusions:
Clear auditory and visual convergence was seen in a region of the lateral superior
parietal lobule while subjects performed a simple reaction time task to randomly
intermixed stimuli in both modalities. Auditory inputs were of somewhat greater
amplitude and were substantially earlier, by ~40 ms, than visual inputs. Nonetheless,
visual responses were also highly robust. Since no manipulation of stimulus intensity was
undertaken, the fact that auditory inputs appeared stronger should not be overemphasized.
Page 25 of 47

Multisensory Integration in Human SPL
25
Auditory and visual inputs also showed multisensory integration, relatively early in
processing (120-160 ms) within approximately 60 ms of the initial visual input to this
region.
Page 26 of 47
Multisensory Integration in Human SPL
26
ACKNOWLEDGEMENTS
We sincerely thank Dr. John Smiley for informative discussions regarding the anatomy of
the parietal cortices. We would like to especially thank Ms. Jeannette Piesco and Ms.
Beth Higgins for their expert data collection. This work was supported by NIMH grants
to JJF (MH65350) and SM (F32 - MH068174). SO was supported by a grant from the
FSBMB (1223/PASMA/111563).
Page 27 of 47
Multisensory Integration in Human SPL
27
Reference List
Andersen RA, Snyder LH, Bradley DC, and Xing J. Multimodal representation of
space in the posterior parietal cortex and its use in planning movements.
Annu.Rev.Neurosci. 20: 303-330, 1997.
Andersen RA, Brotchie PR, and Mazzoni P. Evidence for the lateral intraparietal area
as the parietal eye field. Curr Opin Neurobiol. 2:840-846, 1992.
Astafiev SV, Shulman GL, Stanley CM, Snyder AZ, Van E, and Corbetta M.
Functional organization of human intraparietal and frontal cortex for attending, looking,
and pointing. J.Neurosci. 23: 4689-4699, 2003.
Avillac M, Deneve S, Olivier E, Pouget A, and Duhamel JR. Reference frames for
representing visual and tactile locations in parietal cortex. Nat Neurosci. 8:941-949,
2005.
Barth DS, Goldberg N, Brett B, and Di S. The spatiotemporal organization of auditory,
visual, and auditory-visual evoked potentials in rat cortex. Brain Res. 678: 177-190,
1995.
Bremmer F. Navigation in space--the role of the macaque ventral intraparietal area.
J.Physiol 566: 29-35, 2005.
Page 28 of 47

Multisensory Integration in Human SPL
28
Bremmer F, Schlack A, Shah NJ, Zafiris O, Kubischik M, Hoffmann K, Zilles K,
and Fink GR. Polymodal motion processing in posterior parietal and premotor cortex: a
human fMRI study strongly implies equivalencies between humans and monkeys.
Neuron 29: 287-296, 2001.
Brett-Green B, Paulsen M, Staba RJ, Fifkova E, and Barth DS. Two distinct regions
of secondary somatosensory cortex in the rat: topographical organization and
multisensory responses. J.Neurophysiol. 91: 1327-1336, 2004.
Bushara KO, Weeks RA, Ishii K, Catalan MJ, Tian B, Rauschecker JP, and Hallett
M. Modality-specific frontal and parietal areas for auditory and visual spatial localization
in humans. Nat.Neurosci. 2: 759-766, 1999.
Calvert GA, Hansen PC, Iversen SD, and Brammer MJ. Detection of audio-visual
integration sites in humans by application of electrophysiological criteria to the BOLD
effect. Neuroimage 14: 427-438, 2001.
Celesia GG. Organization of auditory cortical areas in man. Brain. 99:403-414, 1976.
Celesia GG and Puletti F. Auditory cortical areas of man. Neurology. 19:211- 220,
1969.
Page 29 of 47
Multisensory Integration in Human SPL
29
Celesia GG and Puletti F. Auditory input to the human cortex during states of
drowsiness and surgical anesthesia. Electroencephalogr Clin Neurophysiol. 31:603-
609, 1971.
Clark, VP and Hillyard, SA. Spatial selective attention affects early extrastriate but
not striate components of the visual evoked potential. J Cognit. Neurosci. 8:387-402,
1996.
Cohen YE and Andersen RA. Multimodal spatial representations in the primate
parietal lobe. In: Crossmodal Space and Crossmodal Attention, edited by Spence C and
Driver J, New York, Oxford University Press. 2004, 99-121.
Cohen YE, Cohen IS and Gifford GW 3rd. Modulation of LIP activity by predictive
auditory and visual cues. Cereb Cortex. 14:1287-1301, 2004.
Corbetta M, Miezin FM, Shulman GL, and Petersen SE. A PET study of
visuospatial attention. J.Neurosci. 13: 1202-1226, 1993.
Di S, Brett B, and Barth DS. Polysensory evoked potentials in rat parietotemporal
cortex: combined auditory and somatosensory responses. Brain Res. 642: 267-280,
1994.
Driver J and Spence C. Crossmodal attention. Curr.Opin.Neurobiol. 8: 245-253,
1998.
Page 30 of 47
Multisensory Integration in Human SPL
30
Ebeling U and Steinmetz H. Anatomy of the parietal lobe: mapping the individual
pattern. Acta Neurochir (Wien). 136:8-11, 1995.
Eimer M. Crossmodal links in spatial attention between vision, audition, and touch:
evidence from event-related brain potentials. Neuropsychologia 39: 1292-1303, 2001.
Evans KK and Treisman A. Perception of objects in natural scenes: is it really
attention free? J Exp Psychol Hum Percept Perform. 31:1476-1492, 2005.
Foxe JJ, Morocz IA, Murray MM, Higgins BA, Javitt DC, and Schroeder CE.
Multisensory auditory-somatosensory interactions in early cortical processing revealed
by high-density electrical mapping. Brain Res.Cogn Brain Res. 10: 77-83, 2000.
Foxe JJ and Schroeder CE. The case for feedforward multisensory convergence
during early cortical processing. Neuroreport 16: 419-423, 2005.
Foxe JJ and Simpson GV. Flow of activation from V1 to frontal cortex in humans: A
framework for defining "early" visual processing. Exp Brain Res. 142:139-150, 2002
Geyer S, Matelli M, Luppino G, and Zilles K. Functional neuroanatomy of the
primate isocortical motor system. Anat. Embryol. (Berl) 202: 443-474, 2000.
Page 31 of 47

Multisensory Integration in Human SPL
31
Giard MH and Peronnet F. Auditory-visual integration during multimodal object
recognition in humans: a behavioral and electrophysiological study. J Cogn Neurosci.
11:473-490, 1999.
Gifford GW 3rd and Cohen YE. Effect of a central fixation light on auditory spatial
responses in area LIP. J Neurophysiol. 91:2929-2933, 2004.
Grunewald A, Linden JF, and Andersen RA. Responses to auditory stimuli in
macaque lateral intraparietal area. I. Effects of training. J Neurophysiol. 82:330-342,
1999.
Hillyard SA, Simpson GV, Woods DL, Van Voorhis ST, and Munte TF. Event-
related brain potentials and selective attention to different modalities. In: Cortical
Integration, edited by Reinoso-Suarez F ed.. New York, Ravel Press. 1984, 395-414.
Hyvarinen J. Regional distribution of functions in parietal association area 7 of the
monkey. Brain Res. 206: 287-303, 1981.
Iacoboni M, Woods RP, and Mazziotta JC. Bimodal (auditory and visual) left
frontoparietal circuitry for sensorimotor integration and sensorimotor learning. Brain
121 ( Pt 11): 2135-2143, 1998.
Lacquaniti F and Caminiti R. Visuo-motor transformations for arm reaching.
Eur.J.Neurosci. 10: 195-203, 1998.
Page 32 of 47

Multisensory Integration in Human SPL
32
Leinonen L. Functional properties of neurones in the posterior part of area 7 in awake
monkey. Acta Physiol Scand. 108: 301-308, 1980.
Lewis JW, Beauchamp MS, and DeYoe EA. A comparison of visual and auditory
motion processing in human cerebral cortex. Cereb.Cortex 10: 873-888, 2000.
Linden JF, Grunewald A, and Andersen RA. Responses to auditory stimuli in
macaque lateral intraparietal area. II. Behavioral modulation. J Neurophysiol. 82:343-
358, 1999.
Macaluso E and Driver J. Multisensory spatial interactions: a window onto functional
integration in the human brain. Trends Neurosci. 28: 264-271, 2005.
Macaluso E and Driver J. Spatial attention and crossmodal interactions between
vision and touch. Neuropsychologia 39: 1304-1316, 2001.
Mazzoni P, Bracewell RM, Barash S, and Andersen RA Spatially tuned auditory
responses in area LIP of macaques performing delayed memory saccades to acoustic
targets. J.Neurophysiol. 75: 1233-1241, 1996.
McDonald JJ and Ward LM. Involuntary listening aids seeing: evidence from human
electrophysiology. Psychol.Sci. 11: 167-171, 2000.
Page 33 of 47
Multisensory Integration in Human SPL
33
Miller J. Divided attention: evidence for coactivation with redundant signals.
Cognit.Psychol. 14: 247-279, 1982.
Miller LM and D'Esposito M. Perceptual fusion and stimulus coincidence in the
cross-modal integration of speech. J.Neurosci. 25: 5884-5893, 2005.
Molholm S, Ritter W, Javitt DC, and Foxe JJ. Multisensory visual-auditory object
recognition in humans: a high-density electrical mapping study. Cereb.Cortex 14: 452-
465, 2004.
Molholm S, Ritter W, Murray MM, Javitt DC, Schroeder CE, and Foxe JJ.
Multisensory auditory-visual interactions during early sensory processing in humans: a
high-density electrical mapping study. Brain Res.Cogn Brain Res. 14: 115-128, 2002.
Mullette-Gillman OA, Cohen YE, and Groh JM. Eye-centered, head-centered, and
complex coding of visual and auditory targets in the intraparietal sulcus. J
Neurophysiol. 94:2331-52, 2005.
Murray MM, Foxe JJ, Higgins BA, Javitt DC, and Schroeder CE. Visuo-spatial
neural response interactions in early cortical processing during a simple reaction time
task: a high-density electrical mapping study. Neuropsychologia 39: 828-844, 2001.
Ojanen V, Mottonen R, Pekkola J, Jaaskelainen IP, Joensuu R, Autti T, and Sams
M. Processing of audiovisual speech in Broca's area. Neuroimage 25: 333-338, 2005.
Page 34 of 47
Multisensory Integration in Human SPL
34
Pardo JV, Fox PT, and Raichle ME. Localization of a human system for sustained
attention by positron emission tomography. Nature 349: 61-64, 1991.
Rizzuto DS, Mamelak AN, Sutherling WW, Fineman I, and Andersen RA. Spatial
selectivity in human ventrolateral prefrontal cortex. Nat.Neurosci. 8: 415-417, 2005.
Schlack A, Sterbing-D'Angelo SJ, Hartung K, Hoffmann KP, and Bremmer F.
Multisensory space representations in the macaque ventral intraparietal area.
J.Neurosci. 25: 4616-4625, 2005.
Schroeder CE and Foxe JJ. The timing and laminar profile of converging inputs to
multisensory areas of the macaque neocortex. Brain Res Cogn Brain Res. 14:187-198,
2002.
Schroeder CE and Foxe JJ. Multisensory contributions to low-level, 'unisensory'
processing. Curr.Opin.Neurobiol. 15: 454-458, 2005.
Schroeder CE, Mehta AD, and Foxe JJ. Determinants and mechanisms of attentional
modulation of neural processing. Front Biosci. 6:D672-84, 2001.
Schroeder CE, Mehta AD, and Givre SJ. A spatiotemporal profile of visual system
activation revealed by current source density analysis in the awake macaque. Cereb
Cortex. 8:575-592, 1998.
Page 35 of 47
Multisensory Integration in Human SPL
35
Schroeder, CE, Molholm, S, Lakatos, P, Ritter, W, and Foxe, JF. Human-simian
correspondence in the early cortical processing of multisensory cues. Cogn Process. 5:
140-151, 2004
Sereno MI and Huang RS. Mapping the ventral intraparietal area (VIP) in humans.
Society for Neuroscience Conference Abstract. 2005.
Sereno MI and Tootell RB. From monkeys to humans: what do we now know about
brain homologies? Curr.Opin.Neurobiol. 15: 135-144, 2005.
Shomstein S and Yantis S. Control of attention shifts between vision and audition in
human cortex. J.Neurosci. 24: 10702-10706, 2004.
Spence C and Driver J. On measuring selective attention to an expected sensory
modality. Percept. Psychophys. 59:389-403, 1997.
Stanford TR, Quessy S, and Stein BE. Evaluating the operations underlying
multisensory integration in the cat superior colliculus. J.Neurosci. 25: 6499-6508, 2005.
Stein BE and Meredith MA. The Merging of the Senses. Cambrige, MA, The MIT
Press. 1993.
Page 36 of 47
Multisensory Integration in Human SPL
36
Stricanne B, Andersen RA, and Mazzoni P. Eye-centered, head-centered, and
intermediate coding of remembered sound locations in area LIP. J.Neurophysiol. 76:
2071-2076, 1996.
Student. [aka William Sealey Gosset]. The probable error of the mean. Biometrika 6:
1-25, 1908.
Tanabe HC, Kato M, Miyauchi S, Hayashi S, and Yanagida T. The sensorimotor
transformation of cross-modal spatial information in the anterior intraparietal sulcus as
revealed by functional MRI. Brain Res. Cogn Brain Res. 22: 385-396, 2005.
Teder-Salejarvi WA, Munte TF, Sperlich F, and Hillyard SA. Intra-modal and
cross-modal spatial attention to auditory and visual stimuli. An event-related brain
potential study. Brain Res.Cogn Brain Res. 8: 327-343, 1999.
Treisman A. Perceptual grouping and attention in visual search for features and for
objects. J Exp Psychol Hum Percept Perform. 8:194-214, 1982.
Treisman AM and Gelade G. A feature-integration theory of attention. Cognit
Psychol. 12:97-136, 1980.
Vandenberghe R, Gitelman DR, Parrish TB, and Mesulam MM. Location- or
feature-based targeting of peripheral attention. Neuroimage 14: 37-47, 2001.
Page 37 of 47

Multisensory Integration in Human SPL
37
Wallace MT, Meredith MA, and Stein BE. Converging influences from visual,
auditory, and somatosensory cortices onto output neurons of the superior colliculus.
J.Neurophysiol. 69: 1797-1809, 1993.
Wallace MT, Ramachandran R, and Stein BE. A revised view of sensory cortical
parcellation. Proc.Natl.Acad.Sci.U.S.A 101: 2167-2172, 2004.
Watson RT, Valenstein E, Day A, and Heilman KM. Posterior neocortical systems
subserving awareness and neglect. Neglect associated with superior temporal sulcus but
not area 7 lesions. Arch Neurol. 51: 1014-1021, 1994.
Page 38 of 47

Multisensory Integration in Human SPL
38
TABLE AND FIGURE LEGENDS
Table 1 Clinical data.
Clinical data are presented for the three subjects. Seizure types: GTC-generalized tonic
clonic; CPS-complex partial seizures.
Table 2 Behavioral data.
Mean RTs and percent hits for each subject for each stimulus condition.
Table 3 Talairach coordinates of the Electrode of Interest for each of the subjects.
Table 4 Electrophysiological response onsets.
The latency (in ms) at which individual response onsets for the unisensory stimuli
(auditory and visual) reached significance, and at which the non-linearity of the
multisensory response (last column) reached significance.
Figure 1
Violation of the Race model. Positive values indicate that the probability of the RTs to
the AV trials exceeded predictions of the Race model.
Figure 2
The auditory (gray trace) and the visual (red trace) responses are shown in column 1. The
location of the electrodes that met criteria (see methods) are indicated by red dots on the
Page 39 of 47

Multisensory Integration in Human SPL
39
reconstructed brains of the individual subjects in column 2; for landmarks we have put
black arrows to indicate the estimated location of the central sulcus and yellow arrows to
indicate the estimated location of the IPS. The audio-visual (red) and summed
unisensory (auditory alone plus visual alone; in blue) responses are shown in column 3.
For the ERPs, the SEM is represented by the thickness of the trace.
Figure 3
For the electrode of interest (circled in light blue), the stimulus responses are shown
along with the responses from the 8 sites that immediately surrounded it (outlined in
blue). The auditory response is in yellow, the visual response in green, and the audio-
visual response in red. The sensory responses were highly localized, as can been seen by
examining the substantial decrease in amplitude in the responses at the immediately
surrounding sites. Data from VH are shown.
Page 40 of 47
Multisensory Integration in Human SPL
40
Table 1 Subject Clinical Data.
Age at onset
type of seizures location of epileptic foci Neuropsych Language
KK 16 CPS L. hippocampus & lateral temporal lobe no major deficits Left DM 5 CPS, GTC R. Multifocal Neocortical no major deficits Left VH 1 CPS, GTC L. hippocampus poor memory Left
Page 41 of 47

Multisensory Integration in Human SPL
41
Table 2 Behavioral Data
Audio-visual Auditory Visual
KK 359 87% 471 72% 409 82%
VH 243 94% 270 89% 341 91%
DM 236 91% 260 90% 314 88%
RT % hits
Page 42 of 47

Multisensory Integration in Human SPL
42
Table 3 Talairach Coordinates of the Electrodes.
X Y Z
KK -44 -14 46
VH -40 -20 57
DM -52 -18 50
Page 43 of 47

Multisensory Integration in Human SPL
43
Table 4 Electrophysiological response onsets.
A V AV- (A+V)
KK 30 74 130
VH 24 62 116
DM 34 90 160
Page 44 of 47
Multisensory Integration in Human SPL
44
FIGURE 1.
Page 45 of 47

Multisensory Integration in Human SPL
45
FIGURE 2.
Page 46 of 47
Multisensory Integration in Human SPL
46
FIGURE 3.
Page 47 of 47