attributable causes of cancer in france in the year 2000
177
-
Upload
khangminh22 -
Category
Documents
-
view
3 -
download
0
Transcript of attributable causes of cancer in france in the year 2000


�
WORLD HEALTH ORGANIZATION
INTERNATIONAL AGENCY FOR RESEARCH ON CANCER
IARC
Work�ng Group Reports
Volume 3
ATTRIBUTABLE CAUSES OF CANCER IN FRANCE IN THE YEAR 2000
��
Publ�shed by the Internat�onal Agency for Research on Cancer,150 cours Albert Thomas, 69372 Lyon Cedex 08, France
© Internat�onal Agency for Research on Cancer, 2007
D�str�buted by WHO Press, World Health Organ�zat�on, 20 Avenue App�a, 1211 Geneva 27, Sw�tzerland (tel: +41 22 791 3264; fax: +41 22 791 4857; ema�l: bookorders@who.�nt).
Publ�cat�ons of the World Health Organ�zat�on enjoy copyr�ght protect�on �n accordance w�th the prov�s�ons of Protocol 2 of the Un�versal Copyr�ght Convent�on. All r�ghts reserved.
The des�gnat�ons employed and the presentat�on of the mater�al �n th�s publ�cat�on do not �mply the express�on of any op�n�on whatsoever on the part of the Secretar�at of the World Health Organ�zat�on concern�ng the legal status of any country, terr�tory, c�ty, or area or of �ts author�t�es, or concern�ng the del�m�tat�on of �ts front�ers or boundar�es.
The ment�on of spec�f�c compan�es or of certa�n manufacturers’ products does not �mply that they are endorsed or recommended by the World Health Organ�zat�on �n preference to others of a s�m�lar nature that are not ment�oned. Errors and om�ss�ons excepted, the names of propr�etary products are d�st�ngu�shed by �n�t�al cap�tal letters.
The authors alone are respons�ble for the v�ews expressed �n th�s publ�cat�on.
The Internat�onal Agency for Research on Cancer welcomes requests for perm�ss�on to reproduce or translate �ts publ�cat�ons, �n part or �n full. Requests for perm�ss�on to reproduce or translate IARC publ�cat�ons – whether for sale or for noncommerc�al d�str�but�on – should be addressed to WHO Press, at the above address (fax: +41 22 791 4806; ema�l: perm�ss�ons@who.�nt).
IARC Library Cataloguing in Publication Data
Attr�butable causes of cancer �n France �n the year 2000. (IARC Work�ng Group Reports ; 3)
1. Neoplasms–et�ology 2. R�sk Factors 3. France I. Internat�onal Agency for Research on Cancer. II. Ser�es
ISBN 978 92 832 2443 4 (NLM Class�f�cat�on: W1)

���
This report is co-authored by:
The International Agency for Research on Cancer (IARC)P. Aut�er, P. Boffetta, M. Bon�ol, P. Boyle (Co-Cha�r), J. Ferlay
The Académie Nationale de MédecineA. Aurengo, R. Masse, G. de Thé
The Académie des SciencesR. Mon�er, M. Tub�ana (Co-Cha�r), A.J. Valleron
The Fédération Nationale des Centres de Lutte Contre le Cancer (FNCLCC)C. H�ll
In partnership with the Institut National du Cancer (INCa)L. Borella, D. Maran�nch�
Institutions consulted:Inst�tut de Ve�lle San�ta�re (InVS)
Reviewers:France,
For the entire report: J. Ben�chou (Un�vers�té de Rouen), J. Estève (Hosp�ces C�v�ls de Lyon).For specific parts of the report: P. Bougnoux (Inst�tut Nat�onal de la Santé et de la Recherche Méd�cale
[INSERM]) for the sub-sect�on on nutr�t�on, M. Goldberg (INSERM) for the sect�on on occupat�onal exposure, G. Orth (Inst�tut Pasteur) for the sect�on on �nfect�ous agents, H. Rochefort (INSERM) and C. Sureau (Académ�e Nat�onale de Médec�ne) for the sect�on on hormone replacement therapy and oral contracept�ves, H. Sancho-Garn�er (Un�vers�té de Montpell�er) for the sect�on on ultrav�olet l�ght, D. Zm�rou-Nav�er (INSERM) for the sub-sect�on on a�r pollut�on.
International,For the entire report: J. Peto (London School of Hyg�ene and Trop�cal Med�c�ne, London, Un�ted K�ngdom),
J. S�em�atyck� (Un�vers�ty of Montreal, Montreal, Canada).For specific parts of the report: H. zur Hausen (Deutschen Krebsforschungszentrums [DKFZ], He�delberg,
Germany) for the sect�on on �nfect�ous agents.
We thank the following persons and institutions for their collaboration in the provision and interpretation of data: B. Blondel (INSERM), E. Card�s (IARC), D. Costagl�ola (INSERM), S. Francesch� (IARC), S. Gand�n� (Ist�tuto Europeo d� Oncolog�a, M�lan, Italy), E. Imbernon (InVS), E. Jougla (Cep�Dc-INSERM), G. Launoy (Reg�stre des Cancers du Calvados), H. Lér�don (Inst�tut Nat�onal Etudes Démograph�ques [INED]), P. Mull�e (Inst�tut Jules Bordet, Brussels, Belg�um), A. Rannou (Inst�tut de rad�oprotect�on et de sûreté nucléa�re - IRSN), L. Toulemon (INED), F. de Vatha�re (INSERM), W. Zatonsk� (Mar�e Sklodowska-Cur�e Memor�al Cancer Centre, Warsaw, Poland)
Correspondence: Prof. Peter Boyle, Internat�onal Agency for Research on Cancer, 150 cours Albert Thomas, 69372 Lyon, France. Ema�l: d�rector@�arc.fr
Prof. Maur�ce Tub�ana, Académ�e Nat�onale de Médec�ne, 16 rue Bonaparte, 75005 Par�s, France. Ema�l: maur�ce.tub�ana@b�omed�cale.un�v-par�s5.fr
�v
TABLE OF CONTENTS
Introduction 1
Sect�on A1 Object�ves and methodology 1
Sect�on A2 Temporal trends �n cancer �nc�dence and mortal�ty �n France 9
Risk factors selected for estimate calculations 29
Sect�on B1 Tobacco smok�ng 29
Sect�on B2 Alcohol dr�nk�ng 36
Sect�on B3 Infect�ous agents 42
Sect�on B4 Occupat�on 47
Sect�on B5 Obes�ty and overwe�ght 60
Sect�on B6 Phys�cal �nact�v�ty 65
Sect�on B7 Hormone replacement therapy and oral contracept�ves 69
Sect�on B8 Ultrav�olet l�ght 85
Sect�on B9 Reproduct�ve factors 88
Sect�on B10 Water, a�r, so�l and food pollutants 97
Synthesis of results 103
Sect�on C1 Attr�butable fract�ons: summary est�mates 103
Sect�on C2 Interact�ons between cancer r�sk factors 111
Risk factors for which no estimates were calculated 120
Sect�on D1 Ion�z�ng rad�at�on 120
Sect�on D2 Establ�shed r�sk factors assoc�ated w�th cancer occurrence not relevant for France 130
Sect�on D3 Factors suspected, but not demonstrated, to be assoc�ated w�th cancer �n humans 132
Discussion 147
Sect�on E1 Knowledge gaps �n causat�on of cancers: Progress made and further research needs 147
Sect�on E2 General d�scuss�on 165
Sect�on E3 Recommendat�ons 171

1
Introduction
1. Background
Many factors, whether genet�c, or related to l�festyle or the env�ronment, have been �dent�f�ed over the past 50 years as be�ng assoc�ated w�th cancer occurrence.
About 2 to 4% of all cancers seem to have a genet�c or�g�n, �.e., gene defects known to be assoc�ated w�th these cancers can be transm�tted from parents to the�r offspr�ng. Moreover, genet�c polymorph�sms and ep�genet�c phenomena may enhance or reduce the r�sk assoc�ated w�th endogenous or exogenous carc�nogen�c factors. Dur�ng the past two decades, �t has been assumed that most cancers are due to l�festyle or to env�ronmental r�sk factors. Very many ep�dem�olog�cal stud�es have been reported, but they are often contrad�ctory or of debatable value because of methodolog�cal problems or lack of suff�c�ent stat�st�cal power. Hence, the�r results have to be cr�t�cally rev�ewed. In parallel, our understand�ng of carc�nogenes�s has markedly progressed, but the data are st�ll �nsuff�c�ent to fully establ�sh the d�fferent steps of carc�nogenes�s and the �nteract�on between the var�ous endogenous or exogenous factors. In many f�elds, further research �s clearly requ�red. Nevertheless, the strategy of cancer prevent�on must be based on the latest est�mates of the relat�ve we�ght of the var�ous l�festyle and env�ronmental r�sk factors. The a�m of th�s report �s to est�mate the proport�ons of cancer attr�butable to such r�sk factors and also to evaluate the we�ght of each factor �n the burden of cancer. Th�s report d�st�ngu�shes sol�d data from those wh�ch are st�ll dub�ous or controvers�al; the former may be cons�dered and taken �nto account �n dec�s�on-mak�ng �n cancer prevent�on and for pr�or�t�z�ng publ�c health and research efforts.
D�scuss�ons about the roles of l�festyle and of the env�ronment �n cancer are often h�ndered by confus�on
over the mean�ng of the term “env�ronment”, wh�ch �s var�ably �nterpreted to encompass qu�te d�fferent types of factor rang�ng from pollutants to behav�ours. Also, th�s term (or �ts equ�valent) �s g�ven d�fferent mean�ngs �n d�fferent languages. In th�s report, we use the term “env�ronment” as mean�ng “env�ronmental pollutants”, an express�on that �ncludes pollutants of water, a�r, so�l and food.
The f�rst est�mate of the relat�ve �mportance of genet�c and env�ronmental factors �n the global burden of cancer was made by R�chard Doll and R�chard Peto (1981), based on US cancer mortal�ty data. S�nce then, only a few stud�es have tr�ed to est�mate the relat�ve �mportance of cancer r�sk factors (see Sect�on E2, General D�scuss�on for a rev�ew). In 1981, a number of r�sk factors were st�ll unknown and good qual�tat�ve and quant�tat�ve �nformat�on on exposure of populat�ons to r�sk factors was rare. Many nat�ons have now entered the era of “�nformat�on soc�et�es.” In th�s respect, �n 2007, we have more �nformat�on on exposure patterns and thus should be able to est�mate better the burden of cancer that can be attr�buted to known causes, and to prov�de an evaluat�on of the�r relat�ve �mportance.
At the beg�nn�ng of 2005, the IARC created a “th�nk-tank” on th�s top�c, w�th the a�m of develop�ng methods for f�rst obta�n�ng est�mates of the proport�ons of cancers attr�butable to known causes and second est�mat�ng the number of cancers that could be avo�dable. In July 2005, a workshop at IARC brought together cancer ep�dem�olog�sts who concluded that stud�es on attr�butable causes of cancer should start by exam�n�ng a few selected countr�es �n the f�ve cont�nents.
In September 2005, the French Académ�e Nat�onale de Médec�ne and the French Académ�e
Introduction
Section A1: Objectives and methodology
2
des Sc�ences proposed to IARC to collaborate on a study on attr�butable causes of cancer �n France. The present report �s the product of th�s collaborat�on.
2. Objectives
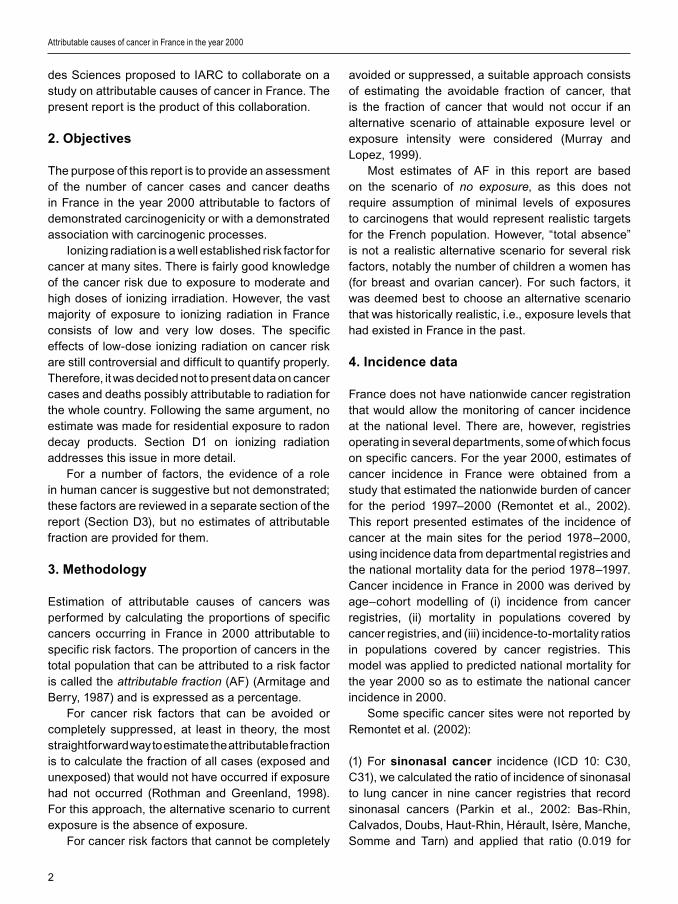
The purpose of th�s report �s to prov�de an assessment of the number of cancer cases and cancer deaths �n France �n the year 2000 attr�butable to factors of demonstrated carc�nogen�c�ty or w�th a demonstrated assoc�at�on w�th carc�nogen�c processes.
Ion�z�ng rad�at�on �s a well establ�shed r�sk factor for cancer at many s�tes. There �s fa�rly good knowledge of the cancer r�sk due to exposure to moderate and h�gh doses of �on�z�ng �rrad�at�on. However, the vast major�ty of exposure to �on�z�ng rad�at�on �n France cons�sts of low and very low doses. The spec�f�c effects of low-dose �on�z�ng rad�at�on on cancer r�sk are st�ll controvers�al and d�ff�cult to quant�fy properly. Therefore, �t was dec�ded not to present data on cancer cases and deaths poss�bly attr�butable to rad�at�on for the whole country. Follow�ng the same argument, no est�mate was made for res�dent�al exposure to radon decay products. Sect�on D1 on �on�z�ng rad�at�on addresses th�s �ssue �n more deta�l.
For a number of factors, the ev�dence of a role �n human cancer �s suggest�ve but not demonstrated; these factors are rev�ewed �n a separate sect�on of the report (Sect�on D3), but no est�mates of attr�butable fract�on are prov�ded for them.
3. Methodology
Est�mat�on of attr�butable causes of cancers was performed by calculat�ng the proport�ons of spec�f�c cancers occurr�ng �n France �n 2000 attr�butable to spec�f�c r�sk factors. The proport�on of cancers �n the total populat�on that can be attr�buted to a r�sk factor �s called the attributable fraction (AF) (Arm�tage and Berry, 1987) and �s expressed as a percentage.
For cancer r�sk factors that can be avo�ded or completely suppressed, at least �n theory, the most stra�ghtforward way to est�mate the attr�butable fract�on �s to calculate the fract�on of all cases (exposed and unexposed) that would not have occurred �f exposure had not occurred (Rothman and Greenland, 1998). For th�s approach, the alternat�ve scenar�o to current exposure �s the absence of exposure.
For cancer r�sk factors that cannot be completely
avo�ded or suppressed, a su�table approach cons�sts of est�mat�ng the avo�dable fract�on of cancer, that �s the fract�on of cancer that would not occur �f an alternat�ve scenar�o of atta�nable exposure level or exposure �ntens�ty were cons�dered (Murray and Lopez, 1999).
Most est�mates of AF �n th�s report are based on the scenar�o of no exposure, as th�s does not requ�re assumpt�on of m�n�mal levels of exposures to carc�nogens that would represent real�st�c targets for the French populat�on. However, “total absence” �s not a real�st�c alternat�ve scenar�o for several r�sk factors, notably the number of ch�ldren a women has (for breast and ovar�an cancer). For such factors, �t was deemed best to choose an alternat�ve scenar�o that was h�stor�cally real�st�c, �.e., exposure levels that had ex�sted �n France �n the past.
4. Incidence data
France does not have nat�onw�de cancer reg�strat�on that would allow the mon�tor�ng of cancer �nc�dence at the nat�onal level. There are, however, reg�str�es operat�ng �n several departments, some of wh�ch focus on spec�f�c cancers. For the year 2000, est�mates of cancer �nc�dence �n France were obta�ned from a study that est�mated the nat�onw�de burden of cancer for the per�od 1997–2000 (Remontet et al., 2002). Th�s report presented est�mates of the �nc�dence of cancer at the ma�n s�tes for the per�od 1978–2000, us�ng �nc�dence data from departmental reg�str�es and the nat�onal mortal�ty data for the per�od 1978–1997. Cancer �nc�dence �n France �n 2000 was der�ved by age–cohort modell�ng of (�) �nc�dence from cancer reg�str�es, (��) mortal�ty �n populat�ons covered by cancer reg�str�es, and (���) �nc�dence-to-mortal�ty rat�os �n populat�ons covered by cancer reg�str�es. Th�s model was appl�ed to pred�cted nat�onal mortal�ty for the year 2000 so as to est�mate the nat�onal cancer �nc�dence �n 2000.
Some spec�f�c cancer s�tes were not reported by Remontet et al. (2002):
(1) For sinonasal cancer �nc�dence (ICD 10: C30, C31), we calculated the rat�o of �nc�dence of s�nonasal to lung cancer �n n�ne cancer reg�str�es that record s�nonasal cancers (Park�n et al., 2002: Bas-Rh�n, Calvados, Doubs, Haut-Rh�n, Hérault, Isère, Manche, Somme and Tarn) and appl�ed that rat�o (0.019 for
Attributable causes of cancer in France in the year 2000
3
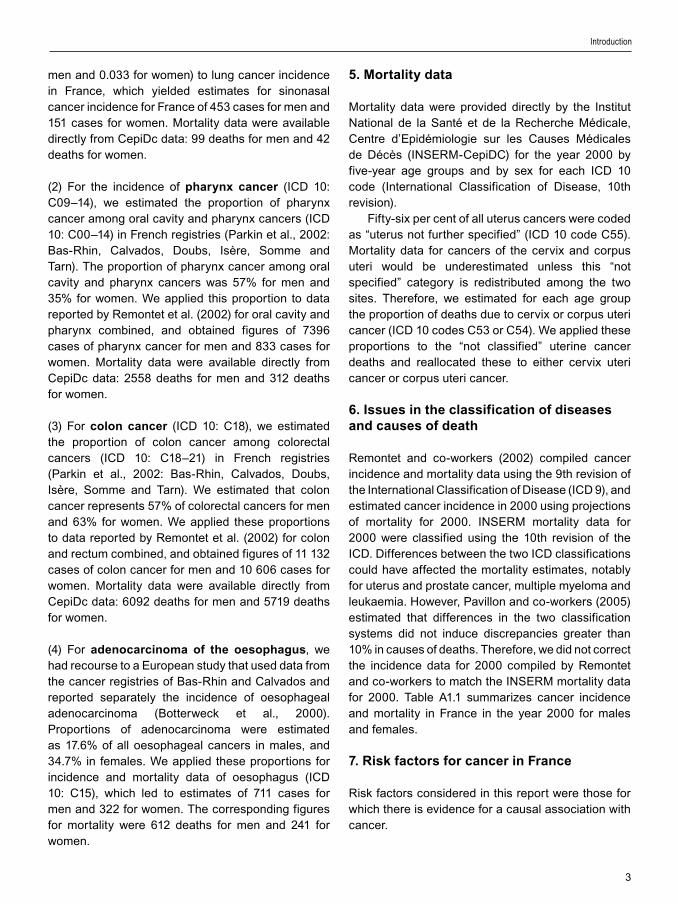
men and 0.033 for women) to lung cancer �nc�dence �n France, wh�ch y�elded est�mates for s�nonasal cancer �nc�dence for France of 453 cases for men and 151 cases for women. Mortal�ty data were ava�lable d�rectly from Cep�Dc data: 99 deaths for men and 42 deaths for women.
(2) For the �nc�dence of pharynx cancer (ICD 10: C09–14), we est�mated the proport�on of pharynx cancer among oral cav�ty and pharynx cancers (ICD 10: C00–14) �n French reg�str�es (Park�n et al., 2002: Bas-Rh�n, Calvados, Doubs, Isère, Somme and Tarn). The proport�on of pharynx cancer among oral cav�ty and pharynx cancers was 57% for men and 35% for women. We appl�ed th�s proport�on to data reported by Remontet et al. (2002) for oral cav�ty and pharynx comb�ned, and obta�ned f�gures of 7396 cases of pharynx cancer for men and 833 cases for women. Mortal�ty data were ava�lable d�rectly from Cep�Dc data: 2558 deaths for men and 312 deaths for women.
(3) For colon cancer (ICD 10: C18), we est�mated the proport�on of colon cancer among colorectal cancers (ICD 10: C18–21) �n French reg�str�es (Park�n et al., 2002: Bas-Rh�n, Calvados, Doubs, Isère, Somme and Tarn). We est�mated that colon cancer represents 57% of colorectal cancers for men and 63% for women. We appl�ed these proport�ons to data reported by Remontet et al. (2002) for colon and rectum comb�ned, and obta�ned f�gures of 11 132 cases of colon cancer for men and 10 606 cases for women. Mortal�ty data were ava�lable d�rectly from Cep�Dc data: 6092 deaths for men and 5719 deaths for women.
(4) For adenocarcinoma of the oesophagus, we had recourse to a European study that used data from the cancer reg�str�es of Bas-Rh�n and Calvados and reported separately the �nc�dence of oesophageal adenocarc�noma (Botterweck et al., 2000). Proport�ons of adenocarc�noma were est�mated as 17.6% of all oesophageal cancers �n males, and 34.7% �n females. We appl�ed these proport�ons for �nc�dence and mortal�ty data of oesophagus (ICD 10: C15), wh�ch led to est�mates of 711 cases for men and 322 for women. The correspond�ng f�gures for mortal�ty were 612 deaths for men and 241 for women.
Introduction
5. Mortality data
Mortal�ty data were prov�ded d�rectly by the Inst�tut Nat�onal de la Santé et de la Recherche Méd�cale, Centre d’Ep�dém�olog�e sur les Causes Méd�cales de Décès (INSERM-Cep�DC) for the year 2000 by f�ve-year age groups and by sex for each ICD 10 code (Internat�onal Class�f�cat�on of D�sease, 10th rev�s�on).
F�fty-s�x per cent of all uterus cancers were coded as “uterus not further spec�f�ed” (ICD 10 code C55). Mortal�ty data for cancers of the cerv�x and corpus uter� would be underest�mated unless th�s “not spec�f�ed” category �s red�str�buted among the two s�tes. Therefore, we est�mated for each age group the proport�on of deaths due to cerv�x or corpus uter� cancer (ICD 10 codes C53 or C54). We appl�ed these proport�ons to the “not class�f�ed” uter�ne cancer deaths and reallocated these to e�ther cerv�x uter� cancer or corpus uter� cancer.
6. Issues in the classification of diseases and causes of death
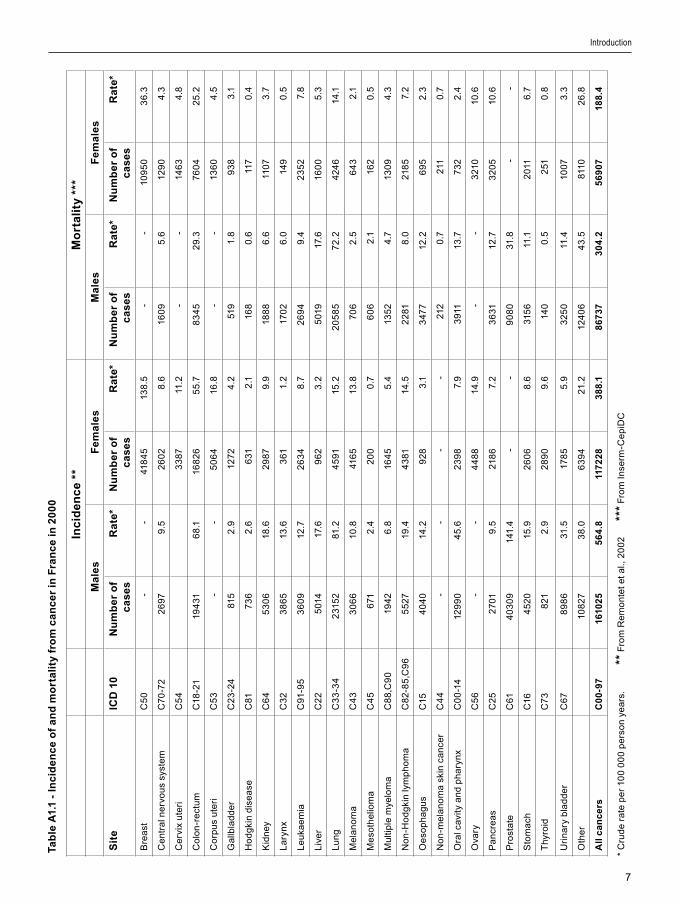
Remontet and co-workers (2002) comp�led cancer �nc�dence and mortal�ty data us�ng the 9th rev�s�on of the Internat�onal Class�f�cat�on of D�sease (ICD 9), and est�mated cancer �nc�dence �n 2000 us�ng project�ons of mortal�ty for 2000. INSERM mortal�ty data for 2000 were class�f�ed us�ng the 10th rev�s�on of the ICD. D�fferences between the two ICD class�f�cat�ons could have affected the mortal�ty est�mates, notably for uterus and prostate cancer, mult�ple myeloma and leukaem�a. However, Pav�llon and co-workers (2005) est�mated that d�fferences �n the two class�f�cat�on systems d�d not �nduce d�screpanc�es greater than 10% �n causes of deaths. Therefore, we d�d not correct the �nc�dence data for 2000 comp�led by Remontet and co-workers to match the INSERM mortal�ty data for 2000. Table A1.1 summar�zes cancer �nc�dence and mortal�ty �n France �n the year 2000 for males and females.
7. Risk factors for cancer in France
R�sk factors cons�dered �n th�s report were those for wh�ch there �s ev�dence for a causal assoc�at�on w�th cancer.
4
The f�rst type of r�sk factor cons�dered compr�ses those agents class�f�ed by the IARC as Group 1 carc�nogens, �.e., agents for wh�ch there �s sufficient evidence of carcinogenicity �n humans. Except�onally, an agent may be placed �n th�s category when ev�dence of carc�nogen�c�ty �n humans �s less than sufficient but there �s sufficient evidence of carcinogenicity �n exper�mental an�mals and strong ev�dence �n exposed humans that the agent acts through a relevant mechan�sm of carc�nogen�c�ty¹. S�nce 1971, the Internat�onal Agency for Research on Cancer has prov�ded evaluat�ons of the carc�nogen�c potent�al of substances based on ep�dem�olog�cal and b�olog�cal ev�dence. The term “substance” encompasses s�ngle phys�cal, chem�cal, or b�olog�cal agents, and m�xtures of phys�cal chem�cal, b�olog�cal and phys�cal agents, and also places or c�rcumstances concentrat�ng st�ll unknown carc�nogen�c agents. Table A1.2 summar�zes the l�st of carc�nogen�c agents cons�dered �n th�s report.
The second type of r�sk factor �ncludes �nd�v�dual cond�t�ons known to be causally assoc�ated w�th cancer occurrence. These factors are not evaluated �n IARC Monographs but some have been evaluated by work�ng groups convened by the IARC. An IARC work�ng group came to the conclus�on that there was suff�c�ent ev�dence �n humans for a cancer-prevent�ve effect of avo�dance of we�ght ga�n (IARC, 2002), and thus th�s report est�mates AFs assoc�ated w�th overwe�ght and obes�ty. The same IARC work�ng group reported that there was suff�c�ent ev�dence for a protect�ve effect of phys�cal act�v�ty on the r�sk of breast cancer and colon cancer (IARC, 2002).
Reproduct�ve factors (e.g., number of ch�ldren, age at f�rst b�rth, durat�on of breastfeed�ng) have never been evaluated by an IARC work�ng group. However, a large body of ev�dence supports strong assoc�at�ons between reproduct�ve factors and breast and ovar�an cancer (CGHFBC, 2001). We therefore �ncluded these factors �n th�s analys�s.
A number of IARC Group 1 carc�nogens were not �ncluded �n th�s report, e�ther because exposure �s very rare �n France or because they are �ns�gn�f�cant. For �nstance, paras�t�c �nfestat�on w�th Schistosoma haematobium (�nvolved �n bladder cancer) and Opisthorchis viverrini (�nvolved �n l�ver cholang�ocarc�noma), and �ntake of nutr�ents such
as aflatox�ns (�nvolved �n l�ver adenocarc�noma) (see Sect�on D2).
8. Prevalence of exposures in France
The burden of cancer observed �n the year 2000 reflects past exposure to r�sk factors. Usually, exposure to a r�sk factor �s spread over many years, and cancer may occur long after cessat�on of the exposure (e.g., lung cancer �n ex-smokers, mesothel�oma �n ret�red sh�pbu�ld�ng workers). For most cancers and r�sk factors, the average latency between f�rst exposure and d�agnos�s �s about 15 years. Hence, for evaluat�ng the burden of cancer �n 2000, we took �nto account exposures that occurred �n or around 1985.
Data on prevalence of exposure to r�sk factors �n France were assembled by scrut�n�z�ng many d�fferent sources, publ�cat�ons, reports and relevant �nformat�on publ�cly ava�lable on governmental organ�zat�on web-s�tes.
The most representat�ve exposure data for the populat�on at r�sk came from populat�on surveys that evaluated the prevalence of spec�f�c exposures �n France, and were conducted us�ng quota methods on age, sex and soc�oeconom�c character�st�cs (e.g., INSEE surveys). For most exposures, however, prevalence surveys were not ava�lable for the year 1985, but only for other years. In th�s case, we calculated a l�near �nterpolat�on of survey results that used a s�m�lar method for years before and after 1985, w�th we�ght�ng for sample s�zes and, when relevant, for age and sex d�str�but�on. When s�m�lar surveys before and after 1985 were not ava�lable, we selected the best ava�lable survey descr�b�ng the s�tuat�on around 1985. When no survey was ava�lable, we used proport�ons of exposed subjects reported �n observat�onal stud�es conducted �n France.
Attr�butable fract�on �s very sens�t�ve to m�sclass�f�cat�on of subjects who could have been exposed (even m�n�mally) as unexposed subjects (Wacholder et al., 1994). For �nstance, the error �n an est�mate of AF due to tobacco smok�ng �s greater when occas�onal smokers are categor�zed as never-smokers than when they are �ncluded �n the ever-smoker category. Therefore, the s�mplest and most robust method for est�mat�ng the attr�butable r�sk from several exposures �s based on d�v�s�on of subjects �nto
Attributable causes of cancer in France in the year 2000
¹ http://monographs.iarc.fr

5
two groups, a basel�ne cons�st�ng of those unexposed and a group �nclud�ng everyone who was exposed.
9. Calculation of the attributable fraction (AF)
The AF can be calculated as a funct�on of the relat�ve r�sk (RR) of cancer assoc�ated w�th exposure to a r�sk factor and the prevalence of exposure (P) of a populat�on to that r�sk factor. Th�s method was or�g�nally descr�bed by Lev�n (1953):
The relat�ve r�sks we used were based on est�mates from the most recent meta-analyses or from best est�mates ava�lable �n publ�shed l�terature.
When a r�sk factor was reported �n the l�terature �n mult�ple exposure categor�es (�.e., exposures class�f�ed �n more than two categor�es), we used Lev�n’s formula adapted by Hanley (2001). Because of the d�str�but�ve propert�es of the AF, mult�-level exposures could be reduced to a s�mple d�chotomous s�tuat�on (�.e., ever vs. never exposed) or to an average exposure of the whole populat�on at r�sk when the relat�ve r�sk was related to an exposure level greater or lower than a pre-determ�ned level. These ways of group�ng or averag�ng strata of exposure do not affect AF est�mat�ons (Hanley, 2001).
Data on exposure prevalence were somet�mes ava�lable only as cont�nuous var�ables. For these cont�nuous-scale exposures, start�ng from relat�ve r�sks est�mated for several exposure categor�es, we der�ved the r�sk of cancer per un�t �ncrease �n exposure (e.g., the �ncrease �n r�sk of oesophagus cancer per un�t gram per day of alcohol consumpt�on). Assum�ng a log-l�near relat�onsh�p between exposure and r�sk of cancer, we est�mated the average r�sk for the whole French populat�on us�ng the average level of exposure of the whole populat�on. Th�s was done by apply�ng the follow�ng formula:
Because th�s log-l�near relat�onsh�p supposes that
each �nd�v�dual has exper�enced a s�m�lar average exposure, we can use the s�mpl�f�ed Lev�n’s formula
for d�rect calculat�on of the AF:
Th�s formula �s val�d when the r�sk of cancer per un�t of exposure was est�mated �n a model us�ng log transformat�on. Th�s �s the case for log�st�c regress�on or Po�sson regress�on, wh�ch are models w�dely used �n case–control and cohort stud�es respect�vely. We checked that the r�sks per un�t we used were all based on models w�th a log transformat�on of the r�sk.
It should be stressed that the dose–effect relat�onsh�p �s �n fact rarely l�near (or log-l�near) over the whole range of exposures, but th�s method �s cons�dered to be the best approx�mat�on ava�lable �n th�s respect.
10. Sensitivity analysis
For exposures hav�ng a large �mpact on cancer burden, �n order to check the robustness of AF w�th respect to latency t�me between exposure and cancer occurrence, we took d�fferent lag-t�mes between f�rst exposure and cancer d�agnos�s (10 and 20 years) when prevalence data were ava�lable for these per�ods.
When for a r�sk factor, the alternat�ve hypothes�s was not total absence of exposure, the sens�t�v�ty analys�s was performed tak�ng d�fferent alternat�ve exposure scenar�os.
A more comprehens�ve descr�pt�on of th�s sens�t�v�ty analys�s �s presented �n Sect�on C2.
References
Arm�tage P, Berry G. Stat�st�cal Methods �n Med�cal
Research, second ed., London, Blackwell Sc�ent�f�c
Publ�cat�ons, 1987.
Botterweck AAM, Schouten LJ, Volov�cs A, et al. Trends
�n �nc�dence of adenocarc�noma of the oesophagus and
gastr�c card�a �n ten European countr�es. Int J Ep�dem�ol
2000;29:645–654.
CGHFBC. Collaborat�ve Group on Hormonal Factors
�n Breast Cancer. Fam�l�al breast cancer: collaborat�ve
reanalys�s of �nd�v�dual data from 52 ep�dem�olog�cal stud�es
�nclud�ng 58 209 women w�th breast cancer and 101 986
women w�thout the d�sease. Lancet 2001;358:1389–1399.
Doll R, Peto R. The causes of cancer: quant�tat�ve
Introduction

6
est�mates of avo�dable r�sks of cancer �n the Un�ted States
today. J Natl Cancer Inst 1981;66:1191–1308.
Hanley JA. A heur�st�c approach to formulas for
populat�on attr�butable fract�on. J Ep�dem�ol Commun�ty
Health 2001;55:508–514.
INSERM-Cp�DC. www.cep�dc.ves�net.�nserm.fr, accessed
�n 2006.
Internat�onal Agency for Research on Cancer. IARC
Monographs on the Evaluat�on of Carc�nogen�c R�sks
to Humans. Overall Evaluat�ons of Carc�nogen�c�ty: An
Updat�ng of IARC Monographs Volumes 1 to 42, Supplement
7, Lyon, IARC, 1987.
Internat�onal Agency for Research on Cancer. IARC
Handbooks of Cancer Prevent�on, Vol. 6, We�ght Control
and Phys�cal Act�v�ty. Lyon, IARC, 2002.
Lev�n ML. The occurrence of lung cancer �n man. Acta
Un�o Int Contra Cancrum 1953;9:531–541.
Murray CJ, Lopez AD. On the comparable quant�f�cat�on
of health r�sks: lessons from the global burden of d�sease
study. Ep�dem�ology 1999;10:594–605.
Park�n, DM, Whelan, SL, Ferlay, J et al. (eds). Cancer
Inc�dence �n F�ve Cont�nents, Vol. VIII. Lyon, IARC, 2002.
Pav�llon G, Bo�leau J, Renaud G, et al. Conséquences
des changements de codage des causes méd�cales de
décès sur les données nat�onales de mortal�té en France, à
part�r de l’année 2000. Bull Ep�dém�ol Hebdom 2005;4:13–
16.
Remontet L, Buem� A, Velten M, et al. Evolut�on de
l’�nc�dence et de la mortal�té par cancer en France de 1978
à 2000. Rapport FRANCIM, Hôp�taux de Lyon, INSERM,
InVS, 2002.
Rothman KJ, Greenland S. Modern Ep�dem�ology,
second ed. Ph�ladelph�a: L�pp�ncott-Raven, 1998.
Wacholder S, Ben�chou J, He�neman EF, et al.
Attr�butable r�sk: advantages of a broad def�n�t�on of
exposure. Am J Ep�dem�ol 1994;140:303–309.
Attributable causes of cancer in France in the year 2000
7
Inc
ide
nc
e **
Mo
rta
lity
***
Ma
les
Fe
ma
les
Ma
les
Fe
ma
les
Sit
eIC
D 1
0N
um
be
r o
f c
as
es
Ra
te*
Nu
mb
er
of
ca
se
sR
ate
*N
um
be
r o
f c
as
es
Ra
te*
Nu
mb
er
of
ca
se
sR
ate
*
Bre
ast
C5
0-
-41
84
513
8.5
--
109
50
36
.3
Ce
ntr
al n
erv
ou
s sy
ste
mC
70-7
2
26
97 9
.5 2
60
2
8.6
160
9 5
.6 1
29
0 4
.3
Ce
rv�x
ute
r�C
54
33
87 1
1.2
--
14
63
4.8
Co
lon
-re
ctu
mC
18-2
119
431
68
.116
82
65
5.7
83
45
29.
376
04
25
.2
Co
rpu
s u
ter�
C5
3-
-5
06
416
.8-
-13
60
4.5
Ga
llbla
dd
er
C2
3-2
481
52
.912
72
4.2
519
1.8
93
83
.1
Ho
dg
k�n
d�s
ea
seC
817
36
2.6
631
2.1
168
0.6
117
0.4
K�d
ney
C6
45
30
618
.62
987
9.9
188
86
.611
073
.7
La
ryn
xC
32
38
65
13.6
361
1.2
170
26
.014
90
.5
Le
uka
em
�aC
91-9
53
60
912
.72
63
48
.72
69
49.
42
35
27.
8
L�v
er
C2
25
014
17.6
96
23
.25
019
17.6
160
05
.3
Lu
ng
C3
3-3
42
315
281
.24
591
15.2
20
58
57
2.2
424
614
.1
Me
lan
om
aC
43
30
66
10.8
416
513
.870
62
.56
43
2.1
Me
soth
el�o
ma
C4
56
712
.42
00
0.7
60
62
.116
20
.5
Mu
lt�p
le m
yelo
ma
C8
8,C
90
1942
6.8
164
55
.413
52
4.7
130
94.
3
No
n-H
od
gk�
n ly
mp
ho
ma
C8
2-8
5,C
96
55
27
19.4
43
8114
.52
281
8.0
218
57.
2
Oe
sop
ha
gu
sC
154
04
014
.29
28
3.1
347
712
.26
95
2.3
No
n-m
ela
no
ma
sk�n
ca
nce
rC
44
--
--
212
0.7
211
0.7
Ora
l cav
�ty a
nd
ph
ary
nx
C0
0-1
412
99
04
5.6
23
98
7.9
391
113
.77
32
2.4
Ova
ryC
56
--
44
88
14.9
--
321
010
.6
Pa
ncr
ea
sC
25
270
19.
521
86
7.2
36
3112
.73
20
510
.6
Pro
sta
teC
614
03
09
141.
4-
-9
08
031
.8-
-
Sto
ma
chC
164
52
015
.92
60
68
.631
56
11.1
201
16
.7
Thy
ro�d
C7
38
212
.92
89
09.
614
00
.52
510
.8
Ur�
na
ry b
lad
de
rC
67
89
86
31.5
178
55
.93
25
011
.410
073
.3
Oth
er
108
27
38
.06
39
421
.212
40
64
3.5
8110
26
.8
All
ca
nc
ers
C0
0-9
716
102
55
64
.811
72
28
38
8.1
86
73
73
04
.25
69
07
188
.4
Introduction
* C
rud
e ra
te p
er
100
00
0 p
ers
on
yea
rs.
** F
rom
Re
mo
nte
t et a
l., 2
00
2 **
* F
rom
In
serm
-Ce
p�D
C
Ta
ble
A1.
1 -
Inc
ide
nc
e o
f a
nd
mo
rta
lity
fro
m c
an
ce
r in
Fra
nc
e in
20
00

8
Attributable causes of cancer in France in the year 2000
Table A1.2 - Selected agents causally associated with cancer (IARC Group 1 carcinogens)
Agent Risk factor IARC Monograph volumes and year*
Alcohol Alcohol�c beverages Vol. 44 1988Chron�c �nfect�on Helicobacter pylori Vol. 61 1994
Hepat�t�s B v�rus Vol. 59 1994Hepat�t�s C v�rus Vol. 59 1994Human pap�llomav�rus Vol. 64 1995
Hormonal therapy and oral contracept�ves
Hormonal therapyOral contracept�ves
Vol. 72, 95 §Vol. 72, 95 §
1999, 2006 §1999, 2006 §
Occupat�onal exposures Aromat�c am�nes Vol. 1 & 4, (7) † 1987Asbestos Vol. 14, (7) 1987Benzene Vol. 29, (7) 1987Boot and shoe manufacture and repa�r Vol. 25, (7) 1987Cadm�um Vol. 58 1993Chrom�um (VI) Vol. 49 1990M�neral o�l Vol. 33, (7) 1987N�ckel Vol. 49 1990Pa�nters Vol. 47 1989Polycycl�c aromat�c hydrocarbons (combust�on fumes, tar, p�tch)
Vol. 35, (7) 1987
Radon decay products Vol. 78 2001Rubber �ndustry Vol. 28, (7) 1987S�l�ca Vol. 68 1997Wood dust Vol. 62 1995
Pollutants Non-occupat�onal exposure to asbestos Vol. 14, (7) 1987Radon decay products Vol. 78 2001Secondhand smok�ng Vol. 83 2004
Rad�at�on Background exposure, terrestr�al gamma and cosm�c rays
Vol. 75 2000
Med�cal d�agnos�s rad�at�ons Vol. 75 2000Solar rad�at�on Sun exposure Vol. 55 1992
UVA and psoralens Vol. 24, (7) 1987Tobacco Tobacco smok�ng Vol. 83 2004
*http://monographs.�arc.fr.§ In press.† (7) refers to the last update of evaluat�on reported �n IARC Monographs on the Evaluat�on of Carc�nogen�c R�sks to Humans, Overall Evaluat�ons of Carc�nogen�c�ty: An Updat�ng of IARC Monographs Volumes 1 to 42, Supplement 7, Lyon, 1987.
9
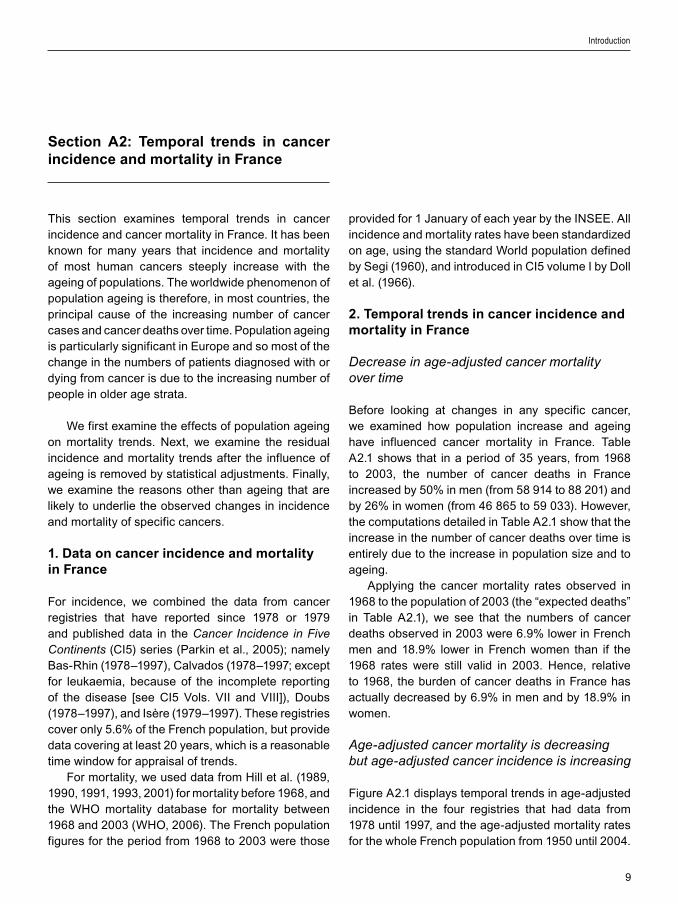
Th�s sect�on exam�nes temporal trends �n cancer �nc�dence and cancer mortal�ty �n France. It has been known for many years that �nc�dence and mortal�ty of most human cancers steeply �ncrease w�th the age�ng of populat�ons. The worldw�de phenomenon of populat�on age�ng �s therefore, �n most countr�es, the pr�nc�pal cause of the �ncreas�ng number of cancer cases and cancer deaths over t�me. Populat�on age�ng �s part�cularly s�gn�f�cant �n Europe and so most of the change �n the numbers of pat�ents d�agnosed w�th or dy�ng from cancer �s due to the �ncreas�ng number of people �n older age strata.
We f�rst exam�ne the effects of populat�on age�ng on mortal�ty trends. Next, we exam�ne the res�dual �nc�dence and mortal�ty trends after the �nfluence of age�ng �s removed by stat�st�cal adjustments. F�nally, we exam�ne the reasons other than age�ng that are l�kely to underl�e the observed changes �n �nc�dence and mortal�ty of spec�f�c cancers.
1. Data on cancer incidence and mortality in France
For �nc�dence, we comb�ned the data from cancer reg�str�es that have reported s�nce 1978 or 1979 and publ�shed data �n the Cancer Incidence in Five Continents (CI5) ser�es (Park�n et al., 2005); namely Bas-Rh�n (1978–1997), Calvados (1978–1997; except for leukaem�a, because of the �ncomplete report�ng of the d�sease [see CI5 Vols. VII and VIII]), Doubs (1978–1997), and Isère (1979–1997). These reg�str�es cover only 5.6% of the French populat�on, but prov�de data cover�ng at least 20 years, wh�ch �s a reasonable t�me w�ndow for appra�sal of trends.
For mortal�ty, we used data from H�ll et al. (1989, 1990, 1991, 1993, 2001) for mortal�ty before 1968, and the WHO mortal�ty database for mortal�ty between 1968 and 2003 (WHO, 2006). The French populat�on f�gures for the per�od from 1968 to 2003 were those
prov�ded for 1 January of each year by the INSEE. All �nc�dence and mortal�ty rates have been standard�zed on age, us�ng the standard World populat�on def�ned by Seg� (1960), and �ntroduced �n CI5 volume I by Doll et al. (1966).
2. Temporal trends in cancer incidence and mortality in France
Decrease in age-adjusted cancer mortality over time
Before look�ng at changes �n any spec�f�c cancer, we exam�ned how populat�on �ncrease and age�ng have �nfluenced cancer mortal�ty �n France. Table A2.1 shows that �n a per�od of 35 years, from 1968 to 2003, the number of cancer deaths �n France �ncreased by 50% �n men (from 58 914 to 88 201) and by 26% �n women (from 46 865 to 59 033). However, the computat�ons deta�led �n Table A2.1 show that the �ncrease �n the number of cancer deaths over t�me �s ent�rely due to the �ncrease �n populat�on s�ze and to age�ng.
Apply�ng the cancer mortal�ty rates observed �n 1968 to the populat�on of 2003 (the “expected deaths” �n Table A2.1), we see that the numbers of cancer deaths observed �n 2003 were 6.9% lower �n French men and 18.9% lower �n French women than �f the 1968 rates were st�ll val�d �n 2003. Hence, relat�ve to 1968, the burden of cancer deaths �n France has actually decreased by 6.9% �n men and by 18.9% �n women.
Age-adjusted cancer mortality is decreasing but age-adjusted cancer incidence is increasing
F�gure A2.1 d�splays temporal trends �n age-adjusted �nc�dence �n the four reg�str�es that had data from 1978 unt�l 1997, and the age-adjusted mortal�ty rates for the whole French populat�on from 1950 unt�l 2004.
Introduction
Section A2: Temporal trends in cancer incidence and mortality in France

10
The trends �n cancer mortal�ty rates observed �n the four departments from wh�ch the �nc�dence data or�g�nate were s�m�lar to those observed �n the ent�re French populat�on.
Most cancers that occurred �n 1950, the year from wh�ch the earl�est mortal�ty data ex�st, were �n�t�ated �n the 1930s, when a large part of the French populat�on was l�v�ng �n rural areas, w�th low numbers of motor�zed veh�cles and less chem�cal substances than after the Second World War.
Over a twenty-year per�od, cancer �nc�dence rates have �ncreased by 23% �n men and by 20% �n women. Because the rates �n F�gure A2.1 are adjusted for age, the �ncreases �n �nc�dence are real, and not related to the age�ng of the French populat�on. In contrast, the cancer mortal�ty rate �n males reached a max�mum around 1985 and decreased stead�ly thereafter, down to the level �t was �n the early 1950s.
To properly �nterpret the d�screpancy between age-adjusted �nc�dence and age-adjusted mortal�ty trends, we need to exam�ne the reasons for changes �n trends for spec�f�c cancers.
3. Reasons for changes in incidence and mortality of specific cancers
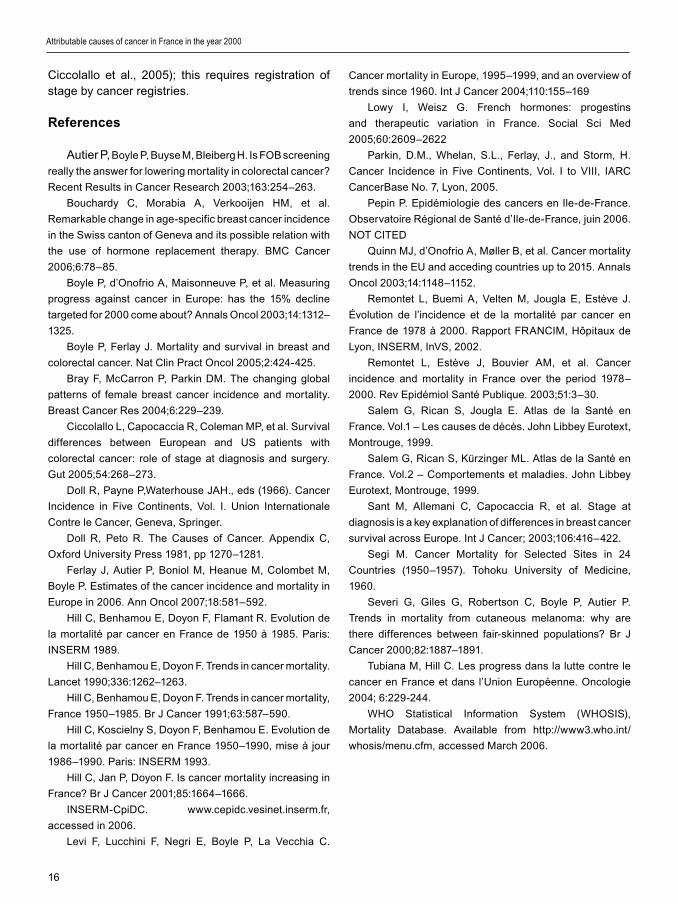
F�gures A2.2 to A2.8 d�splay trends �n age-adjusted �nc�dence and mortal�ty rates of the most common and selected less common cancers �n French men (F�gures A2.2, A2.3, A2.4) and women (F�gures A2.5, A2.6, A2.7, A2.8). F�gure A2.9 d�splays trends �n mortal�ty from cancer �n ch�ldren and adolescents. Cancer �nc�dence data �n ch�ldren could not be used because French ch�ldhood cancer reg�str�es �nclude data cover�ng d�fferent per�ods of t�me, wh�ch made d�ff�cult the product�on of temporal trends.
Reasons for changes �n cancer �nc�dence and mortal�ty other than age�ng, descr�bed by Doll and Peto (1981), are summar�zed below:
1. Adm�n�strat�ve and demograph�c reasons:a. Changes �n h�stolog�cal class�f�cat�on;b. Changes �n d�sease class�f�cat�on;c. Changes �n completeness of reg�strat�on;d. Changes �n populat�ons: changes �n
denom�nators for calculat�on of rates, or s�gn�f�cant �mm�grat�on of populat�ons hav�ng d�fferent cancer ep�dem�olog�cal prof�les;2. Changes �n compet�ng causes of death;
3. Changes �n d�sease d�agnos�s;4. Changes �n earl�er detect�on and screen�ng pract�ces;5. Changes �n exposure to r�sk or to protect�ve factor(s) assoc�ated w�th cancer occurrence:
a. Changes �n nature of r�sk factors (qual�tat�ve change);
b. Changes �n exposure to r�sk factors (quant�tat�ve change).6. For mortal�ty: changes �n eff�cacy of treatments and ava�lab�l�ty of eff�c�ent treatments.
The rema�nder of th�s sect�on exam�nes the �nfluence of these var�ous reasons on trends �n cancer �nc�dence and mortal�ty �n France assoc�ated w�th factors other than age�ng. As a note of caut�on, the reasons outl�ned below by no means expla�n the total�ty of the observed t�me-trends, but the ava�lable data suggest that they have played an �mportant role �n changes �n �nc�dence or �n mortal�ty rates.
In cancers w�th h�gh fatal�ty rates, for wh�ch no eff�c�ent treatment yet ex�sts, changes �n �nc�dence w�ll be paralleled by equ�valent changes �n mortal�ty, but w�th a t�me lag that �s proport�onal to the average surv�val of these pat�ents.
Inc�dence of a cancer may �ncrease wh�le mortal�ty rema�ns stable or decreases. Pers�stence over t�me of a d�screpancy between �ncreas�ng age-adjusted �nc�dence and stable age-adjusted mortal�ty rates �s usually a result of �ncreas�ng d�agnos�s of cancers w�th low mal�gnant potent�al, some of wh�ch would probably never have surfaced as cl�n�cal cancers. Such �ncreased detect�on of slow-progress�ng, non-aggress�ve cancers w�ll not affect mortal�ty unless the �ncreased detect�on �ncludes d�agnos�s at an earl�er stage of cancers that would have been l�fe-threaten�ng �f d�agnosed later. Cancer screen�ng act�v�t�es may affect mortal�ty only �f the latter cond�t�on �s true.
A d�screpancy between �nc�dence and mortal�ty trends may also be due to an �ncrease �n the �nc�dence of cancer, �nclud�ng cancers at an advanced stage, due to chang�ng prevalence of r�sk factors �n the populat�on wh�le eff�c�ent treatment �s ava�lable to l�m�t cancer mortal�ty. When eff�c�ent treatment ex�sts, these two s�tuat�ons can be d�st�ngu�shed by look�ng at trends �n �nc�dence of cancer by stage at d�agnos�s, or by other �nd�cators of cancer progress�on, such as tumour s�ze, lymph node �nvolvement, tumour d�fferent�at�on or b�omarkers of aggress�veness.
Attributable causes of cancer in France in the year 2000
11
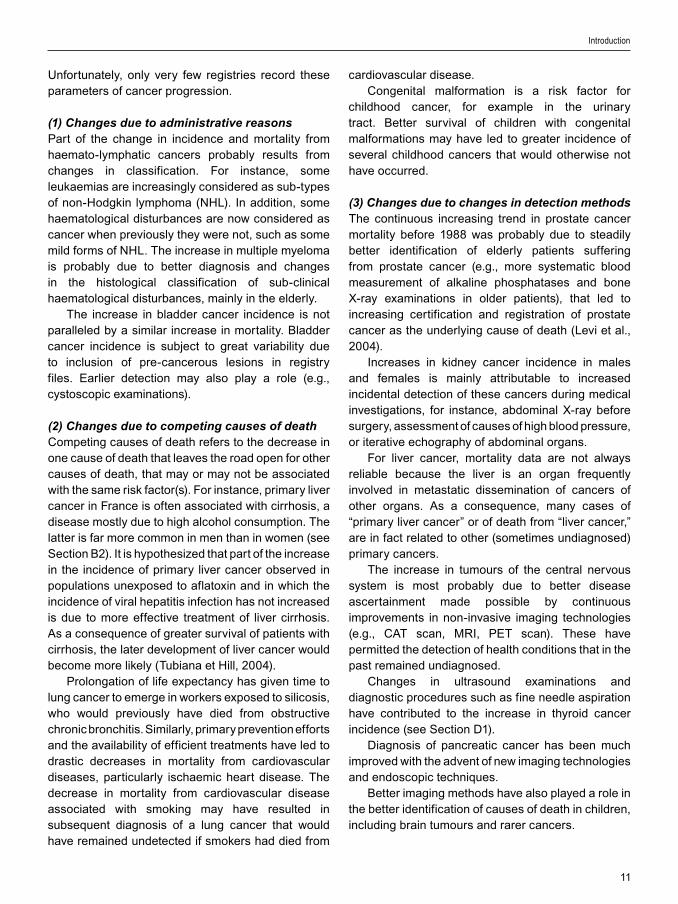
Unfortunately, only very few reg�str�es record these parameters of cancer progress�on.
(1) Changes due to administrative reasonsPart of the change �n �nc�dence and mortal�ty from haemato-lymphat�c cancers probably results from changes �n class�f�cat�on. For �nstance, some leukaem�as are �ncreas�ngly cons�dered as sub-types of non-Hodgk�n lymphoma (NHL). In add�t�on, some haematolog�cal d�sturbances are now cons�dered as cancer when prev�ously they were not, such as some m�ld forms of NHL. The �ncrease �n mult�ple myeloma �s probably due to better d�agnos�s and changes �n the h�stolog�cal class�f�cat�on of sub-cl�n�cal haematolog�cal d�sturbances, ma�nly �n the elderly.
The �ncrease �n bladder cancer �nc�dence �s not paralleled by a s�m�lar �ncrease �n mortal�ty. Bladder cancer �nc�dence �s subject to great var�ab�l�ty due to �nclus�on of pre-cancerous les�ons �n reg�stry f�les. Earl�er detect�on may also play a role (e.g., cystoscop�c exam�nat�ons).
(2) Changes due to competing causes of deathCompet�ng causes of death refers to the decrease �n one cause of death that leaves the road open for other causes of death, that may or may not be assoc�ated w�th the same r�sk factor(s). For �nstance, pr�mary l�ver cancer �n France �s often assoc�ated w�th c�rrhos�s, a d�sease mostly due to h�gh alcohol consumpt�on. The latter �s far more common �n men than �n women (see Sect�on B2). It �s hypothes�zed that part of the �ncrease �n the �nc�dence of pr�mary l�ver cancer observed �n populat�ons unexposed to aflatox�n and �n wh�ch the �nc�dence of v�ral hepat�t�s �nfect�on has not �ncreased �s due to more effect�ve treatment of l�ver c�rrhos�s. As a consequence of greater surv�val of pat�ents w�th c�rrhos�s, the later development of l�ver cancer would become more l�kely (Tub�ana et H�ll, 2004).
Prolongat�on of l�fe expectancy has g�ven t�me to lung cancer to emerge �n workers exposed to s�l�cos�s, who would prev�ously have d�ed from obstruct�ve chron�c bronch�t�s. S�m�larly, pr�mary prevent�on efforts and the ava�lab�l�ty of eff�c�ent treatments have led to drast�c decreases �n mortal�ty from card�ovascular d�seases, part�cularly �schaem�c heart d�sease. The decrease �n mortal�ty from card�ovascular d�sease assoc�ated w�th smok�ng may have resulted �n subsequent d�agnos�s of a lung cancer that would have rema�ned undetected �f smokers had d�ed from
card�ovascular d�sease.Congen�tal malformat�on �s a r�sk factor for
ch�ldhood cancer, for example �n the ur�nary tract. Better surv�val of ch�ldren w�th congen�tal malformat�ons may have led to greater �nc�dence of several ch�ldhood cancers that would otherw�se not have occurred.
(3) Changes due to changes in detection methodsThe cont�nuous �ncreas�ng trend �n prostate cancer mortal�ty before 1988 was probably due to stead�ly better �dent�f�cat�on of elderly pat�ents suffer�ng from prostate cancer (e.g., more systemat�c blood measurement of alkal�ne phosphatases and bone X-ray exam�nat�ons �n older pat�ents), that led to �ncreas�ng cert�f�cat�on and reg�strat�on of prostate cancer as the underly�ng cause of death (Lev� et al., 2004).
Increases �n k�dney cancer �nc�dence �n males and females �s ma�nly attr�butable to �ncreased �nc�dental detect�on of these cancers dur�ng med�cal �nvest�gat�ons, for �nstance, abdom�nal X-ray before surgery, assessment of causes of h�gh blood pressure, or �terat�ve echography of abdom�nal organs.
For l�ver cancer, mortal�ty data are not always rel�able because the l�ver �s an organ frequently �nvolved �n metastat�c d�ssem�nat�on of cancers of other organs. As a consequence, many cases of “pr�mary l�ver cancer” or of death from “l�ver cancer,” are �n fact related to other (somet�mes und�agnosed) pr�mary cancers.
The �ncrease �n tumours of the central nervous system �s most probably due to better d�sease ascerta�nment made poss�ble by cont�nuous �mprovements �n non-�nvas�ve �mag�ng technolog�es (e.g., CAT scan, MRI, PET scan). These have perm�tted the detect�on of health cond�t�ons that �n the past rema�ned und�agnosed.
Changes �n ultrasound exam�nat�ons and d�agnost�c procedures such as f�ne needle asp�rat�on have contr�buted to the �ncrease �n thyro�d cancer �nc�dence (see Sect�on D1).
D�agnos�s of pancreat�c cancer has been much �mproved w�th the advent of new �mag�ng technolog�es and endoscop�c techn�ques.
Better �mag�ng methods have also played a role �n the better �dent�f�cat�on of causes of death �n ch�ldren, �nclud�ng bra�n tumours and rarer cancers.
Introduction

12
(4) Changes due to early detection and screeningEarly detect�on may follow, and be a result of, the �ntroduct�on of new detect�on methods, but �s also due to greater d�sease awareness among pat�ents and doctors, who pay more attent�on to early symptoms or early cl�n�cal s�gns of cancerous processes. Screen�ng denotes the systemat�c search for a spec�f�c cancer wh�le �t �s cl�n�cally s�lent.
(4.1) Earlier detection and screening when precursor cancer lesions existCancer mortal�ty can decrease because of h�gher curab�l�ty of cancers d�agnosed at an earl�er stage or because numbers of �nc�dent cases are lower. Lower �nc�dence results from the removal of cancer precursor les�ons such as polyps �n the colon, and �ntraep�thel�al neoplas�a �n the cerv�x. Th�s scenar�o appears to apply to colorectal cancer and cerv�cal cancer.
The �nc�dence of and mortal�ty from cerv�cal cancer have stead�ly decreased because of w�despread use of screen�ng modal�t�es able to �dent�fy preneoplast�c les�ons that can be removed. Other factors also play a role, such as lower par�ty (number of ch�ldren per mother), gynaecolog�cal hyg�ene and protect�on aga�nst sexually transm�tted d�seases.
Increas�ng trends �n colorectal cancer �nc�dence contrast w�th decreas�ng mortal�ty. Reasons for �ncreases �n �nc�dence (e.g., obes�ty, lack of phys�cal act�v�ty) are d�scussed further below. Unt�l recently, decreas�ng mortal�ty due to earl�er detect�on and downstag�ng of cancer was �n part dr�ven by greater d�sease awareness (Aut�er et al., 2003) and �n part by progress �n treatment (see below). Implementat�on of screen�ng for colorectal cancer (e.g., w�th the faecal occult blood test, FOBT) �s l�kely to further reduce mortal�ty. Also, use of screen�ng methods that can lead to the removal of polyps (�.e., endoscopy and v�rtual colonoscopy) should reduce both �nc�dence and mortal�ty from th�s cancer.
(4.2) Earlier detection and screening when precursor cancer lesions do not existEarly detect�on and screen�ng that does not �nvolve a cancer precursor les�on and can only a�m for earl�er detect�on of cancerous les�ons, can st�ll lead to a lower�ng of cancer mortal�ty because of the greater curab�l�ty of pat�ents w�th screen-detected
cancer. However, �nc�dence may �ncrease because of �ncreased detect�on of �ndolent cancers that would have never (or very slowly) progressed to cl�n�cally apparent d�sease and would probably never have become l�fe-threaten�ng. Th�s scenar�o appears to apply to breast, prostate and thyro�d cancer.
Age-adjusted breast cancer �nc�dence �n France has �ncreased by 65% over a 20-year per�od (the �ncrease �n �nc�dence was 82% �n women 50 years old or more, and 55% �n women below 50 years old), contrast�ng w�th a small permanent �ncrease �n all-age breast cancer mortal�ty unt�l 1994, after wh�ch a decrease of 11.6% occurred between 1995 and 2003 (calculated us�ng jo�npo�nt analys�s from US-SEER Programme) (F�gures A2.5 and A2.6).
Mammograph�c screen�ng has played a major role �n the �ncrease �n �nc�dence of breast cancer, but the r�se started well before such screen�ng became ava�lable to many women. The �ncreas�ng trends observed before around 1995 are due partly to greater d�sease awareness, partly to greater detect�on by phys�cal breast exam�nat�on (e�ther self-exam�nat�on or by a phys�c�an or a nurse), partly to changes �n reproduct�ve factors, partly to �ncreas�ng use of hormone treatment (HRT) after menopause, and partly to �ncreas�ng rates of obes�ty (see below).
Prostate cancer �nc�dence �n France has �ncreased by a factor of 2.6 over 20 years, largely because of the use of test�ng for prostate-spec�f�c ant�gen (PSA). Mortal�ty from prostate cancer reached �ts peak �n 1988. A sl�ght decl�ne �n mortal�ty �s observable just after 1988, and between 1989 and 2002, �t decreased by 16%. Attr�but�on of th�s sl�ght mortal�ty decrease to PSA screen�ng �s quest�onable; the peak �n mortal�ty of 1988 corresponds to the start of PSA test�ng and the follow�ng upsw�ng of the �nc�dence. It �s d�ff�cult to assess the contr�but�on of PSA test�ng that started �n 1988 because of the rather long lag-t�me ex�st�ng between prostate cancer d�agnos�s and death. Other factors may have contr�buted to �mprov�ng the prognos�s of prostate cancer, such as earl�er d�agnos�s (non-PSA-based) and therapeut�c progress, �nclud�ng hormonal treatments (see below).
(5) Changes due to changes in exposure to risk or to protective factorsIn men, lung cancer �nc�dence and mortal�ty have been decreas�ng s�nce the late 1980s. In women, �nc�dence and mortal�ty are r�s�ng sharply and lung
Attributable causes of cancer in France in the year 2000

13
cancer has almost overtaken colorectal cancer as the second most �mportant cause of cancer death after breast cancer. In men, these trends are mostly attr�butable to the decreas�ng number of smokers and also to control of occupat�onal carc�nogens. In women, trends are ent�rely due to the �ncreas�ng number of French women who smoke.
Cancers of the mouth, pharynx, larynx and oesophagus are strongly related to alcohol consumpt�on and tobacco smok�ng. A decrease �n smok�ng and alcohol consumpt�on among French males s�nce 1950 (see Sect�ons B1 and B2) was followed by marked decreases �n the �nc�dence of and mortal�ty from these cancers. Mortal�ty probably further decreased because of greater d�sease awareness, lead�ng to earl�er d�agnos�s and more effect�ve treatment.
The �ncrease �n pr�mary l�ver cancer �nc�dence �s – at least �n part – expla�ned by the �ncreas�ng number of people �n France (and �n Europe) �nfected w�th hepat�t�s C v�rus (HCV). However, the contr�but�on of HCV to l�ver cancer �n France rema�ns to be assessed. Introduct�on of systemat�c test�ng of blood donat�ons for the presence of HCV �s l�kely to curb the ep�dem�c of HCV �nfect�on.
Stomach cancer �nc�dence and mortal�ty have dramat�cally decreased �n France and �n many other �ndustr�al�zed countr�es s�nce 1950. The �nc�dence of th�s cancer cont�nues to decrease but �n 2000, �t st�ll caused 4940 deaths �n France. The decrease �n gastr�c colon�zat�on by Helicobacter pylori �nduced by w�despread use of ant�b�ot�cs and more recently, the poss�b�l�ty to detect the presence of that bacter�um and to erad�cate �t, should contr�bute to further decreases �n stomach cancer �nc�dence and mortal�ty. Other poss�ble factors contr�but�ng to the temporal changes �nclude food preservat�on methods (refr�gerat�on �nstead of salt�ng and smok�ng) and the ava�lab�l�ty of fresh fru�ts and vegetables. However, we st�ll have no f�rm data conf�rm�ng the ex�stence or �mportance of such nutr�t�onal factors �n relat�on to stomach cancer burden.
Colorectal cancer �nc�dence �s st�ll on the r�se, ma�nly �n men, probably because of �ncreases �n overwe�ght and obes�ty and �n phys�cal �nact�v�ty. St�ll un�dent�f�ed d�etary r�sk factors are probably also �nvolved.
Changes �n r�sk factors �mpl�cated �n the �ncrease �n breast cancer �nc�dence �nclude the use of
hormone replacement treatment (HRT) and oral contracept�ves, changes �n reproduct�ve factors, �ncreas�ng prevalence of overwe�ght and obes�ty, and decreas�ng levels of phys�cal act�v�ty. The cumulat�ve effects on breast cancer �nc�dence of HRT use and mammograph�c screen�ng have been descr�bed for other countr�es, such as the USA (Cal�forn�a), Sweden, Denmark and Sw�tzerland (Geneva) (see Bouchardy et al., 2006 for a rev�ew).
In add�t�on to HRT use, s�nce 1980, a w�de var�ety of progest�n-based drugs have been prescr�bed �n France to premenopausal women for treatment of many “female d�sorders” (e.g., the so-called “luteal �nsuff�c�ency”, Lowy and We�sz, 2005), and the �mpact of th�s pract�ce on breast cancer r�sk �s unknown.
Oral contracept�ve use has recently been class�f�ed as a Group 1 carc�nogen by the IARC (see Sect�on B7), but �ts use accounts for few breast cancer cases. In contrast, use of oral contracept�ves decreases ovar�an cancer �nc�dence (see below).
Ovar�an cancer �nc�dence and mortal�ty have been decreas�ng slowly s�nce the late 1980s, probably because of the w�despread use of oral contracept�ves. It �s unknown to what extent the pract�ce of hysterectomy has contr�buted to these favourable trends �n France.
Unt�l the m�d-1990s, �nc�dence of and mortal�ty from non-Hodgk�n lymphoma (NHL) have doubled over 20 years. Reasons for these �ncreases rema�n unknown, although current research �s focus�ng on v�ral and �mmune factors. Ultrav�olet rad�at�on could also be �nvolved, but data are contrad�ctory. The role of chem�cal pollutants, wh�ch were �ncr�m�nated earl�er, has not been supported by more recent data. It should be recalled that the �nc�dence of Hodgk�n lymphoma (HL) has markedly decreased and a number of lymphomas prev�ously class�f�ed as HL are now class�f�ed as NHL. Hence, the �nc�dence of both HL and NHL comb�ned probably deserves more attent�on than the �nc�dence of NHL alone.
S�m�larly to most populat�ons of European descent, test�s cancer �nc�dence �s r�s�ng stead�ly �n France for unknown reasons, probably related to changes �n l�festyle or �n some exogenous r�sk factor. One current hypothes�s focuses on exposure in utero to a substance tr�gger�ng dormant pre-cancerous test�cular les�ons. After the start of adolescence, under the �nfluence of androgens, these les�ons would progress �nto cancer.
Introduction

14
As �n other l�ght-sk�nned populat�ons, �nc�dence of cutaneous melanoma �n France has seen a dramat�c two-fold �ncrease �n the last two decades. Mortal�ty has r�sen at a lower pace, as most of the �ncreas�ng �nc�dence concerns early-stage melanomas curable by surgery. Melanoma �nc�dence and mortal�ty �n France are st�ll generally on the r�se, probably because of delays �n the �mplementat�on of effect�ve prevent�on campa�gns based on sun protect�on (Sever� et al., 2000).
(6) Changes in mortality due to availability of efficient treatmentEff�c�ent treatment modal�t�es comb�n�ng chemotherapy, hormone therapy, rad�otherapy, surgery and support�ve care are now ava�lable for most cancers (e.g., Hodgk�n lymphoma, leukaem�a, breast cancer, colorectal cancer, test�cular cancer). These modal�t�es have contr�buted to the decrease �n mortal�ty observed �n the last th�rty years for a large number of cancers.
Effect�veness of cancer treatments has part�cularly �mproved for ch�ldhood cancer, result�ng �n sharp decreases �n the mortal�ty due to these cancers �n France (F�gure A2.9).
(7) Summary of factors likely to be involved in increasing cancer incidenceTable A2.2 summar�zes factors known or suspected to be assoc�ated w�th the �nc�dence of common and less common cancers �n France. Compet�ng causes, changes �n detect�on and d�agnos�s and screen�ng effects play �mportant roles �n the �ncrease �n �nc�dence, whereas �t seems that a�r, water, so�l and food pollutants have had l�ttle demonstrable �mpact on cancer occurrence, w�th the except�on of mesothel�oma, for wh�ch the causal agent (asbestos) �s clearly establ�shed.
4. Summary graphical representation of temporal trends
F�gures A2.10 and A2.11 summar�ze temporal trends �n age-adjusted �nc�dence and age-adjusted mortal�ty of most common cancers (draw�ngs done after Pep�n, 2006). The s�ze of the lozenges �s related to the �nc�dence rates of cancers �n 1997. Notable �ncreases �n both �nc�dence and mortal�ty are seen for cutaneous melanoma (�n both sexes), l�ver cancer (�n
men), NHL (�n both sexes), mult�ple myeloma (�n both sexes), lung cancer (�n women), k�dney cancer (�n both sexes), and pancreat�c cancer (�n both sexes). Increases �n �nc�dence and mortal�ty are moderate for lung cancer �n men, and for the central nervous system �n both sexes.
For breast and prostate cancer, �ncreases �n �nc�dence are not paralleled by changes �n mortal�ty.
Dramat�c decreases �n �nc�dence and mortal�ty are observed for stomach cancer (both sexes), cancers of the mouth, pharynx, larynx and oesophagus �n men, and cerv�cal cancer �n women.
The ava�lab�l�ty of eff�c�ent treatment for test�cular and colorectal cancer and leukaem�a �s man�fested �n decreases �n mortal�ty wh�le �nc�dence was st�ll on the r�se �n 1997.
As descr�bed earl�er, mortal�ty data for l�ver cancer are not always rel�able, as many cases of “pr�mary l�ver cancer” or of death from “l�ver cancer,” are �n fact related to metastas�s of other (somet�mes und�agnosed) pr�mary cancer.
5. Discussion
Th�s sect�on offers a complementary v�ew to the work done by Remontet and co-workers (2002, 2003), that explored �n much more deta�l cancer �nc�dence and mortal�ty trends �n France. The ma�n d�fference �s that th�s sect�on rel�es only on data from cancer reg�str�es and off�c�al mortal�ty stat�st�cs and no modell�ng approach was used to est�mate recent mortal�ty or �nc�dence rates at the nat�onal level. Interested readers may f�nd deta�led stat�st�cs on cancer mortal�ty �n France on the web-s�te of the Inst�tut de ve�lle san�ta�re (www.�nvs.sante.fr/cancer_1983_2002/default.htm). The “Atlas de la Mortal�té en France” d�splays �n great deta�l the geograph�cal patterns of mortal�ty from cancer and from other causes (Salem et al., 1999a, b). A compar�son between European countr�es of project�ons of cancer �nc�dence and mortal�ty data for the year 2006 may be found �n Ferlay et al. (2007).
W�th the age�ng of the French populat�on, annual absolute numbers of cancer cases and deaths w�ll cont�nue to �ncrease stead�ly. The �ncrease �n �nc�dence due to age�ng �s further �ncreased by early detect�on and screen�ng. Thus, to compare changes �n the overall burden of cancer over t�me that �s not due merely to age�ng or to screen�ng, the best �nd�cator rema�ns the age-adjusted cancer mortal�ty rate.
Attributable causes of cancer in France in the year 2000
15
Temporal trends �n all-cancer mortal�ty �n France for men and women resemble those observed �n most European countr�es (Boyle et al., 2003).
Decreas�ng age-adjusted mortal�ty �s due ma�nly to decreases �n the �nc�dence of cancers w�th h�gh fatal�ty rates, such as lung cancer and cancer of oesophagus �n men, of cancer of the cerv�x uter� �n women, and of stomach cancer �n both sexes. The decreases �n mortal�ty from these cancers �n France are attr�butable ma�nly to temporal changes �n exposure to r�sk or protect�ve factors, notably smok�ng and alcohol dr�nk�ng �n men, oral contracept�ves �n women, and poss�bly reduct�ons �n H. pylori �nfect�on �n both sexes.
Earl�er detect�on has also contr�buted to decreas�ng mortal�ty from many cancers, for �nstance breast cancer, colorectal cancer, cerv�cal cancer, and also cancers for wh�ch no systemat�c screen�ng �s organ�zed but d�agnos�s tends to occur at stead�ly earl�er stage, for �nstance head and neck cancers.
Most of the �ncrease �n cancer �nc�dence �s dr�ven by breast and prostate cancer. Increas�ng breast cancer �nc�dence �s �nduced by changes �n reproduct�ve factors, use of HRT and screen�ng. Increas�ng prostate cancer �nc�dence �s largely attr�butable to PSA screen�ng that detects ma�nly prostate cancers that are not l�fe-threaten�ng and should not be treated.
Changes �n occupat�onal exposures have contr�buted to the trends �n morb�d�ty and mortal�ty due to selected cancers �n men, such as mesothel�oma and s�nonasal cancer. These factors have also contr�buted to a proport�on of lung and bladder cancer, but the�r �nfluence on trends �n �nc�dence of and mortal�ty from these cancers �s far less �mportant than that of tobacco smok�ng.
The ava�lable ev�dence does not allow any temporal trend �n cancer occurrence to be attr�buted w�th conf�dence to changes �n exposure to pollutants. However, g�ven that levels of exposure to many known carc�nogen�c agents have drast�cally decreased dur�ng recent decades, one could argue that these agents m�ght have played a role (�f any) �n cancers w�th decreas�ng �nc�dence, rather than �n cancers w�th �ncreas�ng �nc�dence (e.g., non-Hodgk�n lymphomas).
For more frequent cancers such as breast, prostate and colorectal cancers, no or few data ex�st to support a contr�but�on of occupat�onal factors
or pollutants to temporal changes �n �nc�dence or mortal�ty.
The decl�ne �n cancer mortal�ty observed �n France parallels the general decl�ne �n cancer mortal�ty �n the European Un�on (EU) �n recent decades. Exam�nat�on of trends �n cancer mortal�ty �n Europe over the past 30 years has shown that, after long-term �ncreases, age-standard�zed mortal�ty from most common cancers has fallen s�nce the late 1980s (Qu�nn et al., 2003).
Progress aga�nst cancer �n Europe has been the focus of the Europe aga�nst Cancer programme of the European Comm�ss�on that was launched �n 1985. It was expected that th�s programme would foster cancer control efforts �n EU Member States and ach�eve a 15% decl�ne �n cancer mortal�ty all over Europe (Boyle et al., 2003). In th�s respect, the s�tuat�on �n France seems part�cularly pos�t�ve, as here, between 1985 and 2002, cancer mortal�ty decl�ned by 21% �n men and by 12% �n women. It must be noted, however, that for some cancers, the decl�ne �n mortal�ty occurred for causes largely �ndependent of coord�nated cancer control efforts, for �nstance, the secular decl�ne �n stomach cancer mortal�ty and the secular decl�ne �n alcohol consumpt�on �n France.
Surv�val data are often used as an �nd�cator of the sever�ty and of the management of cancers d�agnosed �n a populat�on. However, surv�val data do not replace mortal�ty data, as surv�val may vary cons�derably over t�me and between countr�es for reasons unrelated to treatment or to earl�er detect�on of cancer that would otherw�se be d�agnosed at a more advanced stage (Boyle and Ferlay, 2005). Surv�val �s cons�derably �nfluenced by the so-called lead-t�me b�as, that �s, the add�t�onal t�me of observat�on of a cancerous pat�ent due to d�agnos�s of the cancer at an earl�er moment �n �ts progress�on. Ignor�ng lead-t�me g�ves a b�ased �mpress�on of longer surv�val that �s �n fact due to a longer per�od of observat�on. Increased detect�on of more �ndolent cancers of good prognos�s by screen�ng �s another source of b�as, called length-t�me b�as, that art�f�c�ally �ncreases surv�val because proport�onally more cancers of good prognos�s are �ncluded for the calculat�on of surv�val durat�on. One way to control these b�ases �s to take �nto account stage at d�agnos�s of cancers reg�stered over t�me or �n d�fferent countr�es. Ava�lab�l�ty of data on stages often leads to better explanat�ons of cancer surv�val observed over t�me or across areas (Sant et al., 2003;
Introduction
16
C�ccolallo et al., 2005); th�s requ�res reg�strat�on of stage by cancer reg�str�es.
References
Aut�er P, Boyle P, Buyse M, Ble�berg H. Is FOB screen�ng
really the answer for lower�ng mortal�ty �n colorectal cancer?
Recent Results �n Cancer Research 2003;163:254–263.
Bouchardy C, Morab�a A, Verkoo�jen HM, et al.
Remarkable change �n age-spec�f�c breast cancer �nc�dence
�n the Sw�ss canton of Geneva and �ts poss�ble relat�on w�th
the use of hormone replacement therapy. BMC Cancer
2006;6:78–85.
Boyle P, d’Onofr�o A, Ma�sonneuve P, et al. Measur�ng
progress aga�nst cancer �n Europe: has the 15% decl�ne
targeted for 2000 come about? Annals Oncol 2003;14:1312–
1325.
Boyle P, Ferlay J. Mortal�ty and surv�val �n breast and
colorectal cancer. Nat Cl�n Pract Oncol 2005;2:424-425.
Bray F, McCarron P, Park�n DM. The chang�ng global
patterns of female breast cancer �nc�dence and mortal�ty.
Breast Cancer Res 2004;6:229–239.
C�ccolallo L, Capocacc�a R, Coleman MP, et al. Surv�val
d�fferences between European and US pat�ents w�th
colorectal cancer: role of stage at d�agnos�s and surgery.
Gut 2005;54:268–273.
Doll R, Payne P,Waterhouse JAH., eds (1966). Cancer
Inc�dence �n F�ve Cont�nents, Vol. I. Un�on Internat�onale
Contre le Cancer, Geneva, Spr�nger.
Doll R, Peto R. The Causes of Cancer. Append�x C,
Oxford Un�vers�ty Press 1981, pp 1270–1281.
Ferlay J, Aut�er P, Bon�ol M, Heanue M, Colombet M,
Boyle P. Est�mates of the cancer �nc�dence and mortal�ty �n
Europe �n 2006. Ann Oncol 2007;18:581–592.
H�ll C, Benhamou E, Doyon F, Flamant R. Evolut�on de
la mortal�té par cancer en France de 1950 à 1985. Par�s:
INSERM 1989.
H�ll C, Benhamou E, Doyon F. Trends �n cancer mortal�ty.
Lancet 1990;336:1262–1263.
H�ll C, Benhamou E, Doyon F. Trends �n cancer mortal�ty,
France 1950–1985. Br J Cancer 1991;63:587–590.
H�ll C, Kosc�elny S, Doyon F, Benhamou E. Evolut�on de
la mortal�té par cancer en France 1950–1990, m�se à jour
1986–1990. Par�s: INSERM 1993.
H�ll C, Jan P, Doyon F. Is cancer mortal�ty �ncreas�ng �n
France? Br J Cancer 2001;85:1664–1666.
INSERM-Cp�DC. www.cep�dc.ves�net.�nserm.fr,
accessed �n 2006.
Lev� F, Lucch�n� F, Negr� E, Boyle P, La Vecch�a C.
Cancer mortal�ty �n Europe, 1995–1999, and an overv�ew of
trends s�nce 1960. Int J Cancer 2004;110:155–169
Lowy I, We�sz G. French hormones: progest�ns
and therapeut�c var�at�on �n France. Soc�al Sc� Med
2005;60:2609–2622
Park�n, D.M., Whelan, S.L., Ferlay, J., and Storm, H.
Cancer Inc�dence �n F�ve Cont�nents, Vol. I to VIII, IARC
CancerBase No. 7, Lyon, 2005.
Pep�n P. Ep�dém�olog�e des cancers en Ile-de-France.
Observato�re Rég�onal de Santé d’Ile-de-France, ju�n 2006.
NOT CITED
Qu�nn MJ, d’Onofr�o A, Møller B, et al. Cancer mortal�ty
trends �n the EU and acced�ng countr�es up to 2015. Annals
Oncol 2003;14:1148–1152.
Remontet L, Buem� A, Velten M, Jougla E, Estève J.
Évolut�on de l’�nc�dence et de la mortal�té par cancer en
France de 1978 à 2000. Rapport FRANCIM, Hôp�taux de
Lyon, INSERM, InVS, 2002.
Remontet L, Estève J, Bouv�er AM, et al. Cancer
�nc�dence and mortal�ty �n France over the per�od 1978–
2000. Rev Ep�dém�ol Santé Publ�que. 2003;51:3–30.
Salem G, R�can S, Jougla E. Atlas de la Santé en
France. Vol.1 – Les causes de décès. John L�bbey Eurotext,
Montrouge, 1999.
Salem G, R�can S, Kürz�nger ML. Atlas de la Santé en
France. Vol.2 – Comportements et malad�es. John L�bbey
Eurotext, Montrouge, 1999.
Sant M, Alleman� C, Capocacc�a R, et al. Stage at
d�agnos�s �s a key explanat�on of d�fferences �n breast cancer
surv�val across Europe. Int J Cancer; 2003;106:416–422.
Seg� M. Cancer Mortal�ty for Selected S�tes �n 24
Countr�es (1950–1957). Tohoku Un�vers�ty of Med�c�ne,
1960.
Sever� G, G�les G, Robertson C, Boyle P, Aut�er P.
Trends �n mortal�ty from cutaneous melanoma: why are
there d�fferences between fa�r-sk�nned populat�ons? Br J
Cancer 2000;82:1887–1891.
Tub�ana M, H�ll C. Les progress dans la lutte contre le
cancer en France et dans l’Un�on Européenne. Oncolog�e
2004; 6:229-244.
WHO Stat�st�cal Informat�on System (WHOSIS),
Mortal�ty Database. Ava�lable from http://www3.who.�nt/
whos�s/menu.cfm, accessed March 2006.
Attributable causes of cancer in France in the year 2000

17
IntroductionTa
ble
A2
.1 -
Nu
mb
ers
of
ca
nc
er
de
ath
s in
Fra
nc
e in
19
68
an
d 2
00
3 w
ith
ap
pli
ca
tio
n o
f c
an
ce
r m
ort
ali
ty r
ate
s o
bs
erv
ed
in
19
68
to t
he
Fre
nc
h p
op
ula
tio
n i
n 2
00
3 *
* M
ort
al�t
y d
ata
fro
m t
he
Cp
�DC
, IN
SE
RM
(2
00
5), D
em
og
rap
h�c
fro
m I
NS
EE
† E
xpe
cte
d nu
mb
ers
of
de
ath
s ca
lcu
late
d fr
om
ap
ply
�ng
can
cer
ag
e-s
pe
c�f�c
mo
rta
l�ty
rate
s �n
19
68
on
num
be
rs o
f p
eo
ple
�n e
ach
ag
e-g
roup
�n F
ran
ce �n
20
03
. T
he
num
be
rs o
f d
eat
hs
�n 2
00
3 d�
v�d
ed
by t
he
exp
ect
ed
num
be
rs o
f d
eat
hs
�n 2
00
3 (a
s �f
rate
s of
19
68
we
re s
t�ll v
al�d
fo
r 2
00
3),
g�v
es
the
% c
ha
ng
e �n
ca
nce
r m
ort
al�t
y �n
F
ran
ce b
etw
ee
n th
ese
tw
o p
er�
od
s

18
Tab
le A
2.2
- F
ac
tors
oth
er
tha
n a
ge
ing
as
so
cia
ted
wit
h i
nc
rea
se
s in
in
cid
en
ce
of
se
lec
ted
ca
nc
er
in F
ran
ce
Th
e �n
flue
nce
of r
�sk
fact
ors
d�s
pla
yed
�n t
he
f�ve
colu
mn
s o
n th
e r�
ght
on
can
cer
�nc�
de
nce
an
d m
ort
al�t
y �n
Fra
nce
�s e
st�m
ate
d �n
th
e re
ma
�nd
er
of t
h�s
re
po
rt.
K
eys:
(+
/–)
fact
or
susp
ect
ed
bu
t not
co
nf�r
me
d to
be
�nvo
lve
d �n
a c
ha
ng
e �n
�nc�
de
nce
; (+)
fa
cto
r m
od
era
tely
ass
oc�
ate
d w
�th a
ch
an
ge
�n �n
c�d
en
ce;
(++)
fa
cto
r �n
volv
ed
�n c
ha
ng
e �n
�nc�
de
nce
; (+
++)
fa
cto
r st
ron
gly
ass
oc�
ate
d w
�th c
ha
ng
e �n
�nc�
de
nce
; (+
?) o
r (+
+?)
ass
oc�
at�o
n su
spe
cte
d b
ut
not
pro
ven
(?)
�nd�
cate
s th
at t
he
re �s
no
ev�d
en
ce f
or
a sp
ec�
f�c r
�sk
fact
or
be
lon
g�n
g to
th
e re
leva
nt r
�sk
fact
or
cate
go
ry
Ca
nce
r s�
teA
dm�n
�str
at�v
e o
r d
em
og
rap
h�c
re
aso
ns
Co
mp
et�n
g ca
use
sC
ha
ng
es
�n
d�a
gn
ost
�c
met
ho
d
Scr
ee
n�n
g ef
fect
Ch
an
ge
s �n
b
eh
av�o
urs
(a)
Ind�
v�du
al
r�sk
fa
cto
rsR
ep
rodu
ct�v
e fa
cto
rsIn
fect
�ou
s fa
cto
rsA
�r, s
o�l,
w
ate
r, f
oo
d p
ollu
tant
s
Pro
stat
e
++
++
+
Thy
ro�d
++
++
++
+
/_ (
b)
Bre
ast
+
++
++
+ (
c, d
)+
Co
lore
cta
l
++
++
+ (
d)
Cu
tan
eo
us
me
lan
om
a
++
++
+
Lun
g �n
wo
me
n
+
+
++
+
(�)
Me
soth
el�o
ma
+
++
?+
++
(e)
CN
S t
umo
urs
++
+
He
pat
oca
rc�n
om
a
++
+
+
Bla
dd
er
+
+
Mu
lt�p
le m
yelo
ma
+
+
+?
+
+ ?
Pa
ncr
ea
s
+
+
?
Ch
�ldh
oo
d ca
nce
rs+
+
? (
f)+
?+
+ ?
(g)
+?
Test
�s
?
??
??
NH
L+
+
?
?
++
??
K�d
ney
++
(h)
+
+ (
d)
??
(a)
e.g.
, To
ba
cco
smo
k�n
g; a
lco
ho
l; la
ck o
f phy
s�ca
l exe
rc�s
e; U
V e
xpo
sure
; (b)
Ra
d�a
t�on;
(c)
Ho
rmo
ne
tre
atm
ent
; (d)
e.g
., o
be
s�ty
; (e
) A
sbe
sto
s; (
f) B
ette
r su
rv�v
al o
f ch
�ldre
n w
�th c
on
ge
n�ta
l ma
lform
at�o
ns;
(g)
e.g
., a
ge
d m
oth
er;
pre
mat
ur�ty
(1.
5–
2.4
kg)
, h�g
h p
rem
atur
�ty (
<1.
5 kg
),
an
d h�
gh
b�r
thw
e�g
ht (
> 4
kg)
; (h)
Ma
�nly
�nc�
de
nta
l det
ect
�on
dur�
ng
me
d�ca
l �nv
est
�gat
�on
s; (
�) S
eco
nd
-ha
nd
smo
k�n
g
Attributable causes of cancer in France in the year 2000

19
Introduction
Figure A2.1 - Evolution of incidence (1978-1997) and mortality (1950-2004) from cancer in France
Mortal�ty trends �n the départements of Bas-Rh�n, Calvados, Doubs and Isère are d�splayed as dotted l�nes.

20
Figure A2.2 - Evolution of incidence (1978-1997) and mortality (1950-2004) by cancer in France
Most frequent cancers - Males
Attributable causes of cancer in France in the year 2000

21
Introduction
Figure A2.3 – Evolution of incidence (1978-1997) and mortality (1950-2004) by cancer in France
Cancers of �ntermed�ate frequency - Males
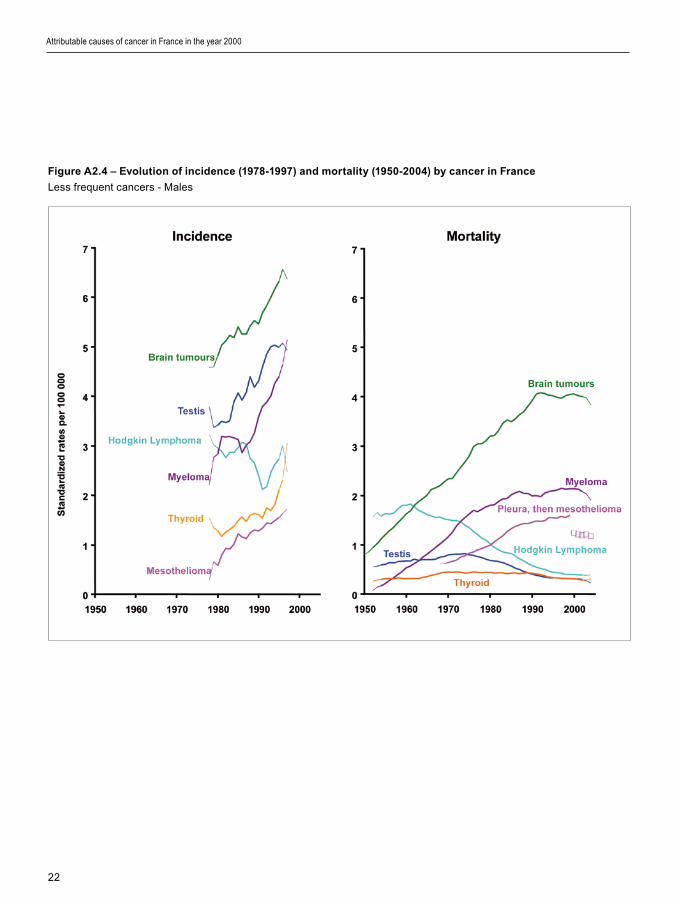
22
Figure A2.4 – Evolution of incidence (1978-1997) and mortality (1950-2004) by cancer in France
Less frequent cancers - Males
Attributable causes of cancer in France in the year 2000

23
Introduction
Figure A2.5 - Evolution of incidence (1978-1997) and mortality (1950-2004) by cancer France
Most frequent cancers - Females

24
Figure A2.6 - Evolution of incidence (1978-1997) and mortality (1968-2004) of breast cancer in France
Over a 20 year per�od, breast cancer �nc�dence has �ncreased by 82% �n women 50 and older
and by 55% �n women younger than 50
Attributable causes of cancer in France in the year 2000
25
Introduction
Figure A2.7 – Evolution of incidence (1978-1997) and mortality (1950-2004) by cancer in France
Cancers of �ntermed�ate frequency - Females

26
Attributable causes of cancer in France in the year 2000
Figure A2.8 – Evolution of incidence (1978-1997) and mortality (1950-2004) by cancer in France
Less frequent cancers - Females
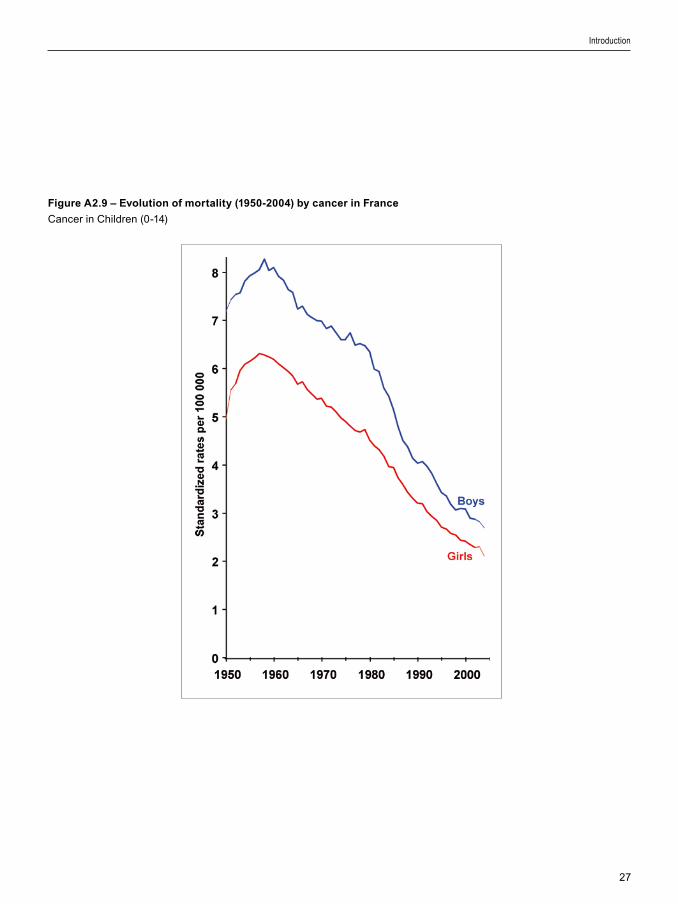
27
Introduction
Figure A2.9 – Evolution of mortality (1950-2004) by cancer in France
Cancer �n Ch�ldren (0-14)

28
Attributable causes of cancer in France in the year 2000
Figure A2.11 - Synthesis of the evolution of the incidence and the mortality from cancer in France, in females,
between 1978 and 1997 (rates adjusted by age). The percentages on the ordinate (incidence) and on the abscissa
(mortality) indicate the annual average change in the rates of incidence and mortality over the period 1978 to
1997. The s�ze of the po�nts �s proport�onal to the rate of �nc�dence of the cancers
Figure A2.10 - Synthesis of the evolution of the incidence and the mortality from cancer in France, in males,
between 1978 and 1997 (rates adjusted by age). The percentages on the ordinate (incidence) and on the abscissa
(mortality) indicate the annual average change in the rates of incidence and mortality over the period 1978 to
1997. The s�ze of the po�nts �s proport�onal to the rate of �nc�dence of the cancers
29
1. Definition of exposure
Tobacco smok�ng causes cancer of the oral cav�ty, pharynx, oesophagus, stomach, nasal cav�ty and s�nuses, larynx, lung, k�dney, ur�nary bladder, urethra and uter�ne cerv�x, as well as acute myelo�d leukaem�a (IARC, 2004). Because of the length of the latency per�od, tobacco-related cancers observed today are related to the c�garette smok�ng patterns over several prev�ous decades. After cessat�on of smok�ng, the �ncrease �n r�sk of cancer �nduced by smok�ng rap�dly ceases: benef�t �s ev�dent w�th�n f�ve years and �s progress�vely more marked w�th the passage of t�me. Tobacco smok�ng also causes many other d�seases, most notably chron�c obstruct�ve pulmonary d�sease, �schaem�c heart d�sease and stroke. All forms of tobacco cause cancer. The greatest lung cancer r�sk �s due to c�garette smok�ng because c�garette smoke �s usually �nhaled. C�gars and p�pes can enta�l s�m�lar r�sks �f the�r smoke �s �nhaled. C�gar and p�pe smoke are assoc�ated w�th s�m�lar r�sks of cancers of the oral cav�ty, pharynx, larynx, and oesophagus.
For the purpose of th�s study, we cons�dered regular smok�ng of any tobacco product. We cons�dered only smok�ng status (current and former smok�ng); durat�on and amount of smok�ng were not taken �nto account. Smokeless tobacco products were not cons�dered because they are not used �n France. Exposure to second-hand smoke, an establ�shed lung carc�nogen (IARC, 2004) �s cons�dered among a�r pollutants (Sect�on B10). The alternat�ve exposure scenar�o �s that of never hav�ng smoked.
Risk factors selected for estimate calculations
2. Data used for relative risk (RR) estimates
We conducted a meta-analys�s of stud�es �ncluded �n the recent IARC Monograph (IARC, 2004). Th�s meta-analys�s �ncluded all cancers for wh�ch a causal assoc�at�on �s establ�shed, w�th the except�on of s�nonasal cancer (small number of attr�butable cases), nasopharyngeal cancer (small number of attr�butable cases) and acute myelo�d leukaem�a (�nc�dence and mortal�ty data not ava�lable for France). We calculated sex-spec�f�c meta-relat�ve r�sks for current and former smok�ng. However, fewer stud�es were ava�lable for tobacco-related cancer �n women than �n men, and RRs for current smokers among women were somet�mes h�gher than the correspond�ng RRs for men, but w�th w�der conf�dence �ntervals. In v�ew of th�s stat�st�cal �nstab�l�ty of RR est�mates for women, when RRs �n women were h�gher than �n men (or were unknown), the RRs for men were used for both sexes (Table B1.1). Est�mates for former smokers among women were also based on few stud�es, ma�nly of case–control des�gn. Therefore, �nstead of est�mat�ng RRs for former smokers among women from meta-analyses, we calculated the rat�o of the ln(RR) for current smokers to that of former smokers among men and we appl�ed th�s rat�o to the ln(RR) for current smokers among women. We est�mated the conf�dence �ntervals that were ava�lable for th�s measure us�ng the var�ance of ln(RR) for current smokers among women (th�s cho�ce was more conservat�ve than us�ng the var�ance of the ln(RR) for former smokers among men). For cancer of the cerv�x uter�, the rat�o ln(RR current)/ln(RR former) and the var�ance used were the average of those of all other s�tes.
Risk factors selected for estimate calculations
Section B1: Tobacco smoking

30
3. Data used for exposure prevalence
Data on prevalence of smok�ng were abstracted from nat�onw�de surveys (Table B1.2). Prevalence data for 1985 were est�mated by l�near �nterpolat�on us�ng results of surveys conducted �n 1983 and 1986, wh�ch y�elded the follow�ng f�gures for 1985: current male smokers: 48.2%, current female smokers: 30.4%, former male smokers: 27.7%, former female smokers: 14.0%.
4. Calculation of AFs
Table B1.3 l�sts the AFs and numbers of cancer cases and deaths attr�butable to tobacco smok�ng �n France �n 2000. A total of 43 466 cases of cancer among men (27.0% of the total) and 7095 cases among women (6.1%) were attr�butable to tobacco smok�ng. Lung cancer represented about 45% of tobacco-attr�butable cancers �n both men and women; �n men, oral cav�ty and pharyngeal cancer represented an add�t�onal 21%. G�ven the h�gh fatal�ty of many tobacco-assoc�ated cancers, correspond�ng f�gures for mortal�ty are h�gher than for �nc�dence (33.4% of all cancer deaths �n men and 9.6% �n women).
5. Sensitivity analysis
Different lag-times
If a lag-t�me of 10 years (�.e., us�ng tobacco smok�ng data for 1990) �s cons�dered, prevalence of tobacco smok�ng for males �s lower than �n 1985 and prevalence for females �s h�gher. The fract�on of �nc�dent cancers attr�butable to tobacco would therefore be 26.8% for men and 6.3% for women. The fract�on of cancer deaths attr�butable to tobacco would be 33.1% for men and 9.9% for women.
If a lag-t�me of 20 years (�.e., us�ng tobacco smok�ng data for 1980) �s cons�dered, prevalence of tobacco smok�ng for males �s h�gher than �n 1985 and prevalence for females �s lower. The fract�on of �nc�dent cancers attr�butable to tobacco would therefore be 27.2% for men and 5.5% for women. The fract�on of cancer deaths attr�butable to tobacco would be 33.5% for men and 8.7% for women.
Indirect estimate of the attributable fraction for women
Surveys of tobacco smok�ng that �ncluded only quest�ons on smok�ng status (current smoker or former smoker) y�eld prevalence data that cannot be adjusted for the number of c�garettes smoked. Indeed, �n surveys conducted �n the 1970s, women who declared be�ng current smokers often had very low consumpt�on. Because we used RRs from a meta-analys�s that �ncluded a large proport�on of stud�es conducted �n the USA or �n Nord�c countr�es, the pattern of tobacco smok�ng for women �n 1985 descr�bed m�ght not have been comparable to that of French women.
We therefore calculated the attr�butable fract�on for tobacco smok�ng us�ng an �nd�rect compar�son for women. Because tobacco smok�ng �s by far the ma�n env�ronmental cause of lung cancer, and because that cancer �s not curable, lung cancer mortal�ty stat�st�cs are good �nd�cators of the ep�dem�c of cancer assoc�ated w�th tobacco smok�ng. We hypothes�zed that �n French women, no lung cancer �n 1950 was related to tobacco smok�ng, and any �ncrease �n lung cancer mortal�ty rates after 1950 was attr�butable to tobacco smok�ng:
AF = (mortal�ty rate �n year X – mortal�ty rate �n 1950)
/ mortal�ty rate �n year X
We performed th�s calculat�on for the year 2000 by age group (Table B1.4). These age-spec�f�c AFs were appl�ed to age-spec�f�c numbers of deaths �n 2000, and among the 4246 lung cancer deaths �n French women �n 2000, 2596 were attr�butable to tobacco smok�ng, correspond�ng to an AF of 61.1%.
6. Comparison with indirect method of calculating AFs
An alternat�ve method of calculat�ng tobacco-attr�butable r�sks has been proposed by Peto and colleagues (1992). The method �s based on the assumpt�on that current lung cancer mortal�ty prov�des a better measure of the effect of the exposure of �nterest – l�fet�me tobacco smok�ng – than does smok�ng prevalence �tself. A Smok�ng Impact Rat�o (SIR) �s calculated by compar�ng the lung cancer mortal�ty observed �n a g�ven populat�on w�th that
Attributable causes of cancer in France in the year 2000

31
expected �n a (reference) populat�on of non-smokers, typ�cally, rates among never-smokers enrolled �n the Amer�can Cancer Soc�ety Cancer Prevent�on Study II (ACP-CPS-II). ASIR=1 �s equ�valent to a populat�on compr�s�ng ent�rely l�fet�me smokers, and SIR=0 �s equ�valent to a populat�on compr�s�ng ent�rely never-smokers. An est�mate of the number of deaths from cancer and other causes attr�butable to tobacco smok�ng �n France and other countr�es �n 2000 has recently been calculated (www.deathsfromsmok�ng.net), based on three groups of cancer: lung, upper aerod�gest�ve tract (oral cav�ty, pharynx, larynx, oesophagus) and all other cancers. Table B1.5 compares the est�mates from that project w�th those we produced. Wh�le f�gures �n men are fa�rly s�m�lar, reflect�ng the fact that the tobacco ep�dem�c has reached �ts matur�ty among French men, d�screpanc�es �n women may be partly expla�ned by the fact that the ACP-CPS-II results on lung cancer mortal�ty �n non-smok�ng women �n the USA are not appl�cable to non-smok�ng French women. The �nd�rect est�mate of the attr�butable fract�on for women we calculated above �n sub-sect�on 5 suggests that the results of the “deathsfromsmok�ng” project may underest�mate the fract�on of lung cancers attr�butable to tobacco �n French women.
7. Discussion
Our analys�s conf�rmed that tobacco �s the ma�n avo�dable cause of cancer �n France among both men and women. There are several reasons why our results for men are l�kely to represent a conservat�ve est�mate of the burden of tobacco-assoc�ated cancer. F�rst, we d�d not �nclude a few rare cancers (cancers of the nasopharynx, nose and paranasal s�nuses, myelo�d leukaem�a) for wh�ch a causal assoc�at�on w�th tobacco smok�ng has been demonstrated (IARC, 2004). Second, for several other cancers, a causal assoc�at�on w�th tobacco smok�ng �s suspected, although not yet demonstrated: a notable example �s colorectal cancer, for wh�ch an assoc�at�on has been reported �n several stud�es. In our meta-analys�s, we also calculated summary r�sk est�mates for colorectal cancer: RRs �n men were 1.17 for current smok�ng and 1.16 for former smok�ng, wh�ch would correspond to 2173 �nc�dent cases of cancer and 933 cancer deaths. Th�rd, the meta-analys�s was based largely on stud�es conducted �n populat�ons smok�ng
pr�mar�ly or exclus�vely blond-tobacco c�garettes, wh�le consumpt�on of black-tobacco c�garettes, wh�ch �s assoc�ated w�th a h�gher RR of most tobacco-related cancers (IARC, 2004), �s a character�st�c of French smokers.
On the other hand, as d�scussed above, the tobacco-related ep�dem�c of lung cancer and other cancers among French women has not yet reached �ts matur�ty, wh�le �n the UK and the USA, the peak �n female smok�ng was already reached �n the 1980s. Also, Amer�can and Br�t�sh women used to smoke more than French women (H�ll and Laplanche, 2005a). For these reasons, the use of RRs ma�nly from stud�es conducted �n populat�ons, such as those of the UK and �n the USA, �n wh�ch women have been smok�ng for a longer t�me and at h�gher level m�ght result �n an overest�mate of the attr�butable fract�on �n French women. However, the alternat�ve approach we used to est�mate the AF of lung cancer among women (rat�o of d�fference �n mortal�ty �n 2000 and 1950 over mortal�ty �n 2000) suggested that any overest�mate was not very large, s�nce �t resulted �n an AF of 61.1%, comparable to the 69.7% obta�ned when the method of Lev�n (1953) was used. Because we cannot exclude the poss�b�l�ty that some lung cancer occurr�ng �n 1950 �n women was attr�butable to tobacco smok�ng, the est�mate of 61.1% has to be cons�dered as a m�n�mal AF for French women and the results of the �nd�rect method proposed by Peto et al. (1992) are l�kely to underest�mate the role of tobacco as a carc�nogen among French women.
Sens�t�v�ty analys�s exam�n�ng a 10- or 20-year lag-t�me y�elded est�mates of attr�butable fract�ons close to those w�th a 15-year lag-t�me.
In our est�mates, we d�d not take �nto account the average consumpt�on of c�garettes and other tobacco products by French smokers. It �s unclear whether the assumpt�on that the level of tobacco consumpt�on �s s�m�lar �n France and �n the populat�ons covered by the meta-analys�s would result �n b�as, and �f so, what the d�rect�on and magn�tude of such a b�as would be.
In conclus�on, the type of tobacco consumed �n France and the exclus�on of some cancers from our calculat�ons, lead us to cons�der our est�mates of lung cancer cases and deaths caused by tobacco smok�ng to be m�n�mum values for France �n 2000.
Some aspects of the carc�nogen�c�ty of tobacco relevant to the burden of cancer �n France are dealt w�th �n other sect�ons of th�s report (Sect�on B10 for
Risk factors selected for estimate calculations
32
second-hand smoke, and Sect�on C2 for �nteract�ons between tobacco smok�ng and other r�sk factors).
References
Gand�n� S, Botter� E, Lod�ce S, Bon�ol M, Lowenfelds AB,
Ma�sonneuve P, Boyle P. Tobaccco smok�ng and cancer: a
meta-analys�s. Int J Cancer 2007 (�n press).
H�ll C, Laplanche A. Le tabac en France les vra�s
ch�ffres. La documentat�on França�se. Par�s, 2004.
H�ll C, Laplanche A. Evolut�on de la consommat�on
de c�garettes en France par sexe, 1900–2003. Bull Ep�d
Hebdomada�re 2005;21–22/2005:94–97.
Internat�onal Agency for Research on Cancer. IARC
Monographs on the Evaluat�on of Carc�nogen�c R�sks to
Humans. Vol 83, Tobacco Smoke and Involuntary Smok�ng.
Lyon, IARC, 2004.
Lev�n M. The occurrence of lung cancer �n man. Acta
Un�o Int Contra Cancrum. 1953;9:531–541.
Peto R, Lopez AD, Boreham J, et al. Mortal�ty from
tobacco �n developed countr�es: �nd�rect est�mat�on from
nat�onal v�tal stat�st�cs. Lancet 1992;339:1268–1278.
Attributable causes of cancer in France in the year 2000

33
Table B1.1 – Relative risks (RR) of cancer of specific organs associated with tobacco smoking, by sex*
* From meta analys�s of stud�es reported �n the IARC monograph on tobacco (2004) and Gand�n� et al. (2007)§ RRs for former smokers among women were est�mated us�ng the rat�o of ln(RR current smoker) to ln(RR former smoker) among men that we appl�ed to ln(RR current smoker) for women.† When RRs for women were h�gher than for men or when no RR was est�mable for women, the RR for men was used �nstead‡ For cerv�x uter�, the rat�o ln(RR current)/ln(RR former) and the var�ance used were the average of those of all other s�tes
Table B1.2 - Surveys on tobacco smoking in France around 1985 (from Hill and Laplanche, 2005b)
Year Number Prevalence (%) of tobacco smoking Source
Men Women
Men Women Smokers Ex-smokers Smokers Ex-smokers
1983 941 1036 51 29 CFES§
1983 707 786 55 27 34 18 CFES§
1985 * – – 48.24 27.67 30.39 14.00
1986 960 1040 46 30 CFES§
1986–1987 5874 7280 28 12 INSEE
* L�near �nterpolat�on for 1985§ Com�té França�s d’Educat�on pour la Santé, now INPES
Risk factors selected for estimate calculations
Cancer site Men Women
Current smoking Former smoking Current smoking Former smoking §
Oral cav�ty 4.22 1.57 1.60 1.16
Pharynx 6.82 2.28 3.29 1.67
Oesophagus 2.52 2.13 2.28 1.96
Stomach 1.74 1.34 1.45 1.22
L�ver 1.85 1.69 1.49 1.41
Pancreas 1.63 1.10 1.63† 1.10
Larynx 5.24 4.96 5.24† 4.96
Lung 9.87 3.18 7.58 2.78
K�dney 1.59 1.27 1.35 1.17
Ur�nary bladder 2.8 1.90 2.73 1.87
Cerv�x uter� – – 1.83 1.32‡
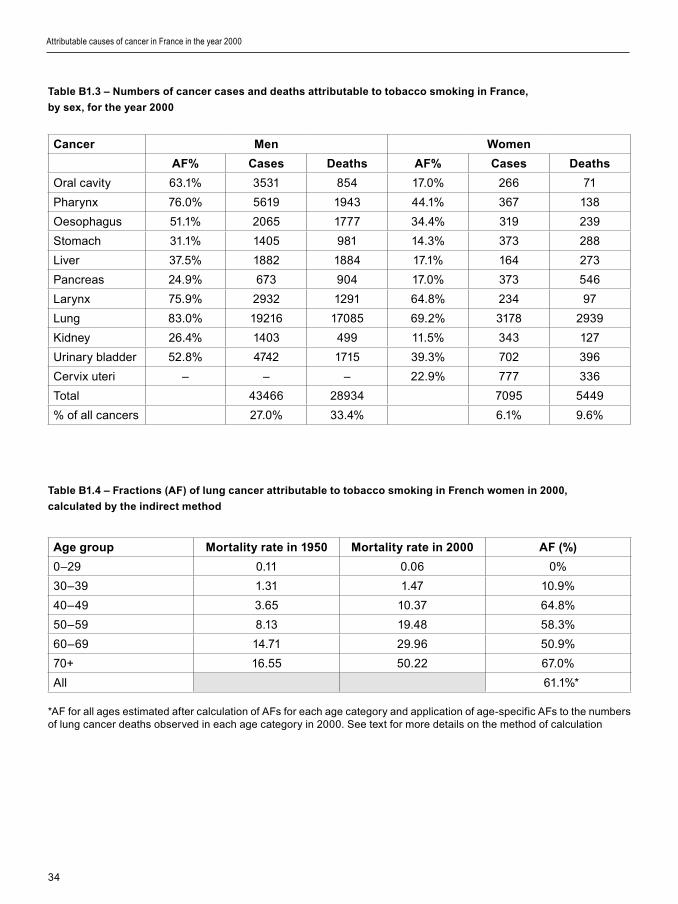
34
Table B1.3 – Numbers of cancer cases and deaths attributable to tobacco smoking in France,
by sex, for the year 2000
Cancer Men Women
AF% Cases Deaths AF% Cases Deaths
Oral cav�ty 63.1% 3531 854 17.0% 266 71
Pharynx 76.0% 5619 1943 44.1% 367 138
Oesophagus 51.1% 2065 1777 34.4% 319 239
Stomach 31.1% 1405 981 14.3% 373 288
L�ver 37.5% 1882 1884 17.1% 164 273
Pancreas 24.9% 673 904 17.0% 373 546
Larynx 75.9% 2932 1291 64.8% 234 97
Lung 83.0% 19216 17085 69.2% 3178 2939
K�dney 26.4% 1403 499 11.5% 343 127
Ur�nary bladder 52.8% 4742 1715 39.3% 702 396
Cerv�x uter� – – – 22.9% 777 336
Total 43466 28934 7095 5449
% of all cancers 27.0% 33.4% 6.1% 9.6%
Table B1.4 – Fractions (AF) of lung cancer attributable to tobacco smoking in French women in 2000,
calculated by the indirect method
Age group Mortality rate in 1950 Mortality rate in 2000 AF (%)
0–29 0.11 0.06 0%
30–39 1.31 1.47 10.9%
40–49 3.65 10.37 64.8%
50–59 8.13 19.48 58.3%
60–69 14.71 29.96 50.9%
70+ 16.55 50.22 67.0%
All 61.1%*
*AF for all ages est�mated after calculat�on of AFs for each age category and appl�cat�on of age-spec�f�c AFs to the numbers of lung cancer deaths observed �n each age category �n 2000. See text for more deta�ls on the method of calculat�on
Attributable causes of cancer in France in the year 2000
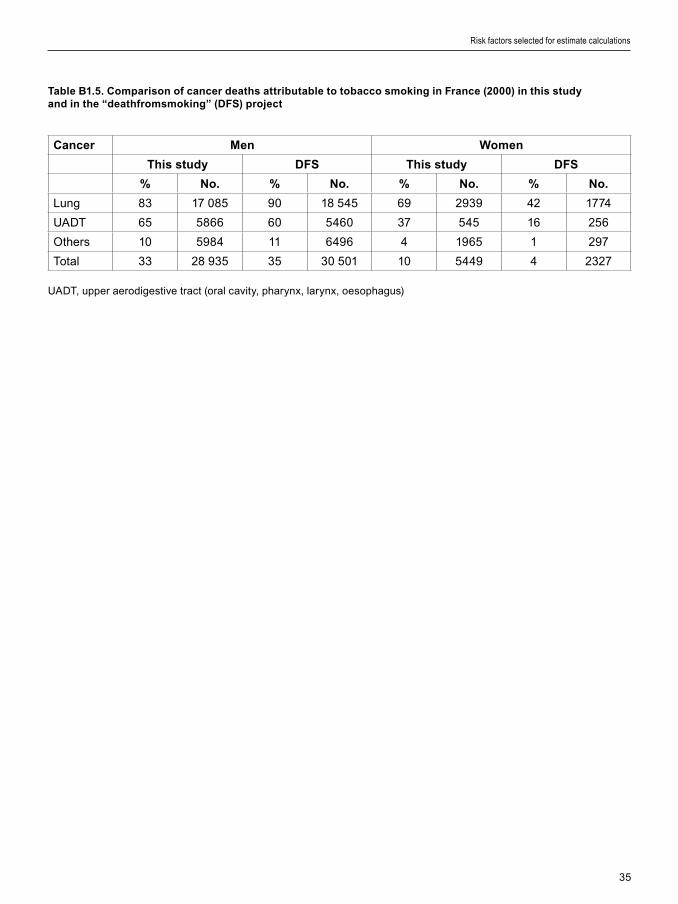
35
Table B1.5. Comparison of cancer deaths attributable to tobacco smoking in France (2000) in this study and in the “deathfromsmoking” (DFS) project
Cancer Men Women
This study DFS This study DFS
% No. % No. % No. % No.
Lung 83 17 085 90 18 545 69 2939 42 1774
UADT 65 5866 60 5460 37 545 16 256
Others 10 5984 11 6496 4 1965 1 297
Total 33 28 935 35 30 501 10 5449 4 2327
UADT, upper aerod�gest�ve tract (oral cav�ty, pharynx, larynx, oesophagus)
Risk factors selected for estimate calculations

36
1. Definition of exposure
The present rev�ew focuses on the carc�nogen�c effects of alcohol dr�nk�ng and does not take �nto account other health effects of th�s hab�t. Furthermore, no d�st�nct�on �s made accord�ng to e�ther type of alcohol�c beverage (e.g., beer, w�ne, hard l�quor, home-made sp�r�ts) or dr�nk�ng patterns (e.g., regular versus b�nge dr�nk�ng), because the data are �nadequate to conclude whether the r�sk of cancer var�es accord�ng to these character�st�cs. The only d�mens�on of dr�nk�ng wh�ch �s cons�dered relevant for r�sk est�mate �s �ntake expressed �n grams per day of ethanol.
The alternat�ve exposure scenar�o �s that of no alcohol �ntake.
2. Data used for RR estimates
For all cancers but breast cancer, RRs were extracted from a recent meta-analys�s (Corrao et al., 2004). S�nce all RRs were compat�ble w�th a log-l�near �ncrease �n r�sk w�th dose, we f�tted a l�near regress�on model to calculate the ln(RR) for �ntake of an add�t�onal gram of ethanol per day. In the case of breast cancer, we used the results of a recent large pooled analys�s, wh�ch prov�ded an RR of 1.071 for �ntake of an add�t�onal 10 g/d (Hamaj�ma et al., 2002). Table B2.1 l�sts the RRs used �n the analys�s.
3. Data used for exposure prevalence
Few temporal surveys on alcohol consumpt�on �n France have been reported. We retr�eved data from the WHO WHOSIS database (www.who.�nt) on adult (≥15 years of age) per capita alcohol consumption. WHOSIS alcohol consumpt�on data were calculated from off�c�al stat�st�cs on product�on, sales and �mports and exports, tak�ng �nto account stocks whenever poss�ble. We used these survey data as measures of alcohol�c beverage dr�nk�ng because self-reported consumpt�on data are l�kely to be
grossly underest�mated. For �nstance, da�ly �ntakes among adults �n an INSEE 1986–87 survey could be est�mated as 24.7 g �n men and 6.0 g �n women, cons�der�ng a standard dr�nk of 10 g; annual total �ntakes calculated from these f�gures were well below the WHOSIS data.
S�nce the consumpt�on f�gures from econom�c data were not broken down by sex, we used INSEE survey data to der�ve the male-to-female rat�o �n alcohol consumpt�on. In the 1986–87 INSEE survey, consumpt�on was reported as the number of dr�nks per day; we used a standard amount of 10 g ethanol per dr�nk to est�mate the da�ly consumpt�on (IARC, 1988). In the INSEE survey, consumpt�on was reported by �ntervals of “number of dr�nks per day”. Therefore, we took the average of the bounds of each �nterval for the calculat�on of da�ly consumpt�on. The alcohol consumpt�on rat�o �n the 1986–87 INSEE survey was 4.12; we part�t�oned the total amount of alcohol drunk per adult �n 1985 (der�ved from the WHOSIS database, 17.22 L of pure alcohol per year) �nto average da�ly �ntakes for men (62.3 g/d) and women (14.4 g/d). Th�s latest part�t�on of alcohol per adult took �nto account a sex rat�o (male/female) of 0.95 to account for sl�ght d�fferences �n populat�on s�ze.
4. Calculation of AFs
Table B2.1 l�sts the results of the calculat�on of attr�butable fract�ons, and Table B2.2 the number of �nc�dent cancer cases and cancer deaths attr�butable to alcohol dr�nk�ng. A total of 17 398 cases of cancer among men (10.8% of the total) and 5272 cases among women (4.5%) were attr�buted to alcohol dr�nk�ng (Table B2.2). Head and neck cancers represented the largest group of alcohol-attr�butable cancers �n men, wh�le breast cancer contr�buted more than 70% of alcohol-attr�butable cancers �n women. Correspond�ng f�gures for mortal�ty are 9.4% of cancer deaths �n men and 3.0% �n women.
Attributable causes of cancer in France in the year 2000
Section B2: Alcohol drinking

37
5. Sensitivity analysis
Lag-time
We mod�f�ed the latency t�me from 15 to 10 years; the level of alcohol dr�nk�ng �n 1990 was lower than �n 1985, w�th 16.24 l�tres of pure alcohol consumed per person and per year �n France. Th�s represents 58.5 g/d of alcohol for men and 13.8 g/d for women. Us�ng these f�gures, the fract�on of �nc�dent cancers attr�butable to alcohol would be 10.4% for men and 4.3% for women, and the fract�on of cancer deaths attr�butable to alcohol 9.0% for men and 2.9% for women.
We further mod�f�ed the latency to 20 years. The level of alcohol dr�nk�ng �n 1980 was 19.66 l�tres of pure alcohol consumed per person. Th�s represents 66.6 g/d of alcohol for men and 20.7 g/d for women. In th�s case, the fract�on of �nc�dent cancers attr�butable to alcohol would be 11.3% for men and 6.3% for women, and the fract�on of cancer deaths attr�butable to alcohol dr�nk�ng would be 9.9% for men and 4.2% for women.
Standard drink of 12 grams per drink
To est�mate the rat�o of alcohol consumpt�on between males and females, we rel�ed on the 1986–87 INSEE survey, wh�ch reported consumpt�on �n dr�nks per day. We repeated the analys�s us�ng 12 g ethanol per dr�nk �nstead of 10 g. S�nce the rat�o est�mate �s �ndependent of the dose cons�dered, the result�ng male to female alcohol dr�nk�ng rat�o was 4.12. The fract�on of �nc�dent cancers attr�butable to alcohol dr�nk�ng was then s�m�lar to the est�mate w�th 10 grams per dr�nk.
6. Discussion
The ev�dence l�nk�ng alcohol dr�nk�ng to cancer r�sk has been rev�ewed (Boffetta and Hash�be, 2006; IARC, 2007). There �s conv�nc�ng ep�dem�olog�cal ev�dence that the consumpt�on of alcohol�c beverages �ncreases the r�sk of cancers of the oral cav�ty, pharynx, larynx, oesophagus, l�ver, colorectum and female breast. The r�sks �ncrease w�th the amount of ethanol drunk.
Bes�des �ncreas�ng cancer r�sk, alcohol dr�nk�ng enta�ls complex health consequences, mak�ng �t
d�ff�cult to draw conclus�ons on the net health effect of d�fferent dr�nk�ng patterns. There �s some ev�dence for a J-shaped pattern of r�sk of total mortal�ty and card�ovascular d�sease w�th �ncreas�ng alcohol consumpt�on. In add�t�on, alcohol dr�nk�ng �ncreases the r�sk of �njury �n all other act�v�t�es and acc�dent mortal�ty rates are �nfluenced by per cap�ta alcohol consumpt�on. Moreover, alcohol dur�ng pregnancy has a detr�mental effect on the development of the fetus and �ts central nervous system, often result�ng �n malformat�ons, behav�oural d�sorders and cogn�t�ve def�c�ts �n the postnatal per�od.
Alcohol dr�nk�ng �n both sexes (F�gure B2.2) has cons�derably decreased �n France over recent decades (CNE, 1999) (F�gure B2.1), result�ng �n sharp decreases �n alcohol-related d�seases such as l�ver c�rrhos�s (F�gure B2.3) and oesophageal cancer (F�gure B2.4).
Although our est�mates of the number of cancers attr�butable to alcohol dr�nk�ng �n men are h�gher than those der�ved �n the past for the USA or Austral�a (Holman and Engl�sh, 1995), they are comparable to those prov�ded for Europe �n recent stud�es (Rehm et al., 2003; Boffetta and Hash�be, 2006). It �s noteworthy that alcohol dr�nk�ng �s the second greatest avo�dable cause of cancer �n French men after tobacco smok�ng. Sens�t�v�ty analys�s based on e�ther a 10- or 20-year latency, or us�ng a d�fferent standard alcohol content of a dr�nk d�d not mater�ally affect the attr�butable fract�on est�mates.
The accuracy of our est�mates �s l�m�ted by the qual�ty of the ava�lable data on �nd�v�dual alcohol consumpt�on. Th�s �s part�cularly problemat�c because patterns of alcohol dr�nk�ng �n France have undergone major changes dur�ng the last 50 years.
References
Boffetta P, Hash�be M. Alcohol and cancer. Lancet
Oncol 2006;7:149–156.
Corrao G, Bagnard� V, Zambon A, La Vecch�a C. A
meta-analys�s of alcohol consumpt�on and the r�sk of 15
d�seases. Prev Med 2004;38:613–619.
CNE. Prem�er M�n�stre. Comm�ssar�at général du Plan.
Conse�l nat�onal de l’Evaluat�on. La lo� relat�ve à la lutte
contre le tabag�sme et l’alcool�sme. Octobre 1999.
Hamaj�ma N, H�rose K, Taj�ma K, et al. Alcohol, tobacco
and breast cancer – Collaborat�ve reanalys�s of �nd�v�dual
data from 53 ep�dem�olog�cal stud�es, �nclud�ng 58,515
Risk factors selected for estimate calculations

38
women w�th breast cancer and 95,067 women w�thout the
d�sease. Br J Cancer 2002;87:1234–1245.
Holman CD, Engl�sh DR. An �mproved et�olog�c fract�on
for alcohol-caused mortal�ty. Austral J Publ�c Health
1995;19:138–141.
Internat�onal Agency for Research on Cancer. IARC
Monographs on the Evaluat�on of Carc�nogen�c R�sks to
Humans. Vol. 44, Alcohol Dr�nk�ng. Lyon, IARC, 1988.
Internat�onal Agency for Research on Cancer. IARC
Monographs on the Evaluat�on of Carc�nogen�c R�sks to
Humans. Vol 96, Alcohol�c Beverage Consumpt�on. Lyon, IARC, 2007 (�n press).
Launoy G, M�lan C, Day NE et al. Oesophageal cancer
�n France: potent�al �mportance of hot alcohol�c dr�nks. Int J
Cancer 1997;71:917–923.
On�V�ns. Enquête sur la consommat�on du v�n en France
en 2000: Prem�ers résultats en mat�ère de fréquences de
consommat�on. On�v�ns – Infos 2000.
Rehm J, Gmel G, Sempos CT, Trev�san M. Alcohol-
related morb�d�ty and mortal�ty. Alcohol Res Health 2003;
27:39–51.
Attributable causes of cancer in France in the year 2000

39
Table B2.1 - Relative risks for alcohol drinking and attributable fractions, by sex
§ Men: 62.3 g/d ; women: 14.4 g/d
* Based on l�near extrapolat�on from results of meta-analys�s (Corrao et al., 2004)
† Based on results of pooled analys�s (Hamaj�ma et al., 2002)
Table B2.2 - Number of cancer cases of and deaths attributable to alcohol drinking in France in 2000, by sex
Cancer Incident cases Deaths
Men Women Men Women
Oral cav�ty, pharynx 9185 591 2765 180
Oesophagus 2228 157 1918 117
Colorectal 2178 455 936 206
L�ver 1593 81 1594 135
Larynx 2214 64 975 27
Breast – 3925 – 1027
Total 17398 5272 8188 1692
% total cancer cases/deaths 10.8% 4.5% 9.4% 3.0%
Risk factors selected for estimate calculations
CancerLn
(Risk per g/d)RR for average consumption§
AF%
Men Women Men Women
Oral cav�ty, pharynx 0.020* 3.41 1.33 70.7 24.6
Oesophagus 0.013* 2.23 1.20 55.2 16.9
Colorectal 0.002* 1.13 1.03 11.2 2.7
L�ver 0.006* 1.47 1.09 31.8 8.4
Larynx 0.014* 2.34 1.22 57.3 17.8
Breast 0.007† – 1.10 – 9.4
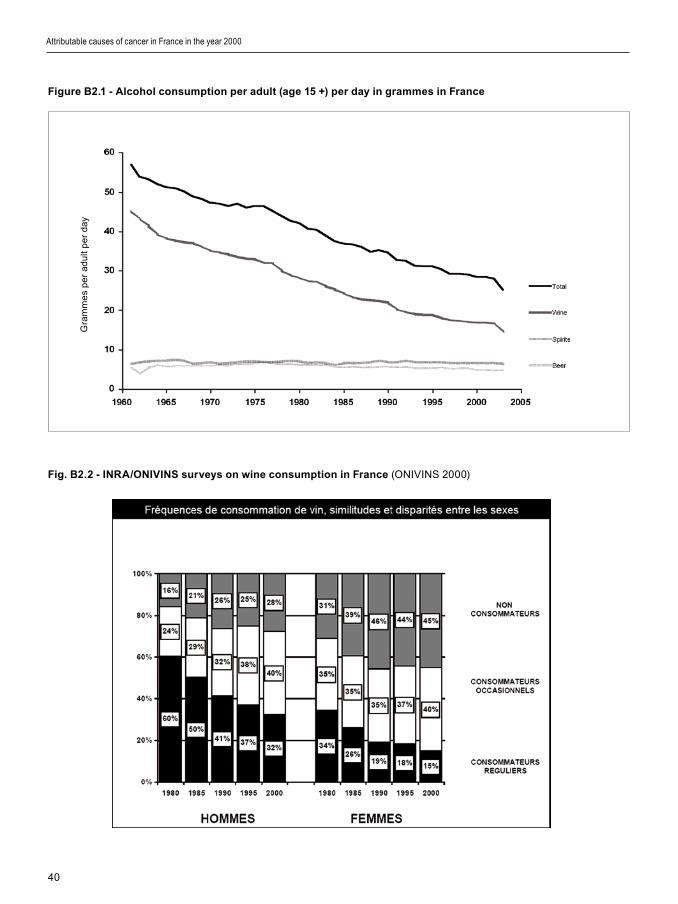
40
Figure B2.1 - Alcohol consumption per adult (age 15 +) per day in grammes in France
Fig. B2.2 - INRA/ONIVINS surveys on wine consumption in France (ONIVINS 2000)
Attributable causes of cancer in France in the year 2000
Gra
mm
es
pe
r a
du
lt p
er
day

41
Figure B2.3 Mortality from liver cirrhosis in France
Data sources : INED and WHO Europe (* European standard populat�on was used for rate calculat�ons)
Figure B2.4 - Incidence of oesophagus cancer in Calvados. Incidence per 100 000 person-years, age-adjusted
(world population). Data from Launoy et al. (1997), updated by G. Launoy for the needs of th�s study
Risk factors selected for estimate calculations
Ag
e-s
tan
da
rd�z
ed
rate
pe
r 10
0,0
00
*
Ag
e-a
dj.�
nc�
de
nce
pe
r 10
0,0
00
*
42
1. Definition of exposure
Several �nfect�ous agents have been �dent�f�ed as caus�ng human cancer. For most of them, an �ncreased r�sk of cancer has been demonstrated only �n relat�on to several years of chron�c �nfect�on. Publ�shed ep�dem�olog�cal data �n France on some spec�f�c cancers or �nfect�ons were �nadequate for est�mat�on of an AF. Table B3.1 summar�zes the current l�st of recogn�zed assoc�at�ons betweens �nfect�ons and cancer, �nd�cat�ng any reasons for exclus�on from th�s report.
An AF was calculated for cerv�cal cancer and oral/pharyngeal cancer follow�ng �nfect�on w�th human pap�llomav�rus (HPV), l�ver cancer follow�ng �nfect�on w�th hepat�t�s B v�rus (HBV) and hepat�t�s C v�rus (HCV), Hodgk�n lymphoma follow�ng �nfect�on w�th Epste�n–Barr v�rus (EBV), non-Hodgk�n lymphoma follow�ng �nfect�on w�th EBV, and stomach cancer follow�ng �nfect�on w�th Helicobacter pylori.
2. Data used for RR estimates
RRs used �n the est�mat�on of AFs are reported �n Table B3.2. The RRs of l�ver cancer follow�ng �nfect�on w�th HBV and HCV were der�ved from a meta-analys�s (Donato et al., 1998).
Pers�stent HPV �nfect�on of the cerv�x �s now cons�dered as a necessary and suff�c�ent cond�t�on for occurrence of cerv�cal cancer and thus the AF for HPV was cons�dered equal to 1. The RR of oral and pharyngeal cancer follow�ng �nfect�on w�th the same agent was der�ved from a pooled analys�s based on Nord�c serum banks (Mork et al., 2001).
The RR of stomach cancer follow�ng �nfect�on w�th H. pylori was der�ved from a meta-analys�s (Esl�ck et al., 1999).
3. Data used for prevalence
Data on prevalence of exposure to �nfect�ous agents are l�sted �n Table B3.2. The sex-spec�f�c prevalence
of HBV and HCV �nfect�on among adults was der�ved from a recent InVS report (InVS, 2005).
The prevalence of HPV �n the anogen�tal tract was der�ved from a survey of French women (Clavel et al., 2004); the same f�gure was used for men. The HPV prevalence �n the oral cav�ty was der�ved from the pooled analys�s of Nord�c serum banks (Mork et al., 2001); the same f�gure was used for men and women.
The prevalence of H. pylori �nfect�on was der�ved from a survey of asymptomat�c pregnant women (Kalach et al., 2002); th�s f�gure was appl�ed to adults of both sexes. One major assumpt�on �n the use of such data, �n the absence of comparable h�stor�cal data, �s that prevalence of �nfect�on has rema�ned stable over t�me.
4. Calculation of AFs
Although �t �s well establ�shed that EBV �s �mpl�cated �n the occurrence of several cancers, e.g., Burk�tt lymphoma (de Thé et al., 1978) and Hodgk�n lymphoma (Mueller et al., 1989), there �s st�ll great uncerta�nty as to the extent of these assoc�at�ons (Thorley-Lawson, 2005). For AF est�mat�on, we took f�gures from the IARC Monograph Vol. 70 on �nfect�ons and cancer (IARC, 1997), wh�ch suggested that 30 to 50% of Hodgk�n lymphoma may be due to chron�c EBV �nfect�on. A s�m�lar est�mate was also used by Park�n (2006). Non-Hodgk�n lymphoma occurr�ng �n �mmunocomprom�sed pat�ents may be due to EBV �nfect�on (IARC, 1997), w�th an est�mated AF of 8% (Engels et al., 2005).
Table B3.3 reports the AFs and attr�butable numbers of cancer cases and deaths for the year 2000. A total of 4206 cases among men (2.6% of the total) and 4871 cases among women (4.2% of the total) were attr�butable to �nfect�ons �n France �n 2000. L�ver cancer due to �nfect�on w�th e�ther HBV or HCV represented about half of the �nfect�on-related cancer
Attributable causes of cancer in France in the year 2000
Section B3: Infectious agents

43
cases �n men, wh�le cerv�cal cancer, all of wh�ch �s attr�buted to HPV �nfect�on, represented almost 70% of �nfect�on-related cancers �n women.
G�ven the h�gh fatal�ty of most �nfect�on-related cancers, th�s group of cancers accounts for a larger proport�on of cancer deaths than of cancer cases (Table B3.3).
5. Discussion
The val�d�ty of our est�mates for France has certa�n l�m�tat�ons:
(1) The RRs we used were largely der�ved from other populat�ons (e.g., the effect of d�fferent genotypes of hepat�t�s v�ruses),
(2) There was a lack of data on prevalence of �nfect�ous agents from representat�ve samples of the French populat�on,
(3) There are no h�stor�cal data on prevalence of �nfect�on that would allow us to relate cancers occurr�ng �n 2000 to past exposures.
Our est�mates are also much lower than those from prev�ous attempts to quant�fy the burden of cancer attr�butable to �nfect�ons (Zur Hausen, 2006; P�san� et al., 1997). P�san� and colleagues (1997) est�mated that 9% of cancers occurr�ng �n developed countr�es �n 1990 were attr�butable to chron�c �nfect�ons. More recently, Zur Hausen (2006) est�mated that about 20% of human cancer �n developed countr�es could be of �nfect�ous or�g�n. Th�s �s based on laboratory �nvest�gat�ons but also on some ep�dem�olog�cal data. For �nstance, space–t�me cluster�ng �s often observed for acute leukaem�as and NHL (Alexander et al., 1999). Moreover, some r�sk factors such as agr�cultural occupat�ons and contact w�th cattle or meat (butchers, abatto�r workers) could be related to a role of v�ruses. Interest�ngly, �nterm�ttent �nfect�ons (wh�ch “educate” the �mmune system) and stays �n k�ndergarten appear to have a protect�ve effect. K�nlen (1995) hypothes�zed that the m�x�ng of two populat�ons w�th d�fferent exposure to a putat�ve v�ral agent could promote an ep�dem�c of the relevant �nfect�on, and some such un�dent�f�ed �nfect�ons could be assoc�ated w�th �ncreased leukaem�a r�sk. Accord�ng to th�s hypothes�s, the h�gh �nc�dence of leukaem�a around some nuclear plants would �n fact represent a cluster�ng of leukaem�a cases due to the arr�val of a new populat�on (dur�ng and after
construct�on of nuclear plants) who m�xed w�th local �nhab�tants who had a d�fferent h�story of contact w�th �nfect�ous agents.
The d�screpanc�es between the est�mates by these authors and our own may have var�ous explanat�ons:
(1) The prevalence of �nfect�ous agents assoc�ated w�th cancer �s lower �n France than �n some other countr�es; �t �s certa�n that a greater proport�on of cancers can be attr�buted to �nfect�ous agents �n countr�es where several �nfect�ous agents are more prevalent, such as EBV, HIV, HPV or HBV.
(2) Our est�mates are based on �nfect�ous agents for wh�ch (�) there �s suff�c�ent ev�dence for a causal role �n the occurrence of several cancers, and (��) exposure data for France are ava�lable. Many other est�mates are based on expert op�n�ons, on ecolog�cal data or on model approaches, wh�ch �nvar�ably lead to est�mates h�gher than those based on demonstrated r�sk levels assoc�ated w�th measured frequency of an agent �n a populat�on.
(3) The actual assoc�at�ons between �nfect�ous agents and cancer are known to be underest�mated, because of the absence of appropr�ate tools to detect known agents (e.g., detect�on of HPV �n some head and neck cancers). Th�s �s the case for agents such as H. pylori and EBV that are l�kely to cause more cancers than those attr�butable to them solely on the bas�s of current knowledge of the�r carc�nogen�c effects.
(4) Underest�mat�on of AF also results from the absence of proof of a causal role of some �nfect�ous agents; for example, some as yet un�dent�f�ed �nfect�ous agents are suspected to play a role �n leukaem�a and NHL.
Cancers are more frequent �n HIV-pos�t�ve �nd�v�duals and AIDS pat�ents than �n the general populat�on (IARC, 1996b). We could not est�mate the burden of cancer assoc�ated w�th HIV carr�age and AIDS, as est�mates of HIV prevalence �n France appear to be �ncomplete: HIV/AIDS Surve�llance �n Europe reported 5778 HIV-pos�t�ve cases �n France for 2004, compared w�th 16 781 �n Belg�um and 68 556 �n the UK (EuroHIV, 2005). It must be ment�oned that the �ntroduct�on of h�ghly act�ve ant�retrov�ral
Risk factors selected for estimate calculations

44
therap�es (HAART) �n recent years has led to cons�derable changes �n cancer occurrence among HIV-�nfected subjects, w�th a rap�d decl�ne �n the �nc�dence of AIDS-assoc�ated cancers (e.g., Kapos� sarcoma and NHL, but not Hodgk�n lymphoma), and an �ncrease of non-AIDS assoc�ated cancers (e.g., colon cancer), because of longer surv�val of HIV-�nfected subjects and of AIDS pat�ents (Bed�mo et al., 2004; Cl�fford et al., 2005; Del Maso et al., 2005).
It �s expected that as coverage w�th ant�-HBV vacc�ne progresses �n France, l�ver cancer �nc�dence and mortal�ty w�ll start to level off and then decl�ne.
References
Alexander FE; Boyle P, Carl� PM, et al. Populat�on
dens�ty and ch�ldhood leukem�a: results of the EUROCLUS
Study. Eur J Cancer 1999;35:439–444.
Bed�mo R, Chen RY, Accortt RA, et al. Trends �n AIDS-
def�n�ng and non-AIDS-def�n�ng mal�gnanc�es among HIV-
�nfected pat�ents: 1989–2002. Cl�n Infect D�s 2004;39:1380–
1384
Clavel C, Cucherousset J, Lorenzato M, et al. Negat�ve
human pap�llomav�rus test�ng �n normal smears selects a
populat�on at low r�sk for develop�ng h�gh-grade cerv�cal
les�ons. Br J Cancer 2004;90:1606–1609.
Cl�fford GM, Polesel J, R�ckenbach M, et al. Cancer
r�sk �n the Sw�ss HIV Cohort Study: Assoc�at�ons w�th
�mmunodef�c�ency, smok�ng, and h�ghly act�ve ant�retrov�ral
therapy. J Natl Cancer Inst 2005;97:425–432.
de Thé G, Geser A, Day NE, et al. Ep�dem�olog�cal
ev�dence for causal relat�onsh�p between Epste�n-Barr v�rus
and Burk�tt’s lymphoma from Ugandan prospect�ve study.
Nature 1978;274:756–761.
Del Maso L, T�rell� U, Polesel J, Francesch� S. Trends �n
cancer �nc�dence among HIV-�nfected pat�ents. Cl�n Infect
D�s 2005;41:124–125.
Donato F, Boffetta P, Puot� M. A meta-analys�s of
ep�dem�olog�cal stud�es on the comb�ned effect of hepat�t�s B
and C v�rus �nfect�ons �n caus�ng hepatocellular carc�noma.
Int J Cancer 1998;75:347–354.
Engels EA, Cerhan JR, L�net MS, et al., Immune-related
cond�t�ons and �mmune-modulat�ng med�cat�ons as r�sk
factors for non-Hodgk�n’s lymphoma: a case-control study.
Am J Ep�dem�ol 2005;162:1153–1161
Esl�ck GD, L�m LL, Byles JE, et al. Assoc�at�on of
Hel�cobacter pylor� �nfect�on w�th gastr�c carc�noma: a meta-
analys�s. Am J Gastroenterol 1999;94:2373–2379.
EuroHIV. End-year report 2004 No 71. 2005 (ava�lable
on www.euroh�v.org).
Internat�onal Agency for Research on Cancer. Hepat�t�s
B v�rus. IARC Monographs on the Evaluat�on of Carc�nogen�c
R�sks to Humans, Vol. 59, Hepat�t�s V�ruses. IARC, Lyon,
1994a, pp. 45–164.
Internat�onal Agency for Research on Cancer.
Hepat�t�s C v�rus. IARC Monographs on the Evaluat�on of
Carc�nogen�c R�sks to Humans, Vol. 59. Hepat�t�s V�ruses.
IARC, Lyon, 1994b, pp. 165–221.
Internat�onal Agency for Research on Cancer. Infect�on
w�th Hel�cobacter pylor�. IARC Monographs on the
Evaluat�on of Carc�nogen�c R�sks to Humans, Volume 61.
Sch�stosomes, L�ver Flukes and Hel�cobacter pylor�. Lyon,
IARC, 1994c, pp. 177–240.
Internat�onal Agency for Research on Cancer. Human
T-cell lymphotrop�c v�ruses. IARC Monographs on the
Evaluat�on of Carc�nogen�c R�sks to Humans, Volume 67,
Human Immunodef�c�ency V�ruses and Human T-Cell
Lymphotrop�c V�ruses. Lyon, IARC, 1996a, pp. 261–390.
Internat�onal Agency for Research on Cancer. Human
Immunodef�c�ency V�ruses. IARC Monographs on the
Evaluat�on of Carc�nogen�c R�sks to Humans, Volume
67 Human Immunodef�c�ency V�ruses and Human T-Cell
Lymphotrop�c V�ruses Lyon, IARC, 1996b, pp. 31–259.
Internat�onal Agency for Research on Cancer.
Epste�n-Barr v�rus. IARC Monographs on the Evaluat�on
of Carc�nogen�c R�sks to Humans, Volume 70. Epste�n-
Barr V�rus and Kapos�’s Sarcoma Herpesv�rus/Human
Herpesv�rus 8. Lyon, IARC, 1997, pp. 47–374.
Internat�onal Agency for Research on Cancer. Human
Pap�llomav�ruses. IARC Monographs on the Evaluat�on of
Carc�nogen�c R�sks to Humans, Volume 90. Lyon, IARC,
2006, �n press.
InVS. Inst�tut de Ve�lle San�ta�re. Est�mat�on des taux
de prévalence des ant�corps ant�-VHC et des marqueurs du
v�rus de l’hépat�te B chez les assurés soc�aux du rég�me
général de France métropol�ta�ne, 2003–2004. Janv�er
2005.
Kalach N, Desrame J, Bonnet C, et al. Hel�cobacter
pylor� seroprevalence �n asymptomat�c pregnant women �n
France. Cl�n D�agn Lab Immunol 2002;9:736–737.
K�nlen LJ. Ep�dem�olog�cal ev�dence for an �nfect�ve
bas�s �n ch�ldhood leukaem�a. Br J Cancer 1995;71:1–5.
Mork J, L�e AK, Glattre E et al. Human pap�llomav�rus
�nfect�on as a r�sk factor for squamous-cell carc�noma of the
head and neck. N Engl J Med 2001;344:1125–1131.
Mueller N, Evans A, Harr�s NL, et al. Hodgk�n’s d�sease
and Epste�n-Barr v�rus. Altered ant�body pattern before
d�agnos�s. New Engl J Med 1989;320:689–95
Attributable causes of cancer in France in the year 2000

45
Park�n DM. The global health burden of �nfect�on-
assoc�ated cancers �n the year 2002. Int J Cancer
2006;118:3030–3044.
P�san� P, Park�n DM, Muñoz N, Ferlay J. Cancer and
�nfect�on: est�mates of the attr�butable fract�on �n 1990.
Cancer Ep�dem�ol B�omarkers Prev 1997;6:387–400.
Thorley-Lawson DA. EBV the prototyp�cal human
tumor v�rus–just how bad �s �t? J Allergy Cl�n Immunol,
2005;116:251–261.
Zur Hausen H. Infect�ons Caus�ng Human Cancer. New
York, John W�ley, 2006.
Table B3.1 - Recognized associations of cancer with infections existing in France
Biological agent Target organ Reference Reason for exclusion*
Epste�n–Barr v�rus (EBV) Hodgk�n d�sease IARC, 1997 Included
EBV Non-Hodgk�n lymphoma �n �mmunocomprom�sed pat�ents
IARC, 1997 Included
EBV Nasopharynx IARC, 1997 P
Human �mmunodef�c�ency v�rus (HIV)
Non-Hodgk�n lymphoma IARC, 1996b P
HIV Kapos� sarcoma IARC, 1996b P, D
Human pap�lloma v�rus (HPV) Cerv�x uter� IARC, 2006 Included
HPV Oral cav�ty, pharynx IARC, 2006 Included
HPV Anus, pen�s, vulva, vag�na IARC, 2006 D
Hepat�t�s B v�rus (HBV) L�ver IARC, 1994a Included
Hepat�t�s C v�rus (HCV) L�ver IARC, 1994b Included
Helicobacter pylori Stomach IARC, 1994c Included
*D: lack of data on �nc�dence and mortal�ty of the cancers �n France
P: lack of relevant data on prevalence or �nc�dence of the �nfect�on �n France
Risk factors selected for estimate calculations

46
Table B3.2 - RRs and prevalence of exposure to infectious agents used in the calculation of AFs
Agent Cancer RR Prevalence of infection %
Men Women
HBV L�ver cancer 18.8 1.19 0.16
HCV L�ver cancer 31.2 0.73 0.99
HPV Cerv�cal cancer ∞ 15.3* 15.3*
HPV Oral pharyngeal cancer
2.1 6.5 6.5
H. pylori Stomach cancer 2.04 21.3 21.3
*Not used for AF calculat�on, that �s assumed to be 100%
Table B3.3 – Numbers of cancer cases and deaths attributable to chronic infection in France,
by sex, for the year 2000
Cancer Agent Men Women
AF% Cases Deaths AF% Cases Deaths
Hodgk�n lymphoma EBV 40.0% 294 67 40.0% 252 47
NHL EBV 8.0% 442 182 8.0% 350 175
L�ver HCV 18.1% 906 907 23.0% 221 368
L�ver HBV 17.5% 876 877 2.8% 27 44
Stomach H. pylori 18.1% 820 572 18.1% 473 365
Oral cav�ty and pharynx
HPV 6.7% 867 261 6.7% 160 49
Cerv�x uter� HPV – 100% 3387 1463
Total 4207 2866 4870 2511
% all cancers 2.6% 3.3% 4.2% 4.4%
Attributable causes of cancer in France in the year 2000
47
1. Definition of exposure
In th�s study, we took �nto account occupat�onal exposures for wh�ch a causal assoc�at�on w�th human cancer has been def�n�tely establ�shed (S�em�atyck� et al., 2004). A number of establ�shed occupat�onal carc�nogens, however, have not been used �n recent decades (e.g., mustard gas, chloro-methyl ethers) and are not further cons�dered. In the case of v�nyl chlor�de and formaldehyde (Cogl�ano et al., 2004), the tumours causally assoc�ated w�th the exposure are very rare (ang�osarcoma of the l�ver and nasopharyngeal carc�noma, respect�vely) and est�mates of attr�butable cases of cancer are not g�ven because these f�gures are very low. We d�d not calculate an AF for occupat�onal exposures to X-rays for reasons d�scussed �n Sect�on D1.
In add�t�on to spec�f�c agents and groups of agents, IARC has class�f�ed several exposure c�rcumstances (ma�nly �ndustr�es and occupat�ons) as Group 1 carc�nogens. W�th the except�on of pa�nt�ng, the rubber �ndustry and boot and shoe manufactur�ng, these were not �ncluded �n the est�mates of AF because e�ther the relevant agents were already �ncluded �n the est�mate (e.g., cab�net and furn�ture mak�ng represented by the agent wood dust) or they are �ndustr�es or occupat�ons that have no longer been operat�ng �n recent decades (e.g., coal gas�f�cat�on).
For all occupat�onal agents, the alternat�ve exposure scenar�o �s that of no exposure.
2. Data used for RR estimates
RRs were extracted from recently publ�shed meta-analyses or pooled analyses. If no such meta-analys�s was ava�lable, one was performed ad hoc for th�s project on the bas�s of or�g�nal publ�shed art�cles and recent rev�ews. B4.1 l�sts the RRs, most of wh�ch
were der�ved from meta-analyses performed at the IARC1. Pract�cally all RRs were der�ved from stud�es �n men; RRs were assumed to be equal �n women.
For occupat�onal exposure to radon, we used a spec�f�c approach outl�ned below.
3. Data used for exposure prevalence
The prevalence of exposure to the agents �ncluded �n the analys�s �s shown �n Table B4.2.
For most agents, the number of exposed workers was obta�ned from the SUMER 1994 survey, that prov�ded est�mates of the numbers of workers employed �n each �ndustry (SUMER 1994). The SUMER 1994 survey was conducted �n 1994 by 1205 occupat�onal phys�c�ans, who each recorded the exposures exper�enced by 50 workers randomly selected �n the�r pract�ces. The survey �ncluded samples from approx�mately 7 000 000 male and 5 000 000 female workers, mostly employed �n the pr�vate sector. It notably excluded farmers, c�v�l servants and self-employed workers. We adopted the follow�ng steps to est�mate the prevalence of l�fet�me occupat�onal exposure for the French populat�on older than 15 years old �n 1994 (22.3 m�ll�on men and 24.2 m�ll�on women �n 1994, accord�ng to INSEE):
Step 1: Active population from SUMER 1994: We est�mated the prevalence of occupat�onal exposures �n the SUMER 1994 populat�on, represent�ng 7 000 000 act�ve males and 5 000 000 act�ve females. Because th�s was a study among the act�ve populat�on, we took the populat�on to be aged 15–64 years.
Step 2: Active population not covered by SUMER 1994: The INSEE stat�st�cs show that the overall act�ve populat�on 15–64 years old �n France �n 1994
1 The meta-analyt�cal work was done for th�s project, and �nvolved rev�ew of large ser�es of stud�es. User-fr�endly summary tables of th�s
work are now under construct�on, and are ava�lable upon request.
Risk factors selected for estimate calculations
Section B4: Occupation
48
compr�sed 14 m�ll�on males and 11 m�ll�on females. We thus calculated that the act�ve populat�on 15–64 years old not covered by SUMER 1994 represented 7 m�ll�on males and 6 m�ll�on females. We appl�ed to th�s populat�on half of the occupat�onal exposure prevalence est�mated from SUMER 1994 �n Step 1.
Step 3: Inactive population: The INSEE stat�st�cs for 1994 �nd�cate the presence of 4.9 m�ll�on �nact�ve men and 7.6 m�ll�on �nact�ve women aged between 15–64 years old. Because th�s populat�on could have been exposed dur�ng an occupat�on pr�or to an unemployment per�od, we cons�dered that �nact�ve people 15–64 years old had an occupat�onal exposure prevalence equal to one fourth of the prevalence est�mated from SUMER 1994 (Step 1).
Step 4: Population over 65 years old: The INSEE stat�st�cs show that there were 3.4 m�ll�on men and 5.6 m�ll�on women aged 65 years old or more �n 1994. For th�s populat�on, we appl�ed a prevalence of past exposure correspond�ng to the prevalence computed for the overall age group 15–64 years old (Steps 1–3). To account for the fact that �n th�s populat�on the rate of unemployment was lower, and to account for the secular decrease �n exposure to occupat�onal carc�nogens, we appl�ed a correct�on factor of 1.25 to the prevalence of occupat�onal exposure der�ved from the SUMER 1994 survey for the 15–64 year age group.
Step 5: Correction factor for lifetime exposure: F�nally, we had to take �nto account the fact that the SUMER 1994 survey was a cross-sect�onal study (�.e., done at a prec�se moment) and concerned only the last job held. Hence, for est�mat�on of l�fet�me occupat�onal exposure prevalence, a factor of 3 was appl�ed, based on the rat�o between cross-sect�onal (last job) and l�fet�me prevalence of exposure to resp�ratory carc�nogens est�mated among controls �ncluded �n a European mult�centr�c case–control study of laryngeal cancer and occupat�on (Berr�no et al., 2003). Th�s rat�o of 3 represented an average number of pos�t�ons held dur�ng profess�onal l�fe.
Exposure to polycycl�c aromat�c hydrocarbons was est�mated by add�ng together the SUMER exposures to polycycl�c aromat�c hydrocarbons, to combust�on fumes and to tar and p�tch. In the case of exposure to m�neral o�ls, the SUMER survey d�d not d�st�ngu�sh between untreated and m�ldly treated o�ls, and treated o�ls. A greater role �n cancer �s establ�shed for
untreated and m�ldly treated o�ls. A separate survey est�mated that 37% of French workers exposed to m�neral o�ls �n var�ous �ndustr�es were exposed to untreated and m�ldly treated o�ls (INRS, 2002), and we appl�ed th�s proport�on to the total number of m�neral-o�l exposed workers �n SUMER. Exposure to �norgan�c ac�ds �n the SUMER survey was not taken �nto account because the carc�nogen�c agent ‘strong �norgan�c ac�d m�sts conta�n�ng sulfur�c ac�d’ represents only a small fract�on of �t.
The SUMER 1994 survey d�d not �nclude est�mates for radon exposure, and we adopted a spec�f�c approach for th�s agent (see below). In the case of asbestos, the AF was est�mated �n a d�fferent way than for the agents l�sted above (see sub-sect�on B4.4).
Occupat�onal exposure to wood dust represents a spec�al case �n France because of the h�gh proport�on of workers exposed to hard wood dust, wh�ch enta�ls a h�gher r�sk of s�nonasal cancer compared w�th soft wood dust; most stud�es have been conducted among workers exposed to soft wood dust (Demers et al., 1995). The calculat�on of AF based on the SUMER exposure data and the results of occupat�onal cohort stud�es (Demers et al., 1995) y�elded a f�gure that was lower than the number of cases of s�nonasal cancer rece�v�ng compensat�on for occupat�onal exposure to wood dust (87 men �n 2000) �n France (D�rect�on des Relat�ons du Trava�l, 2002). We therefore used the number of compensated cases �n men for calculat�on of the AF of s�nonasal cancers attr�butable to wood dust, and appl�ed the same AF to cancer deaths. It �s worth not�ng that numbers of s�nonasal cancers due to wood dust exposure may be underest�mated because only salar�ed workers rece�ve compensat�on, but not craftsmen (e.g., cab�net makers) because they are �ndependent workers. However, the real numbers are not known. No compensat�on for s�nonasal cancer �n women was reported by the D�rect�on des Relat�ons du Trava�l (2002), but profess�onal exposure of women to wood dust �s rare.
The prevalence of hav�ng ever had employment as a pa�nter or �n the rubber �ndustry was der�ved from controls �ncluded �n the European mult�centr�c study of laryngeal cancer and occupat�on (Berr�no et al., 2003).
Attributable causes of cancer in France in the year 2000
49
4. Calculation of the AF for asbestos
Asbestos �s a natural s�l�cate f�bre that causes lung cancer and mesothel�oma of the pleura and per�toneum. It �s a major occupat�onal carc�nogen. In France, �n 1906, the f�rst report was �ssued on h�gh mortal�ty rates observed �n a text�le factory us�ng asbestos �n Condé-sur-No�reau, Calvados (Sénat, 2005). Mass�ve �mports of asbestos �n France started after 1945, peaked �n the 1970s and 1980s and cons�derably decreased s�nce 1990; use �n �ndustry and bu�ld�ng construct�on was forb�dden on 1 January 1997 (Sénat, 2005). To est�mate the AF of mesothel�oma for asbestos, we used the results of the French Nat�onal Mesothel�oma Surve�llance Programme: 83.2% (95% CI 76.8–89.6) for men and 38.4% (95% CI 26.8–50.0) for women (Goldberg et al., 2006).
For lung cancer, we used the RR reported �n a meta-analys�s of 69 occupat�onal cohort stud�es (Goodman et al., 1999). Data on prevalence reported �n the SUMER 1994 survey probably grossly underest�mate l�fet�me exposure prevalence, g�ven the sharp decl�ne �n prevalence and level of asbestos exposure exper�enced �n all European countr�es s�nce the early 1980s. We therefore used data on prevalence reported �n a mult�centr�c French case–control study (Iwatsubo et al., 1998). In th�s study, med�um to very h�gh probab�l�ty of exposure to asbestos represented 9.1% of all job per�ods. We used th�s f�gure as the prevalence of occupat�onal exposure �n men. No rel�able data ex�st for women. We est�mated the rat�o of number of cases of lung cancer to mesothel�oma attr�buted to asbestos among men (rat�o = 1.7) and appl�ed �t to the number of mesothel�omas attr�buted to asbestos for women.
5. Occupational exposure to external ionizing radiation
Accord�ng to French law s�nce 1966–1967, workers occupat�onally exposed to rad�at�on above natural background levels have had to wear �nd�v�dual dos�meters. In 1985, the Serv�ce Central de Protect�on contre les Rayonnements Ion�sants (SCPRI) was respons�ble for collect�ng the recorded doses, but several pr�vate and publ�c laborator�es, us�ng spec�f�c derogat�ons, were allowed to make the�r own measurements. The�r data were then collected
by SCPRI and added to the �nd�v�dual dose f�les, but no annual synthes�s was made before SCPRI was transformed �nto the Off�ce de Protect�on contre les Rayonnements Ion�sants (OPRI), wh�ch produced �ts f�rst annual report �n 1995.
From 1995 to 2005, the number of workers occupat�onally exposed to external �on�z�ng rad�at�on has shown l�ttle var�at�on. Such exposure concerns about 140 000 med�cal and veter�nary workers, 60 000 nuclear �ndustry workers, 25 000 to 40 000 non-nuclear �ndustry workers and 20 000 other workers �nclud�ng research and control staff (M�n�stère du Trava�l, 2006). We have assumed that the same f�gures appl�ed ten years earl�er.
The f�rst overall values reported by OPRI �n 1995 covered 246 945 workers, of whom 187 000 were d�rectly followed by OPRI. The r�sk descr�ptor recommended for rad�olog�cal protect�on purposes �s the sum of the �nd�v�dual doses, called “collect�ve dose”; �n the group followed by OPRI �n 1995 th�s amounted to 84 man Sv (the so-called man.s�evert un�t). Only 10% of �nd�v�dual doses were greater than zero and 46 �nd�v�dual doses were h�gher than the legal l�m�t, wh�ch at that t�me was 50 mSv/year. Th�s l�m�t d�d not change between 1985 and 1995, but �mprovements �n rad�olog�cal protect�on, follow�ng the ALARA (as low as reasonably ach�evable) pr�nc�ple, led to a cont�nuous decrease �n both �nd�v�dual and collect�ve doses. Cons�der�ng doses above 10 mSv �n the same OPRI group, 250 (out of a total of more than 600 for the whole group) were recorded �n 1995, 350 �n 1985 and 700 �n 1975. Th�s prov�des a we�ght�ng factor wh�ch suggests that the collect�ve dose �n 1985 was about 185 man Sv for the whole group of exposed workers. S�nce then, collect�ve doses have cont�nuously decreased from about 120 man Sv �n 1995, to 90 man Sv �n 2000 and 65 man Sv �n 2005. In 2005, about 95% of the workers who had dos�metr�c mon�tor�ng rece�ved annual doses below 1 mSv; 5% �n the range 1 to 20 mSv, and less than 0.02% above 20 mSv.
In the year 2000, on the bas�s of a nom�nal r�sk of 4% of fatal cancer per Sv among workers, l�near extrapolat�on would �mply an engaged r�sk of less than 10 cases for the 185 man Sv recorded �n 1985. However, the Internat�onal Comm�ss�on on Rad�olog�cal Protect�on (ICRP) does not recommend the use of the collect�ve dose to calculate cancer r�sk est�mates (th�s calculat�on would support the val�d�ty of
Risk factors selected for estimate calculations

50
the l�near relat�onsh�p w�th no threshold for assess�ng low-dose r�sk). Est�mat�on of an attr�butable r�sk for such occupat�onal exposures should therefore rely on �nd�v�dual exposure h�story, and on r�sk est�mates for d�fferent dose ranges, assum�ng no a pr�or� dose–r�sk model and tak�ng �nto account accurate est�mates of the ma�n potent�al confound�ng factors, such as tobacco or alcohol consumpt�on, but such data are not ava�lable.
As a result of the �nclus�on of leukaem�a, bone sarcoma and lung cancer �n the off�c�al l�st of occupat�onal d�seases assoc�ated w�th exposure to �on�z�ng rad�at�on, 20 to 30 cases of cancer per year �n France have been legally acknowledged as related to occupat�onal exposure to �on�z�ng rad�at�on, but th�s adm�n�strat�ve process does not have sc�ent�f�c value.
6. Occupational exposure to radon
Uran�um m�n�ng started �n France �n 1946 and ended �n 2001. Exposure levels and cancer mortal�ty �n the cohort of 5098 French m�ners were extens�vely recorded by Cogema and the Inst�tut de Rad�oprotect�on et de Sûreté nucléa�re (IRSN) from 1983 up to December 1999. Ind�v�dual cumulat�ve exposure resulted �n an average effect�ve dose equal to 185 mSv. No cancer excess was observed for exposure levels below 150 Bq/m3 (Rogel et al., 2002). Excess relat�ve r�sk for cancer at h�gher exposures was found at 0.16% per effect�ve mSv. In 1994, lung cancer was the cause of death �n 126 out of 1162 deceased m�ners and �n 1999 �t accounted for 159 out of 1471 deceased m�ners (IRSN “Le radon”.www.�rsn.org/document). Correct�ng for expected deaths from lung cancer �n non-exposed people would �mply that about three deaths were attr�butable to occupat�onal radon exposure �n the year 2000 �n th�s cohort.
Occupat�onal, above-ground exposure to radon �s not documented �n France, although accord�ng to regulatory pol�cy �mplement�ng European d�rect�ve 96/29 s�nce 2003, the respons�ble operators are asked to mon�tor exposure and reduce levels above 400 Bq/m3. However, the reg�ons of the country and the workplaces wh�ch may be of concern have not yet been �dent�f�ed by a spec�f�c regulat�on and so far results of the survey are very scanty. One can make only very crude est�mates of the prevalence of exposure and therefore of the number of attr�butable
lung cancers. Convers�on of exposure levels �n Bq/m3 �n terms of mSv �s also a matter of debate. ICRP 65 suggests a convers�on of about 7 mSv for a 2000 hours of exposure to 1000 Bq/m3, wh�ch represents the level of act�on for the Internat�onal Atom�c Energy Agency (IAEA - Bas�c Safety Standards No. 115). Th�s �s d�rectly der�ved from convers�on factors obta�ned from m�ners, but �t may be supposed that �n France, dur�ng work �n exposed areas, breath�ng patterns and equ�l�br�um factors are more comparable to �ndoor exposure, wh�ch would result �n a lower convers�on factor of about 5 mSv per 1000 Bq/m3 at work.
The Un�ted Nat�ons Sc�ent�f�c Comm�tee on the Effects of Atom�c Rad�at�on (UNSCEAR 2000) prov�ded a crude est�mate of occupat�onal exposure above the ground on the bas�s of enqu�r�es �n the Un�ted K�ngdom and Germany. It was est�mated that about 50 000 workers �n the Un�ted K�ngdom were exposed to an average dose of 5 mSv per year, result�ng �n a collect�ve dose of about 250 man-Sv; �n Germany 70 000 workers were est�mated to be exposed to 1000–3000 Bq/m3. UNSCEAR proposed to adjust the expected worldw�de occupat�onal, collect�ve dose result�ng from radon above the ground on the bas�s of gross domest�c product (GDP). Th�s would lead to very s�m�lar numbers �n France and the Un�ted K�ngdom, account�ng for about 10 fatal cancers �n the year 2000.
Another way to deal w�th th�s problem �s to cons�der that exposure levels at work are s�m�lar to �ndoor exposure levels. Accord�ng to IRSN (Robé and T�rmarche, 2003), 7% of the collect�ve dose to radon �ndoors �s due to exposure levels above 1000 Bq/m3. Assum�ng there were 22 m�ll�on workers �n 1985, the collect�ve dose to radon would be about 30 000 man Sv, w�th some 7% of workers exposed to 1000 Bq or more, result�ng �n 2100 man Sv for 7000 hours �ndoors; for 1600 hours of work t�me �n 1985, th�s leads to a collect�ve dose of about 500 man.Sv per year.
There �s l�ttle doubt that levels of exposure �n the range of 1000 Bq/m3 or more are assoc�ated w�th lung cancer. W�th a nom�nal coeff�c�ent of 4% of lung cancer deaths engaged per Sv, th�s w�ll result �n 20 deaths attr�butable to occupat�onal above-ground radon �n the year 2000 assum�ng that the annual collect�ve dose was constant. Includ�ng the French m�ners cohort leads to an est�mate of 23 deaths attr�butable to radon.
Attributable causes of cancer in France in the year 2000
51
7. Calculation of AFs for other agents
Table B4.3 l�sts the calculated AFs for �nc�dent cancer cases and deaths. For the year 2000, a total of 4012 cases of cancer among men (2.5% of the total) and 316 cases among women (0.3%) were attr�buted to occupat�on. Asbestos, polycycl�c aromat�c hydrocarbons (PAHs) and chrom�um VI were the ma�n occupat�onal carc�nogens. Because of the h�gh fatal�ty of most occupat�on-related cancers, the number of cancer deaths �s close to that of �nc�dent cases, but the percentages over total cancer deaths are h�gher (3.7% �n men and 0.5% �n women). Table B4.4 summar�zes mortal�ty results by type of cancer. The results �n Table B4.4 do not take �nto account potent�al �nteract�ons between exposures. These are addressed �n deta�l �n Sect�on C2.
In the case of untreated and m�ldly treated m�neral o�ls, wh�ch are causally l�nked to squamous-cell carc�noma (SCC) of the sk�n, we calculated an AF only for mortal�ty (assum�ng that nearly all deaths from non-melanoma sk�n cancer are due to SCC), s�nce no rel�able data ex�st on �nc�dence of non-melanoma sk�n cancers.
8. Discussion
There are several reasons why we may have underest�mated the burden of occupat�onal cancer. These �nclude the lack of cons�derat�on of suspected occupat�onal carc�nogens such as d�esel eng�ne exhaust and some groups of solvents; the non-�nclus�on of some establ�shed carc�nogens because rel�able exposure data were not ava�lable (e.g., strong �norgan�c ac�d m�sts); our �ncomplete knowledge of occupat�onal carc�nogens, and the use of current exposure prevalence data (SUMER 1994), wh�ch m�ght underest�mate past exposure. The SUMER survey was repeated �n 2002–3: est�mates of prevalence of exposures d�ffer from those reported �n the 1994 survey essent�ally because of lower spec�f�c�ty �n the def�n�t�on of exposure. Because exposure data used �n the present study should preferably refer to the year 1985, �t �s more log�cal to use the data from the 1994 survey than those from 2002–03. In the case of obv�ous underest�mat�on �n the SUMER 1994 survey of the numbers of workers exposed �n the past (e.g., asbestos, wood dust), we used alternat�ve approaches to est�mate numbers
of workers exposed to these agents. Exposure to benzene has also greatly decreased over t�me, but the rather short latency per�od between exposure to benzene and leukaem�a (around 5 to 7 years) just�f�es the use of exposure data from the m�d-1990s.
In the case of asbestos, benzene, leather dust and wood dust, the prevalence of exposure has also been calculated among 8372 male controls �ncluded �n a database managed at the InVS (unpubl�shed data, Département Santé Trava�l de l’InVS). Analys�s of the InVS database resulted �n est�mates of exposure prevalence �n 1985 to asbestos and leather dust comparable to those der�ved from the SUMER 1994 study, wh�le prevalence of exposure to benzene was h�gher, wh�ch �s expl�cable by the secular trend �n exposure to th�s agent.
However, our est�mates m�ght be h�gher than the real levels because (�) we added together the cases attr�butable to d�fferent exposures, neglect�ng the fact that the same workers may have been exposed to several carc�nogens; (��) the RRs, largely der�ved from stud�es conducted �n the past when exposures were generally h�gher, may not be relevant to the exposure c�rcumstances determ�n�ng the current burden of cancer; and (���) potent�al confound�ng by smok�ng and other factors was not properly controlled for �n many stud�es.
Other l�m�tat�ons to our est�mates, of wh�ch the effects on the results are less clear, �nclude the l�m�ted qual�ty of the exposure data and the fact that RRs were mostly der�ved from stud�es conducted �n the USA and the Un�ted K�ngdom and referred ma�nly to men, w�th very few data for women.
Our overall est�mate of cancers attr�butable to occupat�on �s somewhat lower than those reported by other authors (summar�zed �n Table B4.5 for total cancers, lung cancer and bladder cancer among men). Methodolog�cal d�fferences �n calculat�on of AFs account for most of the d�fferences �n results between stud�es. Prev�ous est�mates based on an approach s�m�lar to the one we adopted resulted �n AFs s�m�lar to ours (Dreyer et al., 1997; Dr�scoll et al., 2005). Other stud�es l�sted �n Table B4.5 are l�kely to have resulted �n overest�mat�on of the burden of occupat�onal cancer for several reasons.
F�rst, cons�der�ng as certa�nly carc�nogen�c a number of exposures that have been found to �ncrease the r�sk of cancer �n a few stud�es (e.g., V�ne�s and S�monato, 1991) �s quest�onable, as there may be
Risk factors selected for estimate calculations

52
many other negat�ve stud�es and one may be select�ng a false pos�t�ve result. A more appropr�ate approach �s to restr�ct the study to establ�shed carc�nogen�c exposures (e.g., IARC Group 1 carc�nogens).
Second, select�ng among many publ�cat�ons a h�gh relat�ve r�sk assoc�ated w�th an exposure because �t �s stat�st�cally s�gn�f�cant (e.g., Nurm�nen and Karjala�nen, 2001) w�ll also b�as the results. The correct approach �s to use relat�ve r�sks from a meta-analys�s of all ava�lable data, wh�ch would also take publ�cat�on b�as �nto account.
Th�rd, transferr�ng an attr�butable fract�on est�mated �n one country to another country assumes that the prevalence of exposure used for a g�ven level of r�sk assoc�ated w�th that exposure �s the same �n both countr�es. The best approach �s to recalculate attr�butable fract�ons us�ng local prevalence of exposure, as far as poss�ble.
Fourth, levels of exposure encountered �n stud�es that revealed relat�ve r�sks assoc�ated w�th carc�nogen�c agents were generally (much) h�gher than levels of exposure encountered �n most work�ng places, espec�ally dur�ng the most recent years. In th�s respect, calculat�on of AFs should avo�d �nclud�ng �n the formulae f�gures on exposure prevalence and on RR obta�ned from stud�es �nvolv�ng qual�tat�vely and quant�tat�vely d�fferent exposures.
Lastly, �t �s plaus�ble that some of the prev�ous est�mates, �nclud�ng those by Doll and Peto (1981), reflected the s�tuat�on of developed countr�es �n the 1980s, when the effect of heavy exposures exper�enced by workers �n the earl�er part of the 20th century was st�ll present.
An example of problems w�th the assessment of the burden of occupat�onal cancer �s prov�ded by the asbestos–mesothel�oma story. Est�mates of mesothel�oma cases �n th�s study do not reflect the sharp �ncrease �n mesothel�oma �nc�dence occurr�ng �n populat�ons exposed to asbestos dur�ng the�r profess�onal l�fe before 1997. Most exposure to asbestos took place between 1950 and 1990, and there �s a lag-t�me of about 30 years between exposure and mesothel�oma occurrence. Hence, �t �s expected that the peak of the mesothel�oma ep�dem�c w�ll be reached around 2020–2030. Accord�ng to one model, pred�cted annual mesothel�oma deaths �n French men w�ll be �n the range 1140 to 1300 between 2026 and 2043 (Banae� et al., 2000), wh�le another model pred�cts that �n 2020, there w�ll be
around 1040 mesothel�oma deaths �n French males and 115 �n French females (Ilg et al., 1998). After 2030, w�th decreas�ng numbers of subjects who were exposed before 1997, the mesothel�oma �nc�dence �s expected to decl�ne stead�ly to a very low level, w�th probably only a few cases per year �n 2060. Industr�al use of asbestos represents one of the most dramat�c cancer ep�dem�c ep�sodes �nduced by human act�v�ty �n France and elsewhere, but est�mat�on of the fract�on of mesothel�oma attr�butable to asbestos exposure and accurate pred�ct�on of the future course of the mesothel�oma ep�dem�c �s challeng�ng for the follow�ng reasons:
1. The term “asbestos” encompasses two ma�n types of s�l�cate f�bres, �.e., chrysot�le and amph�boles. The latter type of f�bre has a greater capac�ty to �nduce mesothel�oma, but the f�bre type �s unknown for most of the asbestos that was �mported �nto France.
2. Most stud�es on exposure to asbestos were performed �n the 1990s, and retrospect�ve assessment based on past profess�onal h�story could prov�de at best a l�kel�hood of hav�ng been exposed to asbestos, w�thout good est�mates of dose or f�bre type.
3. Before 1980, d�agnos�s of mesothel�oma was not always based on b�opsy ev�dence. In France, few local cancer reg�str�es were �n operat�on at that t�me and the ev�dence on the f�rst phases of the mesothel�oma ep�dem�c comes ma�nly from death cert�f�cates, on wh�ch d�agnoses of mesothel�oma are prone to error.
4. Before 1990, class�f�cat�on of pleural cancer �n cancer reg�str�es was �mprec�se, and many ep�dem�olog�cal stud�es referred to pleural cancer, an ent�ty that could encompass cancers d�fferent from mesothel�oma, e.g., pleural metastas�s of another cancer, pleural extens�on of a lung cancer, pleural �nvolvement of haemato-lymphat�c cancer. It has been est�mated that �n France, 81% of “pleural cancers” were mesothel�oma (Banae� et al., 2000).
5. In the 1990s, few deaths from mesothel�oma were reported �n younger age groups (�.e., < 50 years old). Consequently, cons�derable random var�at�on affects pred�ct�ons of mortal�ty from mesothel�oma �n younger age groups.
6. Data both on exposures to asbestos and on
Attributable causes of cancer in France in the year 2000

53
mesothel�oma mortal�ty �n women are less rel�able and prec�se than �n men.
7. Knowledge of past asbestos exposure may �nfluence the accuracy of the d�agnos�s of mesothel�oma.
References
Banae� A, Auvert B, Goldberg M, et al. Future trends �n
mortal�ty of French men from mesothel�oma. Occup Env�ron
Med 2000;57:488–494.
Berr�no F, R�ch�ard� L, Boffetta P, et al. Occupat�on and
larynx and hypopharynx cancer: a job-exposure matr�x
approach �n an �nternat�onal case-control study �n France,
Italy, Spa�n and Sw�tzerland. Cancer Causes Control
2003;14:213–223.
Boffetta P; Jourenkova N, Gustavsson P. Cancer
r�sk from occupat�onal and env�ronmental exposure to
polycycl�c aromat�c hydrocarbons. Cancer Causes Control
1997;8:444–472.
Cogl�ano V, Grosse Y, Baan R, et al. Adv�ce
on formaldehyde and glycol ethers. Lancet Oncol
2004;59:528.
Demers PA, Boffetta P, Kogev�nas M, et al. Pooled
reanalys�s of cancer mortal�ty among f�ve cohorts of workers
�n wood-related �ndustr�es. Scand J Work Env�ron Health
1995;21:179–190.
D�rect�on des Relat�ons du Trava�l. Cond�t�ons de trava�l,
B�lan 2002. M�n�stère des Affa�res Soc�ales, du Trava�l et de
la Sol�dar�té.
Dreyer L, Andersen A, Pukkala E. Occupat�on. Acta
Pathol M�crob�ol Immunol Scand 1997;105 Suppl 76:68–
79.
Dr�scoll T, Nelson DI, Steenland K, et al. The global
burden of d�sease due to occupat�onal carc�nogens. Am J
Ind Med 2005;48:419–431.
Doll, R, Peto, R. The Causes of Cancer. Oxford, Oxford
Un�vers�ty Press, 1981.
Doll R, Peto R. Ep�dem�ology of cancer. In: Oxford
Textbook of Med�c�ne, 4th ed�t�on, Oxford, Oxford Un�vers�ty
Press, 2005.
Goldberg M, Imbernon E, Rolland P, et al. The French
Nat�onal Mesothel�oma Surve�llance Program. Occup
Env�ron Med 2006;63:390–395.
Goodman M, Morgan RW, Ray R, et al. Cancer �n
asbestos-exposed occupat�onal cohorts: a meta-analys�s.
Cancer Causes Control 1999;10:453–465.
Hayes RB. The carc�nogen�c�ty of metals �n humans.
Cancer Causes Control 1997;8:371–385.
Ilg AGS, B�gnon J, Valleron AJ. Est�mat�on of the past
and future burden of mortal�ty from mesothel�oma �n France.
Occup Env�ron Med 1998;55:760–765.
Imbernon E. Est�mat�on du nombre de cas de certa�ns
cancers attr�buables à des facteurs profess�onnels en
France. Par�s, Inst�tut de ve�lle san�ta�re, 2003.
INRS. Inst�tut Nat�onal de Recherche et de Sécur�té.
Cah�ers de notes documenta�res No. 186. Hyg�ene et
secur�te du trava�l, 2002.
Internat�onal Agency for Research on Cancer. IARC
Monographs on the Evaluat�on of Carc�nogen�c R�sks to
Humans, Vol. 47. Some Organ�c Solvents, Res�n Monomers
and Related Compounds, P�gments and Occupat�onal
Exposures �n Pa�nt Manufacture and Pa�nt�ng. Lyon, IARC;
1989
Iwatsubo Y, Pa�ron JC, Bout�n C, et al. Pleural
mesothel�oma: dose-response relat�on at low levels of
asbestos exposure �n a French populat�on-based case-
control study. Am J Ep�dem�ol. 1998;148:133–142.
Kogev�nas M, Sala M, Boffetta P, et al. Cancer r�sk �n
the rubber �ndustry: a rev�ew of the recent ep�dem�olog�cal
ev�dence. Occup Env�ron Med 1998;55:1–12.
Kubas�ew�cz M, Starzy_sk� Z, Szymczak W. Case-
referent study on sk�n cancer and �ts relat�on to occupat�onal
exposure to polycycl�c aromat�c hydrocarbons. II. Study
results. Pol J Occup Med Env�ron Health. 1991;4:141–147.
Lynge E, Antt�la A, Hemm�nk� K. Organ�c solvents and
cancer. Cancer Causes Control. 1997;8:406–419.
‘t Mannetje A, Kogev�nas M, Luce D, et al. S�nonasal
cancer, occupat�on, and tobacco smok�ng �n European
women and men. Am J Ind Med. 1999;36:101–107.
M�n�stère du Trava�l. ‘B�lans annuels sur les Cond�t�ons
de Trava�l (2000–2005) D�rect�on des relat�ons du
Trava�l, Conse�l Supér�eur de la Prévent�on des R�sques
Profess�onnels, 2006.
Nurm�nen M, Karjala�nen A. Ep�dem�olog�c est�mate of
the proport�on of fatal�t�es related to occupat�onal factors �n
F�nland. Scand J Work Env�ron Health 2001;27:161–213.
Robé MC, T�rmarche M. Radon dans les bât�ments;
Collect�on «les techn�ques de l’�ngén�eur». C3 384-année
2003. Inst�tut de Rad�oprotect�on et de Sûreté Nucléa�re
(IRSN).
Rogel A, Laur�er D, T�rmarche M, Quesne B. Lung
cancer r�sk �n the French cohort of uran�um m�ners. J Rad�ol
Prot 2002;22 (3A):A101–106.
Sénat 2005. Rapport d’Informat�on No. 37. Annexe au
procès-verbal de la séance du 20 octobre 2005. Par�s, 2005.
S�em�atyck� J, R�chardson L, Stra�f K, et al. L�st�ng
occupat�onal carc�nogens. Env�ron Health Perspect
Risk factors selected for estimate calculations

54
Attributable causes of cancer in France in the year 2000
2004;112:1447–1459.
Steenland K, Mannetje A, Boffetta P, et al. Pooled
exposure-response analyses and r�sk assessment for lung
cancer �n 10 cohorts of s�l�ca-exposed workers: an IARC
mult�centre study. Cancer Causes Control 2001;12:773–784.
Steenland K, Burnett C, Lal�ch N, et al. Dy�ng for work:
the magn�tude of US mortal�ty from selected causes of death
assoc�ated w�th occupat�on. Am J Ind Med 2003;43:461–
482.
SUMER 1994. http://www.trava�l.gouv.fr/etudes-
recherche-stat�st�ques/stat�st�ques/sante-au-trava�l/87.html
UNSCEAR : Un�ted Nat�ons Sc�ent�f�c Comm�ttee on
the Effects of Atom�c Rad�at�on Sources, effects and r�sks
of �on�s�ng rad�at�on. Report to the General Assembly, w�th
Annexes. Un�ted Nat�ons, New York 2000
V�ne�s P, S�monato L. Proport�on of lung and bladder
cancers �n males result�ng from occupat�on: a systemat�c
approach. Arch Env�ron Health 1991;46:6–15.
V�ne�s P, P�rastu R. Aromat�c am�nes and cancer.
Cancer Causes Control. 1997;8:346–355.
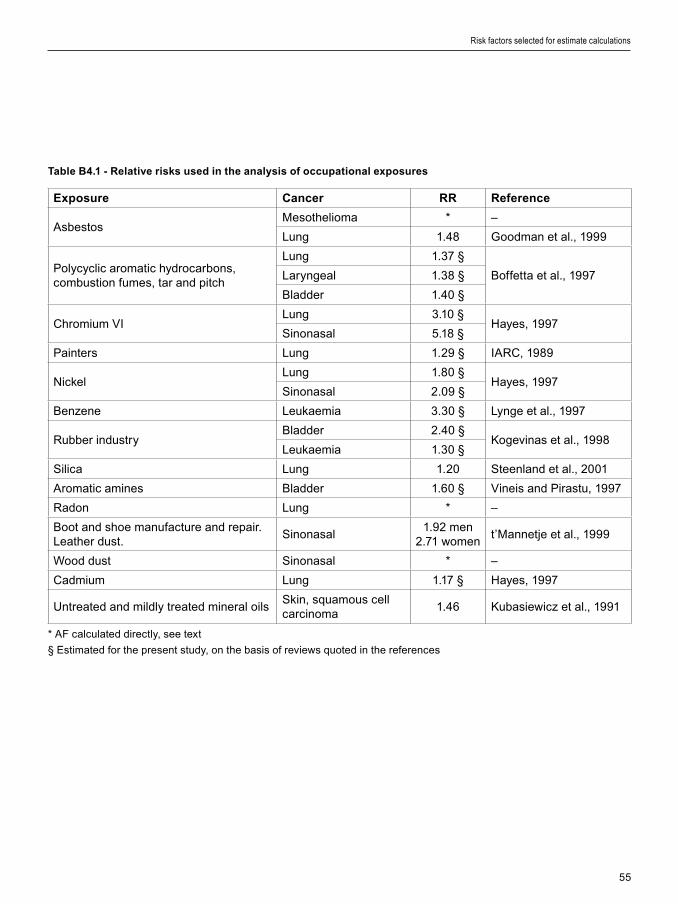
55
Exposure Cancer RR Reference
AsbestosMesothel�oma * –
Lung 1.48 Goodman et al., 1999
Polycycl�c aromat�c hydrocarbons, combust�on fumes, tar and p�tch
Lung 1.37 §
Boffetta et al., 1997Laryngeal 1.38 §
Bladder 1.40 §
Chrom�um VILung 3.10 §
Hayes, 1997S�nonasal 5.18 §
Pa�nters Lung 1.29 § IARC, 1989
N�ckelLung 1.80 §
Hayes, 1997S�nonasal 2.09 §
Benzene Leukaem�a 3.30 § Lynge et al., 1997
Rubber �ndustryBladder 2.40 §
Kogev�nas et al., 1998Leukaem�a 1.30 §
S�l�ca Lung 1.20 Steenland et al., 2001
Aromat�c am�nes Bladder 1.60 § V�ne�s and P�rastu, 1997
Radon Lung * –
Boot and shoe manufacture and repa�r. Leather dust.
S�nonasal1.92 men
2.71 woment’Mannetje et al., 1999
Wood dust S�nonasal * –
Cadm�um Lung 1.17 § Hayes, 1997
Untreated and m�ldly treated m�neral o�lsSk�n, squamous cell carc�noma
1.46 Kubas�ew�cz et al., 1991
Table B4.1 - Relative risks used in the analysis of occupational exposures
* AF calculated d�rectly, see text
§ Est�mated for the present study, on the bas�s of rev�ews quoted �n the references
Risk factors selected for estimate calculations

56
Table B4.2 – Prevalence of lifetime occupational exposure in France
* Numbers (_1000) der�ved from the SUMER study �n 1994. The SUMER study of 1994 covers only 7 000 000 act�ve male
workers and 5 000 000 act�ve female workers, mostly employed �n the pr�vate sector
† Data on prevalence of exposure not ava�lable; assumed to be zero
‡ Prevalence of exposure among controls, not shown �n or�g�nal art�cle and d�rectly obta�ned from F. Berr�no, personal
commun�cat�on
§ For women we used the rat�o of the number of lung cancers to mesothel�omas from men, see text
II AF calculated d�rectly – see text
¶ See text for deta�ls of calculat�on of occupat�onal exposure prevalence
# SUMER 94 data refer to all m�neral o�ls. A factor of 37%, est�mated from INRS data (2002), was appl�ed to all m�neral o�l
exposure to est�mate prevalence
Attributable causes of cancer in France in the year 2000
Agent Men Women Reference
N* % N* %
Asbestos – 9.1 § Iwatsubo et al., 1998
Polycycl�c aromat�c hydrocarbons, combust�on fumes, tar and p�tch
303 8.36 23 0.78 SUMER 1994§
Chrom�um VI 42 1.16 9 0.30 SUMER 1994
Pa�nters – 2.00 † Berr�no et al., 2003‡
N�ckel 23 0.63 23 0.78 SUMER 1994
Benzene 61 1.68 5 0.17 SUMER 1994
Rubber �ndustry – 1.10 † Berr�no et al., 2003‡
S�l�ca 85 2.35 11 0.37 SUMER 1994
Aromat�c am�nes 22 0.61 13 0.44 SUMER 1994
Radon – – – – See text ¶
Leather dust – 2.70 – 2.70 Berr�no et al., 2003‡
Wood dust II – – – – See text ¶
Cadm�um 8 0.22 2 0.07 SUMER 1994
Untreated and m�ldly treated m�neral o�ls
490 4.96 32 0.40 SUMER 1994 #

57
Risk factors selected for estimate calculations
Table B4.3 –Numbers of cancer cases and deaths attributable to occupation in France, by sex, for the year 2000
* AF was not calculated because data on prevalence of exposure were not ava�lable.
† Squamous cell carc�noma.
‡ Inc�dence data not ava�lable.
§ These totals do not take �nto account �nteract�ons between occupat�onal factors. Interact�ons are known to be of low
magn�tude (see Sect�on C2), and totals should thus be sl�ghtly lower
Exposure CancerMen Women
AF% Cases Deaths AF% Cases Deaths
AsbestosMesothel�oma 83.2 558 504 38.4 77 62
Lung 4.2 969 862 2.9 133 108
Polycycl�c aromat�c hydrocarbons, combust�on fumes, tar and p�tch
Larynx 3.1 120 53 0.3 1 0
Lung 3.0 697 619 0.3 13 12
Bladder 3.2 287 104 0.3 5 3
Chrom�um (VI)Nose and s�nuses 4.6 21 5 1.3 2 1
Lung 2.4 550 489 0.6 29 27
Pa�nters Lung 0.6 134 119 *
N�ckelNose and s�nuses 0.7 3 1 0.8 1 0
Lung 0.5 117 104 0.6 28 26
Benzene Leukaem�a 3.7 135 100 0.4 10 9
Rubber �ndustryBladder 1.5 136 49 *
Leukaem�a 0.3 12 9 *
S�l�ca Lung 0.5 108 96 0.07 3 3
Aromat�c am�nes Bladder 0.4 33 12 0.3 5 3
Radon Lung 0.1 26 23 – – –
Leather dust Nose and s�nuses 2.4 11 2 4.4 7 2
Wood dust Nose and s�nuses 19.2 87 19 *
Cadm�um Lung 0.04 9 8 0.011 0 0
M�neral o�ls Sk�n SCC † 2.2 – ‡ 5 0.1 – –
Any exposure �n Table Cancers �n Table 4013 3183 314 256
% of all cancers § 2.5% 3.7% 0.3% 0.5%

58
Table B4.4 - Numbers of cancer deaths attributable to occupational exposures, by type of cancer in 2000
Cancer Men Women
AF% Deaths AF% Deaths
Lung 11.3 2320 4.2 177
Mesothel�oma 83.2 504 38.4 62
Bladder 5.1 165 0.6 6
Leukaem�a 4.1 109 0.4 9
Larynx 3.1 53 0.3 0
Nasal s�nus 27.0 27 6.5 3
Sk�n 2.2 5 0.1 0
All cancers 3.7 3183 0.5 258
Attributable causes of cancer in France in the year 2000

59
Risk factors selected for estimate calculations
Tab
le B
4.5
- E
sti
ma
tes
of
the
fra
cti
on
of
se
lec
ted
ca
nc
ers
am
on
g m
en
att
rib
uta
ble
to
oc
cu
pa
tio
n
Att
rib
uta
ble
fra
cti
on
Re
fere
nc
eP
op
ula
tio
nM
eth
od
Ind
ica
tor
Sex
All
c
an
ce
rsL
un
gB
lad
de
r
Est
�mat
es
base
d o
n re
lat�v
e r�
sks
and
data
on
prev
alen
ce o
f exp
osu
re
Dre
yer
et a
l., 1
997
No
rd�c
co
untr
�es
Rel
at�v
e r�
sk f
rom
rev
�ew
of l
�tera
ture
, pr
eval
ence
of e
xpo
sure
fro
m n
at�o
nal
surv
eys
Inc�
denc
eM
en3%
13%
2%
Dr�
sco
ll et
al.,
20
05
We
ster
n E
uro
pe
Ave
rag
e re
lat�v
e r�
sk fo
r e�
ght
carc
�no
gen
s, p
reva
lenc
e of
exp
osu
re
fro
m �n
tern
at�o
nal d
ata
Mo
rtal
�tyM
enN
A10
%N
A
Pre
sent
stu
dyF
ranc
eR
elat
�ve
r�sk
fro
m m
eta
-ana
lyse
s,
prev
alen
ce o
f exp
osu
re m
ost
ly f
rom
na
t�ona
l sur
veys
Mo
rtal
�tyB
oth
2.4
%10
.1%
4.0%
Men
3.7%
11.3
%5.
1%
Es
tim
ate
s b
as
ed
on
qu
ali
tati
ve r
evie
w o
f th
e li
tera
ture
Do
ll an
d P
eto,
19
81U
SA
Cr�
t�cal
rev
�ew
of l
�tera
ture
Mo
rtal
�tyB
oth
4.2%
12.5
%8
.4%
Men
6.8%
15%
10%
V�n
e�s
and
S�m
ona
to,
1991
Var
�ous
p
opu
lat�o
nsR
ev�e
w o
f �nd
�v�d
ual s
tud�
es
Inc�
denc
e,
mo
rtal
�tyM
enN
A1–
40%
0–
24%
Nur
m�n
en a
nd
Kar
jala
�nen
, 20
01F
�nla
ndIn
clud
es
susp
ect
ed
carc
�no
gen
s an
d fa
lse
po
s�t�v
e re
sults
; l�k
ely
over
est
�mat
�on
of e
xpo
sure
pre
vale
nce
Inc�
denc
e,
mo
rtal
�tyM
en13
.8%
29.
0%14
.2%
Imb
ern
on,
20
02
Fra
nce
Att
r�bu
tabl
e fr
act�o
n fr
om
l�te
ratu
reIn
c�de
nce,
m
ort
al�ty
Men
NA
13–
29
%10
–21.
5%
Ste
enla
nd e
t al.,
20
03
US
AA
ttr�
buta
ble
frac
t�on
fro
m l�
tera
ture
Mo
rtal
�tyM
enN
A6.
1–17
.3%
7–19
%
Do
ll an
d P
eto,
20
05
Un�
ted
K�n
gdo
mR
ev�e
w o
f l�te
ratu
reM
ort
al�ty
Bot
h2
.0%
NA
NA
NA
, not
ava
�labl
e

60
1. Definition of exposure
The body mass �ndex (BMI) �s the we�ght (�n kg) d�v�ded by the square of the he�ght (�n metres) of an �nd�v�dual. Accord�ng to �nternat�onal standards, male and female adults w�th a body mass �ndex (BMI) between 25 and 29.9 kg/m2 are cons�dered overwe�ght, wh�le �f the�r BMI �s equal to or greater than 30 they are obese.
Overwe�ght and obes�ty represent r�sk factors of cons�derable �mportance for card�ovascular d�seases, d�abetes mell�tus and arthros�s. An IARC work�ng group found that these factors were cons�stently assoc�ated w�th the cancers l�sted �n Table B5.1 (IARC, 2002). Th�s systemat�c rev�ew concluded that there was not suff�c�ent ev�dence for an assoc�at�on of overwe�ght or obes�ty w�th prostate or gallbladder cancer.
The alternat�ve scenar�o taken for calculat�on of AF �s that of absence (�.e., zero prevalence) of overwe�ght and obes�ty.
2. Data used for RR estimates
We used data from a meta-analys�s by Bergstrom et al. (2001) (Table B5.1), that can be used for both males and females. Because the ev�dence for an effect of obes�ty and overwe�ght for breast cancer �s l�m�ted to postmenopausal women (IARC, 2002), we appl�ed the attr�butable fract�on to �nc�dence and mortal�ty of breast cancer occurr�ng after 49 years old.
3. Data used for exposure prevalence
We used surveys conducted by the INSEE �n the general population ≥ 20 years of age in 1980 and 1991 and analysed by Ma�llard et al. (1999). In these surveys, samples of 6792 men and 7150 women �n 1980, and 7250 men and 7856 women �n 1991 were asked to self-report the�r we�ght and he�ght. Ma�llard et al. made a d�rect adjustment of prevalences �n 1991 on the age d�str�but�on of 1980. We calculated crude
prevalences of overwe�ght and obes�ty �n 1980 and 1991 by tak�ng the prevalences d�splayed �n F�gure 1 of Ma�llard et al. (1999) and apply�ng them to the 1980 and 1991 French male and female populat�ons (data from the Inst�tut nat�onal d’études démograph�ques (INED)). We then recalculated the numbers of overwe�ght and obese males and females per 10-year age group and thence der�ved the prevalence �n 1980 and 1991 for males and females 20 years of age and older (Table B5.2). To est�mate the 1985 proport�ons of overwe�ght and obes�ty, we performed a l�near �nterpolat�on between the 1980 and 1991 data (Table B5.2 and F�gure B5.1). For breast cancer, we made these �nterpolat�ons only for women aged 50 years and older.
4. Calculation of AFs
Calculat�ons of attr�butable fract�ons for cancer �nc�dence and mortal�ty are summar�zed �n Table B5.3. Overwe�ght and obes�ty are �nvolved �n a greater proport�on of cancers �n females, essent�ally because of the�r role �n endometr�al and breast cancer.
5. Discussion
The results of the INSEE surveys �n 1991 are qu�te s�m�lar to those from a study conducted �n 1988 (Laur�er et al., 1992) �n subjects 16–50 years old, but with obesity reported as BMI ≥ 29 kg/m2 in men and ≥ 27.5 kg/m2 in women. More recent INSEE data from surveys �n 2003 on 21 000 adults 18 years old or more (us�ng self-reported we�ght and he�ght) show �ncreas�ng obes�ty �n both sexes, but a decrease �n overwe�ght �n both sexes (F�gure B5.1).
The ObEPI surveys performed �n 1997, 2000 and 2003 used self-reported data on we�ght and he�ght of subjects 15 years of age and older �ncluded �n a sample representat�ve of the French populat�on (25 770 subjects �n 2003) (Charles et al., 2002; ObEPI,
Attributable causes of cancer in France in the year 2000
Section B5: Obesity and overweight

61
Risk factors selected for estimate calculations
2003). These surveys show an �ncrease �n obes�ty (both sexes comb�ned) s�m�lar to those reported �n the INSEE surveys (F�gure B5.2). There �s, however, a d�vergence between INSEE and ObEPI surveys �n the trends �n overwe�ght, w�th a steady �ncrease �n ObEPI surveys, but a decrease �n the INSEE surveys. Other data from selected populat�ons, but us�ng measured we�ght and he�ght data (and not self-reported we�ght and he�ght) �nd�cate susta�ned �ncreases �n overwe�ght and obes�ty �n the French populat�on (Salem et al., 2006), and suggest that the INSEE data are somewhat b�ased towards underest�mat�on of he�ght and we�ght reported by �nterv�ewees.
In most �ndustr�al�zed countr�es, overwe�ght and obes�ty are �ncreas�ng, wh�ch w�ll contr�bute to stead�ly �ncreas�ng numbers of several cancers �n the future. In the com�ng decades, �f there �s no reversal �n the currently observed trends, obes�ty and overwe�ght w�ll s�gn�f�cantly contr�bute to further �ncreases �n cancer �nc�dence.
References
Bergstrom A, P�san� P, Tenet V, et al. Overwe�ght as
an avo�dable cause of cancer �n Europe. Int J Cancer.
2001;91:421–30. Erratum �n: Int J Cancer 2001;92:927.
Charles MA, Basdevant A, Eschwege E. Prévalence de
l’obés�té de l’adulte en France. La s�tuat�on en 2000. A part�r
des résultats des études OBEPI. Ann. Endocr�nol, 2002;63,
2, Cah�er 1, 154–158
Internat�onal Agency for Research on Cancer. IARC
Handbooks of Cancer Prevent�on, Vol. 5, We�ght Control
and Phys�cal Act�v�ty. Lyon: IARC; 2002.
Lanoë JL, Dumont�er F. Tabag�sme, abus d’alcool
et excès de po�ds. INSEE Prem�ère, N° 1048, Novembre
2005.
Laur�er D, Gu�get M, Chau NF, et al. Prevalence of
obes�ty: a compar�son survey �n France, the UK and the US.
Int J Obes�ty 1992;16:565–572.
Ma�llard G, Charles MA, Th�bult N, et al. Trends �n
the prevalence of obes�ty �n the French adult populat�on
between 1980 and 1991. Int J Obes Relat Metab D�sord
1999;23:389–394.
ObEPI. Commun�qué de presse: Résultats de l’enquête
ObEp� 2003 sur l’obés�té et le surpo�ds en France. Par�s,
Inst�tut Roche de l’Obés�té, 2003.
Salem G, R�can S, Kurz�nger ML. Atlas de la Santé en
France. Vol. 2: Comportements et malad�es. Par�s, John
L�bbey Eurotext, 2006.

62
Table B5.1 – Summary RRs of cancers associated with overweight and obesity*
Cancer site § Overweight Obesity
Oesophagus (adenocarc�noma) 2.00 2.00
Colon-rectum 1.15 1.33
K�dney 1.36 1.84
Corpus uter� 1.59 2.52
Breast �n postmenopausal women 1.12 1.25
* From Bergstrom et al., 2001
§ From IARC, 2002.
Table B5.2 – Prevalence of overweight and obesity in France in 1985
(Ma�llard et al.; 1999, adapted as outl�ned �n text)
Prevalence
Year Males Females
BMI = 25–29.9 1980 32.4% 20.1%
1991 33.7% 20.3%
BMI ≥ 30 1980 6.2% 6.1%
1991 6.3% 6.9%
BMI = 25–29.9 1985 § 33.0% 20.2% (29.2%*)
BMI ≥ 30 1985 § 6.3% 6.4% (9.6%*)
* Only for women ≥ 50 years old
§ Prevalence �n 1985 was est�mated by l�near �nterpolat�on of prevalence �n 1980 and 1991
Attributable causes of cancer in France in the year 2000

63
Risk factors selected for estimate calculations
Table B5.3 – Numbers of cancer cases and deaths attributable to obesity and overweight in France in the year
2000
* See sect�on on Methods for deta�ls on est�mat�on of oesophageal adenocarc�noma
§ AF for �nc�dence/mortal�ty
Figure B5.1 –Trends in overweight and obesity in adults (18+) in France 1980-2003
(Data INSEE �n Ma�llard et al., 1999 and Lanoël and Dumort�er 2005)
% o
f ad
ult
po
pu
lat�o
n
Cancer Men Women
AF% Cases Deaths AF% Cases Deaths
Oesophagus* (adenocarc�noma)
28.2% 200 172 21.0% 68 51
Colon-rectum 6.6% 1273 547 4.8% 826 373
K�dney 14.6% 776 276 11.3% 336 125
Corpus uter� – – – 17.8% 904 243
Breast over 50 years – – – 5.6% 1766 529
All cancers 1.4%/1.1%§ 2249 995 3.3%/2.3%§ 3900 1321
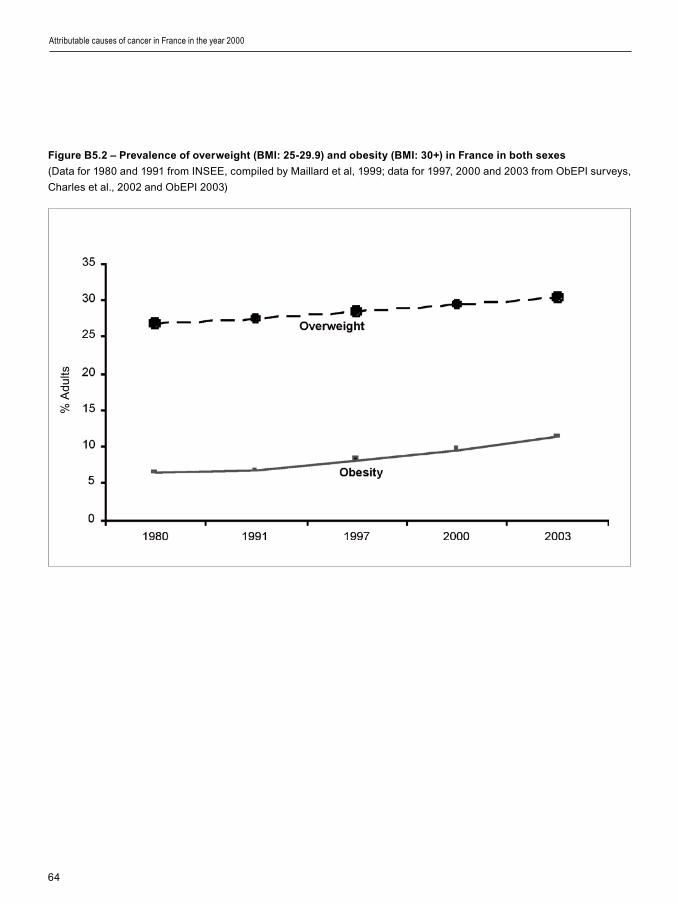
64
Figure B5.2 – Prevalence of overweight (BMI: 25-29.9) and obesity (BMI: 30+) in France in both sexes
(Data for 1980 and 1991 from INSEE, comp�led by Ma�llard et al, 1999; data for 1997, 2000 and 2003 from ObEPI surveys,
Charles et al., 2002 and ObEPI 2003)
Attributable causes of cancer in France in the year 2000
% A
dults

65
Risk factors selected for estimate calculations
1. Definition of exposure
The ev�dence for a cancer-prevent�ve effect of phys�cal act�v�ty was evaluated by an IARC work�ng group (IARC, 2002) wh�ch concluded that “there �s suff�c�ent ev�dence �n humans for a cancer-prevent�ve effect of phys�cal act�v�ty” for cancers of the colon and breast, and prevent�ve effects �ncrease w�th �ncreas�ng phys�cal act�v�ty �n terms of durat�on and �ntens�ty. Th�s protect�ve effect was �ndependent of the effect of body we�ght.
Conversely, phys�cal �nact�v�ty �s a r�sk factor for cancer. We took as alternat�ve exposure scenar�os �nd�cators related to “v�gorous recreat�onal phys�cal act�v�ty”.
Vigorous recreational activity (h/wk)
Cases Total person-years
Multivariate adj. RR
Weight used for RR estimate
Inact�ve† 668 175 292 1.00 (reference) 17.5
0 1097 319 096 0.90 (0.81–0.99) 17.5
[1–2] 845 258 953 0.88 (0.79–0.97) 2
[3–4] 238 78 163 0.82 (0.71–0.95) 31.5
≥ 5 93 38 082 0.62 (0.49–0.78) 31.5
2. Data used for RR estimates
The RR of breast cancer assoc�ated w�th phys�cal �nact�v�ty was computed from the RR reported by the French E3N cohort study (Tehard et al., 2006). Th�s cohort �ncluded 98 995 women, �nsured w�th the “Mutuelle Générale de l’Educat�on Nat�onale”, aged 40 to 65 years at �nclus�on and followed for an average of 11.4 years. S�nce the IARC evaluat�on was based on stud�es of recreat�onal phys�cal act�v�ty, we took the RR reported �n the study for v�gorous recreat�onal act�v�ty.
The RRs we used for calculat�ng an AF had to correspond to the exposure data that could be cons�dered as most representat�ve of phys�cal �nact�v�ty �n France, �.e., results from a European survey (Vaz de Alme�da et al., 1999 – see next sub-sect�on for a descr�pt�on). The two publ�shed tables from wh�ch we der�ved RRs and exposure data are :
Excerpt 1: from Table 3 of Tehard et al., 2006
† Women who reported no moderate nor v�gorous recreat�onal act�v�ty were cons�dered as “�nact�ve”
Excerpt 2: from Table 5 of Vaz de Almeida et al., 1999
Table. Percentage of EU subjects in the different categories of time
dedicated to leisure-time physical activity (number of hours per week) classified by sex
Sex None < 1.5 h 1.5–3.5 h > 3.5 h
Male 28 2 7 64
Female 35 2 9 54
Section B6 : Physical inactivity
66
We used as the “at r�sk category” �n Excerpt 1 the �nact�ve women and women w�th zero v�gorous recreat�onal act�v�ty. We used as a referent category women who had one or more hours per week of v�gorous act�v�ty.
In order to take �nto account the levels of phys�cal act�v�ty descr�bed �n Europe, we computed we�ghts for the relat�ve �mportance of each category of phys�cal act�v�ty reported by Vaz de Alme�da et al. (1999) (Excerpt 2). These we�ghts are d�splayed �n the r�ght-hand column of Excerpt 1. The RRs of Excerpt 1 were transformed �nto the�r nap�er�an logar�thm equ�valent, �.e., ln(RRs), and apply�ng the we�ghts on these ln(RRs), we computed a pooled RR of breast cancer assoc�ated w�th phys�cal �nact�v�ty of 1.32 (95% CI 1.06–1.64) compared w�th phys�cally act�ve women �n the general populat�on.
The RR of colon cancer assoc�ated w�th phys�cal �nact�v�ty was extracted from a recent meta-analys�s (Samad et al., 2005), wh�ch showed a s�gn�f�cant protect�ve effect of phys�cal act�v�ty dur�ng le�sure per�ods. Because d�fferent metr�cs were used �n the publ�cat�ons �ncluded �n the meta-analys�s, the author only presented est�mates of RRs for “phys�cal act�v�ty” w�thout categor�es. Based on 19 cohorts, the comb�ned RRs of colon cancer were 0.79 for men and 0.71 for women. We used the reverse of th�s est�mate as the r�sk of colon cancer assoc�ated w�th phys�cal �nact�v�ty. We found no data on phys�cal act�v�ty and rectal cancer.
Table B6.1 summar�zes the RRs used to est�mate AFs assoc�ated w�th phys�cal �nact�v�ty.
3. Data used for prevalence
We used data reported from a European survey (Vaz de Alme�da et al., 1999, Kearney et al., 1999) conducted �n 1997 �n 15 countr�es of the European Un�on. Th�s survey was conducted on a sample of 15 239 �nd�v�duals (7467 men and 7772 women) aged 15 years and older. For each country, quotas on age and sex were used to obta�n representat�ve samples. Results on phys�cal �nact�v�ty by gender were only reported for the 15 countr�es. We appl�ed these proport�ons of prevalence of phys�cal �nact�v�ty �n Europe to France, as �n the European survey, rates of phys�cal �nact�v�ty �n France d�d not d�ffer from the European average. Twenty e�ght per cent of men and 35% of women reported not hav�ng spent any t�me on
phys�cal act�v�ty dur�ng le�sure per�ods (Table B6.2).
4. Calculation of AFs
Table B6.2 reports the AFs and the attr�butable numbers of cancer cases and deaths for the year 2000. A total of 780 cases among men (0.5% of the total) and 5541 cases among women (4.7% of the total) were attr�butable to phys�cal �nact�v�ty �n France �n 2000. For women, around 75% are breast cancers. Phys�cal �nact�v�ty �s assoc�ated w�th 427 cancer deaths (0.5% of all cancer) �n men and 1812 cancer deaths (3.2% of all cancers) �n women.
5. Discussion
A survey by the Inst�tut Nat�onal de Prévent�on et d’Educat�on pour la Santé (INPES) �n 2005 among 30 514 adults 18–65 years of age suggested a proport�on of 33% of phys�cally �nact�ve adults �n France (INPES, Baromètre Santé, 2005). Th�s est�mate �s close to the f�gures that we used from the European survey.
Add�t�onal data on the prevalence of phys�cal act�v�ty were reported �n 1997 (Steptoe et al., 1997) from a European survey conducted �n 1989–1992. However, th�s survey was conducted on un�vers�ty students aged 18–30 years who could not be cons�dered as representat�ve of the French populat�on. The prevalence of phys�cal �nact�v�ty �n the European survey �s h�gher than that reported �n the French cohort study E3N cohort, exclus�vely of women (Tehard et al., 2006). Only 20.2% of the E3N subjects were categor�zed as “�nact�ve”. However, �t �s probable that more act�ve women were more w�ll�ng than less act�ve women to part�c�pate �n a long-term cohort study. Furthermore, prevalence of phys�cal act�v�ty �s d�rectly correlated w�th educat�on level and the major�ty of women �n the E3N cohort had a h�gh educat�on level.
To the best of our knowledge, no study has yet tr�ed to est�mate the opt�mal level of phys�cal act�v�ty for cancer prevent�on. However, for colon cancer, the IARC work�ng group on phys�cal act�v�ty noted that “at least 30 m�nutes per day of more than moderate level of phys�cal act�v�ty m�ght be needed to see the greatest effect �n r�sk reduct�on” (IARC, 2002). For breast cancer, the “r�sk reduct�on beg�ns at levels of 30–60 m�nutes per day of moderate-�ntens�ty to v�gorous act�v�ty �n add�t�on to the usual levels of
Attributable causes of cancer in France in the year 2000
67
Risk factors selected for estimate calculations
occupat�onal and household act�v�ty of most women” (IARC, 2002). In v�ew of these conclus�ons, �t �s probable that low or moderate phys�cal act�v�ty does not reduce the r�sks of colon or of breast cancer.
References
Kearney JM, Kearney MJ, McElhone S, G�bney MJ.
Methods used to conduct the pan-European Un�on survey
on consumer att�tudes to phys�cal act�v�ty, body we�ght and
health. Publ�c Health Nutr�t�on 1999;2(1a):79–86.
INPES. Inst�tut Nat�onal de Prévent�on et d’Educat�on
pour la Santé. Baromètre Santé 2005.
Internat�onal Agency for Reasearch on Cancer. IARC
Handbooks of Cancer Prevent�on, Vol. 5, We�ght Control
and Phys�cal Act�v�ty. Lyon: IARC; 2002.
Samad AKA, Taylor RS, Marshall T, Chapman MAS.
A meta-analys�s of the assoc�at�on of phys�cal act�v�ty
w�th reduced r�sk of colorectal cancer. Colorectal D�sease
2005;7:204–213.
Steptoe A, Wardle J, Fuller R, et al. Le�sure-t�me
phys�cal act�v�ty exerc�se: prevalence, att�tud�nal correlates,
and behav�oral correlates among young Europeans from 21
countr�es. Prev Med 1997;26:845–854.
Tehard B, Fr�edenre�ch CM, Oppert JM, Clavel-Chapelon
F. Effect of phys�cal act�v�ty on women at �ncreased r�sk of
breast cancer: results from the E3N cohort study. Cancer
Ep�dem�ol B�omarkers Prev 2006;15:57–64.
Vaz de Alme�da MD, Graca P, Afonso C, et al. Phys�cal
act�v�ty levels and body we�ght �n a nat�onally representat�ve
sample �n the European Un�on. Publ�c Health Nutr�t�on
1999;2(1a):105–113.
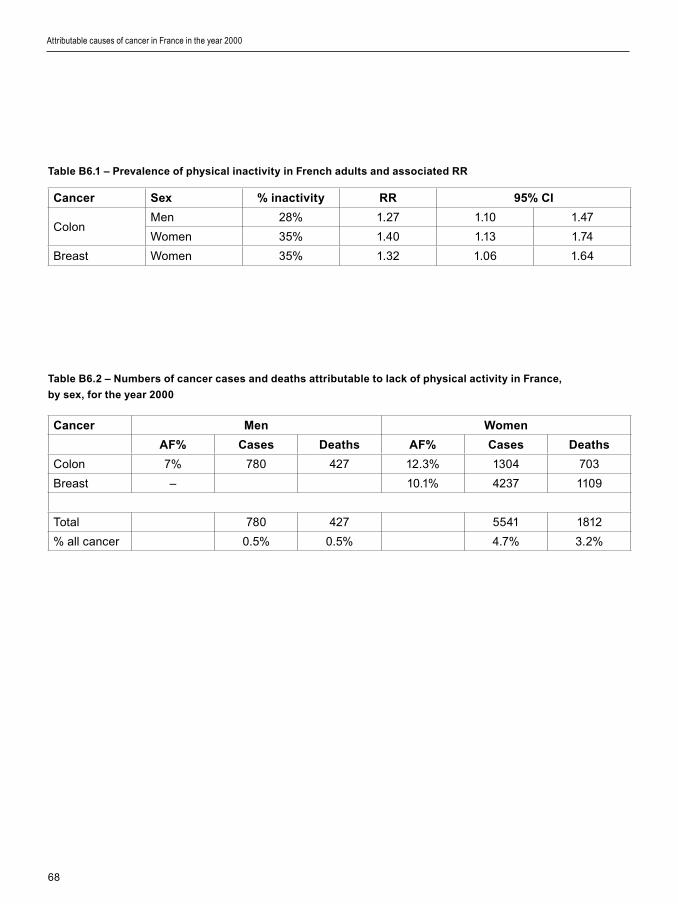
68
Cancer Sex % inactivity RR 95% CI
ColonMen 28% 1.27 1.10 1.47
Women 35% 1.40 1.13 1.74
Breast Women 35% 1.32 1.06 1.64
Cancer Men Women
AF% Cases Deaths AF% Cases Deaths
Colon 7% 780 427 12.3% 1304 703
Breast – 10.1% 4237 1109
Total 780 427 5541 1812
% all cancer 0.5% 0.5% 4.7% 3.2%
Table B6.1 – Prevalence of physical inactivity in French adults and associated RR
Table B6.2 – Numbers of cancer cases and deaths attributable to lack of physical activity in France,
by sex, for the year 2000
Attributable causes of cancer in France in the year 2000

69
Risk factors selected for estimate calculations
I. Hormone replacement therapy (HRT)
Hormone therapy (HRT) for women cons�sts �n the use of pharmaceut�cal products conta�n�ng estrogens (E) alone or a comb�nat�on of estrogens and progestogens (E+P), regardless of reg�men and route of adm�n�strat�on.
1. Context
HRT has been promoted for allev�at�on of symptoms of menopause, or after menopause for the presumed benef�c�al effects of these hormones on var�ous health cond�t�ons such as card�ovascular d�sease and osteoporos�s. In the 1990s, �t was d�scovered that E alone �ncreased the r�sk of endometr�al cancer and sl�ghtly �ncreased the r�sk of breast cancer. HRT was then sh�fted to E+P formulat�ons.
In 1997, a large collaborat�ve study conducted a meta-analys�s of all observat�onal stud�es (ma�nly case–control stud�es) on HRT and breast cancer, show�ng ev�dence for a pos�t�ve assoc�at�on between HRT and breast cancer when HRT use lasted for f�ve years or more (CGHFBC, 1997). The effects of HRT on breast cancer r�sk were present for current HRT users but ceased for women who had stopped tak�ng HRT f�ve years prev�ously or more. Other stud�es reported other s�de-effects of HRT such as deep ve�n thrombos�s, and quest�oned the putat�ve card�ovascular benef�ts of HRT use.
At the end of the 1990s, two large-scale random�zed placebo-controlled tr�als �n the USA, the HERS and HERS II tr�als (Hulley et al., 2002) and the Women’s Health In�t�at�ve (WHI) tr�al (Rossouw et al., 2002; Chlebowsk� et al., 2003; Anderson et al., 2004) were �n�t�ated to try to answer the numerous puzzl�ng quest�ons regard�ng HRT use and var�ous
health cond�t�ons. Both the HERS II and WHI tr�als demonstrated that women tak�ng E+P had a h�gher r�sk of breast cancer, myocard�al �nfarct�ons, card�ovascular d�seases, deep venous thrombos�s, stroke and decl�ne of cogn�t�ve funct�ons. Reduced r�sks for fractures and colorectal cancer were found when E+P was taken for f�ve years or more. E+P d�d not affect endometr�al cancer �nc�dence or all-cause mortal�ty. Tr�als w�th E alone reached s�m�lar conclus�ons except for breast cancer, for wh�ch, unexpectedly, the WHI tr�al found a reduced r�sk (Anderson et al., 2004). The overall conclus�on of the WHI tr�als was that �ncreased d�sease r�sks assoc�ated w�th the use of E or of E+P largely outwe�gh the benef�ts.
S�multaneously w�th the HERS II and WHI tr�als, ten cohort stud�es were conducted on HRT use and cancer r�sk (Table B7.1). Seven of these stud�es were conducted �n the Nord�c countr�es (Jernström et al., 2003; Olsson et al., 2003; Persson et al., 1999; Stahlberg et al., 2004; Tjønneland et al., 2004; Bakken et al., 2004; Ewertz et al., 2005), one was conducted �n the USA (Scha�rer et al., 2000), one �n the UK – the M�ll�on Women Study (MWS) (M�ll�on Women Study Collaborators, 2003), and a tenth �n France (Fourn�er et al., 2005a). The ma�n results from these cohort stud�es are d�splayed �n Table B7.1. The seven Nord�c cohorts reported breast cancer r�sks assoc�ated w�th HRT use (E or E+P) mostly h�gher than those from the MWS (2003). The French E3N cohort (Fourn�er et al., 2005a, 2007) y�elded relat�ve r�sks assoc�ated w�th four or more years of E+P use not very d�fferent from those found by the MWS and several Nord�c stud�es.
The largest cohort study was the MWS conducted
Section B7: Hormone replacement therapy and oral contraceptives

70
�n the UK (M�ll�on Women Study Collaborators, 2003). The MWS �ncluded 1 084 110 women between 50–64 years old who were part�c�pants �n the Nat�onal Health Serv�ce Breast Cancer Screen�ng Programme, half of whom had used HRT. 9364 �nc�dent cases of breast cancer were reg�stered dur�ng follow-up. Overall, compared w�th women not us�ng HRT, the breast cancer r�sk was mult�pl�ed by 1.30 (95% CI 1.22–1.38) for current users of E formulat�ons, and by 2.00 (95% CI 1.91–2.09) for current users of E+P formulat�ons. Because of �ts h�gh stat�st�cal power, the M�ll�on Women Study was also able to assess the r�sk of the relat�vely rare ovar�an cancer w�th current HRT use (M�ll�on Women Study Collaborators, 2007). Th�s �s �mportant s�nce ovar�an cancer �s usually d�agnosed at an advanced stage, at wh�ch there �s no cure.
Cr�t�c�sms of the MWS study (e.g., Wh�tehead and Farmer, 2004; Lopes, 2003; Shap�ro, 2004; van der Mooren and Kenemans, 2004) po�nted to methodolog�cal problems of secondary �mportance and never offered any plaus�ble alternat�ve explanat�on for the f�nd�ngs. For �nstance, �t �s somet�mes cla�med that the MWS had no “control group”. The MWS �s a cohort study, and therefore, the women who never used HRT (�.e., 50% of the ent�re cohort) const�tuted the natural control group, and breast cancer r�sks were calculated us�ng women who never used HRT as the referent category (�.e., the category w�th no �ncreased breast cancer r�sk assoc�ated w�th HRT use). It was also cla�med that d�fferences �n age or �n body mass �ndex between HRT users and non-users could expla�n f�nd�ngs. These arguments do not hold s�nce all r�sk calculat�ons were carefully adjusted on var�ables that could eventually confound the assoc�at�on between HRT use and breast cancer, such as body mass �ndex and age.
The IARC Monograph and the AFSSAPS report on HRT use and cancer
In v�ew of the numerous new results publ�shed from 2000 onwards, the IARC convened a Monograph meet�ng on HRT and cancer r�sk �n June 2005. Summary conclus�ons of th�s meet�ng were publ�shed �n 2005 (Cogl�ano et al., 2005) and deta�ls on conclus�ons of the Monograph may be found at the url: http://monographs.�arc.fr/ENG/Meet�ngs/91-menop-ther.pdf. The full pr�nted Monograph �s �n press. The follow�ng excerpt from the deta�led conclus�ons
about HRT and breast cancer �s access�ble on the ment�oned web-s�te: “Two large randomized trials, 10 cohort studies and seven case–control studies reported on the relationship between the use of combined estrogen–progestogen menopausal therapy and breast cancer in postmenopausal women. The studies consistently reported an increased risk for breast cancer in users of combined estrogen–progestogen therapy compared with non-users. The increased risk was greater than that in users of estrogen alone. The available evidence was inadequate to evaluate whether or not the risk for breast cancer varies according to the progestogenic content of the therapy, or its dose, or according to the number of days each month that the progestogens are added to the estrogen therapy”. Furthermore, concern�ng the doses of estrogens or progestogens �n HRT, “The data are [ ] insufficient to determine whether the risk varies with type of compound or the dose of various compounds used”.
Independently from the IARC Monograph, the experts of the Agence França�se de Sécur�té San�ta�re des Produ�ts de Santé (AFSSAPS) came to s�m�lar conclus�ons (AFSSAPS, 2004, 2006): “Actuellement aucune donnée issue d’essais randomisés ne permet de savoir si les risques associés au traitement hormonal de la ménopause sont influencés ou non par le type d’estrogène (estrogènes conjugués équins, estradiol), ou par le type de progestatif (acétate de médroxyprogestérone, lévonorgestrel, noréthistérone, progestérone, etc.), ou par la voie d’administration de l’estrogène (orale, transdermique), ou enfin par les modalités d’utilisation du progestatif (administration séquentielle ou continue).” (AFSSAPS, 2006, page 5).
There �s thus at present no conv�nc�ng ev�dence from laboratory or human stud�es that the r�sk of breast cancer assoc�ated w�th HRT use would d�ffer accord�ng to the const�tuents and the�r dose, cont�nuous or sequent�al adm�n�strat�on, or the route of adm�n�strat�on.
Timing and duration of HRT use
Pract�cally all the breast cancer r�sk assoc�ated w�th HRT use �s l�nked to current use, as opposed to past use. Past HRT use �s taken to mean that use of HRT ceased at least one year prev�ously, and current use may be def�ned as tak�ng HRT �n the last 12 months.
Attributable causes of cancer in France in the year 2000
71
Risk factors selected for estimate calculations
Past HRT has been assoc�ated rarely w�th a s�gn�f�cant small �ncrease �n breast cancer r�sk.
All stud�es on HRT and breast cancer have shown that the r�sk among current HRT users �ncreases w�th t�me s�nce f�rst use. Table B7.3 shows the �ncreas�ng r�sk assoc�ated w�th HRT use found �n the MWS (2003), w�th a relat�ve r�sk of 2.31 after 10 years of use. HRT use for less than 12 months enta�ls no or only low �ncrease �n breast cancer r�sk (MWS, 2003; CGHFBC, 1997).
The breast cancer r�sk assoc�ated w�th HRT does not pers�st after cessat�on of HRT use, and probably the r�sk becomes very low �f not �nex�stent 12 months after cessat�on of HRT use.
HRT use, age, obesity and breast cancer risk
The breast cancer r�sks found �n the WHI tr�al and the MWS study were �ndependent of the age and the we�ght of the women, because the random�zat�on process �n the WHI tr�al led to a balanced d�str�but�on of women accord�ng to age and body mass �ndex. In the MWS study, all relat�ve r�sks were adjusted for e�ght character�st�cs of the women, �nclud�ng exact age and body mass �ndex. Therefore, arguments reject�ng or downplay�ng the results of these stud�es on the bas�s of d�fferences between usual HRT users �n France and women part�c�pat�ng �n the WHI tr�al or the MWS study are �nval�d.
Impact of the WHI and of MWS results on HRT use
As a f�nal note, s�nce publ�cat�on of the WHI tr�al results �n 2002, HRT use has started to fall �n many countr�es, �nclud�ng France. For example, between the end of 2002 and the end of 2003, 28.3% of women �n the Rhône-Alpes reg�on ceased tak�ng HRT (Gayet-Ageron et al., 2005). In the USA, the fall was part�cularly marked and �t seems that the f�rst s�gns of a subsequent decl�ne �n breast cancer �nc�dence are already observable (Clarke et al., 2006; Ravd�n et al., 2007).
Other aspects relevant to HRT and breast cancer are further covered �n the D�scuss�on, such as the role of the formulat�on and type of HRT used, and the French stud�es on HRT use and breast cancer.
2. Definition of exposure
The r�sk of breast and of ovar�an cancer assoc�ated w�th HRT �s related to current use of these med�c�nes. Cancer r�sk decreases rap�dly after cessat�on of HRT and falls to zero after a few years. Therefore, no lag-t�me between HRT use and breast or ovar�an cancer occurrence was cons�dered �n th�s analys�s.
3. Data used for RR estimates
Cohort stud�es other than the MWS (2003) that prov�ded data on current HRT use for 4 or 5 years and more �ncluded a total of 178 920 women (Table B7.1). If a meta-analys�s of r�sk assoc�ated w�th HRT was performed, because of the s�ze of the MWS (1 084 110 women), the summary relat�ve r�sks would be nearly equal to those found �n th�s study. We therefore used est�mates from the M�ll�on Women Study (2003), a large cohort study conducted �n the UK that �ncluded 1 084 110 women aged 50–64 years, recru�ted between 1996 and 2001 and followed dur�ng an average of 2.6 years. Est�mates from the WHI tr�als are not opt�mal as tr�al stopp�ng rules were based on a comb�nat�on of several endpo�nts. Also, the MWS was more representat�ve of HRT use by women �n Europe.
4. Data used for exposure prevalence
A nat�onal survey was conducted �n France �n 2003, as part of a survey cover�ng Germany, the UK, France and Spa�n (Strothman & Schne�der, 2003). Th�s survey reported durat�on of HRT use for France that allowed est�mat�on of proport�ons of French HRT users by durat�on of HRT use. For th�s survey, representat�ve nat�onal samples of women 45–75 years of age were const�tuted through quota methods based on telephone d�rector�es. Data were collected through telephone �nterv�ews. Informat�on on the total number of women contacted and on response rates was not reported. In France, the f�nal sample �ncluded 2004 women aged 45–75 years, of whom 454 (23%) reported current HRT use.
Proport�ons of women tak�ng E or E+P were der�ved from the ESPS-EPAS survey c�ted �n the AFSSAPS report of 2005, accord�ng to wh�ch 17% of HRT users took E only and 83% took E+P. The ESPS-EPAS survey was conducted every four years

72
on a sample of French c�t�zens reg�stered �n three ma�n soc�al-secur�ty off�ces. For HRT use, data were ava�lable for 1532 women 40 years old or older �n 2000, and 1558 women 40 years old or older �n 2002. Th�s survey d�d not report durat�on of HRT use.
5. Calculation of AFs
Breast cancer
Table B7.3 prov�des deta�ls of AF calculat�ons for breast cancer. Categor�es of durat�on of HRT use �n the MWS study (2003) had a one-year d�fference from those of Strothman and Schne�der (2003), but th�s d�fference was not l�kely to affect the AF est�mates apprec�ably. The overall AF was 18.8% for women aged 45–75 years. In 2000, there were 28 288 breast cancer cases and 5958 deaths from breast cancer �n French women aged 45–74 years (numbers and deaths from breast cancer at exactly 75 years old were not ava�lable). Thus �n France, �n the year 2000, 5313 breast cancer cases and 1119 breast cancer deaths could be attr�buted to HRT use. These f�gures represent 12.7% of breast cancer cases and 10.2% of breast cancer deaths �n women of all ages.
Ovarian cancer
Table B7.4 prov�des deta�ls of AF calculat�ons for ovar�an cancer. Categor�es �n the MWS (2003) had a one-year d�fference from those of Strothman and Schne�der (2003), but th�s d�fference was not l�kely to affect the AF est�mates apprec�ably. The overall AF was 3.5% for women aged 45–75 years, represent�ng 101 ovar�an cancer cases and 62 ovar�an cancer deaths. In 2000, there were 4488 ovar�an cancer cases and 3210 deaths from ovar�an cancer. Thus �n France, �n the year 2000, accord�ng to the MWS data, HRT could have been the cause of 2.6% of ovar�an cancer cases and 2.2% of ovar�an cancer deaths �n women of all ages.
6. Discussion
Comparison with estimates in the AFSSAPS report of 2005
The survey by Strothman and Schne�der was conducted �n 2003 and accord�ng to data on HRT use
�n the Rhône-Alpes reg�on (Gayet-Ageron et al., 2005), �t �s unl�kely that results from the WHI tr�al and the MWS study publ�shed �n 2002 and 2003 had already led to cessat�on of HRT prescr�pt�on �n France. The survey by Strothman and Schne�der sampled women 45 to 75 yeas old, and conf�rmed data show�ng that a non-negl�g�ble fract�on of French women 65 years old and more were tak�ng HRT, essent�ally for prevent�on of osteoporos�s (Aubry and Guégen, 2002).
The AFSSAPS report of 2005 est�mated an AF of 3–6% for women 40 to 65 years of age, such that an annual number of 650 to 1200 breast cancer cases �n France �n the years 2000–2002 would be due to HRT use (AFSSAPS 2005). Est�mates made �n the 2005 AFSSAPS report were based on rates of HRT use �n women 40 to 64 years of age der�ved from var�ous databases, one of them be�ng the ESPS-EPAS survey we used ourselves to est�mate numbers of women tak�ng E or E+P. For relat�ve r�sks of HRT use and breast cancer, the AFSSAPS looked at four d�fferent hypothet�cal r�sk scenar�os for var�ous forms of estrogens and progestogens, used alone or �n comb�nat�on, tak�ng �nto account the durat�on of HRT use (i.e., <5 or ≥5 years). Relative risks taken from four stud�es (CGHFBC, 1997; Chlebowsk� et al., 2003; MWS, 2003; Fourn�er et al., 2005) were attr�buted to each hypothes�s, but the relat�ve r�sks used were chosen from d�fferent stud�es accord�ng to durat�on of use of HRT. Breast cancer numbers �n France were est�mated us�ng data produced by the FRANCIM network of French cancer reg�str�es. The numbers of breast cancers attr�butable to HRT use were then calculated us�ng a mathemat�cal model appl�ed to each r�sk hypothes�s and whose �nputs were, among other parameters, the chosen relat�ve r�sks and the proport�ons of women tak�ng the d�fferent types of HRT. The d�fferences between our est�mates and the AFSSAPS ones have four ma�n or�g�ns:
(1) The RRs we used from the MWS (2003) are h�gher than those used �n the AFSSAPS report. The follow�ng cons�derat�ons support the use of h�gher RRs:
(�) Cohort stud�es �n Nord�c countr�es �nclud�ng
a var�ety of HRT preparat�ons prov�de support for the RRs from the MWS (Table B7.1).
(��) In some models, the AFSSAPS report used
Attributable causes of cancer in France in the year 2000

73
Risk factors selected for estimate calculations
an RR of 1.24 from the �ntent-to-treat analys�s of the WHI tr�al (Chlebowsk� et al., 2003). The �ntent-to-treat analys�s was performed accord�ng to the number of women allocated to the �ntervent�on group, and the presence �n the �ntervent�on group of women who d�d not take HRT decreased the RR found �n th�s group. The RR of 1.49 found for women �n the �ntervent�on group who actually took HRT was more appropr�ate for est�mat�ng attr�butable fract�ons.
(���) In some models, the AFSSAPS report cons�dered that E+m�cron�zed progesterone conveyed no �ncreased r�sk of breast cancer.
(2) The AFSSAPS report cons�dered women 40–64 years of age, wh�le we cons�dered women 45–75 years of age. The age range we cons�dered was probably more representat�ve of HRT use by French women because, as observed �n many other countr�es, at least one report shows that a proport�on of French women 65 years old and more were tak�ng HRT, essent�ally for prevent�on of osteoporos�s (Aubry and Guégen, 2002). Also, because �t was a survey on a random sample of the populat�on, the study of Strothmann and Schne�der (2003) was probably more representat�ve of the French female populat�on, �n sp�te of �ts relat�vely small s�ze and l�m�tat�ons �n the report�ng of the survey methods used (e.g., the proport�on of non-responders was not reported). The women �n the MWS were younger (50–64 years at cohort �ncept�on) than �n the Strothmann and Schne�der survey (45–75 years), but the WHI tr�al has shown that r�sk of breast cancer assoc�ated w�th HRT after menopauses was �ndependent of age and of the same magn�tude �n women 50–59, 60–69, and 70–79 years of age.
Formulation and route of administration of HRT
The HRT formulat�on used �n the WHI tr�al for non-hysterectom�zed women was an assoc�at�on of a cont�nuous comb�nat�on of oral conjugated equ�ne estrogens (CEE 0.625 mg/day) and a synthet�c progestogen, medroxyprogesterone acetate (MPA 2.5 mg/day). The MWS ma�nly stud�ed r�sk assoc�ated w�th estrogens comb�ned w�th MPA, noreth�sterone or norgestrel. In Nord�c countr�es, HRT �ncorporat�ng testosterone der�vat�ves �s w�dely used. Hence,
the tr�als on HRT reported to date (HERS II and WHI), the MWS study and cohort stud�es �n Nord�c countr�es and �n the USA d�d not �nvest�gate all forms of HRT reg�mens, some of wh�ch are more commonly used �n France (e.g., transdermal preparat�ons, or natural progestogens �n the form of m�cron�zed progesterone (E + m�cron�zed P)). For th�s reason, uncerta�nt�es rema�n on the real breast cancer r�sk assoc�ated w�th some HRT formulat�ons (Modena et al., 2005), although the b�olog�cal mechan�sms of these formulat�ons seem not very d�fferent from those of other forms of HRT (IARC 2007; Rochefort and Sureau, 2003). The poss�b�l�ty of a d�fference �n breast cancer r�sk accord�ng to formulat�on and route of adm�n�strat�on was st�mulated by the French E3N cohort study wh�ch found �n a f�rst report that women currently us�ng HRT conta�n�ng m�cron�zed progesterone had a breast cancer r�sk of 0.9 (95% CI 0.7–1.2) that contrasted w�th a r�sk of 1.4 (95% CI 1.2–1.7) �n women who were current users of other E+P formulat�ons (Fourn�er et al., 2005). In a further report (Fourn�er et al., 2007), breast cancer r�sks were presented accord�ng to the type of progestogen used, but w�thout cons�der�ng the route of adm�n�strat�on. The latter study was the f�rst to show breast cancer r�sk accord�ng to var�ous types of progestagen (e.g., progesterone, dydrogesterone, other progestagens) and has no equ�valent �n the l�terature.
Results of the E3N cohort study on E + m�cron�zed P confl�ct somewhat w�th those from the PEPI tr�al (Greendale et al., 2003) that found an �ncrease �n rad�olog�cal breast dens�ty �n women tak�ng E + m�cron�zed P s�m�lar to the �ncrease observed �n women tak�ng a cont�nuous oral comb�nat�on of conjugated equ�ne estrogens (CEE 0.625 mg/day) and MPA (2.5 mg/day) – the formulat�on used �n the WHI tr�al – or cont�nuous conjugated equ�ne estrogens (CEE 0.625 mg/day) and cycl�c MPA (2.5 mg/day) on days 1–11. Rad�olog�cal breast dens�ty �s now known to be the ma�n r�sk factor for breast cancer occurrence (Boyd et al., 2005) and one would expect that a spec�f�c HRT preparat�on lead�ng to an �ncrease �n rad�olog�cal breast dens�ty s�m�lar to that observed w�th other types of HRT would be assoc�ated w�th an equ�valent �ncrease �n breast cancer r�sk.
The E3N study �s the only study to date on spec�f�c transdermal HRT preparat�ons, and these results need to be conf�rmed by other stud�es before val�dat�on of the conclus�on that transdermal E +
74
m�cron�zed P does not convey a h�gher r�sk of breast cancer. Th�s conclus�on was also reached by the AFSSAPS �n �ts last rev�s�on of the HRT �ssue �n June 2006 (AFSSAPS, 2006). The best way to d�sentangle the �ssue of the HRT compos�t�on and formulat�on would be to have large stud�es organ�zed to assess the health effects of HRT preparat�ons that were not stud�ed �n the HERS II, WHI, MWS and Nord�c cohort stud�es. The preferable way forward would be a random�zed controlled tr�al of a transdermal HRT preparat�on conta�n�ng E + m�cron�zed progesterone. In the absence of further conf�rmatory data on cancer r�sk assoc�ated w�th some HRT preparat�ons, �t �s better to base publ�c health th�nk�ng on the best ava�lable sc�ent�f�c ev�dence that has been repeatedly found �n the WHI tr�al, the MWS and the Nord�c cohort stud�es.
Studies on HRT use and breast cancer in France other than the E3N cohort study
Two stud�es �n France compared breast cancer occurrence �n women who were or who were not prescr�bed HRT (de L�gn�ères et al., 2002; Chevall�er et al., 2005; Esp�é et al., 2006). These two stud�es used des�gns that are unconvent�onal �n ep�dem�olog�cal research.
The f�rst study �ncluded 3175 women who attended a large endocr�nology outpat�ent cl�n�c at least once between January 1975 and December 1987, and who were postmenopausal or 50 years old or more at some po�nt dur�ng the per�od of �nclus�on (de L�gn�ères et al., 2002). The mean durat�on between �nclus�on �n the study group and the end of observat�on was 8.9 years (range: 1 to 24 years). H�stor�es of HRT use and of breast cancer d�agnos�s were retrospect�vely reconst�tuted from med�cal f�les or from d�rect contact w�th the women. The denom�nators for numbers of woman-years of observat�on were calculated from f�rst v�s�t to the cl�n�c �f women were postmenopausal (th�s f�rst v�s�t could have taken place before 1975), or from the date of menopause �f �t occurred after January 1975. Women were not �ncluded �f they had a d�agnos�s of breast cancer before potent�al �nclus�on �n the study. Breast cancer occurrence was compared between women who used HRT and those who d�d not. After adjustment for age at menopause, year of b�rth and calendar per�od, the r�sk of breast cancer �n ever-users of HRT was 1.03 (95% CI 0.61–1.75) for
5–9 years of use, and 1.15 (95% CI 0.64–2.05) for use for 10 years or more. Current HRT users had a relat�ve r�sk of 0.83 (95% CI 0.51–1.83), and former users (use stopped �n the four years before breast cancer d�agnos�s) had a relat�ve r�sk of 1.42 (95% CI 0.76–2.44).
The second study, called the MISSION study, compr�sed two d�st�nct phases: a h�stor�cal phase est�mat�ng breast cancer r�sk accord�ng to past HRT use, and a prospect�ve phase st�ll �n progress a�m�ng at exam�n�ng assoc�at�ons between HRT use and �nc�dence of new breast cancer cases. The MISSION study �ncluded 6755 women who attended the pract�ce of 825 volunteer gynaecolog�sts between 5 January 2004 and 28 February 2005 (Chevall�er et al., 2005; Esp�é et al., 2006). All women were postmenopausal at study �nclus�on. Us�ng a standard random procedure, each gynaecolog�st had to sample e�ght women, four currently us�ng or hav�ng used HRT w�th�n the last f�ve years (the “treated group”) and four not us�ng and not hav�ng used HRT w�th�n the last f�ve years (the “untreated group”). Results publ�shed so far are those of the h�stor�cal phase (Esp�é et al., 2006). All data came from med�cal records of women who attended gynaecolog�c pr�vate pract�ces. H�stolog�cally-proven breast cancer cases were �ncluded �n the analys�s �f they occurred after the menopause, and, �n the treated group, �f they had been d�agnosed after the f�rst dose of HRT. Mean HRT use dur�ng th�s phase was 7.9 years. Accord�ng to med�cal records, over the ent�re per�od of retrospect�ve gather�ng of data, �.e., from the f�rst contact of women after menopause w�th the�r gynaecolog�st unt�l study �nclus�on �n 2004, 1.0% of women �n the treated group and 6.2% of women �n the untreated group had a breast cancer after menopause (�.e., the prevalent breast cancer cases). Standard�zed breast cancer �nc�dence rates from 1 January 2003 unt�l 31 December 2003, that �s dur�ng the year before start of �nclus�on of women �n the study, were calculated and age-adjusted tak�ng the standard European populat�on as reference. These age-adjusted �nc�dence rates were then compared w�th age-spec�f�c �nc�dence rates prov�ded by the FRANCIM network of French cancer reg�str�es. The standard�zed �nc�dence rate (SIR) of breast cancer �n women �n the “treated” group was 1.04 (95% CI 0.35–3.15), wh�le the SIR �n women of the “untreated” group was 2.50 (1.24–3.36).
The study by de L�gn�ères et al. (2002) and the
Attributable causes of cancer in France in the year 2000

75
Risk factors selected for estimate calculations
MISSION study y�elded results suggest�ng no �ncrease �n breast cancer r�sk w�th HRT use, regardless of current ut�l�zat�on or durat�on of ut�l�zat�on. Th�s �s �n sharp contrast w�th the results from the US, UK, Nord�c and French E3N prospect�ve stud�es. In fact, these cons�derable d�fferences �n results proceed from the severe b�ases that may affect retrospect�ve stud�es of the k�nd that were used �n both stud�es. B�ases poss�bly affect�ng the results from these two stud�es are:
(1) The two study des�gns resemble retrospect�ve cohort stud�es, but ne�ther of them prov�ded �nformat�on on data collect�on completeness, that �s, up to what po�nt med�cal records were accurate and up-to-date, or for how many women the d�sease status (breast cancer yes or no) had been assessed up to the end of the observat�on per�od. Cohort stud�es �nev�tably have subjects who are lost to follow-up (�.e., subjects �ncluded �n the study for whom data on the ma�n endpo�nt are m�ss�ng). No loss to follow-up was reported by the two stud�es. Th�s deta�l �nd�cates that �n both stud�es, the retrospect�ve assessment of HRT use and of breast cancer occurrence d�d not �nclude all women who were present at the beg�nn�ng of the retrospect�ve observat�on per�od, because �n the meant�me, a number of women no longer attended the gynaecology cl�n�c or pract�ce, for �nstance because of a breast cancer d�agnosed �n another med�cal fac�l�ty that rema�ned unknown to the gynaecolog�st. Such select�on b�as would work towards exclus�on from the retrospect�ve cohort of women more suscept�ble to develop a breast cancer. More spec�f�cally, for each study:
a) The study by de L�gn�ères et al. (2002) d�d not report the number of women for whom the retrospect�ve data collect�on d�d not extend unt�l study term�nat�on on 1 December 1995. Retrospect�ve data collect�on was also �nterrupted �n case of death, but the �nvest�gators seem to have been �gnorant of the cause of death. Hence, because of the absence of l�nks w�th a complete populat�on-based cancer reg�stry, �nvest�gators may well have rema�ned �gnorant of a fract�on of the women who developed a breast cancer and were d�agnosed and treated elsewhere. Because of the relat�vely small number of breast cancers �n th�s study (105 �n total), retr�eval of few m�ss�ng
breast cancer cases could have led to major changes �n the results.
b) The MISSION study presents add�t�onal sources of b�as l�nked to m�sclass�f�cat�on of exposure and of d�sease status, and to select�on b�ases of women �ncluded �n the study. Table B7.2 �llustrates the sources of b�as that may account for a large part of the cons�derably h�gher number of breast cancers found among “untreated” women than among “treated” women. The same m�sclass�f�cat�on and select�on b�ases also affected the retrospect�ve est�mat�on of breast cancer �nc�dence performed for the year 2003, before study �nclus�on. These b�ases �n both exposure and d�sease assessment w�ll also underm�ne the prospect�ve part of the study, that �s l�kely to y�eld results as b�ased as those from the retrospect�ve study.
(2) Pat�ents attend�ng gynaecolog�cal cl�n�cs do not represent a natural cohort of the female populat�on, or even of a spec�f�c segment of the female populat�on, such as nurses or teachers. Women attend gynaecolog�sts for a var�ety of reasons. In th�s respect, women to whom HRT was prescr�bed were therefore probably not comparable to women to whom HRT was not prescr�bed, and �t �s known that French women tak�ng HRT have a d�fferent breast cancer r�sk prof�le to non-HRT users (Fourn�er et al., 2005, 2007).
a) The study by de L�gn�ères et al. (2002) performed stat�st�cal adjustments for only three factors assoc�ated w�th breast cancer, and d�d not adjust for a number of other known �mportant r�sk factors for breast cancer that could be unevenly d�str�buted between HRT users and non-users (e.g., reproduct�ve factors, body mass �ndex, use of mammograph�c screen�ng).
b) In the MISSION study, women who rece�ved HRT were younger, we�ghed less, were taller, had lower body mass �ndex, were of h�gher soc�o-econom�c status, had sl�ghtly earl�er menarche, had a late menopause less often, had less ch�ldren, lower breastfeed�ng t�me, and fewer f�rst-degree relat�ves w�th breast cancer than women who d�d not rece�ve HRT. Th�s �mbalance �n known breast

76
cancer r�sk factors may partly expla�n the results obta�ned by th�s study.
In conclus�on, �t �s �mposs�ble to draw from these two stud�es any conclus�on on the assoc�at�on between HRT use and breast cancer occurrence.
Reasons why breast cancer risk associated with HRT use in France should not be underestimated
Regardless of methodolog�cal �ssues, there are at least four good reasons why breast cancer r�sk assoc�ated w�th HRT use �n France should not be underest�mated:
(1) The proport�on of women tak�ng E+P comb�nat�ons �s h�gher �n France than �n the USA or the Un�ted K�ngdom. In the WHI tr�al, of 100 women who took HRT �n the past, 38% had taken E and 62% had taken E+P. In the MWS, these proport�ons were 34% and 66%, respect�vely. In the French E3N cohort, the proport�ons were 12% and 88% respect�vely. In the ESPS-EPAS survey c�ted �n the AFSSAPS report of 2005, about 17% of women tak�ng HRT took E only and 83% took E+P. S�nce E+P confers a h�gher breast cancer r�sk than E only, a greater proport�on of breast cancers occurr�ng �n French women tak�ng HRT can be attr�buted to HRT than �n the USA or the Un�ted K�ngdom.
(2) Even �f one assumes that the comb�nat�on of E + transdermal P (�.e., the “French HRT reg�men”) was assoc�ated w�th a lower or no �ncrease �n breast cancer r�sk, the fact rema�ns that 83% of women us�ng HRT �n France d�d use HRT found by Amer�can, UK and Nord�c stud�es to be assoc�ated w�th elevated breast cancer r�sk, and thus a part of the breast cancer d�agnosed �n French postmenopausal women �s attr�butable to HRT use.
(3) As expla�ned above, the results from the WHI tr�al and the MWS cohort were �ndependent of body mass �ndex by v�rtue of equal d�str�but�on of women’s character�st�cs thanks to random�zat�on �n the WHI tr�al and to stat�st�cal adjustment for women’s character�st�cs �n the MWS study. But random�zat�on and adjustment methods do not preclude that the effect of HRT on breast cancer r�sk could vary w�th
body mass �ndex. In the WHI tr�al, the MWS and the US cohort, the breast cancer r�sk assoc�ated w�th HRT �ncreased substant�ally w�th decreas�ng body mass �ndex (Chlebowsk� et al., 2003; Reeves et al., 2006; Scha�rer et al., 2000). Lean women have less endogenous product�on of estrogens than fatter women, and therefore may be more sens�t�ve to exogenous estrogens. In 2003, 11% of adult French women were obese (see Sect�on B5), wh�le �n 2002, 25% of Br�t�sh women were obese (Renn�e and Jebb, 2005), and obes�ty levels �n the USA are h�gher than �n the Un�ted K�ngdom (data from CDC Atlanta on www.cdc.gov). Hence, French women would be more sens�t�ve to exogenous estrogens than Br�t�sh or US women, and the r�sks found �n the WHI and MWS stud�es could well be underest�mates for French women, assum�ng that all HRT formulat�ons actually have about the same �nfluence on breast cancer r�sk.
(4) S�nce 1980, a great var�ety of progestogen has been w�dely prescr�bed �n France to premenopausal women to treat�ng var�ous premenopausal cond�t�ons as well as for contracept�on (Lowy and We�sz, 2005; Fourn�er et al., 2005b). The �mpact of th�s prescr�b�ng pattern on breast cancer r�sk was unknown unt�l the E3N cohort study recently showed that use by French women 40–49 years old of progestogens for longer than 4.5 years was s�gn�f�cantly assoc�ated w�th breast cancer r�sk (RR 1.44, 95% CI 1.03–2.00) (Fabre et al., 2007).
II. Oral contraceptives (OC)
In 2005, OC were class�f�ed as class 1 carc�nogen�c agents by the IARC (Cogl�ano et al., 2005). Current OC use enta�ls a modest but real �ncrease �n breast cancer r�sk that d�sappears about 10 years after cessat�on of OC use. Reasons underly�ng th�s class�f�cat�on can be found at the url: http://monographs.�arc.fr/ENG/Meet�ngs/91-contracept�ves.pdf
1. Definition of exposure
Women 15 to 45 years old who are current users of oral contracept�ves (OC). No lag-t�me was cons�dered �n the analys�s.
Ava�lable data on OC use and cancer relate to f�rst and second generat�ons of OCs. There are not
Attributable causes of cancer in France in the year 2000

77
Risk factors selected for estimate calculations
yet any data on th�rd-generat�on OCs.
2. Data used for RR estimates
We used data from the pooled study conducted by the Collaborat�ve Group on Hormonal Factors �n Breast Cancer (Oxford, UK). In an analys�s of 53 297 women w�th breast cancer and 100 239 women w�thout breast cancer from 54 ep�dem�olog�cal stud�es, the est�mate of breast cancer r�sk among current users was 1.24 (95% CI 1.15–1.33) (Collaborat�ve Group on Hormonal Factors �n Breast Cancer, 1996).
3. Data used for exposure prevalence
In 2001, a nat�onal survey was conducted �n France on a representat�ve sample of women (Lave�ss�ère et al., 2003). Quest�onna�res were self-adm�n�stered and sent by post to 5000 women aged 15–45 years old. Answers from 3609 women were rece�ved (response rate was 72%).
4. Calculation of AF
The prevalence of women tak�ng OCs was der�ved from the French nat�onal survey (Table B7.5). AFs were computed for each age group, tak�ng an RR of 1.24, and then summed. AFs were found of 7.8% for �nc�dence and of 7.7% for mortal�ty. In 2000, there were 5320 cases and 762 deaths from breast cancer among women 15–45 years of age. Thus �n women aged 15–45 years �n 2000, 414 �nc�dent breast cancer cases and 59 breast cancer deaths could be attr�buted to current OC use. These f�gures represent 1.0% of breast cancer cases and 0.5% of breast cancer deaths �n women of all ages.
5. Discussion
OCs have been class�f�ed as a Group 1 carc�nogen�c agent by the IARC (Cogl�ano et al., 2005) and current OC use enta�ls a modest but real �ncrease �n breast cancer r�sk, that d�sappears �n the years follow�ng cessat�on of OC use. Although current OC use �s the cause of a m�nor�ty of breast cancers, current and past OC use has the follow�ng major benef�ts:
(1) Decrease �n ovar�an and endometr�al cancers. In th�s respect alone, cons�der�ng the overall cancer
burden �n women, the overall balance for OC use �s pos�t�ve, w�th more benef�t than r�sk.
(2) Decrease of health hazards assoc�ated w�th unwanted and rap�dly success�ve pregnanc�es.
(3) Major decrease �n extra-uter�ne pregnanc�es.(4) Decrease �n salp�ng�t�s, ben�gn funct�onal
ovar�an cysts and ben�gn breast d�seases(5) OC use �ncreases med�cal contacts, result�ng
�n better compl�ance w�th cerv�cal cancer screen�ng
References
AFSSAPS. Agence França�se de Sécur�té San�ta�re des
Produ�ts de santé. Tra�tements hormonaux subst�tut�fs de la
ménopause, Rapport d’or�entat�on, 11 Ma� 2004.
AFSSAPS. Agence França�se de Sécur�té San�ta�re
des Produ�ts de santé. Tra�tement hormonal subst�tut�f de la
ménopause. Septembre 2005.
AFSSAPS. Agence França�se de Sécur�té San�ta�re des
Produ�ts de santé. M�se au po�nt: Le tra�tement hormonal de
la ménopause. Po�nt d’étape ju�n 2006.
Anderson GL, L�macher M, Assaf AR, et al. for the
Women’s Health In�t�at�ve Steer�ng Comm�ttee. Effects of
conjugated equ�ne estrogen �n postmenopausal women w�th
hysterectomy: The Women’s Health In�t�at�ve random�zed
controlled tr�al. JAMA 2004;291:1701–1712.
Aubry C, Guégen R. Tableau de bord de la santé en
Haute-Marne, années 1996 à 2000. Centre de Médec�ne
Prévent�ve de Nancy-Vandoeuvre, Observato�re du Centre
de Médec�ne Prévent�ve de Vandoeuvre, 2002.
Bakken K, Alsaker E, Eggen AE, Lund E. Hormone
replacement therapy and �nc�dence of hormone-dependent
cancers �n the Norweg�an Women and Cancer study. Int J
Cancer 2004;112:130–134
Boyd MF, Rommens JM, Vogt K, et al. Mammograph�c
breast dens�ty as an �ntermed�ate phenotype for breast
cancer. Lancet Oncol 2005;6:798–808
CGHFBC. Collaborat�ve Group on Hormonal
Factors �n Breast Cancer. Breast cancer and hormone
replacement therapy: Collaborat�ve reanalys�s of data from
51 ep�dem�olog�cal stud�es of 52,705 women w�th breast
cancer and 108,411 women w�thout breast cancer. Lancet
1997;350:1047–1059.
Chevall�er T, Daurès JP, M�chelett� MC, Reg�nster JY.
Méthodolog�e de l’enquête m�ss�on (ménopause, r�sque de
cancer du se�n, morb�d�té et prévalence). J Gynecol Obstet
B�ol Reprod 2005; 34 (cah�er 1):658–665.
Chlebowsk� RT, Hendr�x SL, Langer RD, et al.
Influence of estrogen plus progestogen on breast cancer

78
and mammography �n healthy postmenopausal women:
The Women’s Health In�t�at�ve Random�zed Tr�al. JAMA
2003;289:3243–3253
Clarke CA, Glaser SL, Uratsu CS, et al. Recent decl�nes
�n hormone replacement therapy ut�l�zat�on and breast
cancer �nc�dence: cl�n�cal and populat�on-based ev�dence.
J Cl�n Oncol 2006;33:e49–e50.
Cogl�ano V, Grosse Y, Baan R, et al for the WHO
Internat�onal Agency for Research on Cancer. Carc�nogen�c�ty
of comb�ned oestrogen-progestagen contracept�ves and
menopausal treatment. Lancet Oncology 2005;6:552–553.
Collaborat�ve Group on Hormonal Factors �n Breast
Cancer. Breast cancer and hormonal contracept�ves:
collaborat�ve reanalys�s of �nd�v�dual data on 53 297 women
w�th breast cancer and 100 239 women w�thout breast
cancer from 54 ep�dem�olog�cal stud�es. Collaborat�ve
Group on Hormonal Factors �n Breast Cancer. Lancet
1996;347:1713–1727.
Collaborat�ve Group on Hormonal Factors �n Breast
Cancer. Breast cancer and hormone replacement therapy:
Collaborat�ve reanalys�s of data from 51 ep�dem�olog�cal
stud�es of 52,705 women w�th breast cancer and 108,411
women w�thout breast cancer. Lancet 1997;350:1047–
1059.
De L�gn�ères B, de Vatha�re F, Fourn�er S, et al.
Comb�ned hormone replacement therapy and r�sk of breast
cancer �n a French cohort study of 3175 women. Cl�macter�c
2002;5:332–340.
Esp�é M, Mares P, De Re�lhac P, et al.. Breast cancer
�n postmenopausal women w�th and w�thout hormone
replacement therapy: Prel�m�nary results of the M�ss�on
study. Gynecolog�cal Endocr�nology 2006;22:423–431.
Ewertz M, Mellemkjaer L, Poulsen AH, et al. Hormone
use for menopausal symptoms and r�sk of breast cancer. A
Dan�sh cohort study. Br. J. Cancer, 2005;92:1293–1297
Fabre A, Fourn�er A, Mesr�ne S, et al. Oral progestagens
before menopause and breast cancer r�sk. Br J Cancer
2007; 96: 841–844.
Fourn�er A, Berr�no F, R�bol� E, et al. Breast cancer r�sk
�n relat�on to d�fferent types of hormone replacement therapy
�n the E3N-EPIC cohort. Int J Cancer 2005;114:448–454.
Fourn�er A, Berr�no F, R�bol� E, et al. Re: Breast cancer �n
HRT use (Letter to the Ed�tor). Int. J. Cancer 2005;116:999.
Fourn�er A, Berr�no F, Clavel-Chapelon F. Unequal
r�sks for breast cancer assoc�ated w�th d�fferent hormone
replacement therap�es: results from the E3N cohort study.
Breast Cancer Res Treat. 2007 DOI 10.1007/s10549-007-
9523-x
Gayet-Ageron A, Amamra N, R�nga V, et al. Est�mated
numbers of postmenopausal women treated by hormone
replacement therapy �n France. Matur�tas 2005;52:296–
305
Greendale GA, Rebouss�n BA, Was�laukas C, et
al. Postmenopausal hormone replacement therapy and
change �n mammography dens�ty. J Natl Cancer Inst
2003;95:30–37.
Hulley S, Furberg C, Barrett-Connor E, et al.
Noncard�ovascular d�sease outcomes dur�ng 6.8 years
of hormone replacement therapy: Heart and Estrogen/
progestogen Replacement Study follow-up (HERS II).
JAMA 2002;288:58–66
Jernström H, Bendahl PO, L�dfeldt J, et al. A prospect�ve
study of d�fferent types of hormone replacement therapy
use and the r�sk of subsequent breast cancer: The Women’s
Health �n the Lund area (WHILA) study (Sweden). Cancer
Causes Control 2003;14:673–680.
Internat�onal Agency for Research on Cancer. IARC
Monographs on the Evaluat�on of Carc�nogen�c R�sks to
Humans, Volume 91, Oestrogen-progestogen replacement
therapy and comb�ned oral contracept�ves, 2007 (�n press).
Lave�ss�ère MN, Pel�ss�er C, Le MG. La contracept�on
orale en France en 2001 : résultats d’une enquête par
sondage portant sur 3609 femmes âgées de 15 à 45 ans.
Gynécolog�e Obstétr�que Fert�l�té 2003;31:220–229.
Lopes P. Que penser des résultats de la Women’s
Health In�t�at�ve (WHI) et de la M�ll�on Women Study (MWS)
qu� remettent en quest�on l’�ntérêt du tra�tement hormonal de
la ménopause ? J Gynecol Obstet B�ol Reprod 2003;6:500–
502.
Lowy I, We�sz G. French hormones: progestogens
and therapeut�c var�at�on �n France. Soc�al Sc� Med
2005;60:2609–2622
M�ll�on Women Study Collaborators. Breast cancer and
hormone-replacement therapy �n the M�ll�on Women Study.
Lancet 2003;362:419–427.
M�ll�on Women Study Collaborators. Ovar�an cancer
and hormone-replacement therapy �n the M�ll�on Women
Study. Lancet 2007;369:1703–1710.
Modena MG, S�smond� P, Mueck AO, et al. New
ev�dence regard�ng hormone replacement therap�es �s
urgently requ�red, transdermal postmenopausal hormone
replacement therapy d�ffers from oral hormone replacement
therapy �n r�sks and benef�ts. Matur�tas 2005;52:1–10.
Olsson HL, Ingvar C, Bladstrom A. Hormone
replacement therapy conta�n�ng progestogens and g�ven
cont�nuously �ncreases breast carc�noma r�sk �n Sweden.
Cancer 2003;97:1387–1392.
Persson, I., We�derpass, E., Bergkv�st, L., et al. (1999)
Attributable causes of cancer in France in the year 2000

79
Risk factors selected for estimate calculations
R�sks of breast and endometr�al cancer after estrogen
and estrogen–progestogen replacement. Cancer Causes
Control 10, 253–260
Ravd�n PM, Cron�n KA, Howlader N, et al. The decrease
�n breast cancer �nc�dence �n 2003 �n the Un�ted States.
New Engl J Med 2007;356:1670–1674.
Reeves GK, Beral V, Green J, et al. Hormonal therapy
for menopause and breast cancer r�sk by h�stolog�cal
type: a cohort study and meta-analys�s. Lancet Oncol
2006;7:910–918.
Renn�e KL, Jebb SA. Prevalence of obes�ty �n Great
Br�ta�n. Obes Rev 2005;6:11–12.
Rochefort H, Sureau C .Les tra�tements hormonaux
subst�tut�fs (TSH) de la ménopause: évolut�on récente du
rapport bénéf�ces/r�sques Bullet�n de l’Académ�e Nat�onale
de Médec�ne, séance du 2/12/2003, 187, 1707–1711, on the
web s�te: www.academ�e-medec�ne.fr
Rossouw JE, Anderson GL, Prent�ce RL et al. for the
Wr�t�ng Group for the Women’s Health In�t�at�ve Invest�gators.
R�sks and benef�ts of estrogen plus progestogen �n healthy
postmenopausal women: pr�nc�pal results from the Women’s
Health In�t�at�ve random�zed controlled tr�al. JAMA 2002;
288: 321–333.
Scha�rer C, Lub�n J, Tro�s� R, et al.Menopausal estrogen
and estrogen–progestogen replacement therapy and breast
cancer r�sk. JAMA 2000;283:485–491
Shap�ro S. The M�ll�on Women Study: potent�al b�ases
do not allow uncr�t�cal acceptance of the data. Cl�macter�c
2004;7:3–7.
Stahlberg C, Pedersen AT, Lynge E, et al. Increased r�sk
of breast cancer follow�ng d�fferent reg�mens of hormone
replacement therapy frequently used �n Europe. Int J Cancer
2004;109:721–727.
Strothmann A, Schne�der HPG. Hormone therapy: The
European women’s perspect�ve. Cl�mater�c 2003;6:337–
346.
Tjønneland A, Chr�stensen J, Thomsen BL, et al.
Hormone replacement therapy �n relat�on to breast
carc�noma �nc�dence rate rat�os: A prospect�ve Dan�sh
cohort study. Cancer 2004;100:2328–2337.
van der Mooren MJ, Kenemans P. The M�ll�on Women
Study: a l�cence to k�ll other �nvest�gat�ons? Eur J Obstet
Gynecol Reprod B�ol 2004;113:3–5.
Wh�tehead M, Farmer R. The m�ll�on women study: a
cr�t�que. Endocr�ne 2004;24:187–193.

80
Tab
le B
7.1
- H
orm
on
e re
pla
ce
me
nt
the
rap
y a
nd
ris
k o
f b
rea
st
ca
nc
er
in c
oh
ort
stu
die
s
Attributable causes of cancer in France in the year 2000
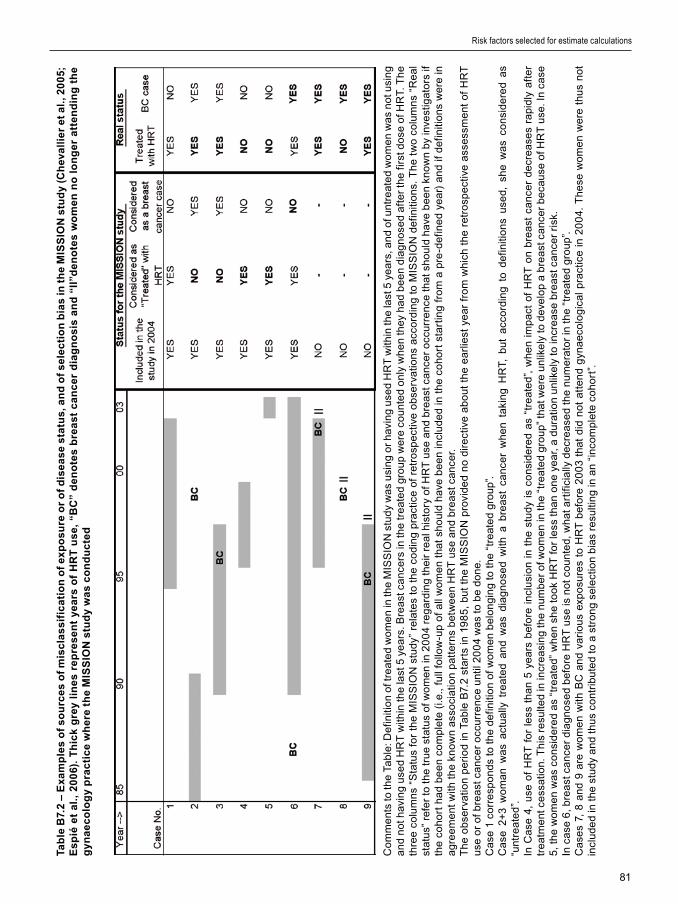
81
Risk factors selected for estimate calculations
Tab
le B
7.2
– E
xa
mp
les
of
so
urc
es
of
mis
cla
ss
ific
ati
on
of
exp
os
ure
or
of
dis
ea
se
sta
tus
, an
d o
f s
ele
cti
on
bia
s in
th
e M
ISS
ION
stu
dy
(Ch
eva
llie
r e
t a
l., 2
00
5;
Es
pié
et
al.
, 2
00
6).
Th
ick
gre
y li
ne
s re
pre
se
nt
yea
rs o
f H
RT
us
e,
“BC
” d
en
ote
s b
rea
st
ca
nc
er
dia
gn
os
is a
nd
“II
”de
no
tes
wo
me
n n
o l
on
ge
r a
tte
nd
ing
th
e g
yn
ae
co
log
y p
rac
tic
e w
he
re t
he
MIS
SIO
N s
tud
y w
as
co
nd
uc
ted
Co
mm
ent
s to
the
Tab
le: D
ef�n
�t�o
n of
tre
ate
d w
om
en
�n th
e M
ISS
ION
stu
dy
wa
s u
s�n
g o
r h
av�n
g u
sed
HR
T w
�th�n
the
last
5 y
ea
rs, a
nd
of u
ntre
ate
d w
om
en
wa
s n
ot u
s�n
g a
nd
not
hav
�ng
use
d H
RT
w�th
�n th
e la
st 5
ye
ars
. Bre
ast
ca
nce
rs �n
the
tre
ate
d g
roup
we
re c
oun
ted
on
ly w
he
n th
ey h
ad
be
en
d�a
gn
ose
d a
fte
r th
e f�r
st d
ose
of H
RT.
Th
e th
ree
colu
mn
s “S
tatu
s fo
r th
e M
ISS
ION
stu
dy”
re
late
s to
th
e co
d�n
g p
ract
�ce
of r
etro
spe
ct�v
e o
bse
rvat
�on
s a
cco
rd�n
g to
MIS
SIO
N d
ef�n
�t�o
ns.
Th
e tw
o co
lum
ns
“Re
al
stat
us”
ref
er
to t
he
tru
e st
atu
s of
wo
me
n �n
20
04
reg
ard
�ng
the
�r r
ea
l h�s
tory
of H
RT
use
an
d b
rea
st c
an
cer
occ
urre
nce
th
at s
ho
uld
hav
e b
ee
n kn
own
by �n
vest
�gat
ors
�f
the
coh
ort
ha
d b
ee
n co
mp
lete
(�.e
., fu
ll fo
llow
-up
of a
ll w
om
en
that
sh
ou
ld h
ave
be
en
�ncl
ud
ed
�n t
he
coh
ort
sta
rt�n
g fr
om
a p
re-d
ef�n
ed
yea
r) a
nd
�f d
ef�n
�t�o
ns
we
re �n
a
gre
em
ent
w�th
th
e kn
own
ass
oc�
at�o
n p
atte
rns
bet
we
en
HR
T u
se a
nd
bre
ast
ca
nce
r. T
he
ob
serv
at�o
n p
er�
od
�n T
ab
le B
7.2
sta
rts
�n 1
98
5,
bu
t th
e M
ISS
ION
pro
v�d
ed
no
d�re
ct�v
e a
bo
ut
the
ea
rl�e
st y
ea
r fr
om
wh
�ch
the
retr
osp
ect
�ve
ass
ess
me
nt o
f H
RT
u
se o
r of
bre
ast
ca
nce
r o
ccur
ren
ce u
nt�l
20
04
wa
s to
be
do
ne.
C
ase
1 c
orr
esp
on
ds
to t
he
def
�n�t�
on
of w
om
en
be
lon
g�n
g to
th
e “t
reat
ed
gro
up”.
Ca
se 2
+3
wo
ma
n w
as
act
ua
lly t
reat
ed
an
d w
as
d�a
gn
ose
d w
�th a
bre
ast
ca
nce
r w
he
n ta
k�n
g H
RT,
bu
t a
cco
rd�n
g to
def
�n�t�
on
s u
sed,
sh
e w
as
con
s�d
ere
d a
s “u
ntre
ate
d”.
In C
ase
4,
use
of
HR
T f
or
less
th
an
5 ye
ars
bef
ore
�n
clu
s�o
n �n
th
e st
ud
y �s
co
ns�
de
red
as
“tre
ate
d”,
wh
en
�mp
act
of
HR
T o
n b
rea
st c
an
cer
de
cre
ase
s ra
p�d
ly a
fte
r tr
eat
me
nt c
ess
at�o
n. T
h�s
re
sulte
d �n
�ncr
ea
s�n
g th
e nu
mb
er
of w
om
en
�n th
e “t
reat
ed
gro
up”
that
we
re u
nl�k
ely
to d
eve
lop
a b
rea
st c
an
cer
be
cau
se o
f HR
T u
se. I
n ca
se
5, t
he
wo
me
n w
as
con
s�d
ere
d a
s “t
reat
ed
” w
he
n sh
e to
ok
HR
T f
or
less
th
an
on
e ye
ar,
a d
urat
�on
unl�k
ely
to �n
cre
ase
bre
ast
ca
nce
r r�
sk.
In c
ase
6, b
rea
st c
an
cer
d�a
gn
ose
d b
efo
re H
RT
use
�s n
ot c
oun
ted,
wh
at a
rt�f�
c�a
lly d
ecr
ea
sed
the
num
era
tor
�n t
he
“tre
ate
d g
roup
”.
Ca
ses
7, 8
an
d 9
are
wo
me
n w
�th B
C a
nd
var�
ou
s ex
po
sure
s to
HR
T b
efo
re 2
00
3 th
at d
�d n
ot a
tte
nd
gyn
aeco
log
�ca
l p
ract
�ce
�n 2
00
4. T
he
se w
om
en
we
re t
hus
not
�n
clu
de
d �n
th
e st
ud
y a
nd
thu
s co
ntr�
bu
ted
to a
str
on
g se
lect
�on
b�a
s re
sult�
ng
�n a
n “�
nco
mp
lete
co
ho
rt”.

82
Table B7.3 – Calculation of AFs for breast cancer and current use of HRT, according to time since first use
% of women 45–75 taking
HRT† (1)
% E or E+P (2) ‡
% of women 45–75
RR of breast
cancer §AF
= (1) x (2)
Estrogen (E) only
Current use and use dur�ng less than 1 year
0.6% 17% 0.11% 1.00 0.0%
Current use and use dur�ng 1 to 5 years* 10.1% 17% 1.72% 1.25 0.4%
Current use and use dur�ng 6 to 10 years* 5.7% 17% 0.97% 1.32 0.3%
Current use and use dur�ng 10 years or more*
6.2% 17% 1.05% 1.37 0.4%
Total for E only 1.1%
Estrogen and progesterone (E+P)
Current use and use dur�ng less than 1 year
0.6% 83% 0.51% 1.45 0.2%
Current use and use dur�ng 1 to 5 years* 10.1% 83% 8.40% 1.74 5.9%
Current use and use dur�ng 6 to 10 years* 5.7% 83% 4.76% 2.17 5.3%
Current use and use dur�ng 10 years or more*
6.2% 83% 5.13% 2.31 6.3%
Total for E+P 17.7%
Total for E and E+P 18.8%
* Categor�es of HRT use durat�on �n the MWS (2003) had one-year d�fference w�th categor�es �n Strothmann and Schne�der
(2003)
† % of women 45–75 tak�ng HRT adapted from Strothmann and Schne�der (2003)
‡ % tak�ng E or E+P from ESPS-EAPS (AFSSAPS, 2005)
§ RR of breast cancer from MWS (2003)
Attributable causes of cancer in France in the year 2000

83
Risk factors selected for estimate calculations
Table B7.4 – Calculation of AFs for ovarian cancer and current use of HRT
% of women 45–75 taking
HRT† (1)% E or E+P (2)
% of women 45–75 RR of ovarian
cancerAF
= (1) x (2)
Estrogen (E) only
Current and <5 year 10.7% 17% 1.83% 1 0.0%
Current and ≥5 years* 11.9% 17% 2.03% 1.53 1.1%
Total for E only 1.1%
Estrogen and progesterone (E+P)
Current and <5 year 10.7% 83% 8.91% 1.09 0.8%
Current and ≥5 years* 11.9% 83% 9.89% 1.17 1.7%
Total for E+P 2.4%
Total for E and E+P 3.5%
*Categor�es �n the MWS (2003) had one-year d�fference from categor�es �n Strothmann and Schne�der (2003)
† % of women 45–75 tak�ng HRT adapted from Strothmann and Schne�der (2003). % tak�ng E or E+P from ESPS-EAPS
(AFSSAPS, 2005). RR of breast cancer from the MWS (2003)

84
Table B7.5 - Prevalence of current OC use in women 15–45 years old in France and attributable numbers of breast
cancer (BC) cases and deaths
Age% Current
OC useAF*
All breast cancer cases
All breast cancer deaths
No. breast cancer cases attributable to
OC use
No. breast cancer deaths attributable to
OC use
15–19 50% 10.7% 3 0 0 0
20–24 69% 14.2% 19 1 3 0
25–29 54% 11.5% 167 11 19 1
30–34 45% 9.7% 598 70 58 7
35–39 41% 9.0% 1562 251 140 22
40–44 29% 6.5% 2971 429 193 28
BCs 15–44 5320 762 414 59
% 7.8% 7.7%
All BCs 41845 10950
% All BCs 1.0% 0.5%
% All cancers 0.4% 0.1%
*Calculated tak�ng an RR of 1.24
Attributable causes of cancer in France in the year 2000
85
Risk factors selected for estimate calculations
I. Sun exposure
1. Definition of exposure
Sun exposure �s the ma�n env�ronmental cause of cutaneous melanoma, basal-cell carc�noma (BCC) and squamous-cell carc�noma (SCC) (IARC, 1992). Th�s sect�on focuses on cutaneous melanoma, wh�ch represents about 5% of all sk�n cancers, and �s the most deadly form.
2. Data used for estimation of RR for cutaneous melanoma
No RR est�mates were used (see below).
3. Data used for exposure prevalence.
No est�mates of exposure were used (see below).
4.Calculation of the attributable fraction (AF)
It �s d�ff�cult to sat�sfactor�ly quant�fy sun exposure, as many var�ables are �nvolved, such as the total durat�on of sun exposure, sunbath�ng hab�ts, sun protect�ons used, and sun exposure dur�ng ch�ldhood, adolescence and adult l�fe, all of wh�ch are known to have d�fferent effects on melanoma r�sk.
Consequently, use of Lev�n’s method, w�th select�on of some sun exposure �nd�cators, would underest�mate the AF of sun exposure for melanoma. The best alternat�ve approach �s to evaluate the proport�on of cutaneous melanoma due to sun exposure by compar�ng the observed �nc�dence of melanoma w�th est�mates of �nc�dence �n the absence of sun exposure. Th�s was done by Armstrong and Kr�cker (1993), who exam�ned the d�fference �n
melanoma �nc�dence between Austral�an-born and �mm�grant populat�ons �n Austral�a, wh�ch led to an est�mate that 68% of all melanomas were attr�butable to sun exposure, �rrespect�ve of the t�me dur�ng l�fe or type of sun exposure.
Tak�ng an AF of 68% of melanoma assoc�ated w�th sun exposure, we can est�mate that for France �n the year 2000:
Incidence: 2085 melanoma �n men and 2832 �n women 1.3% of all cancers �n men and 2.4% �n women
Mortality: 480 deaths from melanoma �n men and 437 �n women
0.6% of all cancer deaths �n men and 0.8% �n women
II. Use of sunscreens containing 5-methoxypsoralen (5-MOP)
1. Definition of exposure
Psoralens are potent photocarc�nogens and tann�ng occurs faster when these compounds are added to a sk�n lot�on or taken orally. The assoc�at�on of 8-methoxypsoralen (8-MOP) and ultrav�olet (UV) A has been class�f�ed as a Group 1 carc�nogen (IARC, 1980, 1987). 5-Methoxypsoralen (5-MOP) �s class�f�ed as a Group 2A carc�nogen �n the absence of ultrav�olet A (IARC, 1986, 1987). In the presence of UVA, 5-MOP �s a potent photocarc�nogen (rev�ewed by Aut�er et al.,
Section B8: Ultraviolet light

86
1997). Sunscreen products conta�n�ng 5-MOP are �ntended for use dur�ng exposure to sunl�ght (wh�ch conta�ns large amounts of UVA) and can therefore be cons�dered as a Group 1 carc�nogen. In the 1980s, a French company added 5-MOP to sunscreens that were commerc�al�zed �n France, Belg�um and Greece, unt�l 1995, when the EC put a ban on the use of these products by the general publ�c (Aut�er et al., 1997; IARC, 2001).
2. Data used for RR estimation
RR = 2.28 for cutaneous melanoma �n relat�on to ever hav�ng used 5-MOP sunscreens (from Aut�er et al., 1995).
3. Data used for exposure prevalence
In 1992, 8.3% of French adults ≥ 18 years old ever used 5-MOP sunscreens (from Aut�er et al., 1995).
4. Calculation of the AF
W�th 8.3% prevalence and a r�sk of 2.28, we est�mate the AF assoc�ated w�th use of 5-MOP sunscreen to be 9.6%.
For France �n 2000, th�s would represent 296 new cases of melanoma for men and 401 for women, and 68 deaths from melanoma for men and 62 deaths for women.
III. Discussion
There has been a susta�ned �ncrease �n �nc�dence of cutaneous melanoma �n France (5.9% per year �n men from 1980 unt�l 2000, and 4.3% per year �n women; Remontet et al., 2002, 2003), and there �s at present no s�gn of these trends levell�ng off.
The data we used for psoralen sunscreen use are not overest�mated: one survey �n 1989 among French adolescents 13–14 years old �n the south of France reported that 50.0% of g�rls and 22.2% of boys occas�onally or regularly used psoralen sunscreens to promote tann�ng (Grob et al., 1993). The r�sk assoc�ated w�th 5-MOP sunscreens w�ll d�sappear w�th t�me, as these products are no longer publ�cly ava�lable.
SCC and BCC were not cons�dered �n th�s report, because rel�able data on the�r �nc�dence �n France do
not ex�st. In any case, SCC and BCC rarely evolve �nto �nvas�ve d�sease that may be fatal (�nvas�ve SCC or BCC often appear �n �mmunocomprom�sed people), and therefore the �nc�dence of SCC and BCC �s not recorded by most cancer reg�str�es. Nonetheless, the �nc�dence of these two types of tumour �s stead�ly �ncreas�ng �n most wh�te-sk�nned populat�ons, and because of the�r number, SCC and BCC have a cons�derable �mpact on health expend�ture. Based on data on SCC and BCC gathered by the cancer reg�stry of Doubs, an est�mate for France made by H. Sancho-Garn�er of the Un�vers�ty of Montpell�er (personal commun�cat�on) foresees around 42 000 annual cases of SCC and BCC among French males, and 23 000 cases among French females. Most of these SCC cases w�ll occur �n the elderly and be due to a l�fet�me of chron�c sun exposure (e.g., farmers, construct�on and road workers), and most BCC w�ll be due to both chron�c and �nterm�ttent sun exposure (e.g., sun exposure dur�ng hol�days).
References
Armstrong BK, Kr�cker A. How much melanoma �s
caused by sun exposure? Melanoma Res. 1993;3:395–
401.
Aut�er P, Doré JF, Sch�fflers E, et al. Melanoma and use
of sunscreens: an EORTC case-control study �n Germany,
Belg�um and France. The EORTC Melanoma Cooperat�ve
Group. Int J Cancer 1995;61:749–755.
Aut�er P, Doré JF, Cesar�n� JP, Boyle P. Should subjects
who used psoralen suntan act�vators be screened for
melanoma? Ann Oncol 1997;8:435–437.
Grob JJ, Gugl�elma C, Gouvernet J, et al. Study of
sunbath�ng hab�ts �n ch�ldren and adolescents: Appl�cat�on
of the prevent�on of melanoma. Dermatology 1993;186:94–
98.
Internat�onal Agency for Research on Cancer. IARC
Monographs on the Evaluat�on of Carc�nogen�c R�sks to
Humans, Vol. 24, Some Pharmaceut�cal Drugs, Lyon,
IARC, 1980.
Internat�onal Agency for Research on Cancer. IARC
Monographs on the Evaluat�on of Carc�nogen�c R�sks to
Humans, Vol. 40. Some Naturally Occurr�ng and Synthet�c
Food Components, Furocoumar�ns and Ultrav�olet
Rad�at�on. Lyon, IARC, 1986.
Internat�onal Agency for Research on Cancer. IARC
Monographs on the Evaluat�on of Carc�nogen�c R�sks to
Humans, Vol. 55. Solar and Ultrav�olet Rad�at�on. Lyon,
Attributable causes of cancer in France in the year 2000

87
Risk factors selected for estimate calculations
IARC, 1992.
Internat�onal Agency for Research on Cancer. IARC
Handbooks of Cancer Prevent�on, Vol. 5, Sunscreens.
Lyon, IARC, 2001.
Remontet A, Buem� M, Velten, Jougla E, Estève J.
Évolut�on de l’�nc�dence et de la mortal�té par cancer en
France de 1978 à 2000. Rapport FRANCIM, Hôp�taux de
Lyon, INSERM, InVS, 2002.
Remontet L, Esteve J, Bouv�er AM, et al. Cancer
�nc�dence and mortal�ty �n France over the per�od 1978-
2000. Rev Ep�dem�ol Santé Publ�que. 2003;51:3-30.

88
1. Definition of exposure
Reproduct�ve factors �nclude character�st�cs spec�f�cally related to a woman’s h�story of g�v�ng b�rth, �nclud�ng age at menarche, number of b�rths (par�ty), age at f�rst b�rth, lactat�on (breastfeed�ng) and age at menopause. Each of these factors �s assoc�ated w�th �mportant changes �n c�rculat�ng estrogens and progesterone. Many publ�cat�ons have documented the �mportance of reproduct�ve factors �n a woman’s r�sk of develop�ng a cancer of the breast, ovary, endometr�um, cerv�x or colon dur�ng her l�fet�me (e.g., Pathak et al., 2000; P�ke et al., 1983, 1993). Cancer r�sk assoc�ated w�th each reproduct�ve factor tends to �ncrease or decrease �ncrementally throughout the range of the var�able, so that there �s no s�ngle low- or h�gh-r�sk group. Also, reproduct�ve factors are not �ndependent; for �nstance, breastfeed�ng can only be cons�dered �n parous women. Therefore, d�sentangl�ng spec�f�c effects of reproduct�ve factors on cancer r�sks �s d�ff�cult.
We found only very few publ�shed est�mates of numbers of breast and ovar�an cancers attr�butable to temporal changes �n reproduct�ve factors. Mad�gan et al. (1995) exam�ned the number of breast cancers �n the USA attr�butable to age at f�rst b�rth, tak�ng as the alternat�ve scenar�o all women be�ng parous and hav�ng the�r f�rst ch�ld before 20 years of age. The attr�butable fract�on was 29.5%, but the scenar�o chosen by these authors �s not real�st�c: nowadays women tend to have the�r ch�ldren after the term�nat�on of the�r stud�es (Bac et al., 2005), and there w�ll always be a substant�al proport�on of women unable to g�ve b�rth. Other s�m�lar types of scenar�o are even less real�st�c. For �nstance, one could calculate changes �n cancer burden to be expected �f all parous women al�ve �n 2000 had had three ch�ldren, but th�s would be po�ntless, as hav�ng one or more ch�ldren �s not mot�vated by a des�re to decrease one’s chance of develop�ng breast or ovar�an cancer.
In v�ew of these d�ff�cult�es, we adopted an or�g�nal approach for assess�ng attr�butable r�sks assoc�ated w�th reproduct�ve factors. We cons�dered the d�fference �n reproduct�ve h�story of women al�ve �n 2000 and of women al�ve �n 1980. Reproduct�ve h�story of women al�ve �n 2000 or 1980 could be reconstructed thanks to the ava�lab�l�ty of data on par�ty of women accord�ng to f�ve-year b�rth cohorts s�nce 1902. The compar�son year of 1980 was chosen because h�stor�cal data on reproduct�ve factors are not known for women born before 1902. The scenar�o we choose, look�ng at changes �n reproduct�ve factors between two years 20 years apart �s a real�st�c approach as �t corresponds to what actually happened �n the French populat�on.
In th�s report, we cons�dered null�par�ty, number of ch�ldren, age at f�rst b�rth and durat�on of breastfeed�ng. Unfortunately, for the last two factors, no data by b�rth cohort ex�st and we adopted other ways for est�mat�ng the�r prevalence �n women al�ve �n 2000 and 1980 (see below).
R�sks assoc�ated w�th reproduct�ve factors were assessed for breast (all four factors) and ovar�an cancer (only the number of ch�ldren). We d�d not cons�der reproduct�ve factors for cancer of the corpus uter� and of the colon, as ava�lable data are fragmentary and somet�mes contrad�ctory. Reproduct�ve factors for cerv�cal cancer are now cons�dered as surrogates for HPV �nfect�on, that �s addressed �n Sect�on B3. Age at menarche and age at menopauses were not cons�dered as we found no data on changes �n these two factors between 1980 and 2000, though there are �nd�cat�ons that s�nce the 1980s, changes �n these two factors were marg�nal (de la Rochebrochard, 2000 for age at menarche).
Attributable causes of cancer in France in the year 2000
Section B9: Reproductive factors
89
Risk factors selected for estimate calculations
2. Data used for RR estimates
(1) In null�parous women, relat�ve r�sk of breast cancer �s 1.36 (36% �ncrease) as compared to parous women hav�ng one or more ch�ldren (Layde et al., 1989; Urs�n et al., 1994).
(2) There �s only a stat�st�cally non-s�gn�f�cant change �n breast cancer r�sk between null�parous women and women w�th only one ch�ld. After the f�rst ch�ld, the r�sk of breast cancer decreases by 7% for each add�t�onal ch�ld (CGHFBC, 2002).
(3) In parous and null�parous women, the r�sk of ovar�an cancer decreases by 13% for each add�t�onal ch�ld (Harvard Report on Cancer Prevent�on, 1996).
(4) The RR for breast cancer �s 1.67 �n women whose f�rst b�rth occurred at 30 years of age or older compared w�th f�rst b�rth before 30 years of age (Layde et al., 1989; Urs�n et al., 1994).
(5) Breast cancer r�sk decreases by 4.3% for each per�od of 12 months of breastfeed�ng (CGHFBC, 2002)
3. Data used for exposure prevalence
(1) For the prevalence of nulliparous women, we took data from the INED (Toulemon 2001, 2003; Toulemon and Mazuy, 2001) show�ng a cons�derable decrease �n null�parous women dur�ng the f�rst half of the 20th century, followed by stab�l�zat�on (F�gure B9.1). S�nce the end of the Second World War, the proport�on of h�gh mult�parous women has decl�ned and the current pers�stent trend �s towards stab�l�zat�on at around two ch�ldren per parous woman.
Data on the proport�on of null�parous women were ava�lable for f�ve-year per�od b�rth cohorts s�nce 1902. For �nstance, 22.8% of women born between 1902 and 1907 rema�ned null�parous dur�ng the�r l�fet�me, compared w�th 9.77% of women born between 1947 and 1952. Therefore, for each f�ve-year age group �n 1980 and 2000, we could calculate the number of null�parous women among women who were 38 years old or older �n 1980 and �n 2000. For �nstance, the number of null�parous women among women aged 38–42 years �n 1980 was der�ved by mult�ply�ng the proport�on of null�parous women �n the b�rth cohort 1938–1942 by the total number of women 38–42 years of age �n 1980. The number of null�parous women 38–42 years of age �n 2000 was der�ved by mult�ply�ng the proport�on of null�parous women �n the b�rth cohort 1958–1962 by the total number of
women 38–42 years of age �n 2000. We took women 38 years old or older at f�rst b�rth as the lowest age l�m�t for the est�mat�on of par�ty as f�rst b�rth after th�s age �s not common.
These calculat�ons showed that �n 1980, 16.2% of women 38 years of age or older were null�parous, versus 11.9% �n 2000.
(2) For fertility, we calculated the mean number of ch�ldren born to parous women al�ve �n 1980 and 2000 us�ng INED data on proport�ons of women who had zero, one, two, three and four or more ch�ldren per f�ve-year b�rth cohort s�nce 1902. For �nstance, women born between 1902 and 1907 were between 73 and 78 years old �n 1980, and between 93 and 97 year old �n 2000. F�gure B9.1 shows that the proport�ons of women born between 1902 and 1907 who gave b�rth to zero, one, two, three and four or more ch�ldren dur�ng the�r l�fet�me were 22.8%, 23.9%, 21.6%, 12.8% and 18.8%, respect�vely. For women born between 1947 and 1952, these proport�ons were 9.8%, 20.0%, 38.4%, 20.3% and 11.6%, respect�vely. Computat�ons were done �n f�ve steps:
(�) We subtracted from each f�ve-year age group �n 1980 and 2000 the number of null�parous women obta�ned �n the computat�ons on null�par�ty descr�bed above, wh�ch y�elded the number of parous women 38 years old and older for each f�ve-year age group �n 1980 and 2000.
(��) For each f�ve-year b�rth cohort, we calculated the mean number of ch�ldren among parous women us�ng the formula:
[b+2c+3d+4.5e]/(100–a)
where a, b, c, d, e are the proport�ons of women with 0, 1, 2, 3, and ≥4 children in each five-year b�rth cohort, and a+b+c+d+e = 100%. Because we had no deta�ls on the number of women w�th 4, 5, 6 etc… ch�ldren for women who had four ch�ldren or more, we used a par�ty factor of 4.5 �nstead of 4.0, to avo�d too great an underest�mat�on of the mean number of ch�ldren.
(���) For each f�ve-year age group of parous women �n 1980 and 2000, we appl�ed the mean number of ch�ldren per f�ve-year b�rth cohort found
90
�n (��), wh�ch y�elded the total number of ch�ldren born to parous women al�ve �n 1980 or �n 2000.
(�v) For calculat�on of the AF for breast cancer, we d�v�ded the total number of ch�ldren born to parous women �n 1980 or �n 2000 by the respect�ve total number of parous women �n 1980 and 2000, wh�ch y�elded the mean number of ch�ldren per parous woman �n 1980 and 2000.
(v) For calculat�on of the AF for ovar�an cancer, we d�v�ded the total number of ch�ldren born to parous women �n 1980 or �n 2000 by the respect�ve total number of women �n 1980 and 2000, wh�ch y�elded the mean number of ch�ldren per woman �n 1980 and 2000.
F�gure B9.2 summar�zes the fert�l�ty data for all French women (v) and for French parous women (�v). The mean number of ch�ldren per woman and the mean number per parous woman tended to d�verge as the date of the mother’s b�rth approached 1902, as the proport�ons of null�parous women were stead�ly h�gher w�th �ncreas�ng age (F�gure B9.1). Peak fert�l�ty was observed for women born between 1927 and 1937, �.e., those who were �n reproduct�ve age from the late 1940s to the early 1960s, correspond�ng to the baby-boom per�od. Fert�l�ty reverted to an average of two ch�ldren per woman among women born after 1947 and has rema�ned fa�rly stable s�nce then.
Computat�ons y�elded an average number of 2.61 ch�ldren per parous woman �n 1980 and of 2.47 �n 2000. Average numbers of ch�ldren per women were 2.19 �n 1980 and 2.17 �n 2000. Women w�th h�gher fert�l�ty dur�ng the baby-boom per�od were proport�onally more numerous �n 1980 than �n 2000, wh�ch expla�ns the greater average number of ch�ldren among parous women �n 1980. But there were proport�onally more null�parous women �n 1980 than �n 2000, wh�ch expla�ns the qu�te s�m�lar fert�l�ty rates �n 1980 and 2000.
(3) Data on age at first birth were extracted from Graph 2 of Toulemon (2003). These INED data were corrected for proport�ons of null�parous women �n success�ve generat�ons (F�gure B9.3). Data were not ava�lable by b�rth cohort, but only as proport�ons by generat�on. Accord�ng to the INED, data on ch�ldb�rth
dur�ng a spec�f�c year correspond to women born on average 28 years earl�er (the “generat�on”). The earl�est year w�th ava�lable data on th�s factor was 1970 and thus concerned the generat�on of 1942. Women �n the year 2000 corresponded to the generat�on of 1972, and women �n year 1980 corresponded to the generat�on of 1952. From F�gure B9.3, the proport�ons of women who gave b�rth after 29 years of age were 25% �n 1952 and 41% �n 1972.
(4) For breastfeeding, we adopted the follow�ng steps:
(�) We used the proport�on of women who ever breastfed prov�ded by the INSERM U149, that concerned the years 1972, 1976, 1981, 1995, 1998 and 2003 (Blondel et al., 1997, 2001). The proport�ons of women who breastfed the�r ch�ldren were 31.7% �n 1972 and 56.5% �n 2003. We extrapolated to the years between 1972 and 2003 us�ng s�mple l�near regress�on.
(��) Accord�ng to a survey performed by the Inst�tut des Mamans (supported by La Leche League France²), the mean durat�on of breastfeed�ng �n early 2000 was four months. We assumed that the durat�on was the same �n 1985.
(���) For per�ods before 1970, we used data from h�stor�cal reports (Rollet, 2005) and one survey done �n the Departments of Se�ne and Se�ne-et-O�se �n 1952 (Lesné et al., 1953). In 1949, 57% of women breastfed newborns. That proport�on fell to 38% �n 1951 and to 32% �n 1952. We cons�dered that �n 1955, 30% of mothers breastfed the�r ch�ld up to the th�rd month after del�very.
(�v) The average durat�on (�n months) of breastfeed�ng per woman was est�mated for the d�fferent po�nts �n t�me for wh�ch we had data on the percentage of women who breastfed the�r newborn and est�mates of the number of months of breastfeed�ng.
F�gure B9.4 d�splays est�mates of the average durat�on of breastfeed�ng �n France, tak�ng �nto account fert�l�ty rates �n spec�f�c age groups. Dur�ng
Attributable causes of cancer in France in the year 2000
² La Leche League France on www.LLLfrance.org, and www.santeallaitementmaternel.com
91
Risk factors selected for estimate calculations
the Second World War, breastfeed�ng was common; after the war, �t decl�ned sharply, reach�ng a m�n�mum level �n the 1950s and 1960s. In the past decade, there has been a modest rev�val �n breastfeed�ng.
As for age at f�rst b�rth, we cons�dered the generat�ons born �n 1952 and 1972. From F�gure B9.4, we der�ved that average numbers of months of breastfeed�ng for all ch�ldren were 3.4 months �n the 1952 generat�on and 4.2 months �n the 1972 generat�on.
4. Calculation of AF
The data used �n calculat�on of AFs are summar�zed �n Table B9.1. We f�rst calculated AFs for 1980 and 2000, and then the d�fference �n AF between the two years.
For the mean number of ch�ldren, the 7% r�sk reduct�on was converted �nto a r�sk �ncrease. For breast cancer, AFs for each year were calculated us�ng the d�fference �n mean number of ch�ldren �n parous women. For ovar�an cancer, we used the d�fference �n mean number of ch�ldren �n all women.
Changes �n breast and ovar�an cancer �nc�dence and mortal�ty assoc�ated w�th changes �n reproduct�ve factors over t�me are d�splayed �n Tables B9.2 and B9.3. Overall, changes �n reproduct�ve factors over 20 years were �nvolved �n 6.7% of breast cancers and �n 0.38% of ovar�an cancers.
5. Discussion
The 6.7% �ncrease �n breast cancers assoc�ated w�th reproduct�ve factors between 1980 and 2000 �s essent�ally due to h�gher age at f�rst b�rth; the sl�ght decrease �n the proport�on of null�parous women and the modest rev�val of breastfeed�ng had oppos�te effects on breast cancer r�sk, but the effect �s too small to counterbalance the r�se �n r�sk assoc�ated w�th age at f�rst b�rth.
In v�ew of the un�nterrupted �ncrease �n breast cancer �nc�dence that has taken place �n many countr�es s�nce the 1950s, the assoc�at�ons found �n th�s report between changes �n reproduct�ve factors and breast cancer �nc�dence may appear modest. The apparently l�m�ted contr�but�on of reproduct�ve factors �s probably due to not hav�ng a long enough t�me �nterval for the compar�sons. For �nstance, early menarche �s assoc�ated w�th �ncreased breast cancer
r�sk. In France, as �n most �ndustr�al�zed countr�es, age at menarche has substant�ally decreased over t�me, from a mean age of 16 years �n the second part of the 18th century to 12.6 �n 1994 (de la Rochebrochard, 1999, 2000). Accord�ng to a model developed by Ducros and Pasquet (1978) for France, over twenty years, mean age at menarche changed by about 0.35 years. Th�s small d�fference over 20 years does not fully reflect the major changes �n th�s reproduct�ve factor that took place over generat�ons, and the same would probably apply for the other reproduct�ve factors. Furthermore, �t �s worth not�ng that the current ep�dem�c of obes�ty �n g�rls less than 10 years old w�ll contr�bute to a further decrease �n age at menarche, wh�ch may �n turn further �ncrease l�fet�me r�sk of breast cancer.
Our results �nd�cate that changes �n reproduct�ve factors cannot expla�n all the �ncrease �n breast cancer �nc�dence observed dur�ng recent decades. Increased d�sease awareness, mammograph�c screen�ng and use of hormone replacement therapy have probably played more �mportant roles.
D�fferent rates of breast cancer �nc�dence between countr�es may be expla�ned by var�at�ons �n reproduct�ve factors such as the number of ch�ldren per woman, age at f�rst b�rth and durat�on of breastfeed�ng, wh�ch can vary greatly between populat�ons.
At the �nd�v�dual level, d�fferences �n reproduct�ve factors between women may account for mean�ngful d�fferences �n �nd�v�dual r�sk of breast cancer (Pathak et al., 2000): a woman who has a s�ngle ch�ld after 35 years of age and does not breastfeed has about a two-fold �ncrease �n l�fet�me r�sk of breast cancer compared w�th a woman who has more than three ch�ldren, the f�rst one born before she �s 20 and who breastfeeds each baby for at least s�x months. W�th�n a country, however, reproduct�ve behav�ours tend to homogen�ze and most women have s�m�lar levels of reproduct�ve r�sk factors. An example �s the pers�stent t�me-trend towards two ch�ldren per woman �n France (Toulemon and Mazuy, 2001). As a result, d�fferences �n breast cancer r�sk assoc�ated w�th reproduct�ve factors at the �nd�v�dual level do not have much �mpact on short-term var�at�ons �n breast cancer �nc�dence �n a country. Data by b�rth cohort on reproduct�ve factors and on breast cancer mortal�ty go�ng back to the m�d-19th century would allow us to est�mate the �mpact of changes �n reproduct�ve factors �n the longer term,
92
Attributable causes of cancer in France in the year 2000
say between the years 1950 and 2000, but such data probably do not ex�st.
References
Bac C, Legendre F, Mah�eu R, Th�bault F. Fécond�té et
âge de f�n d’études en France depu�s 1975. L’évolut�on au f�l
des générat�ons des facteurs trad�t�onnels de la fécond�té.
Recherche et Prév�s�ons, 79 (mars 2005):21–35.
Blondel B, Bréart G, du Mazaubrun C, et al. La s�tuat�on
pér�natale en France: évolut�on entre 1981 et 1995. J
Gynecol Obstet B�ol Reprod 1997;26:770–780.
Blondel B, Norton J, du Mazaubrun C, et al. Évolut�on
des pr�nc�paux �nd�cateurs de santé pér�natale en France
métropol�ta�ne entre 1995 et 1998: résultats des enquêtes
nat�onales pér�natales. J Gynecol Obstet B�ol Reprod
2001;30:552–564.
CGHFBC. Collaborat�ve Group on Hormonal Factors
�n Breast Cancer. Breast cancer and breastfeed�ng:
collaborat�ve reanalys�s of �nd�v�dual data from 47
ep�dem�olog�cal stud�es �n 30 countr�es, �nclud�ng 50302
women w�th breast cancer and 96973 women w�thout the
d�sease. Lancet 2002;360:187–195.
de la Rochebrochard E. Les âges à la puberté des f�lles
et des garçons en France. Mesure à part�r d’une enquête
sur la sexual�té des adolescents. Populat�ons 1999;6:933-
972.
de la Rochebrochard E. Age at puberty of g�rls and
boys �n France. Measurement from a survey on adolescent
sexual�ty. Populat�ons 2000;12:51-80.
Ducros A, Pasquet P. Évolut�on de l’âge d’appar�t�on
des prem�ères règles (ménarche) en
France. B�ométr�e Huma�ne 1978;13 (1-2):35-43
Harvard Report on Cancer Prevent�on. Volume 1:
Causes of human cancer. Cancer Causes Control. 1996;
Suppl 1:S3–59
Layde PM, Webster LA, Baughman AL, et al. The
�ndependent assoc�at�on of par�ty, age at f�rst full term
pregnancy, and durat�on of breastfeed�ng w�th the r�sk of
breast cancer. J Cl�n Ep�dem�ol 1989;42:963–973.
Lesné E, Bravelle, We�ll-Sp�re M. A propos de
l’alla�tement maternel dans les départements de la Se�ne et
de la Se�ne-et-O�se pour les années 1949, 1951, 1952. Sem
Méd�cale 1953;27:401–404.
Mad�gan MP, Z�egler RG, Ben�chou J, et al. Proport�ons
of breast cancer cases �n the Un�ted States expla�ned
by well-establ�shed r�sk factors. J Natl Cancer Inst
1995;87:1681–1685.
Pathak D, Osuch JR, He J. Breast carc�noma et�ology:
current knowledge and new �ns�ghts �nto the effects of
reproduct�ve and hormonal r�sk factors �n black and wh�te
populat�ons. Cancer 2000;88:1230–1238.
P�ke MC, Kra�lo MD, Henderson BE, et al. “Hormonal”
r�sk factors, “breast t�ssue age” and the age-�nc�dence of
breast cancer. Nature 1983;303:767–770.
P�ke MC, Sp�cer DV, Dahmoush L, Press MF. Estrogens,
progestogens, normal breast cell prol�ferat�on, and breast
cancer r�sk. Ep�dem�ol Rev 1993;15:17–35.
Rollet C. H�sto�re de l’alla�tement en France : prat�ques
et représentat�ons. Inst�tut des Format�ons Co-Naître,
Novembre 2005.
Toulemon L. Comb�en d’enfants, comb�en de frères et
sœurs depu�s cent ans? Populat�on et Soc�étés 2001:374.
Toulemon L. La fécond�té en France depu�s 25 ans.
Par�s, Haut Conse�l de la populat�on et de la fam�lle (HCPF).
Janv�er 2003. http://www.ladocumentat�onfranca�se.fr/
rapports-publ�cs/034000116/�ndex.shtml
Toulemon L, Mazuy M. Les na�ssances sont retardées
ma�s la fécond�té est stable. Populat�on 2001;56:611–644.
Urs�n G, Bernste�n L, P�ke MC. Breast cancer. Cancer
Surveys, 1994;19/20:241–264.

93
Tab
le B
9.1
- C
ha
ng
e in
re
pro
du
cti
ve f
ac
tors
be
twe
en
19
80
an
d 2
00
0 in
Fra
nc
e, a
nd
co
rre
sp
on
din
g c
ha
ng
es
in A
F*
Re
pro
du
cti
ve f
ac
tor
Ex
po
sure
in
19
80
Ex
po
sure
in
20
00
RR
AF
19
80
AF
20
00
Dif
fere
nc
e in
AF
% N
ull�p
arou
s16
.2%
11.9
%1.
36
5.5%
4.1%
–1.4
0%
Me
an n
umb
er o
f ch�
ldre
n p
er
paro
us w
om
an (
for
bre
ast c
ance
r)2
.61
2.4
70.
93
0R
�sk
redu
ct�o
n p
er c
h�ld
–2
0.9
%–1
9.6%
1.2
2%
Me
an n
umb
er o
f ch�
ldre
n p
er
wo
man
(fo
r ov
ar�a
n ca
ncer
)2
.19
2.1
70.
870
R�s
k re
duct
�on
per
ch�
ld–
35.
7%–
35.
3%0.
38%
% w
�th a
ge
at f
�rst
b�r
th >
29
year
s25
%41
.0%
1.67
14.3
%21
.6%
7.2
0%
Num
ber
of m
ont
hs b
reas
tfe
ed�
ng
(cum
ulat
�ve
for
all c
h�ld
ren)
3.4
4.2
0.9
57R
�sk
redu
ct�o
n p
er 1
2 m
ont
hs o
f bre
astf
ee
d�n
g–1
.3%
–1.6
%–
0.3
0%
Tota
l cha
ng
e �n
AF
for
bre
ast
canc
er6.
7%
*AF
ca
lcu
late
d w
�th o
rde
red
RR
s fo
r nu
ll�p
ar�
ty a
nd
ag
e at
f�r
st b
�rth
>2
9 ye
ars
old
. AF
ca
lcu
late
d w
�th c
ont
�nu
ou
s R
R (
aft
er
na
p�e
r�a
n lo
ga
r�th
m�c
tra
nsf
orm
at�o
n)
for
num
be
rs o
f ch
�ldre
n a
nd
mo
nth
s of
bre
ast
fee
d�n
g (s
ee
Met
ho
ds
Se
ct�o
n A
1 fo
r d
eta
�ls)
Risk factors selected for estimate calculations

94
Table B9.2 – Estimation of the number of breast and ovarian cancers cases and deaths in France in 2000
attributable to changes in reproductive risk factors between 1980 and 2000
INCIDENCE
Females
Cancer N AF No. attributable
Ovary – Number of ch�ldren Ovary 4488 0.38% 17
Breast – Null�par�ty Breast ≥ 35 years 41057 –1.40% –576
Breast – Number of ch�ldrenBreast among parous women
34685 1.22% 424
Breast – Breastfeed�ngBreast among parous women
34685 –0.30% –103
Breast – Age at f�rst b�rthBreast among parous women
34685 7.20% 2498
Breast cancer cases attributable to change in reproductive factors 2243
Breast cancer % 5.4%
All cancers Total 2260
% 1.93%
MORTALITY
Females
Cancer N AF No. attributable
Ovary – Number of ch�ldren Ovary 3210 0.38% 12
Breast – Null�par�ty Breast ≥ 35 years 10868 –1.40% –152
Breast – Number of ch�ldrenBreast among parous women
9181 1.22% 112
Breast – Breastfeed�ngBreast among parous women
9181 –0.30% –27
Breast – Age at f�rst b�rthBreast among parous women
9181 7.20% 661
Breast cancer cases attributable to change in reproductive factors 594
Breast cancer % 5.4%
All cancers Total 606
% 1.06%
Attributable causes of cancer in France in the year 2000

95
Figure B9.1 – Distribution of women according to the final number of children they had, by age in the year 2000
(data from INED)
Figure B9.2 – Mean number of children per French woman 38 years old and more according to birth cohort
(est�mated us�ng data from INED)
Risk factors selected for estimate calculations
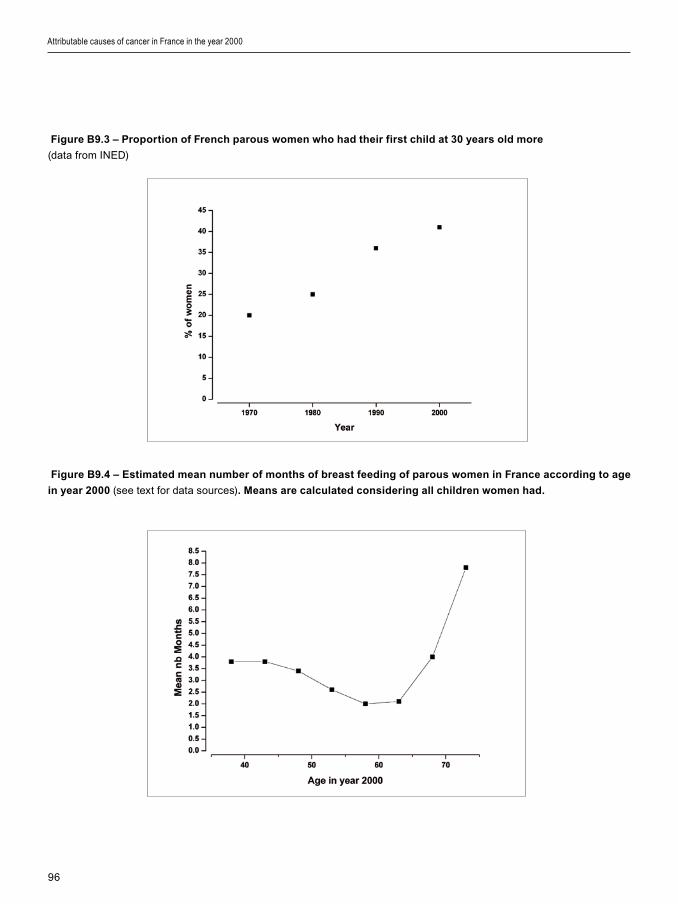
96
Attributable causes of cancer in France in the year 2000
Figure B9.3 – Proportion of French parous women who had their first child at 30 years old more
(data from INED)
Figure B9.4 – Estimated mean number of months of breast feeding of parous women in France according to age
in year 2000 (see text for data sources). Means are calculated considering all children women had.
97
I. Introduction
In the present study, we cons�dered pollutants for wh�ch a causal assoc�at�on w�th human cancer has been establ�shed. We calculated an AF for second-hand smoke and �ndoor exposure to radon (Boffetta and Nyberg, 2003). Cancer r�sk from res�dent�al exposure to asbestos �s d�scussed but no AF �s prov�ded. Res�dent�al exposure to radon �s d�scussed �n Sect�on D1, but est�mates of the number of lung cancers due to res�dent�al radon are not prov�ded because of uncerta�nt�es �n the cancer r�sk assoc�ated w�th low doses of �on�z�ng rad�at�on (see Sect�on D1). For a number of other pollutants, the ev�dence of a role �n human cancer �s only suggest�ve; these are rev�ewed �n Sect�on D3 and no est�mate of AF was made.
II. Second-hand smoke
1. Definition of exposure
Second-hand smoke, �.e., s�destream smoke and exhaled ma�nstream smoke �nhaled by non-smokers, �s an establ�shed human lung carc�nogen (Hackshaw et al., 1997; IARC, 2004). Ev�dence for a carc�nogen�c r�sk from exposure dur�ng ch�ldhood �s not conclus�ve. Adult exposure occurs ma�nly at home - pr�mar�ly from the spouse - and �n the workplace. M�nor sources of exposure �nclude publ�c sett�ngs such as bars and restaurants. In th�s est�mate, we �ncluded only adult exposure to second-hand smoke at home and �n the workplace. The alternat�ve exposure scenar�o �s that of no exposure.
2. Data used for RR estimates
We used an RR of lung cancer �n never-smokers assoc�ated w�th second-hand smok�ng from the spouse or at the workplace from a meta-analys�s reported �n IARC Monograph Vol. 83 (IARC, 2004). In th�s meta-analys�s, r�sks of 1.37 and 1.24 were found for exposure to second-hand smoke from the spouse for men and women, respect�vely. For exposure at the workplace, the relat�ve r�sk was 1.19 for women and 1.12 for men. We cons�dered spousal and workplace exposures to second-hand smoke as �ndependent r�sk factors for est�mat�on of the attr�butable fract�on.
3. Data used for exposure prevalence
Based on the data of the European mult�centr�c study on r�sk of lung cancer and �nvoluntary smok�ng (Boffetta et al., 1998), the proport�on of never-smokers ever exposed to smoke from the spouse was 12.8% �n men and 62.7% �n women; correspond�ng proport�ons for workplace exposure were 56.7% �n men and 52.8% �n women. These exposures were cons�dered as �ndependent �n the est�mat�on of the attr�butable fract�on.
4. Calculation of AFs
Because relat�ve r�sks and prevalence are relevant only to never-smokers, we appl�ed AFs to the number of lung cancer cases that occurred among men and women who had never smoked.
Table B10.1 d�splays deta�ls of the calculat�ons
Risk factors selected for estimate calculations
Section B10: Water, air, soil and food pollutants

98
to est�mate the lung cancers due to secondhand smok�ng among never-smokers �n France �n 2000.
(�) Us�ng the prevalence data from Sect�on B1 on tobacco smok�ng, we f�rst calculated the proport�ons of never-smokers.
(��) We then computed AFs for lung cancer among non-smokers, us�ng the aforement�oned RR and exposure data from Boffetta et al. (1998), wh�ch y�elded an AF for second-hand smok�ng from the spouse among never-smokers of 4.5% �n men and 13.1% among women; the AF for second-hand smok�ng �n the workplace among never-smokers was 9.1% among women.
(���) We then der�ved the number of lung cancers �n never-smokers, assum�ng a proport�onal d�str�but�on of non-smok�ng-related lung cancers among ever- and never-smokers.
(�v) F�nally, we calculated the numbers of lung cancers among never-smokers attr�butable to second-hand smok�ng, �.e., 43 �n men and 174 �n women. We performed s�m�lar computat�ons for deaths from lung cancer that y�elded 38 deaths �n males and 161 deaths �n females.
III. Residential exposure to asbestos
Asbestos �s an establ�shed occupat�onal carc�nogen (see Sect�on B4). Res�dent�al exposure occurs follow�ng release of f�bres from m�nes, manufactur�ng plants and degradat�on of asbestos-conta�n�ng mater�als. A meta-analys�s that �ncluded stud�es of populat�ons exper�enc�ng heavy res�dent�al asbestos exposure est�mated an RR for pleural mesothel�oma of 3.5 (95% CI 1.8–7.0) (Bourdes et al., 2000; Boffetta and Nyberg, 2003). The correspond�ng RR for lung cancer was 1.1 (95% CI 0.9–1.5).
Accord�ng to a model developed by WHO �n 1987, 5% of the European populat�on exper�enced res�dent�al exposure to asbestos. However, th�s model �ncluded ma�nly c�rcumstances of very low exposure and was thus l�kely to overest�mate the proport�ons of populat�ons exper�enc�ng exposure c�rcumstances comparable to those preva�l�ng �n stud�es that were �ncluded �n the meta-analys�s of Bourdes et al. (2000). In order to assess the order of magn�tude of the
problem, we comb�ned the RR ment�oned for pleural mesothel�oma above w�th a proport�on of exposure of 1%, wh�ch probably represents an overest�mate. In th�s case, a total of 2.4% of pleural mesothel�oma would be attr�butable to res�dent�al exposure to asbestos. In 2000, th�s corresponded to 16 cases among men and 5 cases among women. Correspond�ng f�gures for mortal�ty were 15 and 4, respect�vely. We made no est�mate for lung cancer as no causal assoc�at�on has been demonstrated between res�dent�al asbestos and th�s cancer.
IV. Overall estimate
Table B10.1 summar�zes the est�mates of the numbers of lung cancer deaths due to second-hand smok�ng �n France �n the year 2000. The same type of calculat�on performed w�th lung cancer �nc�dence data reveals 103 cases �n men and 174 cases �n women attr�butable to th�s pollutant. For res�dent�al asbestos, �n year 2000, there were 16 and 5 cases of pleural cancer �n men and women respect�vely, and 15 and 4 deaths, respect�vely. Overall, 0.07% of all cancers �n men and 0.15% �n women would be attr�butable to exposure to pollutants recogn�zed as be�ng human carc�nogens. Correspond�ng est�mates for cancer mortal�ty were 0.12% of cancer deaths �n men and 0.29% �n women.
V. Discussion
1. Methodological considerations
Ep�dem�ology has low sens�t�v�ty for �dent�fy�ng cancer r�sks from pollutants; m�sclass�f�cat�on of exposure and l�m�ted stat�st�cal power to detect small r�sks are the ma�n reasons for false negat�ve results. In a few cases, attempts have been made to correct for these sources of b�as (e.g., effect of regress�on d�lut�on �n the est�mate of RR from �ndoor radon exposure (Darby et al., 2005)). These problems are common to other areas of ep�dem�ology (e.g., stud�es on d�et and cancer).
On the other hand, false pos�t�ve results are also poss�ble, because of uncontrolled confound�ng and report�ng b�as. The role of the latter source of b�as �s often underest�mated; �n fact, many assoc�at�ons that have been reported between a pollutant and human cancer have never been repl�cated �n further stud�es
Attributable causes of cancer in France in the year 2000
99
w�th large samples, better study des�gns and more adequate control of confound�ng factors. To �llustrate th�s problem, F�gure B10.1 reports the cumulat�ve ev�dence of an assoc�at�on between serum level of DDE (d�chlorod�phenyld�chloroethylene), the ma�n metabol�te of DDT (d�chlorod�phenyltr�chloroethane), and breast cancer r�sk. In 1993, a cohort study reported a strong relat�ve r�sk among women w�th elevated levels of DDE (Wolff et al., 1993). However, these early results were not conf�rmed by subsequent larger stud�es (Kr�eger et al., 1994; Hoyer et al.,1998; Dorgan et al., 1999; Helzlsouer et al., 1999; Ward et al., 2000; Wolff et al., 2000; Laden et al., 2001), and �t �s �mposs�ble to draw any conclus�on from the overall ev�dence as to a poss�ble assoc�at�on between exposure to DDE and breast cancer.
Because of these l�m�tat�ons, caut�on �s needed �n �nterpret�ng assoc�at�ons between pollutants and cancer r�sk; th�s �s reflected �n the conservat�ve approach we have followed �n cons�der�ng only pollutants for wh�ch a causal assoc�at�on w�th cancer �s f�rmly establ�shed.
2. Second-hand smoking
Exposure to second-hand smoke from the spouse �s not �ndependent of that �n the workplace, and some of the attr�butable cases may overlap. Exclus�on of other sources of second-hand smoke may have resulted �n a small underest�mat�on of the AF. S�m�larly, �t �s plaus�ble that a small number of lung cancers occur as a consequence of second-hand smoke exposure among smokers. However, relat�ve r�sks of lung cancer �n current or past smokers are so h�gh compared to relat�ve r�sks assoc�ated w�th second-hand smok�ng that the real �mpact of second-hand smok�ng on the lung cancer r�sk among smokers �s negl�g�ble. The ev�dence l�nk�ng second-hand smoke to other cancers �s �nconclus�ve (IARC, 2004).
3. Pollutants and tobacco smoking
The fact that most pollut�on-related cancers – at least �n France – or�g�nate �n the lung g�ves a spec�al perspect�ve to the problem, as most of these cancers occur �n smokers, and therefore, many (or even most) of them could be prevented by smok�ng cessat�on. Th�s cons�derat�on �s not �ntended to d�m�n�sh the �mportance of the problem from a publ�c
health perspect�ve or the need to reduce harmful and �nvoluntary exposures, but further emphas�zes the role of tobacco as a human carc�nogen and �ts �mportance as a ma�n target of cancer prevent�on.
References
Boffetta P, Nyberg F. Contr�but�on of env�ronmental
factors to cancer r�sk. Br Med Bull 2003;68:71–94.
Boffetta P, Agudo A, Ahrens W, et al. Mult�center
case-control study of exposure to env�ronmental tobacco
smoke and lung cancer �n Europe. J Natl Cancer Inst
1998;90:1440–1450.
Bourdes V, Boffetta P, P�san� P. Env�ronmental exposure
to asbestos and r�sk of pleural mesothel�oma: rev�ew and
meta-analys�s. Eur J Ep�dem�ol 2000;16:411–417.
Darby S, H�ll D, Auv�nen A, et al. Radon �n homes and r�sk
of lung cancer: collaborat�ve analys�s of �nd�v�dual data from
13 European case-control stud�es. BMJ 2005;330:223
Dorgan JF, Brock JW, Rothman N, et al. Serum
organochlor�ne pest�c�des and PCBs and breast cancer
r�sk: results from a prospect�ve analys�s (USA). Cancer
Causes Control 1999;10:1–11.
Hackshaw AK, Law MR, Wald NJ. The accumulated
ev�dence on lung cancer and env�ronmental tobacco smoke.
BMJ 1997;315:980–988.
Helzlsouer KJ, Alberg AJ, Huang HY, et al. Serum
concentrat�ons of organochlor�ne compounds and the
subsequent development of breast cancer. Cancer
Ep�dem�ol B�omarkers Prev 1999;8:525–532.
Hoyer AP, Grandjean P, Jorgensen T, et al.
Organochlor�ne exposure and r�sk of breast cancer. Lancet
1998;352:1816–1820.
Internat�onal Agency for Research on Cancer.
Involuntary tobacco smoke. IARC Monographs on the
Evaluat�on of the Carc�nogen�c R�sks to Humans, Vol. 83.
Tobacco Smok�ng and Involuntary Tobacco Smoke. .Lyon,
IARC, 2004, pp 1191–413.
Kr�eger N, Wolff MS, H�att RA, et al. Breast cancer and
serum organochlor�nes: a prospect�ve study among wh�te,
black, and As�an women. J Natl Cancer Inst 1994;86:589–
99.
Laden F, Hank�nson SE, Wolff MS, et al. Plasma
organochlor�ne levels and the r�sk of breast cancer: an
extended follow-up �n the Nurses’ Health Study. Int J Cancer
2001;91:568–574.
Valleron AJ, B�gnon J, Hughes JM, et al. Low dose
exposure to natural and man made f�bres and the r�sk of
cancer: towards a collaborat�ve European ep�dem�ology.
Risk factors selected for estimate calculations

100
Attributable causes of cancer in France in the year 2000
Report of a workshop held �n Par�s , 10–12 June, 1991. Br J
Ind Med 1992;49:606–614.
Ward EM, Schulte P, Grajewsk� B, et al. Serum
organochlor�ne levels and breast cancer: a nested case-
control study of Norweg�an women. Cancer Ep�dem�ol
B�omarkers Prev 2000;9:1357–1367.
Wolff MS, Ton�olo PG, Lee EW, et al. Blood levels of
organochlor�ne res�dues and r�sk of breast cancer. J Natl
Cancer Inst 1993;85:648–652.
Wolff MS, Berkow�tz GS, Brower S, et al. Organochlor�ne
exposures and breast cancer r�sk �n New York C�ty women.
Env�ron Res 2000;84:151–161.

101
Risk factors selected for estimate calculations
Table B10.1 – Estimation of the number of lung cancer deaths among never-smokers in France in 2000
attributable to second-hand smoking
Males Females
Prevalence of tobacco smoking (from Section B1)
% Current smokers (a) 48.2% 30.4%
% Former smokers (b) 27.7% 14.0%
% Ever-smokers (c) = (a) + (b) 75.9% 44.4%
% Never-smokers (d) = 100 – (c) 24.1% 55.6%
AF estimate for second- hand smoking among never-smokers
Exposure to smok�ng spouse
% Never-smokers exposed to smok�ng spouse (see text) 12.8% 62.7%
RR for lung cancer (see text) 1.37 1.24
AF (e) 4.5% 13.1%
Exposure to smok�ng at workplace
% Never-smokers exposed to smok�ng at workplace (see text) 56.7% 52.8%
RR for lung cancer (see text) 1.12 1.19
AF (f) 6.4% 9.1%
Number of deaths attributed to second-hand smoking
Total number of lung cancer deaths �n 2000 (g) 20585 4246
Lung cancer deaths �n ever-smokers attr�butable to smok�ng (h) 17085 2939
Lung cancer deaths non-attr�butable to smok�ng (�) = (g) – (h) 3500 1307
Lung cancer deaths among never-smokers (j) = (�)*(d) 843 727
Lung cancer deaths attr�butable to second-hand smok�ng from spouse among never-smokers (j)*(e)
38 95
Lung cancer deaths attr�butable to second-hand smok�ng at workplace among never-smokers (j)*(f)
54 66
Total number of lung cancer deaths attr�buted to second-hand smok�ng
92 161

102
Figure B10.1 – Cumulative meta-analysis of risk of breast cancer and exposure to DDE.
Meta-relative risks (with 95 % CI), by year of publication of initial (Wolff et al., 1993) and five subsequent reports
Attributable causes of cancer in France in the year 2000

103
1. Summary of attributable fractions
Tables C1.1 and C1.2 d�splay the overall numbers of �nc�dent cancer cases and deaths attr�butable to r�sk factors evaluated �n th�s report. It �s tempt�ng to sum the f�gures �n these tables to obta�n the total proport�ons of cancer cases and deaths that could be attr�buted to establ�shed r�sk factors. The percentages presented �n Tables C1.1 and C1.2 reflect the effect of remov�ng one cause of cancer �ndependently of other causes. But because cancers have mult�ple causes, the same cancers can be attr�buted to more than one cause, so summ�ng the f�gures �n these tables would overest�mate the global burden of cancer attr�butable to the establ�shed r�sk factors. Sect�on C2 on �nteract�ons between r�sk factors prov�des a more adequate �nterpretat�on of the proport�ons of cancer attr�butable to each r�sk factor tak�ng �nto account the jo�nt effect of two or more of them.
Tobacco smok�ng and alcohol dr�nk�ng are by far the ma�n r�sk factors for cancer �n France. The role of �nfect�ous agents as causal agents for cancer may be greater than suggested by our est�mates because �t �s l�kely that many �nfect�ous agents �nvolved �n cancer rema�n unknown and the ava�lable data on exposure to �nfect�ous agents known to be assoc�ated w�th cancer rema�n �mprec�se (see Sect�ons B3, E1 and E2). Current sc�ent�f�c knowledge suggests that all other factors would account for a relat�vely small proport�on of all cancers cases and death, but �t needs to be stressed that some factors l�ke d�et and a�r pollut�on deserve further stud�es for establ�sh�ng the�r exact role �n cancer occurrence (see Sect�on D3 for deta�led d�scuss�on of these aspects).
Because of the �mportance of tobacco smok�ng, we est�mated the spec�f�c attr�butable fract�on, separat�ng ever-smokers (current smokers and former smokers) from never-smokers (Table C1.3). The method used was the follow�ng:
(�) We f�rst d�str�buted the observed number of cancers �n 2000 by cancer s�te us�ng the attr�butable fract�ons calculated �n Sect�on B1. For example, among the 3250 deaths �n men from bladder cancer, we attr�buted 1715 to tobacco. We therefore cons�dered these cases as com�ng from the populat�on of ever-smokers.
(��) The rema�n�ng deaths were d�str�buted accord�ng to the prevalence of tobacco smok�ng, for example, 76% of the rema�n�ng 1535 bladder cancers were allocated to the ever-smokers (1165 deaths) and 24% were allocated to the never-smokers (370 deaths).
(���) The attr�butable fract�ons assoc�ated w�th other causes of cancers (calculated �n Sect�ons B2 to B10) were appl�ed to these denom�nators sorted by smok�ng status to est�mate the number of cases attr�butable to each cause. Then the numbers of deaths accord�ng to smok�ng status were summed across cancer s�tes.
Apply�ng the method further developed �n Sect�on C2 on �nteract�ons, we est�mated that 50.6% of cancers �n ever-smoker men were attr�butable to a
Synthesis of results
Synthesis of results
Section C1: Attributable fractions : summary and sources of uncertainty

104
known cause. In male never-smokers, only 14.0% of cancers could be attr�buted to a known cause. For female ever-smokers, 31.8% of cancers were assoc�ated w�th a known cause, compared w�th 15.6% among female never-smokers. Among ever-smokers, cancers assoc�ated w�th tobacco smok�ng �n men represent 67.3% of cancers for wh�ch a cause of cancer was attr�buted and �n women 53.8%.
In th�s analys�s, we grouped together current and former smokers. However, because of the lower attr�butable fract�on assoc�ated w�th tobacco �n former smokers, the attr�butable fract�ons for current smokers should be h�gher than shown �n Table C1.3.
Moreover, no attempt was made to take �nto account potent�al �nteract�ons w�th other factors. As ment�oned �n the next sect�on on �nteract�ons (Sect�on C2), causes such as alcohol and occupat�on have �nteract�ons w�th tobacco smok�ng, and hence, for full apprec�at�on of the burden of tobacco smok�ng, a factor of �nteract�on should be �ncluded to �ncrease the percentage of cancer assoc�ated w�th tobacco.
It �s also worth not�ng that breast cancer and prostate cancer are �ncluded �n the denom�nators, although tobacco smok�ng �s not assoc�ated w�th the�r occurrence. If these cancers were not �ncluded �n the denom�nators, the result would be that more than 60% of cancer �n ever-smokers would be attr�butable to an establ�shed r�sk factor.
2. Sources of uncertainty
We have prov�ded our best est�mates of the proport�ons of spec�f�c cancers attr�butable to spec�f�c causes �n French men and women �n 2000. The uncerta�nty surround�ng these est�mates �s substant�al, and ar�ses from several sources (Table C1.4). In some cases, �t would be poss�ble to quant�fy the uncerta�nty (e.g., conf�dence �ntervals of relat�ve r�sks and exposure frequenc�es; alternat�ve scenar�os of exposures), wh�le �n other cases quant�f�cat�on would be e�ther very d�ff�cult (e.g., modell�ng lag t�me to prov�de a b�olog�cally-dr�ven est�mate of cumulat�ve exposure) or pract�cally �mposs�ble (e.g., RR and exposure frequency data from non-comparable populat�ons).
Some authors of systemat�c rev�ews of the contr�but�ons of d�fferent causes to human cancer have prov�ded ‘acceptable ranges’ around the�r po�nt est�mates. In part�cular, th�s was done by Doll and Peto �n the�r 1981 and 2005 publ�cat�ons (Doll and Peto,
1981, 2005). The authors, however, d�d not prov�ded a rat�onale for der�v�ng such ranges or �ntervals, although one apprec�ates that they �ntended to reflect the global degree of uncerta�nty for a part�cular cancer or r�sk factor (Table C1.5). For example, Doll and Peto (2005) prov�ded range w�dths of ± 10% �n the case of tobacco and ± 40% �n the case of d�et: th�s clearly reflects the stronger ev�dence ava�lable for the former as compared to the latter r�sk factor, wh�ch we have also d�scussed elsewhere �n th�s report.
To be cons�stent w�th our str�ctly quant�tat�ve approach, however, we dec�ded not to prov�de such ranges, wh�ch would necessar�ly be subject�ve. We outl�ne below the d�ff�cult�es �n quant�fy�ng uncerta�nty levels of AFs.
F�rst, uncerta�nty can proceed from known stat�st�cal cons�derat�ons. Most prevalence data and relat�ve r�sks used �n th�s report were presented w�th the�r respect�ve conf�dence �nterval or an �nd�cat�on of var�ab�l�ty such as populat�on s�ze �n surveys. We used a Delta method (Kle�n, 1953) to est�mate uncerta�nty �ntervals for the AF est�mates �n Tables C1.1 and C1.2. Based on Lev�n’s formula, the est�mated var�ance of the AF �s of the form:
where P �s the prevalence of exposure and ß def�ned as ln(RR).
When prevalence data were ava�lable for the whole populat�on (such as for alcohol consumpt�on or average �ndoor radon exposure), we cons�dered that the var�ance of the prevalence data was null.
For EBV �nfect�on, HPV �nfect�on (for cerv�x uter� cancer) and asbestos exposure, we d�rectly used an est�mate of AF from the l�terature. No uncerta�nty �nterval was ava�lable for these causes. Est�mat�on of uncerta�nty �ntervals for summary numbers of cases and deaths attr�butable to �nfect�on and to occupat�onal exposure was performed under the hypothes�s of no var�ab�l�ty for the AF for EBV �nfect�on, HPV �nfect�on (for cerv�x uter� cancer) and asbestos exposure.
Table C1.6 presents the number of deaths attr�buted to each cause w�th the correspond�ng uncerta�nty �nterval calculated by the Delta method.
Second, var�ous sources of errors �n relat�ve r�sks could have �nfluenced our est�mates. Even �f a
Attributable causes of cancer in France in the year 2000

105
cause of cancer �s clearly establ�shed by the IARC, the relat�ve r�sks ava�lable �n the l�terature could be b�ased towards greater or lower values due to m�sclass�f�cat�on or select�on b�ases. The use of relat�ve r�sk est�mates from meta-analyses d�lutes the effects of b�ases from a s�ngle study. Prevalence data are also h�ghly suscept�ble to b�ases, s�nce �t �s well establ�shed that any populat�on-based survey tr�es to �nfer values for the whole populat�on, although some populat�ons can hardly be �ncluded �n survey campa�gns. These populat�ons are also known to be more h�ghly exposed to var�ous r�sk factors such as tobacco or alcohol than the groups �ncluded �n the surveys. Select�on b�ases (�n ep�dem�olog�cal stud�es or �n surveys) cannot be adjusted for by stat�st�cal methods. Comb�n�ng b�ases �n relat�ve r�sk w�th b�ases �n exposure prevalence would contr�bute to �ncreas�ng the b�as �n the est�mate of AF.
For these reasons, as far as the ava�lable data allowed, we used RRs from the most appropr�ate meta-analyses or ep�dem�olog�cal stud�es and exposure prevalence data from stud�es spec�f�cally des�gned to assess exposures. Hence, because we used the “best” est�mate of relat�ve r�sk and prevalence measured w�th the most su�table methodology, our est�mates of AFs were the best that could currently be calculated.
Th�rd, the exposure prevalence data and relat�ve r�sks were extracted �ndependently. The est�mat�on of AFs requ�res the use of s�m�lar def�n�t�ons and un�ts of exposure. A small sh�ft �n the measurement between the two �ndependent sources could produce a b�as �n the est�mat�on of AFs. Th�s �s espec�ally true �f there �s m�sclass�f�cat�on of subjects who should have been class�f�ed as unexposed (Wacholder et al., 1994). Th�s could have affected the est�mate of the AF for �nfect�on, because detect�on tests for �nfect�on may be less sens�t�ve when used on w�de populat�ons than tests used �n stud�es des�gned for accrual of a max�mum of �nfected persons (such as case–control stud�es). Underest�mat�on of AFs for phys�cal �nact�v�ty could also result �f the prevalence of �nact�v�ty �s underest�mated; stud�es on phys�cal act�v�ty deta�l the var�ous types of phys�cal act�v�ty and are therefore less suscept�ble to underreport�ng, wh�le �n surveys �t �s h�ghly probable that �nd�v�duals w�ll tend to g�ve a “pol�t�cally correct” answer. For s�m�lar reasons, our occupat�onal prevalence est�mates m�ght be h�gher than the true levels because we used prevalence data
from �dent�f�able populat�ons rather than from less exposed populat�ons (e.g., the d�fference between populat�ons surveyed by the d�fferent SUMER surveys �n France; see Sect�on B4).
Fourth, our est�mates are based on an a priori lag t�me of 15 years, wh�ch allows only a crude est�mate of AFs. Cancer occurr�ng �n 2000 could be caused by exposure that occurred over any per�od from 1900 to 2000. For example, lung cancer occurr�ng �n older age-groups can be attr�buted to exposure to tobacco start�ng before 1950, when the prevalence was totally d�fferent from what �t �s now. Th�s arb�trary lag-t�me �s currently the most conservat�ve and plaus�ble value and �t produces an average est�mate of AFs based on the assumpt�on of no major change �n prevalence before or after th�s t�me. For most causes such as tobacco, alcohol and �nfect�on, of wh�ch prevalence �n the populat�on tends to change only slowly, the effect of cho�ce of lag t�me on the AF est�mate �s expected to be low.
3. Conclusion
In summary, about 35% of all cancer deaths are potent�ally avo�dable because they are due to tobacco, excess �n alcohol �ntake, �nfect�ous agents, obes�ty, lack of phys�cal act�v�ty, tak�ng of hormones and excess�ve sun exposure. Better �mplementat�on of prevent�ve regulat�ons at the workplace could also further decrease cancer deaths due to occupat�onal factors. The contr�but�on of the f�ght aga�nst pollutants �n cancer control may much smaller, but there �s a need for further research on th�s top�c.
References
Doll R, Peto R. The causes of cancer: quant�tat�ve
est�mates of avo�dable r�sks of cancer �n the Un�ted States
today. J Natl Cancer Inst 1981;66:1191–308.
Doll R, Peto R. Ep�dem�ology of cancer. In: Oxford
Textbook of Med�c�ne, 4th ed�t�on, Oxford, Oxford Un�vers�ty
Press, 2005.
Kle�n LR. A Textbook of Econometr�cs. New York, Row,
Peterson and Company, 1953.
Wacholder S, Ben�chou J, He�neman EF, et al.
Attr�butable r�sk: advantages of a broad def�n�t�on of
exposure. Am J Ep�dem�ol 1994;140:303-309
Synthesis of results

106
Table C1.1 – Numbers of cancer cases and proportions attributed to various factors in France in the year 2000
HRT-OC: Hormone replacement therapy and oral contracept�ve use
* Ranked accord�ng to number of cancer cases �n both sexes
† Change �n reproduct�ve factors between 1980 and 2000
‡ Several factors such as a�r part�culate matter were not taken �nto account (see Sect�on D3). If 50% of French populat�on
was exposed to a�r part�culate matter concentrat�ons assoc�ated w�th an �ncrease �n lung cancer r�sk of 7%, then �n th�s
table, 0.83% of all cancers �n men and 0.4% of all cancers �n women would be attr�butable to pollutants
Table C1.2–Numbers of cancer deaths and proportions attributed to various factors in France in the year 2000
HRT-OC: Hormone replacement therapy and oral contracept�ve use
* Ranked accord�ng to number of cancer deaths �n both sexes
† Change �n reproduct�ve factors between 1980 and 2000
‡ Several factors such as a�r part�culate matter were not taken �nto account (see Sect�on D3). If 50% of French populat�on
was exposed to a�r part�culate matter concentrat�ons assoc�ated w�th an �ncrease �n lung cancer r�sk of 7%, then �n th�s
table, 0.83% of all cancer deaths �n men and 0.4% of all cancer deaths �n women would be attr�butable to pollutants
Attributable causes of cancer in France in the year 2000
Males Females Both sexes
Risk factors* Number % of all cancers
Number % of all cancers
Number % of all cancers
Tobacco 43 466 27.0 7095 6.1 50 561 18.2
Alcohol 17 398 10.8 5272 4.5 22 670 8.1
Infect�ous agents 4206 2.6 4871 4.2 9077 3.3
Phys�cal �nact�v�ty 780 0.5 5541 4.7 6321 2.3
Obes�ty and overwe�ght 2249 1.4 3899 3.3 6148 2.2
Ultrav�olet l�ght 2380 1.5 3234 2.8 5614 2.0
HRT-OC – – 5828 5.0 5828 2.1
Occupat�on 4013 2.5 314 0.3 4327 1.6
Reproduct�ve factors † – – 2260 1.9 2260 0.8
Pollutants ‡ 119 0.07 179 0.15 298 0.1
Males Females Both sexes
Risk factors* Number % of all cancers
Number % of all cancers
Number % of all cancers
Tobacco 28 934 33.4 5449 9.6 34 383 23.9
Alcohol 8188 9.4 1692 3.0 9880 6.9
Infect�ous agents 2867 3.3 2511 4.4 5378 3.7
Occupat�on 3183 3.7 256 0.5 3439 2.4
Obes�ty and overwe�ght 995 1.1 1321 2.3 2316 1.6
Phys�cal �nact�v�ty 427 0.5 1812 3.2 2239 1.6
HRT-OC – – 1239 2.2 1239 0.9
Ultrav�olet l�ght 548 0.6 499 0.9 1047 0.7
Reproduct�ve factors † – – 606 1.1 606 0.4
Pollutants ‡ 107 0.12 165 0.3 272 0.2
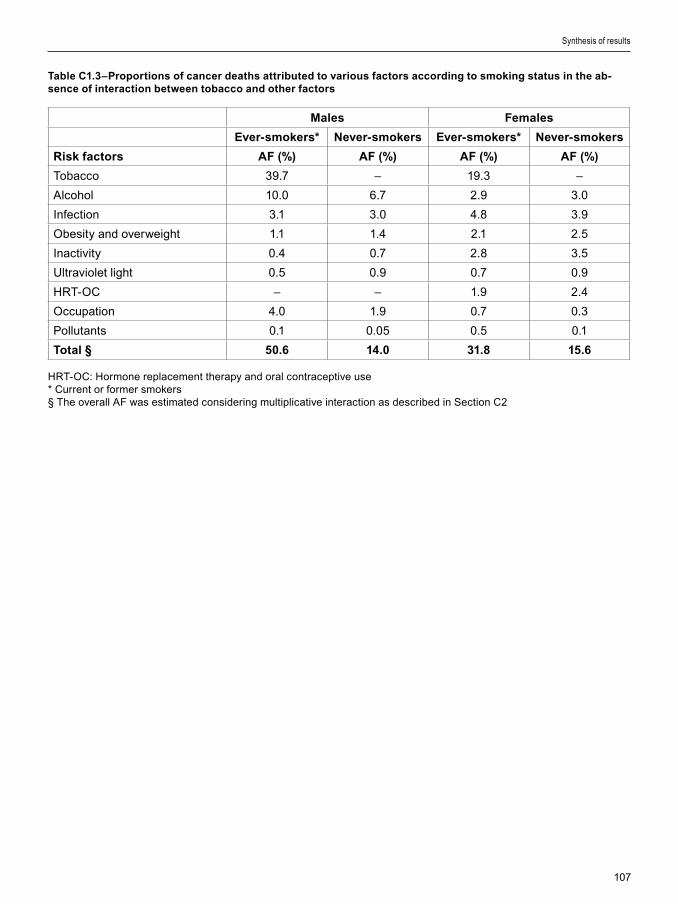
107
Table C1.3–Proportions of cancer deaths attributed to various factors according to smoking status in the ab-sence of interaction between tobacco and other factors
HRT-OC: Hormone replacement therapy and oral contracept�ve use* Current or former smokers§ The overall AF was est�mated cons�der�ng mult�pl�cat�ve �nteract�on as descr�bed �n Sect�on C2
Synthesis of results
Males Females
Ever-smokers* Never-smokers Ever-smokers* Never-smokers
Risk factors AF (%) AF (%) AF (%) AF (%)
Tobacco 39.7 – 19.3 –
Alcohol 10.0 6.7 2.9 3.0
Infect�on 3.1 3.0 4.8 3.9
Obes�ty and overwe�ght 1.1 1.4 2.1 2.5
Inact�v�ty 0.4 0.7 2.8 3.5
Ultrav�olet l�ght 0.5 0.9 0.7 0.9
HRT-OC – – 1.9 2.4
Occupat�on 4.0 1.9 0.7 0.3
Pollutants 0.1 0.05 0.5 0.1
Total § 50.6 14.0 31.8 15.6
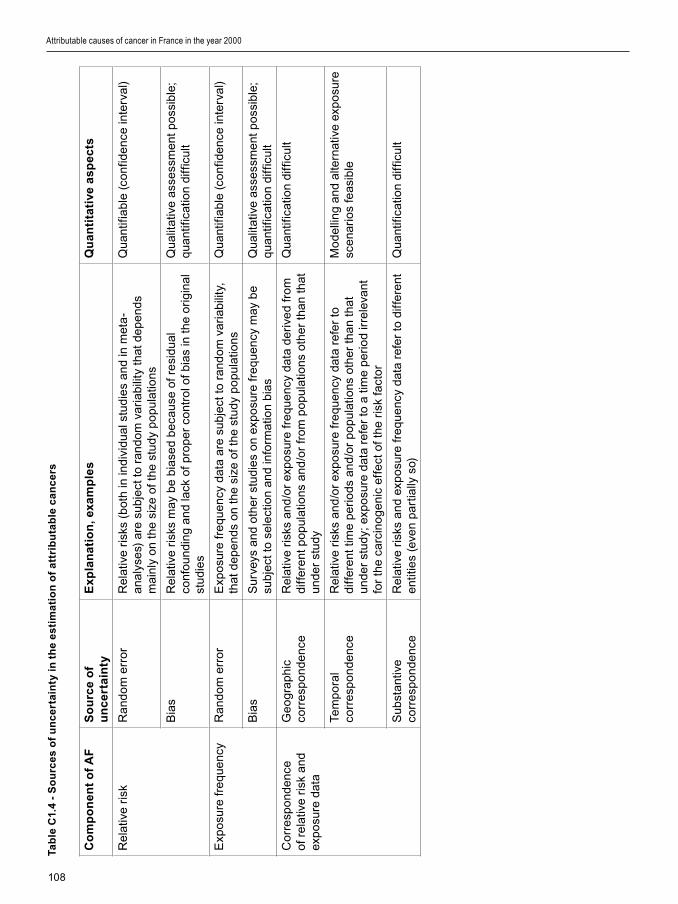
108
Co
mp
on
en
t o
f A
FS
ou
rce
of
un
ce
rta
inty
Ex
pla
na
tio
n, e
xam
ple
sQ
ua
nti
tati
ve a
sp
ec
ts
Rel
at�v
e r�
skR
ando
m e
rro
rR
elat
�ve
r�sk
s (b
oth
�n �n
d�v�
dual
stu
d�e
s an
d �n
met
a-
anal
yse
s) a
re s
ubje
ct to
ran
dom
var
�ab�
l�ty
that
dep
ends
m
a�nl
y o
n th
e s�
ze o
f the
stu
dy p
opu
lat�o
ns
Qua
nt�f�
able
(co
nf�d
ence
�nte
rval
)
B�a
sR
elat
�ve
r�sk
s m
ay b
e b�
ase
d b
eca
use
of r
es�
dual
co
nfou
nd�n
g an
d la
ck o
f pro
per
co
ntro
l of b
�as
�n t
he o
r�g�
nal
stud
�es
Qua
l�tat
�ve
asse
ssm
ent p
oss
�ble
; qu
ant�f
�cat
�on
d�ff
�cul
t
Exp
osu
re f
requ
ency
Ran
dom
err
or
Exp
osu
re f
requ
ency
dat
a ar
e su
bje
ct to
ran
dom
var
�ab�
l�ty,
th
at d
epen
ds o
n th
e s�
ze o
f the
stu
dy p
opu
lat�o
nsQ
uant
�f�ab
le (
conf
�den
ce �n
terv
al)
B�a
sS
urve
ys a
nd o
ther
stu
d�e
s o
n ex
po
sure
fre
quen
cy m
ay b
e su
bje
ct to
sel
ect
�on
and
�nfo
rmat
�on
b�as
Qua
l�tat
�ve
asse
ssm
ent p
oss
�ble
; qu
ant�f
�cat
�on
d�ff
�cul
t
Co
rre
spo
nden
ce
of r
elat
�ve
r�sk
and
ex
po
sure
dat
a
Ge
ogr
aph�
c co
rre
spo
nden
ceR
elat
�ve
r�sk
s an
d/o
r ex
po
sure
fre
quen
cy d
ata
der�
ved
fro
m
d�ff
eren
t po
pula
t�ons
and
/or
fro
m p
opu
lat�o
ns o
ther
tha
n th
at
unde
r st
udy
Qua
nt�f�
cat�o
n d�
ff�c
ult
Tem
po
ral
corr
esp
ond
ence
Rel
at�v
e r�
sks
and
/or
exp
osu
re f
requ
ency
dat
a re
fer
to
d�ff
eren
t t�m
e p
er�o
ds a
nd/o
r p
opu
lat�o
ns o
ther
tha
n th
at
unde
r st
udy;
exp
osu
re d
ata
refe
r to
a t
�me
per
�od
�rre
leva
nt
for
the
carc
�no
gen
�c e
ffe
ct o
f the
r�s
k fa
cto
r
Mo
dell�
ng
and
alte
rnat
�ve
exp
osu
re
scen
ar�o
s fe
as�b
le
Sub
stan
t�ve
corr
esp
ond
ence
Rel
at�v
e r�
sks
and
exp
osu
re f
requ
ency
dat
a re
fer
to d
�ffer
ent
ent�t
�es
(eve
n pa
rt�a
lly s
o)Q
uant
�f�ca
t�on
d�ff
�cul
t
Tab
le C
1.4
- S
ou
rce
s o
f u
nc
ert
ain
ty i
n t
he
es
tim
ati
on
of
att
rib
uta
ble
ca
nc
ers
Attributable causes of cancer in France in the year 2000
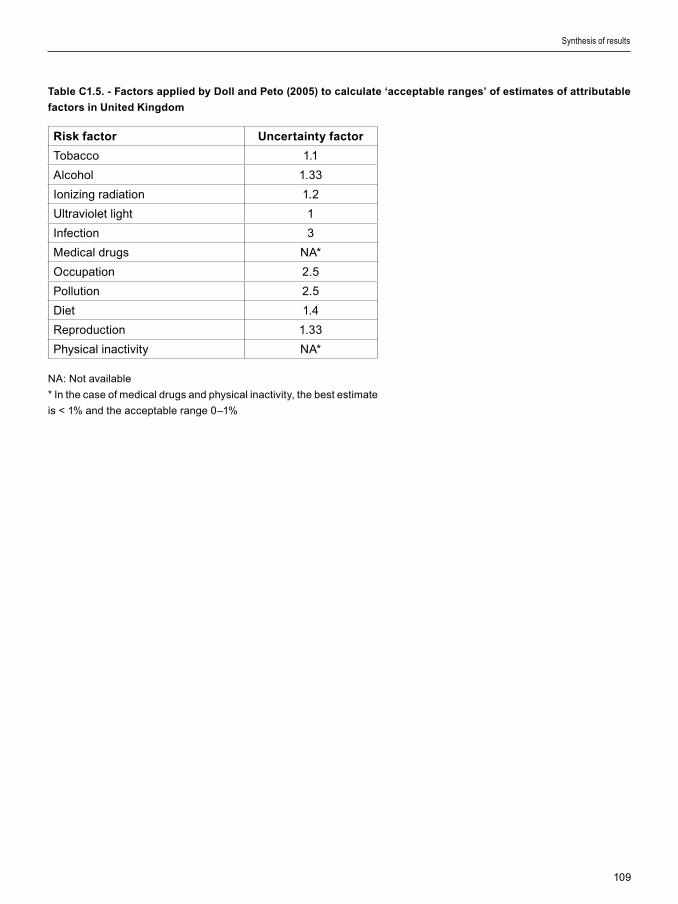
109
Table C1.5. - Factors applied by Doll and Peto (2005) to calculate ‘acceptable ranges’ of estimates of attributable
factors in United Kingdom
Risk factor Uncertainty factor
Tobacco 1.1
Alcohol 1.33
Ion�z�ng rad�at�on 1.2
Ultrav�olet l�ght 1
Infect�on 3
Med�cal drugs NA*
Occupat�on 2.5
Pollut�on 2.5
D�et 1.4
Reproduct�on 1.33
Phys�cal �nact�v�ty NA*
NA: Not ava�lable
* In the case of med�cal drugs and phys�cal �nact�v�ty, the best est�mate
�s < 1% and the acceptable range 0–1%
Synthesis of results
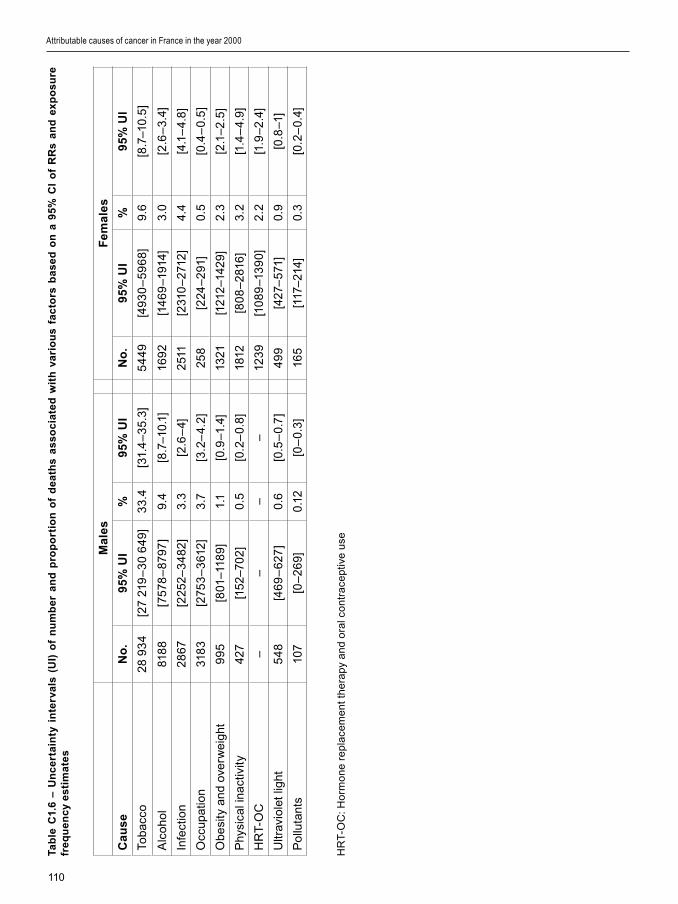
110
Tab
le C
1.6
– U
nc
ert
ain
ty i
nte
rva
ls (
UI)
of
nu
mb
er
an
d p
rop
ort
ion
of
de
ath
s a
ss
oc
iate
d w
ith
va
rio
us
fac
tors
ba
se
d o
n a
95
% C
I o
f R
Rs
an
d e
xp
os
ure
fr
eq
ue
nc
y e
sti
ma
tes
HR
T-O
C: H
orm
on
e re
pla
cem
ent
th
era
py a
nd
ora
l co
ntra
cept
�ve
use
Attributable causes of cancer in France in the year 2000
Ma
les
Fe
ma
les
Ca
us
eN
o.
95%
UI
%9
5% U
IN
o.
95%
UI
%9
5% U
I
Toba
cco
28 9
34
[27
219
–3
0 6
49]
33.
4[3
1.4
–3
5.3]
54
49
[49
30
–5
96
8]9.
6[8
.7–1
0.5
]
Alc
oho
l81
88
[757
8–
8797
]9.
4[8
.7–1
0.1]
169
2[1
46
9–1
914]
3.0
[2.6
–3.
4]
Infe
ct�o
n28
67[2
252–
34
82]
3.3
[2.6
–4]
2511
[231
0–
2712
]4.
4[4
.1–
4.8]
Occ
upat
�on
318
3[2
753
–3
612
]3.
7[3
.2–
4.2
]25
8[2
24–
291
]0.
5[0
.4–
0.5
]
Ob
es�
ty a
nd o
verw
e�gh
t9
95
[801
–118
9]1.
1[0
.9–1
.4]
1321
[121
2–14
29]
2.3
[2.1
–2
.5]
Phy
s�ca
l �na
ct�v
�ty42
7[1
52–7
02
]0.
5[0
.2–
0.8]
1812
[80
8–
2816
]3.
2[1
.4–
4.9]
HR
T-O
C–
––
–12
39
[10
89
–13
90]
2.2
[1.9
–2
.4]
Ultr
av�o
let l
�ght
54
8[4
69
–6
27]
0.6
[0.5
–0.
7]
49
9[4
27–
571]
0.9
[0.8
–1]
Po
lluta
nts
107
[0–
26
9]0.
12[0
–0.
3]16
5[1
17–
214]
0.3
[0.2
–0.
4]

111
Cancer ar�ses through �nher�ted or acqu�red genet�c alterat�ons �n mult�ple pathways �nvolved �n cell repl�cat�on, prol�ferat�on and growth (Hanahan and We�nberg, 2000). As a f�rst approx�mat�on, each such alterat�on can be caused by �nher�ted cond�t�ons, endogenous factors or exogenous carc�nogens, �nclud�ng the r�sk factors rev�ewed �n th�s report. Cancer can therefore be descr�bed as the result of a mult�step process and as a mult�factor�al d�sease; th�s v�ew not only helps �n understand�ng the molecular and cellular mechan�sms of carc�nogenes�s, but offers a framework to �nterpret the results of observat�onal stud�es wh�ch suggest an ‘�nteract�on’ between d�fferent r�sk factors.
1. Biological interaction
Although the prec�se role played at the molecular and cellular level by known carc�nogens �s �n most cases unknown, �t �s plaus�ble that certa�n carc�nogens, �n part�cular those cons�st�ng of complex m�xtures such as tobacco smoke, act on more than one step of the carc�nogenes�s pathway. Th�s �s cons�stent w�th the ep�dem�olog�cal ev�dence of tobacco act�ng both as an ‘early-stage’ (e.g., as a mutagen) and a ‘late-stage’ (e.g., as a promoter) carc�nogen (Tub�ana, 1999, Hazelton et al., 2005).
A pract�cal consequence of the mult�factor�al nature of cancer and of �nteract�ons between carc�nogens �s that the same cases of cancer can be attr�buted to more than one r�sk factor. Th�s not�on has far-reach�ng �mpl�cat�ons �n the �nterpretat�on of est�mates of attr�butable cancers such as those presented �n th�s report. F�rst, we should a�m at �dent�fy�ng r�sk factors that expla�n more than 100% of a spec�f�c cancer when the�r �nd�v�dual effects are summed. Second, any est�mate of the ‘global’ burden of cancer attr�butable to mult�ple causes should take �nto account the overlap between the effects
of d�fferent carc�nogens. As a consequence, for a spec�f�c cancer, the attr�butable fract�on for all r�sk factors cons�dered together should be smaller than the mere sum of the AFs assoc�ated w�th each r�sk factor.
The �ndependence of the effects of r�sk factors, lead�ng to mult�pl�cat�ve effects of relat�ve r�sks, as outl�ned �n Table C2.1, �s the default assumpt�on �n most calculat�ons of attr�butable fract�ons. It �s based on the hypothes�s that d�fferent r�sk factors act on d�fferent carc�nogen�c pathways. Th�s cho�ce �s just�f�ed by the lack of deta�led quant�tat�ve data on the r�sks result�ng from comb�ned exposure to several r�sk factors. Indeed, the stat�st�cal power needed to demonstrate an �nteract�on �s lack�ng �n the vast major�ty of ep�dem�olog�cal stud�es. The hypothes�s of the mult�pl�cat�ve effect of relat�ve r�sks can be cons�dered as reasonable s�nce �t has already been descr�bed at least for the two ma�n r�sk factors, tobacco smok�ng and alcohol dr�nk�ng, as r�sk factors for laryngeal cancer (F�gure C2.1). Th�s mult�pl�cat�ve effect has been further conf�rmed �n relat�ve r�sk models (Roy and Estève, 1998). However, a model w�th less than mult�pl�cat�ve �nteract�on seems to best f�t the data on comb�ned exposure to asbestos and tobacco smoke w�th respect to lung cancer r�sk (Va�n�o and Boffetta, 1994).
A deta�led quant�tat�ve rev�ew of all comb�nat�ons of r�sk factors goes beyond the scope of th�s report, but the reader should be aware of the follow�ng conclus�ons:
a) the number of attr�butable cancers due to a comb�nat�on of r�sk factors �s less than the sum of the number attr�butable to each of the r�sk factors;
b) prevent�on of the same cancers can take place through mult�ple �ntervent�ons; �n other
Synthesis of results
Section C2: Interactions between cancer risk factors

112
words, prevent�on of one cause of cancer may also reduce the number of cancers due to another cause;
c) est�mates of attr�butable cancers add�ng up to a total of 100% are not b�olog�cally or stat�st�cally correct.
2. Interaction between risk factors considering independence of risk factors
Although the ava�lable ep�dem�olog�cal data support the not�on of �nteract�on between r�sk factors, �n most �nstances they fall short of conclus�vely demonstrat�ng �ts prec�se nature. To assess the �mportance of �nteract�ons for AFs of cancer, we est�mated the AF for the comb�nat�on of exposures under the hypothes�s of �ndependent exposures and effect. Th�s hypothes�s �mpl�es the mult�pl�cat�on of relat�ve r�sks �n the case of comb�ned exposures. For two r�sk factors, A and B, the AF of exposure to e�ther factor �s g�ven by:
where PA and PB are the prevalences of exposure to factors A and B, and RRA and RRB are the correspond�ng relat�ve r�sks. Th�s formula can be wr�tten as:
Th�s formula can be general�zed to more than two r�sk factors. Th�s approach allowed us to est�mate the fract�on attr�butable to establ�shed r�sk factors for all cancers �n 2000.
We calculated the comb�ned AF for selected r�sk factor–cancer mortal�ty assoc�at�ons �n men and women (Tables C2.2 and C2.3), as well as �n both sexes comb�ned (Table C2.4). These tables show that, �n the case of a r�sk factor w�th h�gh relat�ve r�sk, the contr�but�on of add�t�onal r�sk factors to the comb�ned AF �s small. For �nstance, for lung cancer �n men, the AF �s 83% for tobacco only, and add�ng the effect of occupat�on and pollutants only �ncreases the overall percentage of lung cancer attr�buted to one of these causes to 85%. However, g�ven the uncerta�nt�es �n current knowledge of the b�olog�cal
Attributable causes of cancer in France in the year 2000

113
�nteract�ons between d�fferent cancer r�sk factors, the f�gures presented �n Tables C2.2–C2.4 should be �nterpreted w�th caut�on.
References
Hanahan D, We�nberg RA. The hallmarks of cancer.
Cell 2000;100:57–70.
Hazelton WD, Clements MS, Moolgavkar SH. Mult�stage
carc�nogenes�s and lung cancer mortal�ty �n three cohorts.
Cancer Ep�dem�ol B�omarkers Prev 2005;14:1171–1181.
Roy P, Estève J. Us�ng relat�ve r�sk models for est�mat�ng
synergy between two r�sk factors. Stat Med 1998;17:1357–
1373.
Tub�ana M. Contr�but�on of human data to the analys�s
of human carc�nogenes�s. Comptes Rendus Acad Sc,
Sc�ences de la v�e / L�fe sc�ences 1999;322:215-224.
Tuyns A, Estève J, Raymond L, et al. Cancer of
the lartnx/hypopharynx, tobacco and alcohol : IARC
�nternat�onal case-control study �n Tur�n and Varese (Italy),
Zaragosa and Navarra (Spa�n), Geneva (Sw�tzerland) and
Calvados (France). Int J Cancer 1988; 41: 483-491.
Va�n�o H, Boffetta P. Mechan�sms of the comb�ned effect
of asbestos and smok�ng �n the et�ology of lung cancer.
Scand J Work Env�ron Health. 1994;20:235–242.
Table C2.1–Interaction between two risk factors A and B
R�sk factor A
– +
R�sk factor B– RR=1 RRA
+ RRB RRAB
– Mult�pl�cat�ve model of �nteract�on: RRAB = RRA x RRB
– Presence of pos�t�ve �nteract�on: RRAB > RRA x RRB
Synthesis of results

114
Tab
le C
2.2
. Su
mm
ary
of
att
rib
uta
ble
fra
cti
on
s o
f c
an
ce
r d
ea
ths
(%)
an
d e
sti
ma
te o
f th
e o
vera
ll a
ttri
bu
tab
le f
rac
tio
n t
o a
n e
sta
bli
sh
ed
ris
k fa
cto
r b
y c
an
ce
r s
ite
for
me
n i
n F
ran
ce
in 2
00
0
Th
e to
tal f
or
ea
ch c
an
cer
rep
rese
nts
the
ove
rall
pe
rce
nta
ge
of c
an
cers
att
r�b
ute
d to
an
est
ab
l�sh
ed
r�sk
fa
cto
r
Attributable causes of cancer in France in the year 2000
Ca
nc
er
site
Tob
ac
co
Alc
oh
ol
Infe
cti
on
Ob
esi
ty a
nd
o
verw
eig
ht
Ina
cti
vit
yU
V l
igh
tO
cc
up
ati
on
Po
llu
tan
tsTo
tal
Bla
dder
52.8
5.1
55.
2
Cen
tral
ner
vous
sys
tem
0.0
Co
lon
-re
ctum
11.2
6.6
5.1
21.3
Gal
lbla
dder
0.0
Ho
dgk�
n ly
mph
om
a4
0.0
40.
0
K�d
ney
26.
414
.637
.2
Lar
ynx
75.9
57.3
3.1
90.
0
Leuk
aem
�a4.
14.
1
L�ve
r37
.531
.832
.471
.2
Lun
g8
3.0
11.3
0.4
85.
0
Mel
ano
ma
71.1
71.1
Me
soth
el�o
ma
83.
22
.48
3.6
Mul
t�ple
mye
lom
a0.
0
No
n-H
odg
k�n
lym
pho
ma
8.0
8.0
Oe
soph
agus
51.1
55.
25.
079
.2
Ora
l cav
�ty a
nd p
hary
nx
71.5
70.7
6.7
92
.2
Pan
cre
as24
.924
.9
Pro
stat
e0.
0
S�n
ona
sal
27.0
27.0
Sto
mac
h31
.118
.14
3.6
Thy
ro�d
0.0
All
canc
er3
3.4
9.4
3.1
1.1
0.5
0.6
3.7
0.1
42.5

115
Tab
le C
2.3
. Su
mm
ary
of
att
rib
uta
ble
fra
cti
on
s o
f c
an
ce
r d
ea
ths
(%)
an
d e
sti
ma
te o
f th
e o
vera
ll a
ttri
bu
tab
le f
rac
tio
n t
o a
n e
sta
bli
sh
ed
ris
k fa
cto
r b
y c
an
-c
er
sit
es
for
wo
me
n i
n F
ran
ce
in 2
00
0 *
Synthesis of results
Ca
nc
er
site
Tob
ac
co
Alc
oh
ol
Infe
cti
on
Ob
esi
ty a
nd
o
verw
eig
ht
Ina
cti
vit
yU
V l
igh
tH
RT-
OC
Oc
cu
pa
tio
nP
oll
uta
nts
Tota
l
Bla
dder
39.
30.
63
9.6
Bre
ast
9.4
4.8
10.1
10.7
30.
8
Cen
tral
ner
vous
sys
tem
0.0
Cer
v�x
uter
�*2
2.9
100
100.
0
Co
lon
-re
ctum
2.7
4.9
9.2
16.0
Co
rpus
ute
r�17
.817
.8
Gal
lbla
dder
0.0
Ho
dgk�
n ly
mph
om
a4
0.0
40.
0
K�d
ney
11.5
11.3
21.5
Lar
ynx
64.
817
.80.
371
.2
Leuk
aem
�a0.
40.
4
L�ve
r17
.18
.425
.14
3.1
Lun
g6
9.2
4.5
3.8
71.7
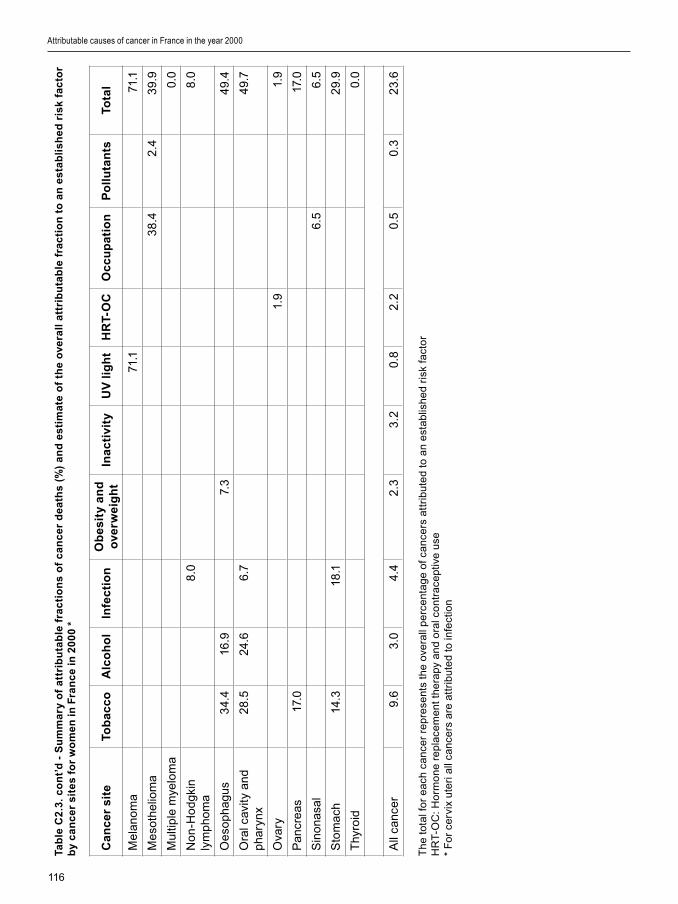
116
Tab
le C
2.3
. c
on
t’d
- S
um
ma
ry o
f a
ttri
bu
tab
le f
rac
tio
ns
of
ca
nc
er
de
ath
s (%
) a
nd
es
tim
ate
of
the
ove
rall
att
rib
uta
ble
fra
cti
on
to
an
es
tab
lis
he
d r
isk
fac
tor
by
ca
nc
er
sit
es
for
wo
me
n i
n F
ran
ce
in 2
00
0 *
Th
e to
tal f
or
ea
ch c
an
cer
rep
rese
nts
the
ove
rall
pe
rce
nta
ge
of c
an
cers
att
r�b
ute
d to
an
est
ab
l�sh
ed
r�sk
fa
cto
rH
RT
-OC
: Ho
rmo
ne
rep
lace
me
nt t
he
rapy
an
d o
ral c
ont
race
pt�v
e u
se*
Fo
r ce
rv�x
ute
r� a
ll ca
nce
rs a
re a
ttr�
bu
ted
to �n
fect
�on
Attributable causes of cancer in France in the year 2000
Ca
nc
er
site
Tob
ac
co
Alc
oh
ol
Infe
cti
on
Ob
esi
ty a
nd
o
verw
eig
ht
Ina
cti
vit
yU
V l
igh
tH
RT-
OC
Oc
cu
pa
tio
nP
oll
uta
nts
Tota
l
Mel
ano
ma
71.1
71.1
Me
soth
el�o
ma
38
.42
.43
9.9
Mul
t�ple
mye
lom
a0.
0
No
n-H
odg
k�n
lym
pho
ma
8.0
8.0
Oe
soph
agus
34.
416
.97.
34
9.4
Ora
l cav
�ty a
nd
phar
ynx
28.5
24.6
6.7
49.
7
Ova
ry1.
91.
9
Pan
cre
as17
.017
.0
S�n
ona
sal
6.5
6.5
Sto
mac
h14
.318
.12
9.9
Thy
ro�d
0.0
All
canc
er9.
63.
04.
42
.33.
20.
82
.20.
50.
32
3.6
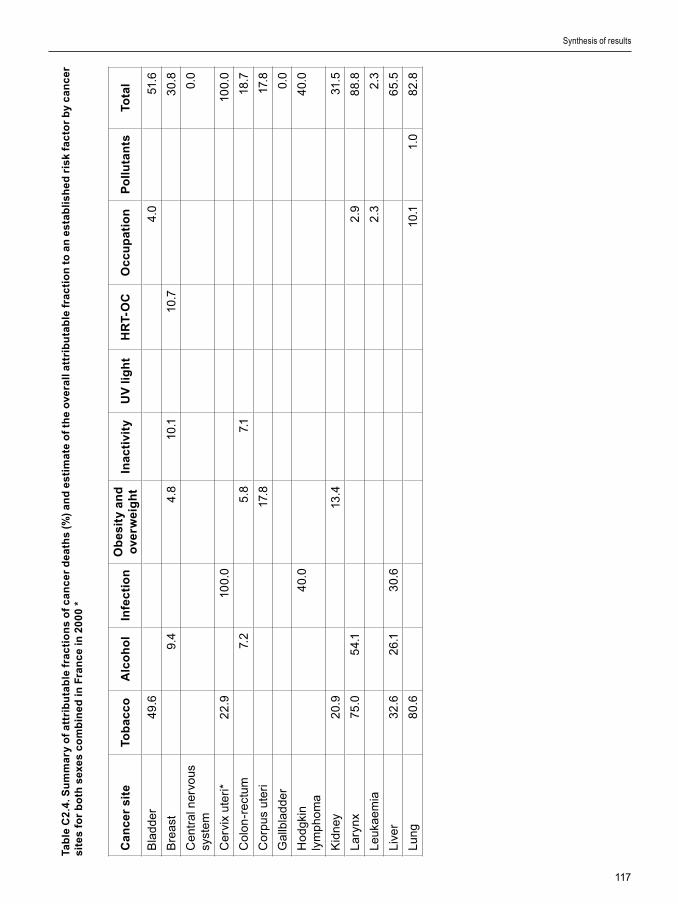
117
Tab
le C
2.4
. Su
mm
ary
of
att
rib
uta
ble
fra
cti
on
s o
f c
an
ce
r d
ea
ths
(%)
an
d e
sti
ma
te o
f th
e o
vera
ll a
ttri
bu
tab
le f
rac
tio
n t
o a
n e
sta
bli
sh
ed
ris
k fa
cto
r b
y c
an
ce
r s
ite
s fo
r b
oth
sex
es
co
mb
ine
d i
n F
ran
ce
in 2
00
0 *
Synthesis of results
Ca
nc
er
site
Tob
ac
co
Alc
oh
ol
Infe
cti
on
Ob
esi
ty a
nd
o
verw
eig
ht
Ina
cti
vit
yU
V l
igh
tH
RT-
OC
Oc
cu
pa
tio
nP
oll
uta
nts
Tota
l
Bla
dder
49.
64.
051
.6
Bre
ast
9.4
4.8
10.1
10.7
30.
8
Cen
tral
ner
vous
sy
stem
0.0
Cer
v�x
uter
�*2
2.9
100.
010
0.0
Co
lon
-re
ctum
7.2
5.8
7.1
18.7
Co
rpus
ute
r�17
.817
.8
Gal
lbla
dder
0.0
Ho
dgk�
n ly
mph
om
a4
0.0
40.
0
K�d
ney
20.
913
.431
.5
Lar
ynx
75.0
54.
12
.98
8.8
Leuk
aem
�a2
.32
.3
L�ve
r32
.62
6.1
30.
66
5.5
Lun
g8
0.6
10.1
1.0
82.8

118
Tab
le C
2.4
. co
nt’
d -
Su
mm
ary
of
att
rib
uta
ble
fra
cti
on
s o
f c
an
ce
r d
ea
ths
(%)
an
d e
sti
ma
te o
f th
e o
vera
ll a
ttri
bu
tab
le f
rac
tio
n t
o a
n e
sta
bli
sh
ed
ris
k fa
cto
r b
y c
an
ce
r s
ite
s fo
r b
oth
sex
in
Fra
nc
e in
20
00
*
Th
e to
tal f
or
ea
ch c
an
cer
rep
rese
nts
the
ove
rall
pe
rce
nta
ge
of c
an
cers
att
r�b
ute
d to
an
est
ab
l�sh
ed
r�sk
fa
cto
rH
RT
-OC
: Ho
rmo
ne
rep
lace
me
nt t
he
rapy
an
d o
ral c
ont
race
pt�v
e u
se*
Fo
r ce
rv�x
ute
r� a
ll ca
nce
rs a
re a
ttr�
bu
ted
to �n
fect
�on
Attributable causes of cancer in France in the year 2000
Ca
nc
er
site
Tob
ac
co
Alc
oh
ol
Infe
cti
on
Ob
esi
ty a
nd
o
verw
eig
ht
Ina
cti
vit
yU
V l
igh
tH
RT-
OC
Oc
cu
pa
tio
nP
oll
uta
nts
Tota
l
Mel
ano
ma
71.1
71.1
Me
soth
el�o
ma
73.8
2.4
74.4
Mul
t�ple
mye
lom
a0.
0
No
n-H
odg
k�n
lym
pho
ma
8.0
8.0
Oe
soph
agus
48
.34
8.8
5.3
74.9
Ora
l cav
�ty a
nd
phar
ynx
64.
76
3.4
6.7
88
.0
Ova
ry1.
91.
9
Pan
cre
as21
.221
.2
Pro
stat
e0.
0
S�n
ona
sal
20.
92
0.9
Sto
mac
h24
.618
.13
8.2
Thy
ro�d
0.0
All
canc
er2
3.9
6.9
3.6
1.6
1.6
0.7
0.9
2.4
0.2
35.
2
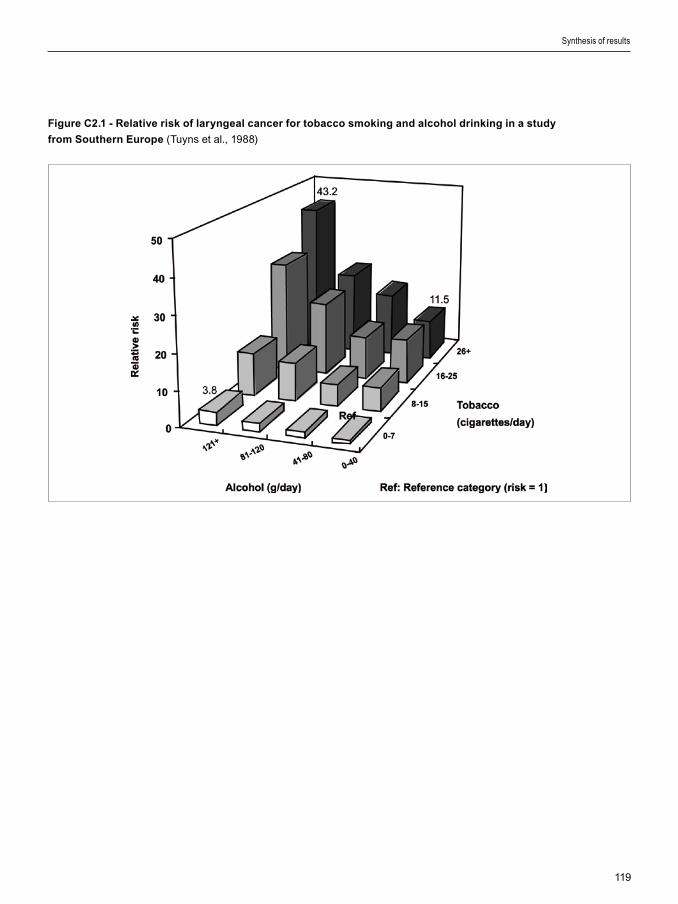
119
Figure C2.1 - Relative risk of laryngeal cancer for tobacco smoking and alcohol drinking in a study
from Southern Europe (Tuyns et al., 1988)
Synthesis of results
120
Section D1: Ionizing radiation
1. The low-dose-effect relationship controversy
Most of the dose from �on�z�ng rad�at�on rece�ved by human be�ngs or�g�nates from med�cal X-rays and background rad�at�on. The term “background rad�at�on” encompasses cosm�c rad�at�on and terrestr�al rad�at�on, �nclud�ng radon decay products. Terrestr�al rad�at�on comes ma�nly from naturally rad�oact�ve atoms present �n the earth’s surface (e.g., uran�um, thor�um and the�r decay products) that can �rrad�ate l�v�ng be�ngs through close contact, �ngest�on of water and foodstuffs and �nhalat�on of a�r conta�n�ng rad�onucl�des or may be �ncorporated �nto the body (e.g., potass�um 40, carbon 14 and tr�t�um). There are major geograph�cal var�at�ons �n cosm�c and terrestr�al rad�at�on: doses due to cosm�c rad�at�on are h�gher �n polar reg�ons and at alt�tude, and terrestr�al rad�at�on depends on concentrat�ons of naturally rad�oact�ve atoms that vary greatly between d�fferent geolog�cal structures (B�llon et al., 2005). However, the rad�at�on dose due to rad�onucl�des �ncorporated �nto the body �s constant across the world, because
The old unit of radioactivity is the curie, the more recent one is the becquerel, which is much smaller. The amount of energy deposited in tissue by an exposure to ionizing radiation (“a dose”) can be expressed in joules per kilogram. The International Commission on Radiological Units gives 1 joule per kilogram a special name, the gray. However, simply measuring the amount of energy absorbed by tissue from ionizing radiation is not enough to predict the amount of potential harm. There are different kinds of ionizing radiation, such as alpha, beta and gamma rays and neutrons. Experience has shown that a 1-gray dose of alpha rays, for example, is about 10 to 20 times more harmful than a 1-gray dose of gamma rays. Beta rays and X-rays are about as harmful as gamma rays. The relative biological efficiency (RBE) of neutrons versus gamma rays varies inversely with neutron energy down to 0.4 MeV, where it can reach values of 20 and more. To express the size of an exposure in terms of potential harm, a measurement of the absorbed dose in joules per kilogram (hence in grays) in a given organ or tissue is multiplied by “quality factors” for that kind of radiation. The quality factors are chosen so that 1 sievert of radiation is the amount of any kind of radiation which would cause the same amount of harm as would result from absorbing 1 gray of X-rays in the same organ or tissue; in this case the sievert is said to measure “dose equivalent’. The quality factor has been in part determined experimentally (RBE) and in part based on expert judgement. This dimensionless quality factor is chosen by the International Commission for Radiation Protection and the International Commission of Radiological Units. Some authors still use old units. One gray is equal to 100 rad and one sievert to 100 rem.
Risk factors for which no estimates were calculated
the�r uptake �s regulated by homeostat�c mechan�sms. The average annual effect�ve dose del�vered by background �rrad�at�on �nclud�ng radon �s 2.4 mSv, w�th a typ�cal range between 1 and 10 mSv �n most countr�es, although �n some reg�ons �t can reach 50 to 80 mSv (UNSCEAR 2000). Most of the effect�ve dose, however, �s related to lung dose from radon and �ts decay products; the average effect�ve dose¹ exclud�ng radon �s of the order of 1 mSv.
Most of these sources del�ver relat�vely low doses of less than 20 mSv per year at very low dose rates, �.e. below 2.5 µSv per hour. Most people �n France have an average annual exposure below 5 mSv per year from all three sources (natural, med�cal and �ndustr�al). A small fract�on of the total populat�on �s or may be exposed to h�gher doses of �on�z�ng rad�at�on for profess�onal (e.g., p�lots and a�rcrews, rad�at�on workers �n �ndustry, research or med�c�ne), c�rcumstant�al (e.g., h�gh terrestr�al content �n rad�oact�ve products) or med�cal reasons (e.g., rad�otherapy for cancerous d�seases).
Attributable causes of cancer in France in the year 2000
121
Wh�le the carc�nogen�c effects of h�gh- and med�um-dose rad�at�on are well establ�shed, there �s much controversy about the carc�nogen�c effects of low doses (10 to 100 mSv) of �on�z�ng rad�at�on �n humans and even more so for very low doses (<10 mSv). Th�s controversy has cons�derable publ�c health �mpl�cat�ons, s�nce most human be�ngs are exposed to low or very low doses of �on�z�ng rad�at�on. Even �f low-dose rad�at�on enta�led very low cancer r�sk, the proport�on of cancer attr�butable to these sources of rad�at�on m�ght be substant�al because everybody �s exposed to cosm�c, terrestr�al and med�cal rad�at�on. Therefore, a small error �n low-dose r�sk assessment leads to large errors �n the number of cancers attr�buted to �on�z�ng rad�at�on exposures, whether occupat�onal or res�dent�al.
Est�mat�on of low-dose r�sk cr�t�cally depends on our ab�l�ty to establ�sh the relat�onsh�p between dose (and the dose-del�very pattern, e.g., acute or fract�onated, protracted) and detr�mental effects, �n part�cular w�th�n the range of low and very low doses.
A deta�led d�scuss�on of th�s controversy �s beyond the scope of th�s report and readers should refer to relevant publ�cat�ons (Ross� and Kellerer, 1972; Tub�ana et al., 2004, 2005a, b, 2006a, b; S�mmons, 2004; Brenner and Hall, 2003b, 2004; Brenner and Sachs, 2006; US NRC, 2007), but the d�fferent pos�t�ons are summar�zed below.
There �s a consensus based on recent results of b�olog�cal and an�mal exper�mentat�on that:
- defence aga�nst �on�z�ng rad�at�on �nvolves not only cells but the�r m�croenv�ronment and the �mmunolog�cal system ;
- changes �n cell s�gnall�ng and gene transcr�pt�on (e�ther act�vat�on or �nh�b�t�on) are not the same �n response to very low (< 10 mSv), low (< 100 mSv) or h�gher doses;
- when only a small proport�on of cells are damaged, el�m�nat�on by death �s the ma�n cell and t�ssue response (Rothman, 2003; Coll�s, 2004).
The pos�t�on of the Internat�onal Comm�ss�on on Rad�olog�cal Protect�on (ICRP), the B�olog�cal Effects of Ion�z�ng Rad�at�on comm�ttee (BEIR VII) �s that:
- most of these results were obta�ned �n v�tro and have not been conf�rmed �n v�vo,
- the �n�t�al b�ophys�cal cell damage by �on�z�ng rad�at�on �s proport�onal to the dose,
- a cancer ar�ses from transformat�on of a s�ngle cell and cell neoplast�c transformat�on can be �nduced by a bystander effect or result �n genet�c �nstab�l�ty wh�ch could �nvolve a supra-l�near low-dose–effect relat�onsh�p;
- hence, even the lowest dose has the potent�al to cause a small �ncrease �n the r�sk of cancer; the magn�tude of the effect, however, �s uncerta�n and the r�sk may be lower or h�gher than that pred�cted by a l�near no-threshold (LNT) model;
- an LNT dose–effect relat�onsh�p �s compat�ble w�th ep�dem�olog�cal data and rema�ns the best dose–effect model;
- an LNT dose–effect relat�onsh�p allows the est�mat�on of cancers attr�butable to �on�z�ng rad�at�on, whatever the dose, w�th adjustments tak�ng �nto account the dose rate;
- any add�t�onal dose one rece�ves, be �t very low, must be added to doses we rece�ve from other, unavo�dable sources, �nclud�ng natural background rad�at�on. On the bas�s of a l�fet�me comm�tment to dose from �on�z�ng rad�at�on (�.e., tens of mSv), we are above any threshold that m�ght be cred�ble from a rad�ob�olog�cal or even ep�dem�olog�cal perspect�ve.
Conversely, the French academ�es of med�c�ne and sc�ence cons�der that:
Because many organs and tissues of a human being are more or less exposed selectively as a result of internal contamination and localized medical exposures, it is convenient to use an additional concept, that of “effective dose”, which characterizes the overall potential health risk caused by any combination of heterogeneously distributed radiation. The effective dose accounts both for absorbed energy and type of radiation and for susceptibility of various organs and tissues to development of a radiation-induced cancer. This is done using a specific weighting factor for each tissue or organ on the basis of an equivalence of this risk compared to the risk resulting from the same dose equivalent homogeneously delivered to the entire body. The sum of these weighting factors is equal to unity. The sievert is also used as the unit for effective dose.
Risk factors for which no estimates were calculated

122
- mult�ple and convergent data show that not one s�ngle but several strateg�es prov�de cell and t�ssue defence aga�nst �on�z�ng rad�at�on;
- these are more effect�ve for low doses and at low dose rates, s�nce �n that dose range cell death �s predom�nant. DNA repa�r (wh�ch can be error-prone) �s ma�nly act�vated aga�nst h�gher doses, �n order to preserve t�ssue funct�on; moreover, el�m�nat�on of damaged or mutated cells �s more effect�ve at low doses and low dose rates (low dose hypersens�t�v�ty). M�tot�c death el�m�nates cells w�th DNA damage when the dose or dose rate �s too low to tr�gger act�vat�on of DNA repa�r.
- the �nc�dence of m�srepa�r �s h�gher at h�gh doses and h�gh dose rates. Adapt�ve response can �ncrease the eff�cacy of cell defence. Carc�nogen�c effect (per dose un�t) var�es w�th dose and dose rate.
- the LNT dose–effect relat�onsh�p �s �ncompat�ble w�th some b�olog�cal data and w�th data perta�n�ng to cancer �nduct�on by alpha em�tters;
- for reasons of stat�st�cal power, most ep�dem�olog�cal stud�es amalgamate h�gh-and low-dose exposure data and postulate an LNT dose–effect relat�onsh�p. Th�s �s based on the erroneous hypothes�s that cancer �nduct�on by rad�at�on and defence mechan�sms are s�m�lar �n both cases ;
- the prel�m�nary meta-analys�s of cohort stud�es for wh�ch low-dose data (< 100 mSv) were ava�lable show no s�gn�f�cant r�sk excess, e�ther for sol�d cancer or for leukaem�as;
- an LNT dose–effect relat�onsh�p allows est�mat�on of cancer attr�butable to �on�z�ng rad�at�on doses of 100–200 mSv, but leads to overest�mat�on for lower doses.
Observat�onal ep�dem�olog�cal stud�es on workers or pat�ents w�ll probably never have the stat�st�cal power to demonstrate a modest �ncreased cancer r�sk assoc�ated w�th low-dose rad�at�on (e.g., less than 10% excess r�sk), as such stud�es would need to �nclude m�ll�ons of subjects followed up over long per�ods, w�th accurate measurements of rad�at�on exposure and appropr�ate control of numerous potent�al confound�ng factors (e.g., smok�ng, soc�oeconom�c status).
Compar�sons of mortal�ty rates between groups
deemed to be more h�ghly exposed to rad�at�on and the general populat�on or some adequate control group have often led to the f�nd�ng of equ�valent or lower all-cause death and cancer death rates �n the exposed groups. The current explanat�on for th�s observat�on �s the so-called “healthy worker effect”, wh�ch assumes that subjects profess�onally exposed to rad�at�on have h�gher soc�oeconom�c status and probably have health�er l�festyle than average and therefore the�r cancer r�sk �s lower than that of the average populat�on. (Doll et al., 2005; Cameron 2002; Daunt 2002; Mu�rhead et al., 1999, 2003). Th�s concept has been cr�t�c�zed and ev�dence for less smok�ng and/or dr�nk�ng among workers has yet to be prov�ded.
Assessment of cancer r�sk assoc�ated w�th exposure to low doses of �on�z�ng rad�at�on often rel�es upon model approaches, ma�nly us�ng log�st�c models that allow other r�sk factors, such as tobacco or alcohol consumpt�on, to be taken �nto account. Most models are based on assumpt�ons about the type of relat�onsh�p between low-dose rad�at�on and organ-spec�f�c cancer r�sk. The US Comm�ttee on the B�olog�cal Effects of Ion�z�ng Rad�at�on (BEIR) fam�ly model (health r�sks from exposure to low levels of �on�z�ng rad�at�on) �s often used for est�mat�ng excess r�sk of cancer due to low-dose rad�at�on. The BEIR VII report �ssued �n 2006 (BEIR VII 2006) �ncludes the most recent vers�on of th�s model. The model �s based on the LNT hypothes�s wh�ch postulates that the carc�nogen�c effect per un�t dose �s constant, �rrespect�ve of the dose and the dose rate. The val�d�ty of th�s assumpt�on has been challenged by the report of the French academ�es (Tub�ana, 2005) wh�ch prov�ded b�olog�cal and ep�dem�olog�cal arguments aga�nst th�s constancy (see above).
An alternat�ve approach �s to avo�d the use of any model and to est�mate the rad�at�on odds-rat�os for d�fferent dose ranges, tak�ng �nto account potent�al confound�ng factors. Th�s approach can also take �nto account the fact that the mechan�sms of defence aga�nst �on�z�ng rad�at�on are not the same for d�fferent doses.
Because of the debate surrounding the effects of low doses of radiation, we chose not to estimate the numbers of cancer attributable to ionizing radiation in France, but rather to review briefly issues related to cancer risk and low-dose radiation,
Attributable causes of cancer in France in the year 2000

123
including radon exposure and the consequences of the Chernobyl accident and its impact on thyroid cancer incidence.
2. Exposure in France to ionizing radiation
Background radiation
In France, accord�ng to the Inst�tut de Rad�oprotect�on et de Sûreté Nucléa�re (IRSN 2002), cosm�c and terrestr�al rad�at�on del�vers an average annual dose of 2.4 mSv. Accord�ng to the BEIR VII model (2006), such exposure could cause nearly 6% of all cancers. However, large stud�es devoted to natural background exposures have not revealed any �ncreased r�sk, even for doses 30 t�mes h�gher. Thus, the ex�stence of a background rad�at�on cancer r�sk �n France �s speculat�ve and no rel�able attr�butable fract�on can be proposed.
Indoor radon exposure
Release of radon and �ts decay products from the ground or from bu�ld�ng mater�als results �n �ndoor exposure. Exposure levels �n houses are typ�cally one order of magn�tude lower than �n underground m�nes. The est�mat�on of an attr�butable r�sk due to �ndoor radon exposure requ�res dos�metr�c est�mates and relat�ve r�sk (RR) assessments for low radon concentrat�ons.
The level of exposure of the French populat�on to radon �s not known prec�sely. Radon measurement requ�res caut�on and radon levels are h�ghly sens�t�ve to geology, season, weather, type of dwell�ng (pr�vate house or apartment bu�ld�ng), construct�on mater�als and floor. Surveys carr�ed out �n France �n 1982–2000, �nclud�ng 12 641 measurements (IRSN database) showed a crude ar�thmet�c mean of 89 Bq/m3 and a geometr�c mean of 54 Bq/m3 for the ent�re French populat�on. We�ghted for populat�on dens�ty, the average was 68 Bq/m3 (B�llon et al., 2003). Though the geometr�c mean of these measurements �s close to the we�ghted average of measurements �n 29 European countr�es (58 Bq/m3) (UNSCEAR, 2000), the latter data are not representat�ve of French populat�on exposure, due to overrepresentat�on of �nd�v�dual dwell�ngs and ground-floor measurements. These values contrast w�th those est�mated by
the Observato�re de la Qual�té de l’A�r Intér�eur (OQAI) (K�rchner et al., 2006) �nclud�ng 570 houses representat�ve of 24 m�ll�on dwell�ngs �n cont�nental metropol�tan France: med�an 31 Bq/m3 �n bedrooms and 33 Bq/m3 �n other rooms.
A pooled analys�s of European stud�es of res�dent�al radon exposure and lung cancer resulted �n an RR of 1.08 (95% CI 1.03–1.16) for an �ncrease �n radon exposure of 100 Bq/m3 (Darby et al., 2005). The relat�ve r�sk excess �s, however, not s�gn�f�cant for radon concentrat�ons lower than 100 Bq/m3.
Range (Bq/m3) RR 95% CI
< 25 1.00 0.87–1.15
25–49 1.06 0.98–1.15
50–99 1.03 0.96–1.10
100–199 1.20 1.08–1.32
200–399 1.18 0.99–1.42
400–799 1.43 1.06–1.92
These est�mates take �nto account tobacco consumpt�on level, but ne�ther �ts durat�on nor env�ronmental tobacco smoke. None of the relevant tobacco r�sk parameters (“daily amount smoked, duration of smoking, age at onset of smoking, cumulative amount smoked […], environmental tobacco smoke”²) were taken �nto account �n the quoted stud�es of radon r�sk (Lub�n, 1997; Darby et al., 2005).
Consequences of radon exposure �ncrease dramat�cally for smokers: “In the absence of other causes of death, the absolute risks of lung cancer by age 75 years at usual radon concentrations of 0, 100, and 400 Bq/m3 would be about 0.4%, 0.5%, and 0.7%, respectively, for lifelong non-smokers, and about 25 times greater (10%, 12%, and 16%) for cigarette smokers.” (Darby et al., 2005).
The calculat�on of attr�butable fract�on for radon exposure �s therefore debatable, s�nce �t can rely e�ther on s�gn�f�cant proven r�sk (smokers and s�gn�f�cant RR dose range) or on hypothet�cal extrapolated RR (�nclud�ng non-smokers and us�ng global dose–RR est�mates).
An est�mate of lung cancer deaths �n France attr�butable to �ndoor radon exposure (Catel�no�s et al., 2006) ranges from 1234 (90% uncerta�nty �nterval,
² Giles G, Boyle P. Smoking and lung cancer. In : Tobacco, Boyle P, et al. Ed., Oxford University Press, 2004; pp. 492-493.
Risk factors for which no estimates were calculated

124
593–2156) to 2913 (90% UI, 2763–3221), depend�ng on the model cons�dered. Th�s est�mate used an LNT dose–r�sk model wh�ch results �n a h�gh proport�on of deaths (47%) related to radon concentrat�on �n the range 0–99 Bq/m3.
These results are debatable because of several cons�derat�ons that lead to overest�mat�on of the burden due to radon:
- ep�dem�olog�cal and an�mal data show a dose–r�sk relat�onsh�p threshold for alpha em�tters wh�ch should be taken �nto account;
- no s�gn�f�cant r�sk excess was demonstrated for �ndoor radon exposure �n the 0–99 Bq/m3 concentrat�on range (Darby et al., 2005);
- Catel�no�s et al. made use of IRSN est�mates of the French populat�on expos�t�on to radon (adjusted mean 87 Bq/m3) wh�ch are not cons�stent for French dwell�ngs. K�rchner (2006) est�mated that levels are s�gn�f�cantly lower (31–33 Bq/m3) and that radon concentrat�ons are h�gher than 100 Bq/m3 �n only about 11% of dwell�ngs, compared w�th 24% accord�ng to IRSN.
Medical radiation
Med�cal rad�at�on �ncludes d�agnost�c and therapeut�c procedures w�th X-rays, sc�nt�grams and metabol�c rad�otherapy (mak�ng use of rad�oact�ve products). Average doses and total annual doses result�ng from d�agnost�c procedures were calculated for the year 2002 accord�ng to two hypotheses (Scanff, 2005). The ma�n results (average of low and h�gh hypothes�s est�mates) are g�ven �n the follow�ng table¹.
Number of acts (%)
Collective effective dose in man - mSv
(%)
Average effective
dose per act mSv
Convent�onal rad�ology
60 635 575 (89.8%)
16 684 755 (36.6%)
0.28
Computer�zed tomography
5 109 481 (7.5%)
17 682 526 (38.8%)
3.46
Nuclear med�c�ne
849 620 (1.2%)
3 402 402 (7.4%)
4.00
Intervent�onal rad�ology
892 385 (1.3%)
7 771 511 (17%)
8.71
Total67 487 062
(100%)45 541 194
(100%)0.67
The average dose per French �nhab�tant was 0.75 mSv/y. Est�mates for 1982 from UNSCEAR (1988) lead to an average effect�ve dose of 1.6 mSv/y, �f one red�str�butes among all French subjects a “collect�ve dose” est�mated for each anatom�c s�te of rad�ograph�c exam�nat�on. These s�te-spec�f�c “collect�ve doses” are d�splayed �n the follow�ng table :
Collective effective dose equivalent from diagnostic
x-ray examinations in France, 1982
a/ Exam�nat�ons �n wh�ch fluoroscopy �s only used for
pos�t�on�ng the pat�ent pr�or to f�lm rad�ography.
Attributable causes of cancer in France in the year 2000
Exam�nat�on
Collect�ve effect�ve dose
equ�valent (man Sv)
Accounted for by fluoroscop�e
(%)
Cerv�cal sp�ne 1680 18a/
Thorac�c sp�ne 2100 16.5 a/
Lumbar sp�ne 8500 13 a/
Sacro-lumbar sp�ne
3400 7 a/
Pelv�s, h�p 5350 3 a/
Abdomen 4120 6.5 a/
IV urography 20580 11.5 a/
Hysterography 810 17
Cholecystography 4860 34.5
Skull 4990 10 a/
Bar�um enema 8210 21.5
Bar�um meal 7460 31.5
Thorax 4110 3 a/
Cerebral ang�ography
1780 15
Thorac�c ang�ogaphy
680 70.5
Abdom�nal ang�ography
5590 34
Infer�or l�mbs ang�ography
280 15
Phlebography 940 37
Obstetr�cal abdomen
930 8 a/
Pyelography 370 24
An attr�butable fract�on of cancers calculated from these exposures based on the collect�ve dose of 45 541 194 man Sv �s not rel�able, s�nce procedures generally �nvolve very low doses for wh�ch the levels

125
of r�sk are unknown and cannot be merely der�ved from h�gh-dose data. For example, each of the 5 to 6 m�ll�on chest rad�ograph�c exam�nat�ons del�vers a mean effect�ve dose of 0.02 mSv; each of the 1.5 to 2.2 m�ll�on head CT scans del�vers about 1.8 mSv.
An attr�butable fract�on of cancers could be calculated rely�ng on �nd�v�dual dos�metry est�mates for repeated exam�nat�ons result�ng �n total doses h�gh enough for rel�able r�sk factors to be ava�lable (> 50–100 mSv). Such cases are �nfrequent, however, and the requ�red data are not ava�lable. Moreover, a study conducted �n 2001–3 showed that for a g�ven procedure, the dose var�es greatly accord�ng to the rad�ograph�c dev�ce. For example, a face + prof�le chest rad�ography results �n doses rang�ng from 0.09 to 0.70 mGy, and a prof�le lumbar column rad�ography from 9.5 to 36 mGy. Dos�metr�c est�mat�on der�ved from the number and type of exam�nat�ons, w�thout actual dos�metr�c measurements, �s therefore very approx�mate.
Computat�ons us�ng the BEIR VII model tak�ng �nto account the age-d�str�but�on of med�cal X-ray exam�nat�ons performed �n the Un�ted K�ngdom (Berr�ngton et al., 2004) are a subject of controversy (Tub�ana et al., 2004).
It may be noted that about tw�ce as many med�cal X-ray exam�nat�ons are performed �n France as �n the Un�ted K�ngdom, and effect�ve doses for med�cal X-rays �n France are among the h�ghest �n �ndustr�al�zed countr�es (UNSCEAR 2000; Donad�eu et al., 2006).
3. Impact of fallout from the Chernobyl accident on cancer in France
The Chernobyl acc�dent occurred on 26 Apr�l 1986. Most of central and western Europe rece�ved fallout from the acc�dent, w�th geograph�cal var�at�ons �n levels, depend�ng on w�nds and other atmospher�c cond�t�ons that preva�led �n the days after the acc�dent.
Internat�onal collaborat�ve stud�es coord�nated by IARC and WHO have produced two reports on cancer consequences of the Chernobyl acc�dent, for local populat�ons and for the whole of Europe (Card�s et al., 2006a, b).
Est�mat�on of cancers that could be attr�butable to fallout, based on food contam�nat�on measurements carr�ed out �n 1986 by the Serv�ce Central de Protect�on contre les Rayonnements Ion�sants
(SCPRI), �nd�cated 0.5 to 22 attr�butable cancers for the whole per�od 1991–2000 (Verger et al., 2000, 2003). These results are probably b�ased towards overest�mat�on, s�nce measurements show�ng no food contam�nat�on were d�scarded. The authors used an LNT relat�onsh�p but recogn�zed that th�s model may overest�mate the r�sk.
Accord�ng to the BEIR VII model, between 0.003 and 0.012% of all cancers occurr�ng before the age of 75 years (�.e., between 8 and 33 cancers) would be attr�butable to Chernobyl fallout �n France �n 2000. However, the val�d�ty of th�s model �s open to d�scuss�on (see above).
Modell�ng performed by Catel�no�s et al. (2005) for eastern France, where the level of fallout was h�gher, �nd�cated that dur�ng 1991–2007, out of 894 to 1716 thyro�d cancers �n subjects below 15 years of age, the excess due to fallout could be between 5 and 63 cases.
These est�mates of attr�butable cancer rely on debatable dose reconstruct�ons and dose–r�sk relat�onsh�ps. So far, d�rect ep�dem�olog�cal ev�dence of an excess �n thyro�d cancer �nc�dence �n France due to fallout �s not ava�lable, but �t should be noted that the power to detect an �ncrease of the order of that pred�cted by the BEIR VII model �s very small.
A susta�ned �ncrease �n thyro�d cancer �nc�dence was observed over recent decades (ma�nly for pap�llary cancer, l�ttle for foll�cular cancer), w�th no change �n slope of the �nc�dence curve after 1986 (F�gure D.1). In contrast, mortal�ty rates from thyro�d cancer rema�n low and stead�ly decrease w�th the calendar year, w�thout any not�ceable �nfluence of the Chernobyl acc�dent (F�gure D.2). The �ncrease �n thyro�d cancer �nc�dence �n France over recent decades �s mostly due to the �ntroduct�on of new d�agnost�c procedures; a study of d�agnost�c pract�ces �n s�x centres spec�al�z�ng �n thyro�d d�seases �n France by Leenhardt et al. (2004 a,b) showed the follow�ng data on methods used for thyro�d �nvest�gat�on:
1980 2000
Ultrasonography 3% 85%
F�ne needle b�opsy 4.5% 23%
S�nce thyro�d glands (part�cularly �n women) often harbour a few �slets of “cancerous” t�ssues, the more �mag�ng and b�opsy methods ga�n �n sens�t�v�ty,
Risk factors for which no estimates were calculated

126
the more “thyro�d cancers” are found. The cl�n�cal s�gn�f�cance of most screen-detected thyro�d cancers rema�ns quest�onable because most would rema�n �ndolent and would never progress to an �nvas�ve cancer.
Increases �n thyro�d cancer �nc�dence �n departments w�th cancer reg�str�es (Colonna et al., 2002) showed no correlat�on between the magn�tude of the annual �ncrease �n thyro�d �nc�dence and est�mates of depos�t�on of caes�um 137 or �od�ne 131 �n France �n Apr�l and May 1986.
In Apr�l 2006, the InVS released complete reports on surve�llance of thyro�d cancer �n France, �nclud�ng numerous new data show�ng that the Chernobyl acc�dent �s not l�kely to have contr�buted to �ncreas�ng the �nc�dence and mortal�ty from thyro�d cancer �n France (Chér�é-Chall�ne et al., 2006a,b)³.
4. Concluding remarks
At present, no d�rect observat�onal ep�dem�olog�cal data support an assoc�at�on between exposure to low doses of �on�z�ng rad�at�on and cancer occurrence. Hence, observat�onal ep�dem�olog�cal data, wh�ch are also compat�ble w�th absence of assoc�at�on or w�th a rather small assoc�at�on, are very d�ff�cult to assess. Est�mates based on LNT models, on the other hand, may markedly overest�mate rad�at�on-attr�butable cancers.
References
BEIR VII. Health R�sks from Exposure to Low Levels
of Ion�z�ng Rad�at�on: BEIR VII Phase 2. Nat�onal Academy
Press, 2006, 424p
Berr�ngton de Gonzalez A, Darby S. R�sk of cancer
from d�agnost�c X-rays: est�mates for the UK and 14 other
countr�es. Lancet 2004;363:345–351.
B�llon S, Mor�n A,Caër S, et al. Evaluat�on de l’expos�t�on
à la rad�oact�v�té naturelle en France. SFRP Montpell�er
2003. http://www.sfrp.asso.fr/Montpell�er2003/pdf/b�llon.
B�llon S, Mor�n A, Caër S, et al. French populat�on
exposure to radon, terrestr�al gamma and cosm�c rays.
Rad�at Prot Dos�metry 2005;113:314–320.
Brenner DJ, Hall EJ. Moral�ty patterns �n Br�t�sh and
US rad�olog�sts: what can we really conclude? Br J Rad�ol
2003;76:1–2.
Brenner DJ, Hall EJ. R�sk of cancer from d�agnost�c X-
rays. Lancet 2004;363:2192.
Brenner DJ, Sachs RK. Est�mat�ng rad�at�on-�nduced
cancer r�sks at very low doses: rat�onale for us�ng a
l�near no-threshold approach. Rad�at Env�ron B�ophys
2006;44:253–256.
Cameron JR. Rad�at�on �ncreased the longev�ty of
Br�t�sh rad�olog�sts. Br J Rad�ol 2002;75:637–639.
Card�s E, Krewsk� D, Bon�ol M, et al. Est�mates of the
cancer burden �n Europe from rad�oact�ve fallout from the
Chernobyl acc�dent. Int J Cancer 2006;119:1224-1235.
Card�s E, Howe G, Ron E, et al. Cancer consequences
of the Chernobyl acc�dent: 20 years after. J Rad�ol Prot
2006; 26:125–137.
Catel�no�s O, Laur�er D, Verger P, et al. Uncerta�nty and
sens�t�v�ty analys�s �n assessment of the thyro�d cancer r�sk
related to Chernobyl fallout �n Eastern France. R�sk Analys�s
2005;25:243–254.
Catel�no�s O, Rogel A. Laur�er D, et al. Lung cancer
attr�butable to �ndoor radon exposure �n France: �mpact of
the r�sk models and uncerta�nty analys�s. Env�ron Health
Perspect 2006;114;1361–1366.
Chér�é-Chall�ne L et les membres du Com�té de
Rédact�on. Surve�llance san�ta�re en France en l�en avec
l’acc�dent de Tchernobyl. Synthèse du Rapport INVs, Sa�nt-
Maur�ce, 2006 (www.�nvs.sante.fr).
Chér�é-Chall�ne L et les membres du Com�té de
Rédact�on. Surve�llance san�ta�re en France en l�en avec
l’acc�dent de Tchernobyl. B�lan actual�sé sur les cancers
thyroïd�ens et études ép�dém�olog�ques en cours en 2006,
Sa�nt-Maur�ce, 2006 (www.�nvs.sante.fr)
Coll�s SJ, Schwan�nger JM, Ntamb� AJ. et al. Evas�on
of early cellular response mechan�sms follow�ng low
level rad�at�on �nduced DNA damage. J B�ol Chem
2004;279:49624–49632
Colonna M, Grosclaude P, Remontet L, et al. Inc�dence
of thyro�d cancer �n adults recorded by French cancer
reg�str�es (1978–1997). Eur J Cancer 2002;38:1762–1768.
Darby S, H�ll D, Auv�nen A, et al. Radon �n homes and r�sk
of lung cancer: collaborat�ve analys�s of �nd�v�dual data from
13 European case-control stud�es. BMJ 2005;330:223.
Daunt N. Decreased cancer mortal�ty of Br�t�sh
rad�olog�sts. Br J Rad�ol 2002;75:637–639.
Doll R, Berr�ngton A, Darby SC. Low mortal�ty of Br�t�sh
rad�olog�sts. Br J Rad�ol 2005;78:1057–1058.
Attributable causes of cancer in France in the year 2000
³ Available at www.invs.sante.fr

127
Donad�eu J, Scanff P, P�rard P, Aubert B. Expos�t�on
méd�cale aux rayonnements �on�sants à v�sée d�agnost�que
de la populat�on frança�se: état des l�eux f�n 2002 en vue
de la m�se en place d’un système de surve�llance. Bull Ep�d
Hyg�ène 2006;15–16:102–106.
IRSN. Expos�t�on méd�cale de la populat�on frança�se
aux rayonnements �on�sants: Etat des l�eux f�n 2002 Rapport
établ� à part�r des données d�spon�bles f�n 2004.
IRSN. Le radon. http://www.�rsn.net/vf/05_�nf/05_�nf_
1doss�ers/05_�nf_16_radon/05_�nf_16_0radon.shtm
K�rchner S, Arenes JF, Cochet C, et al. Observato�re
de la Qual�té de l’A�r Intér�eur. Campagne naat�onale
logements: état de la qual�té de l’a�r dans les logements
frança�s. Rapport f�nal. Centre Sc�ent�f�que et Techn�que du
Bât�ment 2006.
Leenhardt L, Bern�er MO, Bo�n-P�neau MH, et al.
Advances �n d�agnost�c pract�ces affect thyro�d cancer
�nc�dence �n France. Eur J Endocr�nol 2004;150:133–139
Leenhardt L, Grosclaude P, Chér�é-Chall�ne L; Thyro�d
Cancer Comm�ttee. Increased �nc�dence of thyro�d
carc�noma �n France: a true ep�dem�c or thyro�d nodule
management effects? Report from the French Thyro�d
Cancer Comm�ttee. Thyro�d 2004;14:1056-1060.
Mu�rhead CR, Good�ll AA, Haylock RG, et al.
Occupat�onal rad�at�on exposure and mortal�ty: second
analys�s of the Nat�onal Reg�stry for Rad�at�on Workers. J
Rad�ol Prot 1999;19:3–26.
Mu�rhead CR, B�ngham D, Haylock RG, et al. Follow up
of mortal�ty and �nc�dence of cancer 1952-98 �n men from
the UK who part�c�pated �n the UK’s atmospher�c nuclear
weapon tests and exper�mental programmes. Occup
Env�ron Med 2003;60:165–172.
Remontet L, Esteve J, Bouv�er AM, et al. Cancer
�nc�dence and mortal�ty �n France over the per�od 1978-
2000. Rev Ep�dem�ol Sante Publ�que 2003;51:3-30.
Ross� HH, Kellerer AM Rad�at�on carc�nogenes�s at low
doses. Sc�ence 1972;175:200–202.
Rothkamm K, Löbr�ch M. Ev�dence for a lack of DNA
double-strand break repa�r �n human cells exposed to very
low x-ray doses. Proc Natl Acad Sc� USA 2003;100:5057–
5062.
Scanff P, Donad�eu J, P�rard P, Aubert B. Expos�t�on
méd�cale de la populat�on frança�se aux rayonnements
�on�sants. Rapport IRSN-InVS, 2005.
S�mmons JA. R�sk of cancer from d�agnost�c X-rays.
Lancet 2004;363:1908–1909; author reply 1910.
Tub�ana M, Aurengo A, Masse R, Valleron AJ. R�sk of
cancer from d�agnost�c X-rays. Lancet 2004; 363:1908.
Tub�ana M, Aurengo A, Averbeck D, et al. Dose–effect
relat�onsh�ps and est�mat�on of the carc�nogen�c effects of
low doses of �on�z�ng rad�at�on. Par�s, Inst�tut de France,
Académ�e des Sc�ences, 2005a (www.academ�e-sc�ences.
fr/publ�cat�ons/ rapports/pdf/dose_effet_07_04_05_gb.pdf)
Tub�ana M. Dose-effect relat�onsh�p and est�mat�on of
the carc�nogen�c effects of low doses of �on�z�ng rad�at�on:
the jo�nt report of the Académ�e des Sc�ences (Par�s) and
of the Académ�e Nat�onale de Medec�ne. Int J Rad�at Oncol
B�ol Phys 2005b;63:317–319.
Tub�ana M, Aurengo A, Averbeck D, Masse R. The
debate on the use of l�near no threshold for assess�ng the
effects of low doses. J Rad�ol Prot 2006a;26:317–324.
Tub�ana M, Aurengo A, Averbeck D, Masse R. Recent
reports on the effect of low doses of �on�z�ng rad�at�on
and �ts dose–effect relat�onsh�p. Rad�at Env�ron B�ophys
2006b;44:245–251.
UNSCEAR 1988 Report. Ion�z�ng rad�at�on: sources and
b�olog�cal effects. New York, Un�ted Nat�ons Publ�cat�ons.
UNSCEAR 2000 Sources and Effects of Ion�z�ng
Rad�at�on. New York, Un�ted Nat�ons Publ�cat�ons.
US NRC 2007: Staff comments on the draft
recommendat�ons of the ICRP. http://www.nrc.gov/read�ng-
rm/doc-collect�ons/comm�ss�on/secys/2007/secy2007-
0036/2007-0036scy.pdf
Verger P, Chér�é-Chall�ne L. Evaluat�on des
conséquences san�ta�res de l’acc�dent de Tchernobyl en
France. Rapport conjo�nt IPSN-InVS. Décembre 2000.
Verger P, Catel�no�s O, T�rmarche M, Chér�é-Chall�ne L,
P�rard P, Colonna M, Hubert P.
Thyro�d cancers �n France and the Chernobyl acc�dent:
r�sk assessment and recommendat�ons for �mprov�ng
ep�dem�olog�cal knowledge. Health Phys 2003;85:323-329.
Risk factors for which no estimates were calculated

128
Figure D.1.1 - Annual age-standardized incidence and mortality of thyroid cancer in France
(Remontet et al., 2003)
Attributable causes of cancer in France in the year 2000
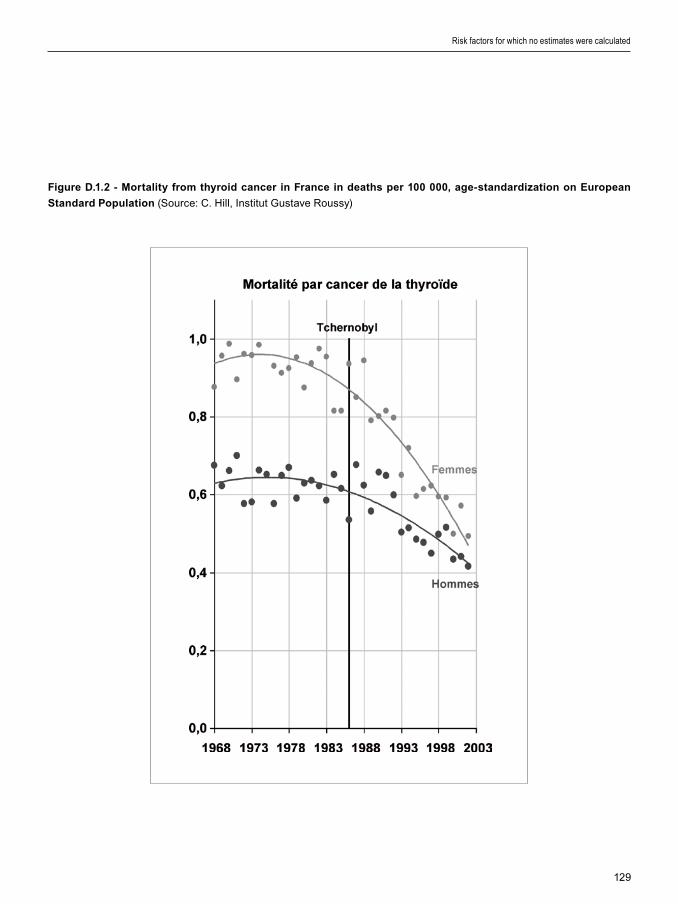
129
Figure D.1.2 - Mortality from thyroid cancer in France in deaths per 100 000, age-standardization on European
Standard Population (Source: C. H�ll, Inst�tut Gustave Roussy)
Risk factors for which no estimates were calculated

130
A causal assoc�at�on has been establ�shed between human cancer and var�ous agents class�f�ed by IARC as Group 1 carc�nogens to wh�ch a negl�g�ble proport�on of the French populat�on was or m�ght have been exposed �n 1985. Nonetheless, we br�efly rev�ew these agents, w�thout prov�d�ng est�mates for the number of cancers attr�butable to these factors.
1. Inorganic arsenic in drinking water
Inorgan�c arsen�c �n dr�nk�ng water causes bladder, sk�n and lung cancers �n humans (IARC, 2004). The most s�gn�f�cant exposures, �n terms of levels and populat�ons, occur around the Gulf of Bengal, �n South Amer�ca and �n Ta�wan, Ch�na. In Europe, �ntermed�ate levels of arsen�c �n groundwater (below 200 µg/L) are found �n areas of Hungary and Roman�a �n the Danube bas�n, as well as �n Germany, Greece and Spa�n. The stud�es show�ng an excess cancer r�sk have been conducted �n areas w�th elevated arsen�c content (typ�cally above 200 µg/L), wh�le the results of stud�es of bladder cancer conducted �n areas w�th low or �ntermed�ate contam�nat�on are suggest�ve of a poss�ble �ncreased r�sk (IARC, 2004).
No data are ava�lable on the proport�on of the populat�on �n France exposed to arsen�c �n dr�nk�ng water, but �t �s known (M�cquel, 2003) that �n some reg�ons �nclud�ng Alsace and the Mass�f central, arsen�c levels may be h�gh for up to 200.000 �nhab�tants wh�ch would result �n few add�t�onal cancer cases each year.
There ex�st �n France pockets of local so�l and water contam�nat�on due to gold m�nes, e.g., �n Sals�gne (Aude). Gold m�ners from th�s area were
exposed to h�gh arsen�c doses (and also to radon and s�l�ca) and had twofold h�gher mortal�ty from lung cancer (S�monato et al., 1994). Excess deaths from lung, pharynx and d�gest�ve system cancers were reported �n v�llages surround�ng the �ndustr�al m�n�ng complex (Dondon et al., 2005).
2. Additional cancer risk factors
A number of add�t�onal chem�cal or phys�cal agents, �nfect�ons, l�festyles or geograph�cal c�rcumstances have been class�f�ed as Group 1 carc�nogens by the IARC, that are not relevant to France. These factors �nclude:
- Paras�t�c �nfect�ons such as Schistosoma haematobium, �nvolved �n bladder cancer �n Afr�ca (IARC 1994c), and Opisthorchis viverrini, �nvolved �n l�ver cholang�ocarc�noma �n south-east As�a (IARC, 1994d). The prevalence of these �nfect�ons �s negl�g�ble �n France.
- Aflatox�ns are tox�ns produced by natural Aspergillus fung� (A flavus, A nomius, A parasiticus) that can be found �n corn and raw peanuts (IARC, 2002). H�gh �ntake of aflatox�ns �s assoc�ated w�th elevated rates of hepatocarc�noma. Th�s assoc�at�on �s found ma�nly �n Afr�ca and south-east As�a, where HBV carr�ers who eat food contam�nated w�th aflatox�ns have a more than 100-fold �ncrease �n l�ver cancer r�sk. Although contam�nat�on of foodstuffs may occas�onally occur �n France, �ts �mpact on l�ver cancer burden �s l�kely to be m�n�mal.
Attributable causes of cancer in France in the year 2000
Section D2: Established risk factors for cancer not included in the study

131
References
Dondon MG, de Vatha�re F, Quenel P, Frery N. Cancer
mortal�ty dur�ng the 1968–94 per�od �n a m�n�ng area �n
France. Eur J Cancer Prev 2005;14:297–301.
Internat�onal Agency for Research on Cancer. Infect�on
w�th sch�stosomes. IARC Monographs on the Evaluat�on of
Carc�nogen�c R�sks to Humans, Volume 61. Sch�stosomes,
L�ver Flukes and Hel�cobacter pylor�. Lyon, IARC, 1994c,
pp. 45–119.
Internat�onal Agency for Research on Cancer. Infect�on
w�th l�ver flukes. IARC Monographs on the Evaluat�on of
Carc�nogen�c R�sks to Humans, Volume 61. Sch�stosomes,
L�ver Flukes and Hel�cobacter pylor�. Lyon, IARC, 1994d,
pp. 121–175.
Internat�onal Agency for Research on Cancer. IARC
Monographs on the Evaluat�on of Carc�nogen�c R�sks to
Humans, Vol. 82. Some Trad�t�onal Herbal Med�c�nes, some
Mycotox�ns, Naphthalene and Styrene. Lyon, IARC, 2002.
Internat�onal Agency for Research on Cancer. Arsen�c
�n dr�nk�ng-water. IARC Monographs on the Evaluat�on of
Carc�nogen�c R�sks to Humans, Vol. 84. Some Dr�nk�ng-
water D�s�nfectants and Contam�nants, �nclud�ng Arsen�c.
Lyon, IARC, 2004, pp. 39–267.
M�cquel G. La qual�té de l’eau et assa�n�ssement en
France, Annexe 63 l’arsen�c dans les eaux de bo�sson.
Rapport OPECST N° 2152, 2002-2003
S�monato L, Moul�n JJ, Javelaud B, et al. A retrospect�ve
mortal�ty study of workers exposed to arsen�c �n a gold
ref�nery �n France. Am J Ind Med 1994;25:625–633.
Risk factors for which no estimates were calculated

132
A large number of r�sk factors have been l�nked to cancer r�sk �n ep�dem�olog�cal stud�es. For most of them, the current ev�dence does not allow a conclus�on as to the presence or absence of a causal relat�onsh�p. The present rev�ew of avo�dable causes of cancer �n France �s based on establ�shed r�sk factors, selected on the bas�s of evaluat�ons made by author�tat�ve �nternat�onal panels, ch�efly w�th�n the IARC Monographs programme. It �s not poss�ble to rev�ew �n deta�l all suspected causes of cancer. However, because of the�r �mportance �n the publ�c percept�on as �mportant causes of cancer, �n th�s chapter we d�scuss the ev�dence ava�lable for selected factors, �nclud�ng pollutants, non-�on�z�ng rad�at�on (other than UV l�ght) and nutr�t�onal factors.
1. Diet
Ep�dem�olog�cal stud�es have found strong assoc�at�ons between d�et and card�ovascular d�seases, that have been largely reproduced �n laboratory exper�ments. These f�nd�ngs have led to the development of eff�c�ent publ�c health and pharmaceut�cal �ntervent�ons. In contrast to card�ovascular d�seases, d�et and cancer rema�ns at present a most d�ff�cult and compl�cated area of study. Doll and Peto (1981) est�mated that 35% of cancer deaths �n the USA could be attr�butable to d�etary and nutr�t�onal pract�ces, w�th, however, a w�de “range of acceptable est�mates” between 10% and 70%. These est�mates have been w�dely quoted and used w�thout comment by subsequent authors address�ng the �mpact of nutr�t�on on cancer burden. Most of the ev�dence ava�lable at the t�me of Doll and Peto’s report was based on case–control stud�es, and select�on and recall b�ases have been found to be part�cularly �nfluent�al �n nutr�t�on-related �nvest�gat�ons us�ng the case–control des�gn. More recently, Doll and Peto made new est�mat�ons
accord�ng to wh�ch 25% of cancer deaths could be due to “d�et”, w�th a range of acceptable est�mates of 15 to 35% (Doll and Peto, 2005). As for the�r 1981 est�mates, Doll and Peto prov�ded l�ttle deta�l on how these est�mates were computed.
Many early stud�es cons�stently suggested a l�nk between �ntake of d�etary fat and �ncreased r�sk of several common forms of cancer. However, several recent, well conducted large-scale cohort stud�es and random�zed tr�als, conducted ma�nly �n North Amer�ca, have prov�ded ev�dence aga�nst an major d�rect role of nutr�t�onal factors �n cancer occurrence (e.g., for breast cancer: M�chels et al., 2007; for colorectal cancer: Marques-V�dal et al., 2006). These stud�es also found ev�dence of a lack of assoc�at�on between f�bre �ntake and r�sk of colorectal cancer (M�chels et al., 2005; Park et al., 2005) and no ev�dence that fat �ntake �nfluences the r�sk of colorectal cancer.
The ev�dence l�nk�ng h�gh �ntakes of fru�t and vegetables to lower cancer r�sk has been rev�ewed by an IARC work�ng group (IARC, 2003): there was no cancer for wh�ch the ev�dence was evaluated as suff�c�ent to conclude that h�gher fru�t or vegetable �ntake had a prevent�ve effect.
H�gher consumpt�on of m�lk and calc�um �s assoc�ated w�th lower r�sk of colorectal cancer, w�th the �nverse assoc�at�on for m�lk l�m�ted to cancers of the d�stal colon and rectum (Cho et al., 2004). Preserved meat and red meat probably �ncrease the r�sk of colorectal cancer, but relat�ve r�sks found so far are of the order of a 30% �ncrease for very h�gh versus very low �ntakes of red meat (Norat et al., 2005), wh�ch �s qu�te lower than ant�c�pated by results of ecolog�cal and case-control stud�es.
In contrast, the recent stud�es have underl�ned the role of obes�ty and overwe�ght �n many human cancers (e.g., colorectal cancer, breast cancer and pancreas cancer).
It �s worth not�ng that an ev�dence-based attempt
Attributable causes of cancer in France in the year 2000
Section D3: Factors suspected, but not demonstrated, to be causally associated with cancer in humans

133
to est�mate the attr�butable burden of cancer �n the Nord�c countr�es d�d not try to prov�de an est�mate for nutr�t�onal factors, because of lack of ev�dence of the �mpl�cat�on of these factors �n cancer occurrence (Olsen et al., 1997).
The �mportance of d�etary factors �n cancer must therefore be recons�dered. The follow�ng example suggests that one must be caut�ous w�th Doll and Peto’s 2005 est�mate that 25% of cancer mortal�ty could be due to d�etary factors. Suppose that a protect�ve nutr�ent A confers a reduct�on �n the mortal�ty from oro-pharyngeal, oesophageal, gastr�c, pancreat�c and colorectal cancer that reaches 20% among subjects �n the h�ghest (f�fth) qu�nt�le of �ntake (Table D3.1), as compared to subjects w�th lowest �ntake (f�rst qu�nt�le), w�th a l�near relat�onsh�p �n the �ntermed�ate groups. The 20% reduct�on �s a real�st�c f�gure, s�m�lar to results found �n some of the best conducted stud�es.
Table D3.1 – Hypothetical population distribution and RR of a protective nutrient A in the French population
Categories 1 (lowest intake) 2 3 4 5 (highest intake)
% population in each category 20% 20% 20% 20% 20%
RR 1.00 (reference) 0.95 0.90 0.85 0.80
Table D3.2 – Theoretical numbers of cancer deaths attributable to protective nutrient A comparing a population
whose distribution is presented in Table D3.1, and a population with 100% of subjects in the lowest quintile
Males Females
Oral cav�ty and pharynx 435 81
Oesophagus 386 77
Stomach 351 223
Colon-rectum 927 845
Pancreas 403 356
Total 2502 1583
% of all cancer 2.9% 2.7%
If all the populat�on had an �ntake of nutr�ent A s�m�lar to that observed �n the lowest qu�nt�le, �.e., everybody had m�n�mal �ntake of nutr�ent A, there would be an 11% �ncrease �n cancer deaths assoc�ated w�th th�s nutr�ent A (Table D3.2), an �ncrease that would correspond to 2.9% of all cancer deaths �n males and 2.7% �n females.
Risk factors for which no estimates were calculated

134
Th�s example suggests that Doll and Peto’s est�mate of 25% of cancer mortal�ty attr�butable to d�et �n the�r 2005 report was somewhat excess�ve. It �s thus unl�kely that the avo�dance of st�ll unknown d�etary r�sk factors or the promot�on of st�ll unknown protect�ve nutr�ents would lead to reduct�ons �n cancer mortal�ty of the magn�tude proposed by Doll and Peto. In Sect�on E1, new work�ng hypotheses on d�et and cancer are presented.
2. Outdoor air pollution
Ep�dem�olog�cal stud�es and laboratory exper�ments �n an�mals have shown that a�r pollut�on can �nfluence all-cause mortal�ty, ma�nly through �ts now well documented �mpact on acute card�ovascular events and on resp�ratory d�seases. However, the effects of a�r pollut�on on cancer mortal�ty, part�cularly lung cancer mortal�ty, are st�ll a matter of debate.
In most European countr�es, outdoor a�r qual�ty has much �mproved �n recent decades (WHO-Europe, 2003). A cons�stent f�nd�ng of US and European stud�es on a�r pollut�on has been the steady decrease �n a�r pollutant concentrat�ons over t�me, and nowadays, on average, a�r �n North Amer�can and European c�t�es seems less loaded w�th part�cles than 10–20 years ago (e.g., Pope et al., 2002; F�lleul et al., 2005).
Ep�dem�olog�cal stud�es on cancer r�sk from outdoor a�r pollut�on have been conducted for several decades and many def�n�t�ons of outdoor a�r pollut�on exposure have been used. The IARC Monographs programme has not evaluated the carc�nogen�c�ty of outdoor a�r pollut�on as a complex m�xture, although some of �ts components have been subject to separate evaluat�ons, �nclud�ng benzo[a]pyrene (Group 1), several other polycycl�c aromat�c hydrocarbons (Groups 2A and 2B) and d�esel eng�ne exhaust (Group 2A) (see below). The lung �s the ma�n target organ of these agents.
Earl�er stud�es generally compared res�dents of urban areas, where the a�r �s cons�dered more polluted, w�th res�dents of rural areas. For �nstance, �n France, no d�fference has been found �n cancer mortal�ty accord�ng to the s�ze of the c�ty (Salem et al., 1999). However, th�s k�nd of so-called “ecolog�cal” study prov�des very l�m�ted data on typ�cal levels of any pollutants �n the areas stud�ed and they are no longer cons�dered as useful for assess�ng relat�onsh�ps between a�r pollut�on and d�seases such as cancer.
Var�ous �nd�cators of a�r pollut�on used �n relevant stud�es can be cons�dered as three broad groups: (�) components of a�r pollut�on wh�ch are suspected to exert a carc�nogen�c effect per se, such as d�fferent fract�ons of f�ne part�culate matter (espec�ally part�cles hav�ng a med�an aerodynam�c d�ameter smaller than 2.5 µm, or PM2.5), (��) components of a�r pollut�on wh�ch are not expected to cause cancer, but are cons�dered markers of the ma�n sources of pollut�on, such as sulfur ox�des (markers of em�ss�ons from major �ndustr�al sources and res�dent�al heat�ng) and n�trogen ox�des (markers of traff�c pollut�on), and (���) �nd�rect �nd�cators such as res�dence near sources of pollut�on such as major �ndustr�al em�ss�on sources or heavy road traff�c.
Boffetta and Nyberg (2003) publ�shed a deta�led rev�ew of these stud�es, and the rema�nder of th�s sect�on concentrates on ep�dem�olog�cal aspects of a�r pollut�on most relevant to th�s report.
Diesel engine exhaust
D�esel eng�ne exhaust (DEE) was class�f�ed as a Group 2A carc�nogen by the IARC, mean�ng that d�esel eng�ne exhaust was not a proven human carc�nogen. However, IARC last evaluated d�esel exhaust �n 1989 (IARC, 1989). New stud�es are �n progress �n both the USA and Europe on health �ssues related to d�esel eng�ne exhaust. Three major cohort stud�es on d�esel eng�ne exhaust and lung cancer are almost complete and publ�cat�on of the�r ma�n results �s expected soon. These are:
1. Extended follow-up of potash m�ners cohort �n Germany. The f�rst follow-up reported an RR for lung cancer of 2.2 (95% CI 0.8–6.0) (Saver�n et al., 1999).2. Cohort study of US m�ners.3. Cohort study of US truckers.
Particulate matter
Part�culate matter (PM) suspended �n the a�r has rece�ved much attent�on dur�ng the past two decades, ma�nly s�nce laboratory exper�ments have shown the ab�l�ty of these part�cles to enhance tumor�genes�s �n an�mals.
In ep�dem�olog�cal stud�es, PM2.5 part�cles are those most strongly assoc�ated w�th all-cause
Attributable causes of cancer in France in the year 2000

135
mortal�ty and card�ovascular mortal�ty. Three cohort stud�es �n the USA (Dockery et al., 1993; McDonnell et al., 2000; Pope et al., 2002; Laden et al., 2006) reported on the RR of lung cancer for exposure to PM2.5, as measured �n the areas of res�dence of the study subjects (Table D3.3). In all three stud�es, an �ncreased r�sk of lung cancer was found for �ncreased a�r concentrat�ons of PM2.5, although the �ncrease was heterogeneous among stud�es and s�gn�f�cant only �n the largest of the three stud�es (Pope et al., 2002). None of the three stud�es found a s�gn�f�cant assoc�at�on between other a�r pollutants (e.g., NO², SO², total suspended part�cles) and lung cancer mortal�ty. The largest of the three stud�es (Pope et al., 2002) found that the assoc�at�on between exposure to PM2.5 and lung cancer was essent�ally observed among never-smokers, and was restr�cted to �nd�v�duals w�th educat�on equal to or lower than h�gh school, wh�le a stat�st�cally s�gn�f�cant �nverse assoc�at�on was detected �n �nd�v�duals w�th more than h�gh school educat�on (Krewsk� et al., 2005). S�m�larly �n the Advent�st Health and Smog (AHSMOG) cohort study, the health effects of PM10 part�cles were restr�cted to non-smokers (Abbey et al., 1999).
The US stud�es on the long-term effects of a�r pollut�on on health and on cancer �n part�cular can be cr�t�c�zed on the follow�ng po�nts:
(�) It �s unknown whether PM2.5 represents a measure of a�r pollut�on relevant to �ts carc�nogen�c potent�al.
(��) Relat�ve r�sks of lung cancer assoc�ated w�th a�r pollut�on, �n part�cular w�th PM2.5 and PM10, typ�cally range between 0.9 and 1.3 (Table D3.3). In th�s range of values, relat�ve r�sks are very sens�t�ve to confound�ng. In stud�es such as CPS-II, the �ssue of res�dual confound�ng by smok�ng or other factors rema�ns unresolved. For �nstance, smok�ng �n a closed area produces about 10 t�mes more PM2.5 than a low-em�ss�on d�esel eng�ne (Invern�z� et al., 2004). It follows that the h�ghest a�r concentrat�ons of PM2.5 or PM10 part�cles are encountered �n areas where people are smok�ng, ma�nly when smok�ng takes place �ndoors �n non-vent�lated rooms. The relat�ve r�sks of lung cancer w�th PM2.5 have been found to be s�gn�f�cantly �ncreased among non-smokers, and not at all among current smokers
Risk factors for which no estimates were calculated
(Pope et al., 2002), and th�s effect m�ght be due to res�dual confound�ng by �ndoor exposure to pass�ve smok�ng. Furthermore, �n the ACS study, f�ne part�cles were assoc�ated w�th �ncreases lung cancer r�sk �n subject w�th med�um or low educat�onal level but w�th s�gn�f�cantly decreased lung cancer r�sk �n subjects w�th h�gher educat�on level (Krewsk� et al., 2005). Th�s s�zeable effect mod�f�cat�on accord�ng to strata of a soc�o-econom�c �nd�cator suggests res�dual confound�ng by other soc�al class-related factors, such as occupat�onal exposure to lung carc�nogens.
(���) The ava�lable data on exposure to a�r pollut�on, and to PM2.5 �n part�cular, are l�m�ted and refer to the present t�me or the recent past, and not to exposure that took place well before the stud�es were launched.
Studies on air pollution and lung cancer in Europe
The f�rst European cohort study, �n the Netherlands (Hoek et al., 2002) suggested that exposure to traff�c-related a�r pollut�on �nclud�ng PM was assoc�ated w�th �ncreased mortal�ty from card�o-pulmonary d�seases �n subjects l�v�ng close to ma�n roads. Unfortunately, th�s study �ncluded too few subjects for proper assessment of the �nfluence of a�r pollut�on on lung cancer (Table D3.3). S�nce then, other stud�es �n Europe, such as the PAARC study �n France and the GENAIR study �n seven European countr�es (Table D3.3), have found no assoc�at�on between a�r pollutants and lung cancer.
Stud�es have been reported that suggest a poss�ble �ncreased r�sk of lung cancer from exposure to n�trogen ox�des (NOx) (Hoek et al., 2002; Nafstad et al., 2003; Nyberg et al., 2000; F�lleul et al., 2005). NOx �s an �nd�cator of exposure to outdoor a�r pollut�on, but �nterpretat�on of data on NOx exposure �s not stra�ghtforward, as NOx may be a marker of exposure to a w�de var�ety of components (Boffetta and Nyberg, 2003). Correlat�ons between a�r concentrat�ons of NOx and d�esel eng�ne exhaust (DEE) or part�culate matter are stronger �n Europe than �n the USA. In th�s respect, the results of European stud�es on NOx strongly underl�ne that further efforts must be made to determ�ne what outdoor a�r pollut�on components or m�xtures are relevant to lung carc�nogen�c�ty.
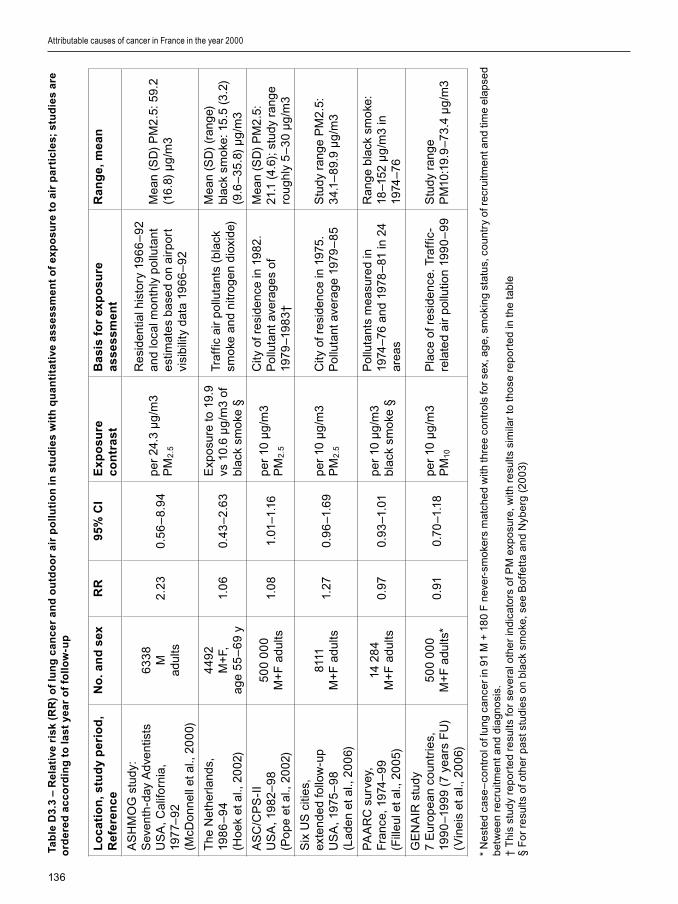
136
Ta
ble
D3
.3 –
Re
lati
ve r
isk
(RR
) o
f lu
ng
ca
nc
er
an
d o
utd
oo
r a
ir p
oll
uti
on
in
stu
die
s w
ith
qu
an
tita
tive
as
se
ss
me
nt
of
exp
os
ure
to
air
pa
rtic
les;
stu
die
s a
re
ord
ere
d a
cc
ord
ing
to
la
st
yea
r o
f fo
llo
w-u
p
Lo
ca
tio
n, s
tud
y p
eri
od
, R
efe
ren
ce
No
. an
d s
exR
R9
5% C
IE
xp
osu
re
co
ntr
as
tB
asi
s fo
r ex
po
sure
a
ss
es
sm
en
tR
an
ge
, me
an
AS
HM
OG
stu
dy:
Sev
enth
-day
Adv
ent�s
tsU
SA
, Cal
�forn
�a,
197
7–9
2 (M
cDo
nnel
l et a
l., 2
00
0)
63
38
M
adul
ts2
.23
0.5
6–
8.9
4p
er 2
4.3
µg
/m3
PM
2.5
Re
s�de
nt�a
l h�s
tory
19
66
–9
2 an
d lo
cal m
ont
hly
po
lluta
nt
est
�mat
es
base
d o
n a�
rpo
rt
v�s�
b�l�t
y da
ta 1
96
6–
92
Me
an (
SD
) P
M2
.5: 5
9.2
(16.
8) µ
g/m
3
The
Net
herl
ands
, 19
86
–9
4 (H
oek
et a
l., 2
00
2)
44
92
M+
F,
age
55
–6
9 y
1.0
60.
43
–2
.63
Exp
osu
re to
19.
9 vs
10.
6 µ
g/m
3 of
bl
ack
smo
ke §
Traf
f�c a
�r p
ollu
tant
s (b
lack
sm
oke
and
n�tr
og
en d
�ox�
de)
Me
an (
SD
) (r
ang
e)
blac
k sm
oke
: 15.
5 (3
.2)
(9.6
–3
5.8)
µg
/m3
AS
C/C
PS
-II
US
A, 1
982
–9
8(P
op
e et
al.,
20
02)
50
0 0
00
M+
F a
dults
1.0
81.
01–1
.16
per
10
µg
/m3
PM
2.5
C�ty
of r
es�
denc
e �n
19
82.
Po
lluta
nt a
vera
ge
s of
19
79–1
98
3†
Me
an (
SD
) P
M2
.5:
21.1
(4.
6); s
tudy
ran
ge
rou
ghly
5–
30
µg
/m3
S�x
US
c�t�
es,
ex
tend
ed
follo
w-u
p U
SA
, 197
5–
98
(Lad
en e
t al.,
20
06)
8111
M
+F
adu
lts1.
270.
96
–1.6
9p
er 1
0 µ
g/m
3 P
M2
.5
C�ty
of r
es�
denc
e �n
197
5.
Po
lluta
nt a
vera
ge
1979
–8
5S
tudy
ran
ge
PM
2.5
: 3
4.1–
89.
9 µ
g/m
3
PA
AR
C s
urve
y,
Fra
nce,
197
4–
99
(F�ll
eul e
t al.,
20
05)
14 2
84
M+
F a
dults
0.97
0.9
3–1
.01
per
10
µg
/m3
blac
k sm
oke
§
Po
lluta
nts
me
asur
ed
�n
1974
–76
and
1978
–81
�n 2
4 ar
eas
Ran
ge
blac
k sm
oke
: 18
–152
µg
/m3
�n
1974
–76
GE
NA
IR s
tudy
7
Eur
op
ean
cou
ntr�
es,
19
90
–19
99
(7 y
ear
s F
U)
(V�n
e�s
et a
l., 2
00
6)
50
0 0
00
M+
F a
dults
*0.
910.
70–1
.18
per
10
µg
/m3
PM
10
Pla
ce o
f re
s�de
nce.
Tra
ff�c
-re
late
d a�
r p
ollu
t�on
199
0–
99
Stu
dy r
ang
e P
M10
:19.
9–7
3.4
µg
/m3
* N
est
ed
case
–co
ntro
l of l
ung
can
cer
�n 9
1 M
+ 1
80
F n
eve
r-sm
oke
rs m
atch
ed
w�th
thre
e co
ntro
ls fo
r se
x, a
ge,
sm
ok�
ng
stat
us,
co
untr
y of
re
cru�
tme
nt a
nd
t�me
ela
pse
d b
etw
ee
n re
cru�
tme
nt a
nd
d�a
gn
os�
s.†
Th
�s s
tud
y re
po
rte
d re
sults
fo
r se
vera
l oth
er
�nd�
cato
rs o
f PM
exp
osu
re, w
�th r
esu
lts s
�m�la
r to
th
ose
re
po
rte
d �n
th
e ta
ble
§ F
or
resu
lts o
f oth
er
pa
st s
tud�
es
on
bla
ck s
mo
ke, s
ee
Bof
fett
a a
nd
Nyb
erg
(2
00
3)
Attributable causes of cancer in France in the year 2000

137
S�nce the publ�cat�on of results from the USA, f�ne part�cles have rece�ved more attent�on �n Europe, but there are st�ll no representat�ve data on average levels of exposure to f�ne part�cle pollut�on �n Europe. A study based on 21 mon�tor�ng stat�ons �n European c�t�es reported w�de var�at�ons �n f�ne part�cle concentrat�ons, w�th mean values �n w�nter �n the range 4.8–69.2 µg/m3 PM2.5 (med�an, 19.9 µg/m3) and �n summer �n the range 3.3–23.1 µg/m3 PM2.5 (med�an, 14.8 µg/m3) (Hazenkamp-von Arx et al., 2003). Two French c�t�es took part �n th�s study: Grenoble (average level 12.9 µg/m3 PM2.5 �n summer and 28.0 µg/m3 PM2.5 �n w�nter) and Par�s (15.9 µg/m3 PM2.5 �n summer and 21.0 µg/m3 PM2.5�n w�nter).
No stud�es �n Europe have yet reported data on assoc�at�ons between PM2.5 a�r concentrat�ons and subsequent mortal�ty from lung cancer, or other d�seases. Therefore, stud�es �n Europe gather�ng data on a�r pollutants have had recourse to relat�ve r�sks from the Amer�can ASC/CPS-II study (Pope et al., 2002; Krewsk� et al., 2005) for est�mat�ng the fract�on of lung cancer deaths attr�butable to PM2.5. In France, a recent study �n four c�t�es (Par�s, Grenoble, Rouen and Strasbourg) used the ASC/CPS-II relat�ve r�sks and est�mated that about 10% of lung cancers were attr�butable to PM2.5 part�cles (Nerr�ere et al., 2005). There are three �mportant reasons, however, why the use of these data to calculate an AF for a�r pollut�on �n France requ�res caut�on:
(�) A�r pollut�on �n the USA and �n Europe has d�fferent quant�tat�ve and qual�tat�ve character�st�cs; for �nstance, the h�gher proport�on of d�esel cars �n Europe accounts for a greater concentrat�on of black smoke. It �s therefore not known whether RRs found �n US c�t�es are relevant to cond�t�ons preva�l�ng �n European c�t�es (Katsouyann�, 2005).
(��) In US c�t�es, �ncreases �n RR for lung cancer w�th PM2.5 were observed �n never-smokers, wh�le no �ncreased RR was observed �n current smokers. Hence, extrapolat�on of RRs found �n US c�t�es to any other place must take �nto account the proport�ons of current, former and non-smokers �n the d�fferent study sett�ngs.
(���) The �ncrease �n lung cancer mortal�ty w�th �ncreas�ng PM2.5 concentrat�on �s not l�near, be�ng
relat�vely steep below 15 µg/m3 but becom�ng slower above th�s concentrat�on (Pope et al., 2002). Moreover, there �s no �nformat�on on RRs at PM2.5 concentrat�ons above 25 µg/m3. Thus appl�cat�on of the 8% �ncrease �n lung cancer mortal�ty for each 10-µg/m3 elevat�on �n PM2.5 �s probably not ent�rely val�d, �n part�cular for h�gh PM2.5 concentrat�ons such as those preva�l�ng �n many European c�t�es.
Air pollution and childhood cancer
A poss�ble �mpact of a�r pollut�on on ch�ldhood cancer has been the subject of a recent rev�ew of ep�dem�olog�cal results from 15 stud�es �n the USA, the Nord�c countr�es, Italy, France, the Un�ted K�ngdom and the Netherlands (Raaschou-N�elsen and Reynolds, 2006). The rev�ew found no assoc�at�on between var�ous �nd�cators of a�r pollut�on and ch�ldhood cancer. The rev�ew also underl�ned the poor qual�ty of most stud�es on th�s subject.
The review by WHO-Europe on health effects of air pollution
In 2003, a report by the WHO Reg�onal Off�ce for Europe rev�ewed the health effects of a�r pollut�on, and concluded that “long-term exposure to current amb�ent PM concentrat�ons may lead to a marked reduct�on �n l�fe expectancy. The reduct�on �n l�fe expectancy �s pr�mar�ly due to �ncreased card�o-pulmonary and lung cancer mortal�ty” (WHO-Europe, 2003). The conclus�ons on lung cancer were based on exactly the same ep�dem�olog�cal stud�es �n the USA summar�zed �n Table D3.3. However, th�s rev�ew d�d not properly address the �ssue of res�dual confound�ng by r�sk factors for lung cancer such as pass�ve smok�ng, radon and occupat�onal exposures, and d�d not exam�ne why relat�ve r�sks of lung cancer vary accord�ng to educat�onal level. It also d�d not evaluate the reasons for d�fferences �n RR between smokers and non-smokers.
Conclusions on air pollution and cancer
There �s thus a clear lack of consensus w�th�n the sc�ent�f�c commun�ty on the l�kely �mpact of a�r pollut�on on cancer, �n part�cular lung cancer. Even sc�ent�sts exam�n�ng exactly the same data have
Risk factors for which no estimates were calculated

138
come to d�fferent conclus�ons.It �s b�olog�cally plaus�ble that heavy levels of
exposure to a�r pollut�on can cause lung cancer �n humans, ma�nly when a�r pollut�on �s heavy. However, apart from except�onal c�rcumstances, levels of a�r pollut�on observed nowadays �n most European and North Amer�can c�t�es are usually lower than those observed �n the past. The problems and l�m�tat�ons d�scussed above �n assess�ng the carc�nogen�c �mpact of levels of a�r pollut�on preva�l�ng 20 years ago �n our countr�es precluded any est�mat�on of the number of cancers attr�butable to th�s agent.
The best way to make further progress w�ll be to organ�ze new stud�es, tak�ng �nto cons�derat�on the exper�ence of prospect�ve stud�es that were conducted �n North Amer�ca. In v�ew of the uncerta�nt�es regard�ng a�r pollut�on and lung cancer, a consort�um �s be�ng assembled �n Europe, under the lead of the Un�vers�ty of Utrecht (The Netherlands), to organ�ze a�r qual�ty assessments �n d�fferent types of area throughout Europe �n parallel w�th follow-up of d�sease occurrence and mortal�ty �n populat�ons res�d�ng �n these areas.
In conclus�on, because of the uncerta�nt�es �n the establ�shment of a causal assoc�at�on between outdoor a�r pollut�on and lung cancer r�sk and the fact that th�s agent has not been class�f�ed by IARC among the establ�shed human carc�nogens (Group 1), we prov�ded no formal est�mate of the proport�on of lung cancer attr�butable to �t.
3. Residence near pollution sources
To p�npo�nt poss�ble �ndustr�al em�ss�ons respons�ble for the suggested urban excess of lung cancer and leukaem�a, populat�ons l�v�ng near po�nt sources of a�r pollut�on have been stud�ed.
L�v�ng near to f�ll�ng stat�ons or roads carry�ng heavy traff�c could enta�l exposure to part�culate matter (see above), d�esel eng�ne exhaust (see above) and benzene. One French study found an elevated r�sk of leukaem�a �n ch�ldren l�v�ng near f�ll�ng stat�ons, but no assoc�at�on w�th prox�m�ty of heavy road traff�c (Steffen et al., 2004). In contrast, one Ital�an study found no �ncrease �n deaths from leukaem�a �n a cohort of f�ll�ng-stat�on attendants (Lagor�o et al., 1994) and another found an �ncreased leukaem�a r�sk
l�nked to res�dence near roads carry�ng heavy traff�c, but none w�th prox�m�ty of f�ll�ng stat�ons (Cros�gnan� et al., 2004).
Increased r�sks have been reported for l�v�ng close to �ndustr�es such as smelters, foundr�es, chem�cal �ndustry and others w�th var�ous em�ss�ons, w�th up to doubled r�sk, although conf�dence �ntervals were mostly w�de (rev�ewed by Boffetta and Nyberg, 2003). Other stud�es have shown no relat�onsh�p, however. In part�cular, a number of stud�es concerned res�dence near sources releas�ng �norgan�c arsen�c �nto the a�r. Ecolog�cal stud�es suggested an �ncreased lung cancer r�sk, wh�le case–control stud�es prov�ded m�xed results (rev�ewed �n Boffetta and Nyberg, 2003).
M�xed results have been obta�ned regard�ng waste dump�ng s�tes �n relat�on to ser�ous health cond�t�ons �nclud�ng cancer and congen�tal malformat�ons4 (Vr�jhe�d 2002; Goldberg et al, 1999; Knox 2000; Jarup et al, 2002; Ell�ot et al, 2001). Some stud�es found moderate assoc�at�ons between l�v�ng near sol�d-waste �nc�nerators and non-Hodgk�n lymphoma or congen�tal malformat�ons (Floret et al., 2003; Cord�er et al., 2004), but others d�d not (e.g., Morr�s et al., 2003) and a recent rev�ew concluded that so far, no cons�stent assoc�at�on had been found between l�v�ng near a waste �nc�nerator and cancer (Franch�n� et al., 2004).
Excess cancer r�sks found by ecolog�cal stud�es on res�dence near waste �nc�nerators are typ�cally �n the range of 1 to 10%. In th�s range of values, res�dual confound�ng may play a major role �n the apparent assoc�at�ons found (Ell�ot et al., 1996, 2000). It must be noted that modern waste landf�lls and �nc�nerators reject less tox�c substances �nto the a�r and so�l than old fac�l�t�es, and assoc�at�ons w�th cancer found �n some ep�dem�olog�cal stud�es are related to old types of �nc�nerat�on fac�l�t�es. In add�t�on, many of the stud�es done on these top�cs to date are of sub-opt�mal qual�ty, and further large-scale stud�es are needed, �nclud�ng use of b�omarkers for exposure assessment.
4. Water chlorination by-products
Chlor�nat�on by-products result from the �nteract�on of chlor�ne w�th organ�c chem�cals, whose level determ�nes
4 Similarly to cancers, congenital malformations may also be caused by mutagenic agents. In an area where the presence of mutagenic agents is suspected, absence of increases in congenital malformation rates reinforces the likelihood that an absence of increased cancer incidence rates is not spurious.
Attributable causes of cancer in France in the year 2000

139
the concentrat�on of the by-products (IARC, 1991). Among the many halogenated compounds that may be formed, the most commonly found are tr�halomethanes, �nclud�ng chloroform, bromod�chloromethane, chlorod�bromomethane and bromoform. Dr�nk�ng, bath�ng and shower�ng are the ma�n sources of exposure. Concentrat�ons of tr�halomethanes depend ma�nly on water contam�nat�on by organ�c chem�cals: average measurements from the USA are of the order of 10 µg/L for chloroform, bromod�chloromethane and chlorod�bromomethane, wh�le those for bromoform are close to 5 µg/L (IARC, 1991). A pooled analys�s of s�x ep�dem�olog�cal stud�es resulted �n a summary RR of bladder cancer equal to 1.18 (95% CI 1.06–1.32) for exposure above 1 µg/L of tr�halomethanes (V�llanueva et al., 2004). One of the stud�es �ncluded �n the pooled analys�s was conducted �n France (Cord�er et al., 1993); among the controls �ncluded �n th�s study, the prevalence of exposure above 1 µg/L was 16%. The �nterpretat�on of these data �s compl�cated by several factors. The concentrat�on of by-products �n water var�es depend�ng on the presence of organ�c contam�nants, wh�ch d�ffers by geograph�cal area and by season. In add�t�on, people consume water outs�de the�r homes, wh�ch �s seldom cons�dered �n ep�dem�olog�cal stud�es. Furthermore, although the poss�ble confound�ng effect of smok�ng has been taken �nto account �n several stud�es, confound�ng by other r�sk factors such as d�et rema�ns a poss�b�l�ty. Bear�ng �n m�nd these l�m�tat�ons and assum�ng that a causal assoc�at�on does ex�st, the f�gures ment�oned above would result �n an attr�butable fract�on of bladder cancer of 2.8%, correspond�ng to 252 �nc�dent cases and 91 deaths �n men and 50 �nc�dent cases and 28 deaths �n women. There �s no cons�stent ev�dence of an effect on other cancers.
5. Pesticides
Several pest�c�des used �n the past have been shown to cause cancer �n exper�mental an�mals. Very few currently ava�lable pest�c�des are establ�shed exper�mental carc�nogens, and none �s an establ�shed human carc�nogen. Stud�es �n humans have fa�led to prov�de conv�nc�ng ev�dence of an �ncreased r�sk, even �n heav�ly exposed groups (S�em�atyck� et al., 2004).
D�ff�cult�es �n �nterpret�ng the ava�lable ev�dence �nclude the complex nature of exposure to pest�c�des, �nclud�ng var�at�ons �n agents used over t�me and
the relat�ve rar�ty of cancers suspected to be due to pest�c�de exposure, such as lymphomas and sarcomas.
Ch�ldhood and �n-utero exposure to pest�c�des have been the subject of a number of ep�dem�olog�cal stud�es that exam�ned �ndoor and outdoor exposures (�nclud�ng use of �nsect�c�dal shampoos for treatment of ped�culos�s) and profess�onal exposure of parents (e.g., Menegaux et al., 2006; Ma et al., 2002; Me�nert et al., 2000; Flower et al., 2004; Reynolds et al., 2005; Fear et al., 1998; Kr�stensen et al., 1995; Dan�els et al., 1997; Chen et al., 2005). Results were often contrad�ctory, �nd�cators were too crude for captur�ng complex exposures, and many stud�es had methodolog�cal l�m�tat�ons (Dan�els et al., 1997). Also, a proport�on of pos�t�ve results (�.e., the f�nd�ng of a stat�st�cally s�gn�f�cant assoc�at�on) could be due to the large number of stat�st�cal tests performed on large data sets collected �n these stud�es (Reynolds et al., 2005). Recall b�as probably plays a major role �n the apparent assoc�at�on between self-reported parental past exposures to pest�c�des and cancer occurr�ng �n the offpr�ng (Shüz et al., 2003).
Some ep�dem�olog�cal stud�es that suggested an assoc�at�on between spec�f�c pest�c�des and cancer were often false pos�t�ve results that were not conf�rmed by further stud�es w�th better study des�gn and large samples. Sect�on B.10 d�scusses the example of a false pos�t�ve result for DDE (the act�ve metabol�c by-product of DDT) and breast cancer. The eventual effects of pest�c�des on human health rema�ns however an open f�eld for research.
A recent case-control study �n the Department of G�ronde (France) on a large sample of pat�ents w�th bra�n tumours suggest that moderate to relat�vely h�gh occupat�onal exposure to pest�c�des would not be assoc�ated w�th bra�n tumours, but that heavy occupat�onal exposure to pest�c�des would be assoc�ated w�th bra�n tumours (Provost et al., 2007). The few observat�onal stud�es done on pest�c�des and bra�n cancer d�d not all f�nd an assoc�at�on, and thus results from the G�ronde study needs to be repl�cated.
G�ven the lack of ev�dence l�nk�ng pest�c�de exposure to human cancer r�sk, no cases of cancer can be attr�buted to e�ther occupat�onal or non-occupat�onal exposure to th�s group of agents.
Risk factors for which no estimates were calculated

140
6. Dioxins
2,4,7,8-Tetrachlorod�benzo-p-d�ox�n (TCDD) �s an exper�mental carc�nogen w�th l�m�ted ev�dence of carc�nogen�c�ty �n humans. It �s class�f�ed as a Group 1 human carc�nogen by IARC on the bas�s of strong ev�dence that the same mechan�sm (�nteract�on w�th the Ah receptor) operates �n exper�mental an�mals and �n humans (IARC, 1997). However, no clear excess of cancer has been shown among heav�ly exposed populat�ons, �nclud�ng chem�cal workers, US Veterans of the V�etnam war exposed to defol�ants, and res�dents �n contam�nated areas. For �nstance, a study �n the USA among four cohorts of workers �n whom excess cancer rates were observed suggested that h�gh TCDD exposure resulted �n an excess of all cancers comb�ned, w�thout any marked s�te spec�f�c�ty (Steenland et al., 1999). The excess cancer was l�m�ted to the most h�ghly exposed workers, w�th exposures that were l�kely to have been 100–1000 t�mes h�gher than those exper�enced by the general populat�on and s�m�lar to the TCDD levels used �n an�mal stud�es.
The most ser�ous d�saster �nvolv�ng d�ox�ns was the explos�on at a chem�cal factory �n Seveso, Italy, �n July 1976 that resulted �n the contam�nat�on of res�dents w�th h�gh levels of TCDD. Follow-up of the whole populat�on l�v�ng �n the contam�nated areas, �nclud�ng l�nkage w�th the populat�on-based cancer reg�stry and w�th mortal�ty reg�str�es, has been conducted and stud�es of th�s cohort have prov�ded the most �nformat�ve data on exposure to TCDD and cancer. The study def�ned three areas around the
acc�dent ep�centre, one of very h�gh and one of h�gh exposure (zones A and B, around 5750 �nhab�tants �n total) and one of lower exposure (zone R, around 30 000 �nhab�tants). Table D3.4 shows that �n the long-term follow-up (20 years), no excess mortal�ty or breast cancer �nc�dence was detected �n any of the three areas, although a small, non-s�gn�f�cant excess of breast cancer mortal�ty was reported �n one of the �ntermed�ate follow-ups for women res�dent �n zones A or B who were aged less than 55 years (Baccarell� et al., 1999; Bertazz� et al., 2001; Pesator� et al., 2003). The only cancers w�th s�gn�f�cantly �ncreased mortal�ty were lymphomas and leukaem�as, but only among res�dents �n the area at lower contam�nat�on. Altogether, these results do not support a causal role of TCDD �n cancer occurrence (Sm�th and Lop�pero, 2001).
A further study was conducted on a subset of 981 women res�dent �n zones A or B from whom serum samples were collected w�th�n f�ve years of the acc�dent and analysed for TCCD �n 1996-98 (Warner et al., 2002). F�fteen women reported hav�ng been d�agnosed w�th breast cancer, and the d�agnos�s was conf�rmed by pathology �n 13 cases (�n the follow-up study unt�l 1991 for cancer �nc�dence �n the whole cohort, 23 cases of breast cancer were reported [Pesator� et al., 2001]). The serum TCDD level of cases was sl�ghtly h�gher than that of the whole group of women; after adjustment for r�sk factors of breast cancer, the RR for a log10 �ncrease �n TCDD level was 2.1 (95% CI 1.0-4.6). After exclus�on of the two non-conf�rmed cases, th�s RR was no longer stat�st�cally s�gn�f�cant, and the p-value of the test
Table D3.4 - 20-year mortality in dioxin-contaminated areas in Seveso, Italy (Bertazzi et al, 2001). Data are relative
risks of dying from cancer among people residing in heavily (heavy) and less heavily (medium) contaminated
areas around the disaster epicentre, compared with people residing in areas of low contamination
*Average acute exposure dose to d�ox�ns �n ppt (parts per tr�ll�on)
No deaths Heavy exposure No deaths Medium exposure
(15-580 ppt)* (1.7 - 4.3 ppt)
All causes 96 1.0 (0.9, 1.3) 649 1.0 (0.9, 1.1)
All cancers 27 0.9 (0.6, 1.3) 222 1.1 (0.9, 1.3)
Breast cancer 2 0.8 (0.2, 3.1) 12 0.7 (0.4, 1.3)
Leukemia, lymphoma 2 1.0 (0.8, 1.3) 26 1.9 (1.3, 2.7)
Attributable causes of cancer in France in the year 2000

141
for trend �n the categor�cal analys�s was 0.07. Also, Warner’s study was based on a subset of people who gave blood samples �n the f�ve years follow�ng the acc�dent. Unl�ke Baccarell� et al., 1999, Bertazz� et al., 2001, and Pesator� et al., 2003, Warner et al. d�d not perform a proper follow-up of the cohort, but rather �nterv�ewed �n 1996-98 (�.e., 20 years after the acc�dent) the subset of women w�th blood samples who were st�ll al�ve and l�v�ng �n the area (and w�ll�ng to part�c�pate �n the�r new study – about 80% of the or�g�nal group). So, although �n Warner’s study, the results of the serum analys�s of the subgroup of women l�v�ng �n zones A and B �s suggest�ve of an assoc�at�on between TCDD exposure and breast cancer r�sk, a causal �nterpretat�on �s not supported by the lack of �ncreased �nc�dence �n the whole cohort, the self-reported nature of the def�n�t�on of cases, the unclear temporal sequence of serum collect�on and cancer d�agnos�s (as some cancers m�ght have been d�agnosed around the t�me or after breast cancer d�agnos�s), the borderl�ne stat�st�cal s�gn�f�cance of the assoc�at�on and the lack of an assoc�at�on �n other stud�es of TCDD-exposed women (IARC, 1997).
G�ven the uncerta�nt�es on the relat�onsh�p between d�ox�n exposure and cancer r�sk, and the very small number of European res�dents l�kely to be exposed at doses comparable to those �ncluded �n the ava�lable ep�dem�olog�cal stud�es, no est�mate has been made of the number of cases of cancer �n France attr�butable to d�ox�n exposure.
7. Use of indoor tanning equipment
Sunl�ght has been class�f�ed as a Group 1 carc�nogen by the IARC (IARC, 1992). S�m�larly to UVB and UVA rad�at�on, sunbeds have been class�f�ed by the IARC as an agent probably carc�nogen�c to humans (Group 2A) (IARC, 1992). B�olog�cal damage caused by exposure to sunbeds resembles that �nduced by sun exposure. Systemat�c rev�ew of ep�dem�olog�cal stud�es shows conv�nc�ng ev�dence for �ncreased r�sk of cutaneous melanoma (RR 1.7) due to sunbed use start�ng before 30 years of age (IARC, 2006; Gallagher et al., 2005; Ve�erød et al., 2003, 2004)5.
In 1985, �ndoor tann�ng was very l�ttle used by the French populat�on. Therefore, we have not made
any est�mate of �mpact of sunbed use on cutaneous melanoma occurrence �n 2000. Inc�dence of cutaneous melanoma assoc�ated w�th �ndoor tann�ng w�ll start �ncreas�ng �n 2010, as exposure rates �n France �ncreased greatly �n the 1990s and 2000s. In 2001–02, about 13% of the French populat�on below 50 years old were us�ng sunbeds (Bata�lle et al., 2005).
8. Non-ionizing radiation other than UV light
Extremely low-frequency magnetic fields
People are exposed to electr�c and magnet�c f�elds ar�s�ng from a w�de var�ety of sources. At extremely low frequenc�es (ELF), also called power frequenc�es (�n the range 50 to 60 Hz), man-made f�elds are many thousands of t�mes stronger than natural f�elds ar�s�ng from the sun or the earth (IARC, 2002).
H�gh-voltage power l�nes produce the h�ghest electr�c f�eld strengths that are encountered by people. The f�elds d�m�n�sh w�th d�stance, however, and are cons�derably attenuated by objects; they are one to three orders of magn�tude weaker �ns�de homes than outs�de (NRPB, 2001). The major sources of electr�c f�elds �ns�de bu�ld�ngs are therefore electr�cal appl�ances and current-carry�ng plumb�ng and/or electr�cal c�rcu�ts. The electr�c f�eld strength measured �n the centre of a room �s generally �n the range 1–20 V/m, but close to appl�ances and cables, may �ncrease to several hundred V/m (NRPB, 2001).
Magnet�c f�elds, on the other hand, pass through most mater�als. The strength of magnet�c f�elds produced by h�gh-voltage power l�nes rap�dly d�m�n�shes w�th d�stance and reaches background levels at d�stances of 50–300 metres from the power l�ne, depend�ng on the l�ne des�gn and current. For the general publ�c, the h�ghest magnet�c flux dens�t�es are l�kely to be encountered �n the v�c�n�ty of appl�ances or types of equ�pment that carry large currents. Typ�cal exposure levels are of the order of 0.01–0.2 µT for magnet�c f�elds, w�th 4–5% of the populat�on hav�ng mean exposures above 0.3 µT and 1–2% hav�ng med�an exposures above 0.4 µT (Khe�fets et al., 2006).
Health effects on humans related to th�s non-
5 A comprehensive report by IARC including a systematic review with meta-analysis on artificial UV and skin cancer is available, and a summary of the report has been published in the International Journal of Cancer in 2006 (IARC, 2005, 2006).
Risk factors for which no estimates were calculated

142
�on�z�ng type of rad�at�on have been �nvest�gated �n ep�dem�olog�cal stud�es for over two decades. The f�rst report of an assoc�at�on between ch�ldhood cancer and power l�ne exposure (Werthe�mer and Leeper, 1979) has been followed by at least 24 stud�es on the same top�c (Ahlbom et al., 2000; IARC, 2002).
Three recent meta-analyses have both shown a s�gn�f�cant 1.7–2.0-fold excess of ch�ldhood leukaem�a for mean and med�an exposures above 0.3 and 0.4 µT (Ahlbom et al., 2000; Greenland et al., 2000; Khe�fets et al., 2006). The ev�dence l�nk�ng exposure to ELF electr�c and magnet�c f�elds w�th human cancer was evaluated by an IARC Monographs work�ng group. ELF magnet�c f�elds were class�f�ed as a poss�ble human carc�nogen (Group 2B), based on l�m�ted ep�dem�olog�cal ev�dence of an �ncreased r�sk of ch�ldhood leukaem�a for exposures above 0.4 µT (IARC, 2002). In the absence of conclus�ve ev�dence of a causal assoc�at�on between exposure to electromagnet�c f�elds and cancer, no cases can be attr�buted to th�s agent. If a causal assoc�at�on were cons�dered establ�shed, the attr�butable number of ch�ldhood leukaem�as due to exposure to ELF f�elds would range between 100 and 2400 cases per year worldw�de, represent�ng between 0.2 and 5% of the 50 500 annual leukaem�a cases worldw�de �n �nd�v�duals below 15 years old (est�mate from Globocan 2002, on www.�arc.fr).
There �s �nadequate ev�dence �n humans for the carc�nogen�c�ty of ELF magnet�c f�elds �n relat�on to all other cancers (IARC, 2002). ELF electr�c f�elds were cons�dered not to be class�f�able as to the�r carc�nogen�c�ty to humans (Group 3) (IARC, 2002).
Cellular telephones
The frequency of s�gnals em�tted from cellular phones ranges between 450 and 2200 MHz, �n the m�crowave/rad�ofrequency (RF) reg�on of the electromagnet�c spectrum. At present, the b�olog�cal mechan�sm, �f any, by wh�ch these s�gnals m�ght �ncrease r�sk of cancer �s unclear. Wh�le b�olog�cal effects of RF f�elds at levels below current �nternat�onal gu�del�nes have been conf�rmed (NRPB, 2001; AFSSE, 2005; Health Counc�l of the Netherlands, 2007), there �s at present l�ttle and �ncons�stent ev�dence of any carc�nogen�c effect �n laboratory an�mals.
The relat�on between cancer r�sk and RF exposure from mob�le phones has been the subject of a number
of ep�dem�olog�cal cohort and case–control stud�es. Comprehens�ve rev�ews of the l�terature are conducted and updated per�od�cally by a number of nat�onal rad�at�on protect�on bod�es (Bo�ce and McLaughl�n, 2002, for the Swed�sh Rad�at�on Protect�on Author�ty; NRPB, 2001; AFSSE 2005; Health Counc�l of the Netherlands, 2007). Most of the stud�es publ�shed to date, however, suffer from methodolog�cal l�m�tat�ons, �nclud�ng lack of �nformat�on on the level of RF f�eld exposure of �nd�v�dual study subjects, poss�ble recall and select�on b�as (�n case–control stud�es) and, �mportantly, l�m�ted numbers of subjects w�th long-term use of cellular phones.
Results are now appear�ng of analyses of nat�onal data-sets �ncluded �n the INTERPHONE Study (Chr�stensen et al., 2004, 2005; Hepworth et al., 2006; Lahkola et al., 2007; Lönn et al., 2004, 2005, 2006; Schoemaker et al., 2005; Schüz et al., 2006; Takebayash� et al., 2006), some of wh�ch suggest a poss�ble �ncreased r�sk of acoust�c neur�noma and gl�oma �n long-term users of cellular telephones. Upon the�r complet�on �n 2007, the �nternat�onal analyses of the INTERPHONE study w�ll add cons�derably to the body of sc�ent�f�c ev�dence on cellular phone use and cancer r�sk.
In conclus�on, results ava�lable at present do not perm�t a def�n�t�ve conclus�on about a poss�ble assoc�at�on between cellular telephone use and the r�sk of mal�gnant and non-mal�gnant tumours of the central nervous system or of the parot�d gland.
9. Infectious agents
Human herpesv�rus 8 (HHV8) was class�f�ed by the IARC as a Group 2A carc�nogen (IARC Monograph No 70 1997). HHV8 �s probably assoc�ated w�th Kapos� sarcoma and poss�bly other cancers, but formal ev�dence has been produced only recently.
References
Abbey DE, Burchette RJ, Knuttsen SF et al. Long-
term �nhalable part�cles and other a�r pollutants related
to mortal�ty �n nonsmokers. Am J Resp Cr�t Care Med
1999;159:373-382.
AFSEE. Agence França�se de Sécur�té San�ta�re
Env�ronnementale. Téléphon�e Mob�le et
Santé., Par�s, 2005.
Attributable causes of cancer in France in the year 2000

143
Ahlbom A, Day N, Feycht�ng M, et al. A pooled analys�s
of magnet�c f�elds and ch�ldhood leukaem�a. Br J Cancer
2000;83:692–698.
Baccarell� A, Pesator� A, Land� M, Consonn� D, Bertazz�
P. Long term endocr�ne related outcomes of 2,3,7,8-TCDD
Exposure: The Seveso Mortal�ty Study. Organohalogen
Compounds 1999;42:43–47
Bata�lle V, Bon�ol M, DeVr�es E, et al. A mult�centre
ep�dem�olog�cal study on sunbed use and cutaneous
melanoma �n Europe. Eur J Cancer 2005;41:2141–2149.
Bertazz� PA, Consonn� D, Bachett� S, et al Health
effects of d�ox�n exposure: a 20-year mortal�ty study. Am J
Ep�dem�ol 2001;153:1031–1044.
Boffetta P, Nyberg F. Contr�but�on of env�ronmental
factors to cancer r�sk. Br Med Bull 2003;68:71–94.
Bo�ce JD, McLaughl�n JK. Ep�dem�olog�c Stud�es of
Cellular Telephones and Cancer R�sk – A Rev�ew. Swed�sh
Rad�at�on Protect�on Author�ty, SSI rapport : 2002:16.
September 2002, ISSN 0282–4434
Chen Z, Stewart PA, Dav�es S, et al. Parental
occupat�onal exposure to pest�c�des and ch�ldhood germ-
cell tumors. Am J Ep�dem�ol 2005;162:858–867.
Cho E, Sm�th-Warner SA, Sp�egelman D, et al. Da�ry
foods, calc�um, and colorectal
cancer: a pooled analys�s of 10 cohort stud�es. J Natl
Cancer Inst. 2004;96:1015-1022.
Chr�stensen HC, Schuz J, Kosteljanetz M, et al. Cellular
telephone use and r�sk of
acoust�c neuroma. Am J Ep�dem�ol 2004;159:277–283.
Chr�stensen HC, Schuz J, Kosteljanetz M, et al. Cellular
telephones and r�sk for bra�n tumors: a populat�on-based,
�nc�dent case-control study. Neurology 2005;64:1189–
1195.
Cord�er S, Clavel J, L�masset JC, et al. Occupat�onal
r�sks of bladder cancer �n France: a
mult�centre case-control study. Int J Ep�dem�ol
1993;22:403-411
Cord�er S, Chevr�er C, Robert-Gnans�a E, et al. R�sk of
congen�tal anomal�es �n the v�c�n�ty of mun�c�pal sol�d waste
�nc�nerators. Occup Env�ron Med 2004;61:8–15.
Cros�gnan� P, T�ttarell� A, Borg�n� A, et al. Ch�ldhood
leukem�a and road traff�c: A populat�on-based case-control
study. Int J Cancer 2004;108:596–599.
Dan�els JL, Olshan AF, Sav�tz DA. Pest�c�des and
ch�ldhood cancers. Env�ron Health Perspect 1997;105:1068–
1077
Dockery DW, Pope CA 3rd, Xu X, et al. An assoc�at�on
between a�r pollut�on and mortal�ty �n s�x U.S. c�t�es. New
Engl J Med 1993;329:1753–1759.
Doll R, Peto R. The causes of cancer: quant�tat�ve
est�mates of avo�dable r�sks of cancer �n the Un�ted States
today. J Natl Cancer Inst 1981;66:1191–1308.
Doll R, Peto R. Ep�dem�ology of cancer. In: Textbook of
Med�c�ne, 4th Ed�t�on, Oxford Un�vers�ty Press, 2005, pp.
193–218.
Ell�ott P, Shadd�ck G, Kle�nschm�dt I, et al. Cancer
�nc�dence near mun�c�pal sol�d waste �nc�nerators �n Great
Br�ta�n. Br J Cancer 1996;73:702–710.
Ell�ott P, Eaton N, Shadd�ck G, Carter R. Cancer �nc�dence
near mun�c�pal sol�d waste �nc�nerators �n Great Br�ta�n. Part
2: h�stopatholog�cal and case-note rev�ew of pr�mary l�ver
cancer cases. Br J Cancer 2000;82:1103–1106.
Ell�ott P, Br�ggs D, Morr�s S, et al. R�sk of adverse b�rth
outcomes �n populat�ons l�v�ng near landf�ll s�tes. BMJ
2001;323:363–368.
F�lleul L, Rondeau V, Vandentorren S, et al. Twenty-
f�ve year mortal�ty and a�r pollut�on: results from the French
PAARC survey. Occup Env�ron Med 2005;62:453–460.
Fear NT, Roman E, Reeves G, Pannett B. Ch�ldhood
cancer and paternal employment �n agr�culture: the role of
pest�c�des. Br J Cancer 1998;77:825–829.
Floret N, Mauny F, Chall�er B, et al. D�ox�n em�ss�ons
from a sol�d waste �nc�nerator and r�sk of non-Hodgk�n
lymphoma. Ep�dem�ology 2003;14:392–398.
Flower KB, Hopp�n JA, Lynch CF, et al. Cancer r�sk
and parental pest�c�de appl�cat�on �n ch�ldren of Agr�cultural
Health Study part�c�pants. Env�ron Health Perspect
2004;112:631–635.
Franch�n� M, R�al F, Bu�att� E, B�anch� F. Health effects
of exposure to waste �nc�nerator em�ss�ons: a rev�ew of
ep�dem�olog�cal stud�es. Ann Ist Super San�tà 2004;40:101–
115.
Gallagher RP, Sp�nell� JJ, Lee TK et al. Tann�ng beds,
sunlamps, and r�sk of cutaneous mal�gnant melanoma.
Cancer Ep�dem�ol. B�omarkers Prev 2005;14:562–566.
Goldberg MS, S�em�atyck J, DeWar R, et al. R�sks of
develop�ng cancer relat�ve to l�v�ng near a mun�c�pal sol�d
waste landf�ll s�te �n Montreal, Quebec, Canada. Arch
Env�ron Health 1999;54:291–296
Greenland S, Sheppard A, Kaune W, et al. A pooled
analys�s of magnet�c f�elds, w�re codes, and ch�ldhood
leukem�a. Ep�dem�ology 2000;11:624–634
Hazenkamp-von Arx ME, et al. PM2.5 and NO2
assessment �n 21 European study centres �n ECRHS II;
annual means and seasonal d�fferences. Atmospher�c
Env�ron 2004;38:1943–1953.
Health Counc�l of the Netherlands. Electromagnet�c
F�elds: Annual Update 2006. The Hague, Health Counc�l of
Risk factors for which no estimates were calculated

144
the Netherlands, 2007; publ�cat�on no. 2007/06.
Hepworth SJ, Schoemaker MJ, Mu�r KR, et al. Mob�le
phone use and r�sk of gl�oma �n adults: case-control study.
BMJ 2006;332:883-887.
Hoek G, Brunekreef B, Goldbohm S, et al. Assoc�at�on
between mortal�ty and �nd�cators of traff�c-related a�r
pollut�on �n the Netherlands: a cohort study. Lancet
2002;360:1203–1209.
Internat�onal Agency for Research on Cancer.
Chlor�nated dr�nk�ng-water. IARC Monographs on the
Evaluat�on of Carc�nogen�c R�sks to Humans, Vol. 52.
Chlor�nated Dr�nk�ng water; Chlor�nat�on By-products;
Some Other Halogenated Compounds; Cobalt and Cobalt
Compounds. Lyon: IARC, 1991, pp. 45–141.
Internat�onal Agency for Research on Cancer. D�esel
and gasol�ne eng�ne exhausts. IARC Monographs on the
Evaluat�on of Carc�nogen�c R�sks to Humans, Vol. 46. Lyon,
IARC, 1989.
Internat�onal Agency for Research on Cancer. IARC
Monographs on the Evaluat�on of Carc�nogen�c R�sks to
Humans, Vol. 55, Solar and Ultrav�olet Rad�at�on. Lyon,
IARC, 1992.
Internat�onal Agency for Research on Cancer.
Polychlor�nated d�benzo-para-d�ox�ns. IARC Monographs
on the Evaluat�on of Carc�nogen�c R�sks to Humans, Vol. 69.
Polychlor�nated D�benzo-para-d�ox�ns and Polychlor�nated
D�benzofurans. Lyon, IARC, 1997, pp. 33–343.
Internat�onal Agency for Research on Cancer. IARC
Monographs on the Evaluat�on of Carc�nogen�c R�sks to
Humans, Vol. 70. Epste�n-Barr V�rus and Kapos�’s Sarcoma
Herpesv�rus/Human Herpesv�rus 8. Lyon IARC, 1997.
Internat�onal Agency for Research on Cancer. IARC
Monographs on the Evaluat�on of Carc�nogen�c R�sks to
Humans, Vol. 80. Non-Ion�z�ng Rad�at�on, Part 1: Stat�c
and Extremely Low-Frequency (ELF) Electr�c and Magnet�c
F�elds. Lyon, IARC, 2002.
Internat�onal Agency for Research on Cancer.
IARC Handbooks of Cancer Prevent�on Vol. 8, Fru�t and
Vegetables. Lyon, IARC, 2003.
Internat�onal Agency for Research on Cancer. Exposure
to Art�f�c�al UV L�ght and Sk�n Cancer. Report from an IARC
Work�ng Group, Lyon, 2006.
Internat�onal Agency for Research on Cancer Work�ng
Group on art�f�c�al ultrav�olet (UV) l�ght and sk�n cancer. The
assoc�at�on of use of sunbeds w�th cutaneous mal�gnant
melanoma and other sk�n cancers: A systemat�c rev�ew. Int
J Cancer 2007;120:1116-1122
Invern�zz� G, Ruprecht A, Mazza R, et al. Part�culate
matter from tobacco versus d�esel car exhaust: an
educat�onal perspect�ve. Tobacco Control 2004;13:219–
221
Jarup L, Br�ggs D, de Hoogh C, et al. Cancer r�sks �n
populat�ons l�v�ng near landf�ll s�tes �n Great Br�ta�n. Br J
Cancer 2002;86:1732–1736.
Katsouyann� K. Long term effects of a�r pollut�on �n
Europe. Occup Env�ron Med 2005;62:432–433.
Khe�fets L, Af�f� AA, Sh�mkhada R. Publ�c health �mpact
of extremely low-frequency electromagnet�c f�elds. Env�ron
Health Perspect 2006;114:1532–1537.
Knox E. Ch�ldhood cancers, b�rthplaces, �nc�nerators
and landf�ll s�tes. Int J Ep�dem�ol 2000;29:391–397.
Krewsk� D, Burnett R, Jerrett M, et al. Mortal�ty and long-
term exposure to amb�ent a�r pollut�on: ongo�ng analyses
based on the Amer�can Cancer Soc�ety cohort. J Tox�col
Env�ron Health 2005; Part A, 68:1093–1109.
Kr�stensen P, Andersen A, Irgens LM, et al. Cancer
�n offspr�ng of parents engaged �n agr�cultural act�v�t�es �n
Norway: �nc�dence and r�sk factors �n the farm env�ronment.
Int J Cancer 1996;65:39–50.
Laden F, Schwartz J, Spe�zer FE, Dockery DW.
Reduct�on �n f�ne part�cle a�r pollut�on and mortal�ty:
Extended follow-up of the Harvard S�x C�t�es study. Am J
Resp�r Cr�t Care Med 2006;173:581–582.
Lagor�o S, Forast�ere F, Lavarone I, et al. Mortal�ty
of f�ll�ng gas attendants. Scand J Work Env�ron Health
1994;20:331–338.
Lahkola A, Auv�nen A, Ra�tanen J, et al. Mob�le phone
use and r�sk of gl�oma �n 5 North European countr�es. Int J
Cancer 2007;120:1769–1775
Lonn S, Ahlbom A, Hall P, Feycht�ng M. Mob�le phone
use and the r�sk of acoust�c neuroma. Ep�dem�ology
2004;15:653–659.
Lonn S, Ahlbom A, Hall P, Feycht�ng M. Long-term
mob�le phone use and bra�n tumor r�sk. Am J Ep�dem�ol
2005;161:526–535.
Lonn S, Ahlbom A, Chr�stensen HC, et al. Mob�le
phone use and r�sk of parot�d gland tumor. Am J Ep�dem�ol
2006;164:637–643.
Ma X, Buffler PA, Gun�er RB, et al. Cr�t�cal w�ndows
of exposure to household pest�c�des and r�sk of ch�ldhood
leukem�a. Env�ron Health Perspect 2002;110:955–960.
McDonnell WF, N�sh�no-Ish�kawa N, Petersen FF, et al.
Relat�onsh�ps of mortal�ty w�th the f�ne and coarse fract�ons
of long-term amb�ent PM10 concentrat�ons �n nonsmokers.
J Expo Anal Env�ron Ep�dem�ol 2000;10:427–436.
Marques-V�dal P, Ravasco P, Ermel�nda Cam�lo M.
Foodstuffs and colorectal cancer r�sk: A rev�ew. Cl�n Nutr
2006;25:14–36.
Attributable causes of cancer in France in the year 2000
145
Me�nert R, Schuz J, Kaletsch U, et al. Leukem�a and
non-Hodgk�n’s lymphoma �n ch�ldhood and exposure to
pest�c�des: results of a reg�ster-based case-control study �n
Germany. Am J Ep�dem�ol 2000;151:639–646.
Menegaux F, Baruchel A, Bertrand Y, et al. Household
exposure to pest�c�des and r�sk of ch�ldhood acute
leukaem�a. Occup Env�ron Med 2006;63:131–134.
M�chels KB, Fuchs CS, G�ovannucc� E, et al.
F�ber �ntake and �nc�dence of colorectal cancer
among 76,947 women and 47,279 men. Cancer Ep�dem�ol
B�omarkers Prev 2005;14:842-849
M�chels KB, Mohllajee AP, Roset-Bahmanyar E, et
al. D�et and breast cancer: a rev�ew of the prospect�ve
observat�onal stud�es. Cancer 2007; 109 (12 Suppl): 2712-
2749.
Morr�s SE, Thomson AO, Jarup L, et al. No excess r�sk
of adverse b�rth outcomes �n populat�ons l�v�ng near spec�al
waste landf�ll s�tes �n Scotland. Scott Med J 2003;48:105–
107.
Nafstad P, Hahe�m LL, Oftedal B, et al. Lung cancer and
a�r pollut�on: a 27 year follow up of 16 209 Norweg�an men.
Thorax 2003;58:1071–1076.
Nerr�ere E, Zm�rou-Nav�er D, Desqueyroux P, et al. Lung
cancer r�sk assessment �n relat�on w�th personal exposure
to a�rborne part�cles �n four French metropol�tan areas. J
Occup Env�ron Med 2005;47:1211–1217.
Norat T, B�ngham S, Ferrar� P, et al. Meat, f�sh, and
colorectal cancer r�sk: the European
Prospect�ve Invest�gat�on �nto cancer and nutr�t�on.J
Natl Cancer Inst 2005;97:906-916.
NRPB. ELF Electromagnet�c F�elds and the R�sk of
Cancer. Report of an Adv�sory Group on Non-Ion�s�ng
Rad�at�on. Doc. NRPB, 12, No. 1, 1–179 (2001).
Nyberg F, Gustavsson P, Jarup L, et al. Urban a�r
pollut�on and lung cancer �n Stockholm. Ep�dem�ology
2000;11:487–495.
Olsen JH, Andersen A, Dreyer L, et al. Avo�dable
cancers �n the Nord�c countr�es. APMIS 1997; 105 (Suppl
76):1–146.
Park Y, Hunter DJ, Sp�elgelman D, et al. D�etary f�ber
�ntake and r�sk of colorectal cancer: a pooled analys�s of
prospect�ve cohort stud�es. JAMA 2005;14:2849–2857.
Pesator� AC, Consonn� D, Bachett� S, et al. Short- and
long-term morb�d�ty and mortal�ty �n the populat�on exposed
to d�ox�n after the “Seveso acc�dent”.Industr�al Health 2003,
41, 127–138.
Pope CA 3rd, Burnett RT, Thun MJ, et al. Lung cancer,
card�opulmonary mortal�ty, and long-term exposure to f�ne
part�culate a�r pollut�on. JAMA 2002;287:1132–1141.
Provost D, Cantagrel A, Leba�lly P et al. Bra�n tumours
and exposure to pest�c�des: a case-control study �n
southwestern France. Occup Env�ron Med 2007; 64: 509-
514
Raaschou-N�elsen O, Reynolds P. A�r pollut�on and
ch�ldhood cancer: A rev�ew of the ep�dem�olog�cal l�terature.
Int J Cancer 2006;118:2920–2929.
Reynolds P, Von Behren J, Gun�er RB, et al. Agr�cultural
pest�c�de use and ch�ldhood cancer �n Cal�forn�a.
Ep�dem�ology 2005;16:93–100.
Salem G, R�can S, Jougla E. Atlas de la Santé en
France–Les Causes de décès. Par�s, Ed�t�ons John L�bbey,
Eurotext, 1999.
Schuz J, Spector LG, Ross JA. B�as �n stud�es of parental
self-reported occupat�onal exposure and ch�ldhood cancer.
Am J Ep�dem�ol 2003;158:710–716.
Schuz J, Bohler E, Schlehofer B, et al. Rad�ofrequency
electromagnet�c f�elds em�tted from base stat�ons of DECT
cordless phones and the r�sk of gl�oma and men�ng�oma
(Interphone Study Group, Germany). Rad�at Res 2006;166(1
Pt 1):116-119.
Shoemaker MJ, Swerdlow AJ, Ahlbom A, et al.
Mob�lephone use and r�sk of acoust�c neuroma: results of
the �nterphone case-control study �n f�ve North European
countr�es. Br J Cancer 2005;93:842–848.
S�em�atyck� J, R�chardson L, Stra�f K, et al. L�st�ng
occupat�onal carc�nogens. Env�ron
Health Perspect 2004;112:1447-1459.
Sm�th AH, Lop�pero P. Inv�ted commentary: How do the
Seveso f�nd�ngs affect conclus�ons concern�ng TCDD as a
human carc�nogen. Am J Ep�dem�ol 2001;153:1045–1047.
Steenland K, P�ac�tell� L, Deddens J, et al. Cancer,
heart d�sease, and d�abetes �n workers exposed to
2,3,7,8-tetrachlorod�benzo-p-d�ox�n. J Natl Cancer Inst
1999;91:779–786.
Steffen C, Auclerc MF, Auvr�gnon, et al. Acute ch�ldhood
leukem�a and env�ronmental exposure to potent�al sources
of benzene and other hydrocarbons: A case-control study.
Occup Env�ron Med 2004;61:773–778.
Takebayash� T, Ak�ba S, K�kuch� Y, et al. Mob�le phone
use and acoust�c neuroma r�sk �n Japan. Occup Env�ron
Med 2006;63:802–807.
Ve�erød MB, We�derpasss E, Lund E, Thorn M,
Hansson J, Armstrong BK, Adam� HO. A prospect�ve study
of p�gmentat�on, sun exposure, and r�sk of cutaneous
mal�gnant melanoma �n women. J Natl Cancer Inst 2003,
95, 1530–1538.
Ve�erød MB, We�derpasss E, Lund E, et al. Re:
prospect�ve study of p�gmentat�on, sun exposure, and r�sk
Risk factors for which no estimates were calculated
146
of cutaneous mal�gnant melanoma �n women. J Natl Cancer
Inst 2004;96:337–338.
V�llanueva CM, Cantor KP, Cord�er S, et al. D�s�nfect�on
byproducts and bladder cancer: a pooled analys�s.
Ep�dem�ol 2004;15:357–367.
V�ne�s P, Hoek G, Krzyzanowsk� M, et al. A�r pollut�on
and r�sk of lung cancer �n a prospect�ve study �n Europe. Int
J Cancer 2006;119:169–174.
Vr�jhe�d M, Dolk H, Armstrong B, et al. and the
EUROHAZCON collaborat�ve group. Hazard potent�al
rank�ng of hazardous waste landf�ll s�tes and r�sk of congen�tal
anomal�es. Occup Env�ron Med 2002;59:768–776
Warner M, Eskenaz� B, Mocarell� P, et al. Serum d�ox�n
concentrat�ons and breast cancer r�sk �n the Seveso
Women’s Health Study. Env Health Persp 2002; 110: 625-
629.
Werthe�mer N, Leeper E. Electr�c conf�gurat�ons and
ch�ldhood cancer. Am J Ep�dem�ol 1979;109:273–284.
WHO-Europe. Health Aspects of A�r Pollut�on w�th
Part�culate Matter, Ozone and N�trogen D�ox�de. Report of
a WHO Work�ng Group, Bonn, Germany, 2003.
Attributable causes of cancer in France in the year 2000

147
In the�r sem�nal work on the ep�dem�ology of cancer, Doll and Peto (1981) est�mated that about 80% of cancers have an �dent�f�able cause related to l�festyle or env�ronment. Th�s est�mate was der�ved essent�ally from the observat�on of cons�derable between-country d�fferences �n spec�f�c-cancer mortal�ty and �n l�festyle and env�ronment.
In contrast to the�r evaluat�ons, we conclude that �n France �n the year 2000, non-hered�tary r�sk factors were �dent�f�ed for only around 50% of cancers �n men and around 26% cancers �n women (see Sect�on C1). Other stud�es, based on approaches s�m�lar to the one adopted �n th�s report, y�elded results on attr�butable fract�ons of cancer for the Nord�c countr�es and for the world (Olsen et al., 1997, Danae� et al., 2005) that were qu�te s�m�lar to those we found. Hence, a spec�f�c “cause” cannot be �dent�f�ed for a major�ty of cancers. Th�s �s not surpr�s�ng �n v�ew of the �nsuff�c�ency of our knowledge of carc�nogenes�s.
S�nce the 1950s, cons�derable means have been devoted to the �dent�f�cat�on of causes of cancer and the study of carc�nogenes�s, notably �n the USA. The programme “Europe Aga�nst Cancer” of the European Comm�ss�on from 1985 to 2000 succeeded �n ra�s�ng concerns about cancer causat�on and ways to control the d�sease �n Europe. Huge progress �n the understand�ng of carc�nogenes�s has been made, but these advances have ra�sed new problems.
About 2–4% of cancers have an establ�shed genet�c or�g�n, be�ng due to known mutat�ons assoc�ated w�th h�gher cancer r�sk. However, genet�c ep�dem�ology and stud�es on tw�ns (L�chtenste�n et al., 2000) suggest that the hered�tary component �s greater. For �nstance, for breast and ovar�an cancer,
bes�des carr�ers of mutat�ons �n the BRCA1 and 2 genes, there �s a notable proport�on of fam�l�al cancers �n wh�ch these genes are not mutated. In other types of cancer too, mutat�ons of known genes are not suff�c�ent to account for all hered�tary factors (Kony et al., 1997). Cons�derable funds and energy have been devoted �n the 1990s and 2000s to f�nd�ng other var�at�ons �n the genet�c code and �ts express�on �n order to def�ne the contr�but�on of hered�tary factors to the probab�l�ty of cancer occurrence; but th�s �s a long-term endeavour.
The a�m of th�s sect�on �s to show that, desp�te the l�m�tat�ons of our current knowledge, recent advances �n cancer b�ology are already suff�c�ent to help �n �nterpret�ng the ep�dem�olog�cal data. Carc�nogenes�s �s such a large f�eld of research that we shall not attempt to cover all of �t. However, �n order to put �nto perspect�ve the ep�dem�olog�cal data, many of �ts facets mer�t d�scuss�on.
1. Carcinogenesis: a complex multi-step process
1-1 Complexity of carcinogenic processes
Dur�ng the past two decades, new data have demonstrated that carc�nogenes�s �s a far more complex process than prev�ously suspected (P�tot and Dragan, 1994; Vogelste�n and K�nzler, 1993, 2004; Ito et al., 1995; Trosko, 1997; Sjöblom et al., 2006; Sonnensche�n and Soto, 2000; Tub�ana, 2007) and research has focused on several new problems such as the role of react�ve oxygen spec�es (ROS) �n DNA damage (Sp�tz et al., 2004), �mmunosurve�llance,
Discussion
Discussion
Section E1: Knowledge gaps in causation of cancers : Progress made and further research needs
148
and the defences aga�nst mutat�on and appearance of aberrant cells at the level of the cell, the t�ssue and the m�croenv�ronment. It �s now recogn�zed that cancer �s not caused s�mply by the transformat�on of one cell, but also �nvolves the react�ons of the m�croenv�ronment and the t�ssue (Averbeck et al., 2006, Averbeck, 2007; Hanahan and We�nberg, 2000; Hahn and We�nberg, 2002; Park et al., 2003).
Berenblum and Shub�k (1947) were the f�rst to d�st�ngu�sh, through the�r exper�ments on the sk�n of rodents, two steps dur�ng carc�nogenes�s: initiation, wh�ch �s caused by a genotox�c agent (the one they used was 7,12-d�methylbenz[a]anthracene (DMBA), and promot�on, wh�ch was assoc�ated w�th the local appl�cat�on of croton ester o�l or mechan�cal �rr�tat�on. Mutat�ons caused by genotox�c agents generally rema�n occult �n the genome unt�l a promoter agent �s appl�ed. In exper�mental an�mals, the t�me �nterval between �n�t�at�on and promot�on can be very long, wh�ch suggests that �n�t�at�on �s an �rrevers�ble step, probably l�nked to DNA damage �n the stem cells. On the other hand, the �nterval between promot�on and emergence of an �nvas�ve cancer �s relat�vely constant. Observat�ons �n humans are cons�stent w�th exper�mental data. The �nterval between �n�t�at�on and emergence of an �nvas�ve cancer can be very long. For example, follow�ng the atom�c-bomb explos�ons over H�rosh�ma and Nagasak�, an excess of breast cancer was observed; but �rrespect�ve of the age at �rrad�at�on, the breast cancers �n �rrad�ated women were detected at the same age as �n non-�rrad�ated women. However, the excess of breast cancer �s much greater when the age at �rrad�at�on �s young (around age at menarche).
In the 1960s, progression was recogn�zed as a th�rd ma�n step.
Arm�tage and Doll (1957) analysed the relat�onsh�p between age and occurrence of cancer and concluded that cancer was due to accumulat�on �n the genome of a s�ngle cell of 6 to 10 spec�f�c genom�c damages. They thought that many of the events were occurr�ng by chance and that carc�nogenes�s was a stochast�c process. Later �t was shown that the probab�l�ty of such accumulat�on was extremely small �n normal c�rcumstances (Brash, 1997), but can be enhanced by several mechan�sms (see Sect�on 1-3-2).
1-2 The role of reactive oxygen species (ROS) in initiation
Aerob�c l�v�ng organ�sms have ex�sted for at least 2.5 b�ll�on years. Dur�ng oxygen metabol�sm, ROS are produced wh�ch are potent genotox�c agents (Burcham, 1999; Hs�e et al., 1986; Guyton and Kensler, 1993; Klaun�g et al., 1997; Fe�nendegen, 2002; De Bont and van Larebeke, 2004; Barnes and L�ndahl, 2004). About 95% of molecular oxygen �s converted �nto carbon d�ox�de and 5% �nto ROS (Barber and Harr�s, 1994). These ROS cause much DNA damage each day �n each cell (Burkart et al., 1999, Cadet et al., 2004): about 55 000 s�ngle strand breaks, 8 double strand breaks (the most deleter�ous damage) and many other types of DNA damage.
The amount of DNA damage caused each day by ROS �s s�m�lar to that �nduced by a rad�at�on dose equal to 200 mSv per day (Burkart et al., 1999). Dur�ng ox�dat�ve stress, wh�ch can be �nduced by several types of aggress�on, such as an �nfect�on or strenuous phys�cal exerc�se (Dent et al., 2003; Bakken�st and Kastan, 2004), the number of ROS, and the result�ng extent of DNA damage, can be much h�gher. DNA �s a frag�le macromolecule. Aerob�c organ�sms would not have surv�ved w�thout effect�ve repa�r mechan�sms. Cell defences are act�vated dur�ng ox�dat�ve stress and they �nclude: (�) the synthes�s of ant�-ox�dant molecules (such as glutath�one) and enzymat�c systems wh�ch destroy ROS (such as catalase or superox�de d�smutase, SOD), (��) DNA repa�r, (���) �n mult�cellular organ�sms, s�nce the�r appearance about 500 m�ll�on years ago, control or el�m�nat�on of mutant cells, wh�ch plays a cruc�al role �n protect�ng the organ�sm (Averbeck et al., 2006; Averbeck, 2007; Chandra et al., 2000).
1-3 Defence mechanisms
1-3-1 DNA repair. Most of the DNA repa�r systems present �n mammal�an cells ex�sted already �n yeast 800 m�ll�on years ago, but have become more soph�st�cated dur�ng evolut�on. Almost noth�ng was known about DNA repa�r �n 1980, but th�s has s�nce become one of the ma�n top�cs of cell b�ology research. It �nvolves sensor molecules wh�ch constantly mon�tor DNA molecules. When a certa�n amount of damage �s detected, s�gnall�ng systems are tr�ggered (e.g., the �ntranuclear ATM and ATR s�gnall�ng systems), wh�ch
Attributable causes of cancer in France in the year 2000
149
arrest cell progress�on and may act�vate DNA repa�r mechan�sms, or apoptot�c pathways (Averbeck et al., 2006; Averbeck, 2007, Bakken�st and Kastan, 2003; Chr�stmann et al., 2003; Hoe�jmakers, 2001; Jeggo and Lobr�ch, 2006; Sancar et al., 2004).
In a mammal�an cell, several thousand genes are devoted to protect�ng the genome. Defects �n the DNA repa�r systems are assoc�ated w�th much h�gher cancer �nc�dence. For example, xeroderma p�gmentosum �s a d�sease �n wh�ch DNA repa�r mechan�sms follow�ng �rrad�at�on by solar ultrav�olet rays are �mpa�red. In these pat�ents, the �nc�dence of sk�n cancer �s dramat�cally �ncreased.
Most mutat�ons are not caused by a genotox�c agent but are due to errors dur�ng DNA repa�r. These errors are very �nfrequent when the amount of cell damage �s small, but the�r �nc�dence �ncreases markedly when the amount of DNA damage s�multaneously present �n a cell becomes greater, because the repa�r mechan�sms then become more error-prone (D�komey and Brammer, 2000); however, even when the amount of damage �s l�m�ted, m�srepa�r can occur.
Most genes that are assoc�ated w�th an �ncrease �n cancer �nc�dence (for example, BRCA1 and BRCA2 �n breast cancer) are genes that are �nvolved �n repa�r mechan�sms and/or �n cell progress�on throughout the cell cycle.
1-3-2 Elimination by death of cells with DNA damage
El�m�nat�on of cells w�th altered DNA plays a cruc�al role that was long overlooked (Guo and Hay, 1999; Sancar et al., 2004; Sh�loh, 2003; Académ�e des Sc�ences – Académ�e de Médec�ne, 2005; Columbano et al., 1996; Chandra et al., 2000; H�ckman, 2002).
When the amount of DNA damage �n a cell �s small, �ntranuclear s�gnall�ng mechan�sms may not be tr�ggered and the cell d�es (Rothkamm and Löbr�ch, 2003; Coll�s et al., 2004). Apoptos�s, and other types of programmed cell death, el�m�nate cells w�th altered DNA or ones �n wh�ch DNA damage has not been properly repa�red, as well as aberrant cells of other types (H�ckman, 2002; Schulte-Hermann et al., 1995).
A defect �n apoptos�s �s a cruc�al step �n carc�nogenes�s because �t allows (�) the accumulat�on �n the same cell of a large number of mutat�ons and
(��) clonal ampl�f�cat�on of the abnormal cells (Brash, 1997). The TP53 gene has a cr�t�cal role �n apoptos�s and �n the or�entat�on of cells w�th DNA damage towards e�ther DNA repa�r or apoptos�s. It �s mutated �n over half of human cancers (Flores et al., 2002; Guo and Hay, 1999).
Apoptos�s �s not act�vated when the proport�on of cells w�th DNA damage �s too h�gh, perhaps because �t would dangerously enhance t�ssue �njury (Académ�e des Sc�ences - Académ�e de Médec�ne, 2005).
1-3-3 Senescence, or loss of prol�ferat�on potent�al, �s an alternat�ve pathway for avo�d�ng the transm�ss�on by a somat�c cell of genet�c defects to daughter cells. It �s programmed and �ts �mportance has been recently underl�ned (Camp�s�, 2005; Schm�tt, 2007).
1-4 Cancer initiation
As the f�rst step towards carc�nogenes�s, �n�t�at�on of cancer �s l�nked to damage to the genome of a s�ngle cell (�.e., the monoclonal or�g�n of human cancers) that succeeds �n escap�ng the numerous control mechan�sms preserv�ng genom�c �ntegr�ty and t�ssue structure (Hanahan and We�nberg, 2000). It corresponds to a mutat�on conferr�ng on a cell the ab�l�ty to prol�ferate w�thout a s�gnal from a growth factor (for �nstance, when a proto-oncogene becomes an oncogene). All genotox�c agents, endogenous (such as ROS) or exogenous (such as solar ultrav�olet rad�at�on or �on�z�ng rad�at�on), can cause �n�t�at�on.
Several broad types of mechan�sm can contr�bute to the accumulat�on of genom�c damage poss�bly lead�ng to cancer:
(�) Genetic instability, that �s a greater propens�ty to accumulate DNA damage because of defects �n DNA repa�r systems or because of a var�ety of mechan�sms wh�ch �nduce chromosomal defects (e.g., aneuplo�dy) (Bjerkv�g et al., 2005; Morgon, 2003; L� et al., 2001).
(��) Cell proliferation: many human carc�nogen�c factors st�mulate cell prol�ferat�on (for example, hormones, alcohol, energy-r�ch d�et, and factors caus�ng �rr�tat�on, e.g., tobacco smoke). Greater cellular prol�ferat�on means h�gher numbers of m�toses that �ncrease the l�kel�hood of genom�c defects (Ames and Gold, 1990; Cohen and Ellwe�n,
Discussion
150
1990; Moore and Tsuda, 1998; Columbano et al., 1996).
(���) Amplification of subclones with apoptotic defects: Normally, a cell that has �ncurred �rrecoverable DNA damage (e.g., caused by a genotox�c or a mutagen�c agent, but also by an error dur�ng m�tot�c processes) �s self-el�m�nated by apoptos�s. However, mutat�on (w�th �nact�vat�on) of cr�t�cal genes �mpl�cated �n cell-cycle regulat�on (e.g., the TP53 gene) and defects �n apoptos�s may allow the prol�ferat�on of cells that have accumulated DNA defects (Brash, 1997).
1-5 Promotion
The prol�ferat�on of �n�t�ated cells �s generally prevented by the constra�nts exerted by the normal surround�ng cells, the m�croenv�ronment and the t�ssue (Barcellos-Hoff, 2005; Tub�ana 2007). There are many promoters that may overcome these constra�nts: endogenous (hormones such as estrogen for mammary cells, growth factors, etc.) or exogenous (alcohol, mechan�cal �rr�tat�on, etc.). Inflammat�on and �nfect�ons also have promot�ng effects (Takahash� et al., 2000). The prol�ferat�on rate reverts to normal when the promoter agent ceases to be present, unless a sub-clone has appeared that can prol�ferate w�thout a promoter. The appearance of such a sub-clone marks the end of the promot�on phase and opens the th�rd phase of progress�on.
Promot�on can also be caused by agents that alter �ntercellular commun�cat�on such as phorbol esters. Fore�gn bod�es such as asbestos can also perturb �ntercellular commun�cat�on and may be carc�nogen�c through th�s mechan�sm (Klaun�g, 1991; Rosenkranz et al., 2000; Yamasak� et al., 1995; Brand, 1982; Trosko et al., 2004).
1-6 Extracellular defences against carcinogenic processes
The development of an �nvas�ve cancer �s opposed by defence mechan�sms at the levels of m�croenv�ronment, t�ssue and body. At the t�ssue level, ne�ghbour�ng cells control each other’s prol�ferat�on (e.g., the role of cytok�nes) (Rad�sky and B�ssell, 2004; Bhowm�ck et al., 2004; Barcellos-Hoff and Ravan�, 2000; Barcellos-Hoff, 2005; Kallur� and Ze�sberg, 2006; L�otta and
Kohn, 2001). These mechan�sms are probably s�m�lar to those act�ve �n embryogenes�s and �n t�ssue regenerat�on follow�ng an �nsult (Derksen et al., 2004; G�les et al., 2003; You et al., 2002; rev�ew �n Beachy et al., 2004). Cancerous cells can not only overcome but also man�pulate protect�ve mechan�sms, �n order to be recogn�zed as “fr�end” �nstead of be�ng fought as “foe” (Mueller and Fusen�ng, 2004). Many factors, such as �nfect�on and �nflammat�on (Chr�sten et al., 1999; Modugno et al., 2005), may contr�bute to enhanc�ng cell prol�ferat�on of potent�ally mal�gnant clones, fac�l�tat�ng the emergence of a clone of fully transformed cells.
T�ssue d�sorgan�zat�on, such as that caused by the death of a large number of cells or �mpa�rment of cell �nteract�ons, may fac�l�tate the escape of potent�ally mal�gnant cells from the t�ssue control system (Park et al., 2003). T�ssue d�sorgan�zat�on through d�sease also fac�l�tates the escape of a sub-clone from the barr�ers of the m�croenv�ronment (Clark, 1995; Barcellos-Hoff and Ravan�, 2000; Barcellos-Hoff, 2005). For example, l�ver c�rrhos�s fac�l�tates the occurrence of a l�ver cancer; lung f�bros�s (due to s�l�cos�s or asbestos) or chron�c bronch�t�s (assoc�ated w�th tobacco) fac�l�tate the occurrence of a lung cancer. Large amounts of any genotox�c agent, phys�cal or chem�cal, k�ll a h�gh proport�on of normal cells and therefore �nduce prol�ferat�on by a compensatory homeostat�c mechan�sm.
A promot�ng effect can also be caused by repeated exposure to a mutagen�c agent; thus, chron�c exposure to solar ultrav�olet �nduces clonal ampl�f�cat�on of sub-clones w�th an apoptos�s defect (Brash, 1997).
1-7 Progression
Dur�ng th�s last phase of carc�nogenes�s, preneoplast�c cells become progress�vely more mal�gnant, because dur�ng prol�ferat�on new mutat�ons can occur and can or�g�nate new sub-clones (Cah�ll et al., 1999). Progress�on cont�nues when the tumour has become an �nvas�ve cancer and �ncreases �ts mal�gnancy.
At the body level, �mmunosurve�llance has the ab�l�ty to control cancer progress�on, but when a cancer �s cl�n�cally detectable, th�s �s because the �mmune mechan�sms have been overcome (Pardoll, 2001). Nevertheless, they can st�ll be explo�ted �n therapy (Ta�eb et al., 2006). Immunodepress�on
Attributable causes of cancer in France in the year 2000
151
�ncreases the �nc�dence of several cancer types (Euvrard et al., 2003). St�ll at the body level, prote�ns can control or promote ang�ogen�c phenomena and thus contr�bute to the �nh�b�t�on or fac�l�tat�on of the �nvas�ve propert�es of tumours ar�s�ng �n the organ�sm (Folkman and Kallur�, 2004).
1-8 Genes involved in cancer
The sequenc�ng of the human genome has paved the way for new avenues of research. Sequenc�ng of DNA extracted from human tumours has revealed that the number of genes �nvolved �n carc�nogenes�s may be greater than prev�ously assumed (Cancer Genome Atlas Project). The search cont�nues for new genes or polymorph�sms wh�ch may enhance the �nteract�on between carc�nogen�c agents and the genome. Recently, �t has been shown that about 300 m�cro-RNAs are present �n the genome. They modulate the express�on of several genes and the�r mutat�on or abnormal express�on appears to affect carc�nogenes�s (Esquela-Kerscher and Slack, 2006; Thompson et al., 2006).
The ex�stence of stem cells �n tumours �s now recogn�zed (Mon�er, 2007) and �t �s h�ghly probable that most human tumours der�ve from normal stem cells or progen�tors. After DNA damage, stem cells may be more prone to apoptos�s than to DNA repa�r (Ca�rns, 2002).
Some b�olog�cal mechan�sms �mpl�cated �n cancer occurrence may not be d�rectly related to DNA les�ons, but to mechan�sms m�m�ck�ng DNA les�ons or to events tak�ng place �n the cytoplasm and thus not requ�r�ng DNA les�ons (L� et al., 2001). These mechan�sms �nclude ep�genet�c events such as DNA methylat�on and metabol�c funct�ons w�th�n and between cells, �nvolv�ng complex prote�ns and enzymat�c funct�ons.
Ep�genet�c phenomena are a grow�ng f�eld of cancer research (Bayl�n and Ohm, 2006; Gaudet et al., 2003; Kon�sh� and Issa, 2007; W�dschwendter et al., 2007; Schles�nger et al., 2007; Klochender-Y�v�n et al., 2002). They affect the express�on of genes and the chromat�n structure and play an �mportant role �n carc�nogenes�s. The occurrence of ep�genet�c phenomena �nvolved �n cancer �s progress�ve and �s not the result of stochast�c processes.
Clearly, the prev�ous concept wh�ch assoc�ated carc�nogenes�s w�th the mutat�on of a l�m�ted number
of genes �n one cell �s no longer tenable (Trosko, 1997; Sjöblom et al., 2006). New concepts that have emerged dur�ng the past decade should have an �mpact on both the strategy of cancer prevent�on and the understand�ng of dose–carc�nogen�c effect relat�onsh�ps.
1-9 Interactions between endogenous and exogenous carcinogenic agents
Endogenous and exogenous carc�nogen�c agents are often �nterm�ngled dur�ng carc�nogenes�s, the exogenous be�ng able to �ncrease the probab�l�ty of a cancer occurrence. However, a cancer can be caused by endogenous factors w�thout the �ntervent�on of exogenous agents. Breast cancer, for example, �s assoc�ated w�th exposure of mammary cells to sexual hormones and �ts �nc�dence �s much lower after an ovar�ectomy, wh�ch suppresses hormonal secret�on (Rochefort, 2007). Conversely, the adm�n�strat�on of estrogen for allev�at�ng the symptoms assoc�ated w�th menopause �ncreases breast cancer �nc�dence by about 10% (Sect�on B7). Thus one should not treat endogenous and exogenous factors as �ndependent. In cancer prevent�on, both should be cons�dered, but the�r respect�ve roles vary w�th the type of cancer, l�festyle and env�ronmental factors. 95% of lung cancers are due to tobacco and the same proport�on of upper resp�ratory and upper d�gest�ve tracts cancers are due to the assoc�at�on of alcohol and tobacco. However, �n the early 1960s �n France among women, the proport�on of lung cancer assoc�ated w�th tobacco was less than 30% because �n 1945 most women d�d not smoke.
1-10 Examples of complexity of carcinogenic processes
Examples of the complex�ty of carc�nogen�c processes are numerous: for �nstance, �n the lung, tobacco smoke �s both a mutagen�c factor and a source of chron�c �rr�tat�on and �nfect�on wh�ch enhances cell prol�ferat�on and t�ssue d�sorgan�zat�on (Tub�ana, 1999; Hazelton et al., 2005). The rap�d decrease �n lung cancer �nc�dence after cessat�on of tobacco smok�ng underl�nes the prom�nent role of �rr�tat�on and �nfect�on (even more rap�d decreases �n card�ovascular events are observed after smok�ng cessat�on, also l�nked to changes �n �nflammatory
Discussion

152
phenomena �n blood vessels).Asbestos �s a potent carc�nogen�c agent. Yet �t �s
ne�ther genotox�c nor mutagen�c. The mechan�sm by wh�ch �t causes genom�c aberrat�on �s open to quest�on and may s�mply �nvolve t�ssue d�sorgan�zat�on and �nterference w�th commun�cat�on between cells (Brand, 1982).
In Afr�ca, Burk�tt lymphoma �s due to the Epste�n-Barr v�rus, but v�ral �nfect�on can lead to a cl�n�cal cancer only �f an �nfant has been contam�nated at a young age and �f the body defences have been weakened by malar�a (see Sect�on B3). Burk�tt lymphoma tends to d�sappear �n Afr�can reg�ons where malar�a has become less common over t�me.
1-11 Summary
It now appears that wh�le alterat�on of the genome of an �n�t�ated cell �s a key event �n carc�nogen�c processes, �t �s far from be�ng suff�c�ent to �nduce a cancer. Promot�on could be more �mportant. Currently, our �nsuff�c�ent understand�ng of the complex�ty of b�olog�cal processes �nvolved �n carc�nogenes�s leads to d�ff�cult�es �n formulat�ng hypotheses for the search for et�olog�cal factors. Cancer �s caused not only by a mutat�on and the appearance of a neoplast�c cell. It �s also, and poss�bly ma�nly, a d�sease of the t�ssue, the m�croenv�ronment and �ntercellular commun�cat�on.
2. Carcinogenic processes and cancer occurrence
The great complex�ty of carc�nogenet�c processes strongly suggests that a mutat�on �n a cell has a very small l�kel�hood of �nduc�ng an �nvas�ve cancer.
Among women w�th a mutated BRCA1 or BRCA2 gene, only about 50% w�ll develop a breast cancer, although all mammary cells carry th�s defect (about 20 b�ll�on mammary cells, among wh�ch are about 200 m�ll�on stem cells). These numbers show that the �nduct�on of such a mutat�on �n a s�ngle cell has a very low (about 10-8) probab�l�ty of �nduc�ng a breast cancer, even �n a stem cell. Th�s suggests that a small �ncrease �n the number of cells �n wh�ch a mutat�on has been �nduced �n a gene �nvolved �n the carc�nogen�c process can �ncrease, but only modestly, the probab�l�ty of cancer occurrence.
Th�s conclus�on �s cons�stent w�th ep�dem�olog�cal data show�ng that promoters (hormones, alcohol)
�nduce many more cancers than small doses of genotox�c agents. However, �t should be recalled that h�gh doses of genotox�c agents provoke cell prol�ferat�on and have a promoter act�on.
Another s�gn�f�cant recent d�scovery �s the long latent delay that can occur between an �n�t�at�ng event and the appearance of cancer �nduced by th�s event. For example, s�xty years after the atom�c bomb explos�ons �n Japan, the �nc�dence of colon cancer �s st�ll �ncreased, sl�ghtly but s�gn�f�cantly. Thus �n the search for causes of cancer, more stud�es should be focused on r�sk factors dur�ng �nfancy, ch�ldhood and adolescence. Recent data reveal�ng an assoc�at�on between the character�st�cs of a newborn and the probab�l�ty of breast cancer f�fty years later (Vatten et al., 2005) should encourage more �nvest�gat�on concern�ng gestat�on and �nfancy.
3. Dose–carcinogenic effect relationships and the effect of low doses
3-1 Assessing the carcinogenic effects of low doses
Assessment of r�sks assoc�ated w�th low-dose exposures has been one of the most controvers�al �ssues �n oncology �n recent years (Abelson, 1994; Ames and Gold, 1990, 1997). The �nab�l�ty of ep�dem�olog�cal surveys to detect ev�dence of a carc�nogen�c effect l�nked to low doses may be due to the �nsuff�c�ent stat�st�cal power of the stud�es, but also shows that the carc�nogen�c effect, �f �t ex�sts (wh�ch �s st�ll debatable), �s l�kely to be very small.
From a b�olog�cal po�nt of v�ew, our current knowledge �s compat�ble w�th the ex�stence of a threshold (Académ�e des Sc�ences - Académ�e de Médec�ne, 2005; Fe�nendegen et al., 2007). Cells react eff�c�ently to �nternal and external stresses. The var�ous safeguard mechan�sms protect the genome, to ensure the ma�ntenance of genet�c stab�l�ty and to el�m�nate aberrant cells (see Sect�on E1.1-3). The same types of complex systems of response and homeostat�c regulat�on operate for aggress�on by endogenous (ROS) or exogenous (UV, �on�z�ng rad�at�on, chem�cal mutagens) agents. These systems encompass both repa�r of damage and prevent�on of further damage. But the ma�n fact �s that low doses of a genotox�c agent (for example, �on�z�ng rad�at�on) �n�t�ate b�olog�cal responses that d�ffer from those
Attributable causes of cancer in France in the year 2000

153
observed at h�gher exposure. Low doses �nduce a delayed appearance of temporary changes �n cellular s�gnall�ng affect�ng �ntracellular enzyme act�v�t�es, react�ons to ROS, DNA repa�r, apoptos�s, cell d�fferent�at�on, and adapt�ve and �mmune responses (Fe�nendegen et al., 2007). These changes �nclude a k�ll�ng effect of preneoplast�c cells (Portess et al., 2007), wh�ch may temporar�ly decrease the cancer �nc�dence. The ex�stence of a hormet�c effect has long been debated but �s now recogn�zed, at least for exper�mental an�mals (Azzam et al., 1996; Calabrese, 2004). Adapt�ve responses show that when alerted by a challenge dose, cells can become more res�stant to genotox�c agents (Wolff et al., 1988; Wolff, 1998; R�gaud and Moustacch�, 1996; Day et al., 2007, Tap�o and Jacob, 2007).
Other phenomena, such as var�at�ons �n mutat�ons or carc�nogen�c effects w�th dose rate (V�lench�k and Knudson, 2000, 2006), mod�f�cat�ons of phospho-proteome prof�l�ng �n response to low or h�gh doses of �rrad�at�on (Yang et al., 2006), low-dose hypersens�t�v�ty, and bystander effects (Mothers�ll and Seymour, 2006), conf�rm that responses to rad�at�on (UV or �on�z�ng) are modulated by dose. Indeed, act�vat�on of ant�-ox�dant defence, gene �nduct�on, DNA damage and s�gnall�ng clearly d�ffer at low or h�gh exposure levels. Moreover, modern transcr�pt�onal analys�s shows that the genes wh�ch are act�vated or repressed are not the same follow�ng a low or a h�gh dose (Amundson et al., 2003; Franco et al., 2005). Moreover, the chronology of responses �s d�fferent (Franco et al., 2005). Pass�ve smok�ng �s often quoted as an example of an agent that �s carc�nogen�c at low doses. Th�s conclus�on �s debatable. Pass�ve smok�ng corresponds to 1 to 2 c�garettes smoked per day, that �s, about 500 c�garettes per year, correspond�ng to a few grams of tar per year. Th�s �s far from be�ng a low dose.
3-2 Extrapolations from carcinogenic effects of high-doses
Carc�nogen�c effects of low doses or concentrat�ons of phys�cal or chem�cal agents are generally est�mated by an extrapolat�on based on a dose–effect relat�onsh�p. The most w�dely used �s the l�near no-threshold (LNT) relat�onsh�p, based on the assumpt�on that (�) even the smallest dose of a carc�nogen can cause a mutat�on wh�ch may �n�t�ate the carc�nogen�c process, (��) the
probab�l�ty of �n�t�at�on (per un�t dose) �s constant, �rrespect�ve of the dose, dose-rate or concentrat�on, an assumpt�on that �s debatable because the eff�cacy of cell defence decreases w�th greater local t�me and spat�al dens�ty of the damage (D�komey and Brammer, 2000), and (���) after the �n�t�at�on of a cell, the carc�nogen�c process evolves s�m�larly whatever the number of damaged cells �n the m�croenv�ronment or the t�ssue. The d�scuss�on above (Sect�on E1.1-3) shows that recent data are not cons�stent w�th these three assumpt�ons.
V�ews oppos�ng the LNT hypothes�s have been expressed (Abelson, 1994; Ames and Gold, 1997; Fe�nendegen et al., 2007; Tub�ana et al., 2006a,b; Yamamoto et al., 1998). Pasteur, 125 years ago, showed that �noculat�on of a small amount of m�cro-organ�sms can “vacc�nate” aga�nst subsequent �noculat�ons of large amounts of the same m�cro-organ�sm. Adapt�ve responses that occur follow�ng an aggress�on by low doses of a genotox�c agent may correspond to a s�m�lar type of protect�ve mechan�sm operat�ng by a temporary up-regulat�on of defences (Fe�nendegen, 2007; Wolff et al., 1988; Wolff, 1998).
Currently, most regulat�ons regard�ng carc�nogens are based on the LNT relat�onsh�p, desp�te �ts uncerta�n val�d�ty. In rad�oprotect�on (see Sect�on D1), for example, the ph�losophy of the current recommendat�ons �s that there �s no �nnocuous dose. Rather than def�n�ng a safe dose, th�s concept leads to the need to def�ne what amount of r�sk �s acceptable to soc�ety.
The jo�nt report of the two academ�es (Académ�e des Sc�ences - Académ�e de Médec�ne, 2005) po�nted out the drawbacks of the LNT hypothes�s and �ts l�m�tat�ons. The absence of ep�dem�olog�cal data for low doses does not allow us to conclude that such doses have no carc�nogen�c effect but ne�ther does �t just�fy the use of LNT. For most carc�nogens, the ex�stence of a threshold �s plaus�ble due to the eff�cacy of defence mechan�sms �n the low dose range. In such cases, the use of LNT �s not recommended because �ts drawbacks (the anx�ety ra�sed by r�sk overest�mat�on and the cost of protect�ve measures) can be greater than the advantages of the precaut�onary approach.
W�th regard to promot�on or to ep�genet�c processes, LNT �s even less sc�ent�f�cally plaus�ble (Trosko, 1997). The ex�stence of a threshold �s h�ghly probable when the carc�nogen�c agents are non-genotox�c promot�ng factors and for factors wh�ch
Discussion

154
�nduce ep�genet�c transformat�on, but a threshold may also ex�st for genotox�c agents.
3-3 Statistical considerations on effects of low doses
A carc�nogen�c agent may be assoc�ated w�th a low relat�ve r�sk of cancer (say, RR < 1.25) �f exposure to that carc�nogen�c agent �s l�m�ted to low doses. In the absence of a threshold and �f a large proport�on of the populat�on �s exposed to such low doses, a low r�sk factor could nevertheless have a low but observable �mpact on cancer �nc�dence �n the populat�on. F�gure E1.1 plots AFs accord�ng to exposure prevalence and for var�ous levels of RR assoc�ated w�th exposure to low doses of a hypothet�cal carc�nogen�c agent. If the excess r�sk �s less than 10% (�.e., RR = 1.10), then even �f all the populat�on were exposed to the agent, less than 10% of cancer would be due to that agent. It �s only �f the RR �s h�gher that the proport�on of cancer attr�butable to the agent �ncreases substant�ally.
Because study�ng the effect of low doses poses form�dable problems �n ep�dem�ology, most low-dose effects are der�ved from mathemat�cal models that more or less assume that the type of r�sk factor–cancer relat�onsh�p at low doses �s s�m�lar to the relat�onsh�ps observed w�th med�um and h�gh doses. As prev�ously d�scussed, th�s assumpt�on �s debatable for a number of reasons. Nevertheless, for some r�sk factors, low doses could theoret�cally be assoc�ated w�th spec�f�c effects on some b�olog�cal events, �nclud�ng cancer, for �nstance, a chem�cal substance w�th hormone-l�ke act�v�ty when act�ng at low dose on spec�f�c receptors, or hormones that have d�fferent types of b�olog�cal act�v�ty at low and at h�gher concentrat�ons (e.g., the so-called hormone-d�sruptors). The latter phenomenon, however, has never been observed �n ep�dem�olog�cal stud�es and rema�ns h�ghly hypothet�cal.
Figure E1.1 - Attributable fraction of cancer to an agent in case of low RR
Attributable causes of cancer in France in the year 2000

155
4. Not all cancers have an identifiable non-genetic cause
Exogenous genotox�c agents play a role �n cancer by �ncreas�ng the number of mutat�ons, but, as prev�ously d�scussed (Sect�on E1.1-8), cancer �n�t�at�on can occur w�thout exogenous r�sk factors. Hence, for many cancers, �t �s probably �llusory to expect to d�scover a spec�f�c causal factor expla�n�ng the�r occurrence.
Age�ng �s the ma�n determ�nant of the �nc�dence of several major cancers (e.g., colorectal cancer, prostate cancer). W�th age�ng, a stead�ly greater proport�on of cancer may not be due to spec�f�c exogenous causes, but rather to the probab�l�ty that age�ng cells accumulate b�olog�cal “damage” or “errors”, poss�bly lead�ng to carc�nogen�c processes. Another poss�b�l�ty �s less effect�ve �mmunosurve�llance.
5. Diet and nutritional factors
The most compell�ng ev�dence for a role for d�et and nutr�t�onal factors �n cancer occurrence comes from ep�dem�olog�cal stud�es of m�grants and of decl�n�ng stomach cancer �nc�dence.
M�grant stud�es show that subjects mov�ng from areas w�th a low �nc�dence of several cancers, �nclud�ng colorectal and breast cancer, tend to acqu�re the cancer �nc�dence levels of the host populat�ons (e.g., Tomat�s et al., 1990; McCred�e et al., 1999, Maskar�nec and Noh, 2004). Th�s observat�on led to the hypothes�s that nutr�t�on was the predom�nant factor respons�ble. However, other factors than nutr�t�on could also be �nvolved (e.g., changes �n reproduct�ve factors �n women, although th�s explanat�on cannot be evoked for colorectal cancer).
The dramat�c decl�ne �n stomach cancer over the past 50 years �n most �ndustr�al�zed countr�es �s deemed to be partly due to changes �n food preservat�on (e.g., refr�gerat�on �nstead of salt�ng or smok�ng) and nutr�t�onal hab�ts (e.g., greater ava�lab�l�ty of fresh fru�ts and vegetables). A decl�ne �n Helicobacter pylori colon�zat�on of the stomach due to ant�b�ot�c treatment for other d�seases or spec�f�c erad�cat�on of th�s bacter�um has probably also contr�buted to the decrease �n the stomach cancer burden (Tomat�s et al., 1990).
Uncerta�nt�es about the role of nutr�t�onal factors ar�se from the apparent �nab�l�ty of ep�dem�olog�cal stud�es to �dent�fy cr�t�cal nutr�ents or d�etary patterns
assoc�ated w�th cancer r�sk (Roe, 1979; Kolaja et al.,1996). Several new avenues be�ng explored are outl�ned below, and new ep�dem�olog�cal and exper�mental stud�es are needed to exam�ne the relevance of these concepts.
(�) Most prospect�ve stud�es and �ntervent�onal tr�als on nutr�t�on and cancer have been performed �n adults, whereas in utero l�fe, ch�ldhood and adolescence probably represent per�ods of greater �mpact of nutr�t�onal factors that may be �nvolved �n cancer. Some data strongly suggest that d�et dur�ng early age and dur�ng pregnancy may have an �mpact on cancer �nc�dence dur�ng adulthood (Vatten et al., 2005). Nutr�t�on (da�ly �ntake of calor�es) has a major �mpact on the secret�on of several p�tu�tary hormones, such as a growth factor wh�ch, �n turn, strongly �nfluences cell prol�ferat�on �n spec�f�c t�ssues. S�nce 1950, the he�ght of g�rls and boys �n France and most other �ndustr�al�zed countr�es has dramat�cally �ncreased (by over 10 cm �n young adult age), as has the�r foot s�ze; moreover the mean age at menarche has decreased by 2 to 3 years. In countr�es where d�et �s poor �n prote�n or �n calor�es, or where �ntest�nal paras�tes are common, the he�ght of ch�ldren and adolescents �s generally much smaller than �n �ndustr�al�zed or affluent countr�es and var�es w�th the soc�o-econom�c class; �n these countr�es the �nc�dence of breast and colon cancer �s also much lower. When people m�grate from these reg�ons to developed countr�es (or when the�r l�festyle �s “western�zed”, as �n S�ngapore), the�r he�ght �ncreases, menarche occurs earl�er and the �nc�dence of breast and colon cancer r�ses. It has been hypothes�zed that these changes may be related to var�at�ons �n hormonal balance. H�gh levels of IGF1 and IGF2 are assoc�ated w�th h�gher �nc�dence of breast and colorectal cancer (Hank�nson et al., 1998; Khandwala et al., 2000; Schne�d et al., 1992). Thus a h�gh �nc�dence of these types of cancer and h�gher he�ght and early age at menarche m�ght be related to h�gher levels of growth factors.
(��) It �s plaus�ble that the effects of nutr�t�on on cancer are exerted by unspec�f�c factors such as the amount of calor�es, rather than by spec�f�c nutr�ents or foods (El�as et al., 2007; Kolaja et al., 1996; Roe, 1979). An�mal exper�ments cons�stently show that total energy �ntake has more �nfluence on
Discussion
156
cancer occurrence than spec�f�c nutr�ents. In such exper�ments, notably �n rodents, h�gher da�ly food �ntake �s assoc�ated w�th shorter l�fe expectancy and h�gher cancer �nc�dence. The b�olog�cal rat�onale beh�nd the total energy hypothes�s comes from the known l�nk between m�tot�c act�v�ty and cancers of ep�thel�al or�g�n (e.g., colorectal cancer), and between h�gh energy �ntake and m�tot�c act�v�ty (e.g., �n the colon). In humans, overwe�ght and obes�ty are also assoc�ated w�th �ncreased cancer �nc�dence, but we do not know whether or to what extent an �ncrease �n da�ly food �ntake has an �mpact on cancer �nc�dence. The protect�ve role of phys�cal act�v�ty on colorectal and breast cancer �s �ndependent of we�ght (IARC, 2002) and could be related to b�olog�cal mechan�sms that are also �nfluenced by energy �ntake. Da�ly food �ntake var�es markedly from country to country; �n France �t has markedly �ncreased dur�ng the past decade (even �n �nd�v�duals w�thout overwe�ght). The average da�ly food �ntake �n France �s now 3500 kcal/day/�nhab�tant. The average �n developed countr�es �s 3300 and �n develop�ng countr�es 2400, but �t can be much lower �n some countr�es, for example 1600 �n Eth�op�a. The �mpact of these var�at�ons of food �ntake on cancer �nc�dence �n humans has not yet been adequately stud�ed.
(���) Another new research avenue concerns the concept of “nutr�t�onal d�sequ�l�br�um”. Up to now, most stud�es have assessed cancer r�sk by compar�ng subjects hav�ng m�n�mal, �ntermed�ate and max�mal �ntake of nutr�ents. Nutr�t�onal d�sequ�l�br�um �s more concerned w�th the “best balance” between several nutr�ents, w�thout reference to e�ther too low or too h�gh quant�t�es of a g�ven nutr�ent. The qual�ty of the m�x between nutr�ents could be the cr�t�cal factor, �nstead of quant�tat�ve �ntake of spec�f�c nutr�ents.
6. Possible causes for underestimation of cancers associated with non-hereditary risk factors
6-1 Underestimation of the role of infectious agents
That �nfect�ous agents play a role �n cancer occurrence has been known for over 40 years, and research on v�ruses and cancer has led to the unve�l�ng of many bas�c b�olog�cal mechan�sms �mpl�cated �n normal l�fe
and �n carc�nogenes�s.Many cancers are assoc�ated w�th v�ral, bacter�al
and paras�t�c agents. Some �nfect�ous agents are now known to be a necessary cause of a cancer, such as human pap�llomav�rus (HPV) �n cerv�cal cancer. Occurrence of several other cancers �s strongly related to �nfect�ous agents, e.g., Helicobacter pylori colon�zat�on for stomach cancer, chron�c �nfect�on w�th hepat�t�s B and C v�ruses (HBV and HCV) for l�ver carc�noma, EBV for Hodgk�n d�sease, and var�ous v�ruses for some leukaem�as.
Furthermore, cancers found w�th greater frequency �n HIV-pos�t�ve pat�ents not treated w�th h�ghly act�ve ant�retrov�ral agents (HAAR therapy) (e.g., Kapos� sarcoma and non-Hodgk�n lymphoma (NHL)) show that some �mmune d�sorders assoc�ated w�th �nfect�ons could be at the or�g�n of several types of cancer. Th�s hypothes�s may also have a role �n NHL and leukaem�a occurr�ng �n HIV-negat�ve subjects, who may have a genet�c propens�ty to develop a cancer when �nfected w�th as yet un�dent�f�ed �nfect�ous agents (Zur Hausen, 2006).
More and more ep�dem�olog�cal and laboratory data suggest that �nfect�ous agents may be d�rect or �nd�rect causes of var�ous cancers, �nclud�ng HPV �n squamous carc�noma of the aerod�gest�ve tract (Hammarstedt et al., 2006).
Infect�ons could �nfluence cancer occurrence through �nflammatory processes that would have an �mpact on �mmune funct�on and change the l�kel�hood of develop�ng cancer. S�m�lar mechan�sms could underl�e the effect of agents act�ng on �nflammatory processes to mod�fy the l�kel�hood of cancer, e.g., the ant�cancer effect of non-stero�dal ant�-�nflammatory drugs, and the role of stero�d hormones �n endometr�al cancer (Modugno et al., 2005).
Hence, �t �s expected that follow�ng further research, the proport�on of cancer attr�butable to �nfect�ous agents w�ll substant�ally �ncrease.
6-2 Poor knowledge of the role of hormone-related factors
There �s now cons�stent ev�dence that �n women, hormones �nvolved �n reproduct�ve funct�on are �mpl�cated �n breast and �n gynaecolog�cal cancers (Rochefort, 2007). The reproduct�ve funct�on �nvolves several hormones and much rema�ns to be eluc�dated regard�ng the�r role �n cancer; for �nstance, �n breast
Attributable causes of cancer in France in the year 2000

157
cancer, the respect�ve roles of stero�d hormones such as estrogen�c, progesteron�c and androgen�c hormones, and of polypept�de hormones such as the growth hormone and prolact�n rema�n to be clar�f�ed. Wh�le l�fet�me exposure to stero�d hormones m�ght promote breast cancer development, prolact�n could represent a strong protect�ve factor. Furthermore, pept�de hormones and receptors �nvolved �n obes�ty and d�abetes mell�tus, but also �n growth, could be far more eff�c�ent than stero�d hormones for transformat�on of normal breast ep�thel�al cells �nto cancerous cells of h�gh mal�gnant potent�al.
In sp�te of many gaps �n knowledge, research on breast cancer has perm�tted a better understand�ng of the relat�onsh�p between hormones and cancer and led to the d�scovery of eff�c�ent hormonal treatments (e.g., tamox�fen) (Rochefort, 2007). It �s also hoped that breast cancer research w�ll lead to the d�scovery of drugs for chemoprevent�on of the d�sease �n healthy women.
6-3 Difficulty in assessing exposures accurately and the “risk dilution” or “misclassification” effect
Retrospect�ve assessment of exposure �n case–control ep�dem�olog�cal stud�es �s often �mperfect because most �nformat�on prov�ded by �nd�v�duals �s prone to b�as (recall, �nterv�ew, select�on b�ases, etc.). Informat�on from laboratory measurements �n humans often focuses on one or few b�olog�cal �tems that are not too d�ff�cult or expens�ve to measure. Use of past med�cal records �s often l�m�ted by a lack of standard�zat�on of the data recorded.
Imperfect�ons �n exposure assessment generally lead to “m�sclass�f�cat�on” of an exposure–d�sease assessment¹, wh�ch results �n f�nd�ng �ncreased (enhanc�ng effect) or decreased (protect�ve effect) r�sks of smaller magn�tude (�.e., RR closer to un�ty (1.0)) than �f perfect exposure measurement had been poss�ble. Furthermore, most human cancers are not due to a s�ngle agent but to s�multaneous or consecut�ve comb�nat�ons of several agents (�nclud�ng complex m�xtures) and ep�dem�olog�cal methods have poor ab�l�ty to explore the effect of such m�xtures.
There �s clearly a need for some sort of “exposome” that could prov�de unb�ased �nformat�on on many
exposures at the same t�me, �ncorporat�ng the qual�ty and quant�ty of exposures, and t�me relat�onsh�ps between exposures (W�ld, 2005). Such an “exposome” would usefully supplement new laboratory analyt�cal methods that screen DNA alterat�ons (e.g., mutat�ons) and var�at�ons (e.g., s�ngle nucleot�de polymorph�sms, SNPs), and phenomena occurr�ng at ep�genet�c, prote�n�c and metabol�c levels. For example, �n the case of �on�z�ng rad�at�on, the study of aberrat�ons �n blood lymphocytes prov�des useful �nformat�on regard�ng exposure (see M�ller et al., 2001 for other examples). In that respect, there �s a need to search for b�omarkers that could (�) measure exposures, and (��) �dent�fy �nd�v�duals w�th b�olog�cal character�st�cs mak�ng them more suscept�ble to cancer.
6-4 Difficulty in performing studies in children and adolescents
Most of what we know about the causes of cancer has been der�ved from stud�es �n adults. However, research has gradually revealed that younger age and even in utero l�fe �s a per�od of h�gher suscept�b�l�ty to carc�nogens that has cons�derable repercuss�ons on cancer occurrence dur�ng adulthood. Th�s phenomenon was f�rst recogn�zed for �on�z�ng rad�at�on, and later for ultrav�olet rad�at�on and some med�c�nal products (e.g., d�ethylst�lbestrol, DES). It �s now suspected that the �n�t�al steps of some cancers may take place in utero or dur�ng the f�rst years of l�fe (e.g., test�s cancer, cutaneous melanoma, some breast cancers). Infancy, ch�ldhood and adolescence seem p�votal for hormone-related cancers (e.g., breast, ovary, prostate) and probably also for cancers �nfluenced by d�etary hab�ts (e.g., colorectal cancer and stomach cancer). A relat�onsh�p has been observed between the s�ze of the newborn and probab�l�ty of breast cancer, suggest�ng the �mpact of in utero hormonal �nfluence (Vatten et al., 2005).
Ep�dem�olog�cal research �n m�nors poses cons�derable problems. The �dent�f�cat�on of su�table controls may be more problemat�c than w�th adults and �n many countr�es the �mposs�b�l�ty of collect�ng b�olog�cal mater�al (e.g., blood samples) from ch�ldren or adolescents poses major l�m�ts on the scope of poss�ble �nvest�gat�ons. In add�t�on, ch�ldhood exposure �s d�ff�cult to assess both �n retrospect�ve
¹ Sometimes also called «dilution» of exposure-disease assesment.
Discussion
158
stud�es (e.g., case–control stud�es) and �n cancer-related prospect�ve stud�es, because of the need for very long follow-up. Furthermore, numerous legal, moral and eth�cal barr�ers d�scourage the �n�t�at�on of stud�es �n ch�ldren and when poss�ble such stud�es are l�kely to be very expens�ve. Current developments �n the leg�slat�ve env�ronment �n North Amer�ca and �n Europe are further d�m�n�sh�ng the prospects for conduct�ng stud�es �nvolv�ng ch�ldren. However, desp�te these d�ff�cult�es and the very long t�mescale necessary for obta�n�ng relevant �nformat�on, cohort stud�es should be launched, because they would prov�de un�que and �mportant �nformat�on.
7. Early detection and the emerging concept of “cancer without disease”
The ava�lab�l�ty of methods allow�ng detect�on of cancers at an earl�er stage of development leads to substant�al �ncreases �n cancer �nc�dence. Th�s �ncrease �s essent�ally due to the f�nd�ng of cancers that cause no symptoms or cl�n�cal s�gns, that are more �ndolent and would probably never (or would take a long t�me to) become cl�n�cally apparent². The �ssue of �ncreased detect�on of tumours hav�ng h�stolog�cal character�st�cs of cancer, but not the cl�n�cal features of cancer, was already ra�sed by Doll and Peto (Append�x C of the�r 1981 publ�cat�on) and other authors (Fox, 1979).
In the past, many of these �ndolent tumours rema�ned un�dent�f�ed and never caused death. Thus the�r detect�on can be cons�dered as an undes�rable s�de-effect of screen�ng. The treatment appl�ed �s often s�m�lar to that of potent�ally more dangerous cancers because, at present, �t rema�ns hard to pred�ct the short-term or long-term outcome of small cancers on the bas�s of ava�lable cl�n�cal, h�stolog�cal, �mag�ng and laboratory parameters. In th�s respect, the �ncrease �n cancer �nc�dence and �n overtreatment �nduced by early-detect�on methods may also be v�ewed as a consequence of the fact that d�agnos�s of cancer �s based on h�stolog�cal cr�ter�a, rather than on cr�ter�a allow�ng pred�ct�on of the l�kely cl�n�cal course
of the d�sease. Many of the small tumours would not evolve �nto �nvas�ve d�sease, �.e., they are “cancers w�thout d�sease” (Folkman and Kallur�, 2004).
It rema�ns to be determ�ned whether �ndolent screen-detected cancers are assoc�ated w�th r�sk factors found to be assoc�ated w�th symptomat�c or cl�n�cally apparent cancers. For several organs, the answer �s l�kely to be negat�ve. For �nstance, spontaneous format�on of small tumours hav�ng cancerous h�stolog�cal character�st�cs takes place �n the thyro�d of many subjects (ma�nly �n females), but most w�ll never evolve �nto l�fe-threaten�ng d�sease. The spectacular �ncrease �n thyro�d cancer �nc�dence observed �n many countr�es �n the last decades parallels the advent of new exploratory tools, such as ultrasonography w�th h�gh-frequency probes and f�ne needle b�opsy methods, and does not seem to be related to changes �n exposure to yet unknown r�sk factors. The cl�n�cal stud�es carr�ed out for early detect�on and treatment of neuroblastoma �n ch�ldren have not resulted �n lower mortal�ty, wh�ch strongly suggests that most of these small screen-detected tumours would not have led to an �nvas�ve cancer (Sch�ll�ng et al., 2002; Woods et al., 2002).
Another example �s prostate cancer. Up to now, no cons�stent env�ronmental or l�festyle r�sk factor has been def�n�tely �dent�f�ed for th�s cancer and prostate cancer occurrence �s largely assoc�ated w�th age�ng. The �nc�dence of prostate cancer has dramat�cally r�sen �n populat�ons where test�ng for prostate-spec�f�c ant�gen (PSA) has become w�despread (See Sect�on A2). Many of the prostate cancers found by PSA test�ng would have rema�ned cl�n�cally s�lent, and probably most of these should not be assoc�ated w�th an env�ronmental or l�festyle r�sk factor.
It �s therefore poss�ble to hypothes�ze that the net �mpact of early-detect�on methods �ncreases the proport�on of cancers for wh�ch there �s no real env�ronmental or l�festyle r�sk factor, so that the proport�on of cancers for wh�ch such r�sk factors may account �s decreased. In th�s respect, AFs est�mated �n th�s report are probably more val�d for mortal�ty data than for �nc�dence data.
² In addition to indolent cancers, finding of in situ cancers is also considerably increased by early detection methods. These are tumours that have not developed beyond the basal membranes separating the epithelium from the conjunctival stroma. Before widespread availability of mammographic screening, in situ breast cancers represented less than 2% of all breast tumours, while they may now represent up to 20%. In situ cancers have low malignant potential, but in many organs, the likelihood of transformation into invasive cancer is uncertain, and therefore, treatment is often similar to that of invasive cancer. Note that regardless of malignant potential to evolve into an invasive cancer, some in situ tumours (e.g., in the breast) may be voluminous and require extensive surgery. Normally, cancer incidence data only include invasive cancers, and in situ cancers should not be counted as incident cancers. However, on needle biopsies, it can be difficult to distinguish in situ and invasive cancer in a small specimen of a small tumour.
Attributable causes of cancer in France in the year 2000

159
References
Abelson PH. R�sk assessment of low level exposure.
Sc�ence 1994;265:1507.
Académ�e des Sc�ences – Académ�e de Médec�ne.
Rapport conjo�nt n° 2 (mars 2005). Relat�on dose-effet et
est�mat�on des r�sques cancérogènes des fa�bles doses.
Ed�t Nucleon –Par�s (www.academ�emedec�ne.fr/actual�tes/
rapports.asp).
Ames BN, Gold LS. Too many rodent carc�nogens:
m�togenes�s �ncreases mutagenes�s. Sc�ence 1990;249:970-
971.
Ames BN, Gold LS. Env�ronmental pollut�on, pest�c�des
and the prevent�on of cancer:m�sconcept�ons. FASEB J
1997;11:1041-1052.
Amundson SA, Lee RA, Koch-Pa�z CA et al. D�fferent�al
responses of stress genes to low dose-rate gamma
�rrad�at�on. Mol Cancer Res 2003;1:445-452.
Arm�tage P, Doll R. A two stage theory of carc�nogenes�s
�n relat�on to the age d�str�but�on of human cancer. Br.J.
Cancer 1957;9:161-169.
Averbeck D. Mécan�smes de défense à l’échelon
cellula�re. Comptes Rendus Acad Sc 2007.
Averbeck D, Testard L, Boucher D. Chang�ng v�ews
on �on�z�ng rad�at�on-�nduced cellular effects. Int J Low
Rad�at�on 2006;3:117-134.
Azzam EI, de Toledo SM, Raaphorst GP, et al. Low-dose
�on�z�ng rad�at�on decreases the frequency of neoplast�c
transformat�on to a level below the spontaneous rate �n C3H
10T1/2 cells. Rad�at Res 1996;146:369-373
Baff�s V, Shr�er I, Sherker AH, et al. Use of �nterferon for
prevent�on of hepatocellular carc�noma �n c�rrhot�c pat�ents
w�th hepat�t�s B or C �nfect�on. Ann Inter Med 1999;131:696-
701
Bakken�st CJ, Kastan MB. DNA damage act�vates ATM
through �ntermolecular autophosphorylat�on and d�mer
d�ssoc�at�on. Nature 2003;421:499-506.
Bakken�st CJ, Kastan MB. In�t�at�ng cellular stress
responses. Cell 2004;118:9-17.
Barber DA, Harr�s SR. Oxygen free rad�cals and
ant�ox�dants:A rev�ew. Am Pharmacy 1994;NS34:26-35.
Barcellos-Hoff M.H., Integrat�ve rad�at�on carc�nogenes�s:
�nteract�ons between cell and t�ssue responses to DNA
damage. Sem Cancer B�ol 2005;15:138-148.
Barcellos-Hoff MH, Ravan� SA. Irrad�ated gland
mammary stroma promotes tumorogen�c potent�al by
un�rrad�ated ep�thel�al cells. Cancer Res 2000;60:1254-
1260.
Barnes DE, L�ndahl T. Repa�r and genet�c consequences
of endogenous DNA base damage �n mammal�an cells.
Annu Rev Genet 2004;38:445-476.
Bayl�n SB, Ohm JE. Ep�genet�c gene s�lenc�ng �n cancer
– a mechan�sm for early oncogen�c pathway add�ct�on.
Nature Rev�ews/Cancer 2006;6:107-116.
Beachy PA, Karhadkar, Berman D. T�ssue repa�r and
stem cell renewal �n carc�nogenes�s. Nature 2004;432:324-
331.
Berenblum I, Shub�k P. The role of croton o�l appl�cat�ons,
assoc�ated w�th a s�ngle pa�nt�ng of a carc�nogen, �n tumour
�nduct�on of the mouse sk�n. Br J Cancer 1947;1:379-382.
Bhowm�ck NA, Chyt�l A, Pl�eth D, et al. TGF-beta
s�gnal�ng �n f�broblasts modulates the oncogen�c potent�al
of adjacent ep�thel�a. Sc�ence 2004;303:775-777.
Bjerkv�g R, Tynes BB, Aboody KS, et al. Op�n�on:the
or�g�n of the cancer stem cell: current controvers�es and
new �ns�ghts. Nature Rev�ews/Cancer 2005;5:899-904.
Brand KG. Cancer assoc�ated w�th asbestos�s,
sch�stomatos�s, fore�gn body or scar. In: Becker, ed. Cancer:
A Comprehens�ve Treat�se. New York, Plenum Press, 1982;
pp.661-692.
Brash DE. Sunl�ght and the onset of sk�n cancer. Trends
Genet 1997;13:410-414.
Burcham PC. Internal hazards: basel�ne DNA damage
by endogenous products of normal metabol�sm. Mutat Res
1999;443:11-36.
Burkart W, Jung T, Frasch G. Damage pattern as a
funct�on of rad�at�on qual�ty and other factors. Comptes-
rendus Acad. Sc. III 1999;322:89-101.
Cadet J, Bellon S, Douk� T et al. Rad�at�on-�nduced
DNA damage: format�on, measurement, and b�ochem�cal
features. J Env�ron Pathol Tox�col Oncol 2004;23:33-43.
Cah�ll DP, K�nzler KW, Vogelste�n B, et al. Genet�c
�nstab�l�ty and Darw�n�an select�on �n tumors. Trend Genet
1999;15:M57-M61.
Ca�rns J. Somat�c stem cells and the k�net�cs of
mutagenes�s and carc�nogenes�s. Proc Natl Acad Sc� USA
2002;99:10567-10570.
Calabrese EJ. Hormes�s: from marg�nal�zat�on to
ma�nstream: a case for hormes�s as the default dose-
response model �n r�sk assessment. Tox�col Appl Pharmacol
2004;197:125-136.
Camp�s� J. Senescent cells, tumor suppress�on and
organ�sm ag�ng. Cell 2005;120:513-522.
Chandra J, Samal� A, Orren�us S. Tr�gger�ng and
modulat�on of apoptos�s by ox�dat�ve stress. Free Rad�c B�ol
Med 2000;29:323-333.
Chr�sten S, Hagen TM, S�genaga MK, et al. Chron�c
�nflammat�on, mutat�on and cancer. In: M�crobes and
Discussion

160
Mal�gnancy: Infect�on as a Cause of Cancer. Parsonnet J
and Horn�ng S, eds. Oxford, Oxford Un�vers�ty Press,1999,
pp. 35-88.
Chr�stmann M, Tom�c� MT, Roos WP, et al. Mechan�sms
of human repa�r: an update. Tox�cology 2003;193:3-34.
Clark WH. The nature of cancer: morphogenes�s and
progress�ve self-d�sorgan�zat�on �n neoplast�c development
and progress�on. Acta Oncolog�ca 1995;34:3-21.
Cohen SM, Ellwe�n LB. Cell prol�ferat�on �n
carc�nogenes�s. Sc�ence 1990;249:503-504.
Coll�s SJ, Schwan�nger JM, Ntamb� AJ, et al. Evas�on
of early cellular response mechan�sms follow�ng low
level rad�at�on-�nduced DNA damage. J B�ol Chem
2004;279:49624-49632.
Columbano A, Endoh T, Denda A et al. Effects of cell
prol�ferat�on and cell death (apoptos�s and necros�s) on the
early stages of rat hepatocarc�nogenes�s. Carc�nogenes�s
1996;17:395-400.
Danae� G, Vander Hoorn S, Lopez AD, et al. Comparat�ve
R�sk Assessment collaborat�ng group (Cancers). Causes
of cancer �n the world: comparat�ve r�sk assessment of
n�ne behav�oural and env�ronmental r�sk factors. Lancet.
2005;366:1784-1793.
Day TK, Zeng G, Hooker AM et al. Adapt�ve response
for chromosomal �nvers�ons on pKZ1 mouse prostate
�nduced by low doses of X rad�at�on del�vered after a h�gh
dose. Rad�at Res 2007;167:682-692.
De Bont R, van Larebeke N. Endogenous DNA damage
�n humans: a rev�ew of quant�tat�ve data. Mutagenes�s
2004;19:169-185.
Dent P, Yacoub A, Contessa J, et al. Stress and
rad�at�on-�nduced act�vat�on of mult�ple �ntracellular
s�gnall�ng pathways. Rad�at Res 2003;159:283-300.
Derksen PW, Tj�n E, Me�jer HP, et al. Illeg�t�mate Wnt
s�gnal�ng promotes prol�ferat�on of mult�ple myeloma cells.
Proc Natl Acad Sc� USA 2004;101:6122-6127.
D�komey E, Brammer I. Relat�onsh�p between cellular
rad�osens�t�v�ty and non-repa�red double-strand breaks
stud�ed for d�fferent growth states, dose rates and plat�ng
cond�t�ons �n a normal human f�broblast l�ne. Int J Rad�at
B�ol 2000;76:773-781.
Doll R, Peto R. The causes of cancer: quant�tat�ve
est�mates of avo�dable r�sks of cancer �n the Un�ted States
today. J Natl Cancer Inst. 1981;66:1191-1308.
El�as SG, Peeters PH, Grobbee DE et al. Trans�ent
calor�c restr�ct�on and cancer r�sk. Cancer Causes Control
2007;18:1-5.
Esquela-Kerscher A, Slack FJ. Oncom�rs m�croRNAs
w�th a role �n cancer. Nature Rev�ews/Cancer 2006;6:259-
269.
Euvrard S, Kan�tak�s J, Claudy A. Sk�n cancer after
organs transplantat�on. New Eng. J. Med. 2003;348:1681-
1691.
Fe�nendegen LE. React�ve oxygen spec�es �n cell
responses to tox�c agents. Human & Exper�mental
Tox�cology 2002;21:85-90.
Fe�nendegen LE, Pollycove M, Neumann RD. Whole
body responses to low-level rad�at�on exposure. New
concepts �n mammal�an rad�ob�ology. Exper�m Hematol
2007;35:37-46.
Flores ER, Tsa� KY, Crowley D et al. P63 and p73 are
requ�red for p53-dependant apoptos�s �n response to DNA
damage. Nature 2002;416:560-564.
Folkman J, Kallur� J. Cancer w�thout d�sease. Nature
2004;427:787-787.
Fox M. On the d�agnos�s and treatment of breast cancer.
JAMA 1979;241:489-494.
Franco N, Lamart�ne J, Frou�n V et al. Low-Dose exposure
to _ rays �nduces spec�f�c gene regulat�ons �n normal human
kerat�nocytes. Rad�at�on research 2005;163:623-635.
Gaudet F, Hodgson JG, Eden A, et al. Induct�on of
tumors �n m�ce by genom�c hypomethylat�on. Sc�ence
2003;300:489-492.
G�les RH, Van Es JH, Clevers H. Caught up �n a Wnt
storm: Wnt s�gnal�ng �n cancer. B�och�m B�ophys Acta
2003;1653:1-24.
Guo N, Hay BA. Cell prol�ferat�on and apoptos�s. Cur
Op�n Cell B�ol 1999;11:745-752.
Guyton KZ, Kensler TW. Ox�dat�ve mechan�sms �n
carc�nogenes�s. Br Med Bull 1993;49:523-544.
Hahn WC, We�nberg RA. Rules for mak�ng human
tumor cells. New Engl J Med 2002;347:1593-1603.
Hammarstedt L, L�nqu�st D, Dahlstrand H, et al. Human
pap�lloma v�rus as a r�sk factor for the �ncrease �n �nc�dence
of tons�llar cancer. Int J Cancer 2006;119:2620-2623.
Hanahan D, We�nberg RA. The hallmarks of cancer.
Cell 2000;100:57-70.
Hank�nson SE, W�llette WC, Cold�tz GA, et al. C�rculat�ng
concentrat�ons of �nsul�n-l�ke growth factor-I and r�sk of
breast cancer. Lancet 1998 ;351:1393-1396.
Hazelton WD, Clements MS, Moolgavkar SH. Mult�stage
carc�nogenes�s and lung cancer mortal�ty �n three cohorts.
Cancer Ep�dem�ol B�omarkers Prev 2005;14:1171-1181.
H�ckman JA. Apoptos�s and tumor�genes�s. Cur Op�n
Cell B�ol 2002;12:67-72.
Hoe�jmakers JHJ. Genome ma�ntenance mechan�sms
for prevent�ng cancer. Nature 2001;411:366-374.
Hs�e AW, Rec�o L, Katz DS, et al. Ev�dence for react�ve
Attributable causes of cancer in France in the year 2000

161
oxygen spec�es �nduc�ng mutat�on �n mammal�an cells. Proc
Natl Acad Sc� USA 1986;83:9616-9620.
Internat�onal Agency for Research on Cancer. IARC
Handbooks of Cancer Prevent�on Vol 6, We�ght Control and
Phys�cal Act�v�ty. Lyon, Internat�onal Agency for Research
on Cancer, 2002.
Ito N, Hagawa R, Imo�da K et al. Concepts �n mult�stage
carc�nogenes�s. Cr�t Rev Oncol Hematol 1995;21:105-33.
Janne PA, Mayer RJ. Chemoprevent�on of colorectal
cancer. New Eng J Med 2000;342:1960-1968.
Jeggo P, Lobr�ch M. Rad�at�on-�nduced DNA damage
responses. Rad�at Prot Dos�metry 2006;122:124-127.
Kallur� R, Ze�sberg M. F�broblasts �n cancer. Nature
Rev�ews/Cancer 2006;6:392-401.
Khandwala HM, McCutcheon IE, Flyvb�erg A, et al. The
effects on �nsul�n-l�ke growth factors on tumor�genes�s and
neoplast�c growth. Endocr Rev 2000;21:215-244.
Klaun�g JE. Alterat�ons �n �ntercellular commun�cat�on
dur�ng the stage of promot�on. Proc Soc Exper B�ol Med
1991;198:688-692.
Klaun�g JE, Xu Y, Bachowsk� S, et al. Free-rad�cal
oxygen-�nduced changes �n chem�cal carc�nogenes�s. In:
Wallace KB, ed. Free Rad�cal Tox�cology. London, Taylor
and Franc�s, 1997 pp. 375-400.
Klochender-Y�v�n C, Muchard et Yan�v M. SWI/SNF
chromat�n remodell�ng and cancer. Curr Op Genet Develop
2002;12:73-79.
Kolaja KL, Bunt�ng KA, Klaun�g JE. Inh�b�t�on of tumor
promot�on and hepatocellular growth by d�etary restr�ct�on
�n m�ce. Carc�nogenes�s 1996;17:1657-1664.
Kon�sh� K, Issa JP. Target�ng aberrant chromat�n
structure �n colorectal carc�noma. Cancer J 2007;13:49-55.
Kony SJ, de Vatha�re F, Chompat A, et al. Rad�at�on and
genet�c factors �n the r�sk of second mal�gnant neoplasms
after a f�rst cancer �n ch�ldhood. Lancet 1997;350:91-96.
L� CY, L�ttle J, Zhang W, et al. Pers�stent �nstab�l�ty
�n cancer cells �nduced by non-DNA-damag�ng stress
exposure. Cancer Res 2001;61:428-432.
L�chtenste�n P, Holm LV, Verkasalo PK, et al.
Env�ronmental and her�table factors �n the causat�on of
cancer. Analyses of cohorts of tw�ns from Sweden, Denmark
and F�nland. New Engl J Med 2000;343:78-85.
L�otta LA, Kohn EA. The m�croenv�ronment of the
tumor-host �nterface. Nature 2001;411:375-379.
Maskar�nec G, Noh JJ. The effect of m�grat�on on
cancer �nc�dence among Japanese �n Hawa��. Ethn�c�ty and
D�sease 2004;14:431-439.
McCred�e M, W�ll�ams S, Coates M. Cancer mortal�ty
�n m�grants from the Br�t�sh �sles and cont�nental Europe
to New South Wales, Austral�a, 1975-1995. Int J Cancer
1999;83:179-185.
Modugno F, Ness RB, Chen C, et al. Inflammat�on
and endometr�al cancer: an hypothes�s. Cancer Ep�dem�ol
B�omarkers Prev 2005;14:2840-2847.
M�ller AB, Bartsch H, Boffetta P, Dragsted L, Va�n�o
H, eds B�omarkers �n Cancer Prevent�on (IARC Sc�ent�f�c
Publ�cat�ons No 154), Lyon, IARC, 2001.
Mon�er R. Avancées récentes sur la cancérogenèse.
Comptes-rendus de l’Académ�e de Médec�ne (�n press).
Mon�er R, Tub�ana M. Avancées récentes sur la
cancérogenèse. Comptes-rendus de l’Académ�e de
Médec�ne (�n press). 2007
Moore MA, Tsuda H. Chron�cally elevated prol�ferat�on
as a r�sk factor for neoplas�a. Eur J Cancer Prev 1998;7:353-
385.
Morgon WF, Non-targeted and delayed effects of
exposure to �on�z�ng rad�at�on. II. Rad�at�on-�nduced genom�c
�nstab�l�ty and bystander effects �n v�vo, clastogen�c factors
and transgenerat�onal effects. Rad�at Res 2003;159:581-
596.
Mothers�ll C, Seymour CB. Rad�at�on-�nduced bystander
effects and the DNA parad�gm: an “out of f�eld” perspect�ve.
Mutat Res 2006;59:5-10.
Mueller MM, Fusen�ng NE. Fr�ends or foes – B�polar
effects of the tumour stroma �n cancer. Nature Rev�ews/
Cancer 2004;4:639-649.
Olsen JH, Andersen A, Dreyer L, et al. Avo�dable cancers
�n the Nord�c countr�es. APMIS 1997;105:Suppl 76.
Pardoll DT Cells and tumors. Nature 2001;411:1010-
1012.
Park CCD, Henshall-Powell RL, Er�kson AC et al.
Ion�z�ng rad�at�on �nduce her�table d�srupt�on of ep�thel�al
cell �nteract�ons. Proc Nat Acad Sc USA 2003;100:10728-
10733.
P�tot HC, Dragan YP. The mult�stage nature of chem�cally
�nduced hepato-carc�nogenes�s �n the rat. Drug Metab Rev
1994;26:209-220.
Portess DI, Bauer G, H�ll MA, et al. Low-dose �rrad�at�on
on nontransformed cells st�mulates the select�ve removal of
precancerous cells v�a �ntercellular �nduct�on of apoptos�s.
Cancer Res 2007;67:1246-1253.
Rad�sky DC, B�ssell MJ Cancer. Respect thy ne�ghbor!
Sc�ence 2004;303:774-775.
R�gaud O, Moustacch� E. Rad�oadaptat�on for gene
mutat�on and the poss�ble molecular mechan�sms of the
adapt�ve response. Mutat Res 1996;358:127-134.
Rochefort H. Cancérogenèse hormonale chez la
femme: des mécan�smes à la prévent�on. Comptes Rendus
Discussion
162
Acad Sc�ences, Par�s, 2007.
Roe EJ. Food and cancer. J Human Nutr�t�on
1979;33:405-415.
Rosenkranz HS, Pollack N, Cunn�ngham AR.
Explor�ng the relat�onsh�p between the �nh�b�t�on of gap
junct�onal �ntercellular commun�cat�on and other b�olog�cal
phenomena. Carc�nogenes�s 2000;21:1007-1011.
Rothkamm K, Löbr�ch M. Ev�dence for a lack of DNA
double-strand break repa�r �n human cells exposed to very
low x-ray doses. Proc Natl Acad Sc� USA 2003;100:5057-
5062.
Sancar A, L�ndsey-Boltz LA, Unsal-Kaçmaz K, et al.
Molecular mechan�sms of mammal�an DNA repa�r and the
DNA damage checkpo�nts. Ann Rev B�ochem 2004;73:39-
85.
Sch�ll�ng FH, Sp�x C, Berthold F et al. Neuroblastoma
screen�ng at one year of age. New Engl J Med 2002;346:1047-
1053.
Schles�nger Y, Straussman R, Keshet I, et al. Polycomb-
med�ated methylat�on on Lys27 of h�stone H3 pre-marks
genes for de novo methylat�on �n cancer. Nat Genet
2007;39:232-236.
Schm�tt CA. Cellular senescence and cancer treatment.
B�och�m B�ophys Acta 2007;1775:5-20.
Schne�d H, Seur�n D, Nogu�ez P, et al. Abnormal�t�es of
�nsul�n-l�ke growth factor (IGF-I and IGF-II) genes �n human
tumor t�ssue. Growth Regul 1992;2:45-54.
Schulte-Hermann R, Bursch W, Grasl-Kraupp B, et al.
Apoptos�s and mult�stage carc�nogenes�s �n rat l�ver. Mutat
Res 1995;333:81-87.
Sh�loh Y. ATM and related prote�n k�nases: safeguard�ng
genome �ntegr�ty. Nature Rev�ews Cancer 2003;3:155-168.
Sjöblom T, Jones S, Wood LD et al. The consensus
cod�ng sequences of human breast and colorectal cancers.
Sc�ence 2006;314;268-274.
Sonnensche�n C, Soto A. Somat�c mutat�on theory of
carc�nogenes�s. Why �t should be dropped and replaced?
Mol Carc�nogen 2000;29:1-7.
Sp�tz DR, Azzam EI, L� JJ, et al. Metabol�c ox�dat�on/
reduct�on react�ons and cellular responses to �on�z�ng
rad�at�on: a un�fy�ng concept �n stress response b�ology.
Cancer Metastas�s Rev 2004;23:311-322.
Ta�eb J, Chaput N, Menard C, et al. A novel dendr�t�c
cell �nvolved �n tumor �mmunosurve�llance. Nature Med�c�ne
2006;12:214-219.
Takahash� S, Ikeda Y, Okoch� E, et al. Mutat�on �nduct�on
by mechan�cal �rr�tat�on caused by urac�l �nduced urol�th�as�s
�n B�g Blue rats. Mutat Res 2000;447:275-280
Tap�o S, Jacob V. Rad�oadapt�ve response rev�s�ted.
Rad�at Env�ron B�ophys 2007;46:1-12.
Thomson JM, Neuman M, Parkes JS, et al. Extens�ve
post transcr�pt�onal regulat�on of m�cro RNAs and �ts
�mpl�cat�on for cancer. Genes Dev 2006;20:2202-2207.
Tomat�s L, A�t�o A, Day NE, Heselt�ne E, Kaldor J,
M�ller AB, Park�n DM, R�bol� E, eds. Internat�onal Agency
for Research on Cancer. Cancer:Causes, Occurrence and
Control. IARC Sc�ent�f�c Publ�cat�ons No 100, Lyon, IARC,
1990.
Trosko JE. Challenge to the s�mple parad�gm that
‘carc�nogens’ are ‘mutagens’ and to the �n v�tro and �n v�vo
assays used to test the parad�gm. Mutat Res 1997;373:245-
249.
Trosko JE, Chang CC, Upham BL, et al. Ignored
hallmarks of carc�nogenes�s: stem cells and cell-cell
commun�cat�on. Ann NY Acad Sc� 2004;1028:192-201.
Tub�ana M. Contr�but�on of human data to the analys�s
of human carc�nogenes�s. Comptes Rendus Acad Sc,
Sc�ences de la v�e / L�fe sc�ences 1999;322:215-224.
Tub�ana M. Progrès des conna�ssances sur la
cancérogenèse. Comptes Rendus Acad Sc 2007.
Tub�ana M, Aurengo A, Averbeck D, Masse R. The
debate on the use of l�near no threshold for assess�ng the
effects of low doses. J Rad�ol Prot 2006a;26:317–324.
Tub�ana M, Aurengo A, Averbeck D, Masse R. Recent
reports on the effect of low doses of �on�z�ng rad�at�on
and �ts dose–effect relat�onsh�p. Rad�at Env�ron B�ophys
2006b;44:245–251.
Vatten LJ, Lund N�lsen TI, Tretl� S et al. S�ze at b�rth and
r�sk of breast cancer: prospect�ve populat�on based stud�es.
Int J Cancer 2005;114:461-464.
V�lench�k MM, Knudson AG. Inverse rad�at�on dose-
rate effects on somat�c and germ-l�ne mutat�ons and DNA
damage rates. Proc Natl Acad Sc� USA 2000;9:5381-5386.
V�lench�k MM, Knudson AG. Rad�at�on dose-rate effects,
endogenous DNA damage, and s�gnall�ng resonance. Proc
Natl Acad Sc� USA 2006;103:17874-17879.
Vogelste�n B, K�nzler K.W. The mult�step nature of
cancer. Trends Genet 1993;9:138-141.
Vogelste�n B, K�nzler K.W. Cancer genes and the
pathways they control. Nature Med�c�ne 2004;10:789-799.
W�dschwendter M, F�egl H, Egle D, et al. Ep�genet�c
stem cell s�gnature �n cancer. Nat Genet 2007;39:157-158.
W�ld CP. Complement�ng the genome w�th an
‘‘exposome’’: The outstand�ng challenge of env�ronmental
exposure measurement �n molecular ep�dem�ology. Cancer
Ep�dem�ol B�omarkers Prev 2005;14:1847-1850.
Wolff S. The adapt�ve response �n rad�ob�ology:
evolv�ng �ns�ghts and �mpl�cat�ons. Env�ron Health Perspect
Attributable causes of cancer in France in the year 2000

163
1998;106:277-283.
Wolff S, Afzal V, W�enke JK, et al. Human lymphocytes
exposed to low doses of �on�z�ng rad�at�ons become
refractory to h�gh doses of rad�at�on as well as to chem�cal
mutagens that �nduce double-strand breaks �n DNA. Int J
Rad�at B�ol 1988;53:39-49.
Woods WG, Gao RN, Shuster JJ, et al. Screen�ng of
�nfants and mortal�ty due to neuroblastoma. New Engl J
Med 2002;346:1041-1053.
Yamamoto O, Seyama T, Ito A, et al. Oral adm�n�strat�on
of tr�t�ated water (THO) �n mouse. III: Low dose-rate
�rrad�at�on and threshold dose-rate for rad�at�on r�sk. Int J
Rad�at B�ol 1998;73:535-541.
Yamasak� H, Mesn�l M, Omor� Y, et al. Intercellular
commun�cat�ons and carc�nogenes�s. Mutat Res.
1995;333:181-188.
Yang F, Steno�en DL, Str�ttmatter EF et al.
Phosphoproteome prof�l�ng of human sk�n f�broblast cells �n
response to low- and h�gh-dose �rrad�at�on. J Proteome Res
2006;5:1252-1260.
You Z, Sa�ms D, Chen S, et al. Wnt s�gnal�ng promotes
oncogen�c transformat�on the �nh�b�t�ng c-Myc-�nduced
apoptos�s. J Cell B�ol 2002;157:429-440.
Zur Hausen H. Infect�ons Caus�ng Human Cancer.
We�nhe�m, W�ley-VCH, 2006.
Discussion

164

165
Th�s study shows that �n France, �n the year 2000, tobacco smok�ng and alcohol dr�nk�ng were by far the ma�n r�sk factors of cancer; tobacco account�ng for 27% of the total cancer burden �n men and 6% �n women, and alcohol account�ng for 11% of the total burden �n men and 4% �n women. Infect�ous agents, obes�ty and overwe�ght, phys�cal �nact�v�ty, ultrav�olet rad�at�on, occupat�on and hormone treatment each accounted for 1 to 3.3% of the total cancer burden �n men or �n women. Reproduct�ve factors and a�r, so�l, food and water pollutants each accounted for between 0.1% and 1% of the total cancer burden. For pollutants, we cons�dered only IARC Group 1 carc�nogens. If suspected carc�nogens such as outdoor a�r pollut�on w�th f�ne part�cles had been cons�dered, pollutants could account for around 1% of all cancers.
Th�s study was based on establ�shed carc�nogen�c agents (�.e., IARC Group 1 carc�nogens), �.e., agents for wh�ch there �s suff�c�ent ev�dence for carc�nogen�c�ty �n humans. Most relat�ve r�sks were der�ved from the most recent meta-analyses of observat�onal ep�dem�olog�cal stud�es. A few attr�butable fract�ons (AFs) were not der�ved from relat�ve r�sks and data on exposure, but from AFs d�rectly est�mated for ent�re populat�ons (�.e., those for sun exposure, EBV �nfect�ons, and occupat�onal asbestos�s). A model approach was never used. We never had recourse to est�mat�ons based on expert op�n�on.
The AF est�mates presented �n th�s report are to be cons�dered as m�n�mal est�mates, as we are aware that prevalence of some exposures may be underest�mated (e.g., �nfect�ons). In the absence of better sc�ent�f�cally val�d sources of data, these rema�n the best est�mates based on current sc�ent�f�c knowledge.
The study d�scarded numerous agents for wh�ch some sc�ent�f�c l�terature suggests that they are
carc�nogen�c �n humans. The bas�c rule �s that only accumulat�on of sc�ent�f�c ev�dence from several sources (e.g., d�fferent �ndependent sc�ent�f�c teams) and several d�sc�pl�nes (e.g., laboratory exper�ments and ep�dem�olog�cal data) can form the bas�s for a set of arguments cons�stent w�th the recogn�t�on of an agent as carc�nogen�c, or not carc�nogen�c, �n humans.
Most stud�es on cancer r�sk factors were carr�ed out �n North Amer�ca, the UK, the Nord�c countr�es, the Netherlands, Italy or As�a. For many r�sk factors, no study has been conducted �n France. Th�s does not mean that relat�ve r�sks der�ved from non-French stud�es are not val�d for France, as tox�c substances, drugs, pollutants, etc., are expected to exert s�m�lar effects �n France and �n other �ndustr�al�zed countr�es.
Weaknesses of th�s study reflect the currently �nadequate knowledge �n several f�elds, �n part�cular:
1. The l�m�ted understand�ng of the complex processes �nvolved �n carc�nogenes�s (see Sect�on E1).
2. The lack of rel�able data on the causal assoc�at�on between many substances and cancer, bear�ng �n m�nd that a stat�st�cal correlat�on between cancer and exposure to a substance does not �mply causal�ty.
3. Uncerta�nty about dose–effect relat�onsh�ps between exposure and cancer occurrence (see Sect�on E1). The shape of the dose–effect relat�onsh�p may be non-l�near, e.g., an agent m�ght be h�ghly carc�nogen�c at h�gh dose and �nnocuous at low dose.
4. The lack of ava�lab�l�ty of accurate data on exposure to known r�sk factors.
5. D�fferences �n length of the lag-t�me for d�fferent carc�nogens. For some factors, lag-t�me
Discussion
Section E2: General discussion

166
may be very long (e.g., reproduct�ve factors and breast cancer occurrence after 50 years old), but �t may also be short, for �nstance benzene and leukaem�a (about 5 years of lag-t�me).
Methodological limitations of the study
The methods we used for est�mat�on of AFs may be cr�t�c�zed on several grounds:
(1) The lag-t�me of 15 years was somewhat arb�trary and exposures may have changed across generat�ons. However, we adapted our cho�ce of lag-t�me accord�ng to �ts relevance for r�sk factors. Thus, for �nstance, for hormone therapy and oral contracept�ves, only current use was taken as relevant to breast cancer. For ultrav�olet rad�at�on and for profess�onal exposure to asbestos, approaches for est�mat�ng AFs were not based on a lag-t�me.
(2) RRs and exposure measurements for AF calculat�ons should be der�ved from s�m�lar populat�ons hav�ng s�m�lar exposure to a spec�f�c r�sk factor. S�nce most of the RRs and data on exposure or�g�nated from d�fferent sources, the cho�ce of RRs and exposures was somet�mes not opt�mal (e.g., for phys�cal �nact�v�ty).
(3) We assumed AFs to be equ�valent for cancer �nc�dence and mortal�ty. Th�s assumpt�on �s true only �f the r�sk factor �s not a prognost�c factor for mortal�ty, as the AF would then be d�fferent. For �nstance, obes�ty �s a r�sk factor for breast cancer occurrence, but probably a stronger r�sk factor for breast cancer mortal�ty after 50 years old. In th�s respect, the AF assoc�ated w�th obes�ty for breast cancer mortal�ty �s probably underest�mated.
Difficulty in finding exposure data for France
We found exposure data for France for the major�ty of r�sk factors. However, we have to deplore the d�ff�culty encountered �n access�ng many of the exposure data, desp�te the devoted efforts of the work�ng group to �dent�fy potent�al sources. For some exposure prevalence data, reports or art�cles do not suff�c�ently descr�be the collect�on methods used and �t therefore rema�ns d�ff�cult to assess the�r qual�ty. Many sources
of data were not publ�shed �n the sc�ent�f�c l�terature or �n other peer-rev�ewed formats. Th�s was part�cularly the case for data on occupat�onal exposures. Great care was taken �n choos�ng exposure data most representat�ve of the preva�l�ng s�tuat�on �n France at the end of the twent�eth century. Data from certa�n sources were not used because they were der�ved from selected sub-populat�ons unl�kely to be representat�ve of the French populat�on. Exposure data doubtless ex�st of wh�ch we are unaware, but �t �s �mprobable that the�r ava�lab�l�ty would s�gn�f�cantly change the est�mates presented �n th�s report.
In any case, th�s work has revealed the need for France to const�tute a central repos�tory of data on exposure prevalence, for �nstance, for the purpose of health surve�llance. Th�s repos�tory should spec�fy the methods used for data collect�on and be updated regularly.
How the study results can address public concerns about the “environment”
In the developed countr�es, exposure to known carc�nogens has s�gn�f�cantly decreased over t�me, ma�nly s�nce the 1950s, as has exposure to many �nd�cators of poss�ble contact w�th carc�nogens (e.g., some gases, “d�rty” �ndustr�al act�v�t�es, uncontrolled mass�ve waste d�sposal). Th�s h�stor�cal fact �n �tself argues aga�nst the common percept�on that the “env�ronment” �s the cause of �ncreases �n cancer �nc�dence.
For many exposures, there �s not suff�c�ent sc�ent�f�c ev�dence to establ�sh them as cancer r�sk factors. In th�s respect, publ�c concern about “env�ronmental pollutants” �s d�sproport�onate to the known magn�tude of �mpact of such pollutants on cancer. As stressed �n the �ntroduct�on to th�s report, some confus�on comes from the d�fferent def�n�t�ons for “env�ronment”, wh�ch has d�fferent mean�ngs accord�ng to language. In the�r most appropr�ate sense, “env�ronmental pollutants” �nclude pollutants of water, a�r, so�l and food.
Attr�but�on of cancers w�th unknown cause to a s�ngle cause by default (or to a group of causes, e.g., “pollut�on”) �s unjust�f�ed and represents a fallac�ous argument. By s�m�larly flawed reason�ng, the gap �n cancer causes could equally be attr�buted to global cl�mate change, to the �ncreas�ng number of telev�s�ons �n our �mmed�ate env�ronment, or to the
Attributable causes of cancer in France in the year 2000
167
�ncrease �n soc�al well-be�ng.It �s unl�kely that all cancers w�th ‘unknown’ cause
are due to factors that w�ll ever be �dent�f�ed. However, as seen �n Sect�ons A2, D3 and E1, even �f we do not know the r�sk factor(s) respons�ble for the �ncreas�ng �nc�dence of a cancer, we usually do have clues as to the l�kely type of r�sk factor �nvolved or not �nvolved. In th�s respect, pollutants of a�r, food, water and so�l, as well as occupat�onal exposures, do not prov�de the preferred work�ng hypotheses for the �dent�f�cat�on of r�sk factors respons�ble for the �ncrease �n �nc�dence of some cancers. The development of new detect�on methods, screen�ng effects, l�festyle factors, d�et dur�ng pregnancy, �nfancy and ch�ldhood and hormonal and �nfect�ous agents are stronger avenues for future research.
Past studies on attributable risk of cancers
Several stud�es that est�mated proport�ons of cancer attr�butable to r�sk factors were restr�cted to one r�sk factor or to one part�cular s�te of cancer (e.g., Mezzett� et al., 1998). Only four stud�es other than the present one est�mated the �mpact of carc�nogens on large populat�ons and they used qu�te d�fferent methodolog�es (Doll and Peto, 1981; Olsen et al., 1997; Danae� et al., 2005; Doll and Peto, 2005). The ma�n results of these stud�es are summar�zed �n Table E2.1.
The f�rst est�mate of the relat�ve �mportance of genet�c and env�ronmental factors �n the global burden of cancer was made by Doll and Peto (1981) us�ng cancer mortal�ty data from the USA. In the�r sem�nal work, these authors came to the conclus�on that around 80% of cancers could be attr�butable to a spec�f�c l�festyle or known env�ronmental cause (Table E2.1). Subsequently, R. Peto and co-workers appl�ed the same method to est�mate the �mpact of tobacco smok�ng on the worldw�de burden of cancer (Peto et al., 1994). Recently, J. Peto updated the est�mates of the relat�ve �mportance of causes of cancer for the world (Peto, 2001).
In 1981, Doll and Peto postulated that the greatest d�fferences �n cancer mortal�ty between countr�es could reveal the pressure of env�ronmental and l�festyle factors on cancer burden. Countr�es w�th the lowest rates for a spec�f�c cancer were more l�kely to reflect the background cancer rate essent�ally attr�butable to genet�c or other endogenous factors.
The�r ranges of “acceptable est�mates” (Table E2.1) were qu�te w�de, reflect�ng uncerta�nt�es �n the est�mates. Thus, for �nstance, d�et was deemed to account for 35% of cancer mortal�ty, but the range of acceptable est�mates was 10 to 70%. These est�mates reflected the qual�ty of the data ava�lable at that t�me. Furthermore, th�s methodology was �mpl�c�tly based on the assumpt�on that each type of cancer can be cons�dered �ndependently. Th�s assumpt�on �s open to d�scuss�on. One factor, such as a h�gh calor�e �ntake through food, may �ncrease the �nc�dence of some cancers (d�rectly or by �ncreas�ng some hormonal secret�ons) and decrease the �nc�dence of others (by enhanc�ng the organ�sm’s defences). Th�s �s why �t �s useful to cons�der the overall �mpact of each r�sk factor. Another assumpt�on was that non-genet�c causes would sooner or later be �dent�f�ed for most common cancers. Nowadays, th�s assumpt�on �s no longer regarded as val�d and �t appears that the occurrence of many cancers �s probably not assoc�ated w�th l�festyle or env�ronmental causes (e.g., most prostate cancers) (see Sect�on E1).
In 2005, Doll and Peto produced new est�mates of the proport�ons of cancer deaths attr�butable to env�ronmental and behav�oural r�sk factors, th�s t�me for cancer deaths �n the Un�ted K�ngdom (Table E2.1). As for the 1981 report, the methods used to est�mate AFs were not clearly deta�led (e.g., sources of relat�ve r�sks, exposure prevalence data, compar�sons of cancer death rates �n populat�ons exposed and non-exposed to cancer r�sk factors). However, compar�son of the f�gures reported �n the two publ�cat�ons by Doll and Peto shows substant�al changes �n AF est�mates for several factors, for �nstance d�et. An accompany�ng note �n the 2005 publ�cat�on sa�d that probably only 2% �s avo�dable �n pract�ce, ma�nly through avo�dance of obes�ty. The AF for occupat�on was halved, probably to reflect changes �n profess�onal env�ronments towards cleaner work�ng places and less contact w�th hazardous substances.
Researchers from the Harvard School of Publ�c Health (Danae� et al., 2005) attempted to determ�ne the proport�on of cancers attr�butable to l�festyle and env�ronmental factors worldw�de. These authors used est�mates of relat�ve r�sks der�ved from systemat�c rev�ews and meta-analyses. Exposure prevalences were est�mated for each World Bank Reg�on. For h�gh-�ncome countr�es, e�ght cancer r�sk factors were selected, and �mportant r�sk factors such as
Discussion

168
reproduct�ve factors were not taken �nto account. Select�on of exposure prevalence data d�d not always p�ck up the most appropr�ate and rel�able sources �n countr�es categor�zed as “h�gh-�ncome countr�es”. The referent category for “no exposure” was chosen as the “theoret�cal m�n�mum r�sk exposure d�str�but�on”, an arb�trary category that seldom corresponds to real-world cond�t�ons. The authors concluded that the n�ne factors they selected accounted for about 43% of cancer deaths �n h�gh-resource countr�es �n 2001.
The stud�es by Doll and Peto (1981, 2005) and by Danae� et al. (2005) were helpful for est�mat�ng the global effects of the ma�n establ�shed causes of cancer. But these approaches were not always based on data on prevalence of exposure of populat�ons (or of populat�on subgroups) to known r�sk factors der�ved from, for �nstance, nat�onw�de surveys or exposure mon�tor�ng. Furthermore, standard def�n�t�ons of r�sk factors were not �mplemented across countr�es. F�nally, the select�on of r�sk factors �n these stud�es was based on expert op�n�on rather than on attempts to systemat�cally �nclude all relevant cancer r�sk factors.
A study �n the Nord�c countr�es systemat�cally exam�ned prevalence of exposure to establ�shed r�sk factors �n each Nord�c country (Denmark, F�nland, Iceland, Norway and Sweden) and then summed the est�mates for all f�ve countr�es, after we�ght�ng for populat�on (Olsen et al., 1997). The relat�ve r�sks used were der�ved from stud�es conducted �n Nord�c countr�es or, �f no such study ex�sted, from meta-analyses or the best ava�lable stud�es. In th�s respect, the methods used by the Nord�c study resemble the approach we used for France. However, the Nord�c study d�d not �nclude several r�sk factors such as hormone replacement therapy, because �n the m�d 1990s the assoc�at�on between use of hormone replacement therapy and cancer had not yet been properly assessed by ep�dem�olog�cal stud�es or random�zed tr�als. The same appl�es to phys�cal �nact�v�ty.
Compared w�th s�m�lar prev�ous work, our report prov�des new and more deta�led �nformat�on. Select�on of r�sk factors was based on the best ava�lable knowledge of cancer r�sk factors �n the year 2007 (and not on expert op�n�on), and exposure prevalences were der�ved from the most relevant French sources of data. However, further progress �s st�ll poss�ble and relevant research �s encouraged.
In sp�te of the d�fferent methodolog�cal approaches, many conclus�ons of the three stud�es based on select�on of establ�shed cancer r�sk factors and est�mates of prevalence of exposures (Olsen et al., 1997; Danae� et al., 2005; Tub�ana et al., 2007) are cons�stent on several po�nts:
(�) Tobacco smok�ng rema�ns by far the ma�n exogenous cancer r�sk factor, followed by alcohol dr�nk�ng. The d�fferences between the three stud�es on attr�butable fract�on for tobacco are ma�nly due to d�fferences �n smok�ng prevalence between countr�es.
(��) Two stud�es (Olsen et al., 1997; th�s study d�d not produce est�mates of attr�butable fract�on for d�etary factors, and one (Danae� et al., 2005) just selected low �ntake of fru�t and vegetables. As a result, at best only a marg�nal number of cancers, �n the range of 0 to 3% were attr�buted to d�etary factors.
(���) The causes of large proport�ons of cancers are unknown and may be endogenous factors w�thout s�gn�f�cant �mpact of exogenous factors,
(�v) The �mpact of occupat�onal r�sk factors �s small and probably has d�m�n�shed over recent decades; efforts should cont�nue to further reduce th�s,
(v) Env�ronmental pollut�on appears to be a relat�vely small r�sk factor. Th�s does not mean that �t should be neglected or overlooked. Rather, further fundamental and ep�dem�olog�cal research should be pursued on a�r, so�l, food and water pollutants, w�th more thorough exam�nat�on of defence aga�nst carc�nogenes�s and dose–carc�nogen�c effect relat�onsh�ps.
(v�) F�nally, �t appears that our knowledge on �nfect�ous factors (ma�nly v�ral) �s �nsuff�c�ent.
References
Danae� G, Vander Hoorn S, Lopez AD, et al. Comparat�ve
R�sk Assessment collaborat�ng group (Cancers). Causes
of cancer �n the world: comparat�ve r�sk assessment of
n�ne behav�oural and env�ronmental r�sk factors. Lancet.
Attributable causes of cancer in France in the year 2000
169
Discussion
2005;366:1784-1793.
Doll R, Peto R. The causes of cancer: quant�tat�ve
est�mates of avo�dable r�sks of cancer �n the Un�ted States
today. J Natl Cancer Inst 1981;66:1191-1308.
Doll R, Peto R. Ep�dem�ology of cancer. In: Oxford
Textbook of Med�c�ne, 4th ed�t�on. Oxford, Oxford Un�vers�ty
Press, 2005.
Mezzett� M, La Vecch�a C, Decarl� A, et al. Populat�on
attr�butable r�sk for breast cancer: d�et, nutr�t�on, and
phys�cal exerc�se. J Natl Cancer Inst 1998;90:389–394
Olsen JH, Andersen A, Dreyer L, et al. Avo�dable
cancers �n the Nord�c countr�es. APMIS 1997;105, Suppl.
76.
Peto J. Cancer ep�dem�ology �n the last century and the
next decade. Nature 2001;411:390-395.
Peto R, Lopez AD, Boreham J, et al. Mortal�ty from
Tobacco �n Developed Countr�es, 1950-2000. Oxford,
Oxford Un�vers�ty Press, 1994.

170
Attributable causes of cancer in France in the year 2000Ta
ble
E2
.1 -
Nu
mb
er
of
ca
nc
er
ca
se
s o
r o
f c
an
ce
r d
ea
ths
an
d p
rop
ort
ion
s a
ttri
bu
ted
to
va
rio
us
fac
tors
sin
ce
the
se
min
al w
ork
of
R D
oll
an
d R
Pe
to i
n
1981
*
NI:
fact
or
not
co
ns�
de
red
as
be
�ng
a ca
nce
r r�
sk f
act
or
by t
he
stu
dy
- *
F�g
ure
s, r
an
ge
s a
nd
«?»
�n t
he
Tab
le a
re a
s re
po
rte
d �n
th
e o
r�g
�na
l pu
bl�c
at�o
n**
In
clu
de
s m
ed�
cal r
ad�
at�o
n, c
he
mot
he
rap
eu
t�c a
ge
nts,
ora
l co
ntra
cept
�ve
s, h
orm
on
e re
pla
cem
ent
th
era
py -
† I
ncl
ud
es
num
ero
us
che
m�c
als
an
d p
hys�
cal a
ge
nts
�ntr
odu
ced
�n d
a�ly
l�fe
by
mo
de
rn �n
dust
ry‡
Ca
lled
«ge
op
hys�
cal f
act
ors
�n D
oll
et P
eto
1981
», a
nd
�ncl
ud
ed
no
n-m
ed�
cal �
on
�z�n
g ra
d�at
�on
an
d u
ltrav
�ole
t l�g
ht§
Au
tho
rs c
on
s�d
ere
d th
at �n
suff
�c�e
nt e
v�d
en
ce e
x�st
ed
for
calc
ula
t�on
of a
n at
tr�b
uta
ble
fra
ct�o
n -
II R
est
r�ct
ed
to p
ass
�ve
smo
k�n
g -
¶ R
est
r�ct
ed
to r
ad
on
- #
Re
str�
c -te
d to
H. p
ylo
ri �n
fect
�on
s∫ R
est
rict
ed
to u
nsa
fe s
ex (
1%)
an
d co
nta
min
ate
d in
ject
ion
s in
he
alth
-ca
re s
ettin
gs
(<0.
5%)
- L
ow f
ru�t
an
d ve
get
ab
le �n
take
- Я
In
clu
de
d �n
th
e ca
teg
ory
«M
ed�
c�n
es
an
d m
ed�
cal p
roce
dure
s» In
clu
de
s se
xua
l be
hav
�our
s, �.
e., �
nfe
ct�o
us
ag
ent
s �m
pl�c
ate
d �n
ca
nce
r of
th
e ce
rv�x
ute
r�

171
Discussion
Section E3 : Recommendations
The conclus�on that only a fract�on of cancers occurr�ng today �n France �s attr�butable to spec�f�c causes (and therefore �s theoret�cally preventable) stresses the l�m�tat�ons of current knowledge on human carc�nogenes�s. Wh�le �t �s expected that �n the future the ev�dence �n favor or aga�nst a role of other r�sk factors w�ll accumulate and eventually contr�bute to eluc�dat�ng the�r contr�but�on to human cancer, recommendat�ons can be formulated to �mprove th�s process.
1. Recommendations to the scientific community
1.1 There �s a need for large-scale, long-term prospect�ve stud�es on exogenous and endogenous r�sk factors of cancer and other chron�c d�seases, w�th repeated measurements of relevant exposures. Wh�le the establ�shment and conduct of such stud�es exceed the resources of �nd�v�dual research groups, the med�cal research commun�ty should be encouraged to coord�nate �tself towards th�s goal. L�nks should be fostered between ep�dem�olog�cal and b�olog�cal research. In the des�gn and �nterpretat�on of ep�dem�olog�cal stud�es, more cooperat�on �s recommended between ep�dem�olog�sts, b�olog�sts, and cl�n�c�ans. Cancer reg�str�es should be better used for cancer research; they should be encouraged to collect data regard�ng tumour character�st�cs as well as bas�c �nformat�on (e.g., occupat�on) on the pat�ents.
1.2 More attent�on should be pa�d to the assessment of pre- and per�-natal exposures, and of those occurr�ng �n �nfancy, ch�ldhood and adolescence. Ideally, the effects of these exposures should be stud�ed w�th�n the framework of prospect�ve stud�es (see recommendat�on 1.1); development of
�ntermed�ate markers of r�sk m�ght reduce the need for long-term follow-up.
1.3 The areas of cancer research wh�ch should be g�ven the h�ghest pr�or�ty to �mprove the current understand�ng of the causes of human cancers – and the ab�l�ty to prevent them – are those on nutr�t�on, hormones, and �nfect�ous agents. The key contr�but�on �s l�kely to come from the development and val�dat�on of sens�t�ve and spec�f�c methods of exposure assessment, �nclud�ng b�omarkers, to be appl�ed to large-scale populat�on stud�es. Intervent�on stud�es would also prov�de cr�t�cal ev�dence �n the f�eld of nutr�t�on and cancer.
1.4 For known and suspected carc�nogens, pr�or�ty should be g�ven to research (based on both ep�dem�olog�cal or b�omarker approaches) a�med at analyz�ng defenses aga�nst mutat�on at the cellular level and aga�nst mutant cells at the t�ssue and organ�sm levels.
1.5 In rev�ew�ng and quant�fy�ng the contr�but�on
of d�fferent causes to human cancers, more we�ght should be g�ven to ev�dence-based summar�es of the ava�lable data, than to the results of �nd�v�dual stud�es. The h�ghest degree of sc�ent�f�c r�gor and cons�stency should be appl�ed to the assessment of ava�lable data. In general, conservat�ve est�mates are preferable to �nferences based on weak ev�dence. Confl�cts of �nterest of rev�ewers should be declared.
1.6 Publ�cat�on b�as should be avo�ded. A reg�stry of all ep�dem�olog�cal stud�es (or at least all long-term prospect�ve stud�es) should be set up and all results (pos�t�ve or negat�ve) should be collected. Lead�ng journals should accept the publ�cat�on of only stud�es wh�ch have been reg�stered.

172
Attributable causes of cancer in France in the year 2000
2. Recommendations to the administration and national or international research foundations
2.1 Amb�t�ous long term stud�es should be encouraged. In part�cular, cohort stud�es should be set up, follow�ng �nd�v�duals from the beg�nn�ng of the�r l�fe �n utero to 50 or 60 years old �n order to better understand the factors wh�ch �nfluence health.
2.2 Data on cancer �nc�dence should be collected from cancer reg�str�es, checked and made ava�lable to the research commun�ty �n a t�mely manner. In normal c�rcumstances, a delay of more than three years should not be accepted. In France, �n the context of the 2003-2007 Cancer Plan, the surve�llance system of the populat�on has been �mproved, �nvolv�ng several �nst�tut�ons such as InVS, INSERM, AFFSET, INCa wh�ch are �n charge of the collect�on and �nterpretat�on of data. Strong cooperat�on between these agenc�es �s recommended �n order to set up a database that would be constantly and rap�dly updated and wh�ch would fac�l�tate mult�d�sc�pl�nary research at the nat�onal, European and �nternat�onal level.
2.3 Large-scale, h�gh-qual�ty cross-sect�onal stud�es should be promoted to assess exposure to known and suspected cancer r�sk factors. Such surveys should be repeated at regular �ntervals. If already �n place, these surveys should be coord�nated and the�r results made eas�ly access�ble to the research commun�ty.
2.4 Pr�or�ty should be g�ven to the support of large-scale, prospect�ve stud�es of cancer r�sk factors (see recommendat�ons 1.1 and 2.1). Novel fund�ng mechan�sms m�ght be taken �n cons�derat�on to support such long term projects.
3. Recommendations regarding the information to the general public and the media
3.1 Emphas�s should be g�ven to comprehens�ve and ev�dence-based rev�ews of the ev�dence on the causes of human cancers. Evaluat�ons made by �nternat�onal, mult�-d�sc�pl�nary panels should be g�ven more we�ght.
3.2 Spec�f�c aspects of cancer r�sks and determ�nants (e.g., one part�cular cancer, one subset of the populat�on, one r�sk factor) should be cons�dered �n a general perspect�ve (e.g., mortal�ty from all cancers, major r�sk factors) rather than �n �solat�on. The role of chance and b�as �n generat�ng false pos�t�ve and false negat�ve results should be g�ven proper cons�derat�on.
3.3 The general publ�c should be educated to cancer r�sk assessment and management. In part�cular, �t �s �mportant that lay �nd�v�duals acqu�re the ab�l�ty to cr�t�cally evaluate results on cancer r�sk factors. Health educat�on at school offers the greatest opportun�ty for such educat�onal efforts.