
Attention Increases the Temporal Precision of Conscious Perception: Verifying the Neural-ST2 Model
13
Attention Increases the Temporal Precision of Conscious Perception: Verifying the Neural-ST 2 Model Srivas Chennu 1 *, Patrick Craston 1 , Brad Wyble 2¤ , Howard Bowman 1 1 Centre for Cognitive Neuroscience and Cognitive Systems, University of Kent, Canterbury, United Kingdom, 2 Department of Brain and Cognitive Sciences, Massachusetts Institute of Technology, Cambridge, Massachusetts, United States of America Abstract What role does attention play in ensuring the temporal precision of visual perception? Behavioural studies have investigated feature selection and binding in time using fleeting sequences of stimuli in the Rapid Serial Visual Presentation (RSVP) paradigm, and found that temporal accuracy is reduced when attentional control is diminished. To reduce the efficacy of attentional deployment, these studies have employed the Attentional Blink (AB) phenomenon. In this article, we use electroencephalography (EEG) to directly investigate the temporal dynamics of conscious perception. Specifically, employing a combination of experimental analysis and neural network modelling, we test the hypothesis that the availability of attention reduces temporal jitter in the latency between a target’s visual onset and its consolidation into working memory. We perform time-frequency analysis on data from an AB study to compare the EEG trials underlying the P3 ERPs (Event-related Potential) evoked by targets seen outside vs. inside the AB time window. We find visual differences in phase-sorted ERPimages and statistical differences in the variance of the P3 phase distributions. These results argue for increased variation in the latency of conscious perception during the AB. This experimental analysis is complemented by a theoretical exploration of temporal attention and target processing. Using activation traces from the Neural-ST 2 model, we generate virtual ERPs and virtual ERPimages. These are compared to their human counterparts to propose an explanation of how target consolidation in the context of the AB influences the temporal variability of selective attention. The AB provides us with a suitable phenomenon with which to investigate the interplay between attention and perception. The combination of experimental and theoretical elucidation in this article contributes to converging evidence for the notion that the AB reflects a reduction in the temporal acuity of selective attention and the timeliness of perception. Citation: Chennu S, Craston P, Wyble B, Bowman H (2009) Attention Increases the Temporal Precision of Conscious Perception: Verifying the Neural-ST 2 Model. PLoS Comput Biol 5(11): e1000576. doi:10.1371/journal.pcbi.1000576 Editor: Karl J. Friston, University College London, United Kingdom Received July 14, 2009; Accepted October 23, 2009; Published November 26, 2009 Copyright: ß 2009 Chennu et al. This is an open-access article distributed under the terms of the Creative Commons Attribution License, which permits unrestricted use, distribution, and reproduction in any medium, provided the original author and source are credited. Funding: This work was supported by a UK Engineering and Physical Sciences Research Council (EPSRC; http://www.epsrc.ac.uk/) grant (GR/S15075/01) and a Research Councils UK (RCUK; http://www.rcuk.ac.uk/) Academic Fellowship grant (EP/C509218/1) awarded to HB and a National Institute of Mental Health (NIMH; http://www.nimh.nih.gov/) grant (NIMH MH47432) awarded to Mary Potter, in addition to a University of Kent (http://www.kent.ac.uk/) Postgraduate Research Scholarship awarded to SC and an EPSRC Doctoral Training Account awarded to PC. The funders had no role in study design, data collection and analysis, decision to publish, or preparation of the manuscript. Competing Interests: The authors have declared that no competing interests exist. * E-mail: [email protected] ¤ Current address: Department of Psychology, Syracuse University, Syracuse, New York, United States of America Introduction During ongoing perception of the world, humans are constantly faced with an abundance of visual sensory information. As this information feeds through the various layers of visual cortex, it is progressively integrated by a sequence of cortical areas that gradually generalise over spatial information to extract complex structural detail [1]. Whereas early visual areas extract orienta- tions, textures and borders, brain areas situated higher in the visual processing pathway can detect complex objects [2]. Bottom- up input flowing through this feedforward hierarchical pathway is constantly monitored for salience (e.g. task relevant or intrinsically prominent features like luminance or orientation pop-outs). Within this general description of the visual system, attention is considered to play a key role, filtering out irrelevant information and selectively enhancing salient input for further processing. Here we investigate the temporal dynamics of visual attention with regard to its role in conscious perception, which becomes apparent when stimuli are presented in rapid succession [3,4]. Such circumstances occur in rapid serial visual presentation (RSVP), in which stimuli are presented at a rate of approximately 10 items per second in the same spatial location. As each stimulus replaces its predecessor, its featural representation becomes fleeting due to masking effects, and a transient enhancement by attention is thought to be crucial in ensuring that salient items can be successfully encoded into working memory [5]. The attentional blink An apparent temporal limitation of visual perception is illustrated by the attentional blink (AB; [6]). The AB describes a finding that observers often fail to detect a second target stimulus (T2) presented in short succession (between 100 and 600 ms) after an identified first target stimulus (T1). If T2 is presented in immediate succession to T1, however, detection accuracy is typically excellent (‘lag 1 sparing’; [7]). Behaviourally, the AB has been replicated numerous times [8,9]. It has also been investigated electrophysiologically [10], where researchers have compared grand average Event-related Potentials (ERPs) evoked by targets outside and inside the AB, to investigate how target processing differs during the AB. PLoS Computational Biology | www.ploscompbiol.org 1 November 2009 | Volume 5 | Issue 11 | e1000576
Transcript of Attention Increases the Temporal Precision of Conscious Perception: Verifying the Neural-ST2 Model

Attention Increases the Temporal Precision of ConsciousPerception: Verifying the Neural-ST2 ModelSrivas Chennu1*, Patrick Craston1, Brad Wyble2¤, Howard Bowman1
1 Centre for Cognitive Neuroscience and Cognitive Systems, University of Kent, Canterbury, United Kingdom, 2 Department of Brain and Cognitive Sciences,
Massachusetts Institute of Technology, Cambridge, Massachusetts, United States of America
Abstract
What role does attention play in ensuring the temporal precision of visual perception? Behavioural studies haveinvestigated feature selection and binding in time using fleeting sequences of stimuli in the Rapid Serial Visual Presentation(RSVP) paradigm, and found that temporal accuracy is reduced when attentional control is diminished. To reduce theefficacy of attentional deployment, these studies have employed the Attentional Blink (AB) phenomenon. In this article, weuse electroencephalography (EEG) to directly investigate the temporal dynamics of conscious perception. Specifically,employing a combination of experimental analysis and neural network modelling, we test the hypothesis that theavailability of attention reduces temporal jitter in the latency between a target’s visual onset and its consolidation intoworking memory. We perform time-frequency analysis on data from an AB study to compare the EEG trials underlying theP3 ERPs (Event-related Potential) evoked by targets seen outside vs. inside the AB time window. We find visual differences inphase-sorted ERPimages and statistical differences in the variance of the P3 phase distributions. These results argue forincreased variation in the latency of conscious perception during the AB. This experimental analysis is complemented by atheoretical exploration of temporal attention and target processing. Using activation traces from the Neural-ST2 model, wegenerate virtual ERPs and virtual ERPimages. These are compared to their human counterparts to propose an explanation ofhow target consolidation in the context of the AB influences the temporal variability of selective attention. The AB providesus with a suitable phenomenon with which to investigate the interplay between attention and perception. The combinationof experimental and theoretical elucidation in this article contributes to converging evidence for the notion that the ABreflects a reduction in the temporal acuity of selective attention and the timeliness of perception.
Citation: Chennu S, Craston P, Wyble B, Bowman H (2009) Attention Increases the Temporal Precision of Conscious Perception: Verifying the Neural-ST2
Model. PLoS Comput Biol 5(11): e1000576. doi:10.1371/journal.pcbi.1000576
Editor: Karl J. Friston, University College London, United Kingdom
Received July 14, 2009; Accepted October 23, 2009; Published November 26, 2009
Copyright: � 2009 Chennu et al. This is an open-access article distributed under the terms of the Creative Commons Attribution License, which permitsunrestricted use, distribution, and reproduction in any medium, provided the original author and source are credited.
Funding: This work was supported by a UK Engineering and Physical Sciences Research Council (EPSRC; http://www.epsrc.ac.uk/) grant (GR/S15075/01) and aResearch Councils UK (RCUK; http://www.rcuk.ac.uk/) Academic Fellowship grant (EP/C509218/1) awarded to HB and a National Institute of Mental Health (NIMH;http://www.nimh.nih.gov/) grant (NIMH MH47432) awarded to Mary Potter, in addition to a University of Kent (http://www.kent.ac.uk/) Postgraduate ResearchScholarship awarded to SC and an EPSRC Doctoral Training Account awarded to PC. The funders had no role in study design, data collection and analysis, decisionto publish, or preparation of the manuscript.
Competing Interests: The authors have declared that no competing interests exist.
* E-mail: [email protected]
¤ Current address: Department of Psychology, Syracuse University, Syracuse, New York, United States of America
Introduction
During ongoing perception of the world, humans are constantly
faced with an abundance of visual sensory information. As this
information feeds through the various layers of visual cortex, it is
progressively integrated by a sequence of cortical areas that
gradually generalise over spatial information to extract complex
structural detail [1]. Whereas early visual areas extract orienta-
tions, textures and borders, brain areas situated higher in the
visual processing pathway can detect complex objects [2]. Bottom-
up input flowing through this feedforward hierarchical pathway is
constantly monitored for salience (e.g. task relevant or intrinsically
prominent features like luminance or orientation pop-outs).
Within this general description of the visual system, attention is
considered to play a key role, filtering out irrelevant information and
selectively enhancing salient input for further processing. Here we
investigate the temporal dynamics of visual attention with regard to its
role in conscious perception, which becomes apparent when stimuli are
presented in rapid succession [3,4]. Such circumstances occur in rapid
serial visual presentation (RSVP), in which stimuli are presented at a
rate of approximately 10 items per second in the same spatial location.
As each stimulus replaces its predecessor, its featural representation
becomes fleeting due to masking effects, and a transient enhancement
by attention is thought to be crucial in ensuring that salient items can be
successfully encoded into working memory [5].
The attentional blinkAn apparent temporal limitation of visual perception is illustrated
by the attentional blink (AB; [6]). The AB describes a finding that
observers often fail to detect a second target stimulus (T2) presented
in short succession (between 100 and 600 ms) after an identified first
target stimulus (T1). If T2 is presented in immediate succession to
T1, however, detection accuracy is typically excellent (‘lag 1
sparing’; [7]). Behaviourally, the AB has been replicated numerous
times [8,9]. It has also been investigated electrophysiologically [10],
where researchers have compared grand average Event-related
Potentials (ERPs) evoked by targets outside and inside the AB, to
investigate how target processing differs during the AB.
PLoS Computational Biology | www.ploscompbiol.org 1 November 2009 | Volume 5 | Issue 11 | e1000576

Despite extensive study of the AB, its effect on the underlying
temporal mechanisms of target identification remains to be fully
explored. Evidence from ERP [10,11] and priming [12,13] studies
suggest that targets, rather than being completely lost during the
AB, are processed quite extensively, but fail to enter the final stage
of conscious perception. Furthermore, researchers have found that
when targets in RSVP consist of multiple features, observers often
report features from items neighboring the target in the RSVP
stream and make binding errors referred to as illusory conjunctions
[14]. Behavioural analysis of the changes in the patterns of such
binding errors provides strong support for the claim that the AB
reveals a reduction in the temporal precision of the deployment of
transient attention and target processing [15,16].
The ST2 modelIn this article, we use the dynamics of temporal visual processing
as embodied in the ST2 (Simultaneous-Type-Serial-Token) model,
a connectionist model of temporal attention and working memory
[5], to propose an explanation for the observed effect of the AB on
the temporal precision of transient attention. The model explains a
broad set of experimental findings relating to the AB, Repetition
Blindness and RSVP in general. Before elaborating on our central
hypothesis, we explain the fundamental principles of how the ST2
model describes temporal attention and working memory. For a
more detailed description please refer to [5]. It should be
emphasised that throughout this article, we retain the model’s
parameters as published in [17], and use it to generate predictions
and virtual EEG traces comparable to human EEG data.
Types & tokens. The ST2 model employs a types-tokens
account [18–20] to describe the process of working memory
encoding. Types describe all feature related properties associated
with an item. These include sensory properties, such as visual
features (e.g. its shape, colour and the line segments comprising it)
and also semantic attributes, such as a letter’s position in the
alphabet. A token, on the other hand, represents episodic
information. It is specific to a particular occurrence of an item,
and provides a notion of serial order. An item is encoded into
working memory by creating a connection between a type and a
token. At retrieval, tokens contain information about when an
item occurred, in addition to a connection to a type. Thus the
information stored in the tokens can be used to recollect both
identity and temporal order of stimuli.
Model architecture. As illustrated in figure 1, the ST2 model
can be divided into three parts. We describe them in turn:
N Input & extraction of types in stage one: Input values, which
simulate target letters and digit distractors in the AB
experiment, are fed into the model at the lowest layer of stage
one. As activation propagates in a feed-forward manner, the
following layers reflect masking in early visual processing and
subsequent extraction of semantic representations. A task
demand mechanism operates at the highest layer of stage one,
and selects targets for encoding into working memory by
suppressing the representations of distractors. Despite the fact
that stimuli are presented serially during the AB task,
processing within stage one may exceed the presentation time
of sequentially presented items. Hence, these layers are parallel
or simultaneous in nature, in that more than one node can be
active at any one time.
N Working memory encoding in stage two: An item is encoded
into working memory by connecting its type node in stage one
to a working memory token in stage two. This process is
referred to as ‘tokenization’. If at the end of a trial, the type
node of a target has a valid connection to a token, the target is
successfully ‘reported’, or ‘seen’, by the ST2 model. Inhibition
between working memory tokens ensures only one token is
active at any one time, thus enforcing a serialisation of working
memory encoding.
Author Summary
Our visual system keeps pace with a rapidly changingstream of information as we view the natural world. To doso, it uses a strongly regulated system of attentional filtersto constrain which visual stimuli are permitted to be fullyprocessed to the level of conscious awareness. This articleexplores what happens when these filters are opened andclosed in response to important visual stimuli. Tounderstand these dynamics, our neural network modelprovides simulations of the role played by attention. Thesesimulations can be tested by recording neural data in theform of ‘brain waves’ (EEG) and comparing the resultantsignals to the output of the model. The data discussedhere confirm a prediction of the model, which suggeststhat after the attentional filter has opened to allow onevisual stimulus in, there is increased temporal variability or‘jitter’ in the subsequent opening of the filter within aninterval of about one-half of a second. These results haveimplications for the way our brains process multipleimportant stimuli perceived in rapid succession, such asthe sequence of events that might occur at a criticalmoment in an airline cockpit or during an automobileaccident.
Figure 1. The ST2 model. (1) Input & extraction of types in stage one(2) Working memory tokens in stage two (3) Temporal attention fromthe blaster. Refer to [5] for an extensive description of individual layers,and the neural circuits comprising the nodes in each layer. Adaptedfrom [17] with kind permission of MIT Press.doi:10.1371/journal.pcbi.1000576.g001
Attention and Temporal Precision
PLoS Computational Biology | www.ploscompbiol.org 2 November 2009 | Volume 5 | Issue 11 | e1000576

N Temporal attention from the blaster: Temporal attention is
implemented by a mechanism termed the blaster, which
provides a non-specific excitatory input to nodes in the later
layers of stage one in response to the detection of salient items
(i.e., targets in the context of the AB). Transient Attentional
Enhancement (TAE) from the blaster allows targets to become
sufficiently active to initiate the tokenization process. During
tokenization, the blaster is suppressed until encoding of the
target has completed. The suppression prevents a second
target from re-firing the blaster while the first target is being
tokenised, thus preventing the episodic representations of the
two targets from being conflated.
Virtual ERPs. Computational modelling of cognition is
commonly focused on the replication of behavioural data. In
particular, neural network models of cognition, in addition to
replicating behavioural data, embody a hypothesis about
underlying structure and function. On the empirical front,
advances in technology now allow researchers to record ongoing
brain activity correlated with a particular behaviour, such as the
electrophysiological markers of neural processing. The natural
question that arises is how such data can be combined with
modelling to understand cognition at the neural level. This is
possible because cognitive neural networks consist of nodes that
derive from the functional characteristics of real neurons. Also, the
activation of nodes in a model can be interpreted as the analogue
of the activation of an assembly of real neurons. Consequently,
activation traces in a neural model are comparable to aggregate
neural activity expressed in EEG data.
The ST2 model simulates human behavioural accuracy in the
AB. Using its neural network implementation, we generate virtual
activation traces, called Virtual ERPs [17], by summing across
layers of the model responsible for replicating specific cognitive
functions. These traces are then compared to human ERPs across
experimental conditions [17,21]. The virtual ERP technique
allows us to replicate, interpret and make predictions about human
EEG data in a way similar to behavioural data. In particular,
virtual ERPs allow us to validate our explanation of how the AB
affects the temporal precision of conscious perception.
Attentional precision, the AB and the ST2 modelThe ST2 model suggests that working memory encoding
involves creating a binding between the type of a stimulus (which
can include its visual features and semantic attributes) and a token
(an episodic representation specific to a particular occurrence of an
item) [18,20]. In the ST2 model, Transient Attentional Enhance-
ment (TAE) from the blaster amplifies the type representation of a
salient (i.e., task relevant) stimulus to assist in its binding to a token,
in a process referred to as tokenization. This TAE can serve as an
attentional gate, which can be temporarily deactivated to allow
one target’s encoding to be completed before a second is begun.
From the perspective of the ST2 model, the AB is an artifact of
the visual system attempting to assign unique tokens to targets
[22]. More specifically, the process of encoding T1 into working
memory is triggered by TAE, and TAE itself is subsequently
suppressed until T1 encoding has completed. The period of TAE
unavailability varies from trial to trial depending on how long it
takes to tokenise T1, depending on its bottom-up strength. In an
RSVP stream, if a T2 is presented 100–600 ms after a perceived
T1 (as is the case during the AB), its processing outcome depends
on multiple factors. T2’s own strength determines its dependence
on TAE, since highly salient T2s can ‘break-through’ the AB [31]
and get encoded relatively early. T2s with strength values slightly
lower in the range ‘outlive’ the AB (and thus the unavailability of
TAE), and hence are indirectly influenced by T1 strength. Overall,
the variability in the temporal dynamics of T2’s encoding process
is influenced both by T1 and T2 strengths. Hence, over all possible
strengths, the ST2 model proposes that there should be increased
variance in processing latency for targets seen during the AB.
OverviewThis article investigates the hypothesis that diminished atten-
tional control increases the temporal jitter in the latency of a target’s
working memory consolidation. The AB provides us with a
suitable phenomenon with which to test our hypothesis: we
propose that the reduced availability of attention during the AB
increases the temporal noise in visual attention. To answer this
question, we compare the EEG signatures evoked by targets seen
outside vs. inside the AB, and determine whether there is a
comparative increase in the variability of the latency of working
memory encoding of targets presented inside the AB. EEG has the
advantage of excellent temporal resolution, allowing us to study
short-lived cognitive events that evoke changes in ongoing EEG
activity. If one averages over multiple segments of such EEG
activity time-locked to the event, the resulting averaged ERP
waveform contains a number of positive and negative deflections,
referred to as ERP components. To test for increased temporal
jitter, we analyse the P3 ERP component, commonly associated
with encoding items into working memory [10,23].
However, analysis of averaged ERP components cannot directly
inform our hypothesis. This is because the averaging collapses
across and hence discards information about temporal fluctuations
in the individual EEG trials contributing to the ERP. Given a set
of trials that are averaged together, both decreases in amplitude
and increases in latency variation within that set will attenuate the
mean amplitude of the ERP. Hence, examining the average does
not directly provide the necessary information to decide which of
the two sources of variation in the individual trials (amplitude or
latency) caused the reduction in ERP amplitude. Further,
measures like 50% area latency analysis [24] cannot be used to
measure latencies in single trials, due to the levels of irrelevant
noise activity. Consequently, we employ time-frequency analysis
techniques that provide alternative measures to investigate single
trial dynamics underlying grand average ERPs. These methods
enable us to perform a more fine-grained analysis of EEG data,
and test our hypothesis using both qualitative and quantitative
means.
In addition to presenting and analyzing human EEG data, we
use the ST2 model’s neural network implementation to generate
virtual P3 ERP components [17], which are hypothesised to
correspond to the human P3 ERP component. For each of the
experimental conditions, the virtual P3 is contrasted with the
human P3, both at grand average and single trial level. This
comparative evaluation allows us to validate the ST2 model and
propose explanations for the human ERP effects.
Results
The following section describes the human EEG activity evoked
by targets outside and inside the AB. The data set used in the
following analysis was the same as that contributing to the analyses
presented in [17]. In the final part of the section, we use the ST2
model to generate virtual ERPs, which we compare to human
ERPs, and discuss the implications of this comparison for the
theory underlying the ST2 model. Please refer to the Materials and
Methods section for more details on the experimental design and
computational modelling.
Attention and Temporal Precision
PLoS Computational Biology | www.ploscompbiol.org 3 November 2009 | Volume 5 | Issue 11 | e1000576

Analysis of behavioural accuracyThe experiment consisted of RSVP trials presented at a rate of
105.9 ms per item, with two letter targets, T1 and T2, embedded
among digit distractors. T2 was presented at lags 1, 3 and 8
following the T1. The P3 EEG data analysed in this section was
recorded at the Pz electrode. Please refer to the Materials and
Methods section for further information.
Mean human accuracy for T1 identification was 82%. The
accuracy of T2 identification (conditional on correct report of T1)
was 83% at lag 1, 54% at lag 3, and 74% at lag 8. There was a
significant effect of lag on accuracy (F(1.48,12.58) = 15.58, MSE
= 0.03, pv0.001, after applying a Greenhouse-Geisser correction
on the degrees of freedom). Additionally, in pairwise comparisons,
T2 accuracy was significantly lower at lag 3 compared to lag 8
(F(1,17) = 11.66, MSE = .03, p = .003) and lag 1 (F(1,17) = 60.88,
MSE = 0.01, pv0.001). Consequently, the paradigm employed in
this study evoked a reliable AB effect.
Qualitative evidence for reduced temporal precisionThe ERPimages [25] in figure 2 compare the P3 evoked by
targets seen outside the AB (seen T2s at lag 8 following a seen T1) with
targets seen inside the AB (seen T2s at lag 3 following a seen T1). They
allowed us to visualise the EEG trials underlying the grand average
P3 ERPs (plotted below them) for targets seen outside and inside
the AB. These ERPimages represent time with respect to target
onset along the X-axis (Note that trials are time-locked to T2
onset), individual trials along the Y-axis, and the single-trial EEG
amplitude using a colour scale. The trials comprising these images
were sorted from bottom to top by descending order of the phase
angle of the single-trial P3 at the time point indicated by the
dashed line, which was set to the peak latency of the corresponding
grand average P3. This phase angle was estimated at the frequency
at which the power of the P3 was maximal. This sorting method
effectively ordered the trials according to the approximate latency
of the single-trial P3 for a target, as estimated by a wavelet-based
time-frequency analysis (see the Materials and Methods section for
more details). The ERPimages were then plotted for each
condition, with trials having longer latency P3s being placed at
the bottom, and trials with shorter latency P3s at the top.
Following from our hypothesis, for targets inside the AB, we
expected to observe an increased ‘‘slope’’ in the red ‘‘smear’’
representing the P3. This would indicate that these targets suffer
greater temporal variance compared to targets outside the AB.
A visual comparison of the ERPimages clearly suggested that
the P3 for targets outside the AB (figure 2A) had relatively little
variation in the phase angle across most trials. In other words, the
P3 onset occurred at approximately the same time in these trials.
In contrast, the P3 evoked by targets inside the AB (figure 2B)
appeared to exhibit an increased temporal fluctuation, as reflected
by the increased variance of the phase angle of the P3 across all
trials. A natural consequence of this jitter in the temporal onset of
the P3 was a ‘smearing out’ of the grand average ERP.
In summary, if there was indeed a reduction in the precision of
the deployment of attention in response to targets during the AB,
we expected this to indirectly affect the working memory encoding
of targets as reflected by the P3. The ERPimages in figure 2
provided qualitative support for our hypothesis. We then extended
this investigation by analysing the distribution of phase angles
corresponding to the P3, to generate numerical evidence that
could be verified statistically.
Quantitative evidence for reduced temporal precisionTo back up the qualitative comparisons of the previous section,
we statistically analysed the time-frequency data obtained therein.
We used an approach similar to inter-trial phase coherence
analysis [25], but adapted the idea to directly examine the subject-
wise P3 phase distributions and quantitatively compare temporal
jitter. The phase angles used to sort the individual trials comprising
the P3 ERPimages in the previous section formed a circular
distribution [26] of angular data values that effectively represented
the temporal latency between the onset of the target and its P3. By
statistically comparing the variance in the distribution of phase
angles across targets outside and inside the AB, we tested whether
the visual differences observed were consistent across subjects.
To do so, we performed a subject-wise grouping of the P3 phase
angles calculated at the peak latency of the grand average P3 for
each condition (the same phase angles that were used to sort the
ERPimages presented earlier). This generated multiple smaller
distributions of P3 phase angles, one per condition and subject.
These distributions were then modelled as von Mises distributions
[26] for which the concentration parameter k was calculated using
maximum likelihood estimation. The k parameter of a distribution
is a measure of its density around its mean value, and is an
analogue of the inverse of its variance. The larger the k value of a
circular distribution, the more concentrated it is around the mean.
Importantly, k is a linear parameter, and can be compared using
conventional statistical tools. Hence, in order to test whether
targets inside the AB suffered from increased temporal jitter, we
compared k values of the subject-wise P3 phase distributions
evoked by targets outside and inside the AB, using a standard one-
way repeated-measures ANOVA. The results of the ANOVA
validated what the visual differences observed in the ERPimages
clearly indicated: The k of the phase distribution for the P3
for targets outside the AB was statistically greater than that
for targets inside the AB: Mean k for targets outside the AB was
0.95, whereas mean k for targets inside the AB was 0.52
(F(1,17) = 15.21, MSE = 0.11, p = 0.001).
The potential confound of reduced amplitude. A
potential confound in our time-frequency analysis arose from the
well-established finding of reduced amplitude of the P3 for targets
presented during the AB [10,17,27,28]. Based on this finding, it
could have been argued that the increased variation in the onset
latency of the P3 for targets inside the AB was due to its reduced
amplitude. This potential confound arose because the reduction in
P3-related power could have effectively diminished the ability of
the time-frequency analysis to calculate the phase of the P3. In
other words, given a pair of P3 datasets, one with reduced P3
power compared to the other, the counter-argument to our
interpretation would have claimed to explain the observed
difference in P3 phase distributions by a reduction in P3 power
during the AB.
To address this claim, we redid our statistical comparison of P3
phase angles, but with an additional step: before comparing the
phase distributions, we first rejected trials from the target outside the
AB condition with the highest power in the P3 window from 300–
700 ms. This had the effect of reducing the mean power of the P3
for that condition, as it consisted only of the remaining trials.
By performing this step, we discounted any influence of the
amplitude of the P3 on the phase calculations. Indeed, we
rejected a sufficiently large number of trials so as to reduce the
mean P3 power for targets outside the AB to a value significantly
smaller than that of the mean P3 power for targets inside the AB.
Specifically, before trial rejection (i.e., including all 938 trials in
the condition) the mean P3 power for targets outside the AB was
7.81 dB. This value was statistically greater than the mean P3
power for targets inside the AB: 6.64 dB (F(1,17) = 33.07, MSE
= 0.37, pv0.001). After rejecting 253 trials with the highest P3
power, the mean P3 power for targets outside the AB was
Attention and Temporal Precision
PLoS Computational Biology | www.ploscompbiol.org 4 November 2009 | Volume 5 | Issue 11 | e1000576

Figure 2. Human P3 ERPimages for targets seen outside and inside the AB. The ERPimages are time-locked to T2 presentation. Trials aresorted by phase at the peak latency of the grand average of the T2 P3 (indicated by the dashed line). The solid line illustrates the variation in phase,and is plotted by mapping the circular range of phase values onto the linear range of time-points encompassed by the wavelet.doi:10.1371/journal.pcbi.1000576.g002
Attention and Temporal Precision
PLoS Computational Biology | www.ploscompbiol.org 5 November 2009 | Volume 5 | Issue 11 | e1000576

reduced to 6.41 dB. This diminished power was statistically lesser
than that for targets inside the AB (F(1,17) = 5.76, MSE = 0.086,
p = 0.028). But in confirmation of our hypothesis, we found that
the difference between the k values for the phase distributions
corresponding to the targets outside the AB (after trial rejection)
and targets inside the AB conditions was still significantly
different: Mean k for targets outside the AB after trial rejection
was 0.78; mean k for targets inside the AB remained unchanged
at 0.52 (F(1,17) = 5.74, MSE = 0.109, p = 0.028). Thus, this
result addressed the potential confound. In other words, it
confirmed that the differences observed in the P3 phase
distributions reflected underlying differences in the correspond-
ing temporal dynamics, which could not be explained away by
differences in amplitude or power.
Phase distributions of the T1. In order to further elucidate
the statistical comparisons presented above, we compared the
phase distributions for the T2s seen at lag 8 (outside) and lag 3
(inside) the AB with the phase distributions for the T1s preceding
them. The ERPimages in figures 3A and 3B depict the P3s evoked
by the seen T1s preceding seen T2s at lag 8 and lag 3, sorted by
the phases at their grand average peaks at 428 ms and 424 ms,
respectively (Note that these two conditions are equivalent to the
target outside and target inside the AB conditions from figure 2,
but are now time-locked to T1 onset and sorted by T1 phase).
In order to confirm the methodological validity of our time-
frequency analysis, we checked for whether the proximity of the
T1 and T2 P3s at lag 3 had adversely affected the estimation of
phases. Specifically, it could have been that the preceding T1 P3
interfered with the wavelet analysis of the T2 P3 (despite the short
wavelet length) and artificially increased the variance of its phase
distribution. To test for this, we compared the T1 lag 8 P3
(figure 3A) and the T1 lag 3 P3 (figure 3B) conditions. If the
wavelet analysis was indeed confounded, we expected a compar-
ative increase in the variance of the phase distribution (and
concomitant decrease in k) of the T1 lag 3 P3, mirroring the
differences observed between the phase distributions of targets
inside and outside the AB. But instead, we found that the T1 lag 3
P3 had a higher mean k of 1.11 than the T1 lag 8 P3 with a mean kof 1.06, although this difference was not significant. (F(1,17) v1,
pw0.4). Thus, the T1 lag 3 P3 had a relatively high k value
despite its proximity to the T2 lag 3 P3. Overall, this suggested
that the wavelet analysis was not confounded by this proximity,
and was indeed capturing the EEG activity associated with the P3
being analysed.
The finding of increased temporal variance in T2 processing
during the AB led us to the question of the influence of variance in
T1 processing thereupon. Towards answering this question, we
compared the differential effect of T1 on T2, across its
presentation outside and inside the AB. We found that there were
no visual differences apparent in the temporal variability of the T1
lag 8 P3 (figure 3A) and the T2 lag 8 P3 (figure 2A). In keeping
with this observation, the k values of the corresponding phase
distributions, 1.06 for the T1 lag 8 P3 and 0.95 for the T2 lag 8 P3,
were not statistically distinguishable (F(1,17) = 1.8, p = 0.2). In
contrast, the visual comparison between the T1 lag 3 P3 (figure 3B)
and the T2 lag 3 P3 (figure 2B) suggested that the former had
higher temporal precision. Also, the k of the phase distribution for
the T1 lag 3 P3 (mean k of 1.11) was statistically greater than that
for the T2 lag 3 P3 (mean k of 0.52): F(1,17) = 15.34, MSE
= 0.202, pv0.01. Taken together, these findings led to some
important conclusions: Firstly, the jitter in T1 encoding was not
affected by the lag position of the T2. Further, T1’s influence on
T2 jitter was temporally limited, i.e., T1 significantly increased T2
jitter only when T2 was presented within the AB window.
Following on from these findings, we were interested in whether
there existed a direct relationship between the latencies of
individual T1 and T2 P3s during the AB, as reflected by their
phase values. To test this, we performed a trial-by-trial circular
correlation of phase values of the T1 and T2 P3s at lag 3, but
failed to find any relationship between the phases. This lack of an
effect agreed with visual inferences from figure 2B, which
suggested that sorting by the phase of the T2 lag 3 P3 did not
result in any evident sorting of the T1 P3 preceding it. In the same
vein, sorting by the phase of the T1 lag 3 P3 in figure 3B did not
produce any sorting of the T2 P3 following it.
Virtual ERPs from the ST2 modelIn order to validate the ST2 model, we used it to generate
‘artificial electrophysiological’ traces, so-called virtual ERPs [17].
In analogy to human ERP components, we generated virtual ERP
components for targets outside and inside the AB. This approach,
in addition to allowing us to validate the internal dynamics of the
ST2 model, provided theoretical explanations for the human EEG
effects observed in the previous section. Please refer to the
Materials and Methods section for more details on how virtual
ERPs and ERPimages were generated.
Simulated behavioural accuracy. The simulated behavioural
accuracy from the ST2 model was 85% for targets outside the AB and
31% for targets inside the AB. The ST2 model thus qualitatively
replicated the human behavioural data.
Virtual ERPimages. As with the analysis of human ERPs,
grand average virtual ERPs are ‘blind’ to underlying trial-by-trial
fluctuations, and could not be used to dissociate potential sources
of aggregate effects. Hence, we investigated the correspondence
between model and human ERP data at the level of individual
trials. This was done by generating virtual ERPimages from the ST2
model. Similar to their human counterparts, virtual ERPimages
illustrate the activation profiles of simulated trials making up a
particular condition. However, human ERPimages unavoidably
include inter-subject variability, occurring naturally in the neural
dynamics across the subject pool. Hence, in order to generate
comparable virtual ERPimages, we simulated inter-subject
variability by introducing a small, random subject-wise delay in
the processing of all stimuli in the model (see the Materials and
Methods section for more details). For each such ‘simulated’
subject with a particular delay value, we executed a complete run
of the model. This procedure was then repeated as many times as
there were experimental subjects. In this way, we generated
multiple datasets of simulated trials, one per subject and condition,
which could then be statistically analysed. Further, by combining
trials across all simulated subjects, we generated virtual
ERPimages that captured some of the complexity present in the
human ERPimages.
Qualitative comparisons to human ERPs. The virtual
ERPimages in figure 4 depict the virtual P3s (with the corre-
sponding grand averages plotted below them) evoked by targets
seen outside the AB (seen T2s at lag 8 following a seen T1) with targets
seen inside the AB (seen T2s at lag 3 following a seen T1). These
conditions mirror the ones analysed with the human EEG data.
However, note that in contrast to the human ERPimages in
figure 2, the virtual ERPimages only depict simulated activity
related to the target in question. This was done for visual clarity,
and was possible because we could isolate and selectively plot
activation generated by a specific target in the ST2 model. Further,
the trials comprising the virtual ERPimages were sorted by 50%
area latency [24] of the appropriate virtual P3 within 200–
1100 ms after target onset (indicated by dashed lines in figure 4) in
Attention and Temporal Precision
PLoS Computational Biology | www.ploscompbiol.org 6 November 2009 | Volume 5 | Issue 11 | e1000576

Figure 3. Human P3 ERPimages for seen T1s with T2 at lag 8 and at lag 3. The ERPimages are time-locked to T1 presentation. Trials aresorted by phase at the peak latency of the grand average of the T1 P3 (indicated by the dashed line). The solid line illustrates the variation in phase,and is plotted by mapping the circular range of phase values onto the linear range of time-points encompassed by the wavelet.doi:10.1371/journal.pcbi.1000576.g003
Attention and Temporal Precision
PLoS Computational Biology | www.ploscompbiol.org 7 November 2009 | Volume 5 | Issue 11 | e1000576
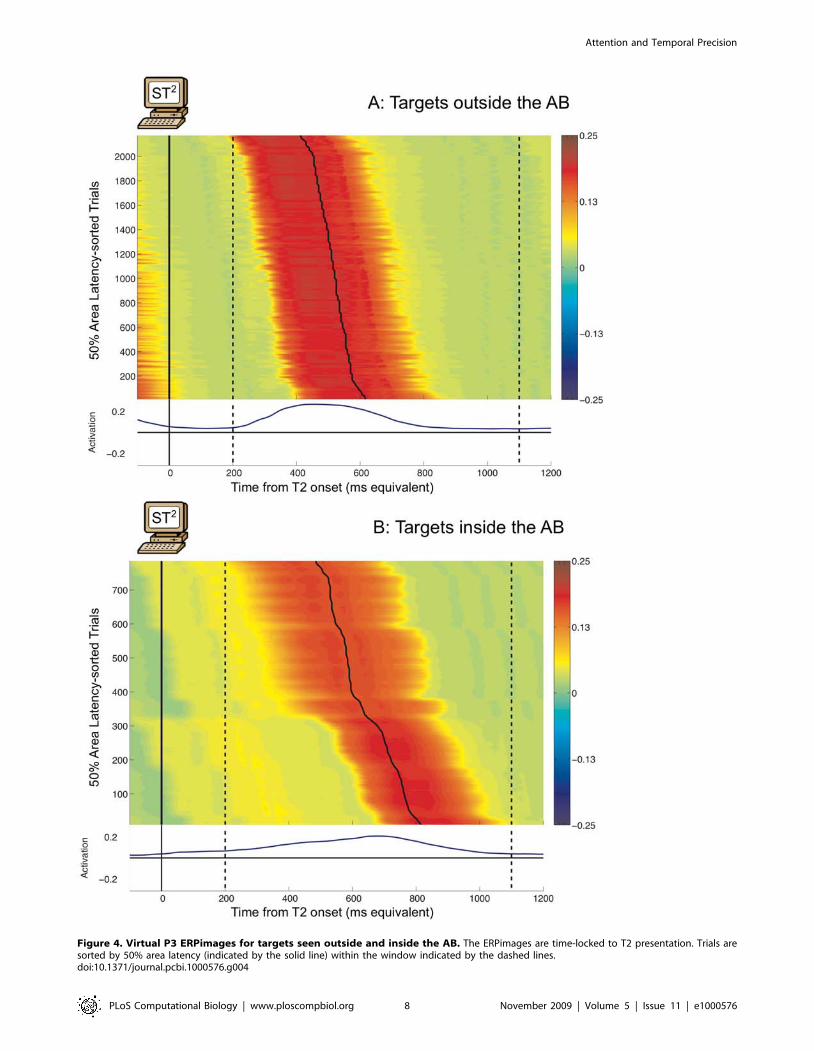
Figure 4. Virtual P3 ERPimages for targets seen outside and inside the AB. The ERPimages are time-locked to T2 presentation. Trials aresorted by 50% area latency (indicated by the solid line) within the window indicated by the dashed lines.doi:10.1371/journal.pcbi.1000576.g004
Attention and Temporal Precision
PLoS Computational Biology | www.ploscompbiol.org 8 November 2009 | Volume 5 | Issue 11 | e1000576

each trial. We used the 50% area latency measure with virtual
ERPs, since, unlike human ERPs, they were free from noise.
The ERPimages for the virtual P3 showed that the simulated
EEG activity for targets outside the AB (figure 4A) was well aligned
with target onset. In comparison, the virtual P3 for targets inside
the AB (figure 4B) varied over a wider range of latencies. This
difference provided a qualitative replication of the pattern of
effects in the human P3 ERPimage (figure 2).
Quantitative comparisons to human ERPs. We statistically
tested the observed qualitative differences in the virtual ERPimages,
by comparing across simulated subjects the 50% area latencies of
the virtual P3 within the 200–1100 ms window (the same latency
values used to sort the virtual ERPimages). We found that targets
outside the AB (mean latency = 529.68 ms) had significantly earlier
mean 50% area latency than targets inside the AB (mean latency
= 649.31 ms): F(1,17) w100, MSE = 6.69, pv0.001. This shift in
the mean latency of the virtual P3 during the AB follows from the
delayed consolidation hypothesis of the ST2 model [29]. Previous
ERP studies of the AB [27,30] have reported such a shift in the
human P3, which is mirrored by the observed shift in the peak
latency of the grand average human P3s in our data.
To quantitatively test whether the virtual P3 suffered from
increased temporal variance for targets inside the AB, we
compared the standard deviations of the 50% area latencies of
the virtual P3 across simulated subjects. In keeping with the
qualitative differences observed in the virtual ERPimages, virtual
P3s evoked by targets outside the AB had much smaller standard
deviation in their latencies (mean S.D. = 44.80 ms) than those
evoked by targets inside the AB (mean S.D. = 93.81 ms). This
difference was highly significant: F(1,17) w100, MSE = 0.052,
pv0.001, and mirrored the statistical differences in the phase
distributions of the human P3s.
Discussion
Our qualitative and quantitative comparisons of human
ERPimages support the notion of increased temporal variance in
target processing during the AB. Further, we have shown that the
observed differences in the phase distributions of targets seen
outside and inside the AB are indeed real, and cannot be explained
by differences in amplitude or any methodological limitations.
Finally, our analysis also suggests that T1 processing significantly
influences the variance in T2 processing during the AB window,
though this could not be confirmed by a trial-by-trial correlation of
T1 and T2 phases. At the end of this section, we interpret this
finding in relation to predictions from the ST2 model.
The virtual ERPs and ERPimages have provided a means for
visualising the theory underlying the ST2 model, at a fine-grained
level of detail. Using this novel methodology of comparing model
and data both at the level of averages and single-trials, we have
shown that, in line with the ST2 model’s hypothesis, activation
traces of attentional response and consequent working memory
encoding show decreased temporal precision for targets inside the
AB compared to targets outside it. However, it is clear from the
virtual ERPimages that the virtual P3 for targets inside the AB is
exaggerated in terms of its delay and duration. This is a
consequence of the strong suppression of TAE in the ST2 model
during target consolidation. But it does not affect the qualitative
comparisons with the human ERPimages, or the conclusions we
have drawn therefrom.
To further clarify the causes of temporal variability in the ST2
model, we now summarise the underlying mechanisms that
produce it. In the model, transient attentional enhancement
(TAE) is evoked by detection of a target, and this attention triggers
the encoding of that target into working memory by binding its
type representation to a working memory token, which results in
this target being correctly reported at the end of the trial. For
targets presented outside the AB, such as a T2 at lag 8, the TAE
mechanism (i.e. the blaster circuit) is readily available. It fires as
soon as an item is classified as a target, and encoding is thus tightly
timelocked to the target onset. Thus, there is little variation in the
tokenization delay and consequently the latency of the virtual P3.
Also, because attention is immediately deployed, the model’s
behavioural accuracy at detecting targets outside the AB is high.
However, as described previously, the processing of a target
presented during the AB (a T2) is complicated by multiple factors.
Firstly, T1’s strength determines the period of unavailability of the
blaster. In addition, T2’s own strength determines its dependence
on the blaster, as highly salient T2s (at upper end of the range of
target strength) can break-through the AB [31] and get encoded
early. T2s with slightly lower strength values can outlive the AB,
but require the blaster’s enhancement. Quite a few T2s, however,
have insufficient strength to survive the delay in the blaster
response and are missed, producing an AB. This complex
relationship between T1 and T2 at lag 3 increases temporal
variability in the latency of T2’s virtual P3, but implies that the
model does not predict a strong, direct correlation between T1
and T2 P3 latencies. A possible reason for the lack of any such
correlation between the corresponding human P3 phase distribu-
tions could be insufficient variation in T1 strength in our
experiment, combined with noise obscuring a weak effect. With
sufficient variation in T1 strength (for example, when comparing
across T1 masked vs. unmasked) the dynamics of the ST2 model
propose a stronger relationship between the duration of the T1 P3
and the latency of the T2 P3 during the AB. Indeed, the model
suggests that there should be a reciprocal influence of T1 strength
on its encoding duration [29], which would in turn have
implications for T2 P3 latency. Testing for such a relationship
would be informative, but a detailed investigation of this topic is
beyond the scope of this article.
Related workOur experimental results and theoretical explorations comple-
ment and inform previous research on temporal selection and the
AB. We now discuss these findings and propose interpretations in
terms of the ST2 model.
Chun (1997), Popple and Levi (2007). Chun [32] provided
initial evidence regarding the effect of the AB on temporal
binding. Employing an RSVP paradigm consisting of letters
enclosed in coloured boxes and target letters marked by a
distinctively coloured box, he investigated the distribution of
responses made by participants when either one or two targets
were presented. He calculated the centre of mass of this
distribution for targets outside and inside the AB, and found
that for targets outside the AB, the distribution was roughly
symmetrical around the target position. But for targets inside the
AB, he observed a significant shift in the response distribution
toward items presented after the target. In addition, behavioural
data presented in [32] shows that the variance of the response
distribution for T2 report increases when it is presented inside the
AB. Popple and Levi [15] presented additional behavioural
evidence consistent with Chun’s findings [32]. Using a colour-
marked RSVP paradigm where each item had two features (colour
and identity), they found that incorrect responses mostly came
from the distractor items that were presented close to, and
generally following the T2. In addition, they observed that this
distribution of responses for T2 showed a pronounced increase in
its spread compared to T1.
Attention and Temporal Precision
PLoS Computational Biology | www.ploscompbiol.org 9 November 2009 | Volume 5 | Issue 11 | e1000576

These findings are well explained by the ST2 model. In ST2, the
inhibition of the blaster delays the deployment of attention to a T2
presented during the AB. Consequently, non-targets presented
right after the T2 are more likely to be tokenised when the second
stage becomes available, resulting in the observed shift in the
response distribution. Also, as explained in the previous section,
due to a combination of factors influenced by T1 and T2
strengths, there is increased temporal variability in T2’s encoding
process. This in turn leads to increased variation in the
behavioural response for T2s presented inside the AB.
Vul, Nieuwenstein and Kanwisher (2008). Vul, Nieuwenstein
and Kanwisher [16] propose that temporal selection is modulated
along multiple dimensions by the AB. They employed an RSVP
paradigm consisting of letters, with targets delineated by simul-
taneously presented annular cues. Their behavioural analysis suggests
that target selection is affected by the AB in one or more of three
externally dissociable dimensions discussed below: suppression, delay,
diffusion. However, with the ST2 model, we demonstrate that all three
can result from the suppression of attention.
N Suppression refers to the reduction in the effectiveness of
temporal selection during the AB, and a concomitant increase
in random guesses. Vul et al. [16] measured this effect in the
form of a decrease in the mean probability of selecting a
proximal response (from +3 item positions) around the target,
when it occurs during the AB. In contrast to results in [15],
they found a significant decrease in this value for T2s during
the AB. In the ST2 model, suppression can be explained by a
reduction in the probability of a target triggering the blaster.
During the AB, a relatively large percentage of T2s fail to fire
the blaster and do not have enough bottom-up strength to be
tokenised. The model would hence predict the suppression
observed by [16], because the percentage of trials in which the
blaster fires in response to a T2 would be reduced during the
AB. Furthermore, as participants were forced to indicate a
response for both targets [16], this reduction would translate to
an increase in the number of random guesses for the T2.
Finally, as one would expect, the time course of suppression
follows the time course of the AB as simulated by the ST2
model.
N Delay refers to a systematic post-target shift in the locus of
responses chosen for T2 when compared to T1. Vul et al. [16]
quantified delay as the centre of mass of the distribution of
responses for each target, calculated similarly to the API
(Average Position of Intrusions) measure in [14] and the
intrusion index score in [32]. This notion of an increase in the
latency of attentional selection is reflected in the ST2 model.
Specifically, suppression of the blaster during T1 encoding
results in an increase in the latency of its response to a T2
during the AB (see [29] for more details on delayed T2
consolidation in the ST2 model). As a result, in an RSVP
paradigm like that used by [16], items presented after T2 are
more likely to get the benefit of the blaster and get chosen as
responses, resulting in the observed shift in the response
distribution. However, this shift in the locus of responses
observed by [16] seems to persist at late T2 lag positions well
beyond the duration of the AB, and is somewhat more
puzzling. This finding could perhaps be attributed to the
cognitive load associated with holding T1 in working memory.
N Diffusion refers to a decrease in the precision of temporal
selection, corresponding to an increase in the overall spread in
the distribution of responses during the AB. Vul et al. [16]
estimated diffusion by comparing the variance around the
centre of mass of the response distributions for T1 and T2, and
found that it is significantly increased for T2s during the AB.
This observation is explained by the ST2 model as follows: in
the context of the paradigm in [16], there would be increased
temporal variation in T2 encoding because of the influence of
T1 processing. Hence, due to the influence of both T1 and T2
strengths on response selection, erroneous responses further
away from the target position would get selected for
tokenization, producing increased variance in the distribution
of responses. Again, the time course of diffusion is similar to
that of suppression, and is in keeping with the window of the
AB predicted by the ST2 model.
In summary, we think that a single underlying mechanism of
variation in the temporal dynamics of attention from trial to trial
could potentially explain the three effects observed in [16]. An
explicit computational account of these three dimensions in terms
of the ST2 model is beyond the scope of this article (and would
require it to be extended to simulate the conjunction of multiple
stimulus features). Nevertheless, the explanation proposed above
highlights the role that the temporal dynamics of transient
attention would play in explaining these effects.
Sergent, Baillet and Dehaene (2005). Sergent, Baillet and
Dehaene [33] combined behaviour and EEG to investigate the
timing of brain events underlying access to consciousness during
the AB. They analysed early and late ERP components evoked by
a pair of targets, a T1 followed by a T2 either at a short lag
(equivalent to our inside the AB condition) or at a long lag
(equivalent to our outside the AB condition). They plotted unsorted
ERPimages to visualise the inter-trial variation in the EEG
activity, and found that when T2 was presented within the AB,
T1’s P3 influenced the temporal dynamics of the ERP components
correlated with conscious access to T2. In particular, the
ERPimage depicting their T1 and T2 P3s clearly shows that
even when T2 is seen during the AB window, it evokes a more
‘smeared out’ P3 as compared to the T1. However, the analysis of
single-trial data in [33] presents ERPimages that are not sorted
(unlike the phase sorting we have performed in this article), thus
limiting their interpretation. Further, they did not compare
temporal variability of targets seen outside and inside the AB.
Despite these differences, their data agree well with ours, and
provide qualitative support for our hypothesis of reduced temporal
precision during the AB. This is because we would expect
increased inter-trial variability in the P3 evoked by a T2 inside the
AB to result in a ‘smearing out’ effect in its ERPimage, when trials
are plotted after smoothing, but without sorting by phase.
ConclusionIn this article, we have presented human ERP evidence in
favour of a reduction in the temporal precision of transient
attention during the AB. The AB provides us with a suitable
phenomenon with which to investigate the interplay between
attention and perception. The interplay between these tightly
linked cognitive processes is adversely affected during the AB,
producing the reduction in precision observed in behavioural and
EEG data.
Using ERPimages, we have provided qualitative evidence
arguing for an increase in temporal variation in the dynamics of
P3s evoked by targets seen outside vs. inside the AB window. This
evidence is supported quantitatively, by statistical comparison of
the phase distributions corresponding to the P3. This analysis
suggests that there is significantly increased temporal jitter in the
ERP activity evoked by targets inside the AB. This notion of a
decrease in the temporal precision of attention is inherent in the
theoretical framework of the ST2 model. Specifically, we have
Attention and Temporal Precision
PLoS Computational Biology | www.ploscompbiol.org 10 November 2009 | Volume 5 | Issue 11 | e1000576

used the ST2 model’s neural implementation to generate both
virtual ERPs and ERPimages, which we have then compared to
their human counterparts. We believe that correlating model and
electrophysiological data in this way provides a two-fold benefit.
Firstly, it has provided a sufficient explanation for the modulatory
effects of the AB on the temporal precision of visual processing.
Secondly, it has allowed us to instantiate and test the model at the
level of single-trial dynamics, and show that the theoretical
assumptions about the nature of temporal visual processing
embodied by it can be validated using EEG data, in addition to
traditional behavioural verification. We believe that the combina-
tion of experimental and theoretical analysis presented in this
article contributes to converging evidence for the notion that the
AB results in a reduction in the temporal acuity of selective
attention, which is an important mechanism for ensuring the
timeliness of conscious perception.
Materials and Methods
Experimental methodsThis section describes the experiment (the same as Experiment
2 from [17]) used to collect the human EEG data analysed in this
article.
Participants. We recruited 20 under- and postgraduate
university students (mean age 23.1, SD 3.2; 10 female; 18 right-
handed). Two participants were excluded from the analysis. The
first one seemed to be a non-blinker [34], as his performance was
at ceiling across all three lags. The second participant was
excluded due to persistently high oscillations in the alpha band
throughout the experiment. Hence, 18 participants remained for
behavioural and EEG analysis (mean age 22.5, SD 2.7; 9 female;
18 right-handed). Participants were free from neurological
disorders and had normal or corrected-to-normal vision.
Ethics statement. All participants provided written consent
and received 10 GBP for participation. The study was approved
by the ethics committee of the Science, Technology and Medical
Studies Faculty at the University of Kent.
Stimuli and apparatus. We presented alphanumeric
characters in black on a white background at a distance of
100 cm on a 21’’ CRT computer screen (10246768@85 Hz)
using the Psychophysics toolbox [35] running on Matlab 6.5 under
Microsoft Windows XP. Stimuli were in Arial font and had an
average size of 1.03u60.69u visual angle.
Procedure. Participants viewed 4 blocks of 100 trials. Before
starting the experiment, participants were asked to make 5 eye
blinks and 5 horizontal eye movements to record the typical
pattern of EOG activity. This was used to configure the algorithm
for eye blink artifact rejection. Participants performed 8 practice
trials, which were not included in the analysis. As shown in figure 5,
RSVP streams were preceded by a fixation cross in the centre of
the screen. After 400 ms, the cross turned into an arrow indicating
the side on which the targets would be presented. After 200 ms,
two streams of digits were simultaneously presented at an equal
distance of 2.6u visual angle to the left and right of fixation. The
RSVP stream consisted of 35 items presented for 105.9 ms each
with no inter-stimulus interval. For 84% of trials in a block, the
stream on the side indicated by the arrow contained 2 targets (T1
& T2), in 16% of trials both streams were made up of distractor
digits only. The ‘distractor only’ trials were randomly inserted to
make the occurrence of targets less predictable. In a trial, T1 and
T2 were selected from a list of 14 possible targets (A, B, C, D, E, F,
G, H, J, K, L, N, P, R, T, U, V, Y); distractors could be any digit
except ‘1’ or ‘0’. T1 appeared between stream position 5 and 17;
T2 followed T1 at position 1 relative to T1 (no intervening
distractors - lag 1), position 3 relative to T1 (2 intervening
distractors - lag 3) or position 8 relative to T1 (7 intervening
distractors - lag 8). The arrow remained in the centre of the screen
until the streams were over and then turned into either a dot or a
comma.
Before the experiment started, participants were told to keep
their eyes fixated on the centre of the screen from presentation of
the cross until the dot/comma, as trials with eye movements would
be identified in the EOG and excluded from the analysis.
Participants were told to direct their covert attention towards
the indicated stream, search for the two target letters and
remember whether the last item was a dot or a comma.
Participants were informed that streams could contain either two
or zero targets. Following stream presentation, participants were
presented with the message ‘If you saw letters - type them in order,
then dot or comma for the final item’ and entered their response
without time pressure using a computer keyboard. The dot-
comma task was included to ensure that participants kept their
eyes fixated on the centre of the screen throughout the RSVP
stream.
EEG recording. EEG activity was recorded from Ag/Ag-Cl
electrodes mounted on an electrode cap (FMS, Munich, Germany)
using a high input impedance amplifier (1000MV, BrainProducts,
Munich, Germany) with a 22-bit analog-to-digital converter.
Electrode impedance was reduced to less than 25kV before data
acquisition [36]. EEG amplifier and electrodes employed
actiShield technology (BrainProducts, Munich, Germany) for
noise and artifact reduction.
The sampling rate was 1000 Hz and the data was filtered at
80 Hz low-pass and 0.25 Hz high-pass at recording. 20 electrodes
were placed at the following standard locations according to the
international 10/20 system [37]: Fp1, Fp2, Fz, F3, F4, F7, F8, Cz,
C3, C4, C7, C8, Pz, P3, P4, P7, P8, Oz, O1, O2, T7 and T8.
Horizontal eye movements, recorded from a bipolar EOG channel
placed below and to the left of the participant’s left eye, indicated
when participants had moved their eyes away from fixation and
towards one of the RSVP streams.
EEG analysis. EEG data was analysed using BrainVision
Analyzer (BrainProducts, Munich, Germany), in conjunction with
EEGLAB 6.01b [25] and custom MATLAB scripts. In Analyzer,
the data was first referenced to a common average online and re-
referenced to linked earlobes offline. Left mastoid acted as ground.
Figure 5. Experimental design. Each trial began with a centralfixation cross, which turned into an arrow indicating the side on whichtargets would be presented. This was followed by two simultaneousRSVP streams on either side of fixation. The central arrow was finallyreplaced by a dot or a comma.doi:10.1371/journal.pcbi.1000576.g005
Attention and Temporal Precision
PLoS Computational Biology | www.ploscompbiol.org 11 November 2009 | Volume 5 | Issue 11 | e1000576

Signal deviations in the EOG channel of more than 50mV within
an interval of 100 ms were identified as eye blink and movement
artifacts, and a window of 200 ms before and after an artifact were
marked for rejection. To verify that these artifacts were accurately
identified by the algorithm, we performed a manual inspection
after the algorithm had been applied.
The continuous EEG data from each participant was loaded
into MATLAB and low-pass filtered at 25 Hz. The data was then
segmented into trials. This was done by extracting a time window
of 2500 ms to 1500 ms around the target onset times for the
conditions of interest, namely seen T2s at lag 8 following a seen T1
(targets outside the AB), seen T2s at lag 3 following a seen T1
(targets inside the AB), seen T1s with a seen T2 at lag 8 (T1 lag 8)
and seen T1s with a seen T2 at lag 3 (T1 lag 3). Trials marked as
containing artifacts by the procedure defined above were excluded
from further analysis. After artifact rejection, the total number of
trials in the above conditions were - seen T2s at lag 8: 938; seen
T2s at lag 3: 853; seen T1s with T2 at lag 8: 1188; seen T1s with
T2 at lag 3: 843. A linear detrend function was applied to all trials.
Finally, trials in all conditions except the targets inside the AB
condition were baselined to the 2200 ms to 0 ms window before
presentation of the target to which the trial was time-locked. Trials
in the targets inside the AB condition were baselined to the 2500
to 2300 ms window before T2 presentation, to ensure that there
was no T1-related activity in the baseline window.
To plot grand average ERPs, ERPimages and to perform
statistical analyses, the P3 was generated using data recorded at
the Pz electrode. Repeated measures Analysis of Variance
(ANOVA) were performed on subject averages using custom
MATLAB scripts, which implement functions from [38]. Where
appropriate, p-values were adjusted using Greenhouse-Geisser
correction.
ERPimages. To plot the ERPimages in this article, trials
were vertically sorted by the phase angle, which is calculated using
wavelet-based time-frequency analysis, performed separately for
each trial. A half-cycle Morlet wavelet (cycle length of 0.5) at
1.53 Hz was used as the template for the time-frequency analysis.
This frequency was set by identifying the peak power spectral
density of the P3 EEG trials contributing to the outside the AB
condition. This frequency generated a wavelet with a half-cycle
duration of 326.8 ms, which when centred on the peak of the
grand average P3, ensured that it only captured activity related to
the single-trial P3 evoked by the target in question. The time-
frequency analysis returned a pair of two-dimensional matrices,
indexed by trial number and time point, and consisting of the
power and phase values calculated at the specified frequency. In
order to then pick out the phase of the phasic P3 across trials in a
condition, the peak of the grand average P3 ERP for that
condition was used. This peak occurred at 444 ms for the T2 at lag
8, and at 496 ms for the T2 at lag 3. For each of these
experimental conditions, this then produced a circular distribution
[26] of phase values within the range {p,zp½ � radians, consisting
only of the phase values at the chosen time point, across all the
trials for the condition. Finally, ERPimages were plotted as a
colour-map for each condition by sorting the trials based on these
phase values, and then vertically smoothing over them using a
sliding window of 50 trials, in order to better visualise patterns in
the single trials underlying the grand average ERP. The phase
distributions thus generated for P3s outside and inside the AB were
statistically compared using R [39] and MATLAB, by first
grouping the phase values by subject and estimating the
concentration parameter k for the subject-wise phase distri-
butions using maximum likelihood estimation, and feeding them
into a standard one-way repeated measures ANOVA.
Computational methodsST2 model configuration. The input patterns presented to
the model were comprised of 25 items presented for 20 timesteps
(equivalent to 100 ms) each. T1 appeared at position 7 in the
RSVP stream and T2 followed T1 with 0 to 7 distractors (lags 1–8)
between the two targets. All target and distractor strength values
and model parameters are fixed to be the same as those published
in [17].
Virtual ERPs and ERPimages. The philosophy we adopted
to generate virtual ERPs from activation dynamics of the model
(discussed in greater depth in [17]), was to employ a
straightforward approach with no parameter fitting, while
keeping it as close as possible to the processes assumed to occur
in the brain (For a more neurophysiologically detailed account of
ERP generation, see [40]). Cortical pyramidal neurons in the
brain have inter-layer connectivity and are aligned perpendicular
to the cortex, which is why they are thought to be a major
contributor to human EEG [41]. We assumed the major weighted
connections across layers in the ST2 model (figure 1) to be
analogues of synaptic projections in the brain. Accordingly, we
generated virtual ERPs by summing across the excitatory
postsynaptic potentials of all relevant nodes in the layers that
perform cognitive functions reflected by the human ERPs in
question. These virtual ERPs are averages of the activation profiles
collapsed across all trials in a complete simulation run of the
model, encompassing a range of target strengths. It is obvious,
however, that virtual ERPs thus calculated remain a coarse
approximation of human ERPs, as physical topography of the
brain, skull and scalp are not taken into account. Consequently,
though one can realistically only expect to obtain a qualitative
match to human ERPs, virtual ERPs can serve as valuable
predictors of the patterns of change in human ERPs, particularly
with regard to temporal factors.
Virtual P3. The human P3 is a broad component spread over
a large group of parietally centred electrode sites, and is considered
to be a correlate of working memory consolidation [10]. In the
ST2 model, working memory encoding occurs by creating a
binding link between types from stage one and tokens from stage
two. Hence, the virtual P3 component contains activation from
later parts of the first stage, the nodes in stage two and the binding
link connecting the two stages.
Virtual ERPimages. Virtual ERPimages are used to
qualitatively compare single trial dynamics of the model to
human EEG data. They depict the individual simulated trials that
underlie the average virtual ERP, just as human ERPimages
depict the experimental trials that contribute to the grand average
ERP. Further, the conditions plotted are defined exactly the same
as with human ERPimages: the targets seen outside the AB
condition includes trials with seen T2s at lag 8 following a seen T1,
and the targets seen inside the AB condition includes trials with
seen T2s at lag 3 following a seen T1.
In order to generate virtual ERPimages comparable to their
human counterparts, we combined simulated trials across multiple
complete runs of the model. For each of the 18 subjects in the
human data, a complete simulation run of the ST2 model was
executed once, over all combinations of T1 and T2 strengths. For
all trials in each such run, a small delay (fixed per subject) was
introduced in the processing of stimuli presented to the model.
This delay was a positive or a negative integer value, randomly
sampled once per run, from a normal distribution with a mean of
0 ms and a standard deviation of 50 ms. It was ensured that,
despite the introduction of this delay, the behavioural performance
of the model was the same as that published in [5]. To generate
the virtual ERPimage for a particular experimental condition, the
Attention and Temporal Precision
PLoS Computational Biology | www.ploscompbiol.org 12 November 2009 | Volume 5 | Issue 11 | e1000576

corresponding trials from all the runs were collected together,
sorted by 50% area latency within the 200–1100 ms window in
each trial, and plotted as a colour-map with a vertical smoothing
window of 15 trials to improve visual clarity.
Acknowledgments
The authors thank Karl J. Friston for helpful comments contributing
towards this work.
Author Contributions
Conceived and designed the experiments: PC. Performed the experiments:
SC PC. Analyzed the data: SC. Wrote the paper: SC. Helped design the
experiment, contributed ideas to the article, and worked on the
development of the cognitive model used in therein: BW. Supervised the
research work, including experimental design, writing of the article, and
development of the cognitive model used therein: HB.
References
1. Hochstein S, Ahissar M (2002) View from the top: Hierarchies and reversehierarchies in the visual system. Neuron 36: 791–804.
2. Maunsell JHR, Newsome WT (1987) Visual processing in monkey extrastriate
cortex. Annual Review of Neuroscience 10: 363–401.
3. Lawrence D (1971) Two studies of visual search for word targets with controlled
rates of presentation. Perception and Psychophysics 10: 85–89.
4. Weichselgartner E, Sperling G (1987) Dynamics of automatic and controlledvisual attention. Science 238: 778–780.
5. Bowman H, Wyble B (2007) The Simultaneous Type, Serial Token Model of
Temporal Attention and Working Memory. Psychological Review 114: 38–70.
6. Raymond J, Shapiro K, Arnell K (1992) Temporary Suppression of Visual
Processing in an RSVP Task: An Attentional Blink? Journal of Experimental
Psychology: Human Perception and Performance 18: 849–860.
7. Potter M, Chun M, Banks B, Muckenhoupt M (1998) Two Attentional Deficits
in Serial Target Search: The Visual Attentional Blink and an Amodal Task-
Switch Deficit. Journal of Experimental Psychology: Human Perception andPerformance 24: 979–992.
8. Shapiro K, Raymond J, Arnell K (1997) The attentional blink. Trends in
Cognitive Sciences 1: 291–296.
9. Visser TAW, Bischof WF, Di Lollo V (1999) Attentional switching in spatial and
nonspatial domains: Evidence from the attentional blink. Psychological Bulletin
125: 458–469.
10. Vogel E, Luck S, Shapiro K (1998) Electrophysiological Evidence for a
Postperceptual Locus of Suppression During the Attentional Blink. Journal of
Experimental Psychology: Human Perception and Performance 24: 1656–1674.
11. Luck SJ, Vogel EK, Shapiro KL (1996) Word meanings can be accessed but not
reported during the attentional blink. Nature 383: 616–618.
12. Shapiro KL, Driver J, Ward R, Sorensen RE (1997) Priming from the
attentional blink: A failure to extract visual tokens but not visual types.
Psychological Science 8: 95–100.
13. Martens S, Wolters G, van Raamsdonk M (2002) Blinks of the Mind: Memory
Effects of Attentional Processes. Journal of Experimental Psychology: Human
Perception and Performance 28: 1275–1287.
14. Botella J, Barriopedro MI, Suero M (2001) A model of the formation of illusory
conjunctions in the time domain. Journal of Experimental Psychology: Human
Perception and Performance 27: 1452–1467.
15. Popple AV, Levi DM (2007) Attentional blinks as errors in temporal binding.
Vision Research 47: 2973–2981.
16. Vul E, Nieuwenstein M, Kanwisher N (2008) Temporal selection is suppressed,delayed, and diffused during the attentional blink. Psychological Science 19:
55–61.
17. Craston P, Wyble B, Chennu S, Bowman H (2009) The attentional blink revealsserial working memory encoding: Evidence from virtual & human event-related
potentials. Journal of Cognitive Neuroscience 21: 550–566.
18. Kanwisher N (1987) Repetition Blindness: Type recognition without tokenindividuation. Cognition 27: 117–143.
19. Chun M (1997) Types and Tokens in Visual Processing: A Double Dissociation
Between the Attentional Blink and Repetition Blindness. Journal of Experimen-
tal Psychology: Human Perception and Performance 23: 738–755.
20. Mozer M (1989) Types and tokens in visual letter perception. Journal of
Experimental Psychology: Human Perception and Performance 15: 287–303.
21. Chennu S, Craston P, Wyble B, Bowman H (2009) The influence of target
discriminability on the time course of attentional selection. In: Taatgen NA, vanRijn H, eds (2009) Proceedings of the 31st Annual Conference of the Cognitive
Science Society. Austin, TX: Cognitive Science Society. pp 1506–1511.22. Wyble B, Bowman H, Nieuwenstein M (2009) The attentional blink provides
episodic distinctiveness: Sparing at a cost. Journal of Experimental Psychology:
Human Perception and Performance 35: 787–807.23. Kok A (2001) On the utility of P3 amplitude as a measure of processing capacity.
Psychophysiology 38: 557–577.24. Luck SJ, Hillyard SA (1990) Electrophysiological evidence for parallel and serial
processing during visual search. Perception & Psychophysics 48: 603–617.
25. Delorme A, Makeig S (2004) EEGLAB: an open source toolbox for analysis ofsingle-trial EEG dynamics including independent component analysis. Journal of
Neuroscience Methods 134: 9–21.26. Mardia KV, Jupp PE (2000) Directional statistics. Chichester; New York: J.
Wiley.27. Sessa P, Luria R, Verleger R, Dell’Acqua R (2006) P3 latency shifts in the
attentional blink: Further evidence for second target processing postponement.
Brain Research 1137: 131–139.28. Kranczioch C, Debener S, Engel AK (2003) Event-Related Potential Correlates
of the Attentional Blink Phenomenon. Cognitive Brain Research 17: 177–187.29. Bowman H, Wyble B, Chennu S, Craston P (2008) A reciprocal relationship
between bottom-up trace strength and the attentional blink bottleneck: Relating
the LC-NE and ST2 models. Brain Research 1202: 25–42.30. Vogel E, Luck S (2002) Delayed Working Memory Consolidation during the
Attentional Blink. Psychonomic Bulletin & Review 9: 739–743.31. Shapiro K, Caldwell J, Sorensen R (1997) Personal Names and the Attentional
Blink: A Visual ‘‘Cocktail Party’’ Effect. Journal of Experimental Psychology:Human Perception and Performance 23: 504–514.
32. Chun MM (1997) Temporal binding errors are redistributed by the attentional
blink. Perception & Psychophysics 59: 1191–1199.33. Sergent C, Baillet S, Dehaene S (2005) Timing of the brain events underlying
access to consciousness during the attentional blink. Nature Neuroscience 10:1391–1400.
34. Martens S, Munneke J, Smid H, Johnson A (2006) Quick Minds Don’t Blink:
Electrophysiological Correlates of Individual Differences in Attentional Selec-tion. Journal of Cognitive Neuroscience 18: 1423–1438.
35. Brainard DH (1997) The Psychophysics Toolbox. Spatial Vision 10: 433–436.36. Ferree TC, Luu P, Russell GS, Tucker DM (2001) Scalp electrode impedance,
infection risk, and EEG data quality. Clinical Neurophysiology 112: 536–544.37. Jasper HH (1958) The ten-twenty electrode system of the International
Federation. Electroencephalography & Clinical Neurophysiology 10: 371–375.
38. Trujillo-Ortiz A, Hernandez-Walls R, Trujillo-Perez R (2004) RMAOV1: One-way repeated measures ANOVA. A MATLAB file. ;Available at URL http://
www.mathworks.com/matlabcentral/fileexchange/5576.39. R Development Core Team (2008) R: A Language and Environment for Statistical
Computing. R Foundation for Statistical Computing, Vienna, Austria. http://
www.R-project.org. ISBN 3-900051-07-0.40. David O, Harrison L, Friston KJ (2005) Modelling event-related responses in the
brain. NeuroImage 25: 756–770.41. Luck SJ (2005) An Introduction to the Event-Related Potential Technique.
Cambridge, MA: MIT Press.
Attention and Temporal Precision
PLoS Computational Biology | www.ploscompbiol.org 13 November 2009 | Volume 5 | Issue 11 | e1000576