Verifying SCR Requirements Specifications Using State Exploration
Upload
khangminh22Category
view
2download
0
HAL Id: hal-01632746https://hal.inria.fr/hal-01632746
Submitted on 10 Nov 2017
HAL is a multi-disciplinary open accessarchive for the deposit and dissemination of sci-entific research documents, whether they are pub-lished or not. The documents may come fromteaching and research institutions in France orabroad, or from public or private research centers.
L’archive ouverte pluridisciplinaire HAL, estdestinée au dépôt et à la diffusion de documentsscientifiques de niveau recherche, publiés ou non,émanant des établissements d’enseignement et derecherche français ou étrangers, des laboratoirespublics ou privés.
Distributed under a Creative Commons Attribution| 4.0 International License
Network Element Stability Aware Method for VerifyingConfiguration Changes in Mobile Communication
NetworksJanne Ali-Tolppa, Tsvetko Tsvetkov
To cite this version:Janne Ali-Tolppa, Tsvetko Tsvetkov. Network Element Stability Aware Method for Verifying Con-figuration Changes in Mobile Communication Networks. 10th IFIP International Conference on Au-tonomous Infrastructure, Management and Security (AIMS), Jun 2016, Munich, Germany. pp.3-15,�10.1007/978-3-319-39814-3_1�. �hal-01632746�

Network Element Stability Aware Method forVerifying Configuration Changes in Mobile
Communication Networks
Janne Ali-Tolppa1 and Tsvetko Tsvetkov2
1 Nokia Bell Labs, Munich, [email protected]
2 Department of Computer Science, Technische Universitat [email protected]
Abstract. Automatic Configuration Management (CM) parameter changeassessment, the so-called Self-Organizing Network (SON) verification, isan important enabler for stable and high-quality modern SONs. However,it also presents a new set of challenges. While improving network stabil-ity and resolving unexpected conflicts caused by parallel configurationchanges, the SON verification can also make the network optimizationless dynamic. This flexibility can be desirable, especially when the net-work is in an unstable state. One such example is Network Element (NE)commissioning, after which it may be preferable for the SON functions toexplore the configuration space more freely in order to find the optimalconfiguration. On the other hand, at some point in time, the NE has toconverge to a stable configuration.
To address these challenges, we introduce in this paper the concept ofNetwork Element Virtual Temperature (NEVT), which indicates thestate of stability of a NE, and propose how it can be utilized to op-timize the verification process. This approach is evaluated in a simulatedenvironment and compared to other verification mechanisms. The re-sults show that the proposed method allows the network to better reactto changes without sacrificing on its stability.
1 Introduction
The Self-Organizing Network (SON) concept is a key enabler for managingthe complex modern networks. It covers the tasks of self-configuration, self-optimization and self-healing [8]. A SON-enabled network is managed by a setof autonomous SON functions performing specific network management tasks.The functions are designed as control loops, which monitor Performance Man-agement (PM) and Fault Management (FM) data, and based on their goalsconfigure the Configuration Management (CM) parameters. For example, theCoverage and Capacity Optimization (CCO) function has been developed to op-timize the coverage within a cell by changing the antenna tilt or the transmissionpower.

However, in a complex system the functions may have unexpected side-effects.Especially, when several SON function instances and human operators are oper-ating independently in parallel. For this reason, policy-based pre-action coordi-nation is applied to avoid known conflicts between SON function instances [3,12].Such conflicts may include, for example, two SON function instances changingthe same CM parameters (lost update problem) or one function influencing theinput data of another (race condition), causing it to base its decisions on invaliddata. However, pre-action coordination can only prevent potential conflicts thatare known beforehand. As a consequence, the concept of SON verification hasbeen developed [5, 7, 17]. It automatically verifies the impact of configurationchanges and, in case a degradation is detected, returns the network to the lastknown stable configuration by performing a rollback of the changes.
The verification process introduces its own challenges too, however. While itmakes the network more stable by quickly rectifying degradations, it can alsomake the system less dynamic by preventing optimization paths that may leadto a minor transient decrease in performance. A related concrete problem is theconfiguration of the verification observation window length. If it is too short,the verification mechanism may try to rollback short, transient performancedegradations, and therefore generate false positive undo requests. On the otherhand, if the observation window is configured long, it makes the verification cycleslower, increases the number of parallel and potentially conflicting verificationoperations and makes determining the CM change causing a degradation moredifficult.
In this paper, we propose an approach that mitigates these issues. We in-troduce the concept of Network Element Virtual Temperature (NEVT), whichindicates the state of stability of a Network Element (NE). The NEs with highNEVT are considered unstable and therefore, for example, more likely to ac-cept optimization steps that lead to minor transient degradations. Similarly, asthe NEs becomes more stable, i.e. there are no further changes in the NE asthe time passes, NEVT ”cools down” and the NE becomes less likely to acceptmajor changes. Utilizing the NEVT, the verification process can give the SONfunctions the necessary freedom when needed, but ensure that the optimizationwill converge to a stable, well-performing configuration.
2 The Verification Process
The purpose of the SON verification is to automatically verify CM changesdone in the network, either by SON functions or human operators, and in casea degradation is detected, return the network back to a stable configurationby performing a rollback, also known as an undo operation. The automaticverification process operates in three phases: (1) it divides the network intoverification areas according to the CM changes, (2) observes each area duringthe so-called observation window and (3) in case a degradation is detected, marksthe changes for an undo that are most likely responsible for it.

Composition of verification areas A verification area consists of the recon-figured cell, also called the target cell, and a set of cells impacted by the CMchange(s), also referred to as the target extension set [16]. The extension set isoften based on the neighbor relations of the target cell. Furthermore, if we haveSON function activities in the network, we may define the verification area asthe combined impact areas [2] of the SON functions that are verified in a givenverification operation. We may also enlarge a verification area based on its lo-cation [6], e.g., more cells are added if they are part of known trouble spots ordense traffic.
Observation window After the verification area has been determined, theverification process monitors the performance of the area after the CM changeshave been applied. It does this by monitoring the set of Key Performance Indi-cators (KPIs) selected to be used in verification. The assessment of the KPIs isusually done by profiling [9] the network behavior, which requires analyzing thenetwork performance indicators and specifying how the network should typicallybehave and how it has behaved before and after the changes.
Generating CM undo requests At the end of the observation window theverification process calculates a verification score for the verified changes. Thisscore can be compared to an acceptance threshold. If the score is higher thanthe threshold, the changes are accepted, otherwise the process attempts to re-turn the degraded verification areas to a known previous stable configurationby performing an automatic CM undo [17]. It determines, which CM changeshave an overlapping impact areas with the verification area, and can thus havecontributed to the degradation, and creates an undo request for them. Severalmethods have been developed to optimize the selection of undo areas and re-quests [15]
3 Challenges
Many SON functions require not only one step, but several, during which theyobserve whether they have moved closer towards achieving their goal. In theprocess, the functions may induce a transient performance decrease in the net-work. For instance, the CCO function monitors the impact of its last deployedantenna tilt or transmission power changes, and adjusts them if required [8].The same applies also to the combined, and often unpredicted, effect of severalindependent SON function instances running in parallel. They might introduce atransient degradation, to which the functions react and adapt to a more optimalconfiguration.
This poses a problem to the SON verification. Namely, how long should theverification observation window be? If the observation window is made too short,there is a risk that the true impact of the CM changes is not yet visible in thenetwork. Changes are rolled back, although they are just transient and the SON

Perf
orm
ance
Time
Observ
atio
n
win
dow
Observ
atio
n
win
dow
Observ
atio
n
win
dow
Observ
atio
n
win
dow
Accept! Accept!
Rollback! Rollback!
Too early!Too early!
CM
ch
ange
CM
ch
ange
CM
ch
ange
CM
ch
ange
Fig. 1: The problem of choosing the correct observation window length
functions would adapt to the situation in the upcoming rounds. In the samemanner, the opposite may happen and changes are accepted before the negativeimpacts show in the monitored KPIs. Figure 1 depicts this problem.
On the other hand, a long observation window is not desirable, because itmeans a longer verification cycle, which can block other SON functions fromexecuting. Also, the longer observation window, the more difficult it becomes tofind out which changes have actually caused a degradation, especially if there areseveral parallel changes made by more than one SON function instances. Yet onemore problem with a long observation window is that as it makes the verificationprocess longer, it increases the number of parallel verification operations, whichcan lead to conflicts between them [15]. This can be problematic, especially inmore complex networks.
The CM scoring method proposed in [10] answers these questions partly. Itintroduces a mechanism that assesses the changes made by SON functions overa certain period of time and categorizes their behavior by assigning them to acertain zone. For example, changes leading to a drop in performance are assignedto a so-called red zone. The difficulty, however, is choosing the correct lengthof the required time period. Once again we would like to keep the observationwindow as short as possible, but if it is too short, the scoring mechanism doesnot work anymore.
4 Concept
To address the problems stated in Section 3, we propose a method to incorporateNE stability awareness into SON functions, especially in the SON verification.We introduce the concept of Network Element Virtual Temperature (NEVT),which indicates the state of stability of a NE. In the following, we are going toexplain the concept in detail and describe how the NEVT can be used to improveSON verification.
4.1 Network Element Virtual Temperature
The Network Element Virtual Temperature (NEVT), similar to the temperatureconcept in simulated annealing [14], shall be understood as an indicator of the

2
a) No activity b) Major reconfiguration c) First step of heat distribution
d) Second step of heat distribution e) Final stable state
0
0
0
0
0
0
0
0
4
0
0
2
2
3
1 2
2
0
0
0
0
01
Reconfigured NE
Fig. 2: Example of distributing NEVT ε [0; 4] in the network
stability of a NE, in particular of a cell. A NE becomes ”hotter” after opera-tions such as commissioning, SON function activity, or manual reconfiguration.Another example is when NE software is upgraded, which inserts new heat intothe NE to indicate the reduced stability of its state. The resulting NEVT valuedepends on the event that has occurred in the network, i.e., a certain type ofchanges results in a much higher increase of the temperature than others. How-ever, if there are no changes in the NE, it will cool down over time accordingto its cooling factor to indicate increased stability. A less stable NE with a highNEVT value is more likely to accept intermediate optimization steps that leadto somewhat reduced performance, in order to reach improved performance inthe future. In contrast, a NE with a low NEVT value should retain its stabilityand is less likely to accept transient degraded optimization steps.
A change in a cell may not only affect the cell itself, but can also have animpact on its neighboring cells. For example, if a CCO function tilts an antennaup, this may not only influence the cell, where the tilt change was made, butalso the neighboring cells may start experiencing higher interference. Therefore,the NEVT is transfered to the neighboring cells, analogous to heat conductionin physics. The amount of heat conducted to the neighboring cells depends onthe selected conduction factor.
These three concepts, i.e., heat introduction, cooling factor and conductionfactor, define the temperature of each NE over time. In Figure 2 we have outlinedan example, where a new NE is introduced into an existing network resulting inintroduction of a new, ”hot” NE, heat conduction and subsequent cooling down.

4.2 Application of NEVT in SON verification
The SON verification function can use the NE stability indication, the NEVT,in several different ways:
– Choose to completely omit hot verification areas– Select the observation window length based on the NEVT– Accept changes causing minor degradations if the NE is hot
Firstly, if the verification function is heavily loaded, i.e., there are several,perhaps overlapping verification operations running, it may opt to completelyomit hot verification areas to reduce the number of potential verification con-flicts. Since the NEs in the verification area are unstable, also the verificationdecision would be unreliable and it might be better to let the SON functionalityto continue optimizing the area.
Secondly, SON verification may adapt the observation window length ac-cording to the NEVT. For more unstable NEs, a longer observation window isused, in order to let them better stabilize after each change before making averification decision. Likewise, for more stable NEs, a shorter window can beused.
Thirdly, the verification may accept changes leading to minor degradations,in case the verification area has a high NEVT value. The verification processaccepts all changes that have a verification score higher than the set accep-tance threshold, but it may in addition accept changes with a score below thethreshold with a certain probability depending on the verification score andthe NEVT. This allows SON functions to explore the configuration space morefreely, without SON verification interrupting the process with a CM undo, andthus ”escaping” potential local optima. On the other hand, the likelihood ofSON verification accepting such intermediate changes should become lower, asthe verification area cools down. Analogous to simulated annealing, this ensuresthat the NE configuration will stabilize and converge to at least a local optimumsolution. Contrary to offline optimization solutions based on simulated anneal-ing [4], however, SON verification can always accept only minor degradations,since it operates in a live network, where sufficient Quality of Service (QoS) mustalways be ensured. In this paper we focus on this third alternative.
4.3 Components
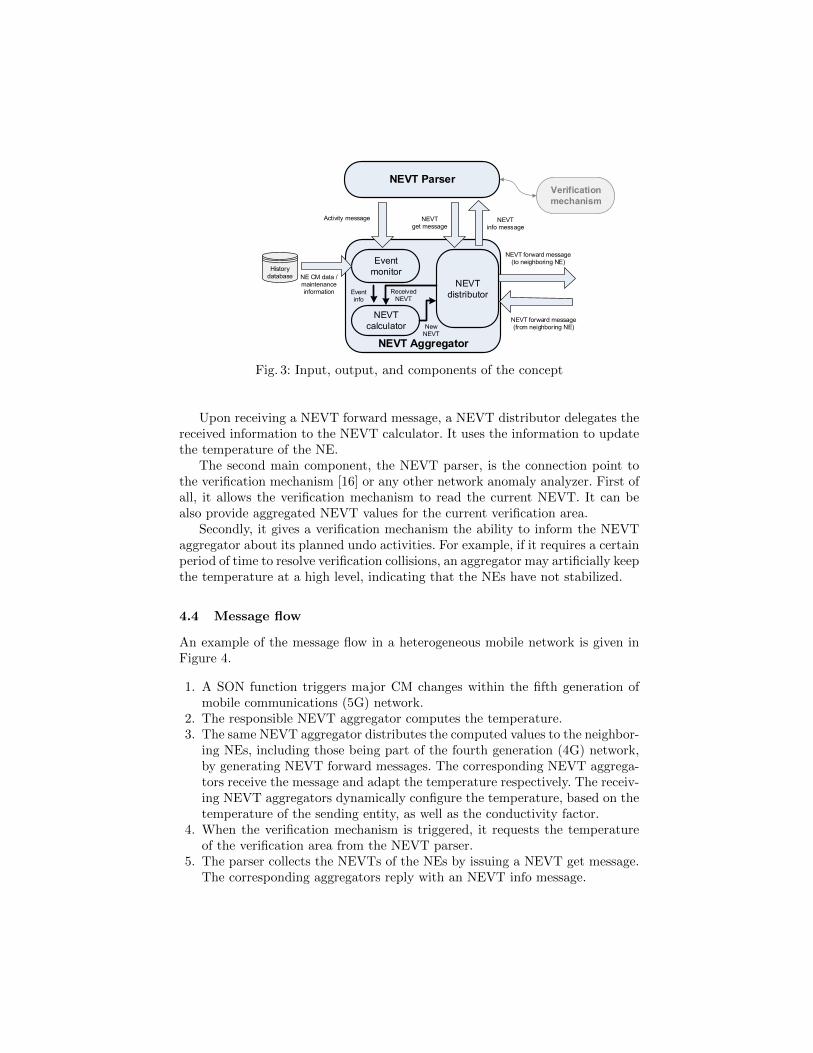
The architecture consists of two components: (1) a NEVT aggregator and (2) aNEVT parser, as shown in Figure 3.
The NEVT aggregator consists of three sub-components. The first one is anevent monitor that is responsible for monitoring the events occurring on the NE.Typical events are the change of CM parameters, software upgrades, etc. Thesecond component, the NEVT calculator, computes the temperature. The thirdcomponent is the NEVT distributor. It is the connection point, used to exchangeNEVT values between the NEVT aggregators of neighboring NEs. Its task is togenerate (send) and receive NEVT forward messages.
NEVT Aggregator
NEVT forward message (from neighboring NE)
NEVT forward message(to neighboring NE)
NEVT info message
Event info
NEVT
distributor
NEVT
calculator
Event
monitorNE CM data / maintenance information
History database
NEVT Parser
Received NEVT
Activity message
New NEVT
NEVT get message
Verification
mechanism
Fig. 3: Input, output, and components of the concept
Upon receiving a NEVT forward message, a NEVT distributor delegates thereceived information to the NEVT calculator. It uses the information to updatethe temperature of the NE.
The second main component, the NEVT parser, is the connection point tothe verification mechanism [16] or any other network anomaly analyzer. First ofall, it allows the verification mechanism to read the current NEVT. It can bealso provide aggregated NEVT values for the current verification area.
Secondly, it gives a verification mechanism the ability to inform the NEVTaggregator about its planned undo activities. For example, if it requires a certainperiod of time to resolve verification collisions, an aggregator may artificially keepthe temperature at a high level, indicating that the NEs have not stabilized.
4.4 Message flow
An example of the message flow in a heterogeneous mobile network is given inFigure 4.
1. A SON function triggers major CM changes within the fifth generation ofmobile communications (5G) network.
2. The responsible NEVT aggregator computes the temperature.3. The same NEVT aggregator distributes the computed values to the neighbor-
ing NEs, including those being part of the fourth generation (4G) network,by generating NEVT forward messages. The corresponding NEVT aggrega-tors receive the message and adapt the temperature respectively. The receiv-ing NEVT aggregators dynamically configure the temperature, based on thetemperature of the sending entity, as well as the conductivity factor.
4. When the verification mechanism is triggered, it requests the temperatureof the verification area from the NEVT parser.
5. The parser collects the NEVTs of the NEs by issuing a NEVT get message.The corresponding aggregators reply with an NEVT info message.

3. NEVT forward
message
Verification mechanism
NEVT
Aggregator
NEVT Parser
Verification process
3. NEVT forward
message
4. NEVT get/info
message
4. NEVT get/info
message
6. Read
NEVT
Aggregator
4. NEVT get / info
message
4. NEVT get/info
message
3. NEVT forward
message
eNB 5G controller
SON function
1. CM changes
NEVT
Aggregator
NEVT
Aggregator
2. Compute
NEVT
5. Trigger
Fig. 4: Message flow
6. Based on the gathered information the verification mechanism is able toassess the change and decide whether or not it can be accepted.
4.5 Design of NEVT Aggregator
Let us define NEVT as χ ∈ [0, 100] and that the NEVT of a cell c at GranularityPeriod (GP) t is given by the function τt(c). An operation performed on a cell c,for example a major re-configuration, can increase the χc to indicate a reducedstate of stability, i.e., τt+1(c) = τt(c) + δ, where δ is the added heat. Note thatδ must be scaled so that τt+1(c) ∈ [0, 100].
NEVT is also conducted to the neighboring cells. To simplify the model andto reduce the need for signaling, the NEVT conduction is done only when NEVTis added in the system. Let us denote the set of all cells as Σ. When δ of NEVTis added to a cell c ∈ Σ, the NEVT conducted to each neighbor of c is given by
τt+1(cn) = τt(cn) +K(τt(c) + δ − τt(cn)),∀cn ∈ N (1)
, where N ⊂ Σ is the set of cells neighboring c and K ∈ [0, 1] is the NEVTconductivity factor.
Additionally, on each GP each cell cools down according to the cooling factor.That is, for each cell c ∈ Σ, τt+1(c) = Fτt(c), where F ∈ [0, 1] is the coolingfactor.
4.6 Design of NEVT Parser
For implementing the improved verification mechanism, we need the NEVTParser to calculate the NEVT of a verification area. For this purpose, let usdenote the set of all cells as Σ and the set of all verification areas as V . Further-more, let us define an extraction function fe that returns the cells of a verificationarea, i.e., fe : V → P(Σ)\{∅}. Now the aggregated NEVT of a verification areav ∈ V at a time t can be defined as
T (v) =1
|fe(v)|
|fe(v)|∑i=1
τt(c)i (2)
, where τt(c) is the NEVT of a cell c ∈ fe(v) as given by the NEVT Aggre-gator.
4.7 Enhanced verification process
In order to compute an anomaly score for verification, we define for each cellan anomaly vector a = (a1, a2, . . . , an) that is an element of Rn. Each elementak ∈ R, k ∈ [1, n] represents the deviation of a KPI from the expected value, alsoknown as the KPI anomaly level. The value of n equals |K|, where K is the setof KPIs that are selected to determine the cell performance.
To calculate the anomaly vector, the expected behavior is learned in a train-ing phase, during which we collect samples p1 . . . pt for each given KPI, where tmarks a training period. Then, we measure the current value of the KPI, denotedas pt+1. The collected data, i.e., p1 . . . pt, pt+1, is normalized by computing thez-score of each data point. The KPI anomaly level is the z-score of pt+1. Thez-score itself represents the distance between the given point and the samplemean in units of the standard deviation. It is negative, when the raw score isbelow the mean, and positive when above. In addition, the anomaly level is nor-malized so that a positive level value means better than average performanceand negative level worse than average. For example, for a success KPI, such asHandover Success Rate (HOSR), we can use the z-score as such. However, for afailure KPI, such as Radio Link Failure (RLF), we use the negative z-score.
The verification is done for a verification area consisting of one or more cells.In order to calculate the verification score for the area, we collect the anomalyvectors of each cell in the verification area into a verification area anomaly matrixA, where each column represents a cell and each row a KPI. Next, we aggregateall elements ajk of the matrix A into one single z-score that represents theoverall verification area performance. The aggregation function ϕ(A) calculatesit by taking the arithmetic average of all ajk, as defined in Equation 3.
ϕ(A) =1
mn
m∑j=1
n∑k=1
ajk (3)
, where m is the number of cells in the verification area.

Now, following the proposal in [13] for simulated annealing, we can define anacceptance function ψ(v,A) ∈ [0, 1] that defines the probability of the verifica-tion process accepting a change, which is resulting in an anomaly matrix A inverification area v ∈ V , as
ψ(v,A) =
1, if ϕ(A) ≥ ε
0, if ϕ(A) < ε and T (v) = 0
e
−c(ε− ϕ(A))T (v) , otherwise
(4)
, where ε is the acceptance threshold and c is a scaling factor.For example, by setting ε = 0, all changes having a positive verification score
will always be accepted and changes with negative score will have a probability ofacceptance depending on the verification score and the NEVT of the verificationarea.
5 Evaluation
In this section we present the results of our experimental case study with thepresented NE stability aware verification method. We also give an overview ofthe used simulation system.
5.1 Environment
To evaluate the behavior of SON coordination and verification concepts, we havedeveloped the SON Simulation System (S3), as presented in [15].
The simulator models a Long Term Evolution (LTE) macro cell networkbased on simulated mobile users and radio propagation models [11]. The simu-lated network consists of 32 cells spread over an area of 50 km2. Furthermore,1500 uniformly distributed mobile users follow a random walk mobility modeland use the network. The PM data calculated based on the radio simulation iscollected in rounds corresponding to approximately 100 minutes in real time, i.e.GPs, and forwarded to the SON functions.
For all simulation test runs, we employ two optimization functions: MobilityRobustness Optimization (MRO) and CCO, and the verification function. TheCCO function adapts the antenna tilt and transmission power and the MROchanges the Cell Individual Offset (CIO) parameters. An instance of each of thetwo functions is running for each cell in the network.
5.2 Setup and scenario
Each simulation round consists of 21 GPs. In the tested scenario, a disturbanceis introduced after the 4th GP by turning one of the cells off. CCO and MROadapt to this change and the verification function keeps monitoring their changes.

0.605
0.61
0.615
0.62
0.625
0.63
0.635
0.64
0.645
0.65
1 2 3 4 5 6 7 8 9 10 11 12 13 14 15 16 17 18 19 20 21
CQ
I
GP
CQI - Verification Area
NEVT 0.8 NEVT 0.9 No NEVT No Verification
(a) CQI of the verification area
0.53
0.54
0.55
0.56
0.57
0.58
0.59
0.6
1 2 3 4 5 6 7 8 9 10 11 12 13 14 15 16 17 18 19 20 21
CQ
I
GP
CQI - Worst Cell
NEVT 0.8 NEVT 0.9 No NEVT No Verification
(b) CQI of the worst performing cell
0.915
0.92
0.925
0.93
0.935
0.94
1 2 3 4 5 6 7 8 9 10 11 12 13 14 15 16 17 18 19 20 21
HO
SR
GP
HOSR - Verification Area
NEVT 0.8 NEVT 0.9 No NEVT No Verification
(c) HOSR of the verification area
0.86
0.87
0.88
0.89
0.9
0.91
0.92
1 2 3 4 5 6 7 8 9 10 11 12 13 14 15 16 17 18 19 20 21
HO
SR
GP
HOSR - Worst Performing Cell
NEVT 0.8 NEVT 0.9 No NEVT No Verification
(d) HOSR of the worst performing cell
Fig. 5: Comparison of different verification strategies
During the 13th GP the cell is turned on again. When the cell is turned on andoff, the NEVT calculator adds a fixed amount of 80 units of NEVT in thereconfigured cell.
The scenario is repeated by using four different configurations:
1. verification with NEVT, cooling factor 0.82. verification with NEVT, cooling factor 0.93. verification without NEVT, i.e., rejecting all changes with verification score
below the acceptance threshold4. no verification
Furthermore, NEVT conductivity factor is set to 0.8 and the verificationacceptance function scaling factor to equal the maximum NEVT value of 100.Verification area is the target cell and its neighboring cells. A short observa-tion window of only one GP was selected. Each scenario in each configurationis simulated 5 times and values for each GP averaged over the simulations. Thefollowed KPIs are the Channel Quality Indicator (CQI) and the Handover Suc-cess Rate (HOSR), which are also used in the verification process. The CQI iscomputed as the harmonic mean over the channel efficiency [1].
5.3 Simulation Results
The simulation results show that the SON verification with the NEVT is ableto adapt better to the disturbances while ensuring the stability of the system.Figure 5 shows the results. It depicts the CQI and HOSR values of the cell that

was shutdown and its neighbors. Both the average value of the KPI of everycell in the whole verification area and the value of the worst performing cell inthe area are shown. Note that all the values are averages of the five simulationrounds.
For the most important KPI, the CQI, we can see that using verificationwithout NEVT slows down the reaction to the degradation introduced duringGP 5 due to higher number of undo operations. Moreover, if we look at the CQIof the worst performing cell, we can see that without verification it ends up in asub-optimal state.
If we look at the verification with NEVT, we can see that the SON functionsare able to react to the disturbance fast and at the same time the degradationof the worst performing cell is avoided. With lower cooling factor of 0.9, in par-ticular, the network stabilizes in clearly better average CQI values than withoutverification or with verification without NEVT. As for the HOSR we see lessdifferences, but the NEVT-based verification mechanism achieves slightly betterresults.
6 Conclusion
The Self-Organizing Network (SON) verification is an important enabler of mod-ern SONs. While it improves the stability of the network, verification can alsomake it less flexible, which can be undesirable in certain circumstances. Forexample, after commissioning a new Network Element (NE), it can be prefer-able to let the SON functions configure the Configuration Management (CM)parameters more freely to better adapt to the environment.
In this paper, we proposed the concept of Network Element Virtual Tem-perature (NEVT), which indicates the state of stability of a NE. Major recon-figurations of a NE increase its NEVT to indicate reduced stability. Over time,if there are no further reconfigurations, the NEVT decreases according to thecooling factor as the NE becomes more stable. NEVT is conducted to the neigh-boring NEs to indicate that they should also adapt to the changes. Utilizing theconcept of NEVT, we introduced a NE stability aware verification process. Inthe process, all CM changes that exceed a set threshold for the verification scoreare accepted. However, also CM changes that do not exceed the threshold havea certain probability of being accepted, depending on the verification score andthe NEVT of the NE.
Our evaluation, based on radio environment and subscriber simulation, showsthat the NEVT-based verification allows the network to react and adapt to majorchanges faster. At the same time it avoids the degradations that occurred, whenno verification was used. Distribution of NEVT to neighboring NEs enables thewhole subnetwork to react to changes in one NE and the ”cooling down” ofNEVT ensures that the network stabilizes to an optimal configuration.
Future work includes studying the application of NEVT to other NetworkManagement (NM) use cases.

References
1. 3GPP: Evolved Universal Terrestrial Radio Access (E-UTRA); Physical layer pro-cedures. Technical specification 36.213 v12.1.0, 3rd Generation Partnership Project(3GPP) (Mar 2014)
2. Bandh, T.: Coordination of autonomic function execution in Self-Organizing Net-works. Phd thesis, Technische Universitat Munchen (Apr 2013)
3. Bandh, T., Romeikat, R., Sanneck, H.: Policy-based coordination and managementof SON functions. In: 12th IFIP/IEEE Int. Symp. Integr. Netw. Manag. (IM 2011)Work. pp. 827–840. IEEE, Dublin, Ireland (May 2011)
4. Berger, S., Fehske, A., Zanier, P., Viering, I., Fettweis, G.: Comparing Onlineand Offline SON Solutions for Concurrent Capacity and Coverage Optimization.In: Proceedings of the Vehicular Technology Conference (VTC Fall). Vancouver,Canada (Sep 2014)
5. Ciocarlie, G., Connolly, C., Cheng, C.C., Lindqvist, U., Novaczki, S., et al.:Anomaly Detection and Diagnosis for Automatic Radio Network Verification. In:6th International Conference on Mobile Networks and Management (MONAMI2014). Wurzburg, Germany (Sep 2014)
6. Ericsson: Transparent Network-Performance Verification For LTE Rollouts. WhitePaper, 284 23-3179 Uen (Sep 2012)
7. Gajic, B., Novaczki, S., Mwanje, S.: An Improved Anomaly Detection in MobileNetworks by Using Incremental Time-aware Clustering. In: IFIP/IEEE Workshopon Cognitive Network and Service Management (CogMan 2015). Ottawa, Canada(May 2015)
8. Hamalainen, S., Sanneck, H., Sartori, C. (eds.): LTE Self-Organising Networks(SON): Network Management Automation for Operational Efficiency. John Wiley& Sons, Chichester, UK (Dec 2011)
9. Novaczki, S.: An Improved Anomaly Detection and Diagnosis Framework for Mo-bile Network Operators. In: 9th International Conference on Design of ReliableCommunication Networks (DRCN 2013) (Mar 2013)
10. Novaczki, S., Tsvetkov, T., Sanneck, H., Mwanje, S.: A Scoring Method for theVerification of Configuration Changes in Self-Organizing Networks. In: 7th In-ternational Conference on Mobile Networks and Management (MONAMI 2015).Santander, Spain (Sep 2015)
11. NSN: Self-Organizing Network (SON): Introducing the Nokia Siemens NetworksSON Suite - an efficient, future-proof platform for SON. White Paper (Oct 2009)
12. R. Romeikat, H. Sanneck, T. Bandh: Efficient , Dynamic Coordination of RequestBatches in C-SON Systems. In: In: IEEE Veh. Technol. Conf. (VTC Spring 2013),Dresden, Germany (Jun 2013)
13. S. Kirkpatrick, C. D. Gelatt, M. P. Vecchi: Optimization by Simulated Annealing.Science, New Series, Vol. 220 (May 1983)
14. Szu, H., Hartley, R.: Fast simulated annealing. In: Physics Letters A. vol. 122, pp.157 – 162 (Jun 1987)
15. T. Tsvetkov, H. Sanneck and G. Carle: A Graph Coloring Approach for SchedulingUndo Actions in Self-Organizing Networks. In: IEEE IM, Ottawa, Canada (May2015)
16. Tsvetkov, T., Frenzel, C., Sanneck, H., Carle, G.: A Constraint Optimization-BasedResolution of Verification Collisions in Self-Organizing Networks. In: IEEE GlobalCommunications Conference (GlobeCom 2015). San Diego, CA, USA (Dec 2015)

17. Tsvetkov, T., Novaczki, S., Sanneck, H., Carle, G.: A Configuration ManagementAssessment Method for SON Verification. In: International Workshop on Self-Organizing Networks (IWSON 2014). Barcelona, Spain (Aug 2014)
Copyright © 2022 FDOKUMEN