On verifying ATL transformations using ‘off-the-shelf’SMT solvers
Upload
khangminh22Category
view
1download
0
ASSESSING AND VERIFYING ELECTION RESULTSA DECISION-MAKER’S GUIDE TO PARALLEL VOTE TABULATION AND OTHER TOOLS
APRIL 2015


ASSESSING AND VERIFYING ELECTION RESULTSA DECISION-MAKER’S GUIDE TO PARALLEL VOTE TABULATION AND OTHER TOOLS
APRIL 2015

Prepared under Task Order, AID-OAA-I-10-00004, Order No. AID-OAA-TO-13-00029
Submitted To:
USAID
Prepared By:
Glenn CowanEvan SmithClaire RobertsonCaroline Sahley (USAID)
Contractor:
Democracy International, Inc.7600 Wisconsin Avenue, Suite 1010Bethesda, MD 20814Tel: 301-961-1660Email: [email protected]
Cover Credit:
Stephanie Funk, USAIDVoting underway in Malawi’s 2014 election.

CONTENTS
ASSESSING AND VERIFYING ELECTION RESULTS:A DECISION-MAKER’S GUIDE TO PARALLEL VOTE TABULATION AND OTHER TOOLS
iii
FOREWORD ......................................................................................V
INTRODUCTION: A GUIDE FOR ASSESSING AND VERIFYING ELECTION RESULTS ................................................ 1
SECTION 1: UNDERSTANDING THE TOOLS ......................... 3
SECTION 2: DECIDING WHETHER TO USE A TOOL FOR ASSESSING AND VERIFYING ELECTION RESULTS .............18
SECTION 3: BEST PRACTICES FOR MANAGING AND IMPLEMENTING PARALLEL VOTE TABULATIONS (PVTS) 31
APPENDIX 1: REQUIREMENTS AND MISPERCEPTIONS OF SAMPLE-BASED TOOLS FOR ASSESSING AND VERIFYING ELECTION RESULTS ......................................................................40
APPENDIX 2: GLOSSARY OF TERMS .......................................42
APPENDIX 3: ENDNOTES ...........................................................45

ASSESSING AND VERIFYING ELECTION RESULTS:A DECISION-MAKER’S GUIDE TO PARALLEL VOTE TABULATION AND OTHER TOOLS
iv

FOREWORD
ASSESSING AND VERIFYING ELECTION RESULTS:A DECISION-MAKER’S GUIDE TO PARALLEL VOTE TABULATION AND OTHER TOOLS
v
Elections are momentous events in a nation’s civic and political life. In developing countries around the world, men and women make their way to their polling stations on election day, often walking long distances, to make their voices heard through the extraordinary power of the vote. We know that elections alone do not make a democracy. But elections are
remarkable processes that demonstrate what is at the heart of democracy – that elected officials are accountable to citizens.
The integrity and fairness of electoral processes are vital to citizen trust in government. Elections must be free and inclusive, conducted without obstacles for citizens to vote or for candidates and political parties to campaign and run for office. Elections must be fair, governed by unbiased and impartial processes. Perceptions of fraud and unfairness, whether founded or not, can shake the very foundation of confidence in government and the legitimacy of the political system.
For these reasons, USAID works with its partners to promote oversight of electoral processes to build citizen confidence, detect and deter fraud, and empower citizen-based observation. Election observation has become increasingly sophisticated over the past decades, including the increased use of systematic and evidence-based approaches.
I am pleased to introduce this manual on Assessing and Verifying Election Results: A Decision-Maker’s Guide to Parallel Vote Tabulation and Other Tools that provides guidance to USAID’s field officers and international development professionals on methodologies designed to assess or verify election results. These include parallel vote tabulations (PVTs), exit polls, and election forensics.
This guide emerges from the Center of Excellence on Democracy, Human Rights and Governance’s robust learning agenda that seeks to be responsive to the needs of our field officers for practical tools grounded in real-life experience. It provides practical information to help DRG officers; (1) understand the functions of these diverse tools; (2) use a step-by-step process for determining when and whether to implement them; and (3) identify best practices for managing PVTs from a donor’s unique perspective. This three-part structure is designed for easy and applied use, with a busy field officer in mind.
Our assistance is used to support electoral processes and expand capacity for systematic electoral oversight. We see this guide as advancing our practice, and we look forward to working with USG officials and implementing partners to improve the delivery of our programs around the world.
Neil LevineDirectorCenter of Excellence on Democracy, Human Rights and GovernanceBureau for Democracy, Conflict and Humanitarian AssistanceUnited States Agency for International Development

ASSESSING AND VERIFYING ELECTION RESULTS:A DECISION-MAKER’S GUIDE TO PARALLEL VOTE TABULATION AND OTHER TOOLS
vi
INTRODUCTION
A GUIDE FOR ASSESSING AND VERIFYING ELECTION RESULTS
Elections put power in the hands of citizens by giving them the ability to choose and replace their leaders. They are a potent tool for holding leaders accountable
and peaceably resolving political and societal conflict. Because elections determine political winners and losers, however, electoral processes—from voter registration through results reporting—have long been targeted for manipulation by unscrupulous regimes and political actors. Such manipulation—or sometimes the mere threat of it—weakens public confidence in democratic processes, erodes the legitimacy of governments, and undermines the will of the people. Suspicions of electoral fraud can catalyze polarization or trigger conflict.
For these reasons, USAID and other donors work to build public confidence in elections by improving the performance and accountability of electoral management bodies, strength-ening meaningful and peaceful political competition, and supporting citizen oversight of electoral processes. Robust citizen oversight of elections is critical not only because it can help deter and detect electoral malfeasance, but also be-cause it helps to engage citizens in democratic processes and build trust in election outcomes. Although elections alone do not create a democracy, free, competitive, and well-managed elections that inspire the confidence of citizens are essential to any democratic system.
PURPOSE OF THE STUDY
This guide provides USAID Democracy, Human Rights and Governance (DRG) officers, donors, and other development stakeholders with information about activities designed to analyze, verify, or otherwise assess the credibility and legiti-macy of election results. Despite being used with increasing frequency, election results assessment and verification ef-
forts—especially their risks and potential impact—are often misunderstood. This guide discusses the purposes and func-tions of the tools and addresses these misunderstandings.
Throughout this guide we focus primarily on parallel vote tabulation (PVT) because it is the most widely used and, in most cases, the most definitive and effective results verifi-cation tool. This guide also includes exit polls and election forensics as tools that can be used in some contexts to help assess and understand election results. Importantly, this guide provides specific guidance on when to support efforts to assess or verify election results. In addition, it offers insight into when each tool is most useful in a given context, when it may be more appropriate to focus limited resources in other ways, and how to proactively design and manage these tools throughout the electoral cycle.
This guide does not examine all methodologies for moni-toring elections, but instead focuses on those used specifi-cally to assess and verify election results.
This manual specifically builds on previous work by the National Democratic Institute for International Affairs (NDI), Democracy International (DI), and others. Larry Garber and Glenn Cowan’s 1993 article, “The Virtues of Parallel Vote Tabulations” describes the development of parallel vote tabulation and offers guidance for practictioners.1 NDI’s The Quick Count and Election Observation: An NDI Guide for Civic Organizations and Political Parties is a comprehensive how-to manual for understanding and effectively imple-menting a parallel vote tabulation, which it also refers to as a quick count.2 DI’s Vote Count Verification: A User’s Guide for Funders, Implementers, and Stakeholders provides detailed consideration and comparison of research and thinking on PVTs, exit polls, other types of public opinion research, and
ASSESSING AND VERIFYING ELECTION RESULTS:A DECISION-MAKER’S GUIDE TO PARALLEL VOTE TABULATION AND OTHER TOOLS
1

election forensics, including consideration of the program-matic, practical, and financial advantages and disadvantages of these different methods.3
This guide is designed to fill a gap in the existing literature by providing USAID DRG officers with high-level background information necessary to understand and compare different tools for election results assessment and verification, a deci-sion-making framework to determine whether and how such tools should be used in specific contexts, and best practice guidance for managing PVTs, the most effective and widely implemented results verification tool.
This guide has three sections:
• Section One discusses the purposes of election results assessment and verification tools; introduces PVTs, exit polls, and elections forensics; and describes what these tools can accomplish and their key considerations and challenges.
• Section Two provides a step-by-step decision-making framework for determining whether assessing or verify-ing election results is feasible or appropriate in certain country contexts. This can help donors and implement-ers alike make informed judgments about what specific tools are likely to achieve, what risks they pose, and whether and how they should be implemented.
• Section Three highlights some best practices for designing and managing PVTs from a donor perspective, acknowledging that PVTs are the most appropriate veri-fication tool for most contexts.
An appendix on the requirements and misperceptions of sample-based assessment and verification tools (Appendix 1), a glossary of terms (Appendix 2), and a section of end-notes (Appendix 3) can be found at the end of this docu-ment.
Leslie Knott, Democracy International
Afghan poll worker at a polling station during 2009 presidential election.
ASSESSING AND VERIFYING ELECTION RESULTS:A DECISION-MAKER’S GUIDE TO PARALLEL VOTE TABULATION AND OTHER TOOLS
2
SECTION 1
UNDERSTANDING THE TOOLS
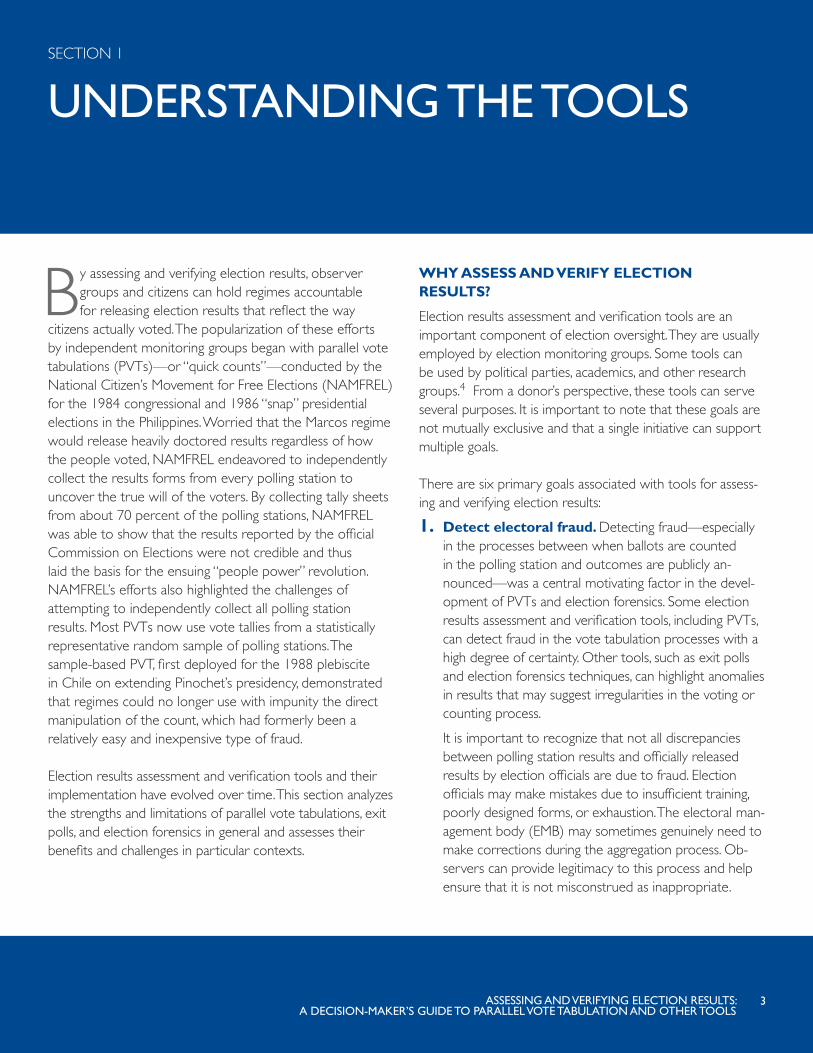
By assessing and verifying election results, observer groups and citizens can hold regimes accountable for releasing election results that reflect the way
citizens actually voted. The popularization of these efforts by independent monitoring groups began with parallel vote tabulations (PVTs)—or “quick counts”—conducted by the National Citizen’s Movement for Free Elections (NAMFREL) for the 1984 congressional and 1986 “snap” presidential elections in the Philippines. Worried that the Marcos regime would release heavily doctored results regardless of how the people voted, NAMFREL endeavored to independently collect the results forms from every polling station to uncover the true will of the voters. By collecting tally sheets from about 70 percent of the polling stations, NAMFREL was able to show that the results reported by the official Commission on Elections were not credible and thus laid the basis for the ensuing “people power” revolution. NAMFREL’s efforts also highlighted the challenges of attempting to independently collect all polling station results. Most PVTs now use vote tallies from a statistically representative random sample of polling stations. The sample-based PVT, first deployed for the 1988 plebiscite in Chile on extending Pinochet’s presidency, demonstrated that regimes could no longer use with impunity the direct manipulation of the count, which had formerly been a relatively easy and inexpensive type of fraud.
Election results assessment and verification tools and their implementation have evolved over time. This section analyzes the strengths and limitations of parallel vote tabulations, exit polls, and election forensics in general and assesses their benefits and challenges in particular contexts.
WHY ASSESS AND VERIFY ELECTION RESULTS?
Election results assessment and verification tools are an important component of election oversight. They are usually employed by election monitoring groups. Some tools can be used by political parties, academics, and other research groups.4 From a donor’s perspective, these tools can serve several purposes. It is important to note that these goals are not mutually exclusive and that a single initiative can support multiple goals.
There are six primary goals associated with tools for assess-ing and verifying election results:
1. Detect electoral fraud. Detecting fraud—especially in the processes between when ballots are counted in the polling station and outcomes are publicly an-nounced—was a central motivating factor in the devel-opment of PVTs and election forensics. Some election results assessment and verification tools, including PVTs, can detect fraud in the vote tabulation processes with a high degree of certainty. Other tools, such as exit polls and election forensics techniques, can highlight anomalies in results that may suggest irregularities in the voting or counting process.
It is important to recognize that not all discrepancies between polling station results and officially released results by election officials are due to fraud. Election officials may make mistakes due to insufficient training, poorly designed forms, or exhaustion. The electoral man-agement body (EMB) may sometimes genuinely need to make corrections during the aggregation process. Ob-servers can provide legitimacy to this process and help ensure that it is not misconstrued as inappropriate.
ASSESSING AND VERIFYING ELECTION RESULTS:A DECISION-MAKER’S GUIDE TO PARALLEL VOTE TABULATION AND OTHER TOOLS
3

2. Deter electoral fraud. Because they can detect certain types of electoral manipulation, these tools can deter actors from engaging in fraud because they fear being caught. Effectively deterring fraud requires that (1) an activity to assess or verify results is publicized and understood by those who might be tempted to commit fraud and (2) there will be some sort of sanction for trying to manipulate the election.
3. Build confidence in electoral processes. In many countries, tools to assess and verify election results are used to build confidence in elections and are implement-ed with the expectation that findings will support official results, rather than raise questions. Having an indepen-dent assessment that aligns with official reported elec-tion results can build citizen confidence in the results as a legitimate reflection of voter preferences. Reaffirming official results can also dissuade losing candidates from making unsubstantiated claims of fraud and encourage them to concede an election to the winning party.
4. Provide a projection of results. Some of these tools can project election results relatively quickly, which can defuse political tensions and fill an information vacuum. Where permitted by law, PVT or exit poll projections can be released, which is particularly helpful when the EMB is slow to issue results. Delayed results can allow political actors to manipulate public expectations, create confusion, and incite unrest.
5. Build local capacity for oversight. Accountability of the state and its leaders to citizens is a fundamental tenet of democracy. As USAID aims to support more participatory and representative democratic processes, supporting oversight of electoral processes can empow-er citizens and civil society. The use of these tools can build the capacity of local groups to use evidenced-based approaches for oversight.
6. Verify official results. By providing an independent tabulation of polling station results, one tool—PVT—can
Democracy International
Election observer in polling station during Afghanistan’s parliamentary election conducted in September 2010.
ASSESSING AND VERIFYING ELECTION RESULTS:A DECISION-MAKER’S GUIDE TO PARALLEL VOTE TABULATION AND OTHER TOOLS
4

verify within a certain margin of error whether official results were properly tabulated on election day. PVTs can thus sometimes provide evidence that is strong enough to call into question the results of an election, either at the polling station or aggregate level.
TERMS AND DEFINITIONS
Understanding approaches for assessing and verifying elec-tion results is sometimes hampered by the lack of commonly held definitions. In this guide, we define each of the terms used as follows:
• Assessing election results refers broadly to an activity that independently evaluates the credibility and legitimacy of election or referendum results. This guide focuses on exit polls and election forensics as tools that analyze and assess election results. These tools can de-tect anomalies and potential irregularities in results, but are not definitive.
• Verifying election results refers to methods that provide a stronger basis of evidence to substantiate or to question the validity of the results. PVTs are often considered verification tools due to their reliability and accuracy when properly implemented.5 Recounts and post-election audits are verification activities that are used by election commissions in contested elections. We do not discuss them in this document because they can-
not be conducted independently of electoral authorities, but they can be observed by monitoring groups.
• Comprehensive election observation is a long-term monitoring activity conducted by a country’s citizens or international observation group to assess the legitimacy of an election. Comprehensive election observation covers all aspects of the electoral cycle. It should include boundary delimitation and analyses of the legal framework and political context. Observation groups also conduct targeted independent monitoring of voter registration, candidate and party registration, campaigning, election day, dispute resolution, and other aspects of the electoral process. Activities to assess and verify election results can complement a comprehensive observation by providing an independent measure of the reliability of the results, but these activities should not replace more comprehensive observation efforts.
This guide discusses three specific tools for assessing and verifying election results:
• Parallel vote tabulation, sometimes called a quick count, is an independent tabulation of polling station results—using data from all stations or a representative sample of them—for the purpose of projecting election results and/or verifying their accuracy. To be credible, a PVT should be conducted by trained observers who observe and report on the entire process at the polling station on election day.
• An exit poll is a survey of a sample of voters, taken immediately after they have cast their ballots and exited the polling stations. An exit poll requests information about voters’ ballot choices, motivations informing those choices, and experience with the voting process. As the only results assessment tool that involves interviewing voters, exit polls can generate useful information about voter intentions and demographics. Exit polls are also used to project results. However, because voters may not be completely candid for a variety of reasons, exit polls cannot provide definitive evidence of fraud or manipulation.
• Election forensics are a set of statistical analyses of official election results data that identify trends or anom-alies that may be the artifacts of manipulation. Election forensics are rarely definitive, but they can suggest types of electoral manipulation beyond the tabulation process,
ASSESSING VS. VERIFYING ELECTION RESULTS
Assessing election results refers broadly to an activity that independently evaluates and assess-es the credibility and legitimacy of election or referendum results. These activities include exit polls and other quantitative tools and approach-es that can assess election results with greater or lesser degrees of accuracy and reliability. Verifying election results refers to methods that provide a stronger basis of evidence to substantiate the results or to call into question their validity. PVT is the only tool discussed in this guide that is designed to verify the tabulation of results.
ASSESSING AND VERIFYING ELECTION RESULTS:A DECISION-MAKER’S GUIDE TO PARALLEL VOTE TABULATION AND OTHER TOOLS
5

such as inflated voter turnout or implausible levels of support for specific candidates or parties.
In discussing what these tools can assess and detect, it is helpful to clarify what is meant by electoral fraud, malprac-tice, and manipulation. Here we use the categorization de-veloped by Chad Vickery and Erica Shein,6 which points to the importance of distinguishing between fraud and electoral malpractice:
• Electoral malpractice is a “breach by an election professional of his or her relevant duty of care, resulting from carelessness or neglect.”
• Electoral fraud is “deliberate wrong-doing by election officials or other electoral stakeholders, which distorts the individual or collective will of the voters.”
• Systemic manipulation is “the use of domestic legal provisions and/or electoral rules and procedures that run counter to widely accepted democratic principles and international standards, and that purposefully distort the will of the voters.”7
• In addition, this study uses electoral manipulation as a broader category for any deliberate effort to manipu-late rules or commit fraud.
Additional terms and definitions have been included in the Glossary of Terms at the end of this guide.
ASSESSING AND VERIFYING RESULTS AS PART OF ELECTION OBSERVATION
Election observation is an important norm developed over the last three decades that serves many important func-tions.8 Properly conceived and implemented, election mon-itoring can provide an objective assessment of a country’s overall electoral process and identify areas for reform. The presence of international and domestic election observers can deter and/or expose forms of electoral manipulation and promotes the transparency and integrity of the electoral pro-cess. Election observation can also bolster confidence in and the legitimacy of electoral processes, encourage civic engage-ment, and strengthen oversight by citizens and civic networks.
Long-term comprehensive observation is the foundation of an effective electoral oversight support strategy. The wide-spread use and effectiveness of PVTs have made it more difficult for regimes to directly manipulate the vote count without detection. As a result, it is more common now for regimes intent on manipulating an election to begin slanting the playing field in their favor well before election day, al-though they may continue to do so on election day and into the post-election period if necessary. This creates an unfair environment that puts the opposition at a disadvantage.
In appropriate contexts, election results assessment and verification tools can augment comprehensive election ob-servation efforts by independently drawing evidence-based conclusions about the results of an election. However, ac-
Voters look for their names outside a polling center in Carrefour, Haiti, on March 20, 2011, in the second round of the presidential elections.
Kendra Helmer, USAID
ASSESSING AND VERIFYING ELECTION RESULTS:A DECISION-MAKER’S GUIDE TO PARALLEL VOTE TABULATION AND OTHER TOOLS
6

tivities such as PVTs or exit polls cannot detect many other types of manipulation that occur before and after election day. In most cases, DRG officers should support comprehen-sive election observation as the primary electoral oversight activity because it includes monitoring of the legal and politi-cal environment, pre-election and election-day processes, and post-election activities.
Short-term election observation involves the deployment of short-term observers throughout the country to observe and collect information on election-day processes, including voting and counting. These observers can be deployed to cover the most competitive districts, to monitor areas vul-nerable to conflict, or to observe any number of other issues. The capacity of monitoring groups and logistical issues, such as the availability of transportation or volunteers, may affect observer coverage. General election observation is designed to give an indication of the conduct of elections. Because it is not based on a representative sample of polling stations its findings are not conclusive when translated to an entire country. Observers can also be deployed to a representative sample of polling stations. In doing so, their findings are more generalizable to the entire country.
PARALLEL VOTE TABULATION
Since the 1980s, domestic election monitoring organizations have conducted parallel vote tabulations to assess the accu-racy and integrity of election results as reported by electoral authorities. Today, many election monitoring organizations routinely incorporate PVTs into their observation activities. PVTs use reported counts by election officials at polling stations. They are the only technique that can verify the vote count aggregation and tabulation to give election observers an accurate assessment of how results should have been tabulated. PVTs can also build confidence in and legitimacy of electoral processes and institutions and offer opportunities to increase the technical and organizational capacity of local monitoring organizations.
WHAT IS A PVT?
A parallel vote tabulation is an independent tabulation of polling station results—using data from all stations or a rep-resentative sample of them—for the purpose of projecting election results and/or verifying their accuracy. PVT observ-ers collect the reported results from the polling stations and use their data to independently tabulate the election results.
Discrepancies between the PVT results and the official results may suggest manipulation or reveal mistakes in the tabulation process.
To be credible, PVTs should be accompanied by a systematic evaluation of polling station processes, including opening of polls, voting, and counting, by the PVT observers, who can collect a wide range of data from a polling station in addition to the posted results. Data on voting, counting, and other processes can be used to determine if pre-count fraud has occurred. Voter intimidation or unconcealed ballot-box stuffing, for instance, could call into question the validity of the polling station vote count upon which the PVT results are based. PVT observers can collect data on the process by observing whether a polling station opened on time, the number of voters who left or were turned away without voting, or whether the ballot box was ever taken out of view
THE EVOLUTION FROM COMPREHENSIVE TO SAMPLE-BASED PVTS
As originally conceived, a PVT was a compre-hensive exercise to collect results data from every polling station to project the election result and assess the accuracy of the official re-sult. Comprehensive PVTs pose serious logistical and methodological challenges, however. It can be difficult to deploy observers successfully to all polling stations. Managing a sufficiently large observation team to ensure complete coverage greatly increases the complexity of the exer-cise. In current practice, most PVTs collect data from a representative sample of polling stations rather than attempting to collect from all of the stations.
It is important to recognize that the quality of a PVT is not necessarily enhanced by increasing the sample size to reduce the margin of error. To be accurate, it is more important to ensure that the data collected are representative, and that there is a high response rate with minimal missing data.
ASSESSING AND VERIFYING ELECTION RESULTS:A DECISION-MAKER’S GUIDE TO PARALLEL VOTE TABULATION AND OTHER TOOLS
7

of observers. Data may also include more subjective assess-ments, including the extent to which voters experienced intimidation or whether officials applied an appropriate standard for determining voter intent when counting ballots. Because process data are collected from a statistically rep-resentative sample of polling stations, they allow an observ-er group to assess the quality of election-day operations. Even when the results data do not detect any problems, these process data may reveal election-day manipulation or problems. It is thus recommended that DRG officers fund PVT efforts that include process data collection to ensure a systematic assessment of election-day processes.
Independent, domestic civil society groups often implement and manage PVTs. A PVT is often part of comprehensive election observation activities. USAID and other internation-al donors often fund PVTs, while international democracy assistance organizations may provide technical assistance to local observer groups.9
Political parties often implement PVTs for their own internal purposes. These activities should not be considered a sub-stitute for independent, nonpartisan results verification. The methodology employed by parties may not meet rigorous standards for credible results verification. For example, a party-implemented PVT may have a sample determined by where they are able to mobilize supporters and party agents, and is therefore not representative.
HOW DO PVTS VERIFY ELECTION RESULTS?
When the context is appropriate and local capacity permits a properly implemented PVT, it is the preferred tool for
verifying election results. A properly implemented PVT can accomplish the six important election results assessment and verification goals discussed earlier.
• Detecting fraud: By collecting polling-station results data, PVTs can definitively detect manipulation of the tabulation of polling station results at the district or national level on election day when such manipulation exceeds the PVT margin of error. A PVT relies on poll-ing-station-level results as its data source and essentially “checks the math” as election results are aggregated and tabulated nationally. By comparing the PVT results to those released by an EMB, election observers can determine whether changes may have been made to the results during the tabulation process. Where PVTs assess voting, counting, and other processes, they can also provide information that explains discrepancies that may exist between PVT and official results. By collecting PVT results and process data, observers can detect and quantify fraud in vote tabulation and can reveal other fraudulent activities that may have occurred on election day.
• Deterring fraud: PVT activities typically include civil society involvement, broad outreach campaigns, and countrywide coverage. The presence of PVT observers can serve to directly deter polling station fraud while the knowledge that a PVT is being implemented can deter tabulation fraud.
• Building confidence in the electoral process: PVTs can build confidence in the electoral process when their results match official results. Process data that sup-ports the results data can affirm a credible election-day process and allows a group to know that PVT results can be trusted. In addition to reassuring citizens, results trends can be shared with local stakeholders, such as the EMB and political actors. This can encourage losing candidates to concede peacefully.
• Projecting results: Where permitted by law, PVTs can provide the public with projected election results, which can preempt and dissuade a government from releasing false or manipulated results. Projected PVT results can also defuse political tensions when election officials are slow to issue results. A PVT can thus diminish the op-portunity for unscrupulous political actors to manipulate public expectations, create confusion, or incite unrest.
PVT DEFINITION
Parallel vote tabulation, sometimes called a quick count, is an independent tabulation of polling station results—using data from all stations or a representative sample of them—for the purpose of projecting election results and/or verifying their accuracy. To be credible, a PVT should be conducted by trained observers who observe and report on the entire process at the polling station on election day.
ASSESSING AND VERIFYING ELECTION RESULTS:A DECISION-MAKER’S GUIDE TO PARALLEL VOTE TABULATION AND OTHER TOOLS
8

• Building local capacity for oversight: PVTs can build the capacity of local civil society organizations and empower them to play a more active role in both immediate and future elections and in civic and political processes more broadly. Conducting PVTs with local civil society organizations (CSOs) can build on enthusiasm for and commitment to electoral accountability and increase CSOs’ capacity for working with evidence-based approaches. The process of conducting a PVT can also empower CSOs in countries where civil society has been constrained or has traditionally been weak.
• Verifying official results: Because PVTs are able to detect manipulation of vote count aggregation at the district or national level with high degrees of accuracy and precision10, PVTs are the only tool discussed here that can be said to verify official election results. Com-paring these results to official results can reveal possible manipulation of the vote count (at the aggregate level or at a specific polling station). The primary benefit of conducting a PVT is that it enables domestic civil society groups to use reliable evidence to verify or to call into question the election results. A PVT’s ability to veri-fy election results is limited to the tabulation process, however. There may be cases—particularly when official results fall within the PVT margin of error—in which a PVT will be unable to verify official results.
HOW CAN OBSERVERS MAXIMIZE PVT CREDIBILITY BY
COLLECTING DATA ON VOTING AND COUNTING?
Parallel vote tabulation is most effective and credible when accompanied by systematic monitoring of the voting, count-ing, and other polling station processes throughout election day for at least two reasons.
First, monitoring polling station processes helps PVT orga-nizers draw broader conclusions about the conduct of the elections and thus enables PVT organizers to situate their independently tabulated results within a broader assessment of election day. This can either increase confidence in official election results or bolster claims of manipulation in the tabu-lation process. The collection of process data can also identify patterns of manipulation or mistakes that may not be evident in the results alone.
Second, systematic monitoring alerts PVT organizers to spe-cific polling stations where the results may not reflect the will
of the voters due to ballot box stuffing, errors in the count-ing process, or other issues. Systematically collecting process data allows PVT organizers to know whether to trust their results data. If PVT observers witness significant problems that may have affected results, the results data from that polling station can be flagged as unreliable. A quarantine of the data within the PVT dataset may help to avoid tainting the overall PVT results.
DRG officers should also be aware that organizations may propose activities labeled PVT that may not be PVTs or that fall short of the standards needed to produce credible re-sults. These efforts may include posting observers in regional results tabulation centers (rather than polling stations), de-ploying observers to a non-representative sample of polling stations, or crowdsourcing polling station results. This guide includes a checklist of questions to answer before support-ing a PVT on page 33, which DRG Officers may find helpful when determining whether a proposed PVT is credible.
HONDURAS: PVT PROJECTIONS REDUCE POLITICAL TENSIONS
The Tribunal Supremo Electoral (TSE) of Hon-duras has used PVTs to confirm official election results and lend greater credibility to the TSE. The TSE collaborates with Hagamos Democ-racia (HD), a local NGO. In November 2013 in the absence of official preliminary results on election night, two candidates declared them-selves the winner of the election. The TSE and HD agreed to release the results of the statisti-cally sound PVT conducted by HD. This reliable forecast of the election results helped to reduce the allegations of fraud and public unrest on election night and the days immediately follow-ing the election as the TSE worked to release the official results. When the TSE announced the final election results a few weeks later, the percentage difference between HD’s projection and the official results was minimal. This raised the credibility of the TSE and assured the candi-dates and citizens of transparency in the election process.
ASSESSING AND VERIFYING ELECTION RESULTS:A DECISION-MAKER’S GUIDE TO PARALLEL VOTE TABULATION AND OTHER TOOLS
9

WHAT ARE THE KEY CONSIDERATIONS AND
CHALLENGES OF USING PVTS?
PVTs can be a useful and important supplement to election observation efforts, but it is important to be aware of their limitations and contextual challenges.
• APVTcannotprojectawinnerwhentheresultsofanelectionfallwithinthemarginoferror.For example, if the top two candidates are separated by 1% of votes but the margin of error for a PVT is ±2.5%, then the PVT cannot project a winner. But in such cases, a PVT that is consistent with official election results may still add credi-bility to the process. If a close election is anticipated, an implementer should strive for low margins of error with a respected local group without using a sample size so large that it will make it too difficult to collect all of the data necessary.
• APVTonitsowndoesnotspeaktothequalityoftheentireelectoralprocess.A PVT focuses on the detection of fraud in tabulation of results. In the worst case scenario, a PVT can confirm an accurate official vote count in an electoral environment where there are problems with voter roll manipulation, voter intimidation, vote-buying, restrictive political competition, or other issues that lead to an unfair election. In these cases, a PVT can inadver-tently lend credibility to a manipulated election. When accompanied by process data collection, PVT observers can detect problems such as tally sheet or voter roll manipulation that occur in the polling station on elec-
tion day itself. However, only comprehensive election observation focuses on the many types of manipulation that occur in the pre-electoral period. A PVT should be used with caution— or not at all—in an environment in which a dramatically unequal playing field or constrained political competition makes integrity of the count itself a less significant concern. In these contexts, it is import-ant to avoid focusing primarily on election day itself and ensure that a comprehensive election observation monitors critical aspects of the pre- and post-election environment.
• PVTsrisklegitimizingaflawedoutcomewhenthereisextensivemanipulationofpolling-stationresults,thoughthisriskcanbesignificantlymitigatedbythecollectionofprocessdata.When there are massive, widespread irregularities, a PVT will be unable to project what the official results would have been had the voting process been free of fraud. When PVT organizers collect robust process data, they can mitigate this risk, as the process data may reveal significant or pervasive irregularities in voting, counting or other polling-station processes. By analyzing this information, PVT organizers may be able to determine that the PVT results are invalid and that releasing them risks legitimizing a bad election.
• PVTsmaynotcountballotsthatarecastbeforeelectionday.Early voting, absentee ballots, and out-of-the-coun-try balloting pose difficulties for two reasons: (1) PVT observers are unable to observe the voting process and (2) the counting may occur over several days or locations. In countries with a significant number of such ballots, a PVT may lack important data.
• PVTsrequireahighleveloftechnicalandorganizationalcapacityaswellaspoliticalandorganizationalwill.An organization or coalition must successfully recruit, train, manage, maintain communication with, accredit, protect (where necessary), and administratively support a large number of observers with specific polling-station assign-ments. In some countries, organizations with the capacity to independently conduct PVTs exist. In most, however, CSOs may be enthusiastic and committed, but they often require significant assistance over more than one electoral cycle before they have the requisite capability to effectively conduct a PVT.
• Largecountries,difficultgeography,andconflictsituationspresentsignificantlogisticalchallengesforPVTimplemen-tation.A PVT requires data from a statistically represen-
ASSESSING AND VERIFYING ELECTION RESULTS:A DECISION-MAKER’S GUIDE TO PARALLEL VOTE TABULATION AND OTHER TOOLS
10
A PVT should be used with caution—
or not at all—in an environment
where there is a dramatically
unequal playing field or severely
constrained political competition.
In these contexts, it is important
to avoid focusing primarily on
election day and to ensure that a
comprehensive election observation
focuses on critical aspects of the pre-
and post-election environment.

tative sample of polling stations to produce valid results. Large countries may have tens of thousands of polling stations, some in locations that are remote or difficult to access. The failure of observers to show up at their assigned polling stations will undermine the quality of the sample and hence the validity of the PVT result. Communication and data collection also can be logistical challenges. The telecommunications infrastructure may not provide network coverage across an entire country, making it impossible or prohibitively expensive to trans-mit data from remote areas. In conflict or post-conflict countries, some geographic areas may be considered off-limits to observers due to security concerns.
• Legislativeandsubnationalelectionswithnumerouselectoraldistrictspresentauniquesetofchallenges.To be effective, PVTs must report a statistically representative result for each constituency or district that observers are monitoring. In national elections with a single or small number of constituencies, this generally does not pose a problem. PVTs are increasingly used for legislative and local elections, however. In these elections, each district requires its own sample and data analysis—in effect, its own PVT. This makes PVTs for such elections harder for groups to implement effectively and adds to both complexity and cost.
• Inpoliticallychargedandfiercelycontestedelections,PVTresultscanbecomeaflashpointfortensions.There is the possibility that PVT results can fuel existing political tensions, particularly during a close election or where alleged fraud may have occurred. In these cases, domes-tic political actors and the international community may look to PVTs for an independent source of information about results. For these reasons, it is essential that PVTs be implemented with uncompromisingly high standards and statistically valid methodologies.
• PVTsmaynotbefeasibleinrestrictivepoliticalenviron-ments.On election day, observer access to polling sta-tions, the vote counting process, and the tally sheets are vital for a credible PVT. In some cases, a regime in power may be able to shut down or impair telecommunications networks, preventing PVT observers from transmitting data. In countries where observer access or communica-tion may be limited, a PVT may not be possible.
• PVTsareoftenrelativelyexpensivetoimplement.PVTs often require substantial technical and communications
investments. They also require capacity building support, usually over multiple election cycles, as local entities develop the capacity to carry out PVT activities.
OTHER TOOLS FOR ASSESSING ELECTION RESULTS
EXIT POLLS
Exit polls are powerful analytical tools most often used to understand why voters voted the way they did and to pro-vide insight into underlying political and social dynamics. In some cases, exit polls also are used to assess election results. Exit polls differ from PVTs in significant ways. Exit polls are not based on polling station results, but instead survey voters to determine their intent. These data can be used to project results that are generally reflective of how people voted. A discrepancy between the votes reported by voters and official results may suggest that results have been manipulat-ed, but it does not prove this to be the case. Exit polls may not always be accurate in projecting election results in part because voters are not always candid about how they voted.
What is an exit poll?
An exit poll is a survey of voters from a random sample of polling stations conducted as voters are leaving the polls after casting their votes. It uses random sampling to select polling stations within electoral districts and voters within polling stations. On election day, exit poll interviewers outside each sampled polling station select voters at specified intervals as voters exit the polling station. This process typically includes counting voters as they leave and selecting every “Nth” voter to interview.
Exit polls often involve short interviews with voters, but they can also be conducted through written, self-administered surveys. Because voters do not have to verbally reveal for whom they voted, this preserves the secrecy of the ballot and may increase voters’ comfort and confidence in the process.
In addition to asking about the vote itself, exit polls may ask about voters’ experiences with intimidation and other forms of misconduct. Exit polls can generate important information about voters’ perceptions of how elections were run and any problems that may have occurred. Exit polls may reveal information about how long voters waited in line to vote, the training and overall demeanor of polling station staff, and
ASSESSING AND VERIFYING ELECTION RESULTS:A DECISION-MAKER’S GUIDE TO PARALLEL VOTE TABULATION AND OTHER TOOLS
11

the design of the ballot. Exit polls may also reveal whether certain categories of voters (e.g., women, youth, or members of certain religious or ethnic groups) faced any obstacles to voting. Because voters are only in the polling station for a short time, however, exit poll data are not as comprehensive with regard to polling station processes as data collected by trained observers.
Exit poll survey responses are sometimes aggregated to project election results. These projections are broadly indic-ative of voter intent and can be compared to official results. Because of the degree of uncertainty inherent in using data reported by voters, however, exit poll results can be used to assess but not conclusively verify election results.
USAID-funded exit polls are usually implemented by a local, professional survey firm or think tank, sometimes in conjunc-tion with a media outlet, academic institution, or other local or international civil society organization. Exit polls can be conducted in countries with credible survey firms, though it is important to be aware that many survey firms are partisan. Survey firms and research organizations are used not only for their expertise, but also because it is inappropriate for election observers to ask voters for whom they voted. For this reason, observation groups generally do not conduct exit polls.
How do exit polls assess election results?
Exit polls use a fundamentally different approach than do PVTs for assessing election results. Essentially, exit polls bypass the polling station results and directly reach out to voters to estimate results. This can be helpful in envi-ronments in which polling station fraud is expected or in restricted political environments where observation may not be conducted freely.
• Detecting fraud: Exit polls provide data that is generally indicative of how people voted. A discrepancy between the aggregated choices reported by voters and official results may suggest, but not prove, that results have been tampered with.
• Deterring fraud: Exit polls can deter fraud at the na-tional level when publicized before an election. However, exit polls are conducted outside polling stations, minimiz-ing the deterrence effect on polling station officials.
• Building confidence in the electoral process: If the results of an exit poll match the official results, an exit poll can help boost confidence in electoral process-es. However, the inherent limitations to the accuracy and reliability of projections make it risky to implement exit polls in politically volatile environments.
• Projecting results: Exit polls may provide early projections of results with greater or lesser degrees of accuracy and precision. This tool faces specific challenges with reliability, particularly in transitional, post-conflict, or developing countries. Exit poll projections may differ
Exit poll interview conducted as part of an International Republican Institute (IRI) exit poll of Bangladesh’s 2008 parliamentary elections at the request of the Bangladesh Election Commission.Aminul Ehsan
ASSESSING AND VERIFYING ELECTION RESULTS:A DECISION-MAKER’S GUIDE TO PARALLEL VOTE TABULATION AND OTHER TOOLS
12

from official results and, depending on the closeness of the election result and the level of understanding of exit polls among citizens, they may heighten rather than soothe political tensions.
• Building local capacity for oversight: Exit polls may build local capacity for oversight. Typically exit polls are conducted by professional survey research firms or media organizations that have robust survey research capabilities. In cases in which conducting or analyzing exit polls involves universities, research organizations, or think tanks, the exit polls may build local capacity for election oversight.
• Verifying official results: Exit polls do not provide sufficient evidence to refute or challenge official results, either at the national level or for individual polling sta-tions. Exit polls may reveal a discrepancy between vote choices reported by voters and official results, but any such discrepancy should be interpreted only as a reason to investigate further or to raise questions about the electoral processes.
How can exit polls contribute to other electoral assistance and democracy promotion efforts?
Exit polls collect a variety of useful data that other tools discussed in this manual cannot. Exit polls can include a range of questions designed to yield important information about voter decision-making, as well as to assess the elec-tion results. These data could be used in future activities to encourage political parties and elected officials to pay more attention to citizen concerns. Exit poll data can also help political parties to understand the reasons behind their elec-toral performance by showing what issues motivated voters. Unlike PVT or other data, the data collected in exit polls can be disaggregated by gender, age, and political preference and cross-tabulated against other questions. This enables political actors to obtain a better understanding of the dynamics of voter decision-making.
The rich data that emerges from exit polls can be used to enhance political party assistance programming and can feed into wider DRG programming. In addition to exit polls, surveys of voters before and after elections can provide data to assess and understand electoral dynamics. Such pre- and post-election surveys are described in more detail on page 15.
What are the key considerations and challenges of using exit polls?
Exit polls directly estimate voter intent (through interviews), which is particularly important in contexts in which polling station results are not expected to be credible due to ballot box stuffing or manipulated turnout numbers, and thus where PVTs are not likely to produce reliable data. Those en-vironments, however, are often rife with intimidation or other forms of coercion that may make voters reluctant or unwill-ing to disclose their true preferences to exit poll researchers. In these contexts, exit polls should be used with caution.
Although exit polls offer benefits for understanding electoral and political processes, they also face considerable method-ological limitations, particularly in transitional, developing, or post-conflict settings, for the following reasons.
• Exitpollsareconductedoutsideofpollingstationsandgatherdatafromvotersaftertheyhaveleftpollingstations.As such, organizations implementing exit polls do not directly observe voting, counting, and other polling sta-tion processes, which limits their power to supplement their results data with analysis and perceptions of trained observers.
• Insomesettings,votersmaynotrespondaccuratelytosur-veyinterviewers.This “falsification error” occurs because voters do not trust the motives of the interviewer or they fear reprisals for reporting their vote. Rather than accurately reporting how they voted, voters might pro-vide the response they think is “correct” from the point of view of an authority.
• Becausevotershavetoagreetoparticipate,exitpollssufferfrom“nonresponseerror,”aspecificselectionbiascausedbyvotersunwillingtotakepartinthesurvey.Nonresponse might be a particular problem in highly polarized, con-flict-affected, or intimidating political environments.
• Duetothesemethodologicallimitations,donorsandimplementersfaceasignificantriskwhenusingexitpollsindevelopingortransitionalcountries,especiallythosewithdeeplypolarizedpoliticsandahistoryoforpotentialforelectoralviolence.In a 2011 study, Democracy Interna-tional concluded, “Exit polls have important limitations that need to be considered before they can be thought of as a reasonable alternative to PVTs for verifying vote counts. These limitations include the extent to which voters will not participate or may not provide candid
ASSESSING AND VERIFYING ELECTION RESULTS:A DECISION-MAKER’S GUIDE TO PARALLEL VOTE TABULATION AND OTHER TOOLS
13

information to unfamiliar questioners.…Exit polls may be especially unreliable in transitional or post conflict envi-ronments.”11 Exit polls are best suited to contexts where the risk of election violence is low, election dispute resolution mechanisms are highly institutionalized, and the public understands that exit polls merely estimate voter intent.
• ExitpollsalsoaresubjecttomanyofthesamechallengesthatfacePVTs.On their own, exit polls do not speak to the quality of the overall electoral process, and they can risk legitimizing a flawed outcome, especially when vot-ers hide their true preferences from interviewers. Like PVTs, exit polls do not include votes cast before election day or out of the country. Their quality can suffer in large countries or in those affected by conflict or with diffi-cult geography; they are complicated by elections with numerous electoral districts; and they can also become focal points in politically charged environments or where election results are contested.
USAID and its partners have used exit polls most often to assess election results in countries where it has not been possible or viable to conduct PVTs. These include challenging environments where polling station results are not posted, polling station results are not credible, or observers are de-nied access to polling stations. While PVTs are the preferred tool for verifying election results, there are cases where conducting a PVT may not be possible. Exit polls are a useful, if less conclusive, tool in the toolkit for broadly assessing and better understanding results in these cases.
ELECTION FORENSICS
Election forensics is an emerging field that involves post-elec-tion statistical analyses of results and other official data to identify possible irregularities. Originally developed by academics to conduct post-election analysis and research, local observation groups are increasingly using election forensics to supplement their efforts. These statistical tools target anomalies in election data to identify particular cases,
John Smith-Sreen, USAID/Kenya
Voting at Mji Wa Huruma polling station in Nairobi during Kenya’s 2013 general election.
ASSESSING AND VERIFYING ELECTION RESULTS:A DECISION-MAKER’S GUIDE TO PARALLEL VOTE TABULATION AND OTHER TOOLS
14

PRE- AND POST-ELECTION SURVEYSPublic opinion surveys, including pre- and post-election surveys, can provide helpful information about the polit-ical climate in a particular country and should be considered as part of an electoral assistance strategy. In combination with other sources of data, the results of these surveys can be used to analyze public opinion and raise questions about election results. Like exit polls, however, pre- and post-election surveys on their own are inconclusive.
What:
Pre- and post-election surveys are nationwide surveys of citizens conducted directly before or after an election. These surveys can gather data regarding citizens’ political preferences before an election or how they voted after an election. Pre-election surveys are conducted as close to an election as possible but before the election occurs. Respondents are asked whether they intend to vote, for whom, and why. Post-election surveys, which are usually conducted within one to three weeks after an election, ask respondents whether they voted, which candidate(s) they supported, and their reasons for these decisions. Like exit polls, these data provide an indication of voting patterns but they do not conclusively determine which party or candidates prevailed. Pre- and post-election surveys can be used to better understand citizens’ experiences with electoral processes, policy leanings, and the drivers of voter preferenc-es. They differ from exit polls in where the survey takes place. Rather than targeting voters as they come out of the polling station, pre- and post-election survey researchers interview citizens in their own homes or on the phone.
Who:
Professional survey organizations are typically hired to conduct the fieldwork and manage the data collection process. Developing appropriate survey methodology, interviewing a random sample of citizens, providing effective quality con-trol, and analyzing survey results require considerable technical skills.
Important uses:
Pre- and post-election surveys can provide valuable information about the political climate around an election. Pre- and post-election surveys give researchers a way to measure citizens’ expectations and perceptions of the electoral process during the campaign period and to compare those to actual experiences on election day. Information can also be disaggregated by segment of the population. Disaggregation might allow organizations to analyze women’s policy preferences and experiences with electoral processes, for instance. If a pre-election survey is conducted well before an election, the results can be used to inform other electoral assistance activities, such as voter education or electoral commission support. In addition, these surveys can be used to estimate turnout, which can be important in restrictive environments. They can also serve as tools in closed or closing environments to gather information where PVTs and exit polls may be difficult or impossible to conduct. Surveys can gather useful information in contexts where PVTs are not productive, such as non-competitive political environments where election results are foregone conclusions or where there is considerable voter intimidation.
Limitations:
Like exit polls, pre- and post-election surveys are affected by respondent bias. Post-election surveys are typically con-ducted several weeks after the election, which allows time for memories to fade, to be rationalized, or to be manipu-lated or influenced by subsequent events. It is important to be cognizant of biases that may result from fading memory or bandwagon effects that influence voters to change their answers after knowing the results of the election.
ASSESSING AND VERIFYING ELECTION RESULTS:A DECISION-MAKER’S GUIDE TO PARALLEL VOTE TABULATION AND OTHER TOOLS
15

locations, or irregularities that merit further investigation or suggest fraud. Statistical analysis can determine, for exam-ple, if election turnout or the incidence of spoiled ballots is distributed normally. Election forensics is a form of statistical analysis, focusing on polling station results, that can detect but not explain anomalies.
What is election forensics?
Election forensics is a field of statistical analysis using offi-cial data released by electoral authorities to detect specific anomalies. Researchers and election monitors can use election forensics to detect potential electoral manipulation by analyzing turnout aberrations and candidate vote shares, among other measures. Based on local political knowledge of issues such as voter turnout, demographics, and voter preferences, researchers can make assumptions about the distribution of each of these indicators. Sudden or large shifts in voting patterns that do not coincide with expectations or political trends may indicate irregularities.12
To study the results of Ukraine’s controversial 2004 presi-dential runoff election, for example, researchers conducted statistical analysis of post-election data to identify indicators of potential manipulation. In an examination of the vote tabu-lations for the second-round elections, the team detected voter turnout patterns that differed significantly from histor-ical trends, which corresponded to widespread accusations of fraud and vote manipulation. Data from the third round, which was widely accepted as more democratic, had a more normal distribution.13
Election forensics relies on a wide range of data to identify ir-regularities. Much like fraud detection in other industries (e.g., credit card transactions), election forensics can utilize any type of data that might be produced (and made available) during an election. Election observer groups and academics use a broad range of sources to create models of expected behavior. Because these models are based on real data, more data collected over a long period of time enables users to improve upon the models.
Importantly, election forensics often requires the availability of official election results data at the polling station level. Election forensics is therefore critically constrained when polling-station level results are not made available on a timely basis—or never released at all. As a result, the findings of
election forensics analysis often come too late to meaning-fully affect the electoral process. Conversely, because election forensics activities use official results data they do not require additional independent data-collection efforts. This can be beneficial in an environment in which collecting data on elec-tion day is not possible due to security concerns or political restrictions.
While election forensics has traditionally been the domain of academics, some election observer groups are increasingly incorporating statistical analyses of turnout, rates of invalid ballots, and election results into their observation techniques. Local observation groups, media organizations, and political parties in some Latin American and Eastern European coun-tries have used election forensics tools to analyze election data. These groups are developing their election forensics capacities by hiring foreign consultants, working with inter-national organizations providing technical assistance, and employing skilled local statisticians. The analyses these groups can conduct are based on the amount and type of official data released. In Latin America and Eastern Europe, where official national and local election data are typically released quickly, groups are increasingly gathering and analyzing official data between elections so that they have comparative data for election analysis. These groups are also collecting data from tally sheets at polling stations on election day to use in their analyses. In advance of recent local elections in Georgia, for example, the International Society for Fair Elections and Democracy (ISFED) gathered and analyzed local election data from previous elections so it had data to compare with the rate of invalid ballots in the 2014 local elections. Having trend data and analysis on hand enabled ISFED to rapidly an-alyze and identify a higher rate of invalid ballots in the 2014 election immediately upon the release of this data.
How can election forensics be used to assess election results?
Election forensics in its current practice remains a limited tool used primarily to detect anomalies that may indicate fraud once official results are available. Moreover, the ability of forensics to detect fraud is context- and data-specific, and the election forensics findings serve as indicators of potential manipulation rather than as definitive evidence.
Election forensics may be particularly useful when it is not possible to conduct either a PVT or exit poll. Election foren-
ASSESSING AND VERIFYING ELECTION RESULTS:A DECISION-MAKER’S GUIDE TO PARALLEL VOTE TABULATION AND OTHER TOOLS
16

sics may also be instrumental when the overall goal is specifi-cally to analyze data in the post-election period—for exam-ple, the initial or diagnostic stage of a post-election recount or audit—or as part of research regarding voting patterns.
• Detecting fraud: Election forensics cannot directly detect fraud, but it can identify irregular patterns that raise questions about election results data and merit fur-ther investigation. The type of statistical analysis used in election forensics can detect but not explain anomalies, which may be due to reasons other than fraud.
• Deterring fraud: Election forensics are not likely to deter fraud because most of these analyses are conduct-ed after official election results have been released and generally well after there is any opportunity to affect the process. As observer groups begin to incorporate sta-tistical methods into their analyses, the deterrent effect could increase.
• Building confidence in the electoral process: To the extent they support reported results, election foren-sics can build public confidence in a particular election after the fact. However, these analyses are not often well publicized and in many cases are released long after the attention on an election has faded.
• Projecting results: Election forensics cannot project election results because they do not provide an inde-pendent approximation of the results and are conducted after the electoral process is complete.
• Building local capacity for oversight: Most election forensics methods require specialized skills that few civil society organizations possess. Less complex types of analyses, however, are increasingly being used to com-plement election observation activities. For example, fo-rensic analysis can identify whether votes for a particular candidate are abnormally high at one or more specific polling stations or whether voter turnout is distributed according to the norm, based on past elections.
• Verifying official results: Election forensics do not provide sufficient evidence to verify or call into question official election results. They can only identify irregular patterns that raise questions for further investigation.
CONCLUSIONS
This section has provided an overview of PVTs and other tools that can be used to assess and verify election results in different ways and with differing degrees of accuracy and utility. As noted above, in most cases PVT is the preferred tool because it can accurately project election results and measure manipulation in the aggregation of results. Moreover, PVT observers should also systematically collect polling-sta-tion process data to add context to PVT results. While no assessment approach on its own is conclusive and definitive in verifying results, PVTs provide the strongest evidence to substantiate or call into question the official results, particu-larly when trained PVT observers have collected both results and process data.
Compared to PVTs, exit polls have significant limitations in developing, transitional, and post-conflict countries. Selection and falsification biases decrease the reliability and accuracy of exit polls. However, exit polls may play an important role in political environments where observation is restricted or polling station results are not credible. By essentially by-passing the polling station results, exit polls can help assess whether the election result reflects the will and intent of voters. Exit polls also are useful tools for gathering data that enables a deeper understanding of the social and political dy-namics that drive voters, which can be used to inform future democracy, human rights, and governance programming.
Election forensics provides an opportunity to assess election results after an election has occurred and without having to collect new data, but this type of analysis is limited in what it can accomplish. These analyses are often dependent on the availability of polling-station-level election data and on the availability of historical data to use as a comparison.
The various methods discussed here are able to detect spe-cific types of fraud, but by themselves are not able to shed light on many forms of electoral manipulation before and af-ter election day that can only be assessed through systematic and comprehensive observation. The importance of assessing the broader electoral process cannot be overemphasized; without evaluating broader electoral processes, election ob-servers are not able to interpret their results data and situate it within a broader assessment of the electoral process.
ASSESSING AND VERIFYING ELECTION RESULTS:A DECISION-MAKER’S GUIDE TO PARALLEL VOTE TABULATION AND OTHER TOOLS
17

SECTION 2
DECIDING WHETHER TO USE A TOOL FOR ASSESSING AND VERIFYING ELECTION RESULTS
A central goal of this guide is to assist USAID DRG officers in making sound decisions on incorporating methods for assessing and verifying election results
into their electoral assistance portfolios. USAID DRG officers and other stakeholders should remember that the activities discussed here should be used in conjunction with other monitoring tools. Comprehensive, long-term election monitoring should provide the foundation for any electoral oversight effort.
It is important to objectively and systematically evaluate several key factors to determine whether or not conduct-ing activities to assess and verify election results assessment makes sense in a given context.
This section introduces six discrete steps that decision-mak-ers can use to consider whether election results assessment and verification is appropriate to a specific context: (1) assess the context; (2) define the purpose; (3) assess local capacity; (4) identify the specific risks associated with assessing and verifying election results; (5) conduct a cost-benefit analysis and assess the timeline; and (6) synthesize this information to decide whether to implement an election results assess-ment or verification activity. (See the chart on page 19 for an overview of these steps.) For DRG officers in particular, this decision-making framework should also be useful in develop-ing statements of work or reviewing proposals. Where some of these questions apply to a particular tool, such as PVTs, it is noted in the text in the relevant section.
STEP 1 – ASSESS THE CONTEXT
In deciding whether to include activities to assess and verify election results in an electoral assistance strategy, it is import-ant to assess whether such an activity is appropriate or even possible. A number of contextual factors may greatly increase
the complexity of implementing an assessment activity or make it unviable. Specifically, decision-makers should ask:
• What types of electoral problems may occur? As part of electoral assistance planning, it is important to identify the kinds of fraud or irregularities that have been observed or alleged in recent past elections or seem possible or likely in the upcoming election. This should include an assessment of the capabilities and historical performance of electoral authorities. Donors also should seek the views of a range of domestic stakeholders and their concerns about the process.
Of the wide array of electoral manipulation that re-gimes can employ, only a few can be detected by the tools discussed in this manual. As noted earlier, regimes are using more sophisticated electoral manipulation, as they move away from direct manipulation of election results to instead change the rules or take other steps to put opponents at a disadvantage. Regimes may use the police force or other resources to make it difficult for candidates and parties to freely campaign or for voters, observers, and the media to carry out their responsi-bilities on election day. Creating additional check-points, blocking telecommunications channels, or refusing to accredit observers are among the many tactics that a regime might employ. In such cases, rather than focusing attention on the vote count, it may be more appropriate to consider other types of oversight and observation tools that look at other aspects of the electoral cycle or to support advocacy approaches that directly address unfair aspects of the electoral system.
• What type of election is being held? PVTs and exit polls are best able to deal with national elections or referendums when a single or small number of constitu-encies or districts pose a direct choice among particular candidates or parties. Legislative and local elections with
ASSESSING AND VERIFYING ELECTION RESULTS:A DECISION-MAKER’S GUIDE TO PARALLEL VOTE TABULATION AND OTHER TOOLS
18

DECIDING WHETHER TO USE A TOOL FOR ASSESSING AND VERIFYING ELECTION RESULTS
STEP 1 – ASSESS THE CONTEXT
• What types of electoral problems may occur?
• What type of election is being held?
• What are the characteristics of the electoral system?
• What level of electoral competition is expected?
• What is the security context in the country?
• Will all parts of the country, polling stations, and necessary information be accessible?
• What laws or regulations exist that may affect implementation?
STEP 2 – DEFINE THE PURPOSE
• Detect electoral fraud
• Deter electoral fraud
• Build confidence in electoral processes
• Provide a projection of results
• Build local capacity for oversight
• Verify official results
STEP 3 – ASSESS EXTENT OF LOCAL CAPACITY
• Are potential local partners viewed as neutral and independent?
• Do available local partners have the necessary operational and technical capacity?
• Is the local partner a single group or a coalition?
STEP 4 – IDENTIFY AND ASSESS POSSIBLE RISKS
• What are the potential assessment outcomes and possible political implications?
• Is there a risk of legitimizing an otherwise flawed election?
• What is the potential for technical or other implementation problems?
• What are the goals and expectations of domestic election observation groups?
• What are the inherent limitations of tools used to assess and verify elections?
STEP 5 – COST BENEFIT ANALYSIS AND TIMELINE
• Estimate and consider costs
• Consider the timeline
STEP 6 – SYNTHESIZE ASSESSMENT FINDINGS TO MAKE DECISIONS
ASSESSING AND VERIFYING ELECTION RESULTS:A DECISION-MAKER’S GUIDE TO PARALLEL VOTE TABULATION AND OTHER TOOLS
19

numerous constituencies pose greater administrative and organizational challenges because each district requires its own sample. In addition, some districts may be so small that sampling is not appropriate and full coverage would be necessary. While it is possible to conduct a PVT or exit poll at the local or legislative level, this great-ly increases the complexity of the exercise, the difficulty of data collection, and consequently cost.
• What are the characteristics of the electoral system? The electoral system can either facilitate or burden the task of assessing and verifying results. Among the questions to consider in a presidential election is whether a plurality will suffice to win the election or a runoff will be required if no candidate receives an ab-solute majority. A run-off system with a second election may require two separate assessment or verification exercises.
Similarly, the number of electoral districts matters. Con-ducting results assessment or verification for a propor-tional representation system with one national district is vastly easier than trying to assess the results from dozens or hundreds of single-member districts. The fragmen-tation of effort across many smaller districts greatly increases the logistical, financial, and human resource re-quirements. If the intent is to assess results for individual seats (as in a parliamentary election) or the results from
particular states (as in a gubernatorial election or a pres-idential election where a candidate must win a majority of the states), then implementers must understand how seats are allocated.
Electronic voting systems, used increasingly often around the world, add to the challenges of observation and results assessment. Direct observation of the voting and counting cannot generally be conducted in electronic voting systems. However, where the electronic voting system generates polling-station-level tally sheets, a PVT can still be used to project results and to assess the existence of tabulation fraud between polling-station and national levels.
• What level of electoral competition is expect-ed? Understanding the degree of genuine political competition in an election can help determine the need and purpose of the activity to assess or verify election results. When a landslide victory is expected and there is no significant likelihood of manipulation, detecting fraud or projecting results may be unnecessary. Conversely, if genuine political competition is restricted, then verifying or assessing results may be counterproductive because it could give legitimacy to the outcome of an unfair and uncompetitive process. It is often difficult to predict in advance how competitive an election will be, however. It is important that donors do not make decisions regard-
Democracy International
Campaign flyers in Bangladesh.
ASSESSING AND VERIFYING ELECTION RESULTS:A DECISION-MAKER’S GUIDE TO PARALLEL VOTE TABULATION AND OTHER TOOLS
20

ing the competitive nature of an election too early.
Implementing tools to assess and verify election results can be important in close elections for two reasons. First, a closely contested election may create added incentives for certain parties or candidates to commit fraud to ensure victory. Second, when an election is close losing parties or candidates may question the election results even in the absence of fraud. In these cases, a PVT can be helpful both in deterring fraud and in building confi-dence in the results, which in turn can help to dissuade losing candidates from making unfounded accusations or challenging the results. However, it is important to recognize that a PVT cannot project a winner when the results of an election fall within the margin of error for a PVT (e.g., the top two candidates are separated by 1% of votes but the margin of error for a PVT is ±2.5%).
• What is the security context in the country? There are many dimensions to security considerations. The ability to ensure the safety of observers and of the data collected is of the utmost importance. Given the potentially destabilizing effects of elections, it is necessary to consider not only the existing security context, but also the possibility of increased instability during or after the election. In addition, donors should take into account the potential for local partners to be harassed or target-ed for attack.
Security issues in the election environment can also prevent specific tools from being implemented effec-tively. Environments with a history of voter intimidation sometimes preclude exit polling. Obtaining a statistically valid sample of polling stations can be difficult or even impossible if security considerations prevent observers from reaching assigned polling stations.
• Will all parts of the country, polling stations, and necessary information be accessible? PVTs require access to relevant political stakeholders, election officials, and information about the electoral process, especially the number and location of polling stations, which are needed to develop the sample. On election day, observer access to polling stations, the vote counting process, and the tally sheets are vital for a credible PVT. Access to polling stations to gather enough data for a statistically significant result may be limited not only by security factors, but also by geography and the availability of roads, transportation, and communications networks.
For election forensics, timely access to polling-station-lev-el results is critical.
• What laws or regulations exist that may affect implementation? Some countries may have strict rules for accreditation and observer access to polling sta-tions, while others may prohibit any independent group from projecting election results, such as those from a PVT or exit poll, until after official results are announced.
UKRAINE: CONDUCTING A PVT IN A DIFFICULT SECURITY ENVIRONMENT
A local election monitoring group, OPORA, conducted a PVT of the pre-term presidential election held in Ukraine on May 25, 2014. The group faced considerable constraints given the security situation in the eastern part of the country, but innovative solutions allowed the group to conduct a successful PVT in all parts of the country. First, OPORA was unsure of the access it would have to the precinct election commissions (PECs) due to the security situa-tion. To address this challenge, the PVT included a larger-than-planned sample size to allow the PVT to cover more PECs and made some additional modifications to the sample model to allow the group to draw conclusions from the data collected, despite some potentially inac-cessible or non-operational PECs. Second, there was the potential for physical risk to the PVT monitors due to the security situation. To ad-dress this risk, OPORA set up a mapping system based on the risk assessment level and put in specific protocols for PVT observers to main-tain their safety and instituted a warning and check-in system. Third, OPORA faced an infor-mation risk, fearing data could be compromised in the east given the tense political environment. OPORA instituted special ID codes which only PVT monitors knew to activate their phones and report the data collected.
ASSESSING AND VERIFYING ELECTION RESULTS:A DECISION-MAKER’S GUIDE TO PARALLEL VOTE TABULATION AND OTHER TOOLS
21

STEP 2 – DEFINE THE PURPOSE
Tools for assessing and verifying election results may serve several different purposes. DRG officers must determine what they hope to achieve by using the tools based on the specific country context and considerations outlined in Step 1. DRG officers should consider and identify which of these purposes, discussed in greater detail in Section One, are relevant to their specific environment:
• Detect electoral fraud
• Deter electoral fraud
• Build confidence in electoral processes
• Provide a projection of results
• Build local capacity for oversight
• Verify official results
STEP 3 – ASSESS EXTENT OF LOCAL CAPACITY
Successful activities to assess and verify election results are conducted by implementers with good knowledge of the local political and social context, as well as with the political savvy to manage results appropriately. Depending on the tool, local implementers may include election monitoring groups, polling firms, universities, think tanks, or groups of
independent researchers. Specific questions to consider regarding local capacity include:
• Are potential local partners viewed as neutral and independent? Local partners that are seen as legitimate, politically neutral, and independent are key to a credible assessment. It is important for donors and their international partners to be aware of local attitudes and to work with the local partners to overcome any perceptions of bias.
• Do available local partners have the necessary operational and technical capacity? Given the high degree of accuracy and precision required, local partners need a wide range of capabilities, including the ability to:
• Effectively apply appropriate statistical methodolo-gies, including drawing a representative sample;
• Manage donor funds and comply with reporting requirements;
• Recruit, train, and deploy hundreds or thousands of volunteers on a national scale;
• Develop and test a system for data collection and reporting;
• Accurately and quickly collect and report data from a specific set of locations on election day (with very
ASSESSING AND VERIFYING ELECTION RESULTS:A DECISION-MAKER’S GUIDE TO PARALLEL VOTE TABULATION AND OTHER TOOLS
22
A voter fills in her ballot paper during the snap parliamentary election held in Ukraine on September 30, 2007.
Viktor Drachev/AFP

low tolerance for missing data points);
• Analyze data collected and draw conclusions;
• Make potentially politically difficult decisions about how, if, and when to release results; and
• Manage relationships with the media, political parties, and election officials.
Many of these capabilities are not required by non-sam-ple-based election observation, and local civil society groups may require greater increases in organizational capacity than a donor may initially suspect. When signifi-cant capacity gaps are noted, international implementing partners can provide technical assistance and help with quality control.
• Is the local partner a single group or a coali-tion? Implementers may choose to partner with a single local organization if the organization has the necessary capacity. In many countries, however, coalitions are needed to ensure national coverage and capacity or help build broad-based support for the effort. Coalitions often struggle with issues of unity and speaking with one voice, making implementation and communications much more challenging, but they often have broader support, further reach, and/or greater legitimacy than does any individual entity.
ZAMBIA: CONFIRMING OFFICIAL RESULTS CONSISTENT WITH PVT RESULTS
Zambia’s President Michael Sata died in October 2014, triggering a constitutionally required by-election within ninety days. An election on such a short timeline creates logistical and political challenges for any country. Organizing robust election observa-tion within that timeframe poses its own challenges. Zambia’s Christian Churches Monitoring Group (CCMG), with support from the National Democratic Institute (NDI), mounted an observation program that featured a PVT. This was possible in the short time frame available only because one member of the CCMG coalition had conducted a PVT with NDI in a previous election and thus was able to build on that existing relationship and capacity.
CCMG fielded PVT observers in 703 polling streams, at 501 polling stations, in every province, all districts, and all 150 con-stituencies. CCMG was successful in producing a high response rate, topping 99%, from observers. The official election results announced by the Electoral Commission of Zambia (ECZ) were very close, with the top two candidates 1.66% apart; this was well within the PVT’s ±3.7% margin of error. Constraints brought about by the short period of time to recruit and train PVT monitors, combined with the unique dynamics of vote distribution for this particular election, made the margin of error slightly greater than generally expected from a PVT.
Although the PVT was unable to project the winner, given the close results, it did build confidence by confirming that official results were consistent with PVT results. CCMG’s carefully worded statement concluded, “Official results as announced by the ECZ are consistent with CCMG’s PVT estimates. This means that the official result for every candidate falls within CCMG’s PVT estimated range. For example, the ECZ has announced that Hakainde Hichilema of UPND received 46.7% of the vote and CCMG’s PVT estimates he should receive between 46.2% ±3.7%. Similarly, the PF’s Edgar Lungu received 48.3% of the vote according to the ECZ, and CCMG’s PVT estimates he should receive 48.6% ±3.7% of the vote. In both examples, the ECZ’s official result falls within CCMG’s PVT estimated range.”
CCMG PVT observers also collected data on the voting and counting processes. Their observation that there were no sig-nificant problems in voting and counting reinforced the PVT findings. CCMG concluded, “Zambians should have considerable confidence that the official results as announced by the ECZ reflect the ballots cast at polling stations. Not only are the ECZ’s official results consistent with the PVT estimates, but, as CCMG indicated in its preliminary statement, voting and counting proceeded with only minor issues at the overwhelming majority of polling stations and polling streams.”
ASSESSING AND VERIFYING ELECTION RESULTS:A DECISION-MAKER’S GUIDE TO PARALLEL VOTE TABULATION AND OTHER TOOLS
23

STEP 4 – IDENTIFY AND ASSESS POSSIBLE RISKS
Supporting the independent assessment and verification of election results is an inherently sensitive task. These tools al-low civil society to scrutinize elections, which are among the most high-stakes of all political events. Whether these activ-ities ultimately support the official results or raise questions about an election’s legitimacy, the outcome has significant im-plications that extend beyond the candidates. These activities may generate input or reactions from a wide range of inter-national political and diplomatic organizations as well as from local political actors and citizens. Donors and implementing organizations should plan accordingly. Donor-supported techniques for assessing and verifying results can be effective for increasing accountability, but they must be carried out with caution and uncompromisingly high standards.
Specific questions to consider include:
• What are the potential assessment outcomes and possible political implications? In the best-case scenario, PVTs (and in some cases, exit polls) provide a quick projection of results, reducing uncertain-ty and discouraging unfounded claims of fraud. However, projected results can also become a focal point in a close or contested election, where candidates, political parties, and the media seek a third-party confirmation of election results. Once election data and projected results are released to the public, they can become fodder for local or international political agendas. As a result, PVT and/or exit poll methodologies must stand up to the strictest scrutiny and be methodologically defensible regardless of the result.
There are at least four possible scenarios, each of which can have different political implications. The first scenario deals with whether PVT or exit poll results should be re-leased at all, and the remaining scenarios deal with how
Democracy International
Afghan women casting their votes in Afghanistan’s presidential election in August 2009.
ASSESSING AND VERIFYING ELECTION RESULTS:A DECISION-MAKER’S GUIDE TO PARALLEL VOTE TABULATION AND OTHER TOOLS
24

PVT or exit poll results agree with, disagree with, or are inconclusive when they are compared to official results.
Scenario One: Projected results are not released due to a highly flawed process.
In situations where election day processes were highly problematic, the local partner may decide not to release PVT or exit poll results to avoid validating a flawed process. In rare cases, the process may be so flawed on election day that the official results, regardless of which contestant won, do not reflect the will of the people. For example, PVTs that collect process data may reveal that large numbers of registered voters have been removed from the voter lists used on election day and therefore they have been unfairly denied their right to vote. Disenfranchisement of a large swath of voters would dramatically affect the outcome of the election. In this scenario, analysis of the data on election day processes may provide evidence on what went wrong and offer an explanation as to why the official results are not to be trusted. Donors and implementers need to carefully consider this scenario and avoid legitimizing a bad process. However, a decision not to release data is one that should be made cautiously and in the context of compelling evidence of manipulation, as it could be misinterpreted by media and local actors as an attempt to withhold information.
Scenario Two: Projected results are consistent with official reported results.
These situations can have a calming effect by building confidence in the official results. When losing candidates resist conceding, the risk of conflict remains high. Inde-pendent and credible assessments can encourage losing candidates to drop unwarranted allegations of fraud and to concede the election to the winning candidate. Particularly when supported by other information, including PVT process data and comprehensive obser-vation of the overall electoral process, this may lead to a more peaceful and credible process and build public confidence in both newly elected representatives and electoral authorities.
Scenario Three: Projected results are inconclusive.
In some cases, the results of a PVT or exit poll exercise may result in a statistical dead heat, whereby the project-ed vote totals of two (or more) candidates are marked
by overlapping margins of error. A variant of this scenario can occur when an assessment is unable to definitively show that a single candidate has surpassed a required vote percentage threshold (e.g., an absolute majority in a first round of voting) because the margin of error for a single candidate includes but does not fully exceed the threshold. This can cause confusion among the media and the voting public, as technical explanations of mar-gins of error may fail to appease concerned stakeholders. It is precisely in very close elections where independent results will be sought most, however, and where these tools will have the least to say. It is essential that local partners do not overstate what their findings are able to accomplish. (For a positive example, see the description of Zambia’s 2015 election on page 23.) In these cases, PVT process data and findings from comprehensive observation can help local partners and donors know whether to have confidence in official results.
Scenario Four: Projected results are not consistent with the official reported results.
This is of course the most politically sensitive scenario. Independent projections of results that do not coin-cide with official results may indicate tabulation fraud or mismanagement, particularly in the case of PVTs. In these cases, it is important to consider whether other information, including PVT process data and comprehen-sive election observation findings, reinforce suspicions of fraud. If these data also support this finding, then there is a more solid basis for the observation group to publicly question results. Other possible explanations for results that fail to match include administrative or technical failure by the group implementing the PVT, or mistakes or other malpractice by election officials.
Contested election results increase the risk of electoral violence. Evidence of manipulation can help citizens hold officials accountable and seek a peaceful and just resolu-tion to a disputed election.
• Is there a risk of legitimizing an otherwise flawed election? In some environments, election results assessment and verification tools can be a useful and appropriate complement to existing election obser-vation plans. In others, a pattern of pre-electoral manip-ulation of the legal framework and constrained political environment may make the accuracy of the official results virtually irrelevant. Where political parties cannot campaign freely or where voters are subject to intimida-
ASSESSING AND VERIFYING ELECTION RESULTS:A DECISION-MAKER’S GUIDE TO PARALLEL VOTE TABULATION AND OTHER TOOLS
25

tion, for instance, an accurate vote count says little about whether the election reflects the will of the people. In these environments, serious consideration should be giv-en to bolstering a range of other monitoring efforts that can shine a spotlight where it is most needed. Rigorous, long-term monitoring can provide much-needed over-sight for voter registration, election law reform, candidate registration, and other key processes.
As discussed previously, PVTs and (to a lesser extent) exit polls assess whether fraud occurred in the tabu-lation of the vote count. However, these tools do not speak to the fairness of the overall election. The election may have occurred in an environment characterized by restrictions on opposition parties, voter disenfranchise-ment, or a host of other types of electoral manipulation. In these contexts, regimes may tout a finding that verifies the official election result as a means of legitimizing a process despite the fact that it does not represent the will of the people. This underscores the importance of assessing election results as part of a comprehensive observation program.
• What is the potential for technical or other implementation problems? PVTs in particular are technically and operationally complex exercises. Any number of technical and/or operational problems could present challenges on election day. Communications or power failures may prevent the tabulation of data on
election night. Observers may not show up on election day, leading to data gaps that threaten the validity of the sample. Logistical preparedness, contingency planning, and the use of international advisors can mitigate these risks.
• What are the goals and expectations of domes-tic election observation groups? USAID generally supports independent, citizen-based groups that con-duct oversight over political processes in their countries. These groups craft their own public statements and de-termine their timing of release of results, which may not coincide completely with the expectations of donors.
• What are the inherent limitations of tools used to assess and verify election results? The previous section provides a lengthy discussion of the inherent limitations and risks of each tool. As discussed, PVTs can provide strong evidence of vote tabulation fraud with a high degree of accuracy, but they require significant capacity to implement. Exit polls can collect important data for understanding voter intent and providing insight into underlying political and social dynamics, but provide limited hard evidence of manipulation. Election forensics can also provide information to aid understanding of voting patterns over time or to identify voting anomalies, but often take weeks or months after an election to be completed. All of these tools provide information only about election day processes and results and not the
ASSESSING AND VERIFYING ELECTION RESULTS:A DECISION-MAKER’S GUIDE TO PARALLEL VOTE TABULATION AND OTHER TOOLS
26
Poll workers fill out election forms after polls close for Zambia’s presidential election held on January 20, 2015.
Carol Sahley, USAID

overall quality of an election or the range of manipula-tion that may occur before election day.
STEP 5 – COST BENEFIT ANALYSIS AND TIMELINE
Donors should consider the costs and tradeoffs associated with funding an assessment or verification tool. It is also nec-essary for donors to make a realistic estimate of the neces-sary timeline for implementation to determine whether this is possible or advisable.
ESTIMATE AND CONSIDER COSTS
Cost considerations play an important role in the design of any assessment or verification exercise. Ensuring small margins of error and high degrees of confidence increase the cost of any kind of quantitative research, including both PVTs and exit polls. Variables that affect cost include:
• Speed. In a given electoral context, donors and their implementing partners should determine when results are needed. Increased speed generally increases costs, but speed may be more important in some cases than in others. If the donor and implementing partner think a regime may engage in tabulation fraud in a close elec-tion, for instance, releasing PVT results before the official results (if permitted) could deter the release of falsified numbers. It is important to recognize that there may be a number of obstacles to speedy results. For instance, limited telecommunications networks may hamper the ability to obtain results from polling stations in an expe-dient manner.
• Precision. There are also costs associated with in-creased precision (i.e., smaller margin of error). There is a minimal threshold of acceptable precision, but marginal gains in precision above that threshold can dramatical-ly drive up cost and complexity. Before deciding on a desired level of precision, a realistic assessment should be made regarding the need for information, the situ-ational constraints on statistical rigor, and the potential for political volatility. Overall, efforts should strive for as much precision as possible within the context of what is feasible and cost effective.
• Complexity. Because PVTs and exit polls require observers or researchers to physically visit a large number of specific locations on election day, the overall complexity of the exercise— including the accessibility of
polling stations, the size of the country, and the type of electoral system—have a significant impact on the over-all cost. In a country that lacks adequate transportation infrastructure, for example, it may be difficult to collect data from a random sample of polling places without a significant investment that may be unwarranted. Similarly, when a country’s electoral system requires presidential candidates to win a majority of the national vote and a majority in more than half of the states or provinces, implementers have to simultaneously conduct nation-al- and state-level activities, which greatly increases the complexity and cost.
• Technology. Another consideration involves managing technology and systems for reporting and communica-tion, and for data aggregation and analysis. In general, the use of more complex technology or systems raises the costs of the exercise and the risk of technical failure. It is often not only possible but desirable to take a “low tech” approach to technology and systems, as long as these produce rigorous, timely results. One example of an effective but relatively low-tech approach is having a cen-tral “phone bank” of mobile phones that observers can use to report back their polling station and vote count numbers by text message. Of course, there are often advantages to more complex technology. Using more advanced technology typically increases the speed of results reporting and minimizes human error. Technology that reduces the number of times a person must input data to the reporting system, for instance, can reduce basic data-entry errors.
Some PVTs have been done at considerable cost due to the creation of new, built-from-scratch solutions for data collection, storage, and analysis. Inexpensive mobile phone SMS reporting or open-source or off-the-shelf data management solutions can help reduce costs. Assessing the relative costs and benefits of any technology needs to take into account the context in which the technology is to be deployed. Issues related to mobile network coverage or internet penetration may affect the desirability of certain alternatives, as can the need for back up systems for every part of the process. Donors should be especially wary of funding an exercise that uses more complex, costly, or custom technology solutions than the needs of the assessment activity and country context require. Regardless, back-up systems need to be in place for every part of the process.
ASSESSING AND VERIFYING ELECTION RESULTS:A DECISION-MAKER’S GUIDE TO PARALLEL VOTE TABULATION AND OTHER TOOLS
27

• Need for capacity building of local partners. Local partners require not only technical expertise but also significant institutional capacity, including manage-ment and accounting abilities. If a local organization has limited capabilities, the donor will need to begin capacity building support very early in the electoral cycle, begin-ning at least 12 months before an election.
• The number of contests. The size and costs of an activity will vary depending on the number of contests. In some cases, an activity will be conducted for a presi-dential election that has just one election round, while in other cases it may involve a parliamentary election with numerous single-member districts.
CONSIDER THE TIMELINE
Donors should conduct an analysis of the electoral calendar to determine the feasibility of planning and implementing a
high-quality exercise to assess or verify election results in the time available. In contexts in which final election dates have not been announced, it is important to start the planning and initial implementation early.
In general, the same factors that increase cost will also increase the amount of time a donor needs to design into its project. Specifically, the amount of capacity building that a local group will need should be the primary driver of timeline planning. Some scenarios to consider in deciding on a timeline include:
• Limited local partner experience with PVTs. Building local capacity often requires a significant and fundamental transformation of local organizations’ cur-rent practices, decision-making strategies, and administra-tive processes—all of which take time to implement. For PVTs, if a local group or coalition has never conducted a PVT and lacks nationwide operational capacity or a
Stephanie Funk, USAID
Voting underway in Malawi’s 2014 election.
ASSESSING AND VERIFYING ELECTION RESULTS:A DECISION-MAKER’S GUIDE TO PARALLEL VOTE TABULATION AND OTHER TOOLS
28

large constituency of volunteers from which to draw, the donor should ideally begin its PVT project at least 12 months (and preferably 18 months) before the election.
• Complex election or new technology. Timelines are also affected by the overall complexity of the under-taking (as described above) and the technology that will be used. Even where local groups have proven capacity, donors need to plan 12 months prior to an election that is more complex than previous elections or involves new technology.
• Experienced local group. In environments where local partners already have a successful track record and are not considering deploying significant new technology or dealing with changes to the election system, a 6- to 12-month implementation timeline will generally suffice.
STEP 6 – SYNTHESIZE ASSESSMENT FINDINGS TO MAKE DECISIONS
These five steps culminate in a final set of decisions about appropriate strategies to assess and verify election results. It is difficult to draw universal conclusions about what are deeply context-specific decisions, and USAID missions will need to balance their intended goals with a realistic analysis of context, risk, capacity, and timeline. However, donors are likely to face two clear decision points: (1) whether to sup-port an activity to assess and verify election results and (2) which tool to implement.
First, donors will need to decide whether or not to support an activity to assess and verify election results. USAID deci-sion makers should carefully weigh the benefits of supporting these tools along with the potential risk, complexity of the country context, time available, and existing local capacity. There may be cases where a PVT or other activity might be highly desirable, yet the donor lacks sufficient time and resources, or local partners with the necessary capacity. In these situations, the risks of a poorly implemented project will likely outweigh its potential benefits.
It is important to understand the context and know that it will allow these tools to be implemented. Accessibility, size, and security affect the viability of these approaches. This is not to say that these tools should not be used in difficult political environments. But turbulent elections may require special planning and tactical strategies to protect the data and people involved.
Given that the tools for assessing and verifying elections focus primarily on the conduct of election day, donors should combine these tools with comprehensive election observa-tion strategies. Comprehensive long-term observation is the main tool that election observer groups can use to identify, document, and assess the many types of electoral manipu-lation.14 Long-term monitoring also can incorporate more specialized tools to rigorously evaluate specific issues, such as:
• State use of resources: Several civil society organiza-tions have made great strides in developing methodolo-gies that can help estimate the extent to which incum-bent candidates are using state resources in an election.
• Violence monitoring: Groups have developed tools for assessing and mitigating electoral violence. Electoral violence monitoring records specific incidents of vio-lence and identifies patterns of violence to raise public awareness of these occurrences as well as to assess how violence may affect election outcomes.15
• Media monitoring: Media monitoring analyzes the amount of media coverage devoted to candidates and election topics, the extent of news bias, the level of me-dia access for candidates, and the adequacy and accuracy of information reported to citizens through various media forms. The goal of media monitoring is to assess whether and to what extent the media has contributed to or undermined the democratic nature of elections.16
• Voter registration audits: Audits of voter registries assess the accuracy of voter lists by verifying the infor-mation on voter lists and surveying citizens to determine how many potential voters are not on voter lists.
• Pre-election assessments: Pre-election assessments can be a helpful component of long-term monitoring or can be used by donors to capture a snapshot of opin-ions. In some missions, experts draw on meetings with political and government leaders and other key actors. Experts can review findings from long-term monitoring and other credible sources to assess and make recom-mendations for improving the electoral process.
• Social media monitoring and crowdsourced reporting: Social media monitoring entails collecting and analyzing data related to elections from social media platforms. Crowdsourced reporting relies on information independently reported by citizens. These new infor-mation sources can be analyzed to better understand electoral processes. However, this information is not
ASSESSING AND VERIFYING ELECTION RESULTS:A DECISION-MAKER’S GUIDE TO PARALLEL VOTE TABULATION AND OTHER TOOLS
29

usually verified and may not be representative. Social media data is often biased and may be easily manipulated by local actors.
If the donor decides that implementing a method for assess-ing and verifying election results is appropriate given the con-text of the election and deems it to be a good investment of resources, the donor will next need to choose the right tool. As discussed earlier, PVTs are the most reliable way to verify the tabulation of results because they are based on report-ed polling station results and verified by local observers. If country-context allows, PVTs are the preferred choice. PVTs are less effective when manipulation is taking place outside of the polling station or if reported polling station results are not reliable. As discussed, exit polls seek to measure the inten-tions of voters, but they are susceptible to selection bias and falsification errors. They may be helpful in restrictive environ-ments where observers may be denied access to polling sta-tions or where polling station results are not expected to be credible. Finally, election forensics represents a potential new field for detecting election manipulation, but it remains largely experimental and is constrained by the availability of data or by country-specific features like long-term voting patterns.
Carol Sahley, USAID
Members of a domestic election observer group, Christian Churches Monitoring Group, run a PVT
simulation during Zambia’s 2015 presidential election with technical assistance from NDI.
ASSESSING AND VERIFYING ELECTION RESULTS:A DECISION-MAKER’S GUIDE TO PARALLEL VOTE TABULATION AND OTHER TOOLS
30

SECTION 3
BEST PRACTICES FOR MANAGING AND IMPLEMENTING PARALLEL VOTE TABULATIONS (PVTS)
Because PVTs are an effective tool for verifying election results and represent the majority of USAID’s considerable investments in this area of electoral
assistance, this section focuses on strategic and operational best practices for managing PVTs from a donor perspective. Much of this guidance—particularly the strategic and management best practices—applies equally well to other tools. Thus, the recommendations in this section can be helpful also to DRG officers working with exit polls and other surveys.
STRATEGIC AND MANAGEMENT BEST PRACTICES
A donor faces a number of important strategic and man-agement decisions after deciding to support a PVT. Much of the analysis from the decision-making process described in Section Two will serve as a foundation for effective imple-mentation.
STRATEGIC AND DESIGN CONSIDERATIONS
PVT planning should begin by tackling many of the important questions raised in the decision-making process described in Section Two, such as timeline, capacity building, and politi-cal context. Planning should include the following strategic considerations:
• Set clear and realistic timelines. One of the most important best practices for implementing effective PVT activities is allowing enough time for local groups to build needed capacity and skills. Donors should identify the date implementation needs to begin and plan backwards from there, taking into account a realistic assessment of their procurement timelines. Monitoring groups will need considerable lead time to recruit volunteers, set up call centers, and establish the myriad processes needed for
an effective PVT.
• Determine whether an international imple-menting partner is needed for capacity build-ing, technical assistance, and/or quality control. Whereas local organizations may engage in election-re-lated programs every four or five years, internation-al implementing partners that specialize in election monitoring will have broad comparative experience in employing PVT tools and a deeper level of technical expertise. Technical support from an international part-ner also sometimes lends additional credibility to a PVT and improves the perception of its neutrality. This may be particularly important in societies that are politically polarized or in which the election environment is charac-terized by deep distrust.
• Plan around milestones. To reduce the potential for unexpected problems, donors should work with implementing partners to build specific milestones and regular check-in points into PVTs they fund. Milestones can include specific goals for capacity building, targets for recruitment and training of volunteers, dates for finalizing deployment plans, and other clearly specified targeted activities. Donors should also include a schedule for checking in during the implementation of the award to address issues related to timeframe and planning, capac-ity, political environment, technology, and materials. See pages 34-36 for suggested check-in points.
• Collect both results and process data. PVTs are most credible when observers conduct a systematic evaluation of the voting and counting processes in ad-dition to collecting polling-station results. Because these process data are collected from a statistically represen-tative sample of polling stations, they can significantly en-hance an observer group’s ability to assess the election
ASSESSING AND VERIFYING ELECTION RESULTS:A DECISION-MAKER’S GUIDE TO PARALLEL VOTE TABULATION AND OTHER TOOLS
31

day process and reveal problems that results data may not identify.
• Balance a PVT with other election observation approaches. PVTs alone cannot tell the full story of how an election has been conducted. An effective PVT fits within a comprehensive observation of the entire electoral process. A PVT alone does not provide suf-ficient data for determining whether election results reflect the will of the people.
SUPPORTING LOCAL CAPACITY
Building the capacity of local partners is critical to mitigating the risk inherent in PVT efforts and ensuring sustainable approaches to citizen-led oversight. Local ownership of PVT activities can increase credibility and strengthen the legitima-cy of PVT results in the eyes of the public. Local partners that are knowledgeable about the local political and social context can make informed decisions and engage in contin-
gency planning for a variety of possible outcomes.
• Incorporate capacity-building goals into activity designs. Donors need to prioritize building local capac-ity to conduct PVT activities. Local partners may need assistance with organizational and financial management, statistical methodologies, advocacy and outreach, and strategic planning. Donors need to take a long-term view about building local capacity and treat it as an investment that will provide cost efficiencies over the long term.
• Support local solutions where capacity exists. Consistent with USAID policy, in cases where strong local capacity exists, donors can provide support for local organizations to conduct PVT efforts independently. Greater emphasis should be placed on providing local organizations with the necessary organizational and technical skills with an eye toward building long-term, sustainable capacity.
Jef Karang’ae, USAID/Kenya
Kenyan election observers from domestic observation group, ELOG, are trained on the PVT results database designed to receive text messages sent by election observers in the field. ELOG received technical assistance from NDI in the implementation of a PVT during Kenya’s 2013 presidential election.
32ASSESSING AND VERIFYING ELECTION RESULTS:A DECISION-MAKER’S GUIDE TO PARALLEL VOTE TABULATION AND OTHER TOOLS
32

COMMUNICATIONS AND OUTREACH
Effective communications and outreach are an integral part of successful PVTs. Even the most technically precise and well-executed PVT will neither deter fraud nor build public confidence if voters and the regime are unaware of the PVT or do not understand its function.
• Require robust and well-articulated communi-cations strategies in proposals and implemen-tation plans. For transparency and deterrence, PVTs need to be appropriately publicized and explained. Local partners often do not have adequate experience with media and public relations and may thus require guid-ance regarding communication strategies. Because the media, political parties, and voters often misunderstand the PVT process and goals, civic education and media outreach are often essential for public acceptance of PVT results. International technical assistance providers play an important role by coaching local groups on if, how, and when to release PVT results.
OTHER STRATEGIC CONSIDERATIONS
• Consider multiple results assessment activities with caution. Use caution if considering multiple ef-forts. Election results assessment and verification activi-ties are statistical exercises with margins of error. These margins of error mean that, if multiple PVTs or both a PVT and an exit poll are conducted, there is the risk of differing results. In a best-case scenario, multiple tools will reinforce each other and their findings. However, it is
important to be cognizant of the risk that discrepancies among the results will confuse citizens and potentially undermine confidence in the electoral process.
• Continuously assess the viability of the PVT. While an initial assessment may lead to a decision to move forward with a PVT, circumstances may change over time. For example, issues with the electoral pro-cess or changes in the political or security context may require the donor to revisit the appropriateness of a PVT. In some cases, a donor may need to work with a local partner(s) to revise its deployment plan. In others, it may be appropriate to suspend implementation entirely. Critical issues that may warrant suspending PVT imple-mentation include:
• Political shifts that make it impossible to operate in the environment;
• Changes in the security environment that raise the security risks to those involved;
• The inability of local partners to build the necessary capacity in time to properly conduct a PVT;
• Lack of necessary data for the PVT, such as a lack of accurate information on the number and location of polling stations or the inability of observers to access polling stations;
• Inability to get accreditation; or
• Problems with the local organization that indicate it is not following best practices.
CHECKLIST OF QUESTIONS TO ANSWER BEFORE SUPPORTING A PVT
• Is the civil society organization (CSO) independent and nonpartisan?
• Is a statistically valid representative sample being selected?
• Will the implementing organization also make a serious effort to observe the opening of the polling station, voting, and counting process in addition to collecting results?
• Is there a plan to ensure a high rate of data collected is returned by observers to the data tabulation center?
• Will observers be trained to fully understand voting and counting procedures?
• Will trained observers be present in the polling station for the entire day?
• Is the CSO committed to releasing PVT results only after a sufficiently high response rate has been received?
• Is there a plan to test the mobile or other technology being used by observers to transmit the results?
ASSESSING AND VERIFYING ELECTION RESULTS:A DECISION-MAKER’S GUIDE TO PARALLEL VOTE TABULATION AND OTHER TOOLS
33

OPERATIONAL BEST PRACTICES
A successful PVT relies on the effective and timely com-pletion of four project phases: planning, preparation, elec-tion-day implementation, and post-election analysis and learning. Although a number of management tasks continue throughout the project, each phase has specific activities and routine check-in points for the donor to assess and discuss how the PVT is progressing with its local partner(s) and international technical assistance providers.
Some of these check-in points also have potential mon-itoring indicators that the donor may use to measure the state of the PVT project. The operational best practices presented here are not a comprehensive list of everything a PVT implementer needs to undertake, but instead focus on what USAID DRG officers or other donors need to know and do to effectively and actively manage PVTs and mitigate potential risk.
PLANNING PHASE (12 TO 6 MONTHS BEFORE ELECTION DAY)
It is advisable to begin planning a PVT roughly twelve months before election day. The planning phase involves obtaining the polling station list and drawing the necessary sample for the PVT; hiring the core staff and enlisting volunteers; and developing communications, reporting, and training plans. In this phase, the donor can monitor several key requirements:
ASSESSING AND VERIFYING ELECTION RESULTS:A DECISION-MAKER’S GUIDE TO PARALLEL VOTE TABULATION AND OTHER TOOLS
34

PREPARATION PHASE (6 MONTHS BEFORE THROUGH ELECTION DAY)
Preparing a PVT involves many elements. Technical requirements in the areas of data collection, outreach, and operational management are integral to this phase. Although the donor will be unable to directly monitor all of the steps taken during the preparation phase, there are critical activities about which the donor should remain aware. These are highlighted in the chart below.
ASSESSING AND VERIFYING ELECTION RESULTS:A DECISION-MAKER’S GUIDE TO PARALLEL VOTE TABULATION AND OTHER TOOLS
35

ELECTION-DAY PHASE
The donor must be prepared to allow the local partner the leeway it needs to effectively conduct the PVT on election day. After the polls close, the donor should ask its implementer about any problems associated with conducting the PVT and whether it was completed successfully.
POST-ELECTION PHASE
Local partners will conduct a number of post-election activities. The donor should expect to receive the final election observa-tion report. Follow-up discussions should focus on operationalizing lessons learned and capacity-building recommendations.
ASSESSING AND VERIFYING ELECTION RESULTS:A DECISION-MAKER’S GUIDE TO PARALLEL VOTE TABULATION AND OTHER TOOLS
36

TECHNOLOGY REQUIREMENTS AND INNOVATIONS
As discussed above, technology for PVTs typically serves two important purposes: (1) communication and report-ing results; and (2) data aggregation and analysis. Speed and precision in PVT results need to be balanced with the availability of funding, although, fortunately, the advance and spread of communications technology and infrastructure are rapidly reducing these costs. PVT planners, however, must also be aware of the risks posed by overly complex systems and technology. Currently, most organizations still use custom designed gateways and databases that are often not reusable. However, these databases, once created, are relatively easy for monitoring groups to use. Open source tools and existing SMS gateways still have limitations in their ability to collect, process, and analyze data quickly, as PVTs require a signifi-cant amount of custom logic and embedded algorithms that open source tools currently do not include. As open source software and SMS gateways evolve, they may become more viable for PVTs.
COMMUNICATION AND RESULTS REPORTING
TECHNOLOGY
Getting data for a PVT requires reliable communications technology that can securely report information in a timely fashion. Substandard or nonexistent physical and communi-cations infrastructure continue to pose barriers to rigorous PVTs in some countries, but these barriers are steadily falling,
thanks largely to cell-phone technology. Cell phones are particularly important for PVT efforts because they enable organizers to quickly and accurately collect and analyze vote-count data at the polling-station level. As cell-phone net-works are rapidly expanding in underdeveloped and remote locations, cell phones should be able to provide coverage in many areas selected for a PVT. The technology options for collecting PVT data include:
• Mobile phone calls and call center: Mobile phones with a call center where trained staff input the data reported into a database are a reliable and cost-effec-tive way to get information. This approach generally does not require additional procurement services or new hardware. Because information is transferred from mobile phones to a land line or to mobile phones in the call center, this approach does not require an SMS gateway. However, this approach requires a relatively well-developed telecommunications structure and high mobile penetration rates. Using land lines or cell phones to contact call centers can be problematic; a limited number of lines or operators on the receiving end can result in delays. This approach also is prone to human error resulting from verbally communicating and manual-ly inputting the results.
• SMS reporting: Increasingly, organizations have introduced SMS reporting in which SMS messages are transmitted directly to a mobile gateway. Using SMS significantly reduces the risk of transcription errors.
A Honduran man casts his vote at a school during the general
elections in El Progreso on November 29, 2009.
Elmer Martinez/AFP
ASSESSING AND VERIFYING ELECTION RESULTS:A DECISION-MAKER’S GUIDE TO PARALLEL VOTE TABULATION AND OTHER TOOLS
37

However, additional layers of technology and technical expertise are needed to programmatically transfer the data from the SMS message and into the database. An SMS reporting system is likely to involve dealing with a vendor or telecom company directly. This system also requires developing an SMS gateway through which SMS messages can be passed and translated into code that the database can read. The procurement of services and custom tools needed for such a gateway can entail significant costs, but less expensive, reliable SMS gateway services, including open source options, are coming into the market, which is likely to reduce the cost in the near future.
• Smartphones and tablets: Smartphone and tablet devices and applications are increasingly used to collect observation data, but there are a number of obstacles to their widespread adoption. In many countries, the cost of hardware is high, and a weak telecommunications infra-structure may prohibit use in some areas. In countries in which smartphone penetration is high and the telecom-munications infrastructure can support the use of these devices in PVTs, they may be the best alternative. Free and low-cost open source toolkits with customizable products are available for organizations interested in piloting “smart” data-gathering methods.
TECHNOLOGY NEEDED FOR DATA AGGREGATION AND
ANALYSIS
Aggregating and analyzing the data from a PVT requires a database with advanced data analysis tools. These databases are often custom designed as proprietary software for or-ganizations conducting PVTs. Custom design allows neces-sary algorithms and code to be embedded to analyze the results. The dashboard tools also can be custom designed to make results analysis easier for users to understand. Custom databases give local partners ownership over the system, but they can be extremely costly. In addition, the databases inevitably need to be updated and modified to incorporate new technologies with each subsequent election.
RESULTS MANAGEMENT
Because of the high stakes involved, donors, local partners, and international technical assistance providers must agree on a communication strategy that takes into account the variety of possible PVT outcomes. There is no one-size-fits-all approach for deciding when PVT results should be
publicly released. In many countries, laws prohibit releasing election results before the election commission has made an announcement. Even where it is legal, the release of results before the official announcement by electoral authorities can create tension between PVT observers and the electoral au-thorities and/or government. On the other hand, announcing PVT results can also severely constrain a regime that intends to engage in tabulation fraud before releasing its results. Early PVT results also sometimes calm political tensions as the candidates and the citizenry wait for official results.
In all cases, PVT results should only be released when the collected data is definitive. The early release of indeterminate PVT data can create significant and unnecessary confusion if contradictory results are later released.
Scenarios and communication plans should be based on the specific election, legal framework, and political context, and should be clearly understood by all from the start. Interna-tional assistance providers often play a key role in advising local organizations on communications and results manage-ment. Donors and their international and local partners also need to address questions related to data ownership and transparency. Some recommended best practices follow.
• Releasing and using PVT results. USAID generally funds domestic citizen observer groups to ensure an independent, civil-society-based observation, including PVTs. Supporting local civil society organizations means that PVT results are the product of the local organi-zation, and the messaging surrounding the PVT results reflects the organization’s independent perspective. Accordingly, USAID should support proactive results management planning with its local partners, but it should not expect to control whether or how they release PVT results. The independence of citizen-based observation from international donors in their findings and statements is a critically important principle.
Neither international observers nor others in the in-ternational community should make PVT results public before electoral authorities or domestic organizations do so. Local partners, host governments, and electoral management bodies may well find such announcements an infringement on their sovereignty; moreover, such announcements coming from international actors un-dermine goals related to increasing local ownership and capacity of both EMBs and civil society observer groups.
ASSESSING AND VERIFYING ELECTION RESULTS:A DECISION-MAKER’S GUIDE TO PARALLEL VOTE TABULATION AND OTHER TOOLS
38

• Data transparency and availability. PVTs should be conducted in a transparent manner to further the credibility of the work being conducted. Information re-garding specific methodology, the result, and contributing data should be made available for public examination and discussion.
CONCLUSIONS
Implementing a credible PVT requires careful planning and a thorough understanding of the strategic, management, and operational best practices described in this section. It is imperative that DRG officers check in with local and interna-tional partners providing technical assistance according to a planned check-in schedule to continuously assess the viability of the PVT. Good working relationships between donors and their partners will enable them to address and adapt to changing circumstances and challenges that may emerge
during implementation. Careful implementation with attention to quality and high technical standards is needed to imple-ment PVTs and any other tool to assess and verify election results.
Mourakiboun
Volunteer operators from Tunisian citizen election observation network, Mourakiboun, assist election observers deployed to polling centers across the country, part of a parallel vote tabulation effort conducted
for the 2014 presidential election.
ASSESSING AND VERIFYING ELECTION RESULTS:A DECISION-MAKER’S GUIDE TO PARALLEL VOTE TABULATION AND OTHER TOOLS
39

APPENDIX 1
REQUIREMENTS AND MISPERCEPTIONS OF SAMPLE-BASED TOOLS FOR ASSESSING AND VERIFYING ELECTION RESULTS
STATISTICAL REQUIREMENTS
There are a number of methodological considerations for maximizing the usefulness and integrity of information gath-ered as part of PVTs, most of which also apply to exit polls. It is essential that USAID decision makers, other donors, and their partners have access to the necessary baseline data, an understanding of statistical sampling methods and imple-mentation, and a plan for the diligent monitoring of results generation and reporting.
• Availability of baseline data: For the rigorous execution of PVT methodologies, local partners need reasonable baseline data to generate a sample, such as a list of polling stations and their distribution around the country. It is also beneficial, but not necessary, for implementers to have voter registration data to deter-mine how the number of voters and logistical constraints will affect the turnout at individual polling sites. If a large enough sample size of polling stations is available, registration lists are not necessary as the large sample size will account for the possible variation in registration numbers. It is best to have a list of polling stations to deploy PVT observers, but if one does not exist a proxy can be created by taking a list of villages (for example) and the population of the villages, determining the sta-tistical probability that a village gets a polling station, and creating a sample proportional to the population.
• Sampling methods: PVTs can use a representative,
random sampling method in which all polling stations in a country are given an equal chance of being included in the PVT sample to obtain either a probability pro-portional to size (PPS) sample or a stratified random sample. In a stratified random sample, polling stations are divided by some characteristic (usually geographic region or province) and a large enough sample is drawn from each region to be statistically precise. Using strat-ified sampling allows local partners to determine PVT results at both the national and subnational levels, but it may require a larger sample than would simple random sampling.
• Sample size and margin of error: Deciding on an appropriate sample size and margin of error are import-ant issues for donors and implementers alike. Sample size and margin of error are directly and inversely relat-ed. As Figure 2 demonstrates, as the sample size increas-es, the margin of error decreases, but each additional increase in the sample size reduces the margin of error by a smaller amount.17 Most PVTs have between 500 and 1,500 polling stations in their sample; even when substantial funding is available, there is rarely a reason to have a sample larger than 3,000 polling stations. Decisions about what margin of error can be tolerated when conducting a PVT will determine the sample size needed in each individual case. The margin of error is also influenced by the variation in the sample (larger variation increases the margin of error). For example, if
ASSESSING AND VERIFYING ELECTION RESULTS:A DECISION-MAKER’S GUIDE TO PARALLEL VOTE TABULATION AND OTHER TOOLS
40

a candidate receives 90% of the vote in one area and 10% in the other area then that candidate will likely have a higher margin of error than a candidate that receives 50% of the vote in most of the country. A typical margin of error for a PVT falls between ±1.5% and ±3.5%. A higher margin of error may be acceptable in an election that is not expected to be highly competitive. In gener-al, DRG Officers should be prepared to ask for more details regarding methodology when a margin of error is estimated to be under ±2% or over ±4%.
• Maintaining data integrity: It is necessary to pay attention to how much data is being reported. Observ-ers reporting results and data analysts in the observation control room should give due diligence to ensure that data are not being reported in duplicate and that more results are not reported from an area than the sample requires. It is also important to consider the method of results reporting that is employed and the unanticipated methods for reporting numbers that observers may be implementing in the field. Phoning in results, for example, could lead to transcription errors.
Figure 2. Margin of Error Curve for Simple Ran-dom Sample Sizes from 100 to 5000 (at the 95% Confidence Level)
COMMON MISPERCEPTIONS
Misperception 1: The quality of the exercise is determined by the size of the margin of error. For activities using a statistically representative random sample (including PVTs and exit polls), it is commonly thought that a smaller margin of error results in higher-quality results. Although a lower margin of error does mean that a PVT or exit poll is more precise, the accuracy of the result is determined more by whether all of the sample points are collected. Missing data is a key determinant of quality for sample-based activities.
Misperception 2: The sample size should be 5 per-cent of the polling stations regardless of how many polling stations exist in a country. Another common misperception is that there is some rule of thumb or mini-mum proportion of polling stations that a PVT or exit poll needs in order to be valid. This is not the case. Because of the nature of the margin of error curve, described above, achieving a margin of error of approximately ±2% will require a sample of approximately 2,000 polling stations regardless of whether there are 10,000 or 100,000 polling stations in the country.
Misperception 3: Larger samples are better. In prac-tical application, after a certain minimum size, increasing the sample only slightly increases the precision of the PVT, but greatly increases the challenges associated with the PVT and data collection.
ASSESSING AND VERIFYING ELECTION RESULTS:A DECISION-MAKER’S GUIDE TO PARALLEL VOTE TABULATION AND OTHER TOOLS
41

APPENDIX 2
GLOSSARY OF TERMS
AssessmentAn activity that independently evaluates the credibility and le-gitimacy of election or referendum results. This guide focuses on exit polls and election forensics as tools that analyze and assess election results. These tools can detect anomalies and potential irregularities in results, but are not definitive.
Comprehensive Election ObservationA long-term monitoring activity conducted by a country’s citizens or international observation group to assess the legitimacy of an election. Comprehensive election observa-tion covers all aspects of the electoral cycle. It should include boundary delimitation, analyses of the legal framework and political context and targeted independent monitoring of voter registration, candidate and party registration, campaign-ing, election day, dispute resolution, and other aspects of the electoral process.
Confidence LevelThe confidence level is a measure of the reliability of a sam-ple-based statistic. For example, if a confidence level equals 95 percent, this means that there is a probability of at least 95 percent that the result is reliable (i.e., in 95 out of 100 times, the result will be within the margin of error).
Election ForensicsA set of statistical analyses of official election results data that identify trends or anomalies that may be the artifacts of manipulation. Election forensics are rarely definitive, but they can suggest types of electoral manipulation beyond the tab-ulation process, such as inflated voter turnout or implausible levels of support for specific candidates or parties.
Election ObservationThe observation of an election by one or more independent organizations to assess the conduct of an election process on the basis of national legislation and international standards. This term is used interchangeably in this study with election monitoring.
Electronic Voting SystemA voting system that uses electronic voting machines to cast and count votes.
Exit PollA survey of a sample of voters, taken immediately after they have cast their ballots and exited the polling stations. An exit poll requests information about voters’ ballot choices, motivations informing those choices, and experience with the voting process. As the only results assessment tool that involves interviewing voters, exit polls can generate useful information about voter intentions and demographics. Exit polls are also used to project results. However, because voters may not be completely candid for a variety of rea-sons, exit polls cannot provide definitive evidence of fraud or manipulation.
Margin of ErrorA measurement that represents the amount of sampling error in survey research. Because statistical sampling relies on drawing inferences from a subset of the population, the result will not be exactly the same as if the results used data from the entire population. Based on the laws of statistics, the margin of error reflects the range of values within which the mean value for the whole population is likely to fall. The lower the margin of error, the smaller the range is of values within which the mean for the whole population is likely to fall.
ASSESSING AND VERIFYING ELECTION RESULTS:A DECISION-MAKER’S GUIDE TO PARALLEL VOTE TABULATION AND OTHER TOOLS
42

Media MonitoringObservation and analysis of the media access and coverage devoted to candidates and elections topics, the extent of news bias, the level of media access for candidates, and the adequacy and accuracy of information reported to citizens through various media. This information is used to assess if the media may have contributed to or undermined the dem-ocratic nature of elections.
Nonresponse BiasNonresponse bias can occur when response rates are low. Bias from nonresponse is introduced when the information actually received by respondents differs from those who did not answer (i.e., those from whom no information was collected).
Panel StudyAn investigation of attitude changes using a constant set of people and comparing each individual’s opinions at different times.
Parallel Vote TabulationSometimes called a quick count, a Parallel Vote Tabulation is an independent tabulation of polling station results—using data from all stations or a representative sample of them—for the purpose of projecting election results and/or verifying their accuracy. To be credible, a PVT should be conducted by trained observers who observe and report on the entire process at the polling station on election day.
Plurality, Plurality Voting SystemA single-winner voting system in which the winner is the per-son with the most votes (plurality or relative majority).
PopulationAll of the relevant individual cases that exist within a certain boundary. A sample can be conceived of as a smaller replica of the entire population from which it was created.
Pre-Election AssessmentAn assessment during the pre-election period in which experts draw on meetings with political and government leaders and other key stakeholders. Experts review findings from long-term monitoring and other credible sources to as-sess and make recommendations for improving the electoral process.
Pre- and Post-Election PollingNationwide surveys of citizens conducted directly before and after an election. These polls are typically conducted by a professional survey research organization and use sampling methodology to generate a random sample of households nationwide. Interviewers ask respondents how they will vote or how they voted in an election. Polls may also include oth-er questions about voter knowledge, attitudes, and prefer-ences and to collect demographic data on respondents.
Random Sampling A process of selecting a sample of subjects randomly so that the resulting sample will be representative of the entire pop-ulation. Random sampling is an important means of ensuring that the probability of a sample point being selected is equal to the probability of any other point being selected, so that each member of the population has the same likelihood of being included in the sample.
Response RateThe number of sample points (e.g., voters or ballots) for which information is actually received divided by the number of sample points targeted overall. It is usually expressed in the form of a percentage. A low response rate can introduce nonresponse bias.
Run-off ElectionA follow-up election that takes place in a two-round system when no candidate receives the required number of votes to win outright in the first round of voting. Generally, the two candidates receiving the most votes compete in a second round, or run-off, election.
Sample Selection BiasA type of bias caused by choosing non-random data for statistical analysis. The bias exists due to a flaw in the sample selection process, where a subset of the data is systematically excluded due to a particular attribute. The exclusion of the subset can influence the statistical significance of the test or produce distorted results.
Social Media MonitoringThe observation and analysis of discourse on social media sites on the Web. Related to elections, social media monitor-ing may be used to gather information from discussions and posts to learn about perceptions related to candidates, the election, and/or the election process.
ASSESSING AND VERIFYING ELECTION RESULTS:A DECISION-MAKER’S GUIDE TO PARALLEL VOTE TABULATION AND OTHER TOOLS
43

Statistical SamplingStatistical sampling uses the selection of a random subset, or sample, of individuals or units (e.g., polling stations) from within a population to estimate characteristics of the entire population. PVTs, opinion and exit polls, and experiments uti-lizing randomized controlled trials all use statistical sampling as the foundation for being able to assert findings with a known degree of precision.
VerificationMethods that provide a basis of evidence to substantiate or call into question the validity of the results. PVTs can be said to verify the tabulation of results due to their reliability and accuracy when properly implemented.
Violence MonitoringObservation and analysis of specific incidents of violence used to identify patterns, raise public awareness of occurrences of violence, and assess whether violence has been used to affect election outcomes.
Voter Registration AuditsA tool used to assess the accuracy of voter lists by verifying information on the list, as well as surveying citizens to deter-mine how many are not on the list.
Weighting A statistical technique in which a data item is emphasized more than other data items comprising a group. A number is assigned to each data item that reflects its relative impor-tance to account for missing data or different response rates.
ASSESSING AND VERIFYING ELECTION RESULTS:A DECISION-MAKER’S GUIDE TO PARALLEL VOTE TABULATION AND OTHER TOOLS
44

APPENDIX 3
ENDNOTES
1Larry Garber and Glenn Cowan. “The Virtues of Parallel Vote Tabulations,” Journal of Democracy, Vol. 4, No. 2 (April 1993).
2Melissa Estok, Neil Nevitte, and Glenn Cowan. The Quick Count and Election Observation: An NDI Guide for Civic Organizations and Political Parties (Washington: National Democratic Institute for International Affairs, 2002). (https://www.ndi.org/files/1417_elect_quickcounthdbk_0.pdf).
3Eric Bjornlund and Glenn Cowan. Vote Count Verification: A User’s Guide for Funders, Implementers, and Stakeholders (Washington: Democracy International Inc., 2011). http://democracyinternational.com/sites/default/files/DI%20VCV%20Study%20(2011).pdf.
4We refer here to election results assessment as the practice of using quantitative tools to independently assess election results, including PVTs, exit polls, and other quantitative tools and approaches. For a more detailed discussion of these tools see Bjornlund and Cowan’s guide listed above.
5Different terminology has been used to describe PVT as a verification tool. In Bjornlund and Cowan’s Vote Count Verification: A User’s Guide for Funders, Implementers, and Stakeholders, PVTs are labeled vote count verification tools. For a more detailed discussion of the role of PVTs as a vote count verification tool see Bjornlund and Cowan’s guide.
6Chad Vickery and Erica Shein, “Assessing Electoral Fraud in New Democracies: Refining the Vocabulary”, White Paper Series, May 2012, IFES, http://www.ifes.org/~/media/Files/Publications/White%20PaperReport/2012/Assessing_Electoral_Fraud_Series_Vickery_Shein.pdf.
7Vickery and Shein, 2012, 2, 9-10.
8This guide uses the terms “election monitoring” and “election observation” interchangeably.
9For further information on how to conduct PVTs see: Melissa Estok, Neil Nevitte, and Glenn Cowan, The Quick Count and Election Observation: An NDI Guide for Civic Organizations and Political Parties, (Washington, National Democratic Institute for International Affairs, 2002).
10The terms “accuracy” and “precision” have specific meanings when they are used to describe the quality of measurements, including PVTs. Precision describes an estimate having a small margin of error. A PVT measures election results with more precision if it has a small margin of error. Accuracy, in contrast, describes how closely the measurement coincides with the true value it is measuring. For example, a PVT that collects data from all of its sampled polling stations is more accurate than
ASSESSING AND VERIFYING ELECTION RESULTS:A DECISION-MAKER’S GUIDE TO PARALLEL VOTE TABULATION AND OTHER TOOLS
45

one where data is missing. For a longer discussion of these terms visit https://stats.oecd.org/glossary/detail.asp?ID=3791.
11Bjornlund and Cowan, 2011, 55.
12Mikhail Myagkov, Peter C. Ordeshook, and Dimitri Shakin, The Forensics of Election Fraud: Russia and Ukraine (Cambridge: Cambridge University Press, 2009), 23, 39, 159-62.
13Mikhail Myagkov, Peter C. Ordeshook, and Dimitri Shakin. “Fraud or Fairytales: Russia and Ukraine’s Electoral Experience.” Post-Soviet Affairs 21, no. 2 (April–June 2005), 120-26; The Carter Center and Democracy International, “Roundtable on Vote Count Verification.”
14Eric Bjornlund, Beyond Free and Fair : Monitoring Elections and Building Democracy (Washington, DC and Baltimore: The Woodrow Wilson Center Press and Johns Hopkins University Press, 2004), 141–144.
15IFES’ Election Violence and Resolution (EVER) Project is one example of a targeted electoral violence monitoring initiative that identifies conditions and causes creating electoral violence in order to prevent and manage opportunities for such tensions during the electoral cycle. For more information about the EVER Project, visit http://www.ifes.org/Research/Cross-Cutting/Election-Violence-Education-and-Resolution/Nav/Electoral-Violence-and-Mitigation.aspx.
16Robert Norris and Patrick Merloe, “Media Monitoring to Promote Democratic Elections: An NDI Handbook for Citizen Organizations.” National Democratic Institute for International Affairs. (Washington, National Democratic Institute for International Affairs, 2002).
17Figure 2 illustrates the margin of error curve for the simple random sampling approach to constructing a random sample. Other sampling methodologies are also used including two-stage cluster sampling and stratified sampling. For a detailed discussion of these approaches see Melissa Estok, Neil Nevitte, and Glenn Cowan, The Quick Count and Election Observation: An NDI Guide for Civic Organizations and Political Parties, National Democratic Institute, 2002.
ASSESSING AND VERIFYING ELECTION RESULTS:A DECISION-MAKER’S GUIDE TO PARALLEL VOTE TABULATION AND OTHER TOOLS
46


U.S. Agency for International Development1300 Pennsylvania Avenue, NW
Washington, DC 20523Tel: (202) 712-0000Fax: (202) 216-3524
www.usaid.gov
Copyright © 2022 FDOKUMEN