Atlas of Phanerozoic Rainfall(Mollweide Projection), Volumes 1-6, PALEOMAP Project PaleoAtlas for...
26
Transcript of Atlas of Phanerozoic Rainfall(Mollweide Projection), Volumes 1-6, PALEOMAP Project PaleoAtlas for...
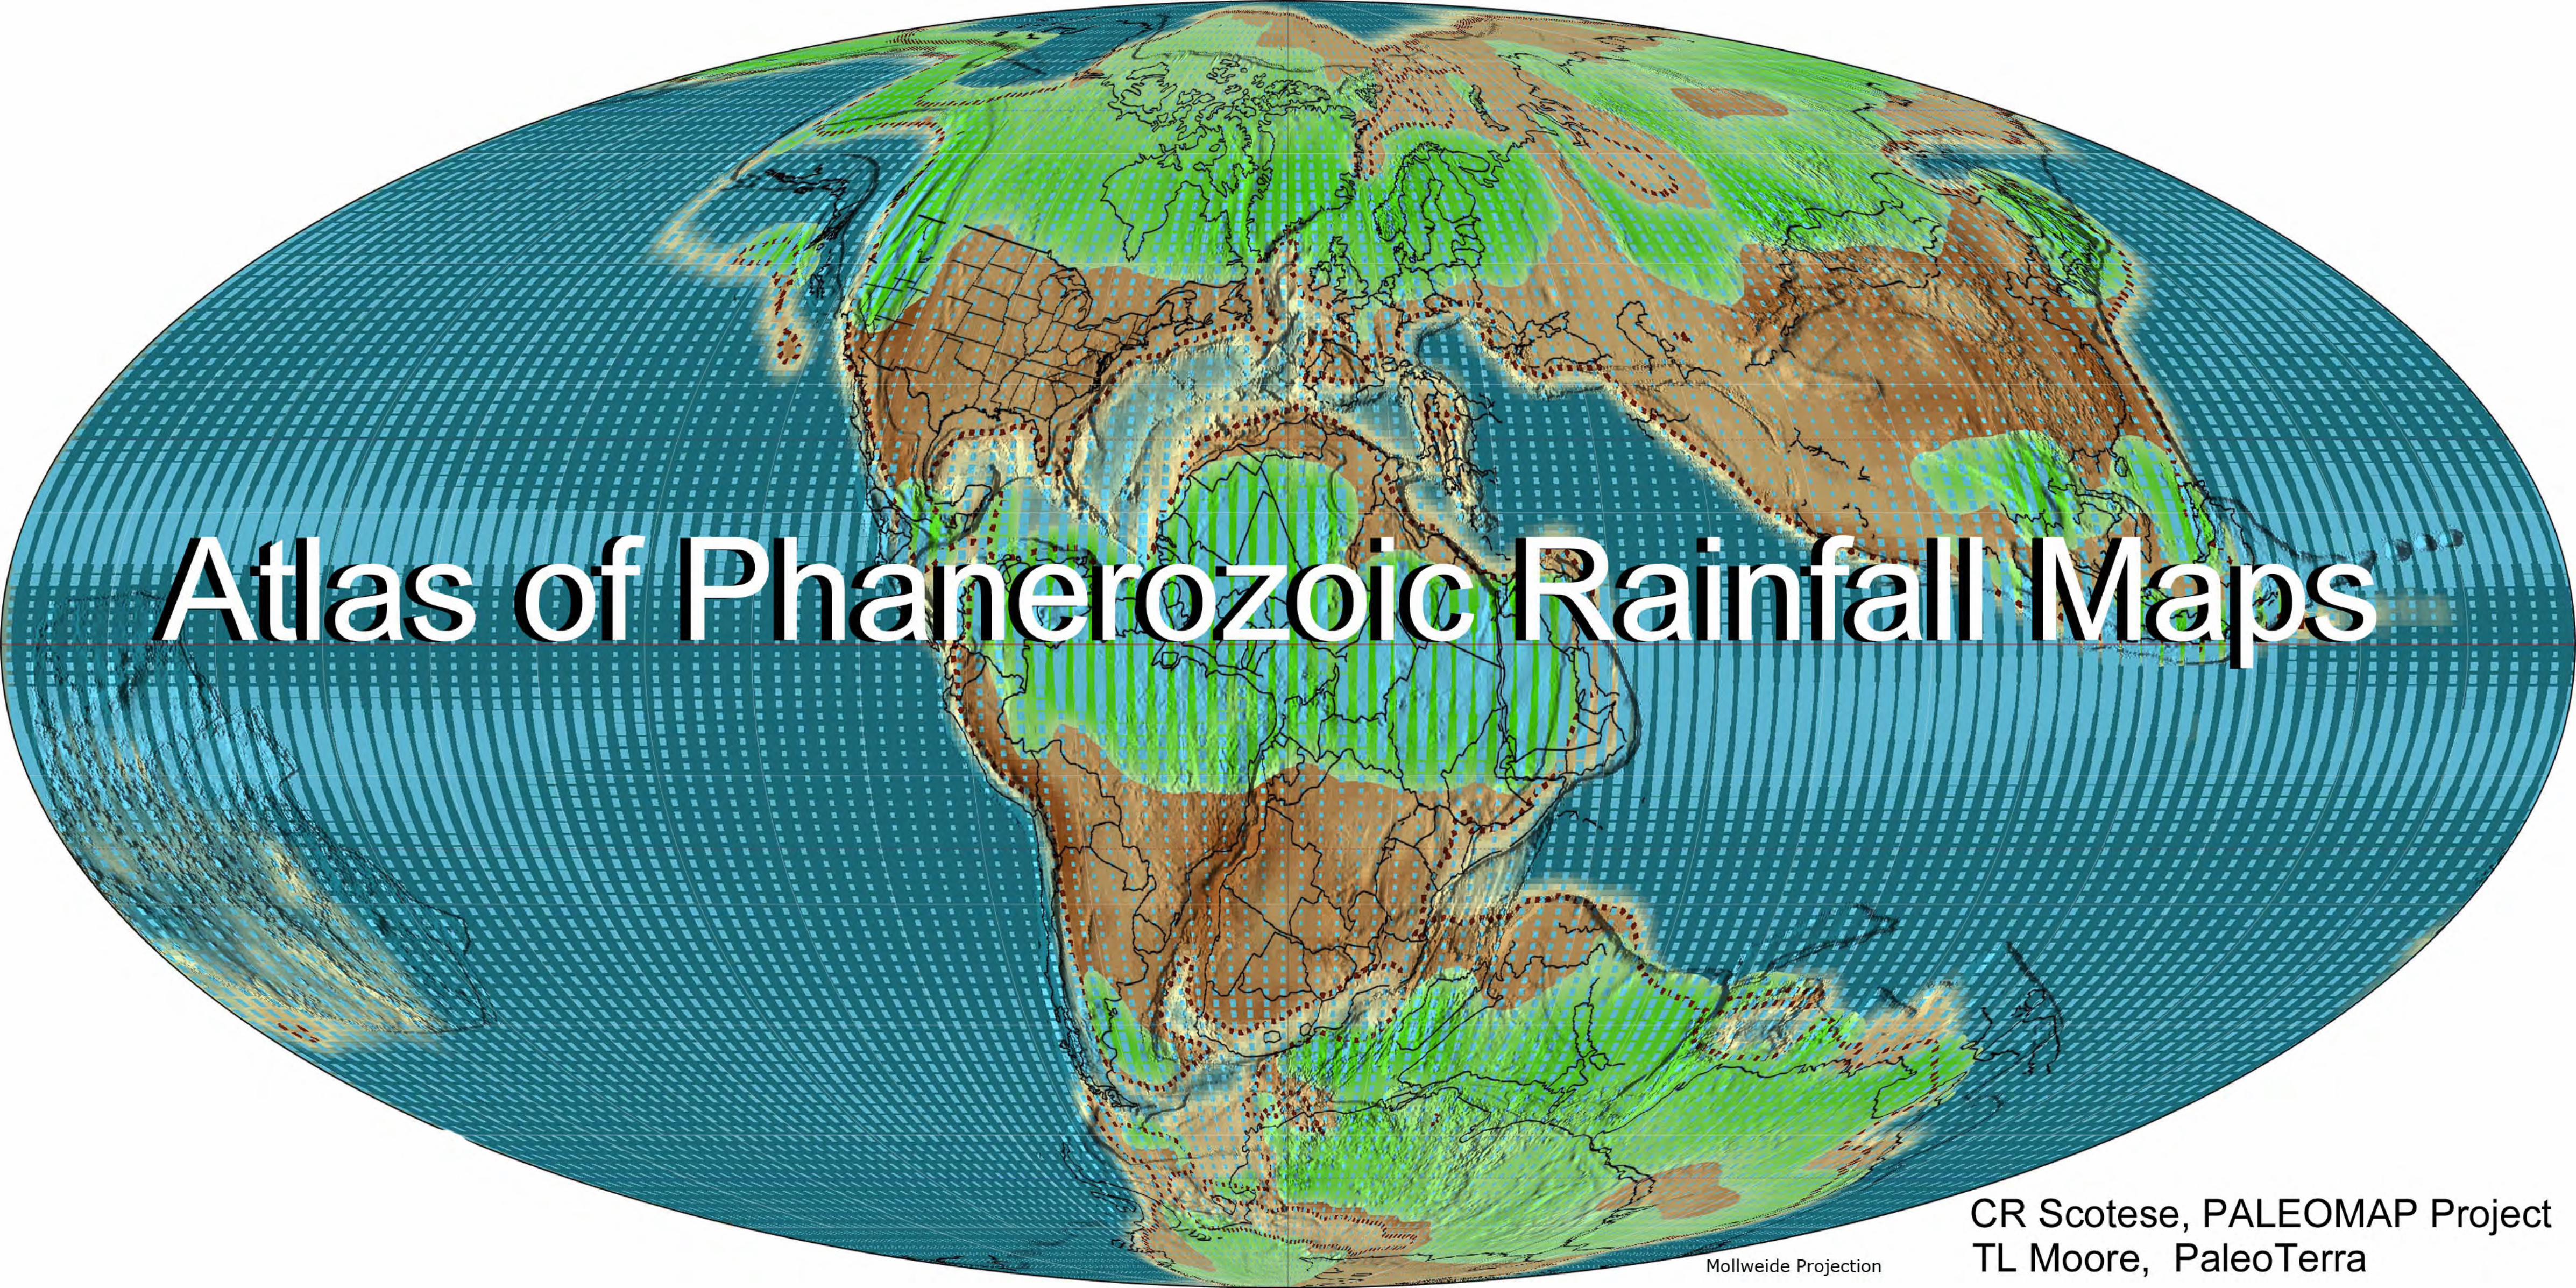

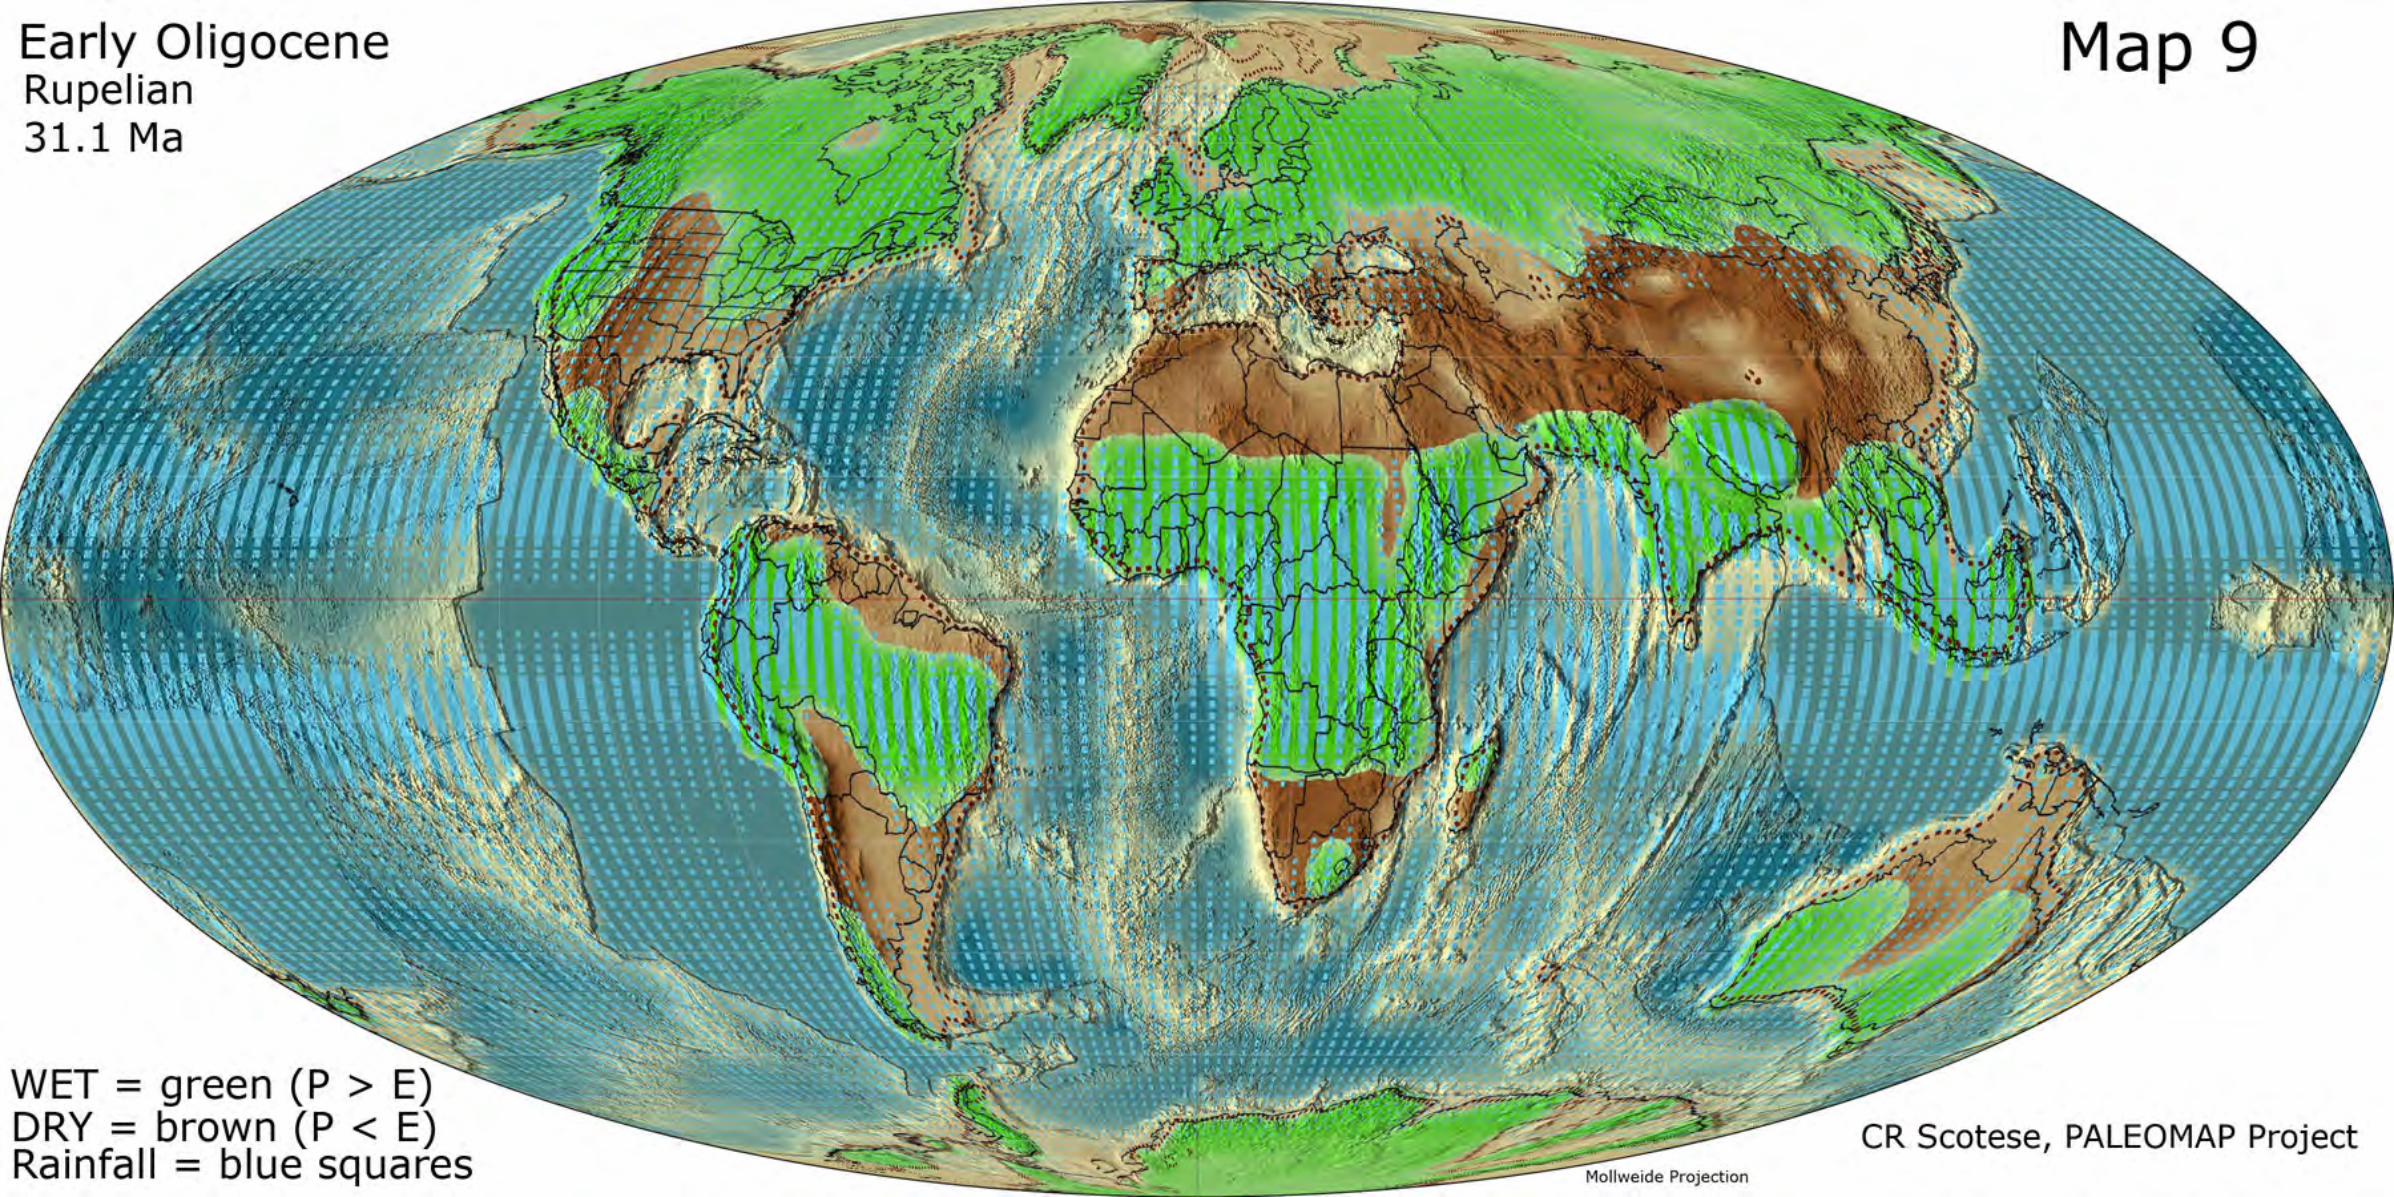
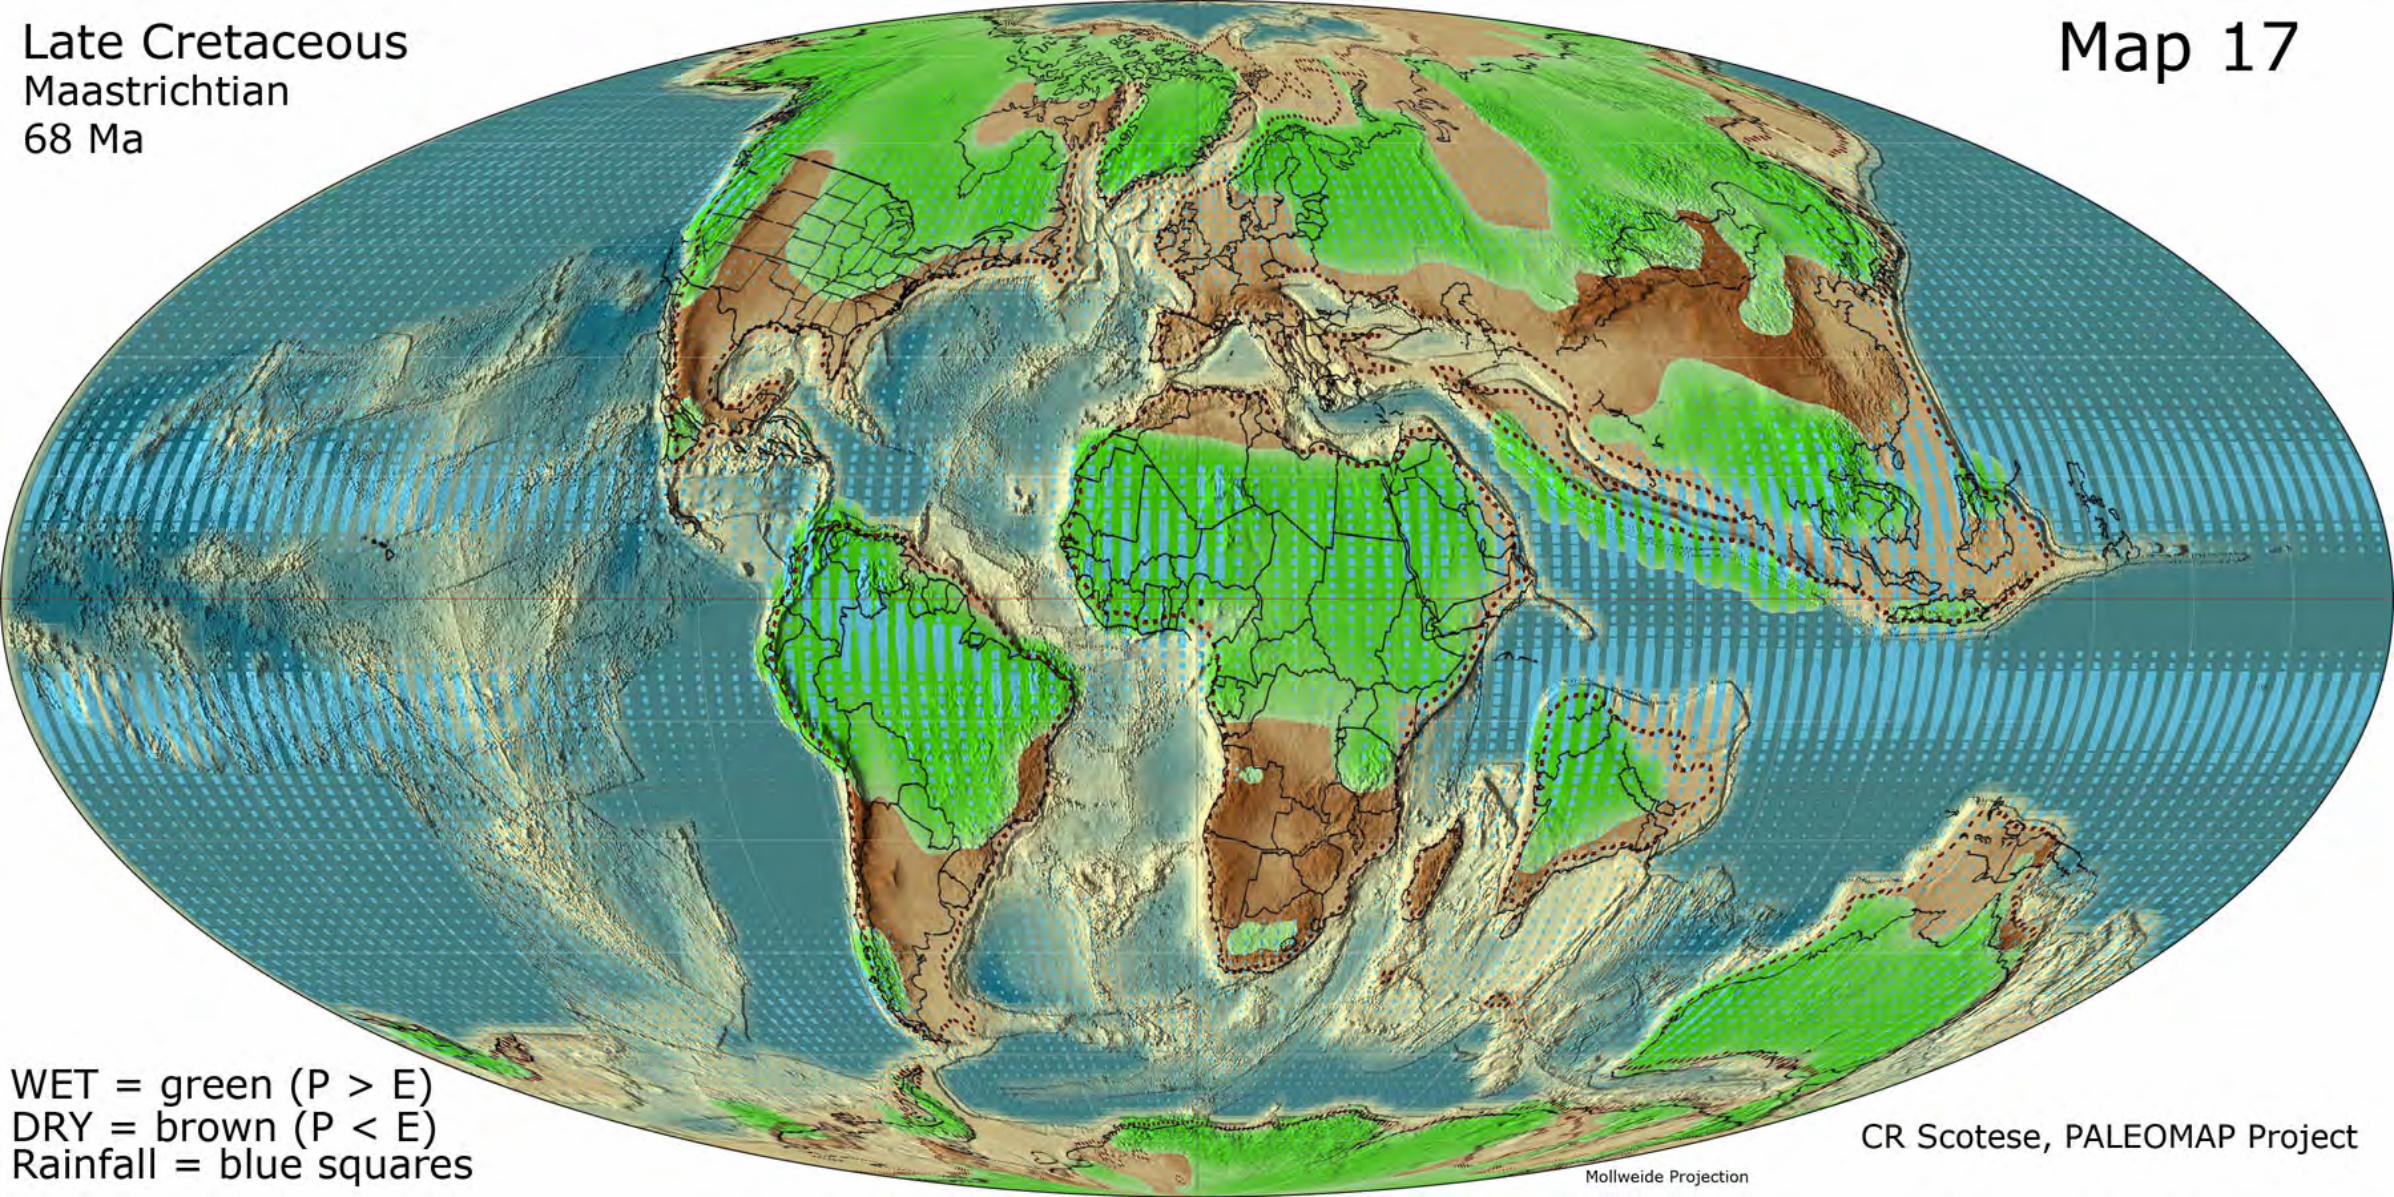
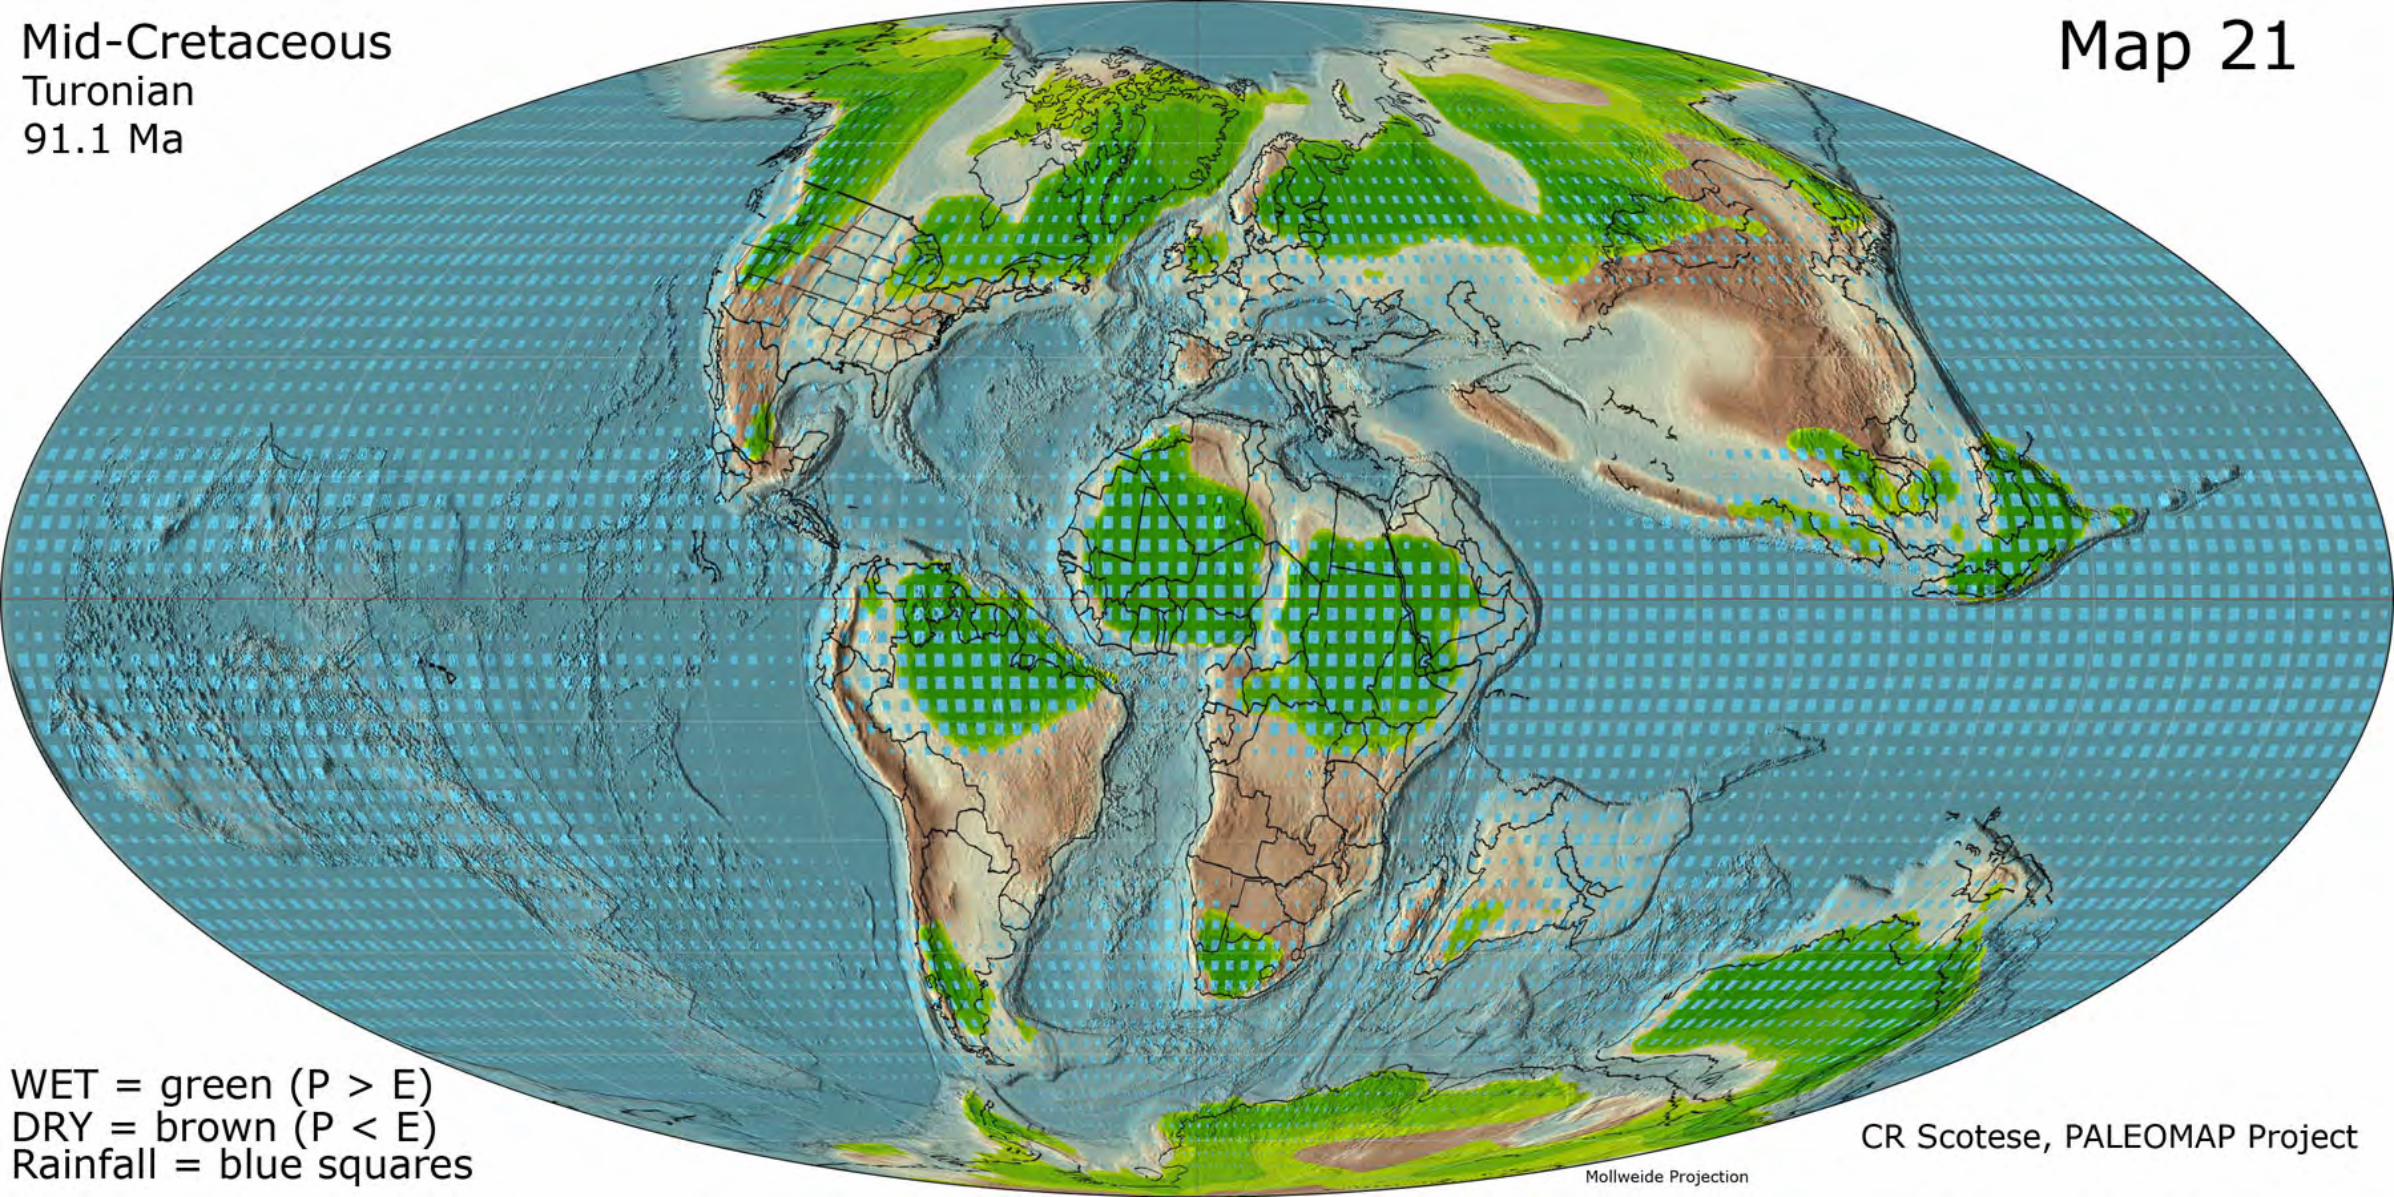
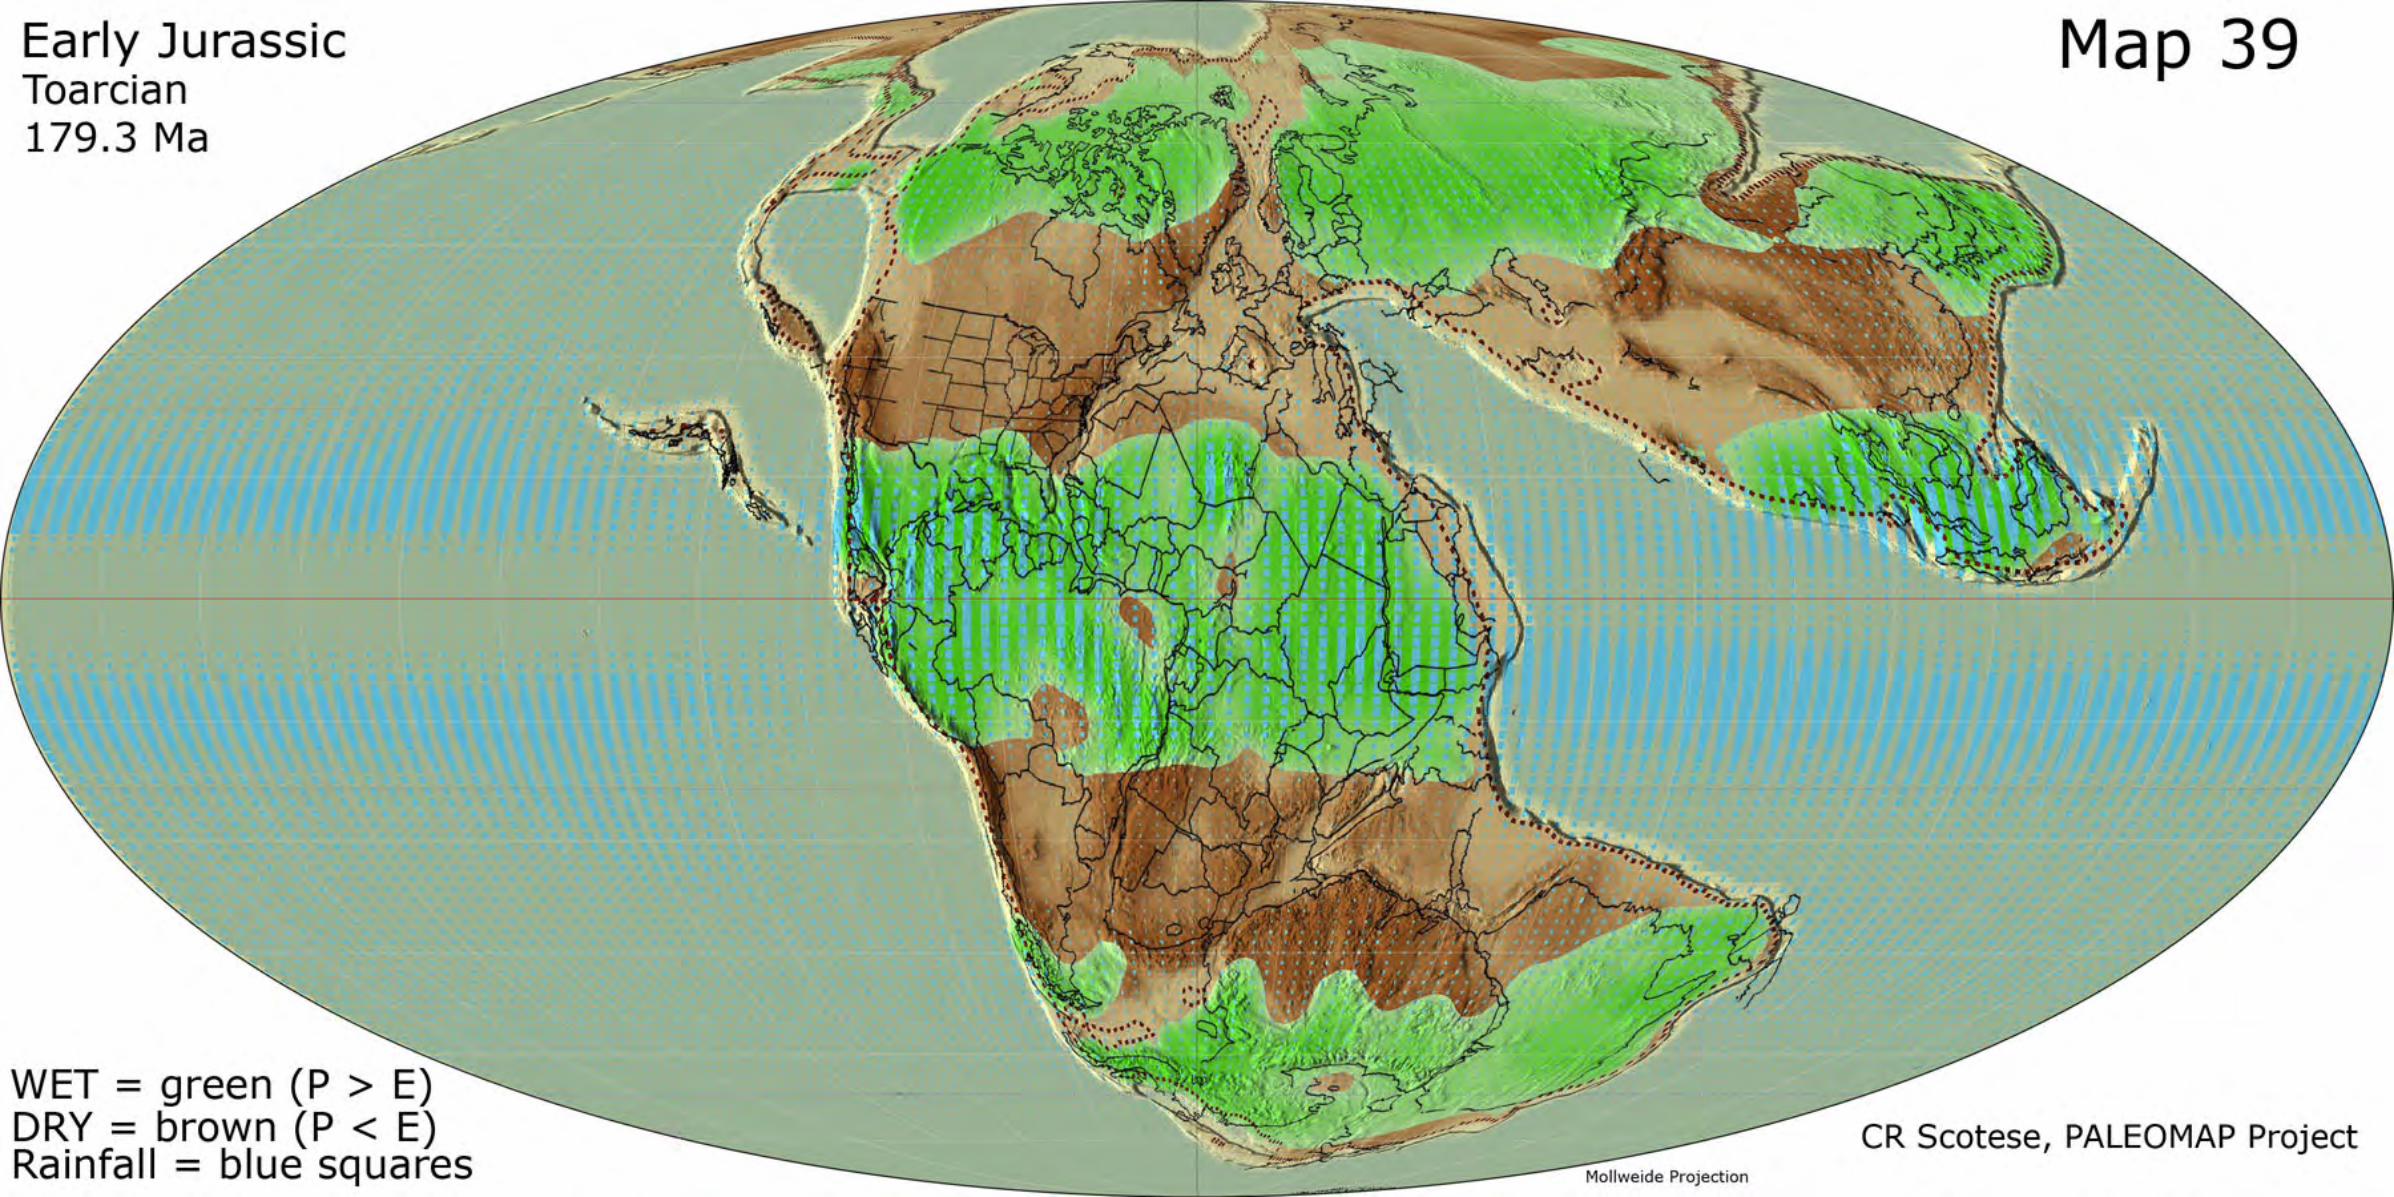
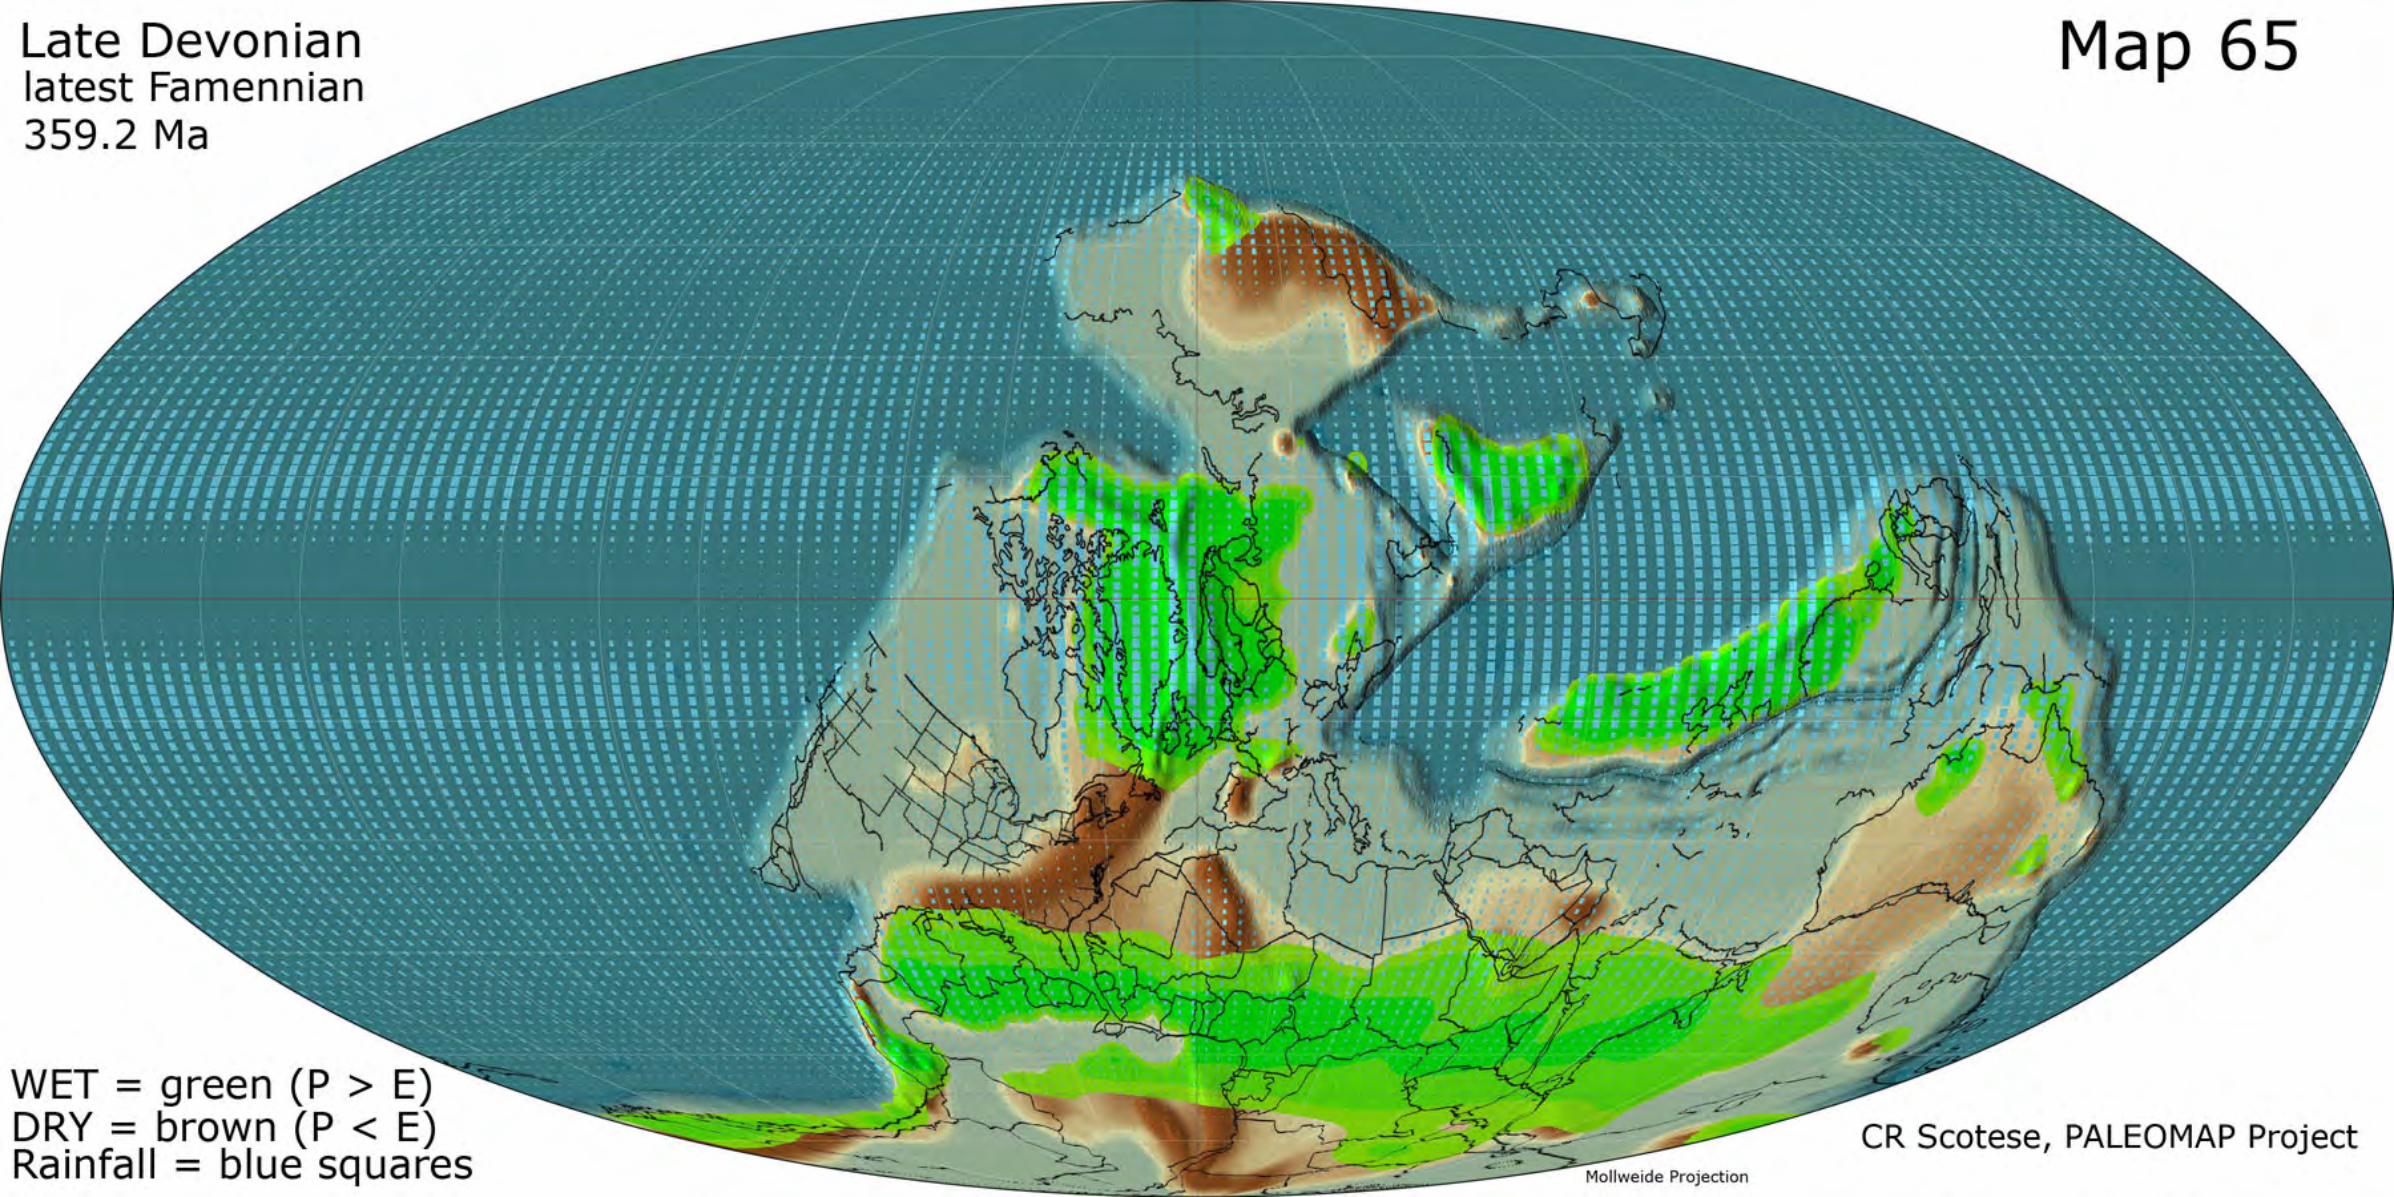
Atlas of Phanerozoic Rainfall Maps This Atlas of Phanerozoic Rainfall Maps shows the pattern of mean annual rainfall for 22 time periods from the base of the Cambrian (542 Ma) to the Middle/Late Miocene (Serravallian & Tortonian, 10.5 Ma), plus one additional map for the Neoproterozoic (Middle Ediacaran, 600 Ma). The light blue squares indicate the amount of rainfall. The areas shaded in green on the maps are regions where precipitation exceeds evaporation (P > E). The land areas in brown and tan on the map are regions where evaporation exceeds precipitation (E > P). These plate tectonic and paleogeographic maps are the work of C. R. Scotese. The paleoclimate simulations were done by T.L. Moore using the FOAM (Fast Ocean and Atmosphere) Climate Simulation Program. The slight color differences between the symbolson the maps are due to the fact that the maps were made for four separate reports (Scotese et al., 2007; 2008; 2009; & 2011). Some interesting patterns are apparent on all the maps. On the continents, Equatorial Everwet Belt generally spans latitudes, 15N – 15S. The Temperate wet belt is more variable, but generally spans the latitudes 45 – 75(N & S). In the oceans there are often noticeable gaps in precipitation apparent along the Equator and along the western sides of continents in the southern hemisphere. These gaps in precipitation are due to the chilling effect of oceanic upwelling, which reduces evaporation, and hence decreases precipitation. The maps are from volumes 1-6 of the PALEOMAP PaleoAtlas for ArcGIS (Scotese, 2014a,b,c,d). Absolute age assignments are from Gradstein, Ogg & Smith (2008). The following maps are included in the Atlas of Cambrian and Early Ordovician Paleogeographic Maps: Map 5 Middle/Late Miocene (Serravallian & Tortonian, 10.5 Ma) Map 7 Early Miocene (Aquitainian & Burdigalian, 19.5 Ma) Map 9 Early Oligocene (Rupelian, 31.1 Ma) Map 12 early Middle Eocene (middle Lutetian, 44.6 Ma) Map 17 Late Cretaceous (Maastrichtian, 68 Ma) Map 21 Mid-Cretaceous (Turonian, 91.1 Ma) Map 23 Early Cretaceous (late Albian, 101.8 Ma) Map 27 Early Cretaceous (early Aptian, 121.8 Ma) Map 31 Early Cretaceous (Berriasian, 143 Ma) Map 35 Late Jurassic (Oxfordian, 158.4 Ma) Map 39 Early Jurassic (Toarcian, 179.3 Ma) Map 45 Late Triassic (Carnian, 222.6 Ma) Map 49 Permo-Triassic Boundary (251 Ma) Map 54 Early Permian (Artinskian, 280 Ma) Map 57 Late Pennsylvanian (Gzhelian, 301.2 Ma) Map 63 Middle Mississippian (early Visean, 341.1 Ma) Map 65 Late Devonian (latest Famennian, 359.2 Ma) Map 70 Early Devonian (Emsian, 394.3 Ma) Map 75 Early Silurian (late Llandovery, 432.1 Ma) Map 82 Tremadoc (480 Ma) Map 88 Cambrian – Precambrian Boundary (542 Ma) Map 90 Late Neoproterozoic (Middle Ediacaran, 600 Ma)

This work should be cited as Scotese, C.R., 2014. Atlas of Phanerozoic Rainfall Maps (Mollweide Projection), Volumes 1-6, PALEOMAP Project PaleoAtlas for ArcGIS, PALEOMAP Project, Evanston, IL. References Cited: Scotese, C.R., Illich, H., Zumberge, J, and Brown, S., and Moore, T., 2007. The GANDOLPH Project: Year One Report: Paleogeographic and Paleoclimatic Controls on Hydrocarbon Source Rock Deposition, A Report on the Methods Employed, the Results of the Paleoclimate Simulations (FOAM), and Oils/Source Rock Compilation, Conclusions at the End of Year One: Cenomanian/Turonian (93.5 Ma), Kimmeridgian/Tithonian (151 Ma), Sakmarian/Artinskian (284 Ma), Frasnian/Famennian (375 Ma), February, 2007. GeoMark Research Ltd, Houston, Texas, 142 pp. Scotese, C.R., Illich, H., Zumberge, J, and Brown, S., and Moore, T., 2008. The GANDOLPH Project: Year Two Report: Paleogeographic and Paleoclimatic Controls on Hydrocarbon Source Rock Deposition, A Report on the Methods Employed, the Results of the Paleoclimate Simulations (FOAM), and Oils/Source Rock Compilation, Conclusions at the End of Year Two: Miocene (10Ma), Aptian/Albian (120 Ma), Berriasian/Barremian (140 Ma), Late Triassic (220 Ma), and Early Silurian (430 Ma), July, 2008. GeoMark Research Ltd, Houston, Texas, 177 pp. Scotese, C.R., Illich, H., Zumberge, J, and Brown, S., and Moore, T., 2009. The GANDOLPH Project: Year Three Report: Paleogeographic and Paleoclimatic Controls on Hydrocarbon Source Rock Deposition, A report on the Results of the Paleogeographic, Paleoclimatic Simulations (FOAM), and Oils/Source Rock Compilation, Conclusions at the End of Year Three: Eocene (45Ma), Early/Middle Jurassic (180 Ma), Mississippian (340 Ma), Neoproterozoic (600 Ma), August 2009. GeoMark Research Ltd, Houston, Texas, 154 pp. Scotese, C.R., Illich, H., Zumberge, J, and Brown, S., and Moore, T., 2011. The GANDOLPH Project: Year Four Report: Paleogeographic and Paleoclimatic Controls on Hydrocarbon Source Rock Deposition, A report on the Results of the Paleogeographic, Paleoclimatic Simulations (FOAM), and Oils/Source Rock Compilation, Conclusions at the End of Year Four: Oligocene (30 Ma), Cretaceous/Tertiary (70 Ma), Permian/Triassic (250 Ma), Silurian/Devonian (400 Ma), Cambrian/Ordovician (480 Ma), April, 2011. GeoMark Research Ltd, Houston, Texas, 219 pp. Scotese, C.R., 2014a, The PALEOMAP Project PaleoAtlas for ArcGIS, version 2, Volume 1, Cenozoic Plate Tectonic, Paleogeographic, and Paleoclimatic Reconstructions, Maps 1-15, PALEOMAP Project, Arlington, Texas. Scotese, C.R., 2014b, The PALEOMAP Project PaleoAtlas for ArcGIS, version 2, Volume 2, Cretaceous Plate Tectonic, Paleogeographic, and Paleoclimatic Reconstructions, Maps 16-32, PALEOMAP Project, Arlington, Texas. Scotese, C.R., 2014c, The PALEOMAP Project PaleoAtlas for ArcGIS, version 2, Volume 3, Triassic and Jurassic Plate Tectonic, Paleogeographic, and Paleoclimatic Reconstructions, Map 33-48, PALEOMAP Project, Arlington, Texas.

Scotese, C.R., 2014d, The PALEOMAP Project PaleoAtlas for ArcGIS, version 2, Volume 4, Late Paleozoic Plate Tectonic, Paleogeographic, and Paleoclimatic Reconstructions, Map 49-74, PALEOMAP Project, Arlington, Texas. Scotese, C.R., 2014e, The PALEOMAP Project PaleoAtlas for ArcGIS, version 2, Volume 5, Early Paleozoic Plate Tectonic, Paleogeographic, and Paleoclimatic Reconstructions, Maps 75-88, PALEOMAP Project, Arlington, Texas. Scotese, C.R., 2014f, The PALEOMAP Project PaleoAtlas for ArcGIS, version 2, Volume 6, Precambrian Plate Tectonic, Paleogeographic, and Paleoclimatic Reconstructions, Maps 89-103, PALEOMAP Project, Arlington, Texas.