Non-invasive Intermittent Mandatory Ventilation in Preterm ...
Upload
nationwidechildrensCategory
view
0download
0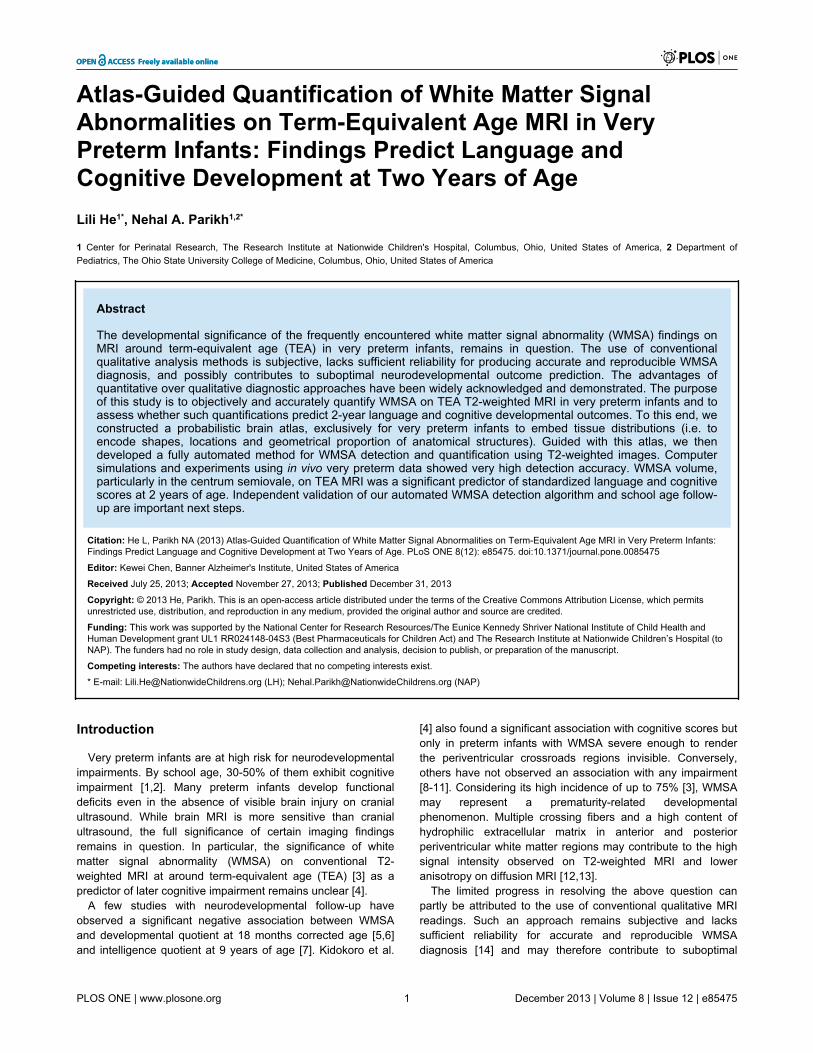
Atlas-Guided Quantification of White Matter SignalAbnormalities on Term-Equivalent Age MRI in VeryPreterm Infants: Findings Predict Language andCognitive Development at Two Years of AgeLili He1*, Nehal A. Parikh1,2*
1 Center for Perinatal Research, The Research Institute at Nationwide Children's Hospital, Columbus, Ohio, United States of America, 2 Department ofPediatrics, The Ohio State University College of Medicine, Columbus, Ohio, United States of America
Abstract
The developmental significance of the frequently encountered white matter signal abnormality (WMSA) findings onMRI around term-equivalent age (TEA) in very preterm infants, remains in question. The use of conventionalqualitative analysis methods is subjective, lacks sufficient reliability for producing accurate and reproducible WMSAdiagnosis, and possibly contributes to suboptimal neurodevelopmental outcome prediction. The advantages ofquantitative over qualitative diagnostic approaches have been widely acknowledged and demonstrated. The purposeof this study is to objectively and accurately quantify WMSA on TEA T2-weighted MRI in very preterm infants and toassess whether such quantifications predict 2-year language and cognitive developmental outcomes. To this end, weconstructed a probabilistic brain atlas, exclusively for very preterm infants to embed tissue distributions (i.e. toencode shapes, locations and geometrical proportion of anatomical structures). Guided with this atlas, we thendeveloped a fully automated method for WMSA detection and quantification using T2-weighted images. Computersimulations and experiments using in vivo very preterm data showed very high detection accuracy. WMSA volume,particularly in the centrum semiovale, on TEA MRI was a significant predictor of standardized language and cognitivescores at 2 years of age. Independent validation of our automated WMSA detection algorithm and school age follow-up are important next steps.
Citation: He L, Parikh NA (2013) Atlas-Guided Quantification of White Matter Signal Abnormalities on Term-Equivalent Age MRI in Very Preterm Infants:Findings Predict Language and Cognitive Development at Two Years of Age. PLoS ONE 8(12): e85475. doi:10.1371/journal.pone.0085475
Editor: Kewei Chen, Banner Alzheimer's Institute, United States of America
Received July 25, 2013; Accepted November 27, 2013; Published December 31, 2013
Copyright: © 2013 He, Parikh. This is an open-access article distributed under the terms of the Creative Commons Attribution License, which permitsunrestricted use, distribution, and reproduction in any medium, provided the original author and source are credited.
Funding: This work was supported by the National Center for Research Resources/The Eunice Kennedy Shriver National Institute of Child Health andHuman Development grant UL1 RR024148-04S3 (Best Pharmaceuticals for Children Act) and The Research Institute at Nationwide Children’s Hospital (toNAP). The funders had no role in study design, data collection and analysis, decision to publish, or preparation of the manuscript.
Competing interests: The authors have declared that no competing interests exist.
* E-mail: [email protected] (LH); [email protected] (NAP)
Introduction
Very preterm infants are at high risk for neurodevelopmentalimpairments. By school age, 30-50% of them exhibit cognitiveimpairment [1,2]. Many preterm infants develop functionaldeficits even in the absence of visible brain injury on cranialultrasound. While brain MRI is more sensitive than cranialultrasound, the full significance of certain imaging findingsremains in question. In particular, the significance of whitematter signal abnormality (WMSA) on conventional T2-weighted MRI at around term-equivalent age (TEA) [3] as apredictor of later cognitive impairment remains unclear [4].
A few studies with neurodevelopmental follow-up haveobserved a significant negative association between WMSAand developmental quotient at 18 months corrected age [5,6]and intelligence quotient at 9 years of age [7]. Kidokoro et al.
[4] also found a significant association with cognitive scores butonly in preterm infants with WMSA severe enough to renderthe periventricular crossroads regions invisible. Conversely,others have not observed an association with any impairment[8-11]. Considering its high incidence of up to 75% [3], WMSAmay represent a prematurity-related developmentalphenomenon. Multiple crossing fibers and a high content ofhydrophilic extracellular matrix in anterior and posteriorperiventricular white matter regions may contribute to the highsignal intensity observed on T2-weighted MRI and loweranisotropy on diffusion MRI [12,13].
The limited progress in resolving the above question canpartly be attributed to the use of conventional qualitative MRIreadings. Such an approach remains subjective and lackssufficient reliability for accurate and reproducible WMSAdiagnosis [14] and may therefore contribute to suboptimal
PLOS ONE | www.plosone.org 1 December 2013 | Volume 8 | Issue 12 | e85475

neurodevelopmental outcome prediction. The advantages ofquantitative over qualitative diagnostic approaches have beenwidely acknowledged and demonstrated [6,15-18].
For T2-weighted sequences without fluid attenuation, thesignal intensity distribution of WMSA greatly overlaps with thatof cerebrospinal fluid (CSF), making the distinction betweenthem difficult [18,19]. To overcome this known difficulty, wepropose a probabilistic atlas-guided WMSA detection andquantification method. In the context of this work, we define aprobabilistic atlas, as a pairing of anatomy template (anaveraged anatomy image from a set of normalized anatomyimages in common reference space) and its correspondingtissue probability maps (averaged gray matter (GM), whitematter (WM), and CSF segmentations from a set of normalizedmanual segmentations in common reference space). The atlasthat embeds tissue distributions (i.e. encodes shapes, locationsand geometrical proportion of anatomical structures) is utilizedto guide WMSA detections.
Atlas-guided analysis methods are usually characterized byhow the atlases are generated and how the knowledgeregarding atlases can be carried forward to target images. Theatlas can be constructed using manual/semiautomatic/automatic segmentations of an individual or a group ofindividuals [20-27]. Our proposed atlas is constructed using aset of manual parcellations of brains, which are optimal andreproducible. We endeavor to reduce bias toward a specificsubject and characterize the variability of a similar agepopulation (extremely low birth weight [ELBW, birth weight≤1000 g] infants) by utilizing anatomical averaging. We areaware of the differences in performance resulting from differentspatial normalization procedures despite use of the same atlasand subject [28]. Large deformation diffeomorphic metricmapping (LDDMM) [29] is well suited to our needs for forwardwarping an individual subject to an atlas as well as backwardwarping the atlas to the same subject. Due to the reciprocalnature of the LDDMM, the transformation can be reliablyaccomplished in either direction [30,31].
In this work, we constructed a probabilistic brain atlas,exclusively for very preterm infants and then guided with thisatlas, we proposed a fully automated WMSA detection andquantification method using clinically available T2-weightedimages. Computer simulations and experiments on clinical MRIdata presented very high detection accuracy. Finally, in aprospective cohort of ELBW infants, we demonstrated asignificant correlation between objectively quantified WMSAvolumes and language and cognitive developmental scores onthe third edition of the Bayley Scales of Infant and ToddlerDevelopment at two years of age.
Methods
Ethics StatementThe Children’s Memorial Hermann Hospital (CMHH) and The
University of Texas Medical School at Houston joint institutionalreview board (IRB) approved the study. Written informedconsent for each infant was obtained prior to enrollment in thestudy. The consent was approved by IRB and signed by each
subject's parent or guardian prior to enrollment andparticipation in the study.
SubjectsThe study population was derived from a cohort of 50 ELBW
infants without any major congenital anomalies, cared for in theNICU of Children’s Memorial Hermann Hospital from 2007 to2009. Their mean (standard deviation [SD]) gestational agewas 25.5 (1.6) with a range of 23 to 30.1 weeks; birth weightwas 750.8 (143.1) grams with a range of 468 to 1000 grams;and the postmenstrual age at MRI was 38.7 (2.3) with a rangeof 34.1 to 43.9 weeks. Nineteen MRI scans were randomlyselected for atlas construction from the cohort study. Theirmean (SD) gestational age was 25.8 (1.8) with a range of 23.4to 30 weeks; birth weight was 724.2 (148.4) grams with a rangeof 489 to 1000 grams; and post-menstrual age at MRI was 38.1(2.1) weeks with range of 34.1 to 41.7 weeks.
MRI acquisitionAll infants were imaged with a 3 T Philips scanner using a
dual-echo fast-spin-echo sequence with use of an eight-channel SENSE-compatible phased array receive head coil.The imaging parameters used were: TE1 = 8.75ms; TE2 = 175ms; TR = 10,000 ms; flip angle = 90°; FOV = 180×180 mm2;the imaging matrix = 256×256 mm2; slice thickness = 2 mm. Inthis study, T2-weighted images (corresponds to TE2) wereused to construct the atlas and perform the analysis. All infantswere transported to the MRI scanner by an experiencedneonatal transport nurse after feeding, swaddling andplacement of silicone ear plugs (E.A.R. Inc., Boulder, CO) andNatus MiniMuffs (Natus Medical Inc., San Carlos, CA) tofacilitate natural sleep and attenuate MRI noise. Sedation wasnot used for any of the cases. All scans were completed underthe supervision of a neonatal research nurse and aneonatologist experienced in neonatal MRI. All MRI scans wereread by a neuroradiologist using a standardized reporting tool.
Very preterm infant probabilistic atlas creationAll 19 ELBW infants randomly chosen for the atlas creation,
had varying degrees of WMSA ranging from only in the frontaland/or occipital periventricular white matter up to signalabnormalities covering two-thirds of the cerebral WM. Theprocedures for atlas creation were similar to the generalconcept for creating an adult/neonatal group-averaged atlas: 1.Extrameningeal tissues were manually stripped and braintissues (CSF, WM and GM) were manually parcellated usingANALYZE 8.1 software (Biomedical Imaging Resource, MayoClinic, Rochester, MN), as previously described in detail in [19];2. T2-weighted images and tissue parcellation maps were thenresliced to 1 mm isotropic resolution; 3. Out of all candidates, arepresentative single-subject image with the brain size/shapefitted to general very preterm infant brains at TEA wasselected; 4. Each subject scan was non-linearly normalized tothe representative subject using LDDMM to create an averagedanatomy image, which worked as a tentative template for thenext step; 5. Each subject was again nonlinearly normalized tothe tentative template using LDDMM to create the desiredaveraged anatomy template; and 6. The resultant nonlinear
Quantification of White Matter Abnormalities
PLOS ONE | www.plosone.org 2 December 2013 | Volume 8 | Issue 12 | e85475
transformation matrices were applied to the correspondingmanual parcellation maps to create the averaged tissueprobability maps. All normalization was performed usingDiffeoMap (www.mristudio.org, Johns Hopkins University). Theatlas is available to interested researchers upon request.
WMSA regionsWhen it was first reported in preterm neonates [3],
hyperintense WMSA was called diffuse excessive high signalintensity on T2-weighted imaging and defined as “excessive”high signal intensity within the periventricular or subcortical WMthat was not limited to the normal distribution of periventricularcrossroads (also called layers, anterior caps, and posteriorarrowheads). However, the boundaries of these crossroadsregions are not well defined. Furthermore, diffusionabnormalities within high signal intensity regions of the centrumsemiovale appear to be pathologic and associated with lowerdevelopmental quotient [6]. Therefore, in addition to subcorticalWM and centrum semiovale, we included anterior and posteriorperiventricular WM in the regions of our interest. In this work,we will investigate the relationship of outcomes with WMSAregional volumes defined at level of the 1. Entire WM; 2.Periventricular WM – on slices beginning with the firstappearance of the frontal horns and ending with the lastimages of the midbody of the lateral ventricles; and 3. Centrumsemiovale – defined as the two axial slices above the last sliceof the midbody of the lateral ventricles.
Probabilistic atlas-guided WMSA detectionVoxels with values greater than or equal to α SD above the
mean of cerebral tissues (WM and GM) were defined to beWMSA, following the same strategy used in [18]. The cut-offthreshold α was determined using computer simulations.Simulated preterm infant T2-weighted brain images withisotropic spatial resolution were constructed based on a normalanatomical model [32,33] combined with manually drawnsynthetic WMSA regions (as shown in the first column in Figure1.) by a neonatologist with more than a decade of experiencein perinatal brain injury and MRI research. In contrast to adultbrains, the intensity of WM is higher than that of GM.Heuristically, we set the mean values of CSF, WM, GM andWMSA to be 400, 260, 190 and 340 respectively. Differentlevels of Rician noise and multiplicative slowly-varying field ofintensity non-uniformity (INU) with a complex shape and rangeof 0.9 to 1.1 (20% level) were imposed. Without loss ofgenerality, we minimized the possible errors that spatialnormalizations may cause by not varying brain sizes/shapes ofeach random Monte Carlo realization. WMSA detections usingvarious α ranging from 1 to 1.8 were conducted and the onethat facilitated maximum accuracy rates was considered to beoptimal, irrespective of the level of noise, the optimal α was 1.4.
Cerebral tissue segmentation is achieved by incorporatingmembership function from unified segmentation [34] with theanatomical information obtained by adapting very preterminfant probabilistic brain atlas to fit individual brain. Morespecifically, let S be a set of voxels/locations in a brain imageand xi (i∈S) be the corresponding intensities. The aim of theproposed algorithm is to segment images into different tissue
regions (background, WM, GM, and CSF), say ωj, j = 1 to 4.We denote µunified(ωj|xi) as membership function derived usingthe generative unified model provided in SPM (WellcomeDepartment of Cognitive Neurology, London, UK). Briefly,unified tissue segmentation requires the images to benormalized with tissue probability maps (refer to the section ofvery preterm infant probabilistic atlas creation). Spatialnormalization is through non-linear deformation, which ismodelled with a linear combination of non-linear 3D discretecosine transforms basis functions. After normalization, thesemaps represent the prior probability of different tissue classesbeing found at each location in an image. Bayes rule can thenbe used to combine these priors with tissue type probabilitiesderived from voxel intensities to provide the posteriorprobability. In this unified segmentation model, intensityinhomogeneity correction was included in the mixture ofGaussian by extra parameters that account for smooth intensityvariations. Partial volume artifact was controlled by assumingthat the intensity distribution of each class may or may not beGaussian (i.e. mixture of Gaussians). Typical numbers ofGaussians are three for grey matter and two for white matter,two for CSF and five for everything else.
We then propose to include an atlas-guided anatomymislabelling correction into the model via individual tissueprobability maps, µatlas(ωj|xi), whose generation is illustrated in aflowchart shown in Figure 2. The final segmentation µij isdetermined by a joint probabilistic membership function,
μij=μuni f ied
p ω j xi ⋅μatlasq ω j xi
∑c=14 μuni f ied
p ωc xi ⋅μatlasq ωc xi
where p and q are two parameters controlling theirrespective contribution.
ValidationBy superimposing ground-truth and automated detections,
four different pixel categories are generated: a (the number ofcorrect detections that a voxel is negative), b (the number ofincorrect detections that a voxel is positive), c (the number ofincorrect detections that a voxel is negative), and d (thenumber of correct detections that a voxel is positive). Sevenmetrics are used: true positive rate = d / (c + d); true negativerate = a / (a + b); false positive rate = b / (a + b); false negativerate = c / (c + d); precision = d / (b + d); accuracy = (a + d) / (a+ b + c + d) and Dice = (2 × precision × true positive) /(precision + true positive) [45].
Language and cognitive developmental outcomesAll discharged ELBW infants were administered a
standardized Bayley Scales of Infant and Toddler DevelopmentIII (BSID-III) at 2 years of age. One infant died after discharge.Forty-seven of the remaining 49 infants (96%) returned forfollow-up. However nine of these infants had to be excluded:seven exhibited behavioral problems and could not be testedfor one or both Bayley scores; one infant had excessive motionartifacts; and one infant had severe encephalomalacia.Therefore, 38 ELBW infants were available for full analyses.The BSID-III language and cognitive subtests (on a scale of 50
Quantification of White Matter Abnormalities
PLOS ONE | www.plosone.org 3 December 2013 | Volume 8 | Issue 12 | e85475

to 150, with a mean of 100 and 150 indicating the mostadvanced development) were administered by a masked,certified examiner. All examiners are blinded to imagingfindings during assessment. Bayley motor and behavioralscales were not administered to study infants. Standardizedmotor function was tested but was not included in our analysesbecause of the low incidence of cerebral palsy and resultinginadequate study power.
Statistical analysisThe relationships between continuous variables of
objectively quantified WMSA volumes vs. BSID-III languageand WMSA volumes vs. BSID-III cognitive scores wereidentified using both Pearson correlation and simple linearregression analyses. Assumptions of both analyses weretested and met.
We use Pearson correlation coefficient r to measure thelinear correlation between the two variables, giving a valuebetween 1 and −1, where 1 is total positive correlation, 0 is nocorrelation, and −1 is negative correlation. In addition, we use
linear regression to model the relationship between the twovariables by fitting a linear equation. A linear regression linehas an equation of the form Y = a + bX, where b is the slope ofthe line and a is the intercept. When b = 1 and a = 0, a perfectagreement can be said to exist between two variables.Coefficient of determination, denoted R2 (0≤R2 ≤1) is used todescribe how well the regression line fits the observed data.The larger the R2, the better the fit.
In bivariate analyses, we tested the influence of sex,gestational age, and postmenstrual age at MRI scan, one at atime with WMSA volume and associated them with cognitiveand language scores. Two-sided P values of <0.05 wereconsidered to indicate statistical significance. No correctionswere made for multiple comparisons [46].
Results
SimulationsThe proposed method was first validated on simulated
preterm infant brains with known ground-truth (manually drawn
Figure 1. WMSA detection on simulated preterm T2-weighted brain images. Images at three mid-axial levels show, from leftto right: noise-free images with manually drawn WMSA regions in yellow (ground truth); addition of Rician noise (SNR = 15) and INU(20% level); and WMSA detection by our proposed method marked in yellow.doi: 10.1371/journal.pone.0085475.g001
Quantification of White Matter Abnormalities
PLOS ONE | www.plosone.org 4 December 2013 | Volume 8 | Issue 12 | e85475

WMSA). Qualitatively, Figure 1 shows that the WMSAdetection and quantification results have strong agreement withthe ground truth. In addition, quantitative comparisonsdisplayed in Figure 3 show very high similarity index valuesand low false detection rates at each signal-to-noise (SNR,which is the mean signal intensity divided by the standarddeviation of the noise) level.
In vivo very preterm dataSkull stripping was performed using the Brain Extraction Tool
(BET) [35]. An experienced neonatologist visually inspected thedetection results. Representative images from one ELBWinfant with WMSA detection highlighted in red are presented inFigure 4. The automated WMSA detection closelyapproximated the visually apparent signal abnormalities.
Figure 2. A flowchart of the generation of individual tissue probability maps. A target individual anatomy was first normalizedto the reference space formed by the very preterm probabilistic atlas using LDDMM and the resultant transformation matrix wassaved. The inverse transformation matric was applied to the tissue probability maps to create the desired target individual tissueprobability maps.doi: 10.1371/journal.pone.0085475.g002
Figure 3. Comparison of automated WMSA detection on simulated infant MR images with ground truth. Quantitatively,automated detection showed very high Dice similarity index values (left) and low false detection rates (right) at each noise level withground truth.doi: 10.1371/journal.pone.0085475.g003
Quantification of White Matter Abnormalities
PLOS ONE | www.plosone.org 5 December 2013 | Volume 8 | Issue 12 | e85475

Figure 4. Automated WMSA detection at six different axial levels. Top row: T2-weighted images; bottom row: detected WMSAmarked in red. The automated detections closely approximated the visually apparent signal abnormalities.doi: 10.1371/journal.pone.0085475.g004
Figure 5. Linear regression and Pearson correlation analyses of automated quantified WMSA within different WM regionsand Bayley III cognitive and language scores. R2 denotes linear regression’s coefficient of determination and r denotes Pearsoncorrelation coefficient. Larger WMSA volumes correspond with both lower cognitive and language scores. WMSA regional volumewithin centrum semiovale is a better predictor of Bayley scores than that within the periventricular WM regions.doi: 10.1371/journal.pone.0085475.g005
Quantification of White Matter Abnormalities
PLOS ONE | www.plosone.org 6 December 2013 | Volume 8 | Issue 12 | e85475

WMSA volume as a predictor of language and cognitiveoutcomes
WMSA volume was quantified by taking the product of totalnumber of positive voxels in the detected binary mask by thevolume of each voxel. The mean (SD) age at follow-up of ourcohort was 23.7 (2.9) months (20.0 [2.8] months correctedage). The cohort BSID-III language scores had a mean of 94.3and a standard deviation of 14.0; cognitive scores had a meanof 88.7 and a standard deviation of 17.4. Correlationalstatistical analyses showed that BSID-III language andcognitive scores were significantly (P value < 0.05) correlatedwith total WMSA volume as well as WMSA within the sub-regions of WM (Figure 5). WMSA at the level of the centrumsemiovale exhibited the strongest linear correlation with Bayleyscores, while WM in the periventricular crossroads exhibitedthe weakest correlation. These relationships modeled by linearregression are also plotted in Figure 5. In bivariate analyses,sex, gestational age, and postmenstrual age at MRI scan werenot significant and exerted minimal influence on the betacoefficients.
Discussions
Accurate and reproducible quantification of WMSA is criticalfor determining its developmental significance and potentiallyidentifying high-risk preterm infants that may benefit fromneuroprotective and early intervention therapies. In this paper,we present a fully automated atlas-guided method to detectand quantify WMSA on conventional T2-weighted imaging.Atlas-guided anatomic information was incorporated withunified segmentation and the relative importance of bothcomponents was controlled by two parameters. We assignedequal weights to both components, recognizing that differentweighting would likely produce different results. Intuitively, if theknowledge carried by an atlas can be precisely forwarded to atarget, µatlas should be weighted heavily; otherwise, one shouldconsider weighing µspm heavily. Importantly, this approach likelycontributed to our finding a significant association betweenWMSA volume and short-term standardized measures oflanguage and cognitive development in ELBW infants.
Several studies have found that adult atlases do not form asuitable reference space for children and neonates, due to theconsiderable differences in size, geometrical proportions andbrain tissue properties [36-39]. However, there are no studieson how well the atlases of full term neonates match verypreterm infants, and vice versa. As compared to healthy termnewborns, the brains of very preterm infants on TEA MRIfrequently exhibit WMSA, delayed cortical maturation, andglobally smaller structural and tissue volumes, even in theabsence of signs of overt perinatal brain injury [40]. With moresubjects being added to our current cohort study, this would bean interesting topic to explore. It is also worth noting that adynamically time-varying atlas with dense duration coveragemay more accurately reflect the fast rate of brain structurechanges during the first few months of life [26,27,41-44].
Our studies were performed on unsedated infants whotypically fall asleep after being fed and swaddled. The ability tonow use conventional T2-weighted over multiple echo weighted
imaging helps reduce scan time, resulting in less motionartifacts and need for sedation. Use of parallel imagingtechniques, as used in our study, is also helping greatly in thisregard. These innovations will facilitate larger multicenterimaging studies in very preterm infants and aid in definitivelyestablishing the role of advanced brain MRI in this vulnerablepopulation. Once more cases can be added to our pretermatlas, additional refinements such as localization of WMSA willbe necessary to fully understand the developmentalsignificance of WM hyperintensities in periventricularcrossroads regions versus subcortical or centrum semiovaleregions [12,13].
In our cohort of very preterm infants, we demonstratedautomatically detected WMSA volume on TEA MRI to be asignificant predictor of cognitive and language development at2 years of age. Prior efforts to correlate WMSA with cognitiveoutcomes may have failed due to the low reliability ofdiagnosing WMSA qualitatively [9,14]. Our findings support theuse of objective automated techniques to accurately quantifythe lesion burden in perinatal-neonatal brain injury.Furthermore, lesion localization appears important indistinguishing developmentally normal from pathologic signalabnormalities, as observed in the periventricular crossroadsand centrum semiovale regions, respectively. This alsofacilitates improved outcome prediction.
The volume of WMSA in the centrum semiovale was thestrongest predictor of Bayley scores, particularly languagescores. This is consistent with findings from Krishnan et al. [6],who reported a significant correlation between apparentdiffusion coefficient values in the centrum semiovale on TEAdiffusion tensor imaging (DTI) and developmental quotient at 2years corrected age. In a related study from this same cohort[47], we measured DTI microstructural measures in thecentrum semiovale and found these to be independentpredictors of cognitive/language scores at age 2. Our findingsare also consistent with several other studies that found arelationship between WMSA and cognitive outcomes [4,5,7,48]but not all studies [8-11]. Similar to our study, both prior studiesthat used a quantitative measure of WMSA found a significantcorrelation with cognitive scores [6,48] but only a fraction of thestudies that used a subjective diagnosis found a significantassociation. This suggests that measurement error may beplaying a role in these variable outcomes, highlighting the needfor objective quantitative diagnosis. Longer follow-up is alsovital to assess if school-age outcome can be accuratelypredicted [49]. Due to the limited cohort size, we modeled thedata using univariate regression only. For future larger studies,many other cofactors and clinical predictors can beincorporated to build a more complete and accuratemultivariable model. Additional larger studies with school-ageoutcomes are needed to determine if WMSA in conjunctionwith other predictive factors could facilitate early infancyidentification of individual infants at high risk for cognitive/language deficits and permit more intensive early interventiontherapies.
In summary, we constructed an age-specific very preterminfant probabilistic atlas. Guided with this atlas, we thenproposed a fully automated method for WMSA detection and
Quantification of White Matter Abnormalities
PLOS ONE | www.plosone.org 7 December 2013 | Volume 8 | Issue 12 | e85475

quantification using clinically available T2-weighted images.Computer simulations and validation using in vivo very pretermdata showed very high detection accuracy. Correlationalanalyses demonstrated that WMSA volume at TEA predictedshort-term language and cognitive developmental outcomes.Our work will facilitate population-based studies to moreaccurately characterize WMSA’s long-term sequelae.
Acknowledgements
We thank Ms. Margaret Layne Poundstone for access to theneurodevelopmental follow-up data.
Author Contributions
Conceived and designed the experiments: LH NAP. Performedthe experiments: LH. Analyzed the data: LH NAP. Wrote themanuscript: LH NAP.
References
1. Behrman RE, Butler AS, editors (2007) Preterm birth: causes,consequences, and prevention. Washington DC: Institute of Medicineof the National Academies. pp. 346-397.
2. Potharst ES, van Wassenaer AG, Houtzager BA, van Hus JW, Last BFet al. (2011) High incidence of multi-domain disabilities in very pretermchildren at five years of age. J Pediatr 159: 79-85. doi:10.1016/j.jpeds.2010.12.055. PubMed: 21349538.
3. Maalouf EF, Duggan PJ, Rutherford MA, Counsell SJ, Fletcher AM etal. (1999) Magnetic resonance imaging of the brain in a cohort ofextremely preterm infants. J Pediatr 135: 351-357. doi:10.1016/S0022-3476(99)70133-2. PubMed: 10484802.
4. Kidokoro H, Anderson PJ, Doyle LW, Neil JJ, Inder TE (2011) Highsignal intensity on T2-weighted MR imaging at term-equivalent age inpreterm infants does not predict 2-year neurodevelopmental outcomes.AJNR Am J Neuroradiol 32: 2005-2010. doi:10.3174/ajnr.A2703.PubMed: 21960493.
5. Dyet LE, Kennea N, Counsell SJ, Maalouf EF, Ajayi-Obe M et al.(2006) Natural history of brain lesions in extremely preterm infantsstudied with serial magnetic resonance imaging from birth andneurodevelopmental assessment. Pediatrics 118: 536-548. doi:10.1542/peds.2005-1866. PubMed: 16882805.
6. Krishnan ML, Dyet LE, Boardman JP, Kapellou O, Allsop JM et al.(2007) Relationship between white matter apparent diffusioncoefficients in preterm infants at term-equivalent age anddevelopmental outcome at 2 years. Pediatrics 120: e604-e609. doi:10.1542/peds.2006-3054. PubMed: 17698966.
7. Iwata S, Nakamura T, Hizume E, Kihara H, Takashima S et al. (2012)Qualitative brain MRI at term and cognitive outcomes at 9 years aftervery preterm birth. Pediatrics 129: e1138-47. PubMed: 22529280.
8. de Bruïne FT, van den Berg-Huysmans AA, Leijser LM, Rijken M,Steggerda SJ et al. (2011) Clinical implications of MR imaging findingsin the white matter in very preterm infants: a 2-year follow-up study.Radiology 261: 899-906. doi:10.1148/radiol.11110797. PubMed:22031710.
9. Hart A, Whitby E, Wilkinson S, Alladi S, Paley M et al. (2011) Neuro-developmental outcome at 18 months in premature infants with diffuseexcessive high signal intensity on MR imaging of the brain. PediatrRadiol 41: 1284- 1292. doi:10.1007/s00247-011-2155-7. PubMed:21681616.
10. Jeon TY, Kim JH, Yoo SY, Eo H, Kwon JY et al. (2012)Neurodevelopmental outcomes in preterm infants: comparison ofinfants with and without diffuse excessive high signal intensity on MRimages at near-term-equivalent age. Radiology 263: 518-526. doi:10.1148/radiol.12111615. PubMed: 22403166.
11. Skiöld B, Vollmer B, Böhm B, Hallberg B, Horsch S et al. (2012)Neonatal magnetic resonance imaging and outcome at age 30 monthsin extremely preterm infants. J Pediatr 160: 559-566. doi:10.1016/j.jpeds.2011.09.053. PubMed: 22056283.
12. Judas M, Rados M, Jovanov-Milosevic N, Hrabac P, Stern-Padovan Ret al. (2005) Structural, immunocytochemical, and MR imagingproperties of periventricular crossroads of growing cortical pathways inpreterm infants. AJNR Am J Neuroradiol 26: 2671-2684. PubMed:16286422.
13. Kostović I, Judas M, Rados M, Hrabac P (2002) Laminar organizationof the human fetal cerebrum revealed by histochemical markers andmagnetic resonance imaging. Cereb Cortex 12: 536-544. doi:10.1093/cercor/12.5.536. PubMed: 11950771.
14. Hart AR, Smith MF, Rigby AS, Wallis LI, Whitby EH (2010)Appearances of diffuse excessive high signal intensity (DEHSI) on MR
imaging following preterm birth. Pediatr Radiol 40: 1390-1396. doi:10.1007/s00247-010-1633-7. PubMed: 20333509.
15. Brickman AM, Sneed JR, Provenzano FA, Garcon E, Johnert L et al.(2011) Quantitative approaches for assessment of white matterhyperintensities in elderly populations. Psychiatry Res 193: 101-106.doi:10.1016/j.pscychresns.2011.03.007. PubMed: 21680159.
16. Counsell SJ, Allsop JM, Harrison MC, Larkman DJ, Kennea NL et al.(2002) Quantitative analysis of the cerebral white matter in preterminfants using diffusion weighted imaging. Pediatr Res 51: 2552.
17. Hagmann CF, De Vita E, Bainbridge A, Gunny R, Kapetanakis AB et al.(2009) T2 at MR Imaging is an objective quantitative measure ofcerebral white matter signal intensity abnormality in preterm infants atterm-equivalent Age. Radiology 252: 209-217. doi:10.1148/radiol.2522080589. PubMed: 19561257.
18. He L, Parikh NA (2013) Automated detection of white matter signalabnormality using T2 relaxometry: Application to brain segmentation onterm MRI in very preterm infants. NeuroImage 64: 328-340. doi:10.1016/j.neuroimage.2012.08.081. PubMed: 22974556.
19. Yu X, Zhang Y, Lasky RE, Datta S, Parikh NA et al. (2010)Comprehensive brain MRI segmentation in high risk preterm newborns.PLOS ONE 5: e13874. doi:10.1371/journal.pone.0013874. PubMed:21079730.
20. Evans AC, Collins DL, Mills SR, Brown ED, Kelly RL et al. (1993) 3DStatistical neuroanatomical models from 305 MRI volumes. NuclearScience Symposium & Medical Imaging Conference, 3. pp. 1813-1817.
21. Mazziotta JC, Toga AW, Evans A, Fox P, Lancaster J et al. (2001) Afour-dimensional probabilistic atlas of the human brain. J Am MedInform Assoc 8: 401-430. doi:10.1136/jamia.2001.0080401. PubMed:11522763.
22. Mazziotta JC, Toga AW, Evans A, Fox P, Lancaster J et al. (2001) Aprobabilistic atlas and reference system for the human brain:International Consortium for Brain Mapping (ICBM). Philos Trans R SocLond B Biol Sci 356: 1293-1322. doi:10.1098/rstb.2001.0915. PubMed:11545704.
23. Mazziotta JC, Toga AW, Evans A, Fox P, Lancaster J (1995) AProbabilistic Atlas of the Human Brain - Theory and Rationale for Its.Development - NeuroImage 2: 89-101. doi:10.1006/nimg.1995.1012.
24. Holmes CJ, Hoge R, Collins L, Woods R, Toga AW et al. (1998)Enhancement of MR images using registration for signal averaging. JComput Assist Tomogr 22: 324-333. doi:10.1097/00004728-199803000-00032. PubMed: 9530404.
25. Rohlfing T, Brandt R, Menzel R, Maurer CR Jr. (2004) Evaluation ofatlas selection strategies for atlas-based image segmentation withapplication to confocal microscopy images of bee brains. NeuroImage21: 1428-1442. doi:10.1016/j.neuroimage.2003.11.010. PubMed:15050568.
26. Shi F, Fan Y, Tang S, Gilmore J, Lin W et al. (2009) Brain tissuesegmentation of neonatal MR images using a longitudinal subject-specific probabilistic atlas. Proc Soc Photo Opt Instrum Eng 1. p. 7259.PubMed: 20414458.
27. Shi F, Fan Y, Tang S, Gilmore JH, Lin W et al. (2010) Neonatal brainimage segmentation in longitudinal MRI studies. NeuroImage 49:391-400. doi:10.1016/j.neuroimage.2009.07.066. PubMed: 19660558.
28. Klein A, Andersson J, Ardekani BA, Ashburner J, Avants B et al. (2009)Evaluation of 14 nonlinear deformation algorithms applied to humanbrain MRI registration. NeuroImage 46: 786-802. doi:10.1016/j.neuroimage.2008.12.037. PubMed: 19195496.
29. Ceritoglu C, Oishi K, Li X, Chou MC, Younes L et al. (2009) Multi-contrast large deformation diffeomorphic metric mapping for diffusion
Quantification of White Matter Abnormalities
PLOS ONE | www.plosone.org 8 December 2013 | Volume 8 | Issue 12 | e85475

tensor imaging. NeuroImage 47: 618-627. doi:10.1016/j.neuroimage.2009.04.057. PubMed: 19398016.
30. Hernandez M, Olmos S, Pennec X (2008) Comparing algorithms fordiffeomorphic registration: stationary LDDMM and diffeomorphicdemons.Workshop on Mathematical Foundations of ComputationalAnatomy, (MICCAI): 24-35.
31. Oishi K, Faria A, Jiang H, Li X, Akhter K et al. (2009) Atlas-based wholebrain white matter analysis using large deformation diffeomorphicmetric mapping: application to normal elderly and Alzheimer's diseaseparticipants. NeuroImage 46: 486-499. doi:10.1016/j.neuroimage.2009.01.002. PubMed: 19385016.
32. Cocosco CA, Kollokian V, Kwan RK-S, Evans AC (1997) BrainWeb:online interface to a 3D MRI simulated brain database. NeuroImage 5:S425.
33. Collins DL, Zijdenbos AP, Kollokian V, Sled JG, Kabani NJ et al. (1998)Design and construction of a realistic digital brain phantom. IEEE TransMed Imaging 17: 463-468. doi:10.1109/42.712135. PubMed: 9735909.
34. Ashburner J, Friston KJ (2005) Unified segmentation. NeuroImage 26:839-851. doi:10.1016/j.neuroimage.2005.02.018. PubMed: 15955494.
35. Smith SM (2002) Fast robust automated brain extraction. Hum BrainMapp 17: 143-155. doi:10.1002/hbm.10062. PubMed: 12391568.
36. Burgund ED, Kang HC, Kelly JE, Buckner RL, Snyder AZ et al. (2002)The feasibility of a common stereotactic space for children and adults infMRI studies of development. NeuroImage 17: 184-200. doi:10.1006/nimg.2002.1174. PubMed: 12482076.
37. Hoeksma MR, Kenemans JL, Kemner C, van Engeland H (2005)Variability in spatial normalization of pediatric and adult brain images.Clin Neurophysiol 116: 1188-1194. doi:10.1016/j.clinph.2004.12.021.PubMed: 15826861.
38. Lenroot RK, Giedd JN (2006) Brain development in children andadolescents: insights from anatomical magnetic resonance imaging.Neurosci Biobehav Rev 30: 718-729. doi:10.1016/j.neubiorev.2006.06.001. PubMed: 16887188.
39. Muzik O, Chugani DC, Juhász C, Shen CG, Chugani HT (2000)Statistical parametric mapping: Assessment of application in children.NeuroImage 12: 538-549. doi:10.1006/nimg.2000.0651. PubMed:11034861.
40. Parikh NA, Lasky RE, Kennedy KA, McDavid GE, Tyson JE (2013)Perinatal factors and regional brain volume abnormalities at term in a
cohort of extremely low birth weight infants. PLOS ONE 8: e62804. doi:10.1371/journal.pone.0062804. PubMed: 23671636.
41. Habas PA, Kim K, Corbett-Detig JM, Rousseau F, Glenn OA et al.(2010) A spatiotemporal atlas of MR intensity, tissue probability andshape of the fetal brain with application to segmentation. NeuroImage53: 460-470. doi:10.1016/j.neuroimage.2010.06.054. PubMed:20600970.
42. Kuklisova-Murgasova M, Aljabar P, Srinivasan L, Counsell SJ, Doria Vet al. (2011) A dynamic 4D probabilistic atlas of the developing brain.NeuroImage 54: 2750-2763. doi:10.1016/j.neuroimage.2010.10.019.PubMed: 20969966.
43. Serag A, Aljabar P, Ball G, Counsell SJ, Boardman JP et al. (2012)Construction of a consistent high-definition spatio-temporal atlas of thedeveloping brain using adaptive kernel regression. NeuroImage 59:2255-2265. doi:10.1016/j.neuroimage.2011.09.062. PubMed:21985910.
44. Shi F, Yap PT, Gilmore JH, Lin WL, Shen DG (2010) Spatial-temporalconstraint for segmentation of serial infant brain MR images. MedicalImaging and Augmented Reality 6326: 42-50. doi:10.1007/978-3-642-15699-1_5.
45. Dice LR (1945) Measures of the amount of ecologic associationbetween species. Ecology 26: 297-302. doi:10.2307/1932409.
46. Rothman KJ (1990) No Adjustments Are Needed for MultipleComparisons. Epidemiology 1: 43-46. doi:10.1097/00001648-199001000-00010. PubMed: 2081237.
47. Pogribna U, Burson K, Lasky RE, Narayana PA, Evans PW et al. (, Sep192013) Role of Diffusion Tensor Imaging (DTI) as an IndependentPredictor of Cognitive and Language Development in ExtremelyPreterm Infants. AJNR Am J Neuroradiol, Sep 19
48. Boardman JP, Craven C, Valappil S, Counsell SJ, Dyet LE et al. (2010)A common neonatal image phenotype predicts adverseneurodevelopmental outcome in children born preterm. NeuroImage52: 409-414. doi:10.1016/j.neuroimage.2010.04.261. PubMed:20451627.
49. Hack M, Taylor HG, Drotar D, Schluchter M, Cartar L et al. (2005) Poorpredictive validity of the Bayley Scales of Infant Development forcognitive function of extremely low birth weight children at school age.Pediatrics 116: 333-341. doi:10.1542/peds.2005-0173. PubMed:16061586.
Quantification of White Matter Abnormalities
PLOS ONE | www.plosone.org 9 December 2013 | Volume 8 | Issue 12 | e85475
Copyright © 2022 FDOKUMEN