
ATL_20-2.pdf - Ancient TL
31
-
Upload
khangminh22 -
Category
Documents
-
view
3 -
download
0
Transcript of ATL_20-2.pdf - Ancient TL
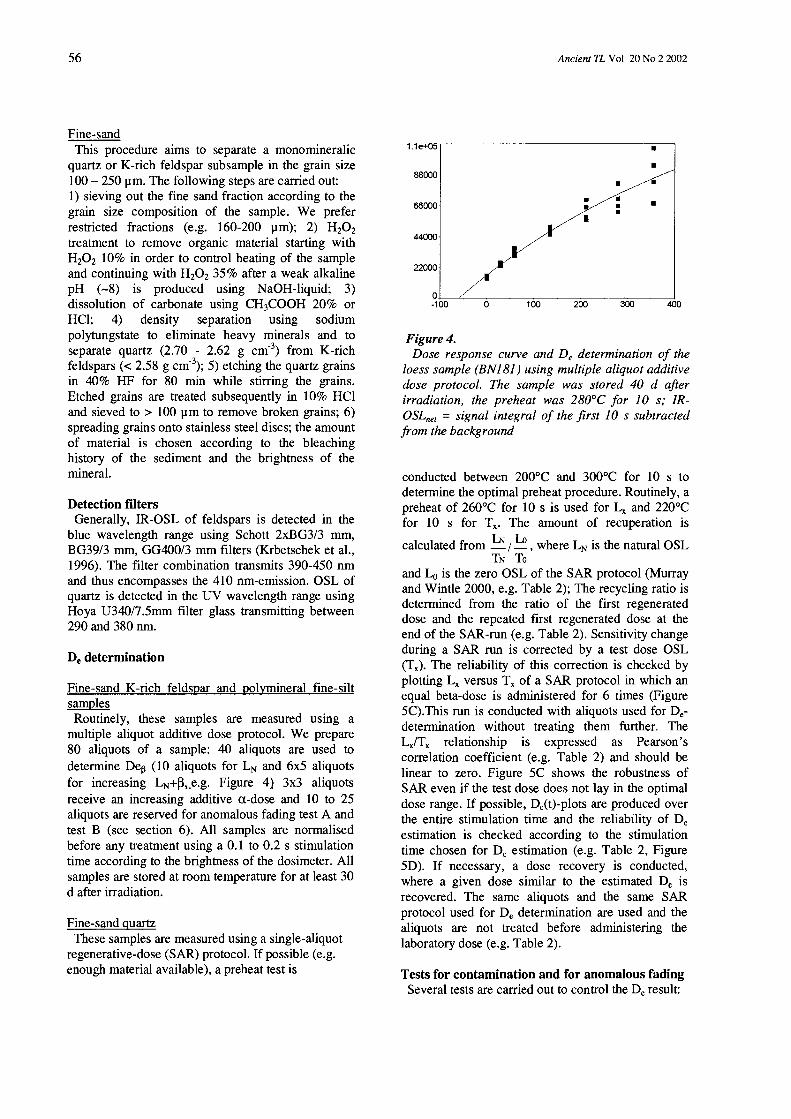
Ancient TL Vol. 20 No 2 2002 41
Detection of far-red IRSL from loess Zhong-Ping Lai1, Lee Arnold1, Stephen Stokes1, Richard Bailey1, and Morteza Fattahi1,2
1. Oxford Luminescence Research Group, School of Geography and the Environment, University of Oxford, Mansfield Road, Oxford, OX1 3TB, UK 2. Institute of Geophysics, University of Tehran, Iran Corresponding author. E-mail: [email protected]. Fax: +44-1865-271929.
(Received 7 October 2002; in final form 20 October 2002) _____________________________________________________________________________________________ Abstract: It has recently been proposed that it may be possible to extend the age range of luminescence dating of loess using the far-red (λ=665-740nm) emission from feldspar, as it is thought not to exhibit anomalous fading. Studies on red luminescence have been hindered due to technical difficulties in suppression of background and other factors. Recently modifications to apparatus (esp. photo-multiplier plus filter combinations) have been reported demonstrating that red IRSL (λ=590-700nm) may be observed from coarse-grained feldspar (Fattahi and Stokes, 2002a). However, this modified system was not able to detect far-red IRSL (λ=665-740nm) from old (>800ka) Chinese loess. In this short note we describe further modifications to the system which have successfully enhanced the far-red IRSL signal, and at the same time reduced background signal levels. As a result, routine measurements of far-red IRSL from loess are possible. Introduction The luminescence dating of feldspar using UV-blue emissions has been hindered by the ubiquitous presence of anomalous fading and associated age underestimation (e.g. Lamothe and Auclair, 1999; Huntley and Lamothe, 2001). Red TL (λ>600nm) of feldspar has been demonstrated not to exhibit anomalous fading (Zink and Visocekas, 1997). The work of Zink and Visocekas (1997) was, however, focussed on a relatively small number of samples and exploited relatively low temperature (<370oC) red TL. A logical extension of their investigations is to study red IRSL from feldspar (Fattahi, 2001). Recently, Fattahi and Stokes (2002a) have successfully demonstrated that it is possible to detect red IRSL (λ=590-700nm) from coarse grain potassium-rich feldspar by careful selection of novel photo-multiplier (PMT) and filter combinations. In further testing we have found that their system is not able to observe far-red IRSL (λ>665nm) from loess sample as old as 800 ka (expected De c. >3,000Gy). Here we describe further developments to the detection system that allow far-red IRSL from loess with doses as low as 50Gy to be measured. Selection of detection window There are a variety of luminescence emissions of feldspar from 280 to 800nm (Krbetschek et al., 1997). The conventionally used UV/blue emissions suffer from anomalous fading (e.g. Lamothe and Auclair, 1999). The pioneering work by Zink and Visocekas (1997) has shown that while blue TL of volcanic feldspars (λ<600nm) suffers severely from
anomalous fading, red TL (λ>600nm) from the same samples does not fade anomalously. Fattahi and Stokes (2002b) reported that orange-red IRSL (λ=590-700nm) from potassium feldspar derived from sediments exhibited anomalous fading, but at a level much lower than blue IRSL, and that far-red IRSL (λ=665-700nm) showed no fading. It seems that the further toward IR we are able to detect red IRSL, the more stable a signal we observe. We interpret this as a reflection of a progressive reduction of the influence of the broad yellow-orange (~570nm) emission centre which has previously been recognized to exhibit fading (e.g. Fattahi and Stokes, 2002b). It has been demonstrated that loess has a strong far-red emission (λ=665-740nm) in both natural and laboratory irradiated polymineral samples (Krbetschek et al., 1997; Lai et al., 2002). Moreover, far-red IRSL is highly reproducible and amendable to Single Aliquot Regenerative (SAR) techniques (Fattahi and Stokes, 2002c; Lai et al., 2002; Arnold et al., 2002). As a result, we here further focus on the wavelength band of 665-740nm (far-red IRSL) as the optimum detection window (filter combination is Schott RG 665 + Omega 740 SP, Fig 1). The difficulty in detecting far-red IRSL at this wavelength is the suppression of high background related to the close proximity of the IR stimulation source (λ=830 ± 5nm).
42 Ancient TL Vol. 20 No 2 2002
0
50
100
300 400 500 600 700 800 900 1000Wavelength (nm)
Tran
smis
sion
(%)
Schott RG780
Comar Industries 830 IL 12
Schott RG665
Omega 740SP
IR StimulationSource
RG665+740SP
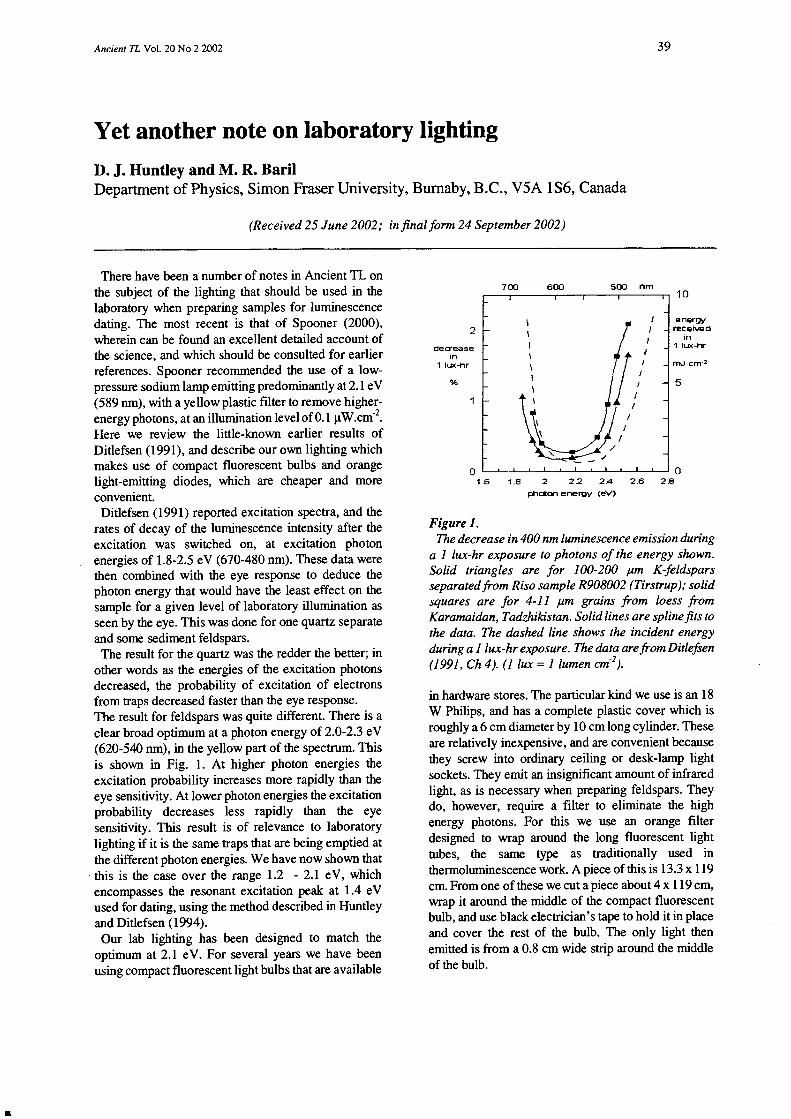
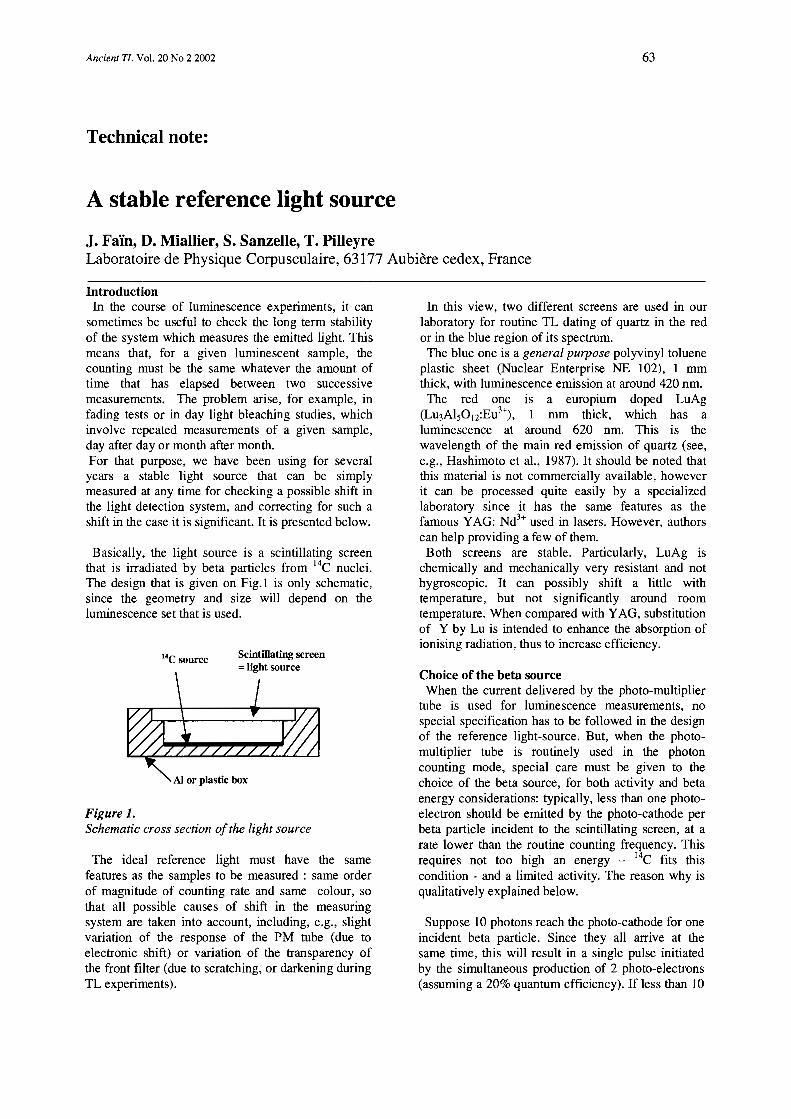
Figure 1. Detection and stimulation windows. The sources of background There are two main contributions to background----dark counts from the photo-multiplier tube (PMT), and reflected light from IR stimulation (Fattahi, 2001). The dark count of the extended range PMTs used for red emission studies is constant and can be reduced by an order of magnitude down to about 200 c/s by cooling the PMTs down to ∼-15oC (Fattahi and Stokes, 2002a). The remaining primary contribution to the background signal is from reflected incident IR stimulation photons and related emissions, due to the close positioning of detection (665-740nm) and stimulation (830 ± 5 nm) windows. A suitable PMT should be chosen for the purpose of detecting far-red IRSL, and at the same time reducing the background from IR stimulation. There is no ideal PMT with high quantum efficiency (QE) at far-red emission and 0% QE at other wavelengths (see Fig 1 in Fattahi and Stokes, 2002a). While the conventionally used EMI bialkaline 9635 PMT (blue) is highly sensitive to UV/blue emission and has also been used for quartz orange-red TL (c. 600-620nm) detection (e.g. Miallier et al., 1991), it has no QE at wavelengths greater than 650nm, making it unsuitable for far-red emission detection. The EMI bialkline S20 9650 (red) PMT has high QE (5%) at 700nm. However, it has a QE of 1% at 830nm (the stimulation peak), which typically results in high background (~>106c/s). The EMI Biakaline D716A S11 (green) PMT has a QE of 0.1% at 700nm and a QE of less than 0.01% at 830nm, making it acceptable for far-red IRSL detection (Fattahi, 2001; Stokes and Fattahi, 2002). In efforts to detect far-red IRSL from fluvial coarse grain feldspar, Fattahi and Stokes (2002a) have made
the following adjustment to the standard Risø TA-15a TL/OSL system (Bøtter-Jensen, 1997), which incorporates an IR laser diode (400mW, 830±5nm) and a 90Sr/90Y beta radioactive source:
1. An extended EMI D716A S11 (green) PMT was used.
2. An S 600 Photocool Thermoelectric Refrigerated Chamber was fitted to cool the PMT (c. ~ - 20oC). This reduces PMT dark counts by an order of magnitude, down to c. 200 c/s.
3. The far-red IRSL was detected using a combination of Schott RG665 + 2*Corion FR400S + Schott BG39 filters, with an estimated detection band of 665-700nm (Fattahi and Stokes, 2002c).
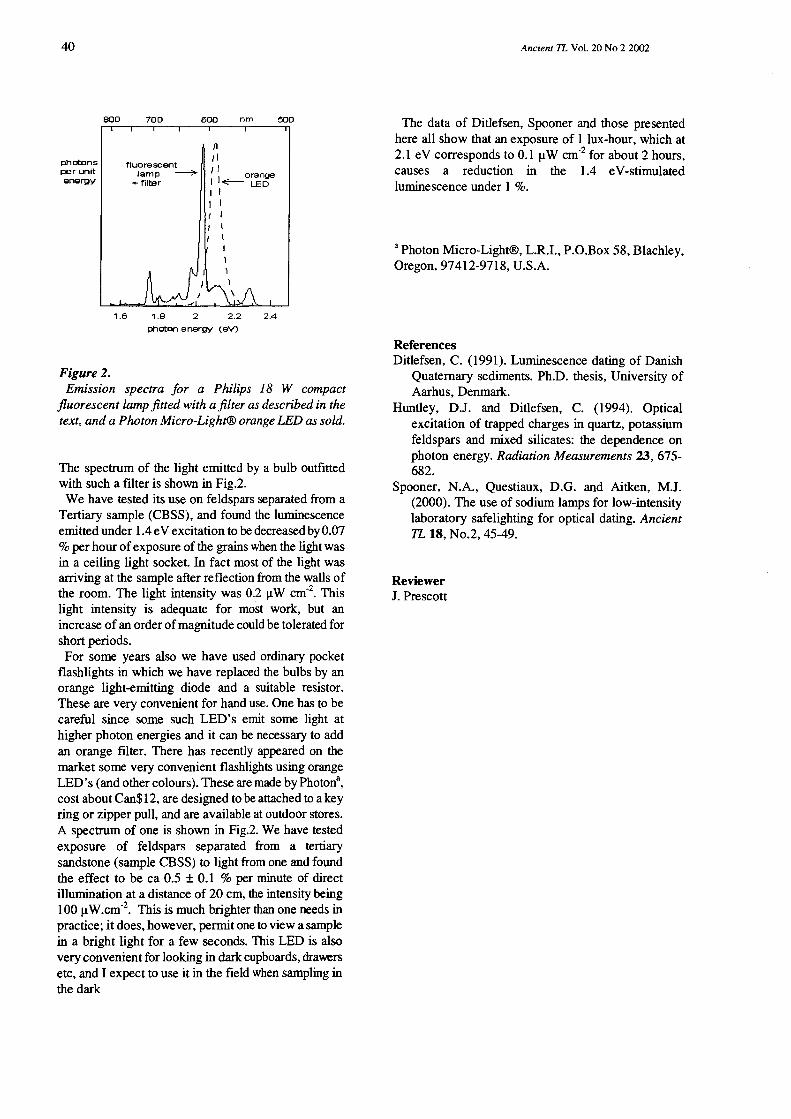
The above modifications make it possible to detect far-red IRSL from fluvial coarse grain feldspar (bright sample), with background at a level of below 500 c/s (Fattahi, 2001). However, using this configuration it has not been able to detect far-red IRSL from loess. Figure 2 shows IR exposure decay curves measured using this configuration. While coarse grain feldspar (sample 15/1, 90-120µm, age c. 23.2 ± 1.8ka) gave a relatively high signal to noise ratio (3.64), no signal was distinguishable above background for a natural loess sample (age c. 800ka, De > 3,000Gy, grain size of 4-11 µm). By increasing the grain size to 11-78µm it is possible to detect a small red emission IRSL signal from this sample (initial signal = 400 c/s above background, ~0.13 c/Gy), but at a level which is not suitable for routine dating application.
0
200
400
600
800
0 20 40 60 80 100Simulation time (s)
Cou
nts
per 0
.4s
15/1 (KF)Loess (>11 micron)Loess (4-11 micron)
Figure 2. Far-red IRSL signal level of loess and fluvial coarse grain feldspar using the detection system development by Fattahi and Stokes (2002a). IRSL was measured at 150oC.

Ancient TL Vol. 20 No 2 2002 43
S11 PMT (Green) Sample: 15/1 S N S/N S-N No. Filter combination (Signal) (Noise) (Net signal) 1 740SP+RG665 301,158 188,157 1.6 113,002 2 FR400S+RG665 346,106 281,803 1.2 64,303 3 2*FR400S+RG665 37,542 6,950 5.4 30,592 4 2*FR400S+740SP+RG665 25,954 4,489 5.8 21,465 5 FR400S+740SP+RG665 61,418 20,178 3.0 41,241 6 BG39+2*FR400S+RG665 3,677 815 4.5 2,862 7 BG39+FR400S+RG665 7,598 1,862 4.1 5,737 8 BG39+740SP+FR400S+RG665 6,668 2,459 2.7 4,208 9 BG39+740SP+RG665 28,499 19,549 1.5 8,950 10 SWP685+2*FR400S+RG665 5,527 1,097 5.0 4,430 11 SWP685+FR400S+RG665 15,244 6,018 2.5 9,227 12 SWP685+740SP+FR400S+RG665 8,952 1,903 4.7 7,048 13 SWP685+740SP+RG665 19,697 4,630 4.3 15,067 14 SWP685+RG665 7,579,798 7,077,072 1.1 502,727 S20 PMT (Red) Sample: 1023/2 S N S/N S-N Filter combination (Signal) (Noise) (Net signal) 15 2*FR400S+RG665 716,193 655,953 1.09 60,240 16 2*FR400S+RG665+SWP685 36,918 34,904 1.06 2,013 17 2*FR400S+RG665+SWP685+BG39 36,354 35,175 1.03 1,179 18 2*FR400S+RG665+SWP685+HA3 250,189 234,695 1.07 15,494 19 2*FR400S+RG665+SWP685+740SP 162,993 152,562 1.07 10,431 20 2*FR400S+RG665+740SP 184,213 172,559 1.07 11,653 21 2*FR400S+RG665+BG39 343,481 324,731 1.06 18,750 Table 1. Results of filter combination and PMT tests Bright potassium-rich samples (90-120µm) 15/1 (age c. 22.2 ± 1.8ka) and 1023/2 (age c. 86 ± 6ka) (Colls, 1999) were used. It has been demonstrated that far-red IRSL from these samples exhibit no sensitivity change (Fattahi, 2001). Sample were mounted on stainless steel discs, bleached and administered a dose of 110Gy. IRSL was measured at 30oC for 100s after preheat at 250oC for 10s, and the IR diode power is kept at 90%. IRSL was then re-measured to obtain a background. The far-red IRSL signal was integrated over the first 1 s. The thickness of filters used: 740SP 4mm; FR400S 8mm; BG39 1mm; others 3mm.
44 Ancient TL Vol. 20 No 2 2002
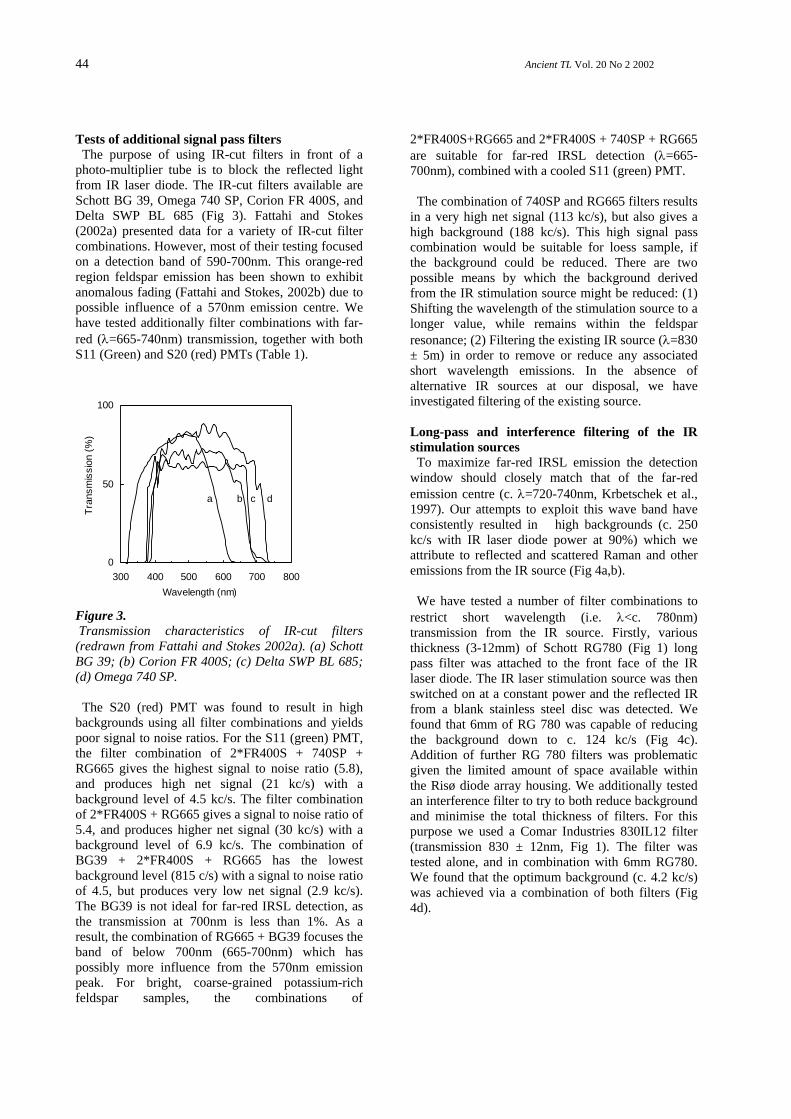
Tests of additional signal pass filters The purpose of using IR-cut filters in front of a photo-multiplier tube is to block the reflected light from IR laser diode. The IR-cut filters available are Schott BG 39, Omega 740 SP, Corion FR 400S, and Delta SWP BL 685 (Fig 3). Fattahi and Stokes (2002a) presented data for a variety of IR-cut filter combinations. However, most of their testing focused on a detection band of 590-700nm. This orange-red region feldspar emission has been shown to exhibit anomalous fading (Fattahi and Stokes, 2002b) due to possible influence of a 570nm emission centre. We have tested additionally filter combinations with far-red (λ=665-740nm) transmission, together with both S11 (Green) and S20 (red) PMTs (Table 1).
0
50
100
300 400 500 600 700 800Wavelength (nm)
Tran
smis
sion
(%)
a b c d
Figure 3. Transmission characteristics of IR-cut filters (redrawn from Fattahi and Stokes 2002a). (a) Schott BG 39; (b) Corion FR 400S; (c) Delta SWP BL 685; (d) Omega 740 SP. The S20 (red) PMT was found to result in high backgrounds using all filter combinations and yields poor signal to noise ratios. For the S11 (green) PMT, the filter combination of 2*FR400S + 740SP + RG665 gives the highest signal to noise ratio (5.8), and produces high net signal (21 kc/s) with a background level of 4.5 kc/s. The filter combination of 2*FR400S + RG665 gives a signal to noise ratio of 5.4, and produces higher net signal (30 kc/s) with a background level of 6.9 kc/s. The combination of BG39 + 2*FR400S + RG665 has the lowest background level (815 c/s) with a signal to noise ratio of 4.5, but produces very low net signal (2.9 kc/s). The BG39 is not ideal for far-red IRSL detection, as the transmission at 700nm is less than 1%. As a result, the combination of RG665 + BG39 focuses the band of below 700nm (665-700nm) which has possibly more influence from the 570nm emission peak. For bright, coarse-grained potassium-rich feldspar samples, the combinations of
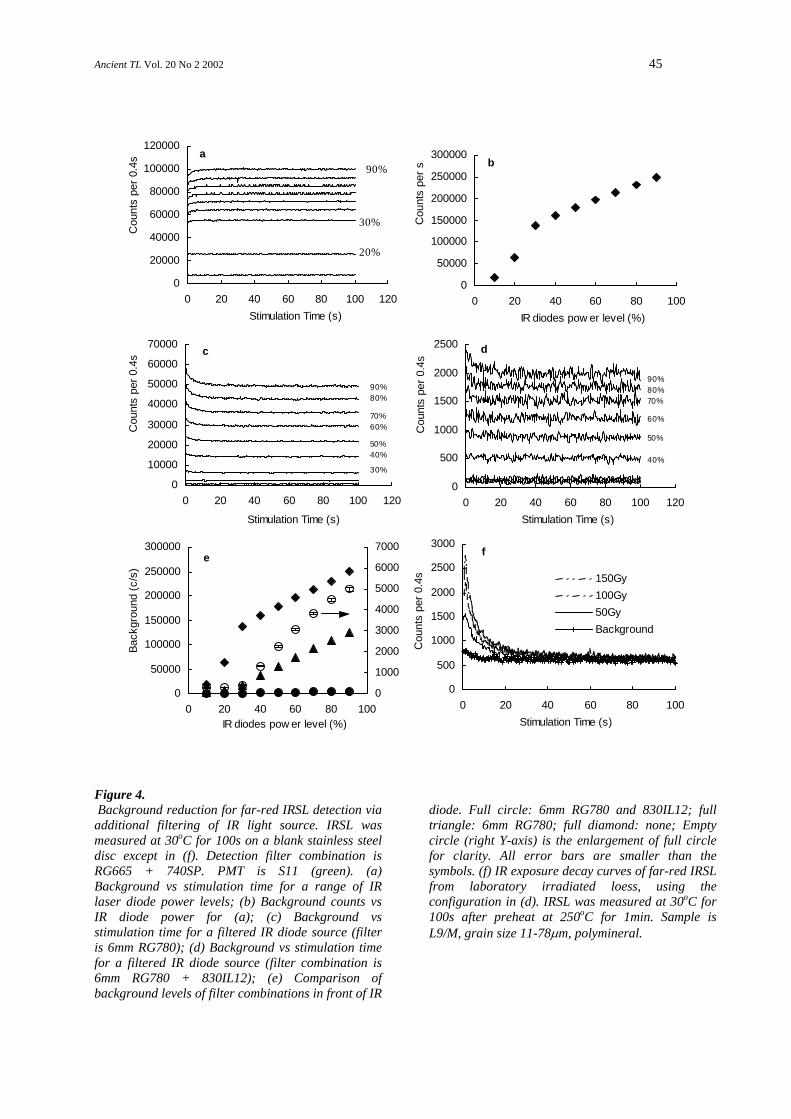
2*FR400S+RG665 and 2*FR400S + 740SP + RG665 are suitable for far-red IRSL detection (λ=665-700nm), combined with a cooled S11 (green) PMT. The combination of 740SP and RG665 filters results in a very high net signal (113 kc/s), but also gives a high background (188 kc/s). This high signal pass combination would be suitable for loess sample, if the background could be reduced. There are two possible means by which the background derived from the IR stimulation source might be reduced: (1) Shifting the wavelength of the stimulation source to a longer value, while remains within the feldspar resonance; (2) Filtering the existing IR source (λ=830 ± 5m) in order to remove or reduce any associated short wavelength emissions. In the absence of alternative IR sources at our disposal, we have investigated filtering of the existing source. Long-pass and interference filtering of the IR stimulation sources To maximize far-red IRSL emission the detection window should closely match that of the far-red emission centre (c. λ=720-740nm, Krbetschek et al., 1997). Our attempts to exploit this wave band have consistently resulted in high backgrounds (c. 250 kc/s with IR laser diode power at 90%) which we attribute to reflected and scattered Raman and other emissions from the IR source (Fig 4a,b). We have tested a number of filter combinations to restrict short wavelength (i.e. λ<c. 780nm) transmission from the IR source. Firstly, various thickness (3-12mm) of Schott RG780 (Fig 1) long pass filter was attached to the front face of the IR laser diode. The IR laser stimulation source was then switched on at a constant power and the reflected IR from a blank stainless steel disc was detected. We found that 6mm of RG 780 was capable of reducing the background down to c. 124 kc/s (Fig 4c). Addition of further RG 780 filters was problematic given the limited amount of space available within the Risø diode array housing. We additionally tested an interference filter to try to both reduce background and minimise the total thickness of filters. For this purpose we used a Comar Industries 830IL12 filter (transmission 830 ± 12nm, Fig 1). The filter was tested alone, and in combination with 6mm RG780. We found that the optimum background (c. 4.2 kc/s) was achieved via a combination of both filters (Fig 4d).
Ancient TL Vol. 20 No 2 2002 45
0
50000
100000
150000
200000
250000
300000
0 20 40 60 80 100IR diodes pow er level (%)
Cou
nts
per s
b
0
20000
40000
60000
80000
100000
120000
0 20 40 60 80 100 120Stimulation Time (s)
Cou
nts
per 0
.4s a
90%
30%
20%
0
10000
20000
30000
40000
50000
60000
70000
0 20 40 60 80 100 120
Stimulation Time (s)
Cou
nts
per 0
.4s c
90%80%
70%60%
50%40%
30%
0
500
1000
1500
2000
2500
0 20 40 60 80 100 120Stimulation Time (s)
Cou
nts
per 0
.4s
d
90%80%70%
60%
50%
40%
0
50000
100000
150000
200000
250000
300000
0 20 40 60 80 100IR diodes pow er level (%)
Back
grou
nd (c
/s)
0
1000
2000
3000
4000
5000
6000
7000e
0
500
1000
1500
2000
2500
3000
0 20 40 60 80 100Stimulation Time (s)
Cou
nts
per 0
.4s 150Gy
100Gy50GyBackground
f
Figure 4. Background reduction for far-red IRSL detection via additional filtering of IR light source. IRSL was measured at 30oC for 100s on a blank stainless steel disc except in (f). Detection filter combination is RG665 + 740SP. PMT is S11 (green). (a) Background vs stimulation time for a range of IR laser diode power levels; (b) Background counts vs IR diode power for (a); (c) Background vs stimulation time for a filtered IR diode source (filter is 6mm RG780); (d) Background vs stimulation time for a filtered IR diode source (filter combination is 6mm RG780 + 830IL12); (e) Comparison of background levels of filter combinations in front of IR
diode. Full circle: 6mm RG780 and 830IL12; full triangle: 6mm RG780; full diamond: none; Empty circle (right Y-axis) is the enlargement of full circle for clarity. All error bars are smaller than the symbols. (f) IR exposure decay curves of far-red IRSL from laboratory irradiated loess, using the configuration in (d). IRSL was measured at 30oC for 100s after preheat at 250oC for 1min. Sample is L9/M, grain size 11-78µm, polymineral.
46 Ancient TL Vol. 20 No 2 2002
Discussions We have extended the investigations of Fattahi (2001) by exploiting the combined result of filtering both the incident (IR) and reflected samples-derived luminescence. By filtering the IR laser diode with both glass and interference filters we successfully reduced the background to an acceptable level, and at the same time by exploiting Omega 740SP and Schott RG665 filters in front of the S11 (green) PMT, maximized the signal from the sample. Figure 4f shows measurements of dose response of far-red IRSL from loess using the present PMT + filter configurations. A 50Gy dose generated a net initial signal level of 1.8 kc/s with a signal to noise ratio of 2.0 and a background level of 1.9 kc/s. The 150Gy has a net initial signal level of 4.3 kc/s with a signal to noise ratio of 4.0. Conclusions For routine analysis of far-red IRSL from loess we recommend the use of an EMI biakaline D716A (green) PMT (S11). The EMI S20 9650 (red) PMT is less suitable due to the difficulties in suppression of background. The filter combination of Omega 740SP + Schott RG665 is chosen for the detection of far-red IRSL (λ=665-740nm) from loess. This combination produces high net signal from sample, but result in high background, and low signal to noise ratio. The background can be reduced to an acceptable level (<2,000 c/s) by attaching additional filters (a 830IL12 plus 6mm of RG780) in front of IR laser diode. The system developments described here enables routine detection of far-red IRSL from loess samples. Acknowledgments We thank Didier Miallier for his review and valuable comments. ZPL thanks the Clarendon Fund, Oxford University, for full support of his D.Phil. study. References Arnold, L., Stokes, S., Bailey, R., Fattahi, M., Colls,
A.E., Tucker, G., 2002. Optical dating of potassium feldspar using far-red (λ>665nm) IRSL emissions: A comparative study using fluvial sediments from the Loire River, France. Quaternary Sciences Reviews, in press.
Bøtter-Jensen, L., 1997. Luminescence technique: Instrumentation and methods. Radiation Measurements, 27: 749-768.
Colls, A.E.L., 1999. Optical dating of fluvial sediment from the Loire Valley, France. M.Sc. Thesis, University of Oxford, Oxford.
Duller, G.A.T., 1997. Behavioural studies of stimulated luminescence from feldspar. Radiation Measurements, 27: 663-694.
Fattahi, M., 2001. Studies on red thermoluminescence and infra-red stimulated red luminescence. Unpublished D.Phil. thesis, Oxford University.
Fattahi, M., Stokes, S., 2002a. Red luminescence from potassium feldspar stimulated by infrared. Radiation Measurements, submitted.
Fattahi, M., Stokes, S., 2002b. Infrared stimulated red luminescence (IRSRL) from potassium feldspar for dating application: a study of some properties relevant for dating. Radiation Measurements, in press.
Fattahi, M., Stokes, S., 2002c. Absorbed dose evaluation in feldspar using a single aliquot regenerative-dose (SAR) infrared stimulated red luminescence (IRSL) in potassium feldspar. Radiation Measurements, in press.
Huntley, D.J., Lamothe, M., 2001. Ubiquitous of anomalous fading in K-feldspar and the measurement and correction for it on optical dating. Canadian Journal of Earth Science, 38: 1093-1106.
Krbetschek, M.R., Gotze, J., Dietrich, A. Traumann, T., 1997. Spectral information from minerals relevant for luminescence dating. Radiation Measurements 27, 695-748.
Lai, Z.-P., Stokes, S., Bailey, R., Fattahi, M. Arnold, L., 2002. Infrared Stimulated Red Luminescence from Chinese Loess: Basic Observations. Quaternary Sciences Reviews, submitted.
Lamothe, M., Auclair, M., 1999. A solution to anomalous fading and age shortfalls in optical dating of feldspar minerals. Earth and Planetary Science letters, 171(3): 319-323.
Miallier, D., Fain, J., Montret, M., Pilleyre, T., Sanzelle, Z., Soumana, S., 1991. Properties of the red TL peak of Quartz relevant to thermoluminescence dating. Nuclear Tracks and Radiation Measurements, 18: 89-94.
Stokes, S., Fattahi, M., 2002. Red emission luminescence from quartz and feldspar: An overview. Radiation Measurements, submitted.
Zink, A., Visocekas, R., 1997. Datability of sanidine feldspars using the near-infrared TL emission. Radiation Measurements 27(2), 251-261.
Reviewer Didier Miallier
Ancient TL Vol. 20 No 2 2002 47
Addendum to “Absorbed dose fraction for 87Rb β particles” M.L. Readhead Defence Science and Technology Organisation, P.O. Box 44, Pyrmont, NSW, 2009, Australia
(Received 30 September 2002)
_____________________________________________________________________________ This recent paper (Readhead, 2002) calculated the absorbed dose fraction for β particles emitted by 87Rb sources uniformly distributed in a spherical grain of quartz, when surrounded by a region not containing any 87Rb sources. The converse situation, of 87Rb-free quartz grains embedded in an medium uniformly emitting 87Rb β particles, was considered by Adamiec and Aitken (1998). Thinking that an “approximate evaluation of this factor is not available”, they “arbitrarily” took the attenuation factor for coarse-grain dating to be 0.75 (see the footnote to Table 8). The two absorber-emitter situations are complimentary, and a more accurate attenuation factor for the latter case can be obtained from Readhead (2002) by simply replacing Equation 1 with . Table 1 can then be used to obtain the attenuation factor. For example, for 100 µm diameter grains the attenuation factor is
, leading to an absorbed dose of MeV/N
( ee SEND −= 100 )
)488.01(512.0 −=512.00825.0 × 0 or 512.03580.0 ×
µGy/a/(ppm Rb). Note that the attenuation factor differs substantially from the value used by Adamiec and Aitken (1998), although in most dating situations this difference will only have a minor affect on the age of the sample. Acknowledgement The author thanks Martin Aitken for bringing his attention to the approximation used in his 1998 paper, and for suggesting this addendum. References Adamiec, G. and Aitken, M. (1998). Dose-rate
conversion factors: update. Ancient TL 16, 37-50.
Readhead, M.L. (2002). Absorbed dose fraction for 87Rb β particles. Ancient TL 20, 25-28.

Ancient TL Vol. 20 No 2 2002 49
A note on the variance of a background-corrected OSL count Rex Galbraith Department of Statistical Science, University College London, Gower Street, London WC1E 6BT, U.K.
(Received 14 May 2002; in final form 25 October 2002) _____________________________________________________________________________________________ It is common practice to calculate the relative standard error of a background-corrected optically stimulated luminescence (OSL) count by assuming Poisson errors. This note corrects a formula given by Banerjee et al. (2000) and suggests alternative formulae for use when the variation in background counts is larger than that implied by the Poisson distribution. For moderately bright samples, the contribution to the relative standard error from estimating the background rate is small, whichever formula is used.
The usual scenario is as follows. Optical stimulation of an aliquot of quartz produces a series of counts - a number of recorded photons for each of N equal length consecutive time intervals (channels). For example, Banerjee et al. (2000) used a stimulation period of 60 s with counts in N = 250 channels each lasting 0.24 s. The OSL "signal'' is measured from the total count in the first n channels minus an estimate of the contribution to this count from background sources. Often n is taken to be quite small, for example n = 5, corresponding to the first 1.2 s of stimulation. The background emission rate is assumed to be constant over the whole 60 s, and is estimated from counts near the end of this period, where the contribution from the signal is assumed to be negligible.
Mathematically, the above may be expressed as follows. Let yi denote the OSL count from channel i,
for i = 1, 2, …, N, and let be the total
count over the first n channels. Write
∑=
=n
iiyY
10
Y0 = S0 + B0
where S0 and B0 are the contributions to Y0 from the signal (or source of interest) and background respectively. Of course S0 and B0 are not observed directly. Assume that S0 and B0 are independent random quantities with expectations µS and µB, and variances σ2
S and σ2B, respectively. Then the
observed count Y0 will have expectation µS + µB and variance σ2
S + σ2B. An estimate of the signal µS is
thus obtained by subtracting an estimate of µB from Y0, i.e.,
BS µYµ ˆˆ 0 −=
We want to calculate the relative standard error of this estimate.
An estimate of µB is usually obtained from the average OSL count over the last m channels, for some suitable m chosen so that the contribution from the signal is negligible. It is useful to choose m be a multiple of n: let m = nk, say. For example, Banerjee et al. (2000) used the last m = 25 channels (6 s) of the series, corresponding to k=5 when n=5. Then let Y1, Y2, …, Yk denote the total counts in the last k sets of n channels, i.e.,
Yj = N−jn+n ∑ i=N−jn+1
yi
for j = 1, 2, …, k. Thus Y1, Y2, …, Yk are all counts over n channels (the same as for Y0) and we assume that they are independent random quantities from the same distribution as that of B0 (i.e., the signal is negligible). In particular, each has expectation µB and variance σ2
B. The estimate of µB may then be written as
∑=
==k
jjB Y
kY
1
1µ̂
and this has variance Hence the variance of the estimated signal (corrected for background) is
kBB /)ˆvar( 2σµ =
kY BBSBS /)ˆvar()var()ˆvar( 2220 σσσµµ ++=+= (1)
and the relative standard error is
50 Ancient TL Vol. 20 No 2 2002
S
BBSs
krse
µσσσ
µ/
)ˆ(222 ++
= (2)
In order to calculate this relative standard error in practice, we need estimates of σS
2 and σB2 in addition
to the estimate of µS.
In the usual case where Y0, Y1 …, Yk are assumed to have Poisson distributions, σS
2 = µS and σB2 = µB.
Then (1) becomes
kBBSS /)ˆvar( µµµµ ++=
which may be estimated as Y0 −⎯Y + ⎯Y + ⎯Y/k = Y0 + ⎯Y/k. Substituting these estimates into (2) gives the following estimated relative standard error:
YY
kYYrse s −
+=
0
0 /)ˆ(µ (3)
This differs slightly from the formula on page 833 of Banerjee et al. (2000), where the second term in the numerator is equivalent to 2⎯Y/k. The above argument shows that the factor 2 should not be there.
A drawback with equation (3) in practice is that there is sometimes evidence that the background counts do not have a Poisson distribution, but are over-dispersed (e.g., Galbraith et al., 1999, p 348). For example, the variance
sY2 = [ 1/(k−1)] ∑j=1
k (Yj − ⎯Y)2
may be substantially larger than the mean count ⎯Y (see below). Then we may write
σB2 = µB + σ2
for some positive value of σ2 to be estimated. An obvious estimate is
YsY −= 22σ̂ (4)
provided this is positive. But there is a drawback with this too: in order to be confident that the contribution to ⎯Y from the signal is negligible, it might be necessary to use a quite small value of k (e.g., k=5 as above), so that sY
2 will be based on a small number of
degrees of freedom. A more reliable estimate may be obtained by pooling the background variances for several series. For example, for four series of stimulation with background means ⎯Y1, ⎯Y2, ⎯Y3, ⎯Y4 and variances sY1
2, sY22, sY3
2, sY42, each with k−1
degrees of freedom, one may use
)(41)(
41ˆ 4321
24
23
22
21
2 YYYYssss YYYY +++−+++=σ (5)
i.e., the average variance minus the average background count for the four series. This pooled estimate of over-dispersion could be used for each series, while at the same time using separate estimates of background level.
It is not so straightforward to obtain a corresponding estimate of σS
2 because the expected counts change rapidly at the start of the stimulation period. But there is perhaps a case for assuming that S0 does have a Poisson distribution, while B0 does not. The former comes from pure OSL emissions while the latter comes from other sources such as scattered light and instrument noise, which may not exhibit Poisson variation. Then we still have σS
2 = µS and the resulting estimated relative standard error is
YY
kkYYrse S −
+++≈
0
20 )/11(ˆ/
)ˆ(σ
µ (6)
This formula will agree closely with (3) when is small, but may be preferable when is large.
2σ̂2σ̂
To get a feel for the numerical consequences, suppose Y0 = 12500 and ⎯Y = 50, with n=5 and k=5. These numbers are comparable with the "bright" sample in Banerjee et al. (2000). Suppose also that
= 75, corresponding to a reasonably substantial amount of over-dispersion (σ
2σ̂B
2/µB ≈ 2.5). Then the relative standard errors from (3) and (6) are 0.00898 and 0.00902, respectively, which are practically equal. The corresponding absolute standard errors are 111.8 and 112.2. Indeed, if we treated the background as being known exactly, the relative standard error of
would be 0.00896, also practically the same. But for a weak signal, with Y
2σ̂0 = 200 and the same ⎯Y
and as above, the two relative standard errors are 0.0966 and 0.1155, and the two absolute standard errors are 14.5 and 17.2. In general, when the signal is weak, equation (6) may give a somewhat larger relative standard error than (3). But when the signal is
2σ̂
Ancient TL Vol. 20 No 2 2002 51
strong, both equations give similar answers and in fact the error in estimating the background is practically negligible.
ad to the following estimated relative standard error:
An alternative assumption when there is over-dispersion is that neither S0 nor B0 have Poisson distributions, but that the ratio of the variance to the mean is the same for each, i.e., σS
2/µS = σB2/µB. It is
perhaps hard to think of a physical justification for this: it would imply a multiplicative error mechanism that affected all counts from whatever source. So it would presumably be error associated with the measurement process rather than the process producing the counts. In any case, this would le
YYkYY
Yrse S −
+×+≈
0
02 /ˆ
1)ˆ( σµ (7)
quation (3
o
where 2σ̂ is given by (4) or (5). Here e ) is
multiplied by a factor corresponding t Bµ/ . In
the above examples this factor would
Bσ 2
5.2 ≈ 1.6. In general, this formula is more conservative than (3) or (6).
. One calculates the Poisson index of dispersion
Some further remarks may be useful. Firstly, there is a simple statistical test for assessing whether the counts Y1, Y2, …, Yk vary consistently with a Poisson distribution
YskI Y /)1( 2−=
and assesses its significance from the χ2 distribution with k−1 degrees of freedom (see for example Kotz and Johnson, 1987, p 25). The quantity I is akin to a χ2 statistic, a significantly large value of I being evidence of over-dispersion, i.e., the ratio sY
2 / ⎯Y is too large to be consistent with σB
2/µB = 1. Of course there are various ways to test whether data agree with a Poisson distribution; this is a useful method when there is only a small number of counts.
orm of the single-aliquot regenerative-dose protocol,
Secondly, estimating a palaeodose typically uses products and ratios of background-corrected OSL counts. Then the approximate relative standard error of the product or ratio is simply obtained by combining the individual relative standard errors in quadrature. For example, for the simplest f
palaeodose = sn
sr
× tr
tn
× regenerative dose ,
where sn, tn, sr and tr are estimated from background-corrected counts arising from optical stimulation of the natural dose, a subsequent test dose, a regenerative dose and its corresponding test dose, respectively. Then the relative standard error of the palaeodose estimate (assuming the regenerative dose is known exactly) is just the square root of the sum of the squared relative standard errors of the estimates of sn, tn, sr and tr.
Thirdly, subtracting an estimated background level from a weak signal can produce inappropriate estimates. An alternative approach is to estimate the signal in the presence of the background using statistical models (e.g., Galbraith et al., 1999).
Finally, when estimating palaeodoses or other OSL parameters from several aliquots of quartz, whether using single- or multiple-aliquot methods, there are usually other sources of variation to account for in addition to those reflected in (3), (6) or (7). These may be more substantial and work on estimating them is in progress.
I thank John Prescott, Bert Roberts and Andrew Murray for useful comments on an earlier version of this note. References Banerjee, D., Bøtter-Jensen, L. & Murray, A.S.
(2000) Retrospective dosimetry: estimation of the dose to quartz using the single-aliquot regenerative-dose protocol. Applied Radiation and Isotopes, 52, 831-844.
Galbraith, R.F., Roberts, R.G., Laslett, G.M., Yoshida, H. and Olley, J.M. (1999) Optical dating of single and multiple grains of quartz from Jinmium rock shelter, Northern Australia: Part I, Experimental design and statistical models. Archaeometry, 41, 338-364.
Kotz,S. & Johnson, N.L., Editors (1987) Poisson Index of Dispersion. Encyclopedia of Statistical Sciences, volume 7, Wiley 1987.
Reviewer John Prescott


Ancient TL Vol. 20 No 2 2002 65
Obituary John C. Alldred 1941-2002
__________________________________________________________
John Alldred died in March this year aged
61, shortly after being diagnosed with lung cancer (not unexpected to those of us who knew him as a chain smoker).
John was at the Research Laboratory for Archaeology at 6 Keble Road, Oxford when I arrived there in 1969. He was employed as a research engineer and was responsible for electronic developments, principally for the thermoluminescence group. Particularly in those days, success in research was highly dependent upon a laboratory’s expertise in equipment development, appropriate commercial products not usually being available. A critical advance in utilizing the generally low levels of thermoluminescence involved in the dating of pottery was development by John of the photon counting system now widely used in luminescence studies; this was presented at the Second International Conference on Luminescence Dosimetry held in Gatlinburg, Tennessee in 1968. Among his other developments was the fluxgate gradiometer, the forerunner of one of the two types of equipment presently used in the magnetic location of buried remains.
John had studied Physics at Brasenose College, Oxford (subsequently completing an M.Phil.) and this enabled him to be much more than an electronic boffin; he was patient with the electronically ignorant and he gave freely of his time to other researchers. He was a valued member of a number of fieldwork expeditions. His publications include one which became a basic reference paper in luminescence dating:- Aitken, M.J. and Alldred, J.C. (1972) The assessment of error limits in thermoluminescent dating. Archaeometry, 14, 257-267.
After a number of years in the Research Laboratory for Archaeology, John joined Protovale Oxford Ltd, designers and manufacturers of Industrial Metal Detectors and Instruments for Non-destructive Testing in Civil Engineering. He was also well known as a writer of a web site that helped people create their own web sites. At a personal level, he was self-effacing, quietly supportive of those around him; outside the laboratory he helped many people who, like him, had an addiction to alcohol. In his case, he gained an extra 23 years by giving it up completely. Fortunately, his other great love, Indian
Cuisine, was indulged in every night without affecting his health. Ann Wintle
Ancient TL Vol. 20 No 2 2002 67
Bibliography (from 1st April 2002 to 30th September 2002) Compiled by Ann Wintle _____________________________________________________________________________ Amit R., Zilberman E., Enzel Y., and Porat N. (2002) Paleoseismic evidence for time dependency of seismic response on a fault system in the southern Arava Valley, Dead Sea rift, Israel. Geological Society of America Bulletin 114, 192-206. Barreto A. M. F., Bezerra F. H. R., Sugio K., Tatumi S. H., Yee M., Paiva R. P., and Munita C. S. (2002) Late Pleistocene marine terrace deposits in northeastern Brazil: sea-level change and tectonic implications. Palaeogeography, Palaeoclimatology, Palaeoecology 179, 57-69. Benny P. G. and Bhatt B. C. (2002) High-level gamma dosimetry using phototransferred thermoluminescence in quartz. Applied Radiation and Isotopes 56, 891-894. Benny P. G., Gundu Rao T. K., and Bhatt B. C. (2002) The E"1'-centre and its role in TL sensitization in quartz. Radiation Measurements 35, 369-373. Benoit P. H., Akridge G. A., Ninagawa K., and Sears D. W. G. (2002) Thermoluminescence sensitivity and thermal history of type 3 ordinary chondrites: eleven new type 3.0-3.1 chondrites and possible explanations for differences among H, L, and LL chondrites. Meteoritics and Planetary Science 37, 793-805. Berger G. W., Pillans B. J., Bruce J. G., and McIntosh P. D. (2002) Luminescence chronology of loess-paleosol sequences from southern South Island, New Zealand. Quaternary Science Reviews 21, 1899-1913. Bray H. E., Bailey R. M., and Stokes S. (2002) Quantification of cross-irradiation and cross-illumination using a Risø TL/OSL DA-15 reader. Radiation Measurements 35, 275-280. Brooks R. J., Finch A. A., Hole D. E., Townsend P. D., and Wu Z. L. (2002) The red to near-infrared luminescence in alkali feldspar. Contributions to Mineralogy and Petrology 143, 484-494. Chung H. W., Delincee H., and Kwon J. H. (2002) The application of different detection methods for irradiated dried anchovy and shrimp. Radiation Physics and Chemistry 63, 411-414. El-Asmar H. M. (2002) Holocene palaeoshorelines along the Manzala lagoon, northeast of the Nile Delta, Egypt. Neues Jahrbuch fur Geologie und Palaontologie - Monatshefte 6, 337-361. Feathers J. K. (2002) Luminescence dating in less than ideal conditions: case studies from Klasies River main site and Duinefontein, South Africa. Journal of Archaeological Science 29, 177-194. Ferko T. E., Wang M. S., Hillegonds D. J., Lipscutcz M. E., Hutchison R., Franke L., Scherer P., Schultz L., Benoit P. H., Sears D. W. G., Singhvi A. K., and Bhandari N. (2002) The irradiation history of the Ghubara (L5) regolith breccia. Meteoritics and Planetary Science 37, 311-327. Forman S. L. and Pierson J. (2002) Late Pleistocene luminescence chronology of loess deposition in the Missouri and Mississippi river valleys, United States. Palaeogeography, Palaeoclimatology, Palaeoecology 186, 25-46. Frechen M. and van den Berg M. W. (2002) The coversands and timing of Late Quaternary earthquake events along the Peel Boundary Fault in the Netherlands. Geologie en Mijnbouw 81, 61-70. Frederick C. D., Bateman M. D., and Rogers R. (2002) Evidence for eolian deposition in the sandy uplands of East Texas and the implications for archaeological site integrity. Geoarchaeology 17, 191-217.
Ancient TL Vol. 20 No 2 2002 68
Greilich S., Glasmacher U. A., and Wagner G. A. (2002) Spatially resolved detection of luminescence - a unique tool for archaeochronometry. Naturwissenschaften 89, 371-375. Grün R. and Ward K. (2002) A long-term fading study for ESR intensity measurement and dose evaluation on fossil tooth enamel. Radiation Measurements 35, 269-274. Hashimoto T., Nakagawa T., Hong D. G., and Takano M. (2002) An automated system for both red/blue thermoluminescence and optically stimulated luminescence measurement. Journal of Nuclear Science and Technology 39, 108-109. Hashimoto T., Nakagawa T., Usuda H., and Yawata T. (2002) Development of an automated system equipped with a small X-ray irradiator for red/blue thermoluminescence and optically stimulated luminescence measurement from natural minerals (in Japanese). Bunseki Kagaku 51, 625-632. Hashimoto T., Yanagawa Y., and Yamaguchi T. (2002) Infrared microspectrometric characterizations and thermoluminescencent properties for natural quartz slices. Bunseki Kagaku 51, 527-532. Hatte C., Pessenda L. C., Lang A., and Paterne M. (2001) Development of accurate and reliable C-14 chronologies for loess deposits: application to the loess sequence of Nussloch (Rhine Valley, Germany). Radiocarbon 43, 611-618. Holdaway R. N., Roberts R. G., Beavan-Athfield N. R., Olley J. M., and Worthy T. H. (2002) Optical dating of quartz sediments and accelerator mass spectrometry 14C dating of bone gelatin and moa eggshell: a comparison of age estimates for non-archaeological deposits in New Zealand. Journal of the Royal Society of New Zealand 32, 463-505. Hossain S. M., de Corte F., Vandenberghe D., and van den Haute P. (2002) A comparison of methods for the annual radiation dose determination in the luminescence dating of loess sediment. Nuclear Instruments and methods A 490, 598-613. Kaufman D. S., Forman S. L., and Bright J. (2001) Age of the Cutler Dam Alloformation (Late Pleistocene), Bonneville Basin, Utah. Quaternary Research 56, 322-334. Khan H. M., Bhatti I. A., and Delincee H. (2002) Thermoluminescence of contaminating minerals for the detection of radiation treatment of dried fruits. Radiation Physics and Chemistry 63, 403-406. Kovacs A., Baranyai M., Wojnarovits L., Miller S., Murphy M., McLaughlin W. L., Slezsak I., and Kovacs A. I. (2002) Applicability of the Sunna dosimeter for food irradiation control. Radiation Physics and Chemistry 63, 777-780. Kwon J. H., Jeong J., and Chung H. W. (2002) Thermoluminescence characteristics of minerals from irradiated potatoes of different origins of production. Radiation Physics and Chemistry 63, 415-418. Laruhin M. A., van Es H. J., Bulka G. R., Turkin A. A., Vainshtein D. I., and den Hartog H. W. (2002) EPR study of radiation-induced defects in the thermoluminescence dating medium zircon (ZrSiO4). Journal of Physics - Condensed Matter 14, 3813-3831. Lawless J. M., Lam S. K., and Lo D. (2002) Non-destructive in situ thermoluminescence using CO2 laser heating. Optica Express 10, 291-296. Lawson M. P. and Thomas D. S. G. (2002) Late Quaternary lunette dune sedimentation in the southwestern Kalahari desert, South Africa: luminescence based chronologies of aeolian activity. Quaternary Science Reviews 21, 825-836. Li S. H. (2002) Luminescence sensitivity changes of quartz by bleaching, annealing and UV exposure. Radiation Effects and Defects in Solids 157, 357-364.
Ancient TL Vol. 20 No 2 2002 69
Li S. H., Sun J. M., and Zhao H. (2002) Optical dating of dune sands in the northeastern deserts of China. Palaeogeography, Palaeoclimatology, Palaeoecology 181, 419-429. Lian L. B. and Huntley D. J. (2001) Luminescence dating. In Tracking Environmental Change Using Lake Sediments, Vol. 1 (ed. W. M. L. a. J. P. Smol), pp. 261-282. Kluwer Academic Publishers. Little E. C., Lian O. B., Velichko A. A., Morozova T. D., Nechaev V. P., Dlussky K. G., and Rutter N. W. (2002) Quaternary stratigraphy and optical dating of loess from the east European Plain (Russia). Quaternary Science Reviews 21, 1745-1762. Lu Y. C., Prescott J. R., Zhao H., Chen J., and Wei L. Y. (2002) Optical dating of colluvial deposits from Xiyangfang, China, and the relation to palaeo-earthquake events. Quaternary Science Reviews 21, 1087-1097. Mangerud J., Astakhov V., and Svendsen J. I. (2002) The extent of the Barents-Kara Ice Sheet during the Last Glacial Maximum. Quaternary Science Reviews 21, 111-119. Mayer J. H. (2002) Evaluating natural site formation processes in eolian dune sands: a case study from the Krmpotich Folsom site, Killpecker Dunes, Wyoming. Journal of Archaeological Science 29, 1199-1211. Murray A. S. and Olley J. M. (2002) Precision and accuracy in the optically stimulated luminescence dating of sedimentary quartz: a status review. Geochronometria 21, 1-16. Murray-Wallace C. V., Banerjee D., Bourman R. P., Olley J. M., and Brooke B. P. (2002) Optically stimulated luminescence dating of Holocene relict foredunes, Guichen Bay, South Australia. Quaternary Science Reviews 21, 1077-1086. Murray-Wallace C. V., Jones B. G., Nghi T., Price D. M., Van Vinh V., Tinh T. N., and Nanson G. C. (2002) Thermoluminescence ages for a reworked coastal barrier, southeastern Vietnam: a preliminary report. Journal of Asian Earth Sciences 20, 535-548. Nichol S. L. (2002) Morphology, stratigraphy and origin of last interglacial beach ridges at Bream Bay, New Zealand. Journal of Coastal Research 18, 149-159. Nott J., Price D., and Nanson G. (2002) Stream response to Quaternary climate change: evidence from the Shoalhaven River catchment, southeastern highlands, temperate Australia. Quaternary Science Reviews 21, 965-974. Novothny A., Horvath E., and Frechen M. (2002) The loess profile of Albertirsna, Hungary - improvements in loess stratigraphy by luminescence dating. Quaternary International 95-96, 155-163. Pledge N. S., Prescott J. R., and Hutton J. T. (2002) A late Pleistocene occurrence of Diprotodon at Hallett Cove, South Australia. Transactions of the Royal Society of South Australia 126, 39-44. Poolton N. R. J., Ozanyan K. B., Wallinga J., Murray A. S., and Bøtter-Jensen L. (2002) Electrons in feldspar II: a consideration of the influence of conduction band-tail states on luminescence processes. Physics and Chemistry of Minerals 29, 217-225. Poolton N. R. J., Wallinga J., Murray A. S., and Bøtter-Jensen L. (2002) Electrons in feldspar I: on the wavefunction of electrons trapped at simple lattice defects. Physics and Chemistry of Minerals 29, 210-216. Pope R. J. J. and Millington A. C. (2002) The role of alluvial fans in mountainous and lowland drainage systems: examples from the Sparta Basin, Lakonia, southern Greece. Zeitschrift fur Geomorphologie 46, 109-136. Porat N., Chazan M., Schwarcz H., and Horwitz L. K. (2002) Timing of the Lower to Middle Paleolithic boundary: new dates from the Levant. Journal of Human Evolution 43, 107-122.
Ancient TL Vol. 20 No 2 2002 70
Prescott J. R., Robertson G. B., and Williams F. M. (2002) Luminescence ages beyond 500 ka: can they be believed? In Australian Connections and New Directions (ed. M. Jones and P. Sheppard), pp. 271-284. Preusser F., Radies D., and Matter A. (2002) A 160,000-year record of dune development and atmospheric circulation in southern Arabia. Science 296, 2018-2020. Rasmussen K. L. (2001) Provenance of ceramics revealed by magnetic susceptibility and thermoluminescence. Journal of Archaeological Science 28, 451-456. Richter D., Schroeder H. B., Rink W. J., Julig P. J., and Schwarcz H. P. (2001) The Middle to Upper Palaeolithic transition in the Levant and new thermoluminescence dates for a Late Mousterian assemblage from Jerf al-Ajla Cave (Syria). Paléorient 27/2, 29-46. Ringrose S., Kampunzu A. B., Vink B. W., Matheson W., and Downey W. S. (2002) Origin and palae-environments of calcareous sediments in the Moshawengdry valley, southeast Botswana. Earth Surface Processes and Landforms 27, 591-611. Rink W. J., Karavanic I., Pettitt P. B., van der Plicht J., Smith F. H., and Bartoll J. (2002) ESR and AMS-based 14C dating of Mousterian levels at Mujina Pecina, Dalmatia, Croatia. Journal of Archaeological Science 29, 943-952. Rousseau D. D., Antoine P., Hatté C., Lang A., Zöller L., Fontugne M., Ben Othman D., Luck J. M., Moine O., Labonne M., Bentaleb I., and Jolly D. (2002) Abrupt millennial climatic changes from Nussloch (Germany) Upper Weichselian eolian records during the Last Glaciation. Quaternary Science Reviews 21, 1577-1582. Ruffini R., Borghi A., Cossio R., Olmi F., and Vaggelli G. (2002) Volcanic quartz growth zoning identified by cathodoluminescence and EPMA studies. Mikrochimica Acta 139, 151-158. Sato H., Takatsuji T., Takada J., Endo S., Hoshi M., Sharofov V. F., Veselkina I. I., Pilenko I. V., Kalimullin W. A. F., Masyakin V. B., Yoshikawa I., Nagatomo T., and Okajima S. (2002) Measuring the external exposure dose in the contaminated area near the Chernobyl nuclear power station using the thermoluminescence of quartz in bricks. Health Physics 83, 227-236. Schwamborn G., Rachold V., and Grigoriev M. N. (2002) Late Quaternary sedimentation history of the Lena Delta. Quaternary International 89, 119-134. Shane P., Lian O. B., Augustinus P., Chisari R., and Heijnis H. (2002) Tephrostratigraphy and geochronology of a ca. 120 ka terrestrial record at Lake Poukawa, North Island, New Zealand. Global and Planetary Change 33, 221-224. Shaw A., Holmes P., and Rogers J. (2002) Depositional landforms and environmental change in the headward vicinity of Dias Beach, Cape Point. South African Journal of Geology 104, 101-114. Souza D. N., de Lima J. F., Valerio M. R. G., Fantini C., Pimenta M. A., Moreira R. I., and Caldas L. V. E. (2002) Influence of thermal treatment on the Raman, infrared and TL responses of natural topaz. Nuclear Instruments and Methods B 191, 230-235. Souza D. N., Lima J. F., Valerio M. E. G., Alves E., and Caldas L. V. E. (2002) Effects of ion implantation on the thermoluminescent properties of natural colourless topaz. Nuclear Instruments and Methods B 191, 196-201. Souza S. O., Chubaci J. F. D., Selvin P. C., Sastry M. D., and Watanabe S. (2002) Thermoluminescence and EPR studies on natural petalite crystals. Journal of Physics D- Applied Physics 35, 1562-1565. Suresh N., Bagati T. N., Thakur V. C., Kumar R., and Sangode S. J. (2002) Optically stimulated luminescence dating of alluvial fan deposits of Pinjaur Dun, NW Sub Himalaya. Current Science 82, 1267-1274. Tanir G., Okuducu S., and Gulen S. (2002) The dependence of OSL intensity on radiation dose for samples of chlorides contained in feldspars. Czechoslovak Journal of Physics 52, 963-968.

Ancient TL Vol. 20 No 2 2002 71
Thomas D. S. G. and Shaw P. A. (2002) Late Quaternary environmental change in central southern Africa: new data, synthesis, issue and prospects. Quaternary Science Reviews 21, 783-797. Turkin A. A., van Es H. J., Vainshtein D. I., and den Hartog H. W. (2002) A kinetic model of zircon thermoluminescence. Nuclear Instruments and Methods B 191, 37-43. Ufimtsev G. F., Shibanova I. V., Kulagina N. V., Mascik I. M., Perevalov A. V., Rezanova A. V., Vogt T., Ignatova N. V., and Misharina V. A. (2002) Upper Pleistocene to Holocene deposits of the Tunka rift (southern Baikal region). Stratigraphy and Geological Correlation 10, 295-304. van Es H. J., Vainshtein D. I., Rozendaal A., Donoghue J. F., de Meijer R. J., and den Hartog H. W. (2002) Thermoluminescence of ZrSiO4 (zircon): a new dating method? Nuclear Instruments and Methods B 191, 649-652. van Huissteden K., Schwan J. C. G., and Bateman M. D. (2001) Environmental conditions and paleowind directions at the end of the Weichselian Late Pleniglacial recorded in aeolian sediments and geomorphology (Twente, Eastern Netherlands). Geologie en Mijnbouw 80, 1-18. Vora K. H., Gaur A. S., Price D., and Sundaresh. (2002) Cultural sequence of Bet Dwarka island based on thermoluminescence dating. Current Science 82, 1351-1356. Wallinga J. (2002) On the detection of OSL age overestimation using single-aliquot techniques. Geochronometria 21, 17-26. Wegmuller S., Preusser F., Muller B. U., and Schluchter C. (2002) Palynostratigraphic investigation and luminescence dating of the Galgenmoos section and implications for the chronology of the last glacial cycle in the northern Alpine Foreland of Switzerland (in German). Ecologae Geologicae Helvetiae 95, 115-126. Whitley V. H. and McKeever S. W. S. (2000) Photoionization of deep centers in Al2O3. Journal of Applied Physics 87, 249-256. Wood W. W., Stokes S., and Rich J. (2002) Implications of water supply for indigenous Americans during Holocene aridity phases on the Southern High Plains. Quaternary Research 58, 139-148. Xiong S., Ding Z., Liu T., and Zhang J. (2002) East Asian monsoon instability at the stage 5a/4 transition. Boreas 31, 126-132. Yasuda H., Kobayashi I., and Morishima H. (2002) Decaying patterns of optically stimulated luminescence from Al2O3:C for different quality radiations. Journal of Nuclear Science and Technology 39, 211-213. Yim W. W.-S., Price D. M., and Choy A. M. S. F. (2002) Distribution of moisture contents and thermoluminescence ages in an inner shelf borehole from the new Hong Kong International airport site, China. Quaternary International 92, 35-43. Yoshimura E. M., Okuno E., and Suszynska M. (2002) Gamma irradiated soda lime silicate glasses of different origin: isothermal light emission. Nuclear Instruments and Methods B 191, 375-378. Young R. W., Young A. R. M., Price D. M., and Wray R. A. L. (2002) Geomorphology of the Namoi alluvial plain, northwestern New South Wales. Australian Journal of Earth Sciences 49, 509-523.

Ancient TL Vol. 20 No 2 2002 72
Selected papers from Radiation Protection Dosimetry, v 100 and 101 Proceedings of the Solid State Dosimetry Conference in Athens, 2001 Complete listing of papers available on http://www.ntp.org.uk/rpd/rpdind.html Bailey R. (2002) Simulations of variability in the luminescence characteristics of natural quartz and its implications for estimates of absorbed dose. Radiation Protection Dosimetry 100, 33-38. Bailiff I. K., Correcher V., Delgado A., Göksu Y., and Hübner S. (2002) Luminescence characteristics of dental ceramics for retrospective dosimetry - a preliminary study. Radiation Protection Dosimetry 101, 519-524. Banerjee D., Blair M., Lepper K., and McKeever S. W. S. (2002) Optically stimulated luminescence signals of polymineral fine-grains in the JSC Mars-1 soil simulant sample. Radiation Protection Dosimetry 101, 321-326. Banerjee D., Blair M., and McKeever S. W. S. (2002) Dose and dose-rate dependence of optically stimulated signals in quartz: theoretical simulations. Radiation Protection Dosimetry 101, 353-358. Banerjee D., Page K., and Lepper K. (2002) Optical dating of paleochannel deposits in the Riverine Plain, Southeastern Australia: testing the reliability of existing thermoluminescence dates. Radiation Protection Dosimetry 101, 327-332. Berger T., Hajek M., Primerano W., and Vana N. (2002) Thermoluminescence dating of archaeological artefacts from the middle Neolithic, Bronze Age and the Roman Empire period. Radiation Protection Dosimetry 101, 363-366. Bos A. J. J., Winkelman A. J. M., Le Masson N. J. M., Sidorenko A. V., and van Eijk C. W. E. (2002) A TL/OSL emission spectrometer extension of the Risø Reader. Radiation Protection Dosimetry 101, 111-114. Bøtter-Jensen L. and Murray A. S. (2002) Optically stimulated luminescence in retrospective dosimetry. Radiation Protection Dosimetry 101, 309-314. Bøtter-Jensen L., Bulur E., Murray A. S., and Poolton N. R. J. (2002) Enhancements in luminescence measurement techniques. Radiation Protection Dosimetry 101, 119-124. Chen R. (2002) The role of retrapping in dose dependence of pulsed optically stimulated luminescence. Radiation Protection Dosimetry 100, 71-74. Chithambo M. L. (2002) Time-resolved luminescence from annealed quartz. Radiation Protection Dosimetry 100, 273-276. Gomez-Ros J. M., Correcher V., Garcia-Guinea J., and Delgado A. (2002) Kinetic parameters of lithium and aluminium doped quartz from thermoluminescence glow curves. Radiation Protection Dosimetry 100, 399-402. Haustein M. and Krbetschek M. R. (2002) Red thermoluminescence of quartz and its application in dating archaeometallurgical slag. Radiation Protection Dosimetry 101, 375-378. Hoffmann D. and Mangini A. (2002) Comparative studies on the CO2 signal in tooth enamel and carbonates. Radiation Protection Dosimetry 101, 359-362. Jain M., Bøtter-Jensen L., Murray A. S., and Jungner H. (2002) Retrospective dosimetry: dose evaluation using unheated and heated quartz from a radioactive waste storage building. Radiation Protection Dosimetry 101, 525-530. Kitis G., Pagonis V., Carty H., and Tatsis E. (2002) Detailed kinetic study of the thermoluminescence glow curve of synthetic quartz. Radiation Protection Dosimetry 100, 225-228.
Ancient TL Vol. 20 No 2 2002 73
Lepper K. and McKeever S. W. S. (2002) An objective methodology for dose distribution analysis. Radiation Protection Dosimetry 101, 349-352. Murray A. S. and Wintle A. G. (2002) Retrospective dose assessment: the measurement of dose in quartz in dating and accident dosimetry. Radiation Protection Dosimetry 101, 301-308. Murray A. S., Wintle A. G., and Wallinga J. (2002) Dose estimation using quartz OSL in the non-linear region of the growth curve. Radiation Protection Dosimetry 101, 371-374. Nanjundaswamy R., Lepper K., and McKeever S. W. S. (2002) Thermal quenching of thermoluminescence in natural quartz. Radiation Protection Dosimetry 100, 305-308. Pagonis V., Tatsis E., Kitis G., and Drupieski C. (2002) Search for common characteristics in the glow-curves of quartz of various origins. Radiation Protection Dosimetry 100, 373-376. Thomsen K., Bøtter-Jensen L., and Murray A. S. (2002) Household and workplace chemicals as retrospective luminescence dosemeters. Radiation Protection Dosimetry 101, 515-518. Thomsen, K., Bøtter-Jensen L., Murray A. S., and Solongo S. (2002) Retrospective dosimetry using unheated quartz: a feasibility study. Radiation Protection Dosimetry 101, 345-348. Townsend P. D., Parish R., and Rowlands A. P. (2002) A new interpretation of depth-age profiles. Radiation Protection Dosimetry 101, 315-320. Visocekas R. (2002) Tunnelling in afterglow: its coexistence and interweaving with thermally stimulated luminescence. Radiation Protection Dosimetry 100, 45-54. Wallinga J., Murray A. S., and Bøtter-Jensen L. (2002) Measurement of the dose in quartz in the presence of feldspar contamination. Radiation Protection Dosimetry 101, 367-370. Wallinga J., Murray A. S., Wintle A. G., and Bøtter-Jensen L. (2-002) Electron-trapping probability in natural dosemeters as a function of irradiation temperature. Radiation Protection Dosimetry 101, 339-344. Woda C., Schilles T., Rieser U., Mangini A., and Wagner G. A. (2002) Point defects and the blue emission in fired quartz at high doses: a comparative luminescence and ESR study. Radiation Protection Dosimetry 100, 261-264. Zacharias N., Mauz B., and Michael C. T. (2002) Luminescence quartz dating of lime mortars: a first approach. Radiation Protection Dosimetry 101, 379-382. Zhao H. and Li S. H. (2002) Luminescence isochron dating: a new approach using different grain sizes. Radiation Protection Dosimetry 101, 333-338.


![$Tl]DH - E-Journal UIN Jakarta](https://static.fdokumen.com/doc/165x107/63260c1d051fac18490d904c/tldh-e-journal-uin-jakarta.jpg)

![TP-Link TL-MR3020 [OpenWrt Wiki] - emoc](https://static.fdokumen.com/doc/165x107/63377625e8797a6c4909364b/tp-link-tl-mr3020-openwrt-wiki-emoc.jpg)